District Census Handbook, Kolaba - Linguistic Survey Of India
Upload
khangminh22Category
view
5download
0
CENSUS OF INDIA 1961
DISTRICT CENSUS HANDBOOK AMRAVATI
Compiled by
THE MAHARASHTRA CENSUS OFFICE
BOMBAY
1967 PIUNTED IN lN9IA BY THE MANAGER, GOVERNMENT CENTRAL PRESS, BOMBAY AND
PUBUSHli.D BY THE DIRECTOR, GOVERNMENT PIUNTIN6 AND STATIONERY. MAHARASHTRA STATE, BOMBAy-4
[Price-Rs: Eight]
» ~ < ~ · ;u , » · :r » 1>
lJ » < " l: » ~
1: -I » r, Ii
0 Z U1 C -!" (J) ::0
-I ~
~ s: ;0 p (II
0 » - • ~
-< () · " -I ·
CENSUS OF INDIA 1961
Central Government PublicatioDS
Census Report. Volume X-Maharashtra. is published in the following Parts
I-A and B
I-e
II-A
U-B (i)
U-B (ii)
ll-C (i)
Il-C (ii)
III
IV
V-A
V-B
VI (1-35)
VII-A (1-8)
VII-B
VIII-A
VIII-B
IX
X (1-12)
General Report
Subsidiary Tables
General Population Tables
General EConomic Tables--Industrial Classificaticn
General Economic Tables--Occu~tional Classification
Social and Cultural Tables \
Migration Tables
Household Economic Tables
Report on Housing and Establishments
Scheduled Castes and Scheduled Tribes in Maharashtra-Tables
Scheduled Castes and Scheduled Tribes in Maharashtra-Ethnographic Notes
Village Surveys (35 monographs on 35 seJected villages)
Handicrafts in Maharashtra l8 monographs on 8 selected Handicrafts)
Fairs and Festivals in Maharashtra
Administration Report-Enumeration (For official use only)
Administration Report-. Tabulation (For official use only)
Census Atlas of Maharashtra
Citeis of Maharashtra (15 Volumes-Four volumes on Greater Bombay
and One each on other eleven Cities)
State Government PublicatioDs
25 Volumes of District CenSus Handbooks (in English)
2S Volumes of District Census Handbooks lin Marathi)
Alphabetical List of Villages and Towns in. Maharashtra (in Marathi)
PREFACE
On the' sugestion of the Census Commissioner, India, the Government of 'Maha.rashtra
decidod to publish tho District Census Handbooks on the basis ,of the material' cOllected! during
the 1961 Census for au tho districts in Maharashtra. . A Committee consisting of the Executive Editor and SeCretary of the District Gazetteers (Revision) Editorial Board" the SuperinteJdent of Ccttsus
" I
Operations, Maharashtm, and the DirectOr, Bureau of Economics and Statistiqs, MallarUhtra, was appointed. to determine the co ntents and review the drafts of each volume. ,This is one of the
, !, ,'I
twenty-five volumes compiled in the Maharashtra Census OffiQC and published 1,lnder that scheme. _ ; • _ ,r' }
District Handbooks had, been publisJied from the 1951: Census data_,akb~ As in the past, the present volume contains a set of 1961 Qensus rabies for the district and alSo Presents basic demo-.
graphic and economic information for eac'" village separately. The fol1owin~ impro~ements have, however, been made in the 1961~ries :-' '
(i) The addition of a "Comprehensive note irit~od~Cing the district ; _
(ii) The four-coloured map of the district ;
(iii) Taluka maps showing the location of each village in the district 'supplemented by alphabetical lists of villages ; ,
(iv) Supplemcmtary information showing basic amenities available for each village; 3nd ,
(v) Addition of Part III containing 33 Tables o~ other official statistics.
These new features will make the volume a valuable reference for the c'ehtral and State Governments, District Administrators, departments engaged in planning and develoPment work, legislatots,
private trade and business. Need for such material is far greater today _a_so the; functions of:~lanning -and implementation of development schemes have now percolated to district, taluka ~Dd village levels.
, \
Marathi version of this volume is also being issued separately.
Part I of the v:olume presents villagewise'statistics, Part II contains the 1961 Census Tables
prepared for t1l;c- district and Part III contains official statistics on Climate, Rainfall, Agriculture,
1n4ustry, Edu~tion, Health and a few other aspects. An explanatory note is added at the beginning of each part to describe the layout of the Tables and the terms or concepts used. 'Parts I and II are
based entirely on the data collected at the 1961 Census. Part III is based on the material furnished by the District Statistical Officer and the officers of the departments concerned. Villagewise populations shown in Part I are valid for Sunrise of 1st March 1961 and are not adjusted for seasonal migration to or from other areas.
The introductory note at the beginning of the volume describes the present administrative
set-up and 'some of the socio-economic facets of life in the district. It will illustrate how the statistics
. presented in the volume could be used for economic accounting or as controls of plan achievements
in the district. For this note, we have drawn heavily' on the District Gazetteers, Survey and Settlement

iv PRSFACB
Reports, Annual Administration' Reports and other Government publications. Some Heads of Departments also supplied the latest available material for the volume. We are indebted to them ail.
Any views expressed in the introductory note or elsewhere in the volume are personal and the
Government is not" responsible for them.
In the Census Office, everyone has done something for this stupendous task of compilation and collation of statistics, preparation of notes and reading of proofs. I should specially mention Shri N. Y. Gore, Tabulation Officer, for ·his sincere_aruftoorough work on ~mpilation and proof
reading of Part I; Shri G. S. Gokarn, Tabulation Officer~ for his painstaking work on MSS and proofs of Parts II and III. Shri S. K. Deshpande, Shri D. O. Pansare and Shri R. E. Chowdhary for assistance in preparing the introductory" note, Shri S. Y. Pradluin and Sbri B. M. Nagarkar, Draughts
men, for Maps, Charts and Diagrams.. Shri K. H. Shevade of our office looked after the layout of I '
the Tables and printing of the volume. Shri R. G. Phadke and Shri D. V. Rangnekar, . Deputy Superintendents of Census Operations, and Shri G. M. Rajadhyaksha., Tabulation omcer~ made valuable contributions at all stages and specially in the preparation of notes. Acknowledgments are due to the Manager~ Government Central Press, Bombay, and. Shri J. D. Gandhi, Manager, Government Photozincogr3fhic Press, Poona. In spite of heavy pressure of work. on their presses they did their best to print \ this volume speedily.
1 am obliged to Shri Asok Mitra, I.C.S., Census Commissioner, Indi~ for valuable suggestions for improving this volume. I am also indebted to Shri Setu Madhava. Rao and Sbri M. A. TeJang,
Members of the District Census Handbook Committee, who not only supplied useful material from their departments. but also read through the MSS and encouraged us through this. 'Venture.
B. A. KULICARNI BoMBAY:
The 2nd December 1965

CONTENTS
INTRODUCING THE DISTRICT
Physical Features (l) ; Administrative Set-up (2) ; Zilla Parishadand Panchayat Samitis(6): Vmage Panchayats (8); PopuJation (9); .Languaaes (19); R-eligions (20); Scheduled Castes (20) ; Scheduled Tribes (22); Welfare of Backward Classes (23) ; Education (24) ; Health and Medical Amenities (28) ; Housing (29); .t\griculture and Irrigation (30); Aararian Structure and Land Reforms (38) ; Co-operation (40); Forests (43); Fisheries (44); Mining and Quarrying (44); Industrjes (44); Power (46); Trade and Commerce (47); Communications and Transport (49) ; Constructioll (SO) ; Other Services (SO); Broad Aspects of Economy (SO).
PART I-Village Direcotry
PART n-census Tables
PART m-other Official Statistics
(Subject wise Contents for Parts I, II and In may be seen at pages 2,99 and 216, respectively).
LIST OF MAPS. CHARTS AND DIAGRAMS
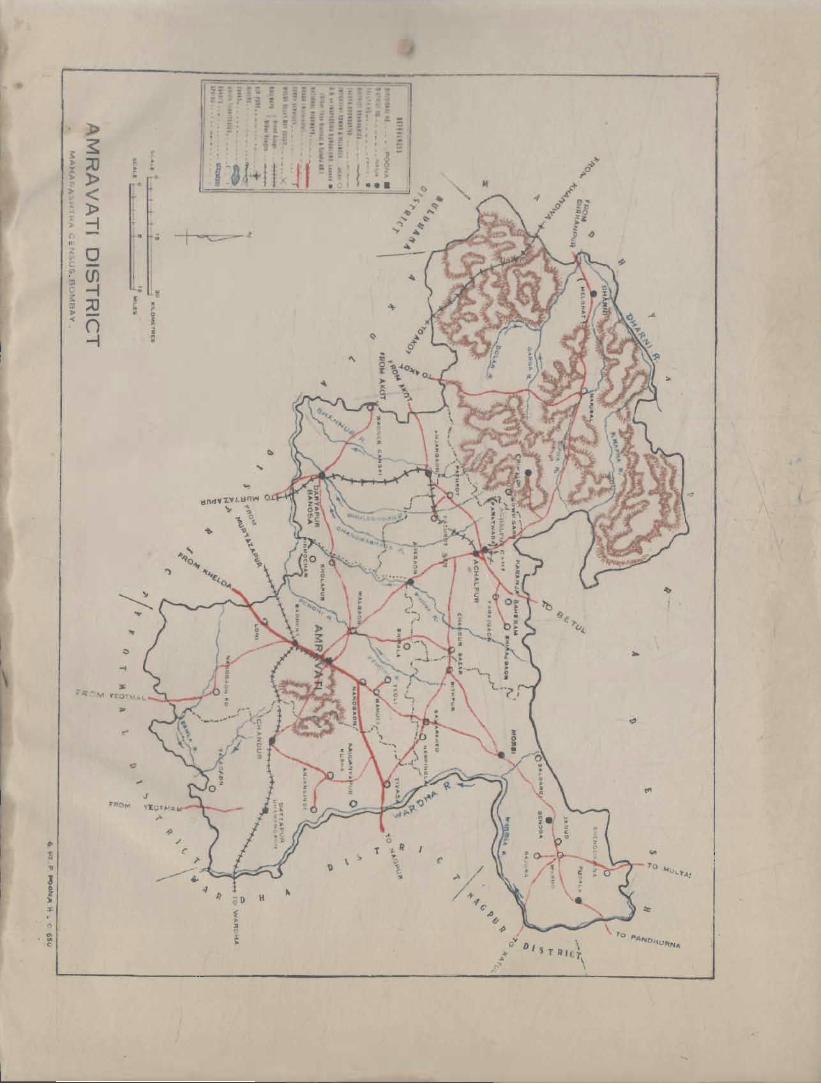
Amravati District
PAG.8S
(1)-(54)
1-95
97-213
215-250
Frontispiece
The District in Maharashtra . "
Percentages by Area and Population ..
Population, 1901-196J •.
.• ~ Facing page (1)
Variation in Population, 1951-1961 ..
Density ofPopulat~on. 1961
Distribution by Age-groups. 1961
Sex Ratio. 1901-1961
Marital Status. 1961
Literacy. 1901-1961
Literacy, 1961
Literacy and Educational Levels, 1961
Land Utilisation
Crop Pattern .•
Distribution o( Workers. 1961
MeJghat Taluka
Achalpur Tahlka
Morsi Taluka
Daryapur Taluka
Amravati Taluka
Chandur Taluka
WeeJdy Markets
Fairs
..J (9)
(10)
(11)
(13)
(14)
(16)
(24)
(25)
(27)
(32)
(34)
(53)
Facing page S
Facing page 19
Facing page 3S
Faci1l/f page 51
Facing Patle 65
Facing page 83
Facing page 247
Facing page 249

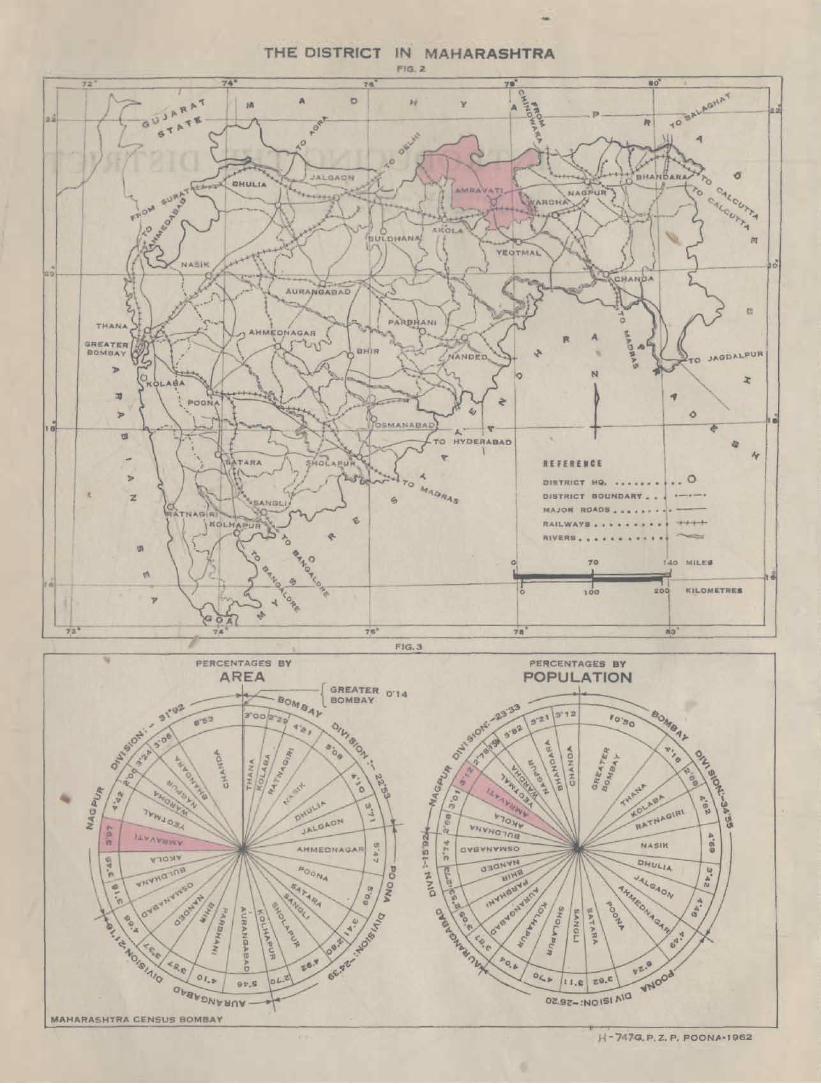
INTRODUCING THE DISTRICT 1 his ll<Jle describes the admillistratire set-lip (lnd l"ome socio-economic facets of fife ill the dislrict
>
" >
.,.
MAHARASHTRA CENSUS BOMBAY
THE DISTRICT IN MAHARASHTRA FIG.2
FIG.3
I o
I l
eo'
. p.,+ __ ~ _______ 0
R[ FERUCE
DISTRICT HQ. • ...... . •. 0 DISTRICT BOUNDARY ••
MAJOft RO"D~ .... I • , i ... -
RAILWAYS. I • • • • • •• ~
RIVERS ••• ,.... ~
70 140 MILEIJ
o 100 KILOMETRE.
PERCENTAGES BY POPULATION
H-747-G.p.Z.P. POONP-1962

INTRODUCING THE DISTRICT
PHYSICAL FEATURES
The district lies mainly in the Tapi basin with . only . some of its portion on the eastern border lying in .the valley of Wardha. The central part of the district is situated in the drainage system of the Puma, which is an important tributary of the Tapi. The Tapi runs for some distance along the north-west boundary of the district. . .
The district lies between 200 32' and 210 46' N. latitude and 760 38' and 780 27' E. longitude. It is bounded on the north by Nimar and Betul districts of Madhya Pradesh on the east by Wardha and Nagpur districts, on the south by Yeotmal and Akola districts
. and by Akola and Buldhana districts towards the west.
The area of the district is~,691'0 sq. miles and .its population in 1961 is 1,232,780:. .In terms of~area and population it constitutes 3'97 per cent and 3'1 per cent of the State, respectively. The Figures facing t 's page show the position of the district in the State.
HillR8Bges There is only one main system of hills which is the
Satpuda and its off-shoots. The Gawilgad hills, a part of the Satpudas, pass through the Melghat tahsil in the north-western region of this district. In the. Melghat bills the summits of the range attain an average elevation of 3,400 feet, the highest point being the Bairat plale!lu of 3,866 feet with Chikhalda and Gawilgad being slightly lower. Chikhalda has been developed by the State Government as a holiday camp for the benefit of middle class people.
The only other range is a low line of trap hills rising in the. vicinity of Amravati and extending eastwards to some distance beyond Chandur Railway with a general average height of two to three hundred feet above the surrounding country, or abo:ut 1,500 feet above the sea-level. Spurs from these hills extend northwards for some distance.
Important Rivers The principal river of the district is the Puma. It
takes its rise ,in the southern slopes of the Gawilgad bills and flows in the middle of the district partly through Achalpur and partly through Amfavati tahsils till it turns westwards and forms the boundary between Murtazapur tahsil of Akola district and Daryapur taltsil. .
The tributaries of Puma are Chandrabhaga., Shahnur and' Bordi. The Chandrabhaga after watering the
. western portion of Ach!llpur tahsil flows' south-west to join the Puma at Dhamana Khurd in Daryapur .tahsil. Shahnur and Bordi drain Daryapur tahsil.
Other important rivers of the district are the Wardha and the Tapi. The Wardha flows along the eastern border of the· district for over 50 miles. The tributaries of Wardha are Chundamani, Bel and Matu which drain Morsi:tahsil.
The Tapi flows along the north-west boundary of the district for about 30 miles and receives through its tributaries th~ Kamda, the K~, the Sipna and the Gar&.a a large share of the rainfall of the Gawilgad ~ll.
Climate Monthly temperature records are available for
Amravati station only. Table 1 in Part III shows monthly temperature records for ten y~a.rs 1951 to 1960.
The rainy season starts from the . second week' of June and lasts upto the middle of October. It is followed by a brief period of hot weather for ~bq~t two weeks and then the, cold season from November\ ,to February and hot summer weather. from March .~ about' the second week of June. .
Within the district, the seasons show local \variations also. The climate of Melghat is entirely. different from the rest of the district. In the plains the climate for the greater part of the year is extreme, yet healthy. Even the scorching heat wlPch prevails in the daytime during summer is to \ some extent mitigated by the extreme dryness of the air and the cooltiess of the nights. In the Melghat, '. the climate is cool· for nine months in the year. During the rainy season weather is depressing.
The hottest time of the year is May and eady part of June.
Rainfall Table 2 in Part III shows the figures of monthly
rainfall and number of rainy days for ten years 1951 to 1960 . .
Rainfall is more or less uniform in all parts of the district except in Melghat tahsil. Dharni in Melgbat tahsil receives annually on an average 1,106 mm. of rain while Achalpur gets only 796 mm. Morsi in the northeast gets nearly 845 mm. while Daryapur in the southwest receives 778 m~
. -The district receives 90 per cent of the rainfall
from the south-west monsoons. The rainfall during the hot weather is chiefly accompflnied by thunderstorms and frequently 'by hail. During cold weather also there are occasional showers. The rains, if received in time during the season, produce a good crop in the plains.
(2) DISTRICT CENSUS HANDBOOK
Dependability of Rainfall and Scarcity ..;\reas The mean rainfall of Amravati is 873'5 mm. The
standard deviation is 254-3 mm. The coefficient of variability is 29'10 per cent. . As rainfall reliability is measured by the coefficient of variability, the degree of reliability at Amravati may be said to be moderate.
As the villages affected by scarcity more ti1an once are few and not in a compact area and further as the rainfall in all tahsils has been generally adequate, the Fact-Finding Committee, appointed by the Government of Bombay in 1960, has opined that no area of this district can be considered as having been affected by chronic scarcity and that the district may be regarded as free from scarcity. . .
SoDs The soils of the district vary from fertile deep loam
of the plains commonly known as black cotton soils to thin red soils of the plateau and the hilly terrain in the Satpudas. The richest soil of the district is found in the Puma valley. It is deep black and very retentive of moisture. The largest stretches of it are found in the north of Daryapur tahsil, west of Amravati tahsil, south-west of Morsi tahsil, east Qf Chandur tahsil and round about Achalpur tahsil. It is known under different names sucl;l as ' A val Kali " ' Chikan ' and 'Gaohari '. It is very fertile and well suited to the cultivation of rabi crops as well as to the kharif crops in the years of short but well distributed rainfall.
In Amravati tahsil a large proportion of the soils comprises rich black loam, though in the neighbourhood of the hills the soil becomes shallow and of a less fertile description. Cultivation of kharif crops greatly predominates over that of rabi crops_ The main crops are cotton, jowar, wheat and linseed_
Soil in Chandur tahsil consists of an undulating plains sloping from west to east, covered for the most part with black alluvial soil varying in <;lepth. The richest part of the district is the eastern portion of the tahsil consisting of valley of the Wardha river with rich deep soils of a very fertile description.
The Morsi tahsil is a continuation of the black soil plains of the Amravati and Achalpur tahsils. Here the soil is somewhat shallower i and slightly inferior.
in nature. Gardening is. well developed in the eastern and northern parts of the tahsil.
Daryapur tahsil is a fertile plain of rich productive soil. It is particularly suitable for cotton and jowar cultivation. In Achalpur tahsil there is deep black soil of a very fertile description where cotton and jowar are the main crops. In the north of the tahsil, the soil is too shallow to retain sufficient moisture for rabi cultivation.
The whole of Melghat tahsil is hilly tract and contains. very dense forest. The soil is generally of the poorest description . with . some small pockets of good soil found in the valleys where 'kharif crops are mostly grown. ' ..
Minerals . No mines are worked in the district, as also no
deposits of any important mineral wealth have, so far been traced., Only in the lower Chikalda range, near Achalpur, clays are found at certain places.
Forests The district comprises two forest divisions, 'Melghat
and Amravati. The latter contains the forests of the five tahsil:; of the . district and the former that \ of Melghat tahsil alone. The forests of the Melghat are rich and dense. The total area of the forests in the district is 1\473'69 sq. miles which is 31'29 per cent, of the geographical area of the district. Babul is the important produce of the forests on the plain while teak grows abundantly in Melghat forests. 'Lac and Rusa oil used in preparing perfumes are two minor forest products of the Melghat forests.
Natural Zones The district can be broadly divided into two Zones.
The Payanghat Zone or the plains comprising the tahsils of Morsi, Achalpur, Amravati, Dacyapur and Chandur and the Mefghat Zone. The former has moderate rainfall and large tracts of fertile black soil along the banks of the rivers especially Puma and Wardha. It grows a variety of crops including cotton, jowar, wheat, tur, etc. It accounts for more than two-third of the total area of the district. The Melgbat Zone comprises Melghat tahsil which contains a stretch of mountainous country and large forests. It has thin red soils and heavy rainfall ..
ADMINISTRATIVE SET-UP
Brief History In 1864, the Yeotmal District at first called the South
East Berar and later the Wun District, was separated from East Berar District. A new district of Ellichpur (Achalpur) was created in 1867 by separating three tahsils of Ellichpur, Melghat and Daryapur from East
. Bernr District. .
With the- Re-organisation of district boundaries in '1905, Ellichpur (Achalpur) District with three tahsils
of Melghat, Ellichpur and Daryapur was amalgamated in Amravati District and Murtizapur tahsil was transferred to Akola District.
There were no major changes in the boundaries 'Of the district or its tahsils between 1911 and 1955.
With the Reorganisation of States in 1956, the district was transferred from Madhya Pradesh to Bombay State. The district forms a part of Maharashtra since 1st May 1960. '
AMRA VATI : ADMINISTRATIVE SET-UP
Present Set-up For administrative pUrposes, the district is divided
into 6 _ tahsi1~ The area, number of. inhabited villages,
D.strict/Tahsil Name of Areainsq_ Headquarters miles
0) (2) (3)
AMRAVATI QISTRICT - - Amravati 4,691'0
I Mel ghat Tahsil .. Dharni 1,546'0
2 Achalpur Tahsil · . Achalpur 490'0
3 Morsi Tahsil .. Morsi 623-0
4 Daryapur Tahsil -- Daryapur Banosa • _ 505'0
5 Amravati Tahsil · . Amravati 833'0
6 Chandur Tahsil · . 'Chandur 694-0
General Administration and Revenue The Collector is in charge of general administration,
law and order, treasury, land revenue and civil supplies. He is assisted by a Resident Deputy Collector in his office and five Deputy Collectors (Sub-divisional Officers) who hold charge of the five revenue divisions covering six tahsils_ Melghat and Achalpur tahsils together form one Sub-division, and the remaining four tahsils constitute four separate divisions. The Sub-divisional Officers have their headquarters at the respective tahsil headquarters. In this respect the system is different from that obtaining in Bombay, Poona and Aurangabad divisions where the Sub-divisional Officers generally have jurisdiction over three or more tahsils with their headquarters at one of them. In this district six tahsildars are in charge of six tahsils,
.. Land Revenue Settlements
The original Revenue Survey and Settlement of different tahsils in the district was completed between 1871 and 1875. The First Revision Settlement was compMed between 1901 and 1905. In Melghat tahsil the original settlement was made in 1909-12 and the revision settlement in 1928-29 .. The land revenue rates have not been revised since then inspite of the expiry of the terms of the revision settlements.
In the original settlements, lands were assessed separately on the basis. of individual soil classification, though the general level of assessment was fixed empirically with reference to the dependability of rainfall, crop pattern, average yields, prices, levels of rent, nearness to the markets, facilities of communications and other similar factors observed from tract to tract. Individual lands were never reclassified during the second revision settlements and landholders were generally allowed the benefits of improvements ~ffected by them during the term of settlements untaxed. The comparative incidence
number of towns, 1961 population and the position in the district by percentages of area and population for each tahsil are as follows:-
Number of Percentage inhabited Number of 1961' Percentage of villages towns population of area population
(4) (5) (6) (7) (8)
],609 13 1,232,780 100'0 . JOO'O
286 72,779 32'9 5'9
237 3 209,189 10'4 17'0
241 3 196,705 13-3 16-0
245 2 174,397 10'8 14'1
356 2 382,708 17-7 31'0
244 2 197,003 14'8 16'0
of land revenue from field to field is thus generally the same as it was at the time of the first revision settlement and the enhancements made from settlement to settlem.t were brought about only by raising the levels of land revenue assessments over a tract uniformly.
The method of land revenue assessments is broadly the same as in the other districts of Maharashtra. In the case of lands irrigated by wells and small bandharas, the land revenue is integrated and is inclusive of the charge for water supplied. For lands irrigated under Government canals, the land revenue at dry land rates is assessed and recovered by the Revenue Department while the water rates determined usually on the basis of actual crops raised are assessed by the Irrigation Department and recovered 6y the Revenue Department .
Table 24 in Pad III shows demand and collection of land revenue during the ttm years 1951 to 1960 for the district and each tahsil separately.
The areas and number of villages for each tahsil in the district have varied from settlement to settlement. Inam or Jagir villages had not been covered by most of them. In fact, some of the Inam villages were unsurveyed and unsettled as late as in 1947. That work has now been completed. Because of such recently settled villages and because of the territorial changes in the tahsil boundaries from time to time, most of the tahsils today have a more varied pattern of land revenue assessments than what is presented in the reports of earlier settlements. Even then the maximum rates fixed at each .settlement or revision settlement or the average land revenue rates per acre should be quite reliable indices of the incidence of land revenue as obtaining in the district from tahsil to tahsil or in the same tahsil from settlement to settlement. Those rates for dry crop lands for each tahsil are given on the next page.

(4)
Average Maximum land rates per
Tahsil Original settlement
or Revision settlemc:pt __
Year Guarantee period
Number of villages
revenue per Group acre for dry acre lands
(1) (2) (3)
Melghat _ . Original Settlement 1909-12 Revision Settlement 1928-29
Achaipur .. Original Settlement 1871-72 Revision Settlement 1901-02
Morsi .. Original Settlement 1872-73 Revision Settlement 1902-03
(4)
Years
15 15
30 30
30 30
Daryapur .. Original Settlement 1870-71 -. N.A. Revision Settlement 1898-99
Amravati -. Original Settlement 1871-72 Revision Settlement 1901-02 ..
Chandur .. Original Settlement , 1874-75 Revision Settlement 1904-05
Asstmbly add ParHamenwy CODStituencies Since 1957 the district has 8 Assembly seats. In 1957
Daryapur constituency was a double member constituency with one of the two seats reserved for Scheduled Castes. After abolition of the double member constituencies in 1961, the seat from Ashti is reserved for Scheduled Castes.
The number of voters on rolls for each Assembly. constituency in 1961 was as follows:-
-Assembly Constituency
0) Daryapur (2) Ashti '" (3 j Melgbat '" (4) Amravati (5) Badnera (6) Chandur (7) Achalpur (8) Morsi ...
Total ...
No. of voters on rolls
70,504 74,947 83,813 78,932 78,758 78,736 80,492 81,146
627,328
In the 1962 General 'Elections, tbe Assembly constituencies Daryapur, Ashti, Melghat, Amravati, Badnera and Chandur together formed one Parliamentary constituency called Amravati constituency and the :remaining Assembly constituencies Achalpur and.
. Morsi combined with Assembly constituencies Katol, Kalnieshwar, Saoner and Ramtek from Nagpur District formed another Parliamentary constituency called Ramtek constituency.
30
30 30
30 30
(5) (6) (7) (8)
as P. B.s. P.
N.A. N.A. 182 (including 0 60 For transferred 3 00
46 transferred ,villages only. villages).
304 1 68 304 2 19 ... ,
I 2 75 331 1 51 331 1 71
2 75 II 2 SO
266 1 66 266 2 03
2' '',.s I 320 .1 33 320 ' 1 80
I 2 75 394 0 82 .. ' .. 394 1 42 .1 •••
I 2 62 n 2 .25
. , : \¥ I \ \
The total number of voters on the r01Is in the. distri~ in 1961 was 627,328. The total population 21 ye~ and above according tq· 1961 Census is 613,310. Com~. parison can, however, be only approximate as two'.·. figures relate to the two different dates in the year 1961. I \
AdmiDistration of Justice The District and the Sessions Judge js the head of the .
Judicial Department in the district. {he Judiciary is entirely separated f10m the Executive. The Collector. continues to be the District ~.gistr~te and the Deputy Collectors and Tahsildars are vested with magisterial powers. But those powers are limited to tho cases falling under Chapter VIII of the Criminal Procedure Code and deal with cases rotating to maintenance of Jaw and order and nOllQofthem ever tries any eriminal case. The District Magistrate does nOt have any administrative control over the othet Magistrates who try crimin~l cases in the distIict. This separation of the Judiciary from the Executive has been brought about in the district in the year 1959.
The District and the Sessions Judge is assisted by one Assistant Judge and Additional Sessions Judge. He has jurisdiction over the entire district. He attends to civil ~d criminal work both original and appellate and seSSIons cases.
There are two Civil Judges o,f the Senior Division with headquarters at Amravati and Daryapur, respectively. They attend to civil work including special, jurisdiction suits in their respective areas.
There are also seven Civil Judges ()fthe Junior Division and Judicial Magistrates, First Class, at diffetent tahsil' places in the district. The} deal with 're&ular civil suits and try ordinary criminal cases.
AMRAVATI: ADMiNIsTRATIVE sirr-trP (5)
The two Judicial Magistrates,.First Class, a,t Amravati attend to criminal work in their respective areas of jurisdiction.
Police The Police force in the district functions under the
(District) Superintendent of Police who is assisted by 3 Deputy Superintendents and 3 Circle Police Inspectors. There are 31 Police Stations in the district. Their headquarters and jurisdictions are shown below:-
Melghat Tahsil
Acha~pur Tahsil
Morsi Tahsil ..
Daryapur Tahsil
Serial No ..
Name of the Municipality
(1) (2)
Chikalda
2 Achalpur Camp
3 Achalpur City
4 Chandur Bazar
5 Morsi
6 Warud
7 Shendurjana
8 Anjangaon
9 Daryapur Banosa
10 Amravati
11 Badnera
12 Chandur
1 2
3, 4 5 6 7. 8.
9. 10. 11. 12.
13. ]4. 15. 16.
Police Station Headquarters
Chikalda Dharni
Achalpur Paratwada .. Asegaon Chandur Bazar Sirajgaon .. Pathrot
Morsi Shrikhed Warud Benoda
Daryapur Banosa Anjangaon Rahimpur Khallar
Year of' Year of the last
Establishment General Election
(3) (4)
1948 1962
1893 1957
1&&7 1962
1948 1957
1937 1959
1936 1959
1948 1962
1930 1960
1837 1960
1887 1959
1936 1961
1948 1962
13 Dattapur-Dhamangaon 1940 1959
No of villages
130 166
1 65 80 69 42 64
76 102 93 54
84 75 43 66
Statutory teI'min
years
(5)
5
6
5
5
5
5
5
5
5
5
5
5
5
Amravati Tahsil
Chandur Tahsil
Police Station Headquarters
17. ~otwali 18. Raja Peth ., 19. Nagpuriate .. 20. Walgaon .' 21. Badnera ., 22. Loni 23. Kholapur ., 24. Mahuli 25. Nandgaon Khande-
shwar. 26. Chandur " 27. Kurha .. 28. Dattapur Dhamangaon 29. Talegaon .. 30. Tivasa 31. Mangrul Dastagir
No. of villages
2 8 8
515 47 58 72 77
107
51 60 18 53 48 48
Average number of villages and population per Police Station in the district is 64 and 39,767 against 69 and 62,547 in the State.
Crime statistics for the district for the years 1950, 1955 and 1960 have been shown in Table 28 in Part III.
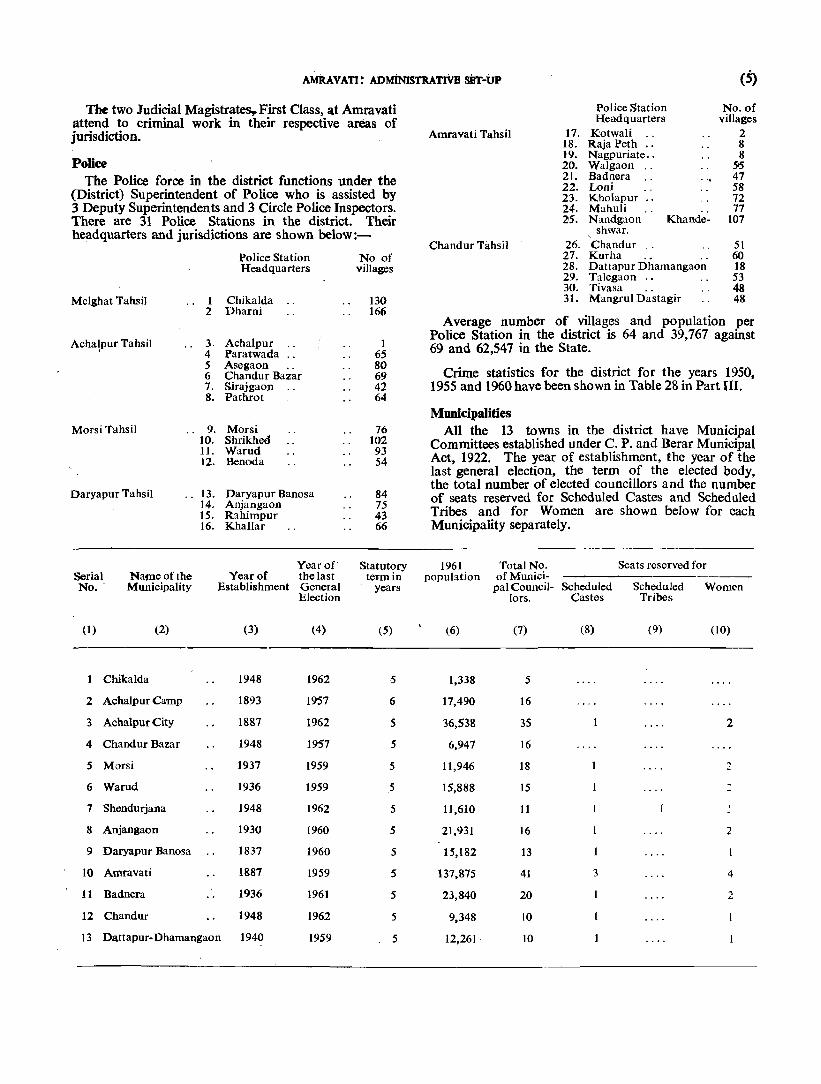
Municipalities All the 13 towns in the district have Municipal
Committees established under C. P. and Berar Municipal Act, 1922. The year of establishment, the year of the last general election, the term of the elected body, the total number of elected councillors and the number of seats reserved for Scheduled Castes and Scheduled Tribes and for Women are shown below for each Municipality separately.
1961 popubtion
(6)
1,338
17,490
36,538
6,947
11,946
15,888
11,610
21,931
15,182
137,875
23,840
9,348
12,261·
Total No. Seats reserved for of Munici-
pal Council- Scheduled Scheduled Women lors. Castes Tribes
(7) (8) (9) (10)
5
16
35 2
16
18
15
11
16 2
13
41 3 4
20 2
10
10

(6) DISTRICT CENSUS HANDBOOK
Chikalda has a. Government nominatl'd body. The Municipality at Daryapur Banosa is the oldest of all Municipalities having been established more than 125 years ago.
The 13 Municipalities together coverl00 per cent. of the urban population or 26'14 per cent of the total 1961 population of the district.
The taxation level of each of the Municipalities is shown below:-
Year 1961-62 Name of the 1961 Municipality population Total Receipts Per capita
receipts from Municipal Municipal tax
taxes Rs. Rs. Rs.
-I. Chikalda 1,338 38,840 7,893 5'90
2. Achalpur Camp 17,490 3,51,460 1,36,438 7'80
3, Achalpur 36,538 3,15,113 1,52.579 4'18
4, Chandur Bazar 6,947 1,13,484 8,523 1 23
5, Morsi 11,946 1,15,385 55,508 4'65 \
Year 1961-62 Nameofthe 1961 Municipality ·population Total Receipts Per ca!pita
receipts frorn Municipal Municipal tax
taxes Rs, Rs. Rs,
6. Warud 15,888 N,A, N,A,
7. Shendurjana .. 11,610 98,924 40,919 3'52
8. Anjangaon .. 21,931 8,26,592 1,41,284 6'44
9. Daryarmr Banosa 15,182 5,58,592' 77,820 5'13
10, Amravati 1,37,875 35,30,520, 20,11,500 14'59
I\, Badnera 23,840 3,83,292 2,00,252 8'40
12, Chandur 9,348 86,785 35,043 3'75
13, DJttapur Dha- 12,261 2.55,540 1,39,048 11'34 ma:1gaon.
Per capita incidence of municipal tax appears to be high at Amravati which is a trade centre and much of it falls on agriculturists who being their produce (mostly cotton) to the market for sale.
ZILLA PARISHAD AND PANCHAYAT SAMITIS
With a view to promoting development of democratic institutions and securing greater measure of participation by the people in Development Plans and in local and governmental affairs by decentralisation of powers and functions, a Zilla Parish ad and 13 Panchayat Samitis have been established in the district in the year 1962 under the Maharashtra Zilla Parishad and Panchayat Samitis Act of 1962. The area under the jurisdiction of the Zilla Parishad and the Panchayat Samitis corresponds to the district and block boundaries except in the case of municipal towns which
(1)
Zilla Pdrishad, Amravati
1. Dharni Panchayat Samiti 2, Chikalda Panchayat Samiti. 3, Achalpur Panchayat Samiti. 4, Chandur Bazar Panchayat
Samiti. 5, Morsi Panchayat Samiti 6, Warud Panchayat Samiti 7, Daryapur Panchayat Samiti 8. Anjangaon Panchayat Samiti 9. Amravati Panchayat Samiti
10. Bhatkuli Panchayat Samiti. 11. Nandgaon-Khan des h war
Panchayat Samiti. 12. Chandur Railway Panchayat
Samiti. 13,. 'Tivasa Panchayat Samiti. .'
Name of Headquarters
(2)
Amravati
Dharni . Cl\ikalda
Achalpur Chandur Bazar
Morsi Warud Daryapur Anjangaon Amravati Bhatkuli Nandgaon-Khande-
shwar, Chandur
Tivasa
Area in sq. miles
(3)
3,545' 5
287'8 213'5 207'2 212'0
322'0 312'5 241'2 243'7 336'9 240'9 204'2
371'5
are not included in its purview, Out" of the six tahsils d,nly one viz., Amravati has three blocks and the remaining five have two blocks each: The Zilla Parishad covers 98'12 per cent of the area and 73' 86 per cent of the total population of the district. The popuiation covered includes total rural population of the district in 1961. The number of villages and population included under the Zilla Parishad and each Panchayat Samiti are shown below. The position of each Panchayat Samiti in the Zilla Parishad is also shown separately by percentages of population in \961:-
No. of inhabited Villages
(4)
1,609
135 151 124 113
117 124
97 148 122 109 125
129
115
popuIitfon in 1961
(5)
910,586
42,186 29,255 63,412 84,802
80,797 76,464 64,110 73,174 83,474 70,511 67,007
82,983
92,411
Percentage by area
(6)
100'00
8'12 6'02 5'85 5'98
9'08 8'81 6'80 6'87 9'50 6'80 5'76
10'48
Percentage bypopula
tion (7)
100'00
4'63 3'21 6'97 9'31
8'87 8'40 7'04 8'04 9'17 7'74 7'36
·10'15
, Notl'.-The are.l figures in colllllln (3) are according to blockwise Census Abstract and do not agree with the figures given in Primary .Census Abstract, Part II-A of the Maharashtra Census Report, The differeJ.ce may be due to the inclusion of Reserved forest areas in the latter.

AMRAVATI: ZILLA PARISHAD AND PANCHAYAT SAMITlS (7)
. Constitution
The Zilla Parish ad has 47 directly elected councillors. Out of 47 seats, 2 seats are reserved for Scheduled Castes and 2 for Scheduled Tribes.. In addition, a woman councillor has been co-opted by the elected councillors. There are five associate councillors who are the chairmen of five federal co-operative societies Conducting business in the district. The elected Chairmen of all Panchayat Samitis are also ex-officio councillors.
At the Block level, the Panchayat Samiti consists of all elected and co-opted councillors fr~m the. area of the Block and a chairman of a co-operatIve socIety conducting the business of purchase and sale of agricultural produce in the area of the Block :;s an as.sociate mem~er and a· chairman of a co-operatIve socIety conductmg the business in agriculture in the area of the· Block as a co-opted member. Sarpanchas elected by members of Village Panchayats are also elected members of the Panghayat Samiti. Their number is at the rate of two fot each electoral division in the area of tQt" Block.
Zilla Parishad elections were held in 1962. The term of office of the councillors is five years. The Zilla Parishad has elected the President and Vice-President from amongst the elected councillors.
An Officer in the senior scale of LA.S. works as the Chief Executive Officer to the Zilla Parishad. The Parish ad is also assisted by various departments and the heads of those departments at the district level are Officers of Class I or Class II Service under the State Government. At the Block level, the Panchayat Samitis have elected Chairmen and Deputy Chairmen. The Block Development Officers work as Secretaries to the Panchayat Samitis. The executive authority for the purpose of carrying out the provisions of the Maharashtra Zilla Parishad and Panchayat Samitis Act vests in the Chief Exedutive Officer and the Block Development Officers. The Deputy Chief Executive Officer works as a Secretary to the Zilla Parishad.
Committees and Office-Bearers The Zilla Parishad functions through a Standing
Committee presided over by the President and six Subject Committees for Finance, Works, Agriculture, Co-operation, Education and Health. Two Subject Committees are presided over by the Vice-President and four 'by two Chairmen elected by the Zilla Parishad to preside over two specified Subject Committees each. The Deputy Chief Executive Officer works as Secretary of the Standing Committee, while the District Heads of Departments work as Secretaries to the Subject eommittees concerned. Co-ordination between the Subject Committees is achieved through the Standing Committee which includes the Chairmen of all the Subject Committees as members.
J:he Panchayat Samitis do, not have Subject Committees.
The elected President of the Zilla Parishad is paid an honorarium of Rs. 500 per month. The VicePresident and the two Chairmen of the Subject Committees are paid an honorarium of Rs. 300 per month. The elected Chairmen and Deputy Chairmen of the Panchayat Samitis are paid an honorarium of Rs. 300
and Rs. 150 per month, respectively. All these persons are also provided with rent free .accomt;nodation as is deemed suitable for them by the Zilla Panshad.
Functions The Divisional and State Officers of the Government
continue to exercise technical supervision and give guidance to Zilla Parishad and Panchayat Samitis. The State Government has powers to give direction to the Zilla Parish ad . regarding works and schemes in the interest of National or State Development Plans. Inspection and supervision are carried out by the Divisional Commissioners.
Except for a few safeguards, the developmental a!ld administrative functions of Government are now, WIth the creation of these democratic bodies at the district and Block level, devolved on them. In other words, the State Government has divested itself of the responsibility of local activities which are now left to the prople's initiative and resources.
The developmental and administrative subjects transferred to the Zilla Parishad and Panchayat Sarnitis have been listed in Schedules I and II to the Maharashtra Zilla Parish ad and Panchayat Samitis Act. By and large, all functions of q~v~rnment ad~istration including development actiVIties at the dIslnct level, but excluding matters relating to law and order, judicial.and quasi-judicial functions, and development ~unctlOns involving high technical skill like Research Stations etc., have been devolved on the Zilla Parishad and Panchayat Samitis. All Class III and Class IV employees of the Government Departments now transferred to the Zilla Parishads have been absorbed as employees of the Parishad. The village Talati (or Patwari) and the entire village establishment of the Revenue Department have been transferred to the Parishad through the village panchayats though for co]]~ction of land r.evenue and maintenance of Record of RIghts they contmue to work under the Revenue Officers.
The Zilla Parishad has replaced the erstwhile statutory bodies known as Janapad Sabha and District Panchayat MandaI. The functions of non-statutory body known as the District Development Board have of course been absorbed. Municipalities, however, remain. u~a~ec~ed as Municipal areas are excluded from the JUrISdIctIOn of the Zilla Parishad.
Finance The law provides for levy of a cess at the rate of twenty
paise on every rupee of land revenue and at a rate not exceeding nineteen paise per rupee of water. rate. The Zilla Parishad can levy taxes on profeSSIOn, trade, calling or employment and taxes on water-supply, public entertainments, amusements and pilgrIms, special tax on land and buildings and other taxes. The stamp duty on transfer of certain immovable properties may be increased by one-halfper/cent by Government for payment to the Zilla Parishad.
The financial assistance given by the State Government includes 70 per cent of the land revenue co]]ected within the area of the Parishad. When, however, the amount ofland revenue payable falls short of the amount arrived at on the basis of two rupees per Capita of the population of the district as appearing in the Census of
(8) DISTRICT CENSUS HANDBOOK
1961, an equalisation grant covering the difference will be paid to the Zilla Parishad. Government also pays what are called purposive grants being grants for specitic works and development schemes tran:sferred tQthe'Zilla Parishad at the rate of not less than 75 per' cent of the expenditure. An establishment grant equal to 75 per cent of the average annual cost on account of salaries and allowances is paid in respect of the posts held by the staff of Government transferred to the Parishad which are included in the District Technical Service (Class III) and District Service (Class III) and District Service (Class IV). The other grants include a deficit adjust-
The total reven'l!C expenditure of the Zilla Parishad is Rs. 184' 01 lakhs. The following are the major items of expenditure:-
General Administration 4' 8 per cent. Education 48' 3 " " Community Development Project.. 12·2 " " Buildings and Communications 6'9" " Miscellaneous 10'3 " " Other items 17' S " "
The Zilla Parish ad ,has raised ceS,S on land revenue to 45 paise in a rupee. It has also proposed to levy tax on motor vehicles in fairs (Pilgriin Tax). -
Per capita expenditure of the Zilla Parishad on different development heads is as fqllows:-
ment grant payable at full rates during the first five years and to be progressively reduced in the next ten years after which it will not be payable, incentive grants calculated to achieve speedier development, and grants General Administration for Plan Schemes. If in pursuance of the proposal of EduCation
Rs. 0'97 9'77 2'47 1-39
a Zilla Parishad of a Panchayat Samiti, a cess on land Community Developmen~,Pr6ject .. revenue at a rate in excess of the minimum . rate prescribed by the Act is levied by the State Buildings and CommuDlcations . ., Government in the whole of the district or in the block. Establishment , the..Zilla Parishad or the Panchayat Samiti, as the case The establishment of the Zilla Parishad comprises may be, shall be paid every year by the State Govern- both gazetted and the non-gazetted staff. The non- , ment a grant caUed the local cess matching ~nt. gazetted staff consists bf the employees of the former
" local bodies ai)d those of the various State Government The total revenue receipts of the Zilla Parishad Departments dow transferred to the Zilla Parishad. .
for the year 1963-64 are Rs. 184'22 lakhs. The major There are 4 Class I and 42 Class II gazetted officers portion o(the receipts is of receipts from Government. working under. t.he Zilla Parisbad. The total strength/ They are 93' 9 per cent and the Zilla Parishad of the non-gazetted employees of Class III and Class IV
categories is 6,166. Moreover, an establishment of receipts are only 6'1 per cent of the total revenue 112 Gramsevaks, 615 talat~, 164 village panchayat receipts. Major items of Zilla Parishad's receipts are secretaries has been transferred from the Revenue local fund cess, cess on water rates an,d profession tax. Department to the Zilla Parishad.
VILLAGE PANCHAYATS The number of independent village Panchayats. The break-up of the total annual income:of all the _
the number of group village panchayats and the number village panchayats in the district for the yehc' 1961-62 of village covered by the group village panchayats 'is as follows:- ' in each tahsil are shown belows-
No. of No. of No. of No. of indepen- group villages
Tahsil inhabited dent village covered villages village paneha- by group
panchayats yats village panchayats
1. Melghat Tahsil -Dharni 135 lQ 35 91 Chikalda 151 1 19 49 Achalpur Tahsil"':"': 2. Achalpur 124 }i 40 155 Chandur Bazar 113 43 136 Morsi Tahsil 3. Morsi 117 16 55 204 Warud 124 23 41 118 Daryapur Tahsil':":' D.lryapur Banosa 97 19 33 88 Anjangaon \ .. 148 19 44 127 Amravati Tahsil -
4.
s. Amravati 122 18 36 115 Bhatkuli 109 II 32 126 N'andgaon-Kha~~ 125 16 42 135 deshwar. ~handur Tahsil-
,.Chandur 129 33 40 111 Tivasa 115 35 34 118
6. -_ ---Total .. 1,609 231 494 1,579
Note. The total of columns 3 and 5 will not tally with the tI,Ul'eS in column 2.
Item Amount Percentage
of total (in '0(0) income
Rs. Grants 11,97 50'13
Taxes on houses and properties 2,29 9·59
Octroi 16 ' 0'67
Other taxes .. 7,22 30'23
Total taxes 9,67 40'49
Incomefrom otlter sources 2,24 9'38 --- --Total Income from other sources 23.88 100'00
The grants include the Government grant of 30 per cent of the land revenue collected in the village or one rupee per head of population whichever is more. The village pancha5'at also get the entire 'local fund cess collected in the villages. At present it is coll~cted at 20 paise per rupee of land revenue. The Village panchayats can raise it with GovernQlent approval '!lp to 100 paise per rupee of land revenue.
724 village panchayats have imposed taxes on houses and properties and 55 village panchayats have started collecting octroi.
AMRAVATI: w.LAOB PANCBAYATS (9)
The break-up of the total annual expenditure of all the village panChayats in the district for the year 1961-62 is as follows :-
Amount Percent-Item (in '0(0) age of total
expenditure
Adniinistration Rs. 347 16.81
Health and Sanitation 192 9.30 Pubbc lighting 115 5.57 Other items 1,410 68.32 Total expenditure 2,064 100.00
Otber items include improvement of village roads, construction of new drinking water wells or repairs to old wells, construction of Panchayat Ghars, schools and such other buildings.
The functions of the Talati (Patwari), Village Panchayat Secretety and Assistant Gram Sevak are now combined in ODe official who now works under the Village Panchayat.
POPULATION
Table A-I in Part II shows the 1961 population of the district and each tahsil for total, rural and urban areas sepuately. Definition of rural and urbaq. area~ lP&y be seen in paragraphs 8 and 9 of the Exp14natory Note to Part II. Table A.oII shows the district population and its variation at each Census since 1901 and the variation in population for each tahsil during 1951-1961. ~
VariatioD The population of the district and the decade
variation rates since 1901 are as foUows:-
Decade Rate of Year Population Variation Variation
1901 806,859 ..... 1911 813,012 +66,153 +8.20 1921 827,867 -45,145 -5.17 1931 941,604 +113,737 +13.74 1941 988.524 +46,920 +4.98 1951 1,031,160 +42,636 +4.31 1961 1,232,780 +201.620 +19.55
Figure in the next column shows the total, rural and urban population of the district for the last se"en Censuses.
Recovery from the famine of 1900 and fairly good agricultural seasons in the decade 1901-11 generally contributed to the growth of the district population at the rate of 8' 20 per cent. In the following decade ho~ever, the severe influenza epidemic of 1918-19 took a heavy toll cf life which resulted in a decreas of 5 '17 per cent in tbe district population. Recovery f~om the influenza epidemic caused. a comparatively hIgher Il'owth rate of 13'74 pel cent in tbe district population during the decade 1921- 31. In the follow .. ins .two decades, although. the district popUlation contInued to increase numerically, the rates of variation have been of a smaller order. It was only in the decade 1951--61 that the district recorded a growth rate of ~me magnitud;e. This grcwth rate of 19' 55 per cent 1~ t~51-6t IS the highest ever attained by the distnct.
This significant increase in the growth rate during the decade 1951-61 appears to be the result of control of ~idetnics and other diseaSes since 1960. Malaria, w.hi~ used to be a major public health problem in the district, bas .now been controlled by DD"P spraying. Mass campatgns for B.C.O. and vaccination against smallpox have their share in improving "the l)urvi¥allate. The death rate has thus been reduced and has resulted in the ~gber growth rate although the birth rate may not have lOOIeased to a great eAtent.
POPULATION 1901 1ge 1
TOTAl. ____ - RU itA I..
HHlllllllnmlll ulta .....
,.,' '92' 1931 '94' '951 '96'
2.
The 1951-61 decade variation for the district and each of the tahsils is as follows :-
AMRA VA Tl DISTRICT
1 Melghat Tahsil
2 Achalpuf Tahsil
3 Morsi Tahsil
4 Daryapur Tahsil
5 Amravati Tahsil
6 Chandur Tahsil
Percentage Variation 1951-61
+19.55
+39.01
+17.32
+22.28
+19.54
+21.34
+10'47
DIS'l'lUCf CBNSUS HANDBOOK
The Figure below shows the areawiSe pattern of 1951-61 growth of population within the district:-
AMRAV A TI DISTRICT
VARIATION IN POPULATION
1951.1961
\
There are wide differences in the rates of variation 'oftahsils in the district. Melghat tahsil has recorded the highest growth rate of 39'01 per cent while Chandur tahsil has the lowest growth rate of 10' 47 per cent. Melghat, Morsi and Amravati are above the district average while Achalpur, Daryapur and Chandur tahsils are below that avelage. High rate of growth in Anuavati tahsil may be due to the existence of fast growing Amravati City in that tahsil. In Morsi tahsil the growth is as high as 22' 28 per cent. because of the cotton growing tract and increasing number of large size cotton ginning and pressing factories in and around the towns Warud, Morsi and Shendurjana. Melghat tahsil which has only a very small town in its limits has shown the highest decade rate of growth in the district. There is no specific reason to explain this rapid growth. Local investigation may be necessary to explain the high growth rate in this tahsil.
The net percentage increase since 1901, 1921 and 1951 for the district and the State has been as follows :-
Amravati Maharashtra District
1901-,-1961 .. +52.79 +103.97
1921...:....:.1961 +48.91 +89.71
19S1-i961 +19.55 +23.60
During the last sixty years the district population :bas increased by 52'79 per cent as against nearly 104 per cent fOl Maharashtra. In the last forty years
1
since 1921 the disttic thas recorded a gro'Wth rate of 48'91 per cent as compared to 89'71 per cent for Maharashtra. Even in the last decade the district has recorded a lower growth ra~e than that of Maha~ rashtra. Generally it may be obsetved that th~ 810wth rate for the district had been much lower than that of the State.
Density of Population
The densities for Maharashtra, Amravati district and its tahsHs for 1951 and 1961 are as follows:-
Density per $<luare Percentage mile of district
popu-1951 1961 lation in
1961
MAHARASHTllA 271 334
AMRA. VA TI DISTRICT 220 263 100:-00
1 Melghat Tahsil 34 47 5'90
2 Achalpur Tahsil 364 427 16'97
3 Morsi Tahsil 258 316 15'96
4 Daryapur Tahsil 289 )45 14'15
S Amravati Tahsil 379 '459 31'04
6 Chandur Tahsil 257 284 15'98
Figure on page 11 shows the approxitn;1te cOntoUl'& of density of population in 1961 within the district.
The density of population has increased sharply from 176 per square mile in 1921 to 263 per square mile in 1961. In the years 1901 and 1911 distriCt
AtdRAVAn: MPULATION (I])
1 • . • , ~ ... ' I • ". • .. ,' , I;; . \ J'-..,...".J'! ............_ _ .....
" ',' I ... ~.,.. • • ~·"V: I ~~, ~ I ~ f
, I . -..
.' ":_~:_,,:,_;_.'_.,:, . r J. \ : :--;'-'-'-":===-:"~-==\ - .: I I . --" '. -:- .. ~ .~-~,-. '-'"
AMR .... VATI 0' -R'CT '\ :7.~ ... ·0. :-_.- .:-';' "\...
DENSITY O~9:'~P~LA~ION 1~~J0~1('~' ., . [' - . !.I ~§i~':~)i/:" i' ') ~ F:;:-III ~[~~ r~/ ': ./ v
o tOO 200 I', • II ','':' ~~.. ~ ....
(density had been higher than that of the State, whereas in 1921 both the densities were equa.l. Since then the state density has increased sharply than that of tne district and as such the district density had been lower than that of the State since 1931.
Within the district the density of population varies from 41 Persons -per square mile in Melghat tahsil to 459 persons per squaJ.e mile in Amravati tahsil.
. It is interesting to obselVe that only Melghat tahsil has 8 density of population below the district average. The abnormally low density in MeJghat tahsil may be attributed to its topography which is not verY congenial to ~tion growth. Higher densities in Achalpur and Arin'avati tahsils may be due to the existence of large urban centres in those tahsils. There seems to be a population concentration in Amravati tahsil which accounts for 31'04 per' cent of the district population and 11'76 pet cent of the district area. On the other hand Melghat tahsil accounts for only 5' 9Q per cent of the dMrict population with 32' 96 per cent of the district area. All otber tahsils account for a smaller percentage of population as compared to their areas.
Urlta Population Urban poPulation of the district at each Census and
. its variation since 1901 ate shown in Table A-IV in Part II. The same Table also shows the variation inpopuJation. for each town in tbe district. The number of towns, the rate of decade variation in ur~an population and the percentage of urban population to total population at each Census since 1901 for the distl iet and the State are showing in the next Column.
114:222-2
Amravati District Maharashtra
Rate of Percentage !tate of Percentage Year No. of variation of urban No. of varia- of urban
towns in urban popula- towns tion in popula-popula- tion to urban tion to
tion total popula- total flOPula- tion popula-
tion tion
1901 " 19 .... 21'93 219 Ib'5' 1911 20 -11'81 17'86 232 + 0'99 15-13 1921 20 + 16'83 22'01 238 + 18·72 18-50 1931 .. 14 + 0'67 19'48 258 + 15' 54 18'60 1941 .. 16 +26'20 23'41 266 +27'1l 2I'1l 1951 " 17 +22'25 27'44 383 +62'42 28'75 1961 .. 13 +13'87 26-14 266 +21'32 28'22
In the Figure on page (9) the actual urban population of the district since 1901 is shown by the shaded portion between the two lines. The net growth in urban population of the district over that of 1901 is 82'07 per cent as against 246' 96 per cent for the State. iii 1961 Census, the district is less urbanised than Maharashtra. The proportion of urban population decreased ootb for the State and the distlict in 1911, since 'then it gradually increased to an all time high value in 1951. For the district the proportion of urban population showed a decrease of small order in 1931. It again decreased in 1961 botb for the State and the district. The number of towns in the district has changed abnor" mally at every Census whereas for the State it bas increased continuously up to 1951 and aecreased considerably in 1961. Because of the redefinition of urban areas in 1961 three towns were declas::.ified as rural in the district. Amravati Camp which was treated as a separate town in 1951 has been merged with Amravati City in 1961 and hence cannot be treated as declassified.

(12) DISTRICT CENSUS HANDBOOK
The names of the three declassified towns treated as villages in 1961<____. are: Karajgaon, Pathrot and Shirajgaon-Kasba. '.-' ____ ~ ___ -
No new town has been added in the 1961 Census· The population of the declassified towns in 1951 was 19,872 or 7' 02 per cent of the urban population in 1951. If population of ~hose towns is excluded from the 1951 urban population, the 1961 urban population would be higher by 22'48 per cent over 1951. The low increase of 13' 87 per cent. now seen in the table above is thus due solely to the change of definition of urban areas and the consequent declassification of three towns. .
Amravati City which is the district headquarters is an important urban area in the distjrict. The population of'Amravati City has increased, by 203'23 per cent over 1921 and 248 95 per cent over 1901. Achalpur town group is another big urban, centre in the district. Its population has increased by 70' 75 per cent over 1921 and by 48'05 per cent over. 1901. Rural Population
The rates of variation in rural !,\opulation and the percentages of rural population to -'.total population of the district and the State since 1901 are as follows:-
Year
1901 1911 1921 1931 1941 1951 1961
Amravati District
Rate of Percentage variation of rural in rural population
population to total population
78'07 + 13'84 82'14 - 9'96 77'99 + 17'43 80'52 - 0-15 76-59 - 1-17 72-56 + 21'70 73-86
Maharashtra ------Rate of Percentage
variation of rural in rural population
population to total population
83'41 + 12'68 84'87 - 6'77 81'50 + 14'77 81'40 + 8-54 78-89 + 7'72 71-25 + 24'51 7t '78
The net increase in rural population of the district has been 44- 56 per cent over that of 1901 and 41'03 per cent over that of 1921. The same figures for the State are 75' 53 per cent\ and 67' 08 per cent, respectively.
The rates of variation of the rural population of the district have never followed any trend. The rural population has actually decrea~d during the decades ending in 1921, 1941 and 1951 and in the remaining decades it has grown at rates faster than tll,ose of urban population. The percentage of the district rural popUlation aradually decreased since 1911 till 1951 except in the
Area in State/DistrictJTahsil sq. miles
I (Rural)
(1) (2)
MAHARASHTRA 115,736' 3 AMRAVATI DISTRICT 4,603' 3
1 Melghat Tahsil 1,539' 8 1 Achalpur Tahsil 459-8 3 _Morsi Tahsil 606'8 4 Daryapur Tahsil' 502;7 S ~mravati Tahsil 812'4 6 Chandur Tahsil 681'8
slump year of 1930: -In 1961 again it has increased to some extent. For the State rural population the trend .has b~e~ one of continuous dec.rease sirpe 1911,; only III 1961 It has shown an OpposIte trend I mostlydue to declassification of a 'number of to}Yns whose population is now included in the rural population of the State.
Size of Villages Table A-III in Part II shows for the district and for
_ each tahsil the number of villages and their population for each' class of villages. .... The -distribution of popula~' Hon by size Qf villages fdr the district and the State is as follows:_;_ , ,:
Size of Class
Amrav~ti District Maharashtra
, Percentage of Percentage No_ of.' I Percentage of of No. of villages population village. to total, to total rural to total No_ <if population No_ of
-~iIIalic$ villages
Percent_lie of population to total rural popuilition
Less than 500 65-20 23-65 47'72 15-02 500---999 21-19 26-29 28'S5 25-71 1,000--1,999 \ 9'32 21'93 16'62 28'55
,2,.000-4,999 3-48 '18-93 6'18 22-40 5_000 and over, 0;81 9-20 0'93 8'32
. Vi)Jages with less than 1,000 population 'are 86' 39 per oent of the total number of villages in th~ district and ~ccount for '49' 94 per cent of the disiri<;:t rural popula..tion_ The corresponding figures for thl\ State ate 76' 27 per cent and 40 -73 per cent, re~pe~ively:, Villages with more than 1,000 population, are ~3-61 per cent of the total number of villages in the d'iStrictand account for sq· 06 per cent of the district r~ral population. For the State such villages form 23·73, lier cent .of the total number of villages in the State and account for 59' 27 per cent of the rural popUlation of~ the State. It is' interesting tc? observe that With considerable disparity in their sh"rt:s of'total number of villages, th~ _::;roall i (less than 1,000 population) l:U1d big (more tha~ 1,000 popu.lati_on) villages hav~ aWJte~t equal proportions of the dlstnct_ rural pupulatlof,;','., '
The area, number of inhabited villages, total rural population, average population per village, and the numper of villages p~r 100 square miles of rural area are shown below for :the State, district and each tahsil separately:-
Average population per village in 1961 is 566 W .the district as against 792 in Maharashtra. An average village in the district thus has much less population than the popUlation of an average village in the State. The average population per village within the district I
No. of Average No. of inhabited inhabited Rural population per villages per villages population inhabited 100 sq. miles
village of rural area (3) (4) (5) (6)
35,851 28,391,157 792 31 1,609 910,586 566 35
286 71,441 250 19 237 148,214 625 ' 52 241 157,261 653 40 245 137,284 560 49 356 220,992 621 44 244 175,394 719 36
AMRAVATI: POPULATIUN (13)
vari~ from 250 in the hilly MeIghat tahsil to 719 in Chandur tahsil. The average population per village in Daryapur tahsil is almo~t' equal to the district average whereas that in Melghat tahsil is much lo'Wer than this average and for the rest of t~e t;1bsils it is higher than the district average. \_
, The number of villages per 100 square miles of rural area is 35 in the district as against 31 in Maharashtra. Among the tahsils of the· district Achalpur tahsil has 52 villages per 100 square miles of rural area compared to 19 in Melghat tabsil., In Melghat tahsil alone this number is below the district average because of large ~ea under forests. Villages in Melghat tahsil thus contradict the usual hypothesis that smaller villages are situated close to each other. It may be added that
the above discussion is based on villages witn their administrative 'boundaries and does not take into account the existence of wadis, padas or hamlets Within those boundaries.
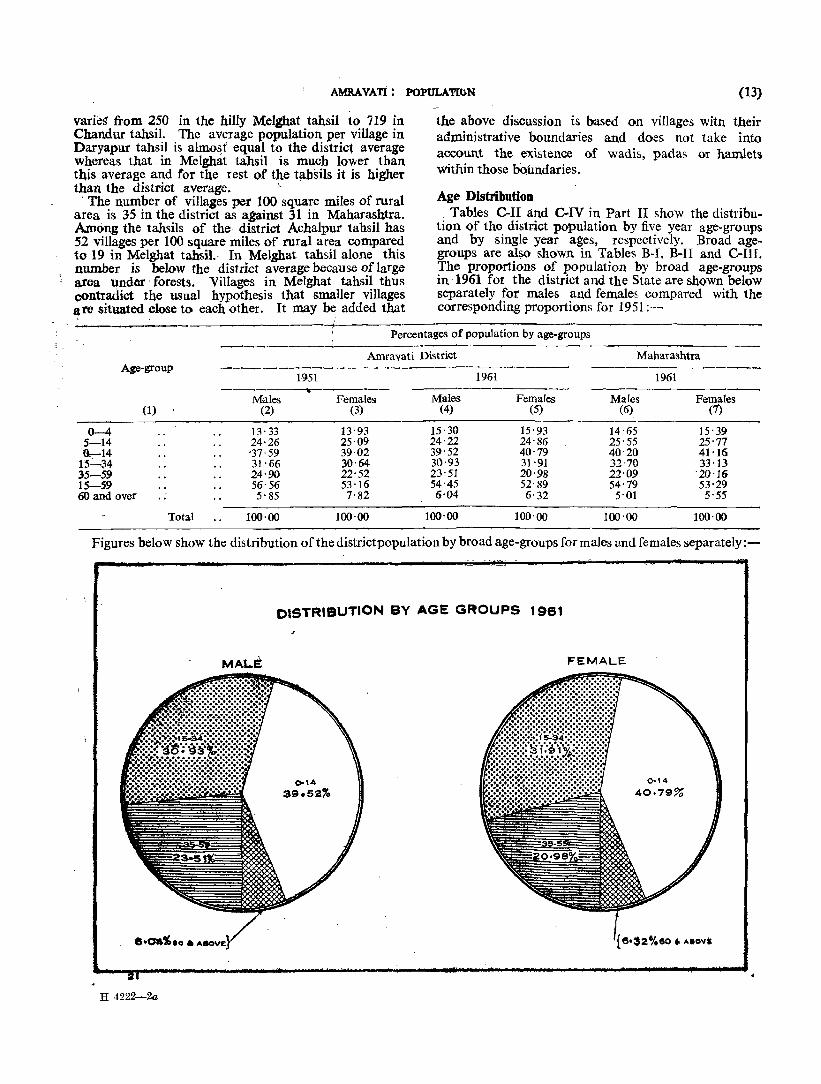
Age Distribution , Tables C-II and C-IV in Part II show the distribu
tion of the district population by five year age-groups and by single year ages, respectively. Broad agegroups are al~ shown in Tables B-1, B-II and C-III. The proportions of population by broad age-groups in 1961 for the district and the State are shown below separately for males and female~, compared with the corresponding proportions for 1951:-
Percentages of population by age-groups
Amravati District Maharashtra Age-group
1951 1961 1961
------Males Females Males Females Males Females (1) (2) (3) (4) (5) (6) (1)
0-4 13' 33 13'93 15·30 15'93 14'65 15'39 5-14 24·26 25'09 24'22 24'86 25'55 25'77 a-14 '37'59 3902 39'52 40'79 40'20 41'16
15':"'34 31'66 30'64 30'93 31'91 32·70 33·13 35-59 24'90 22'52 23'51 20'98 22'09 '20'16 15-59 56'56 53'16 54'45 52'89 54'79 53·29 60 and over .. 5'85 7'82 6'04 6'32 5·01 5'55
Total 1000.00 100·00 100'00 100'00 100'00 100·00
Figures below show the distribution of the district population by broad age-groups for males and females separately:-
OISTRIBUTION BY AGE GROUPS 1961
MALE FEMALE
H 4222--2a
(14) DISTRICT CENSUS HANDBOOK
" During the last decade the proportion of children aged 0-4 increased from,13'33 to 15'30 per cent for
'males and from 13'93 to 15'93 per cent for females. The proportions of males and females in age-group 5-14 showed a. decrease-oLsmall or<ter~ ",The resultant effect is seen in the increase"1n- piOpo!tions of males and females of age-group 0-:-14. 1 he proportion of males in the older age-group (60+ ) has increased while that of females decreased considerably, thus reducing the disparity between the pToportion& of males and females in the older age-5roup. All these changes contributed to lowe! the proportion of wor king (age-group 15- 59) people of both seXes bllt males are seen tobemoreaffectedinthiscase. Comparison with the age struuture of the State shows that the proportion of younger persons is less while that of older versons is more in th-e district than the corresponding pI<;lportions for the State, The proportion of both the sexes for the age-group 15-59- in the district are a little less than those for the State. The main ll:lason, however, is that the district population is more in older a.ge-group probably due to the increase' in survival rate in the older age-group in the district.
Dependency Ratio
The ratio between dependants ~age;.g1.oupS 0-14 and-60+) and 100 of supporting lage-gtoup 15- 59) population has an econcmi{" significance. The dependency ratios and their two components of youth tO~14) and aged 60 and above groups are shown below, for 1951 and 1961 for the district and the State separately :-
Amravati District Maharashtra
Youth Aged Total Youth Aged Total
1951 Total .. 69'8 12'4 82'2 69·9 9'3 79·2 I I
1961 Total 14-8 11'5 86'3 75·2 9'7 84 9
Rural 76'1 11·9 88'0 80·6 10-8 91·4
Urban .. 71'0 10-4 81'4 63'1 7-3 .70'4
The dependency ratios are higher in Amravati district than those for Maharashtra. The dependency ratios for the State and the district are both higner in 1961 than those for 1951. For the State both the ccmponents ha'Ve increased while for the district only youth dependency has increased and the other component for aged has decreased over the decade. The increase in dependency may be the result both of high fertility and declining mortality, The 1961 population in the district thus has a lruger load of dependants than that of 1951. This dependency load is larger in fllr~l
,. areas than in urban areas. It is little less for the rural areas or district than that of the State wbereas much higher for the district in urban areas than that for the State. _
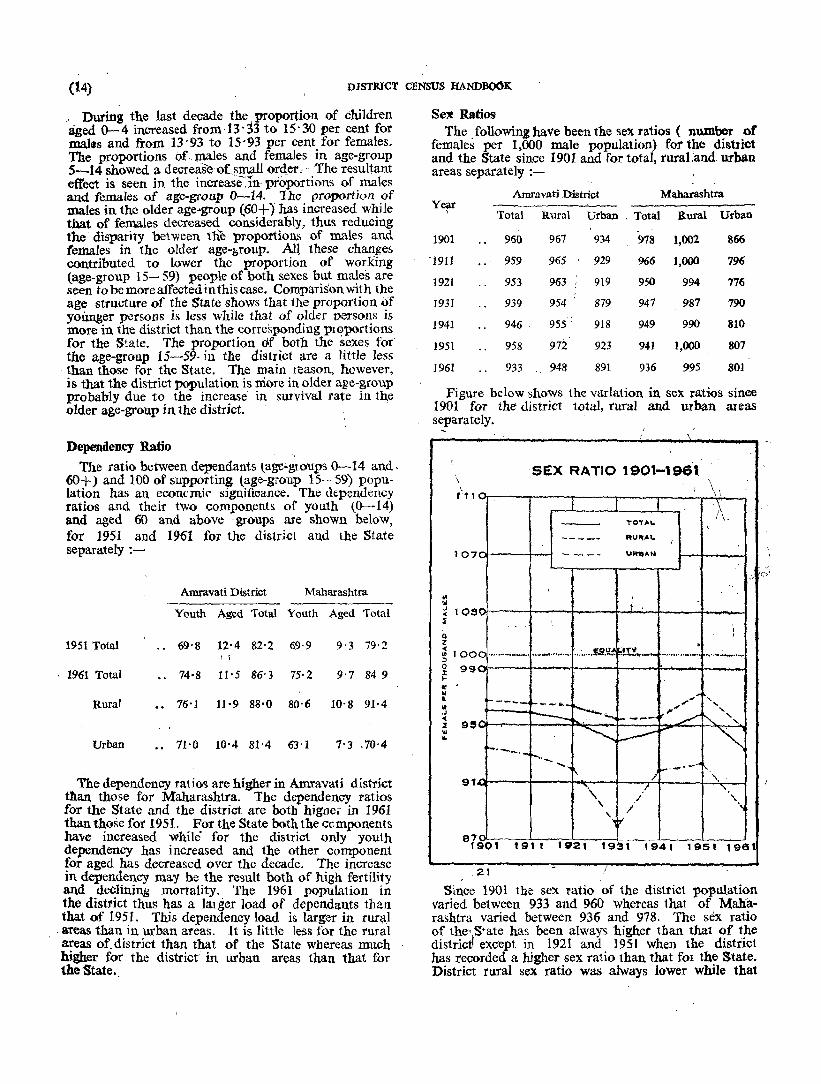
Se:t Ratios The following haw been the sex ratios ( number of
females per 1,000 male population) for the district and the State since 1901 and for total, l'uraI:and ur~n areas separately :-
Amravati District Mabatashtra Ye:u-
Total Rural Urban . Total Rural Urba.n
1901 960 967 934 978 1,002 866
-1911 959 965 929 966 1,000 796
1921 953 963 919 950 994 776
1931 939 954 879 947 987 790
1941 946 . 955 918 949 990 810
1951 958 972 923 941 1,000 807
1961 933 948 891 936 995 801
Figure below shoWS the variation in sex ratios since 1901 for the district total, rural and urban rueas separately.
SEX RATIO 1901-196'1
\ 1 1 J\
TOY"'-
RU""!.
1 07 _OI---+---i URtSAN
i '
.21
Since 1901 the sex ratio of the district population varied between 933 and 960 whereas that of MaJiarashtra varied between 936 and 978. The sex ratio of the'S'ate has been always 'higher than that of the distri~ except in 1921 and 1951 when the district has recorded a higher sex ratio than that fOl the State. District rural sex ratio was always lower while that

AMRA VATI: POPULATION (15) r
of utban was CQnsistently higher than the corresponding sex ratios of the State. The district sex ratio never approached equality. Rural sex ratio was always higher than the w:ban sex ratio both for the district and the State. Except in 1931 and 1961 the ruralurban differences in seX: ratios were not significant enough to suggest any sizable migration from rural to urban ateas within the district.
Following are the sex ratios for different age-groups of population for the district total, rural and urban jlI'eas :-
A&e-group Total Rural Urban
~14 963 968 946
15-34 962 1,095 859 ..
35-59 832 837 819
60 and over 976 969 1,001
All ages 933 948 891
Except. for the age-group 35- 59 the sex ratios in other broad age-groups are normal. Sex ratio is slightly higher than equality in age-group 15-34 for rural areas and in the older age-group (60+) for urban areas. Sex ratio is the least in age-group 35-59 both for rutal and urban areas. Except in the older age-8i'oup the rural sex rati(l) is higher than the urban seX ratio .and their difference is significant only in the agegroup 15-34.
Year Age-group Total Never Married
The sex ratios for each tahsil in the'district for total, rural and urban areas separately are as follows'-
Total I Rural Urban
AMRAVATI DlSTRI~T 933 948 891
1 Melghat Tahsil 953 957 779
" Acha1pur Tahsil 937 944 922 .. 3 Morsi Tahsil 947 955 917
4 Daryapur Tahsil 940 944 923
5 Amravati Tahsil 907 941 862
6 Chandur Tahsil 950 953 933
Within 'the district the sex ratio varies between 907 in Amravati tahsil to 953 in Melghat tahsil. The urban sex: ratio is the least in the tiny urban area of Melghat tahsil. Low urban sex ratio in Amravati tahsil may be attributed to the existence of Amlavati City in that tahsil.
Marital Status Table C-II in Part II shows the distlibution of
population by marital status by five-year age-glOups. The petcentages of population for broad age-glOups classified by marital status are shown below compared to those of 1951 :~
Marital Status
Married Widowed Divorced or Separated
Males Females Males Females Males Females Males Females
(1) (2) (3) (4) (5) (6) (7) (8) (9) (10) (11)
1951 0-01 0-02
0- 74 0-68
1·11 2-17
0-32 3-89
0-51 1-05
1961- 0-04
l' 39 1- 89
1- 76 1- 66
1'18 0-63
0-90 0-98
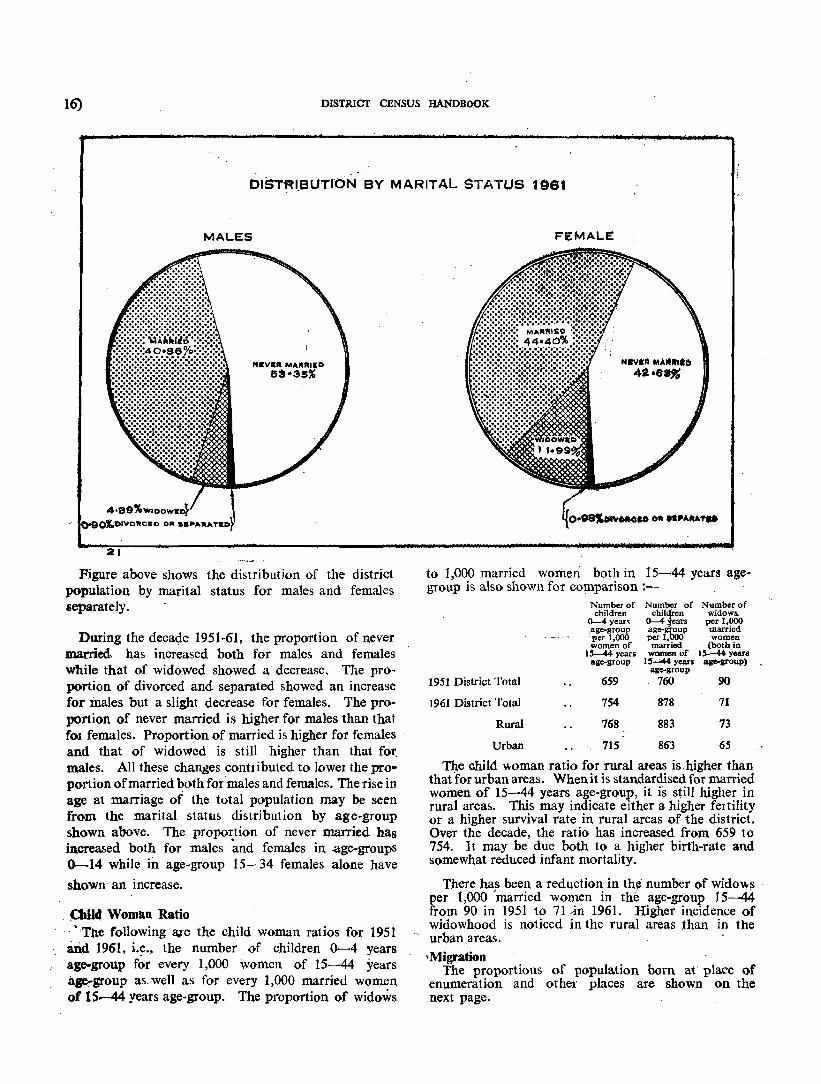
16) DISTRICT CENSUS HANDBOOK
OISTR'.E3UTrON BY MARITAL STATUS 1961
MALES
21
HIrVa" MAIUIllEO 153"35%
Figure above shows the distribution of the district population by marital status for males and females separately.
During the decade 1951-61, the proportion of never married, has increased both for males and females while that of widowed showed a decrease. The proportion of divorced and separated showed an increase for males but a slight decrease for females. The proportion of never married is higher for males than that fOl females. Proportion of married is higher for females and that of widowed is still higher than that f01: males. All these changes contdbuted to lowet the proportion of married both for males and females. The rise in age at marriage of the total population may be seen from the marital status distribution by age-group shown above. The proportion of never married has increased both for males ~nd females in .age-groups 0-14 while in age-group 15- 34 females alone have
shown an increase.
. Qill4 Woman Ratio
.. "Tne following aJ'e the child woman ratios for 1951 Uid 1961, i.~., the number of children 0-4 years age-group for every 1,000 women of 15-44 years aF-group as. well as for every 1,000 married women of 15-44 years age-group. The Pl'oportion of widows
FEMALE
NIVltti MAUI.I!! 4a'6~
to 1,000 married women both in 15-44 years agegroup is also shown for comparison ;-
, Number of Number of Number of children ChHt,en widows.
0-4 years 0-4 ears per 1,000 age-group age-~p married Ifler 1,000 per 1, women women of married Cbothin
15-44 years women of 15--44 years eae-group IS-"44 years aae-aroup)
age-group
1951 District Total 659 760 90
1961 District Total 754 878 71
Rural 768 883 73
Urban 715 863 65
T4e child \\<oman ratio for rural areas is . higher than that for urban areas. When it is standardised for married women of 15-44 years age-group, it is still higher in rural areas. This may indicate either a higher fet tility or a higher survival rate in rural areas of the district. Over the decade, the ratio has increased from 659 to 754. It may be due both to a higher birth-rate and somewhat reduced infant mortality.
There has been a reduction in th¢ number of wido~s . per 1,000 'married women in the age-group 15---44 from 90 in 1951 to 71 --in 1961. Higher incidence. of widowhood is noticed in the rural areas than in the urban areas.
'Migration The proportions of popUlation born at" place of
enumeration and other places are shown on the next page.
AMRAVATI: POPULATION (17)
Total Population
(1) (2)
Peisons 1,232,780
Males 637,861
Fem,ales 594,919
PercOntaac to total population-\
Persons 100.00
100.Op Males. ",4 i i'
Fc,males 100.®
58· 29 per cent of the population was eJ\umerated at places of birth. This percentage for males is 69·34 but for females it is only 46·43. The difference is due to women married outside their places of birth. This movement of females on marriage appears to be remark~e within the district as is revealed by a very high proportion of females born elsewhere in the district. Marriage seems to be the contributory factor in rendering females a preponderance over males among persons born in other districts of Maharashtra. Even in the migration stream from outside the State males and females tend to flow in almost equal proportions. This may be due to its being a border district.
The sex ratios in the district population by five-year age-groups for total, rural and urban areas are as follows :,_
Age-group An ages 0-4 5-9
10--14 15-19 20--24 25-29 30-)4 35-39 40-44 "\ 45-49 50--54 55-59 60 and over
Total 933 971 983 927 860
1,084 1,0]7
885 868 861 80G 828 748 976
Sex Ratios
Rural 948 975 985 938 911
1,[80 1,039
893 877 863 X09 83[ 751 969
Urban 891 960 975 897 755 886 958 861 839 856 794 819 736
1.001
Place of Elsewhere Outside the Outside enumeration in the district district but in Maharashtra
Maharashtra
(3) (4) (5) (6)
717,413 348,730 122,933 41,694
441,693 127,748 46,503 21,041
275,720 .. 220,982 76,430 20,647
58.29 28.33 9.99 3.39 4
69.34 20.06 7.30 3.30 ;1 ~
46.43 37.22 -12' 87 3'48
The rural-urban differentials of sex ratios are less in younger and older age-groups though rural sex ratio is almost always higher than the urban sex ratio. These differences are more significant in adult age-groups among which the age-group 20-:-24 has the highest sex ratio. The high rural sex ratio in age-group 20-24 may be due to the movement of young adult males in search of jobs or for higher education in the urban areas within and outside the district. The sudden drop in the sex ratio for age-group 55-59 in rural and urban population may also be partly due to misreporting of ages of women of that group in the higher age-group.
The percentage distribution of male population born at the place of enumeration, born elsewhere within the district and born outside the district by nine categories of economic activity and of non-workers is shown below. An explanation of the nine categories will be found in the Explanatory Note to Part II, paragraphs 42 to 52.
The proportion of non-workers is less among those born at places other than the place of enumeration. It is the least for persons born outside the district.
C ltegorios of Workers -1---11--II1---IV ---y---vI--Vil-Ylfl --IX- Non
Workers
(1)
District Total
Born a! place" of enumeration
Elsewhere in the district
Outside the district
(2) (3) (4) (5) (6) (7) (8) (9) (10)
.. 17.26 23.26 1.05 2.03 2.43 0.51 3.28 1.44 567
.. 18.55 22.47 0.74 1.68 1.81 0.35 2.57 0.86 3.31
.. 15.89 28.06 1.68 2.30 3.29 0.79 3.25 2.03 10.01
.. 11.39 19.47 1.88 3.78 4.87 .07 7.99 4.09 12'85
(11)
43.07
47· 66
32'70
32·61 -
(IS) DISTRICT CENSUS llANDBOOK
Cultivators have a higher prop'ortion for those bom at the place of enumeration. Agricultural labourers exhibit a tendency to migrate within the district. The differences in the percefttag~ distributioll- of migrants and non-migrants are more -- S:lgnificant in categories VII, VIII and IX. Persons born outside the district have a higher proportion in those categories than those born at the place of enumeration or elsewhere in the district.
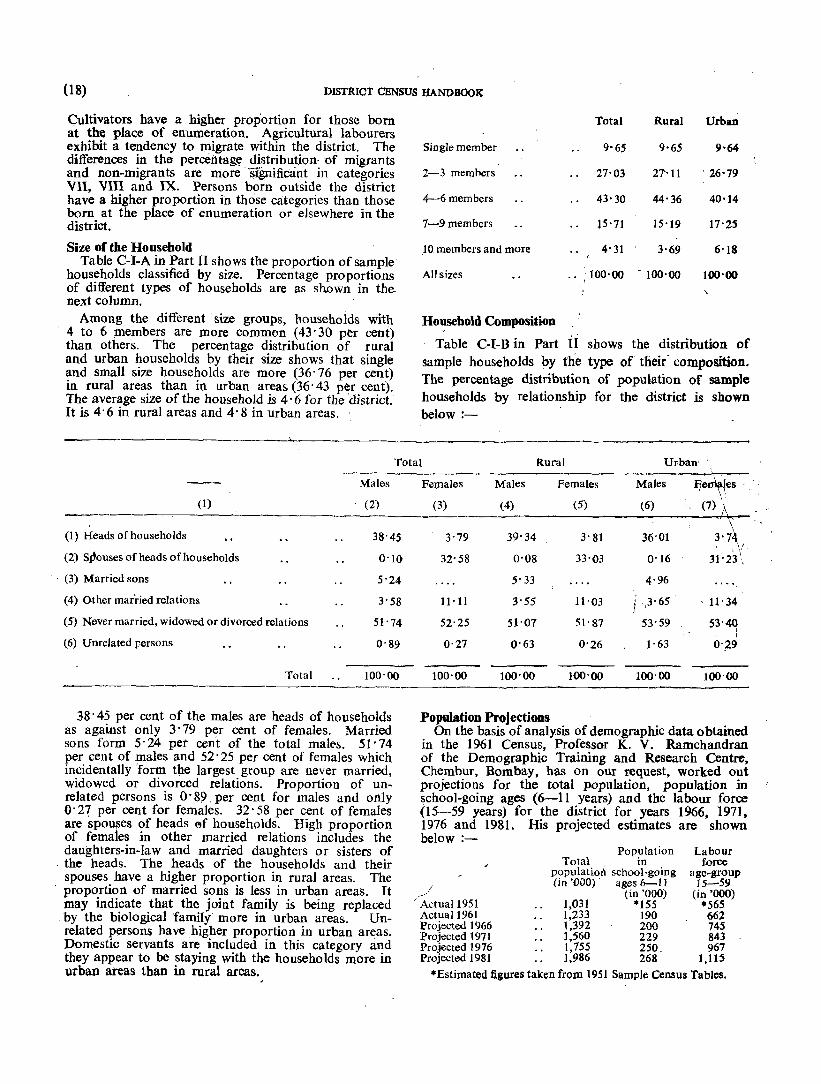
Size of the Household Table C-I-A in Part II shows the proportion of sample
households classified by size. Percentage proportions of different types of households are as shown in the next column,
Among the different size groups, households with 4 to 6 ;members are more common (43' 30 per cent) than others. The percentage distribution of rural and urban households by their size shows that single and small size households are mOre (36' 76 per cent) in rural areas than in urban areas (36' 43 per cent). The average size of the household is 4' 6 for the district. It is 4' 6 in rural areas and 4' 8 in urban areas,
Total Rural Urban
Single member 9'65 9'65 9,64
2-3 memhers 27'03 27'- 11 - 26'79
4-6 members 43'30 44'36 40'14
7-9 members 15'71 15'19 17'25
_1 0 members and more 4'31 3'69 6'18
All sizes -100'00 - 100'00 100'00
Household Composition
Table C-I-B in Part it shows the distribution of sample households by the type of their- composition. The percentage distribution of population of sample households by relationship for the district is shown below:-
Total Rural Urban- -
Males
(1) (2)
(1) Heads of households 38-45
(2) S~ouses of heads ofhouseooJds 0'10
- (3) Married sons 5'24
(4) Other married relations 3'58
(5) Never married, widowed or divorced relations 51'74
(6) Unrelated persons 0'89
Total 100'00
38' 45 per cent of the males are heads of households as against only 3' 79 per cent of females, Married sons form 5'24 pet cent of the total malt's. 51'74 per cent of males and 52' 25 per cent of females which incidentally 'form the largest group are never married, widowed or divorced relations. Proportion of unrelated persons is o· 89 _ per cent for males and only 0'27 per cent for females. 32' 58 per cent of females are spo~es of heads ef households. High proportion of fema1es in other married relations includes the daughters-in-law and married daughters or sisters of
- the heads, The heads of the households and their spouses have a higher proportion in rural areas, The proportion of married sons is less in urban areas. It may indicate that the joint family is being replaced
-by the biological family more in urban areas. Un-related persons have higher proportion in urban areas. Domestic servants are included in this category and -they appear to be staying with the households more in urban areas than in rural areas.
Females Males Females Males Ij'e,fes (3) (4) (5) (6) (7) I~
'I< \
3'79 39'34 3'81 36'01 3'74
32'58 0'08 33'03 O' 16 - - \/ -
31' 23 \
5'33 4'96 .....
11'11 3'55 11'03 ,3'65 - 11'34
52'25 51'07 51'87 53'59 53'40 I I
0'27 0'63 0'26 1'63 0',29
100'00 100'00 100'00 loo·()() 100'00
Population Projections On the basis of analysis of demographic data obtained
in the 1961 Census, Professor K. V. Ramchandran of the Demographic Training and Research Centre, Chembur, Bombay, has on our request, worked out projections for the total population, population in school-going ages (6-11 years) and the labour force (15-59 years) for the district for years 1966, 1971, 1976 and 1981. His projected estimates are shown below:-
I
------I Actual 1951 Actual 1961 Projected 1966 Projected 1971 Projected 1976 Projected 1981
Population Total in
populatior\ school-going (in '000) , ages 6-11
1,031 1,233 1,392 1,560 1,755 1,986
(in '000) *155
190 200 229 250_ 268
Labour force
age-group 15-59
(in '000) "'565 662 745 843 967
1,115
"'Estimated figures taken from 1951 Sample Census Tables.
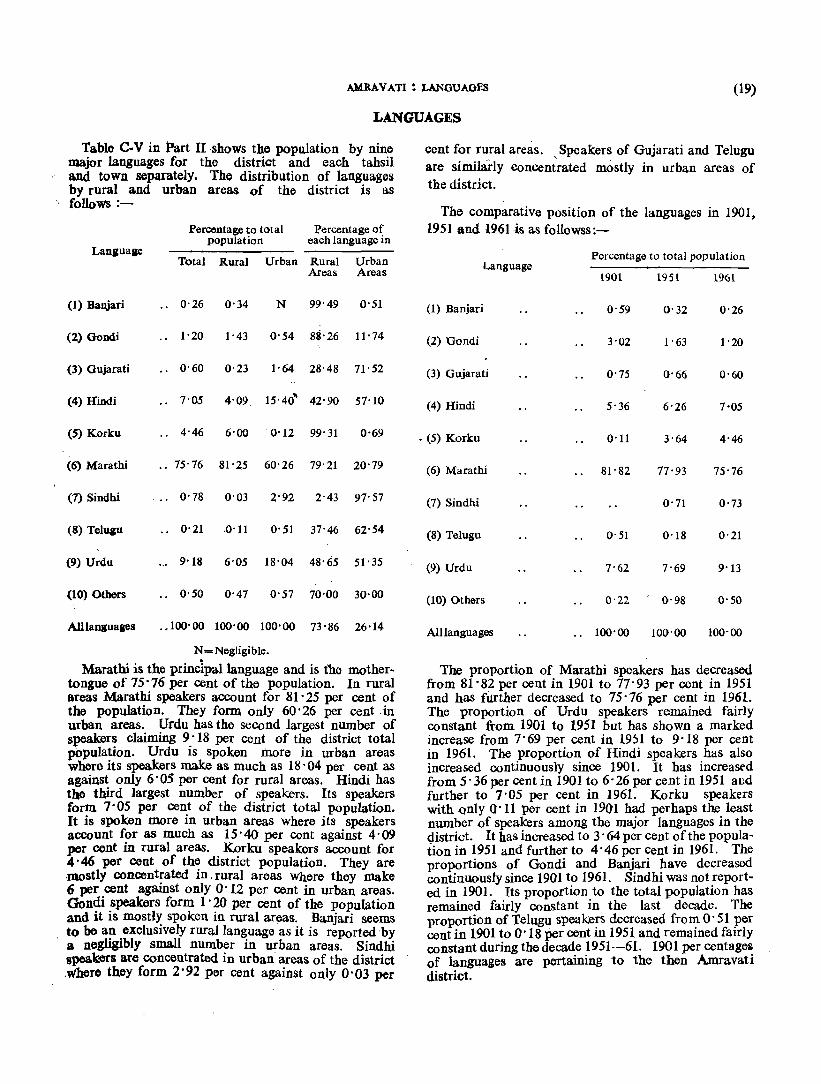
AMRAVATI: LANGUAO~ (19)
LANGUAGES
Table C-V in Part II ,shows the population by nine major languages for the district and each tahsil and town separately. The distribution of languages by rural and urban areas of the district is as
, follows:-
Percentage to total Percentage of population each language in
Lanluaae Total Rural Urban Rural Urban
Areas Areas
(1) Banjari -- 0'26 0-34 N 99-49 0-51
(2) Oondi -- 1-20 1-43 0-54 8$-26 11-74
(3) Gujarati -- 0-60 0-23 1-64 28'48 11-52
(4) Hindi -- 7-OS 4-09 15-40" 42-90 57-10
(5) Korku -- 4-46 6-00 . 0-12 99-31 0-69
(6) Marathi __ 75-76 81-25 60-26 79'21 20-79
(7) Sindhi 0'78 0-03 2-92 2-43 97-57
(8) Tcluau -- 0-21 ,0-11 0-51 37-46 62-54
(9) Urdu -.- 9-18 6-05 18-04 48-65 51-35
(10) Others -- 0-50 0-47 0-57 70-00 30-00
All languages __ 100-00 100-00 100'00 73'86 26-14
N=NegIigible_
Marathi is the princlpallanguage and is the mothertongue of 75'76 per cent of the popUlation. In rural areas Marathi speakers account for 81' 25 per cent of the population. They form only 60' 26 per cent . in urban areas. Urdu has the second largest number of speaker~ claiming 9: 18 per cent of t~e district total pOpulatIon. Urdu IS spoken more m urban areas where its speakers make as much as 18' 04 per cent as against only 6' 05 per cent for rural areas. Hindi has the third largest number of speakers, Its speakers form 7'05 per cent of the district total population. It is spoken more in urban areas where its speakers account for as much as 15'40 per cent against 4'09 per cent in rural areas. Korku speakers account for 4'46 per cent of the district population. They are ,mostly concentrated in, rural areas Where they make 6 per cent against only O· U per cent in urban areas. Gondi speakers form 1 . 20 per cent of the population and it is mostly spoken in rural areas_ Banjari seems to be an exclusively rural language as it is reported 'by a negligibly small number in urban areas. Sindhi speak<ors are concentrated in urban areas of the district .where they form 2'92 per cent against only 0'03 per
cent for rural areas. , Speakers of Gujarati and Telugu are simitarly .concentrated mostly in urban areas of the district.
The comparative position of the languages in 1901, 1951 and 1961-is as followss:-
Percentage to total population Language
1901 1951 1961
(1) Banjari 0-59 0'32 0-26
(2) Gondi 3-02 1'63 1-20
(3) Gujarati 0-75 0'66 0'60
(4) Hindi 5'36 6-26 7'05
, (5) Korku 0'11 3-64 4'46
(6) Marathi 81-82 17-93 75'76
(7) Sindhi 0-71 0'73
(8) Telugu 0'51 0-18 0-21
(9) Urdu 7-62 7'69 9'13
(10) Others 0-22 0'98 0'50
Alllanguages -- 100'00 100-00 100-00
The proportion of Marathi speakers has decreased from 81'82 per cent in 1901 to 77-93 per cent in 1951 and has further decreased to 75' 76 per cent in 1961. The proportion of Urdu speakers remained fairly constant from 1901 to 1951 but has shown a marked increase from 7'69 per cent in 19)1 to 9'18 per cent in 1961. The proportion of Hindi speakers has also increased continuouslY since 1901. It has increaSt'd from 5' 36 per cent in 1901 to 6' 26 per cent in 1951 ar:d further to 7'05 per cent in 1961. Korku speakers with only 0'11 per cent in 1901 had perhaps the least number of speakers among the major languages in the district. It has increased to 3' 64 per cent of the population in 1951 and further to 4' 46 per cent in 1961. The proportions of Gondi and BaDjari have decreased continuously since 1901 to 1961. Sind hi was not reported in 1901. Its proportion to the total population has remained fairlY constant in the last decade_ The proportion of Telugu speake!,s decreased froD?- 0- 51 per cent in 1901 to 0'18 per cent m 1951 and remamed faIrly oonstant during the decade 1951-61. 1901 per centages of langllages are pertaining to the then Amravati district.

(20) DISTRICT CENSUS HANDBOOK
RELIGIONS
Table C-VII in Part~1f~2!Ys the_ -population by religions for the district and ,eaCh tahsil and town separately. -The distribution of, population by religion in both rural and urban areas of the district is as follows:-
- Religion
(1) Buddhists
(2) Christians
(3) Hindus I
(4) Jaitls
(5) Muslims
(6) Others
All Religions
"
"
Percentage to total population
Percfntage of each religion in
Total Rural Urban Rural' Urban
14'28
0' 34
75'04
0'56
9'73
0'05
17'29
0'28
75'54
0'25
6'62
0'02
areas areas
5',77 89'44 10'56
0"52 60' 80 39' 20
73'6474'3525'65'
1'41 33-57 ,66'43
18'51 50'25 49'75
0'15 27'98 72'02 \
.. 100'00 100'00 100'00 \ ,,73 86 26 14
More than 75 per cent of the populatidn reported their religion as Hindu, Their proportion to total popUlation in rural and urban areas is 75' 54 per cent and 73'64 per cent, respectively_ Next to Hindus, Buddqists account for 14' 28 per cent of the district population their respective proportions in the rural and urban areas being 17' 29 per cent and only 5'77 per cent. Muslims form 9'73 per cent of the total popUlation in the district, They constitute only 6'62 per cent in rural ,areas but form as much as 18' 51 per cent in urban areas, Jains are mostly concentrated in urban areas. They are in a sense the most urbanised group and the Buddhists the least urbanised.
!
The comparative position of the religions in 1901 and 1961 is asfollows:-: ,
Religion Percentage to total population
1901 1961
(1) ~uddhis~s .. 14'28
(2) Christians ., 0'12 0'34,
(3) Hindus 88'03, 75'04
(4) Jains 0'93 0'56
(5) Muslims 7'78 9'73
(6) Others 3'14 0'05
AU Religions 100'00 100,00
The proportion,of Muslims has increased from 7'78 , pl'r cent in 1901 to 9'73 per cent in 1961. Christians, have alB? incre(ised from 0-12.per cent_,.1n 1901,to 0'34 per ceqt JU 1961. The proportIOn of Jams h'1-s, however, decrea~d in the last sixty years. The propot;tiop. of Hindus ,also decreased from 88' 03 per cent in 19()1 to 75' 04 p~r cent in 1961. This decrease of 13 per; ~t is presumably due to reduction in the poplJ1ation of Scheduled Castes on ;lccount of conversion of pers~s belonging to the Scheduled Castes among Hindu~r to Buddhism. The combined proportion for Hindus an~ Buddhists shows increase by more than one per tent{ over the last sixty years, '\
Sex ratio for persons belonging to, different religions, is as foHows:-r- j ,
Buddhists 988, Christians 927, Hindus 926, Jains 919~ Muslims 910 and All Religions 933, :, '
Higher sex ratio for Buddhists may indicate that more of their males are going out of the district for work.
SCHEDULED CASTES
Table SeT .I-Part A in Part II shows the population and its distribution by workers and, non~workers for each Scheduled Cas.te for the district and each tahsil separately. Actually, 18 castes are notified as Scheduled Castes in the district but only 15 are reported in 19~1 Census. .
The distribution of' these 15 Scheduled Castes by rural and urban areas of the district is shown on page (11).
Out of the fifteen Scheduled Castes enumerated in the district" the largest number is of Mangs, The second largest group is of Chamars while the Mahars and Khatib rank third' and fourth, respectively. Balahi;'
.. Bhangi and Dohor with a popUlation between two to three thousands are respectively the fifth, sixth arid the seventh groups. The remaining eight Scheduled Castes together have 1,431 persons and form 0'11 p,er cent of the total popUlation. Bahna, Ghasi
and Katia castes have only two females in the case of first two and two males for the third.
The comparative position of the Scheduled Castes population in 1951 and 1961 for the district is as foIlows;-
Percentage to total population in
Total Rural Urban All Scheduled Castes-
1951 16'41 19'18 9'10 1961 . _ 3'9;5 3'57 5'02 The reduction of proportion from 16'41 per cent to
3' 95 per cent is the result of the conversion of a larger number of persons from the erstwhile Hindu Scheduled Castes to Buddhism. Such conversions to Buddhism have, however, been chiefly among the Mahars who, were formerly also numerous of the Scheduled Caste population in tqe district. The combined proportion of the Scheduled Castes and Buddhists in 1961 is 18' 23 per cent which is closer to that of 1951.
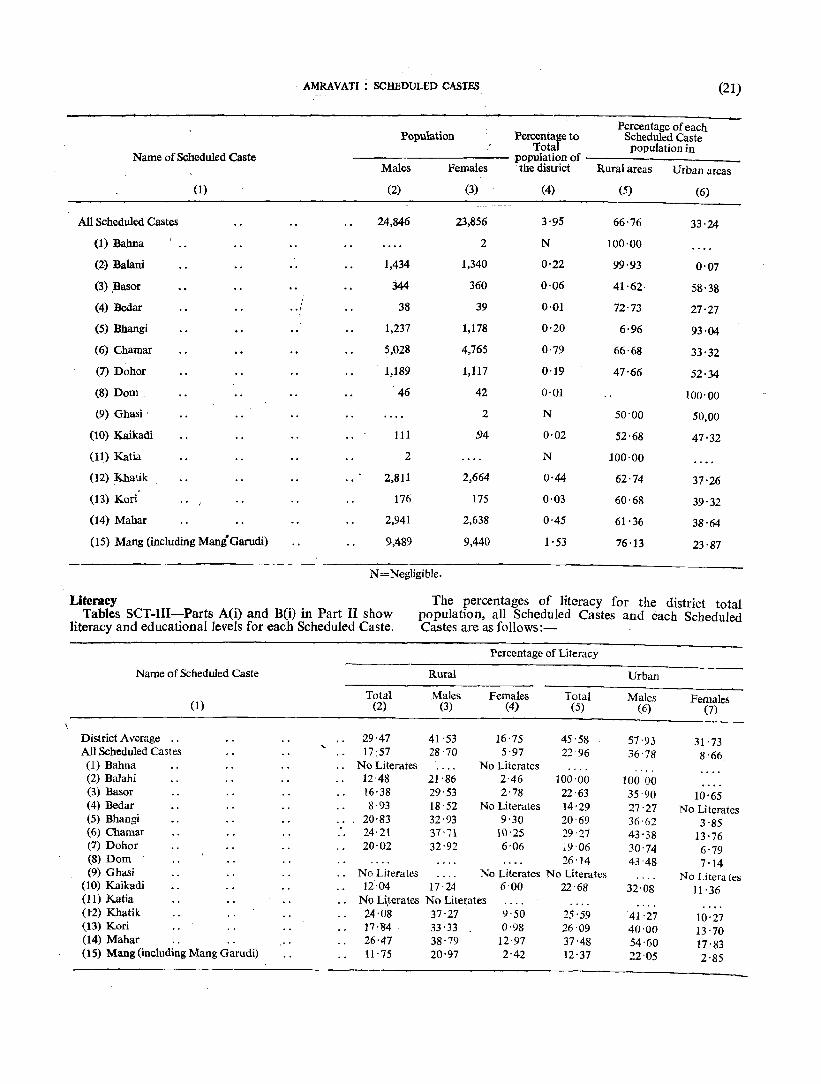
. AMRAVATI : SCHEDULED CASTES (21)
Population Percentage to Percentage of each
Scheduled Caste Total population in
Name of Scheduled Caste population of Males Females . the district Rural areas Urban areas
(1) (2) (3) (4) (5) (6)
All Scheduled Castes 24,846 23,856 3'95 66'76 33'24
(1) Bahna 2 N 100·00
(2) Balani 1,434 1,340 0'22 99'93 0'07
(3) .Basor 344 360 0'06 41'62· 58'38
(4) Bedar 38 39 0-01 72·73 27-27
(5) Bhangi 1,237 1,178 0-20 6'96 93'04
(6) Chamar 5,028 4,765 0-79 66'68 33'32
(7) Dohor 1,189 1,117 0-19 47'66 52-34
(8) Dom 46 42 0'01 100'00
(9) Ghasi 2 N 50'00 50,00
(10) Kaikadi 111 94 0'02 52'68 47'32
(11) Katia 2 N 100·00
(12) Khatik 2,811 2,664 0'44 62'74 37-26
(13) Kod 176 175 0·03 60'68 39'32
(14) Mahar 2,941 2,638 0·45 61'36 38'64
(15) Mang (including Mang'Garudi) 9,489 9,440 I-53 76-13 23-87
N = Negligible-
Uteracy Tables SeT-III-Parts A(i) and B(i) in Part II show
literacy and educational levels for each Scheduled Caste.
The percentages of literacy for the district total population, all Scheduled Castes and each Scheduled Castes are as follows:-
Percentage of Literacy
Name of Scheduled Caste Rural Urban
Total Males Females Total Males Females (1) (2) (3) (4) (5) (6) (7)
District Average -. 29'47 41'53 16·75 45'58 57 '93 31'73 All Scheduled Castes 17:57 28'70 5'97 22'96 36'78 8'66 (1) Bahna .. No Literates No Literates (2) Balahi 12-48 21'86 2'46 100'00 10000 (3) Bawr 16·38 29'53 2·78 22'63 35'90 10'65 (4) Bedar 8·93 18'52 No Literates 14'29 27'27 No Literates (5) Bhangi 20'83 32'93 9'30 20'69 36'62 3'85 (6) Chamar 24·21 37'71 10'25 29'27 43'38 13 '76 (7) Dohor 20·02 32'92 6'06 19'06 30'74 6'79 (8) Dom 26'14 43"48 7 -14 (9) Ghasi No Literates No Literates No Literates No Litera tes
(10) Kaikadi 12·04 17 ·24 6'00 22'68 32'08 11'36 (11) Katia .- N9 Li,terates No Literates (1-2) Khatik 24·08 37'27 9'50 25'59 41'27 10'27 (13) Kori 17·M· 33 '33 0'98 26'09 40'00 13'70 (14) Mahar 26·47 38·79 12'97 37'48 54'60 ]7'83 (15) Mang (including Mang Garudi) 11'75 20'97 2-42 12'37 22'05 2-85

(22) DIS1'R.ICT CENSUS IlANDBOOK
_ . The males of the Scheduled Castes are not very much behind in literacy.than the average male topulation of the district, Their females have, how~Vl , not lllade much progress. Nonetheless; .. the·· Scheduled Castes appear to be taking advantage of the educational facili-ties and concessions made available to them. Economic Activity
The industrial classification of persons at work and non-workers for the district average, all Scheduled Castes and for each Scheduled Casteis shown below:-
Percentage of workers in . categories
. Non-Cultivation Agricul- All other workers
tural ' activities labour
District Average _. 12-97 24'19 9'73 53'11
IAll Scheduled Castes 6'86 30'56 15'84 46'74
1. Bahna 100'00
2 •. Balahi 39'87 12'22 3'53 44'38
3. Basor 4'12 l' 71 48'15 46'02
4. Beda,r ., 32'47 !2'47 35-06
S. Bhangi 0'25 0'37 38'55 60'83
6. Chamar ., 9'19 25'68 16'45 48'68
7. Dohor 6'72 25'07 19·64 48 57
8. Dom 1'14 54'54 44'32
9. Ghasi 50'00 50'00
10. Kaikadi 1'46 17'56 40'98 40·00
11. Katia 50'00 50'00
12. Khatik .- 9'42 28'15 10'61 51'82
B. Kori 5'41 31-34 15'96 47'29
14_ Mahar 6.81 27'17 13-46 52'56 15. Mang (in- 1'19 43-31 14'45 41'05
cludingMa-ng Garudi).
The proportion of workers among the . Scheduled Castes is more th'an the average of the distri<;t. However, their. participation in the economic activity is more as agricultural labourers and other activities. The proportion of workers ib cultivation is lower' and that of agricultural labourers is higher than the district average. This is attribute<J to the association· of the Scheduled Castes with certain services as well as to a fewer persons cultivating their own lands amongst them. .
Size of Land Cultivated Tables C-I and SCT-Vl-Part A in Part II shows
a broad classification of cultivating sample households by size. of land cultivated for the district rural popUlation and all Scheduled Cas~ in rural areas, respectively. The proportions are as follows:-
Size of land cultivated
District rural population
All Scheduled Castes
No. of No. of sample !Percentage sample Percentage
households households All Sizes 21,623 100'00 2,494 100'00 ·Less than 5 acres 7,29 33- 47 780 31' 27 5-9'~acres 4,~2 22'90 586 23'50 10--29:9 acres .. 7,021 32'47 822 32'96 30 acreS and over.. 2,413 11'16 306 12'21
; Out -'of a sample of 21,623 cultivating housetlolds, 2,494 or about 11 .per cent households are from the Scheduled Castes in rural areas, as against their pOpulation, which is 3' 57 per cent of the total rural population of the district. 31' 27 per cen~ of the cultivating ho~holds of the Scheduled Castes are cultivating less than 5 acres of land agaiUst the corresponding average of 33 -47 per cent for the district. The percenfage of households cultivating land ove~, ~ acres among the Scheduled Castes is 68' 73 per cent as against the corresponding average of 66' 53 per cent for the distri,ct. Moreover, the size of holdings held by the Scheduled Castes in the district appears to be comparatively higher than the corresponding average of the district,
SCHEDULED TRIBES Table SCT-I-Part B in Part II shows the population tion of the district. Only Melghat tahsil is a notified
of Scheduled Tribes by each Scheduled Tribe separately. Scheduled Tribe area in the district under the President's Ten Scheduled Tribes Qut of 32 notified tribes of the Order. district are reported in the 1961 Census_ Thek total The distribution of the Scheduled Tribe population population is 54,881 or 4' 45 per cent of the total popula- . by rural and urban areas is as follows:---__,-
Name of SchedUled Tribe Percentage to Percentage of each Scheduled
Population total population Tribe population in of the district
(1r Males Females Rural areas Urban areas (2) (3) (4) (5) (6)
All Scheduled Tribes 27,765 27,116 4'45 99'87 0'13 (l~ Andh 2 1 N ;100'00 (2 Bhil 62 37- 0'01 . 100'00 (3) Bhunjia 5 1 N 50'00 50'00 (4) Binjhwar 4 3 N 100'00 (5) Gond 2,238 2,160 O' 36 ,:))'23 0'71 (6) Halba .. 15 4 N . 100'00 (7) Kawar 1 I N 100'00 (8)_Korku 25,402 .. 24,869 4'08 99'98 0-02 (9) Pardhan 29 31 N 100'00
(10) Pardhi 7 9 N 93'75 6'25
N-Neglia;ible.

AMRAVATI : SCHEDULED TRIBES (23)
The remaining 22 Scheduled Tribes for which no one was returned in the district in 1961 are as follows:-
(1) Baiga, (2) Bhaina. (3) Bharia-Bhumia, (4) Bhattra. (5) Birhul, (6) Dhanwar, (7) Gadaba, (S) Kamar, (9) Khairwar, (10) Kharia, (11) Kondh, (12) Kol, (13) Kolam, (14) Korwa, (16) Majhwar, (16) Munda, (17) Nagesia, (IS) Nihal, (19) Oraon, (20) Parja, (21) Saonta, and (22) Sawar.
Korku with 50,271 persons is the only predominant tribe in the district. Gond with only 4,398 persons is the next group. The remaining eight Scheduled Tribes together have a population of 212 persons which
. accounts for less than even 0' 1 per cent of the total population of the district. ! ,
The Scheduled Tribe popUlation in the district has increased from 35,039 in 1951 to 54,881 in 1961. No Scheduled Tribes were, however, reported from the
urban areas of the district in 1951. However, in 1961, their popUlation in urban areas is o· 02 per cent of the total urban popUlation of the district.
Literacy and Education
The Scheduled Tribes as a group are still in their tradit.iollal backwardness and lag much behind in literacy and education compared to general population and even the Scheduled Castes in the district.
Economic Activity
The proportion of workers among the Scheduled Tribes is more than that of the district. Their participation in economic activity is more as cultivators and agricultural labourers. About 95 per cent of the workers from Korku, the predominant tribe, are engaged in agricultural/activities and most of them work under cultivation.
WELFARE OF BACKWARD CLASSES
The subject of welfare of Scheduled Castes, Scheduled Tribes and other Backward Classes in the district is now in the purview of the Zilla Parish ad. In the membership of Standing Committee which is the most powerful committee of the Zilla Parishad at least two members from Scheduled castes, Scheduled Tribes and other socially and educationally' backward classes are required to be elected by the Parishad. This Standing Committee acts as the subject committee for that subject and the District Social Welfare Officer works under it. The Zilla Parishad is also legally required to spend adequate amounts for the amelioration of the c;ondition of the Scheduled Castes, Scheduled Tribes and of any socially and educationally backward classes and in particular for the removal of untouchability.
Various schemes for the welfare of Scheduled Castes, Scheduled Tribes and other educationally or socially backward classes are in operation in the district.
(1) Educational.-These include schemes of granting tuition fees at all stages of education irrespective of age and income, examination fees of recognised examinations and scholarships to the students from the Scheduled castes, Scheduled Tribes, Nomadic and semi-Nomadic tribes, Vimukta Jatis and the Backward Classes. The concession is awarded in the Primary Schools, High Schools or' Technical Schools, 4,966 students benefited from, and Rs. 171,081 were spent on these schemes during the year 1962-63 Rs. 83,784 were spent on 13 backward class hostels and 15 cosmopolitan hostels in the district during the year 1962-63. In addition to this expenditure, Rs. 2,28,831 were spent on educational activities in the Scheduled area of Melghat tahsil. 63 primary . and 3 middle schools were maintained. To encourage ed~cation among tribals free mid-day meals and school uni!0~s were also supplied. Three hostels were maIntained accommodating 70 hosteliers.
(2) Schemes for Economic Uplist.-These include schemes of granting loan-cum-subsidy for cottage industries and professions and of assistance for purchase of milch cattle to the Scheduled Castes and other Backward Classes. Under the scheme of Ioan-cum-subsidy for cottage industries and professions Rs. 5,250 were given to 29 beneficiaries from the Scheduled Castes and Backward Classes from und~r-developed rural areas during the year 1962-63 and Rs. 1,050 were spent on 5 beneficiaries under the scheme of assistance for purchase of milch cattle. This includes the expenditure of Rs. 2,250 spent for 16 beneficiaries for cottage industries and professions and Rs. 150 for one beneficiary for the purchase of milch cattle in the Scheduled area of Melghat tahsil.
(3) Drinking Water Wel/s.:_An amount of Rs. 43,S53 was spent under this Scheme. Out of this Rs. 40,353 were incurred for constnlction of drinking water wells in Scheduled area of Melghat tahsil.
(4) Medical Aid to Scheduled Tribes and Scheduled Castes.-Monetary aid is given to· the deserving persons belonging to the Scheduled Tribes and Scheduled Castes and Rs. 800 were spent during the year on 3 beneficiaries from Scheduled Tribes in the Scheduled area of Melghat tahsil.
(5) Agricultural.-Financial assistance is given to poor deserving agriculturists from Scheduled Tribes, Vimukta Jatis, under-developed rural areas and other backward classes to purchase ploughs, bullocks implements, seeds, carts, etc. Rs. 6,475 were spent on 56 beneficiaries under this scheme during the year 1962-63. Out of this Rs. 4,450 were spent on 29 beneficiaries in Scheduled area of Melghat tahsil.
(6) Schemes for removal of Untouchability.-These include various schemes of publicity against untouchability. Sanskar Kendras and Balwadis are organised, film shows and gatherings are arranged
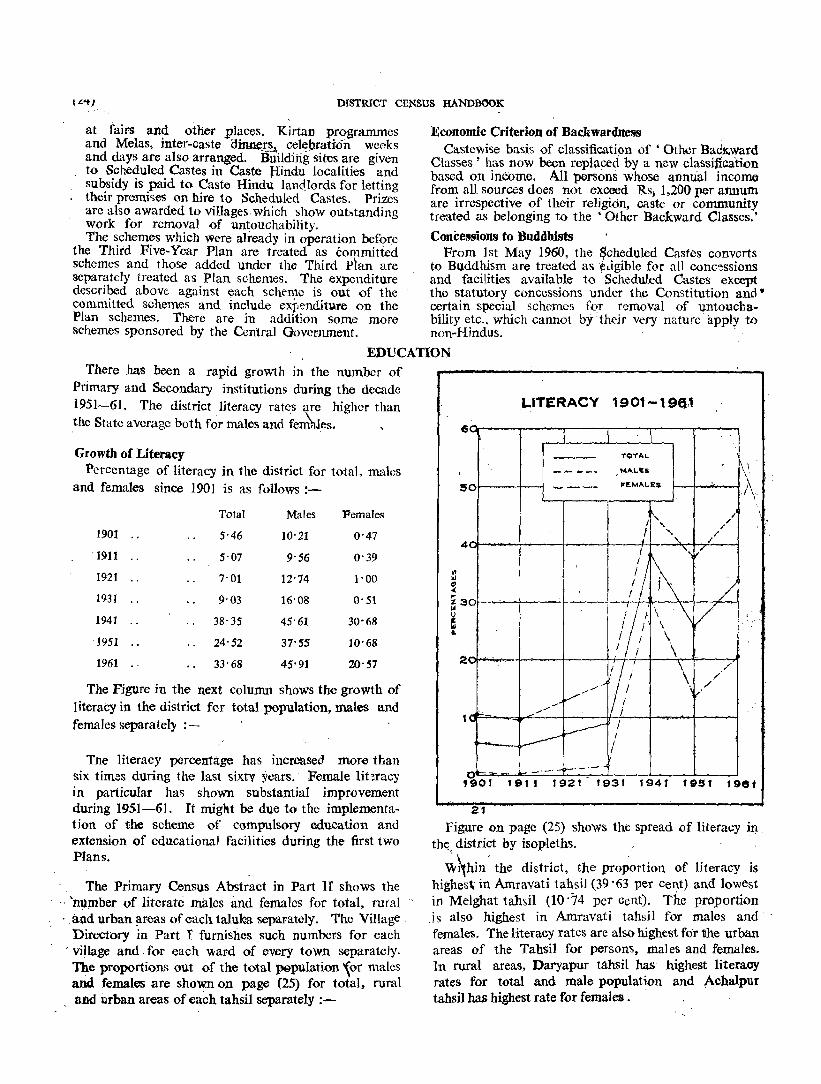
DISTRICT CENSUS HANDBOOK
at fairs and other places. Kirtan programmes and Melas, inter-caste Oinn~Xh cel~bmti6n weeks and days are also arranged. Building sites are given to Scheduled Castes in Caste fIindu localities and subsidy is paid to Caste Hindu lan(ilords for letting their premises on hire to Scheduled Castes. Prizes are also awarded to villages which show oubtanding work for removal of untouchability. ' The schemes which were already in operation before
the Third Five-Year Plan are treated as committed schemes and those added under the Third Plan are separately treated as Plan schemes. The expenditure described above. against each sche-IDe is out of the committed schemes and include ex~enditure oT,l the Plan schemes. There are in addition some more schemes sponsored by the Central Government.
Economic Criterion of Backwardness Caste'Wise basis of classificatibn of ' Other BaCKward
Classes' has now been rephtced by a new classincation based on income. All persons whose annual income from all sources does not exceed Rs, 1,200 per annum are irrespective of their religion, caste or community treated as belonging to the 'Other Backward Classes.'
Concessions to Buddhists From 1st May 1960, the $cheduled Castes converts
to Buddhism are treated as ~tigible for all concessions and facilities available to Scheduled Castes except the statutory concessions under the Constitution and· certain special schemes for removal of untouchability etc., which cannot by their very nature appJy to non-Hindus. ' '
EDUCATION
There has been a rapid growth in the number of Primary and Secondary institutions during the decade 1951-61. The district literacy rates are higher than
, \ ,LITERACY 1901-19EU
the State average both for males and females. ,
Growth of Literacy Percentage of literacy in the district for total, males
and females since 1901 is as follows !-
Total Males Females
1901 .. 5·46 10·21 0·47
'1911 .. 5·07 9·56 0'39
1921 7'01 12·74 1-00
1931 , - ( . 9-03 1{)-O8 o· 51
1941 38·35 45·61 30·68
'1951 .. 24·52 37·55 10·68
1961 .' 33·68 45·91 20·57
The Figure in the next column shows the growth of literacy in the district for total population, males and females separately :-_
Tne literacy percentage has increllseCl more than six tim~s during the last sixtv years.' Female lit~racy in particular ha~ shown substantial improvement during 1951-61. It might be due to the implementation of the scheme of compulsory education and extension of educational facilities during the first two Plans.
The Primary Census Abstract in Part II shows the " 'number of literate males and females for total, rural . ,and urban _areas of each taluka separately. The Village ,
Directory in Part I furnishes such numbers for each . village and, for each 'Ward of every town separately. The proportions out of the total ~pulation ~Qr males and. females are shown on page (25) for total. rural
. lUld urban areas of each tahsil separately :-
! TOTAL
-- -_ .. "'''Llts t\ 0 ~--.._ FI!:,.."I. E:S
I', ; / .-
! " I' .I
I
~" v
/1 -
0 /
t \ -\ V I \ I J \ I \ - -
4
t \\ / ;'
...... ~ / ..- v--v .... 1--, ..-.....
~ I ---- I ~ I
- _' ,-~'-'-' -
t 90 I , 9 1 1 192 t , 931 194 f 105 floe t
2'1
Figure on page (25) shows the spread of literacy in th~. district by isopleths.
~~hin- the district, the proportion of literacy is highes\ in Amravati tahsil (39 ·63 per cent) and lowest in Melghat tahsil (10 ·74 per cent). The proportion
,i s also highest in Amravati tahsil for males and females.' The literacy rates are also highest for the urban areaS of the Tahsil for persons, males and females . In rural areas, Daryapur tahsil has highest literacy rates for total and male population and ,AchaIpur tahsil has highest rate for females. '

, .. __ .
AMRAVATI: EDUCATION (25)
• 10 ,. 20 25 ao SII
Total State/District/Tahsil
Persons Males Females
(1) (2) (3) (.4)
MAHARASHTRA 29'82 . 42'04 16'76 ~RA VATI DISTRICT 33'68 45'91 20'57
Melghat Tahsil .. 10'74 17'40 3'75 2. Achalpur Tahsil 35'03 47'44 21'79 3, Morsi Tahsil 31' 35 43'15 18'90 4. Daryapur Tahsil, . 34'64 47'79 20-65 5_ Amravati Tahsil 39'63 52'45 25'50 ~- Chandur Rly_ Tahsil 30-65 42'91 17'75
Literacy by Age
The percentages of literates by age-groups for the district total, rural and urban areas are as follows.
Total Age-group
Persons Males Females
(l} (2) (3) (4)
All ages 33-68 45'91 20'57
0-4 5-14 45-80 52'59 38'71
15-34 46-20 63'96 27'74 ·35-59 30-50 48-21 9'22 60+ 18'54 34'23 2'48
Rural
Persons Males Females
(5) (6) (7)
21'46 33'51 9'34 29'47 41'53 16'75 10'06 16'56 3'27 32'47 44'76 19'44 29'38 41'14 17'05 33'41 46'81 19'23 31'62 44'61 17'81 29'14 41'25 16'43
Persons
(8)
51'07 45'58 46'86 41'26 39'24 39'17 50-58 42'90
i . I
1 {
Urban
Males
(9)
61'62 57'93 57'85 53'89 50'97 51'37 62-71 56'32
Females
(10)
37'90 31' 73 32'76 27'56 26'46 25'96 36'51 28-52
Actual figures are shown in Table~ C-III-A, Band C in Part II which also give figures for different educa-tionallevels separately:-
Rural Urban
Persons Males Females Persons Males Females
(5) (6) (7) (8) (9) (10)
29'47 41'53 16-75 45-58 57-93 31'73
42-51 50-02 34'73 55-20 59'83 50'26 39'61 57'67 21'64 63'09 78'89 44'69 26'11 43'12 5'78 43-59 63-25 19'60 15'83 29'96 1'25 26'97 47'71 6'24
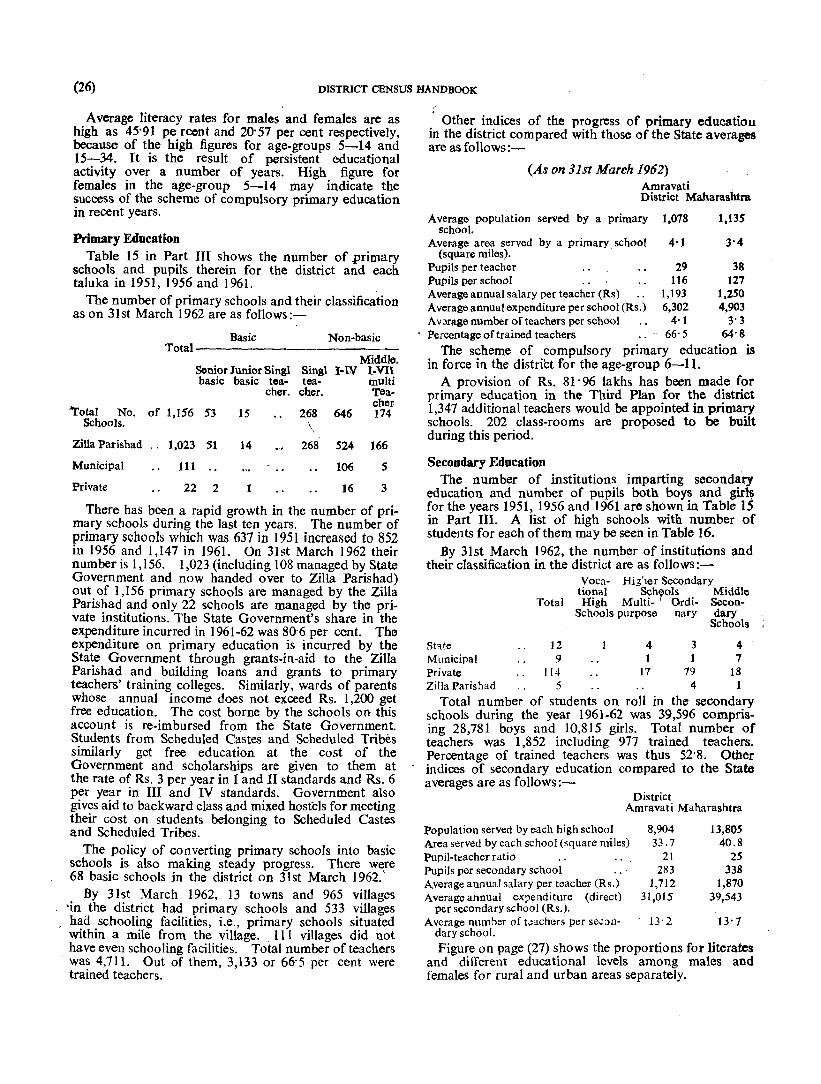
(26) DISTRICT CENSUS HANDBOOK
Average literacy rates for males and females are as high as 45'91 pe rcont and 20'57 per cent respectively, because of the high figures for age-groups 5-14 and 15-34. It is the result of persistent educational activity over a number of years. High figure for females in the age-group 5-14 may indicate the success of the scheme of compulsory primary education in recent years.
Primary Education Table 15 in Part III shows the number of .primary
schools and pupils therein for the district and each taluka in 1951,1956 and 1961.
The number of primary schools and their classification as on 31st March 1962 are as follows:-
Basic Non-basic Total
Middle. Senior JuniorSingl Singl I-IV I-VII basic basic tea- tca- multi
chel'. cher. Tea-
Total cher
No. of 1,156 53 15 268 646 174 Schools. \
Zilla Parishad .' 1,023 51 14 268 524 166
Municipal 111 106 5
Private 22 2 16 3
There has been a rapid growth in the number of primary schools during the last ten years. The number of primary schools which was 637 in 1951 increased to 852 in 1956 and 1,147 in 1961. On 31st March 1962 their number is 1,156. 1,023 (including 108 managed by State Government and now handed over to Zilla Parishad) out of 1,156 primary schools are managed by the Zilla Parishad and only 22 schools are managed by the private institutions. The State Government's share in the expenditure incurred in 1961-62 was 80'6 per cent. The expenditure on primary education is incurred by the State Government through grants-in-aid to the Zilla Parishad and building loans and grants to primary teachers' training colleges. Similarly, wards of parents whose annual income does not exceed Rs. 1,200 get free education. The cost borne by the schools on this account is re-imbursed from the State Government. Students from SchedUled Castes and Scheduled Tribes similarly get free education at the cost of the Government and scholarships are given to them at the rate of Rs. 3 per year in I and II standards and Rs. 6 per year in III and IV standards. Government also gives aid to backward class and mixed hostels for meeting their cost on students belonging to Scheduled Castes and Scheduled Tribes.
The policy of converting primary schools into basic schools is also making steady progress. There were 68 basic schools in the district on 31st March 1962.'
By 31st March 1962, 13 towns and 965 villages .. 'in the district had primary schools and 533 villages
had schooling facilities, i.e., primary schools situated within a mile from the village. . III villages did not have even schooling facilities. Total number of teachers was 4,711. Out of them, 3,133 or 66'5 per cent were trained teachers.
/
. Other indices of the progress of primary educatiou in the district compared with those of the State averages are as follows:-
(As on 31st March 1962) )\nlravati . District Maharashtra
Average population served by a prinlary 1,078 1,135 School.
Average area served by a prinlary, school 4'1 3'4 (square nliles).
Pupils per teacher 29 38 Pupils per school 116 127 Average annual salary per teacher (Rs) 1,193 1,250 Average annual expenditure per school (Rs.) 6,302 4,903 AVJrage number ofteachers per school 4'1 3' 3 Percentage of trained teachers " ~ 66' 5 64' 8
The scheme of compulsory primary education is in force in the district for the age-group 6-11.
A provision of Rs. 81' 96 lakhs has been made for primary education in the Third Plan for the district 1,347 additional teachers would be appointed in primary schools. 202 class-rooms are proposed to be built during this period.
Secondary Edllcation The number of institutions imparting secondary
education and number of pupils both boys and girls for the years 1951, 1956 and 1961 are shown in Table 15 in Part III. A list of high schools with number of students for each of them may be seen in Table 16.
By 31st March 1962, the number of institutions and their classification in the district are as follows:-
VOC;:t- Hig'ler Secondary
Total tional Schfols Middle High Multi- Ordi- Secon-
Schools purpose nary dary Schools I
State 12 4 3 4 Municipal 9 I 1 7 Private 114 17 79 18 Zilla Parishad 5 4 1
Total number of students on roll in the secondary schools during the year 1961-62 was 39,596 comprising 28,781 boys and 10,815 girls. Total number of teachers was 1,852 including 977 trained teachers. Percentage of trained teachers was thus 52'8. Other indices of secondary education compared to the State averages are as follows;-
District Amravati Maharashtra
population served by each high school Area served by each school (square miles) Pupil-teacher ratio Pupils per secondary school .. Average annual salary per teacher (Rs.) Average annual expenditure (direct)
per secondary school (Rs.). Average number of t~achers per se';;Jn
dary school.
8,904 33.7
21 283
1,712 31,015
13,805 40.8
25 338
1,870 39,543
Figure on page (27) shows the proportions for literates and ditferent educational levels among males and females for rural and urban areas separately.

umAVATI EDUCATION (27)
~gTERACY AND EDUCATIONAL LEVEL 1961
.. 42·07%
''-'''''Te:.R-A.'''~
{
'.59% 'fIi!tCHNICAL 6: NON·TI!.CHNtc:AJ.
PIPL,.OMAS,UNIVERSITYt <_ POSTt;;'RAOUATE; &,
TEC .... NICAt".. OEGR£~9
MAl,...E
69'46% ILLITEAAT6.-
0'9S% } frrIfATllllteULAT.Q,., ""IIrIO ABOVE
H 4""'''-3
URBAN
RURAl-
FEMAl..E
68"27% ....... 'TERATS'
Q'351-TECHNICAl.. & NON·"tECHNICA&.
OIPL.O""'AS~UNI\JERSITY ... POSTGRAOUATE .. ,
TECHNICAL. Ce;GREES'
FEMALE
83.26% I\"'LlTE'R ATE.
U'TERATE"':. WITHOUT EC1uCATIONAL. LEVEL.
!:
(28) DISTRICT CENSUS HANDBOOK
The progress of secondary education in the district has also been rapid. The number of secondary schools increased from 32 in 195()..51 to 57 in 1955-56 and to 116 in 1960-61. It stood at 140 on 31st March 1962. The secondary schools are located throughout the district. Melghat tahsil has two which is the smallest number in the district. Amravati tahsil has as many as 30 secondary schools.
Private bodies run about 81 per cent of the secondary schools in the district. The Government share in the total expenditure on secondary education (in 1961-62) is, however, 74·3 per cent. It is incurred through different schemes of grants for maintenance, salaries, buildings, building sites, equipment, free-ships, scholarships, loans etc., and special concessions to Scheduled Castes, Scheduled Tribes or other Backward class students.
Considering the rapid growth in the number of pupils in the primary schools, the number of pupils in the secondary schools, may rise to about 45,000 by 1965-66 and to 65,000 by 1970-71.
Higber S.S.C. and S.S.C. Examinations \ Vidarbha Board of Secondary Education, Nagpur,
conducts public examinations at the end of the secondary school course. Two examinations are held every year in March (or April) and October. Amravati Badne~a, Mozri, -Sirafgaon Band, Anjangaon-Surji: Dharm, Achalpur, Walgaon, Chandur, Daryapur Morsi, Karajgaon, Dhamangaon and Warud are th~ examination centres in the district.
S.S.C. Examinations
Examination held inMarch 1962 Octo ber 1962
Higber S.S.C. Examinations Examination held in
March 1962 October 1962
Higber Education
Appeared
4,374 955
1,206 268
Passed
2,489 426
727 99
Talukawise List of Colleges is given in Table 16 . in Part III along with the 1960-61 number of studentS for eac~ c.ollege. In 196.2-63, there were 13 colleges In the dIstnct. They proVIde education in Arts, Science, Commerce, Law, Agriculture, Ayurved, Teaching. There are two Government Diploma Training Institutes, one for men and other for women. There is also one Post-Graduate Basic Training College at Amravati.
The total number of college students was 4,684 in 1960-61. Out of the 13 colleges, only one, viz., Vidarbha Mahavidyalaya at Amravati is managed by Government: The remaining colleges are managed by private institutions and receive grants for maintenance, dearness allowance and buildings from Government.
Technical Education There are 10 institutions imparting technical educa
tion in the district, four of which are managed by Government. The Industrial Training Institute at Amra vati provides training. in the courses of blacksmith, car:penter, mechanical .draughtsman, electrician, electroplator, fitter, machinist, motor mechanic, radio mechanic moulder, painter and decorator, pattern maker, turner and welder. 323 students were under~ going training at this institute in 1964-65. The Kala Niketan, Amravati, imparts trainin_g in S.S.C. (technical) courses. 135 students are studying in this i1\stitute. The Government Vocational High School at Am_ravati, is training 138 students in carpentry, blacksmithy, leatherwork, tailoring and electrical engineering. The Industrial Training Institute, Chanda, is also temporarily located at Amravati.
The non-Government technical institutes in the district are Vanita Samaj Occupational Institute, Sharda Udyog Mandir, Maheshwari Mahila MandaI, Goteskar Shivankala Vidyalaya, Sharma Tailoring College and Jagadamba Kushtha Niwas. All these institutes are located at Amravati where 221 students are undergoing training.
Libraries There are 20 libraries in the district which are
recognised by the State Government. These libraries were sanctioned Rs. 2,649 as grant-in-flid during 1963-64. There is also one Government District Library at Amravati. All these libraries are under the control of the Deputy Director of Education, Nagpur.
Printing Presses, Journals and Newspapers There are 40 printing presses in the district. The
total number of journals and newspapers published is 16. Three are dailies, 8 weeklies, 3 monthlies and 2 journals.
Radio Licenses The number of radio licenses in the district has
increased ff<?m 1,594 in 1955-56 to 1,983 in 1960-61.
Cinema Theatres There are 18 permanent cinema theatres and 15 touring
talkies in the district as on 21st December 1963.
HEALTH AND MEDICAL AMENITmS
'}'he Health Department's work in the district is . ~ow in the purview of the Zilla Parishad. A Subject . Committee looks after its working and the District
lIealth Officer works as Secretary to that Committee as well as the Officer-in-Charge of Health activitieS in the district.
Drinking Water Supply Column (5) of the Village Directory in Part I shows
the sources and adequacy of drinking water for each village in the district.
138 villages draw drinking water from 22 villages from nallahs, 7 villages from
rivers, tanks,
AMRAVATI : HEALTH AND MEDICAL AMENITIES (29)
7 towns and 1,121 villages froi. wells and 6 towns and 321 villages have more than one of these sources of water. Drinking water supply is not adequate in 9 towns and 176 villages.
Malaria Eradication A Malaria Control Unit under the National Malaria
Eradication Programme was established for the district in 1953-54 with headquarters at Achalpur. This was to check spread of Malaria in Melghat tahsil. The spraying of DDT is done in the entire rural area along with free distribution ofpaludrin and quinine.
Anti-T.B. Campaign B.C.G. Vaccination Campaign was first introduced
in the district in 1954. Under this campaign a team is working both for Amravati and Akola districts.
For the treatment of T.B. patients, there is one Gopikrishna Ganeshdas Rathi T. B. Hospital at Amravati managed by the Government. There is'" also a T.B. Hospital with a provision of 50 beds attached to the Irwin Hospital at Amravati.
Leprosy Control There are four renowned institutions where leprosy
patients are treated. They are running four hospitals at Amravati, Kothara, Palasmandal and Kashikhed, respectively. There are also sub-centres at Warud, Daryapur, Tiwa, Morsi, Tivara, Anjangaon and Dharni. Nearly 15,000 patients (outdoor and indoor) are treated at these centres which provide isolation as well as some form of occupations to keep the patients busy in some sort of activities.
Family Planning Centres There are seven Government managed Family
Planning Centres at Anjangaon, Daryapur, Morsi, Warud, Talawet, Tivasa, and Chikalda, respectively. Besides, there are two centres rUll by private institutions viz., Vanita Samaj, Amravati and Guru Kunj Hospital, Mozri. These institutions receive grants from the Government.
Medical Facllities Medical Facilities available in the district are shown
in Table No. 17 in Part III. The figures in the Table relate to the facilities provided by Government and other aided institutions. The number of private practitioners, hospitals and dispensaries is not shown therein.
The number of doctors and nurses, number of beds available and the number of indoor and outdoor patients have all increased between 1955 and 1960. The number of doctors and nurses has increased from 51 and 10 in 1955 to 58 and 162 in 1960, respectively. The number of beds has increased from 335 in 1955 to 583 in 1960. The number of indoor patients has increased from 10,606 in 1955 to 17,498 in 1960. The number of outdoor patients has increased from 561,868 in 1955 to 735,396 in 1960.
Hospitals There were 19 hospitals in the district in 1960. Four
out of these are managed by Government. The district Hospital at Amravati is the main Government Hospital in the district. The other three Government Hospitals are Vidarbha Mahavidyalaya Hospital, Amravati, Badne-ra Railway Hospital and Gopikrishna Ganeshdas Rathi T. B. Hospital.
The remaining 15 hospitals are maintained by the Zilla Parishad and aided by the State Government.
Dispensaries In 1960, there . were 22 dispensaries in the d.istrict
in addition to one maternity home in the district.
Primary Health Centres The number of Primary Health Centres in the district
was 11 in 1960. Each centre had three sub-centres functioning under it,
The total number of persons working as physicians, surgeons, dentists, nurses, pharmacists and other medical and health technicians in the district is 2,182.
The persons returned in the 1961 Census as physicians surgeons and dentists and their classifications by se~ are shown in Table B-V in Part II. The number of medical personnel per one lakh popUlation in the district is 91 as against 54 for Maharashtra.
HOUSING
Tables E-I, E-U, E-IV and E-V in Part II present material on different aspects of housing in rural and urban areas of the district and each tahsil separately.
68 '11 per cent of the houses are used as dwellings, 16'84 per cent as cattle sheds, etc. 7'43 per cent were reported vacant at the time of Census and the remaining are used as shops, workshops or factories, schools, etc.
The density of residentia.I houses per sq. mile in the district has increased along with the density of popUlation per sq. mile from 47'0 in 1951 to 55'7 in 1961. Number of persons per residential house has also increased from 4'67 in 1951 to 4'71 in 1961. This may be an indication of tendency towards bigger families as well as decreased mobility of population from rural to ur ban areas.
Classified by "owned" and "rented" categories 79-68 per cent of the dwellings in the district are owned and only 20' 32 per cent are rented. The proportion of owned is higl;J.er (87' 74 per cent) in rural areas but lower (55 '49) per cent) in urban areas. Even this low proportion of 55' 49 per cent for the urban areas in the district is more than the average of 30' 28 per cent for all urban areas of Maharashtra.
Out of the various materials used for walls, mud appears to be predominant in the district with a proportion of 69' 66 per cent. Its proportion in the tahsil of Melghat is, however, lower and the difference is made up by grass, leaves, reeds, bamboos, etc. The use of mud is more in rural areas than in the urban, Its proportions are 79' 03 per cent in rural areas and 41 . 54 per cent
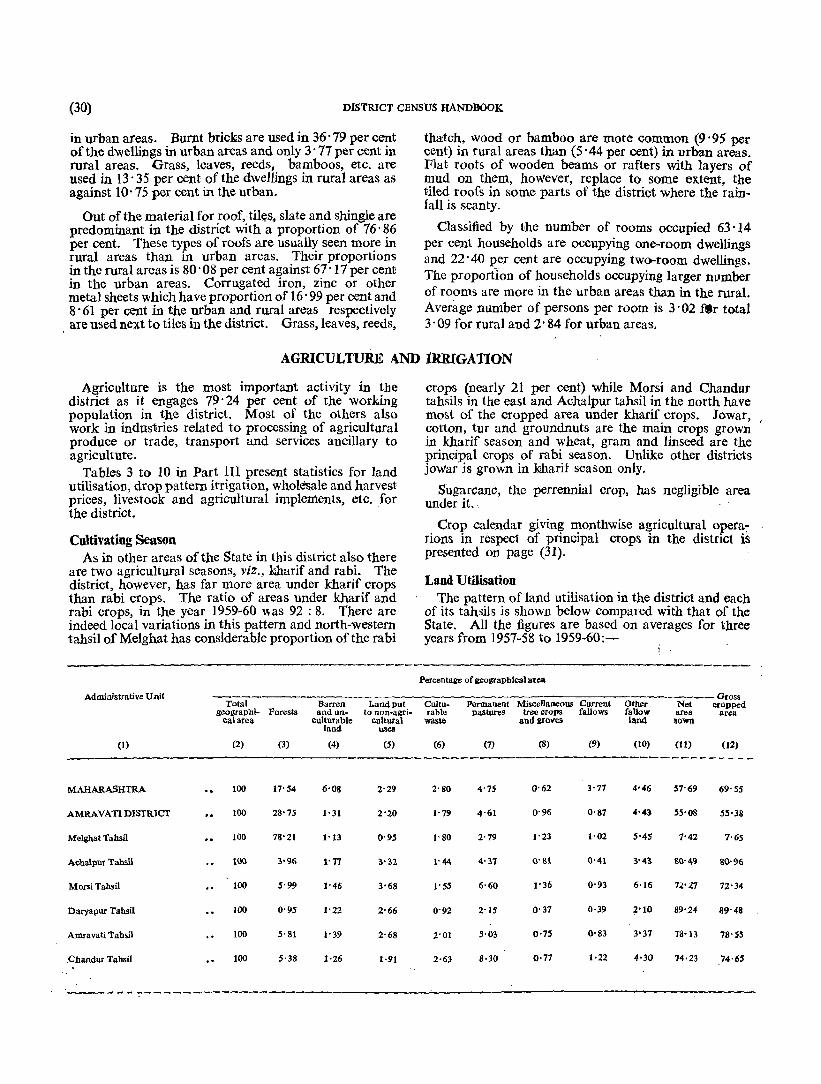
(30) DISTRICT CENSUS HANDBOOK
in urban areas, Burnt bricks are used in 36' 79 per cent of the dwellings in urban areaS and only 3' 77 per cent in rural areas. Grass, leaves, reeds, bamboos, etc. are used in 13' 35 per cent of the dwellings in rural areas as against 10' 75 per cent in the urban.
Out of the material for roof, ,til<;;s. slate and shingle are predominant in the district with a proportion of 76' 86 per cent. These types of roofs are usually seen more in rural areas than in urban areas. Their proportions in the rural areas is 80' 08 per cent against 67' 17 per cent in the urban areas. Corrugated iron, zinc or other metal sheets which ha ve proportion of 16' 99 per cent and 8' 61 per cent in the urban and rural areas respectively are used next to tiles in the district. Grass, leaves, reeds,
thatch, wood or bamboo are more common (9' 95 per cent) in rural areas than (5' 44 per cent) in urban areaS. Flat roots of wooden beams or rafters with layers of mud on them, however, replace to some extent, the tiled roofs in some parts of the district where the rainfall is scanty.
Classified by the number of rooms occupied 63'14 per cent households are occupying one-room dwellings and 22 -40 per cent are occupying two-room dwellings. The proportion of households occupying larger number of rooms are more in the urban areas than in the rural. Average number of persons per room is 3' 02 ~r total 3'09 for rural and 2' 84 for urban areas.
AGRICULTURE AND lRRIGATION
Agriculture is the most important activity in tbe district as it engages 79 -24 per cent of the working popUlation in the district. Most of the others also work in industries related to processing of agricultural produce or trade, transport and services ancillary to agriculture,
Tables 3 to 10 in Part III present statistics for land utilisation, drop pattern irrigation, whol~ale and harvest prices, livestock and agricultural implements, etc. for the district.
Cultivating Season As in other areaS of the State in this district also there
are two agricultural seasons, viZ" kharif and rabi. The district, however, has far more area under kharif crops than rabi crops. The ratio of areas under kharif and rabi crops, in the year 1959-60 ",as 92 : 8, There are indeed local variations in this pattern and north-western tahsil of Melghat has considerable proportion of the rabi
Administrative Unit Total Barrell Lalldput
geographi- Forests and un- to non·agri-calarell culturable cultural
land uses
(I) (2) (3) (4) (5)
MAHARASHTRA 100 17'54 6-08 2'29
AMRAVATI DISTRICT 100 28'75 1'31 2'20
Melgbat Tahsil 100 78'21 1'13 0'95
Acba\pur Tahsil 1oo 3'96 t'11 3'32
Morsi Tahsil 100 5'99 1'46 3'68
Daryapur Tahsil 100 0'95 1'22 2'66
Amravati Tahsil 100 5' 81 1'39 2'68
.Chandur Tabsil 100 5·38 1-26 1·91
----------~---~--
crops (nearly 21 per cent) while Morsi and Chandur tahsils in the east and Achalpur tahsil in the north have most of the cropped area under kharif crops. Jowar, cotton, tur and groundnuts are the main crops grown ' in kharif seaSon and wheat, gram and linseed are the principal crops of rabi season. Unlike other districts jowar is grown in kharit season only_ .
Sugarcane, the perrennial crop, has negligible area under it ..
Crop calendar giving monthwise agricultural opera:rions in respect of principal crops in the distnct is presented on page (31). .
Land Utilisation The pattern ofland utilisation in the district and each
of its tahsils is shown below compared with that of the State. All the figures are based on averages for three years from 1957-58 to 1959-60:-
Percentage of geographical area
Miscellaooous Current Gross
CuIIU- Permanent Other Net cropped rable pasture' tree crops fallows fallow area area
waste and groves land 301m
(6) (7) (8) (9) (10) (11) (12)
------------2'80 4'75 0'62 3'77 4-46 57-69 69'55
1'7~ 4'61 0'96 0'87 4'43 55-08 55'38
l' 80 2'79 1'23 1'02 5'45 7'42 7'65
l' 44 4'37 Q' 81 0'41 3'43 8\1'49 80'96
l' 55 6'60 1'36 0'93 6·16 n'}'7 72'34
0'92 2'15 0'31 0·39 2'10 89-24 89'48
2-01 5'03 0'75 0'S3 3'31 18'13 78'S5
2-63 8'30 0·71 t·22 4'30 74·23 74·65

AMRAVATI : AORICUL1'U;RE AND IRlUOA'FION (31)
Crop Calemltzr showing month-wise operations in respect of Principal Crops
Name of the crop
(1)
April
(2)
May
(3)
Agricultural Operations
June July August September
(4) (5) (6) (7)
Kharif Jowar " Preparatory tillage. Harrowing . . Sowing . . Top dressing and Hoeing. interculture.
~otton
Tur
Groundnut
Wheat
Gram
" Preparatory tilla;e Harrowing.. Sowing and basal applica-tion of farmyard manure.
· . Preparatory tillage. Harrowing. . Sowing
.. Harrowing and pre- Harrwoing.. Sowing paratory till\ige.
· . Preparatory tillage Preparatory and basal applica-, tillage. tion of farmyard. manure.
.. Ploughing
. . Interculture. Lop dressing and Spraying of interculture. insecticides and
hoeing.
. . Interculture. Top dressing and Hoeing and spray-interculture. ing of insecti
cides. . . Interculture. Earthing
Harrowing
Preparation of land.
Agricultural Operations Name of the
crop October November December January February March
(1) (8) (9) (10) (11) (12) (13)
Kharif Jowar Crop protection .. Crop protec- Harvesting .. Itarvesting and Threshing Uprooting jowar tion threshing stubbles and pre-
paratory tillage.
Cotton .. Cotton picking .. Cotton picking. Cotton picking. Cotton picking. Uprooting of cotton Preparation of stubbles. land.
Tur Harvesting .. Harvesting .• Uprooting tur Preparation of stalks. land.
Groundnut Harvesing Ploughing
Wheat · . Preparatory tillage Sowing Hoeilll and Crop protection Harvesting Harvesting and and sowing. weeding. threshing.
Gram .. Harrowing Sowing
The Figure on page (32) shows the land utilisation pattern for the year 1959-60 for the district and each tahsil separately.
The net area sown in the district is 55'08 per cent of the geographical area as against 57' 69 per cent for Maharashtra. Compared to the State averages, the district has considerably lower proportions of areas under barren and unculturable categories, culturable wastes and current fallows. The district proportion under forests is, however, about It times the State average.
'Within the district the proportion of net area sown to the geographical area range between 7' 42 per cent for Melghat tahsil and 89' 24 per cent for Daryapur tahsil. Melghat tahsil has 78' 21 per cent of the geographical area under the forests and as such the proportion of net area sown is very low. On the other hand
Crop protection Crop protection .. Harvesting.
Daryapur tahsil has very low proportion of areas under forests, culturable wastes and also fallow lands. In the eastern part sizable areas are under permanent pastures.
Because of changes in classification of land utilisation effected in 1950-51, it is not possible to determine if there has been any shift in the pattern of land utilisation over the last 40-50 years.
CropPattem The proportion of areas under the important food
and non-food crops for the district and each of its tahsils are shown on page (33) compared with the corresponding figures for Maharashtra State.
All figures are averages for 3 years 1957-58 to 1959-60.
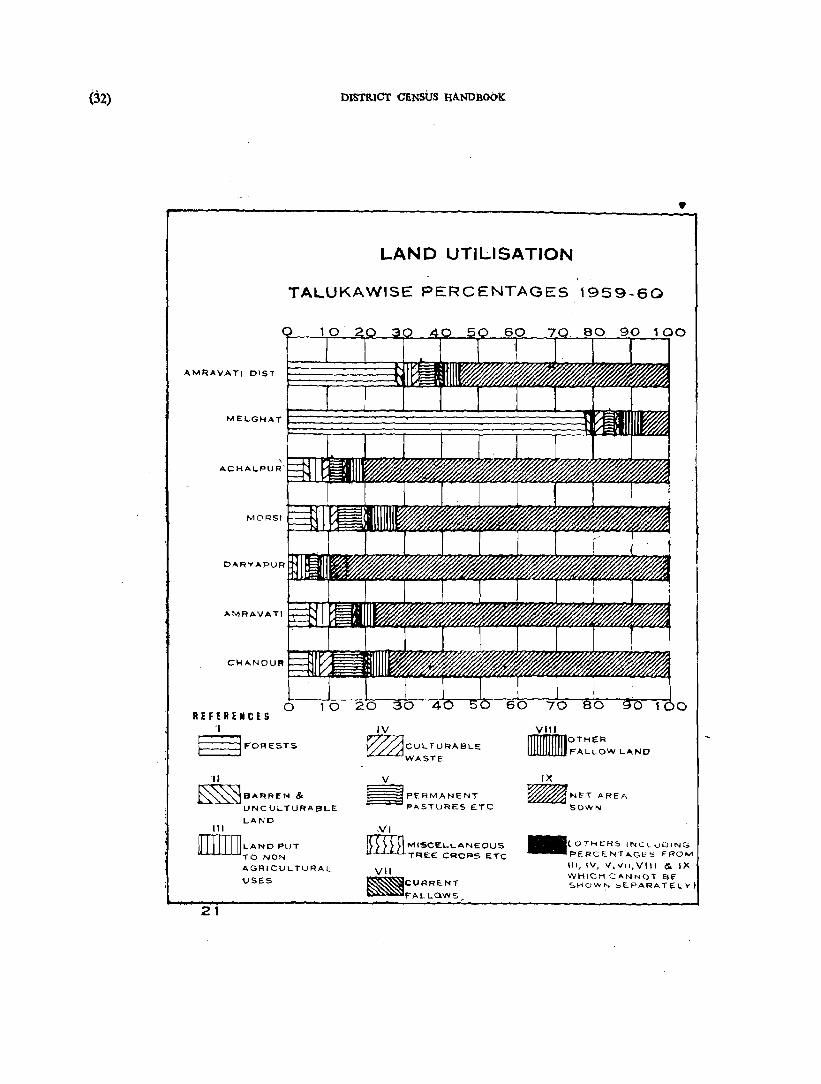
(32) DISTRICT CE.NSUS HANDBOOk
•
L.AND UTILISATION
TALUKAWISE PERCENTAGES 1959-60
AMRAVATI OIST
REFERENCES -I
SF'ORESTS
'11
~BARREN & UNCULTURABLE
III
[J]J]I]]I..ANO PUT TO NON AGRICUL'TlJ RA L
'USES
21
IV
~CULTURABLE WASTE
V
~PERMANENT PASTURES ETC
VI mIn MISCELLANEOUS TREE CROPS ETC
VII ~CURRr::NT ~PA1..LaW5
VIII
tIIII°THER
FALLOW L"NO
IX
~NET AREA
SOWN
o
•(OTHERS INCLUOING
PERCENTAGES FROM
III, IV, V,VII,VIII & 'X WHICH CANNOT SE SHCJWN "EPARATELV)

AMRAVATI = AORICULTURIlAND IRRIGAnON (33)
Detai~s of cropped area Maha- Amravati Melghat rashtra District Tahsil
(1) (2) (3) (4)
Gross cropped area .. 100'00 100·00 100'00
Total area under food crops .. 69'88 45·12 76'40
Area under cereals 52·97 34.27 55'94
Rice 6·67 0'83 14'94
Wheat 4.68 5'70 4'95
Jowar 30·95 26'41 25·94
Bajri 9·42 0'80 0,26
Other Cereals 1·25 0'47 9·85
Area under pulses 10'69 9'27 18·83
Sugarcane 0·63 0'01
Other food crops 5·59 1'57 1'63
Area under non-food crops .. 30·12 54'88 23·60
. Area under oil-seeds 8·18 4·10 5·13
Groundnut 6·11 3'09 0·11
Othel oil-seeds 2,07 1·61 4·42
Cotton 13'62 49'46 18·12
Tobacco Ool2 0·01
Other non-food crops incIud-ing fodder crops.
8'20 0'11 0'35
Figure at page (34) shows the crop pattern for the district and each tahsil separately.
The district has only 45' 12 per cent of the gross cropped area under food crops. This pattern is completely different from the average crop pattern of the State wherein food crops occupy 69' 88 per cent of the cropped areas. Cotton is the most important crop of the district covering half the gross cropped area. In fact, Amravati ranks first in acreage under cotton among all the districts of Maharashtra and covers little over eighth part of area of cotton in the State.
Jowar is the most important food crop of the district which accounts for 26' 47 per cent of the gross cropped area. Pulses with 9' 27 per cent of the cropped area rank next in importance. Wheat occupies 5' 70 per cent and is also an important food crop of the district. Compared to the State averages the district has lower proportion of all food crops except wheat. The district proportions of rice, bajri, other cereals and sugarcane are extremely poor.
Among non-food crops, more than 90 per cent of the area is covered by the prin<;ipal crop cotton. The remaining area is occupied mostly by oil-seeds. Groundnut is the important oil-seed of the district and nearly 3/4th of the area in that group is under it.
Achalpur Morsi Datyapur Amravati Chandur Tahsil Tahsil Tahsi1 Tahsil Tahsil
(5) (6) (7) (8) (9)
100·00 100'00 100·00 100'00 100'00
39'20 46·15 41·76 46·33 43'05
26'73 34·56 33.26 36'58 32'78
0·02 0'08 0'24 0'37
3.40 2·41 11·14 8·53 2'08
22-93 30·98 30·97 26'66 29'06
0·38 1.09 0·15 1·07 1'24
0'08 0'03
9·75 8'91 7·60 8·58 9·37
0'03 0·03
2·69 2'68 0'90 1·14 0'90
60'80 53.85 58·24 53·61 56'95
1·21 2'89 3·84 5·89 8'03
0'62 2·24 0·41 4·25 7'10
0'65 0·65 3·43 1·63 0'93
58'94 48·95 53'94 41.42 48·41
0·04 0'01 0·02
0·5; 2·01 0'45 0·34 0'51
The remaining area is covered by linseed, seasamum and others. Tobacco is grown to a negligible extent.
From 1951-52 to 1959-60 there is a slight decrease (from 50' 83 per cent to 45' 04 per cent) in the proportion of food crops to the gross cropped area and corresponding increase in the proportion of non-food crops. Amongst food crops, proportion of cereals reduced from 39' 35 per cent to 33' 96 per cent and the proporetion of pulses from 9' 91 per cent to 9' 47 per cent. The areas under rice and wheat have increased gradually but those under jowar and bajri have reduced to a considerable extent. The area under wheat has increased by 20,100 acres and the area under rice by 4,700 acres. Areas under fruits and vegetables, spices and condiments have also shown considerable increase. The area under different oil-seeds has fluctuated from year to year but cotton has recorded an increase of 1 . 49 lakh acres (or 22 per cent) in coverage during the decade.
Comparable statistics are not available for the entire district for years prior to 1951-52. The proportion of areas under different crops reported by District Gazetteer in 1907 were: Rice 0'24 per cent, wheat 4' 60 per cent, jowar 30' 33 per cent, tur 5' 80 per cent gram l' 29 per cent, Hnseed O' 56 per cent, cotton 49' 82 per cent, and sugarcane O' 01 per cent.
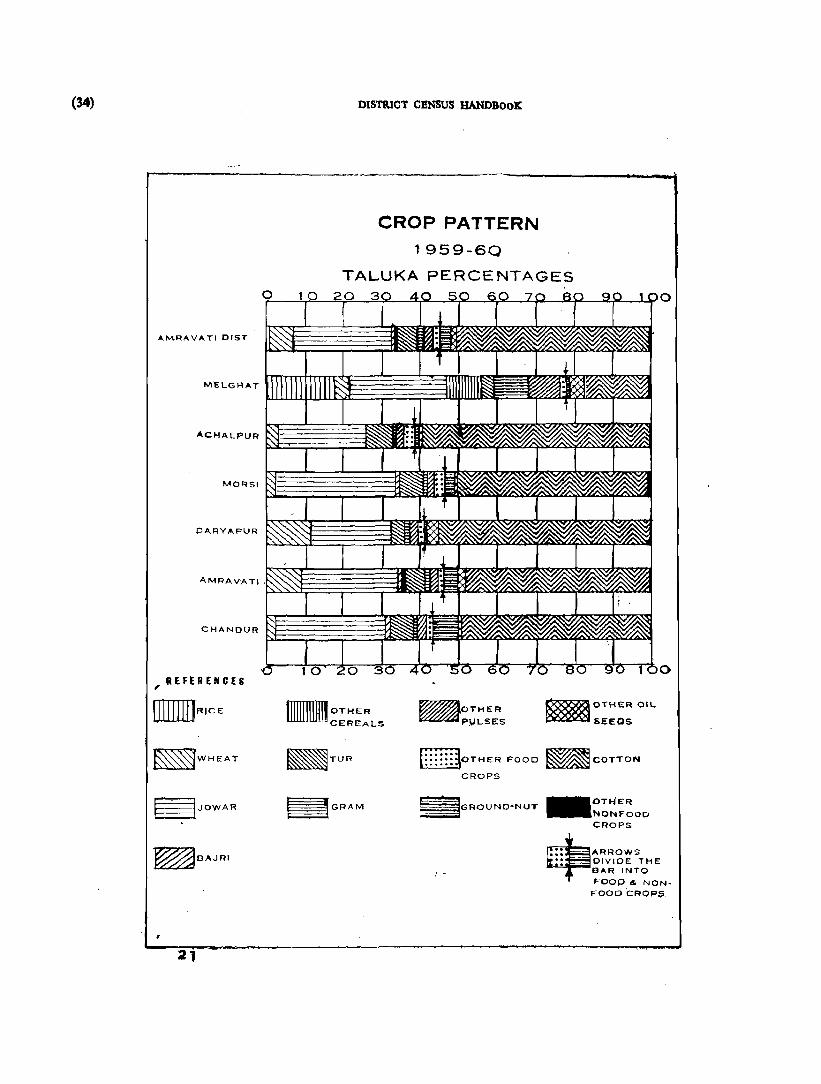
(34)
AMRAYATI DIST
MORSI
OARYAPUR
CHANDUR
, REFERENCES
_~ICE
~WHEAT
SJOWAR
~8AJRl
21
OISTR.ICT CENSUS BANOBooIC
CROP PATTERN
1959-6Q
TALUKA PERCENTAGES
IlIIIlIIIlllI 0 THE R CEREALS
~TUR
~GRAM
~OTHER ~P\JLSES
~OTHEROIL
~SEEDS
o
§OTHER 1"000 mCOTTON
CROPS
- GROUND-NUT
I'
_OTH"ER
NONFOOD CROPS
+ARROWS DIVIDE THE BAR INTO
FOOD'" NON.
FOOD CRO~~"
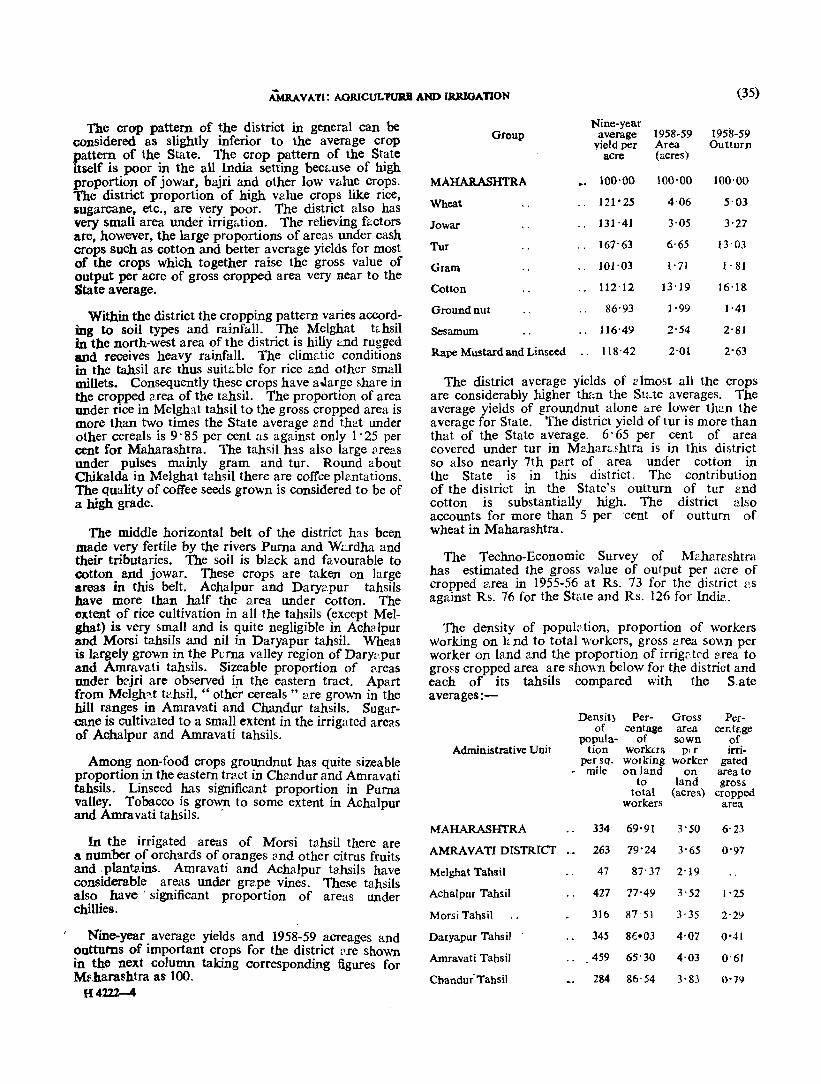
Ai.m.AVATl: AOlUCUL'PUlUI AND IlUUGAnON (35)
l'he crop pattern of the district in general can be considered as slightly inferior to the average crop pattern of the State. The crop pattern of the State itself is poor in the all India setting bec .. use of high proportion of jowar, bajri and other low value crops. The district proportion of high wlue crops like rice, iugarcane, etc., are very poor. The district also has very small area under irrigation. The relieving factors are, however, the large proportions of areas under cash crops such as cotton and better average yields for most of the crops which together raise the gross value of output per acre of gross cropped area very near to the State average.
Within the district the cropping pattern varies according to soil types and rainfall. The Melghat tc.hsil in the north-west area of the district is hilly and rugged and receives heavy rainfall. The clim<:tic conditions in the tahsil are thus suitable for rice and other small millets. Consequently these crops have aJarge share in the cropped area of the tahsil. The proportion of area under rice in Melgh:tt tahsil to the gross cropped area is more than two times the State average 2nd that under other cereals is 9·85 per cent as against only 1·25 per cent for Maharashtra. The tahsil has also large 8reas under pulses mainly gram and tur. Round about Chikalda in Melghat tahsil there are coffee plwtations. The quality of coffee seeds grown is considered to be of a high grade.
The middle horizontal belt of the district has been made very fertile by the rivers Puma and Wardha and their tributaries. The soil is black and favourable to cotton and jowar. These crops are taken on large areas in this belt. Achalpur and Daryapur tahsils have more than half the area under cotton. The extent of rice cultivation in all the tahsils (except Melghat) is very small and is quite negligible in AchaJpur and Morsi tahsils and nil in Daryapur tahsil. Whea~ is mrgely grown in the Pvrna valley region of DarY".pur and Amravati tahsils. Sizeable proportion of £fleas under b:::'jri are observed ip the eastern tract. Apart from Melgh'1t h~.hsil, " other cereals" are grown in the hill ranges in Amravati and Chandur tahsils. Sugaralne is cultivated to a small extent in the irrigated areas of Achalpur and Amravati tahsils.
Among non-food crops groundnut has quite sizeable proportion in the eastern trll.ct in Ch8.ndur and Amravati tahsils. Linseed has significant proportion in Purna valley. Tobacco is grown to some extent in Achalpur and Amra vati tahsiis. .
In the irrigated areas of Morsi tahsil there are a number of orchards of oranges and other citrus fruits and :planta-ins. Amravati and Achalpur tahsils have consldemble areas under grape vines. These tahsils also have I significant proportion of areas under chillies.
, Nine-year. average yields and 1958-59 acreages and outturns of Important crops for the district 2.re shown in t1~e next column taking corresponding figures for Mf.harashtra as 100.
H422l-4
Group
MAHARASHTRA
Wheat
]owar
Tur
Gram
Cotton
Ground nut
Sesamum
Rape Mustard and Linseed
· .
· .
· . .. ..
.. ..
Nine-year average
yield per acre
100·00
121·25
131·41
161·63
101'03
112·12
86·93
116·49
118·42
1958-59 Area (acres)
100·00
4·06
3·05
6·65
1·71
13'19
1·99
2·54
2·01
1958-59 Outturn
100'00
5·03
3·27
13·03
1·81
16·18
1·41
2·8J
2·63
The district average yields of C? Imost all the crops are considerably higher th,:n the Stl:;.te averages. The average yields of groundnut alone are lower th<:n the average for State. The district yield of tur is more than that of the State average. 6' 65 per cent of area covered under tur in Mahan..shtra is in this district so also nearly 7th part of area under cotton in the State is in this district. The contribution of the district in the State's outturn of tur end cotton is substantially high. The district also accounts for more than 5 per cent of outturn of wheat in Mabarashtra.
The Techno-Economic Survey of Maharashtra has estimated the gross value of output per acre of cropped area in 1955-56 at Rs. 73 for the district ~\s against Rs. 76 for the Sthte and Rs. 126 for Indi::.
The density of popUlation, proportion of workers working on h nd to total workers, gross area SO\\11 per worker on land and the proportion of irrigrtt'd area to gross cropped area are shown below for the district and each of its tahsils compared with the S.ate averages:-
Densit) Per- Gross Pcr-of centage area cente.ge
popula- of sown of Administrative Unit tion workers plr irri-
persQ. working worker gated . mile on land on area to to land gross
total (acres) cropped workers area
MAHARASlITRA 334 69·91 3·S0 6·23
AMRA VA TI DIsTRrcr 263 19·24 3·65 0·97
Mclghat Tahsil 47 87·37 2'19
Achalpur Tahsil 427 17·49 3·52 1·25
Morsi Tahsil 316 87 51 3'35 2'29
Daryapur Tahsil 345 8(;·03 4·07 0'41
Amravati Tahsil 459 65'30 4·03 0'61
Chandui Tahsil 284 86·54 3'83 0·79

(36) DISTRICT CENSUS HANDBOOK;
79' 24 per cent of the total workers in the district work on land. Of these 51' 59 per cent ar~ agricultural labourers as ag::.inst 23.80 per cent for MJ.h:lfashtra. Th~ propodon of workers working on land is mc.ch higher than the S:ate average (69' 91 per cent), The gross area sown p..:r worker on land in the district (3·65 acres) is also higher than the State average (3' 50 acres). Consequently the gross value cf agriculture produc~ion per worker on land in the district is also somewhat about the State average.
Wi:hin the district the proportion of workers working on lctnd to the' total working population ranges between 65'30 per cent for Amravati tahsil and 87' 51 per cent for Morsi tahsil. The proportion is low in Amravati tah:;il b~c:l.Use of large proportion of urban popuLl.tion. In all oth~r tahsils the proportion is higher than the State averag~. The gross a.rea Sown per worker on land ranges b~Lween 2 '19 acres in Mdghat tahsil and 4'07 <'.crcs in D_ryapur tahsil. More than 3/4th pJ.rt of M.!lgh3.t tahsil is under forests which leaves little area for cul~iv~.tion, The area sown per \\-orker on land is consequently low there. The gross area sown per worker on land is in general large in the southern pa.rt of the district.
Because of the very low proportion of irrigated lands and very hrge proportion of crops covering both kharif and rabi ~easons the proportion of net area sown more them once to the total net a.re:l sown in the district is considerably lower than the S~ate average. In 1959-60 the proportion w'~.s only O· 69 per cent as agdnst the State average of 5' 05 per cent. The proportion varies according to rainLll from year to ye::>.r. In 1950-51 the proportion was 0'34 per cent, in 1952·53 Q' 21 per cent, in 1955-56 0' 36 per cent and in 1957-58 O' 39 per cent .. The net area sown more th:).n once was brgest (12,600 acres or 0'76 per cent) in 1956-57. Within the district, the double cropped are2.S are very sm JI in all tahsils, except in Melghat which is having heavy rainfall and hilly 2.rea. In 1959·60, the proportion was 3' 75 per cent in Melghat tahsil and the same was 0'71 per cent in Achalpur and Amravati tahsils. In other tahsils it was less than O' 4 per cent.
Irrigation As in 1959-60 the proportion of gross irrigated area to
gross cropped area in the district (0'97 per cent) is . very poor compJ.red to the State average (6'23 per cent). The extent of irrigation is somewhat considerable in Morsi (2' 29 per cent) and Ach:llpur (I' 25 per cent) tahsil". The proportion is insignificantly low in baryapur, Amravati and Chandur tahsils. The hilly and rug~ed tahsil of Melghat. has no area under irrigation.
Table 4 in Part III gives the break-up of irrigated are2.S by sources of irrigrtion for the district and each tahsil separately. Excepting for a negligible proportion (1' 23 per cent) of net irrig?ted area which is irrig~.ted bY' canals, the entire irrig".tion is done by wells. Only Ach"lpur and Morsi tahsi1s have about 100 acres each
. under canal irrigation. In aU other tahsils weUs are . the only source of irrigation.
The net irrigated area has increased from 14,900 acres in 1950-51 to 16,200 acres in 1959-60, i.e. by 1,300 acres or 8' 72 per cent. The area irrigated by weUs has increased by 1,500 acres and about 100 additional acres have b~en brought under irriga.tion in each of the tahsils of AchCllpur and Morsi by Government cana.ls. In the year 1950-51 about 400 acres were irrigated by "oth~r sources", In tIle year 1959-60, however, there is no area under irrig9tion by " other sources ". Irrigated area has increased in AChalpur, Morsi and D.tryapur tahsils while it has decreased to some extent in Chandur and Amravati tahsils,
A recent but rem-'.rkable increase is also abserv~d hi the number of pumping sets, worked on oil engines and electric power, used for irrigation. The number of oil enjines which WCl.S 436 in the year 1951 increased to 1,078 in the year 1961.
There has been a considerable increase in the number of electric pumps during 1951-61. In 1961 there were 1,680 electric pumps in the district 2.5 2.g,>inst only 21 pumps in 1951. Morsi tahsil h'ld highest number of oil engines(577) and electric pumps (734) in 1961.
Crop Pattern un.Jer Irrigation Table 5 in Part III shows the crop pattern under
irrigntion, In the yeax 1959-60, 93'21 per cent of the irrig<'ted ~l.rea was under food crops 2nd only 6' 19 per cent under non-food crops. The bulk of the irrigted area (81' 48· per cent) wa.s covered by condiments, spices <'nd other miscella.neous food crops. Another 7'41 per cent were covered by whea.t. gra.m occupied 3' 09 per cent Rnd suga.rc:me l' 23 per cent. Among non-food crops 4' 32 per cent (,rea was covered by fodder crops 2nd cotto .. occupied 2'47 per cent. The proportion of irrigated are?s to total cultivated areas under different crops is : Wheat 1 '16 per cent, gram 2 '14 per cent, cotton O· 05 per cent and Jodder crops 8; 87 per cent. ' .
Production The annual outtum of principal crops in the district
is shown in Table 6 in Part III. The avera.ge produotion of food~r2.ins, groundnut and cotton from 1951 to 1956 and from 1956 to 1960 compares with the production of 1951-52 as follows:-
Average production in hundred tons during
Crop 1951-52 1951-56 1956·60
Rice 29 22 37
Wheat 150 153 182
Jowal 1,539 1,386 991
Bajri 28 26 18
Other cereals 7 7 12
Total cereals 1,753 1,594 1,240
Total pulses 750 515 ,.443
Total foodgrains 2,503 2,169 1,683
Groundnut 116 91 98
Cotton (io bales of 3921bs. each) 1,819 1,400 1,582
AMRAVATI: AGRICULTURE AND IRRIGATION (37)
Such a comparison i.e. taking single year as base may not be very much conclusive as the base year itself may perhaps be a very favourable or a very bad agricultural season. Nevertheless such comparison brings out the following very interesting results.
Compared to the production in 1951-52 the average annual production of foodgrains was lower by 13' 34 per cent in the First Plan period and was lower by 32' 76 per cent during the Second Plan period. Among cereals the production was particularly lower in case of jowar. The average annual production of rice during the First Five-Year Plan period was lower by 24'14 per cent than the 1951-52 production but during the Second Plan period it was higher by 27' 59 per cent. The average annual production of jowar during the Second Plan period was 35' 61 per cent lower than the 1951-52 production. There is substantial d(creas( in the average annua.l production of pulses also. The .average annual production of groundnut and cotton improved slightly during the Second Plan period over the average production in the First Plah period. It appears that 1951-52 was a good agricultural year.
Agricultural Implements
The number of agricultural implements for the district and for each of its tahsils for the year 1951, 1956 and 1961 are separately shown in Section C of the Table 9 in Part TIl.
The remarkable increase in the number of oil-engines and electric pumps for irrigation has already been Teferred to. Duri ng the deca de 1951-61, the number of wooden ploughs increased by 4,682 (or 17'18 per cent) and the number of iron ploughs by 4,366 (or 56· 61 per cent.). This is probably the indication of the suitability of iron ploughs to the tract. Both the typ~s togethel increased from 34,968 to 44,016, i.e., by 25' 88 per cent. The number of tractors which was 80 in 1951 increased to 205 in 1956 but again decreased in 1961 to 177.
By using standard average prices to the agricultural implements shown in Table 9 in Part ill the total outlay on them for the year 1961 may be estimated at Rs. 166 lakhs or Rs. 10'03 per acre of the net areas sown. . The agricultural implements not shown in the table may not together make more than Rs. 2 pe.r acre. The total outlay on this item in the district may approximately be presumed to be less than Rs. 12 per acre.
Agricultural Extension
Agricultural development in the district is now looked after by the Zilla Parishad. A SUbject Committee of the Zilla Parishad deals with it and the Agricultural Development Officer works as a Secretary 10 that Committee. There are Agricultural Extension Officers at tahsil level working under the Block Development Officers. The latter work as Secretaries to the Tahsil Samitis. Talatis and Gram Panchayat Secretaries work as Assistant Gram Sevaks.. Village Panchayats are expected to work for agricultural extension at the. village level.
Agricultural Researcb Two Ag'icultu"al Refearch centres have been esta
blished in the district to carry out experiments on different crops. One of them is at Amravati and the other at Achalpur.
The Agricultural Research Station at AChalpur was established in the year 1929. It has a farm area of 301' 33 acres. Research is conducted on cotton and jowar as principal crops and chiHies and groundnut as su bsidiary crops.
The Government Farm at Amravati, established in the year 1954, conducts experiments on cotton, jowar and groundnut. The fann has an area of 404'10 acres.
Agricultural Improvements (i) increasing the area under irrigation.-The most
important single item of increasing the agricultural production is increasing the area under irrigation. There is very little scope in the district for irrigation by way of major and minor irrigation projects. During the first two Plan periods stress was therefore laid on minor irrigation schemes like construction of bandharas, wells and tanks etc. Some of the minor irrigation schemes undertaken during the first two Plan periods were:-
(I) Pak Nala Project (irrigation potential 900 acres), (2) Pak Nala Project (irrigation potential 390 acres), (3) Damayanti Nala Project (irrigation potential 100 acres), (4) Jatam Zari Nala Project (irrigation potential 125 acres), (5) Dabheri Tank Project (irrigation potential 350 acres)-all in Morsi tahsil, (7) Pak Nala Project (irrigation potential 377 acres), Achalpur tahsil and (7) Kllrha Tank Project (irrigation potential 100 acres), Chandur tahsil. Construction of new wells and repairs to the old
ones is the quickest and cheapest way of increasing the irrigational potential though to a limited extent. Much stress is therefore laid on expanding this sector. Between 1951-52 and 1959-60 about 2,500 wells were constructed and about 1,100 wells were renovated. In addition about 650 pumping sets run on oil-engines and about 1,650 electric pumps were installed during the two Plan periods. The Third Five-Year Plan envisages construction of 1,600 wells and installat.on of 1,312 pumping sets.
With the increasing facilities for irrigation the question of full utilisation of the created potential is likely to assume importance. Statistics of the available potential and current actual utilisation are not, however, available for the district separately.
(i) Improved Seeds.-Another item of improving food production is the recommendation of appropriate varieties or strains of crops suitable for the tract. Agricultural Development has recommended the following improved varieties or strains of crops for the district:-
(1) Rice (2) Jowar
(3) Wheat
(4) Gram (5) Groundnut ... (6) Cotton
No. 22 and No. 27. Improved Saoner, Improved
Ramkel. Jay (Bansi palli-808) Hy.
65-A. Chafa. A. K. 12-24, Upati. A. K. 235 ; Buri L-147.
(38) DISTRICT CENSUS HANDBOOK
Seed farms have been established at 10 places in the district to provide improved seed to farmers. The combined area of all the seed farms is 565' 70 acres.
(iii) Soil Conservation or Bunding.-During the first two pl<.n periods an area of about 27,000 acres has been bunded. In the Th' rd Plan it is estimated that an area of O· 58 lakh acres will be brought under improvement by construction of bunds which will involve an outlay of Rs. 30' 80 lakhs. .
Livestock
The number of livestock for the year 1951, 1956 and 1961 has been shown separately for each tahsil and the district in Table 9 in Part III.
The total livestock as per 1961 Livestock Census in the district is 7' 83 lakhs. This constitutes 47 livestock per 100 acres of cultivated area. The corresponding figure for the State is 139.
The total bovine population in the district in 1961 is 74' 35 per cent of the total livestock. The number of male bovines over 3 years is l' 89 lakhs. The area cultivated per pair of male bovines over 3 years is thus, 17' 67 acres as against 5' 48 acres for'the State. There are 1 . 96 lakhs female bovines over 3 years in the district. That makes 159 female bovines over 3 years, per 1,000 population in the district. The State average is also 159.
During the first half of the decade 1951 to 1961 there was a considerable increase in the number of livestock. However, during the latter half (1956-61) there was some reduction in each type of livestock with the result that on the whole there has been an overall increase of only 15'41 per cent in the total livestock during the decade. Increase is observed in all types of livestock except horses and ponies and other livestock." The number of cattle and buffaloes increased by 8' 96 per cent and 7' 36 per cent respectively. During the s<..me period, the increase in number of sheep and goats is 73' 36 per cent and 44' 21 per cent, respectively. The number of horses and ponies decreased to even less than half. The number of ponies livestock decreased by 15' 31 per cent during the decade. The number of poultry has multiplied more than twice during the decade.
Veterinary Facilities There are 11 full-fledged veterinary dispensaries
located in the following places in the district:-(I) Daryapur, (2) Morsi, (3) Achalpur, (4) Chandur ..
(5) Chikalda, (6) Anjangaon, (7) Warud, (8) Dharni, (9) Tivasa, (10) Amravati and (11) Amravati Camp.
In addition to this there are 55 veterinary aid centres located at 41 different places in the district. Treatment of animal diseases, control of epidemics, castration of scrub bulls, and control and destruction of animal parasites are the main services rendered at these dispensaries.
Majority of cattle found in the district are of nondescript type. Khamla breed of cattle are observed to a small extent in the hilly western areas and Gaolao breed in plain areas adjoining Wardha District. The type of buffaloes in the district are of 2 strains. The Puma-thadi type are seen in Daryapur tahsil, AnjangaonSurji and part of Achalpur. Nagpur breed dominates in the rest of the district. Both these types are noted for milk rich in fat contents.
For upgrading the local breed, two cattle breeding farms have been established at (1) Pohra and (2) Bod. The Pohra farm has maintained animals of Hariana and Gaolao breed. The Cattle Breeding Farm at Bod has animals of Nemadi breed. Selective breeding in Nemadi cattle is taken up in this farm.
For development of livestock, the District Artificial Insemination Centre has been established at Amravati with sub-centres at Morsi, Tivasa and Warud. Under the Key Village Scheme, breeding bulls are located for selective breeding at the 7 key village centres. The cattle development work is also taken up through the Gorakshan Sansthas at Amravati and Mozri. ,
A sheep breeding farm has been ~stablished at Pohra for development of sheep in the! district. Improved quality of sheep are distributed to shephards for rearing and increasing wool production. A wool utilisation centre has also been established to produce woollen articles.
There is a District Poultry Breeding Farm at Amravati and Poultry Demonstration Centres at Achalpur, Tivasa and Warud. Birds and eggs are distributed to the interested persons for upgrading the local poultry flook.
AGRARIAN STRUCTURE AND LAND REFORMS
District of Amravati is one of the four Berar districts in which occupancy tenure has been in existence prior to the adven~ of the British. The Khatedar, i.e., the occupant, now known as Bhumiswami held the land directly from Government on payment of land revenue.
Till 1948, there were 44 Jagir Inam and 3 lzara (leasehold) villages, but the right of the Jagirdars to hold the lands of the village with an exemption from the payment of full assessment, and of the Izaradar to hold the lands of the Izara villages on payment of fixed lzara amounts was taken away by Government
by enacting the Central Provinces and Berar Revocation of Land Revenue Exemption Act, 1948.
The proprietary rights of the Jagirdars and Izaradars in respect of the Inam or Izara villages were abolished under the Madhya Pradesh Abolition of Proprietary Rights (Estates, Mahals and Alienated Lands) Act, 1950.
All the lands of the district are now held, on Bhumiswami or Bhumidhari tenures, which are a~alogous to the occupancy tenure.

AMltAVATI : AGRARIAN STRUCTURE AND LAND REFORMS (39)
Record of Rights A Record of Rights in land is maintained by the
Revenue Department for each village separately. It is integrated with annual crop returns and inspections and is, therefore, easily maintained up to date. Rights on land in respect of ownership, tenancy, mortgage and other encumbrances are recorded and a form is maintained for each parcel of land separately. It is obligatory on every person acquiring any right on land to report it within three months. Annual Revenue accounts are prepared on the basis of the Record of Rights.
Ownership Rights to Tenants Tenancy rights are regulated under the Bombay
Tenancy and Agricultural Lands (Vidarbha Region) Act, which is in force since 1958. It provides security of tenure to and payment of only reasonable rents by the tenants.
In pursuance of the" Land to the Tiller" policy, the Act provided for compulsory transfer of ownership rights of tenanted lands to the tenants from 1st April 1961, which is known as the "Tiller's Day". This was an important step towards the removal of absentee landlordism which was one of the disincentives in any programme of agricultural improvement.
" Up to 31st March 1964, ownership rights have been conferred upon 33,678 tenants for 227,533 acres of land in the district. In three cases the revenue officers settled the price.
Size of/Land Holdings
Census Table B-X in Part II shows that 45·78 per cent of the total number of households cultivate land and the remaining 54·22 per cent do not cultivate any land.
Census Table B-XI in Part II shows the break-up of cultivating households by size of land cultivated and by the interest in the land. 81· 42 per cent of the cultivating househlods cultivate their owned lands only. 5' 24 per cent of the households cultivate tenanted lands only and the remaining 13· 34 per cent cultivate lands partly owned and partly taken on lease. Percentage distribution of CUltivating households by the size of land cultivated is shown below.
The distribution of households in Table B-XI and the same shown in percentage in column 2 below is based on cultivation (operational) holdings as returned in the 1961 Census.
A classification of holdings on the basis of area owned against the area cultivated for the year 1952-53 is shown in table 10 in Part III. The percentage distribution of ownership holdings is also shown in column 3 below:
Area
Less than 1 acre 1 to 4·9 acres 5 to 9' 9 acres
10to 14· 9 acres 15 to 29' 9 acres 30 to 49' 9 acres 50+ acres
H 4222-5
1961 1952-53 cultivation ownership
holdings holdings 0'98 10'84
32'56 42·19 22· 92 19· 99 13'45 9'06 18'62 10'23 6'82 3'92 4' 65 3.' 77
Total.. 100'00 100'00
The average size of cultivation holding in the district in 1960-61 is 13 79 acres. Average size of the ownership holding in the district and the State was 11 95 in 1952-53.
Ceiling on Holilings of Agricultural Land
The Maharasht,a Agricultural Lands (Ceiling on Holdings) Act came in force from 26th Ja'1Uary 1962. Six local areas, viz., Daryapur, Amravati, Morsi, Chandur, Melghat I and Melghat II have been notified in the district with different ceiling areas for dry crop land, viz., 78, 84,96,114, 114 and 126 acr .s, respectively. In the case of irrigated lands, the ceiling area in all the 6 local areas is the same, viz., 18 acres in the case of perennially irrigated areas, 27 acres in area irrigated in two seasons, and 48 acres in areas which get irrigation water for one season only. Holders of land in excess of the ceiling areas are not now free to transfer or partition any land until the land in excess of the ceiIihg is determined under the Act. They were required to furnish returns of their holdings to the Collectors. The Conectors are to make enquiries to determine the surplus lands and take them over in possession. Those lands shall afterwards vest in the State Government. The Act also provides for payment of compensation to the holders at specified rates and for distribution of surplus lands to landless or other persons in the prescribed order of priority. At the moment, the enquiries to be made by the Collectors are in progress.
Consolidation of Holdings
The provisions of the Bombay Prevention of Fragmentation and Consolidation of Holdings Act, 1947, were applied to the district in 1960 and work of consolidation of holdings was started in the same year in Amra vati tahsil. The scheme is to arrange mutual exchange of small and scattered fragments of holdings and to make the land holdings as compact as possible. Up to the end of March, 1963,9 villages have been completed covering an area of 9,030 acres with 1,186 holdings. The work is suspended since October, 1962.
The standard areas specified as minimum necessary for profitable cultivation under the Prevention of Fragmentation and Consolidation of Holdings Act are as follows :-
(i) Dry crop land
(ii) Bagait land
2'00 acres.
0'25 acres.
All plots of land less in area than the standard area are treated as fragments and their transfer, ~xcep.t
to holders of contiguous plots, is prohibited.
(40) DISTRICT CENSUS HANDBOOK
CO-OPERATIO~
Administration
The Deputy Registrar of Co-operative Societies is in charge of the Co-operative movement in the district, He is assisted by two Assistant Registrars who have territorial jurisdiction and deal with all the aspects of the Co-operative movement in the district, In addition an Assistant Registrar works under the Zilla Parishad, He carries out the duties of registration, deciding appeals against non-admission of members, r.ppr6val to bye-iaws and administrative supervision in respect of Co-opertive Societies whose working capital does not exceed Rs, 51akhs and whose jurisdiction does not extend beyond the district., The Zilla Parishad also looks to the promotion and extension of Co-operative movement in the district.
The Co-operative movement though originated in the second decade of the century lacked popular enthusiasm till attainment of independence,· Since the intrduction of Five-Year Plans ~d with emphasis on development of rural areas, concentrated efforts were made during the last decade which have resulted in a rapid progress in the Co-operative movement in the district. Nearly 95 per cent of villages in the district are noW covered by rural Co-operatives. Besides agricutural credit, the activities are now extended to processing of agricultural products, dairying, farming, marketing, fisheries, etc.
The following description is based on the report for the year j 960-61.
Co-operat!ve Credit
(a) Agricultural Credit Societies.-The number and membership of Agricultural Credit Societies have incre<Jsed at a rapid pace during the last decade especially during the Second Plan period.
The position of Agricultural Credit Societies in 1950-51 arid 1960-61 is as follows:-
1950-51 ,1960-61
(1) Number Societies.
of Agricultural Credit 595 641
(2) Number of members 11,418 51,349
(3) Share Capital (Rs. inlakhs) 1'21 31' 82
(4) Reserve and other funds (Rs. in lakhs) 2-25 8'92
(5) Working Capital (Rs. in lakhs) 20'01 179-62
(6) Number of members to whom loan 9,203 40,478 was advanced.
. (7) Amount advanced (Rs: in lakbs) .. 16·37 145'16
(8) Amount recovered (Rs.in lakhs) .. 14-89 116'05
(9) Loans outstanding (Rs. in lakhs) 15'03 143'38
(10) Overdues .'. (Rs.in lakhs) 2'16 38'57
Average membership per primary society in the district is 79 against the average of 96 members fOl Maharashtra. 94' 82 per cent villages in the district have been covered.
Total o:wned fund~ (Share capital plus reserve funds) of the Pnmary Agncultural Credit Societies in the district amounted to Rs. 40' 74 lakhs in 1960-61 and formed 23 per cent of their working capital against 26 per cent for the State. ,
The loan operations of ~alI the Primary Agricultural Societies in the district amounted to 145 '16 lakhs in 1960-61. The average amount of loan per borrowing member in the district worked out to Rs. 359 as against Rs. 329 for the State.
During the decade 1951-61, the number of the Agricultural Credit Societies has not increased significantly but memberShip has multiplied 4i times. Their share capital increased by Rs. 30'61 lakhs and the working capital has flared up from Rs. 20)akhs in 1950-51 to Rs. 180 lakhs in 1960-61. There' is also an inGrease of Rs. 128 '79 lakhs in the amount advancedas loa~s by the sdCieties in 1960-61 over the' amount advanced in 1950-51.
The proportion of overdlles to outstanding loans is however, high.
(b) Central Co-operative Bank.-During the year under report, there were 4 Central Co-operative Ban~s working independently at (1) Amravati, (2) Achalpui-, (3) Morsi and (4) Daryapur. The Amravati Central Bank had 5 branches, Achalpur Bank had 3 and Morsi and Daryapur Bank had one b~anch each. These four banks were amalgamated into one Bank on 26th January 1962 and is since known as" The Amravati District Central Co-operative Bank Ltd.". The Bank has been working as a federal financing agency catering for credit requirements of all the primary credit societies in the district. Since 1962, the Zilla Parishad also transacts its financial business through this Bank.
In the year 1960-61, the position of the bank was as follows:-
(1) Numberofrnembers-
(a) Individuals (b) Societis
(2) Paid up share capital (Rs. in lakhs)
(3) Reserve and other funds (Rs. in lakhs)
(4) Deposits-:-
(a) Individuals (Rs: in lakhs) (b) Societies and Banks (Rs. in lakbs)
(5) Borrowings-
1,954 108
26'42
11'42
30'40 30'99
(a) State Co-operative Banks and the Reserve Bank of India (Rs.inlakbs) .. 102'50
(b) Government (Rs. in lakhs) O' 97 (c) Other Sources (Rs. in lakhs) l' 95
(6) Working Capital (Rs. inlakhs) ., 204'65
AMRAVATI : CO-OPERATION (41)
(7) Cash-(a) Onhand (b) At Banks
(8) Investments-(a) Government and other
(Rs. in lakhs) (Rs. in lakhs)
Trustee securities (B.s. in lakhs)
(9) Percentage of cash in hand to deposits (10) Percentage of investment to deposits
11'73 21'46
20'43 19'11 33'28
(11) Loans outstanding-(a) Individuals (Rs. in lakhs) 1 . 27 (b) Societies (Rs. in lakhs) 149'63
(12) Percentage ofloans outstanding to deposits . . 245' 81 (13) Percentage ofloans outstanding to working capital 73' 74 (14) Overdues (Rs. in lakhs) 33 '16 (15) Percentage of overdues to loans outstanding . . 21 ·97 (16) Cost of management .. (Rs. in lakhs) 3 '09 (17) Percentage of cost of management to working 1'51
capital. . (18) Profit (B.s. in lakhs) (19) Number of branches and pay offices in the district
1'95 14
The society membership of the. Bank increased by 3'66 per cent as compared with t~ last year 1959-60; but the individual membership has fallen down by 227 members. On the whole there has been a very small drop in the total membership of the Bank. The share capital of the Bank has however increased by 50' 54 per cent and there is an addition of Rs. 9' 71 lakhs in the owned funds. There is also an increase of Rs. 29' 40 lakhs in the working capital. The Bank advanced loans of Rs. 223' 21 lakhs as against Rs. 123 '18 lakhs in the previous year. On the side of recovery also there seems to be some improvement and the proportion of overdues to outstanding loans has reduced to 21'97 per cent from 42 per cent in the previous year. The Bank made a profit of Rs. 1 '95 lakhs during the year as against a profit of Rs. 1 . 37 lakhs in the previous year.
(c) Land Mortgage Bank.-Primary Land Mortgage Bank was established at Amravati in the year 1933, with a view to providing long-term finance to the cultivators. The membership of the Bank, is 1,936, paid-up share capital Rs. 32 thousand and working capital Rs. 6'85 lakhs. Loans amounting to Rs. 3'41 lakhs were advanced during the year. The Bank collected an amount of Rs. 84,100 towards Rural Debentures floated by the State Land Mortgage Bank. Recently the Tagai Loans are diverted through the Land Mortgage Bank and since then it has registered a considerable increase in business.
(d) Urban Banks and Credit Societies.-There are 35 Urban Banks and Credit Societies in the district. One of them is Urban Bank, 31 are Salary Earners' Societies, two Millhands' and one miscellaneous Society. Their combined membership is 5,022, paid-up share capital is Rs. 3' 09 lakh~ and working capital Rs. 12' 82 lakhs. Loans amountmg to Rs. 9'65 lakhs were advanced by these societies during tpe year. The Urban Bank advances loans against pledge of movable and immovable properties. The Bank, however, does not stand wellin competition with other commercial banks. at the district headquarters and moreover the scope of this Bank is rather restricted as compared to the other banks.
H 4222-5a
Agricultural Processing Societies Three Cotton Ginnin& and Pressing Societies have been
organised in the district. The combined membership of the Ginning and Pressing Societies is 890, share capital Rs.' 4' 92 lakhs and working capital Rs. 8' 66 lakhs. Of these chree societies, only "The Shetkari Ginning and Pressing Society, Amravati" was in production during the year under report and nearly 12,000 quintals of cotton was ginned and 1,931 bales were pressed by it. The Anjangaon Ginning and Pressing Society received Government share contribution of Rs. 73,000. It purchased an established factory in 1961-62 at Anjangaon for Rs. 3' 25lakhs. The Daryapur Ginning and Pressing Society was registered in the year under report with a share capital of Rs. 55,00QO. It has yet to start the work.
Industrial Societies There.are 14 weavers' societies and 84 other industrial
societies in the district. All the 14 weavers' societies are handloom weavers' societies. Their combined membership is 2,950, share capital Rs. 2' 01 lakhs out of which Government contribution is Rs. 47,000 and working capital Rs. 14·25Iakhs. The number of looms under co-operative fold is 3,003. The value of goods produced by the societies during the year amounted to Rs. 9' 09 lakhs and the value of sales to Rs. 18' 43 lakhs.
The other types of industrial societies include 10 oil ghanis, three cane and bamboo, three tanning, 10 leather working, 12 carpentry and smithy, one metal working, 17 pottery and brick making, one coir and rope making, two neera and palm gur, 25 miscellaneous, etc. Their combined membership is 1,985, share capital Rs. l' 72 lakhs and working capital Rs. 5' 45 lakhs. The value of production of these societies is R&. 2' 33 lakhs and sales value Rs. 3' 65 lakhs.
Forest Labourers' Societies and Labour Contract Cooperative Societies There an~ two Forest Labourers' Societies and seven
Labour Contract Co-operative Societies in the district. The combined membership of Forest Labourers'
Societies is 82, share capital Rs. 6,500 and working capital Rs. 34,000.
Labour Contract Societies have 276 members, share capital is Rs. 7,000 and working capital Rs. 34,000. The societies received Rs. 3,000 as loans and Rs. 2,000 as subsidy from the Government. The societies executed work contracts worth Rs. l' 5 lakhs during the year.
Co-operative Farming Societies There are two Collective Farming and two Joint
Farming Co-operative Societies in the district. The collective farming societies have 29 members, Rs.6,000 as share capital and working capital of Rs. 15,000. The area cultivated by the societies is 195 acres out of 252 acres under their command.
The combined membership of two joint farming societies is 24, share capital of Rs. 8,000 and working capital of Rs. 10,000. The societies have 391 acres under their command of which 86 acres are cultivated.

(42) DISTRICT CENSUS HANDBOOK
Fishery Societies One Co-operative Society has been organised during
the year under report. The society has 31 members, Rs. 1,000 as share capital -and Rs. l~OOO as working capital. The society has yet to" start its activities.
Dairy Societies There is one milk supply union and there are 16 milk
supply societies in the district. The membership of the milk supply union is 29 individualS, the paid:'up sh'.lfe capital of Rs. 5,000 and working capital Rs. 28,000. The only milk union known as "The Anjangaon Milk Union" is registered during the yea! under report and did not start work for want of equipme~t, machinery, et~. Out of 16. supply societies, 14 were registered along WIth the union ,as feeder societies. The other two societies had not started the work.
The combined membership of all the milk. supply societies is 261 individuals, share capital Rs. 10,000 and working capital Rs. 15,000. Milk worth Rs. 1,406 was purchased and sold during the year.
Purchase and Sales Societies There are Seven Purchase and Sales Societies in the
district which together have 378 society members 3,078 individual members and Rs. 2' 56 lakhs as shar~ capital. The Government has contributed Rs. 86,000 in the share capital of the societies. The value of purchase and sales by the Societies during the year amounted to Rs. 50'93 lakhs and Rs. 52'22 lakhs, respectively.
These societies are dealing in agricultural produce, distribution of agricultural requisites like fertilisers ~,nd other consumers goods. Attempts of linking credit with marketing are in progress,
Consumers' Movement There are 73 primary consumers' stores in the district.
Many of these stores are however more or less stagnant.
The combined membership of all the societies is 1,138, share capital Rs. l' 65 lakhs and working capital Rs. 4' 60 lakhs. During the year 1960-61, the values of purchases and sales of these societies amounted to Rs. 80'15 laths and Rs. 86'84 lakhs, respectively. 21 of these societies made a profit of Rs. 80,000, 11 suffered a loss of Rs. 4,000 and 41 others neither showed profit nor loss.
Housing Societies There are 15 Co-operative Housing Societies in the
district, of which Three ar~ for persons belonging to Backward Classes. The, total membership of all societies is 934, share capital Rs. 1'09 lakhs and working capital Rs. 23'82 lakhs. 158 independent houses valued at Rs. 48' 82 lakhs have been constructed by the members ofthe societies.
Co-operative Activity for Backward Classes One farming society, 12 credit societies and 3 house
ing societies as described already have been organised for Backward Class persons.
The farming society has membership of 15 individuals, share capital Rs. 2,100 and working capital Rs. 6,165, The $ociety cultivated 85 acres of land during the year. ,The credit societies have membership of 783 members, share capital of Rs. 20,000 and working capital of Rs. 1'46 lakhs. The loans advanced by the credit societies during the year amounted to Rs. 99,000.
The housing societies have membership of 88 indivi· duals, Rs. 5,000 as share capital and Rs, 7,000 as working capital. Efforts are being made to secure land, etc., for these societies. i '
Audit Classification The audit classification of different types of
societies in the district on 30th June 1961 is as follows:-
Number ofS:>cieties classified as Number of Number of S:):;ieties S:>cieties
not not Total A B C D classified audited
(1) (2) (3) (4) (5) (6) (7) (8)
(1) Central C<J-operative Banks I 2 4
(2) Agricultural Credit Societies 3 317 259 22 46 647
(3) Non-agricultural Credit Societies ... 14 14 1 35
(4) Primary Land Mortgage Bank 1
(43)
FORESTS
The district has an area of 1,473' 69 square miles under forest of which 1,428'44 square miles are in charge of the Forest Department and remaining 45'25 square miles are in charge of the Revenue Department. The forest area forms 31'29 per cent of the total geographical area as against 17' 56 per cent for Maharashtra.
Of the forest in charge of Forest Department, 1,396'18 square miles are occupied by reserved forests. These are very valuable, well preserved and well managed forests. The remaining area comprising protected forests represent the ex-proprietory forests vested in State in 1951.
The forests are administered by the Divisional Forest Officer, Amravati Forests Division with headquarters at Amravati. The division works under Conservator of Forests, Amravati Circle, Amravati. The forest in charge of Revenue Department is looked after by the District Collector. ..
The forests are mainly concentrated in the north-west portion of the district fn Melghat tahsiL In all other tahsils their intensity is very low. The forests in the district fall in the broad type "South Tropical Dry Mix Deciduous Forests" and are distinguished in two distinct categories as follows :-
(1) The plain forests in east and south-e~st of the district, an area of about 240 square miles; and
(2) The Me1ghat forests in the north-west, an area of 1,180 square miles.
The plain forest lie scattered in small blocks amidst the intensively cultivated tract. The terrain of Melghat forests is hilly occupying the Gawilgarh ridge of the Satpuda ranges. In the plain forest babul bans have been created to meet the demand of fuel and fodder of the agriculturists. The areas have also been retained for supply of fodder.
The most valuable species found in the forests is "Teak". In the plain forests its associates are : Salai, Dhaora, Tendu, Achar and Rohan. In sheltered valleys scattered bamboo clumps, are met with. The Melghat forests have a higher percentage of teak varying from 40 per cent to almost 100 per cent of good quality. Its associates are: Haldu, Dhaora Sag, Shewan, Tiwas Kalam etc. Bamboo occurs in the lower storey and is of good quality in the northern portion.
The other commercially important associates found in the forests are: (1) Tendu leaves useful in Bidi Industry; (2) Kadai or Kulha and Dhaora. for Gum; (3) Fodder and Thatching grass, etc. Distillation
, of Rusa grass oil is the industry set up in the forests. At chikalda, coffee plantations have been raised by the missionaries. A plantation of about 6'2 acres of coffee is with the forest Department.
The forest produce is exploited departmentally as well as through the agencies to whom cotract is given
and also through the Forest Labourers' Co-operative Societies. These societies are given certain privileges by the department. The important forest produce collecting cCJ}tres in the district are at Paratwada and Dharni. At the depots forest produce is sold by auction and purchasers from all over India attend it to purchase the material. The total revenue realised during 1961-62 Was Rs. 55' 52 lakhs. In the following year, viz., 1962-63 it increased to Rs. 61 ·45Iakhs. As per 1961 Census, 977 persons are reported as engaged in forestry and logging as principal work. Their distribution for industry minor groups is shown in Table B-IV-C in Part II.
Exploitation of forest is regulated by scientifically prepared wor1cing plans which are different for different types of forests. Under the existing plan 8 working circles are formed as under :-
(1) Selection; (2) Coppice (3) Improvement plantation; plantation; (5) Miscellaneous ;
with reserve ; (4) Babul ban
(6) Protection (1) Bamboos ,overlapping; (8) Rusa Grass
overlapping.
For development of forests, with an aim of increasing the forest potential .. ith the plantation of economic species, a number of schemes have been undert<lken during the five-year plans. During the Second FiveYear Plan the schemes executed were: (1) Extension of regular plantation of teak, semal and wet nurseries ; (2) Construction of roads; (3) Construction of wells and buildings; (4) Raising of eco,nomic status (Jf forest labourer; (5) Construction of dams and bunds ; (6) Aftorestation of catchment area; and (7) Survey and Demarcation of private forests. In the Third Five-Year Plan the following important schemes have been included among others :-
(1) Plantation of valuable trees.-Plantation of Teak, Semal and Eucalyptus trees in 350 acres involving an outlay of Rs. 0·46Iakhs.
(2) Afforestation for soil conservation.-200 acres to be afforested involving an outlay of Rs. O· 56 lakhs.
(3) Development of forest pastures.-Plantation to be raised over 75 acres for which Rs. O· 38 lakhs are sanctioned;
(4) Development and supply of substitutes for tet1k.-Sale of 5 lakh cft. of timber is contempl[l.ted with an outlay of Rs. 17' 61lakhs.
The forests in Melghat are fairly rich in game. The animals found are: Bison, Tiger, Panther, Bear, Sambar, Barking deer, Pig and Chital.
(44) DISTRICT CENSUS HANDBOOK
FISHERIES
Fishing activities in the district are naturally restricted to inland waters only, rivers, tanks and ponds being the chief sources. The total lengt.h of semi-perennial rivers in the district is about 240 -tm. There are also 9 perennial tanks and about 100 seasonal tanks and ponds which provide 1,020 acres of water spread area which is rather inadequate for development of fishing industry.
The commercially important varieties of fish found in the district are :-
Murrel, Dhadkya, Botri, Padhan, Tambu, Karvadi, Poshti, Dhaora, Gane or Konheri, Chela, Katva, Seenghan, Chandni, Mahaseer, KohlS, Magur and Zinga.
These varieties are, however, not of a fast growing type. As such, under the Five-Year Plan schemes, quick growing "Bengal Carps" are, imported every year and released in the tanks for propagation of pisciculture. The varieties stocked are Catla Catla, Rohu, Mrigal and Cyprinus Carpio. During the Second Five-Year Plan period about 3· 28 lakhs of F~y was stocked
while during only the first 2 years of the Third Plan period the quantity stocked amounted to 4' 18 lakhs.
In the 1961 Census, 801 persons, 643 males and 158 females are reported engaged in fishing as principal work. Fishermen in the district belong to the communities known as Dheemar, Bhoi and Kahar. Since fishing industry has a limited scope, some of the fishermen take jobs in workshops and few others in seasonal agriculture. Fishing is generally done with the help of Gill nets known as Udan or Tangar, Castnets called Bhawan Jal, Drag nets'or Odhe Jal and Longlines (Dawan). The nets are mostly made of cotton twine but these days nylon twine is also used. Under the fishery requisites scheme, financial assistance in the form of subsidy is given for purchase of nylon and cotton twine.
Three co-operative societies of fishermen have been organised in the district. :rhe co-operative societies are given financial assistance in the form of loans and subsidy. They are also helped to secure tanks and ponds on lease for propagation of pisciculture.
MINING AND QUARRYING
sedimentary clay deposits sulable for potteries, earthern-ware, refractory bricks, stoneware pipes, etc., occur in the lower Chikalda range near Achalpur in the district. The localities where the deposits are reported are : (1) the main Khairalli-Bhairamghat ridge, (2) nallah to the north-east of Nimbhora, (3) the southern slope of the hill to the north-east of Pandhari, and (4) the lower ridge to the east of Belkheda. The reserves are estimated
at 1'75 inillion tons but the deposits are not pres~ntly exploited. "
Deposits of no other mineral of economic significance has so far been reported anywhere in the district and the mining activities are so far restricted only to quarrying, of stones, clay, sand gravel, etc. In the 1961 Census. 642 persons, 350 males, and 292 females are reported as engaged in mining activities as principal work.
INDUSTRIES
Principal crops being cotton and oil-seeds, almost all the large-scale factories in the district pertain to cotton processing and oil-crushing. There are 40 larg~scale factories in the district. However, the non-agrIcultural employment leans equally towards village and cottage industries, i.e. the village crafts working on traditional lines with the locally available raw materials and for local demand alone. With the availability of more power from the Paras Thermal Station in AlCola district and setting up of new industrial estates at Achalpur and Dhamangaon, the prospects of further industrial development in the district are bright.
There are in all 34,344 workers engaged in manufacturing industries, 17,147 dr 49·93 percent of them ar(:; in household industries and ,17,197 or 50·07 per cent. in non-household industries. The total number of workers in the registered factories in 1961 is 6,879 which makes 20· 03 per cent of all workers engaged in industries or only 6 factory workers per thousand of total population against 20 per cent thousand of total popUlation of 'Maharashtra. ..
The distribution of workers engaged in each industry major and minor group is shown in Table B-IV-C in
Part II. The number of establishments and thc:~J.1: ...... -: ber of workers for each industry mitIor group prepared from the house lists are also shown separately, for each village in the Village Industries Table presented at the end of Part II.
Large-scale Factories
As already stated, there are 40 large-scale registered factories in the district using power and employing 50 or more workers.
There are two cotton spinning and weaving mills in the district. Theyare: (1) The Vidarbha Mills, Achalpur and (2) The Berar Manufacturing Company, Badnera. The first one has the spindlage of 13,500 and 347 looms and employs'more than 1,150 workers, while the latter, with 21,384 spindles are 369 looms, employs, nearly 790 workers.' .
Cotton is grown extensively in the district. This has, therefore, facilitated to the establishment of a number of cotton ginning and pressing units. 31 such establishments are working as large-scale registered factories, clustered mostly in and around Amravati, Chand-ur, Badnera Achalpur, Warud, Anjangaon, Dhamangaon, etc. The~

AMRAVATI :. INbUS1RIES (4$)
establishments are engaged either in cotton ginning or both ginning and pressing. -Important among these which employ more than 500 workers are: (I) Adulji Framji Dhotiwala Ginning and Pressing Factory, Amravati, (2) lamnadas Gokuldas Dossa Ginning and Pressing Factory, Anjangaon-Surji, (3) Laxmi Industries Ginning and Pressing Factory, Amravati, and (4) Shri Pandurang Ginning and Pressing Factory, Achalpur ..
Groundnut, sesamum, safflower, linseed, etc. are grown on a large scale in the district. A number of oil mills are established all over the district. Six such units are registered under large scale factories. Two of these are located at Amravati, two at Badnera and one each at Chandur and Dhamangaon. The two oil mills of Amravati together employ nearly 400 workers.
There is also a workshop of State Rqad Transport for repairs and maintenance of buses, at Amravati.
(i) Elichem, Amravati, (ii) Amravati Sahakari Gimi Ltd., Amravati and (iii) Vidarbha Mills Berar Ltd., Elichpur (Achalpur) have been licens'M for the production of cotton yarn and are expected to go into production shortly. Similarly Laxmi Industries Ltd., and New Vijay Oil and Dal Mills (Private) Ltd., both at
, Amravati have been licensed for the production of Nitro"glycerine, geletinised dynamites, blasting supplies and vegetable oils, extraction of cotton seed and Groundnut oils, respectively.
Small-scale Registered Factories
Apart from the large-scale registered establishments, there are a number of small-scale registered units manufacturing art silk, oil and oil cakes, cosmetics, "Kum-kum ", " Lobhan ", aluminium utensils, chakki (flour mill), oil engines and their spare parts, musical instruments like fiutes, etc., in addition to dal mills, cotton ginning and pressing units, saw mills, etc., employidg in all nearly, 1,300 workers.
.The number of registered factories has, however, decreased from 83 in 1956 to 77 in 1961.
The number of workers in the registered factories has also decreased from 8,214 in 1956 to 6,879 in 1961. This may be due to the closure of certain seasonal units pertaining to cotton ginning and pressing and oil mills.
According to the Census of Manufacturing Industries in 1959, the manufacturing industries in the district had a combined fixed capital of Rs. 74· 9 lakhs and working capital of Rs. 14· 5 lakhs. The total value of annual production was Rs. 220·1 lakhs and the value added by manufacturing was Rs. 29· 2lakhs. These figures relate only to the industries covered by the Census of Manufacturing Indutries Act.
The value added by manufacturer in the district in 1959 was, however, only O· 14 per cent of the total for Maharashtra.
Small-scale and Cottage lndustries Some of the agricultural and forest resources in this
area are sufficient to support economic units of small industries a few of which serve as anciallary units for large industries. In the small-scale and cottage industries sector, hand 109m, cane and bamboo works, tanning and leather working, metal works, carpentry and smithy, oil ghanies, hand gins, potteries, brick making, rope making, etc., are some of the important industries in the district. Quite a good number of these manufacturing industries are traditional crafts conducted on household and cottage industries scale. Moreover, in the rural areas, the Industrial co-operatives have been started on a very large scale in the district. Most of the Cottage industries mentioned above have been brought under the co-operative fold.
5,466 workers are engaged in the production and rearing of livestock. Agriculture is the main occupation ill the district and cattle are used both for cultivation and milk. According to the 1961 Livestock Census, there are over seven lakhs of livestock in the district. " Gaolao" is a well known breed of bullocks and cows which are useful for cultivation and milk, respectively.
5,458 persons are engaged in the manufacturer of miscellaneous textiles out of which 4,754 persons are tailors engaged in making garments for men and women.
2,554 persons are working in cotton ginning, cleaning, pressing and bailing. They are the workers engaged in the various cotton ginning and pressing units spread all over the district.
2,452 workers are engaged in cotton weaving in hand looms in the district. Handloom weaving is one of the important industries run on village and cottage industries basis in the district. At the end of May 1961. there were 4,688 cotton handlooms. Out of these over 3,003 have come under co-operative fold. Achalpur Industrial Weaving Co-operative Society is the largest and considered to be the ideal society in Vidarbha region. The handloom industry is concentrated at Achalpur and Borgaon Peth in Achalpur Tahsil, AnjangaonSurji in Daryapur Tahsil, Kholapur and Badnera in Amravati Tahsil, Pusala and Warud in Morsi Tahsil and Mangrul Dastagir in Chandur tahsil.
There are 939 flour or rice mills engaging 1,252 workers. There are factories manufacturing turdal at Amravati, Dhamangaon and Badnera. There is a great demand for .• Kum-kum ", in the district due to the existence of the oldest temple of the goddess Ambadevi at Amravati. It is the practice of the devotees of this goddess that " Kum-kum" is offered to her as a mark of respect and devotion. With a view to meeting the demad there are about five factories manufacturing "Kum-kum" and located at Amravati and Norpinglai and Shendurjana in Morsi tahsil. Cement pipes and grates are manufactured by the Hume Pipe Co. Ltd., at Amravati. Plastic and backelite electrical accessories such as switches, holders, etc. are produced at Amravati. Aurvedic medicines are manufacture at Amravati and Mozri (Chandur tahsil). A factory manufacturing
(46) DISTRICT CENSUS HADNBOOK
bicycles has recently been established near Amravati. It is ~xpected to produce neatly 12,000 bicycles per annum. "LoLas" and bullock bells are made at Amravati ano a1 Karajgaon in AChalpur tahsil. Glass beaus anu bangks of coarse Y,aritity are made at Brahmanwada (ThacH) (Achalpur taIiSil). There is a factory run un co-operative basis producing lemon and orange juices. There is also a match factory at Achalpur. Woolkn biankti1S are woven at Kholapur (Amravati tahsil).
Classified by occupation 4,476 workers are engaged as tailors, dress makers and garment makers while 2,841 persons are working as carpenters, joiners and pattern makvrs t wood) who manufacture, fix or repair doors and door-f;ames, wouuen roof beams, furniture and agricultu:al implem(;nts.
2,078 workers are engaged in making earthen potted!. They are the village potters. Most of them still woft on the traditional baluta system under which they get a fixud quantity of foodgrains at the harvest time for supply of earthen ware during the year.
The proportions of different groups of artisans to one lakh of total population in the district are as follows:-
Blacksmiths-97; Carpenters-230; Shoe-makers and repairers-122; Potters-169; Tailors and dress makers-363; Spinners, drawers and weavers-72; Basket weavers-74.
The Industries Department has origanised peripatetic demonstration parties for improving the skill of the existing craftsmen. Central organisagions to encourage village artisans to take up the training and join the production-cum-marketing centres have been organised for the following principal crafts: (1) Handloom and Tadhar weaving, (2) Tannery and leather goods,
(3) Pottery and bricki making, (4) carpentry and blacksmithy, (5) Cane and bamboo work, (6) Oil ghanies, (7) Tailoring and other allied industries. Under the Community Development Programme, there are eight ~entres. of handloom weaving and tadhar weaving mdustnes located at Pusala, Ganeshpur, Jamthi Nerpinglai, Rithpur, Walgaon, Daryapur and Sh~durjana. Loca~ tanners ar~ trained in improved tanning process for hIdes and skins at Daryapur, Thugaon, Nerpinglai, Shirkhed and Shendurjana. A co-operative dyeing and printing society is formed at village Gadegaon.
Extension centres with 20 to 25 machines are organised at Amravati and Warud for facilitating the craftsmen
/ to get their -work done on nominal rent at these centres. The mechanical workshop of Shivaji Education Society has started training classes for carpentry, manufacture of paper clips, pins, etc~
The "Master Plan" prepared by the Industries Department in 1960 had indicated scope for establishment of the following new industries in the district:-
(1) Cott.on seed oil, solvent extraction, refining, fat splitting and distillation of fatty acids. .
(2) Ceramic industries.
(3) Manufacture of industrial machinery. \1
lndustrial Estate
An Industrial Estate with 30 sheds has been started by Government on Amravati-Badnera Road. All amenities such as water, electricity, etc., are provided in this estate. A new estate at Dhamangaon has also been proposed to be established on co-operative basis, jnitially in the Third Five-Year Plan.:. Another industrial estate of agro-industrial character 1 is proposed to be set up at Achalpur in near future.
POWER
The number of electrified towns and villages irt the district is 144. Their tahsilwise lists are given in Table 31 in Part III. The total population of these electrified places is 45·53 per cent of the total popul~tion of the district.
The district consumption of electricity on different items is shown in Table 30 in Part III.
The per capita consumption of electricity is naturally much lower than the State average, as only 144 towns and villages in the district had been electrified.
The district receives electric supply by the Maharashtra State Electricity Board through the Khaperkheda Thermal Power Station near Nagpur. Prior to this
.electricity in the district was generated in small units belonging to the private companies and catering to the needs of the residents of towns Where power-houses were
situated. Before the First Five-Year Plan only~: towns in the district were supplied with electricity and the power was used only by the people in the towns. with the setting up of the Southern Grid, viz., Khaperl<ilieda Thermal Station in 1951 a number of towns and villages were electrified at the end of the First Five-Year
-Plan. The private generating stations in the district were, therefore, dosed. The programme of electrification in the district was proposed in three schemes, Viz.:-
(1) Central Thermal Station Scheme,
(2) Town Electrification Scheme,
(3) Sausar-Warud Scheme.
Under the Central Thermal Station Scheme a substation waS erected at Deogaon and energised during 1956-57. This scheme helped in supplying

AMRAVA'fl:POWER (47)
power to Dhamangaon and beyond Talegaon and Chandur, etc. Under the second scheme electrification of Daryapur, Chandur, Morsi, Talegaon, Dhapori and Benoda waS completed while under the third scheme, the mainline from Sausar to Warud waS completed during the year 1956-51 and the supply of electricity was extended to Warud, Jarud, Shendurjana and Pusala. Almost all the towns and villages having a population of more than 5,000 have thus been electrified and about 1,700 electric pumps for irrigation purpose have also been installed in the district.
Moreover, according to the Vidarbha Grid Scheme and the Khandesh-Marathwada-Electrification Scheme, capacities of the Khaparkheda Thermal Station near Nagpur and the Paras Thermal Station near Akola are to be stepped up' and additional power will be supplied to all the eight districts of Vidarbha. Due to increased power potential, it would be possible to supply power to new industries and electrify the existing ginning and pressing fatories, oil mills, power looms, etc., and instal power pumping machinery for increasing area under irrigation in the district.
TRADE AND COMMERCE
Cotton is, by far, the most important item of export in the district. It is exported both in raw and manufactured forms. The other chief exports of the district are cotton seed, oil cakes, jowar, chillies, betel-leaves, hides and skins, tur dal, oil-seeds, timber, etc. Greater part of the cotton goes to Bombay. Chillies from Achalpur, Paratwada and Pathrot ~re exported to Bombay and Madras. The timber from Paratwada depot is sent a11 over the country. Tur dal is exported outside India. Coal and coke, food-grains, pulses, metals, kerosene oil, salt, betel-nuts, sugar, tobacco, groceries and other consumer goods are the chief items of imports.
Agriculturists themselves bring their produce for sale to the markets. In some cases commodities arc imported from villages through commission agents or the agents themselves go to the villages and purchase the produce from the producers. Generally, the producers prefer to bring their produce to the regulated markets, established at important assembling centres ~ith a view to securing for them better price and freedom from illegal deductions by commission agents. The distribution of goods beyond the wholesale trade centres takes place at market places and weekly bazars held at different piaces on .different days of the week.
Shops
. Every village except the smallest has one or more shops which provide the inhabitants with their day to day requirements. They deal in all kinds of grains, salt, groceries, oils, gur, sugar, spices, coconuts, washing soap, tea, tobacco, chillies and such other i~umberable articles required by people for their dally use. There are in all 8,534 shops in the district. 3,959 are in rural areas and 4,575 in the urban areas. These do not inclUde the shops temporarily set up in the weekly markets or fairs. The number of shops per 1,000 dwellings is 32' 4 for the district as a whole, 22'4 for rural areaS and 68'4 for urban areas. It will be seen that the shops per 1,000 dwellings in urban areas are nearly three times more than in rural areas. The ratio between shops and 1,000
. dwellings fo~ t~e district is less than the State average of 36' 4. Tahsllwlse number of shops may be seen in Table E-I in Part II.
Weekly Markets
The markets are popularly known as " bazars " and are distributing rather than collecting centres. All sorts of articles like food-grains, pulses, oils, chillies, spices, gur, cloth, fruit, vegetables, etc. are sold in these markets. Pedlars and hawkers set up temporary booths on the market days. Agriculturists from the nearby villages also bring their farm produce. The traders and Shop-keepers belonging to the market place also set up temporary stalls. Buyers come from nearby villages within 4-5 miles. Weekly markets start in the morning and after a slack of an hour or two, in the afternoon start again and close by six in the evening to enable the buyers and sellers to reach home before it is4ark.
Column 7 of the Village Directory in Part I shows for each village in the district if a weekly market is held and if so, on which day of the week. A list of weekly markets in the district given in Table 32 in Part III shows the location and day on which each bazar is held. The maps facing page 247 shows locations of all these markets and also the days on which they are held.
The District Gazetteers of 1911 reported about 175 weekly markets in the district. There are now altogether 272 weekly and bi-weekly markets in the district. Out of these 13 are also cattle markets. 43 weekly markets are held on Sunday, 33 on Monday, 40 on Tuesday, 44 on Wednesday, 33 on Thursday, 43 on Friday and 36 on Saturday .
The map facing page 247 will show that four or five weekly markets cluster as satellites around a central village. Each has its bazar on one of the week days, keeping the pedlars and hawkers engaged throughout the week and also providing a choice to buyers to go to one nearby market or the other. Moreover, these weekly markets are concentrated in almost all tahsils except Melghat which is a hilly terrain inhabited by majority of tribal population. The concentration is rather very heavy towards the central part of the district.
Fairs
As far as trade is concerned fairs vary little from weekly markets and are complementary to weekily markets. They are attended by unusually large number of persons. Most of the fairs held in the district are in the commemoration of some local ascetic or anchorite

DISTRICT Cl:lNStJS HANDnoo~
or a miraculous manifestation of one of the gods or a religious festival. Considerable quantities of agricultural produce and other articles of daily use as well as lUxury goods including lOy$.~rc. an~ hrought for sale. In addition to the usual booths and stalls, these fairs also contain recreation stalls. A list of fairs held in the district showing locations, duration and dates and approximate number of persons attending is presented in Table 33 in Part III. The map facing page 249 shows location of all the fairs in the district having 1,000 or more congregation. A volume giving details regarding fairs and festivals in Maharashtra is also issued separately.
Trade Centres Apart from the weekly markets and fairs, there are
six wholesale trade centres in the district, as far as collection and export of agricultural produce are concerned. They are: (1) Amravati, (2) Dhamangaon. (3) Daryapur, (4) Anjangaon, (5) Achalpur, [cnd (6) Warud. There are separate grain and cottoil markets at the first four centres while the last two centres have only the cotton markets. All these markets are regulated under the Central Provinbes and Berar Agricultural Produce Markets Act, 1935" and the Central Provinces and Berar Cotton Markets Act. 1932.
Amravati and Dhamangaon are very important collecting and distributing centres in the district. Of these, Amravati Cotton Market is supposed to be the biggest cotton market in Asia. The average annual arrival of cotton in this market is l' 50 lakhs of cart loads. In order to provide facilities for storage of agricultural produce and to make available a cheap source of credit to the farmers with a view to avoiding distress sale, one large sized, nine medium sized and sixteen small sized godowns have been constructed at various places in the district. In addition, one warehouse has been constructed by the Central Warehousing Corporation at Amravati which stores 97 per cent of the agricultural produce of the cultivators and another at Dhamangaon by the State Warehousing Corporation.
The figures of value of annual turnover of cotton and other commodities in the six market centres in tn.e district for the year 1961-62 are given below:--
Value of annual turnover of Market Centre
Cotton Other Total Commodities
Rs. Rs. Rs. (1) Amravati 5,00,00,000 1,18,89,845 6,18,89,845
(2) Dhamangaon 1,11,81,280 24,22,395 1,36,03,675
(3) Daryapur 67,27,700 14,60.113 81,87,813
(4) Warud 92,74,296 92,74~296
(5) Anjangaon 79,38,300 79,38,300
(6) Achalpur 45,00,010 45,00,010
Workers in Trade .and Commerce The total number of persons engaged in trade and
ccmmerce in the district in 1961 is 22,010, out of which 6,860 or 31'17 per cent are in rural areas and 15,150 or 68' 83 per cent are in urban areas. The number of workers in trade and commerce forms 3'81 per cent .. of all the workers in the district. Nearly 50 per cent of the district total is in Amravati tahsil.
Only 5' 64 per cent of the workers in trade and commerce are engaged hi wholesale trade, 89-92 per cent in retail trade and 4: 44 per cent in miscellaneous trade and commerce. About 94 per cent of the wholesalers are in urbari areaS. !
The number of wholesale trading exclusively in cereals and pulses is 61 only. i Mostly, the wholesale trade of cereals and pulses appe~rs to be combined with wholesde trade of gur, sugar, spices, groundnut, oil etc .. as the number for the: group is 438 for the district.
A detailed break-up of the workers in trade and CQI)1lnerce by industry major groups and minor groups is shown in Table B-IV-C in Part II.
Banking Offices ",\
A list of banking offices with their yea:~s of establishment, type and location is given in Table 23 in Part III. Their break-up by tahsils and type is shown below:-
Number of Banking Offices
Scheduled ; Co-• Operative
Total
n[STRICT TOTAL 11 14
1 Melghat Tahsil 1
2 Achalpur Tahsil 2 3
3 Morsi Tahsil 2 3
4 Daryapur Tahsil 2 3
5 Amravati Tahsil 6 3 9
6 Chandur Tahsil 2 4 6
Amravati tahsil with its commercially important city of Amravati is leading,in banking activities and accounts for nearly one-third of banking offices in the dis1rict. All the tahsils except Melghat tahsil have at least two branches of the Central Co-operative Bank Melghat has one.
The State Bank of India works for the treasury in the district and has branches at AchaJpur, Warud, Daryapur. Amravati and Dhamangaon.
AMRAVA1'I : COMMUNICATIONS AND TRANSPORT (49)
COMMUNICATIONS AND TRANSPORT
Railways pass through all tahsils of the district, except Morsi. Railway line of the Bombay-Calcutta (Howral) was first commissioned in the district in 1866. This broad-gauge double line rail link cuts across the entire length of about 48 miles in the district. The stations on this line are Takli, Badnera, Timtala, Malked, Chandur, Dipore, Dhamangaon and Talani. Amravati, the district headquarters, is connected by a broad-gauge single line of about 8 ·97 miles. This railway link was started in 1871 and at present the total length of the broad-gauge line in the district thus in 57·30 miles. It is also proposed to extend this track up to Narkhad on Delbi-Nagpur main line to serve the orange growing tract of Morsi tahsil. A section of about 24 ·10 miles of the metre-gauge single line of the Khandwa-Hingoli also passes through the south-west corner of Melghat tahsil. This line traverses through the hilly terrain and has two tunnels, a number of bridges and Daulghat and Wan Road as stations. The fourth one is~ narrow-gauge single railway line of 39 ·77 miles from Murtizapur in Akola district to Achalpur. Bhujwada, Banosa, Labegaon, Kokalda, Kapurstalni, Anjangaon, Pathrot, Kusta l\uzurg, Chamak and Nawbaug are the stations between Mnrtazapur and Achalpur on this line. '
The total length of the railway line in the district is about 121 ·17 miles. Existing railway mileage, therefore, is 2·58 miles per 100 sq. miles of area against 2 ·66 miles per 100 sq. miles in the State.
Table 21 in Part III shows the existing road mileage in the district as well its break-up by the type of road surface. The district map facing the title page shows all these roads.
The district is well connected by roads with the adjoining districts of Nagpur, Wardha, Yeotmal, Akola Buldhana and E. Nimar and Betul districts of Madhya Pradesh. The district headquarters is also well connected by roads with all the tahsil headquarters. The northern part of the district and specially Melghat tahsil is a hilly terrain and the roads are, therefore, few in this area. The Bombay-Nagpur National Highway passes through Amravati for a length of 46 -16 miles in the district.
During the period 1951-61, there was no change in the mileage of National Highways. The State Highways major district roads and the village roads, however, increased by 177.06 miles, 37·35 miles and 32·16 miles. respectively. The other district roads on the contrary decreased by 70·51 miles. The total increase in all types of roads (excluding municipal roads) is 176·06 miles.
Under the Nagpur Plan, the district should have 1,750 miles of road~. 1t was short of that target by 1,064 ·92 miles on 31 st March 1961.
New Roads The following roads 'are under construction or
improvement (as on 31st March 1962) :-(1) Daryapur-Asegaon Road, (2) Daryapur-Anjan
gaon Road, (3) AShti-Morsi Road, (4) Improvement to Badnera-Yeotmal Road, (5) Asegaon-Yavli Road. (6) Amravati-Asara Road, viz.,· Bhatkuli Road.
. t7) Chandur Bazar-Asegaoll Road, and (8) Shendur-jana-Dhanodi Road.
New Bridges Work on the' following bridges is in progress (as on
31st March 1962) :-(1) Submersible bridge across Pill river on Achalpur
Chandur Bazar Road, (2) Bridge across Puma river on Achalpur-Chandur Bazar Road.
Posts, Telegrapbs and Telepbones The district is included in the East Berar Postal
Division the Head Post Office of which is situated at Amravati and sub-offices at tahsil headquarters and towns. The bigger villages have branch post offices. During the year 1961-62 there were 36 sub-post offices and 255 branch post offices in the district. The number of post boxes in the district is 96.
There are telegraph offices at the following 22 places :-
(1) Amravati Camp, (2) Anjangaon, (3) Badnera, (4) Badnera Town, (5) Chandur, (6) Chandur Bazar, (7) Chikalda, (8) Daryapur, (9) Dhamangaon, (10) Ellichpur (Achalpur), (11) Ellichpur City (Achalpur), (12) Gurukunj Ashram, Mozri, (13) Karajgaon, (14) Morsi, (15) Nandgaon Peth, (16) Sakkarsath, (17) Shendurjana, (18) Shrirajgaon Kasaba, (19) Takhatmal Estate, (20) Talegaon (Dasasar), (2l) Walgaon, and (22) Warud. The following 14 places have telephone connections :-
(1) Amravati Camp, (2) Anjangaon, (3) Badnera, (4) Chandur, (5) Chikalda, (6) Daryapur, (7) Dhamangaon, (8) Ellichpur (Achalpur), (9) Ellichpur City (Achalpur), (10) Gurukunj Ashram, Mozri, (11) Morsi (12) Sa kkarsath , (13) Takhatmal Estate, and, (14) Warud.
Passenger Road Transport Passenger road transport in the district had been
nationalised as early as 1946 when the State Government took over from the Central Provinces Transport Services and finally purchased it in 1955. After reorganisation of States in November 1956. the transport organisation used to function as one of the Government departments. It has been amalgamated with the Maharashtra State Road Transport Corporation from 1st July 1961. By the end of the Second Five-Year Plan, the extent of nationaIisation of passenger road transoprt was 34 per cent. It is proposed to extend it to 53 per cent. by the end of the Third Five-Year Plan. It is also proposed to construct additional bus stations, pick-up stands and provide other facilities for the travelling public during the Third Five-Year Plan.
The district is included in the jurisdiction of Nagpur division of the State Road Transport Corporation. There is only one depot at Amravati in the district. No separate figures of passenger transport are available for the district. The depot at Amravati runs buses on 10 routes which make 146 single trips per day.
Goods Transport The goods transport is totally managed by private
transport agencies. Separate figures for lorries operated in the district are not available, as the Regional Transport
(50) , DIstRICT CBNSUS HANDBOOK;
Officer working at Nagpur keeps combined records of Nagpur, Wardha, Buldhana, Akola, Amravati, Yeotmal, Bhandara and Chanda districts.
Wotkers in Transport aocl Communications 8,517 persons are engaged in transport and 776 in
postal telegraph and telephone communications in the district.' Out of the workers in transport, 2,627 are in
railway transport, 2,238 in motor and bus transport and 3,652 in other kinds of transport like bullockcarts, horses on hire, coolies, etc.
Communication in Rural Areas The Village Directory in Part I gives information for
each village in the district whether it is served by a railway or a road or has a post office or not.
CONSTRUCTION
The total number of persons engaged in construction is 3,812 comprising 3,273 males and 539 females. Their distribution by minor groups is shown in Table B-IV-C in Part II.
Only 2' 23 per cent of the total workers are engaged in the construction and maint~nance of dams, waterways and canals, etc., 18' 73 per cent.in construction and maintenance of roads, bridges, etc. and 19' 04 per cent in construction and maintenance of buildings. telegraph and telephone lines, etc. The large proportion.
engaged in the construction of buildings includes th_ose working on private houses as well as those engaged in construction of _ buildings, for administrative officers, residential· quarters for Government employees, educational institutions, hospitals, tenements under low-income group, rural housing and slum clearance, etc. .
All the workers engaged in construction together form only 0'66 per cent of the total workers in the district.
OTHER SERVICES
42,536 persons comprising 36,.\50 males and 6,386 emales are engaged in ., Other Services" in the district.
The major categories out of them are (i) Public Services: (ii) Educational Services; (iii) Personal Services. "Public Services" include administrative employees of Central and State Governments and local bodies. " Educational Services" comprise all classes of teachers and "Persona I Services" include domestic servants as well a s barbers, washermen and others rendering services to persons or households. The distribution of workers in other services by minor groups is shown in Table B-IV-C in Part n.
l' 35 per cent of the total workers in the district are engaged in "Other Services" as against 8' 54 per cent in the State. 28'18 per cent of the total workers in "Other Services" in the district are engaged in the" Public Services" and 19' 58 per cent in " Educational Services". The former is slightly lower while the latter is higher than the corresponding proportions
(23'.86 per cent and 12'40 per cent) for Maharashtra.· The low proportion of Public Services and high proportion of Educational Services are mainly due to compa~tively few urban centres, business services and recreation services and more educational institutions in the district. The proportion of "Personal SC;l:Vices" in the district is also lower, i.e. 20' 23 per ceht. than the State average of27'15 per cent.
The number of domestic servants is 2,644 or OIl~' for 466 population. The number of barbers is 2,104. The \ number of persons in laundry services (including thewashermen) is 1,164.
There are 296 legal practitionrrs and 2,153 persons working in medical and health -services excluding veterinary services. .
The number of persons including the teaching staff in technical schools and colleges is 390 and that in other schools and colleges is 1,913.
The number of State Government employees including those now working under the Zilla Parishad is 7,094.
BROAD ASPECTS OF ECONOMY
Individual sectors of economy of the district have so far been described separately. A few broad aspects may now be discussed for the economy as a whole, Labour Pl\rticipation Rate
The proportions of workers to total population, Illales and females for the district and each tah.sil arc as follows :--
MAHARASHTRA AMRAVATI DISTRICT Mclghat T2hsil Achalpur Tahsil MQrsi Tahsil Daryapur Tahsil Amravati Tahsil Chandur Tahsil
Percentage proportions of workers
Total Males Females 47'91 57'09 3S- 10 46'89 56'93 36'13 55'74 60'49 50'75 44'92 56 03 33'07 49'97 58'53 40.93 47'39 57'OS 37'07 42' 52 54'55 29'26 50'70 59-59 41-34
Labour participation rates in the district are lower than those for Maharashtra for total and both for males and females. Within the district participation rate varies from 55' 74 per cent in Melghat tahsil to 42: 52 per cent in Amravati tahsil. Male participation is highest with 60' 49 per cent in Melghat tahsil and the female participation is also highest with 50'75 per cent in the same tahsil_ Amravati tahsil has the lowest participation rates both for males and females because of the larger urban area (Amravati city) included in the tahsil. Higher participation rates than those for the State both for males and females are in Melghat, Morsi. and Chandur tahsils. Male participation rate (51'08 per cent) is almost equal to tIlat of the State (57'09 per cent) in Daryapur tahsil and the female Pilrticipation rate in the same tahsil is also lower by 1 per cent than that for the State.

AMRAVATJ : BROAD ASPECTS OF ECONOMY (51)
Primary, Secondary and Tertiary Sectors
The Primary Census Abstract in Part II shows the distribution of workers in the nine categories of economic activity. Table B-IV-C in Part II shows detailed industrial classification of all workers other than those at cultivation. The percentage distribution of workers in Primary, Secondary and Tertiary activities for the district and the State is as foIlows:-
Maharashtra .. Total \ Rural
Urban
AmravatiDistrict .. Total Rura\ Urban
Total Primary Secon-workers
100 72'25 100 88' 73 100 11'97
100 80'77 100 91'74 100 36'10
dary
12'34 5'68
36'69
6'44 3- }l
19-90
Terti-ary
15'41 5'59
51'34
12'79 5-15
43-70
The primary sector which includes cultivation and ancillary activity dominates the economy of the district with 80'77 per cent of the total workers engaged in it.
_ Urban areas have a larger proportion of workers in the primary sector and smaller proportion in both the secondary and tertiary sectors than the average for urban areas in Maharashtra. Tertiary sector however dominates in the urban areas and consists mainly of trade, administration and other services among whom many are engaged in teacbing profession. Secondary sector accounts for only 19'90_per cent urban workers in the district as against 36' 69 per cent for the State urban.
Categories of Economic Activity The distribution of workers, males and females by
nine categories of ecoriomic activities for the district and the State is as follows:-
Maharashtra Amravati District
Persons Males Females Persons Males Females
I Cultivation .. 46-11 40-69 54·79 27-65 30-31 23-15
II Agricultural Labour 23·80 18·12 32-90 51-59 40-86 69-72 \
III Mining, Quarrying, Live-stock, Forestry. Fishing, etc.
2'16 2·91 0-86 1·36 1-85 0'54
IV Household Industry 4'39 4·80 3-74 2-97 3-57 1·94
V Manufacturing other 6-88 10-22 tb.an. Household
1·54 2-97 4-26 0·81
Industry.
VI Construction .. 1·24 1·69 0·53 0-66 0-90 0-25
VII Trade and Commerce 4· 52 6·61 1-17 3·81 5·76 0-51
VIn Transport. Storage 2-36 3·65 0'29 1·63 2'S5 O-lt and Cmmurucatious.
IX Other Services 8·54 11-25 4'18 7·36 9·96 2-97
Total Workers .. tOO·OO 100·00 100-00 100·00 100'00 100·00
The proportion of agricultural labourers in the district is very high (51' 59 per cent), and is more than double that of the State average (23' 80 per cent). The large proportion of agricuIturallabourers is due to the labour intensive cropping pattern dominated by the cotton and large ownership holdings. The female labour participa~ tion is also more than double the correspondiilg State average for females. The proportion of cultivators (27' 65 per cent) is, however, much less than that of the State (46'11 per cent) average. Both the categories taken together account for a larger percentage than that for the State because there is no alternative employment in industry available in the district. The proportions in all other categories are less in the district than the corresponding State averages.
Tahsilwise distribution of workers in nine categories of economic activities is shown on page (52). Corresponding figures for the State and the district are also shown for comparison.
Distribution of workers by nine categories of economic activities is also shown in the Figure at page (53) for the district and each tahsil separately.
The proportions of cultivators and agricultural labourers differ considerably from tahsil to tahsil. The pro portion of cultivators varies from 18' 15 per cent in Amravati tahsil to 67' 15 per cent in Melghat tahsil. The proportion for agricultural labourers varies from 20' 22 per cent in Melghat tahsil to 60' 65 per cent in Daryapur tahsil. Such wide variations within the district may be due to the differences in fertility of soils and resulting cropping and land holding patterns. 4'43 per cent workers are in household industry in Achalpur tahsil which represents a little higher percentage than that for the State average. 5' 87 per cent. workers in Amvarati tahsil and 3' 79 per cent workers in Achalpur tahsil are in manufacturing other than household industry. Much higher percentage of workers than the State average is seen in other services (13-07 per cent) in Amravati tahsil only. This is follow~ ed by 7' 29 per cent in Achalpur tahsil and is less than the State average.
Labour Participation by Age The labour participation rates by age-groups are
shown below for the district for total, males and females separately. Corresponding figures for the State are also shown for comparison :-
Amravati District Maharashtra Age-groups
Total Males Females Total Males Females
All Ages .• 46·89 56-93 36·13 47-91 57-09 38'10
0-14 .. 7-46 6-73 8·22 8-n 8·62 8·84
15-34 .. 69-23 &5-47 52·36 74·53 87·45 60-90
5-59 .. 83·05 97'71 65·44 81-57 96-86 63'68
60+3 .. 59·08 80'59 37·04 49'13 12·82 26·28
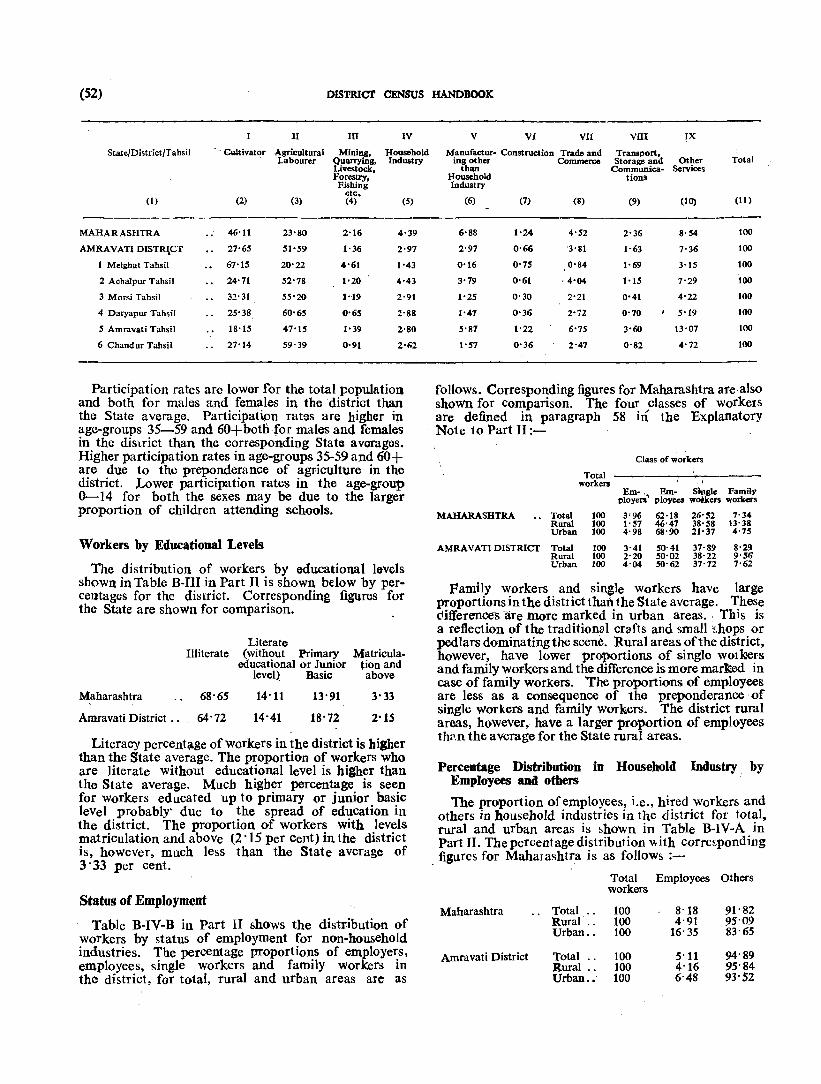
(52) DISTRiCT CENSUS
II m IV
State/District/Tahsil Cultivator Agricllltural Mining, Household Labourer Quarrying, Industry
Uvestock, Forestry, Fishing
etc .. (1) (2) (3) (4) (5)
MAHARASHTRA 46'11 23'80 2'16 4'39
AMRAVATI DISTR\CT 27'65 51'59 1'36 2'97
1 Melghat Tahsil 67'15 20'22 4'61 1'43
2 Achalpur Tahsil .. 24'71 52'78 1'20 4'43
3 Morsi Tahsil 32'31 55'20 1 "19 2'91
4 Daryapur Tahsil 25'38 60-65 0'65 2'88
5 Amravati Tahsil 18'15 47'15 1'39 2'80
6 Chandur Tahsil 27'14 59'39 0'91 2'62
Participation rates are lower for the total popUlation and both for males and females in the 'district than the State average, Participatipn rates are higher in age-groups 35-59 and 60+botn-for males and females in the district than the corresponding State averages. Higher participation rates in age-groups 35-59 and 60+ are due to the preponderance of agriculture in the district, Lower participation rates in the age-group 0-14 for both the sexes may be due to the larger proportion of children attending schools.
Workers by Educational Levels
The distribution of workers by educational levels shown in Table B-IlI in Part II is shown below by percentages for the district. Corresponding figures for the State are shown for comparison.
Illiterate
Maharashtra 68' 65
Amravati District.. 64'72
Literate (without Primary Matricula
educational or Junior tion and level) Basic above
14'11
14'41
13'91
18'72
3'33
2'15
Literacy percentl!\ge of workers in the district is higber than the State average. The proportion of workers who are literate without educational level is higher than the State average, Much higber percentage is seen for workers educated up to primary or junior basic leVel probably' due to the spread of education in the dirstrict, The proportion of workers with levels matriculation and above (2 '15 per cent) in the district is, however, much less than the State average of 3 '33 per cent.
Status of Employment
Table B-IV-B in Part II shows the distribution of workers by status of employment for non-household industries. Tue percentage proportions of employers, employees, single workers and family workers in the district, for total, rural and urban areas are as
HANDBOOK
V VI VII VIII IX
Manufactur- Construction Trade and Transport, Total ing other Commerce Storage and Other
than Communica- Services Household tions Industry
(6) (7) (8) (9) (10) (11)
"88 1'24 4'52 2'36 8'54 100
2'97 0'66 '3'81 1-63 7-36 100
0'16 0'75 0'84 1'69 3'15 100
3'79 0'61 ' 4-04 1'15 7'29 100
1'25 0'30 2'21 0'41 4-22 100
1'47 0'36 2'72 0'70 I 5'19 100
5'87 1'22 6'75 3-60 13'07 100
1'57 0'36 2'47 0'82 4'72 100
follows. Corresponding figures for Maharashtra are·a]so shown for comparison. The four classes of workers are defined in paragraph 58 in the Explanatory Note to Part II :-
Class of workers
Total workers
Em- , Em- Single Family ployers' ployecs wolkers workers
MAHARASHTRA .. Total 100 3'96 62,18 26'S2 7-34 Rural 100 I' 57 46'47 38'58 13'38 Urban 100 4'98 68'90 21'37 4'75
AMRA VATI DISTRICT Total 100 3'41 50'41 37'89 8'29 Rural 100 2'20 50'02 38'22 9'56 Urban 100 4-04 50'62 37'72 7-62
Fami]y workers and single workers have large proportions in the distIict than the State average, These <fiffertmces are filore marked in urban areas.· Tbis is a reflection of the traditionlJl crlJfts and small :~hops or pedlars dominating the scene. Rural areas of the district, however, have lower proportions of single wOlkers and family workers and the difference is more marked in case of family workers. 'The proportions of employees are less as a consequence of the preponderance· of single workers and family workers. The district rural areas, however, have a larger proportion of employees th?n the average for the State rural areas,
Percentage Distribution in Household Industry by Employees and others
The proportion of employees, i.e" hired workers and others in household industries in the district for total, rural and urban areas is &hown in Table B-IV-A in Part II. Thepercentagedistribu1ion "With corrcf-ponding figures for Mabarashtra is as follows :-
Total Employees Others workers
Maharashtra Total, , 100 8'18 91'82 Rural·, , 100 4'91 95'09 Urban. , 100 16'35 83'65
Arnravati District Total, , 100 5'11 94'89 Rural, , 100 4'16 95'84 Urban .. 100 6'48 93'52

AMRAVATI: BROAD ASPECTS OF ECONOMY
TALUKAWISE DISTRIBUTION OF
WORI:(I!RS AS PERCENTAGES OF THE"TOTAL POPULATION
&MRAVATI CIST ..
46·89
RURAl.
5090
URBANI
35·5~
MELGHAT
55-74
ACHALPUR
44·92
MORSI
49·97
CARYAPUR
47-39
... MRAVATI
42·52
CHANDUR
50·70
REFEREICES
§CUL. TIVATQR
~AGRICUL. TURAL UI~~~~LABOURER
_ MINING, LIVESTOCK ETC
21
WORKERS 1961
V'7'}AHOUSEHOL.D
~INDUSTR"
~MANUFACTUR'
~ING OTHER THA~
HOUSEHOL.D INOUSTRY
~ CONSTRUCTION
_ TRAOEANI:.
COMMERCE
~TRANSPORT, ~STORAGE AND
COMMUNICATIONS
_OTHER SERVICE!!:
(53)
o
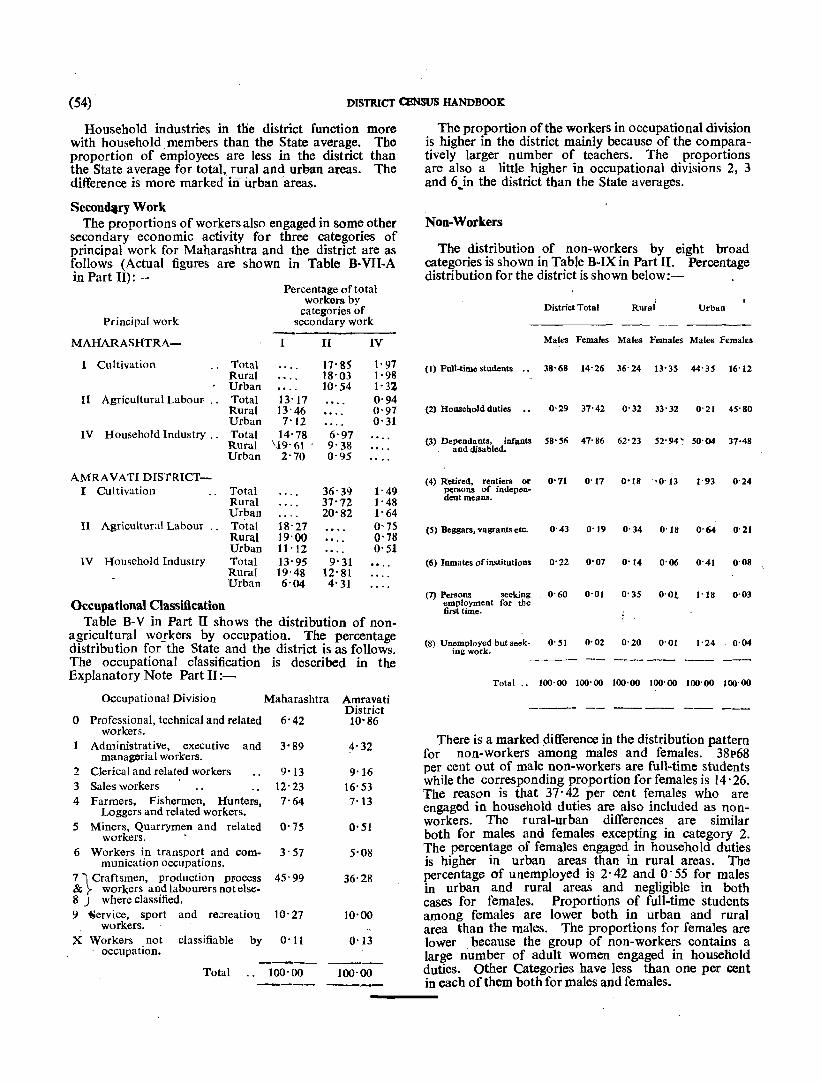
(54) DISTRICT CENSUS HANDBOOK
Household industries in the district function more with household members than the State average. The proportion of employees are less in the district than the State average for total, rural and urban areas. The difference is more marked in urban areas.
Seconqry Work The proportions of workers also engaged in some other
secondary economic activity for three categories of principal work for Maharashtra and the district are as follows (Actual figures are shown in Table B-VII-A in Part 11):-
Percentage of total workers by
categories of Principal work secondary work
MAHARASHTRA- I II IV
I Cultivation Total 17'85 l' 97 Rural 18'03 1-98 Urban 10-54 1-32
II Agricultural Labour ., Total 13'17 0'94 Rural 13'46 0-97 Urban 7'12 0- 31
IV Household Industry .. Total 14'78 6-97 Rural '19'61 . 9'38 Urban 2-70 0'95
AMRAVATI DISTRICT-I Cultivation Total 36'39 1'49
Rural 37'72 1'48 Urban 20'82 1'64
II Agricultural Labour .. Total 18'27 0-75 Rural 19'00 , ... 0-78 Urban 11'12 0'51
IV Household Industry Total 13-95 9'31 Rural 19'48 12'81 Urban 6'04 4'31
Occupational Classification Table B-V in Part II shows the distribution of nO'n
agricultural woskers by occupation. The percentage distribution for the State and the district is as follows_ The occupational classification is described in the Explanatory Note Part 11:-
Occupational Division Maharashtra Amravati District
o Professional, technical and related 6- 42 10' 86 workers.
1 Administrative, executive and 3' 89 4' 32 managerial workers.
2 Clerical and related workers 9'13 9'16 3 Sales workers 12' 23 4 Farmers, Fishermen, Hunters. 7' 64
Loggers and related workers. 5 Miners, Quarrymen and related O' 75
workers. 6 Workers in transport and com- 3' 57
munication occupations. 7 ') Craftsmen, production PI'ocess 45' 99 &}- workers and labourers not else-8 J where classified, 9 iiervice, sport and re;;reation 10' 27
workers, X Workers not classifiable by 0'11
occupation.
Total 100'00
16'53 7'13
0'51
5'08
36'28
10'00
0'13
100'00
The proportion of the workers in occupational division is higher in the district mainly because of the comparatively larger number of teachers. The proportions are also a little higher in occupational divisions 2, 3 and 6)n the district than the State averages.
Non-Workers
The distribution of non-workers by eight broad categories is shown in Table B-IX in Part II, Percentage distribution for the district is shown below:- ,
Distri~t Total
Males Females
(I) Full-time students " 38'68 14'26
(2) Household dutiCll .. 0'29 37'42
(3) Dependants, infants 5S'56 47'86 , and disabled.
(4) Retired, rentiers or 0'71 0'17 pe;rsons of indepen-dent means.
(5) Beggars, vagrants etC. 0'43 0'19
(6) Inmates of institutions 0'22 0'07
(7) Persons seeking 0'60 0'01 employment for tbe first time.
(8) Unemployed but seek· 0'51 0'02 ingwork. ----
Total .. 100'00 100'00
I Rural Urban
Males Females Males Females
36'24 13'35 44'35 16'12
0'32 33'32 0'21 45'80
62'23 52'94 ' 50'04 37,48
0'18 "0'13 1'93 0'24
0'34 0'18 0'64 0'21
0'14 0'06 0'41 ,-0'08
0'35 0'01. 1'18 0'03
0'20 0'01 1'24 0'04
-----100'00 100'00 100'00 100'00
---- ---
There is a marked difference in the distribution pattern for non-workers among males and females. 38p68 per cent out of male non-workers are full-time students while the corresponding proportion for females is 14' 26. The reason is that 37' 42 per cent females who are engaged in household duties are also included as nonworkers. The rural-urban differences are similar both for males and females excepting in category 2. The percentage of females engaged in household duties is higher in urban areas than in rural areas. The percentage of unemployed is 2' 42 and O· 5S for males in urban and rural areas and negligible in both cases for females. Proportions of full-time students among females are lower both in urban and rural area than the males. The proportions for females are lower because the group of non-workers contains a large number of adult women engaged in household duties. Other Categories have less than one per cent in each of them both for males and females.

H 4222-1
PART I
VILLAGE DIRECTORY This Directory renders an account of each Vi/lage and each ward of TOWIl
CONTENTS
PAGE
Explanatory Note 3
1 Melghat Taluka .. 5
2 Achalpur Taluka .. 19
3 Morsi Taluka 3S
4 Daryapur Taluka .. 51
5 Amravati Taluka .. 65
6 Chandur Taluka .. 83
\
EXPLANATORY NOTE
This Part I presents 1961 Population Census figures for all villages and towns in the district. In the case of towns, the figures are also presented separately for each ward. These basic statistics are not published for such small administrative units in any other country
in the world.
2. For each village, ward or town are shown its area, number of occupied residential houses, number of households, total population and its break-up by sex, literacy, Scheduled Castes, Scheduled Tribes, workers and non-workers. The figures for workers are further split up by sex aad by a broad classification of industrial activity in nine categories described in paragraph 16 below.
3. In the village directory, the villages are presented talukawise and within a taluka in the order of their location code numbers. These code numbers had been assigned to them for organising 1961 Census work and follow a regular north-west to south-east direction. The taluka map shows approximate locations of all villages with their code numbers. An alphabetical list of villages will be found facing each taluka map. It shows the code number of each village and its population in 1951 and 1961. The taluka map and the alphabetical list will together facilitate location of any village in the village directory as well as on the spot.
4. A" village" is a statutorily recognised village having a defined boundary and separate land records. Hamlets, wadies or padas have, therefore, not been shown separately. On the other hand, statutorily recognised villages having no population have been shown with separate code numbers but with word "uninhabited" shown against them.
5. Forest villages, however, make an exception. They are population centres situated within reserved forest areas. Their popUlation mainly consists of
H 4222-1 a
forest labourers and their families. Most of them are however, permanent localities and also have attached cultivated areas leased out by the Forest Department under certain conditions. Their land records are not maintained by the Revenue Department. Statistics for these forest villages have also been presented in the village directory. They may, however, be dstinguished from other statutory revenue villages from the letters " (FV) " suffixed after their names.
In Melghat Taluka, the forest villages have been assigned Code Nos. beginning with 1. In order to make a distinction between a forest village and a revenue village, the former have been shown after listing all revenue villages.
6. Survey of India maps, taluka maps, previous Census Handbooks and many other official sources have been referred both to secure accurate coverage and to get the correct spellings of village names. A very high standard of accuracy may now be claimed for both.
7. Urban areas or towns are places which either have a municipality or cantonment or have been treated as towns because they have-
(a) a popultion of over 5,000 ; and
(b) 75 per cent or more of male workers engaged in non-agricultural occupations.
Census figures for all these towns are presented ward wise after the completion of rural portion. Their names will also be found in the alphabetical lists of villages in capital letters with code numbers shown in Roman figures. They are also shown on the taluka map.
8. The taluka maps and the alphabetical lists are both improvements over the 1951 District Census Handbooks. The village figures are, moreover, extracted directly from Census records and not, as was done in 1951, from their copies prepared for some other purposes. The figures presented in the village directory, therefore, tally with the taluka and district Census tables perfectly.
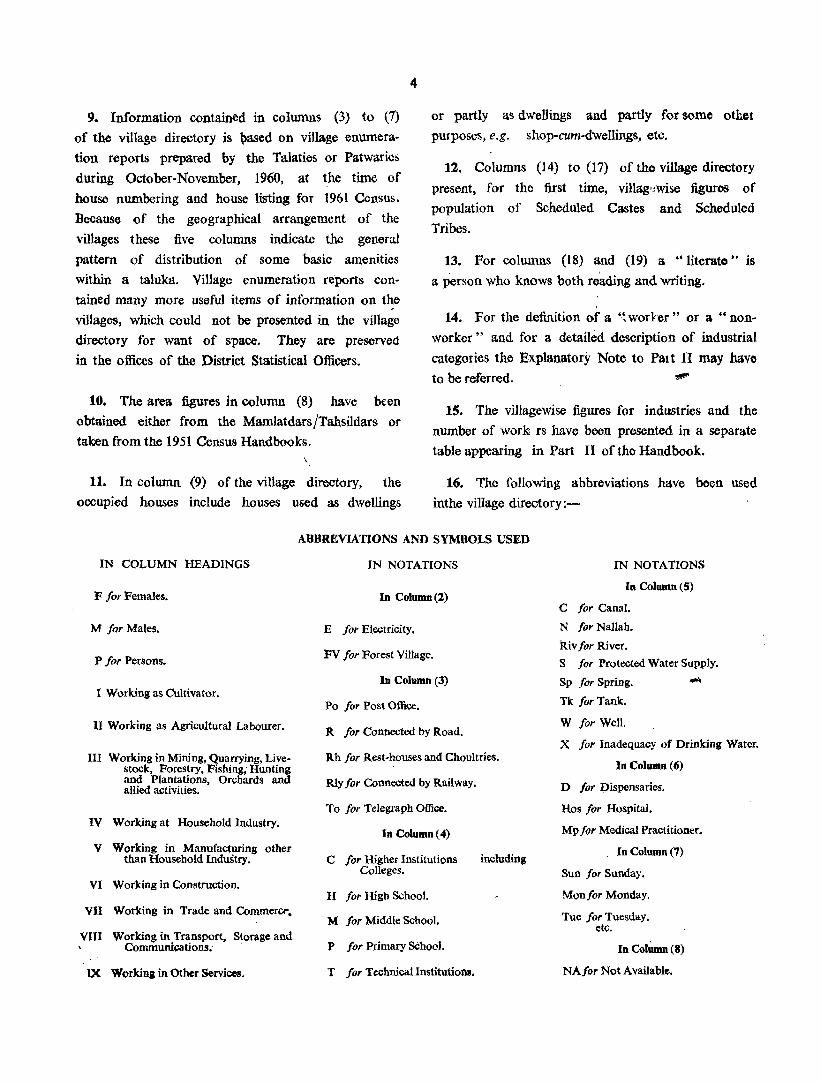
4
9. Information contained in columns (3) to (7)
of the village directory is \lased on village enumeration reports prepared by the Talaties or Patwaries
during October-November, 1960, at the time of house numbering and house listing for 1961 Census. Because of the geographical arrangement of the
villages these five columns indicate the general
pattern of distribution of some basic amenities within a taluka. Village enumeration reports con
tained many more useful items of information on the villages, which could not be presented in the village directory for want of space. They are preserved
in the offices of the District Statistical Officers.
or partly as dWellings and partly for some othel purposes, e.g. shop-cum-dwellings, etc.
12. Columns (14) to (17) of the village directory
present, for the first time, villagf!wise figures of population of Scheduled Castes and Scheduled
Tribes.
13. For columns (18) and (19) a "literate" is
a person who knows both reading and writing.
14. For the definition of a '~worl'er" or a "non·
worker" and for a detailed description of industrial
categories the Explanatory Note to Pal t II may have to be referred.
10. The area figures in column (8) have been
obtained either from the Mamlatdars/Tahsildars or taken from the 1951 Census Handbooks.
15. The villagewise figures for industries and the number of work rs have been presented in a separa.te
table appearing in Part II of the Handbook. \
11. In column (9) of the village directory, the 16. The following abbreviations have been used
inthe village directory:-occupied houses include houses used as dwellings
IN COLUMN HEADINGS
F for Females.
M for Males.
P for Persons.
I Working as Cultivator.
II Working as Agricultural Labourer.
III Working in Mining, Quarrying. Livestock, Forestry, Fishing; Hunting and Plantations, Orchards and allied activities.
IV Working at Household Industry.
V Working in Manufacturing other than 'Household Industry.
VI Working in Construction.
VII Working in Trade and Commer~.
VIII Working in Transport, Storage and Communications; .
IX Working in Other Services.
ABBREVIATIONS AND SYMBOLS USED
IN NOTATIONS
In Column (2)
E for Electricity.
FV for Porest Village.
In Column (3)
Po for Post Office.
R for Connected by Road.
Rh for Rest-houses and Choultries.
Rly for Connected by Railway.
To for Telegraph Office.
In Column ( 4)
C for Higher Institutions Colleges.
H for High School.
M for Middle School.
P for Primary School.
T for Technical Institutions.
including
IN NOTATIONS
In Column (5)
C for Canal.
N for Nallah.
Riv for River.
S for Protected Water Supply.
Sp for Spring.
Tk for Tank.
W for Well.
X for Inadequacy of Drinking Water.
In Column (6)
D for pispensaries.
Hos for Hospital.
Mp for Medical Practitioner.
In Column (7)
Sun for Sunday.
Monfor Monday.
Tue for Tuesday. etc.
In ColUmn (8)
NAfor Not Available.

Melghat Talul(8
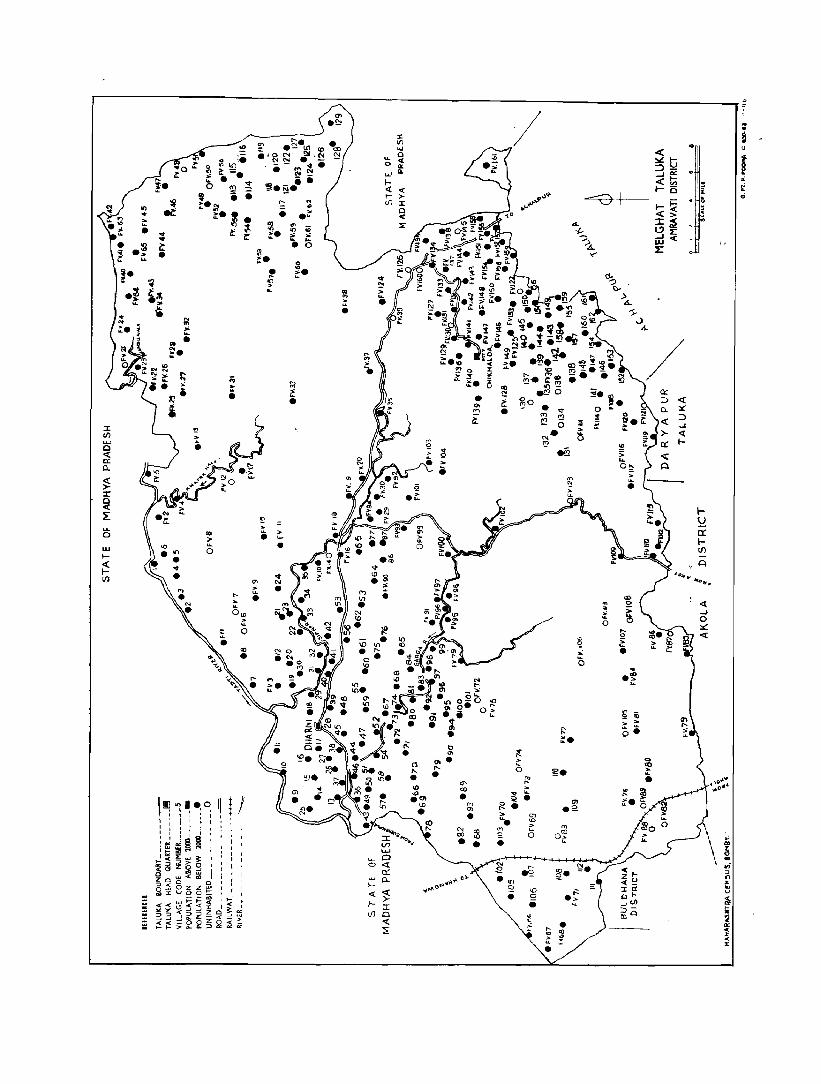
r-------~~--------------~
::I: If) .... o oct c: a.
~ ::r o oct ~ ... o UJ ~
« I-11)
II) ... .. ... • .~ ...
-M
~ ei::
.. .. ,. ~ •
.~.tt'1 ~
i'~~ !lI <0
~ l{)ti ·N ._. • ~ • .. - ... ,. ~ -. ... D . ~ ~.'!l.i i
m = ~ i • !:.~ !::: " '" ~·l • i .i:'
~ ~ '" I:: .,.,
'" I:: ~. It ,: .... • 0 I'l 1:-
~ . • ,.. ~ "-
;;; .. •
~ .. • >
~ ...
0 •
'" >-t'- U.
,. • ... O~
0
~ •
11ij"1~~~ II t J \ : i : i : I I , I ~ •
: : ; : I •
'",oi§§1 11.1.1 Y.I,... I"'( j , .... ., ,
I ~~~UJ~ I
~az~g I I , ~o~~~ I I
5~§ZZ~ , I ,
coX 00_ I __ CD L I
~~t:5~~~ !(; ::>:::><:::lo:::lzo~a::
~~g~2§~~~
:x: III oJ 0 ... '" 0 a:
uJ Q.
~ t--If)
GO ., . ~ •
.~ v ~a?
i:: IY')
: •
'" 1(1 • 0
'" 01 • " •
'" CD • '" '" •
'" co 0) co • • ...... "'- CI 0 <t
a:: f- '"-« « I- >-
:r: If) 1:1 « ~
~ 0
'" .... .. ~
... • 0 • " ,. '" ... <0 ,.
'" 0 Q
• '" .e .§ .0()
Q '" • 0
i '" <> if
~ . a>
.Q
n')
0'7: "-
~. ~ .
.~ -
...
"'I-Zu "'-:tel ",I-_,<.fl :J-m Cl
~
I~ c:: IIf)
, A .(o~ ...
-"°tr,_
,.;
'" z: o .. .,;
" ., z '" v
~ I< ~ 0: .. r < >:
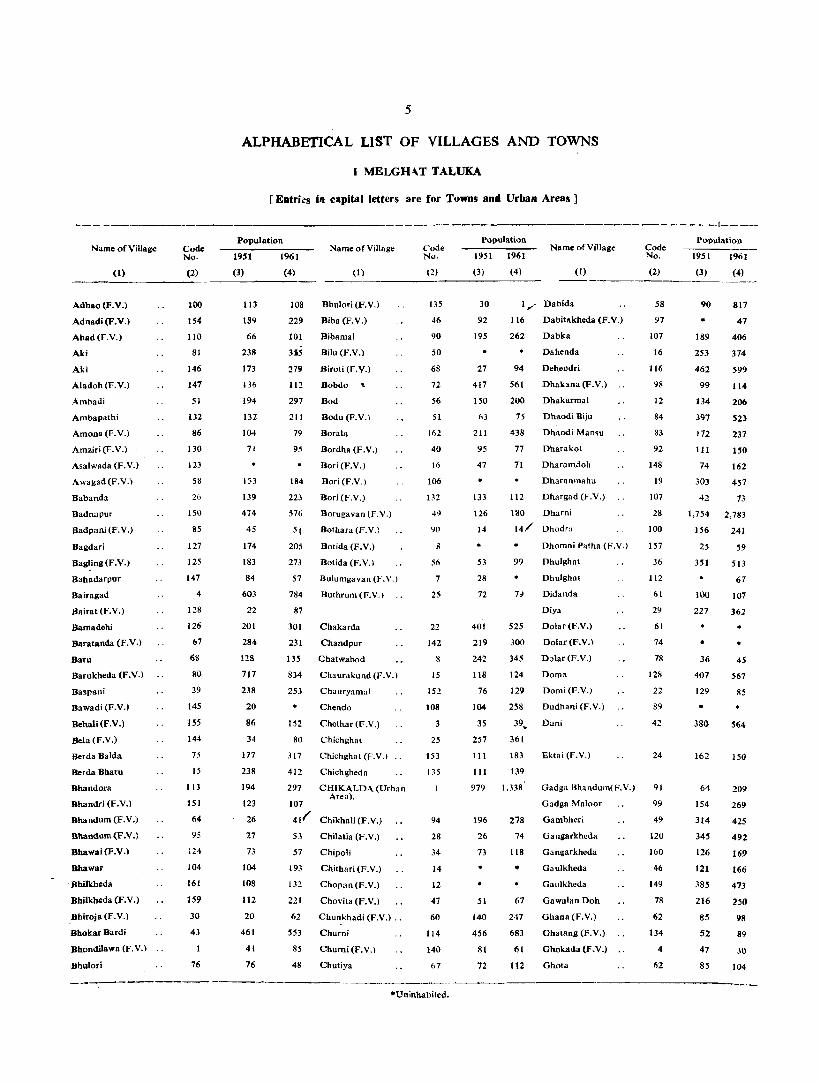
Name of Village
(I)
Adhao (F.V.)
Adnadi (F.V.)
Ahad(F.V.)
Aki
Aki
Aladoh(F.V.)
Ambadi
Ambapatlti
Amona (F.V.)
Amziri(F.V.)
Asalwada (F. V.)
Awagad (F.V.)
Babanda
Badnapur
Badpani(F.V.)
Balldari
Bagling (F.V.)
Bahadarpur
Bairagad
BaiTat (F.V.)
Bamadehi
Baratanda (F.V.)
Baru
Barukbeda (F.V.)
Ba.pani
Bawadi (F.V.)
Beha\i(F.V.)
Bela (F.V.)
Serda Balda
Berda Bharu
Bhandora
Bhandri (F.V.)
Bhandum(F.V.)
Bbandum (F.V.)
Bhawai(F.V.)
Bhawar
'Bbilkbeda
Bhilkheda (F. V.)
Bhiroja (F.V.)
Bhokar Bardi
Bhondilawa (F.V.)
·Bhulori
Code No·
(2)
100
154
110
81
146
147
51
132
86
130
123
58
26
ISO
85
127
125
147
4
128
126
67
68
80
39
145
) 55
144
75
15
113
151
64
95
124
104
161
159
30
43
76
5
ALPHABETICAL LIST OF VILLAGES AND TOWNS
I MELGHAT TALUKA
[Entrks in capital letters are for Towns and Urban Areas)
- __ . _____________________ -- ---·1-__ _
Population Name of Village
19S1 1961
(3)
113
189
66
238
173
136
194
132
104
71
153
139
474
45
174
183
84
603
22
201
284
!!S
717
238
20
86
34
177
238
194
123
26
27
73
104
lOS
112
20
461
41
76
(4)
108
229
101
US
279
112
297
211
79
95
184
223
576
51 205
273
57
784
87
301
231
(I)
Bhulori (F.V.)
Biba(F.V.)
Bibamal
Bilu(F.V.)
Biroli (F.V.)
Bobdo ..
Bod
Bodu(F.V.l
Borala
Bordha (F.V.)
Bori(F.V.)
Bori (F.V.)
Bor; (F,V.)
Borugavan iF.V.)
Bothara (F. V.)
Botida (F.V.J
Botida (F.V.l
SUlurngavan (LV.)
Butnrurn (F.V.I
Chakarda
Chandpur
135 Chatwabod
834 Chaurakund(F.V.)
253 Chauryamal
152
80
317
412
Chendo
Cheth.ar (F.V.)
Chichghat
Chichghat (F.V.)
Cbichgheda
297 CHIKALDA (Urban Area).
107
411' Chikhali (F.V.)
53
57
193
In 221
62
553
85
48
Chilatia (F.V.)
Chipoli
Chithari (F.V.)
Chopan (F. V.)
Chovita (EV.)
Chunkhadi (F.V.) ..
Churni
Chumi(F.V.)
Chutiya
Code N,,·
(2)
135
46
90
50
68
72
56
51
162
40
16
106
131
41)
90
8
56
25
22
142
R
15
152
108
25
153
135
94
28
34
14
12
41
60
114
140
67
·Uninhabited.
Population Name ofViJiage
1951 1961
(3)
30
92
195
27
417
150
('3
211
95
47
133
126
14
* 53
28
72
401
219
242
118
76
104
35
257
III
III
(4) (I)
1,- Dabida
116 Dabitakbeda (F.V.)
262
94
561
200
75
438
77
71
Dabka
Dahenda
Deheodri
Dhakana (F.V.)
Dhakarmal
Dltaodi Hi.iu
Dhaodi Mansu
Dharakot
Dnaramdoh
Dh.aranmahu
112 Dhargad (F.V.J
180 Dharni
14/ Dhodra
99
525
300
345
124
129
258
Dhomni Patha (F.V.)
Dhulghat
Dhulghat
Didanda
Diya
Dolar (F.V.)
Dolar (F.V.)
Dolar (F.V.)
Doma
Domi (F.V.)
Dudhani (F.V.)
39. Duni
361
183 Ektai (F.V.)
139
979 1.338' Gadga Hhandurn(F.V.)
Gadga Maloor
196 278 Gambhcri
26
73
51
140
456
81
72
74
118
•
67
247
683
61
112
Gangarkheda
Gangarkheda
Gaulkheda
Gaulkheda
Gawalan Doh
Ghana (F.V.)
Ghatang (F.V.)
Ghokada (F.V.)
Gho!a
Code No.
(2)
58
97
107
16
116
98
12
84
83
92
148
19
107
28
100
157
36
112
61
29
61
74
78
128
22
89
42
24
91
99
49
120
160
46
149
78
62
134
4
62
Population
1951 1961
(3)
90
* 189
253
462
99
134
397
172
III
74
303
(4)
817
47
406
374-
599
114
206
523
237
150
162
457
42 73
1,754 2,783
156 241
25
351
100
227
• 36
407
129
* 380
162
64
154
314
345
126
121
385
216
8S
52
47
85
59
513
67
107
362
45
567
85
•
150
209
269
425
492
169
166
473
250
98
89
30
104
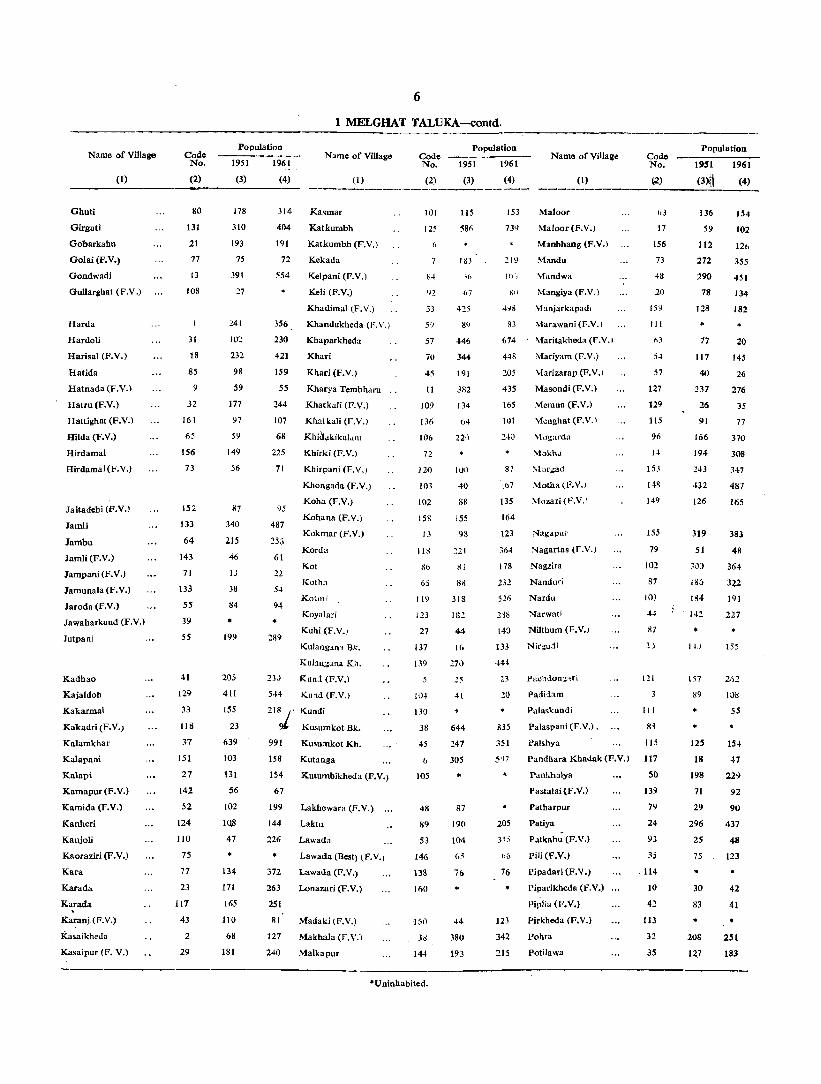
Name of Village
(1)
Ghuti
Girguti
Gobarkahu
Golai (F.V.)
Gondwadi
Gullarghat (F.V.)
Harda
Hardoli
Harisal (F.V.)
Hatida
Hatnada (F.V.)
Hatru(F.V.l
Hattighat (F.V.)
Hilda (F.V.)
Hirdamal
Hirdamal (F.V.)
Jaitadehi (F.V.l
JamB
Jambu
Jamli (F.V.)
Jampani {F.V.J
lamunala (F.V.l
laroda (F.V.)
lawaharkund (F.V.)
Jutpani
Kadhao
Kaja1doh
Kakarmal
Kakadri (F.V.)
Kalamkhar
Kalapani
Ka\api
Kamapur(F.V.)
Kamida (F.V.)
Kanheri
Kanjoli
Kaoraziri (F.V.)
Kara
Karada
Karada
Karanj.(F.V.)
Kasaikheda
Kasaipur (F. V.)
Code No.
(2)
80
131
21
77
13
108
31
18
85
9
32
161
65
156
73
152
133
64
143
71
133
55
39
55
41
129
33
118
31
151
21
142
52
124
Ito
75
77
23
117
43
2
29
6
1 MELGHAT TALUKA-contd.
Population
1951 1961 Name of Village
(3) (4) (I)
178
310
193
75
391
:'7
241
101
232
98
59
177
97
59
149
56
87
340
215
46
IJ
38
84
• 199
205
411
155
23
639
103
131
56
102
IQI!
47
134
171
165
110
68
181
314 Kasmar
404 Katkumbh
191 Katkumbh (F.V.)
72
554
356
Kekada
Kelpani (P.V.)
Keli (F.V.)
Khadimal (F. V.l
Khandukheda (F. Y.)
230 Khaparkheda
421 Khari
159 Khari (F.V.)
55 Kharya Tembharu
244 Khatkali (F.V.)
107 Khatkali (F.V.)
68 Khi~akika1,tnl
225
71
95
487
61
22
5-1
94
• 2~9
23,)
544
Khirki (F. V.)
Khirpani (P. V.)
Khongada (F.V.)
Koha{F.V.)
Kohana (F.Y.)
Kokmar (F.Y.)
Korda
Kot
Kothn
Kotmi
Royalari
Kuhi (F.Y.)
Kulang'n1 Bk.
Kuni(F.V.)
KU'ld (P.V.l
218 r Kandi
9L Kusumkot Bk.
991
158
154
67
199
144
226
372
263
2S1
81
127
240
Kusumkot Rh.
Rutanga
Kutumbikheda (F.V.)
Lakhewara (F.V.)
Laktu
Lawada
Lawada(Best) tr.Y.)
Lawada (F.V.)
Lonazari (P. V.)
Madaki (F. V.)
Makhala (F.V.)
Malkapur
Code No.
(2)
101
125
53
5')
57
7U
45
11
109
136
106
72
120
103
102
15R
13
lIS
116
65
119
123
27
137
139
104
13()
38
45
6
105
48
89
53
146
138
160
'150
38
144
·Uninhabited.
Population Name of Village
1951 1961
(3) (4) (I)
Code No.
Population
1951 1961
(3~1 (4) --------------~
115
580
183
4:!5
446
344
191
382
134
64
22()
Ill')
40
88
155
98
221
81
S~
318
182
44
16
27J
25
41
644
247
305
87
190
104
;6
44
380
193
153
739
21Y
83
674
448
205
435
165
101
240
Maloor
MalOOf (F. Y.)
Manbhang (F.V.)
~{andu
Mandwa
Mangiya (F.V.)
Manjarkapad.
Marawani (F.V.l
\{aritakheda (1'. Y:,
\iariyam (F.V.)
v[arizarap {F. V.'
Masondi (F. V.)
,"femna (F.V.)
"\1~nghat (F.V.)
\Iogarda
Mokhd
87 ''''r .. ad
,b7 Moth" (F.V.)
13S Mozari (r.v.' 164
123 :"{agaplli'
364 :"{agartas (F.V.)
178 Nagzira
232 Nanduri
516 Nardu
2:l8 Narwati
14~ Nilthum (F.V.)
441
:n Padidam
Palaskundi
Palaspani (1'. V.) •
•• 1
63
17
156
73
48
20
159
III
~3
54
57
127
129
115
96
14
15.1
148
149
155
79
102
87
103
44
117
2)
III
III
R~ 835
351 i'alshya 1 15
205
315
76
123
342
215
Pandhara Khadak (P. V.) 117
Panl<halya
Pastalai{F.V.)
Patharpur
Patiya
Poltkahu (F.V.)
Pili (F.V.)
Pipadari(F.V.)
Piparikheda (r.v.)
Pipli. (F.V.)
Pirkheda (F.V.)
l'ohra
Potilawa
50
139
79
24
93
35
114
10
42
113
32
35
136
59
112
272
190
78
128
77
117
40
137
26
91
166
194
243
-132
126
319
51
JO~
1&5
134
142
1-1.1
157
S9
• 125
18
198
71
29
296
25
75
30
83
208
12}
154
101
12"
355
451
134
182
20
145
26
276
3$
77
370
308
347
487
165
383
48
364
322
191
227
155
2;)2
1;)8
55
• 15-1
47
229
92
90
437
48
123
42
41
2S1
183
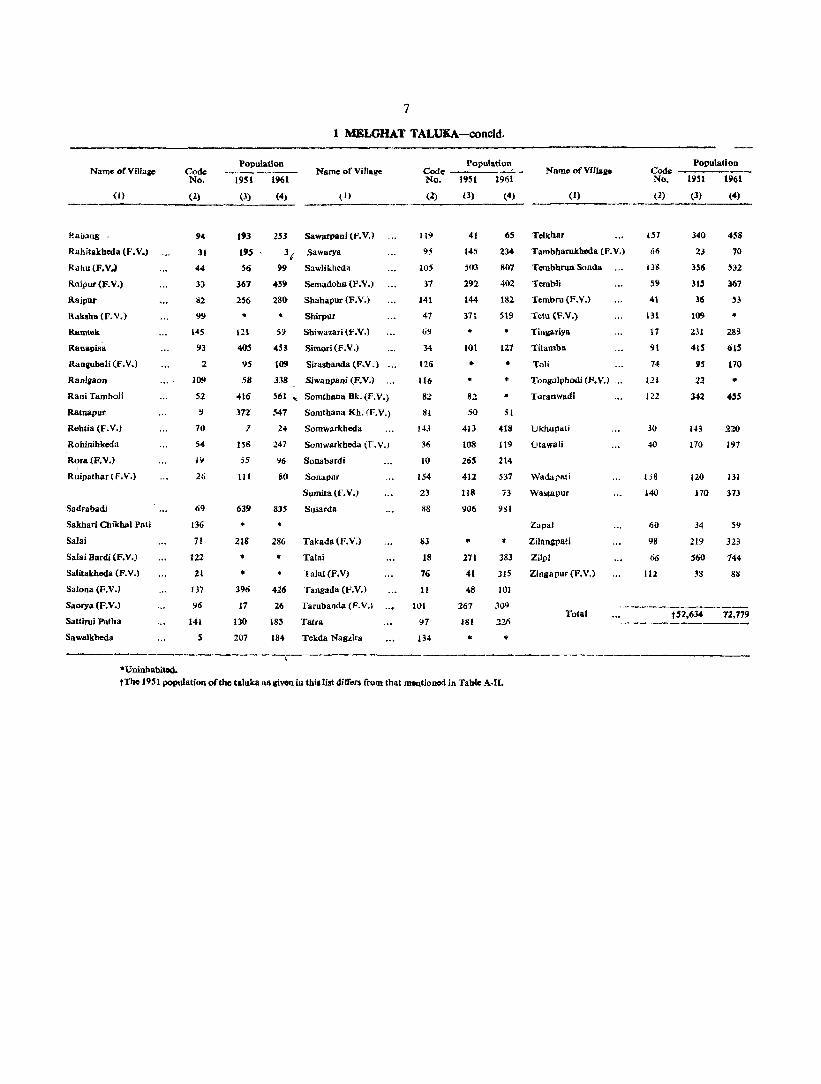
Name ofViIlaiW
(1)
Rallang ,
Rahitakheda (1'. V.)
Rahu(F.V.)
Raipur (F. V.)
RajpllJ'
Rakllha(1'.V.)
Ramu,k
Ranapi.<R
Ranllubeli (f. V.)
Ranigaon
Rani Tamboli
Ratnapur
Rehtia (F.V.)
Rohinihkeda
Rora(F.V.)
Ruipathar (F.V.)
Sadrabadi
Sakhari Chikhai Pati
Salai
Salai Bardi (P.V.)
Salitakhoda (1'. V.)
Salona (F.V.)
Saorya (F.V.)
Sattirui Palha
Sawalkbeda
·UninbabitoO.
Code No.
(2)
94
31
44
33
82
99
145
93
2
109
52
~
70
54
III
26
69
136
11
122
21
137
96
141
S
7
1 MELGHAT TALUKA-concld.
Population Name of Village
1951 1961
(3) (4)
193
19$
56
367
256
• III
405
9S
58
416
372
1
158
55
III
639
218
• •
396
17
130
253 Sawarpani (F.V.)
3" Sawarya
99 Sawlikheda
459 Semadoha (F.V.)
281} Shahapur (F.V.)
• Sbirpur
S9 Shiwa1.ari (F.V.)
453 Simori(F.V.)
109 Sirasbanda(F.V.)
338 Siwanparu (1'. V.)
561 ... SomthanaBk.(F.V.)
547 Somthana Kh. fEV.)
24 SomwiU'khoda
247 SomwiU'kbeda (LV.)
\/6 Sonab8Cdi
80 Sonapur
Sumita (r. V.)
835 Susarda
286 Takada (F.V.)
• Talai
Talai(F.V)
426 'rangada (F.V.J
26 Tarubanda (F,V,)
185 Taira
Population, Code -----.:.- Name ofVUIaIlO No. 1951 1961
(2)
119
95
105
37
141
47
34
126
116
82
81
14.~
36
10
154
23
~8
113
18
16
II
101
')7
(3) (4) <I)
41
145
503
2n 144
~7t
lOt
• • 82
50
413
108
265
412
118
906
• 271
41
48
267
181
65 Telkhar
234 Tambharukheda (1'. V.)
807 Tembhrun Sonda
402 Tembli
182 Tembru (F.V.)
SI9 Tetu (F.V.)
Tinil31'iya
127 Tilamba
.. Tali
• T0nB,,)phodi (F. V.)
Ioranwadi
51
418 Ukhupati
119 Utawali
214
537 WadaJ)ftli
13 Wastapur
9S1
Zapal
• ZilanfWati
383 Zilpj
315 Zill1lapur (F.V.)
101
31)9 Total
226
207 184 Tekda Nagzlra ••• ' 134 •
tTho 1951 population of tho talllka as given in this list "ilfers from that moutionod in Table A-II.
Population Code -, __ --:-:~-No. 1951 1961
(2)
137
ti6
13&
59
41
131
17
91
74
III
122
30
40
158
140
60
98
112
(3) (4)
340
23
356
31S
lIS
109
231
415
9S
22
342
458
10
532
167
~3
289
615
no ..
455
143 220
170 197
120 131
170 373
34
219
560
38
t52,634
59
323
144
88
72.719
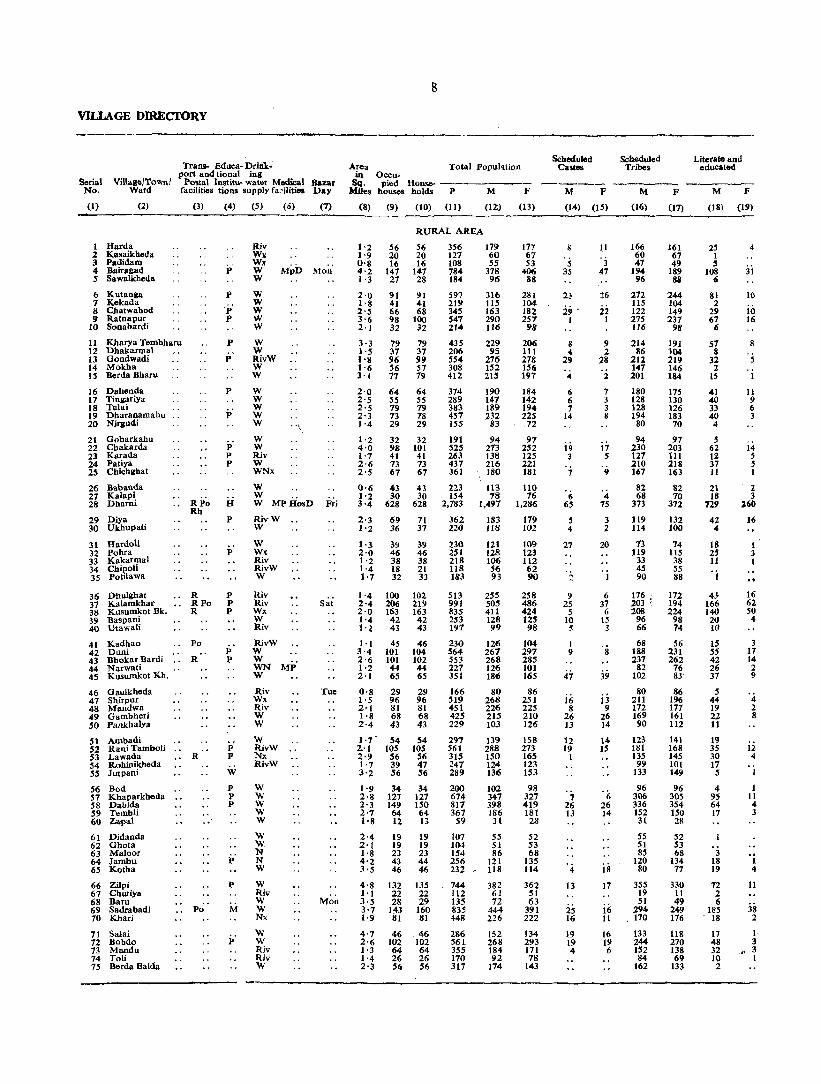
VILLAGE DlREcrORY
Serial No.
Trans- Educa- Drililc~ port and tional in&
Village/Town I Postal Institu- water Modical Bazar Ward facilities tions supply fadlities Da.y
(1) (2)
1 Harda 2 Kasaikheda 3 Padidam 4 Bairagad 5 Sawalkheda
6 Kutanga 7 Kekada 8 Chatwabod 9 Ratnapur
10 Sonabardi
11 Kharya Tembharu 12 Dhakarmal 13 Gondwadi 14 Mokha 15 Herda Bhar ..
16 Dahenda 17 Tingariya 18 Talai 19 Dharanamahu 20 N:irgudi
21 Gobarkahu 22 Chakarda 23 Karada 24 Patiya 2S Chichghat
26 Babanda 27 Kalapi 28 Dharni
29 Diya 30 Ukhupati
31 Hardoli 32 Pohra 33 Kakarmal 34 Chipoli 35 potilawa
36 Dhulghat 37 Kalamkhar 38 Kusumkot Bk. 39 Baspani 40 Utawali
(3)
R RPo R
41 Kadhao .. Po 42 Duni 43 Bhokar Bardi . . R 44 Narwati 45 Kusomkot Kh.
46 Gaulkheda 47 Shirpur 48 Mandwa 49 Gambheri 50 Pankhalya
51 Ambadi
(4) (5) (6) (7)
P
p
p p
p
p
p
P
p p p
H
p
p
p p p
p p
P
Riv W ... Wx W Mph Mon W
W W W W W
W W RivW W W
W W W W W
W W Riv W WNx
"\
W W W MP HosD P;i RivW W
W W" Riv RivW W
Riv Riv s~i Wx w Riv
RivW W
~ MP' W
Riv Wx Riv W W
Toe
52 Rani Tamboli 53 Lawada R P
W RivW Nx RivW 54 R.ohinikheda
55 Jutpani
56 Bod 57 Khaparkheda 58 Dabida 59 Tembli 60 Zapal
61 Didanda 62 Ghota 63 Maloor 64 Jambu 65 Kotha
66 Zilpi 67 Chutiya 68 Baru 69 Sadrabadi 70 Khari
11 Salai 12 Bobdo 73 Mandu 14 Toli 15 Berda Bahia
Po
W
P P P
p
p
M
p'
w w w w w w ~ N W
W Ri" W W Nx
W W Riv Riv W
8
Total Popuhtion Area in Occu-
Sq. pied House- -------Miles houses holds P M F
(8) (9) (10) (II) (12) (13)
RURAL AREA
1'2 56 56 1'9 20 20 0'8 16 16 4'2 141 141 1'3 21 28
2'0 91 91 1'8 41 41 2'5 66 68 3'6 98 100 2'1 32 32
3·3 1'5 1'8 1'6 ]-1
2'0 2'5 2'5 2'3 1'4
79 37 96 56 77
64 55 79 73 29
79 37 99 57 79
64 55 79 78 29
1'2 32 32 4'0 98 101 1'7 41 41 2'6 73 73 2'5 67 67
0'6 43 43 1'2 30 30 3'4 628 628
2'3 69 71 1-2 36 31
1-3 39 39 2'0 46 46 1'2 38 38 1'4 18 21 1'7 32 33
1'4 100 102 2'4 206 219 2'0 163 163 1'4 42 42 1'24343
1'1 45 46 3'4 101 104 2'6 101 102 1'2 44 44 2'1 65 65
0'8 29 29 1'5 96 96 2'1 81 81 1-8 68 68 2,4 43 43
1'7 S4 S4 2'1 105 105 2·9 56 56 1'7 39 47 3-2 56 56
1'9 34 34 2'8 127 127 2'3 149 150 2-7 64 64 t'8 12 13
2'4 19 19 2'1 19 19 1'8 23 23 4'2 43 44 3'5 46 46
4'8 132 135 1'1 22 22 3·S 28 29 3'7 143 160 1'9 81 81
4'7 46.46 2'6 102 102 1'3 64 64 1'4 26 26 2'3 56 56
356 127 108 784 184
597 219 345 547 214
435 206 554 308 412
374 289 383 457 155
191 525 263 437 361
223 154
2.783
362 220
230 251 218 118 183
513 991 835 253 191
230 564 553 221 351
166 519 451 425 229
179 60 55
378 96
316 US 163 290 116
229 95
276 152 215
190 147 189 232 83
94 :213 138 216 180
tl3 78
1.491
183 Jl8
121 128 106 56 93
255 505 411 128 99
126 267 268 126 186
80 268 226 215 103
291 139 561 288 315 150 241 124 289 136
200 102 674 347 817 398 367 186
59 3t
107 55 104 51 154 86 256 121 232 , U8
744 112 135 835 448
2S6 561 355 110 317
382 61 12
444 226
152 268 184 92
114
177 67 53
406 88
281 104 182 257 98
206 111 178 156 197
184 142 194 225 12
97 252 125 221 181
ItO 76
1.286
179 102
109 123 112 62 90
258 486 424 tn 98
104 297 285 101 165
86 251 225 210 126
158 273 165 123 153
98 327 419 181 28
52 53 68
135 114
362 51 63
391 222
134 293 171 78
143
Scheduled Castes
M F
(14) (15)
's 35
2,
29 . 1
g 4
29
04
6 6 7
14
i9 3
. 7
6 65
5 4
27
2
9 25
5 10 ~
I 9
47
16 8
26 13
12 19
I
1 26 13
4
13
25 16
19 19 4
1.1
3 ~7
26
22 I
9 :2
28
:2
7 3 3 8
ii s 9
'4 1S
3 2
20
'j
6 37
6 15 3
:i9
i3 9
26 14
14 15
'6 26 14
is 17
iii 11
16 19 6
Scheduled Tribes
M
(16)
166 60 41
194 96
212 115 122 275 116
214 86
212 147 201
180 128 128 194
80
94 230 121 210 167
82 68
373
119 fl4
73 119
33 45 90
t76 ' 203 1 208
96 66
68 188 237
82 102
80 211 172 169 90
123 181 135 99
133
96 306 336 152 3l
55 51 85
120 80
355 19 51
294 170
133 244 152 84
162
F
(17)
161 67 49
189 88
244 104 149 237
98
191 104 219 146 184
175 130 126 183 70
91 203 111 218 163
82 70
372
132 100
74 115 38 55 88
172 194 224
98 14
56 231 262
76 83'
86 196 177 161 112
141 168 145 101 149
96 305 354 150 28
52 53 68
134 17
330 11 49
249 176
118 270 138 69
133
Literate and edocated
M F
(18) (19)
25 1 5
108 6
81 2
29 67
6
57 8
32 2
15
41 40 33 40 4 ,
62 1Z 37 11
21 18
729
42 4
IS 25 11 -j
4J 166 140 20 1(1
15 55 42 26 31
S 44 19 22 11
19 35 3(1 17 5
4 95 64 17
'3 18 19
72 2 6
185 18
17 48 32 10 2
4
ji
10
10 16
8
I
11 9 6 3
14 5 5 1
2 3
260
16
1 ' 3 I
16 62 50 4
3 17 14 2 9
4 2 8
12 4
1 11 4 3
1 4
11
38 2
1 3
. .., 3 I

Total workers (I-IX)
M
(20)
100 40 38
258 57
176 77
100 188
65
131 53
136 94
132
114 97
117 138 45
57 160 71
118 122
72 47
759
111 64
68 77 67 31 55
161 303 246
83 69
80 172 169
73 108
57 163 160 130
71
85 171 103
84 83
72 218 249 120 22
28 44 53 76 79
212 36 45
235 133
87 161 95 58 99
F
(21)
108 41 30
210 55
152 62
102 163
58
138 65
173 105 124
115 93 92
132 40
49 146 60
124 120
53 42
249
101 56
63 75 60 23 52
130 230 153 86 51
54 67
159 59 82
53 125 138 117 90
97 161 102
74 90
60 165 240 116 20
33 37 40 77 72
147 30 37
199 103
77 124
52 39 86
M
(22)
61 36 33
147 50
144 59 71
\5\ 57
92 42
10\ 79 90
85 SS 50 68 43
49' 103 65 91
103
42 19
150
82 54
44 62 48 22 45
77 97
122 65 29
2S 128 102
31 45
44 107 115 64 48
66 101 80 63 74
49 129 193
78 18
25 41 50 72 64
135 22 38
117 95
82 101 76 17 91
F
(23)
61 38 28
137 52
130 ~4
74 136
52
106 52
\0\ 84 84
96 61 42 78 37
39 106 54 93
102
37 12 18
79 50
48 65 47 20 46
54 99 76 57 17
8 29 91
38
43 75 98 71 55
75 108 82 57 84
44 74
186 78 18
31 35 39 74 60
90 2
31 135
81
71 75 35
78
9
WORKERS
II III IV V VI
M F M F M F M F M
VII VIII
F M F M F
1 MELGHAT TALUKA
IX
M F
NON-- WORKERS
SeriJI No,
M F
(24) (25) (26) (27) (28) (29) (30) (31) (32) (33) (34) (35) (36) (37) (38) (39) (40) (41) (1)
24 1 3
69 4
11 6
12 ~4
6
28 8
63 12 34
17 37 54 52
7 39
5 18 15
47 3 1
59 3
21 8
22 26 6
32 13 58 20 37
16 32 48 49
3
9 35 6
30 18
27 16 25 30
182 217
15 6
15 7
17 3 5
19 6
II 10 12 3 6
'62 69 124 120 67 69 14 29 34 33
49 28 53 28 50
11 40 40 55 20
46 37 67 54 44
10 47 40 39 35
13 21 61 52 13 18 10 9 5 6
20 80 26 30
4
2
1 3
10
51 14
1 41 19
15 87 37 37 2
2
I 3 8
5J 2~
6 58 17
3 6 46 47 16 17 41 39
3 8
14 3
15 2
8 12 13 6 2
6 2 3 2 I
5'
~" 4 2
1 7 4 5 3
2 21
8 2
3 4 2 4 2
7 2 2 3
4 4 4 2 1
2 5
4 2
4 I 9 3 4
I 4
16 12
1 2 2
2
4
I 4
11
2 3 I
4
2
I 2
2 I
2
1
2
2 6
I 2
I II
3 1 I 8
2
21
3
3 1
5 26
8
2
in 2 7 2
10 2 4
1 3
6
4
7
ii 5
6 1
5
RURAL AREA
I 8
2 1
\0
3
2
2
2
3 5 4
7
1
7
7
2
23
I 4 I
2 I
4
23
9 9 I I
9
4 1
1
2
4
I
I 1
2 113
2
I
3 6 20 4 20
2
4 2 8
2
I 4
2
8
4 5 3
I 6
15
3 5
2
4
3 4
b 2 3
2 I
2 2
6 21 16
I 2 4 I 1
3 3 I
I 4 1
1 4 6
7
I 35
79 69 20 26 17 23
120 196 39 33
140 129 38 42 63 80
102 94 51 40
98 42 90 58 83
76 SO 72 94 38
37 113
61 98 58
68 46
105 51 73
69 49
102 93 32
48 106 65 97 61
J 2 3 4 5
6 7 8 9
10
11 12 13 14 15
16 1'7 18 19 20
21 22 23 24 25
41 57 26 31 34 27
738 1,037 28
n 78 29 54 46 30
53 46 31 51 48 3" 39 52 33 25 39 34 38 38 35
4 94 128 36
1 4
4
202 256 37 165 271 38 45 39 39 30 47 40
46 50 95 230 99 126 53 42 78 83
23 33 105 126 66 87 85 93 32 36
41 42 43 44 45
46 47 48 49 50
54 61 51 117 112 52 47 63 53 40 49 54 53 63 55
30 38 129 162 149 179
66 65 9 8
27 7
33 45 39
19 16 28 58 42
170 215 25 21 27 26
209 192 93 119
65 57 107 169 89 119 34 39 75 57
56 57 58 59 60
61 62 63 64 65
65 67 68 69 70
71 72 73 74 75

VILLAGE DIRECTORY
Serial No.
(I)
VillagelTown} Ward
(2)
Trans- Educa- Drink-port and tional ing
postal I nomu- water Medical facilities tions supply facilities
(3) (4) (5) (6)
Bazar Day
(7)
10
Area in
Sq. Miles
(8)
Occupied
houses
(9)
Households
(10)
Total Population Scheduled
Castes
P M F M F
(11) (12) (13) (14) (IS)
Scheduled Literate and Tribes educated
M
(16)
F M F
(17) (18) (19) ------------------.--------_
76 Dhul<>r; 77 Kara 78 GawaJan D"h 79 Patharpur 80 Ghuti
81 Aki 82 Rajpur 83 Dbaodi Mans" 84 Dbaod; Biju 85 Hatid"
86 Kot 87 Nanduri 88 Susarda 89 Laktu 90 Bibamal
91 Titamba 92 Dbarakot 93 Ranapisa 94 Rabang 95 Sawarya
96 Mogarda 97 Tatra 98 Zilangpati 99 Gadga Maloor
100 Dhodra
101 Kasmar 102 Nagzirll 103 Nardu 104 Bbawar 105 SawHkbedr.
106 Khidakikalam 107 Dabka 108 Cbendo 109 Ranigaon 110 Kanjoli
HI Palaskundi 112 Dbulghat 113 Bhandora t14 Churni 115 Palshya
116 Dehendri 117 Karad. H8 Korda Il9 Kotmi 120 Gangarkheda
121 Pachdongari 122 Toranwadi 123 Koyalari 124 Kanheri 125 Katkumbha
126 Bamadehi 127 Bagdari 128 Doma 129 Kajaldoh 130 Kundi
131 Girgut; 132 Ambapathi 133 Jamali 134 Tekda Nagzira 135 Cbichkheda
136 Sakhari Chikha I Pati 137 KulanganaBk 138 Tembbrun Sonda 139 Ku1angana Kh 140 Wastapur
141 Saltirui Patha 142 Chandpur 143 Somwarkheda 144 Malkapur 145- Ramtek
146 Aki 147 Bahadarpur 148 })hararndoh 149 Gaulkheda 150 Badnapur
Po
....... _ ._-------------
p
p P
p
P
P
P
p
P P
p P
p
p
P
p
P P
P
p p
Sp,< W W Nx Riv
Riv W W W W
N N W W W
W W W W N
N W W Riv Nx
Nx W Riv Riv W
W WN WVNSp
Wx
NSp Riv W WNx WNx
WNSpv. .. WNx WN RivW RivW
WN Wx WN WN WN
RivW RivW RivW WN
Riv Riv WN
WN
WN RivW WN Riy
Nx Riv RivW:< W W
W Riv Riv RivW Mp' W
RURAL AREA--c'md.
S~t Mon
Tue
2'1 2·0 3·8 3·4 2·0
6 69 46 15 59
6482325 69 372 186 186 46 250 136 1'14 15 90 44 46 S9 314 154 160
5
4
1· 5 3·6 1·5 2·3 2-6
59 S4 38 74 27
59 355 181 174 12
2·5 2·6 3'7 3·2 3·6
3·0 1-2 3·5 2·0 1'8
3'5 1'5 1·8 1·6 1·5
2·[ 4·7 3·9 2·9 5·8
2·7 2·7 3·3 3·4 3·4
NA NA }·3 2·2 2·0
3·2 3·1 2·9 2·7 2·5
2·2 2·6 1·1 2·4 2·7
31 61
150 34 43
85 24 80 42 39
67 '59 62 45 34
28 70 34 33
163
49 95 58 S9 38
10 20 53
117 26
95 41 66 73 81
42 87 56 27
129
S4 280 141 139 38 237 109 128 80 523 269 254 29 159 85 74
31 178 89 89 61 322 175 147
152 981 489 492 34 ~05 102 103 43 262 126 136
98 615 300 315 24 150 78 72 80 453 224 229 42 253 130 123 39 234 127 107
75 370 181 189 39 226 110 116 66 323 169 154 46 269 129 140 34 241 118 123
28 153 72 81 75 364 200 164 35 191 106 85 34 193 99 94
166 807 415 392
49 240 120 120 100 406 2~1 18S
58 258 140 118 59 338 IS9 179 38 226 116 110
10 S5 25 30 33 67 48 19 53 297 154 143
121 683 363 320 26 154 78 76
105 599 41 251 71 364 82 526 94 492
301 298 120 131 175 189 280 246 241 251
43 262 134 128 87 45S 231 224 56 288 142 146 28 144 74 70
146 739 361) 370
2·3 53 53 301 144 157 20S 1(}<) 96 567 290 277 544 261 283
2·3 34 34 3,0 99 109 3·2 91 101 2·4 Uninhabired
4·1 74 74 1·7 34 35 2·2 90 90 1·6 Uninhabited 1·3 32 32
1 . 2. Uninhabited
404 213 191 211 110 lOt 487 261 226
\39 64 75
3
5 6 1 I
4
12
60 53 38
24
8 15
164
19 18 10
42 58 18 91 19
14
30
3'3 24 24 133 71 62 1·7 193 113 532 2S1 281 'i9 Z·O 74 77 444 220 224 6 1·0 62 63 373 195 178 2
1·9 1·9 2'9 0·6 0'7
2·0 1·9 1·6 1·4 1·6
36 53 70 39 12
48 13 34 87 81
38 ISS 5S 300 80 418 39 215 12 S9
94 91 151 149 212 206 101 114 29 30
SO 279 138 14\ 14 57 26 31 34 162 84 78 96 473 252 221 99 576 276 300
2. 4
4 11 6
7
7
22 151 136 39
105
20 154 114 43 94
16 IS 6
11
10 151 151 32 139 135 17 104 120 6 255 242 18 83 72 3
38 29 160 128 410 412 87 93
117 128
21 32 79 14
3
3 281 295 68 6 71 6S 7
37 10 5
168 186 126 119 127 107
152 149 24 110 116 23 161 149 .20 115 125 '1 117 121
64 65 3 178 157 11 103 84 II 81 76 2
380 347 93
120 120 2 154 147 39 101 83 21 158 177 29 116 110. 9
13 14
49 94 94 3
25 27
110 42 181 156 30 39 42
16
ii 11
166
23 15 16
:i7 58 12 86 17
12
39
191 187 120 131 160 172 21t 204
76 84
112 102 188 191 llS 122 56 55
170 159
86 89
192 234
181 89
209
26
99 83
180 254
169 85
189
26
ii 156 180 6 184 193 2. 129 120
'j 7
"j 9 7
74 151 163 94 27
73 149 1'59 106 28
a7 132 26 31 76 72
176 151 165 188
6
22 3 5
29 24
11 41 IS 10 92
13 12 21 67
39 9
56
6
20 79 65 26
6 29 16 17 3
25 2 8
79 69
2
4
4 7 5 I
15
7 2
3 I 1
1 18
2
S
2
ii
2
it 2
1 S
'j 24
9 1 3
3
2 10 14
j
. i
4
jii 17
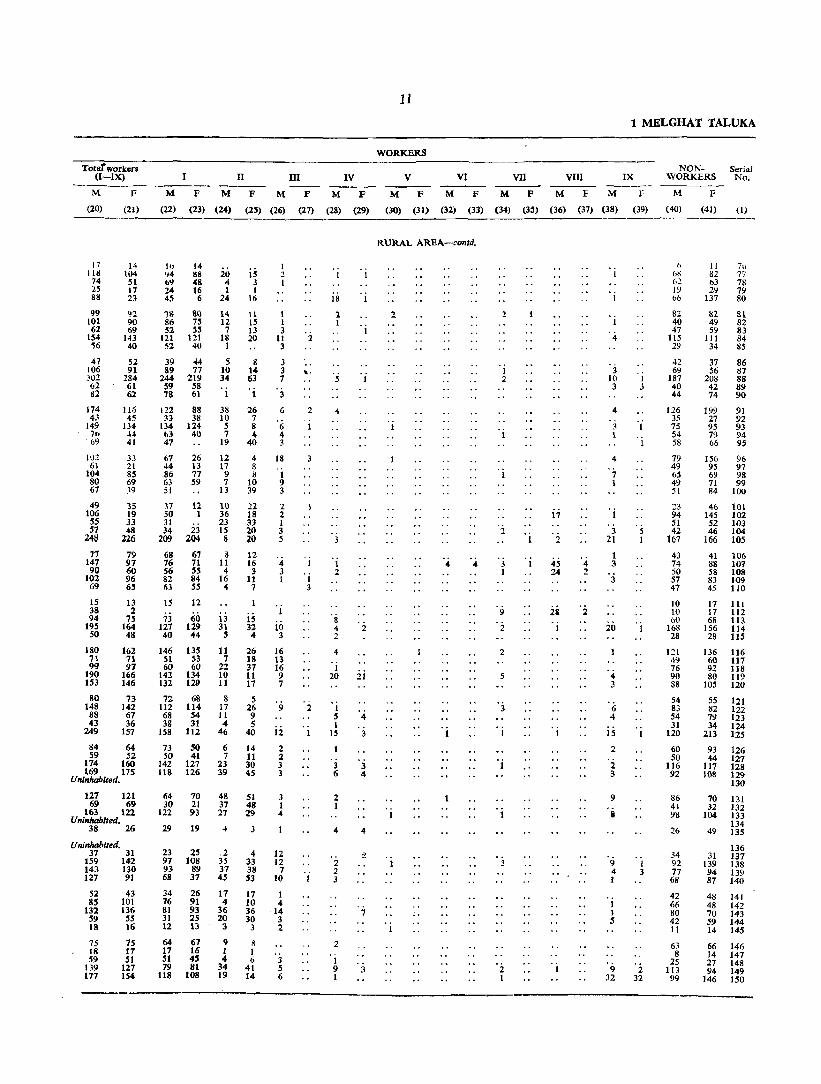
Totar workers (I-IX) II
M F M F M F M
(20) (21) (22) (23) (24) (25) (26)
17 11~ 74 25 88
99 101 62
154 ~6
47 106 302 62 S2
174 43
149 70
, 69
11)1 61
104 80 67
49 106 5S 57 ~S
71 147 90
102 69
15 38 94
195 50
180 71 99
190 153
1:'; l04 51 17 23
92 90 69
143 40
52 91
284 61 62
116 45
134 ~4 41
33 21 85 69 )9
35 19 33 48
2:l6
79 97 60 96 65
13 2
75 164 48
162 71 97
166 146
80 73 148 142 88 67 43 36
249 157
84 64 59 52
174 160 169 175
Uninhabited.
127 121 69 69
163 122 Uninhabited.
38 26
Uninhabited. 37 31
159 142 143 130 127 91
52 8S
132 S9 18
75 18 59
139 177
43 101 136 55 16
75 17 51
127 154
----------,----------
II> 14 ·j4 H8 20 69 4& 4
is 24 16 1
3 1
16 45 6 24
7S 80 14 It 86 75 12 is 52 55 7 13
121 121 18 20 52 40 I
39 44 89 77
244 219 59 58 78 61
122 88 33 38
134 124 63 40 47
S 8 10 14 34 63
1 'i 38 26 10 7
5 8 7 4
19 40
67 26 12 4 44 13 17 8 86 77 9 8 63 59 7 10 51 13 39
37 12 10 22 50 1 36 18 31 23 33 34 23 15 20
209 204 8 20
68 67 ~ 12 76 71 11 16 56 55 4 3 82 84 16 1l 63 55 04 7
15 12
73 60 13 is 32 4
127 129 31 40 044 5
146 135 51 53 60 60
142 134 132 129
11 26 7 18
22 37 10 11 11 17
72 68 8 5
I 2
1 1 3
11 3
3 3 7
3
6
6 4 3
18
1 9 3
2 2 1 3 5
4 3 1
1
iii 3
16 13 16 9 7
112 114 17 26 9 685411 9 38 31 4 5
158 112 46 40 ii 73 50 6 14 2 50 41 7 11 2
142 127 23 30 3 118 126 39 45 3
64 70 30 21
122 93
29 19
23 25 97 108 93 89 68 37
48 51 37 48 27 29
4
,2 4 3S 33 37 38 45 53
3 1 4
12 12
7 10
34 26 17 17 I 76 91 4 10 4 81 93 36 36 ,14 31 2S 20 30 3 12 13 3 3 2
64 67 17 16 51 45 79 81
118 108
9 S I I 4 6
34 41 19 14
3 5 6
m IV
F M F
(27) (28) (29)
2
.. '
2
1
2
18
1 1
4
'j 2.
'8 4 2
4
'j
, i
2
20 21
'i 5 1
15
3 6
2 I
2 2 3
2
'j 9 1
4
3
3 4
4
:2
7
3
11
WORKERS
v VI M F M F
(30) (31) (32) (33)
RURAL AREA-conto.
2.
4 4
. i
VII vm M F M F M
(34) (33) (36) (37) (38)
I 2
9
2
5
. i
. i
3
'2 1
17
45 24
4 2
4
3 10 3
4
3 1
4
7 1
'i 3
21
1 3
3
20
4 3
6 4
15
2
2 3
9
Ii
9 4 1
I 1 5
9 32
1 MELGHAT TALUKA
IX
r (39)
I
1
5 1
I 3
2 32
NONWORKERS
Serial No.
M F
(40) (41) (1)
(,
6~ 6Z 19 66
82 40 47
115 29
42 69
187 40 44
126 3S 75 54 58
79 49 65 49 51
23 94 51 42
167
43 74 50 57 47
10 10 (l0
168 28
1:!1 49 76 90 88
54 83 54 31
120
60 50
116 92
86 41 98
26
34 92 77 68
42 66 80 42 11
63 8
25 113
99
11 7., 82 77 03 78 29 79
137 80
S2 8t 49 82 59 83
111 84 34 85
37 86 56 87
208 88 42 89 74 90
199 91 27 92 95 93 79 94 66 95
156 96 95 97 69 98 71 99 84 100
46 101 145 102 52 103 46 104
166 105
41 106 88 107 58 108 83 109 45 1 ro 17 111 17 112 68 113
156 114 28 115
136 116 60 117 92 118 80 119
105 120
55 121 82 122 79 123 34 124
213 125
93 126 44 127
117 128 108 129
130
70 131 32 132
104 133 134
49 135
136 31 137
139 138 94 139 87 140
48 141 48 142 70 143 59 144 14 145
66 146 14 147 27 148 94 149
146 150
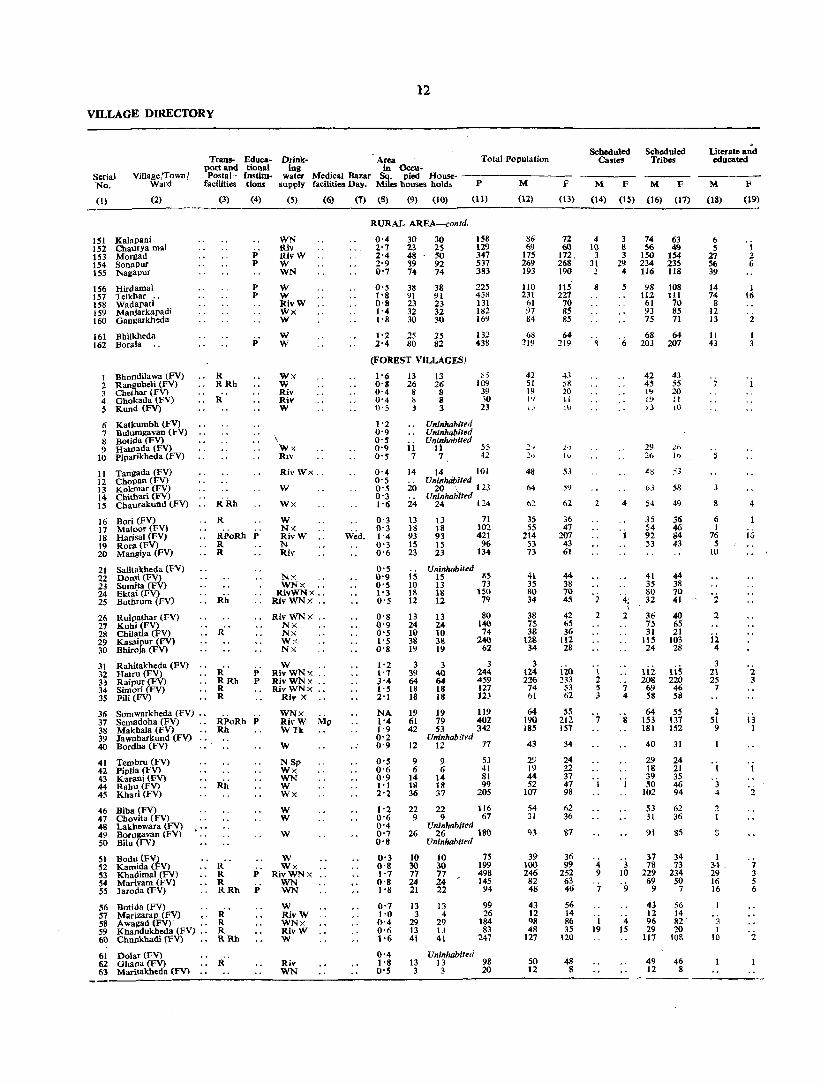
12
VILLAGE DIRECTORY
Serial No,
VilIageJTown/ Ward
(I) (2)
151 Kalllpani 152 Chaurya mal 153 Morgad 154 Sonapur 155 Nallapur
156 Hirdamal 157 Telkbar ., 158 Wadapati 159 Manjarkapadi 160 Gangarkh<:da
161 Bhilkheda 162 Bonda
I Bhondilawa (FV) 2 Rangubeli (FY) 3 Chethar (Fv) 4 Gbokada (FV) 5 Kund (FY)
6 Katkumbh (Fy) 7 Bulumgavan (FV) 8 Botida (FV) 9 Hawada (Fy)
10 Piparikheda (Fy)
II Tangada (FV) 12 Chopan (FV) ) 3 Kokmar (FV) 14 Cbithari (FY) 15 Chaurakund (Fy)
16 Bon (FY) 17 Maloor (Fy) 18 Harisal (FV) 19 Rora(Fy) 20 Mangiya (FV)
21 Salitakheda (FY) 22 Domi(FV) 23 Sumita (FV) 24 Ektai (FY) 25 Butbrum (FV)
26 Ruipathar (Fy) 27 Kuhi(FV) 28 Chilatia (Fy) 29 Kasaipur (Fy) 30 Bhiroja (FV)
31 Rahitakheda (FV) 32 Hatru (FV) 33 Raipur (FV) 34 Simon (FY) 35 Pili (FY)
36 Somwarkheda (FV) " 37 Semadoha (Fy) 38 Makhala (FV) 39 Iawaharkund (FY) 40 Bordha (FV)
41 Tembru (FV) 42 Piplia (Fy) 43 Karanj (Fy) 44 Rahu (FV) 45 Khari (Fy)
46 Biba(Fy) 47 Chovita (FV) 48 Lakbewara (FY) 49 Borugavan (FV) 50 Bilu (FV)
51 Bodu (FV) 52 Kamida (FV) 53 Khadimal (FY) 54 Manyam (FY) 55 laroda (FV)
56 Botida (FV) 57 Manzara p (FV) 58 Awagad (FVY 59 Khandukheda (FV) 60 ChUllkhadi fPV)
61 Dolar (FV) 62 Gharta (Fy) 63 . Maritakbeda (FV)
Trans- Eduea- Drink- Area Total Population port and tional ing In Occu-Postal·· Institu- water Medical BaZ#r Sq, pied House-
facilities dons supply facilities Day_Miles houses holds P M
(3)
R RRh
R'
RRh
R
(4)
P P
P P
P
RPoRh P R R
Rh
R
(5)
WN Riv RivW W WN
W W RivW Wx W
W W
Wx W Riv Riv W
RivWx ..
W
Wx
W Nx RivW N Riv
Nx
(6)
WNx ., RivWNx .,
RivWNx
RivWNx Nx Nx Wx Nx
R' RRh R R
j; Ri~WNX P RivWNx
RivWNx Rivx
RPoRh j, Rh
R R R RRh
RR R RRh
P
p'
WNx RlvW ivi" WTk
W
NSp Wx WN W Wx
W W
W
W Wx
RivWNx WN WN
W RivW WNx RivW W
Riv WN
(7) (8) (9) (10) (11) (12)
Wed_
RURAL AREA-colI/d,
30 23 48 ~9 74
38 91 23 32 30
25 80
30 25 SO 92 74
38 91 23 32 30
25 82
158 129 347 537 383
225 458 131 182 169
132 438
(FOREST VILLAGES)
1'2 0'9 0'5 0-9 0'5
0'4 O'S 0'5 0'3 1-6
0'3 0·3 1'4 0'3 0'6
0'5 0'9 0'5 1-3 0'5
0'8 0'9 0'5 I'S 0'8
1-2 1'7 3'4 1'5 2'1
NA 1'4 1'9 0-2 0'9
0'5 0'6 0'9 1'1 2'2
1'2 0-6 0'4 0'7 0-8
0-3 0-8 '-7 0'8 1'8
0'7 1'0 0'4 0'6 1-6
0'4 l,g 0-5
i3 26
8 8 3
II 7
14
20
24
13 18 93 15 23
15 10 18 12
13 24 10 38 19
3 39 64 18 18
19 61 42
12
9 6
14 18 36
13 26
8 8 3
Uninhabited Uninhabited Uninhabited
~5 109
39 .,0 H
11 5S 7, 42
14 101 U ninhcibited
20' 123 Uninhabited
24 124
13 18 93 15 23
Uninhabi",d
71 102 421 96
134
IS as 13 73 18 150 12 79
13 80 24 140 10 74 38 240 19 62
3 40 64 18 18
3 244 459 127 123
19 119 79 402 53 342
Uninhabited 12 77
9 S3 6 41
14 81 18 99 37 205
22 22 116 9 9 67
UninhabiUd 26 26 ISO
10 30 77 24 21
13 3
29 13 41
Uninhabited
10 30 77 24 22
13 4
29 13 41
Uninhabited
75 199 498 145
94
99 26
184 83
247
13 13 98 3 3 20
M6 69
175 269 193
110 231
61 97 84
68 119
42 51 19 I"
48
64
62
35 55
214 S3 n
41 35 80 34
38 7S 38
128 34
3 124 226
74 (l[
64 190 185
43
29 19 44 52
107
54 31
93
39 100 246 82 48
43 12 98 48
127
SO 12
Scheduled Castes
Scheduled Tribes
F
(13)
M F
(14) (IS)
M F
(16) (17)
72 4 60 HI
172, 3 268 31 190
115 221
70 8~ 85
64 219
43 58 20 II lU
h 10
53
59
62
36 47
207 43 61
44 38 70 45
42 65 36
112 28
iio 233
53 62
55 21Z 157
34
24 22 37 47 98
62 36
87
36 99
252 63 46
56 14 86 35
120
48 8
8
8
2
2
2
1 2 S 3
4 9
7
I 19
3 74 63 S 56 49 3 150 154
29 234 235 4 116 118
5
4
2
"
4
'j
'3 10
'9
'4 15
98 108 112 111
61 70 93 85 75 71
68 64 203 201
42 45 19 19 13
29 26
4~
63
54
35 54 92 53
41 35 80 32
36 75 31
115 24
43 55 20 11 i\)
).6 l()
53
58
49
36 46 84 43
44 38 70 41
40 65 21
103 28
Iii I is 208 220
69 46 58 58
64 153 181
40
29 18 39 50
102
53 31
91
37 78
229 69
9
43 12 96 29
117
49 12
55 131 152
31
24 21 35 46 94
62 36
85
34 73
234 50
7
56 14 82 . 20
108
46 8
Literate and educated
M F
(18) (19)
6 5
27 56 39
14 74
8 12 13
11 43
6 I
76 5
10
2
2
i:i 4
3 21 25
7
2 51 9
1
3 4
1 34. 29 16 16
3 1
10
\ 2 6
1 L6
2
4
i.i
2 3
13 1
2
7 3 5 6
2

Total workers (I-IX)
M
(20)
F
(21)
S5 39
102 160 116
10 119
39 53 SO
34 1t8
29 41 12 12 9
UI,lnhabited. Uninhabited. Uninhabited.
53 39
105 ISS 99
73 122 44 46 55
30 83
27 36 12
6 6
20 14 19
25 Uninluiblted.
31 Uninhabited.
, 33
23 31
138 29 45
Un;nhabiUd.
3
3
4
2 2'
66 8
10
29 31 23 21 46 41 2S 23
26 52 22 84 26
3 74
132 40 41
23 39 23 66 IS
iii 100 31 41
36 36 125 118 118 80
Uninhabited. 23 11
IS II 2S 32 68
16 12 21 23 56
34 34 19 15
Uninhabited. 62 S5
Uninhabited.
20 58
141 52
, 28
32 7
6S 34 71
Ullinhabited.
15 49
146 23 18
36 9
46 21 80
M
(22.)
31 23 77
132 '12
51 82 30 49 44
33 68
23 21 11 8 6
IS l'
20
23
17
20 25 49 26 39
23 10 27 20
19 44 17 69 23
51 101 28 38
27 I3 42
20
14 10 14 19 54
21 16
42
15 41 94 41 II
2S 5
35 25 41
36 20 A21 6 5 <' 6
13
WORKERS
II m IV v VI
F M F M F M F M F M F
vn VIf[
M F M F
1 MELGHAT TALUKA
TX
M F
NON. WORKERS
M F
Serial No,
(23) (24) (25) (26) (21) (28) (29) (30) (31) (32) (33) (34) (35) (36) (37) (38) (39) (40) (41) (I)
29 25 87
136 80
~I 90 31 41 46
19 15 19 16 11
15 29
9 2 6
27 1 32 44
19 3 20 11 6 5
11
2.
2
21i 7 6
27
2
''2 I
24 14 17 [9 19
22 31 13
.5 , 3
51
8 9 I
1
3
3
2
11 6 10 35 1l 9 22
2 t 2 4
'2
3 20
I 4 2.
5
S
8
It
2 4
62 3 , 3'0
1 4
6 4
~ "j 3 I
S S I
3 3
10
20 32 15 56 12
2 3 4 7 2
3 4 7 9 3
~ 1 "i
50 85 24 37
6 3 8
27 6 40 57 4
IS
IS II 12 6 15 3 50 2
30 14
41
4 1
.5
13 I 29 10 86 22
:~ IP
30 1 5 2.
27 24 14 3 48 3
18 5
2.
7 15 7 2
3 14 21 2 2
'4
1 3 2 4 71 62
14 60 8
2 2
I I 9 7 S
4 I
13
2 20 :56
4 3
S 4
19 6
22
2
I 2 3 7 8
3 2
8
4 I
19 1
14
3
"05 6
32
7
OOj
••• S
1
''3 I
'2
RURAL AREA-contd.
"j
"i
OOi
OOi
"j,
"i
'".4 1
''2
'3 "j 4 1
1
'3
2.
2
'"4 4 4
2 2
2
"j 2 1
9
'"4 3
2
'3
31 19 151 30 21 152 73 67 IS3
109 113 154 77 91 ISS
40 42 156 112 105 151 22 26 158 44 39 159 34 30 160
34 34 161 101 136 162
13 16 1 10 22 2 783 754 445
6 7 8
9 12 9 1 16 10
23
33
29
12 24 76 24 28
SO
56
58
34 45
141 35 51
11 12 13 14 15
16 17 18 19 20
21 12 13 22 12 17 23 34 23 24
9 22 25
12 19 26 23 26 27 16 13 28 44 46 29
8 13 30
50 5'9 94 133 34 22 20 21
28 65 67
20
19 94 71
11
31 32 33 34 35
36 37 38 39 40
14 8 41 7 10 42
19 16 43 20 24 44 39 42 45
20 28 12 21
31 32
19 21 42 SO
105 106 30 40 20 28
it 20 5 :5
33 40 14 14 SO 40
46 47 48 49 SO
51 52 53 54 55
56 57 58 59 60
61 14 28 62
6 3 63
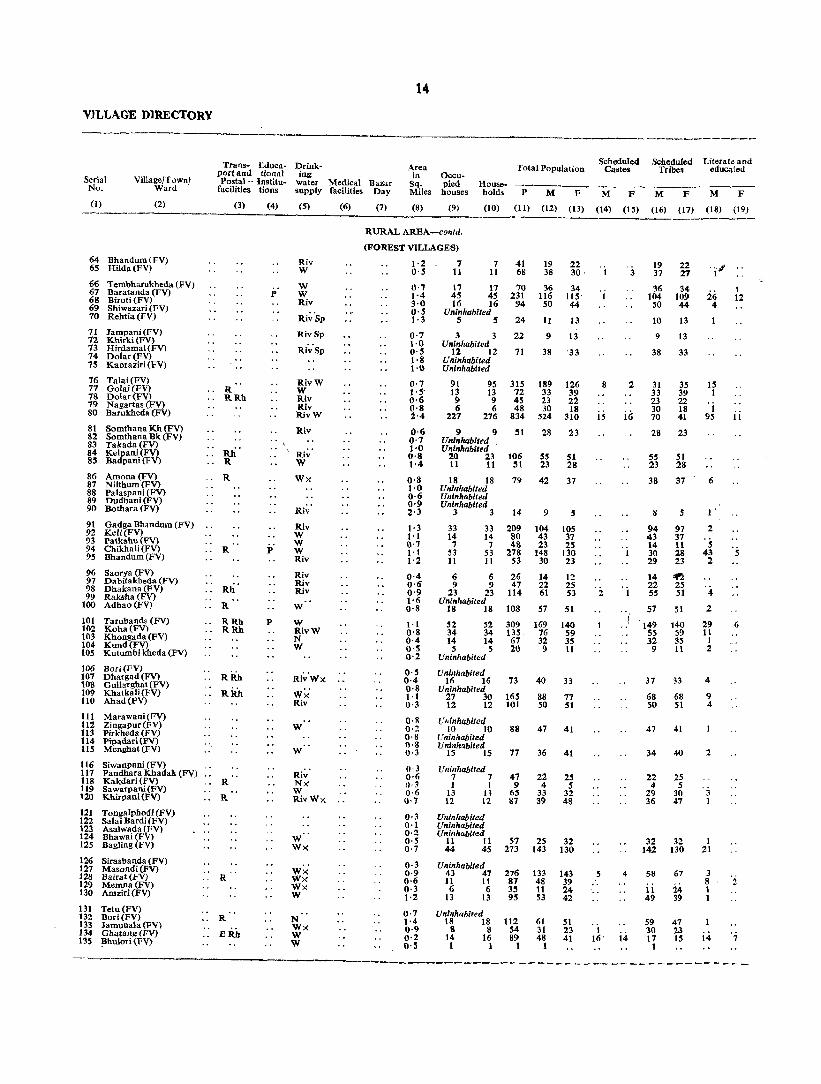
14
VlLLAGE DlRECTORY
Trans- Educa- Drink- Area in
Sq. Miles
Scheduled Scheduled Literate and
Serial No.
(i)
Village/T ownl Ward
(2)
port, and tional ing Postal -- lnstit\l- water Medical Bazar
facilities tions supply facilities Day
(3) (4) (5) (6) (7) (8)
Occupied houses
(9)
Households
(10)
Total Population Castes
-------------------------------------P M F M F
(11) (12) (13) (14) (1 S)
64 Bhandum(FV) 65 Hilda (FV)
66 Tembharukheda (FV) 67 Baratanda (FV) 68 Biroti (FV) 69 Shiwazari (FV) 70 Rehtia (FV)
71 Janlpani (FV) 72 Khlrki (FV) 73 Hirdamal (FV) 74 Dolar (FV) 75 Kaoraziri (FV)
76 Talai (FV) 77 Golai (FV) 78 Dolar (FV) 79 Nagartas (FV) 80 Barukheda (FV)
81 Somthana Kh (FV) 82 Somthana Bk (FV) 83 Takada (FV) 84 Kelpani (FV) 85 Badpani (FV)
86 Amona (FV) 87 Nilthum (FV) 88 Palaspani (FV) 89 Dudhani (FV) 90 Botbara (FV)
91 Gadga Bhandum (FV) 92 KeJi(FV) 93 Patkahu(FV) 94 Chikhali (FV) 95 Bhandum (FV)
96 Saorya (FV) 97 Dabitakbeda (FV) 98 Dhakana (FV) 99 Raksha (FV)
100 Adhao (FV)
101 Tarubanda (FV) 102 Koha (FV) 103 Khongada(FV) 104 Kund (FV) 105 Kutumbi kheda (FV)
106 Bori(FV) 107 Dhargad (FV) 108 Gullarghat (FV) 109 Khatkali(FV) 110 Abad(FV)
111 Marawani(FV) 112 Zingapur (FV) 113 Pirkheda(FV) 114 Pipadari(FV) liS Mcnghat(FV)
116 Siwanpani (FV)
R RRh
rui· R
R
R
R
RRh RRh
RRh
117 Pandhara Khadak (FV) 11 8 Kakdari (FV) R 119 Sawarpani(FV) 120 Khirpani(FV) .. R
121 Tongalpbodi (FV) 122 Salai Bardi (FV) 123 Asalwada (FV) 124 Bhawai (FV) 125 Bagling (FV)
126 Sirasbanda (FV) 127 Masondi (FV) 128 Bairat (FV) R 129 Memna (FV) 130 Amziri(FV)
131 Tetu (FV) 132 Bori(FV) R 133 Jamunala(FV) 134 Gbatang (FV) E Rh 135 Bhulori (FV)
p
Riv W
W W Riv
Ri~·Sp
RivSp
Ri~·Sp
RivW W Riv Riv RivW
Riv
Ri~· W
Wx
Riv
Riv W W W Riv
Riv Riv Riv
W
W RivW N W
Ri~·Wx
Wx Riv
W
W
Ri~· Nx W RivWx
W·· Wx
Wx Wx Wx W
N Wx W W
RURAL AREA-contd.
(FOREST VILLAGES)
1·2 7 22 O·S 11
7 11
41 68
19 38 30, I
0·7 1·4 3·0 o·s 1·3
0·7 1·0 0·5 1·8 1·0
0·7 1·5' 0·6 0·8 2'4
0·6 0·7 1·0 0·8 1·4
O·S 1·0 0·6 0·9 2·3
t·3 1·1 0·7 1·1 1·2
0·4 0·6 0·9 1·6 0·8
1·1 0·8 0·4 0·5 0·2
0·5 0·4 0·8 t·l 0·3
0·8 0·2 0·8 O·g 0·3
0,3 0·6 O-J 0,6 0·7
0·3 0·1 0·2 O·s 0·7
0·3 0·9 0·6 0·3 1·2
0·7 1·4 0·9 0·2 O·S
17 n 10 ~ 34 45 45 231 116 115 16 16 94 50 44.
Uninhabited S S 24 11 13
3 3 22 9 13 U ninl.abited
12 12 71 38 33 Uninhabited Uninhabited
91 95 315 189 126 13 13 n 33 39 9 9 45 23 22 6 6 48 30 18
227 276 834 524 310
9 9 51 28 23 Uninhabited Uninhabited
20 23 106 5S 51 11 11 51 23 28
18 18 79 42 37 Unitthabited Uninlrllbited Uninhabited
3 3 14 9 S
33 33 209 104 lOS 14 14 80 43 37 7 7 48 23 25
S3 53 278 148 130 11 11 53 30 23
6 6 26 14 12 9 9 47 22 25
23 23 114 61 53 Uninhabited
18 18 108 57 SI
52 52 309 169 140 34 34 135 76 59 14 14 67 32 35
5 5 20 9 11 Uninhabited
U niflhabited 16 16 73 40 33
Uninhabited 27 30 165 88 77 12 12 101 50 51
Uniflhabited 10 10 88 47 41
Uninhabited Uninhabited
15 IS 77 36 41
Uninhabited 7 7 47 22 25 1 1 9 4 5
13 n 65 33 32 12 12 87 39 48
Uninhabited Uninhabited Uninhabited
11 11 57 25 32 44 45 273 143 130
Uninhabited 43 47 276 133 143 11 11 87 48 39 6 6 35 11 24
13 13 95 53 42
Uninhabited 18 18 112 61 51
8 8 54 31 23 14 16 89 48 41 1 1 1 1
8
15
s
. i 16'
3
2
i6
4
i4
Tribes educated
M F M F
(16) (17) (18) (19)
19 22 37 27
36 34 104 109
50 44
10 13
9 13
38 33
31 35 33 39 23 22 30 18 70 41
28 23
SS 51 23 28
38 37
8 5
94 97 43 37 14 11 30 28 29 23
14 ~ 22 25 55 51
57 51
'149 55 32
9
140 S9 35 11
37 33
68 68 SO 51
47 41
34 40
22 4
29 36
32 142
58
11 49
59 30 17
1
25 5
30 47
32 130
67
24 39
47 2.3 IS
26 4
15 1
1 95
6
1 '
2
5 43
2
·4 2
29 11
1 2
4
9 4
2
'3 1
1 21
3 8 1 1
i4
1 12
11
5
6
2
·7
----------_.~------- - -- --- ----- -------- - .. ~

lS
WORKERS
Total workers (I-IX) I II 1ll IV V VI
M F M F MF MF MF MF MF
(20) (21) (22) (23) (24) (25) (26) (27) (28) (29) (30) (31) (32) (33) -------
11 10 2' 13
22 21 76 60 30 ?S
Uninhabited 11 9
7 6 Unlrahablled
23 25 Unlrahabiled Unirahabiled
137 20
~ 380
19 Unlrahablted Uninhabited
31 l4 24'
Unlrahablted Unlrahablt"d Ulllrahabited
72 tt 13 12
126
6
27 8
6 3
73 25 14 98 24
SO 20 12 59 8
9 4 19 11 42 30
U nj1flulbited 36 32
too 71 56 27 21 20
7 S UIII""abited
Unlnhabll"t/ 27 16
Uninhabited 56 35 30 26
Uninhabited 26 2j
Ulllnhahiled U ni"habited
23 24
Un,,,lulblted 13 15 4 2
19 17 22 26
UnlnlrabltM Ulllnhablt"d Uninhabited
17 15 82 61
Unlnhahltetl 82 78 30 1
1'1 9 31 24
U1fi1f1Iabit"d 38 30 19 It 21 14 1
10 10 20 11
20 20 " 45 41 17 25 20 5
9 8
6 6
17 22
8 15 12
5 16
11
28 14
14
. i to
6
24
4 3
5
14 5 2
10 10
8
3
4
2
41 33 S 21 18 12 12 64 55' 18 8
7 8
24 l '6
23 6
28 26 . 3
67 6S 29 24 16 IS 7 S
19 14
29 21 2S 20
18 16
19 18
2
8
4
'2 2
18 5
20 10 3
12 8
6
3 8
! 5
48
6
9 20
'9 3
3
'2 14 6
1 5 9
19 8 2
2 6
3 18 6 I
9
6
9 6 3 8
11 ii 14 14
14 15 64 49
'4 18 6
16
t9 16 J4 1
56 21
2 1
8 to 12
2 4 5 7 JJ
2 15
17
12
16
'2
. i
"
. j I
I 2
11 12
'5
10 1
10
4
5 . i
3
8
6
RURAL AREA-conld.
(FOREST VILLAGES)
'2
7 .. 2 2
, i
'3 4
9 16
9
3
'4 3
3 3
3
1 MELGHAT TALUKA
VII . vtll IX
M P M F M F
(34) (35) (36) (37) (38) (39)
108 S2
9 17
6
1
4 2
'2 7
8
'7 13
22
NON· WORKERS
M F Serial No,
(40) (41) (I)
8 13
14 40 20
2
15
52 13 9 15
144
9
24 9
18
3
31 18 9
SO 6
5 3
19
21
69 20 11 2
13
32 20
21
13
9
. i4 17
8 61
SI 18 3
22
23 12 21
12 64 17 6S
12 66 55 67 19 68
69 4 70
7 71 72
8 73 74 75
28 54
9 6
184
17
24 20
76 77 78 79 80
81 82 83 84 85
36 86 87 88 89
2 90
5S 91 17 92 t3 93 71 94 IS 95
8 96 14 97 23 98
99 19 100
69 lOt 32 102 IS 103 6 104
105
106 17 107
108 42 109 25 110
111 16 tl2
113 114
l7 115
116 10 117 :I 118
IS 119 22 120
In 122 123
17 124 69 125
65 18 IS IS
21 12 21
126 127 128 129 130
131 132 133 134 135
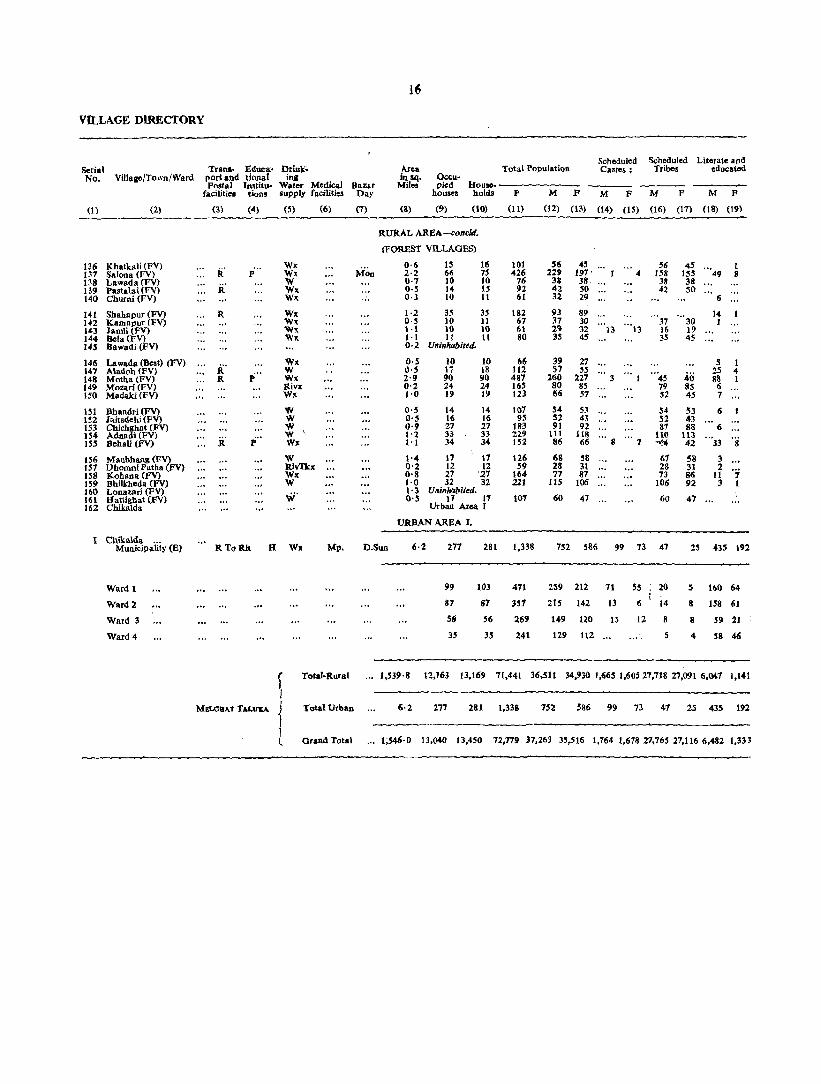
16
VILLAGE DiRECTORY
£d=· Drink~ Scheduled Scheduled Literate and
Serial TUna- Area Total Population Castes; Tribes educated No. Villagc!To\vn/Ward port and tional 'IIi in sq. OCCIl-
Po.tal lnstitu· Water Medical Bazar Miles pied House-facilitiel tions $UPp!y facilities Day houses holds P M F M F M F M F
(I) (2) (3) (4) (5) (6) (7) (8) (9) (10) (11) (12) (13) (14) (IS) (16) (17) (18) (19)
RURAL AREA-COfield.
(FOlmST VILLAGBS)
136 Khatkali (FV) i( p" Wx
Mon 0·6 l' 16 101 S6 45 56 45 '" I
137 Salona (PY) Wx 2·2 66 75 426 229 197' .. 158 ISS 49 8 138 Lawada(FV}
if W 0·7 10 10 76 38 38, 38 38
139 Pastala; (PV) WlI. 0·5 14 IS 9Z 42 SO 42 50 140 Churni (FY) Wx .. , 0·3 to It 61 32 29 6
141 Sbahapur (FV) R. Wx 1·2 35 3S 182 93 89 14 142 Karnapur (FV) W" 0·5 10 11 67 37 30 ... . .. 37 30 I 143 lamli (1'V) W" \·1 10 10 61 29 32 13 13 16 19 144 Bela (FV) Wx 1·1 11 11 80 35 45 35 45 145 lIawadi (FV) 0·2 Uninhabited.
146 Lawada (Best) (FV) i\.'
Wx O·S 10 10 66 39 27 S 1 147 Aladoh (Fv)
p'" W O'S 17 18 112 57 55
"-45 25 ..
148 Motha(FV) R Wr. 2-' 90 90 487 260 227 3 40 88 1 149 Mozari(FV) Rivx 0·2 24 24 165 80 85 79 85 6 ISO Madaki(FV) Wr. j·O 19 19 123 66 57 S2 45 7
lSI Bhandri (FV) W O-S 14 14 107 S4 S3 S4 53 6 152 1 aita<!ehi (FV) W O-S 16 16 9' 52 43 52 43 153 Chichllhat (FV) W 0-9 27 27 183 91 92 81 88 6 154 Adnadi (FV) W \ 1'2 3! 33 229 111 118 no III 155 Bebali (l'V) R' p'- Wx I-I 34 34 152 86 66 8 7 ~ 42 "-33 '8
156 Manbbang (FV) W 1-4 11 11 126 68 58 61 58 3 157 Dhomm Patha (l'V) lllvTkx 0-2 12 12 59 28 31 28 31 2 158 Kahana (FV) WlI. 0-8 27 '21 164 77 87 73 86 11 "i 159 Bhilkbeda (FV) W 1·0 32 32 221 llS 106 106 92 3 1 160 Lonazarl (FV) vi' 1-3 Uninhabited_ 161 Hattighat (FV) O-S 11 17 101 60 47 60 47 162 Chikalda Urban Area I
URBAN AREA I.
I Cbika\da Municipa'tity (B) R ToRh H Wx MI'. D_Sun 6·2 271 281 1,338 7S1 586 99 73 41 25 435 192
Ward I 99 103 411 259 212 71 55 20 5 1(>0 64
Ward 2 87 87 351 215 142 13 6 14 8 158 61
Ward 3 56 56 269 149 120 15 12 8 8 59 21
Ward 4 35 35 241 129 tt2 .. " S 4 58 46
f Total-Rural 1,539-8 12,763 13,169 71,441 36,S It 34,930 1,665 1,60S 27,718 27,091 6,041 1,141
I MELGIIAT T.u.u~ i Total Urban 6·2 277 281 1,338 752 536 99 73 41 25 435 192
Grand Total , __ 1;546-0 13,040 13,450 72,779 31.263 35,516 1. 1,164 1.61821,76527,116 6,482 I.~H

17
1 MELGHAT TALUKA
Total workers (I-IX) I II
WORKERS
III IV V VI VII VIII IX
M F M F MF MF MF MF MF M F MF MF
(20) (21) (22) (23) (24) (25) (26) (21) (28) (29) (30) (31) (32) (33) (34) (35) (36) (37) (38) (39) --------.----------------------~----~--~--------------------------------
33 35 131 III 27 19 28 30 19 19
61 47 23 17 18 15 24 23
Uninhabited.
17 26
149 50 39
30 32 61 56 49
14 35
114 46 30
31 20 57 52 34
'37 22 18 17 43 4S 64 54
Uninhabited. 34 28
Urban Area I.
371
126
UO
86
49
131
35
19
32
4S
'74 23 23 12
35 IS 12 23
9 78 19 25 19
27 11 12 22
9 10 16 17
101 86 38 33 3S 23
23 19 24 17 48 46 36 32 22 13
10
3
is s
3 4 10 IS 8 13 3 7
33 29 4 2 7
22 2 1
8 6
33 2 1
5 12 2 223
12 11 1 17 19 1
1 4 11
27 17 9 5 4 7
10
1 2 2 3
~j 3~ '4 40 44 20
28 22 5
9
2
5
2
4
6
2 28
2
3
20
3
26 9
17
3 1
12 ,~
6
4
, i
1 4
9
6
RURAL AREA-cocld.
(FOREST VILLAGES)
1 3
13
URBAN AREA
8 :5 29.
5 2 11
11
2 3 3
4
3 -j
3 12
2 5
4
3
2 18
2
9
3
4
2
3 6
'j
1 9
2
3 6
I 7 1
'j
12
'4 2
257 109
85 26
82 16
51 26
39 41
Serial NON· No.
WORKERS
M
(40)
23 98 II 14 13
32 14 II II
22 31
III 30 :11
24 20 30 55 37
31 10 34 51
26
381
133
105
63
80
F
(41)
10 86 19 20 10
42 13 7 22
I
(1)
136 137 138 139 140
141 142 143 144 145
13 146 20 147
III 148 39 149 27 150
22 151 23 152 35 153 66 154 32 155
36 156 14 157 42 158 52 159
160 19 161
455
177
123
88
67
2.2,171 17,895 14,640 12,590 3,779 4,420 1,518 317 395 177 47 6 216 57 304 22 530 137 742 169 14,340 17,035
371 131 9 4 2 28 6 9 II 5 19 12 2 18 257 109 581 455
22,542 18.026 14.649 12.594 3,780 4,422 1.546 323 404 177 55 11 245 60 316 24 .548 137 999 278 14,721 17,490

Achalpur Taluka
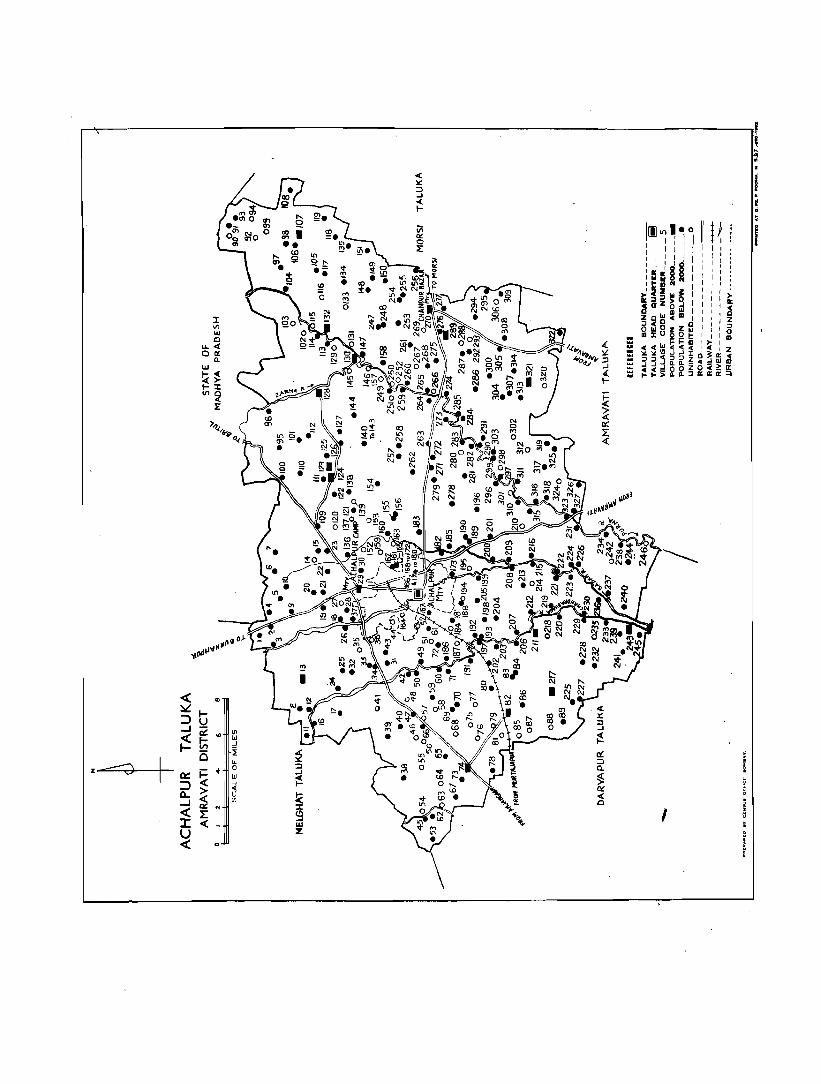
r-------:--------:----~.!
• ... ., .
< .. ~
b :::> ...J ~ I/)
~ F-.. w
V'l ...J
0 ~
% _.....-:=J L!.
i= .. 0 a::: w :::> « ;( > CL « u ...J I/)
< a:: " I:
. J: «
, ~ .~
U < ~
\ ~

1 Name of Village
(I)
AbduUaplll'
Code No.
(2)
19
ALPHABETICAL LIST OF VILLAGES AND TOWNS
Population
1951 1961
(3) (4)
Z ACHALPUR TALUKA
[ Entries in capital letters are for Towns and Urban areas J
Name of Village
(I)
Bopapur
Code No.
(2)
11
Population
1951 1961
(3) (4)
124 77
Name of Village
(I)
Dilalpur ,.
ACHALPUR (Urban 11 35,712 36,538 Bopapur 205
256
907
188
1,139 Donoda Area)
ACHALPUR CAMP (Urban Area).
Ajitpur
Akhatwada
A1ampur
A1ipur
Ambada Kandari
Ambuj
AmruUapur
Angatpur
Antargaon
Aregaon
Asatpur
Asegaon
Aurangpur
Avarangpur
Bagambada
Bahadarpur
Bajitpur
Balegaon
Barhan!>ur
Begampura
Belaj
Belkheda
Belkheda
Beltnandali
Belura
Beni
Bhalcwadi
Bhilona ,.
Bhitkheda
Bhupon
Bodad
H 4222-.20
:292
125
248
136
88
262
129
137
42
15,082
223
193
243
167
18
197
243 2,707
327
58
27
152
301
246
206
313
932
318
183
17,490
225
346
411
* 249
287
3,218
1,193
423
245
168 Included Included in Urban in Urban Area II Area II
278
6
117
106
283
34
295
122
71
187
823
319
133
381
79
23
356
5
406
189 1,024
110 146
858
485
155
486
109
12
507
2/ 616
1,135
206
Boraj
Borala
Bordi
Borgaon Dari
Borgaon Mohana
Borgaon Peth
• Borgaon Talni
309 1,088
204
208
493
539
281 463
200 1,008
209
Bramhanwada Pathak. 148
128
500
Bramhanwada (Thadi). 132 4,762
Buradgbat
Chachondi
Chamak Bk.
CbamakKlt.
Cbandura Jahagir
CHANDUR BAZAR (Urban Area).
Cbausala ..
Cbichkumbha
Cbikhali ..
Cbincholi Bk.
Cwncholi Kh.
Dabigaon
Darapur ..
Daryabad
Dattapur. ,
Datura ..
Deogaon
Deurwada
Dewapur
Dewari
Dhamangaon
Dhanora
Dharampur
Dhoktirth
Dhotarkheda
2
203
192
193
184
58
398
464
32 35
III 5,578
207
91
162
114
316
311
51
24
287
35
12
246
192
55
206
136
894
290
28
128
130 2,083
146
186 86
13 2,328
297
64
131
18
347
668
• Uninhabited.
204
1,038
662
648
645
1,043
176
581
5,490
242
85
469
555
47
6,947
361
235
45
269
187
1,079
382
13
216
2,246
126
2,538
485
976
Drugwada
Fajalapur
Fupagaon
Ganoja .,
Gaurkbeda
Gaurkheda
Ghatladki
Ghodgaon
Gondvihir
Gond Wagholi
Govindpur
Govindpur
Haidatpur
Hanawatkheda
Haram .•
Hilalabad
Hirapur
Hirur
Hiwara
Hiwaradevi
Inapur ..
Inayatpur
Isapur
hegaon
Jagannathpur
Jahanpur
Jabanpur
Jainpur ..
Jalal!>ur ..
Jamapati
Jaroapur
Jarobhala
Janori
Population Code No. 1951 1961
(2)
253
223
306
279
285
151
20
115
(3)
155
330
J52
536
310
520
107 2,711
156
5
38
111
326
275
25
49
157
351
100
154
439
III
233
501
918
254 25
290 1,116
231
92
133
257
225
212
317
63
76
300
17
90
276
41
86
362
liS
504
109
198
312
39
64
(4)
245
542
249
523
268
724
3,540
481
120
153
502
138
256
680
1,2l!
24
1,459
454
140
457
192
166
Z8g
37
39
83

Name of Village
(I)
Januna
Jasapor
Jawala
Jawalapur
Jawara
Jawardi
Kajali
Kakda
Kalhodi
Kalwit
Kamat Wada
Kandali .'
Karanja-Baheram
Karimpur
Kasampur
Kawitha Bk.
Kawitha KIl.
Khairi
Khambora
Khanapur
Khanapur
Khanapur
Khanaput
Khanjamabad
Khanjamanagar
Khanjirpur
Kharala
Kharpi "
Kharwadi
Khatijapur
Khel Bari
Khel Bhalerao
Khel Bhonde Bonde ..
Khel Bocha
Khel Chaudhar (Karajgaon)
KhelDeomali
Code No.
Population
1951 1961
20
2 ACHALPUR TALUKA-contd.
Name of Village Code No.
Population
1951 1961 Name of Village Code
No.
Population
1951 1961
(2) (2) (3) (4) (3) (4) _____________________________ (~2) (I) (I) (3) (4)
53
261
86
823
304 1,143
78 257
102
185 335
147 695
217 2,037
126 319
4 155
79
30 1,206
95 713
320
65 317
155 1,351
77
226 249
191 94
72 74
188
236
242
218
50
52
77
74
591
308 1,388
109
305
40
633
854
43
lSI
771
1,232
399
397
774
2,274
365
193
1,338
864 \
463
1,772
• 306
114
79
66
93
697
1,492
866
876
60
177 Incltlded Included in Urban in Urban Area II Area IJ
172 Do.
176' Do.
178
175
124
180
Do.
Do.
3,733
67
Do.
Do.
Do.
Do.
4,268·
InclUded in Urban Area II
Khel Ghumat 171 Included Included in Urban in Urban Area II Area II
Khel Guiar J 70 Do. Do.
Kbel Ianuji (Chaudhar 141 508 694 Kurha).
Kbel Ianuji Desh- 142 390 421 mukh (l(urha).
Khel Khushal Kurha.
Khel Mahal (Karajgaon)
Khel - Sakharam
Khel Tapmali (I)
Khel Tapmali (2)
Khel Tekad
Khel Trimbak-Narayan
Khinkhini
Khojampur
Khudavantpur
Khushalpur
Khushalpur
Kodori ..
Kolha
Kondwardha
Kopra
Kotgaondi
Kothara ..
Krishnapur
Krishnapur
Kumblti "
Kural
Kuranklted
Kusta Ilk.
KustaRh.
Lakltanwadi
Madban ..
Mahamadpur
Mahamadpur
Makrllmpur
Malhara ..
Malkapur
140 509
123 3,445
143 334
113 56
626
4,446
413
69
Included in Urban Area II
174 Included Included in Urban in Urban
Area II Area II
169
99
lSI
37
165
214
158
Do.
..
160
228 1,228
258 354
60
299
23
266
325
21
274
118
83
84
22
276
267
* 671
184
827
455
976
522
154 436
247 1,106
85
267
138
9 117
312
Do.
• 114
9
* 144
1,336
518
I 86
347
496
664
223
1,008
435
1,064
548
493
{,273
• •
II
701
•
• Uninhabited.
Malkapur Kh.
Markanda
Masod ..
Mastapur
Menganalhpur
Mhasona
Mocbakheda
Mohangaon
Mukindpur
MLlradpur
Nababpur
Nagarwadi
Nagarwadi
Naigaon ..
Nanori ..
Narayanpur
Narayanpur
Narsala
Narsari
Narsingpor
Nawbag Jahagir
Nijampur
Nimbhari
Nimbhora
Nimdari .,
Nimkbeda
Nimkheda
Nimk\lnd
Pala
Palaswada
Pancharnba Ilk.
Pancharnba Kh.
Pandhari
l'andhari
Paratwada
Pardi
Parsapur
Parsoda "
54
113
273
314
201
10
272
288
213
36
190
97
160
198
255
161
302
211
19
232
164
199
240
260
16
14
135
96
153
S6
57
7
144
351
44
148
53
138
4
70
IS
575 •
664
232
64
148
162
, . 29\
303
200
256
• 450
171
• • •
182
140
459
4
194
199
91
207
•
91
3
693
695
294
54
200
133
389
460
226
270
512
211
123
• •
%89
138
29 Included Included in Urball in Urban Area I Area I
68
47
98
186 1,158
65

Name of Village
(I)
Parsoda
Pathrot
Pimpalkhuta
Pimpalkhuta
Pimpari Talegaon
Pimpri.Thugaon
Pithoda
Pohi
Pralhadpur
Rahatgaon
Rahimapur
Raipur
. Raipur
Raipura
Raipur J.
Rajan.
Rajura.
Ramapur
Ramapur Bk.
Ramapur Kh.
Ramapur N. Belaj
Ramgaon
Rangar Wasni
Rasegaon
Rasidpur ..
Rasul.pur
Ratanpur
Ratnapur
Rawalgaon
Rayani ..
Razakpar
Redawa
Rodori
Saidapur
Saidpur .•
Saikheda
Salabatpur
Salebad
Population Code No. 1951 1961
(2) (3)
294 295
74 5,282
8
265
263
259
94
80
277
293
194
45
81
167
241
296
163
48
67
73
196
203
241
105
649
196
9
47
19
99
1,062
320
255
360
179 Included
239
211
269
319
112
210
221
75
46
93
2SQ
284
280
101
87
61
in Ubran Area II
162
1,674
460
131
157
107
91
24
2S
(4)
385
6,571
175
322
160
no .. 280
16
•
13
* 15
9S
1,321
• • 468
340
410
Included in Urban Area II
201
2,041
• 500
151
.. 322
.. .. 159
..
118
_ 33
4S
.. Uninhabited:
21
2 ACHALPUR TALUKA-contd.
Name of Village
(1)
Salepur ..
Sambhora
Sangvi Nijampur
.. San~\'i N. Khail'i
Sanjaptlr
Sarafapur
Sarfabad
Sawalapur
Saw.1i Bk.
Sawali Datura
Sawali Kh.
Shahapur
Shahapur N. Hirur
Shahapur N. Jawala ..
Shahapur N. Wadgaon
Shampur
Shankarpur
Shekapur
Shirajgaon Kasaba
Sindi Bk.
Sindi Kh.
Sirajgaon Ardak'
Sirajgaon Band
Somthana
Sonori
Subhanpur
Sultanpur
Sultanpur
Sundarpur
Surali
Surwada
Takarkheda
Talegaon Mobana
Talni
Talwel
Tamaswadi
Tawalar
Thugaon
Tirmalpur
Population Code No. 1951 1961
(2)
15
108
195
224
251
127
291
(3)
377
86
93
458
816
244 1,262
229
26
230
245
303
307
43
227
219
182
203
302
141
355
105
358
11
174
75
11
128 7.412
82 1,963
121
286
289
139
149
100
ISO
32j1
298
134
197
323
271
315
321
310
59
249
235
183
2,747
745
152
343
955
154
448
726
363
2,269
171
772
997
(4)
463
109
168
513
914
1,428
351
404
268
386
172
375
8
255
96
14
8,589
2,534
2
199
2,976
576
209
603
..
1,100
204
674
947
573
2,396
237
1,026
1,120
Name of Village
(l)
Tondgaon
Tonglabad
Tonglapur
Tulajapur
Tuljapurgadhi
Udapur
Umri
Upat Kheda
Vani
Virkheda ..
Virpur
Virul
Vishroli
Vitalapur
Vithalapur
Wadala ..
Wadgaon Fattepur
Wadgaon Kh.
Wadhona
Wadner Bhujang
Wadura
Wadura
Wadura
Wagdoho
Wagholi
Wajjar
WalmikpUI'
Walni Bk.
Walni Kh.
Waruli
Wasni Bk.
WasniKh.
Yelk;
Yeni
Yeota
Yesurna
Code No.
Population
1951 1961
(2) (3) 4) ------
183
238
264
202
282
103
120
39
105
184
821
98
91
'239
655
172
1,004
166 Included
318
104
116
159
268
31
233
222
89
22
145
322
62
55
3
66
69
70
119
215
216
234
33
220
237
in Urban Area II
565
793
245
636
41
88
309
852
74
431
65
10
* 68
446
378
438
38
728
869
1,172
143
109
202
805
235
1,206
Included in Urban
Area II
668
997
247
944
29
172
453
941
138
501
170
38
2
112
689
641
TOTAL •• t 178,92J
534
69
966
1,271
209.i89-
t The 19S1 population ofthe Taluka as aiven in this list ditTers from that mentioned in Table A·D,
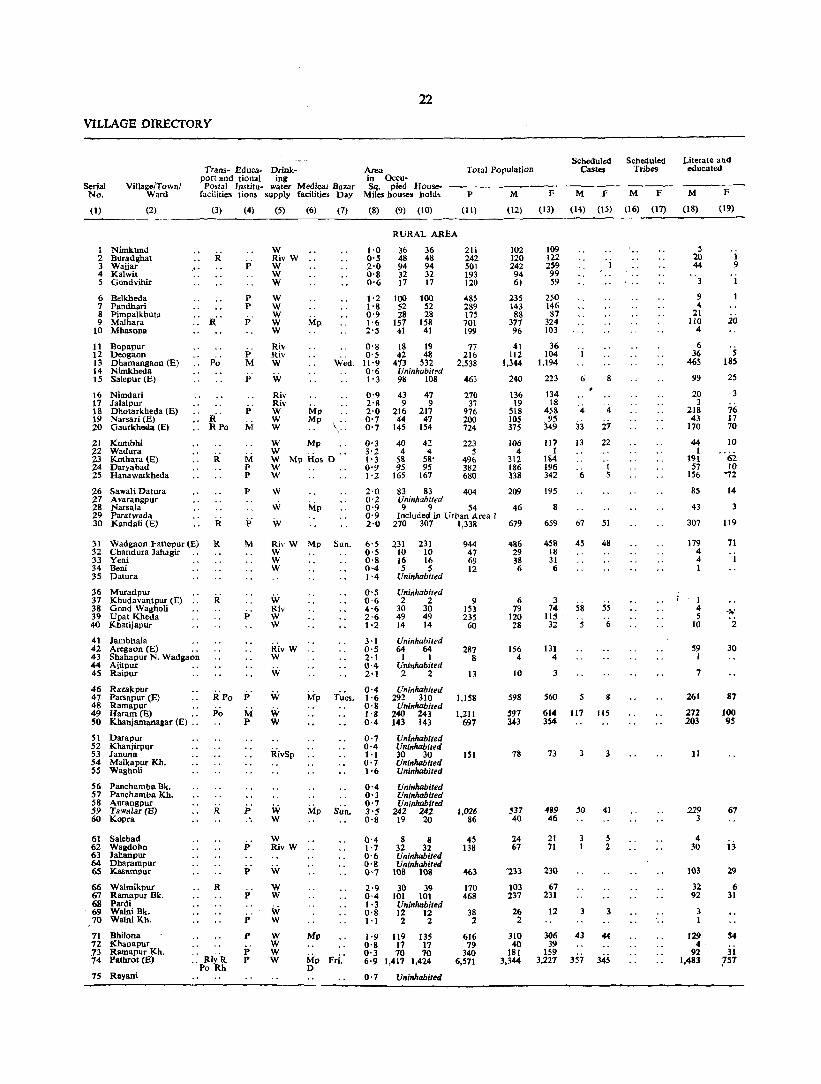
VILLAGE DIRECfORY
Serial No,
(1)
Village/Town/ Ward
(2)
1 Nimkund 2 Buradghat 3 Wajjar 4 Kalwit 5 Gondvihir
6 Belkheda 7 Pandhari 8 Pimpalkbuta 9 Malhara
10 Mhasona
11 Bopapur 12 Deogaon 13 Dhamangaon (E) 14 Nimkheda 15 Salepur (E)
16 Nimdari 17 Ialalpur
Trans- Educa- Drink-port and tional ing Postal Institu- waler Medical Bazar
facilities tions supply facilities Day
(3)
R
(4)
p
p P
P
i> M
P
(5)
W Riv W W W W
W W W W W
Riv Riv W
W
(6) (7)
Mp
Wed,
18 Dhotarkheda (E) 19 Narsar! (E) " R'
p'
M
Riv Riv W W W
Mp Mp
20 Gaurkheda (E)
21 Kumbhi 22 Wadura 23 KOlhara (E) 24 Daryabad 25 Hanawatkheda
26 Sawali Datura 27 Avarangpur 28 Narsala 29 Paratwada 30 Kandali (E)
::ll Wadgaon Fattepur (E) 32 Chandura J ahagir , ' 33 Yeni :34 Beni 35 Datura
36 Muradpur 37 Khudavantpur (E) 38 Gond Wagholi 39 Upat Kheda 40 Khatijapur
41 Jambhala 42 Aregaon (E) , , 43 Shahapur N, Wadgaon 44 Ajitpur " 45 Raipur
46 Razakpur 47 Parsapur (El 48 Ramapur 49 Haram (E) , , SO Kbanjamanallar (E) "
51 Darapur 52 Kbanjirpur 53 Januna 54 Malkapur Kh, 55 Wagholi
56 Panchamba Bk, 57 Panchamba Kh, S8 Aurangpur 59 Tawalar (E) 60 Kopra
61 Salebad 62 Wagdoho 63 Jahanpur 64 Dbarampur 6S Kasampur
66 Walmikpur 67 Ramapur Bk, 68 Pardi
.. 69 Walni Bk, 70 Walni Kh.
11 Bhllona 12 Khanapur
R. Po
R
R
R
R
R
R
.13 Ramapur Kh, 14 Palmol (E) Rly'R
Po Rh 75 Rayani
M p p
p
p'
M
j.
p'
M P
p
i.;
P
P
P
P P
W Mp W W Mp Hos D W W
W
w Mp W
Ri\' W Mp Sun. W W W
W Riv W W
w w w
RivSp
w W
W
Mp S~n,
Riv W "
W
W W
W W
W W W W
Mp
Mp Fri: D
22
Area in Occu-Sq. pied House
Miles houses hold,
Total Population
P M F
Scheduled Castes
M f
Scheduled Tribes
M F
Literate and educated
M F
(8) (9) (to) (11) (12) (13) (14) (15) (16) (n) (18) (19)
RURAL AREA
1'0 O'S 2'0 0'8 0'6
36 48 94 32 17
36 48 94 32 17
1'2 100 100 1'8 52 52 0'9 28 28 1'6 157 158 2'5 41 41
0'8 0'5
11'9 0'6 1'3
18 19 42 48
413 532 Uninhabited 98 108
2Jl 242 501 193 120
485 289 175 701 199
77 216
2,538
463
0'9 2·g 2'0 0'7 0'7
43 47 270 9 9 37
216 217 976 44 47 200
145 154 724
0'3 3'2 1'3 0'9 1'2
40 42 223 4 4 5
58 58' 496 95 95 382
165 167 680
2'0 0'2 0'9 0'9 2'0
83 83 404 Uninhabited 9 9 54
Included in Urban Area I 270 307 1,338
6'S 231 231 0'5 10 10 0,8 16 16 0-4 5 5 I ,4 Uninhabited
0-5 0'6 4'6 2·6 1'2
3·1 0'5 2,1 0'4 2'1
0,4 1'6 0,8 1'8 0,4
0,7 0'4 1'1 0·7 1'6
Uninhabited 2 2
30 30 49 49 14 14
Uninhabited 64 64
1 I Uninhabited 2 2
Uninhabited 292 310
Uninhabited 240 243 143 143
Uninhabited Uninhabited 30 30 Uninhabited Uninhabited
0'4 Uninhabited 0' 3 Uninhabited 0'7 Uninhabited 3 '5 242 242 0'8 19 20
0'4 8 8 1'7 32 32 0·6 Uninhabited O' 8 Uninhabited 0'7 108 108
2,9 30 39 0·4 101 101 1· 3 Uninhabited 0,8 12 12 1,1 :2 2
1'9 119 135 0·8 17 17 0,3 70 70 6'9 1,417 1,424
0·7 Uninhabited
944-47 69 12
9 153 235
60
287 8
13
1,158
1,211 697
151
1,026 86
45 138
463
170 468
38 2
616 79
340 6,571
102 120 242 94 61
235 143 88
377 96
41 112
1,344
240
136 19
518 105 375
106 4
312 186 U8
209
46
679
486 29 38 6
6 79
120 28
156 4
10
598
597 343
78
537 40
24 67
"233
103 237
26 2
310 40
181 3,344
109 122 259 99 59
250 146 87
324 103
36 104
1,194
223
134 18
458 .95 349
117 I
184 196 342
195
8
659
458 18 31 6
3 74
lIS 32
131 4
3
560
614 354
73
489 46
21 71
230
67 231
12
6
4
33
13
6
67
45
58
117
50
3 1
3
4
27 22
51
48
55
6
115
41
5 2
306 43 44 39
159 3,227 357 345
5 20 44
9 4
21 110
4
6 36
465
99
20 3
218 43
170
44 1
19\ 57
156
85
43
307
179 4 4 1
1 4 5
10
59 I
7
261
272 203
11
229 3
4 30
103
32 92
3 1
129 4·
92 1,483
I 9
20
5 18S
25
3
76 17 70
10
"62 10
'72
14
3
119
71
30
87
100 9S
67
ij
29
6 31
S4
31 I S1
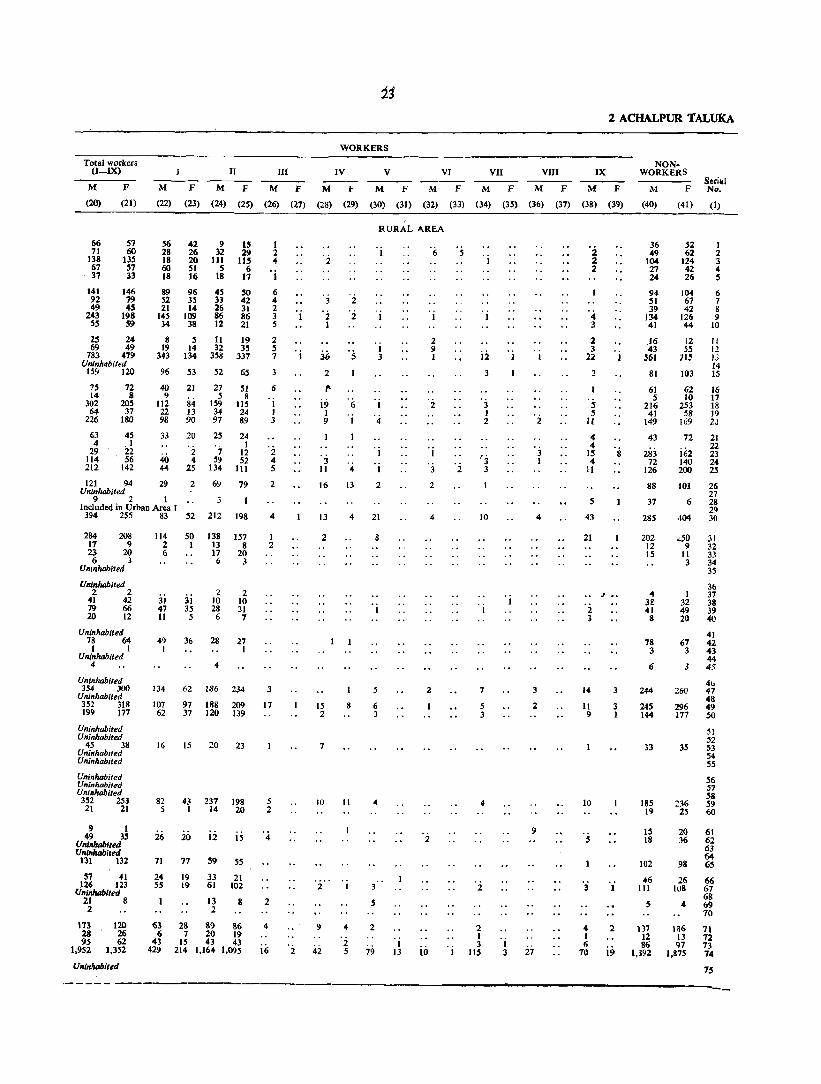
Total workers (I-IX) II III
M F
(20) (21)
M
(22)
F M F M F
(23) (24) (25) (26) (27)
66 71
138 67 37
57 60
135 57 33
141 146 92 79 49 45
243 198 55 59
2S 24 69 49
783 479 Uninhabited
159 120
75 14
302 64
226
63 4
29 114 212
72 8
205 37
180
45 .1 22 56
142
5642915 28 26 32 29 18 20 III 115 60 51 S 6 18 16 18 17
89 96 45 SO 52 35 33 42 21 14 26 31
145 109 86 86 34 38 12 21
8 5 11 19 19 14 32 35
343 134 358 331
96 53 52 6S
40 9
112 22 98
33
40 44
21
84 13 90
27 51 5 8
159 115 34 24 97 89
20 25
2 7 4 59
25 134
24 I
12 52
111
121 94 29 2 69 79 Uninhabited
9 2 1 Included in Urban Area I 394 255 83 52 212 198
284 208 17 9 23 20 6 3
Uninhabited
Uninhabited 2 2
41 42 79 66 20 12
Uninhabited 78 64
I I Uninhabited
4
Uninhabited 354 300
Uninhabited 352 318 199 177
Uninhabited Uninhabited
45 38 Uni~hablled Uninhabited
Uninhabited Uninhabited Uninhabited 352 253
21 21
9 I 49 35
Uninhabited Uninhabiled
131 132
57 41 126 123
Uninhabited 21 8 2
173 28 95
1,952
120 26 62
1,352
Uninhabited
114 50 138 157 2 1 13 8 6 17 20
31 47 II
49 1
ji 35 5
6 3
2 2 10 10 28 31 6 7
36 28 27 I
4
134 62 186 234
107 97 188 209 62 37 120 139
16 15 20 23
82 43 237 198 5 I 14 20
26 20 12 IS
71 17 59 55
24 55
19 33 21 19 61 102
13 8 2
63 28 89 86 6 7 20 19
43 IS 43 43 429 214 1,164 1,095
I 2 4
, i
6 4 2 3 5
2 5 7
3
6
I I 3
'2 4 5
2
4
1 2
3
17
5 2
4
2
4
16
'j
2
23
WORKERS
IV V VI VII VIll
MF MF MF M
(28) (29) (30) (31) (32) (33) (34)
, j
'2 I
ji)
2
f-
19 1 9
'j II
16
13
2
IS 2
7
10
2
9
42
:5
'6 1
4
13
4
II
4
2 :5
RURAL AREA
I 3
1
4
I
I
2
21
8
S
6 3
4
3
s
2
79 I
13
2 9 I
1 , 3
2
4
2
2
10
5
2
'j
ii
"
3
3 1 2
3 3
10
7
5 3
4
2
2 1 3
115
F M F
(35) (36) (37)
1 3
2
3 1
4
3
2
9
27
2 ACmLPUR TALUiU
IX
M F
(38) (39)
'2 :2 :2
4 3
2 3
22
3
s S
lJ
4 4
IS .. II
S
43
21
'2 3
14
11 9
10
5
3
4 1 6
70
.I _,
3
2
j9
NONWORKERS
M F Sori.l No,
(40) (41) (I)
36 49
104 27 24
94 51 39
134 41
!~ '61
81
61 5
216 41
149
43
283 72
126
88
37
285
202 12 15
4 3f 41 8
78 3
6
244
245 144
33
185 19
15 18
102
46 111
s
137 12 86
1,392
52 62
124 42 26
I 2 3 4 5
104 6 67 7 42 8
126 9 44 10
12 II 55 12
715 IJ 14
103 15
62 10
2s) S8
169
72
ii;2 140 200
101
6
404
16 17 18 19 20
21 22 23 24 25
26 27 28 29 30
,,50 31 9 32
11 33 3 34
35
36 1 37
32 38 49 39 20 40
41 67 42
3 43 44
J 4.~
4u 260 47
48 296 49 177 SO
51 52 53 54 55
56 57 58
n6 S9 2S 60
20 61 36 62
63 64
98 65
26 66 108 67
68 4 69
70
136 13 97
1,875
71 72 73 74
75
--------------------------------------------------------

24
VILLAGE DIRECTORY
Serial No.
(I)
Village/Town} Ward
(2)
76 lahanpur
Trans- Educa- Drink-Area port and tional iog in O<:cu-Postal Institu- water Medical Bazar Sq. pied Housefacilities tioDS .. s_IIPply facilities Day Miles hOllSes holds
(3) (4) (5) (6) (7) (8) (9) (10)
RURAL AREA-con,d.
0'3 Uninhabited 1 . 3 Uninhabited
Total Population
P M
(11) (l2l
77 Kawitha Kh. 78 Jawalapur P W
W
0·9 84 84 399 185
144 I· J Uninhabited 79 Kamat Wada
80 Pohi P, '-6 61 61 280
81 Raipur 82 Sindt Bk. {E} 83 Kusta Bk. (E) 84 Kusta Kh. 85 Mab,amadpur
86 Janori 87 Salabatpur 88 Ambuj 89 Wadner Bhujang 90 Jamapati
91 Cbichkumbha 92 Hiwaradevi 93 Redawa 94 Pithoda 95 Karanja-Baheram
96 Pal. 97 Naaarwadi 98 Parsoda 99 Kbinkhini
100 Subhanpur
101 Saikheda 102 Jawara 103 Udapur 104 Vishroli lOS Vani
106 Belmandali 107 Ghatladki 108 Sambhora 109 Kharpi 110 Bodad
111 Govindpur 112 Ratanpur In Markanda 114 Chincholi Bk. 115 Gaurkheda
116 Vitalapur 117 Belkheda IJ8 Kurankhed 119 Waruli 120 Urnri
121 Sindi Kh. 122 Bhalewadi 123 Khel-Mahal
(Karajgaon). (E) 124 Khel-Chaudhar
(Karajgaon). (E) 125 Alampur
.. Po' _, Po
Po
.. Po
.. Po
R
R' RPo
RPo
126 Kalhodi .. 127 Sarafapur ., R 128 Shirajgaon-Kasaba (E) R Po 129 Angatpur
_ 130 Deurwada (E) Po
M M P
j;
P
P
P
rr p M
p' P
P
p
ii P
j, H
M
w W W
Mp D Wed • ., Sun.
W
W
w Wx
W
Mp
Riv W ._ W Riv \. .•
W
W
W Mp W
W Mp RivW MpD Riv x W W
W W W W
W W W
W~d_ Tue.
S~t.
W W W MpD F~i.
W
W
W W W
W
Mp Fri.
MpD Sat.
MpD Fri.
0·5 4·9 1·8 0·6 0-5
Uninhabited 505 520 204 237 103 120
Uninhabited
1'41518 0·4 Vninhabited 0-7 Uninhllibled 2-6 93 99 1-2 Uninhabited
0'4 43 46 1'6 Uninhabited 0·9 34 38 1·8 Uninhabited 6'9 181 181
2·4 25 25 3·4 I 1 I-I 17 17 0·8 Uninhabited 1-5 40 53
0-9 0·8 1·2 6·3 1'6
0·9 2·2 I-g 7'2 1'7
7 7 Uninhabit.d Uninhabited 193 210 201 255
84 103 625 792
24 25 177 177 39 44
I-I 120 120 0'8 33 33 O'S 1 I 1'4 S8 58 O· 7 {/ni"habiled
0'6 Uninhabited 1'1 28 31 2'4 84 96 2'4 27 2& O· ~ Uninhabited
1'2 I t 1'9 1 I 1'5 1,058 1,058
I'S 910 910
0'4 44 48
0'7 78 86 0'6 103 113
17'8 1,587 1,802 O' 5 Uninhabited 1'9 477 481
O'S Uninhabited 131 Dhoktirth i32 Bramhanwada Po H W Mp Thu. 3' 5 990 1.141
(Thadt). (EJ 133 lnapur 134 Small 135 Nimkheda
136 Ambada Kandari 137 Antargaon 138 Makrampur 139 Somthana .. 140 Khel-KhushaI-Kurha (E) R Po
141 Khel-Ianuji R Po (Chaudhar-l{urha)_
142 Khel.Januji Deshmukh R Po (Kurha).
143 Khel-Sakharam ., It Po 144 Patldhari (E) 145 Wadura
M P
P
M
P
P
W W
W
W
W
W
W
w W
Mp
Mp
146 Dewapur 147 Kajali (E) . . -Po P W Mp 148 Bramhanwada Pathak P W Mp 149 Sonori .. Po M W Mp ISO. SQ1!an_PJrr.(E) • __ Po.,. _M _......Yi __ .. . Mp
O' 7 Uninhabited 3'6 223 248 I-I 71 94
3'1 90 90 O'S Uninhabited 0·9 3 3 I' I Uninhabited
Wed. 1·9 133 136
1'3 140 140
1·7 110 112
1-7 102 102 0'7 .27 27 I' 3 Uninhabited
Uninhabited 153 158 12$ 132 121 134 12& 142
1,534 1,064
548
83
45.3
235
159
864
123 1
65
209
33
997 1,206
486 3,540
109 866 206
502 lSI
1 269
155 435 tt2
'4 2
4,446
4,268
:l.2S
365 513
8,589
2,246
5,490
1,100 512
411
9
626
694
421
413 138
774 581 576 603
1,310 547 285
4S
116
75
438
68 1
40
105
17
521 604
245 1,799
51 449 100
260, 84
1 143
78 250
S4
1 2
2,269
2,202
116
194 259
4,553
1,188
2,825
544 256
214
2
318
352
:m 202
70
404 288 301 309
F
(13)
214
136
1,224 517 263
119
84
426
55
2S 104
16
416 602
241 1,741
,58 417 106
242 67
126
77 185 58
Scheduled Castes
Scheduled Tribes
M F M F
(14) (15) (16) (17)
2
44 1I I
4
S 65 8 1 5
40 IS 1
6
3 4
9 64 11 4 3
2,i77 Ii? 126 2,066 114 104
109
171 254
4,036
I,OS8
2,665
556 256
197
7
)08
342
199
211 68
370 293 275 294
4 89
33
87
5 I
26
9
2
I 15 11
66 26
116
8 2
39
II
2 13 9
Literate and educated
M F (18) (19)
91
56
622 2$8 122
16
118
9
9
163
17
6.
46
6
194 235
65 760
1 165 49
114 24 1
56
31 95 11
2 1,213
1,099
5S
92 167
2,245
489
1.345
212 119
69
134
ISO
129
101 28
165 133 12l IS8
52
32
273 103 .9
42
70
2
20
68 100
33 255
'28 26
48 7
. i6
13 32 11
;80 536
19
33 72
907
204
581
102 78
33
61
73
52
37 14
76 80 64-88
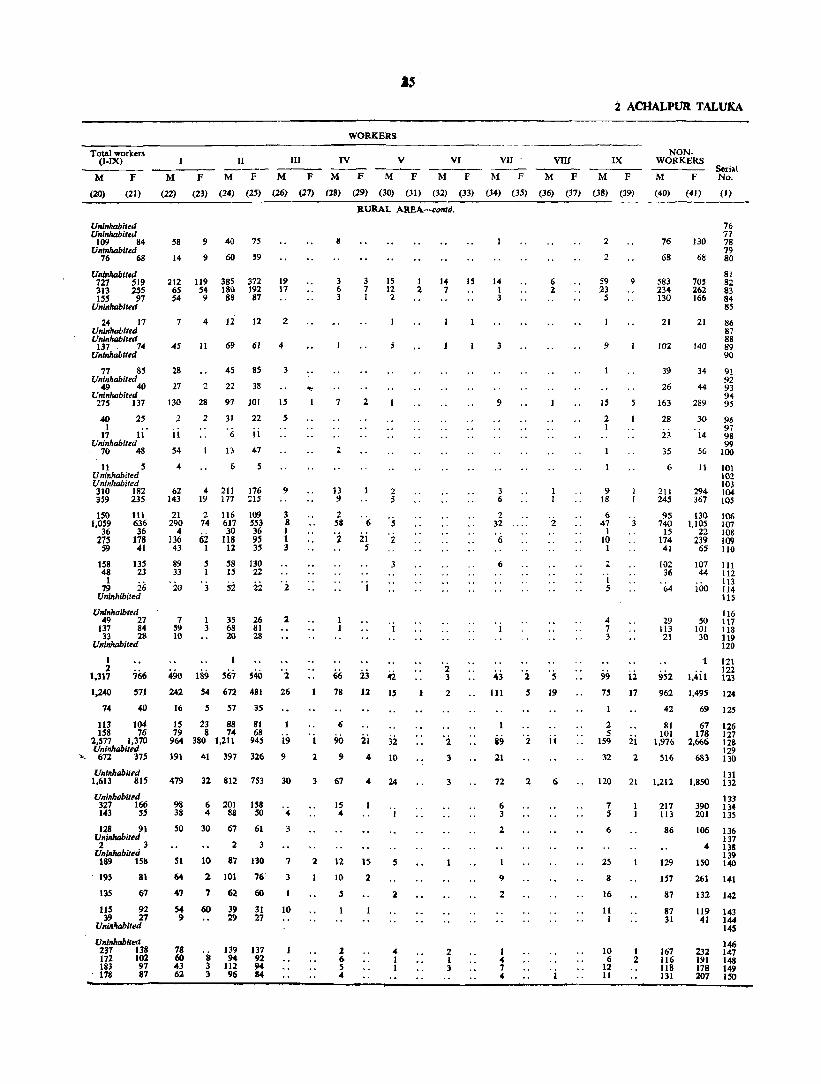
2 ACHALPVR TALUKA
WORKERS
Total workers (I-IX) II III IV V VI VII VIII IX
----M F M F MF M FMF MF MF MF MF MF
(20) (21) (22) (l3) (l4) (2S) (26) (27) (28) (29) (30) (3J) (32) (33) (34) (35) (36) (37) (38) (39)
------------------ RURAL AREA-collld,
Ullinhabiled Uninhabited
109 84 Uninhabited
76 68
Unlnhabit.d 727 519 313 235 1~5 97
Unin/ulblted
24 17 Uninhabited Uninhabited
137 74 Uninhabited
77 85 Uninhabited
49 40 Uninhabited
275 137
40 25 1 ..
17 1\ Uninhabited
70 48
11 5 Uninhabited Uninhabited 310 182 359 235
150 1,059
36 275
59
111 636 36
178 41
158 135 48 23
1 79 26
Uninhibited
Ullinhoibted 49 27
137 84 33 28
Uninhabited
1 2
1,317
1,240
74
571
40
113 104 158 76
2,577 1,370 Uninhabited
"672 375
Uninhabited
58
14
9 40 75
9 60 59
212 119 385 372 19 65 54 181l 192 17 54 9 88 87
7 4 12 12 2
45 II 69 61 4
28 45853
2722238
130 28 97 JOJ 15
2
ii 54
2 31
6
13
4 6
22
i i 47
62 4 211 176 143 19 177 215
21 290 .. 136 43
89 33
'20
2 74
iii 1
5 1
3
116 617 30
lI8 12
58 IS
si
109 553 36 95 35
130 22
22
7 59 10
I 35 26 3 68 81
20 28
490
242
16
189 567 54 672
5 57
IS 23 79 8
964 380
191 41
88 74
1,211
391
540 481
35
81 68
945
326
5
9
3 8 1 1 3
2
'2 26
19
9
I
2
8
3 6 3
7
2
13 9
2 58
'2
66
78
6
90 9
3 15 7 12 1 2
2
6
ii 5
23 12
2i 4
2 5
3
"2
IS
32 10
1 14 15 14 271
3
'2 3
2
3
9
3 6
2 32
'(,
6
43
III
&9 21
'2 5
'2
6 2
2
's 19
11
2
2
59 23
5
9
15
2 I
9 18
6 47
I 10 I
2
1 5
4 7 3
99
75
2 5
159
32
9
12
17
21
2
NONWORKERS
M F Serial No,
(40) (4J) (1)
76
68
583 234 130
21
102
39
26
163
28
i3 35
6
211 245
95 740
15 174 41
102 36
64
29 113 21
952 962
42
81 101
1,976
516
76 77
130 78 79
68 80
81 705 82 262 83 166 84
85
21 86 87 88
140 89 90
34 91 92
44 93 94
289 95
30
14
56
96 97 98 99
100
11 101 102 103
294 104 367 lOS
130 1,105
22 2W 65
107 44
100
106 107 108 109 110
III 112 113 114 115
116 50 117
101 118 30 119
120
1
l,.iil 1,495
69
61 178
2,666
683
121 122 123
124
125
126 127 128 129 130
131 1,613 815 479 32 812 753 30 67 3 72 2 6 121l 21 1,212 1,850 132
Uninhabited 327 166 143 55
128 91 Uninhabited 2 3
Uninhabited 189 ISIS
195 81
135 67
115 92 39 27
Uninltabited
Vlllnhabited 231 138 172 102 183 97
, 178 87
98 6 201 158 38 4 88 50 ..
50 30 67 61 3
2 3
51 10 87 130 7
64 2 lOt 76' 3
47 7 62 60
S4 60 39 31 10 9 29 27
78 60 43 62
's 3 3
139 94
112 96
137 92 94 B4
IS 4
2 12 15
10 2
5
2 6 S
"
2
4 I 1
2 1 :.
6 3
2
9
2
1
" 7 4
1 5
6
25
8
16
11 1
10 6
12 II
1 2
217 113
86
129
157
87
87 31
167 116 118 UI
133 390 134 2111 135
106 136 137
4 138 139
ISO 14U
261 141
132 142
119 143 41 144
145
146 232 147 191 148 178 1<W 201 1~0
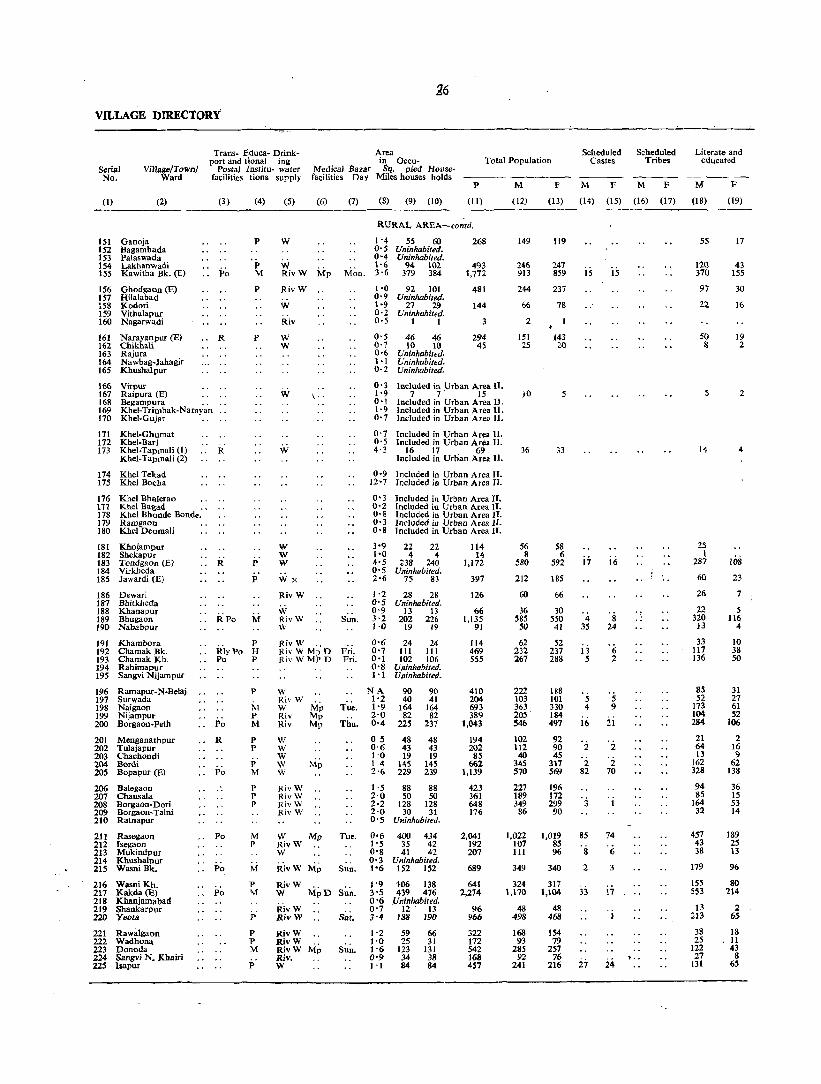
26
VILLAGE DIRECTORY
Area Trans- Educa- Drinkport and tional ing
Postal Institu- water facilities tions supply
ill ceeu- Total Population Scheduled
Castes Scheduled
Tribes Literate and
educated Serial No.
Village/Town! Ward
(I) (2)
151 Ganoja 152 Bagambada 153 Palaswad. 154 Lakhanwadi 155 Kawitha Bk. (E)
156 Ghodgaon (E) 157 HiJalabad 158 Kodori 159 Vithalapur 160 Nagarwadi
161 Narayanpur (E) 162 ChikhaH 163 Rajura 164 Nawbag-Jahagir 165 Khushalpur
166 Virpur 167 Raipura (E) 168 Begampura .. 169 Khel-Trimbak-Narayan 170 Kbe1-Gujar ..
171 Khel-Ghumat 172 Khel-Bari 173 Khel-Tapmali (I)
Khel-Tapmali (2)
174 Khel Tekad 175 Kbel Bocha
176 Khel Bhalerao 177 Khel Bagad •• 178 Khel Bhonde Bonde. 179 Ramg.on 180 Khel Deomali
181 Khojampur 182 Sbekapur 183 Tondgaon (E) 184 Virkheda 185 Jawardi (El
186 Dewari 187 Bbitkbeda 188 Khanapur 189 Bbugaon 190 Nababpur
191 Khambora 192 Cbamak Bk. 193 Chamak Kh, 194 Rahimapur 195 Sangvi Nijampur
196 197 198 199 200
Ramapur-N-Belaj Surwada Naigaon Nijampur Borgaon-Pelh
201 Menganathpur 202 Tulajapur 203 Chachondi 204 Bordi 205 Bopapur (E)
206 Balegaon 207 Chausala 208 Borgaon-Dori 209 Borgaon-Taloi 210 Ratnapur
211 Rasegaon 212 Isegaon 213 Mukindpur 214 Khushalpur 215 Wasoi Bk.
216 Wasni Kh. 217 Kakda (E) 218 Khanjamabad 219 Shankarpur 220 Yeota
221 Rawiilgaon 222 Wadhona 223 Donoda 224 Sangvi N. Kbairi 22S lIapur
(3)
R
R
R
RPo
(4)
p
P M
P
p
p
p
M
P RlyPo H Po P
Po
R
Po
Po
Po
Po
p
M P M
P P
P M
P P P
M P
M
P M
p
p P M
p
Medical Bazar Sq. pied Housefacilities Day Miles houses holds
(5)
W
W RivW
RivW
w Riv
W W
W
W
W W W
Wx
RivW
W RivW W
(6)
Riv \V ..
(7)
M~n.
Riv W Mp D Fri. Riv W MP D Fri.
W RivW W Mp Riv Mp Riv Mp
VI W W W W
RivW RivW RivW RivW
Tue.
Th~.
(8) (9) (10)
p
(11)
RURAL AREA.-contd.
1-4 55 60 O' 5 Uninhabited. 0-4 Uninhabited. \-6 94 102 3·6 379 384
1'0 92 101 O· 9 Uninhabited. 1·9 27 29 0-2 Uninhabited. 0'5 1 I
0'5 46 46 0'7 10 10 0·6 Uninhabited. 1·1 Uninhabited. o· 2 Uninhabited.
268
493 1,772
481
144
3
294 45
O' 3 Included in Urban Area II. 1'9 7 7 15 0'1 Included in Urban Area U. 1· 9 Included in Urban Area II. O· 7 Included in Urban Area 11.
O· 7 Included in Urban Area II. O' 5 Included in Urban Area IT. 4'3 16 17 69
Included in Urban Area 11.
0'9 Included in Urban Area II. IZ'7 Included in Urban Area II.
O· 3 Included in Urban Area II. 0'2 Included in Urban Area II. O' 8 Included in Urban Area H. 0'3 Included in Urban Area If. O· 8 Included in Urban Area n. 3'9 22 22 1'0 4 4 4'5 238 240 0'5 Uninhabited. 2'6 75 83
1'2 28 28 0'5 Uninhabited. 0'9 I3 13 3 -2 202 226 1·0 19 19
0'6 24 24 0'7 1I1 111 0'1 102 106 0'8 Uninhabited. I '1 Uninhabited.
NA 1'2 1''1 2'0 0'4
90 40
164 82
225
90 41
164 82
237
OS 48 48 0'6 43 43 1'0 19 19 I 4 145 145 2'6 229 239
1 '5 88 88 2'0 50 50 2·2 128 128 2·0 30 31 0'5 Uninhabited.
114 14
1,172
397
126
66 1,135
91
114 469 555
410 204 693 389
1,043
194 202 85
662 1,139
423 361 648 176
W Mp Tue. 0, 6 400 434 2,041 192 207
RivW 1'5 35 42 W 0'8 41 42
0'3 Uninhabited. R'ivW Mp Sun. 1'6 152 152
RivW W MpD S~~.
R'ivW RivW s~i.
RivW RivW RivW Mp Riv. W
1'9 106 138 3'5 439 476 0'6 .Uninhabited. 0'7 12· 13 3'4 133 190
1'2 59 1'0 25 1'6 123 0'9 34 1'1 84
66 31
131 38 84
689
641 2,274
96 966
322 172 542 168 457
M
(12)
149
246 913
244
66
2
1;1 25
.10
36
56 8
580
212
60
36 585
50
62 232 267
222 103 363 205 ~46
102 112 40
:~45 570
227 189 349
86
1,022 107 III
349
324 1,170
48 498
168 93
285 92
241
F M F M F M
(13) (14) (15) (16) (17) (18)
119
247 859
237
78
143 20
33
58 6
592
185
66
30 550 41
52 237 288
188 101 330 184 497
92 90 45
317 569
196 172 299
90
1,019 85 96
340
317 1,104
48 468
154 79
257 76
216
is
17
4 3S
13 5
5 4
i6
'2 2
82
3
85
·s 2
33
27
is
ii;
's 24
6 2
5 9
21
2
'2 70
74
6
3
i'i
24 , ..
55
120 370
97
2l
50 8
14
2S 1
287
60
26
22 320
13
33 117 136
85 52
173 104 284
21 64 13
162 328
94 85
164 32
457 43 38
179
155 5~3
13 213
38 25
122 27
131
F
(19)
17
43 155
30
16
19 2
2
4
lOS 23
7
5 116
4
10 38 50
31 27 61 52
106
2 16 9
62 138
36 15 53 14
189 25 13
96
80 214
2 55
18 11 43
8 6S

Total workers (I-IX)
M F M F
II III
M F M F
27
WORKERS
IV v M F M F
VI VII VIII
M F M F M F
:2 ACHALPUR TALUKA
IX
M F
NON· WORKERS
M F
Serial No.
(20) (21) (22) (23) (24) (25) (26) (27) (28) (29) (30) (31) (32) (33) (34) (35) (36) (37) (38) (39) (40) (41) (I)
84 60 23 52 57 Uninhabited. Uninhabited.
148 98 500 407
4589090 249 130 196 261
149 99 40 Uninhabited.
40 20 11 Uninhabited.
2
90 59 13 13 9
Uninhabited. Uninhabited. Uninhabited. ..
Included in Urban Area II. 9 I ..
Included in Urban Area II. Included in Urban Area II. II'lCluded in Urban Area II.
14 89 85
10
28 19
2
48 49 8 9
7
Included in Urban Area II. Included in Urban Area II.
22 12 2 9 Included in Urban Area II.
Included in Urban Area II. InclUded in Urban Area II.
Included in Urban Area II. Included in Urban Area II. Included in Urban Area II. Included in Urban Area II. Included in Urban Area II.
34 13 7 5
360 198 Uninhabited.
1I9 71
35 36 Uninhabited.
18 7 319 190
25 21
38 24 145 117 142 148
Uninhabited. Uninhabited.
127 57
206 107 326
59 66 20
194 303
61 51
169 46
194
60 30 17
169 261
128 77 107 85 202 163
49 34 Ur';nhabited.
587 410 .59 28 52 30
Uninhabited. 211 1.58
198 134 69.5 404
Uninhabited. 30 15
304 233
100 .53
166 .50
139
S9 29 78 45 62
22 2
105
43
20
10 147
6
6
24 7
22
4 54
5
6 4 53 41 40 SO
12 7 4 5
200 162
62 63
13 11
6 3 125 133 18 16
28 20 58 63 81 94
59 8 61 53 21 23 28 28 78 68 113 100 34 I 62 45
147 30 106 146
22 13
29 55 42 30
6 3 13 14 61 28 120 139
122 ISO 162 108
50 16 74 S9 67 44 33 39 66 30 121. 133 23 4 10 18
201 105 278 288 29 5 21 23 2212628
82 55 112 101
76 57 98 77 192 83 368 305
19 8 10 7 116 30 161 202
38 31 45 13 49
'2 51 56 1 22 28
16 98 61 2 36 43 6 69 5S
10
8
6
2
17 1
1 4 2 4
15
I 4 I
3
I 2 6 8
24 5
2 6
4
I
2
8
..
10
11
3
2
6
19
11
II
11
2
4 I
3 I
20
I 2
10
2
2 17
6
8
2
'i
RURAL AREA-contd.
3
4
4
9
2
2 1
6
2
2 3
23 4
7
9
4 S
. 3
2
2 I
9
4
2 15 7 - 5
5
8
3 32
7
2
'i 3
2 4 3
5 8
5
2
1 2 4 2
16
2 2
1 3
24 4
3
2 35
'2
2
6
4
6 14
5
1 15
5
2 30
I
4 8
13
5 1 6 4
19
4 1
8 11
I 5 6 3
28
2
5
15 40
I 9
14 1
12
2
I 2
1 . i
10
2
5
65
98 413
95
26
61 1-"
14
22 1
220
93
25
18 266
25
24 87
125
95 46
157 98
220
43 46 20
151 267
99 82
147 37
435 48 59
138
126 475
18 194
68 40
119 42
102
59 151 152 153
149 154 452 155
138 156 157
58 158 159 160
84 161 11 162
163 164 165
\66 4 167
168 169 170
171 172
21 173
45 1
394
114
30
23 360 20
174 175
176 i77 178 179 180
181 182 183 184 185
186 187 188 189 19Q
28 191 120 192 140 193
194 195
127 196 50 197
161 198 138 199 303 200
32 201 60 202 28 203
148 204 308 205
119 206 87 207
136 208 56 209
210
609 211 57 212 66 213
214 182 215
183 216 700 217
218 33 219
235 220
95 221 50 222
179 223 31 224
154 225
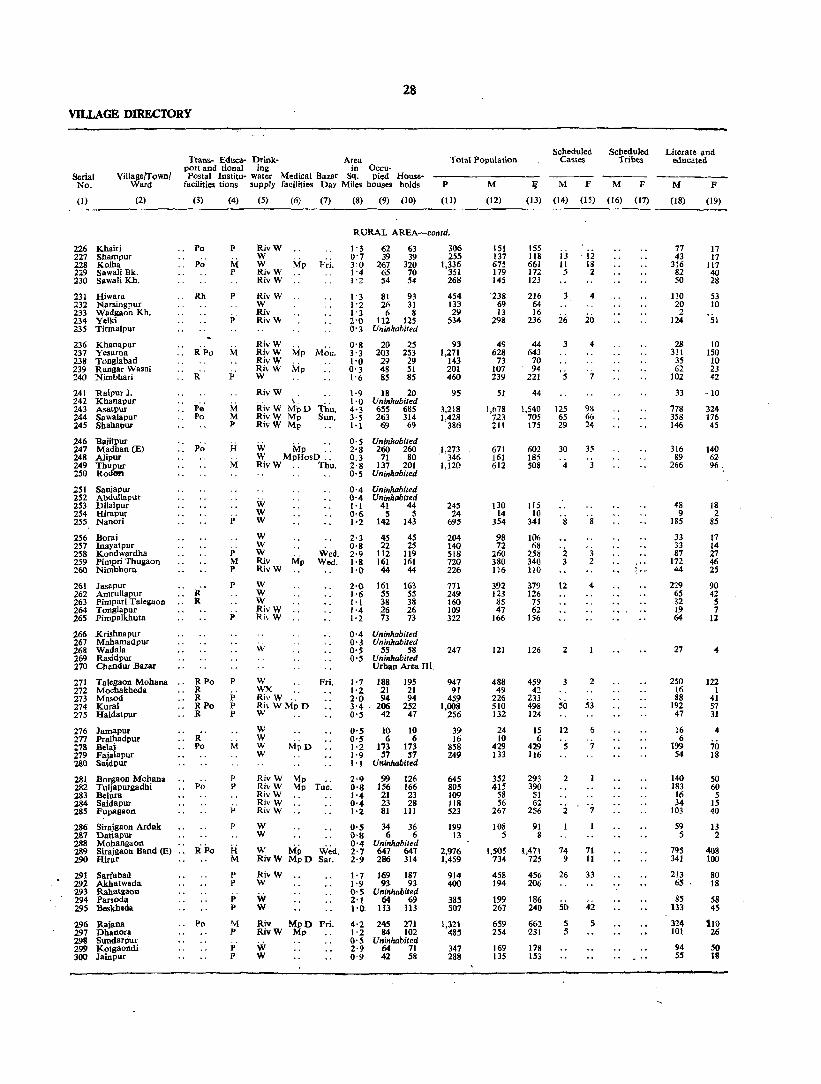
28
VILLAGE DIRECTORY
Trans- Eduea- Drink- Area port and tional iog in Oecu-
Total Population
Serial No.
Village/Town/ Ward
Postal Institu- water Medical aa""r Sq. pied House-facilities tions supply facilities Day Miles bouses holds P M
(I)
226 Khairi 227 Shampur 228 Kolba
(2)
229 Sawali Bk. 230 Sawali Kh.
231 Hiwara 232 Narsingpur 233 Wadgaon Kh. 234 Yclki 235 Tinnalpur
236 Khanapur 237 Yesurna 238 Tonglabad 239 Rangar Wasni 240 Nimbhari
241 Raipur l. 242 Khanapur 243 Asatpur 244 Sawalapur 245 Shahap'"
246 Bajitpur 247 Madhan (E) 248 Alipur 249 Thupur 250 Rodllft
251 Sanjapur 252 Abdullapur 253 Dilalpur 254 Hirapur 255 Nanmi
256 Boraj 257 Inayatpur 258 Kondwardha 259 Pimpri Thugaon 260 Nimbhora
261 Jasapur 262 Amrullapur 263 Pimpari Talegaon 264 Tonglapur 265 Pimpalkbuta
266 Krishnapur 267 Mahamadpur 268 Wadala 269 Rasidpur 270 Chandur Bazar
271 Talegaon Mohan. 272 Moehakbeda 273 Masod 274 Kural 275 Haidatpur
276 Jamapur 277 Pralhadpur 278 Bela; 279 Fajalapur 2&0 Saidpur
(3)
Po
.. Po
Rh
RPo
'. R'
" Pe' Po
R R
RPo R
.. R RPo
.. R
.. R
.. Po
281 Borgaon Mohana 282 Tuljapurgadhi . . Po 283 Belura 284 Saidapur 285 Fup"gaon
286 Sirajgaon Ardak 287 Dauapur 288 Mobangaon 289 Sirajgaon Band (E) Ii Po 290 Hirllr
291 Sarfllbad 292 Akhlltwada 293 Rabatgaon 294 Parsoda 29S Beskheda
296 Raia.na .. Po 297 Dhanora 298 Sundarpur 299 Kotgaondi 300 Jainpur
(4)
p
M P
p
M
P
M M p
H M
p
P M P
P
p
P
P P P
P P
P
P
H M
P P
P p
M p
P P
(5) (6) (7)
RivW W W Mp F~i. RivW RiyW
RivW W Riy RivW
R;vW RivW Mp M;'~. R;vW RivW Mp W
RivW
Riv W ~j, D Thu. RivW Mp Sun. RivW Mp
W Mp W MpHosD .. RivW Thu.
W W W
W W W Riv Mp RivW
W W W RivW Ri\ W
W
w WX Ri\'W .. Rh WMpD W ..
W W W W
W~d. Wed.
Fri.
RivW Mp RivW Mp Tu~: RivW Rh'W RivW
W W
W IMp W;d. Riv W Mp D Sat.
RivW W
W W
Riv MpD Fri. RivW Mp
W W
(8) (9) (10) (11) (12)
RURAL AREA-comd.
1'3 62 63 0'7 39 39 3:0 267 320 1'4 65 70 "2 54 54
1'3 81 93 "2 26 31 1'3 6 8 2'0 112 125 O' 3 Uninhabited
0'8 20 25 3'3 203 253 1'0 29 29 0'3 48 51 1'6 85 85
1'9 18 20 1'0 Uninhabited 4'3 655 685 3'5 263 314 "1 69 69
0'5 Uninhabited 2'8 260 260 0.3 71 80 2·S 137 201 o· 5 Uninhabited
0'4 Uninhabited 0'4 Uninhabited 1'1 41 44 0'6 5 5 1'2 142 143
2'3 0'8 2'9 1'8 1'0
45 22
112 161 44
45 25
1I9 161 44
306 255
1,336 351 268
454 133 29
534
93 1,271
143 201 460
95
3,218 1,428
386
1,273 . 346 1,120
245 24
695
204 140 518 720 226
1-() 161 163 771 1'6 55 55 249 1'1 38 38 160 1'4 26 26 109 1'2 73 73 322
0'4 Uninhabited O· 3 Uninhabited 0'5 S5 5S 247 0'5 Uninhabited
Urban Area III.
1'7 188 1'2 21 2'0 94 3'4 ' 206 O'S 42
195 21 94
252 47
0" 10 10 0" 6 6 1'2 173 173 1'9 S7 57 I' \ Uninhabited
2'9 99 126 0'8 156 166 1'4 21 23 0'4 23 28 1'2 81 III
o·s 34 36 0'8 6 6 0'4 Uninhabited 2'7 647 647 2'9 286 314
1'7 169 187 1'" 93 93 O· 5 Uninhabited 2'1 64 69 1'0 113 113
4'2 245 271 1'2 84 102 o· 5 Uninhabited 2'9 64 71 0'9 42 5S
947 91
459 1,008
256
39 16
858 249
645 80S 109 118 523
199 13
2,976 1,459
914 400
385 507
1,321 48S
347 288
lSI 137 675 179 145
238 69 13
298
49 628
73 107 239
51
1,678 123 211
671 161 612
130 14
354
98 72
260 380 116
392 123 85 47
166
121
488 49
226 510 132
24 10
429 133
352 415
58 56
267
108 5
1,505 734
458 194
199 267
659 254
169 135
i (13)
155 Jl8 661 172 123
216 64 16
236
44 643 70 94
221
44
1,540 705 175
602 ISS 508
115 10
341
106 68
258 340 110
379 126 75 62
156
126
459 42
233 498 124
15 6
429 1J6
293 390
51 62
256
91 8
1,471 725
456 206
186 240
662 231
178 153
Scheduled Castes
M F
(14) (15)
13 '12 11 Ig 5 2
3.
26
, 5
125 65 29
30
4
8
2 3
12
2
3
12
5
2
2
74 9
26
50
5 5
4
20
4
7
93 66 24
35
3
8
3 2
2
53
6
7
7
71 II
33
42
5
Scheduled Tribes
M F
(16) (17)
Literate and educated
M F
(18) (19)
77 43
316 82 50
110 20 2
124
28 311
3S 62
102
33
778 358 146
316 89
266
48 9
185
33 33 87
172 44
229 65 32 19 64
27
250 16 88
192 47
16 6
199 54
140 183 16 34
103
59 5
795 341
213 65
85 133
324 101
94 55
17 17
117 40 28
53 10
51
10 150 10 23 42
-10
324 176
4S
18 2
85
17 14 27 46 25
90 4Z S 7
II
122 1
41 57 31
" 70 IS
50 60 5
15 40
13 2
408 100
80 18
58 45
110 26
SO 18
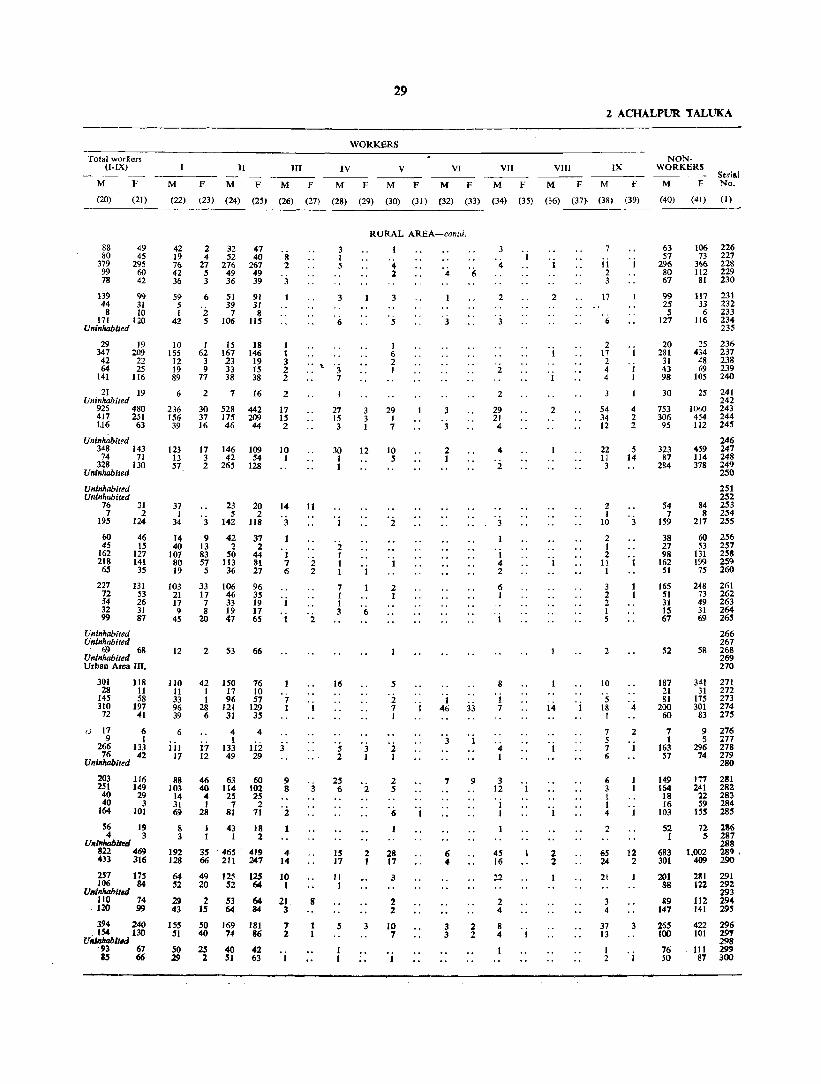
Total worRers (I-IX)
M F
(20)
88 80
379 99 78
(21)
49 45
295 60 42
139 99 44 31
8 10 171 120
Uninhabited
29 347 42 64
141
19 209
22 25
116
21 19 Uninhabited
925 480 417 251 U6 63
Uninhabited 348 143
74 71 328 130
Uninhabited
Uninhabited Uninhabited
76 31 7 2
195 124
60 45
162 218
65
227 72 54 32 99
Uninhabited Uninhabited
46 15
127 141
35
131 53 26 31 87
'69 68 Uninhabited Urban Area III.
301 28
14S 310
72
118 11 58
197 41
(.) 17 6 9 I
266 133 76 42
Uninhabited
203 251
40 40
164
116 149 29
3 101
56 19 4 3
U1fu.ltabil~d 822 469 433 JI6
257 175 106 84
U"'nhabil~ 110 74
. 120 99
394 240 . 154 130
UlIlnhabltNi '93 67 as 66
29
WORKERS
II III IV V
M F M F M F M F M F
VI VII VIII
M F M F M F
2 ACHALPUR TALUKA
IX
M F
NONWORKERS
M F Serilll No.
(22) (23) (24) (25) (26) (27) (28) (29) (30) (31) (32) (33) (34) (35) (36) (37) (38) (39) (40) (41) (I)
42 2 32 47 19 4 52 40 76 27 276 267 42 5 49 49 36 3 36 39
59 5 I
42
10 155
12 19 89
6
2 5
I 62
3 9
77
51 39
7 106
15 167 23 33 38
91 31 8
115
18 146 19 15 38
6 2 7 16
236 30 528 442 156 37 175 209 39 16 46 44
123 17 146 109 13 3 42 54 57. 2 265 128
37 1
34
23 20 5 2
3 142 118
14 94237 40 13 2 2
107 83 50 44 80 57 113 81 19 5 36 27
103 33 106 96 21 17 46 35 17 7 33 19 9 8 19 17
45 20 47 65
12 2 53 66
110 42 150 76 11 1 17 10 33 1 96 57 96 28 121 129 39 6 31 35
6
III 17
17 12
4 1
133 49
4
112 29
88 46 63 60 103 40 114 102
14 4 25 25 31 1 7 2 69 28 81 71
8 43 18 3 1 2
8 2
3
1 I 3 2 2
2
17 15 2
10 I
14
3
1 7 6
7 1
3
9 8
192 35' 465 419 4 128 66 211 247 14
64 49 125 125 10 52205264 1
29 2 53 64 21. 43 IS 64 84 3
155 SO 169 181 51 40 74 86
50 25 40 42 29 2 51 63
7 2
II
2 2
2
g
3 I 5
3
6
3 7
27 15 3
30 1 1
2 I 1 I
7 1 I 3
16
5 2
2S 6
15 17
11 1
5
RURAL AREA-contd.
12
6
3 1
2
4 2
3
S
I 6 2 I
29 I 7
10 5
2 1
5
2 7 1
'2 1
2 !5
2 28 1 17
3
3
2 2
10 7
. i
4
3
2 I
1 46 33
3
7
6 4
3 3
9
2 2
4
2
3
2
2
29 21 4
4
2
3
1 4 2
6 I
8
I 7
4 I
3 12
I 1
45 16
22
2 4
8 4
2
2
i4
2 2
11 2 3
17
<>
2 17 2 4 4
54 34 12
22 11 3
2 I
10
2 I 2
11 1
3 2 2 1 5
2
10
5 18
I
7 5 7 6
6 3 1 1 4
2
65 24
21
3 4
37 13
1 2
4 2 2
5 14
4
2
1
12 2
3
. i
63 57
296 80 67
99 25 5
127
20 281
31 43 98
30
753 306 95
323 87
284
54 7
159
38 27 98
162 51
165 51 31 15 67
52
187 21 81
200 60
7 1
163 57
149 164
18 16
103
106 226 73 227
366 228 112 229 81 230
117 231 33 232 6 233
116 234
25 434
48 ~9
105
235
236 237 238 239 240
25 241 242
1060 243 454 244 112 245
246 459 247 114 248 378 249
250
251 252
84 253 8 254
217 255
60 256 53 257
131 258 199 259 75 260
248 261 73 262 49 263 31 264 69 265
266 267
58 268 269 270
341 271 31 272
175 273 301 274
83 275
9 276 5 277
296 278 74 279
280
177 281 241 282
12 283 59 284
15S 285
52 72 286 1 5 287
288 683 1,002 289. 301 409 290
201 281 291 88 122 292
293 89 112 294
147 141 295
265 100
76 50
422 296 101 297
298 III 299 87 300

30
VILLAGE DIRECTORY
Scheduled Scheduled Literate and Trans- Educa- I?rink- Area Total Population Castes Tribes educated
Serial Village/Town! port and tional mg in Oecu-No. Ward Postal Institu- water Medical Bazar Sq. pied House- ~-----
facilities tions supply facilities Day Miles houses holds P M F M F M F M F
(I) (2) (3) (4) (5) (6) (7) (8) (9) (\0) (II) (12) (\3) (14) (15) (16) (\7) (18) (\9)
RURAL AREA-cOne/d.
301 Bahadarpur .I: 0-6 Uninhabited • 302 Narayanpur
RivW 0·7 Uninhabited.
303 Shahapur N. Hirur Mp
0·8 24 27 172 89 83 36 13 304 Jawala Po P W Thurs. 2.7 216 252 1,232 606 626 5 6 372 200 305 Kharwadi R p W 1'9 199 199 876 452 424 42 41 202 69
306 Drugwada .. Mp
0'2 Unjnhabited . 307 Shahapur N. Jawala. W 1·0 66 66 375 204 171
20 115 39
308 Kharala (E) Po P W 4'1 314 340 1,492 755 737 28 320 119 309 Borala p W Mp'D 1'8 217 219 1.038 536 502 13 15 199 86 310 Tamaswam p Riv 0·8 37 48 237 131 106 56 23
311 Dahigaon Po M RivW Mp SUll. 3·5 226 257 1,079 544 535 15 10 264 133 312 Malkapur 0·7 Uninhabited .
. 313 Barhaopur W 1'7 45 45 245 112 133 19 27 46 23 314 Mastapur W 1·2 3 3 4 3 I 2 I 315 Talni M RivW 1'8 89 112 573 290 283 II 15 128 55
316 Chincholi Kh. p Riv 0·7 36 39 187 \06 &1 61 18 317 Jagannathpur W 1·0 22 28 166 83 83 '(; 28 5 318 Virul P Riv 1·8 129 151 668 339 329 1 173 70 319 Rasulapur p W 0·5 64 88 500 255 245 156 60 320 Karimpur 0·6 Uninhabited.
321 Talwel RPo H W Mp Fri. 4'6 527 527 2,396 1,229 1.167 700 303
322 HosD
Wadura p W 2'1 190 224 941 478 463 2 3 191 74 323 Takarkheda R P W 2'8 129 145 674 350 324 169 69 324 Sultanpur 0'5 Uninhabited. 325 Krishnapur P W 0'4 109 129 664 339 325 9 7 ISO 71
326 Govindpur RPoRh
W W~.
0·6 21 23 138 86 52 si 44 32 6
327 Asegaon M W 1 ·9 196 262 1.193 609 584 322 124 328 Achalpur Urban Area n. 329 Achalpur Camp Urban Area I.
URBAN AREA
I Achalpur Camp " RToRh H W Mp Thu. Municipality (E). HosD
2 '43,274 3,335 17,490 9,176 8,314 646 637 5,357 2,783
Ward 1 507 507 2,654 1,415 1,239 101 123 835 382 Ward 2 421 431 2,350 1,223 1,127 107 88 550 239 Ward 3 286 297 1,440 725 715 91 92 386 188 Ward 4 208 209 1,259 660 599 4\0 280 Ward 5 206 206 1,134 591 543 454 311 Ward 6 291 291 1,446 778 668 \0 \I 534 303 Ward 7 228 237 1,22" 617 612 62 62 345 202 Ward 8 317 327 1,656 881 775 101 109 502 247 Ward 9 235 243 1,171 62\ 550 28 23 422 245 Ward 10 282 293 1.550 791 759 25 IS 452 166 Ward II 293 294 1,601 874 727 121 114 467 214
II Achalpur RlyR C Wx Mp Sun. 23· 8 6,806 6,880 36,538 18,903 17,635 799 837 9,851 4.385 Municipality (El. ToRh HosD
Ward 1 299 320 \,464 747 717 III 125 383 139 Ward 2 305 306 1,588 839 749 421 171 Ward 3 258 258 1,591 832 759 422 203 Ward 4 273 274 1,697 862 835 31 27 4\7 223 Ward 5 241 243 1,600 810 790 30 3\ 4\4 257 Ward 6 323 323 1,810 973 837 114 109 424 134 Ward 7 272 272 1,381 717 664 35 36 299 109 Ward 8 321 325 1,979 1,048 931 14 10 545 236 Ward 9 3\2 312 1,679 890 789 580 307 Ward 10 254 254 1,339 700 639 3 2 344 186 Ward 11 316 316 1,566 837 729 36 27 486 286 Ward 12 277 278 1,693 874 819 110 101 405 196 Ward 13 331 333 1,668 839 829 8 10 528 297 Ward 14 304 304 1,512 798 714 1 3 434 188 Ward 15 313 316 1,445 741 704 55 55 409 \31 Ward 16 254 254 1,316 687 629 13 13 372 96 Ward 17 293 293 1,572 796 776 63 64 434 216 Ward 18 287 290 1,558 711 'lS7 1 1 491 243 Ward 19 271 276 1,480 748 732 7 4 430 170 Ward 20 313 319 1,560 786 774 28 39 421 194 Ward 21 294 298 1,540 717 763 52 45 441 171 Ward 22 333 349 1,684 817 807
135 391 125
Ward 23 362 367 1,816 954 862 87 360 101

31
WORKERS
Total workers (I-IX) II III IV V
F F M F M F M F M
VI VII
F M F M F
VIII
M F
2 ACHALPUR TALUKA
IX
M F
NONWORKERS Serial --- No.
F M
(20) (21) _ (22) (23) (24) (25) (26) (27) (28) (29) (30) (31) (32) (33) (34) (35) (36) (37) (38) (39)
M
(40) (41) (1) -----.
Uninhabited. Uninhabited.
48 32 343 180 251 ISS
Uninhabited. 99 38
427 208 293 178 78 41
332 175 Uninhabited.
59 60 2 1
179 164
62 50 41 50
.202 lSI 154 83
Uninhabited.
675 457
275 155 222 163
Uninhabited. 188 111
46 21 340 221
Urban Area II. Urban Areal'
4,791
743 679 405 :l26 291 387 337 431 315 413 464
1,084
197 192 154 17 18 32
IS8 76 46
112 82
22 11 25 21 155 32 157 148 72 27 143 127
45 2 196 57 115 23 39 5
139 18
15 7
100 101
45 4
41 63
32
38 IS
48 189 147 36
159
43 2
54
16 37
136 81
36 141 154
36
154
53
59
17 50
109 68
149
90 54
27 398 412
81
9 47
390
30 51 42 28 47 39 46 27 29 20 31
13 162 137 35 137 121
10 99 101
14
92
7 10 16
3 5 3
33 5 3 4 3
34 21 166 184
401
73 86 70 11 2 4
19 17 18 55 46
516
79 83 81 12
io 61 30 21 77 62
2 13
4 7
'3
8
2 4
2
68
12 11
5 1 3 4 6 3 6 4
13
6
'6
3 1
'6 6
10
7
15
3
4
1 7
366
51 20 39 2
10 32 21 53 31 20 87
RURAL AREA-cone/d.
3
2
166
59 14 38
"2 5
27 5 7 8 1
7 7
2 4 7
4
. i
5 2
16
5 Ii
11
7
l
5 4
11
lJRBAN AREA
682
124 70 40 62 23 54 63 56 48 95 47
30
12 I 1
"2 "2 2 6 4
100
6 8 9 2 4 6 8
12 4
16 25
9,913 3,656 1,159 411 1,793 1,930 196 10 1,328 787 1,849 81 117
395 425 408 429 .17 542 393 535 468 384 394 456 .55 424 399 388 398 383 395 411 .12 478 524
237 175
32 31 97
248 143 71
152 116 105 138 90
140 258 168 213 168 207 249 156 130 332
57 59 45 52 84 20 60 30 81 42
8 67 24 67 51 45 64 44 26 40 43 43
107
54 67 142 11 143 142
3 53 14-6 42 2
29 33 5 10 118 85 6 '95 109 9 30 27
43 n 73 9 79 60
24 7 41 7 63 48 6 26 20
14 93 99 22 79 150 10 60 101 24 131 15S 32 34 72 10 11 25 12 89 123 7 89 89
10 137 81 53 242 253
4 7 II 14 8 3
10 8 4 7 5 8
23 18 9
13 4 1
14 4 3
12 6
4 I
'i
'j
22 5
28 26 54
149 32 38
9 23
21 35 14 70 89 65
162 149 108 137 57 35
24 I 2 5
43 104
15 14 6 9 1
46 37 7
38 33 25 54
153 87 53 26 4
139 101 79 35 6S 66 54 74
102 7S
294 57 76 97
114 56 73 55 50 46 41 48 52
9 I I
II 2 1 3 I 5
25 1 1 4 2
6 5
1 1
5 2 8 2 1
17 4
4 9 3 2 2
15 6 5 7 1 8
15 1
7
'2
6
" :3
'2
7 1
1 3
2
'3 3
17
2 3
11
907
184 118 13 74
120 78 45 44 45 65 61
3 1,277
34 45 75 96 51 61 92
130 58 30 8
61 114 36 24 45 27 33 51 70 37 61 38
37
10 7 I 1 2 6 4 1 4 I
2
-2
447
34 94 34 36 6
30 9
76 33 45 50
71 358
3 1 1 2 1
10 5
10 1 2
1 5
1 2 4 3 1
18
24 16 15 37 26 13 13 51 21 27 19 28 17 14 3 5
5 I 7 7 6 3
I 11 10
3 16 11 3
18
i4
'9 5
77
11 14
3
2 83
2
4
14
4
23
." 1,430 231
229 39 221 74
93 11 110 1 76 10
140 10 120 25 143 27 101 12 93 13
104 9
41 263 201
105 328 243
53
212
53 1
111
44 42
137 101
554
203 128
151
40 269
4,385
672 544 320 334 300 391 280 450 306 378 410
301 302
51 303 446 304 269 305
133 529 324 65
360
73
ii9
31 33
178 162
306 307 308 309 310
311 312 313 314 315
316 317 318 319 320
710 321
308 322 161 323
324 214 325
31 326 363 321
7,230
1,042 935 561 582 525 636 454 699 504 647 645
328 329
.. 1,836 363 8,990 13,979 II
48 49 97
125 88
110 36
157 117 101 49
142 137 83 47 60 28 44 86 46 47 99 40
8 17 11 17 7
46 2
12 19 28 10 36 23 11 46 18 5 9 8
13 4
10 3
352 414 424 433 393 431 324 513 422 316 443 418 384 374 342 299 398 388 353 375 365 399 430
480 574 727 804 693 589 521 860 637 523 624 681 739 574 446 461 563 619 525 525 607 677 530

32
VILLAGE DIR!:CTORY
Scheduled Scheduled Literate and Trans- Educa- Drinlc- Area T ota \ Population Castes Ttibell educated
Serial Village/Town/ port and tlonal ing In <>Ceu-No. Ward Postal Institu· water Medical Bazar Sq. pied House-
facilities tions supply facilities Day Miles houses bold& P M F M F M F M F (I) (2) (3) (4) (5) (6) (7) (8) (9) (10) (11) . (12) (13) (14) (IS) (16) (17) (18) (19)
URBAN ARBA-COllcld.
III Chandur Bazar Muni. RTo H W MpO Sun. 4'0 1,394 1,450 6,941 3,641 3,306 163 184 1,886 895 cipality (E). Rh
Ward 1 182 183 923 49S 428 24 27 262 lSI Ward 2 148 ISS 821 416 40S 92 106 184 88 Ward 3 110 110 663 344 319 5 4 183 114 Ward 4 145 150 n4 391 383 IS 11 183 87 Ward 5 127 132 623 324 299 9 11 152 68 Ward 6 166 176 812 446 366 12 12 160 46 Ward 7 118 123 563 292 271 176 78 Ward II IS6 157 695 361 334 209 94 Ward 9 122 127 547 298 249 4 S 190 70 Ward I() 120 131 526 274 lS2 2 2 187 99
f Total-Rural .. 459'8 29,582 31,760 148.214 76,250 71,964 2,630 2,538 34,131 13.993
i ACHALPUI TALUltA1 Total-Urban .. 30'2 11,474 11,665 60,975 31.720 29,255 1.608 1,658 .. 17,094 8,063
t Grand Total .. 490' 0 41,OS6 43.425 209.189 107.970 101,219 4,238 4,196 .. 51,225 22,056

33
2 ACHALPUR TALUKA
WORKERS
Total workers NON-(I-IX) n ill IV V VI VII VIII IX WORKERS
M F M F M F M F M F M F M F M F M F Serial
M F M F No.
(20) (21). (22) em (24) (25) (26) (27) (28) (29) (30) (31) (32) (33) (34) (35) (36) (37) (38) (39) (40) (41) (I)
URBAN AREA-cancld.
1.920 794 309 114 528 5S7 29 56 28 134 6 10 379 29 114 361 59 1.721 2.512 nr
244 90 31 7 43 62 2 4 5 15 56 2 13 79 14 251 338 216 75 13 1 68 57 14 12 14 2 ·2 51 1 18 38 2 200 330 173 24 25 1 29 15 3 9 2 14 47 4 13 31 2 171 295 190 53 34 6 31 36 1 4 4 6 44 22 48 7 201 330 170 59 17 3 44 47 1 1 15 .j 21 2 S 44 5 18 6 154 240 250 129 4 1 124 98 II 7 15 39 19 14 36 8 196 237 164 88 22 25 33 50 8 ,
2 2 26 1 25 1 10 37 10 128 183 201 134 65 27 57 98 3 9 1 1 31 8 27 8 160 200 169 91 53 24 62 65 6 25 1 3 20 1 129 158 143 51 45 19 37 29 1 8 1 17 1 8 27 1 131 201
----"3.872 27.9'37 14.989 5.758 22,532 21.342 729 91 1.137 293 749 31 232 tOO 1,073 26 157 1 2.274 295 32.378 44,027
16.624 5.534 1.858 617 2.722 3.003 293 17 1.750 981 2.665 117 227 9 2.563 137 919 .. 3,627 653 15,096 23,721
60.496 33,471 16.847 6,375 25,254 24,345 1,022 108 2,887 1,274 3,414 148 459 109 3,636 163 1,076 1 5,901 948 47,474 67,748 -_
H4222-3

Morsi Taluka

~--------~'--------~----------~----------------------------------------------------~ I
u. o UJ I-
~ II)
a......-;)
f
.,
~~ .. ,III 31;; ~ .( Q ,1
.... i= • II. 0
- < .~
~ > 0(
~ 0 .. II)
L 1: « -
.on 0 0 !\IN .0
.. o .. •
!!
;!:: N
o 10 OJ o
IDO ~ =1 .. 100 0 !:: (;
cno~o 0
co. ~
o
IU 0:: lII)
o < ::I: Cl
'" < 3
(
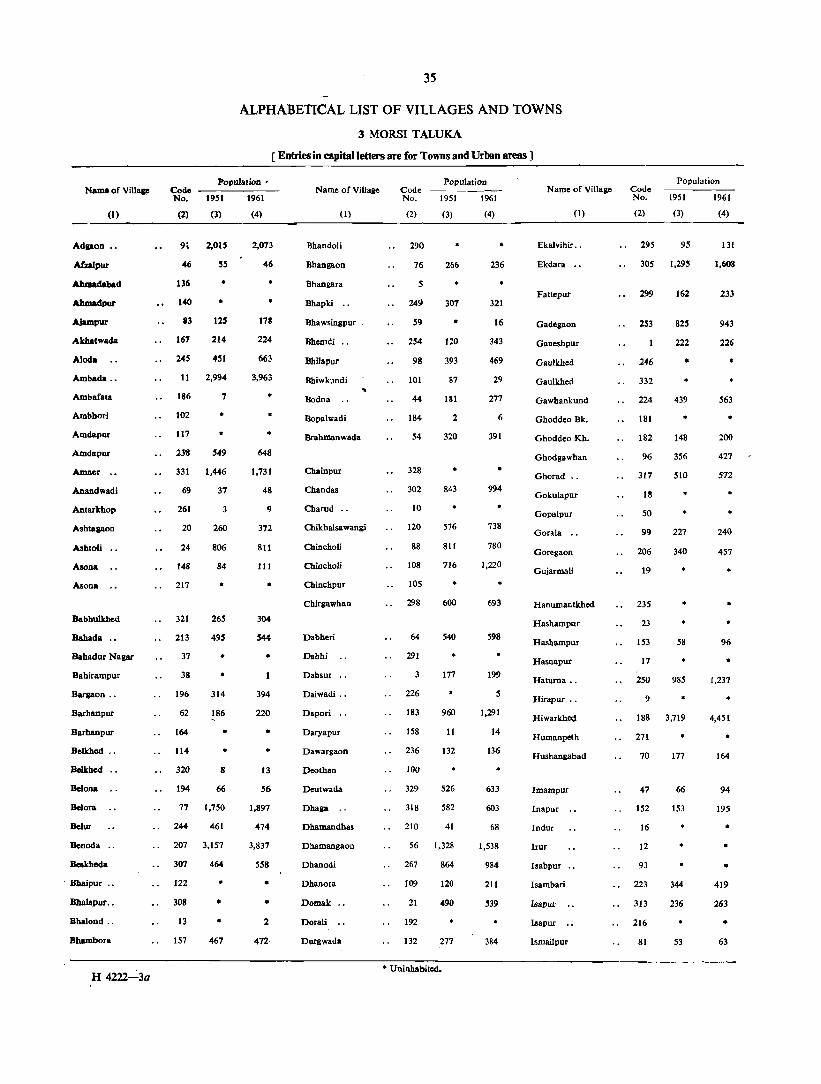
NamoofViIlap
(I)
Adgaon
Ahalpur
Ahmadabad
Ahmadpur
Ajampur
Alchatwada
Alod.
Ambada .•
Ambafat.
Ambhori
Amdapur
Amdapur
Amner .•
Anandwadi
Antarkhop
Ashtagaon
Ashtoli
Asooa
Asona
Babhulkhed
Bahada .•
Bahadur Nagar
Bahirampur
Bargaon .,
Barhanpur
Barhanpur
Belkhcd
Belkhed
Belon.
Belora
Belur
Benoda
Beskheda
, BAaipur ••
Bhalapur .•
Dhalond .•
Bhambora
H 4222~3a
35
ALPHABETICAL LIST OF VILLAGES AND TOWNS
3 MORSI TALUKA
[ Entries in capital letters are for Towns and Urban areas ]
Population ' Code No. 1951 1961
(2)
91
46
136
140
83
167
245
11
186
102
117
238
(3)
2,015
55
• •
125
214
451
2,994
7
549
331 1,446
69
261
20
24
148
217
321
213
37
38
196
62
164
114
320
37
3
260
806
84
*
265
495
• 314
186
8
194 66
77 1,750
244 461
207 3,157
307 464
122
308
13
157
• •
467
(4)
2,073
46
178
224
663
3,963
• 648
1,731
48
9
372
811
III
•
304
544
•
394
220
• •
13
56
1,897
474
3,837
558
• • 2
472
Name of Village
(I)
Bhandoli
Bhangaon
Bhangafa
Bhapki ••
Bha wsingpur
Bhemdi .•
Bhilapur
Bhiwkundi
Bodna
Bopalwadi
Brahmanwada
Chainpur
Chandas
Charud ..
Chikhalsa wangi
Chincholi
Chincholi
Chinchpur
Chirgawhan
Dabheri
Dabhl
Dahsur
Daiwadi ..
Dapori .,
Daryapur
Dawargaon
Deathan
Deutwada
Dhaga ..
Dhamandhas
Dhamangaon
Dhanodi
Dhanora
Domak
Dorali
Durgwada
Population Code No. 1951 1961
(2)
290
76
5
249
59
254
98
101
44
184
54
328
302
10
120
88
108
lOS
298
64
291
3
226
183
158
236
100
329
318
(3)
266
307
• 120
393
87
181
2
320
• 843
* 576
811
716
600
540
177
960
11
132
526
582
210 41
56 1,328
267 864
109 120
21 490
192
132 277
• Uninhabited.
(4)
236
321
16
343
469
29
277
6
391
• 994
738
780
1,220
693
598
199
5
1,291
14
136
• 633
603
68
1,538
984
211
-'39
384
Name of Village
(I)
Ekalvihir ..
Ekdara ••
Fattcpur
Gadegaon
Ganeshpur
Gaulkhed
Gaulkhed
Gawhankund
Ghoddeo Bk.
Ghoddeo Kh.
Ghodgawhan
Ghorad •.
Gokulapur
Gopalpur
Gorala .•
Goregaon
Gujarmali
Hanumantkhed
Hashampur
Hashampur
Hasnapur
Hatuma •.
Hirapur "
Hiwarkhed
Humanpeth
Hushangabad
Imampur
Inapur
Indur
Irur
Isabpur
I.ambari
lsapur
Isapur
Ismailpur
Code No.
(2)
295
305
299
2S3
246
332
224
181
182
96
317
18
50
99
206
19
235
23
153
17
250
9
Population
1951 1961
(3)
95
1,295
162
825
222
•
439
148
356
510
227
340
•
58
985
(4)
131
1,608
233
943
226
563
200
427
572
240
457
•
96
• 1,237
188 3,719 4,451
271
70
47
152
16
12
93
223
313
216
81
177
66
153
344
236
53
• 164
94
195
• • •
419
263
• 63

Name of Village
(1)
Ismailpur
Ismailpur
Ittamgaon
Il1dhaopur
Jaimalpur
JllInapur
Code No.
(2)
187
319
228
72
57
25
Population
1951 1961
(3)
• 154
794
92
551
(4)
160
905
95
•
1amalpur 227 III
633
91 I
Jamathi .. 179·
Jamathi Ganeshpur . . 296 1,050 983
1,208
231
Jamgaon 198 1,003
Jamgaon
Jamlal
lanuna
1ared
Jasapur
Jatamziri
Jayatapur
Kabilpur .•
Kachurna
Kamalapur
Karajgaon
Karajgaon
Karhad
Karli
Karwar
Kasampur
Kasari ..
Kasimpur
Kasimpur
Kati
Katpur
Katpur
Kawathal
Kekatwada
Khadka ••
Khanapur
Khanapur
Khanjirpur
Khanpur
277 159
264 • 103
220 5,472
71
255
170
137
247
172
• 215
•
13
478
225
131 451
231 1,011
293
276
286
94
204
45
139
248
67
89
171
282
• 143
122
161
738
574
589
678
•
6,344
8
280
557
274
572
1,257
202
148
178
2
• *
840
850
713
789
197 462 679
127 1,751 2,245
327 213 - 271
51
154
271
• 302
•
36
3 MORSI TALUKA~ontd.
Name of Villaae
(1)
Khaparkhcda
Khed
Khedi
Khedi Krishnapur
Khopada
Kolvihir .•
Kopara ..
Kumbhikhed
Kumdara
Kurli
Ladki
Lakhara (FV) \
Lashkarpur
Lehegaon
Lihida
Linga
Lorn
Mahapur
Maiwadi
Malkapur
Malkapur (I)
Malkapur (2)
Malkhed
Malkhed
Mamdabad
Mamdapur
Mamdapur
Mamdapur
Mangona
Mangrul
Mangruli
Mani Ardhi
Manimpur
Mankapur
Mehendri
Mendhi ••
Mcngwadi
Milanpur
Mirzapur
Code No.
Population
1951 1961
(2) (3)
273 38
15 1,695
269 7
175
43
30
112
281
199
289
, 58
195
41
168
159
540
526
6S
703
779
79
• 338
658
285 917
229 4,053
222
110
6
263
280
20
(4)
43
2,424
5
* 711
748
• 91
918
1,120
86
• so~
731
1,054
4,574
IS
310
• 18
Included Included in Urban In Urban Area III. Area III.
138
268
146
7
60
202
212
638
81
747
178
IS
95 530
234 1,594
2
116
209
275
315
119
241
49
177
110
58
203
201
• 178
• 746
• 9
1,139
295
38
608
1,791
• 196
132
117
248
270
201
* Uninhabited.
Name of Villaae
(I)
Molvan ..
Molvihir
Motagoa ••
Motchud
MorshiKh.
Code No.
(2)
185
270
237
312
323
Population
19.51 1961
(3)
4
• •
422
87
(4)
• • •
Morsi (Rural Area) •• 129 •
513
148
24
'MORSI (Urban Area).
Mubarakgaon
Munaimpur
Muradpur
Musalkhed
Nabipur ••
Nagarwadi
Nagziri
Naigaon .•
Najarpur ..
Najarpur ..
Namapur
Nands.on
Nasirpur
Natala ••
Nibharru
Nimbhi
Pala
Palaswada
Palsona •.
Pandharghati
Pandhari
Paon;
Pardi
Pardi
Patur
Peth Mangruli
Pimpalagad
Pimpalkhuta
Pimpalkhllta
Pimpalkhuta
Pimpalkhuta
79
ISS
73
303
65
31
208
316
27
48
230
251
143
201.
9,798
274
• 15
48
• •
80
• •
165
• 446
327
69
169 5,558
173 121
151
107
243
211
191
274
326
142
279
90
232
708
572
365
142
74
46
975
888
12
204
981
278 129
145 213
150 1,501
219
239
272
•
11,946
234
21
57
•
80
194
559
288
144
7,354
193
1,029
952
445
161
140
20
1,276
1,188
9
208
1,112
163
362
1,786
321
16

Name of Village Code Population
1951 1961
(I)
Pimpalshenda
Pimpalvihir
Pimpri
Porgawhan
Porgawhan
pJa Pusala
Pusli
Ragadgaon
Raipur
Rajura
Rajura (Small)
Rajurwadi
Rlimapur
Ramdalpur
Rasulpur •.
Rasulpur Belkhed
Rasulpur Kopra
Rasulpur Y crta
Rawala .,
Rithpur .,
Rohanal ••
Rohankhed
Roshankhed
Sadatpur ••
Sahadapur
Sahadapur
Saiwada .,
Salbardi .,
Salepur .,
Sambbapur
Samoar
Sawang
SawaniP .,
Sawarkhed
Sawarkhed
Sbahanawajpur
No.
(2)
257
306
4
(3)
11
134
40 1,043
309 379
165 9
283 5,377
265 166
134 • 14 43
297 2.189
82 279
174 1,598
272
78
330
liS
118
• • • • •
(4)
20
200
1,155
461
34
5,549
201
95
2,601
295
1,703
•
• •
12.5 lncluded Included in Urban in Urban Area I, Area I.
256 211 275
36 2,777 3,663
135 • •
85
288
121
63
240
8
178
177
147
259
218
521
917
62
81
120
437
730
292 1,362
86
106
163
622
,
754
1,133
• 49
105
129
*
544
1,037
1,526
856
•
• Uninhabited
~7
·3 MORSIITALUKA-concld.
Code No.
Population Name of Village
1951 1961
(I)
Shabapur
Sbahapur
Sharyatpur
Shekapur
(2)
26
221
74
133
(3)
•
169
Shekapur 301 • Shekdari (F V) 214 60
Shendurjana (Rural (1) 262 84 Area).
SHENDURJANA (2) m 10.424 (Urban Area).
Shingori .•
$hirajgaon
~hirallill .•
Shirkhed
Shirpur
Shirpur
Shiypuri .•
Shivpuri •.
Shiwanga
Shiwara ..
SUimpur ..
Simora
Simora
Songaon
Sultanpur
Supala
Surll
Surwadi Dk.
SurwadiKh.
Suryakhed
Taiegaon
Talni
Taroda
Taroda
Tarodi
Tembhi
Tembhi
Tembhurkheda
Thani
Thuni
21S 628
97 769
176 495
161 1,831
144 67
281
75
124
61
166
35
34
149
42
5'
• 154
• 123
7
• •
113 •
300 1,004
193 324
200
280
66
141
22
III
294
104
252
341
•
370
318
841
97
• 51
225 1,811
126
123
157
240
(4)
9
167
86
156
11,610
756
825
680
2,548
82
16
150
80
13
37
570
1,182
297
421
14
'56
460
1,022
173
6
49
2,182
169
364
Name of Village
(I)
Tiwasa .•
Trimaipur
Trimalpur
Tuljapur
Tuljapur
Tuljapur
Udapur
Udkhed
Umarkhed
Urad
Vedhapur
Vichori ••
Vishuora
Vithalpur
Wadala ••
Wadegaon
Wadhona
Waghal ••
Wagholi .•
WaiBk •••
WaiKh.
Wandli
Warha
Population Code No. 1951 1961
(2)
258
80
53
28
130
160
314
32
189
(3)
818
56
•
61
631
806
79
284 211
322 39
84 1,145
39 770
92
311
310
205
324
68
260
266
325
33
515
324
• 489
290
80
285
466
314
(4)
887
56
81
747
1,357
194
239
73
1,434
1,001
• 600
492
Warud <I) (Rural Area) 242 344
64
219
526
407
376
WARUD (2) (Urban n 11,657 Area.)
Wathoda ..
Wathoda
Wathoda ..
Wawruli ••
Yadavpur
Yashwantpur
Yawali
Yeoti
Yerandwadi
Yerla
Zolamba
87
162
623
740
304 1,391
233
29
52
180
156
190
313
• 180
604
482
• 128 1,109
203 315
15,881
559
986
1,718
2lS
297
852
59l
1,221
511
TOTAL t 160,847 196,705
t The 1951 pOpulation of the Taiuka as !liven in this list differs from that mentioned in Table A-U.

VILLAGE DIRECTORY
Serial No.
(I)
Village/Town! Ward
Tran!- Eduea- Drink- Area port and tional ing in Occu-
Postal Inslitu- water Medical Bazar Sq. pied House facilities lions _~u'pply facilities Day Miles houses holds
(2) (3) (4) (5) (6) (7) (8) (9) (10)
----__ - ----------------P
(11)
Total Population Scheduled
Castes Scheduled
Tribes Literate and
educated
M F MF MF M F
(12) (13) (14) (IS) (16) (17) (18) (19)
----------------~----------------
1 GanesbpuT (J3) 2 Mani Ardhi
w iN w
RURAL AREA
1-7 47 51 226
199 200
119
111 97
t07
88 103
2 15
18 13
3 Dahsur 4 Pimpri 5 Bhangara
6 Malkapur 1 Mamdapur 8 Saiwada 9 Hirapur
10 Charud
11 Arnbada 12 Irur 13 llhalond 14 Raipur 15 Khed
16 lndor 17 H,snapur 18 Goku1apur 19 Gujarmali 20 Ashtagaon
21 Dornak 22 Taroda 23 Hashampur 24 Ashtoli 2S Jalnapur
26 Shahapor 27 Najarpur 28 Tuljapur 29 Yadavpur 30 Kolvihlr
31 Nagarwadi 32 Udkhed 33 Warha 34 Simora 3S Silimpur
36 Rithpor 37 Bahadur Nagar 38 Bahirampur 39 Vishnora 40 Porgawhan
41 Lashkarpur 42 Songaon 43 Khopada 44 Bodria 4S Kasimpur
46 AfzaIpnr 47 Imampur 48 Najarpur 49 Mirzapur 50 GopaIpur
51 Khanjirpnr 52 Yashwantpur 53 TritnaIpur 54 Brahmanwada 55 Sultanpur
56 Dhamangaon 57 J aimaJpur 58 Ladki 59 Bhawsingpur 60 Mamdapur
61 Shiwanga 62 Barhanpnr 63 Sahadapnr 64 Dabheri 65 Nabipur
66 Ta1egaon 67 Katpur 68 Wagholi 69 Anandwadi 70 Hushangabad
71 Jasapur 72 Jadhaopur 73 Muradpur 74 Sharyatpur 75 ShlYpuri
Po
Po
RPo
Po RPo
i'
R
iPo
R RPo R
P
H
P
P M
P P
Riv W
w W W Wx
iN w w w w
Mp
MpD
Mp
j, Riv'W Mpn P W Mp
W
M
p' M
p' P
p'
i·
M
i· ii
p; i,
P H P
Wx
W w w
w w
W W W W
w W
Wx
Mp
Mp
W MpD
W W W Mp w W W wnx
WTk x .. W Mp W Wx W
W W W W W
O' 7 Uninhabited 2'3 32 50 2-7 46 50 2' 2 Uninhabited
2'4 \'2 1'7
'1'1 1'3
Uninhabited \ 1
27 27 Uninhabited Uninhabited
Fri. 2'2 815 975 3'1 0'3 1'2
Uninhabited 2 2
16 20 Mon. 8'6 468 604
W~d.
Thu.
Fri.
Sat.
Tue.
Thu.
Sat.
Wed.
Mon.
o· 5 Uninhabited 0'6 Uninhabited o· 3 Uninhabited 0'9 Uninhabited_ 3'1 85 97
1 '6 97 120 1'5 205 235 O' 6 Uninhabited 1'5 201 201 0'6 111 150
l' 8 Uninhabited 0'8 Uninhabited 0'6 Uninhabited O' 6 Uninhabited 3'2 164 170
0'7 - 3'7
1'2 1'0 0'9
3'2 l' 3 0'9 3'3 1'3
Uninhabited 254 325 72 \02 14 14
Uninhabited
703 907 Uninhabited
1 1 139 225 147 260
1 . 0 Uninhabited 0'5 Uninhabited 1'8 154 170 1'3 64 70 O' 5 Uninhabited
0'4 10 10 2'0 21 21 0'3 32 45 0'5 50 50 0'4 Uninhabited
0'3 60 75 0'5 67 75 0'5 Uninhabited 1'5 77 85 1'4 Uninhabitl'd
5'3 0'3 2'7 0'2 2'1
0'4 1'0 1'7 2'0 1 '1
351 375 Uninhabited
223 250
24i 2sA 19 21 46 51 3 3
118 140 Uninhabited
Sat. 1'4 Mon. 1'3
3 '1 0'4 O'S
108 137 190 208 11 1 120
7 9 30 38
0'2 0'3 O·g t'3 0'5
3 21 4
28 29
3 23 4
39 34
9 105
3,963
2 95
2,424
372
539 1,022
811 633
748
1,357 407
37
3,663
1 I,OOt 1,155
711 277
46 94
194 201
302 297
391
1,538
1,120 16
1,139
80 220
49 \598
556 850 4.92 48
164
8 95 21
167 150
5 54
2,066
2 47
1,220
203
285 529
406 309
400
682 206
19
1,783
1 519 586
369 145
22 50
102 103
157 154
194
799
573 9
610
38 III 33
323
286 403 253 27 91
5 49 11 89 82
4 51
1,897
48 1,204
169
254 493
40S 324
348
675 201
18
1,880
482 569
342 132
24 44 92 98
145 143
197-
739
547 7
529
42 109 16
275
270 447 239 21 73
3 46 10 78 68
56
'7 20
3 2
3 2
32 3
12
'2 34
3
6t 57
2
15
6
6
4 5.
'7
51
4 14
1 3
6 5
27 2
62
5 39
46 46
5
17
13
8
5
2 7
2
849
ii 555
69
12R 260
182 152
199
263 92
I
763
155 62
8 13 33 49
79 61
82
388
241
261 24 46
6 174
89 192 124
11 47
2 24 -9 64 51
4
336
6 232
16
69 lOS
82 70
70 .,
99 39
344
si 88
4 12 22
39 12
37
137
87
87
13 25
I 57
33 92 64
3 7
1 7 6
26 21

Total workers a-IX)
M P (20) (21)
86 70 Uninhabited
68 62 12 70
Uninhabited
I'ninlrlfited 4
40 38 Uninhabited Uninhabited
1,235 824 Uninhabited
;~ ""8 740 295
Uninhabited Uninhabited Uninhabited Uninhabited
123 87
166 46 325 272
Uninhabited 261 194 181 102
Uninhabited Uninhabited Uninhabited Uninhabited
240 145
Uninhabited 445 231 140 U6
IS 11 Uninhabited
962 562 Uninhabited
301 2(iJ 322 210
Uninhabited Uninhabited
22S 166 94 79
Uninhabited
10 14 27 22 66 44 54 44
Uninhabited
92 57 86 83
Uninhabited 121 73
U1Iinhabited
467 354 Uninhabited
341 163 5 S
357 145
24 18 72 3S 17 12
200 U8 Un/nJrabited
188 227 141
18 46
2 32
5 51 47
140 101
1 :5
34
1 25
1 18 14
M
(22)
F
(23)
n M F
(24) (25)
11 47366
2 2 61 60 37 21 34 49
I 4
591
to 353
232 1 35 37
346
94
461
2 15
349
461
"8 198
48 18 63 69
69 79
106 98
9i 64 18
87 202
12S 72
44 180
123 84
76 10 138 135
192 '188 211 99 86 35 30
264 74 526 449
16~ 43 1 i6 155 140 15 140 187
29 35
1 4
23 15
35 46
53
119
130
i27 7
26 5
76
96 81 41 4
11
i3 2
36 35
14
15 9
6 33
5
8
26
14
10
"2 6
39 19
I
2
", 8 ..
177 158 53 79
1~ 22 24 24 33 33
45 44 26 49
59 67
287 342
181 137
142 122 11 7 37 35 4 10
96 110
84 108 ,98
14 32
1 17 2 9 5
101 80
5 32
1 18 1
10 10
39
WORKERS
m IV V
MF MF MF]I(
(26) (27) (28) (29) (30) (31) (32)
S 1
" i
13
4
3
5
is 9
"3 3
2 14
2
It
10
37
ii
13 ..
27
3 4
6 1
"5 1
5 2
2
2
2
7
2
18
", 3 1
RURAL AREA.
34
8
4
42
3
2
12 1
11
"i , 7
VI vn F M' p
(33) (34) (35)
4
1 7
5
64
"3 6
" i
2 S
3
5
8
1 5 2
10
12
36
4
4
ill
3 7
5
7
8 8
10
4 13
3
2 1
1
·2
1 9
2
vm M F
(36) (37)
3
8
:3
10
3
3 MORSI TALUKA
IX
M F
(38) (39)
2
48
I 20
7
.. 20
12 6
10
23 1
9
ii 19
2 5
"3 4
S 7
4
26
8
31
2 1
10
I 12 2
1 2
"2 4
9
3
6
2
3
4
NON. WORKERS
M F
(40) (41)
33
43 25
I 14
831
" is 480
37
26 33
13
1,073
"40 909
Serial No.
(1)
1 2 3 4 5
6 7 8 9
to
11 12 13 14 15
16 17 18 19
80
119 204
82 20
145 128
160
237 66 4
-208 221
211 222
21 22 23 24 25
26 27 211 29
203 30
444 85 7
31 32 33 34 3S
821 1,318 36 37 38 39 40
2is 279 264 359
144 51
12 23 36 49
6S 68
73
332
232 4
253
14 39 16
123
98 176 112
9 45
3 17 6
38 35
41 42
176 43 53 44
10 22 48 54
88 60
124
38S
384 2
384
24 74
4 I" 130 346 238
16 39
2 21 9
60 54
4' 46 47 48 49 SO
51 52 53 54 5' 56 57 58 59 60
61 62 63 64 65
66 67 68 69 70
71 72 73 74 75
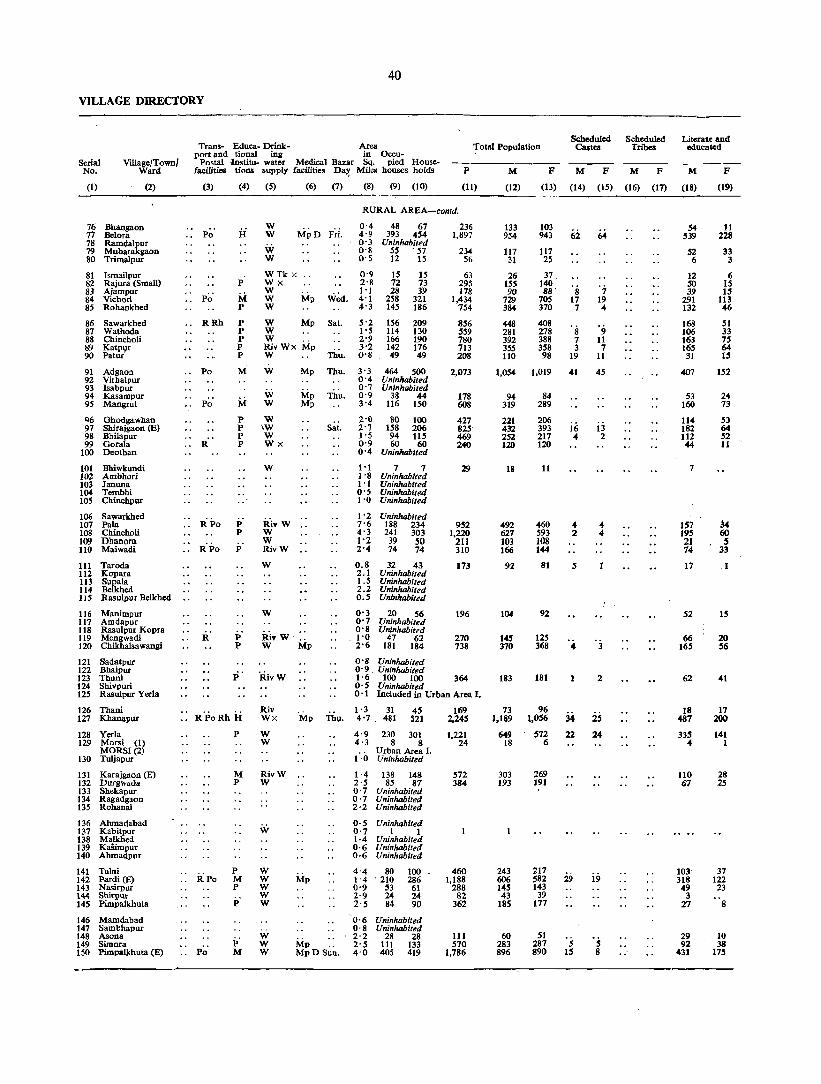
40
VILLAGE DIRECTORY
--------------------------------------------------------------------------
Serial No.
(1)
Village/Townl Ward
(2)
76 Bhangaon 77 Belora 78 Ramdalpur 79 Mubarakgaon 80 Trimalpur
81 Ismailpur 82 Rajura (Small) 83 Ajampur 84 Vichorl 85 Rohankhed
86 Sawarkhed 87 Wathoda 88 Chincholi 89 Katpl,l1' 90 Patur'
91 Adgaon 92 Vithalpur 93 Isabpur 94 Kasampur 95 Mangrul
Q6 Ghodgawhan 97 Shirajgaon (E) 98 Bhilapur 99 Gorala
100 Deothan
101 Bhiwkundi 102 Ambhori 103 Januna 104 Tembhi lOS Chinchpur
106 Sawarkhed 101 Pala 108 Chincholi 109 Dhanora 110 Maiwadi
111 Tarod. 112 Kopara 113 Supala 114 Belkhed 115 Rasulpur Belkhed
116 Manimpur 117 Amdapur 118 Rasulpur Kopra 119 Mengwadi 120 Chikhalsawangi
121 Sadatpur 122 Bhaipur 123 Thuni 124 Shivpuri 125 Rasulpur Yerla
126 Thani 127 Khanapur
128 Yerla 129 Morsi (1)
MORSI(2) 130 Tuljapur
131 Karajgaon (E) 132 Durgwada 133 Shekapur 134 Ragadgaon 135 Rohanal
136 Ahmadabad 137 Kabitpur 138 Malkhed 139 Kasimpur 140 Ahmadpur
141 Talni 142 Pardi (E) 143 Nasirpur 144 Shiqlur 145 Pimpalkhuta
146 147 148 149 150
Mamdabad Sambhapur Asona Simora Pimpalkhuta (E)
Trans- Educa- Drink- Area port and tional ing in Oceu-
Postal Institu- water Medical Bazar Sq. pied Housefacilities tions supply facilities Da~ Miles houses holds
Total Population
P M F
Scheduled Castes
M F
Scheduled Tribes
M F
Literate and educated
M F
(3) (4) (5) (6) (7) (8) (9) (10) (11) (12) (13) (14) (15) (16) (17) (18) (19)
Po
Po
RRh
Po
Po
RPo
RPo
R
p
M P
P P P P p
M
M P P P P
P P
P
i; P
W W
W w
MpD F~i.
W Tk x " Wx W W Mp W
W Mp W W .. RivWx Mp W
RURAL AREA-collld.
0'4 48 67 236 4' 9 393 454 1,897 0'3 Uninhabited 0'8 55 . 57 234 0'5 12 15 56
15 72 28
258 145
156 114 166 142 49
15 73 39
321 186
209 130 190 176 49
63 295 178
1,434 754
856 559 780 713 208
W Mp Thu. 3'3 464 500 0'4 Uninhabited 0'7 Uninhabited
2,073
W W
W \W W Wx
W
RivW W W RivW
W
W
Mp Thu. 0'9 38 44 Mp 3'4 116 150
Sat. 2'0 80 100 2'7 158 206 1'5 94 115 0'9 60 60 0'4 Uninhabited
1'1 7 7 1 . 8 Uninhabited 1 • 1 Uninhabited 0'5 Uninhabited 1'0 Uninhabited
1'2 7'6 4'3 1'2 2'4
0.8 2.1 1.5 2.2 0.5
0'3 0'7 0'8 1'0
- 2'6
Uninhabited 188 234 241 303
39 50 74 14
32 43 Uninhabited Uninhabited Uninhabited Uninhabited
20 56 Uninhabited Uninhabited
47 62 181 184
178 608
427 825 469 240
29
952 1,220
211 310
173
196
270 738
p' RivW
0'8 Uninhabited 0'9 Uninhabited 1'6' 100 100 364
M p
P RPo M
P
p'
Riv Wx
W W
RivW W
W
W W W W W
W W W
Thu.
MP .. MpD Sun.
0·5 Uninhabited o . 1 Included in Urban Area I.
1'3 31 45 4'7. 481 521
4·9 230 301 4'3 8 8
Urban Area J. 1·0 Uninhabited
1·4 138 148 2·5 85 87 0·7 Uninhabited 0·7 Uninhabited 2·2 Uninhabited
0·5 Uninhabited 0'7 1 1 1·4 Uninhabited 0·6 Uninhabited 0·6 Uninhabited
4'4 80 100 1'4 . 210 286 0'9 53 61 2'9 24 24 2'5 84 90
'0'6 0'8 2'2 2'5 4'0
Uninhabited Uninhabited
28 28 111 133 405 419
169 2,245
1,221 24
572 384
460 1,188
288 82
362
III 570
1,786
133 954
117 31
26 15S 90
729 384
448 281 392 355 110
103 943
117 25
37. 140 88'
705 370
408 278 388 358 98
1,054 1,019
94 84 319 289
221 432 252 120
18
492 627 103 166
92
104
145 310
183
73 1,189
649 18
303 193
243 606 145 43
185
60 283 896
206 393 217 120
11
460 593 108 144
81
92
125 368
181
96 1,056
572 6
269 191
217 S82 143
39 177
51 287 890
62
8 17 7
8 7 3
19
41
if; 4
4 2
5
4
34 22
29
5 IS
'" 19 4
'9 11 7
11
45
i3 2
4 4
3
2
2; 24
i9
5 8
54 539
52 6
12 50 39
291 132
168 106 163 165 31
407
53 160
114 182 112 44
7
1S7 195 21 14
17
52
66 165
62
18 487
335 4
110 67
103 318 49
3 27
29 92
431
11 228
33 3
6 15 IS
113 46
51 33 75 64 15
152
24 73
53 64 52 11
j.4 60 S
33
.1
15
20 56
41
17 200
141 1
28 25
37 122 23
8
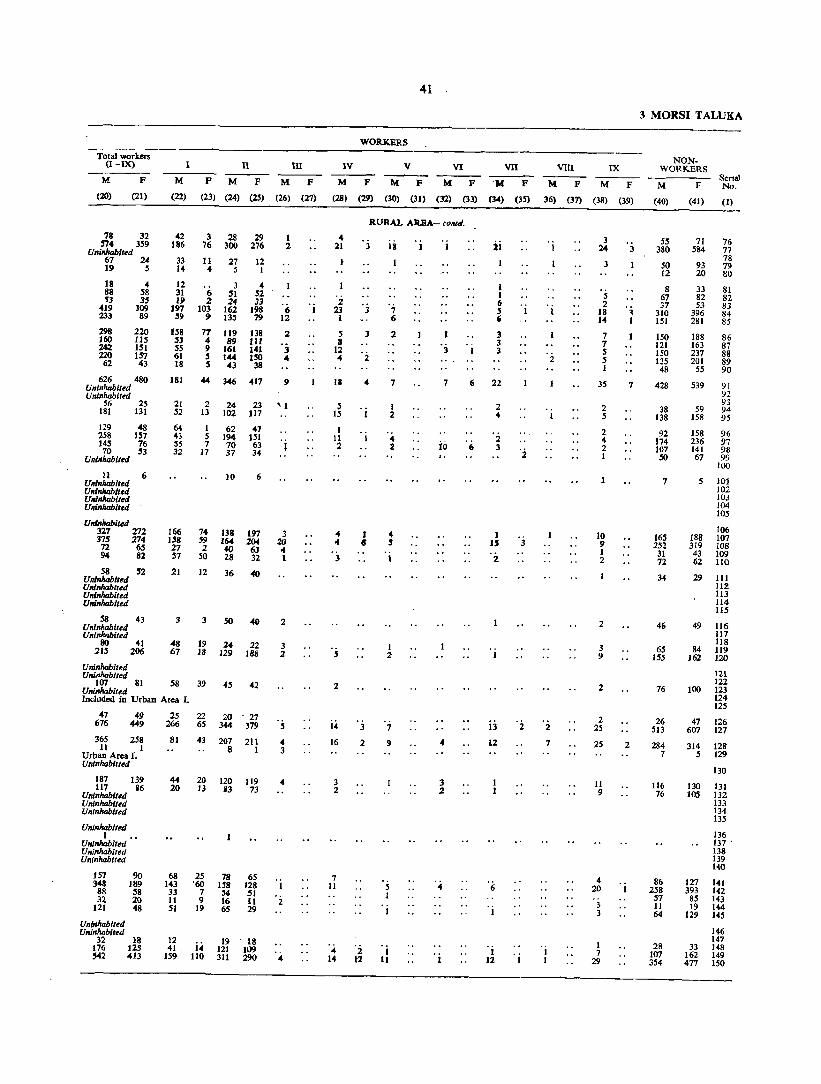
Total workers (I-IX)
M F
(20) (21)
78 32 574 359
Uninhabited 67 24 19 5
18 88 ~3
419 233
298 160 24:l 220 62
4 58 35
309 89
220 US 151 157 43
626 480 Uninhabited Unil1habited
56 25 181 131
129 48 258 157 145 76 70 53
Uninhabited
U 6 Uninhabited Uninhabited Uninhabited Uninhabited
Unlnh<lbited 327 272 375 274 72 65 94 82
58 52 Uninhabited Uninhabited Uninhabited Uninhabited
58 43 Uninhabited Unlnh4bited
80 41 215 206
Uninhabited Uninhabited
n m M
(22)
F M F M F
(23) (24) (25) (26) (27)
4232829 186 76 300 276
33 11 27 12 '4 4 5 I
12 31 19
197 59
US 53 55 61 18
6 2
103 9
J !II 24
162 135
4 52 33
198 79
77 119 138 ... 89 111 9 161 141 5 144 150 !I 43 38
1 2
'6 12
2
'j 4
181 44 346 417 9
21 52
22423'1
64 43 55 32
13 102 117
1 62 47 5 194 151 7 70 63
J7 37 34
10 6
166 74 138 197 3 158 59 !64 204 20 2724063 ... 575028321
21 12 36 40
3 3 SO 40
48 19 24 22 67 J8 J29 188
2
3 2
'j
107 81 58 39 45 42 Uninhabited Included in Urban Area I.
47 49 676 449
365 258 11 1
Urban Area I. Unlnhabitted
187 139 117 86
Unlnhabiled Uninhabiled Uninhabited
Uninhabited 1
Uninhabited Uninhabited Uninhabiled
U7 348 88 32
121
Uninhabited Unillhabited
90 189 !l8 20 48
32 18 176 125 ,...2 413
25 22 20 '27 266 65 344 379
81 43 207 211 8 I
44 20 120 119 20 13 B3 73
68 25 78 65 143 '60 158 128 33 7 54 51 11 9 16 11 51 19 65 29
12 19 18 41, 14 121 109
159 110 311 290
4
1
2
41
WORKERS
IV v VI vn M P M P M F OM F
(28) (29) (30) (31) (32) (33) (34) (35)
4 21
:2 23
I
S 8
12 4
13
S IS
1 11 2
... ... 3
2
14
16
3 2
7 11
4 14
'j
3
1 8
3
2
'2 12
111
7 6
2
7
1 2
4 2
4 S
I
1 2
'7 9
. j JI
7
io
3 :2
ii
1 1 Ii S , 3 3 3
6 22
2 3
1 1.5
'2
13
12
6
1 12
'j
vm IX
M P M F
36) (37) (38) (39)
'2 7
3 24
3
5 2
18 14
7 7 5 5 1
3S
2 5
2 4 2 1
10 9 I 2
2
3 9
2
2 25
25
11 9
4 20
3 3
I 7
29
3 1
7
2
3 MORSI TALUKA
NON· WORKERS
M F SerIal No.
(40) (41) (1)
55 380
50 12
8 67 37
310 151
150 121 150 135 48
428
38 138
92 174 107 50
7
165 252 31 72
34
46
65 155
76
26 513
284 7
116 76
86 258
57 11 64
28 107 354
71 76 584 77
78 93 79 20 80
33 82 53
396 281
81 82 83 84 85
188 86 163 87 237 88 201 89
55 90
539 91 92 93
59 94 158 95
158 96 236 97 141 98 67 99
100
5 101 102 103 104 105
106 188 107 319 108 43 109 62 110
29 III 112 113 114 115
49 116 111 118
84 119 162 120
121 122
100 123 124 125
47 126 607 127
314 128 5 129
130
130 131 105 132
133 134 135
136 137 ~
138 139 140
127 141 393 142
85 143 19 144
129 145
146 147
33 148 162 149 477 ISO
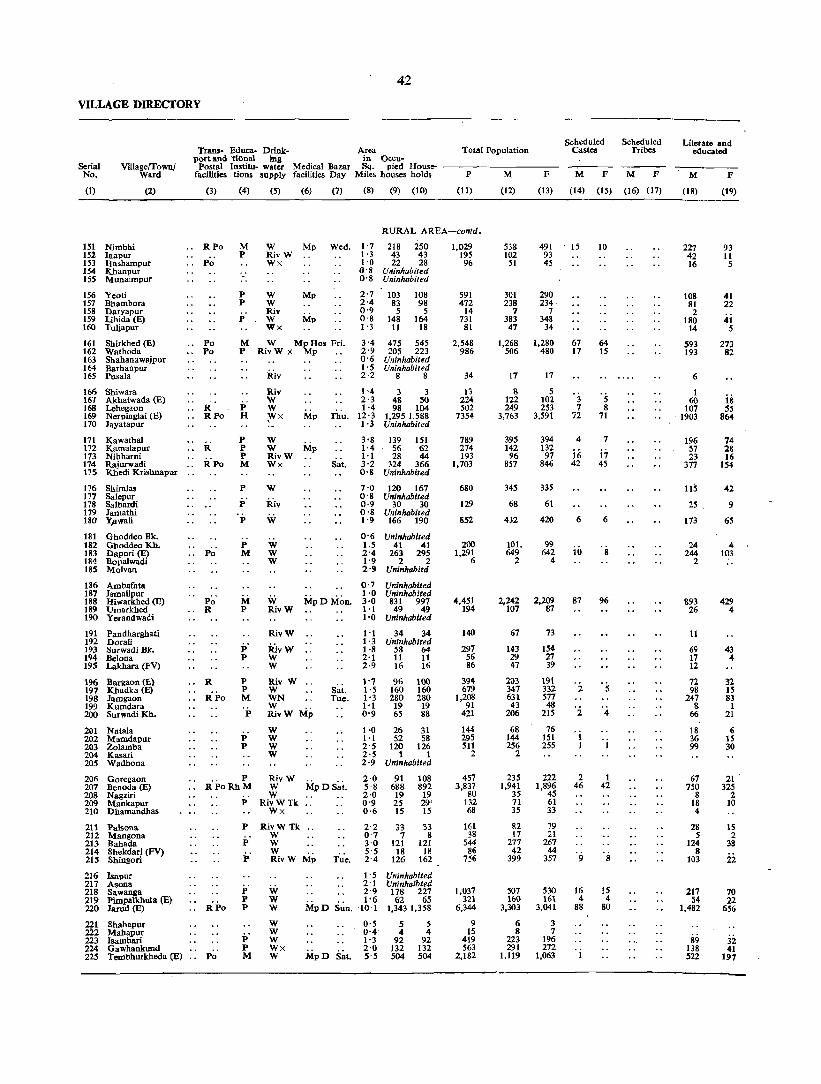
42
VILLAGE DIRECTORY
Trans- Educa- Drink- Area Total Population Scheduled
Castes Scheduled
Tribes
Serial No.
Village/Town/ Ward
port and -tiOna) ins in Occu-Postal lnstitu- water Medical Bazar Sq. pied Hous .. ----------
(I) (2)
151 Nimbhi 151 Inapur 153 lIashampur 154 Khanpur 15S Munaimpur
156 Yeoti 157 Bhambora 158 Daryapur 159 Lihida (E) 160 TuIjapur
161 Shirkhed (E) 162 Wathoda 163 Shahanawlljpur 164 Barhanpur 165 Pusala
166 Shiwara 16., Akhatwada (E) 168 Lehegaon 169 Nerpinglai (E) 170 Jayatapur
171 Kawathal 172 Kamalapur 173 Nibharni 174 Rajurwadi 175 Khedi Krislmapur
176 Shiralas 177 Salepnr 178 Salbardi 179 Jamathi 180 Ypwali
181 Ghoddeo Bk. 182 Gboddeo Kh. 183 Dapori (E) 184 Bopalwadi 185 Molvan
186 Arobafata 187 Isroallpur 188 lIiwarkhed (E) 189 Urnarkhed 190 Yerandwadi
191 Pandhargbati 192 Dorali 193 Surwadi Bk. 194 Belona 195 Lakhara (FV)
196 Bargaon (E) 197 Kbadka (E) 198 Jamgaon 199 Kumdara 200 Surwadi Kh.
201 Natala 202 Mamdapur 203 Zolamba 204 Kasari 205 Wadhona
206 Goregaon 207 Benoda (El 208 Nagziri 209 Mankapur 210 Dhamandhas
211 Palsona 212 Mangona 213 Bahada 214 Shekdari (FV) 215 Shingori
216 217 218 219 220
221 222 223 224 225
Isapur Asona Sawanga PiIDpalkhuta, (E) Jarud (E)
Shahapur Mahapur lsambari Gawhankund Tembhurkheda (E)
facilities tions supply facilities Day Miles houses holds P M
(3) (4) (5) (6) (7) (8) (9) (10) (11) (12)
RURAL AREA-coli/d.
RPo
Po'
Po Po
i' RPo
it R'po
P~;
Po R
R
iPo
M P
P P
P
W RivW Wx
w W Riv W Wx
Mp
Mp
Mp
Wed. 1'7 1'3 1'0 a'8 0'8
218 250 43 43 22 28
Uninhabited Uninhabited
2'7 103 108 2'4 83 98 0'9 5 5 0'8 148 164 1'3 II 18
M W Mp Hos Fri. 3'4 475 545 2'9 205 223 P RivW X Mp
P H
p p P M
P
P
P
P M
Riv
Riv W W Wx , W
Mp
W Mp RivW Wx
W
Riv
W
w W W
Thu.
S~t.
0'6 Uninhabited I' 5 Uninhabited 2·2 8 8
1'4 3 3 2'3 48 SO 1·4 98 104
12'3 1,2951,588 I . 3 Uninhabited
3'8 139 151 1·4 56 62 1·1 28 44 3·2 324 366 0-8 Uninhabited
7·0 120 167 0'8 Uninhabited 0·9 30 30 o . 8 Uninhabited 1'9 166 190
0'6 Uninhabited 1.5 41 41 2'4 263 295 1'9 2 2 2·9 Uninhobitd
M P
W MpDMon.
O' 7 Uninhabited 1·0 Uninhabited 3·0 831 997 1'1 49 49
iP
P P M
P
P P
RivW
RivW
:R;vW W W
Riv W W WN W RivW Mp W W W W
1'0 Uninhabited
1'13434 1 ·3 Uninhabited 1·8 58 64 2·1 11 11 2·9 16 16
1'7 Sat. 1·5 Tuc, 1'3
1'1 0'9
96 100 160 160 280 280 19 19 65 88
1·0 26 31 1·1 52 58 2'5 120 126 2'5 1 I 2 '9 Uninhabited
.. P RivW RPoRhM W MpDSat.
2·0 91 108
RPo
Po'
W P RivWTk
Wx
P
P
P
RivW Tk ..
P P p
p P M
W W W RivW Mp T;;c.
W W W
W W W Wx W
MpD S~n.
MpD Sat.
5·8 688 892 2·0 19 19 0'9 25 29' 0·6 15 15
2'2 0'7 3'0 5'5 2-4
1'5 2'1 2'9 1'6
-to'l
0'5 0'4 1'3 2'0 5'5
33 7
121 18
126
33 8
121 lR
162
Uninhabited Uninhaibted
178 227 62 65
1,343 1,358
5 5 4 4
92 92 132 132 504 504
1,029 195 96
591 472
14 731
81
2,548 986
34
13 224 502
7354
789 274 193
1,703
680
129
852
200 1,29~
4,451 194
140
297 56 86
394-679
1,208 91
421
144 295 5tl
2
457 3,837
80 132 68
161 38
544 86
756
1,037 321
6,344
9 15
419 563
2,182
538 102
51
301 238
7 383 47
1,268 506
17
8 122 249
3,763
395 142 96
857
345
68
432
101. 649
2
2,242 107
67
143 29 47
203 347 631 43
206
68 144 256
2
235 1,941
35 71 35
82 17
277 42
399
507 lW
3,303
6 8
223 291
1,119
F M F M F
(13) (14) (15) (16) (17)
491 93 45
290 234
7 348
34
1,280 480
17
5 102 253
3,591
394 132 97
846
335
61
420
99 642
4
2,209 87
73
154 27 39
191 332 577 48
215
76 151 255
222 1,896
45 61 33
79 21
267 44
357
530 161
3,041
3 7
196 272
1,063
15
67 17
3 7
72
4
iii 42
6
iii
87
2
'2
'i I
2 46
16 4
88
10
64 15
5 8
71
7
17 45
6
8
96
5
4
1 42
8
15 4
80
Literate and educated
M F
(18)
227 42 16
108 81 2
180 14
593 193
6
1 60
107 , 1903
196 57 23
377
liS 25 .
173
24 244
2
893 26
11
69 17 12
72 98
247 8
66
18 36 99
67 750
8 18 4
28 5
124 8
103
217 54
1,482
89 138 522
(19)
93 II
5
41 22
4i 5
273 82
is 55
864
74 28 16
154
42
9
65
4-103
429 4
43 4
32 IS 83
1 21
6 15 30
21 325
2 10
15 2
38
22
70 22
656
32 41
197
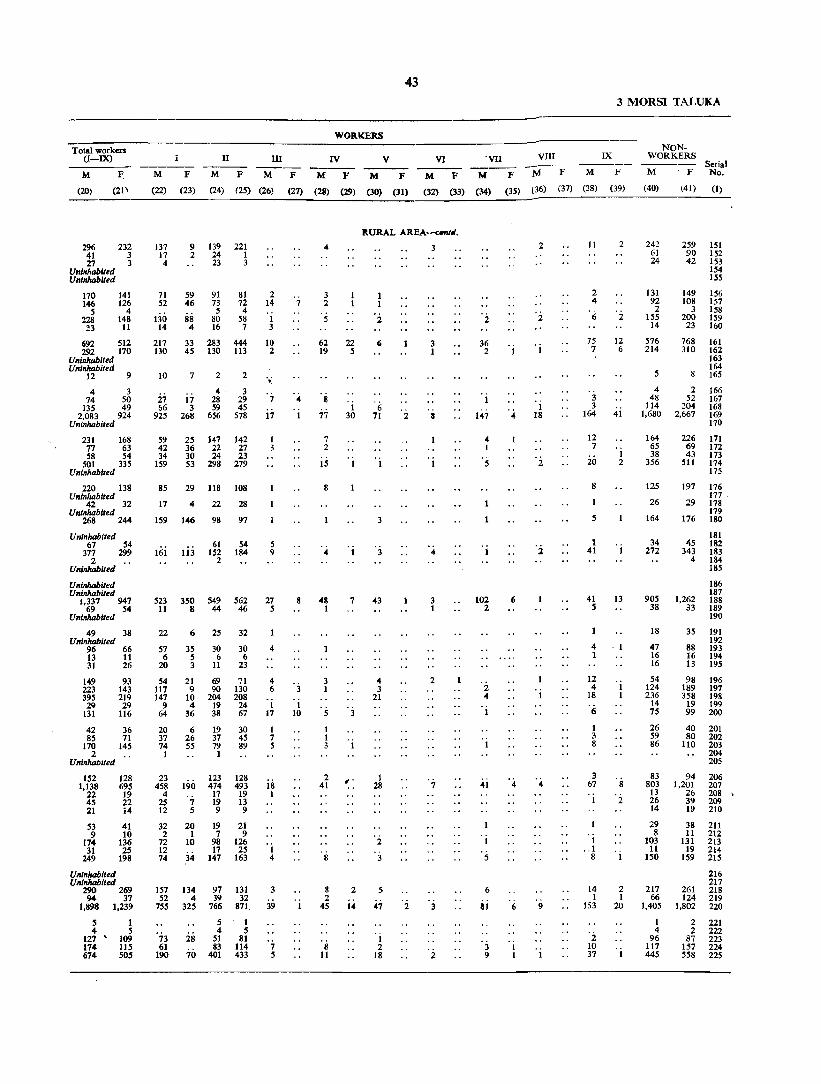
43 3 MORSI TALUKA
WORKERS :~~~----------------------------~~==~----.------------------------------Total workers
(I-IX)
M F.
(20) (21'
296 232 41 3 27 3
Uninhabited Uninhabited
170 141 146 126
5 4 228 148 ~3 11
692 512 292 170
Uninhabited Uninhabited
12 9
4 3 74 50
J35 49 2,083 924
Uninhabited
231 168 77 63 58 54
501 335 Uninhabited
220 138 Uninhabited
42 32 Uninhabited
268 244
Uninhabited 67 54
377 299 2
Uninhabited
Uninhabited Uninhabited
1,337 947 69 54
Uninhabited
49 38 Uninhabited
96 66 13 11 31 26
149 223 395 29
131
93 143 219 29
116
42 36 85 71
170 145 2
Uninhabited
152 1,138
22 45 21
53 9
174 31
249
Uninhabited Uninhabited
128 695 19 22 i4
41 10
136 2S
198
290 269 94 37
1,898 1,239
5 1 4 5
127' 109 174 115 674 50S
IT m M
(22)
F
(23)
M F M
(24) (25) (26)
137 17 4
71 52
130 14
217 130
10
27 66
925
9 139 221 2 24 1
23 3
59 91 81 46 73 72
5 4 88 80 58 4 16 7
33 283 444 45 130 113
7 2 2
17 3
268
4 28 59
656
3 29 45
578
59 25 147 142 42 36 22 27 34 30 24 23
159 53 298 279
85 29 118 108
17 4 22 28
159 146 98 97
161 1ij 61
152 2
54 184
2 14
1 3
10 2
.~
7
17
5 9
523 350 549 562 27 11 844465
22 6 2S 32
57 3S 30 30 656 6 2031123
54 21 69 71 117 9 90 130 147 10 204 208
9 4 19 24 64 36 38 67
20 6 19 30 37 26 37 45 74 55 79 89
1 1
23 458
4 25 12
190
7 5
123 474
17 19 9
128 493 19 13 9
32 20 19 21 2 1 7 9
72 10 98 126 12 17 25 74 34 147 163
157 134 97 131 5243932
755 325 766 871.
73 61
190
2S 70
5 4
SI 83
401
1 5
81 114 433
4
4 6
I 17
1 7 5
is I
I 4
3
39
7 5
IV
F M F
(27) (28) (29)
7
4
4
3 2
5
62 19
8
77
7 2
IS
4
22 5
1 30
v M F
(30) (31)
{;
. (; 71 2
3
3 48 1
7 43
'3 I
10
3 1
5
2 41
8 2
45
8 11
...
2
14
4 3
21
1 28
2
3
5
47
.~ 18
2
VI °vn VIII IX ----- --- -----
M F M F M F M F
(32) (33) (34) (35) (36) (37) (38) (39)
3 1
I
4
3 1
2
7
3
2
2
36 2
147
4 1
5
102 2
2 4
1
.4i
5
6
a1
3 9
4
6
4
6
2
OJ
1 18
l
4
9
11
2 4
6
75 7
3 3
164
12 7
20
8
5
1 41
41 5
4 1
12 4
18 .;;
1 3 8
3 67
1 .. 1
8
14 1
153
2 10 37
2
2
12 6
41
1 2
13
8
2
2 1
20
NON· WORKERS
M F Serial No.
(40) (41) (I)
242 61 24
131 92
2 155
14
576 214
5
4 48
114 1,680
164 65 38
356
125
26
164
34 272
259 151 90 152 42 153
154 155
149 156 108 157
3 158 200 159 23 160
768 161 310 162
163 164
8 165
2 52
204 2,667
166 167 168 169 170
226 171 69 172 43 173
511 174 175
197 176 177
29 178 179
176 180
181 45 182
343 183 4 184
185
186 187
905 1,262 188 38 33 189
18
47 16 16
54 124 236
14 75
26 59 86
83 803
13 26 14
29 8
103 11
150
217 66
1,405
1 4
96 117 445
190
35 191 192
88 193 16 194 13 195
98 196 189 197 358 198
19 199 99 200
40 201 80 202
110 203
94 1,201
26 39 19
204 205
206 207 208 , 209 210
38 211 11 212
131 213 19 214
159 215
216 217
261 218 124 219
1,802 220
2 2
87 157 558
221 222 223 224 225
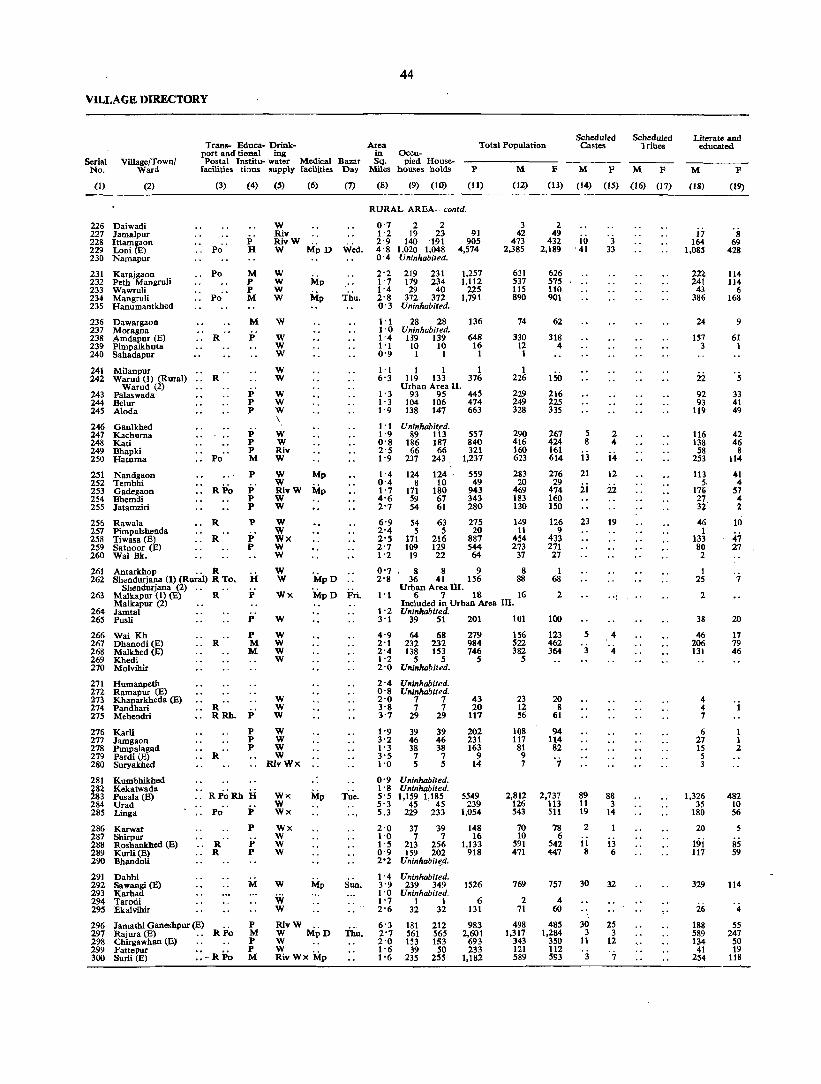
VILLAGE DIRECTORY
Trans- Educa- Drinkport and tionAl ing
Serial No,
Village/Town/ Ward
Postal Institu- water Medical Bazar facilities tions supply facilities Day
(I) (2)
226 Daiwadi 227 JamaJpur 228 Ittamsaon 229 Loni (E) 230 Namapur
231 Karajgaon 232 Peth Mangruli 233 Wawruli 234 Mangruli 235 Hanumantkhed
236 Dawargaon 237 Moragna 238 Amdapur (E) 239 Pimpalkhuta 240 Sabadapur
241 Milanpur 242 Warud (1) (Rural)
Warud (2) 243 Palas wada 244 Belur 245 Aloda
246 Gaulkhed 247 Kachurna 248 Kati 249 Bhapki 250 Hatuma
251 Nandgaon 252 Tembhi 253 Gadesaon 254 Bhemdi 255 Jatamziri
256 Rawala 257 Pimpalshenda 258 Tiwasa (E) 259 Satnoor (E) 260 Wai Bk,
(3)
Po
Po"
R
R
(4) (5) (6)
P H
W Rlv RlvW W MpD
M P P M
W W W W
M W
P W W W
W W
P W P W P W
P P P M
P
W W Riv W
W Mp
RPo P P P
W RivW Mp W W
R
R
P
i; p
W W Wx W W
261 262
Antarkhop , , R Shendurjana (1) (Rural) R To. H
p
W W
263
264 265
266 267 268 269 270
Shendurjana (2) " , , Malkapur (I) (B) R Malkapur (2) Jamtal Pusli
Wai Kh Dhanodi (E) Malkhed (E) Khedi Molvihir
R
271 Humanpeth
P
P M M
272 Ramapur (E) 273 Kbaparkheda (E) 274 Pandhari 275 Mehendri :Rh, p' 276 277 278 279 280
281 282 283 284 285
Karli Jamsaon Pimpalagad Pardi (E) Suryakhed
Kumbhikhed Kekatwada Pusala (E) Urad Linga
286 Karwar 287 Shirpur 288 Roshankhed (E) 289 Kurli (E) 290 Bhandoli
291 Dabh! 292 Sawangi (E) 293 Karhad 294 Tarodi 295 Ekalvihir
R
R R
P P P
P P
M
Wx
W
W W W W
W W W
W W W W
RivWx
Wx W Wx
Wx W W W
w Vi W
(7)
Wed,
Thu,
Tue,
s.i.o,
296 Jamath! Ganeshpur (E) P 297 Rajura (E) R Po M 298 Chlrgawhan (E) P
R1v W " W MpD Thu.
299 Fattepur P 300 Surli (E) : : - R Po M
W W " RivWx Mp
44
Area in Oceu-Sq, pied House
Miles houses holds
Total Population
P M F
Scheduled Castes
M F
Scheduled Tribes
M F
Literate and educated
M F
(8) (9) (10) (11) (12) (13) (14) (15) (16) (17) (18) (19)
RURAL AREA-contd.
0'7 2 2 1'2 19 23 2'9 140 191 4'8 1,020 1,048 0'4 Uninhabited,
2'2 219 231 1 '7 179 234 1'4 29 40 2'8 372 372 0'3 Uninhabited,
91 905
4,574
1,257 1,112
225 1,791
1'12828 136 l' 0 Uninhabited, 1'4 139 139 648 1'1 10 10 16 0'9 I I I
1'1 I I 6'3 119 133 376
Urban Area II, I' 3 93 95 445 1'3 104 106 474 1'9 138 147 663
1'1 Uninhabit,ed, 1'9 89 113 0'8 186 187 2'5 66 66 1'9 237 243
1'4 124 124 0'4 8 10 1'7 171 180 4'6 S9 67 2'7 54 61
6'9 54 63 2'4 5 5 2'5 171 216 2'7 109 129 1'2 19 22
557 840 321
1,237
559 49
943 343 280
275 20
887 544 64
3 42
473 2,385
631 537 115 890
74
330 12 I
I 226
229 249 328
290 416 160 623
283 20
469 183 130
149 II
454 273
37
0'7 8 8 9 8 2'8 36 41 156 88
Urban Area m, 1'1 6 7 18 16
Included in Urban Area III, I ' 2 UninlJabited, 3' I 39 51 201 101
4'9 64 68 279 156 2' 1 232 232 984 522 2'4 138 153 746 382 1'2 5 5 5 5 2'0 Uninhabited,
2'4 Uninhabited, 0'8 Uninhabited, 2'0 7 7 3'8 7 7 3'7 29 29
1'9 39 39 3'2 46 46 1'3 38 38 3'5 7 7 1'0 5 5
0'9 Uninhabited, 1'8 Uninhabited. 5'5 1,159 1,185 5'3 45 45 5,3 229 233
2'0 37 39 1'0 7 7 1'5 213 256 0'9 159 202 2'2 Uninhabite_d,
1'4 Uninhabited,
43 20
117
202 231 163
9 14
5549 239
1,054
148 16
1,133 918
3'9 239 349 1526 1'0 Uninhabited. 1'7 I 1 6 2'6 32 32 131
6' 3 181 212 2'7 561 565 2'0 153 153 1'6 39 50 1'6 235 255
983 2,601
693 233
1,182
23 12 ~6
108 117
81 9 7
2,812 126 543
70 10
591 471
769,
2 71
498 1,317
343 121 589
2 49
432 2,189
626 575 110 901
62
318 4
ISO 216 225 335
267 424 161 614
10 '41
5 8
i3 276 21
4~~ ii 160 150
126 23 9
433 271 27
1 68
2
100
123 462 364
20 8
61
94 114 82
'7
2,737 113 511
78 6
542 447
757
4 60
485 1,284
350 112 593
5
'3
89 II 19
2
II 8
30
30 3
11
'3
3 33
2 4
i4 12
22
19
. . ~
,4
'4
88 3
14
13 6
32
2S 3
12
7
17 164
1,08S
222 241
43 386
24
157 3
22
92 93
119
116 138
58 253
113 5.
176 27 3t 46
1 133 80 2
I 25
2
38
46 206 131
4 4 7
6 27 15
5 3
1,326 35
180
20
19i 117
329
26
188 589 134
41 254
'8 69
428
114 114
6 168
9
61 I
. 5
33 41 49
42 46
8 114
41 4
57 4 2
10
47 27
7
20
11 79 46
I 1 2
482 10 56
5
85 59
114
4
55 247
50 19
118

Total workers (I-IX)
M F
(20) (11)
M F
(22) (23)
II III IV
M F M F M F
(24) (25) (26) (27) (28) (29) -----------------------
45
WORKERS
V
M F
(30) (31)
VI
M F
(32) (33)
RURAL AREA-contd.
2. 1 30 .23
273 204 1,383 969
Uninlrabited
378 362 293 246
6S 33 510 370
Uninhabited
42 26 Uninhabited
186 156 10 I I
I 167 93
Urban Area II 132 80 149 68 188 169
Uninhabited 169 84 250 194 94 80
",·,",,~S 298
17l 9
289 109 84
107 6
289 168 2S
8
152 16
259 9~ 95
57 5
262 140
16
1 1 9 7 15 16
101 63 125 140 SSG 259 620 683
165 105 191 254 114 95 139 149 3672526
138 43 312 327
9
84 I
2 32 24
57 73 93
3
57 SO 82
18 3
48
9 1 I
1 162 93
60 61 86 65 96 120
98 40 54 44 115 80 102 112 47 41 32 38
134 94 185 204
86 59 72 93 5 9 4 7
107 116 130 135 50 2 54 93 46 2 38 93
31 4 61 53 6 5
95 94 167 167 51 26 III 114 2 23 16
62 32 13 8
46 1
32 Urban Area III
16 2 .. 16 2 Included in Urban Area III Uninhabited
66 52 35 19 27 33
94 76 318 254 235 181
5 Uninhabited
Uninhabited Uninhabited
15 8 10 5 42 35
66 82 57 9 6
Uninhabited Uninhabited
65 :n 38
6
1,656 1.229 81 68
331 198
51 44 8 5
319 203 286 174
Unlnlrablted
Uninlrabited 447 381
Uninhabited 1 2
46 34
298 755 207 66
340
276 561 127
SO 197
54 13 145 118 114 78
1
14 4
15 I
16
44 30 45 20 40 23
760 398 20 9
156 77
30 63 125 128 103 99
3
I 3
21
18 31 13 7 I
8 4
19
35 57 15
467 682 54 59
135 118
28 5 17 39 6 5
113 59 164 138 107 29 135 140
263 210
ii; 9
149
26
171
2 25·
83 II 107 185 178 123 411 403 82 8 101 119 33 21 25 29
192 86 133 111
2 13 13
3 8
10
9 3
3 2 2 1
3 4
II
5 2
3
6 17
3 1
2 I
3 6 3
50 2
18
3 2
10 12
12
1 3
2
3
2
2
12 6 10= 7 5 1
iii 46
6 15
i3
13
'z 6
6 10 4
19
ii;
3 1
8
194
'9
:ii 15
11
9
2
6
. i
'j
122
1
60 69 48 27
" '3
5 32
3
3
2
2
2
18
6 6
27
6
2
2
15 33
2
8
5
2 3
6
5
8 2
3
5 6
16 "
2
VII
M F
(34) (35)
1 2
'i;
1 2 1 3
2
3
1
" "
72
3
" 3
2
6 26
1 . i
°i
6
2 2
VIII
M
(36)
2
1
'2
5
3
I
2
IX
F M F
(37) (38) (39)
1
" 16 66
12 II 4
26
13
2
6 7 1
7 14 8
10
8
10 1
4
8 3
3
3 5 5
1 2
I 2
67 5 9
2
7 12
8
1
13 47 10
3 10
I 15
3
2 I
9
3 MORSI TALUKA
NONWORKERS
M F Serial No.
(40) (40 (I)
1 12
200 1002
253 244
50 380
32
144 2
. 59 97
100 140
121 166 66
268
112 11
180 74 46
42 5
165 105
12
35
62 204 147
8 2
14
42 35 24
1156 45
206
19 2
272 185
322
1 25
200 562 136
55 249
I 226 26 221
228 228 1220 229
230
264 231 329 232
77 233 531 234
235
36 236 237
162 238 3 239
. 57 136 157 166
240
241 242
243 244 245
246 183 247 230 248
81 249 316 250
124 251 13 252
215 253 65 254 55 255
69 256 4 257
171 258 131 259
11 260
48
261 262
263
264 265
47 266 208 267 183 268
269 270
271 272
12 273 3 274
26 275
29 '1.76 37 277 44 278
279 280
281 282
1508 283 45 284
313 285
34 286 t 287
339 288 273 289
376
2 26
290
291 292 293 294 295
209 296 723 297 223 298
62 299 396 300

46
VILLAGE DIRECTORY
Serial No.
(I)
Village/Town/ Ward
(2)
Trans- Educa- Drink- Area port and tional ing in Dccu-
Postal Institu- water Medical Bazor Sq. pied House-facilities tions supply facilities Day Miles houses holds
(3) (4) (5) (6) (7) (8) (9) (10)
Total Population
P M F
Scheduled Castes
M F
Scheduled Tnbes
M F
(11) (12) (13) (14) (15) (16) (17)
RURAL AREA-concld.
301 Shekapur 302 Chandas 303 Musalkhed 304 Wathoda 305 Ekdara
306 Pimpalvihir 307 Beskheda 308 Bhalapur 309 Porgawhan (E) 310 Wadegaon
311 Wadala 312 Morchud (E) 313 Isapur (E) 314 Udapur 315 Mendhi
316 Naigaon 317 Ghorad 318 Dhaga 319 Ismailpur 320 Belkhed
321 Babh ulkhed 322 Vedhapur 323 Morshi Kh. 324 Waghal 32' Wandli
326 Paoni (E) 327 Khanapur 328 Chainpur 329 Deutwada 330 Rasulpur
331 Amner 33:l GilU~ed
R
R Po
R R
Po
R
P
M M
P
p
W W W W RivW hlp
w ruvw RivW •.
p W P W P W P RivWx Mp
RivW
p P
p
W RivW x \W 'wx W
Mp M
RivW .. W W p
p RivW Mp
M W P W
P Riv
Mp
M RivW Mp
0'7 I I 1.8 162 211 1'9 8 13 2-3 274 401 .01-4 378 381
0- S Uninhabited. )'8 109 109 1'9 UnlnhQ/Jiud. 4'0 91 91 1-9 83 83
2,0 130 141 1'3 99 99 1'0 43 60 1'2 114 169 1'0 41 54
1'2 Uninhabittd. 2'5 150 150 0'9 )39 139 0'9 34 34 0'8 3 3
0'7 60 60, 1'1 20 20 0'9 26 26 3'4 129 129 2'5 86 88
4'0 259 259 0'9 52 61 O' 3 Uninhabited. 1.4 89 129 0'9 Uninhabited.
1'9 297 369 0'0 Uninhabited.
URBAN AREA
I Morsi Municipality (E). R To Rh H W)( Mp Tue. 5.972,535 2,641
Ward 1 Ward 2 Ward 3 Ward 4 WardS
Ward 6 Ward 7 Ward 8 Ward 9 Ward 10
Ward 11 Ward 12 Ward 13 Ward 14
HosD
285 287 205 216 228 231 116 126 273 275
126 126 138 193 192 203 226 227 172 172
119 124 147 150 137 137 111 174
II Warud Municipality R To Rh C Riv Wx Mp D We4. 6.33 3,158 3,310 (E).
Ward 1 Ward 2 Ward 3 Ward 4 W..,d5
Ward 6 Ward 7 Ward 8 Ward 9 Ward 10
Ward 11 Ward 12 Ward 13
.~ .
291 313 279 286 255 275 247 247-147 259
201 207 207 244 354 360 278 283 158 175
15.01 163 299 301 18& 197
1 994 57
1,718 1,608
S58
461 410
658 513 263 747 248
572 603 160 13
304 73
148 600 526
1,276 271
633
1,731
11,946
1,332 945
1,037 532
1,336
582 773 938 895 667
'612 661 702 934
15,888
1,.0106 1,297 1,395 1,102 1,250
1,020 1,141 1,87S 1,161
889
857 1,642
853
I 518 29
908 80S
282
231 204
340 270 143 395 128
293 327
86 6
156 41 69
304 254
648 132
321
919
21
37 23
276 4
230 20 206
318 243 120 352 120
279 276 74
7
148 32 79
296 272
2 1
is
2 10
19
37 36
.01
13
2
io
1 4
628 139
9 12
312 2 2
812 140 107
6,214 5,732 267 233
691 507 548 280 712
295 400 481 462 334
313 345 372 474
641 55 . 52 438 50 44 489 13 15 252 624
287 373 21 m i9 ii; 333
299 3 6 316 63 60 330 37 35 460 6 5
8,332 7,556 351 307
782 703 702 553 642
541 576
1,025 634 448
624 89 37 594 40 31 693 72 90 549 54 58 608
479 565 850 527 441
442 415 847 795 51 51 431 .. 416 45 40
.. ••
'.'
literate and educated
M F
(18)
233 12
408 326
103
45 82
162 97 67
146 56
111 149 40
59 10 18 86 8&
2~
114
455
(19)
ici9 6
170 126
47
15 24
61 16 25 46 22
48 51 7
19 2
'33 30
lOS 18
45
194
3,459 1,636
317 304 355 170 490
211 249 290 183 190
184 154 156 206
126 123 213 79
303
126 109 147 47 81
100 61 29 92
4,222 2,044
337 307 346 281 381
330 316 543 363 215
217 338 248
97 138 181 150 232
184 185 285 115 94
85 210 88
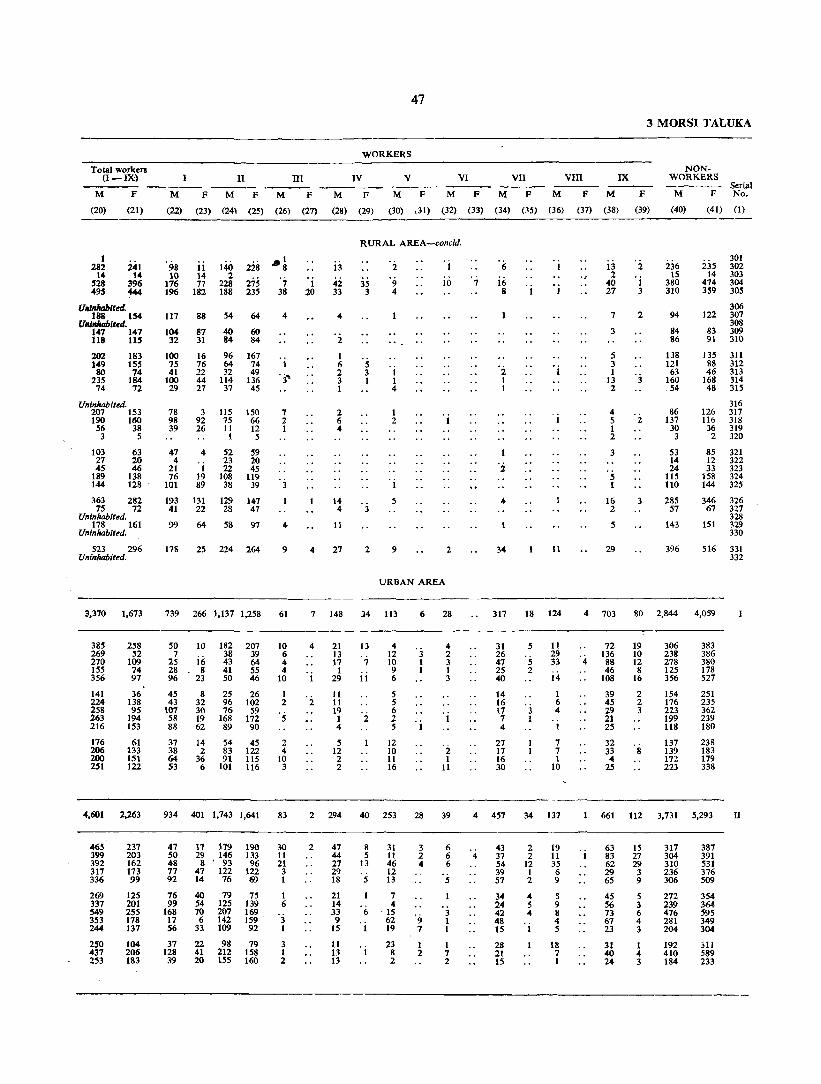
WORKERS
Total workers (I-IX) II ill IV
M F M FMFM F M F
(20) (21) (22) (23) (24) (2~) (26) (27) (28) (29)
M
(30)
V
47
VI VII
M F M F M
(32) (33) (34) OS) (36)
VIII IX
F M
(37) (38)
3 MORSI TALUKA
F
(39)
NONWORKERS
M F Serial No.
(40) (41) (I)
----------------------------------------------------------------------------
1 282
14 528 495
241 14
396 444
Ullinhabittd. 188 154
Ulllnltabittd. 147 147 118 U5
202 183 149 1S5
80 74 235 184
74 72
Uninhabited. 207 153 190 160 56 38 3 5
103 21 45
189 144
63 20 46
138 128
363 282 75 72
Uninhabited. 178 161
Uninhabited.
523 296 Uninhabited.
3,370 1,673
385 269 270 155 356
141 224 258 263 216
176 206 200 251
258 52
109 74 97
36 138 95
194 153
61 133 151 122
4,601 2,263
465 399 392 317 336
269 337 549 353 244
250 437 253
237 203 162 173 99
125 201 255 178 137
104 206 183
·98 10
176 196
11 14 77
182
140 228 .. ~ 22~ 275 ·7 188 235 38
117 88 54 64
104 87 40 60 32 31 84 84
100 16 96 167 75 76 64 74 41 22 32 49
100 44 114 136 29 27 37 45
78 3 115 ISO 98 92 75 66 39 26 11 12
47 4
21 76
101
4
1 19 89
1 5
52 59 23 20 22 45
108 119 38 39
193 131 129 147 41 22 28 47
99 64 58 97
178 25 224 264
4
7 2 I
4
9
739 266 1,137 1,258 61
50 7
25 28 96
10
iii 8
23
182 207 38 39 43 64 41 55 50 46
45 8 25 26 43 32 96 102
107 30 76 59 58 19 168 172 88 62 89 90
37 14 54 45 38 2 83 122 64 36 91 115 53 6 101 116
934 401 1,743 1,641
10 6 4 4
10
1 2
5
2 4
10 3
83
47 17 179 190 30 50 29 146 133 II 48 8' 93 96 21 77 47 122 122 3 92 14 76 69 1
76 99
168 17 56
40 79 75 1 54 125 139 6
72 ;~ :~~. .j 33 109 92 1
37 22 98 79 3 1 2
128 41 212 158 39 20 155 160
1 :20
13
42 33
4
2
1 6 2 3 1
2 6 4
14 4
11
4 27
RURAL AREA-concld.
35 3
5 3 I
3
2
2
9 4
I I 4
1 2
I
5
9
1
iii
2
URBAN AREA
7 148 34 113 6 28
4
2
21 13 17
1 29
11 11 19 1 4
5 12 2 2
13
'; 11
·i
4 12 10 9 6
5 5 6
·3 1 1
; . i
12 10 11 16
4 2 3 1 3
·i 1
11
2 294 40 253 28 39
2 47 44 27 29 18
21 14 33 9
15
11 13 13
8 5
13
5
6
1
31 11 46 12 13
7 4
15 62 19
23 8 2
3 2 4
'9 7
1 2
6 6 6
5
3 1 1
1 7 2
7
·6 iii 8
·2 1 1
4
34
317
31 26 47 25 40
14 16 17 7 4
21 17 16 30
11
18 124
5
5 2
3 1
11 29 33
14
I 6 4
1
7 7 1
10
4 457 34 137
4 43 37 54 39 57
34 24 42 48 15
28 21 15
2 2
12 1 2
'" 5 4
1
19 11 35 6 9
5 9 8 4 5
18 7 1
ij 2
40 27
7
3
5 3 1
13 2
4 5 1 2
3
S 1
16 2
5
29
2
2
3
ij6 15
380 310
94
84 86
138 121 63
160 ,54
86 137
30 3
53 14 24
115 110
285 57
143
396
ij5 14
474 359
301 302 303 304 305
306 122 307
308 83 309 91 310
135 311 88 312 46 313
168 314 48 315
316 126 317 116 318 36 319
2 320
85 12 33
158 144
321 322 323 324 325
346 326 67 327
328 151 329
330
516 331 332
4 703 80 2,844 4,039
72 136 88 46
108
39 45 29 21 25
32 33 4
25
19 10 12 8
16
2 2 3
8
306 238 278 125 356
154 176 223 199 118
137 139 172 223
383 386 380 178 527
251 235 362 239 180
238 183 179 338
661 112 3,731 5,293
63 IS 83 27 62 29 29 3 65 9
45 56 73 61 23
31 40 24
5 3 6 4 3
1 4 3
317 304 310 236 306
272 239 476 281 204
192 410 184
387 391 531 376 509
354 364 595 349 304
31l 589 233
II
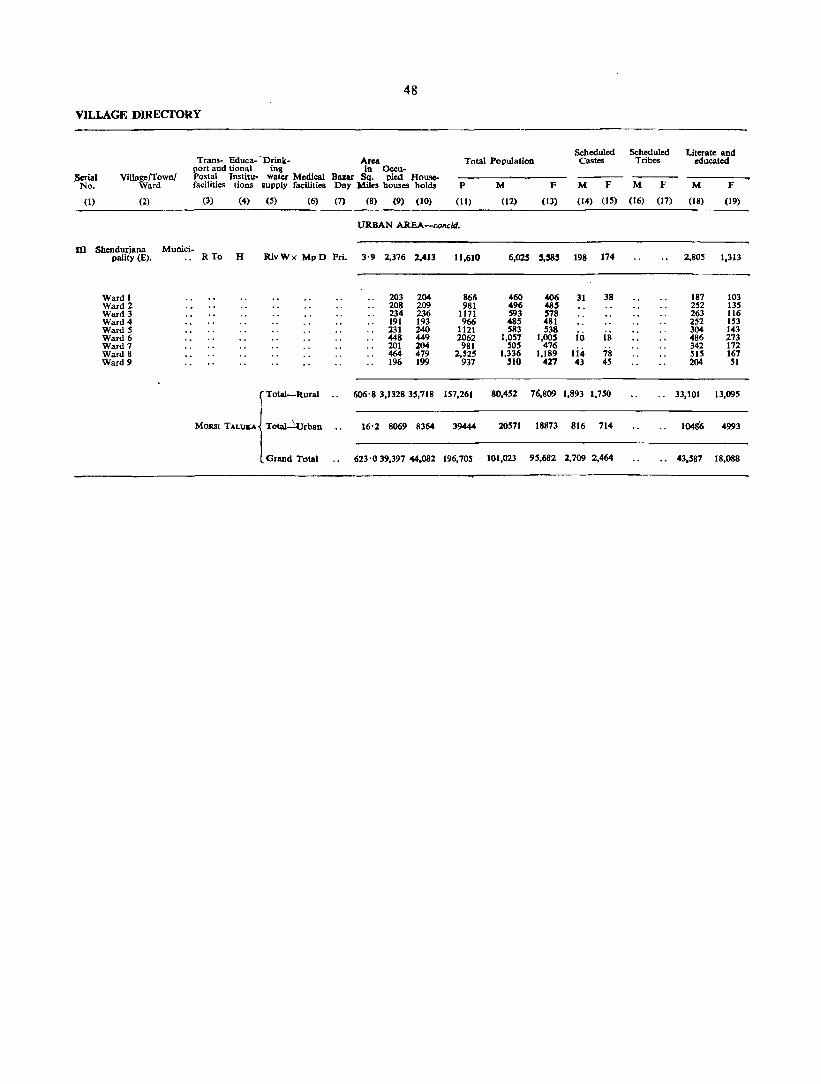
48
VILLAGE DmECTORY
Scheduled Scheduled Literate and Trans- Educa:-Orink- Area Total Population Castes Tribes educated
port and tional ing in Occu-,Serial Village/Town/ Postal Inslitu- water Medical Bazar Sq. pied House-
No. Ward facilities tiODS supply facilities Day Miles houses holds P M F M F M F M F
(I) (2) (3) (4) (5) (6) (7) (8) (9) (10) (11) (12) (13) (14) (15) (16) (17) (18) (19)
URBAN AREA-concld.
m Shcndurjana Munici-pality (E). R To H RivWx MpD Fri. 3'9 2.376 2,413 11.610 6,02S 5.585 198 174 2,805 1,313
Ward 1 203 204 866 460 406 31 38 187 103 Ward 2 208 209 981 496 485 252 135 Ward 3 234 236 1171 593 578 263 116 Ward 4 191 193 966 485 481 252 153 Ward 5 231 240 1121 583 S38 io 304 143 Ward 6 448 449 2062 1,057 1,005 13 486 273 Ward 7 201 204 981 SOS 476
Ii .. 342 172
Ward 8 464 479 2,525 1,336 1,189 78 515 167 Ward 9 196 199 937 510 427 43 45 204 51
J Total-Rural 606'8 3,1328 35.718 157,261 80,452 76,809 1.893 1,750 33,101 13,095
MORSI TALUJtA TotaJ~rban 16'2 8069 8364 39444 20571 18873 816 714 1048'6 4993 I I L Grand Total 623'039.397 44.082 196.705 101,023 95,682 2,709 2,464 .. 43,587 18,088

49
3 MOR.SI TALUKA
WORKERS NON-
Total workers WORKERS (I-IX) II 1lI IV v VI VII VIII IX
---- --- -_-- ---Serial M F M F M F M F M F M F M F M F M F M F M F No,
(20) (21) (22) (23) (24) (25) (26) (27) (28) (29) (30) (31) (32) (33) (34) (35) (36) (37) (38) (39) (40) (41) (I)
URBAN AREA-concld,
3,481 2,260 1,317 788 1,382 1,339 59 206 84 80 5 19t 16 6 235 29 2,544 :,32S III
271 196 106 89 103 91 1 9 13 3 14 35 3 189 210 306 198 93 50 139 119 2 23 22 4 19 3 1 25 4 190 287 357 140 146 S6 146 82 I 11 15 I 20 1 4 11 '2 236 438 286 236 179 176 63 56 2 4 I 15 I 22 199 245 31\1 171 130 75 108 85 3 17 3 9 26 4 I 25 4 264 367 657 394 284 94 307 300 I 6 '2 13 18 28 400 611 262 147 87 47 84 92
44 26 3 41 2 21 4 243 329
756 566 173 107 331 396 1 99 44 20 I I 26 5 62 12 580 623 267 212 119 94 101 118 7 13 9 12 6 243 215
47,674 32,968 18,893 8,420 22,176 23,580 849 lOll 1,575 477 717 .. 30 177 42 1,082 59 133 " 2,072 251 32,778 43,841
11,452 6,196 2,990 1,455 4,262 4,238 203 10 648 158 446 37 72 4 965 68 267 5 1,599 221 9,119 12,677
59,126 39,164 21,883 9,875 26,438 27,818 1,052 119 2,223 635 1,163 67 249 46 2,047 127 400 5 3,671 472 41,897 56,518
H422Z~

Daryapur Taluka
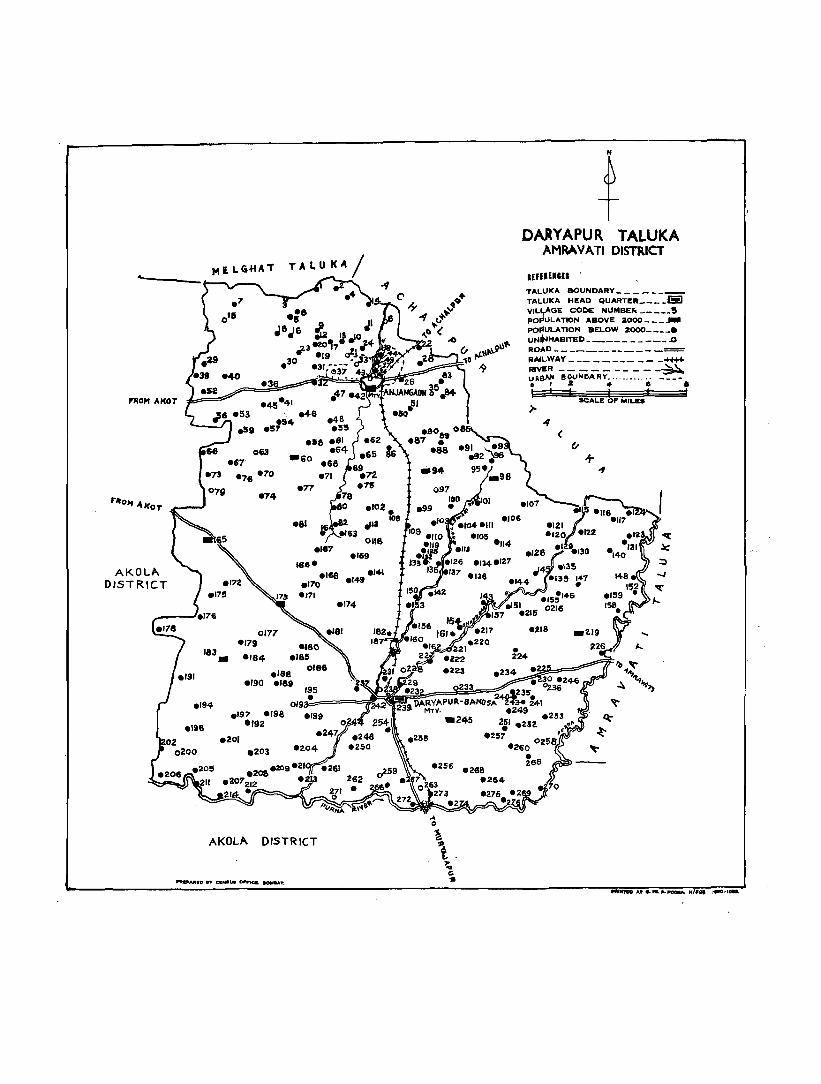
-
I'lIOM "MOT
AKOLA. DISTRICT
MI.L6~AT TALU
0177 .179
183. .'84
.'94
.,96
.188 .'90 .189
.'97 .,96 .,92 .20,
Olla
.,69
.'68 .,41 .,70 .149
.171 .174
AKOLA. DISTR leT
OARYAPUR TALUKA AMRAVATI DISTRICT
mUuln TALIJKA BOUNDARY _______ _
TALIJKA HEAD QUARTE" ____ &I VILI,.AGE CODE NUMBEr. _____ 5 POPULATION ABOVE 2000 ___ __
PO"ULATION BELOW 2000 ____ 8 UNII'lHABITED _______ - __ ..0 ROAD _____________ = RAILWAY _________ -_+H+ RIVER __________ ~
~AsAl' B~VNI)AIIY+ ....•.. 6 ----a E:: " , I I
<
seALE OF MILES
+ .,

]ia_ of Villap
(1)
Mpo.
Mpon
Mula
AIlmac1pllr
Aiwajpur (1)
Aiwajpur (2)
AjljplU'
Ajitpllr
Alampllr
A1ampllr
AliplU
AtsIa
ANJANGAOl'{ (Urban ArM).
AaW'POIl
AatlllWllOIl
Anra.",ur
.abhali (I)
.a."hali (2)
.ahaidarpur
.anosa (1)
.aaBoN (2)
:8.10r.
:&mbala Bk.
8embala n. •• ambora
.hamod
.handaraj
l!Ihilkhcda (2.)
Bllowi
Bhuikhed
Bhujwada
.Ilnruklleda
51
ALPHA})ETI~AL LIST OF VILLAGES AND TOWNg
4 DARYAPUR TALUKA
I Entries in Cllpital letters are for Towns and Urban areas]
Code No.
(.2)
Population
1951 1961
(3) (4)
41 648 855
61 134
190 1,033
SO
234
26
91
291
172
1,()48
96
314
Included in Urban Area I.
33 fucluded in Urban Aru I.
230
29
210
21
26S
149
318
22
170
357
33
ClfO
Name of Villalc
(1)
Bhuraa Ramaiad
Borala
Borala
Borpon Ambada
Brambanwada
Chandhai
Chandkhed
Chandola
Chanc1ur ..
Chausala
Ch.ndakapur
Chlncholi Bit.
Chincholi Bk.
Population Code No. 1951 1961
(2) (3) (4)
180
13
22S
91
126
146
201
206
196
348
506
IllS
2117
146
118
325
229 135
30 1,302
219 2,856
77 1,233
101
2()4
505
513
146
260
157
152
479
154
1,665
3,140
1,494
Name of Villa,e Code No.
(1) (2)
Bldara Bhamod
Elichpur
Elori Mirzapllr
Fajalpur
Fattepur
Oaiwadi
Oajipur
Oaneshpur
Oaneshpur
Oarajdari (1)
Oaulkheda
Oau1khoc1a
200
260
124
133
17
255
156
118
254
5
Population
1951 1961
(3) (4)
5
212
301
196
162
868
181
57
273
,.
301
339
237
274
956
226
300
ll8
,.
641
1:01,810 21,931 Chlncholi KII. 1$0
7
628
422
47
722
552
127
Oaorkheda 147 454
9
438
1,409
161
459
149
17.
234
95
237
35Q
214
530
43
413
420
460
62
3
Iaeluded in Urban Area n.
1'3 •
242 5
.. Inluded ill Urban Area II.
144 456
120 595
130 213
240 121
1'4 191
40 1,336
2 24
57 «
211 136
213
66
157
61
528
595
272
195
1,057
1,923
9
66
1.12
170
77
Chinchona
Dahiaaon Bk.
Daltiaaon Kh.
Darkheda
Daryapur (I)
9
12
263
239
DARYAPUR. (2) (Urb&ll II Area).
Deoaaoft
Deulgaon
Dhadi
DhamanaKh.
Dhamodi
Dhanegaon
Dhanora Jahalir
Dhanwadi
Dighi
Dombala
Dongar,aon
Donaare.on
Echor.
Ekalara
11
In
4
213
261
14
243
53
IH
142
15
159
214
1()4
256
389
11,065
111
15~
16
772
"0
33
143
212
228
343
144
367
• Vaiahabite4.
397
505
,.
38
IS,1I2
154
225
53
778
1,150
12
204
195
278
366
132
401
Gavandeaon Bk. 74 1,243
Oavanc1aaon Kh.
Oavanwadal
Ohada
Ghodaspon
Ohodchadi
Ghuikhed
GoIe,aon
Haibatpur
Hantoda
Hasanpur
Hasanpur Par"i
70
169
122
106
134
258
247
233
S5
162
46
Hayapnr 127
Hinpni 76
Hinlani Mirzapur . . 262
Hir.pur 16
Husenpur 161
Husenpur Dhudki 67
Husenpur Khodllaon 14
Indalwadi
!tki
259
174
161
370
330
231
477
149
453
403
250
414
470
«1
4M
323
165
2'5
6'8
345
321
402
• 245
,.
505
536
307
483
560
560
680
323
203
415
•

Name of Village
(1)
Jahanpur
Jahanpur
Jaiapar
Jaitapur
Jasapur
Jawala Bk.
Jawala Kh.
Jawardi
JetharnalpuJ'
Jltapur
Jogarwadi
Kalam Gavan
Kalashi
Kalga"an
Kalwada
Kamalpur
Kanholi
Kapsru
Kapustalni
Karatkheda
KarIa
Kasampur
Kasbegavan
Katkhed
Katwel
Khairi
Khalilpur
Khallar
Khallarlandi
Khanarnpur
Khanpur
Kharsan&alud
Khaspur
Khel Babuii (1)
Khel Sabuji (2)
Khel Gangaji
,~elHagone
. l{hel Hiraji
l:lopuiation Code No. 1951 1961
(2) (3)
123 126
232 81
191 1,193
267
241
92
93
59
24
235
177
33
412
285
158
257
110
*
257 282
264 1,263
73 823
68 41
111 285
154 491
228
94 3,285
207 389
52 1,010
195 548
98 1,953
171
79
276
236
73
230
128 1,602
135 303
22
lSI
186
110
38
911
266
270
(4)
135
89
1,138
48
412
355
217
307
119
294
1,464
948
42
342
554
* 4,028
656
1,285
698
2,372
153
* 248
1,813
329
1,156
349
364
20
Included in Urban Area I
43 Included in Urban Area I.
3S Included in Urban Area I.
25 Included in Urban Areal.
52
4 DARYAPUR TALUKA-contd.
Name of Village
Khel Hodole
Khel Khadse
Khel Kokat (I)
Khe! Kokat (2)
Khe1 Kri'hnaii (I.)
Khol Krishnaii (2)
Khel Nagawe
Khirada
Khirgavan
Khudawanpur \
Khurasanpur
Khurmabad
Kokarda
Kolambi
Kotegaon
Kotha
Kuberi
Kuksa
Kumbhargaon Ilk.
Kumbhargaon Kh.
Lakhad ..
Lakhanwadi
Lasur
Lehegaon
Loharajpur
Lohitkhed
Londhipur
Lotawada
Madarpur
Population Code No. 1951 1961
(2) (3) (4) ._---44 Included in Urban
Area I.
27 Included in Urban Area I.
49 6
Included in Urban Area I.
34 7 10
Included in Urban Area L
226
23
108
139
58
423
218
65
64 327
187 351
150 265
136 1,174
143 489
113 1,052
114
167
275
163
82
32
137
209
160
69
212
238
196
6
152
175
152
136
917
673
645
502
591
242
146
752
175
588
216
46
423
473
333
1,273
580
1,119
192
243
179
175
1,064
994
954
681
846
304
194
941
Mahamadpur Atakli.. 271.
Mahimapur
Mahuli '.
Malkapur
Malkapur Bk.
Malkapur Kh .
Mamrabad
117
222
58
145
28
*Uninhabited,
341
602
360
166
304
569
378
709
42S
202
386
652
Name of Village
(1 )
Markanda
Masamapur
Matargaun
Mhaispur
Mbaispur
Mohabatpur
M~lfatabad
MlIrha Sk.
Mllrtizapur
Mllstafapur
Nabapur
Nachona
Naigaon "
Nalwada
Nartded Bk.
Nandrnn
Nandura
Narayanpur Bk.
Narayanpur Kh.
Nardoda
Narsingpur
Nimbhari
Nimkhed Ade
Nitnkhedbazar
Pa!askh~da
Panora
Pardi
Pathar-Vira
Pelh ltbarpur (1)
Peth ltbarpur (2)
Pimpalg~van
Pimpalkhuta
Pimp!od
Pohi
Pralhadpur
RallilJl<lpur
Rajapur
Code No.
Population
1951 1961
(2)
152
36
218
155
197
48
216
72
75
54
244
(3)
661
31
340
372
376
426
541
346
129
45 91
153 652
249 352
215 618
253 1,393
198 681
223
88
138
217
252
112
~6
386
486
704
433
876
88
18 1,029
8
266
164
192
231
20
537
lOS
122
185
(4)
681
14
389
419
452
434
• 656
367
IS8
•
118
787
436
748
1,544
852
416
513
3
978
450
983
106
1,341
2
731
175
159
232
InclUded in Urban Area II.
103
185
348
252
183 2,128
87 342
129 171
78 174
63 17
395
283
2,386
415
159
%08
*

53
4 DARYAPUR TALUKA-conc[d.
---~----------------------.-------
Name of Village
(1)
Rajkhed ••
Ramagad
Ramgaon
Ramgaon
Ramtirtha
Rashidpur
Ratnapur
Ratnapur
Ra!napur Jogarda
Rawandalpur
Rustampur
Sa!lllrwadi
Saidagaon
Saidapur
Saidapur
Sakhari
Samada
Samsherpur
Sangawa Bk.
Sangawa Kh.
Sangltid
Saraya
Sarfabad
Sarfabad
Sasan Bk.
*Uninhabited.
Code No.
(2)
175
203
20
157
208
19
86
89
100
85
214
179
119
96
109
107
199
102
116
ll5
181
97
31
134
188
Population
1951 1961
(3) (4)
265
217
118
604
1,158
275
289
83
III
374
116
44
75
216
59U
762
155
626
19
978
32
87
793
357
297
150
615
1440
361
355
69
155
344
115
99
82
198
756
907
206
656
34
1.455
59
129
815
Name of Village
(I)
Sutegaon
Saundali Hiral'ur
Shahapur
Shahapur
Shekapur
ShelgaoJ1
Shikandarl'ur
i>hinganapur
Shinganwadi
Shirajgaon
Shirasgaon
Shiwar Bk.
Shiwarkheda
ShilVar Kh.
Songaon
Sonkhas
Sonkhed
Sujapur
Sukli
Surji (I)
Surji (2)
Takarkheda Kaware ..
Takarkheda More
Code No.
(2)
Population
1951 1961
(3) (4)
189 951 967
60 2,660 3.198
204 188 236
37 Included in Urea f1
Area I.
227
90
13
:m
246
256
47
269
250
121
248
99
J82
205
268
202
42
158
51
240
103
240
1.803
570
80
572
94
497
76
" 130
450
340
~52
121
271
1,964
642
73
546
825
95
765
610
78
156
440
526
241 260
Included in Urban Are" T.
325
1,619
418
1,828
Name of Village
(ll
Takli
Tamaswadi
Tarod"
Telkhed
Thilori
Tongalabad
Turkheda
Umri Itabarpur
Umri Kurankhed
Umri Mamdabad
Uparai ..
Vihigaon Bk.
Vihigaon Kh.
v-./adali "
\Vadner~Gangaj
Wadura
Wanoja
Warud Bk.
Warud Kb.
Yeoda
Yerandgaon
Zingla
Cod~ :-.10.
(2)
272
141
105
170
245
210
39
168
251
166
148
62
6S
10
165
140
81
172
71
173
176
270
Population
1951 1961
(3) (4)
491
196
334
197
1,899
758
731
804
155
744
610
1,130
179
264
3,155
440
512
1,293
224
4,931
208
706
238
397
211
2,047
750
851
1,075
143
939
778
1,312
245
342
3,967
549
731
1,576
287
5,887
305
2
TOTAL.. t 145,863 174,397
, The 1951 populati()n of the Taluka as given in this lis! differs [ro.n th,lt mentioned in Table A-II.
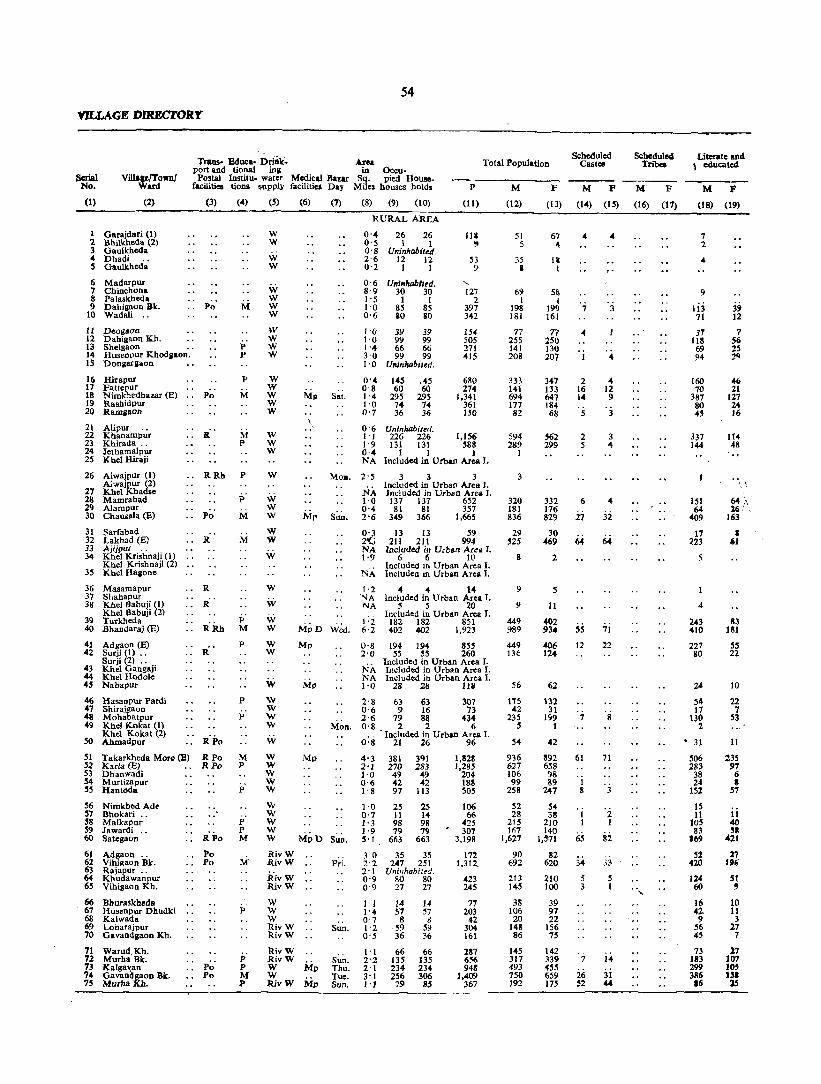
54
VILLAGE DIREC.rORr
Tl'III1S. Educa. DriiiI(~ port and tional inll Postal Institu· water
facilities tions supply
Area in Oceu·
Medical Bazar Sq. pied House· facilities Day Miles houses hold.
Total Population
Serial No.
(1)
ViJla.rIrJwn/ (2)
I Garajdari (1) 2 Bhilkheda (2) 3 Gaulkheda 4 Dhadi .. 5 Gaulkheda
6 Madarpur 7 Chinchona 8 Pa laskheda
(3)
9 Dahigaon Bk. Po 10 Wadali ..
II Deogaoa 12 Dahigaon Kh. 13 Shelgaon .. 14 Husenour Khodllaon. 15 Dongarllaon
16 Hirapur 17 Fa.ttepur 18 Nimkhedbuar (E) 19 Rashidpur 20 Ramllaon
21 Alipur .• 22 Khanarnpur 23 Khirada .. 24 Jethamalpur 25 Khel Hiraji
26 Aiwajpur (I) Ai'Hajpur (2)
2'7 Khel Khad.e 28 Mamrabad 29 Alampur 30 Challiala (E)
31 Sarfabad 32 Lakhad (E) 33 Ajijpur .. 34 Khel Krishnaji (I)
Khel Krishnaji (2) 35 Khel Hallone
36 Masamapur 37 Shahapur 38 Khel Babuj; (I)
Khel Babuji (2) 39 Turkheda 40 Bhandaraj (E)
41 Adgaon (E) 42 Surii (I) .•
Surj; (2) .. 43 Khel Gangaj; 44 Khel Hodole 43 Nabapur
46 HasanpUt" Pardi 47 Shirajgaon 48 Mohabatpur 49 Khel Kokat (I)
Khel Kokat (2) SO Abmadpur
Po
RRh
Po
R
R
R'
(4)
M
p p
P
M
M P
P
P
M
M
P M
P
P
P
51 Takarkheda More (E) R Po M 52 Karla (E) R Po P 53 Dhanwadi 54 Murtizapur 55 Hantoda P
56 Nimkbed Ad~ 57 Bhokari .. 38 Malkapur 59 Jawardi .. 60 Salegaon
61 Adgaon .. 62 Vihigaon Bk. 63 Rajapur .. 64 Khudawanpur 65 Vihigaon Kh.
66 Bhuraskheda 67 Eusenpur Dhudki 68 Kalwada 69 Loharajpur 70 . Gavandgaon Kh.
71 Warud.Kh. 72 Murha Bk. 73 Kalgal(an 74 Gavandgaon Bk. 75 Murha Kh.
RPo Po Po
P~Po
P P M
M
P
p P M P
(5)
W W
W W
W W W W
W W W W
W W W W W
w W W
(6) (7)
Mp s~i.
(8) (9) (10)
RURAL AREA
0'4 26 26 0'5 1 1 O'S Uninhahtltd. 2'6 12 12 0'2 I 1
O· 6 Uninhabited. 8'9 30 30 1'5 1 1 1'0 85 85 0'6 ao 80
1'0 39 39 1'0 99 99 1-4 66 66 3'0 99 99 1'0 Uninhobited.
0-4 145 .45 0'8 60 60 1'4 295 295 1'0 74 74 0'7 36 36
Uninhabited.
P
(II)
111 ~
53 9
.... 121
2 397 342
154 505 271 415
680 274
1.341 361 150
0'6 I-I 1-9 0'4 NA
226 226 1,156 131 131 588
1 1 1 Included in Urban Area I.
W Mo •. 2'5 3 3 3
W W W
W W
W
W
W
W W
W W
w w w W W
W
W W W W W
W W W
SM.
MpD W~.
Mp
Mp
Mon.
Mp
W w Mpn S~~. RivW Riv W Fri.
RlvW RivW
W W W RivW Sun. RivW
RivW RivW W Mp w RivW Mp
Sun. Thu. Tue. Sun.
NA 1'0 0'4 2'6
0'3 2'!.i NA 1'9
NA 1'2 NA NA
1'2 6'2
O'S 2'0
NA NA 1'0
Included in Urban AreB I. Inel uded in Urban Area J. 137 137 652 81 81 357
349 366 1,665
13 13 59 211 211 994
Included in Urban Area 1. 6 6 10
Included 10 Urhan Area 1. Includea ill Urban Area I.
4 4 14 Included in Urban Area I.
5 5 20 Included in Urban Area 1.
182 182 S51 402 <W2 1,923
194 194 855 55 55 260
Included in Urban Area J. Included in Urban Area I. Included in Urban Area 1.
28 211 118
2'S 63 63 307 0'6 9 16 73 2'6 79 88 434 0'8 2 2 6
.. 'Included in Urban Area I. O'S 21 26 96
4' 3 381 391 2'1 270 283 1'0 49 49 0'6 42 42 1'8 97 113
25 25 11 14 98 98 79 79
663 663
35 35 247 251
Uninhabiud. 80 SO 27 27
14 14 57 57 8 8
·59 59 36 36
66 135 234 256
79
66 135 234 306 85
l,828 1,285
204 188 505
106 66
425 307
3,198
171 1,31"-
423 245
77 203
42 304 161
287 656 948
1,409 367
M F
(12) (13)
51 5
]S a
69 1
198 181
77 255 141 208
333 141 694 177 82
594 289
1
320 181 836
29 525
8
9
9
449 989
449 BE
56
175 42
235 5
54
936 627 106 99
258
52 28
215 167
1,627
90 692
213 145
38 106 20
148 86
145 317 493 750 192
6, ...
1& I
52 I
199 161
77 250 130 207
347 133 647 184 68
562 299
332 176 829
30 469
2
5
11
402 934
406 124
62
1:'.2 31
199 1
42
892 6$8 98 S9
247
54 38
210 140
1,~71
82 620
210 100
39 97 22
156 75
142 339 <455 659 175
Scheduled Castes
M P (14) (15)
7
'j
2 16 14
:;
2 5
6
27
55 12
7
61
1 8
. i 1
65
34
5 3
7
26 52
3
4 12 9
. .3
3 4
4
32
71
22
8
71
3
2 1
82
33
5 1
14
31 44
Scheduled Tribes
M F
(16) (17)
Literate and , educated
M P
(18) (19)
7 2
4
9
li3 71
31 118 69 94
160 70
387 80 45
337 144
151 64
409
11 223
4
243 410
227 lIO
24
54 17
130 2
• 31
506 28.3
38 24
152
15 II
105 83
169
52 420
124 60
16 42-9
56 4S
73 183 299 386 16
39 12
7 56 25 ;II)
46 21
127 24 16
114 48
' .. .\ \ 64\ 26/ ,
163
1 'I
83 181
55 22
10
22 7
S3
11
235 97
6 a
51
ii 4() ~I
421
27 196
51 , 10 11
3 27 7
27 107 lOS lSi 15

Total workers (I-IX) I II m IV
M
(20)
F
(21)
M
(22)
F
(23)
M F M P M F
(24) (25) (26) (27) (28) (29)
34 31 2 2
Uninhabit.d. 22 10
3 1
Uninhabited. 53 .3
1 1 114 sa 109 9.
53 20 144 106
86 43 126 97
Uninhabited.
200 79
383 106
54
159 60
304 90 40
Uninhabited.
12
, 22 17
'66 5 311 29
7 108 70 29 2 !l9 43
125 47
101 53 28
94
i7 32 10
19 31 2
I~ 10 3 1
31 1
32 6.
43 29 5!1 49
70 31
260 47 21
26 1
52 69
20 36 41 53
65 60
287 58 30
324 258 170 114 126 140 170 110 108 37 56 73 1'".. ,.
Includtd in Urban Area I.
3 .• .. Included in Urban Area I. IncL.ded in Urban Area I.
178 148 61 S 112 84 82 58 477 322 171 48
94 '142 27 26
224 263
17 10 4 12 10 276 131 107 17 146 106
Included in Urban Area I. ~ 2 .. 2
Included in Urban Area 1. Included in Urban Area 1.
7 .. .. 3 1ncIucted in Urban Area I.
7 !I " Included in Urban Area I.
1 2
2
4
1
3
is I 6
265 196 175 128 74 68 562 381 336 223 140 148 is 276 225 62 61 175 152 72 62 23 14 41 47
Included in Urban Area I. Included in Urban Area I. Included in Urban Area 1.
32 29 14 14 29
114 55 77 43 16 12 26 13 9 !I 16 8
120 62 38 10 78 '2 2 1 .. 1 2
Included in Urban Area I. 32 9 20 11 6
1 !ll0 354 84 100 242 244 8 388 320 156 100 197 216 65 49 48 34 16 1!1 62 42 31 20 14 9
148 83 43 13 93 68
36 20
132 106 907
4!1 17 367 202
Uninhabited. 113 73 79 43
23 13 63 63 9 9
23 14 10 14 9 3 11 12
86 38 41 !l4 67 4 37 48
364 105 403 4O!I
27 6 17 11 116 21 210 177
76 45 26 '18 31 17 3. 26
19 10 3 3 28 23 35 40 4 3 !I 6
87 !H 30 54444 4 '58 II
87 189 31~ 43!1 125
43 132 191 221 10
52 18
42 3 34 3!1 76 29 87 96
160 84 131 107 III 7 260 210 3677270
4 2
4
it> 2
, 2
.. 3
8 3
22
5
2 5
27 3
2
19
23 14
iis
41
1 14
1 6
4 1 1 7
5 11 13
3
'7
5
!I 1
7 2
i3
i7
5
'2 3
WORKERS
v VI VII
M F WPM P
(30) (31) (32) (33) (34) (35)
RURAL ARliA
2
2
2
3 18
. i
10 2
' ..
1 •
3
2
2
3
2
4
6 2
10
, i
is 3
12 10
7
1 8
7
'9 4
11 1
, i
.. DARYAPUIt TALUXA
VIl1 IX
W F W P
(36) (37) (38) (39)
2 2
7 3
3 1
3 5 2 1
1 1
11 ,I 2
12 2
7 1
29
'6 4
9 22
a I
I 1 3
28 8 1 1 a
'3 61
ii 5 2
6 • 12 19 3
. i
2
2 2
8
NONWORKERS
M
(40)
17 3
13 5
16
84 72
24 III 5S 12
133 62
311 71 28
270 119
142 69 3~9
12 249
2
2
184 427
173 64
24
61 16
115 3
22
426 239 41 37
110
F
(41)
29 2
8
15
l .. i 63
57 144 87
110
188 73
343 94 28
Serial No.
(I)
1 2 3 4 5
6 7 8 9
10
11 12 13 14 IS
16 17 18 19 20
21 304 22 189 23
181 92
507
24 25
26
27 :8 29 10
20 31 338 32
33 34
35
5 36 37
6 38
206 39 553 40
181 41 62 42
43 44
33 4.
17 46 18 47
137 48 49
33 !IO
538 !II 338 52 49 53 47 54
164 5!1
16 26!56 8 23 !l7
83 118 58 61 88 59
720 1,036 60 ., 325
100 66
15 43 II 61 21
58 128 179 31.5
67
65 61 418 62
63 137 64 !l7 65
26 66 34 67 13 68
105 69 57 70
99 71 207 72 264 73 438 74
95 7S
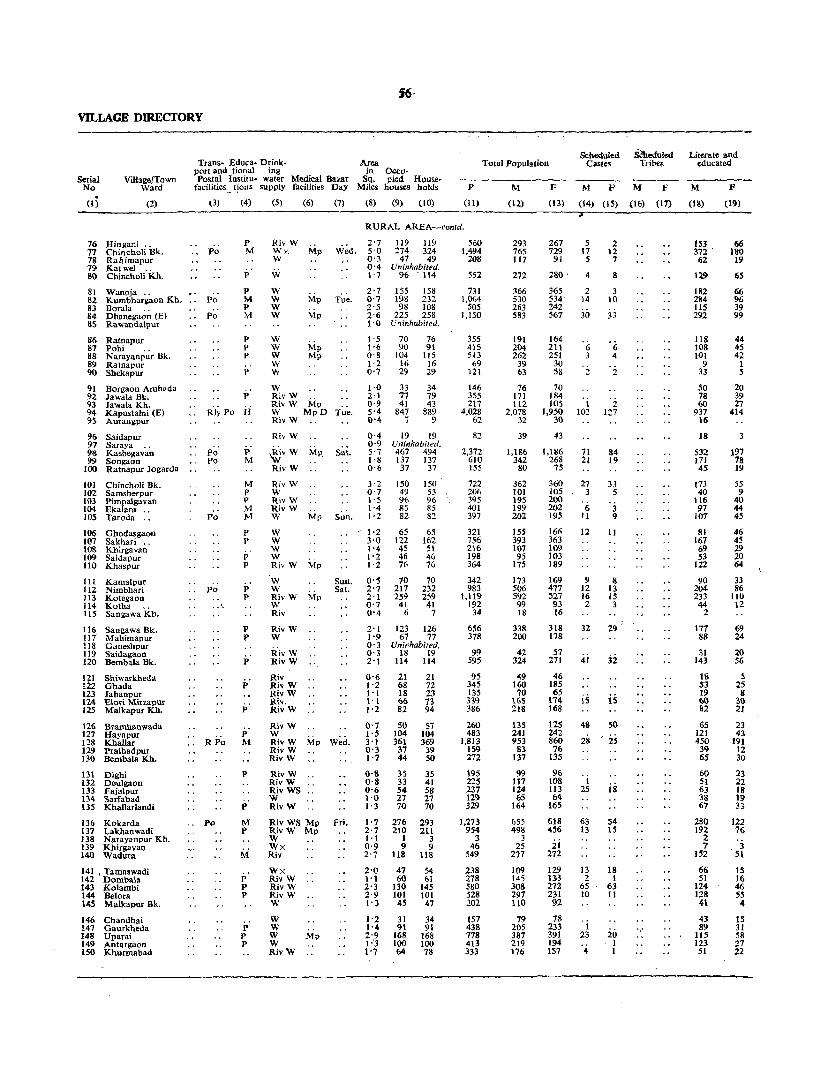
VILLAGE DIRECTORY
Serial No
(I)
Village/Town Ward
(2)
Trans- Educa- Drink- Area port and tional ing in OCCll-Postal Institu- water Medical Bazar Sq. pied House-
facilities _ dons supply facilities Day Miles houses holds
(3) (4) (5) (6) (7) (8) (9) (0)
p
(II)
Total Population
M F (12) (13)
Scheduled Castes
M F
(14) (15)
RURAL AREA-contd.
76 Hingani " 77 Chincholi Bk. 7S Rahimapur 79 Kat wei .. SO Chincholi Kh.
81 Wanoja .. 8'2 Kumbhargaon Kh. 83 Borala .. 84 Dhanegaon (E) 85 Rawandalpur
86 Ratnapur 87 Pohi .. 88 Narayanpur Bk. 89 Ratnapur 9(} Shekapur
91 Borgaon Ambada 92 Jawala Bk. 93 Jawal. Kh. 94 Kapustalni (E) 9S Aurangpur
96 Saidapur 97 Saraya 98 Kasbegavan 99 Songaon
tOO Ratnapur Jogarda
101 Chincholi Bk. 102 Samsherpur 1m Pimpa1gavan 104 Ekalara .. lOS Taroda ..
106 Ghodasgaon 107 Sakhari .. 10& Khirgavan 109 Saidapur 110 Khaspur
111 Kamalpur 112 Nimbhari 113 Kotegaon i14 Kotha ._ 115 Sangawa Kh.
116 Sangawa Bk. 117 Mahimapur 118 Ganeshpur 119 Saidagaon 120 Bembala Bk.
121 Shiwarkheda ~22 Ghada 123 Jahanpur 124 Elori Mirzapw: 125 Malkapur Kh.
126 Bramhanwada 127 Hayapur 128 Khallar 129 Pra1hadpur 130 Bembala Kh.
131 OiShi 132 Deulgaon 133 Fajalpur 134 Sarfabad 135 Khallarlandi
136 Kokarda 137 Lakhanwadi 138 Narayanpur Kh. 139 Khirgavan 140 Wadura
141 • Tamaswadi 142 Dombala 143 Kolambi 144 Belora 145 Malkapur Bk.
146 Chandhai 147 Gaurkheda 148 Uparai 149 Antargaon ISO Khuonabad
Po
Po
Po
P M
p
P M p M
P P P
P
P
Rlypo ii
Po Po
Po
po
RPo
Po
P M
M p P M M
P P
p p
p p
P P
p-
p
P
P M
p
P
M P
M
p p p
P P P
RivW W'/. Mp W
W
W W Mp W W MP
W W MP W Mp W W
W RivW Riv W Mp W MpD Tue. RivW
Riv W
~v W MP. Sat.
RivW
2'7 119 119 5'0 274 324 0'3 47 49 0'4 Uninhabited. 1'7 96 "1l4
2'7 155 158 0'7 198 232 2'5 98 108 2-6 225 258 1-0 Vninhabited.
\-5 70 76 1-6 90 91 0-8 104 liS 1'2 16 16 0'7 29 29
1-0 33 34 2'1 77 79 0'9 41 43 5'4 847 889 0'4 7 9
0'4 19 19 0'9 Uninhabited. 5'7 467 494 1'8 137 137 0'6 37 37
Riv W 3'2 150 150 W 0'7 49 53 Riv W 1'5 96 96 RivW 1'4 85 85 W Mp Sun. 1'2 82 82
W W W W Riv W Mp
'w Sun. W _. Sat. RivW Mp W Riv
RivW W
RivW RivW
Riv RivW RivW Riv. RivW
RivW W RivW Mp W~d. RivW RivW
RivW RivW RivWS .. W RivW
Riv WS Mp Fri. RivW Mp W Wx Riv
Wx RivW RivW RivW W
W W W Mp W RivW
/ 1'2 65 6S 3'0 122 162 \'4 45 51 1'2 46 46 1'2 76 76
0'5 70 10 2'7 217 232 2'1 259 259 0'7 41 41 0'4 6 7
2'1 123 126 1'9 67 77 o· 3 Uninhabited. 0'3 18 19 2'1 114 li4
0'6 21 21 1'2 68 72 1'1 18 23 \'1 66 '13 1'2 82 94
0'7 SO 57 1'5 104 104 3'1 361 369 0'3 37 39 1'7 44 50
0'8 0'8 0·6 1'0 l' 3
35 33 54 27 10
35 41 58 27 70
1'7 276 293 2'7 210 211 1·1 1 3 0'9 9 9 2'7 118 11&
2'0 47 54 1'1 60 61 2'3 130 145 2'9 101 101 1'3 45 41
1'2 31 34 1'4 91 91 2'9 168 168 1:3 100 100 1'7 64 78
560 1,494
208
552
731 1,064
505 1.150
355 415 513
69 121
146 355 217
4,028 62
82
2,372 610 155
722 20f) 395 401 397
321 756 216 198 364
342 983
1,119 192
34
656 378
99 595
95 345 135 339 386
260 483
1,813 159 272
195 225 237 12~ 329
1,273 954
3 46
549
238 278 580 528 202
157 438 778 413 333
293 765 117
272
366 530 263 583
191 204 262
39 63
76 171 112
2,078 32
39
1,186 342
80
362 101 195 199 202
155 393 107 95
175
173 506 592 99 18
338 200
42 324
49 160 70
165 218
135 241 953
83 137
99 1t7 124 65
164
655 498
3 25
277
109 145 308 297 110
79 205 387 219 176
267 729
91
280 -
365 534' 242, 567
164
5 17 5
4
2 14
30
2 12
7
8
3 10
33
211 6 6 251 3 'I
~g 2 '2 70
1~1 1 'i 1,950 102 127
30
43
1,186 268
75
360 105 200 202 195
166 363 109 103 189
169 477 527 93 16
318 178
57 271
46 185 65
174 168
125 242 860 76
135
96 108 113 64
165
618 456
ii 272
129 133 272 231 92
78 233 391 194 157
71 21
27 3
6 11
12
9 12 16 2
32
4i
is 48
2S
1 25
63 13
13 2
65 10
1 23
4
&4 19
33 5
3 9
11
8 13 15
3
29
3i
is 50
2S
is
S4 15
18 1
63 11
20 1 1
Sdtedllled Tribes
M F
(16) (17)
Literate and educated
M F
(IS) (19)
153 372 " 62
129
182 284 11S 292
118 108 101
9 33
50 78 60
937 16
18
532 171 45
173 40
116 97
107
81 167 69 53
122
90 204 233 44
2
177 88
31 143
18 53 19 6() 82
65 121 450
39 65
60 51 63 38 67
280 192
2 7
152
66 51
124 128 41
43 89
115 123 51
66 180
19
6S
66 96 39 99
44 45 42
1 5
20 39 27
414
197 78 19
55 9
40 44 45
46 45 29 20 64
33 86
110 12
69 24
20 56
5 25
8 31) 21
23 43
191 12 30
23 22 18 19 33
122 76
'3 51
IS 16 46 55 4
IS 31 58 27 22
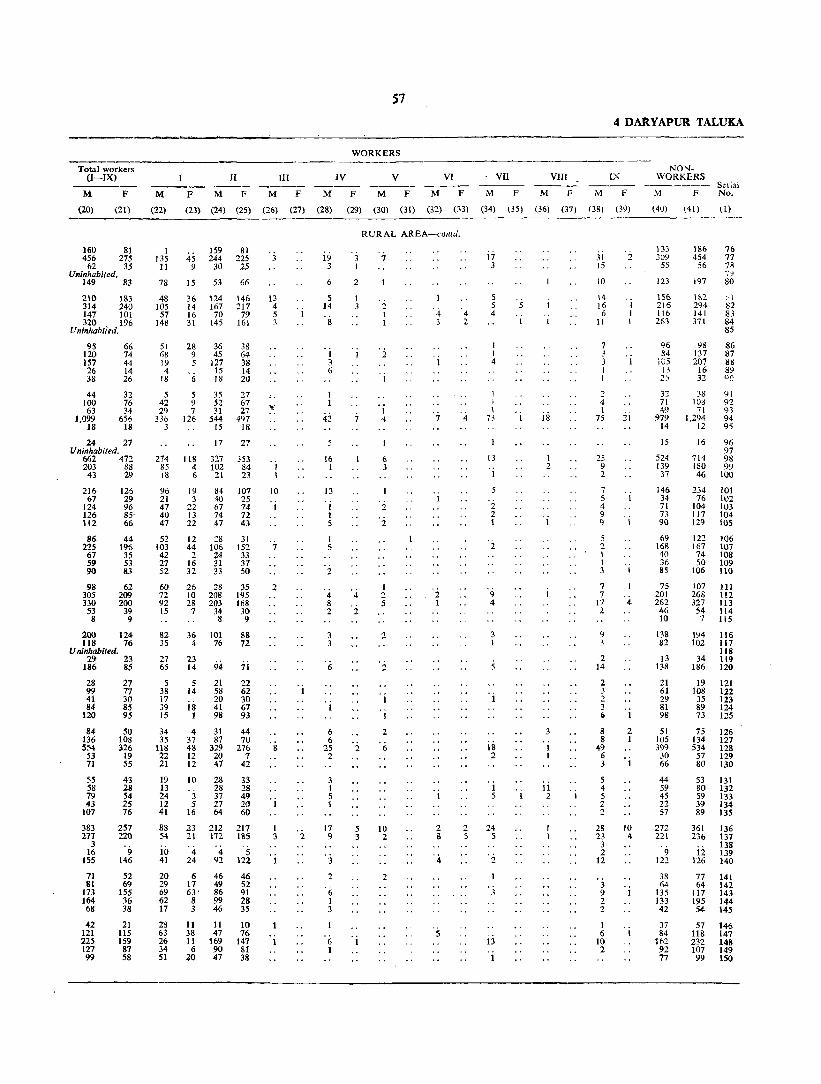
Total workers (I-IX)
M F
(20) (21)
160 81 456 275
62 35 Uninhabited.
149 83
210 183 314 240 147 101 320 196
Uninhabiied.
95 120 157 26 38
44 100 63
1,099 18
66 74 44 14 26
32 76 34
656 18
24 27 Uninhabited.
662 471 203 88 43 29
216 67
124 126 112
86 225 67 59 90
98 305 330
53 8
126 29 96 85 66
44 1% 35 53 83
62 209 200
39 9
200 124 118 76
Uninhabited. 29 23
186 85
28 99 41 84
120
84 136 554 53 71
55 58 79 43
107
383 277
3 16
155
71 81
173 164 68
42 121 225 127 99
27 77 30 85 95
50 108 326
19 55
43 28 54 25 76
257 220
9 146
52 69
155 36 38
21 liS 159 87 58
II III
M F M F M F
(22) (l3) (24) (25) (26) (27)
I 135 11
78
48 105
57 148
45 9
15
159 244
30
53
81 225 25
66
36 124 146 14 161 217 16 70 79 31 145 161
51 28 36 38 68 9 45 64 19 5 127 38 4 15 14
18 6 18 20
5 5 35 27 42 9 52 67 2<) 7 31 27
336 126 544 497 3 15 1&
17 27
274 118 327 353 85 4 102 84 18 6 21 23
96 21 47 40 47
52 103 42 27 52
19 84 107 3 40 25
22 67 74 13 74 72 22 47 43
12 ~8 31 44 106 152
2 :24 33 16 31 37 32 33 50
60 26 28 35 72 10 208 195 92 28 203 168 15 7 34 30
82 35
27 65
5 38 17 39 15
34 35
118 22 21
19 13 24 12 41
8 9
36 101 4 76
H 94 5 21
14 58 20
18 41 1 98
88 72
71
22 62 30 67 93
4 31 44 37 87 70 48 329 276 12 20 7 12 47 42
10 28 28
3 37 5 27
16 64
33 28 49 20 60
88 23 212 217 54 21 172 ISS
10 4 4 5 41 24 92 122
20 29 69 62 17
28 63 26 34 51
6 46 46 17 49 52 63' 86 91
8 99 28 3 46 35
11 11 10 38 47 76 11 169 147
6 90 81 lO 47 3&
13 4 5 3
....
10
I
7
2
1 3 2
57
WORKERS
IV
M F
(28) (29)
V VI
M F M F
(30) (31) (32) (33)
RURAL AREA-cant".
19 3
6
5 14
8
1 3 6
42
5
16 I
13
1 1 5
1 5
2
4 8 2
3 3
6
6 6
25 2
3 1 5 1
17 9
3
2
6 1 3
6 1
2
I 3
7
4
'2
2
5 3
7
2 I I
2
1 4
()
3
2
2
2 5
2
2
'i 1
2
'(;
10 2
2
4
7
2 1
2 8
'4
5
4 2
4
2 5
VII
M F
(34) (35)
17 3
5 5 4
I I 4
1 1 1
73
13
I
5
2 2 I
2
'9 4
18 2
24 S
2
13 . i
5
1
VIII
M F
(36) (37)
18
:2
11 2
4 DAltYAPUR TALUKA
IX
M F
(38) (39)
31 15
iO
14 16
6 11
7 3 3 I I
2 4 I
75
25 9 2
7 5 4 9 9
5 2 1 1 3
7 7
2
'i
21
j
17· 4 2
2 14
2 3 2 3 Ii
8 8
49 6 3
5 4 5 2 2
28 23
3 2
12
3 9 2 2
1 6
10 2
, i
2 1
10 4
NON· WORKERS
M F Serial No.
(40) (41) \.1)
133 309
55
123
15{> 216 lib 26~
96 84
lD5 1.1 15
186 454
56
197
76 77 7X ~i,:)
80
1~2 "~I 294 82 141 83 371 84
85
98 86 137 87 207 88
16 89 32 00
32 38 91 92 93 94 95
71 1O~ 49 71
979 1,294 14 12
15
524 139 37
146 34 71 73 90
69 168 40 36 85
75 201 262 46 10
138 82
13 138
21 61 29 81 98
51 105 399
30 66
44 59 45 22 57
272 221
9 122
38 64
135 133 42
37 84
162 92 77
16 96 97
714 98 180 99 46 100
234 101 76 102
104 103 117 104 129 105
122 106 167 107 74 108 50 109
106 110
107 III 268 112 327 113 54 114 7 115
194 116 102 117
118 34 119
186 120
19 121 108 122 35 123 89 124 73 125
75 126 134 127 S34 128
57 129 80 130
S3 131 80 132 S9 133 39 134 89 135
361 136 236 137
138 12 139
126 140
77 141 64 142
117 143 195 144 54 145
57 146 118 147 232 148 107 149 99 ISO
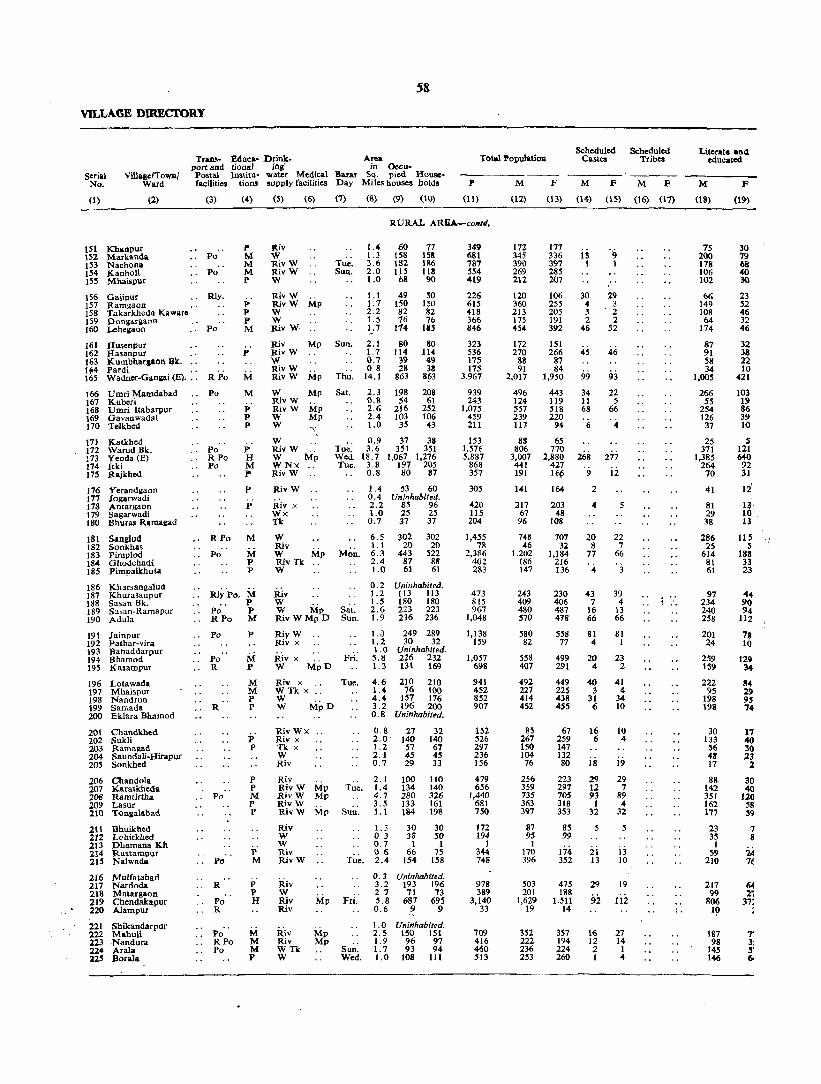
58
VILLAGE DlREcrORY
Ser~l No.
(1)
Villal!~ITo_1 Ward
(2)
Tran..- !!duca-· Drink- Area port and tiona' iNt in Qccu. Postal }nstitu- water Medical :Saar Sq. pied Housefacilities tions supply facilities Day Miles houses holds
(3) (4) (5) (6) (7) (8) (9) (10)
Total Population
P M F
(11) (12) (13)
RURAL AJUiA-COllld,
lSI JChanpur 152 Markan.a 153 Nachona 154 Kanholi 155 Mhaispur
156 Gajipur 157 Ramgaon 158 'fakarkheda Kaware 159 Dongarllaon 160 Lehellaon
161 162 163 1~4 165
166 167 168 169 170
Husenpur Rasanpur Kumbharpon Bk. Pardi .' Wadner-Ganilai (E) .. ,
Umri Mamdabad Kubed Umri Itabilrpur Gavanwadill Telkhed
Po
Po
Rly.
Po
RPo
Po
1" M M M p
p p P M
p
M M
p P p
171 172 173 174 175
Katkhed Warud Bk. Yeoda (E) Jtki Rajkhed
Po RPo
.. Po
P H M P
176 177 178 179 180
181 182 183 184 185
¥erandllaon Jogarwadi Antargaon Sagarwadi Bhuras Ramapd
Sanglud Sonkhas Pimplod Ghodchadi Pimpalkbuta
186 Kharsangalud 187 Khurasanpur 188 Sasan Bk. 189 S"san-Ramapur 190 Adula
191 Jainpur 192 Pathar-vira 193 sattaddarpur 194 Bhamod 195 KaJampur
196 Lotawada 197 Mhaispur 198 Nandrun 199 Samada 200 Eklara Bhamod
201 Chandkhed 202 Sukli 203 Rarnagad 204 Saundali-Hirapur 205 Sonkhed
206 Chandola 207 Karatkheda 208 Ramtirtha 209 Lasur 210 Tonllalabad
211 Bhuikhed 212 Lchitkhed 213 Dhamana Kh 214 Rustaropur 2H Nalwada
216 Mulfatabad 217 Nardoda 218 Matargaon 219 Chendakapur 220 Aiampur
221 Shikandarpur 222 Mabuli :a23 ·Nandura 224 Arala :a25 Borala
RPo
Po
P
P
M
M P p
RlY·po. M P
Po P RPo M
Po
Po R
R
Po
R
Po R
1'0 RPo Po
p
:M P
M M P P
P P
P P M P P
P M
P P H
M M M P
j(iv 1.4 60 77 W 1.3 158 IS! Riv W Tue. 3.6 182 186 Riv W Sun. 2.0 11' 113 W 1.0 68 90
Riv W 1. I 49 SO Riv W Mp 1. 7 150 ISO W 2.2 82 82 W 1.5 76 76 Riv W 1. 7 114 115
Riv RivW W RivW RivW
W RivW RivW W W
W
Mp
Mp
Mp
Mp Mp .~
RivW .. W Mp WNx RivW
RivW
ruv x Wx Tk
W Riv W hlp RivU W
Rlv W W Mp RivWMpD
ru~,:
SUIl.
Th'U.
Sat.
Tue. Wed. The.
Riv x F;i: W MpD Riv x .. Tue. WTk x .. W W MpD
RivWx Riv x Tk x W Riv
Riv
2.1 1.7 0.7 08
14.1
2.3 0.8 2.6 2.4 1.0
0.9 3.6
18.7 3.8 0.8
80 114
39 28
863
198 54
216 103 35
80 114
49 38
863
20a 61
252 106 43
37 31S 351 351
1,067 1.276 197 205 80 87
1.4 53 60 0.4 Uninhabited. 2.2 85 96 1.0 25 25 0.7 37 37
6.5 302 302 1.1 2020 6.3 443 522 2.4 87 88 1.0 61 61
0.2 Uni1lhabiltd. 1.2 113 1t3 1.5 180 180 2.6 223 223 1.9 216 236
1.3 249 289 1.2 30 32 1.0 Uninhabited. 5.8 226 232 I. 3 131 169
4.6 210 210 1.4 76 100 4.4 157 176 3.2 196 200 0.8 Uninhabited.
0.8 27 32 2.0' 140 140 1.2 57 67 2.1 45 45 0.7 29 33
RivW Mp RivW Mp RivW RivW Mp
Tue. 2.1 1.4 4.7 3.5 1.1
100 134 280 133 184
110 140 326 161 198
Riv w W Riv RivW
Riv W Riv Riv
Riv Riv WTk W
hlp Fri.'
1.3 0.3 0.7 o 6 2.4
30 38
I 66
154
30 SO
1 75
158
O. 3 Uninhabited. 3.2 193 196 2 7 71 73 5.8 687 695 0.6 9 9
1 .0 Uninhabited. Mp 2.5 150 151 Mp 1.9 96 . 97
Sun. I. 7 93 94 Wed. 1.0 108 111
349 681 787 554 419
226 615 418 366 846
323 536 175 175
3.967
939 243
1,075 459 211
IS) 1,576 5,887
868 357
305
420 115 204
1,455 78
2,386 402 283
473 815 967
1,048
1,138 159
1,057 698
941 452 852 907
152 526 297 236 156
479 656
1,440 681 750
J72 194
1 344 748
978 389
3,140 33
709 416 460 513
172 345 390 269 212
120 360 213 175 454
172 270
88 91
2,017
496 124 557 239 117
88 806
3,007 441 191
141
217 67 96
748 46
1.202 186 147
243 409 480 570
580 82
558 407
492 227 414 452
85 267 150 104 76
256 359 735 363 397
87 95
I 170 396
503 201
1,629 19
352 222 236 253
177 336 397 285 207
106 255 205 191 392
151 266
87 84
1,950
443 119 518 220
94
65 770
2,880 427 ltiti 164
203 48
108
707 32
1,184 216 136
230 406 487 418
558 77
499 291
449 225 438 455
67 259 147 132 80
223 297 705 318 353
85 99
174 352
47S 188
1.511 14
357 194 224 260
Scheduled Scheduled Castes Tribes
M F M F
(14) (15) (16) (17)
13 1
30 4 3 2
46
45
99
34 It 68
6
2
4
20 8
77
4
43 7
16 66
81 4
20 4
40 3
31 6
16 6
18
29 12 93
I 32
5
ii 13
29
92
16 12 2 1
'9 1
29 3 2 :2.
52
46
93 22
5 66
4
277 12
5
22 7
66
3
39 4
13 66
81 I
23 2
41 4
34 10
10 4
19
29 7
89 4
32
5
13 10
19
liZ
27 14
1 4
Literate and educated
M F
(18) (19)
75 200 178 106 102
66 149 108 64
174
87 91 58 34
1,005
266 55
254 126 37
25 371
1,385 264 70
41
81 29 38
286 25
614 81 61
97 234 240 258
201 24
259 159
222 95
198 198
30 133 S6 4~ 17
88 142 351 162 177
23 35
1 59
210
217 99
806 19
187 98
145 146
30 79 68 40 30
23 52 46 32 46
32 38 22 10
421
103 19 86 39 10
S 121 640 92 31
12'
1~' 10 13
115 5
183 33 23
44 90 94
112
78 10
129 34
84 29 95 74
17 40 30 .23
2
30 40
120 58 S9
7 8
i4 7E

59
4 DAR.YAPUR TALUKA
WORKERS
Total workers NON-(I - IX) 11 III IV V VI VII VIII IX WORKERS
M F MFMF M F MF lIolF MF lIlF MP M F M F Ser:al No,
(lO) (2l) (22) (23) (24) (25) (26) (27) (28) (29) (30) (31) (32) (33) (34) (35) (36) (37) (38) (39) (40) (41) (I)
------------------------------------------------------------------------------------------------
109 194 207 168 119
64 227 119 97
251
101 167 53 47
1,197
280 72
323 154 61
,46 479
1,657 256 113
34 149 188 131 90
32 119 89
101 211
66 120
32 45
623
169 58
260 108 48
31 366 923 177 80
90 92 Uninhabit.d,
134 97 35 21 54 46
441 335 l4 15
735 526 105 108 94 53
U""""ablt~d, 134 90 218 154 287 20S 343 164
371 287 42 42
Uninhabited, 329 213 255 162
320 143 121 134 248 214 260 187
UII;nhabiled.
46 140 90 70 43
21 87 51 22 27
132 145
149 215 441 223 213
, 306
54 55
;; 218
U.i1lhabite4,
163 195
20 42
70 101
28; 184 119 81 888 586
10 5
Unillhabited, 199 128 128 74 137 63 155 125
43 52 62 47 21
10 v5 24 23 102 125 47 123 141 16 liS 115 9 C03 1i0
32 12 19 19 90 13 126 106 41 26 50 62 24 17 72 84 56 31 179 1&4
57 21 43 41 42 15 110 105 19 3 31 29 8 I 33 39
359 114 583 481
85 15
108 39 34
11 95
415 45 29
25
42 13 9
125 2
214 47 32
10 154 1511 5 50 j2
70 173 186 4 113 104
19 22 2!1
35 31 11 355 352 44 855 829
9 191 165 13 75 65
17
15
'j
66 1
79 6 7
62
71 21 42
286 13
420 51 52
74
82 21 45
l68 13
436 102 45
26 6 94 82 98 50 99 104
103 37 160 168 95 25 194 135
57 9
74 59
143 26 87 74
21 77 43 30 23
30 266 244 32 42
32 217 IS! 19 168 143
8 150 133 23 93 111 52 143 161 29 154 156
9 22 12 10 55 n
47 51 39 22 18 27
40 30 97 102 31 4 149 133
117 27 243 270 78 43 127 120 97 38 149 152
27 13
38 76
69 45
261 3
74 45 84 68
17 36
48 107
17 40
64 92
6 171 170 8 69 73
55 454 486 3 4
22 21 10 49
102 52 41 64
102 53 52 75
2 , 5
, 5
3
2
34
14
17
4 1
2
1 9
13
2 9
10 1
2
5
16
'~
2
5
4
19 1
7 3
6
2 1 6
6
5 4S
13 2
14
21 62
7
2
8 4
23
'6
4 6 4
10
21
1~ I
14
'j :!
2 2
4 30 10 17
4 I
3 11
11 I
49 2
6 9 2 4
RUaAL AREA· -conti,
2
5 9
3 17
1 2
2
3
2
2 2
4
16
4
2 I 2 2
2
19
26 1 3
12
1 4
10
5 1
3 10
',4 2
6 1
9 1
3
2
4 1
5
20
7
2
2
4
2
2
14 2
4
2
49
9
14
6 94
4
5 1
12 2
I 3 4 7
7
3
2 8
9 9 1 4
g t
27
2 3 3 3
2
10
1 25
1
, i 3
2
6
2
I 16 13 • 11
I 7
17 I 5
4 6 3 1
99
18 5
14 2 5
1 146
7 6
2
13 3
47 4 3
8 10 11 25
17
11 7
9 2
11 7
I 2
10 7
21 6 6
2 1
fl 16
8 3
66 I
12 18 7
11
5
1 1 4
26 3 2
5
3
8
1 6
1
9
, i
63 151 183 101 93
56 133 94 711
203
143 151 187 152 209 153 154 154 117 155
74 156 136 157 116 158 90 159
175 160
64 85 161 103 146 152 35 55 163 44 39 164
820 1,327 165
216 52
234 85 56
42 327
1,350 185 78
51
83 32 42
307 22
467 81 53
109 191 193 227
20'1 40
229 152
172 106 166 192
39 127 60 34 33
107 144 294 140 124
33 40
I 73
178
222 82
741 9
153 94 99 98
274 166 61 167
258 168 112 169 46 170
34 171 404 172
1,957 173 250 174
86 175
72
106 27 62
372 17
658 108 83
176 177 178 179 180
181 182 183 18. 185
186 140 187 252 188 279 189 314 190
271 191 35 192
193 286 194 129 195
306 196 91 197
224 198 268 199
200
46 201 172 202 96 203
110 204 53 205
91 206 152 207 39? 20g 155 209 158 210
65 57
104 251
211 212 213 214 215
216 291 217 107 218 925 219
9 220
229 120 161 135
221 222 213 224 225
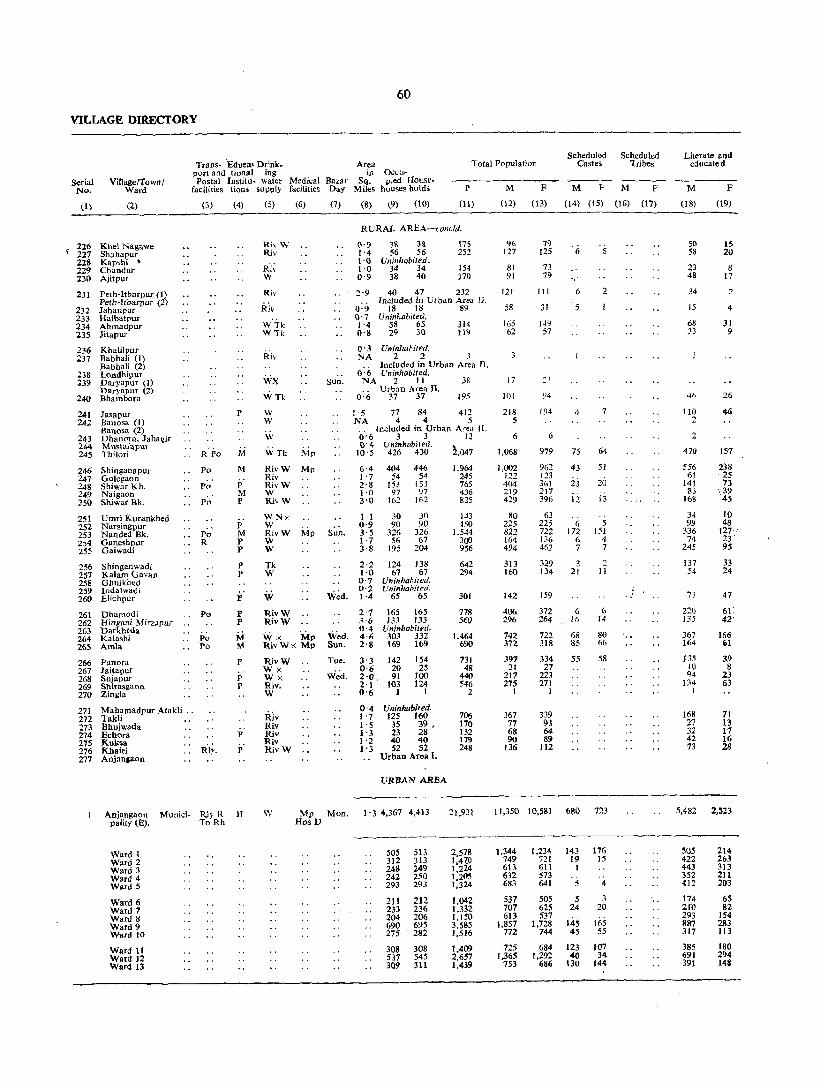
VILLAGE DIRECTORY
Serial No.
Village/,foWIlI Ward
Trans- 'Eduea- Drink_ port and tional ing Postal Instilu- water
facilities tions supply
60
Area in Ooell-
Medical Bazar Sq. pied House-faciUties Day Miles houses holds
T DIal Population
P M F
Scheduled Castes
M F
Scheduled 'Tribes
M F
(I) (2) (3) (4) (5) (6) (7) (8) (9) (10) (11) (12) (13) (14) (15) (16) OJ)
226 Kllei Nagawe 227 Shahapur 228 Kapshi • 229 ChandUl' 230 Ajitpur
231
232 233 234 235
236 ;;!37
238 239
240
Peth-Itbarpur (1) Peth-ftbarpuf (2) Jahanpur Haibatpur Ahmadpur Jitapur
Khalilpur Babhali (1) Babhali (2) Londhipur Daryapur (I) DaryapuT (:n Bhambora
241 Jasapur 242 Banosa (I)
Banosa (2) 243 Dhanora. Jahagir
P
2~ Mustafapur 245 Thilori RPo M
246 Shinganapur 247 Golegaon 248 Shiwar Kh. 249 Naigaon 250 Shiwar Bk.
251 Umri Kurankhed
Po
Po
Po
252 Narsingpur 253 Nanded Bk. 254 Ganeshpur 255 Gaiwadi
Po .. R
256 Shinganwadi 257 Kalam Gavan 258 Ghuikh.d 259 Indalwadi 260 Elichpur
261 Dhamodi 262 Ringalli Mifz~pur 263 Darkhtda 264 Kalashi 265 Amla
266 Panora 267 Jaitapur 268 Sujapur 269 Shira.gaon 270 Zingla
271 Mahamadpur Atakli .. 272 Takli .. 273 Bhujwada 274 Echora
Po
275 Knksa 276 Khairi . . RIY. 277 Anjan,aon
M
P M P
P M P P
P P
j;
p p
M M
P
P r
Anjangaon Munici- RJy R Ii paUty (E). To Rh
Ward 1 Ward 2 Ward 3 Ward 4 Ward 5
Ward 6 Ward 7 Ward 8 Ward 9 Ward 10
Ward 11 Ward 12 Ward 13
RiYW Riv
R·i~' W
Riv
Riv
W'Tk WTk
Sun.
RURAL AREA-conc/d.
0'9 38 38 1 '4 56 56 \'0 Uninhabited. 1 '0 34 34 0'9 38 40
17S 252
154 170
2'9 40 47 232 Included ;n Urban Area II.
0'9 18 18 89 O' 7 Uninhabited. 1'4 S8 65 314 0'8 29 30 119
o· 3 UninhaNted. NA 2 2 .1
Included in Urban Area II. 0'6 Uninhabited.
NA 2 11 38
o:i; U~br .l>3e.;, n. 195
96 127
81 91
121
58
165 62
17
WI
WX
WTk W 1'5 77 84 412 218 W NA 4 4 5 5
" Included in UrbaJ'l Area II. W 0'6 3 3 12 6
WTk "Ip RivW Mp Riv
I)' 0\ UninhabiteQ. , 10' 5 426 430 2.047 1,068
6,4 404 446 1'7 54 54
RivW 2'8 153 153 W 1'0 97 97 RivW 3'0 16:? 162
W N>: 1 '1 30 )0 W 0·9 90 90 Riv W Mp SUD. 3·5 326 326
56 67 W 1·7 W 3·8 195 204
Tk W
VI RivW RivW
Wx 'hlp RivWx Mp
RivW Wx Wx Riv. W
Rlv illv Riv Riv RivW
Wed. SUD.
Tue.
vi~d.
2,2 124 138 1·0 67 67 0·1 Uninhabited. 0·2 Uninhabited. 1 ·4 65 65
2'7 165 165 3'6 133 133 0'4 Uninhabited. 4·6 303 332 2'8 169 169
3'3 142 0'6 20 2'0. 91 2'1 103 0'6 1
154 25
100 124
I
0'4 Uninhabited. 1'7 125 160 1'5 35 39 • 1-3 23 28 1'2 40 40 1'3 52 52
Urban Area I.
URBAN AREA
1.964 245 765 436 825
143 450
1,544 3(J() 956
642 294
301
778 560
1.464 690
731 48
440 546
2
706 170 132 179 248
1,002 122 404 219 429
80 225 822 164 494
313 160
142
406 296
742 372
397 21
217 275
1
367 77 68 90
136
79 125
73 79
III
31
149 57
~l
94
194
6
979
962 123 361 217 396
63 225 722 136 4~2
329 134
159
372 264
722 318
334 27
223 271
1
339 93 64 89
112
6
6
5
4
75
43
i:i ii
6 172
6 7
3 2J
6 16
68 85
55
6
2
64
51
20
13
5 151
4 7
2 II
6 14
80 66
58
w Mp Mon. 1'3 4,367 4,413 21,931 11,350 10,581 680 723 HosD
50S 513 312 313 248 249 242 250 293 293
20 212 233 236 204 206 690 695 275 282
308 308 537 545 309 311
2,578 1,4~O 1.2..:4 1,205 1,324
1,042 1,332 1,150 3,585 1,516
1,409 2,657 1,439
1,344 749 613 632 683
537 707 613
1.857 772
725 1,365
753
1,234 143 176 721 19 15 611 I 573 641 5 4
50S 5 3 625 24 20 537
1,728 145 165 744 45 55
684 123 107 1,292 40 34
686 130 144
. J
Literate and educated
M F
(18)
50 58
23 48
34
15
68 33
46
110 2
2
470
556 61
141 83
168
34 99
336 74
245
137 54
73
220 135
367 164
135 10 94
134 I
168 21 32 42 73
(19)
15 20
8 17
2
4
31 9
26
46
157
238 , 25 73
\ 39 45
10 48
127' ' 23 9S
33 24
47
61'. 42'
166 101
39 8
23 63
71 13 17 16 28
5,482 2,523
505 422 443 352 412
174 21'0 293 887 317
385 691 391
214 263 313 211 203
65 82
154 283 113
180 294 148
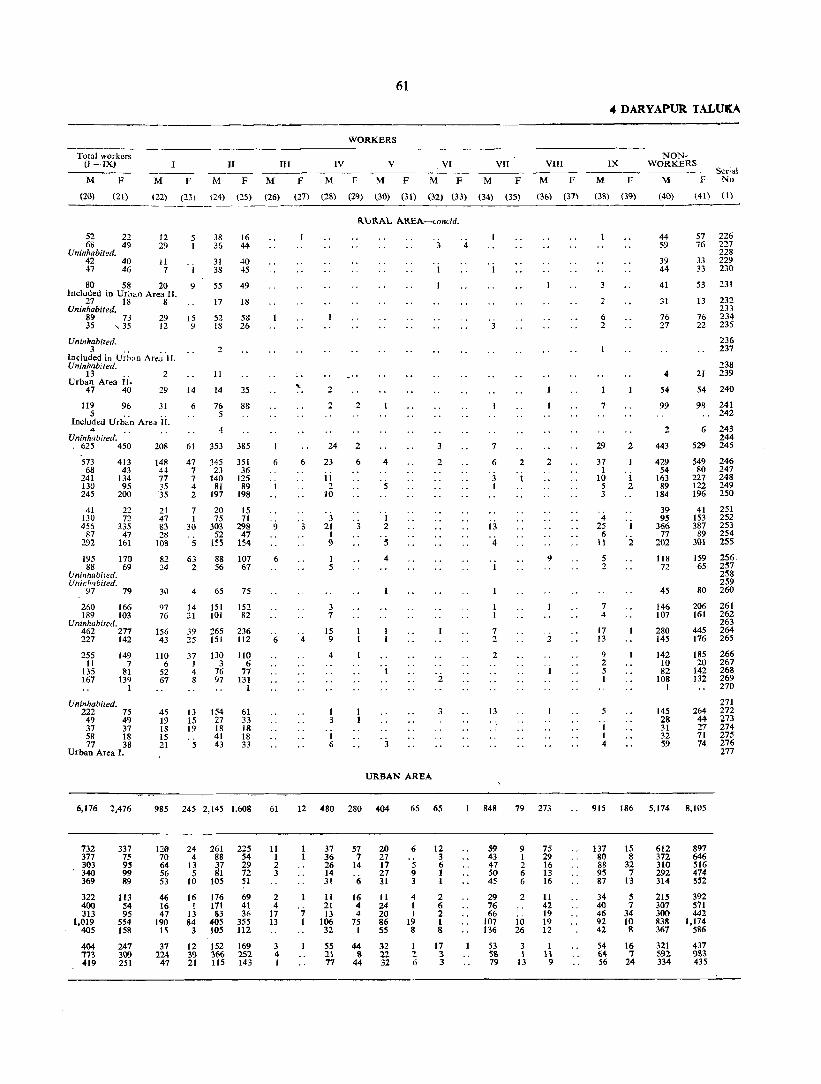
Total workers (l -IX)
M F M F
II III
M F M F
61
WORKERS
IV V
M F M F
. VI VII VIII
M F M F M F
4 DARYAPUR TALUKA
IX
M F
NONWORKERS
M F
(20) (21) (22) (23) (24) (25) (26) (27) (28) (29) (30) (31) (32) (33) (34) (35) (36) (37\ (38) (39) (40) (41) (1)
---
52 22 68 49
Uninhabited. 42 40 47 46
12 29
II 7
5 I
38 16 36 44
31 40 38 .. 5
80 58 20 9 55 49 Included in Urilan Area II.
27 18 8 17 18 Uninhabited.
89 73 29 15 52 58 35 ,,35 12 9 18 26
Uninhabited. 3 .. ..
Induded in Urban Area II. Uninhabited.
13 .. 2 Urban Area II·
11
47 40 29 14 14
76
25
119 96 31 5 " ..
Included Urban Area II. 4
Uninhabited. 625 450
573 68
241 130 245
41 130 456
87 292
413 43
134 95
200
22 72
335 47
161
195 170 88 69
Uninhabited. Unil:/1flbited.
97 79
260 166 189 103
Uninhabited. 462 277 227 142
255 11
135 167
Uninhabited.
149 7
81 139
I
222 75 49 49 37 37 58 18 77 38
Urban Area I.
208
148 44 77 35 35
21 47 83 28
108
82 24
30
q7 76
156 43
110 6
52 67
45 19 18 15 21
6 88 5
4
61 :353 385
47 345 351 7 23 36 7 140 125 4 81 89 2 197 198
7 20 15 1 75 71
30 :303 298 52 47
5 155 154
63 2
88 107 56 67
4 65 75
14 151 152 21 101 82
39 265 236 25 151 112
37 130 110 136 4 76 77 8 97 131
13 154 15 27 19 18
41 5 43
1
61 33 18 18 33
6,176 2,476 985 245 2, 145 1,608
732 377 303 340 369
322 400 313
1,019 405
404 773 419
337 7~ 95 99 89
113 54 95
554 158
247 309 251
120 70 64 56 53
46 16 47
190 15
37 224
47
24 4
13 5
10
261 88
~i 105
225 54 29 72 51
16 176 69 171 41
13 83 36 84 405 355
3 105 112
12 152 169 39 366 252 21 115 143
6
9
6
6
61
11 I 2 3
2 4
17 .13
3 4 1
;.
6
4
2
2
24
23
11 2
10
3 21
1 9
1 5
3 7
15 9
4
1 6
RURAL AREA-concld.
2
2
6 4
5
1 2
5
4
3
URBAN AREA
3
3
2
3
12 0480 280 404 65 65
7 1
37 36 26 14 31
11 21 13
106 32
57 7
14
6
16 4 4
75 1
20 27 17 27 31
II 24 20 86 55
55 44 32 21 8 22 77 44 32
6
5 9 3
4 1 I
19 8
12 3 6 1 1
2 6 2 I 8
1 17 2 3 6 3
4
7
6
3 1
13
'4
7 2
2
13
",
848
59 43 47 50 45
29 76 66
107 136
53 58 79
2
1
2
9
2
79 273
9 1 2 6 6
2
10 26
3 1
13
75 29 16 13 16
11 42 19 19 12
1 H
9
3
2
6 2
7
29
37 1
10 5 3
4 25
6 II
5 2
7 4
17 13
9 2 5 1
1 1 4
2
1 2
44 59
39 44
41
31
76 27
4
54
99
2
443
429 54
163 89
184
39 95
366 77
202
118 72
45
146 107
280 145
142 10 82
108 I
145 28 31 32 59
57 226 76 217
228 33 229 33 230
53 231
13 232 233
76 234 22 235
236 237
238 21 239
54 240
98 241 242
6 243 244
529 245
549 246 80 247
227 248 122 249 196 250
41 251 153 252 387 253 89 254
301 255
159 256 65 257
258 259
80 260
206 261 161 262
263 445 264 176 265
185 266 20 267
142 268 132 269
270
271 264 272
44 273 27 274 71 275 74 276
277
915 186 5,174 8,105
137 80 88 95 87
34 40 46 92 42
15 8
32 7
13
5 7
34 10 8
54 16 64 7 56 24
612 372 310 292 314
215 307 300 838 367
321 592 334
897 646 516 474 552
392 571 442
1,174 586
437 9S3 435

62
VILLAGE DIRECTORY
Scheduled Scheduled IJterato and Traos- Educa- Drink- At ... Totall'opulation Castes Tribes educate4
pornm<t tional ina in Occu-s.ria1 ViUailo/Townf Postal lrtlItIt\\- water Medicall!Auar Sq. pied House N". Ward facilitiea dollS Ilupply facilitHl Day Milos hou ... holdi P M F M F M F M F
(O (2) (3) (4) (5) <D) (1) (I) (9) (10) (11) (12) (13) (14) (IS) (16) (17) (18) (19)
URBAN ARJilA-concili.
11 It DaryapU1' Banosa Rly. C lth' WX Mp 'flo". 1'0 3,111& 3,260 :5,182 7,945 7,237 699 712 4,430 2,103 wticipality (E). R To Ho.
Rk D
Ward 1 346 360 1,4&3 774 7('1) 90 92 523 31S Ward 2 457 468 2,359 J,228 1,131 150 204 545 250 Ward 3 218 223 1,138 582 556 50 58 255 146 Ward 4 207 207 1,045 545 500 49 26 346 163 Ward 5 23& 243 1,081 552 529 39J 253
Ward 6 266 269 1,237 653 584 54 54 353 180 Ward 7 247 2'5 1,201 664 537 11 16 435 203 Ward 8 264 ::267 1,199 666 533 30 18 477 194 Ward 9 226 ::233 1,036 545 491 138 101 279 78 Ward 10 231 ::241 1,0&2 564 SIS 322 141
Ward 11 .olliS 4'4 2.311 1,172 1,149 127 143 504 laO
r Tot~l----Rural .. 502'7 28,465 30,052 137,284 70,607 66,677 3,353 3,318 33,050 12,823 I I
DAltYA)'\lP. TAl,ultA { Total--Urblln .. 2'3 7,555 7,673 37,113 19,295 17,818 1,379 1,435 9,912 4,626
i LGr~ Total .. 505·0 36,02037,725 174,397 '9,902 84,495 4,732 4,753 42,962 :J'f,44'
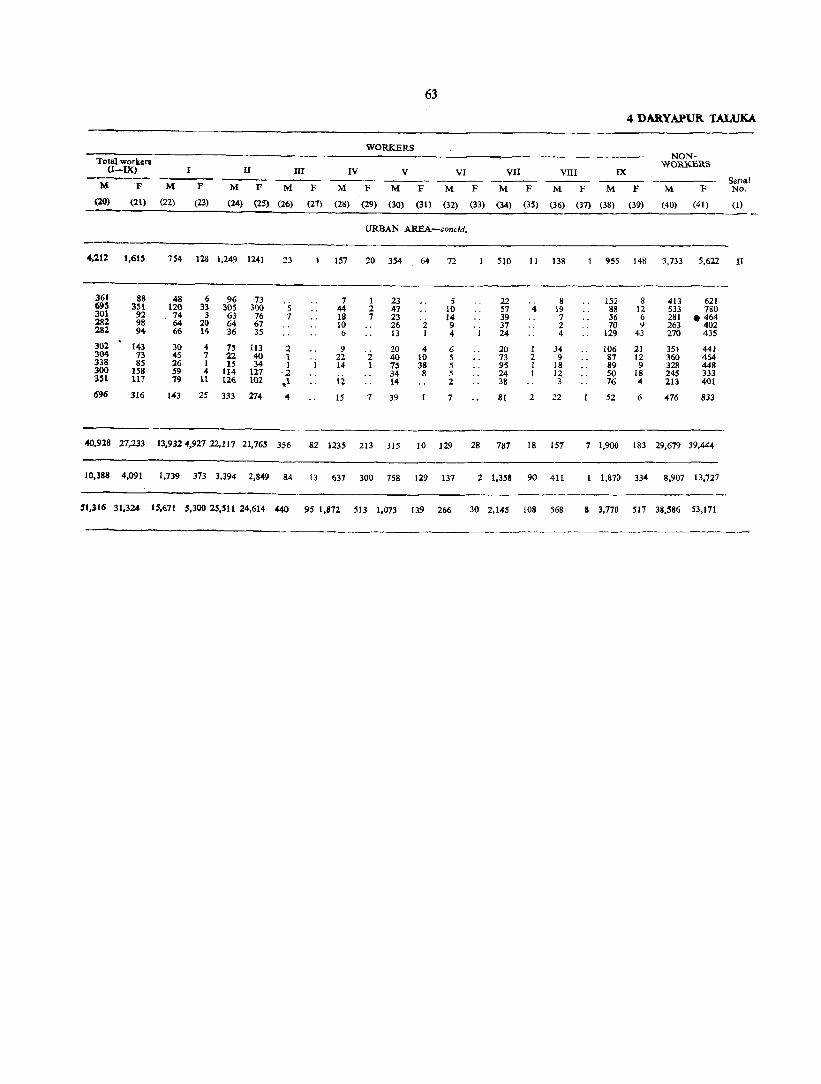
63
4 DARYAPUR TALUKA
WORKERS NON-
Total workers WORKBRS (I-IX) I II III IV V VI VII VIII IX --- Senal M F M F M F M F M F M F M F M F M F M F M F No. (20) (21) (22) e23} (24) (25) (26) (27) (28) (29) (30) (31) (32) (33) (34) (35) (36) (37) (38) (39) (40) (41) (I) ----
URBAN AREA-.:onc/d.
4,212 1,615 754 128 1,249 1241 23 157 20 354 64 72 510 11 138 955 148 3,733 5,622 II
361 88 48 6 96 73 7 1 23 5 22 8 152 8 413 621 695 351 120 33 305 300 5 44 2 47 10 57 4 19 88 12 533 780 301 92 74 3 63 76 7 18 7 23 14 39 7 56 6 281 .464 282 98 64 20 64 67 10 26 2 9 37 2 70 9 263 402 282 94 66 14 36 35 6 13 1 4 24 4- 129 43 270 435
302 143 30 4- 75 113 2 9 20 4 6 20 1 34 106 21 351 44t 304 73 45 7 22 40 1 22 2 40 10 5 73 2 9 87 12 360 464 338 85 26 1 15 34 1 1 14- 1 75 38 5 95 1 18 89 9 328 448 300 158 59 .. 114 127 -2 34 8 5 24 1 12 50 18 245 333 35t 117 79 H 126 102 ~l 12 14- 2 38 3 76 4 213 401
696 316 143 ~.
"-- 333 214 4 15 1 39 1 81 2 22 52 6 476 833
40.928 27,233 13,932 4,927 22,117 21,765 356 82 1235 213 315 10 129 28 787 18 157 7 1,900 183 29,679 39,444
10,388 4,091 1,739 373 3,394 2,849 84 13 637 300 758 129 137 2 1,358 90 411 1 1,870 334 8,907 13,727
51,316 31.324 ",671 5,300 2S,Sll 24,614 440 9S 1,872 513 1,073 139 266 30 2,145 108 568 8 3,770 517 38,586 53,171

Amravati Taluka
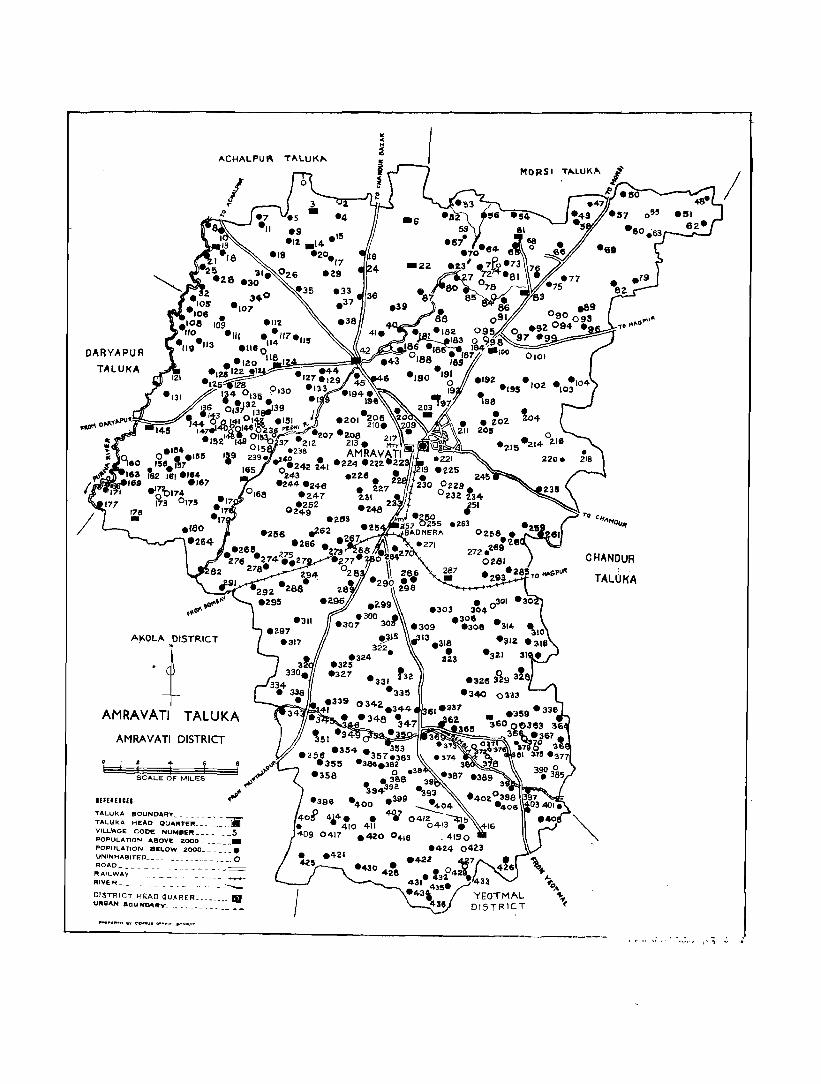
OAFIYAPUR
TALUKA
A~O~ISTR'CT
ACHALPU"
! .! ...
AMRAVATI TALUKA
AMRAVATI DISTRICT
SCALE OF MILES
IEfElUGEI
TALUKA I!IOUNDARV _______ , __
TALIJKA HEAD QU"RTE" ________ I!!I VILL~GE COOl!: NUMflEft _____ ~ _ 5 POF»ULATION A.BOVe: 2000 ______ _
POPULATION I!IELOW 2000 __ ____ • UNINHAEnTEO __________ . ______ . 0 ROAD _ ... _________________ ===
RAILWAY . ________ +++_ RIVE R _ _ _ ________ . _______ ____
DISTRICT Ho;AD QUARER ________ III UIIIBAH aQUN"~"v _______ _
-314-
-312
-321
-326 :8!.l 3!a -340 033~
CHANOUR
TALUKA
L-_____________________________ _
/
'I \ ') ~, '.
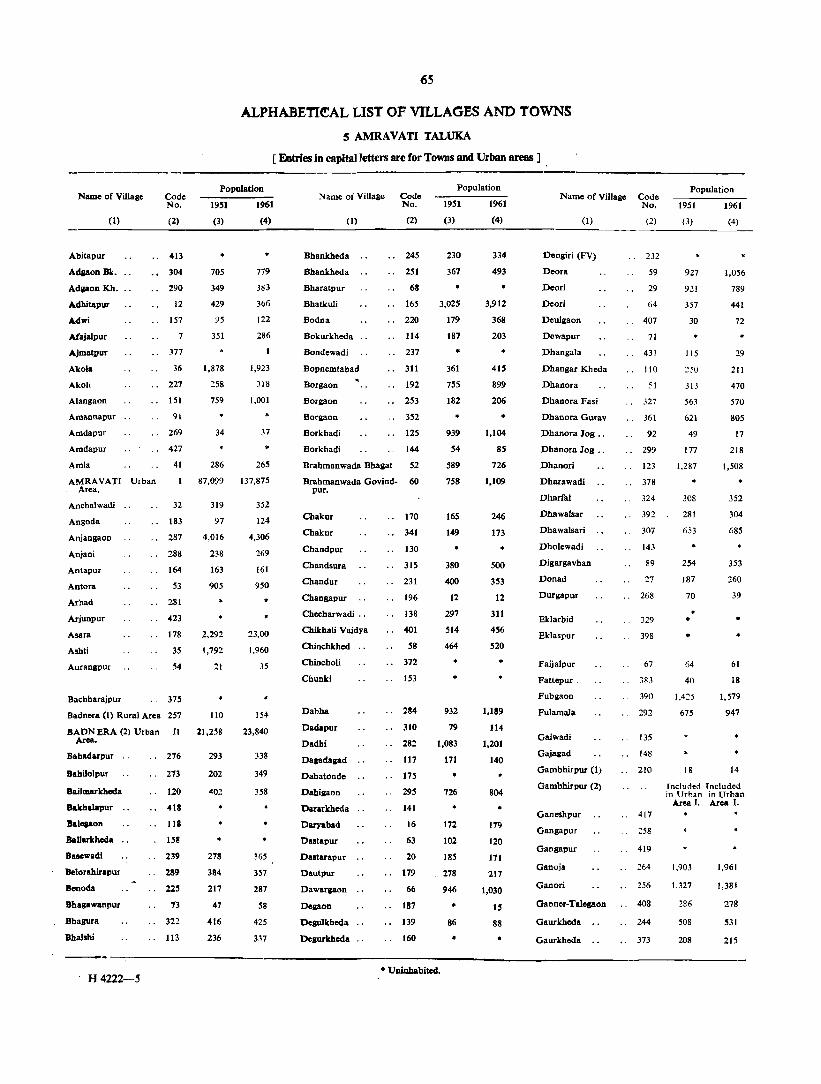
65
ALPHABEn<!:AL LIST OF VILLAGES AND TOWNS
5 AMRAVATI TALUKA
[ Entries in capital letters are for Towns and Urban areas ]
----------------------------------------------------Population
Name of Village Code No.
Population
1951 1961 Name of Village Code
No. 1951 1961 Name of Village Code
No.
(1) (2) (3) (4)
Abitapur
AdaaonBk.
AdponKh.
Adhitapur
Adwi
Afajalpur
Ajmatpur
Akola
Akoli
Alangaon
Amannapur ..
Amdapur
Amdapur
413
)04
290
12
157
7
377
36
227
151
91
269
427
705
349
429
95
351
1.878
258
759
34
779
383
366
122
286
1,923
318
1,001
37
Amla 41 286 265
AMRAVATI Urban 87,099 137,875 Area,
Anchalwadi 32 319 352
Angoda 183 97 124
AnjangaoD 287 4,016 4,306
Anjani
Anlapur
Antora
Arbad
Arjunpur
Asara
Ashti
AuraDgpuf
Bachharajpur
288
164
53
281
423
178
3S
54
Badnera (I) Rural Area 257
238
163
905
2,292
1,792
21
110
BADN ERA (2) Urban II 21,258 Area.
Babadarpur 276 293
Babilolpur
Bailmarkheda
Bakhalapur
Balepon
BaUarkheda
Basewad!
Belorahirapur
Benoda
Dhasa wanpur
Bhagura
Bhalshi
H4222-5
273
120
411
118
158
239
289
225
13
322
113
202
401
278
384
217
47
416
236
269
161
950
..
23,00
1,960
35
154
23,840
338
349
358
~65
357
287
58
425
337
(I) (2)
Bhaukheda
Bhaukheda
Bharatpur
Bhatkuli
Bodna
Bokurkheda
Bondewadi
Bopnemtabad
Borgaou
Borgaon
Borgaon
Borkhadi
Borkhadi
..
245
251
68
165
220
114
237
311
192
253
352
125
144
Brahmaowada Bhagat 52
Brahmanwada Govind- 60 pur.
Chakur 170
Chakur 341
Chandpur
Chaodsura
Chandur
Chaugapur
Checharwadi ..
Chikhali Vaidya
Chinehkhed
Chincholi
Chunki
Dabha
Dadapur
Dadhi
Dasadagad
Dahatonde
Dahillaon
Dararkheda
Dsryabad
Dastapur
Dastarapur
Dautpur
Dawaraaon
Degaon
Degli]kheda
Degurkheda
130
315
231
196
138
401
58
372
153
284
310
282
117
175
.. 295
141
16
63
20
179
66
187
139
160
(3) (4)
230
367
3,025
179
187
* 361
755
182
939
54
589
758
165
149
.. 380
400
12
297
514
464
932
79
1,083
171
726
172
102
185
278
946
86
334
493
3,912
368
203
415
899
206
* 1,104
85
726
1,109
246
173
500
353
12
311
456
520
1,189
114
1,201
140
804
179
120
171
217
1,030
H
88
• UDinhabikd.
(I) (2)
Deogiri (FV)
Deora
Deori
Deori
Deulgaon
Dewapur
Dhangala
Dhangar Kheda
Dhanora
Dhanora Fasi
Dhanora Gurav
Dhanora Jog ..
Dhanora Jog ..
Dhanori
Dharawadi
Dharfal
Dhawalsar
Dhawalsari
Dholewadi
Digargavhan
Donad
Durgapur
Eklarbid
Eklaspur
Faijalpur
Fattepur .
Fubgaon
Fulamala
Gaiwadi
Gajaaad
Gambhirpur (1)
Gambhirpur (2)
Ganeshpur
Gangapur
Gangll.pur
Ganoja
Ganori
Gaoner-Ttlepon
Gaurkheda
Gaurkheda
232
59
29
64
407
71
431
110
51
327
361
92
299
123
378
324
392
307
143
89
27
268
329
398
67
383
390
292
135
148
210
417
258
419
264
256
408
244
373
Population
1951 1961
(3) (4)
927
921
357
30
115
250
313
563
621
49
177
1,287
308
281
653
254
187
70
*
*
64
40
1,425
675
18
1,056
789
441
72
29
211
470
570
805
17
218
1,508
352
304
(,85
353
160
39
61
18
1,579
947
14
[neluded Ineluded in Urban in Urban
Area I. Area I.
1,903
1.327
286
508
208
1,961
1,381
278
531
215
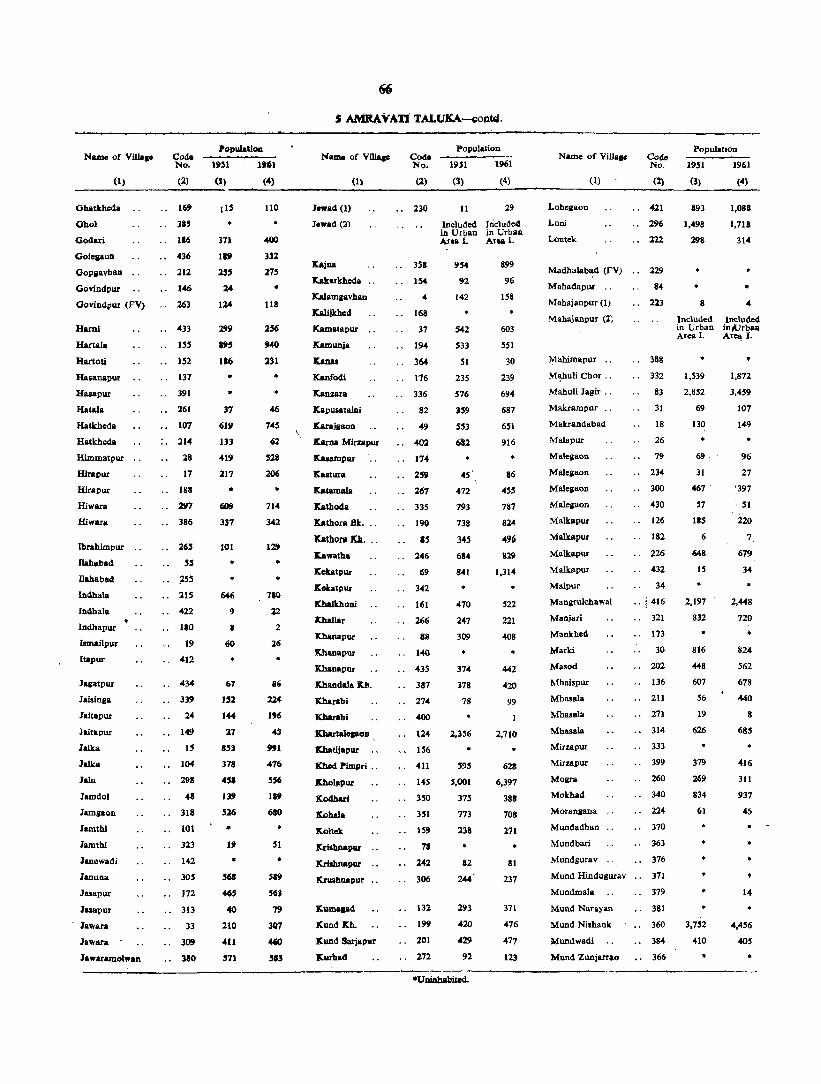
Name of Villa,_ Co4. No.
PopulatiOll
11m U61 Name of Vlllap Co<1.
No. 1951 1961
Populalion Name of Villa,. Co40
No.
Population
1951 1961
______ (I~) ________ (2_) __ ~~) _____ (~~~) __________ ~(1~) ______ ~~=)~ __ (~1)~ __ ~~~) __________ ~(~I) ______ ~n~) __ ~~~) ____ ~~~) __
Ohatkh04a
Ohol
Go4ari
Oolepon
Oopaavhan
Oovindpur
Govindpur (FV)
Hami
Hartala
Hartoli
Huanapur
Hasapur
Hatala
Hatkhe4a
Hatkh04a
Himmatpur
Hirapur
Hlrapur
Hiwara
Hiwara
Ibrahimpur
I1ahaba4
I1ahabaa
In<1hala
In<1hala
Indhapur
Ismailpur
Itapur
J.&atpur
Jaisinga
Jaitapur
Jaitapur
Jallca
Jallca
JUIl
Jam401
Jamllaon
lamthl
Jamthi
lanewadi
Januna
Jasapur
Iasapur
Iawara
lawara
lawaramo}wan
1(i'
385
.. 1&6
436
212
146
.. 263
.. 433
.. ISS
152
131
391
.. 261
107
214
18
17
188
.. 297
386
265
SS
.7S5
21S
422
110
19
412
.. 434
339
24
149
15
104
298
48
318
101
323
142
30S
172
313
33
.. 3~
380
liS
171
119
2" ~
I~
~9
US
186
• •
l7
619
133
419
117
* 60fi
337
101
*
646
9
II
IiO
67
IS2
144
27
as3
378
4S.
139
526
19
SGB
46S
40
210
411
S71
110
4QQ
332
215
118
• •
46
745
62
518
206
• 714
342
l~
• *
710
22
2
26
•
86
224
1'6
45
"I 476
S" II'
680
• 51
• SI9
563
79
307
4lO
503
I_ad (1)
J."ad (2)
ltajna
Jr.altarkheda
Kalamaavh ...
Kalijkhed
Kamatapur ..
Kamunja
Itanas
Kanfodi
Kanzara
lCapusatalDi
lCaraiaaon
Itarna Mirzapllr
ICuampur
ltaatura
lCatamala
lCatho4a
lCathora Bk.
KathoralOi ...
ltawatha
lCebtpllr
lCekatpllr
lChaIkhoni
natlar
lChanapur
Khanapur
IChanapUr
lChandala n. ICharabi
Kbarabi
KlwtaIepas
lChatijapur
Khed Pimpri ..
lChol.pur
JCodhari
Kohala
ltoltck
Krilhnapw
Kriahnapw
lCrushnapur
Kumaplt
lCun4lCh.
lCun4 Sarjapur
lturhad
230
3S1
154
4
168
37
194
364
176
336
82
49
402
174
2" 267
335
190
IS 246
69
342
161
266
88
140
435
387
274
400
124
156
411
145
3'0
l51
159
78
~2
306
132
199
201
272
11 29
Inc1ud04 Included in Urban in Urball »01. Ar .. I.
9'4
92
142
542
533
SI
235
576
359
553
6112
• 45
472
793
738
345
684
841
470
247
309
374
378
78
2,356
595
',001
37:5
773
138
112
244
293
420
429
92
899
96
ISII
603
SSI
30
239
694
687
651
916
86
45S
787
8~
496
829
1,314
522
221
408
* 442
420
99
2,710
628
6,397
388
70S
271
* 31
237
371
476
477
123
Lohe&aon
Lom
Lontck
421
296
222
Madhalabaa (FV) .. 229
Mahadapuc ., 84
Mahajanpur (I) 223
Mahajanpur (l~
Mahimapur .. 388
M~huli Chor ..
Mahuli Jagir .,
Makrampur ..
Makrandabaa
Malapur
Maleiaon
Maleiaon
Malcllaon
Maleiaon
Maikapur
Maikapur
Maikapur
Malkapur
Malpur
Man~ulchawa!
Manjari
Mankhed
Marki
Masod
Mhaispur
Mhasala
Mhasala
Mhasala
Mirzapur
Mirzapur
Mogra
Mokhad
Moranpna
Mundadhan
Mundbari
Mundgurav
Mund Hindugurav
Mundrnala
Mund Narayan
Mund Ni.hank
Mundwadi
Mund Zunjarrao
.. 332
83
31
18
26
79
.. 234
.. lOO
430
.. 126
.. 182
226
.. 432
34
.. i 416
321
173
30
.. 202
.. 136
.. 211
271
314
., 333
399
.. 260
340
224
370
.. 363
376
371
319
381
360
384
366
893
1,4911
298
1,088
1,711
314
• 8 4
Included Inciudc4 in Urban in,urbllA Area I. Area I.
• • 1,539
2,852
69
130
69
31
467
" las 6
648
15
2,191
832
816
448
607
36
19
626
379
269
834
61
•
1,872
3,459
107
149
* 96
27
" '397
, SI
220
7,
679
34
2,448
720
824
562
678
440
8
685
416
311
937
45
14
4,456
405
*
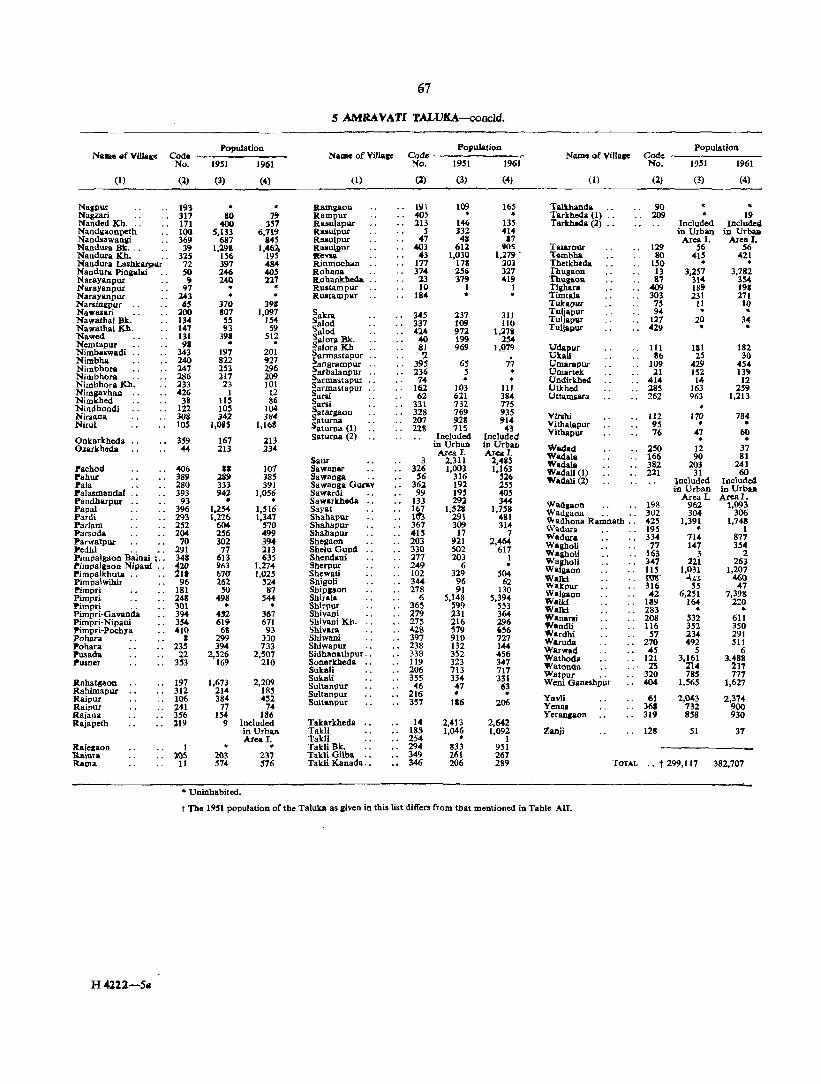
87
5 AMRAVATI TALUKA-concld.
N ....... rViIlllp Population Population Population
Code NaOlC of VillaCC Code N&aM of Vllla&e Code No. 1951 1961 No. 1951 1961 No. 1951 1961
(1) (l) (3) (4) (1) (l) (3) (4) (1) (2) (3) (4)
NallPU< 193 RanliaOIl 19l 109 165 Talkhanda. 90 • Nagzari 317 80 7~ Rampur 405 • Tarkheda (I) 209 • 19 Nauded Kh. 171 400 3S7 Ruulap .... 213 146 135 T arkheda (2) Included Included Nandl!;aonpetb. . 100 S,133 6,119 Rallulpur 5 332 414 in Urban in Urbaa Nandsawanlli 369 687 845 Raaulpur 47 48 .7 Area 1. Area I. Nandura Bk ... 39 1,298 1,~ Raauljlnr -403 612 <jOS TalarPur 129 56 56 Nandura Kh. 32S 156 195 ~VllIl 43 1,030 1,279 . Tembh& 80 415 421 Nandura Lasbkarpllf' . 72 397 484 Rinmoch&n 177 17. 203 Thetkheda ISO • * Nandura Pinllalal .. SO 246 405 Rohana 374 aSCi 327 ThugaoD 13 3,257 3,782 Narayanpur 9 240 227 Rohankheda. 23 379 419 Thui&Oll &7 314 354 Narayanpur 97 • • R .... tampur 10 1 1 Tla;har. 409 189 191 Narayanput :143 • R .... tawp .. r 184 Timtala 303 231 27l NarsiniPUI 65 370 39. Tukapw: 75 II 10 Nawasari 200 807 1,097 Sana 345 237 311 Tuljapur 94 · · Nawathal Bk. 134 55 154 ~aIOd. 337 109 110 Tuljapur 127 20 34 Nawathal 10>. 147 93 59 SBlod. 424 972 1,27& Tuljapu< 429 • • Nawed 131 39& 512 40 199 254 Nemtapur 9& • . S"lora Bk.
alora Kh 81 969 1.979 lJdaplU 111 III 182 Nimbaiwadi 343 197 201 ~ .. rmastapur .'2 UItaH 86 25 30 Nimbha 240 822 927 i7 Nimbhora 247 253 296 angrampur 395 65 Umarapur 109 429 454
Nimbhora 286 :117 209 ~arbalanpur 236 5 Umartek 21 152 13~
Nimbhora Kh· .. 233 23 101 armastapur 74 Undirkbe4 414 14 12
Nimgavhan 426 1 12 ~arIJ?llstapur 162 103 III Utkhed 285 163 259
Nimkhed 38 115 86 S:~ 62 621 384 UttaDljara 262 963 1,213
Nindhondi 122 105 104 331 732 775
Niriana 308 342 384 ~atarjaon 328 769 935 Virohi 112 170 784 207 928 914 Nirul 105 1 ,OilS 1,168 S:~=(l) 228 715 43 Vithalapur 95 • • Vithapur 76 47 60
Onkarkhed" 359 167 213 Saturna (2) Included Included • • O~arkheda 44 213 234 in UrbSll in Urban Wadad 250 12 37 Area I. Area I. Wa4a1a 166 90 81 Saur 3 2,311 l,4i5 Wadala 382 203 241 Pachod 406 II 107 Sawan ... 326 1,003 1,163 Wadali(l) 221 31 60 Pahur 389 J81l 385 Sawanga " 56 316 '26 Pala 280 333 391 Sawanga Gurav 362 192 255 W.4ali (2) Included Include4 Palasmandal 393 942 1,056 Sawardi 99 195 405 in Urban in Urb .. Pandharpur 93 • • Sawarkheda 133 292 344 Area l. Area I. Papal 396 1,254 1,516 Sayat 167 1,528 1,758 Wad.aon 19S 962 1,093
Pardi 293 1,226 1,347 Shahapur 1\f3 291 481 Wadgaon .. " 302 304 306
Parlam 252 604 570 Shahapur 367 309 314 VVadhona Ramnath .. 425 1,391 1,748
Parsoda 204 256 499 Shahapur 41S 17 7 Wadura 195 • 1
Parwatpw- 70 302 394 Shegaon 203 921 2,464 WIld.ura 334 714 877
Pedhi 291 77 213 Shelu Gun" 330 S02 617 Wlll!;holi 77 147 354
Pimpalgaon B"ainai ;~: 348 613 635 Shendani 277 203 1 Wallholi 163 3 2
Pimpa1llaon Nipaai .. 420 963 1,274 Sherpur 249 6 Waaholl 347 221 263
Pimpalkhuta :2lt ~7{J 1,025 Shewati 102 329 504 Walgaon 115 1,031 1,207
Pimpalwib.lr 96 262 524 ShigoJi 344 96 62 Walld I.Uir ~l:L 460 I"impri 181 '0 87 Ship,aon 278 91 130 waltpur 316 55 47
Pimpr; 248 498 544 Shirai. 6 5,148 5,394 Walgilon 42 6,251 1,398
Pimpri .. 301 • Shlrpur 365 599 553 WalId 189 164 2:0
Pimpri-Gavanda 394 4'2 367 Sh;vani 279 231 364 Walld 283 • Pimpri-Nipani 354 619 671 Shivani Kh. 275 216 296 Wanani 208 532 61t
Pimpri-Poch18 410 68 93 Shiv.ra 428 579 '56 Wandli 116 352 350
Pohara I 299 330 Shiwani 397 910 727 Wardhi 57 234 291
Pohara 23S 394 733 Shiwapur " 238 132 144 Waruda 270 492 511
Pusada 22 2,526 2,507 Sidhanathpur .. 338 352 456 Warwad 4S 5 6
Pusner 353 169 210 Sonarkheda 119 323 347 Wathocia 121 3,161 3_488
Sukali 206 713 717 ""atonae. 75 714 237
Sukali 355 334 331 Watpur .. 320 785 777 Rahat~a.on 197 1,673 2,209 Sultanpur 46 47 63 Weni Ganeshpur 404 1,565 1,627 Rahimapur 312 214 185 Sultanpur 216 • • Raipur 106 384 452 Sultanpur 357 1&6 206 Yavli 61 2,043 2,374 Raipur 241 77 74 Yenal 368 732 900 Rajana 3S6 154 186 Yeranaaon 319 858 930 Rajapeth 219 9 Included Takarkheda 14 2,413 2,642
in Urban Takli 185 1,046 1,092 Zanji 128 51 37 Area I. Takli 254 • 1
Kajelaon I • Takli Bk. 294 833 951 Itaim" 105 203 237 Takli Gitba 349 261 267 Rama It 574 576 Takli Kanada: : 346 206 289 TOTAL .. t 299,117 382,707
• Uninhabited.
t The 1951 population of the Taluka as liven in this list differs from that 11lentioned in Table AIL
H4121-Se
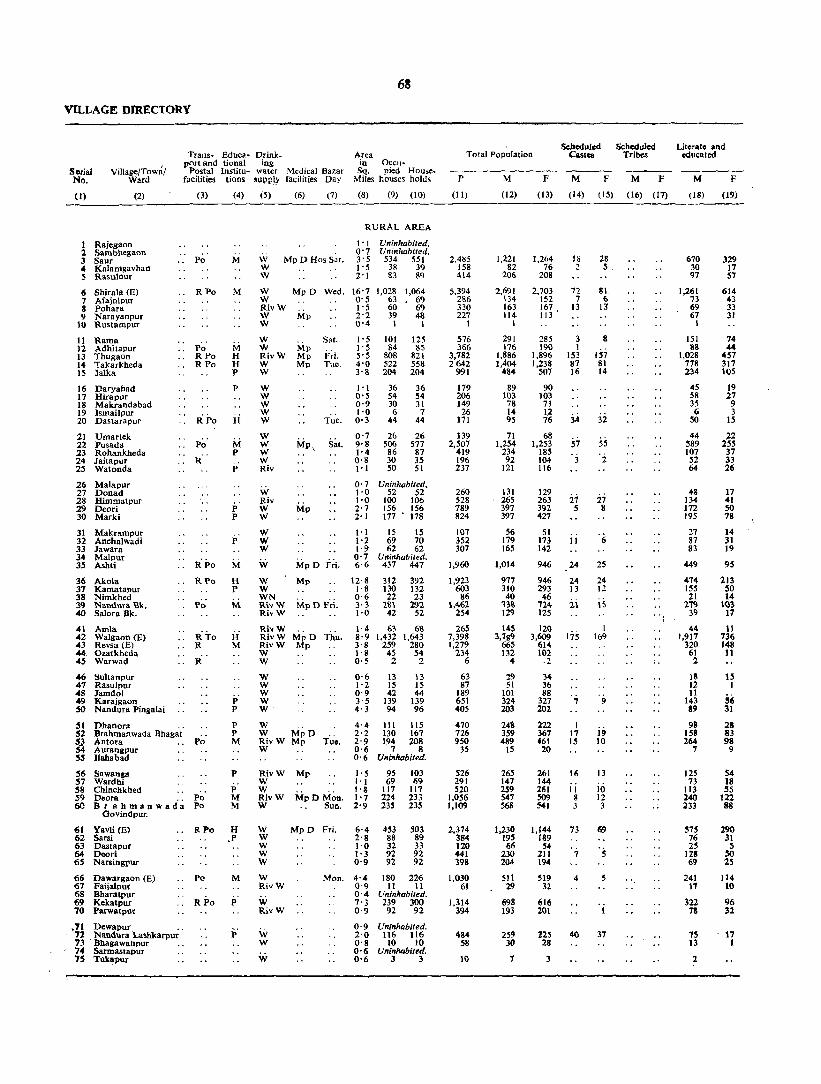
VILLAGE nmECTOR'\'
Vill.ge/Tow~1 Ward
Trans- Educa- Drink· port and tiona I ing
Postal Institu- water Medical Bazar facilities tions sUllply facilities Day
Serial No.
(I)
1 Rajegaon
(2)
2 Sambhegaon 3 Saur 4 KalaIIlgavhan 5 Rasul1>ur
6 Shirala (E) 7 Afajalpur 8 Pohara 9 Narayanpur
10 Rustampnr
11 Rama 12 Adhitapur 13 Thugaon 14 Takarkheda 15 lalka
16 Daryabad 17 Hirapur 18 Makrandabad 19 IsIIlailpur 20 Dastarapur
21 Umartek 22 Pusada 23 Rohankheda 24 Jaitapur 25 Watonda
26 Malapur 27 Donad 28 Himrnatpur 29 Deori 30 Marki
31 Makrllmpur 32 Anchalwadi 33 Jawara 34 Malput 35 Ashti
36 Akola 37 Kamatapur 38 Nirnkhed 39 Nandura "Bk. 40 Sal ora Bk.
41 Amla 42 Walgaon (E) 43 Revsa (E) 44. Ozarkheda 45 Warwad
46 Sultanpur 47 Rasulpur 48 Jamdol 49 Karajgaon ~ Nandura Pinllalai
51 Dhanora .' 52 Brahmanwada Bhagat
(3)
Po
R Po
Po RPo RPo
R Po
R
apo R "Po
RTo R
a'
51 Antora . . Po 54 Aurangpur !IS lIahabad
56 SawanSIl 57 Wardhi 58 Chinchkhed 59 Deora .. Po 6C Brahrnanwada Po
Govindpur.
(4) (5) (6) (7)
M
M
M H H P
P
ii
M P
P
P P
p
M
H P
M
H M
p P
P P M
P
P M M
W W W
W Mp 0 Wed. W RivW W Mp W
W Sat. W Mp RivW Mp F~i. W Mp Tue. W
W W W W W
W W W W Riv
W Riv W W
W W W
W
W Mp W
Tue.
Sat.
WN Riv W Mp D F~i. RivW
RivW Riv W Mp D Thu. RivW Mp W W
W W W W W·
W W MpD RivW Mp T·~ •. W
RivW W W RivW W
Mp
MpD M~n. Sun.
61 Yavli (E) 62 Sarsi
RPo H W MpD Fri.
63 Dastapur 64 Deori 65 Narsingpur
.p W W W W
68
Area in Occu-Sq. pied House-
Miles houses holds
(8) (9) (10)
RURAL AREA
1'1 Uninhabited. 0'7 Uninlwbited. 3' 5 534 551 1'5 38 39 2'1 83 89
16'7 1,028 0'5 63 1'5 60 2'2 39 0'4 1
1,064 69 69 48
I
1'5 iOl 125 1'5 84 85 5'5 808 821 4'0 522 558 3'8 204 204
1'1 O'S 0'9 1'0 0'3
0'7 9'8 1'4 0·8 1'1
36 54 30 6
44
26 506 86 30 50
36 54 31
7 44
26 577 87 35 51
o· 7 Uninhabited. 1·0 52 52 1·0 100 106 2·7 156 156 2'1 177 178
1'1 15 15 1·2 69 70 1·9 62 62 0'7 Uninhabited. 6·6 437 447
12·8 1·8 0·6 3·3 1'0
312 130 22
1111 42
1·4 63 8'9 1.432 3·8 259 \·s 45 O'S 2
392 132 23
292 52
68 1,643
280 54
2
0·6 13 13 1·2 15 15 0·9 42 44 3· 5 139 139 4'3 94 96
4·4 111 115 2'2 130 167 2'9 194 208 0·6 7 8 o· 6 Ultinhabited.
1·5 1·1 I·g 1'7 2'9
9S 69
lJ7 224-23S
103 69
117 233 235
6'4 453 503 2'8 88 89 1·0 32 33 1· 3 92 92 0'9 92 92
66 Dawargaon (E) 67 Faijalpur
Po M W RivW
Mon. 4'4 180 226
68 Bharatpur 69 Kekatpur 70 Parwatpur
RPo p.
• '1 Dewapur .. 72 Nandura Lashkarpur 73 . Bhagawanpur .. 74 Sarmastapur 75 Tukapur
W R,vW
w W
W
0·9 11 II 0·4 Uninhabited. 7· 3 239 300 0·9 92 92
0·9 Unillhabited. 2'0 116 116 0'8 10 10 0'6 Ullillhabited. 0'6 3· 3
Sebedulcd Scbedllled Total Population Castes Tribes
P M
(II)
2,485 158 414
5,394 286 330 227
I
576 366
3,782 2642
991
179 206 149 26
171
139 2,507
419 196 237
260 528 789 824
107 352 307
1,960
1,923 603
86 \,462
254
265 7,398 1,279
234 6
63 87
189 651 405
.70 726 950
35
526 291 S20
1.056 1,109
2,374 384 120 441 398
1,030 61
1,314 394
484 58
10
(12)
1,221 82
206
2,691 134-163 114
I
291 176
1,886 1,404
484
89 103 78 14 95
71 1,254
234 92
121
131 265 397 397
S6 179 165
1,014
977 310 40
7311 129
145 3,789
665 HZ
4
29 51
101 324 203
24' 359 489
IS
265 147 259 547 568
1,230 195 66
230 204
511 29
698 193
259 30
1
F M F M F
(13) (14) (15) (16) (17)
1,264 76
208
2,703 152 167 113 •
18
72 7
13
285 3 190 I
1,896 153 1,238 87
507 16
90 103 71 12 76
68 1,253
185 104 116
129 263 392 427
51 173 142
946
946 293 46
'124-125
120 3,609
614 102 -2
34 36 88
327 202
222 367 461 20
261 144 261 S09 S41
1,144 189 S4
211 194
519 32
616 201
125 28
3
57 . j
21 5
II
24
24 13
21
175
I 17 15
16
II 8 J
73
7
4
40
81. 6
13'
8
IS7 81 14
32
55 '2
27 8
25
24 12
IS
I 169
19 10
13
io 12 3
69
37
Literato and educated
M F
(18)
670 30 97
1,261 73 69 67
I
151 88
1,028 778 234
45 58 3S 6
50
44 589 107 52 64
48 134-In 195
27 87 83
449
4-74-ISS 21
219 39
44 1,917
)20 61 2
18 12 11
143 89
98 ISS 264
7
125 73
113 240 233
575 76 25
128 69
241 11
322 78
15 13
2
(19)
329 17 5"1
614 43 33 31
74 44
4S7 317 105
19 27
9 3
15
22 255 37 33 26
17 .1 50 78
14 31 19
9S
213 SO 14
103 17
11 136 148 11
15 I
56 31
28 83 98
9
54 18 55
122 88
290 31
5 ~ 2S
114 10
96 31
17 I

Total workers (I-DC)
M
(20)
F
(21)
WORKERS
II III IV v M FMF MF M FM
69
F
(31)
M
(32)
VI
(22) (23) (24) (2S) (26) (21) (28) (29) (30)
----------------~--~~----
U ninhabi/~d. Uninhablt~d.
712 471 45 28
109 76
1,S4(I 882 79 60 94 75 59 29
1
171 116
1,067 758 283
46 61 37 8
58
39 785 132 49 66
117 99
612 439 183
42 45 27
7 26
23 566
58 22 48
Uninhabited. 82 54
149 100 229 189 208 202
32
. ~~ 24 98 61
Uninhabited. 571 406
548 177 26
418 69
99 2,118
367 75 4
19 31 66
210 132
359 147
14 310
42
64 1,222
241 56
1
12 23 54
144 97
173 108 223 159 255 183
9 10 Uninhabited.
160 94
1.59 323 362
704 104 48
126, 121
108 85
124 220 221
444-56 11
104 87
264 185 IS 7
Uninhabited. 453 265 129 74
Uninhabited. 147 122 18 11
Uninhabited. 4
202 16 27
401 15 IS 25
56 402 404 4 29 24
18 67 57
64 829 781 12 53 47
1 66 73 J 31 26
53 22 101 95 37 \3 70 8S
263 54 510 509 172 42 448 393 91 22 166 Hit
16 32
2
6
14 177
51 23 22
23 59 62 98
8 29
3 2
64 3 I 2
30 34 28 16 19 24
6 5 34 25
24 23 468 496
66 55 23 21 38 46
11 51 43 10 56 83 12 147 177 70 103 132
14 4 17 20 43 46 ·44 50 22 60 67
102 20 402 385
122 41
3 108 16
11 373 67 17
17 5
340 333 118 142 22 14
29 I
213 270 39 41
2 76 86 1,092 9 271
55 2
62 1,047
237 56
I
11512 6 1 25 22
23 13 43 41 18 27 104 ll6 58 39 53 57
106 74 83
5
55 58 53 8 103 143
21 136 161 426
6
45 3 5
1 17 6 2
12 7
13
17
5 48
5 3
8 1
51 21 86 &6 1 42 35 43 50 2 55 t3 86 110 1 94 11 126 180 28
136 37 191 183
249 135 324 295 5464850 24 7 23 10 54 32 54 72 3618580
112 9
80 36
72 15
2
27 130 158 463
I 274 250 3 84 71
60 10
64
2
62
13
5 1
10
1 3
10
"
3
6
7
2
3
24
33 5 3
5 2
8 5
6
2
25 9
5 36
7
I
11 8
3 20
7 1
6 I 6
4
31 3
3
27
5 I
36 16 12 I
14
S 1
6
7 3
6
9
OJ
RURAL AREA
22 .j
49
2 I
5 3
48 30 5
30
3
14
11 1
9
62 I
2
4
1 I 2 7 2
30
2
7
2
8
2
II
3 7 I
12
4
3
2
4S
4
F
(33)
VIr
M
(34)
25
4
43
93 21
6
2
22 3
2
12
11 3
13 1
·1 1
I J 2
5 2 3
10 3
22 I
3
6 2
F
(35)
2
2
. i 1
2
VIII
M F
(36) (37)
15
4 2
8
1
3
2
56
·i
8
S AMRAVA TI TALUKA
IX NON·
WORKERS
M F M F Serial Na.
(38) (39) (40) (41) (1)
52
7
117 8 3 2 1
8 5
96 61 9
I 3 2 8
1 60 10 2 3
ii 8 3
I 3 I
28
47 14
1 31 4
2 261
IS 3
10 509 793 48
132 37 97
17 1,151 1,821 92 92 84
1 55 I 69
II 1
. i
7
41 1
55
120 168 61} 91
819 1,284 646 799 201 324
43 42 41
6 37
32 469 102 43 55
49 116 168 189
24 84 81
443
429 133 14
320 60
46 1,671
298 57
48 58 44
5 50
45 687 127 82 68
75 163 203 225
27 75 75
540
587 146 32
414 83
56 2,387
367 46
1
j 2 3 4 5
II 7 8 9
10
11 12 13 14 15
16 17 18 19 20
21 22 23 24 25
26 27 28 29 30
31 32 33 34 35
36 37 38 39 40
41 42 43 44 45
22 46 13 47
10 '''i .• 7
10 20 35
114 71
34 48 183 49 105 50
5 11 21
1
9 3 6
20 11
52 I I 6 2
11
68 4
2
75 136 234
6
105 53
100 224 206
526 91 18
104 77
247 14
245 64
112 12
3
114 208 278
10
51 52 53 54 55
153 56 59 57
137 58 289 59 320 60
700 61 133 62 37 63
107 64 107 6S
334 66 2S 67
68 351 69 127 70
103 17
2
71 72 73 74 75
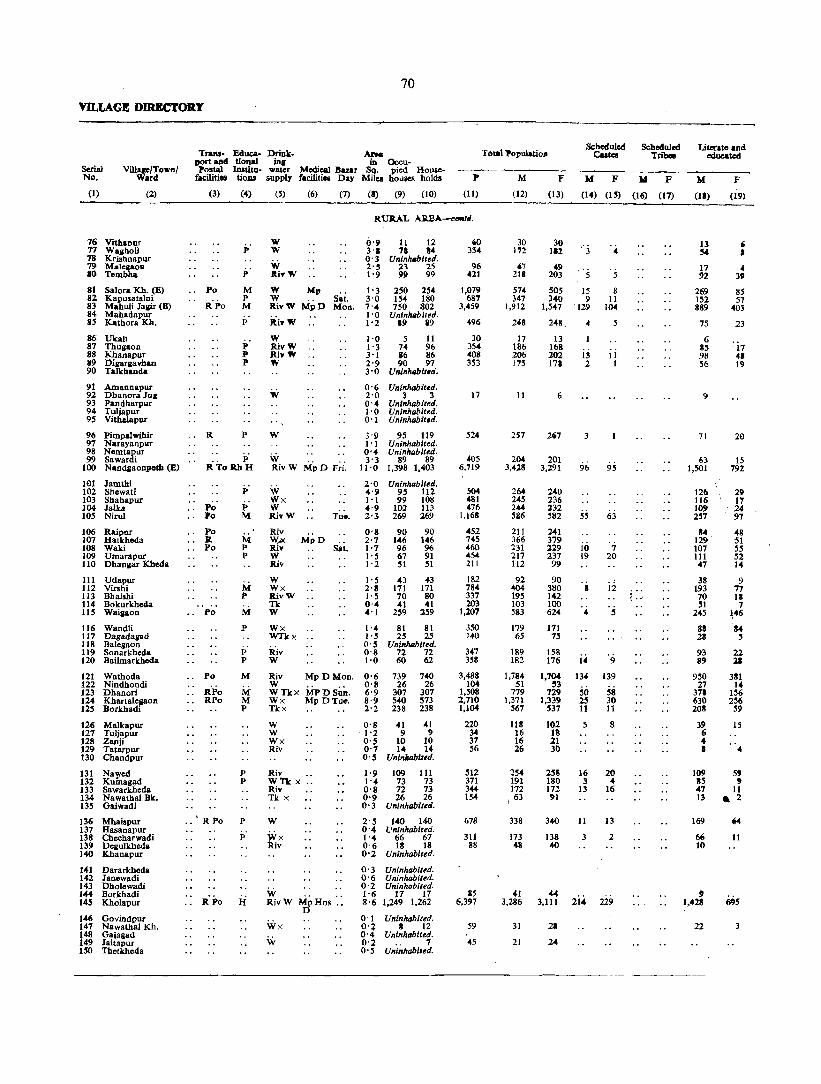
70
VILLAGE DI.R.KCTORY
Serial No.
Villaae/To,.,,,/ Ward
(1) (2)
76 VithaDur 77 Wallholi 78 Krishnapur 79 Maicilaoll ao Tcmbha
81 Salora Kh. (1)) 82 Kapusatalni 83 Mahuli Jallir (Il.) 84 Mahadapur as Kathora lOt.
86 Ukali 87 Thugaon 88 Khanapur 89 Digarllavhan 90 Talkhanda
91 Amannapur 92 Dhanora Joe 93 Pandharpllr 94 Tuljapur 95 Vithalapur
96 Pimpalwihir 97 Narayanpllr 98 Nemtapur 99 Sawardi
100 Nandiaonpotll (E)
101 Jamthi 102 Shewati 103 Shahapur 104 Jill. 105 Nirul
106 Raipnr 107 Hatkheda 108 Waki 109 Umarapur 110 Dhanllar Kheda
111 Udapur 112 Virshi 113 Bbalshi 114 Bokurkheda 115 Waiaaon
116 Wandli 117 Dagadagad 118 Balegaon 119 Sonarldleda 120 Bailmarkheda
121 122 123 124 125
126 127 128 129 130
Wathoda Nindhondi Dhanori Kbartalellaon Borkhadi
Maikapur Tuljapur Zanji Tatarpur Chandpur
131 Nawed 132 Kumagad 133 Sawarkheda 134 Nawathal Bk. 135 Gaiwadi
136 Mhaispur 137 Hasanapur 138 Checharwadi 139 Degulldleda 140 Khanapur
141 Dararkheda 142 lanewadi 143 Dholewadi 144 Borkhadi 145 Kholapur
146 Govindpur 147 Nawathal Kh. 148 Gaiagad 149 laitapur 150 Tbetkheda
TraIUI' Educa· Drink. ArM port and tiona! in. in Occu· 1'ostal Inatitu· water Medical Bazar Sq. pied House
facilities tiODIL supply facilities Day Mires houses holds
(3) (4)
i·
i· M P M
p
p P J>
R P
.. p' R ToRhD
Po Po
Po R Po
Po
Po
RPo RPo
p
P M
M p p
M l'
M
p
P P
M
M M P
p P
.. ' RPo P
p'
RPo i:i
(5)
w W
W IU,W
(6) (7)
W Mp W .. S~t. ltiv Vi Mp D Mon.
iii,,... W RivW Ri,"" ,...
W
W Riv W Mp D F~i.
(8) (9) (10)
0'9 11 12 3'1 7. 84 O' 3 UlIlnMblted. 2'5 23 25 1'9 99 99
1'3 250 254 3'0 154 180 7'4 750 802 1 . 0 Uninhabited. 1'2 19 119
1'0 5 11 1'3 74 96 3'1 86 86 2'9 90 97 3'0 UninludJlt.d.
o· 6 Unlnh.wlt.d. 2'0 3 3 0'4 Uninhabited. l' 0 Uninhabited. 0'1 Uninh.wit.d.
95 119 Uninhabited. Uninhabited.
89 89 1,398 1,403
2'0 Uninhabited. 4'9 95 112 1'1 99 108 4'9 102 113
W Wx W RivW Tu.. 2-3 269 269
Riv W.;x MpD Ri.. Sat. W Riv
W Wx RivW n W
Wx WTkx
Riv W
Riv W WUx Wx Tkx
W W Wx Riv
MpDMon.
MPDSun. Mp DTue.
Riv •. wn x .. Riv Tk x
w
W RivW MpHos ::
Wx W
D
o·g 90 90 2·7 146 146 1'7 96 96 1'5 67 91 1'2 51 51
1'5 43 43 2'8 171 171 1'5 70 80 0'4 41 41 4'1 259 259
1'4 81 81 J'5 2S 25 O· !5 UninludJiled. 0'8 72 72 1'0 60 62
0'6 0'8 6'9 8'9 2'2
0'8 " 1-2 0'5 0'7 O'S
739 740 26 26
307 307 540 373 238 238
41 41 9 9
10 10 II, II,
Uninhabited.
1-9 109 111 1'4 73 73 0'8 72 73 0'9 26 26 o· 3 Uninh.wited.
2'S 140 140 O· 4 Uninh.wited. 1'4 66 67 0'6 18 18 0-2 Uninh.wited.
O· 3 Uninhabited. o· 6 Uninhabited. 0'2 Uninhabited. 1'6 17 17 8-6 1,249 1,262
O' 1 Uninhabited. 0'2 l! 12 O' 4 Unlnh.wited. 0'2 .. 7 o·s Uninhabited.
p
(11)
4iO 354
96 421
1,07Cj 681
3,459
49(0
30 354 40S 353
17
524
405 '6.119
504 481 476
1,I6S
452 745 460 454 211
182 784 337 203
1,207
350 140
347 358
3,488 104
1,508 2,710 1,104
220 34 37 56
512 371 3# 154
678
311 88
115 6,3'7
59
45
T blal 'Populatioa
M F
(12) (13)
30 112
47 211
574 347
1,912
248
17 186 206 115
11
257
204 3,428
264 245 2# SS6
211 366 :231 217 112
92 404 195 103 583
179 6S
189 182
1,784 51
77') 1,371
567
118 16 16 26
254 191 172
I 63
30 II!
.. 9 203
505 340
1,547
24S
13 168 202 171
6
201 3,291
240 236 232 582
241 379 229 237 99
90 380 1"2 100 624
171 75
lS8 176
1,704 !!3
729 1,339
537
102 18 21 30
258 180 172 91
Sc:heduled Cutcll
M F
(14) (1S)
15 9
129
4
13 2
3
96
10 19
i4 134
~O 25 11
5
16 3
13
5
8 11
104
5
II I
95
63
7 20
12
5
9
139
sa '30 11
8
20 .. 16
338 340 11 13
173 138 2 48 40
41 .... 3,286 3,111 2i4 229
31
21
21
24
Seheduled Tribes
14 F
(16) (17)
{ .. '
Literate and educated
M F
(1S) (19)
13 !54
17 92
269 152 389
75
6 15 98 56
9
71
63 1,501
126 116 lO~ 2"
84 129 101 111 47
38 193 10 !51
245
S8 23
93 8'
950 27
37. 630 208
39 6 4 •
, J
I,
3' 85 57
403
23
20
15 792
29 11 24 97
48 51 55 52 14
9 17 11 7
~46
"34 :;
22 21
381 14
156 256 59
15
4
109 5' 115 , 47 11 13 _ 2
169
6& 10
!I 1,428
22
'" 11
3

Total worken (I-IX)
M
(20)
F
(21)
17 II 112 98
Uninhabited. 36 13
147 93
303 235 229 137 982 699
Uninhabited. 135 101
16 5 98 85
124 97 109 102
Uninhabited.
Uninhabited 9
Uninhal>ited. Uninhabited. Uninhabited.
156 132 Yninhabiled. Uninhabited.
125 87 1.932 945
Uninhabited. 161 106 152 141 168 156 333 236
94 62 201 103 138 116 128 97 78 60
61 29 239 177 109 74
64 57 333 277
109 58 39 40
Uninhabited. 105 67 109 26
1,017 29
«4 760 338
634 18
265 568 307
67 61 13 9 13 16 16 13
Uninhabited.
140 118 116 94 105 91 38 50
Ullinhabited.
184 179 Ullinhabited.
106 76 30 26
Uninhabited.
Ulli~habit.d. Uninhabited. Uninhabited.
25 21 1,788 886
Uninhabitt!d. . I~ 15
Uninhabited. 11 S
U"lnhabit,d.
M F
(22) (23)
II
M F
(24) (25)
. WORKERS
1Il IV V
M F M F M
(26) (27) (28) (29) (30)
I
1J
VI VII VlIl
F MF MF UF
(31) (32) (33) (34) (35) (36) (37)
RURAL AREA-('Q"ti.
7 S 38 34
~~ i6 123 63 130 53 280 124
43 12
.. 1 21 11 36 16 53 36
8
9 3 59 64
IS 13 7i 75
140 166 86 83
530 548
89 89
7 4 63 73 79 79 52 66
62 46 73 83
45 27 68 60 552 125 1,003 776
72 39 80 67 71 71 77 70 53 57 99 99 84 23 190 206
46 99 25 65 13
16 87 21 19
121
41 5
42 26
30 57
5 20
2
32 5
68 9
IS 1
42 31 95 46 94 III 52 75 62 58
39 28 118 145 77 69 44 57
176 208
59 49 34 40
59 52 79 25
6
1
7
5
5 4 1 1
2
3 25
2
I
'j
3 10
1
7
'j
166 40 525 537 29 4 I 18 15
106 36 218 217 27 242 60 416 496 10
87 45 207 259 11
18 1 2 S
4
1 1
30 9 33 2S 33 5 8 5
38 11 11 10
57 9
15 12
92 108 75 69 66 86 27 45
47 2S 109 154
36 14 68 61 30 26
1 1 23 26 334 67 991 761
11 8 7
1 2
1 15
10
2
5
6
6 6
22
2
2 3 1
1 S8
1 1
15 It
1 6 2
4
74
io 7 1
5
9 3
12
2
i1
5
2
31
's 5
2
26
1 51
1
ii 2
3
7
2
17 1
19 21
S
2
6
34 4;' 11
11 5
2
2 1 7
11
2
11
I
7 I
36
9
1 114
1 1 1
1 2 1 :2
3 4 5
3
3
101 1
26 20
7
2 1
s
160
1 7
I
6
'2
'_'
ii
9
'2 1
2
5 AM'RAVATI TALUKA
IX
U F
(3') (39)
1 3
:2 S
11 ,. n
7
S 110
6 1
i1 3 3 7 6 3
is 5 1
14
S
2 1
115 5
36 41 20
3 1
1
S 3 S 1
13
14i
3 ,
17
10 :2 1 S 1
NON. WORKERS
M
(40)
13 CiO
11 71
271 118 930
113
I 8S 12 66
2
Serial F No.
(41) (I)
22 14
36 110
270 203 84&
147
I 13
lOS 76
76 77 7. 79 80
81 82 83 84 85
86 87 88 89 90
91 5 ,,2
93 94 95
101 135 96 97 98
79 114 99 1,496 2,346 100
103 93 76
253
117 165 93 89 34
31 165 86 39
250
70 26
84 73
101 134 102 9S 103 76 104
346 105
179 276 113 140 39
61 203
68 43
347
113 3S
91 ISO
106 107 108 109 110
111 112 113 114 115
116 117 118 119 120
761 1,070 121 22 3' 122
33S 464 123 611 771 124 229 230 125
51 3 3
10
114 75 67 :as
154
67 III
41 126 9 127 , 128
17 129 130
140 131 86 [32 81 133 41 134
135
161 136 131
62 138 14 139
140
141 142 143
Ifi 17 144 1.4911 2,225 145
16
10
146 13 147
148 19 149
150

VILLAGE DIRECfORY
Trans- Eduea- Drink- Area port and tional ing in Occu-
Total Population Scheduled
Castes Scheduled
Tribes
Serial No.
(1)
Village/Townl Wanl
(2)
151 Alangaon 152 Hartoti 153 Chunki 154 Kakarkheda 155 Hartala
156 Khatijapur 157 Adwi 158 Ballarkheda 159 Koltek 160 Degurkbeda
161 Khalkhonj 162 SaTmastapur 163 Wagholi 164 Antapur 165 Bhatkuli
166 Wadala 167 Sayat 168 Kalijkhed 169 Ghatkheda 170 Chakur
171 Nanded!{b. 172 ]a.apur 173 Mankhed 174 Kasamput 175 Dahatonde
176 Kanfadj 177 Rinmochan 178 Asara 179 Dautpur 180 lndhapur
181 Pimpri 182 Malkapur 183 Angoda 184 RUstampur 185 Takli
186 Godad 187 Degaan 188 Hirapur 189 WaIki 190 Kathora Bk.
191 Ramgaon 192 Borgaon (E) 193 Nagpur 194 Kamunja 195 Wadura
196 197 198 199 200
201 202 203 204 205
206 201 208 209
210
2I1 212 213 214 215
216 217 218 219 220
Changapur Rahatgaoll (E) Wadgaan (E) KundKh. Nawasari (E)
Kllnd Sarjapur Masod Shegaan (E) Parsoda Rajura
Sukali Saturna Wanarsi Tarkheda (1) Tarkheda (2)
Gambbirpur (I) Gambhlrpur (2)
Mhasala (E) Gopgavhan Rasulapur Hatkheda Indhala
Sultanpur Amravati Pimpalkhuta Rajapeth Bodua.
221 Wada!i (l) Wadali (2)
222 -Lontek 223 Mahaj anpur (1)
Mahajanpur (2) 224 Moranganll 225 Benoda
Postal ltiStitu- water Medical Bazar facilities tions supply facilities Day
Sq. pied HouseMiles houses holds P M
(3) (4) (5) (6) (7) (8) (9) (10) (11) (12)
Po
Po
R RPa
R
RPo
P
p
P
p
M
p p
p p
P
M
p
p
P
ip
M M p M
p P p p
P M p
P
j;
Riv Mp Wx
W WTk Tu,;.
w Vi
RURAL AREA-con/d.
3'4 197 197 0'7 S5 56 0'8 Uninhabited. 0'2 17 11 3' 3 212 219
l' 1 Uninhabited. 1'0 24 25 O' 3 Uninhabited. 0'9 44 SO O'S UI/inhabited.
1,001 231
96 940
122
271
Wx 0'7 97 106 522 III
2 161
3,912
W 0'5 22 23 Riv 1'0 I 1 Wx 0'8 32 32 RivW MpD Fri. 15'1 744 883
Riv W
Riv Riv
Riv Riv W Riv Tkx
RivW W RivW
RivW
W_ W
RivW W
W W Mil RivW W
W W W RivW. W
RivW W W Wx Wx
WX RivW W ws
W
M~D. 20 21
373 384 Uninhabited.
2S 26 49 49
1'3 78 82 1'1 113 122 0'4 Uninhabited. 0'1 Uninhabited. 0'3 Uninhabited.
1'5 49 49 O'S 33 35 8'3 484 507 1'3 SI 51 1'0 I 1
0'9 14 15 0'4 3 3 1'0 26 26 0'4 Uninhabited. 1-6 236 236
1'2 73 79 1'4 3 3 O' 5 Uninhabited. 0'9 SO 50 3'0 180 180
1'6 39 39 1'1 153 203 l' 7 Uninhabited. 2'4 108 108 0'8 1 1
81 1,758
I10 246
357 563
239 203
2.300 217
2
87 7
124
1,092
400 IS
220 824
165 899
551 1
1'2 5-7 1'9 1'3 3'6
2 4 12
1'8 4'0 1'9 2'3 1'9
2'6 3'1
435 447 2,209 182 243 1,093 99 1I4 476
157 237 1,097
98 99 477 119 139 S62 692 702 2,464 93 104 499 36 52 237
163 164 717 112 173 914
" 4'6 136 136 611 Sun. &; 1'3 Wed.
1'1
4 4 19 Included in Urban Area I.
4 4 14 Included in Urban Area I.
~ Mp Hos D Wed.
W
1'0 1'3 1'0 2'2 3'8
83 83 440 53 53 275 29 29 135
W 14 17 62 W 102 150 780
l' 1 Uni"habited. Urban Area I.
3" 3 233 250 J ,025
P W l' 5 Included in Urban Area I. 3'2 72 86 368
" R To Rh II WS Mp Has D Fri. 6'9 20 20 60 " InCluded in Urban Area I .
.. R Vi R W
W W
2'1 . 58 6S 314 0'6 1 1 4
Included in Urban Area I. 1'0 II II 45 1'4 63 63 287
502 117
49 497
65
135
246 60
1 89
1,985
42 902
S3 115
195 281
129 109
1,176 106
2
41 7
64
554
229 15
106 439
76 469
308 1
4 1,1~
567 256 546
239 309
1,499 269 124
373 4'19 319
9
7
302 146 63 31
41B
549
193
36
158 :2
25 151
F
(13)
M F M F
(14) (15) (16) (17)
499 19 16 114
~~ 126 Iii
57
136
276 51
1 72
1,927 1~6
39 856
57 131
162 282
110 94
1,124 III
46
'60
538
171
114 385
89 430
243
8 1,045
526 220 551
238 253 965 230 113
344 435 292
10
7
138 129
72 31
362
476
175
24
156 2
20 130
8 1
30
6
47
2.
':i 3
30 IS
'j
.~
42 2 6
4 29
3
17
5
IS8
44
3
6 1
30
10
38
3
36
'2 3
29 18 .. ' 2
4 21 "
2 25
4
15
6
3
II
Literate and edUCllted
M F
(18) (19)
176 ..... 8
260
20
26
84 15
1 42
679
8 423
11 48
71 102
50 41
591 28 _
2
17 2
38
226
92 2
34 213
28 212
ISO
2 501" 293 99
243
106 122
1,055 96 45.
148 151) 93
'" :3
250 4S 27 7
136
89
41
28
46
1 67
59 S
8
4
24 1
13 252
146 6
19
21 21
7
10
S9 29
10 101
10 82
4)
184 109 4' ill
53 36
286 17 12
56 .5 22
64 l' 6
40
23
:&1
• 14
17
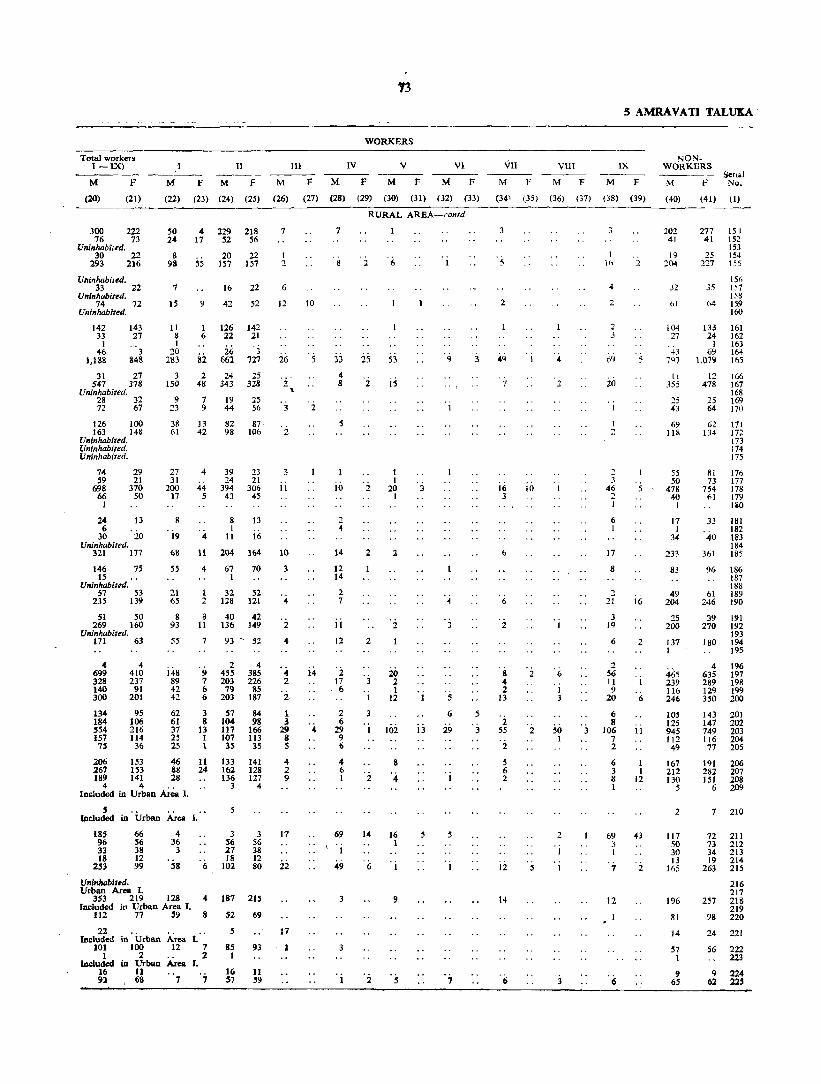
Total workers I-IX) -----M F M
II
F M F
WORKERS
III IV v M F M F M F
VI VII VIII
M F M F M F
5 AMRAVATI TAL~·
IX
M F
NONWORKERS
M F Seri.1 No.
(20) (21) (22) (23) (24) (25) (26) (27) (28) (29) (30) (31) (32) (33) (34\ (35) (36) (37) (38) (39) (40) (41) (1)
300 222 76 73
Uninhabitt'd. 30 22
293 216
Uninlwbiled. 33 22
Uninhabited. 74 72
UniflhabiUd.
142 33
I 46
1,188
143 27
3 848
31 27 547 378
Uninhabited. 28 32 72 67
126 100 163 148
Uninhabited. Uninhabited. Uninhabited.
74 59
698 66
1
29 21
370 50
24 13
3g '20 Uninhabited.
321 177
146 75 15
Uninhabited. 57 53
235 139
51 50 269 160
Uninhabited. 171 63
4 699 328 140 300
134 184 '54 157 7S
4 410 237
91 201
9S 106 216 114
36
SO 24
8 911
7
15
tl 8 I
:10 283
4 17
55
9
I 6
S2
229 218 52 56
20 22 157 157
16
42
22
52
126 142 22 21
26 3 662 727
3 2 24 25 150 48 343 328
9 7 19 25 23 9 44 56
38 61
27 31
200 17
19
68
55
21 65
8 93
55
i48 89 42 42
62 61 37 25 25
13 42
4
44 5
4
11
82 87· 98 106
39 23 24 21
394 306 43 45
8 1
11
204
13
if, 164
4 67 70 I
1 32 52 2 128 121
8 40 42 11 136 149
7 93 - 52
9 7 6 6
2 4 455 385 203 226 79 85
203 187
3 57 84 9 104 98
13 117 166 1 107 113 1 3.5 35
206 153 46 11 133 141 267 153 88 24 189 141 28
4 4 .. Included in Urban Area 1.
Incluled in' Urban Area I.
185 96 33 18
253
66 56 38 12 99
Uninhabited. Urban Area I.
4 36
3
58 6
162 128 136 127
3 4
J 56 27 18
102
3 56 38 12 80
353 219 128 4 187 215 Included in Urban Area I.
112 77 59 8 52 69
22 Ittc:luded
101 1
lDduded 16 91
in . Urban 100
2 in Urban
11 68
Area I. 12 7
2 Area I.
7 ';
5
85 1
16 57
93
11 59
7
2
6
12
26
2
10
...
3 2
2
3
11
10
3
4
4 2
2
1 3
29 9 5
4 2 9
17
22
17
14
7
33
4 8
10
2 4
14
12 14
2 7
ii 12
'2 17 6
2 6
29 9 6
4 6 I
69
3
. i
RURAL AREA-contd
2
25
2
2
2
'j
14
6
2
53
is
1 I
20 1
2
20 2 1
12
loi
g
4
16 1
9
5
3
ij
5
9
4
5
6
29
5
"
3
5
2
49
7
if, 10 3
.. I
6
6
2
8 4 2
13
'i 55
2
5 6 2
12
14
2
2
5
4
2
6
50 I
2
3
I If)
" 2
2 J
iii
2 3
46 :;
6 I
17
8
2 21
3 19
6
2 56 11 9
20
6 8
106 7 2
6 3 8 I
69 3 I
7
12
6
5
16
2
I
6
II
1 I
12
43
'i
102 41
19 104
32
61
104 27
43 jy7
11 355
:!5 43
6~ 118
55 50
478 40
I
17 I
34
233
83
49 204
25 200
137 I
465 239 116 246
105 125 945 tl2 49
167 212 130
5
2
117 SO 30 13
165
196
81
14
57 1
9 65
277 41
25 227
151 152 153 154 155
15~ 35 157
158 64 159
133 24
I 69
1,079
160
161 162 163 164 165
12 166 478 167
168 25 169 64 170
61 171 134 172
81 73
754 M
33
'40 361
173 174 175
176 177 178 179 lao 181 182 183 184 185
96 186 187 188
61 189 246 190
39 191 270 192
193 180 194
4 635 289 129 350
195
196 197 198 199 200
143 201 147 202 749 203 ) 16 204 77 205
191 206 282 207 151 208
6 209
7 210
72 211 73 212 34 213 19 214
263 215
216 217
257 21S 219
98 220
24
56
9 62
221
222 223
224 225
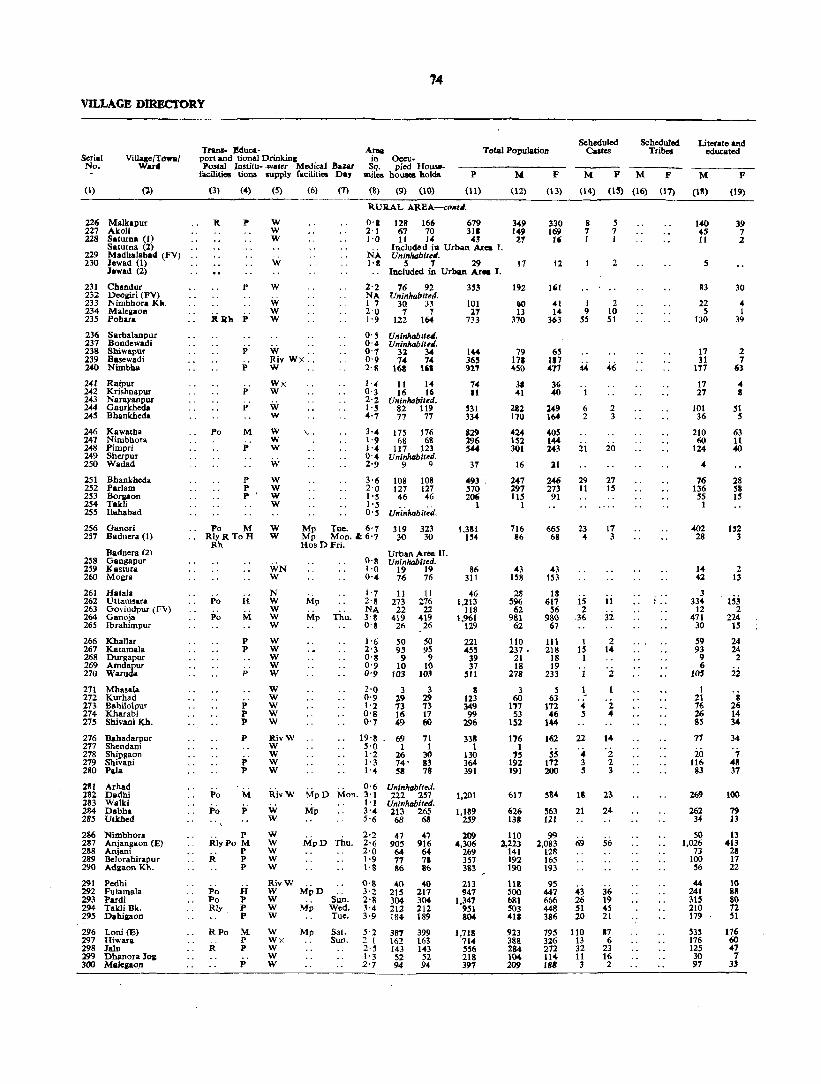
14
VILLAGE DlREC'fORY
Serial No.
Villa&e/T01nl! War ..
(1) (1)
226 Malkapur 227 Akoli 228 Saturna (I)
Saturna (2) 229 Madhalaba4 (FVJ 230 lewad (1)
I.wad (2)
231 Chandur 232 Deolliri (PY) 233 Nimbhora Kh_ 234 Mllleaaoft 235 Pohara
236 Sarbalanpur 237 Bondewadi 238 Sbiw.pur 239 Basewadi 240 Nimbba
241 Raipur 242 Krishnapur 243 Narayanpur 244 Gaurkheda 24:5 Bhankheda
246 Kawatha 247 Nimbhora 248 Pimpri 249 Sherpur 250 Wadad
251 Bhankheda 252 Parlam 253 Boraaon 254 Talcli 255 llahabad
256 Ganori 257 Badnera (1)
Badnera (2) 258 Gangapur 259 Kastura 260 MOifa
261 Hatala 262 U ttam.at .. 263 Govindpur (Fv) 264 Ganoja 265 Ibrahimpur
266 Khallar 267 Katamala 268 Durgapur 269 Amdapur 270 Waruda
271 Mh ... ala 272 Kurhad 273 Bahilolpur 274 Kharabi 275 Sbivani Kh.
276 Bahadarpur 277 Shendani 278 Shipgaon 279 Shivani 280 Pala
281 282 283 284 285
286 287 288 289 290
291 292 293 294 29:5
296 297 298 299 300
Arhad Dadhi Walki Dabha Utkhed
Nimbhora Anjangaon (E) Aniani Belorahirapur Adaaon Kh.
Pedhi Fulamala Pardi T.kli Bk_ Dahiaaon
Loni (E) Hiwara Jalu DhanoraJo& Maleaaon
Trans- !duea-port and tional Drinkin& Postal Institu- ·_ter Medical Buar
facilities tions supply facilities Day
(3)
Po
(4)
p
P
P
p
p
M
P
P
~I
(3)
W W W
W
W
W W W
(6)
<.it __ Riv Wx __ W
Wx W
W W
W W W
W
W W W W
\- -
(7)
Ar ... Total Population Seheduled
Calles Seheduled
Tribee in Oceu-
Sq. pied HolWI-miles houael holds
(8) (9) (10)
P
(11)
RURAL ARBA-c""ti_
o-a 2') 1'0
128 166 679 67 70 311 11 14 43
NA Included ill Urban Area I. Uninhobiteti.
1'8 5 1 29 Included in Urban Ar .. I.
2'2 76 92 NA Uninhabited. 1 7 30 33 2·0 7 7 1'9 122 164
0- S Uninltab.teti. 0-4 Un;nhob;teti. 0-7 32 34 0-9 74 74 2·S 1611 1"
1·.- 11 14 0'3 16 Hi 2· 2 UlIin""bit.d_ l'S 82 119 4'7 77 77
3'4 175 176 1-9 68 68 1-4 117 123 0-4 UninMblted_ 2'9 9 9
3'6 108 108 2-0 127 127 I·S 46 46 I·S O· S Ul;i~/tabit~~_
353
101 2"1
733
144 36' 921
74 II
531 334
829 196 544
31
493 510 20'
1
N F M P M F
(12) (13) (14) (15) (16) (17)
349 149 2'r
17
192
60 13
370
79 17. 450
38 41
282 170
424 152 301
16
247 297 115
1
330 169
" 12
161
8 7 1
41 1 14 9
363 55
65 1S7 477 44
~ -i 249 6 164 2
40S 144 243
21
246 273 91
21
29 11
5 7 I
2
2 10 51
2 3
20
27 1:5
Po M W Mp Tue. 6'7 319 323 1,381 )54
716 86
665 68
23 4
17 3 RlyR ToR W
Rh
Po
Po
H
M
p P
p
P P P
p
p p
Po M
Po P
-- P RlyPo M
P R P
P
Po Po Rly.
RPo
R
R P P P
M P P
i·
WN W
N W W W W
W W W W W
W W W W W
RivW W W W W
Ri~W
W W
W W W W W
RivW W W W W
W Wx W W W
Mp Mon. ~ 6'7 30 30 HosDFri.
!\Ip
Mp Thu.
MpD Mon.
Mp
MpD Thu.
MpD
Mp
Mp
Sun. Wed. Tue.
Sat. Sun.
Urban Area II. 0'8 Uninhabited. t·O 19 19 86 0'4 76 76 311
1'7 11 11 276
22 419
26
2-8 273 NA 22 3-S 419 0'8 26
1'6 50 50 2-3 95 95 0-8 9 9 0-9 10 10 0'9 103 103
2'0 3 3 0-9 29 29 1-2 13 73 0-8 16 17 0'7 49 60
19·5 69 71 5'0 1 1 1'2 26 30 1-3 74' 83 1-4 58 78
0-6 3-1 1'1 3-4 5-6
2'2 2'6 2-0 1'9 l-g
O-s 3-2 2'8 3'4 3'9
5'2 2-1 2-5 1'3 2-7
Uninhabited. 222 257
Unill/tabited. 213 265 68 68
47 47 90~ 916 64 64 77 7. 86 86
40 21:5 304 212 184
387 162 143 52 94
40 217 304 212 189
399 163 143 52 94
'-6 1,213
118 1,961
129
221 453
39 37
511
II 123 349 99
296
338 1
130 364 391
1,201
1,189 259
209 4,306
269 357 383
213 947
1,347 9:51 804
1,718 714 '56 218 397
43 158
28 596 62
981 62
43 153
18 617
56 9&<l
67
110 111 237 • 218
21 18 18 19
278 233
3 5 60 63
177 172 53 46
152 144
176 162 1
" 55 192 172 191 200
617
626 138
110 2,223
141 192 190
118 500 68.1 503 411
923 388 284 104 209
5M
563 121
99 2,083
128 165 193
95 447 666 448 386
79:5 326 272 114 188
15 2
36
ii 32
I 2 15 14
1
1 2
~ 4 '2 5 4
22 14
4 -2 3 2 , 3
18
21
69
.3 26 :51 20
110 13 32 11 3
23
24
56
36 19 45 21
87 6
23 16 2
Literate and educated
M F
(18) (19)
140 '-5 II
5
83
22 5
130
17 31
117
17 27
101 36
210 60
124
4
76 136 55
I
402 28
14 42
3 334
12 471
30
59 93
9 6
10:5
I 21 76 26 85
77
20 116 83
269
262 3'-
50 1,026
73 100 56
44 241 315 210 179
533 176 125 30 97
39 7 2
30
4 1
39
2 7
63
4 8
" 5
63 It 40
28 58 IS
1S2 3
2 13
153 2
224 15
24 24
'2
22
8 26 14 34
34
7 48 37
100
79 13
13 413
28 17 22
10 88 80 72 51
176 60 47
7 33

Total1Vorkers (I-IX)
M 1" M F
II III
F M F
75
WORKERS
IV v
M F M F
VI VII VllI
M F M F M F
5 AMRAVATI TALUKA
IX
M F
NON. WORKERS
M F Seriol No
(20) (21) (22) (23) (24) (25) (26) (27) (28) (29) (30) (31) (,12) (31) (34) (35) (36) (37) (38) (39) (40) (41) (1)
----------------------------233 121 61 10 150 11' 95 78 2' 11 5& S9
Inclu2Jled in Jrbaft kea I. Uninhabited.
11 2
10 • 1 .. 4 r"cluded in Urban Area I.
121 III Uninhabited.
+oJ 21 9 7
231 136
Uninhabiteti. Uninhabited.
SO 37 109 90 2Ci2 235
24 12 26 1-4
Uninhabited, 173 98 102 63
262 182 81 81
,156 124 Uninhabited.
11 11
155 105 190 154 12 4"
U ninh;U;lteti.
437 64
263 31
Urban Area II. Uninhabit.d.
2S 15 94 85
20 337
42 516
35
66 132
10 11
143
3 40
106 2& liS
101 1
3S 113 116
Uninhabited.
9 211
24 381
14
48 83
10 97
4 21 91 21 56
53
31 85 85
345 243 Uninhabited.
359 219 8Ci 76
35
2 6
51
30 5. 6
10
43 50
82 32 34
5
55 82 18
191 6
18 55
16 71 95
2 24 16 433
31 151 104
41 37 15 64 7S 2 175 231
18 12 9 14
3 103 93 1 :52 62
12 142 169 14 36 66
7 911 111
456
6 85 99 39 91 110
6 38 42
25 1117 238 1 35 28
2 38
5 38
13 41
9 11 9 123 40 111 169
16 3 26 21 146 61 321 313
12 22 14
24 37
'6 43
2 27 26 4
21
49
5 35 49
81
152 35
8 12
'5 11
3
33 67
5 48
9 13 22 52 4 21
16 39
15
2 17 36
43
29 :54 :58
31 69
5 16
1 12 68 11 39
38
:i.9 68 49
42 200 195
87 146 127 24 41 52
1 2
8
1 10 2
8
6 3
5
10 1
2
6
2
4
10
7 2
65 50 18 5 41 45 5 1.312
88 115 110
66 284 400 301 2S1
543 231 197 67
123
822 55 53 92
18 213 299 147 171
295 188 172
70 81
473 201 504 332 80 35 15 49 40 3 35 24 38 26 5 50 46 38 4S
18 45 18 69 39 177 172
104 69 230 227 133 48 139 99 96 60 130 113
123 68 293 220 65 50 144 138 94 81 71 90 43 41 22 28 :50 19 63 68
2 5
3
5 3
6
2
58
RURAL AREA-·, rnld,
8 4 4
5
6
3
8
11 3
6 10
1
15
2
8
21
2
5
6 1 3
10 1
12
9 7
2
2
1
1
2
'j
1
2
2
13 -13
2 1 2 1
8 23 13 4
24 2
13 1 1
2 2
4
1 1
4
2
1 1 6
4 6
3
8
is
2
18
9
'j 18
'i 1
4
10 5 1
3
2
2
3
2
1
9
a 5
6
2
2
2 1
13
7
:i.i
2 18
6
1 2
10
17
13
2 4
11 6 6
2~ 5 1
2
2
6
1 1 6
2 11
3
3
4 9
14
19 I
10
1 1
• I
2
24
3
3 11 2
6 4 1
3
2
12
1 7
4
8
17 5 9
4 6 6
20 6
22
32
3 6 I
6
2 1 4
5 1 1 2 3
28
8 1
I 75
1 :c ).
I 17 14 13
8
56 7 6
4
<4
3
12
116 54 7
7
71
16 4
133
29 69
188
14 15
109 68
162 71
143
92 101 43
I
279 22
18 64
8 259 20
405 27
44 105
11 7
135
20 71 25 67
75
40 79 75
272
267 52
203 226 91 227 13 228
229
a 230
50 231 232
20 233 7 234
227 235
236 237
28 238 97 239
242 240
24 241 26 242
243 151 244 101 245
223 246 63 247
119 248 249
10 250
141 251 119 252
42 253 254 255
402 256 31 251
258 28 259 68 260
9 261 406 262
32 263 593 264
53 265
63 266 135 267
18 268 9 269
136 210
1 271 42 212 81 273 25 274 88 215
109
24 81
115
276 277 278 279 280
281 341 282
283 344 284 45 285
45 49 286 911 1,261 287
53 73 288 77 112 289 80 101 290
52 216 281 196 167
380 157 81 37 86
77 291 234 292 367 293 301 294 209 295
500 296 138 297 100 293 44 299
101 300
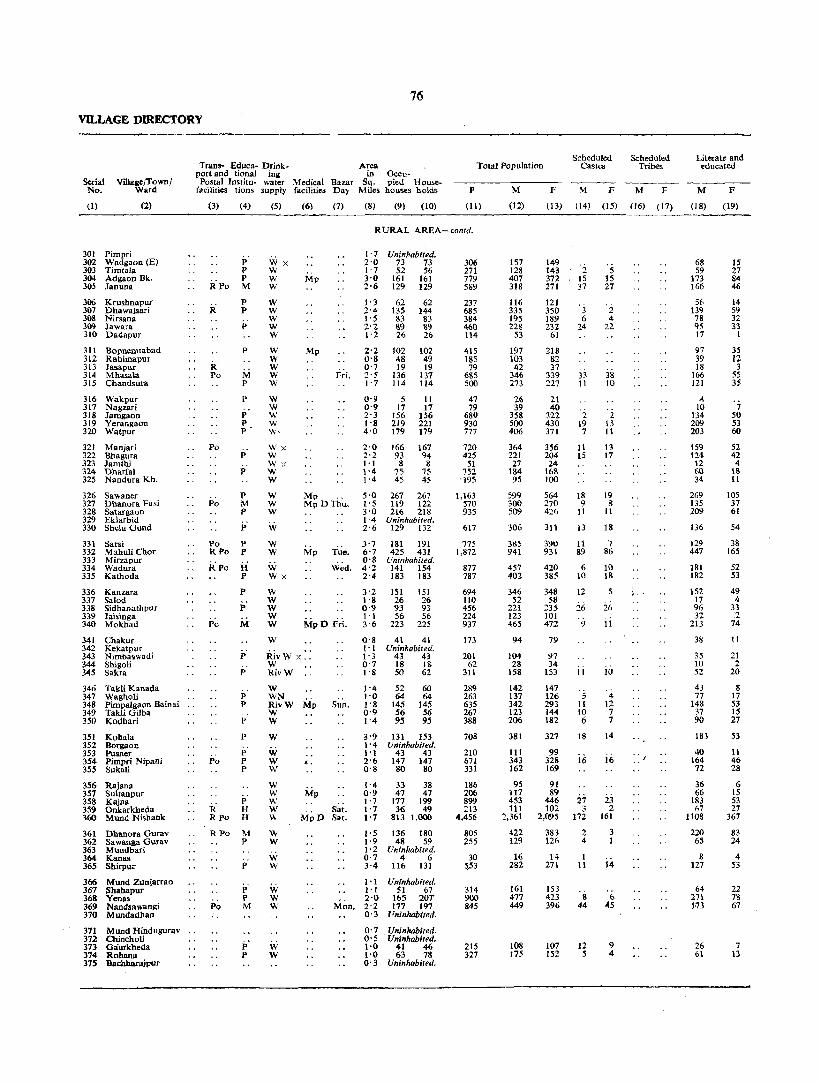
76
Vll...LAGE DIRECTORY
Serial Village/Town/ No. Ward
(2)
Trans- Eaue.· Drink- Area port and tional ing in Oceu· Postal Institu· water Medical Bazar Sq. pied House.
facilities tions supply facilities Day Miles houses holds
(3) (4) (5) (6) (7) (8) (9) (10)
Total Population
P M F
Scheduled Castes
M F
Scheduled Tribes
M F
(II) (12) (13) (14) (IS) (16) (17)
RURAL AREA-contd.
301 Pimpri 302 Wadgaon (E) 303 Timta]a 304 Adgaon Bk. 305 .Tan una
306 Krushnapur 307 DhawaJsari 308 Nirsana 3W Jawara 310 Dadapur
311 Bopnemtabad 312 Rabimapur 313 Jasapur 314 Mhasala 315 Chandsura
316 Wakpur 317 Nagzari 318 Jamgaon 319 Yerangaon 320 Watpur
321 Manjari 322 Bhagura 323 Jamthi 324 Dharfal 325 Nandura Kh.
326 Sawaner 327 Dhanora Fasi 328 Satargaan 329 Eklarbid 330 Shelu Gund
331 Sarsi 332 Mahuli Char 333 Mirzapur 334 Wadura 335 Kathoda
336 Kanzara 337 Salod 33B Sidhanathpur 339 Jaisinga 340 Mokhad
341 Chakur 342 Kekatpur 343 Nimba.wadi 344 Shigali 345 Sakra
346 Takli Kanada 347 Wagholi 348 Pimpalgaon Bainai 349 Takli Gilba 350 Kodhari
351 Kohala 352 Borgaon 353 Pusner 354 Pimpri Nipaoi 355 Sukali
356 Rajana 357 Sultanpur 358 Kajna 359 Onkarkheda 360 Mund Nishank
361 DhanoT8 Gurav 362 Sawanga Gurav 363 Mundbari 364 Kanas 365 Shirpur
366 Mund Zunjarrao 367 Shahapur 368 Yenas 369 Nandsawangi 370 Mundadhan
371 Mund Hindugurav 372 Chineholi 373 GaUrkheda 374 Rohana 375 Bachbarajpur
R
R Po
Po
Po
P P P M
P P
P
p
M P
P
i, P P-
P
P
P M P
j;
Po P RPo P
RPo H
Po
P
P
P
M
P
P
P p
l'
P
P Po P
p
P R H RPo H
RPo M
Po
P
P
P P M
P P
Wx W W W
W W W W W
W W W W W
W W W W w' Wx W W" W W
Mp
Mp
1·7 Uninhabited. 2·0 73 73 1·7 52 56 3'0 161 161 2·6 129 129
1'3 62 62 2·4 135 144 I· 5 83 83 2·2 89 \\9 1·2 26 26
2·2 O·S 0·7
Fri. 2'5 1·7
102 102 48 49 19 19
136 137 114 114
0·9 5 11 0·9 17 17 2·3 156 156 1·8 219 221 4·0 179 179
2'0 166 167 2·2 93 94 1·1 8 8 1·4 75 75 1·4 45 45
W W W
Mp ., 5·0 267 267 Mp DThu. 1·5 119 122
W
W W
W Wx
w W W W W
W
RivW x .. W RivW
W WN RivW Mp W W
W
W W W
.. Mp
3'0 216 218 1'4 Uninhabited. 2'6 129 132
J·7 181 191 Tue. 6·7 425 431
0'8 Uninhabited. Wed. 4·2 141 154
Sun.
2·4 IB3 183
3·2 151 151 1·8 26 26 0·9 93 93 1·1 56 56 3·6 223 225
O·S 41 41 I ' I Uninhabited, 1'3 43 43 0·7 18 18 1·8 50 62
52 60 64 64
145 145 56 56 95 95
;·9 131 153 1·4 Uninhabited. 1·1 43 43 2·6 147 147 0·8 80 80
1·4 33 38 0·9 47 47
w w w W W
.. S~t. 1·7 177 199 1·7 36 49
W W
W W
W W W
w W
MpO Sat. 1·7 813 1,000
1·5 136 180 1·9 48 59 1 ·2 Uninhabited. 0·7 4 6 3·4 1I6 J31
I ·1 Uninhabited. 1·1 51 67 2·0 165 20T
Mon. 2·2 177 197 0·3 Uninhabited.
0·7 Uninhabited. 0·5 . Uninhabited. 1·0 41 46 1·0 63 78 0·3 Uninhabited.
306 271 779 589
237 685 384 460 114
415 185 79
685 500
47 79
680 930 771
720 425
51 352 195
1,163 570 935
617
775 1,872
877 787
694 110 456 224 937
173
201 62
311
289 263 635 267 388
708
210 671 331
186 206 899 213
4.456
805 255
30 ~53
314 900 845
215 327
1S7 128 407 318
116 335 195 22&
53
197 103 42
346 273
26 39
358 500 406
364 221 27
184 95
599 300 509
306
3&5 941
457 402
346 52
221 123 465
94
104 28
158
142 137 342 123 206
381
III 343 162
95 117 453 111
2,361
422 129
16 282
161 477 449
108 175
149 143 372 271
121 350 189 232
61
218 82 37
339 227
2\ 40
322 430 371
356 204 24
168 100
564 270 420
311
390 931
420 385
348 58
235 101 472
79
97 34
153
147 126 293 144 181.
2 IS 37
3 6
24
33 11
2 19 7
Jl 15
18 9
11
13
11 89
6 10
12
26 . 9
11
5 II 10 6
327 18
99 328 16 169
91
J~ 27 102 3
2,W5 172
383 126
14 271
153 423 396
107 152
2 4
I 11
8 44
12 .5
5 15 27
'2 4
22.
.is 10
2 13 II
13 17
19 8 II
18
f 86
10 IS
5
26
II
10
4 12 7 7
14
iii
23 2
161
3 1
14
6 45
9 4
Literate and educated
M F
(I B) (19)
68 59
173 166
56 139 78 'IS 17
97 39 18
166 121
4 10
134 2W 203
159 124 12 60 34
269 135 209
136
129 447
181 182
152 17 96 32
213
38
35 10 52
43 17
148 37 90
183
40 164 72
36 66
183 67
1108
220 65
8 127
64 271 l'73
26 61
15 27 84 46
14 59 32 33
1
35 12 3
5S 35
7 SO 53 60
52 42 4
1& 11
105 37 61
54
38 165
52 53
49 4
33 :2
74
1I
21 2
20
8 17 53 IS 27
53
11 46 28
6 15 53 27
367
83 24
4 53
22 78 67
7 13
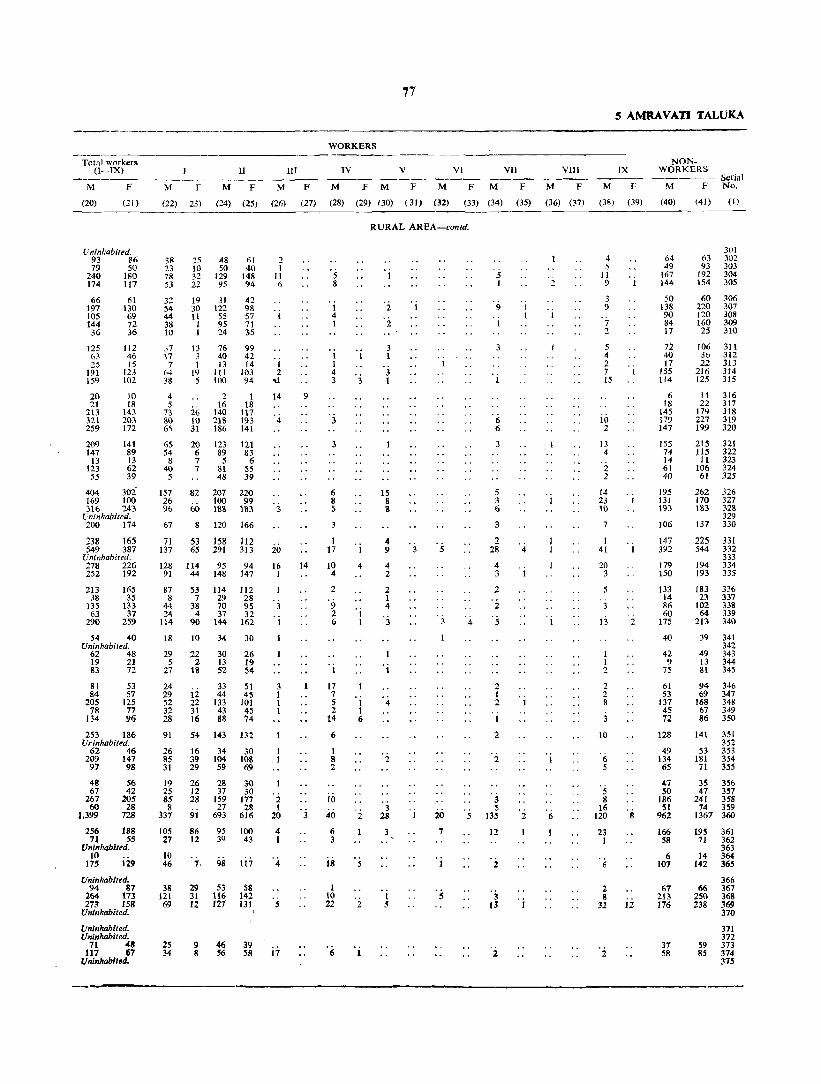
Total workers (I-IX)
M F M F
n M F
III
M F
77
WORKERS
IV V
M F M F
VI VII VIll
M F M F M F M
5 AMRAVATI TALUKA
IX
F
NONWORKERS
F Serial No_
(20) (21 ) (22) 23) (24) (25) (26) (27) (28) (29) (30) (31) (32) (33) (34) (35) (36) (~7) (38) (39)
M
(40) (41) (l)
-------
Uninhabited, 93 86 79 50
240 180 174 117
66 197 105 144 36
125 63 25
191 159
20 21
213 321 259
2(\'j 147
13 123 55
61 130 69 72 36
112 46 15
123 \02
10 18
143 203 172
141 89 13 62 39
404 302 169 100 }16 243
L'ninhabited, 200 ,174
238 165 549 387
Uninhabited, 278 226 252 192
213 38
135 63
290
165 35
133 37
259
54 40 Uninhabited,
62 48 19 21 83 72
81 84
205 78
134
53 57
125 77 96
253 186 U"inhabited,
62 46 209 147 97 98
48 67
267 60
1.399
S6 42
205 28
728
256 t88 71 55
Uninhabited, to
175 129
Uninhabited, 94 87
264 173 273 158
Uninhabited,
Uninhabited, Uninhabited.
71 411 117 67
Uninhabited.
38 ''i 48 61 23 10 50 40 78 32 129 148 53 22 95 94
32 54 44 38 10
31 17 7
64 38
4 5
n 80 6S
19 31 42 30 122 98 11 55 57
I 95 71 I 24 35
13 76 99 3 40 42 1 13 14
19 III 103 5 100 94
26 10 31
2 16
140 218 186
1 18
1\7 193 141
65 20 123 121 54 6· 89 83 875 6
40 7 81 55 5 48 39
157 26 9&
67
82
61l
8
207 100 188
120
220 99
183
166
71 53 158 112 137 65 291 313
128 114 95 94 91 44 148 147
87 53 114 112 8 7 29 28
44 38 70 9S 24 4 37 32
114 90 144 162
18 IQ 34 30
29 22 30 26 5 2 13 19
27 18 52 54
24 29 52 32 28
ii 22 31 16
33 44
133 43 88
51 45
101 45 74
91 54 143 132
26 16 34 30 85 39 104 108 31 29 59 69
19 25 85 8
337
26 12 28
9i
28 37
159 27
693
30 30
177 :z.s
616
105 86 95 100 27 12 39 43
!~ 1. 98 Iii
38 121 69
2S 34
29 S3 58 31 116 142 12 127 131
9 8
46 S6
39 58
2 I
11 6
1 2
'<l
14
:>
20
16 1
3 1 1 1
2 1
20
4 1
17
9
14
3
5 8
1 4 I
I 1 4 3
3
3
6 8 5
3
1 17
10 4
2
'9 2 6
1
17 7 5 2
14
6
1 8 2
10
40 6 3
18
1 10 22
3
I
4
-j 1
'j 1 6
2
5
2
RURAL AREA-contd,
2
2
3 1
15 8 8
4 9
4 2
2 1 4
3
-i
4
3 28
- j 5
5
4
20 5
7
5 1
9
6 6
3
5 3 6
3
2 28
4 3
2
2 I 2
2
2
3 5
135
12
2
3 13
2
4
2 6
4 5
11 9
3 9
7 2
5 4 2 7 15
10 2
13 4
2 2
14 23 III
7
1 41
20 3
3
13
2
2 2 8
10
6 5
'5 8
16 120
23 I
6
2 8
32
2
2
8
64 49
167 144
50 138 90 84 17
72 40 17
155 114
6 18
145 179 147
155 74 14 61 40
195 131 193
106
147 392
179 150
133 14 86 60
175
40
42 9
75
61 53
137 45 72
128
49 134 65
47 50
186 51
962
166 58
6 107
67 213 176
37 58
3(ll 63 302 93 303
192 304 154 305
60 306 220 307 120 J08 160 309 25 310
106 311 36 312 22 313
216 314 125 315
II 22
179 227 199
316 317 318 319 320
215 321 )15 322 11 323
106 324 61 325
262 326 170 327 183 328
329 137 330
225 331 544 332
333 194 334 193 335
183 336 23 337
102 338 64 339
213 340
39 341 342
49 343 13 344 81 345
94 346 69 347
168 348 67 349 86 350
141 351 352
53 353 181 3S4 71 355
35 356 47 357
241 358 74 359
1367 360
195 361 71 362
363 14 364
142 365
366 66 367
250 368 238 369
370
371 372
59 373 85 374
375

78
VJLLAGE DIRBCTORY
Trans- E~llca- Drink- Area port and tional ing in Oeeu-
Total Population Scheduled
Castes Scheduled
Tribes Villalle/ToWD/
Ward Postal Institu- water Medical Bazar Sq. pied House-facilities tic"" iu!'ply faciliu.. Day Mil •• hous.. holds PM F MF M F M F
(1) (2) (3) (4) (5) (6) (7) (8) (9) (10) (11) (12) (13) (14) (15) (16) (17) (18) (1')
----------~------~--~--~------~--------~--------~----------~--~--~-
376 Mundgurav 377 Ajmatpur 37& Dharawadi 379 Mundmala 380 Jawaramolwan
381 Mund Narayan 382 Wadala 383 Fattepur 384 Mundwadi 3SS Ghol
386 Hiwara 387 Khandala Kh. 388 Mahimapur 389 Pahur 390 Fubllaon
391 Hasapur 392 Dhawalsar 393 Palasmandal 394 Pimpri Gavanda 395 Sanlll'ampur
396 Papal 397 ShiwanJ 398 Eklaspur 399 Mirzapllr 400 Kharabi
401 Chikhali Vaidya 402 Karna Mirzapur 403 Rasulpur 404 Weni Ganeshpur 405 Ramou!
406 Pachod 407 Deulgaon 408 Gaoner-Talegaon 409 Tighara 410 Pimpri-Pochya
411 Khed PirnprJ 412 Hapur 413 Abitapur 414 Undirkhed 415 Shahapur
416 Mangrulchawal 417 Oaneshpur 418 Bakha\apur 419 Gangapur 420 Pimpaliaon Nipani
421 Lohegaon 422 Indhala 423 Arjunpur 424 Salod __ 425 Wadhona Ramnath ..
426 Nimgllvhall 427 Amdapur 428 Shivara 429 Tuljapuf 430 MaleiaOn
431 Dhangllia 432 Malkapur 433 Harni 434 Jagatpur 435 !(hanapur
436 Ooloiaon
R
Po
Po
P
p
P
P P
P M
P P P
w Vi w
W W W
Wx W
Vi w
w w W W
\
Po RPo
M W M RivWx
P W
Po M M
RPo M Po P
R p
p
Po H
P
W
W W W W
W W W W W
w
W W
W
w
RURAL AREA-condo.
0- 3 Uninhabited_
Mp Mp
Wed.
0'9 1 1 O· 9 Uninhabited. 0'7 2 3 "'0 98 125
O' 6 Uninhabited. 1'9 50 54 0'7 3 .3 2'0 90 94 1 . 1 Uninhabited.
t'7 64 76 1'7 100 101 o . 9 Uninlutbited_ 2'3 84 86 4'5 324 370
0'9 Uninhabited. l' 3 64 73 2'3 233 249 2'0 103 103 0-6 17 19
Sun. 6-1 Mon. 2'6
O'S 1'4 1'2
274 330 136 174
Uninhabited. 83 91 1 1
0'9 115 liS 3-1 168 194
Mon_ 1'5 168 189 Mp Tue. 3 '8 374 392
0'4 Uninhabited.
MpD Thu.
Fri.
0'9 1'9 3'2 1'4 1'7
20 17 64 37 23
24 17 64 44 23
2'1 110 125 0-5 Uninhabilpd. o . 8 Uninhabited. 0'9 4 4 1'3 2 2
4' J 534 565 0'9 Uninhabited. \-0 Uninhabited. O· 8 Uninhabited. 2'0 272 300
14 563
241 IS
405
342 420
385 1,579
304 1,056
367 n
1,516 727
416 1
456 916 905
1,627
107 72
278 ]98 93
628
12 7
2,448
1,274
p W Mp 3'5 1'1 1-3 4'7 5'3
212 257 7 8
1,038 22
Po Po
Po
M M
P
p'
P
P
W
W W X MpD
w W
W
W Riv. W W W
w
Mon. Uninhabited. 278 281 300 366
2'3 4 4 1'2 Uninhabited. 2'7 133 158 0-5 Uninhabited. l·g 8 8
0'7 -4 , 0'5 9 9 1'1 60 60 1'3 19 21 0'8 104 104
2'1 82 82
1.278 1.748
12
656
51
29 34
256 86
442
332
10 2%
123 9
206
171 217
202 803
169 533 179 43
793 390
212 I
231 471 469 800
54 37
141 103
51
335
7 5
1,259
648
552 11
646 905
7
333
26
17 17
ISS 48
229
153
4 267
118 ~
19~
171 203
183 776
135 523 188 34
723 337
204
225 44S 436 827
53 3S
137 95 42
293
5 .2
1.189
626
536 11
632 843
5
323
25
12 17
101 38
213
179
.1 6
23 1
11
12 1
38
3
18
13
6 7
4
12
19
• 70
13
6
3
26 2
is -
36
2
12
iii i: :
6 5
6
4S
9
12
8 61
14
.~
5 112
49 6
87
80 82
71 410
41 221
71 9
261 190
91
122 221 228 375
21 8
70 39 17
134
1 3
556
249
196
252 441
124
7
10 4
59 7
67
43
2 39
12 2
26
34 26
40 154
15 '8 26
2
J6 16
24
46 100 90
126
12
'27 7 4
25
234
49 " '., 114 135
29
5
1 1
15 (I
15
12
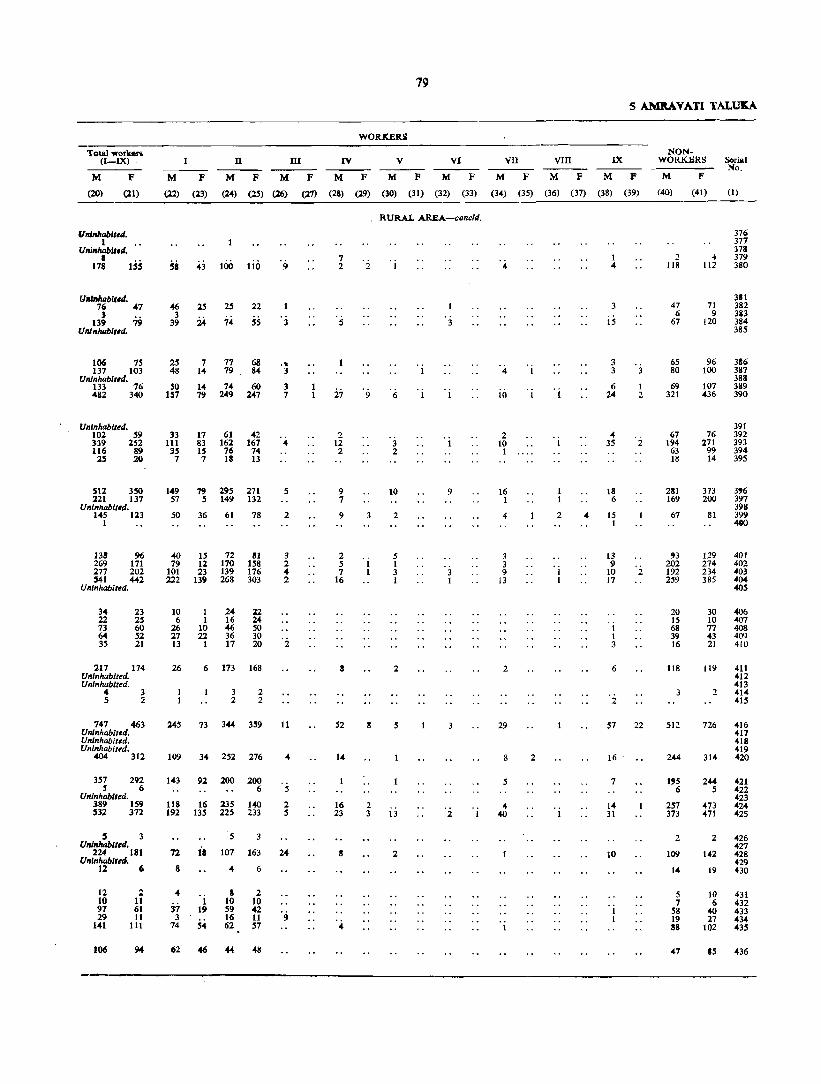
79
5 AMRAVATI TALUKA
WORKERS
TQtaI .. orkcN NON-(I-IX) n ill IV V VI VII VIII IX WORKBRS Soria 1
No. M F M F MP MF MF MP MF MP MF MP M F
(20) (l1) (22) (23) (24) (25) (l6) (71) (28) (29) (30) (31) (32) (33) (34) (35) (36) (37) (38) (39) (40) (41) ----~~~~~~~~--~--~~-------------------------------------------------
(1)
Uninhabited. 76 47
) 139 79
Unlnhilblted.
106 75 137 103
Uninhabited. 133 76 482 340
Uninhabited. 102 59 339 252 116 89
2.5 20
!l12 3SO 2.21 137
Unlnhabft.d. 145 123
1
138 96 269 171 277 202 !!41 442
Uninhabited.
34 22 73 64 35
23 25 60 52 21
217 174 Uninhabited. Uninhabited.
4 3 5 2
747 463 Uninhabited. U nlnhabit.d. Uninhabited.
404 312
357 292 S 6
Uninhabited. 389 159 !l32 372
!I 3 Uninhabited.
224 181 Uninhabited.
12 6
12 10 97 29
141
106
:2 II 61 11
111
si 43 100 110
46 25 2S
7.4 22
55 3~ 24
2577768 48 14 79 84
SO 14 74 60 157 79 249 247
33 17 61 42 111 83 162 167
35 IS 76 74 7 7 111 13
149 79 295 271 57 5 149 132
SO 36 61 78
40 15 12 81 79 12 170 158
101 23 139 176 222 139 268 303
10 1 24 22 6 1 16 24
26 10 46 SO 27 22 36 30 13 1 17 20
26 6 173 168
3 2 2 2
245 73 344 359
109 34 252 276
143 92 200 200 6
118 16 235 140 192 135 225 233
72
8
4
37 3
74
5 3
IS 107 163
1 19
5.4
4 6
8 2 10 .10 59 42 16 11 62 57
62 46 44 48
3
., 3
3 7
5
2
3 2 4 2
2
It
5
2 5
24
.~
7 2
5
27
2 12 2
9 7
9
2 5 7
16
a
52
14
16 23
4
2
9
3
2 3
RURAL AREA-cQndli.
6
3 2
10
2
5 1 3 1
2
5
13
2
3
9
3 1
2
4
4
10
2 10 1
16 1
4
3 3 9
13
2
29
8
5
4 40
2 4
2
1 4
3
is
3 3
6 24
4 35
18 6
15 1
13 9
10 17
1 1 3
6
·2
2
2
2
57 22
16
7
14 31
10
.j 1
2 118
47 6
67
65 80
69 321
67 194 63 18
281 169
67
'3 202 192 259
20 IS 68 39 16
118
512
244
2
109
14
5 7
S8 19 88
47
376 377 3711
4 379 112 380
381 71 382 9 3i3
120 384 385
96 386 100 387
3811 107 389 436 390
391 76 392
271 393 99 394 14 395
373 3'6 200 397
398 81 399
4to
129 401 274 402 234 403 385 404
405
30 406 10 407 77 408 43 409 21 4lU
119 411 412 413
2 414 415
726 416 417 41B 419
314 420
244 421 5 422
423 473 424 471 425
2 426 427
142 428 429
19 430
10 6
40 27
102
.5
431 432 433 434 435
436
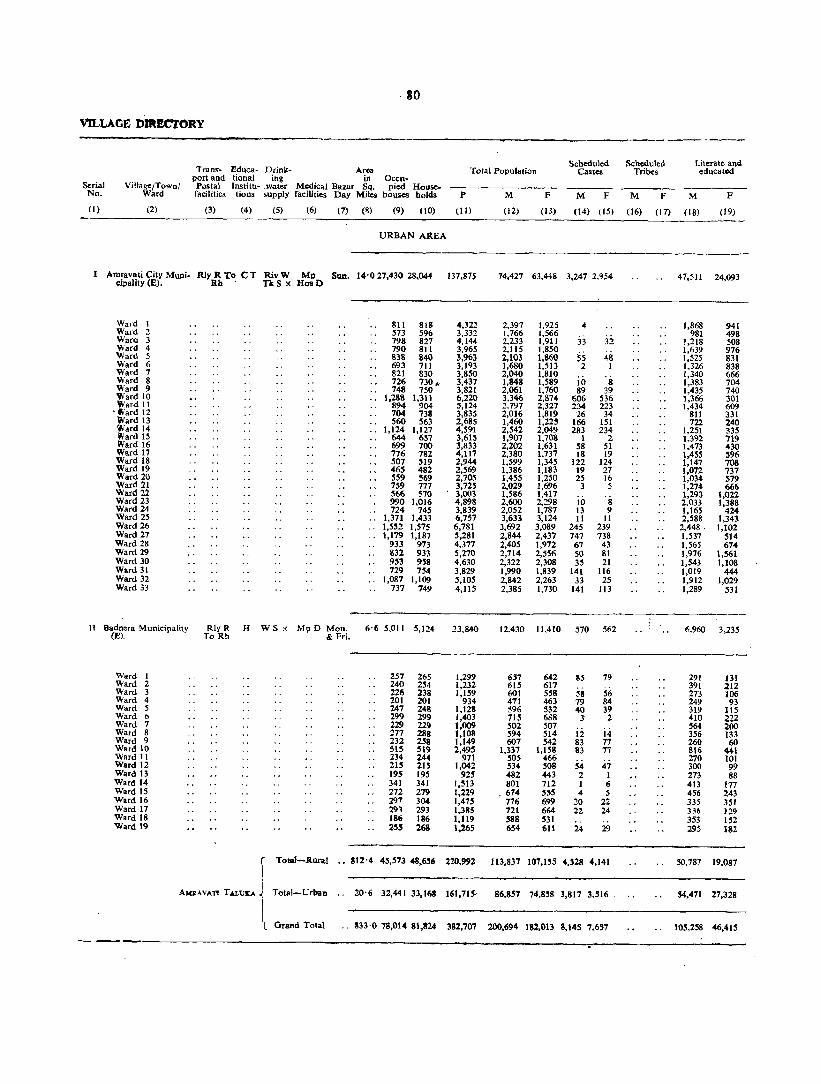
·30
VILLAGE nnmCTORY ---'---
Scheduled S<:heduled Literate and Trans .. £duca· Drink- Area Total Population Castes Tribes educated
port and tional ing in Oecu-Serial Village/Town! Postal Imtrtu- ,water Medical Bazar Sq. pied House-No. Ward facilities tions supply facilities Day Miles houses holds P M F M F M F M F
0) (2) (3) (4) (5) (6) (7) (8) (9) (10) (II) (12) (D) (14) (15) (16) (17) (18) (19)
URBAN AREA
I Amravati City Muni- RlyRTo CT RivW Mp SlID. 14'027,430 28,044 137,815 74,427 63,448 3,247 2.~54 47,511 24,093 cipality (E). Rh . TkS X HasD
Ward 811 818 .01,322 2,397 1,925 4 1,868 941 Ward 2 573 596 3,332 1,766 1,566
ji 981 498
Waro 3 798 827 4,144 2,233 1,911 33 1,218 508 Ward 4 790 8i1 3,965 2,115 1,850
55 1,639 976
Ward 5 838 840 3,963 2,103 1,860 48 1,525 831 Ward 6 693 7i1 3,193 1,680 1,513 2 1 1,326 838 Ward 7 821 830 3,850 2,040 1,810 io 1,340 666 Ward 8 726 730" 3,437 1,848 1,589 8 1,383 704 Ward 9 748 750 3,821 2,061 1,760 89 39 1,435 740 Ward 10 1,288 1,311 6,220 3.346 2,874 606 536 1,366 301 Ward 11 894 904 5,124 2.797 2,327 234 223 1,434 609
. Ward 12 704 738 3,835 2,016 1,819 26 34 811 331 Ward 13 560 563 2,685 1,460 1,22S 166 151 722 240 Ward 14 1,124 1,121 4,591 2,542 2,049 283 234 1,251 335 Ward 15 644 637 3,615 1,907 1,708 1 2 1,392 719 Ward 16 699 700 3,833 2,202 1,631 58 51 1,473 430 Ward 17 776 782 4,117 2,380 1,737 18 19 1.455 596 Ward 18 507 $19 2,944 1,$99 1,345 122 124 1,147 708 Ward 19 465 482 2,569 1,386 1,183 19 27 1,072 737 Ward 20 559 569 2,705 1,455 1,250 25 16 1,034 579 Ward 21 7$9 771 3,725 2,029 1,696 3 5 1,274 666 Ward 22 566 570 3,003 I,S86 1,417 io '8 1,290 1,022 Ward 23 990 1,016 4,898 2,600 2,298 2,033 1,388 Ward 24 724 145 3,839 2,052 1,787 13 9 1,165 424 Ward 25 .. 1,371 1,433 6,757 3,633 3,124 11 11 2,588 1,343 Ward 26 .. 1,5$2 1,57S 6,781 3,692 3,089 245 239 2,448. 1,102 Ward 27 .. 1,179 1,187 5,281 2,844 2,437 747 738 1,537 514 Ward 28 933 973 4,377 2,405 1,972 67 43 1,565 674 Ward 29 832 933 5,270 2,714 2,556 50 81 1,976 1,561 Ward 30 953 958 4,630 2,322 2,308 35 21 1,543 1,108 Ward 31 729 754 3,829 1,990 1,839 141 116 1,019 444 Ward 32 ., 1,087 1,109 5,10S 2,842 2,263 33 25 1,912 1,029 Ward 33 737 749 4,115 2,385 1,730 141 113 1,289 531
11 Badnera Municipality RlyR H WS x Mp 0 Mon. (E). To Rh &0 Fri.
6'6 5,011 5,124 13,840 12,430 11,410 570 562 6,960 3,235
Ward 1 251 265 1,299 637 642 85 79 291 131 Ward 2 240 254 1,232 615 617 391 212 Ward 3 226 238 1,159 601 558 58 56 273 106 Ward 4 201 201 934 411 463 79 84 249 93 Ward 5 247 248 1,128 596 532 40 39 319 liS Ward 6 299 299 1,403 115 688 3 2 410 222 Ward 7 229 229 1,009 502 507
i4 564 200
Ward 8 217 288 1,108 594 $14 12 356 133 Ward 9 232 258 1,149 601 542 83 77 260 60 Ward 10 SIS 519 2,495 1,337 1,158 83 71 816 441 Ward II 234 244 971 50S 466
S4 47 270 101
Ward 12 21S 21S 1,042 534 508 300 99 Ward 13 19S 195 925 482 443 2 1 273 88 Ward 14 341 341 1,513 801 712 1 6 413 171 Ward 15 212 279 1.229 .674 555 4 5 456 243 Ward 16 291 304 1,475 776 699 20 22 335 351 Ward 17 293 293 1.385 721 664 22 24 336 129 Ward 18 186 186 1,119 588 531 353 152 Ward 19 2~S 268 1,165 654 611 24 29 295 182
r Total-Rural .• 812'4 45,573 48.656 220,992 1l3,S37 107,155 4,328 4,141 SO,787 19,087
! Total-Urbao 20'6 32,441 33,163 54,411 27,328 ""'KAVAn T,u,tJi<A ~ " 161,71S-- 86,857 74,858 3,817 ),516
t Grand Total .. 833'0 78,014 81,824 382,707 200,694 18M13 8,145 7,657 105,258 46,415 ---
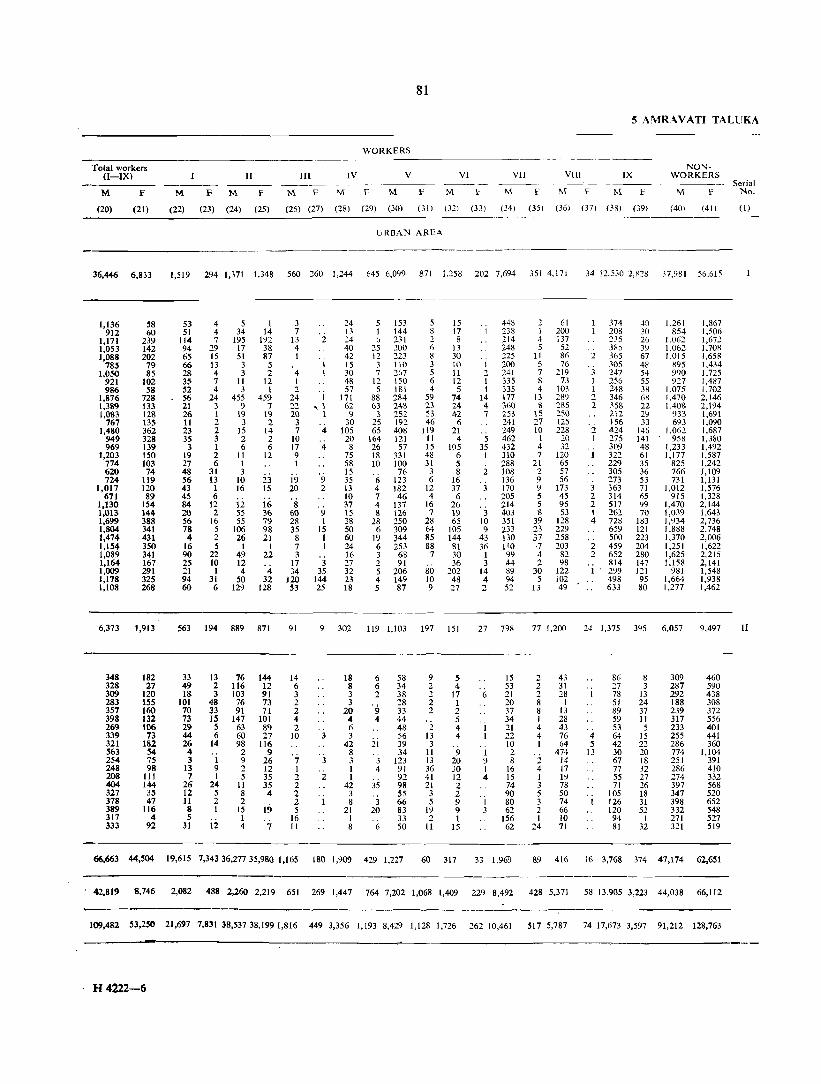
81
5 AMRAVATI TALUKA
WORKERS ~---~~ __ --__ ---
Total workers NON-(I-IX) II III IV V VI VII Vlll IX WORKERS
----- --- - __ -- __ --- Serial M F M F M F M F M F M F M F M f M F M F M F No.
(20) (21) (22) (23) (24) (25) (26) (27) (28) (29) (30) (31 ) (321 (33) (34) (35) (36) (37) (38) (391 (401 (41) (I) ~-__ ------
URBAN ARE<\
36,446 6,833 1,519 294 1,371 1,348 560 Z60 1,244 645 6,099 871 1,258 202 7,694 3514,171 34 12,530 2,~28 37,981 56,615
1,136 58 53 4 5 1 3 24 5 153 15 448 61 374 -10 1,261 1,867 912 60 51 4 34 14 7 13 I 144 17 238 I 200 208 30 854 1.506
1,171 239 114 7 195 192 13 2 24 6 231 2 8 214 4 137 2.15 26 1.062 1,672 1,053 142 94 29 17 38 4 40 25 200 6 13 248 5 52 3~5 3Y 1.062 1.70R 1,088 202 65 15 51 87 1 42 12 223 8 30 225 11 86 :2 365 67 1,015 1,658
785 79 66 13 3 5 15 3 110 3 10 1 200 5 76 305 48 895 1,434 1,050 85 28 4 3 2 4 30 7 267 5 11 2 241 7 219 247 54 990 1,725
921 102 35 7 II 12 I 48 12 150 6 12 1 335 8 73 256 55 927 1,487 986 58 52 4 3 I 2 57 5 181 4 5 1 335 4 103 248 38 1,075 1.702
1,876 728 56 24 455 459 24 1 171 88 284 59 74 14 177 13 289 2 346 68 1,470 2,146 1,389 133 21 3 9 ., 22 ~ 1 62 63 248 23 24 4 360 8 285 2 .\58 22 1,408 2,194 1,083 128 26 1 19 19 20 1 9 3 252 53 42 7 253 15 250 212 29 933 1,691
767 13S II 2 3 2 3 30 25 192 46 6 241 27 125 156 33 693 1.090 1,480 362 23 2 15 14 7 4 105 65 408 119 21 249 10 228 2 424 J46 J,062 1,687
949 328 35 3 2 2 10 20 164 121 11 4 5 462 1 20 275 141 958 1,380 969 139 3 1 6 6 17 4 8 26 57 15 105 35 432 4 32 309 48 1,233 1,492
1,203 150 19 2 11 12 9 75 18 331 48 6 1 310 7 120 1 322 61 J,I77 1,587 774 103 27 6 1 1 58 10 100 31 5 288 21 65 229 35 825 1,242 620 74 48 31 3
23 15 76 3 8 2 108 2 57 305 36 766 1,109
724 119 56 13 10 19 9 35 6 123 6 16 136 9 56 273 53 731 1,131 1,017 120 43 1 16 15 20 2 13 4 182 12 37 3 170 9 173 3 363 71 1,012 1,576
671 89 45 6 10 7 46 4 6 205 5 45 2 314 65 9J5 1,328 1.130 154 84 12 12 16 8 37 4 137 16 26 214 5 95 2 517 99 1,470 2,144 1,013 144 20 2 55 36 60 9 \5 8 126 7 19 3 403 S 53 \ 262 70 1,039 1,643 1,699 388 56 16 55 79 28 1 38 28 250 28 65 10 351 39 128 4 728 183 1,934 2,736 1,804 341 78 5 106 98 35 15 50 6 309 64 105 9 233 23 229 659 121 1,888 2,748 1,474 431 4 2 26 21 8 1 60 19 344 85 144 43 130 37 258 500 223 1,370 2,006 1,154 350 16 5 1 1 7 1 24 6 253 88 81 36 110 ·7 203 2 459 204 1,251 1,622 1,089 341 90 22 49 22 3 16 3 68 7 30 1 99 4 82 2 652 280 1,625 2,215 1,164 167 25 10 12 17 3 27 2 91 36 3 44 2 98 814 147 1,158 2,141 1,009 291 21 1 4 4 34 35 32 5 206 80 202 14 89 30 122 1 . 299 121 98J 1,548 1,178 325 94 31 50 32 120 144 23 4 149 10 48 4 94 5 102 498 95 1,664 1,938 1,108 268 60 6 129 128 53 25 18 5 87 9 27 '2 52 13 49 633 80 1,277 1,462
6,373 1,913 563 194 889 871 91 9 302 119 1,103 197 151 27 798 77 1,200 24 1,375 395 6,057 9,497 II
348 182 33 13 76 144 14 18 6 58 9 5 15 '2 43 86 8 309 460 328 27 49 2 116 12 6 8 6 34 2 4 53 2 31 27 3 287 590 309 120 18 3 103 91 3 3 2 38 2 17 6 21 2 28 1 78 13 292 438 283 155 101 48 76 73 2 3
'9 28 2 1 20 8 1 51 24 188 308
357 160 70 33 91 71 2 20 33 2 2 37 8 13 89 37 239 372 398 132 73 15 147 101 4 4 4 44 5 34 1 28 59 11 317 556 269 106 2~ S 63 89 2 6 48 2 4 21 4 43 53 5 233 401 339 73 44 6 60 27 10 3 56 13 4 22 4 76 4 64 15 255 441 321 182 26 14 98 116 42 21 39 3 10 I 64 5 42 22 286 360 563 54 4 2 9 8 34 11 9 1 2 474 13 30 20 774 1,104 254 75 3 I 9 26 7 3 3 3 123 13 20 9 8 2 14 67 18 251 391 248 98 13 9 2 12 1 I 4 91 36 30 I 16 4 17 77 32 286 410 208 111 7 I 5 35 2 2 1 92 41 12 4 15 1 19 55 27 274 332 404 144 26 24 11 35 2 42 35 98 21 2 74 3 78 71 26 397 568 327 3S 12 5 8 4 2 3 55 3 2 90 5 50 105 18 347 520 378 47 11 2 2 2 1 8 3 66 5 9 1 80 3 74 126 31 398 652 389 116 8 I 15 19 5 21 20 83 19 9 3 62 2 66 120 52 332 548 317 4 S 1 16 1 33 2 1 156 I 10 94 1 271 527 333 92 31 12 4 7 11 8 6 50 11 15 62 24 71 81 32 321 519
66.663 44,504 19,615 7,343 36,277 35,980 1,165 180 1,909 429 1,227 60 317 33 1,969 89 416 16 3,768 374 47,174 62,651
42.819 8,746 2,082 488 2,260 2,219 651 269 1,447 764 7,202 1,068 1,409 229 8,492 428 5,37i 58 13.905 3,223 44,038 66,112
109.482 53,2~ 21,697 7,831 38,53738,199 1,816 449 3,356 1,193 8,429 1,128 1,726 262 10,461 517 5,787 74 17,673 3,597 91,212 128.763
H 4222-6

Chandur Tainka

MORSI
.61
072
.77
_86
.103
.22 23 • 2l II
;00 27 JI .32
34 035 .42 ·39
048.430 41
049
.168
.169
_104 0172.105
.170 -171 .,73
YEOTMAL DISTRICT
h +
CHANDUR TALUKA AMRAVATI DISTRICT
IEfUElCE8 TALUKA BOUNDARY_~~~~ ____ _
TALUKA HEAD QUA~TER _____ 1iiI VILLAGE CODE NUMBER __ ~ __ 5 POPULATION ABOVE 2000 ____ _
POPULATION BELOW 2000 ____ • UNINHABITED _____________ 0 ROAD ________________ = RAILWAY _____________ ++++ RIVER _____ - ----_ - _____ ~
uRS"N BOuNDARY---- - - - --~--o I 2 4 6 8 ! !! ! ! I
SCA.LE OF MILES
WARDHA DISTRICT
• • 188 • .175 202., 2 189 .,91 ~6·
.203 .205 )): 199 01940201 .204 2 9~ _ 0 0
200 _208
"'~'NT'D AT aI ~"-"OO"'A. ""IS" , ... 0-,"1:
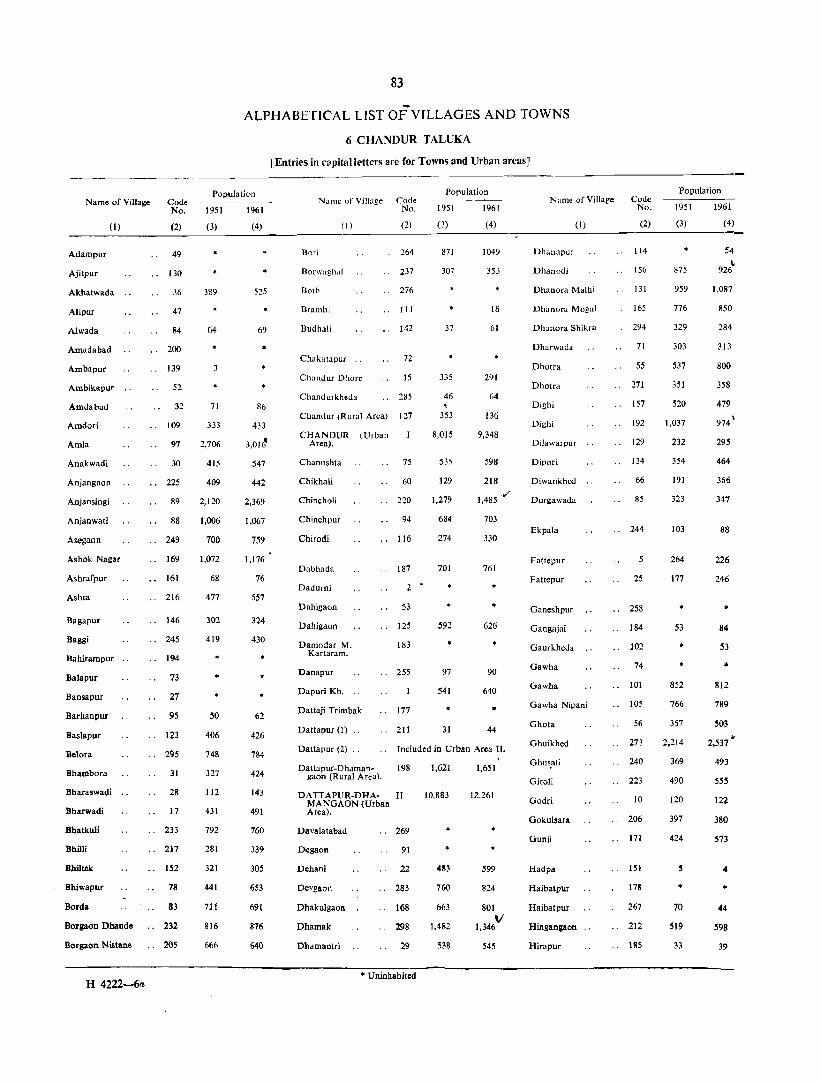
Name of Village Code No.
83
ALPHABETICAL LIST OF VILLAGES AND TOWNS
6 CHANDUR TALUKA
[Entries in (,:Jpitallettcrs are for Towns and Urban areas]
Population
1951 1961 1951 1961 Name of Village Code
No.
Population Name of Village Code
No.
Population
1951 1961
(I) (2) (3) (4) (I) (2) (3) (4) (I) (2) (3) (4) ----~----~~~~--~---------------------------~~----~---------------
Adampur
Ajitpur
Akbatwada
Alipur
Alwada
Amadabad
Ambapur
Ambikapur
Amdabad
Amdori
Amla
Anakwadi
Anjangaon
Anjansingi
Anjanwati
Asegaon
Ashok Nagar
Ashrafpur
Ashta
Bagapur
Baggi
Bahirampur
Balapur
Bansapur
Barhanpur
Baslapur
Belora
Bhambora
Bharaswadi
Bharwadi
Bbatkuli
BhilIi
Bhiltek
Bbiwapur
Borda
Borgaon Dbande
Borgaon Nistane
H 4222-6a
49
130
36
47
84
200
139
52
32
109
97
30
225
89
88
249
169
161
216
146
245
194
73
27
95
123
295
31
28
17
233
217
1~2
78
83
232
205
389
64
71
333
2,706
415
409
2,120
1,006
700
1,072
68
477
302
419
50
406
748
327
112
431
792
281
321
441
711
816
666
525
69
86
433
3,OUJi
547
442
2,369
1,067
759
1,176
76
557
324
430
62
426
784
424
143
491
760
339
305
653
691
876
640
Bori 264
Borwaghd] 237
Both 276
Bramh~ III
BudhaJi 142
Chakatapur .. 72
Chandur Dhore 15
Chandurkheda .. 285
Chandur (Rural Area) 127
CHANDUR (Urban Area).
Chanushta 75
Chikhali 60
Chincholi 220
Chinchpur
Chirodi
Dabhada
Dadurni
Dahigaon
Dahigaon
Damodar M. Kartaram.
Danapur
Dapuri Kh.
Dattaji Trimbak
94
116
187
2
53
125
183
255
177
211
871
307
37
335
46
353
8,015
535
129
1,279
684
274
701
592
97
541
31
1049
353
18
61
291
64
136
9,348
598
218
1,485 ,,/
703
330
761
626
90
640
44 Dattapur (I)
Dattapur (2) Included in Urban Area II.
Dattapur.Dhaman. 198 1,621 gaon (Rural Area).
DATTAPUR·DHA· II 10,883 MANGAON (Urban Area).
Davalatabad
Degaon
Dehani
Devgllon
DhakuJgaon
Dbamak
Dhamantri
269
91
22
283
168
298
29
• Uninhabited
483
760
663
1,482
538
1,651
17.,261
599
824
,
801
1,346V
545
Dhanapur
Dhanodi
Dhanora Malhi
Dhanora Mogal
Dhanora Shikra
Dharwada
Dhotra
Dhotra
Dighi
Dighi
Dilawarpur
Dipori
Diwankhed
Durgawada
Ekpala
Fattepur
Fattepur
Ganeshpur
Gangajai
Gaurkheda
Gawha
Gawha
Gawha Nipani
Ghota
Ghuikhed
Ghusali
Giroli
Godri
Gokulsara
Gunji
Hadpa
Haibatpur
Haibatpur
Hingangaot!
Hirapur
114
156
131
165
294
71
55
271
157
192
129
134
66
85
.. 244
25
258
184
102
74
101
105
56
.. 273
.. 240
.. 223
10
206
171
151
178
267
212
185
875
959
776
329
303
537
351
520
1,037
232
354
191
323
103
264
177
53
852
766
357
2,214
369
490
120
397
424
~
• 70
519
33
54
926~
1,08i
850
284
313
800
358
479
974'
295
464
366
347
88
226
246
• 84
53
• 812
789
503
2,537 v
493
555
122
380
573
4
44
598
39
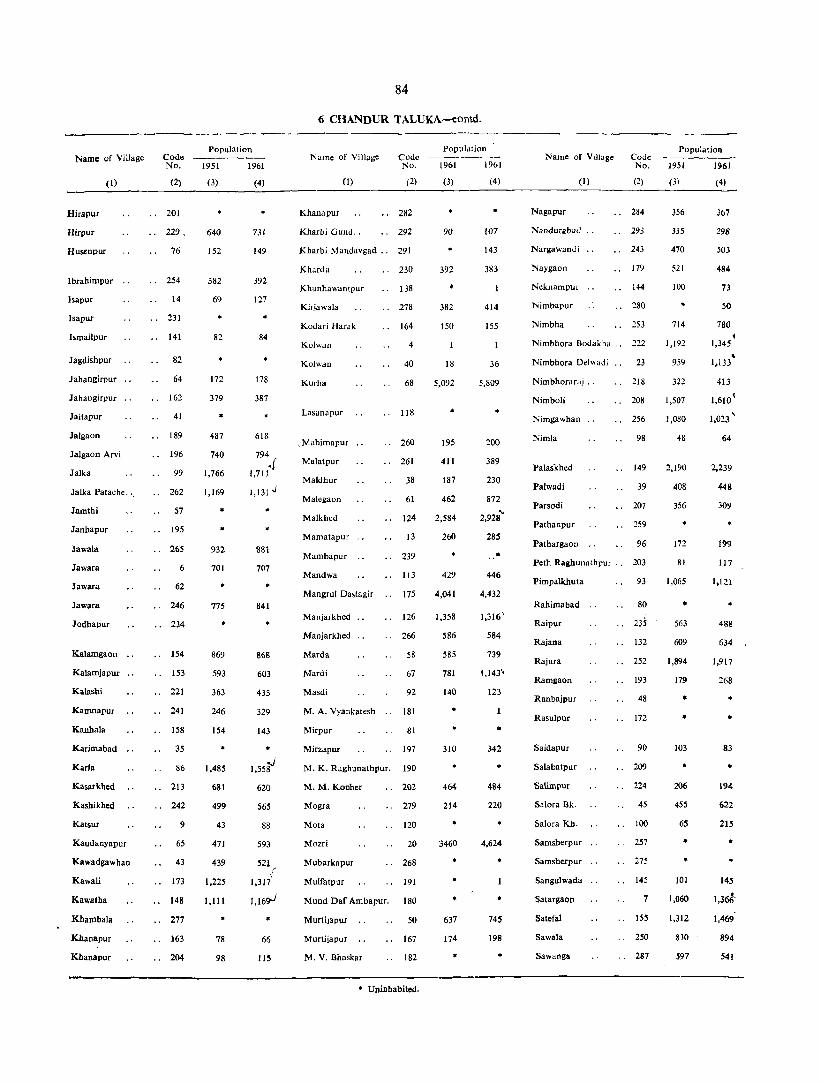
Name of Village
Hirapur
Hirpur
Husenpur
(I)
lbrahimpur
lsapur
lsapur
lsmailpur
Jagdishpur
Jahangirpur
Jah.ngirpur
Jaitapur
Jalgaon
Jalgaon Arvi
Jalka
Jalka Patache. '.
Jamthi
Janhapur
lawala
Jawara
lawara
Jawara
Jodhapur
Kalamgaon
Kalamjapur
Kalashi
KalDIlapur
Kanhala
Karirnabad
Karla
Kasarkhed
Kashikhed
Katsur
Kaudanyapur
Kawadgawhan
Kawali
Kawatha
Kbambala
Kbanapur
Kbanapur
Code No.
(2)
201
229,
76
254
14
231
141
82
64
162
41
189
196
99
262
57
195
265
6
62
246
234
154
153
221
241
158
35
86
213
242
9
65
43
173
148
277
163
204
population
1951 1961
(3)
* 640
152
382
69
82
172
379
487
740
1,766
1,169
*
*
932
701
*
775
869
593
363
246
154
1,485
681
499
43
471
439
1,225
1,111
78
98
(4)
731
149
392
127
84
178
387
618
794
·f 1,711
1,131,j
*
881
707
841
868
603
435
329
143
1,55sJ
620
565
88
593
521 r 1,317'
1,169-"
66
115
84
6 CHANDUR TALUKA-eontd.
Name of Village
(I)
Khanapur
Kharbi Gund ..
Code No.
(2)
282
292
Kharbi Mandavgad .. 291
Kharda
Khunhawanlpur
Kirjawala
Kodari Harak
Kolwan
Kolwan
Kurha
Lasanopur
,Mahimapur
Malalpur
Ma1dhur
Malegaon
Malkhed
Mamatapur
Mambapur
Mandwa
Mangrul Dastagir
Manjarkhed
Manjarkhed
Marda
Mardi
Masdi
M. A. Vyankatesh
Mirpur
Mirzapur
230
138
278
164
4
40
68
118
260
261
38
61
124
13
239
113
175
126
266
58
67
92
181
81
197
M. K. Raghunathpur. 190
M. M. Konher
Mogra
Mota
Mozri
Mubarkapur
Muifatpur
202
279
120
20
268
191
Mund Dar Ambapur. 180
Murtijapur
Murtijapur
M. V. Bhaskar
50
167
182
• Uninhabited.
Population
1961 1961
(3)
90
392
382
150
18
5,092
195
411
187
462
2,584
260
429
4,041
1,358
586
585
781
140
310
464
214
3460
637
174
(4)
*
107
143
383
414
155
36
5,809
•
200
389
230
872
2,928'"
285
446
4,432
1,316"
584
739
1,143'
123
• 342
• 484
220
* 4,624
• 745
198
•
Name of VIllage
(I)
Nagapur
Nanduraba<l
Nargawandi
Naygaon
Neknampur
Nimbapur
Nimbha
Code No.
(2)
284
293
243
179
144
280
253
Nimbhora Bodakha .. 222
Nimbhora Dclwadi 23
Nimbhoraraj .. 218
Nimboli 208
Nimgawhan 256
Nimla 98
Palaskhed 149
Palwadi 39
Parsodi 207
Pathanpur 259
Pathargaon 96
Peth Raghunathpur " 203
Pimpalkhuta 93
Rahimabad
Raipur
Rajana
Rajura
Ramgaon
Ranbajpur
RasuJpur
Saidapur
Salabatpur
Salimpur
Salora Bk.
Sa10ra Kb.
Samsherpur
Samsherpur
Sangulwada
Satargaon
Satefal
Sawa1a
Sawanga
80
235
132
252
193
48
172
90
209
224
45
100
257
275
145
7
ISS
250
287
Population
1951 1961
356
335
470
521
100
• 714
1,192
959
322
1,507
1,080
48
2,190
408
356
81
1,065
• 563
609
1,894
179
• •
103
• 206
455
65
• *
101
1,060
1,312
830
597
(4)
367
298
503
484
73
50
780 ~
1,345
• 1.133
413
1,6101
1,023 '
64
2,239
448
309
199
117
1,121
488
634
1,917
268
•
83
• 194
622
215
• *
145
1,366'
1,469
894
541
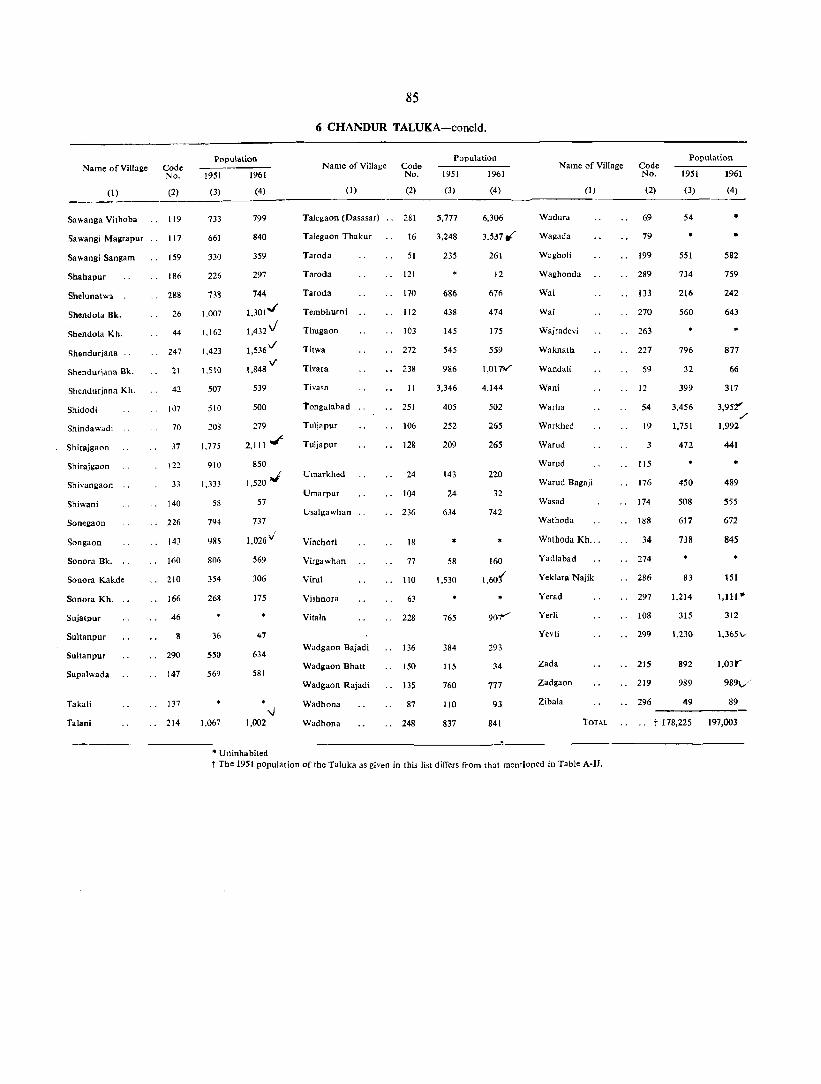
Population Name of Village Code
No. !951 1961
(I) (2) (3) (4) ----
Sawanga Vithoba
Sa wangi Magrapur
Sawangi Sangam
Sbahapur
Sbelunatwa
Shendol. Bk.
Shendol. Kh.
Shendurjana ..
Shendurjana Bk.
Shendurjana Kh.
Shidodi
Shindawadi
Shirajgaon
Shirajgaon
Shi\'angaon
Shiwani
Sonegaon
Songaon
Sonora Bk.
Sonora Kakde
Sonora Kh.
Sujatpur
Sultanpur
Sultanpur
Supalwada
Takali
Talani
119
117
159
186
28&
26
44
247
21
42
107
70
)7
J 2:2
33
140
226
143
160
210
166
46
8
290
147
137
214
733
661
330
226
n&
1.007
1.162
1,423
1.510
507
510
208
1.775
910
1,333
58
79~
'ISS
806
354
268
36
550
569
1,067
799
840
359
297
744
1.301"
1,432'11
1,536\/
if 1,848
539
500
279
2,111.F
850
1,520 .,.;
57
569
306
175
47
634
581
-.J 1,002
• Uninhabited
85
6 CHANDUR TALUKA-concld.
Name of Village Code
(I)
Talegaon (Dasosar)
Talegaon Thakur
Taroda
Taroda
Tarod.
Tembhurni
Thugaon
Ihwa
Tivara
Tivasn
1'ongalabad
Tuljapur
Tuljapur
Umarkhed
Umarpur
Usalgawhan
Vinchori
Virgawhan
Virul
Vishnora
Vitala
Wadgaon Bajadi
Wadgaon Bhatt
Wadgaon Rajadi
Wadhona
Wadhona
No.
(2)
281
16
51
121
170
112
103
272
238
11
251
106
128
24
104
236
18
77
110
63
228
136
150
135
87
248
Population
1951 1961
(3)
5,777
3,248
235
686
438
145
545
986
3,346
405
252
209
143
24
634
58
1,530
765
384
115
760
110
837
(4)
6,306
3,537 ,;-
261
12
67('
474
175
559
1,01Y
4,144
502
265
265
220
32
742
160
1,60{
293
34
777
93
841
Population Name of Village Code
(I)
Wadura
Wagada
Wagholi
Waghonda
Wai
Wai
Wajrade\'i
Waknatb
Wandali
Wani
Warha
Warkhed
Warud
Warud
Warud Bagaji
Wasad
Wathoda
Wathoda Kh ...
Yadlabad
Yeklara Najik
Yerad
Yerli
Yevti
Zada
Zadgaon
Zibala
TOTAL
No. 1951 1961
(2)
69
79
199
289
133
270
263
227
S9
12
54
19
3
115
176
174
188
34
274
286
297
lOS
299
215
219
(3)
54
551
734
216
560
796
32
399
3,456
1,751
472
450
508
617
738
83
1,214
315
1,230
892
989
296 49
.. t 178,225
(4)
..
.. 582
759
242
643
• 877
66
317
3,952' ,/'
1,992
441
.. 489
555
672
845
151
1,111 ..
312
1,365\/
1,03!"
989\..-"
89
197,003
t The 1951 population of the Taluka as given in this list differs from that mentioned in Table A·II.
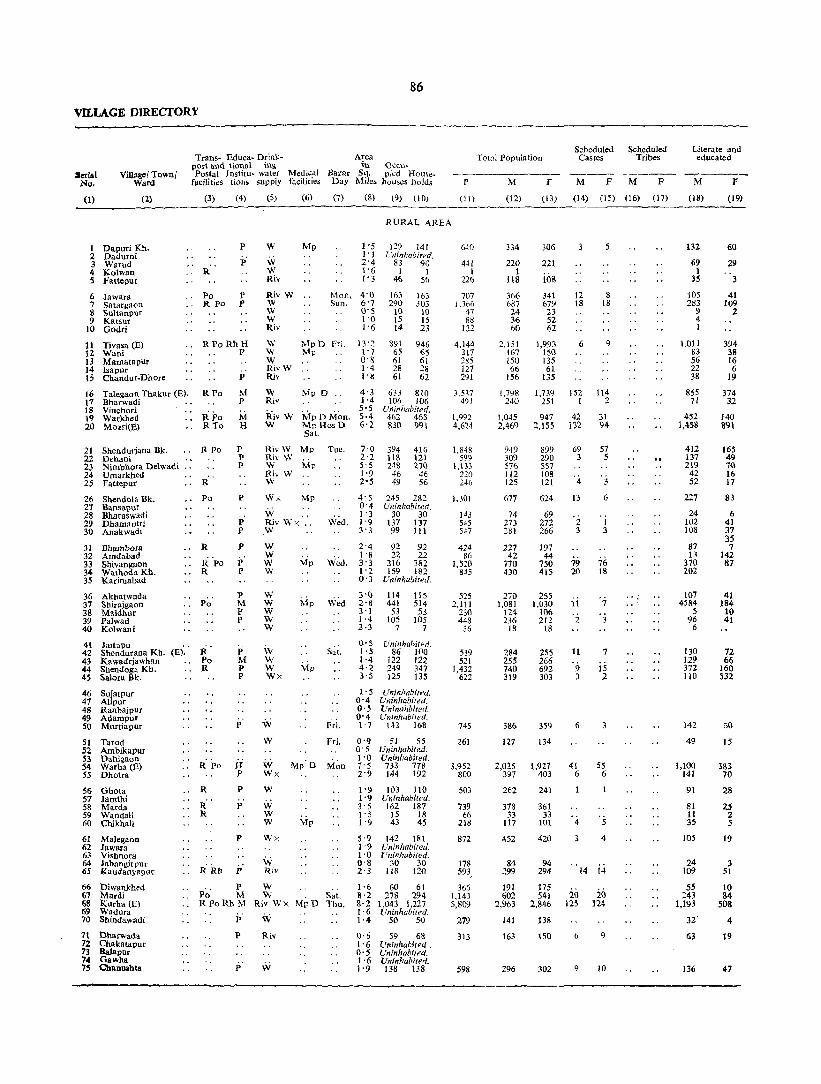
86
VILLAGE DIRECTORY
Serial No.
(1)
Vil!Bge/ 'fownl Ward
(2)
Trans- Educa- Drink- Area port tlnd tional ing in CCCli-Postal lnslilu- water Medical Bazar Sq. pied Hou~e-
fllcilities tions supply facilities nay Miles houses holds
(3) (4) (5) (6) (7) (8) (9) (10)
Total Population
-----------------P M F
Scheduled Castes
M F
Scheduled Tribes
M F
(II) (12) (13) (14) (15) (16) (17)
RURAL AREA
1 Dapuri Kh. 2 Dadurni 3 Warud 4 Kolwan 5 Fattepur
6 Jawara 7 Satargaon 8 Sultanpur 9 Katsur
10 Godri
11 Tivasa (E) 12 Wani 13 Mamatapnr 14 Isapur 15 Chandur-Dhore
16 Talegaon Thakur (E). 11 Bharwadi 18 Vinchori 19 Warkhed 20 Mozri(E)
21 Shendurjana Bk. 22 Dehani 23 Nimbhora Delwadi 24 Umarkhed 25 Fattepur
26 Shendola Bk. 27 Bansapur 28 Bharaswadi 29 Dhamantri 30 Anakwadl
31 Bhambora 32 Amdabad 33 Shivangaon 34 Wathoda Kh. 35 Karimabad
36 Akhatwada 37 Shirajgaon 38 Maldhur 39 Palwad 40 Kolwani
R"
P
p
Po P R Po P
R Po Rh H P
R Po
iPo RTo
R Po
R
Po
R
P
M P
M H
p P P
p
P P
P
:i' p
P 1\1 P P
41 Jaltapu . 42 Shenduraoa Kh. (E). R . P
M P P
43 Rawadriawhan Po 44 Shendoga Kh. R 45 Salora Bk.
46 Sujatpur 41 Alipur 48 Ranbajpur 49 Adampur 50 Murtiapur
51 Tarod 52 Ambikapur 53 Dahlgaon 54 Warha(£) 55 Dholra
56 Ghota 57 Jamthi 5& Marda 59 WaodaJi 60 Chikhali
61 Malegaon 62 Jawara 63 Vishnora
R
R R
p
ii p
p
p
p
64 Jahangirpur 65 Raudanyapur RNb P
w W W Riv
Ri\' W W W W Riv
Mp 1 '5 129 141 1 . 1 l:ilinhabited. 2'4 83 90 l' 6 I 1 l' 3 46 56
Mon. 4-0 Sun. - 6'7
O'S 1'0 j'6
163 163 290 303
10 10 15 15 14 23
W Mp n Fri. 13-~ 891 946 W Mp 1-7 65 65 W O'S 61 6[ RivW 1'4 28 28 Riv )'8 61 62
W MpD Riv
Riv W MP 1) M~n. W Mpllosn
Sat.
RivW Mp Tue. Riv W W MP Riv W W
W" Mp
W .. Riv Wx .. W
W W W Mp w
w w ~1p W W W
w w W Wx
w Wx
W
W W W
iN Riv
Mp
s~i.
Fri. Fri.
4'3 1'4 5'5 5·4 6·2
633 8 to 106 106
Uninhabifec/. 462 465 830 991
7'0 394 416 2-2 118 121 5' 5 248 21Q 1-9 46 46 2·S 49 56
245 282 Uninhabited_
30 30 137 137 99 111
92 92 22 22
316 382 159 182
Uninhabited.
114 115 441 514 53 S3
105 105 7 7
Q. 5 Uninhabited. 1'5 86 100 1 '4 122 122 4'2 249 347 3·5 125 135
1·:; Uninhabited. 0'4 Uninhabited. O' 5 Uninahblte<l. O' 4 Uninhabited. 1-7 143 168
0'9 51 55 0- 5 Uninhabited. 1'0 Uninhabited. 7'5 733 178 2'9 144 t92
1 '9 [03 110 1'9 Uninhabited. 3'5 162 187 1'5 15 18 1 '9 43 45
5'9 142 181 I '9 Uninhabited. I . 0 Uninhabited. 0'& 30 30 2'3 llS 120
66 biwankhed 67 Mardi
.. P W 1·6 60 61
68 Rurha {El 69 Wadura 70 Shindawadi
- 7l Dharwada 72 Chakatapur 73 Balapilr 74 Gawha 7S Chanushta
Po M W Sat. R Po Rh 1\1 Riv Wx Mp D 1'11U.
P W P Riv
j,
8·2 278 294 8·2 1,043 1,227 1· 6 Uninhabited. 1·4 50 50
0·6 59 6& 1 . 6 Uninhabit"i. 0'5 Uninhabited. 1 . 6 Unlnhabitec!. 1'9 138 138
640
441 1
226
707 1.366
47 88
122
4,144 317 285 127 291
3,537 491
1.992 4,6~4
1,848 599
1,133 210 2016
1,301
143 545 547
424 86
1.510 845
525 2,111
230 448
36
539 521
1,432 622
745
261
3,952 800
503
739 66
218
872
178 593
366 1,143 5,809
279
313
598
334
220 1
118
366 687 24 36 60
2,151 167 150 66
156
1,798 240
1,045 2,469
949 309 576 112 125
677
74 273 281
227 42
770 430
270 1,081
IN 236
18
284 255 740 319
386
127
2,025 397
262
378 33
117
452
84 299
[91 602
2,963
141
\63
296
306
221
i08 341 679 23 52 62
1,993 150 135 61
135
1,739 251
947 2.155
899 290 557 108 121
624
69 272 266
197 44
750 415
255 1,030
106 2[2
18
255 266 692 303
359
134
1,927 403
241
361 33
101
420
94 294
175 541
2,846
138
150
302
12 18
6
152 I
42 132
69 3
4
13
2 3
79 20
11
2
11
'9 3
6
41 6
4
8 18
9
114 2
31 94
57 5
6
1 3
76 18
7
3
7
15 2
3
5S 6
5
4
14 14
20 125
9
20 124
9
10
Literate and educated
M P
(18)
132
69 1
3S
lOS 283
9 4 I
1,011 83 56 22 38
855 11
452 lASS
412 137 219
42 52
227
24 102 108
87 13
370 202
107 4584
5 96
6
130 129 372 110
\42
49
1,100 141
91
81 11 35
105
24 109
55 243
1,193
32'
63
136
(19)
60
29
41 109
2
394 38 16 6
19
374 32
140 891
165 49 '10 16 17
83
6 41 37 35 1
142 87
41 184 10 41
72 66
160 532
50
15
3&3 70
28
2S 2 5
19
3 51
10 84
508
4
19
47

Total workers (I-IX)
M F
(20) (21)
200 166 Uninhabited.
141 82 1
76 78
242 166 405 322
15 14 21 27 37 37
1.190 104 97 42 91
670 70 77 18 58
1,037 678 134 101
Uninhabitect. 651 360
1,290 769
515 170 359
64 80
408 112 212 48 44
426 282 Uninhabited.
50' 24 181 147 151 87
12g 62 26 12
458 246 224 126
Uninhabited
151 631
71 136 13
Uninhabited.
52 523
50 109
8
149 98 143 135 384 269 190 117
Uninhabited. Uninhabited. Uninhabited. Uninhabited.
240 181
69 74 Uninhabited. Uninhabited.
1,199 820 232 158
138 110 Uninhabited.
232 175 19 18 71 34
279 238 Uninhabited. Uninhabited.
51 45 191 125
109 95 373 186
1,673 851 Uninhabited.
90 62
96 77 Uninhabited .. Uninhabited. Uninhabited. . 189 139
II
M
(22)
F
(23)
M
(24)
F M
(25) (26)
122 78 68 88
59 15 70 57
2~ 40 77 13 1 195 162
177 92 182 223 3 2 11 12 8 2 13 25
21 16 15 21
331 45 62 21 34
107
38 4
17
525 55 33 19 49
532 70 39 14 39
4
7 1
. i
15 2
262 97 600 558 22 38 18 85 82 2
lSI 51 380 299 19 461 241 349 449 20
194 66
182 41 19
84 241 313 36, 73 74 79 152 132 26 21 22 3 45 39
135
7 64 69
53 16
168 71
33
47 19
8 19
237 242
38 24 78 99 80 68
68 62 10 12
230 229 113 104
66 6 77 45 267 228 317 292 34 19 36 30 61 43 57 65
2 I 11 7
65 20 75 78 71 4S 55 90
186 29 131 232 36 3 144 114
110 32 117 149
29 30 32 44
468 249 552 549 70 14 146 139
41 23
101 80 9 9
45 13
68 51
7 2 57 21
47 39 167 65 554 192
26
54 36
90 54
89 87
110 92 9 - 9
23 20
120 182
42 43 113 101
31 34 158 121 771 628
63 61
39 41
87 85
8 6 1
2
12
I 4
2 . Ii 3
2 8
9
3 4
7 3
2
4
5
3
1 5
15
III
F
(27)
3
2
M
(28)
4
4
4 16
47 1 2
4
40 3
38 52
14 12 10
'2 21
2 6 1
20 21
2 19
2
3 3
35 2
2
4
45 3
9
2
6
25 18 84
7
WORKERS
IV
F M
(29) (30)
87
V
F
(31)
M
(32)
RURAL AREA
2 4
14
2 15
8 2
2
6
7 1
. i
13 2
2
2
22
'(;
2
8
15
5 2
2
2
'2 1
8
4 11
4
2
11
5
7
2 26
7 1
2
I 9
VI
F
(33)
10
2
M
(34)
1 6
51
29 2
12 49
14 6 1 1 I
10
ii
15 4
2 5
2
3 2 8 2
2
27 3
2
74
I 2
2 7
103
VII VIII
F M F
(35) (36) (37)
. i
4 I
I 3
. i
14
17
2
2 4
'j
I
2
1 IS
M
(38)
'2 s
10
189 1
2 3
78 4
47 314
33 5
12 1
11
8
1 17 1
4
is 9
2 14 1 4
3 9
17 5
8
4
83 6
4
5 I 1
5
6
3 12
105
s
6 CHANDUR TALUKA
IX
F
(39)
14
NONWORKERS
M F
(40) (41)
134
79
'42 124 282
9 15 23
961 63 53 24 65
140
139
30
175 357
9 25 25
1,323 80 58 43 77
Serial No.
(I)
1 2 3 4 5
6 7 8 9
10
11 12 13 14 15
8 761 1061 16 106 150 17
18 7 394 587 19
59 1,179 1,386 20
2
'j 2
I 2
1
9 I
11
434 139 217 48 45
251
24 92
130
99 16
312 206
119 450 53
100 S
135 112 356 129
146
58
826 165
124
146 14 46
173
33 108
82 229
1,290
51
67
107
491 21 178 22 345 23 60 24 77 25
342
45 125 179
BS 32
504 289
26 27 28 29 30
31 32 33 34 35
203 36 507 37 56 38
103 39 10 40
157 131 423 186
41 42 43 44 45
46 47 48 49
178 50
60
1107 245
131
186 15 67
182
49 169
80 355
1,995
76
73
163
51 52 53 54 55
56 57 58 59 60
61 62 63 64 65
66 67 68 69 70
71 72 73 74 75
.------------------------------___
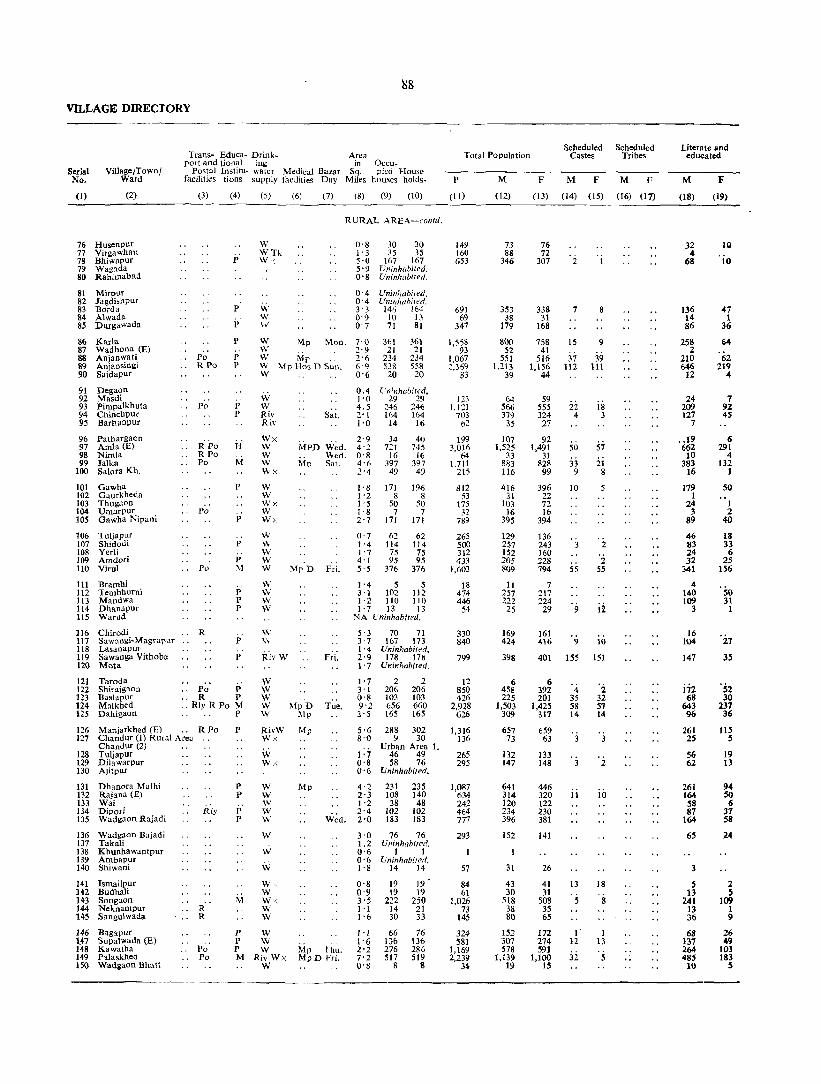
VILLAGE DIRECTORY
Serial No.
Village/Town! Ward
(I) (2)
76 Husenpur 77 Virgawhan 78 Bhiwapur 79 Wagada 80 Rahimabad
81 Mirpur 82 J agdishpur 83 Borda 84 Alwada 85 Durgawad.
86 Karla 87 WadhOna (E) 88 Anjanwati 89 Anjansingi 90 Saidapur
91 Degaon 92 Masdi 93 Pimpalkhuta 94 Chinchpur 95 Barhanpur
96 Pathargaon 97 Amla (E) 98 Nimla 99 Jalka
100 Salora Kh.
101 Gawha 102 Gaurkheda 103 Thugaon 104 Urnarpur 105 Gawha Nipani
106 Tuljapur 107 Shidodi 108 Yerli 109 Amdori 110 Virul
111 Bramhi 112 Tembhurni 113 Mandwa 114 Dhanapur 115 Warud
Trans- Educa- Drink_ Arca port and tjonal 111g in Occu~
Postal Institu- water Medical Bazar Sq. pied House facilities tions supply facilities Day Miles houses holds-
(3)
Po RPo
Po
RPo .. RPo
Po
Po
.. Po
(4)
P
P
p
P
P P
p p
If
M
p
p
p
P M
p P P
(5) (6) (7) (8) (9) (10)
RURAL AREA-contd.
W WTk W"
w w ~v
~ Mp Mon.
W Mp W Mp Hos D Sun. W
W W Riv Riv
Wx W W W \Vx
W W \\,1 X W W>:
W W W W W
W v"\; W W
s~i.
MPD Wed. \\-ed.
Mp Sat.
:'>fp D Fri.
0-8 30 30 1 -3 35 35 5'0 167 167 5' 9 Uninhabited. 0-8 Uninhabited.
0'4 Uninhabited. O' 4 Uninhabited. 3'3 146 164 0'9 10 L\ O' 7 71 81
36\ 21
234 538 20
361 21
234 558
20
0.4 UninhClbited_ 1'0 29 29 4.5 :46 246 2'1 1M 164 1'0 14 16
34 721
16 397
49
40 745
16 397 49
I'S 171 196 1-2 8 8 1'55050 ]'8 7 7 2'7 171 171
0'7 ('2 62 1'4 114 114 1 '7 75 75 4'1 95 95 5' 5 376 376
1-4 5 5 3'1 102 112 1'2 110 110 1'7 13 13
NA Uninhabited.
116 Chirodi .. R 5'3 70 71 117 Sawangi-Magtapur 118 Lasanapu, 119 Sawanga Vithoba 120 Mota
121 Taroda 122 Shirajgaon 123 Baslapur 124 Malkhed 125 Dahigaon
p
P
Po P .. R P .. Rly R Po M
p
w w w w w
126 Manjarkhed (E) .. R Po P RivW W.< 127 Chandur (l) Rural Area
Chandur (2) 128 Tuljapur 129 Dila warpur 130 Ajitpur
131 Dhanora Malhi 132 Rajana (E) 133 Wai 134 Dipod 135 Wadgaon Rajadi
136 Wadgaon Bajadi 137 TakaU 138 Khunhawantpur 139 Ambapur 140 Shiwani
141 Ismailpur 142 Budhali 143 Songaon 144 Neknampur 145 Sangulwada
146 Bagapur \47 Supalwad. (E) 148 Kawatha 149 P~laskhed 150 Wadgaon Bhatt
Rly
R R
., P~' Po
p P
P P
M
W W"
w w w w w w w \\1 W< w 'f\,'>( W W
p W P W P W M Riv Wx
W
3'7 \67 173 1'4 Uninhabited. 2'9 178 178 1'7 Uninhabited.
1'7 2 2 3'1 206 206 0'8 103 103
Mp D Tue. 9-2 656 660 l\Ip 3'5 165 165
Mp
Mp
Mp Thu. MpD Fri.
5'6 8'0
d 0'8 0'6
4·2 2'3 1·2 2'4 2'0
288 302 9 30
Urban Area I. 46 49 58 76
Uninhabited.
231 108 38
102 183
235 140 48
102 183
3'0 76 76 1 .2 Uninhabited. 0'6 I I a . 6 Uninhabited. 1'8 14 14
0'8 19 0'9 19 3' 5 222 1'1 14 1'6 30
66 136 276 517
8
19 ' 19
250 21 33
76 136 28G 519
8
Total Population
P M F
Scheduled Castes
M F
Scheduled Tribes
M F
(11) (12) (13) (14) (15) (16) (17)
149 160 653
691 69
347
1,558 93
1,067 2.369
83
123 1.1:1
703 ()2
199 3,016
64 1.711
215
812 53
175
7~~ 265 500 312 433
1,603
18 474 446
54
330 840
799
12 850 426
2,928 626
1,316 136
265 295
1,087 634 242 464 777
293
57
84 61
1,026 73
145
324 581
1,169 2,239
34
73 88
346
353 38
179
800 52
551 1,113
39
64 566 379
35
107 1,525
33 883 116
416 31
103 16
395
129 257 152 205 809
It 257 222
25
169 424
398
6 458 225
1,503 309
657 73
132 147
641 314 120 234 396
152
31
43 30
518 38 80
152 307 578
1,139 19
76 72
307
338 31
168
758 41
516 1,156
44
59 555 324 27
92 1,491
31 828
99
396 22 72 16
394
136 243 160 228 794
7 217 224
29
161
2
7
15
37 112
22 4
50
33 9
10
55
9
8
9
39 111
18 3
57
21 8
5
2
2 55
ii
416 9 10
401 155 151
6 392 201
1,425 317
659 63
133 148
446 320 122 230 381
141
26
41 31
508 35 65
172 274 591
1,100 15
4 35 58 14
11
13
5
I' 12
3i
2 32 57 14
2
10
18
8
1 13
5
Literate and educated
M F
(18)
32 4
68
136 14 86
258 2
210 646
12
24 209 127
7
.. 19 662
10 383
16
179 1
24 3
89
46 83 24 32
341
4 140 109
3
16 104
147
i72 68
643 96
261 25
56 62
261 164 58 87
164
6S
3
5 13
241 13 36
68 131 264 485
10
(19)
HI
'io
47 1
36
64
'62 219
4
7 92 4S
6 291
4 132
1
50
1 2
40
18 33 6
25 156
'50 31
1
'27 3S
'52 30
237 36
llS S
19 13
94 50 6
37 58
24
2 ~
109 1 9
26 49
103 183
S
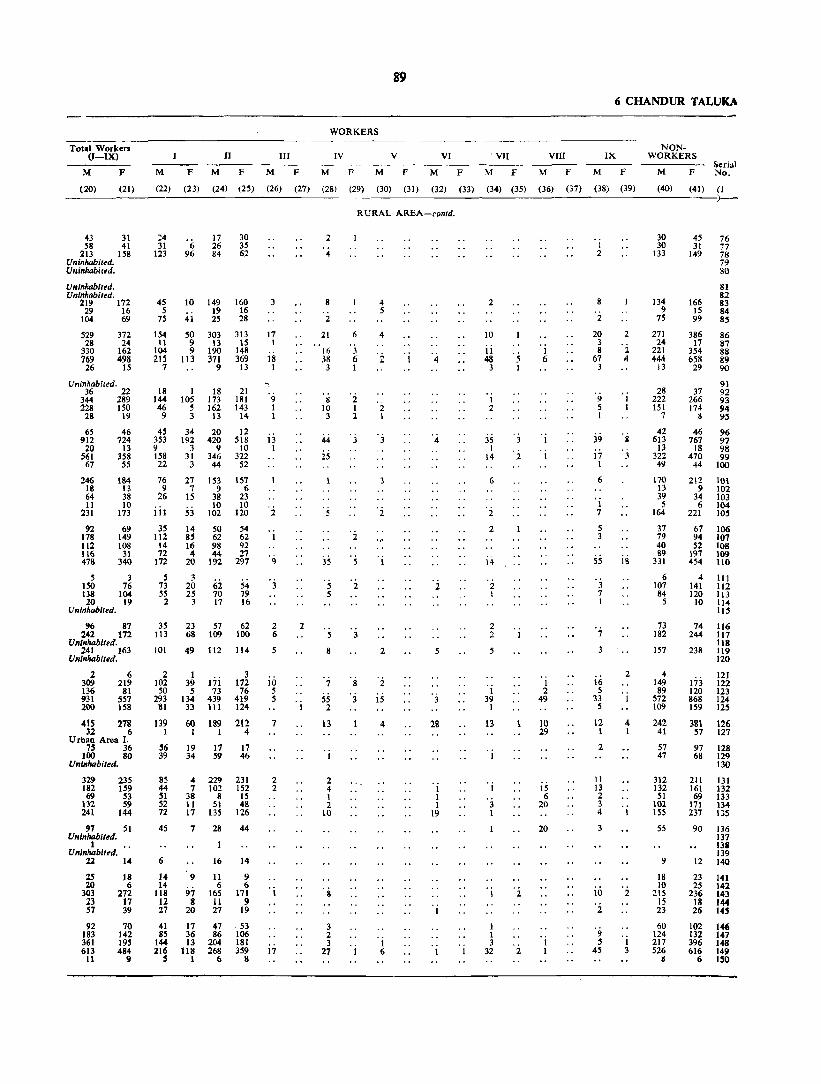
Total Workers (I-IX)
M
(20)
F
(21)
43 31 58 41
213 158 Ultinhabited. Uninhabited.
Uninhabited. Unllthabited.
219 172 29 16
104 69
529 28
330 769 26
Uninhabited.
372 24
162 498
15
36 22 344 289 228 ISO
28 19
65 912
20 561
67
246 18 64 11
231
92 178 112 116 418
46 724
13 358 55
184 13 38 10
173
69 149 108
31 340
5 3 ISO 76 138 104 20 19
Uninhabited.
96 87 242 172
Uninhabited. 241 163
Uninhabited.
2 6 309 219 136 81 931 557 200 158
41S 278 32 6
Urban Area I. 75 36
100 80 Uninhabited.
329 182 69
132 241
235 159 53 59
144
97 51 Uninhabited.
1 Uninhabited.
2Z 14
2S 20
303 23 57
92 183 361 613
11
18 6
272 17 39
70 142 195 484
9
89
WORKERS
II III IV V
M F M F M F M F M F
VI , VII VIII
M F M F M F M
6 CHANDUR TALUKA
IX
F
NONWORKERS
M F Serial No,
(22) (23) (24) (25) (26) (27) (28) (29) (30) (31) (32) (33) (34) (35) (36) (37) (38) (39) (40) (41) (I
~4 31
123
45 5
75
6 96
17 26 84
30 35 62
10 149 160 19 16
41 25 28
154 50 303 313 11 9 13 15
104 9 190 148 215 113 371 369 7913
18 1 18 21
17 1
18 1
~.
144 105 173 181 9 46 5 162 143 I
9 3 13 14 1
45 34 20 12 353 192 420 518 9 3 9 10 IS8 31 346 322 22 3 44 52
76 9
26
iiI 35
112 14 72
172
27 153 157 7 9 6
15 38 23 10 10
53 102 120
14 50 54 85 62 62 16 98 92 4 44 27
20 192 297
7~ 2~ 62 54 79 16
55 25 70 2 3 17
35 23 57 62 113 68 109 100
101 49 112 114
213 102 39 171 172
SO 5 73 76 293 134 439 419
81 33 III 124
139 60 189 212 I I I 4
56 19 17 17 39 34 59 46
85 44 51 52 72
45
6
14 14
118 12 27
41 85
144 216
S
4 229 231 7 102 152
38 8 IS 11 51 48 17 135 126
7 28
9
97 8
20
17 36 13
lI8 1
16
II 6
165 11 27
47 86
204 268
6
44
14
9 6
171 9
19
53 106 181 359
8
13 I
2
9
. j
2 6
5
10 5 S
7
2 2
. i
17
2
2
4
8
2
21
16 38 3
8 10 3
44
25
35
5 5
8
7
5S 2
13
2 4 I 2
10
8
3 2 3
27
RURAL AREA-comd.
6
3 6 1
'2 I 2
2
5
2
3
8
3
4 5
4
2 I
2
2
IS
I 6
4
5
28
1 1 1
\9
2
10
11 48
3
1 2
35 I
14
6
2
2
14
2 1
2 2
1 39
1
13
1
'j 1
'j
I I 3
32
2
2
I 6
I 2
49
10 29
15 6
20
20
1 2
8
2
20 3 8
67 3
9 5 \
39
17 I
6
1 7
5 3
55
3 7 1
7
16 5
33 5
12 1
2
11 13 2 3 4
3
iii '2
9 5
45
2
2 4
'j I
18
2
4 I
'2
1 3
30 30
133
134 9
75
271 24
221 444
13
28 222 151
7
42 613
J3 322 49
170 13 39 5
164
37 79 40 89
331
6 107 84
5
73 182
157
4 149 89
572 109
242 41
57 47
312 132 51
102 155
55
9
18 10
215 15 23
60 124 217 526
8
4S 31
149
166 15 99
)-
76 77 78 79 80
81 82 83 84 85
386 86 17 87
354 88 658 89
29 90
91 37 92
266 93 174 94
3 95
46 96 767 97
18 98 470 99
44 100
212 10\ 9 102
34 103 6 104
221 105
61 106 94 107 52 108
197 109 454 ltO
4 III 141 112 120 113
10 11<1 115
74 116 244 117
118 238 119
120
121 173 122 120 123 868 124 159 125
381 126 57 127
97 128 68 129
130
211 131 161 132 69 133
171 134 231 135
90 136 137 1311 139
12 140
23 25
236 18 26
102 132 396 616
6
141 142 143 144 145
146 147 148 149 150

VILLAGE DIRECTORY
Serial No.
(l)
Village/Town/ Ward
(2)
Trans- Educa- Drink-port and tional ing Postal JnsHtu- water M~dical
facilities tions supply facilities
(3) (4) (5) (6)
90
Area in Occu~
Bazar Sq. pied House-Day Miles houses holds
(7) (8) (9) (10)
P
(11)
RURAl. AREA-con!d.
151 Hadp. )52 Bhiltek 153 Kalamjapur )54 Kalamgaon 155 Satef.l
156 Dhanodi (E) 157 Dighi 158 Kanhal. 159 Sawangi Sangam 160 SGnor. Bk.
161 Ashrafpur ;62 Jahangirpur 163 Khanapur 164 Kodari Haral< 165 Dhanora Mogol
166 Sonora Kh. 167 Murtijapur 168 Dhakulgaon 169 Ashok Nagar 110 Taroda
Po
Po
R R Po
111 Gunji R 112 Rasulpur 113 Kawali (E) Po 174 Wasad 115 Mangrul Dastagir (E) Po
176 Warud Bagaji 177 Dattaji Trirnbak 178 Haibatpur 179 Naygaon .. 180 Mund Oaf Ambapur
181 M. A. Vyankatesh .. 182 M. V. Bhaskar .. 183 Darnodar M. Kartaram 184 Gangajai 185 Hirapur R . 186 Shahapur R 187 Dabhada 188 Wathoda 189 Jalgaon .. 190 M. K. Raghunathpur.
191 Mulfatpur 192 Dighi 193 Ramgaoll 194 Bahirarnpur 195 Janhapur
196 J algaon Arvi 191 Mirzapur 198 Dattapur Dhamangaon
(I) Rural R Po (2) Urban
199 Wagholi 200 Amadabad
201 Hirapur 202 M. M. Konher 203 Peth Raghunathpur 204 Khanapur 205 Borgaon Nistane
206 Gokulsara 207 Parsodi 208 Nimboli 209 Salabatpur 210 Sonora Kakde
211 Dattapur (1) (E)
P~;
Po
P P P M
P P
P
P
p
P P H p
P
M P H
P
P
P P P
P
p
p
H
P
P
M
W RivW RivW MP RivW W Mp
W W W W W
Riv W Riv W W W
Mp
W Mp
W RivW W w> W
'.
W
W
Wed
4 58
114 143 327
4 58
146 148 327
'1'2 216 218 2'2 11g 118 1'1 31 32 1'0 75 75 2'1 138 138
Thu. 0'3 Thu. 1'3
0·5 1'3
Mon. 3'3
Thu.
Wed.
Mon.
1·3 0·6 ~'1 4·4 3'1
15 91 16 41
19Z
4b 46
184 258 176
15 97 16 41
192
46 46
184 258 176
96 125 Uninhabited_ 304 304
W Wx
_ . Fri.
1 ·9 0'9 4·3 4'1 0'·5
139 139 Mp OWed.
RivW
W Mp
W
w W
W W W W
w" W
W
\~ ..
Mp
Mp
s~i.
934 1022
1-5 122 122 0-2 Uninhabited. O' 2 Uninhabited. 1-5 108 108 O' 8 Unihahited.
0·5 1 I O· 3 Uninhabited. O· 5 UninhabiTed. 1·7 20 20 0-7 9 9
2·2 61 79 3'3 161 163 2·2 138 147 2'9 130 141 0'7 Uninhabited.
0-9 1 1 1·8 216 219 1·6 58 58 0'4 Uninhahited. I . 0 Uninhabited.
3'2 171 172 1'2 82 82
4'1 392 392
4"8 UI~4n Am IT. 0'8 Uninhabited.
W·,. MpD W~d. O· 7 Uninhabited. 1'1 96125
W Riv W Riv
Riv \, W
Riv
o Fri.
1'0 25 30 O' 5 25 25 2'2 143 143
1-2 91 92 1'4 72 72 4'8 333 379 O· 3 Uninhabited. 1'6 78 78
4 305 603 868
1,469
926 479 143 359 569
76 387 6~
155 85D
175 19H 801
1.176 (17(1
573
1,317 550
4,432
489
484
84 39
297 761 672 618
1 974 268
794 342
1,651
582
484 117 115 640
380 309
1,610
30ti
3'8 14 14 44
Total Popuiatii)n
M F
Scheduled Castes
M F
Scheduled Tribes
M F
(12) (13) (14) (15) (16) (17)
4 155 294 441 753
461 247
7] 186 280
41 198
36 62
443
81 106 426 613 329
285
675 291
2,301
252
262
37 17
154 407 334 316
1 509 136
400 166
864
300
264 59 63
321
194 166 814
157
26
150 309 427 716
465 232 72
173 289
35 189 30 9'.
407
94 Y2
375 563 347
288
642 264
2.131
237
222
47 22
143 354 338 302
465 132
394 176
787
282
220 58 52
319
186 143 796
149
18
7 3
13
2 1
15
33
7 7
11
4
25 7
70
14
13
52
14 8
86
2
10
10
14
·5 11 13
22 8
63
11
15
44
16 7
77
19
27 30
5 6
DattapuT (2) 2n Hingangaon 213 Kasarkhed 214 Talani
W
W W
Induded in Urban Areo lJ.
2\5 Zada Rly. Po
P P p
216 Ashta P 217 Bhilli 218 Nimbhoraraj 219 Zadgaon P 220. Chincholi P~' M
221 Kalashi . . . . P 222 Nimbhora Bodakha ., RI.f Po P 223 Giroli P 224 Salimpur 225 Anjangaon I'
W Mp Thu. RivW
HIV
W W W W
W W W W W
Mp
Mp
1'6 136 136 598 2'1 151 151 620 3 -4 168 207 1,002 2'6 185 225 1,031
1'5 110 136 1-4 79 79 2-7 87 88 5'8 214 222 2'8 332 340
2'5 104 104 1'5 259 259 1'9 113 113 1'2 45 45 1'6 101 101
557 339 413 989
1,485
435 1,345
555 194 442
309 343 530 519
280 169 211 495 737
209 685 279 100 218
289 277 472 S12
277 170 202 494 748
226 660 276
94 224
I 3 4
2 7
7 4
3 4 11 '18 52 61
2 2 17 19 1 3 3 2 2 5
Literate and educated
M F
(18)
4 70
129 180 401
184 97 40 61
125
29 62 15 21
140
48 42
139 302 138
119
298 91
1,218
95
82
17 12
72 147 III 95
203 48
167 66
386
101
82 11 20
117
74 55
365
55
9
125 112 224 173
106 52 74
206 275
92 232 lOS 42 99
(19)
27 55 87
116
79 25 25 19 51
8 16 5
10 57
24 9
55 102 57
46
137 36
512
24
25
3 8
24 48 32 37
38 10
59 29
162
~9

Total workers (I-IX)
M F M F
II III
M F M F
WORKERS
IV V
M F M F
VI VII VIII
M F M F M F
6 CHANDVR TALVKA
IX
M F
NON· WORKERS
M F Serial
No,
(20) (21) (22) (23) (~4) (25) (26) (27) (28) (29) (30) (31) (32) (33) (34) (35) (36) (37) (38) (39) (40) (41) (I)
4 98
196 267 454
283 158 43
114 192
20 135 22 44
251
53 64
241 358 215
44 157 204 326
210 84 28 81
119
8 107 16 52
170
40 41
176 237 150
160 91 Uninhabited,
414 262 190 152
1,330 856
154 73 Uninhabited, Uninhabited,
154 112 Uninhabited,
1 Uninhabited, Uninhabited,
23 30 8 10
83 47 267 181 206 198 214 152
Uninhabited,
30l i43 84 74
Uninhabited, Uninhabited,
252 109
177 108
522 378 Urhan Area II,
202 134 Oninhabited,
Uninhabited, 150 126
39 37 37 26
207 148
124 99 99 79
503 374 Uninhabited,
103 75
4 ,28 59 98
154
5 63 39 47 101 106 59 132 143 36 252 288
117 60 128 148 76 32 64 51 17 3 22 25 32 6 79 75 61 29 114 86
14 41 9
15 68
, 2 3 28 83 79
1~ n 48 10 131 156
16 5 29 35 17 10 41 30 74 23 129 148
112 33 198 199 55 2 115 144
65 17 77 74
139 36 218 223 66 31 107 119
440 144 603 685
37
39
15 4
28 86 96 80
54 43
15
102 70
107 110
8 3
15 10
13 46 34 11 158 168 73 91 124
6 119 142
J3 26
18~ 2iz 38 48
76 25 106 143 37 13 63 85
154 55 323 319
71 35 111 98
29 8
IS 60
35 13
184
36
17 1
3
104 108 25 36 22 26
125 143
1 82 97 10 45 66 14 267 352
6 61 69
18 9 1 14 9 Included in Urban Area II,
189 113 57 13 89 99 216 144 63 21, 131 121 319 199 117 6 163 191 315 223 105 10 183 210
150 118 144 302 451
131 394 159 65
138
137 94
117 234 334
96 306
86 46
108
66 9 52 122 42 20 65 74 42 13 89 100 85 62 130 158
103 27 284 304
49 15 71 79 188 159 122 143 46 21 63 64 25 34 46 43 4 83 104
's 7 1
3 11
1
io
i5 3 7
4
7
24
S 2
6
2
'3 1
7
20 14
2
3 5
2
8
1 9
4
2 9 9
14
14 4
10
5 3 7 9 9
18 5
49
4 8 4
17
11 1
20
4
24
4 5
14 16
15 5 9
11 17
4 16 13 , i
'j
2 I 6
'z '4
2.
2
4 10 1
1 2 1
RURAL AREA-contd,
1
1 6
6 1
2 2
16
4
3 2
2
ii
5 2 1 2
9 13
3 18 2 2
4
2 2
2
2
4 1
2 I
1 8 4
10
4
2 3
I 2
1 8
2 \ 4 3 2
4
5 2
111
3 4 I
4
16 3
9
6
'4 9
1 2 2 2
3 3
'6 1
2.
4
2
I 2
2
2
16
11
7
4 1
10 2
1 39 13
3 10 14 Hi
14 3 4
1 2
I 14
2. 10 24 26
30 5
101
2
2
q
8 4 4
II
27 3
16
9
1
5
2 y
19
22 13
S 5
9 1 3
33 15
6 18 5 1 2
2 1 2
2
5 5 4
15
3
7
1 2 1 1
4 1
57 98
174 299
178 8" 28 72 88
21 63 14 III
192
28 42
185 255 l!4
106 152 223 390
151 152 153 154 155
255 156 148 157
44 158 92 159
17U 160
27 161 82 162 14 163 41 164
237 165
54 166 51 167
199 168 326 169 197 170
125 197 171 172
261 380 173 101 112 174 971 1.275 175
98
108
14 9
71 140 128 102
205 52
148 57
342
%
114 20 26
114
70 67
311
54
8
120 127 211 204
130 51 67
193 286
78 291 120
35 80
164 176 177 178
110 179 180
181 182 183
17 184 12 185
96 186 173 1~7 140 188 ISO 189
il2 58
190
191 192 193 194 195
217 196 68 197
409 198
148 199 200
201 94 202 21 203 26 204
171 205
87 206 64 207
422 208 209
74 210
9 211
176 212 133 213 273 214 289 215
140 216 76 217 85 218
260 219 414 220
130 221 354 222 190 223 48 224
116 225
VILLAGE DIRECTORY
Serial No.
(I)
ViUagejToW nj Ward
(2)
Trans. Educa- Drink-port and tional ing
Postal lnstitu- water Medical Bazar facilities tiolls supply facilities Day
(3) (4) (5) (6)
92
Area in Occu-
Total Population
Sq, pied House-Miles hOllses holds P M F
(8) (9) (10) (I I) (12) (13)
RURAL AREA-ron,hl,
226 SonegaOn 227 Waknath 228 Vital" 229 Hirpur 230 Kharda
231 lsapur 2;2 Bo<lIaotl. Dhande 233 Bhatkuli 234 Jodhapur 235 Raipur
236 UsalgaVihan 237 Borwaghal 23& Ti"ara 239 Mambapur 240 Ghusali (E)
241 Kamnapur 242 Kashikhed (E) 243 Nargawandi 244 Ekpala 245 Baggi
246 Jawara 247 Shendurjana (E) 248 Wadhona 249 Asegaon (E) 250 Sawnla
251 Tongalubad 232 Rajura 253 Nimbha 254 Ibrahimpur 235 Danapur
256 Nimgawhan 257 Samsherpur 258 Ganeshpur 259 Pathanpur 260 MahimapuT
261 Malatpur 262 Jalka Patache 263 Wajradevi 264 Bori 265 Jawala
266 Manjarkbed 267 Haibatpur 268 Mubarkapur 269 Davalatabad 270 Wai
271 272 273 274 275
Dhotra Titwa Ghuikhed Yadlabad Samsherpur
276 Both 277 Khambala 278 Kirjawala 279 Mogra 280 Nimbapur
" R" RPo
R R Po
RPo Po R
Po
Po
iro
PO
R
Po
281 282 28~ 284 285
Ta\egaon (Dasasar) (El R Po Kbanapur Devg80n R Nagapur " R Cbandurkheda
286 Yeklara Najik 281 Sawanga 288 Shelunatwa 289 Wagbonda " 290 SuJtanpur Po
291 Kharbi Mandavaad 292 Kharbi Gund 293 Nandurabad "P~' 294 Dhanor. Shikra 295 Belora
296 Zibala 297 Y"rad 298 Dhatnak 299 Yevti
Po Po Po
p p p P
P :\1
p
P
p
p
P P
p
p p P p p
P M p p
p
P M
H P
P
p
P H
P
H
p p
p P p p
p p
j; M M'
W W Riv W W
Rivw Mp W
W W W \V MD
W W \V W W W
Tue,
Wed,
Fri. Thu,
Thu,
W W W W W
MD Sat, Mp
2 '8 3'0 I,D 3'1 1'6
156 183 192 168 89
156 185 192 168 89
0'9 Uninh"bited, 2'9 195 196 1'9 181 191 0, 8 Uninhabited, 0'9 119 119
2'5 183 183 1'4 83 85 3'5 254 255 0' J L'ni,}j1obited. 2'0 102 102
I' 5 70 70 1'9 lOll 110 3'4 119 119 1'7 15 25 1'2 105 105
2'6 207 208 6'9 368 368 4'1 179 186 3'0 182 IS2 3'6 208 210
W 2'6 RivW" 'Mp Tuc, 7'2
80 111 426 426
W 2'6 176 170 'II' 0'8 99 99 W 2'0 19 19
W
'II'
w w Vi W
Mp T~~,
Mp Tue, Mp
Ri\ \\ 1\·1(1 W
W
W RivW \\' Mp D W~d,
W Ri\'W:., W
W
'II' 'II' W
MpDMon,
Mp Fri.
W W Mp RivW / Sun, 'II' Mp Fri, W
W RivW W RivW W
4'2 232 232 0' 5 Unlnhabitcd, 0'7 Uninhabited, 1 . 0 UninhabIted. 1'0 56 56
2'2 102 102 4'4 260 264 0, 3 Uninhabited, 3'8 218 235 1'9 198 198
1'1 131 131 O,g 9 9 0' 2 (minhahited, O· 5 Uninhabited, 2'0 163 163
0'9 1,8
14'0 1'0 0'2
81 81 137 137 569 569
Uninhabited, Uninhabited,
I' 4 Uninhabited, 0, 9 Uninhabited, 3'1 90 90 1'7 48 48 1'0
1,367 1,401 Uninhabited, 205 205
75 81 16 16
0'9 21 28 0'9 133 133 1'6 193 193 3'Il 150 182 1'5 127 127
0'6 34 34 1'7 17 25 I'S 68 69 1'7 48 68 2' 6 163 179
W W Mp
1'6 Fri. 2'4
17 18 259 265
Thu, 4'1 Wed, 4'4
278 306 293 335
W Mp RivW
737 871 907 731 383
876 760
488
742 353
1,017
493
329 565 503 SS
430
841 1.536
841 75<) 894
502 1.917
780 392 90
1.023
200
189 I, 131
J ,049 881
584 44
643
358 559
2.537
414 220 50
6,306
814 367 64
151 541 744 759 634
143 107 298 284 784
89 1,111 1,346 1,365
365 443 433 386 208
43\ 391
251
392 174 499
261
165 310 257 42
228
417 758 436 387 461
251 949 388 203
47
504
93
206 566
526 427
315 27
335
177 300
1,296
202 111 30
3,189
417 184 30
83 285 376 375 338
78 51
153 153 415
42 S77 698 717
372 434 474 345 175
-145 .169
237
351) 179
51K
232
1M 255 246 46
202
424 778 405 372 433
251 968 392 189 43
519
107
183 565
523 454
269 17
308
181 259
1.241
212 109 20
3,117
407 183 34
('8 256 368 384 296
65 5ti
145 131 369
47 534 648 648
Scheduled Castes
M F
Scheduled Tribes
M F
(14) (IS) (16) (17)
36 5
24
4
Ii I
1'1
4 2
2 37
22
7
14 22
8 21
65
il
129
4 4
.1 7 4 9
34 18 18
30 5
22
34 27
7
5
19
3
7 4 6
9 1
7
I 42
ii
4
R 17
12 25
5
61
121
7 6
I 7 5
10
26 20 13
Literae and edeutated
M F
(18) (19)
ISS 208 III 154 79
1M> 163
83
116 59
202
86
55 III 89 26
112
186 309 :lIS 165 190
101 386 185 62 17
211
36
~7 271
217 199
158 3
146
43 130 566
78 25
1,489
132 73 11
23 86
112 163 150
29 12 72 39
166
16 220 299 279
63 74 50 52 13
46 65
25
39 22 77
31
23 15 44
5 45
72 134 82 44 73
32 123
77 IS 5
54
22
30 87
89 77
42 1
39
7 26
204
28 10
653
52 30
3
II 25 36 75 52
1 2
37 13 64
2 82
116 114
Total workers (I-IX)
------M F
(20) (21)
1.27 246 242 271 124
Uninhabited.
180 215 162 193 100
289 185 248 220
U ninhabiled. 160 120
244 165 116 69 331 218
Cnil1l1abited. 167 121
110 168 143 29
129
280 448 252 227 286
69 127 127
17 72
238 354 159 163 208
166 131 619 445 244 159 134 103 26 24
325 24& Uninhabited. Uninhabited. Uninhabited.
65 61
138 102 358 242
Uninhabited. 318 274 280 223
189 126 17 13
Uninhabited. Uninhabited.
210 186
126 99 199 140 781 576
Uninhabited. Uninhabited.
Uninhabited. Uninhabited.
i42 86 69 41 15 1
1,873 1,195 Uninhabited.
271 176 108 53
17 21
28 17 179 135 245 180 254 185 218 162
47 37
101 98
245
29 365 463 447
36 31 54 60
125
20 264 289 308
93
WORKERS
II III IV V
M F M F M F M l-' M F
VI VII VIll
M F M F M F
6 CHANDUR TALUKA
IX
M F
NONWORKERS --_____ Serial
M F No.
(22) (23) (14) (25) (26) (:7) (18) (29) (30) (31) (32) (33) (34) (35) (36) (37) (38) (39) (40) (41) (I)
107 52 95 121 67 47 135 165 25 16 131 140 79 11 135 179 23 85 100
51 60
8 205 177 11 143 206
51 96 117
51 48 81
7 180 159 59 69
24 20S 194
58 14 101 107
29 13 66 56 '\s 40 97 87 36 26 8<) 99 17 4 " 13 71 15 45 56
92 154 68 53
107
52 86
o 27 40
72 42 218 121
81 25 39 17 10 8
125 51
28 12
48 20 113 49
137 113 83 60
57 24 I
1~7 97
24 (6 77 25
235 125
46 20
3 15
549 188
102 23 56 21 3
18 10 67 45 67 37 82 30
101 11
17 12 45 17
101
8
i9 7
15Y 185 211i 254 154 154 137 130 138 167
82 89 329 309 \50 \33 84 86 13 14
168 195
36 49
85 82 181 190
151 159 lli5 162
113 100 15 \3
97 89
92 82 113 115 372 435
91 45
S2 26
953 95S
126 152 38 31 14 21
10 7 98 88
164 140 146 153 107 151
17 21 25 31 45 34 76 60-
120 117
20 14 5 5 91 35 226 218
136 60 270 226 140 72 251 230
I 12 24
2 1
4
2 h
9
2 :2
1 14
18 6
15
14
4
's 5
1
1 2 2
I 10 3
4 1
4
II II 7
20 9
12 23
4
5 I
13
3 4
4 19 18 4
16
1 23 10 9 1
13
1 23
14 10
3 5
56
72
6 5
16 4
6
12 12 18
5 I
11
2
17
RURAL AREA-concld_
7 52
10 1
17
20
3
1 5
2
4
9
9 3
2 15 9
I 5
2 8
4
5
2 2
4
14 8
4 8
2 24
I
2 9
3 12
4
3 2
26
WS
15 2
I I 4
'j I 4
8 8
16
4 I
2
2
8
1 2
8 2
2 1 1
2
6 13 12 12 I
7 10
4
3 2
14
2
2 7 6 I 7
7 30 II II
10
5 23
3 1 2
10
2 26
12 10
7 1
4
4 2
67
3 3
146
11 3
1 3 6 5
3 2
12
2 10 26 18
3 1
I
'4 1 2 1
2
2
'j
1 1
2
23
'j
1 2
3
138 197 191 115 84
142 143
91
148 58
168
94
55 142 114
13 99
137 310 184 160 175
85 330 144
69 21
17<)
28
68 208
208 147
126 10
125
51 101 515
60 42 15
1,316
146 76 13
55 106 131 121 120
3\ 14 52 55
170
13 212 235 270
192 226 219 227 312 228 152 229 75 230
231 260 232 149 233
234 117 235
184 236 110 237 300 238
239 III 240
95 241 128 242 119 243 29 244
130 245
186 246 424 247 246 248 209 249 225 250
120 523 233
86 19
271
46
81 323
249 231
143 4
122
251 252 253 254 155
256 257 258 259 260
261 262 263 264 265
266 267 268 269 270
82 211 119 272 665 273
274 275
276 277
126 278 68 279 19 280
1,922
231 130 13
51 121 ISS 199 134
281 282 283 284 285
286 287 28& 289 290
29 291 25 292 91 293 71 294
244 295
27 296 270 297 359 298 340 299
94
VILLAGE DIRECTORY
Scheduled Scheduled Literate and Trans· Educa- Drink. Area Total Population ' Castes Tribes educated
port and tional ing in Occu-Serial Village/Town! Postal Institu- water Medical Bazar Sq. pied House- --------- -.---- --------No. Ward facilities tion<; supply facilities Day Miles houses holds P 1\1 F M F M F M F
(I) (2) (3) (4) (5) (6) (7) (8) (9) (10) (II) (12) (13) (14) (15) (16) (17) (18) (19)
URBAN AREA
Chandur Municipality Rly R H W" Mp All (E). ToRh Hos D days
8'0 2,037 2,067 9,348 4,838 4,510 219 227 2,762 1,218
Ward I 329 329 1,466 759 707 71 72 345 82 Ward 2 171 172 895 439 456 II 8 273 144 Ward 3 258 259 1,136 583 553 9 7 358 156 Ward 4 287 302 1.221 626 595 2 5 294 119 Ward 5 226 226 978 486 492 9 6 319 182 Ward 6 332 335 1,651 902 749 59 63 614 328 Ward 7 249 252 1,117 571 546 13 10 250 83 Ward 8 185 192 884 472 412 45 56 309 124
II Daltapur Dhamangaon RlyR C W Mp Sun. 4'22,677 2,692 12,261 6,341 5,920 315 314 3,534 1,757 Municipality (E). To Rh HosD
Ward I 417 419 2,037 1,012 1,025 58 49 552 336 Ward 2 204 209 1.038 545 493 41 48 334 162 Ward 3 414 415 1,944 1,052 892 5 46 737 399 Ward 4 270 274 1,210 612 598 35 340 181 Ward 5 355 358 1.626 856 770 23 13 507 299 Ward 6 258 258 1,232 627 605 52 60 310 116 Ward 7 397 397 1,638 843 795 65 65 411 140 Ward 8 362 362 1,536 794 742 36 33 343 124
r Total-Rural " I
681'837,683 39,916 175,394 89,830 85,564 2,724 2,567 37,051 14,061
CHANDUR TALuKA I ~ Total-Urban 12'2 4,714 4,759 21,609 1l,179 10,430 534 541 6,296 2,975 I I
l Grand Total . , 694' 0 42,397 44,675 197,003 101,009 95,994 3,258 3,108 .. 43,347 17,036
........ ,---_-

95
6 CHANDUR TALUKA
WORKERS
Total workers NON-(I-IX) II III IV V VI VII VIII IX WORKERS
---- ---- ---- ---- ------- Serial M F M F M F M F M F M F M F M F M F M F M F No.
(20) (21) (22) (23) (24) (25) (26) (27) (28) (29) (30) (31) (32) (33) (34) (35) (36) (37) (38) (39) (40) (411 (1)
URBAN AREA
2,592 1,211 454 165 700 905 45 73 21 250 20 37 327 16 143 13 563 71 2,246 3,299
436 274 51 35 139 218 15 21 4 56 9 58 7 80 5 323 433 244 88 82 22 49 62 1 30 3 42 2 35 3 195 368 329 193 74 11 152 177 7 15 7 3 28 2 41 4 254 360 362 200 52 14 152 172 14 2 22 9 26 I 15 70 12 264 395 233 102 52 22 53 71 I 6 II 6 36 4 I 67 5 253 390 437 62 45 2 27 19 4 19 9 48 1 99 1 19 175 31 465 687 307 204 77 52 104 146 3 2 38 4 4 9 1 45 25 1 264 342 244 88 21 7 24 40 8 6 38 10 2 29 2 52 13 70 10 228 324
3,420 1,051 259 39 382 489 65 189 80 705 202 52 650 42 281 837 191 2,921 4,869 II "
503 151 42 8 84 93 1 8 2 73 4 12 107 1 36 140 43 509 874 289 43 23 1 9 17 5 I 19 2 51 8 5 70 2 44 63 12 256 450 534 66 47 1 24 29 5 17 3 94 6 8 165 I 29 145 26 518 826 335 127 31 4 19 18 7 35 39 77 33 3 77 3 22 64 30 277 471 441 89 32 11 18 22 3 14 5 36 9 8 76 1 81 173 41 415 681 34{; 75 13 2 15 10 4 39 10 101 30 4 38 4 9 123 19 281 530 509 223 29
i2 64 82 17 4 26 7 186 93 5 85 24 44 53 13 334 572
463 277 42 149 218 23 3 31 12 87 19 7 32 6 16 76 7 331 465
54,177 37.425 18,619 7,57527,786 29,055 739 57 1,972 278 377 16 239 32 1,332 99 377 1 2,736 312 35,653 48,139
6,012 2,262 713 204 1,082 1,394 110 8 262 101 955 222 89 977 58 424 13 1,400 262 5,167 8,168
60,189 39,687 19,332 7,779 28,868 30,449 849 65 2,234 379 1,332 238 328 32 2,309 157 801 14 4,136 574 40,820 56,307

H4222-7
PART II
CENSUS TABLES These include General Population, Economic, Household Economic, Social, Cultural, Housing and other Special Tables


CONTENTS
EXPLANATORY NOTE (with Appendices I-ill>
A-GENERAL POPULATION TABLES
PAGE
101
A-I Area, Houses and Population 12 3 Appendix I-Statement showing 1951 Not printed
Territorial Units constituting the pre-sent 1961 set-up of the District.
Appendix II-Number of Villages with 124 a Population of 5,000 and over and Towns with a PopUlation under 5,000.
Appendix III-Houseless and Institu- 124
A-II
A-III
A-IV
tional Population.
Variation in Population during sixty years. ~
Villages classified by Population ..
Towns (and Town-groups) classified by Population in 1961 with Variation since 1901.
B-ECONOMIC TABLES (i) General Economic Tables
Primary Census Abstract B-1 and Workers and Non-Workers in Talukas
B-II and Towns classified by Sex and by Broad Age-groups.
B-III
11-IV
B-V
B-VI
B-VII
Industrial classification of workers and non-workers by educational levels-
Part A-District Total Part B-District Rural Part C-District Urban Part D-Talukawise Rural only ..
Part A-Industrial classification by sex and class of worker of persons at work at household industry.
Part B-Industrial classification by sex and class of worker of persons at work in non-household industry, trade, business, profession or service.
Part C-Industrial classification by sex and divisions, major groups and minor groups of persons at work other than cultivation.
Occupational classification by sex of persons at work other than cultivation.
Occupational divisions of persons at work other than cultivation classified by sex, broad age-groups and educational levels ~n Urban areas only.
Part A-Persons working principally (i) as Cultivators, (ii) as Agricultural Labourers or (ill) at Household Industry classified by sex and by secondary work (i) at - household industry, (ii) as cultivator or (iii) as agricultural labourer.
H 4222-7a
125
128 130
138 138 138 139
141
142
144
151
156
158
B-VUcontd.
B-VIII
B-IX
B-X
B-ECONOMIC TABLES-concId.
(i) General Economic Tables-concld.
Part B-Industrial classification by sex of persons working in non-household industry, trade, business, profession or service who are also engaged in household industry.
Part A-Persons unemployed, aged 15 and above, by sex, broad age-groups and educational levels in Urban areas only.
Part B-Persons unemployed, aged 15 and above, by sex and educational levels in Rural areas only.
Persons not at work classified by sex, broad age-groups and type of activity.
(if) Household Economic Tables
Sample households (i) engaged neither in cultivation nor household industry, (ii) engaged either in cultivation or household industry but not in both and (iii) engaged both in cultivation and household industry.
B-XI Sample households engaged in cultiva-tion classified by interest in land and size of land cultivated.
B-XII Sample households engaged in culti-vation only classified by size of land cultivated and number of family workers and hired workers.
B-XIII .. Sample households engaged both in cultivation and household industry showing size of land cultivated classified by principal household industry.
B-XIV Sample households engaged only in
B-XV
B-XVI
Household Industry classified by Principal Household Industry-
Part A-Households classified by major groups of principal household industry and number of persons engaged.
Part B-Households classified by minor groups of principal household industry.
Sample households engaged both in cultivation and household industry classified by size of land.
Sample principal household industry classified by period of working and total number of workers engaged in household industry.
PAGB
159
160
160
162
163
163
164
167
168
169
170
174

C-SOCIAL AND CULTURAL TABLES
C-I Size and composition of sample
C-Il
C-III
C-IV C-V C-VII C-VIII
households -Part A-Size of sample households
classified by participation in household cultivation or industry.
Part B-Composition of sample households.
Age and Marital Status
Part A-Age, Sex and Education in the Di"trict.
Part B-Age. Sex and Education in the District and Talukas Rural.
Part C-Age, Sex and Education in the District Urban.
Single Year Age Returns Mother-tongue Religion Part A-Classification by liter¥lcy and
industrial category of workers and non-workers among Scheduled Castes.
Part B-Classification by literacy and industrial category of workers and non-workers among Scheduled Tribes.
SCT-SPECIAL TABLES FOR SCHEDULED CASTES AND SCHEDULED TRIBES
SCT-I Part A-Industrial classification of persons at work and non-workers by sex for Scheduled Castes for the District and Talukas Rural only.
Part B-Industrial classification of persons at work and non-workers by sex for Scheduled Tribes for the District and Talukas Rural only.
SCT-III .. Part A (i)-Education in Urban areas only for Scheduled Castes.
Part A (ii)-Education in Urban areas only for Scheduled Tribes.
Part B (i)-Education in Rural areas only for Scheduled Castes.
Part B (H)-Education in Rural areas only for Scheduled Tribes.
100
CONTENTS
PAGE
180
180
181
182
182
184
184 185 186 188
190
194
196
196
196
197
SCT-SPECIAL TABLES FOR SCHEDULED CASTES AND SCHEDULED TRIBES-coneld.
SCT-V .. Part A-Sample households engaged in cultivation classified by interest in land and size of land cultivated by Scheduled Castes in Rural areas only.
Part B-Sample households engaged in cultivation classified by interest in land and size of land cultivated by Scheduled Tribes in Rural areas only.
SC-SPECIAL TABLES FOR SCHEDULED CASTES ONLY
SC-I Persons not at work classified by sex, type of activity and educational levels for Scheduled Castes.
ST-SPECIAL TABLES FOR SCHEDULED TRIDES ONLY
ST-I Mother-tongue and Bilingualism for Scheduled Tribes.
STOll Persons not at work classified by sex and type of activity for Scheduled Tribes.
E-HOUSING T.\.BLES
E-J Census houses and (iC uses to which they are put.
E-II Tenure status of Sample Census Households living in CenS;us Houses used as dwellings. '
E-IV Distribution of Sample Households living in Census Houses used wholly or partly as dwellings by predominant material of wall and predominant material of roof.
E-V Sample Households classified by num-ber of members and by number of rooms occupied.
Number of Establishments and Workers for Industries classified by Minor Groups of Industrial Classification.
PAGE
197
197
198
199
201
202
203
204
205
206

EXPLANATORY NOTE
This Part contains 58 Tables presenting 1961 Census data for the district. 29 Tables also present material for each talu:kia and 6 for each town separately. These talukawise and towmvise tables have been prepared specially fOT this volume.
2. A few Tables (e. g., A-IV, B-VI, B-VILl-A, etc.) present material for urban areas only. An urban area is the aggregate of all towns in the district or in the taluka concerned. All the other tables p.escnt material for total, rural and urban areas separately. In a few cases (e. g., B-lII-D, B-VIlI-B, B-IX. C-lII-B, etc.), talukawise break-up is given for rural areas only bec<:.Use the corresponding data for the urban areas had h;cn compiled only for the district as a Whole and not for each taluka separately.
3. Tables on migratiun and a few other topics could not be included in this volume for want of space. They will be found in the volumes of r.ho Maharashtra Census Report.
'. 4. An account of how th;:: Census Was taken and
a description of the defiaitions and C011copts followed will be found in Part II-A onhe Maharashtra Ccmus Report. The material presented hore relates to the 1st March 1961, which was the reference date fix,)d for th0 Cellsus and which very closely appi'oximatcd the completion of the Second Five-Year PIa-n. An analysis ofthis material will be found in the Introductory Note on jh~ district at the beginning of this volume.
5. The following paragraphs contain briefnoteson the tables included in this Part. Concepts and definitions of terms used are briefly described in the notes on the tables where those terms first appear in the Series. Each table starts with the entries for the district and the talukas follow in the order of th0ir code numbers fixed by their geographical locations for purposes of the 1961 Census.
A SERIES
GENERAL POPULATION TABLES
6. There are four General Population Tables and three Appendices in this Series. They arc the basicpopulation tables. They will be useful to study the variation of popUlation, sex ratios, distribution by size of villages or towns and trends of urbanisation in the district.
Table A-I 7. This table presents area, de~lsity, number of
villages and towns, occupied residential houses and popUlation total, 1Jl.ales and females. Material is presented lor the district and for each taluka (Tahsil or Mahal) for total, rural and urban arcas separately. Towns arc shown immediatelY after the entries of the taluka in which they are situated.
8. A town or an Ul ban area is a place Which has a municipality, a cantonment or a ci',illinc or a popUlation of 5,000 or over and at least 3/4ths of male population dependent on nOll-agricultural pursuits. A popu-
lation enumerated in urban arcas is urban population and the population enumerated in all othor places is rural population. Total includes the popUlation of both urban and rural areas.
9. Area figures have been obtaiw)d through Revenue and Municipal Officers. Rural area is the difference betvieen the Total and the Urba,l a!·cas. The area figures for the dish ir:t have been l,btained from the Director of Land Records.
10. Th::: term" viUagu has b:::Cll cXplaijlCd in paragraphs 4 and 5 of tho Explanatory Note to Part 1.
11. The figures for number of occupied residential houses include houses used partly as dWellings and partly for some 01her PU1pO~() lib:: shup, workshop, factory, etc., but do not include vacant residential houses whore no per5011 Was found to be residing at the time of the Census. Appendex I
12. There have been no tcrritoi iar changes during th,) decade 1951-1961. Appendix 1 docs not, thorefore, appear here. Appendix II
13. This shows the 111llnbor of villages which ill spite of a population of 5,000 or oVer have )lot been treated as towns and the numbcr of towns which h'lvC [css than 5,000 popUlation hut which have b.::eil treated a~~ towns only because they have Municipalitie~. Columns (4) and (1) shoW the perccntag.:: of populatiolls ill villages of over 5,000 and towns ofless than 5,000 to the respective rural or urban populations of the district or the taluka concerned. Appendix III
14. Houseless Population.-Houscless persons were enumerated in all areas on the night of 28th February 1961. These include: (i) persons Who might be doing domestic service or some other work with 011e or more households but who do not reside in any house and sleep in the corridors, verandahs or passages ill buildings or on the streets; (ii) wandering or nomadic tribes found to be staying ill temporary huts, rahooties, etc. or residing without any such huts just on the' open groun.ds ; and (iii) beggars, vagrants, tramps, sadhus, fakirs, lepers, etc., who are found on the footpaths, streets, otlas, in places like parks, gardens, seashore, railway yards, etc.
15. Institutional Population includes persons enumerated in penal, charitable or mental institutions, hostels, hotels, hospitals, boarding hous{)s, etc.
Table A-II 16. This table presellt5 popUlation of the district
for the seven Censuses from 1901 to 1961 and the variation by actual figures and perCciltages. Population figures for 1951 and 1961 and. variation during the decade arc presented for each taluka separately. The popUlation figures ~or earlier Censuse5 s~own in the table have been adjusted for the bOUlldancs or areas of the district and t::dukas as they existed at the time of 1961 Census.
Table A-m 17. This table gives for the district and each
taluka the distribution of inhabi ted villages classified by seven population size groups which are: (i) less than 200: (ii) 200-499 ; liii) 500-999 ; (iv) 1,000-1,999 (v) 2,000-4,999 ; (vi) 5,000-9,999 ; and (vii) 10,000 and above.
18. Hamlets are included in the village. The classification here is on the basis of the combined population of the village and its hamlets if there are any. In other words, the classification is 110t strictly according to the size of each individual nucleus of rural population but is based on the size of population of the revenue village which may in some cases be a single nucleus of population and in others a group of two or more scattered localities.
Table A-IV 19. This table shows thc growth of each town since
1901. It shoWs population for each town for the last seven Censuses. TO\\11S are presented in the follo\l>irg six classes classified oy their popubtion in 1961. Within a class, the names of tOWl s are arranged ill the order of population:
Class I 100,000 and over.
Class II 50,000 to 99,999.
Class III 20,000 to 49,999.
Class IV 10,000 to 19,999.
Class V 5,000 to 9,999
Class VI Less than 5,000
20. Wheres two or more towns are -adjacent and together form a compact urban unit, the entire town group is classified with reference to the combined population of the group, In such cases, the total population of the group is shown along with the population of each of its constituent towns.
21. Where a town was not treated as a town in some earlier Census, its population at that Census had neen included in ru: al population. It is not presented here as the table p."csents ~res of urban population only.
22. The total urban popUlation of the district and its variation in the last sixty years are shown at the beginning of the tao1e.
B SERIES
(i) GE:t-.IBRAL ECONOMIC TABLES
Z3. There are 16 Tables in this Series showing the distribution of population by economic activity correlated with sex, age and educational level. The classifi..; cation by eCOI omic activity is first by workers and nonworkers. The workers are then classified in nine broad categories of economic activity. A more elaborate
102
classification of workers by industry under the Standard Industrial - Classification Scheme is presented in Tables B-IV-A, Band C and by occupation under the National Occupational Classification in Table B-V. Two Tables B-VII-A and B-VII-B shoW the classification of workers by secondary 'Work. The last three tables present distribution of non-workers by sex, age and eight broad classes.
24. In the 1951 Census Reports, the popUlation Was classified into eight livelihood classes and each class was further divided with reference to economic status into-
(i) self-supporting persons; (ii) earningdependents; and (iii) non-earning dependents.
25. The concept of dependency has been abandoned for economic classification at the 1961 Census. Instead, the population is classified into workers and nonworkers. The emphasis is now on work and not on income or economic dependence.
26. A person is classified as worker if-
(a) in case of seasonal work lige cultivation, livestock, dairying, household industry etc., he has had some regular work of more than one hour a day throughout the greater part of the working season; and
(b) in the case of regular employment in any trade, profession, service, business or commerce, he was employed during any of the fifteen day!; preceding the day of the enumeraor's visit to the household.
21. A person who Was working out was absent from his work during the fifteen days preceding the day on which enumerated or even exceeding the period of fifteen days due to illness or other ;causes has been treated as a worker. A person who had been offered work but had not actually joined has been treated as a non-worker.
28. "Work" includes not only actual work but effective supervision and direction of work also.
29. Persons under training as apprentices with or -without stipend or wages are regarded as workers.
30. An adult woman who was engaged in household duties but doing no other productive worki to augment the family's resom'ces has not been considered as working. If, however, in addition to her househo~d work she engaged herself in wo~k suc~ as nce poundmg for sa~e or wages, or in domes.tIc serVIces for wage? for,others,. III minding cattle or sellmg firewooa or makmg and sel1111g cowdung cakes, or grass, ei:c.) or any such work she has been treated as a worker.
31. Persons like beggars, pensioners, agricultural or non-agricultural royalty, rent or dividend receivers, who earn an income but who are not participating in any productive 'Work are not treated as 'Workers unless they also Work in cultivation, industry, trade, profession, business or commerce.
32. A public or social service worker who is engaged in public service actively or a political worker who is actively engaged in furthering the political activity of his party is regarded as a worker.
33. The population classified as 'Workers here is the economically active population including family workers but not including unemployed persons.
34. The Census Questionnaire did not have any question to determine the extent of full employment or under-employment.
35. Classification of workers, doing two or more different types of work, has been done on the basis of their principal work, i.e., the work which cosumes large portion of their time and not necessarily the Work which earns larger portion of their income.
Primar&, Census 4bstract
36. This table shoWS 1961 summary figures for the district and talukas, each for total, rural and urban areas separately. Similar details for each village, toWn and ward of a town are presented in Part I.
37. For each unit, the table shows area in square miles, number of occupied houses, number of households. total popUlation, popUlation of Scheduled Castes and Scheduled Tribes, number of literate and educated persons and number of workes and non-workers. The workers are shown further classified for nine categories of economic activity.
38. Couron (5) shows the number of households for each unit. The" household" is slightly different from a "family". A" household " is a group of persons who commonly live together in the same house and take their meals from a common kitchen unless the exigencies of Work prevented any of them from doing so. A domestic servant residing and eating at the employer's house is a member of the household. Similarly, a friend or a guest (related or unrelated) residing and eating with the host during the Census period is treated as a member of the (host) household. On the other hand, a son or a daught~r residing in a hostel (may be in the same town) is not treated as a member of the household.
39. Columns (9) to (12) of the Primary Census Abstract show 'population of the Scheduled Castes and Scheduled Tribes, respectively, by males and ·females. The figures are related only to the two
103
group of totals of all Scheduled Castes and all Scheduled Tribes. Their break-Up by individual Scheduled Castes or Scheduled Tribes will be found in Table SCT-1.
40. The limitations in coverage of these two groups may be mentioned here. The groups of Scheduled Castes or Scheduled Tribes do not include all backward castes or tribes living in the district. They include only the castes or tribes declared as Scheduled Castes or Scheduled Tribes in the district. In cases where a caste or a tribe is declared as a S:cheduled_ Castes or a Scheduled Tribes for a -specified area that caste or tribe has been separately presented only for that specified area and not for any other areas of the district.
41. Columns (13) and (14) shoW figures for literates and educated persons. A" literate" is a prerson who can both read and write a simple letter. Persons having higher education are also included in these figures. More material on literacy and education cross tabulated with age-groups is presented in Table C-I1I.
42. The workers are shoWn classified by sex and in the folloWing nine categories of economic activity :-
I. As cultivator.
II. As Agricultural Labourer.
III. In Mining, Quarring, Livestock, Forestry, Fishing, Hunting and Plantations, Orchards and allied activities.
IV. At Household Industry.
V. In Manufacturing other than Household Industry.
VI. In Construction.
VII. In Trade and Commerce.
VIII. In Transport, Storage and Communications.
IX. In other Services.
Category I 43. This category includes both the oWner cultivators
and tenant cultivators. Along with workers personally doing work on land are also included persons who are engaged in supervision or direction of cultivation. All persons working kin cultivation of land on which they have either ownership or tenancy rights are included in this category.
Category II 44. All other persons Working on land as labourers
on wages without holding any right upon the land are classified as agricultural labourers and included in the second category.
Category III 45. Workers in mining, quarring, livestock, forestry,
fishing, hunting, plantations, orchards and allied acti~ vities are included in this category.
Category TV 46. A" Household Industry" is defined as an
industry conducted by the hGad of the household himsdf and/or majnly members of the household at home ?r within the vilkg~ in rural arCas and only at home In
urban areas. A hou,>ehold i1ldustry is not run on the scale of a regi'>tercd factory. ThlIs, the main criterion for a household industlY i:> Ih.:; participation of one or more members of a household in rural areas. In the urban areas, household indu<;try is confined to the house.
47. A household industry rdates to production, processing, servicing, ropairing or making and soiling of goods, It docs not include professions such as pleader. doctor, barb~r, washlJ'man or astrologer. Persons working in other pJrson's househnld industry as paid employ,;e:; are ~dso treated as WOrki)fS in household industlY·
Category V 48. "Manufacturing" includes all types of produc
tion, processing, servicing or repai 1'ing of goods. This category does not include production or processing which may be classified as household industry.
Category VI 49. This category includes workers engaged in
construction and maintenance of buildings, roads, railways, bridges, telegraph, telephones, waterways, reservoirs, etc.
Category VII . 50. This category includes workers engaged in any capacity kin wholesale or retail trading activity and commercial transactions relating to imports and exports real estates and properties, stocks and shares, insurance, moneylending, banking, etc.
Category VIII 51. This category includes workers engaged in
transport activities by air, rail, road or water and in services incidental to transport such as packing, carting, loading, unloading. etc. Workers engaged in storage, warehousing and communication services such as Posts. Telegraphs, T dephones, Wirelese
, Signalling, Information and Broadcasting are also inclUded in this category. Category IX
52. This category includes (i) Public utility services like electricity or gas or water supply, sanitary services; (ii) Central, State or Municipal employees; (iii) Professional services ; (iv) Trade or labour a~sosiations, Recreation services, etc.
Table B-1 and B-1I _ 53. This combined table gives break-up of the
Primary Census Abstract distribution of workers in . nine industrial categories and non-workers by four broad
age-groups. The material is presented for the district and each taluka as well as for total, rural and urban areas separately. Towns are also shown immediately after the entries of the talukas in which they are situated.
104
For talukas which do not have any urban areas, cntrics are given only for total which correspond to those for rural areas.
Table B-ID 54. This table gives break-up of the p, im~~ry Census
abstract distribution of workers in niJle industrial categories and non-workers by educatiO'llal levels. Material for the district is presented for total, rural and urban areas separately, while that for the talukas is presented only for rural arcas .. The classification by education levels is more elaborate in the case of the urban areas. Classification oy educational levels and ag,~-groups will be found in Table C-TII. Industrial Classification
55. Industry of a worker is : hat branch of ~conol11ic activity in which he is engag~d in produci.lg goods or services. Tables B-IV-A, B-IV-B, B-IV-C, B-VU-A and B-VII-B of the present Series and Tables B-xnI. B-XIY-A, B-XIY-B and B-XVI of the following Series show the distribution of workers by industry according to the Standard Industrial Classifictation which is reproduced as Appendix I to this note. For want of space it has not been possible to give dese;-iption of each group ofindustry in the tables. They are shown only by industry cbdes in one, two or three digits as the case may be.
56. The nine categories shown in the Primary Census Abstract and Tables B-1, B-II and B-llI conform to the industry divisions as follows :-
Category Industry Division I. Cultivator .• 1 Minor groups 000, 001, 002,
r 003 and 004 frorll Division O. II. Agricultural Labourer.J
HI. Mining Quarrying, etc. Division 0 except minor groups , 000 to 004 and Division 1.
IV. Household Industry. . Division 0 except minor groups 000 to 004, Division 1, 2 and 3.
V. Manufacturing . . Division 2 and J. VI. Construction .. Division 4.
VII. Trade and Commerce. Division 6. VIII. Transport, Storage Division 7.
and Communications IX. Other Services .. Divisions 5, 8 <lnd 9.
Table B-IY-A 57. This table gives the distribution of workers
engaged in household industry by status ofcmployment and by each division and major group (Appendix; l) of household industry separately. Material is presented only for the district but for total, rural and urban areas separately. Major groups of household industry which do not haVe any workers in the district are not shown here. Columns (7) and (8) show the workers Who worki at -their own household industry (i.e., who are either employers, single workers or family work(~rs in those housohold industries). Columns (5) and (6) on the other hand show the workers who are working as employees in household industries not of their own . Table B-IV-B
~8. This table presents distribution of all workers (other than those working in Categories 1. II and IV) by industry divisions and major groups (Appendix J)
and by employment status. Material is prescnted for the district only but for total, rural and urban areas separately. Classification of workers by employment status is in four classes "employer"," employee ", "single worker" and "family worker" :
An "employer" is a person 'Yho ~~plo'ys ot~er persons in order to perform economIc actIvIty III whIch he is engaged.
An " employee" is a person who u~ually works under some other person for salary. or wages in cash or kind.
A "single worker" is a person who works ~y himself. He is not employed by anyone else and III his turn does not employ anyone else, not even members of his household, except casually.
A "family worker" is a member who works, witho~t receiving wages, in cash or kind, in any industry, bUSIness or trade conducted mainly by mcmbocs of the family and ordinarily does at lea<;t one hour of work every day during the working season.
Table B-IV-C 59. This is a very important table as it gives the
employment position in all sectors of economy in the district. It shows the distribution of all workers (other than those in Categories. I and II) by indus.try division, major groups and mmor groups accordmg to the Standard Industrial Classification (Appendix I). The number of workers against each division, major group or minor group is further split up and shown separately for household industry and non-household industry. Material is presented only for the district but for total, rural and urban areas separately. Major or minor groups which do not have any workers in the district are not shown here. Occupational Classification
60. Occupation of a worker is the function which he performs in any branch of economic activity (whiCh is called his industry). For a clerk working in a textile mill the industry is textile and occupation is clerical. For'a person working as a driver on a bank's vehicle, the Industry is banking and occupation is driver.
61. Tables B-V and B-VI show the distribution of workers by occupation according to the National Occupational Classification Scheme which is reproduced as Appendix II to this note.
Table B-V 62. This table presents the distribution of workers
(other than those engaged in Categories I and II) by occupational divisions and groups (Appendix II). For each division or group the workers are shown by a categorywise break-up of their industry. The material is presented only for the district but for total, rural and urban areas separately. Occupational groups which do not have any workers in the district are not shown in the table. For an occupational group which has all the workers in only one category of industry, only one line shows the total workers for that group as well as for that category of industry.
Occupational distribution of workers in the 1961 Census has been worked out and presented in Maharashtra Census Report, Part U-B (ii), even for occupa-
105
tional families, i.e., up to three digits. For want of space it is presented here for occupational groups, i.e., up to two digits only. Table B-VI
63. This table presents t he distribution of workers (other than Categories I and U) classified by sex, occupational divisions (Appendix ll), broad age-groups and by educational levels. This table is presented only for the total urban area of the district. Table B-VII-A
64. This ta ble presents workers engaged as cLtltivators, agricultural labourers and at household industry classified by the nature of their secondary work. In case a worker is engaged in two or 1110re kinds of work the one which consumes larger portion of his time not necessa.rily earning a larger portion of his incomc is treated as his principal work. another consuming second larger portion of his time is his secondary work. The secondary work is shown in the table classified only in three broad categories, viz., IV-Household Industry, I-Cultivator and IIAgriculturallabourer. Workers who may be engaged in secondary work in other categories, viz. III, V, VI, VII, Vin and IX are not shown in this table. The break-up of principal work in household industry by major industrial groups (Appendix I) is shown in column (1). It will enable analysis of wurkers engaged in secondary work by major branches of their principal work at household industry. The material is presented for the district only but for total, rural and urban areas separately. Table B-VII-B
65. This table shows workers engaged in nonhousehold industry-Categories III a.nd V to IX-as principal work and doing some additional work in household industry. The additional work in household industry is classified by industrial divisions (Appendix J) only. Similarly, the break-up of principal industry in column (1) is also by industrial divisions only. Workers engaged in the indui>try divisions shown in column (1), but who are doing additional work in any sector other than household ind us try are not shown in this table. Material is presented for the district only but for total, rural and urban areas separately. Table B-VIII-A
66. This table presents the distribution of unemployed persons aged 15 and above by agegroups and educational levels. The number of unemployed have been fLlrther split up by persons seeking employment for the first time and persons employed before but now out of employment and seeking work. Material is presented only for the total urban area of the district. Such detailed information on the unemployed is compiled for the first time in the 1961 Census.
Table B-VID-B 67. This table presents the distribution of un
employed aged 15 and above in rural areas of the district by educational levels. The break-up of educational levels is not as elaborate as in Table B-VIII (Part A) and classification by age-groups
or by persons seeking employment for the first time, etc., is not shown in this table. As a compensatory factor, the material is presented for the rural area of the district and each taluka, separately.
Table B-IX 68. This table presents the distribution of non
working population by broad age-groups and eight classes of non-workers. Such information on the non-working population had never been compiled before. The material is presented for the district separately for total, rural and urban areas and for each taluka for rural areas only.
(ii) HOUSEHOLD ECONOMIC TABLES 69. Tables B-X to B-XVI present the economic
activity of the households as units. They relate to--(i) the size of or interest in land cultivated and/
or the household industry conducted by the households; and
(ii) the number of family workers and/or hired workers working in either of the two activities separately or combined in both.
70. In the case of countries of such economic status as ours where not all the goods produced enter the money market and where much of what is produced is consumed by the family itself, presentation of information on economic activity of individuals alone is likely to be slightly misleading unless that information is supplemented by material relating to economic activity of the households as entities. Such information is presented here for the first time. These tables are prepared from the household schedules specially introduced for that purpose as one of the three Questionnaire forms in the 1961 Census. The tables have been prepared on a 20 per cent sample of aU the households in the district drawn for rural and urban areas separately.
71. Cultivation here includes cultivation both as owners and tenants. Size of holding shown is also of operational holding, i.e. land actually cultivated and does not include land owned but not cultivated by the household. Table B-X
72. This table presents distribution of sample households by those-
(i) engaged neither in cultivation nor household industry ;
(ii) engaged in cultivation only ; (iii) engaged in household industry only; and (iv) enga'ged both in cultivation and household
industry. The material is presented for the district and each
taluka for total, rural and urban areas separately. Table B-XI
73. This is an important table. It shows the distribution of sample households engaged in cultivation classified by size of land and interest in land cultivated. Ten size-groups are shown horizontally while the interests in land are classified in three types, viz.-
(a) Entirely owned or held from Government. (b) Entirely held from private persons or institu
tions for payment in money, kind or share.
106
(c) Partly held from Government and partly from private persons or institutions for payment in money, kind or share.
The material is presented separately for total, rural and urban areas of the district and only for rural areas of each taluka.
Table B-XII 74. This table shows the distribution of sample
households engaged in cultivation classified by size of land cultivated and the total number of family workers and hired workers. The material is presented for the district for total, rural and urban areas separately and only for rural areas of each taluka.
Table B-XIII 75. This table shows the distribution of sample house
holds engaged both in cultivation and household industry classified by size of land cultivated and by industry division and major group of the household industry (Appendix I). The table shows the sizes of cultivation holdings and the branches of household industry for which the two household economic activities combine in varying degrees. The material is presented only for the district but for rural and urban areas separately.
Table B-XIV-A 76. This table shows the distribution of sample
households engaged in household industry only by the number of workers engaged and by industry division and major group of the household industry (Appendix 1). Material is presented for the district only but for total, rural and urban areas separately.
Table B-XIV-B 77. This table shows the distribution of sample
households engaged in household industry only classified by industry minor groups (Appendix I) for the household industry. The industry minor group is shown with a break-up in four-digit codes in column (1). These four-digit codes are shown in Appendix III. The material is presented for the district only but for total, rural and urban areas separately.
Table B-XV 78. This table shows the distribution of sample
households engaged both in cultivation and household industry classified by size of land cultivated and the number of family workers and hired workers working in the two activities combined. The material is presented for the district for total, rural and urban areas and for each taluka only for rural areas separately.
Table B-XVI 79. Tills table shows the distribution of sample
households engaged in household industry classified by the period for which the household industry is worked and by industry division and major groups (Appendix I) of the household industry. A further split-up of figures is shown for household industry combined with cultivation and without cultivation. The material is presented for the district only but for total, rural and urban areas separately.

C SERIES
SOCIAL AND CULTURAL TABLES
80. There are 11 Tables in this Series dealing with Social or Cultural aspects like sizes and composition of home holds, age, marital status, literacy and education, language, religion, Scheduled Castes and ScheduJed Tribes. The first two Tables C-J-A and C-J·B relatIng to Size and Composition of households are prepared from the household schedules on a 20 per cent sample. All the other tables are prepared from individual slips and on a total count. Table C-I-A
81. This table presents distribution of sample households classified by their size and by economic activity,i.e., by work in cultivation or household industry. Households working at cultivation are further classified by size of land holding. The materia~ is presented only for the district but separately for total, rural and urban areas. Classification by economic activity as well as by size of land holding is presented only for rural areas and classification by size of the household is alone presented for total and urban areas. This table is prepared from household schedules on a 20 per cent sample. This table appears as Table B-XVII in Part III of the Maharashtra Census Report.
82. The classification by size is as one member, small (2 to 3), medium (4 to 6), large (7 to 9) and very large (over 10) households. By definition, a Census household is not the same as a family. The household also includes persons who are not members of the family but who were residing with the family during the Census period. All the same, the table will give a general idea of the family sizes as in the majority of families outsiders are not likely to be present. Table C-I-B
83. This table presents distribution of population of sample households by heads of the households, spouses of heads of households, married relations, never married, widowed or divorced relations and unrelated persons. These details are also shown for sample households classified by economic activity, i. e., participation in cultivation or household industry. For cultivation, the sample households are further classified by size of land holdings. This table is prepared from the household schedules on a 20 per cent. sample. Material is presented for the district only but for total, rural and urban areas separately. The classification of households bv economic activity and size of land holding is, however, shown for rural areas only. This table is of sociological interest indicating the strength of the joint family system. Table C-I1
84. This table presents distribution of population by sex, age and marital status. Classification of age between 10 and 70 years is by five year age-groups. The other two groups are 0-9 years and 70 and over. The entire population in 0-9 years age-group has been treated as never married and no further classification
. by marital status is shown against them. The material is presented only for the district but for total, rural and urban areas separately. From this table it may be
107
ascertained whether proportions in various marita I status groups have changed sin~e the last Cen~l\s and whether any trend is observed III age of marnage. A corresponding table at the 1951 Census was prepared on a 10 per cent. sample. This table is, however, prepared on a full count.
Tables C-III-A. Band C 85. These three tables present the distribution by
age, sex, literacy and educational levels. Classification by age is by five-year age-groups up to 59 years. Classification by educational levels is the same as in Table B-IlI. It is more elaborate in H,e case of urban areas. Part A presents material only for the district total while Part B presents material for rural areas of the district and of each taluka separately. Part C presents material only for the district urban area') but with more elaborate classification by educational levels.
86. These tables arc a measure of the growth of literacy in the tot:il population as well as in the diff~rent age-groups since the List Census. They are also b~ely to furnish information on the spread of adult educatIOn. The corresponding table at the 1951 Census was prepared on a 10 per cent. sample. These tables have been prepa· red on a full count.
Table C-IV 87. This table presents distribution of the district
population by single year ages both for males and females separately. Figures presented are based on the actual returns recorded in the Census, i. e., they have not been smoothed or adjusted for preferences for digits 0, 5, etc. The material is presented only for the district total.
88. This is an important demographic table which is used for computing mortality rates. The corresponding table at the 1951 Census was prepared on a 10 per cent. sample. This table has been prepared 0'l1 a full count.
Table C-V 89. This table presents the distribution of population
by mother-tongues. The figure~ are pr~sen.tcd on.ly for 9 top ranking mother-tongues In the dIstrICt. FIgures for all the other mother-tongues have been shown combined in the group "Others". Mother-tongues are arranged in the alphabetical order. Material is presented for total, rural and urban areas for the district and each tal uk a separately. At the end material is also presented for each town separately.. A fo~tn~te is added to show the number of speakers III the dIstnct for each of the mothcr-tollgues combined in the group " Others ".
90. "Mother·tongue" is defined as a language spoken by the person's mother to the person in his childhood or mainly spoken in the house. Dialects have been included in the main languages on the basis of Grierson's Classification.
91. Another Table (C-VI) 011 bilingualism has been prepared in the 1961 Census. .It is not incl?ded in this volume and may be found In Part II-C (I) of the Maharashtra Census Report.
108
Table c-vn 92. This table presents di'itribution of population
by religion. Eight ma;n religions have been shown in their alphabetical order. All other religions returned in the Census are combined in the group " Others". Figures for various sects returned as religion during the Census have been combined with the main religions concerned. Table C-VIII-A
93. This table presents the total population of Scheduled Castes classified by literacJ and by economic activity. Classification by economic activity is the same as in the Primary Census Abstract or Tables B-1 and B-II. Material is presented for total, rural and urban areas of the district separately and only for rural areas of each taluka separately. Paragraph 40 a bove, on Primary Census Abstract, may be seen for explanation of the special group treated as Scheduled Castes. Table C-VIlI-B
94. This table presents the total, population of Scheduled Tribes classified by literacy and by economic activity. Classification by economic activity is the same as in the Primary Census Abstract or Tables B-1 and B-Il. Material is presented for total, ru':l.1 and urban areas of the district sep~l.rately and only for rural areas of each taluka. Paragraph 40 above, on Primary Census Abstract, may be seen for explanation of the special group treated as Scheduled Tribes.
SCT, SC & ST SERIES SPECIAL TABLES FOR SCHEDULED CASTES
AND SCHEDULED TRIBES 95. There are 11 Tables in this Series specially
prepared for the population of Scheduled Castes and Scheduled Tribes in the district. These classes of people are declared by the President's orders issued under Articles 341 and 342 of the Constitution of India as Scheduled Castes or Scheduled Tribes. Under Article 46 of the Constitution the State has to promote, with special care, the educational and economic interests of the weaker sections of the people and in particular of the Scheduled Castes and Scheduled Tribes and has to protect them from social injustice and all forms of exploitation. For ensuring adequate representation to these classes, seats are also reserved for them in the House of the People, State Legislature and other elective bodies.
96. These special tables have bee~ prepar~d to furnish data on the present SOClo-economlC conditions of these people to be studied not only as a combined group as in 1951 but also for each Scheduled Caste and Scheduled Tribe separately.
97. These tables relate to economic activity, education, mother-tongue and classification of persons not at work. Material is presented for each Scheduled Caste and Scheduled Tribe separately. It will be useful information for formulating various schemes for their welfare.
98. Classi.fication by Castes and Tribes is on the basis of returns recorded in response to question
5 (c) of the 1961 Ccnsus Questionnaire. Every person was asked if he belonged to one of the Scheduled Castes or Scheduled Tribes notified for the district and in case he belonged to one of them he. was asked the name of his caste or tribe. Paragraph 40 above on the Primary Census Abstract explains the limitations of these castewise or tribewise figures. The population of Scheduled Castes shown here is much less than that for the district in 1951 as many persons from that group have returned their religion as Buddhist or NavBuddha, and under the Constitution, there can be Scheduled Castes only among Hindus and Sikhs and in no other religion.
99. Two more Tables SCT-II and SCT-IV on age, marital status and religion of the Scheduled Castes and Scheduled Tribes prepared in the 1961 Census are not presented here for want of space. They may be seen in Part V-A of Maharashtra Census Report.
Table SCT-I-A 100. This table presents the distribution of Scheduled
Castes population by economic activity. Material is presented for the total of an Scheduled Castes as well as for each Scheduled Caste separately. Scheduled Castes are arranged in the alphabetical order. Classification by economic activity is in the same nine categories as in the Primary Census Abstract and Tables B-1 and B-II. 111 a way, this table presents castewise break-up of the material presented in Table C-VIII (Part A). The last group of castes " not stated " is of persons who were returned as belonging to Scheduled Castes but in whose case the name of the Scheduled Caste concerned had not been sta~q in the Census.
101. Columns (28) to (31) present Scheduled Castewise figures of persons engaged in unwholesome occupations like tanning, currying of hides and skins and scavenging. The number of workers shown in these occupations as well as in any other category is on the basis of principal work. Persons engaged in cultivation or any other activity as principal work and also engaged in tanning, currying or scavenging as secondary work are not included in the figures of columns (28) to (31).
102. The material is presented for total, rural and urban areas of the district separately and only for rural areas for each taluka.
103. There are some more castes declared as Scheduled Castes for the district. They are not shown in this table because no one belonging to those castes was enumerated in 1961 Census in the district.
Table SCT-I-B 104. This table presents the distribution of
Scheduled Tribes population by economic activity. Material is presented for the total of all Scheduled Tribes as well as for each Scheduled Tribe separately. Scheduled Tribes are arranged in the alphabetical order. Classification by economic· activity is in the same nine categories as in the Primary Census Abstract and Tables B-1 and B-lI. In a way, this table presents tribewise break-up of the material

presented In Table C-VIII (Part B). The last group of tribes" not stated" is of perso~s who we~e returned as belonging to Scheduled TrIbes but III
whose case the name of the Scheduled Tribe concerned had not been stated in the Census.
105. The material is presented for total, rural and urban areas of the district separately and for rural areas only for each taluka.
106. There are some more Scheduled Tribes declared as Scheduled Tribes for the district. They are not shown in this table because no one belonging to those tribes was enumerated in 1961 Census in the district.
Table SCT -III-A (i)
107. This table presents the distribution of each Scheduled Caste population by sex and educational levels. The table presents material fpr the district urban areas only. The classification of educational levels is the same as in Tables B-III and C-III applicable for urban areas.
Table SCT-III-A (ii)
108. This table presents the distribution of each Scheduled Tribe population by sex and educational levels. The table presents material for the district urban area only. The classification of educational levels is the same as in Tables B-llI and C-HI applicable for urban areas. Table SCT-III-B (i)
109. This table presents the distribution of population for each Scheduled Caste by educational levels only for the district rural area. The classification by educational levels is somewhat reduced than that of Table SCT-III (Part A).
Table SCT-IU-B (ii)
110. This table presents the distribution of population for each Scheduled Tribe by educational levels only for the district rural area. The classification by educational levels is somewhat reduced than that of Table SCT-III (Part A).
Table SCT-V-A
111. This table presents the distribution of sample Scheduled Caste households of the district (Rural) by interest in land cultivated and by size of land cultivated. The interests in land cultivated are shown in three categories :-
(i) entirely owned or held from Government ; (ii) entirely held from private persons or institu
tions for payment in money, kind or share; and
(iii) partly held from Government and partly from private persons, etc.
Classification by size of land cultivated is the same as in the B Series household economic tables. Material here is presented only for the district rural and for all the Scheduled Castes as a group. The table is prepared from the household schedules on a 20 per cent sample.
109
Table SCT-V-B 112. This Table for Scheduled Tribes (same as
Part A) is presented only for the district rural. The table is prep::tred from household schedules on a 20 per cent sample.
Table SC-I 113. This table presents the total non-working
population of all the Scheduled Castes as a group classified by four categories of non-workers, viz. :-
(i) full-time students ; (ii) persons seeking employment for the first time;
(iii) persons employed befo_re but now out of employment and seekmg work; and
(iv) others. The non-working population is further classified ?y educational levels. The material is presented for the dIStrict only but for total, rural and urban areas separately.
Table ST-I 114. This t:l.ble presents the distribution of
population of each Scheduled Tribe by 111othertongue and the s'lbsidiary languages spoken. Material is presented only for the district but for total, rural and urban areas separately. Scheduled Tribes are arranged in their alphabetical order and mother-tongues when there are more than one for any Scheduled Tribe are also shown in the alphabetical order.
Table ST-II
115. This table presents the total nOll-working population of each Scheduled Tribe classified by four categories of non-workers viz.-
(i) full-time students ; (ii) persons seeking employment for the first
time; (iii) persons employcd before but now out of
employment and seekin£, work: and (iv) Others
The material is presented for the district only but for total, rural and urban areas seperately.
E SERIES
HOUSING TABLES
116. There are five tables in this Series. Four of them relate to housing conditions and furnish data on the purposes for which the houses are used, the tenures on which they are occupied by the households, material of construction of walls and roofs and the distribution of households by the number of rooms occupied. The last table relates to industries and shows the number of establishments and the number of workers for each industry classified by industry division, major groups and minor groups. Another Table (E-III) on industrial establishments prepared from the house lists gives a break-up by industry and the fuel used cross-tabulated by the size of the establishments. It is not presented here for want of space. It may be seen in Part IV of the Maharashtra Census Report.

117. All the five tables of this Series are prepared from the houselists which were prepared at the time of numbering of houses in September-October of 1960. Such data on housing conditions are furnished here for the first time.
118. A "bouse" was defined for purposes of the Census as " a structure or part of a structure inhabited or vacant, a dwelling, a shop, a shop-cum-dwelling or a place of business, workshop, school, etc., having a separate entrance. The entrance may be directly on the road, street, or lane or to a common staircase, court-yard or a gate". Table E-I
119. This table presents the distribution of houses classified by uses to which they are put to. The various uses are shown in columns (4) to (16). Houses which were not being used for any purpose at the time of houselisting were treated as vacant. A" workshop" is a place where some kind of production, processing, repairs or servicing of goods, goes on a commercial scale. Manufacturing or processing establishments registered under the Factories Act are treated as factories. When a house was used both as a shop and as a dwelling or workshop and as a dwelling it is treated as a shopcum-dwelling or workshop-cum-dwelling. The houses which were used as schools, offices, factories or restaurants and also used by some people for residence, have been treated for purposes of this table as schools, offices, factories or restaurants and not as school-cum-dwelling, office-cum-dwelling and so on.
120. The last category of "Others" includes all purposes not included in columns (4) to (15) prominent among them being cattle-sheds, garages, show-rooms, locked houses, etc. Table E-l presents material for the district and each taluka and for total, rural and urban areas separately. The table is prepared from the houselists on a full count. Table E-ll
121. This table presents- the distribution of sample households by the tenure of houses occupied by them. Tenure here is of only two kinds, owned or rented. " Rent free" or " Caretaker" occupation is included in the ., Rented" category. The houses occupied under each tenure are further classified by the nature of uses such as dwellings, shop-cum-dwellings, etc. Tenure of occupation of non-residential houses such as schools, hospitals, etc., is not shown here.
122. This table is prepared from the houselists and on a 20 per cent sample.
123. Material is presented for the district and each taluka and for total, rural and urban areas separately. TableE-IV
124. This table presents distribution of sample houses used wholly or partly as dwelling by material of wall and material of roof. The material of wall is the material out of which most of the walls of the house are constructed. Where a house has separate portions each of different material, the material of the walls for this table is the one out of which the walls of the main bed-rooms are constructed. Similarly, the material of roof is one out of which most of the roof exposed to
'llO
weather is constructed. In case of multi-storeyed buildings, the intermediate floor is treated as the roof of the lower storey.
125. Material is presented here for the district and each taluka and. for total, rural and urban areas separately. This table is prepared from the houselists on a 20 per cent sample.
Table E-V 126. This table presents the distribution of sample
households classified by the number of rooms occupied. For each class of households the total number of members of the households is shown by males and females separately. This will help measure congestion or overcrowding particularly in urban areas.
127. The table is prepared from the houselists on a 20 per cent sample. The material is presented for the district and each taluka and for total, rural and urban areas separately.
128. The table relates only to the family households. Institutional households like hostels, boardings, prisons, etc., are not shown here.
129. A" room" has four walls with a door and a roof overhead and is not less than 6' x6'. Unenclosed verandah, kitchen, store, garage, cattle-shed, etc., though used for residential purposes are not treated as rooms. Households resi.ding in such places are shown in columns (7) to (9) as having no regular room.
Table on Industrial Establishments and Workers 130. This is a very important table and presents the
number of establishments and number of workers for each branch of industry classified by industry divisions and minor groups according to the Standard Industrial Classification (Appendix I). For ea¢h industry division, minor group figures are shown in the brackets flrst for the number of establishments and second for the number of workers.
131. The table is prepared from the houselists.. on a full count. Material is presented here for the district and talukas for total, rural and urban areas as well as for each village and town separately. The presentation is in the run-on style and the villages are shown both by their names and code numbers. These latter will help locate them in the taluka maps included in Part I. Villages which do not have any industrial establishments are not shown here. Similarly, for any village, town or taluka, the industry minor codes for which there are no establishments are not shown in the table.
132. The material presented here relates to September-October of 1960. Establishments where processing, repairing or servicing of goods is done are also included along with the manufacturing establishments. The number of workers shown here includes the proprietor and/or the other household members if any were working in the industry during the week preceding the enumerator's visit.
133. The list of industries presented here may not include some seasonal industries which were not actually working during the period when houselists were prepared, viz., September-October 1960.
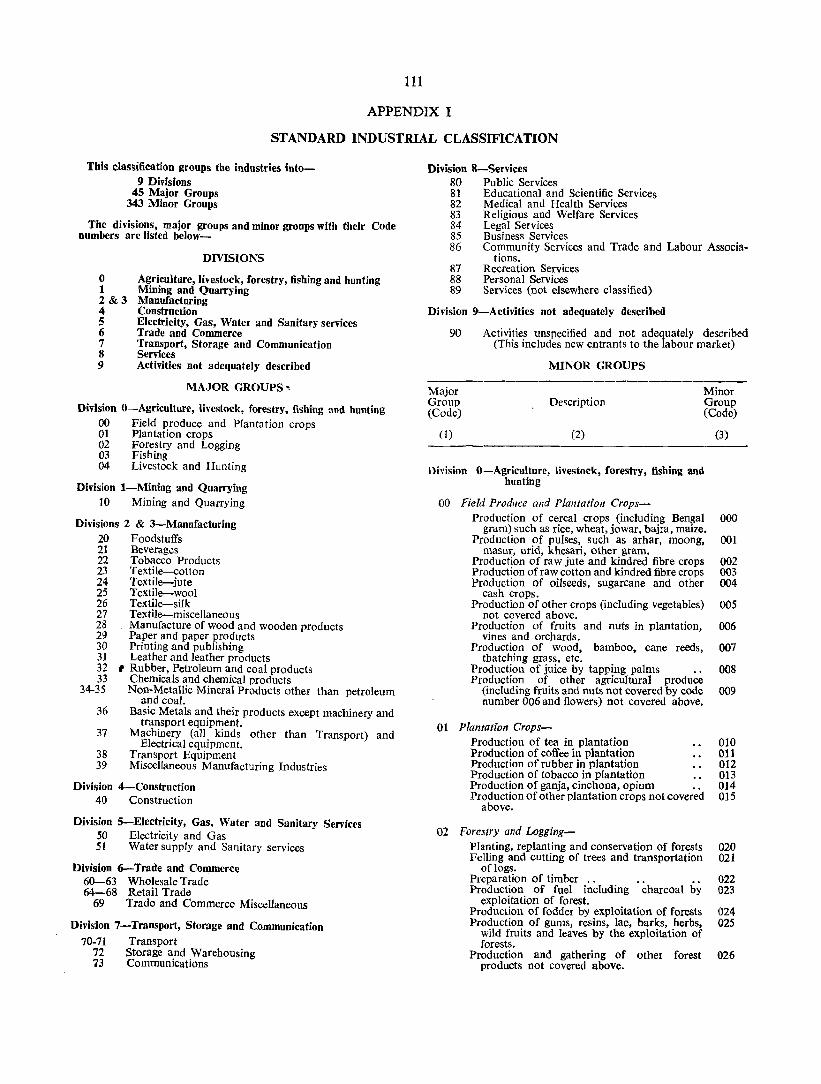
111
APPENDIX I
STANDARD INDUSTRIAL CLASSIFICATION
This classification groups the industries into-9 Divisions
45 Major Groups 343 Minor Groups
The divisions, major groups and minor groups with their Code numbers are listed below-
o I 2&3 4 5 6 7 8 9
DIVISIONS
Agriculture, livestock, forestry, fishing and hunting Mining and Quarrying Manufacturing Construction Electricity, Gas, Water and Sanitary services Trade and Commerce Transport, Storage and Communication Services Activities not adequately described
MAJOR GROUPS '"
Division O-Agriculture, livestock, forestry. fishing and hunting 00 Field produce and Plantation crops 01 Plantation crops 02 Forestry and Logging 03 Fishing 04 Livestock and Hunting
Division I-Mining and Quarrying 10 Mining and Quarrying
Divisions 2 & 3-Manufacturing 20 Foodstuffs 21 Beveragl!s 22 Tobacco Products 23 Textile-cotton 24 Textile-jute 25 Textile-wool 26 Textile-silk 27 Textile-miscellaneous 28 Manufacture of wood and wooden products 29 Paper and paper products 30 Printing and publishing 31 Leather and leather products 32 'Rubber, Petroleum and coal products 33 Chemicals and chemical products
34-35 Non-Metallic Mineral Products other than petroleum and coal.
36 Basic Metals an~ their products except machinery and transport eqUIpment.
37 Machinery (all kinds other than Transport) and Electrical equipment.
38 Transport Equipment 39 Miscellaneous Manufacturing Industries
Division 4-Construction 40 Construction
Division 5-Electricity, Gas. Water and Sanitary Services 50 Electricity and Gas 51 Water supply and Sanitary services
Division 6-Trade and COll,lll1erce 60-63 Wholesale Trade 64-68 Retail Trade
69 Trade and Commerce Miscellaneous
Division 7-Transport. Storage and Communication 70-71 Transport
72 Storage and Warehousing 73 Communications
Division 8-Services 80 Public Services 81 Educational and Scientific Services 82 Medical and Health Services 83 Religious and Welfare Services 84 Legal Services 85 Business Services 86 Community Services and Trade and Labour Associa.
tions. 87 Recreation Services 88 Personal Services 89 Services (not elsewhere classified)
Division 9-Activities not adequately described
90 Activities unspecified and not adequately described
Major Group (Code)
(1)
(This includes new entrants to the labour market)
MINOR GROUPS
Description
(2)
Minor Group (Code)
(3)
Division O-Agriculture, livestock, forestry, fishing and hunting
00 Field Prodllce and Plantation Crops-Production of cereal crops (including Bengal 000
gram) such as rice, wheat, jowar, bajra, maize. Production of pulses, such as arhar, moong, 001
masur, urid, khesari, other gram. Production of raw jute and kindred fibre crops 002 Production of raw cotton and kindred fibre crops 003 Production of oilseeds, sugarcane and other 004
cash crops. Production of other crops (including vegetables) 005
not covered above. Production of fruits and nuts in plantation, 006
vines and orchards. Production of wood, bamboo. cane reeds, 007
thatching grass, etc. Production of juice by tapping palms 008 Production of other agricultural produce
(including fruits and nuts not covered by code 009 number 006 and flowers) not covered above.
01 Plantation Crops-Production of tea in plantation 010 Production of coffee in plantation 011 Production of rubber in plantation 012 Production of tobacco in plantation 013 Production of ganja, cinchona, opium 014 Production of other plantation crops not covered 015
above.
02 Forestry and Logging-Planting, replanting and conservation of forests 020 Felling and cutting of trees and transportation 021
of logs. Preparation of timber .. 022 Production of fuel including . ~harcoal by 023
exploitation of forest. Production of fodder by exploitation of forests 024 Production of gums, resins, lac, barks, herbs, 025
wild fruits and leaves by the exploitation of forests.
Production and gathering of other forest 026 products not covered above.
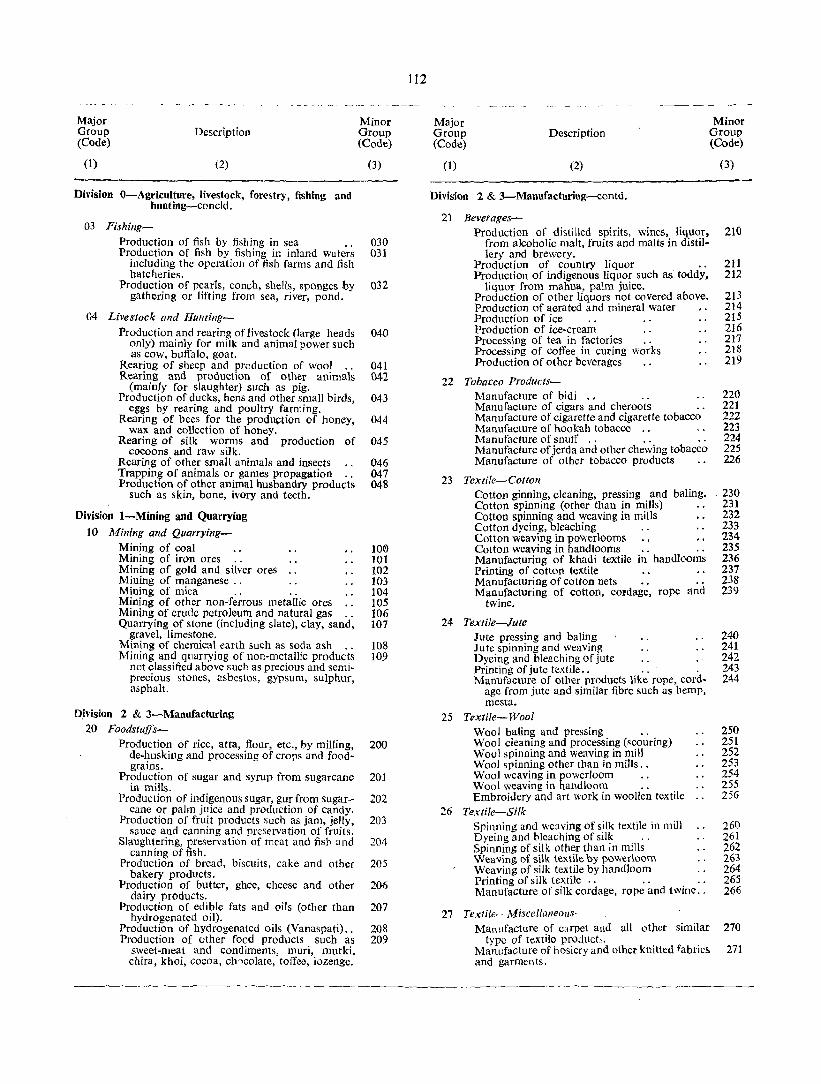
Major GrouP (Code)
(1)
Description
(2)
Division O-Agriculture, livestock, forestry, fishing and hunting-concJd.
03 Fishing-Production of fish by fishing in sea .. Production of fish by fishing in inland waters
including the operation of fish farms and fish hatcheries.
Production of pearls, conch, shells, sponges by gathering or lifting from sea, river, pond.
04 Livestock and Ifunt;lIg-
Production and rearing of livestock (large heads only) mainly for milk and animal power such as cow, buffalo, goal.
Rearing of sheep and production of wool .. Rearing and production of other animals
(mainly for slaughter) such as pig. Production of ducks, hens and other small birds,
eggs by rearing and poultry farming. Rearing of bees for the prod~tion of honey,
wax and collection of honey. Rearing of silk worms and production of
Cocoons and raw silk. Rearing of other small animals and insects .. Trapping of animals Or games propagation .. Production of other animal husbandry products
such as skin, bone, ivory and teeth.
Division I-Mining and Quarrying
10 Mining and QuarryingMining of coal Mining of iron ores Mining of gold and silver ores Mining of manganese .. Mining of mica . . . . Mining of other non-ferrous metallic ores .. Mining of crude petroleum and natural gas .. Quarrying of stone (including slate), clay, sand,
gravel, limestone. Mining of chemical earth such as soda ash .. Mining and qllarrying of non-metallic products
not classified above such as precious and semiprecious stones, asbestos, gypsum, sulphur, asphalt.
Oivision 2 & 3-Manufacturing 20 Foodstulfs-
Production of rice, atta, flour, etc., by milling, de-husking and processing of crops and foodgrains.
Production of sugar and syrup from sugarcane in mills.
Production of indigenous sugar, gur from sugarcane or palm juice and production of candy.
Production of fruit products such as jam, jelly, sauce and canning and preservation of fruits.
Slaughtering, preservation of meat and fish and canning of fish.
Production of bread, biscuits, cake and other bakery products.
Production of butter, ghee, cheese and other dairy products.
Production of edible fats and oils (other than hydrogenated oil).
Production of hydrogenated oils (Vanaspati) .. Production of other food products such as
sweet-meat and condiments, muri, murki, chira, khoi, cocoa, ch'xolate, toffee, lozenge.
Minor Group (Code)
(3)
030 031
032
040
041 042
043
044
045
046 047 048
10(i) 101 102 103 104 105 106 107
108 109
200
201
202
203
204
205
206
207
208 209
112
Major Group (Code)
Description Minor
Group (Code)
(1) (2)
Division 2 & 3-Manufacturing-contd.
21 Beverages-Production of distilled spirits, wines, liquor,
from alcoholic malt, fruits and malts in distillery and brewery.
Production of country liquor Production of indigenous liquor such as' toddy,
liquor from mahua, palm juice. Pmduction of other liquors not covered above. Production of aerated and mineral water Production of ice PrOduction of ice-cream Processing of tea in factories Processing of coffee in curing works Production of other beverages
22 Tobacco Products-Manufacture of bidi ., Manufacture of cigars and cheroots Manufacture of cigarette and cigarette tobacco Manufacture of hookah tobacco .• Manufacture of snuff Manufacture of jerda and other chewing tobacco Manufacture of other tobacco products
23 Textile-Cotton Cotton ginning, cleaning, pressing and baling. Cotton spinning (other than in mills) " Cotton spinning and weaving in mills Cotton dyeing, bleaching Cotton weaving in powerlooms Cotton weaving in handlooms Manufacturing of khadi textile in handlooms Printing of cotton textile Manufacturing of cotton nets Manufacturing of cotton, cordage, rope and
twine.
24 Textile-lute Jute pressing and baling Jute spinning and weaving Dyeing and bleaching of jute .. Printing of jute textile. . " . . Manufacture of other products like rope, cord-
age from jute and similar fibre such as hemp, mesta.
25 Textile-Wool Wool baling and pressing Wool cleaning and processing (scouring) Wool spinning and weaving in mill Wool spinning other than in mills .. Wool weaving in powerloom Wool weaving in handloom Embroidery and art work in woollen textile
26 Textile-Silk Spinning and weaving of silk textile in mill Dyeing and bleaching of silk .. Spinning of silk other than in mills Weaving of silk textile by powerloom Weaving of silk textile by handloom Printing of silk textile " .. Manufacture of silk cordage, rope and twine ..
27 Textile- Miscellaneous--Manufacture of carpet and all othor similar
type of textile produc!:;. Manufacture of hosiery and other knitted fabrics and garmcn ts .
(3)
210
211 212
213 214 215 216 217 218 219
220 221 222 223 224 225 226
.230 231 232 233 234 235 236 237 238 239
240 241 242 243 244
250 251 252 253 254 255 256
260 261 262 263 264 265 266
270
271
Major Group (Code)
(1)
Description
(2)
Minor Group (Code)
(3)
Division 2 & 3-Manufacturing-contd.
27 Textile-Miscellaneous-contd.
Embroidery and making of crepe lace and 272 fringes.
Making of textile garments including raincoats 273 and headgear.
Manufacture of made up textile goods except 274 wearing apparel such as curtains, pillow cases, bedding materials, mattress, textile bags.
Manufacture of waterproof textile products 275 such as oil cloth, tarpaulin.
Manufacture and recovery of all types of 276 fibres for purposes of paddinJ:, wadding and up-holstery filling.
Manufacture of coir and coil" products 277 Manufacture of umQrelIas • • 278 Processing and manufacture of textile products 279
not covered above.
28 Manufacture of Wood and Wooden Products-
Sawing and planing of wood 280 Manufacture of wooden furniture and fixtures. 281 Manufacture of structural wooden goods (in- 282
eluding treated timber) such as beams, posts, doors, windows.
Manufacture of wooden industrial goods other 283 than transport equipment such as bobbin and similar equipment and fixtures.
Manufacture of other wooden products such as 284 utensils, toys artwares.
Manufacture of veneer and plywood 285 Manufacture of plywood products such as tea 286
chest. Manufacture of boxes and packing cases other 287
than plywood. Manufacture of materials from cork, bamboo, 288
cane, leaves and other allied products. Manufacture of other wood and allied products 289
not covered above.
29 Paper and Paper Products-
Manufacture of pulp from wood, rags, waste- 290 paper and other fibres and the conversion of such pulp into any kind of paper and paper board in mill.
Manufacture of pulp from wood, rags, waste- 291 paper and other fibres and the conversion of such pulp into any kind of paper and paper board handmade.
Manufacture of products, such as paper bags, 292 boxes, cards, envelopes and moulded pulp goods from paper, paper board and pulp.
30 Printing and Publishillg-
Printing and publishing of newspapers and 300 periodicals.
Printing and publishing of books 301 All other types of printing including lithography, 302
engraving, etching, block making and other work connected with printing industry.
All types of binding, stitching, sizing and other 303 allied work connected with binding industry.
113
Major Group (Code)
(1)
Description
(2)'
Minor Group (Code)
(3)
Division 2 & 3-Manufacturing-contd.
31 Leather and Leather Products-Currying, tanning and finishing of hides and 310
skins and preparation of finished leather. Manufacture of shoes and other leather foot- 311
wear. Manufacture of clothing and wearing apparel 312
(except footwear) made of leather and fur. Manufacture of leather products (except those 313
covered by code Nos. 311, 312), such as leather upholstery, suitcases, pocket books, cigarette and key cases, purses, saddlery, whip and other articles.
Repair of shoes and other leather footwear .. 314 Repair of all other leather products except foot- 315
wear.
32 Rubber, Petroleum and Coal Products-Manufacture of tyres and tubes 320 Manufacture of rubber footwear . . 321 Manufacture of rubber goods used for industrial 322
purpose. Manufacture of all kinds of other rubber 323
products from natural or synthetic rubber including rubber raincoat.
Productions of petroleum, kerosene and other 324 petroleum products in petroleum refineries.
Production of coaltar and coke in coke oven . . 325 Manufacture of other coal and coaltar products 326
not covered elsewhere.
33 Chemicals and Chemical Products-Manufacture of basic industrial chemicals such 330
as acids, alkalis and their salts not elsewhere specified.
Manufacture of dyes, paints, colours and 331 varnishes.
Manufacture of fertilizers 332 Manufacture of ammunition, explosives and fire 333
works. Manufacture of matches 334 Manufacture of medicines, pharmaceutical pre- 335
parations, perfumes, cosmetics and other toilet preparations except soap.
Manufacture of soap and other washing and 336 cleaning compounds.
Manufacture of turpentine, synthetic, resin and 337 plastic products and materials (including synthetic rubber).
Manufacture of common salt . . 338 Manufacture of other chemicals and chemical 339
products not covered above (including inedible oils and fats).'
34 Non-metallic Mineral Products other than Petroleum and Coal-Manufacture of structural clay products such 340
as bricks, tile5. Manufacture of cement and cement products 341 Manufacture of lime 342 Manufacture of structural stone goods, stone 343
dressing and stone crushing. Manufacture of stonewares, other than images 344 Mannfacture of stone images . . • • 345 Manufacture of plaster of paris and its products. 346 Manufacture of asbestos products 347 Manufacture of mica products 348
-------------------------------------- --_- --
H 4222-8
Major Group (Code)
(1)
Description
(2)
Minor Group (Code)
(3)
Division 2 & J-Manufacturing-contd.
35 Manufacture of earthenware and earthen 350 pottery.
Manufacture of chinaware and crockery 351 Manufacture of porcelain and its products 352
- Manufacture of glass bangles and beads 353 Manufacture of glass apparatus .354 Manufacture of earthen image, busts and statues. 355 Manufac;ture of earthen toys and artwares except 356
those covered by code No. 355. Manufacture of glass and glass products except 357
optical and photographic lenses and glass pro-ducts covered above.
Manufacture of other non-metallic mineral 359 products not elsewhere specified.
j6 Basic Metals and their Products except Machinery and Transport Equipment-Manufacture of iron and steel inclu~g smelt- 360
ing, refining, rolling, conversion into basic forms such as billets, blooms, tubes, rods.
Manufacture including smelting, refining of non- 361 ferrous metals and alloys in basic forms.
Manufacture of armaments. . 362 Manufacture of structural steel products such 363
as joist, rail, sheet, plate. Manufacture of iron and steel furniture 364 Manufacture of brass and bell metal products. 365 Manufacture of aluminium products ., . . 366 Manufacture of metal products (other than of 367
iron brass, bell metal and aluminium) such as tin can.
Enamelling galvanising, plating (including 368 electroplating), polishing and welding of metal products.
Manufacture of sundry hardwares such as G. I. 369 pipe, wire net, bolt, screw, bucket, cutlery (I'his will also include the manufacture of sundry ferrous engineering products done by jobbing engineering concerns which cannot be classified in major groups 36, 37, 38 and 39).
!7 Machinery (All kinds other than Transport) and Electrical equipment-Manufacture and assembling of machinery 370
(other than electrical) except textile machinery. Manufacture and assembling of prime mover 371
and boilers, other than electrical equipment, such as diesel engines, road rollers, tractors.
Manufacture of machine tools 372 Manufacture of textile machinery and accessories 373 Manufacture of heavy electrical machinery and 374
equipment such as motors, generators, transformers.
Manufacture of electric lamps and fans 375 Manufacture of insulated wires and cables 376 Manufacture of all kinds of battery 377 Manufacture of electronic equ~pment such as 378
radio, microphone. Manufacture of electric machinery and appara- 379
tus, appliances not specified above.
38 TrallJport Equipment_;. Manufacture, assembly and repairing of loco- 380
motives. Manufacture of wagons, coaches, tramways and 381
other rail road equipment other than that covered by code No. 363.
114
Major Group (Code)
(1)
Description
(2)
,
Minor Group (Code)
(3)
Division 2 & 3-Manufacturing-concld.
38 Transport Equipment-concld. Manufacture and assembling of motor vehicles 382
of all types (excepting motor engines). Manufacture of motor vehicles engines parts and 383
accessories. , Repairing and servicing of motor vehicles 384 Manufacture of bicycles and tricycles and acces- 385
sories such as saddle, seat frame, gear. Building and repairing of water transport equip- 386
ment such as ships, boats and manufacture of marine engines.
Manufacture and repair of air transport equip- 387 ment including aeroplanes, aeroengines.
Repairing of bicycles and tricycles. . 388 Manufacture of other transport equipment not 389
covered above such as animal drawn and hand-drawn vehicles.
39 Miscellaneous Manufacturing Industries-Manufacture of optical instruments and lenses,' 390
opthalmic goods and photographic equipment ,and supplies.
Manufacture of scientific, medical and surgical 39~ instruments and equipment and supplies.
Assembling and repairing of watches and clocks 39,Z Manufacture of jewellery, silverware and wares 393
using gold and other precious metals. Manufacture and tuning of musical instruments 394 Manufacture of stationery articles not covered 395
eleswhere such as pencil, penholder, fountain-pen.
Manufacture of sports goods 396 Manufacture and repair work of goops, not assign-· 399
able to any other group. '
Division 4--Construction
40 Construction-Construction and maintenance of buildings 400
including erection, flooring, decorative constructions, electrical and sanitary installations.
Construction and maintenance of roads, 401 railways, bridges, tunnels.
Construction and maintenance of telegraph and 402 telephone lines.
Construction and maintenance of water ways and 403 water reservoirs such as bund, embankments, dam, canal, tank, tubewells, wells.
Division 5-Electricity, Gas, Water and Sanitary Services
50 Electricity and Gas-Generation and transmission of electric energy 500 Distribution of electric energy 501 Manufacture of gas in gas works and distribu- 502 , tion to domestic and industrial consumers.
51 Water Supply and Sanitary Services-. Collection, purification and distribution of water 510
to domestic and industrial consumers. Garbage and sewage disposal, operation of 511
drainage system and all other types of work connected with public health and sanitation.
Major Group (Code)
(1)
Description
(2)
Division 6-Trade and Commerce
60 Wholesale Trade-Wholesale trading in cereals and pulses Wholesale trading in vegetables, fruits, sugar,
spices, oil, fish, dairy products, eggs, poultry and other food stuff (not covered elsewhere).
Wholesale trading in all kinds of fabrics, and textiles products such as garments, hessian, gunny bag, silk and woollen yarn, shirtings, suitings, hosiery products.
Wholesale trading in beverages, such as tea (leaf), coffee (seed and powder), aerated water.
Wholesale trading in intoxicants such as wines, liquors.
Wholesale trading in other intoxicants such as opium, 'ganja, etc. ..
Wholesale trading in tobacco, bidi, cigarettes and other tobacco products.
Wholesale trading in animals Wholesale trading in straw and fodder , .
61 Wholesale trading in medicines and chemicals Wholesale trading in fuel and lighting products
such as coke, coal, kerosene, candle.' Wholesale trading in toilets, perfumery and
cosmetics. Wholesale trading in metal, procelain and glass
utensils, crockery, chinaware. Wholesale trading in wooden, steel and other
metallic furnItUre and fittings. Wholesale trading in footwear Wholesale trading in tyres, tubes and
allied rubber products. Wholesale trading in petrol, mobil oil and allied
products. Wholesale trading in other household equipment
not covered above. 62 Wholesale trading in bricks, tiles and other build.
ing materials. Wholesale trading in wood, bamboo, cane,
thatches and similar products. 63 Wholesale trading in paper and other stationery
goods. Wholesale trading in agricultural and industrial
machinery equipment and tools and applian. ces other than electrical. '
Wholesale trading in electrical machinery and equipment like motor, battery, electric fan, bulb.
Wholesale trading in all kinds of transport and storage equipment.
Wholesale trading in skins, leather and fur •. Wholesale trading in clocks, eye glasses, frames. Wholesale 'trading in hardware and sanitary
equipment. Wholesale trading in scientific, medical and surgi
cal instruments. Wholesale trading in precious metals and stones,
gold and silverwares and jewellery. Wholesale trading in all goods not covered above.
64 Retail Trade-Retail trading in cereals, pulses, vegetables,
fruits, sugar, spices, oil, fish, dairy products, eggs, poultry.
Retail trading in beverages such as tea (leaf), coffee (seed and powder), aerated water.
Retail trading in intoxicants such as wines, liquor.
Retail trading in other intoxicants such as opium, ganja, etc.
H 4222-84
I
Minor Group (Code)
(3)
600 601
602 •
603
604
605
606
607 608 610 611
612
613
614
615 616
617
618
620
621
630
631
632
633
634 635 636
637
638
639
640
641
642
643
115
Major Group (Code)
Description Minor Group (Code)
(1) (2)
Division 6-Trade and Commerce-coneld.
64 Retail Trade-coneld.
65
66
67
68
Retail trading in tobacco, bidi, cigarettes and other tobacco products.
Retail trading in fuel such as coke, coal, firewood and kerosene.
Retail trading in foodstuffs like sweetmeat condiments, cakes, biscuits, etc.
Retail trading in animals Retail trading in straw and fodder Retail trading in fibres, yarns, dhoti, saree,
readymade garments of cotton, wool, silk and other textiles and hosiery products (this ineludes retail trading in piece-goods of cotton, wool, silk and other textiles).
Retail trading in toilet goods, perfumes and cosmetics.
Retail trading in medicines and chemicals Retail trading in footwear, head-gear such as
hat, umbrella, shoes and chappals. Retail trading in tyres, tubes and allied rubber
products. Retail trading in petrol, mobiloil and allied
products. Retail trading in wooden, steel and other metal
lic furniture and fittings. Retail trading in stationery goods and paper. Retail trading in metal, porcelain and glass
utensils. Retail trading in earthenware and earthen toys. Retail trading in other household equipment
not covered above. Retail trading in bricks, tiles and other building
materials. Retail trading in hardware a sanitary equipment. Retail trading in wood, bamboo cane, bark and
thatches. Retail trading in other building materials .. Retail trading in agricultural and industrial
machinery equipment, tools and appliances. Retail trading in trans}JOrt and storage equipments. Retail trading in electrical goods like electric fan,
bulb,etc. Retail trading in skins, leather and furs and their
"roducts excluding footwear and headgear. Retail trading in clock and watch, eye glass, frame. Retail trading in scientifio, medical and surgical
instruments. Retail trading in precious stones and jewellery. Retail trading in musical instruments, gramo
phone record, pictures and paintings including curio dealing.
Book-selling Retail trading in goods unspecified
69 Trade and Commerce Miscellaneous-Importing and exporting of goods and commodi-
ties. Real estate and properties Stocks, shares and futures Providents and insurances Moneylending (indigenous) Banking and similar type of financial operation Auctioneering .. Distribution of motion pictures. . . . . . All other activities connected with trade and
commerce not covered above, including hiring out of durable goods such as electric fan, microphone, rickshaw, etc.
(3)
644
645
646
647 648 650
651
652 653
654
655
660
661 662
663 664
670
671 672
673 680
681 682
683
684 685
686 687
688 689
690
691 692 693 694 695 696 697 699
Major Group (Code)
(1)
Description
(2)
Minor Group (Code)
(3)
Division 7-Transport, Storage and Communication
70 Transport-Transporting by railways . . . . 700 Transporting by tramway and bus service 701 Transporting by motor vehicles (other than 702
omnibus). Transporting by road through other means of 703
transport such as hackney carriage, bullock-cart, ekka.
Animal transporting by animals such as horses, 704 elephant, mme, camel.
Transporting by man such as carrying of luggage, 705 handcart driving, rickshaw pulling, cycle rick-shaw driving.
Transporting by boat, steamer, fetry, etc., by 706 rivet. canal. '
Transporting by boat, steamer, ship, cilrgo boat 707 by sea or ocean.
Transporting by ait . . . . . . . . 708 Transporting by other means not covered above. 709
11 Services incidental to transport such as packing, 710 carting travel agency.
72 Storage and Warehollsing-Operation of storage such as ware-houses 720 Operation of storage such as cold storage 721 Operation of storage of other type . . 722
73 Communication-Postal, telegraphic, wireless and signal commu· 730
nications. Telephone communication 731 Information and broadcasting 732
Division 8-Services 80 Public Services (This does not include Govt., Quasi
Govt. or local body activities, other than administrative, in such fields as transport, communication. information and broadcasting, education and scientific services, health, industries, production, construction, marketin8 and operation of finanf:ial institution each of which is classified in the appropriate industry groupS).
Public Services in Union and State army includ- 800 ing territorial corps and volunteer corps.
Public service in Navy .. 801 Public service in Air Force. . 802 Public service 4n Police " . . . . . . 803 Public service in administrative departments and 804
offices of Central Government. Public service in administrative departments and 805
offices of quasi-government organisation, municipalities, local boards, etc.
Public services in administrative departments 809 and offices of State Governments.
81 Educational and· Scientific Services-Educational services such as those rendered by 810
technical colleges, technical schools and similar technical and vocational institutions.
Educational services such as those rendered by 811 colleges, schOOls and similar other institutions of non-technical type. '
Scientific services and research institutions not 812 capable of classification under any individual group.
116
Major Croup (Gode)
(1)
Description
(2)
Minor Group (Code)
(3)
Division 8-Services-contd.
82 Medical and Health Servr'ces-Public health and medical services rendered by 820
organisations and individuals such as by hospitals, sanatoria, nursing homes, mater-nity and child welfare clinic as also by hakimi, unani, ayurvedic, allopathic and homeopathic practitioners.
Veterinary services rendered by organisations ~21 and individuals.
83 Religious and Welfare Services-Religious services rendered by religious orga- 830
nisations and their establishments maintained for worship or promotion of religious actiVities, this includes missions, ashrams and other' allied organisations.
Religious and allied services rendered by pandit. 831 priest, preceptor, fakir. monk.
. Welfare services rendered by organisations 832 operating on a non-profit basis for the promotion of welfare of the community such as relief societies, red-cross organisation for. the collection and allocation of contributions for charity.
84 Legal Services-Legal services rendered by barrister. advocate, 840
solicitor, mukteer, pleader, mukurie, muushi. Matrimonial services rendered by organisations 841
and individuals.
85 Business Services-Bngineerjng services rendered by professional SSO .
organisations or individuals. Business services rendered by organisations of 851
accountants, auditors, book-keepers or like individuals.
Business services rendered by professional 852 organisations or individuals such as those of advertising and publicity agencies.
Business services rendered by professional 853 organisations or individuals such as of those ' rendered by news-agency, newspaper correspondent, columnists, journalists, editors, authors.
86 Community Services and Trade and Labour Associations-Services rendered by trade a,.'isociations, cham- 860
bers of commerce, trade unions and similar other organisations.
Services rendered by civic, social, cultural, 861 political and fraternal organisatiOIls such as rate payers association, club, library.
Community services such as those rendered by 862 public libraries, museums, botanical and zoological gardens, etc.
87 Recreation Ser'lices-Production of motion picture and allied services 870
such as processing, editing, etc. . Recreation services rendered by cinema houses 871
by exhibition of motion pictures.

Major Group (Code)
(1)
Description
(2)
Minor Group (Code)
(3)
DivisioD B-Services-contd.
87 Recreation Services-conc1d. Recreation services rendered by organisations 872
and individuals such as those of theatres, opera companies, ballet and dancing parties, musicians, exhibitions, circus, carnivals.
Recreation services rendered by indoor and 873 outdoor sports by organisations and individuals including horse, motor, etc., racing.
88 Personal Services-Services rendered to households such as those 880
by domestic servants, cooks. Services rendered to households sucq as those 881
by governess, tutor, private secretary • Services rendered by hotels, boarding houses, 882
eating houses, cafes, restaurants and similar other organisations to provide lodging and boarding faciJjties.
Laundry services rendered by organisations and 8lB individuals, this includes all types of cleaning, dyeing, bleaching, dry cleaning services.
IH..
Major Group (Code)
(1)
Description
(2)
Minor Group (Code)
(3)
Division 8-Services-concld.
88 Persona! Services-concld. Hair dressing, other services rendered by organi- 884
sation and individuals such as those by barber, hairdressing saloon and beauty shops.
Services rendered by portrait and commercial 885 photographic studios.
89 Services (not elsewhere classi/iedJ- ' Services rendered by organisations or individuals 890
not elsewhere classified.
Division 9-Activities not adequately described
90 Activities unspecified and not adequatelY described 900 including activities of such individuals who fail to provide sufficient information about their industrial affiliation to enable them to be classified.
Fresh entrants to the Labour Market 999
118
APPENDIX II
NATIONAL CLASSIFICATION OF OCCUPATIONS
A Code structure which classifies oc~upltions into-11 Occupational Divisions (one-digit code numbers) 75 OccupatIonal Groups (two-digit code numbers)
Note: n.e.c.=not elsewhere classsified.
DIVISIONS
o Professional, technical and related workers 1 Administrative, executive and managerial workers 2 Clerical and related workers 3 Sales workers 4 Farmers, fishermen, hunters, loggers and related workers 5 Miners, quarrymen and related workers 6 Workers in transport and communication occupations
7-8 Craftsmen, production process workers, aud labourers not elsewhere classified
9 Serivce, sport and recreation workers X Workers not classifiable by occupations
DIVISIONS AND GROUPS
o Professional, Technical and Related Workers 00 Architects, Engineers and Surveyors 01 Physicists, Chemists, Geologists and other Physical
Scientists 02 Biologists, Veterinarians, Agronomists and Related
Scientists 03 Physicians, Surgeons and Dentists 04 Nurses, Pharmacists and other Medical and Health
Technicians 05 Teachers 06 Jurists 07 Soda1 Scientists and Related Workers 08 Artists, Writers, and Related Workers 09 Draughtsmen, Science and Engineering Technicians,
n. e. c. OX Other Professional, TeChnical and Related Workers
1 Administrative, Executive and Managerial Workers 10 Administrators, and Executive Officials, Government 11 Directors and Managers, Wholesale and Retail Trade 12 Directors, Managers and Working Proprietors, Finan-
cial Institutions 13 Directors, Managers and Working Proprietors, Other
:1 Clerical and Related Workers 20 Book-Keepers and Cashiers 21 Stenographers and Typists 22 Office Machine Operators 28 Clerical Workers, Miscellaneous 29 Unskilled Office Workers
3 Sales Workers 30 Working Proprietors, Wholesale and Retail Trade 31 Insurance and Real Estate Salesmen, Salesmen of
Securities and Services and Auctioneers 32 Commercial Travellers and Manufacturers' Agents 33 Salesmen, Shop Assistants and Related Workers 34 Money Lenders and Pawn Brokers
4 Farmers, Fishermen, Hunters, Loggers and Related Workers 40 Farmers and Farm Managers 41 Farm Workers 42 Hunters and Related Workers 43 Fishermen and Related Worken 44 Loggers and Other Forestry Workers
5 Miners, Quarrymen and Related Workers 50 Miners and Quarrymen 51 Well Drillers and Related Workers 52 Mineral Treaters 59 Miners, Quarrymen and Related Workers, n. e. c.
6 Workers in Transport ani! Communication Occupations 60 Deck Officers, Engineer Officers and Pilots, Ship 61 Deck and Engine-Room Ratings (Ship), Barge Crews
and Boatsmen 62 Aircraft Pilots, Navigators and Flight Engineers 63 Drivers and Firemen, Railway Engine 64 Drivers Road Transport 65 Conductors, Guards and Brakesmen (Railway) 66 Inspectors, Supervisors, Traffic Controllers and
Despatchers, Transport 67 Telephone, Telegraph and Related Telecommunica
tion Operators 68 Postmen and Messengers 69 Workers in Transport and Communication Occupa-
7 tions, n. e. c.
8 Craftsmen, Production Process Workers, and Labourers not elsewhere classified 70 Spinners, Weavers, Knitters, Dyers and Related
Workers 71 Tailors, Cutters, Furriers and Related Workers 72 Leather Cutters, Lasters and Sewers (Except Gloves
and Garments) and Related Workers 73 Furnacemen, Rollers, Drawers, Moulders and Related
Metal Making and Treating Workers 74 Precision Instrument Makers, Watch Makers, Jewel
lers and Related Workers 75 Tool Makers, Machinists, Plumbers, Welders, Platers -
and Related Workers 76 Electricians and Related Electrical and Electronics
Workers 77 Carpenters, Joiners, Cabinet Makers, Coopers and
Related Workers . 78 Painters and Paper Hangers 79 Bricklayers, Plasterers and Construction Workers
n. e. c. 80 Compositors, Printers, Engravers, Book Binders and
Related Workers 81 Potters, KiInmen, Glass and Clay Formers and Related
Workers 82 Millers, Bakers, Brewmasters and Related Food and
Beverage Workers 83 Chemical and Related Process Workers 84 Tobacco Preparers and Products Makers 85 Craftsmen and Production Proce~s Workers, n. e. c. 86 Testers, Packers, Sorters and Related Workers 87 Stationary Engine and Excavating and Lifting
Equipment Operators and Related Workers 89 Labourers, n. e. c.
9 Service, Sport and Recreation Workers 90 Fire Fighters, Policemen, Guards and Related Workers 91 House Keepers, Cooks, Maids and Related Workers 92 Waiters, Bartenders and Related Workers 93 Building Caretakers, Cleaners and Related Workers 94 Barbers, Hairdressers, Beauticians and Related Workers 95 Launderers, Dry Cleaners and Pressers 96 Athletes, Sportsmen and Related Workers 97 Photographers and Related Camera Operators 99 Service, Sport and Recreation Workers, n. e. c.
X Workers Dot Classifiable by Occupations XO Workers without occupations X8 Workers Reporting Occupations Unidentifiable or
Un classifiable X9 Workers Not Reporting Occupations
119
APPENDIX III
COMMON HOUSEHOLD INDUSTRIES WITH THEIR INDUSTRIAL CODE NUMBERS Note: n.e.c. = not elsewhere classified
Industrial Code
Number Household Industry
Major Group OO-Field Produce and Plantation Crops 005.1 Production of Vegetables 005.2 Production of roots etc., not included above 006.1 Production of fruits and nuts in plantation, vines and
orchards 006.2 Production of copra (from coconuts) 007. 1 Production of thatching grass 007.2 Production of wood, bamboo, cane reeds, etc. (exclu
ding thatching grass). 008. 1 Production of juice (N'eera) by tapping coconut trees 008.2 Production of juice by tapping other palms like date
Palmyra n. e. c. 009 Production of other agricultural produce (including
fruits and nuts not covered by 006 and flowers) not covered above.
Major Group Ol-Plantation Crops 013 Production of tobacco in plantation 015.1 Pan Cultivation 015.2 Plantation crops except tea, coffee, rubber, tobacco,
ganja, cinchona, opium and pan
Major Group 02-Forestry and Logging 023. I Production of Charcoal 023.2 Production of other fuels by exploitation of forests 024 Production of fodder by exploitation of forests 025.1 Production of Kathha 025.2 Production of Lac 025.3 Production of gum 025.4 Production of resins, barks, herbs, wild fruits, berries
and leaves, etc., n. e. c. 026 Production and gathering of other forest products not
covered above Major Group 03-Fishing
030 Production of fish by fishing in sea 031 Production of fish by fishing in inland waters and
ponds including fish farms and fish hatcheries 032 Production of pearls, conch shells, sponges, sea herbs,
corals, etc., by gathering or lifting from sea, river, pond.
Major Group 04-Livestock and Hunting 040.1 Rearing of goat for milk and animal power 040.2 Rearing of buffalo for milk and animal power 040.3 Rearing of cows for milk and animal power 040.4 Rearing of camels and other big domestic animals 040.5 Production and rearing of livestock mainly for milk
041.1 041.2 042.1
and animal power n. e. c. Sheep breeding and rearing Production of wool Rearing and production of pigs and goats (mainly for
slaughter). 042.2 Rearing and production of other animals ~mainly for
slaughter) n. e. c. 043.1 Poultry keeping and production of eggs 043.2 Rearing and production of ducks, hens, etc., and other
small birds e.g., pigeons, parrots, peacocks, maina
044.1 044.2 045
046.1 046.2 048.1 048.2 048.3 048.4
etc. Bee keeping for production of honey and wax Collection of wax and honey Rearing of tassarleriimulberry and other silk worms
and production of cocoons and raw silk. Dog breeding, rearing of rabits and guinea-pigs Rearing of other small animals and insects n. e. c. Collection of bones Manufacture of glue from animal carcasses Manufacture of gut Production of other animal husbandry products such
as skin, ivory, teeth and hair, etc.
Industrial Code
Number Household Industry
Major Group to-Mining and Quarrying 107. 1 Extraction of chalk 107.2 Quarrying of lime-stone 107.3 Stone and slate quarrying 107.4 Quarrying of sand, clay, gravel, etc., n. e.c.
Major Group 20-Foodstuffs 200.1 Production of flour by village chakkies or flour mill
by grinding wheat, maize, gram, etc. 200.2 Hand pounding of rice by Dhekhi or UkhaI. 200.3 Production of rice by milling.dehusking and proces-
200.4 200.5 200.6 200.7
202.1 202.2 202.3
sing of paddy by rice mill. Grinding of chillies, turmeric, etc. Production of pulses Parching of grains Production and processing of other crops and food-
grains n. e. c. Gur and Khandsari making from sugarcane and palm Production of bhoora and candy Production of jaggery from coconut and palmyra juice
(neera) 202.4 Production of other indigenous pr~ducts from sugar
203.1 203.2 203.3 203.4 203.5 203.6 203.7
andjaggery n. e. c. Manufacture of achar, pickles, chutney and murabba Production of sauce jam and jelly Processing of cashew nut Manufacture of kokam products Fruit preservation (canning of fruits) Making dried vegetables Production of other fruit products and preservation
of fruitsn. e. c. 204.1 Slaughtering, preservation of meat and fish and
canning of fish. 204.2 Fish currying or curing and salting (currying applies
205
206
207 209.1 209.2
more to skin and hide). Production of bread, biscuit, cake and other bakery
products. Production of butter, cream, ghee, cheese chhana.
khowa and other dairy products. Oil pressing ghani, kolhu or by sman machines Confectionery Making of sweet-meats, laddu, peda, barphi, batasa,
etc. 209.3 Sattu, bhunja, papar, barri, danauri, tilauri, sewai,
209.4 209.5 209.6 209.7 209.8
apalam, etc. Making of chura or chira, muri, murki, khoi Making of chat Making of dalmot, chanachur (jor) garam, rewari, etc. Making of other food products for residuary snacks Production of other food products like cocoa, choco-
late, toffee, lozenge.
Major Group 2l-Beverages 210.1 Manufacture of vinegar from coconut juice (neera) 210.2 Manufacture of distilled spirits, wines, liquor from
alcoholic malt, fruits and malts in distillery and brewery.
211 Production of country liquor from material obtainod from sources other than trees and shrubs
212.1 Production of indigenous liquor such as liquor, toddy, neera from mahua and palm trees
212.2 Production of other indigenous liquor, from other materials from trees and shrubs
214. 1 Production of mineral water 214.2 Production of aerated water such as sodawater, lemo
nade,etc. 215 . Production of ice

Industrial Code
Number Household Industry
Major Group 21-Beverages-concld. 216 Production of ice-cream, ice-candy or kulphimalai
218 219.1 219.2 219.3
milk-shake, etc. Grinding of Coffee Preparation of sharbats and squashes Preparation of jeerapani Production of other beverages n. e. c.
Major Group 22-Tobacco Products 220 Manufacture of bidi 221 Manufacture of cigars and cheroots 223 Manufacture of hookah tobacco 224 Manufacture of snuff 225 Manufacture ofjerda, kimam, khaini and otherchew-,
ing tobacco. 226 Manufacture of other tobacco products n. e. c.
Major GrolJ{l 23-Textile-Cotton 230 Cotton ginning, cleaning, carding, pressing and
baling 231 Cotton spinning (by charkha and takli) 233.1 Dyeing of cloth (cotton) and yarn 233.2 Bleaching of cloth (cotton) and yarn 233.3 Tie and dye (bandhani) of cloth and yarn 234 Cotton cloth weaving in powerlooms 235 Cotton cloth weaving in handlooms 236 Manufacture of khadi textile in handlooms 237 Printing of cloth (cotton) 238.1 Making of fishing net 238.2 Making of mosquito net 238.3 Making of other nets 239.1 Making of sacred thread 239.2 Making of thread, rope, cordage and twine (cotton)
Major Group 24-Textile-Jute 240 Jute pressing and baling 241 Jute spinning and weaving of mats, asanis, etc. 242 Dyeing and bleaching of jute 244.1 Making of rope and cordage, out of hemp 244.2 Making of rope and cordage, out of jute 244.3 Making of rope by palm fibre 244.4 Making of rope by date palm fibre 244.5 Making of fibre, sunn-hemp fibre
120
244.6 Making of other products from jute and similar fibres such as hemp, mesta
Major Group 25-Textile-Wool 250 Wool baling and pressing 251 Cleaning, sorting, carding, scouring and processing
of wool 253 Spinning of wool by charkha or takali 254 Weaving of woollen cloth in powerloom such as
blankets, asanis, etc. 255 Weaving of woollen cloth in handloom such as
blankets, rugs, pashmina, thulma, gudma, etc. 256.1 Embroidery with various colours, combinations of
various threads and art work in woollen textile 256.2 Shawls (with traditional borders)
Major Group 26-Textile-Silk 261 Dyeing and bleaching of silk 262.1 Spinning of tussar, other than in mills 262.2 Spinning cf eri, other than in mills 262.3 Spinning of silk, other than in mills n. e. c. 263.1 Weaving of Traditional silk (Atlas) by powerJoom 263.2 Weaving of tussar by powerloom 263.3 Weaving of eri by powerloom 263.4 Weaving of silk and artificial silk in powerloom n.e.c. 264.1 Weaving of mashru, himroo, brocade, kinkhab by
264.2 265 266.1 266.2
handloom Weaving of silk and artificial silk in handloom n. c. c. Printing of silk textile Goaf making Making of silk cordage, rope and twine n. e. c.
Industrial Code
Number Household Industry
Major Group 27-Textile-Miscellaneous 270.1 Making of durries 270.2 Making of carpets and druggets 270.3 Manufacture of other similar textile products n. e. c. 271.1 Making of hosiery goods such as banyans, socks,
271.2 271.3 271.4
272.1 272.2 172.3 272.4 272.5 272.6 272.7 272.8 273.1 273.2 273.3 273.4
sweaters, mumers, etc. Making of nalas and azarbands Making of par and as and chootelas Manufacture of hosiery and other knitted fabrics and
garments 11. e~ c. Embroidery and making of phulkari Making of jarithread, zardoshi Traditional embroidery Patchwork embroidery Lace garland making Making of fringes and crepe laces Making of kargota, main garlands, shell garlands, etc. Making of other embroidery products n. e. c. Making of cap, hat, and other head-gear Traditional garments Chrochet work (bora caps) Making of textile garments including rain-coats and
head-gears n. e. c· 274.1 Weaving of khes, bed covers, curtains, pillow cases
and table-cloth, cloth bags, etc. 274.2 Making of newar 274.3 Manufacture of other made-up textile goods like
275
.276.1 276.2 276.3 276.4 276.5
mattress, quilt, rezai, etc., n.e.c. Manufacture of waterproof textile products such as
oil cloth, tarpaulin, etc. Making of namda felt Making ofsuzani (padded quilts) Processing of coconut fibre for upholstery Handicraft articles made of flax and fibre , Manufacture and recovery of all types of fibres for
purposes of padding, wadding and upholstery filling n. e. c. ,
277.1 Manufacture of coir matting, cactus, fibre for ropes
277.2 277.3 277.4 277.5 278 279.1
and rope making from coconut fibre Making of brush, broom, etc., from coconut fibre Coir spinning Coconut curing i . Other allied products of coir industry n. e. c. Manufacture and repair of umbrellas Making of daura (thread) batua, cotton thread,
buttons 279.2 Manufacture of dolls and toys (rags' and cotton) 279.3 Manufacture of other textile products not elsewhere
classified
Major Group 28-Manufacturc of Wood and Wooden Products 280 Sawing, planing and milling of wood 281 Manufacture of wooden furniture and fixtures 282 Manufacture of structural wooden goods (including
treated timber such as beams, posts, doors, windows 283.1 Carpentry works concerned with repairs of agricul
tural implements (wood) 283.2 Manufacture of wooden industrial goods other than
transport equipment such as bobbin and similar equipments and fixtures
284. 1 Lecquerware (if on wood) 284.2 Manufacture of wooden utensils, artware and deco-
284.3 284.4 284.5 284.6
'284.7 284.8
284.9 285 287
rative wooden boxes (patras) Manufacture of wooden toys Sandal wood and oth~r wood carving Bead making from wood Sawdust and plaster figure making Marquetry boxes (inlay work) Manufacture of photo frames and framing of photo
paintings, etc. Manufacture of other wooden products n. e. c. Manufacture of match' splinters, plywood and veneers Manufacture of boxes and packing cases other than
plywood ---- .-.----------------

Industrial Code
Number Household !J;tdustry
121
Major Group 28-Manufacture of Wood and Wooden Products-coneld.
288.1 Making of box from moonj grass. . 288.2 Making of rope mats, etc., from moon) and sawal
grass and making of cadjar for thatchmg purposes 288.3 Making of mats, handfans and umbrellas from palm
leaves 288 .4 Making of sirki, moora and chhaj 288.5 Making of baskets and broomsticks 288.6 Making of donas (drone) and pattals (patravali)
from leaves 288.7 . Caning of chairs . 288.8 Making of chicks, cuscus-tatti and fans, sticks and
poles from bamboo 288.9 Manufacture of other artieles from leaf, cane,
bamboo, cork: and other allied products n. e. c. 289.1 Making of sticks and poles from wood 289.2 Making of wooden kharaus and other wooden sandals 289.3 Making of cartwheels 289.4 Manufacture of other wood and allied products n. e. c.
Major Group 29-Paper and Paper F£uuu.aIJ
291 Manufacture of pulp and paper by hand 292.1 Making of envelopes and paper bags 292.2 Papier mache articles 292. 3 Making of kite 292.4 Paper decorations for homes 292.5 Making of card-board boxes and cards 292.6 Making of paper toys 292.7 Making of paper flowers, etc. 292.8 Manufacture of other paper products from paper,
paper board and pulp n. e. c.
Major Group 30-Printing and Publishing 301 Printing and publishing of books 302.1 Printing works, printing of handbills, invitation cards
etc. 302.2 Lithography, engraving, etching. block making, type
cutting and other work connected with Printing Industry.
303 Book binding, stitching, sizing and other work, connected with book binding industry
Major Group 31-Leatber and Leatber Products 310.1 Flying, processing of hides and skins including
taxidermy 310.2 Currying, tanning and finishing of hides and skins,
preparation of finished leather 310.3 Stuffed animals 311.1 Making of leather boots,~shoes or chappals (slippers,
sandals) 311.2 311.3 312
313
314 315
Making of Poola shoes Manufacture of other footwear n. e.c. Making of clothing and wearing apparel (except foot
wear) made of leather and fur Manufacture of leather products such as leather up
holstery, suit cases, pocket-books, cigarette and key cases, purses, saddlery, whip, acquaducts (Kos), charsa and other articles
Repair of shoes, chappals and other leather footwear Repair of all otherleather products except footwear
Major Group 32-Rubber, Petroleum and Coal Products 320 Vulcan ising tyres and tubes 321 Manufacture of chappals from torn tyres and other
rubber footwear 322 Manufacture of rubber products from natural and
synthetic rubber including rain-coats, oil cloths, waterproof cloths etc.
Industrial Code
Number Household Industry
Major Group 33-Chemicals and Chemical Products 331.1 . Manufacture of dyes. paints, colours, abir, sindo or
331.2 332 333
334 335.1 335.2 335.3 335.4
335.5 335.6 335.7
varnish etc. Manufacture of indigo Manufacture of fertilizer (including from bones) Manufacture of fireworks and other explosives such
as pataka, etc. Manufacture of matches Manufacture of incense and perfumes Manufacture of Agarbatti Manufacture of rose water Manufacture of powder, snow, cream, bindi, tikali,
hair oil and nail polish Manufacture of kum kum and hinglo Manufacture of mascara and kajal Manufacture of medicines (ayurvedic, unani, etc.)
and pharmaceutical preparations 335.8 Manufacture of perfumes, cosmetics and other toilet
preparationsn. e. c. 336.1 Manufacture of soap and washing soda 336.2 Manufacture of other washing and cleaning com-
337.1 337.2 337.3 337.4 337.5
pounds n. e. c. Manufacture of plastic toys Making of plastic buttons Manufacture of other plastic goods Making of celluloid goods Manufacture of turpentine, synthetic resin and other
materials n. e. c. 338 Salt production . 339. 1 Manufacture of ink including fountain pen ink 339.2 Making of candles 339.3 Making of tooth powder 339.4 Making of boot polish and inedible oils, etc. 339.5 Manufacture of other chemicals products n. e. c.
Major Group 34-35-Non-metaUic Mineral Productli other than Petroleum and Coal
340.1 Making of bricks 340.2 Manufacture of roofing tiles 340.3 Manufacture of other clay products ll. e. c. 341.1 Manufacture of cement door frames and sanitary
341.2 341.3 341.4 342.1 342.2 343.1 343.2 343.3 343.4
fittings Manufacture of cement jali and tiles Making of cement statues Making of cement products n. e. c. Manufacture of lishu Manufacture omme Stone carving Marble carving Granite carving Manufacture of other structural stone goods, stone dressing and stone crushing ll. e. c.
344 Making of chakki, chakla, sHaut, lorha, jaint utensils
345 346.1 346.2
and other articles from stone Manufacture of stone images and toys Making of images from soap stone Manufacture of images toys and other articles of
plaster of paris 348. 1 Mica splitting , 348.2 Manufacture of mica products including mica grind-
350 351 353.1 353.2 353.3
354 355
356.1 356.2 357
ing Making of earthenware such as pottery, etc. Manufacture of crockery Making of glass bangles Making of glass beads Manufacture of bead garlands (where making of gar
lands is undertaken at the place of manufacture of beads) (also see 399)
Manufacture of Laboratory glass apparatus Making of clay models, earthen images, busts and
statues Making of earthen toys and artware Decorative ceramics Manufacture of glass and glass products except optical
and photographic lenses
Industrial Code
Number Household Industry
Major Group 36-Basic Metals and their Products except Machinery and Transport Equipment
360.1 Re-rolling of M. S. Rods 360.2 Manufacture of iron and steel including smelting,
refining, rolling, etc., such as billets, blooms, tub~,
362
364 365.1 365.2 365.3
365.4 365.5 366.1 366.2 367.1 367.2 367.3 367.4
rods, n. e. c. . Manufacture of arms and weapons and their repair
service Manufacture of iron and steel furniture Making of utensils of brass and bell metal Making of brass ware Making of bottom part of hookha from brass and
beUmetal Making of brass and bell metal ornaments Making of other brass and bell metal products n. e. c. Making of aluminium utensils Making of other aluminium products n. e. c. Making of tin utensils Making of articles from tin sheets Copper utensils \ Bronze works including bronze images, medals and
articles of alloys . 367.5 Manufacture of other metal products (excluding iron,
brass, bell metal, aluminium) n. e. c. 368.1 368.2 368.3
Lacquerware (if on metal) Nickel plating and electroplating Engraving, embossing, polishing and welding of
metal products 368.4 Enamelling and galvan~ing of metal products 368.5 Plating and electroplating of metal n. e. c. including
silverplating, goldplating, E. P. N. S., etc. 369.1 Manufacture of agricultural implements such as
ploughshare, kburpi, kudal, etc. 369.2 Manufacture of light engineering goods including
bolts and screws 369.3 Making ofiron utensils (e.g., buckets, etc.) and articles
369.4 369.5 369.6 369.7 369.8 369.9
from iron sheets Making and repairing of locks and trunks Cutlery Manufacture of pins , Manufacture of scales, weights and measures Foundry Industry (including blacksmithy) Manufacture of other sundry hardware such as
G. I. pipe, wire net, etc., n. e. c.
Major Group 37-Machinery (All kinds otber than Transport) and Electrical Equipment
370
372
373 375 376 377.1 377.2 377.3 378 379.1 379.2
Manufacture of mechanical water pumps, tube well pumps, air pumps, etc. '
Manufacture of small machine tools and machine parts
Manufacture of sewing machine parts Repairing and servicing of fans Manufacture of insulated wires Manufacture of storage batteries Manufacture of charging batteries Manufacture of other batteries n. e. c. Repairing and servicing of radios Manufacture of domestic electrical appliances Repairing and servicing of electrical apparatus,
heaters, oveR, etc.
122
Industrial Code
Number Household Industry
Major Group 38-Transport Equipment 382 Manufacture of body of trucks and buses including
carpentry and joinery work involved 384 Repairing and servicing of automobiles 385.1 Manufacture of cycle parts and accessories such as
385.2 386 388 389
saddle, seat frame and gear, etc. Manufacture of rikshaw parts Manufacture of boats and barges Repair of cycle and rikshaw Manufacture of animal drawn and hand drawn
vehicles such as bullock cart, tamtam, lagadi, palaki, cab, wheelbarrow, handbarrow, etc.
Major Group 39-Miscellaneous Manufacturing Industries 390.1 390.2 390.3
391 392 393.1 393.2 393.3
393.4
393.5 393.6 393.7 393.8 393.9 394
395.1 395.2 395.3 395.4 395.5
396.1
396.2 396.3
399.1 399.2 399.3
399.4 399.5 399.6
399.7
399.8 ,399.9
Repair of spectacles Manufacture of small photographic equipment Manufacture of optical and photographic equipment
n.e.c. Manufacture of scientific goods Repairing and servicing of watches and clocks Inlay work with ivory and brass Goldsmithy Manufacture of jewellery, silverware and wares
using gold and other precious metal alld prllCious and semi-precious stonei .
Silver artware, including Silver repousse work on copper (such as in Tanjore) and silver images
Silver filigree industry Manufacture of gold and silver leaves Gold covering work (fancy jewellery) Bidriware industry Manufacture of jewellery, silverwares, etc. n. e. c. Manufacture, repairing and tuning of musical instru.
ments such as harmonium, tabla, sitar, bansuri, etc. i .
Manufacture of chalk pieces Making of slate and slate pencil Making of rubber stamps Manufacture of fountain pen parts Manufacture of other stationery articles such as
pencils, penholders, etc. Manufacture of deshi sports goods such as lezzim and
dumbells Making of rubber balls and balloons Manufacture of other sports goods n. e. c. bats, rackets, balls, etc.
Making of tikka and cowdung cakes Making of beads, from conch shells and horn goods Making oftraditional objects such as Orissa, Mysore
and Tanjore paintings, etc. Making ofIac bangles Making of buttons (bone, shell, ivory) Making of gangavan (making of wig from human
hair) Making of garlands from flowers, camphor, sandal
wood shavings, seeds and other materials, like beads, etc.
Repair of petromax lights, etc. Making and repairing of goods n. e. c.
Distrlct/Taluka Town-Group/Town
(I)
DISTRICT TOTAL
RURAL
URBAN
Meillhat Taluka
Chikalda (M)
AChaipur Taluka
Achalpur Town Group
(a) Achalpur Camp (M)
(b) Achalpur (M)
Chandar Bazar (M)
Morsi Taluka
Morsi(M)
Warud (M)
Shendurjana (M)
paryapur Taluka
Anjangaon (M)
Daryapur Banosa (M) ...
Amravati Taluka
Amravati (M)
Badnera (M)
Chandur Taluka
Chandur (M) •••
Dattapur Dhamangaon (M)
------------
123
A.I-Area, Houses and Population
Total Area in Population No. of Villages No. of Rural -------- per Sq. Mile Towns Urban Sq. Miles Sq. Km. Inhabited Uninhabited
(2)
Total
Rural
Urban
Urban
Total
Rural
Urban
Urban
Urban
Urban
Urban
Total
Rural
Urban
Urban
Urban
Urban
Total
Rural
Urban
Urban
Urban
Total
Rural
Uranb
Urban
Urban
Total
Rural
Urban
Urban
Urban
(3-a) (3-b)
4,691'0 12,149.7
4,603' 3 11,922' 5
87'7
1,546'0
1,539'8
6'2
6'17 , 490'0
459.8
30'2
26'21
2.38
23·83
4'00
623'0
606·8
16.2
5'97
6·33
3'94
227'2
4,004'1
3,988 '1
16'0
15'98
1269.1
1,190'9
78.2
67'88
6.16
61'72
10·36
1,613'6
1,571'5
42'1
15'46
16'39
10'20
505'0 1,307'9
502'7 1,302'0
1.29
1'00
5,9
3'34
2'59
833'0 2,157'5
812'4 2,104'2
20'6
14'03
6'57
53'3
36·34
17'02
694,0 1,797'5
681'8 1,765'8
12'2 31'7
7.98
4'25
20'67
11'01
(4)
263
198
3,672
47
46
217
217
427
322
2,01&
2,061
7,349
1,533
1,737
316
259
2,429
2,001
2,510
2,947
345
273
16,207
17,001
15,182
459
272
7,850
9,827
3,629
284
257
1,767
1,171
2,885
(5)
1,609
1,609
286
286
237
237
241
241
245
245
356
356
244
244
(M)- Municipality,
(6)
359
359
37
37
75
75
90
90
24
24
78
78
~s
55
(7)
13
13
3
2
3
2
2
2
2
2
2
No. of Occupied
Residential Houses
(8)
Persons
(9)
A SERIES
Population
Males Females
(10) (11)
249,924 1,232,780 537,861 594,919
185,394 910,586 467,487 443,099
64,530 322,194 170,374 151,820
13,040
12,763
217
277
72,779
71,441
1.338
1,338
37,263
35,511
752
752
35,516
34,930
586
586
41,056
29,582
11,474
209,189 107,970 101,219
71,964
29,255
148,214 76,250
60,975 31,720
10,080
3,274
6,806
1,394
39,397
31,328
8,069
2,535
3,158
2,376
54,028
17,490
36,538
6,947
196.705
157,261
39,444
11,946
15,888
11,610
36,020 174,397
28,465 137,284
7,555
4,367
3,188
37,113
21,931
15,182
28,079
9,176
18,903
3,641
101,023
80,452
20,571
6,214
8,332
6,025
89,902
70,607
19,295
11,350
7,945
25,949
8,314
17,635
3,306
95.682
76,809
18,873
5,732
7,556
5,585
84,495
66,677
17,818
10,581
7,237
78,014 382,707 200,694 182,013
45,573 220,992 113,837 107,155
32,441 161,715
27,430 137,875
5,Oll 23,840
42,397 197.003
37,683 175,394
4,714 21,609
2,037 9,348
2,677 12,261
86,857 74,858
74,427 63,448
12,430 11,410
101,009 95,994
89,830 85,564
11,179 10,430
4,838
6,341
4,510
5,920

124 CENSUS TABLES
APPENDIX U
NumbeI' of Villages with a Population of 5,000 and over and Towns with a Population under 5,00&
District/Taluka Villases with a Population of 5,000 and over Towns with a Population under 5,000
Percentage of Percentage of Number Population Total Rural Number Population Total Urban
Population Population
(I) (2) (3) (4) (5) (6) (7)
DISTRICT TOTAL 13 83,807 9'2 1,338 0'04
MeIghat Taluka 1,338 100
Allhalpur Taluka 3 20,650 13'9
Morsi Taluka 3 19,247 12'2
Daryapur Taluka 5,887 4'3
Atnravati Taluka 4 25.908 11'7
Chandur Taluka 2 12,115 6'9
-----------------,-----------------
APPENDIX m Houseless and Institutional Population
Total 1:Iouseless Population Institutional Population District/Taluka Rural
Urban Persons Male. Females Persons Males Females
(1) (2) (3l (4) (5) (6) (7) (8)
DISTRICT TOTAL 5,370 3,106 2,264 5,715 4,016 1,699
RURAL 4,729 2,676 2,053 1,591 1,127 '464
URBAN ••• 641 430 211 4,124 2,889 ' 1,235
Melghat Taluka Total 335 182 153 283 250 33
Rural 334 181 153 169 163 6
Urban 114 87 27
Acbalpur Taluka Total 811 475 336 600 447 153
Rural 732 417 315 471 319 152
Urban 79 58 21 129 128
Morsi Taluka Total 1,056 611 445 172 152 20
Rural 834 486 348 30 19 11
Urban 222 125 97 142 133 9
Oaryapur Taluka Total 715 414 301 96 63 33
Rural 661 383 278 93 60 33
Urban 54 31 23 3 3
Allll'avati Taluka Total 1,753 1,003 750 4,266 2,855 1,411
Rural 1,485 800 685 582 358 224
Urban 268 203 65 3,684 2,497 1,187
Cbandur Taluka Total 700 421 279 298 249 49
Rutal 683 409 274 246 208 38
Urban 17 12 S 52 41 11

125 A SERIES
A-II-Variation in Population during Sixty Years
District/Taluka Year Persons Decade Variation
Percentage Decade Variation
Males Females
(1) (2) (3) (4) (5) (6) (7)
DISTRICT TOTAL 1901 806,859 411,663 395,196
1911 873,012 +66,153 +8'20 445,739 427,273
1921 827,867 -45,145 -5,17 423,802 404,065
1931 941,604 +113,737 +13'74 485,593 456,01l
1941 988,524 +46,920 +4'98 507,920 480,604
19S1 1,031,160 +42,636 +4'31 526,593 504,567
1961 1,232,780 +201,620 + 19'55 637,861 594,919
Melghat Taluka 1951 52,356 26,550 25,806
1961 72,779 +20,423 +39'(} 37,263 35,516
Achalpur Taluka '" 1951 178,312 90,909 87,4(}3
.. 1961 209,189 +30,817 +17'3 107,970 101,219
Morsi Taluka 1951 160,863 81,66,,4 79,J99
J961 196,705 +35,842 +22'3 101,023 95,682
Daryapur Taluka 1951 145,890 74,696 71,194
1961 174,397 +28,507 +19'5 89,902 84,495
Amavati Taluka '" 1951 315,410 162,359 153,051
1961 382,707 +67,297 +21'3 200,694 182,013
Chamdur Taluka '" 1951 178,329 9~,415 87,914
1961 197,003 +18,674 +lO'S 101,009 95,994
CENSUS TABLES
;;'1 "'"'I
! 1 I
126
t;; &l ;Z ~
1 ~ ~ ~
.. j

127
\0 .... on -.,_ 0\
'"
~ :: ~ ~ ~ ~ N_O ...... NN_·
+ :; :; :; 4. +
00 \0
'" ."" ... + T
'" '"
:!:~~ ~;:~ ~~&o~~M~ r--~\I') ~oo\t') V'lOONt'OOI""'"~
f\l"'NN" M"'tf"l".q." ( .... f_;'N'<iN'Mtri'
~ ~ s ~ C$ g
I + ! t ; ~
A SERms
8

128
CENSUS TABLES
Serial District/Taluka No.
(I) (2)
DISTRICT TOTAL
RURAL
URBAN
Melghat Taluka
Total
Rural
Urban
2 Achalpur Taluka
Total
Rural
Urban
3 Morsi Taluka
Total
Rural
Urban
Oaryapur Taluka
Total
Rural
Urban
5 Amravati Taluka
Total
Rural
Urban
6 Chandur Taluka
Total
Rural
Urban
Area Occupied Residen- Total No. of persons in square Hal Houses enumerated (including
miles inmates of institutions No. of No. of and houseless persons) Houses House-
holds
Persons Males Females
(3) (4) (5) (6) (7) (8)
Scheduled Castes
M
(9)
F
(10)
Scheduled Literate and Tribes educated persons
M F
(11) (12)
M
(13)
F
(14)
PRIMARY CENSUS
WORKERS
Total Workers (I-IX)
M
(15)
F
(16)
I As Cultivator
M
(17)
F
(18)
••• 4,691'0 249,924 265,181 1,232,780 637,861 594,919
... 4,603' 3 185,394 199,271 910,586 467,487 443,099
87'7 64,530 65,910 322,194 170,374 151,820
24,846 23,85627,76527,116 292,861 122,377 363,151 214,922 110,079 49,754
16,593 15,91927,71827,091 194,167 74,200 275,485 187,962 100,688 46,613
8,253 7,937 47 25 98,694 48,177 87,666 26,960 9,391 3,141
1,546'0 13,040 13,450 72,779 37,263 35,516
1,539'8 12,763 13,169 71,441 36,511 34,930
1,764
1,665
99
1,678 27,765 27,116 6,482
1,605 27,718 27,091 6,047
1,333 22,542 18,026 14,649 12,594
1,141 22,171 17,895 14,640 12,590
6'2 277 \ 281 1.338 752 586 73
490'0 41,056 43,425 209,189 107,970 101,219 4,238 4,196
459'8 29,582 31,760 148,214 76,250 71,964 2,630 2,538
30'2 11,474 11,665 60,975 31,720 29,255 1,608 1,658
623'0 39,397 44,082 196,705 101,023 95,682 2,709 2,464
606·8 31,328 35,718 157,261 80,452 76,809 1,893 1,750
16'2 8,069 8,364 39,444 20,571 18,873 816 714
505'0 36,020 37,725 174,397 89,902 84,495 4,732
502'7 28,465 30,052 137,284 70,607 66,677 3,353
4,753
3,318
2' 3 7,555 7,673 37,113 19,295 17,818 1,379 1,435
833'0 78,014 81,824 382,707 200,694 182,013
812'4 45,573 48,656 220,992 113,837 107,155
20'6 32,441 33,168 161,715 86,857 74,858
8,145 7,657
4,328 4,141
3,817 3,516
694'0 42,397 44,675 197,003 101,009 95,994 3,258 3,108
681'S 37,683 39,916 175,394 89,830 85,564 2,724 2,567
12-:~ 4,714 4,759 21,609 11,179 10,430 534 541
47 25 435 192 371 131 9 4
51,225 22,056 60,496 33,471 16,847 6,375
34,131 13,993 43,872 27,937 14,9~9 5,758
17,094 8,063 16,624 5,534 1,858 617
43,587 18,088 59,126 39,164 21,883 '~,875
33,101 13,095 47,674 32,968 18,893 8,420
10,486 4,993 11,452 6,196 2,990 1,455
42,962 17,449 51,316 31,324 15,671
33,050 12,823 40,928 27,233 13,932
9,912 4,626 10,388 4,091 1,739
105,258 46,415 109,482 53,250 21,697
50,787 19,087 66,663 44,504 19,615
54,471 27,328 42,819 8,746 2,082
5,300
4,927
373
7,831
7,343
488
43,347 17,036 60,189 39,687 19,332 7,779
37,051 14,061 54,177 37,425 18,619 7,575
6,296 2,975 6,012 2,262 713 204
ABSTRACT
11 As Aaricu1tural
Labourer
m IV In Minlna. At Household Quarrying, Industry Livestock,
WORKERS
V VI In Construction
129
VII In Trade and Commerce
Forestry, Flshlna, " Huntin. and
In Manufacturing
other than Household Industry
.. (19)
F
(20)
148,388 149,847
134,667 136,142
13,721 13,705
P1antatiollS, Orchards and
allied activities
M P (21) (22)
6,725 1,159
5,356 836
1,369 323
MF MF M F M F
(23) (24) (2'> (26) (27) (28) (29) (30)
12,976 4,171 15,466 1,131 3,273 S39 20,914 1,096
11,223 1,867 3,432 153 1,310 292 6,547 313
4,753 2,304 12,034 1,$18 1,963 247 14,367 783
!,780 4,422 1,546 323 404 177'" 55 11 245 60 316 24
3,779
1
4,420
2
25.~4 24,345
22,532 21,342
2,722 3,003
!t!,438 27,818
22,116 23,580
4,262 4,238
25,511 24,614
22,117 21,7~5
3,394 2,849
1,518 317
28 II
1,022
729
108
91
395
9
177 47
8
2,887 1,274 3,414
1,137 293 749
6 216
5 29
148
31
459
232
293 17 1,750 981 2,665 117 227
1,052 119 2,223 635 1.163
849 109 1,575 477 717
203 10 648 158 446
67 249
30 171
37 72
57
109
100
304
12
3,636
1,073
22
2
163
26
9 2,563 137
46 2,047 127
42 1,082 59
4 965 68
440 9~ 1,872 513 1,073 139 2.66 30 2,145 108
356 82 1,235 213 315 10 129 28 787 18
84 13 637 300 758 129 137 2 1,358 90
PRIMARY CENSUS ABSTRACT
VITI' In Transport' Storage and Communi
catiODI
IX In Other Service.
X NON
WORKERS
M F M F M F
Serial DistrlctfTaluka No.
(31) (32) (33) (34) (35) (36) (1) (2)
9,180 239 36,150 6,386 274,710 379,997
1,770 162 13,492 1,584 192,002 255,137
7,410 77 22,658 4,80l 82,708 124,860
548 137 999 278 14,721 17,490
530 131 742 169 14,340 17,035
18 257 109 381 455
1,076
IS7
919
400
133
267
568
157
411
5,901
2,274
948 47,474 67,748
29S 32,378 44,027
3,627 653 15,096 23,721
5 3,671 472 41,897 56,518
2,072 251 32,778 43,841
5 1,599 221 9,119 12,677
3,770 517 38,586 53,171
7 1,900 183 29,679 39,444
1,870 334 8,907 13,727
DISTRICT TOTAL
RURAL
URBAN
Melghat Taluka
Total
Rural
Urban
2 Achalpur Talul,.
Total
Rural
Urban
3 Morsl Taluka
Total
Rural
Urban
4 Daryapur Taluka
Total
Rural
Urban
5 Amravatl Taluka
38,537 38,199 1,816 449 3,356 1,193 8,429 1,128 1,726 262 10,461 517 5,787 74 17,673 3,597 91,212 128,763 Total
36,277 35,980 1,165 180 1,909 429 1,227 60 317 33 1,969 89 416 16 3,768 374 47,174 62,651
2,260 2,219 651 269 1,447 764 7,202 1,068 1,409 229 8,492 428 S,371 S8 13,905 3,223 44,038 66,112
28,868 30,449
27,786 29,055
1,082 1,394
H 4222-9
849 6~ 2,234 379 1,332 238 328 32 2,309 157
739 57 1,972 278 377 16 239 32 1,332 99
110 8 2.62 101 955 222 89 977 58
801 14 4,136 574 40,820 56,307
377 2,736 312 35,653 48,139
424 13 1,400 262 5,167 8,168
Rural
Urban
6 Chandur Taluka
Total
Rural
Urban
130
CENSUS TABLES B-1 and B-n-Workers and Non·workers in Talukas and
WORKERS
11 ill
DlstrlctlTalukt,f Total Age- Total Popul&ticn Total Workers As Cultivator As Agricultural In Mining, Quarry-
ing' Livestock, Forestry, Town Rural group (I-IX) Labourer Fishing, Hunting and
Urban Plantations, Orchards and allied activities
Persons Males Females Males Females Males Females Males Females M"les Females.
(I) (2) (3) (4) (5) (6) (7) (8) (9) (10) (11) (12) (13) (14)
DISTRICl' TOTAL Total 1,232,780 637,861 594,919 363,151 214,922 110,079 49,154 148,388 149,847 6,725 1,159 0-14 494,471 251,933 242,538 16,952 19,948 3,250 3,448 10,851 15,857 1,197 130
15-34 386,972 197,230 189,742 168,577 99,341 43,357 22,261 71,647 69,975 2,790 571 35-59 274,738 149,952 124,786 146,:522 81,656 49,628 20,483 55,182 54,756 2,227 404 60+ 76,130 38,~~~ 37,610 31,042 13,932 13,821 3,551 10,689 9,232 510 54
Age not 469 243 58 45 23 II 19 27 1 stated
RURAL Total 910,586 ~7,487 443,099 275,485 187,962 100,688 46,613 134,667 136,142 5,356 836 0-14 368,454 1 7,180 181,274 14,988 18,764 3,138 3,385 10,200 15,027 1,058 116
15-34 278,357 138,814 139,543 125,758 87,898 40,255 21,103 65,258 64,120 2,196 <W7 35-59 205,773 112,045 93,728 110,279 69,391 45,103 18,895 49,673 48,682 1,711 274 60+ 57,605 29,260 28,345 24,415 11,872 12,171 3,219 9,519 8,292 390 39
Age not 397 188 209 45 37 21 II 17 21 1 slated
URBAN Total 322,194 170,374 151,820 87,666 26,960 9,391 3,141 13,721 13,70S 1,369 323 0-14 126,017 64,753 61,264 1,964 1,184 112 63 651 830 139 14
15-34 108,615 58,416 50,199 42,819 11,443 3,102 1,158 6,389 5,855 594 164 ' 35-59 68,965 37,907 31,058 36,243 12,265 4,525 1,588 5,509 6,074 516 130 60+ 18,525 9,260 9,265 6,627 2,060 1,650 332 1.170 940 120 l' '
Age not 72 38 34 13 8 2 2 6 ", stated
MILGIIA'I TALUS:A T Total 72,779 37,263 35,516 22,542 18,026 14,649 12,594 3,780 4,422 1,546 323 0-14 32,747 16,652 16,095 2,629 2,410 1,577 1,650 575 '<l9 290 80
15-34 23,29$ 11,654 11,641 11,309 9,749 7,012 6,763 2,054 2,411 713 ISO 35-59 13,735 7,474 6,261 7,367 5,274 5,115 3,779 995 1,236 491 88 60+ 2,998 1,482 1,516 1,231 590 945 402 156 166 52 5 Age not 4 1 3 3 stated
R Total 71,#1 36,511 34,930 22,171 17,895 '14,640 12,590 3,779 4,420 1,518 317 0-14 32,159 16,325 15,834 2,610 2,406 1,577 1,650 575 609 289 80
15-34 22,822 11,383 11,439 11,092 9,671 7,Oa 6,760 2.054 2AI0 696 145 35-59 13,521 7,352 6,169 7,248 5,233 5,108 3,779 994 1,235 484 87 60+ 2,935 J,450 1,485 1,221 0582 944 401 156 166 49 ;5 Al.'enot 4 1 3 3 stated
U Total 1,338 752 586 371 131 9 4 2 28 6 0-14 588 327 261 19 4 , :3 'j
1 '5 15-34 473 271 202 217 78 I 17 35-59 214 122 92 Il9 41 7 I 7 1 60+ 63 32 31 16 8 1 I 3
AS" not stated
Chlkalda (M) Total 1,338 752 S8G 371 131 9 4 2 28 6 0-14 588 327 261 19 4 "j "j
I 's 15-34 473 271 20l 217 78 3 "i 17
35-59 214 122 n 119 41 7 "j I 7 I 60+ 63 32 31 16 8 1 3 Age not atated
ACKALPUll TALUJ:A T Total 209,189 107,970 101,219 60,496 33,471 16,847 6,375 25,254 24,345 1,022 108 (J._.14 85,471 43,588 41,883 2,239 2,676 250 271 1,538 2,296 181 6
15-34 63,498 31,726 31,772 27,631 15,386 6,266 2,710 12,399 11,398 415 49 35-59 46,960 25,785 21,175 25,152 lJ,248 7,919 2,824 9,538 9,273 336 47 60+ 13,171 6,824 6,347 5,451 2,150 2,404 566 1,774 1,371 90 6
Age not , 89 47 42 11 11 8 4 5 7 stated
It Total 148,214 76,250 71,964 43,872 27,937 14,989 5,758 22,532 21,342 729 91 (),.-.14 60,147 30,599 29,548 1,841 2,360 230 264 1,391 2,064 150 6
15-34 44,964 22,335 22,629 20,008 13,106 5,699 2,484 11,110 10,188 293 43 35-59 33.682 18,372 15,310 ' 18,001 10.754 7.03/ 2.508 8,494 7,9311 224 38 60+ 9,357 4,910 4,447 4,010 1,708 2,023 498 1,532 1,147 62 4 Age not 64 34 30 12 9 6 4 5 5 stated
U Total 60,975 31,720 29,255 16,624 5,534 1,858 617 2,722 3,003 293 17 0-14 25,324 12,989 12,335 398 316 20 7 147 232 31
15--34 18,534 9,391 9,143 7,629 2,280 567 226 1,289 1,210 122 6 35--59 13,278 7,413 5,865 7,151 2,494 888 316 1,044 1,335 112 9 60+ 3,814 1,914 1,900 1,441 442 381 68 242 224 28 2 Age not 25 13 12 ~ 2 2 :2
stated
(M)=MunicipaUty.
131
B SERIES
Towns classified by Sex and by Broad Age-groups
WORKERS
IV V VI VII vm rx x At Household In Manufacturing In ConstrUction In Trade and In Transport, In Other NON· Ag~ Total District/Taluka/
Industry other than Commerce Storage and Services WORKERS group Rural Town Household Communications Urban
Industry
------Males Females Males Females Males Females MaJes Female. Males Females Males Females Males Female.
(IS) (16) (11) (18) (19) (20) (21) (22) (23) (24) (25) (26) (21) (28) (3) (2) (ll
12,976 4;i71 1',466 1,731 3,273 '39 20,914 1,096 9,180 239 36,150 6,386 274,710 379,997 Total DISTRICT TOTAL 277 219 228 49 156 40 272 37 72 9 649 159 234,981 222,590 0--14
45,188 2,145 8,413 647 1,655 275 10,233 310 4,941 152 19,353 3,005 28,653 90,401 15-34 5,352 1,574 6,123 913 1,235 198 8,806 568 3,866 74 14,103 2,686 3,430 43,130 35-59 1,159 233 701 120 227 26 1,599 179 299 3 2,037 534 7,478 23,678 60+
1 2 4 2 2 1 8 2 168 198 Age not stated
"-.,223 1,867 3,432 1'3 1,310 292 6,547 313 1,770 162 13,492 1,584 192,002 255,137 Total RURAL
191 108 3S 8 116 34 100 22 12 9 138 55 172,192 162,510 0-14 4,034 975 2,009 75 659 162 3,203 88 1,049 116 7,095 852 13,056 51,645 15-34 3,299 690 1,21:5 61 458 86 2,768 145 670 34 5,382 :124 1,766 24,337 35-59
699 94 173 9 77 10 474 56 39 2 873 151 4,845 16,473 60+ 2 :2 1 4 2 143 172 Age not
stated
4,753 2,304 12,034 1,578 1,963 247 14,367 783 7,410 77 22,658 4,802 82,708 124,860 Total URBAN 86 111 193 41 40 6 172 15 60 511 104 62,789 60,080 0--14
2,154 1,170 6,404 572 996 113 7,030 222 3.892 36 12,258 2,153 15,597 38,756 15-34 2,053 884 4;908 852 777 112 6,038 423 3,196 40 8,721 2,162 1,664 18,793 35-59
460 139 5211 111 150 16 1,125 123 260 1 1,164 383 2,633 7,205 60+ 1 :2 2 2 4 25 26 Age not
stated
404 177 '5 It 245 60 316 24 548 137 999 278 14,721 17,490 Total T MELGHAT TALUKA 31 14 1 2 92 16 7 11 1 6 SS 22 14,023 13,685 0--14
213 114 38 7 81 30 167 3 425 107 606 164 345 1,892 15-34 141 46 13 '2 61 14 121 7 118 23 312 81 107 987 35-59
19 3 3 11 21 1 4 "i 26 11 245 926 60+
2 1 Age not stated
395 177 47 6 216 '7 304 22 530 137 742 169 14,340 17,035 Total R 30 14 1 2 91 16 7 It 6 40 18 13,715 13,428 0--14
206 114 34 3 69 28 160 :3 414 107 448 101 291 1,768 15-34 1<10 46 9
"i 49 13 118 5 113 23 233 45 104 936 35-59
19 3 3 7 19 1 3 "i 21 5 229 903 60+ 2 1 Age not
staled
9 8 5 29 12 2 18 257 109 381 455 Total U 1 '4 '4
1 "2 "-; 1 15 4 308 257 0--14 ., 12
'2 II 158 63 54 124 15-34
1 4 "i
12 I :3 5 79 36 3 51 35-59 4 2 1 5 6 16 23 60+
Age not stated
!> 8 , 29 :3 12 2 18 2S? 109 381 455 Total ChikaJda (M) 1
'~ 1
'7 1 15 4 308 257 0--14
7 4 12 2 "i 11 158 63 54 124 15-34
1 4 "i
12 1 3 5 79 36 3 51 35-59 .c 2 1 S 6 16 23 60+
Age not stated
2,887 1,274 3,414 148 459 109 3,636 163 1,076 5,901 948 47,474 67,748 Total T ACHALPuR TALUKA 60 '6 34 4 17 11 54 :3 7 98 29 41,349 39.207 0--14
1,295 623 1,688 S4 243 56 1,689 SS 561 "i
3,081 441 4,089 16,386 15-34 1,251 SIO 1,567 79 165 37 1,562 83 454 2,360 394 633 7,927 35-59
281 85 124 II 34 5 328 22 54 362 84 1,373 4,197 60+ 1 3 30 31 Age not
stated
1,137 293 749 ,31 232 100 1,073 26 157 2,274 295 32,378 44,027 Total R 22 11 5 1 1I II 16 2 14 3 28,758 27,188 0-14
557 156 444 14 127 54 510 10 85 "j 1,183 157 2,327 9,523 15-34
456 110 262 14 77 31 458 11 63 936 103 371 4,556 35-59 102 16 38 2 17 4 8& S 7 141 32 900 2:7:>.9 W+
1 22 21 Age not stated
1,750 981 2,665 117 227 9 2,563 137 919 3,627 653 15,096 23,721 Total U 38 45 2!) 3 6 38 3 5 84 26 12,591 12,019 0--14
738 467 1,244 40 116 2 1,179 4S 476 1,898 284 1,762 6,863 15-34 79S 400 1,305 6S 88 6 1,104 n 391 1,424 291 262 3,371 35-59 179 69 86 9 17 1 240 17 47 221 52 473 1,458 60+
1 2 8 10 Age not stated
(M)=Municipality,
H 4222-9a
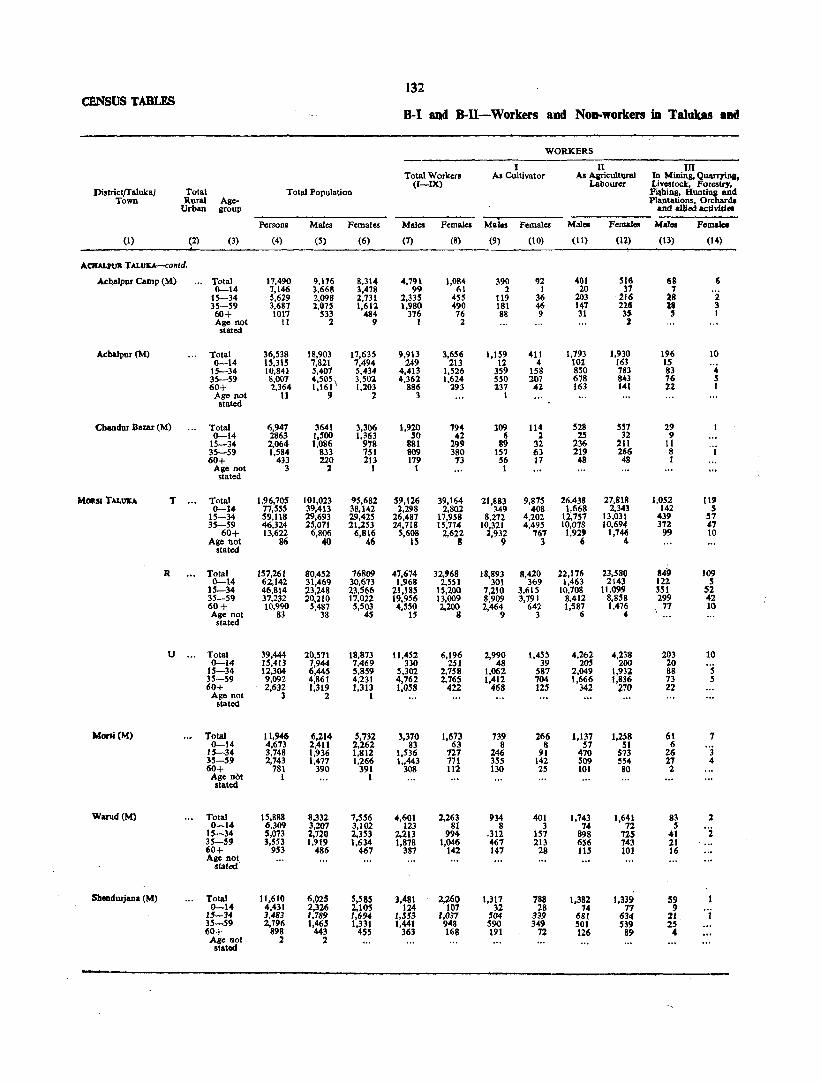
132 CENSUS TABLES
B-1 and B-U-Workers and Non-workers in Talukas Illd
WORKERS
I II III Total Workers ~ Cultivator As Aaricultlll&l In Mining, Quarmna.
(I-IX) Labourer Livestock, Forestry, Di,tQctfTaluka) Total Tottd Population Fi,hing, Hunting and
Town Rural Age- Plantations, Orcharda Urban group and alll<>d actIvidee
Persons Males Females Males Females Males Females Males Females Wal.,. Femal.
(I) (2) (3) (4) (5) (6) (7) (8) (9) (10) (I I) (U) (13) (14)
ACRAJ..PUll TALU'IU.-contd,
Athalpur Camp (M) Total 11,490 9,116 8.314 4,791 1,084 390 92 401 ~16 68 6 0-14 7,146 3,668 3,478 99 61 1 I 20 37 1 '2 15-34 5,629 2,098 2,731 2,335 4$' 119 36 203 21tS as
35-59 3,687 1,075 1,612 1,980 490 181 46 147 116 28 3 60+ 1017 .533 484 376 76 88 9 31 lS , 1 Age not stated
11 2 9 I 1 2
Athalpur (M) Total 36,538 18,903 17,635 9,913 3,656 1,159 411 1,793 1,930 196 10 0-14 IS,31S 7,821 7,494 249 213 t2 4 10l 163 IS
15-34 IO,84J 5,401 5,434 4,413 1,526 359 158 8S0 783 83 4 35-59 8,007 4,50S\ 3,502 4,362 1,624 SSO 207 678 843 76 S 60+ 2,364 1,161 1,203 886 293 237 42 163 141 22 I
Age not 11 9 2 3 1 stated
Chandur Bazar (M) Total 6,947 3641 3,306 1,920 794 309 114 528 .5" 29 0-14 2863 1,500 1,363 SO 42 6 2 2.5 32 9
15-34 2,064 1,086 978 8S1 299 Se} 32 236 211 11 "i 35-.59 1,584 833 751 809 380 157 63 219 266 8 60+ 433 220 213 179 13 56 17 48 48 1
Age not stated
3 2 I t 1
MOIlSl TALUVo T ,., Total 1,96,705 101,023 95,682 59,126 39,164 21,883 9,87.5 26,438 21,818 I,OS2 119 0-14 77,555 39,413 38,142 2.298 2,802 349 408 1,668 2,343 142 S
15-34 59,118 29,693 29,42.5 26,487 17,958 8,272 4,202 12,751 13,031 439 57 35-59 46,324 25,071 21,253 24,718 15,774 10,321 4,495 10,078 10,694 372 47
60+ 13,622 6,806 6,816 S,608 2,622 2,932 761 1,92' 1,746 99 10 Age not 86 40 46 IS 8 9 1 6 4
stated
R Total 157,261 80,452 76809 47,674 32,968 18,893 8,420 22,176 23,580 849 109 0-14 62,142 31,469 30,673 1,968 2,551 301 369 1,463 2143 122 5
15-34 46,814 23,248 23,566 21,185 15,200 7,210 3,615 10,708 11,099 351 52 35-59 37,232 20,210 17,022 19,956 13,009 8,909 3,791 8,412 8,8S8 299 42 60+ 10,990 5,487 5,503 4,.550 2,200 2,464 642 1,587 1,476 77 10 Age not 83 38 45 IS 8 9 3 6 4
stated
U '" Total 39,444 20,571 18,873 11,452 6,196 2,990 1,45~ 4,262 4,238 203 10 ~14 1.5,413 7,944 7,469 330 251 48 39 20S 200 20
15-34 12,304 6,445 5,859 5,302 2,758 1,062 587 2,049 1,93~ 88 5 35-59 9,092 4,861 4,231 4,762 2,765 1,412 704 1,666 1,336 73 S 60+ 2,632 1,319 1,313 1,058 422 468 125 342 'PO 22
Age not 3 2 1 stated
Morli(M) Total 11,946 6,214 5.732 ),370 1,673 139 266 1.137 1.258 61 7 0-14 4,673 2,411 2,262 83 63 S 8 57 '1 6
15-34 3,748 1,936 1,812 1,536 727 246 91 470 573 26 3 35-59 2,743 1,477 1,266 1 .. 443 771 3.505 142 309 .554 27 4 60+ 781 390 391 308 112 130 25 101 80 2 Age not 1 I slllt<id
Warud(M) Total 15,888 8,332 7,.556 4,601 2,263 934 401 1,743 1,6~~ 83 2 ~14 6,309 3,201 3,102 123 81 8 3 74 .5 "i 15-34 5,073 2,720 2,353 2,213 994 ,312 157 898 715 41
35-59 3,S53 1,919 1,634 1,878 1,046 467 213 656 743 21 60+ 953 486 467 387 142 147 28 liS 101 J6 Age not
stat<>d"
Sbeedurjana (M) Total 11,610 6,025 5,S85 3,481 2,260 1,317 788 1,382 1,339 59 ~14 4,431 2,326 2,10.5 124 107 32 28 74 77 9 "i 15-34 3,483 1,789 1,694 1,553 1,037 S04 339 681 634 21.
35-59 2,796 1,46.5 1,331 1,441 948 590 349 501 539 25 60+ 898 443 455 363 168 191 72 126 89 4 Age not 2. 2.
stated
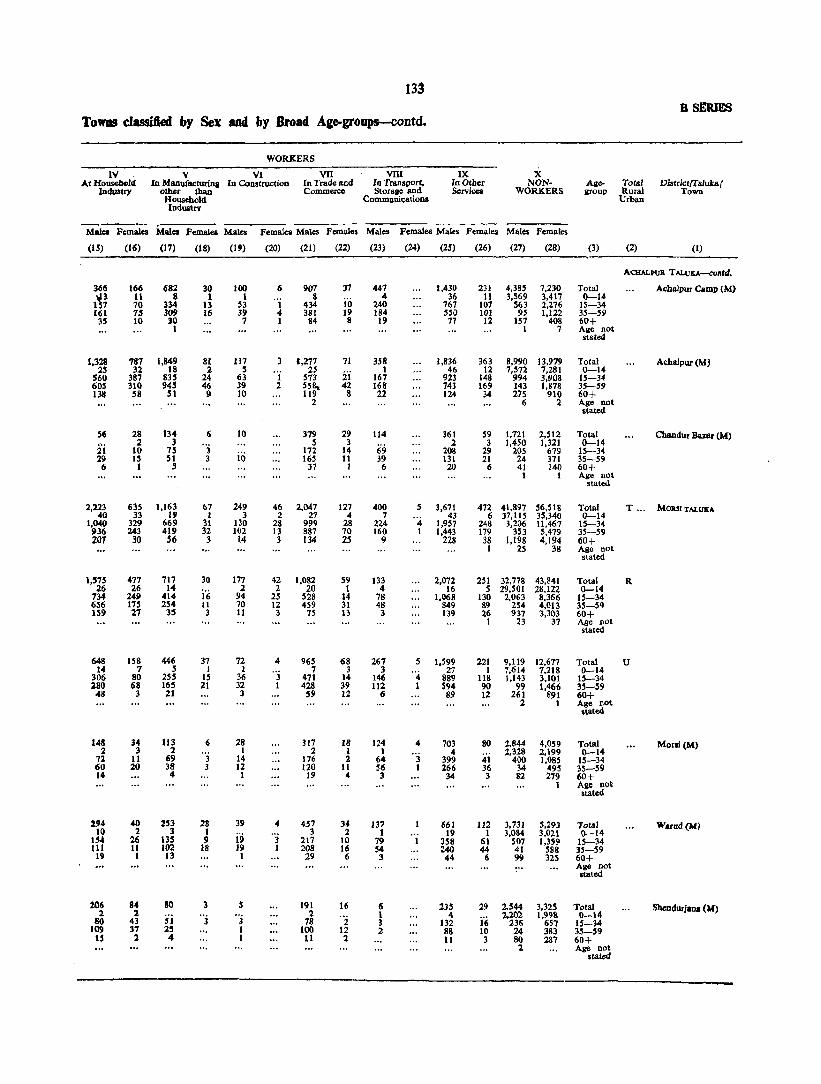
133 B SERIES
ToWIIS classified by Sex and by Broad Ag~groups-contd.
WORKERS
IV V VI VII VIII IX X AI Housebeld In ManufaclUrina In Construclioo In Trade and In Transport, In Other NON· Age- Total District(l'alub I
IndUSI,., other than Commerce Stofaae and Services WORKERS &rOUP kural Town Household Communications Urban Industrv
----_-_ MalCI Females Mala Females Males Females Males Females Males Females Males Females Males Females
(IS) (16) (17) (18) (19) (20) (21) (22) (23) (24) (25) (26) (27) (28) (3) (2) (1)
ACHALPIJI\ T ALlJKA-conld.
366 166 682 30 100 6 907 37 441 1,430 231 4,385 7,230 Total Achalpur Camp (M)
1~~ 11 8 1 1 8 4 36 11 3,569 3,417 0--14 70 334 13 53 1 434 10 240 767 107 563 2,276 15-34
161 75 309 115 39 .. 381 19 184 550 101 95 1,122 35-59 35 10 )0 1 1 84 8 19 77 12 157 408 60+
1 1 7 Age not stated
1,328 787 1,849 81 117 3 1,277 11 358 1,836 363 8,990 13,979 Total Adlalpur (M) 25 3l 18 2 S "j 2S
i'i 1 46 12 7,572 7,281 0-14
560 387 835 24 63 S1! 167 923 148 994 3,908 15-34 60S 310 94$ 46 39 2 SS~ 42 168 743 169 143 1,878 35-59 138 58 51 9 10 119 8 12 124 34 275 910 60+
2 6 2 Age not stated
56 28 134 6 10 379 29 114 361 59 1,121 2,512 Tolal ChlUldur Duar (M)
!ii 2 3 ") 5 3
69 2 3 1,450 1,321 0-14
10 15 io 172 14 208 29 205 619 15-34 29 15 51 3 165 11 39 131 21 24 311 35-59
6 t 5 37 1 6 20 6 41 140 60+ I 1 Age not
stated
2,2.23 635 1,163 67 249 46 2,047 127 400 5 3,671 472 41,897 56,518 Total T .. , MOIUI TALlIE" 40 33 I, 1 3 2 27 4 7 43 6 37,115 35,340 0-14
1,040 329 669 31 130 28 999 28 224 4 1,957 248 3,206 11,467 15-34 936 243 419 32 102 13 887 10 160 1 1,443 179 353 5,419 35-59 207 30 56 3 14 3 134 2S 9 228 38 1,198 4,194 60+
I 25 38 Age not stated
1,'75 477 717 30 177 42 1,082 59 133 2,072 251 32,778 43,841 Total R 26 26 14
i''; 2 2 20 1 4 16 5 29,501 28,122 0--14 134 249 414 94 2S 528 14 78 1,068 130 2,063 8,366 15-34 656 115 254 11 70 12 459 31 48 849 89 254 4,013 35-59 IS9 27 35 3 11 3 7~ 13 3 139 26 931 .,303 60+
I 23 37 Age not stated
648 158 446 37 72 4 965 68 261 5 1,599 221 9,119 12,677 Total U I. 1 5 1 1 "j 7 3 3 "4 27 1 7,614 7,218 0-14 306 80 25S 15 36 471 14 146 889 U8 1,143 3,101 15-34 280 68 165 21 32 1 428 39 112 1 594 90 99 1,466 35-S9 48 3 21 3 59 12 6 89 12 261 891 60+
2 1 Age not stated
148 34 tl3 6 28 l17 18 124 4 703 80 2,844 4,059 Total Moni(M) 2 3 2 I 2 1 1 "j 4 ;ji 2,328 2,199 0--14
12 11 69 3 14 176 1 64 399 400 1,085 15-34 60 20 38 3 12 120 11 56 I 266 36 34 495 35-59 14 4 1 19 4 3 34 3 82 279 60+
1 Age not stated
294 40 lS3 28 39 .. 457 34 137 661 112 3,731 5,293 Total Wuud {All 10 2 3 1
i'9 '3 3 2 1 19 1 3,084 3,021 (}-14 154 26 135 ') 217 10 79 358 61 507 1,359 15-34 III 11 102 18 19 I 208 16 54 240 44 41 588 35-59
19 1 13 I 29 6 3 44 6 99 325 60+ Age not atated
206 84 SO 3 $ 191 16 IS 23S 29 2,544 3,325 Total Shendurjan. (M) 2 1 "3 ".1 2 '2 1 4 i'6 2,202- 1,9911 0-14
80 43 51 18 3 132 236 657 15-34 109 37 2' I ... 100 12 2 88 10 24 383 35-59
15 1 4 I II 2 11 3 80 287 60+ 2 Age oot
stated

134 CENSUS TABLES
B-1 and B-ll-Workers and Non-workers in Talukas and
WORKERS
I IT ill Total Workers As Cultivator As Agricultural In Mining, Quarrying,
DistrictlTalukal Total Age- Total Population (I-IX) Labourer Livestock, Forestry, Town Rural group Fishing, Hunting and
Urban Plantations, Orchards and allied activities
Persons Males Females Males Females Males Females Males Females Males Females
(1) (2) (3) (4) (5) (6) (7) (8) (9) (10) (11) (12) (13) (14)
DARYAPUR TALUKA T .. Total 174,397 89,902 84,495 51,316 31,324 15,671 5,300 25,511 24,614 440 95 0-14 71,478 36,404 35,074 2,179 2,998 203 273 1,758 2,678 87 8
15-34 53,758 26,871 26,887 23,704 14,827 6,029 2,231 12,424 11,863 175 53 35-59 38,555 21,227 17,328 20,890 11,514 7,363 2,349 9,562 8,641 129 30 60+ 10,500 5,348 5,152 4,535 1,974 2,075 445 1,760 1,423 >49 4 Age not 106 52 54 8 11 1 2 7 9
stated
R Total 137,284 70,607 66,677 40,928 27,233 13,932 4,927 22,117 21,765 356 82 0-14 56,385 28,707 27,678 1,864 2,780 190 268 1,559 2,493 75 8
15-34 41,908 20,736 21,172 18,783 12,980 5,442 2,100 10,829 10,572 138 45 35-59 30,634 16,891 13,743 16,668 9,806 6,535 2,173 8,224 7,450 103 25 60+ 8,256 4,223 4,033 3,606 1,659 1,764 384 1,499 1,244 40 4 Age not 101 50 51 7 8 1 2 6 6
stated
U Total 37,113 19,295 17,818 10,388 4,091 1,739 373 3,394 2,849 84 13 0-14 15,093 7,697 7,396 315 218 13 5 199 185 12
15-34 11,850 6,W 5,715 4,921 1,847 587 131 1,595 1.291 37 8 35-59 7,921 4,3 Q 3,585 4,222 1,708 828 176 1,338 1,191 26 5 60+ 2,244 1,125 1,119 929 315 311 61 261 179 9 Age not 5 2 3 1 3 1 3
stated
Anjanllaon (M) Total 21,931 11,350 10,581 6,176 2,476 985 245 2,145 1,608 61 12 0-14 9,010 4,577 4.433 176 120 9 2 115 98 4 '8 15-34 6,832 3,479 3,353 2,879 1,146 331 94 1,0:?! 736 32
35-59 4,707 2,605 2,102 2,552 1,032 459 110 843 689 18 4 60+ 1,382 689 693 569 178 186 39 156 8S 7 Age not
stated
Daryapllf Banol3 (M),. Total 15,182 7,945 7,237 4,212 1,615 754 128 1,249 1.241 23 0-14 6,083 3,120 2,963 13" 98 4 3 84 87 8
15-34 5,018 12,656 2,362 2,042 701 256 37 564 555 5 35-59 3,~~~ 1,731 1,483 1,670 676 369 66 495 502 8 1 60+ 436 426 360 137 125 22 lOS 94 2 Age not 5 2 3 1 3 1 3
stated
AMRAVATI TALun T .. Total 382,707 200,694 182,013 109,482 53,250 21,697 7,831 38,537 38,199 1,816 449 0-14 149,401 76,506 72,895 4,220 4,916 395 381 2,768 4,298 310 26
15-34 127,143 67,020 60,123 52,377 23,942 8,431 3,234 18,323 17,531 743 238 35-59 83,331 45,644 37,687 44,080 2Q,590 9,892 3,526 14,486 13,815 618 163 60+ 22,8g~ 11,514 11,293 8,800 3,800 2,979 690 2,960 2,555 145 22 Age not 10 15 5 2
stated
R Totd 220,992 113,837 107,155 66,663 44,504 19,615 7,343 36,277 35,980 1,165 180 0-14 88,344 45,057 >43,287 3,470 4,652 372 374 2,711 4,198 251 13
15-34 68,529 34,388 34,141 30,439 20,367 7,762 3,093 17,330 16,670 452 101 35-59 49,786 27,112 22,674 26,649 16,368 8,863 3,240 13,504 12,720 366 56 60+ 14,333 7,280 7,053 6,105 3,117 2,618 636 2,732 2,392 96 10 Aile not
.tated
U Total 161,715 86,857 74,858 42,819 8,746 2,082 488 2,260 2,219 651 269 0-14 61,057 31,449 29,608 750 264 23 7 57 100 59 13
15-34 58,614 32,632 25,982 21,938 3,575 669 141 993 861 291 137 35-59 33,545 18,532 15,013 17,431 4,222 1,029 286 982 1,095 252 107 60+ 8,474 4,234 4,240 2,695 683 361 54 228 163 49 12 Age not 25 10 15 5 2
.tated
Amra,.ati(M) Total 137,875 74,427 63,4>48 36,446 6,833 1,519 294 1,371 1,348 560 260 0-14 51,358 26,497 24,861 605 201 10 2 36 62 30 13
15-34 50,963 28,669 22,294 18,811 2,846 478 80 593 522 257 134 35-59 28,304 15,629 12,675 14,719 3,236 764 172 598 662 229 102 60+ 7,226 3,622 3,604 2,306 549 267 40 144 102 44 11 Age Dot 24 10 14 5 1
stated
.. ' Bauera (M) Total 23,840 12,430 11,410 6,373 1,913 563 194 889 871 91 9 0-14 9,699 4,952 4,747 145 63 13 5 21 38 29 ":; 15-34 7,651 3,963 3,688 3,127 729 191 61 400 339· 34
35-59 5,241 2,903 2,338 2;7:12 986 265 114 384 433 23 5 60+ 1,248 612 636 389 134 94 14 84 61 5 1 Age not 1 I 1
stated
(M)=Municipality.
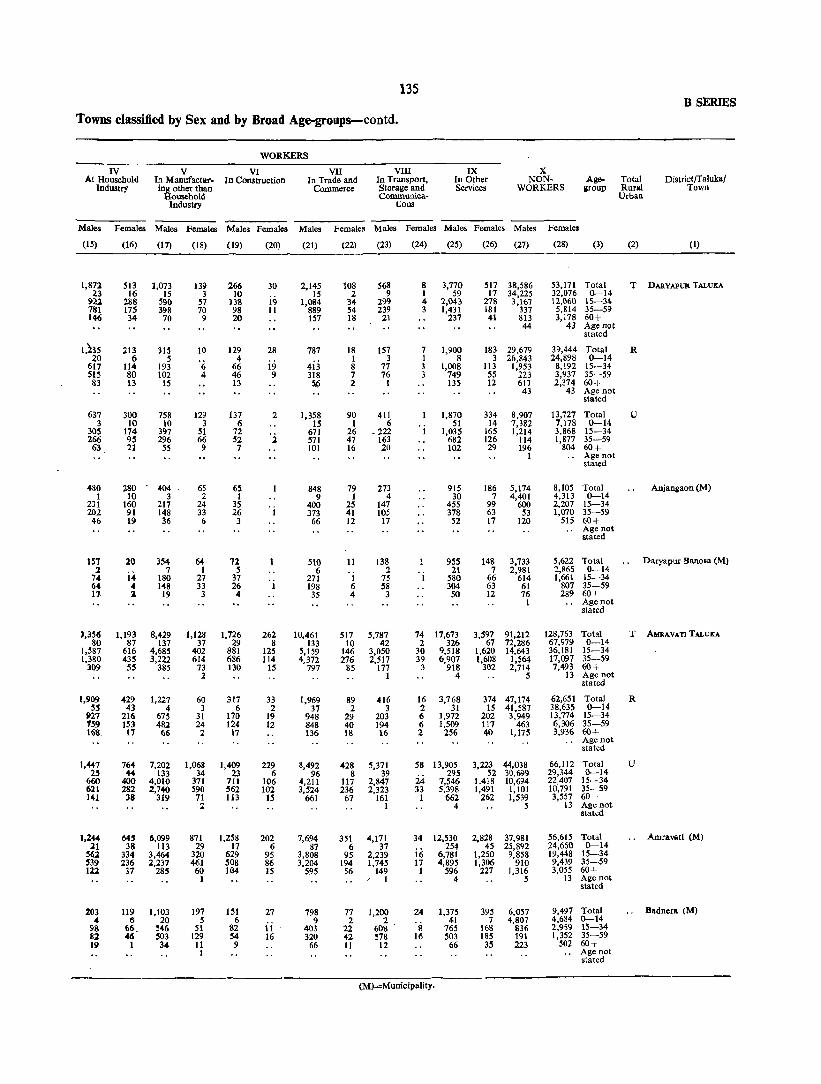
135 B SERIES
Towns classified by Sex and by Broad Age-groups-contd.
WORKERS
IV V VI VII VIII IX X At Household In ManufactW'- In Construction In Trade and In Transport, In Other NON- Age- Total DistrictjTaluka!
Industry ing other than Conunerce Storage and Services WORKERS IIroup Rural Town Household Communica- Urban
Industry lions
Males Females Males Females Males Females Males Females Males Females Males Females Males Females
(IS) (16) (17) (18) (19) (20) (21) (22) (23) (24) (25) (26) (27) (28) (3) (2) (1)
I,S72 513 1,073 139 266 30 2,145 lOS 568 8 3,770 517 38,586 53,171 Total T DARYAPUR TALUXA 23 16 15 3 10 15 2 9 1 59 17 34,225 32,076 0-14
922 288 590 57 138 19 1,084 34 299 4 2,043 278 3,167 12,060 15-34 781 175 398 70 9S 11 889 54 239 3 1,431 181 337 5,814 35-59 146 34 70 9 20 157 18 21 237 41 813 3,178 60+
44 43 Age not stated
1,235 213 315 10 129 28 787 18 157 7 1,900 183 29,679 39,444 Total R 20 6 S 4 1 3 I 8 3 26,843 24,898 0-14
617 114 193 6 66 19 413 8 77 3 1,008 113 1,953 8,192 15-34 SIS SO 102 4 46 9 318 7 76 3 749 55 223 3,937 35-59
83 13 15 13 5ti 2 I 135 12 617 2,374 60+ 43 43 Age not
stated
637 300 758 129 137 2 1,358 90 411 1,870 334 8,907 13,727 Total U 3 10 10 3 6 15 1 6 51 14 7,382 7,178 0-14
305 174 397 51 72 '2 671 26 _ 222 1 1,035 165 1,214 3,868 15-34 266 95 296 66 52 571 47 163 682 126 114 1,877 35-59
63 21 55 9 7 101 16 20 102 29 196 804 60+ I Age not
stated
480 280 404 65 65 848 79 273 915 186 5,174 8,105 Total Anjanllaon (M) 1 10 3 2 1 9 I 4 30 7 4,401 4,313 0-14
231 160 217 24 35 400 25 147 455 99 600 2,207 15-34 202 91 148 33 26 1 373 41 105 378 63 53 1,070 35-59
4(> 19 36 6 3 66 12 17 52 17 120 515 60+ .. Age not stated
IS7 20 354 64 72 510 11 138 955 148 3,733 5,622 Total Daryapllr Banosa (M) l 7 1 5 6 2 21 7 2,981 2,865 0-14
74 14 180 27 37 271 1 75 580 66 614 1,661 15-34 64 4 148 33 26 1 198 6 58 304 63 61 807 35-59 17 1 19 3 4 35 4 3 50 12 76 289 60+
I .. Age not stated
3,356 1,193 8,429 1,128 1,726 262 10,461 517 5,787 74 17.673 3,597 91,212 128,763 Total T AMRA-VA11 TALUICA 80 87 137 37 29 8 133 10 42 2 326 67 72,286 67,979 0-14
1,587 616 4,685 402 881 125 5,159 146 3,050 30 9,518 1,620 14,643 36,181 15-34 1,380 435 3,222 614 686 114 4,372 276 2,517 39 6,901 1,608 1,564 17,097 35-59
109 55 385 73 130 15 797 85 177 3 918 302 2,714 7,493 60+ 2 1 4 5 13 Age not
stated
1,909 429 1,227 60 317 33 1,969 89 416 16 3,768 374 47,174 62,651 Total R 5!l 43 4 3 6 2 37 2 3 2 31 IS 41,587 38,635 0-14
P27 216 675 31 170 19 948 29 203 6 1,972 202 3,949 13,774 15-34 159 153 482 24 124 12 848 40 194 6 1,509 117 463 6,306 35-59 168. 17 66 2 17 136 18 16 2 256 40 1,175 3,936 60+
" Age not stated
1,447 764 7,202 1,068 1,409 229 8,492 428 5,371 5S 13,905 3,223 44,038 66,112 Total U 2~ « 133 34 23 6 96 8 39
24 295 52 30,699 29,344 0-14
660 400 4,010 371 711 106 4,211 117 2,847 7,546 1.418 10,694 22,407 15-34 621 282 2,740 590 562 102 3,524 236 2,323 33 5,398 1,491 1,101 10,791 35-59 141 38 319 71 113 15 661 67 161 I 662 262 1,539 3,557 60+
2 1 4 5 13 Age not stated
1,244 64!1 6,099 871 1,258 202 7,694 351 4,171 34 12,530 2,828 37,981 56,615 Total Amraviitl (M) 21 38 113 29 17 6 87 6 37
iii 254 45 25,892 24,660 0-14
56:1 334 3,464 320 629 95 3,808 95 2,239 6,781 1,250 9,858 19,448 15-34 '39 236 2,237 461 508 86 3,204 194 1,745 17 4,895 1,306 910 9,439 35-59 112 37 285 60 104 15 595 56 149 I 596 227 1,316 3,055 60+
1 1 4 5 13 Age not stated
203 119 1,103 197 151 27 798 77 1,200 24 1,375 39~ 6,057 9,497 Total Badnera (M) 4 II 20 5 6 9 2 2 41 7 4,807 4,684 0-14
98 66 546 51 82 11 403 22 60S 8 765 t6S 836 2,959 15-34 8:1 46 503 129 S4 16 320 42 578 16 503 185 191 1,352 35-59 19 1 34 11 9 66 11 12 66 35 223 502 60+
1 Age not stated
(M)=Municipality,
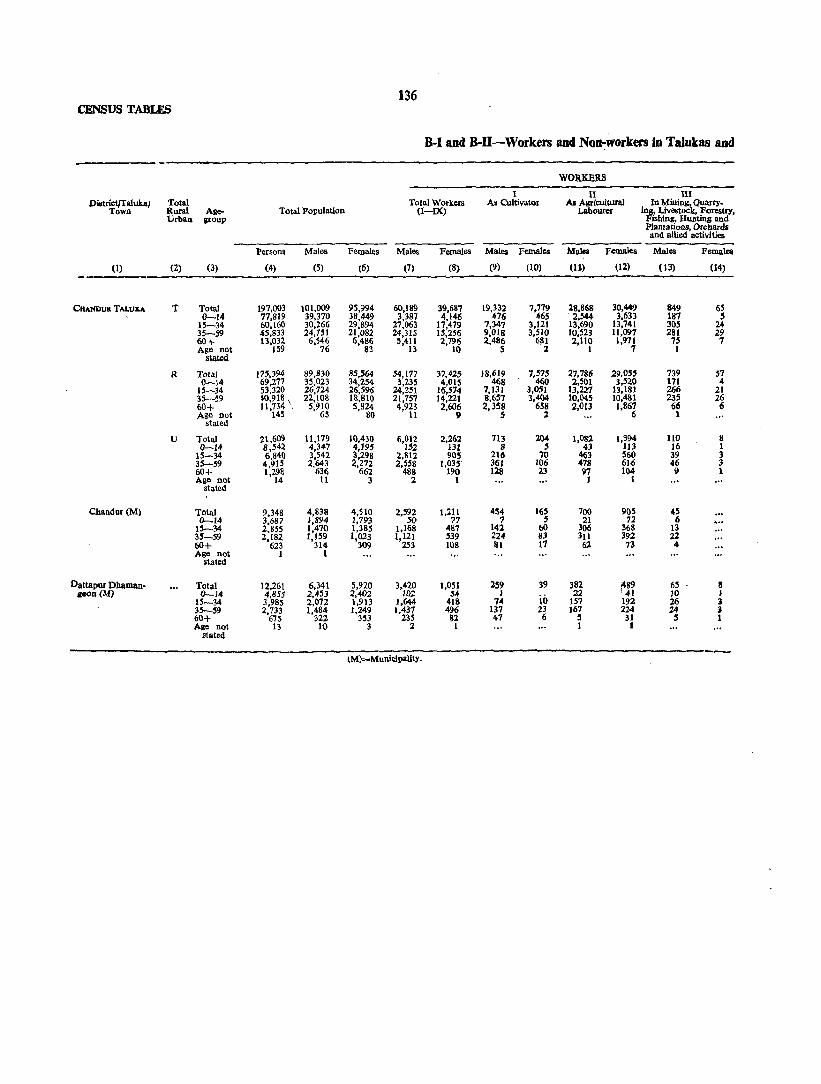
136 CENSUS TABLES
JJ..I aDd JJ..U-Workers and Non-workers in TaJukas and
WORKERS
1 11 III District/Taluka/ Total Total Workers As Cultivator As Agricultural In Mining, Quarry-
Town Rural Age- Totall'opulation (I-IX) Labourer ing, Livestock, ForestrY, Urban group Fisbing, Hunting and
J>lantations, Orchards and allied activities
Persons Males Females Males Females Malel Females Malea Females Males Females
(I) (2) (3) (4) (5) (6) (7) (8) (9) (10) (lL) (12) (13) (14)
CHAND(Jll TAl.ul:" T Total 197,003 101,009 95,994 60,189 39,687 19,332 7.779 28,868 30,449 849 65 0-14 77,819 39,370 38,449 3,387 4,146 476 465 . 2,344 3,633 187 S
15-34 60,160 30,266 29,894 27,063 17,479 7,347 3,121 13,690 13,741 30S 24 35-59 45,S33 24,151 21,082 24,315 15,256 9,018 3,510 10,523 11,091 281 29 60+ 13,032 6,546 6,486 5,411 2,796 2,486 681 2,110 1,971 75 7 Age not 159 76 83 13 11) S 2 1 1 1
stated
R Total 115,394 89,830 85,564 54,177 )7,425 18,619 7,515 27,786 29,055 739 57 0-14 69,277 35,023 34,254 3,235 4,015 468 460 2,501 3,520 171 4
15-34 53,320 26,724 26,596 24,251 16,574 7,131 3,051 13,227 13,181 266 21 35-59 '0,918 \ 22,108 18,810 21,757 14,221 8,657 3,404 10,045 10,481 235 26 60+ 11,734 ' 5,910 5,824 4,923 2,606 2,3:58 658 2,013 1,867 66 6 Age not 145 65 80 Ii 9 S 2 6 1
stated
U Total 21,609 11,179 1(),430 6,012 2,262 713 2().4 1,082 1,394 110 8 0-14 8,542 4,347 '1,195 152 13l 8 5 43 113 16 1
15-34 6,S4() 3,542 3,298 2,812 90S 216 70 463 560 39 3 35-59 4,915 2,643 2,272 2,558 1,035 3tH 106 478 616 46 3 60+ 1,298 636 662 488 190 128 23 97 104 9 1 Age not 14 11 3 2 1 t 1
stated
Chandur (M) Total 9,348 4,838 4,510 2,592 1,211 4S4 165 700 905 4S 0-14 3,687 1,894 1,793 50 71 7 5 21 12 6 1'""
15-34 2,855 1,470 1,385 1,168 487 142 60 306 368 13 35-59 2.18~ 1,159 1,023 1,121 539 224- 83 311 392 22 60+ 623 314 309 253 108 III 11 62 73 4 Age not 1 1
stated
Dattal'ur Dhaman- Total 12,261 6,341 5,920 3,420 1,051 259 39 382 489 6S 8 eaoll(M) 0-14- 4,853 2,453 2,402 102 54 I io 22 < 41 10 1
15-34 3,985 2,072 1,913 1,644 418 74 157 192 26 3 35-59 2,733 l';~i 1,249 1,437 496 137 23 167 224 24 l 60+ 675 353 235 82 47 6 5 31 S 1 Age not 13 10 3 2 1 1 1
stated
lM)=Mun!~paUt)'"
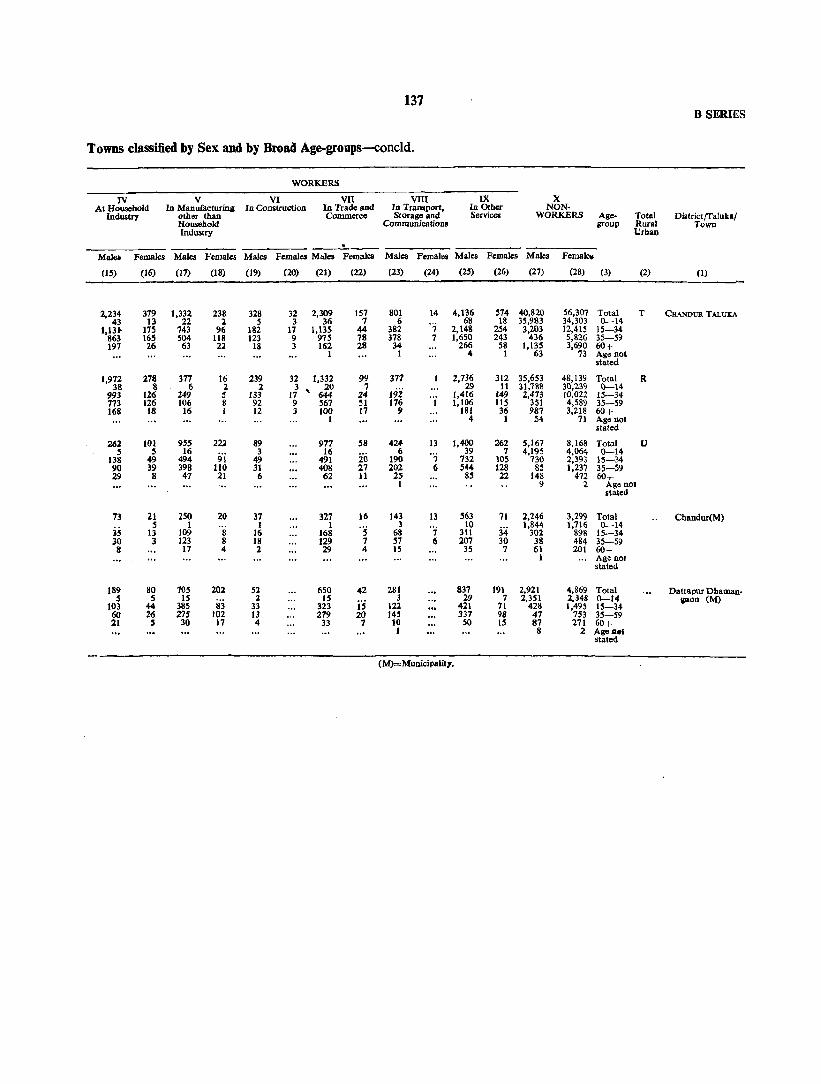
137 8 SERIES
TOWDS classified by Sex and by Broad Age-groups-concld.
WORKERS
IV V VI VII VIII IX X At Household In Manufacturing In Construction In Trade and In Transport, In Other NON·
Industry other than Commerce Storage and Service. WORKERS Age- Total Di.trict/Talukal Household Communications group Rural Town Intlustry Urbao
Malel Females Males Females Males Females Males Females Males Females Males Females Males Fernal ..
(15) (16) (17) (18) (19) (20) (21) (22) (23) (24) (25) (26) (27) (28) (3) (2) (1)
2,234 379 1,332 238 328 32 2,309 157 801 14 4,136 374 40,820 56,307 Total T CHANDUR TALUKA 43 13 22 :2 5 3 36 7 6
" 68 18 35,983 34,303 0-14
1,131' 175 743 96 182 17 1,135 44 382 2,148 254 3,m 12,415 15-34 863 165 504 118 123 9 975 78 378 7 1,650 243 5,826 35-59 197 26 63 22 18 3 162 28 34 266 58 1,135 3,690 60+
1 1 4 1 63 73 Age not stated
1,972 278 377 16 239 32 1,332 99 377 2,736 312 35,653 48,139 Total R 38 8 6 2 2 3 .... 20 7
19Z 29 11 31,7'ilS 30,239 0-14
993 126 249 S 133 17 644 24 "i 1,416 149 2,473 1O,()22 15-34 773 126 106 8 92 9 567 51 176 1,106 115 351 4,589 35-59 168 18 16 1 12 3 100 17 9 181 36 987 3,218 60+
1 4 1 S4 71 Age nol stated
262 101 955 222 89 977 58 424 13 1,400 262 5,167 8,168 Total []
5 S 16 i,ij
3 16 20
6 '1 39 7 4,195 4,064 0-14 138 49 494 49 491 190 732 105 730 2,393 15-34 90 39 398 110 31 408 27 202 6 544 128 85 1,237 35-59 29 8 47 2J 6 62 11 25 85 22 148 472 60+
1 9 :2 Ageno. stated
73 21 250 20 37 327 16 143 13 563 71 2,246 3,299 Total Chandur(M) 5 1 1 1 ·s 3 '7
10 34
1,844 1,716 0-14 3S 13 109 8 16 168 68 311 302 898 15-34 30 3 123 8 18 129 7 57 (I 207 30 38 484 35-59 8 17 4 2 29 4 15 3S 7 61 201 60+
1 Age nol stated
189 80 705 20:1 52 650 42 281 837 191 2,921 4,869 Total Dattapur Dhaman. S 5 IS 2 IS is
3 29 7 2,351 2,348 0-14 &aon (M) 103 44 385 83 33 323 122 421 71 428 1,495 15-34 60 26 275 102 13 279 20 14~ 337 98 47 753 35-59 21 5 30 17 4 33 7 10 SO 15 87 271 60+
I 8 2 Age A.I statetl
(MJ=Municipalit;y.
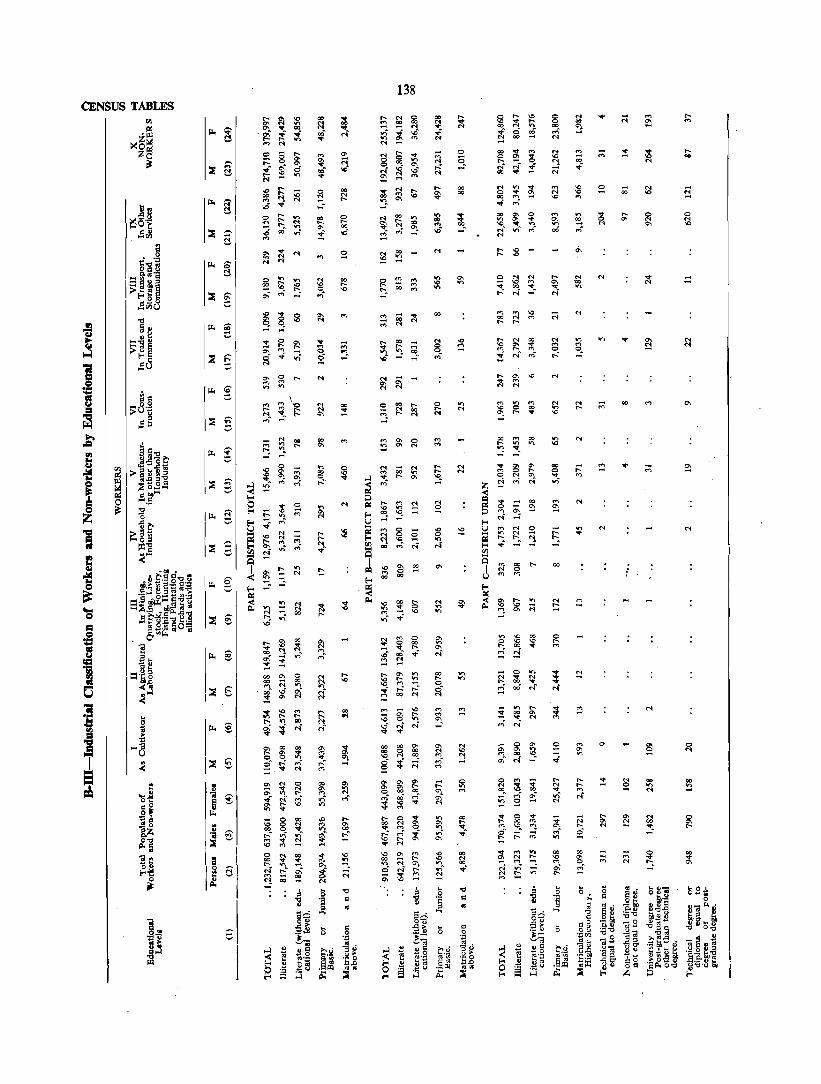
138 CENSUS TABLES
~ ~ to
"'N .... ~ ~ M C") ~
8 . ... ~ ~ ..... V> '"
("f') ('f) \~ r- .... .... ~ !~ ('
o
~.
co co
0\ on
'" ...,
....
-...
'" '" ...
00
....
... ..
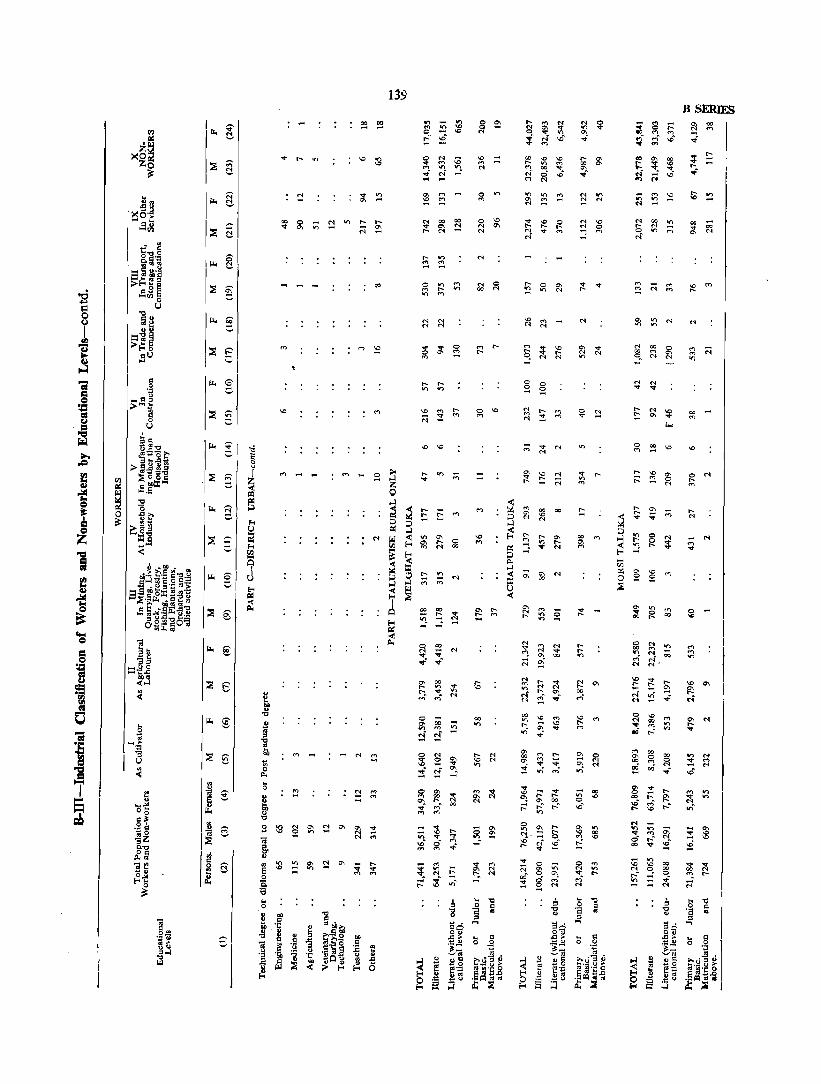
I~ §
I~ a I~ gl I ~
I~ §
~ &;' I ~
I~ g
/:::E :::;-
c
139
o '" M
o 00 '" '" -
B SERIES
o '" .... '"
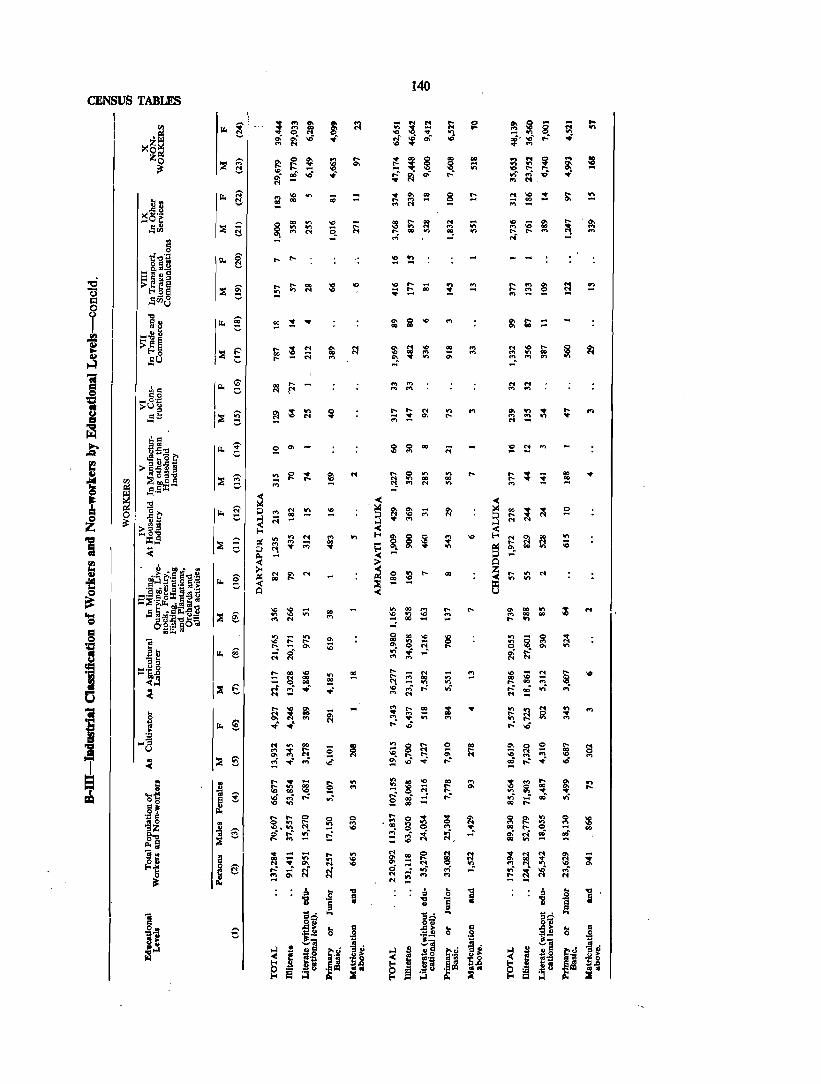
CENSUS TABLFS
j ~ j 5:
IJ 81
go ...,
140
.., ..., ... ..,
... ...
-on on
.., ..,
...
... ...
:::: 10
... on
....
..
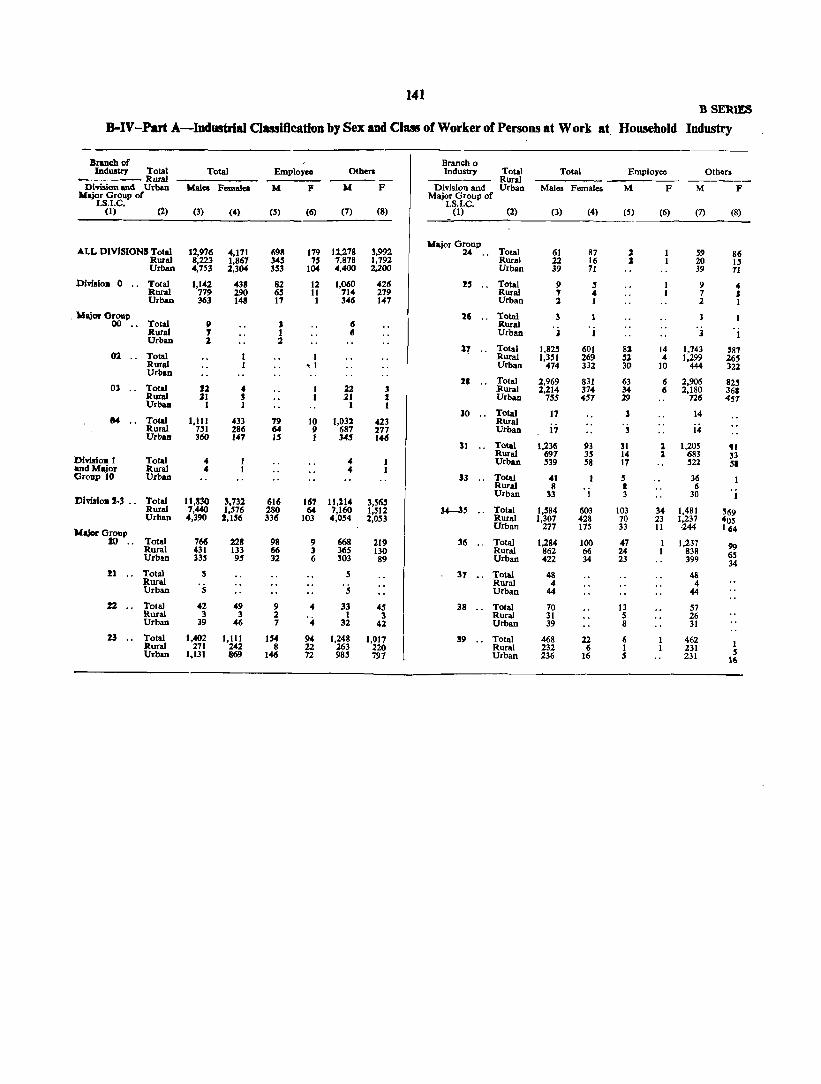
141 BSERmS
B-IV -Part A-Industrial OassiflcatioD by Sex and Class of Worker of Persons at Work at, Household Industry
Branch of Branch 0 Industry Total Total Employee Othen Industry Total Total Employee Others
Rural Rural Di"fision and Urban Wale41 Fcmalca M P ),{ P Division and Urban Males Females M F M F
W.jor Group or Major Group of I.S.I.C. I.S.I.C.
(1) (2) (3) (4) ($) (6) (7) (8) (I) (2) (3) (4) (5) (6) (7) (8)
ALL DIVISIONS Total 12,976 698 ll,278 3,992 M&jor Group
Total 61 87 2 4,171 179 24 .. S9 86 Rural 8,223 1,861 3<4$ 7$ 7,878 1,792 Rural 22 16 2 20 Jj Urban 4,753 2,304 3'3 104 4,400 2,200 Urban 39 71 39 71
Dhisloa 0 .. Total 1,142 438 82 12 1,060 426 l' .. Total 9 S 9 4 Rural 779 290 6$ 11 714 279 Rural 7 4 7 3 Urban 363 148 11 1 346 147 Urban 2 1 2 I
. Major Oroup 16 .. Total 3 00 .. Total il' l 6 Rural
'j 'j 'j Rural ., I 6 Urban I Urban 1 2
11 .. Total 1,82$ 601 82 14 1,743 S87 02 Total I Rural 1,351 269 S2 4 1,299 265
Rural ~ I Urban 474 332 30 10 444 322 Urban
21 .. Total 2,969 831 63 15 2,906 8H 03 Total !l 4 22 3 Rural 2,214 374 34 6 2,180 368
Rural 21 S 21 1 Urban 755 457 29 726 457 UrbaA I J 1 1
JO .. Total 17 3 14 04 Total 1,111 433 19 10 1,032 423 Rural
Rural 751 286 64 51 687 277 Urban 17 3 14 Urbaa 360 147 IS 1 345 146
31 .. Total 1.236 93 31 1 1,205 ., Rural 697 35 14 2 683 33
Dlvisioa 1 Total 4 4 Urban S39 58 17 S22 5. and Major Rural 4 4 Groap 10 Urban 13 .. Total 41 S 36
Rural 8 'j I 6 Urban 33 3 30 . j
DhlaloaJ..3 .. Total U,S30 3,732 616 161 11,214 3,565 Rural 7,440 1,576 280 64 7,160 1,512 34-3$ .. Total I,S84 603 103 34 1,481 569 Urban 4,390 2,156 336 103 4,054 2,053 Rural 1,307 428 70 23 1,237 405
Urban 277 115 33 II ·244 164 NajorGroup 20 .. Total 766 228 98 9 668 219 l15 .. Total 1,284 100 47 I 1,237 99 Rural 431 133 66 3 3.65 130 Rural 862 66 24 I 838 65 Urbllll 335 95 32 6 303 89 Urban 422 34 23 399 34 21 .. Total S 5 31 Total 4& 4&
Rural • S • S Rural 4 4 Urban Urban 44 44
12 .. Total 42 49 9 4 33 45 38 Total 70 13 57 Rural 3 3 2 1 3 Rural 31 5 26 Urban 39 46 7 4 32 42 Urban 39 8 31
23 .. Total 1,402 1,111 154 94 1,248 1,017 39 .. Total 468 22 6 462 1 Rural 271 242 8 22 263 220 Rural 232 6 I 231 Urban 1,131 869 146 72 985 797 Urban 236 16 5 231 5
16
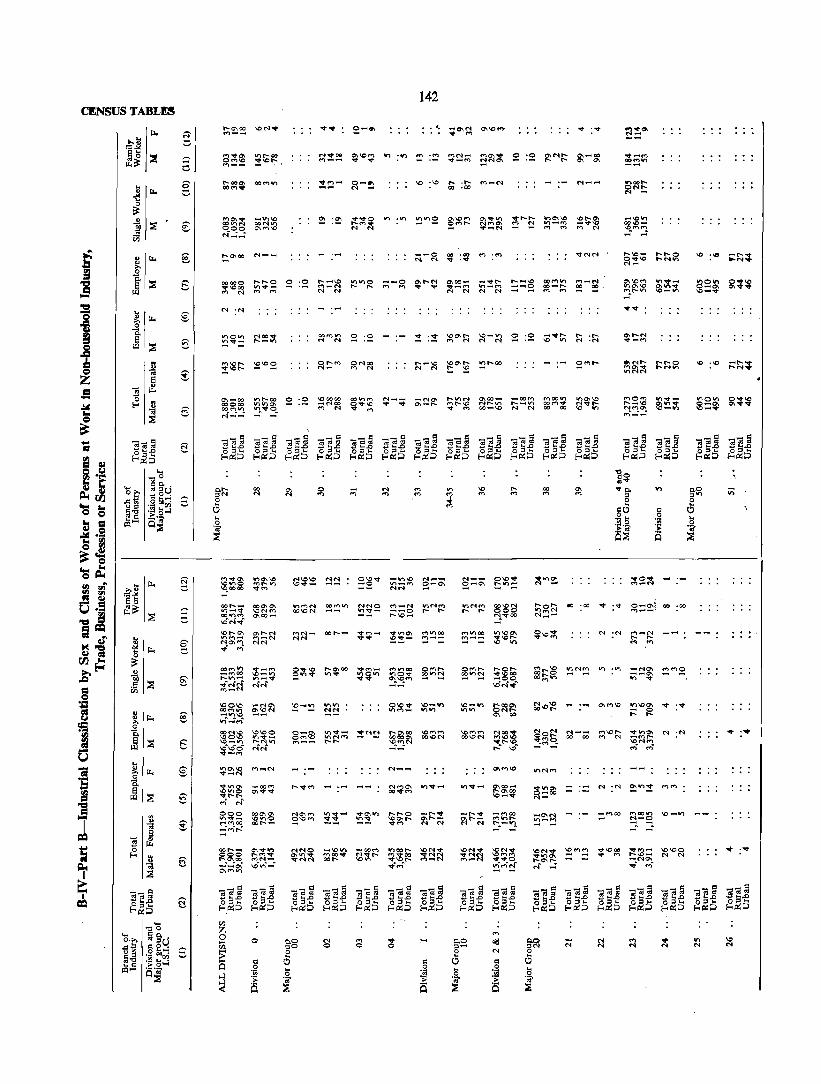
aN'SUSTABLM
~ ~ i ::!! • Oii
j
I :
"'--
co N
\00\0 _.~~
~i;{~ ~~N .,.;'_"'tf')' oo~\O \0\00 \00-.0 l()~_
~~d- ~~tn .... -....
...........
.......
.......... ..,--
o ....
." . ."
'" . ...,
142
• ' .. -O\M ... ....
.........
'" .... .... '"
01 .... '"
"''''''' In- .... .... ....
-...... '" In
co ....
... ..... N ·N
0\
'"
~~~ ~M:! t'0',t--- - -N ..:
.......
.,,"'''' - 0 .... ...
.... 'V
\() .\()
..t 'V

'" 00 .... 00
.., ·M
'" . .., on .",
.........
'" 00
143
.... eo
"'~oo "''''00 00 ... ..,
ri' ~ ........
00 00
'" ....
000'" ",\0", .... ~'"
"' .... '" ~..,oo
~vr---
00000 .... .., .... "' .... 00 M _ ..
-00"> "'''' .... "''''''' M M"
01\0«1 ~..,oo
.... 0000
..;O;~ .. N -
B SERIES
.......

'" -
. ..., . ...,
. .., . ",
o 8 8S§
...
144
~ ~~II\"'~'" otri ~
~J ~!M~~tn .... ~
... 'N
....
. ...
... .;:;
.....
:~"4~~-:a (f\ .., - ... ....
. . . . . . . . . . . .... . . . .. . . . . . . . .... .
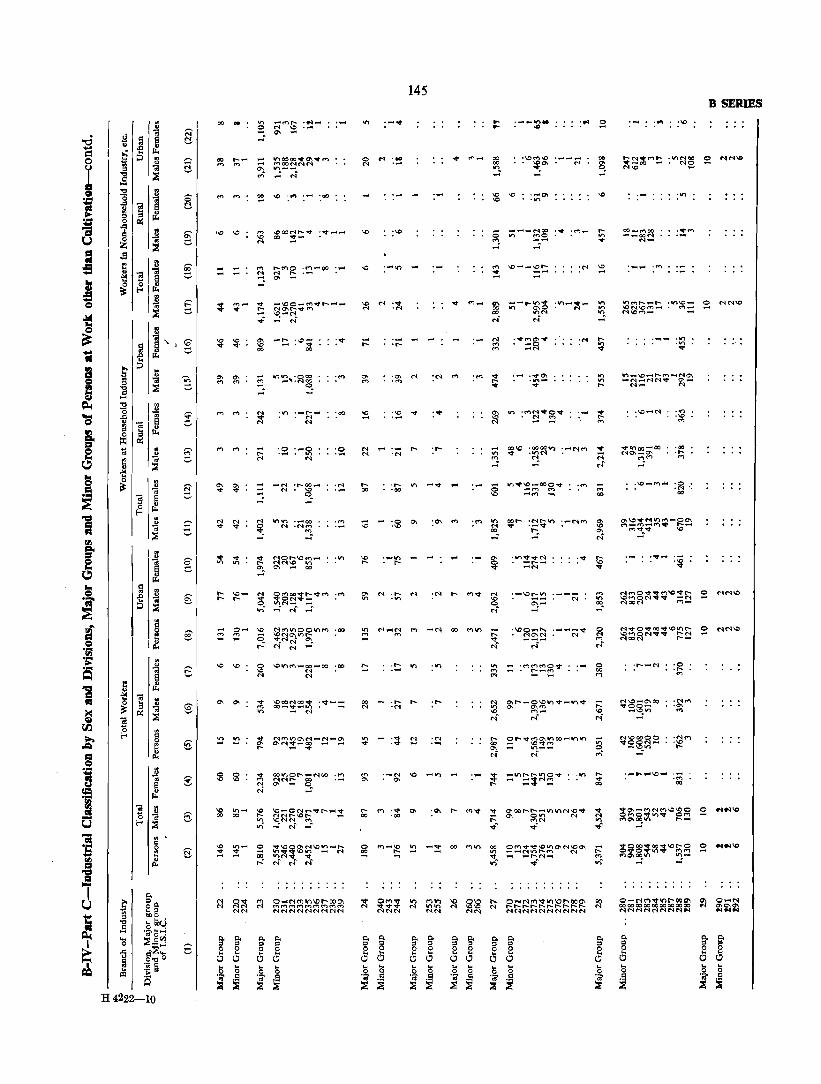
00 ..
E .. ~Cf')~ :~~QQ .~ -:.r
:~
:~
.",
-....
-'"
co M
._
. ....
145
.", M
.",
'0 '" .",
·_on .....
..... .... 'M
·on
.....
..... ('I" _ co
00 """
co on. -'" '" '"
·M .... on .r
. .r
.-~-
'"
fS ~r---_~~V)v~-n~~
~... M"'
·on .... ... 00
~OOt'-o~~I()'f)N~V ~ V~ "'ft"
.",
·on
·In .".. ....
·CD ..... '"
:"IIt- :::0 ....
·0 ..... '"
B SERIES
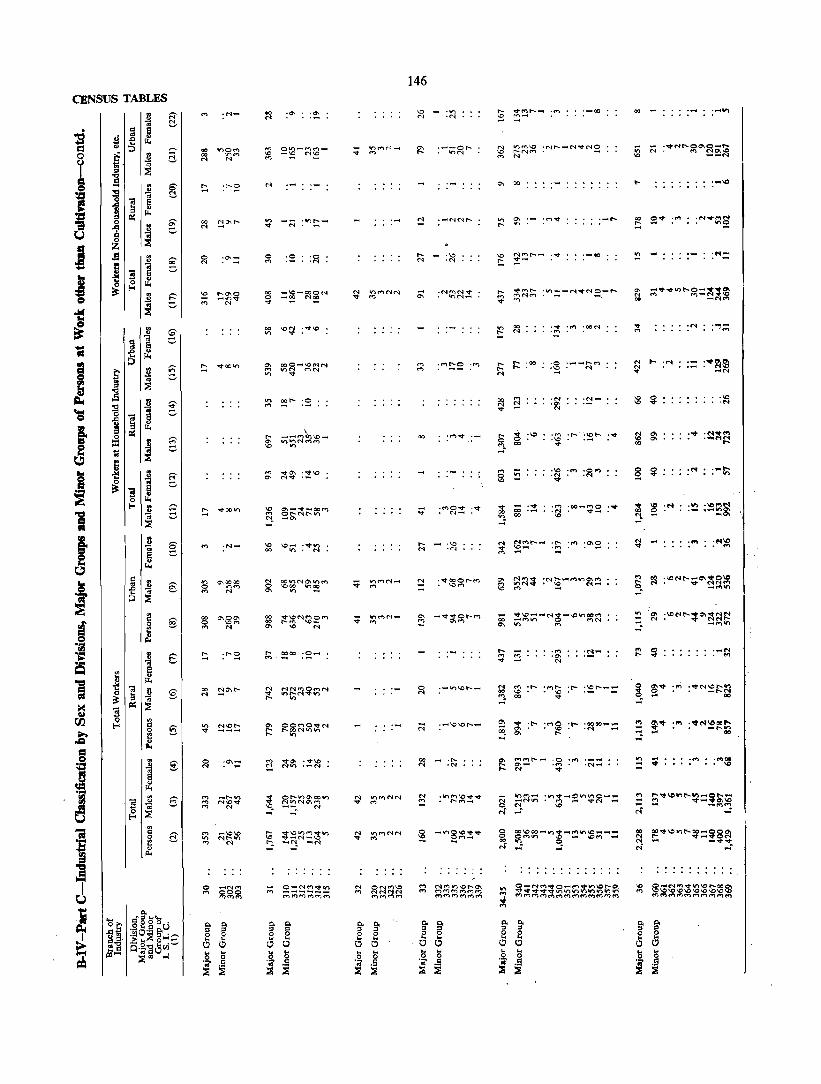
CENSUS TABLES
00 0\00\ o "'«> «> N
."" :~
'0 'M
146
'" N
r
'"
-'"
00
.... '"
. ..., • COl
·--or--. . "''''
00 .... '" .",
.... , . . . . . . .
~ ~~~ :C'1 ..... _M~N~ ..., N
. _r-
. ..,. . .-,
·0' __ l'fI') .~. N
:~-
:{2 .t'"-,,:~t-- :"IIt ..,.
.-'M _
_ ""H'f')~ '1I')"Ct-Olf'lI,f")O~tt N .. Nv) . ~ - vN -
'"
. . . . . . . . . . . . ...
00 ...
...
'M
....
: :!!::
....
.-· '...,
.-.... · on
.~IC · ...,
~ .~ :\oNI'::"'~~~ _..,on -
= !~ of"i :~N:e~~ -
. ....... . . .. , ... .
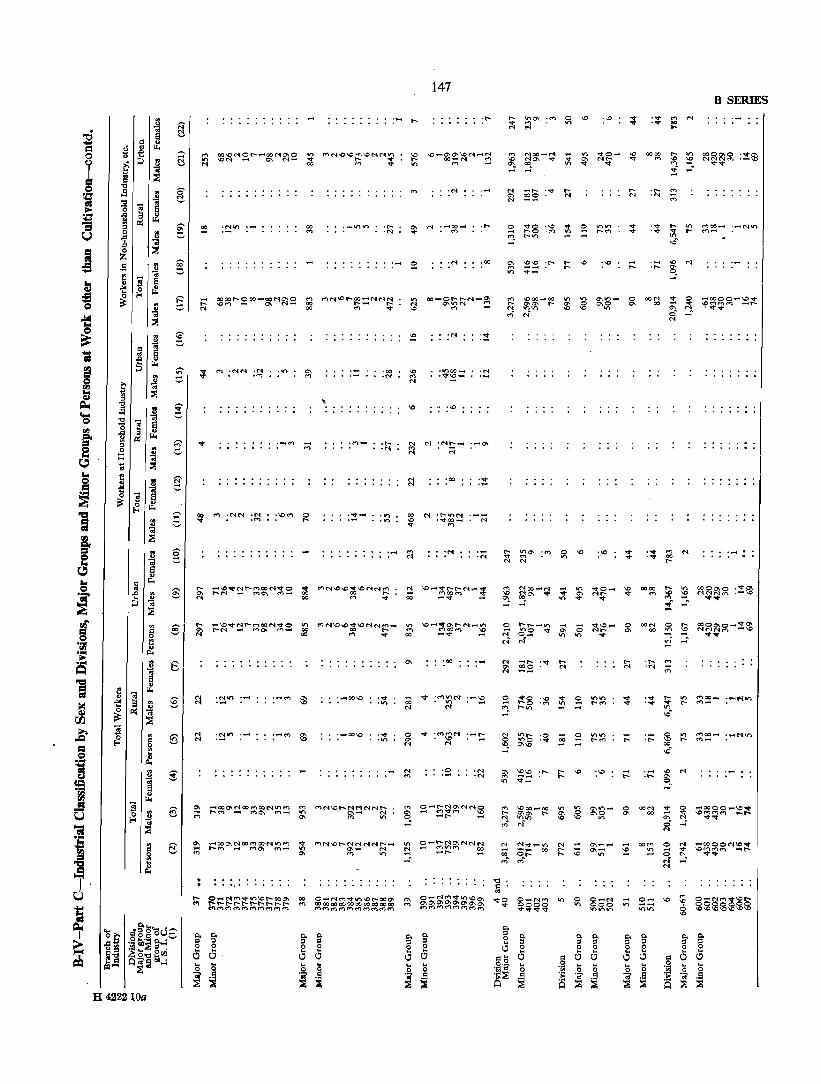
H 422210a
~ ~~M~~-~N~9 ~ MN~~~~~N~ N 00 C""l V
• or>
. .. . . . . . . . .. . , ...... .
...
..... . ",
'00 'N
·on ·on
~ (f'J(',l\O\o~\OMN~
00 "' ...
~ f:I"lN\o"'~I,OMN~_
00 "' ...
.... ·vo
.... ·on
147
.....
~ \o-~~~M-~ on '" ....
.....
.00
'" '\0
.-.", ~ \O~;;:;&;~M~~ 00 _~ .-01
""' '"
........ . ...... .
'\0
-r-o 00,",
'" 00
0000
'"
00,,", 00
B SERIES
:~ ~ ~ ~~- :-MlI')
-0
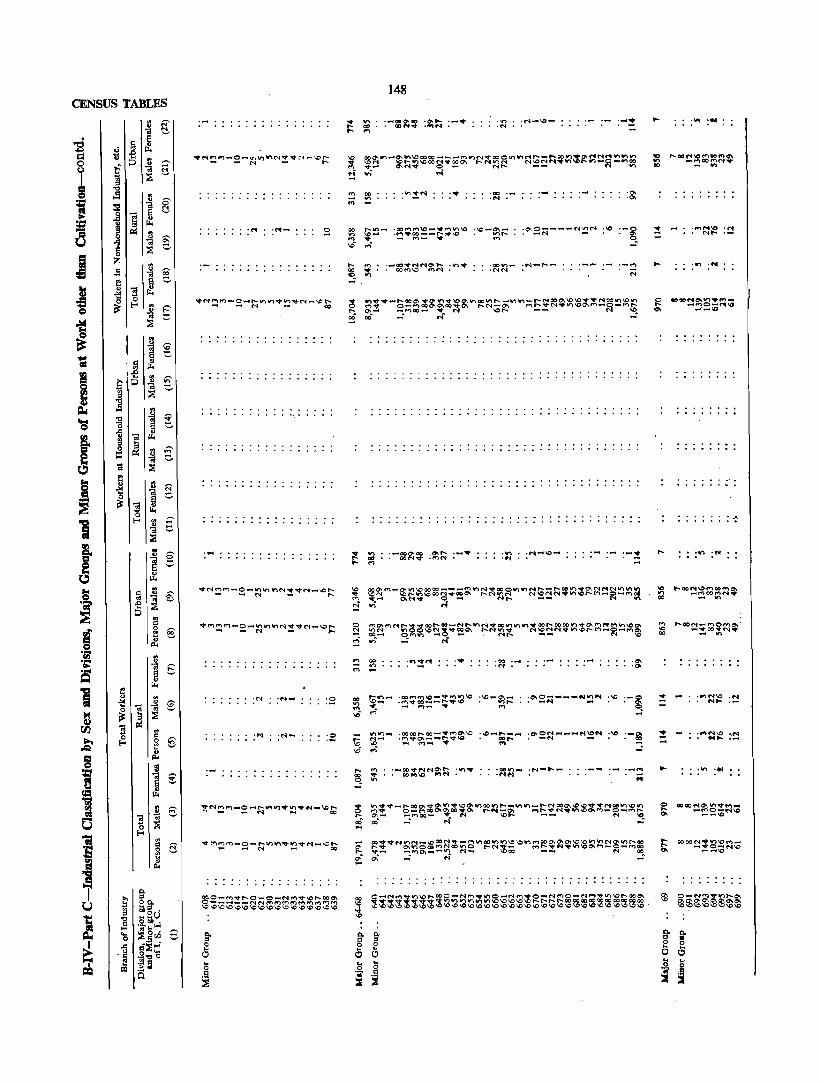
CENSUS TABLES
-t'C ·M-
"
:~
148
..... ·00 ....
® ~~_ ·oo~~~-.~~~ .~_~_ ~ ~~ ·M.~ __ ~.~ . ~~
M ~ - ~- • ~ 'IS '"
.....
.It') 'M-\Q....
·00 ·M
:&
:-~ -
~ ~!V-e~~;~~~~~~~~~~~~~t£~~~~:~~~~~~ oQ co" ...: ... r ...;
. .,., :e.I
-:~
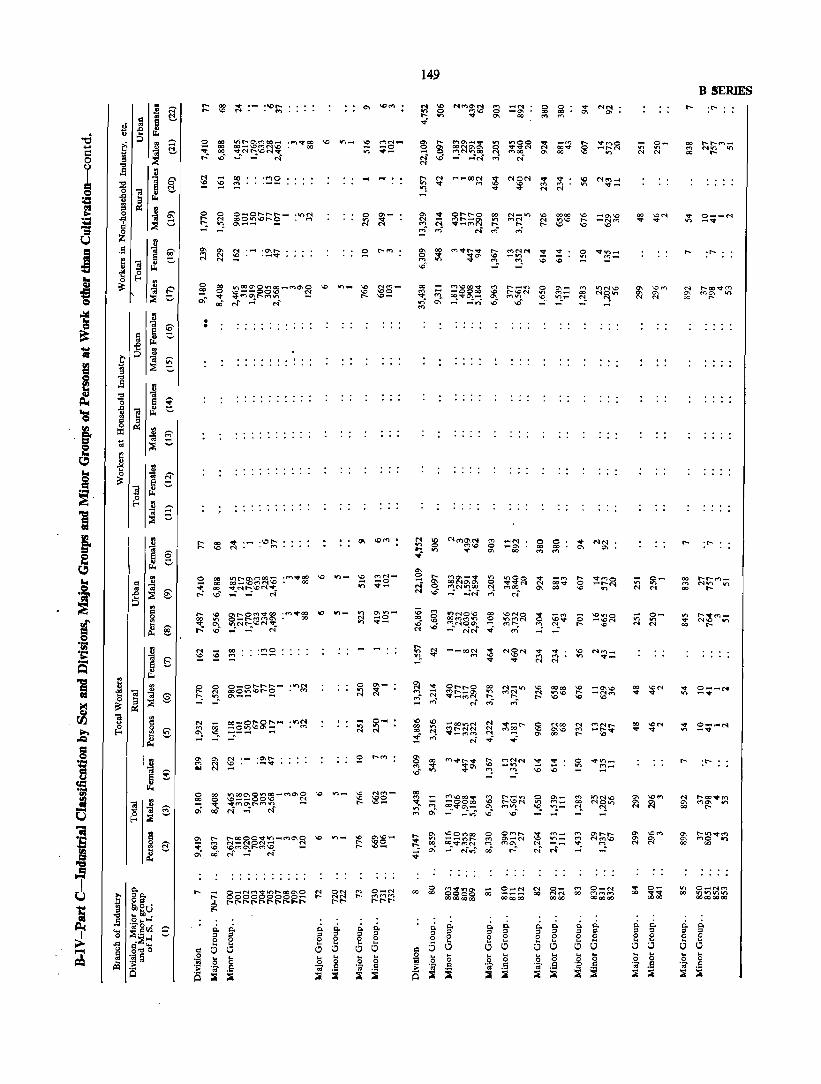
. .
."' .... . ..,
.\0 .... . ..,
.., V>_
.......
149
~ ~ N~~~ ~ ..;
10 10 00 .,., 00 "!. '! .. ~
-'" -'" 00
0_ .,., .,., N N
00 "'''' .... ....
00 "'''' .... ....
B SERIES . ....
.... .....
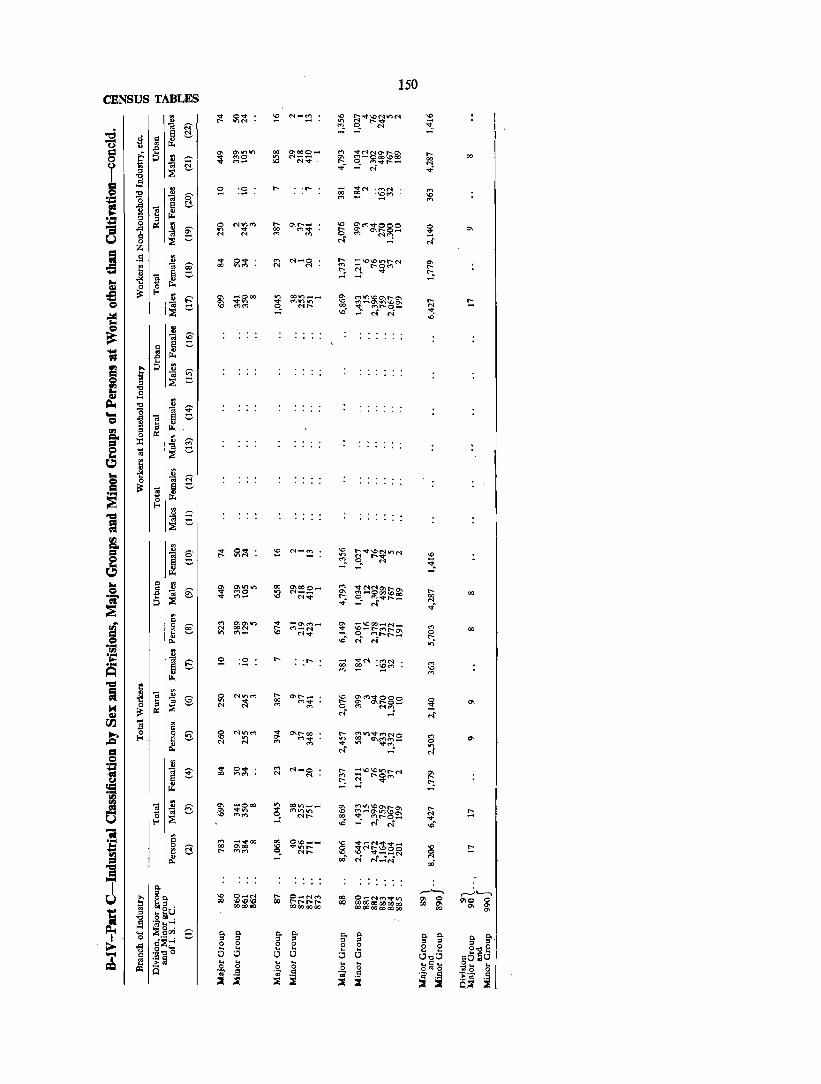
150 CENSUS TABLES
:l ;:t ~~ ~ N_~ \0 t---o:t\ONV'lN \0
'" ~ ..... ;t ~ ';;j R ""!. -d <3 § ~ c, '0 'is
= .0
~ ow',,, 00 0'1000_ '" ~NNo\t'--O'\ ..... 00 i ;:J .. "'0 '"
N __ a.. t'fi~Ooo\OOO 00 0 ., al "'- >0, N .... ..... 0 .. M...~r----
~
~ ';;j ... - - N ::g
0:1 .... :l ~ :~ ..... . ..... - ;~ ''''N '" "" 6'
00 '~M '" :Q '0 Ol '" '" I! -5 <I ~ C,
~ l'l ~ ~
0 ., 0 N~rt') ..... "' ........ 10 ~t'I'l~F:gS ~ '" :; '6 " 3 '" 00 "' .... ..... Ol N '" '" 0 C""'I NM",
U 0 ::g '" N-
i z .S tl .... 0 .... '" N-O ..... -\C\OII'\t"-M '" il Ol ~ 00 "'''' N N '" '0""( r--OM .....
~ c ~ N_ .... ":. -l! Ol
t 0 '0 ~
i6 ~ Eo< :l '" -000 '" 001.1") __
'" t'f")II()\OO'\t--O\ S '" .... '" ... "''''''' '" ~-0'1\(')\Oo... ..... ~ Ii 00 '" = '" "'''' o_ N ..... ",-
"d'" t"'lt--O_ ...
~ ".... .. N" NO.
'<i
~ ; <: e
li .. " .0 ~
! ... ;:J ~ § tl
! .g ::s .s ., :g ~ ; OS 0 .. ~ ~ EI ~ I'll 6 ~ =- ~ :I tI: &;'
~ ... ~
._,
4 ~
~ .. g ~
~ 8
:§ ~ Eo<
~ -= C
~ ~ c
I J ;:t 0 .... ~ N_~ \0 l'~\OM""'N '0 g on", on ~ ..... C1i ::: : ..
~ § ~ ~ "''''''' IX) 0'\000_ '" ;;;~8~&;~ ..... Ol € "'0 '" "'-- '" 00
~ ... "'- '" "'''' ..... 0 .. t!'l..'¢r--_ 00
~ ~ .... - N ... '" .... <':l
f Sl € '" g)~lI'i ~ -O\M_
~ --..oOO_N_
'" 00 N "'-N ~-:;;~r::~ 0 Il II'> "' ... "'''' ..... p.. '<i M" N ",-0li.! tl o£: 1 c ~ :~ ..... : ..... ;;;; ...'" .",,,,
'" s ~ '~M '0 '" '" ~
1 ~ .. :l € 0 "'on", ..... "' ........ 10 ~~~gg::: 0 EI .. on
C1i 00 "' ... .....
:!: '" ~ N '" '" 0 "'''"!. ~ ~ ~ N- N" 00. ~ a ~ ~ ~
0 N"'", ... "' ..... 00 ..... ~V\~t'I"'lNO '" Eo< '" on '" "' ... on
to O\~~_ 0 N '" '" '" .... on
8 '" N'
~ ~ ~ ... O..j- '" "''''0 ..... ~\O~~~M '" '. 00 "'''' '" '" '" ..... y 8 ~ ":.
i ~ ...
~ .. ~ '" "'000 II'>
00..,., __ $ ~~~~§~ ..... ~ ~ e '" .... '" ~- "''''''' '" !:; 0 '" "'''' N ..... 00 .... I-< ::.1 0,£ ~ ci N ",-... a '" ... ..j-OO 00
0\0 __ \0 .q- ...... N.q-~_ E 0 a 00 "'00 '" ... "' ..... @ \Z .. ~!.; .. ~s .. ~ '" ~ ~ ..... "'''' ~ N ..... 0 ; r;Q '" p.. N N_N r;Q -=
T §' ,,_,._, ,-_..,'-~ u ... 0"" '" O"'N ..... O_NM 00 O-MM"'It'lfl '" 0 910 0
~ lil.s . 00 1010'" 00 ............... r- "" ooOOoooooocb 00 '" '" '" 000000 0000-0000 <XlOOOOQOOOQO 00
'" ~ "" !ll;j,~ 0:1 '6' 1-<1-1 .... ::s 0 . ~
"" ._
0:1'" §' "" "" 15' §' '" '" 15' 5'1 ~ 0
g~: ._, :s :s :s :s :s
~ 0 0 0 0 8 0 o 0 0",,0 ... ... ... ...
c'5 '1 .~"" 0 0 0 0 0 0 C5",C5 ]~~~I ~ :~ ~ ... ... ... ... ... ... ... 0:1 ...
== 0 0 .52, 0 .52, 0 0010 "0 0 A .;; :i 01 ~ .. ~ .... S
~i ~ ::a ~ = ::a ::a
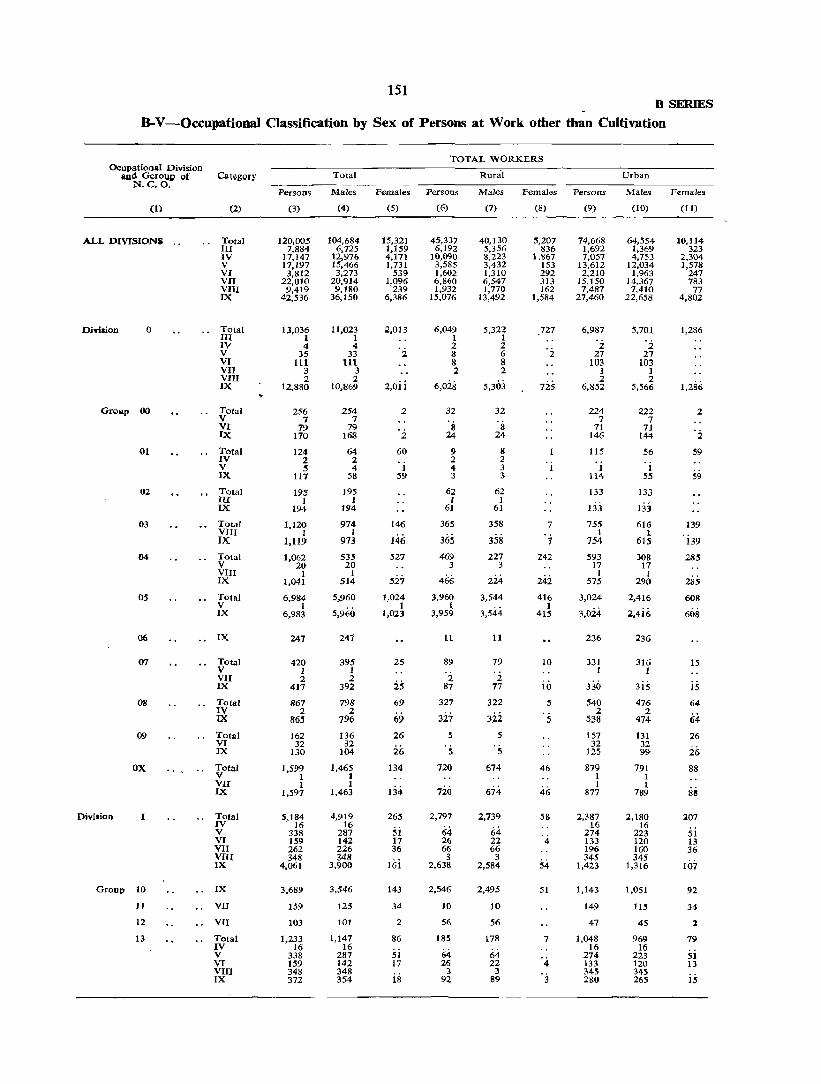
151 B SERIES
B-V-Occupational Classification by Sex of Persons at Work other than Cultivation
Ocupational Division 1Ulc1 Gcroup of Category
N.C.O.
(I)
ALL DIVISIONi "
Di.ision o
Grollp 00
01
02
03
04
os
06
07
08
09
ox
Divilion I
Group 10
11
12
13
(2)
Total III IV V VI VII VIII IX
Total III IV V VI VII VIII IX
Total V VI IX
Total IV V IX
Total III IX
Total VIII IX
Total V VIII IX
Total V IX
IX
Total V VII IX
Total IV IX
Total VI IX
Total V vn IX
Total IV V VI VII VIII IX
IX
VII
VII
Total IV V VI Vin IX
Persons
(3)
120,OO.s 7,884
17,147 17,197 3,812
22,010 9,419
42,536
13,036 1 4
35 Itt
3 2
12,880
256 7
79 170
124 2 5
117
195 1
194
1,120 1
1,119
1,062 20
1 1,041
6,984 1
6,983
247
420 1 2
417
867 2
86~
162 32
130
1,599 1 1
1,597
5,184 16
338 159 262 348
4,061
3,689
159
103
1,233 16
338 159 348 372
Total
Males
(4)
104,684 6,725
12,976 15,466 3,273
20,914 9,180
36,150
11,023 1 4
33 111
3 2
10,869
254 7
79 168
64 2 4
58
195 1
194
974 1
973
535 20
1 514
5,960
5,960
241
395 1 2
392
798 2
796
136 32
104
1,465 1 1
1,463
4,919 16
287 142 226 348
3,900
3,546
125
101
1,147 16
287 142 348 354
TOTAL WORKERS
Females Persons
(5)
15,321 1,159 4,171 1,731
539 1,096
239 6,386
",013
2
2,oii
2
'2 60
1 59
146
146
527
527 1,024
1 1,023
25
25 69
69
26
26 134
134
265
si 17 36
16i
143
34
2
86
51 17
18
(6)
45,337 6,192
10,090 3,585 1,602 6,860 1,932
15,076
6,049 1 2 8 & 2
6,Oig
32
·s 24
9 2 4 3
62 I
61
365
365 469
3
466 3,960
I 3,959
11
89
'i 87
327
327 5
5
720
7io
2,797
64 26 66
3 2,638
2,546
JO
56
18.5
64 26
3 92
Rural
Males
(7)
40,130 5,356 8,223 3,432 1,310 6,547 1,770
13,492
5,322 1 2 6 8 2
5,303
32
's 24
8 2 3 3
62 1
61
358
358
227 3
224
3,544
3,544
11
79
2 77
322
3:ii 5
5
674
674
2,739
64 22 66
3 2,584
2,495
10
56
178
64 22
3 89
Females Persons
(8)
5,207 836
1.867 153 292 313 162
1,584
.727
'2
7
1
242
24i 416
I 415
10
46
46
4
54
51
7
4
3
(9)
74,668 1,692 7,057
13,612 2,210
15,150 7,487
27,460
6,987
2 27
103 1 2
6,852
224 7
71 146
115
1 114
133
l:ij
755 I
754
593 17
1 575
3,024
3,024
236
331 1
330
540 2
538
157 32
125
879 1 1
877
2,387 16
274 133 196 345
1,423
1,143
149
47
1,048 16
274 133 345 280
Urban
Males
(10)
64,554 1,369 4,753
12,034 1,963
14,367 7,410
22,658
5,701
2 27
103 1 2
5,566
222 7
71 144
56
1 55
133
133 616
1 615
308 17 1
290
2,416
2,4ii;;
236
316 1
3is 476
2 474
131 32 99
791 1 1
789
2,180 16
223 120 160 345
1,316
1,051
115
45
969 16
223 120 345 265
Females
(11)
10,114 323
2,304 1,578
247 783
77 4,802
1,286
1,286
2
2
59
59
139
. i39
285
285 608
608
15
is
64
64-26
26 88
l07
5i 13 36
107
92
34
1
79
51 13
is

152 CENSUS TABLES
B-V -Occupational Classification by sex of Persons at Work other than Cultivation-contd.
TOTAL WORKERS Occupational Division
and Group of N.C.O.
Category Total _ Rural Urban
Persons Males Females Persons Males Females Persons Males Females
(1) (2) (3) (4) (5) (6) (7) (8) (9) (10) (11)
Division 2 Total 10,991 10,421 510 1,312 1,257 55 9,679 9,164 ~15 III 20 20 8 8 12 12 IV 26 26 26 26 28 V 1,474 1,446 28 8 8 1,466 1,438 VI 196 196 27 27 169 169
26 VII 1,622 1,596 26 48 48 1,574 1,548 VIII 608 604 4 16 15 1 592 589 3 IX 7,04!! 6,533 512 1,205 1,151 54 5,840 5,382 458
Group 20 Total 1,281 1,222 65 235 235 1,052 987 65 V 114 162 12 114 162 12 VII 413 413 8 8 405 405 VIII 47 47
53 4 4 43 43 sj IX 653 600 223 223 430 377
21 Total 355 355 1 7 348 348 V 29 29 29 29 VII 50 50 50 50 VIII 6 6 '7
6 6 IX 270 270 7 263 263
22 Total 10 10 2 2 8 8 V 8 8 8 8 VII 1 I 1 1 IX I 1 1 1
28 Total 5,596 5,415 181 609 606 3 4,987 4,809 178 III 16 16 8 8 8 8 IV 26 26 26 26
ii V 840 829 11 7 7 833 822 VI 129 129
ii; 25 25 104 104
ii; VII 601 575 35 35 , i 566 540 VIII 478 475 3 12 II 466 464 2 IX 3,506 3,365 141 522 520 1. 2,984 2,845- 139
Z9 Total 3,743 3,419 324 4~9 407 52 3.284 3,012 27'). III 4 4 ·s . i 4 4 '5 V 423 418 1 422 417 VI 67 67 2 2 65 65 VII 557 557 , i 4 4 553 553 . i VIII 77 76
52 17 76
IX 2,615 2,297 318 452 400 2,163 1,897 266
Divialon 3 Total 19,838 18,838 1,000 6,731 6,418 313 13,107 d,420 687 V 2 2 1,000 6,73i 6:;U8
2 2-687 VII 19,836 18,836 313 13,105 12,418
Group 30 VII 13,946 13,252 694 5,745 5,464 281 8,201 7,788 413
31 VII 520 516 4 43 43 477 473 4
32. Total 371 370 4 4 367 366 V 2 :2 '4 2 2 VII 369 368 4 365 364 1
U VII 4,906 4,605 301 927 895 32 3,979 3,710 269
34 VII 95 95 12 12 83 83
Division 4 Total 8,553 7,398 1,155 6,830 5,909 921 1,123 1,489 234 III 7,172 6,288 884 5,914 5,154 760 1,258 1,134 124 IV 1,327 1,057 270 862 702 160 465 355 110 V 2 2 2 2 IX 52 51 S2 51 1
Group 40 Total 1,269 1,065 204 81 2.1 60 1,188 1,044 144 III 836 730 106 81 21 60 755 709 46 IV 433 335 98 433 335 98
41 Total 5,269 4,653 616 4,855 .,322 533 414 331 83 III 4,345 3,899 446 3,961 3,587 374 384 312 72 IV 870 701 169 840 682 IS8 30 19 11 V 2 2 2 2 IX 52 51 52 51 1
42 In 300 226 74 300 226 74
41 Total 788 632 156 713 563 150 75 69 6 III 765 611 lS4 692 543 149 73 68 5 IV 23 21· 2 21 20 1 2 1 ' 1
44 Total 927 822 105 881 777 104 46 45 III 926 822 104 880 177 103 46 45 IV 1 1 1 1
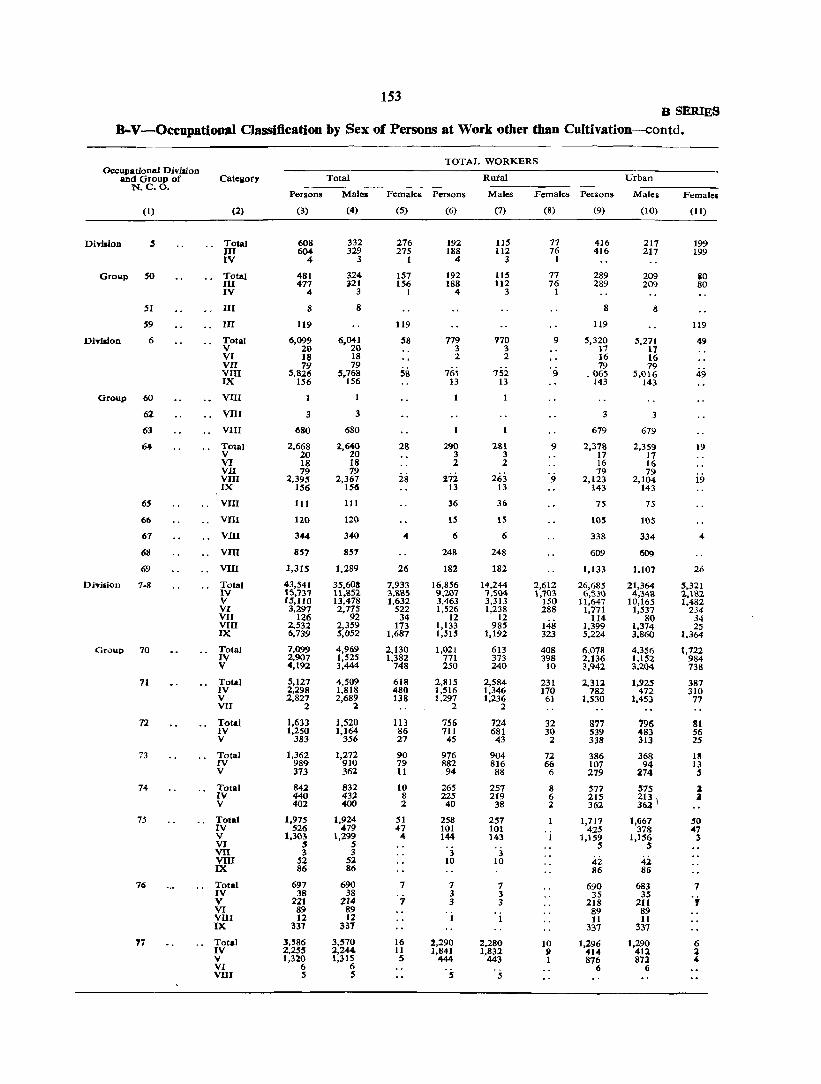
153 B SERIES
B-V-Occupational Classification by Sex of Persons at Work other than Cultivation-contd.
Occupational Division and Group of
No Co 00
(I)
DiYiJion ,
Grollp '0
DiYiJlon
51
'9 6
Group 60
62
63
64
65
66
61
68
69
GNllp 70
71
72
73
74
75
76
77
Catellory
(2)
Total III IV Total III IV
III
III
Total V VI VII VIII IX
VUI
VIII
VllI
Total V VI VlI VIII IX
VIII
00 VIII
VIII
VIII
VIII
Total IV V VI VII VIII IX
Total IV V
Total IV V VII
Total IV V
Total IV V
Total IV V
Total IV V VI VII YIlI IX
Total IV V VI VUl IX
Total IV V VI VIII
TOTAL WORKERS
Total Ruial
Persons Males Females Persons Males
(3) (4) (5) (6) (7)
608 6().4.
" 481 477
4
8
119
6,099 20 18 79
5,826 156
3
680
2,668 20 18 79
2,395 156
III
120
344
857
1,315
43,541 15,n7 LS,IIO 3,297
126 2,532 6,739
7,099 2,907 4,192
5,127 2,298 2,827
2
1,633 1,250
383
1,362 989 373
842 440 402
1,975 526
1,303 5 3
52 86
697 38
221 89 12
337
3,586 2,255 1,320
6 5
332 329
3
324 ;121
3
8
6,041 20 18 79
5.768 156
3
680
;t,6~g
18 79
2,367 156
111
120
340
857
1,289
35,608 H,S52 13,478 2,775
92 2,359 5,OS2
4,969 1,525 3,444
4,509 1,818 2,68i 1,520 1,164
356
1,272 910 362
832 432 400
1,924 479
1,299 , 3
5l 86
690 38
214 89 12
331
3,579 2,244-1,315
6 5
276 275
1
157 156
1
119
58
58
28
2S
4
26
7,933 3,885 1,632
522 34
173 1,687
2,130 1,382
748
618 480 138
113 86 27
90 79 11
10 8 2
51 47
"
7 OJ
16 11 5
192 188
4
192 188
4
779 3 2
76i 13
290 3 2
17i 13
36
15
6
248
182
16,856 9,207 3,463 1,526
12 1,133 1,515
1,021 771 250
2,815 1,516 1.297
2
756 711 45
976 882 94
265 225 40
258 101 144
3 10
7 3 3
. i
1,290 1,841
444
5
115 112
3
115 112
3
770 3 2
752 13
281 3 2
263 13
36
15
6
248
182
14,244 7,5(14 3,313 1,238
12 985
1,192
613 373 240
2,584 1,346 1,236
2
724 681 43
904 816 88
257 219
38
257 101 143
3 10
7 3 3
1
2,280 1,832
443
5
Urban
Females Persons Males
(8) (9) (10)
77 76
1
77 76
1
9
9
9
2,612 1,7(13
150 288
148 323
408 398 10
231 170 61
32 30
2
72 66
6
8 6 2
10 II 1
416 416
289 289
8
119
5,320 17 16 79
• (165 143
3
679
2,378 17 16 79
2,123 143
75
lOS
338
609
1,133
26,68S 6,53(1
11,647 1,771
114 1,399 5,224
6,078 2,136 3,942
2,312 782
1,530
877 539 338
386 107 279
577 215 362
1,717 425
1,159 5
42 86
690 35
218 89 11
337
1,296 414 876
6
217 217
209 209
8
5,271 17 16 79
5,016 143
3
679
2,359 17 16 79
2,104 143
75
105
334
609
1.10'7
21,364 4,34'<1
10,165 1,537
80 1,374 3,860
4,356 1,152 3.204
1,925 472
1,453
796 483 313
368 94
274
575 213 \ 361
1,667 378
1,156 5
42 86
683 35
2ll 89 11
337
1,290 41:1 87l
6
Female.
(11)
199 199
iO 80
119
49
49
19
19
26
5,321 2,\82 1,482
234 34 25
1,364
t,722 984 138
387 310
77
81 56 25
IS 13 5
2 i
50 47
3
7 OJ
6 :1 4

154 CENSUS TABLES
B-V-Occupational Classification by Sex of Persons at Work other than Cultivation-contd.
TOTAL WORKERS
Occupational Divtsien Category Total Rural Urban 1Ul<1 Group of
N,C. o. Persons Males Females Persons Males Females Persons Maleil Female.
(1) (2) (3) (4) (5) (6) (7) (8) (9) (10) (11)
Group 78 Total 53 38 15 7 5 2 46 33 13 IV 5 3 2 5 3 2 V 1 I 1 1 33 VI 46 33 I3 . i 46 13 VIII 1 I I
79 Total 2,175 1,874 301 722 587 136 1,453 1.287 166 V 11 11
3(ii 722 587- 13.5 11 11
VI 2,164 1.863 1.442 1.276 166
80 Total 287 269 18 53 37 16 234 232 2 IV 11 11
i8 37-11 11
V 276 258 53 16 223 221 2
81 Total 2,476 1,739 737 1,670 1,274 396 806 465 341 IV 2,048 1,486 562 1,608 1,221 387 440 265 175 V 428 253 175 62 53 9 366 100 166
12 Total 3,075 2,714 361 l'268 1,122 146 1,807 1,59l liS IV 996 769 227 61 429 132 435 340 95 V 2,079 1,945 134 5707 693 14 1,372 1,252 120
83 Total 91 83 8 5 5 86 78 II IV 33 33 4 4 29 29 V 58 SO S 1 1 57 49 i ,
84 Total 161 91 70 15 9 6 146 82 64 IV lOa 42 58 6 3 3 94 39 5S V 61 49 12 9 6 3 52 43 9
i5 Tntal 2.010 1,020 990 965 460 505 1,045 560 485 IV 1,801 862 939 940 440 500 ·861 422 439 V 171 120 51 23 18 5 148 102 46 IX 38 38 2 2 36 36
Total 142 142 10 10 132 132 V 9 9 7 7 2 2 VII 4 4 3 3 1 I VIII 25 25 25 25 IX 104 104 104 104
87 Total 208 208 169 169 39 39 IV 32 32 32 32
i3 V 141 141 128 128 13 VI 32 32 6 6 26 26 VIII 1 1 1 1 IX 2 2 2 2
89 Total 10,542 8,144 2,398 3,584 2,940 644 6,95~ 5,204 1,75! IV 8 4 4 1 1 3 V 854 562 ~2 155 135 20 699 427 272 VI 955 747 208 798 645 153 IS7 102 5S VII 117 83 34 4 4 113 7<} 34 VIII 2,436 2,263 173 I,JlS 967 148 1,321 1,296 25 IX 6,172 4,485 1,687 1,511 1,188 323 4,661 3,297 1.364
DIYidon 9 .. Total 12,004 9.976 2,028 3,7~i 3,334 433 8,23~ 6,64~ 1,595 III 87 87 81 IV 7 4 '3 7 4 3
153 V 189 179 10 36 35 I 144 9 VI 31 31 13 13 18 18 VII 82 82 I 1 ·4 81 81 VIII 99 95 4 19 15 80 80
1,586 IX 11.509 9,498 2,011 3,610 3,185 425 7,899 6,313
Gro.p 90 Total 2.792 2,754 38 1,028 1,020 8 1,764 1,73: 30 III 81 87 81 81 6 V 110 ) 10 6 6 104 104 VI 15 IS 7 7 8 8 VII 81 8) 1 1 80 80 VIII 7J 68 3 14 11 3 57 57
30 IX 2.428 2,393 35 919 914 5 1,509 1,479
91 Total 3,021 1,930 1,097 676 484 192 2,351 1.446 905 V 25 21 4 3 2 1 22 19 3 VIII 10 10
1,093 613 10 10
IX 2,991- 1,899 482 191 2,319 1,417 90:i
92 Total 1,781 1,736 45 90 90 1.691 1,646 45 V 32 32 4S 27 27 5 5 IX 1.749 1,704 63 63 1.686 1,641 45
93 Total 891 483 408 173 133 40 718 350 368 IV 7 4 3 7 4 3 V 22 16· 6 ·6 '6 22 16 6 VI 16 16 10· 10 VII I )
'i ·S . i I 1 VIII 18 17 4 13 13 IX 827 429 398 155 119 36 672 310 362

155 8 SERIES
B-V -Occupational Classification by Sex of Persons at Work other than Cultivation-conc1d.
TOTAL WORKERS Occupational Divaion
and Group of Category Total, Rural Urban N.C.O.
Persons Males Females PerioDi Males Females Persons Males Females
(1) (2) (3) (4) (5) (6) (7) (8) (9) (10) (11)
Group 94 IX 1,939 1,909 30 1,330 1,300 30 609 609
9~ IX 1,127 722 405 433 270 163 694 "~2 242
97 IX 132 129 3 12 12 120 117 3
99 IX 315 313 2 25 25 290 288 2
Dvision X Total lSI 128 23 24 22 2 127 106 21 IV 26 14 12 8 8 18 6 12 V 27 19 8 1 1 26 18 8 VIII 4 4 .. 4 IX 94 91 3 IS 13 2 79 711 . i
Group X8 Total 140 119 21 13 13 127 106 tl IV 19 7 12 I 1 18 6 12 V 27 19 8 1 1 26 18 8 VIII 4 4 4 .. IX .. 90 89 1 11 II 79 7. I
X9 Total 11 9 2 11 9 2 IV 7 7 7 7 IX 4 1. 1 4 1 1.
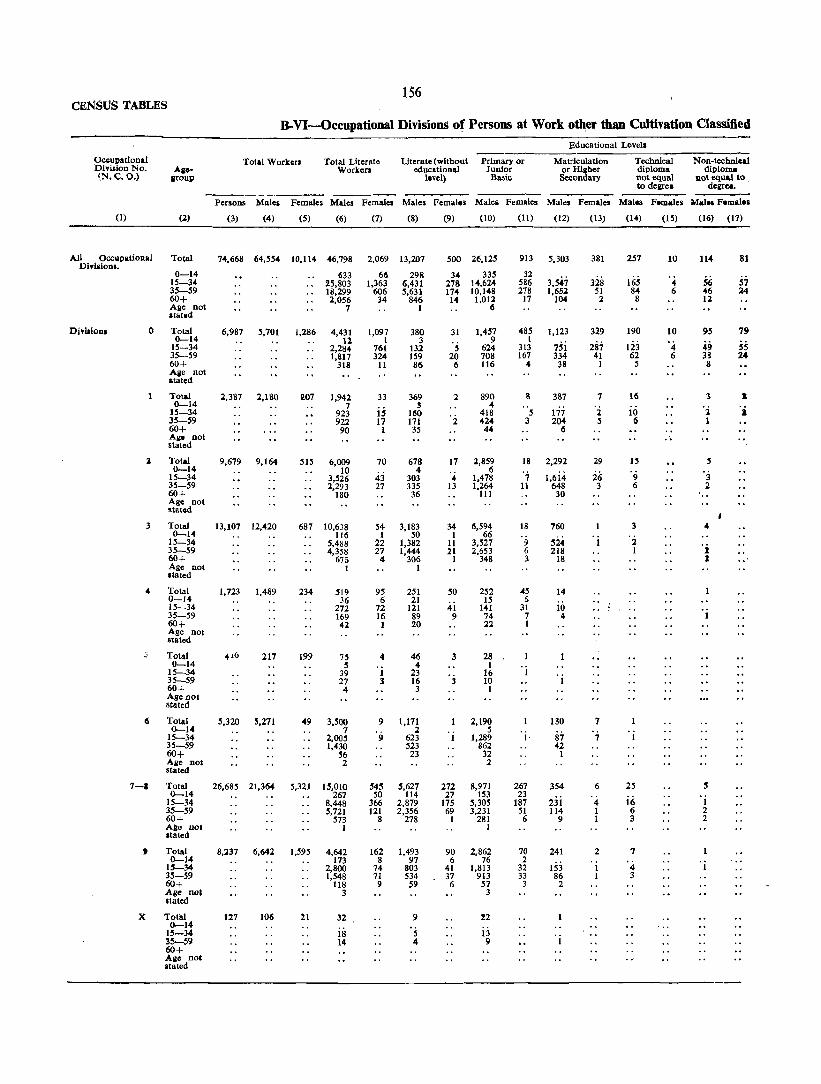
156 CENSuS 'tABLES
B-VI-Occupational Divisions of Persons at Work oth.er than Culthation Classified
Educational Levels
Oceupat!onal Total Workers Total Literate Literate (without Primary or Matriculation Technical Non-technical Division No, Ale- Workers educational Iunlor or Wilber diploma diplom. ~N,C,O.) aroup l.vel) BlI3ic Secondary not equal Ilotequ .. lto
to dellfe. dellfee, .
Persons Males Females Male. Female. Male. FernalllS Male. Female. Males Female. Males Females Mal .. Femal.»
(1) (2) (3) (4) (5) (6) (7) (8) (9) (10) (11) (12) (13) (14) (13) (16) (17)
All Occupational Divia!onl,
Total 74,668 64,554 10,114 46,798 2,069 13,207 300 26,125 1113 5,303 381 257 10 114 81
0-14 633 66 298 34 335 3l 3,547 328 lii~ 56 57 15-34 25,803 1,363 6,431 278 14,624 586 4
35-59 18,299 606 5,631 174 10,148 278 1,652 51 84 6 46 24 60+ 2,036 34 846 14 1 ,Oil 17 104 2 8 12 Age not 7 1 6 stated
Dhillon. 0 Total 6,987 5,701 1,286 4,431 1,097 380 31 1,457 485 1,123 329 190 10 95 79 0-14 11 1 3 9 1
287 55 15-34 2,284 761 III 5 624 313 751 123 4 49 35-59 1,817 324 159 20 708 167 334 41 62 6 38 24 60+ 318 11 86 6 116 4 38 1 5 8 Age not stated
Total 2,387 2,180 207 1,942 33 369 2 890 8 387 7 16 3 • 0-14 7 5 4 ':i 15-34 923 15 160 418 5 177 2 10 S 35-59 922 17 171 2 424 3 204 :5 6 1 60+ 90 1 35 44 6 Aile not ,. stated
3 Total 9,679 9,164 51S 6,009 70 678 17 2,859 18 2,292 29 13 3 0-14 10 4 6 '7 26 'j 13-34 3,326 43 303 4 1,478 1,614 9
35-59 2,293 27 335 13 1,264 11 648 3 6 2 60+ 180 36 III 30 .. Age not stated
3 Total 13,107 12,420 687 10,638 54 3,183 34 6,594 18 760 3 4 0-14 116 1 SO 1 66
'9 :524 '2 15-34 5,488 22 1,382 11 3,527 1 'j 35-59 4,358 27 1,444 21 2,653 6 218 1 60+ 675 4 306 1 348 3 18 1 ,. Age not 1 1 stated
4 Total 1,723 1,489 234 519 95 251 50 252 45 14 0-14 36 6 21 15 6 15-34 272 72 121 41 141 31 10 35-59 169 16 89 9 74 7 4 60+ 42 1 20 II I Age not stated
Total 4,6 217 199 75 4 46 3 28 0-14 5 4 I
15-34 39 1 23 16 I 35-59 27 l 16 3 10 60+ 4 3 1 Age not stated
CI Total 5,320 5,271 49 3,500 9 1,171 2,190 130 7 0-14 7 l 5
15-34 2,005 I} 623 1,289 I 87 7 1 35-59 1,430 523 862 42 60+ 56 23 32 1 Ale not 2 2 stated
7-' Total 26,685 21,36<4 5,321 15,010 545 5,627 272 8,971 267 354 6 25 5 0-14 267 SO 114 27 153 23
23i iii ' i 15-34 8,448 366 2,879 175 5,305 187 4 35-59 5,721 121 2,356 69 3,231 51 114 I 6 2 60+ 573 8 278 1 281 6 9 1 3 2 A~e not 1 I .tated , Total 8,l37 6,642 1,595 4,642 162 1,493 90 2,862 70 241 2 7 0-14 173 8 97 6 76 2
15-34 2,800 74 803 41 1,813 32 153 4 1 35-59 1,548 71 534 37 913 33 86 3 60+ 118 9 59 6 57 3 2 Age not .tated
3 3
X Total 127 106 21 32 9 %2 0-14
is 1:5-34 5 13 35-59 14 4 9 60+ Age not stated

157 B &ERlES
by Sex, Broad Age-groups and Educational Levels in Urban Areas only Educadonal Levels
Unlverllty degree or post-llrad uato Technical degree Or diploma equal to dellree or post-graduate dellree
OccupAtional de/lIe<: other Ap-than tcchnieal Enameering Medicin~ Agriculture Veterinary and Technology Teaching Others ,roup. Dividon No.
degree Dairyinll (N. C. 0.)
Wales Fcmllca Males Females Males Female. Male. Female. Males Female. Males Female. Male. Females Males Fe-
(18) (19) (20) (21) (22) (23) (24) (25) (26) (27) males
(28) (29) (30) (31) (32) (33) (I) (2)
1.109 63 61 9~ 12 53 t:l 8 221 94 236 15 Total .. All Occupational Division •.
~9; 0-14 « 37 41 9 38 9 5 86 43 169 14 15-34
461 18 22 41 3 14 3 3 130 51 64 1 35-59 53 1 1 10 I 5 3 60+ .. Agenot
stated
651 49 48 91 10 22 9 5 201 89 159 H Total Dh1.ioJl 0
306 32 40 i6 Iii 0-14
34 8 7 3 79 41 14 15-34 296 15 15 41 :l 5 2 2 118 48 37 1 35-59 49 1 10 I 4 60+
Age not .tated
200 8 8 , 17 3 2 12 4 34 Total
lio ." ·3 .j ii ·5 0-14 2 2 1 21 15-34
87 1 4 5 1 7 3 12 35-59 3 1 1 1 60+ Agenol .tat.d
135 5 1 18 Total J
104 0-14 5 4 11 15-34
30 3 5 35-59 I 1 60+
Age not Itated
.,4 3 3 12 Total 15-34
41 1 1 9 35-59 34 2 3 60+
Allenol stated
Total 0-14
1 15-34 35-59 60+ Aile not stated
Total 0-14
15-34 35-59 All' not .Iated
g Total 0-14
5 15-34 3 35-59
60+ Aile not stated
15 2 2 T Total T-' io 0-1"
1 3 15-34 5 1 4 35-59
60+ Aile not stated
23 6 3 6 Tot .. 1 9 0-14
18 S 3 15-34 5 1 3 3 35-59
60+ Aile not stated
Total 10 0-14
15-34 35-59 60+ Age not stated
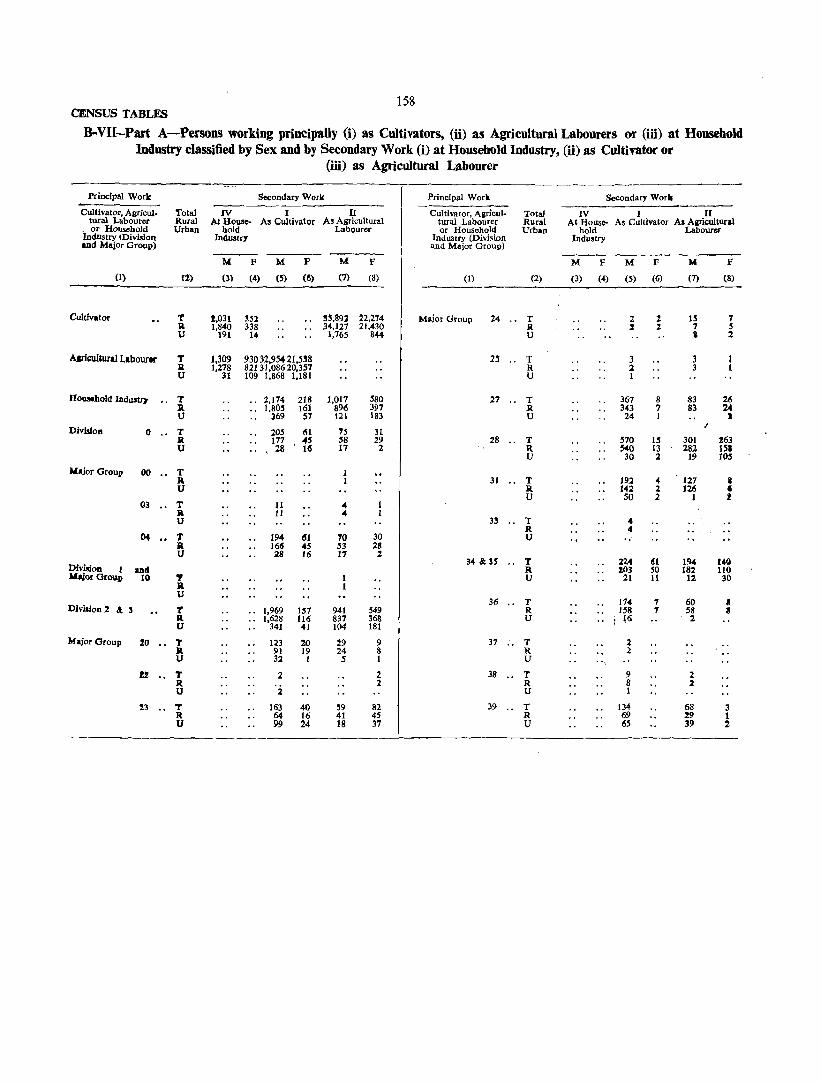
158 CENSUS TABLES
B-VU-Part A-Persons working principally (i) as Cultivators, (ii) as Agricultural Labourers or (iii) at Household Industry classified by Sex and by Secondary Work Ci) at Household Industry, (ll) as Cultivator or
Principal Work
Cultivator, Agricul-tural Labourer
. or Household Industry (Division and Major Group)
(I)
Cultivator
AJrl,uItural Labour.
Houaehold Industl'7
Total Rural Urban
(1)
T Il U
T Jil U
T It U
Divisloll o ., T R U
Wajor Group 00
03
Division 1 anel Wajor Group 10
Divlalon 2 a: 3
Major Group 20
!%
T It U
T .R U
?: Il U
l' 1l U
T R U
T R U
T R U
23 " T R U
(iii) as Agricultural Labourer
Secondary Work
IV I II AllJousc- As Cultivator As Agricultural
hold Labourer IndustrY
M F M F
m (4) (5) (6)
M
(7)
F
(8)
t,031 Bl 1,840 338
3~,891 22,274 .• 34,127 21,430
191 14
1,309 1.278
31
93032,95421,538 82131,08620.357 109 1,868 1.181
.. 2,174 218
.. 1.80S 161 169 57
20S 61 177 4$ 28 16
11 11
194 166 28
., 1,969
., 1,628 341
~1 4S 16
IS7 Wi 41
123 20 III 19 32 1
2
2
163 40 64 16 99 24
1,765 844
1,017 896 121
15 S8 17
10 S3 17
941 837 104
19 24 5
S9 41 18
580 397 183
31 29 2
30 28 1
549 368 181
9 8 1
2 2
82 45 37
Princlpal Work
Cultivator, Aificultural Labourer or Household
Industry (Division aud Major Group)
Total Rural Urban
(ll
Maior Group
(2)
24 ., T R U
2~ ., T R U
27 .• T R U
28 " T R U
31 " T R U
33 " T R U
34 &3S .. T .R U
36 .. T R U
37 .• T R U
38 .. T R U
39 .. T R U
Secondary Worll
IV I II At House- As Cultivator As Agricultural
hold Labourer Industry
M F M F
(3) (4) (5) (6)
2 %
3 2 1
367 3-43 24
570 ~ 30
192 1-42 SO
4 4
224 203
21
2 :2
9 8 1
134 69 65
8 7 1
IS 13 2
-4 1 2
61 50 11
7 '1
M
(7)
IS 7 a
3 3
F
(8)
7 5 2
83 26 83 24 ,
I
301 %63 282 lSI
19 lOS
127 126
1
194 182 12
60 58 2
:2 2
68 29 39
140 110 30
II II
3 1 l

159 B SERIE5
B-VII-Part B-Industrial Classification by Sex of Persons working in Non-household Industry, Trade, Business, Profession or Service who are also engaged in Household Industry
Principal Work Persons working additionally at Principal Work Persons working additionally at Branch ofIndustry Household Industry Branch ofIndustry , Household Industry
Total Total Non-household Industry, Rural Industry Industry Induotry Non-household Industry, Rural Industry Industry Industry
Trade, Business, Urban Division Division Division Trade, Business. Urban Division Division Division Profession or Service 0 1 2&3 Profession or Service 0 1 2&3
Division ----- Division M F M F M F M F M F M F
(1) (2) (3) (4) (5) (6) (7) (8) (I) (2) (3) (4) (5) (6) (7) (8)
TOTAL T 107 15 237 22 Division 4 T 12 R 33 is 92 4 R 6 U 74 145 18 U 1 6
DlvlafoD 0 T 11 8 6 T 20 66 4 R 8 S R 10 25 1 U 3 1 l U 10 41 3
T 7 T 11 R 'j . i R 1 U U 10 3
2.&3 T 36 .... 2 45 7 8 T 27 12 102 10 R 4 9 R 10 47 2 U 32 2 36 1 U 17 12 SS 8

160 CENSUS TABU:~
B-VIU-part A-Persons Unemployed, aged 15 and above, by Sex,
Seeking employment for the first time
Age·groups
Educational Lcvea . Total Unemployed
Age not Total 15-19 20---24 25-29 30---34 35+ atate
--- ---- --_--Persons Males Females M f M F M F M F M F M F M F
(1) (2) (3) (4) (5) (6) (7) (8) (9) (10) (11) (12) (13) (14) (IS) (16) (17) (18)
DISTRICI' URBAN TOTAL .. , 1,9S8 1,871 87 937 .oil 376 18 406 13 93 4 18 2 ..... 4
Illiterate 319 284 35 61 4 27 IS 9 I. 2 8 2
Literate (without educational level) 274 271 3 97 47 22 16 2 10
Primary or Junior Basic 886 869 17 444 13 186 186 4 42 9 2 21
Matriculation or Higher Secondary 429 410 19 308 14 lIS 9 169 4 18 3 3
TechniCl1-1 diploma not equal to degree 10 8 2 6 2
Non-technical diploma not equal to degree 10 9 6 3 2
University degree or post-graduate degree 25 24 18 10 4 2 2 other than technical degree.
Technical degree or diploma equal to degree 5 4 2 or post·graduate deareo.
Engineering \
Medicine
Agriculture
, Veterinary and Dairyinl .... Technology
Teaching
Othen S 4 2
B-VIll-Part B-Persons Unemployed, aged 15 and above,
Unemployed by educational levels
District/Taluka Tota] Unemployed Illiterate
Perions Males Females Persons Males Females
(I) (2) (3) (4) (5) (6) (7)
DISTRICT RURAL TOTAL 1.033 99S 38 132 109 23
Melghat Talnka 18 16 2 5 3 2
Achalpur Talnka 174 161 13 25 19 6
Morsi Taluka '" 176 173 15 12
Daryapur Taluka 129 126 3 8 S 3
Amravati Talnka 244 240 4 39 37 2
Cbandur Taluka 292 279 13 40 33 7
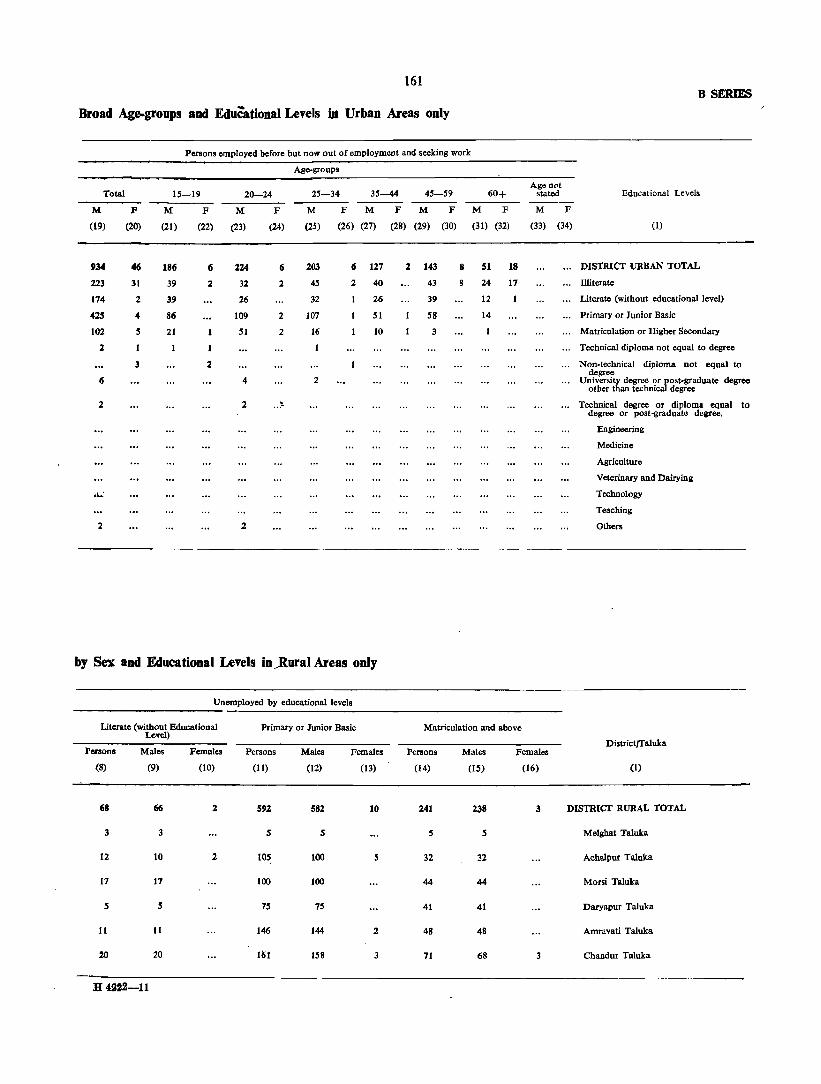
161 B SERIES
Broad Age-groups aDd Educational Levels in Urban Areas only
Persons employed before but now out of employment and seeking work
Age-groups
Total 1S-19 20-24 25-34 35-44 45-59 60+ Age not
stated Educational Levels
M F M F M F M F M F M F M F M F
(19) (20) (21) (22) (23) (24) (25) (26) (27) (28) (29) (30) (31) (32) (33) (34) (I)
934 46 186 6 224 6 203 II 127 2 143 8 51 18 DISTRICT URBAN TOTAL
223 31 39 2 32 2 45 2 40 43 24 17 Illiterate
174 2 39 26 32 26 39 12 Literate (without educational level)
425 4 86 109 2 107 51 58 14 Primary or Junior Basic
102 5 21 51 2 16 10 3 Matriculation or Higher Secondary
2 Technical diploma not equal to degree
3 2 Non-technical diploma not equal to
6 4 2 degree
University degree or post-graduate degree other than technical degree
2 2 .. ~ Technical degree or diploma equal degree or post-graduate deifee_
to
Engineeriug
Mediciue
Agriculture
Veteriuary and Dairyiug
.•. : Technology
Teaching
2 2 Others
by Sex and Educational Levels in_Rural Areas only
Unemployed by educational levels
Literate (without Educational Primary or Junior Basic Matriculation and above Level)
Districtrraluka Persons Males Females Persons Males Females Persons Males Females
(8) (9) (10) (11) (12) (13) (14) (1S) (16) (1)
6S 66 2 592 582 10 241 238 3 DISTRlcr RURAL TOTAL
3 3 S S S S Melghat Taluka
12 10 2 lO~ 100 S 32 32 Achalpur Taluka
17 17 100 100 44 44 Morsi Taluka
S 5 7S 7S 41 41 Daryapur Taluka
11 11 146 144 2 48 48 Amravati Taluka
20 20 lIil 158 3 71 68 3 Chandur Taluka
H49,2-U

CENSUS TABLES
OO~M_MOO OO-V"IOO_00_0'1("'\ N"-.:i-"\O"O'I" !-OOCf"'l
&:~;!i~ :;r; --'" 'V"O"'M"
""'"' 'VN\OIO .-\,Or"')OOt""1 .-
N"'''' I.6~M S;OON ,,0-00000 0\0'.0('1'),....'" O'Ilf')~_\O_
¢gfg~f~" M'" O-MO-ooOO _OOlrlt'l"ll:"--l.O t'--O\\O~V_ "7 ... ..j:OO"~r' ,_..,'" N'"
:0\ ~~~~ .M "'0,,", v5'V~N'" M"'_
162
00 '00
. .".
.OO_O'I_r'-- •
. lnM_O\_ .
'" -
..., . ...,
'" ~ '-C"'I
..., . ...,
~~~~~~ <f<;; "'N ~~~~~~ ~N\O"a;.N .. ~ O\~_
'~~! :~ ..ov)

163 B SERmS
B-X-Sample Households (i) engaged neither in Cultivation nor Household Industry, (ii) engaged either in Cultivation or Household Industry but not in both, and (iii) engaged both in Cultivation and Household Industry
(Based on 20 per cent Sample)
Total Number of Households
Households engaged neither in Cultivation
nor Household Industry Households engaged in
Cultivation only Households engaged in Household Industry only
Households engaged both in Cultivation and Household Industry
District/Talub Total Rural Urban Total Rural Urban Total Rural Urban Total Rural Urban Total Rural Urban
(1)
DISTRICT TOTAL
Melgbat Taluka
Achalpur Taluka
Morsi Taluka
Daryapur Taluka
Amravatl Talulql
Chandur Taluka
(2) (3) (4) (5) (6) (7) (8) (9) (10) (11)
.. 52,928 39,749 13,179 27,121 17,156 9,965 23,291 20,928 2,363 1,577
2,656 2,599 57 851 800
8,711 6,379 2,332 4,103 2,578
8,634 6,961 1,673 3,440 2,580
7,527 5,993 1,534 3,460 2,474
16,412 9,780 6,632 10,703 4,885
8,988 8,037 951 4,564 3 839
51 1,711 1,708
1,525
860
986
5,818
725
4,033
4,677
3,750
5,109
4,011
3,541
3,989
3,314
4,547
3,829
3
492
688
436
562
182
56
378
270
188
438
247
(12)
895
55
143
183
99
203
212
(13)
682
235
87
89
235
35
(14)
939
38
197
247
129
162
166
(15)
770
36
117
209
106
145
157
(16)
169
2
80
38
23
17
9
B-XI-Sample Households engaged in Cultivation classified by Interest in Land and Size of Land Cultivated
(Based on 20 per cent Sample)
(a)=Owned or held from Government. (b)=Held from private persons or Institutions for payment in money, kind or share. (c) = Partly held from Government and partly from private persons or Institutions for payment in money, kind or share.
No. of Cultivating Interest In Land
Cultivated Households Less than 1 l' 0-2'4
(1)
DISTRICT TOTAL (a) (b) (c)
DISTRICT RURAL (a) (b) (c)
DISTRICT URBAN (a) (b) (c)
WELGHAT TALUKA (a) (b) (c)
(2)
.. 24,230 19,727 1,271 3.232
21,698 17.501
1,149 3.048
2,532 2.226
122 184
1,744 1,394
187 163
ACHALPUR TALUKA .. (a.)
3,658 2,869
202 587
(b) (c)
MORSI TALUKA (a) (b) (c)
DARYAPUR TALUKA .. (a.) .. (b) (c)
AMRAVATI TALUKA (a) (b) (c)
CHANDUR TALUKA (a) (b) (c)
H4222-lIa
4.198 3.640
138 420
3.420 2,662
151 607
4,692 3,663
284 745
3,986 3,273
187 526
(3)
237 214
20 3
207 189 1~ 3
30 :IS
5
'IS 68
7
39 39
38 34 2 2
43 36 6 1
11 11
(4)
3,419 3,280
115 24
3,093 2,967
103 23
326 313
12 1
15 14 1
714 682
24 8
618 597
19 2
629 598 24
7
732 700 27
5
385 376
8 I
Households engaged in Cultivation by Size of Land in Acres
2'5-4'9
(5)
4,442 4,016
258 168
3,937 3,543
237 157
505 473
21 11
5'0-7'4
(6)
3,459 2,970
234 255
3,068 2,623
208 237
391 J47 26 18
7'5-9'9
(7)
2,075 1,676
142 257
1,884 1,507
132 245
191 169
10 1:1
TALUKAWISE RURAL ONLY
56 40 16
751 661 55 35
888 837
31 20
661 567 46 48
866 763
55 48
715 675 34 6
138 103 31 4
496 392 40 64
767 690
3S 42
456 380 29 47
635 532 47 56
576 526 26 24
163 123 35 5
313 239
17 57
372 315
12 45
292 225
13 54
380 296
31 53
364 309 24 31
10'0- 12'5- 15'0-12'4 14'9 29'9
(8)
2,221 1,694
185 342
1,986 1,495
170 321
235 199
IS 21
262 193 50 19
296 210
21 65
365 301
19 45
273 192
16 65
398 283
oM! 75
392 316 24 52
(9)
1,027 723
61 243
936 654
55 227
91 69 6
16
112 89 10 13
152 86 14 52
190 ISO
2 38
139 89 4
46
160 103
14 43
183 137 11 35
(10)
4,496 3,134
216 1,146
4,099 2,814
192. 1,093
397 320 24 53
726 600
44 82
547 330
24 193
629 463
18 148
527 328
12 187
870 552
49 269
800 541 45
214
30'0- 50+ Unspecified 49'9
(11)
1,647 1,126
28 493
1,469 979
27 463
178 147
1 30
205 175
30
186 107
79
202 145
1 56
233 142
4 87
335 210
12 113
308 200
10 98
(12)
1,121 809
12 300
944 656
10 278
177 153
2 22
44 34
io 118
84
34
121 96
1 24
163 99
1 63
261 176
3 82
237 167
S 65
(13)
86 85 . i
75 14 . i
11 11
22 22
10 10
7 1
9 8 . i
I) 12
15 IS
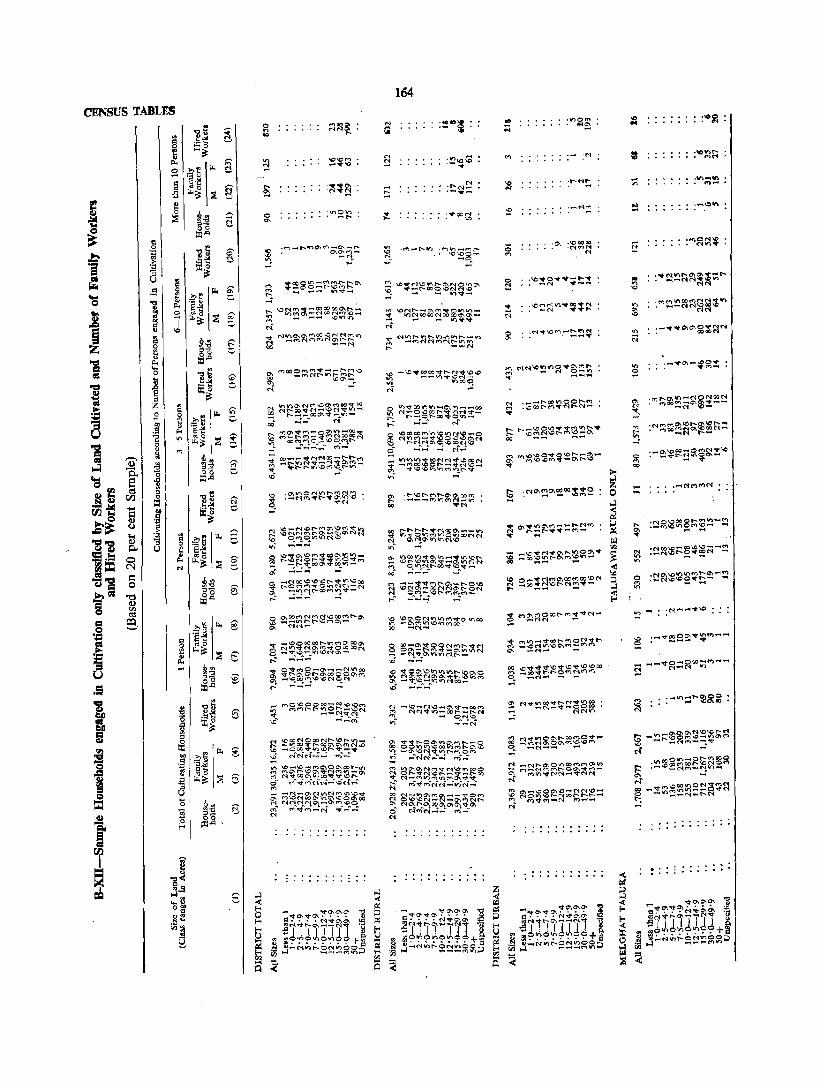
CENSUS TABLES .. :;-"
"3\; IS :E~
~
~ Po< p;
~ f '" ~ ~
~ ~
.s t<.~ ::i. a ~ ~ .... i ell ~ .... Q .. i z 1 -= ~ 1\1 ~ :i U
1 'Qi' ~ .-I
'S S" ~ri ~
til .s:! .l1li
5 oo~ ~~ (,)
'"' "2"2 II)
~
~:S 0 N
S"Ct l:l Cj= 0
~= "d g II)
'" c<S
.. !5
~~ '" :g -60 ~ 1l1.<:1
i\ 'i] 8 ~ .. tJ,
"3 ~ U a .S ~ ",,,,
Ilo ; "0
:;ij .. p.. ~~ .. 0 .. J il<~ ~ ; ..
" .. C b., S ~
.,'" ,,-0 0
p.. !I:.I': ... 0 ogS \j <C' .c -=~ ~
~ !I:~ Z
~ S II< ~ ",:,: .. II =~ ~
.S '" ~:s '" '" ;1 !5 \ ~~ ::;:
~ ~! "'-l! ~ b §
1 0 ei g ::t:
.go iE~ g!
'"' .;j § "3 ~e!1lo -u ~ ]J.l ....,
OIl; Po. P-<C!: :E ~ '"
£.a e ,,-0 0 ill""
CI Q:l Q '-' Ilo §
".C
~ C
::;: E
€ .S
i 6
{I.I
~ i ..,
"," Pot ~
]~ ~~ ::;: '"' e
~ ~
i £.a fi 6'0
1l1'""
~ = ~ ~ 0 ...: t3 r-
~ !n ... Q
0 m~~~ on .. ...
'" '.,,"'" ~ -.. '" t- ~l~ ~
0 :IrIOV)
'" -t-
~ ;=g§5~~t; ... EO\ 3 :;; \O~~~~~~rl~~= t'I') -- _ .... 1tQIrt-ll)
<i ~ N~~~~~~~a~l()
~ ~oo~~~tt;::r:~~\,j :J\ \00'1--r-i ,..;
~ ~E~!E~~E~~~ ~.. ...:_.. 'f"i
t; ~e:~~::Sf~~~~~ ~ oo~I"f't0~ ......... 100o-"1." _ _ ___ C'I'J""';
.:; oo __ ~NC'lOO-r--.r--M ~ -~~~"G~~g::~-1.0"'- -'"
°_00 ~~~~~~~~;g~;;: .-:,t-:-=tooO\-.:t' 00 .. 1("}-
o-.~ ---- -
~ t::g~~~~&:;~~~~ o~ ~"lrtl"'-c¢~"1."IIt-r-- --1""1 ....
-~Q\"'f"o\"'!'?'~~ -g I'l ••• ·N"'o\O\ S ~JnlJJn 'It
~ " ........ +a ~-Ntnr--ONV"100:l
III _..-. __ t""I""
~
~ <t ~ ;;J ~
"" U
~ III .... Q
164
'" :~ .. ~ I; '"
E ::!!~::o
!::: :!:rJ~
;!: o "",OCN \0
~ \O~~~~t.1:~~~::: N '1""1 ""'I 1/") ......
~ ~~~~u;~~~r;:;;::;~ l""- --M
g ~~~it~Ot:'tMt--~M ~ ~~",!-o-.lf)~t;i~~V;M
~ ~~~~~~~~~~~~~ Il5 .... -_
-;;~0\~C"l~'!''='~ "S ;91ilt~1~1 ] fIlO'" ",J",J +1>.
~
~ ~~~~;"9~~g~~ :::: 0(
~ Ie ~ ;:l I-<
~ !;; is
!! .t/')Q~
... .... :!::
'" .",
'" ...... N~
'" :e ....... N("'\
0 .c- .\0 0000
'N'MN ..., M
~ _Nt--o-.OI()OOIl""')-("'lo;lll')
~ M;;)~~~M~~~N-
~ O\;;;\cOo\\o-NMIDM.. N~~~~t:lQ!)~~.!:t-....
-~0\ ... 0\:r~<:"~ "2 a:: ••• 'N~O\Q\ cc ~N1t'-oO'.-""N1 '0 .sJ JIJIJ .. :l rII tn I,f) Vl 0+ ~
~ 3~N~~ia~~g~~
~
~ :3 <:
"" ~ 3 ~ :s
"" :"'~ ...
~ .,.",t""-• ..,t1
'"" .V\ .. .."
'" ... -:l ,_\0'"
5 ,~ON.I,O • ("\11() ....
.. :~~~~~~~~" on
'" rlN
... :M~~~~~~:$1tl $
... :-~~C-"'~;:;::i''' ;::;
'" :_ .... O\-~~~
8
'" '1!'I'lr--c:r.1n1""l~ONC(lN
~~ • ("I'l.OO~-O\O'I-.:t--
-<'f \0-
;:! '('qf'l') M.O\ toO 1:"-0\ IC ......... • f")oct"'.o·""OI.\oOON-
~ -N t-- .....
0 :-~~~E~~~:!\C '" 00
.... ..... t1rf)fflN· -t- :~g~~8~~~-:: 0\ '"' ... ~
... :~~~r:S~!N-: on '" 0 :~~~~:g~r:~~~ '" --on
~ :N_~"'\O
~ ._..rooOO"l"'l'\I')f9)--· __ ........
a __ "to...-lOQQ-M-~
C"t-N to
-","O\ ... ",..,.~~~ is <l- ..• "'.,."'''' !S ""'1""'--"'1 8 ., i~~J~~~~. +a
~ :S-Nv)t'--~~~~~~
:::: .<

'" 00
00
'00 ·1tjrt)t'f).q-O('1')~_'lll:t_
CO . - - --N
'" 00
165
. ." ·00
.\D
:~
.0.
0'\ -If')('I")('lV'lOt'l'lt---ooo\O r-- II)O_O_~ooaor--. o -t")t"')("H''l_'''''t_
'" In Mo:1'OOO~~V)I,f")r--.1:"--"'t" OO['\OO_t---\OOV1
~ ---- C"'I--
0\ 1"'-~_OO_\OOO\C"lr--tr) §. -~M~Q\oo~2N '
~ ~@~~~~~N~f'ooolf) :J C'H"'lN- --
'" _ r-OO\O~OOO'l:f'l'"'-"'ItVr-.. 00 C""l['C""lNV)V)OOOO",_ 0\ 1000['("!"}M .... \Q __
«i
·on
00 _O\_O'IO\t"'U· ... Ir)('f")O'\M 'V _ ....... N~Or--('_OM ;:} ('O")VC""lM- C"'l_
,.... OO\ffl~r--OO("l")M--OO V 'VMNMV)('I")OOMVII'l ~ \Ot--V"Itr'jt'f')-J:-..('f)('i .... ... f'_Ot'l'l\OIi"'I-.:tMr--_t--
;;;. M@~~~~:!&1~~ '"
B SER.D:S
:~ :~ -
.--~
~ ['gfi~~~::::~~~~ N
~ ~§g~~~~~8~~-:.; -- <"")--
~ t-1~~~~~~\C~Sr-. N" 'VI(')'VNN_V) ..... ~
~ ft")('f"j~(f')IONI.O~O\I.OO " .. ~~O\g~~~~~~ .... ." -~ ~S~S~~~~~~~ ..".... I:'OO\OC"')M_ooC"'lM

CENSUS TABLES
\
00
'"
, 00
5
166
'" ...
~ ~ ~ ~ ~ § 2 ~ ~ ~ ~
~ ~ ~ ~ ~ = ~ ~ ~ ~ ®
~ ~ ~ ~ ~ ~ ~ ! ~ ~ ~ <'f
00
o ® ~ ~ ~ N ~ ~ ~ ~ ~ ~ ~ ~ ~ ~ ~ ~ ~ ~ ~ M '<f ~
~ s ~ ~ $ ~ ~ ~ ~ « ~ ~ M ~ ~ ~ ~ ~ ~ ~ ~ ",.

167 B SERIES
B-XID-Sample Housebolds engaged both in Cultivation and Household Industry showing Size of Land Cultivated classified by Principal Household Industry
(Based on 20 per cent Sample)
Number of Households by Size in Acres of Land Cultivated
Code No. Total No. of of House-
I.S.I.C. holds Less tban 1 1·0- 2·5- 5,0- 7·5- 10'0- 12·5- 15·0- 30·0- 50+ Unspecified 2·4 4·9 7'4 9'9 12·4 14·9 29·9 49 '9
(1) (2) (3) (4) (5) (6) (7) (8) (9) (10) (II) (12) (13)
DISTRICT RURAL All Industries 770 5 132 172 139 71 57 25 108 35 24 2
Division 0 157 13 26 22 18 18 7 30 13 9
MlijorOroup 00 3 2
03 9 2 3
04 145 11 23 19 18 17 7 29 13 7
Division 2 & 3 613 ,. 119 146 117 53 39 18 78 22 IS
"lajor Oroup 20 52 4 8 4 3 6 12 5 II
21
22 2
23 26 6 7 6 2 3
24 5 I.
26
27 143 19 31 29 14 6 8 26 S 4
28 176 2 35 53 37 15 12 3 16
31 66 20 17 12 5 4 4
33
34-35 77 21 16 16 7 3 9 3
'6 33 5 8 7 3 2 6 2
37 2
38 3 2
39 25 7 5 4 3 2 2
DISTRICT URBAN All Industrlca 169 25 49 31 12 II 10 25 6
Division 0 47 5 11 7 3 4 3 11
MajorOroup 04 47 5 11 7 3 4 3 11 3
Division 2 & 3 122 20 38 24 9 7 14
Major Group 20 8 2 2 3
21
23 48 9 16 10 4 2 6
27 17 .l 5 4 2
28 18 5 II 2
II 11 5 3
34-35 7 3
36 4 2
38
39 "I 2

168 CENSUS TABLES
B-XlV -Sample Households engaged only in Household Indo.stry classified by Principal Household Industry
(Based on 20 per cent Sample)
Part A -Households classified by major grOllps of Principal Household Industry and number of Persons engaged
Total Households engaged In Household Industry I
Total Households engaged In Household Indus!?
Code Total according to the Number of Persons engaged Code Total according to the Number of Persons engag No. of Rural Number No. of Rural Number I.S.I.C. Urban of I.S.I.C. Urban of
Househol<1s 1 2 3-5 6-10 More than Households 2 3-5 6-10 More than Person persons persons persons 10 persons person persons persons persons 10 persona
(I) (2) (3) (4) (5) (6) (7) (8) (1) (2) (3) (4) (5) (6) (7) (8)
DISTRICl' TOTAL- Major Group
All Industries T 1,577 930 406 218 20 3 25 T 1 R 895 564 21S 105 11 .j R 1. U 682 366 191 113 9 U
27 T 211 161 34 14 :2 Division 0 T 164 90 S3 20 R 115 96 15 3 1
R 109 61 31 16 U 96 6' 19 11 1 U 55 29 22 4
28 T 421 253 98 66 3 1 Major Group 00 R 290 194 65 29 :2 . i T 2 U 131 59 33 37 1
R 1 U 1 1 30 T 3 2
R OJ ·2 03 T 12 7 4 U 1 R 11 6 4 U 1 1 31 T 139 102 23 14.
R 71 59 7 5 04 T 150 82 48 19 U 68 43 16 9
R 97 54 27 15 U 53 28 21 4 33 T 9 7 2
R '9 " °2 U Division 2 & 3 T 1,413 840 353 198 19
R 786 503 184 89 10 34 & 35 T 146 44 51 41 9 U 627 337 169 109 9 3 R 110 33 36 34 1. ·i U 36 11 15 7 2
Major Group 20 T 77 48 21 7 36 T 139 78 38 22 R 38 29 7 1 OJ R 89 49 28 11 ·i U 39 19 14 5 U SO 29 10 10
22 T 8 3 3 2 37 T 2 2 R '3 'j '2
R '2 '2 U 8 U
23 T 169 69 70 28 2 38 T 12 12 R 30 7 19 4 ·l R 4 4 ,. U 139 62 51 24 U 8 8
24 T 9 3 6 39 T 67 56 7 1 1 R 6 1 5 R 32 30 2 '2 '2 U 3 2 1 U 3S 26 S
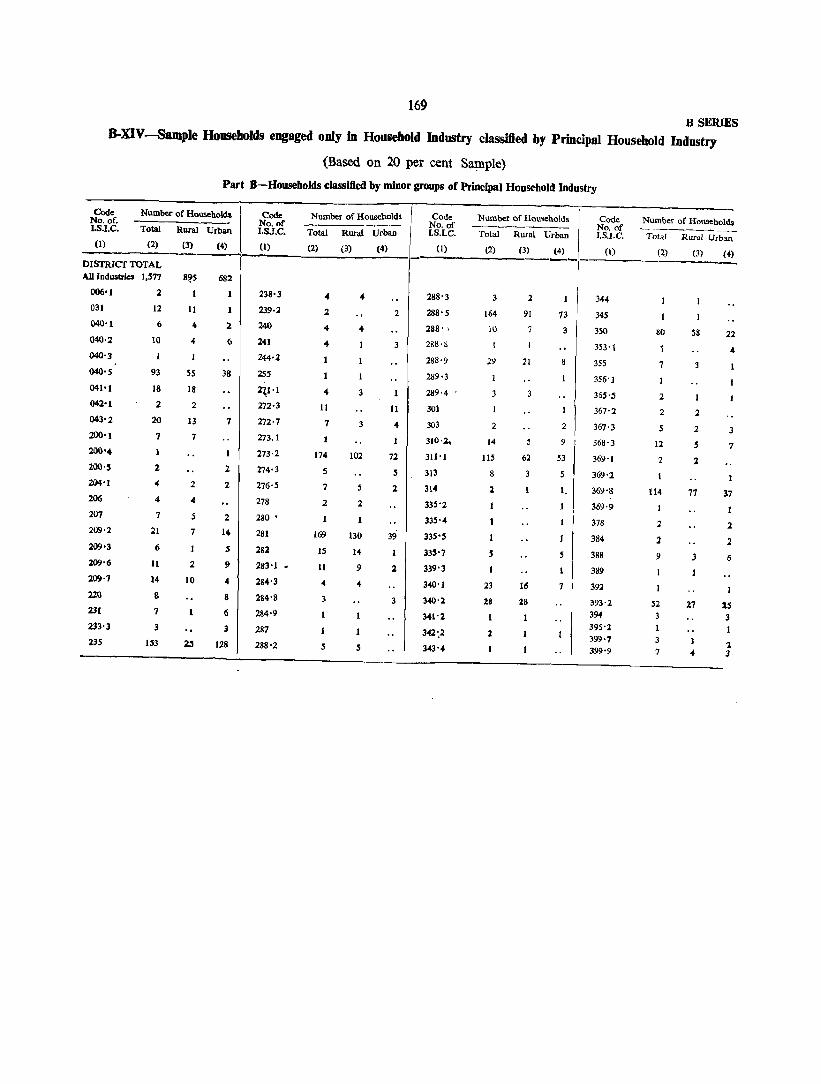
169 B SERIES
B-XlV-Sample Households engaged only in Houiehold Industry classified by Principal Household Industry
(Based on 20 per cent S~ple)
Part B-Households classified by minor groups of Principal Household Industry
Code No. of. I.S.I.C.
Number of Householda
Total Rural Urban
(1) (2)
DISTRICf TOTAL AD Industries 1,577
006'1 2
031 12
040'1
040·2
040'3
040'5
041-1
042'1
043'2
200'1
200'4
200·S
204'1
206
207
209'2
209'3
209'6
209'7
220
231
233-3
235
6
10
93
18
2
20
7
2
4
'" 7
21
6
11
14
8
7
3
153
(3)
8!?S
11
4
4
5S
18
2
13
7
2
'" 7
2
10
(4)
682
2
6
38
7
2
2
2
14
5
9
4
8
6
3
128
Code No. of I.SJ.C.
(1)
238'3
239,2
240
241
244·2
255
2~l'l
272,3
272,7
273.1
273·2
274·3
276'5
278
280 •
281
282
283 'I •
284'3
284·8
284·9
287
288'2
Number of Households
Total Rural Urban
(2)
'" :2
'" '"
'" 11
7
174
5
7
2
169
IS
11
4
3
5
(3)
4
3
3
102
2
130
14
9
4
5
(4)
2
3
11
4
72
5
2
3
Code No. of I.S.I.e.
(I)
288'3
288'5
22S' J
288'0
288'9
289'3
289'4
301
303
310'2,
311'1
313
314
335'2
335'4
335'5
33S'7
339'3
340'1
340';&
341'2
342'.2
343'4
Number of Households
Total Rural Urban
(2)
3
164
1U
29
2
14
115
:1
5
23
18
l
I
(3)
2
91
21
6J
3
16
28
(4)
73
3
2
9
53
5
1.
I
5
7 I
.. I
Code No. of I.S.I.C.
(I)
344
345
350
353'1
355
356'1
365'5
367'2
367'3
368'3
369'1
369'2
369'8
369'9
378
384
388
389
39l
393'2 394
395'l 399'7 399'9
Number of Households -
Total Rural Urban
(2)
80
7
2
2
5
Il
2
114
2
1
9
52 3
I
7
(3)
58
2
2
S
l
77
3
27
4
2l
4
3
7
37
2
2
6
15 3
1 3

170 CENSUS TABLES
B-XV -Sample Households engaged both in Cultivation
(Based on
Total of Cultivating Households which are Cultivating lIouseholds engaged In Household Industry
Size of Land also engaged In Household Industry
2 Persons 1 Person (Class ranlles in Acres) Family Workers
Fanilly Workers House- Hired Family Workers holds Males Females Workers House- House- Hired
holds Males Females holds Males Felllaies Workers
(1) (2) (3) (4) (5) (6) (7) (8) (9) (10) (11) (12)
DISTRICT TOTAL
All Sizes 939 1.481 714 203 231 220 11 332 438 211 15
Less than 1 6 6 4 '3 3 3 , 3 2 2 2 'j 1'0-2'4 " 157 224 119 52 49 62 78 45
2'5-4'9 " 221 309 158 8 12 68 4 83 104 60 :l 5'0-7'4 .. 170 257 148 15 39 37 2 71 93 48 1 7'5-9'9 .. 83 128 66 12 17 15 2 36 48 24 · i 10'0-12'4 .. 66 123 44 14 11 11 25 38 11
12'5-14'9 .. 35 49 24 6 7 7 15 20 8 ::I 15'0-29'9, . 133 244 97 41 25 25 30 42 12 6 30'0-49'9 .. 41 17 35 52 4 4 4 6 , i :2 50+ 25 62 18 :51 4 7
Umpeclfied, . 2 2
\ DISTRICT RURAL
.AlI Sizes 770 1.212 602 164 191 182 9 268 351 172 13
Less than 1 S 5 4 '2 2 2 . j 2 :i; ::I 1'0-2'4 .. 132 186 91 45 42 53 67 38 1 2'5-4'9 " 172 233 122 7 63 60 3 59 72 44 2 5'0-7'4 " 139 212 132 12 28 26 2 60 77 42 1 7'S-9'9 " 71 109 59 12 14 13 1 32 41 23
10'0-12'4 .. 57 110 40 9 7 7 23 36 9 1 12'5-14'9. , 25 36 17 6 6 6 7 10 2 1 15'0-29'9 .. 108 193 88 30 22 22 24 33 11 4 30'0-49'9 .. 35 66 30 36 3 3 4 6 , i 1 50+ 24 60 18 49 4 7
Unspecified. , :2 :2
DISTRICT URBAN
AU Sizes 169 269 112 39 40 38 ::I 64 87 39 I
Less than 1 1 1 2S " i 1 1 "; 1"0--2"4 .. 25 38 7 7 " i 9 11
2'5-4'9 .. 49 76 36 1 9 8 24 32 16 5'0-7'4 .• 31 45 16 3 11 11 11 16 6 7'5-9'9 " 12 19 7 "5 3 2 1 4 7 1
10'0-12'4." 9 13 4 4 4 2 2 :2 12"5-14'9. , 10 13 7
ii 1 1 8' HI 6 ":i 15'0-29'9,. 25 51 9 3 3 6 9 1
30'0-49'9, . 6 II 5 16 1 1 50+ 1 2 2
Unspeci1ied, ,
TALUKAWISE RURAL ONLY MELGHAT TALUKA-
All Sizes 36 63 36 6 6 12 16 1
Less than 1 '2 . i 1'0-2'4 ". 1 '2 'i 'i 2·s-4'9 .. 3 5 S . i 5'0-7'4 .. 2 2 3 1 '3 7'S-9'9 .. S 6 3 2 2 2 1
10'0-12'4 .. 7 14 4 'j 5 8 '). · i 12'5-14'9, , 2 3 1 '3 1 1 'i 15'0-29'9" 14 2S III 1 3 '). 2
30'0-49'9" 1 3 1 'j 50+ 1 3
Unspecified
ACHALPlJR TALUKA-
All Sizes 117 177 94 S 32 :2S 4 46 64 27
Less than 1 1 1 1 1 ji 1'0-2'4 ., 24 33 17 "j 8 7 1 10 1
2'S-4'9 ." 28 35 18 10 8 2 13 18 8 5'0-7'4" 21 34 20 3 5 4 1 6 9 3 7·s-9'9 •• 13 17 7 'j 3 3 9 12 6
10'0-12'4 6 12 S 1 I 1 2 12'S-14'9 4 6 4 "j 1 1 1 2
'3 · i IS'0-29'9 15 25 II 3 3 6 8 30'0-49'9 '). 3 S I 50+ 3 11 7 1
Unspecified
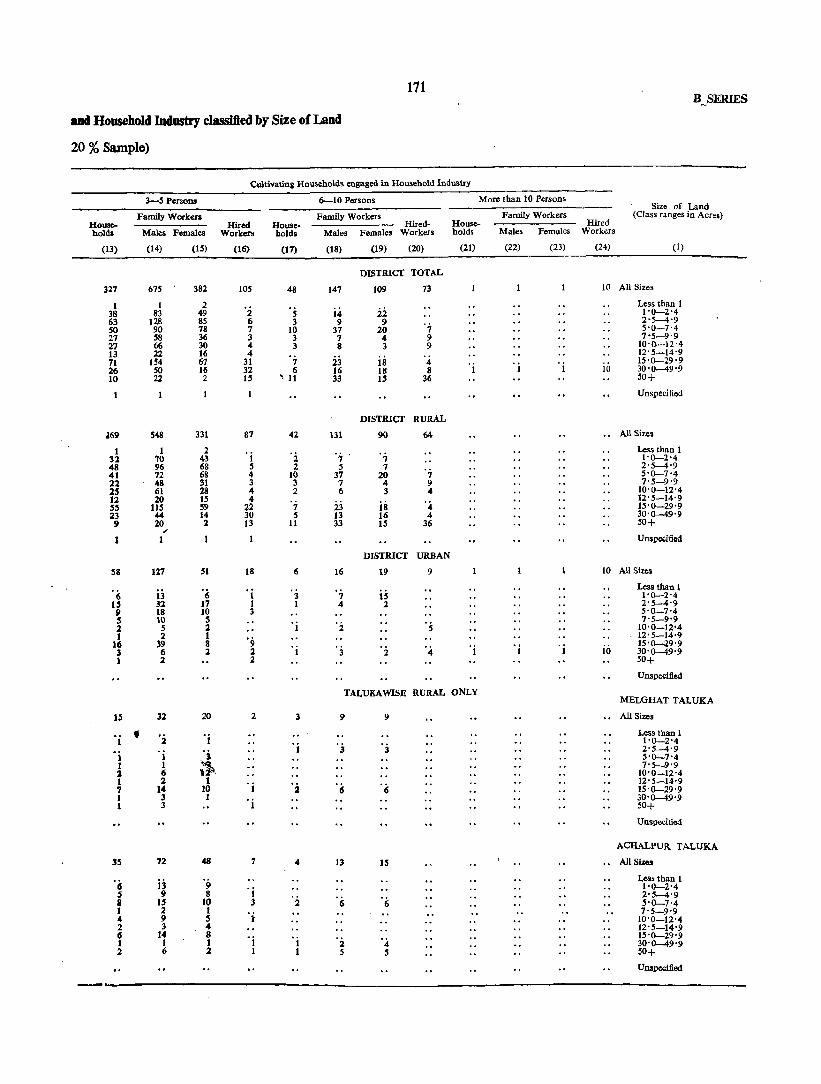
111 B~SERIES
IUlC1 Household Industry classified by Size of Land
20 % Sample)
Cultivating Households engaged in Household Industry
3-5 Persons 6-10 Persons More than 10 Persons Size of Land
Family Workers Family Workers Family Workers (Class ranges in Acres) House- Hired House- Hired- House- Hired holds Males Females Workers holds Males Females Workers holds Males Females Workers
(13) (14) (15) (16) (17) (18) (19) (20) (21) (22) (23) (24) (1)
DISTRICf TOTAL
327 675 382 105 48 147 109 73 10 All Sizes
1 1 2 '2 's Less than 1
38 83 49 14 2.2 1'0-2'4 63 128 85 6 3 9 9 '7
2-5-4'9 50 90 78 7 10 37 20 5'0-7'4 27 58 36 3 3 7 4 9 7'5-9'9 'r1 66 30 4 3 8 3 9 10'0-12'4 13 22 16 4 12' 5-14'9 71 154 67 31 7 23 18 4 'j 15'0-29'9 26 SO 16 32 6 16 18 8 1 1 10 30'0-49'9 10 22 2 IS ~11 33 IS 36 50+
1 Unspecified
DISTRICf RURAL
.69 548 331 87 42 131 90 64 All Sizes
1 I 2 , i '2 " " Less than I
3:1 70 43 1'0-2'4 48 96 68 5 2 5 7 '1
2'5-4'9 41 72 68 4 10 37 20 5'0-7'4 22 48 31 3 3 7 4 9 7'5-9'9 2S 61 28 4 2 6 3 4 10'0-12'4 12 20 15 4
23 is '4 12'5-14'9
" 115 59 22 7 15'0-29'9 :u 44 14 30 5 13 16 4 30'0-49'9 9 20 2 13 11 33 IS 36 50+
" 1 Unsp",lfied
DISTRICf URBAN
58 127 51 18 6 16 19 9 10 All Sizes
'(; i3 '6 . i '3 ':' is Less than 1 1'0-2'4
IS 32 17 I 1 4 2 2'5--4'9 P 18 10 3 5'0-7'4 S 10 S , i '.2
7'5-9'9 :1 5 2 's 10'0-12'4 1 2 1 '9
12'5-14'9 16 39 8 , i ' 3 ' i ' i ' i 15'0-29'9 3 6 :2 :2 2 4 10 30'0-49'9 1 :2 :2 50+
Unspecified
TALUKA WISE RURAL ONLY MELGHAT TALUKA
IS 32 20 2 3 9 9 All Sizes
. i • '2 . i Less than I , i '3
1'0-2'4
'i ' i '; '3 2'5--4'9 5'0-7'4
1 1 ~. 7'5-9'9 2 6 10'0-12'4 1 2 1 , i 'j 12'5-14'9 7 14 10 '6 '6 15'0-29'9 1 3 1 , i 30'0-49'9 1 3 50+
Unspecified
ACHALPUR TALUKA
35 72 48 7 4 13 15 All Sizes
'6 i3 '9 Less than 1
'j 1'0-2'4 S 9 8 2'5--4'9 8 15 10 3 2 '6 '6 5'0-7'4 1 :1. 1 'i 7'5-9'9 4 9 S 10'0-12'4 :1. 3 4 12'5-14'9 6 14 8 'j 15'0-29'9 1 1 1 I 2 4 30'0--49'9 :1. 6 :1. I 1 5 5 50+
Unspecified

172 CENSUS 'tABLES
B-XV-Sample Households engaged both in Cultivation
(&sed on
'l'etal ofCuitivatinll Households which are Cultivating Households engaged in Household Industry
Size of Land aIIo enllaa;ed in Household Industry 1 Person 2 Persons (Cla~ ranlle~ in ACTOi)
Family Workers Family Workers Family Workers House- Hired House- House- Hired holds Males Femalei Workers holds Males Females holds Males Females Worken
(I) (2) (3) (4) (5) (6) (7) (8) (9) (10) (11) (12)
TALUKAWISE RURAL ONLY-coacJd, MORSl TALUKA
,,-USizes 209 317 173 43 42 39 3 85 106 62 2
Less than 1 2 2 I I 1 1 1 1 1'0--2'4 40 58 35 1 10 8 2 16 19 12 1 2'5-4'9 52 68 34 1 19 18 1 21 23 18 1 5'0--7'4 43 64 43 4 4 4 25 34 16 7'5-9'9 14 20 9 I :2 2 9 13 j
10'0--12'4 15 30 13 3 '2 5 5 S 12'5-14'9 6 7 4 1 2 2 3 1 15'0--29'9 22 41 25 4 4 4 5 7 3 30'0--49'9 8 16 6 10 , i . i 50+ 7 11 3 18 1 Unspecified
DARYAPUR TALUKA
All Sizes 106 175 72 IS 31 30 37 49 24 I .
Less than 1 I 1 1 I 1 I 1'0--2'4 28 45 13 1 8 's 13 19 7 2'5-4'9 31 43 20 2 11 11 , i 12 16 8 5'0--7'4 13 28 9 1 3 2 4 5 3 7'5-9'9 6 9 6 1 I 3 3 3·
10'0--12'4 8 15 9 2 2 2 3 1 12'5-14'9 5 6 4 2 2 1 1 l.. 'i 15'0--29'9 4 6 2 1 2 2 1 I 30'0--49'9 6 12 7 5 1 I 50+ I 2 8 4 Unspecified 2 2 I 1
AMRAVATI TALUKA
A.1l Sizes 14' 237 107 32 39 39 44 62 U 1
Less than 1 jj io i2 1'0--2'4 25 18 10 10; 8 2'5-4'9 27 40 19 I 11 11 51 5 5 5'0-7'4 28 43 22 I 9 9 8 12 3 1 7'5-9'9 15 30 18 5 1 1 5 6 4
10'0-12'4 10 20 6 1 1 5 9 1 12'5-14'9 2 3 2 I 1 :8 . i 15'0-29'9 25 43 13 7 4 4 12 3 30'0-49'9 7 12 5 6 1 1 1 2 50+ , 13 4 11 2 4 UnsPecified
CHANDUR TALUJ(A
All Size. 157 143 ao 63 41 40 44 54 2S 6
Less than 1 I 1 ! 1'0-2'4 14 15- ., 9 9 4 4 4 2'5-4'9 31 42 15 2 12 12 6 8 3 1 5'0-7'4 32 41 35 3 6 6 17 17 17 7'5-9'9 18 27 16 6 5 4 1 4 4 4
10'0-12'4 11 19 3 5 3 3 5 9 1 12'5-14'9 6 11 2 4 2 3 1 15'0-29'9 28 53 19 16 6 6 2 3 1 30'0-49'9 11 20 6 14 3 4 2 50+ 5 14 4 13 I 2 Unsp~ified

173 B SJ:RIES
and Household Industry classified by Size of Land"":concld.
20% Sample)
Cultivating Households engaged in Household Industry
3-' Persons 6-10 Persons MOA than 10 Penons Size of Lsnd
Family Workers Family Workers Family Workers (ClaM! ranaes in Acres) Hous~- Hired House- Hired House- Hired holds Males Females Workers holel_ Males Females Workers holds Males Femalee Workerl
(13) (14) (15) (16) (17) (18) (19) (20) (21) (22) (23) (24) (I)
TALUKAWISE RURAL ONLY-concld, MORSI TALUKA
72 1<12 84 25 10 30 24 I' .. All Sizes
i3 iii ' is 'j Less than 1
1 5 1'0-2'4 12 27 15 2'5--4'9 11 17 19 3 9 II 4 5,0-7,4 3 5 4 1 7'5-9,9 9 21 5 3 4 3 10'0-12'4 2 2 3 t '! 12'5-14'9
11 23 14 4 7 I 15'0-29'9 8 16 6 10 30'<1-49'9 3 5 6 3 5 1 12 50+
", Unspecified
., 1JARYAPT,TR TALUKA
32 69 38 10 6 27 9 4 All Sizes
'1 is '6 Less than 1 1 , i '2
1,0-2,4 '1 14 8 1 4 2'5-4,9 .. 8 ~- 1 2 13 5,0-7'4 :: 5 3"f' 7'5-9'9 <I 10 8 10'0-12'4 i 3 3 12'5-14'9 1 3 2 'j -; 15'0-29,9 3 IS 2 J 5 3 30'0-49'9 1 1 3 1 ., 1 50+ 1 1 1 1 Unspecified
AMRAVATl TALUIC.A
55 118 66 14 1 13 11 16 .. All Sizes
'9 '6 '. Less than 1
4 2 1'0-2'4 11 24 14 1 2'5-4'9 10 19 16 1 3 3 , S 5'0-7'4 7 17 II 2 6 3 7'5-9'9 4 10 5 10'0.-12'4 1 2 2 12'5-14'9
13 27 10 6 15'0-29'9 3 5 2 5 1 3 3 1 30'0-49'9 2 5 2 2 4 4 to 50+
Unspecified
CHANDUR T ALUKA
60 115 '15 29 12 34 16 2& .. All Sizes
1 I 2 Less than I 1 2 3 1'0-2'4
13 22 23 2'5-4'9 7 12 15 2 6 3 3 5,0-7'4 8 18 10 2 1 1 1 4 7'5-9'9 2 5 3 1 2 4 10,0-12'4 4 8 2 3
iii 12'5-14'9 17 34 15 11 3 4 4 15'0-29'9 7 13 2 12 1 3 4
i3 30'0-49'9 4 12 4 50+
Unspecified

174 CENSUS TABLES
B-XVI-SampJe Principal Household Industry classified by Period of Workina
(Based on
Total Total 1 to 3 months 4 to 6 months CedeNo. Rural
Household Industry Urban Family Workers Family Workers Family Workers (Division and (a) With cultivation. House- Hired House- Hired House- Hired
Major Group only) (b) Without cultivation holds Males Females Workers holds Males Females Workers holds Males Females Workers
(1) (2) (3) (4) (5) (6) (1) (8) (9) (10) (11) (12) (13) (14)
DISTRICT TOTAL All Industries " Total 2,516 3,336 1,396 321 85 115 56 4 389 504 279 48
(a) 939 1,481 714 203 47 71 '38 3 164 238 143 25 (b) 1,517 1,855 682 118 38 44 ,18 1 22S 266 136 23
Rural 1,665 2,297 917 192 79 109 53 4 325 434 227 25 (a) 770 1,212 602 164 41 71 38 3 153 225 135 20 (b) 895 1,085 315 28 32 38 IS 1 172 209 92 5
Urban 851 1,039 479 129 6 6 3 64 70 52 23 (a) 169 269 112 39
'(; 11 13 8 5 (b) 682 770 367 90 6 3 53 57 44 18
Division 00 .. Total 368 504 225 89 3 4 51 62 32 12 (a) 204 319 155 77 2 3 34 46 28 12 (b) 164 185 70 12 1 1 17 16 4
Rural 266 373 185 62 3 4 4S 55 31 7 (a) 157 245 135 58 2 3 31 42 27 7 (b) 109 128 50 4 1 1 14 U 4
Urban 102 131 40 27 6 7 S (a) 47 74 20 19 3 4 5 (b) 55 57 20 8 3 3
Major Group 00 Total 5 7 3 4 (a) 3 5 2 4 I, (b) 2 2 1 1 1
.. Rural .. 6 2 4 (a) 3 5 2 4 , i (b) 1 I 1
Urban(b) .,
03 .. Total 21 28 14 3 3 (a) 9 15 9 '3 (b) 12 13 5 3
Rural 20 27 14 2 2 (a) 9 15 9
'2 (b) 11 12 5 '2
Urban (b)
04 .. Total 342 469 208 85 3 4 47 58 J2 12 (a) 192 299 144 73 2 3 34 46 28 12 (b) ISO 170 64 12 I 1 13 12 4
Rural 242 340 169 58 3 4 42 52 31 7 (a) 145 225 124 54 2 3 31 42 27 7 (b) 97 115 45 4 1 I II 10 4
.. Urban 100 129 39 27 5 6 5 (a) 47 74 20 19 3 4 !I (b) 53 55 19 8 2 2
Dfvisioll 2 and 3 Total 2,148, 2,832 1,171 232 82 111 56 4 338 442 247 36 (a) 735 1,162 559 126 45 68 38 3 130 192 115 13 (b) 1,413 1,670 6i2 106 37 43 18 1 208 250 132 23
Rural 1,399 1,924 732 130 76 105 53 4 280 379 196 18 (a) 613 967 467 106 45 68 38 3 122 183 108 13 (b) 786 957 265 24 31 37 15 1 158 196 88 5
Urban 749 908 439 102 6 6 3 58 63 51 18 (a) 122 195 92 20 8 9 7 (b) 627 713 347 82 6 6 3 50 54 44 18
Major Group 20 .. Total 137 178 47 72 15 19 9 (a) 60 88 27 58 9 11 4 (b) 77 90 20 14 I 6 8 S
Rural 90 121 30 55 10 12 5 (a) 52 77 26 $4 . i 8 10 4 (b) 38 44 4 I I 1 2 2 1
Urban 47 57 17 17 5 7 4 (a) 8 11 I 4 I 1 . (b) 39 46 16 13 4 6 4
21 .. Total (a) 2 3 2 3
Rural (a) 2 2
Urban (a) 1
175
and Total Number of Workers engaged in Household Indmtry
20% Sample)
7 to 9 months
Family Workers Households Males
Hired Females Workers
10 months to I Iyear
Family Workers House- -----holds Males Females
(IS) (16)
283 380 106 170 177 210
202 282 89 145
113 137
81 98 17 25 64 73
55 72 35 49 20 23
41 26 15
14 9 5
9 5 4
9 5 4
55 37 18
17 12 5
'j
13 8 5
13 8 5
45 58 30 41 15 17
32 42 21 29 11 13
13 9 4
16 12 4
228 308 71 121
157 187
161 221 63 108 98 119
67 81 8 13
59 68
13 5 8
8 4 4
5 1 4
13 7 6
8 5 3
5 2 3
(17)
211 103 108
157 85 72
54 18 36
41 32 9
36 28 8
5 4 1
7 5 2
7 5 2
33 27
('
29 23
6
4 4
170 71 99
121 57 64
49 14 35
7 2 5
3 2 1
4
4
(18) (19)
30 1,595 16 554 14 1,041
23 14 9
7 2 5
10 10
8 8
2 2
10 10
8 8
2 2
20 6
14
IS 6 9
5
5
2
2
2
2
914 423 491
681 131 550
240 121 119
159 87 72
81 34 47
8 3 5
8 3 5
232 118 114
151 84 67
81 34 47
1,355 433 922
755 336 419
600 97
503
97 39 58
61 33 28
36 6
30
(20) (21)
2,114 784 883 384
1,231 400
1,275 670 60S
839 213 626
340 204 136
234 147 87
106 57 49
10 5 5
10 5 5
330 199 131
224 142 82
106 57 49
1,774 679
1,095
1,041 523 518
733 156 577
127 57 70
84 49 35
43 8
35
419 301 118
365 83
282
139 86 53
105 71 34
34 15 19
5 2 3
5 2 3
134 84 50
100 69 31
34 15 19
645 298 347
314 230
84
331 68
263
24 15 9
15 14
1
9 1 8
Months not stated
Family Workers Hired House- -----
Workers holds Males Females
214 138 76
115 106
9
99 32 67
59 47 12
39 35 4
20 12 8
59 47 12
39 35 4
20 12 8
15S 91 64
76 71 5
79 20 59
59 47 12
44 43
1
15 4
11
(23) (24)
164 223 68 119 96 104
14~ 5& 87
19 10 9
19 12 7
18 11 7
3 3
3 3
I~ 8 1
14 7 1
145 56 89
127 47 80
18 9 9
II 7 4
10 7 3
197 101 96
26 18 8
26 17 9
25 16 9
5 5
5 5
2 2
2 2
19 10 9
18 9 9
197 102 95
172 85 87
25 17
8
18 13 5
16 13 3
2
2
(25)
66 46 20
61 43 18
5 3 2
13 9 4
13 9 4
2 2
2 2
2 2
2 2
9 5 4
9 5 4
53 37 16
48 34 14
5 3 2
6 6
6 6
Total Rural Urban
B SERIES
Code No.
Hired (a) With cultivation Workers (b) Without cultivation
Household Industry (Division and
Major group only)
(26)
25 21 4
2S 21 4
8 8
8 8
.. 4
4 4
4 4
4 4
17 13 4
17 13 4
10 10
10 10
(2) (I)
DISTRICT TOTAL Total All Industrie. Ca) (b)
Rural (a)
Cb)
Urban (a) (b)
Total (a) (b)
Rural (a) (b)
Urban (a) (b)
Total (a) (b)
Rural (a) (b)
Urban (b)
Total (a) (b)
Rural (a) (b)
Urban (b)
Total (a) (b)
Rural (a) (b)
Urban (a) (6)
Total (It) (b)
Rural (a) (b)
Urban (a) (b)
Tot .. l (a) (1))
Rural (a) (b)
Urban (a) (b)
Total (a)
Rural (a)
Urhan (a)
Dlri.loD 00
~ ajor Groul> 00
03
04
Division 2 and 3
Major Group 20
21
------_

176 CENS{JS TABLES
B-XVI-5ample Principal Household Industry c1assifiecl by Period of Workiq
(Based on
Total Total 1 to 3 months "t06 months Code No. Rural
Hou.ehold Industry Urban Family Workers Family Workers Family Workers (Divisioo and (a) With cultivation House- HIred House- HIred House- HIred
:Uajor Group only) (b) Without cultivation holds Males Females Workers hold.! Males Females Workers holds Males Females Worker&
(1) (2) (3) (4) (5) (6) (7) (8) (9) (10) (11) (12) (13) (14)
Major Group 12 .. Total 10 12 9 (a) 2 5 ·9 (b) a 1
Rural (al • 5
Urban (b) 8 1 9
23 .. Total 243 311 !07 7 3 3 2 20 25 10 (a) 14 122 74 2 I 2 1 12 16 a (b) 169 189 133 5 1 1 8 9 2
Rural 56 18 52 1 2 2 2 IS n 7 (a) 215 42 30 1 2 2 2 8 S (b) 30 311 22 7 8 :I
Urban 187 :133 ISS 6 S 6 3 (a) 48 80 44 I .j 4 S 3 (b) 139 153 111 :5 1 1 1
24 .. Total 14 22 1l , 13 8 3 " J (a) 5 11 8 3 8 S 2 3 3 (b) 9 11 4 4 5 3 1 1
Rural 11 18 12 1 13 8 3 4 3 (a~ S 11 8 3 8 S ! 3 3 (b • 7 4 , S 3 1 1
Urban (b) 3 4
!5 Rural (b)
!6 Rural (a) 3
2'1 .. Total 371 457 190 31 3 3 3 21 25 12 S (a) 160 26S 103 20 I 1 2 14 19 10 ., (b) !11 192 S1 11 2 2 1 1 6 2
Rural !58 352 12S 20 ! 3 18 13 10 (a) 143 237 96 19 1 ! 14 19 10 (b) 11S tiS 29 1 1 1 4 4
Urban 113 lOS 6S 11 2 3 2 2 , (a) 17 28 1 1 .j ·1 ·3 -i ·2 ·s (b) 915 77 58 10
2. Total 61S 752 373 14 24 27 13 ISO 166 131 ! (a) 194 278 160 3 9 13 8 48 6S 49 l (b) 421 474 213 Il IS 14 S 102 101 83
Rural 466 '577 249 3 23 2'5 12 121 135 9S :2 (a) 176 2'53 139 3 9 13 8 46 '3 4S 2 (b) 290 324 110 14 12 4 1S 72 SO
Urban 149 17'5 124 11 2 29 31 37 (a) 18 2'5 21 2 2 4 (b) 131 1:50 103 11
. j ·2 . j 27 29 33
JO Urban (b) 3 S
31 .. Total 216 300 76 9 6 10 4 12 29 13 (a) 77 128 57 S 6 10 4 10 11 12 (b) 139 172 19 4 12 12 1
Rural 137 192 61 :5 6 10 4 17 24 13 (a) 66 110 52 S 6 10 4 10 17 12 (b) 71 82 9 "1 7 1
Urban 79 108 15 4 :5 5 (a) 11 18 5 ·4 ·s (b) 68 90 10 S
33 Total 10 12 3 3 (a) I 2 .j (b) 9 10 3
Rural (a) 2
Urban (b) 9 10 3 3
34 & 35 Total 230 380 186 47 30 46 25 3 89 lS3 60 27 (a) 84 148 89 13 19 29 17 2 26 SO 23 9 (b) 146 232 97 34 11 17 8 1 63 103 37 18
Rural 187 321 149 30 27 45 23 3 82 146 :5S 14 (a) 77 134 79 12 19 29 17 2 26 SO 23 9 (b) 110 187 70 18 8 16 6 1 S6 96 32 :5
177 B SERIES
... Total Number of Workers engaged in Household Industry-contd.
20.% Sample)
7 to , Dlonths to months to I year Moilths not stated Total Code No. Rural Household Industry
Famlly Worken Family Workers Family Workers Urban (Division and Ho~ HIred House- Hired House- Hired <a> With cultivation Major Group only) hOlds Males Females Worken bo1ds Males Females Workers holds Males Females Workers (b) Without cultivation
(IS) (16) (17) (18) (19) (20) (21) (22) (23) (24) (2S) (26) (2) (1)
9 9 9 3 Total •• Major Group 22 1 2 3 (a> _ 8 1 9 (b)
2 3 Rllral (al
8 1 9 Urban (b)
12 10 IS 205 265 115 6 3 g 5 Total 23 3 3 6 54 93 53 1 3 8 5 (a) 9 1 9 151 172 122 5 (b)
2 2 3 34 41 35 3 8 5 Rural 1 1 2 12 20 16 3 8 5 (a) 1 1 1 22 27 19 (b)
10 8 12 171 2UI 140 6 Urban 2 2 4 42 73 37 1 (a> 8 6 8 129 14S 103 5 (b)
2 2 2 3 Total 24 '2 '2 'i '2 ' 'j (a)
(b)
Rural . i . i (a)
1 (b)
2 3 Urban (b)
Rural (b) 25
Rural (a) 26
17 25 13 287 352 141 24 43 52 21 2 Total 27 5 9 1 114 204 76 18 16 32 13 2 (a) 12 16 1l 163 148 65 6 21 20 8 (b)
13 19 13 189 264 82 18 36 45 17 2 Rural 4 7 2 112 184 71 17 12 26 11 2 (a) 9 12 11 71 80 11 1 24 19 6 (b)
4 6 98 88 59 6 7 7 4 Urban 1 2 12 20 5 I 4 6 2 (a) 3 4 86 68 54 5 3 1 2 (b)
66 81 51 324 416 159 12 51 62 12 Total 28 18 2S 20 104 148 74 1 15 27 9 (a) 48 56 37 220 268 85 11 36 35 3 (b)
48 63 38 229 301 93 45 53 11 Rural 16 23 13 93 133 65 12 21 8 (a) 32 40 25 136 168 28 33 32 3 (b)
111 18 19 95 115 66 11 6 9 lIrba.n 2 2 7 11 15 9
ii 3 6 <a) 16 16 12 84 100 57 3 3 (b)
3 5 Urba.n (b) 30
37 5S 12 140 193 44 8 11 13 3 Total 31 15 29 11 41 66 28 4 5 6 2 (a) 22 26 I 99 127 16 4 6 7 I (b)
31 47 12 73 99 29 4 10 12 3 Rural 15 29 11 30 48 23 4 5 6 2 Ca) 16 18 I 43 51 6 S 6 1 (b)
6 8 67 94 15 4 Urbl.ll
'6 'i 11 18 5 '4 . i Ca) S6 76 10 1 (b)
10 12 3 Total 33 1 2 '3 '3 (a) 9 10 (b)
2 . Rv.ral(a)
9 10 3 3 Urban (b)
61 95 60 13 42 67 38 8 19 3 3 Total 348<35 21 40 29 1 16 27 19 2 2 I (a) 40 55 31 12 26 40 19 6 17 2 3 (b)
4S 69 47 10 2S 42 21 8 19 3 3 Rural 19 3S 26 1 11 18 12 2 2 1 (a) 26 34 21 9 14 24 9 6 17 2 3 (b)
H4222-12
178 CENSUS TABLES
B-XVI-Sample Principal Household Industry classified by Period of WorJdDg
(Based on
Total Total 1 to 3 months 4 to 6 mont)!. Code No. Rural
Household Industry Urban Family Workers Family Workers Family Workers (Division and (a) With cultivation House- Hired House- Hired House- Hired
Major Group only) (b). Without cultivation holds Males Females Workers holds Male. Females Workers holds Males Females Workers
(I) (2) (3) (4) (5) (6) (7) (8) (9) (10) (II) (12) (13) (14)
Major Group 34 &35 .. Urban 43 59 37 17 2 7 7 S 13 (a) 7 14 10 I '2 '7 's jj (b) 36 4S 27 16 3 I 7
J6 Total 176 252 49 28 2 2 8 9 6 (a) 37 56 29 9 2 2 4 5 5 (b) 139 196 20 19 4 4 1
Rural 122 176 42 12- 2 2 7 8 6 (a) 33 52 26 8 2 2 4 5 5 (b) 89 124 16 4 3 3 1
Urban 54 76 7 16 (a) 4 4 3 I . i (b) 50 72 4 IS
37 Total 4 7 (a) 2 5 (b) 2 2
Rural (a) 2 5
Urban (b) 2 2 .. 38 Total 16 18 2
(a) 4 6 2 (b) 12 12 I I
Rural 7 9 2 (a) 3 5 2 (b) 4 4 1 1
Urban 9 9 (a) 1 I (b) 8 8
39 Total 99 121 14 18 5 S 8 9 (a) 32 44 7 13 3 3 3 3 (b) 67 77 1 5 2 2 5 6
Rural 57 64 1 5 5 6 6 (a) 25 31 6 3 3 3 3 (b) 32 33 1 2 2 3i 3 1
Urban 42 57 7 17 2 (a) 7 13 1 12 (b) 35 44 6 S 2
179 B SERlEb
and Total Number of Workers engaged in Household Industry-concld.
20 % Sample) ~
Total , to 9 months 10 months to I year Month. not stated Rural Code No.
Urban Household Industry Family Workers Family Workers Family Workers (a) With cul- (Division and
House· Hired HOllse- Hired House· Hired tivation Major Group only) holds Males Females Workers holds Males Females Workers holds Males Female! Workers (b) Without
cultivation (\5) (16) (17) (1&) (19) (20) (21) (22) (23) (24) (25) (26) (2) (I)
16 26 13 17 25 11 Major Group
Urban 34 & 35 2 :5 3 5 9 7 (a)
14 21 10 3 12 16 10 (b)
15 22 5 144 211 36 22 7 2 Total 36 3 1 1 28 42 23 4 (a)
12 15 4 116 169 13 18 7 8 2 (b)
11 16 4 96 143 30 6 6 7 2 (Rural 3 7 1 24 38 20 3 ·7 (a) g 9 3 72 105 10 3 6 2 1 (b)
4 6 48 68 6 16 Urban 4 4 3 1 (a)
4 6 1 44 M 3 15 (b) '.
4 7 Total 37 2 5 (a) 2 2 (b)
2 Rural (a)
2 2 Urban (b)
13 15 2 Total 38 4 6 2 . i (a)
1 9 9 1 (b)
5 7 2 Rural 3 :5 2 . i (a) 2 2 (b)
8 8 Urbau 1 1 (a) 7 7 (b)
4 4 73 90 12 17 9 13 1 Total 39 1 1 18 26 6 12 7 11 1 (a) 3 3 55 64 6 5 2 2 (b)
2 2 31 43 :5 7 8 Rural 1 1 13 18 5 :5 6 ( .. ) 1 I 24 25 2 2 (b)
2 2· 36 47 7 17 2· 5 Urban .. ·2 5· 8 1 12 2 :5 (a) 2 31 39 6 :5 (b)
------....-
H4222-12a
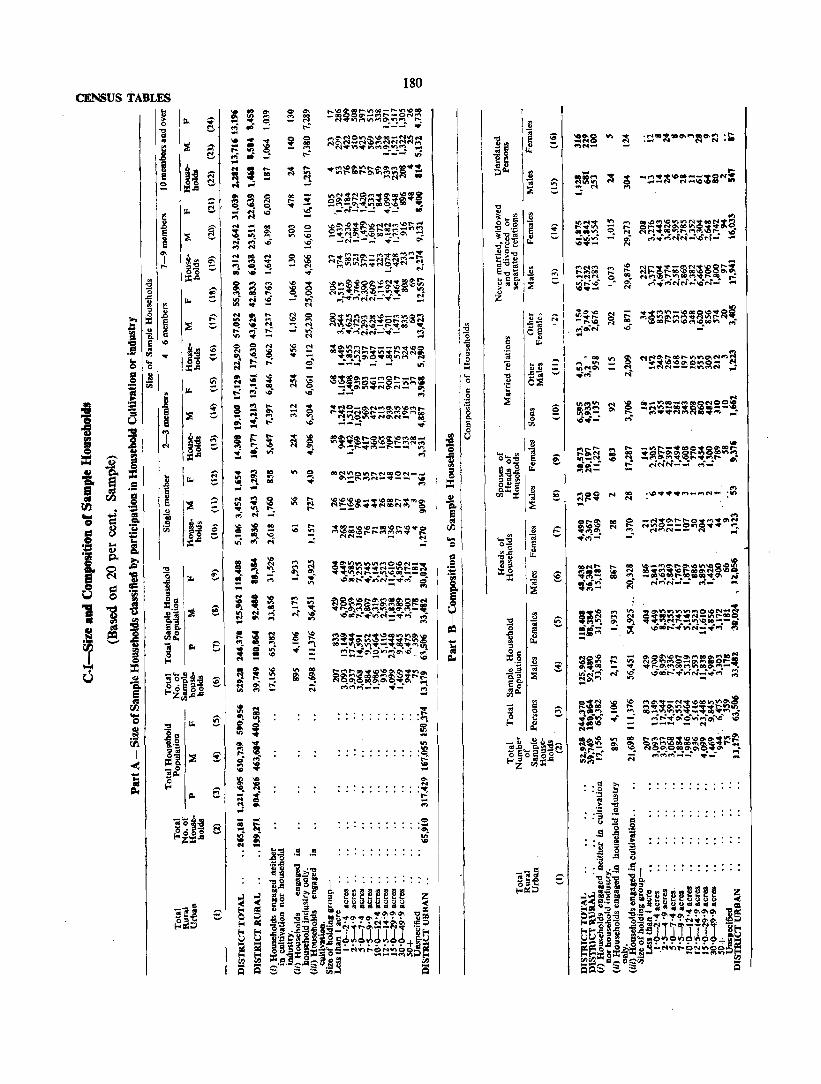
CENSUS TABLES
i !
1110<
. --'"'
180
~;~~~~~~~~.~ ~ ... , ... - - r.1
,.;;
I I
I I", !:::! l,g j ~ Ii:!: I'"' 1 :
Il :i 18 il ",I 5\ =1 ~I ~i 131 "I
~I J\
1 ~!
~I
I" I';
~
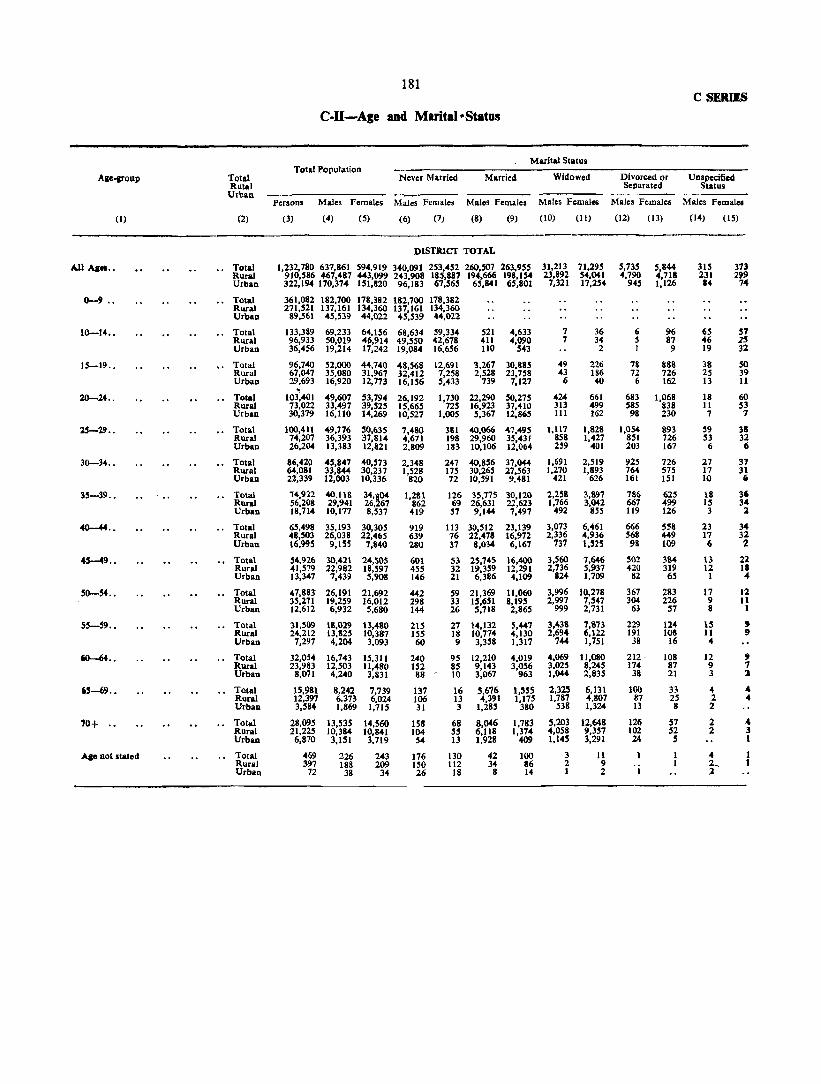
181 C SERIES
C-ll-Ale and Marital·Statns
Marital Status
Ale"ll'onp Total Population
Never Married Widowed Divorted or Total Married Unspecified Rutal Sellarated Status
Urban Persons Males Females Males Females Males Females Males Females Males Females Males Females
(I) (2) (3) (4) (5) (6) (7) (8) (9) (10) (11) (12) (13) (14) (15)
DISTRICT TOTAL
All AI-.. Total 1,232,780 637,861 594,919 340,091 253,452 260,507 263,955 31,213 71,295 5,735 5,844 315 373 Rural 910,586 467,487 443,099 243,908 185,1187 194,666 198,154 23,892 54,041 4,790 4,718 231 299 Urban 322,194 170,374 151,820 96,183 67,S6S 65,841 65,801 7,321 17,254 945 1,126 84 74
0-9 .. Total 361,082 182,700 178,382 182,700 178,382 Rural 271,521 137,161 134,360 137,161 134,360 Urban 89,561 45,539 44,022 45,539 44,022
10-14,. .. Total 133,389 69,233 64,156 68,634 59,334 521 4,633 7 36 6 96 65 57 Rural 96,933 50,019 46,914 49,550 42,678 411 4,090 7 34 5 87 46 2S Urban 36,456 19,214 17,242 19,084 16,656 tlO 543 2 I 9 19 3l
15-19 .• .. Total 96,740 52,000 44,740 48,568 12,691 3,267 30,88S 49 226 78 888 38 SO Rural 67,047 35,080 31,967 32,412 7,258 2,528 23,758 43 186 72 726 2S 39 Urban 29,693 16,920 12,773 16,156 5,433 739 7,127 6 40 6 162 13 11
20-24 .. Total 103~401 49,607 53,794 26,192 1,730 22,290 50,275 424 661 683 1,068 18 60 Rural 13,022 33,497 39,525 15,665 725 16,923 37,410 313 499 585 838 II S3 Urban 30,379 16,110 14,269 10,527 I,OOS 5,367 12,865 111 162 98 230 7 7
2.5-29 •• Total 100,411 49,776 50,635 7,480 381 40,066 47,495 1,117 1,828 1,054 893 59 38 Rural 74,207 36,393 37,814 4,671 198 29,960 35,431 858 1,427 851 726 53 32 Urban 26,204 13,383 12,821 2,809 183 10,106 12,064 259 401 203 167 6 6
30-34 .• Total 86,420 45,847 40,573 2,348 247 40,856 37,044 1,691 2,519 925 726 27 31 Rural 6<4,081 33,844 30,237 1,528 175 30,265 27,563 1,270 1,893 764 575 17 31 Urban 22,339 12,003 10,336 820 72 10,591 9,481 421 626 161 151 10 Ii
35-39 •• Total 14,912 40.118 34,~04 1,281 126 35,775 30,120 2,258 3,897 786 625 18 3' Rural 56,2~8 29,941 26, 67 862 119 26,631 22,623 1,766 3,042 667 499 15 34 Urban 18,714 10,177 8,537 419 57 9,144 7,497 492 aS5 119 126 3 2
4O--f4 .• Total 6',498 35,193 30,305 919 113 30,512 23,139 3,073 6,461 666 558 23 34 Rural 48,S03 26,038 22,465 639 76 22,478 16,972 2,336 4,936 568 449 17 32 Urball 16,99S 9,155 7,840 280 37 8,034 6,167 137 1,52S 98 109 6 2
45-49 •• Total 54,926 30,421 24,505 601 53 2S,745 16,400 3,560 7,646 502 384 13 22 Rural 41,579 22,982 18,597 455 32 19,359 12,291 2,736 5,937 420 319 12 11 Urban 13,347 7,439 5,908 146 21 6,386 4,109 124 1,709 82 6S 1 4
50-' ... Total 47,8S! 26,191 21,692 442 59 21,369 11,060 3,996 10,278 367 283 17 12 Rural 35,271 19,259 16,012 298 33 15,651 8,195 2,997 7,547 304 226 9 II Urban 12,612 6,932 5,680 144 26 5,718 2,86S 999 2,731 63 57 8 1
55-59 .. Total 31,509 18,029 13,480 215 27 14,132 5,447 3,438 7,873 229 124 15 9 Rural 24,212 13,1125 10,387 ISS 18 10,774 4,130 2,694 6,122 191 lOS 11 9 Urban 7,297 4,204 3,093 60 9 3,358 1,317 744 1,751 38 16 4
~ .. Total 32,054 16,743 15,311 240 95 12,210 4,019 4,069 11,080 212 108 12 , Rural 23,983 12,503 11,480 152 85 9,143 3,056 3.025 8,245 174 87 9 7 Urban 8,071 4,240 3,831 88 - 10 3,067 963 1,044 2,835 38 21 3 :a
65-(1) .• Total 15,981 8,242 7,739 137 16 5,676 1,555 2,325 6,131 100 33 .. .4 Rural 12,397 6.373 6,024 106 13 4,391 1,175 1,787 4.807 87 25 2 4 Urball 3,584 1,869 1,715 31 3 1,285 380 S38 1,324 13 8 2
70+ .. Total 28,095 13,535 14,560 15S 68 8,0«6 1,783 5,203 12,648 126 57 2 .4 Rural 21,225 10,384 10,841 104 55 6,118 1,374 4,058 9,357 102 S2 2 3 UrbaD 6,810 3,151 3,719 54 13 1,928 409 1,145 3,291 24 S 1
Ale aot stated Total 469 226 243 176 130 42 100 3 11 4 Rural 397 188 209 150 112 34 86 2 9 2... Urban 72 38 34 26 18 8 14 1 2 1 2
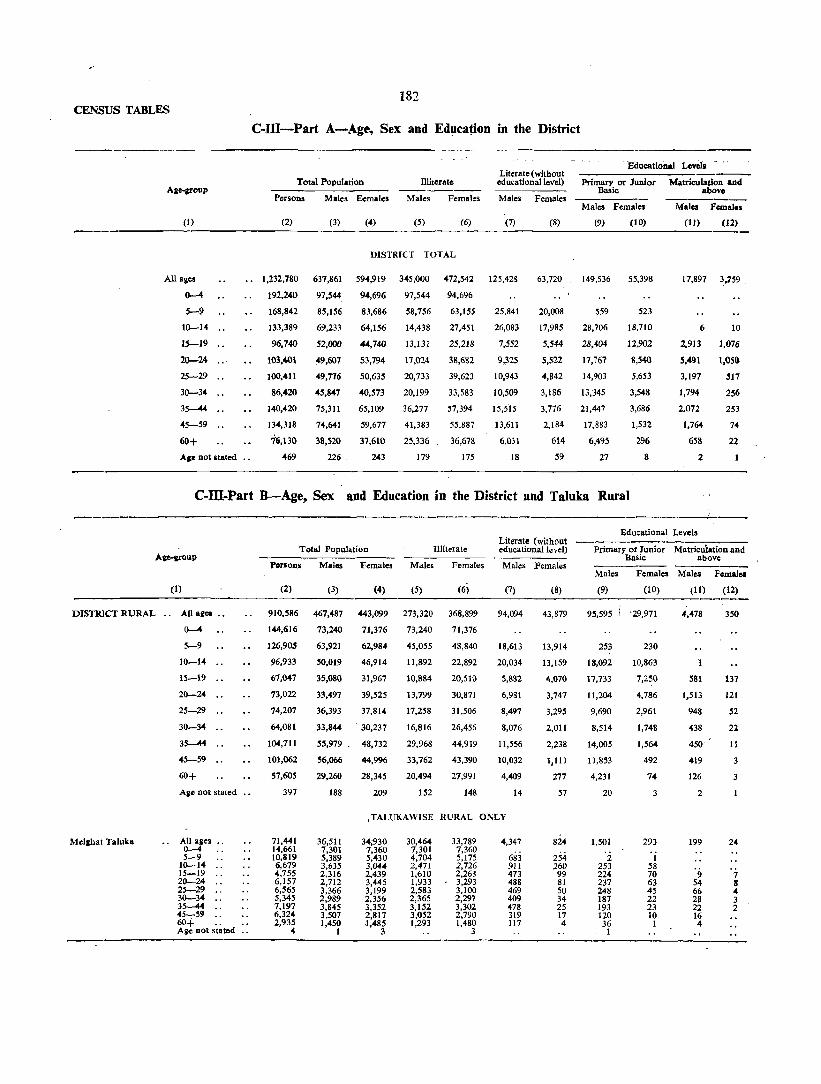
182 CENSUS TABLES
C-ill-Part A~Age, Sex and Education in the District
A,e-;rOUp Total Population
Persons Males Eemales
miterate
Males Females
(I) (2) (3) (4) (5) (6) --------------------------------
All ages
0--4
5-9
10--14
15-19
20--24
25-29
30-34
3~
45-59 ..
61>+ Ale not Itated
1,232,780
192,240
168,842
133,389
96,740
103,401
100,411
86,420
140,420
134,318
16,130
469
637,861
91,544
85,156
69,233
52,000
49,607
49,776
45,847
75,311
74,641
38,520
226
DISTRICT TOTAL
594,919
94,696
83,686
64,156
44,140
53,794
50,635
40,573
65,109
59,677
37,610
243
345,000
97,544
58,756
14,438
13,131
17,024
20,733
20,199
36,277
41,383
25,336
179
472,542
94,696
63,155
27,451
25,218
38,682
39,623
33,583
57,394
55,887
36,678
175
Literate (without educational level)
Males Females
(7)
125,428
25,841
26,083
7,552
9,;325
10,943
10,509
15,S'15
13,611
6,031
18
(8)
63,720
20,008
17,985
5,544
5,522
4,842
3,186
3,776
2,184
614
59
Educational Levds
Primary or Junior Basic
Mal .. Females
(9)
149,536
559
28,706
28,404
17,761
14,903
13,345
21,447
17,883
6,495
27
(10)
55.398
523
18,710
12,902
8,540
5,653
3,548
3,686
1,532
296
8
Matriculation anel abovo
Males Femal ••
(11)
17,897
6
2,913
5,491
3,197
1,794
2,072
1,764
653
2
(12)
3,259 .
10
1,016
1,056
517
256
253
74
22
C-ID-Part B-Age, Sex and Education in the District and Taluka Rural
A&e-aroup
DISTRICT RURAL
Mellhat Taluka
(1)
AllaiCII
0--4
5-9
10--14
15-19
20--24
25-29
30--34
35-44
45-59
60+
Aie not stated
All alles .. 0--4 5-9
10--14 15-19 .. 20--24 25-29 30--34 •. 35-44 45-59 60+ .. Aile not stated
Total Population Illiterate
Porsons Malos Females Males Females
(2) (3) (4) (5)
910,586 467,487 443,099 273,320
144,616 73,240 71,376 73,240
126,905 63,921 62,984 45,055
96,933 50,019 46,914 11,892
67,047
73,022
74,207
64,081
104,711
101,062
57,605
397
35,080
33,497
36,393
33,844
55,979
56,066
29,260
188
31,967
39,525
37,814
30,237
48,732
44,996
28,345
209
10,884
13,799
17,258
16,816
29,968
33,762
20,494
152
(6)
368,899
71,376
48,840
22,892
20,510
30,871
31,506
26,456
44,919
43,390
27,991
148
Literate (without educational level)
Males Females
(7)
94,094
18,613
20,034
5,882
6,981
8,497
8,076
11,556
10,032
4,409
14
(8)
43,879
13,914
13,159
4,070
3,747
3,295
2,011
2,238
1,111
277
57
,TALUKAWISE RURAL Ol\LY
71,441 14,661 10,819 6,679 4,755 6,157 6,565 5,345 7,197 6,324 2,935
4
36,511 7,301 5,389 3,635 2,316 2,712 3,366 2,989 3,845 3,507 1,450
1
34;930 7,360 5,430 3,044 2,439 3,445 3,199 2,356 3,352 2,817 1,485
3
30,464 7,301 4,704 2,471 1,610 1,933 2,583 2,365 3,152 3,052 1,293
33,789 7,360 5,175 2,726 2,263 3,293 3,100 2,297 3,302 2,790 1,480
3
4,347
683 911 473 488 469 409 478 319 117
824
254 260
99 81 50 34 25 17 4
Bducational Levels
Primary or Junior Basic
Matriculation and above
Males Females Males Females
(9)
95,595
253
18,092
17,733
11,204
9,690
8,514
14,005
11,8~3
4,231
20
1,501
2 253 224 237 248 187 193 120 36
1
(10) (11) (12) ._------'29,971
230
10,863
7,250
4,786
2,961
1,748
1,564
492
74
3
293
. i 58 70 63 45 22 23 10
I
4,478
581
1,513
948
438
450
419
126
2
199
9 54 66 28 22 16 4
350
137
121
52
22
11
3
24
7 8 4 3 2

Achalpur Taluka
Morsi Taluka
Daryapur Taluka
Amravati Taluka
Chandur Taluka
183 C SERIES
c-m-Part B-Age, Sex and Education in the District and Talukas Rural-concld.
Alle-aroup
(1)
All alles 0-4 5-9
1(}-14 15-19 2(}-24 25-29 30-34 35-44 45-59 60+ .. Age not stated
Allalles .. 0-4 5-9
1(}-14 15-19 .. 2(}-24 25-29 3(}-34 .. 35-44 45-59 60+ •. Age not stated
All ages .. 0-4 5-9
1(}-14 15-19 .. 2(}-24 .. 25-29 .. 3(}-34 3S-44 .. 45-59 60+ .. Ago not stated
All ages .. 0-4 5-9
1(}-14 15-19 2(}-24 .. 25-29 3(}-34 " 35-44 45-59 .. 60+ .. Age not stated
All ages .. 0-4 S-9
1(}-14 IS-19 .. 2(}-24 25-29 .. 30-34 .. 35-44 45-59 .. 60+ .. Age not stated
Educational Levels
Total Population Illiterate Literate (without educational level) Primary or Junior Matriculation and
Persons
(2)
148.214 23,378 20,746 16,023 10,905 11,788 11,923 10,348 17,153 16,529
9,357 64
157,261 24,616 -oll,316 16,210 11,087 11.954 12,718 11,055 18,618 18,614 10,990
83
131,284 21,660 19,763 14,962 9,983
11,161 11,191 9,561
15,751 14,883 8,256
101
220,992 34,132 30,182 24,030 11,087 18,333 17,728 15,381 25,370 24,416 14,333
175,394 26,169 24,079 19,029 13,230 13,629 14,076 12,385 20,622 20,296 11,734
145
Males Females Males Females Males
(3) (4) (5) (6) (7)
TALUKAWISE RURAL ONLY-coneld.
76,250 1l,869 10,435
8,295 5,641 5,352 5,900 5,442 9,144 9,228 4,910
34
80,452 12,507 10,772 8,190 5,804 5,539 6,106 5,799 9,907
10,303 5,487
38
70,607 11,038 9,946 7,723 5,121 5,032 5,550 5,033 8,434 8,457 4,223
50
113,837 11,333 15,281 12,443 9,001 8,547 8,174 8,066
13,617 13,495 7,280
89,830 13,192 12,098 9,733 7,197 6,315 6,691 6,515
11,032 11,076 5,910
65
71,964 11,509 10,311
7,728 5,264 6,436 6,023 4,906 8,009 7,301 4,447
30
76,809 12,109 10,544 8,020 5,283 6,415 6,612 5,256 8,711 8,311 5,503
45
66,677 10,622 9,817 7,239 4,862 6,129 5,647 4,534 7,317 6,426 4,033
51
107,155 16,799 14,901 11,581 8,086 9,7&6 8,954 7,:H5
11,753 10,921 7,053
85,564 12,977 11,981 9,296 6,033 7,314 7,379 5,870 9,590 9,220 5,824
80
42,119 11,869 7,359 1,607 1,583 2,034 2,467 2,302 4,373 5,232 3,271
22
47,351 12,501 7,471 1,547 1,625 2,258 2,902 2,923 5,449 6,638 4,002
29
37,557 11.038 6,763 1,260 1,241 1,724 2,243 2,184 4,045 4,326 2,685
48
63,050 17,333 10,068 2,602 2,496 3,189 4,002 3,812 6,906 7,720 4,922
52,779 13,192 8,690 2,405 2,329 2,661 3,061 3,230 6,043 6,794 4,321
53
57,971 11,509 7,896 3,218 2,995 4,725 4,836 4,131 7,254 6,996 4,386
25
63,714 12,109
8,030 3,550 3,226 5,030 5,481 4,663 8,065 8,069 5,441
44
53,854 10,622 7,274 3,059 2,957 4,577 4,594 3,884 6,688 6,161 3,988
50
88,068 16,799 11,087 5,595 5,149 7,539 7,348 6,383
10,714 10,503
6,951
71,503 12,977 9,378 4,744 3,920 5,707 6,141 5,098 8,896 8,871 5,745
26
16,077
2,974 3,540
953 1,155 1,489 1,423 2,026
I,~~ 6
16,291
3,279 3,436
986 1,209 1,481 1,389 2,033 1,723
751 4
15,270
3,156 3,2'12
842 1,115 1,341 1,260 1,776 1,739
141 2
24,054
5,142 4,928 1,352 1,725 2,104
2,026 2,989 2,607 1,181
18,055
3,379 3,927 1,276 1,289 1,607 1,569 2,254 1,95S
797 2
Females Males
(8) (9)
7,874
2,340 2,236
890 722 606 396 432 207
40 5
7,797
2,500 2,452
674 625 627 315 380 179 4S
7,681
2,sis 2,376
644 667 547 340 367 182 39
I
11,216
3,724 3,221 1,041
943 819
492 618 275
83
8,487
2,578 2,614
722 109 646 434 416 251
66 51
17,369
102 3,148 3,041 1,940 1,799 1,656 2,662. 2,225
790 6
16,141
22 3,207 3,107 1,867 1.578 1,418 2,351 1,874
713 4
17,150
27 3,171 2,967 1,980 1,803 1,534 2,540 2,345
783
25,304
7i 4,912 4,920 3,079 2,399 2,103 3.618 3,058 1,144
18,130
29 3,401 3,474 2,101 1,863 1,616 2,641 2,231
765 9
Basic above
Females Males Fernal ..
(IO) (II) (12)
6,051
75 2,274 1,357
968 568 373 321 96 19
5,243
14 2,018 1,361
140 491 275 263
63 17
1
5,107
25 1,804 1,247
871 S04 308 260
82 6
7,178
90 2,771 1,859 1,266
774 438 419 143
18
5,499
25 1,938 1,356
878 579 332 278
98 13 2
685
64 223 145 61 83 82 27
669
86 205 145 69 74 68 21
1
630
71 213 157 5S 73 47 14
1,429
I 233 554 269 125 104 110 33
866
lis 264 166 100 94 96 27
1
68
22 21 13 6 l 2 2
S5
22 20
7 3 3
3S
i4 14 2 2 2 I
93
31 38 13 2 2
75
35 20 13 6

184 CENSUS TABLES
c-m-Part C-Age, Sex and Education in the District Urban
Eduational Levels
Literate (without Ma.tr4:u1ation Technical diploma Non-techDica Aae-aroup Total Population Illiterate educational Primary or or HiBher Dot equal diploma llOuqual
level) I unior Basic Secondary to desree to dear-
Persons Males Females Males Females Males Females Males Females Males Females Males Females Males Females
(I) (2) (3) (4) (5) (6) (7) (8) (9) (10) (11) (12) (13) (14) (IS) (16)
DISTRICT URBAN
AlI.pa 322,194 170,374 151,820 71,680 103,6043 31,334 19,841 53,941 25,427 10,721 2,377 297 14 129 102
0-4 47,624 24,304 23,320 24,304 23,320 7,riS 6,094 306 293
.. S-9 41,937 21,235 20,702 13,701 14,315 io 10--14 36,4.56 19,214 17,242 2,.546 4,.559 6,049 4,826 10,614 7,847 5 '8 'j ...
1S-19 29,693 16,920 12,773 2,247 4,708 1,670 1,474 10,671 5,652 2,314 922 1 20-24 30,379 16,110 14,269 3,225 7,811 2,344 1,775 6,563 3,754 3,592 714 76 1 25 33 2S-29 26,204 13,383 12,821 3,475 8,117 2,446 1,5041 5,213 2,692 1,545 338 71 2 21 20 30--34 22,339 12,003 10,336 3,383 7,127 2,433 1,175 4,831 1,800 892 148 33 2 12 18 3S--U 35,709 19,332 16,377 6,309 12,475 3,959 1,538 7,442 2,122 1,111 143 49 7 18 17 4S-,59 .. 33,2.56 18,57S 14,681 7,621 12,497 3,579 1,073 6,030 1,040 898 30 47 1 30 a 60+ .. 18,525 9,260 9,265 4,842 8,687 1,622 337 2,264 222 3604 12 13 22 2 Aae not Itated 72 38 34 27 27 4 2 7 5
c-m-Part C-CODcld.
Educational Lcvcls-concld,
University dCll'ee Technical dCll'cc or diploma equal to degree or Post-araduate dearee Aae-aroup or post-araduate \
Veterinary and dearce other than ' technical dearee Enaineerina Medicine Agriculture Dairyiq TechnoloJ)' Teachina Others
Males Females Males F=a1es Males Females Males Females Male. Females Males Females Males Females Males Females
(I) (17) (18) (19) (20) (21) (22) (23) (24) (25) (26) (27) (28) (29) (30) (31) (32)
DISTRICT tJB.BAN~on~ld.
AIlaaCl 1,482 25. 65 102 13 59 12 9 229 112 314 33
0-4 S-9
10-14 '. ." '2 's 'i 1S-19 '8 '2 's '3 .,. 20--24 187 86 9 '2 13 69 20 2S-29 407 73 18 17 7 18 5 33 17 112 • 30--34 256 37 14 21 1 16 1 4 51 25 56 3 3S--U 274 34 12 21 1 13 1 2 80 39 41 1 4S-59 .. 252 16 11 22 2. 3 1 1 53 14 26 60+ ., 102 3 2 12 4 .. S 2 5 Aa. Dot stated
C-IV -Single Year Age Returns
Total Total Total Total Sinale Year Slnlle Year Sioale Year Slnale Year Aa_Returns Males Females Aae Returns Males Fomales AlllORetums Males Females AaeReturns Males Femalea
(I) (2) (3) (1) (2) (3) (1) (2) (3) (I) (2) (3)
DISTRICf TOTAL All ales 9 25 18,6045 22,618 51 3,015 2,165 77 179 " 637,861 594,916 .. .. .. 14'1'
0 .. 22,220 21,522
26 .. 9,043 8,337 52 .. 4,497 3,352 78 .. 317 307 1 .. 18,291 17,,53
5 27 .. 7,238 6,117 S3 .. 1,644 1,078 79 .. 179 335
2 .. 19,017 18,142
28 .. 10,283 9,307 54 .. 2,221 1,638 80 .. 1,513 1,730 3 .. 18,842 18,95 29 .. 4,567 4,256 55 .. 10,387 7,923 81 202 217 4 19,174 18,5~ 30 20,660 21,322- .. .. .. 56 2,694 1,915 82 262 262 S .. .. .. 19,134 18,0 9 31 .. 5,257 4,074 57 .. 1,388 1,044 83 .. 56 58 6 .. I1t,811 17,747 32 .. 11,693 9,118 58 .. 2,264 1,640 84 .. 98 76 7 .. 17,690 17,939 33 .. 3,770 2,432 S9 .. },296 958 85 .. 534 549 8 .. 15,108 15,232
34 .. 4,467 3,627 60 .. 10,647 10,375 86 89 86 9 35 21,S31 19,525 " .. 14,413 14,731 .. 61 2,018 1,450 87 64 67 10 16,3504 16,35, .. .. .. 36 .. 6,671 5,246 62 .. 2,426 2.041 88 .. 44 43 11 .. 12,,524 12,9~ 37 .. 3,523 2,993 63 .. 694 585 89 .. 39 3 • 12 .. 17,248 14,5 6 38 .. 5,304 4,290 64 .. 958 860 90 .. 434 546 13 .. 10,414 9,35 39 .. 3,089 2,750 65 .. 5,608 5,360 91 56 51 14 12,693 10,950 40 19,013 17,669 .. .. " 66 807 728 92 73 6 • 15 9,785 7,927 .. .. .. 41 .. 3,986 3,156 67 .. 6(}S SSI 93 .. 25 14 16 .. 11,598 9,645 42 .. 7006 5,430 68 .. 738 654 94 .. 26 18 17 .. 8,230 7,083 43 .. 2;.'17 1,800 69 .. 484 446 95 .. 143 ISO 18 .. 14,098 12,903 44 .. 2,711 2,250 10 .. 4,030 4,699 96 35 25 19 8,289 7,182 45 17,070. 14,315 .. .. .. 71 635 605 97 19 24 20 11,978 15,,12 .. .. .. 46 .. 3,942 2,901 72 .. 986 991 98 .. 24 31 21 .. 9,537 9,376 47 .. 2,&88 1,968 13 .. 256 211 99 .. 23 II 22 .. 13,273 14,378 48 .. 4,105 3,330 14 .. 349 322 100 + .. 220 249 23 .. 7,11S 6.420 49 .. 2,416 1,991 75 .. 2,204 2,200 24 .. 7,704 7,801 SO .. 14,814 13,459 76 .. 421 380 Ale Dot stated 226 243
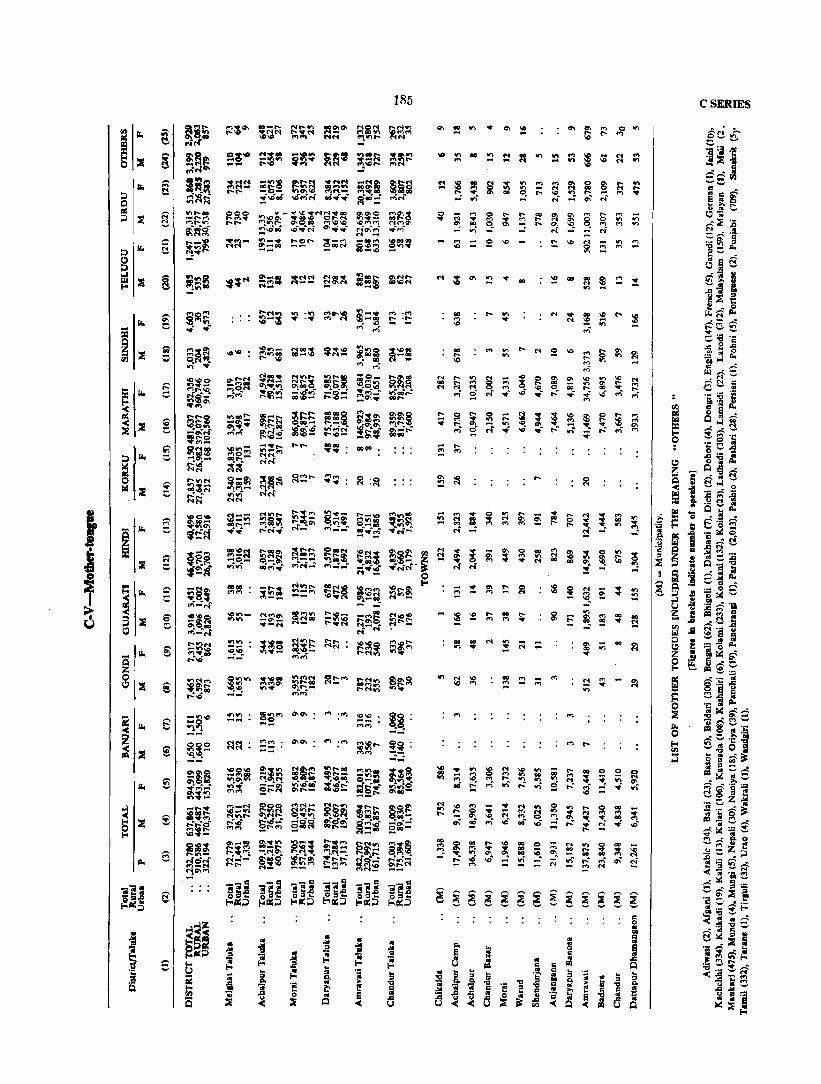
~ : o
~ --
ii! ~oO= CICIO "' .. -"' ...... t"f~M
'" -O~:::: 00_'"
00 00 "'00$ 00_
185
"' .... 2 10 ..
CSERIES
00
00
:0 ~ ~ ~ ~ 2 ~ ~ ~ ~ ~ ... ,.;
- .... ~ '"
....
~ ~ ~ ~ ~ E ~ - ~ t"'I 00 00
r-- ~ GO ... ~
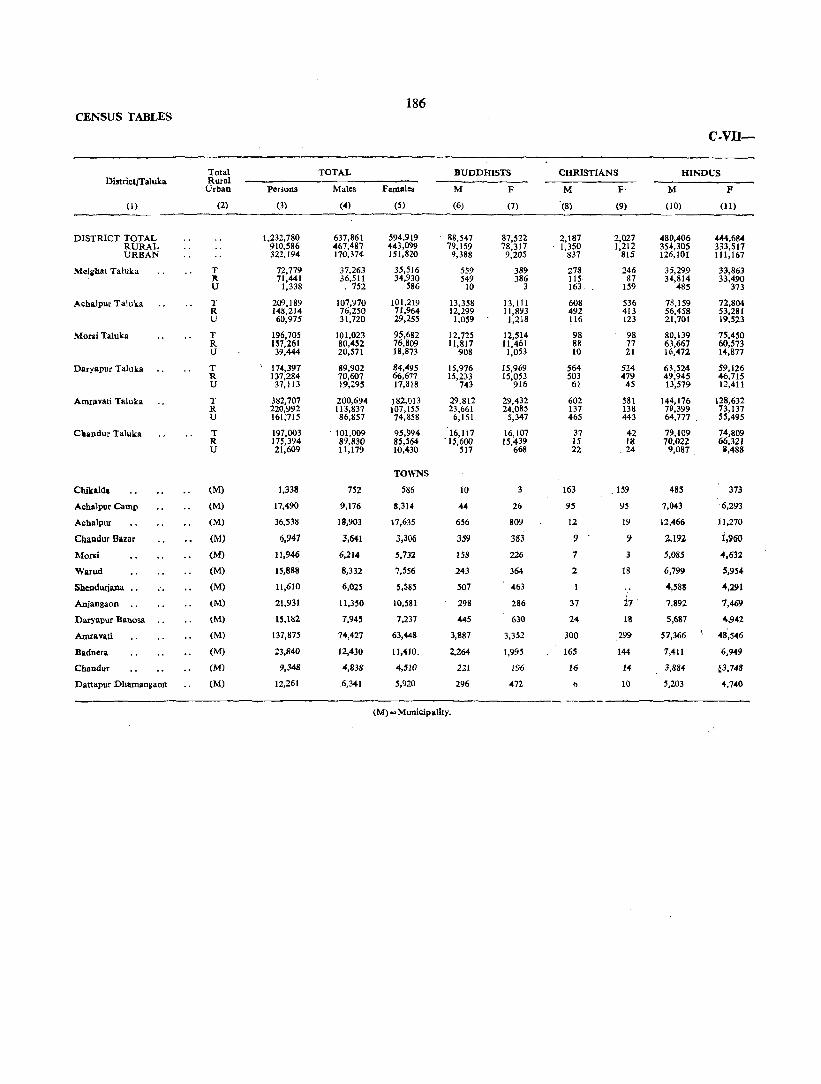
186 CENSUS TABLES
C-VD-
Total TOTAL BUDDHISTS CHRISTIANS HINDUS District/Taluka Rural
'Urban Persons Males Females M F M F· M F
(1) (2) (3) (4) (5) (6) (7) (8) (9) (10) (11)
DISTRICT TOTAL 1,232,780 637,861 594,919 88,547 87,522 2,187 2,027 480,406 444,684 RURAL 910,586 467,487 443,099 79,159 78,317 1,350 1,212 354,305 333,517 URBAN 322,194 170,374 151,820 9,388 9,205 837 815 126,101 111,167
Melithat Taluka T 72,779 37,263 35,516 559 389 278 246 35,299 33,863 It 71,441 36,S11 34,930 549 386 115, 87 34,814 33,490 U 1,338 , 752 586 10 3 163 159 485 373
Achalpur Ta1uka T 209,189 107,970 101,219 13,358 13,111 608 536 78,159 72,804 R 148,214 76,250 71,964 12,299 11,893 492 413 56,458 53,281 U 60,975 31,720 29,255 1,059 1,21S 116 123 21,701 19,523
MoniTaluka T 196,705 101,023 95,682 12,725 12,514 98 98 80,139 75,450 R 157,261 80,4~2 76.809 !l,S17 11,461 88 77 63,667 60,573 U 39,444 20,571 18,S73 908 1,053 10 21 16,472 14,877
Daryapur Taluka T \ 174,397 89,902 84,495 15,976 15,969 564 524 63,524 59,126 R 131,284 70,607 66,677 B,233 15,053 503 479 49,945 46,715 U 37,113 19,295 11,818 743 916 61 45 13,579 12,411
Amravati Taluka T 382,707 200,694- 182,013 29,812 29,432 602 581 144,176 128,632 R 220,992 113,837 107,155 23,661 24,085 137 138 79,399 73,137 U 161;715 86,857 74,858 9,151 5,347 465 443 64,777 55,495
Cltandur Talukll T 197,003 . 101,009 95,994 16,117 16,107 37 42 79,109 74,809 R 175,394 89,830 85,564 - 1~,6oo 15,439 15 18 70.022 66,321 U 21,609 11,179 10,430 517 668 22 ,24 9,087 i,488
TO,\\'NS
Chikalda (M) 1,333 752 586 10 163 _ 159 485 373
Achalpur Camp (M) 17,490 9,176 8,314- -« 26 95 95 7,043 6,293
Achalpur (M) 36,538 18,903 17,635 636 809 12 19 12,466 11,270
Cballdur Bazar (M) 6,947 3,641 3,306 359 383 9 9 2,192 i,960
Morsi (M) 11,946 6,214 5,732 158 226 7 5,085 ",632
Warud (M) 15,888 8,332 7,556 243 364 2 18 6,799 5,954-
ShClldurjaJlll .. (M) 11,610 6,025 S,S8S 507 463 ",588 ",291
Anjangllon (M) 21,931 11,350 10,581 298 286 37 1.7 7,892 7,469
Daryapur Banosa (M) 15,182 7,945 7,237 445 630 24 IS 5,687 4,942
Aroravati (M) 137,875 74,427 63,448 3,887 3,352 300 299 57,366 48,546
Badnera (M) 23,840 12,430 11,410. 2,264 1,995 165 144- 7,411 6,949
Chandur (M) 9,348 4,838 4,S10 221 196 16 1<4 3,884 ~3,748
Dattapur Dhamangaon (M) 12,261 ,6,341 5,920 296 472 6 10 5,203 4,740
(M) - Municipality.

187 C SERIES
RELIGION ~
JAINS rows MUSLIMS SIKHS ZOROASTRIANS OTHERS Total Rural Di!trict/Taluka
M F M F M F M F M F M F Urban
(11) (13) (I.) (IS) (16) (17) (18:) (19) (20) (21) (22) (23) (2) (1)
3,567 3,279 62,761 57,121 320 217 41 41 32 28 DISTRICT TOTAL 1,187 I,HI 31,380 28,858 74 56
..ii 32 28 RURAL
2,3S0 2,161> 31,381 28,263 ·246 161 41 URBAN
3 1,108 1,013 14 5 2 T Melghat Taluka 3 1,015 962 13 5 2 R
, 93 51 1 U
339 299 15,488 14,463 13 2 2 4 3 T Achalpur Taluka 116 100 6,876 6,275 6 2 3 R 223 199 8,612 S,HIS 7 2 4 U
477 477 7,541 7,110 43 33 T Mor.i Taluka 294 298 4,575 4,387 11 13 R 183 179 2,966 2,723 32 20 U
332 320 9,483 8,530 2 21 25 T Daryapur Taluka . 102 86 4,S03 4,319 21 25 R 230 234 4,680 4,211 2 I U
• 1,906 1,632 23,910 21,524 246 176 38 36 4 T Amravati Taluka 467 416 10,125 9,343 44 36
38 36 4 R
1,439 1,216 13,785 12,181 202 140 U
510 551 5,231 4,481 2 2 3 T Chandur Taluka :t05 211 3,986 3,572 2 3 R 305 340 1,245 909 2 I U
TOWNS
'" 93 51 (M) Chikalda
124 92 1,869 1,808 (M) Achalpur Camp
67 68 5,700 5,465 2 4 (l\f) Achalpur
32 39 1,043 915 6 (M) Chandur Bazar
:5 9 959 862 (M) Mors!
40 58 1,216 1,142 32 20 (M) Warud
138 112 .. 791 719 (M) Shendurjana
181 176 2,942 2,623 (M) Anjangaon
-49 58 1,738 1,588 2 (M) Daryapur Banolll
1,220 1,025 11,«5 10,093 187 110 22 23 (M) Amrav_ti
219 191 2,340 2,088 15 30 l' 13 (M) Badnerll
174 172 543 380 .. (M) Chandur
131 168 702 529 2 (M) Dattapur Dhamanaaon
(M)= MUllicipalily.
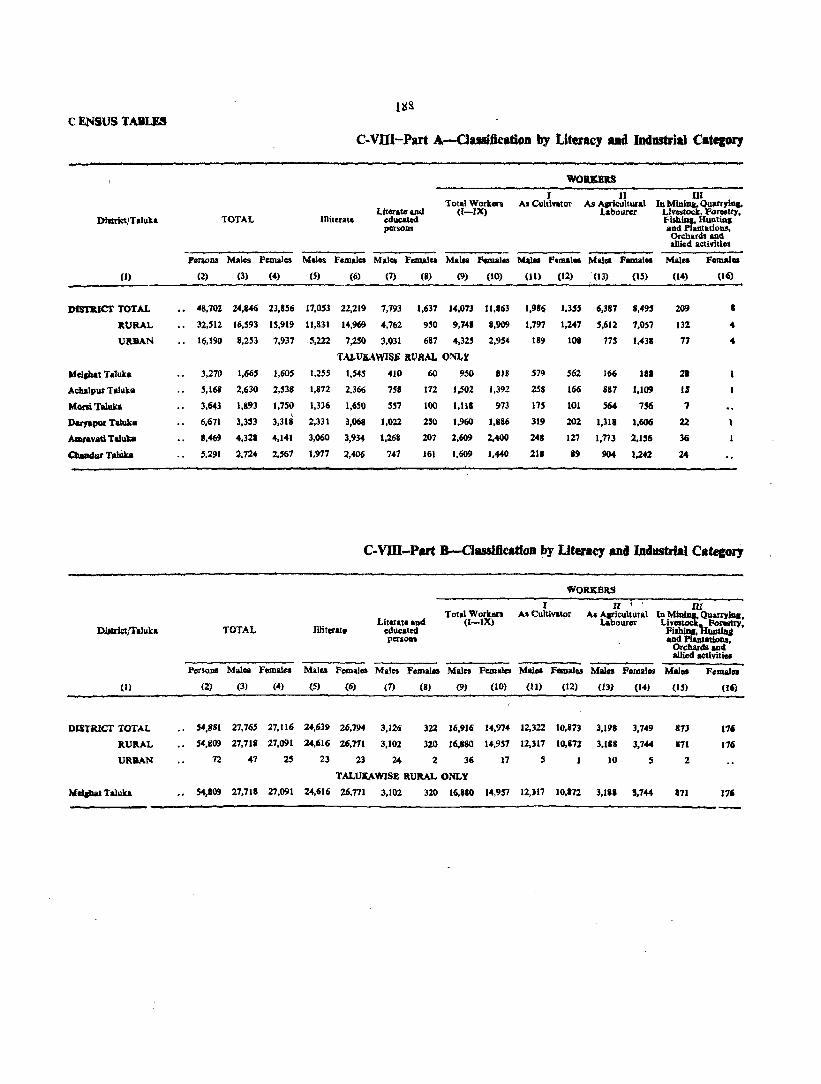
llS& C !.NSUS TAaLES
C .. vm-part A-CJasaiJKatiOD by Literacy ud lad_trial Category
WORDItS
J II III Total Worken As Cultivator As Al!iwltural In MiniDa QuarryillJ,
literate 1.114 (I-IX) LabolltCt" Ltvostoe'" Forestry, Di1trictjT alub TOTAL Illiterate ed_led Fisb.~, HuatiAI
persons and P aatadons, Orchards and a1Ued activitlos
l'cnous M"les Females Males F.malos M.les Fcm,ales Ma," Fcmal.s Mill. Felll.l .. Males Families Males FOtU.lea
(I) (2) (3) (4) (5) (6) (7) (8) (9) (10) (11) (12) (13) (IS) (14) (16)
Dli11lICT TOTAL 48.7OZ 24.«0 23.856 17.053 22,219 1,793 1.631 14,073 11.863 1,9'6 1.355 6.387 '.495 209 I
RURAL ., 32,5lZ 16.593 IS,919 11,831 14,969 4,762 950 9.14. 8,909 1,191 1,2"7 5.612 1.0S7 13:1 4
URBAN 16,190 8,253 7,937 -5,222 7)50 3,1)31 687 4,32' 2,9S4 189 108 175 1,438 17 4
T.u.UXAWlSI RVRAL ONLY
t{elfbat Taluka 3.270 1,66$ 1,605 1,255 1,545 410 60 9'0 81' 579 562 166 liB 21
Aclaalpur Taluk. 5,1" 2,630 2,538 1,&72 2,366 758 172 1,502 1,392 2$8 166 887 1,109 IS
Morsi Taluka 3,641 1,893 1,750 1,336 1,650 SS7 100 1,111 973 17' 101 564 1S6 7 \
Darnpur Taluka 6,671 3.353 3.318 2,331 3,068 1,022 2S0 1,960 1,886 319 202 1,1l8 1,606 22
AllltavaU Tllub 8,469 4,321 4,141 3,060 3,934 1,268 207 2,609 2,400 248 127 1,713 2,156 36
Chaadur TalUka 5,291 2,724 2,S61 1,977 2,406 741 161 1,609 1,440 218 89 904 1)42 24
c. vm-Part B-ClassificaUOD by Literacy ancJ IacJustrial Cateco.r1
WORItBRS
I II ,
111 Total Workers As Cultivator As Aaricultural Ia~Qullfl')'iq.
Illiterat. Llterat. and. (I-IX) Labourer Ll"atcK:lc"k 1'0I'eItlY,
DjJtrJ~JTlluka TOTAL educated Filblq. lIJIw.; perS01l1 and PlaataUolII.
Or~dsllll4 allied activities
Perso.DI Mal. Females Males Fem~os Males Femal. Males Females Milos Females Males Fornales Mal. F,mal ..
(1) (2) (3) (4) ($) (6) (7) (8) (9) (10) (11) (12) (13) (14) (IS) (16)
DISTRICT TOTAL .. 54.881 27,765 27.116 24,639 26.194 3.126 322 16,916 14,974 12,322 10,S73 3.198 3.749 873 17 •
R.URAL '4,800 21.7UI 21,091 24,616 26,711 3,102 320 16,180 14,951 12.311 10,872 3,188 3.744 811 116
URBAN 72 41 2S 23 23 24 2 36 17 S 10 S 2
TALtlJtAWISI!: RUltAL ONLY
¥~tTaluka 54,800 27,118 27,091 24,616 26,771 3,102 320 lUIO 14,957 12,ll7 10,172 3,11' 3,144 871 176
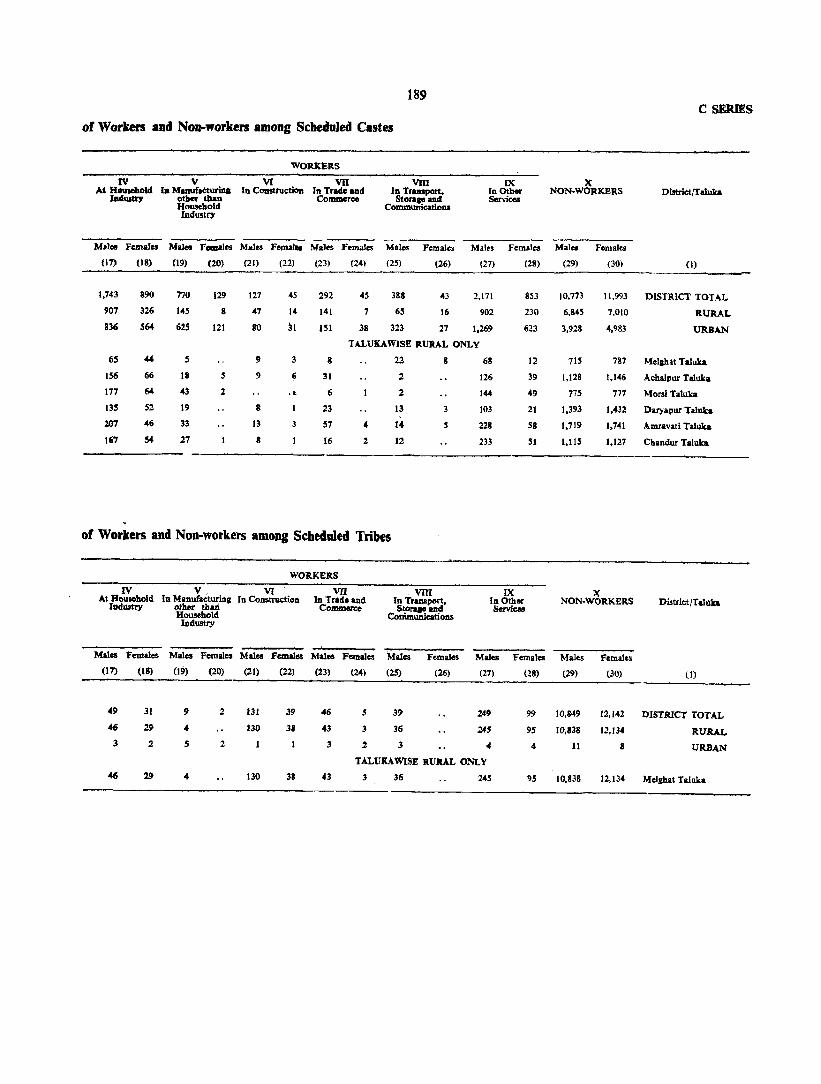
189 C SERIES
of Workers a' NOll-workers among ScbetluJed Castes
WORKERS
IV V vr VlI VIII rx X At Household In ManufatturiJla In CODSttUctioa In Trade IUld In Traasport. In Other NON.WOIlKERS DlstrittrraIuka
&l4uatry other than Co_ce Storaae aJUI Services Household Communications Industry
Males Females Males Females Males Femal .. Males Females Males Females Males Females Mal ... Females
(17) (18) (19) (20) (21) (22) (23) (24) (25) (26) (27) (28) (29) (30) (I)
1.743 890 770 129 127 45 292 4S 388 43 2,171 853 10,773 11,993 DISTRICT TOTAL
907 326 145 8 47 14 141 7 6S 16 902 230 6,845 7,010 RURAL 836 564 62S 121 80 31 lSI 38 323 27 1.269 623 3.928 4.983 lJR.BAN
TALUKAWlSE RURAL ONLY
65 044 S 9 8 22 8 68 12 715 787 Melahat T aluka
156 66 18 S 9 Ii 31 2 126 39 1,128 1,146 Achalpur Taluka
177 64 43 2 .~ 6 2 144 49 775 777 Morsi Taluka
I3S 52 19 8 23 13 3 103 21 1.393 1.432 Darya.p1ll Taluka
2/)7 46 33 13 57 4 14 5 228 58 1,719 1.741 Amravati Taluka
167 54 27 8 16 2 12 233 51 1,11S 1.121 Chandur Taluka
of Workers aD' NOD-workers amoog ScbecJaJed Tribes
WORKERS
IV V VI' vn , VIII rx x At Rousohold In Manufaeturing In Construction In Trade and In TrQlS.p0rt, In Other NON·WORKERS Distriet/TalUka lndllStry olher than Commerce c!un~=ODS Services Household Industry
Males Females Males Females Males Females Males Females Males Females Males Females Males Females (17) (18) (19) (20) (21) (22) (23) (24) (25) (26) (27) (28) (29) (30) 0)
49 31 9 2 131 39 46 5 39 249 99 10,849 12,142 DISTRICT TOTAL 46 29 .. 130 38 43 3 36 245 95 10,838 12,134 RURAL 3 :2 5 2 3 2 3 4 4- 11 8 URBAN
TALUItAWISE RURAL ONLY
46 29 4 130 38 43 3 36 245 95 10,838 12,134 Melghat TaJuka

CENSUS TABLES
Name of Scheduled Ca~tc
Total Rural Urban
(I) (2)
ALL SCHEDULED CASTES
'. DISTRICT TOTAL RURAL URBAN
1. Bahna' ".
2. Balahi ".
3. Basor ".
4. Bedar ••.
5. Bhangi
6. Chambhar
7. Dohor
8. Dam
9. Ghasi
10. K3Jkadi
-11. Katia
12. Khatik
13. Kori
14. Mahar
15. Mang
Total Rural Urban
Total Rural
/ Urban
Total Rural Urban
Total Rural Urban
Total Rural Urban
Total Rural' . Urban
Total Rural Urban
Total Rural Urban
.". Total Rural Urban
Total Rural Urban
Total Rural Urban
Total' Rural Urban
Total Rural Urban
Total Rural Urban
Total Rural Urban
Persons
(3)
48.702 32,512 16,190
2 2
2,774 2,772
2
704 293 411
77 56 21
2,415 168
2,247
9,793 . 6,530 . 3,263
2,306 1,099 1.2!l7 __ .
88
88
2
205 108 97
2 2
5,475 3,435 2,040
351 213 138
5,579 3,423 2,156
18,929 14,410 4,519
190
SCT-I-Part A-Industrial Classmcati.on .of Persons.at Work and Non-workers
Population
Males
(4)
24,846 16,593 8,253
1,434 1,432.
2
344 149 195
38 27 11
1,237 82
1,155
5,028 3,320 1,708
1,189 571 6_1_& .
46
46
III 58 53
2 2
2,811 1,803 1,008
176 111 65
2,941 1,789 1,152
9,489 7,249 2,240
Females
(5)
23,8~6 15,919 7,937
2 2
1,340 1,340
360 144 216
39 29 10
1,178 86
1,092
4,765 3;210 1,555
1,117 528 $.!i9.
42
42
2 1 I
94 50 44
2,664 1,632 1,032
175 102 73
2,638 1,634 1,004
9,440 7,161 2,279
I Total Workers
(I-IX) As Cultivat?r
M
(6)
14,073 9,748 4,325
812 812
212 86
126
26 2\
5
574 42
532
2.896 1,959
937
665 330 335
26
26
70 37 33
2 2
1,538 975 563
112 76 36
1,458 1,000
458'
5,682 4,408
1274
F
(7)
11,863 8,909 2,954
2 2
731 731
168 74 94
24 16 8
372 37
335
M
(8)
1,986 1,797
189
562 562
18 18
5 1 4
2.130 535 1,715 478
.415 57
521 91 276 72 24.L .. 19
23
is
53 ~8 25
1,100 775 325
73 52 21
1,189 812 377
5;476 4,391 1,085
3 3
359 276
83
15 11 4
241 226
15
156 149
7
F
(9)
1,355 1,247
108
544 544
II 11
365 310
35.
64 40 2'\.
157 119 38
4 4
139 131
8
70 67
3
• WORKERS
II 1II A, Agricultural In Mining.
Labourer Quarrying Live-
IV At
v . In
stock, Forestry, Fishing, Hunting
Plantations.
. 'Household Industry
ManUfa.eturinlli other than Household Industry
Orchards and allied activities
M
(10)
6,387 5,612
773
161 161
7 5 2
10 6 4
6 5 I
F
(11)
8,49~ 7,OS7 1,438
178 178
5 4 1
15 R 7
M
(12)
209 132 77
28 28
2
2
894 f 621 . 12 . 830. 1:363 9
64 258 3
230 348 9 139 211 4 . 91__ I}L._._ 5
18 15
3
634 471 163
54 45
9
646 525 121
3,726 3,409
317
18 13
5
907 651 256
56 43 13
870 648 222
4,471 3,936
535
2
41 12 29
10 I 9
31 20 II
74 58 16
F M M F
(13) (14) (IS) (16) (17)
8 1,743 890 770 4 907 326 145 4 836 564 625
5 5
153 145 58 59 95 86
4 4
"i
2 2
7 1 6
1
7
129 8
121
3
3
"i
3
"j
913 .•. 537· ."., ;376'
42-- 377· 48
I 1
4
4
i 264 101
.163
13
13
29 16 13
25 17 8
.10 .. 38 1 32. 3:l~ 47
105 31 2 25 3
. 8.0. ___ }8. '2
\1
11
10 6 4
2
"j
199 85
114
4
4
48 3
45
14 2
12
2
27 I
26
2 335 574 92 13 79
28 3
25 2 168. 223
167 351
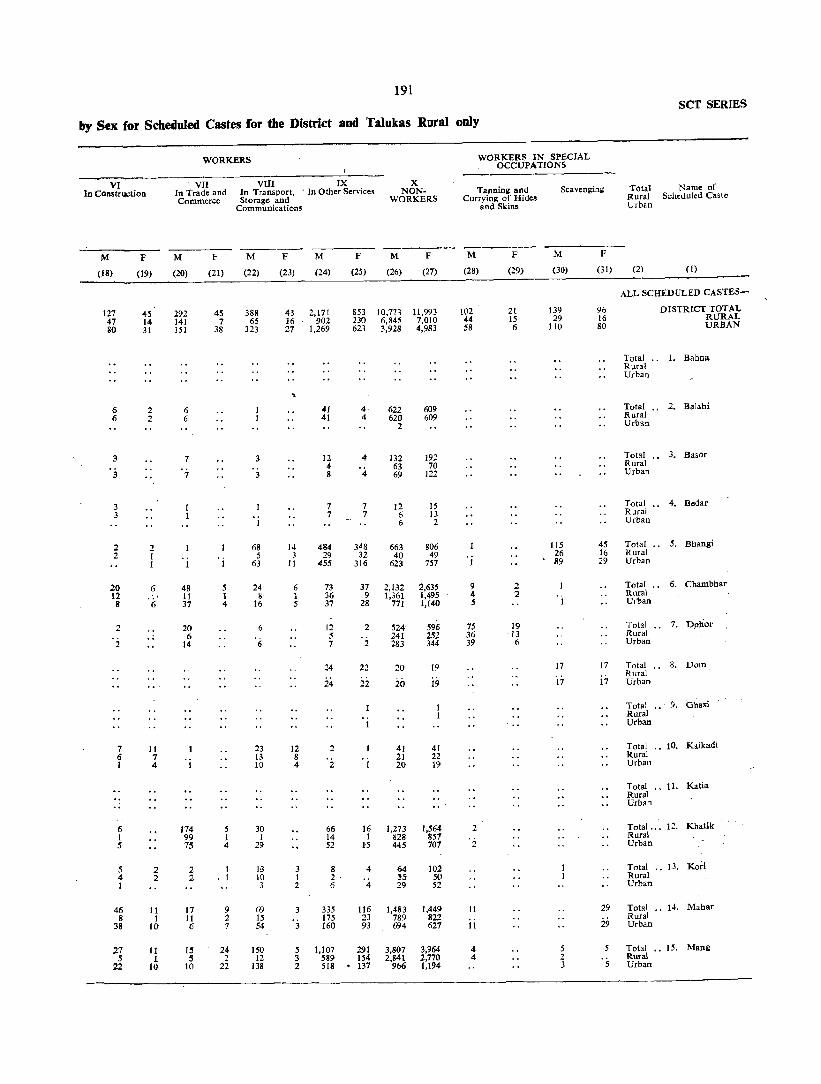
191 SCT SERIES
by Sex for Scheduled Castes for the District and Talukas Rural only
WORKERS WORKERS IN SPECIAL OCCUPATIONS
VI VII VIII IX X In COllStruction In Trade and In Transport, - In Other Services NON- Tanning and Scavenging Total Name of
Commerce Storage and WORKERS Currying of Hide. Rural Scheduled Caste Communications and Skin. Urban
------M F M F M F M F M F M F M F
(18) (19) (20) (21) (22) (23) (24) (25) (26) (27) (28) (29) (30) (31) (2) (I)
ALL SCHEDULED CASTE3-
127 45 292 45 388 43 2,171 853 10.773 11,993 102 21 139 96 DISTRICT TOTAL 47 14 141 7 65 16 902 230 6,845 7,010 44 15 29 16 RURAL
80 31 151 38 323 27 1,269 623 3,928 4,983 S8 6 110 80 URBAN
Total .. 1. Bahna Rural Urban
6 2 6 41 4· 622 609 Total •• 2. Balahi 6 2 6 41 4 620 609 Rural
2 Urban
3 7 12 '* 132 192 Total .. 3. Baser 4 63 70 Rural
3 7 3 8 4 69 122 Urban
3 7 7 12 15 Total .. 4. Bedar 3 7 7 6 13 Rural
1 6 2 Urban
2 2 68 14 484 348 663 806 115 45 Total .. 5. Bbangi 2 1 5 3 29 32 40 49 'i
26 16 Rural 1 63 11 455 316 623 757
, 89 29 Urban
20 6 48 5 24 6 73 37 2,132 2,635 9 2 Total .• 6. Chambhar 12 .. 11 1 8 1 36 9 1,361 1,495 4 :2 Rural 8 6 37 4 16 5 37 28 771 1,140 5 Urban
2 20 12 2 524' 596 75 19 Total .. 7. D.olior .. 6 5 241 25~ 36 ·13 Rural
:2 14 6 7 2 283 344 39 6 Urban
:4 Z2 20 19 17 17 Total .. 8. Dotn
24 ii i9 i7 i7 Rural
20 Urban
Total .. 9. Ghasi Rural
1 Urban
7 11 23 12 2 41 4! Total .. 10. Kaikadi 6 7 13 8 21 22 Rural 1 4 1 10 4 2 20 19 Urban
Total .. 11 • Katia Rural Urban
6 174 5 30 66 16 1,273 1,564 2 Total ... 11. Khatik 1 99 1 1 14 1 828 857 Rural 5 75 4 29 52 15 445 707 2 Urban
5 2 2 13 3 8 4 64 102 Total .. 13. Koi-i 4 2 2 10 1 2- ~5 50 Rural 1 3 2 6 4 29 52 Urban
46 11 17 9 69 335 116 1,483 1.449 11 29 Total .. l·t Mahar 8 1 11 2 15 '3 175 23 789 822 Rural
38 to 6 7 54 160 93 694 627 11 29 Urban
27 11 15 24 150 5 1,107 291 3,807 3,964 4 5 5 Total .. 15. Mang 5 1 5 2 12 3 589 154 2,841 2,770 4 2 Rural
22 10 10 22 138 2 518 137 966 1,194 3 '5 Urban

CENSUS TABLES
Nama or Scheduled Ca.t.
(I)
MELGHATTALUKA
2. Balahi 3. BasOI 5. Bhanp 6. Chambhar
12. Khatik 13. Korl 14. Mahar 15. Mana:
ACHALPUll TALUKA
2. Balah!
t ~..:p 6. Chambhar 7. Dohor
10. Kaikadi 12. Khatik 13. Kori 14. Mahar IS. Mana:
MORSI TALUKA
3. Basor S. Bhangi 6. Chambhar 7. Dohor
10. Kaikadi 12. Khatik 13. Korl 14. Mahar IS. Mana:
DARYAPUR TALUKA
4. Bedar 5. Bbanp 6. Cbambhar 7. Dohor
10. Kaikadi II. Katia 12. Khatik 13. Korl 14. Mah .. r 15. Mana:
AMRAVATI TALUKA
1. Babna 3. Basor 4. Bedar S. Bhanai 6. Chambhar 7. Dohor 9. Ghasi
10. Kaikadi 12. Khatik 13. Korl 14. Malnr IS. Mana:
CHANDUR TALUKA
5. 'BhaQi 6. Chamblnr 7. Dohar
12. Khatik 14. Mahar 15. Man,
Total Rural Urban
(2)
192
SeT-I-Part A-IItclostrial Classification of Penons at Work ad Non-workers
Population
Persons Males Females
(3) (4) (5)
Total WOTkers (I-IX)
M
(6)
F
(7)
WORKERS
J II A. Cultivator As Apicultural
Labourer
M
(8)
F
(9)
M
(10)
F
(11)
m In MiniDa,
Qumyina, Live-1ItOek. F«estry.
Fishina, Huntinc and Plantations,
Orchards and allied activities
M
(12)
F
(13)
TALUKA WISE RURAL ONLY
3,270
2,599 245 24
115 IS 67 14~ 56
5,168
173 21 11
1,272 471 40
651 25
346 2,158
3,643
41 36
917 90 10
399 35
447 1,668
6,671
1 24
2,033 57 22 2
490 33
562 3,447
8,469
2 7
34 27
1,445 266
1 36
1,374 53
876 4,348
5,291
46 748 21S 506
1,043 2,733
1,665
1,340 127 10 56 10 33' 64 25
2,630
92 It 5
641 255 22
355 12
In 1,065
1,893
17 IS
481 42 4
211 20
231 872
3,3S3
1 12
1,015 27 14 2
259 19
287 1,717
4,328
's IS IS
740 140
18 707 27
468 2,193
2,124
25 387 107 261 S67
1,377
1,605
1,259 118
14 59
S 34 85 31
2,538
81 10 6
631 216
18 296
13 174
1,093
1,750
24 21
436 48
6 188
IS 216 796
3,318
i2 1,018
30 8
23i 14
275 1,730
4,141
2 2
19 12
70S 126
1 18
667 26
408 2,m
2,567
21 361 108 245 476
1,356
950
765 65 8
35 8
24 33 12
I,S02
47 7 2
362 148
14 195
8 95
624
1,118
17 7
277 29 2
129 16
145 496
1,960
1 7
591 18 10 2
141 12
165 1,013
2,609
4-13 7
445 80
II 375
16 268
1,390
1,609
11 249
55 127 294 873
818
689 S3 4
21 2
II 28 10
1,392
42 4 3
334 121 II
144 9
78 646
973
19 12
21S 23
2 98 10
123 471
1.886
'6 544
15 5
106 10
130 1,070
2,400
2 2
12 6
401 74
io 309
12 221
1,345
1,440
6 194 43
116 232 849
579
539 18
'9 '6 7
258
23
loj 46
SO I
16 21
175
59 3
49 3
37 24
319
209 1 1 1
32 I
44 30
248
S5 15
'2 95
4S 36
21S
I 45
7 SO 77 38
562
522 11
i2 4
12 1
166
22
76 29
26 4 9
101
38
28 i9 16
202
'j 147
io jo 14
127
37 8
38
29 IS
89
20 3
17 37 12
166
145 :1
'6 3 7 3
887
16 6
172 67 10
108 7
48 453
564
76 10 2
39 13 73
351
1,318
':2 267
9 3 I
72 II 98
85S
1,773
'j
224 29
201 11
166 1,139
188
161 3
6 2 3 8 S
1109
17 4
:153 91
7 117
9 71
540
756
174 13 2
70 10
102 385
1,606
395 8 2
9S 10 99
997
2,156
:1 I 4
364 60
'2 270
11 186
1.256
904 1,242
9~ 6i 24 39 4S 97
133 182 608 753
28
26
. i
. i
IS
2
2 2
'j 8
7
2
'2 2
22
'3 4
15
36
'2 2
'4 I 6
21
24
'4 2 6
12
1
IV At HOusehold
Industry
M
(I4)
65
5 42
14
I 1 2
156
;; 27
'2
SO 177
15
Iii 15
8
'j 14
lk
'2
33 207
. i 4
129 30
4
7 32
167
103 21
"6 37
F
(15)
44
I 39
'2 . i 1
66
'3 I
62 64
19
3 10
1 7
« 46
1 (
I 6
j; 54
1
5 48
V In ManofllduriDa 0111. tIIan
Household Industry
M
(16)
5
I I
'3
18
I
'j 1
ii 'i 1
43
i2 I 1
33
is 2
i4
'2 27
ii 1 S
F
(17)
5
1
1 1
2
'i
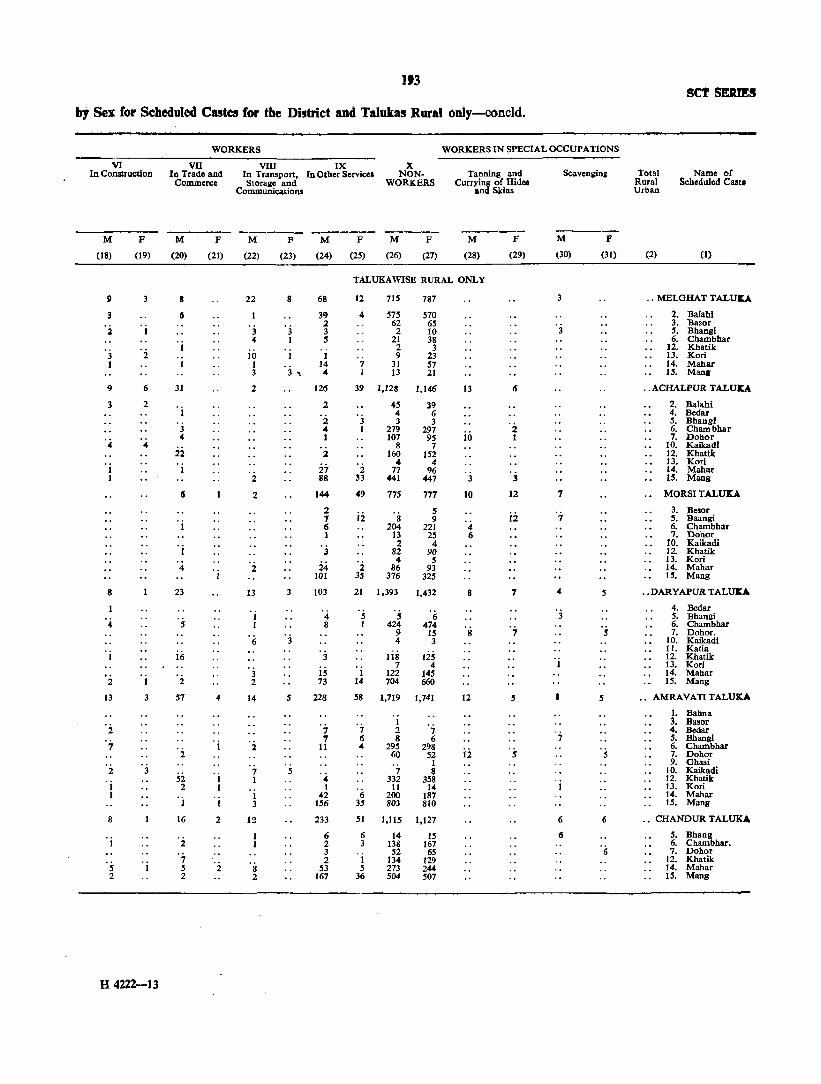
1'3 set SERIES
bt Sex tor Scheduled Castes for the District and Taluka! Rural only-ooncld.
WORKERS WORKERS IN SPECIAL OCCUPATIONS
VI vu VIIJ IX X In Construction In Trade and In Transt>0rt, In Other Service. NON- Tanning and Scaveniini Total Name of
Commerce Storage and WORKERS Currying or Hidea Rural Scheduled Cast. CommUDications and Skins Urban
----- ------ ----- ------ ------M F M F M F M F M F M F M F
(18) (19) (20) (21) (22) (23) (24) (25) (26) (27) (28) (29) (30) (31) (2) (1)
TALUKAWISE RURAL ONLY
9 3 a 22 8 68 12 715 787 3 .. MELGHAT TALUU
II 31} 4 575 570 2. Balahl
• :3 2 62 65 3. Basor 2 1 3 3 2 10 3 S. Bhang!
4 I 5 21 38 6. Chambhar
'2 I 2 3 12. Khatik 3 10 1 1 9 23 13. Kori 1 1 14 7 31 57 14. Mahar
3 3 , 4 1 13 21 15. Mang
9 6 31 2 126 39 1,123 1,146 13 II .. ACHALPUR TALUlt:A
3 2 2 45 39 2. Balahi I 4 6 4. Bedar
2 3 3 3 5. Bhangl 3 4 I 279 297
io 2 6. Chambhar
4 1 107 95 1 7. Dohor 4 4 22 8 7 10. Kaikadi
2 160 152 12. Khatilc
27 4 4 13. Kori
1 I 2 77 96 '3 '3 14. Mahar
1 2 88 33 441 447 15. Mang
6 2 144 49 175 777 10 12 7 MORSI TALUXA
2 5 ii 3. Besor
"I 12 8 9 7 5. Baangi I I) 204 221 4 6. Chambhar
1 13 25 6 7. Dohor 2 4 10. Kaikadi
3 82 90 12. Khatik
'2 24 4 5 13. Kori
4 2 86 93 14. Mahar 1 101 35 376 325 U. Mang
8 23 13 3 103 21 1,393 1,432 8 7 4 5 .. DARYAPUR TALUKA
4. Bedar
'4 's I 4 5 5 6 3 5. Bhangi I 8 1 424 474 '7
6. Chambhar 9 15 8 5 7. Dohor.
6 3 4 3 10. Kaikadi
· i iii lis lis II. Katia 3 12. Khatik
is 7 4 1 13. Kori
3 I 122 145 14. Mahar 2 1 2 2 73 14 704 660 15. Mang
13 3 57 4 14 5 228 58 1,719 1,741 12 5 5 .. AMRAVATITALUKA
1. Bahnll 1 3. Basor
2 , 7 2 7 ';- 4. Bedar
';- "I 6 8 6 5. Bhangi [ 1 11 4 295 298 ·s 6. Chambhar
2 60 52 12 5 7. Dohor
'2 1 9. Ghasi 3 7 5 7 8 10. Kaikadi
· i 52 I I 4 332 358 12. Khatik 2 I 1 11 14 I 13. Kori
1 I 42 6 200 187 14. Mahar 1 I 3 156 3S 803 810 15. Manll
8 16 2 12 233 51 1,115 1,127 6 6 .• CHANDUR TALUKA
· i 6 6 14 15 II 5. Bhang 2 2 3 138 167 6. Chambhar.
3 52 65 6 7. Dohor
·s 7 '2 2 1 134 129 12. Khatik
1 5 8 53 5 273 244 14. Mahar 2 2 2 167 36 504 507 IS. Mans
H 4222-13
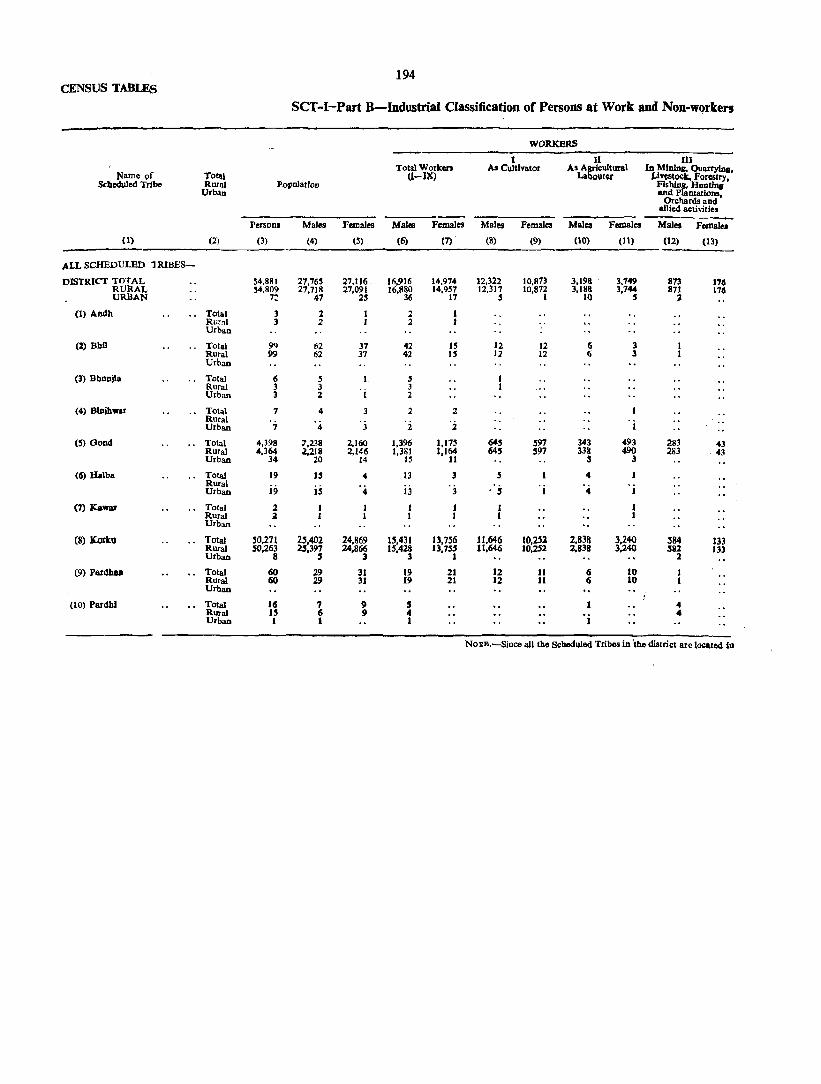
194 CENSUS TABLES
seT-I-part B-Industrial Classification of Persons at Work and Non-workers
WORKERS
1 n III Total Worken As Cultivator As AQrieuitaral In Mining, Quarrylnl.
Name (Jf 'follli (I-J~ Lal)our~ Uvesto<:il;, Forestry, Scbeduled Tribe Rural PopolatJon Fls~ Hunllnji
Urban and P ntatlons, Orehards aad
aUied activities
Persons Males Females Males Females Males Females Males Females Males FMlales (1) (2) (3) (4) (S) (6) (7) (S) (9) (10) (ll) (l2) (13)
ALL SCHEDULED TRIBES-
DISTRICT TOTAL 54,881 27,765 27.116 16,916 14,974 12.322 10.873 3,198 3,149 873 116 RURAL 54,809 27,718 27.091 16,8~~ 14,957 12.317 IO.87i 3.188 3.7 .... 871 176 URBAN n 47 25 17 5 10 , 2
(1) AlI4h Total 1 2 2 Rur31 J 2 2 Urban
(2) BhD Total 9<l 62 37 42 IS 12 12 6 3 Rural 99 62 37 42 IS 12 12 6 3 Urban
(3) BhonJla Total 6 S I , Rural 3 3 3 Urban 3 2 2
(4) Blnihwar " Total 7 4 3 2 2 Rural '2 .. Urban 7 4 3 2 1
(5) Oond Total 4,398 7.238 2,160 1,396 1,175 645 597 343 493 283 43 Rural ".364 .1,218 2,146 1,381 1.164 64' 597 338 490 283 ·43 Urban 34 20 14 B 11 $ 3
(6) Balba Total 19 U 4 13 3 .5 4 I Rural
i9 is jj 'j , i Urban 4 , 1 4
(7) Kawar Total 1 Rural a Urban
(8) Korko Total 50.271 2'.402 24.869 15.431 13.756 11.646 10.25l 2.838 3.240 384 133 Rural 50,263 25,397 24,866 15.428 U.75$ 11.646 10,252 2.838 3,240 582 III Urban 8 , 3 3 1 2
(9) Pardluul Total 60 29 31 19 21 12 11 6 10 Rural 60 29 31 19 21 12 11 fi 10 Urban
(10) Pardhl Total 16 1 9 , 1 .. Rotal IS 6 II 4 . i .. Urban I I 1
NOTB.-Since all tho Scheduled Tribes in the diatdet are 10000ted In
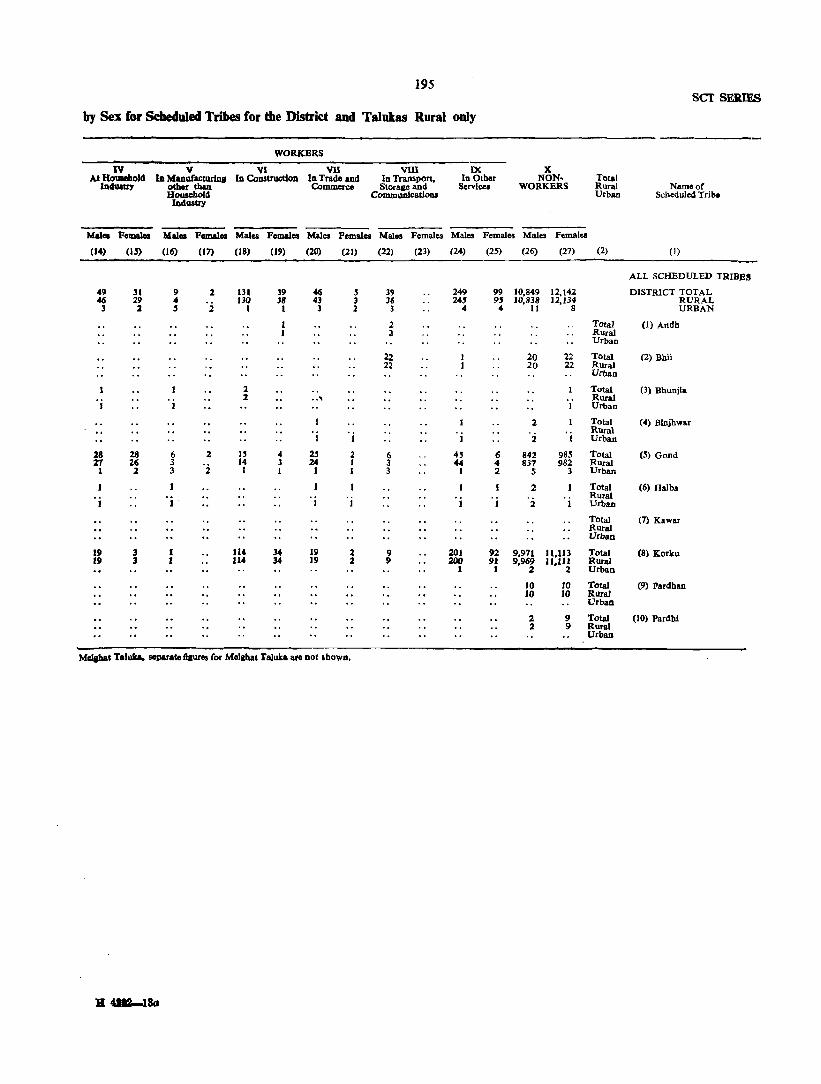
195 SCI SEItIES
by Sex for Scheduled Tribes for the District and Talukas Rural only
WORKERS
IV V VI vn VIll IX X At HOUIehol4 III ManufactllrlnJ In Construction In Trade BIId In Transport, In Other NON. Total
In41MU7 other thaq CoDlDlCl'CO Storage and Services WORKERS Rural Name of Household Communlcations Urban Scheduled Trib.
Industry
Mal.,. Females Malea Fema1ea Males Femalea Males Females Males Females Males Females Males Females
(14) (15) (16) (17) (18) (19) (20) (21) (12) (23) (24) (2.5) (26) (27) (2) (I)
ALL SCHEDULED TRIBES
411 31 9 :I 131 39 46 ~ 39 249 99 10,849 12,142 DISTRICT TOTAL 46 29 .. 130 38 43 3 36 245 95 JO,838 J2,134 RURAL
3 :I , 2 I J 3 :I 3 4 4 J1 8 URBAN
2 Total (I) Arldh :a Rural
Urban
22 20 22 Total (2) Bbll 22 20 22 Rural
Urban
1 Total (3) Bhunjla :I .. , Rural
J J I Urban
2 Total (4) Blnjhwar Rural
1 1 2 1 Urban
28 28 6 2 U .. 2.5 2 6 4' 6 842 985 Total (~) Oond 21 16 3 14 3 24 1 3 44 4 837 982 Roral 1 l 3 2 I 1 1 I 3 1 2 5 3 Urban
2 Total (6) Halba . i . i Rural
I I 1 I 2 1 Urban
Total (7) Kawar Rural Urban
19 3 1 114 34 19 2 9 201 92 9,971 11,113 Total (8) KOfku 19 3 1 114 34 )9 2 II 200 91 9,969 11.Jl~ Rnral
I 1 2 Urban
10 10 Total (9) Pardhan 10 10 Rnral
Urban
2 II Total (10) Pardh! 2 II Roral
Urban
Melihat Taluta. separate fiaures for Molahat Talulta arc Dot shown.
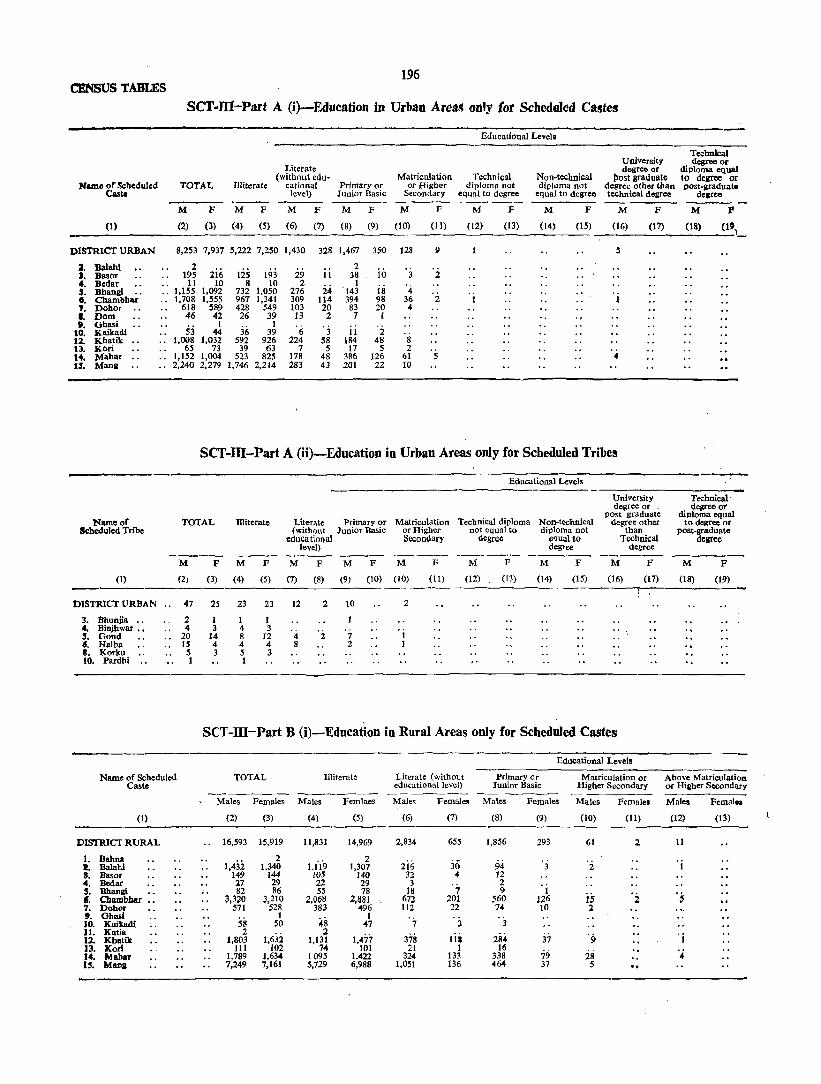
196 CENSUS TABLES
SCT·n1-Part A (i)-Education in Urban Areas only lot Scheduled Castes
Educational Levels
TecbnicaJ
Literate University degree or
desree or diploma equal
(without edu- Matriculation Technical Non-technical tlost graduate to degree or Namo or Scheduled Illiterate or Higher TOTAL cational Primary or diploma not diploma not degree other than post-graduate
Caste level) Junior Basic Secondary equ~l to degree equal to degree technical dearee deareo
M F M F M F M F M F M F M F M F
(I) (2) (3) (4) (5) (6) (7) (8) (9) (10) (11) (12) (13) (14) (15) (16) (17)
DISTRICT URBAN 8,253 7,937 5,222 7,250 1,430 328 1,467 350 128 9 !'i
2. Balahl 2 2ii; tis
2 iii ,. Basor 195 193 29 11 38 3 2
4_ Bedar 11 10 8 10 2 24 1 is ,- Bhang! .. .. 1,155 1,092 732 1,050 276 '143 4
8_ Chambhar .. 1,70S 1,555 967 1,341 309 114 394 98 36 2 1 1 ,. Dohor 61S 589 428 549 103 20 83 20 04
•• Dom 46 42 26 39 13 2 7 1 ~. Ghas; 1 1 'i; '3 '2 10. Kaikadi 53 44 36 39 11
n. Khatik 1,008 1,032 S92 926 224 58 184 48 8 13. Kor; 65 73 39 63 7 5 17 5 2 14. Milhar 1,152 1,004 523 825 178 48 386 126 61 5 .. U. Mans 2,240 2,279 1,746 2,214 283 43 201 22 to
SCT-ID-Part A (ii)-Education in Urban Areas only for Scheduled Tribes
Name 0' Scheduled Tribe
TOTAL llliterate
Educational Levels
Literate Primary or Matriculation Technical diploma Non-techniCal (witbout Junior Basic or Higher not equal to diploma not
educa tiona! Secondary degree e~ual to level) degree
University degree or
post graduate degree otber
than Tecbnical
degree
M
(2J
FMF MF MF M F
(11)
M
(12)
F
(13)
M
(14)
F
(15)
M
(16)
F
(17) (\) (3) (4) (5) (7) (8) (9) (10) (10)
DISTRICT VRBAN •. 47 2S 23 23 12 2 10 2
3. Bhunjia " 2 I 4. Binjbwar.. 4 3 5. Gond 20 14
1 I
: 1~ 4 2 ':' 6. Halba IS 4 448 2 8. Korku 5 3 S 3 to. Pardbi 1 1
SeT-ill-Part B (i)-Education in Rural Areas only for Scheduled Castes
Educational Levels
Name of Scheduled TOTAL JIIiterate Literate (without Primary or Matriculation or Caste educational level) J Ullior Basic Higher Secondary
Males Females Males Femlaes Males Female. Males Female. Males Females
(I) (2) (3) (4) (5) (6) (7) (8) (9) (10) (11)
DISTRICT RURAL 16,593 15,919 11,831 14,969 2,834 655 1,856 293 61 2
1. Bahna 1,432
2 1.119
2 2ii; 30 94 'j '2 !. Balam 1,340 1,307
S. Basor 149 144 105 140 32 4 12
•• Bedar 27 29 22 29 3 '7 2 'i 5. Bbangi 82 86 S5 78 18 9 is '2 f. Chambhar 3,3.20 3,210 2,068 2,881 672 201 :;60 1;26
7. Dobor 571 528 383 496 112 22 74 10 2 ,. Gh ... i 1 48 1 '3 to. Kaikadi 58 SO 47 7 3 11. Kalia 2 2
1,477 378 Iii 284 '9 12. Khatik 1,803 1,632 1,131 37 13. Korl 111 102 74 101 21 I 16
79 28 J •• Mahar 1,789 1,634 1095 1.422 3204 133 338 U. Mana 7,249 7,161 5,729 6,988 1,051 136 0464 37 5
M
(18)
P
(1')
-_ , ,
Technical' degree ot
diploma equal to degree or
post-graduate degree
M
(18)
F
(19)
Above Matriculation or Hiaber Secondary
Males Females
(12) (13)
11
. i
'5
' i ',4

197 scr SERIES
set -m-Part B (ii)-Education in Rural Areas only for Scheduled Tribes
Educational Levels
Namo of Sc;hcduJed TOTAL IHitcntc Literat~ (without Primary or M atricul;ltioD Tribe educational level) Junior Basic and abovo ------- -------- -------- --------
Males Female. Males Females Males Females Males Females Males FemalOi
(1) (2) (3) (3) (5) (6) (7) (8) (9) (10) (11)
DISTRICT RURAL 27,718 27,091 24,616 26,771 2,333 284 756 36 13
1. Andh 2 2
2. Bhit .. 62 37 50 33 3 3 I
3. Bhunjia 3 3
S. Gond 2,218 2,146 1,897 2,116 216 26 102 4 l
7. Kawlr
8. Korku 25,397 24,866 22,638 24,582 2,108 254 642 30 II
9. Pardhan 29 31 23 29 IS
10. Pardbi 6 '} 6 II
~
SCT -V -Part A-Sample Households engaged in Cultivation classified by Interest in Land and Size of Land Cultivated by Scbeduled Castes in Rural Areas only
(Based on 20 per cent Sample) - ----~----------------------
Household, engaged in Cultivation by Size of Land in Acres
Interest In Land Cultivated Number of -------Cultivatinl! Less 1'0- 2'5- 5'0- i'5- 10-0- 12'5- 15'0- 30'0-- 50+ Un-Households than I 2'4 4'9 7'4 9'9 \2'4 14'9 2Q ·9 49'9 specifie4
(1) (2) (3) (4) (5) (6) (7) (8) (9) (10) (11) (12) (13)
DISTRICT RURAL 2,501 13 18!) 478 353 233 238 103 481 174 131 7
Owned or held from Government. 2,032 13 280 443 318 188 187 70 321 112 93 7
Held from private persons or 114 8 20 19 17 14 6 22 S 3 institutions for payment In money. kind or share.
Partly held from Government and 355 IS 16 211 JI ,of 138 57 36 partly from orivate lX"r.ons or Institutions for payment in money kind or MlaTe.
SCT-V-Part B-Sample Households engaged in Cultivatioo classified by Interest in Land and Size of Land Cultivated by Scbeduled Tribes in Rural Areas only
(Based on 20 per cent Sample)
Households engaged in Cultivation by Size of Land in Acres
Interelt in Land Cultivated Number of Cultivating Less 1'0- 2',- 5'0- 7.5- 10'0- 12'5- 15'0 30'0- 50+ Un-Households than 1 2'4 4'9 7'4 9'9 12'4 14.9 29'9 49'9 IpocifiN
(I) (2) (3) (4) (5) (6) (7) (8) (9) (10) (11) (12) (13)
DISTRICT RURAL 1,466 25 57 121 133 225 87 601 165 31 21
Owned or held from Government 1,173 24 44 87 100 162 6') 503 140 23 21 Held from private persons or
institutions for payment in money, kind or share.
157 13 29 28 46 7 33
Partly held from Government and 136 17 11 65 25 8 partly from private persons or institutions for payment in money. kind or share.

198 CENSUS I'ABLES
SC-I-Persons DOt at Work classified -by Sex, Type of Activity and Educational Levels for Scheduled Castes
Total-Non-worklng Population FulI-tlmo students Persons see!dna Unemployed but
E4ucatlonal Loyela employment for th. seeldna work \ Othel'l first time
Persons Males Females Males Females Males FelDales Males Females Males Females
(I) (2) (3) (4) (S) (6) (7) (8) (9) (10) (11) (12)
DISTRICT TOTAL .. 22,766 10,773 11,993 3,258 898 ~4 14 67 6 7,394 l1,07S
OOtento 18,309 1,~66 10,743 360 111 14 12 3' 2 7,1" 10,618
Uterate (without educational level). 2,:530 1,769 761 1,'85 ~48 8 10 3 166 210
PrImary or Junior Basic 1,816 1,335 481 1,22:5 234 24 2 19 67 244
Matriculation or Hlgber Secondary. 100 92 8 80 5 6 3 3 l
Abovo Matriculation or Higher 11 II 8 2 Secondary.
DISTRICI' RURAL 13,85S 6,845 7,010 1,929 "2 12 7 9 4,895 6,451
IUtterate 11,37' 5,032 6,343 270 70 2 7 2 4,7S8 6,266
Literate (without educatloniillevel). 1,592 1,108 484 1,011 379 96 10:5
PrImary or Junior Basic 860 678 182 628 103 7 4 39 79
Matriculation or Higher Secondary. 23 22 16 2 2 2
Above Matriculation or Higher 5 S 4 Secondary.
DISTRICT URBAN 8,911 3,928 4,983 1,329 346 42 7 58 6 2,499 4,624
IJUterate 6,934 2,:534 4,400 90 41 12 :5 33 2 2,399 4,352
Literate (without educational level). 938 661 277 574 169 8 9 3 70 lOS
PrImary or Junior Basic 9:56 6" 299 597 131 17 2 1:5 28 165
Matriculation or Higher Secondary. 77 70 7 64 ~ 4 -1
Above Matriculation or Higher 6 6 4 Secondary,
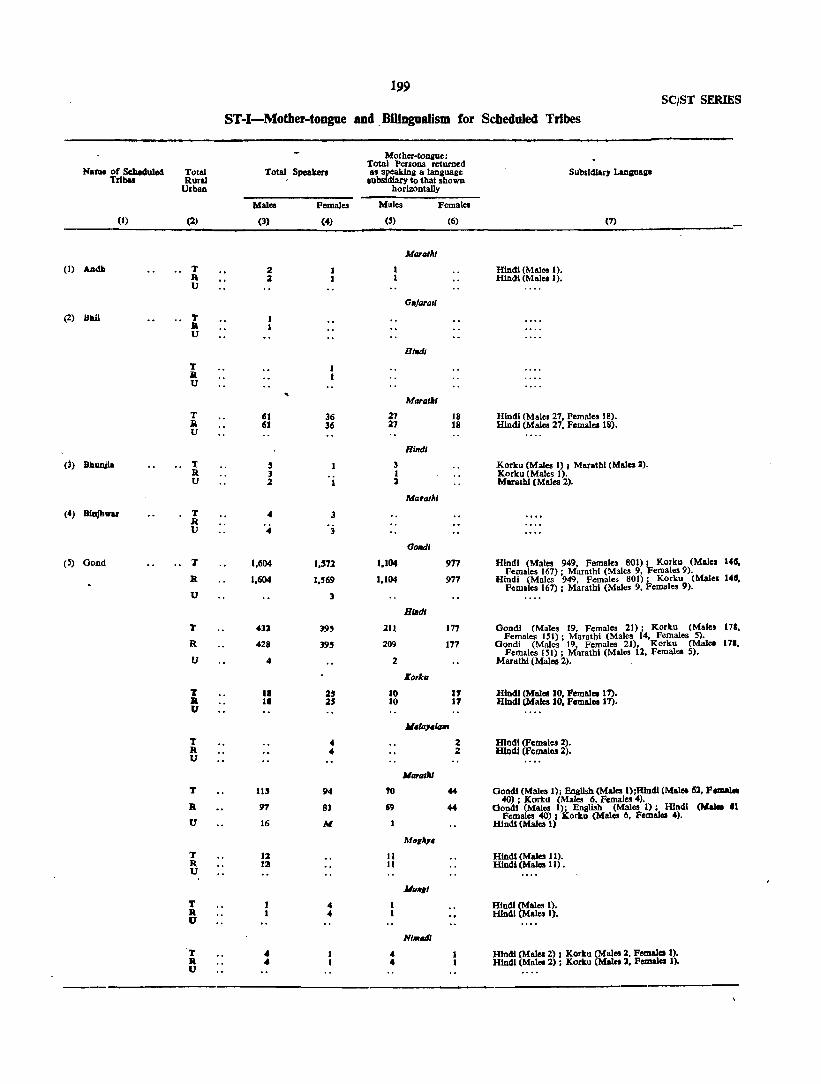
199 SC/ST SERIES
ST-I-Motber-tongae and. BU1ngaalism tor Scheduled Tribes
MOlher·(OlliUc: Total Persons returned
Name of Scbc4u1cd Total Total Speakers as~ a language Subsll1lar1 LanPile Trlbes Rural IU diary Co that shown
UrbaD horizontally
Males Females Males Females
(1) (2) (3) (4) (~) (6) (1)
MIJr4llti
(I) Andll T 2 HIndi (Males I). a 2 HindI (Mal .. 1). U
GIl/ara"
(2) BIril T a u
HI""I
T a u ..
Maral.'
T 61 36 27 18 Hindi (Male. 27, Females 18). II 6J 36 27 18 Hindi (Males 27, Female. 18). U
Hindi
(3) Bhunjla T , 3 Korku (Males I) I Marathl (Males :). R 1 1 Korku (Males I). U 2 :I Maratbt (Males 2).
MIJPiJllt1
(4) BllljhwU' T R
4 3
U 4 3
OD"dl
(S) Goud T 1,604 1,"2 1.104 977 Hindi (Males 949, Females 801); Korku (Malci I4d, Females 167); Marathl (Males 9. Females 9).
R 1,604 1.~69 1,104 977 Hindi (Males 949. Females 801); Korku (Males 14d, Females 167) ; Marathl (Males 9, Females 9).
U l
Bllldl
T 4ll 39' lit 177 Gond! (Males 19. Female. 21): Korku (Males 178, Females lSI): Marathi (Male. 14. Females S).
17., R 428 39' 209 177 Goud! (Males 19, Females 21), Korku (Malee
U Females "I) ; Marathl (Males 12, Females 5).
4 2 Marathl (Males 2).
KDrk"
T II 2' 10 17 HIndi (Males 10, Fernslel 11). a 1. 2' 10 17 H1n<li (Males 10. Femalee 11). V
1I.'IJ:/.IQm
T 4 2 Hindi (Female.! 2). R 4 2 HIndi (Females 2). U
IoIMQIIiI
T III 94 YO 44 Oondl (Male.! 1): EnglIsh (Males 1):HinI1l (Males til, Femal. 40) ; Korku (Males 6, Females 4),
R 97 8) 69 44 Oon41 (Males 1); EngUsh (Males 1); HIndi (Mal •• l
U Females 40) I Korka (Males 6, Female. 4).
16 M Hln<li (Males t)
MOIIII:/.
T 12 11 HIn<li (Males II). R I:! II HIndi (Males 11) • U
Mu.,1
T 4 HIndi (Males 1). R 4 Hindi (Male.! I). U
Nllffdl
T 4 4 HIn& (Males 2) I Kortu (Males :I, Pernales 1). R 4 4 HInI1l (Mal .. 2) : Korku (Malta 1, Females I). U
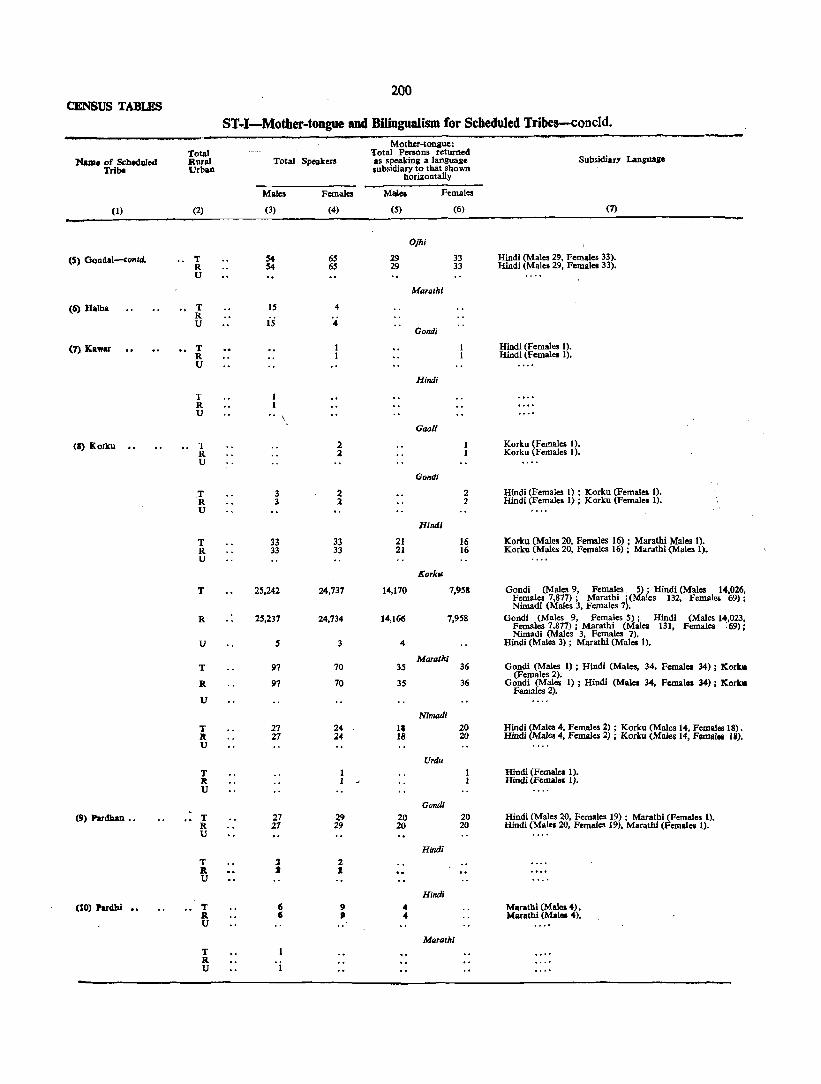
CENSUS TABLES
N_ of Scheduled Tribe
(1)
(S) Gondal~ontd.
(6) Halba
(7) Kawar
(8) Korku
(9) Pardltan ••
(10) 'ardhi
Total Rural Urban
(2)
T R U
T R U
T R U
T R U
T R U
T R U
T R U
T
R
u
T
R
U
T It U
T It U
T R U
T It U
T R U
T R U
200
ST.I-Motber-tongue and Bilingualism for Scheduled Tribes-concld.
Total Speakers
Males
(3)
54 54
15
is
3 3
33 33
25,242
25,231
s
91
91
21 21
21 21
2 S
6 II
'i
Females
(4)
65 65
2 1
2 2
33 33
24,731
24,734
3
70
70
29 29
2 J
9 ,
Motber-tongue: Total Persons returned as speaking a language subsidiary to that shown
horizontally
MIlliCi
(5)
29 29
21 21
14,170
14,166
4
35
35
1. 18
20 20
4 4
Females
Qjhi
Marathl
Gond;
Hindi
Gaoti
Gondi
Hindi
Xork ..
(6)
33 33
2 2
16 16
7,958
7,958
Marathi
Nimadl
Urdu
Gontil
Hindi
Hindi
MQ'Olhl
36
36
20 20
20 20
Subsidiary Langualle
(7)
Hindi (Males 2~, Females 33). Hindi (Malei 29, FelJ1alet 33).
Hindi (Females O. Hindi (Females 1).
Korku (Females I). Korku (Female. 1).
Hindi (Females 1) ; Korku (Females I). Hindi (Females 1) ; Korku (Females 1).
Korku (Males 20, Females 16) ; Marathi Males 1). Korku (Males 20, Females 16); Marathi (Males 1).
Gondl (Males 9, Females, 5); Hindi (Males 14,026, Females 7.877); Marathi 1 (Males 132, Females 69); Nimadi (Males 3, Fenlales 7).
Gondi (Males 9, Females 5) ; Hindi (Males 14,023, Females 7.877) ; Marathi (Males 131, Females : 69); Nimadi (Males 3, Females 7).
HIndi (Males 3) ; Maratbl (Males 1).
Gondi (Males 1) ; HIndi (Males, 34, Females 34) ; Korh (Females 2).
Gondi (Males 1); Hindi (Maleo 34, Femal .. 34); Korkw Females 2).
HIndi (Males 4, Females 2) ; Korku (Males 14, Females 18). Hindi (Males 4, Females 2) ; Korku (Males 14, FlIll1alli Ii).
Hindi (Females 1). Hindi (Females I).
Hindi (Males 20, Females 19) ; Marathl (Females 1). Hindi (Males 20, Females 19), Marathi (Females 1).
Marathi (Males 4:). Marathi (Mal. 4).
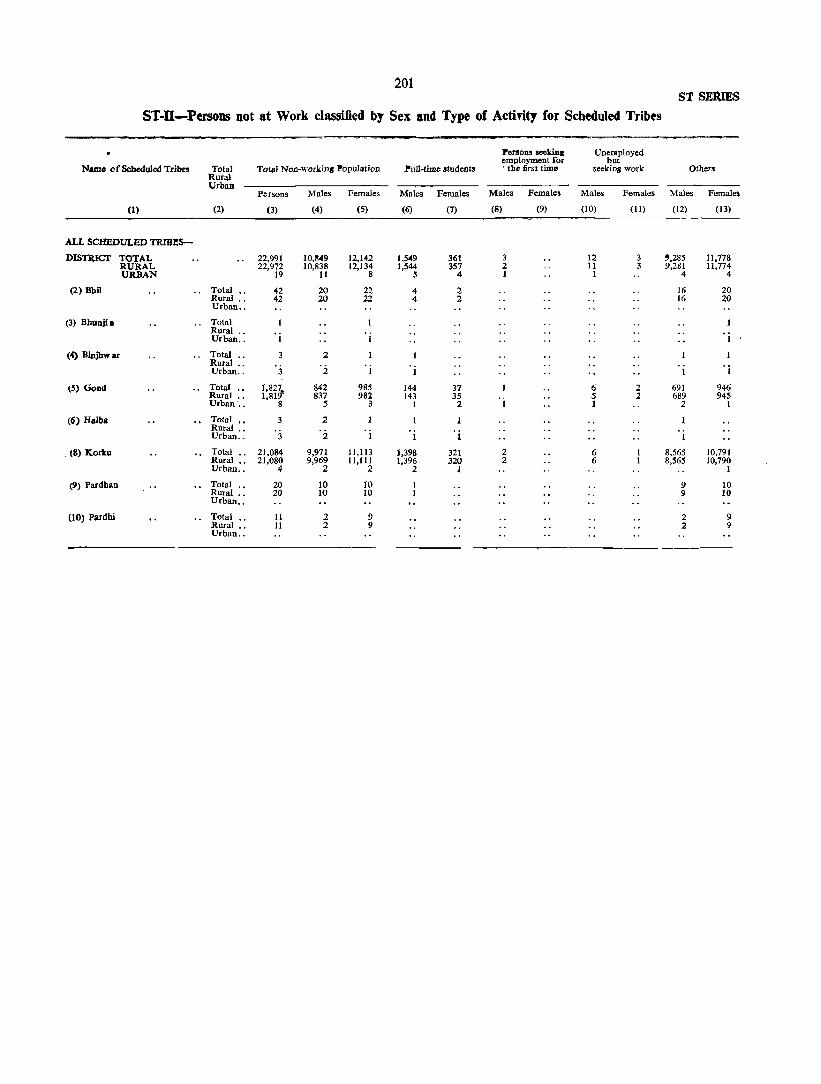
201 S1 SElUE$
ST·U-Persons Dot at Work classified by Sex and Type of Acthity for Scheduled Tribes
Persons seekin, Unemployed employment for but
Nuno of Scheduled Tribe. Total Total Non-worldn, Population Pull-time students . the first time seeking work Other! Rural Urban
Persons Males Females Males Females Males Females Males Females Males Females
(1) (2) (3) (4) (5) (6) (7) (8) (9) (10) (11) (12) (13)
ALL SCHEDULED TRIBES-
DISTRICT TOTAL 22,991 10,849 12,1.012 1,5.019 361 3 12 3 ',285 11,778 RURAL 22,972 10,838 12,134 1,544 357 2 II 3 9,281 11,774 URBAN 19 II 8 5 4 I I 4 4
(2) Bhil Total .• 42 20 22 4 2 16 20 Rural .. 42 20 22 4 2 16 20 Urban ••
(3) Bhunjia Total Rural ..
'j Urban .. I
(4) Binjhw ar Total .. 3 2 Rural .. Urban .. 3 2 1 1 I I
lS) Good Total •• 1,82~ 842 985 144 37 6 2 691 946 Rural •. 1,81 837 982 143 35 5 2 689 945 Urban •• 8 5 3 I 2 1 2 1
(6) Halba Total" 3 2 Rural .• Urban .. 3 2 1 1 1
. (8) Korku Total •. 21,084 9,971 11,113 1,398 321 2 6 8,565 10.791 Rural •• 21,080 9,969 11,111 1,396 320 2 6 8,565 10,790 Urban .. 4 2 2 2 1 1
(9) Pardhan Total •. 20 10 10 9 10 Rural •• 20 10 10 9 10 Urban ••
(10) Pardhi Total .. 11 2 9 2 9 Rural •• 11 2 9 2 9 Urban ..

202 CENSUS TABLES
is "'Ow "'Nt- -...... 0>:)000 SS!O 00"" .... :!~!O
.., ~ ~~~ .... 0 "''''''' ... c'"" ot-'" ,...
_0_ \O .. "l-.. ""' ... f"';.oe> ".;'~!:! 0"''' ~ .. t-- ~ d "'..,'" d'o~ "' ... - 00t- ~~"_vi' ~~ 0 "' .... --.sa" ri·i~ '8 rl -"'a -=:r3i:l=~ ~:;"'1" 'Ot-'" -0- 0"'''' ~~~
\0 U 11'0.8."'5 "''''00 E~iE ~ "' ... ." ....... '" ~I,O'O
"'''' QO ~ Z'2·~ ~oS 5 ~ ,._.., ..... ~ -~ .. .E.<.lltl8. ~
~.g~ i:l
~ ~ ~tG~ o .... 1:::1 >._ t- ........ "''''- ~~;;; ~ .... "0 ~ .... ct:t ""'
~ _'0"" .., .... - i)\~~ "'''' .... 8~~§~-5~ ..... 0000
oo .... _ N __ 00""" "NO
00"'" NN O .. I.Q"I:t 00 ..... -00 .... _
~;:..'O -:<:c-_g~ SrJ~CO "";"<t~_'"
~&i 8 t()e:. - ., g.~8 (ljU~.!
S Nt-'" "'N- 0-'" §~;Z ~~a "" .... - ~ "8"'" ........ '" ~lillll' ...,"' .... .. '" ~coco ~1of)\Q ... "'''' ~""I(') '" .., ... -VJ i,t; 0· ...
~ ~rlJi~
t:\ "0 .,..en iIIIj'"
~ ~ ~§~ .~~~ ..... ., t 0-'- ~~'~ '" g ........... "'''' ... t".ft"lO oU'lm .....0'" g~::: ..... 0 -.,c: .... -a"'l::). IIl1]UJ- ">_M 0000 -....... 1n0" ... "'''' ... 00 .... ~ 0~3~" l3 1:!u 0'0,," ,.,'" .... '" ..,'" IOoq-", ,.,«
1:; ~ _g 0 :;'iu'o:s-u ~ ~ Q, M":
=- r}J ~.s.s!:: °u~ .,
~ 0 :f~ 1 =:
"t:~"tl" ~
~=~ ....... 0 0(""'0 N ..... '" 0",_ m~~ ~"'- '" til ~~~~ - ;;0-.- "'",0 "."'- ..... 0\0 ... '"
~ ~ t- oo,""", """'''' "' ... '" 0"'''' :: .. 00-;J ._, Wi"~N f'i ...;
oS ~ ~~ ~ ~
'5 ~ ~:l't)8 S :a ~ ; ... <to "'''''- "'''',., ~@~ "I ... ", ~,~~ ~2ro ~ .E :g lijf£l "' .... 0 "' ... - ~"Q\ ::!f'.f"o :; ~ :go 0 :;.nQ:) 10-'" I)<
;J 1Il.<.l .s u go.. U Il} 0 .. ~ DO II>
~ a~~~ ..... 0 ... ... "'''' 0 ......... ...-'" !-... _0_ ... "'''' :z: 0
..8 ::;,-:!. € "",IDCX> 1010 ""C"" No\'" OON ('o4M'" """'." <>: ... {/JCl~O '" ~O>
",,.,,,, "' ... ~ "' ... '" ",,,,on ..... on'" l:t: '" ~ 'C"rfr.,) ~ N ". """, i:'< oS 0
I>l "CI -B1rl aQll"~~'~:S ~ "" 1:1 "'''''''' '0_'" "' ....... 0"'- "" .... "" ""'" '" «", ..... III ..... ; tI3~.;: S"t)tj Ql "' ...... -- N __
... <'1-N __
~('f')a-. ... .., ::E "" 0\;1;"'''0;1'''' e N-'" Il} =:"'~~~,Q l~ " ~ ~ g Po a ... := _g • .s t;;~::: ~~ ... ::;-'" ",>0'0 Me"" -"' ... 0.,..., .. ~ ...
00'" ...,ont- "'000 -.... '" """'",. ;!; ~E'll e <1.o;.~ - .. NClO 'C'" "'-'" '0"'_ ......
Il} ",,"il: "'-- '" = ~'"A :z;
e ~ .... "''''' tet!M .... 00'0 ~
U l:.i::§ ",,000 ...,,,,00 -"'''' "'",,0 ... '" 00"''''' ~"' .... ",."' ... 1000,," -,..'" "' ..... 0
j _8;to € CQ .. N .. 1f'1 "'- N- ", ... ....... - .., ...... ... 10" ~
_ ... ~ ;,
i "' .... ..,. "''''''' ...... '" ~~~ "' ...... "''''.., -..,.., ~ ~-~.~
... oo.a 100010 "''It ... ...."''It 0",,,,
6 ~tn,.N .... 0'"'' ....... 0 "'-'" --'" "''''''' 00
\0"'''' ::!~ "':0'''0 _"!")oo" l&J"ctJ"r: O"r--'M" Moe .. ... " "'''''''' ... "'- ~ ... '" "'<'I 00 ... '" ... '" N
Q N-
-'5 .... "':laSQ't:e "'N- 0_", "' ... '" ~~~ "'-'" "' ..... '" ... ..,\0
ag~~~~ ........ 0 ...... "" ...... '" 0""'" _ .... '" ;r:~ 8
~ "'''' .... - .. 0\ ..... ... "' ... ... ... - '0.0'" M ~o\oO - rti'ci-:' ~~. ";C'fi": ~","'''¢'' Ill,," ~=:;:..5.<.l:a N-
-"38 ... ",M ......... -"'''' "",,,CO ... ",,'0 ",.0", ",_00 ~ s~~a \0 .... '" ~~iZ ........ '" el@~ "'-0 .,,"'''' "'00'"
€ "'''l''' 0-", \0 .... '" "',,",0
__ 0\ ... ~o 0 ..cri'~ 1(')"'.,,"' vIo.,.; r--."'r..:o''' t'I")"'~"o· .,.j'\O"'C1\" ~O\C .. 0
:z; =: ..... 000\ MN "' ... _ "' ... - "' ...... ::\0. '0'0 ... ..,'" -;1a;~ : ,," .. 1a .. ,,~ ~'22 ~S~ s" ~ 01'"2 ~!:l'" 8 ... "'" -l=l'" o"~ o!:l~ ~~~ ~~:J 0"" ~~:J .e~:J i-<~;J i-<Il: i-<Il:
! ~~~ ~ :;
~ ~ .. ~
os ] ~ ~~p J: 11 ~ ~ " ~ '"' ~ ;: .. os Oi
~ e .... 11 ... I-<
! u t3 ~ ;:; ~ l:l ~ ~ ~ CIo Qo
~
~ > .. e os
~ '" ~ ~ :a r: a s .. Q ..c ..c

203 E SERIES
E-D-Tenure Status of Sample Census Housebolds living in Census Houses used as Dwellings
(Based on 20 per cent Sample)
Households In Census Householc1llln Censul Houses used as Houses used as
Total Total Total Total DIIVlct/TaIw Rural Tenure No. of Work· Dwell- Dlstric&/TaIuka Rural Tenure No. of Work. Dwell·
UrbaD Status house- Shop. shop. ing Urban Status house· Shop- ,hop. Inll holds Owen. cum~ cum .. with holds Dwell· eum- cum- with
lAS Dwell. Dwell. other inll Dwell· Dwell· other inS inS uses Inll Inll mea
(I) (2) (3) (4) (5) (6) (7) (8) (1) (2) (3) (4) (~) (6) (7) (8)
DiSTRICT TOTAL Total 52,968 52,\14 226 414 154 Oaryapur Taluka Total Total 7,306 7,398 34 46 28 Owned 42,204 41,535 174 396 99 Owned 6,393 6,303 27 43 20 Rented 10,764 10,579 52 78 " Rented 1,113 I,09~ 7 3 S
RUIlA!. .. Total 39,729 39,184 161 265 119 Rural Total 5,969 5,894 28 31 16 Owned 34,858 34,407 134 234 83 Owned 5,226 5,164 22 30 10 Rented 4,811 4,777 27 31 36 Rented 743 730 6 I 6
UJUIAN ,. Total 13,239 12,930 65 209 35 Urban Total 1,537 1,504 6 1~ 11 Owncd 7,346 7,128 40 162 16 Owned 1,167 1.139 -' 13 10 Rented ',893 5,802 25 47 19 Rented 370 36' I l a
MelshU T&luka Total Total 2.848 2~21 14 4 II Owned 2.533 2, 13 12 2 6 RCDted 315 308 2 :2 3 Amravati Taluka Total Total 16,399 16,247 56 71 24
Owned 11,080 10,990 37 47 6 Rural Total 2,792 2,767 12 4 9 Rented 5,319 5,257 19 25 18
Owned 2,~16 2,498 10 2 6 RCDted 276 269 2 2 3 Rural Total 9,737 9,646 34 47 10
Owned 8,343 8,272 27 41 3 Urban Total 56 54 2 Rented 1,394 1.374 7 6 V
Owned 17 15 a Rented 39 39 Urban Total 6,662 6,601 22 25 14
Owned 2,731 2,718 lO 6 5 Ach&lpar Talldta Total Total 8,699 8,4'" 43 190 12 Rented 3,925 3,883 12 19 11
Owned 7,382 7.172 37 169 4 Rented 1,317 1,282 6 21 8
Rural Total 6,339 6,263 30 38 8 Chandur Tliluka Total Total 8,961 8,790 52 68 .51 Owned 5,677 5,609 27 38 3 Owned 7,460 7,324 40 55 41 Rented 662 654 3 5 Rented I.S01 1.466 12 13 10
Urban Total 2;'360 2,191 13 152 4 Rural Total 1,989 7,842 36 64 47 Owned 1,705 1,563 10 131 1 Owned 6,999 6.873 31 55 40 Rented 655 628 3 21 3 Rented 990 969 5 9 .,
MonlTalaka .. Total Total 8,55.5 ,8,404 27 94 30 Urban Total 972 948 16 .. 4 Owned 7,356 7,233 21 80 22 Owned 461 4~1 9 1 Rented 1,199 1,'71 6 14 8 Rented Sll 497 7 4 l
Rural Total 6,903 6,772 2t 81 29 Owned 6.097 .5,991 17 68 21 Rented 806 f81 4 13 Ii TOWNS HAVING MORE THAN 50,000 POPULATION
UrbaD Total 1,652 1,632 6 13 Amravall (M) Total .5,635 !5.581 115 24 14 Owned 1,259 1,242 4 12 Owned 2,lO8 2;192 7 6 3 Rented 393' 390 2 1 Rented 3,427 3.389 9 18 11
M=Municipality.

CENSUS TABLES
.J
.g e
Po<
204

,.... -
lOS
~ ~ ~_~ E § ~ $ E ~ ~ ~ ~ * ~ ~ ~ ~ ~ ~ ~ ~ ~ rf ~ ~ ~ ~ _ ~ ~ ~ ~ ~ ~ _ ~ ~ N _ _ ~ ~ ~
~ ~ ~ ~ ~ ~ ~ ~ ~ ~ ~ ~ N ~ ~ ~ ~ ~ ~ ~ N ~ ~ ~ ~ ~ ~ ~ ~ ~ ~ ~ ~ ~ 00 ~ M ~ ~ 5 ~ ; N N ~ N ~ ~ ~ ~; ~ N ~ ~ ~ ~ ~ T
00 o ~
'" ;::;

206 C;;ENSUS TABLES
Number of Establi~hments and Workers for Industries classified by Minor Groups of Industrial Classification
NOTE.-(l) For description of Code, see Appendix I to the Explanatory Note. (2) The first figure in' the bracket is of number of Establishments, the second is for number of Workers.
AMRAVATI DISTRICT
Total.-Division 2 & 3 (8,753-14,595}-200 (939-1,257), 202 (17-30),
203 (4-7), 205 (34-85), 206 (5-5), 207 (108-584), 209 (448-873), 214 (27-64), 215 (4-7), 216(4-16), 220 (18-113), 230 (73-834), 231 (22-32), 232 (2-110), 233 (7-19), 234 (1-20), 235 (896-1,398), 236 (10-24), 237
• (3-4), 239 (2-4), 242 (2-6), 244 (6-13), 255 (1-1), 262 (1-5), 271 (5-29), 272 (1-2), 273 (2,427-2,918), 274 (10-14), 278 (1-1), 280 (39-129), 281 (577-810), 282 (20-52), 284 (157-323), 288 (87-151),289 (10-13), 292 (8-21), 301 (18-75), 302 (15-48), 303 (10-16) 310 (18-27), 311 (395-584), 313 (27-35), 314 (100-128), 320 (1-6) 326 (1-1), 331 (5-8), 333 (1-2), 335 (4-41), 336 (11-25), 339 (2-12), 340 (3-11), 342 (3-3), 343 (3-6), 350 (291-469), 353 (3-5), 355 (10-17), 364 (2-3), 365 (40-62), 367 (52-116), 368 (45-70), 369 (813-1,410), 372 (1-2), 377 (6-6), 382 (5-27), 383 (6-101), 384 (68-178),388 (132-167),389 (4-8), 390 (5-8), 392 (31-48), 393 (402-500), 394 (5-15), 399 (239-381).
Rural .-200 (726-804), 205 (1-2), 207 (30-54), 209 (173-237), 214 (3-4), 216 (1-1), 220 (1-1), 23Q (2-16), 233 (4-6), 235 (195-274), 237 0-2), 239 (2-4),242 (1-3), 255 (1-1), 271 (1-2), 273 (1,780-1,953), 274 (4-5), 278 (1-1), 280 (3-8), 281 (478-619), 282 (3-8), 284 (121-138), 288 (47-74), 289 (1-1), 292 (1-1), 302 (1-10), 310 (10-14), 311 (211-288), 313 (7-11), 314 (81-98), 336 '(2-4), 339 (2-12), 340 (1-3), 342 (1-1), 350 (212-322), 365 (11-14), 367 (1-1), 368 (2-2), 369 (555-826), 384 (1-2), 388 (51-63), 392 (2-3), 393 (170-181), 394 (1-2), 399 (156-179).
Urban.-200(213-453), 202(17-30), 203 (4-7), 205 (33-83), 206 (5-5), 207 (78-530), 209 (275-636), 214 (24-60), 215 (4-7), 216 (3-15), 220 (17-112), 230 (71-818), 231 (22-32), 232 (2-110), 233 (3-13), 234 (1-20), 235 (701-1,124), 236 (10-24), 237 (2-2), 242 (1-3), 244 (6-13), 262 (1-5), 271(4-27), 272 (1-2), 273 (647-96S), 274 (6-9), 280 (36-121), 281 (99-191), 282 (17-44), 284 (36-185), 288 \40-77), 289 (9-12), 292 (7-20), 301 (18-75), 302 (14-38), 303 (10-16), 310 (8-13), 311 (184-296), 313 (20-24), 314 (19-30), 320 (1-6), 326 (1-1), 331 (5-8), 333 (1-2), 335 (4-41), 336 (9-21), 340 (2-8), 342 (2-2), 343 t3-6), 350 (79-147), 353 (3-5), 355 (10-17), 364 <2-3), 365 (29-48), 367 (51-115), 368 (43-68), 369( 258-584), 372 (1-2), 371 (6-6), 382 (5-27), 383 (6-101), 384 (67-176), 388 (81-104), 389 (4-8), 390 (5-8), 392 (29-45), 393 (232-319), 394 (4-13), 399 (83-202).
MELGHAT TALUKA
Total.- _ Division 2 & 3 (152-286),-200 (23-24), 207 (2-4), 209 (2-3),
273 (27-34), 274 (1-1), 281 (9-66), 288 (2-3), 311 (2-2), 350 (6-7), 365 (2-2), 369 (62-123), 384 (1-2), 388 (2.3), 393 (10-11), 399 (1-1).
Rural.-200 (21-22), 207 (2-4), 209 (2-3), 273 (20-27), 274 (1-1), 281 (7-64), 288 (2-3), 311 (2-2), 350 (6-7), 365 (2-2), 369 (61-121), 384 (1-2), 388 (1-2), 393 (10-11).
Urban.-200 (2-2), 273 (7-7), 281 (2-2), 369 (1-2), 388 (1-1), 399 (1-1).
VILLAGES
(4) Bairagad.-288 (1-1), 311 (2-2), 350 (3-4), 365 (2-2). (6) Kutanga.-369 t1-1). (8) Chatwabod.-369 (1-1).
(10) Sonabardi.-369 (1-1). (16) Dahenda.-369 (1-1). (19) Dharanmahu.-369 (1-1). (22) Chaharda.-369 ti-2). (23) Karada.-369 (1-2).
MEL GHAT TALUKA-collc/d.
VILLAGES-cone/d.
(24) Patiya.-369 (1-2). (27) Kalapi.-369 (1-2). (28) Dharni.-209 0-2), 273 (15-21), 274 tl-1), 281 (1-1).
288 (1-2), 350 (1-1), 369 (1-5), 384 (1-2), 388 (1-2). (29) Diya.-369 (1-2). ' (36) Dhulghat.-200 (1-1); 369 (1-2). (37) Kalamkhar.-200 (2-2). 369 (1-9). (39) Baspani.-200 (4-4), 273 (1-1), 369 (1-4). (42) Duni.-350 (1-1), 369 (1-2), '393 (5-5). (48) Mandwa.-369 (1-2). (56) Bod.-369 (1-2). (58) Dabida.-369 0-1). (66) Zilpi.-369 (1-4). (67) Chutiya.-207 (1-3), 273 (1-1), 281 (4-60), 369 (1-3),
393 (3-3). (70) Khari.-369 (1-1). (77) Kara.-369 (1-4). (81) Aki.-369 (1-1). (83) DhaOdi Mansu.-369 0-2). (88) Susarda.-369 (3-5), 393 (1-2). (96) Mogarda.-393 (1-1). (98) Zilangpati.-369 (1-1).
(104) Bhawar.-273 (1-2), 369 (1-1). (105) Sawlikheda.-200 (1-1), 209 (1-1), 273 (1-1), 369 ,(1-2). (107) Dabka.-369 (1-1). !
(114) Churni.-2oo (2-2), 207 (1-1), 281 (1-1), 369 (3-4). (116) Dehendri.-369 (3-6). ' (119) Kotmi.-350 (1-1), 369 (1-1). (133) Jamali.-369 (1-2). (138) Tembharnn Sonda.-200 (2-2), 369 (2-4). (139) Kulanganakh.-369 (1-2). (140) Wastapur.-369 (1-1). (143) Somwarkheda.-200 (2-2). (145) Ramtek.-273 (1-1). (146) Aki.-369 (1-2). (150) Badnapur.-369 (1-2). (153) Morgad.-369 (1-2). (157) Telkhar.-281 (1-2), 369 (1-~). F(18) Harisal.-369 (4-4). ' F(28) Chilatia.-369 (1-2). F(29) Kasaipur.-369 (1-1). F(37) Semadoha.-369 (1-2). F(40) Bordha.-369 (1-1). F(43) Karanj.-369 (1-5). F(50) Khadimal.-369 (1-2). F(75) Kaora2.iri.-2oo (7-8). F(79) Nagartas.-369 (1-3). F(94) Chikhali.-369 (1-2). F(137) Salona.-369 (2-4).
URBAN
Chikalda Municipality.-200 l2-2), 273 t7-7), 281 (2·2), 369 (1-2)0 388 (1-1), 399 (1-1).
ACHALPUR TALUKA
Total.-Division 2 & 3 (1,965-3,027}-2oo (160-186), 202 (11-19)
205 (3-4), 206 (5-5), 207 (16-31), 209 (120-223), 214 (6-9) 215 (3-5), 220 (1-1), 230 (11-63), 232 (1-100) 233 (3-13), 235 (626-1,007), 236 (9-15), 242 ll-3) 244 (6-13), 271 (2-8), 273 (342-429), 274 (3-4) 278 (1.1), 280 (7-10), 281 (77-112), 284 (14-23) 288 (16-35), 301 (1-6), 302 (4-14), 310 (4-4), 311 (100-128) 314 (28-36), 326 (1-1), 331 (1-1), 335 (1-2), 336 (1-2) 350 (53-79),353 (2-3), 355 (2-2), 365 (1-2), 367 (14-21),368 (1-1) 369 (126-184), 377 (1-1), 382 (1-2), 384 (17-35), 388 (46-60), 392 (9-9), 393 (54-62), 394 (1-1), 399 (52-52).
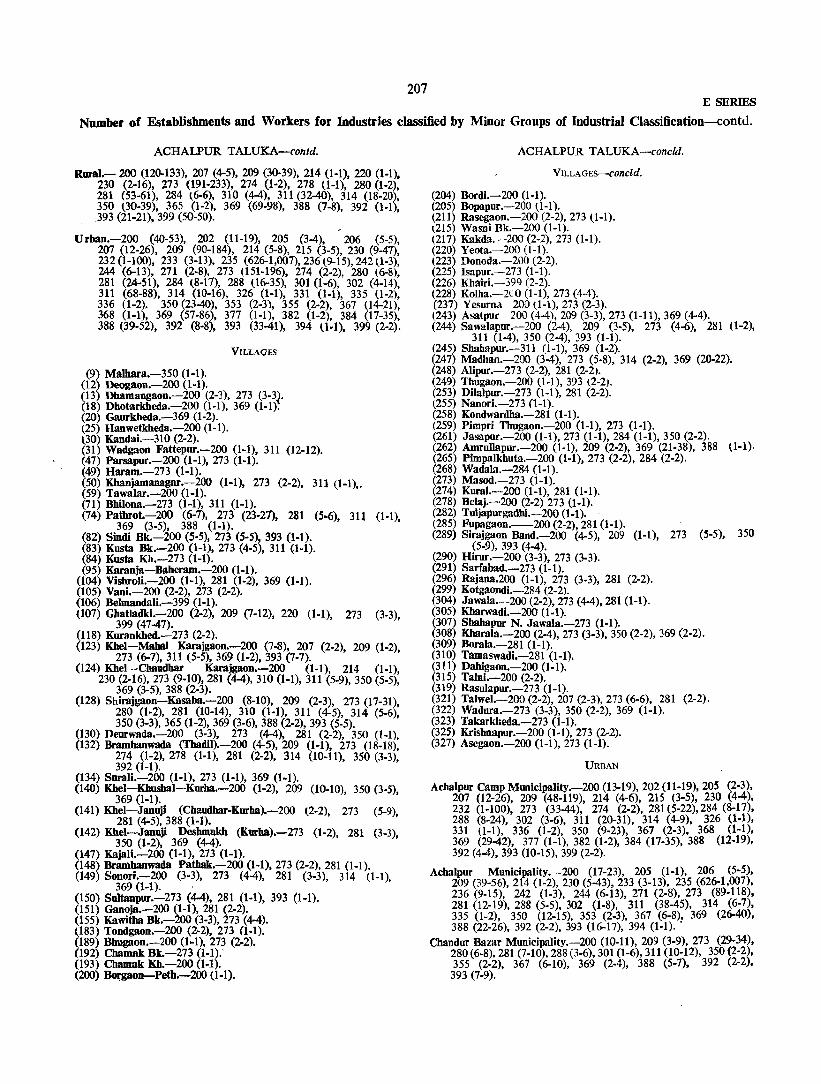
207 E SERIES
Number of Establishments and Workers for Industries classified by Minor Groups of Industrial Classification-contd.
ACHALPUR TALUKA-contd.
Rural.- 200 (12()"133), 201 (4-5), 209 (30-39), 214 (1-1), 220 (1-1), 230 (2-16), 273 (191-233), 274 (1-2), 278 0-1), 280 (1-2), 281 (53-61), 284 (.6-6), 310 (4-4), 311 (32-40), 314 (18-20), 350 (30-39), 365 (1-2), 369 (69-98), 388 (7-8), 392 (1·1) _393 (21-21), 399 (50-50). '
Urban.-200 (40-53), 202 (11-19), 205 (3-4), 206 (5-5), 207 (12-26), 209 (90-184), 214 (5-8), 215 (3-5), 230 (9-41), 232 (1-100), 233 (3-13), 235 (626-1,001),236 \9-15),242 (.1-3), 244 (6-13), 271 (2-8), 213 t151-196), 274 (2-2), 280 l6-8), 281 (24-51), 284 (8-17), 288 (16-35), 301 (1-6), 302 (4-14), 311 (68-88), 314 (10-16), 326 (1-1), 331 (1-1), 335 0·2), 336 (1-2). 350 (23-40), 353 (2-3), 355 (2-2), 367 (14-21), 368 (1-1), 369 (57-86), 377 (1-1), 382 (1-2), 384 (17-35), 388 (39-52), 392 (8-8), 393 (33-41), 394 0-1), 399 (2-2).
(9) Malhara.-350 (1-1). (12) Deogaon.-200 (1·1).
VILLAGES
(13) Dbanlangaon.-200 (2-3), 213 (3-3J. (18) Dhotarkhedll.-200 (1-1), 369 (1-1). (20) Gaurkheda.-369 (1·2). (25) Hanwetkheda.-200 (1-1). (.30) Kandai.-310 (2-2). (31) Wadgaon Fattepur.-200 (I-I), 311 (12-12). (47) Parsapur.-200 (1-1), 273 (1-1). (49) Haram.-273 (1-1). (50) Khanjamanagar.-200 (1-1), 273 (2-2), 311 (1-1),. (59) Tawalar.-200 (1-1). (71) Bhilona.-273 (1-1), 311 (1-1). (74) Pathrot.-200 (6-7), 273 (23-27), 281 (5·6), 311 (1·1),
369 (3-5), 388 (1-1). (82) 8indi Bk.-200 (5·5), 273 (5-5), 393 (1.1). (83) Kusta Bk.-200 (1-1), 273 (4·5), 311 (1-1). (84) Kusta Kh.-273 (1-1). (95) Karanja-Baheram.-200 (1-1).
(104) Visbroli.-200 (1-1), 281 (1-2), 369 (1·1). (105) Vani.-200 (2-2), 273 (2-2). (106) Belmandali.-399 (1-1). (107) Gbatladki.-200 (2-2), 209 (7-12), 220 (1-1) 213 (3-3),
399 (47-47). ' (118) Kurankhed.-273 (2-2). (123) Kbel-Mahal Karajgaon.-200 (7-8), 207 (2-2) 209 (1·2)
273 (6-7), 311 (5-5), 369 (1-2), 393 (7.7).' , (124) Kbel-Chaudbar Karajgaon.-200 (1-1), 214 (1-1),
230 (2-16), 273 (9-10),281 (4-4), 310 (1-1), 311 (5-9) 350 (5-5) 369 (3-5), 388 (2-3). "
(128) Shirajgaon-Kasaba.-2oo (8-10), 209 (2-3), 273 (17-31), 280 (1·2), 281 (10-14), 310 (1-1), 311 (4-5), 314 (5-6), 350 (3-3), 365 (1-2), 369 (3-6), 388 (2-2), 393 (5·5).
(130) Deurwada.-200 (3-3), 273 (4-4), 281 (2-2) 350 (1-1) (132) Bramhanwada (TbadiI).-200 (4-5), 209 (1-1), 273 (18-18):
274 (1-2), 278 (1.1), 281 (2-2), 314 (10-11), 350 (3.3) 392 (1-1). '
(134) Surali.-200 (1-1), 273 (1-1), 369 (1·1). (140) Kbel-Kbnsbal-Kurba.-200 (1-2), 209 (10-10) 350 (3-5)
369 (1-1). ' , (141) Kbel-Januji (Chaudbar-Kurba).-2oo (2-2) 273 (5-9)
281 (4-5), 388 (1-1). " (142) Kbel-Januji Deshmukh (Kurba).-273 (1-2) 281 (3-3)
350 (1-2), 369 (4-4). " (147) Kajali.-200 (1-1), 213 (1·1). (148) Bramhanwada Pathak.-200 (1.1), 273 (2-2), 281 (1-1). (149) Sonori.-200 (3-3), 273 (4-4), 281 (3-3), 314 ll·1),
369 (1-1). . (150) Sultanpur.-273 (4-4), 281 (1-1), 393 (1-1). (151) Ganoja.-200 (1-1), 281 (2-2). (155) Kawitha Bk.-200 (3-3), 273 (4-4). ~183) Tondgaon.-200 (2-2), 273 (1·1). (189) Bhugaon.-200 (1-1), 273 (2-2). (192) Chamak Bk.-273 (I-I); (193) Cbamak Kh.-2oo (1-1). (200) IJomaon-Petb.-200 (.1-1).
ACHALPUR TALUKA-concld.
VILLAGES-concld.
(204) Bordi.-200 (1-1). (205) Bopapur.-200 (1-1). (211) Rasegaon.-200 (2-2), 273 (1-1). ~215) Wasni Bk.-2oo (1-1). (217) Kakda.-200 (2-2), 273 (1-1). (220) Yeota.-200 (1-1). (223) Donoda.-200 (2-2). (225) Isapur.-273 (1-1). (226) Khairi.-399 (2-2). (228) Kolha.-2CO (1-1), 273 (4-4). (237) Yesurna 200 (1-1), 273 (2-3). (243) Asatpur 200 (4-4), 209 (3-3), 213 (1-11), 369 (4·4). (244) Sawalapur.-200 (2-4), 209 (3·5), 273 (4·6), 281 (1-2),
311 (1-4), 350 (2-4), 393 0-1). (245) Shahapur.-311 (1-1), 369 (1-2). (247) Madhan.-200 (3-4), 273 (5·8), 314 (2-2), 369 (20·22). (248) Alipur.-273 (2-2), 281 (2-2). (249) Thugaon.-200 (1-1), 393 (2·2j. (253) DiIalpur.-273 (1-1), 281 (2-2). (255) Nanori.-273 0-1). (258) Kondwardha.-281 (1-1). (259) Pimpri Thugaon.-2oo (1-1), 273 (1-1). (261) Jasapur.-2oo (1·1), 213 (1-1), 284 (1-1), 350 (2-2). (262) Amrullapur.-200 (1·1), 209 (2-2), 369 (21-38), 388 (1-1). (265) Pimpalkhuta.-200 (1·1),273 (2·2), 284 (2-2). (268) Wadala.-284 0-1). (273) Masod.-273 (1-1). (274) Kural.-2oo (1-1), 281 (1-1). (278) Belaj.-200 (2-2) 273 (1-1). (282) Tuljapurgadbi.-200 (1-1). -(285) Fupagaon.-200 (2·2), 281 (1-1). (289) Sirajgaon Band.-2oo (4-5), 209 (1-1), 273 (S·5), 350
(5-9), 393 (4-4). (290) Hirur.-200 (3-3), 273 (3-3). (291) Sarfabad.-273 (1-1). (296) Rajana.2oo (1-1), 273 (3-3), 281 (2·2). (299) Kotgaondi.-284 (2-2). (304) Jawala.-200 (2-2), 273 (4-4), 281 (1-1). (305) Kharwadi.-2oo (1-1). (307) ShalUlpur N •. Jawala.-273 (1-1). (308) Kbarala.-200 (2-4), 213 (3-3), 350 (2-2), 369 (2-2). (309) Borala.-281 (1-1). (310) Tamaswadi.-281 (1-1). (311) Dahigaon.-200 (1-1). (315) Talm.-200 (2-2). (319) Rasulapur.-273 (1-1). (321) Talwel.-200 (2-2),201 (2·3), 273 (6-6), 281 (2-2). (322) Wadura.-273 (3-3), 350 (2-2), 369 (1-1). (323) Takarkheda.-273 (1-1). (325) Krishnapur.-200 (1-1), 273 (2-2). (327) Asegaon.-200 (1-1), 273 (1-1).
URBAN
Achalpur Camp Municipality.-200 (13-19), 202 (11-19), 20S (2-3), 207 (12-26), 209 (48-119), 214 (4-6), 215 (3-5), 230 (4-4), 232 (1-100), 273 (33-44), 274 (2-2), 281 (5-22),284 (8-17), 288 (8-24), 302 (3-6), 311 (20-31), 314 (4-9), 326 (1-1), 331 (1-1), 336 (1-2), 350 (9-23), 367 (2-3), 368 (1-1), 369 (29-42), 377 (1-1), 382 (1.2), 384 (17-35), 388 (12-19), 392 (4-4), 393 (10-15), 399 (2-2).
Achalpur MunicipaIity.-200 (17-23), 205 (1·1), 206 (5-5), 209 (39-56), 214 (1-2), 230 (5-43), 233 (3-13), 235 (626-1,007), 236 (9·15), 242 (1-3), 244 (6·13), 271 (2·8), 273 (89-118), 281 (12-19), 288 (5-5), 302 (1-8), 311 (38-45), 314 (6-7), 335 (1-2), 350 (12-15), 353 (2-3), 367 (6-8), 369 (26-40), 388 (22-26), 392 (2-2), 393 (16-17), 394 (1·1) ..
Chandur Bazar Municipality.-200 (10-11), 209 (3-9), 273 (29.34), 280 (6-8),281 (7·10),288 (3-6), 301 (1-6), 311 (10-12), 350 (2-2), 355 (2-2), 367 (6·10), 369 (2-4), 388 (5-7), 392 (2-2), 393 (7-9).
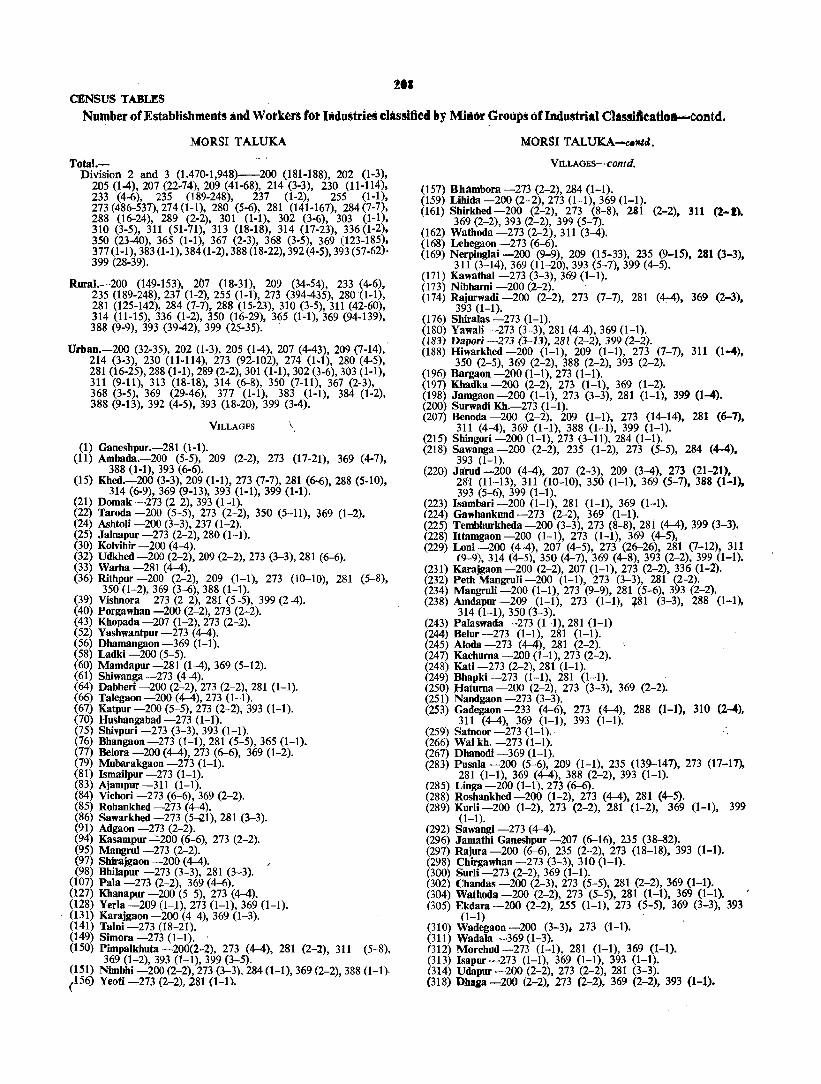
:lea CENSUS TABLI~S
Number otEstablisbrnents and Worker~ tot IJidustriei classifiecllty Mitior Groups of {Muldrial Classifieatioll-¢ODtd.
MORSI TALUKA
TotaJ.-Division 2 and 3 (1.470-1,948)-200 (181-188), 202 (1-3),
205 (1-4), 207 (22-74), 209 (41-68), 214 (3-3), 230 (11-114), 233 (4-6), 235 (189-248), 231 (1-2), 255 (1-1), 273 (486-537), 274 (1-1), 280 (5-6), 281 (141-167), 284 (7-7), 288 (16-24), 289 (2-2), 301 (1-1), 302 (3-6), 303 (1-1), 310 (3-5), 311 (51-11), 313 (18-18), 314 (17-23), 336 (1-2), 350 (23-40), 365 (1-1), 361 (2-3), 368 (3-5), 369 (123-185), 371 (1-1),383 (1-1), 384 (1-2), 388 (18-22), 392 (4-5), 393 (51-62)· 399 (28-39).
Rural.-200 (149-153), 207 (18-31), 209 (34-54), 233 (4-6), 235 (189-248),237 (1-2), 255 (1-1), 273 (394-435), 280 (1-1), 281 (125-142), 284 (7-7), 288 (15-23), 310 (3-5), 311 (42-60), 314 (11-15), 336 (1-2), 350 (16-29), 365 (1-1),369 (94-139), 388 (9-9), 393 (39-42), 399 (25-35). .
Urban.-200 (32-35), 202 (1-3), 205 (1-4), 207 (4-43), 209 (1-14), 214 (3-3), 230 (11-114), 273 (92-102), 274 0-1), 280 (4-5), 281 (16-25),288 (1-1), 289 (2-2), 301 (1-1), 302 (3-6),303 (1-1), 311 (9-11), 313 (18-18), 314 (6-8), 350 (7-11), 367 (2-3), 368 (3-5), 369 (29-46), 377 (1-1), 383 (1-1), 384 (1-2), 388 (9-13), 392 (4-5), 393 (18-20), 399 (3-4).
VILLAGES \
(1) Ganeshpur.-281 (1-1). (11) Ambada.-200 (5-5), 209 (2-2), 273 (11-21), 369 (4-7),
388 (1-1), 393 (6-6). (15) Khed.-2oo (3-3), 209 (1-1), 273 (7-1), 281 (6-6), 288 (5-10),
314 (6-9), 369 (9-13), 393 (1-1), 399 (1-1). (21) Domak -273 (2-2), 393 (1-1). (22) Taroda -200 (5-5), 273 (2-2), 350 (5-11), 369 (1-2). (24) Ashtoli -200 (3-3), 237 (1-2). (25) Jaluapur -273 (2-2),280 (1-1). (30) Kolvihir -200 (4-4). (32) Udkbed -200 (2-2), 209 (2-2), 273 (3-3), 281 (6-6). (33) Warha -281 (4-4). (36) Rithpur -200 (2-2), 209 (1-1), 213 (10-10), 281 (5-8),
350 (1-2), 369 (3-6), 388 (1-1). (39) Vishnora -273 (2-2), 281 (5-5), 399 (2-4). (40) Porgawhan -200 (2-2), 273 (2-2). (43) Khopada -207 (1-2), 273 (2-2). (52) Yashwantpur -273 (4-4). (56) Dhamangaon-369 (1-1). (58) Ladki -200 (5-5). (60) Mamdapur -281 (1-4), 369 (5-12). (61) Shiwanga -273 (4-4). (64) Dabheri -200 (2-2), 213 (2-2), 281 (1-1). (66) Talegaon -200 (4-4),273 (1-1). (67) Katpur -200 (5-5), 273 (2-2), 393 (1-1). (70) Hushangabad -273 (1-1). (75) Shivpuri -273 (3-3), 393 (1-1). (76) Bhangaon -273 (1-1),281 (5-5), 365 (1-1). (17) Belora -200 (4-4), 273 (6-6), 369 (1-2). (79) Muharakgaon -273 (1-1). (81) Ismailpur -273 (1-1). (83) Ajampur -311 (1-1). (84) Vichori -273 (6-6), 369 (2-2). (85) Rohankhed -273 (4-4). (86) Sawarkbed -273 (5-.21),281 (3-3). (91) Adgaon -213 (2-2). (94) Kasampur _::.200 (6-6), 273 (2-2). (95) Mangrul-273 (2-2). (97) Shirajgaon -200 (4-4). / (98) Bhilapur -273 (3-3), 281 (3-3).
(101) Pala -273 (2-2), 369 (4-6). (121) Khanapur -200 (5-5), 213 (4-4). (128) Verla -209 (1-1), 273 (1-1), 369 (1-1) •
. (131) Karajgaon -200 (4-4), 369 (1-3). (141) Talni -213 (18-21). (149) Simora -273 (1-1). (150) Pimpalkhuta -200(2-2), 273 (4-4), 281 (2-2), 311 (5-8),
369 (1-2), 393 (1-1), 399 (3-5). (1S1) Nimbhi -200 (2-2),273 (3-3), 2840-1),369 (2-2), 388 (1-1). (156) Yeoti -273 (2-2),2810-1),
MORSI TALUKA~"'d.
VILLAOEs-contd.
(151) Bhambora -273 (2-2), 284 (1-1). (159) Lihida -200 (2-2), 273 0-1), 369 (1-1). (161) Shirkhed -200 (2-2), 213 (8-8), 2S1 (2-2), 311 (2-1). . 369 (2-2), 393 (2-2), 399 (5-1). (162) Wathoda -273 (2-2), 311 (3-4). (168) Lehegaon -213 (6-6). (169) Nerpinglai -200 (9-9), 209 '(15-33), 235 (9-15), 281 (3-3),
311 (3-14), 369 (11-20), 393 (5-7), 399 (4-5). (171) Kawathal -273 (3-3), 369 (1-1). (173) Nihharni -200 (2-2). ' (174) Rajurwadi -200 (2-2), 213 (1-7), 281 (4;-4), 369 (2-3),
393 (1-1). (176) Shiralas -273 (1-1). (180) Yawali -273 (3-3),281 (4-4), 369 (1-1). (183) Dapol'i -273 (3-13), 281 (2-2),399 (2-2). (188) Hiwarkhed -200 (1-1), 209 (1-1), 273 (7-1), 311 (l4),
350 (2-5), 369 (2-2), 388 (2-2), 393 (2-2). (196) Bargaon -200 (1-1), 213 (1-1). (197) Khadka -200 (2-2), 273 (1-1), 369 (1-2). (198) Jamgaon -200 (1-1), 273 (3-3), 281 (1-1), 399 (1-4), (200) Surwadi Kh.-273 (1-1). (207) Benoda -200 (2-2), 209 (1-1), 213 (14-14), 281 (6-7),
311 (4-4), 369 (1-1), 388 (1-1), 399 (1-1). (215) Shingori -200 (1-1), 273 (3-11), 284 (1-1). (218) Sawanga -200 (2-2), 235 (1-2), 213 (5-5), 284 (4-4),
393 (1-1). (220) Jarud -200 (4-4), 207 (2-3), 209 (3-4), 273 (21-21),
281 (11-13), 311 (10-10), 350 (1-1), 369 (5-7), 388 q-l), 393 (5-6), 399 (1-1).
(223) Isambari -200 (1-1), 281 (1-1), 369 (1-1). (224) Gawhankund -213 (2-2), 369 (1-1). . (225) Tembhurkheda -200 (3-3), 213 (8-8), 281 (4-4), 399 (3-3). (228) Ittamgaon -200 (1-1), 273 (1-1), 369 (4-5), (229) Loni -200 (4-4), 207 (4-5), 213 (26-26), 281 (1-12), 311
(9-9), 314 (4-5), 350 (4-7), 369 (4-8), 393 (2-2), 399 (1-1). (231) Karajgaon -200 (2-2), 207 (1-1), 273 (2-2), 336 (1-2), (232) Peth Mangruli -200 (1-1), 273 (3-3), 281 (2-2), (234) Mangruli -200 (1-1), 273 (9-9), 281 (5-6), 393 (2-2). (238) Amdapur -209 (1-1), 213 (1-1), ~81 (3-3), 288 (1-1),
314 (1-1), 350 (3-3). (243) Palaswada -273 (1-1),281 (1-1) (244) Belur -273 (1-1), 281 (1-1). (245) Aloda -273 (4-4), 281 (2-2). (247) Kachurna -200 (1-1), 273 (2-2). (248) Kati -273 (2-2), 281 (1-1). (249) Bhapki -273 (1-1), 281 (1-1). . (250) Haturna -200 (2-2), 273 (3-3), 369 (2-2). (251) Nandgaon -273 (3-3). (253) Gadegaon -233 (4-6), 213 (4-4), 288 (1-1), 310 (2-4),
311 (4-4), 369 (1-1), 393 (1-1). (259) Satnoor -273 (1-1).· (266) Wal kh. -213 (1-1). (267) Dhanodi -369 (1-1). (283) Pusala -200 (5-6), 209 (1-1), 235 (139-141), 273 (11-17),
281 (1-1), 369 (4-4), 388 (2-2), 393 (1-1). (285) Linga -200 (1-n, 213 (6-6). (288) Roshankhed -200 (1-2), 273 (4-4), 281 (4-5). (289) Kurli -200 (1-2), 273 (2-2), 281 (1-2), 369 (1-1), 399
(1-1). (292) Sawangi -213 (4-4). (296) Jamathi Ganeshpur -201 (6-16), 235 (38-82). (297) Rajura -200 (6-6), 235 (2-2), 273 (18-18), 393 (1-1). (298) Chirgawhan -273 (3-3), 310 (1-1). (300) Surli -273 (2-2), 369 (1-1). (302) Chandas -200 (2-3), 273 (5-5), 281 (2-2), 369 (1-1). (304) Wathoda -200 (2-2), 273 (5-5), 281 (1-1), 369 (1-1), (305) Ekdara -200 (2-2), 255 (1-1), 273 (5-5), 369 (3-3), 393
0-1) (310) Wadegaon -200 (3-3), 213 ('1-1). (311) Wadala -369 (1-3). (312) Morchud -213 (1-1), 281 (1-1), 369 (1-1). (3l3) Isapur -273 (1-1), 369 (1-1), 393 (1-1). (314) Udapur -200 (2-2), 273 (2-2), 281 (3-3). (318) Dhllia -200 (2-2), 213 (2-2), 369 (2-2), 393 (1-1).
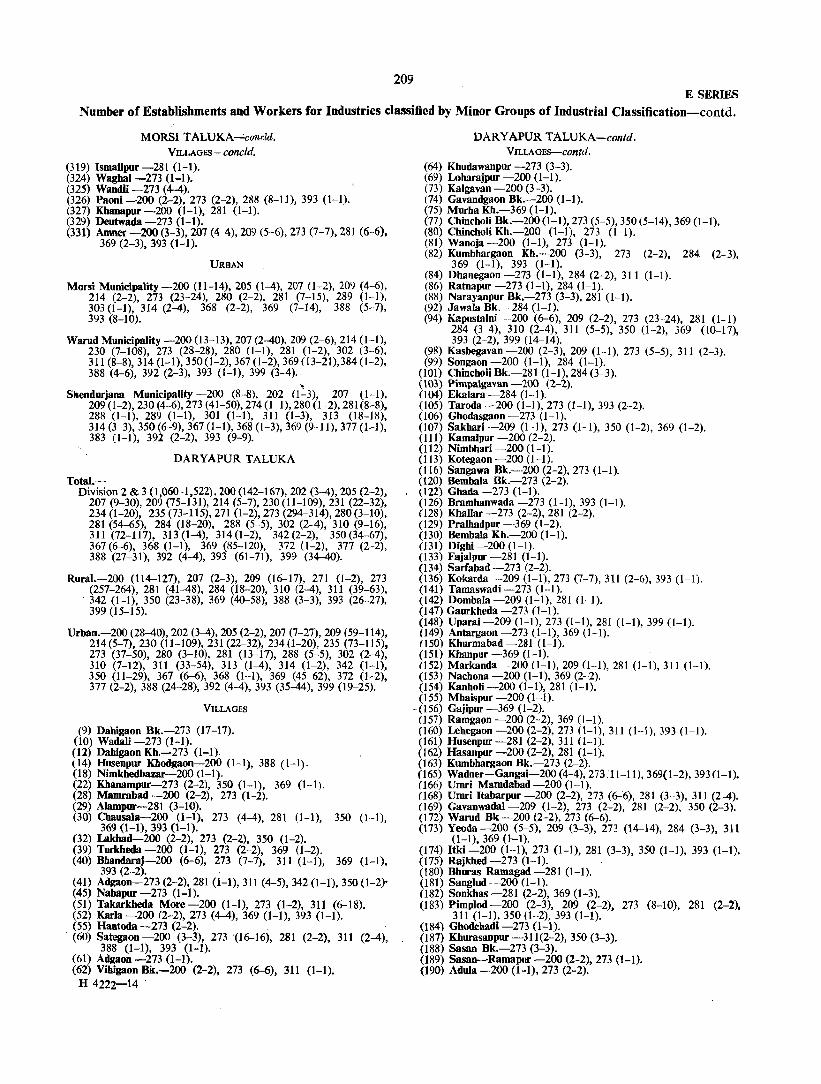
209 E SERIES
Number of Establishments and Workers for Industries classified by Minor Groups of Industrial Classification-contd.
MORSI T ALUKA--.:cQndd. VILLAGES-concld.
(319) Ismailpur -281 (1-1). (324) Waghal-273 (1-1). (325) Wandli -273 (4-4). (326) Paoni -200 (2-2), 273 (2-2), 288 (8-11), 393 (1-1). (327) Kbanapur -200 (I-I), 281 (1-1). (329) Deutwada -273 (1-1). (331) Amner -200 (3-3),207 (4-4), 209 (5-6), 273 (7-7),281 (6-6),
369 (2-3), 393 (1-1).
URBAN
Morsi Municipality -200 (11-14), 205 (1-4), 207 0-2), 209 (4-6), 214 (2-2), 273 (23-24), 280 (2-2), 281 (7-15), 289 (1-1), 303 (1-1), 314 (2-4), 368 (2-2), 369 (7-14), 388 (5-7), 393 (8-10).
Warud Municipality -200 (13-13), 207 (2-40).209 (2-6), 214 (1-n, 230 (7-108), 273 (28-28), 280 (I-I), 281 (1-2), 302 (3-6), 311 (8-8), 314 (1-1),350 (1-2),367 (1-2),369 (13-21),384 (1--2), 388 (4-6), 392 (2-3), 393 (I-I), 399 (3-4).-
.. Shendurjana Municipality -200 (8-8), 202 0-3), 207 (1-1),
209 (1-2), 230 (4-6), 273 (41-50),274 (1-1),280 {1-2}, 281 (8-8), 288 (1-1), 289 (1-1), 301 (1-1), 311 (1-3), 313 (18-18), 314 (3-3),350 (6-9),367 (1-1),368 (1-3), 369 (9-11),377 (1-1), 383 (1-1), 392 (2-2), 393 (9-9).
DARYAPUR TALUKA
TotaI.-Division 2 & 3 0,060-1,522), 200 (142-167),202 (3-4), 205 (2-2),
207 (9-30), 209 (75-131), 214 (5-7), 230 (11-109), 231 (22-32), 234 (1-20), 235 (73-115), 271 (1-2),273 (294-314), 280 (3-10), 281 (54-65), 284 (18-20), 288 (5-5), 302 (2-4), 310 (9-16), 311 (72-117), 313 (1-4), 314 (1-2), 342 (2-2), 350 (34-67), 367 (6-6), 368 (1-1), 369 (85-120), 372 (1-2), 377 (2-2), 388 (27-31), 392 (4-4), 393 (61-71), 399 (34-40).
Rural.-200 (114-127), 207 (2-3), 209 (16-17), 271 (1-2), 273 (257-264), 281 (41-48), 284 (18-20), 310 (2-4), 311 (39-63),
- 342 (1-1), 350 (23-38), 369 (40-58), 388 (3-3), 393 (26-27), 399 (15-15).
Urban.-200 (28-40), 202 (3-4), 205 (2-2), 207 (7-27),209 (59-114), 214(5-7),230 (11-109), 231 (22-32),234(1-20),235 (73-115), 273 (37-50), 280 (3-10), 281 (13-17), 288 (5-5), 302 (2-4), 310 (7-12), 311 (33-54), 313 (1-4), 314 (1-2), 342 (1-1), 350 (11-29), 367 (6-6), 368 (1-1), 369 (45-62), 372 (1-2), 377 (2-2), 388 (24-28), 392 (4-4), 393 (35-44), 399 (19-25).
VILLAGES
(9) Dahigaon Bk.-273 (17-17). (10) Wadali -273 (1-1). (12) Dahigaon Kb.-273 (1-1). (14) Husenpur Khodgaon-200 (I-I), 388 (1-1). (18) Nimkhedbazar-200 0-1). (22) Kbanampur-273 (2-2), 350 (1-1), 369 (1-1 l. (28) Mamrabad -200 (2-2), 273 (1-2). (29) Alampur-281 (3-10). (30) Chausala-200 (1-1), 273 (4-4), 281 (1-1), 350 (1-1),
369 (I-I), 393 (I-I). (32) Lakhad-200 (2-2), 273 (2-2), 350 (1-2). (39) Turkheda -200 (1-1), 273 (2-2), 369 (1-2). (40) Bhandaraj-200 (6-6), 273 (7-7), 311 (1-1), 369 (1-1),
393 (2-2). (41) Aclgaon-273 (2-2), 281 (1-1),311 (4-5),342 (1-1),350 (1-2)' (45) Nabapur -273 (1-1). (51) Takarkheda More-2oo (1-1), 273 (1-2), 311 (6-18). (52) Karla -200 (2-2), 273 (4-4), 369 (1-1), 393 (1-1). (55) Hantoda -273 (2-2). _ (60) Sategaon -200 (3-3), 273 -(16-16), 281 (2-2), 311 (2-4),
388 (1-1), 393 (1-1). (61) Aclgaon -273 (1-1). (62) Vibigaon Bk.-200 (2-2), 273 (6-6), 311 (1-1).
H 4222-14 -
DARYAPUR TALUKA-contd. VILLAGES-con/d.
(64) Khudawanpur -273 (3-3). (69) Loharajpur -200 (1-1). (73) Kalgavan -200 (3-3). (74) Gavandgaon Bk.-200 (1-1). (75) Murha Kh.-369 (1-1). (77) Chincholi Bk.-2oo (1-1), 273 (5-5), 350 (5-14),369 (1-1). (80) Chincholi Kh.-200 (1-1), 273 (1-1). (81) Wanoja -200 (1-1), 273 (1-1). (82) Kumbhargaon Kh.-200 (3-3), 273 (2-2), 284_ (2-3),
369 (1-1), 393 (1-1). (84) Dhanegaon -273 (1-1), 284 (2-2), 311 (1-1). (86) Ratnapur -273 (1-1), 284 (1-1). (88) Narayanpur Bk.-273 (3-3), 281 (1-1). (92) Jawala Bk.-284 (1-1). (94) Kapustalni -200 (6-6), 209 (2-2), 273 (23-24), 281 (1-1)
284 (3-4), 310 (2-4), 311 (5-5), 350 (1-2), 369 (10-17), 393 (2-2), 399 (14-14).
(98) Kasbegavan -200 (2-3), 209 (1-1), 273 (5-5), 311 (2-3). (99) Songaon -200 (1-1), 284 (1-1).
(101) ChincholiBk.-281 (1-1),284(3-3). (l03) Pimpaiga"an -200 (2-2) . (104) Ekalara -284 (1-1). (105) Taroda -200 (1-1), 273 (1-1), 393 (2-2). (106) Ghodasgaon -273 (1-1). (107) Sakhari -209 (1-1), 273 (1-1), 350 (1-2), 369 (1-2). (111) Kamalpur -200 (2-2). (112) Nimbhari -200 (I-I). (113) Kotegaon -200 (1-1). (116) Sangawa Bk.-200 (2-2), 273 (1-1). (120) Bembala Bk.-273 (2-2). (122) Ghada -273 (1-1). (126) Bramhanwada -273 (1-1), 393 (1-1). (128) Khallar -273 (2-2), 281 (2-2). (129) Pralbadpur -369 (1-2). (130) Bembala Kh.-2oo (1-1). (131) Dighi -200 (1-1). (133) Fajalpur -281 (1-1). (134) Sarfabad -273 (2-2). (136) Kokarda-209 (1-1), 273 (7-7), 311 (2-6),393 (1-1). (141) Tamaswadi -273 (1-1). (142) Dombala -209 (1-1),281 (1-1). (147) Gaurkheda -273 (1-1). (148) Uparai -209 (1-1), 273 (1-1), 281 (1-1),399 (1-1). (149) Antargaon -273 (1-1), 369 0-1). (150) Khurmabad -281 (1-1). (151) Kbanpur -369 (1-1). (152) Markanda -200 (1-1), 209 (1-1),281 (1-1),311 (1-n. (153) Nachona -200 (1-1), 369 (2-2). (154) Kanholi -200 (1-1), 281 (1-1). (155) Mhaispur -200 (1-1).
-(156) Gajipur -369 (1-2). (157) Ramgaon -200 (2-2), 369 (1-1). (160) Lehegaon-2oo(2-2), 273 0-1), 311 (1-1),393 (1-1). (161) Husenpur -281 (2-2), 311 (1-1). (162) Hasanpur -200 (2-2), 281 (1-1). (163) Kumbhargaon Bk.-273 (2-2). (165) Wadner-Gangai-200 (4-4),273:11-11),369(1-2),393 (1-1). (166) Umri Mamdabad -200 (1-1). (168) Umri Itabarpur -200 (2-2), 273 (&-:6), 281 (3-3), 311 (2-4). (169) Gavanwadal-209 (1-2), 273 (2-2), 281 (2-2), 350 (2-3). (172) Warud Bk -200 (2-2),273 (6-6). (173) Yeoda -200 (5-5), 209 (3-3), 273 (14-14), 284 (3-3), 311
(1-1),369 (l--l). (174) Itki -200 (1-1), 273 (1-1),281 (3-3),350 (1-1),393 (1-1). (175) Rajkhed -273 (1-1). (180) Bhuras Ramagad -281 (1-1). (181) Sanglud -2000-1). (182) Sonkhas -281 (2-2), 369 (1-3). (183) Pimplod -200 (2-3), 209 (2-2), 273 (8-10), 281 (2-2),
311 (1-1), 3500-2), 393 (1-1). (184) Ghodchadi -273 (1-1). (187) Kburasanpur -311(2-2),350 (3-3). (188) Sasan Bk.-273 (3-3). (189) Sasan-Ramapur -200 (2-2), 273 (1-1). (190) Adula -200 (1-1), 273 (2-2).

210 CENSUS TABLES
Number of Establishments and Workers for Industries classified by Minor Groups of Industrial Classific:atioQ-contd.
DARYAPUR TALUKA-concld.
VILLAGBS-conc/d.
(191) Jainpur -273 (4-4). (194) Bbamocl-200 (1-1), 273 (4-4), 369 (3-4), 393 (1-1). (195) Kasampur -200 (2-2), 273 (1-1), 281 (3-3). (196) Lotawada -200 (1-1), 273 (1-1). (197) Mhalspur -273 (2-2). (198) Nandrun -200 (1-1), 273 (1-1),281 (2-2). (199) Samada -350 (1-1). . (203) Ramagad -273 (1-1). (207) Karatkbeda -200 (1-1), 369 (1-2). (2Q8) Ramtirtba -200 (2-3), 273 (1-1), 281 (1-1), 393 (1-1). (209) Lasur -200 (1-2), 273 (1-1). (210) Tongalabad -273 (1-1). (214) Rustampur -273 (1-1). (215) Nalwacia -200 (1-1), 273 (2-2), 369 «(-4). (217) Nardoda -200 (1-1), 273 (4-4). (219) Cheadakapur -200 (1-1), 207 (2-3), 271 (1-2), 273 (11-11),
369 (2-4), 388 (1-1), 393 (2-2). (222) Mahuli -200 (1-1),273 ($-7). (223) Nandura -284 (1-1). (225) BonIa -200 (2-2). . (239) Daryapur 311 (1-1). (240) Bbambora -273 (1-1). (241) Jasapur -200 (1-1). (245) 'IbiIori -273 (1-1), 281 (1-1). (246) SlaiDgauapur -200 (3-3), 209 (2-2), 213 (3-8), 311 (3-4)·
393 (2-3). (248) Sbiwar Kb.-273 (1-1), 350 (3-3). (249) Naigaon -200 (1-1),273 (1-1). (250) Sbiwar Bk.-2oo (1-10), 273 (1-1), 311 (I-I), 393 (1-1). (253) Nancled Bk.-200 (1-1),369 (1-1), 393 (1-1). (255) Gaiwadi -200 (1-1), 273 0-1). (256) Shlnganwadi -273 (1-1). (260) Elichpur -200 (1-1). (261) Dhamodi -200 (1-1). (262) Hingapi Mirzapur -200 (1-1). (264) Kalashi -200 (1-1), 273 (2-2), 393 (2-2). (265) AmJa -200 (1-1), 273 (1-1), 311 (1-2). (266) Panora -273 (1-1), 350 (1-1). (269) Shirasgaon.-200 (1-1), 273 (1-1). (272) TaJdi -200 (1-1).
URBAN
AnjangaOD MunicipaUty.-200 (13-18), 202 (3-4), 207 (7-27), 209 (50-90), 214 (1-2), 230 (7-93), 231 (22-32), 234 (1-20), 235 (73-115), 273 (23-30), 280 (3-10), 281 (6-6), 288 (5-5), 302 (1-2), 310 (6-11), 311 (23-32), 314 (1-2), 342 (1-1), 350 (11-29), 367 (6-6), 368 (1-1), 369 (39-53), 372 (1-2), 377 (2-2), 388 (14-14), 392 (4-4), 393 (23-29), 399 (19-25).
Daryapur Danosa Municipality-200 (15-22), 205 (2-2), 209 (9-24), 214(4-5),230(4-16),273(14-20),281(7-11),302(1-2),310(1-1). 311 (10-22), 313 (1-4), 369 (6-9), 388 (10-14), 393 (12-U).
AMRAVATl TALUKA Total.-
Division 2 & 3 (2,626-5,658)-200 (270-469),202(2-4), 203(3-6), 205(26-71), 207(43-372), 209(147-356), 214(11-42), 216 (3-15), 220(15-40), 230(28-411), 232(1-10), 235(7-26), 236 (1-9), 237(1-1), 239(2-4), 262(1-5), 271(2-19), 272(1-2), 273(793-1,071), 274(3-5), 280(21-95), 281(159-242), 282 (20-52), 284(85-23;3), 288(23-45), 292(8-21), 301(14--66) 302(2-2), 303(9-15), 310(1-1), 311(115-187), 313(2-3), 314 (20-28), 320(1-6), 331(4-7), 333(1-2), 335(3-39), 336(9-21), 340(3-11), 342(1-1), 343(3-6), 350(92-141), 353(1-2), 355 (7-13), 364(2-3), 365(31-50), 367(29-85), 368(36-59), 369 (213-508), 377(2-2), 382(4-25), 383(5-IOO}, 384(49-139), 388(14-16), 389(4-8), 390(5-8), 392(10-24), 393(170-240) 394(4-14), 399(84-200). '
RuraI.-200(l81-202),207(3-6), 209(44-61),214 (2-3),235(5-24), 239(2-4), 273(474-519), 274(1-1), 281(116-149),282(3-8),
284(57-65), 288(6-12), 292(1-1), 311(51-69), 313(1-1), 314 (19-26), 336(1-2), 340(1-3), 350(68-105), 365(2-2), 369 (103-158), 388(14-16), 392(1-2), 393(39-44), 394(1-2), 399. (30-38).
AMRAVATI TALUKA-contd.
Urban -200(89-267),202(2-4), 203(3-6), 205(26-71), 207(40-366), 209(103-295), 214(9-39), 216(3-15), 220(15-40), 230(28-411), 232(1-10), 235(2-2), 236(1-9), 237(1-1), 262(1-5), 271(2-19), 272(1-2), 273(319-552), 274(2-4), 280(21-95), 281(43-93), 282(17-44), 284(28-168), 288(17-33), 292(7-20), 301(14--66), 302(2-2),303(9-15),310(1-1),311(64-118),313(1-2),314(1-2), 320(1-6), 331(4-7), 333(1-2), 335(3-39), 336(8-19), 340(2-8), 342(1-1), 343(3-6), 350(24-36), 353(1-2), 355(7-13), 364(2-3), 365(29-48), 367(29-85), 368(36-59), 369(110-350), 377(2-2), 382(4-25), 383(5-100), 384(49-139), 389(4--8), 390(5-8), 392(9-22), 393(131-196). 394(3-12), 399(5 ..... 162).
VJiLAGES
(3) Saar -200(8-10), 209(2-3), 273(11-11), 281(1-2), 284(2-2), 311(1-1), 369(1-2), 393{1-1).
(6) SbiraIa -200(9-10), 209(1-1), 173{S-7), 281(3-6), 369(3-3), 393(44).
(1) Afajalpur -273(2-2). (11) Rama -284(2-2). (12) Adhitapur -200(1-2), 369(1-2). (13) TIlugaon -200(4-6), 209(1-5), 214(1-2), 239(2-4), 273(7-7),
281(4-7), 311(1-1), 314(1-2), 369(2-3), 388(2-2), 393(2-4), 399(2-9),
(14) Takarkheda -200(6-6), 273(7-1). (15) Jalka -200(1-1),273(2-2),284(2-2), 369(1-2). (17) Hirapur -273(2-2). (20) Dastarapur -273(3-9). . (22) Pusada-200(6-7), 273(3-3), 281(2-2). (23) Rohankheda -273(1-1),284(1-1). (29) Deorl-273(1-l), 284(1-1). (30) Marld -200(1-1),273(1-1),284(1-1),369(1-1). (32) Ancha1wadi -273(1-1),281(3-6). (35) Asbti -200(7-8),273(3-5),281(1-1). (36) Atola -200(2-2),273(2-2),369(1-1). (37) Kamatapur -273(1-1), 284(1-1). (39) NanduraBk-200(2-2), 273(8-8),393(1-1). (42) Walgaon -200(5-5), 209(1-3), 273(24-26), 284(1-1), 311
(1-1), 369(4-5), 388(2-2), 393(3-3). (43) Rena -200(7-7),273(19-19),284(1-1),311(1-3). (46) Sultanpur -273(1-1). (49) Karajgaon -273(3-3), 281(1-2). (SO) Nandura PiDgalai -200(6-6), 273(2-2), 281(1-1), (51) Dbanora -273(1-1),281(1-4). (52) Brahmanwada Bhagat-273(2-2),281(3-3). (53) Antora -200(6-6), 273(2-2), 284(3-3), 311(1-1). (59) Deora -200(1-2), 273(5-5), 274(1-1), 281(4-5), 350(3-6)
369(1-2),393(1-1). ' (60) Brahmanwacla Gomctpar-2OO(t-l), 273(1-1), 281(3-3)
350(1-2), 369(2-3). ' (61) Yavli -200(7-7), 207(1-1), 209(1-1), 235(1-1), 213(8-9)
311(2-2), 336(1-2). ' (62) Sarsl-200(I-l), 281(2-2), 369(1-1). (69) Kekatpur -273(3-3), 284(1-2), 350(1-1), 369(2-2). (70) Parwatpur -273(1-1), 281(1-1), (77) Wagboli -273(1-1). (80) TemhIIa -273(7-7), 284(2-2). (81) Salon kh.-273(S-5),284(3-4). (82) Kapasatalni -273(3-3), 281(2-2). . (83) Maboli Jagir-200(6-6), 207(1-2), 273(1'1-11) 234(8-12),
311(3-5). 350(3-3), 369(2-2), 393(2-2). ' (85) Kathora Kh.-209(2-2). (87) Tbugaon -284(1-1), 350(1-i), (88) Kbanapur -273(1-1). (89) Digargavban -284(1-1), 314(1-1). (99) Sawardi -273(1-1).
(100) -Nandgaonpeth -200(7-7), 207(1-3), 209(2-1), 214(1-1), 273(22-22),281(5-5),284(5-7), 288(4--i), 311(1-2), 314(1-2) 350(5-10), 369(5-6), 388(3-3), 399(3-4). •
(102) Shewati -281(1-1). (103) Shahapur -273(3-3). (104) Jalka -369(1-2). (105) Nirul-209(2-2), 273(7-1), 281(2-2), 311(1-1), 169(1-,-1). (109) Umarapur -273(1-1). . (112) V'U'Shi -200(1-2), 273(2-2).

211 E SERIES
Number of Establisbments and Workers for Industries classified by Minor Groups of Industrial Classification-contd.
AMRAVATI TALUKA-contd.
VILLAGES-contd.
(115) Waigaon -200(6-6), 273(3-3). (116) Waodli -273(1-1). (I21) Wathoda -200(4-4), 209(7-8), 273(19-19), 281(2-3), 314
(2-3), 350(5-7), 369(4-7), 393(2-2), 399(1-1). (123) Dhaoori-200 (3-5), 209 (2-2), 273 (9-10), 284 (8-8),
350 (2-2), 369 (2-2), 388 (1-1), 393 (1-1). (124) Khartalegaoo-200 (2-2), 209 (1-1), 273 (6-6) 284 (I-I),
314 (2-2). ' (125) Borkhadi -273 (2-2). (131) Nawed-311 (2-2). (132) Kumagad-284 (1-1), 399 (4-4\ (136) Mhaispur-200(3-3), 273 (3-3). (138) Checharwadi-273 (1-1). (145) Kholapur-200 (4-5), 209 (1-1), 235(2-4), 273 (17-20),
350 (5-8),369 (3-5),388 (1-1), 393 (I-I). (l51) Alaogaoo-273 (1-1), 350 (1-1), 369 (2-4). (155) Hartala-200 (1-1), 273 (3-3), 284 (1-1) 311 (2-2),
350 (2-4). ' (165) Bbatkuli-200 (3-3), 209 (3-3),.273 (15-19) 284 (2-2),
311 (3-3), 350 (4-6), 393 (3-4). -, (167) Sayat-200 (3-4), 273 (4-4),281 (2-2), 28~ (2-2), 311 (2-2)
314(1-1),399(9-9). ' (171) Naoded Kh.-273 (1-1). (178) Asara-200 (2-3), 273 (11-11), 350 (1-2) 365 (I-I),
369 (1-2), 393 (1-2), ' (185) TakIi-314 (1-1). (190) KatboraBk-281 (1-1),369(1-2). (192) Borgaoo-200 (1-1), 273 (1-1), 369 (1-1). (194) Kamunja-273 (I-I). (197) Rahatgaon-200 (1-1), 369 (2-2), 399 (8-8). (198) Wadgaon-200 (2-3), 273 (2-3), 311 (2-2),369 (1-1). (201) Kuod Sarjapur-281 (1-1).
I (202) Masod-399 (1-1). (103) Sbegaon-388 (1-2). (206) Sukali-281 (1-1). (211) Mbasala-235 (2-19), 273 (I-9), 281_ (1-4), 311 (1-'1),
369 (3-7). -(238) Shiwapur-311 (1-2). (240) Nimbha-273 (2-2) (244) Gaurkheda-273 (I-1), 281 (1-1), 369 (2-3),. (246) Kawakha-200 (1-2), 273 (2-4), 314 (1-3) 350 (1-3),
369 (3-3), 393 (1-1). ' (252) Parl~-273 (1-2), 281(1-1), 369 0-2). (256) Gaoon-273 (3-3), 281 (1-1), 311 (1-1). (260) Mogra.-273 (1-1). (262) Uttamsara-273 (5-5), 281 (3-3) 340 (1-3) 350 (4-4)
369 (2-4). ", (264) Gaooja-200 (2-2), 209 (1-2), 273 02-12), 281 (3-3),
311 (1-1), 369 (2-4), 394 (1-2). (266) Khallar-350 (2-2), (270) Waruda-350 (3-8). (279) Shivani-200 (1-1), 273 (2-2). (282) Dadbi-200 (1-1), 209 (1-1) 273 (3-3) 281 (2-2), 350 (1-2),
393 0-1). " (284) Da~ha-273 (2-3), 281 (1-I), 292 (1-1), 350 (1-1), 369 (1-1). (287) An]angaon-200 (3-3), 273 (10-13), 281 (2-2), 313 (1-1),
369 (4-&), 388 (2-2), 393 (3-3), 399 (1-1). (292) Fula~a-273 (3-4), 311 (5-5), 350 (1-1). (293) Pardi-200 (1-1), 273 (4-4),284 (4-4), 314 (1-1) 350 (2-3)
369 (3-6), 393 0-1). " (294) Takli Bk·-200 (1-1), 209 0-1), 273 (2-~), 281 (1-1),
311 (1-1), 350 (2-3), 369 (2-8). (295) Dahigaon.-200 (1-1), 273 (1-1), 311 0-2) 350 (1-2) (296) Loni -200 (1-1), 209 (1-2), 273 (6-6), 281 (4-5), 311 (1-1), . 350 0-3), 369 (2-4), 392 (1-2), 393 (2-2).
(297) Hiwara.-273 (2-2). (298) Jalu -281 (2-2). (300) Malegaon -273 (1-1). (304) Adgaon Bk .-200 (1-1), 393 (1-1). (305) Januna.-273(2-2). 311 (I-n.
. (307) Dbawalsari -200 (1-1). . (308) Nirsana.-273 (2-2). (311) Bopoemtabad.-2oo (1-1), 209 (1-1) 281 (1-1) (312) Rahimapur.-273 (2-2). ' ,
H 4222-14a
AMRAVATI TALUKA-coflcld.
VILLAGES-Concld.
(314) Mhasala.-273 (3-3), 369 (1-1). (315) Chandsura-273 (1-1), 281 (2-3). (318) Jamgaon.-281 {1-1). (319) Yerangaon.-200 (I-I), 273 (4-4), 369 (1-1). (320) Watpur.-273 (1-1). (321) Manjari -200 (2-2), 273 (2-2), 369 (1-1). (322) Bhagura.-273 (1-1), 281 (1-1), 369 (1-2). (326) Sa"aoer.-273 (3-3), 281 (1-1), 369 (1-1). (327) Dbaoora Fasi.-273 (4-4). (328) Satargaon.-273 (3-4), 281 (1-1), 369 (1-1). (30) Shelu Gund.-273 (2-2), 281 (2-2), 393 (1-1). (331) Sarsi.-273 (I-I), 284 (1-1), 311 (1-1),369 (1-1), 393 (1-1). (332) Mahulichor.-273 (9-10),281 (2-4), 314 (2-3). 369 (2-3). (334) Wadura.-273 (1-2), 369 (1-1). mS) Kathoda.-273 (2-2), 281 (4-4), 369 (1-2). (3%) Kanzara.-273 (1-1), 2&1 0-1), 369 (1-1). (343) Nimba~"adi.-273 (1-1), 281 (1-1). (345) Sakra.-281 (1-1), 369 (1-1). (346) Takli Kaoada.-284 (I-I). (348) Pimpalgaoo Baioai.-200 (1-2). (350) Kodbari -200 (1-1). (351) Kohala.-200 (1-1), 273 (3-3), 314 (1-1), 350 (1-1). (354) Pimprioipur -314 (1-1). (355) Sukali -281 (1-1). (358) Kajna.-200 (1-1),209 (2-2), 273 (4-4), 281 (2-3), 350(1-1). (360) Mund Nishank.--200 (3-4),273 (6-7). 311 (2-4), 369 (2-2),
388 (2-3). (361) Dhanora Gura, -200 (1-1), 209 (4-4), 273 (3-3), 369 (1-2). (36S) Shirpur.-281 (1-2). (368) Yenas.-369 (1-2). (369) Nandsawaogi.-200 (2-2), 209 (2-2), 273 (1-1), 281 (1-1),'
311 (2-2), 314 (1-1), 350 (4-4), 369 (2-4). (374) Rohana.-281 (1-1), 369 (1-2). (379) Mundmala.-200 0-1). , (380) Ja"aramolwan.-200 (1-1), 273 0-1). (384) Muod"adi.-273 (1-1), 28\ (i-I). (386) Hiwara -273 (1-1). (390) Fubgaon.-209 (1-1),273 (S-5), 281 (1-4),2820-3),288(2-4),
311 (S-8), 350 (6-11),369 (1-2),393 (2-3), 399 (1-1). (393) Palasmaodal.-200 (2-2), 273 (2-2). 282 (2-5), 369
(1-1). (394) Pimpri Ga,anda.-281 (1-2). (396) Papal.-200 (2-2). 369 (1-2). (397) Sbiwaoi.-200 (1-1). (399) Mirzapur.-200 (1-1), 273 (2-2), 281 (1-1), 369 (2-2). (-tOO) Kbarabi.-200 (1-1), 281 (1-1). . (402) Kama Mirzapur.-200 (1-1), 281 (3-4). (403) Rasulpur.-200 (1-2), 273 0-1). (-404) Wenigaoeshpur.-200 (1-2),273 (4-4), 281 (3-3), 311 (2-2),
369 (2-3), 393 (1-1). (4l3) Abitapur.-200 (1-1), 273 (1-1). (416) Maogrulchawal.-200 (2-2), 209 (3-5), 273 (13-16),
281 (8-11), 311 (3-3), 350 (3-3), 369 (1-1), 393 (3-3). (420) Pimpalgaoo Nipaoi -200 (1-1),281 (3-3). (421) Lohegaon.-200 (1-1), 209 0-1). (424) Salod.-200 (2-2), 273 (2-2), 281 0-1). (42S) Wadhona Ramnath.-200 (3-3), 273 (11-11), 314 (3-4), 365
(1-1), 369 (4-5). (428) Shi,ara.-200 (1-1). (433) Hami.-273 (2-2).
URBAN
Amravati Municipality -200 (74-237), 202 (2-4), 203 (3-6), 205 (22-62), 207 (31-333). 209 (100-291), 214 (8-38), 216 (3-15),220 (13-24), 230 (26-391), 235 (2-2) 236 (1-9), 237 0-1), 262 0-5), 271 (2-19), 272 0-2), 27J (245-454), 274 (2-4), 280 (20-94), 281 (42-83),282 (17-44).284 (28-168), 288 (7-23), 292 (7-20), 301 (13-65), 302 (2-2), 303 (9-15), 310 (1-1),311(63-117),313(1-2),320(1-6),331(4-7),333('1-2), 335 (3-39), 336 (8-19), 340 (2-8), 342 0-1), 343 (2-4), 350 (22-34), 353 (1-2), 364 (2-3), 365 (29-48), 367 (24-68), 368 (29-52), 369 006-336), 377 (2-2), 382 (4-2S), 383 (5-100), 384 (44-129), 389 (4-8), 390 (5-8), 392 (8-21). 393 (129-193), 394 (3-12), 399 (44-152).
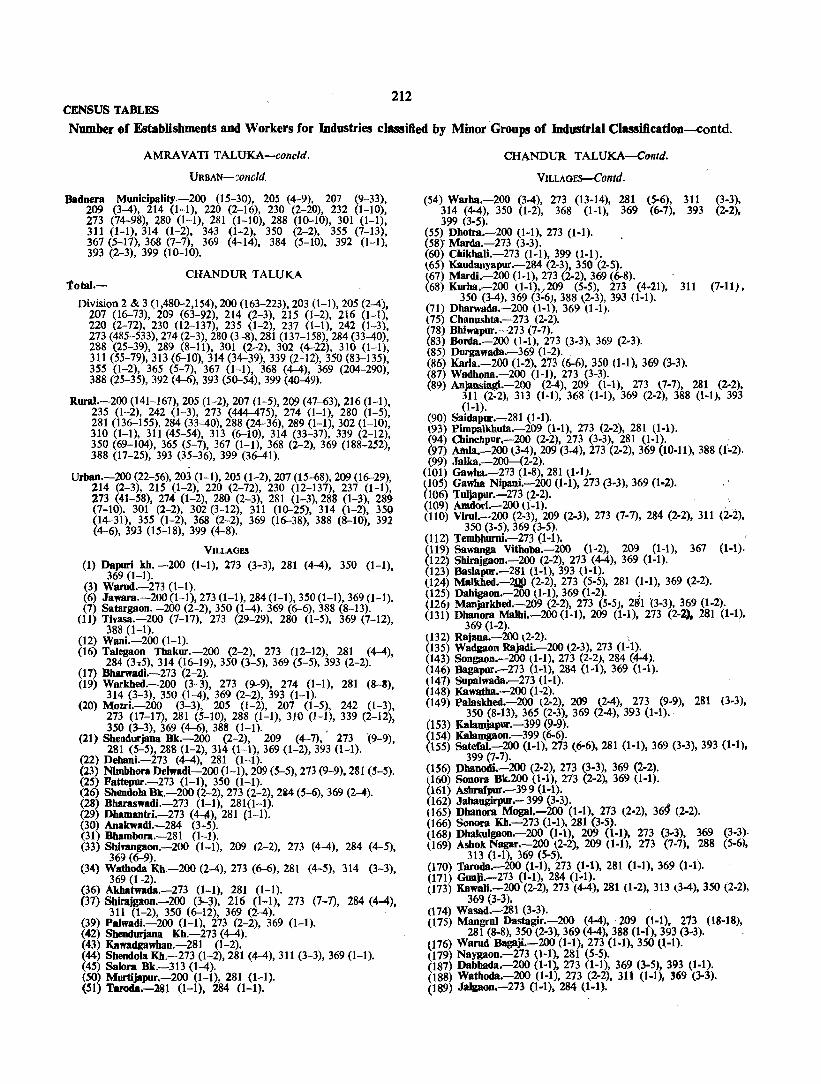
212 CENSUS TABLES
Number of Establishments and Workers for Industries classified by Minor ·Groups of Industrial Classification-contd.
AMRAVATI TALUKA-concld.
URBAN-~oncld.
Badnera Municipality.-200 (15-30), 205 (4-9), 207 (9-33), 209 (3-4), 214 (1-1), 220 (2-16), 230 (2-20), 232 (1-10), 273 (74-98), 280 (1-1), 281 (1-10), 288 (10-10), 301 (1-1), 311 (1-1), 314 (1-2), 343 (1-2), 350 (2-2), 355 (7-13), 367 (5-17), 368 (7-7), 369 (4-14), 384 (5-10), 392 (1-1) 393 (2-3), 399 (10-10). '
CHANDUR TALUKA total.-
Division 2 & 3 (1,480-2,154),200 (163-223), 203 (1-1), 205 (2-4), 207 (16-73), 209 (63-92), 214 (2-3), 215 (1-2), 216 (1-1), 220 (2-72), 230 (12-137), 235 (1-2), 237 (1-1), 242 (1-3), 273 (485-533), 274 (2-3),280 (3-8), 281 (137-158),284 (33-40), 288 (25-39), 289 (8-11), 301 (2-2), 302 (4-22), 310 (1-1), 311 (55-79),313 (6-10), 314 (34-39),339 (2-12), 350 (83-135) 355 (1-2), 365 (5-7), 367 (I-I), 368 (4-4), 369 (204-290): 388 (25-35), 392 (4-6), 393 (50-54), 399 (40-49).
RuraI.-200 (141-167), 205 (1-2), 207 (1-5), 209 (47-63), 216 (1-1), 235 (1-2), 242 (1-3), 273 (444-475), 274 0-1), 280 (1-5), 281 (136--155), 284 (33-40), 288 (24-36), 289 (1-1), 302 (1-10), 310 (1-1), 311 (45-54), 313 (6-10), 314 (33-37), 339 (2-12), 350 (69-104), 365 (5-7), 367 (1-1), 368 (2-2), 369 (188-252) 388 (11-25), 393 (35-36), 399 (36-41). '
Urban.-200 (22-56),203 (1-1), 205 (1-2), 207 (15-68),209 (16--29), 214 (2-3), 215 (1-2), 220 (2-72), 230 (12-137). 237 (1-1), 273 (41-58), 274 (1-2), 280 (2-3), 281 (1-3),288 (1-3), 28~ (7-10). 301 (2-2), 302 (3-12), 311 (10-25), 314 (1-2), 350 (14-31), 355 (1-2), 368 (2-2), 369 (16-38), 388 (8-10) 392 (4-6), 393 (15-18), 399 (4-8). '
VILLAGES
(1) Dapurl kh. -200 (1-1), 273 (3-3), 281 (4--4), 350 (1-1) 369 (1-1). '
(3) Warud.-273 (1-1). (6) Ja'll'lU'll.-200 (1-1),273 (1-1),284 (1-1),350 (1-1),369 (1-1). (7) Satargaon.-200 (2-2), 350 (1-4). 369 (6--6), 388 (8-13).
(11) Tivasa.-200 (7-17), 273 (29-29), 280 (1-5), 369 (7-12) 388 (1-1). '
(12) Wani.-200 (1-1). (16) Talegaon Thakur.-200 (2-2), 273 (12-12), 281 (4-4),
284 (375), 314 (16-19), 350 (3-5), 369 (5-5), 393 (2-2). (17) Bharwadl.-273 (2-2). (19) Warkhed.-200 (3-3), 273 (9-9), 274 (1-1), 281 (8-8)
314 (3-3), 350 (1-4), 369 (2-2), 393 0-1). , (20) Mozri.-200 (3-3), 205 (1-2), 207 (1-5), 242 (1-3),
273 (17-17), 281 (5-10), 288 (1-1), 310 (1-1), 339 (2-12) 350 (3-3), 369 (4-6). 388 (1-n. , '
(21) Shendurjana Bk.-200 (2-2), 209 (4-7), 273 -(9-9), 281 (S-5), 288 (1-2), 314 (I-I), 369 (1-2), 393 (1-1).
(22) Debani.-273 (4-4), 281 (1-1). (23) Nlmbhora Delwadi-200 (1-1),209 (5--5), 273 (9-9), 281 (5-S). (25) Fattepur.-273 (1-1), 350 (1-1). (26) Shendo)a Blt.-200 (2-2),273 (2-2), 2i4 (5-6), 369 (2 ...... ). (28) Bbaraswadi.-273 (1-1), 281(1-1). (29) DhAmantri.-273 (4-4), 281 (1-1). (30) Anakwadi.-284 (3-5). (31) Bbambora.-281 0-1). (33) Shinmgaon.-200 (1-1), 209 (2-2), 273 (4-4), 284 (4-5),
369 (6-9). (34) Wathoda Kh.-200 (2-4), 273 (6-6), 281 (4-5), 314 (3-3)
369 (1-2). ' (36) Akhatwada.-273 (1-1), 281 (1-1). (37) Shirajgaoo.-200 (3-3), 216 (1-1), 273 (7-7), 284 (4-4)
311 (1-2), 350 (6-12), 369 (2-4). . ' (39) Palwam.-200 (1-1), 273 (2-2), 369 (1-1). (42) Shendurjana Kh.-273 (4-4). (43) Kawadgawban.-281 (1-2). (44) Sbendo)a Kh.-273 (1-2),281 (4-4),311 (3-3), 369 (1-1). (45) Safom Bk.-313 (1-4). (50) Murtijapur.-200 (1-1), 281 (1-1). (51) TvocIa.-l81 (1-1), 284 0-1).
CHANDUR TALUKA-Contd.
VILLAGES--Contd.
(54) Warha.-200 (34), 273 (13-14), 281 (S-6), 311 (3-3), 314 (4-4), 350 (1-2), 368 (1-1), 369 (6-7), 393 (2-2), 399 (3-5).
(55) Dbotra.-200 (1-1), 273 (1-1). (58} Marda.-273 (3-3). (60) ChikhaJi.-273 (1-1), 399 (1-1). ~6S) Kaudanyapur.-284 (2-3), 350 (2-5). (67) Mardi.-200 (1-1),273 (2-2), 369 (6-8). (68) Kurha.-200 {1-1),/209 (5-5), 273 (4-21), 311 (7-11),
350 (3-4),369 (3-6), 388 \2-3), 393 0-1). (71) Dbarwada.-200 (1-1), 369 0-1). (75) Chanushta.-273 (2-2). (78) Bhiwapur.-273 (7-7). (83) Borda.-200 ll-1), 273 ~3.3), 369 (2-3). (85) Durgawada.-369 (1-2). . (86) Karla.-200 (1-2), 273 (6-6), 350 (1-1), 369 (3-3). (87) WadhODa.-200 (1-1), 273 (3-3). (89) Anjansingi.-200 (2-4), 209 (1-1), 273 \7-7), 281 (2-2),
311 (2-2), 313 (I-I), 368 (I-I), 369 (2-2), 388 (I-I), 393 0-1).
(90) Saidapur.-,-281 (I-I). (93) Pimpalkbuta.-209 (1-1), 273 (2-2), 281 ll-1). (94) Chinchpur,-200 (2-2), 273 (3-3), 281 (1-1). . (97) AtnIa.-200 (34), 209 (34), 273 (2-2), 369 (10·11), 388 (1.2). (99) Jalka.-200--(2-2).
(101) Gawha.-273 (1-8), 281 (1·1). (105) Gawba Nipani.-200 (1-1),273 (3-3), 369 (1-2). (106) Tuljapur.-273 (2·2). (109) Amdori.-200 u-1). . (110) ViruJ.-200 (2-3), 209 (2-3), 273 (7-7), 284 (2·2), 311 (2.2),
350 (3.5), 369 (3-5). (112) Tembhurni.-273 (1-1). . (119) Sawanga Vithoba.-200 (1·2), 209 (1-1), 367 (1-1). (122) Shirajgaon.-200 (2-2), 273 (4-4), 369 (1-1). (123) BasJapur.-281 (1-1), 393 (1-1). (124) Ma)khed.-2.® (2-2), 273 (5-5), 281 (1-1), 369 (2-2). (125) Dahigaon.-200 (1-1),369 (1-2).; . (126) Manjarkhed.-209 (2-2), 273 (5-5), 281 (3-3), 369 (1-2). (131) Dhanora Malhi.-200 (1.1), 209 (1.1), 273 (2-2). 281 (1-1),
369 (1-2). . (132) Rajana.-200 \2-2). , (135) Wadgaon Rajadi.-200 (2·3), 273 (1-1). (143) Songlloo.-200 tl-I), 273 (2-2), 284 (4-4). (146) Bagapur.-273 (1-1), 284 (1-1), 369 (1-1). (147) Supahvada.-273 (1-1). (148) Kawatha.-200 (1-2). (149) Palaskhed.-200 (2·2), 209 (24), 273 (~-9), 281 (3-3),
350 (8-13), 365 (2-3), 369 (2-4), 393 (1.1). (153) Kalamjapur.-399 (9-9). (154) KaJamgaon.-399 (6-6). (155) Satefal.-200 (1-1), 273 (6-6), 281 (1.1), 369 (3-3), 393 (1'1),
399 (7-7). (156) Dhanodi.-200 (2-2), 273 (3-3), 369 (2·2). (.160) Sonora Bk.200 (1-1), 273 (2-2), 369 (1·1). (161) Asbrafpur.-399 (1·1). (162) Jahangirpur.- 399 (3-3}. (165) Dhanora Mogal.-200 (1.1), 273 (2.2), 36~ (2-2). (166) Sonora Kh.-273 (1.1), 281 (3-5). (168) Dhaku)gaon.-200 (1·1), 209 (1-1), 273 (3-3), 369 (3·3). (169) Ashok Nagar.-200 (2-2), 209 (1-1), 273 (7-7), 288 (5-6),
313 (1·1), 369 (5-5). (170) Taroda.-200 (1-1), 273 (1.1), 281 (1-1),369 (1·1). . (171) Gunji.-273 (1-1), 284 (1.1). (173) Kawali.-200 (2-2), 273 (44), 281 (1-2), 313 (34), 350 (2·2),
369 (3-3). (74) Wasad.-281 (3-3). (175) Maogrul Dastagir.-200 (4-4),' 209 (1-1), 213 (18·18),
281 (8-8), 350 (2-3), 369 (4-4), 388 (1-1), 393 (3-3). (176) Warud Bagaji.-200 (1-1),273 (1-1), 350 (1-1). (179) Naygaon.-273 (1-1), 281 (5-5). (187) Dabhada.-200 (1'1), 273 (1-1), 369 (3-5), 393 (1-1). (188) Watboda.-200 (1-1), 273 (2·2), 311 (1-1), 369 (3·3). (189) Ja!&aon.-273 (1·1), 284 (1-1).

213 ESERIES
Number of Establishments and Workers for Industries classified by Minor Groups of Industrial Classification-concld.
CHANDUR TALUKA-contd.
VILLAGES-contd.
(192) Diglli.-2oo (1-1), 273 (5-5), 369 (5-11), 399 (2-2). (196) Jalgaon Ani. 288 (1-1). 097) Mirmpur.-21l (1-1), 393 (1-1). (198) Dattapur Dbamangaon.-273 (1-1), 302 (1·10), 311 (1-1),
350 (1·2), 369 (2-4). (199) Wagholi.-213 (1-1), 369 11-2). (202) M. M. Konher.-273 (1-1), 369 (1.1). (205) Borgaon Nistane.-200 (1.1), 273 (3-3), 311 (2-3), 350 (1-3),
399 (1.3). (206) Gokulsara.-369 (1-2), 399 (1-2). (208) Nimboli.-200 (3-3), 209 (1·2), 235 (1-2), 273 (9-9), 311
(2·2), 369 (2·3), 393 (1·1). (210) Sonora Kakde.-399 (1-1). (212) Hingangaon.-311 (1-1). (213) Kasarkhed.-200 (1-1), 288 (5-8). (214) Talani.-200 (1-1),273 (4-4), 311 (1-1), 369 (3-3). (215) Zada.-2oo (1.1), 273 (5·5), 281 (6-6), 369 (1-1). (216) Ashta.-273 {l.l}, 369 (2·2). ' ~217) Bhilli.-369 (3.3). (218) Nimbhorara;.-369 (1·1). (219) Zadgaon.-281 (1-1). (220) Chincholi.-2oo (1-1), 369 (1.1). (221) Kalashi.-2oo (1-1). (222) Nimbhora Bodakna.-200 (2-2), 273 (7-8), 350 (5·6), 369
(5-8), 399 (1.1). (224) Salimpur.-273 (3-3). (225) Anjaogaon.-213 (2-2). (227) Waknath.-281 (2-2). (229) Hirpur.-273 (1-1); 311 (1-3), 369 (2-2). (233) Bhatkuli.-200 (2-2), 213 (8·8), 311 (5-5), 369 (5-5). (236) Usalgawhan.-200 (1-1), 213 (2-2), 369 (3-3). (231) Borwagbal.-2oo (1-1), 273 (2-2), 369 (1·1). (238) Tivara.-200 (2-2), 273 l2-2), 350 (2-2), 369 (5-6). (240) Ghusali.-311 (1-1), 369 (1-1). (242) Kashikhed.-200 (2-2), 281 (2-3). (243) Nargawandi.-288 (6-13), 365 (1-1). (245) 8Ilggi.-2oo (1-1), 273 (2-2),288 (1-1), 369 (1-1). (246) Jawara.-2oo (1-1), 273 (4-4), 288 (1-1), 369 (1-1). (2-2), (241) Shendurana.-200 (2-2), 273 (3·3), 281 (1-1), 350
369 (1-1). (248) Wadhona.-200 (2-4), 273 (3·3), 284 (1.1), 311 (1-1),
393 (1·1). (249) Asegaon.-273 (2-2), 281 (1-1). (250) Saw8Ia.-2oo (1-2), 273 (2-2),281 (2-2), 314 (5-5), 369 (1-2).
CHANDUR TALUKA-concld.
VILLAGES-concld,
(251) Tongalabad.-2oo (1·1), 350 (3-3). (252) Rajura.-2oo (2-2), 209 (1-1), 273 (6-6), 281 (1.1),
350 (5-5), 369 (1-1). (253) Nimbia -273 (1-1), 281 (1-1). (254) Ibrabimpur,-273 (2-2). (256) Nimgawhan.-2oo (3-3), 273 (3-3), 281 (4-4), 369 (1-1). (261) Malatpur.-281 (2-2), 369 (1-1). (264) Bori.-2oo (2-2), 209 (1-1), 273 (4-4), 281 (2-2), 369 l3·5),
·393 (1-1.) (265) Jawala.-200 (1-1), 213 (4·4), 281 (2-2), 393 (1-1). (266) Manjarkhed.-281 (1-1). (210) Wai.-288 (3-3). (271) Dhotra.-213 (1-1), 281 (1.1), 369 (1-2). (212) Titwa.-273 (1-1), 281 (2-2). (273) Ghuikhed.-200 (2-3), 209 (1-3), 273 (14-16), 281 (1-1),
311 (5-6), 350 (1-1), 369 (2-3), 393 (4-4). (278) Kirjawala.-213 (1-1), 281 (2-2). (281) TaJegaon (Dasasar).-2oo (5-6), 209 (11-17), 273 (17-19),
281 (6-10), 289 (1-1), 314 (1-2), 350 (7-10), 365 (1-2), 369 (2-2), 388 (2-3), 393 (3-4).
(283) Devgaon.-200 (1-1), 273 (5-5), 281 (2-2), 369 (1-1). (288) Shelunatwa.-273 (3-3), 281 (1·1), 369 (1·2). (289) Waghonda.-200 (1-1), 273 (3-3), 350 (1-2), 365 (1-1),
369 (2-4). (290) SuJtanpur.-200 (1-1), 273 (4-4), 281 (1-1). (293) Nandurabad.-200 (2-2). 213 (1.1), 281 (1-1), 369 (1-1). (295) Belol'8.-2oo (1-1), 273 (1-1), 369 (4-9). (297) Yerad.-200 (1-1), 273 (1-1), 281 (1-1). (298) Dhamak.-200 (1-1), 213 (5-5), 311 (2-2), 350 (1-1),
369 0-2), 393 (8-8). (299) Yevti.-200 {\-I), 273 (1-7), 281 (1-4), 311 (4-4), 369 (1.1).
URBAN
Chandur MunicipaIity.-200 (10·27), 203 (1-1), 209 lI3-24), 230 (6-86) 237 (1-1), 213 (12-20), 280 (2-3), 281 (1-3), 289 (4-4); 301 (2-2), 302 (2-5), 311 (1-1), 350 (5-11), 368 (2-2), 369 (1-22), 388 l5-6), 392 l3-5), 393 (4-4).
Datta ur Dhamangaon Municipality.-2oo (12-29), 205 (1-2), 2~7 (15-68), 209 (3-5), 214 (2-3), 215 (1-2), 220 (2-72), 230 (6-51) 273 (29-38), 214 (1-2), 288 (1-3), 289 (3-6), 302 (1-7)' 311 (9-24), 314 (1-2), 350 (9-20), 355 (1-2), 369 (9-16),388 (3-4), 392 (1·1),393 (11-14), 399(4·8).

PART III
OTHER OFFICIAL STATISTICS These Include Statistics on Cllmote and Rain/ali, Agriculture, Industr),. &/ucalicm_ Health and few othN aspects
EXPLANATORY NOTE
CLIMATE AND RAINFALL
1. Highest and Lowest temperatures
2. Rainfall
AGRICULTURE
3. Land utilisation and area under different crops 4. Irrigated area classified by sources of water-
supply. 5. Acreage of crops under irrigation ., 6. Yield per acre and Outturn of principal crops. 7. Wholesale prices of principal crops 8. Harvest Prices 9. Livestock and Agricultural Implements
10. Classification of land holdings according to size. .
INDUSTRIES
11. Employment in factories 12. Distribution of factories according 10 products
and their working strength. 13. Distribution of factories according to number
of days worked. 14. Manufacturing Industr!es
EDUCATION
15. Educational institutions by types and by number of students enrolled.
16. Names of colleges and high schools with location and number of students.
CONTENTS
PAGE
217
221
222
226 230
231 235 235 235 236 238
238 239
239
239
240
241
PUBLIC HEALTH
17. Medical facilities
18. Registered births, deaths and infant deaths
19. Registered deaths and, causes of deaths
MISCELLANEOUS
PAGl!
242
242
242
20. Railway mileage and stations 243
21. Roads 243
22. Post 9ffices, Telegraph offices and Radio licences 243
23. Banks 244
24. Land Revenue 244
25. Sales Tax and Entertainment Tax .• 245
26. Dealers under Sales Tax Act 245
iT.. Documents registered and value of property 245 transferred.
28. Police force and Crime statistics " , 24S
29. Cases decided in Civil and Criminal Courts 245
30. Electrical energy generated. purchased and 245 consumed.
31. Towns and Villages electrified 246
32. Weekly markets and Cattle mark;-ets 247
33. Fairs 249

EXPLANATORY NOTE
The scope of the 1961 Distri~ Ce~sus Handboo~s has been enlarged to inc!ude lD tP.IS Part,. OfficIal Statistics on climate and raInfall, agnculture, mdustry, education health and a few other topics. The material 'presented here was mainly collected an.d compiled by the District Statistical Officer, for thIS volume. The concerned Departments of the State and Central Governments have also been consulted. For most of the Tables the footnotes show the sources from which the material has been obtained.
2. There are 33 Tables in this Part. They may be broadly grouped as follows :-
(1) Climate and Rainfall-Tables 1 and 2.
(2) Agriculture-Tables 3 to 10.
(3) Industries-Tables 11 to 14. ~
(4) Education-Tables 15 and 16.
(5) Public Health-Tables 17 to 19.
(6) Miscellaneous-Tables 20 to 33.
(1) CLIMATE AND RAINFALL
Table 1
This table presents the highest and the lowest temperatures recorded at one or more stations in the district for all the 12 months for the years 1951 to 1960. Annual averages are shown in the last column.
Temperature data are maintai.ned ~y the. Meteorological Department and are publIshed In theIr monthly weather reports and their summary which is published annually.
Table 2
This table shows monthly and annual rainfall and the number of rainy days for the various stations in the district. "Normal rainfall" [column (28)] is the average rainfall over a long period-usually 80 years. Where rainfall records over such a long period are not available it may be the average for a shorter period-in some caseS even five years. Rainfall records are maintained at t~uka headquarters, dispensaries and a few police stations where rain-gauges \ have been supplied. These statistics are published in Part III of the State Government Gazette and Annual Season and Crop Reports issued by the Department of Agriculture. They are subsequently consolidated and issued by the Meteorological Depart. ment in two annual pUblications, viz., " Daily Rainfall of India" and" Monthly Rainfall of India."
Rainfall statistics are presented in this table separately for each of the tel! years from 1951 to 1960.
(2) AGRICULTURE
Table 3
This table shows the utilisation of land and areas under various crops. Material is presented for the district as a whole and for each taluka separately. It is presented for ten years 1950-51 to 1959-60 :
(i) Geographical area: This area represents the total land area and is worked out from the Survey and Settlement Records. The changes in the geographical area from year to year may be due to territorial changes or corrections on account of adjustments in the areas of former unsurveyed villages which are now surveyed;
(ii) Forests: This category includes all areas actually under forests whether State owned or private and c]assed or administered as forests under any legal enactment dealing with the forests;
(iii) Barren and unculturable land: This includes barren and unculturable lands like mountains, riverbeds, etc. (land which cannot be brought under culti· vation unless at a very high cost) ;
(iv) Culturable waste: This includes lands which can be brought under cultivation but which have not been cultivated or having been cultivated for some time have not been cultivated successively for more than five years. Such lands may either be fallow or covered with shrubs ;
(v) Permanent pastures and other grazing lands ! This includes all grazing lands whether they are permanent pastures and meadows or not;
(vi) Miscellaneous tree crops and groves not included in the net area sown; This category includes lands under casuarina trees, thatching grass, bamboo bushes or other trees used for fuel, etc. Lands which are not included under orchards are included in this class. These are lands which are put to some agricultural use but whose area is not included in the net area sown;
(vii) Current fallows: This includes lands which _ are left fallow during the current year
only;
(viii) Other fallow land: All lands .which have been cultivated but which are temporarily out of cultivation for a period of not less than one year and not more than five years;

(ix) Net area sown: The net area sown is the actual area under crops counting areas sown more than once in the same year only once ;
(x) Gross cropped area.. This is the sum of areas under all crops and represents the sum of net area sown and area sown more than once in the year.
After the land utilisation statistics under section A in column (1) the table presents in section B the details of areas under different crops. The crops are classified in two main groups, viz., foodcrops and non-foodcrops. Foodcrops are further grouped by .. cereals, pulses and others ". Non-foodcrops are similarly shown under "oilseeds and others".
The data on land utilisation and areas under crops are primarily prepared by the village officials of the Revenue Department. They are subsequently consolidated by the Agriculture Department.
Talukawise land utilisation aqd crop statistics arc being presented for the first tIme in this volume. They have not been published so far anywhere else.
Table 4
This table presents gross and net irrigated areas and the distribution of net irrigated area by sources of irrigation. To facilitate comparison, the gross cropped area is also shown in column (3). The data are presented for three years, viz., 1950-51, 1956·57 and 1959-60. Presentation is for the district as a whole and for each taluka separately.
Table 5
This table shows the acreages of various crops under irrigation for each year from 1950-51 to 1959-60. To facilitate comparison, the gross cropped area, and the gross irrigated area, are presented in the beginning. This is followed by acreages under irrigation for each crop.
The material is presented for the district as a whole and for each taluka separately. -
Sources for the district and talukawise material are different and there may, therefore, be a few small discrepancies between the two sets of figures.
Table 6
This table presents the outturn and average yields per acre of principal cropS in the district. The crops presented are foodcrops like rice, wheat, jowar, bajri, ragi, maize, tUT, gram and sugarcane and non-foodcrops like groundnut, sesamum, cotton and tobacco. Crops which are loeally important are only shown in this ta~le.
The outturn figures are in hundred tons while average yields are shown in pounds per acre.
218
The estimates of average yields and production in respect of rice, bajri, jowar (kharif and rabi), wheat, gram, cotton, groundnut, tobacco, ragi and tur are based on the results of crop estimation surveys conduct~d annually by the Agriculture Department. The estimates of yields for other remaining crops are based on the anna valuation figures and normal yields reported by the Revenue Officers. The figures relate to the years 1950-51 to 1959-60.
. Table 7
This table presents wholesale prices of principal crops. The material is presented for previous years by monthly averages and for the last year separately for each month. The prices shown are for the places having regulated markets or for the district headquarters.
Table 8
This table presents harvest prices of principal crops. The" harvest price" is the average wholesale price at which the commodity is disposed of by the producer to the trader at the village site during the . specified harvest period. These prices are published in the Season and Crop Reports. The figllres relate to the years 1950-51 to 1959-60.
Table 9
This table presents figures for livestock and agriculttlral implements for the district and each taluka separately for three years, viz., 1951, 1956 and 1961. The material is obtained from the three livestock censuses conducted in those years. The reference date to which the data relat~ is the 15th April of the concerned year. j ,
" Poultry " in section B of the table includes hens, cocks, chicken, ducks, drakes' and ducklets.
Section C presents statistics for agricultural implements. The figures for carts shown in the table are in respect of carts used for agricultural purposes only.
The number of tractors is inclusive of those owned by the Government and those owned by private persons.
The material is presented for the district as a whole and for each taluka separately.
Table 10
This table presents the distribution of the number of land holdings and their areas by size of holdings. The material has been taken from the census of agricultural holdings conducted in the year 1952-53 or 1953-54 in different parts of the State.
The figures presented here are for ownership holdings and the area figures are in terms of converted dry acres, i.e., calculated after giving due weightage for irrigated lands.
Where the district has undergone major changes because of the reorganisation of States in 1956 or 1960, the material relates to the area of the district as it existed in the year 1952-53 or 1953-54.
(3) INDUSTRIES Table 11
This table presents, for each industry, the total number of working factories, the number of mandays for which they worked during the year and th:e average daily number of workers employed claSSIfied by adults (18 years and above), adolescents (15 to 17 years) and children (14 or less). Statistics presented in columns (3) to (11) relate only to ~he reporting factories. The number of non-reportmg factories and their estimated average daily number of workers are shown in columns (12) and (13). These details of factories are further split up by the type of industry shown under column (1) both by industry code and a brief desc~ption. The industry codes shown here (as well as in Table 12) are those used for compilation of data by t.he Chief Inspector of Factories. They are different from the Standard Industrial Classification used . in the Census Tables and reproduced in Appendix I to the Explanatory Note to Part II.
The material is presented only for the district as a whole and only for one year, viz., 1961.
The word "factories" here includes only the registered factories. They are of three types :-
(i) Factories using no power but employing 20 or more workers;
(ii) Factories using power and employing 10 or _ more workers; and
(iii) Factories not covered by (i) and (ii) above but notified by the Government as covered by the Factories Act.
The material presented in this table is for all the three types combined.
Table 12
This table presents the distribution of factories for each type of industry by size of employment. For each size group, the number of factories and their total working strength are shown for each industry separately. The material is presented only for the district as a whole and only for one year, viz., 1961.
Table 13
This table presents the distribution of factories for each type of' industry by the number of days worked during the year. The material is shown for each industry and the number of factories and their total workers are shown for each group of working periods. This will show· the seasonal or perennial pattern of employment in industries in the district. Material. is presented only for the district as a whole and relates to the year 1961.
219
Table 14
This table presents a summary of data regarding the manufacturing industries as obtained through the annual Census of Manufacturing Industries conducted during the year 1958.
The 1958 Census had covered only 29 important industries. It moreover covered only the factories using power and employing 20 or more workers.
The figures for capital, etc., relate to 31st December 1958. "Value" added by manufacture denotes the increase in the total value of commodities as calculated by deducting the cost of materials, supplies, containers, fuel, electric energy and depreciation of fixed assets from the total value of the product~.
The table presents only the combined figures for the 29 industries covered in the 1958 Census.
(4) EDUCATION
Table 15
This table shows the number of different types of educational institutions in the district and the total number of pupils (boys and girls) and teachers for each type for the years 1951, 1956 and 1961. The material is presented for the district as a whole and for each taluka separately.
The number of institutions relates to the academic year ending June and the number of pupils is as on 31st March of the respective years.
Table 16
This table presents a list of colleges and high schools in the district with their locations. The material relates to 31st March 1961, and does not include institutions started after that date.
Lists are presented talukawise.
(5) PUBLIC HEALTH
Table 17
This table shows medical facilities available in the district. The material is presented for three years 1950 1955 and 1960 and shows the number of hospitals, maternity homes, dispensaries, rural health centres, doctors, nurses, beds available and indoor and outdoor patients treated.
Material is presented for each taluka separately.
The material presented here includes only civil hospitals and Government dispensaries, local or Municipal Funds institutions, private-aided or Railway dispensaries. It does not cover private unaided institutions run by individuals or associations. Similarly, the number of doctors, nurses or patients shown in this table does not include that relating to unaided hospitals, dispensaries or private practitioners.
Table 18 This table shows data about births, deaths and infant
deaths for the years 1951 to 1960. Wherever possible, figures for each taluka are.also shown separately. For the districts of Aurangabad and Nagpur divisions, material is available and presented only for the years 1957 and onwards.
The figures of infant deaths relate to deaths of children below one year.
The coverage and reporting on births, deaths and epidemic diseases in the rural areas are incomplete in many respects. The material presented in Tables 18 and 19 should not, therefore, be treated as any accurate representation of actual conditions in the district and should be used only, after allowing a margin for those limitations. The Department of Public Health is working on many schemes to improve the present position in respect of vital statistics.
Table 19 This table shows the number of deaths due to principal
causes in the district for the 10 years 1951 to 1960. The causes of deaths shown are cholera, small-pox, plague, dysentery and diarrhoea, fever, respiratory diseases and other causes. The figures of fevers include deaths due to enteric fever, cerebro-spinal fever, malaria, influenza, typhus, etc. Respiratory diseases include pneumonia, pulmonary tuberculosis, whooping cough, etc. Tn the other causes are included diphtheria, chickenpox. poliomyelitis, leprosy, cancer, deaths from child birth. etc.
(6) MISCELLANEOUS
Tables 20 to 31
Tables 20 to 31 are self-explanatory and need no further ;}'_vi I ~ltjon.
220
Table 32
This table presents talukawise lists of weekly markets. The table also shows the day on which the weekly bazar is held. Places where cattle bazars are held are also indicated. The list is based on the information collected from the Mamlatdar's offices and the Census enumerators' reports, prepared in September-October 1960.
Table 33 This table gives a talukawise list of villages where
different religious 0,1- cultural fairs are held. The list includes only those fairs which have a congregation of 1,000 or more. Inform:ltion regarding-
(i) Location Code Number,
(ii) the name of the village 10 which the fair is held,
(iii) distance from Railway station and S. T. Bus stop,
(iv) name of the fair, and month and date of the fair, and
(v) average congregation,
is furnished for each fair separately.
The list is prepared on the basis of inforhtation collected from the District Superintendents of Police, Municipalities and the Census enumerators' reports. The number of people gathering at the fair is based on eye estimates and should; be treated as a broad approximation.
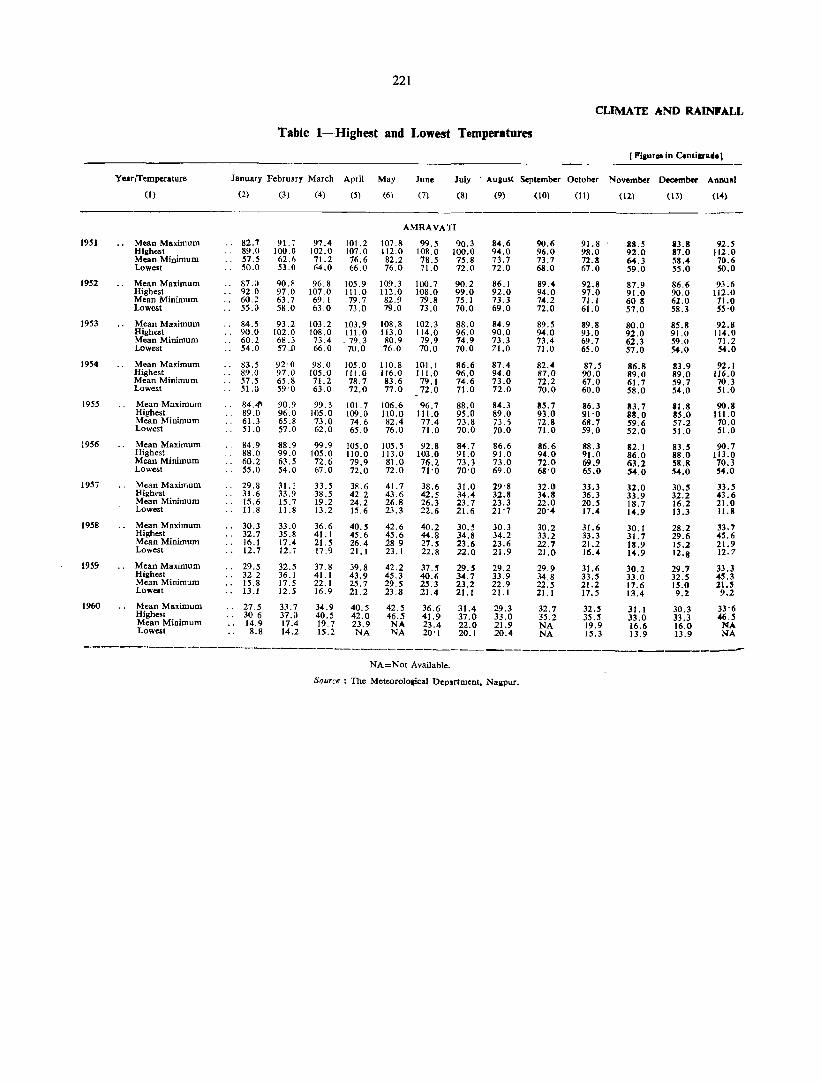
221
CLIMATE IrNO RAINFALL
Table I-Highest and Lowest Temperatures
[ Plaur ... in Centiaratl.)
Year/Temperature January February March April May June July . AUllust September October November December Annual
(1) (2) (3) (4) (5) (6) (7) (8) (9) (to) (11) (ll) (13) (4)
AMRAVATI
1951 Mean Maximum 82.7 91.7 97.4 101.2 107.8 99.5 90.3 84.6 90.6 91. 8 8S.S 113.8 92.5 Highest 89.0 100.0 102.0 107.0 112.0 108.0 100.0 94.0 96.0 98.0 92.0 87.0 112.0 Mean Minimum 57.5 62.6 71.2 76.6 82.2 78.5 75.8 73.7 73.7 72.8 64.3 58.4 70.6 Lowest 50.0 53.0 64.0 66.0 76.0 71.0 72.0 72.0 68.0 67.0 59.0 55.0 50.0
1952 Mean Maximum 87.0 90.8 96.8 105.9 109.3 100.7 90.2 86.1 89.4 92.8 87.9 86.6 93.6 Highest 92.0 97.0 107.0 111.0 112.0 108.0 99.0 92.0 94.0 97.0 91.0 90.0 112.0 Mean Minimum 60.2 63.7 69.1 79.7 82.9 79.8 75.1 73.3 74.2 71.1 603 62.0 11.0 Lowest 55.0 58.0 63.0 73.0 79.0 73.0 70.0 69.0 72.0 61.0 57.0 58.3 55'0
1953 Mean Maximum 84.5 93.2 103.2 103.9 108.8 102.3 88.0 84.9 89.5 89.8 80.0 85.S 92.8 Highest 90.0 102.0 108.0 111.0 113.0 114.0 96.0 90.0 94.0 93.0 92.0 91.0 114.0 Mean Minimum 60.2 68.3 73.4 _ 79.3 80.9 79.9 74.9 73.3 73.4 69.7 62.3 59.0 71.2 Lowest 54.0 57 . .1) 66.0 70.0 76.0 70.0 70.0 71.0 71.0 65.0 57.0 54.0 54.0
1954 Mean Maximum 83.5 92'0 98.0 105.0 110.8 101.1 86.6 87.4 82.4 87.5 86.8 83.9 92.1 Righest 89.0 97.0 105.0 111.0 116.0 111.0 96.0 94.0 87.0 90.0 89.0 89.0 116.0 Mean Minimum 57.5 65.8 71.2 78.7 83.6 79.1 74.6 73.0 72.2 67.0 61.7 59.7 70.3 Lowest 51.0. 59'0 63.0 72.0 77.0 72.0 71.0 72.0 70.0 60.0 58.0 54.0 51.0
1955 Mean Maximum 84.4' 90.9 99.3 101. 7 106.6 96.7 88.0 84.3 35.7 86.3 83.7 .1.11 90.8 Highest 89.0 96.0 105.0 109.0 110.0 111.0 95.0 89.0 93.0 91'0 88.0 85.0 1Il.0 Mean Minimum 61.3 65.8 73.0 74.6 82.4 77.4 73.8 73.5 72.8 68.7 59.6 57.2 70.0 Lowest 51.0 57.0 62.0 65.0 76.0 71.0 70.0 70.0 71.0 59.0 52.0 51.0 51.0
1956 Mean Maximum 84.9 88.9 99.9 105.0 10S.5 92.8 84.7 86.6 86.6 88.3 82.1 83.5 90.7 Highest 88.0 99.0 105.0 110.0 113.0 103.0 91.0 91.0 94.0 91.0 86.0 88.0 113.0 Mean Minimum 60.2 63.5 72.6 79.9 81.0 76.2 73.3 73.0 72.0 69.9 63.2 58.8 70.3 Lowest 55.0 54.0 67.0 72.0 72.0 71'0 70'0 69.0 68'0 65.0 54.0 54.0 54.0
1957 Mean Maximum 29.8 31.1 33.5 38.6 41.7 38.6 31.0 29'8 32.0 33.3 32.0 30.5 33.5 Highest 31.6 33.9 38.5 42.2 43.6 42.5 34.4 32.8 34.8 36.3 33.9 32.2 43.6 Mean Minimum 15.6 15.7 19.2 24.2 26.8 26.3 23.7 23.3 22.0 20.5 18.7 16.2 21.0 Lowest 11.8 11 .8 13.2 15.6 23.3 22.6 21.6 21'7 20'4 17.4 14.9 13.3 11.8
1958 Mean Maximum 30.3 33.0 36.6 40.5 42.6 40.2 30.5 30.3 30.2 31.6 30.1 28.2 33.7 Highest 32.7 35.8 41.1 45.6 45.6 44.8 34.8 34.2 33.2 33.3 31.7 29.6 45.6 Mean Minimum 16.1 17.4 21.5 26.4 289 27.5 23.6 23.6 22.7 21.2 18.9 15.2 21.9 Lowest 12.7 12.7 17.9 21.1 23. I 22.8 22.0 21.9 21.0 16.4 14.9 12·11 12.7
1959 Mean Maximum 29.5 32.5 37.8 39.8 42.2 37.S 29.S 29.2 29.9 31.6 30.2 29.7 33.3 Highest 32.2 36.1 41.1 43.9 45.3 40.6 34.7 33.9 34.8 33.5 33.0 32.5 45.3 Mean Minimum 1S.8 17.5 22.1 25.7 29.5 25.3 23.2 22.9 22.5 21.2 17.6 15.0 21.5 Lowelt 13.1 12.5 16.9 21.2 23.8 21.4 21.1 21.1 21.1 17.5 13.4 9.2 9.2
1960 Mean Maximum 27.5 33.7 34.9 40.5 42.5 36.6 31.4 29.3 32.7 32.5 31.1 30.3 33'6 Highest 306 37.0 40.5 42.0 46.5 41.9 37.0 33.0 35.2 35.5 33.0 33.3 46.5 Mean Minimum 14.9 17.4 19.7 23.9 NA 23.4 22.0 21.9 NA 19.9 16.6 16.0 NA Lowest 8.8 14.2 15.2 NA NA 20'1 20.1 20.4 NA 15.3 13.9 13.9 NA
--------._-----------------------------------------------------------NA=Not Available.
Source : The Meteorolopcal Department, NallPur.
OTHER. OFFICIAL STATISTICS
Station/Year
DHARNI
1951
1952
1953
1954
1955
1956
1957
1958
1959
1960
(1)
ACHALPUR
1951
1952
1953
1954
1955
1956
1957
1958
1959
1960
MORSI
1951
1952
1953
1954
1955
1956
1957
1958
1959
1960
DARYAPUR
1951
1952
1953
1954
1955
1956
1957
1958
1959
19W
January
Rainy days
(2)
4
NA
4
NA
2
2
4
2
4
(3)
117-2
3'7
NA
54'S
110'8
24'4
NA
5'}
11'4
97'6
0'8
38'7
26'6
29'0
222
February March
Rainy days
(4)
NA
NA
Rainfall Rainy Rainfall days
(5)
NA
6,3
NA
(6)
NA
2
NA
4
2
(7)
0'9
4'8
NA
14'0
7"
2'5
11,4
NA
43-4
2,1
0,5
1,5
2,5
33' 5
NA = Not Avai\able.
April
Rainy days
(8)
2
Rainfall
(9)
5'6
4"
.3' 7
2 115'0
2
NA
2
4
2
NA
6
23'1
NA
7'2
70"
1'3
2'5
17'8
39,4
NA
31,2
1,0
4-4
9,4
10-2
May
Rainy Rainfall day.
(IQ)
6
2
NA
5
NA
4
4
(11)
2'S
1'0
9'0
122'0
0']
7-6
2' 3
NA
65'0
10'2
4-1
)-5
NA
123'5
5'1
12'7
3, j
6' \
152' 5
19,8
3,1
Table 2-
June
Rainy Rainfall day.
(12)
7
6
13
10
I)
5
10
8
2
7
NA
13
13
7
7
9
9
8
5
NA
16
12
7
3
7
6
5
4
5
8
7
10
4,
6
9
(13)
116'3
167'6
101'6
114'3
211'0
253'2
224,2
47-0
115'5
239'5
206'3
"'4
101- 3
NA 199'1
229'0
124'7
84-6
107-2
80-2
166'1,
55'9
66'0
NA
254'0
286-0
139'7
31'8
101'3
108'7
85 '9
15'2
88 ,9
247'0
162'5
206'2
59'4
91'5
118'2

223
CLIMATE AND RAINFALL
Rainfall [ Figure. in mm_]
July August September October November December Annual Station/Year
Rainy Rain.. Rainy Rain- Rainy Rain- Rainy Raill- Rainy Rain- Rainy Rain- Rainy Rain-days faU days fall days fall days full d,IYs fall days fall days fall
Normal Rainfall
{I 4) (15) (16) (\7) (18) (19) ------~---------- ------------
13
16
17
11
19
23
25
18
16
10
12
13
11
NA
11
14
11
15
18
12
11
12
15
357'9
331-2
560-6
485-4
168-0
497-0
157'0
364-5
575 -5
322'5
179-3
175-8
345'7
NA
205-5
230'5
152-1
170'7
256 5
153-8
232'7
257-1
281-4
NA NA
10
8
8
17
11
9
11
14
155'2
148-9
270-1
172'3
124-2
91-9
187-2
NA NA
6
17
7
12
16
10
158-5
139-2
93'2
155-5
310-0
84-6
17 336'3
12 201-7
18 636 0
15 163 -3
24 11')-1
II 169-2
19 292-0
23 426 '2
21 314-7
22 27-1
NA NA
16 196'7
8 88'7
12 259'3
16 170-9
11 141'7
II 117'8
4
15 192'8
NA NA
24 282-0
f) 271-5
16 311'9
5 47-0
4 132-S
12 166-4
NA NA
24 282-0
7 If') 7
9 13\1 9
17 176-8
9 71'4
2 22'1
724
29'7
185'4
19 538-2
l6 25S'"!
10 147'0
5 1l0'O
17 447-6 , 16 511-'
5 40'S
6
NA
75-9
55-6
NA
15 226'7
11 106'0
4 188-0
10 166-4
15 365-2
8 108-7
6
NA NA
12 130'0
5 254'5
8 114-8
7
11 164-3
-NA NA
12 130'5
I) 82-5
4 140'2
8 79-8
(20)
3
4
9
5
3
2
NA
(21)
660
42'9
1'2
58-7
52-6
40'S
39-'
1:1-5
NA
2 25'2
1'0
2 82'7
6 48-3
4 94-4
3
NA
2
33' 8
12'7
NA
4 !lS'8
NA NA
22-6
5 90'9
3 48'2
(22) (23)
(; 85'7
29 -,
0'6
NA NA
157 0
32-5
NA NA
4 58-7
2
NA NA
2 60'0
2 88-9
NA Not Available_
(24)
NA
NA
NA
(25) (26) (27) (28) ______ (1_) __ _
5-0
47
39
53
52
79
72
61
68
76
53
23
27
46
969'0 1,106
740'9
1528-S
1306-8
1556'S
1332'0
899-4
1376-9
1615-9
670-8
398-0 796
360-4
936-7
NA NA NA
25 '8
60
60
42
51
59
51
22
34
45
890'3
901-4
822'7
707'8
918-9
704-6
429-7 845
513 -I
672-1
NA NA NA
2'0
63
20
42
39
28
24 '0 37
15
28
43
NA NA
52
51
35
46
52
39 ~
830-2
470'2
907'0
721-5
400-4
644'4
214-0 778
390-1
616-2
NA
859'2
721-6
608-9
596-3
1036'7
450-6
DHARNI
1951
1952
1953
1954
1955
1956
1957
1958
1959
1960
ACHALPUR
1951
1952
19S3
1954
1955
1956
1957
1958
1959
1960
MORSI
1951
1952
1953
1954
1955
1956
1957
1958
1959
1960
DARYAPlJR
1951
1952
1953
1954
1955
1956
1957
1958
1959
1960
224
OTHER OFFICIAL STATISTICS
Table 2-
January February March April May June
Station/Yea .. -------Rainy Rain- Rainy Rain- Rainy Rain- Rainy Rain- Rainy Rain- Rainy Rain-days CaU days CaU day. CaU days Can days faU day. fall
(l) (2) (3) (4) (5) (6) (7) (8) (9) (10) (11) (12) (13)
AMRAVATI
1951 2 11'9 9'4 7'6 4 27-7 7 79'3
1952 7'4 7'1 2'5 1'8 49'S
1953 3 29'0 1'3 6 122'9
1954 1'>;\ NA NA NA NA NA NA NA NA NA NA NA
1955 2 0'1 2 7'7 11 175'5
1956 0'2 4 50'0 13 184'0
1957 5 81'3 3 53'! 2 12'5 8 117'9
1958 0'8 3'9 13'2 3,8 7 90'7
1959 0'4 12'4 0,1 11 186'9
1960 8 96'1 2 16,6 2'8 12 231'4
CHANDUR
1951 2 12'2 7,9 6 52'3
1952 4 29'0 4-3 8 92'7
1953 2 9'1 4 101'1 , ,
1954 NA NA NA NA NA NA NA NA NA NA N",," NA
1955 36'2 II 88',7,
1956 40'2 10 182'7
1957 0'5 34'5 4 39'6 S'I 7 66'S
1958 1'8 6'6 6'1 40'2 6 93'1
1959 3 25'9 271'8
1960 5 73,9 4 36'7 2 6,8 11 224'5
-----------NA-Not Availablr_

CLIMATE AND RAINFALL
RainfaU-concld_
July Augu.t September October November December Annual Normal
Rain-fall Rainy Rain- Rainy Rain- Rainy Rain- Rainy Rain- Rainy Rain- Rainy Rain- Rainy Rain~ ~ ~ ~ ~ ~ ~ ~ ~ ~ ~ ~ ~ ~
(14) (IS)
15 211-8
10 230-1
15 247'7
NA NA
18 436'0
13 190'5
11 105-2
13 159-6
19 283'0
12 157'4
13 350-0
14 246'1
15 282'5
NA NA
NA 196'0
16 191'5
12 129-8
14 256-4
16 313-8
12 144'5
H 4222-15
(16) (17)
5 143'5
12 282'2
NA NA
17 327-5
6. 93-7
14 201 '2
19 333'3
12 123'8
8 120-6
3 74'9
8 183'4
NA NA
18 356-7
5 55-2
9 164-3
16 261-8
11 201'5
6 119-5
(18) (19)
2 60'0
7 79-8
NA NA
12 163-2
11 182'7
5 201-9
7 161-8,
12 317-5
10 106' 5
6 159-3
11 153-9
NA NA
6 130-2
12 145-5
7 217-9
10 221'5
12 381-6
6 118 '4
(20) (21) (22) (23) (24)
2 23'6
4 15-8
NA NA NA NA NA
2
(25)
NA
(26)
30
27
47
(27) (28)
347-7 851
525'5
798-7
NA NA
62 1,110-6
49
49
51
780'3
781-5
816-4
37'2
8-4
22-0
4 119'5
3 42'7
11-2 60 1,054-9
4 73'4
4 73-4
NA NA NA NA NA
a 5
62-0
19-6
36'0
4 206-5
2 75'0
3 18-2
23'4
NA-Not Available_
26-6 57 800-7
NA
0'5
22
40
44
NA
NA
Sl
46
55
422-4 855
679-7
803'4
NA
807-8
695-3
678-1
946-9
54 1,401-1
48 799'8
Source; The Meteorological Department, Nagpur_
[Figures in mm_l
Station/Year
AMRAVATI
1951
1952
1953
1954
1955
1956
1957
1958
1959
1960
CHANDUR
1951
1952
1953
1954
1955
1956
1957
1958
1959
1960
(I)

226
OTHER OFFICIAL STATISTICS
Table 3-Land"Utilisation and Area wider Different Crops [Area figures in hundred acres]
Classi fication 0 f Area 1950·51 1951·52 1952·53 1953·54 1954·55 1955·56 1956·57 1Jl57-S8 19S8-59 1959-60
(1) (2) (3) (4) (5) (6) (7) (8) (9) (10) (11)
DISTRICT TOTAL
(A) Total Geographical A"a 30,138 30,138 30,138 30,138 30,138 30,138 30,138 30,139 30,139 30,139 Forests .. 8,961 8,962 8,962 8,919 8,628 8,535 8,535 8,676 8,674 8,644 Barren and unculturabi~ land oo} 2,555 2,547 2,547 { 506 506 293 411 384 406 399 Land put to non-agricultural uses .. 1,066 744 680 696 650 660 677 Culturable waste 218 247 248 387 401 431 437 513 476 632 Permanent pastures and' other gratii,il1ands .. } { 1,641 1,1164 1,724 1,409 1,420 1,392 1,355
30 Miscellaneous tree crops and groves not 136 176 369 371 276 293 296
included in area SOwn. Current fallows . ·1 f 235 254 283 267 240
Other fallow land ~ 3,005 2,771 2,443 1,240 1,375
.. ) ll,358 1,448 1,379 1,313 1,310 Net area sown 15,369 15,611 15,938 16,243 16,444 16,513 16,577 16,558 16,658 16,586 Total Gross Cropped kea 15,421 15,704 15,981 16,292 16,494 16,572 16,703 16,622 16,748 16,701 Gross Irrigated Area .. 150 143 114 110 132 136 131 159 163 162
«B) Details of Cropped Area-Total area under food crops NA 7,983 8,005 7,821 7,735 7,713 8,030 7,580 7,490 7,522 Area under cereals NA 6,180 6,334 6,066 6,040 5,911 6,214 5,773 5,714 5,672
Rice 142 103 97 91 85 103 118 125 140 150 Wheat 813 832 857 860 919 990 1,037 957 863 1,033 Jowar 5,907 5,012 5,090 4,880 4,816 4,609 4,823 4,485 4,489 4,278 Bajri .. 176 155 156 154 154 147 142 133 137 132 Ragi NA 3 2 4 2 1 2 2 I I Maize NA 16
132 77 I 5 1 1 1 1 Other cereals NA 59 63 56 91 70 83 77
Area under purse, NA 1,557 1,479 1,566 1,564 1,594 1,563 1,536 1,~~~ 1,581 Tur 744 830 853 931 908 894 874 911 933 Gram 780 182 153 149 181 248 218 195 180 234 Other pulses NA 545 473 486 475 452 471 430 416 414
Sugarcane NA 2 I I 1 1 3 2 2 2 Fruits and vegetabi~ 92 90 79 86 27 92 90 92 95 103 Condiments and spices NA 154 104 99 111 160 177 156 164 Miscellaneous food crops NA 8 3 103 4
Area under non-food crops NA 7,721 7,976 8,471 8,759 8,85 8,673 9,042 9,258 9,179 Area under 011 seeds NA 744 694 487 577 639 691 774 805 773
Groundout NA 495 467 298 378 411 373 474 572 SOl Sesamum NA 101 104 96 89 82 73 83 92 81 Other oU seeds NA 148 123 93 110 132 245 217 141 191
Cotton 5,569 5,837 7,160 7,891 7,978 8,127 7,858 8,073 8,365 8,325 Tobacco
fodd~~ NA 4 3 5 7 7 4 2 2 2
Other non-food crops including NA 136 119 88 197 97 120 193 86 79 crops.
MELGHAT TALUKA
(Al Total Geographical Area NA NA NA NA NA 9,863 9,863 9,863 9,863 9;863 Forests •• NA NA NA NA NA 7,714 7,715 7,715 7,714 7,714 Barren and Unculturabie land NA NA NA NA NA 33 124 124 106 103 Land put to non· agricultural uses :: NA NA NA NA NA 91 91 91 89 100 Culturable waste . . . . NA NA NA NA NA 104 110 153 118 262 Permanent pastures and other grazing lands .. NA NA NA NA NA 523 267 267 307 253 Miscellaneous tree crops and groves not included NA NA NA NA NA 110 100 100 130 133
in area sown. Current fallows NA NA NA NA NA 128 128 128 125 50 Other fallow land NA NA NA NA NA 417 586 586 526 SOl Net area sown NA NA NA NA NA 743 742 699 748 747 Total Gross Cropp~d Area NA 586 646 667 NA 745 777 719 769 775 Gross Irrigated Area ., NA NA NA
(B) Details of cropped Area-Total area under food crops NA NA 507 504 NA 588 612 543 580 606 Area under cereals NA 290 384 386 NA 437 457 401 430 435
Rice ., NA 75 86 84 74 89 91 103 117 118 Wheat NA 43 40 44 51 95 84 32 29 51 Jowar NA 152 157 179 182 196 183 192 199 196 Bajri NA 2 2 2 2 2 2 2 2 2 Ragi NA 2 2 4 2 I 2 2 I 1 Maize NA lIS 97 73
I 1 1 1 I 1 Other cereals NA 53 88 69 81 66
Area unde, pur ••• NA NA 116 112 NA 144 147 130 137 159 Tur NA 16 19 21 23 24 24 24 24 24 Gram :: NA 62 53 49 56 80 78 67 65 73 Other pulses NA NA 44 42 NA 40 45 39 48 62
Sugarcane NA Fruits and vegetables NA '9 Condiments and spices NA 7 6 7 8 12 13 12 Miscellaneous food crops NA
Area under non food crops NA NA 139 163 NA 157 165 176 189 169 Area under oil seeds NA 33 48 39 34 36 40 3& 41 37
Oroundnlit NA '2 4 5 4 4 5 S- 6 5 SesamuID NA 30 37 27 30 20 14' 20 21 18 Other oil seeds NA I 7 7 NA 12 21 13 14 14
Cotton NA 73 88 122 122 118 119 136 146 128 Tobacco
including fodd~~ NA
Other non-food crops NA 3 3 2 6 2 2 4 crops.
NA-NotAvailable.
227
AGRICULTURE
Table 3-Land Utilisation and Area under Different Crops-contd.
Classification of Area
(I)
(A) Total Geographical Area
Forests .. .. Barren and unculturable I,md ..
1950·51
(2)
Land put to non·agricultural uses .. Culturablo waste . . . . Permanent pastures and other grazing lands Miscellaneous tree crops and groves not
included in area sown.
NA
NA NA NA NA NA NA
Current fallows Other fallow land Net area sown .. Total Gross Cropped Area Gross Irrigated Area ..
NA NA NA
.. NA NA
(B) Details of Cropped Area-Total area under food crops NA Area under cereals NA
Rice .. NA Wheat.. NA Jowar .. NA Bajri " NA Ragi " NA Maize.. NA Other cereals NA
Area under pulses NA Tur .. NA Gram.. NA Other pulses NA
Sugarcane NA Fruits and vegetables NA Condinicnts and spices NA Miscellaneous food crops NA
, A,.a under non-food crops NA Area under oil seeds . . NA
Groundnut NA Sesamum NA Other oil seeds NA
Cotton ...... NA Tobacco " .. .. NA Other non·food crops including odder IropS.. NA
(A) Total Geographical Area NA
Forests .. .. NA Barren and unculturable land . . NA Land put to non·agricultural uses . . NA Culturable waste . . . . NA Permanent pastures and other grazing lands NA Miscellaneous tree crops and groves not NA
included in area sown Current fallows NA Other fallow land NA Net area sown . . NA Total Gross Cropped Area NA Gross Irrisated Area .. N A
(B) D.tails of Cropped A reaTotal area under food crops Area under cereals ..
Rice .. Wheat .. Jowar .. Bairi " Rag; .. Maize .. Other cereals
Arta under pulses Tur •. Gram .. Other pulses _
Sugarcane Fruits and vegetables Condiments and spices Miscellaneous food crops
Area under non·food crops Arta under oil seeds
Groundnut Sesamum Other oil seeds
Cotton
NA NA NA NA
.. NA NA NA NA NA
NA NA NA NA NA NA NA NA
.. NA NA
.. NA NA NA NA NA NA
Tobacco .... .. Other non·food crops mcluding fodder crops ..
1951·52 1952·53 1953·54 1954·55
(3) (4) (5) (6)
[Area figures in hundred acres]
1955·56 1956·57 1957·58
(7) (8) (9)
1958-59
(10)
1959·60
(11) --------------------------------------------ACHALPUR TALUKA
NA
NA NA NA NA NA NA
NA NA NA NA NA
NA NA
I 90
694 13 1
NA NA 179
8 NA
5S
NA 46 26 11
9 1,223
i3
NA
NA NA NA NA NA NA
NA NA NA
2,447 NA
1,189 882
80 786
16
NA 256 172
7 77
14 34
3
1,258 26 9
11 6
1,216 1
15
NA
NA NA NA NA NA NA
NA NA NA
2,575 24
1,098 782
72 694
14
2
264 183
8 73
19 33
1,477 24
7 12
5 1,440
I 12
MORSI TALUKA
NA
NA NA NA NA NA NA
NA NA NA
2,732 NA
NA NA
1 58
907 32
NA: 166 IS8
8
14
NA 44 22 11 10
1,391
74
NA
NA NA NA NA NA NA
NA NA NA
2,779 NA
NA
NA NA NA NA NA NA
NA NA NA
2,812 45
1,313 I 1,276 1,018 976
1 56 48
928 897 32 30
I
241 254 172 186
5 3 64 65 1
36 33 16 13 1
1,466 42 23 II 8
1,371
53
1,536 34 13 13 8
1,483
19
NA-Not Available.
NA
NA NA NA NA NA NA
NA NA NA NA
26
NA NA
72 631
14
NA 17S
8 58
36
NA NA
7 13
NA 1,480
1
NA
NA NA NA NA NA NA
NA NA NA NA
46
NA NA
59 849 39
NA 193
9 68
16
NA
43 14
NA 1,512
1 1
3,153
113 55
124 44
155 24
18 126
2,494 2,508
42
1,011 705
72 616
12
4 1
256 176 20 60
ii; 32 2
1,497 23 4
12 7
1,459 I
14
3,988
239 54
147 59
300 53
20 209
2,907 2,906
49
1,318 999
I 65
901 31
260 184 14 62 I
41 17
1,588 50 41
8 I
1,513 2
23
3,153
97 81
101 49
141 30
18 91
2,545 2,564
27
1,049 740
91 638
10
251 173 12 66
14 44
1,515 23
8 10
:5 1,469
1 22
3,988
239 54
147 59
300 53
34 229
2,873 2,863
51
1,354 1,014
2 73
906 32
1
278 172 14 92
I 44 17
1,509 39 17 7
15 1,~41
I 28
3,153
125 55
102 46
150 27
7 98
2,543 2,550
32
1,001 686
95 582
9
248 171
10 67
I 16 50
1,549 28 II 12
5 1,511
1 9
3,989
239 55
146 59
300 53
34 221
2,882 2,875
69
1,363 1,009
2 68
908 31
265 178
13 74
46 43
1,512 73 51 10 12
1,311
128
3,153
125 56
106 45
140 25
16 113
2,527 2,546
33
1,005 684
1 82
591 10
248 176
10 62
1 17 55
1,541 32 15 12 S
1,489 1
19
3,989
·239 60
147 63
245 52
29 257
2,897 2,903
69
1,300 977
2 63
879 33
252 179
8 65
48 23
1,603 79 63 10 6
1,500
24
31,53
125 56
106 45
123 25
16 113
2,544 2,562
32
996 677
I 83
583 10
251 ISS 12 S4
17 51
1,566 37 21 11
S 1,514
1 14
3,989
239 60
147 63
245 58
49 259
2,869 2,879
66
1,332 1,006
3 78
895 30
254 177 IS 62
49 23
1,547 98 80 10 8
1,427
22

228
OTHER OFFICIAL STATISTICS
Table 3-Land Utilisation and Area under Different Crops-contd. [Area figures in hundred acres] -----
Classification of Area 1950-51 1951-52 1952-53 1953-54 1954-55 1955-56 1956-57 1957-58
(I) m w w ~ ~ ro 00 00
(A) Total Geographical Area NA
Forests .. ., NA Barren and uncultntable land . . NA Land put to non-agricultural uses. . NA Culturable waste . . • . .. NA Permanent pastures and other grazing lands .. NA Miscellaneous tree crops and groves not includ- NA
ed in area sown. Current fallows NA Other fallow land NA Net area sown . • NA Total Gross Cropped ArOll NA Gross Irrigated Area ., NA
(B) Ddails oj Cropped Area-Tetal area under food crops Area under cereals
Rice ., Wheat lowar Bajri .' Ragi ., Maize ., Other cereals
Area under pulses Tur Gram Other pulses
Sugarcane Fruits and vegetables .. Condiments and spices Miscellaneous food crops
NA NA NA NA NA NA NA
., ~! NA NA NA NA NA NA NA NA
Area under non-food crop.. NA Area under oil seem NA
Groundnut NA Sesamum NA Other oil seeds NA
Cotton NA Tobacco .• ., .• NA Other non-food crops including fodder crops. NA
(A) Total Geographical Area N A
Forests .' .. NA Barren and UDculturable land . . NA Land put to non-agricultural uses . . NA Culturable waste . • . . . • NA Permanent pastures and other grazing lands NA Miscellaneous troe crops and groves not includ- NA
ed in area sown. Current fallows NA Other fallow land NA Net area sown . • NA Total Gross Cropped Area NA Gross Irrigated Area .. NA
(B) Details of Cropped AreaTotal area under food crops Area under cereals
Rice .' Wheat lowar Bairi .' Ragi .' Maize .. Other cereals
Area under pulses Tur Gram Other pulses
Sugarcane Fruits and vegetables Condiments and spices Miscellaneous food crops
Area under non-food crops Ana under oil seeds
Groundnut Sesamuro
- Other oil seeds Cotton Tobacco .. ., Otlter non-food crops including fodder crops.
NA NA NA NA NA NA NA NA NA
NA NA NA
.. NA NA NA NA NA
NA NA NA NA NA NA NA NA
DARYAPUR TALUKA
NA NA NA
NA NA NA NA NA
·NA
NA NA NA NA NA
NA NA
I 271 181
6
NA NA 107 60
NA
ii;
NA NA 28 18 61
1,258 1
12
NA NA NA NA NA NA
NA NA NA
2,773 NA
1,407 1,163
3ii; 840
7
224 97 51 76
':' 11 2
1,366 86 13 15 58
1,264
i6
NA NA NA NA NA NA
NA NA NA
2,831 7
1,353 1,106
30i 797
8
224 104 48 72
·s 13 2
1,478 49 7
13 29
1,406 1
22
AMRAVATI TALUKA
NA
NA NA NA NA NA NA
NA NA NA
4,078 NA
NA NA
5 301
1,334 55
NA NA 212
33 NA
1
ji;
1,946 244 181 20 43
1,686
iii
NA
NA NA NA NA NA NA
NA NA NA
4,110 NA
2,069 1,681
4 306
1,314 57
351 213 27
111
i2 24
1
2,041 262 212 20 30
1,760 2
17
NA
NA NA NA NA NA NA
NA NA NA
4,230 18
2,079 1,666
2 329
1,278 56
1
374 231
30 107
1 IS-22
1
2,151 166
- 123 19 24
1,966 2
17
NA = Not Available.
NA
NA NA NA NA NA NA
NA NA NA NA
9
NA NA
3ie) 730
8
NA 104 49 52
ii NA NA
5 4
NA 1,496
1 NA
NA
NA NA NA NA NA NA
NA NA NA NA
29
2,161 1,739
3 342
1.337 57
NA 368 224
38 106
27-27
348 NA 131 18
NA NA
3
3,241
27 41 58 19 52 68
15 92
2.869 2,874
10
1,225 992
309 675
8
212 82 63 67
·s 13
1,649 88 4
16 68
1,546 I
14
5,453
301 49
163 102 271
8
20 224
4,315 4,333
17
2,094 1,658
4 369
1,232 52
1
388 234 41
113
17 30
1
2,239 206 152 17 37
2,Q15 2
16
3,l41
'27 41
, i~ . 53
71
16 86
2,871 2,877
10
1,287 1,042
33i 705
5
1
220 103 49 68
8 17
1,590 119
7 19 93
1,456 1
14
5,453
317 45
203 73
265 II
24 204
4,311 4,341
18
2,169 1,753
8 374
1,323 48
347 211 40 96
1 14 54
,2172 233 131 15 87
1,921 I
17
3,241
32 41 85 29 70 15
17 73
2,879 2,886
9
1,229 985
322 659
4
222 103 53 66
7 15
1,657 122
8 21 93
1,521 1
13
5,453
317 , 52 145 112 279
43
41 216
4,248 4,260
26
1,995 1,579
8 371
1,154 46
363 238
30 95
1 15 37
2,265 230 161 16 S3
2,024
ii
1958-59 1959-60
(10) (11)
3,241
30 39 84 27 69 8
8 61
2,915 2,920
10
1,216 974
303 667
4
215 110 45 60
·s 19
1,704 99 14 23 62
1,592
13
5,453
317 88
147 108 272 40
39 161
4,281 4,308
26
1,985 1,576
9 327
1,193 47
365 240 34 91
1 14 29
2,323 278. 220
17 41
.2,025 1
19
3,241
30 39 90 33 70 13
13 70
2,883 2,894
12
1,188 93S
344 586
s
224 112 52 60 r' . 8 21
1,706 113 14 13 86
1,580
jj
5,453 •
317 88
147 108 272 40
55 174
4,252 4,282
26
1,973 1,546
14 398
1,079 44
ii 375 233
52 90 2
19 31
2,309 249 167 21 61
2,04i 14
229
AGRICULTURE
Table 3-Land Utilisation and Area under Different Crops-concld.
Classification of Area
(I)
1950·51
(2)
(A) Tolal Geographical Area NA
Forests .. .. NA Barren and unculturable land . . NA Land put to noa·agricultural uses . • NA Culturable waste . . . . NA Permanent pastures and other grazing lands .. NA Miscellaneous tree crops and groves not includ· NA
ed in area sown. Current fallows NA Other fallow land NA Net area sown . . NA Total Gross Cropp~ Area NA Gross Irrigated Area NA
(B) Details of Cropped Area-
Tolal area under food crops
Arta under cereals
ltice .. Wheat Jowar Bajri •. Raai .. Maize .. Other cereals
A"a unlitr pulses Tor Gram Other pulses
Sugar cane Fruits and vegetable. Condiments and spices MiscellaneQ.us food crops
Art" under non· food crops
Area under oil seeds
.. NA ... NA
NA NA NA NA
NA
NA NA NA NA
NA NA NA
NA
NA
Groundnut NA :sesamum NA Other oil seeds NA
Cottou NA Tobacco .... .. NA Other non·food crops includinll fodder crops. NA
NA=Not Available.
[Area figures in hundred acres I
1951·32 1952·53 1953·54 1954·55 1955·56 1956·57 1957·58 1958.59 1959-60
(3) (4) (5) (6) (7) (8) (9) (10) (11)
CHANDUR TALUKA
NA
NA NA NA NA NA NA
NA NA NA
3,095 NA
)lA
NA
20 69
1,144 47
NA
NA 158 11
NA
NA 24
1,492
268
236 10 22
1,2M NA 18
NA
NA NA NA NA NA NA
NA NA NA
3,192 NA
NA
NA
6 59
1,065 42
NA
291 180
10 101
10 12 1
1,706
230
206 10 14
1,461 NA
15
NA
NA NA NA NA NA NA
NA NA NA
3,177 16
1,511
1,150
5 66
1,035 44
NA 338 200 II
127
II 12
1,666
175
143 12 20
1,474 I
16
NA
NA NA NA NA NA NA
NA NA NA NA
22
1,472
1,212
8 76
1,0&7 34
NA
317 189 21
107
13
NA
188 10
NA 1,537
1 NA
4,440
141 61 91
103 423 106
34 290
3,185 3,206
18
1,477
1,120
9 80
9&9 42
334 194 30
110
10 12
1
1,729
228
207 9
12 1,473
1 27
4,440
140 66 96
128 383 106
34 252
3,235 3,281
25
1,559
1,208
11 84
1,068 45
320 191 25
104
II 20
1,722
237
205 8
24 1,4.52
33
4,440
248 57 81
114 354 38
56 185
3,307 3,332
23
1,449
1,113
12 69
990 41
·i 308 197 22 89
·s 20
1,883
283
238 4
41 I,S70
30
4,440
249 57 87
115 359
38
50 195
3,290 3,302
25
1,404
1,073
II 59
960 41
·2 306 198
18 90
8 17
1,898
276
254 9
13 1,613
·9
--------,--------------Source: Season and Crop Report. and Land Records Department.
4,440
219 53 87
121 392
27
57 193
3,291 3,309
26
1,427
1,073
14 7' 939 41
318 202
30 86
10 26
1,882
239
214 8
17 1,.31
ii

230
OTHER OFFICIAL STATISTICS
Table 4-Irrigated Area classified by Sources of Water Supply [ Area figures ill. hundred acres 1
Gro .. Gross Net Govern. Private Total Tank. Tube Wells Other Wells Other District/Taluka Year Cropped Irrigated Irrigated ment Canal Canal ----- Sources
Area Area Area Canal Area Area No. Area No. Area No. Area Area Area
(I) (2) (3) (4) (5) (6) (7) (8) (9) (10) (11) (12) (13) (14) (lS)
DISTRICT TOTAL 1950-51 15,421 150 149 NA NA 145 4
1956-57 16.703 131 131 8 10,109 127 3
1959·60 16.701 162 162 2 2 13 13.445 160
Melghat Taluka 1950-51 NA NA NA NA
1956-57 777 6
1959·60 775 20
Achalpur Taluka 1950-S1 NA NA 21 NA NA 20
1956-57 2,564 27 27 2 887 27
1959·60 2.562 32 32 2 1,957 31 '.
Morsi Taluka 195()"51 NA NA 62 NA NA 59
1956·57 2.863 51 51 5,551 47 3
1959·60 2.879 66 66 6,546 65
Daryapur Taluka 1950·51 NA NA 9 NA NA 9
1956·57 2,877 10 10 647 ··10
1959·60 2,894 12 12 5 724 12
Amravati Taluka 1950-51 NA NA 30 NA NA 30
1956·57 4,341 18 18 1 1,690 18
1959·60 4,282 26 26 1,877 26
Chandur Taluka 1950-51 NA NA 27 NA NA 27
1956·57 3.281 25 25 4 1.328 25
1959·60 3,309 26 26 4 2,321 26
NA~Not Available.
Source: Season and Crop Reports and Land Records Department.
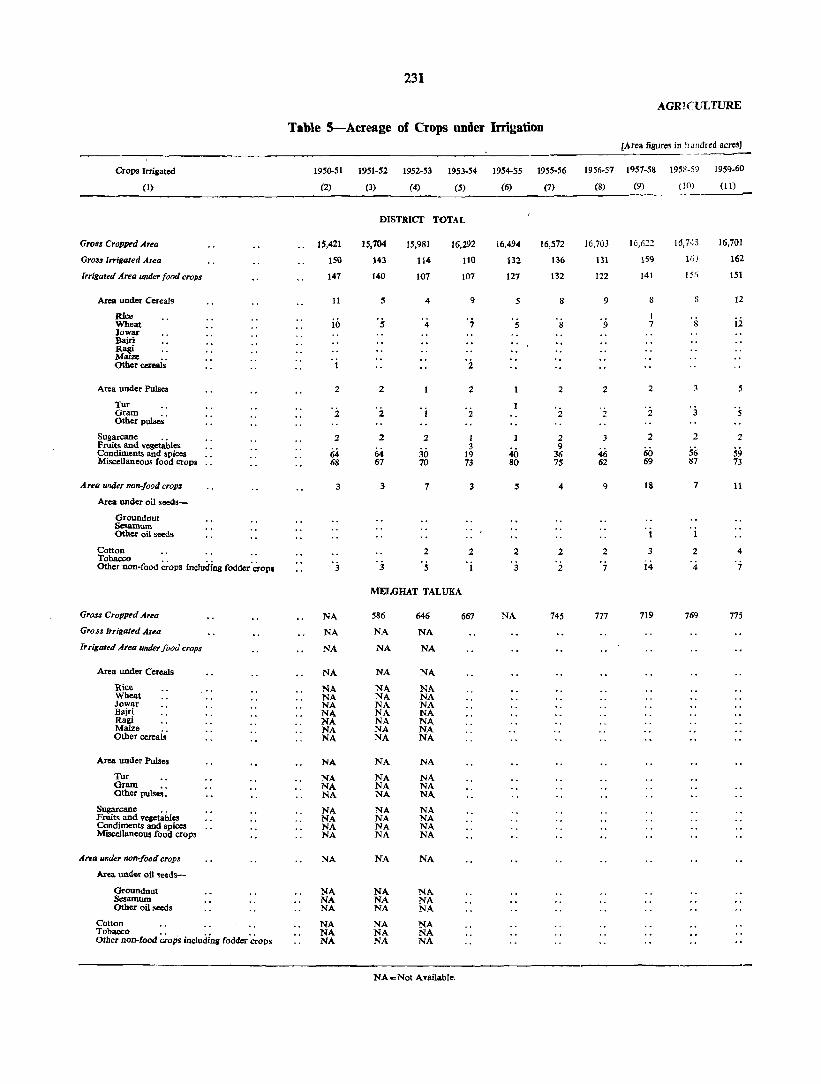
231
AGRICULTURE
Table S-Acreage of Crops under lnigation [Area figures in hundred acre~J
Crops Irrigated 1950-51 1951-52 1952-53 1953-54 1954-55 1955-56 1956·57 1957·58 1958·59 1959·60
(1) (2) (3) (4) (5) (6) (7) (8) (9) (10) (11) _-- --____,.-
DISTRICT TOTAL
G~$ Cropped Ar~a 15.421 15,704 15.981 16.292 16.494 16,572 16,703 16,622 Id,7L~S 16,701
Gr088 Irrigated Area 150 143 114 110 132 136 131 159 163 162
Irrigated Area under food crops 147 140 107 107 127 132 122 141 1.5~ 151
Area under Cereals 11 5 4 9 5 8 9 8 8 12
.Rice '7 '9 1
ii Wheat 10 5 4 5 8 7 8 Jowar llajri Ragi J'daize Other cereai; . i '2
Area under Pulses 2 2 2 2 2 2
Tor '2 'j '5 Gram 2 2 2 2 2 3
Other puLseS .
Sugarcane " 2 2 2 1 2 3 2 2 2 Fruits and vegetables
64 30 3
40 9 46 56 59 Condiments and spices 64 19 36 60
Miscellaneous food crops 68 67 70 73 80 75 62 69 87 73
A rea under non-/ood crop. 3 3 7 3 5 4 9 18 7 11
Area under oil seeds-
Groundnut Sesamum Other oil seeds 1
Cotton .. .. .. 2 2 :2 2 2 3 :2 4 Tobacco Other non-food ~;'ops Including fodder 'CroPI 3 3 ·s 1 '3 2 '7 i-i: 4 '7
MELGHAT TALUKA
Gross Cropped Area NA 586 646 667 NA 745 777 719 769 775
Gross Irrigated Area NA NA NA
lrrigat~d Area un4er food crops NA NA NA
Area under Cereals NA NA NA
Rice NA NA NA Wheat NA NA NA Jowar NA NA NA Bajri NA NA NA Ragi NA NA NA Maize NA NA NA Other cereais' NA NA NA
Area under Pulses NA NA NA
Tor NA NA NA Gram NA NA NA Other pulse;: NA NA NA
Sugarcane .. NA NA NA Fruits and veletables NA NA NA Condiments and spices NA NA NA Miscellaneous food crops NA NA NA
Area lIIIlier non·food crops NA NA NA
Area und"r oil seeds-
Groundnut NA NA NA Sesamum NA NA NA Other oil seeds NA NA NA
Cotton NA NA NA Tobacco NA NA NA Otber non-food ;;;'ops includinfl fodder ".:'rops NA NA NA
NA-Not Available.
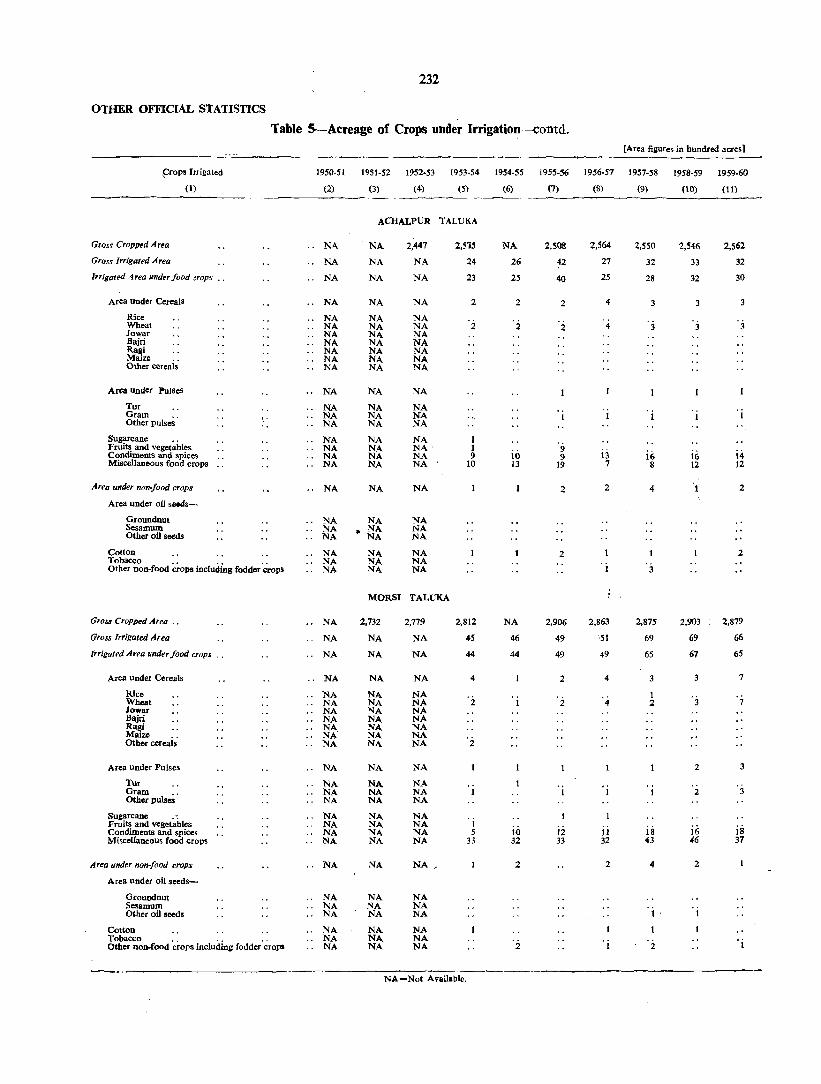
232
OTHER OFFICIAL STATISTICS
Table S-Acrellge of Crops under Irrigation-contd. [Area fiillres in hundred acres]
~rops Irrigated 1950-51 1951-52 1952·53 1953-54 1954-55 1955-56 1956-57 1957-58 1958-59 1959-60
(1) (2) (3) (4) (5) (6) (7) (8) (9) (10) (11)
ACHALPUR TALUKA
Gross Cropped Area NA NA 2,447 2,5~ NA 2,508 2,564 2,550 2,546 2,562
Gross Irrigated Area NA NA NA 24 26 42 27 32 33 32
Irrigated Area IInder food :rops NA NA NA 23 25 40 25 28 32 30
Area Under Cereals NA NA NA 2 2 2 4 3 3
Rice NA NA NA '3 Wheat NA NA NA 2 2 2 4 3 3 Iowar NA NA NA Bajri NA NA NA Ragi NA NA NA Maize NA NA NA Other cereais NA NA NA
Area Under PulseS NA NA NA
Tur NA NA NA 'i Gram NA NA NA 1 Other pulses' \' NA NA NA
Sugarcane •. NA NA NA 1 Fruits and vegetables NA NA NA 1 9
i6 iii i4 Condiments and spices NA NA NA 9 10 9 13 Miscellaneous food crops NA NA NA 10 13 19 7 8 12 12
Area under non-food crops NA NA NA 2 2 4 1 2
Area under oil se.ds-
Groundnut NA NA NA Sesamum NA • NA NA Other oil seeds NA NA NA
Cotton NA NA NA 2 2 Tobacco NA NA NA Other Don-food c~ops including fodder 'Crops NA NA NA 1 '3
MORSI TALUKA
Gras. Cropped Area , , NA 2,732 2,779 2,812 NA 2,906 2,863 2,875 2,903 2,879
Gross Irrigated Area NA NA NA 45 46 49 ,51 69 69 66
Irrigated Area under food crops NA NA NA 44 44 49 49 65 67 65
Area under Cereals .. NA NA NA 4 2 4 3 3 7
Rice NA NA NA 1 '3 " Wheat NA NA NA 2 2 4 2 Iowar NA NA NA Bajri NA NA NA Ragi NA NA NA Maize NA- NA NA '2 Other eereab' NA NA NA
Area under Pulses NA NA NA 2 3
Tur NA NA NA 'j Gram NA NA NA 1 2 3
Other pulse; , NA NA NA
Sugarcane , , NA NA NA Fruits and vegetables NA NA NA I
ii is iii is Condiments and spices NA NA NA 5 10 12 Miscellaneous food crops NA NA NA 33 32 33 32 43 46 37
A rea under non-food crops NA NA NA, 2 2 4 2
Area under oU seeds-
Groundnut .. NA NA NA Sesamum NA NA NA OIher oil seeds NA NA NA 1
Cotton NA NA NA Tobacco NA NA NA '2 'j , i Other non.food ~rops includins foddet'~rops NA NA NA 2
NA-Not Available,

233
Table 5-Acreage of Crops under IrrigatiOll-CODtd.
Crops Irrliatcd (1)
Groll .Cr()pt)IId Jfretl "
Grou l"/gated .Mea
,,,,,GI,4 Ana IDIIkr food crop~ .'
Area IlJlder CereaIa
Rico Wheat lowar Bajri R~ Maize . , Other cereals
Area under Pulses
Tur Gram .. Otherpu1ses
Sugarcane FruitS 'IUld vegetables Conditnents and spices Miscellaneous food crops
Ar,a IDIIkr "on-/oo4 crOp8
Area under oil·seeds
Grounl1nut Sesamutn ., Other oil seeds
Cotton Tobacco .• •• •• Other non·food crops incilldina fodder crops
~l';r088 Cropped Area
Gross lrrigllled Area
Irr/gated Area under [004 CTOl'8
Area under Cereals
Rice Wheat Jowar Bajd
~ ., Other cereals
Aroa under Pullet
Tur Gram ., Other puIsea
Su,arcane FruitS and vegetables Condiments and spices Miscellanoous food crops
AreG""'r _food cr0ll8
Area under oil seeds
Groundnut Sesamum .. Other on seeds
Cotion .• ., •• Tobacco .• •• " Oth« uou-fooc1 crop' iw:ludin& ~ crops
H 4222-16
195O-S1
(2)
NA
NA
NA
NA
NA ., NA
NA NA NA
., NA
., NA
NA
., NA NA
., NA
NA NA NA NA
NA
Nt.. NA NA NA NA 1'110.
NA
NA
NA
NA
Nt.. NA Nt.. NA NA 1'110. NA
NA NA NA NA
NA NA NA NA
NA
.NA ., NA
NA NA NA Nt..
19S1-$2 1952-S3
(3) (4)
19$3-54
(S)
DARYAPUR TALUKA
NA
Nt..
NA
NA
NA NA NA NA NA NA NA
NA
NA NA NA
NA NA NA NA
NA
NA NA NA
NA NA NA
2173
NA
NA
NA
NAC NA NA NA 1'110. NA NA
NA
NA NA NA
NA NA NA NA
NA
NA NA NA
NA NA NA
2,831
7
7
'j
AMRAVATl TALUKA
4,078
NA
NA
1'110.
NA NA NA NA NA NA NA
NA NA NA NA
NA NA NA NA
NA
NA NA NA
NA NA Nt..
4.110
NA
NA
1'110.
NA NA NA NA NA 1'110. 1'110.
NA
NA NA NA
NA NA NA NA
NA
NA NA NA
NA NA Nt..
4,230
18
17
'i
iii
, i
NA - Not Available.
1954-SS
(6)
NA
9
9
. ,.
'2 7
NA
29
28
1
'i
's 18
. i
1955-56
(7)
2.874
10
10
"i 7
4,333
17
15
'4 10
1
AGRICULTURE
[Area figures in hundred acres}
1956-57
(8)
2,877
10
7
3
,
4,341
18
18
. 5 12
1957-58
(9)
2,886
9
6
2 3
3
4,260
26
ZO
1
'i
7 11
6
1958-59
(10)
2,920
10
7
'j
4,308
'26
26
8 17
1959-60
(11)
2.894
12
9
'4 s
3
4.282
26
24
. i
2 "
14
2
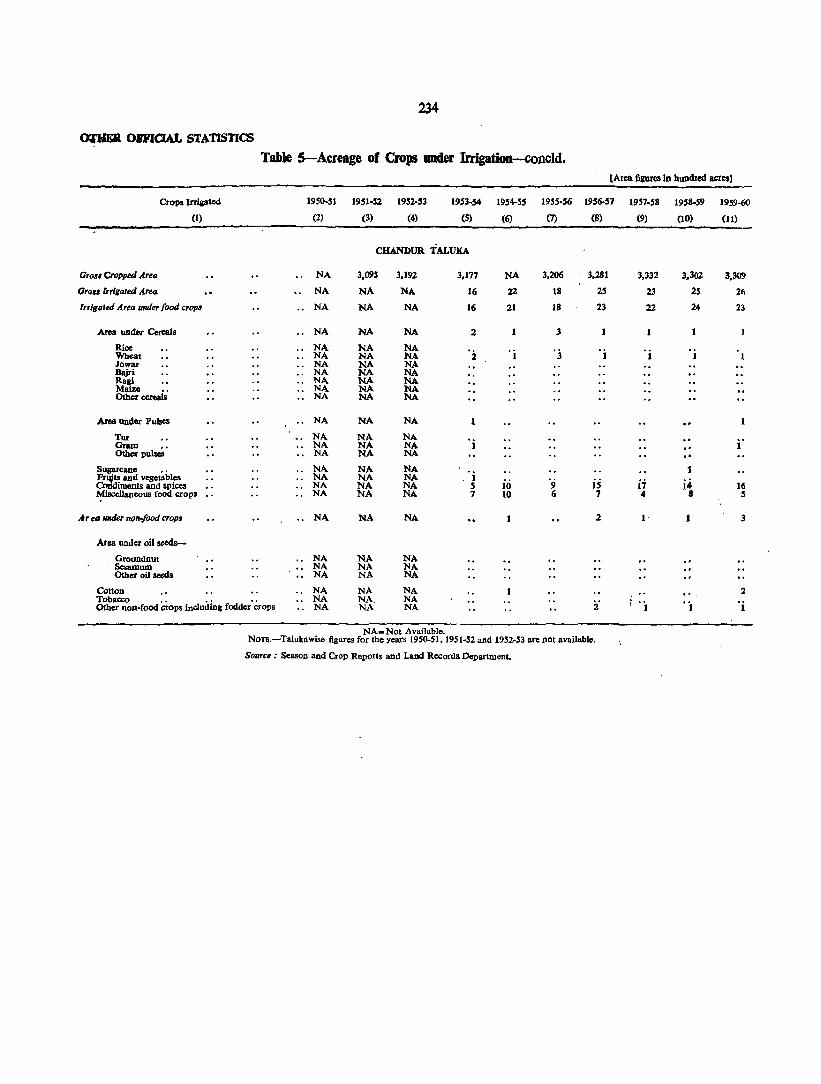
~ OD'ICIAL STATISTICS
Table·5-Aereage of Crops under Irrigation-concld, [Area figurea In hundred acres}
Grollll Cropped Area
Groll' Irrigated Are<!
Crops Irrigated
(I)
Irrigated Area under food crops
Area under Cereals
Rice Wheat Jowar Bajri R' ~~ .. Other cetea1s
Area IlDder PuIaeS
Tur Gram •• Othor pulse$
Supreane , . Felli" and vegetables Corldiments and spices ~isce1laneous food crops
Ar ea under non-food crOPIl
Area Under oil seeds
Groundnut Sesamum Other oil seeds
Cotton .' Tobacco .. .. .. Other non·food crops including fodder crops
1950-51
(2)
NA
NA
.. NA
NA
.. NA NA NA NA NA
.. NA NA
NA
NA NA NA NA NA
" NA NA
NA
" NA .. NA
NA
" NA NA NA
1951·52 1952-53 1953·54 19S4-55
(3) (4) (5) (6)
CHANDVlt TALUKA
3,095 3,192
NA NA
NA NA
NA
NA NA NA NA NA NA NA
NA
NA NA NA NA NA NA NA
NA
NA NA NA NA NA. NA
NA NA NA NA NA NA NA NA
NA
NA NA NA NA NA NA NA
NA
NA NA NA
NA NA NA
NA-Not Available.
3,177
16
16
2
'i
1 S 7
NA
22
21
. i
ici 10
1955·56 1956-57 1957.58
(7) (8) (9)
3,206
18
18
3
'3
'9 6
3,281
2S
23
'i
is 7
2
z·
3,332
23
22
1
ij 4
'j
NOTE.-Talukawise figures for the years 1950-51,1951·52 and 1952.53 arc not available.
SourcB : Season and Crop Reports and Land Records Department.
19'8-59
(10)
'i
.0
:l
i4 8
1
'1
1959-60
(11)
3,309
26
23
r
16 5
3
2
'i

Principal Crops
Rice
Wheat
Jowar
Sajri
Total Cereals
Total Pulses
Tur
Gram
(I)
Sugarcane (Gur)
Total Foodgrains
Groundnut
Se~amum
235
AGRICULTURE
Table 6-Yield per Acre and Outturn of Principal Crops [Yield per acre in Ibs. and Outt urn in hundred tons)
1950-51 1951-52 1952-53 1953-54 1954-55 1955-56 1956-57 1957-58 1958-59 1959.60
Yield Out- Yield Out- Yield Out- Yield Out~ Yield Out- Yield Out- Yield Out- Yield Out- Yield Out- Yield Out-per turD per turn per turn per turn per turn per turn per turn per turn per turn per turn acre acre acre acre acre acre acre acre acre acre
(2) (3) (4) (5) (6) (7) (8) (9) (to) (lI) (12) (13) (14) (15) (16) (17) (18) (19) (20) (21)
., NA NA 631 29 647 28 468 19 422 16 391 18 873 46 735 41 560 35 448 27
., NA NA 404 ISO 306 117 336 129 439 180 425 188 462 214 229 98 535 206 5\2 213
NA NA 688 1,539 555 1,261 779 1,697 654 1,406 498 1,025 649 1,397 433 866 523 1,048 339 653
NA NA 405 28 345 24 407 28 407 28 320 21 394 25 202 12 278 17 264 16
NA NA 635 1,753
NA NA 1,079 '750
510 1.441 695 1,881 607 1,637 477 1,258 611 1,696 398 1,027 517 1,319 369 919
547 391 576 380 1,037 725 639 446 807 574 615 429 602 413 784 533
NA NA 1,549 514 727 277 1,359 565 893 362 1,273 508 843 329 843 343 1,104 457 820 331
NA NA 345
NA NA 2,240
!8 249
2 2,240
17 331
2,240
22 384
4,480
31 271
2 2,240
30 319 31 218
2,240 2,240
19 299
2 2,240
24 231 34
2 2,240 2
NA.. NA 725 2,503 522 1,821 765 2,606 614 2,083 547 1,832 612 2,125 441 1,440 573 1,852 4091,316
NA NA 525 116 321 88 517 95 727 121 350 74 368 94 441 104
219 8 215 7 297 II 219 9 208 8
Rape. mustard and linseed
NA NA 244
.. NA NA 227
11 172
14 206
67 654
8 233
10 217
87 521
10 227
9 244 12 216 13 236 21 172 15 255 14 254 16
Cotton (in bales of 392 lb •. each) NA
Tobacco NA
NA
NA
104 1,819
560
76 1,392
747
80 1,614
448 1
59 1,192
640 2
NA=Not Available.
47 982
640 2
95 1,898
560
Source: The Statistician, Department of Agriculture, Maharashtra State, Poona.
Table 7-Wbolesale Prices of Principal Crops [Prices in Rs. nP. per Bengal Maund)
Year/Month Wheat Jowar Bajri Gram Tur
(I) (2) (3) (4) (5) (6)
70 1,433
Groundnut
(7) ---------------
1957-58 (Monthly Average) 1958-59 ( ) 1959-60 ( ,,) April 1959 (Actual) May 1959 " June 1959 July 1959 August 1959 September 1959 October 195!} November 1959 December 1959 January 1960 February 1960 March 1960
17'95 22'19 22'90 20'75 22'25 22'75 23'75 23 '38 25 '31 26'06 25.13 22'63 24'00 19'75 19,00
11'75 11'51 12'77 10'75 11'13 11'56 11'94 0'81 14'19 14'63 13'75 12-50 14'50 13·]3 13 ·31
14'46 13'85 15'50 15'09 13'41 16'91 16'25 16'18 J,H9 17'19 15'13 14'87 15'75 15'00 14'00
Source: Tahsildars, Amravati District.
Table 8-Harvest Prices
12'62 16'57 14'13 15'00 16'47 15'50
12'50 11'50 17'19
12'38 12"50
13'60 1942 ~f) 14 IY'75 21·94 26'38 20.63 20'19 21 '00 20'19 18'81 17'69 19 12 17'81 18'12
19'83 21'60 23 '63 24'12 2"69 24'87 24'38 22'50 22'25 21'69 21'12 24'63 20'75 25'06 25'45
[Prices per Bengal Maund)
Wheat lowar Bajri Turdal Gram Cotton Groundnut Castorseed Linseed Sesamum
H 4222-17 (626-9-66)
Crops
(n
1955-56
(2)
Rs. nP.
18 86 7 84 9 24
1956-57
(3)
Rs.nP,
1834 1287 1570
16'00 2905 1706 12 87 1853 2789
1957-58
(4)
Rs.nP.
1900 1206 12 55
13'50 2870 1212
16'00 2688
NOTE.-Figures for the years 1950-51 to 1954-55 are not available. Source : Season and Crop Reports.
1958-59
(5)
RS.nP.
22 19 1040 11 40 1660 14 38 2890 1880
21 '75 2325
1959-60
(6)
Rs. nP.
2094 1\ 75 II 80 2624 1622 2960 1980 1225 2200 2480
94 2,002 45 996
560 2
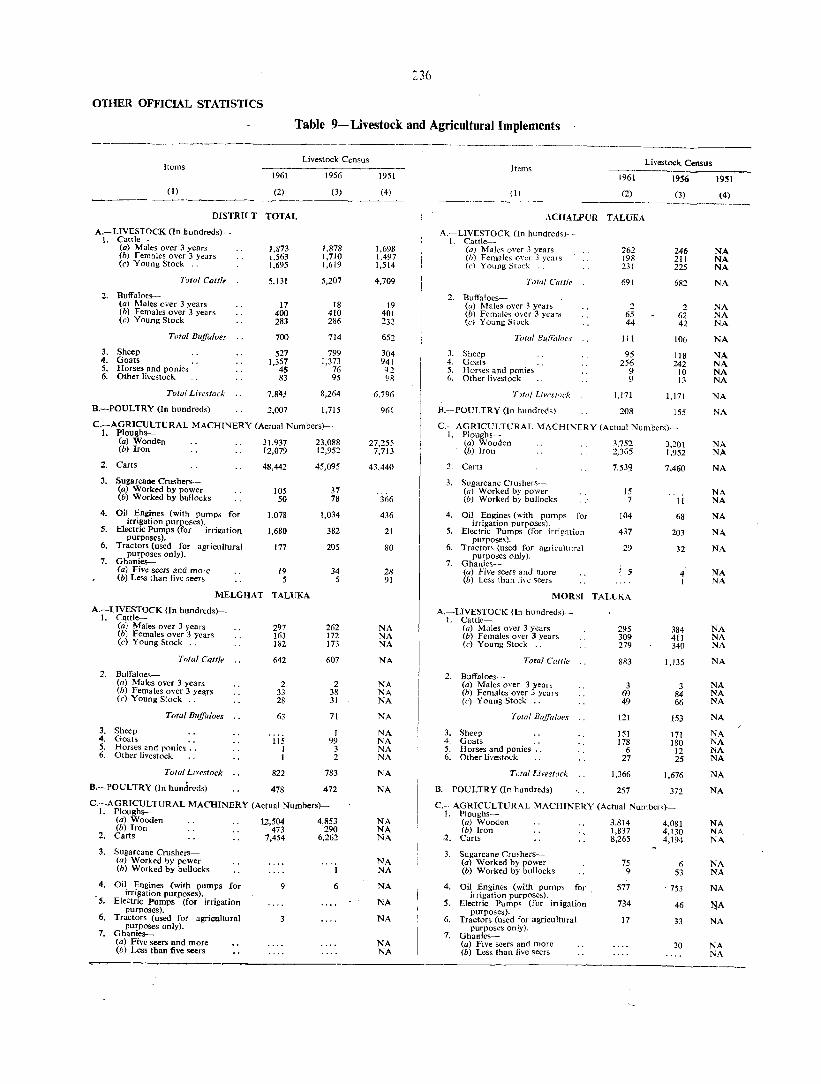
OTHER OFFICIAL STATISTICS
Table 9-Livestock and Agricultural Implements
Livestock Census Items
1961
(1) (2)
DISTRfCT TOTAL
A.-LIVESTOCK (In hundreds)-1. Cattl~
(a) MaJes over 3 years (b) Females over 3 years (c) Young Stock
Total Calli,
2. Buffaloes-(a) Males over 3 years (b) Females over 3 years (c) Young Stock
Total Buffaloes
3. Sheep 4. Goats 5. Horses and ponie.<; 6. Other livestock
Total Li,'esto( k
B.-POULTRY (In hundreds)
1,873 1.563 1,695
5,131
17 400 283
700
527 1,357
45 83
7,8lf~
2,007
1956
(3)
1,878 1,710 1,619
5,207
18 410 286
714
799 1,373
76 95
8,264
1,715
C.-AGRICULTURAL MACHINERY (Actual Numbers)-I. Ploughs-
(a) Wooden (b) Iron
2. Carts
3. Sugarcane Crushers(a) Worked by power (b) Worked by bullocks
4. Oil Engines (with pumps for irrigation purposes).
S. Electric Pumps (for irrigation purposes).
6. Tractors (used for agricultural purposes only).
7. Ghanies--(a) Five seers and more (b) Less than five seers
31,937 12,079
48,442
105 50
1.078
1,680
177
19 5
MELGHAT TALUKA
A.-LIVESTOCK (In hundreds}-1. Cattle-
(a) Males over 3 years (b) Females over 3 years (c) Young Stock ..
Total CallIe
2. Buffaloes-(a) Males over 3 years (b) Females over 3 years (c) Young Stock .. .
Total Buffaloes
3. Sheep 4. Goats .. 5. Horses and ponies .. 6. Other livestock
Total Ln'estock
B.-POULTRY (In hundreds)
297 163 IS2
642
2 33 28
63
115 I I
822
478
23,088 12,952
45,095
37 78
1,034
382
205
34 5
262 172 173
607
2 38 31
71
1 99
3 2
783
472
C.-AGRICULTURAL MACHINERY (Actual Numbers}-1. Ploughs-
(a) Wooden 12,504 4,853 (b) Iron 473 290
2. Carts 7,454 6,26~
3. Sugarcane Crushers(a) Worked by power (h) Worked by bullocks
4. Oil Engines (with pumps for irrigation purposes).
-5, Electric Pumps (for irrigation purposes).
6. Tractors (used for agricultural purposes only).
7. Ghanies-I a) Five seers and more (b) Less than five seers
9 6
1951
(4)
1,698 1.497 1,514
4,709
19 401 232
652
304 941 g2 ~lS
6.796
961
27,255 7,713
43-440
3(,6
436
21
80
28 91
NA NA NA
NA
NA NA NA
NA
NA NA NA NA
NA
NA
NA NA NA
NA NA
NA
NA
NA
NA NA
Items Livestock Census
(I)
1961
(2)
ACHALPUR TALUKA
A.-LIVESTOCK (In hundreds)--1. Cattle-
(a) Males over 3 years (b) Females OYer 3 years (e) Young Stock
Total Cattle
2. Buffaloes-(a) Males over 3 years (b) Females over J years (c) Young Stock
Total Bujraloes
3. Sheep 4. Goats 5. Hones and ponies G. Other livestock
Total Liv('s/()('k
B.--POULTRY (In hundreds)
262 198 231
691
2 65 44
III
95 256
9 9
1.171
208
1956
(3)
246 211 225
682
2 62 42
106
118 242
10 13
1,171
155
C.-AGRICULTURAL MACHINERY (Actual Numbers)-I. Ploughs
(a) Wooden (b) Iron
Carts
3. Sugarcane Crushers-(a) Worked by power (b) Worked by bullocks
4. Oil Engines (with pumps for irrigation purposes).
5. Electric Pumps (for irrigation purposes).
6. Tractor; (used for agricultural purposes only).
7. Ghanies-(a) Five seers and more (b) Less than five seers
3,752 1,365
7.532
15 7
104
437
29
i 5
MORSI TALUKA
A.-LIVESTOCK (In hundreds)--I. Cattle-
(a) Males over 3 years (b) Females over 3 years (c) Young Stock ..
Total Cattle
2. BuffaJoes-(a) Males over 3 years (b) Females over 3 years (e) Young Stock ..
Total BlijJei/oes
3. Sheep 4. Goats 5. Horses and ponies " 6. Other livestock
Total Livestock
B.-POULTRY (In hundreds) ' ..
295 309 279
883
3 69 49
121
151 178
6 27
1,366
257
3,201 1,952
7,460
11
68
203
32
4 I
384 411 340
1.135
3 84 66
IS3
171 180
J2 25
1,676
372
C.-AGRICULTURAL MACHINERY (Actual Numbml-I. Ploughs
(a) Wooden (b) Iron
,2. Carts
3. Sugarcane Crushers(a) Worked by power (b) Worked by bullocks
4. Oil Engines (with pumps for irrigation purposes).
5. Electric Pumps (fDr irrigation purpose::;).
6. Tractors (used for agricultural purposes only).
7. Ghanies-(a) Five seers and more (b) Less than five seers
3,814 1,837 8,265
75 9
577
734
17
4,081 4,130 4,194
6 53
. 753
46
33
20
1951
(4)
NA NA NA
NA
NA NA NA
NA
NA NA NA NA
NA
NA
NA NA
NA
NA NA
NA
NA
NA
NA NA
NA NA NA
NA
NA NA NA
NA
NA NA NA NA
NA
NA
NA NA NA
NA NA
NA
~A
NA
NA NA

237
AGRICULTURE
Table 9--Livestock and Agricultural Implements-coneld.
Livestock Census Items ----------
1961 1956 1951
(1) (2) (3) (4)
-------------------------DARYAPliR TALUKA
A.-LIVESTOCK (In hundreds)-I. Cattle--
(a) Males over 3 years (b) Females over 3 years (c) Young Stock
Total Caltle
2. Bulfaloes-(a) Males over 3 years (b) Females over 3 years (d Young St(lck
Tolal Buffaloe,
3. Sheep
4. Goats
5. Horses and ponies
6. Other livestock
Total Livestock
B.-POULTRY (In hundreds)-
255 184 222
66[
2 SO 37
89
105
10
13
1,115
263
229 195 217
641
2 46 34
82
167
241
II
IS
1,157
101
C.-AGRICULTURAL MACHINERY (Actual Numbers)-I. Ploughs--
(a) Wooden 1,259 1.369 \b) Iron 2,424 2.192
2. Carts .,
3. Sugarcane Crushers(a) Worked by power (b) Worked by bullocks
4. Oil Engines (with pumps for irrigation purposes).
5. Electric Pumps '(for irrigation purposes).
6. Tractors (used for ngricultural purposes only).
7. Ghanies--(0) Five seer;.. and more (b) Less than five seers
6,470
34
209
52
6 I
AMRAVATI TALUKA
A.-LIVESTOCK (In hundreds)-1. Cattle-
(a) Males over 3 years 419 (b) Females over 3 years 354 (c) Young Stock 413
Total Cattlc 1.186
2. Buffaloes-(0) Males over 3 years (b) Females over 3 years (c) Young Stock
TOlal Buffaloes
3. Sheep
4. Goats
5. Horses and ponies
6. Other livestock
Total Lil'estock
-POULTRY (In hundreds)
5 114
75
194
109
311
13
20
1,833
408
fi,t112
28
43
46
7 1
431 368 376
1.\75
5 115 70
190
226
358
27
22
1,998
306
NA NA NA
NA
NA NA NA
NA
NA
NA
NA
NA
NA
NA
NA NA
NA
NA NA
NA
NA
NA
NA NA
"A 'iA NA
NA
NA NA NA
NA
NA
NA
NA
NA
NA
NA
Livestock Census Items
(I)
1961
(2)
AMRAVATI TALUKA-condd.
1956
(3)
C.~AGRICULTURAL MACHINERY (Actual Numbers)
\. Plou!(h,--(a) Wooden (h) Iron
~_ Carts .'
J. Sugarcane Crllshers(a) Worked by power (b) Worked by bullocks
4. Oil Engines (with pumps for irrigation purposes).
5. Electric Pump' (for irrigation purposes).
6. Tractors (used for agricultural purposes only).
7. Ghanies-(a) Five seen and more (b) Less than five .eers
4.775 3.139
10,376
10 22
141
168
59
7 3
CHANDUR TALUKA
\ .. -LIVESTOCK (Tn hundreds)-
I. Cattle-(a) Males over 3 years (b) Females over 3 years (c) Young Stock
Total Cattle
2. Buffaloes-(a) Males over 3 years (b) Females over 3 years (c) Young Stock
Total Buffaloes
3. Sheep
4. Goats
5. Horses and ponies
6. Other livestock
TOlal Livestock
B.-POULTRY (In hundreds)
345 355 368
1,068
3 69 50
122
67
260
6
13
1.536
393
4,482 2,944
12,51:2
29 5
90
87
74
2 3
326 353 288
967
4 65 43
112
116
253
13
18
1,479
309
C.-AGRICULTURAL MACHINERY (Actual Numbers)-
1. Ploughs(a) Wooden (b) Iron
2. Carts
3. Sugarcane Crushers(a) Worked by power (b) Worked by bullocks
4. Oil Engines (with pumps for irrigation purposes).
'\. Electric Pumps (for irrigation purposes).
6. Tractors (used for agricultural purposes only).
7. Ghanies-(a) Five seers and more (b) Less than five seers
5,833 1,841
8,338
5 10
213
132
17
5,102 1,4~4
8,045
1 7
89
:!o
Source: Bureau of Economics and Statistics, Bombay.
H 4222-17a
1951
(4)
NA NA
NA
NA NA
NA
N .. \
NA
NA NA
NA NA NA
NA
NA NA NA
NA
NA
NA
NA
NA
NA
NA
NA NA
NA
NA NA
NA
NA
NA
NA NA
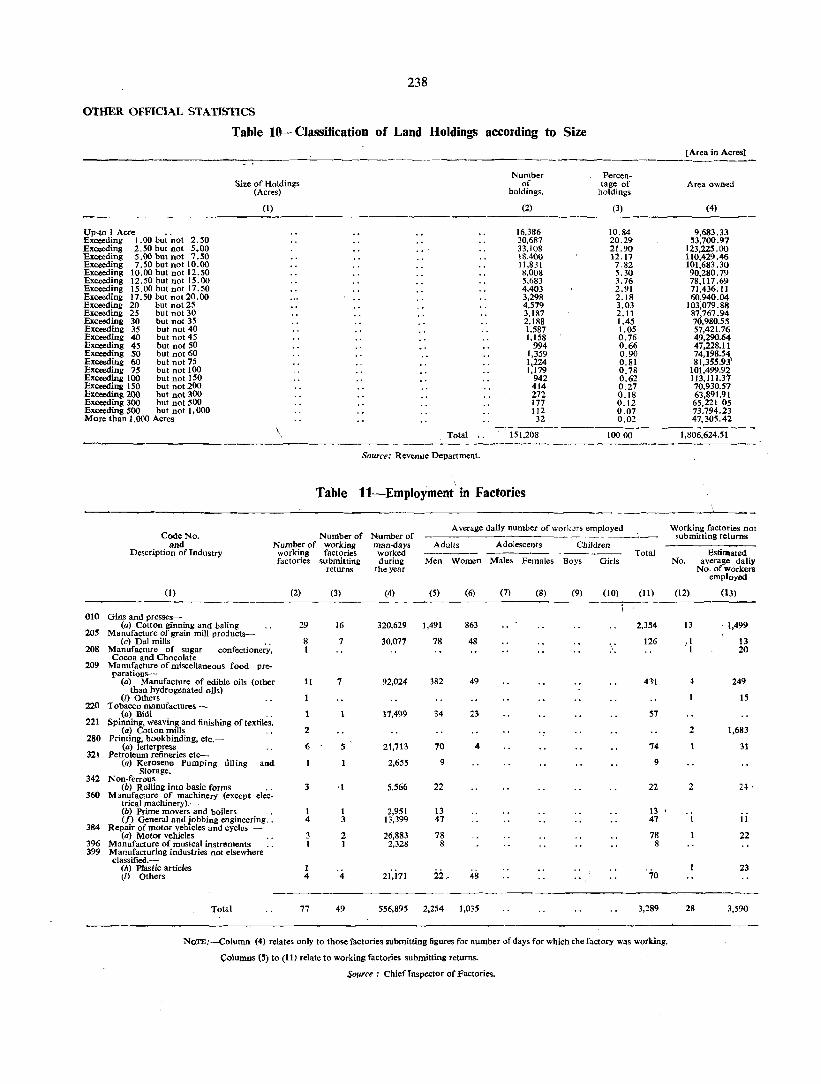
238
OTHER OFFICIAL STATISTICS
Table 10- Classification of Land Holdings according to Size
Size of Holdings (Acres)
Up-to 1 Acre " Exceeding 1.00 but not 2.50 Exceeding 2 . 50 but not 5.00 Exceeding 5.00 but not 7. SO Exceeding 7.50 but not 10.00 Exceeding 10.00 but not 12. 50 Exceeding 12.50 but not 15. 00 Exceeding 15.00 but not 17.50 Exceeding 17.50 but not 20.00 Exceeding 20 but not 25 Exceeding 25 but not 30 Exceeding 30 but not 35 Exceeding 35 but not 40 Exceeding 40 but not 45 Exceeding 45 but not SO Exceeding SO butnot60 Exceeding 60 but not 75 Exceeding 75 but not 100 Exceeding 100 but not 150 Exceeding 150 butnot200 Exceeding 200 but not 300 Exceeding 300 but not 500 Exceeding 500 but not I, 000 More than 1,000 Acres
Code No.
(1)
and Number of Description of Industry working
factories
(I) (2)
010 Gins and presses-(a) Cotton ginning and baling 29
205 Manufacture of grain mill products-(c) Dul mills
confectione;y, 8
208 Manufacture of sugar I Cocoa and Chocolate
209 Manufacture of miscellaneous food parations-
pre-
(a) Manufacture of edible oils (other 11 than hydrogenated oils)
(i) Others 220 Tobacco manufactures-
(a) Bidi 221 Spinning, weaving and finishing of textiles.
(a) Cotton mills 2 280 Printing, bookbinding, etc.-
(a) letterpress 6 321 Petroleum refineries etc-
(a) Kerosene Storage.
Pumping filling and
342 Non-ferrous (b) Rolling into basic forms 3
360 Manufacture of machinery (except elec-trical machinery).-(b) Prime movers and boilers 1 (f) General and jobbing engineering '. : 4
384 Repair of motor vehlcles and cycles -(a) Motor vehicles 3
396 Manufacture of musical instruments I 399 Manufacturing industries not elsewhere
classified.-(h) Plastic articles 1 (I) Others 4
Total 77
Number Percen-of tage of
holdings. holdings
(2) (3)
16.386 10.84 30,687 20.29 33,108 21.90 18,400 12.17 11,831 7.82 8,008 5.30 5,683 3.76 4,403 2.91 3,298 2.18 4,579 3.03 3,187 2.11 2,188 1.45 1,587 1.05 1,158 0.76
994 0.66 1,359 0.90 1,224 0.81 1,179 0.78
942 0.62 414 0.27 272 0.18 177 0.12 112 0.07 32 0.02
Total 151.208 10000
Source: Revenue Department.
Table ll-Employment'in Factories
Number of Number of Average daily number of work~rs employed
working man-days Adults Adoiescents Children factories worked ------ ------- Total
submitting during Men Women Males Females Boys Girls returns the year
(3) (4) (5) (6) (7) (8) (9) (10) (11)
16 320,629 1,491 863 2,354
7 30,077 78 48 126 ..
7 92,024 382 49 431
11,499 34 23 57
5 21,713 70 4 74
2,655 9 9
,I 5,566 22 22
I 2,951 13 13 3 13,399 47 47
2 26,883 78 78 1 2,328 8 8
4 21,i71 22, 48 70
49 556,895 2,254 1,035 3,289
[Area in Acresl
Area owned
(4)
9,683.33 53,700.97
123,225.00 110,429.46 101,683.30 90,280.79 78,117.69 71,436.11 60,940.04
103,079.88 87,767.94 70,980.55 57,421.76 49,290.64 47,228.11 74,198.54 81,355.93' 101,499.9~ 113,111.3 70,930.57 63,891.91 65,221 OS 73.794.23 47,305.42
1,806,624.51
_______""___-' -Working factories not
submitting returns
Estimated No. average daliy
No. of workers employed
(12) (13)
13 1.499
/1 13 I 20
4 249
IS
2 1,683
31
2 20t '
11
22
23
28 3,590
NOl"E :-Column (4) relates only to those factories submitting figures for number of days for which the factory was working.
Columns (5) to (II) relate to working factories' submitting returns.
Source: Chief Inspector of Factories.
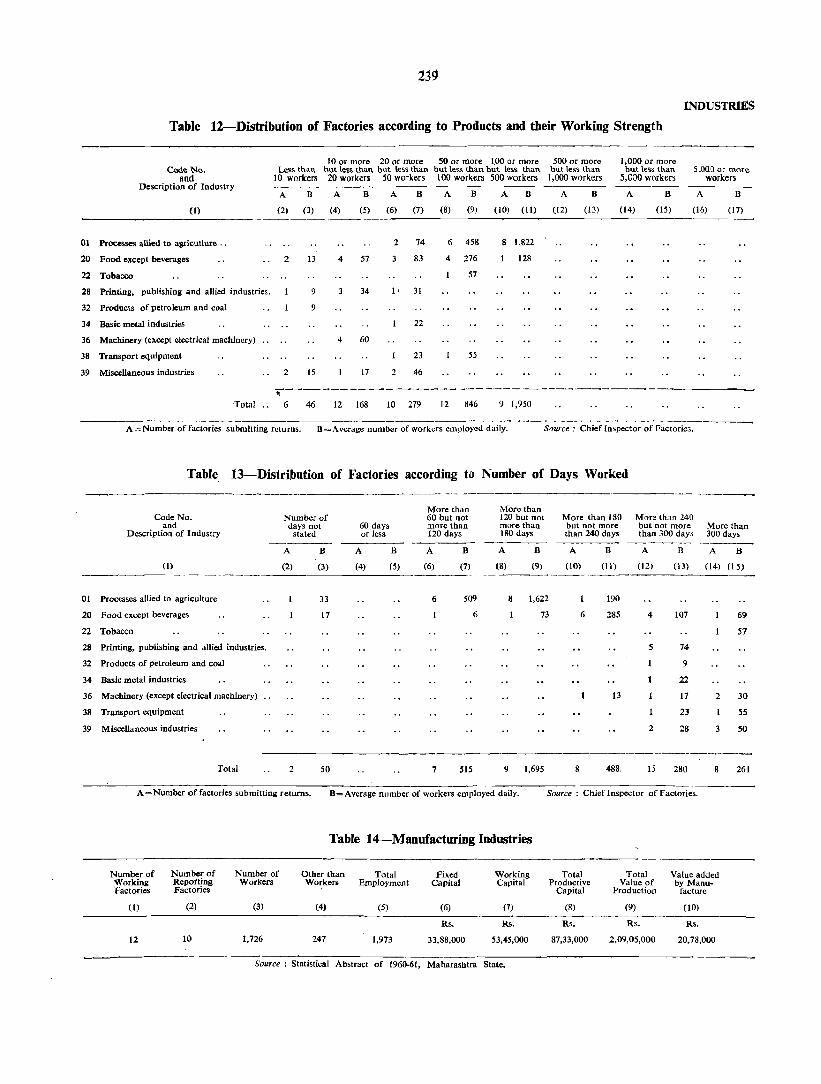
INDUSTRmS
Table 12-Distribution of Factories according to Products and their Working Strength
10 or more 20 or more SO or more LOO or more 500 or more I ,000 or more CodeN". Less than but less than but tess than but Ie" than bnt less than but tess than but less than 5,00;] or more
and 10 workers 20 workers 50 workers 100 workers 500 workers 1,000 workers 5,GOO workers workers Description of Industry ---- ----_ -------
A B A B A B A B A B A B A B A B
(I) (2) (3) (4) (5) (6) (7) (8) (9) (10) (II) (12) (13) (14) (15) (16) (17)
01 Processes allied to agricutlure .. 2 74 6 45& 8 1,822
20 Food except beverages 2 13 4 57 83 4 276 128
22 Tobacco 57
28 Printing, publisbing and allied industries. 34 I, 31
32 Products of petroleum and coal 9
34 Basic metal industries 22
36 Machinery (except electrical machinery) 4 60
38 Transport equipment 23 55
39 Miscellaneous industries 2 15 17 2 46
~-------- ----- ------- --- -------------------Total .. 6 46 12 168 10 279 12 846 9 1,950
-------A = Number of factories submitting returns. B=Average number of workers em910ycd daily. Source: Cbief Inspector of Factori.3.
Table 13-Distribution of Factories according to Number of Days Worked
More than More than Code No. Number of 60 but not 120 but not More than 180 More than 240
and days not 60 days more than more than but not more but not more More than Description of Industry stated or less 120 days 180 days than 240 days tban 300 days 300 days ---_--- ------
A B A B A B A B A B A B A B
(I) (2) (3) (4) (5) (6) (7) (8) (9) (10) (II) (12) (13) (14) (15)
01 Processes allied to agriculture 33 6 509 8 1,622 190
20 Food except beverages 11 6 13 6 285 4 101 69
22 Tobacco 57
28 Printing, publishing and allied industries. 5 74
32 Products of petroleum and coal 9
34 Basic metal industries 22
36 Machinery (except electrical machinery) 13 11 2 30
38 Transport equipment 23 55
39 Miscellaneous industries 2 28 3 50
Total 2 50 7 SIS 9 1,695 8 488. 15 280 8 261
A = Number of factories submitting returns. B= Average number of workers employed daily. Source: Chief Inspector of Factories.
Table 14-Manufacturing Industries
Number of Numborof Number of Otber than Total Fixed Working Total Total Value added Working Reporting Workers Worker. Employment Capital Capital Productive Value of by Manu-Factories Factories Capital Production facture
(I) (2) (3) (4) (5) (6) (7) (8) (9) (10)
Rs. Rs. Rs. Rs. Rs.
12 10 1,726 247 1,973 33,88,000 53,45,000 87,33,000 2,09,05,000 20,78,000
Source: Statistical Abstract of 1960-61, Maharashtra State.
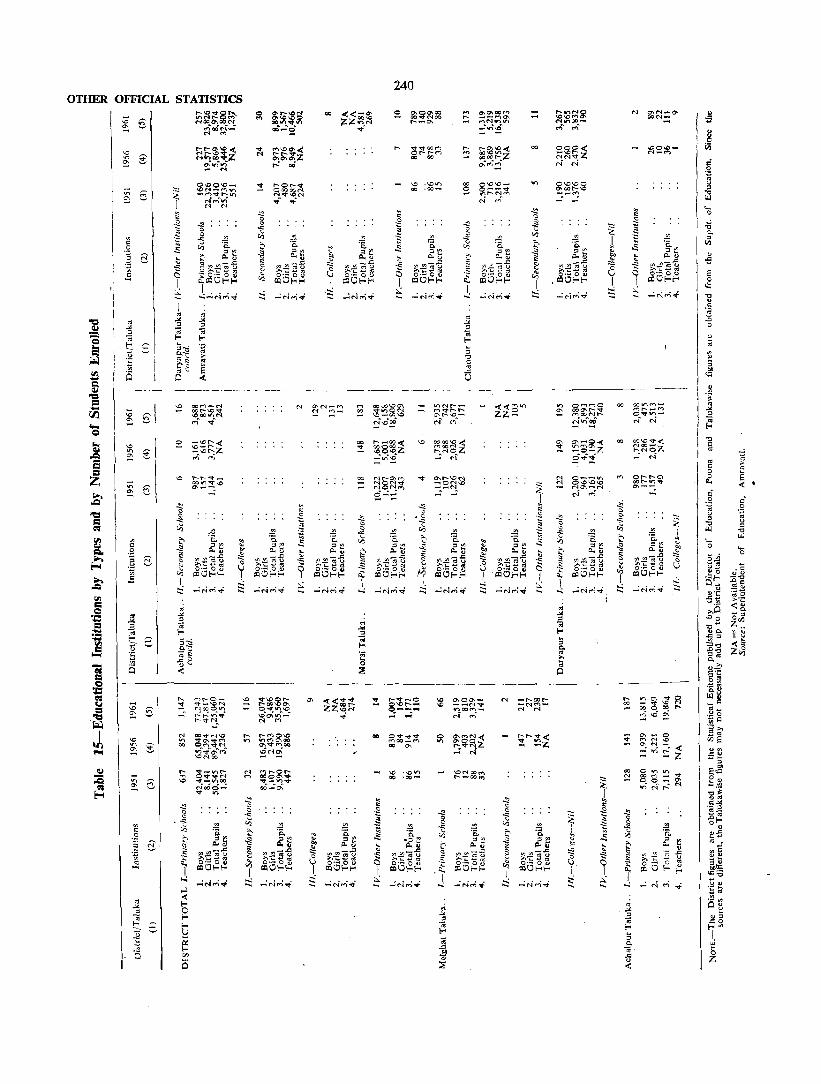
OTHER OFFICIAL STATISTICS
I (0 ~ ~
: 61 ~ ~! ~ c
8 ~~~~ ~ r.)
N
240
~ ,,~
to Q..t; E ~~]g ~ ~O~~ ~ "";NCf'i~
=
a ~~§~ ~ t'f")
~ ~~~:; It'lOOM_ N r..;
00 00 lI')(''''lfflt'--_M O~V)-
n" r-f
00 ~~~~ ..: N
~
.0 OJ" -"0 .00 "OJ ~.~ <" -g-0'" z .. II ~ <::: z~
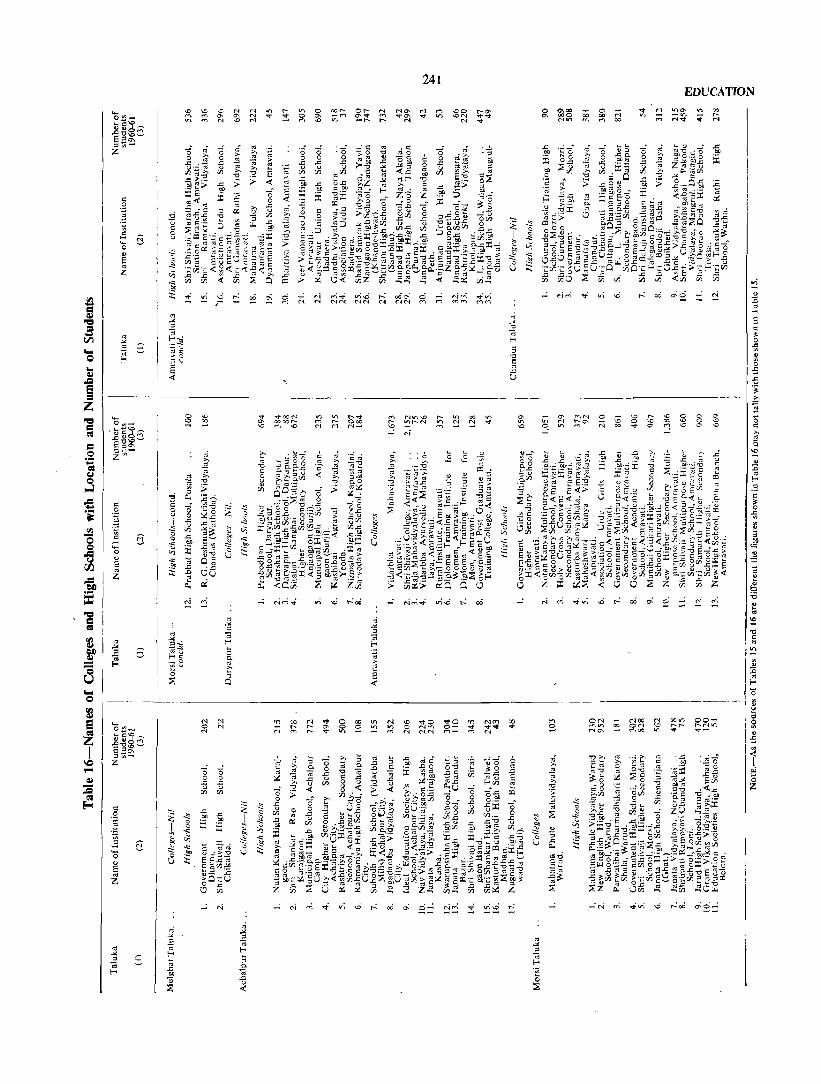
t
1 z \---
~l N
00
'" '"
241
I"f") t"IV'l\O r- V) 00 V'l
~ lI'1l'"'-M ~ N ~ 'O!;f
oi
<to 0-<'.-
EDUCATION

242
OTHER OFFICIAL STATISTICS
Table 17-Medical Facilities
Number of Beds Indoor Patients treated Outdoor Patients treated
DistrictjTaluka Years -liospi- Mater- Dispen- Rural Doctors Nurses tals nilY saries Health
Females Males including Males Females Children Males
children
(I)
DISTRICT TOTAL
Melgbat Ta1uka
Acha1pur Taluka
MOf5i Taluka
Daryapur Taluka
Amravati Taluka
Chandur Taluka
(2)
1955 1960
1955 1960
1955 1960
1955 1960
1955 1960
1955 1960
1955 1960
Homes Centres
(3) (4) (5) (6) (7) (8) (9) (10) (11) ------------ -------------------__ -----
18 19
, 1 1
3 3
3 3
2 3
7 7
2 2
18 22
3 5
4 3
5 7
5 5
ii
2
2
2
3
2
51 58
3 5
3 5
7 8
6 7
24 24
8 9
to 162
10
ii> 2
10
1 15
7 107
10
219 230
6 15
27 27
21 34
13 33
144 103
8 18
116 353
9
16 21
12 31
9 31
3,683 6,387
NA 7
NA 1,696
NA 103
NA 241
73 NA 236 4,264
6 25
NA 76
(12)
4,379 3,967
NA 6
NA 2,jJ94
NA 374
NA 468
NA 609
NA 416
Females Children
(13) (14)
2,544 194,136 7,144 279,168
NA NA 4 4,174
NA NA 1,384 30,180
Ni\ NA 278 55,086
NA NA 413 33,462
(15)
135,621 180,100
NA 1,367
NA 37,050
NA 28,578
NA 19,280
(16)
232,111 276,128
NA 4,056
NA 28,917
NA 69,556
NA 47,958
NA NA NA NA 4,788 116,261 68,746 73,4{)6
NA 277
NA NA 40,005 25,079
NA 52,235
NOTE.-Figures for the year 1950 are not available. NA=Not Available. Source : The Civil Surgeon, Amravati.
\ Table IS-Registered Births, Deaths and Infant Deaths
Years District(Taluka Births and Deaths
(1) (2)
1951
(3)-
1952
(4)
1953
(5)
1954
(6)
1955 1956 1957 1958 1959 1960
(7) (8) (9) (10) (11), . (12)
-----------------------------------------------------__ .-------------------------DISTRICT TOTAL
Melghat TaJuka
Achaipur Taluka
Morsi Taluka
Daryapur Ta1uka
Amravati Taluka
Chandur Taluka
., Births Deaths
Births Deaths
., Births Deaths
Births Deaths
., Births Deaths
Births Deaths
Births Deaths
Causes of Deaths
(1)
TOTAL DEATHS
Cholera
Smallpox
Plague
Fever
Dysentery and Diarrhoea
Respiratory Diseases
Other Causes
1951
(2)
2,625
110
736
24
86
4,820 2,625
5,236 2,310
4,753 2,306
4,386 1,760
5,871 9,713 10,751 4,436
12,437 ~ 6,428
14,135 19,251 6,203 7,081
8 5
2,162 1,231
653 397
1,374 540
623 452
2,370 1,067
821 451
1,316 415
729 374
4 2
1,999 968
3
750 462
1,372 498
628 373
4 3
2,036 824
3
735 342
1,351 466
260 122
2,152 3,997
7 6
2,458 1,007
16 5
887 307
1,597 420
906 407
22 10
2,463 915
81 9
844 311
1,691 398
4,612 2,354
NOTE .-FigureS for Infant deaths are not available separately. Source: The Civil Surgeon, Amravati.
Table 19-Registered Deaths and Causes of Deaths
1952
(3)
2,310
1953
(4)
2,306
29
9
1954
(5)
1,760
1955
(6)
2,152
29
1956
(7)
3,997
13
109
1957
(8)
4,436
52
80
16 6
2,332 927
8111 334
2,190 412
4,714 2,639
1958
(9)
6,428
179
40
16 5
2,187 935
,116 356
1,177 474
2,162 446
5,779 4,212
921 544
2,283 837
1,144 576
1,145 382
2,735 377
5,907 3,487
1959
(10)
6,203
19
501 706 377 652 999 1,332 2,170 2,453
226 24 t" 124 134 468 599 849 . 658
61 40 58 72 265 345 555 446
. 1,746 582
2,310 980
3,270 1,393
1,241 403
3,361 406
7,311 3,317
1960
(11)
7,081
37
2,407
564
510
1,669 1,522 1,281 1,200 1,265 2,143 2,028 2,635 2,627 3,563
--~-----------------~-------------~~~-------------------~---------------Sourc,,: The Civil Surgeon, Amravati.

243
Table 2O-Railway Mileage and Stations
I.-RAILWAY MILEAGE (In miles) n.-RAILWAY STATIONS
(1)
Broad Gauge
Metre Gauge
Narrow Gauge
Total
Type of Roads
(1)
1.-SURFACEWISE-
Cement Concrete
Bl.ck Topped
Water Bound Macadum
Lower Type ..
(2)
57.30
24.10
39.77
121.17
Taluka
(1)
Melghat Taluka
Achalpur T.lnka
Daryapur Talnk.
Stations
(2)
Dhulghat. Wan Road.
Achalpur. Nawbag. Chamak. Pathrot. Kusta Buzurg.
Banos •. Lehegoon. Anjang.on • .lI;..apustalni. Kokald •• Bhujwada.
Taluka
(1)
Amravati Taluka
Chandur Taluka
Source: The Divisional Superintendent, Central Railway, Bhusawal.
Table 21-Roads
1961 Type of Roads
(2) (1)
II.-CATEGORYWISE-
0.50 National Highways
271.36 State Highways
405.64 Major District Roads
7.58 Other District Roads
Village Roads
Total .. 685.08 Total
Source: Buildings and Communications Department, Government of Maharashtra, Bombay.
Table 22-Post Offices, Telegrapb Offices and Radio Licences
Radio Licences
MISCELLANEOUS
1961
(2)
46.16
176.25
268.15
42.30
52.22
685.08
Stations
(2)
Amravati Badnera. Takli Timt.la.
Ch.ndur. Malkhed. Dipare. Dhamangaon. Talani.
[Figures in miles]
1956 1951
(3) (4)
46.16 46.16
99.19 99.19
246.82 230.80
163.11 112.81
29.55 20.06
584.S3 509.02
Radio Licences
Post Telegraph Letter Postmen Telephone Tele- in force Post Telegraph Letter Postmen Telephone Tele- in force Year Offices Offices Boxes Offices phones on 31st
December Year Offices Offices Boxes Offices phones on 31st
December
(I) (2) (3) (4) (5) (6) (7) (8) (1) (2) (3) (4) (5) (6) (7) (8)
195()"51 154 13 232 80 101 NA 1956-57 225 21 420 90 5 593 1,675
1951-52 154 13 234 81 110 NA 1957-58 .. 230 22 440 90 5 609 4,182
1952-53 167 15 242 81 165 NA 1958-59 .. 252 23 470 91 5 793 1,501
1953-54 185 1.5 262 82 229 NA 1959-60 .. 255 23 476 91 5 806 1,671
1954-55 189 15 341 82 312 NA 196().61 258 24 480 91 5 799 1,983
1955-56 209 17 370 89 4 444 1,594
NOTE.-Figures relating to years before 1954-55 about Telephone Offices and Telephones relate to calendar years. NA= Not available
Source: (1) The Superintendent of Post Offices, East Berar Division, Amravati.
(2) The S D.O., Telephones and Telegraphs,' Akola., ,
OTHER OFFICIAL STATI"TI~S
Taluka
(1)
Melghat Taluka.
Achalpur Taluka.
Morsi Taluka
Daryapur Taluka.
Arnravati Taluka.
Name oftlie B=k with Locatiott
Year of Establishment
(2) (3)
1. Elichpur Central Coo. operative Bank, Dharni.
1. State Bank of Indi". 1-7-1955 Acha1pur.
2. Elichpur Central Co-operative Bank. Achalpur.
3. Vidarbha Co-operative Bank, Achalpur.
1. Mo"i Central Cooperathc Bank. Mor~i.
2. l\forsi Central Co-operative Bank, Warud.
3. State Bank of India 1-7-1955 Warud.
1. Daryapur Central Co-operative Bank, Daryapur.
2. State Bank of Indi", J -7-1955 Daryapur.
3. Daryapur Central Co-operative Ban k~, Anjangaon.
I. Amra"ati Central Co-operative Bank, Amravati.
244
Table 23-Banks
Type
(4)
Co-operative.
Scheduled.
Co-operative.
C;o-operative.
Co-operati vc.
ClJ-operati\'c.
Scheduled.
Co-operative.
Scheduled.
Co-operative.
Co-operati ve.
Taluka
(1)
Name of the Bank with Location
(2)
Year of Estab lishmen t
(3)
Amravati Taluka- 2. Amravati People's Co-cone/d. operative Bank,
Amravati. 3. Bank of Maharashtra.
Amravati. 4. B_tI~avat Nagpur,
5. Central Bank of India, Amravilti.
6. New Citizen Bank of India, ' Amravati.
7. Punjab National Bank Amravati.
8. State Bank of India, Amravati.
9. Vidarbha Co-operative Bank, Arnravati.
Chandur Taluka.· 1. Amravati Central Co-operative Bank, Chandur.
2. Elichpur Central Co-operative Bank, Chandur.
16·9-1935
13·11-1937
21-12-1911
31-7-1937
19-5-1894
1-7-1955
3. Bank of Nagpur, 13-11-1937 Dattapur. Dhamangaon.
4. Malkapur Co-operative Central and Land Mortgage Bank, Dattapur Dhamangaon.
5. State Bank of India, 1-1- 1955 Dattapuf Dhamangaon.
6. Amravati Central Cooperative Bank, Mozri.
Type
(4)
Co-operative.
Scheduled.
Scheduled.
Scheduled.
Scheduled,
Scheduled.
Scheduled.
Co-operative.
Co-operative.
Co-operative.
Scheduled.
Co-operative,
Scheduled.
Co-operative.
Source: Statistical Tables relating to Banks in India (Reserve Bauk of IndIa).
Distrid/Taluka
(I)
DlS:rruCT TOTAL
Achalpur Taluka
Daryapur Taluka
Arnravati Talnka
District/Taluka
(I)
DISTRICT TOTAL
Achalpur Taluka
Daryapur Taluka
Amravati Talnka
Table 24-I~and Revenue
1951 1952. 1953 1954 i Demand Collection Demand Collection Demand Collection Demand Collection
(2)
Rs.
NA
NA
6,29,082
9,71,395
Demand
(12)
Rs.
NA
3,68,991
6,29,743
7,41,698
(3)
Rs.
NA
NA
6,10,075
9,05,535
(4)
Rs.
NA
NA
6,29,304
9,71,020
(5)
Rs.
NA
NA
6,25,418
9,64,540
(6)
Rs.
NA
NA
6,29,507
9,71,135
(7)
Rs.
NA
NA
6,14,676
9,57,083
(8)
Rs.
NA
NA
6,29,444
9,71,332
(9)
Rs.
NA
NA
6,25,331
9,49,440
1956 1957 1958 1959
Collection
(13)
Rs.
NA
3,62,314
5,97,813
6,94,499
Demand
(14)
Rs.
NA
5,66,929
6,29,833
9,71,514
Collection
(15)
Rs.
NA
5,62,331
6,17,159
9,59,882
Demand
(16)
Rs.
NA
5,66,834
6,29,621
9,73,374
Collection
(17)
Rs.
l"A 5,64,711
6,16,724
9,60,319
Demand
(18)
Rs.
NA
5,66,174
6,29,769
9,73,609
NOTE.-Figures for Melghat, Morsi and Chandur talukas are not available. NA=Not Available. Source: The Collector, Arneavati.
Collection
(19)
Rs.
NA
5,54;460
6,16,220
9,58,319
1955
Demand Collection
(10)
Rs.
NA
NA
6,29,453
9,71,061
Demand
(20)
Rs.
NA
5!62,379
6,29,843
9,72,381
1960
(11)
Rs.
NA
NA
6,20.525
9,40,613
Collection
(21)
Rs.
NA
5,17,566
5,85,870
8,51,687

Table 25-Sales Tax and Entertainment Tax
Receipts 1950-S1 1955-56 1960 -61
(I) (2) (3) (4)
Rs. Rs. Rs.
Sales Tax NA 18,61,862 28,08,230
Entertainrn ent Tax NA NA 3,98,668
NA=Not Available. Source : (l) Excise Office, Amravati.
(2) Sales Tax Office. Amravati.
, Table 26---Dealers under Sales Tax Act
Year Registered Dealers
(I) (2)
1957-58 2,154
1958-59 1,897
Source: Administration Reports of Sales Tax Department.
Table 27-Documents Registered and Value of Property Transferred
Number of Value of Year Documents Property
Registered transferred
(I) (2) (3)
Rs.
1950 23,841 2,92,24, I 14 27,731 2,69,66,293
1951 28,941 2,78,10,532
1952 20,280 2,15,13,982
1953 22,316 2,38,66,258
1954 24,455 2,40,30,810
1955 27,813 2,46,62,121
1956 37,801 3,97,60,196
1957 41,092 4,71,56,014
1958 39,560 5,12,14,510
1959 20,975 4,79,22,681
Source: The Sub-Registrar, Amravati.
245
MISCELLANEOUS
Table 28-Police Force and Crime Statistics
Sub- Assis- Head Con- Total Cog- Non-Year Officers Inspec- tant Cr1n- stdbles Police nizable cogni-
tors Sub- ~tablc') Force crimes zable Inspec~ reported crimes
tOf'::.l. reported
(I) (2) (3) (4) (5) (6) (7) (8) (9)
1950 8 8 158 844 1,018 10,355 NA 1955 .. 9 28 153 860 1,050 14,728 NA 1960 11 28 290 1,267 1,596 5,552 NA
NA = Not Available. Source: District Superintendent of Police, Amravati.
Table 29-Cases decided in Civil and Criminal Courts
CIVIL CRIMINAL Year --------------
Original Appellate Original Appellate ------ -------_ -------
Regu- Miscel- Regu- Mlscel- Regu- Miscel- Regu- Misce~ lar laneous lar laneous lar laneous lar laneous
(I) (2) (3) (4) (5) (6) (7) (8) (9)
1950 3,006 1,151 313 36 368 42
1955 2,207 1,073 287 52 322 23
1960 2,084 2,305 440 59 8,222 5,502 267 162
'Information Dol available. Source: The Dhtrict and Sessions Judge, Amravati.
Table 3O-Electrical Energy Generated, Purchased and Consumed
( (In thousands 01 K. w. R)
K.W.H. K.w.H. K. W. H. Sold to Public
Year Gene- Pur- Do- Com- Indus- Public Other Total rated chased mestic mercial trial light- Pur-
consump- Light Power ing poses tion and
sm"n power
(I) (2) (3) (4) (5) (6) (7) (8) (9)
---------
1956-57 NA NA 2,447 320 3,115 445 696 7,023 1957-58 NA NA 3,160 440 3.219 595 ~.163 9.577 1958-59 NA NA 3.403 409 3,885 641 2,397 10,735 1959-60 NA NA 4,715 469 4,457 709 2,999 13,349 1960-61 NA NA 4,133 1,031 4,501 1,288 15,247 26,200
---------------------------NA = Not Available.
NOTE.-Figures from 1950-51 to 1955-56 are not available. Source: Deputy Director, Bureau of Economics and St"tistics, Nagpur.

OTHER OFFICIAL STATISTICS
Taluka
(1)
Melghat Taluka
Achalpur Taluka
Morsi Taluka
Vii1ages Electrified
(2)
Dhamangaon Salepur Dhotarkheda. Narsari Gaurkheda. Kothara. Kandali. Wadgaon Fattepur. Khudavantpur. Aregaon. Parsapur. Haram. Khanjamanagar. Tawalar. ' Pathrot. Sindi Bk. Kusta Bk. Khel-Mahal (Karajgaon) Khel-Chaudhar (Karajgaon) Shirajgaon-Kasaba. Deurwada. Bramhanwada (Thadi). Khel-Khushal-Kurha. Pandhari. Kajali. Suitanpur. KawithaBk. Ghodgaon. Narayanpur. Raipura. Tondgaon. Jawardi. Bopapur. Kakda. Madhan. Sirajgaon Band. Kharala. Nimkheda. Paratwada.
Ganeshpur Shirajgaon Karajgaon Pardi. Pimpalkhuta. Lihida. Shirkhed. Akhatwada. Nerpingiai. Dapori. Hiwarkhed. Bargaon. Khadka. Benoda. Pimpalkhuta. Jarod. Tembhurkheda. Loni. Amdapur. Tiwasa. Satnoor. Malkapur. Dhanodi. Malkhed. Ramapur. Khaparkheda.
246
Table 31-Towns and Villages Electrified
Towns Electrified
(3)
Chikalda.
Achalpur. Achalpur Camp. Chandur Bazar.
Morsi. Warud. Shendurjana.
Taluka
(I)
Morsi Taluka---concld ...
Daryapur Taluka
Amravati Taluka
Chandur Taluka
Source: Maharashtra State Electricity Board, Amravati.
Villages Electrified
(2)
Pardi. Pusala. Roshankhed. KurH. Sawangi. Jamatbi Ganeshpur RaJura. Chirgawhan. SurH. Porgawhan Morchud. Isapur. Paoni.
Nimkhedbazar Chausala. Lakhad. Bhandaraj. Adgaon. Takarkheda More. Karla. Dhanegaon. Kapustalni. Wadner-Gan61ai. Yeoda.
Shirala Walgaon. Revsa. YavIi. Dawargaon. Salora Kh. Mahuli Jagir Nandgaonpeth Borgaon. Rahatgaon. Wadgaon. Nawasari, Jamthi Shegaon. Mhasala. Anjangaon. Karajgaon. Loni. Wadgaon. Benoda. Rohankheda. Pardi.
Tivasa Talegaon ThakUr. ' Mozri. Shendurjana Kh. Warha. Kurha. Wadhona. Amla. Manjarkhed. Rajana. Supalwada. Dhanodi. KawalL Mangrul Dastagir. Daltapur. Ghusali. Kashikhed. Shendurjana. Asegaon. Talegaon (Dasasar).
Towns Ele<:trificd
(3)
Anjangaon. Daryapur Banosa.
Amravati City. Badnera.
Chaadur. Dattapur Dhamangaon.

~ II)
I 0 ~ " ..
01 ... :t ~
" .. .. () ~
en e Ii .L S I a' v;/: ;:, ct
'" ) 2 ... , '"' <I
,.;
" ~ .. SO;
'" I}
m I- «
YEOT"""'l a: '(
III ':t
~ :r
• Q
lit
o
• 0.
>
!""\ _._.J . ...... ~ I!! (
./ ;. (,/'" ! . l \ . i i L" .",
"
Q
'-j I
._.

Serial No,
(I)
J :z 3 .. 5 6 7 8 9
10 II 12 1J
1 2 J 4 5 6 7 8 9
10 II J2-
13 14 IS J6 17 18 19 20 21 22 2.3 24 2' 26 27 28 29 30 31 32 33 34 3' 36 37 38 39 40 41 42 43 44
45 46
I 2. 3 4 5 6 7 i 9
10 II 12 13 14 IS 16 17 18 19 20
247
MISCELLANEOUS
Table 32-WeekJy Markets and Cattle Markets
Name of Village Location
Code No. of Village
(2), (3)
MELGHAT TALUKA
Bair_d Dharili Kalamkhar GauJI<hM •.. Baru Susarda .. Kalkumbh .. Tcmbbarun Sonda Kulangana Kh. Gaull:heda
4 28 37 46 68 88
125 138 13'1 149
Harisal fF. V,) " 18 137
I Salona (F.V,) , . Chikalda Municipality
ACHALPUR TALUKA
Dhamangaon . , 13 Wadgaon Faltepur 31 PIlrSBI1Ur 47 Tawalar 59 Pathrct 74 Sindi Bk. 82 Kosta Bk. 83 Vishroli 104 Van; 105 Ghatladki .. .. 107 K!rel-Mahal (Karajgaon) 123 Khel-Cbaudbar (Karaj- 124
,",On). Shlrajgaon-Kasaba 128 Deurwada ., . . 130 Bramhanwada (Thadi) 132 Kb"j·KhushaJ-Kurlw 140 Kawitha Bk. 155 Bhugaon .. 189 Cbamak Bk. 192 Chamak Kh. 193 Naigaon .. 198 BOTgaon-Peth 200 Rasegaon 21 I WasniBk. 215 Kakda 217 Yeota 220 Donoda 223 Kolha 228 Ye.5urna 237 Asatpur 243 Sawalapur 244 Thugaon ., 249 Kondwardha . , 258 Pimpri Thugaon ., 259 Talegaoll Mohan. 271 TuljaplJl'gadhi 282 Sirajgaon Band 289 HiTur 290 Rajan. 296 lawala 304 Da higaon 311 Talwel 321 Asellllon .. .. " 327 Achalpur Camp Municipa· I
Jity. Achalpur City Municipality II Cbandur Bazar Municipa· III
lity,
~da Taroda Aahtoli KoMhir Udkbed Rithpur Porgawhan Khopada ., Brahmanwada Dbamaogaon Mamdapur Talcgaon Katpur .Bclora Vkhori Sawarkhe<! Patur Adllllon Kasampur
MORSI TALUKA
II 15 22 24 30 32 36 4Q 43 54 56 60 66 67 17 84 86 9Q 91 94
lla?ar Day
(4)
Monday. FridaY· Saturday, TuesdaY· MondaY Wednesday. Thllrsday. Saturday. Monday, Tuesday. Wednesday. Monday. SUnday.
It Wednesday. Sunday. Tuesday .. Sunday. Friday. Wednesday. Sunday. Wednesday. Tuesday. Saturday. Friday Friday.
Saturday. Friday. Tbursday. Wednesday. Monday. Sunday. Friday, Friday. Tuesday. Thursdal'. Tuesday. Sunday. Sunday. Saturday. Sunday. Friday. Monday. Thursday. Sunday. Thursday. Wednesday. Wednes4ay. Friday. Tuesday. Wednesday. Saturday. Friday. Thursdav. Sunday .. Friday. Wednesday, Thursday.'
Sunday, Sunday,-
Friday. Monday. Wednesday. Thursday. Friday. Saturday. Tuesday. Thursday. Wednesday. Saturday. Wednesday. Monda)', Saturday. Monday. Friday. Wednesday. Saturday. Thal'sday. Thursday. Thursday.
• Also a Cattle Market.
s"rial No.
(1)
21 22 23 24 2S 26 27 28 29 30 31 32 33 34 35 36 37 38 39 40 41 42 43
1 2 3 4 5 6 7 a 9
10 11 12 13 14 IS 16 17 18 19 20 21 22 23 24 25 26 27 23 29 30 31 32 33 34 35 36 37 38 39 40 41 42 43 44 45 46 47 48 49
1 2 3 4 5 6 7 8 9
10 II 12
Name of Village
(2)
Location Code
No. of Village
(3)
MORSl TAtUKA-condd.
Shirajgaon .. KhanapUT Pimpalkhuta Nimbhi Shirkbed Nerpinglai Rajurwad;
~;;;;~ahed " Jamgaon Benoda Shjngorj larud .. Tembhurkheda Loni Mangruli Malkapur Pu.ala Sawangi Rajura " " Mors; Municipality Warud Municipality Shendurjana Mllnicipalily
~1 127 150 151 161 169 174 188 197 198 207 215 220 225 229 234 263 281 292 297 I
If 1lI
DARY APUR TALUKA
Nimkhedba.ar 18 Aiwajpur . , 26 Chausala . , 30 Bhandaraj .. 40 Khell<okat 49 Sategaon . . 60 Vihigaon Bk, 62 [oharajpur 69 MurbaBk. 72 Kalgavan '. 73 Gavandgaon Bk. 74 Murha Kh. 75 Chincholi Bk. . . 71 Kuntbhargaan Kh, 82 Kapustalni 94 Kasbegavan 98 Taroda 105 Kamalpur ! 11 Nim"hari 112 KhaUar 128 Kokarda B6 Nachon. 153 Kanbali 154 Hustnpur 161 Wadner·Gangai .. 165 Urnr; M.mdabad .. 166 Warud Bk. 172 Yeoda 113 Ilk; 174 Pimplt>d . . 183 Sasan-RamapuT 189 Adula 190 Bhamod .. 194 totawada '. 196 Karatkheda 207 Tongal.bad 210 Nalwada . . 215 Chendakaput 219 Arala 224 Borala " 225 Daryapur '. 239 Nanded Bk. 253 Elichpur 260 Kala.hi 264 Amla 265 Panora 266 Sujapur . . , . . . 268 Anjang"on Municipality " r Daryapur Banos. Munkipality II
AMRAVATI TALUKA
Saur ShiraI. Ram. Thu,gaon " Takarkheda Dastarapur Pusada Ashti " NanduraBk. Walgaon Antora Deora
3 6
II 13 14 20 22 3S 39 42 ~3 59
Bazar Day
(4)
Saturday. Thursday. Sunday. Wednesday. Friday." Thursday. Saturday. Monday. Saturday. Tuesday. Salurday. Tue.day, Sunday. Saturday. Wednesday. Thursday. Friday. Tuesday. Sunday. Thursday,· Tuesday. Wednesday, Friday.
Saturday Monday. Sunday. Wednesday. Mond,y. Sunday. Friday. Sundoy. Sunday, Thursday. Tuesday. Sunday. Wednesday. Tuesday. Tuesday. Saturday. Sunday. Sunday. Saturday. Wednesday, Friday. Tuesday. Sunday. Sunday. Thurs<!ay. Salmday, Tuesday. Wednesday. Tuesday. Monday. Sa,ur4ay, Sunday. Friday. Tuesday. Tuesday. Sunday. Tue,day. Friday. Sunday, Wednesday. Sunday. Sunday. Wednesday. Wednesday. Sunday. Tuesday. Wednesday. Monday.' Thursday.·
Saturday. Wednesday, Satorday. Friday. Tuesday. Tuesday. Soturclay. Friday. Friday. ThW'llday. Tuesday. Mon~.

248
OTHER OFFICIAL STATISTICS
Table 32-Weekly Markets and Cattle Markets-concld.
Location Location Serial Name of Village Code Sazor Day Serial Name of Village Code Bazar Day No. No. of No. No. of
Village (I) (2)
Village (l) (2) (3) (4) (3) (4)
------------~--___.-----------~--------
AMRAVATI TALUK<\-concld. CHANDUR TALUKA
13 Brahmanwada GovindpUf 60 Sunday. Jawara 6 Monday. 14 Yavli 61 Friday. 2 Salargaon 7 Sunday. 15 Dawargaon 66 Mond:ty. 3 Tivasa II Friday. 16 Kapu:-;atalni 81 Saturday. 4 Warkhed 19 Monday. 17 M ahuli Jagir 83 Monday. S Mozri 20 Saturday. 18 Nandgaonpeth 100 Friday.· 6 Shendurjana' Bk. 21 Tuesday·. 19 Nirul 10; Tuesday. 7 Dhamantri 29 Wednesday. 20 Waki 108 Saturd8Y.
8 Shivangaon .. 33 Wednesday. 21 Wathoda 121 Monday.
9 Shirajgaon .. 37 Wednesday. 12 Dhanori 10 Murtijapur 50 Friday.
123 Sunday. 11 Shendurjana Kh. 42 Saturday. 23 Khartalegaon 124 Tuesday. 12 Taroda 51 Friday. 24 Hartala 155 Tuesday. 13 Warha 54 Monday. 25 Bhatkuli 165 Friday. 14 Mardi 67 Saturday. 26 Sayat 161 Monday. 15 Kurha 68 Thursday. 27 Asara 178 Saturday. 16 Karla 86 Monday. 2R TaJ..Jj 185 Tuesday. 11 Anjansingi 89 Sunday. 2<) \Vad(!ann 198 Tuesday.
18 Chinchpur 94 Saturday. 30 '; arkltt.,lu 19 Amla 97 Wednesday.
209 Sunday. 20 Nimla 98 Wednesday.
31 Wedne<iday. 21 Ja1ka 99 Saturday.
.: 'li=!s:di.l 2l! Wednesday. 22 Viru1 110 Friday. 32 Pid1]);.-, i t'.bma 211\ Wedneday. 23 S~wanga Vithoba :: 119 Friday. 33 \\'~~,!!; 221 ' Friday. 24 Malkhed .. 124 Tuesday. 34 GanoeJ 256 Tuesday. 25 Wadgaon Rajadi 135 Wednesday, 35 Badner" 257 Monday.
26 Kawatha .• 148 Thursday.
Friday. 27 Pa1askhed .. 149 Friday.
36 Ganojn 264 1.8 Satefal .. 155 Wednesday. 37 Dadhi Thursday. 29 AshrafpUT " 161 Thursday. 38 Anjangaon
282 Monday. 30. Jahangirpur 162 Thursday. 39 Pardi
287 Thursday 31 Dhanora Mogal 165 Monday~*' 40 Takli Bk.
2)3 Sunday. 32 Murtijapur 167 Thursday> 41 Dahigaon
294 Wednesday. 33 Ashok Nagar 169 Wednesday. 42 Loni
295 Tuesday. 34 Kawali 173 Monday .. 296 Saturday. 43 Hiwara 297 35 Wasad 174 Friday. 44 Mhosala Sunday. 36 Mangrul D~;tagir 175 Wednesday. 45 Dhanora F~~i
314 Friday. 37 Dighi ., 192 Saturday. 46 Mahuli Char
327 Thursday·. 38 M. M. Konher 202 Wednesday. 47 Wadara
332 Tuesday. 39 Nimboli 208 Friday. 48 Mokhad
334 Wednesday. 40 Talani 214 Thursday. 49 Pimpalgaon' BainJi .
340 Friday. 41 Sonegaon 226 Tuesday 50 Onkarkheda ..
348 Sunday. 42 Hirpur 229 Wednesday, 359 51 Mund Nishank 360
Saturday. 43 Borgaon Dh~nde 232 Friday. 52 Nandsawangi 369
Saturday. 44 Bhatkuli 233 Thursday. 53 Fubgaon .. Monday. 45 Usa Iga wha"; .
~!~ Thursday. 54 Palasmandal
39:) Wednesday. 46 Shendurjana Saturday. 55 Papal
393 Sunday. 47 Rajura 252 Tuesday. 56 Shiwani
396 Sunday. 48 J alka Patach~ 262 Tuesday. 57 Rasulpur
397 Monday. 49 Bori 264 Tuesday. 58 \Veni Ganeshpur
401 Monday. 50 Ghuikhed 273 Wednesday. 59 Mangrulcha wal
404 Tuesday. 51 Talegaon (Dasasari' 281 Monday." 60 Pirnpalgaon Nipani
416 Thursday. 52 Devgaon 283 Friday. 420 Friday. ..
61 Wadhona Ramnath 53 Shelunatwa 288 Sunday. 62 AmTavati City Municjpality
425 Monday. 54 Waghonda .. 289 Friday. 63
1 Sund~y. 55 Yerad 297 Friday. t~adnera Municipality .. II Monday. 50 Dhamak 298 Thursday. Friday. 57 Yevti 299 WednesdaY.
58 Dattapur Dhamang~on II Sunday. Municipality. -_
----------~--
, Also a Cattle Market
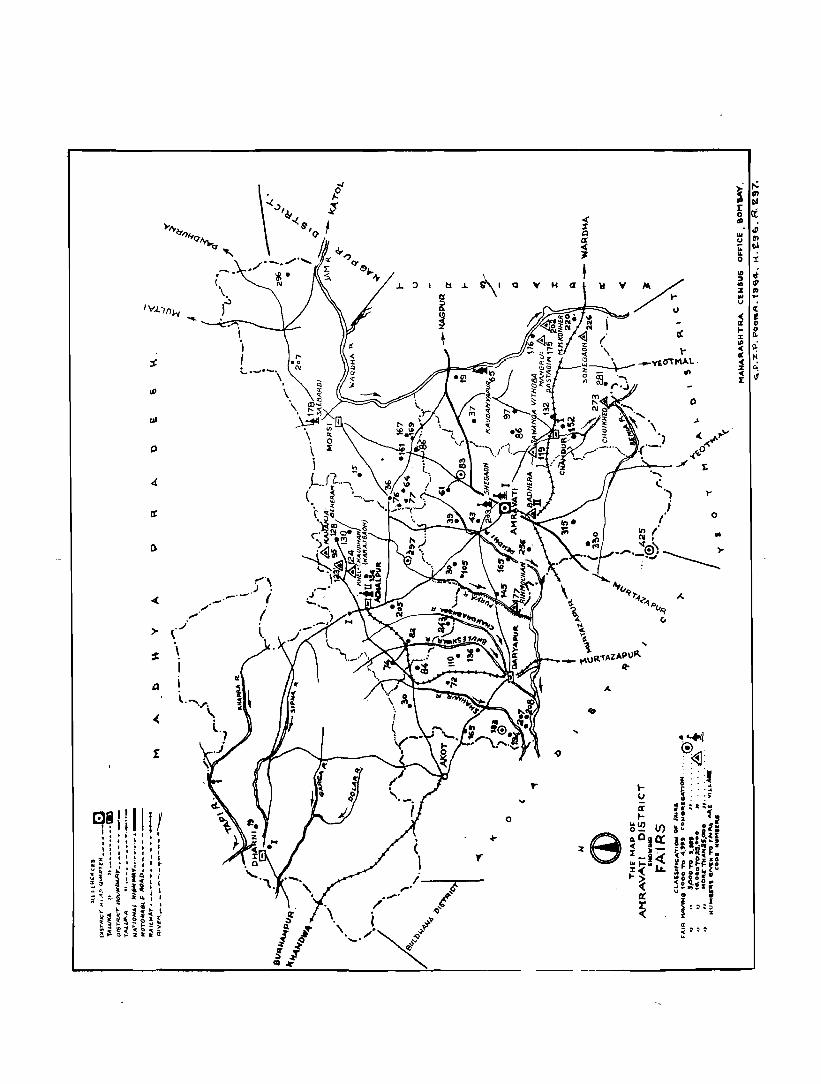
"--------------------------------------------------------------------------------------------------------~~
S :I ~ ri
::t
. ..1 \ \ I
~. ,... .
..... ,.-._.,
.J. 'J I
dI
1:1 J. ~I Q
o
..
A
,..
o
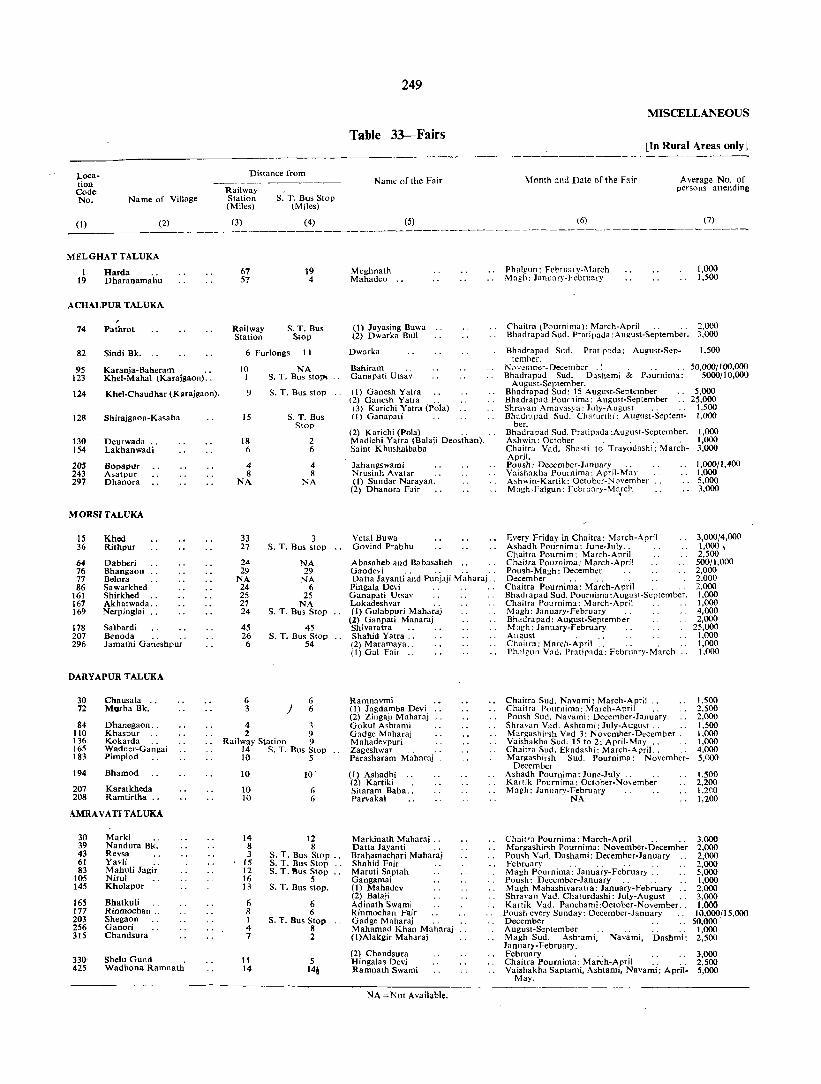
Location
Code No.
(l)
Name of Village
(2) ._----
MELGHATTALUKA
1 19
Harda Dharanamahu
ACHALPUR T ALUKA
74
82
95 123
124
128
130 154
205 243 297
Pathrot
Sindi Bk.
KaranjaaBaberam .. Khel-Mahal (Karajgaon) ..
Khel-Chaudhar (Karajgaon).
Shirajgaon-Kasaba
Deurwada .. Lakhanwadi
Bopapur Asatpur Dhanora
MORSI TALUKA
15 36
64 76 77 86
161 167 169
178 207 296
Khed Rithpur
Dabheri Bhangaon Belora Sawarkhed Shirkhed .. Akhatwada .. Nerpinglai
Salbardi Benoda .. .. Jamathi Ganeshpur
DARYAPUR TALUKA
30 Chansala .. 72 Marha Bk.
84 Dhanegaon .. 110 Khaspur 136 Kokarda 165 Wadner-Ga~gai 183 Pimplod
194 Bhamod
207 Karatkheda 208 Ramtirtha .•
.-\MRAVATI TALUKA
30 Marki 39 Nandura Bk. 43 Revsa 61 . Yavii 83 Mahuli Jagi~'
105 Nirul 145 Kholapur
165 Bhatkuli 177 Rinmochan o. 203 Shegaon 256 Ganori 315 Chandsura
:nO' Shelu Gund 425 Wadhona Ramnati;
Distance from
Railway Station (Miles)
(3)
67 57
Railway Station
S. T. Bus Stop (Miles)
(4)
19 4
S. T. Bus Stop
6 Furlongs I I
10 NA 1 S. T. Bus stoP'<
9 S. T. Bus; stop
15 S. T. Bus Stop
18 2 fi 6
4 4 8 8
NA NA
33 27
24 29
NA 24 25 27 24
45 26 6
6 3
3 S. T. Bus stop
NA 29
NA 6
25 NA
S. T. Bus Stop
45 S. T. Bus Stop
54
) 6 6
4 3 2 9
Railway Station 9 14 S. T. Bus Stop 10 5
10
10 10
14 8 3
15 12 16 13
6 8 I 4 7
It 14
10'
6 6
12 8
S. T. Bus Stop .. S. T. Bus Stop S. T. !'Ius Stop
5 S. T. Bus stop.
6 6
S. T. Bus SJoP
2
5 14i
249
Table 33-Fairs
Name of the Fair
Meghnath Mahadeo
(S)
(I) Jayasing Buwa (2) Dwarka Bull
Dwarka
Bahiram ., Gan.pati Utsav
(1) Ganesh Yatra (2) Ganesh Yatra .. (3) Karichi Yatra (Pola) (I) Ganapati
(2) Karichi (Pola) .. Madichi Yatra (Balaji Deosthan). Saint Khushalbaba
Jahangswami Nrusinh Avatar (I) Sundar Narayan.
(2) Dhanora Fair
Yetal Buwa Govind Prabhu
Abasaheb and Ba basaheb Gaodevi .. .. .. Datta Jayanti and Punjaji Maharaj.
Pingala Devi Ganapati Utsav Lokadeshvar (1) Gulabpuri Maharaj
(2) Ganpati Maharaj Shivaratra Shabid Yatra ., (2) Maramaya .. (1) Gal Fair ..
Ramnavmi (I) Jagdamba Devi (2) Zingaji Maharaj Gokul Ashtami Gadge Maharaj Mahadevpuri Zageshwar .. Parasharam Maharaj.
(1) Ashadhi (2) Kartiki . Sitaram Baba .. Parvakal
Markinath Maharaj .. Datta Jayanti .• Brahamachari Maharaj Shahid Fair Maruti Saptah Gangamai (1) Mahadev (2) Balaji Adinath SWami Rinmochan Fair Gadge Maharaj .. Mahamad Khan Maharaj (I)Alakgir Maharaj
(2) Chandsura Hingalas Devi Ramnath Swami
NA = Not Available,
MISCELLANEOUS
[In Rural Areas only]
Month and Date of the Fair Average No. of persons attending
(6)
Phnlgun: FehrUlll y-l\Iarch Magh: Janunry·j-ebruary
(7)
1,000 1.500
Chaitra (Pournima): March·April .. 2.000 Bhadrapad Sud. Pratipada :August·September. 3.000
Bhndrapad Sud. Pratipada: August·September.
November-December . Bhadrapad Sud. Dashami & Pournima:
August·September. Bhadrapad Sud: 15 August·September Bhadrapad Pournima: August-September Shravan Amavas.ya: July-August . . . . Bhad .. :tpad Sud. Chaturthi: August·Septem·
ber. Bhadrapad Sud. Pratipada :August-September. Ashwin: October . . . . . . . ehailra Vad. Shasti (0 Trayodnshi: MarchApril. Poush: December-January Vaishakha Pournima: April·May A~hwin-Kartik: October-November Magh-Falgun: February.Mn.rch
Every Friday in Chaitra: March·April Ashadh Pournima: June-July .. Chaitra Pournim: March·April ChaitTa Pournima: March-April Poush-Magh: December December . . .. Chaitra Pournima: March-April . . . . Bhadrapad Sud. Pournima :August-September. Chaitra Pournima: March-April Magh: January-February Bhadrapad: August-September M ugh: January·February August Chaitr:!: March-April .. . . . . ]lhalgun V:1d. Pratipada: February-March
Chaitr:! SUd. Navami: March-April .. Chaitra PournimJ.: March-April .. POlish Sud. Navami: December-January Shrav.n Vad. Ashtami: July-Augu,t . . . . Margashirsh Vad 3: November·December . Vaishakha Sud. 15 to 2: April·May .. Chaitra Sud. Ekadashi: March-April.. .' Margashirsh Sud. Pournima: Novemher-
December Ashadh Pournima: June.July .. .. Kartik Pournima: October-November Magh: J'lnttnry.Februnry
NA
Chaitrn Pournima: March·April ., ., Margashir~h Pournima: November-December Poush Vad. Dashami: December·January February . . . . . . Magh POllrnima: January-February .. Poush: December-January Magh Mahashivaratra: January·February Shravan Vad. Chaturdashi: July·August .. Kartik Vad. Panchami :October-November .. Poush every Sunday: December-January December August-September .. Magh Sud. Ashtami, Navami, Dashmi: January-February. February . . .. .. Chaitra Pournima: March-April .. .. Vaishakha Saptami, Ashtami, Navami: April-
May.
1,500
50.000/100.000 5000/ I 0,000
5.000 25.000
1.500 1.000
1.000 1,000 3,000
1,000/1,400 t.OOO 5.000 3.000
3,000/4,OO(l 1.000 \ 2,500
500/1.000 2,000 2.000 2.000 t,OOO 1.000 4,000 2,000
25,000 1.000 1,000 1.000
1.500 2.500 2.000 1,500 1.000 1.000 4.000 5.000
1.500 2.200 1.20.0 1.200
3,000 2,000 2,000 2.000 5.000 1,000 2,000 3,000 1,000
10.000/15.000 50,000
1.000 2,500
3.000 2,500 5,000
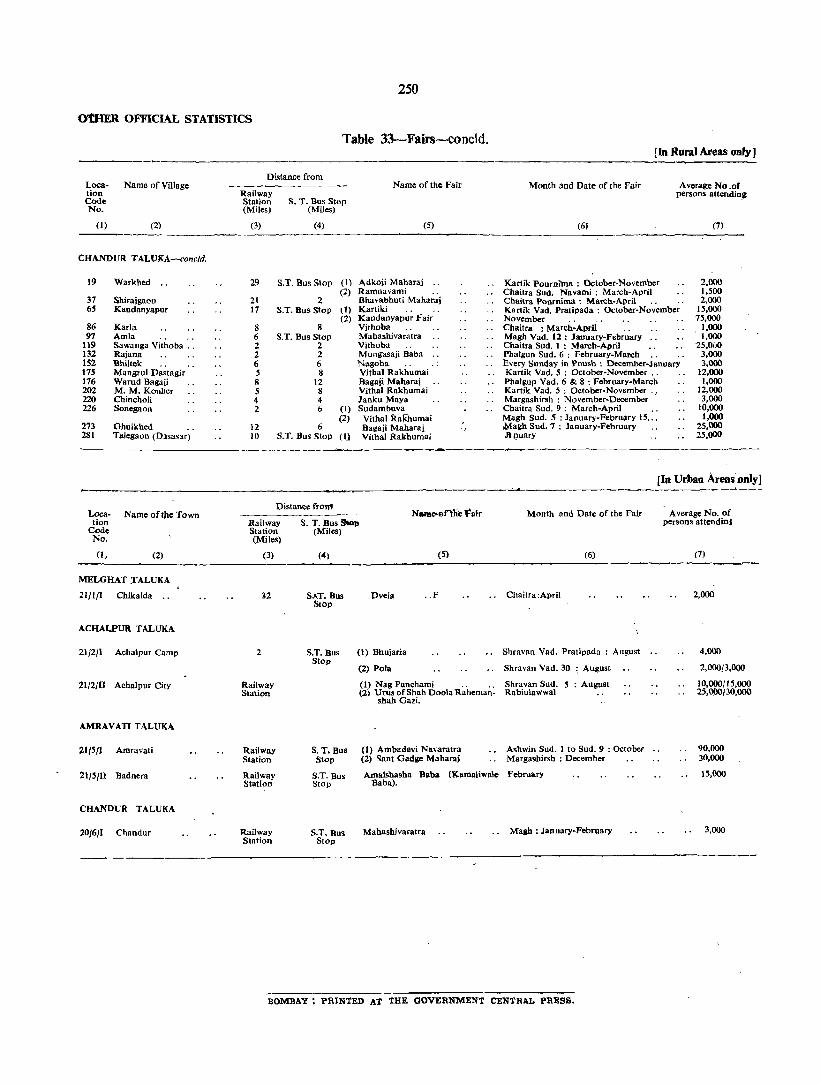
250
otHER OFFICIAL STATISTICS
Table 33-Fairs-concld.
Distance from Loca- Name of Village tion Code No.
(1) (2)
Railway Station (Miles)
(3)
S. T. Bus Stop (Miles)
(4)
Name of the Fair
(5)
Month and Date of the Fair
(6)
[In Rural Areas only]
Average No .of persons attending
(7)
--------------------------------------------------------------------------~----
CHANDUR TALUKA-concld.
19
37 65
86 97
119 132 IS2 175 176 202 220 226
273 281
Warkhed ..
Shirajgaon Kaudanyapur
KarIa Amla Sawanga Vithoba .. Rajana Bhiltek Mangeul Dastagir Warud Bagaji M. M. Konher Chincholi Sonegaon
Ohuikhed Talegaon (D~sas~r)
Loca· Name of tile Town lion
Code No.
(I, (2)
MELGHAT .TALUKA
21/1/1 Chikalda
ACHALPUR TALUKA
21/2/1 Achalpur Camp
21/2/11 Achalpur City
AMRAVATI TALUKA
21/S/1 Amravati
21/5/11 Badnera
CHANDUR TALUKA
20/6/1 Chandur
29
2t 17
8 6 2 2 6 ; 8 5 4 2
12 10
S.T. Bus Slop (I) (2)
2 S.T. Bus Stop tl)
(2) 8
S.T. Bus Stop 2 2 6 8
l2 8 4 6
6
(1) (2)
S. T. Bus Stop (tJ
Distance front
Adkoji Maharaj .. Ramnavami Bhavabhuti Maharaj Kartiki Kaudanyapur Fair Vithoba Mahashivaratra Vithoba Munga.aji Baba Nagoba Yithal Rakhumai Bagaii Maharai Vithal Rakhumai Janku Maya Sudambuva Yithal Rakhumai Bagaii Maharai Vithal Rakhumai
.,
Railway Station (Miles)
S. T. Bus S'l<ip (Miles)
(3)
12
2
Railway Station
Railway Station
Railway Station
Railway Station
(4)
S ... T, Bus StOP
S.T.Bus Stop
S. T, Bus Stop
S.T.Bus Stop
S.T. Bus Stop
(5)
Dveia .. F
(l) Bhujaria
(2) Pola
(I) Nag Panchami . . . . (2) Urns of Shah Doola Raheman·
shah Gali.
(I) Ambadavi Na\'aratra (2) Sant Gadae Maharaj
Amalsha.ha Baba (Kamaliwale Baba).
Mahashivaratra
Kartik Pourni'lna : October·November Chaitra Sud. Navami: March-April Chaitra Pournirna : March·April Kartik Vad. Pratipada : October-November November Chaitra : March-April Magh Vad. 12 : January-February .. Chaitra Sud. 1 : March-April Phalgun Sud. 6 : February-March .. Every Sunday in Poush : December-January Kartik Vad. 5 : October-November •. Phalgup Vad. 6 & 8 : FebruarY-March Kartik Vad. 5 : October·November .. Margashirsh : November-December . Chaitra SUd. 9 : March-April Magh Sud. 5 : January-February 15, .. .Moab Sud. 7 : January-February Jt~uary
2,000 1,500 2,000
15,000 75,000
1,000 1,000
25.0i)() 3,000 3,000
12,000 1,000
12,000 3,000
10,000 1,000
25,000 25,000
[In Urban Are8~~~!
Month and Date of the Fair
(6)
Chaitra :April
Shravan Vad. Pratipada : August
Sbravan Vad. 30 :, August
Shravan SUd. Rabiulawwal
5 : August
Ashwin Sud. I to Sud. 9 : October Margashirsh : December
February
Magh : January-February
. Average No. of persons attendini
2,000
4,000
2,000/3.000
10,000/15,000 25,000130,000
90,000 30,000
15,000
3,000
BOMBAY: PRINTED AT THE GOVERNMENT CENTRAL PRESS.
Copyright © 2022 FDOKUMEN