District Census Handbook, Kolaba - Linguistic Survey Of India
372
CENSUS OF INDIA 1961 DISTRICT CENSUS HANDBOOK KOLABA Compiled by THE MAHARASHTRA CENSUS OFFICE BOMBAY Printed in India by the Manager, Government Press and Book Depot, Nagpur, and Published by the Director, Government Printing and Stationery, Maharashtra State, BombaY-4. 19 6 4 [Price-Rs. Eight]
-
Upload
khangminh22 -
Category
Documents
-
view
0 -
download
0
Transcript of District Census Handbook, Kolaba - Linguistic Survey Of India
CENSUS OF INDIA 1961
DISTRICT CENSUS HANDBOOK KOLABA
Compiled by
THE MAHARASHTRA CENSUS OFFICE BOMBAY
Printed in India by the Manager, Government Press and Book Depot, Nagpur, and Published by the Director, Government Printing and Stationery,
Maharashtra State, BombaY-4. 1964
[Price-Rs. Eight]
I l£IIilml I,"IIIIIL IL . .... . POONA •
. . NASI • • 11111111 It IIUII". .• . • • • NtlCL. •
1IIIIIn 1111111111
TlIllIIIIUIII!I
11111111111111' IIlIUU . 1'1'" 0 II If IU'E'lIIiItIUl.l t..lIllII' •
(IU., IlUIIUr l'tl Ttl.klll)
11111111111"111 . .. _. 11"5 (1".".,.) IIlIlIEllieu .
IIEIIIIII' an tim .
IIUII! I"'" "'I' "",8 .. ,,, 1111111 111111
11111 .
11111111111""1 111111 . mill
. tIImm +
THAL
ALIBAG
eOR!."1
N
o IS 30
SC ALE !:::t.; ... ;,;;:otbt:;;;.:!:=t=l!::;:;;;;;;:==~J
/I .4 KILOMETRES
o s '6 ~t;;;;±:;;t:;;;;;;1jt;;:;;;;I;;;;;;I;1 ===;;;;:;;:::11 MII,.E.S SCALf"
KOLAB·A DISTRICT NlAliARASHTRA CENSUS1 BOMBAY.
A D I S , r I c
0<)
~~~~ ___ TO ~HEO
l'
C I I}
I
l eT
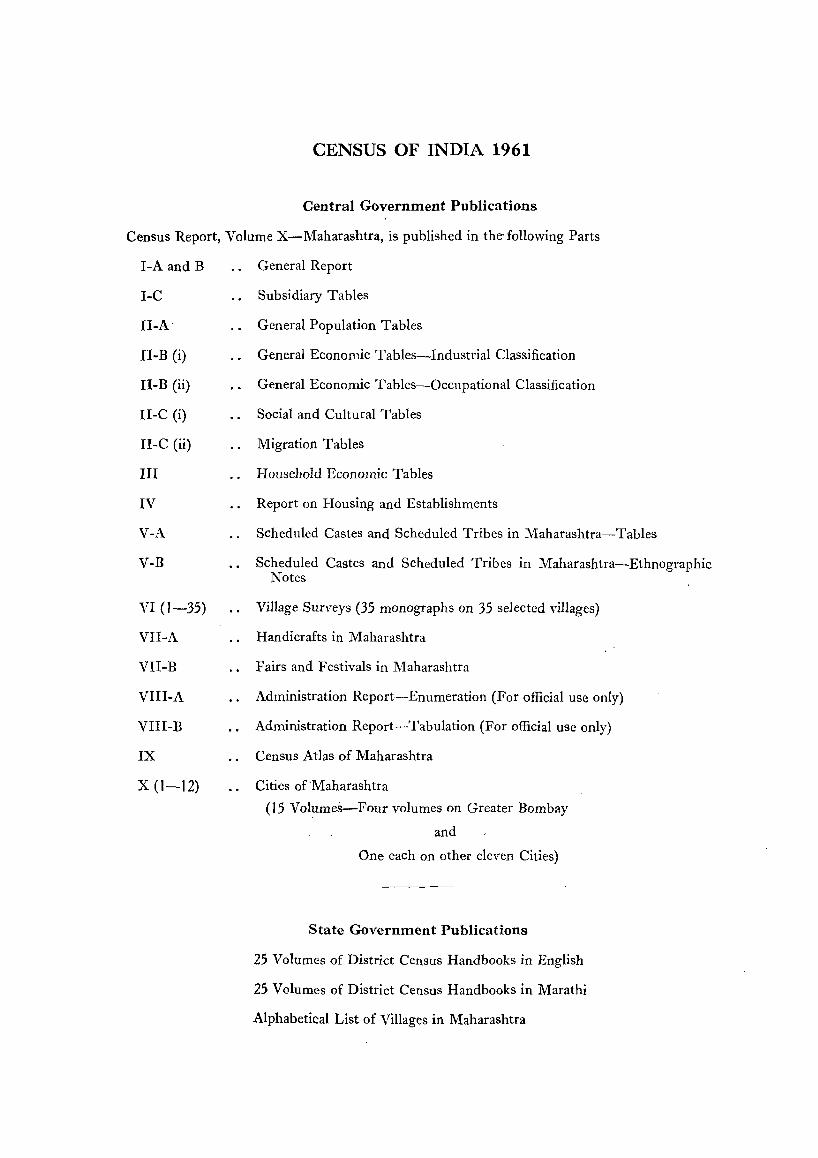
CENSUS OF INDIA 1961
Central Government Publications
Census Report, Volume X-Maharashtra, is published in the' following Parts
I-A and B
I-C
II-A
II-B (i)
II-B (ii)
II-C (i)
I1-C (ii)
III
IV
V-A
V-B
VI (1-35)
VII-A
VII-B
VIII-A
VIII-B
IX
X (1-12)
General Report
Subsidiary Tables
General Population Tables
General Economic Tables-Industrial Classification
General Economic Tables-Occupational Classification
Social and Cultural Tables
Migration Tables
Household Economic Tables
Report on Housing and Establishments
Scheduled Castes and Scheduled Tribes in Maharashtra-Tables
Scheduled Castes and Scheduled Tribes in Maharashtra-Ethnographic Notes
Village Surveys (35 monographs on 35 selected villages)
Handicrafts in Maharashtra
Fairs and Festivals in Maharashtra
Administration Report-Enumeration (For official use only)
Administration Report-Tabulation (For official use only)
Census Atlas of Maharashtra
Cities of'Maharashtra
(15 Volumes-Four volumes on Greater Bombay
and
One each on other eleven Cities)
State Government Publications
25 Volumes of District Census Handbooks in English
25 Volumes of District Census Handbooks in Marathi
Alphabetical List of Villages in Maharashtra
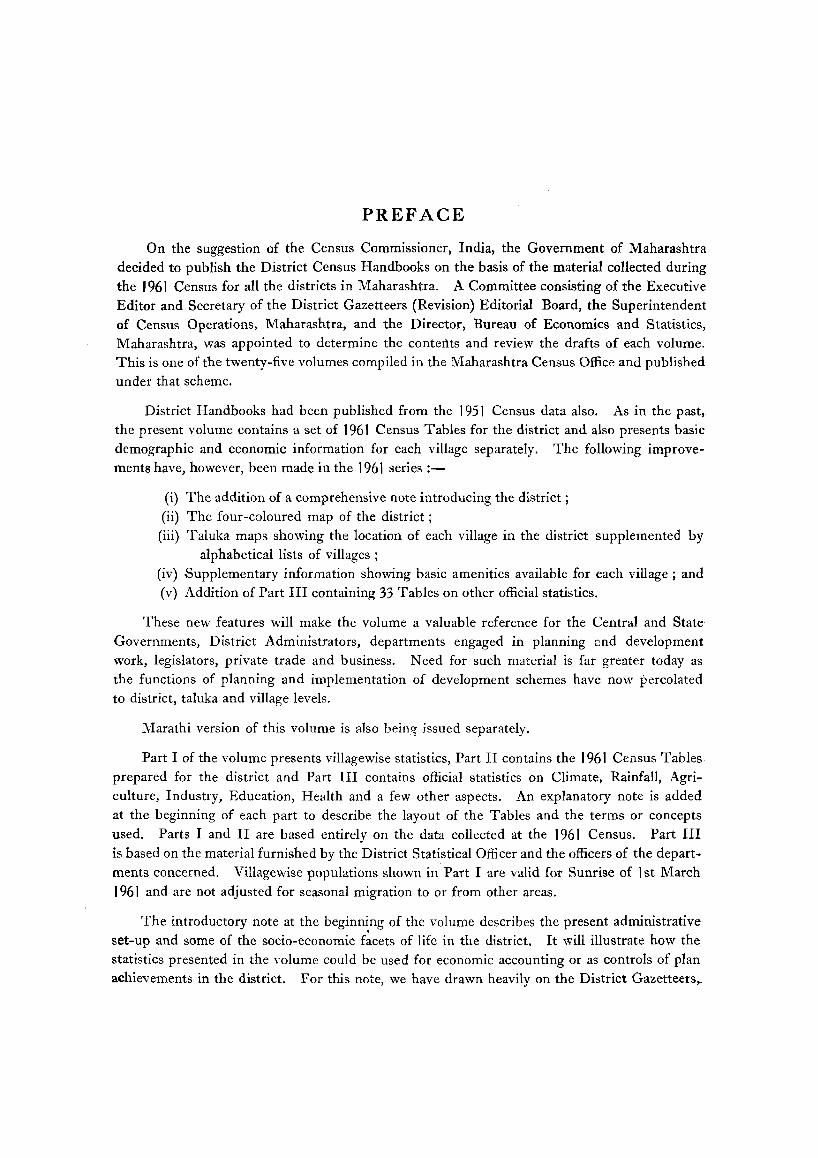
PREFACE
On the suggestion of the Census Commissioner, India, the Government of Maharashtra decided to publish the District Census Handbooks on the basis of the material collected during the J 961 Census for all the districts in lVIaharashtra. A Committee consisting of the Executive Editor and Secretary of the District Gazetteers (Revision) Editorial Board, the Superintendent of Census Operations, lVIaharashtra, and the Director, Bureau of Economics and Statistics, lVIaharashtra, was appointed to determine the contents and review the drafts of each volume. This is one of the twenty-five volumes compiled in the Maharashtra Census Office and published under that scheme.
District Handbooks had been published from the 1951 Census data also. As in the past, the present volume contains a set of 1961 Census Tables for the district and also presents basic
demographic and economic information for each village separately. The following improvements have, however, been made in the 1961 series :-
(i) The addition of a comprehensive note introducing the district;
(ii) The four-coloured map of the district; (iii) Taluka maps showing the location of each village in the district supplemented by
alphabetical lists of villages; (iv) Supplementary information showing basic amenities available for each village; and (v) Addition of Part III containing 33 Tables on other official statistics.
These new features will make the volume a valuable reference for the Central and State Governments, District Administrators, departments engaged in planning und development work, legislators, private trade and business. Need for such material is far greater today as the functions of planning and implementation of development schemes have now percolated to district, taluka and village levels.
Marathi version of this volume is also being' issued separately.
Part I of the volume presents villagewise statistics, Part II contains the J 961 Census Tables prepared for the district and Part III contains official statistics on Climate, Rainfall, Agriculture, Industry, Education, Health and a few other aspects. An explanatory note is added at the beginning of each part to describe the layout of the Tables and the terms or concepts used. Parts I and II are based entirely on the data collected at the 1961 Census. Part III is based on the material furnished by the District Statistical Officer and the officers of the departments concerned. Villagewise populations shown in Part I are valid for Sunrise of 1 st March 1961 and are not adjusted for seasonal migration to or from other areas.
The introductory note at the beginn~ng of the volume describes the present administrative set-up and some of the socia-economic facets of life in the district. It will illustrate how the statistics presented in the volume could be used for economic accounting or as controls of plan achievements in the district. For this note, we have drawn heavily on the District Gazetteers~

IV PREFACE
Survey and Settlement Reports, Annual Administration Reports and other Government publications. Some Heads of Departments also supplied the latest available material for the volume. We are indebted to them all.
Any views expressed in the introductory note or elsewhere in the volume are personal and the Government is not responsible for them.
In the Census Office, every one has done something for this stupendous task of compilation and collation of statistics, preparation of notes and reading of proofs. I should specially mention Shri N. Y. Gore, Tabulation Officer, for his sincere and thorough work on compilation and proof reading of Part I, Shri G. S. Gokarn, Tabulation Officer, for his painstaking work on MSS and proofs of Parts II and III, Shri S. K. Deshpande and Shri R. E. Chowdhary for assistance in preparing the introductory note, Shri S. Y. Pradhan and Shri B. M. Nagarkar, Draughtsmen, for Maps, Charts and Diagrams. Shri S. G. Deshpande of our office at Nagpur looked after the layout of the Tables and printing of the volume. Shri R. G. Phadke and Shri D. V. Rangnekar, Deputy Superintendents of Census Operations, and Shri G. M. Rajadhyaksha, Tabulation Officer, made valuable contributions at all stages and specially in the preparation of notes. Acknowledgments are due to Shri S. R~ Desai, Manager, Government Press and Book Depot, Nagpur, and Shri J. D. Gandhi, Manager, Government Photozincographic Press, Poona. In spite of heavy pressure of work on their presses they did their best to print this volume speedily.
I am obliged to Shri Asok Mitra, I.C.S., Census Commissioner, India, for valuable suggestions for improving this volume. I am also indebted to Shri Setu Madhava Rao and Shri M. A. Telang, Members of the District Census Handbook Committee; who not only supplied useful material from their departments but also read through the MSS and encouraged us through this venture.
BOMBAY: B. A. KULKARNI The 30th November 1964.
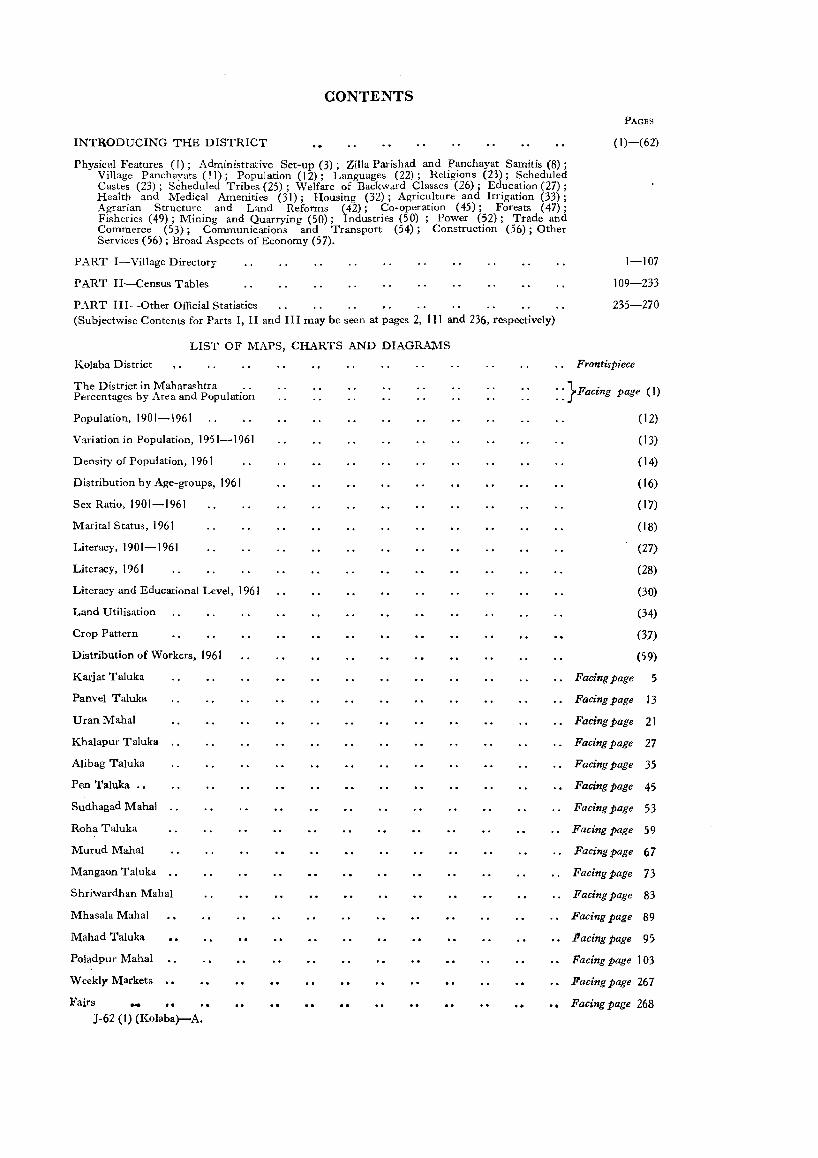
CONTENTS PAGES
INTRODUCING THE DISTRICT ( 1)-(62)
Physical Features (I); Administrative Set-up (3); Zilla Parishad and Panchayat Samitis (8) ; Village Panchayats (11); Population (12); Languages (22); Religions (23); Scheduled Castes (23); Scheduled Tribes (25); Welfare of Backward Classes (26); Education (27) ; Health and Medical Amenities (31); Housing (32); Agriculture and Irrigation (33); Agrarian Structure and Land Reforms (42); Co-operation (45); Forests (47); Fisheries (49); Mining and Quarrying (50); Industries (50) ; Power (52); Trade and Commerce (53); Communications and Transport (54); Construction (56); Other Services (56) ; Broad Aspects of Economy (57).
PART I-Village Directory
PART II-Census Tables
PART III-Other Official Statistics (Subjectwise Contents for Parts I, II and III may be seen at pages 2, 111 and 236, respectively)
LIST OF MAPS, CHARTS AND DIAGRAMS
Kolaba District
The District in Maharashtra Percentages by Area and Population
Population, 1901-1961
Variation in Population, 1951-1961
Density of Population, 1961
Distribution by Age-groups, 1961
Sex Ratio, 1901-1961
Marital Status, 1961
Literacy. 1901-1961
Literacy, 1961
Literacy and Educational Level, 1961
Land Utilisation
Crop Pattern
Distribution of Workas, 1961
Karjat Taluka
Panvel Taluka
Uran Mahal
Khalapur Taluka
Alibag Taluka
Pen Taluka .•
Sudhagad Mahal
Roha Taluka
Murud Mahal
Mangaon Taluka
Shriwardhan Mahal
Mhasala Mahal
Mahad Taluka
Poladpur Mahal
Weekly Markets
Fairs -J-62 (1) (Kolaba)-A.
1-107
109-233
235-270
Frontispiece
: : }FaCing page (I)
(12)
(13)
(14)
(16)
(17)
(18)
(27)
(28)
(30)
(34)
(37)
(59)
Facing page 5
Facing page 13
Facing page 21
Facing page 27
Facing page 35
Facing page 45
Facing page 53
Facing page 59
Facing page 67
Facing page 73
Facing page 83
Facing page 89
Facing page 95
Facing page 103
Facing page 267
Facing page 268

J-62·(Kolaba)-i-B.
INTRODUCING THE DISTRICT This note describes the administrative set-up and
some socrio-economic facets at lite in the district

THE DISTRICT IN MAHARASHTRA. I"IG. 2
A o
()
•
N
• I. FEREICE
D •• TRleT 1!lQ. • •••••• • .. 0 DI.TRICT BOUNDAR" • .,
MAJOR ROAD .......... . ---
RAILWAYS......... ~
RIVERS ••••••
140 MI ....
• 7.' • o~
I"IG.3
PERCENTAGES BY PERCENTAGES BY AREA POPULATION
MAHARASHTRA CENSUS BOMBAY
a . p . z . P. POONA-le62
INTRODUCIiNG THE DISTRICT
PHYSICAL FEATURES
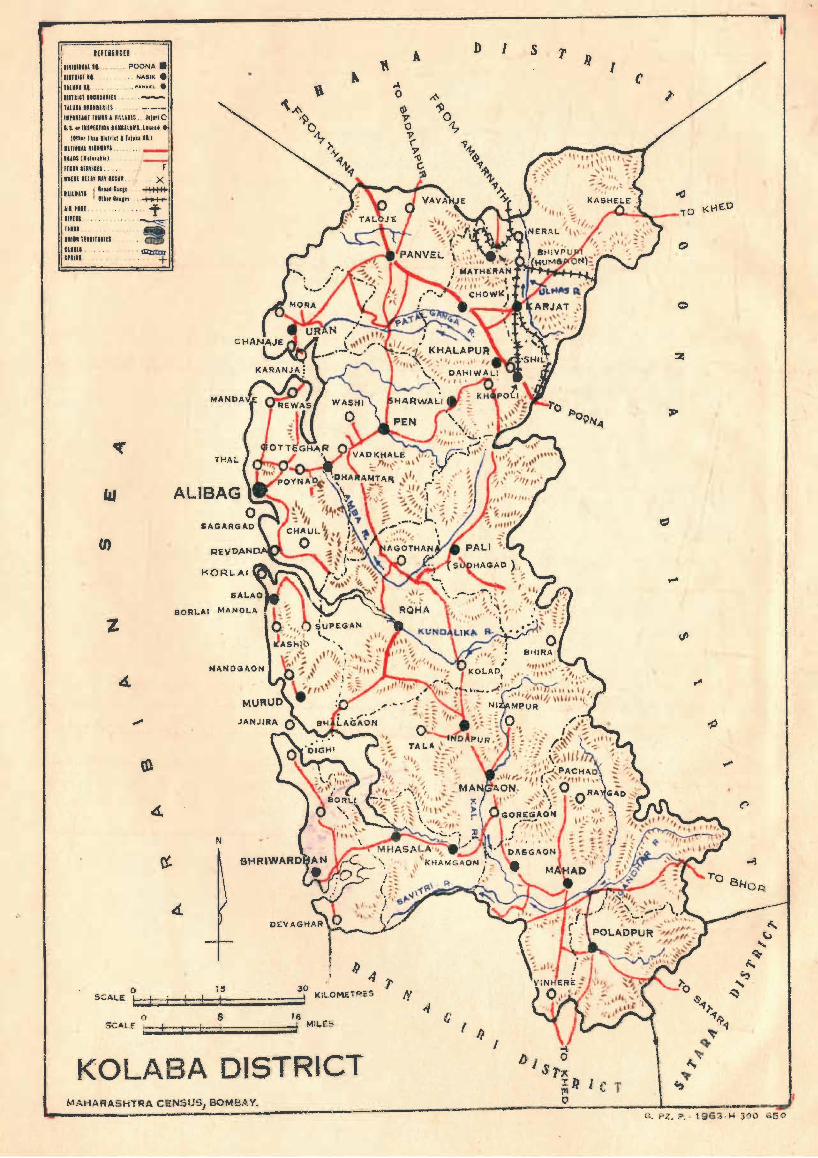
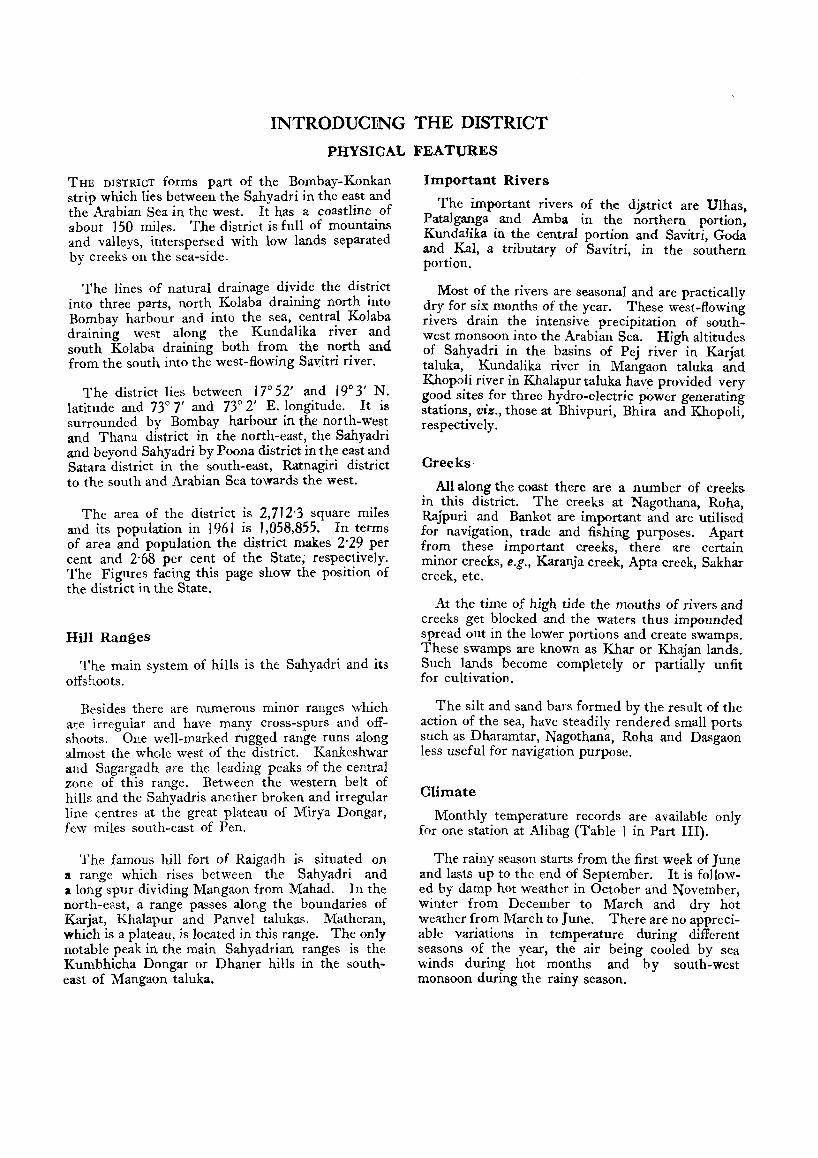
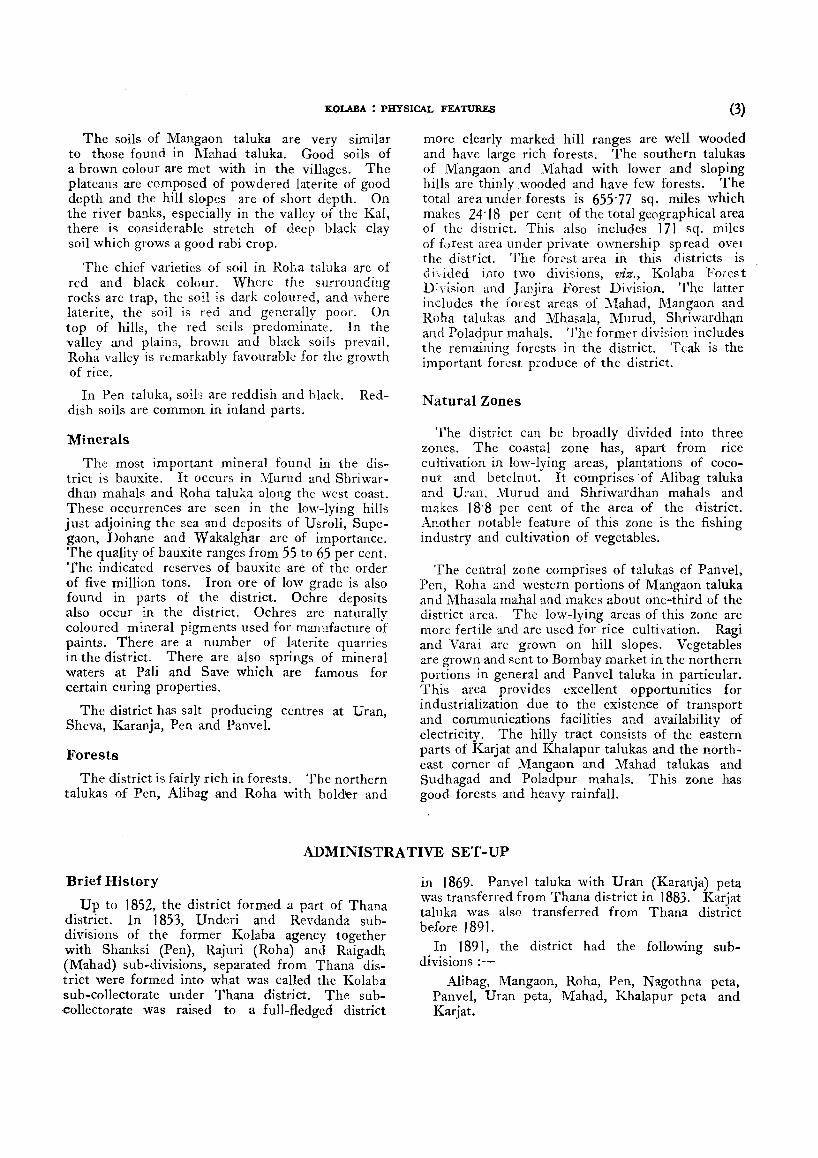
THE DISTRICT forms part of the Bombay-Konkan strip which lies between the Sahyadri in the east and the Arabian Sea in the west. It has a coastline of about 150 mlles. The district is full of mountains and valleys, interspersed with low lands separated by creeks on the sea-side.
The lines of natural drainage divide the district into three parts, north Kolaba draining north into Bombay harbour and into the sea, ~entr~l Kolaba draining west along the Kundahka nver and south Kolaba draining both from the north and from the south into the west-flowing Savitri river.
The district lies between 17° 52' and 19° 3' N. latitude and 73° 7' and 73° 2' E. longitude. It is surrounded by Bombay harbour in the north-wes~ and Thana district in the north-east, the Sahyadrr and beyond Sahyadri by Poona district in t~~ ea~t a~d Satara district in the south-east, Ratnagtn dIstnct to the south and Arabian Sea towards the west.
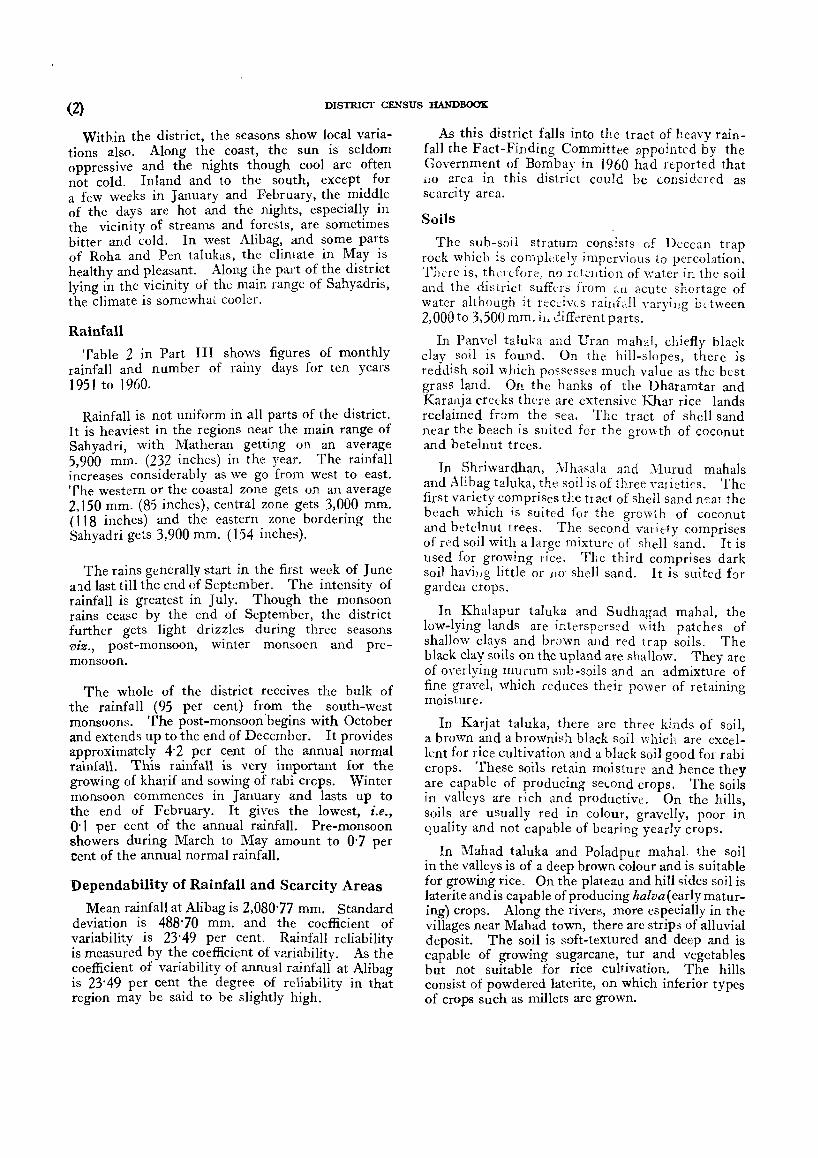
The area of the district is 2,712'3 square miles and its population in 1961 is 1,058,855. In terms of area and population the district makes 2'29 per cent and 2'68 per cent of the State; respectively. The Figures facing this page show the position of the district in the State.
Hill Ranges
The main system of hills is the Sahyadri and its offshoots.
Besides there are numerous minor ranges which are irregular and have many cross-spurs and offshoots. One well-marked rugged range runs along almost the whole west of the district. Kankeshwar and Sagargadh are the leading peaks of the central zone of this range. Between the western belt of hills and the Sahyadris another broken and irregular line centres at the great plateau of Mirya Dongar, few miles south-east of Pen.
The famous hill fort of Raigadh is situated on It range which rises between the Sahyadri and a long spur dividing Mangaon from Mahad. In the north-east, a range passes along the boundaries of Karjat, Khalapur and Panvel talukas. Matheran, which is a plateau, is located in this range. The only notable peak in the main Sahyadrian ranges is the Kumbhicha Dongar or Dhaner hills in the southeast of :\langaon taluka.
Important Rivers
The important rivers of the diPtrict are Ulhas, Patalganga and Amba in the northern portion, Kundalika in the central portion and Savitri, Goda and Kal, a tributary of Savitri, in the southern portion.
Most of the rivers are seasonal and are practically dry for six: months of the year. These west-flowing rivers drain the intensive precipitation of southwest monsoon into the Arabian Sea. High altitudes of Sahyadri in the basins of Pej river in Karjat taluka, Kundalika river in Mangaon taluka and Khopoli river in Khalapur taluka hav,e provided very good sites for three hydro-electric power generating stations, viz., those at Bhivpuri, Bhira and Khopoli, res pectively.
Creeks
All along the coast there are a number of creeks in this district. The creeks at Nagothana, Roha, Rajpuri and Bankot are important and are utilised for navigation, trade and fishing purposes. Apart from these important creeks, there are certain minor creeks, e.g., Karanja creek, Apta creek, Sakhar creek, etc.
At the time of high tide the mouths of rivers and creeks get blocked and the waters thus impounded spread out in the lower portions and create swamps. These swamps are known as Khar or Khajan lands. Such lands become completely or partially unfit for cultivation.
The silt and sand bars formed by the result of the action of the sea, have steadily rendered small ports such as Dharamtar, Nagothana, Roha and Dasgaon less useful for navigation purpose.
Climate
Monthly temperature records are available only for one station at Alibag (Table I in Part III).
The rainy season starts from the first week of June and lasts up to the end of September. It is followed by damp hot weather in October and November, winter from December to March and dry hot weather from March to June. There are no appreciable variations in temperature during different seasons of the year, the air being cooled by sea winds during hot months and by south-west monsoon during the rainy season.
(2) DISTRIcr CENSUS HANDBOOK
Within the district, the seasons show local variations also. Along the coast, the sun is seldom oppressive and the nights though cool are often not cold. Inland and to the south, except for a few weeks in January and February, the middle of the days are hot and the nights, especially in the vicinity of streams and forests, are sometimes bitter and cold. In west Alibag, and some parts of Roha and Pen talukas, the climate in May is healthy and pleasant. Along t.he part of the distr~ct lying in the vicinity of the mam range of Sahyadns, the climate is somewhat cooler.
Rainfall
Table 2 in Part III shows figures of monthly rainfall and number of rainy days for ten years I 951 to 1960.
Rainfall is not uniform in all parts of the district. It is heaviest in the regions near the main range of Sahyadri, with Matheran getting on an average 5,900 mm. (232 inches) in the year. The rainfall increases considerably as we go from west to east. The western or the coastal zone gets on an average 2,150 mm. (85 inches), central zone gets 3,000 mm. ( I I 8 inches) and the eastern zone bordering the Sahyadri gets 3,900 mm. (154 inches).
The rains generally start in the first week of June a:ld last till the end of September. The intensity of rainfall is greatest in July. Though the monsoon rains cease by the end of September, the district further gets light drizzles during three seasons viz., post-monsoon, winter monsocn and premonsoon.
The whole of the district receives the bulk of the rainfall (95 per cent) from the south-west monsoons. The post-monsoon'begins with October and extends up to the end of December. It provides approximately 4'2 per cent of the annual normal rainfall. This rainfall is very important for the growing of kharif and sowing of rabi crops. Winter monsoon commences in January and lasts up to the end of February. It gives the lowest, i.e., 0'1 per cent of the annual rainfall. Pre-monsoon showers during March to May amount to 0'7 per 1::ent of the annual normal rainfall.
Dependability of Rainfall and Scarcity Areas
Mean rainfall at Alibag is 2,080'77 mm. Standard deviation is 488'70 mm. and the coefficient of variability is 23"49 per cent. Rainfall reliability is measured by the coefficient of variability. As the coefficient of variability of annual rainfall at Alibag is 23'49 per cent the degree of reliability in that region may be said to be slightly high.
As this district falls into the tract of heavy rainfall the Fact-Finding Committee appointed by the Government of Bombay in 1960 had rtported that HO area in this district could be C;OIlsidcred as scarcity area.
Soils
The sub-soil stratum consists of Deccan trap rock which is compkte1y impervious to percolation. There is, thcn.:f(Jre, no rctelltion of water in the soil and the district suffers from all acute shortage of water although it recc:ives raihfa!1 va::-yillg between 2,000 to 3,500 mm. iI, t!lffcrent parts.
In PanveI taluka and Uran mahal, chiefly black clay soil is found. On the hill-slopes, there is reddish soil which posseSSes much value as the best grass land. On the banks of the Dharamtar and KanlJlja creeks there arc extensive Khar rice lands reclaimed fram the Sea. The tract of shell sand near the beach is suited for the grm"th of coconut and hctelnut trees.
In Shriwardhan, Mhasala and lVIurud mahals and Alibag taluka, the soil is of three nrictics. The first variety comprises the tr act of shell sand ncar the beach which is suited for the growth of coconut and bete1nut trees. The second varidy comprises of red soil with a large mixture of shell sand. It is used for growing rice. The third comprises dark soil havilJg little or JtO' shell sand. It is suited f!)r garden crops.
In Khalapur taluka and SUdhagad mahal, the low-lying lands are interspersed v.ith patches of shallow clays and brown alld red trap soils. The black clay soils on the upland are shallow. They are of onrlying murum sub-soils and an admixture of fine gravel, \vhich reduces their power of retaining moisture.
In Karjat taluka, there arc three kinds of soil, a brown and a brownish black soil which are excellent for rice cultivation and a black soil good for rabi crops. These soils retain moistur:: and hence they are capable of prOducing sec.;ond crops. The soils in valleys are rich and productive. On the hills, soils are usually red in colour, gravelly, poor in quality and not capable of bearing yearly crops.
In Mahad taluka and Poladpur mahal. the soil in the valleys is of a deep brown colour and is suitable for growing rice. On the plateau and hill sides soil is laterite and is capable of producing halva (early maturing) crops. Along the rivers, more especially in the villages near Mahad town, there are strips of alluvial deposit. The soil is soft-textured and deep and is capable of growing sugarcane, tur and vegetables but not suitable for rice cultivation. The hills consist of powdered laterite, on which inferior types of crops such as millets are grown.
KOLABA : PHYSICAL FEATURES (3)
The soils of Mangaon taluka are very similar to those found in l\Iahad taluka. Good soils of a brown colour are met with in the villages. The plateaus are cc:mposed of powdered laterite of good depth and the hill slopes are of short depth. On the river banks, especially in the valley of the Kal, there is considerable stretch of deep black clay soil which grows a good rabi crop.
The chief varieties of soil in Roha t~luka are of red and black colour. Where the surrounding rocks are trap, the soil is dark coloured, and where laterite, the soil is red and generally poor. On top of hills, the red soils predominate. In the valley and plains, brown and black soils prevail. Roha valley is remarkably favourable for the growth of rice.
In Pen taluka, soils are reddish and black. Reddish soils are common in inland parts.
Minerals
The most important mineral found in the district is bauxite. It occurs in Murud and Shriwardhan mahals and Roha taluka along the west coast. These occurrenCes are seen in the low-lying hills just adjoining the sea and deposits of Usroli, Supegaon, Dohane and Wakalghar are of importance. The quality of bauxite ranges from 55 to 65 per cent. The indicated reserves of bauxite are of the order of five million tons. Iron ore of low grade is also found in parts of the district. Ochre deposits also occur in the district. Ochres are naturally coloured mineral pigments used for manufacture of paints. There are a number of l::tterite quarries in the district. There are also springs of mineral waters at Pali and Save which are famous for certain curing properties.
The district has salt producing centres at Uran, Sheva, Karanja, Pen and Panvel.
Forests
The district is fairly rich in forests. The northern talukas of Pen, Alibag and Roha with bolder and
mOre clearly marked hill ranges are well wooded and have large rich forests. The southern talukas of Mangaon and Mahad with lower and sloping hills are thinly.wooded and have few forests. The total area under forests is 655'77 sq. miles which makes 24' J 8 per cent of the total geographical area of the district. This also includes 17 J sq. miles of furest area under private ownership spread ovel the district. The for,;st area in this districts is di·, ided into two divisions, viz., Kolaba Fores t Diyision and J anjira Forest Division. The lattcr includes the forest areas of l\'Iahad, l\1angaon and Roha talukas and Mhasala, Murud, Shriwardhan and Poladpur mahals. Thc former division includes the remaining forests in the district. Teak is the important forest produce of the district.
Natural Zones
The district can be broadly divided into three zones. The coastal zone has, apart from rice cultivation in low-lying areas, plantations of coconut and betclnut. It comprises' of Alibag taluka and Uran, MUTud and Shriwardhan mahals and makes J 8'8 per cent of the area of the district. Another notable feature of this zone is the fishing industry and cultivation of vegetables.
The central zone comprises of talukas of Panvel, Pen, Roha and western portions of Mangaon taluka and Mhasala mahal and makes about one-third of the district area. The low-lying areas of this zone are more fertile and are used for rice cultivation. Ragi and Varai are grown on hill slopes. Vegetables are grown and sent to Bombay market in the northern portions in general and Panvel taluka in particular. This area provides excellent opportunities for industrialization due to the existence of transport and communications facilities and availability of electricity. The hilly tract consists of the eastern parts of Karjat and Khalapur talukas and the northeast corner of Mangaon and Mahad talukas and Sudhagad and Poladpur mahals. This zone has good forests and heavy rainfall.
ADMINISTRATIVE SET-UP
Brief History
Up to J 852, the district formed a part of Thana district. In J 853, Underi and Revdanda subdivisions of the former Kolaba agency together with Shanksi (Pen), Raj uri (Roha) and Raigadh (Mahad) sub-divisions, separated from Thana district were formed into what was called the Kolaba sub-collectorate under Thana district. The subcollectorate was raised to a full-fledged district
in J 869. Panvel taluka with Uran (Karanja) peta was transferred from Thana district in 1883. Karjat taluka was also transferred from Thana district before 189 J •
In J 89 J , the district had the following subdivisions :-
Alibag, Mangaon, Roha, Pen, Nagothna peta, Panvel, Uran peta, Mahad, Khalapur peta and Karjat.
(4) DISTRICf CENSUS HANDBOOK
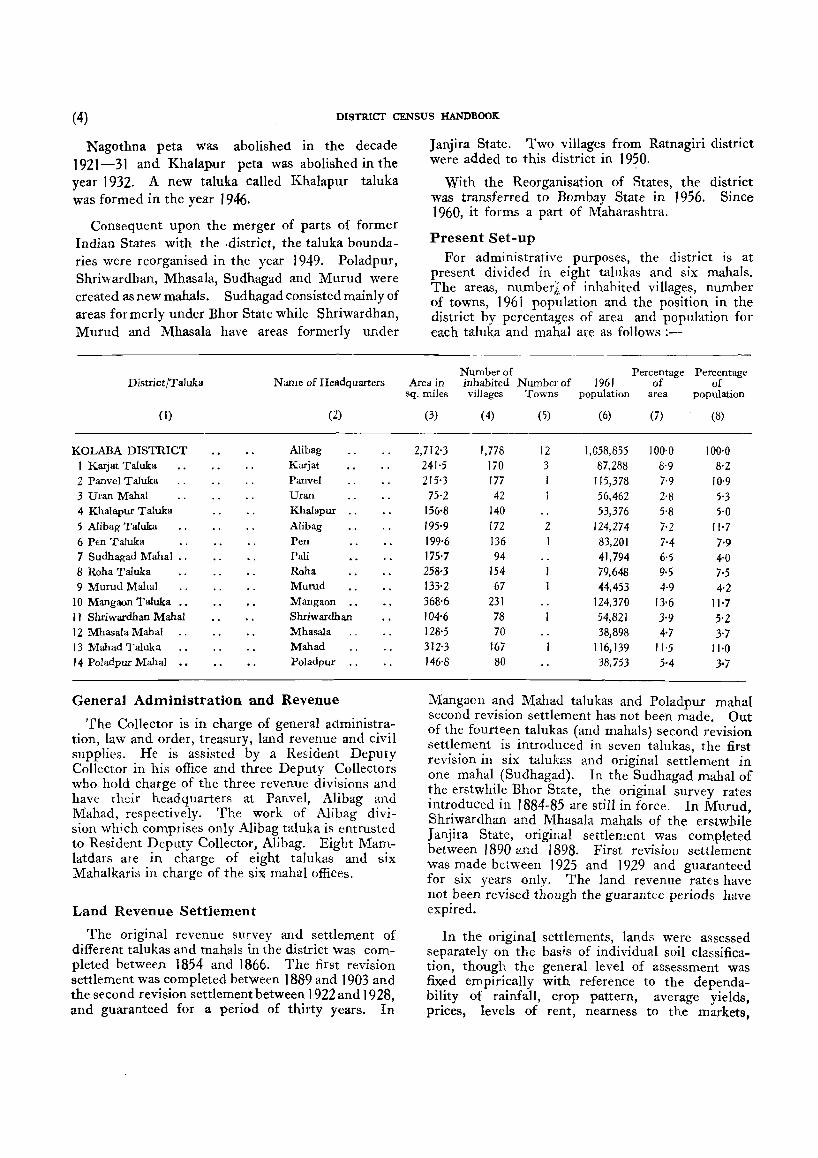
Nagothna peta was abolished in the decade 1921-31 and Khalapur peta was abolished in the year 1932. A new taluka called Khalapur taluka was formed in the year 1946.
Consequent upon the merger of parts of former Indian States with the -district, the taluka boundaries were reorganised in the year t 949. Poladpur, Shriwardhan, Mhasala, Sudhagad and Murud were created as new mahals. Sudhagad consisted mainly of areas formerly under Bhor State while Shriwardhan, Murud and Mhasala have areas formerly under
District /Taluka Name of Headquarters
( 1) (2)
KOLABA DISTRICT Alibag
1 Karjat Taluka Karjat 2 Panvel Taluka Panvel
3 Uran Mahal Uran 4 Khalapur Ta!uka Khalapur .. 5 Alibag Taluka Alibag
6 Pen Taluka Pen 7 Sudhagad Maha! .. Pali 8 Roha Taluka Roha 9 Murud Mahal Murud
10 Mangaon Taluka Mangaon II Shriwardhan Mahal Shriwardban 12 Mhasala Mahal Mhasala 13 Mahad Taluka Mahad 14 Poladpur Mahal Poladpur
General Administration and Revenue
The Collector is in charge of general administration, law and order, treasury, land revenue and civil supplies. He is assisted by a Resident Deputy Collector in his office and three Deputy Collectors who hold charge of the three revenue divisions and have their headquarters at Panvel, Alibag and Mahad, respectively. The work of Alibag division which comprises only Alibag taluka is entrusted to Resident Deputy Collector, Alibag. Eigbt Mamlatdars are in charge of eight talukas and six Mahalkaris in charge of the six mahal offices.
Land Revenue Settlement
The original revenue survey and settlement of different talukas and mahals in the district Was completed between 1854 and 1866. The first revision settlement was completed between t 889 and 1903 and the second revision settlement between t 922 and t 928, and guaranteed for a period of thirty years. In
Janjira State. Two villages from Ratnagiri district were added to this district in 1950.
With the Reorganisation of States, the district was transferred to Bombay State in 1956. Since 1960, it forms a part of Maharashtra.
Present Set-up For administrative purposes, the district is at
present divided in eight talukas and six mahals. The areas, numberlof inhabited villages, number of towns, 1961 population and the position in the district by percentages of area and population for each taluka and mahal are as follows ;-
Number of Percentage Percentage Area in inhabited Number of 1961 of of
sq_ miles villages Towns population area population
(3) ( 4) (5) (6) (7) (8)
2,712'3 l,n8 12 1,058,855 100-0 100·0 241·5 170 3 87,288 8'9 8·2 215-3 177 115,378 7-9 10'9
75'2 42 56,462 z.s 5-3 156·8 140 53,376 5-8 5-0 195'9 172 2 124,274 7'2 11·7 199-6 136 83,201 7-4 7'9 175·7 94 41,794 6-5 4·0 258·3 154 79,648 9·5 7-5 133'2 67 44,453 4·9 4·2 368·6 231 124,370 13-6 11·7 104-6 78 54,821 H 5'2 128'5 70 38,898 4-7 H 312-3 167 116,139 11-5 IJ-O 146-8 80 38,753 5'4 3-7
Mangaon and Mahad talukas and Poladpur mahaI second revision settlement has not been made. Out of the fourteen talukas (and mahals) second revision settlement is introduced in seven talukas, the first revision in six tal uk as and original settlement in one mahal (Sudhagad). In the Sudhagad mahal of the erstwhile Bhor State, the original survey rates introduced in 1884-85 are still in force. In Murud. Shriwardhan and Mhasala mahals of the erstwhile J anjira State, origiual settlement Was com.pleted between 1890 and 1898. First revision settlement Was made between t 925 and 1929 and guaranteed for six years only. The land revenue rates have not been revised though the guarantee periods have expired.
In the original settlements, lands were assessed separately on the basis of individual soil classification, though the general level of assessment was fixed empirically with reference to the dependability of rainfall, crop pattern, average yields, prices, levels of rent, nearness to the markets,
KOUBA: ADMINISTRATIVE SET-UP (5)
facilities of communications and other similar factors observed from tract to tract. Individual lands were never reclassified during the second revision settlements and landholders were generally allowed the benefits of improvements effected by them during the term of settlement untaxed. The comparative incidence of land revenue from field to field is thus generally the same as it was at the time of the first revision settlement and the enhancements made from settlement to settlement were brought about only by raising the levels of revenue assessments over a tract uniformly.
The method of land revenue assessments is broadly the same as in the other districts of Maharashtra. In the case of lands irrigated by wells ap.d small bandharas, the land revenue is integrated and is inclusive of the charge for water. For lands irrigated under Government canals, the land revenue at dry crop rates is assessed and recovered by the Revenue Department while the water rates determined annually on the basis of actual crops raised are assessed by the Irrigation Department and recovered by the Revenue Department.
Table 24 in Part III shows demand and collection of land revenue during the ten years 1951 to 1960 for the district and each taluka separately.
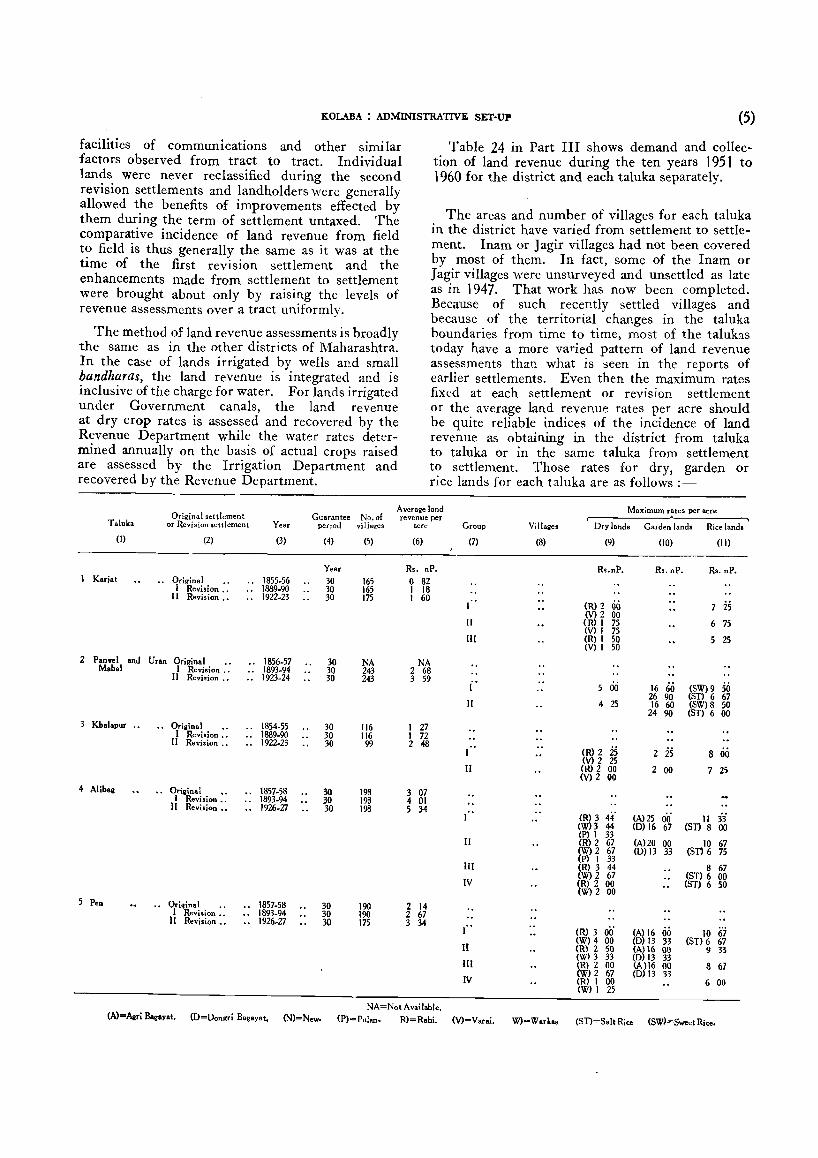
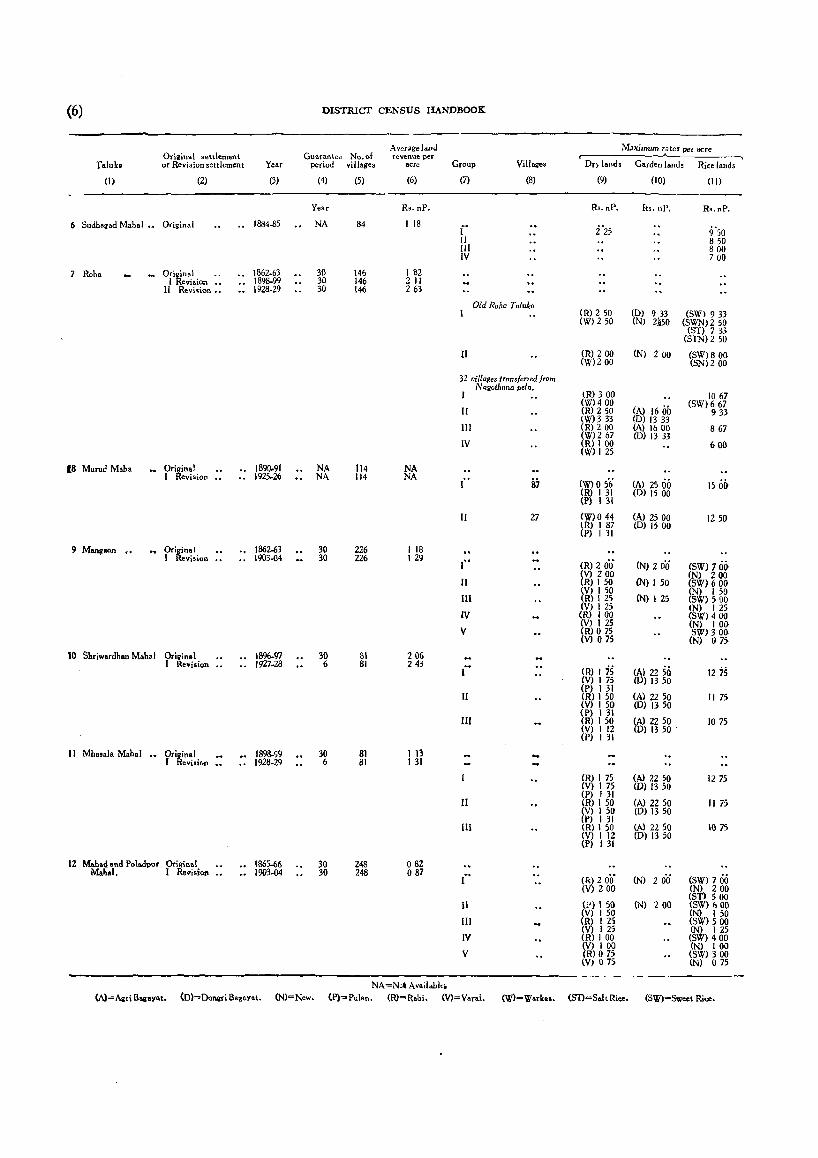
The areas and number of villages for each taluka in the district have varied from settlement to settlement. Inam or Jagir villages had not been covered by most of them. In fact, some of the Inam or Jagir villages were unsurveyed and unsettled as late as in 1947. That work has now been completed. Because of such recently settled villages and because of the territorial changes in the taluka boundaries from time to time, most of the talukas today have a more varied pattern of land revenue assessments than what is seen in the reports of earlier settlements. Even then the maximum rates fixed at each settlement or revision settlement or the average land revenue rates per acre should be quite reliable indices of the incidence of land revenue as obtaining in the district from taluka to taluka or in the same taluka from settlement to settlement. Those rates for dry, garden or rice lands for each taluka are as follows:-
Original settlement Average land Maximum rates per acre
Guarantee No. of revenue per Taluka or Revision settlement Year period villages acre Group Villages Ory lands Garden lands Rice lands
(I) (2) (3) (4) (5) (6) (7) (8) (9) (10) (11)
Year Rs. nP. Rs.nP. Rs. nP. Rs. nP. I Karjat .. Original •• .. 1855-56 30 165 0 82
I Revision •• .. 1889-90 30 165 I 18 II Revision ., .. 1922-23 30 175 I 60
00 is (R) 2 7 (V)2 00
II (R) I 75 6 75 (V) I 75
III ~R) I 50 25 V) I 50
2 Panve! and Uran Original •• .. 1856-57 30 NA NA Mahal I Revision •. .. 1893-94 30 243 2 68 II Revi,jon .• .. 1923-24 30 243 3 59
j' 60 50 00 16 (SW) 9 26 90 (ST) 6 67
II 4 25 16 60 (SW) 8 50 24 90 (ST) 6 00
3 Khalapur •• .. Original .. .. 1854-55 30 116 I 27 I Revision .• .. 1889-90 30 116 I 72
II Revision ., .. 1922-23 30 99 2 48 25 is 00 (R) 2 2 8
(V) 2 25 II (R) 2 00 2 00 7 25
(V) 2 00 4 Alibq .. Original ~. .. 1857-58 30 198 3 07
I Revision ~. .. 1893-94 30 198 4 01 II Revision .. .. 1926-27 30 198 5 34 ..
(R) 3 44' (A)25 00 33 I 11 (w}3 44 (0) 16 67 (ST) 8 00 (P) 1 33
II (R) 2 67 (A)20 00 10 67 (W) 2 67 (0)13 33 (S1') 6 75 (P) 1 33
III ~R) 3 44 8 67 W}2 67 (S1') 6 00
IV (R) 2 00 (ST) 6 50 (W) 2 00
5 Pen .. Oriieinal .. .. 1857-58 30 190 2 14 I Revision •• .. 1893-94 .. 30 190 2 67
II Revision •• .. 1926-27 30 175 3 34 .. 0'(; I (R) 3 (A~ 16 00 10 (,'7
(W)4 00 (D 13 33 (ST) 6 67 II (R) 2 50 (A) 16 00 9 33
(Wl3 33 (D) 13 33 III ~R) 2 00 (A)16 00 8 67
W)2 67 (0) 13 33 IV (R) 1 00 6 00
(W) J 25
NA=Not Available. (A)=Agrj &gayat. (O=Oongrj Bagayat. <N)=New. (P)=Pulan. R)=Rabi. (V)=Varai. W}=Warkas. (ST)=Salt Rice (SW)~Sweet Rice.
(6) DISTRICT CENSUS HANDBOOK
Average land Mllximum rates per acre Original settlement Guarantee No. of revenue per
raluko or Revision settlement Year period villages acre Group Villages Do lands Garden lands Rice lands
(I) (2) (3) (4) (5) (6) (7) (8) (9) (10) (II)
Year Rs. nP. Rs.nP. ft,. nP. Rs.nP.
6 Sudhagad Mohol ._. Original .. 1884.85 NA 84 I 18 r 2'25 9'50 II 850 JII 800 IV 700
7 Roha Original '. 1862-63 30 146 I 82 I Revision •• .. 1898-99 30 146 2 II
II Reviflion •• .. 1928-29 30 146 263
Old Roha T alu!,_o (R) 250 (D) 9 33 (SW) 933 (W) 250 (N) 2_~50 (SWN) 2 50
(ST) 733 (STN) 250
II (R) 2 00 (N) (W)200
200 (SW) 8 00 (SN) 2 00
32 villages iransferTed from Nagothana pela.
(R) 3 00 I 10 67 (W)400
(A) 16 00 (SW) 667 II (R) 2 50 933
(W) 333 (D) 1333 III (R) 200 (A) 1600 867
(W)267 (D) 1333 IV (R) 100 600
(W) 125
18 Murud M.ha Original .. .. I 89{).91 NA 114 NA I Revision •• .. 1925-26 NA 114 NA l' 87 eW) 05·6 (A) 2500 1500
(R) I 31 (D) 1500 (P) I 31
II 27 (W)O 44 (A) 2500 lZ 50 (R) 1 87 (D) 1500 (P) I 31
9 Mangaon .. Original .. 1862-63 30 226 1 18 I Revition •• .. 1903-04 30 226 129 ..
(R) 2 oii (N) 2 00 (SW) 700 I (v) 200 (N) 200
II (R) I 50 eN) I 50 (SW) 6 00 (V) 1 50 (N) I 50
III (R) I 25 eN) I 25 (SW) 500 (V) 125 (N) 125
LV (R) 100 <SW) 4 00 (V) 1 25 (N) 100
V !R) 075 SW) 3 00 v) 075 (N) 075
10 Shriwardhan Mahal Original .. 1896.97 30 81 206 I Reyision .. .. 1927.28 6 81 243 i· (R) I is (~ 2250 1275
(V) I 75 ( ) 1350 (P) I 31
II (R) I 50 CA) 22 50 II 7S (V) 150 (D) 1350 ~p) 1 31
1Il R) 150 ~A) 2250 107S (V) I 12 D) 1350 -(P) 131
II Mha.al. Mahal .. Oriiinal .. 189&.99 30 81 113 I Revisir,n ... .. 1928-29 6 81 131
(R) I 75 (Al 22 50 1275 (V) 175 (D) 13 50 ~P) 1 31
II R) I 50 CA) 2250 II 75 (V) 1 50 (D) 13 50 (P) I 31
(A) 2250 III (R) I 50 107S (V) I 12 (D) 13 50 (P) 1 31
12 Mahad and P"ladpur Original .. 1865.66 30 248 082 M.hal. I Re .. isioll .. .. 1903-04 30 248 087 - (R) 2 O'rj 2 00 (SW) 700 I (N)
(V) 200 (N) 200 (ST) 500
Il (P) 1 50 eN) 200 (SW) 600 (V) 150 ~N) I 50
III (R) I 25 SW) 5 00 (V) 1 25 (N) I 25
IV (R) I 00 (SW) 400 (V) 100 (N) 100
V (R) 075 (SW) 3 00 (V) 07S (N) o 7S
NA=Nct Avail.ble. (A)= Airi Bagua.t. (O)=Dongri Bagay.t. (N)=New. (P)=Pulan. (R)-R.bi. (V)=Vatai. (W}=Warlcas. (Sn=s.1t Rice. (SW)=Sweet Rice.
KOLABA : ADMINISTRATIVE SET-UP (7)
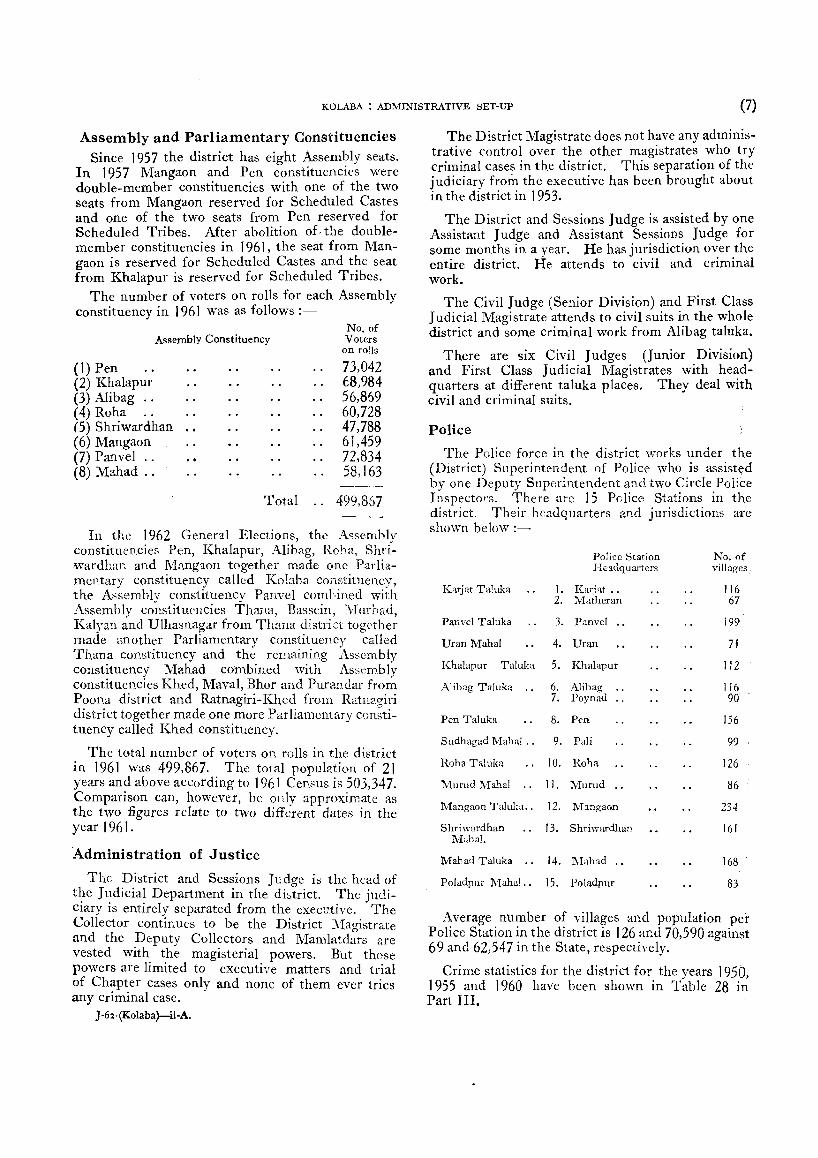
Assembly and Parliamentary Constituencies Since 1957 the district has eight Assembly seats.
In 1957 Mangaon and Pen constituencies were double-member constituencies with one of the two seats from Mangaon reserved for Scheduled Castes and one of the two seats from Pen reserved for Scheduled Tribes. Mter abolition of. the doublemember constituencies in 1961, the seat from Mangaon is reserved for Scheduled Castes and t?e seat from Khalapur is reserved for Scheduled Tnbes.
The number of voters on rolls for each Assembly constituency in 1961 was as follows :-
Assembly Constituency
(1) Pen (2) Khalapur (3) Alibag .. (4) Roha .. (5) Shriwardhan (6) Mangaon (7) Panvel (8) Mahad ..
Total
No. of Voters
on roIi3
73,042 68,984 56,869 60,728 47,788 61,459 72,834 58,163
499,867
In the 1962 General Elections, the Assembly constituencies Pen, Khalapur, Alibag, Roha, Shri'wardhan and Mangaon together made one Parliamentary constituency called Kobba constituency, the Assembly constituency Panvel combined with Assembly constituencies Thana, Bassein, Murbad, Kalyan and Ulhasnagar from Thana district together made another Parliamentary constituency called Thana c:onstituency and the remaining Assembly cO!1stituency Mahad combined with Assembly constituencies Khed, Maval, Bhor and Purandar from Poona district and Ratnagiri-Khed from Ratnagiri district together made.one more Parliamentary constituency called Khed constituency.
The total number of voters on rolls in the district in 1961 Was 499,867. The total population of 21 years and above according to 196 J Census is 503,347. Comparison can, however, be only approximate ::\s the two figures relate to two different dates in the year 1961.
Administration of Justice
The District and Sessions Judge is the head of the Judicial Department in the district. The jlldiciary is entirely separated from the executive. The Collector continues to be the District Magistrate and the Deputy Collectors and Mamlatdars arc vested with the magisterial powers. But these powers are limited to executive matters and trial of Chapter cases only and none of them ever tries any criminal case.
J ·61-(Kolaba)-ii-A.
The District Magistrate does not have any administrative control over the other magistrates who try criminal cases in the district. This separation. of the judiciary from the executive has been brought about in the district in 1953.
The District and Sessions Judge is assisted by one Assistant Judge and Assistant Sessions Judge for some months in a year. He has jurisdiction over the entire district. He attends to civil and criminal work.
The Civil Judge (Senior Division) and First Class Judicial Magistrate attends to civil suits in the whole district and some criminal work from Alibag taluka.
There are six Civil Judges (Junior Division) and First Class Judicial Magi'3trates with headquarters at different taluka places. They deal with civil and criminal suits.
Police
The Police force in the district works under the (District) Superintendent of Police who is assisted by one Deputy Superintendent and two Circle Police Inspectors. There arc 15 Police Stations in the district. Their headquarters and jurisdictions are shown below :-
Police Station No. of Headquarters villages:
Karjat Ta1uka J. Kat:iat .. 116 2. Matheran 67
Panvel Taluka 3. Panvel 199
Uran Mahal 4. Uran 71
Khalapur Taluka 5. Khalapur 112
Alibag Taluka 6. Alibag .. 116 7. Poynad .. 90
Pen Taluka 8. Pen 156
Sudhagad MahaI .. 9. Pali 99
Roha Taluka 10. Roha 126
Murud Ma11al 11. Murud 86
l'vIangaon Taluka .. 12. :r.Iangaon 234
Shriwardhan 13. Shriwardhan 161 MJha!.
Mahad Taluka 14. Mahad .. 168
Poladpur Maha! .• 15. Poladpur 83
Average number of yillages and population per Police Station in the district is 126 ar..d 70,590 against 69 and 62,547 in the State, respectively.
Crime statistics for the district for the years J 95(), 1955 and 1960 have been shown in Table 28 in Part III.
'(8) DISTRICT CENSUS HANDBOOK
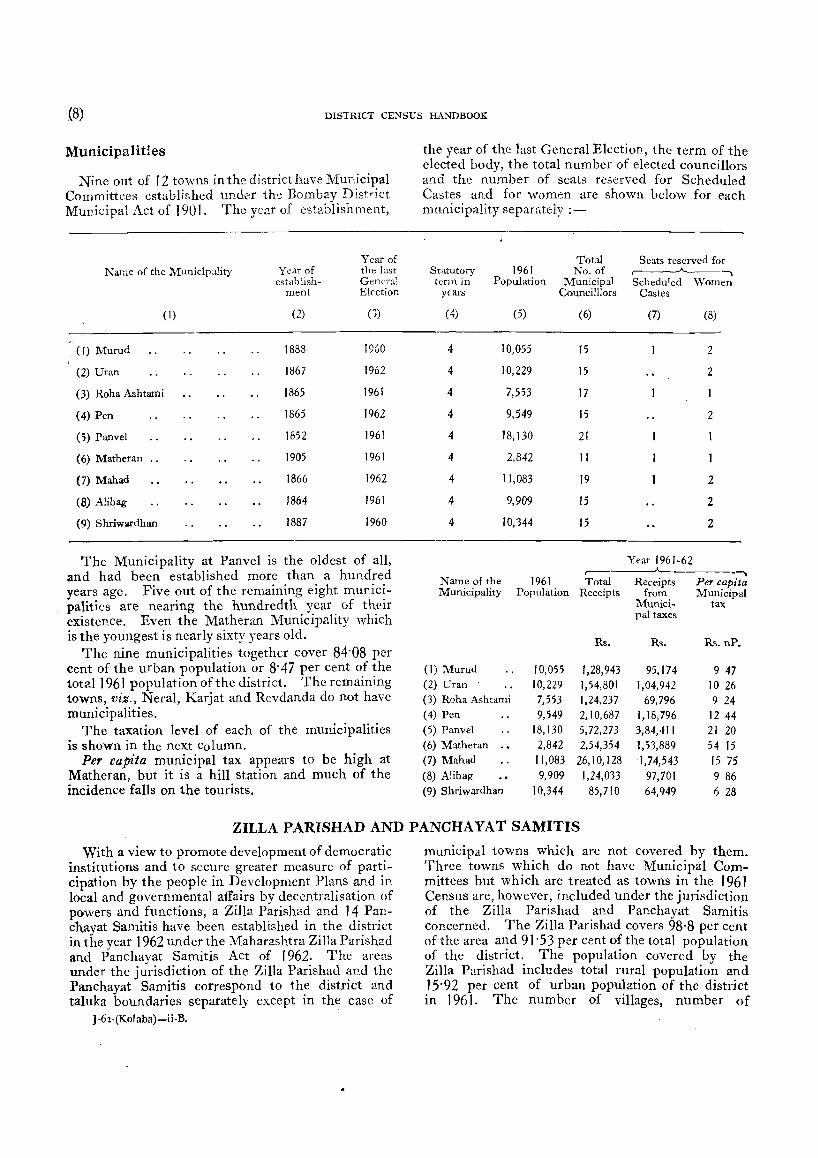
Municipalities
Nine out of '2 tovms in the district have Municipal Committees established under the Bombay District Munici pal Act of 1901. The year of establishment,
Year of Name of the Municlpality Year of the last
establish- Gene~~:1.1
ment Election
(I) (2) (3)
, (I) Murud 1888 1960
(2) Uran 1867 1962
(3) Roha Ashtami 1865 1961
(4) Pen 1865 1962
(5) Panvel 1852 1961
(6) Matheran .. 1905 1961
(7) Mahad 1866 1962
(8) Alibag 1864 196)
(9) Shriwardhan 1887 1960
The Municipality at Panvel is the oldest of all, and had been established more than a hundred
Five out of the remaining eight munici-years ago. palities are nearing the hundredth year of their existence. Even the Matheran Municipality which is the youngest is nearly sixty years old.
The nine municipalities together cover 84·08 pcr cent of the urban popUlation or 8'47 per cent of the total 1961 population of the district. The remaining towns, viz., Neral, Karjat and Revdanda do not have municipalities.
The taxation level of each of the municipalities is shown in the next column.
Per capita municipal tax appears to be high at Matheran, but it is a hill station and much of the incidence falls on the tourists.
the year of the last General Election, the term of the elected body, the total number of elected councillors and the number of seats reserved for Scheduled Castes and for women are shown below for each mLlnicipality separately :-
Total Seats reserved for Statutory 1961 No. of .------'"--, term in Population Municipal Scheduled Women
years Councilllors Castes
( 4) (5) (6) (7) (8)
4 10,055 15 2
4 10,229 15 2
4 7,553 17
4 9,549 15 2
4 18,130 21
4 2,842 II
4 11,083 19 2
4 9,909 15 2
4 10,344 15 2
Year 1961-62 -,
Name of the 1961 Total Receipts Per capita Municipality Population Receipts from Municipal
Munici- tax pal taxes
Rs. Rs. Rs. nP.
(I) Murud 10,055 1,28,943 95,174 9 47 (2) Uran 10,229 1,54,801 1,04,942 10 26 (3) Roha Ashtami 7,553 1,24,237 69,796 9 24 (4) Pen 9,549 2,10,687 1,18,796 12 44 (5) Panvel 18,130 5,72,273 3,84,m 21 20 (6) Matheran 2,842 2,54,354 1,53,889 54 15 (7) Mahad 11,083 26,10,128 1,74,543 15 75 (8) Alibag 9,909 1,24,033 97,701 9 86 (9) Shriwardhan 10,344 85,710 64,949 6 28
ZILLA PARISHAD AND PANCHAYAT SAMITIS
With a view to promote development of democratic institutions and to seCUre greater measure of participation by the people in Development Plans and if'. local and governmental affairs by deccntr2.1isation of powers and fUnctions, a Zilla Parishad and 14 Panchayat Samitis have been established in the district in the year 1962 under the Maharashtra Zilla Parishad and Panchayat Samitis Act of 1962. The areas under the jurisdiction of the Zilla Parishad af'.d the Panchayat Samitis correspond to the district and taluka boundaries separately except in the case of
J -62-(Kolaba)-ii-B.
municipal towns which are not covered by them. Three towns which do not have Municipal Committees but which are treated as towns in the 1961 Census are, however, included under the jurisdiction of the Zilla Parishad and Panchavat Samitis concerned. The Zilla Parishad covers 98·8 per cent of the area and 9 J ·53 per cent of the total population of the district. The population covered by the Zilla Parishad includes total rural population and 15·92 per cent of urban population of the district in 1961. The number of villages, number of
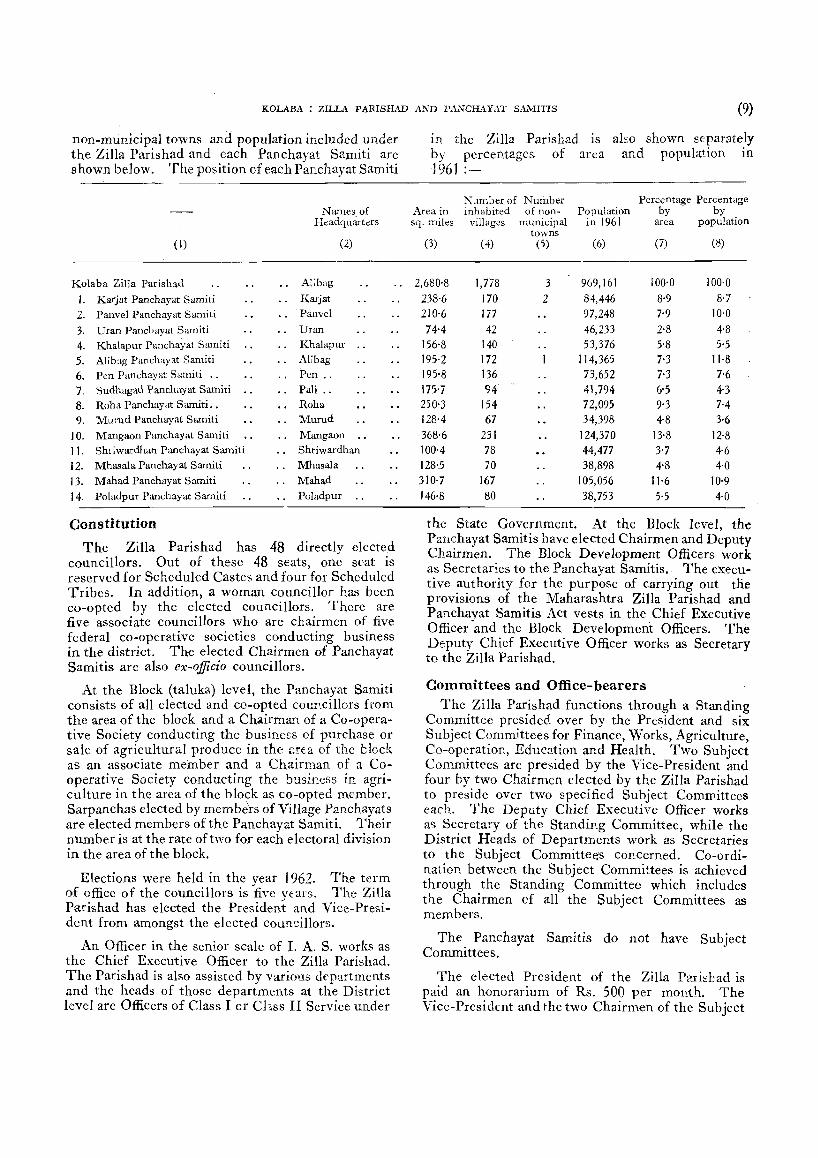
KOLABA : ZILLA PARISHAD AND PANCHAYAT SMIITIS (9)
non-municipal towns and population included under the Zilla Parishad and each Panchayat Samiti are shown below. The position of each Panchayat Samiti
(1)
Kolaba Zilla Parishad
I. Karjat Panchayat Samiti
2. Panvel Panchayat Samiti
3. Uran Panchayat Samiti
4. Khalapur Panchayat Samiti
5. Alib:l.g Panchayat Samiti
6. Pen Panchayat Samiti "
7. Sudhagad Panchayat Samiti
8. Roha Panchayat Samiti. •
9. Murud Panchayat Samiti
10. Mangaon Panchayat Samiti
11. Shtiwardhan Panchayat Samiti
12. Mhasala Panchayat Samiti
13. Mahad Panchayat Samiti
14. Poladpur Panchayat Samiti
Constitution
Names of Headquarters
AlibClg
Karjat
Panvel
(2)
Uran
Khalapur
Alibag
Pen ..
Pali ..
Roha Murud
Mangaon
Shriwardhan
Mhasala
Mahad
PoJadpur ..
The Zilla Parishad has 48 directly elected councillors. Out of these 48 seats, one seat is reserved for Scheduled Castes and four for Scheduled Tribes. In addition, a woman councillor has been co-opted by the elected councillors. There are five associate councillors who are chairmen of five federal co-operative societies conducting business in the district. The elected Chairmen of Panchayat Samitis are also ex-officio councillors.
At the Block (taluka) level, the Panchayat Samiti consists of all elected and co-opted councillors from the area of the block and a Chairman of a Co-operative Society conducting the business of purchase or sale of agricultural produce in the 3.rta of the block as an associate member and a Chairman of a Cooperative Society conducting the busif'.cSS in agriculture in the area of the block as co-opted member. Sarpanchas elected by members of Village Panchayats are elected members of the Panchayat Samiti. Their number is at the rate of two for each electoral division in the area of the block.
Elections were held in the year 1962. The term of office of the councillors is five years. The Zilla Parishad has elected the President and Vice-President from amongst the elected councillors.
An Officer in the senior scale of I. A. S. works as the Chief Executive Officer to the Zilla Parishad. The Parish ad is also assisted by various departments and the heads of those departments at the District level are Officers of Class I or Chss II Service under
in the Zilla Parishad by percentages of 1961 :-
IS
area also shown separately
and population in
Nmnber of NUr11ber Percentage Percentage Area in inhabited of non- Population by by sq. miles villages municipal in 1961 area population
towns (3) ( 4) (5) (6) (i) (8)
2,680'8 l,n8 3 969,161 100'0 100·0
238'6 170 2 84,446 8·9 8·7
210'6 177 97,248 7·9 10·0
74-4 42 46,233 2·8 4·8
156'8 140 53,376 5-8 5·5
195'2 172 114,365 7·3 11·8
195'8 136 73,652 i-3 7-6 liS'i 94 41,794 6·5 4'3 250'3 154 72,095 9'3 7'4 128·4 67 34,398 4'8 3-6 368·6 231 124,3iO 13-8 12'8 100'4 78 44,477 3·7 4-6 128·5 70 38,898 4'8 4·0 310·7 16i 105,056 11·6 10·9 146·8 80 38,753 5·5 4·0
the State Government. At the Block level, th~ Panchayat Samitis have elected Chairmen and Deputy Chairmen. The Block Development Officers work as Secretaries to the Panchayat Samitis. The executive authority for the purpose of carrying out tne provisions of the Maharashtra Zilla Parishad and Panchayat Samitis Act vests in the Chief Executive Officer and the Block Development Officers. The Deputy Chief Executive Officer works as Secretary to the Zilla Parishad.
Committees and Office-bearers The Zilla Parishad functions through a Standing
Committee presided over by the President and six Subject Committees for Finance, Works, Agriculture, Co-operation, Education and Health. Two SUbject Committees are presided by the Vice-President and four by two Chairmen elected by the Zilla Parishad to preside over two specified Subject Committees each. The Deputy Chief Executive Officer works as Secretary of the Standing Committee, while the District Heads of Departments work as Secretaries to the Subject Committee.s concerned. Co-ordination between the Subject Committees is achieved through the Standing Committee which includes the Chairmen of all the Subject Committees as members.
The Panchayat Samitis do not have Subject Committees.
The elected President of the Zilla P:>.riEbad is paid an honorarium of Rs. 500 per month. The Vice-President and the two Chairmen of the Subject
(10) DISTRICT CENSUS HANDBOOK
Committees are paid an honorarium of Rs. 300 per month. The elected Chairmen and Deputy Chairmen of the Panchayat Samitis are paid an honorarium of Rs. 300 and Rf. 150 per month, respectively. All these persons are also provided with rent-free accommodation as is deemed suitable for them by the Zilla Parishad.
Functions
The Divisionai and State Officers of the Government continue to exercise technical supervision and give guidance to Zilla Parishad and Panchayat Samitis. The State Government has powers to give direction to the Zilla Parishad regarding works and schemes in the interest of National or State Development Plans. Inspection and supervision are carried out by the Divisional Commissioners.
Except for a few safeguards, the developmental and administrative functions of Government are now with the creation of these democratic bodies at the district and block level, devolved on them. In other words, the State Government has divested itself of the responsibility of local activities which are now left to the people's initiative and resources.
The developmental and administrative subjects transferred to the Zilla Parish ad and Panchayat _Samitis have been listed in SchedUles I and II to the Maharashtra Zilla Parishad and Panchayat Samitis Act. By and large, all functions of Government iadministration including development activities, at the district level, but excluding matters relating to law and order, judicial and quasi-judicial functions, and development functions involving high technical skill like Research Stations, etc., have been devolved on the Zilla Parishad and Panchayat Samitis. All Class III and Class IV employees of the Government Departments now transferred to the Zilla Parishads have been absorbed as employees of the Parishad. The Village Talati (or Patwari) and the entire village establishment of the Revenue Department have been transferred to the Parishad through the Village Panchayats, though for collection of land revenue and maintenance of Record of Rights they continue to work under the Revenue Officers.
The Zilla Parishad has replaced the erstwhile statutory bodies known as District Local Board, District School Board and District Panchayat MandaI. The functions of non-statutory body known as the District Development Board have of course been absorbed. Municipalities, however, remain unaffected as municipal areas are excluded from the jurisdiction of the Zilla Parishad.
Finance
The law provides for levy of a cess at the rate of twenty naye paise on every rupee of land revenUe
and at a rate not exceeding nineteen naye paise per rupee of water rate. The Zilla Parishad can levy taxes on profession, trade, calling or employment and taxes on water supply, . public entertainments, amusements and pilgrims, special tax on land and bUildings and other taxes. The stamp duty on transfer of certain immovable properties may be increased by one-half per cent by Government for payment to the Zilla Parishad.
The financial assistance given by the State Government includes 70 per cent of the land revenue collected within the area of the Parishad. When, however, the amount of land revenUe payable falls short of the amount arrived at on the basis of two rupees per capita of the popUlation of the district as appearing in the Census of J 96 J, an equalisation grant covering the difference will be paid to the Zilla Parishad. Government also pays what are called purposive grants being grants for specifkworks and development schemes transferred to the Zilla Parishad at the rate of not less than 75 per cent of the expenditure. An establishment grant equal to 75 per cent of the average annual cost on account of salaries and allowances is paid in respect of the posts held by the staff of Government transferred to the Parishad which are inclUded in the District Technical Service (Class III), District Service (Class III) and District Service (Class IV). The other grants include a deficit adjustment grant payable at full rates during the first five years and to be progressively reduced in the next ten year:s after which it will not be payable, incentive grants calculated to achieve speedier development and grants for Plan Schemes. If in pursuance of the proposal of a Zilla Parishad or a Panchayat Samiti, a Cess on land revenUe at a rate in excess of the minimum rate prescribed by the Act is levied by the State Government in the whole of the district or in block, the Zilla Parishad or the Panchayat Samiti, as the case may be, shall be paid every year by the State Government a grant called the local cess matching grant.
The total revenue receipts of the Zilla Parishad for the year J 963-64 are Rs. J 36 lakhs. The major portion of the receipts is of receipts from Government. They are 91' 7 per cent and the Zilla Parishad receipts afe 8'3 per cent of the total revenUe receipts. Major items of Zilla Parishad's receipts are local fund cess, cess on water rates and profession tax.
The total revenUe expenditure is Rs. 141 lakhs. Followir.g are the major items of expenditure :-
General Administration 5'2 per cent Education 53'1 " " Community Development 8' 7" "
Project. Buildings and Communications J JO "
" Miscellaneous 8'1 " " Other items I J '9 " H
KOLABA : ZILLA pARISHAD AND PANCHAYAT SA,\fiTIS (11 )
A proposal to raise cess on land revenue to 30 nP. per rupee is reported to be under consideration.
Per capita annual expenditure of the Zilla Parish ad .on different development heads is as follows :-
General Administration Education Community Development Buildings and Communications
Establishment
Rs. 0'76 7'71 1'26 1'89
The establishment of the Zilla Parishad comprises of the gazetted and the non-gazetted staff. The
non-gazetted staff consists of the employees of the former local bodies and those of the various State Government Departments now transferred to the Zilla Parishad .
There are 6 Class I and 32 Class II Gazetted Officers working under the Zilla Parishad. The total strength of the non-gazetted employees of Class III and Class IV category is 5,5. Moreover an establishment of 161 Gram SeiVaks, 336 Ta1atis and 217 Village Panchayat Secretaries has been transferred from the Revenue Department to the Zilla Parishad.
VILLAGE PANCHAYATS
The number of independent village panchayats, the number of group village panchayats and the number of villages covered by group village panchayats are shown below :-
No. of No. of No. of No. of inhabited inde- group villages
Taluka villages pendent village covered and village pancha- by group
non- pancha- yats village municipal yats pancha-
towns yats
I Karjat 170+2 5 38 179 2 Panv,", 177 5 48 188 3 Uran Mahal 42 11 13 56 4 Khalapur .. 140 Nil 22 150 5 Alibag 172+1 42 202 6 Pen 136 9 27 146 7 Sudhagad Mahal 94 4 23 95 8 Roha 154 3 38 171 9 Murud Mahal 67 2 15 78
10 Mangaon 231 4 67 232 11 Shriw a r d han 78 8 20 76
Mahal.
12 Mhasala Mahal 70 20 79 13 Mahad 167 11 55 157 14 Poladpur Mahal 80 Nil 24 81
---- ----Total " 1,778+3 64 452 1,890
---- ---_ ---Note-The figures in column (5) perhaps include hamlets.
The totals of columns (3) and (5) do not therefore tally With column (2).
All the villages in the district are covered by village panchayats.
The break-up of the total annual income of all the village panchayats in the district for the year J 961-62 is as follows as shown in the next column.
Item Amount Percentage (in'OOO) of total
income Rs.
Grants 945 52'15 TlU;es on houses and properties 201 11'09 Octroi 166 9'16 Other taxes .. 317 17'50 Total taxes .. 684 37-75 Income from other sources 183 10'10 Total income 1,812 100'00
The first item inclUdes the Government grant of 30 per cent of the land reVenUe collected in the village or one rupee per head of population whichever is more. The village panchayats also get the entire lotal fund cess collected in the village. At present it is collected at 20 nP. per rupee of land revenue. The village panchayats can raise it with Government approval up to 100 nP. per rupee of land revenue.
The break-up of the total annual expenditure of all the village panchayats in the district for the year 1961-62 is as follows :-
Item
Administration Health and Sanitation Public Lighting Other items Total Expenditure
Amount (in '000)
Rs.
287 467 113 951
1,818
Percentage of total expen-diture
15'79 25-69 6'21
52'31 100'00
Other items include improvement of village roads, construction of new drinking water wells or repairs to old wells, construction of panchayat ghars, schools and such other buildings.
Functions of the Talati (Patwari), Village Panchyat Secretay and Assistant Gram Sevak are combined in one official who now works under the Village Panchayat.
(12) DISTRICT CENSUS HANDBOOK
POPULATION
Table A-I in Part II shows the 1961 population of the district and each taluka for total, rural and urban areas separately. Dtfinition of rural and urban areas may be seen in paragraphs 8 and 9 of the Explanatory Note to Part II. Table A-II shows tl:e district population and its variation at each Census since 190 I and the variation in population for each taluka during 1951-1961.
Variation
The population of the district and the decade variation rates since 190 J are as follows :-
Year
1901
1911
1921
1931
1941
1951
1961
Population Variation
721,083
714,371
677,586
756,315
805,157
-6,712
-36,785
+78,729
+48,842
909,083 + 103,926
1,058,855 + 149,772
Rate of vatiation
-0·93
-5·15
+11'62
+6'46
+ 12·91
+ 16'48
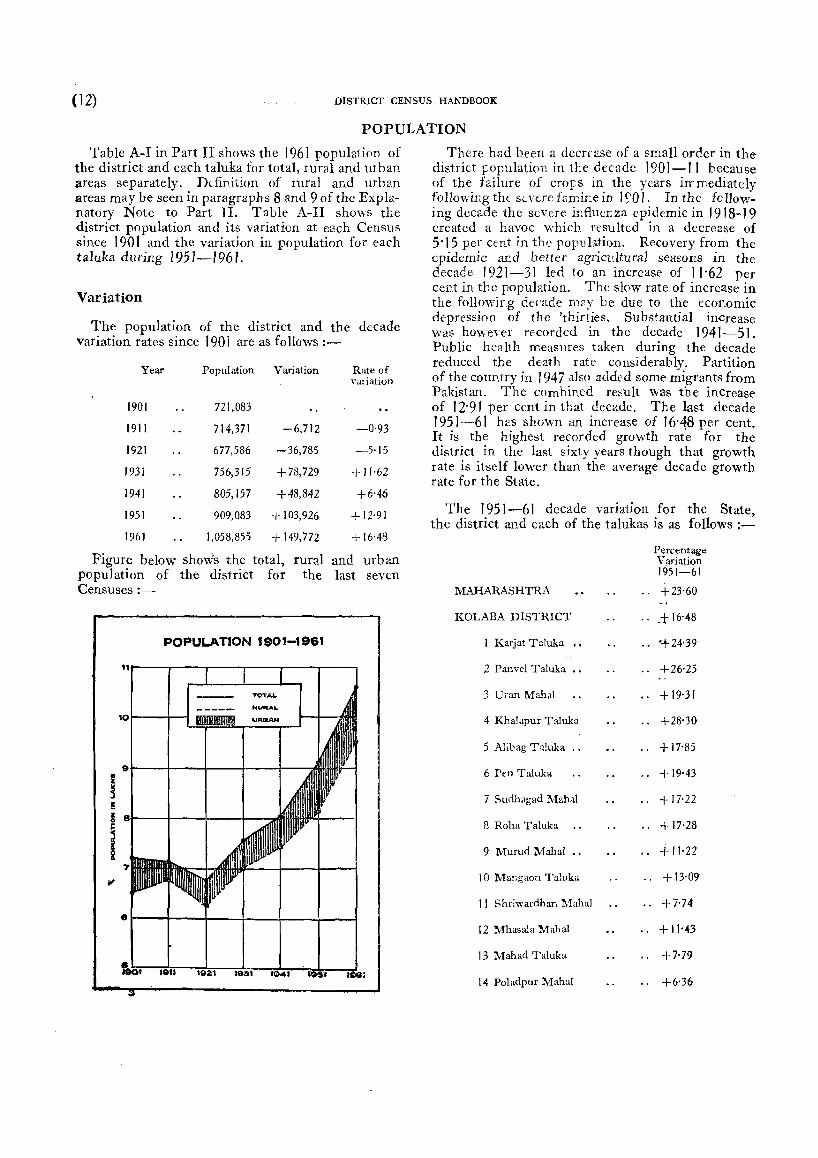
Figure below shows the total, rural and urban population of the district for the last seven Censuses :-
POPULATION 1901-1961
There had been a decrease of a small order in the district Fopulation in the decade 190 J -II because of the failure of croFs in the years irrmediately following the s(:n:1'e fc:mir.e in 1 ~O J. In the fo 11owing decade the severe influeLza epidemic in 1918-19 created a havoc which resulted in a decrease of 5'15 per cent in the population. Recovery from the epidemic ard better agrictdtu1'al seasons in the decade 1921-31 led to an increase of 11'62 per cent in the population. The slow rate of increase in the foHowirg decade m~.:y be due to the economic depression of the 'thirties. Substantial increase was however recorded in the decade 1941-51. Public health measures taken during the decade reduced the death rate considerably. Partition of the country in 1947 also added some migrants from Pakistan. The combined result was the increase of 12'91 per cent in that decade. The last decade 1951-61 has shown an increase of 16'48 per cent. It is the highest recorded growth rate for the district in the last sixty years though that growth rate is itself lower than the average decade growth rate for the State.
The 1951-61 decade variation for the State, the district and each of the talukas is as follows:-
MAHARASHTRA
KOLABA DISTRICT
I Karjat Taluka ••
2 Panvel Taluka ••
3 Uran Mahal
4 KhaJapur Taluka
5 Alibag Ta!uka ..
6 Pm Taluka
7 Sudhagad Mahal
8 Roha Taluka
9 Murud Mahal
10 Mangaon Taluka
J I Shriwardhan Maha!
12 Mhasala Mahal
13 Mahad Taluka
14 Poladpur Milial
Percentage Variation 1951-61
.. +23-60
... t 16'48
.. ,,+24'39
+26'25
.. +19'31
.. +28'30
.. + 17'85
.. + 19'43
.. +17-22
.. +17-28
+ 11'22
.. + 13·09
.. +7-74
.. + 11'43
.. +7·79
.. +6'36
KOLABA : POPULATION (13)
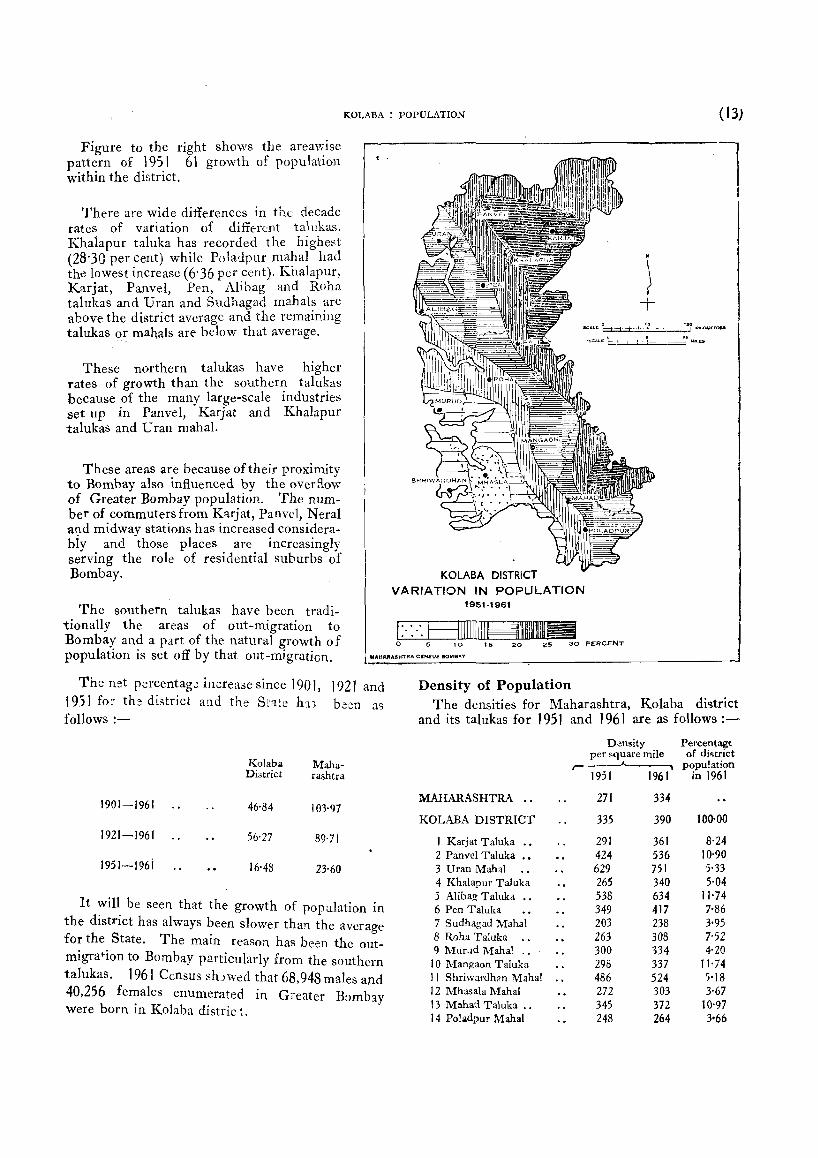
Figure to the right shows the areawise pattern of 1951-61 growth of population within the district.
There are wide differences in the decade rateS of variation of different talukas. Khalapur taluka has recorded the highest (28'30 per cent) while Poladpur mahal had the lowest increase (6'36 per cent). Khalapur, Karjat, Panvel, Pen, Alibag and Roha talukas and Uran and Sudhagad mahals are above the district average and the remaining talukas or mahals are below that average.
These northern talukas have higher rates of growth than the southern talukas because of the many large-scale industries set up in Panvel, Karjat and Khalapur talukas and U ran mahaI.
These areaS are because of their proximity to Bombay also influenced by the overflow of Greater Bombay population. The number of commuters from Karjat, Panvel, Neral m.ld midway stations has increased considerably and those places are increasingly serving the role of residential suburbs of Bombay.
I' I
l , .
1 &CALL 6+ ! _~ KlLOtoIETRI,:.S
KOLABA DISTRiCT
VARIATION IN POPULATION 1951-1961
I::;;±=~==""""
The southern talukas have been traditionally the areas of out-migration to Bombay and a part of the natural growth of population is set off by that out-migration. "At1A1tA~HTRA CEmus BOMBII-V
The net percentage increase since 190), 1921 and f 951 fo:- the district and the State h:n been as follows :-
Kolaba Maha-District rashtra
1901-1961 46'84 103'97
1921-1961 56'27 89·71
1951-196i 16'48 23-60
It will be seen that the growth of population in the district has always been slower than the average for the State. The main reason has been the outmigration to Bombay particularly from the southern talukas. 1961 Census sh)wed that 68,948 males and 40,256 females enumerated in Greater Bombay were born in Kolaba distric t.
Density of Population The densities for Maharashtra, Kolaba district
and its talukas for 1951 and J 96 J are as follows :-
D~nsity Percentagt per ~quare mile of district
r----A. population 1951 1961 in 1961
MAHARASHTR>\ .. 271 334
KOLABA DISTRICT 335 390 100·00
1 Karjat Taluka .• 291 361 8·24 2 Panvel Taluka •• 424 536 10'90 3 Uran Mahal 629 751 5'33 4 Khalapur Taluka 265 340 5-04 5 Alibag Taluka •• 538 634 11'74 6 Pen Taluka 349 417 7-86 7 Sudhagad Mahal 203 238 3-95 8 Roha Taluka .. 263 308 7'52 9 Murud Mahal .. 300 334 4-20
10 Mangaon Taluka 298 337 11'74 II Shriwardhan Mahal 486 524 5'18 12 Mhasala Mahal 272 303 3-67 13 Mahad Taluka .• 345 372 10-97 14 Pollldpur Mahal 248 264 3066
(14) DISTRICT CENSUS HANDBOOK
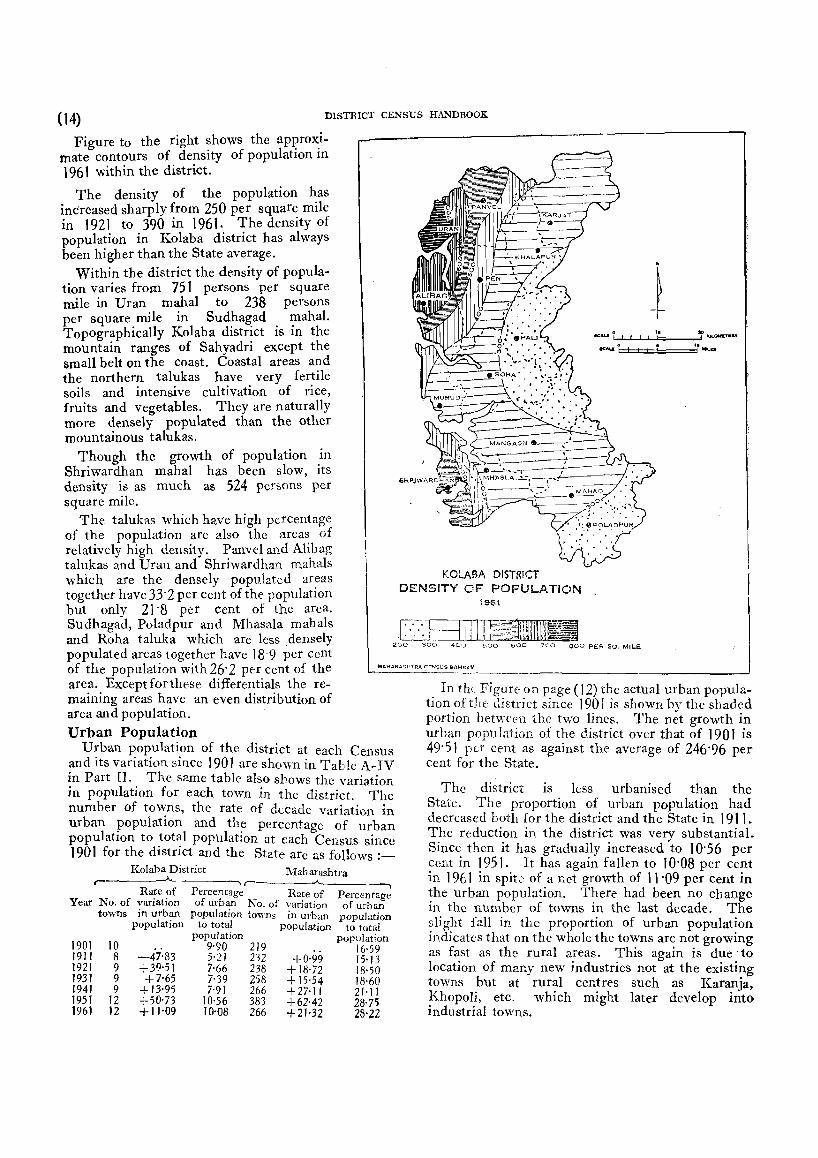
Figure to the right shows the approximate contours of density of population in 1961 within the district.
The density of the population has increased sharply from 250 per square mile in 1921 to 390 in 1961. The density of population in Kolaba district has always been higher than the State average.
Within the district the density of population varies from 751 persons per square mile in Uran mahal to 238 persons per square mile in Sudhagad mahal. Topographically Kolaba district is in the mountain ranges of Sahyadri except the small belt on the coast. Coastal areas and the northern talukas have very fertile soils and intensive cultivation of rice, fruits and vegetables. They are naturally more densely populated than the other mountainous talukas.
Though the growth of population in Shriwardhan mahal has been slow, its density is as much as 524 persons per square mile.
The talukas which have high percentage of the population are also the areas of relatively high density. Panvel and Alibag talukas and Uran and Shriwardhan mahals which are the densely populated areas together have 33'2 per cent of the popUlation
KOLASA DISTRICT DENSITY OF POPULATION
1961 but only 21'8 per cent of the area. Sudhagad, Poladpur and Mhasala mahals and Roha taluka which are less densely popUlated areaS together have 18'9 per cent of the population with 26'2 per cent of the area. Except for these differentials the remaining areas have an even distribution of
MAHAflASI-ITRA ~r:"'~us eOMs.llV
-----------.. --.-----------~
area and population. Urban Population
Urban population of the district at each Census and its variation since 1901 are show'n in Table A~ IV ~n Part II .. The same table also shows the variation m popUlatIOn for each town in the district. The number of towns, the rate of de.cade variation in urban popUlation and th~ percentage of urban populatIon to total populatlon at each Census since 1901 for the district and the State are as foI1~ws :_
Kolaba District Maharashtra r- --, r--------"--___ __
Ra!e ?f Percentage Rate of Percentage Year No. of -yanatlon of urb~n No. of variation of urban
towns 10 urb~n populatlOn towns in urban population populatlOn to total population to total
1901 1911 1921 1931 1941 1951 1961
10 8 9 9 9
12 12
-47,83 +39-51 +7-65
+ 13'95 +50073 + "'09
population population 9'90 219 16·59 5'21 232 +0·99 15'13 7-66 238 + 18·72 18'50 7'.39 258 + 15'54 18'60 7'91 266 +27'11 2!·1I
10·56 383 + 62·42 28· 75 10'08 266 +21'32 28'22
In the Figure on page (12) the actual urban population ofthe district since 190 J is shown by the shaded portion between the two lines. The net growth in urban popuJation of the district over that of 1901 is 49'51 pa cent as against the average of 246'96 per cent for the State.
The district is less urbanised than the State. The proportion of urban popUlation had decreased both for the district and the State in 1911. The reduction in the district Was very substantial. Since then it has gradually increased to 10'56 per cent in 195 J. It has again fallen to 10'08 per cent in 1961 in spite of a net growth of 11'09 per Cent in the urban population. There had been no change in the number of towns in the last decade. The ~ljg~t fall if'. the proportion of urban popUlation mdlcates that on the whole the towns are not growing as fast as the rural areas. This again is due to location of many new industries not at the existing towns but at rural centres SUch as Karanja, Khopoli, etc. which might later develop into industrial towns.
KOLABA : POPULATION (15)
Rural Population The rates of variation in rural population and ~he
percentages of rural population to total populatIon of the district and the State since 190 1 are as follows:-
Year
Kolaba District r--
Rate of variation in rural
population
Percentage of rural
population to total
population
M ah ar ashtra
Rate of variation in rural
population
-----, Percentage
of rural population
to total population
1901 90·10 83-41 1911 .. + 4'22 94'79 +12-68 84-87 1921 " - 7-60 92'34 - 6'77 81·50 1931 + 11'95 92·61 + 14·77 81'40 1941 + 5'86 92'09 + 8·54 78'89 1951 + 9·66 89'44 + 7'72 71'25 1961 + 17·11 89'92 +24·)1 71'78
The net increase in rural popUlation of the district has been 46'55 per cent, over that of 1901 and 52'19 per cent, over that of 1921. The same figures for the State are 75'53 per cent and 67'08 per cent, respectively.
The rates of variation have never followed any trend. During 1921-1951 the urban population had grown faster at the exper.se of rural population. For the first time in 1961 the growth rate of rural population (17·11 per cent) is higher than the growth rate of urban popUlation. As a result the percentage of rural population in the district is higher in 1961 than 1951.
State/District/Taluka Area in
sq. miles (rural)
Size of Villages Table A-III in Part II shows for the district an~
for each taluka the number of villages and ~he~r popUlation for each class of villages. The ~Ist~Ibution of population by size of villages for the dIstnct and the State is as follows :-
Size Class
Kolaba District Maharashtra r--~ ,-.-----"------.,
Percentage Percentage Percentage Percentage of No. of of No. of .
of villages population of villages populatIOn to total to total to total to total No. of rural No. of rural. villages population villages populatIon
Less than 500 62'49 29·95 47-72 15'02 500-999 25-93 33·15 28·55 25-71 1,000-1,999 8·94 22-36 16·62 28·55 2,000-4,999 2'53 13·04 6'18 22040 5,000 and over 0·11 1 ·50 0·93 8·32
Villages with less than 1,000 popUlation are 88'42 per cent of the total number of villages in the district and have 63'10 per cent of the rural pop~lation. Villages with more than 1,000 populatIOn are 11'58 per cent of the total number of viIlage~ and account for 36·90 per cent of the rural populatIOn.
The area, number of inhabited villages, total rural popUlation, average population. per village and the number of villages per 100 sq. miles of rural area. are shown below for the State, district and each taluka separately :-
Number of inhabited villages
Rural population
Number of Average inhabited
population villages per per J 00 sq. miles
inhabited of rural vill age area
(2) (3) (4) (5) (6) --------------------------- -------------------------------------~---(1)
MAHARASHTRA 115,736'3 35,851 28,391,157 792 3T KOLABA DISTRICT 2,670'9 1,778 952,174 536 67
I Karjat Taluka 233-7 170 73,699 434 73 2 Panvel Taluka 210'6 177 97,248 549 84 3 UranMahal.. 74'4 42 46,233 1,101 57 4 Khalapur Taluka 156'8 140 53,376 381 89 5 AIibag Taluka 190· 2 172 108,125 629 90 6 Pen Taluka " 195'8 136 73,652 542 70 7 Sudhagad MahaI 175·7 94 41,794 445 54 8 Roha Taluka 250·3 154 72,095 468 62 9 Murud MahaI 128'4 67 34,398 513 52
10 Mangaon Taluka 368·6 231 124,370 538 63 11 Shriwardha'n Mahal 100·4 78 44,477 570 78 12 Mhasala Maha! 128·5 70 38,898 556 55 13 Mahad Taluka 310-7 167 105,056 629 54 J 4 Poladpur Mahal 146'8 80 38,753 484 55
The average population per village in the district is 536 against 792 in Maharashtra. It is the lowest average in Bombay and Poona Divisions and the third lowest figure in Maharashtra. The district has more number of small villages. The average
J·62-(Kolaba)-iii-A.
population per village within the district varies from 381 in Khalapur taluka to 1,10 1 in Uran mahal. The number of villages per 100sq. m.iles of rural area is 67 in the district and 31 in Maharashtra. Among the talukas of the district the number of villages per
(16) DISTRICT CENSUS HANDBOOK
100 sq. miles of rural area varies from 52 in Murud mahal to 90 in Alibag taluka. It seems that there are a large number of small villages located very near to each other. The dense population in the district thus lives in closely located small villages and not like Sangli district in large villages situated away from each other. Age Composition
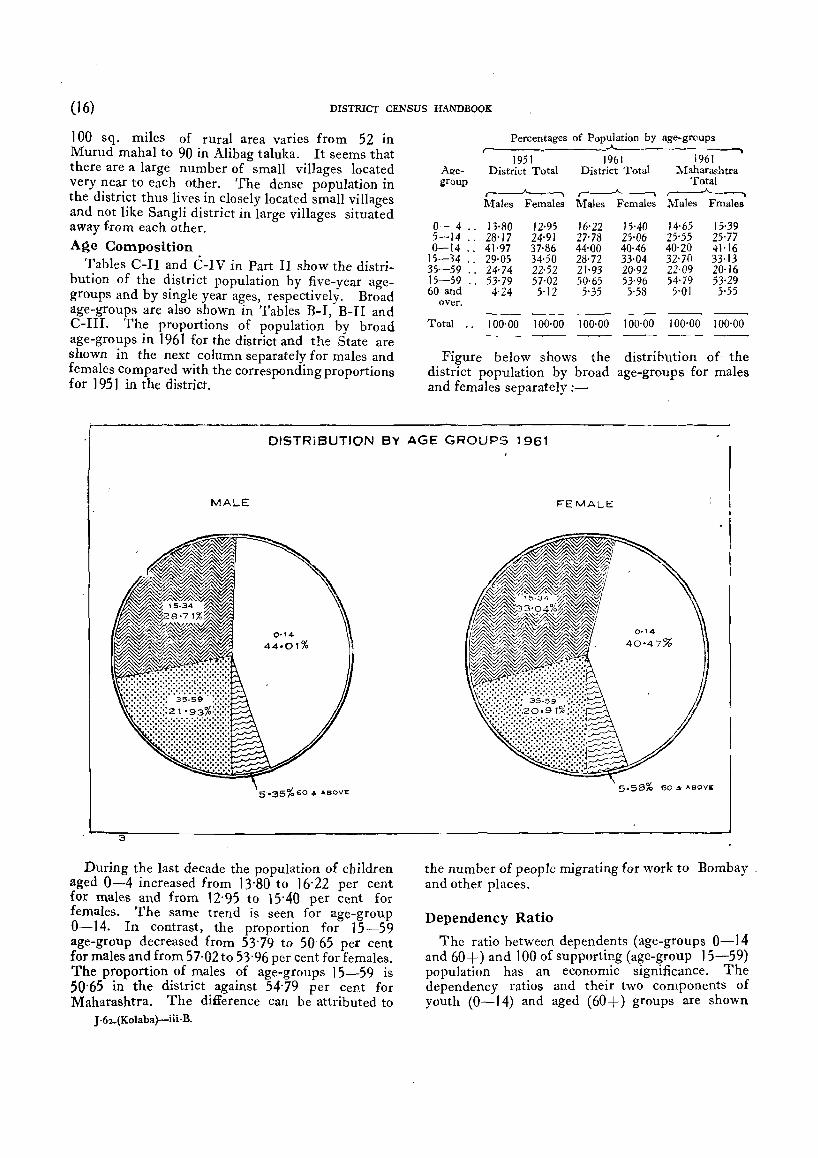
Tables C-II and C-1V in Part II show the distribution of the district population by five-year agegroups and by single year ages, respectively. Broad age-groups are also shown in Tables B-1, B-II and C-III. The proportions of population by broad age-groups in 1961 for the district and the State are shown in the next column separately for males and females compared with the corresponding proportions for 1951 in the district.
Agegroup
0- 4 .. 5-14 " 0-14 "
15-34 " 35-59 " 15-59 " 60 and
over.
Total "
Figure
Percentages of Population by age-groups r----,_---_.A..---
1951 District Total
r--~ Males Females
13-80 12·95 28,17 24-91 41·97 37-86 29·05 34·50 24·74 22·52 53'79 57·02 4'24 5·12
100'00 100'00
1961 District Total
r-----'------> Males Females
16'22 15'40 27'78 25'06 44'00 40'46 28'72 33-04 21'93 20·92 50'65 53'96 )'35 5·58
100·00 100·00
1961 Maharashtra
Total ,-------"----. Males Fmales
14-65 15·39 25'55 25·77 40'20 41·16 32-70 33· 13 22'09 20·16 54'79 53,29 5'01 5·55
100'00 100·00
below shows the distribution of the district population by broad age-groups for males and females separately :-
I DISTRiBUTION BY AGE GROUPS 1961
MALE ~EMALE
3
0'14
44-01%
During the last decade the popUlation of children aged 0-4 increased from 13'80 to 16·22 per cent for males and from 12'95 to 15'40 per cent for females. The same trend is seen for age-group 0-14. In contrast, the proportion for 15-59 age-group decreased from 53'79 to 50'65 per cent for males and from 57'02 to 53'96 per cent for females, The proportion of males of age-groups J 5-59 is 50'65 in the district against 54'79 per cent for Maharashtra. The difference can be attributed to
j-62_(Kolaba}-iii-B,
I
-I I
5.58% 60'" "BOVE:
the number of people migrating for work to Bombay. and other places,
Dependency Ratio
The ratio between dependents (age-groups 0-14 and 60+) and 100 of supporting (age-group J 5-59) population has an economic significance. The dependency ratios and their two components of youth (0-14) and aged (60+) groups are shown
KOLASA : POPULATION (17)
below for 1951 and 1961 for the district and the State, separately :-
Kolaba District Maharashtra r-----"---. -. Youth Aged Total Youth Aged Total
1951 Total 72'0 8·5 80-5 69-9 9'3 79·2 1961 Total 80'6 10·5 9),1 75-2 9-7 84-9
Rural 81'4 10'6 n-o 80-6 10-8 91-4 Urban 7306 9·4 83·0 63·1 7-3 70·4
The dependency ratios are higher in Kolaba district than those for Maharashtra. It is because a part of the supporting population migrate.s for work out of the district. The dependency ratlOS for the State and the district are both higher in 1961 than those of 1951. Both the components of youth and aged have increased. The increase in dependency may be the result both of high fertility and declining mortality. The 1961 popUlation in the district thus has a larger load of dependents than that of 1951. The dependency load is moreover larger in rural than urban areas. It is the effect of the differences in age-structure of rural and urban population resulting from the migration of working age (15-59) people from rural to urban areas within and outside the district.
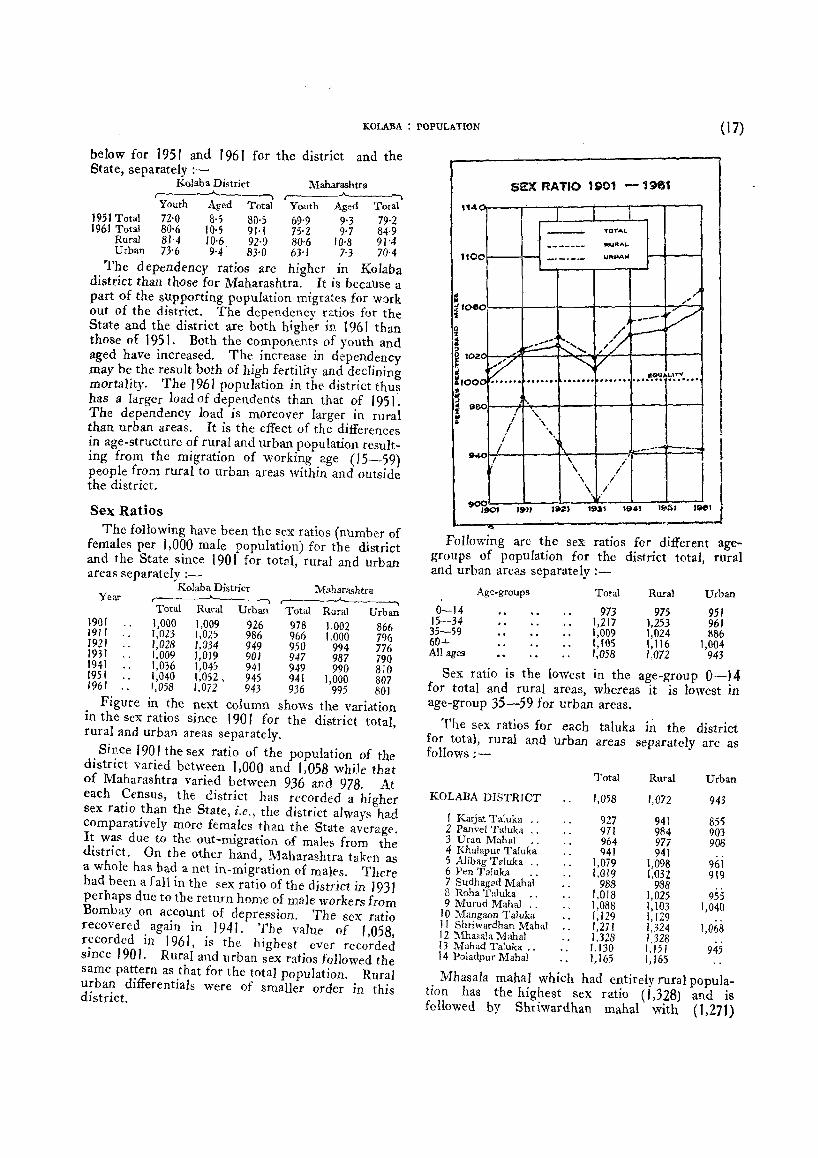
Sex Ratios The following have been the sex ratios (number of
females per 1,000 male population) for the district and the State since 1901 for tot?J, rural and urban areas separately :-
Rolaba District Maharashtra Year r---~~----,
Total Rural Urban Total Rural Urban 1901 1,000 1,009 926 978 1.002 866 19 rl 1,023 1,025 986 966 1,000 796 1921 1,028 1,034 949 950 994 776 1931 1,009 1,019 901 947 987 790 1941 1,036 1,04'> 941 949 990 810 1951 1,040 1.052, 945 941 1,000 807 1961 1.058 1.072 943 936 995 801
Figure in the next column shows the variation in the sex ratios since 190 I for the district total, rural and urban areas separately.
Since 190 I the SeX ratio of the population of the district varied between 1,000 and 1,058 While that of Maharashtra varied between 936 and 978. At each Census, the district has recorded a higher sex ratio than the State, i.e., the district always had comparatively mOre females than the State average. It was due to the out·migration of males from the district. On the other hand, Maharashtra takfn as a whole has had a net in-migration of males. There had been a fall in the sex ratio of the district in 1931 perhaps due to the return home of male workers from Bombay on account of depression. The sex ratio recovered again in 1941. TIle value of 1,058, recorded in 1961, is the highest ever recorded since 190 I. Rural and urban sex ratios followed the same pattern as that for the total popUlation. Rural urban differentials were of smaller order in this district.
SEX RATIO 1901 - '961
.,4 1 I I
_____.. TOTAL
... - ----- JtUFtAL.
110 0 _ .. ---- URPAf<I1
I I
;' ,
0
V ,--,; ~ .... ,.' r"~, /L , p-- ....... "':' 2
~ '" V aQ\JAL.\,.",
)0 .~ ..... ....... ....... .. '.fI·" ...............
&0 l " I \ I ,
i .-.-'- ,....-.-.~ 40
i ,
= :1 10El 'I
9
-~ L-~--~----------
.I \ I \ i
\ I \ /
00 lB .. , I • 190' 7911 1931 1941
Following are the sex ratios for different agegroups of population for the district total, rural and urban areas separately :-
Age.groups Total Rural Urban
0--14 973 975 951 15--34 1,217 1,253 961 35-59 1,009 1,024 886 60+ 1,105 1,116 1,004 All ages 1,058 1,072 943
Sex ratio is the lowest in the age-group 0-14 for total and rural areas, whereas it IS lowest in age-group 35-59 for urban areas.
The sex ratios for each taluka in the district for total, rural and urban areas separately are as follows ;-
KOLABA DISTRICT
I Karjat Taluka " 2 Panvel Taluka .. 3 Uran Mahal 4 Khalapur Taluka 5 Alibag Teluka " 6 Pen TaJuka 7 Sudhag~d Mahal 8 Roha Taluka .. 9 Murud Mahar "
10 Mangaon Taruka 11 Shriwardhan Mahal 12 Mha3alaMahal 13 Mahad Taluka .• 14 Poladpur Mahal
Total
1,058
927 971 964 941
1,079 1,019
988 1,018 1,088 1,129 1,27 I 1.328 1.130 1,165
Rural
1,072
941 984 977 941
1,098 L03Z
988 1,025 1,103 1,129 1,324 1.328 1.l51 1,165
Urban
943
855 903 90B
961 919
955 1,040
1,068
945
Mhasala mahal which had entirely rural popUlation has the highest Sex ratio (1,328) and is followed by Shriwardhan mahal with ( 1,271)
(18) DISTRICT CENSUS HANDBOOK
and Karjat taluka the least (927). Generally the southern and predominantly rural talukas have a higher seX ratio than that of the northern talukas. In Murud and Shri wardhan mahals, the sex ratios of urban population are also as high as 1,040 and 1,068, respectively. The variation in the sex ratio confirms that Mhasala, Shriwardhan, Poladpur, Mahad, Mangaon and Murud are in that order the areas which send out very high proportions of migrants to Greater Bombay and other places.
Year Age-group Total Never married
A__ __ --,
Males Females
( I) (2) (3) ( 4) (5)
J951 0-14 100 99'82 95·52 15-34 100 37,35 7'85 35-54 100 2,02 0·63 55+ 100 1,05 0·36 All ages 100 53,25 39·03
1961 0-14 100 99·56 97'00 15-34 100 37·30 9·05 35-54 100 2-62 0'22 55+ 100 0·97 0·19 All ages 100 55,12 4z.31
The rural urban differentials in sex ratio are not very significant as the urban population consists mostly of small tcwns.
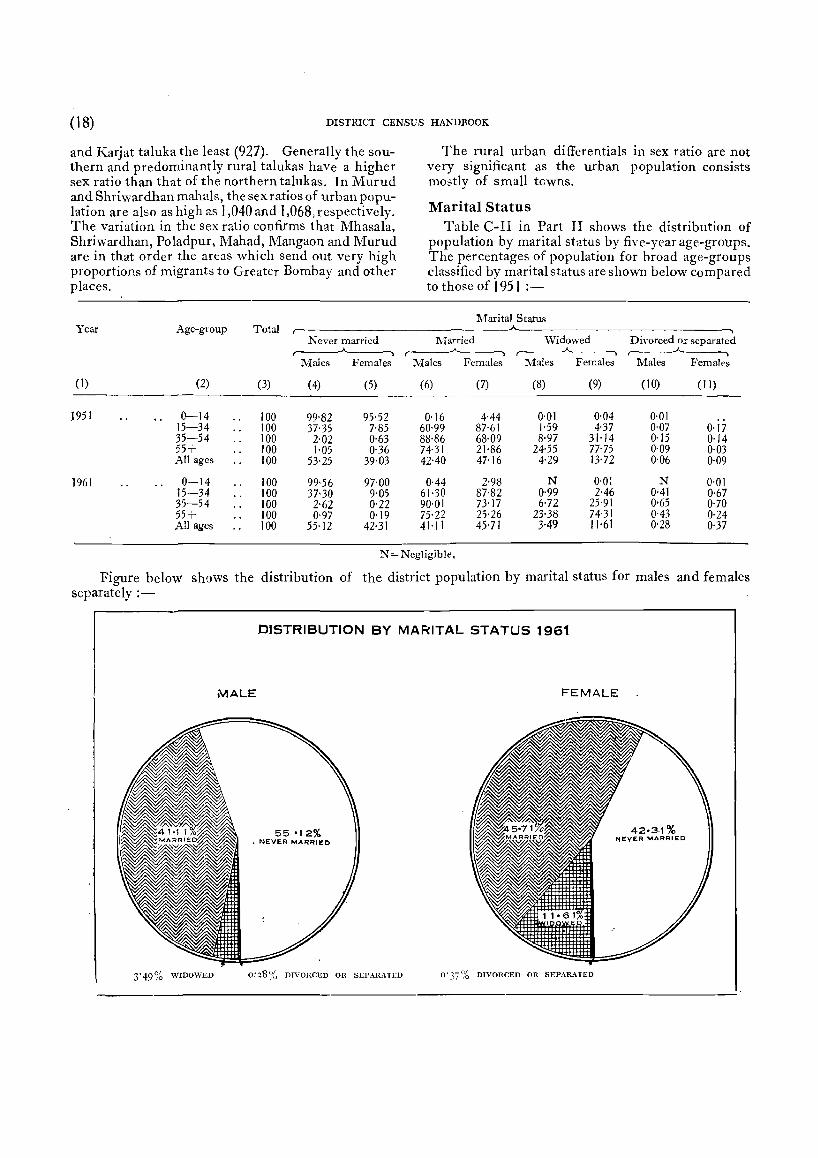
Marital Status Table C-II in Part II shows the distribution of
population by marital status by five-year age-groups. The percentages of population for broad age-groups classified by marital status are shown below compared to those of 1951 :-
Marital Status --,
l\Tarried Widowed Diyorced or separated ..A....__--,
Males Females Males Females Males Females
(6) (7) (8) (9) (10) (I I)
0·16 4'44 0·01 0·04 0'01 60·99 87·61 1·59 4'37 0·07 0·17 88·86 68·09 8·97 31·14 0·15 0·14 74·31 21·86 24·55 77'75 0·09 0·03 42-40 47·16 4·29 13·72 0·06 0·09
0·44 2'98 N 0·01 N 0·01 61·30 87-82 0·99 2·46 0·41 0·67 90·01 73·17 6·72 25'91 0,65 0·70 75'22 25'26 23-38 74·31 0·43 0'24 41·1 I 45,71 3049 11'61 0'28 0,37
N=Negligible.
Figure below shoWS the distribution of the district population by marital status for males and females separately :-
DISTRIBUTION BY MARITAL STATUS 1961
MALE FEMALE
55 '12% I NEVER MARRIED
3'49% WIDOWED O~2S~~ DIVORCED OR SEPARATl:D O' 37 % DIVORCED OR SEPARATED
KOLABA : POPULATION (19)
During the decade 1951-61 the proportion of :never married has increased for both sexes. The proportion of widowed showed a decrease. The proportion of divorced or separated showed an increase. Consequently the proportion of married decreased for both males and females. The proportion of married is higher in r'ural areas than urban areas. The proportion of widowed is almost the same in rural and urban areas. The proportion of never married is more in urban areas.
The rise in the age at marriage of the total population may be seen from the marital status distribution by age-groups shown on page (18).
Child Woman Ratio
The following are the child woman ratios for 1951 and 1961, i.e., the number of children 0-4 years age-group for every 1 ,000 women of 15-44 years age-group as well as for every 1,000 married women of 15-44 years age-group. The proportion of widows to 1,000 married women of 15-44 years age-group is also shown for comparison.
195 I District Total
196 I District Total
Rural
Urban ..
Number of children
0-4 years age-group per 1,000 women of
15-44years age-group
574
703
712
614
Number of children
0-4 years age-group per 1,000 married
women of 15-44 years age-group
671
812
811
826
Number of widows per
1.000 married ~omen (both
in 15-44 years
age-group)
98
67
66
79
The child woman ratio for rural areas is higher than that for urban areas. When standardised for married women of 15-44 years age-group it is slightly higher in urban areas. This may indicate either a higher fertility or a higher survival rate in urban areas of the district. Over the decade the child woman ratio has increased from 574 to 703 for all women of 15-44 age or from 671 to 812 for married women of 15-44 age. It means that in 1961 eight out of every ten married women in 15-44 age had on an average one child of less than five years age each. The increase in the number of children may be partly due to a higher birth rate and reduced infant mortality.
The number of widows per 1,000 married women in the age-group 15-44 is reduced from 98 in 1951 to 67 in 1961. There had been a significant decrease in the incidence of w1dowhood over a decade. In the district the number of widows per 1,000 married women in age-group 15-44 is 79 in urban areas and only 66 in rural areas. It indicates that remarriages of widow3 are more common in rural than urban areas.
Migration The 1961 Census showed the proportions of popu
lation enumerated at places of birth and other places as shown below.
68'27 per cent of the population was enumerated at places of birth. This proportion for males is 80"30 per cent but for females it is only 56'89 per cent. The difference is due to women married at places other than their places of birth. This movement of females on marriage appears to be mostly within the district as the proportion of women born outside the district is only 6'47 per cent against 6'32 per cent for males.
Proportions of Population by Places of Birth
Outside the Total Place of Elsewhere in district but in Outside
population enu:neration tae district M'lharashtra l\11harashtra
( I) (2) (3) ( 4) (5) (6)
Persons 1,058,855 722,175 268,001 53,372 14,252
Males 514,534 412,847 6B,803 23,597 8,879
Females 544,321 309,328 199,198 29,775 5,373
Percentage to total population-
Persons 100·00 68·27 25'33 5'05 1·3j
Males 100·00 80'30 13-33 4·59 1·7)
Females 100·00 56·89 36·64 5043 0·91

(20) DISTRICJ' CENSUS HANDBOOK
The sex ratios in the district population by five-year age-groups for total, rural and urban areas are as follows :-
Sex Ratios Age-group
Total Rural Urban
All ages 1,058 1,072 943 0-4 1,004 1,007 976 5-9 997 1,000 970
10-14 898 896 905 15-19 1,173 1.207 946 20-24 1,375 1,430 1,003 25-29 1,210 1,238 986 30-34 1,112 1,139 904 35-39 I,on 1,040 918 40-44 1,081 1,102 913 45-49 994 1,009 871 50-54 979 991 881 55-59 918 932 799 60+ 1,105 1,116 1,004
Rural sex rl!tio is almost always higher than urban sex ratio except in the age-group 10-14. These differences are more significant in adult age-groups among which the age-group 20-24 has the highest sex ratio. The same pattern can be observed for the total populatiop. The rural sex ratio is very hig h in the age-group 20-24 compared to the corresponding ratio for urban areas. Age-groups 15-19 and 25-29 also have very high sex ratios in rural areas. The sex ratios for age-groups 20-24 and 25-29 are very high for urban, rural and total popUlation. This is due to the movement of males
I II
( I) (2) (3)
District Total . - . - 31·" / 5-09
Born at place of enumeration . _ 34'64 4'88
Elsewhere in the district . - 21,73 8·14
Outside the district 6·30 1-24
Migration to Greater Bombay
A special study of Migrants in Greater Bombay undertaken in 1961 Census has revealed the follow~ ing very interesting features regarding migrants from Kolaba district. The full report on that study is published in Part X (I-C) of the 1961 Maharashtra Census Report_ There arc (in 1961) 109,204 persons in Gr(atcr Bombay who are born in Kol:lba district. Of these 68,948 or 63·14 per ced are males and 40,256 or 36·86 per cent are females. 53,618 or 77'77 per cent of the males are workers and the remaining 22·23 per cent are rron-workcrs. Among the females only 5,057 or 12'56 per cent are workers and the remaining 87·44 per cent are non~workers.
III
(4)
3-88
3-62
5·52
3-82
in these age-groups outside the district in search ofemployment and/or for -higher education. The balance in sex ratio is almost attained in the old age-groups partly due to the migrants returning home to their usual places of residence after retirement from jo bs and services. The low sex ratioforthe age-group 55-59 may also be partly the effect of misreporting of ages of women of that groupin the higher age-group.
The percentage distribution of male population born at the place of enumeration, born elsewhere within the district and born outside the district by nine categories of economic activity· and nonworkers is shown below. An explanation of the nine categories will be found in the Explanatory Note to Part II (paragraphs 42 to 52).
The percentage of non-workers is. lower in the population born outside the district. The percentage of workers in cultivation is higher for those born at the place of enumeration. The percentage of agricultural labc:urers is higher among the people born elsewhere in the district. Migrants from outside the district are engaged more in non-agricultural sectors. The differences in the percentage distribution of migrants and non-migrants are more significant in categories V, VI, VII, VIII and IX. The percentage of non-workers is higher among the people born at place of enumeration.
Categories of Workers -., Non-
IV V VI VII VIII IX Workers
(5) (6) (7) (8) (9) (10) (11)
1'39 1·94 0-55 2-09 1·52 5-49 46'94
1·11 1,19 0-27 1-20 1-17 3-29 48-63
2·26 2-66 0·70 3-31 1-87 13-33 40,48
3·14 9-86 3-89 10-90 5'11 16'82 38'92
Bulk of migration is from rural areas. Twenty-five per cent of females are, however, from the urban areas of the district while the corresponding proportion for ~ales is only 20 per cent.
A significant difference is observed between the pattern of migration to Greater Bombay from this district and other districts of Maharashtra. In case of other districts it is found that of late more females are going to Bombay with the result that seX ratio of migrants from those districts is gradually improving. In case of Kolaba district the sex ratio has remained peculiarly constant. For Kolaba migrants with stay of 15 years and more in Bombay, there are 562 females per 1,000 males. For migrants with stay of
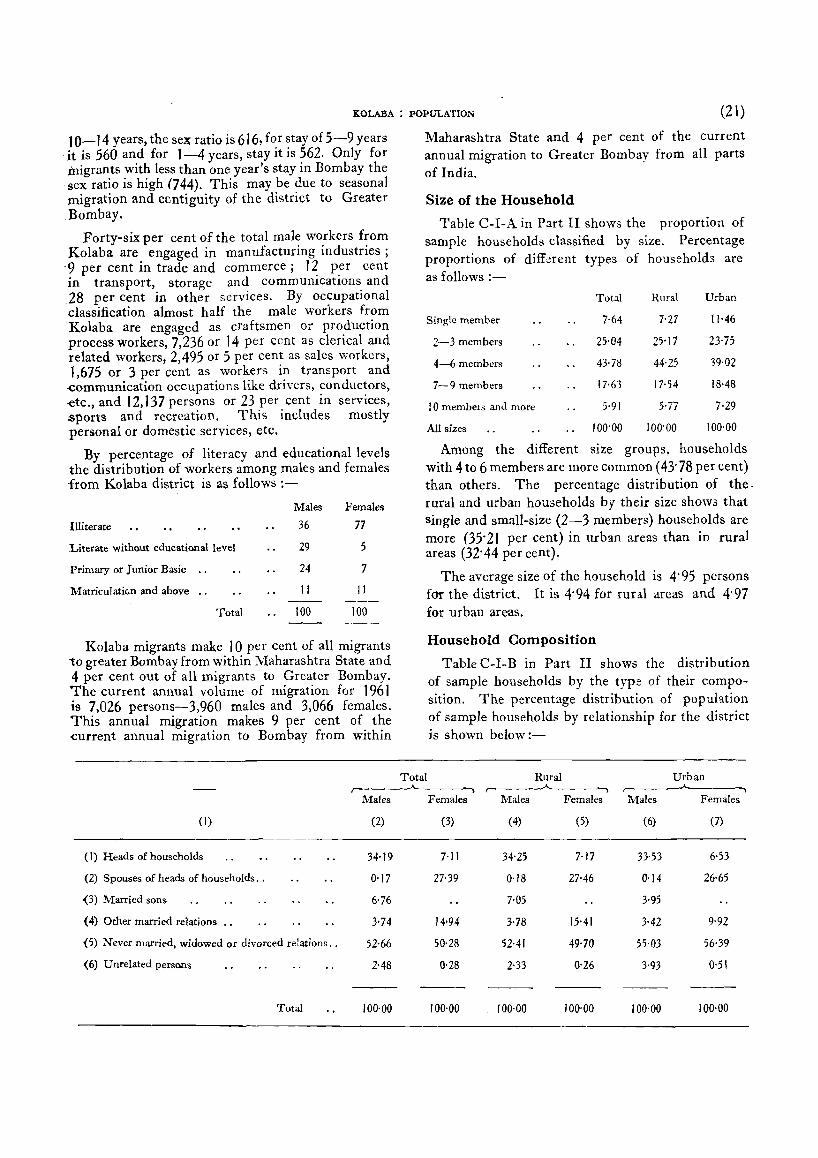
KOLABA : POPULATION (21)
10-14 years, the se~ ratio is 616, for stay of 5 -9 years it is 560 and for 1 -4 years, stay it is 562. Only for migrants with less than one year's stay in Bombay the
. sex ratio is high (744). This may be due to seasonal migration and ccntiguity of the district to Greater Bombay.
Forty-six per cent of the total male workers from Kolaba are engaged in manufacturing industries;
'9 per cent in trade and commerce; 12 per cent in transport, storage and communications and 28 per cent in other services. By occupational -classification almost half the male workers from Kolaba are engaged as craftsmen or production process workers, 7,236 or 14 per cent as clerical and related workers, 2,495 or 5 per cent as sales workers, 1,675 or 3 per cent as workers in transport and -communication occupations like drivers, conductors, -etc., and 12,137 persons or 23 per cent in services, sports and recreation. This includes mostly personal or domestic services, etc.
By percentage of literacy and educational levels the distribution of workers among males and females from Kolaba district is as follows :-
Males Females
Illiterate 36 77
Literate without educational level 29 5
Primary or Junior Basic .. 24 7
1Vlatriculation and above .. II II
Total 100 100
Kolaba migrants make 10 per cent of all migrants to greater Bombay from within Maharashtra State and 4 per cent out of all migrants to Greater Bombay. The current annual volume of migration for 1961 is 7,026 persons-3,960 males and 3,066 females. This annual migration makes 9 per cent of the current annual migration to Bombay from within
Males
( I) (2)
(1) Heads of households 34·19
(2) Spouses of heads of households .. 0·17
(3) Married sons 6'76
< 4) Other married relations .. 3-74
(5) Never married, widowed or divorced relations .. 52·66
(6) Unrelated persons 2-48
Total 100'00
Maharashtra State and 4 per cent of the current annual migration to Greater Bombay from all parts of India .
Size of the Household
Table C-I-A in Part II shows the proportion of sample households classified by size. Percentage proportions of different types of households are as follows :-
Total Rural Urban
Single member 7-64 7-27 11-46
2-3 members 25·04 25'17 23·75
4-6 members 43·78 44'25 39·02
7-9 members 17-63 17·54 18·48
10 membels and more 5-91 5·77 7-29
All sizes 100'00 100'00 100·00
Among the different size groups, households with 4to 6 members are more common (43'78 per cent) than others. The percentage distribution of the. rural and urban households by their size shows that single and small-size (2-3 members) households are more (35'21 per cent) in urban areas than in rural areas (32'44 per cent).
The average size of the household is 4'95 persons for the district. It is 4'94 for rural areas and 4'97 for urban areas.
Total
Household Composition
Table C-I-B in Part II shows the distribution of sample households by the type of their composltlOn. The percentage distribution of population of sample households by relationship for the district is shown below:-
Rural Urban
Females Males Females :Males Females
(3) (4) (5) (6) (7)
7·11 34-25 7·17 33'53 6·53
27·39 0·18 27-46 0·14 26'65
7·05 3-95
14-94 3-78 15-41 3'42 9·92
50·28 52·41 49·70 55-03 56·39
0·28 2·33 0'26 3-93 0·51
---100'00 100·00 100'00 100'00 100·00
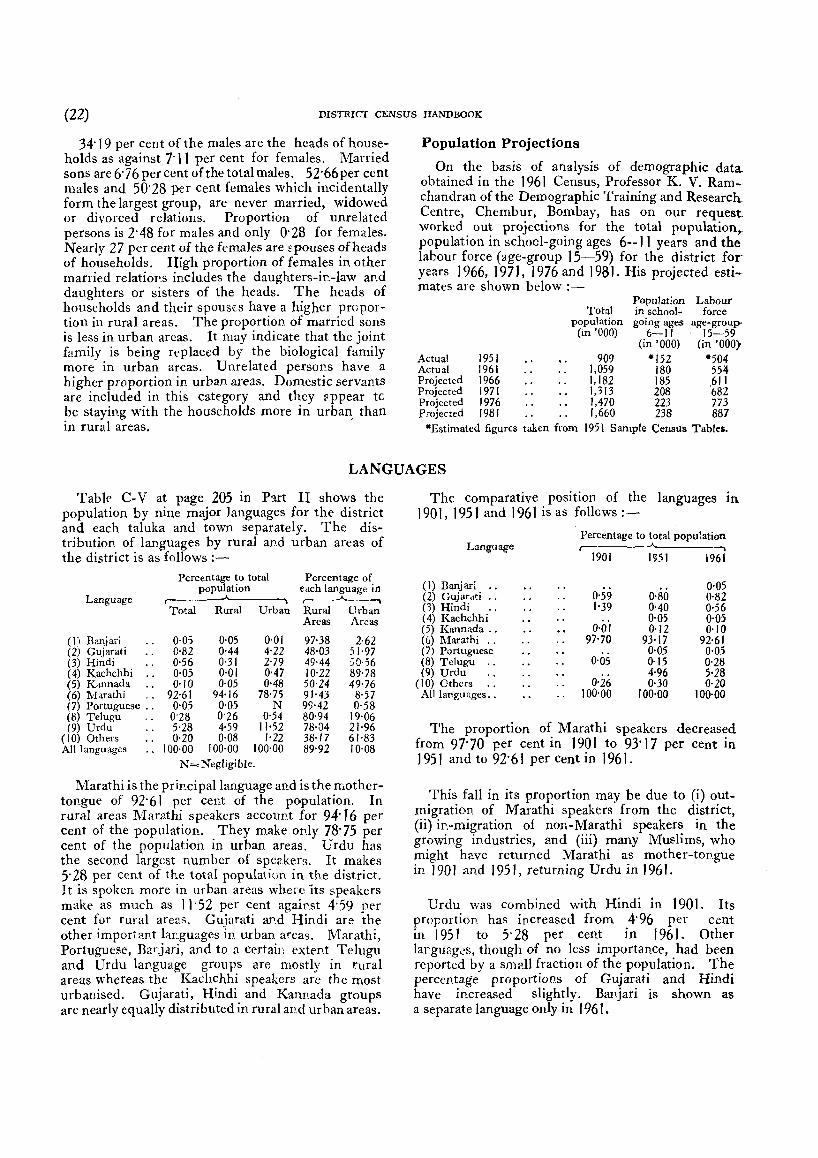
(22) DISTRICT CENSUS HANDBOOK
34'19 per cent of the males are the heads of households as against 7'11 per cent for females. Married sons are 6'76 per cent of the total males. 52'66per cent males and 50'28 per cent females which incidentally form the largest group, are never married, widowed or divorced relations. Proportion of unrelated persons is 2'48 for males and only 0'28 for females. Nearly 27 per cent of the females are Epouses of heads of households. High proportion of females in. other married reiatiops includes the daughters-jr.-law al'.d daughters or sisters of the heads. The heads of households and their spouses have a higher proportion in rural areas. The proportion of married sons is less in urban areas. It may indicate that the joint family is being replaced by the biological family more in urban areas. Unrelated persons have a higher proportion in urban areas. Domestic servants are included in this category and they l1ppear tc be staying with the households more in urban than in rural areas. '
Population PrOjections
On the basis of analysis of demographic data obtained in the 1961 Census, Professor K. V. Ramchandran of the Demographic Training and Research. Centre, Chembur, Bombay, has on our request. worked out projections for the total population. population in school-going ages 6--11 years and th~ labour force (age-group 15-59) for the district for years 1966, 197 J, 1976 and J 981. His projected estimates are shown below :-
Total population
(in '000)
Population Labour in school- force going ages age-group-
6-11 15-59 (in '000) (in 'ODD)
Actual 1951 909 -152 -504 Actual 1961 1,059 180 554 Projected 1966 1,182 185 611 Projected 1971 1,313 208 682 Projected 1976 1,470 223 773 Projected 1981 1,660 238 887
·Estimated figures taken from 195 I Sample Census Tables.
LANGUAGES
Table C-V at page 205 in P:1rt II shows the population by nine major languages for the district and each taluka and town separately. The distribution of languages by rural and urban areas of the district is as follows :-
Language
(1) Banjari (2) Gujarati (3) Hindi (4) Kaehchhi (5) Kannada
.. (6) Marathi (7) Portuguese .. (8) Telugu (9) Urdu
(10) Others All languages ..
Percentage to total Percentage of population each language in
r----"---, Total Rural Urban Rural Urban
Areas Areas
0·05 0·05 0·01 97·38 2·62 0·82 0'44 4·22 48·03 51'97 0·56 0'31 2'79 49-44 ::;0·56 0·05 0·01 0'47 10'22 89'78 0·10 0·05 0·48 50·24 49'76
92-61 94·16 78·75 91'43 8·57 0'05 0·05 N 99'42 0'58
0'28 0'26 0·54 80'94 19'06 5'28 4·59 11·52 78·04 21·96 0·20 0·08 1'22 38'17 6 r'83
100·00 roo·oo 100·00 89'92 rO'08 N = Negligible.
Marathi is the prir.cipallanguage and is the mothertongue of 92'61 per cent of the population. In rural areas 1\1 arathi speakers account for 94' T 6 per cent of the population. They m.ake only 78' 75 per cent of the popUlation in urban areas. Urdu has the second largest number of speakers. It makes 5'28 per cent of the total population in the district. It is spoken more in urban areas where Its speakers make as much as II' 52 per cent against 4'59 per cent for rural areas. Gujarati af'.d Hindi are the other important languages in urban areas. Marathi, Portuguese, Ba1",j,ui, and to a certain extep.t Telugu and Urdu language groups are mostly in rural areas whereas the Kachchhi speakers are the most urbanised. Gujarati, Hindi and Kannada groups are nearly equally distributed in rural af'.d urban areas.
The comparative position of the languages in 1901, 1951 and 1961 is as follews:-
Percentage to total population Language -..
1901 1~51 1961
(I) Banjari 0'59
0·05 (2) Gujar4ti " 0'80 0'82 0) Hindi " 1'39 0·40 0·56 (4) Kachchhi
0'0'1 0'05 0'05
(5) Kannada .. 0·12 0·10 (6) l\'Iarathi 97'70 93·17 92-61 (7) Portuguese 0'05 0·05 (8) Telugu " 0'05 0·15 0'28 (9) Urdu . .
0'26 4'96 5'28
(10) Others 0'30 O'ZO All languages .. 100'00 100·00 100·00
The proportion of Marathi speakers decreased from 97' 70 per cent in 190 I to 93'17 per cent in 1951 and to 92'61 per cent in 1961.
This fall in its proportion may be due to (i) outmigration of M arathi speakers from the district, (ii) ir.-migration of non-Marathi speakers in the growing industries, and (iii) many Muslims, who might have returned Marathi as mother-tongue in 190 I and 1951, returning Urdu in 1961.
Urdu was combined with Hindi in 190 I. Its proportion has increased from 4'96 per cent in 1951 to 5' 28 per cent in 1961. Other la~.guagcs, though of no less importance, had been reported by a small fraction of the population, The percentage proportions of Gujarati and Hindi have increased slightly. Banjari is shown as a separate language only in 1961.

KOLABA : RELIGIONS (23)
RELIGIONS Table C-VII at pages 206-07 in Part II shows
the pop\llation by religions for the district and each taluka and town separ'ltely. The distribution of religions by rural and Urban areas of the district is as follows :-
Percentage to total Percentage of population each religion in
Religion ~---, ~ Total Rural Urban Rural Urban
Areas Areas
(1) Buddhists 4,36 4'70 1,2.5 97·1 I 2·89 (2) Christians 0·14 0·12 0·39 72-92 27·08 (3) Hindus 88'96 89·59 83'29 90·57 9·43 (4) lains 0·35 0·19 ),75 49·96 50·04 (5) Muslims 5-95 5· 19 12·75 78'41 21·59 (6) Others 0·24 0'21 0,57 75,71 24·29
All religions 100·00 100·00 100·00 89-92 10·08
88'96 per cent of the population of the district reported their religion as Hindu. Muslims and Buddhists account [or 5'95 and 4'36 per cent of the population, respectively. The percentage of Buddhists is higher in rural than in urban' areas. In contrast, the percentage of Muslims is higher in urban (12' 75 per cent) than in rural areas (5'19 per cent). Christians and Jains have higher proportions in urban areas. Considering the distribution of religious groups in rural and urban areas, a striking difference can be observed among them in their degree of urbanisation. Jains are the most urbanised group. Christians and Muslims follow in that order. Buddhists are mcstly in rural areas, so also are Hindus.
The comparative position of the religions 1U
t 90 t and 196 t is as follows :-
, Religion
Percentage to total population ,--..A...___,
1901 196\ (1) Buddhists 4· 36 (2) Christians O' 21 O· I 4 (3) Hindus 94' 23 83·96 (4) Jains 0·28 0·35 (S) Muslims 4,85 5'95 (6) Others 0,43 0·24 All religions 100'00 100'00
Proportion of Hindus decreased from 94'23 per cent in 1901 to 88'96 per cent in 1961. In the same period the percentage of Buddhists incr~ased to 4,36. Decrease in the percentage of Hmdus is mostly accounted by the rise in the' percentage of Bnddhists. The increase in the Buddhist group is due to the conversion of a large number of erstwhile Hindu Scheduled Castes to Buddhism. This can further be seen from a corresponding decrease in the percentage cf SchedUled Castes. Percenta~e proportion of Christians has also gone dow~ In the last sixty years. The percentflge proportIOns of Muslims and Jains have increased.
Sex: ratio for each religion is as follows:Buddhists t, 105, Christians 803, Hindus 1,053,
Jains 790, Muslims I, 131, All religions 1,058. Higher sex ratio for Buddhists indicates that
more of their males are going out of the district for work. Sex ratio is the highest among the Muslims. It ~onfirms the general imprcst;ion that many Muslims from Kolaba district migrate to Bombay and to far off lands in Africa.
SCHEDULED CASTES Table SCT-I-Part A at pages 210-11 in Part II
shows the popUlation and its distribution by workers and non-workers for each Scheduled Caste for the district and each taluka se'parately. Actually
24 castes are notified as Scheduled Castes in the . district but only 11 arc reported in the 1961 Census. 4
The distribution of the Scheduled Caste popu~ lation by rural and urban areas is ~.s follows :-
Name of Scheduled Caste Population
r------'-----,
Percentage to total
population of the district
Percentzge of each Scheduled Caste
population in ,.. ____ . .A___ ___ ,
( I)
-All Scheduled Castes (1) Ager " (2) Bhangi .. (3) Chalvadi (4) Chambhar (5) Dhor (6) Holar " (7) Lingader (8) Mahar " (9) Mang "
(10) Mang Garudi (11) Mukri ..
.. } ..
IVrales Females
(2) (3)
7,177 6,710 16 2
312 197 1 2
4,100 4,Oj7 13 9 4 4 1
2,561 2,281 169 156
2
( 4)
1·31 N
0·05 N
0·77 N N N
0·46 .0,03
N
-Inclusive of persons from the Scheduled Castes who hav~ not reported their inJividual castes.
J-6z-(Kolaba)-iv-A.
Rural Urban Areas Areas
(5)
82-61 72"22 17-49
100'00 81·89 18'13
100'00 100'CO 92'23
63-38
(6) --_-
17·39 27'78 82·5 I
18·11 81 '82
7'72
36'62 100'00
N = l'J egligible.
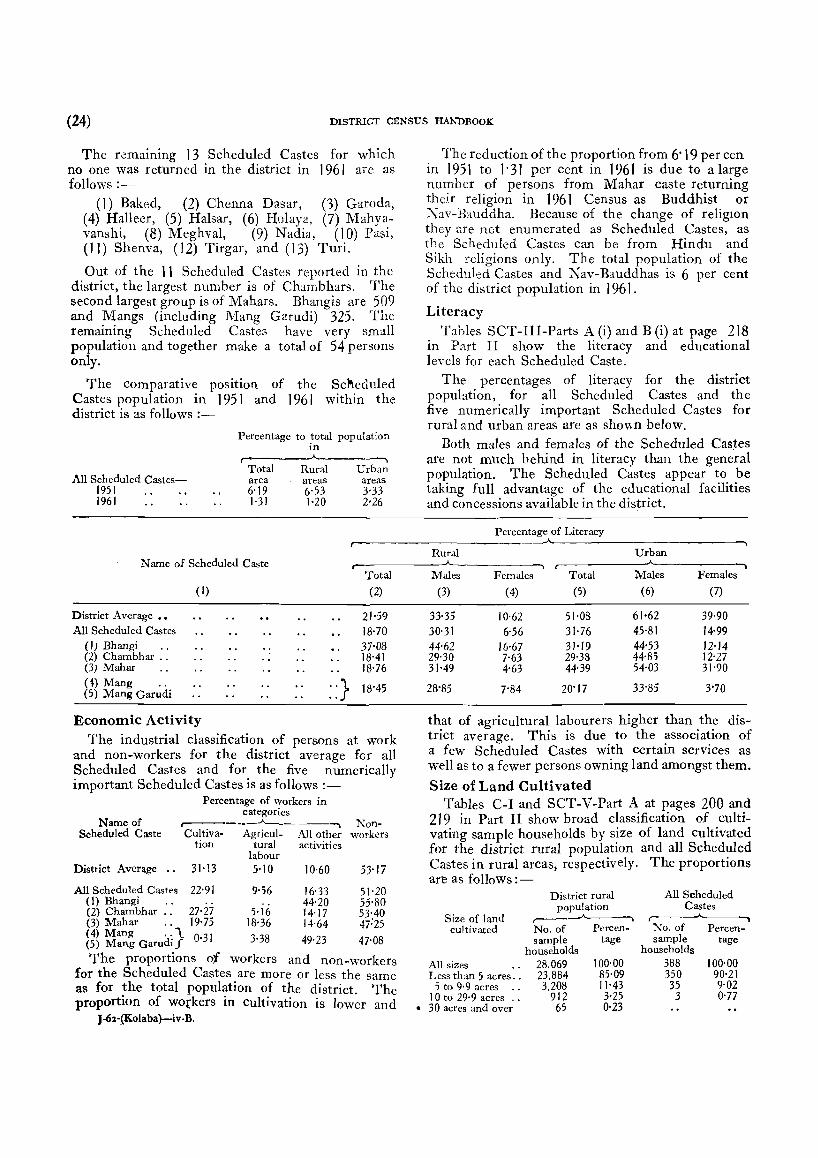
(24) DISTRICT CENSUS HANDBooK
The r0rnallllng 13 Scheduled Castes for which no one was returned in the district in 1961 are as follows :-
(1) Baked, (2) Chenna Dasar, (3) Garoda, (4) HalIeer, (5) Halsar, (6) Holaya, (7) Mahyavanshi, (8) Meghval, (9) Nadia, (10) Pasi, (11) Shenva, (12) Tirgar, and (13) Turi.
Out of the 11 Scheduled Castes reported in the district, the largest number is of Chambhars. The second largest group is of Mahars. Bhangis are 509 and Mangs (including Mang Garudi) 325. The remaining Scheduled Castes have very small population and together make a total of 54 persons only.
The comparative position of the Scfteduled Castes population in 1951 and 1961 within the district is as follows :-
Percentage to total population in
r-------~--------,
All Scheduled Castes-1951 1961
Total area 6'19 1·31
Name of Scheduled Caste
District Average •• All Scheduled Castes
(I) Bhangi .. (2) Chambhar .. (3) Mahar (4) Mang .. (5) Mang Garudi
( I)
Economic Activity
Rural areas 6·53 1·20
.) ..
Urban areas 3-33 2·26
Total
(2)
21·59 18·70 37·08 18'41 18'76
18·45
The industrial classification of persons at work and non-workers for the district average fer all Scheduled Castes and for the five numerically important Scheduled Castes is as follows :-
Percentage of workers in
Name of Scheduled Caste
categories ----"-------, Non-
Cultiva- Agricul- All other workers tion tural activities
labour Disttict Average •. 3H3 5·10 10·60 53·17
All Scheduled Castes 22'91 9·56 16'33 (I) Bhangi . . . . 44'20 (2) Chambhar .. 27'27 5· I 6 14·17 (3) Mahar " 19·75 18·36 14'64
51'20 55'80 53'40 47:25
(4) Mang .. 1. 0 31 3 3 (5) Mang Garudi_r' . 8 49·23 47-08
The proportions of workers and non-workers for the Scheduled Castes are more or less the same as for ~he total popul~tion of the district. The proportlOn of workers In cultivation is lower and
J-6l-(Kolaba}-iv-B.
The reduction of the proportion from 6·19 per Cen in 1951 to 1· 31 per cent in 1961 is due to a large number of persons from Mahar caste returning their religion in 1961 Census as Buddhist or Nav-Rtllddha. Because of the change of religlOn they are net enumerated as Scheduled Castes, as the Scheduled Castes can be from Hindu and Sikh religions only. The total population of the Scheduled Castes and Nav-Bauddhas is 6 per cent of the district population in 1961.
Literacy Tables SCT-Ill-Parts A (i) and B (i) at page 218
in Part II show the literacy and educational levels for each Scheduled Caste.
The percentages of literacy for the district population, for all Scheduled Castes and the five numerically important Scheduled Castes for rural and urban areas are as sho~n below.
Both males and females of the Scheduled Castes are not much behind in literacy than the general popUlation. The Scheduled Castes appear to be taking full advantage of the educational facilities and concessions available in the district.
Percentage of Literacy
Rural Urban ""\
Males Females Total Males Females
(3) ( 4) (5) (6) (7)
33-35 10'62 51·08 61-62 39'90 30'31 6·56 31·76 45·81 14'99 44-62 16'67 31·19 44'53 12·14 29'30 7-63 29'38 44'85 12'27 31-49 4-63 44'39 54·03 31'90
28'85 7'84 20·17 33-85 3'70
that of agricultural labourers higher than the district average. This is due to the association of a few Scheduled Castes with certain services as well as to a fewer persons owning land amongst them.
Size of Land Cultivated Tables C-I and SCT-V-Part A at pages 200 and:
219 in Part II show broad classification of cultivating sample households by size of land cultivated for the district rural population and all Scheduled Castes in rural areas, respectively. The proportions are as follows:-
Size of land cultivated
All sizes .. Less than 5 acres ..
5 to 9'9 acres .. 10 to 29·9 acres ..
• 30 acres and over
District rural population
,-----_.A.., __ ..--,.
No. of Percen-sample tage
households 28.069 23,884 3,208
912 65
100·00 85-09 11'43 3'25 0·23
All Scheduled Castes
,-~ No. of Percen-sampJe tage
households 388 350 35
3
100·00 90'21 9'02 0·77
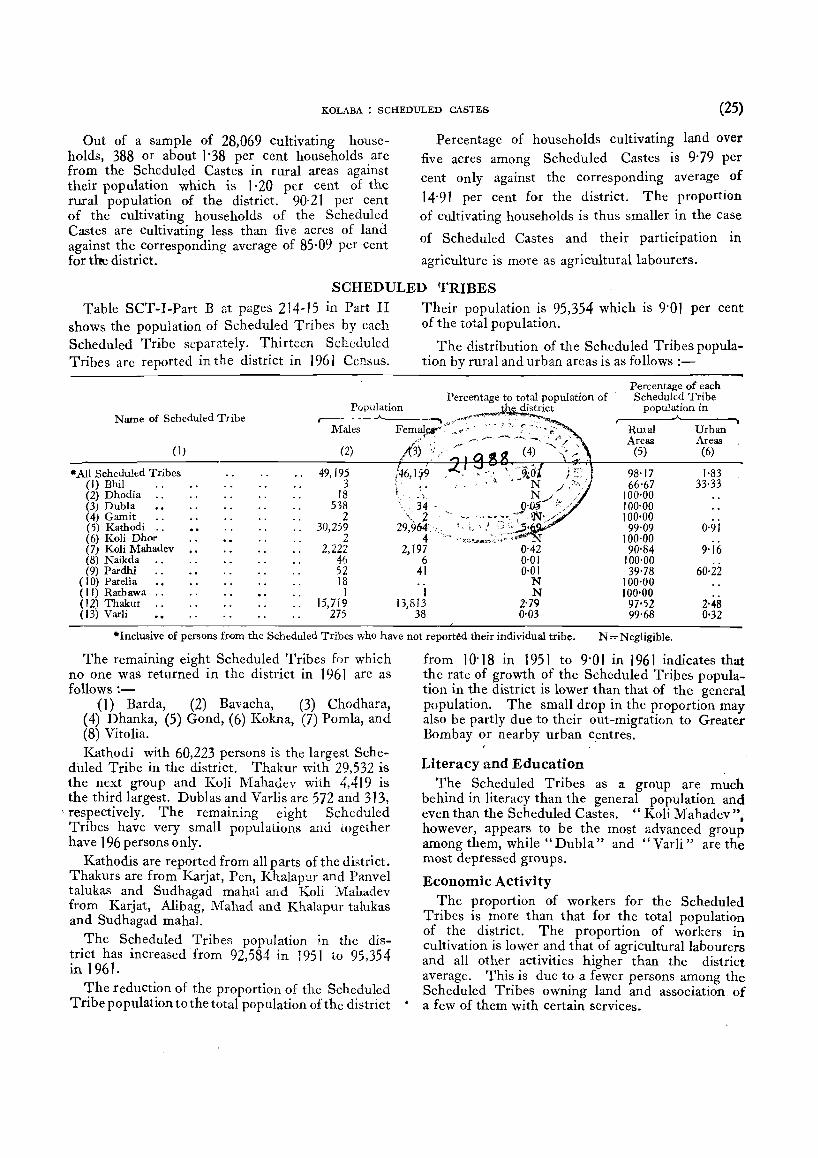
KOLABA : SCHEDULED CASTES (25)
Out of a sample of 28,069 cultivating households, 388 or about 1'38 per cent households are from the Scheduled Castes in rural areas against their population which is 1·20 per cent of the rural popUlation of the district. 90· 21 per cent of the cultivating households of the Scheduled Castes are cultivating less than five acres of land against the corresponding average of 85·09 per cent for the district.
Percentage of households cultivating land over five acres among Scheduled Castes is 9'79 per cent only against the corresponding average of
14'91 per cent for the district. The proportion of cultivating households is thus smaller in the case
of Scheduled Castes and their participation III
agriculture is more as agricuhurallabourers.
SCHEDULED TRIBES
Table SCT-I-Part B at pages 214-15 in Part II shows the popUlation of Scheduled Tribes by each Scheduled Tribe separately. Thirteen Scheduled Tribes are reported in the district in 1961 Census.
Their popUlation is 95,354 which is 9'01 per cent of the total population.
The distribution of the Scheduled Tribes population by rural and urban areas is as follows :-
Percentage to total population of Population ,J,he district
r------"----~ ._,.,..,..d·"~~ - .~~_ Name of Scheduled Tribe
Percentage of each Scheduled Tribe
population in
Males Femalei''''''- ,,~' "", ;"'" - ' .. ,,)' ,r'. ~~" .. ~~ .. ",.._ . ....-... .~, _, ,r /! ~'~
(2) 13) ',;,' /. (4) "', t" \
Rmal Urban Areas Areas
( I)
*' All Scheduled Tribes (I) Bhil (2) Dhodia (3) Dubla (4) Gamit (5) Kathodi " (6) Koli Dhor (7) Koli Mahadev (8) Naikda (9) Pardhi
( I 0) Patelia (11) Rathawa .. (12) Thakur , . (13) Varli
49,195 3
18 538
2 30,259
2 2,222
46 52 18
1 15,719
275
t' . ,
i'
~ , ,'. -..:, 34 . ',< '2
29,964, 4
2,197 6
41
1 13,813
38
.' '
(5) (6)
98'17 66'67
100'00 100'00 100,00
99'09 100,00 90'84
100'00 39·78
100'00 100'00
97'52 99'68
1,83 33-33
0·91
9'16
60'22
2048 0'32
·Inclusive of persons frQm the Scheduled Tribes who have not report~d their individual tribe. N = Negligible,
The remaining eight Scheduled Tribes for which no one waS returned in the district in 1961 are as follows :-
(1) Barda, (2) Bavacha, (3) Chodhara, (4) Dhanka, (5) Gond, (6) Kokna, (7) PomIa, and (8) Vitolia. Kathodi with 60,223 persons is the largest Sche~
duled Tribe in the district. Thakur with 29,532 is the next group and Koli Mahadev with 4,419 is the third largest. Dublas and Varlis are 572 arid 313,
'respectively. The remaining eight Scheduled Tribes have very small populations and together have 196 persons only.
Kathodis are reported from all parts of the district. Thakurs are from Karjat, Pen, Khalapu.r and Panve1 talukas and Sudhagad mahal and Koli Mahadev from Karjat, Alibag, Mahad and Khalapur talukas and Sudhagad mahal.
The Scheduled Tribes popnlation in the district has increased from 92,584 in J 951 to 95,354 in 1961.
The rednction of the proportion of the Scheduled Tribe population to the total pop ulation of the district
from 10'18 in 1951 to 9'0 I in 1961 indicates that the rate of growth of the Scheduled Tribes population in the district is lower than that of the general popUlation. The small drop in the proportion may also be partly due to their out-migration to Greater Bombay or nearby urban centres.
,
Literacy and Education The Scheduled Tribes as a group are much
behind in literacy than the general population and even than the Scheduled Castes. " Koli Mahadev". however, appears to be the most advanced group among them, while "Dubla" and "Varli" are the most depressed groups.
Economic Activity The proportion of workers for the Scheduled
Tribes is more than that for the total population of the district. The proportion of workers in cultivation is lower and that of agricultural labourers and all other activities higher than the district average. This is due to a fewer persons among the Scheduled Tribes owning land and association of
• a few of them with certain services.
·(26) DISTRICT CENSUS HANDBOOK
WELFARE OF BACKWARD CLASSES
The subject of welfare of Scheduled Castes, Scheduled Tribes and other Backward Classes in the district is now in the purview of the Zilla Parishad. In the membership of the Standing Committee which is the most powerful Committee of the Zilla Parishad at least two members from Scheduled Castes~ Scheduled Tribes and other socially and educationally backward classes are required to be elected by the Parishad. This Standing Committee acts as the Subject Committee for that subject and the District Social Welfare Officer works under it. The Zilla Parishad is also legally required to spend adequate amounts for the amelioration of the condition of the Scheduled Castes, Scheduled Tribes and of any socially and educationally backward classes and in particular for the removal of untouchability.
Various schemes for the welfare of S;;heduled Castes, Scheduled Tribes and other educationally or socially backward classes are in operation in the district :-
(i) Educational.-These include schemes of granting tuition fees at all stages of education irrespective of age and income, examination fees of recognised examinations and scholarships to the students from the Scheduled Castes, ScheduLd Tribes,Nomadic and Semi-nomadic Tribes, Vimukta Jatis and the other Backward Classes. The concessions are awarded in the Primary Schools, High Schools or Technical Schools. 2,521 s:udcHts
.- benefited from and Rs. 37,864 Were spent Oll these schemes during the year 1962-63. Rs.32,929were spent on 6 backward class hostels in the district in 1962-63. 174 students were admitted in these hostels. In addition Rs. 25,821 were spent on building grants to two (new) and five (old) backward class hostels.
(ii) Schemes for Economic Uplift.-These include schemes of granting loan-cum-subsidy for cottage industries and professions. Rs. 22,254 were spent on more than 126 beneficiaries. Assistance for purchase of milch cattle to the ScheduL:d Castes and other backward classes was given to the extent of Rs. 18,350 to 82 beneficiaries. R',. 19,425 were also given for purchase of agricultural implements during the year 1962-63. This includes expenditure of Rs. 4,000 for purchase of 2 oil pumps to be used in underdeveloped rural areas.
(iii) Housing.-A number of housillg societies of backward classes have been fornled in the district. These societies construct houses for their members. Financial assistance in the form of loans and subsidies is given to those societies. Assistance in cash or kind for repairs to houses of Scheduled Castes and other backward classes is also provided. An amount of Rs. 1,41,390 was
spent under .th~s sche~e, Rs. 23,015 were given to 112 beneficlanes whlle Rs. 89,375 were incurred on 131 houses during 1962-63.
(iv) Drinking Water Wells.-An amount of Rs. 51,819 was spent under this scheme. Rs. 1,500 Were spent for repairs of 2 wells in or n_ear Sc~eduled Castes 10caEties fOJ: two ben~:ficia~'les whlle Rs. 8,750 Were incurred for drinklUg water wells for 15 beneficiaries from Sche-duled Castes. .
. (v~ M~dical aid to Sc~eduled Castes.-Monetary aId IS ~lven to deserVIng persons belonging to th~ Backward Classes. Out 01 Rs. 2,130 spent under ~hlS scheme, Rs.600 were spe!lt on persons belong_ lllg to Scheduled Castes dUrIng the year 1962-63.
(vi) ?chemes for Removal of Untouchability.These lUcl,!~e various schemes of publicity against untouchabIlIty. Sanskar Kendras and Balwadis are organised, ~lm shows and gatherings are addressed at fairs and other places. Kirtan programmes and Melas, inter-caste dinners cel.eb~ation. weeks and days are also arranged: ~UlldlUg SItes are given to Scheduled Castes In Cast~ Hindu localities and subsidy is paid to caste. Hmdu l~ndlords for letting their premises on hIre to Scneduled Castes. Prizes are also awarded to villages which show outstanding work for removal of untouchability. Rs. 13,130 Were spent under the schemes during the year 1962-63. The schemes which were already in operation
before the Third Five-Year Plan are treated as committed schemes and those added under the Third Plan are separately treated as Plan schemes. The expenditure described above against each scheme is out of the committed schemes. There are in addition some more schemes sponsored by the Central Government.
Economic Criterion of Backwardness Castewise basis of classification of "Other Back
ward Classes" has now been replaced by a new classification based on income. The income limit was raised from Rs. 900 per annUm to Rs. 1,200 per annum with effect from 1 st June 1960. All persons whose annual income from all sources does not exceed this limit are irrespective of their religion, caste or cummunity treated as belonging to the "Other Backward Classes".
Concessions to Nav-Bauddhas From 1 <;t May 1960, the Scheduled Castes
converts to Buddhism are treated as eligible for all concessions and facilities available to Scheduled Castes except the statutory concessions under the Constitution and certain special schemes for removal of untouchability, etc., which cannot by their very nature apply to non-Hindus.
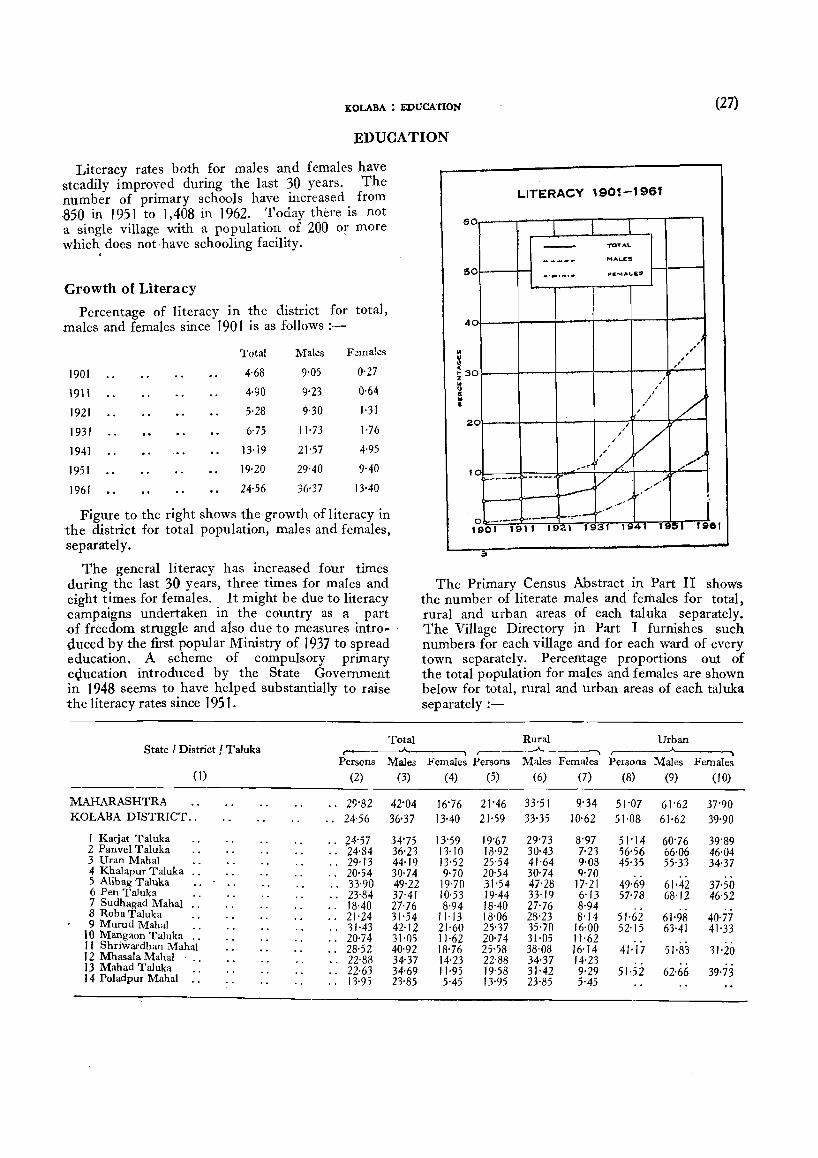
KOLABA : EDUCA nON (27)
EDUCATION
Literacy rates both for males and females have steadily improved during the last 30 years. The number of primary schools have increased from 850 in 1951 to 1,408 in 1962. Today there is not a single village with a population of 200 or more which does not ha,ve schooling facility.
,
Growth of Literacy
Percentage of literacy in the district for total, males and females since 190 I is as follows :-
Total Males Females
1901 4·68 9'05 0·27
191\ 4·90 9'23 0·64
1921 5·28 9·30 HI
1931 6·75 11·73 1·76
1941 13·19 21'57 4·95
1951 19·20 29'40 9·40
1961 24·56 36'37 13040
Figure to the right shows the growth of literacy in the district for total population, males and females, separately.
The general literacy has increased four times during the last 30 years, three times for males and eight times for females. It might be dUe to literacy campaigns undertaken in the country as a part of freedom struggle and a1so due to measures introduced by the first popular Ministry of 1937 to spread education. A scheme of compulsory primary eQ.ucation introduced by the State Government in 1948 seems to have helped substantially to raise the literacy rates since 195 I .
Total State r District! Taluka t· -A.
Persons Males (1) (2) (3)
MAHARASHTRA 29'82 42'04 KOLABA DISTRICT .. .. 24·56 36'37
I Karjat Taluka 24'57 34'75 2 Panve1 Taluka 24·84 36'23 3 Uran Mahal 29·13 44'19 4 Kha!apur Taluka .. · . 20'54 30'74 5 Alibag Taluka 33'90 49'22 6 Pen TaJuka 23-84 37·41 7 Sudhagad Mahal
" 18·40 27·76 8 Roha Taluka 21'24 31'54 9 Murud Mahal 31·43 42'12
10 Mangaon Taluka .. · . 20·74 31'05 II Shriwardhan Mahal 28·52 40'92 J 2 Mhasala Mahal
" 22·83 34'37 13 Mahad Taluka · . 22·63 34·69 J 4 Poladpur Mahal .. · . 13-95 23-85
" III
60
50
40
~ 30 z '" ~ .. &
2 0
"
0
... ----
.-'
LITERACY 1901-1961
t I - ,.OTAL
---_ ... MAL.ES _._._ . .., FIEMAI..E$
, ,. , , ,-, , , ,
I
/_ / , I ,
/ I I
,'/ ..-,-' ....... ~ /"
.. ---- / .".." --- ".
~." j ~-__.. ~- ..... -__.
y ......
t901 1911 1921 1931 11341 hOJ 19 Of
The Primary Census Abstract. in Part II shows the number of literate males and females for total, rural and urban areas of each taluka separately. The Village Directory in Part I furnishes such numbers for each village and for each ward of every town separately. Percentage proportions out of the total popUlation for males and females are shown below for total, rural and urban areas of each taluka separately:-
Rural Urban
Females Persons Males Females Persons Males Females ( 4) (5) (6) (7) (8) (9) (10)
16'76 21'46 33'51 9'34 51'07 61'62 37'90 13-40 21·59 33-35 10'62 51·08 61-62 39'90
13'59 19"67 29'73 8'97 51'14 60'76 39'89 13'10 18'92 30'43 7'23 56-56 66·06 46·04 13'52 25'54 41'64 9·08 45'35 55'33 34'37 9'70 20·54 30·74 9·70
19'70 31'54 47'28 17'21 49-69 61·42 37'50 10'53 19·44 33·19 6·13 57·78 68'12 46'52 8'94 18·40 27'76 8·94
11·13 18'06 28'23 8'14 51·62 61'98 40·77 21'60 25'37 35'70 16·00 52·15 63-41 41'33 11-62 20·74 31·05 11'62 18'76 25'58 38'08 16'14 41·17 51'83 31'20 14'23 22-88 34·37 14·23 11·95 19·58 31·42 9·29 51·52 62·66 39·73 5'45 13'95 23-85 5'45
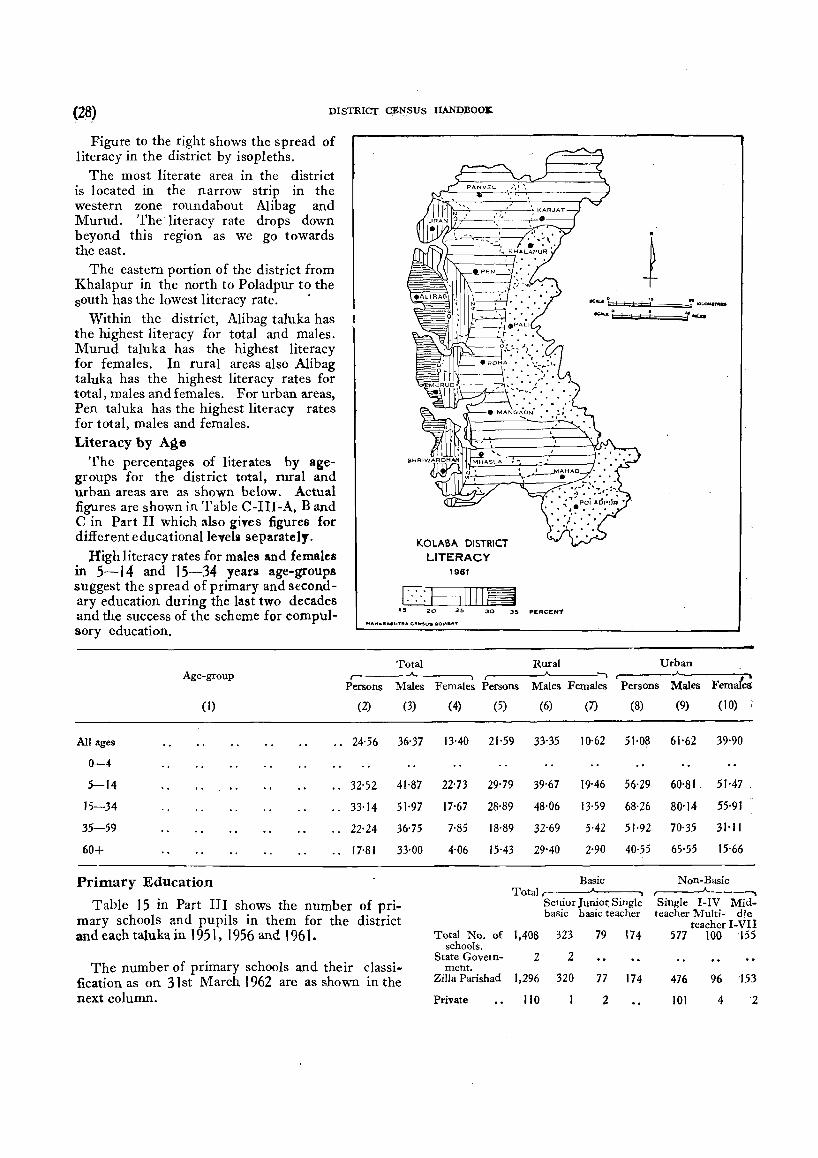
(28) DISTRICT C;EN_SUS HAN1)1300lC.
Figure to the right shows the spread of literacy in the district by isopleths.
The most literate area in the district is located in the narrow strip in the western zone roundabout Alibag and Murud. The literacy rate drops down beyond this region as we go towards the east.
The eastern portion of the district from Khalapur in the north to Poladpur to the south has the lowest literacy rate. .
Within the district, Alibag tahtka has the highest literacy for total and males. Murud taluka has the highest literacy for females. In rural areas also Alibag taluka has the highest literacy rates for total, males and females. For urban areas, Pen taluka has the highest literacy rates for total, males and females. Literacy by Age
The percentages of literates by agegroups for the district total, rural and urban areas are as shown below. Actual figures are shown in Table C-III-A, Band C in Part II which also gives figures for different educationalleveli separately.
High literacy rates for males and females in 5-14 and 15-34 years age-groups suggest the spread of primary and stcondary education during the last two decades and the success of the scheme for compulsory education.
KOLABA DISTRICT LITERACY
1961
1:-:-:81111. ts 20 25 30 3~ PERCENT
--------------------------------------.--------------------------------------------------Total Rural Urban
Age-group ,.------''-----'1 r- .A. '""
Persons Males Females Persons Males Females Persons Males Females:
(I) (2) (3)
All ages 24·56 36·37
0-4
5-14 32'52 41·87
15-34 33·14 51'97
35-59 .. 22'24 36'75
60+ 17'81 33·00
Primary EdUcation
Table 15 in Part III shows the number of primary schools and pupils in them for the district and each taluka in 1951) 1956 and 1961.
The number of primary schools and their classification as on 31st March 1962 are as shown in the next column.
(4) (5) (6) (7) (8)
13-40 21-59 33·35 10·62 51'0~
22'73 29·79 39'67 19'46 56·29
17-67 28·89 48·06 13·59 68·26
7'85 18'89 32-69 5-42 51'92
4-06 15'43 29-40 2-90 40·55
Basic Total
Senior Juniot: Single basic basic teacher
Total NQ. of 1,408 323 79 174 schools.
State Govetn- 2 2 ment.
Zilla Parishad 1,296 320 77 174
Private 110 2
(9) (10) ,
61-62 39·90
60'81 51·47
80'14 55·91
70'35 31'11
65'55 15-66
Non-Basic ~
Single I-IV Mid-teacher Multi- dJe
teacher I-Vn 577 100 '155
476 96 '153
101 4 2
lWLABA : EDUCATION (29)
There has been an impressive growth in the number of primary schools in the district during the last ten years. There Were 850 primary schools in 1951. The number rose to 1,178 in 1956 and to 1,350 in 1961. On 31 st March 1962, it stood at 1,408. Out of the 1,408 primary schools, 1,296 or more than 92 per ce1'.t are managed by Zilla Parish ad and only 7'81 per cent are managed by private institutions. The State Government's share in the expenditure on primary education in 1961-62 was about 87 per cent of the total expenditure. The expenditure on primary ed'LI:cation i( incUrred by the State Government through grants-in-aid to the Zilla Parishads and building loans and grants to primary teachers' training colleges. Similarly, wards of parents whose annual income does not exceed Rs. 1,200 get free education. The cost borne by the schools on this account is reimbursed from the State Government. Students from Scheduled Castes and Scheduled Tribes similarly get free education and scholarships are given to them at the rate of Rs. 3 per year in I and II standards and Rs. 6 per year in III and IV standards. Government also gives aid to backward class and mixed hostels for meeting their cost on students belonging to Scheduled Castes and Scheduled Tribes.
The State Government's policy of converting primary schools into basic schools is also making rapid progress in this district. At the end of the First Five-Year Plan, there were 108 basic schools. This number rose to 224 by the end of Second Plan. On 31st March 1962, it stood at 576.
By 31 st March 1962, 12 towns and 1,110 villages' in the district had primary schools and 553 villages had schooling facilities, i.e., primary schools situated within a mile from the village. 115 villages did not have even schooling facilities. Total number of primary teachers was 3,647 and 1,797 or 49'3 per cent of whom were trained.
Other indices of the progress of primary education in the district compared with those of the State averages are as follows :-
(As on 31st March 1962)
Average population served by a primary school
Average area served b~ a primary school
Pupils per teacher (sq. miles)
Pupils per primary schcol
Average annual salary per primary teacher (Rs.)
Average annual eJi;penditure per school (Rs.)
Average number of teachers per school
Percentage of trained teachers "
Kolaba MahaDistrict rashtra
762 1,135
1'9 3-4
39 38
100 127
1,059 1,250
2,962 4,903
2-6 3·3
49·3 64'8
• The scheme of compulsory primary education was
introduced in 1948-49. In the beginning 1 13 villages with a population of 1,000 or above were covere under the scheme. In 1954-55 the benefit of the scheme was extended to groups of villages with a total population of 1,000 and above. In the Second Five-Year Plan period, compulsory education at the primary stage was extended to all places with population of less than 1,000 progressively to children of age-groups of 7-8, 7-9, 7-10 and 7-11 so that during the period of Second Plan the agegroup 7-11 was brought under compulsion. Now the scheme has been applied to the age-group 7-11 and in all villages having population of 200 or above.
One of the Third Plan schemes is to extend the scheme of compulsory primary education to all children in the age-group 6-11. A provision of Rs. 13'05 lakhs has been made for primary education in the Third Plan in the district. During the Plan period, 205 class-rooms would be built and additional 120 teachers would be appointed in the primary schools. The number of students is expected to rise by 6,000.
Secondary Education
The number of institutions imparting secondary education and number of pupils both boys and girls for the years 1951, 1956 and 1961 are shown in Table 15 in Part III. A list of High Schools with number of students for each of them may be seen in Table 16.
By 31st March 1962, the number of institutions and their classification in the district are as follows :-
Voca- Higher Secondary tiona! Schools
Total High Schools Multi- Ordinary
purp('se
Private 42 5 36
Total number of students on roll in the secondary schools as on 31 8t March 1962 was 1 1,770. Out of them 8,673 were boys and 3,097 girls. Total number of teachers was 475. Out of them 290 were trained teachers. Percentage of trained teachers was thus 61'0. Other indices of secondary education compared to the State average are as follows :-
Population sewed by each high school. Area served by each school (sq. miles) Pupil-teacher ratio Pupils per secondary school Average annual salary per teacher (Rs.) Average annual expenditure (direct) per secon-
dary school . • . . . . .. (Rs.) Average number of teachers per secondary
school.
Kolaba MahaDistrict rashtra
25,530 13,805 64-6 40'8
25 25 280 338
1,806 1,870
31,838 39,543 11-3 13'1
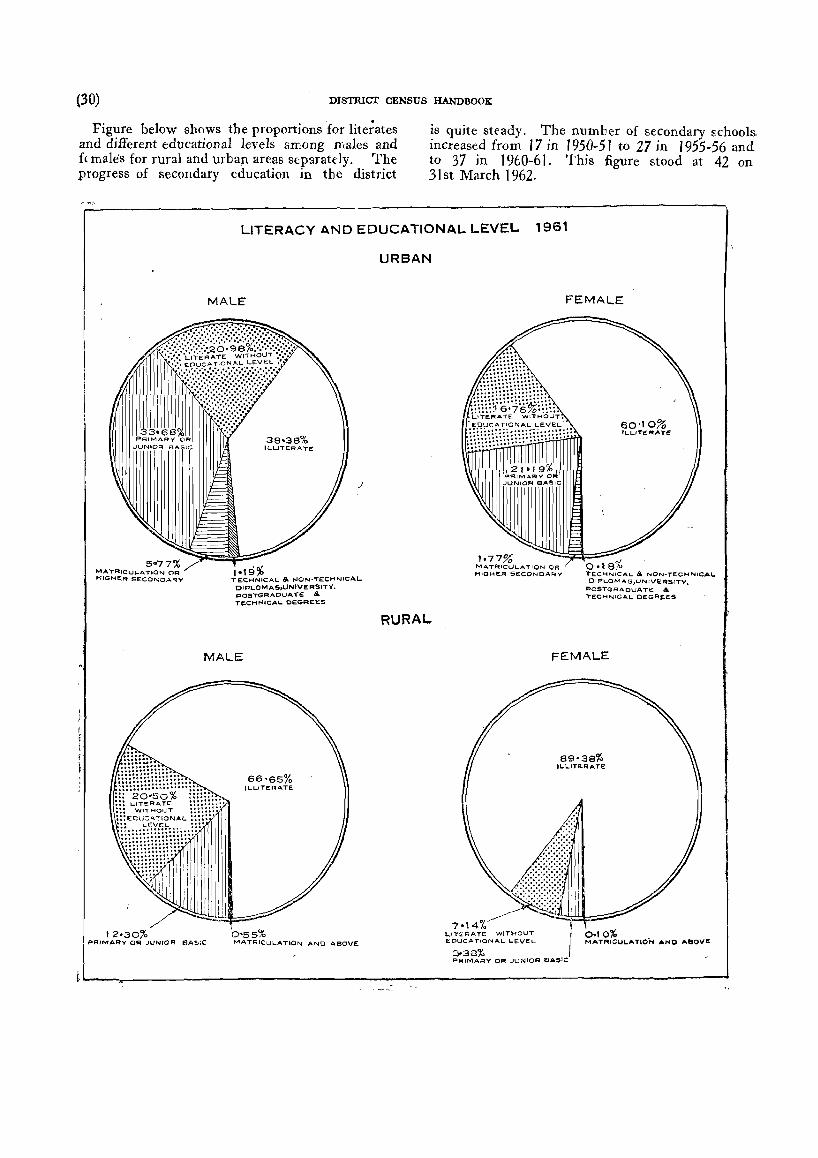
(30) DISTRICT CENSUS HANDBOOK
Figure below shows the proportions for lite;ates and different educational levels among males and f(male's for rural and urban areas sepsrateiy. The progress of secondary education in the district
is quite steady. The number of secondary schools, increased from 17 in 1950-51 to 27 in 1955-56 and to 37 in 1960-61. This figure stood at 42 on 3 J st March J 962.
LITERACY AND EDUCATIONAL LEVEL. 1961
MALE
,.'9%
38-38% It-LITERATE
j
TECHNICAL.. &. NON-TECHNICAl. OIPl-OMAS,UNIVERSITY. POSTGRAOUA1"E & T~CHr-.lIC,A.L. CEGREE!;
MALE
66'65% ll..l-ITERATE
0'55% MATFtICUL-ATION AND ABOVE
URBAN
RURAL..
FEMALE
60"0% 1l.L.ITEiIIt.AT£
1.77% MATR1cu .... A.T10N OR HIGHeR SECONOARY
o·! 810 l"ECHNICAL. &. NON-TECHNICA", OIPLOMA,S,UNIV£RSITY .. ~OS"'GRADUATE & Ye:CHNICA.I- DEGA~ES
FEMALE
69'38% ILLITe:~ATe
0.'0% MATRICU~AT'O'N AND AGOVE
3038% FtRIMARY OR JUNIOR ElAS!C
KOLABA : EDUCATION (31)
The secondary schools are dispersed throughout the district. Sudhagad and Poladpur mahals, however, have only one secondary school each. Only Mhasala mahal had no secondary school till 196]. Alibag taluka has as many as eight secondary schools.
Private institutions alone manage all the secondary schools in the district. The Government share in the total expenditure on secondary education in 1961-62 is, however, 67'2 per cent and is incurred through different schemes of grants for maintenance, salaries, buildings, building sites, equipment, freeships, scholarships, loans, etc., and special concessions to Scheduled Castes, Scheduled Tribes or other Backward Class students.
Looking to the very fast growth in the number of pupils in the primary schools, the number of pupils in the secondary schools may rise to 17,500 by 1965-66 and to 20,000 by 1970-71.
S. S. C. Examinations Secondary School Certificate Examination Board,
P oona, conducts public examinations at the end of the secondary school course. Two examinations are held every year in March and October and Alibag, Mahad, Roha and Panvel are the examination centres in the district. The number of candidates who appeared and passed from these centres during the year 1962 are as follows :-
Examination held inMarch 1962 .. October 1962 "
Higher Education
Appeared Passed
.. 1,523 737 424 J 42
Total .• 879
There was no facility for college education in the district till 1960. However two colleges have been established at Alibag and Mahad in 1961. They
provide education in Arts, Science .and ~o~me.rce. Both the colleges are managed by pnvate lllstltutlOns and receive grants for maintenance, dearness allowance and buildings from Government.
Technical Education
There are six schools in the district which provide facilities for technical education along with secondary education. They are: (I) Gov~rnm~nt Technical High School, Mahad; (2) Industnal. wmg attached to V. K. High School, Panvel ; (3) Toplwalla Industrial High School, Alibag; ,( 4) Marine College and Seamen's Orphanage, Nhave, Panvel; (5) Pen Industrial School, Pen and (6) Commerce Centre attached to the Industrial High School, Alibag. About 400 students are taking education in these schools.
Libraries
There are 19 libraries in this district, recognised by the State Government as standing on 31 s~ March 1964. The district library gets a Government grant subject. to a maximum o~ Rs .. 6,000~ Fourteen taluka libranes and four town hbranes get a grant subject to a maximum of Rs. 1,000 each.
Printing Presses, Journals and Newspapers
There are 21 printing presses in the district. The number of periodicals and journals published in the district is 7, out of which four are weekliesa two monthlies and one annual journal.
Cinema Theatres
There are five permanent and five quasi-permanent cinema theatres and six touring talkies in the district (as on 21st December 1963).
HEAL TH AND MEDICAL AMENITIES
The Health Department's work in the district ,is now in the purview of the Zilla Parishad. A subject committee looks after its working and the District Health Officer works as Secretary to that Committee as well as the Officer-in-charge of Health activities in the district.
Three towns and five villages have piped watersupply. Out of the remaining towns and villages one town and J 34 villages draw drinking water from rivers, 13 villages from nallahs, 39 villages from tanks, 7 viliages from springs and 2 towns and 899 villages from wells. Six towns and 681 villages draw drinking water from more than one of these sources. The water-supply is not adequate in summer in the case of 3 towns and 571 villages.
(·62-(Kolaba)--v-A.
Malaria Control The malaria eradication campaign was started in the
district under the National Malaria Eradication Programme in 1953-54. Under the control phase, each house was sprayed twice in a year by DDT in the limited area where the percentage of malaria cases was high. But when the control phase passed into eradication phase each house of the district was sprayed twice in a year. The population protected under the Malaria Eradication Programme is cent per cent. Malaria surveillance programme was introduced during the year 1960-6 1. Under this phase the epidemic· will be brought under control by distribution of anti-malaria drugs.
(32) DISTRICT CENSUS HANDBOOK
Anti-T. B. Campaign B. C. G . Vaccination campaign was started in 1954·
82,314 persons were exan:ined and 28,951 persons were vaccinated in the district till the end of 1960.
Leprosy Control There are two leprosy hospitals at Pui in Roha
taluka and Poladpur. In addition, a leprosy centre at Pen, sub-centres at Jite, Warsai, Kasu and Survey, Education and Treatment Units at Mahad, Roha, Alibag and Shriwardhan are functioning. In the leprosy hospital at Pui, occupational therapies were also started for the benefit of patients. The leprosy hospitals at Pui and Poladpur have 200 and 180 beds, respectively. In J 960, these hospitals treated 1,707 and I, 133 patients, respectively. Family Planning Centres
There are six Family Planning Centres at Karj2t, Khopoli, Nagothana, Mangaon, Nere (Panvcl) and Alibag in the district. 161 vasectomy operations were performed by these centres during 1962. Control of Smallpox
There were 211 deaths due to smallpox in 1958. This number came down to 84 in 1960. The number of vaccinations was 9,867 in 1961. The number of re-vaccinations increased from 61,991 in 1951 to 109,108in 1956 and to J36,95Zin 1961.
Medical Facilities Medical facilities available in the district are
shown in Table 17 of Part III. The figures in the table relate to the facilities provided by Government and other aided institutions: The number of private practitioners, hospitals and dispensaries are not shown there.
The number of doctors and nurses was 24 and 36, respectively, in 1960. The number of beds available decreu.sed from 527 in J 956 to 502 in 1960.
The number of indoor and outdoor patients treated have increased between I 956--{)0. The
number of indoor patients increased from 3,750 in 1956 to 4,663 in 1960. Similarly, the number of outdoor patients increased from 201,365 in 1956 to 226,093 in J 960.
Hospitals
Th?re are five .hospitals in the district. They are sItuated at Ahbag, Murud, Karjat, Roha and Poladpur. Of these the Civil Hospital now called the General Hospital is at Alibag the Leprosy Hospital is at Pui in Roha taluka and Fatima Begum Hospital is at Murud-JanJira. These three hospitds are run by Government. There is also a Government Cottage Hospital at ,Mangaon. Leprosy Hospital at Poladpur is run by' a private body. Di spensaries
I_,-! 1960, there ,vere 20 dispensaries in the dis. trict. Two of them are run by Government, 8 by municipdities and 10 by the District Local Board (now Zilla Parishad).
Primary Health Centres
At the end of 1960, there were 8 maternity homes and 18 primary health centres functioning in different parts of the district.
There were 27 subsidiced medical practitioners working in rur~l areas of the district in 1960. In these centres 79,715 patients were treated during that year.
. The total number of. persons workir.g as PhysiCIans, Surgeons, DentIsts, Nurses, Pharmacists and other medical and health technicians in the district is 773.
The persons returned in the 1961 Census as PI-:ysicians, Surgeons and Dentists and their classifications by sex are shown in Table B-V in Part II. The number of medical personnel per one lakh popUlation in the district is 23 as against 55 for Maharashtra.
HOUSING
Tables E.l, E-II, E-IV and E-Vin Part II present material on different aspects of housing in rural and urban areas of the district and each taluka separately.
66·2 per cent of all the houses are used as dwellings, 23-0 per cent as cattle sheds, etc" 4·8 per cent were vacant at the time of the Cens'Us and the remaining are used as shops, workshops or facto:-ies, schools, etc.
The density of residential houses per square mile in the district has increased along with the density of population per square mile from 61·9 in 1951 to 75·5 in 1961. The number of persons per residential house has, however, decreased from
}-61·(Kolaba)-v·B.
5 ·41 in 1951 to 5 ·17 in 1961. This may indicate an increased mobility of population from rural to urban are~.s as well as a tendency towards smaller families in urba:>. areas.
CI 'fi db" d" d " d" . aSSl e y owne an rente categones, 88 per cent of the dwellings in the district are owned and only 12 per cent are rented. The proportion of "owned" in the rural areas is slightly higher (92 per cent) and very much lower (48 per cent) in the urban areas. Even this low proportion of 48 per cent for the urban areas in the district is somewhat higher than the average of 30 per cent for all urban areas of Maharashtra.
KOLABA : HOUSING (33)
Out of the various materials used for walls, grass, leaves, reeds or bamboo appear to be predomin~\nt in the district with a proportion of 42· 7 per cent. The proportions in Alibag taluka and Murud, Shriwardh:m, Mhasala and Poladpur mahals are much lower, as the differences are made up by unburnt or burnt bricks. Unburnt bricks art predominantly used in the western (coastal) and the southern parts of the district while in the eastern and the northern parts, which are hilly and mostly occupied by tribal population, grass ,leaves, reeds or bamboo are predominantly used. Stone is not used much in the district except in Mhasala and Poladpur malIals where it is used along with unburnt bricks. Burnt bricks are more common in urban areas than in the rural. Its proportion in the urban areas is 70 9 per cent against 19·9 per cent in the rural. Unburnt bricks appear to be predominant in the rural areas with a proportion of 26·9 per cent.
Out of the material of roof, tiles are predominant in the district with a proportion of 51'4 per cent. Tiled roofs are, however. more common in urban areas. Their proportion in the urban areas is 79·5 per cent against 48'6 p~r cent in rural areas. In the rural areas along with the tikd roofs, roofs
of grass, leaves, reeds, etc., are also common and have a proportion of 49·6 per cent. Tiled roofs are very common in the southern and north-western parts of the district comprising of Panvel, Mangaon and Mahad talukas and Uran, Murud, Shriwardhan, Mhasala and Poladpur mahals. The district falls under heavy rainfall tract and the roofs are, therefore, s~oping. The distribution corresponds more or less to the economic condition of the people in the district. This is evident from the fact that roofs of either grass or leaves are predominant in the eastern parts.
Corrugated iron or zinc sheets appear to be more in use in urban areas with 5·9 per cent. Their use in the rural areas seems to be very much restricted.
Classified by the number of rooms occupied, 54, 7 per cent of households are occupying one room dwellings and 34·1 per cent are occupying two-room dwellings. Households occupying larger number of rooms are more in urban areas than in rural areas. Average number of persons per room is 3'06 for total, 3·17 for rural and 2·33 for urban areas.
AGRICUL TURE AND IRRIGATION Agriculture is the predominant economic acti
yity in the district. 77'37 per cent of the total working population work on agriculture in the district as against 69'91 per cent in Maharashtra and 69'52 per cent in India.
Statistics regarding land utilisation, crop pattern, irrigation, wholesale and harvest prices, live-stock and agricultural implements, etc., for the district are given separately in Tabl~s 3 to lOin Part III.
Cultivating Seasons As in the ether area~ of the State, there are two
agricultural seasons, viz., kharif and rabi in this district also. But the district has almost negligible area under cultivation irr rabi season. Rice, ragi,
small millets, kodra and varai, pulses, kUlthi, udid and mung are the main crops of the kharif season. Winter rice, kulthi and wal are grown in rabi season. Rice is grown in both the seasons. Nirpunja. Bhadas, Halva, Kolamb and Ghosalval are the popular local varieties of rice.
The monthwise agricultural operations in respect of the principal crops in the district are shown in the crop calendar on page (35).
Land Utilisation The pattern of land utilisation in the district and
each of its talukas is shown below compared with that of the State. All the fi~ures are based on average for three years from 1957-58 to 1959-60 :-
Percentage of geographical area --------------------- ------, Total
Administrative Unit Total Barren and Land put Culturable Permanent Miscella .. Current Other fallow Net area gross fallows land soWn cropped
(I)
MAHARASlITRA KOLABA DISTRICT
KarjatT :'lluJm PanveITahlka UraoMahal KhalapurTaluka
" Alibac Taluka Pen Taluka Sudha~ad Mahal " RohaT.luk. MurudMahal Mangaon Talllka ',', Shriwardhan M.h.l .. Mhasala Mahal M.h.dTaluka PoladpurMahal
lleoln'3?hical Forests area
(2) (3)
100 17.54 100 24.15 100 27.01 100 31.37 100 14.47 100 35.39 100 28.32 100 32.40 100 36.79 100 35.84 100 26.62 100 15.03 100 10.54 100 16.76 100 11.79 100 12:15
unculturable to non.. waste pa.sture. neous crops agricultural and groves
uses
(4) (5) (6) (7) (8) . 6.0B 2.29 2.80 4.75 0.62
17.58 0.29 4.65 1.78 5.69 12.77 0.64
0.56 9.65 27.88
12.01 0.18 1.19 1.66 22.25 0.43 9.21
14.96 0.23 2.09 4.73 9.34 0.16 3.91
2.00 8.47 1.62 1.79 2.41 15.19
0.25 26.66
1.9i 4.46 22.09 0.15 5.44 20.81 0.13 3.17 1.65 21.86 17.45 24.19
0.10 6.62
0.60 22.26 41.62 0.02 18.90 0.26 0.04
area
(9) (10) (11) (12)
3.77 4.46 57.69 60.55 2.85 12.35 30.66 32.28 0.15 2.30 19.60 20.55 0.89 15.20 38.60 41.35
o.io 5.18 46.80 47.23 0.27 46.96 48.02
I.:ij 2.28 51.26 53.73
16.56 33.42 34.15 0.58 0.29 20.49 20.72
11.82 14.14 31.57 35.05 9.57 11.25 24.8B 26.41 0.88 32.66 25.67 27.54 7.81 4.66 37.68 40.51
23.46 28.97 29.74
13.98 0.25 23.36 24.98 33.98 20.69 20.88
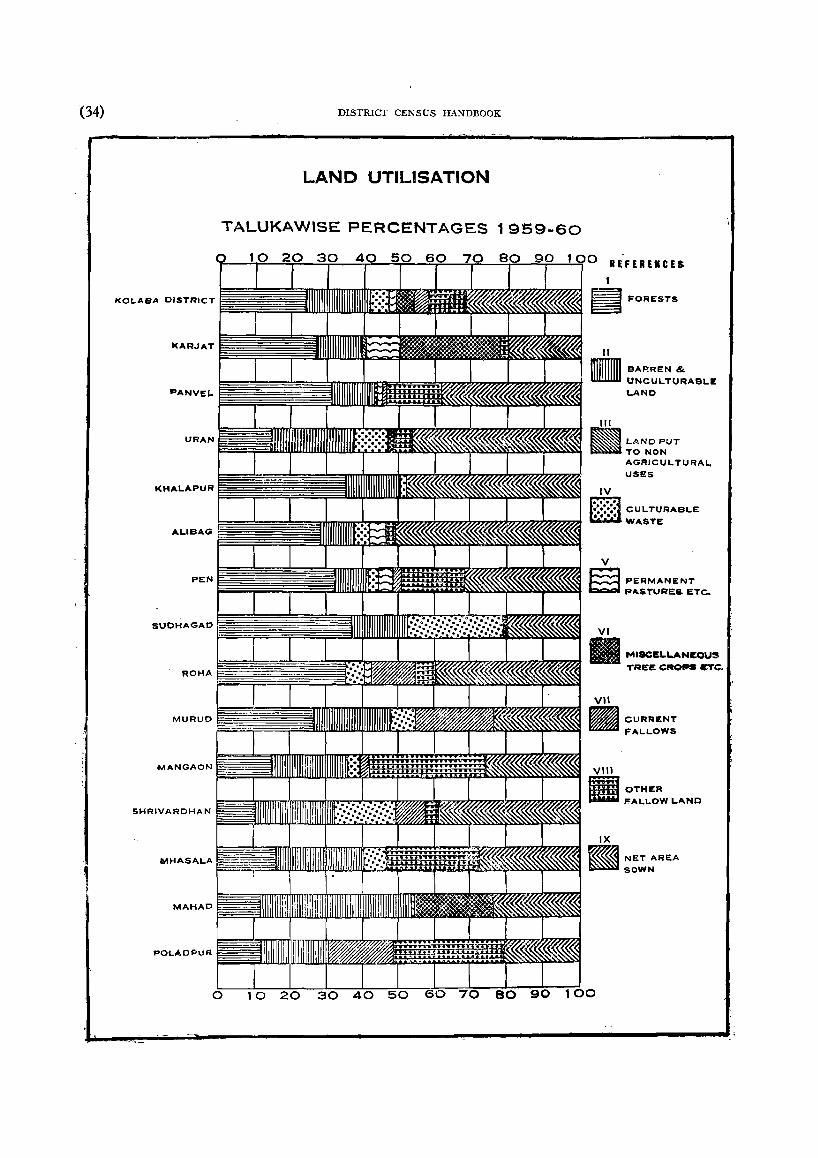
(34) DISTRICT CENSUS HANDBOOK
LAND UTILISATION
TALUKAWISE PERCENTAGES 1959-60
KHALAPUR
AL'BAG
PEN
ROHA
5HRIVARDHAN
,
40 50
II
nrmmn BARREN & Ulll1llill UNCULTURABLE
LAND
V
LAND PUT TO NON AGRICUL TURAL USES
CULTURABLE
WASTE
~ PERMANENT b:;;;;:'J PA.STURE5 ETC.
VII
MISCELLANEOUS
TREE CROPS trc.
~ CURRENT
~ FALLOWS
VIII
fiiim OTHER
fHHD FALLOW LAND
IX
~ NET AREA
~SOWN
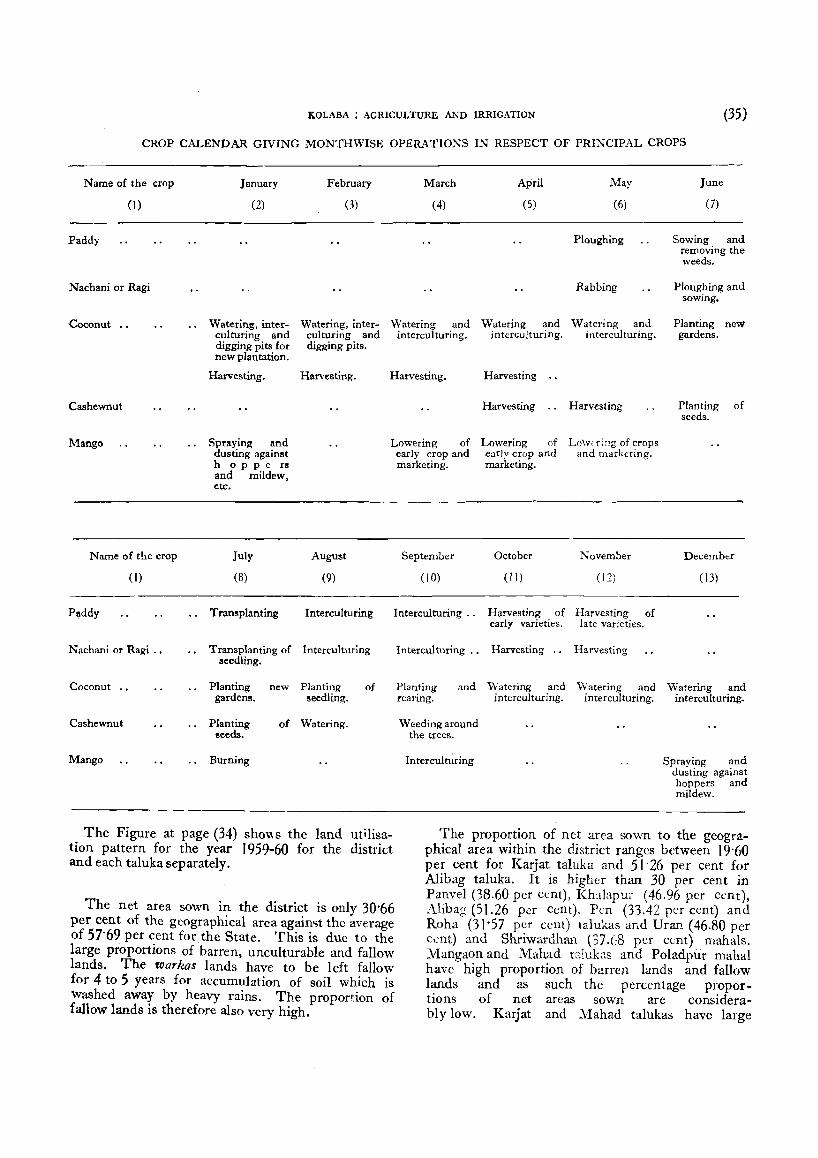
KOLABA : AGRICULTURE AKD IRRIGATION (35)
CROP CALENDAR GIVING MONTHWISE OPERATIONS IN RESPECT OF PRINCIPAL CROPS
Name of the crop January February March April May June
(I) (2) (3) ( 4) (5) (6) (7)
Paddy Ploughing Sowing and removing the weeds.
Nachani or Ragi Rabbing Ploughing and sowing.
Coconut .. Watering, inter- Watering, inter- Watering and Watering and Watering and Planting new culturing and culturing and interculturing. intercuituring. interculturing. gardens. digging pits for digging pits. new plantation.
Harvesting. Harvesting. Harvesting, Harvesting
Cashewnut Harvesting Harvesting Planting of seeds.
Mango Spraying and Lowering of Lowering of LO\Vi-ri~g of crops
Name of the crop
(1)
dusting against h o p p e rs and mildew, etc.
July
(8)
August
(9)
early crop and early crop and and marketing. marketing. marketing.
September October November December
(10) (11) ( 12) (13)
Paddy Transplanting Interculturing Interculturing .. Harvesting of Harvesting of
Nachani or Ragi ..
Coconut .•
Cashewnut
Mango
Transplanting of Interculturing seedling.
Planting new Planting of gardens. seedling.
Planting lIeeds.
Burning
of Watering.
The Figure at page (34) sho"s the land utilisation pattern for the year ) 959-60 for the district and each taluka separately.
The net area sown in the district is only 30'66 per cent of the geographical area agaimt the average of 57'69 per cent forthe State. This is due to the large proportions of barren, unculturable and fallow lands. The warkas lands have to be left fallow for 4 to 5 years for accumulation of soil which is washed away by heavy rains. The proportion of fallow lands is therefore also very high.
Interculturing ..
Planting and rearing.
Weeding around the trees.
Interculturing
early varieties.
Harvesting ..
'Watering and interculturing.
late varieties.
Harvesting
'Watering and interculturing.
Watering and interculturing.
Spraying and dusting against hoppers and mildew.
The proportion of net area sown to the geographical area within the district ranges between ) 9 '60 per cent for Karjat taluka and 5) '26 per cent for Alibag taluka. It is higher than 30 per cent in Panvel (38.60 per cent), Kh::dapui' (46.96 p.er cent), Ahbag (51.26 per cent), Pen (33.42 per cent) and Roha (31'57 per cent) talukas and Dran (46.80 per cent) and Shriwardhan (37.(;8 per ccnt) mahals. Mangaon and Mahad talubs and Poladpur mahal have high proportion of barren lands and fallow lands and as such the percentage proportions of net areas sown are considerably low. Karjat and Mahad talukas have large
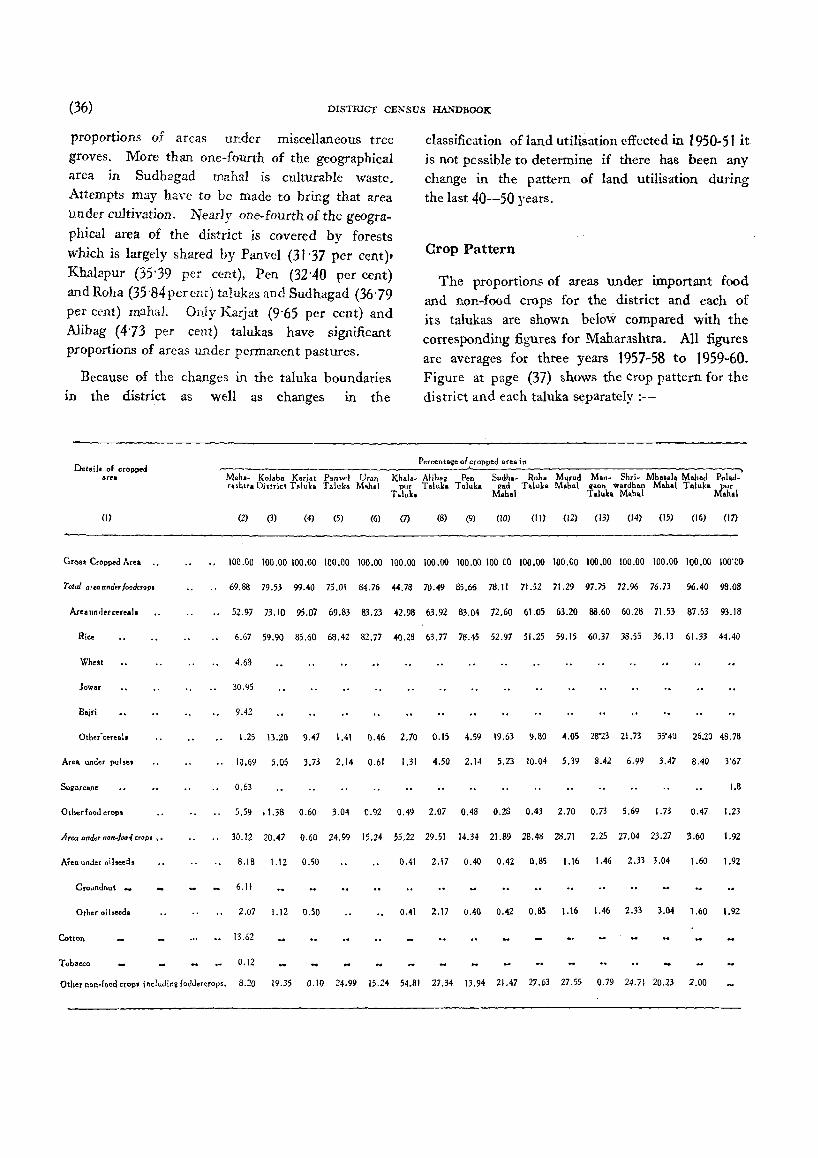
(36) DISTRICT CENSUS HANDBOOK
proportions of arcas under miscellaneous tree groves. More than one-fourth of the geographical area in Sudhagad mahal is culturable waste. Attempts may have to be made to bring that area under cultivation. Nearly one-fourth of the geogra
phical area of the district is covered by forests which is largely shared by Panvel (31'37 per cent), Khalapur (35'39 per cent), Pen (32'40 per cent) and Roha (35'84perent) talukas and Sudhagad (36'79 per cent) mahal. Only Karjat (9'65 per cent) and Alibag (4'73 per cent) talukas have significant proportions of areas under permanent pastures.
Because of the changes in the taluka boundaries lD the district as well as changes m the
classification of land utilisation effected in J 950-51 it is not possible to determine if there has been any change in the pattern of land utilisation during the last 40-50 years.
Crop Pattern
The proportions of areas under important food and non-food crops for the district and each of its talukas are shown below compared with the corresponding figures for Maharashtra. All figures are averages for three years 1957-58 to 1959~60.
Figure at page (37) shows the crop pattern for the district and each taluka separately :-
Det.il. 01 cropped Percenta~e of cropped area in
-"--area M.h.- Kol.ba Karia' Ponv.! Uran Kh.la- Alibag Pen Sudha- RoJ,. Murud Mon- Shri- Mha •• l. M..b.d Pol.d.
r.,h,r. Di,'rict T.lu" T.luk. Mob.1 pur Toluk. Toluk. gad T.luke Mobot laon wardhan Mohol Taluk'rl.ur T.lu'. Mahel T .I"k. M.h.1 ahal
(I) (2) (3) (4) (5) (6) (7) (8) (9) (10) (II) (12) (13) (14) (15) (16) (17)
eros. Cropped Ar .. " .. 100.00 100.00 100.00 lCO.OO 100.00 100.00 100.00 100.00 100 CO 100.00 100.CO 100.00 100.00 100.00 100.00 100'c()
Total aTta anri.r loader. PI ., 69.88 79.53 99.40 75.01 84.76 44.78 70.49 85.66 78.11 71.52 71.29 97.75 72.96 76.73 96.40 98.08
At •• unrlercet •• 1s .. 52.97 73.10 95.07 69.83 83.23 42.98 63.92 83.04 72.60 61.05 63.20 88.60 60.28 71.53 87.53 93.18
Rice 6.67 59.90 85.60 68.42 82.77 40.28 63.77 78.45 52.97 51.25 59.15 60.37 38.55 36.13 61.33 44.40
Wheat 4.68
Jow.r 30.95
Bajti 9.42
Other·cereal. 1.25 13.20 9.47 1.41 0.46 2.70 0.15 4.59 19.63 9.80 4.05 28'23 21.73 3S'4U 26.20 48.78
Area. under pulse, 10.69 5.05 3.73 2.14 0.61 1.31 4.50 2.14 5.23 10.04 5.39 8,42 6.99 3.47 8.~0 3'67
Sugarcane 0.63 1.8
Otb.deed crop. 5.59 .1.38 0.60 3.04 0.92 0.49 2.07 0.48 0.28 0.43 2.70 0.73 5.69 1.73 0.47 1.2:>
Area und.r non-/M' crop • • , .. 30.12 20.47 0.60 24.99 15.24 55.22 29.51 14.34 21.89 28.48 28.71 2.25 27.04 23.27 3.60 1.92
Area under oilseed. 8.18 1.12 0.50 0.41 2.17 0.40 0.42 0.85 1.16 1.45 2.33 3.04 1.60 1.92
Croundnut - 6.11
Otber oilseed. 2.07 1.12 0.50 0.41 2.17 0.40 0.42 0.85 1.16 1.46 2.33 3.04 1.60 1.92
Cotton " 13.62
Tobacco 0.12
Other non-feod crcp' includi"~ fedder~fop', 8.20 19.35 0.10 24.99 15.24 54.81 27.34 13.94 21.47 27.63 27.55 0.79 24.71 20.23 2.00
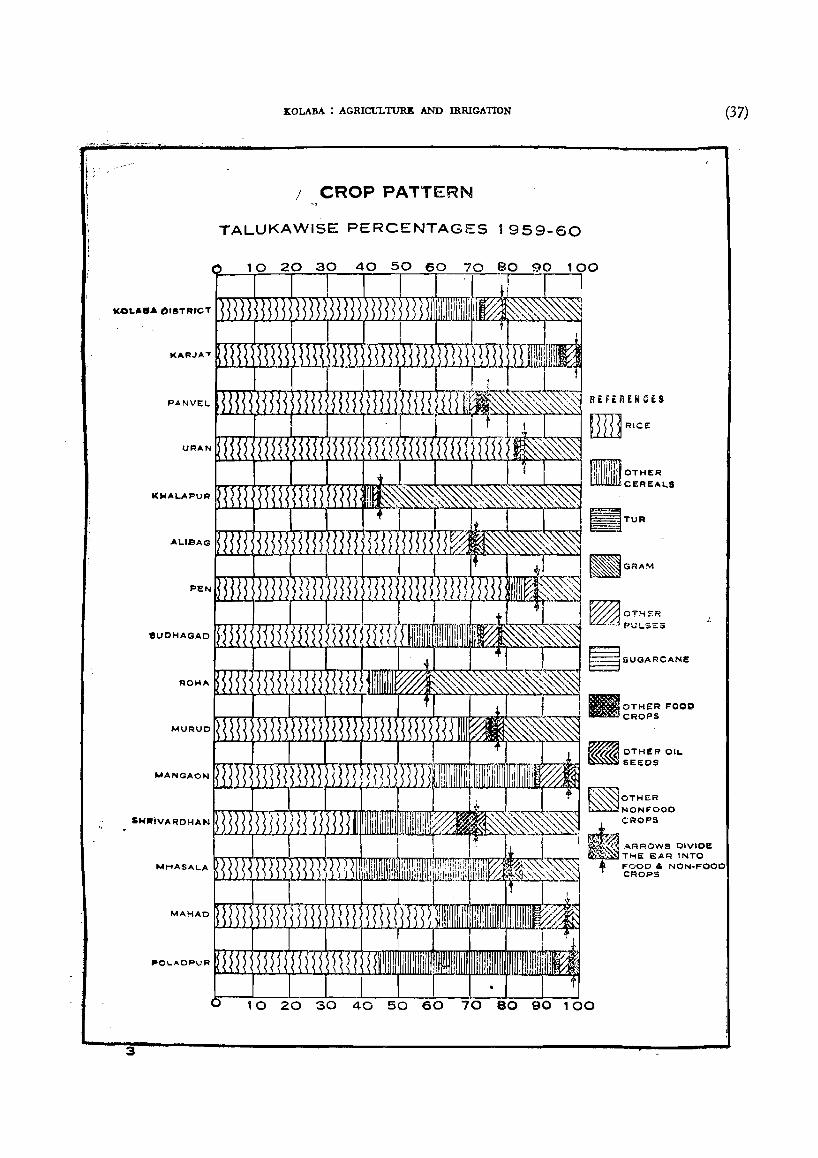
I·' \ I
KOLASA E>ISTRfCT
KARJAT
ICWALAPUR
ALIBAG
tSuOHAGAO
ROHA
MURUD
MANGAON
SNllflvAROHAN
MHASALA
""AHAD
POLADPUR
3
ltOLABA: AGRICULTURE AND ffiRIGATION
/ CROP PATTERN
TALUKAWISE PERCENTAGES 1959-60
RHi:.IlENCES
OTHER CEREALS
CROPS
., ARROWS O'V'O< - ~ THe: eAR INTO
FOOD & NON-FOOD CROPS.
30 40 50 60 100
(37)
(38) DISTRICT CENSUS HANDBOOK
The crop pattern of the district is typical of the Konkan region. Crops like wheat, jowar, bajri, cotton and tobacco are absent and rice is the principal crop with 59'90 per cent of the gross cropped area under it. Next in order of importance are ragi, varai, kodra and other millets which together occupy 13-20 per cent of gross cropped area. Pulses have5'05percentandotherfood crops 1'38 percent. All the food crops together make 79-53 per cent of the gross cropped area against the average of 6988 per cent for Maharashtra. Compared to the State average the district naturally has a very high proportion of rice and other cereals but low proportion of pulses and other food crops. The pulses grown in the district in order of the area covered are wal, mung, udid, tur and chavli. Among condiments and spices, betelnut (supari) and chillies are important. Betelnut is an important garden crop and the district stands first in its area and production in the State. Among other food crops a large area is covered by fruit trees mainly mangoes and cashew. Though the area covered by them appears to be small in comparison with other crops, these tree crops are very important in the economy of the district.
Bulk of the area under non-food crops is under fodder crops. Oil-seeds occupy only 1'12 per cent of the gross cropped area. Groundnut is conspicuously absent. The oil-seeds of im.portance are coconut and sesamum.
Comparable statistics for the entire district prior to 1950-51 are not available. It is, therefore, difficult to study the changes in crop pattern during the last 40-50 years.
The crop pattern is considerably rich in comparison with the average for the State. The district has a very high proportion of high value crops like rice, mangoes, cashewnuts and betelnuts. The average yields per acre for most of the crops are also better than the State averages. The adverse factors are the smaller proportion of irrigated areas and considerably larger proportion of low value crops like ragi and other small millets. The estilY'.ated gross value of output per acre of cropped area in the district is Rs. 196 in 1955-56 and is the highest among all the districts of Maharashtra.
Within the district, the cropping pattern varies according to rainfall and soil types. Karjat and Pen talukas and Urjln mahal have more than three-fourths of the gross cropped area under rice, the maximum being in Karjat (85'60 per cent). Ragi is generally grown along slopy hills, mountainous lands and in inferior soils. It is predominant in Mangaon, Mahad and Roha talukas and Shriwardhan, Mhasala, Poladpur and Sudhagad mahals. Nearly half of the
gross cropped area in Poladpur mahal is occupied by ragi and other millets. In the southern talukas of Mangaon and Mahad and Shriwardhan mahal, the pulses cover sizable proportions of cropped areas. Shriwardhan mahal has a high proportion (5'69 per cent) of cropped area under other food crops consisting mainly of fruit trees and betelnuts. Panvel and Alibag talukas and Murud mahal also have sizable proportions under "Other food crops" . Mangoes are found all over the district. The coastal areas of the district mainly Alibag taluka and Uran t
M urud and Shriwardhan mahals have considerable areas under betelnuts.
The proportion of non-food crops to the gross cropped area varies considerably from taluka to taluka. Itis highest (55'22 percent) in Khalapur taluka and lowest (0'60 per cent) in Karjat taluka. Most of the area under non-food crops is covered by fodder crops. Only Karjat and Mangaon talukas have higher proportion of oil-seeds in the non-food crops~ while Poladpur mahal has no fodder crop at all. Amongst oil-seeds, coconut is prevalent in the coastal areas of the district mainly in Alibag taluka and Murud, Uran and Shriwardhan mahals.
Nine~year average yields and 1958-59 acreages and outturns of important crops are -shown below compared with the corresponding figures for Maharashtra taken as 100 :-
Ni~e-year 1958-59 average 1958-59
yields area outturn per acre
MAHARASH'l'RA. 100'00 100'00 100'00
Rice 132-79 10-54 14'24
Ragi 103-74 7·86 7-82
Tur 47·12 0·18 0·09
Gram 103-78 0·11 0-15
Sesamum 110-31 1·16 1'25
Except for tur, the district average yields are better than the averages for Maharashtra. The difference is significant in the case of rice. 10'54 per cent of the State's area under rice alone produced 14'24 per cent of the total outtum of rice in the State in 1958-59. The contribution of the district in the outturn of ragi is also significant.
The Techno-Economic Survey of Maharashtra has estimated the gross value of output per acre of cropped area in 1955-56 at Rs. 196 for the district as against Rs. 76 for the State and Rs. J 26 for India.
The density of population, proportion of workers working on land to total workers, gross area sown per worker on land and the proportion of irrigated
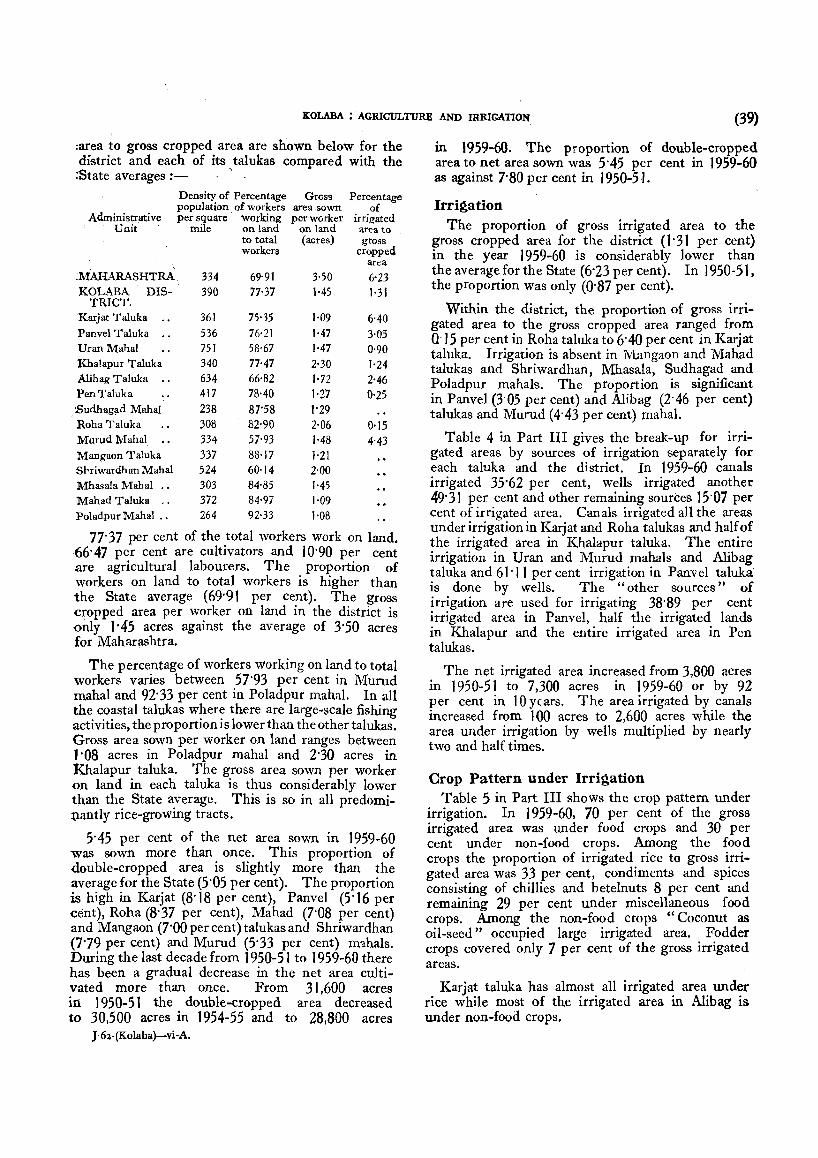
KOUBA :. AGRICULTURE AND mRIGATION (39)
:area ~o gross cropped area are shown below for the district and each of its ,talukas compared with the :State averages :-
Density of Percentage Gress Percentage population of workers area .sown of
Administrative per square working per worker irrigated Unit mile on land on land area to
to total (acres) gross workers cropped
area MAHARASHTRA 334 69'91 3·50 6'23 KOLABA DIS- 390 77·37 1·45 ),31
TRIeT. Xarjat Taluka .. 361 75'35 '·09 6·40 Panvel Taluka .. 536 76·21 1·47 3-05 -Uran Mahal 751 58'67 1·47 0'90 Khalapur Taluka 340 77-47 2'30 "24 AIibag Taluka .. 634 66'82 1'72 2'46 Pen Taluka 417 78·40 ),27 0'25 :Sudhag;td Mahal 238 87'58 )'29 Roha Taluka 308 82'90 2·06 0·15 Murud Maha1 .. 334 57-93 1'48 4'43 Mangaon Taluka 337 88·17 1·21 Shriwardhan Maha! 524 60·14 2'00 Mhasala Mahal ., 303 84·85 "45 Mahad Taluka ., 372 84·97 "09 Poladpur Mahal ., 264 92· 33 "08
77'37 per cent of the total workers work on land. '66'47 per cent are cultivators and 10'90 per cent are agricultural labourers. The proportion of workers on land to total workers is higher than the State average (69'91 per cent). The gross cropped area per worker on land in the district is only 1 ;45 acres against the average of 3'50 acres for Maharashtra.
The percentage of workers working on land to total workers varies between 57'93 per cent in Murud mahal and 92'33 per cent in Poladpur mahal. In all the coastal talukas where there are large-scale fishing activities, the proportion is lower than the other talukas. Gross area sown per worker on land ranges between 1'08 acres in Poladpur mahal and 2'30 acres in Khalapur taluka. The gross area sown per worker on land in each taluka is thus considerably lower than the State average. This is so in all predomitlandy rice-growing tracts.
5'45 per cent of the net area sown in 1959-60 was sown more than once. This proportion of double-cropped area is slightly more than the average for the State (5'05 per cent). The proportion is high in Karjat (8'18 per cent), Panvel (5 '16 per cent), Roha (8'37 per cent), Mahad (7·08 per cent) and Mangaon (7'00 per cent) talukas and Shriwardhan (7'79 per cent) and Murud (5'33 per cent) m'lhals. During the last decade from 1950-51 to 1959-60 there has been a gradual decrease in the net area cultivated more than once. From 3 J ,600 acres in 1950-51 the double-cropped area decreased to 30,500 acres in 1954-55 and to 28,800 acres
J -62·(Kolaba)-vi-A.
in 1959-60. The proportion of double-cropped area to net area sown was 5'45 per cent in 1959-60 as against 7'80 per cent in 1950-5.1,
Irri~ation
The proportion of gross irrigated area to the gross cropped area for the district (J '31 per cent) in the year 1959-60 is considerably lower than the average for the State (6'23 per cent). In 1950-51, the proportion was only (0'87 per cent).
Within the district, the proportion of gross irrigated area to the gross cropped area ranged from Q. J 5 per cent in Roha taluka to 6'40 per cent in Karjat taluka. Irrigation is absent in Mangaon and lVlahad talukas and Shriwardhan, Mhasala, Sudhagad and Pol ad pur mahals. The proportion is significant in Panvel (3'05 per cent) and Alibag (2'46 per cent) talukas and Murud (4'43 per cent) mahal.
Table 4 in Part III gives the break-up for irrigated areas by sources of irrigation separately for each taluka and the district. In 1959-60 canals irrigated 35'62 per cent, wells irrigated another 49'31 per cent and other remaining sources 15'07 per cent of irrigated area. Canals irrigated all the areas under irrigation in Karjat and Roha talukas and half of the irrigated area in Khalapur taluka. The ex:tire irrigation in Uran and Murud mahals and Ahbag taluka and 61'11 per cent irrigation in Panvel taluka is done by wells. The" other sources" of irrigation are used for irrigating 38'89 per cent irrigated area in Panvel, half the irrigated lands in Khalapur and the entire irrigated area in Pen talukas.
The net irrigated area increased from 3,800 acres in 1950-51 to 7,300 acres in 1959-60 or by 92 per cent in 10 yc ars. The area irrigated by. canals increased from 100 acres to 2,600 acres wh11e the area under irrigation by wells multiplied by nearly two and half times.
Crop Pattern under Irrigation Table 5 in Part III shows the crop pattern under
irrigation. In 1959-60, 70 per cent of the gross irrigated area was under food crops and 30 per cent under non-food crops. Among the food crops the proportion of irrigated rice to gross irrigated area was 33 per cent, condiments and spices consisting of chillies and betelnuts 8 per cent and remaining 29 per cent under miscellaneous food crops. Among the non-food crops "Coconut as oil-seed" occupied large irrigated area. Fodder crops covered oniy 7 per cent of the gross irrigated areas.
Karjat taluka has alm?st. all irrigate~ area. und:r rice while most of the ungated area m Ahbag IS
under non-food crops.
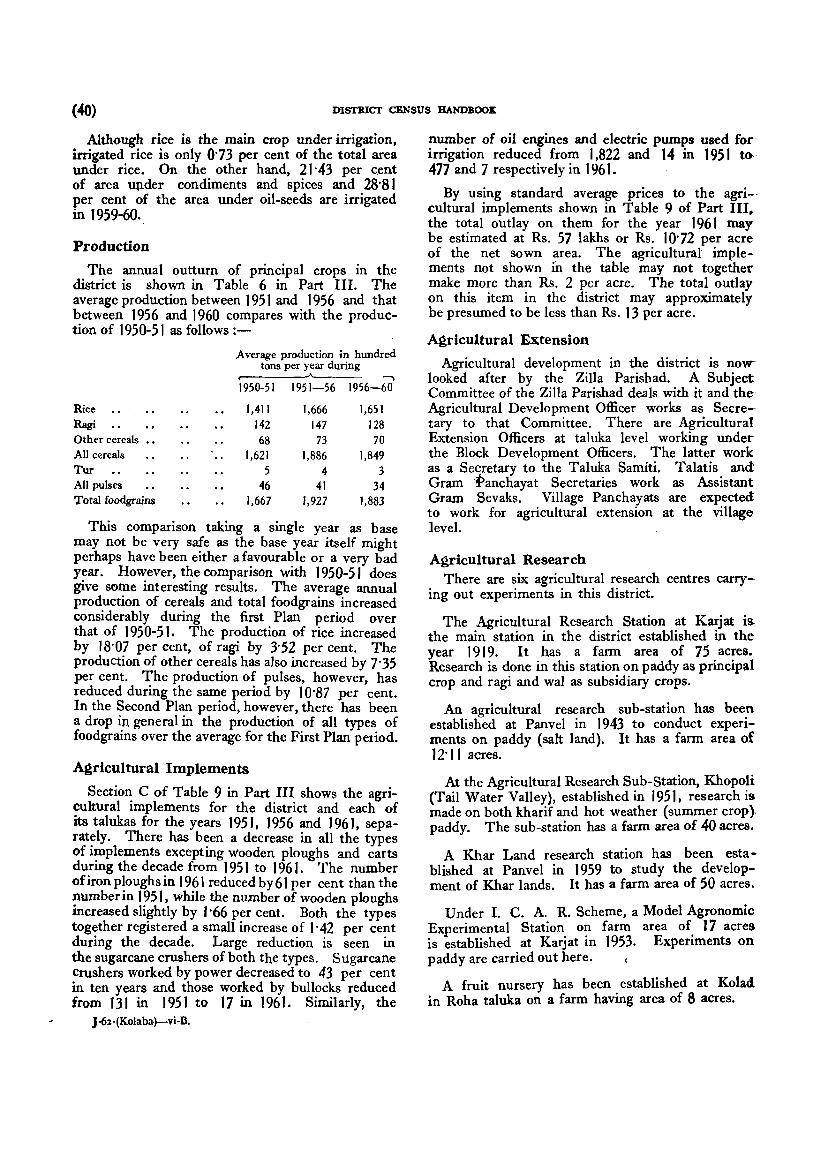
(40) DISTRICT CENSUS HANDBOOJt
Although rice is the main crop under irrigation, irrigated rice is only 0'73 per cent of the total area under rice. On the other hand, 2 I . 43 per cent of area up.der condiments and spices and 28'8 I per cent of the area under oil-seeds are irrigated in 1959-60.
Production
The annual outtum of principal crops in the district is shown in Table 6 in Part III. The average production between 1951 and 1956 and that between 1956 and 1960 compares with the production of 1950-5 I as follows :-
Rice Ragi Other cereals •• All cereals Tur All pulses Total foodgrains
Average production in hundred tons per year during
....... 1950-51 1951-56 1956-60
1,411 1,666 1,651 142 147 128 68 73 70
1,621 1,886 1,849 5 4 3
46 41 34 1,667 1,927 1,883
This comparison taking a single year as base may not be very safe as the base year itself might perhaps have been either a favourable or a very bad year . However, the comparison with 1950-51 does give some interesting results. The average annual production of cereals and total foodgrains increased considerably during the first Plan period over that of 1950-5 I. The production of rice increased by 18'07 per cent, of ragi by 3-52 per cent. The production of other cereals has also increased by 7'35 per cent. The production of pulses, however, has reduced during the same period by 10'87 per cent. In the Second Plan period, however, there has been a drop in general in the production of all types of foodgrains over the average for the First Plan peliod.
Agricultural Implements
Section C of Table 9 in Part III shows the agricultural implements for the district and each of its talukas for the years J 95 J, J 956 and J 96 J, separately. There has been a decrease in all the types of implements excepting wooden ploughs and carts during the decade from J 951 to 196 J • The number of iron ploughs in 1961 reduced by 61 per cent than the number in 195 J, while the number of wooden ploughs increased slightly by ) '66 per cent. Both the types together registered a small increase of 1'42 per cent during the decade. Large reduction is seen in the sugarcane crushers of both the types. Sugarcane Crushers worked by power decreased to 43 per cent in ten years and those worked by bullocks reduced from ) 3 I in 195 I to 17 in 1961. Similarly, the
J-61-(Kolaba)-vi-B.
number of oil engines and electric pumps used foeirrigation reduced from 1,822 and 14 in 1951 t~ 477 and 7 respectively in 1961.
By using standard average prices to the agricultural implements shown in Table 9 of Part III. the total outlay on them for the year 1961 may be estimated at Rs. 57 lakhs or Rs. 10'72 per acre of the net sown area. The agricultural implements not shown in the table may not together make more than Rs. 2 per acre. The total outlay on this item in the district may approximately be presumed to be less than Rs. 13 per acre.
Agricultural Extension
Agricultural development in the district is now looked after by the Zilla Parish ad. A Subject Committee of the Zilla Parishad deals with it and th~ Agricultural Development Officer works as Secretary to that Committee. There are Agricultural Extension Officers at taluka level working under the Block Development Officers. The latter work as a Secretary to the Taluka Samiti. Talatis and Gram i'anchayat Secretaries work as Assistant Gram Sevaks. Village Panchayats are expected to work for agricultural extension at the village level.
Agricultural Research There are six agricultural research centres carry
ing out experiments in this district.
The Agricultural Research Station at Karjat is. the main station in the district established in the year 1919. It has a farm area of 75 acres. Research is done in this station on paddy as principal crop and ragi and wal as subsidiary crops.
An agricultural research sub-station has been established at Panvel in 1943 to conduct experiments on paddy (salt land). It has a farm area of 12-11 acres.
At the Agricultural Research Sub-Station, Khopoli (Tail Water Valley), established in 1951, research is made on both kharif and hot weather (summer crop). paddy. The sub-station has a farm area of 40 acres.
A Khar Land research station has been established at Panvel in 1959 to study the development of Khar lands. It has a farm area of 50 acres.
Under I. C. A. R. Scheme, a Model Agronomic Experimental Station. o? farm area of. 17 acres is established at KarJat 10 1953- Expertments on paddy are carried out here.
A fruit nursery has been established at Kolaci in Roha taluka on a farm having area of 8 acres.
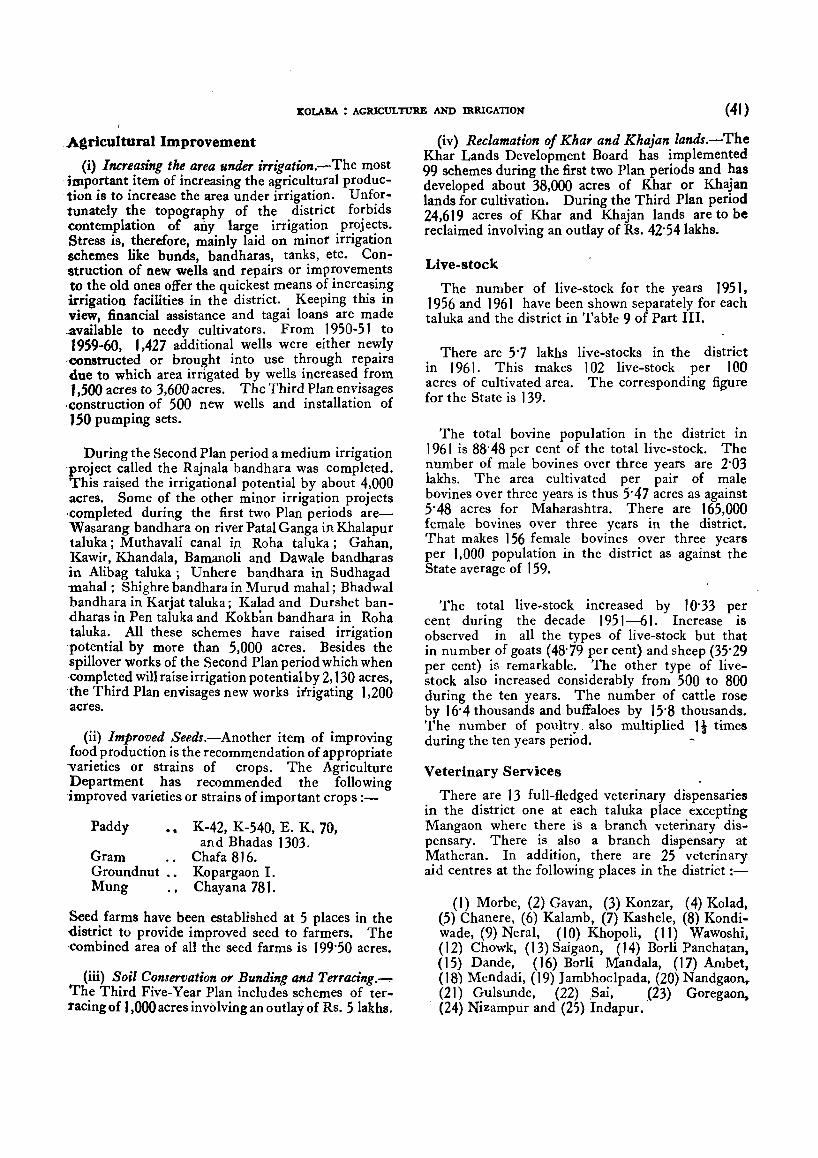
ltOLABA : AGRICULTURE AND mRIGATlON (41 )
Agricuttural Improvement
(i) Increasing the area under i"igation.-The most important item of increasing the agricultural production is to increase the area under irrigation. U nfortunately the topography of the district forbids contemplation of any large irrigation projects. Stress is, therefore, mainly laid on minor irrigation schemes like bunds, bandharas, tanks, etc. Con-struction of new wells and repairs or improvements to the old ones offer the quickest means of, incre~si~g irrigation facilities in the district. Keepmg this m view, financial assistance and tagai loans are made .available to needy cultivators. From 1950-51 to 1959-60, 1,427 additional wells were either ne~ly
-constructed or brought into use through repaIrs due to which area irrigated by wells increased from 1,500 acres to 3,600 acres. The Third Plan envisages
·construction of 500 new wells and installation of 150 pumping sets.
During the Second Plan period a medium irrigation project called the Rajnala bandhara was completed. This raised the irrigational potential by about 4,000 acres. Some of the other minor irrigation projects .completed during the first two Plan periods areWasarang bandhara on river Patal Ganga in Khalapur taluka; Muthavali canal in Roha taluka; Gahan, Kawir, Khandala, Bamanoli and Dawale bandharas in Alibag taluka; Unhere bandhara in Sudhagad -mahal; Shighre bandhara in Murud mahal; Bhadwal bandhara in Karjat taluka; Kalad and Durshet bandharas in Pen taluka and Kokb~m bandhara in Roha taluka. All these schemes have raised irrigation potential by more than 5,000 acres. Besides the spillover works of the Second Plan period which when completed will raise irrigation potential by 2, 130 acres, the Third Plan envisages new works itrigating 1,200 acres.
(ii) Improved Seeds.-Another item of improving food production is the recommendation of appropriate varieties or strains of crops, The Agriculture Department has recommended the following improved varieties or strains of important crops :-
Paddy .. Gram Groundnut •• Mung
K-42, K-540, E. K. 70, and Bhadas 1303,
Chafa 816. Kopargaon I. Chayana 781.
Seed farms have been established at 5 places in the district to provide improved seed to farmers. The combined area of all the seed farms is 199'50 acres.
(iii) Soil Conservation or Bunding and Terracing._,. The Third Five-Year Plan includes schemes of terracing of 1,000 acres invblving an outlay of Rs. 5 lakhs.
(iv) Reclamation of KhaT and Khajan lands.-The Khar Lands Development Board has implemented 99 schemes during the first two Plan periods and has developed about 38,000 acres of Khar or Khajan lands for cultivation. During the Third Plan period 24,619 acres of Khar and Khajan lands are to be reclaimed involving an outlay of Rs. 42'541akhs.
Live-stock
The number of live-stock for the years 1951, 1956 and 1961 have been shown separately for each taluka and the district in Table 9 of Part III.
There are 5'7 lakhs live-stocks in the district in 1961, This makes 1 02 live-stock per 100 acres of cultivated area. The corresponding figure for the State is 139,
The total bovine population in the district in 1961 is 88'48 per cent of the total live-stock. The number of male bovines over three years are 2'03 lakhs. The area cultivated per pair of male bovines over three years is thus 5'47 acres as against 5'48 acres for Maharashtra. There are 165,000 female bovines over three years in the district. That makes 156 female bovines over three years per 1,000 population in the district as against the State average of 159.
The total live-stock increased by 10'33 per cent during the decade 1951-61. Increase is observed in all the types of live-stock but that in number of goats (48'79 per cent) and sheep (35'29 per cent) is remarkable. The other type of livestock also increased considerably from 500 to 800 during the ten years. The number of cattle rose by 16'4 thousands and buffaloes by 15'8 thousands. The number of poultry also multiplied Ii times during the ten years period.
Veterinary Services
There are 13 full-fledged veterinary dispensaries in the district one at each taluka place excepting Mangaon where there is a branch veterinary dispensary. There is also a branch dispensary at Matheran. In addition, there are 25 veterinary aid centres at the following places in the district :-
(I) Morbe, (2) Gavan, (3) Konzar, (4) Kolad, (5) Chanere, (6) Kalamb, (7) Kashele, (8) Kondiwade, (9) Neral, (10) Khopoli, (11) Wawoshi) (12) Chowk, (13) Saigaon, (14) Borli Panchatan, (15) Dande, (16) Borli Mandala, (17) Ambet, (18) Mendadi, (19) Jambhoclpada, (20) Nandgaon,. (21) Gulsunde, (22) Sai, (23) Goregaon, (24) Nizampur and (25) Indapur.·
(42) DISTIUCl' CENSUS HANDBOO:S:
Treatment of animal diseases, control of epi
demics, castration of male bovines, and control and
destruction of animal parasites are the main services
rendered at these dispensaries a~d aid centres.
The breed commonly found in the district is: of non-descript type. D~ngi breed of cattle has, been recommended for the tract. Under the' premium bull scheme three bulls of Dangi breed' are located in Khalapur circle.
AGRARIAN STRUCTURE AND LAND REFORMS
The following tenures prevailed in the district before the introduction of the various Land Tenure Abolition Acts since 1949 :-
(1) The Surveyor Ryotwari tenure,
(2) Khoti tenure,
(3) Kauli and Katuban tenures,
(4) Shilotri tenure, and
(5) Other inam tenures.
The first tenure alone prevails 10 the district now and the other tenures which were more or less concessional tenures have been abolished.
(1) Survey tenure.-The ordinary surveyor ryotwari tenure prevailed over most of the areas of the district. It may be described as the heritable and transferable occupancy right of land continuable in perpetuity on payment of the Government demand. Later on (in 1901) it was slightly modified in respect of lands granted by Government which were subjected to certain restrictions about transfer or sale and the new occupancy rights were called new or restricted tenure. The new tenure applied only to the unalienated lands and WaS introduced with t~e object of restricting injudicious transfers in backward areas and safeguarding the lands of backward classes against falling into the hands of savkaT,).
The surveyor ryotwari tenure was based upon a complete survey and soil classification and fixation of land revenue assessment upon each individual field separately.
(2) Khoti tenure.-The Khoti tenure originated in the Konkan owing to the rugged nature of the tract and the difficulties of collecting land revenue.
The Khoti villages had been more or less farmed' out on permanent leases to the Khots.
The land in a Khoti village was either Khoti Khasgi (i.e., land originally held by the Khot or which he had acquired by purchase, etc., in his private capacity or brought under cultivation out of the waste land at his own expense) or Khoti Nisbat which included all the remaining land held by him only in his capacity as a Khot. The Khoti villages included some personal inam villages and some Paragana Watan Khoti villages also. The Khots held the villages on payment to Government of the aggregate assessment of the village. Their rights to the Khoti villages were heritable and transferable. They also had reversionary rights in respect of the Khoti Nisbat lands forfeited, lapsed for failure of heirs, . and resigned by permanent tenants. They were to collect rents (Khoti Faida) from the permanent tenants and quasi-Dharekaris. The Khoti Khasgi lands were the private property of the Khots on which they had full rights. The
Khoti Nisbat land, however, vested in Government and they were entitled only to rent from them ..
The Khoti tenure in Kolaba district had been recognised by the Khoti Settlement Act, 1880. It has since been abolished with effect from May 15, 1950, with all its incidentals by the introduction of the Bombay Khoti Abolition Act of 1949 (Born. VI of 1950). Four hundrep. and sixty-four villages were covered under this Abolition Act.
The Bombay Merged Territories (J anjira and Rhor) Khoti Tenure Abolition Act, 1954, is applicable to the merged territories of Murud, Mhasala, Shriwardhan and Sudhagad mahals and has come into operation with effect from August 1, 1954.
KOUBA : AGRARIAN STRUCl11ItE AND LAND REFORMS (43)
(3) Kauli and Katuban tenures.-The KauIi and Katuban tenures were found in the former State of J anjira, now merged in the Kolaba district. The expression" Kaul "ordinarily meant an agreement and implied a contract or lease of land granted on favourable terms ..for the reclamation of the land. It was, in essence, a reclamation lease under which land was allowed to be held free from payment of assessment for some years and the assessment was levied on a graduated scale. The expression « Katuban "meant fixed rent o.r assessment not able to 'fluctuation since 1880. The terms" Kauls " and" Katubans" came to be treated as synonymous. They covered only scattered lands in 186 villages. The Kauli aSsessment was generally less than the survey assessment.
These tenures have been resumed with effect from August 15, 1953, under the Bombay Kauli and Katuban Tenures Abolition Act, 1953. All such lands have since been subjected to payment of full assessment.
(4) The Shilotri tenure.--This again was a concessional tenure granted in order to encourage reclamation of Khar lands and ensure maintenance of the lands. Shilotri lands Were lands that had been embanked and reclaimed from the sea and the permanence of which was dependent on the embankments being kept up. These reclamations were commonly known as Khars. The Shilotri tenure existed in Alibag and Pen talukas of the district.
This tenure has been abolished and the lands resumed with effect from February 1, 1956, under the Bombay Shilotri Rights (Kolaba) Abolition Act, 1955.
(5) Inam tenures.-Inam lands were gifted or granted by the Government for meritorious service in the past or in lieu of or on condition of some continuing service useful to the Government or to the village community. Inam lands were held free of land revenue. There were five classes of inams in the district :-
(i) Political or Saranjam inams (ii) Personal inams
Year of abolition
1952 1953
(iii) Hereditary Watan inams (iv) Village servants useful to the
(a) Community (b) Government-Patels
Mahars (v) Deosthan inams.
Year of abolition
1951
1954 1963
1959
All inams, excepting the last category of Deosthan inams held by religious institutions or for religious services, have now been abolished under various measures of land reform. The year in which each class of inarn was abolished is shown above. All hereditary Watan lands held for village services have also been abolished and all village servants now work on a salary basis. The occupancy rights of abolished inam lands have been conferred on their holders or tenants, as the case may be, on conditions of payment of occupancy price to the Government and/or compensation to the erstwhi~e holders. Consequential processes of determining titles for occupancy rights and of recovery of occupancy price or compensation are in some cases still in progress. The process of abolition of intermediary interests in land is thus being completed in the district.
J'a~irs
J agirs were a sort of Inam villages granted by the' rulers of the erstwhile States. The J agirs of 41
villages of the former Janjira and Bhor States were abolished under the" Bombay Merged Territories and Areas (J agirs) Abolition Act, 1953", with effect from August 1, 1954.
With the abolition of all the special or concessional tenures as described above the only tenure now prevailing throughout the district is the ryotwari OJ.- survey tenure in which the occupant holds the land directly from the Government and the assessments had been determined by survey and soil classification of each individual field.
Record of Ri~hts
A record of rights in lands is maintained by the Revenue Department for each village separately. It is integrated with annual crop returns and
(44)
inspections and is, therefore, easily maintained up to date. Rights on land in respect of ownership, tenancy, mortgage and other encumbrances are recorded and a form is maintained for each parcel of land separately. It is obligatory on every person acquiring any right on land to report it within three months. Annual revenue accounts are prepared on the basis of the Record of Rights.
Ownership Ri~ht8 to Tenants
Tenancy rights are regulated under the Bombay Tenancy and Agricultural Lands Act which is in force since 1948. It provides security of tenure to and payment of only reasonable rents by the tenants.
In pursuance of the" land to the tiller'l policy, the Act provided for compulsory transfer of ownership rights of tenanted lands to the tenants from 1 st April 1957, which is known as the "Tillers' Day". This was an important step towards the removal of absentee landlordism which was one of !he disincentives in any programme of agricultural Improvement.
Up to 30th September 1963, o"Wnership rights have been conferred upon 82,830 tenants for 38,298 acres of land in the district. Out of these, 12,886 tenants had mutually agreed with the landholders on the price to be paid by them in respect of 19,830 2cres. In the remaining 69,944 cases, the prices were fixed by the Revenue Officers in respect of 18,468 acres.
Size of Land Holdings
Census Table B-X in Part II of this Volume shows that 67·73 per cent of the total number of households cultivate land and the remaining 32·27 per cent do not cultivate any land.
Census Table B-XI in Part II shows the break-up of cultivating households by size of land cultivated and by interest in the land. 39'90 per cent of the cultivating households cultivate their owned lands only. 36·88 per cent of the households cultivate tenanted lands only and the remaining 23·22 per cent cultivate lands partly owned and partly taken <1n lease. Percentage distribution of cultivating household~ by the size of land cultivated is shown below.
The distribution of households in Table B-XI and th.e same shown in percentages in wlumn 2 below IS ba~ed on cultiVation (operational) holdings as returned m the 196\ Census.
A classification of holdings on the basis of area owned (against the area cultivated) for the year t952-53 is shown in Table lOin Part III.
The percentage distribution of these ownership holdings is also shown in column 3 below :-
1961 1952-53 cultivation ownership holdings holdings
Area
Less than I acre 1·0 to 4·9 5·0 to 9'9
10'0 to 14·9 15·0 to 29·9 30'0 to 49·9 .50+
Total
15-67 30·99 69-47 4H6 11'35 13'51 2'03 4-63 1'23 3-90 0·17 1·08 0'08 0'73
100·00 100·00
The average size of cultivation holding in the district in 1960-61 is 6·3 acres. Average size of the ownership holding in the district was 5·0 acres in 1952-53 against the average of 12 acres for the State.
Ceiling on Holdings of Agricultural Land The Maharashtra Agricultural Lands (Ceiling on
Holdings) Act came in force from 26th January 1962. Ceiling area for dry crop land is 66 acres and for 'Warkas 126 acres. In the case of irrigated lands, the ceiling area is 18 acres in the caSe of perennially irrigated areas, 27 acres in areas irrigated in two seasons, and 48 acres in areas which get irrigation water for one season. Holders of land in excess of the ceiling areas are not now free to transfer or partition any land until the land in eXcess of the ceilin~ is determined under the Act. They were required to furnish returns of their holdings to the Collectors. The Collectors are to make enquiries to determine the surplus lands and take them over in possession. Those lands shall afterwards vest in the State Government. The Act also provides for payment of compensation to the holders at specified rates and for distribution of surplus lands to landless or other persons in the prescribed order of priority. At the mo~ent, the enquiries to be made by the Collectors are 1D progress.
Consolidation of Holdings The provisions of the Bombay Prevention of
Fragmentation and Consolidation of Holdings Act, 1947, were applied to the district in 1949 and work of consolidation of holdings was started in 1949. The scheme is to arrange mutual exchange of small and scattered fragments of holdings and to make the land holdings as compact as possible. Up to end of March 1963, 142 villages have been completed covering an area of 47,654 acres.
The standard areas specified as minimum necessary for profitable cultivation under the Prevention of Fragmentation and Consolidation of Holdings Act are as follows :-
Acres (i) Dry crop lands . . 2'0 (ii) Bagait and rice lands • • 0'5
All plots of land less in area than the standard area are treated as fragments and their transfer except to horders of contiguous plots is prohibited.
K:OLABA : CO-OPERATION (4,5)
CO-OPERATION
Administration
The Deputy Registrar of Co-operative Societies is in charge of the co-operative movement in the district. He i~ assisted by two Assistant Registrars who have territorial jurisdiction and deal with all the aspects of the co-operative movement in the district. In addition, an Assistant Registrar works under the Zilla Parish ad. He carries out the duties of registration, deciding appeals against non-a~s.sion . of members, approval to bye-laws and admlllistratlVe supervision in respect of co-operative societies whose working capital does not exceed Rs. 51akhs and .wh?se jurisdiction does not extend beyond the dIstrIct. The Zilla Parishad also looks to the promotion and extension of co-operative movement in the district.
Since the introduction of the Five-Year Plans and with the emphasis on development of rural areas, the co-operative credit movement in the district has advanced at a very rapid pace. Activities re1atnig to production, processing, distribution, marketing and banking are being organised on co-operative lines. Many industrial co-operatives h~ve yet to make progress.
Following is the description of co-operatives in the district based on the report for the year 1960-61.
Co-operative Credit
(a) Agricultural Credit Societies.-The number and membership of Agricultural- Credit Societies have increased at a very rapid pace during the last decade especially during the Second Plan period.
The position of Agricultural Credit Societies in 1950-51 and 1960-61 is as under :-
(I) Number of Agricultural Credit Societies •. .. " .•
(2) Number of members .. (3) Share Capital •. (Rs. in lakhs) (4) Reserve and other funds (Rs. in Iakhs) (5) Working capital .. (Rs. in lakhs) (6) Number of members to whom loans
Were advanced) . . . . _ .
(7) Amount advanced •. (Rs. in lakhs) (8) Amount recovered .. (Rs. in lakhs) (9) Loans outstanding •. (Rs. in lakhs)
(10) Overdues •. (Rs. in Iakhs)
1950·51 1960-61
112 10,511
1-60 0'52 3-93 Not
available
1'25
"'5 1'66 0'26
459 48,809
16·45 1-61
56·00
37,04 45·69 30075 45·16 9·07
Average membership per primary society in the district is 106 against the average of 96 members for Maharashtra. 92 per cent villages in the district have been covered. The membership coverage of rural families in the district Was 29 per cent against 32 per cent for Maharashtra.
Total owned funds (share capital plus reserve funds) of the Primary Agricultural Credit Societies in the district amounted in 1960-61 to Rs. 18'06 lakhs and formed 32·25 per cent of their working capital against 26 per cent for Maharashtra.
The loan operations of all the Primary Agricultural Societies in the district amounted to Rs. 45·69 lakhs in 1960-61. The average amount of loan per borrowing member in the district worked out to Rs. 456 as against Rs. 329 for Maharashtra.
During the decade t 95 t to t 96 t, the number of Agricultural Credit Societies has multiplied four-fold. the membership has increased by 364 per cent, the share capital has increased almost ten times ~d there has been an addition of Rs. 52·01 lakhs III
the working capital. In 1961 the societies advanced Rs. 44'44 lakhs more than the amount in 1951. These are ample proofs of the spectacular progress made by co-operatives in this district. The proportion of overdues to the outstanding loan has increased from 16 per cent to 20 per cent and points out to the need for improving recoveries,
(b) Central Co-operative Bank.-The Central Cooperative Bank was established in the year 1960-61 at Pen. Pen town is centrally located in the district and is easily accessible from almost all taluka places. The Bank has been working as a federal financing agency catering for the credit requirements. of all the primary co-operatives in the district_ Since 1962, the Zilla Parish ad also transacts its financial business through this Bank. Prior to the inauguration of the Bank, the credit requirements of the agriculturists of the district 'Were met with through the branches of the Maharashtra State Co-operative Bank.
Below is the position of the Bank during 1960-61, the year of its inauguration :-
(I) Number of members-(a) Individuals .• (b) Societies ..
(2) Paid-up share capital (3) Reserve and other fWlds (4) Deposits (5) Borrowings (6) Working Capital (7) Cash-
(a) On hand (b) At Banks
(8) Investments(a) Goverrunent and other
· . (Rs"i~ Iakhs) · . (Rs. in lakhs) · . (Rs. in Iakhs) · . (Rs. in lakhs) · . (Rs. in Iakhs)
· . (Rs. in lakhs) · . (Rs. in lakhs)
Securities (Rs. in lakhs) (b) Fixed deposits. . . . (Rs. in lakhs)
(9) Loans advanced . . . . (Rs. in lakhs) (10) PlOfit .. .. .. .. (Rs. in lakhs) (II) Number of branches and pay offices . . • •
390 337
2·8S 0·0. Nil Nil
2'8>
Nil 0·11
Nil 2-75 Nil
0'01 I
The Bank started working in the month of October J 961 and, therefore, no transactions are seen in the data above.

. (.46) DISTRICT CENSUS HANDBOOK
(c) Land Mortgage Bank.-In the year 1960-61, the Thana and Kolaba District Land Mortgage Bank had ·a branch at Alibag and was catering for the needs
. for long-term finance of the agriculturists in this district. A separate 1 and Mortgage Bank has noW been registered and has started working very recently.
(d) Urban Banks and Credit Societies.-There are 23 Urban Banks and Credit Societies in the district of which 7 are Urban Banks, 5 Urban Credit Societies and 11 Salary Earners' Societies. Their combined membership is 10,229, share capital Rs. 11·30 lakhs and working capital Rs. 47·03 lakhs. Nineteen of these societies together advanced an amount of Rs. 49·68 lakhs to 10,007 members during the year and made a profit of Rs. 96,000. The remaining four societies are more or less stagnant.
Agricultural Processing Societies There are 6 Paddy Husking Co-operative Societies
having membership of 865 individuals and 79 societies. Their combined share capital is Rs. 2·43 lakhs of which Government's contribution amounts to Rs. 1·07 lakhs. Only three of these societies are in production and during the_year produced 39,226 maunds of husked rice. Two of these societies made a profit of Rs. 8,000 and four suffered a loss of Rs.9,000.
Industrial Societies There are 4 ·Weavers' Co-operative Societies and
57 other Industrial Societies in the district. Out of four weavers' societies, three are Khadi Weavers' and one Wool ·Weavers' Society. Their combined membership is 136, share capital is Rs. 9,000 and working capital is Rs. 13,000. The number of looms under co-operative fold is 182. The societies produced goods worth Rs. 10,000 during the year.
The other types of industrial societies include 3 Oil Ghanis, 2 Hand Pounding, 8 Cane and Bamboo workers, 10 Leather workers, 2 Carpentry and Smithy, 4 Metal workers, 5 Pottery and Brickmaking, 11 Neera and Palm Gur~ 1 Coir and Rope, and 11 miscellaneous Societies. The combined membership of these societies is 3,477, share capital Rs. 2·10 lakhs and working capital Rs. 5·69 lakhs. The value of production of the societies during the year was Rs. 4·17 lakhs.
Forest Labourers' and Labour Contract Societies
There are 33 Forest Labourers' Co-operative Societies and 14 Labour Contract Societies in the district with membership of 1,749 and 660, respectively. Their respective paid-up share capital is Rs. 1·05 lakhs and Rs. 12,000 and their working capital is Rs. 4'941akhs and Rs.44,000, respectively. The Forest Labourers' Societies received subsidy of
Rs. 34,000 from Government and the . Labour Contract Societies received loan of Rs. 1,000 and subsidy of Rs. 2,000 during the year. The Forest Labourers' Societies extracted forest produce \\orth Rs. 9'21 lakhs and the value of contracts ex:ecuted by Labour Contract Societies during the year was Rs.97,000.
Co-operative Farming SOcieties There are 11 Co-operative Farming Societies,
of which 2 are collective farming societies, 6 tenant farming and 2 gram swarajya societies.
The Collective Farming Societies have membership of 66, share capital Rs. 700, working capital Rs. 8,057 and 128 acres under command all of which are cultivat..,d. .
The Tenant Farming Societies have a membership of 225, share capital Rs. 3,420 and working capital Rs. 12,000. They have yet to acquire land.
The Gram Swarajya Societies have 52 members, Rs. 1,005 as share capital and Rs. 1 lakh as working capital. The societies cultivated all the 17 acres under their command.
These farming societies hitherto did not either have lands or funds and hence did not function properly. Now that they have acquired land and some of them have been granted financial assistance, they are likely to shoW good progress in the near future.
Lift Irrigation Societies Three Co-operative Lift Irrigation Societies have
been formed in the district. The Irrigation Schemes are: (1) The Kalbhairav Schf:-me on Kal river, (2) Wayal and (3) Turde Schemes on Khopoli tail waters. The first scheme has alone been completed. It has an irrigation potential of 25 acreS of which only three acreS are irrigated. The combined mem.bership of these three socidies is 71, share capital Rs. 2,000 and working capital Rs. 9,000.
Fishery Societies There are 16 Fishermen's Co-operative Societies
in the district during the year under report. Their combined membership is 2,020, share capital Rs. 29,000 and working capital Rs. 65,000. The societies received Rs. 4,000 as loan and Rs. 2,000 as subsidy from the GOVernment during the year. Catch value of the fish by the societies during the year is Rs. 3'47 lakhs. Seven societies made a profit of Rs. 8,000, six suffered loss of Rs. 2,000 while the remaining three were stagnant.
These co-operative societies supply fishing material such as nylon twine for nets, tar and paints for boats, fishing hooks, etc., to their members. Loans are 'also advanced for purchase of fishing requisites.
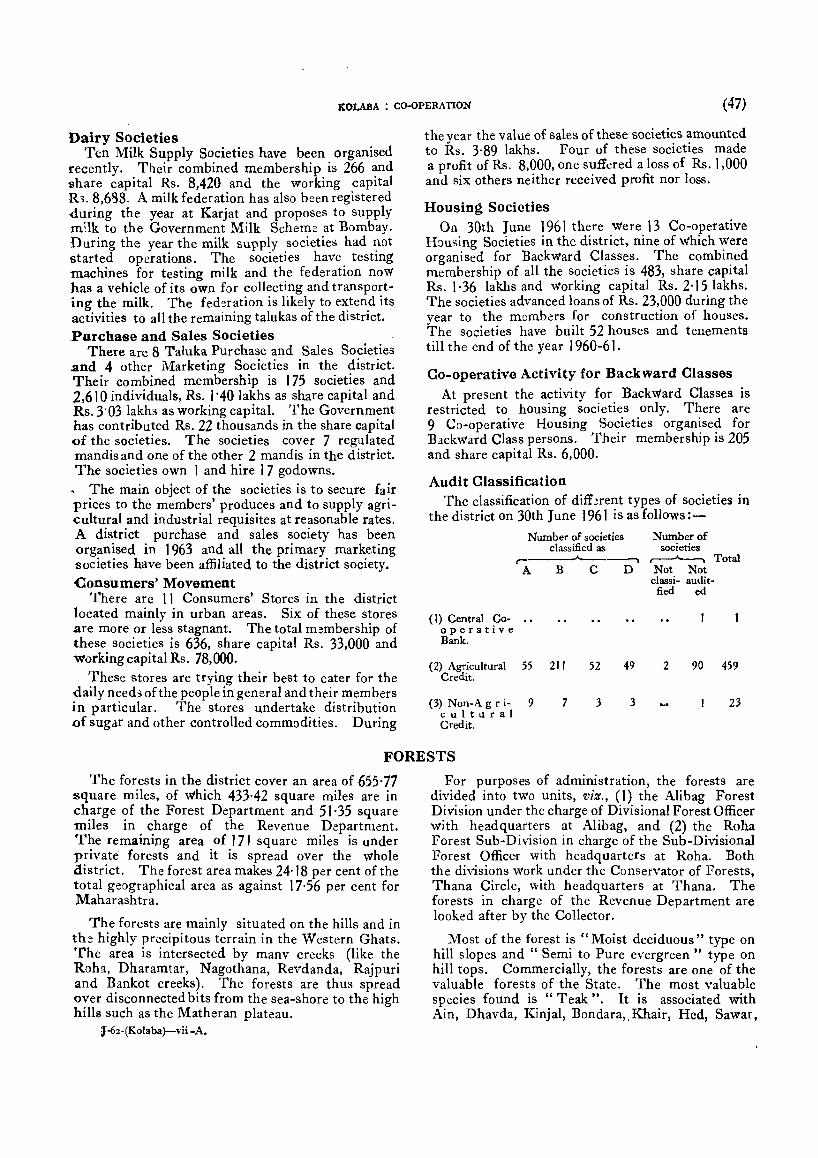
KOLABA : CO-OPERATION (47)
Dairy Societies Ten Milk Supply Societies have been organised
recently. Their combined membership is 266 and share capital Rs. 8,420 and the working capital R3. 8,6138. A milk federation has also been registered -during the year at Karjat and proposes to supply mllk to the Government Milk Scheme at Bombay. During the year the milk supply societies had not started operations. The societies have testing machines for testing milk and the federation now has a vehicle of its own for collecting and transporting the milk. The federation is likely to extend its activities to all the remaining talukas of the district. Purchase and Sales Societies
There are 8 Taluka Purchase and Sales Societies .and 4 other Marketing Societies in the district. Their combined membership is 175 societies and 2,6 I 0 individuals, Rs. 1'40 lakhs as share capital and Rs. 3'03 lakhs as working capital. The Government has contributed Rs. 22 thousands in the share capital <>f the societies. The societies cover 7 reglliated mandis and one of the other 2 mandis in the district. The societies own 1 and hire 17 godowns.
, The main object of the societies is to secure fair prices to the members' produces and to supply agricultural and industrial requisites at reasonable rates. A district purchase and sales society has been organised in 1963 and all the primary marketing societies have been affiliated to the district society. Consumers' Movement
There are 11 Consumers' Stores in the district located mainly in urban areas. Six of these stores are more or less stagnant. The total membership of these societies is 636, share capital Rs. 33,000 and working capital Rs. 78,000.
These stores are trying their best to cater for the <laily needs of the people in general and their members in particular. The stores undertake distribution .of sugar and other controlled commodities. During
the year the value of sales of these societies amounted to Rs. 3·89 lakhs. Four of these societies made a profit of Rs. 8,000, one suffered a loss of Rs. 1,000 and six others neither received profit nor loss.
Housing Societies On 30th June 1961 there were 13 Co-operative
H~)U<;ing Societies in the district, nine of which Were organised for Backward Classes. The combined membership of all the societies is 483, share capital Rs. 1·36 lakhs and working capital Rs. 2· 15 lakhs. The societies advanced loans of Rs. 23,000 during the year to the members for construction of houses. The sodeties have built 52 houses and tenements till the end of the year 1960-61.
Co-operative Activity for Back ward Classes At present the activity for Backward Classes is
restricted to housing societies only. There are 9 Co-operative Housing Societies organised for Backward Class persons. Their membership is 205 and share capital Rs. 6,000.
Audit Classification The classification of diff~rent types of societies in
the district on 30th June 1961 is as follows:-
( I) Central Co-operative Bank.
(2) Agricultural Credit.
(3) Non-A g r i-cultural Credit.
Number of societies Number of classified as societies
r----"------"\ ~ Total ABC D Not Not
classi- audit-fied ed
55 211 52 49 2 90
9 7 3 3
459
23
FORESTS
The forests in the district cover an area of 655·77 square miles, of which 433·42 square miles are in charge of the Forest Department and 51 ·35 square miles in charge of the Revenue Department. The remaining area of 171 square miles is under private" forests and it is spread over the whole district. The forest area makes 24·18 per cent of the total geographical area as against 17·56 per cent for Maharashtra.
The forests are mainly situated on the hills and in the highly precipitous terrain in the Western Ghats. The area is intersected by many creeks (like the Roha, Dharamtar, Nagothana, Revdanda, Rajpuri and Bankot creeks). The forests are thus spread over disconnected bits from the sea-shore to the high hills such as the Matheran plateau.
lJ-fu-(Kolaba}-vii -A.
For purposes of administration, the forests are divided into two units, viz., (1) the Alibag Forest Division under the charge of Divisional Forest Officer with headquarters at Alibag, and (2) the Roha Forest Sub-Division in charge of the Sub-Divisional Forest Officer with headquarters at Roha. Both the divisions work under the Conservator of Forests, Thana Circle, with headquarters at Thana. The forests in charge of the Revenue Department are looked after by the Collector.
Most of the forest is "Moist deciduous" type on hill slopes and II Semi to Pure evergreen" type on hill tops. Commercially, the forests are one of the valuable forests of the State. The most valuable species found is "Teak". It is associated with Ain, Dhavda, Kinjal, Bondara"Khair, Hed, Sawar,
(48) DISTRICf CENSUS HAlIJDBOOK
Shish am, Nana, Bibla, etc., in the moist deciduous forests. The prominent species found in semievergreen hill forests are Pissa, Parjambul, Anjani, Katekumbal, Bhoma, Lokhandi, Pabba, Phansi, Taitali, Tupa, }ambul, Jamb, Mango, etc. There is a fairly profuse undergrowth of Ukshi, Dhayati, Karwand, Nirgudi and Kewani on the middle slopes and lower plains. There is a fairly luxuriant growth of climbers like Gulwel, Kuily, Kusari, Palas vel, Chilar, etc. Bamboo is relatively rare and occurs in low level areas and along nallahs and river banks in moist deciduous forests. The Dowga or Kalak bamboo is the principal variety found. The Manwel or Medar bamboo is practically absent in moist areas.
In the other minor forest produce, more important are: Apta-Tembhurni leaves, Chilhar bark, Hirda, Shikekai and Kath from Khair.
Fodder and thatching grasses are available in large quantities. Julari, Husali, Bhuri, etc., are the varieties of grass found mostly in regeneration and blank areas.
Forest produce is transported in bullock carts to several forest depots whence they are transported to Bombay, Poona and other important places by trucks or country crafts. The important forest depots in the district are at Karjat, Neral and Khopoli.
The forest produce is exploited through the contractors and also through Forest Labourers' Co-operative Societies. These co-operative societies are given certain privileges. A few coupes in the forest are also worked departmentally. The revenue from the forest produce in the district is steadily rising. The annual production has increased from Rs. 6'89 lakhs in 1951 to Rs. 11'08 lakhs in 1956 and to Rs. 12'451akhs in 1961.
According to 1961 Census 7,927 persons are working in forestry and logging. Their distribution for industry minor group is shown in Table B-IV -C in Part II.
Recent geological surveys have revealed large deposits of bauxite in the tree clad hills of Murud, Shriwardhan and Roha ranges. The exploitation of bauxite had started since 1960-61. I
The exploitation of forests is done under scientifically managed working plans which are different for different divisions and types of forests. Under the working plan in force in the Kolaba division (exclusive of the Sudhagad range of erstwhile Bhor State) the forests are constituted into 10 working' circles, viz., Main Teak, Fuel, Protection, Hill Station (Matheran), Ca~uarina, Dalhi, Fuel and Fodder Reserves, Matchwood and Minor Forest
J -6z-(Kolaba)-vii-B.
Produce Working Circles. The treatment pres.,.cribed for the Main Teak Wor king Circle, is- se lectioncum-improvement fellings ",ith clear fdling of at least one-third area of concentrated regeneration by plantations on gentler slopes and flatter portions. The rotation fixed is 90 years to avoid heavy soil erosion on steep slopes which Was fcur"d to cccur under the previous clear felling systor.. The (xploitable girth for teak is 48" (0. B.) and for other species 36" (0. B.). In the area treated with selectioncum-improvement felling, large g~ps of the size 68' X 66' or more are also to be rabbed an" planted up.
In the Fuel Working Circle which ,ccIT:.prj~es mostly semi-evergreen vegetation in transiticnaI stage in Karj at and Alibag Ranges, the area is divided into three felling series with 30 years' felIir.g cycle. The treatment applied is selection-cum-improvement fellings with an exploitable girth of 38" (0. B.).
The average area to be artificially regenerated is about 1,200 acreS annually. It is done both departmentally and by agri-silvi method.
The forests in the Roha sub-division are mainly worked under se1ection-cum-improvement system with clear-felling up to one-third of the coupe are~, :w~i~~ is r~generated with teak and other superior llljalh specIes. Cultural operations such as weedings~ cleanings and thinnings are carried out at suitable intervals. '
A number of schemes Were undertaken during the first two Five-Year Plans for development of forests in the district. By the end of the Second Plan 17 wet nurseries were established, plantation of teak Was raised OVer 100 acres, matchwood and cashewnut plantation Was done in 400 and 750 acres, respectively. Bamboo"" as propagated over 1 0 acres and agave plantation Was raised in 87 miles. About 570 acres of denuded and arid areas Were afforested.
The following important schemes have been included in the Third Five-Year Plan ;-
(1) Plantation of Valuable Trees.-Plantation of teak and eucalyptus trees in 3,188 acres, cashewnut trees in 1,084 acres and Khair trees in 500 acres. The outlay involved is Rs. 2·85 lakhs. During: the first two years of the Plan, teak plantation was raised oVer 232 acres, cashewnut oVer 453 acres and Khair over 105 acres.
(2) Bamboo Plantation.,-Physical and financial target is not available. In the first two years of the Plan plantation has been raised OVer 115 acres.
(3) Afforestation in blank and arid areas.During the first two years of the Plan period 215, acres are already afforested.
KOLABA : FISHERIES (49)
FISHERIES
Fishing industry is a vital economlC activity :.and as far as fisheries are concerned the district is one of the most important districts of the State. The district has a long coastal belt :stretching oVer 150 miles fDIll Mora in the north to Devaghar in the south. In addition to this, rivers
;and tanks in the district aft:)rd large water-spread' area for inland Water fishery. HoWeVer, marine :fishcry predominates over inland water fishery in .the district and nearly 70 p~r cent of the persons ,engaged in Fishing Industry work in Marine Fishery.
Fishing in the Sea is carried out all along the coastal line and is mainly concentrated within a distance of 10 miles from the coast. In few caSes the area is extended much further. The important Marine Fishery Centres in the district are Mora, K'lranja, Rewas, ThaI, Navedar-Navagaon, Alibag, Nagaon, Revdanda, Karlai, Nandgaon, Murud, Rajpuri, Dighi, Bharadkhol, Shriwardhan and -Bagmandle. Extensive fishing activities are carried OVer nine months from September to May. In .the creeks and estuaries, fishing is carried out even .during the monsoon.
Commercially important varieties of fish which are available in large quantities in sea and creek waters are: Saranga (white pomfret), Halwa (black pomfret), Dadha, Rawas, Ghol, Koth, Bombil, Kolambi, X'lrandi, Shingala, Wam, Mandeli, Mushi, Pakat, Waghli (B:>lad), Bhing, Palla, Shevand, etc. B~sides these, clams and oysters are also available along the entire coastal line, mainly in number of creeks and estuaries along the coast. About 520,000 metric tonnes of fish worth approximatly Rs. 60 lakhs are caught annually in the district.
Most of the fishing is carried out in small sailing boats. A few boats have been mechanised. There are about 1,900 boats engaged in fishing in the district <>f which 257 boats have been fitted with engines. The types of nets used for fishing are: (1) Longlines or hooks called khanda, (2) Barrier nets known as uana, (3) cast nets called pag, (4) Gill nets called .daldi, and (5) Bag nets known as dol. Among these nets, special nets are knitted for catching particular types of fish. Bag nets or dais are very important nets in the fishing industry of the district. The nets are mainly prepared of cotton and hemp twine but now-a-days nylon twine is also effectively used.
Majority of the sea fish caught is transported by sea to Bombay. The fishing centres in the north of the district being close to Bombay, important varieties ·of fish caught there are directly brought to Bombay Jor sale as they fetch good price. The fishing centres in the south however do not have this advantage. Transportation facilities are rather inadequate and mainly belong to private sector. Facilities for cold
storage for preservation of fish are also lacking in ~he district. Curing of fish by salt is the only effectlVe method in the district by which supplies of fish available during a particular season are maintained throughout the year. In view of this, the State Department of Fisheries has recently established a Fish Curing Yard at M urud. This yard will enable local fishermen to cure fish in hygienic conditions and to market it at a good price.
A large portion of the fresh fish which is in surplus of the local consumption and which cannot be economically exported out of the district is dried. Dry fish is colle<.:ted on large scale in the fishing centres in southern part of the district whence it is despatched to the interior parts of the district and to other districts also. Oil from Shark liver is extracted at various centres, in the district. Supply of shark fins and air bladders of fishes form an important aspect of the trade in the district.
The State Department of Fishery is. contemplating a number of schemes for development of marine fishery in the district. With a view to explore the off-shore fishing grounds, to indicate possibilities of commercial fishing, to chart the bottom of the sea, to locate submerged obstructions for navigation if any and to facilitate fishing operations like trawling, the department has started operation of multipurpose boats in the district. For education of the fishermen's children the department runs a primary fishery school at Bagmandle with special fishery bias. Financial assistance is granted to the fishermen and fishermen's co-operative societies in the form of loan and subsidy for mechanisation of fishing crafts, purchase of fishery requisites, etc. Shark liver oil extraction centres have been established at important places as Shark fishing takes place on grand scale in the district.
The inland or fresh water fishing does not compete with the marine fishery, yet it is also an important branch of fisheries in the district. Rivers, tanks and reservoirs are the principal sources of inland waters. The important rivers of the district are Kundalika, Savitri, Goda and Kal. Most of them are however seasonal. There are more than 200 tanks in the district having a water-spread area of 660 acres. Of these 82 tanks are seasonal.
The commercially important varieties of inland water fish found in the district are: Shinghala (Kirkit), Murrel, Shivda (Pahadi or Daku), Chamar (Chalat), Pal (Dandaonya), Khavlya, Khaval, Kolshi, Zinga', Boi, Ka1under, Kharabi, Muri, etc.
These varieties are however of 1I0t fast growing types. As such, for propagation of pisciculture, the perennial tank waters in the district are stocked w~th quick-growing Bengal Carps, imported flom
(50) DISTRIcr CENSUS HANDBOOK
Calcutta. The varIetIes stocked are Catla Catla, Rohu and Mrigal. During the Second Five-Year Plan period 6'891akhs of Carp-fry have been stocked while during only the first two years of the Third Plan period, the quantity stocked is neatly 5 lakhs carpfry. During the Third Plan period a fish farm with an area of eight acres has been established at Khopoli f01 research On pisciculture and experiments in induced breeding. Thefarm is also used for rearing the baby fishes of major carps to the fingerlin!; size.
In the 1961 Census, 11,306 persons are reported as engaged in fishing as principal work: 8,062 of them are males and 3,244 females. 7,704 persons (5,579 males and 2,125 females) are engaged in sea-fishing and the rest in inland water fishing. Fishermen in the district mostly belong to the community known
as " Son- Koli ". The" Daldi Mohammedans" and the "Kharvi" also take to fishing in this district.
The Third Five-Year Plan envisages an amount of Rs. 30'43 lakhs for the development of fisheries in the district. This includes mechanisation of fishing crafts, assistance for the purchase of fishing; requisites, boat-building yards, preservation,.. marketing and transport facilities for fish, etc.
Twenty-two Fisheries Co-operative Societies have now been organised in the district. These co-opera-· tive societies get loans and, subsidies from the Government for mechanisation of fishing crafts, etc •. Loans amounting to Rs. 6'83 lakhs and subsidy of Rs. 1'65 lakhs have been granted to the fishermen and the fisheries co-operative societies during the:; first two years of the Third Plan period.
MINING AND QUARRYING Large areas of the disttict are covered by Dec.can
trap. The lava beds of the plateau tops are capped by Laterite which has resulted from weathering of the Deccan tt ap. Bauxite is found in these Laterite capped plateaus. It occurs in Roha taluka and Murud and Shriwardhan mahals along the West coast. The occurrenceS are observed in the low-lying hills adjoining the sea. Most of the area" lie in the Government forests. Bauxite is found 5 to 10 feet below the capping of Laterite and the thickness of the belts ranges flOm 5 to 8 feet. The reconnaissance surveys and the detailed prospecting of bauxite are being carried out and the quantitative estimates of the reserves are yet to be prepared. The indicated reServes are of the order of 5 million tons. The investigations and observations carried out so far show that the bauxite reserves in the district are quite promising for locating an Alumina plant in the district. For the present however bauxite is exploited only for export. Mining leases for extraction of bauxite in 750 acreS of Murud and Shriwardhan mahals Were granted to five companies and 8,285 tons of bauxite Was exploited during the year 1959-60.
The district al!;o has materials suitable for building: construction, roads, etc. These comprise of clays for manufacture of bricks, sands for concrete, building: stones, material for road metal, etc. The value of material extracted m the year 1959-60 Was as. follows ;-
(1) Ordinary sand (2) Gravel (3) Murrum .. (4) Building stone (5) Brick earth (6) Boulders "
Rs. 37,835 85,214 27,949
2,756 1,912
98
The mining activitie.s in the district are however mainly confined tOiquarrying of stones, etc. In 1961 Census, 2,573 persons are reported to be working on quarrying of stones and 21 persons in other mining activities. Their distribution by industrial minor groups is shown in Table B-IV -C in Part II.
There are springs of mineral waters at Pali and Save in the district. These springs are reported to have properties of curing skin diseases.
INDUSTRIES Industrially the district is very backward. Lack of There are 22,087 workers engaged in industries ..
power and transport facilities has hindered its indus- 10,899 or 49·35 per cent of them are in household .. trial development. The existing industtial units are industries and 11,188 or 50·65 per cent in non-mostly small and very few are oflargeor medium size. household industries. The total number of workers. They are mostly processing industries such as rice in registered factories in 1961 Was 2,943 which makes. and flour mills. The employment in the non- 13'32 per cent of all workers engaged in industries or -agricultural sector leans heavily towards village and 3 factory workers per thousand of total population cottage industries, i.e., the village artisans, working on against 20 per thousand of total population of' traditional lines, producing articles of coarse variety Maharashtra. required. by local population with the locally available The distribution of workers engaged in each. raw materials. With the completion of the proposed industry major and minor group is shown in Table Diva-Dasgaon railway line, availability of cheap B-IV -C in Part II. The number of establishments power from Koyna and because of the proximity of and the number of workers for each industry minor an industrially advanced city and a port like Bombay, group prepared from the houselists are also shown. there is a vast Scope for rapid industrial development separately for each Village in the Village Industries> in the district in the near future. Table presented at the end of Part II.
KOLABA : INDUSTRIES (51 )
Large-scale Factories
There are 17 large-scale registered factories in the district working with 50 or more workers and using power.
Salt manufacture is an important large-scale industry in the district. There are three registered units together employing about 180 workers and producing about 40 lakh Bengal maunds of salt. The industry is located mainly in Uran mahal and Panvel and Pen talukas.
The paper and pulp factory at Khopoli known as Pa~~r and Pulp Conversion I td. manufactures paper for wrapping and packing, etc. Vijaylaxmi Board Mills, Khopoli Paper Factory and Amin & Patel Industries Ltd., all located at Khopoli, produce mill boards, cardboard cartons and allied products. These four units together employ 1,250 workers daily.
Coated Fabrics Pvt. Ltd. situated at Khopoli manufactures adhesive tapes, insulating, packing, waterproof and varnish tapes.
Swadeshi Chemicals Pvt. Ltd. of Khopoli manufactures potassium permanganate and has a capacity of 1,300 tons per month.
Dhootpapeshwar Industries Ltd. of Panvel is the oldest pharmacy in the State manufacturing A vurvedic pharmaceuticals. "'
Hume Spun Pipe Co. at Pen produces R. C. C. spun pipes (used for drainage) and other concrete products.
Grindwel Abrasives Ltd. at Mora (Uran) manufactures grinding wheels, segments, stones, sticks, etc.
. The Tat~ Hydro:Electric Power Supply Co. has Its generatlllg statlOns at Bhivpuri Bhira and Khopoli. The Andhra Valley Power' Supply Co. Ltd. is also at Bhivpuri and is engaged in generation and transmission of electric energy.
In addition, there are (i) Wooden articles factory at Pen, (ii) Stone crushing factory at Poladpur and (iii) Bidi manufacturing factory at Mahad. '
The following four more units have been licensed. They have yet to start production:-
(1) .Production of Soda Ash (66,000 tons p.a.), Caustic Soda (16,500 tons p.a.), Potassium Chloride (420 tons p.a.), Gypsum (4,800 tons p.a.) in Uran.
(2) Hindustan Organic Chemicals Ltd. for basic chemicals and intermediates at Savale-Turade in Panvel taluka.
(3) Indian Organic Chemicals for Acetic Anhydride (600 tons), Ethyl acetate (1,080 tons), Ethyl auto acetate (300 tons) at Khopoli in Khalapur taluka.
(4) Acme Pig Iron and Centrifugal Pipe Works, for pig iron (capacity 15,000 tons) and C. I. spun pipes (9,000 tons) at Khopoli in Khalapur taluka.
Small-scale Registered Factories There are 57 small registered manufacturing and
processing units. The more important of·them are rice and poha mills, bidi, plastic and clay models, cutlery articles and salt works. Eighteen registered units work on paddy milling, polishing of rice and processing of p~ddy for poha. Nineteen establishments are engaged in manufacture of salt.
The total number of registered factories has increased from 71 in 1955 to 76 in 1961. The number of workers in the registered factories has, however, increased considerably from 1,430 in 1955 to 2,943 in 1961.
According to the Census of Manufacturing Ip.dustries in 1959, the manufacturing industries in the district had a combined fixed capital of Rs. 43'071akhs and working capital of Rs. 22'1 Olakhs. The total value of annual production was Rs. 90'61 lakhs and the value added by manufacturing was Rs. 25'96 lakhs. These figures relate only to the industries covered by the Census of Manufacturing Industries Act.
The value added by manufacture in the district in 1959 was only 0'13 per cent of the total for Maharashtra.
Small-scale and Cottage Industries The traditional crafts are conducted as household
or cottage industries. They are mostly servicing and processing industries catering for the requirement of the local population. Manufacture of
Ii' salt, soap, coarse mill board, copper and brass utensils, nails, pins, jewellery, bricks, umbrellas, oil ghanis, handloom weaving, carpentry, cane and bamboo works, fishing, etc., are some of the important industries in the district.
7,704 persons are engaged in production of fish. by fishing in sea. The district has a coastline of 150 miles and in the absence of other non-agricultural activities, agriculture and fishing are the main sources of livelihood. There Were sixteen co-operative fishing societies in 1960-61. The production of fish in inland waters, i.e., in tanks and rivers is also encouraged in the district. In addition to the persons mentioned above, 3,601 persons are engaged in this type of fishing. They are mostly the persons who rear fish in ponds, tanks and perennial waters and also in fish farms and hatcheries. Carp-fry are specially brought from Calcutta and supplied to the fishermen.
(52) DISTRICT CENSUS HANDBOOK
5,232 workers are engaged in the production of fuel including charcoal by exploitation of forests. Forests are spread from north to south and are rich in almost all types of trees. Trees are cut for the production of charcoal and wood for fuel and simultaneously new plantations are made in the open space. 2,783 persons engaged in the production of fruits and nuts in plantations are mostly the workers engaged in the above schemes.
Many cottage industries are run on co-operative lines. Co-operative societies are formed for-
(i) Pottery and brick-making at Mahad, Poynad, Pali and Khalapur,
(ii) Oil ghanis at Pali and Roha, (iii) Bangles at Asare, (iv) Leather working at Matheran, Ramraj,
Chowk, Murud, Roha and Bori, (v) Handlooms at Roha, Goregaon, Ranwali
and Murud, (vi) Brass and copper utensils at Roha, Mahad,
Pali and ThaI. (vii) Bamboo and cane work at Panvel and
Chowk, (viii) Coir work at J anjira,
(ix) Salt rpanufacture at Uran, (x) Hand-pounding of rice at Vaijnath and
Taloje, (xi) Umbrellas at Karjat,
(xii) Grinding wheels at Uran, (xiii) Carpentry at Roha. (xiv) Idols of plaster of Paris and clay images at
Pen.
Being principally a rice producing area, the district provides considerable employment in rice milling and hand pounding. There are 380 flour or rice mills engaging 1,266 workers.
1,833 persons are engaged as carpenters. They fix or repair doors and door frames, wooden roof beams, furniture and agricultural implements.
1,155 workers are engaged in basket weaving. Bamboo required for this industry is available in the forests of the district.
1,014 persons are engaged as potters while 1,539 workers are working as stone cutters.
The proportions of"different groups of artisans to one lakh of total populat:on in the district are as follows ;-
Blacksmiths 55, Carpenters 173, Shoe-makers and repairers 72, Potters 96, Tailors 139, Spinners and Weavers 21, Basket weavers 109.
The Industries Department has started peripatetic schools in the district to impart training in cane, and bamboo work, carpentry and smithy, tailoring, etc~ The Maharashtra Village Industries Board has also taken up development work of certain selected village industries such as Khadi, Salt, Hand-made paper, Hand-pounding of rice, etc.
The 'Master Plan' prepared by the Industries Department in 1960 had indicated scope for establishment of the following new industries in the district ;__:__
(1) Rice bran-oil. (2) Sulphuric acid. (3) Calcium Carbide. (4) Strawboard from paddy straw. (5) Chemically pure salt. (6) By-products of salt and bitterns. (7) Acetate rayon. (8) Viscose rayon.
The Maharashtra Industrial Development Corporation has set up a 100-acre industrial area at Roha in February 1964. The industrial area will provide water and power facilities to engineering industries.
In the Third Plan, two Industrial Estates are proposed to be set up at Panvel and Khopoli on co-operative lines.
POWER The number of electrified towns and villages in
the district is 26. Their talukawise lists are given in Table 31 in Part III. The total population of these electrified places is only 10·6 J per cent of the total population of the district.
The district consumption of electricity on different items for eight years is shown in Table 30 in Part III.
The per capita consumption is naturally much lower than the State average, as only 26 towns and villages in this district had been electrified.
The electric supply is through the State Electricity Board as well as from the private concerns. The hydro-electric stations in the district are of particular significance. These power stations are located
at Khopoli, Bhivpuri and Bhira and have, respectively, installed capacities of 70,000 KW, 72,000 KW and 132,000 KW. Although the total capacity of the hydro-electric projects in the district is 274,000 KW, bulk of it is consumed by the industry in Greater Bombay and neighbouring areaS and the railways for electric traction on Bombay-Poona section. In addition to Greater Bombay, bulk supply of power from these projects is made available to Panvel, Khopoli and Karjat in the district. Besides these major hydro-electric projects, there are diesel generating stations at J anjira, Murud, Mahad and Matheran with installed capacities of 51 KW, 3 J 5 KW and 246 KW, respectively. The first one is under the State Electricity Board while the second and the third are maintained by private licensees.
KOLABA : POWER (53)
During the Third Five-Year Plan, it is proposed available from the Koyna Project. With the to electrify a number of towns and villages completion of all these schemes and supply of cheap in the district under the Kolaba Electrification power from Koyna, the prospects of accelerating Scheme, the Rural Electrification Scheme of the industrial pace in the district appear to be very State Electricity Board and the power to be made bright.
TRADE AND COMMERCE The chief articles of export in the district are
rice, salt, timber, sand, betelnuts, coconuts, straw, firewood, fresh and dry fish, charcoal, etc. Most of these articles are exported to Bombay. Of manufactured articles, grinding wheels and abrasives manufactured at Mora in Uran mahal have a demand outside the country also. Vegetables produced in the district are mostly exported to Bombay. Salt is exported to Bombay and other districts above the Ghat. Grocery and grains of all varieties (except rice), cloth, oil, medicines and hardware, sugar, .gur, chillies, kerosene, etc., are the chief articles of import. Most of these goods come from Bombay and Thana. Agriculturists themselves bring their produce for sale at markets. The commission agents of dealers purchase goods from the producers. The distribution of goods outside the wholesale trade centres is done at market places and weekly bazars held at different places and on different days of week.
Shops Every village is within the reach of one of the
weekly bazars or in addition has one or more shops. These shops provide the inhabitants with their day-to-day requirements. They deal in all kinds of articles, such as grains, groceries, oils, gur, spices, salt, coconuts, soap, tea, tobacco, betelnuts, chiIIie~ and innumerable articles required by people for their daily use. There are in all 5,422 shops in the district: 3,793 are in rural areas and 1,629 in the urban areas. This does not include the shops temporarily set up in the weekly markets or fairs. The number of shops per 1,000 dwellings is 26'6 for the district as a whole, 20'6 for rural areas and 88'6 for urban areas. It will be seen that the urban areas have about four times more shops per 1,000 dwellings than-rural areas. The ratio between shops and 1,000 dwellings for the district is below that of the State average of 36'4. Talukawise number of shops may be seen in Table E-I in Part II. Weekly Markets
These are generally trade centres popularly known as "bazars" and are distributing rather than collecting centres. All sorts of articles like foodgrains, pulses, oils, chillies, spices, gur, cloth, fruit, vegetables, miscellaneous articles such as pots, pans, etc., are sold in these markets. Pedlars and hawkers set up booths on the market days. Agriculturists from the nearby villages also bring their farm produce. The traders and shopkeepers belonging to the market place also set up
temporary stalls. Buyers come from nearby villages within 4-5 miles. The weekly markets start early in the morning and after a slack of an hour or so in the afternoon close by six in the evening to enable both the buyers and sellers to reach home before it is dark.
Column (7) of the Village Directory in Part I shows for each village in the district if a weekly market is held and, if so, on which day of the week. A list of weekly markets in the district given in Table 32 in Part III shows the location and day on which each bazar is held. The map facing page 267 shows the locations of all these markets and also the days on which they are held.
There are altogether 24 weekly and bi-weekly markets in the district. This is the only district in the State where there are no cattle markets. Four weekly markets are held on Sunday; 1 on Monday; 5 on Tuesday; 3 on Wednesday; 4 on Thursday; 2 on Friday and 5 on Saturday.
The map facing page 267 will show that the weekly markets are comparatively few and spread sparsely in the district. Their concentration is, however, along the west coast areas. Each has its bazar on one of the week days keeping the pedlars and hawkers engaged throughout the week. Fairs
Fairs vary little from weekly markets and sometimes consist of gatherings hardly known outside the villages. Most of the fairs held in the district are associated with important deities and religious festivals. So far as trade is concerned, faif3 are complementary to the weekly markets. Considerable quantities of agricultural produce and other articles of daily use are brought for sale. A list of fairs held in the district showing their locations, duration, dates and approximate number of persons attending is presented in Table 33 in Part III. The map facing page 268 shows location of all the fairs in the district having 1,000 or more gatherings. A volume giving details of fairs and festivals in Maharashtra is also issued separately.
Trade Centres Apart from the weekly markets and fairs (1) Karjat,
(2) Panvel, (3) Pen, (4) Roha, (S) Alibag, (6) Murud; (7) Khalapur and (8) Mahad are important wholesale trade centres known as principal markets in the district; as far as collection and export of agricultural produce are concerned. In addition, there is a sub-market at Neral which is under the jurisdiction of Karjat
(54) DISTRICr CENSUS HANDBOOK
principal market. Agricultural produce markets at these places are regulated under the Bombay Agricultural Produce Markets Act, 1939.
The annual turnover of commodities (by value in rupees) at the two important centres during the year 1962-63 was as follows ;-
Commodities
Paddy .. Rice
Principal Market Yard
Karjat Rs.
8,71,781
Panvel Rs.
1,14,68,385 1,12,49,784
Workers in Trade and Commerce The total number of persons engaged in trade
and commerce in the district is 14,691 out of which 7,922 or 53-92 per cent are in rural areas and 6,769 or 46·08 per cent are in urban areas. The number of workers in trade and commerce makes 2·96 per cent of all workers in the district. 15· 84 per cent and 13·47 per cent of the district number are in Alibag and Panvel talukas, respectively.
Only 2·55 per cent of the workers in trade and commerce are in wholesale trade, 95·04 per cent are in retail trade and 2· 41 per cent in miscellaneous trade and commerce. Sixty-eight per cent of the wholesalers are in urban areas.
The number of wholesalers trading exclusively in cereals and pulses is 142. The number of wholesalers of gur, sugar, spices, oil, etc., is 110.
A detailed break-up of workers in trade and . commerce by industry major groups and minor groups is shown in Table B-IV -C in Part II.
Banking Offices A list of banking offices with their years of esta
blishments, type and location is given in Table 23 in Part III. Their break-up by talukas and type is shown below :~ .
DISTRICT TOTAL (I) Karjat Taluka .. (2) Panvel Taluka .. (3) Uran Mahal .. (4) Khalapur Taluka (5) Alibag Taluka .. (6) Pen Taluka " (7) Sudhagad Mahal (8) Roha Taluka " (9) Murud Mahal
(10) Mangaon Taluka (I I) Mhasala Mahal (12) Shriwardhan Mahal (13) Mahad Taluka (14) Poladpur MahaI
Number of Banking Offices r---------A ________ ~.
Scheduled
8
2
2
Non- Co- Total scheduled operative
1 7
. . I
J 2
16
3
1 2 3
2 2
3
The district appears to be very backward in banking activities. Out of 8 talukas and 6 mahals only 6 talukas and one mahal have banking offices in them. Panvel, Pen and Mahad are important trade centres and together have more than half of the total number of banking offices in the district. Karjat and Mangaon talukas and Vran, Sudhagad, Mhasala, Shriwardhan and Poladpur mah(Jls have no banking offices at all.
The State Bank of India works for the treasury in the district and· has branches at Panvel, Alibag, Roha, Murud and Mahad.
COMMUNICATIONS AND TRANSPORT Fairly large portion of the district is not served
by rail communications. The Bombay-Poona broad gauge line (30·19 miles) and Neral-Matheran narrow gauge line ( 12·61 miles) both of the Central Railway pass through the talukas of Karjat and Khalaptlr alone. Thus the total railway mileage in the district is 42·80 miles. In addition, there are two trolly lines (about 31 miles) run by Tatas. One of them is of 8 miles running from Bhivpuri Road to Bhivpuri and the other (of 23 miles) from Roha to Bhira. Both these Hnes are, however, utilised only for the transportation of the material required for the electric stations at Bhivpuri and Bhira.
The construction of a railway line between Diva and Dasgaon is in progress. Panve1 and U ran are also proposed to be linked by this railway line. The proposed lines will pass through Patalganga and Kundalika valleys and will certainly provide several Iocational advantages for the establishment of new industries.
Existing railway mileage in the district is I· 58 miles per 100 sq. miles of area against 2·66 miles in the State.
Table 21 in Part II shows the eXlstlOg road mileage in the district as well as its break-up by the type of road surface. The district map facing the title page shows all these roads.
The district is well connected by roads with the adjoining districts of Thana, Poona, Greater Bombay and Ratnagiri. The district headquarters is also connected by roads with all the taluka headquarters. The eastern part is a hilly terrain and roads are, therefore, fewer in Sudhagad and Poladpur maha Is and Mangaon and Mahad talukas. The Bombay-PoonaBangalore National Highway of 32 miles in length passes through Panvel and Khalapur talukas in the district. Bombay-Konkan-Goa State Highway of about 95 miles also passes through Panvel, Pen, Roha, Mangaon and Mahad talukas and Poladpur maha!.
During the period 1951-61, there has been~ no addition in the National Highways. The State Highways increased by 25· 81 miles and other district roads by 83·29 miles. The major district and the village roads decreased by 26·62 miles and 27·21 miles, respectively, both due to higher classification. The total increase in all types of roads (excluding municipal roads) is 55·27 miles.
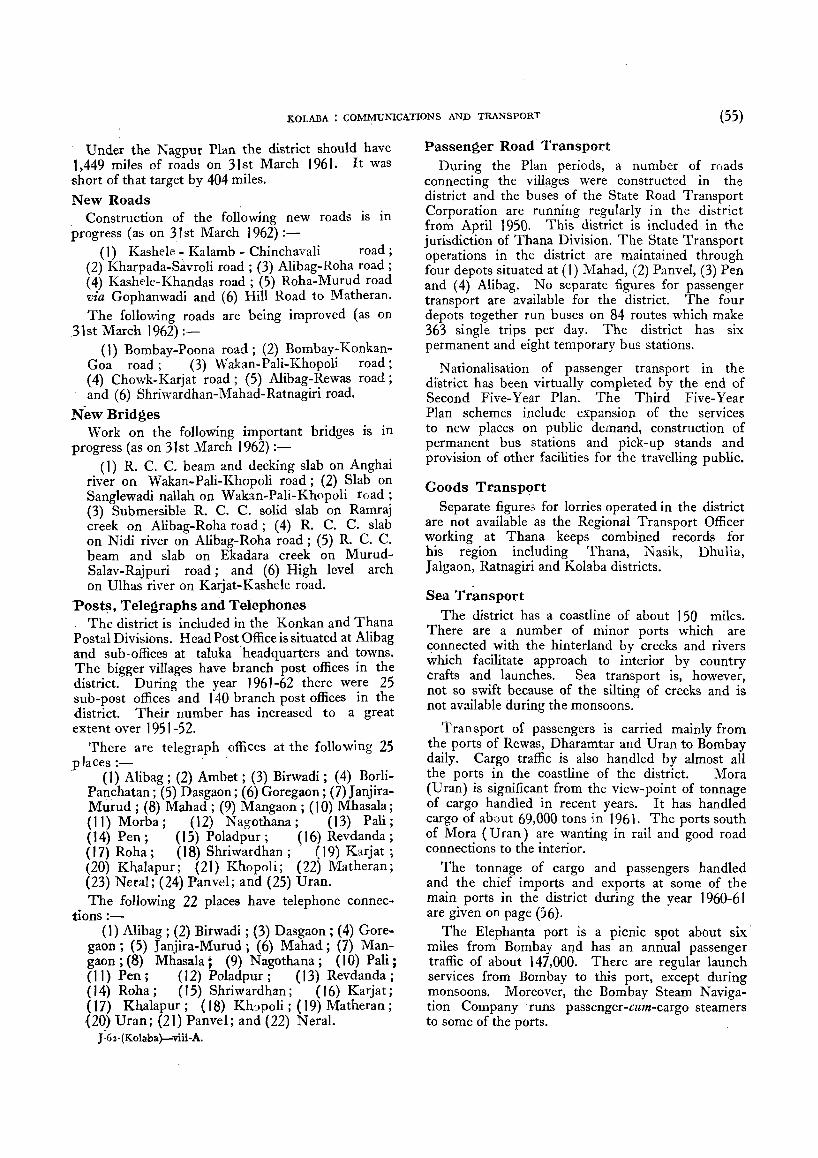
KOLABA : COMMUNICATIONS AND TRANSPORT (55)
Under the Nagpur Plan the district should have 1,449 miles of roads on 31 st March 196 1. It was short of that target by 404 miles.
New Roads Construction of the following new roads is in
progress (as on 3 J st March J 962) :-(1) Kashele -: Kalamb - Chinchavali road;
(2) Kharpada-Savroli road; (3) Alibag-Roha road; (4) Kashele-Khandas road; (5) Roha-Murud road via Gophanwadi and (6) Hill Road to Matheran. The following roads are being improved (as on
31st March 1962):-(1) Bombay-Poona road; (2) Bombay-Konkan
Goa road; (3) Wakan-Pali-Khopoli road; (4) Chowk-Karjat road; (5) Alibag-Rewas road; and (6) Shriwardhan-Mahad-Ratnagiri road.
New Bridges Work on the following important bridges IS in
progress (as on 31 st March J 962) :-( J) R. C. C. beam and decking slab on Anghai
river on Wakan-Pali-Khopoli road; (2) Slab on Sanglewadi nallah on Wakan-Pali-Khopoli toad; (3) Submersible R. C. C. solid slab on Ramraj creek on Alibag-Roha road; (4) R. C. C. slab on Nidi river on Alibag-Roha road; (5) R. C. C. beam and slab on Ekadara creek on MurudSalav-Rajpuri road; and (6) High level arch on Ulhas river on Karjat-Kashele road.
Post$, Telegraphs and Telephones The district is included in the Konkan and Thana
Postal Divisions. Head Post Office is situated at Alibag and sub-offices at taluka headquarters and towns. The bigger villages have branch post offices in the district. During the year 1961-62 there were 25 sub-post offices and 140 branch post offices in the district. Their number has increased to a great extent over 1951-52.
There are telegraph offices at the following 25 places :-. (1) Alibag ; (2) Ambet; (3) Birwadi; (4) Borli-
e Panchatan; (5) Dasgaon; (6) Goregaon; (7)JanjiraMurud; (8) Mahad ; (9) Mangaon ; (10) Mhasala; (11) Morba; (12) Nagothana; (13) Pali; (14) Pen; (15) Poladpur; (16) Revdanda; (17) Roha; (18) Shriwardhan;' (19) Karjat ; (20) Khalapur; (21) Khopoli; (22) Matheran; (23) Neral; (24) Panvel; and (25) Uran. The following 22 places have telephone connec
tions :-(1) Alibag ; (2) Birwadi ; (3) Dasgaon ; (4) Gore
gaon; (5) Janjira-Murud; (6) Mahad; (7) Mangaon; (8) Mhasala; (9) Nagothana; (10) Pali; (II) Pen; (12) Poladpur; (J 3) Revdanda; (14) Roha; (15) Shriwardhan; (16) Karjat; (17) Khalapur; (18) Kh'Jpoli; (19) Matheran ; (2q) Uran; (21) Panvel; and (22) Neral.
J-6:t-(Kolaba}-viii·A.
Passenger Road Transport During the Plan periods, a number of roads
connecting the villages were constructed in the district and the buses of the State Road Transport Corporation are running regularly in the district from April 1950. This district is included in the jurisdiction of Thana Division. The State Transport operations in the district are maintained through four depots situated at (1) Mahad, (2) Panvel, (3) Pen and (4) Alibag. No separate figures for passenger transport are available for the district. The four depots together run buses on 84 routes which make 363 single trips per day. The district has six permanent and eight temporary bus stations.
Nationalisation of passenger transport in the district has been virtually completed by the end of Second Five-Year Plan. The Third Five-Year Plan schemes include expansion of the services to new places on public demand, construction of permanent bus stations and pick-up stands and provision of other facilities for the travelling public.
Goods Transport Separate figure3 for lorries operated in the district
are not available as the Regional Transport Officer working at Thana keeps combined records for his region including Thana, N asik, Dhulia, J aigaon, Ratnagiri and Kolaba districts.
Sea Transport The district has a coastline of about 150 miles.
There are a number of minor ports which are connected with the hinterland by creeks and rivers which facilitate approach to interior by country crafts and launches. Sea transport is, however, not so swift because of the silting of creeks and is not available during the monsoons.
Transport of passengers is carried mainly from the ports of Rewas, Dharamtar and Uran to Bombay daily. Cargo traffic is also handled by almost all the ports in the coastline of the district. Mora (Uran) is significant from the view-point of tonnage of cargo handled in recent years. I t has handled cargo of about 69,000 tons in 1961. The ports south of Mora (U ran) are wanting in rail and good road connections to the interior.
The tonnage of cargo and passengers handled and the chief imports and exports at some of the main ports in the district during the year 1960-61 are given on page (56).
The Elephanta port is a picnic spot about six miles from Bombay aqd has an annual passenger traffic of about 147,000. There are regular launch services from Bombay to this port, except during monsoons. Moreover, the Bombay Steam Navigation Company runs passenger-cllm-cargo steamers to some of the ports.
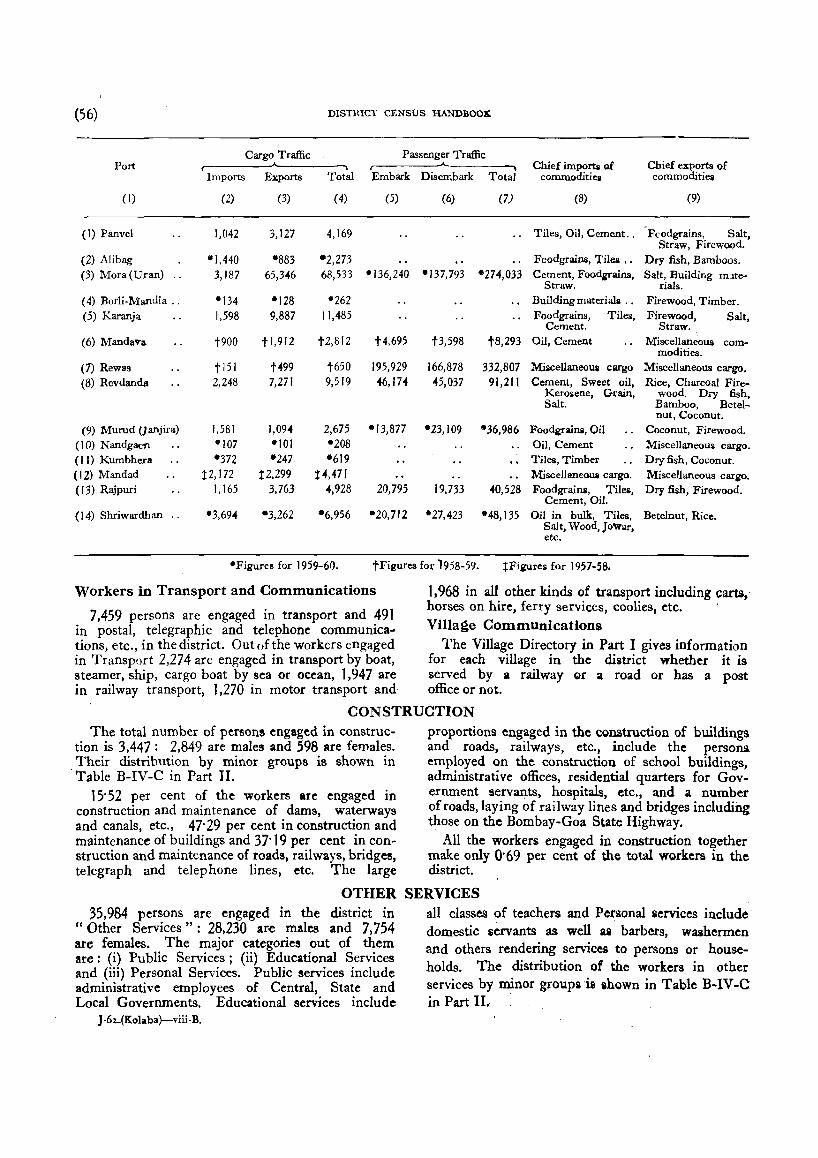
(56) DISTRICT CENSUS HAND:BOOX
Cargo Traffic Passenger Traffic Port Chief importa of Chief exports of
Imports Exports Total Embark Disembark Total conunoditiell commoditiea
(I) (2) (3) (4) (5) (6) (7) (8) (9)
(1) Panvel 1,042 3,127 4,169 .. Tiles, Oil, Cement .. Fcodgrains, Salt, Straw, Firewood.
(2) Alibag "1,440 "883 ·2,273 Foodgrains, Tiles .. Dry fish, Bamboos. (3) Mora (Uran) .. 3,187 65,346 68,533 "136,240 "137,793 "274,033 Cement, Food,iTains, Salt, Building ffi'lte-
Straw. rials. (4) BorIi-Mandla .. "134 "128 "262 " Building materialll .. Firewood, Timber. (5) Karanja 1,598 9,887 11,485 Foodgrains, Tiles, Firewood, Salt,
Cement. Straw. (6) Mandava t900 tl,9lZ tZ,8IZ t4,695 t3,598 t8,293 Oil, Cement Miscellaneous com-
modities. (7) Rewas tl51 t499 t650 195,929 166,878 332,807 Miscellaneoua cargo Miscellaneous cargo. (8) Revdanda 2,248 7,271 9,519 "6,17" -45,037 91,211 Cement, Sweet oil, Rice, Charcoal Fire-
Kerosene, Grain, wood, Dry fish, Salt. Bamboo, Betel-
nut, Coconut. (9) Murud (] anjira) 1,581 1,094 2,675 "13,877 ·Z3,109 "36,986 Foodgraina, Oil " Coconut, Firewood.
(10) Nandgacn "107 "101 "208 Oil, Cement Miscellaneous cargo. (II) Kumbhera "372 "247 "619 Tiles, Timber Dry fish, Coconut. (12) Mandad :1:2,172 :1:2,299 t",471 Miscellaneoui cargo. Miscellaneous cargo. (13) Rajpuri 1,165 3,763 ",928 20,795 19,733 40,528 Fooclgrains, Tiles, Dry fish, Firewood.
Cement, Oil. (14) Shriwardh an . . "3,694 -3,262 ·6,956 -20,71 2 -27,423 "48,135 Oil in bulk, Tiles,
Salt, Wood, Jowar. Betelnut, Rice .
etc.
"Figures for 1959-60. tFigures for 1958-59. tFigures for 1957-58.
Workers in Transport and Communications 1,968 in all other kinds of transport including carts, horses on hire, ferry services, coolies, etc. . Village Communications
7,459 persons are engaged in transport and 491 in postal, telegraphic and telephone communica-tions, etc., in the district. Outofthe workers engaged The Village Directory in Part I gives information in Transport 2,274 are engaged in transport by boat, for each village in the district whether it is steamer, ship, cargo boat by sea or ocean, 1,947 are served by a railway Qf a road or has a post in railway transport, 1,270 in motor transport and office or not.
CONSTRUCTION The total number of persons engaged in construc- proportions engaged in the construction of buildings
tion is 3,447: 2,849 are males and 598 are females. and roads, railways, etc., include the persons. Their distribution by minor groups is shown 10 employed on the construction of school buildings,
. Table B-IV -C in Paft II. administrative offices, residential quarters for Gov-15'52 per cent of the workers are engaged in ernment servants, hospitals, etc., and a number
construction and maintenance of dams, waterways of roads, laying of railway lines and bridges including and canals, etc., 47'29 per cent in construction and those on the Bombay-Goa State Highway. maintenance of buildings and 37'19 per cent in con- All the workers engaged in construction together struction and maintenance of roads, railways, bridges, make only 0'69 per cent of the total workers in the telegraph and telephone lines, etc. The large district.
OTHER SERVICES 35,984 persons are engaged in the district in
"Other Services": 28,230 are males and 7,754 are females. The major categories out of them are: (i) Public Services; (ii) Educational Services and (iii) Personal Services. Public services include administrative employees of Central, State and Local Governments. Educational services include
J -6z..(Kolaba)-viii -B.
all classes of teachers and Personal services include domestic servants as well as barbers, wasbermen alld others rendering services to persons or households. The distribution of the workers in other services by minor groups is shown in Table B-IV-C in Part II. .
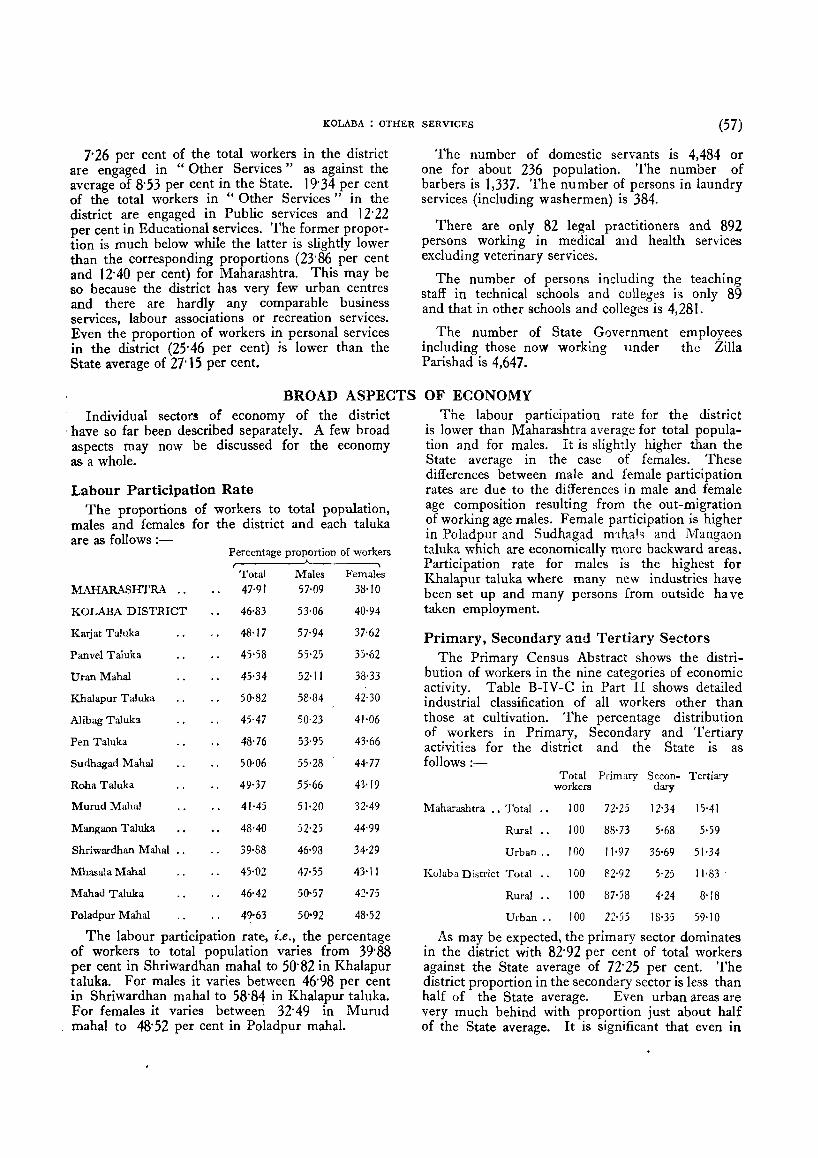
KOLABA : OTHER SERVICES (57)
7'26 per cent of the total workers in the district are engaged in "Other Services" as against the average of 8'53 per cent in the State. 19'34 per cent of the total workers in "Other Services" in the district are engaged in Public services and 12' 22 per cent in Educational services. The former proportion is much below while the latter is slightly lower than the corresponding proportions (23'86 per cent and 12'40 per cent) for Maharashtra. This may be so because the district has very few urban centres and there are hardly any comparable business services, labour associations or recreation services. Even the proportion of workers in personal services in the district (25'46 per cent) is lower than the State average of 27'15 per cent.
The number of domestic servants is 4,484 or one for about 236 population. The number of barbers is 1,337. The number of persons in laundry services (including washermen) is 384.
There are only 82 legal practitioners and 892 persons working in medical and health services excluding veterinary services.
The number of persons including the teaching staff in technical schools and colleges is only 89 and that in other schools and colleges is 4,281.
The number of State Government employees including those noW working under the Zilla Parishad is 4,647.
BROAD ASPECTS OF ECONOMY Individual sectors of economy of the district
have so far been described separately. A few broad aspects may now be discussed for the economy as a whole.
Labour Participation Rate The proportions of workers to total population,
males and females for the district and each taluka are as follows :-
Percentage proportion of workers
Total Males Females
MAHARASHTRA .. 47·91 57·09 38·10
KOLABA DISTRICT 46'83 53-06 40,94
Karjat Taluka 48'17 57·94 37-62
Panvel Taluka 45·58 55·25 35'62
Uran Mahal 45·34 52·1 I 38·33
Khalapur Taluka 50·82 58·84 42·30
Alibag Taluka 45-47 50·23 41·06
Pen Taluka 48'76 5}95 43-66
Sudhagad Mahal 50·06 55·28 44·77
Roha Taluka 49·37 55,66 43·19
Murud MahaI 41'45 51'20 32-49
Mangaon Taluka 48-40 52-25 44-99
Shriwardhan Mahal .. 39·88 46'98 34'29
Mhasala Mahal 45·02 47·55 43'11
Mahad Taluka 46·42 50·57 42-75
Poladpur Mahal 49'63 50'92 48·52
The labour participation rate, i.e., the percentage of workers to total population varies from 39'88 per cent in Shriwardhan mahal to 50'82 in Khalapur taluka. For males it varies between 46'98 per cent in Shriwardhan mahal to 58'84 in Khalapur taluka. For females it varies between 32'49 in Murud mahal to 48'52 per cent in Poladpur mahal.
The labour participation rate for the district is lower than Maharashtra average for total population and for males. It is slightly higher than the State average in the case of females. These differences between male and female participation rates are due to the differences in male and female age composition resulting from the out-migration of working age males. Female participation is higher in Poladpur and Sudhagad m1hals and Mangaon taluka which are economically more backward areas. Participation rate for males is the highest for Khalapur taluka where many new industries have been set up and many persons from outside ha ve taken employment.
Primary, Secondary and Tertiary Sectors The Primary Census Abstract shows the distri
bution of workers in the nine categories of economic activity. Table B-IV-C in Part II shows detailed industrial classification of all workers other than those at cultivation. The percentage distribution of workers in Primary, Secondary and Tertiary activities for the district and the State is as follows :-
Total Primary Secon- Tertia."Y workers clary
Maharashtra •• Total 100 72-25 12-34 15'41
Rural 100 88'73 5-68 5·59
Urban .. 100 11·97 36'69 51·34
Kolaba District Total 100 82-92 5'25 11-83
Rural .. 100 87'58 4'24 8'18
Urban .. 100 22·55 18·35 59·10
As may be expected, the primary sector dominates in the district with 82'92 per cent of total workers against the State average of 72' 25 per cent. The district proportion in the secondary sector is less than half of the State average. Even urban areas are very much behind with proportion just about half of the State average. It is significant that even in
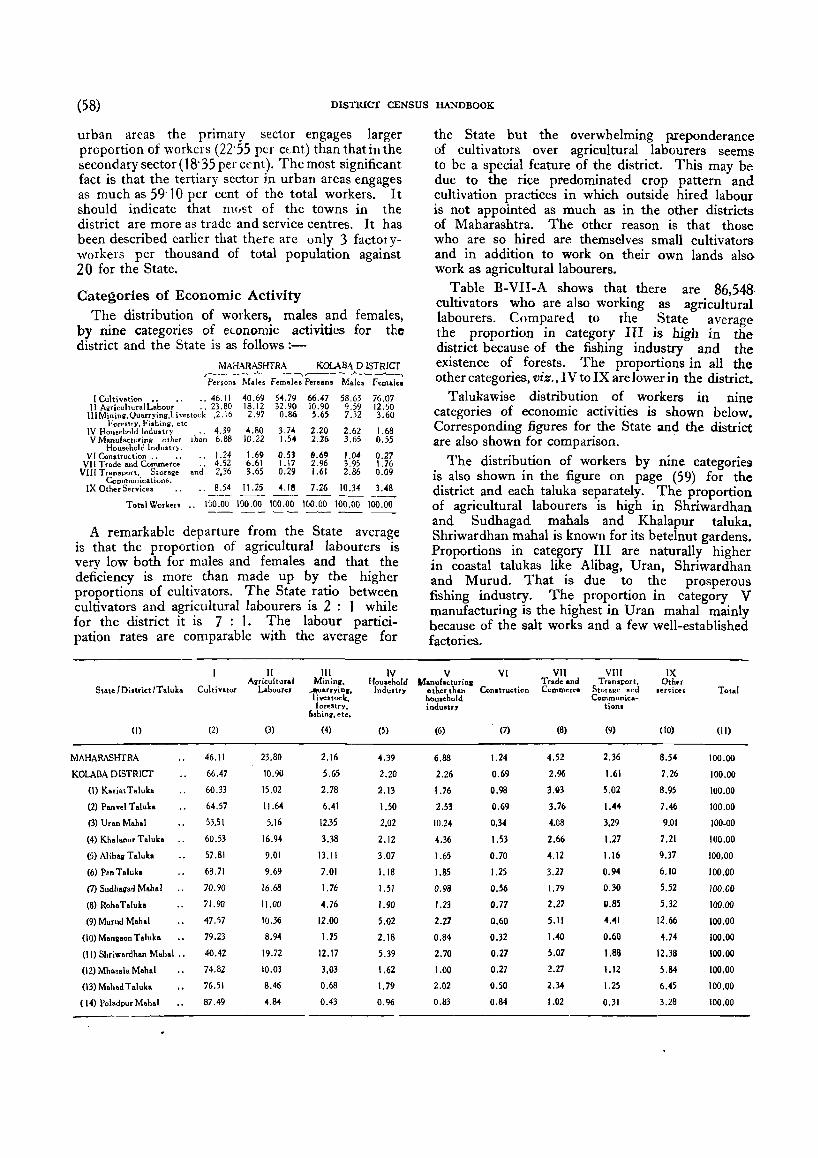
(58) DISTRICT CENSUS HANDBOOK
urban areas the primary sector engages larger proportion of workers (22'55 per ctnt) than that in the secondary sector (18'35 per cent). The most significant fact is that the tertiary sector in urban areas engages as much as 59'10 per cent of the total workers. It should indicate that most of the towns in the district are more as trade and service centres. It has been described earlier that there are only 3 factoryworkers per thousand of total population against 20 for the State.
Categories of Economic Activity The distribution of workers, males and females,
by nine categories of economic activities for the district and the State is as follows :-
MAHARASHTRA KOlABA D ISTRICf r----...A..--~ r------A--.. --.... Persons Male, female. Penon. Males Female.
I Cultivation .. 46.11 40.69 54.79 j)6.47 58.63 76.07 II Agricultur.IL~bour·· " 23.80 18.12 32.90 10.90 9.59 12.50
III Minina. Quarrying,l i vestock ,2.16 2.97 0.86 ~.65 7.32 3.60 Forestry. Filhing, etc
4.39 4.80 3.74 2.20 2.62 1.68 IV Household Industry th~~ V Manufacturing other 6.88 10.22 1.54 2.26 3.65 0.55
Household Indus try. 1.24 1.69 0.53 &.6' 1.04 VI Construction .• .. 0.27
VII Tr.de and Commerce and'
4.52 6.61 1.17 2.96 3.95 1.76 VIII Transport. StoraK'~ 2,36 3.65 0.29 1.61 2.86 0.09
Communications. IX Other Services .. 8.54 11.25 4.18 7.26 10.34 3.48
Total Wor"" .. ICO.OO 100.00 100.00 100.00 100.00 100.00
A remarkable departure from the State average is that the proportion of agricultural labourers is very low both for males and females and that the deficiency is more than made up by the higher proportions of cultivators. The State ratio between cultivators and agricultural labourers is 2: ) while for the district it is 7: 1. The labour participation rates are comparable with the average for
II III IV Airicultural Mininl'~ Houlehold
St.te 'Diltrict IT aluka Cultivator L.bourer _quarryina, lndu.try liveuock, forestrY'~
6shinsr, etc.
(l) (2) (3) (4) (5)
MAHARASHTRA 46.11 23.80 2.16 4.39
KOLABA DISTRICT 66.47 10.90 5.65 2.20
(1) Karia, T.luka 60.33 15.02 2.78 2.13
(2) Panv.1 Taluh 64.57 11.64 6.41 UO (3) Uran M.h.1 53.51 5.16 12.35 2.02
(4) Kh.l.put T alulca 60.53 16.94 3.38 2.12
(5) Alibag T .Iuk. 57.81 9.01 13.11 3.07
(6) Pen T.luk. 68.71 9.69 7.0J 1.18
(7) Sudh.g.d Malt. I 70.90 16.68 1.76 1.51
(8) Roh. T.luk. 71.90 11.00 <1.76 1.90
(9) Murud M.h.1 47.57 10.36 12.00 5.02
(10) Mana.on T.luka 79.23 8.94 1.15 2.18
(II) Shriw.rdhan M.h.l .• 40.42 19.72 12.17 5.39
(12) Mhos.l. Mah.1 74.82 10.03 3,03 1.62
(13) M.h.d T .Iuh 76.51 8.46 0.68 1.79
( 14) Pol.dpur M.h.1 87.49 4.84 0.43 0.96
the State but the overwhelming preponderance of cultivators over agricultural labourers seems to be a special feature of the district. This may be due to the rice predominated crop pattern and cultivation practices in which outside hired labour is not appointed as much as in the other districts of Maharashtra. The other reason is that those who are so hired are themselves small cultivators and in addition to work on their own lands also work as agricultural labourers.
Table B-VII-A shows that there are 86,548 cultivators who are also working as agricultural labourers. Compared to the State average the proportion in category III is high in the district because of the fishing industry and the existence of forests. The proportions in all the other categories, viz., IV to IX are lower in the district.
Talukawise distribution of workers in nine categories of economic activities is shown below. Corresponding figures for the State and the district are also shown for comparison.
The distribution of workers by nine categories is also shown in the figure on page (59) for the district and each taluka separately. The proportion of agricultural labourers is high in Shriwardhan and Sudhagad mahals and Khalapur taluka. Shriwardhan maha! is known for its betelnut gardens. Proportions in category III are naturally higher in coastal talukas like Alibag, Uran, Shriwardhan and Murud. That is due to the prosperous fishing industry. The proportion in category V manufacturing is the highest in Uran mahal mainly because of the salt works and a few well-established factories.
V VI VII VIII IX Manufacturinl Trade and Transport, Other
other than Conltruction CQmmerc. Storage Br.d lervicu Total hauI.hold Communica-industry tions
(6) (7) (8) (9) (10) (II)
6.88 1.24 4.52 2.36 8.54 100.00
2.26 0.69 2.96 1.61 7.26 100.00
1.76 0.98 3.113 5.02 8.95 100.00
2.53 0.69 3.76 1.44 7.46 100.00
10.24 0.34 4.08 3.29 9.01 JOO.OO
436 1.53 2.66 1.27 7.21 100.00
1.65 0.70 4.12 1.16 9.37 100,00
1.85 1.25 3.27 0.94 6.10 100.00
0.98 0.56 1.79 0.30 5.52 100.00
1.23 0.77 2.27 II.BS 5.32 100.00
2.27 0.60 5.11 4.41 12.66 100.00
0.84 0.32 1.40 0.60 4.74 100.00
2.70 0.27 5.07 1.88 12.38 100.00
1.00 0.27 2.27 1.12 5.84 100.00
2.02 0.50 2.34 1.25 6.45 100.00
0.83 0.84 1.02 0.31 3.28 100.00
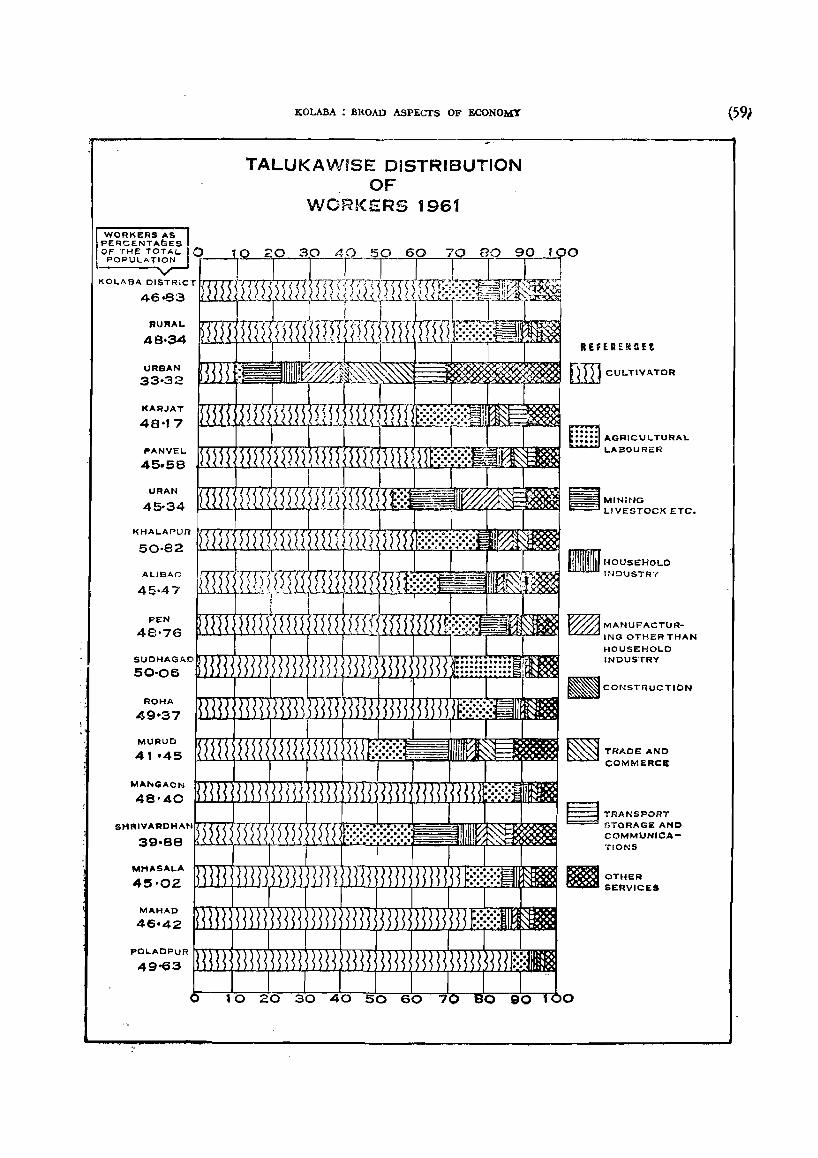
RURAl..
URBAN
33-32
KARJAT
48'17
PANVEL.
URAN
50·82
ALIBAC
45·47
PEN
48'76
SUOHAGAD
50-06
ROHA , 49·37
MURUO
... A .... GAON
KOLABA : BROAD ASPECTS OF ECONOMY
TALUKAWISE DISTRIBUTION OF
WORKERS 1961
(59j
REHRE!UU
AGRIC\) L TURAI..
LABOURER
IiiIMINlNG LIVESTOCK ETC.
~ MANUFACTUR-ING OTHER THAN
HOUSEHOLD INDU5<rRY
~ TRAOEANO COMMERCE
~TRANSPORT 5TORAGE AND COMMUNICA-TIONS
DISTRICT CENSUS HANDBOOK
Labour Participation by Age Labour participation rates by age-groups are
shown below for the district for total, males and females separately. Corresponding figures for the State are also shown for comparison :-
Kolaba District Maharashtra Age-group --" I
Total Males Females Total Males Females All Ages 46'83 53-06 40'94 47-91 57·09 38·10
0-14 5·03 5'39 4'65 8'72 8·62 8·84
15-34 80·93 8%9 73·73 74·53 87-45 60·90
35-59 .. 81'31 97·02 65'73 81·57 96·86 63-68
60+ .. 41'56 68'48 17·19 49·13 72-82 26'28
Labour participation rates for the total population are lower than the Maharashtra average in 0-14, 35-59 and 60+ age-groups. They are higher only in the age-group 15-34 mainly because of a very high participation rate for females in that age-group. Lower participation in 0-14 age-group indicates that a large proportion of children are sent to schools.
Workers by Educational Levels
The distribution of workers by educational levels shown in Table B-III is shown below by percentages for the district. Corresponding figures for the State are also shown for comparison :-
Literate Illiterate (without Primary or Matricu'a-
educational Junior tion and'
Maharashtra
Kolaba District
68·65
74·71
level) Basic above
14·11
13-67
13091
10·39
3'33
1·23
The proportion of urban population IS lower and agriculture is more dominating the economy in the district than the State average. The literacy rate in the district is also lower (24'56 per cent) than the State average (29'82 per cent). The proportion of illiterates among the workers is, therefore, naturally very high and the proportions of other educational levels are consequently lower. There are however 6, 117 workers with education level matriculation and above. 3,763 of them are engaged in other services, 504 in transport, storage and communications, 568 in trade and commerce, 555 in manufacturing industry (including household industry), 146 in mining, quarrying, forestry, fishing, etc., 199 in construction and as many as 382 in agriculture.
Status of Employment
Table B-IV -B in Part II shows the distribution of workers by status of employment for non-household industries. The percentage proportions of employers, employees, single workers and family workers in the district, for total, rural and urban
are2.s are as follows. Corresponding figures for Maharashtra are also shown for comparison. The four classes of workers are defined in paragraph 58 in the Explanatory Note to Parl: II.
Class of workers Total r-~-~
workers Emp- Emp- Single Family loyers loyees ,workers workers
Maharashtra Total 100 3-96 62·18 26·52 7'34
Rural 100 1·57 46'47 38·58 13-38
Urban 100 4·98 68'90 21·37 4·75
K 0 I a b a Total loa 3-07 46'91 30·07 19'95 District.
Rural 100 2-33 45-93 30'54 21'20
Urban 100 4'88 49'32 28·93 16·87
The proportion of single workers is lower in rural areas and higher in urban areas as compared to State averages. Proportion of employers is not much lower in the distnct. In fact it is higher in rural areas than the State average. But the proportions of employees are considerably lower than the State average. It may be so because there are very few large-scale establishments or factories in the district.
Percentage Distribution in Household Industry by Employees and others
The proportion of employees, i.e., hired workers and others in household industries in the district for total, rural and urban areas is shown in Table B-IV-A in Part II. The percentage distribution with corresponding figures for Maharashtra is as follows:-
Total Emp- Others workers loyees
Maharashtra Total 100 8·18 91·82
Rural 100 HI 95'09
Urban 100 16'35 83-65
Kolaba District Total 100 11·64 88'36
Rural 100 12'30 87'70
Urban IUD 8·86 91'14
The proportions of employees in household industries are higher in the district. In rural areas the proportion is approximately three times higher than the State average. But in urban areas it is as low as half of the State average. The proportion of empluyces in household industry is so high in rural areas because 424 women arc employed in fishing industry, 136 men in food industry like rice-pounding or poha-making, 79 men in livestock and hunting and 121 men in manufacture of non-metallic products like pottery, stone or clay images, etc.
KOLABA : BROAD ASPECTS OF ECONOMY (61)
Secondary Work The proportions of workers also engaged in some
other secondary economic activity for three categories of principal work for Maharashtra and the district are as follows (Actual figures are shown in Table B-VII-A in Part II) ;_
Caterories of Principal work
MAHARASHTRA
Total Rural Urban
PetCGnt~e of total workers by cate~ories of secondary work ,---
I II IV
I CultiTltion .. Totol 17.85 1.97 Runl " 18.03 1.98 Urba, " 10.54 1.32
II Aario"lturalLabour Total.. 13.17 0.94 Rural.. 13.46 0.97 Urban " 7.12 0.31
IV HouI.holcllndu.try 'Total •. 14.78 6.97 Ruul " 19.61 9.38 Urban.. 2.70 0.95
KOLABA DISTRICf
I Cultivation •• Total . • 26.26 1. 39 Rural .• 26.33 1.39 Urban.. •• 19.48 1.25
II Aaricultural LabourTota) " 25.15 0.61 Rural.. 25.45 0.62 Urban.. 6.70 0.24
IV Holl.ahold Indu.try Total 19.52 4.50 Rural .. 22.02 5.28
. Urban .. 8.91 1.16
86,548 or about one-fourth of the total number of cultivators in the district also work as agr~cultural labourers. Similarly, one-fourth of the agncultural labourers also work as cultivators as a secondary or subsidiary work. These proportions are higher for total and rural areas than the State averages. All these workers having the dual classi-' fication are actually the holders of very small land holdings who work in the secondary categories to supplement their earnings from the principal ~ork. More .than o~e-fifth of the workers engaged m household llldustnes also work as cultivators.
Occupational Classification Table B-V in Part II shows the distribution
of non-agricultural workers by occupation. The percentage distribution for the State and the district is as follows. The occupational classification is described in the Explanatory Note to Part II :_
Occupational Division
o Professional, technical and related workers.
Administrative, uecutive and mana-i:erial workers.
2 Clerical and related workeri 3 Sales workers .. . . . . . . 4 Farmers, fishermen, hunten, loggerJi
and related workers. 5 Miners, quarrymen and related
workers. 6 'Workers in transport and commu
nication occupations. 7 & Craftsmen, production and process 8 workers and labourers not elsewhere
classified. 9 Service, sport and recreation workers
X Workers not classifiable by occupation.
Total "
M'lh!lrashtra
6·42
3'89
9·13 12'23 7'64
0·75
3·57
45'99
10'27
0·"
100·00
Kolaba District
6'27
3'08
4'32 12'27 23-67
2·34
4·18
34·19
9·53
0·15
100·00
The district proportions in occupational division8 excepting divisions 3 (sales workers), 4 (farmers, fishermen, etc.), 5 (miners, quarrymen, etc.) and 6 (workers in transport and communication occupations) are lower than the State average. The proportions in occupational divisions 4 and 5 are higher for the district because of the prosperous fishing industry and large extents of forests.
Non-Workers
The distribution of non-workers by eight broad categories is shown in Table B-IX in Part II. Percentage distribution for the district is shown below:-
Di. l'ict Total Rural Urban ,...--A.----, ,-----A---, ~ Mal •• Female. Mal •• Femal.. Male. Femal ..
(I) Full-tim. It.dont. i4.:.11 12.34 32.71 I1.Q5 46.03 :.10.50
(2) Houlehold duties 0.57 31.69 0.60 29.25 0.39 47.14
(3) Dependento.infants and di •• bled 62.65 55.55 64.76 59,33 46.10 31.5'
(4) Retired. ronli ... or indopendent 0.83 0.22 0.60 0.21 2.57 0.31 means.
(5) Bellia ... vqrant •. etc ... 0.16 0.09 0.14 0.08 0.a5 0.16
(6) Inmates of institutions .• .. 0.12 0.02 0.12 0.03 0.10 '1.411 (7) Persons ••• kinll .mploymentlor
the first tim~. 0.68 0.04 0.52 0.02 1.94 0.18
(8) Unemployed but ••• ltin~ work .• US 0.05 0.55 0.03 2.52 0.1 1
Total .. 100.00 100.00 100.00 100.00 100.00 100 00 -- -- -- -- -- --
There is a marked diffdence in the distribution pattern for non-workers among males and females. 34· 21 per cent out of male non-workers are fulltime students while the corresponding proportion for females is 12·34 per cent. The reason is that 31·69 per cent femaleS Wil0 are engag~d in household duties are also included as non-workers.
. There are rural-urban differences in the propor~ han of dep~ndents. Tne remaining categories each has less than one per cent of non-working population. The rural-urban differences are similar both for males and ft.males. In urban areas, the percentag~ of full-time students is almost equal to that for dependents for males. The percentage of females engaged in household duties is higher in urban areas than in rural areas, The percentage of unemployed is 4' 46 and 1'07 for males in urban and rural areas and negligible in both caSes for females. Proportions of full-time students among females are low..:r both in urban and rural areas. The difference is not, however, entirely due to social customs of attending more to the ~ducation of boys than that of girls. The proportIOns for females are lower because the group of non-workers contains a large number of adult women engaged in household dutie6.
(62) DISTRICT CENSUS HANDBOOK
Seasonal Migration
The houselist population reported for the district on 1 st October 1960 was 10·53 lakhs. With the decade average rate of growth it Was estimated for 1 st March 1961 at 10·60lakhs. It actually came to be 10·59 lakhs Of one thousand short of the estimate. It may be due to the net seasonal out-migration from the district. Talukawise differences in the tvyo sets of figures are striking in a few cases. Sudhagad mahal is short. by four thousands, Karjat taluka by two thou.sands and Panvel, Khalapur, Pen and Mangaon ~alukas by one thousand each. These seasonal migrants are accounted as follows. Mahad taluka and Poladpur. mahal three thousands each, Uran mahal two thousands and Alibag taluka one thousand. Seasonal migration to Uran mahal ~nd !\libag taluka can be understood because o~ fishmg industry, garden crops and salt works. But If Mahad taluka and Poladpur mahal also attract workers on land or forests may need local investigation. A large number of shepherds are however known to migrate with their flocks from up-Ghat afeas down to Konkan.
Majority of seasonal migrants appear to 'be males as would be obvious from the following sex ratios for the total popUlation reported in October 1960 and March 1961 :-
1st 1st October March . 1960 1961
KOLABA DISTRICT Total 1,050 1,058 Rural 1,063 1,072 Urban .. 942 943
Karjat Taluka 921 927 PanveI Taluka 963 971 Uran Mahal 987 964 Khalapur Taluka .. 933 941 Alibag Taluka 1,075 1,079 Pen Taluka 1,002 1,019 Sudhagad Mahal .. 966 988 Roha Taluka 1,010 1,018 Murud Mahal 1,073 1,088 Mangaon TaJuka 1,121 1,129 Shriwardhan Mahal 1,276 1,271 Mhasala Mahal 1,309 1,328 Mahad Taluka 1,125 1,130 Poladpur Mahal 1,152 1,16.5-
PART I
VILLAGE DIRECTORY This Directory renders an account of -each Village and each ward 0/ Town
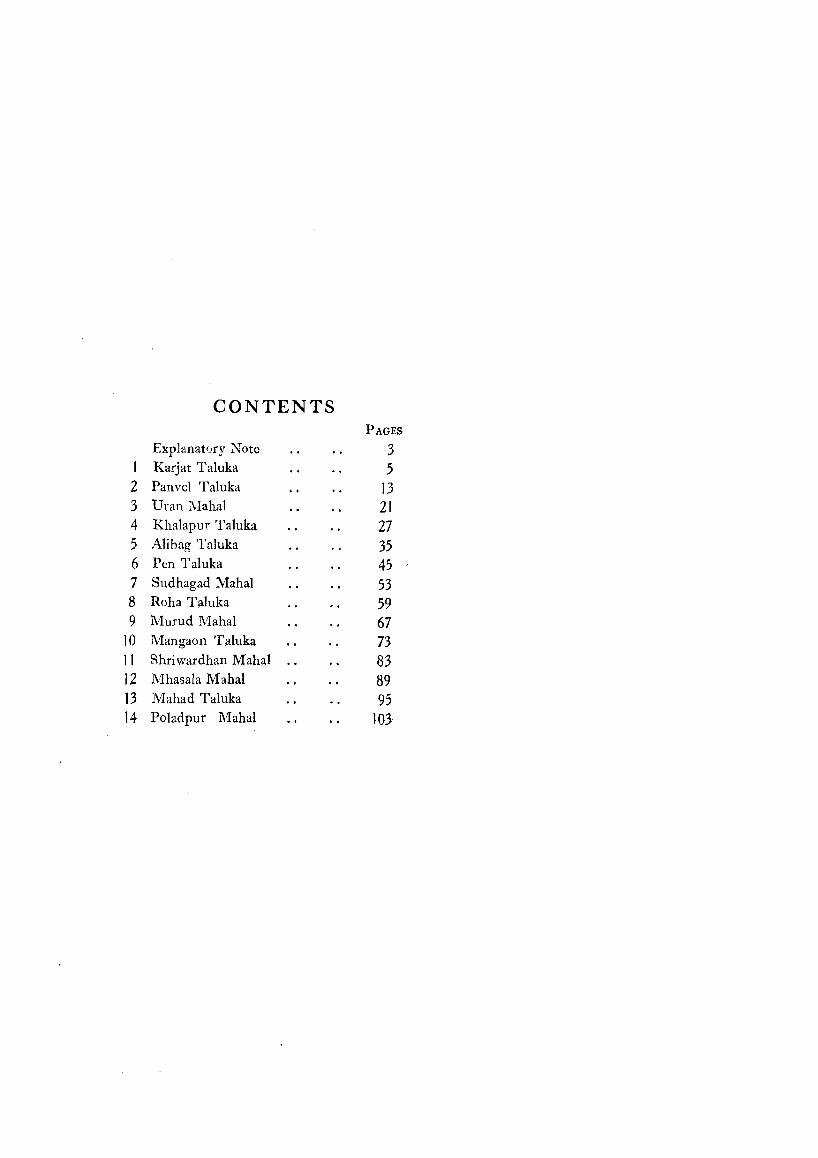
CONTENTS PAGES
Explanatory Note 3 I Karjat Taluka 5 2 Panvel Taluka 13 3 Dran l\Iahal 21 4 Khalapur Taluka 27 5 Alibag Taluka 35 6 Pen Taluka 45 7 Sudhagad Mahal 53 8 Roha Taluka 59 9 Murud Mahal 67
10 Mangaon Taluka 73 11 Shriwardhan Mahal 83 12 Mhasala Mahal 89 13 Mahad Taluka 95 14 Poladpur Mahal t03
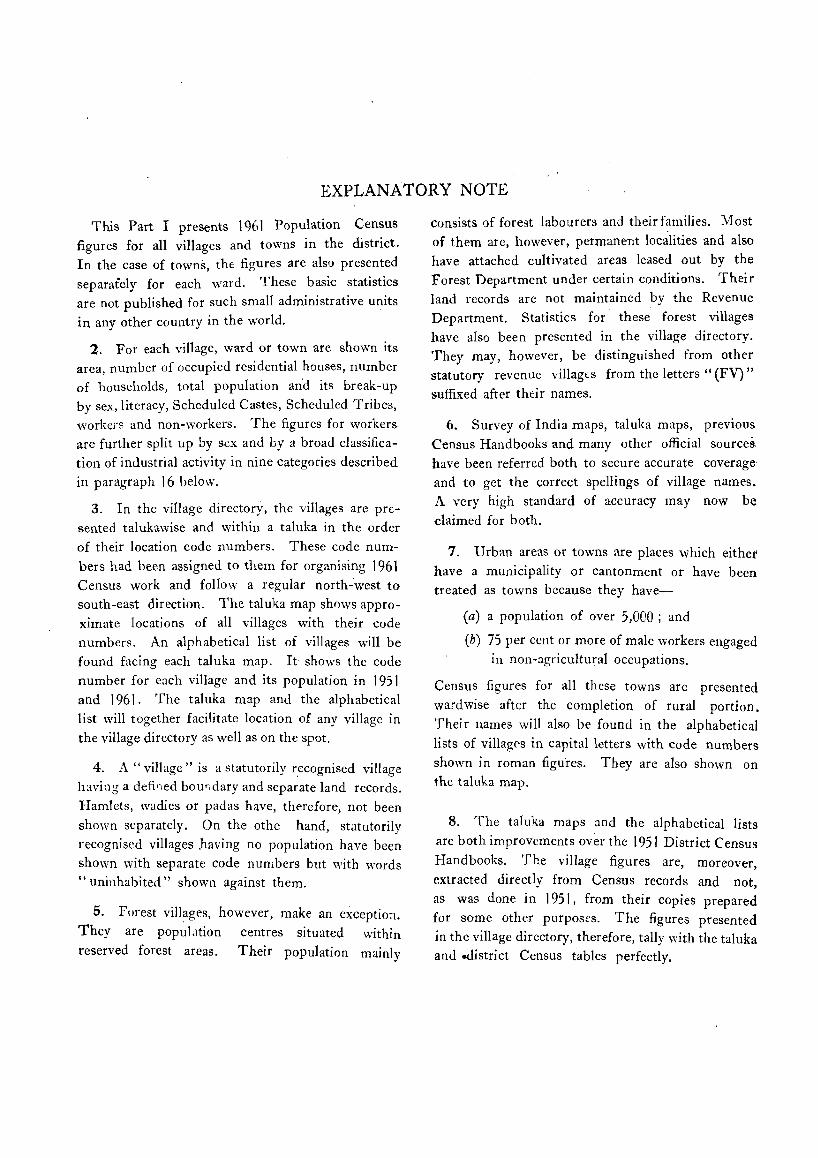
EXPLANATORY NOTE
This Part I presents 1961 Population Census figures for all villages and towns in the district. In the case of towns, the figures are also presented separately for each ward. These basic statistics are not published for such small administrative units
in any other country in the world.
2. For each village, ward or town are shown its area, number of occupied residential h0uses, number of households, total population an'd its break-up by sex, literacy, Scheduled Castes, Scheduled Tribes, workers and non-workers. The figures for workers are further split up by sex and by a broad classification of industrial activity in nine categories described
in paragraph 16 below.
3. In the village directory, the villages are presented talukawise and within a taluka in the order of their location code numbers. These code num
bers had been assigned to them for organising 1961 Census work and follow a regular north-west to south-east direction. The taluka map shows approximate locations of all villages with their code numbers. An alphabetical list of villages will be found facing each taluka map. It shows the code number for each village and its population in 1951 and 1961. The taluka map and the alphabetical list will together facilitate location of any village in the village directory as well as on the spot.
4. A" village" is a statutorily recognised village having a defi'1ed boundary and separate land records. Hamlets, wadies or padas have, therefore, not been
shown separately. On the othe hand, statutorily recognised villages having no population have heen shown with separate code numbers but with words " uninhabited" shown against them.
5. Forest villages, however, make an exception. They are population centres situated within reserved forest areas. Their population mainly
consists of forest labourers and their families. Most of them are, however, permanent localities and also have attached cultivated areas leased out by the Forest Department under certain conditions. Their land records are not maintained by the Revenue Department. Statistics for' these forest villages
have also been presented in the village directory. They may, however, be distinguished from other statutory revenue villagts from the letters" (FV)"
suffixed after their names.
6. Survey of India maps, taluka maps, previous Census Handbooks and many other official sources have been referred both to secure accurate coverage and to get the correct spellings of village names. A very high standard of accuracy may now be
claimed for both.
7. Urban areas or towns are places which either have a municipality or cantonment or have been treated as towns because they have-
(a) a population of over 5,000; and
(b) 75 per cent or more of male workers engaged in non-agricultural occupations.
Census figures for all these towns arc presented
wardwise after the completion of rural portion. Their names will also be found in the alphabetical lists of villages in capital letters with code numbers
shown in roman figures. They are also shown on the taluka map.
8. The taluka maps and the alphabetical lists are both improvements over the 1951 District Census
Handbooks. The village figures are, moreover, extracted directly from Census records and not , as was done in 1951, from their copies prepared for some other purposes. The figures presented in the village directory, therefore, tally with the tal uk a and .district Census tables perfectly.
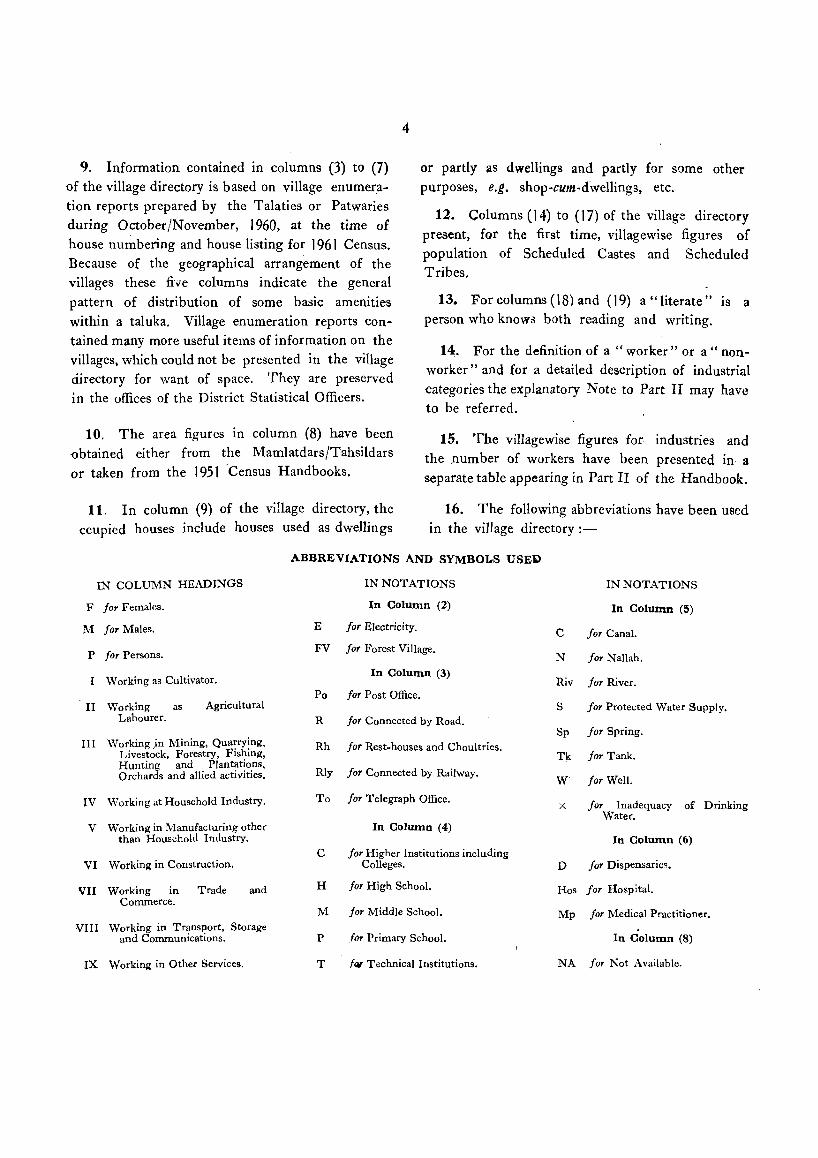
9. Information contained in columns (3) to (7) of the village directory is based on village enumeration reports prepared by the Talaties or Patwaries during October/November, J 960, at the time of house numbering and house listing for J 96 J Census. Because of the geographical arrangement of the villages these five columns indicate the general pattern of distribution of some basic amenities within a taluka. Village enumeration reports Contained many more useful items of information on the villages, which could not be presented in the village directory for want of space. They are preserved in the offices of the District Statistical Officers.
10. The area figures in column (8) have been -obtained either from the Mamlatdars/Tahsildars or taken from the J 95 J 'Census Handbooks.
11. In column (9) of the village directory, the ccupied houses include houses used as dwellings
4
or partly as dwellings and partly for some other purpo3es, e.g. shop-cum-dwellings, etc.
12. Columns (14) to (17) of the vil1ag~ directory present, far the first time, villagewise figures of population of Scheduled Castes and Scheduled Tribes.
13. For columns (J 8) and (19) a" literate" IS a person who knows both reading and writing.
14. For the definition of a "worker" or a" nonworker" and for a detailed description of industrial categories the explanatory Note to Part II may have to be referred.
15. The villagewise figures for industries and the number of workers have been presented in a separate table appearing in Part II of the Handbook.
16. The following abbreviations have been used in the village directory;-
ABBREVIATIONS AND SYMBOLS USED
IN COLUMN HEADJNGS IN NOTATIONS IN NOTATIONS
F for Females. In Column (2) In Column (5)
M for Males. E for Electricity. C for Canal.
P for Persons. FV for Forest Village.
N for Nallah.
Working as Cultivator. In Column (3)
Riv fOT River. Po for Post Office.
II Working as Agricultural S for Protected Water Supply. Labourer. R for Connected by Road.
Sp fOT Spring. III Working,in Mining, Qua:rY!ng, Rh for Rest-houses and Choultries.
Livestock, Forestry, Flshmg, Tk fOT Tank. Hunting and Plantations,
Rly for Connected by Railway. Orchards and allied activities. W for Well.
IV Working at Household Industry. To for Telegraph Office. faT Inadequacy of Drinking X
Water. V Working in Manufacturing other In Column (4)
than Household Industry. In Column (6) C fOT Higher Institutions including
VI Working in Construction. Colleges. D for Dispensaries.
VII Working in Trade and H for High School. Hos for Hospital. Commerce.
M fOT Middle School. Mp JOT Medical Practitioner. VIII Working in Transport, Storage
and Communications. P for Primary School. In Column (8)
IX Working in Other Services. T fQl' Technical Institutions. NA JOT Not Available.

Karjat Taluka
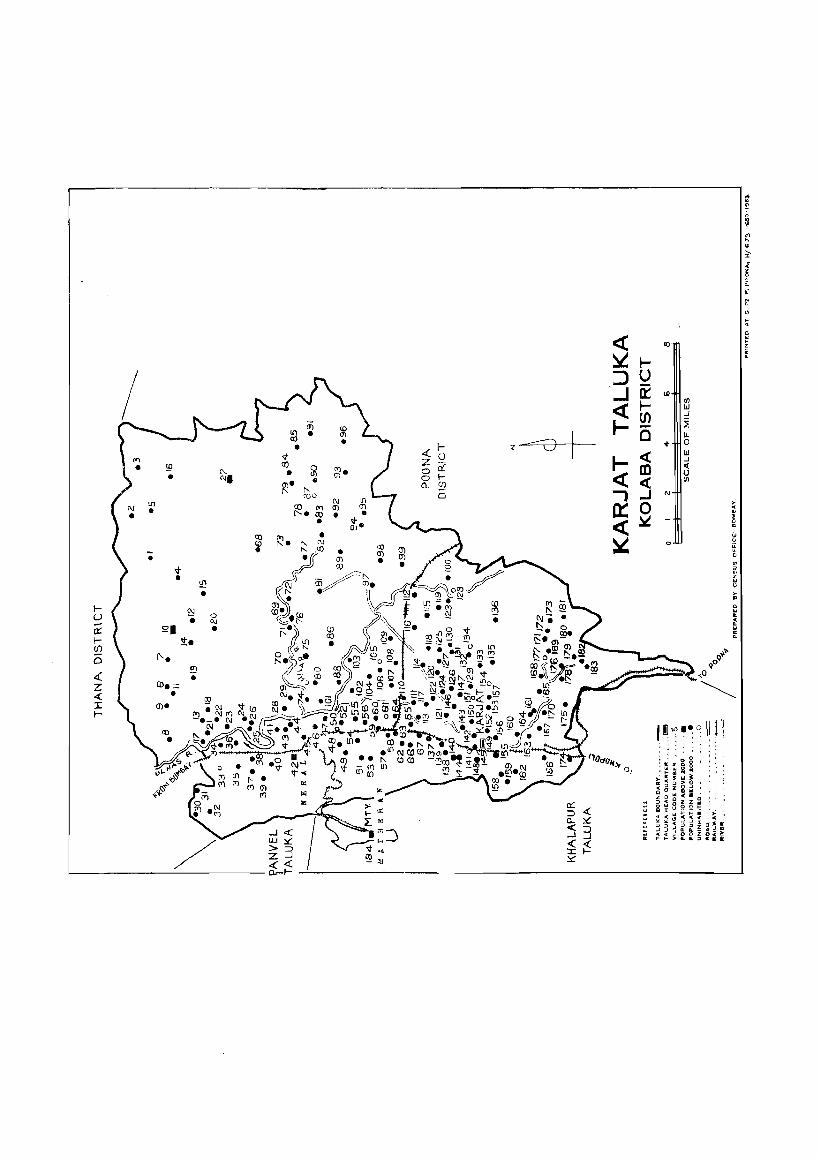
U1 •
Sf! •
'Ii" •
~
• -=Zl
". ~.
~
•
• o OJ •
I\. N,
iii Ul • <n • .q-
<lJ 0 • (J)
0). • " t"-coo
re. (I'J co •
U> I/)
w _j
<0 :i
a) l1. • <(r- z -----a &/.
z ~ o cL O f-0.. ~
+ 0 w _J 0( u I/)
t\! a N ,
(J)
• < m ~ 0 m
W v [ 0
'" 1,\ :i " ,.. II
Ii: 0: < .. ... '" ..
~ ... 0° q
,0
~
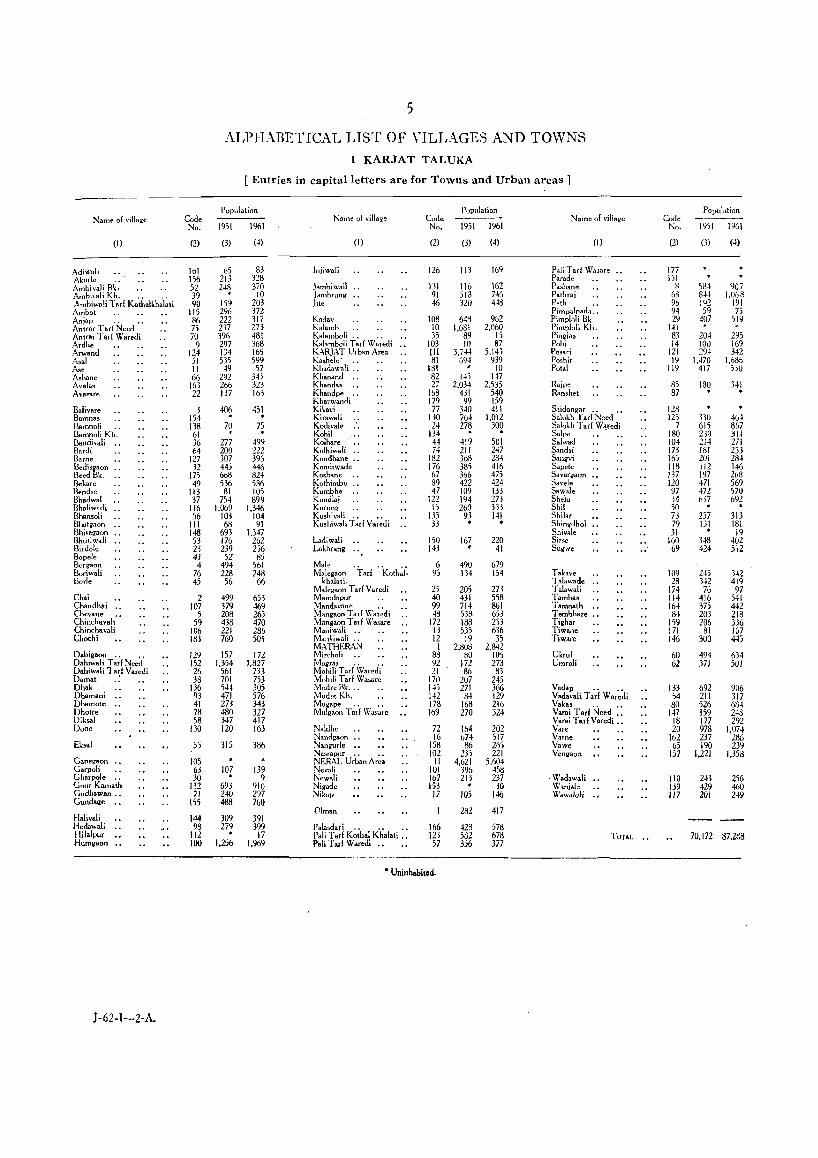
!':ame of vi 1132'('
(I)
Adiwali Akurle .. Ambivali Bk. Ambi,"li Kh. .. .. Amhiwali Tarl Kothalkhnla.i Ambot Anjap .. Antrar Tad Need AntTar T arl Waredi Ardhe Arwand Asal Ase Aghane AV!llas AV8.sare
Balivate Bamnas Bamnoli .. Bamnol; Kh. Bandi"Ii Rardi Barne Bedisgaon Beed Bk. .. Bekare Bendse Bhadwal Bh.liwndi BhansoIi Bhc.tgaon, Bhisegaon Bhutiwali Birdo!c Bopelc Borgaon Boriwali Berle
Chai Chandh.i Chevane .• Chincha"ali Chinchavali Chochi
Dahigaon .. •• DahiwaJi Tarl Need D.hiw.li Tarl VaTedi Damat Dhak Dhamani Dhamote Dholre Diksal Done
Ek,.1
Ganegaon Garpoli Gharpole .• Gour Kamath Gudhawan •• GUl,dage
Hali"ali Hedawali Hilalpur Humgaon
J-62-1-2-A.
Code No.
(2)
161 156 52 39 90
115 86 73 70
9 124
51 II 66
163 22
3 154 138 61 36 64
127 32
J7j 49
113 37
116 56
III 148 53 23 43 4
76 45
2 107
5 59
106 183
129 152 26 38
136 93 41 7R 58
130
55
105 63 30
132 71
15S
144 98
112 100
5
ALPH.\I3ETICAL LIST OF VILLAGES AND TOWNS 1 KARJAT TALUKA
[ Entries in capital letters are for Towns and Urban areas]
Population
19';1 1%1
(3)
65 213 248
* 159 296 222 237 3% 297 JJ4 535 49
292 266 137
406 · 70 · 277 200 307 445 668 536
81 754
1,069 103 68
693 176 239 52
494 228 56
499 379 208 438 221 760
157 1.354
561 701 544 471 273 480 347 120
315
107 · 693 240 488
309 279 · 1.256
(4)
83 328 3/0
10 203 372 317 273 481 368 165 599
57 343 323 163
451 . 75 .
499 222 395 446 824 536 105 899
1,346 104 91
1.347 262 256 85
561 248 66
653 469 263 470 286 501
172 1.827
733 753 305 576 343 327 417 163
386
139 9
910 297 760
391 399
17 1,969
Name of village
(I)
Injiwali
Jambiwail .. Jambrunll lite
Kadav Kalamb K.lamboli .. .. Kahmboli Tad ~' arcdi KARJAT Urban Area Ka,hel.- .. Khadawali .• Khanand .. Khandas .. Khandpe .• Kharwandi Kika"i Kirawali Kodivale Kohil Kolhare Kolhiwali Kondhane Kondiwade Koshane Kothimbe Kumbhe Knndlaj Kurun? Kushivali .. .• Kushiwali Tad Varedi
Ladiwali Lakh,.ng
Male Mnlegaon Tad' Koth~l:
khalati. Malegaon Tar! Voredi Mamdapur Mandavane .. l\hngaon Tad \"arcdi Mangaon TarE Wasare Maniwali •• Mankiwali .. MATH£Rr'u'J Mircholi i\1ograj •• •• Mohili Tarl Waredi Mohili Tarl Wasare Mudre Bk ... Mudr. Kh. Mu~apc .• .. MulgMn Tarl Wasar.
Naldhc .• Nandgaon •• Nangurle .• Nasrapur .. •• N£RAL Urban Area Nedi Newali N;gade Nikop
Cllman
Palasdari •• •. •• Pali Tarl Kothal Khalati .• Pali Tarl Waredi
Population Code ----No. 1951 1961
(2)
126
131 91 46
108 10 35
103 III 81
181 82 27
168 179 77
140 24
134 44 74
182 176 67 89 47
122 15
U5 33
150 143
6 95
25 40 99 48
172 U 12 I
83 92 21
170 14; 142 178 169
72 16
158 102
Jl 101 167 153 17
·1
166 IZI 57
(3)
113
116 513 320
648 1,681
89 10
3,744 694 · 14,
2.034 431
99 340 764 278 · 419 211 368 38S 366 422 109 194 26~
93 · 167 · 490 134
205 431 714 53~ 188 535
19 2,808
80 172 86
207 271 84
168 270
164 674 86
23> 4,621
396 213 • 105
282
428 5S1 356
(4)
169
162 74() 448
962 2.060
15 87
5,143 939
10 147
2535 540 159 411
1.012 300 . 501 247 284 416 475 424 J3j 273 333 141 . 220
41
679 154
273 558 861 653 253 636
35 2.842
106 273
83 245 366 129 216 324
202 517 265 221
5,604 458 237 30
146
417
578 678 377
• Uninhabited.
Name of village
(I)
Pali Tad WaJare Parade Pashane Pathraj Peth .. Pimp.lIpada .. Pimploli Bk Pimploli Kh. Pingla, Pohi Posari Poshir Pot.1
Rajpe Ranshet
Saidongar .. Salokh T arf Need Salokh Tad W4redi Salp" .. .. Sal wad Sand,i Sangvi Sapele SavatlS'aon Savele Sawale Shelu Shil Shilar Shingdhol Shiv.le Sirse Sugwe
Takave Talawade Talawali Tamba, Tamnath Tembhare Tighar Tiwane Tiware
Ukrul Umroli
Vad.p .. .. Vadavali Tarl \V aredi Vak.. .. .. Var.i Tarl Need .. Var.i Tarl Varedi .• Vare Varne Vawe Vcnllaon
\'('adawali \~/anja[~ Wawaloli
TOTAL ..
Code No.
(2)
177 lSI
8 68 96 94 29
141 83 14
121 19
119
85 87
128 125
7 180 104 173 165 118 137 120 97 34 50 73 79 31
160 69
109 28
174 114 16~ 84
159 171 146
60 62
133 54 80
147 18 20
162 65
157
110 139 117
Population
1951 1961
(3)
584 84·\ 1"2 59
407 . 204 100 29--l
1,470 417
ISO •
330 615 230 214 181 201 112 197 471 472 637 · 217 131 · 343 4Z4
245 342
76 416 375 203 206
81 300
494 371
692 211 526 159 J77 978 237 190
1,221
243 429 201
(4)
907 1.068
191 75
519 . 295 169 342
1.6d6 530
341 •
464 867 311 271 233 284 146 268 569 570 69~
3J3 181
19 402 512
342 419
97 541 442 218 336 107 445
634 5vl
906 317 684 248 292
1,074 28p 239
1,358
256 460 249
70,172 87.2~8
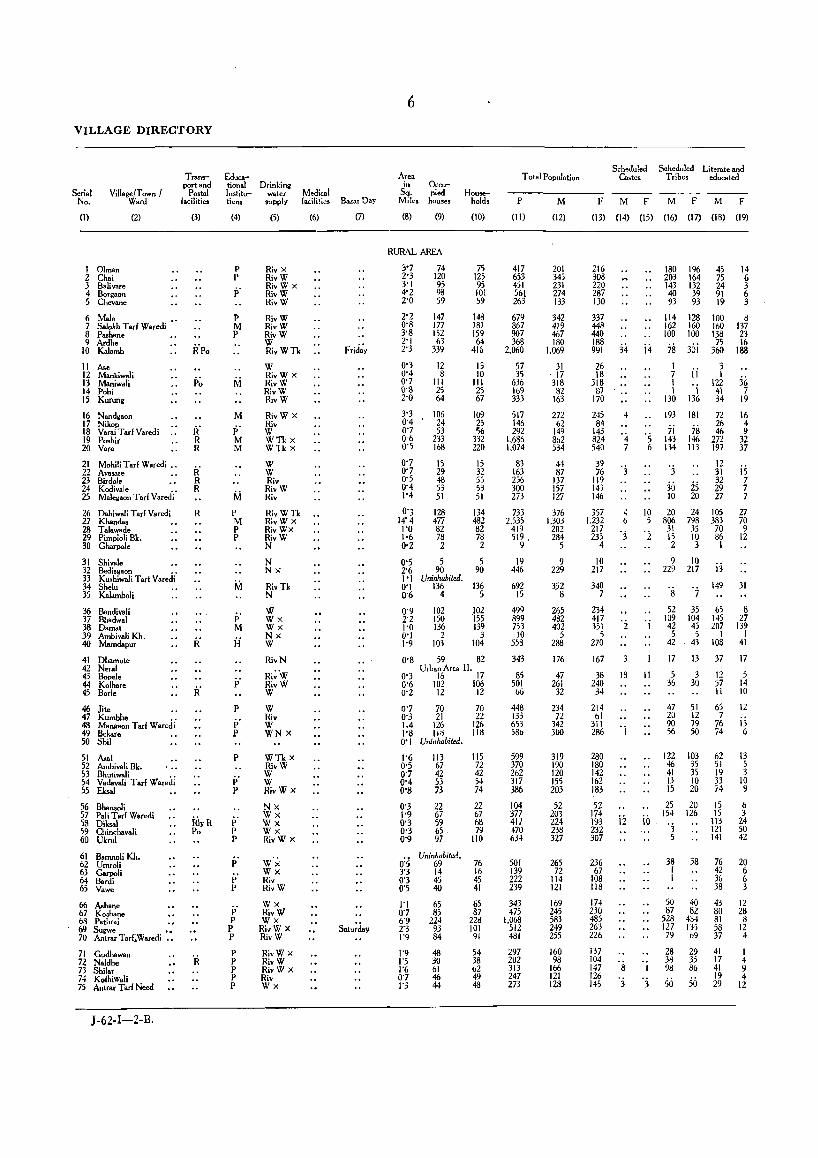
VILLAGE DIRECTORY
Serial No.
Village/Town / Ward
(Il
1 Olman 2 Chai 3 Balivare 4 BOTg80n 5 Chevane
6 Male
(2)
7 Salokh T arf Waredi 3 Pashane 9 Ardhe
to Kalamb
11 As. 12 MankiWllli 13 Maniwali 14 Pohi 15 Kurung
16 Nand~aon 17 Nikop 18 Varai Tarl Varedi ., 19 Poshir 20 Vare
21 Mohili Tarl Waredi ., 22 Ava .. re 23 Birdole 24 Kodivale .. 25 Mal""aon T arl Varedi
26 Dahiwali Tar! V.redi 27 Khandas 28 Talawade 29 Pimploli Bk. 30 Charpole
31 Shivale 32 Bediswaon .. 33 Ku,hiwali Tart Vatedi 34 Shelu 35 KaI.unboli
36 Bandivali 37 Bhadwal 38 Damat 39 AmbivaJi Kh. 40 Marodapur
41 Dhamote 42 Neral 43 Hopele 44 Kolhare 45 Borle
46 Jite 47 Kumbh. ., "'~ Mangaon Tar! Waredi 49 Bekare 50 Shil
51 Asal 52 Ambivali Bk. 53 Bhutiwali .. 54 Vadavali T ar£ Waredi 55 Eksal
56 Bhansoli 57 Pali Tarl Waredi 53 Diksal 59 Chinchavali 60 Ukrul
61 Bamnoli Kh. 62 Umroli 63 Carpali 64 Bardi 6S Vawe
66 Ashane 67 K03bane 6R Pathraj 69 Sugwe " 70 Antrar Tarl;Waredi ..
71 Gudhawan 72 Naldhe 73 Shilar 74 Kolhiwali 75 Antrar Tar! Need
J-6Z-I-Z-B,
Transport and
Postal facilities
(3)
l~' R R
R' R R
R
.'. R
Educa-tional Drinking Institu- water tions supply
(4) (5)
p p
p'
P M P
M p' M M
M P M P P
p' M
H
P
P' p
P
p' P
f p P
p
p' p
p' P
P P
P P p P P
Riv X RivW RivW X RivW RivW
RivW RivW RivW W RivWTk
W RivW X RivW RivW RivW
RivW X Riv W WTkx WTkx
W W Riv RivW Riv
RivWTk RivW X RivWx RivW N
N Nx
RivTk N
W Wx Wx Nx W
RivN
Ri~'W RivW W
W Ri. W WNX
WTkx Ri. \V W W RivW X
Nx \VX WX Wx RivW X
Wx Wx Riv RivW
Wx RivW Wx
Ri"W X RivW
RivWx RivW Riv \V X Riv Wx
Medical facili!ies
(6)
Baau Day
(7)
6
Area in
Sq. Miles
(8)
Occupied
houses
(9)
RURAL AREA
'j'7 2'3 3'1 4'2 2'0
2'2 0'8 3'8 2'1 2'3
0'3 0'4 0'7 O'S 2'0
3'3 0'4 0'7 0'6 0'5
74 120 95 98 59
147 177 1;2 63
339
12 8
III 25 64
106 24 53
233 168
0'7 15 0'7 29 0'5 48 0'4 53 1'4 51
0'3 128 14' 4 477 1'0 82 1'6 78 0'2 2
0'5 5 2'6 90 I 'I Ullinhabited. 0'1 136 0'6 4
Households
(10)
75 125 95 101 59
148 181 159 M
416
13 10
III 2) 67
109 25 56
332 220
15 32 5) 53 51
134 482 82 78 2
5 90
136 5
0'9 102 .102 2'2 150 155 1'0 136 139 0'1 2 3 1'9 103 104
0'8 59 82 Urban Area II.
0'3 16 17 0'6 102 106 0'2 12 12
0'7 70 70 0'3 21 22 1.4 126 126 I'S II~ 118 0'1 Uninhabited.
1'6 0'5 0'7 0'4 O'S
0'3 1'9 0'3 0'3 0'9
113 67 42 53 73
22 67 59 65 ' 97
115 72 42 54 74
22 67 68 79
110
Uninhabited, 0=5 69 76 3'3 14 16 0'3 45 45 0'5 40 41
1'1 07 6'9 2'3 1'9
1'9 1'5 1'6 07 1'3
65 85
224 93 84
48 30 61 46 44
65 87
228 101 91
54 38 62 49 48
Total Population
P M
(II) (12)
417 653 451 561 263
679 867 907 368
2.060
57 35
636 109 333
517 146 292
1.686 1.074
83 163 256 300 273
733 2.535
419 519.
9
19 446
692 15
499 899 753
10 558
343
85 501 66
448 133 653 580
599 370 262 317 386
104 377 417 470 634
501 139 222 239
343 475
1.068 512 481
297 202 313 247 273
201 345 231 274 133
342 419 467 180
1.069
31 . 17 318 82
163
272 62
149 862 534
44 87
137 157 127
376 1.303
202 284
5
9 229
352 8
265 482 402
5 288
176
47 261 32
234 72
342 300
319 190 120 155 203
52 203 224 238 327
265 72
114 121
169 245 583 249 2S5
160 98
166 121 128
Scheduled Soheduled Literate and Castes Tribes educated
FMF MFMF
(13) (14) (15) (16) (17) (18) (19)
216 30B 220 287 130
337 448 440 188 991
26 18
318 87
170
245 84
143 824 540
39 76
119 143 146
357 1.232
217 235
4
10 217
340 7
234 417 351
5 270
167
38 240 34
214 61
34
4
'4 7
18
%~ 'j
280 180 142 162 183
52 174 \93 232 307
236 67
108 118
174 230 485 263 226
l37 104 147 126 145
ii
i4
'5 6
10 5
'i
'i
II
io
I
'j
180 1% 203 164 143 132 40 39 93 93
114 128 162 160 100 100
78 30i I 7 1 1
130
II
1 136
45 75 24 91 19
100 160 138 75
360
3 I
122 4\ 34
193 181 72
ii 78 ~~ 143 146 272 134 113 197
'3 30 10
20 806
31 15 2
9 229
is 20
24 798 35 10 3
10 217
12 31 32 29 27
105 383 70 86 1
i:i 149
14 6 3 6 3
8 137 23 16
188
36 7
19
16 4 9
32 37
is 7 7 7
27 70 9
12
31
52 35 65 8 109 104 145 27 42 45 207 139 5 5 I I
42 43 108 41
17 13 37 17
5 3 12 5 36 30 57 14
II 10
47 51 65 12 20 12 7 90 79 76 13 56 50 i4 6
122 103 46 35 41 35 i3 10 15 20
25 20 154 126
'3 5
62 51 19 33 74
15 15
113 121 141
13 5 3
10 9
6 3
24 50 42
38 38 76 20 I 42 6 I 36 6
38 3
50 40 43 12 87 8Z 80 28
528 484 81 8 127 135 58 12 79 69 37 4
28 29 38 35 9d 86
50 50
41 17 41 19 29
I 4 9 4
12
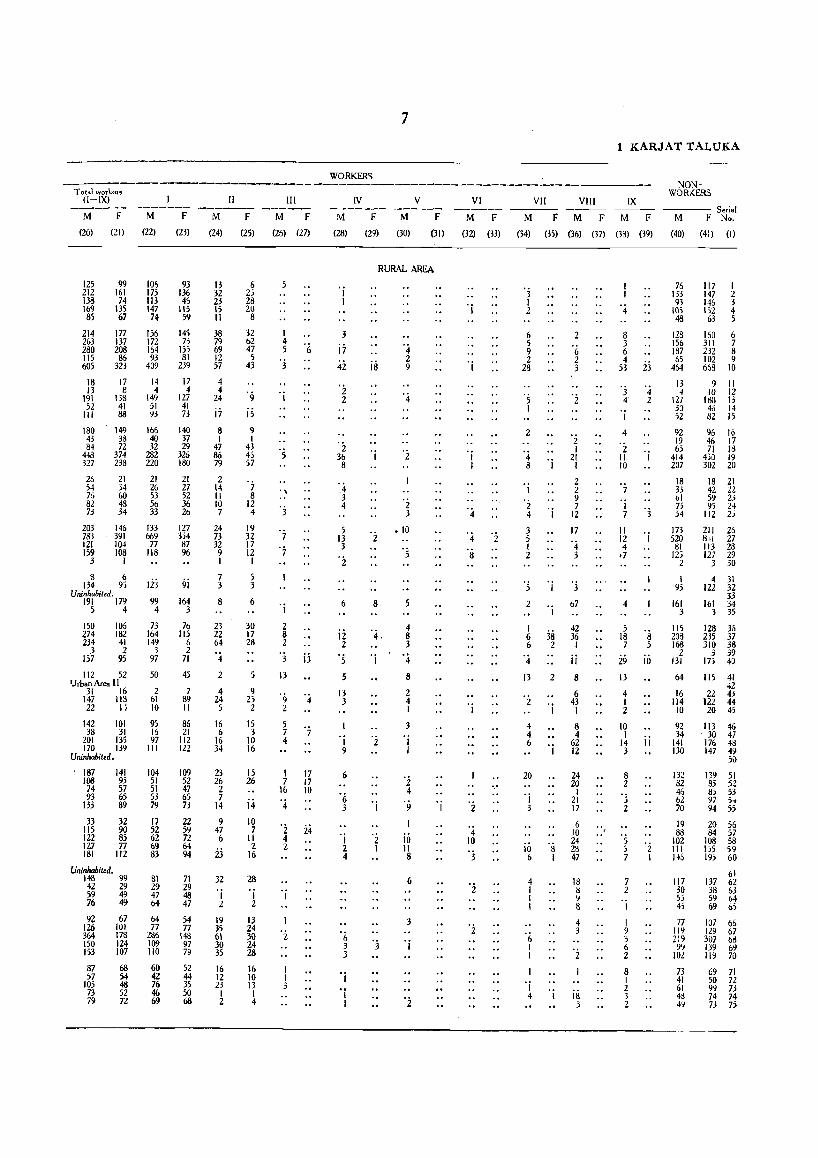
T otdi worker~ (I-IX)
------M F M F
(20) (21) (22) (23)
IB " I~ " 212 161 J7j 136 138 74 113 45 169 135 147 115 85 67 74 59
214 177 156 145 263 137 172 7) 280 208 164 155 115 85 93 81 605 323 409 239
18 17 14 17 13 e 4 4
191 138 149 127 52 41 51 41
III 88 93 73
180 43 84
448 327
26 54 76 82 73
149 38 72
374 233
21 34 60 48 34
203 146 783 391 121 104 159 108
3 1
8 6 134 95
Uninhabited. 191 179
5 4
150 106 274 182 234 41
3 2 157 95
112 52 lJrban Area II
31 16 147 113 22 1\
142 101 38 31
201 135 170 139
Uninhabited.
187 141 lOB 95 74 57 93 65
133 89
33 32 115 90 122 85 127 77 181 112
Uninhabited,
166 40 32
282 220
21 26 53 56 33
133 669
77 118
lij
99 4
73 164 149
3 97
50
2 61 10
95 15 97
III
104 51 51 53 79
17 52 62 69 83
148 99 81 42 29 29 59 49 47 76 49 64
92 67 64 126 101 77 364 178 286 150 124 109 153 107 110
87 ')7
105 73 79
63 54 48 52 72
60 42 76 46 69
140 37 29
326 180
21 27 52 36 26
127 354 87 96
9j
164 3
76 115
6 2
71
45
7 89 II
86 21
112 122
109 52 47 65 73
22 59 72 64 94
71 29 48 47
54 77
148 97 79
52 44 35 50 63
II
M F
(24) (25)
13 32 23 15 II
38 79 69 12 57
4 4
24
jj
8 I
47 86 79
2 14 II 10 7
24 73 32 9 I
7 3
8
23 22 64
'4 2
4 24 5
16 6
16 34
23 26 2 7
14
9 47 6
i3
32
'j 2
19 35 61 30 35
16 12 23 I 2
6 2, 28 20 8
32 62 47 5
43
'9 is 9 I
43 4, 57
'j 8
12 4
19 32 17 12 I
5 3
6
30 17 28
5
9 2,
2
15 3
10 16
15 26
i4 10 7
II 2
16
28
1 2
13 24 30 24 28
16 10 13 I 4
1II
M F
(26) (27)
I 4 5 '6 'j
, \
'j
'7 'j
'i 2 8 2
'j
13
9 2
5 7 4
I 7
16
'4
'2 4 2
'j
I 1 3
jj
17 17 10
24
WORKERS
IV
M F
(28) (29)
7
V
M F
(30) (31)
RURAL AREA
'j I
3
ij 42
'2 2
2 36 8
5 13 3
'i
6
ii 2
'5 5
13 3
I 9
6
OJ
2 4
'6 3 3
OJ
°i I
is
8
'j
'j
'2 I
'j
'4 2 9
'2
'2 3
.10
4 8 3
'4 8
2 4 I
3
'j I
'i 4
'9
jo II 8
6
3
'j
'2
'i
VI VII VlII ---- _--- ---M F M F M F
1 KARJAT TALUKA
IX
M F
N07'JWORKERS
--- Serial M F No.
(32) (33) (34) (35) (36) (37) (33) (39) (40) (41) (I)
'i
'j
4 10
'j
'i
'i
3 I 2
6 5 9 2
28
's I
2
'4 8
1
OJ
~ 'j
3 5 I 2
"s 2
I 6 6
'4 13
'2
4 4 6
20
'j 3
io 6
4 I I I
'I, I I
'j
38 2
2
'j
'j
'8 I
2 '(, 2 3
'2
'2 I
21 I
2 2
5 12
17
'4 3
'j
67
42 36 I
ii 8
6 43 I
8 4
62 12
24 20
I 21 17
6 10 24 28 47
18 S 9 8
4 3
'i
'j 4 I is
3
8 3 6
5t i3
'3 '4 4 2
OJ
4
'2 II 10
7
~ 'j
l1 'j 4
.7
4
5 18 7
29 13
4 I 2
10 I
14 3
8 2
's 2
. S 5 7
7 2 'j
I 9 3 6 2
8 I 2 3 2
8 5
io
jj
'2 I
76 117 I J33 147 2 93 146 3
10; 152 4 43 63 5
123 160 6 1)6 311 7 187 232 8 65 102 9
464 663 10
13 9 II 4 10 12
127 180 13 3) 46 14 52 82 15
92 19 63
414 207
18 33 61 75 54
173 520
81 125
2
1 95
161 3
115 208 168
2 131
64
16 114 10
92 34
141 130
132 82 46 62 70
19 88
102 111 14&
96 16 46 17 71 18
430 19 302 20
18 21 42 ZZ 59 23 93 24
112 2j
211 26 811 27 113 23 127 29
3 30
4 31 122 32
33 161 34
3 35
128 36 235 37 310 38
3 39 175 40
115 41 42
22 4.$ 122 44 20 43
113 46 30 47
176 48 147 49
50
139 51 85 52 83 53 97 )~ 94 55
20 56 84 57
108 58 I'» 59 195 60
61 117 137 62 30 38 63 55 59 04 4, 69 0:>
77 107 66 119 129 67 219 307 68 99 139 o~
102 119 70
73 41 61 4~ 49
69 71 50 n 99 7) 74 74 73 75
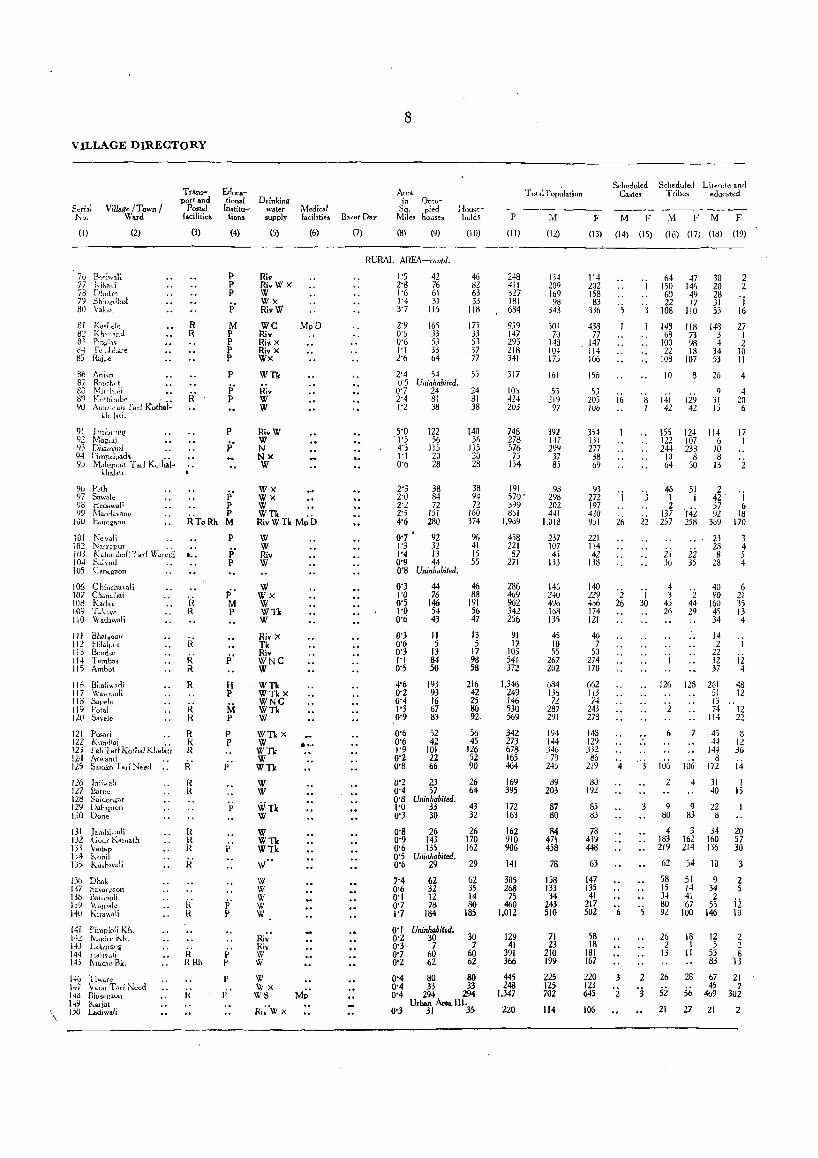
\
VILLAGE DIRECTORY
Seri.'ll No,
Village fTown I Ward
(I)
76 B·')yiv.al; 77 Kihavi 78 D!H","" j9 Sh:ngdhol 80 Vak."
f! Kil~Lde 82 Kh<"~a!"'.d 83 Pin«,rl~ . ., i1-l. r e -,lbl-.are 8S Raj,;.
86 Aninp 87 R""h"t Eo f'vli,,·holi
(2)
89 K"thimlJ(' .•• 90 '\m""".1. rad Koth.l-
kh,I"i,
91 .hl'I'lbr'~lnll
~} N~!~::!ni 94 f'im~alpad. • . 9j Mdl.q,O.l Tad Kolhal·
khal.u
Y6 Yeth 97 Srrw".!e 9<> Hcdawal; 99 r..1andc.:vanc
IOU HUfO£aon
101 "leva!; I G2 Na~r<J.pur .. 103 Kc.lntllboli Tad \t:ult:di 104 Sah-ad 1 U5 CaOt.'gaon
106 C hin(ha-.li 107 C~lanLhai 108 Kad.v 109 T"bve 110 'lVadawali
111 Bhatiflo" 112 Hilal"vl 1!3 Bendee II"" Tamba:j 115 Ambot
116 Bl1aliwacli 117 Wawr.loli 118 Sapeic IIY I'otal 120 S .. cJe
121 Pos.ri I ZZ Kundl,j , , 12, f'ald arf KOlhal Khalati 124 Arwand 125 Salokh Tad Need ..
126 IniiwC'di 127 Barne 128 Saidon:<ar 129 l>alu&f3on 130 Dune
131 lambi"'ali 132 Cour Karnat!J. 13'3 'Ii,nap 1A ;,."hil U) K.ushiH!!i
l30 Dhak 137 ~avar;;.ort 13~ B'''olnv\i ))9 \.\ bll}aic 14U "ira"ali
141 Pimploli Kil, i 41 IVlucrt' 1\.h. 143 Lakhra"lI 144 i ldl;vdli 14) I\'iudre Bk.
146 1 iware 141' Varai Tarf Nctd 1 if;> Bh1seguon I.~ had., 1)0 Lad.wa/i
Transport and
Postal facilities
(3)
R R
R'
...
'f{ R
R k' R
R
R' H
R f< R
R' R R
R R R
k'
k' R
R HRh
Educational
Institu-tions
(4)
" p p
p'
~ p p p
p
p' p
p
p'
i' P
p' M P
H P
M p
p p
i' p
P' p
p
p'
Drin~ing water" supply
(5)
Ri. RivWX W Wx Ri.W
Medical facilities
(6)
we MpD Riv Ri. x Riv x Wx
WTk
Hiv W W
Ri. W W N Nx W
Wx Wx W WTk .. Ri.wn MpD
\V W Riv W
W wx W WTk W
Riv X TIt Riv WNC W
WTk WTkx WNC WTk W
WTkx W WTk W WTk
W W
wn W
W WTk WTk
W"
W W W W W
W \Vx WS Ri;'W X
•...
8
Area in O("cu-
Bazar Day Sq, pied
Miles houses
(7) (8) (9)
llou,cholds
(10)
RURAL AREA-co1lld,
1'5 2'8 1'6 1'4 3'7
2'9 0'6 0'6 1'1 2'6
42 76 61 31
m 165 33 53 33 64
46 82 63 33
118
175 33 53 37 77
2'4 54 55 0'5 Uninhabited, 0'7 24 24 2'4 81 81 1'2 38 38
5'0 1'5 4'3 1'1 0'6
2'3 Z'O 2'2 2'5 4'6
0'7 • 1'3 1'4 0'9 0'8
0'3 1'0 0'5 1'0 0'6
0'3 0'6 0'3 1'1 0'5
4'6 0'2 0'4 1'3
,0'9
122 56
115 20 28
38 84 72
151 280
92 32 13 44
Uninhabited,
44 76
146 54 43
II 5
13 84 50
193 93 16 67 83
140 56
115 20 28
38 94 72
160 374
96 41 15 55
46 88
191 56 47
13 5
17 98 58
216 42 25 80 92,
0'6 52 56 0'6 42 45 1'9 101 126 0'2 22 52 O'S 66 90
0'2 23 26 0'4 57 64 O'S Uninhabitecl, 1'0 33 43 0'3 30 32
O'S 26 26 0'9 143 170 0'6 135 162 0'5 Uninhabited. 0'6 29 29
7'4 62 62 0'6 32 35 0'1 12 14 0'7 78 SO 1'7 184 185
0'1 0'2 0'3 0'7 0'2
0'4 0'4 0'4
0'3
Uninhabited, 30 30 7 7
60 60 62 62
80 80 33 33
294 294 Urban Are. Ill,
31 35
p
(II)
248 411 327 181 684
939 147 295 218 341
317
10" 424 203
746 278 576
75 154
191 570 ' 399 861
1,909
458 221 87
271
286 409 962 342 256
91 17
105 541 372
1,346 ~49 146 530 569
342 273 678 165 464
169 395
172 163
162 910 906
141
305 268
75 460
1,012
129 41
391 366
445 248
1,347
220
T ot'll Pop~lation
;VI
(12)
134 209 169 98
343
501 70
143 10. 175
161
53 219
97
392 14i 299
37 85
93 29~ 202 441
1,013
237 107 45
133
146 2.fD 496 168 135
45 10 55
267 202
684 136 72
287 291
194 144 346
79 245
89 203
87 80
84 471 4SB
78
158 133 34
243 510
71 23
210 199
225 125 702
114
Scheduled Castes
M F
Scheduled Literate and Tribes edllcated
M F M F
(13) (14) (15) (16) (17) (18) (19)
114 202 158 83
336
438 77
147 114 166
156
53 20, 106
354 131 277
38 69
93 272 197 4LO 951
221 114 42
138
140 229 4)6 174 121
46 7
50 274 170
662 1U 74
243 278
143 129 332 86
219
80 192
85 83
73 439 448
63
147 135 41
217 502
58 18
181 167
220 123 645
106
16
26
2 26
4
3
'2
64 150 60 22
108
143 68
100 22
103
47 146 49 17
110
118 73 98 13
107
10 8
30 20 28 31 53
148 3 4
34 53
26
2 2
1 16
27 1 2
10 11
4
4 8 141 129
9 31 15
20 6 1 42 42
22
1 30
3
2
'3
15; m 114 17 1 122 107 6
244 233 10 10 8 8 64 50 13 2
46 1 2
137 257
2i 36
4 3
45 26
'j
126
6
51 1
14i 258
22 35
'2 44 29
128
106 Hi£'
2 4
9 9 80 83
4 3 183 162 219 214
62 54
58 51 15 14 34 41 80 67 92 100
26 2
13
26
52 21
18 I
II
28
56 27
2 42 57 92
369
23 23 8
28
'j 6
18 170
3 4 5 4
40 6 90 21
160 35 45 13 34 4
14 2 1
22 32 12 37 4
261 48 51 12 13 .. 74 12
114 22
45 44
144 8
172
31 40
22 ~
34 160 136
10
9 34 2
55 146
12 ';
53 83
67 45
469
21
S 12 36
i4 1
15
20 57 30
3
2 5
i:i 10
2 2 8 -13
21 7
302
2
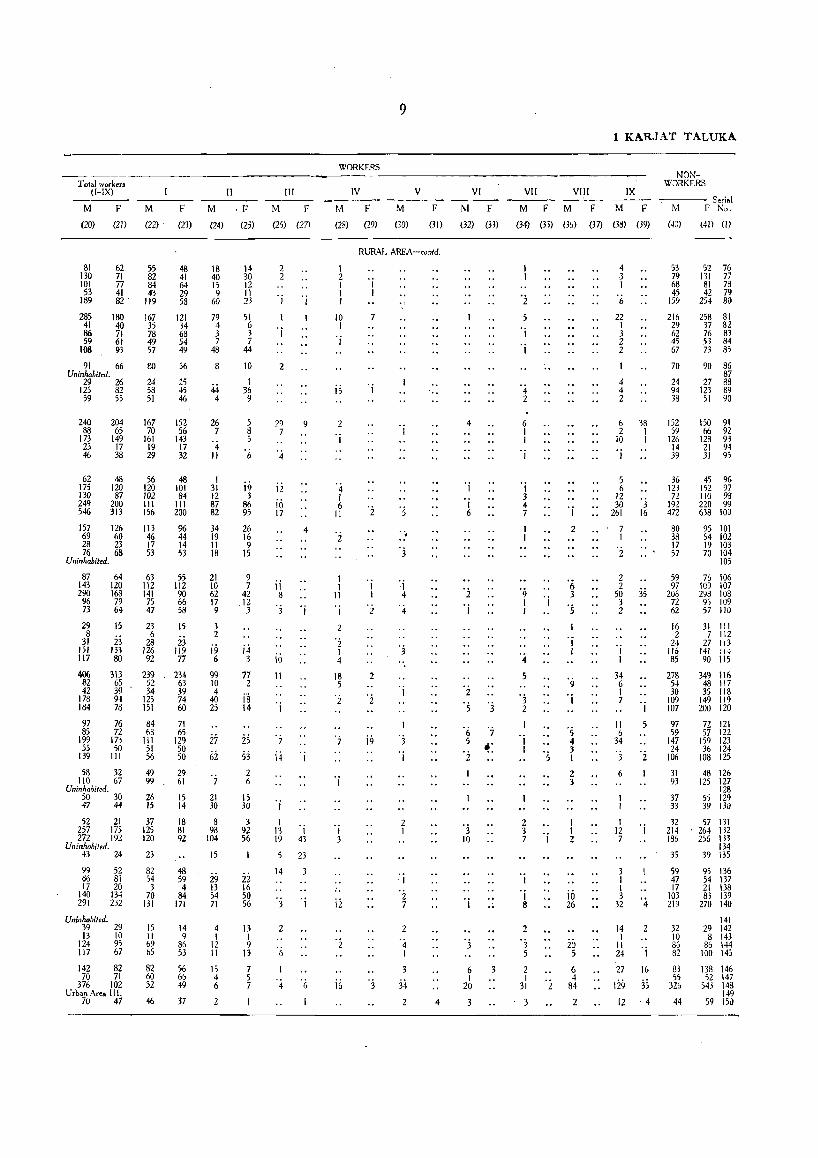
T o18J workers ([-[X)
M F
(20) (21)
M
(22)
81 130 101 53
J89
62 55 71 82 77 84 41 43 82' 119
285 41 86 59
J08
180 40 71 61 93
91 66 Uninhabited,
29 26 125 82 59 55
240 88
173 23 46
62 175 130 249 546
204 65
149 17 38
48 120 87
200 313
157 126 69 60 28 23 76 68
Uninhabited,
87 143 290
96 73
29 8
31 151 117
406 82 42
178 184
97 85
199 55
139
64 120 168 79 64
15
23 133 80
313 65 39 94 78
76 72
173 50
III
58 32 110 67
Uninha&ited, 50 30 47 44
52 21 257 m 272 192
Uninhabited, 43 24
99 86 17
140 291
Uninhabited,
52 81 20
134 232
39 29 13 10
124 95 117 67
142 82 70 71
376 102 Urban Area Ill.
70 47
167 35 78 49 57
eo 24 58 51
167 70
161 19 29
56 120 102 III 156
113 46 17 53
63 112 141 75 47
23 6
28 126 92
239 52 34
125 151
84 68
III 51 56
49 99
26 15
37 125 120
23
82 54 3
70 131
15 II 69 65
82 60 52
46
F
(23)
48 41 64 29 53
121 34 68 54 49
56
25 45 46
152 56
143 17 32
48 101 84
III 200
96 44 14 53
55 112 90 66 58
15
23 119 77
234 63 39 74 60
71 65
129 50 50
29 61
15 14
18 81 92
48 59 4
84 171
14 9
86 53
56 66 49
37
M
(24)
18 40 15 9
60
79 4 3 7
48
8
44 4
26 7
'4 II
I 31 12 87 82
34 19 11 18
21 10 62 17 9
3 2
jil 6
99 10 4
40 25
27 6i
7
21 30
8 93
104
15
29 13 54 71
4 I
12 II
15 4 6
2
[[
,F
(2:5)
14 30 12 II 23
51 6 3 7
44
10
f 36 9
5 8 5
';'
i9 3
86 95
26 16 9
15
9 7
42 ,12
3
j4 3
77 2
is 14
25 53 2 6
15 30
3 92 56
22 16 50 S6
13 I 9
13
7 5 7
M F
(2S) (27)
2 2
I 'j
'j
2
29 7
12
io 17
ji 8
9
4
3 'j
i6 11
'i
'7 i4
'j
I 13 I 19 43
23
14
'3 'j
2
'(,
I
9
WORKERS
[V v M F M F
(28) (29) (30) (31)
RURAL AREA-cantd,
1 2 I I I
10 I
'j
js
2
'j
'4 I 6
II
'2
I I
II
'j
2
'2 I 4
18 5
'2
'j 3
i2
°2
16
7
'j
I I
2
2
2
i9
'3
"
~ i 4
4
'j
'3 'j
2 I
'j
'2 7
2
4 I
34 2
."
4
V[
M F
(32) m)
4
'j
I 6
°2 OJ
OJ, 5
°2
OJ 10
'j
6 I
20
3
Vll VII[
M F M
(3~) (3i) (3~)
I
'j
'4 2
6 I I
'j
I 3 4 7
°9 I 'j I
'4 5
'3 2
'j I
2 3 7 I
OJ
'j 8
2
° :3 5
2 I
31
3
'2
'i 2
'6 3
'5
'9 'j
°5 4 3 I
2 3
I f 2
j6 26
20 5
6 4
84
1 KARJAT TALUKA
IX
F M F
(37) (38) (39)
4 3 I
6
22 I 3 2 2
I
4 4 2
6 38 2 I
10 I
I
5 6
12 30 3
261 16
7 I
'2
2
55 35 3 2
I I
34 6 I 7
II 6
34
'j
6
'j
3 I I 3
32 '4
14 I
II 24
27
129 12
2
'j
16
3S ,4
NO:--JWORKERS
.,.----- Serial M F No,
(4J) (41) (l)
53 79 68 45
159
216 29 62 45 67
70
24 94 38
152 59
126 14 39
36 12l 72
192 472
80 38 17 57
59 97
206 72 62
16 2
24 116 85
278 54 30
109 107
97 59
147 24
106
31 93
37 33
52 76 131 77 81 78 42 79
254 80
258 81 37 82 76 83 53 84 73 85
90 86 87
27 88 123 89
51 90
ISO 91 66 92
128 93 21 94 31 95
45 96 152 97 110 93 220 99 638 100
95 101 54 102 19 103 70 104
105
76 106 109 107 298 108
95 109 57 110
31 III 7 112
27 113 141 :f~ 90 115
349 116 48 117 35 118
149 119 200 120
72 121 57 122
159 123 36 124
108 125
48 126 125 127
128 55 129 39 130
32 57 131 214 '264 132 186 256 133
134 35 39 135
59 47 17
103 219
32 10 86 82
83 55
326
44
95 136 54 137 21 138 83 139
270 140
141 29 142 8 143
86 144 100 143
138 146 52 147
543 148 149
59 ISO
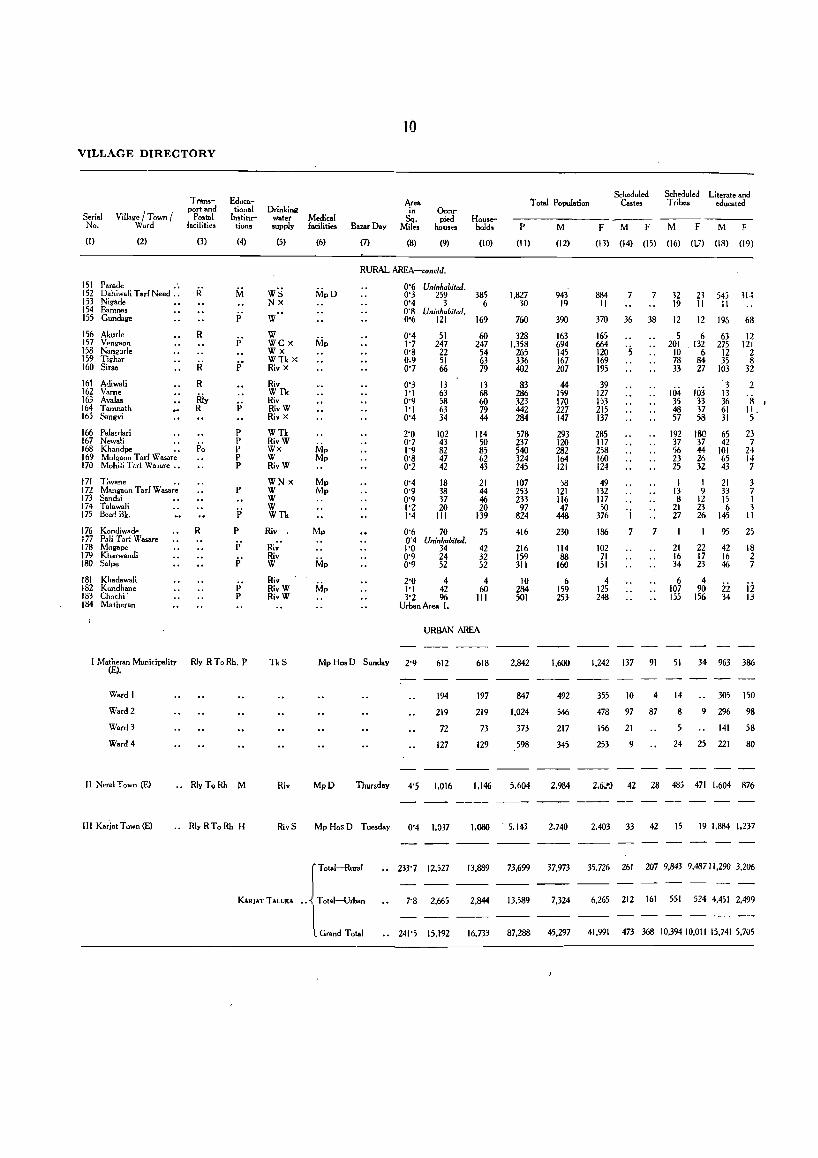
VILLAGE DIRECTORY
Serial No.
Village I Town I Ward
(I) (2)
151 Parade ., 152 Dahiwali T .rl Need. , Jj3 Nigade 154 Bamna, 155 Cundage
156 Akurle 157 Vengaon 158 Nangurle 159 Tighar 160 Sir..,
161 Adiwali 162 Vame 163 AvaJa. 164 Tamnath 165 Sangvi
166 Pal.,dari 167 Newa!i 168 Khandpe .. 169 Mulgaon Tarl \V asar. 170 Mohili Tart \Vas.re ..
171 T;wAne .. 172 Mangaon Tarl Wasar. 173 Sand,i 174 T alawali 175 Seed Bk,
176 Kondiwade 177 PaJi Tarl Wasare 178 Mllgape 1 79 Kharwandi 180 Salpe
181 Khadawali 182 Kondhane 183 Chochi' 184 Matheran
Transport and
Postal facilities
(3)
R
R
R
Educational
Institutions
(4)
P P P p p
p
p p p.
P'
p' p
I Matheran Municipality Rly R To Rh, P (E),
Ward I
Ward 2
Ward 3
Ward 4
II Neral T QV,n (EJ .. RlyToRh M
.. RlyRToRh H
Drinking water supply
(5)
W's Nx W"
W wex WX WTk X Riv X
Riv WTk Riv RivW Riv X
WTk RivW Wx W RivW
WNx W W W WTk
Riv .
Ri~' Riv W
Riv RivW RivW
TkS
Riv
RivS
KARJAT TALUKA
10
Scheduled Scheduled Literate and Area in
Tow Population Castes T rihe. educated
Medical facilities
(6)
Mp Mp
Mp
Bazar Day Sq,
Miles
(7) (8)
Occupied
houses
(9)
Household.
(10)
RURAL AREA--concld.
0'6 Uninhabited. 0'3 259 0'4 3 0'8 Uninhabited. 0'6 121
0'4 51 1'7 247 0'8 22 Q.9 51 0'7 66
0'3 13 1'1 63 0'9 58 1'1 63 0'4 34
2'0 102 0'7 43 1'9 82 0'8 47 0'2 42
0'4 0'9 0'9 1'2 1'4
18 38 37 20
III
385 6
169
60 247
54 63 79
13 68 60 79 44
114 50 85 62 43
21 44 46 20
139
0'6 70 75 0'4 Uninhabited, 1'0 34 42 0'9 24 32 0'9 52 52
2'0 4 1'1 42 3'2 96
Urban Area I,
4 60
III
URBAN AREA
Mp Ho, D Sunday 2'9 612 618
Thursday
194
219
72
127
4'5 1,016
197
219
73
129
1.146
P M
(II) (12)
1,827 30
760
328 1,358
265 336 402
83 286 323 442 284
578 237 540 324 245
107 253 233 97
824
416
216 159 311
10 284 501
2,842
847
1.024
373
598
5,604
943 19
390
163 694 145 167 207
44 159 170 227 147
293 120 282 164 121
58 121 116 47
448
230
114 88
160
6 159 253
1,600
492
546
217
345
2,984
Mp Hos D Tuesday 0'4 1,037 1,080 . 5,143 2,740
r Total-Rural
, , ~ Total-Urban
I L Crand T olal
233'7 12,527 13.889
7'8 2.665 2,844
241'5 15,192 16,733
73.699 37,973
13,589 7,324
87,288 45,297
FMFM FMF
(13) (14) (15) (16) (L7) (18) (19)
884 II
370
165 664 120 169 195
39 127 153 215 137
285 117 258 160 124
49 132 117
7
36
3~g 'i 186
102 71
151
4 125 248
7
7
38
32 23 19 II
12 12
5 6 201 . 132 10· 6 78 84 33 27
104 103 35 33 48 37 57 58
192 180 37 37 56 44 23 26 25 3Z
54i II
196
63 275
12 35
103
3 13 36 61 31
65 42
101 65 43
314
68
12 12i
2 8
32
2
's , Ii. 5
23 7
24 i4 7
I 1 21 3 13 9 33 7 8 IZ 15 I
21 23 6 3 27 26 145 II
7 95 25
21 22 42 18 16 17 16 2 342346 7
6 4 107 90 ii ii 155 156 34 13
1,242 137 91 51 34 963 386
355 10 4 14 305 150
478 97 87
156 21
253 9
8
5
9 296 98
141 58
24 25 221 80
2,6~·J 42 28 485 471 1,604 876
2.403 33 42 15 19 1.884 1.237
35,726 261 207 9,843 9.48711 ,290 3,206
6,265 212 161 551 524 4,451 2.499
41,991 473 368 10.39410,011 15,741 5,705
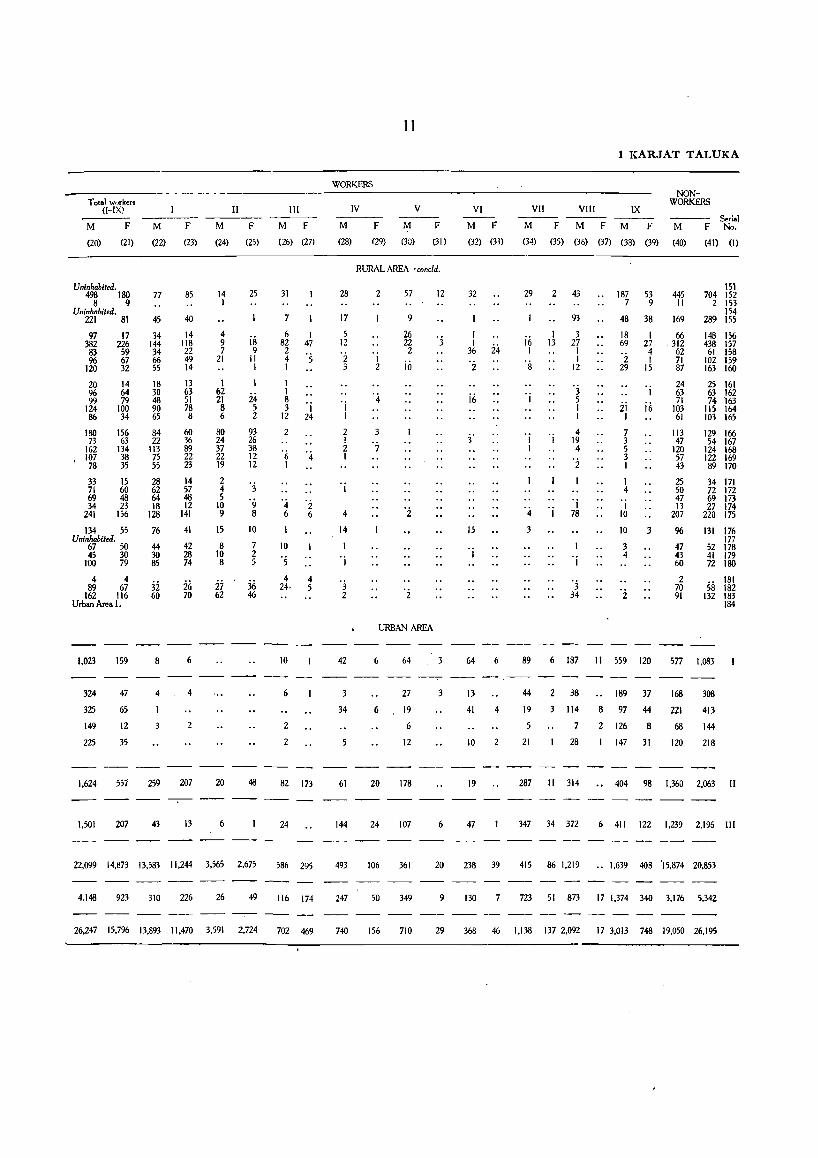
Total w()Tk(.rs (I-IX) II
M F M F M F
(20) (21) (22) (23) (24) (25)
Urrinha~ited. 498 180
8 9 Uninhabited.
221 81
97 17 382 226 83 59 96 67
120 32
20 96 99
124 86
14 64 79
100 34
180 156 73 63
162 134 107 38 78 35
33 15 71 60 69 48 34 23
241 156
134 55 Uninhabited.
67 50 45 30
100 79
4 4 89 67
162 116 Urban Area I.
1.023
324
325
149
225
159
47
65
12
35
77
45
34 144 34 66 55
18 30 48 90 65
84 22
113 75 55
28 62 64 18
128
76
44 30 85
32 60
8
4
3
1.624 557 259
1,501 207 43
85
40
14 118 22 49 14
13 63 51 78 8
60 36 89 22 23
14 57 48 12
141
41
42 28 74
26 70
6
4
2
207
13
14 I
4 9 7
21
I 62 21 8 6
80 24 37 22 19
2 4 5
10 9
15
8 10 8
27 62
20
6
25
is 9 il I
24 5 2
93 26 38 12 12
'3 '9 8
10
7 2 5
36 46
48
22,099 14.873 13,583 11,244 3,565 2.675
4.148 923 310 226 26 49
26.247 15.796 13.893 11,470 3,591 2.724
III
M F
(26) (27)
31
7
6 82 2 4 I
I I
I 47
8 3 'i
12 24
2
'6 4 I
'4 '2 6 6
10
'5 4 4
24· 5
10
6
2
2
82 173
24
586 295
116 174
702 469
11
WORKERS
IV
M
(28)
V
F M F
(29) (30) (31 )
RURAL AREA-concid.
28
17
5 12
2 3
'i I
2 I
:2 I
4
14
'j
'3 2
42
3
34
61
144
493
247
2
I 2
4
3
7
57
9
26 22 2
iil
URBAN AREA
6
6
20
24
106
50
64
27
19
6
12
178
107
361
349
12
'j
3
3
6
20
9
VI
M F
VII
M
VIII ---F M F
1 KARJAT TALUKA
IX
M F
NONWORKERS
M F S"ial No.
(32) (33) (34) (35) (36) (37) (33) (39) (40) (41) (I)
32
I
3~ 24 '2
i6
15
'j
64 6
13
41 4
10 2
19
47
238 39
130
29
i6 I
's
2
I 13
'j I I
'4 'i 3
43
93
3 27
1 1
12
'3 5 I I
4 19 4
'2
'j 78
'j
'3 34
187 7
48
18 69
2 29
53 445 9 II
38 169
I 66 27 ·312 4 62 I 71
15 87
'i ii i6 I
24 63 71
103 61
7 3 5 3 1
I 4
I 10
10
3 4
3
113 47
120 57 43
25 50 47 13
207
96
47 43 60
2 70 91
151 704 152
2 153 154
289 155
148 156 438 157
61 158 102 159 163 160
25 161 63 162 74 163
115 164 103 165
129 166 54 167
124 168 122 169 89 170
34 171 72172 69 173 27 174
220 175
131 176 177
52 178 41 179 72 180
181 58 182
132 183 184
89 6 187 II 559 120 577 1,083
44 2 38
19 114
5
21
7
28
189 37 168 308
8 97 44 221 413
2 126 8
147 31
68
120
144
218
287 II 314 .. 404 98 1.360 2.063 II
347 34 372 6 411 122 1.239 2,196 III
415 86 1,219 •. 1,639 408 "15,874 20.853
723 51 873 17 1.374 340 3.176 5.342
740 156 710 29 368 46 1.138 137 2.092 17 3.013 748 19,050 26,195


Panvel Taluka
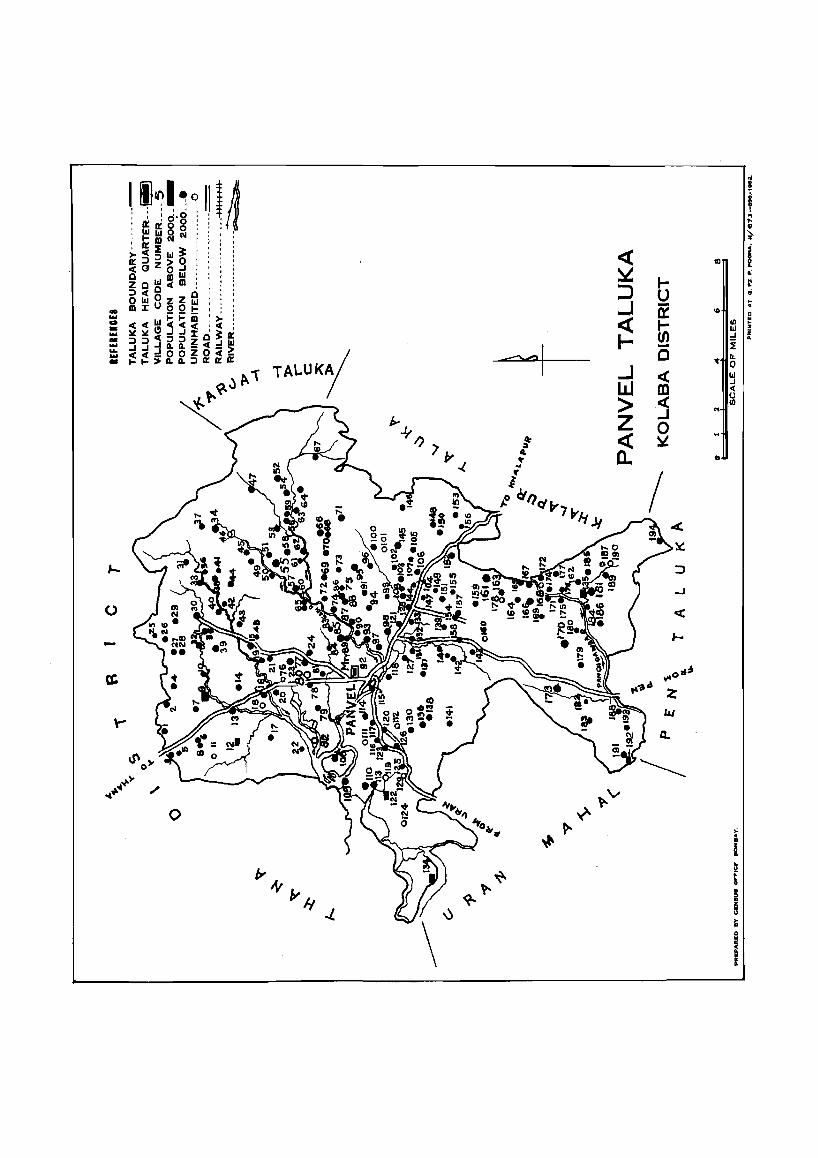
,_
o
-
o
.« ~ :J ..J « I-
..J W > Z « a.
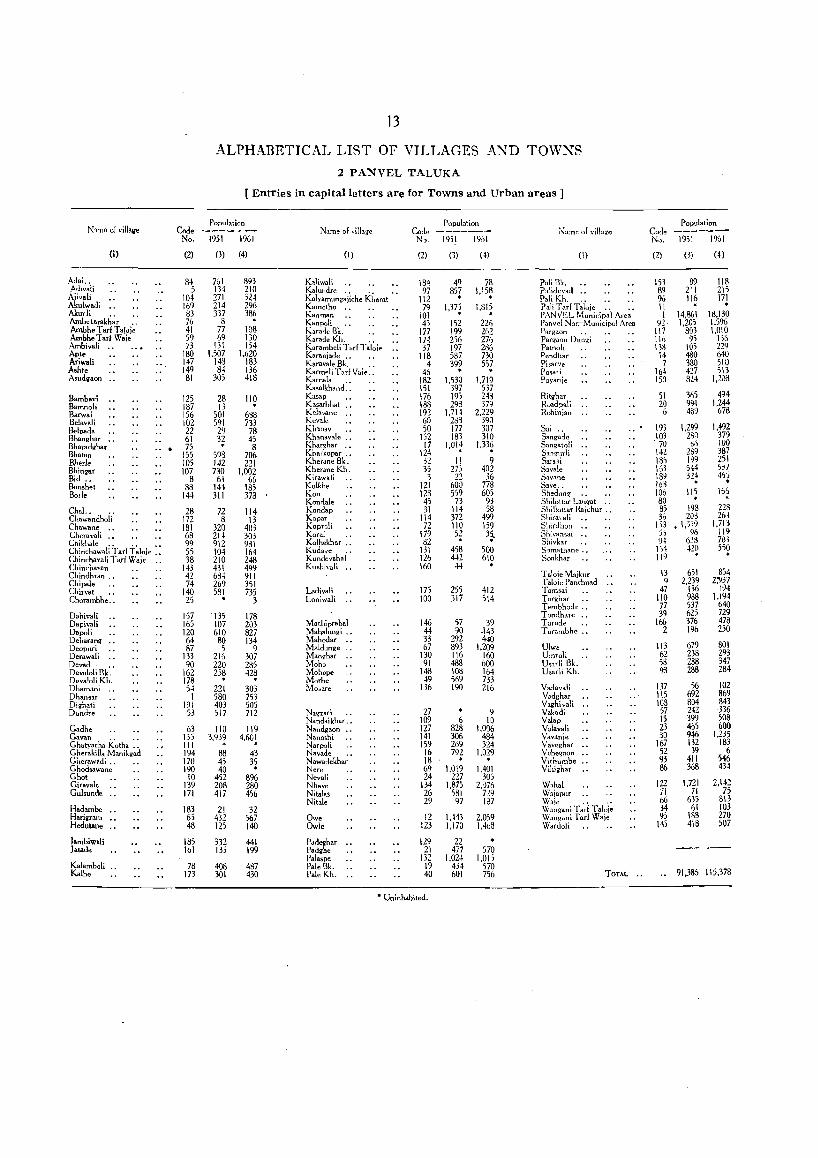
N'\ 'ne of viUage
Adai .. .A.divali Ajivali Akulwadi
(l)
Akurli .. AmbetarakhaT .. Ambhe Tarl Tala;e Ambh. Tarl Waie Ambivali Apt. Ariwali Ash!e Asudgaon
Bambavi Bamnoli Barwai Belavali Ilelpada Bhanghar BharadghaT Bhatan Bheri. Bhingar Bid .• Bonshet Bode
Chal.. •• CI.awandholi Chawane .•
...
Cheravali •• Chikhale.. .. .• Chinchawn!i Tarf Taloje .• Chinchayali Tarl \Va;e Chinchavan .. Chindhran .• Chi pale ChirYa! .• Chorambhe .•
Dahivali Dapivali Dapeli Deharang Deopuri Derawali Devad .• Devaloli Bk. Devaloli Kh. Dharnani Dhan::lu Dighati Dundre
Gadhe Gavan .. .. Ghatyncha Kotha .• Cherakilla Manikgad Ghctawadi .. Ghodsawanc Ghat Giravalc Guisundc
Hadambe Harigram Hedutane
lambiwali Jatade
Kalamboli Kalhe
Code No.
(2)
8~ 5
104 169 83 76 41 59 73
180 147 149 81
125 187 156 102 22 61 75
155 IDS 107
8 88
144
28 172 181 68 99 55 38
143 42 74
140 25
157 165 120 64 87
133 90
162 178 54 I
191 53
63 133 III 194 170 190
10 139 171
183 63 48
185 161
78 173
13
ALPHABETICAL LIST OF VILLAGES AND TOWNS
2 PANVEL TALUKA
[ Entries in capital letters are for Towns and Urban areas]
Population
1931 1%1
(3) (4)
761 134 271 214 337
8 77 69
131 1,507
143 84
303
28 13
501 591 2Y 32 · 598
142 730
61 144 311
72 8
320 214 912 104 210 431 684 269 581 ·
·135 107 610 80 5
216 220 2;8 · 221 580 403 517
110 3,932
88 4, 40
452 208 417
21 432 125
332 13,
408 301
893 210 324 296 386 · 108 130 154
1,620 183 136 418
110 · 6~8 733 78 45 8
706 221
1,002 66
18S 373
114 13
403 303 981 164 248 499 911 351 735
3
178 203 827 134
9 307 285 42~
303 753 505 712
119 4,60!
43 35 · 896
280 456
32 567 140
441 199
487 430
Name of "mage
(I)
Kaliwali Kalundre .• .• '. Kalyamungajiche Kharat Kamothe " " .• Kanrn~? Kanpoll Kara~e Bk. KaTade Kh. .. Karambeli T ud Taloie Karan;ade .• .. Karavale Bk. . • Karrneli Tad Vuje- •• Karnala " .• Ka.alkhand .• Kasap .• Kasarbhat .• Kelavane ,. Kevale Kh'nav .• Khanavale ,. Khanlhar .• Knarkopar .• Kher.n. Bk. Kherane Kh. Kirawali Kolkhe Kon Kondal. Kondap Kopar Kopr,li Koral .. Kolhekhar .• Kuda ... e .. Kundevahal Kushi\'uli
Ladivali Loniwali
MachipTabal :\1ahalungi .. Mahodar Maldunge .. Manghar Moho Mohope MOTbe Mosare
Nagzari " Nandaikhar .. Nandgaon ,. Nanoshi Narpoli Navade .. Nawartekh.r Nere Nevali Nhaye Nitalas Nitale
Ow. Owl.
Padeghar Padghe Palaspe Pale Bk. Pale Kh.
Popula~ion Code N, 19,1 1961
(2) (3) (4)
lB4 97
112 79
101 43
177 174 37
liB 4
45 182 151 176 108 19l 60 50
152 17
12~ :32 35 3
121 123 45 31
114 72
179 82
131 126 160
175 100
146 44 33 67
130 91
148 49
136
27 109 127 141 159 16 18 69 24
134 26 29
12 123
49 857 •
1,37~
152 199 2,6 197 587 392
1,530 397 195 298
1,714 2~3 177 183
1,01~
11 27;
22 603 559
73 114 372 110 5~
458 442 44
255 317
57 90
292 893 116 488 108 569 190
6 828 306 269 792 •
1,019 227
1,875 581 97
1,441 1,170
129 22 21 477
132 1.024 19 434 40 601
78 1.158 • 1.815 · 226
262 276 2d6 730 557 · 1.719 537 248 379
2,229 390 307 310
1.336 · 9 402 36
778 60S 93 S8
499 1;9 35. · 500
610
412 314
39 .143 440
1,209 160 600 164 733 216
9 10
1,006 4B4 324
1,029 . 1,401
305 2m6
729 137
2,059 1.408
570 1,015
570 756
• Uninhabited.
?~a:ne of villa~e
(I)
Pali Bk. P.,lidevad Pali Kh. .. Pali Tad Taloi. .. .• PANvEL Municipal Area Panvel Non-Municipal Area Pargaon '. Pargdoll Dungi Patnoli Pendhar Pi3a.r .... e Posari Poy:mje
Ritghar Road?li Rohinian
Sai " Sangade Sangatoli Sang-urli Sars.li Savale Sava'1e Save. , Shedun~ .• Shilottar L'lllgat " Shillottar Raichur .. Shira\'ali '. Shird~on ., Shivansai '. Shi"k.r S'Jmathane .• Sonkhar
T aloie Maikur r aloie Panchnad Tamsai Targhar .. Tembhode .. Tondhare •. Turade •. Turnmbhc .•
Ulwe Umroli U,arli Bk. Usadi Kh,
Vadavali Vadghar Vaghivali Vak.di Val.p V.lay.li Vavanje Vaveghar Vehegaon Vichumbe Vihighar
Wahal Waja!)ur Wale .. .. Wangani Tal f Taloie W'angani r ad Waje Wardoli
TOTAL ••
Code No.
(2)
153 89 90 11 1
92 117 116 138
14 7
164 15J
51 20 6
193 103 . 70 142 180 163 139 168 10& 80 8S 3&
1,3 5) 9~
1';4 119
13 q
47 110 77 39
166 2
113 62 58 93
137 115 103 57 IS 23 30
167 52 93 86
122 71 66 34 9;
14:>
Population
1931 1961
0) (4)
89 211 116 · 14,861
1,20S 803 9,
10, 480 380 427 8N
305 991 439
1,299 2Bi) 66
289 199 544 32!
lIS · 193 20:l
• 1,)}i) 96
628 420 · 6S1
2,239 136 938 537 623 376 196
679 238 288 288
56 692 804 242 399 465 946 132 39
411 368
1,721 71
63'; 61
lB3 418
118 215 171 · 18,130
1.596 1,010
136 229 640 510 513
1,208
494 1.244
678
1,492 379 100 387 251 587 4~'; · 16, · 228 26,
1,713 119 7d3 550 · 854
27m 194
1,194 640 729 478 2S0
801 293 347 284
102 869 843 336 508 600
1,235 183
6 546 434
2,142 75
813 103 270 507
91,335 115,378
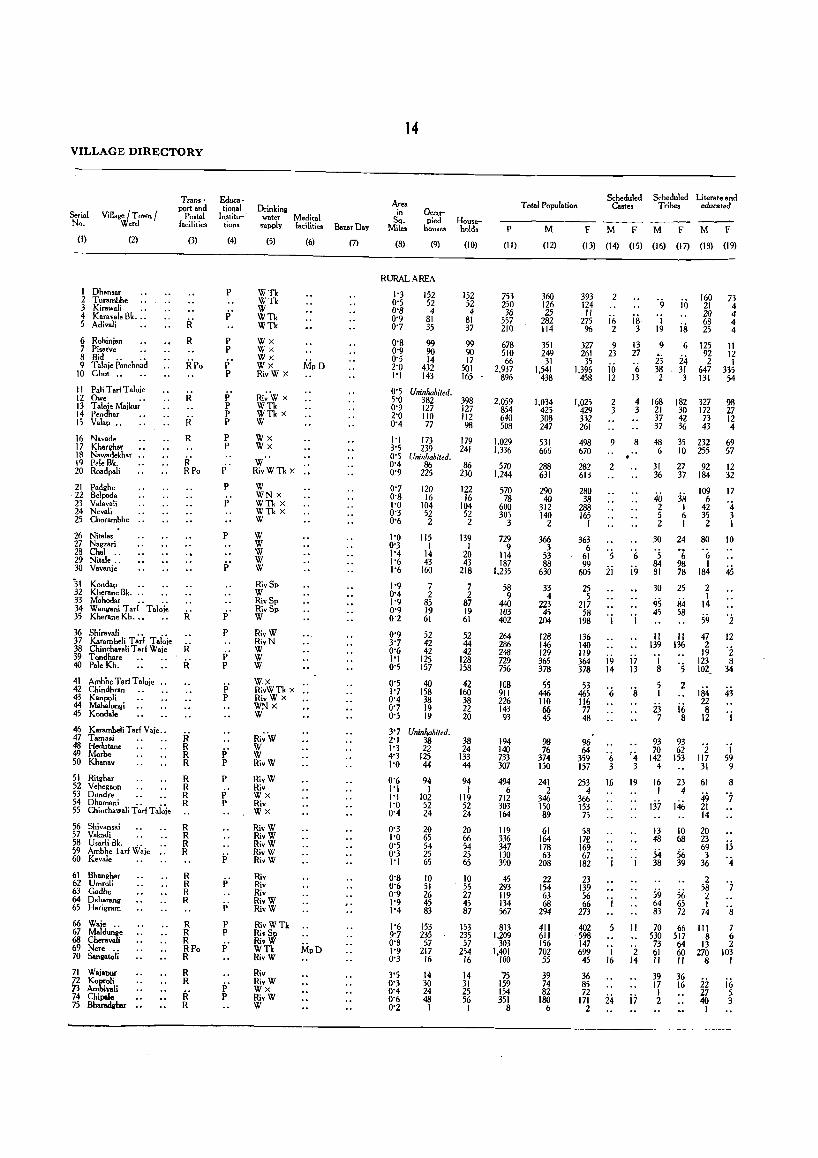
VILLAGE DIRECTORY
Serial No,
Village f Town f Ward
(I) (2)
1 Dhan,ar 2 Turambhe 3 Kir_wali " 4 Karavale Bk, " 5 Adivali
6 Rohinian 7 Pisarve 8 Bid " " 9 Taloi. ranchnad
10 Ghot "
11 PaliTariT.loie 12 Owe " 13 T atoie Maikur 14 Pendhar IS Valap "
16 Nav_d. 17 Khargh., 1 R Nawad.khar " 19 PaleBk, 20 Roadpali
21 Padghe ·22 Belp.da 21 Valavali 24 Nevali 25 Chor_mbhe , ,
26 Nit_las 27 Nagzari 28 Chal " 29 Nitale" 30 Vavanje
"31 Kondap " 32 Kherane Bk, 33 Mahoda, " " 34 Wangani Tarl Tatoi. 35 Kherane Kh, ,.
36 Shiravali , , , . 37 Karambeli Tarl Taloje 38 Chinchavali T arl Waie 39 Tondhare 40 Pate Kh,
41 Amhhe T arl T aloie ,. 42 Chindhran 43 KanP9Ii 44 Mahalungi 4S Kondal.
46 Kararnheli Tarl Vaje, , 47 Tam •• i 48 Hedutane 49 Morbe 50 Khanav
TransP9rt and
Postal facilities
(3)
R
R
R
R' R
R' RPo
R' R R R
51 Rilghar R 52 Vehegaon R 53 Dundre R 54 Dhamani , , , • R 55 Chinchawali Tar! Taloje
56 Shivansai R 57 Vakadi R 58 U,arli l3k, . , R 59 Arnbhe farl Waje " R 60 Keyale
61 Bhanghar 62 Urnroli 63 Gadhe 64 Deharang 65 Harigrarn
66 Waje " 67 Maldunge 68 Cheravali 69 Nere " 70 Sangatoli
71 Waiapur
~j t',t:\; 74 Chipol. 75 Bharadvhar ••
R R R R
R R R RPo R
R R
R' R
Educational
Institu-tions
(4)
P
P'
P P
p' P
P P P P
P P
p' P
p'
P
p'
P
P' P
p' P
p P
P
P P
P
p'
P P
p'
p' p
DrinkinQ water Medical supply fe.cilitle!. Bazar Day
(5) (6) (7)
WTk WTk W WTk WTk
Wx Wx Wx Wx RiyW X
Ri;'W X WTk WTk X W
Wx Wx
W RivWTk X ..
W WNx WTk X WTk X W
W W W W W
RiySp W RiySp RiySp W
RiyW RivN W W W
Wx RivWTk X .. RivW X WNx W
Ri;'W W W RivW
RivW Riy Wx Riv Wx
RivW RivW RivW RivW RiyW
Hiv Riv Riv RivW RivW
RiyWTk RiySp RiyW WTk RivW
Riv RivW Wx RivW W
14
Area in
Sq, Mil ..
(8)
0ccu-pied House-
houses holds
(9) (10)
RURAL AREA
1'3 0'5 O'S 0'9 0'7
0'8 0'9 0'5 2'0 1'1
152 52 4
81 35
99 90 14
432 143
0'5 Uninhabited,
152 52 4
81 37
99 90 17
501 165
5'0 382 398 0'9 127 127 2'0 110 JJ2 0'4 77 98
1'1 173 179 3'5 239 241 0'5 Uninhabited, 0'4 86 86 0'9 225 230
0'7 0'8 1'0 0'3 0'6
1'0 0'3 1'4 1'6 1'6
1'9 0'4 1'9 0'9 0'2
0'9 3'7 0'6 1'1 0'5
0'5 1'7 0'4 0'7 0'5
120 16
104 52 2
115 I
14 43
160
7 2
85 19 61
52 42 42
125 157
40 158 38 19 19
3'7 Uninhabited,
122 16
104 52 2
139 I
20 43
218
7 2
87 19 61
52 44 42
128 158
42 160 38 22 20
2'1 38 38 1'3 22 24 4'3 125 133 1'0 44 44
0'6 1'1 1'1 1'0 0'4
0'3 1'0 0'5 0'3 1'1
0'8 0'6 0'9 1'9 1'4
1'6 9'7 0'8 1'9 0'3
3'5 0'3 0'4 0'6 0'2
94 I
102 52 24
20 65 54 25 65
10 51 26 45 83
153 235 57
217 16
14 30 24 48 1
94 1
119 52 24
20 66 54 25 65
10 55 27 45 87
153 235 57
254 16
14 31 25 56 1
Scheduled Scheduled Literate and Total Population Caste. Tribe. educated
P M F M F M F M F
(I)) (12) (13) (14) (15) (16) (17) (18) (19)
753 250 36
557 210
678 510 66
2,937 896
2.059 854 640 508
1,029 1.336
570 1,244
570 78
600 305
3
729 9
114 187
1,235
58 9
440 103 402
264 286 248 729 756
108 911 226 143 93
194 140 733 307
494 6
712 303 164
119 336 347 130 390
45 293 119 134 567
813 1.209
303 1,401
100
i5 159 154 351
8
360 126 25
282 114
351 249
31 1,541
438
1.034 425 308 247
531 666
288 631
290 40
312 140
2
366 3
53 88
630
33 4
223 45
204
128 146 129 365 378
55 446 110 66 45
98 76
374 150
241 2
346 150 89
61 164 178 63
208
22 154 63 68
294
411 611 156 702 55
39 74 82
180 6
393 124 II
275 96
327 261 35
1,396 458
1,025 429 332 261
498 670
282 613
280 38
288 165
I
363 6
61 99
605
25 5
217 58
198
136 140 119 364 378
53 465 116 77 48
96 64
359 157
253 4
366 153 75
58 17£ 169 67
182
23 139 56 66
273
402 598 147 699
45
36 85 72
171 2
2
i6 2
9 23
iii 12
2 3
9
2
's ii
'i
i9 14
6
'6 3
16
'i
'i
5
'i 16
24
18 3
13 27
'6 13
'9 I
19
9
23 38 2
i6
is 6
24 31 3
160 21 20 68 25
125 92 2
647 131
4 168 182 327 30 172 3 21
37 37
42 73 36 43
8 48 35 232 10 255
'(,
i9
17 13
'4 3
19
11
'2 14
i7
6
31 36
27 92 37 184
4iJ 2 5 2
3S I 6 1
109 6
42 35 2
30
's 84 81
24 80
'6 6 98 1 78 184
30 25
95 84 45 58
11 11 139 136
~ 's 5 2 1
23 i6 7 8
93 70
142 4
93 62
153
16 23 1 4
13 10 48 68
54 56 38 39
59 64 83
70 530 73 61 11
39 17 1 2
56 65 72
66 517 64 60 11
36 16
2 1
14
S9 47 2
19 123 102_
184 22 8
12
'2 117 31
61
49 21 14
20 23 69 3
36
2 58 2 I
74
III 8
13 270
8
ii 27 40 1
73 4 4 4 4
11 12 1
335 54
98 27 12 4
69 57
12 32
17
'4 3 1
10
4S
'2 12
'i 8
34
43
'j
'j 59 9
8
'7
is '4
's 7 6 2
103 1
i6 5 3
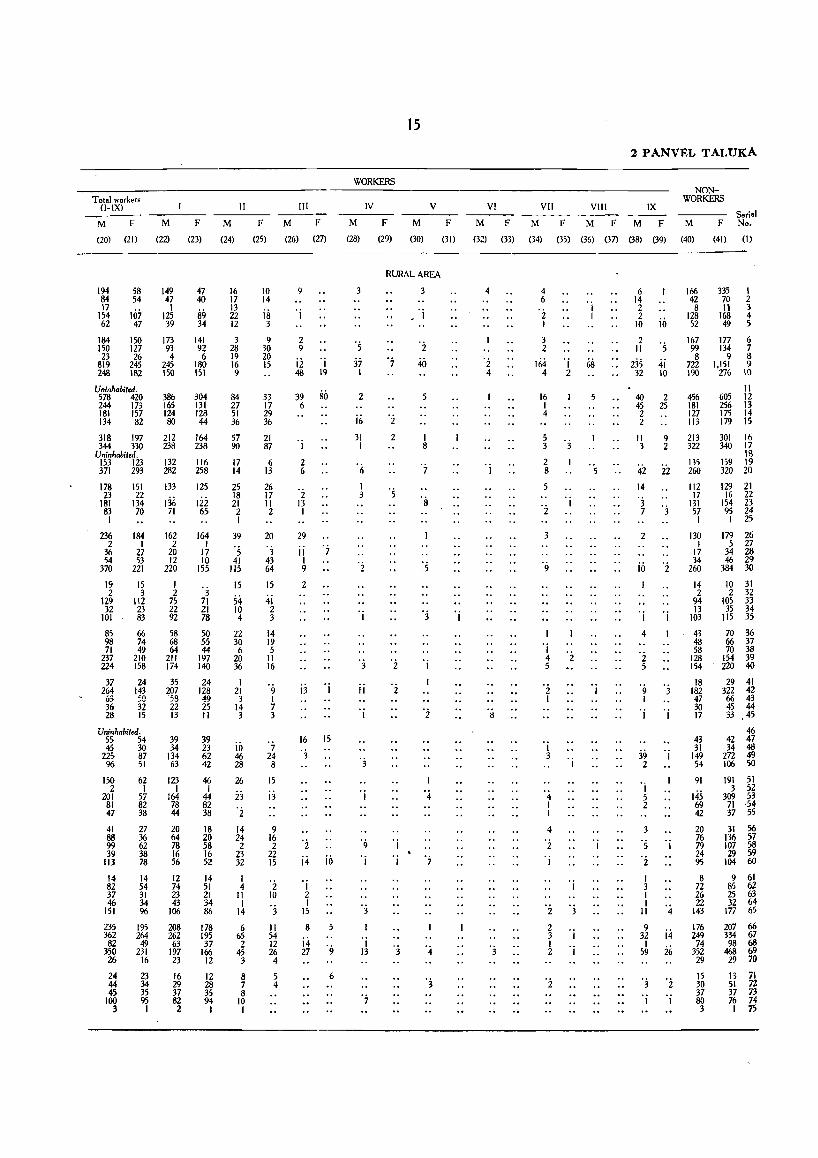
T olal workers (I-IX)
M F
(20) (21)
194 84 17
154 62
58 54
lIi7 47
184 150 150 127 23 26
819 245 248 182
Uninhabited, 578 420 244 173 181 157 134 82
318 197 344 330
Uninhabited, 153 123 371 293
178 151 23 22
181 134 83 70 I
M
(22)
149 47 1
125 39
173 93 4
245 150
386 165 124 80
212 238
132 282
133
136 71
236 184 162 2 I 2
36 27 20 54 53 12
370 221 220
19 15 I 2 3 2
129112 75 32 23 22
101 83 92
85 66 58 98 74 68 71 49 64
237 210 211 224 158 174
37 24 35 264 143 207 63 en 59 36 32 22 28 15 13
Uninhabited, 5S 54 4S 30
22S 87 96 51
150 2
201 81 47
41 88 99 39
113
62 I
57 82 38
27 36 62 38 78
39 34
134 63
123 I
164 78 44
20 64 78 16 56
14 14 12 82 54 74 37 31 23 46 34 43
151 96 106
235 195 208 362 264 262 82 49 63
350 231 197 26 16 23
24 23 16 44 34 29 45 35 37
100 95 82 3 I 2
F
(23)
47 40
S9 34
141 92 6
180 151
304 131 128 44
164 238
116 258
125
Iii 65
164 I
17 10
155
3 71 21 78
50 55 44
197 140
24 128 49 25 II
39 23 62 42
46 I
44 82 38
18 20 58 16 52
14 51 21 34 86
178 19S 37
166 12
12 28 3S 94 I
M
(24)
II
16 17 13 22 12
3 28 19 16 9
84 27 51 36
57 90
17 14
25 18 21 2 I
39 , 5 41
115
15
54 10 4
22 30 6
20 36
I 21 3
14 3
10 46 28
26
ij
'i 14 24 2
23 32
I 4
11 I
14
6 65 2
45 3
8 7 8
10 1
F
(25)
10 14
is 3
9 30 20 15
33 17 29 36
21 87
6 13
26 17 11 2
20
'j 43 64
15
4i 2 3
14 19 5
II 16
9 I 7 3
7 24 8
15
13
9 16 2
22 15
'2 10
3
II 54 12 26 4
5 4
M
(26)
III
F
(27)
'i
2 9
12 I 48 19
39 80 6
1
2 6
'2 13 I
29
ji '7 I 9
Z
j3 'i
16 15
'3
'2 j4 10
'i 2 1
IS
8 5
j4 27 '9
6
15
WORKERS
M
(28)
IV
3
'5 37
I
2
j6 31 I
'(,
I 3
'i
3
ij
'j
'i
9
'i
'j 13
F
(29)
M
(30)
v
RURAL AREA
3
'i 2
'j
'j
3
5
I 8
'j
4
F
(31)
VI
M
(32)
4
8
F
(33)
2 PANVEL TALUKA
VII V!lI IX
M
(34)
F M F M F
(35) (36) (37) (38) (39)
4 6
'i I
3 2
164 4
16 I 4
5 3
2 8
5
3
I 2
'j 4 '2 5
'j I
6 14 2 2
10 10
17 '5 68 " 235 <ij
32 10
40 2 45 25 2 2
11 9 3 2
'5 42 22 14
'3 7 3
2
iii 'i
'j 'j
4 1
'2 5
2 I '9 3 I
'j 3
4 I I
4
'2 I
I
'j
'2 3
2 3 I
1 'j
1
'j 'j
39 'j 2
'j 5 2
3
'5 'j
'2 1 3 I
Il '4 9
32 i4 5~ 26
'3 '2 I 'j
NONWORKER..'i
M F Serial No,
(40) (41) (I)
166 335 I 42 70 2
8 11 3 128 168 4 52 49 5
167 177 6 99 134 7 8 9 8
722 1,151 9 190 276 10
11 456 605 12 181 256 13 127 175 14 113 179 15
213 301 16 322 340 17
IS m 159 19 260 320 20
112 129 21 17 16 22
131 154 23 57 95 24 I I 25
130 I
17 34
260
14 2
94 13
103
43 48 58
128 154
18 182 47 30 17
179 26 5 27
34 28 46 29
384 30
10 31 2 32
105 33 35 34
115 35
70 36 66 37 70 38
154 39 220 40
29 41 322 42 66 43 45 44 33 45
46 43 42 47 31 34 48
149 272 49 54 106 50
91
145 69 42
20 76 79 24 95
191 51 3 52
309 53 71 ,54 37 55
31 56 136 57 107 58 29 59
104 60
8 9 61 72 85 62 26 25 63 22 32 64
143 177 65
176 207 66 249 334 61 74 98 68
352 468 69 29 29 70
15 13 71 30 51 72 37 37 73 80' 76 74 3 I 75
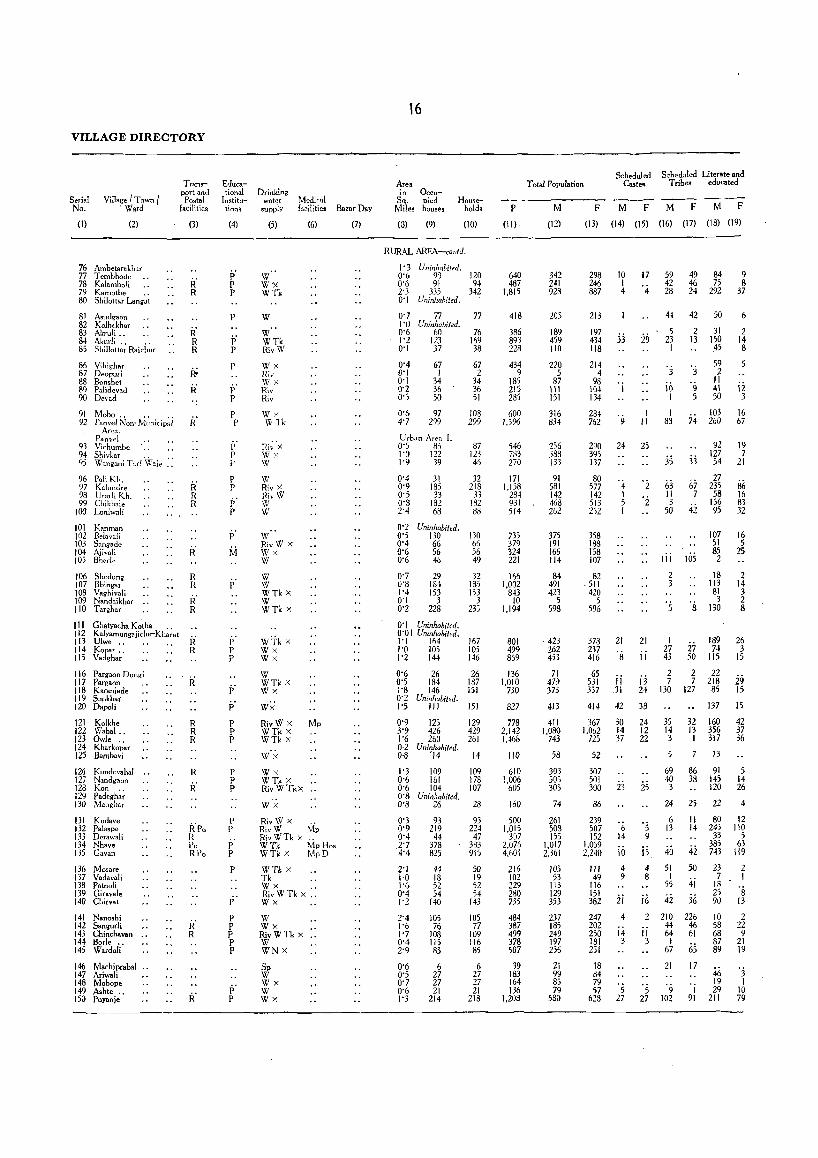
VILLAGE DIRECTORY
Serial No,
Village I Town / , Ward
(I) (2)
76 Ambetarnkhar 77 Tembhode 78 Kalamboli 79 Kamothe " 80 Shilottar Lang"t
81 Asudgaon 82 Kolh,khar 83 Ahuli" 84 Akurli" " 85 Shillottar Raiehur
86 Vihighar 87 Deopuri 88 Bonsbet 89 Palidevad 90 Devad
91 Moho" " " 92 Pamrel Non-I\t.uni('ipal
Area. Panvt'i
91 Vichumbe 94 Shivkar " " 95 \Vangani T:lrf \V[!.jc ..
96 Pali Kh, 97 Kalundre 98 Ucar!i Kh, 99 Chikhaie
100 Loniwali
101 Kanman 102 Belavali 103 Sangade 104 Aiivali 10j Bherle
Tnmr port and Postal
facilities
(3)
R' R
R' R R
R'
R' R R
106 107 108 109 110
Sbedung R Bhingar R Vaghivali Nandaikhar , , R' Tar.har R
Ghatyach. Koth. , , 111 112 113 114 Jl5
Kalyamungajiche-Kharat Ulwe" " " R' Kopar" R Vadghar
116 Pargaon Dungi 117 P.rg.on Jl8 Karanjade 119 Sankhar 120 Dapali
121 Kolkhe 122 Wah.I" 123 Owle " 124 Kharkopar 125 Bambavi
126 Knnde vahal , , 127 Naod.aon 128 Kon " 129 Padeghar 130 Manghu[
131 Kudave 132 Pala,pe 133 Derawali 134 Nhave 135 Gavan
136 Mosare 137 Vadava1i 138 Patnoli 139 Giravale 140 Chirv.t
141 Nano.hi 142 Sangurli 143 Chinchavan 144 Borle " 145 Wardol;
146 Machiprabal " 147 Ariwali 148 Mohope 149 Ashte " 150 Poyonje
R R R
R
R'
R'po R Po RPo
R' R
E,lucational
Institutions
(4)
p' P P
P
j:; P
P
p' P
P p
i; p I'
P P
p' P
p' M
i> P P
j;
p
P P P
P P P
P P
p' P
P
p'
P P P P P
p' p
Drinking water
sllPply
(5)
w" wx WTk
W
W" WTk RivW
Wx Riv WX Riv Riv
Wx II Tk
\V Riv X HivW W W
w" RivW X Wx W
'VI W WTk X W WTk X
WTk )( W)( W)(
W wnx Wx wi(
RivW X WTk X WTk X
W'x Wx
Medical hcilities
(6)
WTk X RivWTkx "
W·x RivW X .' RivW Mp RivWTk X " WTk Mp Hos wn X l\1pD
WTk X Tk W X .. Riv WTk x,, Wx
W Wx RivWTk X .. \V WNx
Sp W Wx W wx
B ... rDay
(7)
16
Area in Occu-
SQ, pied Miles houses
Hotl'!!ehold.
(8) (9) (10)
RURAL AREA--contJ.
I' 3 Uninhabited, 0'6 98 120 0'6 91 9~ 2'3 335 342 0'1 Uninhabited.
0'7 77 77 1'0 Uninhabiled, 0'6 60 76 1'2 J23 169 0'1 37 38
0'4 0'1 0'1 0'2 0'5
67 I
34 36 50
0'5 97 4'7 2?9
Urban Arra l. 0'5 86 I'D 122 1'9 39
0'4 0'9 O'S ~'S N
31 185 33
182 68
0'2 Uninhabited,
67 2
34 36 51
103 299
87 12l 46
32 218
33 ISZ 88
0'5 130 130 0'4 66 65 0'6 56 56 0'6 46 49
0'7 29 0'8 184 1'4 153 0'1 3 0'2 228
0'1 Uninhabili'd, 0'0 I Uninhabited, 1'1 164 1'0 105 1'2 144
32 18; 153
3 235
167 IOj 146
0'6 26 26 0'5 184 187 1'8 146 151 0'2 Uninhabited, 1'5 III 151
0'9 125 129 3'9 426 429 1'6 260 261 0,2 Uninhabited, 0,8 '14 14
1'3 109 109 0'6 161 178 0'6 104 107 0'8 Uninhabited. 0'8 26 28
0'3 93 93 0'9 219 224 0'4 44 47 2'7 378 383 4'4 825 915
2'1 44 50 1,0 18 19 1'6 52 52 0'4 54 54 1'2 140 143
2'4 105 105 1'6 76 77 1'7 108 109 0'4 115 116 2'9 85 85
0'6 6 6 0'5 27 27 0'7 27 27 0'6 21 21 1'3 214 218
Total Population Scheduled
Castes Sched.lled Literate and
Tribe. educated
p M F M F l\1 F M F
(11). (12) (13) (14) (15) (16) (17) (18) (19)
640 487
1,815
418
386 893 228
434 9
185 215 285
600 1596
546 783 270
171 1,158
284 981 514
733 379 324 221
166 1,002
843 10
1,194
136 1,010
730
827
778 2,142 1,468
110
610 1,006
605
160
500 1,015
3:)7 2,076 4,601
216 102 229 2dO 735
484 387 499 378 507
39 18.3 164 136
1,203
342 241 928
205
189 459 110
220 5
87 111 151
316 834
256 388 133
91 581 142 468 262
375 191 166 114
84 491 423
5 593
423 262 453
71 4n 373
413
411 1,030
743
58
303 50, 30;
74
261 508 15;
1,017 2,361
105 53
113 129 353
237 185 249 197 256
21 99 85 79
580
298 10 17 246 1 887 4 '4
213
m :i:i 29 118
214 4
98 104 134
284 762
290 395 137
80 577 142 513 252
358 183 158 107
82 511 420
5 596
373 237 416
65 531 357
414
367 1.062
725
52
307 501 300
86
239 507 152
1,0)9 2,240
111 49
116 151 382
247 202 250 181 251
18 84 79 57
628
9
24
'4 1 5 I
21
's ii 31
42
30 14 37
23
6 14
iiJ 4 9
ii 4
14 3
5 27
1 11
25
'z '2
21
ii
ij 24
38
24 12 22
• 5 9
is 4 8
iii 2
II 3
'5 27
59 42 28
44
5 23
1
'j
iii 1
1 88
:is
63 11 3
50
Iii 2 3
1 27 43
2 7
130
35 14 3
5
69 40 3
24
6 13
40 51
1 55
4i 210 44 64
I 67
21
9 102
49 84 9 46 75 8 24 292 37
42 50 6
2 31 2 13 150 14
~5 8
'j
9 5
74
33
67 7
42
105
27 50
59 2
11 41 50
103 260
92 127 54
27 235 58
156 95
107 51 85 2
18 113
81 3
130
189 74
115
2 22 7 218
127 85
137
32 160 13 356
I 317
7 13
86 33
25
11 14
4i 50
4i 31i
226 46 61
65 17
I 91
91 145 120
22
80 245 33
385 743
23 7
18 25 9u
10 58 68 87 89
46 19 29
211
iz 3
16 67
19 7
21
86 16 83 32
16 5
25
2 14 3 2 8
26 3
15
ig 15
15
42 37 36
5 14 26
4
12 110
5 63
119
2 1
's 13
2 22 9
21 19
'j I
10 79
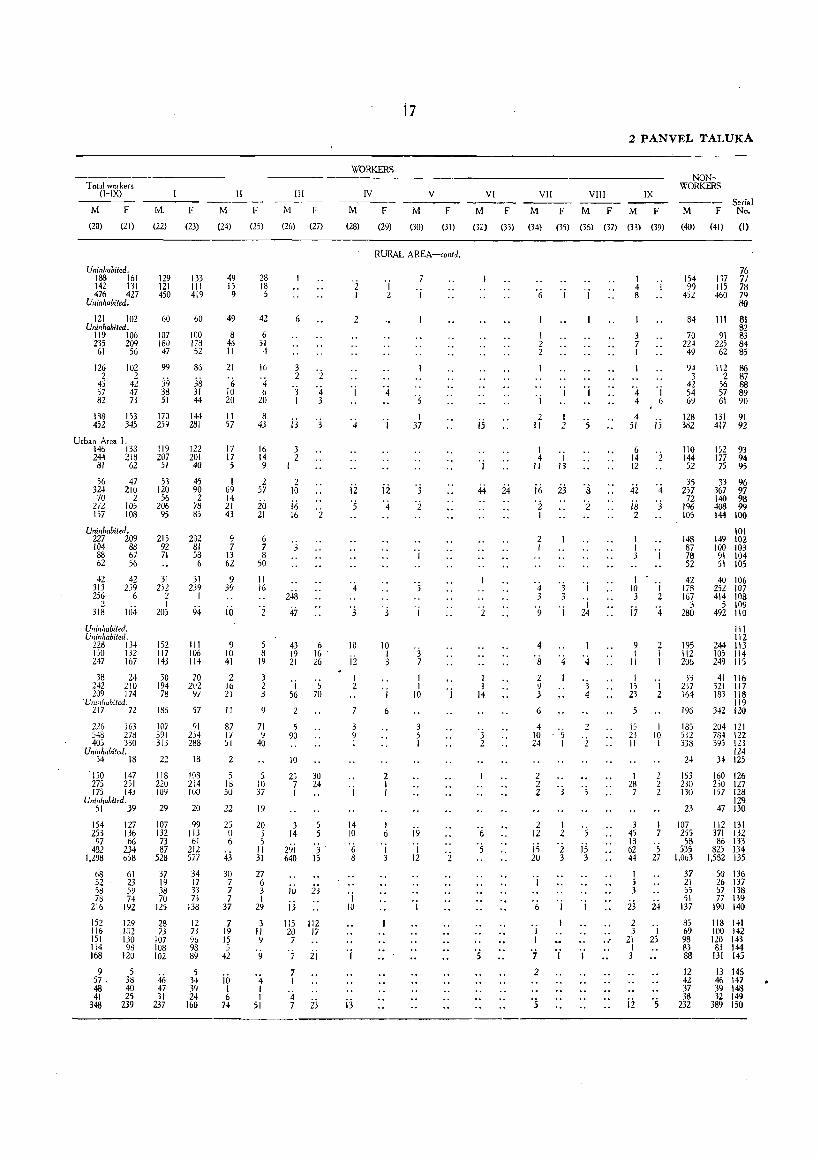
Total workers (I-IX)
M F
(20) (21)
Uninhabited_ 188 161 142 131 476 427
Uninhabited.
121 102 Uninhabited_
119 106 235 209
61 56
126 2
45 57 82
188 452
102 2
42 47 73
153 345
Urban Arca L 146 138 244 218
81 62
56 324
70 272 157
47 210
2 105 108
Uninhabited_ 227 209 104 88 88 67 62 56
42 313 2j6
2 318
42 2'>9
6
J(j,j
Uninhabited_ Ullinhabited.
228 134 150 132 247 167
38 24 242 210 209 174
·UlIIilhl1biled. 217 72
226 163 548 27d 405 330
Uninhabited_ 34 18
IjO 147 275 2) I 175 143
Uninhabited _ 51 39
154 253
97 432
1,298
68 32 58 78
2i6
127 136 66
234 658
61 23 59 74
192
152 129 116 102 151 130 114 98 168 120
9 5 57 _ 38 48 40 41 25
348 239
M.
(22)
129 121 450
60
107 1811 47
99
jiJ 38 51
170 259
119 207
51
53 120
56 206
95
215 92 71
31 2j2
2 I
20)
152 117 143
30 194 78
186
107 391 313
22
118 220 109
29
107 132 73 87
528
37 19 38 70
125
28 73
107 108 102
46 47 31
237
F
(23)
133 III 419
60
100 178 52
86
38 31 44
144 281
122 201 40
45 90 2
78 8,
202 81 58 6
31 239
I
94
III 106 114
20 2(12
97
57
91 254 288
18
103 214 IfJJ
20
99 113 61
212 571
34 17 33 73
138
12 73 96 98 89
5 34 39 24
160
M
(24)
49 15 9
49
8 46 11
21
-6 10 20
11 57
17 17 5
1 69 14 21 43
9 7
13 62
9 39
io
9 10 41
2 16 21
II
87 II 01
2
5 18 50
22
25 10 6
43
30 7 7 7
37
7 19 15 5
42
10 I 6
74
II
F
(25)
28 18 5
42
6 31 4
16
-4 6
20
8 43
16 14 9
2 57
20 21
6 7 8
50
11 16
2
5 8
19
3 2 3
9
71 9
40
5 10 37
19
20 3 5
II 31
27 6 3 I
29
3 II 9
9
4 I I
51
III
M
(26)
6
F
(2i)
-z ":i 4 I 3
ij -j
3 2
I
2 10
i6 16 2
3
43 6 19 16 21 26
1 '5 56 70
2
5 90
10
23 30 7 24 I
3 14
29j 640
i6 j3
3 15
23
115 112 20 17 7
7 zi 7 I
-4 7 ij
WORKERS
IV
M F
(28) (29)
17
M
(30)
V
F
(31)
RURAL AREA-conti.
-z I
2
-j
iz -5
4
10
12
I 2
7
3 9 I
-j
14 JO
-6 8
-j 10
-j
j3
-i 2
-j
iz -4
10 I 3
I
6
2 I I
I 6
-j 3
-:5
I 37
-j
3
-j
3 7
I I
10
3 j I
j9 -j 12
VI
M F
(32) (33)
i5
-2
I 1
14
3 2
2 PANVEL TALUKA
VII VIII IX
M
(34)
F M F M F
(35) (36) (37) (33) (39)
"6 -j -i
1 2 2
-j
2 II
-j
l -j II 13
-j
i6 23 "8 -Z -2 I
2 1
-4 3
-9
4
3 3 -j
-j
1 24
8 -4 -4 2 Y 3 3 4
6
4 2 10 5 24 I 2
2 2 235
2 12
is 20
-j
6
I I
-j
2
I 2
2 3
-j
'j
-5 i5 3
l -i 8
I~ -Z 12
42 -4 i8 -3 2
I 10 3
i7
-j
1 2
-4
9 2 1 I
II I
I 15 I 23 2
15 I 23 10 II I
1 28 7
3 45 18 62 44
I 5 3
23 2
2 2 2
-5 27
24
3 I 21 25
I 3
i2 -S
NONWORKERS
M F Serial No.
(40) (41) (l)
154 99
452
84
70 224 49
94 3
42 54 69
128 382
110 144 52
35 257
72 196 105
148 87 78 52
42 178 IG7
3 280
195 112 206
33 207 164
196
185 532 333
24
153 230 130
23
76 117 77 115 78 460 79
8{)
111 81 82
91 83 225 84 62 85
112 86 2 87
56 88 57 89 61 90
131 91 417 92
152 93 177 94 75 95
33 96 367 97 140 98 408 99 144 100
101 149 102 100 103 91 104 51 105
40 106 2j2 107 414 108
5 109 492 110
111 112
244 113 105 114 249 115
41 116 321 117 183 118
119 342 120
204 121 784 122 395 123
124 34 125
160 126 2,0 127 157 128
129 47 130
107 112 131 255 371 132 58 86 133
535 825 134 1,063 1,582 135
37 50 136 21 26 137 55 57 138 51 77 139
137 190 140
85 69 98 83 88
12 42 37 38
232
118 141 100 142 120 143 83 144
131 145
13 145 46 147 39 148 32 14'1
389 1;0

VILLAGE DiRECTORY
Serial No.
Village I Town I Ward
(I) (2)
151 K....Jkh.nd .• 152 Khanaval. 153 Pali Bk. 154 Som.thane 155 Bhatan ..
156 Barw.i .. 157 D.hivali .. 158 Shirdhon (E) .. 159 Narpoli 160 Kushivali
161 Jatade .. 162 Devaloli Bk. .. 163 Savale .. 164 Po .. ri .. 165 Dapivali
166 Turade 167 Vaveghat 168 Save .. 169 Akulwadi 170 Ghorawadi .•
171 Gulsunde .. 172 Chawandholi .. 173 Kalhe .. 174 Karade Kh. .. 175 Ladivali
176 Kaup .. 1 77 Karade Bk. 178 Devaloli Kh. 179 Koral .. 180 Apte "
181 Chawane 182 Kamala 183 Had.mbe 184 Kaliwali 185 }ambiw.li
186 S.rsai" 187 Bamnoli" 188 Kasarbhat 189 Savan... Oo 190 Chod •• wane ,.
191 Dighati 192 Kelavane 193 Sai Oo Oo
194 Cherakilla Manikg8d
Transport and Po,tal
facilities
(3)
R ii
R
ii R
R R R
R:
Educational
Institutions
(4)
p'
M p
p
M p
j;
p p
p'
M p' p p
p' p p
p'
p P M
Drinking water supply
(5)
W RivW Nx W W
RivW W WTIx W
W Wx Wx W Riv
RivW Riv
W'x W
Riv Riv Wx RivW Riv
Riv W wOo RivW
RivW Wx W RivW Wx
Riv
W'x W
Tk X WTk WTk X RivW
I Panvel Municipalit~ (El,
RToRh H S
Ward I
Ward 2
Ward 3
Ward 4
Ward 5
Ward 6
Ward 7
P"NVE.!. TALUKA "
Medical faciliti""
(6)
Bazar Day
(7)
t8
Are. in
Sq. Miles
(8)
Occupied
house$
(9)
Household.
(10)
RURAL N{EA-concld.
(T olal-Rural
I ~ T ,,!aI-Urban
I L Grand Total
0'8 0'8 0'4 0'6 1'6 '
99 70 27
100 130
99 70 29
100 130
1'8 124 124 0'3 29 38 I'S 346 362 0'5 47 64 0'4 Uninhabiled,
0'8 0'7 0'6 1'0 0'3
27 49 75 79 28
33 72
113 95 33
0'6 79 82 0'2 19 23 0'1 Uninhabited, 1'5 51 55 1'0 8 8
0'7 97 0'2 2 2'4 76 0'3 49 0'7 43
0'4 36 O'S 34 O,S Uninhabiled, 1'2 6 2'8 284
99 3
87 57 76
38 40
7 362
0'9 94 94 3'6 2j3 332 0'9 6 7 0'9 15 15 1'1 91 91
2'6 53 56 0'6 Uninhabiled, 0'2 49 49 2'0 72 87 0'5 Uninhabiled.
1'5 0'2 2'9 3'1
44 302 226
9'
URBAN AREA
481
434
514
458
537
618
463
210'6 16,785
4'7 3,505
215'3 20,290
97 436 281
9
3.548
499
439
520
458
537
620
475
18.136
3.548
21,684
Scheduled Scheduled Literate and Total Population Castes Tribes educated
P M F M F M F M F
(11) (12) (13) (14) (15) (16) (17) (18) (19)
537 310 118 550 706
6Il8 178
1.713 324
199 428 587 513 203
478 183
296 35
456 13
430 276 412
248 262
35 1,620
403 1.719
32 78
441
251
379 466
505 2.229 1.492
43
264 173 55
270 368
273 137 63
280 338
1 6
'2 6
37' 42 45 35 52 62
332 356 21 23 54 57
96 83
836 160
95 3 877 30
7 24 100
164 3 Z 2
100 99 205 223 is ii> 300 • 287 29 28 268 245 41 35 40 24 109 94 4 4 2
245 90
146 20
228 7
225 143 204
123 136
19 8~0
217 863
17 45
213
126
193 224
233 93
150 15
228 6
205 133 203
125 126
16 820
186 856
15 33
228
1.25
186 242
25 36
35 is
ii i9
37 3i
249 256 1 4 1.164 1.0b5 32 31
742 750 23 18 24 19
8f) 90 7 4
44 40 19 IS
6 7
89
37
16 174
2 6
76
43
16 153
60 64 91 82 17 14 32 22 49 45
120 123
2 131 16~
S 20 20 63 61 24 19
71 8 47 6 2
101 41 116 36
115 17
208 36
21 1
70 3
19 1 64 20
107 18 82 12 75 90
64 13 23 4
30 8
123
64 68 42
36 45
48
3i 33 8
2 4
162 45 15
320 170
's 30 '9
72 6 30 3
IDS 297 285
1
11 19 64
18.130 9,528 8.602 366 288 75 64 6,294 3.960
2.345
2.364
3.052
2,417
2,342
2.856
2,754
97.248
18.130
115,378
1,267 1.078 69 57 21 15
1.223 1,141 4 7
1.590 1,462 259 200 22 21
1,328 1.089 36 31 23 20
1,169 1.173
1,484
1,467
1,372
1.287
3
2
655 460
680 347
890 419
953 484
906 708
1,194 922
1,006 620
49.013 48,235 901 911 5,888 5.736 14.915 3,486
9.5Z8 8,60Z 366 288 75 64 6.294 3.%0
58,541 56,837 1,327 1,199 5,%3 5,800 21,209 7,446
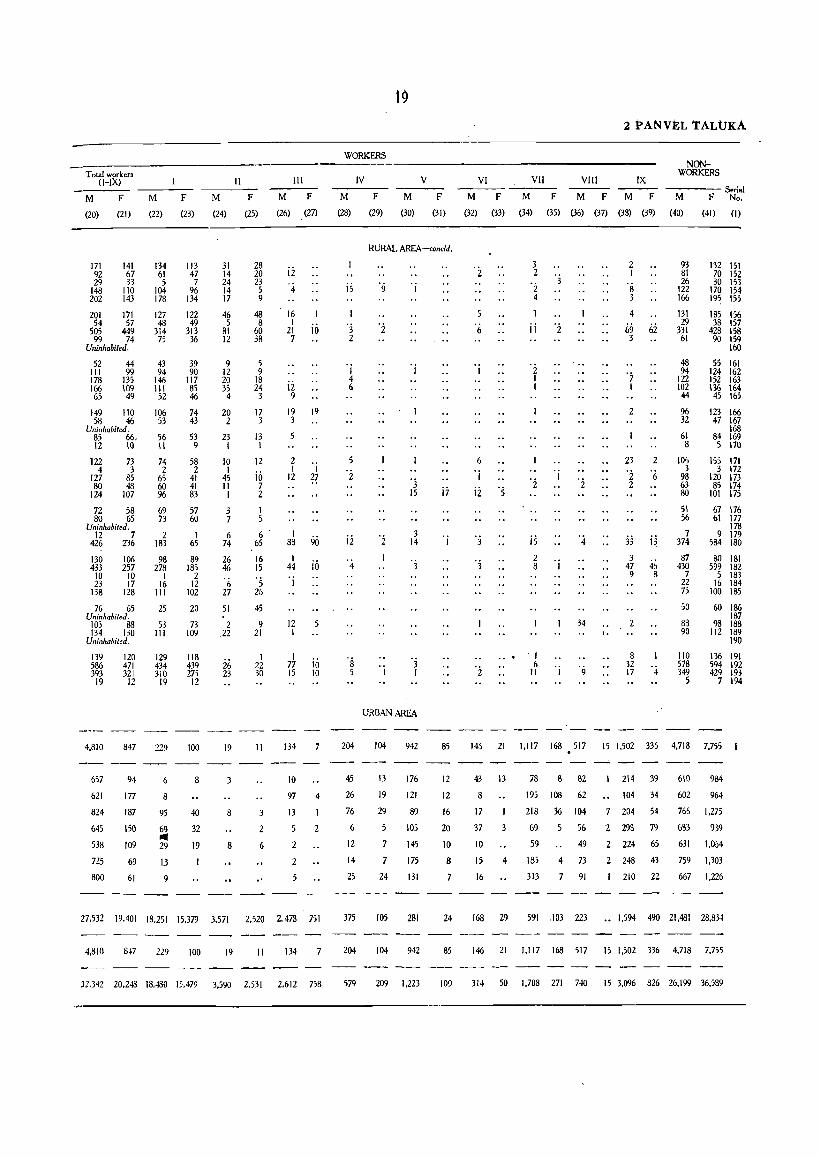
Total workers (I-IX)
M F
(20) (21)
171 141 92 67 29 33
148 110 202 143
201 171 54 57
505 449 99 74
Uninhabited,
52 III 178 166 65
44 99
135 109 49
149 110 58 46
Uni'lhabited. 85 66. 12 10
122 73 4 3
127 85 80 48
124 107
72 58 80 65
Uninhabited, 12 7
426 236
M
(22)
134 61 5
104 178
127 48
314 7~
43 94
146 111 52
106 53
56 11
74 2
65 60 96
69 73
2 183
130 106 98 433 257 278
10 10 1 23 17 16
138 128 111
76 65 25 Uninhabited,
105 88 53 134 130 III
Uninhabited,
F
(23)
113 47 7
96 134
122 49
313 36
39 90
117 85 46
74 43
53 9
58 2
41 41 83
57 60
I 65
89 18S
2 12
102
20
73 109
139 586 393
120 129 118
19
4.810
657
621
824
645
538
725
800
471 434 439 321 310 27)
12 19 12
847 229
94
177
187
150
109
69
61
6
8
95
69 ... 29
13
9
100
8
40
32
19
M
(24)
31 14 24 14 17
46 5
81 12
9 12 20 35 4
20 2
23 I
10 I
45 II I
3 7
6 74
26 46
6 27
51
2 ,22
26 23
19
3
8
8
II
F
(25)
28 20 23 5 9
48 8
60 38
5 9
18 24 3
17 3
13 I
12
io 7 2
I 5
III
M F
(26) (27)
i2 '4
16
2l iii 7
ii 9
19 19 3
5
2 1 'j
12 27
6' I 65 88 90 16 15 , 5 26
45
9 21
I 22 30
II
3
2
6
4~ iii I
12 I
I 77 iii 15 10
134
10
97 4
13 I
S 2
2
2
27.532 19.401 18.251 15.379 3.571 2.520 2.478 751
4.810 8.7 229 100 19 II 134 7
32.342 20.248 18.480 10.479 3.590 2.531 2.612 758
19
WORKERS
M
(28)
is
"3 2
I 4 6
ii
204
4S
26
76
6
12
14
25
375
204
IV
F
(29)
M
(30)
V
F
(31)
RURAL AREA-conc/d,
'i
'3 15
3 14
3 I
URBAN AREA
104 942
13
19
29
5
7
24
105
176
121
89
105
145
175
131
281
104 942
i:i
'j
85
12
12
16
20
10
8
7
24
85
VI VII
2 PANvEL 'rALtrKA
VIIl IX
NONWORKERS
---_;_--- -----S.rial M F
(32) (33)
6
'j
ji
2
M
(34}
3 2
2 4
ij
2 1 1
is
F M F M F
(35) (36) (37) (33) (39)
3
'j
2 I
8 3
4
69 62 3
'7 I
2
23
'2 2
2
'6
jj i~
~ . j 4~ 4S 9 8
34 2
I 6
II I 9
I.
M F No,
(40) (41) (I)
93 81 26
122 166
131 29
331 61
48 94
122 102 44
96 32
61 8
10, 3
98 63 80
51 56
7 374
87 430
7 22 75
50
83 90
110 578 349
5
132 151 70 152 30 153
170 154 195 155
185 156 38 157
428 158 90 159
160
55 161 124 162 152 163 136 164
45 165
123 166 47 167
168 84 169 5 170
155 171 3 172
120 173 85 174
101 175
67 176 61 177
178 9 179
584 180
80 181 599 182
5 183 16 184
100 185
60 186 187
98 188 112 189
190
136 191 594 192 429 193
7 194
145 21 1.117 168.517 15 1.502 336 4.718 7.755
43 13 78 8 82 214 39 610 984
8 195 108 62 104 34 602 964
17 I 218 36 104 204 54 765 1.275
37 3 69 5 56 2 293 79 6113 939
10 59 49 2 224 65 631 1.064
15 4 18j 4 73 2 243 43 759 1.303
16 313 7 91 210 22 667 1.226
168 29 591 .103 223 •• 1,594 490 21.481 28,834
146 21 1.117 168 517 15 1.502 336 4.718 7.755
579 209 1.223 109 314 50 1.708 271 740 15 3.096 826 26.199 36.589

Uran Mahal
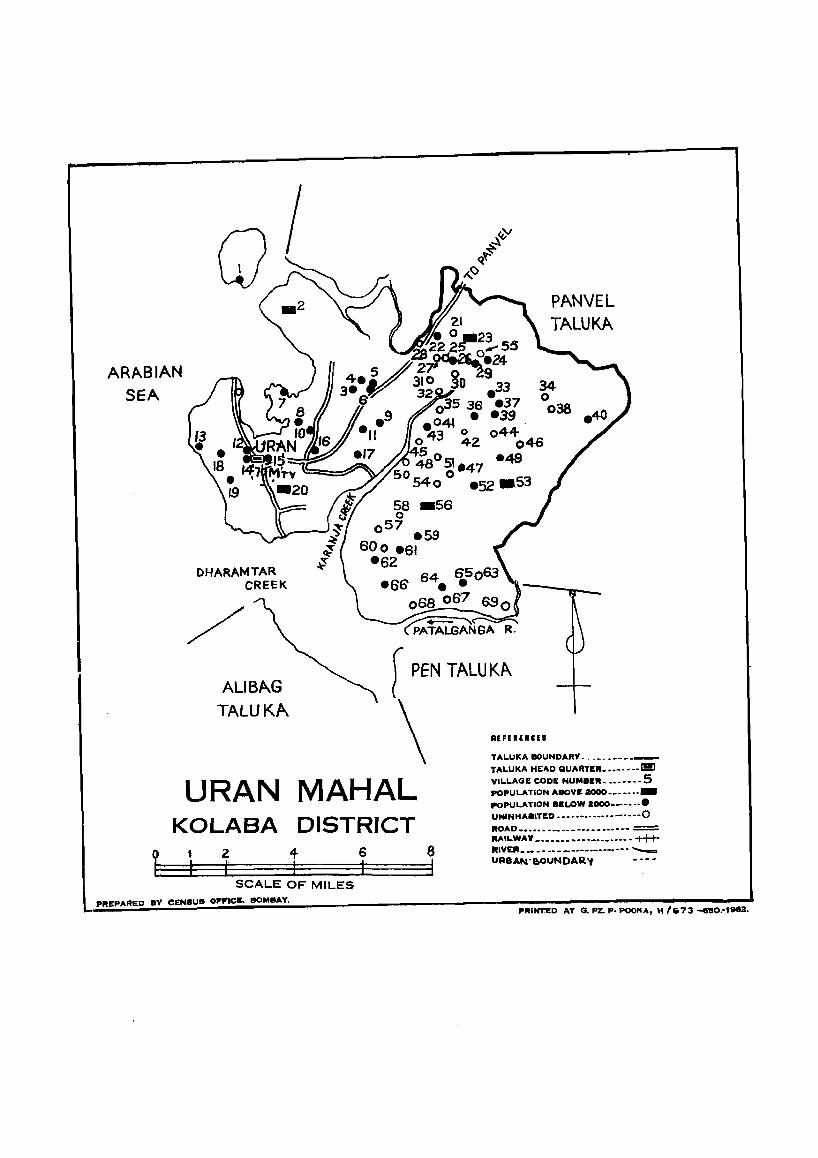
ARABIAN SEA
DHARAMTAR CREEK
PANVEL TALUKA
ALI BAG TALUKA
f PEN TALUKA
\ URAN MAHAL
KOLABA 1 2 I r
DISTRICT 4-I
G I
SCALE OF MILES
PREPARED BY CENSUII 01'11"1011. BOMBAY.
8 I
REFUElCli
TALUKA BOUNDARY. _________ _
TALUKA HEAD QUARTER •• _- ___ I!!l VILLAGE CODE NUMB.R _____ ., - 5 POPULATION ABOVE aooo •• -·· •• _ POPULATION B .. LOW 2000--· .. •• UNINHABITED ••• -.-•• - •• -.--. --0 "OAD ••••••••••• - •••••• -•••• = RAILWAY ~_ •••• , •••••••• _ •••• -t++ItIVEIt __ ••••• __ •••• __ •••••• __
UR8AN·e,OUNDAR.'1
PRINTED AT G. PZ. p. POOHA, "'fi73 "'150.-1"3.
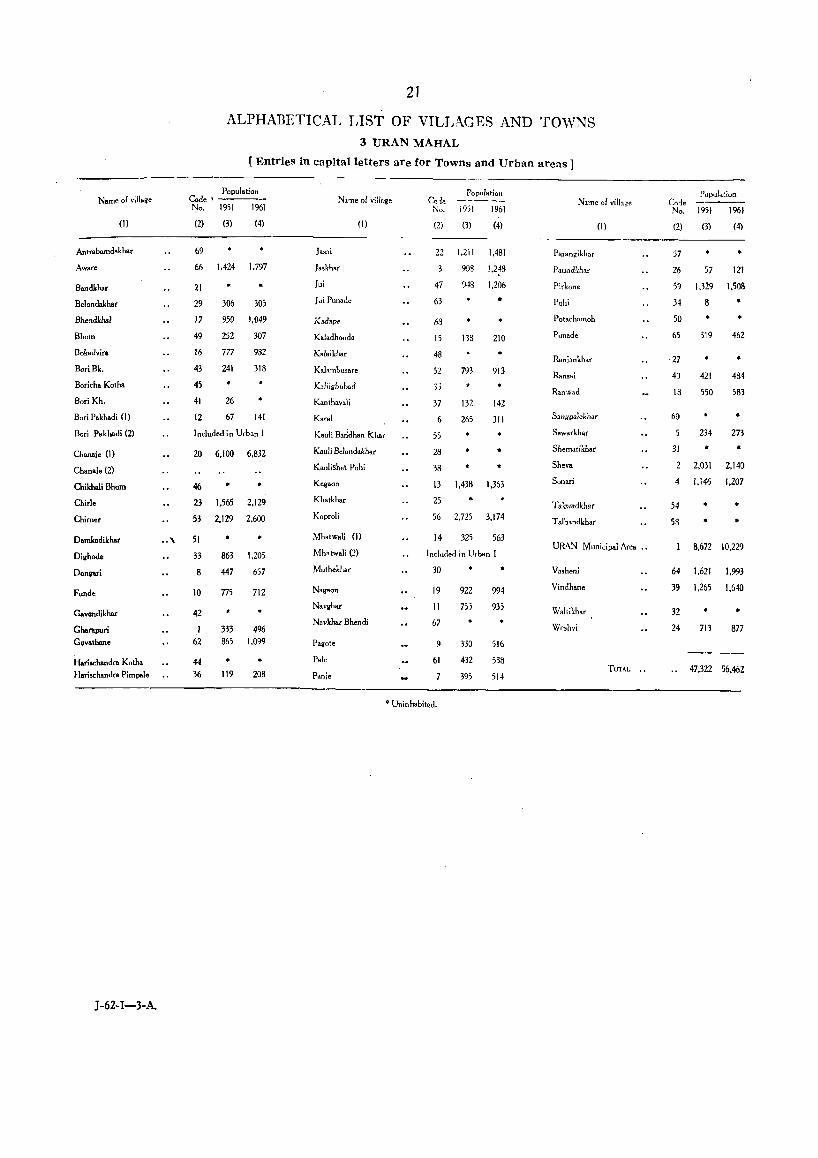
Name of village
(1)
Antrabamdakhar
Aware
Bandkhar
Belondakhar
Bhendkhsl
Bhom
Bokadvira
Bori Bk.
Boricha Kotha
Bori Kh.
Bori Pakhadi (1)
Sori Pakhadi (2)
Chana;. (1)
Chan.i. (2)
Chikhali Bhom
Chimer
Damkadikhar
Di~hod.
Donpri
Fund.
Gavendikhar
Ghatapuri Govathane
Harischandr. Kotha H.rischandra Pimpaie
J-6Z-1-3-A.
.. '\
21
ALPHABETICAL LIST OF VILLAGES AND TOWNS 3 URAN MAHAL
[ Entries in capitalletters are for Towns and Urban areas]
POPlllation Population Code 1----No. 1951 1961
Nl'11e of village Col. No. 19j1 1961
Name of village
(2) (3) (4)
69
66 1.424 1.797
21
29 306 305
17
49
16
43
45
41
12
950 1.049
252
777
241
* 26
67
307
982
318
141
Included in Urban I
20 6.100 6,832
46
23 1,565 2.129
53 2,129 2.600
51
33
8
10
42
62
44 36
• 863 1.205
447
775
333
657
712
496 865 1.099
119 208
Jas:li
Jaskh.r
Jui
Jai Punade
Kaaape
Kal.dhooda
Kala,khar
Kalambusare
Kanthavali
Karal
(I)
Kauli Ba~dhan Kbar
Kauli Belondakhar
KauliShet Pohi
Kegaon
Khatkhar
Koproli
Mhatwali (1)
Mh.twali (2)
MUlhekhar
Nagaon
Navgh"
Navkhar Bhend;
Pagote
Pale
(2) (3) (4)
22 1.211 1.481
47
63
63
15
43
52
33
37
6
55
28
38
90S 1.2~3
948 1.206
133
793
132
265
•
210
913
142
311
13 1,438 1.363
25
56 2,m 3,174
14 325 563
Included in Urban I
30
19
11
67
9
61
• Uninhabited.
922
75j
330
432
395
994
935
516
538
514
Parangikhar
Paund!,har
P:rkone
Pohi
Potachomoh
Pun.de
Raniankhar
Ransai
Ranwad
(I)
Sangpalekhar
Sawarkhar
Shemotikh.r
Sheva
Sonari
Takwadkhar
Talbandkhar
URAN Municipal Area ..
Va!l:heni
Vindhane
W.ltikhar
We,hvi
TOTAL ••
Population Co1e No.
(2)
57
1951 1961
(3) (4)
26 57 121
59 1,329 1508
34 8
50
65
27
40
18
60
319
421
550
234
31 •
2 2.031
4 1.146
54
53
• 462
434
583
• 273
• 2.140
1.207
8.672 10.229
64 1.621
39 1.265
32
24 713
1.993
1,640
877
47.322 56.462
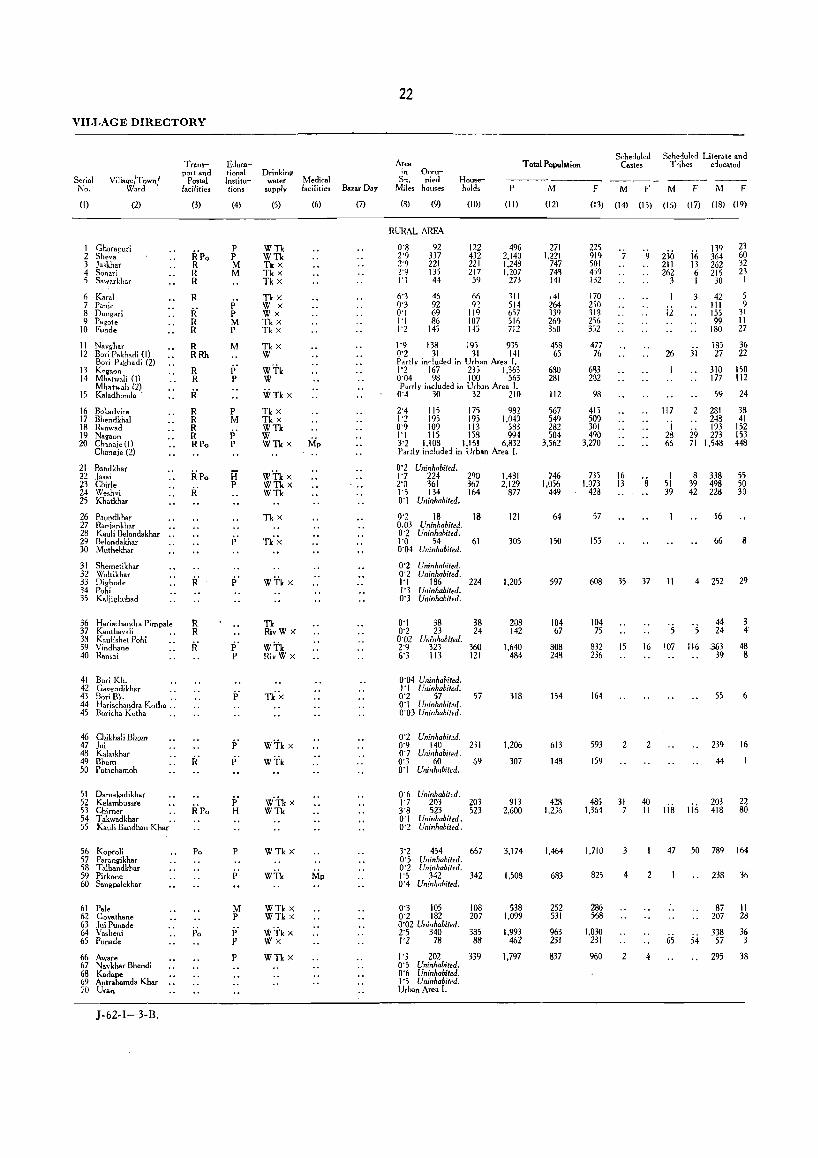
VILLAGE DIRECTORY
Serial No.
Villa'l'e!T oy.rn! Word
(I)
1 Gharaouri 2 Sheva' 3 ja,khar 4 Sonari 5 Sawarl,:har
6 Karal 7 Panje 8 Dongari 9 Pagote
10 Fund.
11 Navghor
(2)
12 Bori Pakhadi (1) Bori Pakhadi (2)
13 Kegaon 14 Mhotwali (1)
Mhatwali (2) 15 Kalodhonda'
16 Bokadvira 17 Bhendkhal 18 Ranwad 19 Nagaon 20 Chma;e(ll
Chana;e (2)
21 B,ndkhar 22 Jasai 23 Chirle 24 Weshvi 25 Khatkhar
26 Paundkhar 27 Ran;ankhar 28 Kauli BeiondakhaT .. 29 Belondakhar 30 Muthekhar
31 Shemetikhar 32 Waltikhar 33 Dighode 34 Pobi 35 Kaljighubad
36 Harischandra Pimpale 37 Kanthavali •• 38 KauEshet Pohi 39 Vindhane 40 Rans.i
41 Bori Kh. 42 C"'endikhar 43 Bori Bk. .. 44 Harischandra Koth •.. 45 Baricha Kotha
46 Chikhali Bhom 47 jui 48 Kalai khar 49 Bhom 50 Potachamoh
51 Damakadikhar 52 Kalambusare 53 Chimer 54 T akwadkhar •• 55 Kauli Bandhan Khar
56 Koproli 57 Parangikhar 58 T albandkhar 59 Pirkone 60 Sangpalekhar
61 Pale 62 Covathane 63 jui Punade 64 Vasheni 65 Punade
66 Aware 67 Navkhar Bhendi 68 Kadape 69 Antrabamda Khar 70 Uran
J-62-1-3-B.
Transport and
Post.1 facilities
(3)
liro R R R
R
R R R
R RRh
R R
k·
R R R R RPo
RPo
k·
R R
k·
Po
Educational Institutions
(4)
P P M M
p' P M P
M
p. P
P M p. P
H P
P
p. p
pH
p
P
M P p. P
P
Drinking water
supply
(5)
WTk WTk Tk X Tk X Tkx
Tkx W X wx Tk X Tk X
Tk X W
WTk W
WTkx
Tk X Tkx WTk W WTkx
WTkx WTk x WTk
Tkx
W'J\x
Tk RivW X
w'I'k RivW X
TkX
W·Tkx WTk
WTk X
WTk X WTk X
WTkx \'11 x
WTkx
Medical facilities
(6)
Mp
Bazar Day
(7)
22
Area in Occu-
Total Population
Sl. pied Miles houses
(8) (9)
RURAL AREA
0'8 2'9 '1'9 :Z·q 1'1
6·3 0·3 0·1 1·1 1'2
92 337 221 135 44
45 92 69 86
145
Households
(10)
122 432 221 217 59
66 92
119 107 1~5
P
(11)
496 2.140 1,24S 1,207
273
311 514 657 511\ 712
1·9 138 195 935 0'2 31 31 141 PdTtly included in Urhan Area I. 1'2 167 23:; 1,363 0·04 98 100 563 Partly included in Urbln Area I.
0'4 30 32 210
2"4 115 17; 982 1'2 195 195 1.049 0'9 109 113 583 1·1 115 158 994 3"2 1,108 1.151 6.8>2 P .. rtly inc!udei in Urban Area I.
0'2 Uninhabited. 1·7 224 290 2·0 361 367 1·5 134 164 0'1 Uninhabited.
0·2 18 18 0.03 Uninhabited. 0'2 Uninhal,ited. 1'0 54 61 0"04 Uninhabited.
0·2 Uninhabited. 0'2 Uninhabited. 1·1 186 224 1·3 Uninhabited. 0·3 Uninhabited.
0·1 38 38 0·2 23 24 0'02 Unr·nhalited. 2'9 323 360 6·3 113 121
0·04 Uninhabited. 1·1 Uninhabited. 0·2 57 57 0'1 Uninhabited. 0"03 Uninhabited.
0·2 Uninhabited, 0·9 140 231 0'7 Uninhabited. 0·3 60 69 0'1 Uninhabited.
0·6 Uninhabited. 1'7 203 203 3"8 523 523 0'1 Uninhabited. 0·2 Uninhabited.
3·2 454 667 0'5 Uninhabited. 0'2 Uninhabited. 1·5 342 342 0'4 Uninhabited.
0·3 105 108 0'2 182 207 0'02 Uninhabited. 2·5 340 385 1'2 78 88
1'3 202 339 0"5 Uninhabited. 0·6 Uninhabited. 1·5 Uninhabited. Urb,n Area I.
1.431 2,129
877
121
305
1,205
208 142
1.640 484
318
1,206
307
913 2.600
3,174
1,508
538 1.099
1,993 462
1,797
M
(12)
271 1.221
747 743 141
,41 264 339 2m 3;,0
453 65
630 281
112
567 549 282 504
3,562
746 1,056
449
64
150
597
104 67
808 248
154
613
148
428 1.236
1,464
683
252 531
963 231
837
Scheduled Sche~ule~ Literate and Castes Tribes educated
F M F M F M F
(13) (14) (15) (1,) (17) (18) (19)
22) 919 501 459 132
170 2,0 ,13 251\ 352
477 76
6q3 232
98
41 j 50~ 301 490
3,270
73) 1,073
428
57
155
608
104 75
832 236
164
593
159
485 1.364
1,710
825
286 568
1.030 231
960
7
16 13
35
15
2
31 7
4
2
9 230
·s
37
16
2
40 11
2
4
211 262
3
ii
26
117
'i 2g 66
1 51 39
11
·5 107
118
47
65
i6 13 6 1
139 364 262 21S 30
23 60 32 23
1
42 5 111 9 ISS 31 99 11
180 27
3i 185 27
310 177
59
2 281 2~8
29 m 71 1,543
8 338 39 498 42 22B
16
66
4 252
44 24
116 -363 39
55
239
44
203 418
36 22
150 112
24
38 41
152 153 448
55 50 30
8
29
3 4'
48 8
6
16
22 80
50 739 164
54
238 36
87 207
338 57
29;
II 28
36 3
38
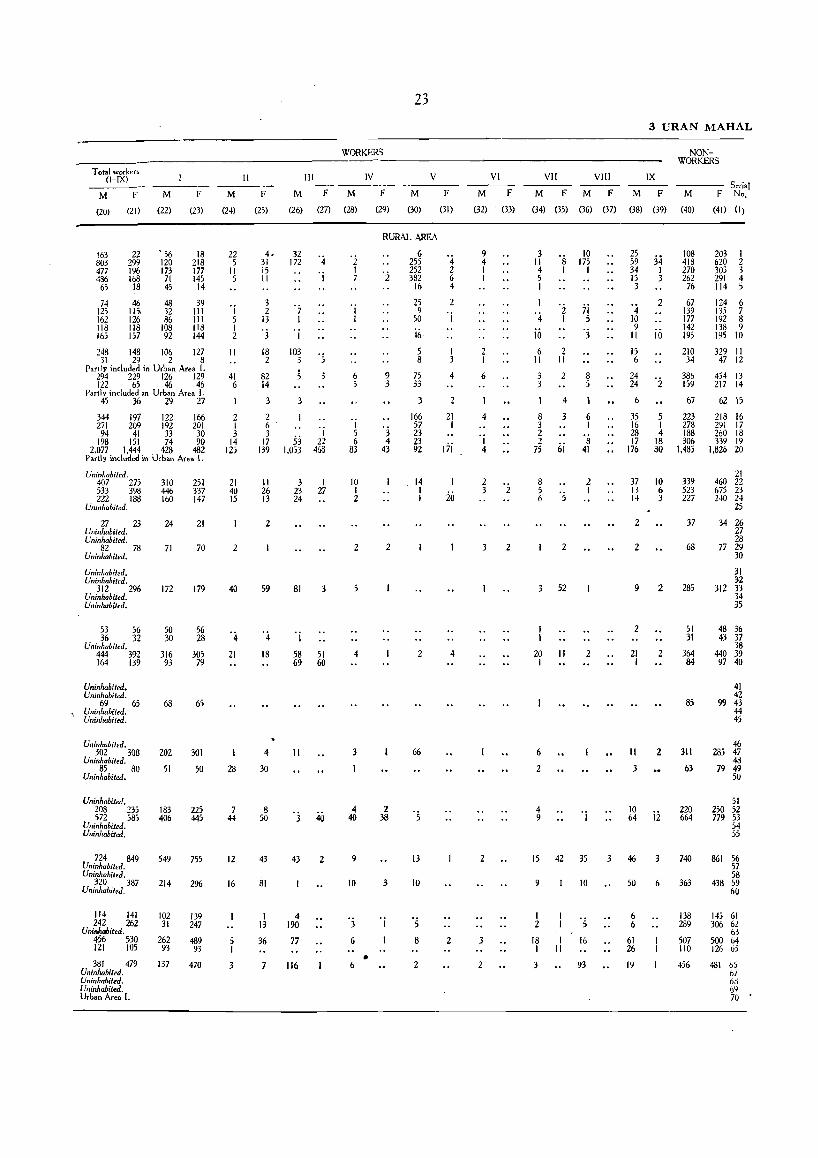
23
3 URAN MAHAL
WORK£RS -------------------------- .------------~-------------------------NON
WORKERS Total workers
(I-IX)
M F M
(20) (21) (22)
163 803 477 486
65
74 125 162 118 165
22 299 196 168
18
46 liS 126 118 157
, 56 120 173
71 45
48 32 86
108 92
F
(23)
18 218 J77 145
14
39 III III 118 144
~8 148 1% III 31 29 2 8
Partly included in Ur':>an Area I. 294 229 126 129 In M 46 46
Partly included in Urban Area I. 45 36 29 27
344 197 122 166 271 209 192 201 94 41 33 30
198 151 74 90 2.077 1.444 428 482
Partly included in Urban Are. l.
Uninhabited. 407 275 533 398 222 188
Uninhabited,
27 23 Uninhabited. Uninhabiled.
82 78 Uninhabited,
UninhaUted. Uninhabited.
312 296 Uninhabited. Uninhabited.
53 56 36 32
Uninhabited, 444 392 164 139
Uninhabited. Uninhabiled.
69 65 Uninhabited, Uninhabited.
Uninhabited. 302 308
Uninhabited, 85 80
Uninhabited.
Uninhnbited. 208 235 572 585
Uninhabited, Uninhabited,
724 849 Uninhabited, Uninhabited,
320 387 Uninhabited,
114 141 242 262
Uninhabited, 456 530 121 105
381 479 Uninhabited, Uninhabited, Uninhabited, Urban Area I.
310 446 160
24
71
172
50 30
316 93
68
ZOZ
51
183 406
549
214
102 31
262 93
137
251 337 147
21
70
179
56 28
305 79
65
301
50
225 445
755
296
139 247
489 93
470
II
M F
(24) (25)
22 5
II 5
I 5 I 2
II
41 6
I
2 I 3
14 125
21 40 15
2
40
'4 21
28
7 44
12
16
3
4. 31 15 II
3 2
13
'3 18 2
82 14
3
2 6 3
17 139
II 26 13
2
59
'4 18
4
30
8 50
43
81
I 13
36
III IV V
M F M F M F
(26) (27) (28) (29) (30) (31)
32 172
'7 I
'j
103 3
3
53 1.053
'4 'j
'j 22
458
3 I 23 27 24
81 3
'j
58 51 69 60
II
'3 40
43
4 190
77
116
2
'2 I 7
'j I
6 5
'j 5 6
83
10 I 2
2
5
4
4 40
9
10
3
6
6 •
RURAL AREA
6 255
'2 m 16
25 9
50
46 5 8
9 75 3 33
'3 4
43
2
2 38
3
3
166 57 23 23 92
14 I I
2
66
'5
13
10
'5 8
2
'4 2 6 4
2 'j
I 3
4
2
21 I
17j
20
4
2
VI
M F
(32) (33)
9 4 I I
2 I
6
4
'j 4
2
2
2
VII VIII
M F M F
(34) (35) (36) (37)
3 II 4 5 I
'4 jli 6
II
3 3
I
8 3 2 2
75
's I
'2 I
2 II
2
4
3
6j
2
3 52
20 11 I
6
2
4 9
10 175
I
71 5
'j
8 5
6 I
8 41
2 I
2
'j
IX
M F
(38) (39)
25 59 34 15 3
'4 10 9
II
15 6
24 24
6
35 16 28 17
176
34 I 3
2
iii
5 I 4
18 80
37 10 13 6 14 3
2
2
9
2
21 I
11
3
2
2
2
10 64 ji
IS 42 35 3 46 3
9 10
I 2
18 I I II
'5 16
93
50
6 6
61 26
19
6
M
(40)
108 418 270 262
76
67 139 177 142 195
210 34
386 159
67
223 278 188 306
1.483
339 523 227
37
68
285
51 31
364 84
85
311
63
220 664
740
363
138 289
507 110
456
Serial F No.
(41) (I)
203 I 620 2 303 3 291 4 114 5
124 6 133 7 192 8 138 9 195 10
329 II 47 12
454 13 217 14
62 15
218 16 291 17 260 18 339 19
1.826 20
21 460 22 675 23 240 24
25
34 26 27 28
77 29 30
31 32
312 33 34 35
48 36 43 37
38 440 39 97 40
41 42
99 43 44 45
46 285 47
48 79 49
50
51 250 52 779 53
54 55
861 56 57 58
438 59 60
145 61 306 62
6j
500 64 126 65
481 6S b7 6d 69 70
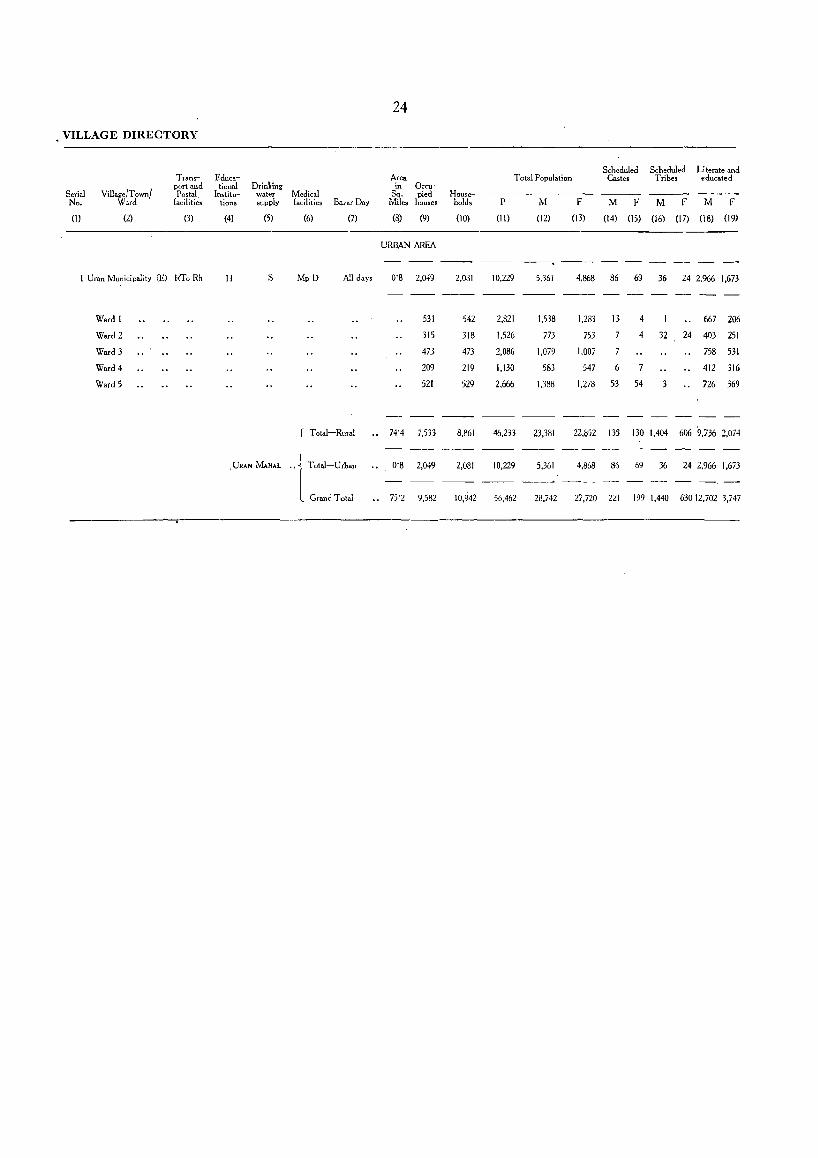
24
VILLAGE DIRECTORY
Scheduled Scheduled Literate and Trsns- Educa- Area Total Population Castes Tribes educated
port and tional Drinking in Occu-Serial Village/Town! Postal Institu- water Medical Sq, pied House- ----No, Ward facilities tions supply facilities Bazar Day Miles houses holds P M F M F M F M F
(I) (2) (3) (4) (5) (6) (7) (~) (9) (10) (II) (12) (13) (14) (15) (16) (17) (18) (19)
URBAN AREA
--. I Uran Municipality (El RToRh H S MpD All days 0'8 2.049 2,081 10.229 5.361 4.868 86 69 36 24 2.966 1.673
Ward 1 531 542 2.821 1,538 1.283 13 4 667 206
Ward 2 315 318 1,526 773 753 7 4 32 24 403 251
Ward 3 473 473 2.086 1.079 1.007 758 531
Ward 4 209 219 1.130 583 547 6 7 412 316
Ward 5 521 529 2.666 1.388 1.278 53 54 3 726 369
r T atal-Rural 74'4 7.533 8.861 46.233 23.381 22,852 135 130 1.404 606 9.736 2.074
1 ToOI-U". URAN MAHAL 0'8 2,049 2,081 10,229 5,361 4,868 86 69 36 24 2.966 1.673
-- -l Grand Total 75'2 9.582 10.942 56.462 28.742 27.720 221 199 1,440 630,12.702 3.747
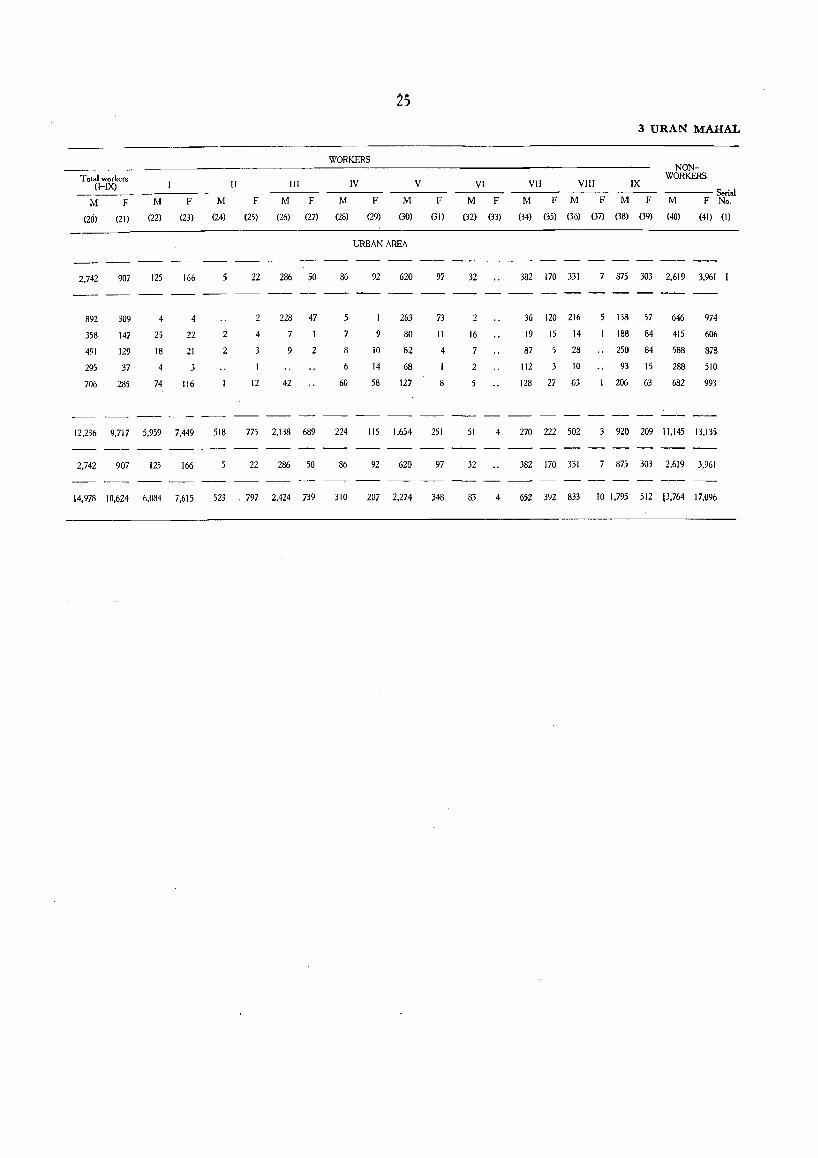
25 3 URAN MAHAL
WORKERS NON-
Total workers WORKERS (I-IX) II III IV V VI VII VllI IX
--- Serial M F M F M F M F M F M F M F M F M F M F M F No.
(20) (21) (22) (23) (24) (25) (26) (27) (28) (29) (30) (31) (32) (33) (34) (35) (36) (37) (38) (39) (40) (41) (I)
URBAN AREA
2,742 907 125 166 5 22 286 50 86 92 620 97 32 382 170 331 7 875 303 2,619 3,961
892 309 4 4 2 228 47 5 263 73 2 36 120 216 5 138 57 646 974
358 147 25 22 2 4 7 7 9 80 11 16 19 15 14 188 84 415 606
491 129 18 21 2 3 9 2 8 10 82 4 87 28 250 84 588 878
295 37 4 3 6 14 68 2 112 10 93 15 288 510
706 285 74 116 12 42 60 58 127 8 5 128 27 63 206 63 682 993
12,236 9,717 5,959 7,449 518 775 2,138 689 224 115 1,654 251 51 4 270 222 502 3 920 209 il,I45 13,135
2,742 907 125 166 5 22 286 50 86 92 620 97 32 382 170 331 7 875 303 2,619 3,961
14,978 10,624 6,084 7,615 523 797 2,424 739 310 207 2,274 348 83 4 652 392 833 10 1,795 512 13,764 17,096


Khalapur Taluka
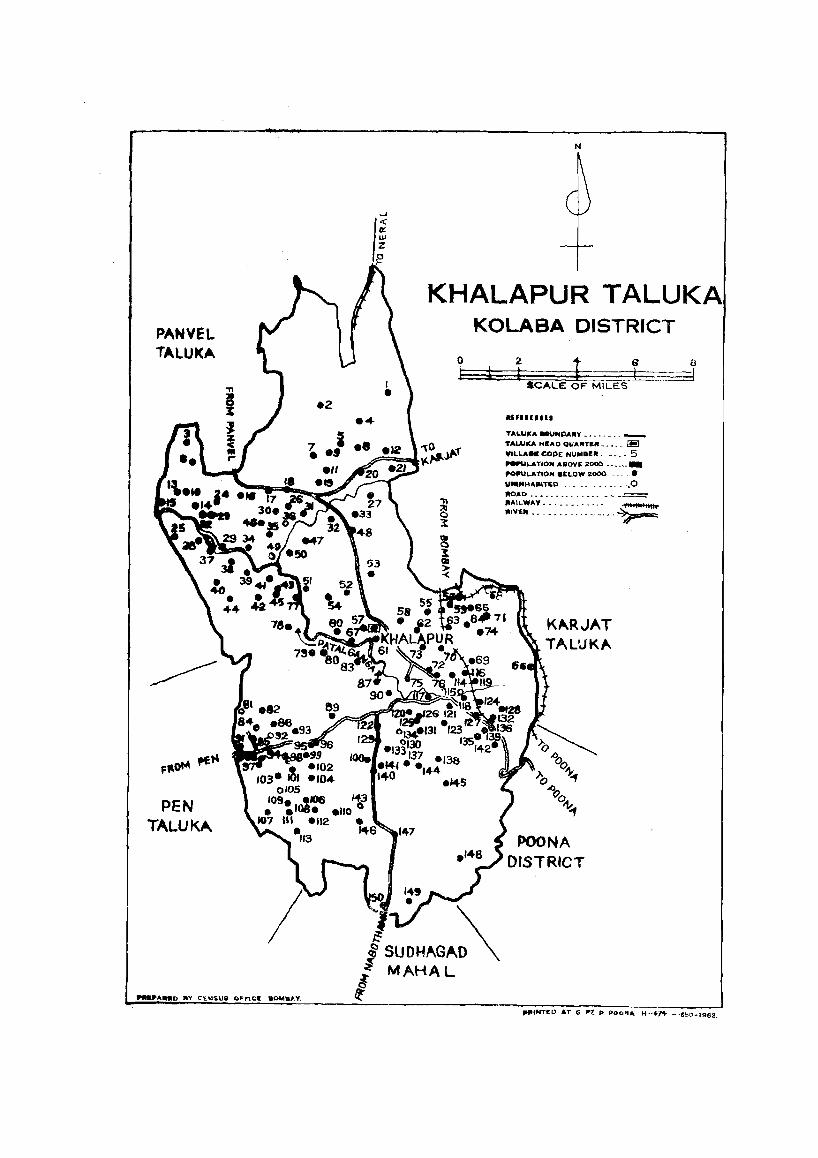
PANVEL TALUK~
PEN TALUKA
.... PA .. O BY CE.NSUS OF-Flee: 80MBJo.".
_.
11
N
KHALAPUR T ALUKA KOLABA DISTRICT
I 1: i 1 -- i _:.i--d SCALE OF MILES
U'III1.11
TAI,.UKA .ouNPAIIY ••••.•. __
TAl-UKA HEAD QUARTEII ••••• [iii YILLA .. cope NUMBE" - ' ••• 5 _ ..... TION AIiOVe: 2000 •••••• _
l'OI'ULATION ."LOW 2000 _ _ _ • U .. MHAIlITEO ___________ ._.0 ItOA!:) "'."." • _ ••• __ .= IIAII..WAV ••.••• __ •.•• ___
ItIVf.It._ .••. _._ .•• _ ••• _~
K~RJAT
TALUKA
POONA DISTRICT
;SUOH"'G"~ : MAHAL
~ P"fNTE:D AT G II"Z ~. POClrrtA H-$14 - "650,,1962.
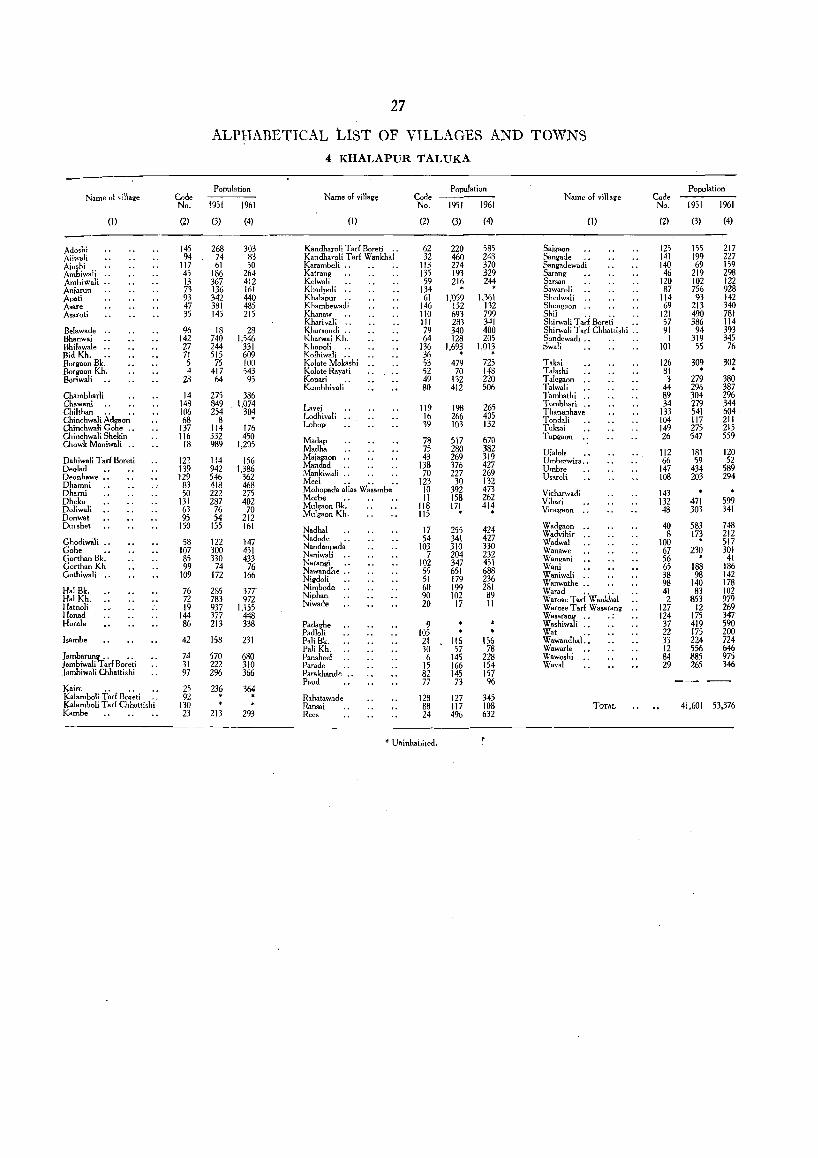
Name of viUage
(1)
Adoshi Aiiwali Aioshi Ambiwali Ambiwali .. Anjarun Apati Asare Asaroti
Belawade Bhanwaj Bhilawale Bid Kh. .. Borgaon Bk. Borgaon Kh. Boriwali
Chambharli Cha.wani Chilthan.. •• Chinchwali Adgaon Chinchwali Goh' ., Chinchwali Shekin Chowk Maniwali ..
Dahiwali TarE Boreti Deolad' ., Deonhawe ., Dhamni Dhami Dheku Doliwali Donwat Durshet
Chodiwali ., Goh. " Gorthan Bk. Gorthan Kh Gothiwali
HalBk. Hal Kh. Hatnoli Honad Horale
Isambe
Jambarunll'_.. •. }a.mbiwali T arf Boreti lambiwali Chhaltishi
Kairc .• II
Kalamboli TarE Boreti .. Kalamboli Tarl Chh.ui,hi Kambe
Code No.
(2)
145 94
117 45 13 73 93 47 35
96 142 27 71 5 4
28
14 148 106 68
137 116
18
122 139 129
83 50
131 63 95
150
58 107 85 99
109
76 72 19
144 86
42
74 31 97
25 92
130 23
27
ALPHABETICAL LIST OF VILLAGES AND TOWNS
Population
1951 1961
(3)
268 74 61
186 367 136 342 381 145
18 740 244 515
75 417 64
275 849 254
8 114 332 989
114 942 546 418 222 287
76 54
155
122 300 330
74 172
285 783 937 377 213
158
570 222 296
236 . 213
(4)
303 83 50
264 412 161 440 485 215
28 1,546
331 609 100 543 95
386 1,074
304 . 176 450
1,205
156 1,386
362 468 275 402
70 212 161
147 431 433
76 166
377 972
1,155 448 338
231
680 310 366
364 . 293
4 KHALAPUR TALUKA
Name of village
(I)
Kandharoli TarE Boreti .• Kandhamli Tarl Wankhal Karambeli .. Katrang Kelwali .. Khadpoli Khalapur .. Khambewadi Khanaw .• Kharivali .• Kharsondi .. Kharwai Kh. Khopoli .. Kolhiweli .• Kolote Mokashi Kolote Rayati Kopati .. Kumbhivali
Lavej LodhivaIi Lohop
Madap Madha Majagaon Mandad Mankiwali Meel .• .. •. Mohopada alias Wasambe Morhe ., MulgaonBk. Mulgaon Kh.
Nadhal Nadode ., Nandan""da Naniwali Natangi .' Nawandhe ., Nigdoli Nimbode Niphan Niwade
Padaghe Padloli P.lil:lk. Pali Kh. Pansheel Parade .• Parakhande .• Paud
Rahatawade Ransai Rees
Code No.
(2)
62 32
113 135 59
134 61
146 110 III 79 64
136 36 53 52 49 80
119 16 39
78 75 43
138 70
123 10 11
118 115
17 54
103 7
102 55 51 60 90 20
9 105 21 30 6
15 82 77
128 88 24
• Uninhabited.
Population
1951 1961
(3)
220 460 274 193 216 · 1;059 152 693 283 340 128
1,693 · 479 70
132 412
198 266 103
517 280 269 376 227 30
392 158 171 · 255 341 310 204 347 651 179 199 102
17
116 57
145 166 145 73
127 117 496
(4)
585 248 370 329 244 · 1,361 132 799 341 400 205
1,013 · 725 148 220 506
265 405 132
670 382 319 427 269 132 473 262 414 · 424 427 330 232 451 688 236 281 89 11
156 78
228 154 157 96
345 108 632
Name of village
(I)
Sajgaon Sangade .• Sangadewadi Sarang Sarsan Sawaroli Shedwali Shengaon Shil .... Shirwali Tad Boreli .. Shirwali TarE Chhattishi .. Sondewadi .• Swali
Takai Talashi Talegoon Talwali Tambathi Tembhari ., Thanenhave Tondali Tuksai .• Tupgaon .~
Ujaloli .• Umberwira .• Umbre Usaroli
Vicharwadi Vihari Vinegaon
Wadgaon Wadvihir Wadwal Wanawe Wangani Wani Waniwali Wanwathe Warad •• . •. Warose Tar! Wankhal Warose T arf Wasaranll Wasarang.. .. Washiwali .• Wat .. Wawandbal .• Wawarle Wawoshi Wayal
TOTAL
Code No.
(2)
125 141 140
46 120 87
114 69
121 57 91
I 101
126 81 3
44 89 34
133 104 149 26
112 66
147 108
143 132 4S
40 8
100 67 56 65 38 9S 41 2
121 124 37 22 33 12 84 29
Population
1951 1961
(3) (4)
155 217 199 227 69 159
219 298 102 122 756 928 93 142
213 340 490 7S1 386 114 94 393
319 345 55 76
309 302 · . 279 380 296 387 304 296 279 344 541 604 117 211 275 215 547 559
181 120 59 52
434 589 203 294
471 599 303 341
583 748 173 212
• 517 230 301
• 41 188 186 98 142
140 178 83 102
853 979 12 269
175 347 419 590 175 200 224 724 556 646 885 975 265 346
41.601 53.376
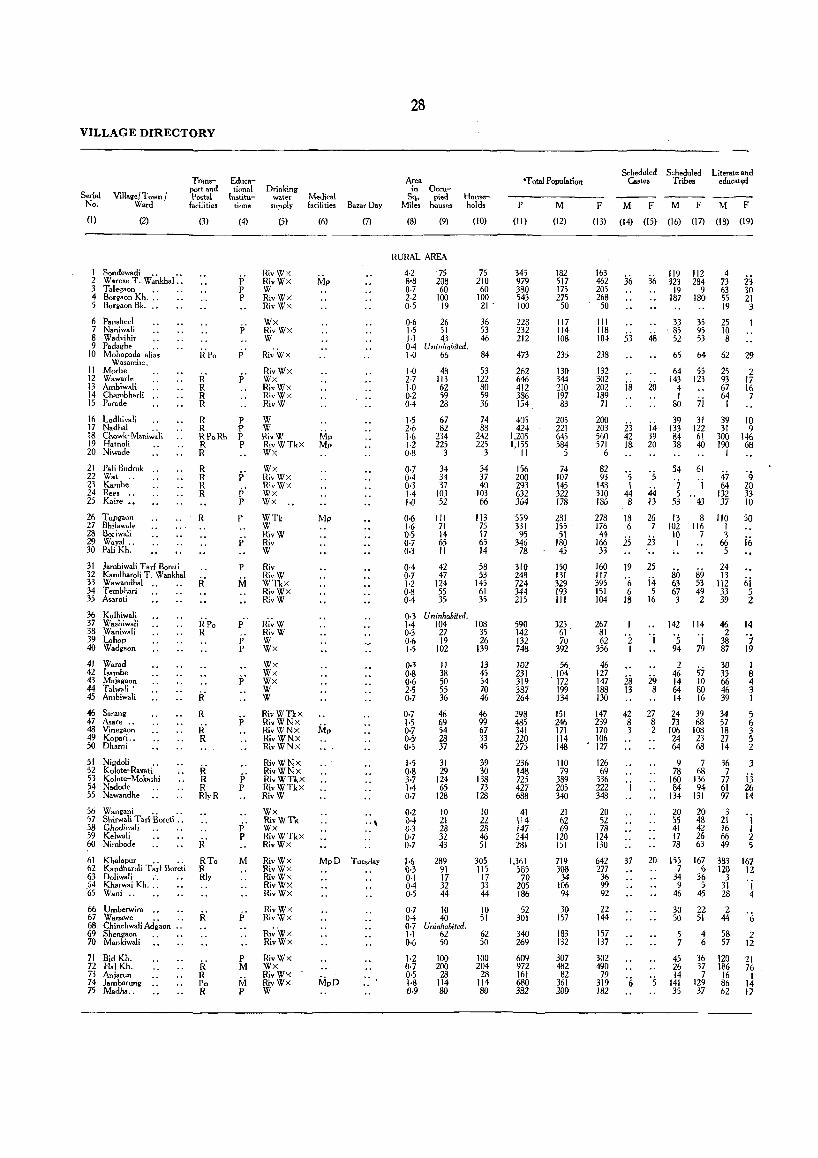
VILLAG E DIRECTORY
Serial No.
(I)
Villa~./Townl Ward
(2)
1 Sondewadi . . . . 2 Warose T. Wankhal .. 3 Talegaon ., 4 Borgaon Kh. ., 5 Borllaon Bk. ..
6 Paosheel 7 Naniwali 8 Wadvihir 9 Padaghe .,
10 Mohopada alias W'asambe.
11 Morbe 12 Wowarle 13 Arnbiwali 14 Chambharli .. 15 Parade
16 Lodhivali 17 Nadhal .. 18 Ch"wk~Maniw"li 19 Hatnoli 20 Niwade
21 Pali Budruk 22 W.t .. 23 Kambe 24 Rees .. 25 Kaire ••
26 Tupgaon 27 Bhit.wale 28 Boriwali 29 Wayal .. 30 Pali Kh.
31 Jambiwali Tarl Boreli 32 Kandharoli T. Wankhal 33 Wawandhal 34 Tembhari 35 Asaro!i
36 Kolhiwali 37 Washiwali 38 Waniwali 39 Lohop 40 Wad~aon
41 Wat.d 42 lsambe 43 M.jagaon 44 Talwali' 45 Ambiwali
46 Satang 47 Asare .. 48 Vine"aon 49 Kopari .. 50 Dh.wi
51 Nigdoli .. 52 Kolow-Ray.ti 53 Kolote--Mokashi 54 Nadode 55 Nawandhe
56 Wangani .. .. 57 Shimali Tar! Bore!i .. 58 Chodiw.li 59 Kelwali 60 Nimbode
61 Khal.pur .. .. 62 Kaodharoli Tar! Boreli 63 Doliwa1i .. 64 Kharwai Kh ..• '65 Wani ..
66 Umberwira .. 67 Wanawe .. .. 68 Chinchwali Adgaon .. 69 Shengaon 70 Mankiwali
71 BidKh. 72 HaiKh. 73 Anjarun 74 lamb.runa 75 Madh ...
Transport and Postal
facilities
(3)
Educational
Institutions
(4)
j; P P
RPo P
R' p' R R R
R P R 'P RPoRh P R P R
R R R R
R
R' R
R' R
R R R RlyR
R' RTo R Rly
k' R Po R
P P
p
P
M
P
P P
P
P P
p' P
M
P M
M p
Drinking water
supply
(5)
RivWx RivWx W RivWx RivWx
Wx RivWx W
Ri~WX
RivWx Wx RivWx RivWx RivW
W W RivW RivWTkx Wx
Wx RivWX RivWx Wx \Vx
WTk W RivW Riv W
Riv RivW WThx RivWx RivW
R'i~W RivW W Wx
Wx Wx Wx W W
RivWTkx RivWNx RivWNx RivWNx RivWNx
RivWNx RivWNx RivWTkx Riv WTkx RivW
Wx RivWTk Wx RivWTkx RivWx
RivWx RivWx RivWx RivWX RivWx
RivWx RivWX
Ri~'WX RivWx
RivWx Wx RivWX RivWX W
MoJical facilities
(6)
Mp Mp
Mp
Bazar Day
(7)
MpD Tuesday
28
Area in
Sq. Miles
(8)
Occupied
houses
(9)
RURAL AREA
4·2 75 8'8 208 0·7 60 2·2 100 0·5 19
0·6 26 1·5 51 1·1 43
Households
(10)
75 210 60
100 21 .
36 53 46
0·4 Uninhabited. 1·0 66
1·0 48 2·7 113 1·0 62 0·2 59 0·4 28
1·5 67 2·6 82 1·6 234 1·2 225 0·8 3
Q.7 0·4 0·3 1·4 1·0
0·6 1·6 0·5 0·7 0·3
0·4 0·7 1·2 0·8 0·4
34 34 37
103 52
111 71 14 65 II
42 47
124 55 35
0·3 Uninhabited.
84
53 122 80 59 36
74 88
242 225
3
34 37 4\)
103 66
113 75 17 65 14
58 53
145 61 35
1·4 104 108 0·3 27 35 0·6 19 26 1·5 102 139
0·3 0·8 0·6 2·5 Q.7
Q.7 \·5 0·7 0·5' 0·5
1·5 0·8 J.7 1·4 0·7
0·2 0·4 0·3 0·7 Q.7
1·6 0·3 0·1 0·4 0·5
II 38 50 55 36
46 69 54 28 37
31 29
124 65
128
10 21 28 32 43
289 91 17 32 44
0·7 10 0·4 40 0·7 Uninhabited. 1·1 62 0·6 50
1·2 100 0·7 200 0·5 28 1·8 114 0·9 80
13 45 54 70 46
46 99 67 33 45
39 30
138 73
128
10 22 28 46 51
305 115
17 33 44
10 51
62 50
100 204
28 114 80
'Total Population
P M
(11)
345 979 380 543 100
228 232 212
473
262 646 412 386 154
40:; 424
1,205 1,155
II
156 200 293 632 364
559 331 95
346 78
310 248 724 344 215
590 142 132 748
102 231 319 387 264
298 485 341 220 275
236 148 725 427 688
41 114 147 244 281
1,361 585
70 205 186
52 301
340 269
609 972 161 680 382
(12)
182 517 175 275
50
117 114 108
23:>
130 344 210 197 83
205 221 645 584
5
74 107 145 322 178
281 155 . 51
180 45
150 131 329 193 111
323 61 70
392
56. 104
. 172 199 134
151 246 171 114 148
110 79
389 205 340
21 62 69
120 151
719 303 34
106 94
30 157
183 132
307 482 82
361 200
Scheduled Scheduled Ca,!es Tribe.
F M F M F
Literate and educate<!
M F
(13) (14) (15) (16) (17) (18) (19)
163 462 205 268
50
111 118 104
238
132 302 202 189
71
200 203 560 571
6
82 93
148 310 186
278 176 44
166 33
160 117 395 151 104
267 81 62
356
46 127 147 188 130
147 239 170 106 127
126 69
336 222 348
20 52 78
124 130
642 277 36 99 92
22 144
157 137
302 490
79 319 182
36
53
is
23 42 18.
'5 1
44 B
18 6
25
19
'(, 6
18
1
'i 1
2S 13
42 8 3
'i
37
'6
36
48
i-i 39 20
'5 44 B
26 7
23
25
i4 5
16
119 323
19 187
33 , 85
52
65
64 143
4 1
80
39 133 84 38
112 284
9 180
35 95 53
64
55 123
7i 31
122 61 40
54 61
7 'j
5~ "43
13 8 102 116 10 7 1
80 89 63 53 67 49 3 2
142 114
4 73 63 55 19
25 10 8
62
25 93 67 64
1
39 3f
300 190
I
47 64
132 37
110 I 3
66 5
24 13
112 33 39
1 '5 'j 46
2 38 87
29 8
27 8 2
94 79
4~ 57 14 10 64 80 14 16
24 39 73 68
106 108 24 23 64 68
9 7 78 68
160 136 84 94
134 131
30 33 66 46 39
34 57 18 27 14
36 7
77 61 97
20 20 3 55 48 21 41 42 16 17 26 66 78 63 49
23 30 21 3
29
2 17 16 7
10 9
146 68
'9 20 33 10
50
j6
i,i 5 2
14
'7 19
I 8 4 3 I
5 6 3 5 2
3
ij 26 14
1 1 2 5
20 155 167 383 167 7 6 120 12
34 36 3 9 5 31 'j 4645284
30 50
5 7
45 26 14
141 35
22 51
4 6
36 37 7
129 37
2 44
58 57
120 186
16 86 62
'6 2
12
21 76
1 14 17
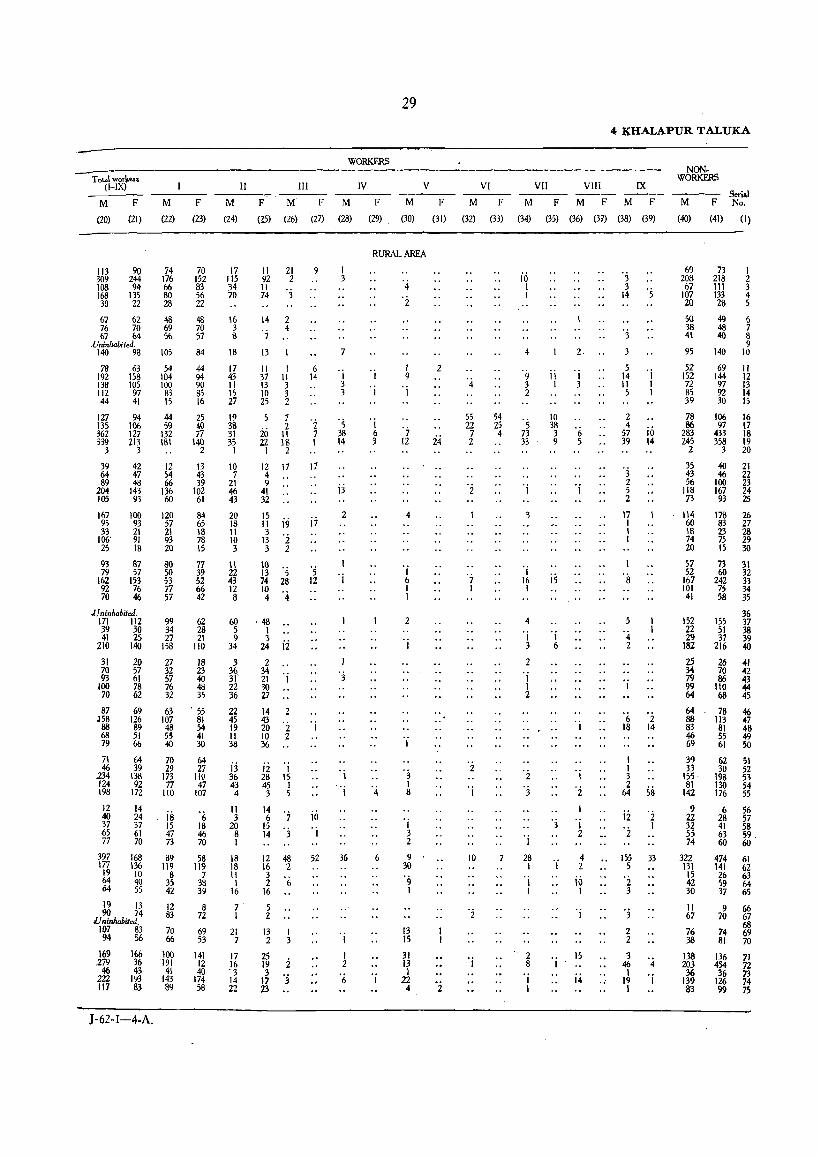
Total wor"'." (I-IX)
M F
(20) (21)
113 90 309 244 lOB 94-168 135 30 22
67 62 76 70 67 64
.uninhabitedo 140 98
78 63 192 158 138 105 112 97 44 41
127 94 135 106 362 127 339 213
3 3
39 64 89
.204 lOS
42 47 48
143 93
167 100 95 93 33 21
106' 91 25 18
93 87 79 57
162 153 92 76 70 46
.l}ni"habit.Jo 171 112 39 30 41 25
210 140
31 20 70 57 93 61
100 78 70 62
87 69 ,158 126
88 89 68 51 79 66
71 64 46 39
234 138 124 92 198 172
12 40 37 65 77
14 24 37 61 70
397 168 177 136
19 10 64 40 64 55
19 13 90 74
Vninhabiledo
107 83 94 56
169 166 279 36
46 43 222 193 117 83
J-62-I-4-Ao
M
(22)
74 176 66 80 28
4B 69 56
105
54 104 100 83 15
44 59
132 181
12 54 66
136 60
120 57 21 93 20
SO SO 53 77 57
99 34 27
158
27 32 57 76 32
63 107 48 55 40
70 29
173 77
110
is 15 47 73
89 119
8 35 42
12 83
70 66
100 191
41 143 89
F
(23)
70 152 83 56 22
48 70 57
84
44 94 90 85 16
25 40 77
140 2
13 43 39
102 61
84 65 18 78 15
17 39 52 66 42
62 28 21
110
18 23 40 48 35
, 55 81 54 41 30
64 27
110 47
107
"6 18 46 70
58 119
7 38 39
8 72
69 53
141 12 40
174 58
II III
M F M F
(26) (27) (24) (25)
17 115 34 70
16 3 8
18
17 43 11 15 27
19 38 31 35
1
10 7
21 46 43
20 18 II 10 3
1\ 22 43 12 8
60 5 9
34
3 36 31' 22 36
22 45 19 11 38
ij 36 43 4
11 3
20 8 1
18 18 11 1
16
7 1
21 7
17 16 "3 14 22
II 92 11 74
14 OJ
13
21 2
"3
2 4
11 I 37 11 13 3 10 3 25 2
5 7 2 io 11
22 18 1 2
12 17 4 9
41 32
15 11 i9 1~ °i 3 2
19 Os 74 28 10 4 0.j
° 48 00 1 3
24 ii 2
34 21 °i 30 27
14 2 43 20 °z 10 2 36
12 1 28 15 45 1 3 5
12 °7 15 14 °3
12 48 16 2
i °6 16
5 Z
13 2
25 19 i 1~ OJ 23
9
6 14
°2 7 1
17
i7
Os 12
°i
io 1
52
29
WORKERS
IV v M F M F
(28) (29) (30) (31)
RURAL AREA
7
°i 3 3
Os 38 14
jj
2
°i
OJ
OJ
I
36
I
I 2
°6
°i OJ
°i 6 3
I 9
OJ
0'7 12
4
1 6 1 I
2
OJ
OJ
°3 1 8
°i 3 2
9 30 °9 1
13 15
31 13 1
22 4
2
24
°i
VI
M F
(32) (33)
4
55 22
7 2
OJ
10
OJ
54 25 4
4 KHALAPUR TALUKA
VII VIIi IX
M F M F M F
(34) (35) (36) (37) (38) (39)
10 1 I
4
° 9 3 2
Os 73 33
OJ
3
OJ 16 1
4 OJ
3
2 OJ 1 2
OJ
28 I
°i 1
2 8
OJ
I
2,
ii °i 1 3
10 3~ °6 9 5
is
OJ 6
°3
OJ
°i
1
°i
1 2
4 2
iii 1
15
i4
°3 3
14
°3 3
5 14 11 5
2 4
57 39
OJ 2 5 2
17 1 1 I
°4 2
°i
6 18
I I 3 2
64
jz °z
155 5
°2 3
°3 2 2
3 46 1
19 1
°i 1 1
iii 14
2 14
58
°z 1
33
°4 OJ
NON. WORKERS
Serial M F Noo
(40) (41) (I)
69 208 67
107 20
SO 38 41
95
52 152 72 85 39
78 S6
283 245
2
35 43 56
118 73
114 60 IS 74 20
57 52
167 101 41
152 22 29
182
25 34 79 99 64
64 88 83 46 69
39 33
155 " 81
142
9 22 32 55 74
322 131
15 42 30
11 67
76 38
138 203 36
139 83
73 I 218 2 111 3 133 4 28 5
49 6 48 7 40 8
9 140 10
69 11 144 12 97 13 92 14 30 15
106 16 97 17
433 18 358 19
3 20
40 21 46 22
100 23 167 24 93 25
178 26 83 27 23 28 75 29 15 30
73 31 60 32
242 33 75 34 58 35
36 155 37 51 38 37 39
216 40
26 41 70 42 86 43
110 44 68 45
78 46 113 47 81 48 55 49 61 50
62 51 30 52
198 53 130 54 176 55
6 56 28 57 41 58 63 59, 60 60
474 61 141 62 26 63 59 64 37 65
9 66 70 67
68 74 69 81 70
136 71 454 72 36 73
126 74 99 75
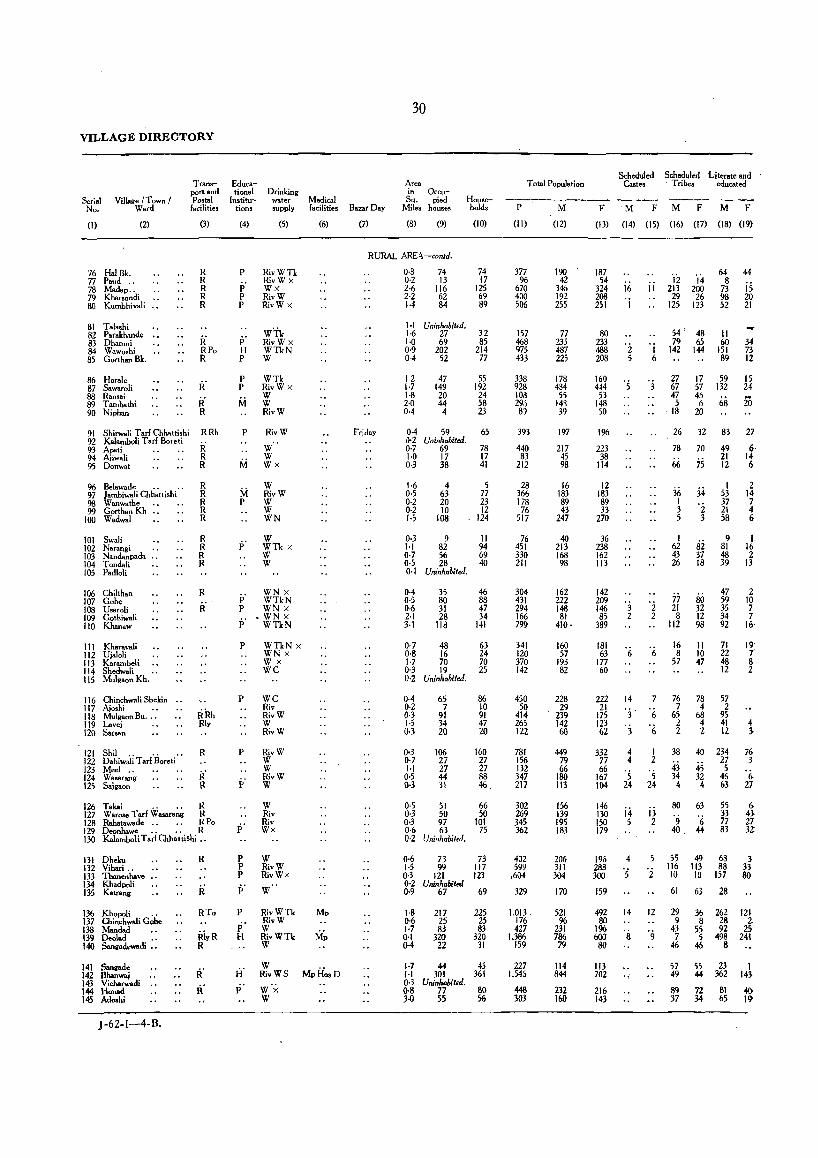
VILLAGE DIRECTORY
Serial No.
Village fTown f Ward
(I)
76 Hal Bk. 77 Paud ., 78 Madap .. 79 Kharsondi
(2)
SO Kumhhivali "
81 Talashi 82 Parakhande •• 83 Dhanmi 84 Wawoshi 85 Gorthan Bk.
86 Horale 87 Sawarali 88 Rans.i 89 Tamhathi 90 Niphan
Transport and Postal
facilities
(3)
R R R R R
R RPo R
R' R' R
91 Shirwali Tar! Chhattishi R Rh 92 Kalamboli Tar! Boreti 93 Apati R 94 Ajiw.li R 95 Donwat R
96 Belawade .. 97 }ambiwali Chhattishi 98 Wanwathe 99 Gorthan Kh "
100 Wadwal
101 Swali 102 Narangi .. 103 Nandanpada 104 Tondali 105 Padloli
106 Chilthan 107 Gohe 108 Usaroli 109 Gothiwali 110 Khan.w
111 Kharavali 112 Ujaloli 113 Karambeli 114 Shedwali 115 Mulgaon Kh.
116 Chinchwa1i Shekin " 117 Ajoshi .. 118 Mulgaon Bu .. , 119 Lavej 120 Sarson
121 Shil.. .. 122 Dahiwali Tar! Boreti 123 Meel ., 124 Wasarang 125 Sajgaon
R R R R R
R R R R
R
R
R
126 Takai .... R 127 W arose Tar! Wasarang R 128 Rahatawade .. R Po 129 Deonhawe ., .. R 130 KalamboliTarIChhattishi ..
131 Dheku 132 Vihari .. 133 Thanenhave ., 134 Khadpoli 135 Katrang
136 Khopoli .. 137 Chinchwali Gohe 138 Mandad 139 Deolad ., 140 Sangadewadi .•
141 Sangade 142 8hanwaj 143 Vicharwadi .. 144 Honad 145 Adoshi
J -6Z-1-4-B.
R
RTo
Educational
Institutions
(4)
P
P P P
p' H P
P P
!Vi
P
1\1 P
p'
Drinking water supply
(5)
RivWTk RivWx Wx RivW RivWx
WTk RivWx WTkN W
WTk RivW X W W RivW
RivW
W" W Wx
W RivW W W WN
W WTk X W W
p' ~~k~ P WN X
.WNx p' WTkN
P
P
P
p P P
p'
P
p' H
WTkNx WNx Wx WC
WC Riv RivW W RivW
RivW W W RivW W
W Riv Riv Wx
W RivW RivWx
W
RivWTk RivW W Ri~WTk W
Medical facilities
(6)
Mp
W RivWS MpH'o.D
W'x W
30
Area in Occu-Sq. pied
Bazar Day Miles houses
(7) (8) (9)
Households
(10)
RURAL ARE-\-conJd.
Friday
0·8 0·2 2·6 2·2 1·4
74 13
116 62 84
1·1 Uninhabited.
74 17
125 69 89
1·6 27 32 1·0 69 85 0·9 202 214 0-4 52 77
12 1·7 1·8 2·0 0·4
47 149 20 44 4
55 192 24 58 23
0·4 59 65 \)02 Uninhabited. 0·7 69 78 1·0 17 17 0·3 38 41
1·6 0·5 0·2 0·2 1·5
4 63 20 10
108
5 77 23 12
124
0·3 9 11 1·1 82 94 0·7 56 69 0·5 28 40 0·1 Uninhabited.
0·4 0·5 0·6 2·1 3·1
35 80 31 28
118
46 88 47 34
141
Q.7 48 63 0·8 16 24 1·7 70 70 0·3 19 25 0·2 Uninhabited.
0·4 0·2 0·3 1·5 0·3
0·3 0·7 1·1 0·5 0·3
65 7
91 34 2Q
106 27 27 44 31
86 10 91 47 20
160 27 27 88 46
0·5 51 66 0·3 SO 50 0·3 97 101 0·6 63 75 0·2 Uninhabited,
0·6 73 73 1·5 99 117 0·3 121 123 0·2 Uninhabited (}'9 67 69
1·8 (}'6 1·7 0·1 04
217 25 83
320 22
225 25 83
320 31
1·7 44 43 J.1 301 361 0·3 Uninhabited. 0·8 77 80 3.() 55 56
Total Population
---,-------.....-P
(II)
377 96
670 400 506
157 468 975 433
333 928 loa 290 8~
393
440 83
212
28 366 178 76
517
76 451 330 211
304 431 294 166 799
341 120 370 142
450 50
414 265 122
781 156 132 347 217
302 269 345 362
402 599
.604
329
1.013 176 427
1.386 159
227 1,545
448 303
M
(12)
190 42
346 192 255
77 235 487 225
178 434 55
143 39
197
217 45 98
16 183 89 43
247
40 213 168 98
162 222 148 81
410·
160 57
193 82
228 29
239 142 60
449 79 66
ISO 113
156 139 195 183
206 311 304
170
521 96
231 786 79
114 844
232 160
F
(13)
187 54
324 208 251
80 233 488 208
160 444 53
148 50
196
223 38
114
12 183 89 33
270
36 238 162 113
142 209 146 85
389
181 63
177 60
222 21
175 123 62
332 77 66
167 104
146 130 ISO 179
196 288 300
159
492 80
196 600 80
113 702
216 143
Scheduled Scheduled "Literate and Castes Tribes educated
M F M F M F
(14) (15) (16) (17) (18) (l9}
16
'i
'z 5
'3 2
6
14
'3 . 3
4 4
'5 24
i4 5
4
'5
14
8
·f
ii
I 6
'2 2
6
7
6
'6
I 2
'5 24
ij 2
12
'li '14 213 200 29 26
125 123
54', 48 79 65
142 144
64 8
73 98 52
II 60
151 89
27 67 47
17 59 57 132
5 18
4~ 68 20
26 32
78 70
66 ;5
36 1 3 5
34 'z 3
83
49 21 12
1 53 37 21 58
44
is 20 21
34 73 12
IS 24
iO
27
6· 14 6
2 14 7 4 6
1 62 8i 9 I
81 16 43 37 48 2 26 18 39 13
77 21 8
112
80 32 12 98
16 11 8 10
57 47
76 7
65 2 2
38
43 34
4
78 4
68 4 2
40
45 32 4
80 63
'9 '6 40. 44
47 59 35 34 92
71 22 48 12
57 2
95 41 12
234 27 5
46 63
55 33 77 83
55 49 68 116 113 88 10 10 157
61 63 28
2 10 7 7
16·
19' 7 S 2
4 3
76 3
6 27
6-43 27 32:
3 33 80
29 9
43
36 262 121
7 46
57 49
89 37
8 28 2 55 92 25 5 498 241
46 8
55 23 1 44 362 143-
72 81 4() 34 65 19
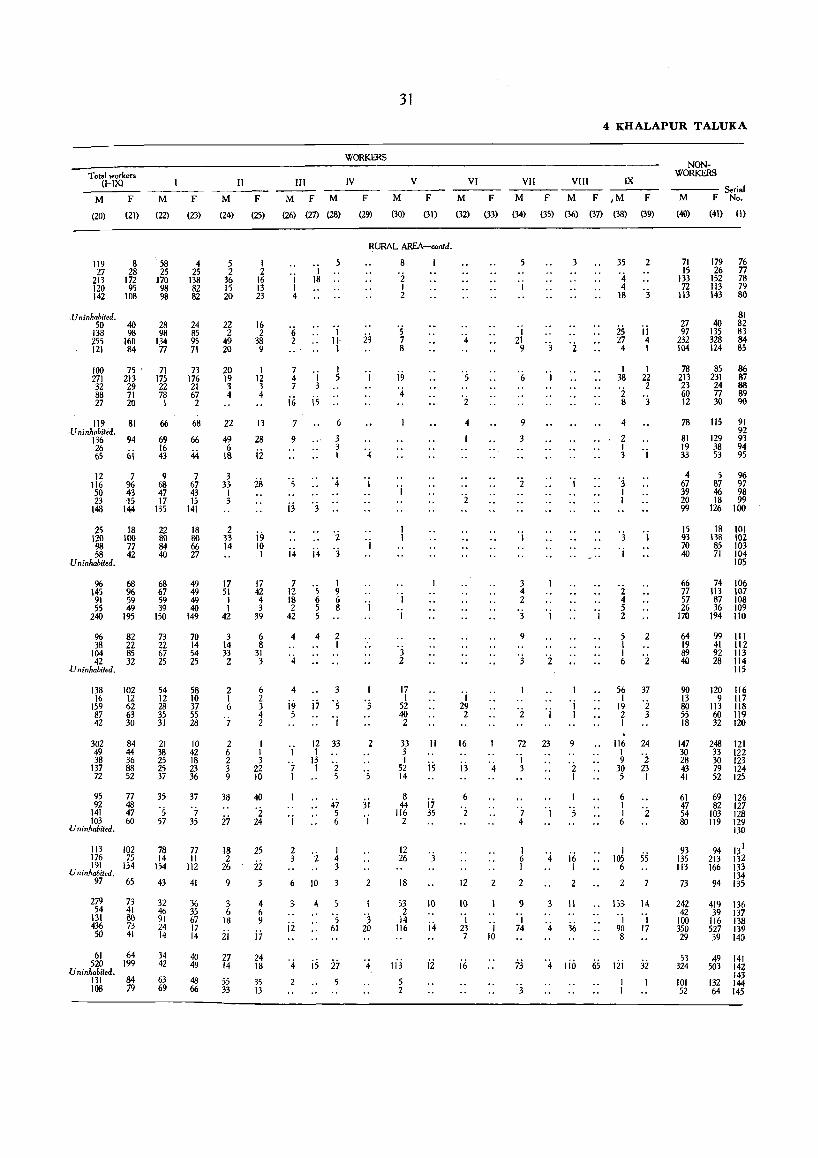
Total workers (HXl
M F
(20) (21)
119 27
213 120 142
,Uninhabited,
8 28
172 95
108
50 40 138 98 255 160 121 84
M
(22)
58 25
170 98 98
28 98
134 77
100 271 32 88 27
75' 71 213 175 29 22 71 78 20 1
119 81 ,U ninhabited,
136 94
~~ 6i
12 116 50 23
148
7 96 43 15
144
25 18 120 100 98 77 58 42
Uninhabited,
96 145
91 55
240
68 96 59 49
195
96 82 38 ZZ
104 85 42 32
V ninhabited,
138 16
159 87 42
302 49 38
137 72
102 12 62 63 30
84 44 36 88 52
95 77 92 48
141 47 103 60
V ninhabited.
113 102 176 75 191 134
V ninhabited, 97 65
279 54
131 436 50
73 41 80 73 41
61 64 520 199
Uninhabited, 131 84 108 79
66
69 16 43
9 68 47 17
135
22 80 84 40
68 67 59 39
150
73 ZZ 67 25
54 12 28 35 31
21 38 25 25 37
35
'5 57
78 14
154
43
32 46 91 24 14
34 42
63 69
F
(23)
4 25
138 82 82
24 85 95 71
73 176
21 67 2
68
66
44
7 67 43 15
141
18 80 66 27
49 49 49 40
149
70 14 54 25
58 10 37 55 28
10 42 18 23 36
37
7 35
77 II
112
41
36 35 67 17 14
40 49
48 66
II
M F
(24) (25)
5 2
36 15 20
22 2
49 20
20 19 3 4
22
49 6
18
3 33
1 :3
2 33 14
17 51 1 1
42
3 14 33 2
2 I 6
'7
2 6 2 3 9
38
27
18 2
26
9
3 6
IS
ij
27 14
55 33
1 2
16 13 23
16 2
38 9
I 12 3 4
13
28
ii
iii
i9 10 1
17 42 4 3
39
6 8
31 3
6 2 3 4 2
1 1 3
22 10
40
'2 24
25
ii 3
4 6 9
i7
24 18
35 13
31
WORKERS
III IV V
M F M F M F
(26) {27) (28) (29) (30) (31)
RURAL AREA-confd,
S
'j I 4
I 18
'j 11 1
~ 'j 7 3
if, is
9 3 3 1
jj 3
'i i4 i4 'j
7 12 18 2
42
4
4
i9 5
1
'7 I
's 6 5 5
1 9 6 8
4 2 I
3
i7 ·s 'j
12 33 1
13 1 '2
5
47 5 6
1 4 3
6 10 3
ii
4 5
's 61
'4 is i7 2
23
'j
'j
'j
1
'3
2
ji
'i
2
1
'3 20
'2 1 2
'5 7 8
i<i '4
'j
3 2
17 1
52 40 2
33 3 1
52 14
II
is
8 44 j7
116 35 2
12 26
18
53 2
14 116
1 ij 5 2
3
1()
i4
ii
VI
M F
(32) (33)
'j 29 2
16
ij
12
1()
'j 23 7
i6
2
'j 10
4 KHALAPUR TALUKA
VII VIII IX
M F M F 1M F
(34) (35) (36) (37) (38) (39)
9
3
'i
3 4 2
3
9
3
72 23 9
'j 3
1 6 I
2
9 'j 74
'2 1
if, 1
2
3 II
4 36
35
'4 4
18
2
25 ii 27 4 4 I
1 38
'2 8
4
2
I 22 2
'3
l 'i
'3 1 I
'2 4 5 2
5 2 I
~ '2
56 37
1~ '2 2 3 1
116 24
~ '2 30 23 5 1
6
I 'i 6
I 105
6
2
55
153 14 'j 'j 90 17 8
73 '4 dli 65 Iii 3i
3
NON· WORKERS
---- Serial M F No.
(40) (41) (1)
71 15
133 72
113
27 97
232 104
78 213 23 60 IZ
78
81 19 33
4 67 39 20 99
15 93 70 40
66 77 57 26
170
64 19 89 40
90 13 80 55 18
147 30 28 43 41
61 47 54 80
93 135 113
73
242 42
100 350 29
53 324
101 52
179 76 26 77
152 78 113 79 143 80
81 40 82
135 83 328 84 IZ4 85
85 86 231 87 24 88 77 89 30 9Q
115 91 92
129 93 38 94 53 95
5 96 87 97 46 98 18 99
126 100
18 101 I3B I()Z 85 103 71 104
10'5
74 106 113 107 87 108 36 109
194 110
99 111 41 112 92 113 28 114
115
120 116 9 117
113 118 60 119 32 120
248 121 33 122 30 123 79 124 52 125
69 126 82 127
103 128 119 129
130
94 131 213 132 166 133
134 94 135
419 136 39 137
116 138 527 139 39 140
49 141 503 142
143 132 144 64 145
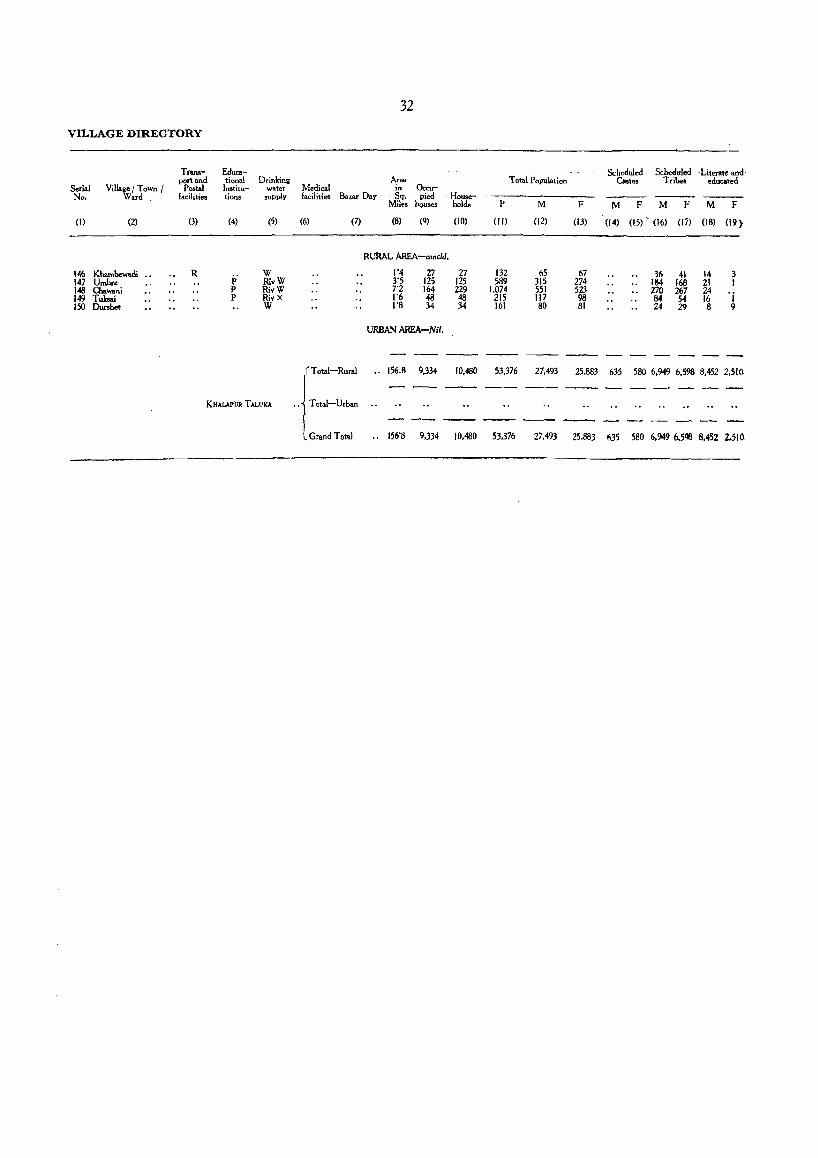
32
VILLAGE DIRECTORY
TrllnS- Educa- Scheduled Sche<luled -Literate and· port and tional Drinkini Area Total POpUlation Castes Tribe. educated
Serial Village I Town I Postal Institu- water Medical in Occu-No. Ward. facilities tions supply facilities Bazar Day Sq, pied House-
Miles houses holds P M F M F M F M F
(I) (2) (3) (4) (5) (6) (7) (8) (9) (10) (II) (12) (13) (14) (15) ,
(16) (17) (18) . (19)
RURAL AREA-concld.
146 Kbambew.di R ji W 1"4 27 27 132 65 67 36 41 14 3 147 Umbre Ri~W 3"5 125 125 589 315 274 184 168 21 I 148 Chawani P RivW 7'2 164 229 1.074 551 523 270 267 24 'j 149 Tubai P RivX 1"6 48 48 215 117 98 84 54 16 150 Our.het W 1"8 34 34 161 80 81 24 29 8 9
URBAN AREA-Nit.
-------( Total-Rural .. 156.8 9.334 10.480 53.376 27.493 25.883 635 580 6.949 6.598 8.452 2.510.
I K"ALArV~ T ALVKA .. i Total-Urban
l Grand Total .. 156'S 9.334 10,480 53.376 27.493 25.883 635 580 6,949 6,598 8.452 2.51(1
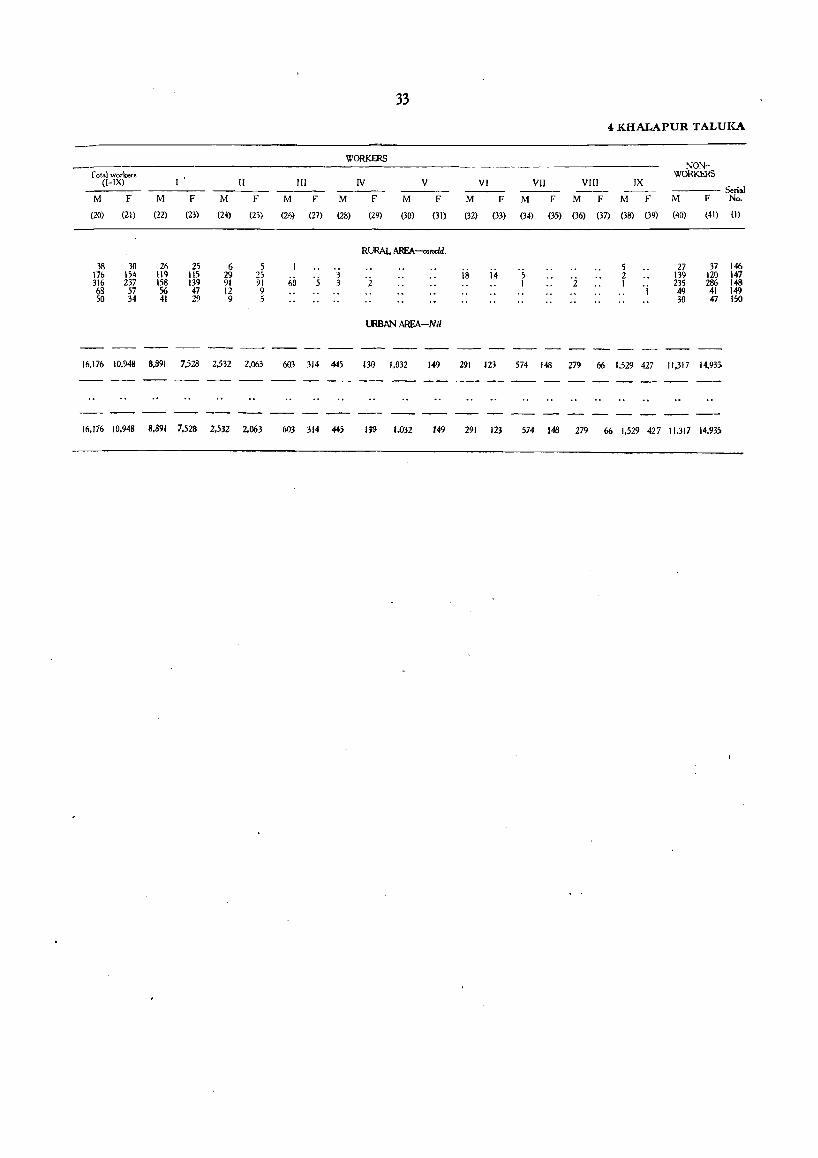
33
4 KHALAPUR TALUKA
WORKERS ~ NON-
Total workers WORKERS (l-IX) I' II III IV V VI VII VIII IX
Seri.l ---- --M F M F M F M F M F M F M F M F M F M F M F No.
(20) (21) (22) (23) (24) (25) (21)) (Z7) (28) (29) (30) (31) (32) (33) (34) (35) (36) (37) (38) (39) (40) (41) (1)
RURAL AREA-concld.
38 30 26 25 6 5 i-i
5 27 37 141> 176 154 m 115 29 25
60 '5 3 '2 18 5 2 139 120 147 316 237 158 139 91 91 3 I 2 I 'i 235 286 148 68 57 56 47 12 9 49 41 149 50 34 41 29 9 5 30 47 ISO
UR8AN AREA-Nil
---- -- -- -- --16.176 10.948 8.891 7.528 2.532 2.063 603 314 445 1J(j 1.032 149 291 123 574 148 279 66 1.529 427 11.317 14.93>
16.176 10.948 8.891 7.528 2.532 2.063 603 314 #5 Ijf) 1.032 149 291 I2:l 574 148 279 66 1.529 427 11.317 14.93S


Alibag Taluka
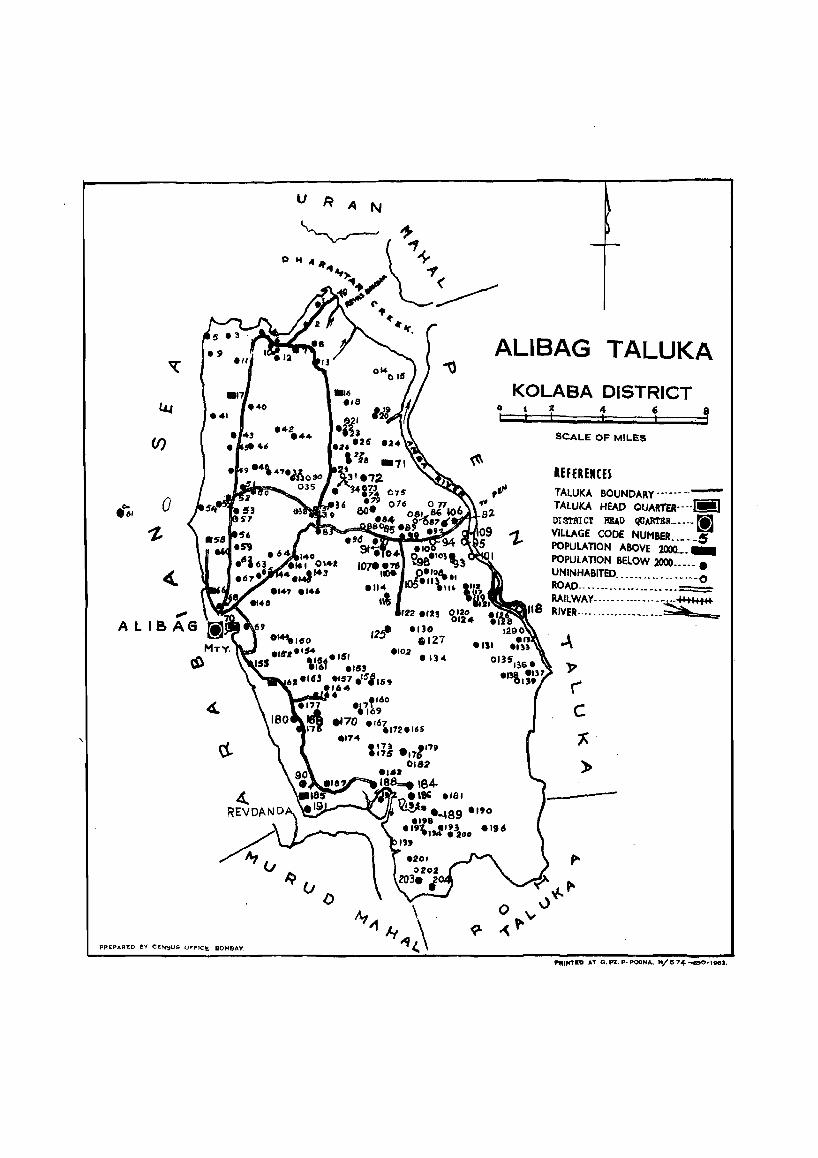
4l
(/)
~, a 't
ct
., , .11
.17 '40
'41
• 43
• _46
PP.EPAf'ED ev eEN'$US O"'FICE, BOMBAY,
.4\4 ....
ALIBAG TALUKA
.102 '1'34
: 17l1 • "" 175 176 OUl2 ... ,
18~184-
0
~
• l8' .lIl.
'Qil. -""S9 • 190 "'8 "'\.,1':\00 "96
'"
KOLASA DISTRICT 4 , 8
SCALE OF MILES
REFERENCES TALUKA BOUNDAR.Y •. ---- --TALUKA HEAD OUARTER----'-I DISTRICT HlAD QUAR'rIll. _____ ~
VILLAGE CODE NUMBER ____ -5 POPULATION ABOVE 2000 __ _
POPULATION BELOW 2000-----. UNINHABITED_ .--.- .•• ---- -- '--0 ROAD .... ___ ........ __ • __ .. _
RAILWAy-··· •• · -----.---~tl'" 118 RIVER ........... _____ ... __ _
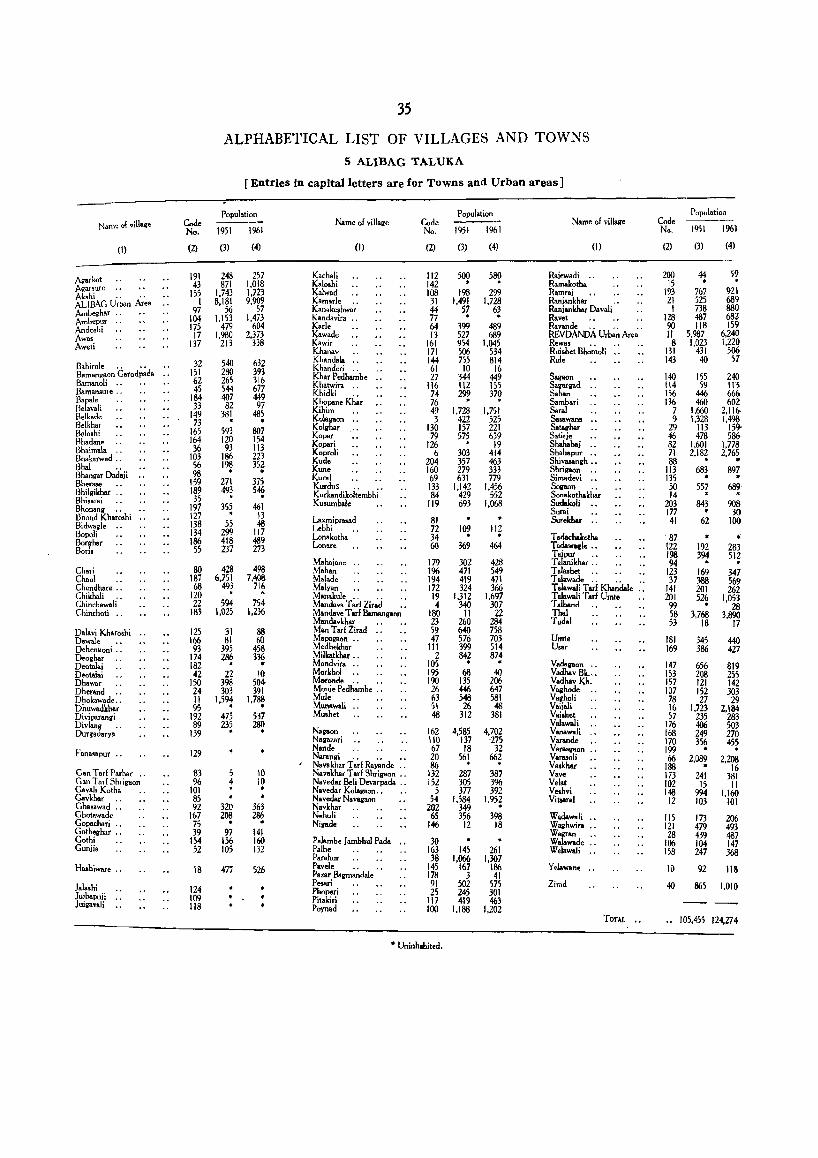
N.me.,! vill,ge
(1)
Agarkot Agarsure .. Akshi .. .. ALI BAG Urban Area Arnbegh.r .. Ambepur Ando,hi Awas Aweli
B,hirole .. .. ., Bamangaon Catodpada Bamanoli Bamansure .. B.p,l. Belavali Belkade Belkhar Beloshi Rh,dane .. Bhaimala .• Bhakatwad .. Bhal .. Bhangar D.doii Sherase Shilgikhar .. Bhisarai .• Bhon.ng .. Shond Kharoshi .. Bidwagle .. Sapoli Sarghar Boris
Chari Chaul .. Chendhare " Chikhali .. Chinchawali Chinchoti ..
Dalavi Kharoshi Dawale ., Dehenkoni ., Dooahor Deotalai Deotalai Dhawar Dherand ., Dhokawade .. Dhuwadkhar Diviparangi Divlang Durgad.rya
FBnasapur ..
Can T arf Parhar .. Gan T arf Shrigaon Cavali Kolha .. Cavkhar .. Cha •• wad .. Chotawade Gopachari .. Gotheghar .. Gothi .. Gunii.
H .. hiware ..
J.lashi Juihapuii JuillOvali
Code No.
(2)
191 43
155 I
97 104 175
17 137
32 151 62 45
184 33
149 73
165 164 36
103 56 98
159 189 35
197 127 138 134 186 5, 80
187 68
120 22
183
125 166 93
174 182 42
150 24 11 95
192 89
139
129
83 96
101 85 92
167 75 39
154 52
18
124 109 118
35
ALPHABETICAL LIST OF VILLAGES AND TOWNS
5 ALJBAG TALUKA
[Entries in capital letters are for Towns and Urban areas]
Population
1951 1%1
(3)
248 871
1.743 8.181
56 1.153
479 1.980
213
540 280 265 544 407 82
381 · 593 120 93
186 198 • 271 493 · 355 •
55 299 418 237
428 6.751
493 · 594 1.025
31 81
395 286 · 22 398 303
1,594 • 475 235 •
5 4 •
320 208 •
97 156 105
477
(4)
257 1.018 1.723 9.909
57 1.473
604 2.373
338
632 393 316 677 449 97
485 •
807 154 113 223 352 • 375 546 · 461
13 48
117 489 273
498 7.408
716 *
754 1.236
88 60
458 336 ..
10 504 391
1.788 • 537 280 ·
10 10 •
363 286 • 141 160 132
526
Name of village
(I)
Kachali K.loshi Kalwad Kamarl. .. Kan.<Jkeshwar Kandavira .. Karle Kawade Kawir Khanov Khandala " Khanderi .. Khar Pedhambe Khatwira .. Khidki .. Khopane Khar Kihim KolOllOon Koighar Kopar Kopari Koproli Kude Kune Kural Kurdus " .. Kurkandikoltembhi Kusumbale
Laxmiprasad Lebhi Lonakotha Lonare
Mohajane Mahan Malade M.lyan Manakule .. .. Mandava T arf Zirad , . Mandave T arl Bamangson Mandavkhar , . . , Man Tarl Zirad " MapallOon .. Medhekhar Milkatkhar .. Mondvira .. Morkhol ., Ml>t'onde., .. Mouie Pedh.mbe .. Mule MUMW1lli Mushet
Napon Navazari Nande Naranlri " "
, Navakhar Tar! Rayande .. N.va.bar T arf Shrigaon .. Navedar Beli Devarpada .. Navedar KolallOon. , N.vedar NaVOllOon Navkhar Nehuli NillOd.
Palambe ]ambhul Pad. Palh. Parahur Pavele .. Pour Bagmandale Pesari Plwperi Pitakiri Pornad
Code No.
(2)
112 142 108
31 44 77 64 13
161 171 144 61 27
116 74 76 49 3
130 79
126 6
204 160 69 133 84
119
81 72 34 60
179 1% 194 172 19 4
180 23 59 47 III
2 105 195 190 26 63 51 48
162 110 67 20 86
132 152
5 54
202 65
146
30 163 38
145 178 91 25
117 100
• Uninhabited.
Population
1951 1%1
(3)
500 • 198
1.491 57 •
399 527 954 506 755
10 344 112 299 · 1.728 422 157 575 · 303 357 279 631
1.142 429 693
109 •
369
302 471 419 324
1.312 340
11 260 640 576 399 842 • 68
135 446 548 26
312
4,585 137 18
561 • 287 305 377
1.584 349 356
12
145 1.066
167 3
502 245 419
1.188
(4)
580 • 299
1.728 63 · 489
689 1.045
534 814
16 449 155 370 · 1.751 525 221 659
19 414 463 333 779
1,456 552
1.068
112 • 464
428 549 471 366
1.697 307
22 284 758 703 514 874 •
40 206 647 581 48
381
4.702 '275
32 662 · 387 3% 392
1,952 •
398 18
261 1.307
186 41
575 301 463
1.202
Name of village
(I)
Raiewadi .. Ramakotha Ramraj Raniankhar Raniankhar Davali Ravet .. Ra_de.. " .. REVDANDA Urban Area Rewa. .. Ruishet Bhomoli Rule
SallOon SOIIOrgad Saban Sambari Sara! Sasawans Satagbar Satirje Shahabai Shah.put .. Shivasanih ,. Shrigaon .. Simadevi .. Soeaon .. Sonakothakhar Sudakoli Surai .. Surekhar ,.
T .dachaltotha Tadawql. ,. Taipur .. Talorukhar .. Tal .. het .. T.lawade.. .. .. T alawal; T arf Khandale .. T alawali T.r! Umt. T.lband Thai Tudal
Umte Usar
V.dagaon .. Vadhav Bk... Vadhav Kh. Vaghode Vallholi V.ijali Vaishet Valawali Vanawali Varande ., VarasllOon ., Varasoli V .. khar Vave Velat V .. hvi Vitsaral
W.dawali ., Waghwira .. W"¥'an ., Walawade ., Welawali ..
Y.laWBne ..
Zirad
TOTA~ "
Code No.
(2)
200 15
193 21 1
128 90 II 8
131 143
140 114 156 136
7 9
29 46 82 71 88
113 135 50 14
203 177 41
. 87 IZZ 198 94
123 37
141 201 99 58 53
181 169
147 153 157 107 78 16 57
176 168 170 199 66
188 173 102 148
IZ
115 121 28
106 1S8
10
40
Population
1951 1961
(3)
44 • 767 525 738 487 118
5.987 1.023
431 40
ISS 59
446 460
1.660 1.328
113 478
1,601 2.182 · 683 •
557 · 843 •
62
192 394 · 169 388 201 526 · 3.768
18
345 386
656 208 121 152 27
1.723 235 406 249 356 •
2.089 · 241 15
994 103
173 479 439 104 247
92
865
(4)
59 · 921 689 880 682 159
6.240 1.220
506 51
240 113 6660 602
2.116-
l·t~ 586
1.778 2.765 ..
897 • 689 · 908 30
100
283 512 · 347 569 262
1.053 28
3.890 17
440 427
819 255 142 303 29
2.1114 283 503 270 455 · 2.208
16 381
II 1.160
101
206 493 487 147 368
118
1.010
.. 105,455 124.274
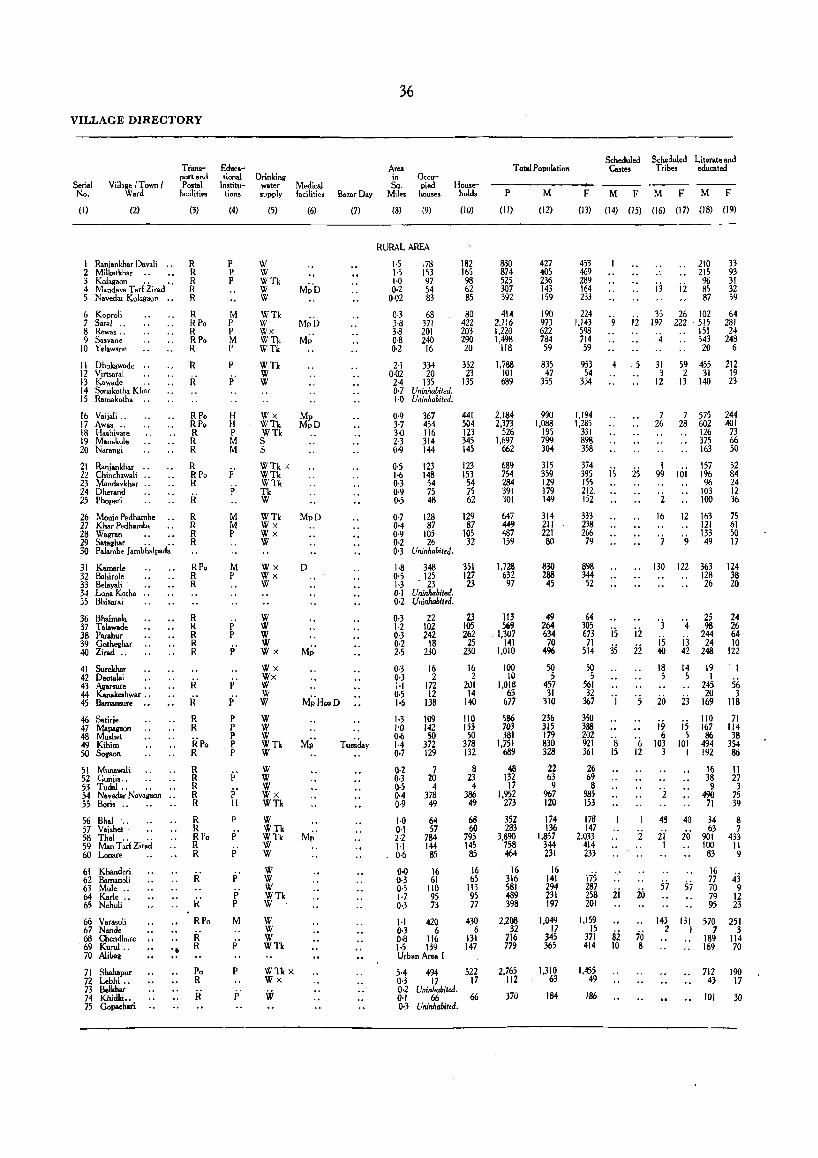
VILLAGE DIRECTORY
Serial No.
(I)
Viil.ge/Town! Ward
(2)
1 R.niankhar Davali .• 2 Milkatkhar .. 3 Kolagaon .. " 4 Manda"" Tar! Zirad 5 Navedar Kol"gaon ••
6 Koproli 7 Saral .. 8 Rew .... 9 So.vane
10 Yel.wane
II Dhokawade •. 12 Virtsaral 13 Kowade .• 14 Sonakotha Khar 15 Ramakotha ..
16 Vaij.li .. 17 Awes .. 18 H .. hivar. 19 Manakul. 20 Narangi
21 Raniankhar .. 22 Chinch.wafi .. 23 Mandavkhar .. 24 Dherond 25 Phoperi
Transport and Postal
facilities
(3)
R R R R R
R RPo R RPo R
R
R'
R Po RPo R R R
R RPo R
R' 26 Mouie Pedhambe R 27 Khar Pedhambe R 28 Wagran R 29 Sataghar . . .. R 30 Palombe Jombh.lpado
31 Kamarl. 32 Bahirole 33 Belayali . 34 Lm. KOlha .. 35 Bhis.rai
36 Bhaimala 37 Talawade 38 Parahur 39 Gotheghar 40 Zirad ..
41 Surekhar 42 Deolalai 43 Agarsuce •• 44 Kanakeshwar .. 45 Bamansure ••
46 Satirie 47 M.papon 48 Mushet 49 Kihim 50 Soiaon
51 Munawali 52 Gunji •.. 53 Tudal.. .. 54 Navedar NavallBOn •. 55 Boris ..
56 Bh.f .. 57 Vaishet· 58 Thai.. .. 59 Man Tart Zir.d 60 Lonare
61 Khanderi 62 Bamanoli 63 Mule .. 64 Karle .. 65 Nehuli
66 Varasoli 67 Nande 68 Chendhare •• 69 Kurol .. 70 A1iboll
71 Shahapur 72 Lebhi .• 73 Belkhat 74 Khidki .. 75 Gopachari
.,
RPo R R
R R R R R
R' R' R R
RPo R
R R R R R
R R RPo R R
R'
Ii: RPo
R' R
Po R
ii
Educational
Institu-tions
(4)
p p p
M p P M p
p
[>
H H p M M
M M J.>
M I'
f p
1'>'
p
f P p P P p
P' p' H
P
p' p
p' p' P
M
p
Drinking water Medical supply facilities
(5) (6)
W W WTk W W
WTk W Wx WTk WTk
WTk W W
Wx Mp WTk MpO WTk S S
WTk x WTk WTk Tk W
WTk Wx Wx W
Wx Wx W
W W W W Wx
Wx Wx W W W
W W W WTk W
W W W Wx WTk
W WTk WTk W W
W W W WTk W
W W W WTk
WTkx Wx
W
D
Bazar Day
(7)
Area in Sq.
Miles
(8)
0«.,.pied
houses
(9)
RURAL AREA
1·5 1·5 1·0 0·2
0·02
178 153 97 54 83
Households
(10)
182 165 98 62 85
0·3 68 80 3-8 371 422 3·8 201 203 0·8 240 290 0·2 16 20
2·1 334 352 0·02 20 23 2·4 135 135 0·7 Uninhabited. 1·0 Uninhabited.
0·9 3·7 3·0 2·3 0·9
0·5 1·6 0·3 0·9 IJ.5
367 454 116 314 144
123 148 54 75 48
441 504 123 345 145
123 153 54 75 62
Q.7 128 129 0·4 87 87 0·9 105 105 0·2 26 32 0'3 Uninhabited.
j·8 348 351 0·5 125 127 J.3 . 23 23 0·1 Uninhabited. 0·2 Uninhabited.
0·3 22 23 1·2 102 lOS 0·3 242 262 0·2 18 25 2·5 230 230
0·3 16 16 0·3 2 2 i·1 172 201 0·5 12 14 1·6 138 140
1·3 109 110 1'0 142 153 0·6 50 50 1·4 372 378 0.7 129 132
0·2 7 8 0·3 20 23 0·5 4 4 0·4 378 386 0·9 49 49
1·0 64 0·1 57 l·2 784 1·1 144 0·6 85
0·0 16 0·3 61 0·5 110 1·7 95 0·3 73
1·1 420 0·3 6 0·8 116 1·5 139 Urban Area (
68 60
795 145
85
16 65
113 95 77
430 6
131 147
5·4 494 522 0·3 17 17 0·2 Uninhabit,d. 0·1 66 66 0·3 Uninhabit,d.
Total Population
P M F
(II) (12) (13)
880 874 525 307 392
414 2.116 1.220 1,498
118
1,788 101 689
2.184 2.373
526 1.697
662
689 754 284 391 301
647 #9 487 159
1.728 632 97
113 569
. 1,307 141
1.010
100 10
1.018 63
677
586 703 381
1.751 689
48 132
17 1.952
273
352 283
3.890 758 464
16 316 581 489 398
2.208 32
716 779
2.765 112
370
427 405 236 143 159
190 973 622 784 59
835 47
355
990 1.088
195 799 304
315 359 129 179 149
314 211 221 80
830 288 45
49 264 634
70 496
50 :;
457 31
310
236 3lS 179 830 328
22 63 9
967 120
174 136
1.857 344 231
16 141 294 231 197
1.049 17
345 365
1.310 63
184
4j3 469 289 164 233
224 1,143
598 714 59
953 54
334
1.194 1,285
331 898 358
374 395 155 212. 152
333 238 266
79
898 344
52
64 305 673
71 514
50 5
561 32
367
350 388 202 921 361
26 69 8
985 153
178 147
2.033 414 233
175 287 258 201
1.159 15
371 414
1.455 49
186
Scheduled Scheduled Literate and Ca.t.. Tribe. educated
M F M F M F
(14) (15) (16) (17) (18) (19)
15
is 35
'j
's 15
2i
82 10
ij ii
210 215 % 85 87
35 26 102 ii 197 222 515
151 '4 543
20
5 31 59 455
is
ii ii
'(, 12
20
70 8
3 12
2 31 13 140
7 7 575 26 28 602
126 m 163
I 157 99 101 196
96 '2' 103 100
16
'7
130
'3 is 40
18 5
26
i9 6
103 3
'i
48
it' I
57
143 2
12 163 121 133 '9 49
122 363 128 26
25 '4 98 244
i3 24 42 248
14 5
23
i5 5
101 I
19 1
245 20
169
110 167 86
494 192
16 38 9
490 71
40 34 63 io 901
100 83
57
131 I
16 77 70 79 95
570 7
189 169
33 93 31 32 59
64 281 24
248 6
212 19 23
244 401
73 66 50
52 84 24 12 36
75 61 50 17
124 38 20
24 26 64 10
122
. 1
56 3
118
71 114 38
354 86
11 27 3
75 39
8 7
433 II 9
43 9
12 23
251 3
114 70
712 190 43 17
101 30
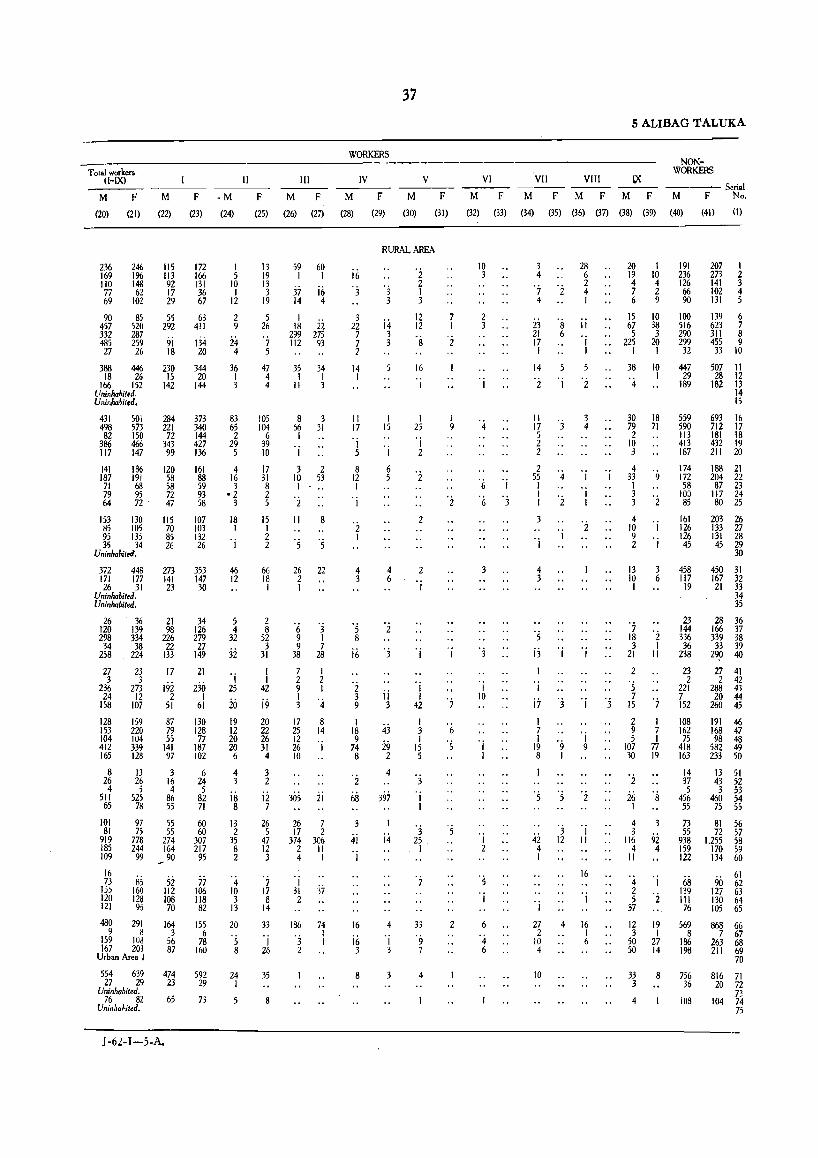
Total workers (I-IX)
M F
(20) (21)
236 169 110 77 69
90 457 332 485 27
246 1% 148 62
102
85 520 287 259 26
388 446 18 26
166 152 Uninhabited, Uninha~iled,
431 498 82
386 117
141 187
71 79 64
501 573 150 466 147
186 191 68 95 72
153 130 85 105 95 m 35 34
Uninhabitetl,
372 448 171 177 26 31
Uninhabit.d, Uninhabited,
26 36 120 139 298 334 34 38
258 224
27 3
236 24
158
128 153 104 412 165
8 26 4
511 65
101 81
919 185 109
16 73
155 120 121
23 3
273 12
107
159 220 104 339 128
13 26 5
525 78
97 75
778 244
99
85 160 128 95
480 291 9 8
159 103 167 203
Urban Area I
M
(22)
115 113 92 17 29
55 292
9i 18
230 15
142
284 221
72 343 99
120 58 58 72 47
115 70 85 26
F
(23)
172 166 131 36 67
63 411
134 20
344 20
144
373 340 144 427 136
161 88 59 93 58
107 103 132 26
273 353 141 147 23 30
21 34 98 126
226 279 22 27
133 149
17
192 2
51
87 79 55
141 97
3 16 4
86 55
55 55
274 164 90
52 112 108 70
164 3
56 87
21
230 I
61
130 128 77
187 102
6 24 5
82 71
60 60
307 217
95
77 106 118 82
155 6
78 160
554 639 474 592 27 29 23 29
Uninhabited, 76 82 65 73
UninhaJ.ileJ.
J-62-1-5-A.
II
.M F
(24) (25)
I 5
10 I
12
2 9
24 4
36 I 3
83 65 2
29 5
4 16 3
·2 3
18 I
'i
46 12
5 4
32
32
'j 25
20 19 12 20 20 6
4 3
18 8
13 2
35 8 2
4 10 3
13
20
'5 8
24 I
13 19 13 3
19
5 26
7 5
47 4 4
105 104
6 39 10
17 31 8 2 5
15 I 2 2
66 18 I
2 8
52 3
31
I I
42
i9 20 22 26 31 4
3 2
i2 7
26 5
47 12 3
7 17 8
14
33
'j 26
35
III
M F
(26) (27)
59 60 I I
3; j6 14 4
I 18 2i
299 275 112 93
35 34 I I
II 3
8 3 66 31 I
'j
3 2 10 53 I
'2 II 8
26 22 2 I
6 'j 9 I 9 7
38 28
7 2 9 I 3
17 8 25 14 12 26 'j 10
305 2i
26 7 17 2
374 306 2 II 4 I
186
'3 2
74 I I
37
WORKERS
IV V
M F M F
(28) (29) (30) (31)
RURAL AREA
i6 , 3
3 22 7 7 2
14 I
II 17
'i 5
8 12 I
'j
'2 I
4 3
'5 8
i6
'2 3 9
I 18 9
74 8
3
4i I
16
i6 3
8
'3 3
i4 3 3
I 15
I
6 5
4 6
'2
'j
ji 3
43 29 2
4
i4
4
'i 3
'2 2 I 3
12 12
8
16
I
I 25
'j 2
'2
2
'j
OJ
I I
42
I 3 I
15 5
'3 I I
'j 25
I
33
'9 7
4
I 9
'2
'j
6
's
2
VI
M F
(32) (33)
10 3
'i
'(, 'i '6 'j
3
'j
I 10
'j I
I 2
6
'4 6
5 ALIBAG TALUKA
VII VIII LX ------M F M F M F
(34) (35) (36) (37) (38) (39)
3 4
'; 4
23 21 17 I
14
8 6
2 I
28 6 2 4 I
ii I I
2
II 3 17 'j 4 5 2 2
20 19 4 7 6
15 67 5
.. 225 I
38
'4
I 10 4 2 9
10 38 3
20 I
10 I
30 18 79 71 2
10 3
2 55 4 I 'j
4 33 '9
I I 'i I 2 I
3
4 3
's jj 'j 'j
I
i; I 7
I~ °9 8 I
I
'5 5
42 4 I
I
27 2
10 4
OJ 12
4
'j
'i 9
'2
'j II
16
°i
16 I 6
I 3 3 '2 4
10 'j 9 2 I
13 3 10 6 I
7 18 '2 3 I
21 II
2
'5 7
15
2 I 9 7 5 I
107 77 30 19
'2 26 '8 I
4 3 3
116 92 4 4
II
°4 I 2 5 '2
37
12 3
50 50
19 I
27 14
NONWORKERS
----- Serial M F No,
(40) (41) (I)
191 236 126 66 90
100 516 290 299 32
447 29
189
559 590 113 413 187
174 172 58
100 85
161 126 126 45
458 117
19
23 144 336 36
238
23 2
221 7 152
108 162 75
418 163
14 37 5
456 55
207 I 273 2 141 3 102 4 131 5
139 6 623 7 311 8 455 9 33 10
507 II 28 12
182 13 14 15
693 16 712 17 181 18 432 19 211 20
188 21 204 22 87 23
liT 24 80 25
203 26 133 27 131 28 45 29
30
450 31 167 32 21 33
34 35
28 36 166 37 339 38
33 39 29p 40
27 41 2 42
288 43 20 44
260 45
191 46 168 47 98 48
582 49 233 50
J3 51 43 52 3 53
460 54 75 55
73 81 56 55 72 57
938 1.255 58 159 170 59 122 134 60
68 139 III 76
569 8
186 198
61 90 62
127 63 130 64 105 65
868 66 7 67
263 68 211 69
70
10 33 3
8 756 816 71 36 20 72
73 4 108 104 74
7;
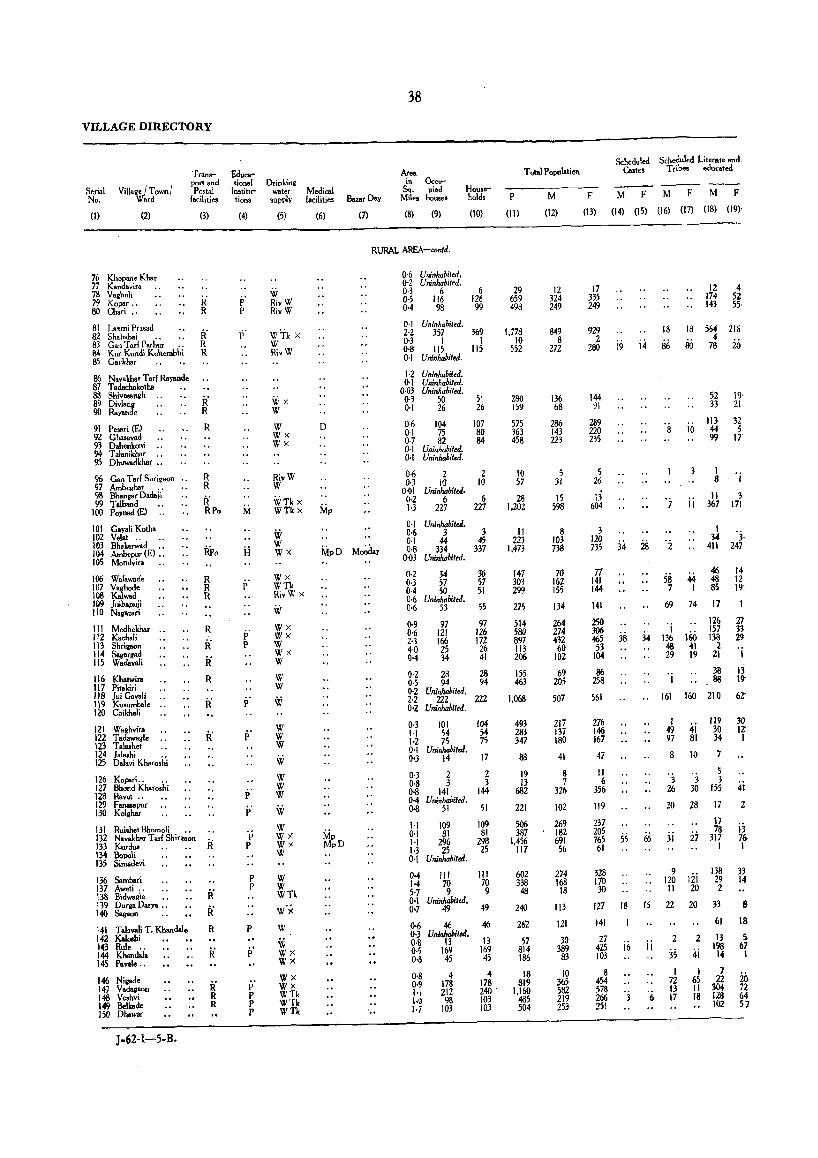
VILLAGE DIRECTORY
Serial No.
Village I Town I Ward
(1) (2)
76 Khopane Khar 77 Kandavira 7S Vaghali 79 Kopar .• 80 Chari ..
Trans""rt and Postal
facilities
(3)
R R
81 Laxmi Prasad 82 Shah.hai .. R' 83 Can T arf Parhur . . R 84 Kut Kundi Koltembbi R 85 Cavkhar
86 Navakhar T arf Ra)'llnde 87 T adachakotha 88 Shi"asanRh .. 89 Divlan. R' 90 Rayande R
91 Pe .... i (E) R 92 Gh ... v.d 93 Dahenkoni .. 94 Talanikhar .. 95 Dhuwadkhar ..
96 Can Tar! Shrigaon .. 97 Ambo_har .. 98 Ebangar Dadaii 99 Tolband ..
100 PO)'lllld (E) ..
101 Gayali Kotha 102 Vela!.. .. 103 Bhakarwad .• 104 Ambepur (E) .. 105 Mondvira
106 Wafawade 107 Vaghade 108 Kalwad 109 )uibapuji 110 Nag.zari
111 Medhekhar .. 112 Kochali 113 Shriaaon 114 Sagargad 115 Wada..aJi
116 Khatwira 117 Pitakiri 118 lui Cavali 119 Kusumhale .. I ~O Chikhali
R R
R' Rl'o
R R R
R
R' R R
121 Wa.hvir. 122 T adawagl. . . R' 123 T.I .. het 124 Jaloshi .. 125 Dol.vi Kharoshi
126 Kapari.. .. 127 Bhond Kharoshi 128 Ravet .. 129 Fanasapur 130 Kolvhar
131 Ruishel Bhomoli .. 132 N.vakhar T arl Shirll1lon 133 Kurdus R' 134 Be""li 135 Simadevi
136 Sambari 137 Aweli .. 138 Bidwagle .. 139 Dutga Darya .. 140 Sagaon
141 Tal.wli T. Khandal. 142 Kaloohi 143 Rule .. 144 Khandala 145 Pavel •.•
146 Nigade 147 Vadagaon 148 V.shvi 149 Belkade 150 Dha .... r
J-62-1-5-B.
R R R
Educational
Institu"" tions
(4)
p' P
i-i
i; p
p'
'p P
P l'
p
p'
P' P P P
Drinking waler Medical
supply facilities
(5) (6)
W RivW RivW
WTk X W RivW
WX W
W Wx Wx
RivW W
WTk X WTkx
W W Wx
Wx WTk RivW X
W WX Wx W wx W
W W
if;
W W W
if;
W W W
if;
W W)l. Wx W
W W Wik
W·X W
W W';< Wx WX WX WTk WTk Wn
o
38
Area in Occu-
Bazar Day Sq. pied
Miles hou.es
(7) (8) (9)
Households
(10)
RURAL AREA-conld.
0·6 Uninhabited. 0·2 Uninhabited. 0-3 6 6 0·5 116 126 0,4 98 99
0-1 Uninhabited. 2·2 357 369 0·3 I I 0·8 115 J.I5 0·1 Uninhabited.
1·2 Uninhahited. 0·1 Uninhabited.
0·03 Urrinhahit.d. 0-3 50 51 0·1 26 26
0·6 104 107 0·1 75 80 0·7 82 84 0·1 Uninhahited. 0·1 Uninhabited.
0·6 2 2 0·3 10 10
0·01 Uninhabited. 0·2 6 6 1·3 227 227
0·1 Uninhabited. 0·6 3 3 0·1 44 45 0·8 334 337
0·03 Uninhabited.
0·2 34 36 0·3 57 57 0·4 SO 51 0·6 UninhabiteJ. 0·6 53 55
(lo9 97 97 0·6 121 126 2·3 166 172 4-0 25 26 04 34 41
0·2 28 28 0·5 94 94 0·2 Uninhabited. 2·2 222 222 Q.2 Uninhabited.
0·3 101 104 1·1 54 54 1·2 75 75 0'1 Uninhahited. 0'3 14 17
0·3 2 2 0·8 3 3 0·8 141 144 0-4 Uninhabited. 0-8 51 51
1-1 109 109 0·1 81 81 H 296 298 1·3 25 25 0·1 Uninhabited.
0-4 III 111 14 70 70 5·7 9 9 0'1 Uninhahited. 0.7 49 49
0.6 46 46 0-3 Uninhabited. 0·8 13 13 0·5 169 169 0.8 45 45
0·8 4 4 0·9 178 178 1.1 212 240 . 1.0 98 103 1.7 103 103
Total Popelal;on
P M F
(11) (12) (13)
29 659 498
1,778 10
552
280 159
S7'i 363 458
10 57
28 1,202
11 223
1,473
147 303 299
27S
514 580 897 113 206
ISS 463
1,068
493 283 347
88
19 13
682
221
5()6 387
1,456 117
602 338
48
240
26'2
S7 814 186
18 819
1,160 48S 504
12 324 249
849 8
272
136 68
286 143 223
5 31
15 598
8 103 738
70 162 ISS
134
264 274 432 60
102
69 205
507
217 137 180
41
8 7
326
102
269 182 691 56
274 168
18
113
121
30 389 83
10 365 582 219 253
17 335 249
929 2
280
144 91
289 220 235
5 26
13 604
3 120 735
77 141 144
141
250 306 465
53 104
86 258
561
276 146 167
47
11 6
356
119
237 205 765 61
328 170 30
127
141
27 425 103
8 454 578 266 251
Scheduled Scheduled Literate and, Castes T rib.. educated
M F M F M F
(14) (15) (16) (17) (18) (I9)
i9
34
38
55
18
i6
12 4 174 52 143 55·
18 18 564 216
i.i 86 4
80 78 20
8
58 7
69
52 19' 33 21
113 32 io 44 5
3
ii
44 I
74
99 17
1 8 I
11 3 367 171
1 34
411
46 48 85
17
126
'j. 247
14 12 19
'j lSi 34 136 160 138
21 33 29
6S
15
ii
6
48 41 l 29 19 21
38 _88 I
161 160 210
I 49 97
8
4i 81
10
119 30 34
7
3 26
~ 3 3
30 155
20 28 17
ji 17 78
27 317
12& Iii II 20
22 20
2 2
35 4i I I
72 65 13 II 17 18
I
138 29 2
33
61
13 198
14
7 22
304 128 1()2
'j
13 19'
62'
30 12' I
.ii 2'
i3 76 I
33 14
8
18
5. 67 I
in 72 64 57
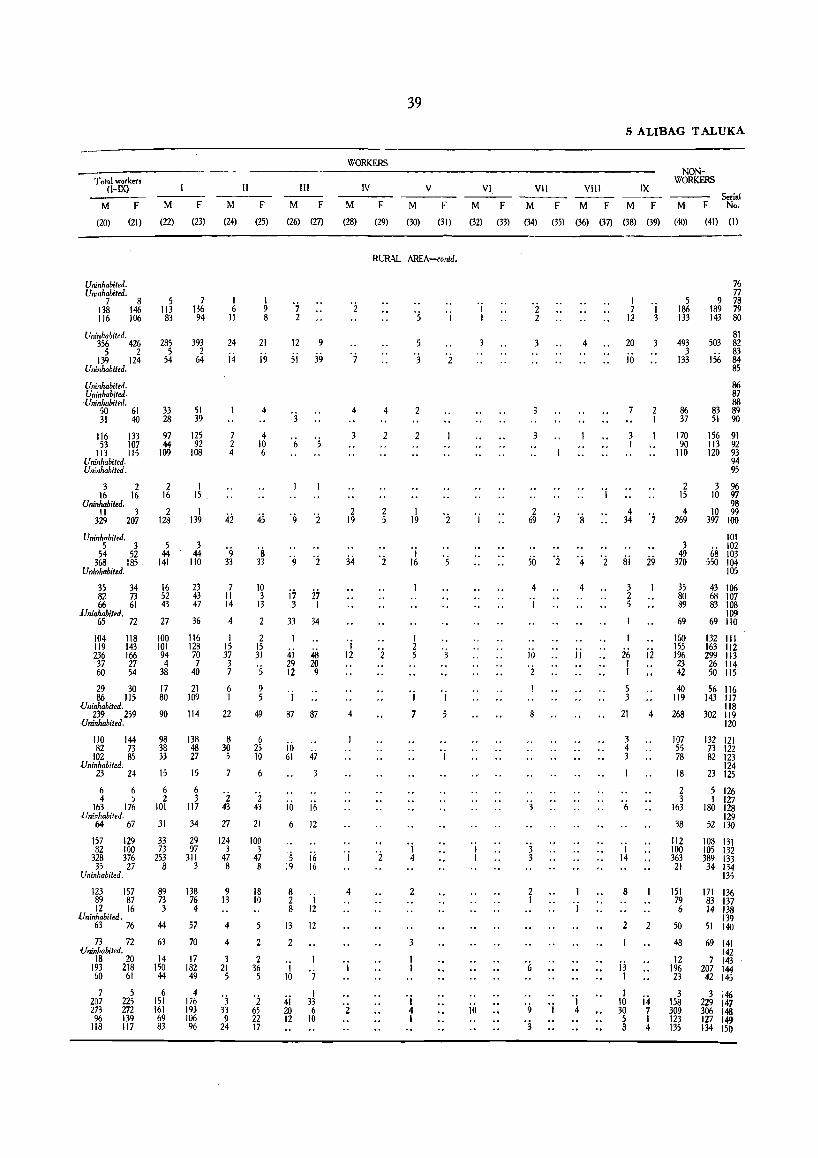
Total workers (I-IX)
M F
(20) (21)
Uninhabited. Uninhabited.
7 8 138 146 116 106
Uninhabited.
M
(22)
5 113 83
F
(23)
7 136 94
356 426 285 393 5 2 5 2
I~ U4 ~ M Uninhabited.
. Uninhabited. Uninhabited.
,uninhabited. 50 61 31 40
33 28
51 39
116 133 97 125 53 107 44 92
JJ3 liS 109 108 Uninhabited. Uninhabited.
3 2 16 16
Uninhabited. II 3
329 207
Uninhabited. 5 3
54 52 368 185
Uninhabiled.
35 34 82 73 66 61
llninhabiled. 65 72
104 118 119 143 236 166 37 27 60 54
29 30 86 115
Vninhabited. 239 259
Uninhabited.
2 16
2 128
5 44
141
16 52 43
27
100 101 94 4
38
17 80
90
110 144 98 82 73 38
102 85 33 .uninhabited.
23 24 15
6 6 6 4 J 2
163 176 101 Vninhabited.
M 67 31
I 15 .
I 139
3 44
110
23 43 47
36
116 128 70 7
40
21 109
114
138 48 27
15
6 3
117
34
157 129 33 29 82 100
328 376 35 27
Uninhabited.
123 157 89 87 12 16
Vninhabited. 63 76
73 72 Uninhabiled.
18 20 193 218 60 61
7 5 207 225 273 272 96 139
118 117
73 97 253 31 I
8 3
89 73 3
44
63
14 150 44
6 151 161 69 83
138 76 4
57
70
17 182 49
4 176 193 106 96
M
(24)
I 6
II
24
14
7 2 4
42
9 33
7 11 14
4
I 15 37 3 7
6 I
22
8 30 5
7
"i 43
27
124 3
47 8
9 13
4
4
3 21 5
°3 33 9
24
II
F
(25)
1 9 8
21
i<i
4
4 10 6
4S
's 33
10 3
13
2
2 IS 31
'5 9 5
49
6 25 10
2 43
21
100 3
47 8
18 10
2
2 36 5
°2 65 22 17
III
M F
(26) (27)
°7 2
12 9
si 39
i7 i7 3 I
33 34
41 48 29 20 12 9
'j
87 87
io 61 47
10 16
6 12
. 5 i6 19 16
8 2 8
13
2
I 10
4i 20 12
'j 12
12
°7 I
33 6
10
WORKERS
M
(28)
IV
F
(29)
39
M
(30)
V
F
(31)
RURAL AREA-conldo
7
4
3
2 19
34
OJ
12
4
'j
4
OJ
2
4
2
2 5
°2
'3
2
2
I 19
I 16
I 2 5
°i 4
2
3
°i 4 I
2
3
VI,
M F
(32) (33)
'j I
'j
10
5 ALIBAG T ALUKA
Vll
M
(34)
°2 2
VIII IX
F M F M F
(35) (36) (37) (38) (39)
4
OJ
I 7 'i
12 3
20 3
jli
3 I
4 34 °7
50 °2 °4 '2 si 29
'j
10
'i
'j
OJ
3
OJ
4
jj
OJ
°i 4
3 2 5
26 j2 1 I
5 3
21 4
3 4 3
I
I 14
8
2
i3 I
I 10 30 5 8
2
i4 7 1 4
NONWORKERS
Serial M F Noo
(40) (41) (1)
5 186 133
493 3
133
86 37
170 90
110
2 15
4 269
3 49
370
35 80 89
69
160 155 196 23 42
40 119
268
107 55 78
18
2 3
163
38
112 100 363 21
151 79 6
50
48
12 196 23
3 158 309 123 135
76 77
9 78 189 79 143 80
81 503 82
83 156 84
85
86 87 88
83 89 51 90
156 91 113 92 120 93
94 95
3 96 10 97
98 10 99
397 100
IOJ 102
68 103 550 104
105
43 106 68 107 83 108
109 69 110
132 111 163 112 299 113 26 114 50 115
56 116 143 117
118 302 119
120
132 121 73 122 82 123
124 23 125
5 126 I 127
180 128 129
52 130
103 131 105 132 389 133 34 134
135
171 136 83 137 14 138
139 51 140
69 141 142
7 143 207 144 42 145
3 146 229 147 306 148 127 149 134 ISO
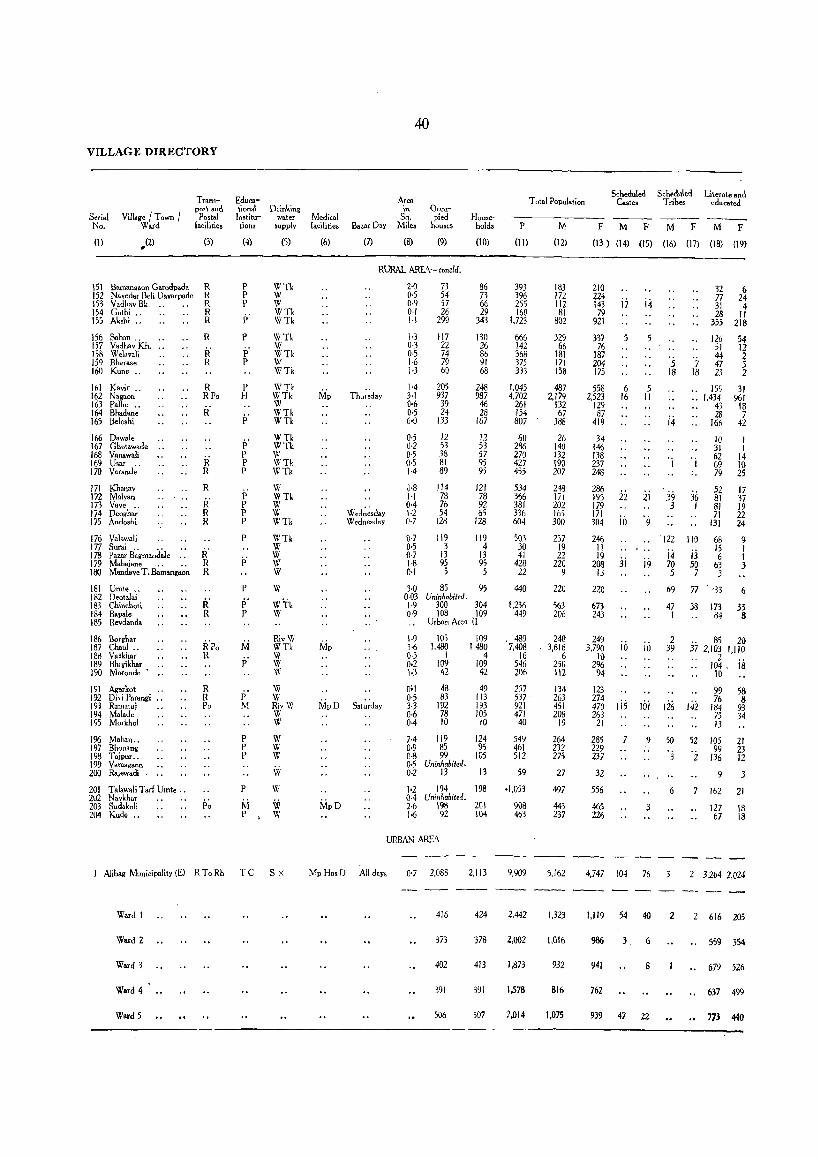
VILLAGE DIRECTORY
Serial No.
(1)
Village I Town I Ward
Transport and
Postal facilities
(3)
151 Bamang.on Garodp.da R 152 Navedar Beli Dav.rpade R 153 Vadhav Bk. .. R 154 Gothi .. R 155 Ak,hi .. R
156 Sahan .. 157 Vadhav Kh. .. 158 Welavali 159 Shera,e 160 Kune ..
161 Kayir .. 162 Nagaon 163 Palh •.. 164 Bhadane 165 Belo.hi
166 Dawale 167 Ghatawade .. 168 Vanawali 169 Usar .. 170 Varande
171 Khan.v 172 Maly.n 173 Vaye .. 174 Deoghar 175 Andoshi
176 Valawali 177 Surai .. .. 178 Pazar Bagmandale .. 179 Mahajane . . . . ISO Mandaye T. Bamangaon
181 Urn! •.. 182 Deotalai 183 Chinchot; 184 Sapal. 185 Revdanda
186 Borgh.r 181 Chaul .. 188 Vaskh.r 189 Bhifrikhar 190 Moronde' ..
191 Agarkot .. 192 Divi Par.ngi •• 193 Ramaraj 194 Malade 195 Morkhol
1% Mahan .. 197 Bhonang 198 Tajpur .. 199 Varas .. on 200 R.jew.di
201 Talawali Tarf Urnte .. 202 Naykhar 203 Sudakali 204 Kude ..
R
R' R
R RPo
R'
R R
R
R' R R
R' R R
R' R
R R Po
Educa'tlona\ Institutions
(4)
p P P f;
P
p' P
P H
f; P P P
p' p p p
p
P
p' P
1\1 p'
p' M
p p p
P
I\.i P
Drinking water
,upply
(5)
WTk W W WTk WTk
WTk W WTk W WTk
WTk WTk W WTk WTk
WTk WTk W WTk WTk
W WTk W W WTk
WTk W W W W
W
W1\ W
RivW WTk W W \V
W W RivW W W
W W w iii w iii W
I Alibag Municipality (El R To Rh T C S X
Ward I
Ward 2
Ward 3
Ward 4
Ward 5
Medical facilities
(6)
Bazar Day
(7)
40
Area in
Sq. Mile.
(8)
Oc.c.upied
houses
(9)
Household,
(10)
RURAL ARE.'.-concld.
Wed~~sday Wednesday
2·0 0·5 0·9 0·1 1·1
\·3 0·3 0·5 \·6 )·3
1·4 3-1 0·6 0·5 6·0
0·5 0·2 0-5 0·5 1·4
J·8 1·1 0·4 '·2 0·7
0·7 0·5 0·7 1·8 0·1
3·0 0·03 1·9 0·9
73 54 57 26
299
ll7 22 74 79 60
205 937
39 24
133
12 51 38 81 89
114 78 76 54
128
86 73 66 29
343
130 26 86 91 68
248 987
46 28
167
12 53 57 95 95
121 78 92 6<;
128
119 119 3 4
13 13 95 95 5 5
85 95 Uninhabited.
300 304 108 109
Urban Area II
1·9 105 \09 1,480 3·6 1.480
0·3 I Q.2 109 1.3 42
0·1 0·5 }3 0·6 0·4
48 83
192 78 10
4 109 42
49 113 193 105 10
7-4 119 124 0.9 85 95 0·8 99 105 0·5 Uninhabiled. 0.2 13 13
1.2 194 198 0-4 Uninha'itd. 2·6 198 201 106 92 104
URBAN AREA
Mp Hos n All day, 0·7 2.088 2.113
416 424
373 378
402 413
391 391
506 507
Total Population
P M
(11) (12)
393 396 255 160
1.723
666 142 368 375 333
1.045 4.702
261 154 807
60 286 270 427 4;;
534 366 381 336 604
503 30 41
428 22
440
1,236 449
489 7.408
16 546 206
237 537 921 471 40
549 461 512
59
.1.053
908 463
9.909
2.442
2,002
1.873
1,578
1,014
183 172 112 81
B02
329 66
181 iii 158
487 2.179
132 67
388
26 140 132 190 207
248 17i 202 16') 300
257 19 22
220 9
220
563 206
240 3.618
6 250 112
134 263 451 208
19
264 232 275
27
497
443 237
5,162
1,323
1,016
932
816
1.075
Sohedul.d Scheduled Litetate and Castes Tribe, educated
F M F M F M F
(13) (14) (15) (16) (17) (18) (19)
210 224 143 i7 i4 79
921
337 76
187 204 175
558 2.523
129 87
419
34 146 138 237 248
286 195 179 171 304
246 II 19
208 13
220
673 243
249 3,790
10 296 94
123 274 470 263
21
285 229 237
32
556
465 226
5
6 16
ii
i6
3i
io
5
5 11
ii
;9
io
10;
9
3
4.747 104 76
1.119 54 40
3 6
941 8
762
939 47 22
5 18
;4
39 3
122
i4 70 5
69
47 1
2 39
126
32 6 77 24 31 4 28 11
355 218
7 18
126 51 44 47 23
155 .. 1,434
43 28
166
j/, 1
110
jj 50 7
10 31 62 69 79
52 81 81 71
131
68 15 6
63 3
77 . '33
38 173 84
54 12 2 5 2
31 961
18 7
42
1 1
14 10 25
17 37 19 22 24
9 I 1 3
6
33 8
.. 85 20 372.103 1.110
2 104, iil
10
142 99 76
184 75 13
58 8
93 34
50 . 52
'3 '2 105 99
136
21 23 12
6
2
162
127 67
3
21
18 13
2 3,264 2,024
2 616 205
559 354
.679 526
637 499
m 440
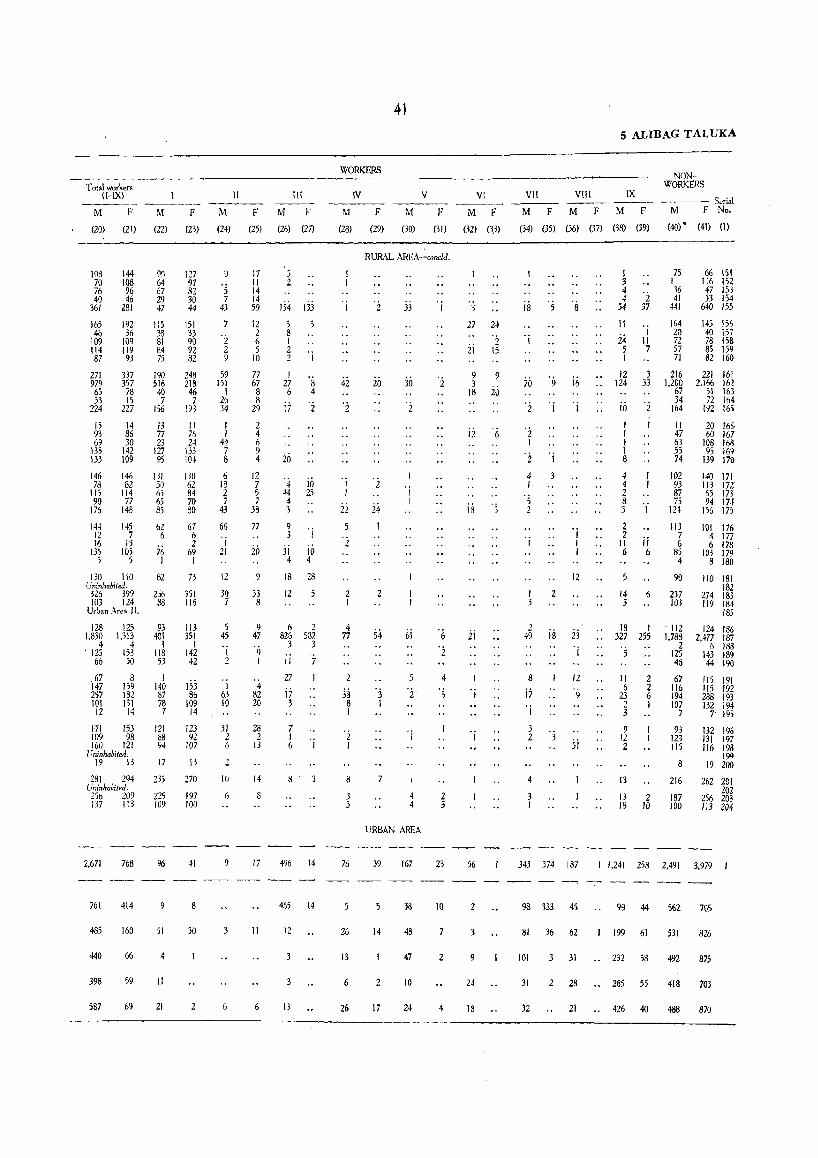
Total workers (HX) II
------- ------- -------M F M F M F
(20) (21) (22) (23) (24) (25)
108 70 76 40
361
165 46
109 114 87
271 979
65 33
224
15 93 69
135 133
146 78
115 90
176
144 12 16
135 5
144 lOB 96 46
281
192 36
109 119 93
337 357
78 15
227
14 86 30
142 109
146 82
114 77
148
145 7
13 105
5
9Q 64 67 29 47
115 38 81 84 75
190 516
40 7
156
13 77 23
127 95
131 50 6S 65 85
62 6
76 I
130 110 82 Uninhabited.
326 399 266 103 124 88
Urban Area I l.
128 125 1.830 1.313
4 4 , 125 153
66 50
,67 147 257 IQI
12
8 159 182 131
14
171 153 109 98 160 121
[ Ininhabiled, 19 13
281 294 Uninhabited, 25b 209 137 113
93 401
1 118 53
I 140 87 7B 7
121 88 94
17
235
225 109
127 97 82 30 44
151 33 90 9Z 82
248 218 46 7
191
" 76 24
133 104
130 62 84 70 80
67 6 2
69 I
73
351 116
113 351
1 142 42
153 86
109 14
123 92
107
13
270
197 100
9
'j 7
43
7
'2 2 9
59 151
1 26 34
I I
44 7 8
6 18 2 7
43
66
'i 21
12
31) 7
5 4S
'i 2
1 63 10
31 2 6
10
6
17
" 14 14 59
12 2 6 S
10
77 67 8 B
29
2 4 6 9 4
12 7 5 7
38
77
20
9
33 8
9 47
'9 I
4 B2 20
28 2
13
14
III
M F
(26) (27)
:; 2
154 Ijj
5 5 8 I 2 2 'j
I 27 6
i7
io
8 4
'2
'4 io 44 25 4 3
9 3 'j
ji 10 4 4
18 28
12
6 2 826 582
3 3
i i 7
27
i7 3
7 I 6
8
'j
2.671 768 96 41 9 17 496 14
761 414 9 8 465 14
485 160 51 30 3 11 12
440 66 4
398 59 II
587 69 21 6 6 13
41
WORKERS
IV V
M F M F
(28) (29) (30) (31)
42
I I
22
2 I
4 77
2
33 8 I
'2 I
8
3 5
76
26
13
6
26
RURAL AREA-concld.
20
2
24 1
54
'3 I
7
jj
30
'j 1
6i
5
'2
'j
4 4
URBAN AREA
39 167
38
14 48
47
2 10
17 24
4
·s
2 3
23
10
7
2
4
VI VII VlII
5 ALIBAG TALUKA
IX
NONWORKERS
-M--F- --M--F- M F M F ----- Serial
M F No.
(32) (3) (34) (35) (36) (37) (38) (39) (40)' (41) (I)
3
27
21
9 3
18
24
'2 15
9
20
ii 'j,
is '5
2i
'j
'j
56
2
9
24
18
i8
70
4 1
's 2
'j
I 3
2 49
8
i7 'j
3 2
4
3 1
3
is
8
i6
'j
'j I I
12
12
'9
5j
343 374 187
98 33J 4)
BI 36 62
101 3 31
31 2 28
1 3 4 4
S4
11
24 5 I
12 124
io 1 I I I 8
I
" 7
3 33
75 I "l6 41
441
164 20 72 57 71
66 151 116 IS2 47 153 33 154
640 155
145 156 40 157 78 158 85 159 82 160
216 221 161 1,200 2,166 162
67 51 163 34 72 164
164 192 165
II 47 63 55 74
20 166· 60 167
108 168 95 169'
139 170
4 102 140 171 113 17l 65 173 94 J7.f
156 J7j
4 93 2 87 8 75 3 1 124
2 113 101 176 2 7
II ii 6 4 177 6 178
103 179 8 180
6 6 85
14 6 3
18 I ., 327 255
·s
" 2 6 2 23 6 2 I 3
9 12 2
13
13 2 18 )0
4
90
237 103
110 181 182
274 183 119 184
185
. 112 124 186 1,788 2,477 187
2 6 188 125 143 189 46 44 190
67 115 191 116 115 192 194 288 193 107 132 194
7 7 195
93 123 liS
8
216
187 100
132 196 131 197 116 198
199 19 200
262 201 202
256 203 113 204
I 1,241 25B 2,491 3.979
99 44 %2 70S
199 61 531 826
232 58 492 875
285 55 418 703
32 21 • , 426 40 488 870
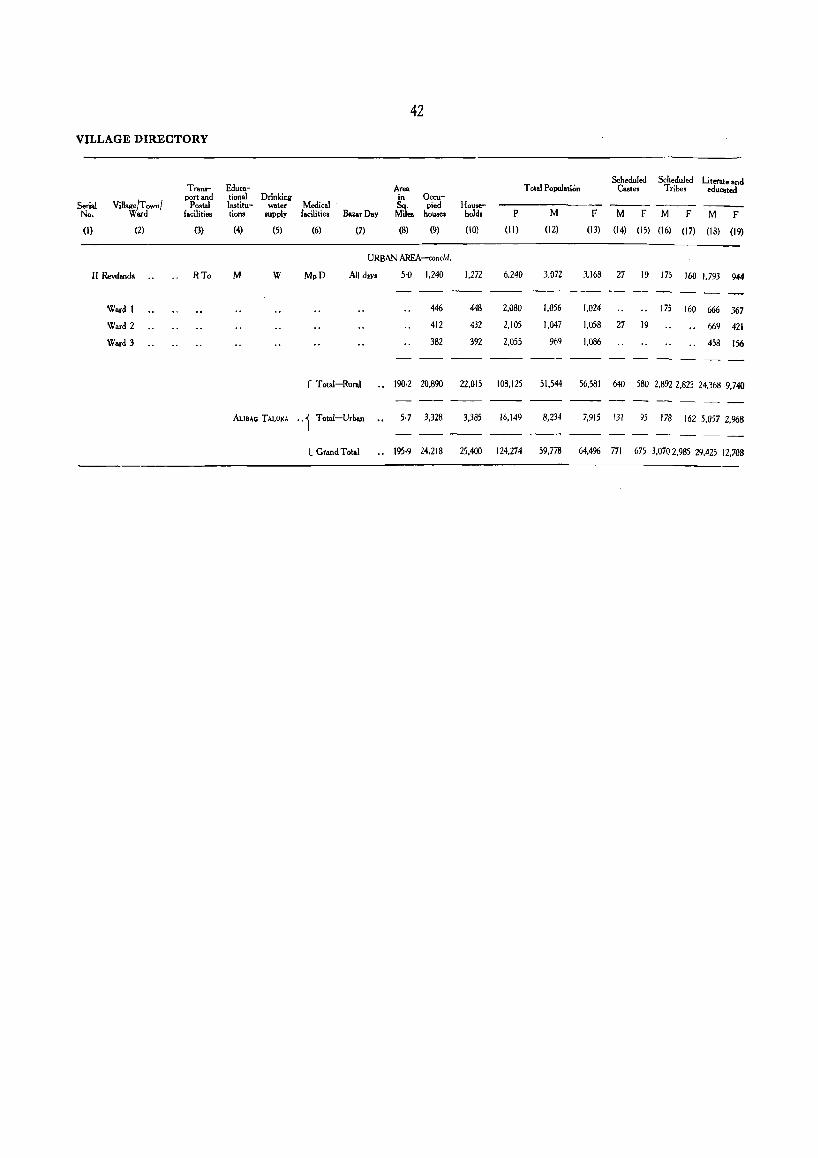
42
VILLAGE DIRECTORY
Scheduled Scheduled Literat. and Trans- £duca- Ar ... Total Population Caste. Tribes educated
ViIlage!T own! port and tiona! Drinking in Occu-
Serial Postal Institu- water Medical Sq. pied House- -------No. Ward facilities trons supply facilities Bazar Day Mil .. house. hold. P M F M F M F M F
(I) (2) (3) (4) (5) (6) (7) (8) (9) (10) (11) (12) (13) (14) (15) (16) (17) (18) (19)
URBAN AREA-concld.
II Revdanda RTo M W MpD All day. 5'0 1,240 1,272 6,240 3.072 3,168 27 19 175 160 1.793 944
Ward 1 446 448 2.080 1,056 1,024 175 160 666 367
Ward 2 412 432 2.105 1.047 1.058 27 19 669 421
Ward 3 382 392 2.055 969 1.086 458 156
r Total-Runl .. 190·2 20,890 22,015 108,125 51,544 56.581 640 580 2.892 2.823 24.368 9,740
---AUBAG TALUKA "I Total-Urban 5·7 3,328 3,385 16.149 8,234 7,915 131 95 178 162 5,057 2.%8
---L Grand T olal .. 195·9 24,218 25,400 124.274 59.778 64,4% 771 675 3.0702.985 29,425 12,708
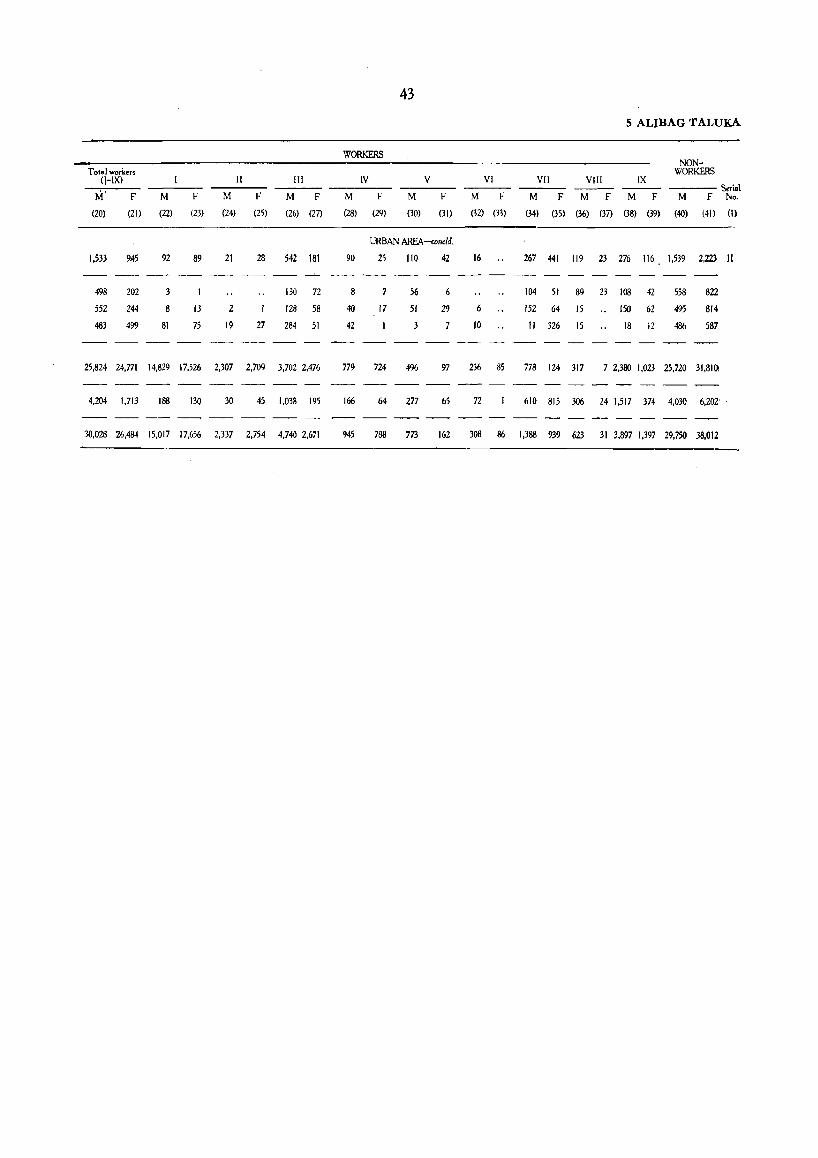
43
5 ALI BAG TALUKA
WORKERS NON-
Total workers WORKERS (I-IX) II III IV V VI VII VIII IX
M --- Serial
F M F M F M F M F M F M F M F M F M F M F No.
(20) (21) (22) (23) (24) (25) (26) (27) (28) (29) (30) (31) (32) (33) (34) (35) (36) (37) (38) (39) (40) (41) (I)
URBAN AREA-amclcl.
1.533 9.45 92 89 21 28 542 181 90 25 110 42 16 267 441 119 23 276 116 1.539 2,223 II
498 202 130 72 8 7 56 104 51 89 23 108 42 558 822
552 244 13 2 128 58 40 17 51 29 6 152 64 15 ISO 62 495 BI4
483 499 81 75 19 27 284 51 42 3 7 10 II 326 15 18 12 486 587
25.824 24.771 14,829 17,526 2,307 2,709 3,702 2,476 779 724 496 97 236 85 778 124 317 7 2,380 1,023 25.720 31,81()'
4,204 1,713 188 130 30 45 1,038 195 166 64 277 65 72 610 815 306 24 1,517 374 4,030 6,202:
-- -- ---30,028 26,484 15,017 17,656 2,337 2,754 4,740 2,671 945 788 773 162 308 86 1,388 939 623 31 3,897 1,397 29,750 38,012


Pen Taluka
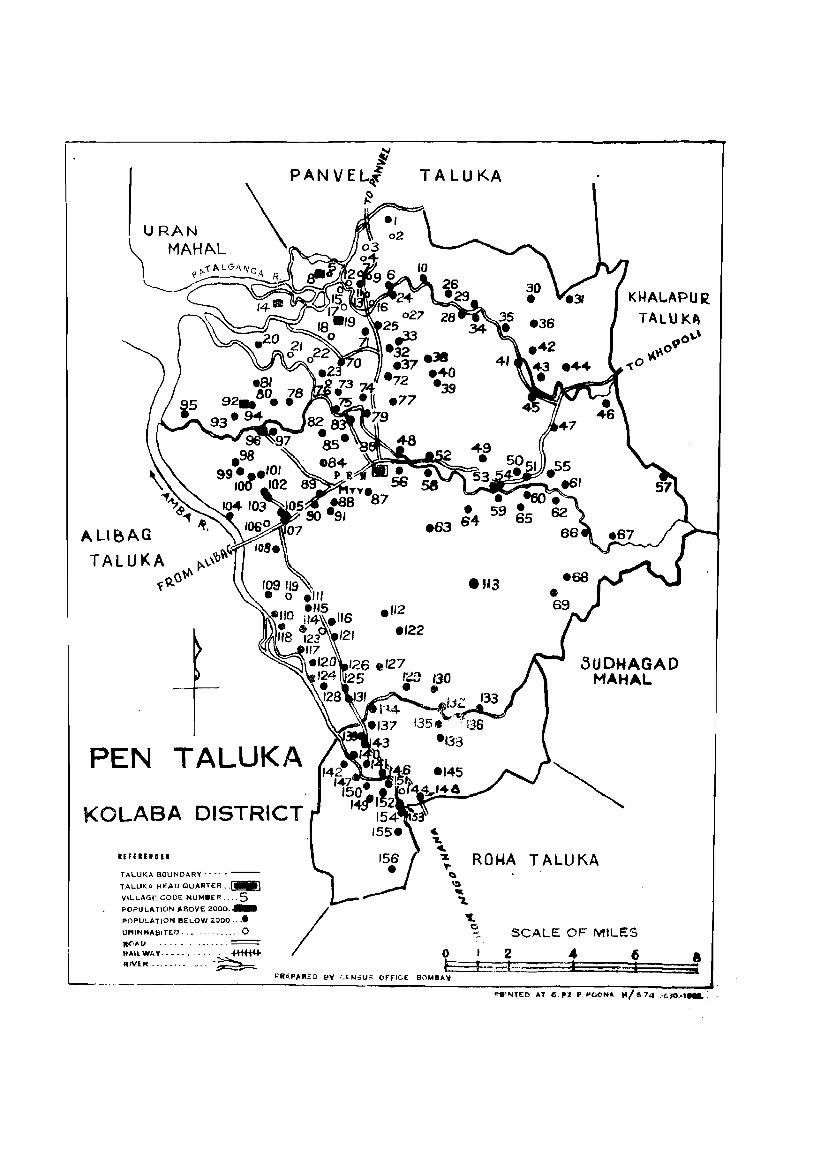
l
URAN MAHAL
A LlBAG TAL U K A f' \.\'b~
T~O~
PEN TALUKA
KOLASA DISTRICT
IHllllOlI
TA.! .. UKA BOUNDARy···· .-
TAL.UK. HEAD QUARTER •. ~ VIL.LAGI: CODE NUM.ER .... 5 POPUL.ATlON ",SDVE ZOOO. __
POPUL.ATION I5EL.OW 2000., ••
\11'1 IN H"III TEf) , .• '" .... 0 1I(11'D ....•..••... = RAIL WAy...... . . . . +Ht*fRIVER ••.••••.. _ .... -~
/
.112
.,22
.63
'" 'L
'"
K~AL.APU R. TALUKA
o\.\ 0;,0"
"(O~
SUOHAGAD MAHAL
~ ROI-4A T AlUKA ~ ~ -'t.
~. SCALE OF MILES
o I 2 .. 6 L I ·-,d-" , --;1
I'RilPjlllIED BV ClNSU;; OfFICE SOMe"".
& ;
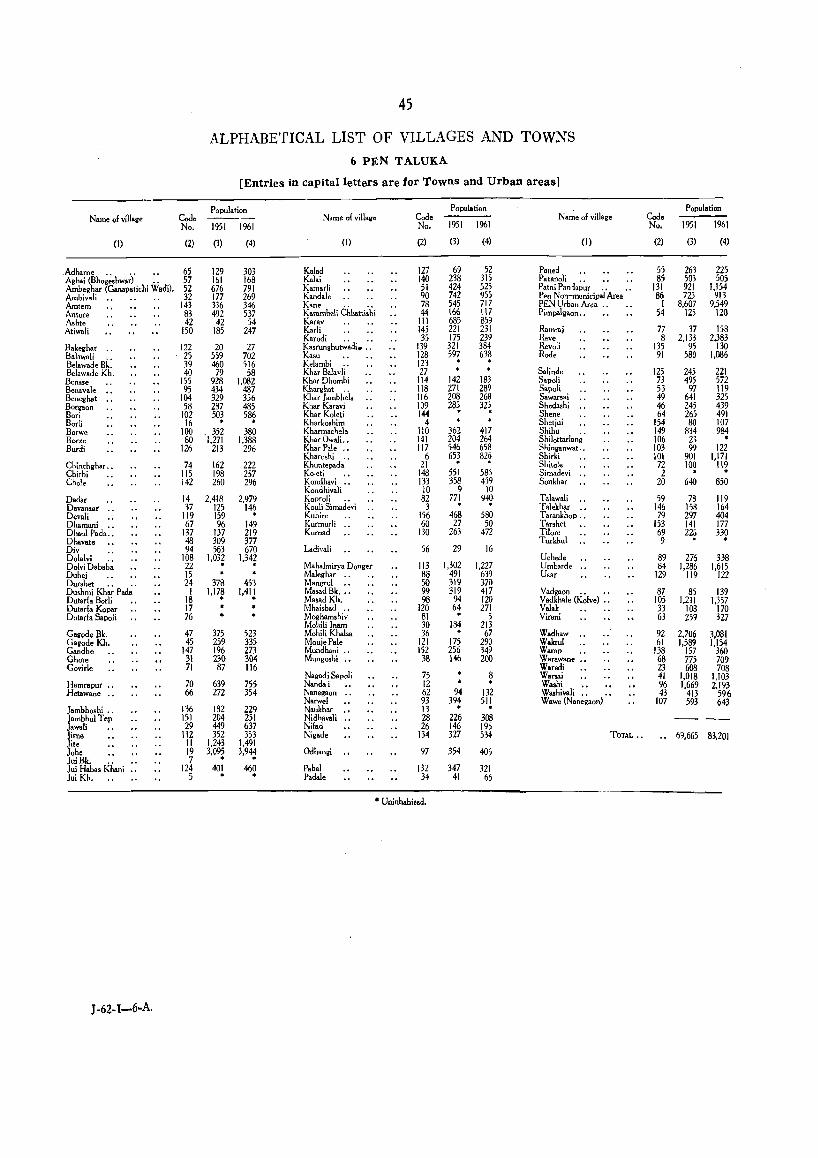
45
ALPHABETICAL LIST OF VILLAGES AND TOWNS
(, PEN TALUKA
[Entries in capital letters are for Towns and Urban areas]
Population Population Population Name of village Cod. Name of villalle Code Name 01 village Code
No. 1951 1%1 No. 1951 1961 No. 1951 1961
(1) (2) (3) (4) (I) (2) (3) (4) (I) (2) (3) (4)
. Adhame .. 65 129 303 K.I.d 127 69 52 Paned 55 263 225 Aghaj (Bho~~.hw.;) .. 57 161 168 Kalai 140 238 315 Patartoli 85 503 505 Ambeghar (Ganapatichi Wadi). 52 676 791 Kamarli 51 424 525 Patni Pan1a~~r .• 131 921 1,154 Ambiv.li .• 32 177 269 Kandale 90 742 955 Pen Non"'""1l1unicipal Area 86 723 913 Amtem 143 336 346 Kane 78 545 717 PEN Urban Area .. I 8,607 9.549 Antore 83 492 537 Karamb.li Chhatti~hi 44 166 117 Pimpalgaon .• 54 125 120 Ashte 42 42 54 Karav III 685 859 Atiwali 150 185 247 Karli 145 221 231 Raml'aj 77 37 158
Karodi 35 175 239 Rttve 8 2.133 2,383 Bakegh.r .. 122 20 27 Kastunghu~~di. :: 139 321 384 Revoli 135 95 130 Bal_wali 25 559 702 Kasu 128 597 638 Rode 91 580 1,086 Belawade Bi.: 39 460 516 K.lambi 123 · · Bel_wade Kh. 40 79 58 Khar Balavli' 27 Salinde 125 245 221 Benase 155 928 1.082 Khat Dhombi 114 142 183 Sapoli 73 495 572 Benavale 95 434 487 Khatghat 118 271 289 Sapo!i 53 97 119 Beneghat .. 104 329 356 Khar l.mbh;la 116 208 268 Sawarsai .. 49 641 325 Borgaoo 58 287 485 Khar Karavi 109 285 325 Shed.shi .. 46 245 439 Bori 102 503 586 Khar Koleti 144 · · Shene 64 265 491 Borli 16 • • Kharkoshim 4 Shetjui 154 80 107 Borwe 100 . 352 380 Kharmachela 110 362 417 Shihu 149 834 984 Borze 80 1,271 1,388 KharOwali .. 141 204 264 Shilottarlan~ . 106 23 • Burdi 126 213 296 Khar Pale ., 117 546 658 Shinganwat .• 103 99 122
Kharoshi 6 653 826 Shirki 101 901 1,171 Chinchghar .. 74 162 222 Khuntepad~ . 21 • ,
Shitole 72 100 119 Chirhi 115 198 257 KOleti •• 148 551 586 Simadevi 2 . • Chole 142 260 296 Kondhavi .. 133 358 459 Sonkhar 20 640 850
Kondhivali JO 9 10 Dadar 14 2,418 2.979 Koproli 82 771 9~ Talawali 59 78 119 Davansar 37 125 146 Kouli Simad;vi 3 · Talekhar 146 158 164 Devali 119 159 · Kuhire 156 468 580 Tarankhop : : 79 297 404 Dhamani 67 96 149 Kurmurli ,. 60 27 50 Tarshet 153 141 177 Dhaul Pada: : 137 137 219 Kurnad 130 263 472 Tilore 69 226 330 Dhavate 48 309 377 Turkhul 9 • • Div 94 563 670 Ladivali 56 29 16 Dol.1vi 108 1,032 1.34~ Uchede 89 276 338 Dolvi Dabab~ 22 · Mah.lmirya Danger 113 1,302 1,227 Umb.,de 84 1,286 1,615 Dubei 15 Maleghar •. 88 491 639 Usar 129 119 122 Durshet 24 378 453 Mangrul 50 319 370 Dushmi Kh~~ Pad~ . 1 1,178 1,411 MasadBk. :: 99 319 417 Vadgaon.. .. 87 85 139 Dutarl. Borli 18 • • Masad Kh. 98 94 120 Vadkhale (Kolve) " 105 1.211 1.357 Dutar!a Kopar 17 Mhaisbad ., 120 64 271 Valak 33 loa 170 Dutarfa Sapoli 76 Moghamshiv 81 • 5 Virani 63 259 327
Mohili Inam 30 184 213 Gagode Bk. 47 375 523 Mohili Khalsa 36 • 67 Wadhaw 92 2,706 3,081 G8IIode Kh. 45 259 335 MouiePale 121 175 290 Wakrul 61 1,589 1.154 Gandhe 147 196 273 Mundhani ., 152 256 349 Warap 138 157 360 Chat. 31 230 304 Mungo,hi •• 38 146 200 Warawane :: 68 775 709 Covirle 71 87 116 Waredi 23 608 708
Nagadi Sapoli 75 8 Warsai 41 1,018 1,103 Hamrapur ., 70 639 755 Nandai 12 • Washi 96 1,669 2.193 Hetawane .• 66 272 354 Nanegaon .. 62 94 132 Washivali .• 43 413 596
Narwel 93 394 511 Wawe (Nanegaoo) 107 593 643 .Iambhoshi •. 136 182 229 Naukhar 13 · · lambhulTep 151 204 251 Nidhavali .• 28 226 308 lawali •• 29 449 637 Nifad 26 146 196 J!me 112 352 353 Nigade 134 327 534 TOUL .• 69,665 83,201 'te 11 1.243 1,491
lohe 19 3.095 3,9~ Odhangi 97 354 406 luiBk. 7 · lui Habas Khani ., 124 401 460 Pabal 132 347 321 lui Kh. 5 • · Padale 34 41 66
• Uninhabited.
J -62-1-6-A.
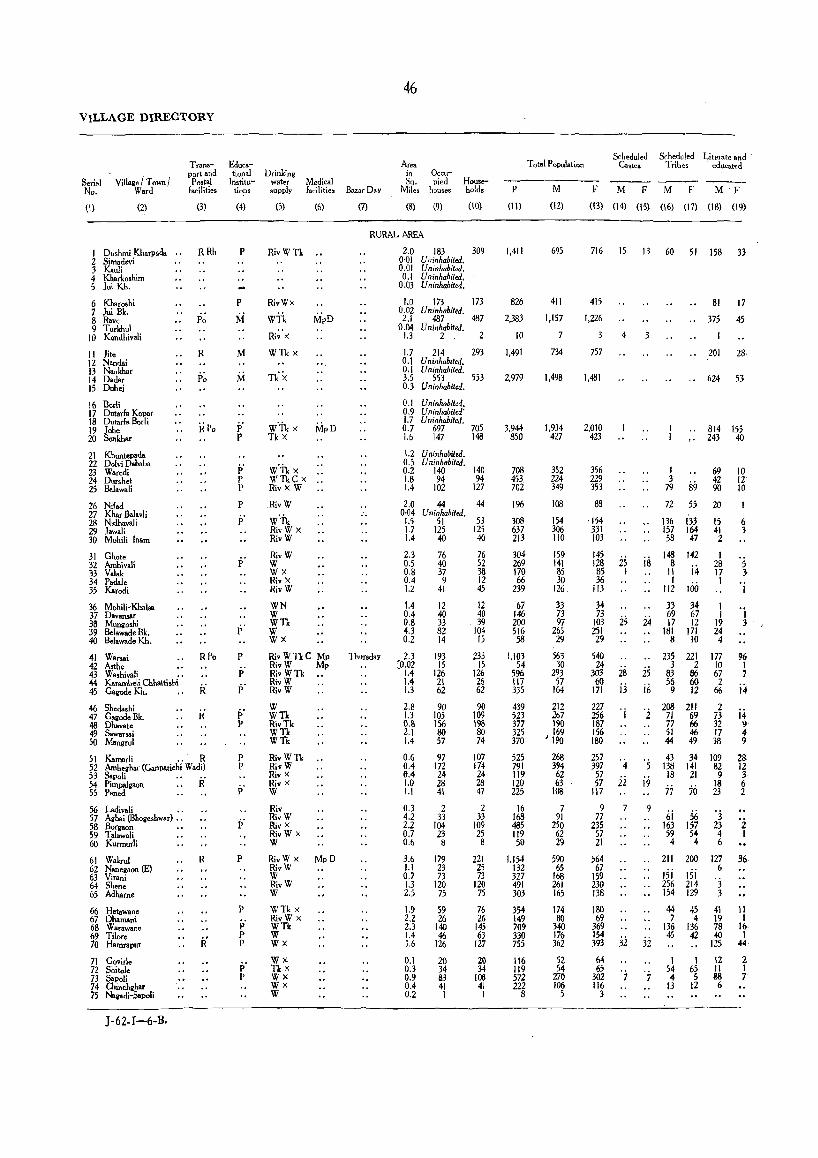
VILLAGE DIRECTORY
Serial No.
(I)
Village / Town / Ward
(2)
Transport and postal
facilities
(3)
I Dushmi Kharpada • • R Rh 2 Sirnadevi 3 Kauli 4 Kharkoshim S lui Kh.
6 Kharoshi 7 lui Bk. 8 Rave 9 Turkhul
10 KQndhivali
\I Jite 12 Nandai 13 Naukhar 14 Dadar 15 Dubei
16 s"rli 17 Dutarfa Kopar 18 Dutarfa Borli 19 Jobe 20 Sonkhar
21 Khuntepllda 22 Dolvi Dababa 23 Waredi 24 Dur.het 25 Balawali
26 Nilad 27 Khar Balavli 28 Nidhavali 29 Jawali 30 Mohili lnam
31 Chate 32 Ambivali 33 Valak 34 Padale 35 Karodi
36 Mohili-Kbalsa 37 Davansar 38 Mungo.hi 39 Belawade Bk. 40 Balawade Kh.
41 Wan.i 42 Asthe 43 Washivali ., 44 Karambeli Chhattishi 45 Caa-ode Kh.
46 Shedashi 47 Cagode Bk. 48 Dhowt. 49 Sawarsai 50 Mangrul
Po
R
RPo
51 KamarIi .. R 52 Arnbeghar (Ganpati.hi Wadi) 53 Sapoli .... 54 Pimpalgaon R 55 Paned
56 Ladivali ., 57 Aghai (Bhogeshwar) .• 58 BorgBon ., 59 Talawali 60 Kurmurli
61 WaW 62 Nanegoon (E) 63 Virani 64 Shene 65 Adbarne
66 Hetawane 67 Dhomani 68 Warawane 69 Tilore 70 Harnrapur
71 Covirl. 72 Shilole 73 Sapoli 74 Chinchghar 75 NBgadi-Sapoli
J-62-I-6-B,
R
Educational
Ins.titu-tions
(4)
p
P
M
M
p' P
p' P P
P
p'
p'
P p' p'
P' p
p P
P
p
j; p P
p' p
Drinking water supply
(5)
RivWTk
RivWx
Medical facilities
(6)
WTk MpD
Ri~'x
WTk X
w'n X WTkC X .. Riv X W
RivW
W'n RivWX RivW
RivW W Wx Riv X RivW
WN W WTk W WX
RivWTkC Mp RivW MI' RivWTk RivW RivW
W WTk RivTk WTk WTk
Riv WTk RivW Riv X Riv X W
Riv RivW Riv X RivW X W
RivW X RivW W RivW W
WTk X RivW X WTk W WX
WX Tkx Wx wx W
Bazar Day
(7)
46
Area in SQ.
Miles
(8)
Occupied
houses
(9)
Households
(10)
RURAL AREA
Thursday
2.0 183 309 0·01 Uninhabited. 0.01 Uninhabited. 0.1 Uninhabited.
0.03 Uninhabited.
1.0 173 173 0.02 Uninhabited. 2.1 487 487
0.04 Uninhabited. 1.3 2 2
1.7 214 293 0.1 Uninhabited. 0.1 Uninhabited. 3.5 553 553 0.3 Uninhabited.
OJ Uninhabited. 0.9 Uninhabited' 1.7 Uninhabited. 0.7 697 705 1.6 147 148
1.2 U "inhabited. 0.5 Uninhabited. 0.2 140 140 1.8 94 94 1.4 102 127
2.0 0·04
1.5 1.7 1.4
2.3 05 0.8 0.4 1.2
1.4 0.4 0.8 4.3 0.2
2.3 :0.02
1.4 1.4 1.3
2.8 1.3 0.8 2.1 1.4
0.6 0.4 0.4 1.0 1.1
0.3 4.2 2.2 0.7 0.6
3.6 1.1 0.7 1.3 2.5
1.9 2.2 2.3 1.4 1.6
0.1 0.3 0.9 0.4 0.2
44 44 Uninhabited.
51 53 125 125 40 40
76 76 40 52 37 38 9 12
41 45
12 12 40 40 33 39 82 104 14 15
193 15
126 21 62
90 105 156 80 57
97 172 24 28 41
2 33
104 23 8
179 23 73
120 75
59 26
140 46
126
20 34 83 41 1
233 15
126 26 62
90 109 198
SO 74
107 174 24 28 47
2 33
109 25 8
221 25 73
120 75
76 26
145 63
127
20 34
108 41 1
P
(11)
1,411
826
2.383
10
1,491
2.979
3,944 850
708 453. 702
196
308 637 213
304 269 170 66
239
67 146 200 516 58
1.103 54
596 117 335
439 523 377 325 370
525 791 119 120 225
16 168 485 119 50
1.154 132 327 491 303
354 149 709 330 755
116 119 572 222
8
Total Population Scheduled Scheduled Literate and
Castes T rib es ' educatd
M
(12)
695
411
1,157
734
1,498
1,934 427
352 224 349
108
154 306 lID
159 141
B5 30
126.
33 73 97
265 29
563 30
293 57
164
212 267 190 169
J 190
268 394 62 63
108
7 91
250 62 29
590 65
168 261 165
174 80
340 176 362
52 54
270 106
5
F M F M F M'F
(13) (14) (15) (16) (17) (IS) (19)
716 15 13 60 51 158 33
415
1,226
3
757
1,481
2,010 423
356 229 353
88
·154 331 103
145 128 85 36
113
34 73
103 251 29
540 24
303 60
171
227 256 187 156 180
257 397 57 57
117
9 77
235 57 21
564 67
159 230 138
180 69
369 154 393
64 65
302 116
3
4
25 1
2S
2S ij
'i
'4 ii
7
32
81 17
375 45
3
201 28
., 624 S3
814 155 ,. 243 40
1 3
79 89 72 55
136 1'33 157 164 58 47
is 1~ 142 11 i4 1
112 100
33 34 69 67
24 17 12 181 171
8 10
235 221 3 2
83 B6 2S 56 60 9 12 i6
'z' 208 211 71 69
'5 i9
9
32
77 66 51 46 44 49
43 34 138 141 18 21
jj 70
6i 56 163 157 59 54 4 4
211 200
lsi lsi 256 214 154 129
44 45 7 4
136 136 45 42
1 1 54 65 4 5
13 12
69 42 90
20
IS 41 2
1 28 17 I
1 1
19 24 4
177 10 67 2
66
2 73 32 17 38
109 82 9
18 23
j 23
4 6
127 6 'j 3
41 19 78 40
125
12 11 88 6
10 12 10
6 3
I 3'
% 1 7
i4
i4 9 4 9
28 12 3 6 2
°i 1
II I
16 1
44
2 1 7
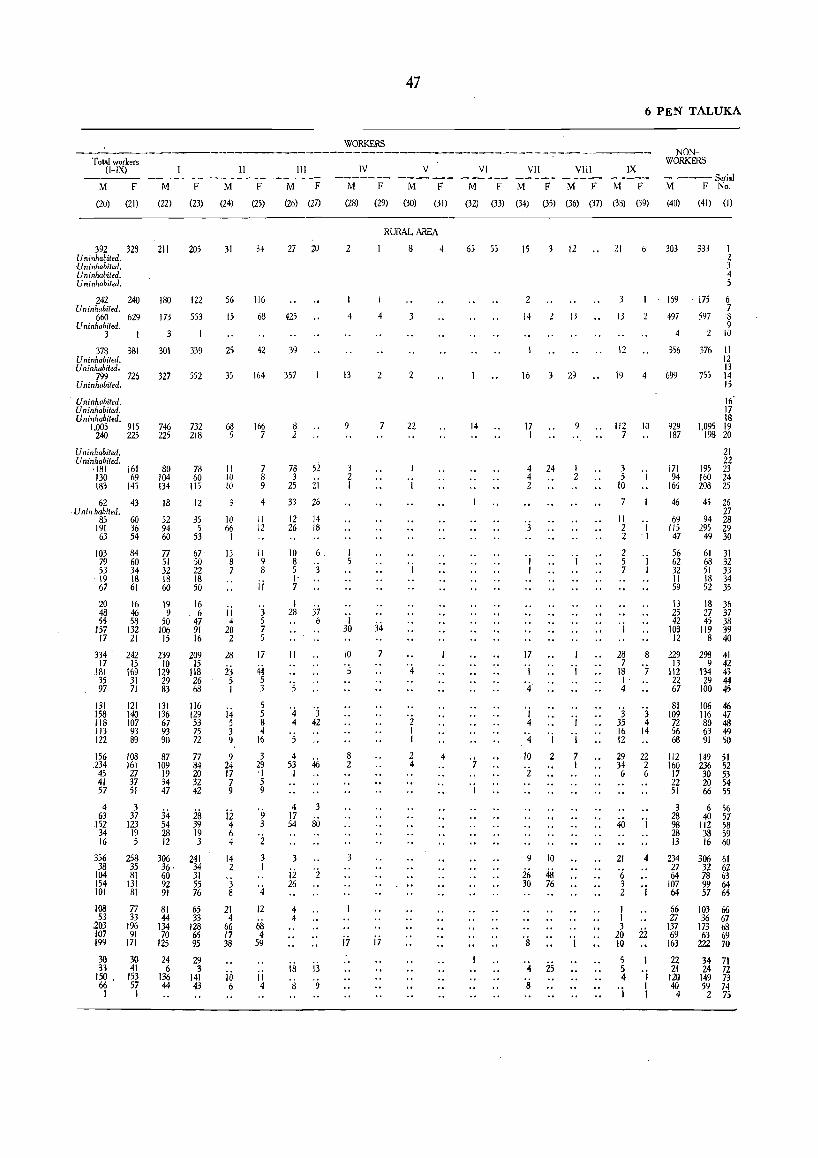
T oial workers (HX) II III
M F M F M F M F
(26) (27) (20) <ZI) (22) (23) (24) (25)
392 328 211 205 Uninhabited. V ninhabited. -Uninhabited. U ninhabiled.
242 240 Uninhabited.
660 629 Uninhabited.
3
180 122
173 553
3
378 381 301 339 Uninhabited. U ninhahiled.
799 726 327 552 Uninhabited.
Uninhabited. Uninhabited. Uninhabited.
1,005 915 746 732 240 225 225 218
Uninhabited. Uninhabited,
,181 161 130 69 183 145
62 43 -Uninhabited.
85 60 191 36 63 54
103 79 53 19 67
20 48 55
157 17
84 60 34 18 61
16 46 58
132 21
334' 242 17 15
181 169 35 31 97 71
131 121 158 140 118 107 113 93 122 89
156 108 _234 161
45 27 41 37 57 51
4 3 63 37
,152 123 34 19 16 5
356 258 38 35
104 81 154 131 101 81
lOS 77 53 33
203 196 107 91 199 171
30 30 33 41
ISO. 153 66 57 I I
80 78 104 60 134 115
18 12
52 35 94 5 60 53
77 51 32 18 60
19 9
50 106
15
239 10
129 29 83
131 136 67 93 90
87 109
19 34 47
34 54 28 12
306 36· 60 92 91
81 44
134 70
125
24 6
136 44
67 50 22 18 50
16 6
47 91 16
209 15
liB 26 68
116 129 53 75 72
77 84 20 32 42
28 39 19 3
241 34 31 55 76
65 33
128 65 95
29 3
141 43
31
56
15
25
35
68 5
II 10 10
10 66
I
13 8 7
ii 4
20 2
28
23 5 I
14 5 3 9
9 24 17 7 9
iz 4 6 4
14 2
3 8
21 4
66 17 38
iii 6
34 27 20
116
68 425
42 39
164 357
166 7
7 8 9
4
II 12
II 9 8
ii
3 5 7 5
17
44 5 3
5 5 8 4
16
3 29 -I 5 9
'9 3
'2 3 I
'4 12
68 4
59
ii 4
8 2
78 52 3
25 ii 33 26
12 14 26 18
10 6 8 5 3 I 7
I 28 37
6
II
'4 '3 4 42
·s 4
53 46 1
4 17 54
3
ii 26
4 4
18
8
80
13
9
47
WORKERS
IV V
M F M F
(28) (29) (30) (31)
RURAL AREA
2
4
13
3 2 I
I 30
10
·s
8 2
3
i7
4
2
7
34
i7
8
3
2
22
'j
2 I I
2 4
4
4
6 PEN TALUKA
NONWORKERS
VI VII Vlll IX ---- ----Serial M F M
(32) (33) (34)
F M F M F
(35) (36) (37) (33) (39)
M F No.
(40) (41) (I)
65 55
14
7
'j
15 3 12
2
14 2 13
16 3 2~
17 I
4 24 4 2
3
17
'i 4
I 4
4 I
10 2
'2
9
i6 30
4
8
10
48 76
25
9
'i
'i
I
'j
7 I
'j
21 6
13
303 333 I 2 3 4 5
169 - J7j 6 7
497 597 8 9
4 10
12 356 376 II 12 13
19 4 699 755 14 15
16' 17 IS
112 10 929 1,095 19 7 187 198 20
3 5 . j 10
7
II 2 I 2 1
2 5 'j 7 I
'j
28 8 7
18 ':] I-4
'3 '3 35 4 16 14 12
29 22 34 2 6 6
40
21
'6 3 2
1 I 3
20 10
5 5 4
'j
4
'j
ii
'j I 1
21 22
171 195 23 94 160 24
165 208 25
46 45 26 27
69 94 28 115 295 29 47 49 30
56 62 32 II 59
13 25 42
108 12
229 13
112 22 67
81 109 72 56 68
112 160 17 22 51
:3 28 98 23 13
234 27 64
107 64
66 27
137 69
163
22 21
120 40
4
61 31 68 32 51 33 18 34 52 35
13 36 27 37 45 38
119 39 8 40
298 41 9 42
134 43 29 44
100 45
106 46 116 47 80 48 63 49 91 50
149 51 236 52 30 53 20 54 66 55
6 56 40 51
112 58 38 59 16 60
306 61 32 62 78 63 99 64 57 65
103 66 36 67
173 68 63 69
222 70
34 71 24 72
149 73 59 74
2 75
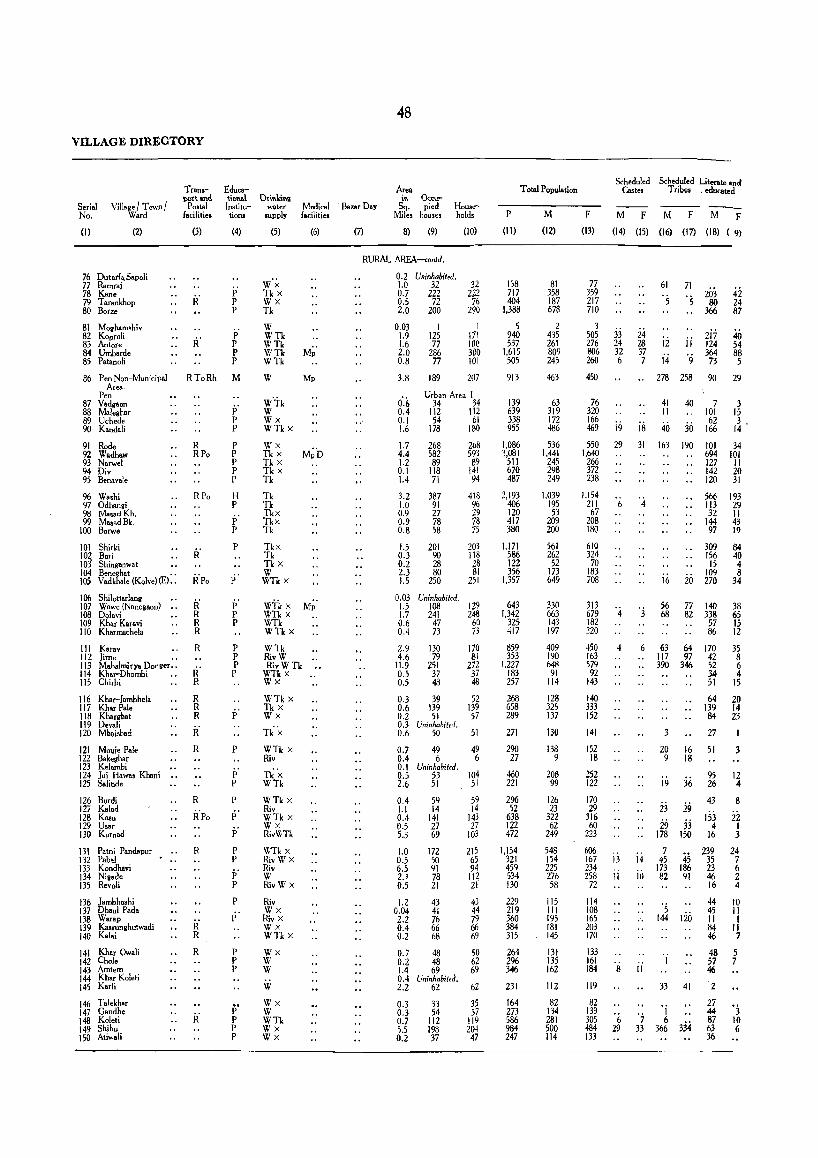
VILLAGE DIRECTORY
Seri.1 No.
Village I Town I Ward
(I) (2)
76 Dutarf, Sapoli 77 Rarnraj 78 Kane 79 T arankhop 80 Borze
81 Moghamshiv 82 KODroli 83 Anlore 84 Umbarde 85 PalaIloli
86 Pen Non-Municipal Area.
Pen 87 Vadgaon 88 Maleghar 89 Uchede 90 Kandali
91 Rode 92 Wadhaw 93 Narwel 94 Div 95 Benavale
% Washi 97 Odhangi YM Masad Kh. 99 MasadBk.
100 Borwe
101 Shirki 102 Bori 10J Shinganwat 104 Beneghat .. 105 Vadkhale (Kolve) (E) ••
106 Shilotlar!ang 107 Wnwe (Nanegaon) , . 108 Dolavi 109 Khar Karavi 110 Kharmachel.
III Karav 112 Jime .. 113 Mahalmirya Danger .. 114 Kha...-Dhombi 115 Chirbi
116 Khar-1.mbhela 117 Khar Pale 118 Kharghat 119 Devali 120 Mhaisbad
121 Mouje Pale 122 Bakeghar 123 Kelambi 124 lui Hawa. Khan; , , 125 Salinde
126 Burdi 127 Kal.d 128 Kasu 129 Usar 130 Kurnad
131 Palni Pandapur 132 Pabal 133 Kondhavi 134 Niwade 135 Revoli
136 lamhhoshi 137 Dhaul Pada 138 Warap 139 Kasrunghulwadi 140 Kalai
141 Khar Ow.li 142 Chole 143 Amtem 144 Khar Koleli 145 Karli
146 Talekhar 147 Gandhe 148 Koleti 149 Shihu ISO Atiwali
Trans\><>ttand
Postal facilities
(3)
RToRh
R RPo
R Po
R R R R
R
R' R
R R R
k' R
R
R R
R
Educa-tj""al Drj"kj~ Institu- water tiOllJ supply
(4) (S)
Medical . Bazar Day facilities
(6) (7)
48
Area in Occu-
Sq. pied Mil.s houses
8) (9)
Households
(10)
W'x Tk X Wx Tk
RURAL AREA-contd.
0.2 Uninhabited.
p' P P
i; P P P
M
j:, p P
P P P P P
H P
p' P
P
p' P P
P P P P
P
p p
p
p'
P" P P p' P
P p'
P P P
P' P p p
W WTk WTk WTk M~' WTk
W Mp
W·tk W Wx WTkx
Wx Tk x Tk X Tk X Tk
Tk Tk Tkx Tkx Tk
Tkx Tk Tkx W WTk X
WTk x M~' WTk x WTk WTk x
WTk RivW RivWTk
WTk x Wx
WTk x Tk X Wx
Tk'x WTk X Riv
Tk'x WTk
WTkx Riv wTk X Wx RivWTk
WTk x RivW X Riv W RivW x
Riv Wx Riv X Wx WTkx
Wx W W
Vi Wx W WTk Wx Wx
1.0 32 32 0.7 222 222 0.5 72 76 2.0 200 290
om 1.9 1.6 2.0 0.8
I I 125 171 77 IOQ
286 300 77 101
3.8 189 207
0'.6 0.4 0.1 !.6
Urban Area I 34 34
112 112 54 61
178 ISO
1.7 4.4 1.2 0.1 1.4
3.2 1.0 0.9 0.9 0.8
1.5 0.3 0.2 2.3 1.5
268 582 89
118 71
387 91 27 78 58
201 90 28 80
250
0.03 Uninhabited.
268 593 89
141 94
418 96 29 13 7'>
203 118 28 81
2,1
1.5 108 129 1.7 241 248 0.6 47 60 0.4 73 73
2.9 130 170 4.6 79 81
11.9 251 272 0.5 37 37 0.5 48 48
0.3 39 0.6 139 0.2 51 0.3 Uninhabited. 0.6 50
0.7 49 0.4 6
52 139 57
51
49 6
0.1 Uninhabited. 0.5 53 104 2.6 51 51
0.4 1.1 0.4 0.5 5.3
1.0 0.5 6.5 2.1 0.5
1.2 0.04 2.2 0.4 0.2
59 14
141 27 69
172 50 91 78 21
43 41 76 66 68
0.7 48 0.2 48 1.4 69 0.4 Uninhabited. 2.2 62
0.3 33 0.3 54 0.7 112 5.5 198 0.2 37
59 14
143 27
103
215 65 94
112 21
43 44 79 66 69
50 62 69
62
35 57
119 204 47
Total Population
P M F
(11) (12) (13)
158 717 404
1,388
5 940 537
1,615 505
913
139 639 338 955
1.086 3,081
511 670 487
2,193 406 120 417 380
1,171 586 122 356
1,357
643 1,342
325 417
859 353
1,227 183 257
268 658 289
271
290 27
460 221
296 52
638 122 472
1,154 321 459 534 130
229 219 360 384 315
264 2% 346
231
164 273 586 984 247
81 358 187 678
2 435 261 809 245
463
63 319 172 486
536 1,441
245 298 249
1.039 195 53
209 200
561 262 52
173 649
330 663 143 197
409 190 648
91 114
128 325 137
130
138 9
208 99
126 23
322 62
249
548 154 225 276 58
115 III 195 181 145
131 135 162
112
82 134 281 500 114
77 359 217 710
3 505 276 806 260
450
76 320 166 469
550 1,640
266 372 238
1.154 211 67
208 180
610 324
70 183 708
313 679 182 220
450 163 579 92
143
140 333 152
141
152 18
252 122
170 29
316 60
223
606 167 234 258
72
114 108 165 203 170
133 161 184
119
82 139 305 484 133
Scheduled Scheduled Literate and Castes T rib.. , educated
M F M F M F (14) (15) (16) (17) (18) (9}
33 24 32 6
19
29
6
'4
4
ij ii
8
'6 29
24 28 37 7
is 31
4
'3
i4 io
11
61 71
5 ·s 2~ 366
42 24 87
12
i4 ii 9
2i7 124 364
73
:ro 54 88 5
278 258 90 29
41 II
40 7 3 15
40 101 62
30 166 3 •
14
163 190 101 34 694 101 127 11 142 20 120 31
566 193 113 29 32 11
144 43 97 19
309 84 156 40
15 4
i6 109 8
20 270 34
56 77 140 68 82 338
57 86
63 64 170 117 97 42 390 346 52
3
20 9
19
16 18
36
23 i9 29 33
178 150
7 45 45
173 186 82 91
'5 144 120
33 41
34 51
64 139 84
27
51
95 26
43
153 4
16
239 35 23 46 16
44 45 11 84 46
48 57 46
2
38 65 15 12
35 8 6 4
15
20 14 23
1
3
12 4
8
22 1 3
24 7 6 2 4
10 11 1
11 7
5 7
'7 ~ 33 366 334
27 44 87 63 36
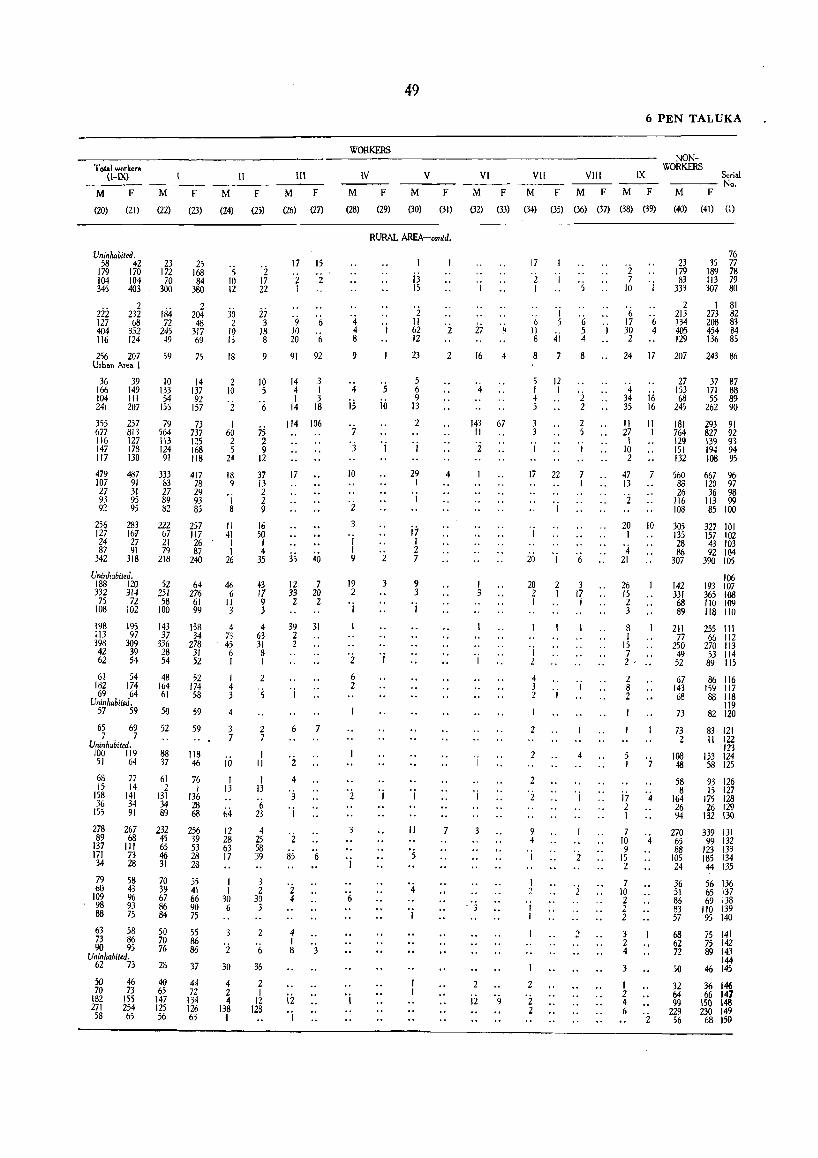
Total workers (I-IX)
M F
(ZQ) (ZI)
Uninhabited,
M
(22)
F
(23)
58 42 23 25 I~ 1m In 1M 1M 104 m M 345 403 300 380
222 127 404 116
2 232 68
352 124
256 207 Urban Area I
IB4 n
245 49
59
36 39 10 166 149 133 104 111 54 241 207 155
355 257 79 677 813 564 116 127 113 147 178 124 117 130 91
2 204 48
317 69
75
14 137 92
157
73 737 125 168 118
479 487 333 417 107 91 27 31 93 95 92 95
256 127 24 87
342
283 16'1 27 91
318
Uninhabited,
83 78 27 29 89 93 82 85
222 67 21 79
218
257 117 26 87
240
188 120 52 64 332 314 251 276
75 n 58 61 100 1~ 100 ~
1% 1~ Ie 1~ i13 97 37 34 398 309 336 278 42 39 28 31 62 54 54 52
61 54 48 52 I~ IN 1M IN 69 64 61 58
Uninhabited, 57 59 50 59
65 69 7 7
Uninhabited, 100 119 51 64
68 77 15 14
158 141 36 34
155 91
278 89
137 171 34
79 60
109 98 88
267 M
III 73 28
58 43 96 93 75
63 58 73 86 90 95
Uninhabit,d, 62 73
50 46 70 73
182 155 271 254 58 65
52
88 37
61 2
131 34 89
232 45 65 46 31
70 39 67 86 M
50 70 76
28
40 65
147 125 56
59
118 46
76 I
136 28 68
256 39 53 28 28
55 41 66 90 75
55 86 86
37
44 72
134 126 63
M
(24)
'5 10 12
:30 2
10 13
18
2 10
2
I 60 2 5
24
18 9
'j 8
II 41 1 1
26
46 6
II 3
4 73 45 6 1
1 4 3
3 7
10
1 13
64 12 28 63 17
1 1
30 6
'2 30
4 2 4
138 1
I!
F
(25)
'2 17 22
27 3
18 8
M
(26)
II!
F
(27)
17 15
'2 2 1
'9 10 20
6
"(,
9 . 91 92
10 5
6
75 2 9
12
37 13 2 2 9
16 50 I 4
35
43 17 9 3
4 63 31 8 1
2
·5
2 7
1 11
1 13
6 23
4 25 58 39
3 2
30 3
6
36
2 I
12 128
14 3 4 1 1 3
14 18
114 106
17
35 40
12 7 33 20 2 2
39 31 2 2
'j
6
'i 4
'j
1
'2
7
85 6
'2 4
4 1 8
12
1
WORKERS
IV
M F
(Z8) (29)
49
M
(30)
V
F
(31)
RURAL AREA-eontd,
'4 4 8
9
4
i5
7
':3
10
'2 3
I 1 9
19 2
I
'2 6 2
2
3
'j
'(,
5
i6
'j
2
3
'j
jj 15
'2 11 62 12
23
5 6 9
13
2
'j
29 1
1
ji I 2 7
9 3
'j
II
'5
4
'2
2
4
VI
M
(32)
27
16
4
F
(33)
143 67 11
'2
'j
'j
. 3
ii
6 PEN TALUKA
NONWORKERS
VII Vlll IX Setial ---- No,
M F M
(34)
F M F M F
(35) (36) (37) (38) (39) (40) (41) (I)
17
2 'i 1 '5
6 J) 8
8
'j 5
4j
5 12
'(, .5 4
8
1 I '2 5 2
2 5
1 1
17 22
20 1
7 1
'j,
20 2 3 2 I [7 1 1
'j 2
4 3 1 2 'j
2
2
'2 2
4
.j
'2 7
10 I
6 17 30 2
'(, 4
76 23 35 77
179 189 78 83 113 79
333 307 80
2 213 134 405 129
1 81 273 82 208 83 454 84 136 85
24 17 207 243 86
'4 34 i6 35 16
11 11 27 1 1
10 2
47 13
'2
20 10 1
'4 21
26 15 2 3
8 1
15 7 2, ..
2 8 2
j7 '4 2 \
27 37 87 153 171 88 68 55 89
245 262 90
181 293 91 764 827 92 129 139 93 151 194 94 132 100 95
560 667 % 8B 120 97 26 36 98
116 113 ~ 108 85 100
305 135 28 86
307
327 101 157 102 43 103 9Z 104
390 105
106 142 193 107 331 365 108 68 110 109 89 118 110
211 255 111 77 66 112
250 270 113 49 53 114 52 89 115
67 86 116 143 159 117 68 88 118
119 73 82 120
73 83 121 2 11 122
123 108 133 124 48 58 125
58 93 126 8 15 127
164 175 128 26 26 129 94 132 130
7 270 10 '4 65
339 131 99 132
123 133 185 134 44 135
9 88 IS 105 2 24
7 10 2 2 2
3 2 4
3
1 2 4 6 'i
36 56 136 51 65 137 86 69 138 83 110 139 57 95 140
68 62 72
50
32 64 99
229 56
75 141 75 142 89 143
144 46 145
36 146 66 147
150 \48 230 149
68 150
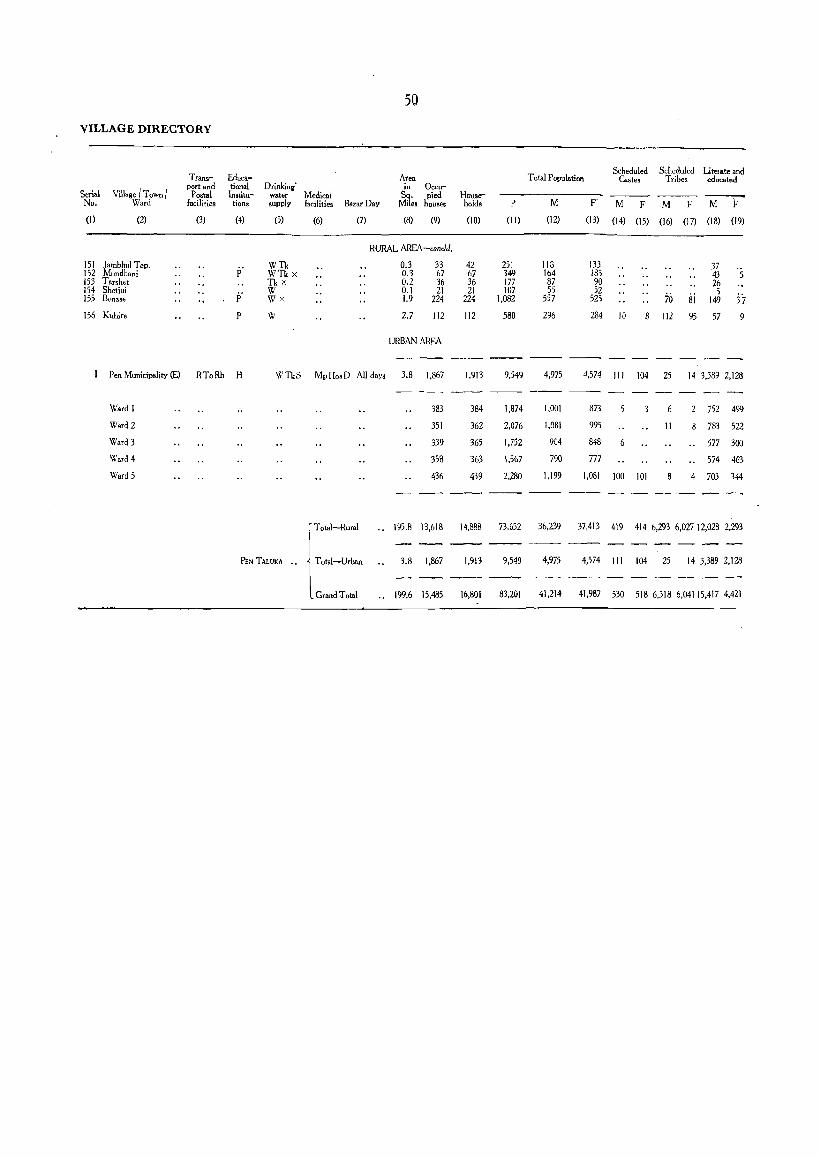
50
VILLAGE DIRECTORY
TranS'"" Educa- T Dtal Population Scheduled Scheduled Literate and
A.rea Castes Tribes educated
Village I Town I port and tional Drinking' III Oeou-
Senal Postal Institu- water Medical Sq. pied House-No. Ward facilities tions supply facilities Bazar Day Mile. houses holds P M F M F M F M F-(1) (2) (3) (4) (5) (6) (7) (8) (9) (10) (11) (12) (13) (14) (15) (16) (17) (18) (19)
RURAL AREA-coneld.
151 }ambhul Tep. p' WTk 0.3 33 42 251 118 133 37 152 Mundhani WTk X 0.3 67 67 349 164 185 43 '5 153 Tar,het Tk )( 0.2 36 36 177 87 90 26 154 Shetjui p' W 0.1 21 21 107 55 52
70 5
155 Benase WX 1.9 224 224 1,082 557 525 si 149 37 156 Kuhire P W 2.7 1I2 112 580 296 284 10 112 95 57 9
URBAN AREA
---Pen Municipality (E) RToRh H wns MpHosD All days 3.8 1,867 1.913 9.549 4,975 4,574 III 104 25 14 3,389 2.128
Ward I 383 384 1.874 1,001 873 752 499
Ward 2 351 362 2,076 1.081 995 II 783 522
Ward 3 339 365 1,752 904 848 6 577 300
Ward 4 358 363 1,567 790 777 574 463
Ward 5 436 439 2.280 1.199 1,081 100 101 8 4 703 344
r T oml-Rural .. 195.8 13,618 14.888 73,652 36.239 37.413 419 414 6,293 6,02712,028 2,293
I ---PEN TALUKA " 1'"'"-0'"
3.8 1,867 1.913 9,549 4,975 4,574 III 104 25 14 3,389 2,128
---Grand :r oml " 199.6 15,485 16,801 83,201 41.214 41,987 530 518 6,318 6.04115,417 4.421
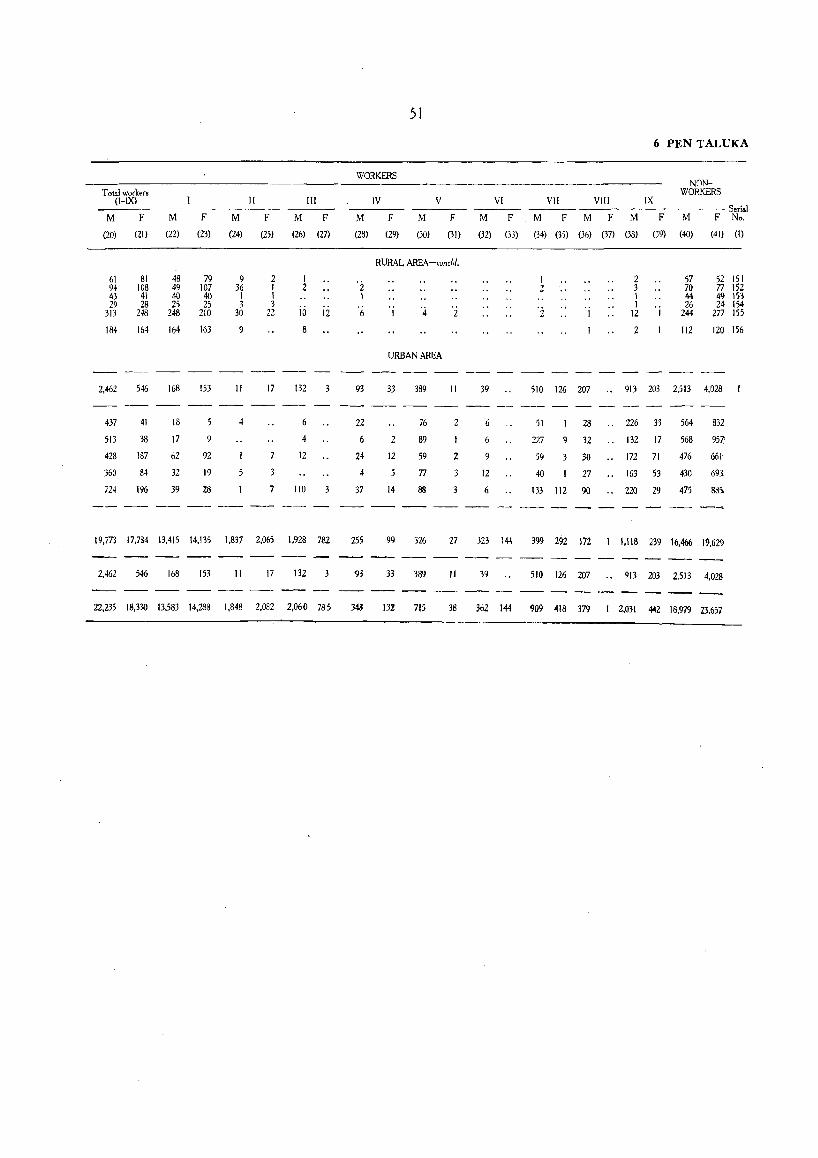
51
6 PEN TALUKA
WORKERS NON-
T alaI workers WORKERS (l-lX) II III IV V VI VII VIII IX
Serial M F M F M F M F M F M F M F M F M F M F M F No,
(20) (21) (22) (23) (24) (25) (26) (27) (28) (29) (30) (31) (32) (33) (34) (35) (36) (37) (38) ()9) (40) (41) (I)
RURAL !>JI.EA-concld,
61 81 48 79 9 2 1 '2 I 2 57 52 151
94 108 49 107 36 1 2 2 3 70 77 152 43 41 40 40 I I 1 1 44 49 153 29 28 25 25 3 3
';' '4 'z I 26 24 154 313 248 248 210 30 22 10 12 I 2 I 12 I 244 277 155
184 164 164 163 8 2 112 120 156
URBAN AREA
2,462 546 168 153 II 17 132 3 93 33 389 11 39 510 126 207 '. 913 203 2,513 4,028
437 41 18 4 6 22 76 2 6 51 28 ., 226 33 564 832
513 38 17 9 4 6 2 89 6 227 9 32 .. 132 17 568 957:
428 187 62 92 12 24 12 59 2 9 59 3 30 .. 172 71 476 661
360 84 32 19 5 3 4 77 3 12 40 27 .. 163 53 430 693-
i24 196 39 28 7 110 3 37 14 88 6 133 112 90 .. 220 29 475 885.
19,773 17,784 13,415 14,135 1,837 2,065 1,928 782 25j 99 ')26 27 323 144 399 292 172 1 1,118 239 16,466 19,629
2,462 546 168 153 11 17 132 3 93 33 389 II 39 510 126 207 .• 913 203 2,513 4,028
22,235 18,330 13,583 14,288 1,848 2,082 2,060 785 343 132 715 3B 362 144 909 418 379 1 2,031 442 18.979 23.657

Sudhagad Mahal
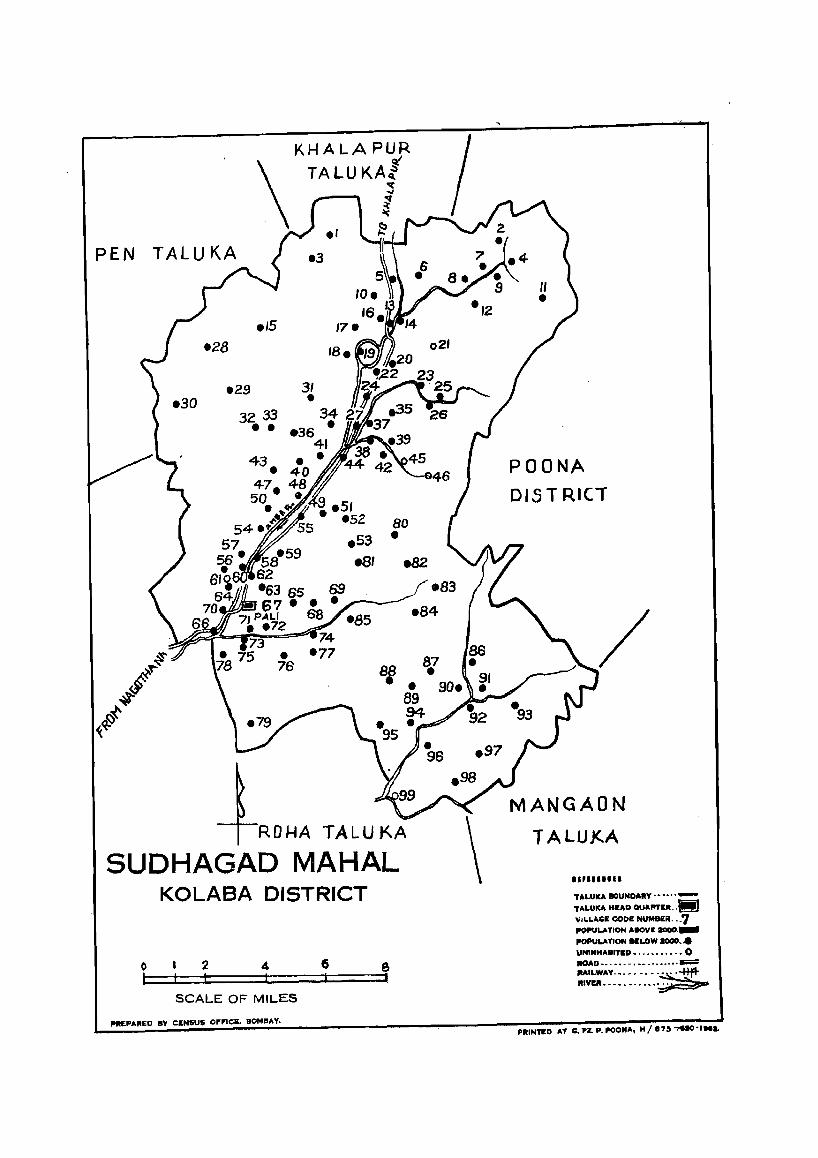
PEN
.30
.15 .28
.29 31
32 33 • •
• 53 .81
80 •
ROHA TALUKA
SUDHAGAD MAHAL KOLASA DISTRICT
o 2 4
SCALE OF MILES
PR~PA"ED IIY ~NSU& OFFICE. BOMBAY.
POONA DISTRICT
MANGAON
TALUJ(.A
II' ..... U
T4LUIU. IIOUNDAIIY······
TALUIU. HEAD QUARTU .. ~ I/II.LAGE CODE NUMSER .•• 7 PO~~TION ABOYIE aaoo._ I'OPU~TION _LOW 2000." UNIHHASITIIO. ,_ ........ 0 IIOAD.~ .••• - ......... - ... ···==-MILWAY._ ..... • .~ IIIVE" •••••• - ••••• --
'''INTED AT ... pz.p.POONA, H/17,'"I'IIO"ML
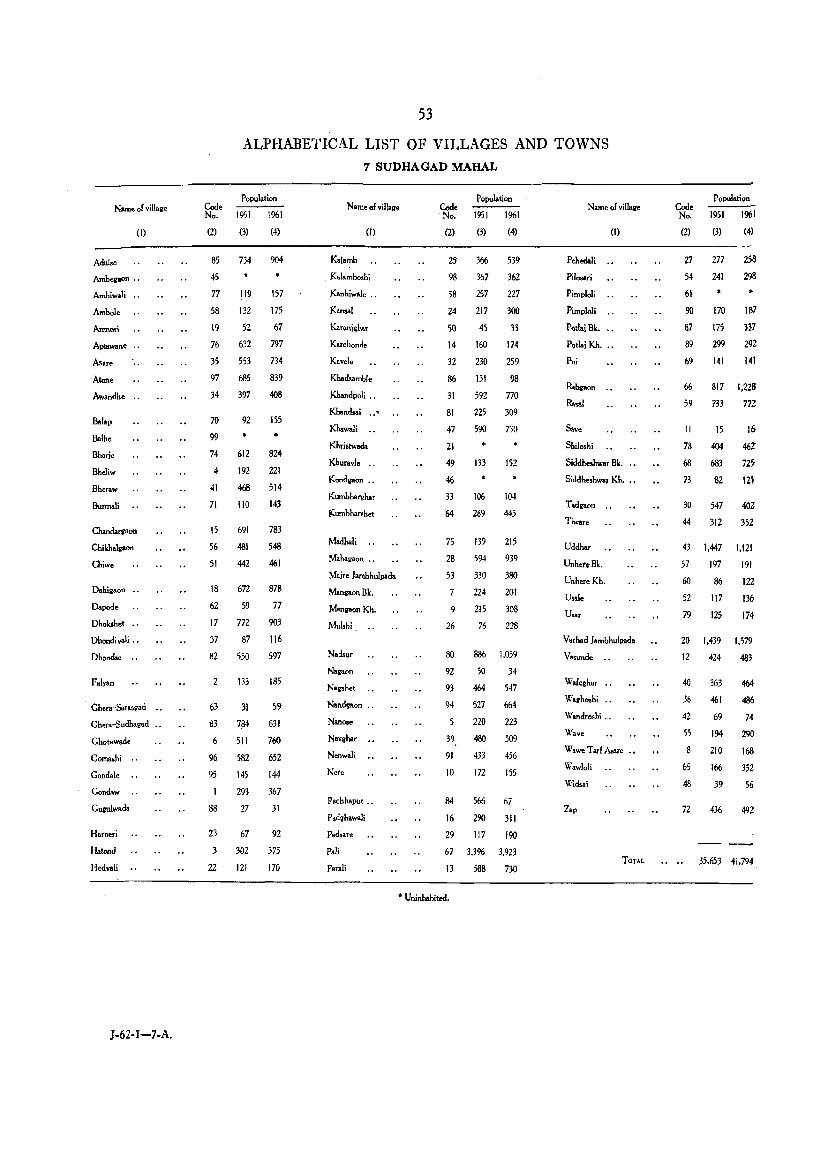
Name of village
(J)
Adulse
Amhevaon ••
Ambiwali
Ambol.
A.mnor\
Aptawane ..
Asare
Aton.
Awandhe •.
Balap
Balh.
Bharie
Bheliw
Bheraw
Burm.1i
Chandargaon
Chikhalgaon
Chiwe
Dahigaon ..
Dapode
Dh.kshet ..
Dhondiva1i ..
Dhonds. ..
F.lyan
Ghera-Sara,gad ••
Chera-Sudhagad ..
Chotawade
Comashi ..
Gondale
Gondaw
GUfU)wada
Harneri
Hatond
Hedvali
J-62-I-7-A,
Cod. No.
(2)
85
45
77
58
19
76
35
97
34
70
99
74
4
41
71
15
56
51
18
62
17
37
82
2
63
83
6
96
95
88
23
3
22
53
ALPHABETICAL LIST OF VILLAGES AND TOWNS
7 SUDHAGAD MAHAL
Population
1951 1%1
(3) (4)
734
)19
132
S2
632
553
686
397
92
612
192
468
110
691
481
442
672
59
772
87
550
133
31
784
511
582
145
293
27
67
302
121
904
151
175
67
797
734
839
408
155
824
221
514
143
783
548
461
818
77
903
116
591
185
59
631
760
652
144
367
31
92
375
170
Nam.ofvillage Code No.
(1)
Kalamb
. Kalambo.hi
Kanhiwale ..
Kansal
Karaniltn..r
Karchonde
Kavele
Khadsambl.
Kbandpoli •.
Khand •• i .. '
Khawali ..
Khristwada
Khuravle ..
Kondvaon ..
Kumbhal'll'har
Kumbharshet
M.dhali
Mahagaon ..
Maire Jambhulpada
MangaonBk.
ManvaonKh.
Md.hi.
Naelsur
Nagaon
Nagshct
Nandvaon ..
Nanos.
Navghar
Nenwali
Ne1e
Pachh.pur ..
Padghawali
Pad"r.
Pali
Parali
(2)
2~
98
38
24
50
14
32
86
31
81
47
21
49
46
33
64
75
28
53
7
9
26
80
92
93
94
39
91
10
84
16
29
67
13
• Uninhabited,
Population
1951 1%1
(3) (4)
366
367
257
217
45
160
230
13l
592
225
590
133
106
269
139
594
330
224
215
76
886
50
464
527
220
480
433
172
566
290
117
3.3%
588
539
362
227
300
33
114
2S9
98
770
309
730
152
104
445
215
939
380
201
308
228
1,059
34
547
664
223
509
456
155
67
311
190
3,923
730
Name of villave
(1)
Pehedali ..
Pilosari
Pimploli
Pimploli .,
P~tlai Bk ...
Potlaj Kh .• ,
Pili
Rabwoon '.
R .... l
Save
Shiloshi
Siddheohwar B~. '.
Siddheohwar Kh, "
T.dgaon ..
Tiware
Uddh.r
Unh.reBk.
Unhere Kh.
U,.I.
Usar
Varhael Jambhulpaela
VaslI!ld.
Waleghar
Waghoshi ..
Wandroshi ..
Wave
Wowe Tori Asaro
Wawloli
Widsai
Zap
TOTAL
Code No.
(2)
27
54
61
90
87
89
69
66
59
II
18
68
73
30
44
43
57
60
52
79
20
12
40
36
42
55
8
65
48
72
Population
1951 1961
(3) (4)
277 258
241 298
110 187
175 337
299 292
141 141
817 1.228
733 71Z
15 16-
404 462'
683 72,
82 121
547 402
312 352
1.447 1.121
197 I'll
86 122
117 136
125 174
1.439 1.519
424 483
363 464
461 486
69 74
194 290
210 168
166 352
39 S6
436 492
35,653 41.794
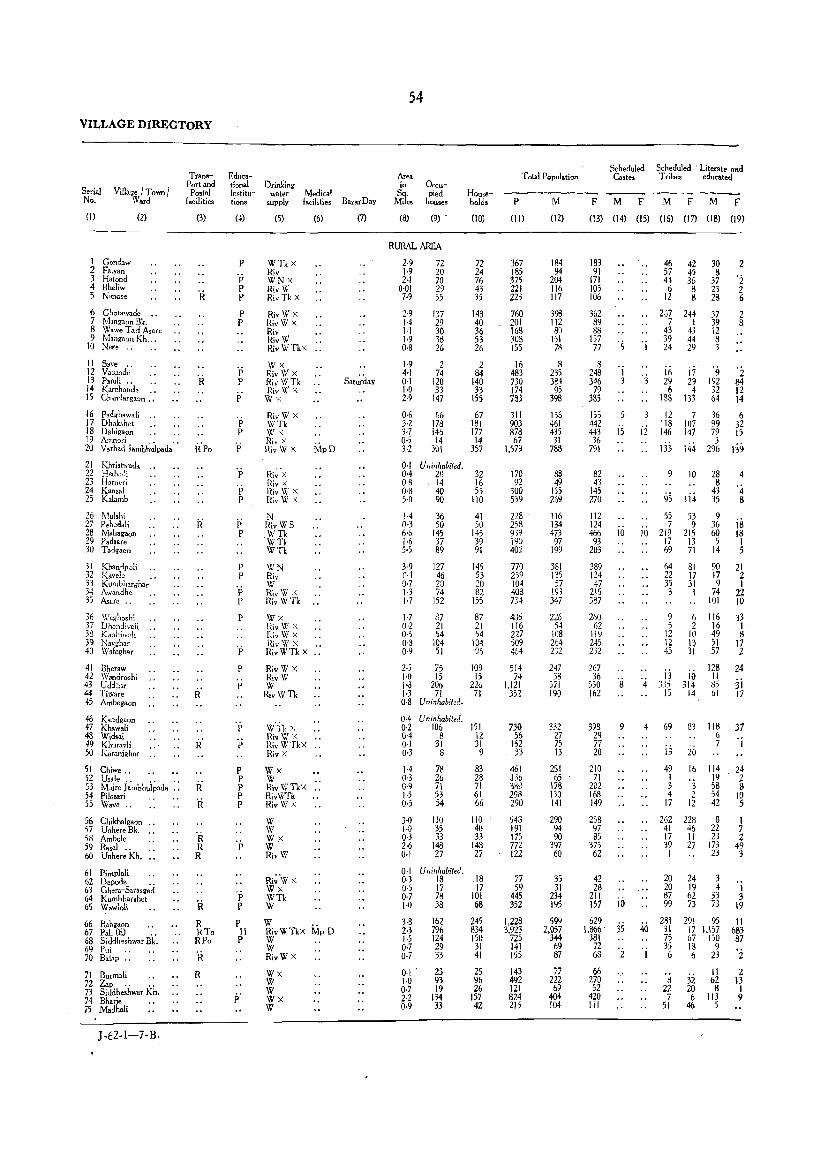
VILLAGE DIRECTORY
Serial No.
(I)
Village / Town/ Ward
(2)
I Gondaw 2 Falyan 3 Hatond 4 Bheliw '5 Nanose
(; Ghotawade .. 7 M,n1aon Bk. 8 Wawe Tarl Asare 9 Mangaon Kh ...
10 Nete ..
II Save .. 12 V .. unde 13 Parali .. 14 Karchond, ., 15 Chlldarg3.on ..
16 Padghawali .. 17 Dhokshet 18 D.higaon 19 A:nnori .. .. 20 '·",h.d J.mbhulpad.
21 Khristw,da .• 22 !-ledv:." 23 Harm·ri 24 Kansal 25 Kalamb
26 Mulshi 27 . Pehedali 28 M.h.gaon 29 Pads,'e 30 Tadgacn
31 Khandpoli 32 Kavd. .• 33 Kumbhar.har 34 Awandhe 35 Asare ..
36 \Vaghoshi 37 Dho~di·.uli 33 Kanhil>oli 39 Nav,har 40 Wafeghar
41 Bheraw 42 Wandro,hi 43 Uddh" 44 Tiware 45 Ambegaon
46 Kandgnon 47 Khawali 48 Wid .. ; 49 KhuTavli 50 K.ronjghar ..
51 Chiwe .. 52 Usale.. .. ..
Tran ... Port and Postal
facilities
(3)
R
53 Maire Jambhulpad. .. R 54 Pilosari .. .. . 55 Wave.. 'R
56 Chikhalgaon 57 Unhere Bk. 58 Ambcle R 59 Rasel .. R 60 Unhere Kh. R
61 Pimploli 62 Dapode .. 63 Ghoro-S.rasgad 64 Kumbharshet 65 W.wlcli
66 Rabgaon 67 Pali (E) .• 68 Siddhesh,,"r Bk. 69 Pui .. 70 Bal,p ..
71 Burmali .. 72 Zap.. .. 73 Siddheshwar Kh. 74 Bharie 75 M.dhali
J-62-I-7-B.
'R R l<To RPo
'R R
Educational Institutions
(4)
p
'p P P
P P
P P
P
P
P P
p P
P P
'1' p
P
'p
P
P
P
'r p P p P P
'p p
P H P
Drinking water Medical
supply facilities
(5) (6)
WTkx Riv WNx RivW RivTk X
Riv INx RivW X Riv RivW RivWTkx ..
Wx Riv \V X Riv WTk RivW X Wx
RivW X WTk \'(Ix Hiv X RivW X
Ri~'x Riv x RivW X Hiv'W' X
N HivWS _WTk wn WTk
WN Riv W RivW x RivWTk
Wx niv \V X I~iv W X HivW X RivWTk X ..
RivWX RivW W
RivWTk
W'11 x Riv'W' X j{iv WTkx .. Hiv X
Wx W Riv\VTkx .. RivWTk HivW x
W \V Wx W RivW
Ri~\V X Wx wn w W RivWTkx Mp D W W RivW x
Wx W W Wx W
Bazar Day
(7)
S.tu~day
54
Ar(l<a. in
~~s (8)
occupied
houses
(9) -
RURAL AREA
2·9 1·9 2·1
0·01 7·9
2·9 1·4 1·1 1·9 0·8
1·9 401 0·1 1·0 2·9
72 20 70 29 35
137 29 30 38 26
2 74
120 33
147
Household.
(10)
72 24 76 43 35
148 40 36 53 26
2 84
140 33
155
0·6 66 67 3-2 178 181 3·7 145 177 0·) 14 14 H 301 357
0·1 Uninhabited. 0·4 20 32 08 14 16 0·8 40 55 5·0 90 110
!·4 0·3 6·6 1·6 5·5
J.9 0.·1 0·7 J.3 1·7
1·7 0·2 0·5 0·3 e·9
36 50
145 37 89
127 46 20 74
152
87 21 54
104 51
41 50
145 39 91
145 53 20 82
l:i5
87 21 '54
104 %
2·5 75 109 1·0 15 15 I·a 206 226 1·3 71 71 0·8 Uninhabited.
0·4 Uninhabited. 0·2 106 151 0·4 8 12 0·1 31 ]1 0·3 8 9
1·4 0·3 0·9 1·5 0·5
3·0 1·0 OJ 2·6 0·1
78 26 7\ 53 54
110 35 33
148 27
0·1 Uninhabited.
83 2~ 7\ 61 66
110 ' 40 33
148 27
0·3 18 .18 0·5 17 17 0·7 78 101 1·0 38 68
3·8 162 245 z.3 796 834 1·5 124 150 0·7 29 31 0·7 33 41
0·1' 25 25 1·0 93 96 0·7 19 26 2·2 134 157 0·9 33 42
T olal Population
P M (II) (12)
367 185 375 221 223
760 201 168 308 155
16 483 730 174 783
311 903 878 67
1.579
\70 92
300 539
228 ' 258 9,9 IYO 402
770 259 104 408 734
436 116 227 509 464
514 74
1,121 352
730 56
152 33
461 -136 380 298 290
543 191 175 772 122
77 59
445 352
1,228 3,923
725 141 155
143 492 121 824 215
184 94
204 116 117
398 112 80
151 78
8 235 384
95 39B
156 461 435
31 788
8S 49
155 269
116 134 473
97 199
381 135 57
193 347
00' ~~O
54 lOB 264 232
247 33
571 190
332 27 75 13
251 65
178 130 141
290 94 90
397 60
35 31
234 195
599 2,057
344 69 87
77 222 69
404 104
Scheduled Scheduled Literate and Ca,t", Tribes educated
FMF MFMF
(13) (14) (15) (16) (17) (18) (19)
183 91
171 105 106
362 89 88
157 77
8 248 346
79 385
155 442 443 36
79\
82 43
145 270
112 124
'i 3
466 10 93
203
389 124 47
215 387
200 62
119 245 232
267 36
550 162
393 29 77 20
210 71
202 168 149
258 97 85
375 62
8
9
42 28
211 157 i6 629
1,866 3S 381
72 68 2
66 270 52
420 111
ii
46 42 57 45 44 36 6 8
12 B
2·)7 244 7 I
43 43 39 44 24 29
30 8
37 23 28
37 39 12 8 3
i~ i7 '9 29 29 192 6 4 32
188 133 64
12 118 146
\33
9
7 36 107 99 147 79
3 144 296
10
\14
28 8
43 35
2
'2 2 6
2 B
'2 84 12 14
6 32 IS
ri9
4
'4 B
55 53 9 7 9 36 is
10 219 215 60 18 17 13 5 1 69 71 14 5
64 81 90 21 22 17 17 2 35 31 9 1 3 I 74 22
101 10
9 6 116 33 5 2 16 1,
12 10 49 8 12 13 51 17 45 31 57 2
13 in '4 335 314
123 II So 61
24
ji 17
4
15 14
69 83
jj 20
118 6 7
37 'j
49 16 114 24 1 19 2 3 '3 58 8 4 ') 54 10
17 12 42 5
262 228 8 1 41 46 22 7 17 11 23 2 39 27 173 49 1 23 3
20 20 87 99
24 3 19 4 62 33 73 73
1 3
19
281 40 31
291 95 17 1.157
II 683 87 75
35 I 6
8 22 7
51
67 IjO 18 9 6 23
32 20 6
46
11 62 8
113 5
'i 2
13 1 9
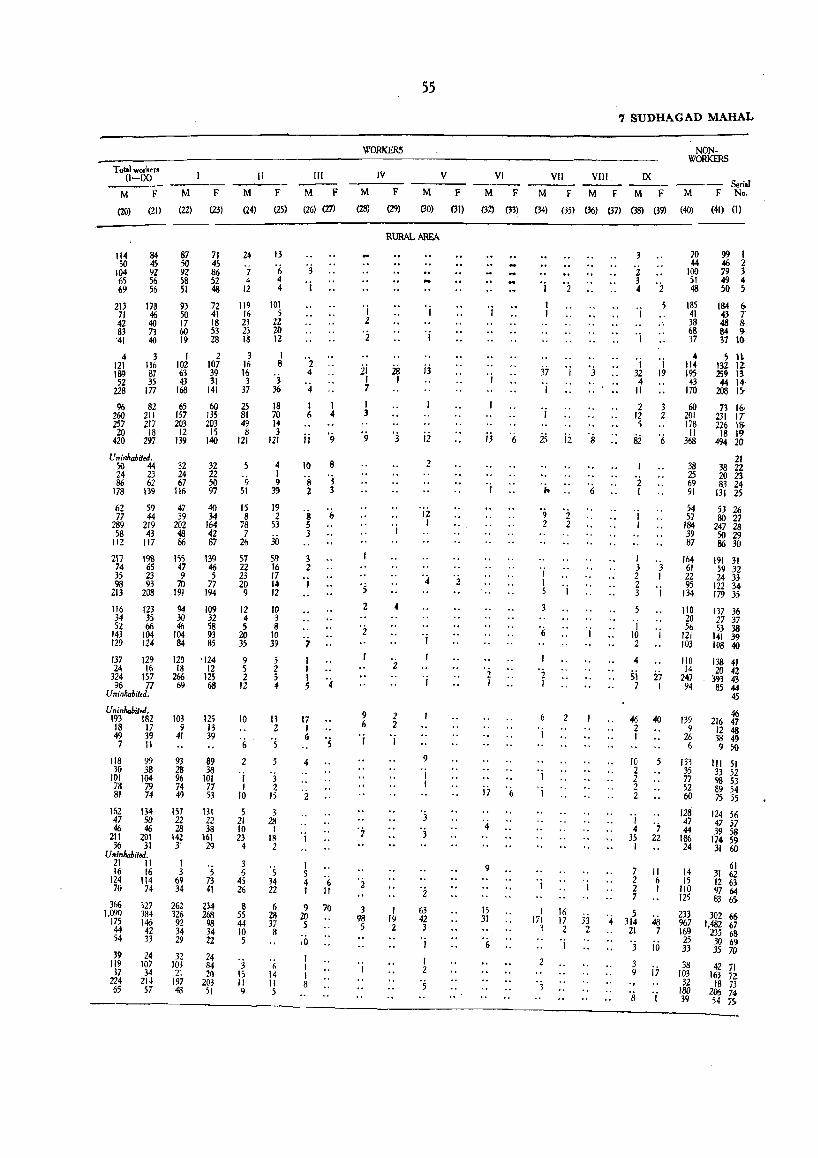
T ota! worker. O-DO
M F
(2{) (Zt)
M
(22)
F
(23)
Il
M F
(24) (25)
114 84 87 71 24 13 50 45 50 45
104 9Z 92 86 7 ';" 65 56 58 52 4 4 69 56 51 48 12 4
213 178 93 72 119 101 71 46 50 41 16 5 42 40 17 18 23 22 ~ n w g n w '41 40 19 28 18 12
4 3 1 2 3 I 121 116 102 107 16 8 189 87 63 39 16 '3' 52 35 43 31 3
228 177 168 141 37 36
96 82 65 60 25 18 2W 211 157 135 81 70 Z57 217 203 203 49 14 20 18 12 15 8 3
420 297 139 140 121 121
Uninhab~ed. 50 44 24 23 86 62
178 139
62 59 77 44
289 219 58 43
112 JI7
217 \98 74 65 35 23 98 93
213 208
116 123 34 35 52 66
143 104 129 124
137 129 24 16
324 157 'J6 77
Uninhabit,d.
Uninhabited. 193 182 18 17 49 39 7 II
118 99 30 38
101 104 78 79 81 74
162 134 47 50 46 46
211 201 36 31
Uninhabited. 21 " 16 16
124 114 70 74
366 327 1,091) 384
175 146 44 42 54 33
39 24 119 107 37 34
224 214 65 57
32 24 67
116
47 39
202 48 86
3Z 22 50 97
40 34
164 42 87
155 139 47 46 9 5
70 77 191 194
94 30 46
104 84
120 18
266 69
103 9
41
93 28 96 74 49
157 22 28
142 31
I 3
69 34
262 326 92 34 29
32 103 21
197 48
109 32 58 93 85
'124 12
125 68
125 13 39
89 38
101 77 53
131 22 38
161 29
5 73 41
234 268
98 34 22
24 84 20
203 51
9 51
15 8
78 7
26
57 22 23 20 9
12 4 5
20 35
9 5 2
12
10
'f,
2 'j 1
10
5 21 10 23
4
3 6
45 26
8 55 44 10 5
'3 15 II 9
4 I 9
39
19 2
53
30
59 16 17 14 12
Ig 8
10 39
5 2 5 4
13 2
·s 5 'j 2
15
3 28
I IS 2
'5 34 22
6 28 37 8
6 14 II 5
1II
M F
(26) (21)
'3 'j
'2 4
4
I 1 6 4
ji '9
10 8
'8 '3 2 3
·s '(, 5 3
3 2 ,
'7 1 , 1 5
17 I 6
4
2
1 5 4 'f, 1 " 9 70
20 5
ib I I I 8
WORKERS
M
(28)
IV
F
(29)
55
V
M F
(30) (31)
RURALAREI\
'j z 'i
ii I 7
1 3
'9
'5 2
9 b
'j
3 98 5
is 1
3
4
z
2 2
1
1 19 2
'j
jj
12
2
12 1
'j
9
1 I
2
63 42 3
1
I 2
·s
2
VI
M F
(32) (33)
'j
'j
;3 6
'i I
17 '6
9
15 31
6
7 SUDHAGAD MAHAL
VII Vlll IX ----
NONWORKERS
Serial M F M F M F M F No.
(34) (35) (36) (37) (38) (39) (4O) (41) (1)
37 I 'j
1
'j
2.S ii, 8
,. 6
'9 2 2 2
'j I 5 I
6
'i 1
2
I I
1 16 IiI 17 33 322
'j
2
'j
'j
'j 'j 32 19 4
11
2 3 12 2 5
si '6
2 I
I 3 '.3 2 I 2 3 I
'j 10 '; 2
4
si 27 7 1
46 40 2 1
10 5 2 2 2 2
'j 4 '7
35 22 I
7 II 2 6 2 I 7
5 4 314 48
21 7
j 10
3 9 ;7
8 'i
70 99 I 44 46 2
100 79 3 51 49 .. 4S 50 5
185 184 I; 41 43 7' 38 48 8. 68 S4 9J 37 37 10·
4 ,It 114 132 IZ 195 259 Il 43 44 14
170 208 17
60 73 16-201 131 11 178 226 IS; II 18 19
368 494 20
38 25 69 91
54 57
184 39 87
164 61 22 95
134
110 20 56
121 103
110 14
247 94
139 9
26 6
133 35 77 52 60
128 47 44
186 24
14 15
110 125
21 38 22 20 23 83 24
131 25
53 26 80 27
247 28 5029 86 30
191 31 59 32 24 33
122 34 179 35
137 36 27 37 53 38
141 39 108 40
138 41 20 42
393 43 85 44
45
46 216 47
12 48 38 49 9 50
J 11 51 33 52 98 53 89 54 75 55
124 56 47 57 39 58
174 59 31 W
61 31 62 12 63 97 64 83 6>
233 302 66 967 1,482 67 169 235 68 25 30 69 33 35 70
38 42 11 103 163 n 32 18 73
180 206 74 39 54 7>
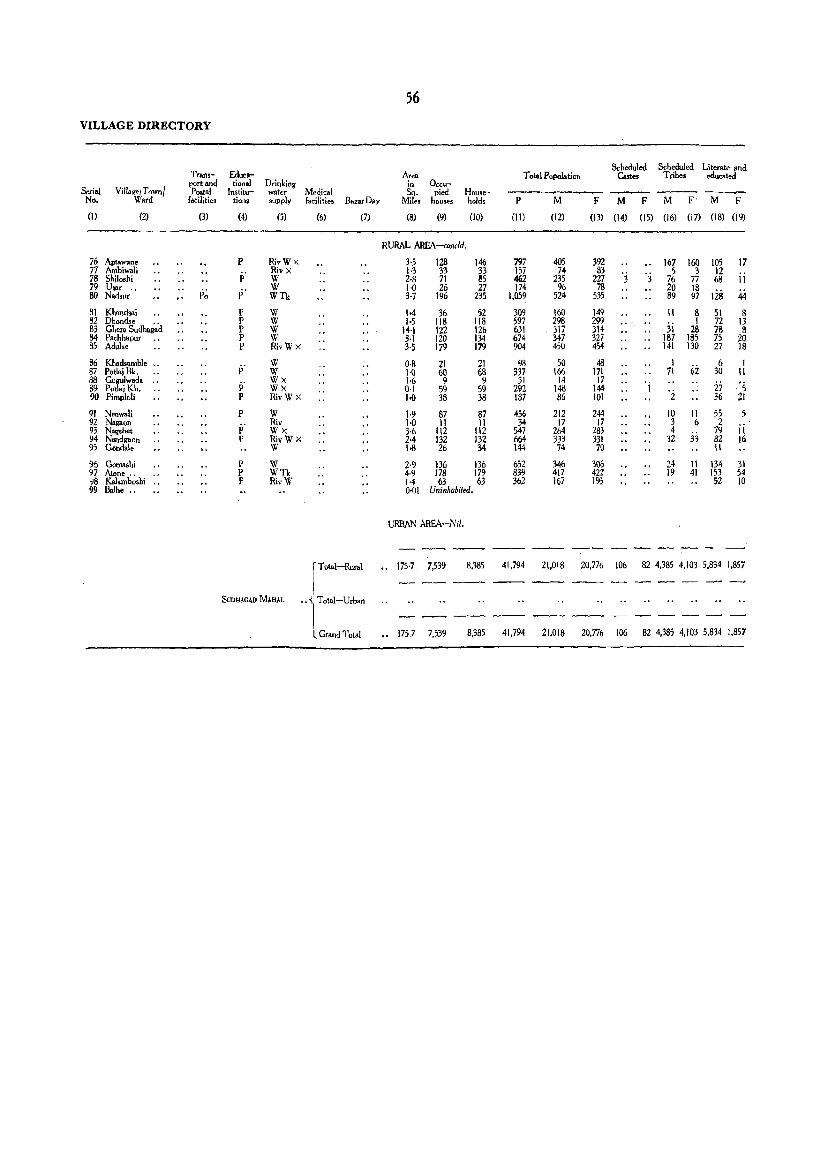
56
VILLAGE DIRECTORY
Scheduled Scheduled Literate snd Trarls- Educa- Ar •• T olal Popu],.tion Cast .. Tribes educated
Village' Town I port and lional Drinking in OCC\I-
Serial Postal lnstitu- water Medical Sq. pied House- ----No. Ward facilities tions supply facilities BazarOay Miles houses holds P M F M F M F M F (I) (2) (3) (4) (5) (6) (7) (8) (9) (10) (II) (12) (13) (14) (15) (16) (17) (18) (19)
RURAL ARfA-concld.
76 Aptawane P RivWx J.5 128 146 797 405 392 167 160 105 17 77 Ambiwali p' Rivx 1·3 33 33 157 74 83 '3 'j 5 3 12
ii 78 Shilo.hi W 2·8 71 8S 462 235 227 76 77 68 79 Usar ..
p~ p' W 1·0 26 27 174 96 78 20 18 12S 80 Nad,ur WTk 3·7 196 235 1,059 524 535 89 97 44
81 Kh""dsai P W 104 36 52 309 160 149 II 8 51 8 82 Dhondse P W 1·5 118 118 597 298 299
3i 1 72 13
83 Chera Sudh.g,;d P W 14·1 122 126 631 :)17 314 28 78 8 84 PachhapUf P W 3·1 120 134 674 347 327 187 18S 7S 20 85 Adul.e P RivW>< 3·5 179 179 904 450 454 141 130 27 18
86 Khadsamble •. P'
W 0·8 21 21 98 50 48 I 6i
6 1 87 Pauaj Bk. W 1·0 60 68 337 166 171 71 30 11 88 GUr.fwada .. p' Wx 1·6 9 9 31 14 17 'i 27 's 89 Pot.j Kh. Wx 0·1 59 59 292 148 144 90 Pimploli P RivWx 100 38 38 187 86 101 2 .. '. 36 21
91 Nenwali P W 1·9 87 87 450 212 244 10 11 55 5 92 Nagaon p' Riv 1·0 11 11 34 17 17 3 6 2
ii 93 Nagshet Wx % 112 1\2 547 264 283 4 33
79 94 Nandg.on P RivWx z.4 132 132 664 333 331 32 82 16 95 Gondale W 108 26 34 144 14 70 11
95 Gomashi P W z.9 136 136 652 346 306 24 11 134 31 97 Atone .. P WTk 4·9 178 179 839 417 422 19 41 153 54 98 Kalamboshi .. P RivW J.4 63 63 362 167 J9j 52 10 99 Balhe .. 0·01 Uninhabited.
URBAN AREA-Nil.
------f T <>tal-Runl .. 175·7 7,539 8,385 41,794 21,018 20,776 106 82 4,385 4,103 5,834 1,857
SUOHAGAD MAHAL .. i
l Total-Urban
8,385 41,794 21,018 20,776 106 82 4,385 4,103 5,834 1.857 l Grand Total .. 175.7 7,539
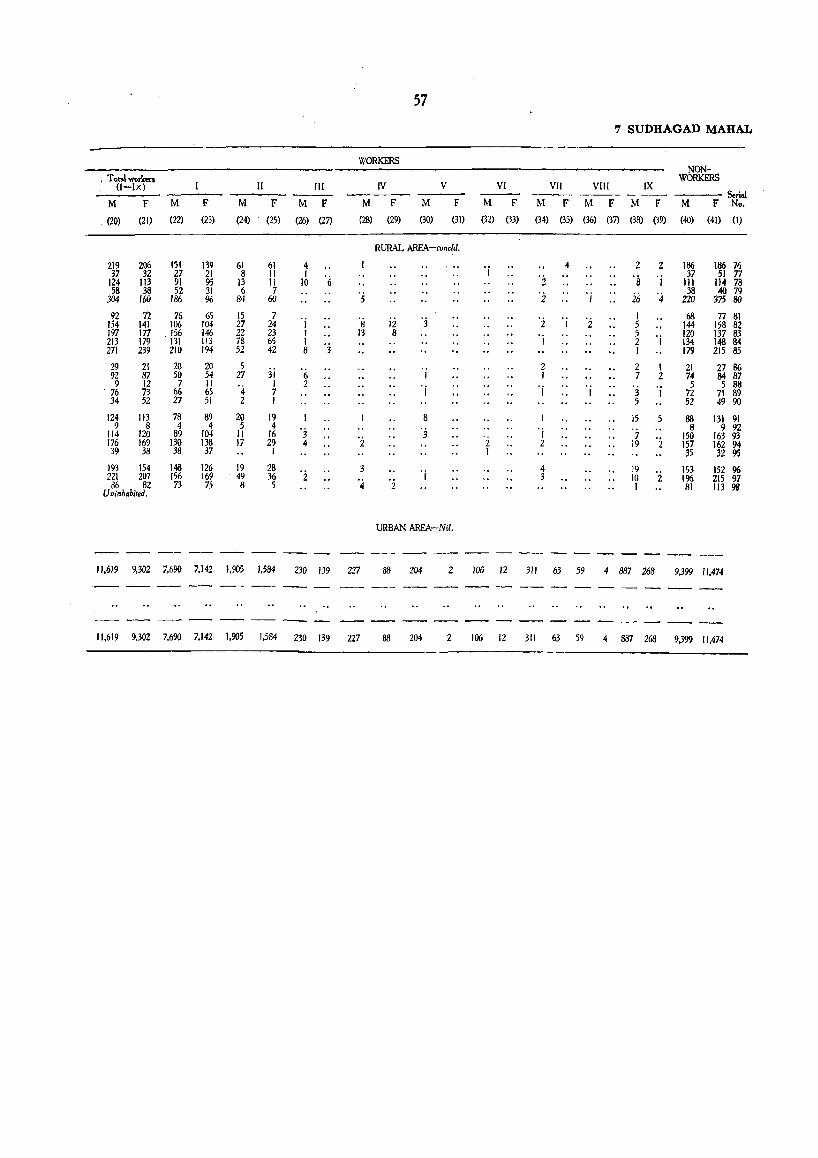
57
7 SUDHAGAD MAHAL
WORKERS NON-
, T atal workers WORKERS (I-Ix) II IJI IV V VI VIJ VIlI IX --- --- --- --- --- Serial
M f M F M F M F M F M F M F M F M F M F M F No,
, (20) (21) (22) (23) (24) (25) (26) (27) (28) (29) (30) (31) (32) (33) (34) (35) (36) (37) (38) (39) (40) (41) (I)
RURAL AREA-concld,
219 206 151 139 61 61 4 'j 4 2 2 186 186 76 37 32 27 21 8 II I '6 '2 's 'j 37 51 77
124 113 91 95 13 11 10 111 114 78 58 38 52 31 6 7 '2 'j 26 '';
38 40 79 304 160 186 % 84 60 5 220 375 80
92 72 76 65 15 7 '8 ;2 'j '2 '2 I 68 77 81 154 141 106 104 27 24 I 1 5 144 158 82 197 In . 156 146 22 23 I 13 8 5 'j 120 137 B3 213 179 131 113 78 65 I 'j 1 2 134 148 84 271 239 210 194 52 42 8 I 179 215 115
29 21 20 20 5 3; 2 2 I 21 27 86 92 87 50 54 27 6 1 1 7 2 74 84 87 9 12 7 II '4 I 2 'j 'j 'j 'j 5 5 88
76 73 66 65 7 3 72 71 89 34 52 27 51 Z 1 5 52 49 90
124 113 78 89 20 19 I 8 15 5 88 131 91 9 8 4 4 5 4 '3 '3 8 9 92
114 120 89 104 rr 16 '2 '2 1 7 '2 150 163 93
176 169 130 138 17 29 4 2 J9 157 162 94 39 38 38 37 1 1 35 32 95
193 154 148 126 19 28 '2 3 'j 4 J9 153 152 96
221 207 156 169 49 36 '4 '2 3 to 2 196 215 97
86 82 73 75 8 5 1 81 rr3 98 Uninhabited,
URBAN MEA-Nil,
-- -- --- ----rr,619 9,302 7,690 7,142 1,905 1,584 230 139 227 8B 204 2 106 12 :m 63 59 4 887 268 9,399 11,474
rr,619 9,302 7,690 7,142 1,905 1,584 230 (39 227 88 204 2 106 12 311 63 59 4 887 268 9,399 11,474

Roha Taluka
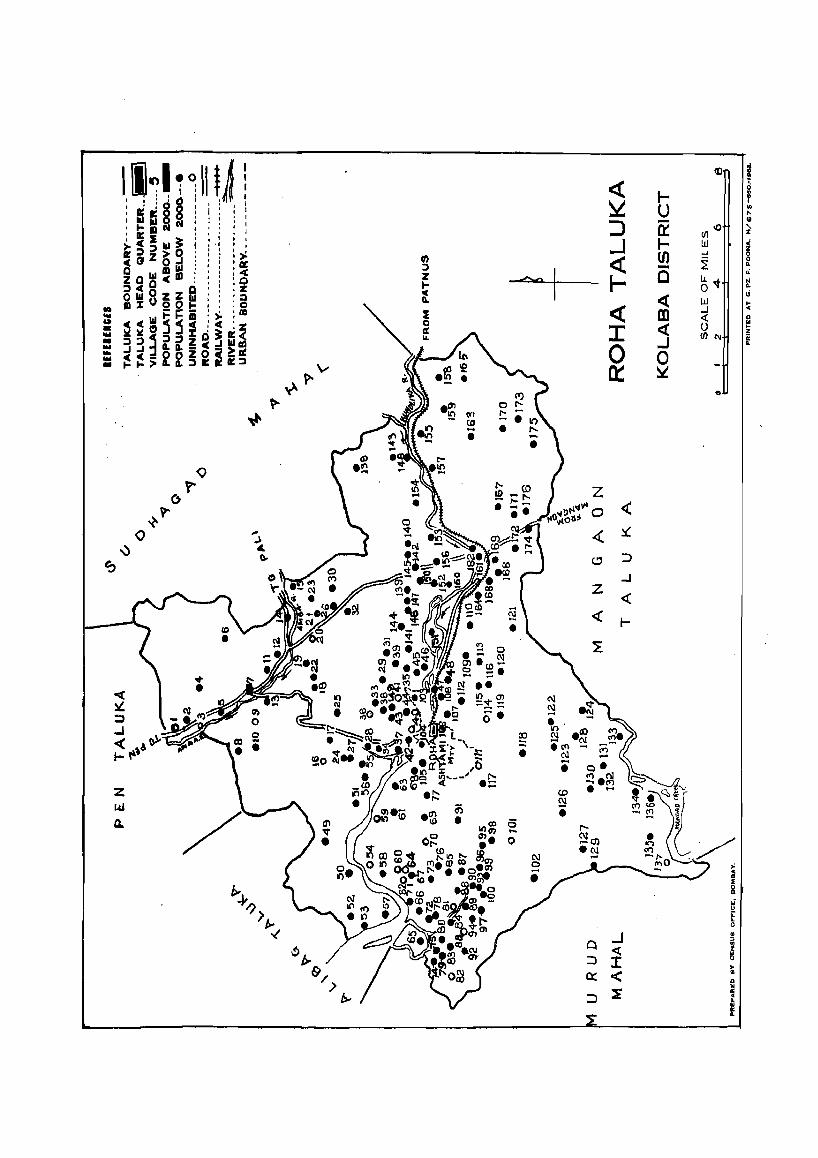
I, .i~ ~ ill, tA ! CD ~ <t: i;
l- f ~ U ..
I-18
' I '8 § I I ' I I
:J - I() " ' a:: at 1 Ii j I
n:: %
1111111 0 til • , , : I
rJ) , ~. N : : II I
...J I- w .;, , 1t::E ~ • I I I
'" (J) ..... 0 'e 1&1 • ,t • ,
<t: ~ 0
>:l;) Q "'. w ~
It z> ':'> - ~ .a o.J ::a: :J
l- e ~1" N o III GI = :: "" z ~ .. ZOo. , : ,0 I-0; 5~8~~m '1~ c « w ~
0..
<t: .J m « Q 10
Gil: ___ ,~
« () ~ ... "'I-Gl'>·
:r '" u .. ~.Od:.:. :%
1J)C\i iii - ..J L ... 33~ii~~~li 0 •
0 III ...
~~>22~~~i::J a:: ~ III
V • ~t>-
0
~ .(1) 0 !!? (I') !:: • ~ (0 - • • •
<;)
Z 'r () « ~t-
:L () ,. .)
..,) 4-(!) :::> 0-
~ -' z «
« I-
~ 0 ~ • - C\l m· w ... to -. - -~ ..
11'1 - . !Q"", ~ (\I '< CII - .... - ~ ~ o· 'I() :;:)
~ C\l .~ -I i('(\ « .\ 0)-
• (\I l- ", i Q'
!l.~ CD . .... z ~ UJ
-$ • a ~
0 C\] 0
• b-.} ,;
u t /» 0 J;,
.J en ::> ..(
Q " « z ~ ~f>. ::::l :r u
~ &/ ex < " w ~ 0: >t>, c :J ..
~
f
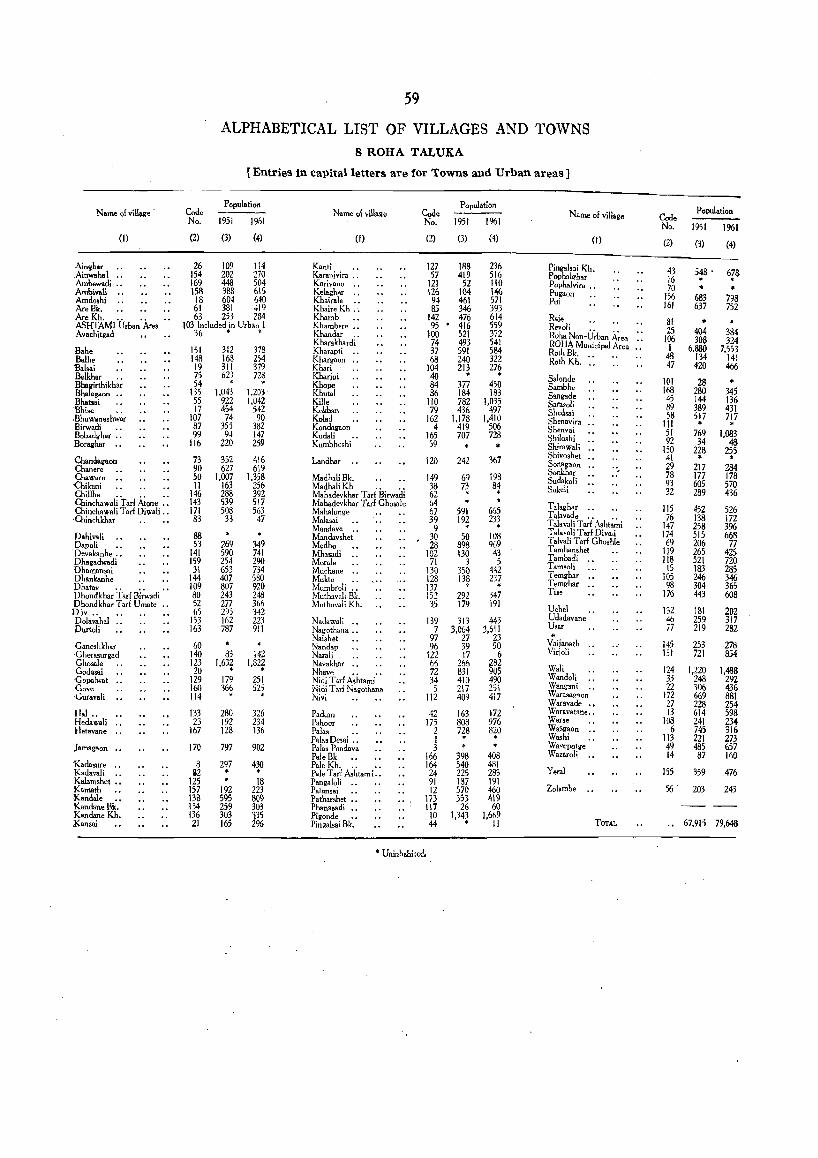
Name 01 village
(I)
Ainghar .AinWllha I .. Ambewadi .. Ambivali Amdoshi AreBk. AreKh. •. .. ASHTAMI Urban Are. Avachitgad
Bahe Balh.
'Balsai Belkhar .• Bballirthikhar Bhalag.on .• Bhalsai Bhi.. .. ,Bhuwaneshwar Birwadi .. Bob.dghar .. Borogh.r ••
Chandagaon Chanere .. Chaware .. 'Chikani Chillhe .. .. .. Chinch. wali T arf Atone •• Chinch.wali Tarf Diwali .. ,Chinchkhar
Dahi.ali Dapoli •• Devakanhe .• Dh.gadwadi Dhamansoi Dhankanhe Dhatav " D hondkhar T arf Birwadi Dhondkhar Tar! Urnate Div.. .. Dol.vaha! .. Durtoli
G.neshkhar ·Gherasurgaq Ghosale 'Godasai ,Gopalwat .. Cove ~urav.li
Hal .• Hed.wali .• Hetavane "
J.magaon
K.dosure " Kadav.li " Kalamshet •• Kamath Kandale .• KandaneBk. Kandane Kh. Kansai
59
ALPHABETICAL LIST OF VILLAGES AND TOWNS
8 ROHA TALUKA
[Entries in capital letters are for Towns and Urban areas}
Code No.
(2)
Population
1951 1961
(3) (4)
26109114 154 202 270 169 448 504 158 38B 615
18 604 640 61 381 419 63 253 284
103 Included in Urban I
36 • • 151 148
19 75 54
135 55 17
107 87 99
116
73 90 50 11
146 143 171 83
88 53
141 159 31
144 109 80 52 65
153 163
60 140 123 20
129 160 114
133 23
167
170
8 i2
125 157 138 134 136 21
312 168 311 623 .
1.043 922 454
74 355 94
220
352 627
1.007 163 288 539 508
33
269 590 254 653 407 807 243 277 295 162 787
83 1.632 •
179 366
280 192 128
797
297 • 192 595 259 303 165
378 254 379 728 · 1,203
1,042 542 90
382 147 259
416 619
1,358 256 392 517 563
47
349 741 290 734 580 920 248 366 342 223 911
142 1,822 •
251 525 · 326 234 136
902
430 * 18
223 809 303 135 296
Name of vill.ge
(I)
Kanti ., Karanivira •. Karivane " Kelaghar .. Khairale .. Khaire Kh .. Kbamb .• Kh.mbere .. Khandar .. Kharakhardi Kh.rapli Khargaon Khari Kbarjui Khope Khutal Kille Kokban Kolad Kondagaon Kudoli Kurnbhoshi
Landbar
MadhaliBk. MadhaliKh .. .• Mah.devkhar Tar! Birwadi Mabadevkhar Tarl Ghosale Mahalunge Malasai .• Manda.. " Mandovshet Medhe Mhasadi Morale Muchane Mulcte Mumbroli .. Muthavali Bk. Muth.vali Kh.
Nad.wali .. Nagothana •• Naishet Nandap Narali Naval,hor .. Nhave •. .• Nidi Tarl Ashtami Nidi Tar! Nagothana Nivi
Padum Pahoor Palas .. Pala. Desai .. Palas Pandava PaleBk •• Pale Kh. .. " Pale T arf Ashtam i .. Pang.loli .. Patansai •• Patharshet •• Phanasadi .• Pigonde .. Pingalsai Bk.
Code No.
(2)
127 57
121 126 94 85
142 95 •
100 74 37 68
104 40 84 86
110 79
162 4
165 59
120
149 38 62 64 67 39 9
30 28
102 71
130 128 137 152 35
139 7
97 96
122 65 72 34 5
112
42 175
2 1 3
166 164 24 91 12
173 117
10 44
• Uninh.bi t£~.
Population
1951 1%1
(3) (4)
188 419
52 104 461 346 476 416 521 493 591 240 213 • 377 184 782 436
1,178 419 707
242
69 73 ·
591 192
SO 898 130
3 350 138
292 179
313 3,064
27 39 17
266 831 410 217 409
163 808 728 . 398 540 225 187 570 353
26 1,343 ·
236 516 110 146 571 393 614 559 372 541 584 322 276 • 450 183
1,035 497
1.410 506 728
367
198 84 *
665 233 · 108 969 43 5
442 237 · 347 191
443 3,611
23 50
6 282 905 490 2S1 417
172 976 820 . 408 481 283 191 460 4\9 60
1,669 11
Name of village
(I)
Pingalsai Kh. Pophalghar Pophalvira •. Pugaon Pui
R.j, R,voH .• Roha Nan-Urban A~ea .. ROHA Municipal Area Roth Bk. Roth Kh.
Salond. Sambhe Sangade Sarasoli Shedsai Shenavira Shenvai Shiloshi Shirawali Shivoshet Sonagaon SoRkhar Sudakoli Sulteli
Talaghat .. Talavade .. .. Talavali TarE Asbtarni T alavali T arf Divali T alv.li Tarf Ghoshle Tamhanshet Tambadi Tamsali Ternghar Temghar Tise
Uehel Ud.davane Usar .. Vaiian.th Vidoli
Wali Wandoli Wa.~crani ~. \Varasa1l30n War.vade .. Waravatane .• Warse .• Wasgaon .. Washi Wavepotge Wazarol~
Y,ral
Zolambe
TOTAL
Code No.
(2)
43 16 70
156 161
81 25
106 I
48 47
101 168 45 89 58
III 51 92
150 41 29 78 93 32
115 76
147 174 69
119 118
15 105 98
176
132 46 77
145 131
124 33 22
172 27 13
108 6
113 49 14
155
56 '
PollUlation
1951 1961
(3) (4)
548' 678 · . 683 798 637 752
404 384 308 324
6,880 7,553 134 141 420 466
28 280 345 144 136 389 431 517 717 · . 769 1.083 34 48
228 255 • •
217 284 177 178 605 570 289 436
452 526 138 172 258 396 515 668 206 77 265 425 521 720 183 285 246 346 304 365 443 608
181 202 259 317 219 282
253 278 721 854
1,220 1,488 248 292 306 436 669 881 228 254 614 598 241 234 745 316 221 273 485 657 87 160
359 476
203 243
67,915 79,648
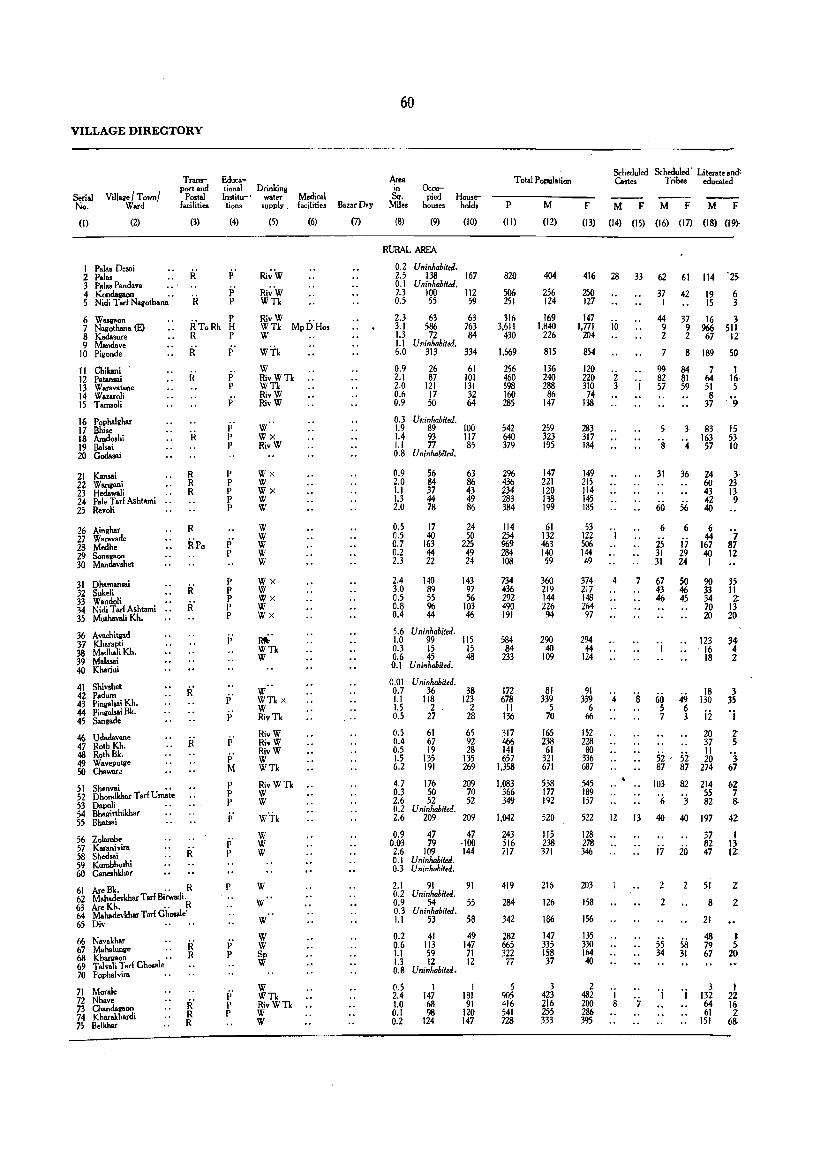
VILLAGE DIRECTORY
Serial No.
(I)
ViUage I Town! Ward
(2)
1 Pal •• Des.i 2 Pal .. 3 Pal .. Pandava .. ' 4 Kondagaon .• 5 Nidi T arl Nagothana
Transport and
Postal facilities
(3)
R'
Educa-tional Drinking Institu-' water tions supply.
(4) (5)
f p' P
Medical facilities
(6)
6 Wasgaon 7 Nagothana (E) 8 Kadasure
P R'ToRh H R P
RivW W Tk Mp D' Ho. W
9 Mandave 10 Pigonde R' P" II Chikani ' 12 Patansai R' j> 13 Waravatane 14 Wazaroli 15 Tarnsoli
16 Pophaighar 17 Bhi.e IS Amdoshi 19 Balsai 20 Godasai
21 Kansai 22 Wangani 23 Hedswali 24 Pale T arl Ashtarni .. 25 Revoli
26 Ainghar 27 Waravade 28 Medhe 29 Sonagaon 30 Mondavshet
31 Dhamansai 32 Sukeli 33 Wandoli 34 Nidi Tar! Ashtami .. 35 Muthavali Kit.
36 Avachitpd 37 Kharapti 38 Madhali Kh. 39 Malasai 40 Khariui
R R R
R
RPo
R'
41 Shiv.het R' • 42 p.dum 43 Ping.lsai Kh. 44 Pin ...... iBk. 45 Sangade
46 Udadav.ne .. 47 Roth Kh. R 48 RothBk. 49 Wav,potlle 50 Chawar.
51 Shenvai •• 52 Dhondkhar Tar! Urnate 53 Dapoli 54 Bhagirthikhar 55 Bhatsai
56 Zolambe 57 Karanivira 58 Shedsai R 59 Kumbho.hi 60 Ganeshkhar
61 AreBk. .. R 62 M.h.devkhar Tar! Birwadi. 63 AreKh. •. R 64 MahadevkharTarl Ghosale" 65 Div
66 N •• akh.r 67 Mahalunge 68 Khargaon •. 69 T alvali T arf Ghoaale 70 pophaivira
71 Morale n Nhave 73 Chandavaon 74 Kharakhardi 75 Belkhar
R R
R' R R
P
P"
p' P I'
P p p p p
f p
p p p p p
j;
p
P" p' M
p p p
p
p' p
p
j; p
WTk
W RivWTk WTk RivW RivW
W Wx RivW
Wx W Wx W W
W W W W W
Wx W Wx W Wx
~.
WTk W
W WTkx W RivTk
RivW RivW RivW W WTk
RivWTk W W
W'Tk
W W W
W
W
W
W W Sp W
W WTk RivWTk W W
Bazar Day
(7)
60
Area 10
Sq. Mile.
Occupied
houses Household.
(8) (9)
RURAL AREA
0.2 Uninhabit.a. 2.5 138 0.1 Uninhabited. 7.3 100 0.5 55
2.3 63 3.1 586 1.3 72 1.1 Uninhabitet!. 6.0 313
0.9 26 2.1 87 2.0 121 0.6 17 0,9 50
0.3 Uninhabited.
(10)
167
112 59
63 763 84
334
61 101 131 32 64
1.9 89 100 1.4 93 117 1.1 77 85 0.8 Uninhabited.
0.9 2,0 1.1 1.3 2.0
0.5 0.5 0.7 0.2 2.3
56 84 37 44 78
17 40
163 44 22
2.4 140 3.0 89 0.5 55 0.8 % 0.4 44
5.6 Uninhabilecl. 1.0 99 0.3 IS 0.6 45 0.1 Uninhabited.
0,01 Uninhabited.
63 86 43 49 86
24 50
225 49 24
143 97 56
103 46
115 IS 48
0.7 36 38 1.1 118 123 1.5 2 2 0.5 27 28
0.5 61 65 0.4 67 92 0.5 19 28 1.5 135 135 6.2 191 269
4.7 176 209 0.3 50 70 2.6 52 52 0.2 Uninhabited. 2.6 209 209
0.9 47 47 0.03 79 ·100 2.6 109 144 0.1 Uninhabited. 0.3 Uninhabited.
2.1 91 91 0.2 Uninhabited. 0.9 54 55 0.3 Uninhabited. 1.1 53 58
0.2 41 49 0,6 113 147 1.1 59 71 1.3 12 12 0.8 Uninhabited.
0.5 2.4 1.0 0.1 0.2
1 147 68 98
124
I 181
91 120 147
Total Popclation
P M
(11) (12)
820
506 251
316 3,611
430
1,669
256 460 598 160 285
542 640 379
296 436 234 283 384
114 254 %9 284 108
734 436 292 490 191
584 84
233
172 678
11 136
317 466 141 657
1,358
1,083 366 349
1,042
243 516 717
419
284
342
282 665 322 77
5 905 416 541 728
404
256 124
169 1,840
226
815
136 240 288
86 147
259 323 195
147 221 120 138 199
61 132 463 140 59
360 219 144 226 94
290 40
109
81 339
; 70
165 238
61 321 671
538 177 192
520
115 238 371
216
126
186
147 335 158 37
3 423 216 255 333
F
(13)
416
250 127
147 I,m
204
854
120 220 310
74 138
283 317 184
149 215 114 145 135
53 122 506 144 49
374 217 148 264 97
294 44
124
91 339
6 66
152 228 80
336 687
545 189 157
522
128 278 346
203
ISS
156
135 330 164 40
2 482 200 286 395
Scheduled Scheduled', Literattand' Castes Tribe. educated
M F M F M F
(14) (15) (16) (17) (18) (19).
28
iil
12
I 8
33
'j
7
13
62
37 I
44 9 2
7
99 82 57
61 114
42 19 15
37 16 9 966 2 67
8 189
84' 7 81 64 59 51
8 37
"25
6 3
3 511
12
50
1 16· 5
'9
5 3 83. IS 's· '4' 163 53 57 J(}
31
60
6
2S 31 31
67 43 46
60 5 7
36
56 6
i7 29 24
50 46 45
24 60 43 42 40
6 44
167 40 1
90 33 34 70 20
123 16 18
18 49 130 6 3 ii
20 37 II si, si 20
87 87 274
103
'(,
40
jj
82 214 55
3 82
40 197
37 82
20 47
2 2
2
51
S
21
48 79 67
55 58 34 31
'i 'j 3 132 64 61
151
3· 23 13 9
'7 87 12
35 II
2: 13 20
34-4 2
3 35
'j
2' 5 'j. 67
62 7 S.
42:
1 13 12:
2:
Z
t 5
2()
1 22 If> 2
680

Total workers (I-IX)
M F
(20) (21)
Uninhabited. 260 218
Uninhabited. 143 136 69 68
91 72 964 313 128 98
Uninhabited. 439 405
77 146 178 45 91
67 91
178 35 58
Uninhabited, 147 162 177 142 111 94
Uninhabited,
89 122 67 73
116
41 77
257 78 41
216 136 78
111 59
Uninhabited,
73 104 19 76
113
26 77
187 72 28
187 103 81
109 65
159 159 22 25 78 65
Uninhabited,
Uninhabited, 55 59
178 121 3 3
47 40
103 87 168 143 40 41
188 171 41tl 323
266 241 105 85 93 86
Uninhabited. 300 273
M
(22)
198
73 49
75 261 103
274
3 43
125 23 81
12) 158 90
65 81 57 65 76
31 42
16; 54 30
153 58 54
100 57
146 19 68
37 117
44 96
130 36
lSI 322
196 91 81
247
63 65 62 141 139 130 233 188 197
Uninhabited, Uninhabited,
122 125 Uninhabited,
78 76 Uninhabited,
10:1 79
97 77 204 In 89 91 14 18
Uninhabited,
3 244 126 138 173
I 228 88
149 140
99
69
104
97 167 12 14
3 133 110 117 139
J-62-I-B-A_
II
F
(23)
M F
(24) (25)
174
75 49
61 136 86
215
6 33
123 16 56
149 133 89
57 83 15 69 73
23 48
151 5S 20
144 44 54
106 64
159 24 63
44 80
37 81
130 40
148 286
207 79 83
236
64 137 169
118
74
78
76 169
78 18
39
23 14
II 47 9
142
61 48 48 2 6
19 II 6
4 5 8 5
23
7 32 5 4 3
13 62 5
I I 2
8 32 'j
'2 37
27 5 3
29
I 3
22
4
is 8
181 is 79 8
135' 4 124 2
44
27 19
II 49 5
185
61 42 49 2 2
12 7 4
2 3 3 6
24
3 28 10 2 6
24 54 3 2 I
I 2
12 34
'j
6
I 30
30 4 3
34
I I
16
I 22
4
23 9
14 10
III
M F
(26) (27)
13
44
2 89 13
12
12 II 5
'2
i3
4 14 I
17
3
j.j 9 ')
34 9
18
'j
2 17 i
I
28 24
20 I Z
'4
·7 9
20
27
"
16
;6 15
19 4
24
'6 2
17
II
61
WORKERS
IV V
M F
(2A) (29)
M F (30) (31)
RURAL AREA
I 89 I
2
'j
2
26
'i
'6 '; I
2
10 '(,
2 3 5 I
49 I
2
I
'5 I 3
2
6
2 I
7 '5 i j 3
'j
'j 2 I
4 ·6 I
'5
2
3
I 4
'i
2
VI
M: F
(32) (33)
53
2
10
19
'5 2
4
'j I
4
2
25
3
2
2
8 ROHA TALUKA
VII VIII IX
M F'\1FMF
(34) (3) (%) (37) (38) (39)
iiJ
II
'6 2
'j
28
2
57
2
I
I 2
3 I
20 2
5 I 3
I I 2
9
·7 3 4 9
4
'j 43 I 2
2
2 2
2 196
I
7
I 17 3
I I 6 2 2 I
16 14 17 14 I I 2
3~ '9 9
12 I I I 3 I
I 2
3 6 I
13 'j 2 7
II
13 3 3
18
I 2 2
I
3 I 4 I
13 2
8 2
3
19 3
10 12
6
·6
NO"lWORKERS
---- Serial M F No,
(40) (41) (l)
144
113 55
7a 876 93
37"
59 94
110 40 SO
112 146 84
58 99 53 65 83
20 55
206 62 18
144 83 66
115 35
131 18 31
26 161
2 2J
62 70 21
133 253
272 72 9,}
220
52 97
138
94
48
81
50 131 69 23
17j ~O
117 160
I 198 2
3 114 4 59 5
75 6 1.458 7
10& 8 9
449 10
53 II 129 12 132 13 39 14 80 15
16 121 17 175 18 90 19
ZO
76 21 III 2l 95 23 69 24 n 25
27 26 45 27
319 28 72 29 21 30
187 31 114 32 67 33
IJ) 34 32 3>
36 135 37
19 38 59 39
40
41 32 42
Zid 43 3 44
26 45
65 46 85 47 39 48
165 49 364 50
304 51 104 52 71 53
54 249 ,5
63 56 139 57 158 58
59 60
73 61 62
8.2 6:> 64
77 65
58 66 138 67 73 68 22 .,9
70
I 71 2,)~ 72 112 73 Jj/ 74 2jj 75
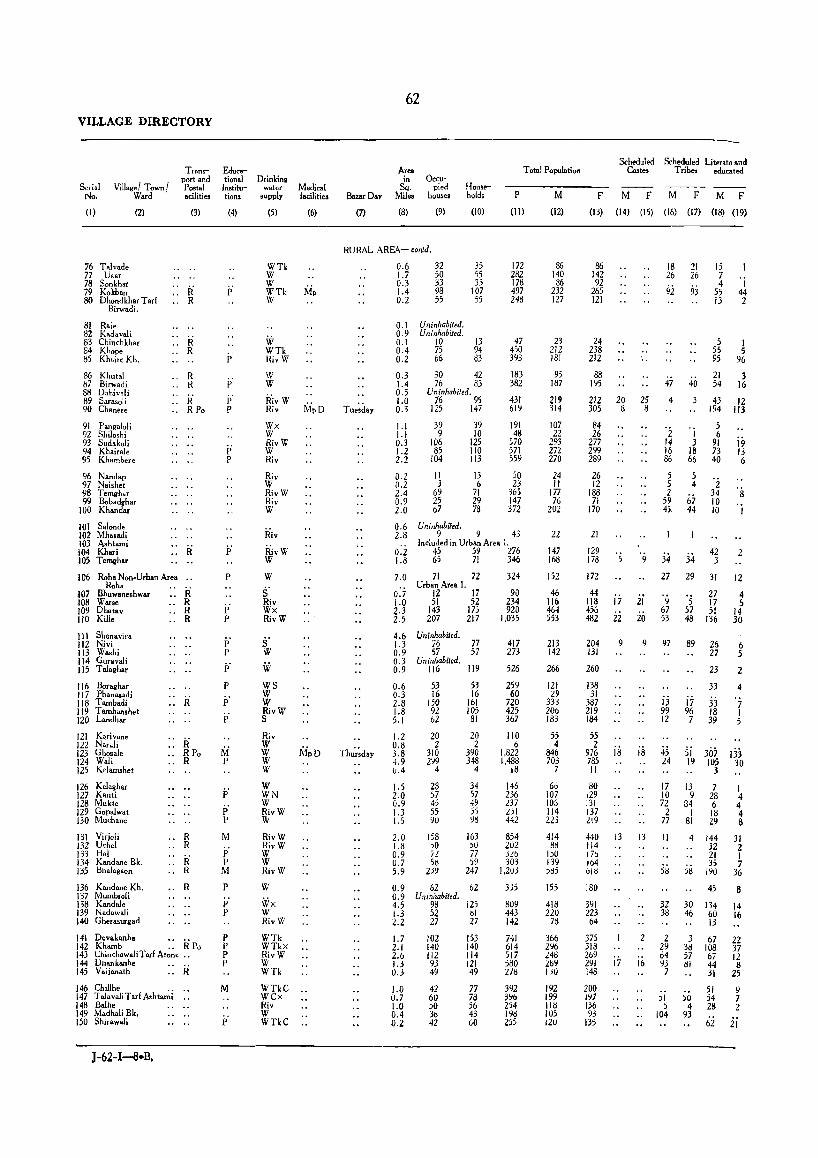
VILLAGE DIRECTORY
Serial No.
Village/ Town/ Ward .
Transport and Postal acilities
(I) (2) (3)
76 Talvade 77 Us.r 78 Sonkha, 79 Kokban 80 Dhondkhar Tar!
:: R .. R
Birwadi.
81 Raje 82 Kadavali 83 Chinchkh.r 84 Khope 85 Khbire Kh.
86 Khutal b7 Birwadi 88 Dahivali 89 Sarasoli 90 Ch'nere
91 Pang.loli 92 Shiloshi 93 Sud.koli 94 Kh.ir.le 95 Khambere
96 Nandap 97 Nai,he! 98 Temghor 99 Bcbadghar
100 Khandar
:: R .. R
.. R
.. R :: ii " R Po
101 Salonde 102 Mhasadi 103 Ashtami l04 Khari :: R 105 Temghar
106 Roha Non-Urban Area .. Roha
107 Bhuwaneshwar : : R 108 Warse .. R 109 Dh.,a. .. R 110 Kille .. R
111 Shena .ira liZ Ni.i 113 Washi 114 Guravali 115 TaI,ghar
116 BoT"h'T 117 Phanas.d, 118 Tambadi :: R 119 Tamhanshet 120 Landhar
121 K.rivane 122 NaT.!i 123 Ghosale 124 Wali 125 K,lamshet
126 Kelaghar 127 Kanti 128 Mukte 129 Gopalwat 130 Muchane
131 ViTioii 132 Uohel 133 Hal 134 Kandane Bk. 135 Bhalagaon
136 Kandane Kh. 137 MumbToli 138 KandaJe 139 Nadawali 140 GheTasurllad
:: R " RPo .. R
.. R
.. R
:: R .. R
.. R
141 De.akanhc .... 142 Khamb .. R Po 143 Chinchawali T arf Atone .. 144 Dhankanhe 145 V..iianath :: R 146 Chillh. .. .. 147 TalavaliTaTf Ashtami .. 148 Balhe 149 M.dh.li Bk. 150 ShiTawali
J-62-I-8·B.
Educational
Institutions
(4)
P
p' p
P
M p
p' p' P
M p' P M
P
p' p
p p P P
M
Drinking water
supply
(5)
WTk W \V WTk W
W WTk Ri.W
Wx W Ri.W W Ri.
Riv W Ri.W Riv W
Ri.
Ri.W W
W S· Riv Wx Ri.W
s· W
W WS W W Ri.W S
Medical facilitie.o
(6)
Riv W W ~ipD W W
W WN W Ri.W W
Ri.W Ri.W W W Ri. \V
W
\Vx W Ri.W
WTk WTkx RivW W WTk
WTkC WCx Riv \V WTke
Bazar Day
(7)
62
Area in
Sq. Mil ..
(8)
Occupied
houses
(9)
Household.
(10)
Total Population
P M
(II) (12)
RURAL AREi\- contd.
Tue~d.y
0.6 1.7 0.3 1.4 0.2
32 50 33 93 55
0.1 Uninhabited. 0.9 Uninhabited.
35 55 33
107 55
0.1 10 13 0.4 75 94 0.2 66 83
0.3 30 42 1.4 76 83 0.5 Uninhabifed. 1.0 76 95 0.3 125 147
1.1 1.1 0.3 1.2 2.2
0.2 0.2 2.4 0.9 2.0
39 9
106 85
104
II 3
69 25 67
Uninhabiled.
39 10
125 110 113
13 6
71 29 78
172 282 178 497 248
47 450 393
183 382
431 619
191 48
570 571 559
50 23
365 147 372
0.6 2.8 9 9 43
0.2 1.8
7.0
0.7 1.0 2.3 2.5
4.6 1.3 0.9 0.3 0.9
0.6 0.3 2.8 1.8 5.1
1.2 0.8 3.8 4.9 (1.4
1.5 2.0 0.9 1.3 1.5
Included in Urban Area I. 45 59 276 65 71 346
71 72 324 Urban Areal.
12 17 90 51 52 234
143 17; 920 207 217 1,035
Uninhabiled. 76 77 417 57 57 273
Uninhabited. 116 119 526
53 53 259 16 16 60
150 161 720 92 105 425 62 81 367
20 2
310 299
4
23 ')7 45 55 ~O
20 2
390 348
4
34 57 49 55 y~
110 6
1.822 1.488
18
146 236 237 L:il 442
2.0 158 163 854 202 5Lfl 303
1.8 JO ,0 0.9 iL 77 0.7 5ti 59 5.9 2JY 247
0.9 62 62 0.9 Unimiabiled. 4.5 98 125 1.3 52 lSI 2.2 27 27
1.7 2.1 2.6 1.3 0.3
1.0 0.7 1.0 0.4 0.2
102 140 liZ 93 49
42 60 )0 3~ 42
153 140 114 121 49
77 78 56 43 60
1,2U;
335
809 443 142
741 614 517 SSO 2J~
392 3~6 254 IYd 255
86 ]40 86
232 127
23 212 181
95 Iti7
219 314
107 22
293 272 270
24 II
177 76
202
22
147 168
152
46 116 464 553
213 142
266
121 29
333 206 183
55 4
846 703
7
66 107 105 114 223
414 8d
IJO 139 Jd5
155
418 220
78
366 2~6 24d L~9 IJO
192 19~ 118 105 120
F
(13)
86 142 92
265 121
24 238 212
88 195
212 305
84 26
277 299 289
26 12
188 71
170
21
129 178
172
44 118 456 482
204 131
260
138 31
387 219 184
Scheduled Scheduled Literate ,"d Cast.. T ribllS educated
M F M F M F
(14) (15) (16) (17) (18) (19)
20 8
17
22
9
25 8
9
ii 26
9
18 26
ci:.?
47
4
21 26
93
40
2 'j 14 3 16 18 86 66
5 5 2
59 45
34 27
'9 67 53
97
13 99 12
5 4
67 44
34 29
's 57 48
89
17 96 7
15 7 4
55 13
5 55 95
21 54
43 194
5 6
91 73 40
'2 34 10 10
42 3
31
27 17 51
136
26 27
23
33
33 18 39
I 44 2
1 5
96
3 16
12 113
i9 13 6
8
I
2
12
4 5
14 30
6 5
2
4
'] I 5
55 2
976 is 785
iii 45 si 307 133 24 19 105 30
II
80 129 131 137 219
440 114 176 164 bid
180
391 223 64
375 318 269 291 148
200 191 136 93
135
13 13
2
17 16
3
17 13 7 I 10 9 28 4 72 84 6 4
2 I 18 4 77 81 29 B
II
58
32 38
2 29 64 93 7
)1 :)
104
4
58
30 46
144 32 21 35
190
45
134 60 13
3 67 311 108 57 67 81 44
50 4
93
31
51 54 28
62
31 2 I 7
36
8
14 16
22 37 12 8
25
9 7 2
ii
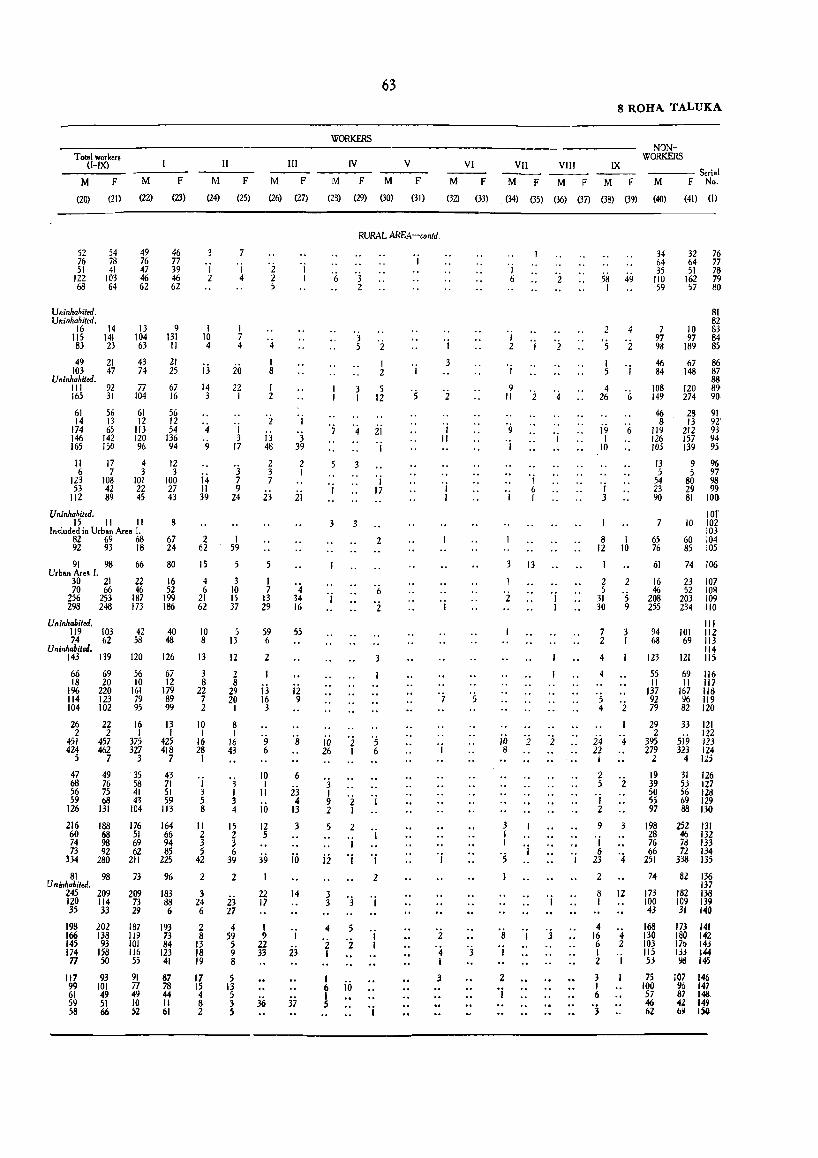
T olal workers ([-IX)
M F
(20) (21)
52 76 51
122 68
Uninhabited. Uninhabited.
54 78 41
103 64
16 14 115 141 83 23
49 21 103 47
Uninhabited. III 92 165 31
61 56 14 13
174 65 146 142 165 150
II 17 6 7
123 108 53 42
112 89
Uninhabited,
M
(22)
49 76 47 46 62
13 104 63
43 74
77 104
61 12
113 120 96
4 3
101 22 45
15 11 II Included in Urban Area 1.
82 69 68 92 93 18
91 98 66 Urban Areol.
30 21 22 70 66 46
256 253 187 298 248 173
Uninhabited, 119 103 74 62
Un inhabit..!, 143 139
66 69 18 20
196 220 114 123 104 102
26 22 2 2
451 457 424 462
5 7
47 49 68 76 56 75 59 68
126 131
216 188 60 68 74 98 73 92
334 280
81 98 Un inhabit..!,
245 209 120 114 35 33
198 202 166 138 145 93 174 158 77 50
117 93 99 101 61 49 59 51 58 66
42 58
120
56 10
161 79 95
16 I
375 327
3
35 58 41 43
104
176 51 69 62
211
73
209 73 29
1B7 119 101 116 55
91 77 49 10 52
F
(23)
46 77 39 46 62
9 131 II
21 25
67 16
56 12 54
136 94
12 3
100 27 43
8
67 24
80
16 52
199 186
40 48
126
67 12
179 89 99
13 I
425 418
7
43 71 51 59
113
164 66 94 85
225
96
183 88 6
193 73 84
123 41
87 78 44 II 61
M
(24)
'j 2
I 10 4
ij 14 3
i.j II 39
2 62
15
4 6
21 62
10 8
13
3 8
22 7 2
10 I
16 28 I
I 3 5 8
11 2 3 5
42
2
3 24 6
2 8
13 18 19
17 15 4 8 2
II
F
(25)
7
I 4
I 7 4
26 22 I
I 3
17
'j 7 9
24
I 59
5
3 10 15 37
5 13
12
2 8
29 20 I
8 I
16 43
'j I 3 4
15 2 3 6
39
2
ij 27
4 59 5 9 8
5 13 5 3 5
JII
M F
(26) (27)
'i 2 5
'4 I 8
I 2
'i ij 48
2 3 7
23
5
I 7
13 29
59 6
2
ij 16 3
9 6
10 I
11
10
12 5
39
22 I]
I 9
22 33
36
'j I
1
'3 39
2 I
ij
'4 34 16
55
ii 9
6 ij 4
13
3
iii
14
I
23
37
WORKERS
M
(2B)
IV
F
(29)
63
V VI ----M F M F
(30) (31) (32) (33)
RURAL AREA-contd.
'6 3
"
2
3 5 2
I 2
5 12
4 ij
3
I
'j 17
3 3
'j
10 'i 26 I
'3 I 9 2 2 I
5 2
I
ii 'j
3 3 '3
4 5 2 'i I
I 6 i6 I s
2
3
'j
2
'j I
'j
'j
3
'j II
'j
'j
2
'4 I
3
VII
M F
8 ROHA TALUKA
VIII IX
M F M F
NONWORKERS
----Serial M F No.
(34) (35) (36) (37) (3B) (39) (40) (41) (I)
I 2
I
9 II
9
'j
'j 6 I
13
'2 'j
jo 8
3 I I
's
B
'j
2 'j
I
'j
'j
3
2 58 49 I
2
'5
4 26
i9 I
10
'j 3
4
2
6
34 64 35
110 S9
7 97 98
46 84
108 149
46 8
119 126 105
13 5
54 23 90
7
8 I 65 12 10 76
I 61
2 2 16 5 46
31 '5 208 30 9 255
7 3 2 I
4
4
24 '4 22 1
2 5 2
'j 2
9
'j 6
23 '4 2
8 12 I
4 16 '4 6 2 I 2 I
3 I I 6
'3
94 68
123
55 II
137 92 79
29 2
395 279
2
19 39 50 55 97
198 28 76 66
251
74
173 100 43
168 130 103 115 53
75 100 57 46 62
32 76 64 77 51 78
162 79 57 80
81 82
10 83 97 84
189 85
67 86 148 87
88 120 89 274 90
28 91 13 92
212 93 157 94 139 95
9 96 5 97
80 98 29 99 81 loa
lor 10 102
103 60 104 85 lOS
74 106
23 107 52 108
203 109 234 110
III 101 112 69 113
114 121 II:>
69 116 II 117
167 IIIl 96 119 82 120
33 121 122
5i9 123 323 124
4 W
31 126 53 127 56 128 69 129 88 130
252 131 46 132 71l 133 72 134
338 135
82 136 137
182 138 109 139 31 140
173 141 180 142 17() 143 J3j 144 9Il 145
107 145 96 147 87 14& 42 149 6~ 150
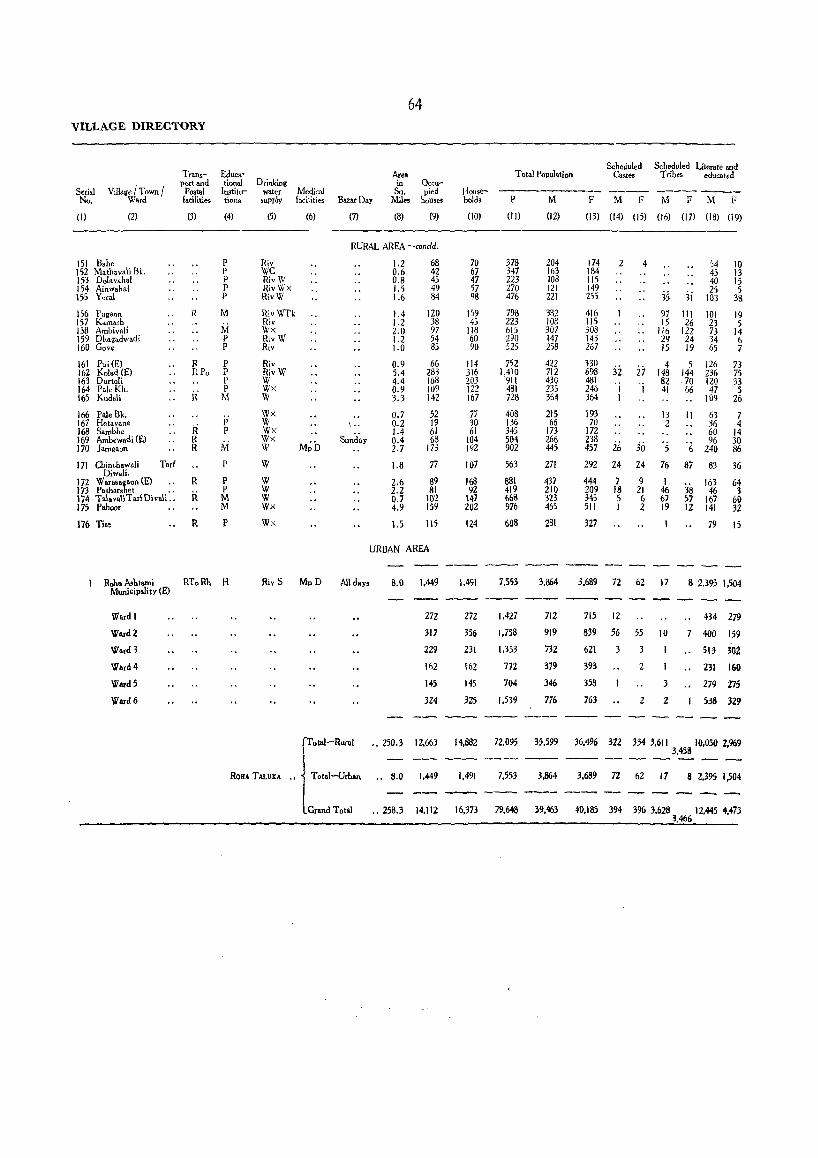
64 VILLAGE DIRECTORY
Scheduled Scheduled Liferate and Trans" Ecluca- Area Total Population Ca,tes Tribes educated
Village / Town I port and tiona! Drinking in Qccu-
Serial Postal Institu- water Medical SQ. pied Hous .... ----------_ ----- ------No. Ward I.cilities tions ,uPpl1 faci~ities Sal'rDay Miles houses hold. P M F M F !vi F M F
(I) (2) (3) (4) (5) (6) (7) (8) (9) (10) (11) (2) (13) (14) (15) (16) (17) (18) (9)
RURAL AREA -concld.
151 Bahe P Riv 1.2 68 70 378 204 174 2 4 54 10 152 Mathavali Bk. p we 0.6 42 67 347 163 184 45 13 153 Dolavahal P RivW 0.8 45 47 223 108 115 40 IS 154 Ainwahal P RivW)( 1.5 49 57 270 121 149
35 25 5 ISS Yeral P RivW 1.6 84 98 476 221 255 3i 103 38
156 Pug_on R M RivWTk 1.4 120 159 798 382 416 97 111 101 19 157 Kamath
!Vi Riv 1.2 38 45 223 108 I I 5 15 26 23 5
158 Ambiv_Ii W)( 2.0 97 JIB 615 307 308 116 122 73 14 159 Dhagadwadi P RivW 1.2 54 60 290 147 143 29 24 34 6 160 Gove P Riv 1.0 85 90 525 258 267 15 19 65 7
161 Pui(E) R P Riv 0.9 66 Jl4 752 422 330 32 27 4 5 126 73
162 Kolad (E) RPo P RivW 5.4 283 316 1,410 712 698 148 144 236 75 163 Durtoli P W 4.4 168 203 911 430 4BI
'j OJ 82 70 120 33
164 Pale Kh. R' P Wx 0.9 109 122 481 235 246 41 66 47 5 165 Kudali M W 3.3 142 167 7Z8 364 364 I 109 26
166 Pale Bk. \VX 0.7 52 77 408 215 193 13 II 63 7 167 Hetavane
R P W \ .. 0.2 19 30 136 66 70 2 36 4
168 Sambhe P Wx Sund~y
1.4 61 61 345 173 I72 60 14 169 Ambewadi (E) R
1\1 Wx
M~b 0.4 68 104 504 266 238
30 96 30 170 j_mg"On R W 2.7 173 192 902 445 457 26 5 6 240 86
171 Chinchawali Tarl P Diw_li.
W 1.8 77 107 563 271 292 24 24 76 87 83 36
172 War ... ga"n (E) R P W 2.6 89 168 881 437 444 i 9 1 38 163 64
173 P. tharshet .. R P W 2.2 81 92 419 210 209 18 21 46 46 3
174 Tal.valiTarIDivali .. M W 0.7 102 \47 66S 323 345 S 6 67 57 167 60 175 Pahoor M Wx 4.9 159 202 976 465 511 I 2 19 12 141 32
li6 Tis. R P Wx 1.5 115 124 608 281 327 79 15
URBAN AREA
---Roh. Ashtami RToRh H Riv S
Municipality (E) MpD All days 8.0 1.449 1.491 7.553 3,864 3.689 72 62 17 8 2,395 1.504
Ward I 272 27Z 1.427 ilZ 715 12 434 279
Ward 2 317 350 1.758 919 839 56 55 fO 7 400 159
Ward 3 229 231 1,353 732 621 3 3 1 513 302
Ward 4 162 162 172 379 393 2 1 231 160
Ward 5 145 14) 704 346 358 3 279 275
Ward 6 324 325 1.539 776 763 Z 2 538 329
r-~I .. 250.3 12,663 14.882 72,095 35,599 36.496 322 334 MIl 10.050 2.%9
3,458 ---ROllA TALuKA . • Total-Urban .. 8.0 1,449 1,491 7,553 3,864 3,689 72 62 11 8 2,395 1,504
---l Grand T ot.l .. 258.3 14.112 16,313 79.648 39,463 40,185 394 396 3,628 12,445 4,413
3,466
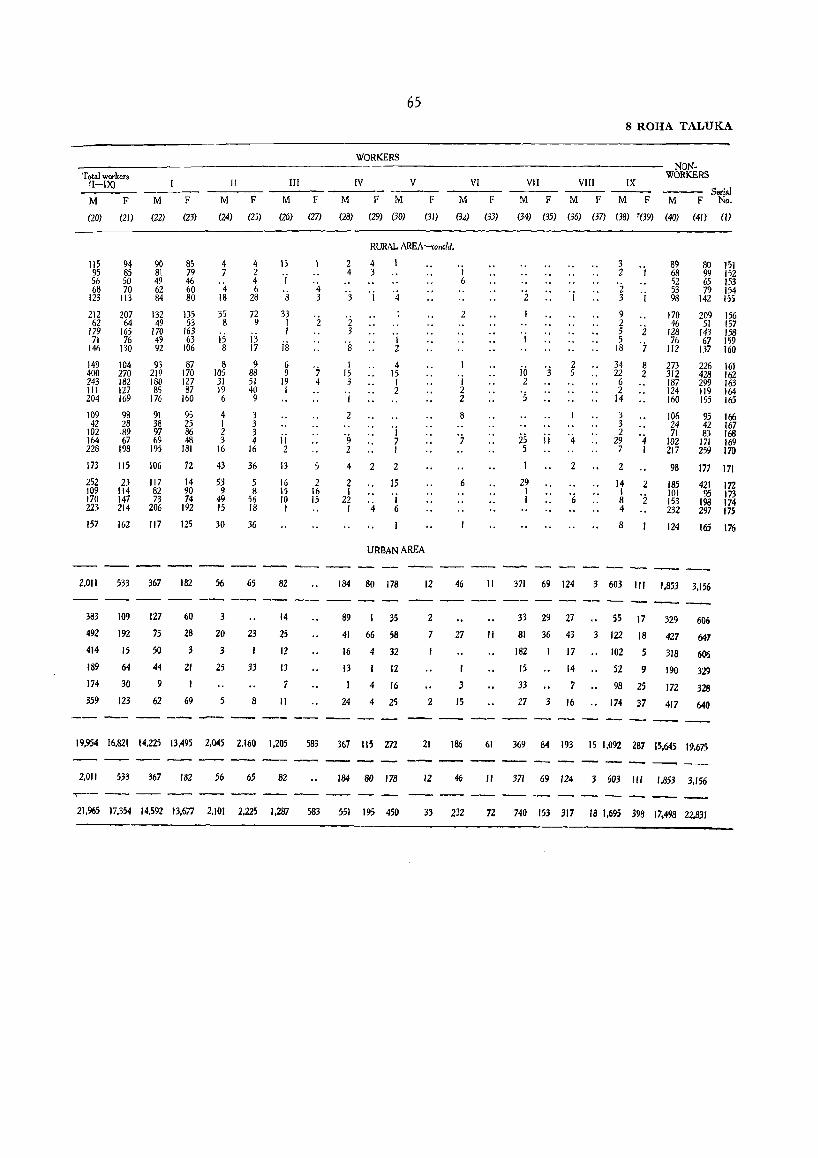
Total workers (I-IX)
M F
(20) (21)
115 94 95 85 56 50 68 70
123 113
M
(22)
90 8\ 49 62 84
F
(23)
85 79 46 60 80
212 207 132 135 62 64 49 53 1~ 1M 1~ 1~ 71 76 49 63
146 130 92 106
149 400 243 111 204
109 42
102 164 228
173
252 109 170 223
157
104 270 182 127 169
98 28 89 67
198
115
23 114 147 214
162
93 219 180 85
176
91 38 97 69
195
106
117 82 73
206
117
87 170 127 87
160
95 25 86 48
181
72
14 90 74
192
125
2,011 533 367 182
383
492
414
IB9
174
359
109
192
15
64
30
123
127
75
50
44
9
62
60
28
3
21
69
[[
M
(24)
4 7
'4 18
35 8
is 8
8 105 31 19 6
4 1 2 3
16
43
53 9
49 15
30
56
3
20
3
25
5
F
(25)
4 2 4 6
28
n 9
13 17
9 88 51 40 9
3 3 3 4
16
36
5 8
56 18
36
65
23
I
33
8
III
M
(26)
IS
'j
8
33 1 1
is 6 9
19 I
ij 2
13
16 15 10 I
82
14
2;
12
13
7
II
F
(27)
4 3
2
"7 4
S
2 16 15
65
WORKERS
IV V
M F M
(28) (29) (30)
F
em
RURAL AREA-concld,
2 4 4 3
'j 1 4
"z 3
"s 1
15 3
I
2
'9 2
4
2 1
22 I
2
1 2
4 15 1 2
"j 7 1
2
15
"i 6
URBAN AREA
184 80 178
89 35
41 66 58
16 4 32
13 I 12
I 4 16
24 4 25
12
2
7
2
VI
M F
(3J) (33)
"j 6
2
I 2 2
8
6
VII
M F
(34) (35)
"2
iii 'j 2
"5
25 JI 5
29 I I
8 ROHA TALUKA
VIII IX ------M F M F
(36) (37) (38) '(39)
2 5
2
3 2 "j
"2 3 "i 9 2 5 Z 5
18 "7 34 8 22 2
6 2
14
3 3 2
29 "4 7 I
2
14 2 1 8 '2 4
8
NONWORKERS
--- Serial M F No,
(40) (41) (1)
89 80 151 68 99 152 52 65 153 53 79 154 98 142 155
170 209 156 46 51 157
128 143 158 76 67 159
liZ 137 160
273 312 187 124 160
106 24 71
102 217
98
185 101 153 232
124
226 161 428 162 299 163 119 164 195 165
95 166 42 167 83 168
171 169 259 170
177 171
421 172 95 J73
198 174 297 175
165 176
46 11 371 69 124 .3 603 IJ1 1,853 3,156
27
I
3
15
II
33 29 21
81 36 43
182 17
15 14
33 7
27 3 16
55 17
3 122 18
" 102 5
52 9
98 25
'. 174 37
329
427
318
190
172
417
606
647
606
329
328
640
19,954 16,821 14,225 13.495 2.045 2.160 1.205 583 367 liS 272 21 186 61 369 84 193 15 1,092 287 15,645 19.615
2,01 I 5.33 367 182 56 65 82 184 80 178 12 46 II 371 69 124 3 603 111 1.853 3.156
21.965 17.354 14.592 13,677 2.101 2.225 1,287 583 551 195 450 33 232 72 740 153 317 18 1.695 398 17.498 22.831

Murud Mahal

.50 49.
/ SHRIVARDHAN
MAHAL
P"EPAIlIED BY CENSUS OI'I'ICI! BOMBAY.
RAJPURI CREEK
o b
ROHA
MURUD MAHAL KOLABA DISTRICT
i 1 6 I
SCALE OF MILES
RUIIUCII
TALUKA tIOUNDAIIY ••••••••• , _
TALUKA HEAD QUAftTE" •••••••• IiiJ VILLAGE CODE NUMBER •. _ •••• -_5 I'OPULATION ABOVE 2000 ••••••• _
I'OPULATION BELOW 2000 _ •• , ••••
UMIMHABITED ••••••••••••••••• 0 1I0AD .••••••••••••••. _ •• = IIAILWAY •••••.•••••••• - ••• -t++ IIIVEII •••••.•••••••••••••••• ~
6 I
MHASALA MAHAL
PRINTED AT G. PZ. P. PooNA. H/875 -8SO.'IIIo.
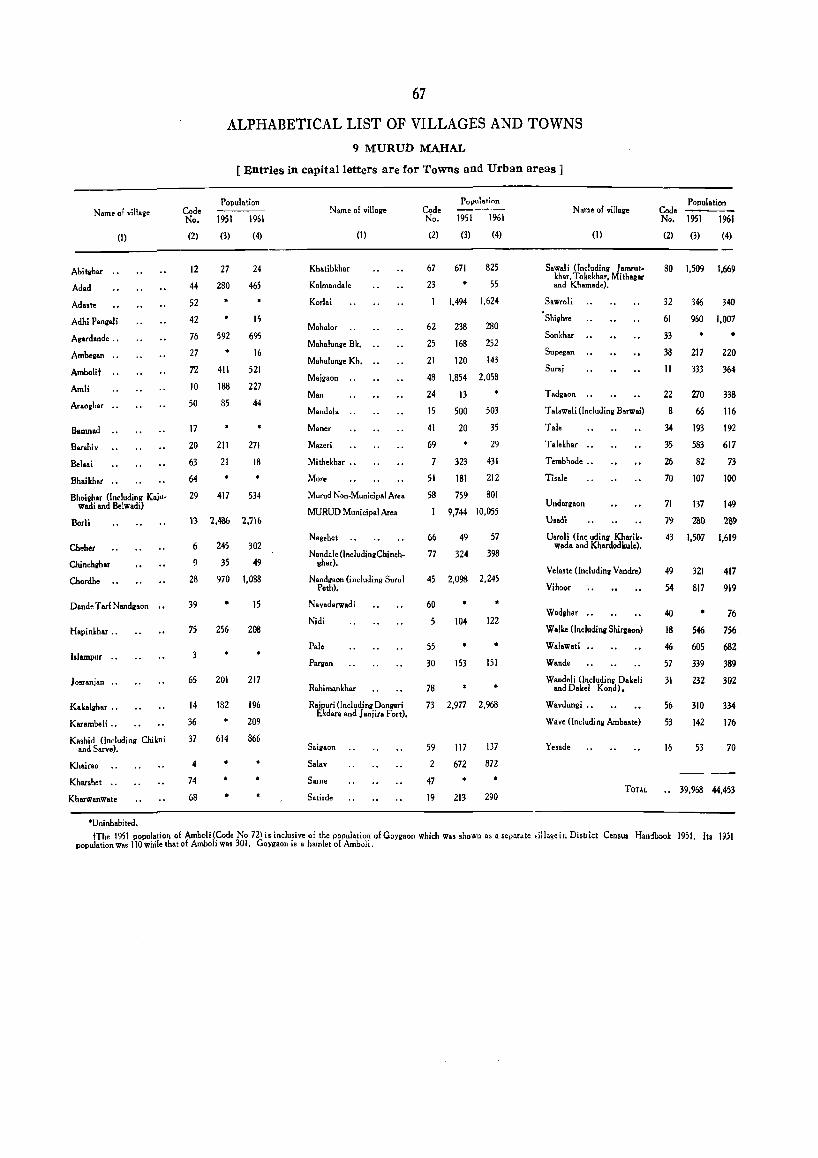
Name of village
(1)
Abitwbar
Ad.d
Ada.te
Adhi Paniali
Agardande .•
Ambegan
Ambolit
Amli
Ar.ollh.r ..
B.mn.d
Barshlv
Bel .. i
Bhaikhar
Bhoiehar (Including K.juwadi and Belwadi)
Borli
Cheher
Chinchrhar
Chordhe
Dand. T arl Nandgaon
H.pinkhar ..
Islampur
Josranjan ..
K.k.lghar ..
Karambeli ••
Kashid (Including Chikni and Sarve).
Khairao
Kharshet .•
Kharwanw.te
·Uninhabited.
67
ALPHABETICAL LIST OF VILLAGES AND TOWNS
9 MURun MAHAL
[ Entries in capital letters are for Towns and Urban areas]
Code No.
(2)
12
44
52
42
76
27
72
10
50
17
20
63
64
Population
1951 1961
(3) (4)
27
280
592
411
188
85
211
21
*
24
465
15
695
16
521
227
44
271
18
29 417 534
n 2,486 2,71&
6
9
28
39
75
65
14
36
37
245 302
35 49
970 1,088
15
2S6 208
201
182
614
217
196
209
866
Name 01 village
Kh.tibkhar
Kolm.nd.l.
Korl.i
(1)
Mah.lor
Mahalunge Bk.
Mahalunge Kh.
Majgaon
Man
Mandala ..
Maner
Mazeri
Mithekh.r .•
More
Murud Non-Municipal Area
MURUD Municipal Area
Nag.het
Nandale(IncludiniChincbghar).
Nandgaon (including Surul Peth).
Nav.darw.di
Nidi
Pale
Parllan
Rahimankhar
R.jpuri (Including Donllari Ekdara and ]anjira Fort).
Saigaon
Salav
Same
Cod. No.
(2)
67
23
62
POl">ulation
1951 1961
(3) (4)
671 825
55
1,494 1.624
238 280
25 168 252
21 120 143
48 1.854 2.058
24 13
15 500 503
41
69
7
51
58
20
323
181
35
29
431
212
759 801
9,744 10.055
66 49 57
77 324 398
45 2.098 2.245
60
55
30
78
104 122
153 151
73 2,977 2,968
59 117 137
672 872
N am. 01 village
(I)
SawaIi (Includinll Jamrutkhar, Tokekhar, Mithagar and Khamade).
Sawroli
'Shighre
Sonkhar
Supegan
Suraj
Tadgaon
T al.wali (Including Barwai)
Tal.
Tal.khar
Tembl.ode ..
Tisale
Undariaon
UsaQ;
Usroli (Inc uding Kharikwada and Kh.rdodkul.).
Vel.,te (Including Vandre)
Vihoor
Wadghar ..
W.lke ((neludine Shireaon)
W.I.w.ti
Wande
Wandeli {Including Dakeli and Dahl Kondl.
Wavdungi ..
Wave (Including Amba.te)
Yes.de
Cod. No.
(2)
Population
1951 1961
(3) (4)
80 1.509 1,669
32
61
33
38
11
22
8
34
35
26
70
71
79
346 340
960 1,007
* ZI7
333
270
66
193
583
82
107
137
2aO
• 2Z0
364
338
116
192
617
73
100
149
289
43 1,507 1,619
49 321 417
54 817 919
40 * 76
18 546 756
46 605 682
57
31
56
53
16
339
232
310
142
53
389
302
334
176
70
4
74
68 Satirde
2
47
19 213 290 TOTAL .. 39,968 44,453
nhe 1951 population of Amboli(Code No 72) is inclusive of the population 01 Goygaon which Was shown as. separate ,illagein District Census Han~book 1951. Ito 1951 population Was Il0whil. that of Amboli Was 301. Goygaon is • hamlet 01 Amboli.
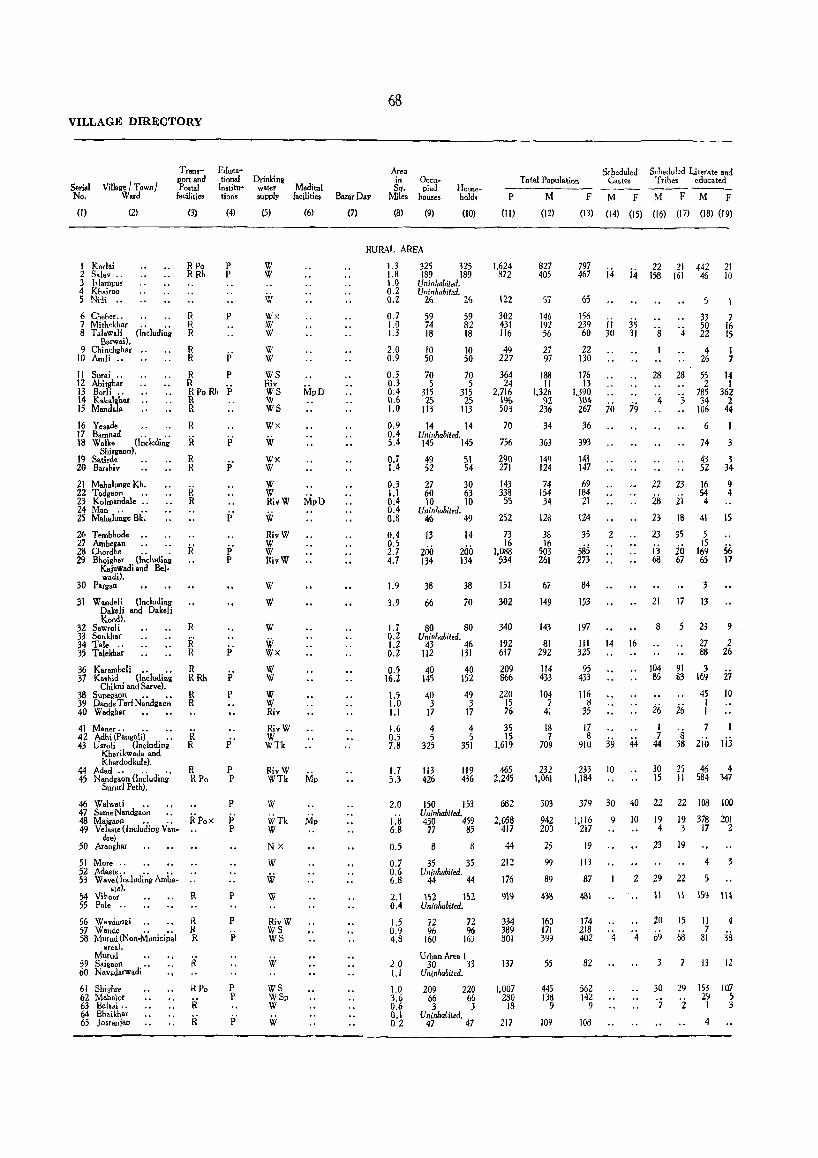
VILLAGE DIRECTORY
Educa-
Seri.1 No.
Village I Town} Ward
Transport and Po,tal
facilities
tional Drink; ni Institu'" water tion. supply
(I) (2) (3) (4) (5)
1 Korlai 2 Salay .. 3 hlampur 4 Khairao 5 Nili ..
6 Cheher .. 7 Mi th"khar .. .. 8 T alawali (Including
B.rwai). 9 Chi nchghar ..
10 Amli ..
II Surai .. 12 Abitghar 13 Borli ., 14 Kahlgbaf .. lS Mandala
16 Yesad. 17 Bamnad .. .. 18 Walke {Inclcding
Shiri8on}. 19 Satird. 20 Borshiv
21 Mahalunge Kh. 22 Tadiaon .. 23 Kohnandale .. 24 Man.. .. 25 Mah.lunge Bk.
26 Tembhode .. 27 Ambegan 28 Chordhe ., .. 29 Bhoighar (Includina
Kajuwadi and Belwadi).
30 Pargan
31 W .... deIi (Including Dakeli and Dak.1i Kond).
3,2 Sawroli 33 Sonkhar 34 Tale .. 35 Talekhar
36 Karamheli.. .. 37 Kaohid (Including
Chikn; and Sarve). 38 Supegaon . • • • 39 Dande Tar! Nandgaon 40 Wadghar
41 Maner.. .. .. 42 Adhi (Panga!i) .. 43 Usroli (Including
Kharikwada and Khardodkule).
44 Ad.d .. .. .. 45 Nandgaon (Including
Sururl Peth).
46 Walwati ..
R Po P R Rh P
R P R R
R R p' R P R RPo Rh P R R
R
R P-R R p'
R R
R p' p
R
R R i; R RRh p' R P R
R R
R R Po
p'
P P
47 Same Nandiaon •• 48 Majga"n .. . • R Po X 49 Vela.te {Including Van-
P
p' P
dre} 50 Araoghar
51 More .. 52 Adast... .. .. 53 Wave (Including Amba- ..
ste). 54 Viroot R 55 Pale ..
56 Wavdungi R 57 Wand. .. .. R 58 Murud (Non-Munidpal R
area). Murud
59 S.igaoll.. ii 60 Navadarwadi
61 Shighre 62 Mahalor 63 Beisai .. 64 Bhaikhar 65 J osranjan
RPo
ii R
p
P
'p
P P
P
W W
W
Wx W W
W W
WS Riv WS W WS
Wx Vi;
Wx W
W W RivW
VI RivW W W RivW
W
W
W
VI Wx
W W
W W Riv
RivW W WTk
RivW WTk
W
WTk W
Nx
W
W W
RivW WS WS
W
ws WSP W
VI
Medital facilities
(6)
B .. arDay
(7)
68
Area in Sq.
Miles
(8)
Occupied
houses
(9)
House4
hold,
(10)
RURAL AREA
1.3 1.8 1.0 0.2 0.2
0.7 1.0 1.3
2.0 0.9
0.3 0.3 0.4 11.6 1.0
0.9 0.4 5.4
0.7 1.4
0.3 1.1 0.4 0.4 O.S
0.4 0.5 2.7 4.7
1.9
3.9
1.7 0.2 1.2 0.2
0.5 16.2
1.5 1.0 1.1
1.6 0.3 7.8
1.7 5.3
2.0
dl 6.8
0.5
0,7 0.6 6,8
2.1 0.4
1.5 0.9 4.8
2.0 1.1
1,0 3.6 0.6 0.1 02
325 325 189 189
Uninhabited. Uninhabi/ed.
16 2<;;
59 59 74 82 18 18
10 10 50 50
70 70 5 5
315 315 25 25
113 113
14 14 Uninhabited. 145 145
49 51 52 54
27 30 60 63 10 10
Uninhabited. 46 49
13 14
200 200 134 134
38 38
66 70
80 80 Uninhabited.
43 46 112 131
40 40 145 152
40 49 3 3
17 17
4 5
325
113 426
4 5
351
119 436
150 153 Uninhabited. 450 459
77 85
8 8
35 35 Uninhabited.
44 44
152 152 Uninhabited.
72 72 96 96
160 163
Urban Areal 30 33
Uninhabited,
209 220 66 66 3 3
Uninhafiled. 47 47
Total Population Scheduled Scheduled Literate and
Cast.. Tribe. educated
P M F M F M F M F
(14) (15) (16) (17) (18) (l9) (II) (12) (13)
1.624 872
122
302 431 116
49 227
364 24
2.716 1% 503
70
756
290 271
143 338
55
252
73 16
1.088 534
151
302
340
192 617
209 866
220 15 76
35 15
1.619
465 2.245
682
2.058 417
44
212
176
919
334 389 801
137
1.007 280
18
217
827 405
57
146 192 56
27 97
188 11
1.326 n
236
34
363
149 124
74 154 34
128
38 16
503 261
67
149
143
81 292
114 433
104 7
41
18 7
709
232 1.061
303
942 200
25
99
89
433
160 171 399
55
445 138
9
109
797 467
65
156 239 60
22 130
176 13
1.390 104 267
36
393
141 147
69 184
21
124
35
585 273
84
153
197
111 325
95 433
116 8
35
i4
ii 30
70
2
14
17 8
910 39
233 10 1,184
379 30
1.116 9 217
19
113
87
431
174 218 402 4
82
562 142
9
108
i4 I~ 1~1 442 46
21 10
35 31
79
16
44
28
22
28 23
23
jj 68
21
8
104 85
26 1 7
44
30 15
40 22
10 19 4
23
2 29
11
5
33 50 22
4 26
28 55 2
'3' 785 34
23
ii 18
35
io 67
17
91 83
26
106
6
74
43 52
16 54 4
41
5 15
169 65
13
23
27 88
3 169
45 I I
1
7 16 IS
1 7
14 1
362 2
44
I
3 34
9 4
IS
56 17
9 .
2 26
i7 10
's 38 2ib lij
25 46 4 II 584 347
22 108 100
19 378 201 3 17 Z
19
4 3
22
1\ 159 \I~
20 15 II 7
81
4
3S '4 69 68
30
'7
7 13 12
29 153 107 29 S '2 I 3
4
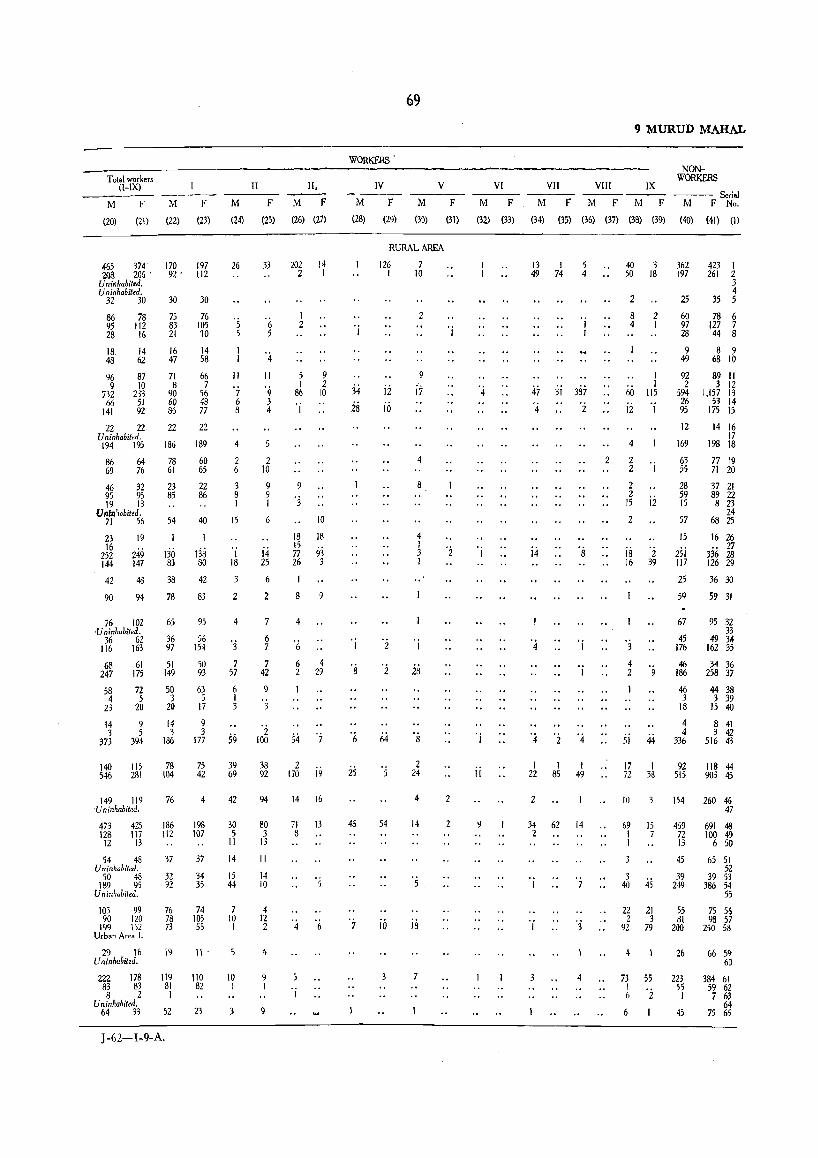
Total workers (I-IX)
M F
(20) (21)
465 374 208 206 '
Uninhabited, Uninhabited,
32 30
86 78 95 112 28 16
18. 48
14 62
M
(22)
F
(23)
170 197 92' 112
30 30
75 76 83 105 21 '10
16 47
14 58
96 87 71 66 9 10 8 7
732 233 90 56 66 51 60 48
141 92 86 77
22 22 22 22 Uninhabited, 1~ 1~ 1~ 1~
86 69
64 76
46 32 95 95 19 J3
{l nfn 'wbited, 71 56
23 19 16
252 249 144 147
42 48
90 94
76 102 -Uninhabited,
36 62 116 163
68 247
61 175
58 72 4 5
23 20
14 9 3 5
373 394
140 115 546 28\
149 119 'Uninhabited,
473 425 123 1I7
12 J3
54 48 Uninhabited,
50 48 189 95
Uninhabited,
IOj 99 90 120
199 152 Urban Area L
29 16 Uninhabited,
222 178 83 83 8 2
Uninhabited, 64 33
78 61
23 85
54
130 83
38
78
60 65
22 86
40
138 80
42
83
65 95
36 56 97 154
51 149
50 3
20
14 3
186
78 104
76
IB6 \12
37
32 92
76 78 73
\9
\19 81 I
52
50 93
63 5
17
9 3
177
75 42
4
\98 107
37
34 35
74 105 55
1\ '
110 82
23
J-62-1-9-A,
M
(24)
26
's 5
II
'7 6 8
4
2 6
3 8 I
\5
'i 18
3
2
4
'j
7 57
6 I 3
59
39 69
42
30 5
II
14
15 44
7 10 I
10 I
3
II
F
(25)
33
'4 11
'9 3 4
2 10
9 9 I
6
i4 25
6
2
7
6 7
7 42
9
3
'i 100
38 92
94
80 3
13
II
14 10
4 12 2
4
9 I
9
II,
M F
(26) (27)
202 2
14 \
5 9 1 2 ~ 10
I
9
'3 10
18 18 15 77 93 26 3
1
8
4
6
6 4 2 29
2 170 ;9
\4 16
71 13 8
4 '6
';
WORKERS '
IV
M F
(28) (29)
69
M
(30)
V
RURAL AREA
j.j
28
'8
25
46
7
126 I
ii i6
2
64
54
iiJ
7 10
2
17
4
8
4 I 3 I
2S
8
2 24
4
14
jiJ
F
(31)
VI
M F
(32) (33)
4
II
9
9 MURUD MAHAL
NONWORKERS
VII VIII IX ------ --- Serial M F No, M F M F M F
(34) (35) (36) (37) (38) (39) (40) (41) (1)
13 49
I 74
5 4
47 31 387 4 2
j.j
'4 'j
'j
'4 2 '4
I 1 I 22 85 49
2
34 62 14 2
1 7
'j
4
2
40 50
2
8 4
3 18
2 I
I I
60 115
12 I
4
2 2 'j
2 2
15 ji 2
is '2 16 39
'3 4 2 9
5i 44
17 1 72 38
10
69 15 I 7 I
3 40 45
362 197
25
60 97 28
9 49
423 1 261 2
3 4
35 5
78 6 127 7 44 8
6~ 16
92 89 II 2 3 12
594 1,157 13 26 53 14 95 175 15
12 14 16 17
169 198 18
63 55
28 59 15
57
15
2si 117
25
59
67
45 176
77 19 71 20
37 21 89 22 8 23
24 68 25
16 26 27
336 28 126 29
36 30
59 31
95 32 33
49 34 162 35
46 34 36 186 258 37
46 44 38 3 3 39
18 15 40
4 8 41 4 3 42
336 516 43
92 118 44 515 903 45
154 260 46 47
469 691 48 72 100 49 13 6 50
45 65 51 52
39 39 53 249 3~ 54
55
22 21 55 75 56 98 57
250 58 2 3 81
92 79 200
2&
73 55 223 I 55 6'2 I
4;
66 5'> 60
38.4 61 59 62 7 63
64 75 65
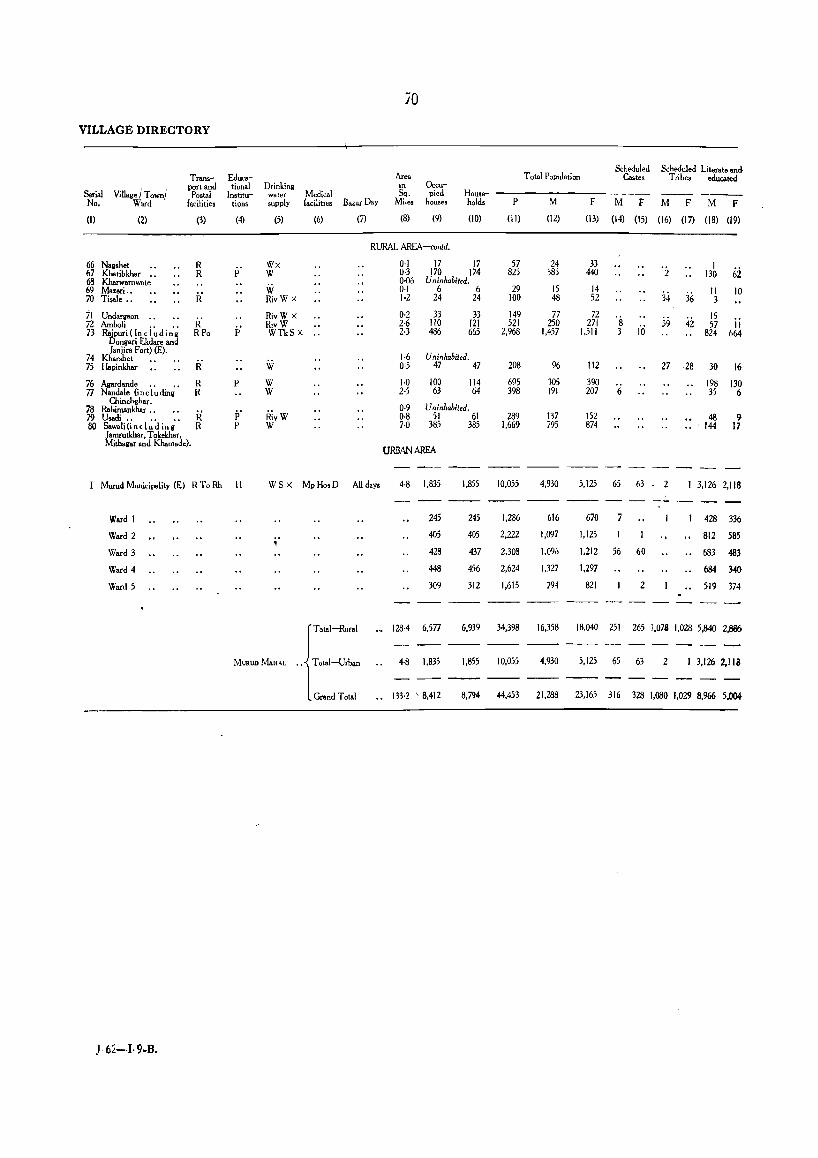
70
VILLAGE DIRECTORY
Total Population Scheduled Scheduled Litetate and
Castes T rib.. edu<ated
Serial Village I Town/
Transport and Postal
Educational
Institutions
Drinking water supply
Medical facilities
Are. in Sq.
Miles
Occupied
houses House- ---------
No. Ward facilities Bazar Day holds
(l) (2) (3) (4) (5) (6) (7) (8) (9) (10)
RURAL AREA-contd.
66 Nagshet 67 Khatibkhar .. 68 Kharwarnwate 69 Mazeri .. 70 Tisale •.
71 Undargaon .. 72 Amboli .. .. 73 Rajpuri(lncludin~
Dongari J:.kdare and ]anjira Fort) (E).
74 Kharshet • • • • 75 Hapinkhar
76 Agard.nde • • . • 77 Nand.le (including
o,inchghar. 78 Rahimankhar .. 79 Usadi.. .. .• 80 Sawali(includinll
Jamrutkhar. Tokekh.r. Mithagar and Kham.de).
R R
R' RPo
R
R R
R R
p
p'
P
p' p
Wx W
iii RivW X
RivW X RivW WTkS X .,
iii W W
Rivw w
I Murud Municipality (E) R To Rh II WS X MpHo,D Allday.
Ward 1
Ward 2
Ward 3
Ward 4
Ward 5
J 62-I·9.B.
f T atal-Rural
MUllUIl MAH.L "1 T otal-Urban
l Grand T atal
0·1 17 17 0·3 170 174 0·06 Uninhabited. 0·1 6 6 1·2 24 24
0·2 2·6 2·3
33 110 486
33 121 665
1·6 Uninhabited. 0·5 47 47
1·0 2·5
100 63
114 64
0-9 Uninhabited. 0·8 51 61 7·0 385 385
URBAN AREA
4·8 1,835
245
405
428
448
309
128-4 6,577
4-8 1,835
133·2 '8,412
1,855
245
405
437
456
312
6.939
1,855
8.794
P M F M F M F M F
(14) (15) (16) (17) (18) (19) (II) (12) (13)
57 825
29 100
149 521
2,968
208
695 398
289 1,669
10,055
1,286
2,222
2,308
2,624
1,615
24 385
15 48
77 250
1,457
96
305 191
137 795
4,930
616
1,097
1,096
1.327
794
34,398 16,358
10.055 4.930
44.453 21.288
33 440
14 52
72 271
1.511
112
390 207
152 874
-s 3
6
'i
34
39
27
5.125 65 63 2
670 7
1,125
1.212 56 60
1.297
821 2
36
42
28
1 130
11 3
15 57
824
30
198 35
48 144
62 10
11 664
16
130 6
9 17
1 3.126 2,118
428 336
812 585
683 483
684 340
519 374
18.040 251 265 1,073 1.028 5.840 2,886
5,125 65 63 2 I 3,126 2,118
23,165 316 328 1,080 1,029 8,966 5,004
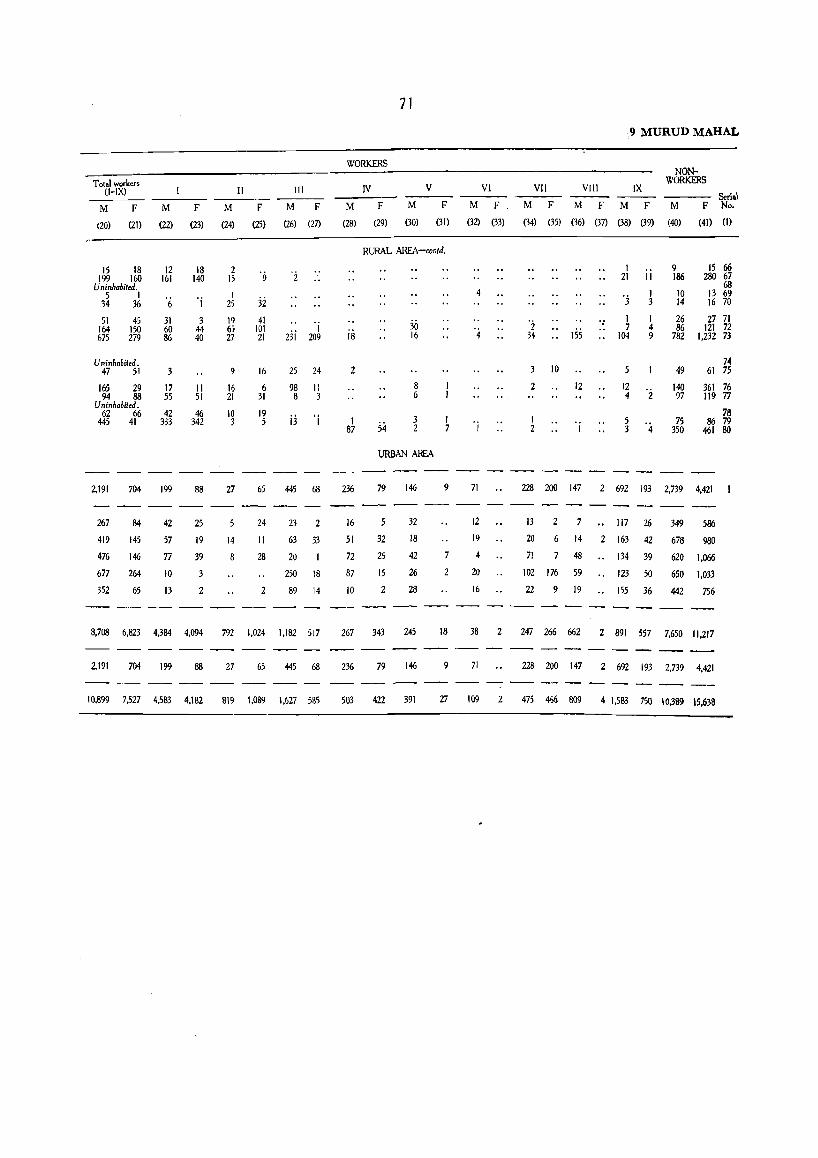
Total workers ([-IX)
M F
(20) (21)
15 18 199 160
Uninhabited. 5 I
34 36
51 164 675
45 150 279
Uninhabited. 47 51
M
(22)
12 161
'6 31 60 86
F
(23)
18 140
'j
3 44 40
165 29 17 II 94 88 55 51
Uninhabited. 62 66 42 46
445 41 333 342
2,191 704 199
267
419
476
84
145
146
677 264
352 65
42
57
77
10
13
88
25
19
39
3
2
II
M F
(24) (25)
2 15
I 2S
19 65 27
9
16 21
10 3
32 41
101 21
16
6 31
19 5
III
M F
(26) (27)
I 23j 209
25 24
98 Il 8 3
jj 'j
27 65 445 68
14
8
24
II
28
2
23
63 33
20 I
250 18
89 14
8,708 6,823 4,384 4,094 792 1.024 1,182 517
2.191 704 199 88 27 65 445 68
10,899 7,527 4.583 4,182 819 1,089 1,627 585
71
WORKERS
IV V
M F M F
(28) (29) (30) (31)
18
2
I 87
236
16
51
72
87
10
RURAL AREA-ccntd.
54
.30 16
8 6
3 2
URBAN AREA
79 146
32
25
15
2
32
18
42
26
28
I 7
9
7
2
267 343 245 18
236 79 146 9
VI
M F
(32) (33)
4
'j
71
12
19
4
20
16
;9 MURUD MAHAL
NONWORKERS
VII VlII IX --- Serial
M F M F M F M F No,
(34) (35) (36) (37) (38) (39) (40) (41) (I)
I 21
'j
I
II
I 3
9 186
10 14
15 66 280 67
68 13 69 16 70
26 27 71 '2 34 .. 155
• 7 .. 104
I 4 9
86 121 72 782 1,232 73
74 10 49 61 75
12 12 140 361 76 4 'i 97 119 77
78 5 758679 3 '4 350 461 80
228 200 147 2 692 193 2,739 4,421
13
20
71
2 7 .. 117 26
6 14 2 163 42
7 48 .. 134 39
349 586
678 980
620 1,066
102 176 59 " 123 50 650 1,033
22 9 19 155 36 442 756
38 2 247 266 662 2 891 557 7,650 ",217
71 228 200 147 2 692 193 2,739 4.421
503 422 391 27 109 2 475 466 809 4 1,583 750 10,389 15,638


Mangaon Taluka
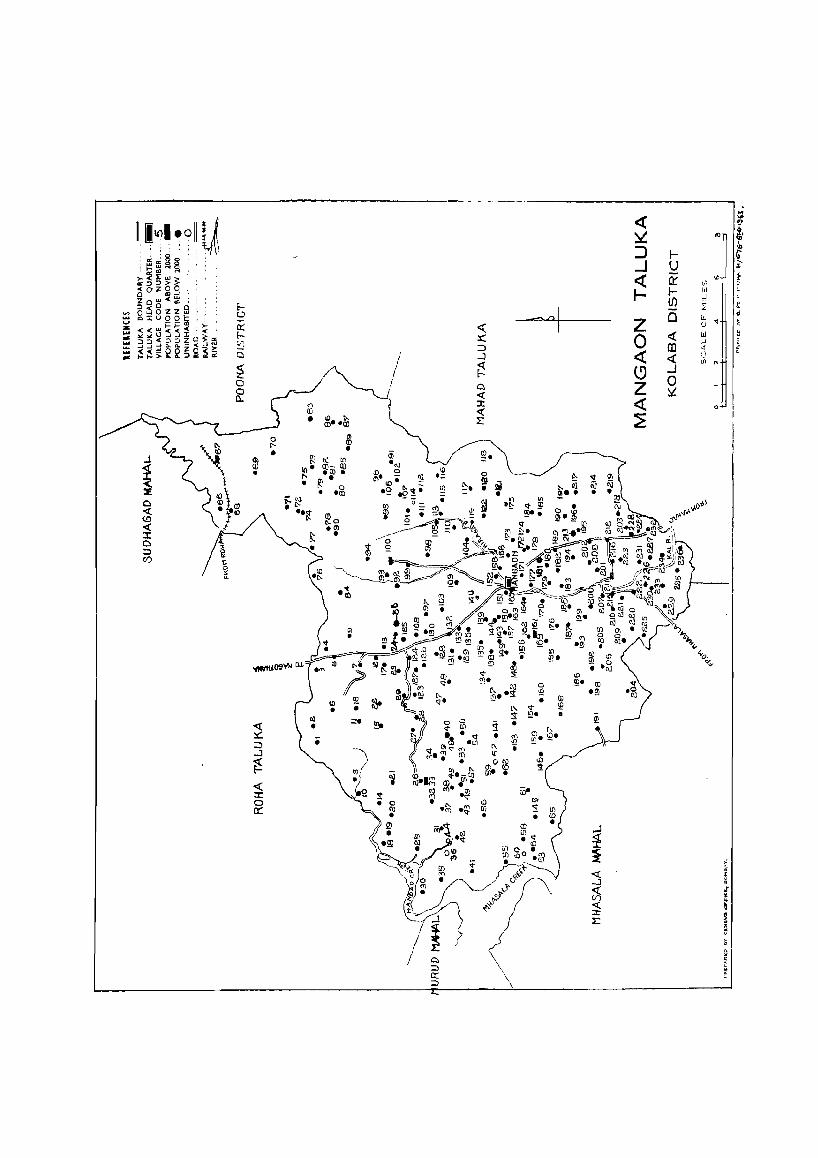
11;1 ~oll: i~ : ffi~ §:3 : ; : :t:~M~: ::
>. < L uJ S ' . , ~5~§g ~ow<~ ,
E--'" 5~8zzs Q ~
"':I: U g g ~ : >-0::
..... z: «0:S~~:..(' E--... "" ~~<:>::>~~~ffi :2 ...
...J....J-Ja..a. z -> :::; ~~~~~:>~~2 a -~ a a 0..
Q '« (.D
« ::t: c ::::> V)
0 t-
• m •
'<:l: :x::: :::l ..J
~ « ::z:: a a:::
! /~ I
/ ~ '" (!j
• ~ •• fij
=. ~
~
« ~Ol x: :::l ....J
~ c « ::r: « :r:
~ « ~ ::i '" "' :J I- ~ "-..J U '" <t iE <.0 t I})
I- w I- _j (J) ~ r 0 d
II ~ Z 0
<t w 0 ..J en « <t q: C'
iii "
t9 _J
I 0 Z ::i
<t 0 I
I ::;E i , !
..J ~ ~ ,:
;; <;( ,
g ....J J ~ ~
'« ~ ::r ! :L ~
0 . <
j
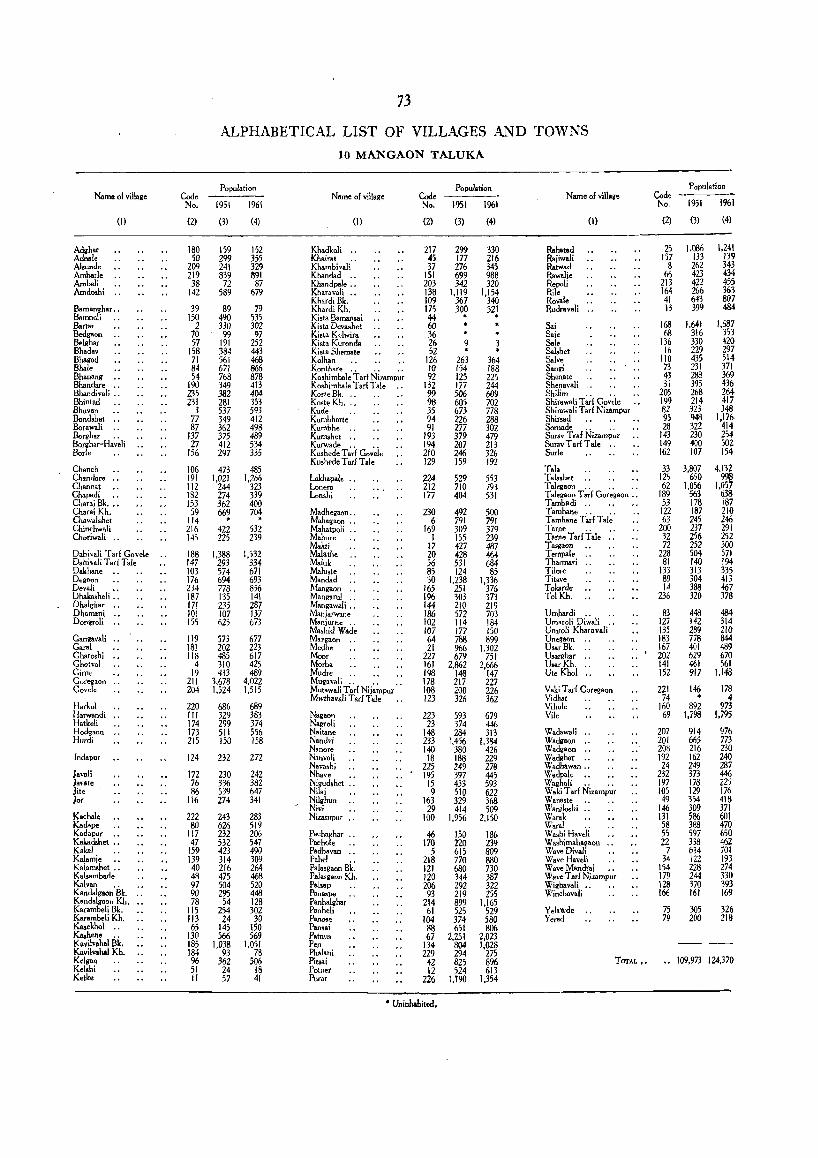
Nam. 01 village
(1)
Adghar Adnale AI,unde Amharle Ambeli Amdo,hi ..
Bamanghar .• Bamnoli Barpe Bedgaon 8olgh.,. Bhadav Bhagad Bhale Bh_nang Bhandare •. Bhandivali .. Bhintad Bhuvan .. Bondshet .• BorawaH .. Borghar ,. Borgha ..... Haveli Borle
Chanch Chandar ••. Channat Chapadi .. CharaiBk .•• Charai Kh. Ch.walshe' Chinchwali Choriwali ..
Dahivali Tarf Govele Oahivali Tarl Tal. Oakhane .. Degaon Dev.li " Dhakasheli .. Dholghar " Dh"rnani " Dongyoli
Gangavali " Garal Gharashi Ghotval Girne Go'(egaon " Covele
Harkol Harwandi •. Hatkeli Hodgaon ,. Hurdi
lnd.pur
Javali Javat. Jite Jor
Kachal. Kadape Kadapur .• Kakadshet ., Kaka! Kalami. .• Kalamshet .. Kal.ambade Kalvan .. Kalldalgaoh Bk. .. Kandalgaon Kh. Kar.mbeli Bk. Karambeli Kh. Ka..khol .. Ka.hene ,. Kavilvahal Bk. Kavilvahal Kh. Kelgan Kel.hi Kotke
Code No.
(2)
180 50
209 219 38
142
39 150
2 70 57
158 71 84 54
190 235 231
3 77 87
137 27
156
106 191 112 182 153 59
114 216 145
188 147 103 176 234 187 171 101 155
119 181 118
4 19
211 204
220 III 174 173 215
124
172 76 86
116
222 80
117 47
159 139 40 48 97 90 78
115 113 65
130 185 184 96 51 II
73
ALPHABETICAL LIST OF VILLAGES AND TOWNS
10 MANGAON TALUKA
Population
1951 1961
(3) (4)
159 299 241 839
72 589
89 490 330 99
191 384 561 671 768 349 382 281 537 349 362 375 412 297
473 1.021
244 274 362 669 • 422 225
1.388 293 574 694 778 135 235 107 625
573 202 485 310 433
3.678 1,524
686 329 299 511 150
232
230 336 539 274
243 626 232 532 423 314 216 475 504 295 54
254 24
145 566
152 355 329 ~91 87
679
79 535 302
97 252 443 468 866 878 413 404 353 593 412 498 489 534 335
485 1.266
323 339 400 704 . 532 239
1,532 334 671 693 856 141 287 137 673
677 223 617 425 489
4.022 1.515
689 383 374 556 158
272
242 382 647 341
283 519 206 547 490 309 264 46B 520 448 12B 302 30
150 569
Name 01 village
(1)
Kh.dkoli .. Khairot .. Khambiv.1i Khandad .. Khandpale .. Khar.vali .• Khardi Bk. Khardi Kh. Kista Baman .. i Kist. Oeva,het Ki,t. Kolwira Kista Kuronda Kist. Shemate Kolhon " Konthare .• .. ., Koshimbale Tar! Nizampur Koshimbale Tar! Tale .. KosteBk. " KosI. Kh. " Kude Kumbharte Kumbhe ., Kumshet " Kurw.de '. .. Kushede T arf Govele KllShede Tar! Tale
Lakh.pale '. Loners Lonshi
Madheg.on, . Mahagaon .. Mah.tpoli " M.hure " Makti Mal.the Maluk Maluste Mandad Mangaon ., Mangorul " Mangawali, . Manjarwane Manjurne .. Mashid Wade Malg3.0n •. Medhe Moor Morb. Mudre Mugav.li .. " Mutawali Tar! Ndampur Mwthav.li Tarl Tale
Nagaon Nagyoli Naitan. Nandvi Nanore Nam'ali Navashi Nhave .. Nigudshet ., Nilaj Nilghun
" Nivi Nizampur ..
Pachaghar ., Pachol. p.dhavan ., Pahel •• Pnl.,gaon Bk. P.lasgaon Kh. P.I.ap Panaspe Panhalghar Panh.li Panose Pansai Palnu. Pen Ph.lani
Population Code No. 1951 1%1
(2) (3) (4)
217 299 45 177 37 276
151 699 203 342 138 1.119 109 367 175 300 44 • 60 36 26 9 52 •
126 263 10 154 92 125
132 177 99 506 98 605 35 673 94 226 91 277
193 379 194 207 210 246 129 159
224 529 212 710 177 404
230 492 6 791
169 309 I 155
17 427 20 428 56 531 85 124 30 1.238
165 251 196 303 144 210 186 572 102 114 107 177 64 788 21 966
227 679 161 2,862 198 148 178 217 108 ZOO 123 326
223 593 23 374
148 Z84 233 1.456 140 380 18 188
225 249 195 397
15 433 9 510
163 329 29 414
100 1.956
46 150 170 220
5 615 218 770 121 680 120 344 206 292 93 219
214 899 61 525
104 374 88 651 67 2,251
134 804
330 216 345 988 320
1,154 340 .321 . 364 188 225 244 609 702 778 288 302 479 213 326 192
553 793 531
500 791 379 239 487 464 684 85
1.336 376 373 219 703 184 150 899
1.302 751
2.666 147 227 226 362
679 446 313
1.384 426 229 279 445 593 622 368 509
2.150
186 239 809 880 730 387 322 255
1.165 529 580 806
Name 01 village
Rabat,d R'iiwali RalWad R.walie Repoli Rile
(1)
Rovale Rudravali ..
Sai S.ie 5.1. SaI.het Salve Sangi Shenate Shenavali ,. Shilim ,. " Shirawali Tarl Govele Shirawali Tarf Nizampur Shirsad Sonsade ,. ., Surav T raf Nizampur Surav Tar! Tale .. Surle
T.ua T.lashet Talegaon .. .• .. T al.gaon T arf Goregaon " Tambadi .. Tamhane.. .. T amhane Tarf Tale Tarne .. Tatn. TarfTaIe •. Tasgaon Tempate .. Tharmari " Tilore Titave Tokard. ToiKh.
Umbardi .. Umaroli Diwali .. Umroli Kharavali Unegaon ., UsarBk. " Usarghar " UsarKh. " Ute Khol ..
Vaki T arf Goregaon Vidhat Vihule Vile
Wadawali .. Wadgaon •. W.dg'on .. Wadghar .. Wadhawan .. W.dpal. .. Wagholi ., .. Waki Tarl Nizampur Wanaste .• Waniloshi .. Warak Waral .. Wa,hiHavJi Washimahagaon .• Wave Divali Wave Haveli Wave Mandrai •. Wave Tarl N;zampur Wighavali " \l;!inchavafi
Yelawde Yerad
Code No,
(2)
25 157
8 66
213 164 41 13
168 68
136 16
110 73 43 31
205 199 82 95 28
143 149 162
33 125 62
189 53
122 63
200 32 72
228 81
133 89 14
236
83 127 135 183 167
• 202 141 152
221 74
160 69
207 201 208 192 24
232 197 105 49
146 131 58 55 22
7 34
154 179 128 166
75 79
Population
1951 1961
(3) (4)
1.086 133 262 423 422 266 643 399
1.641 316 330 229 435 231 288 395 268 214 323 948 322 230 400 107
3.807 650
1.056 563 178 187 245 237 256 252 504 140 313 304 388 320
448 142 289 778 401 629 461 917
146 . 892
1,798
914 665 216 16Z 249 373 178 129 354 309 586 388 597 338 634 122 228 244 370 161
305 200
1.241 139 343 434 455 363 807 484
1.687 353 420 297 514 371 369 436 264 417 348
1,176 414 254 502 154
4.m, 1,051
638 187 210 246 291 252 300 571 194 335 413 467 378
484 314 210 844 489 670 561
1.148
178 4
973 1.795
976 m 230 240 287 446 225 176 418 371 601 470 650 462 701 193 274 330 393 169
326 218
1.038 93
.362 24 57
1.051 78
506 18 41
Pitsai 229 294 42 825
2.023 1.028
275 8% 613
TOTAL •• .. 109.973 124.370 Polner Pur.r
12 524 226 l.t90 1.354
• Uninhabited.
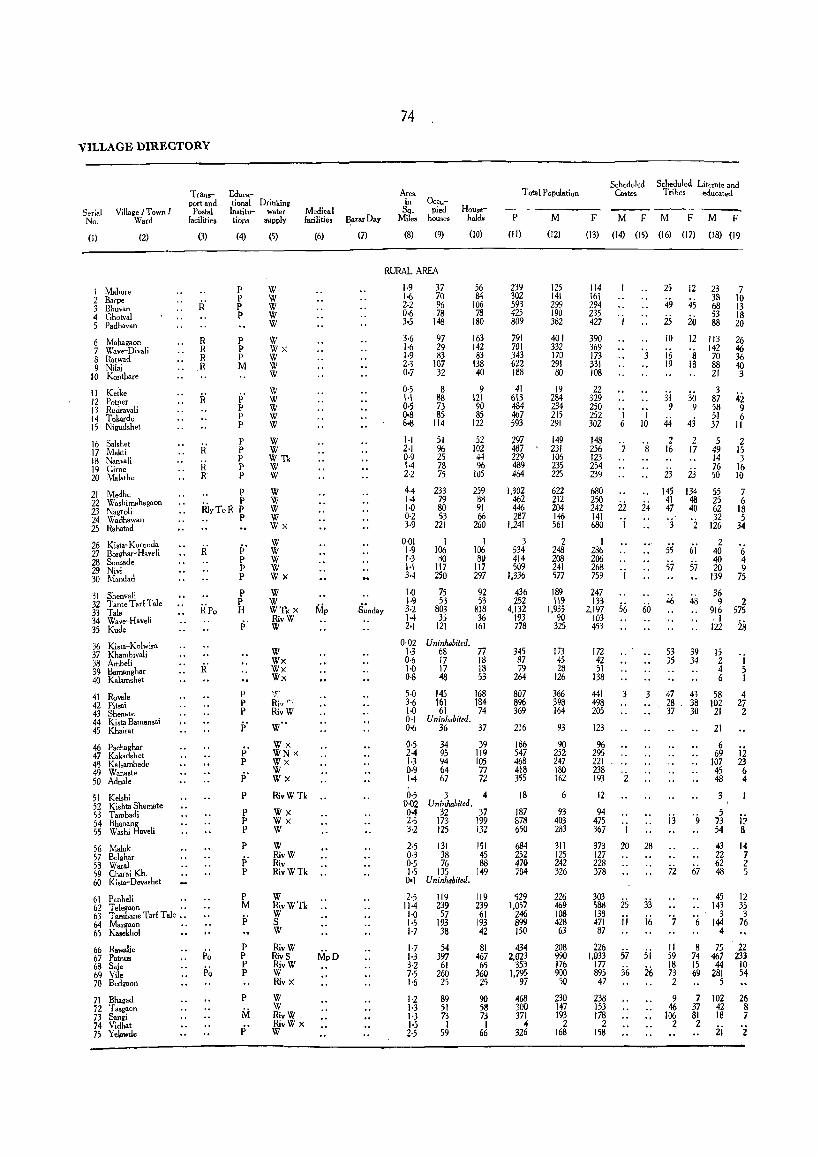
VILLAGE DIRECTORY
Serial No.
Village IT own I Ward
(1)
1 Mahure 2 Barpe 3 Bhuvan 4 Ghotval 5 Padh.van
(2)
6 Mah.gaon 7 \(Tave-Divali 8 Ratwad 9 Nilai
10 Konthare
II Keike 12 Potner 13 Rudravali 14 Tokarde 15 Nigudshet
16 Salshet 17 Makti 18 Nanvali 19 Gime 20 Malathe
21 Medhe 22 Wa,himahagaon 23 Nagroli 24 W.dh.wan 25 Rahatad
26 Ki,ta-Kuronda 27 Borghar-Haveli 28 Sonsade 29 Nivi 30 Mandad
31 Shenvali 32 Tame TarlTale 33 Tala 34 Wave-Haveli 35 Kude
36 Kista-Kolwira 37 Khambivali 38 Ambeli 39 Barnanghar 40 Kalamshet
41 Rovale 42 Pitsai 43 Shenate 44 Kista Bamansai 45 Khairat
46 Pachaghar 47 Kakadshet 48 Kalsambade 49 Wanaste 50 Adnale
51 Kelshi 52 Kishla Shemate 53 Tambadi 54 Bhanang 55 Washi Haveli
56 Maluk 57 Belghar 58 Wala! 59 Charai Kh. 60 Ki,ta-Devashet
61 Panheli •• 62 T eleg.on .. 63 Tamhane Tarl Tale,. 64 Mazgaon 65 Kasekhol
66 R.walie 67 Patnus 68 Saie 69 Vile 70 Bedgoon
71 Bhagad 72 Ta,gacn 73 Sangi 74 Vidhat 75 Yelawde
Educa-Transport and
Postal facilities
tional Drinking Institu- water tions supply
Medic. 1 facilities
(3) (4) (5)
R
R R R R
k'
R' R R
p p p p
P P P M
p' P P P
P p p p p
P .. P RlyToR P
P
i> p p p
P p H
p'
p p p
p'
p' p
P' p
p p p
P
p' P
P M p'
p p P P
P
M p'
W W W W W
W Wx W W W
W W W W W
W W W Tk W W
W W W W Wx
W W W W Wx
W W WTkx RivW W
W Wx Wx Wx
\~,T
Riv \~,
RivW
W"
Wx WNx Wx W Wx
RivWTk
Wx Wx W
W RivW Riv RivWTk
W RivWTk W S W
RivW RivS RivW W Rivx
W W RivW RivW X W
(6)
B.azarDay
(7)
S~nd.y
74
Are. in
Sq. Miles
(8)
Occupied
houses
(9)
RURAL AREA
1·9 1-6 2·2 0·6 3·5
3·6 1·6 1·9 2·3 0·7
0·5 1·1 0·5 (}OS 8·8
1·1 2·1 0·9 1·4 2·2
4·4 1·4 1·0 0·2 3·9
0·01 1·9 1·3 1·1 3·4
1·0 1·9 3·2 14 2,1
37 70 96 78
148
97 29 83
107 32
8 88 73 85
114
51 96 25 78 75
233 79 80 53
221
I 106 80
117 250
75 53
803 35
121
Households
(10)
56 84
106 78
180
163 142 83
138 40
9 121 90 85
122
52 102 44 %
105
259 88 91 66
260
1 106 80
117 297
92 53
818 36
161
0·02 Uninhabited. 1·3 68 77 0·6 17 1$ 1·0 17 18 0·8 48 53
5·0 145 168 3·6 161 184 1·0 61 74 0·1 Uninhabited. 0-6 36 37
0,5 34 39 2·4 95 119 1·3 94 105 0·9 64 77 1·4 67 72
0·5 3 4 0·02 Uninhabited. 0·4 32 37 2·5 173 199 3·2 125 132
2·5 131 151 0·3 38 45 0·5 76 88 1·5 135 149 0.1 Uninhabited.
2·5 11·4 1'0 1·5 1·7
1·7 J.3 3·2 7·5 1'6
1·2 1·3 1·3 1·5 2·5
119 239 57
193 38
54 397
61 260 25
S9 51 73 I
59
119 239 61
193 42
81 467 65
360 25
90 58 73 1
66
Total Population
P M F
(11) (12) (13)
239 302 593 425 809
791 701 343 622 188
41 613 484 467 593
297 487 229 489 464
1,302 462 446 287
1,241
3 534 414 509
1.336
436 252
4.132 193 778
345 87 79
264
807 896 369
216
186 547 468 418 355
18
187 878 650
684 252 470 704
529 1,057
246 899 150
434 2,023
353 1.795
97
468 300 371
4 326
125 141 299 190 382
401 332 170 291 80
19 284 234 215 291
149 231 106 235 225
622 212 204 146 561
2 248 208 241 577
189 119
1,935 90
325
173 45 28
126
366 398 164
93
90 252 247 180 162
6
93 403 283
311 125 242 326
226 469 108 428 63
208 990 176 900
50
230 147 193
2 168
114 161 294 235 427
390 369 173 331 108
22 329 250 252 302
148 256 123 254 239
680 250 242 141 680
I 286 206 268 759
247 133
2,197 103 453
172 42 51
138
441 498 205
123
96 295 221 238 193
12
94 475 367
373 127 228 378
303 588 138 471 87
226 1,033
177 895
47
238 153 178
2 158
Scheduled Scheduled Literate and Castes Tribes educated
M F M F M F
(18) (19 (14) (15) (16) (17)
I 6
7
22 'i
56
3
'i 20
25 ij
57 ji,
3
I 10
8
24
60
3
28
33 i6
5i 26
25 12
49 45
25 20 10 12
16 8 19 18
3i 30 9 9
44 43 2 2
16 17
23 23
145 134 41 48 47 40
'j '2
55 57
46
61
57
48
23 38 68 53 88
113 142 70 88 21
3 87 58 51 37
5 49 14 76 50
55 25 62 32
126
2
7 10 13 18 20
26 46 36 40 3
42 9 6
II
2 15 3
16 10
7 6
18 5
34
40 6 40 4 20 9
139 75
36 9 2
916 575 . I . 122 28
53 39 15 35 34 2 I
47 28 37
ij
72
43 38 30
67
4 5 6 I
58 102
21
21
6 69
107 45 48
3
5 73 54
43 22 62 48
45 143
3 144
4
4 27 2
ii 23 6 4
i:! a 14 7 2 5
12 35 3
76
II 59 18 73 2
8 75 74 467
22 233
10 54
9 46
106 2
IS 44 69 281
7 37 SI 2
5
102 42 18
ii
26 8 7
'2
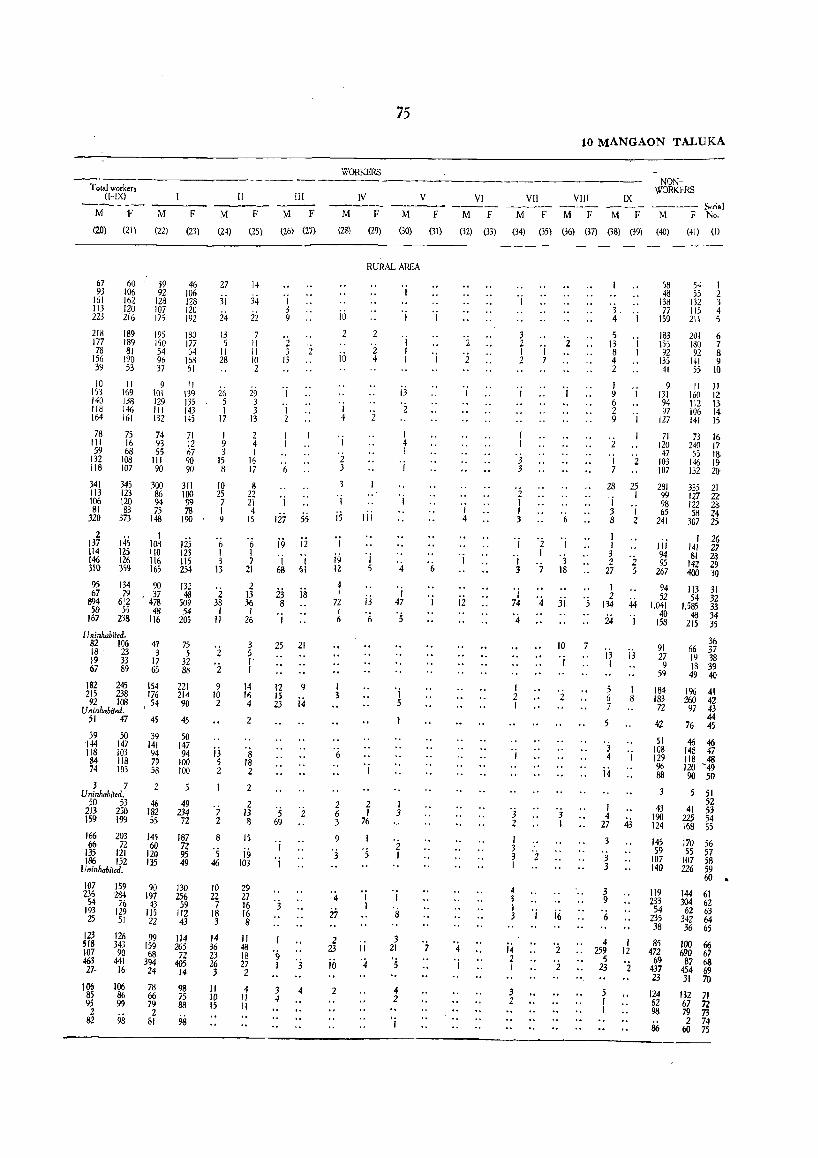
T olal workers (HX) II -------- ------- --------M F
(20) (21)
M
(22)
F
(23)
67 60 39 46 93 106
161 162 92 106
113 120 128 128
223 216 107 120 175 192
218 177 78
156 39
189 189 81
190 53
195 150 54 96 37
ISO 177 64
168 51
10 II 9 II 153 169 10\ \39 I~ I~ I~ I~ 118 146 III 143 164 161 132 145
78 III 59
132 118
341 113 106 81
320
2 137 114 146 310
95 67
894 50
167
75 16 68
108 107
345 123 120 83
373
145 125 126 359
74 93 55
III 90
300 86 94 75
148
I 108 110 116 16S
134 90 79 ° 37
612 478 )5 48
238 116
Uninhabitedo 82 106 18 23 19 33 67 89
47 3
17 6S
182 245 154 21S 238 176 92 108 ,54
U "inhabitedo 51 47 45
39 50 39 144 147 141 118 103 94 84 118 79 74 103 58
3 7 2 U ninhabitedo
50 53 46 213 250 182 159 199 55
166 203 145 66 72 60
135 121 120 186 152 135
Uninhabitedo
107 236
54 193 25
123 518 107 463 27-
106 85 95 2
82
159 284 76
129 51
126 343 90
441 16
106 86 99
98
90 197
43 115 22
99 159 68
394 24
78 66 79 2
81
71 12 67 90 90
311 100 99 78
190
IZ5 123 lIS 254
132 48
509 54
205
75 5
32 88
221 214 90
45
50 147 94
100 100
49 234
72
187 72 95 49
130 2)6 59
112 43
114 265
72 405
14
98 75 88
98
M F
(24) (25)
27
3i 24 13 5
II 28
26 5 I
17
I 9 3
15 8
10 25 7 I 9
°6 I 3
13
2 38 I
IJ
2
°i 9
10 2
j3 5 2
I
°7 2
8 °5 46
10 22 7
18 3
14 36 23 26 3
II 10 15
14
34 2Z 7
11 II 10 2
29 3 3
13
2 4 I
16 17
8 22 21 4
15
'6 1 7
21
2 13 36 I
26
3 5 I I
14 16 4
2
Os 18 2
2
2 13 8
15
j9 103
29 27 16 16 8
II 48 18 27 2
4 II 11
III
M F
(26) (27)
OJ
3 9
2 3 2
13
OJ
I 2
OJ
127 55
19 ;2 °i I 68 61
23 18 8
I
25 21
12 9 15 23 i4
°5 2 69
I OJ
° j
9 I j
3 4 4
WORKERS
IV
M F
(2B) (29)
75
M
(30)
RURAL AREA
10
10
I 4
OJ
2 3
3 OJ
is '; i9 12
4 I
72 I 6
1 3
2 6 3
9
3
4
27
2 23
i6
2
2
2 4
2
III
OJ
5
jj 0;'
2 I
76
OJ
I
II °4
jj
2
I 4 I
I
4
I 47 °5
OJ
5
I 3
2 I
I
8
3 21
5
4 2
V
F
(31)
OJ
6
';
VI VII --- -----M F M F
(32) (33) (34) (35)
2
2
OJ
4
OJ
12
3
T '; 2 7
OJ
3 3
°2 I 1 3
OJ
OJ
3
I 74 °4
1 2 I
°i
"j 2
°4
I 3 3 °2 I
4 3 1 3
;4 2 I
3 2
OJ
10 MANGAON TALUKA
VIII
M F
()6) (37)
IX
M F
OS} (39)
2
OJ
6
I
° :3 18
31
10 OJ
2
3 I
j6
'2 °i
° :3 4 OJ
5 13 OJ 8 I 4 2
I 9 I 6 2 9 °i
°2 I 7
28 OJ
3 8
I I
3 2
27
1 2 '5 134
24
2
25 I
OJ
2
°z 5
44 OJ
13 i3 1
5 1 6 8 7
5
3 4 OJ
i4
I 4
27 43 3
3 3
3 9
°6
4 I 0o 259 12
5 23 2
5 I 1
NONWORKERS
---- Serial !vi F Noo
(40) (41) (I)
58 54 I 48 'is 2
138 J32 3 77 115 4
159 211 5
183 155 92
135 41
201 6 180 7 92 8
141 9 55 IQ
9 II II 131 160 IZ 94 112 n 97 106 14
127 141 15
71 120 47
103 107
281 99 98 65
241
III 94 95
267
94 52
1,041 40
158
91 27 9
59
184 183 72
42
51 108 129 96 88
43 190 124
145 59
107 140
JJ9 233 54
235 38
85 472
69 437 23
124 62 98
86
73 II'> 240 17 )5 H~
146 19 132 20
335 21 127 22 122 21S 58 24
307 25
I 26 141 27 81 28
142 29 400 30
1J3 31 54 32
1,585 33 48 34
215 35
36 66 37 19 38 \B 39 49 40
196 41 260 42
97 43 44
76 45
46 46 148 47 JJ8 48 120 -49 90 50
51 52
41 53 225 54 168 55
170 56 55 57
107 58 226 59
60 •
144 61 304 62
62 63 342 64 36 65
100 66 690 67
87 68 454 69 31 70
132 71 67 72 79 73 2 74
60 75
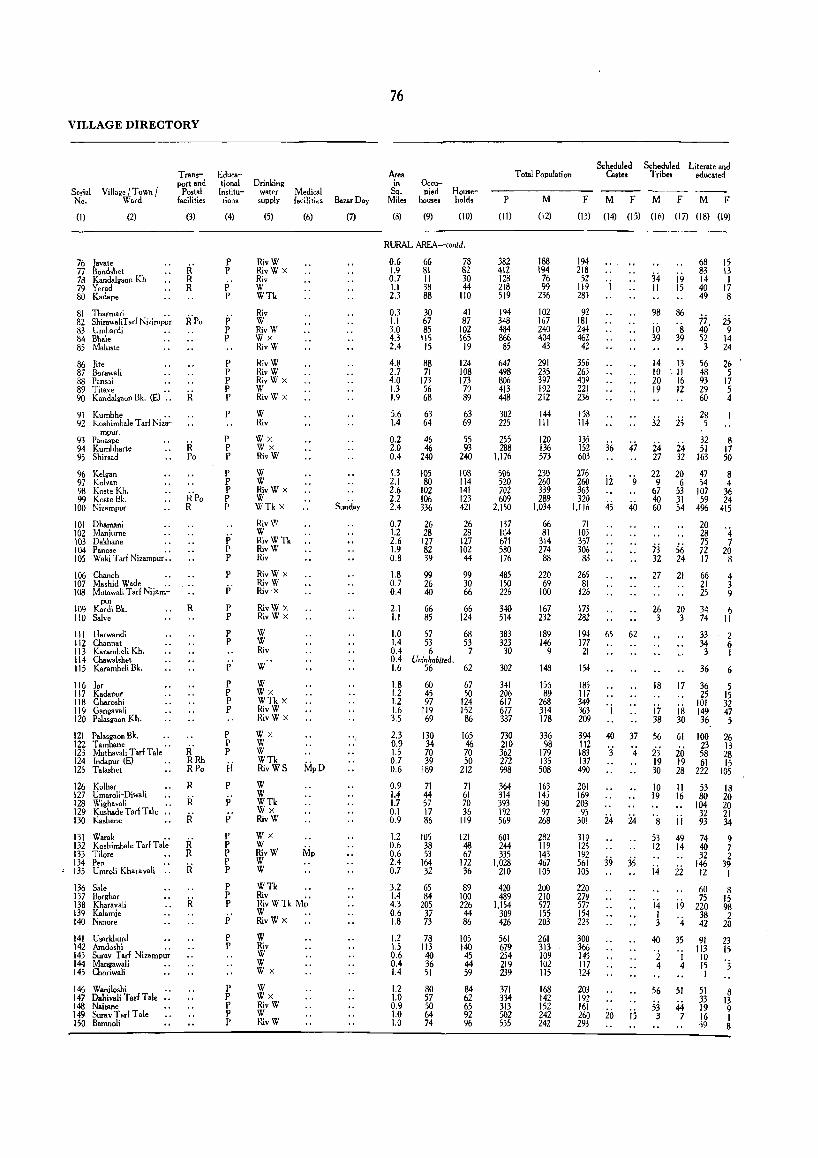
VILLAGE DIRECTORY
Serial No.
Village fTown I Ward
(I) (2)
76 Javate 77 Bondshe! 78 Kandalgaon Kh 79 Yerad 80 Kadape
TranspOrt and Po.tal
facilities
(3)
R' R R
81 Thormari . . . . 82 ShirawaliTarl Nizirnpur R Po 83 Umbardi 1>4 Bhale 85 Maluste
86 Jite 87 Borawali 88 Pans3.i 89 Titave •... 90 Kandalgaon Bk. (E) .. R
91 Kumbhe .. 92 Koshimbale Tar! Niza-
mpur. 93 Panaspe 94 Kumbharte 95 Shirsad
96 Kelgan 97 Kolvan 98 Koste Kh. 99 Koste Bk.
100 Nizampur
101 Dharnani 102 Manjume 103 Dakbane 104 Panose .• 105 Waki TarINizampur ..
106 Chaneh 107 Mashid Wade .. 108 Mutawali Tarl Nijam-
pUT
109 Kardi Bk. 110 Salve
111 Harwandi 112 Channat 113 Kararnbeli Kh. 114 Chawalshet 115 Karambeli Bk.
116 Jor 117 Kadapur 118 Gharoshi 119 Gangavali 120 Palasgaon Kh.
121 Palasgaon Bk. 122 Tamhane 123 Muthavali Tad Tale 124 Indapur (E) 125 T alashet
126 Kolhar 127 Umaroli-Diwali 128 Wighavali .. 129 Kushade Tarl Tale 130 Kashene
131 Warak .. 132 Koshimbale T arf Tale 133 Tilor. 134 Peo 135 Umroli Kharavali
136 Sale 137 Borghar 138 Kharavali 139 Kalamj. 140 Nanor.
141 Usarkhurd 142 Amdoshi .. 143 Surav Tarl Nizampur 144 Mangawali 145 Choriwali
146 Waniloshi .. 147 Dahivali TarE Tale 148 Naitane 149 SuravTarfTale 150 Barnnoli
R Po
R
R' RRh RPo
R
R R'
R' R
R
Edueational
Institutions
(4)
f' p
P P
p' p P
P P P P P
P
P P P
P P P p P
p P P
P
p'
P P
P P
p
P P P p
P P P
H P
P
P
P P P p P
P P p
p
P P
P P P P P
Drinking water supply
(5)
RivW RivW X Riv W WTk
Riv W RivW Wx RivW
RivW RivW RivW X W RivW X
W Riv
WX Wx RivW
W W RivW X W WTk X
Riv \VI W RivWTk RivW Riv
RivW X RivW Riv'x
RivW X RivW X
W W Riv
W
W Wx WTkx RivW RivW X
Wx W W WTk RivWS
W W WTk Wx RivW
Medical facillties
(6)
WX W RivW Mp W W
WTk Riv •• RivWTk l\1p W RivW X
W Riv W W Wx
W Wx RivW W nivW
Bazar Day
(7)
Su~.iay
76
Ar.a in
Sq. Miles
(8)
Occupied
houses
(9)
House"'" hold.
(10)
RURAL AREA-contd.
0.6 1.9 0.7 1.1 2.3
0.3 1.1 3.0 4.3 2.4
4.8 2.7 4.0 1.3 1.9
5.6 1.4
0.2 2.0 0.4
1.3 2.1 2.6 2.2 2.4
0.7 1.2 2.6 1.9 0.8
1.8 0.7 0.4
66 81 11 38 88
30 67 85
115 15
88 71
173 56 68
63 64
46 46
240
105 80
102 106 336
26 28
127 82 39
99 26 40
2.1 66 1.1 85
1.0 57 1.4 53 0.4 6 0.4 Uninhabited. 1.6 56
1.8 1.2 1.2 1.6 3.5
2.3 0.9 1.5 0.7 0.6
0.9 1.4 1.7 0.1 0.9
1.2 0.6 0.6 2.4 0.7
3.2 1.4 4.3 0.6 1.8
1.2 1.5 0.6 0.4 1.4
1.2 1.0 0.9 1.0 1.0
60 45 97
119 69
130 34 70 39
189
71 44 57 17 86
105 38 53
164 32
65 84
205 37 73
78 113 40 36 51
80 57 50 64 74
78 82 30 44
110
41 87
102 165 19
124 108 173 79 89
63 69
55 93
240
IDS 114 141 123 421
26 28
127 102 44
99 30 66
66 124
68 53 7
62
67 50
124 152 86
165 46 70 50
212
71 61 70 36
119
121 48 67
172 36
89 100 226 44 86
105 140
45 44 59
84 62 65 92 96
Total Population
P M F
(II) (12) (13)
382 412 128 218 519
194 348 484 866
85
647 498 806 413 448
302 225
255 288
1.176
506 520 702 609
2.150
137 11]4 671 580 176
485 150 226
340 514
383 323
30
302
341 206 617 677 387
730 210 362 272 998
364 314 393 192 569
188 194
76 99
236
102 167 240 404
43
291 235 397 192 212
144 111
120 136 573
230 260 339 289
1.034
66 81
314 274 88
220 69
100
167 232
189 1-16
9
148
155 89
268 314 178
336 98
179 135 508
163 14j 190 97
268
194 218
52 119 283
92 181 244 462 42
356 263 409 221 236
158 114
135 152 603
276 260 363 320
1.116
71 103 357 306
88
265 81
126
173 282
194 177
21
154
185 117 349 363 209
394 112 183 137 490
201 169 203
95 301
319 125
Scheduled Scheduled Literate and Castes Tribes educated
M F M F M F
(14) (15) (16) (17) (18) (19)
'j
36 47
ii 9
45 40
65 62
40 37
'3 4
24 24
34 II
98
io 39
i9 15
86
8 39
68 83 14 40 49
15 13 I
17 8
77. 25 40 9 52 14 3 24
14 13 56 26 10.11 485 20 16 93 17 19 12 29 5
60 4
32 2S 28 5
24 27
22 9
67 40 60
73 32
27
26 3
18
i7 38
56
23 19 30
10 19
8
53 12
24 32
32 51
163
20 47 6 54
53 107 31 59 54 496
56 24
21
20 3
17
18 30
20 28 75 72 17
66 21 25
34 74
33 34 3
36
36 25
101 149 36
61 100
26 l~ 19 61 28 222
11 16
11
49 14
53 80
104 32 93
8 17 50
8 4
36 24
415
'4 7
20 8
4 3 9
" II
2 6 I
6
5 15 32 47 5
26 13 28 15
105
18 20 20 21 34
601 244 335
1.028 210
282 119 143 467 105
192 561 39 35
i.j 22
74 40 32
146
9 7 2
39 I
420 489
1.154 309 426
561 679 254 219 239
371 334 313 502 535
200 210 577 155 203
261 313 109 102 115
168 142 152 242 242
105
220 279 577 154 223
300 366 145 117 124
203 192 161 260 iiJ i5 293
;4 I 3
40
2 4
56
53 3
12
60 75
i9 220 '4' 38
42
35
I 4
51
44 7
91 113
10 15 I
51 33 19 16 59
8 15 98 2
20
23 15
'3
8 13 9 1 8
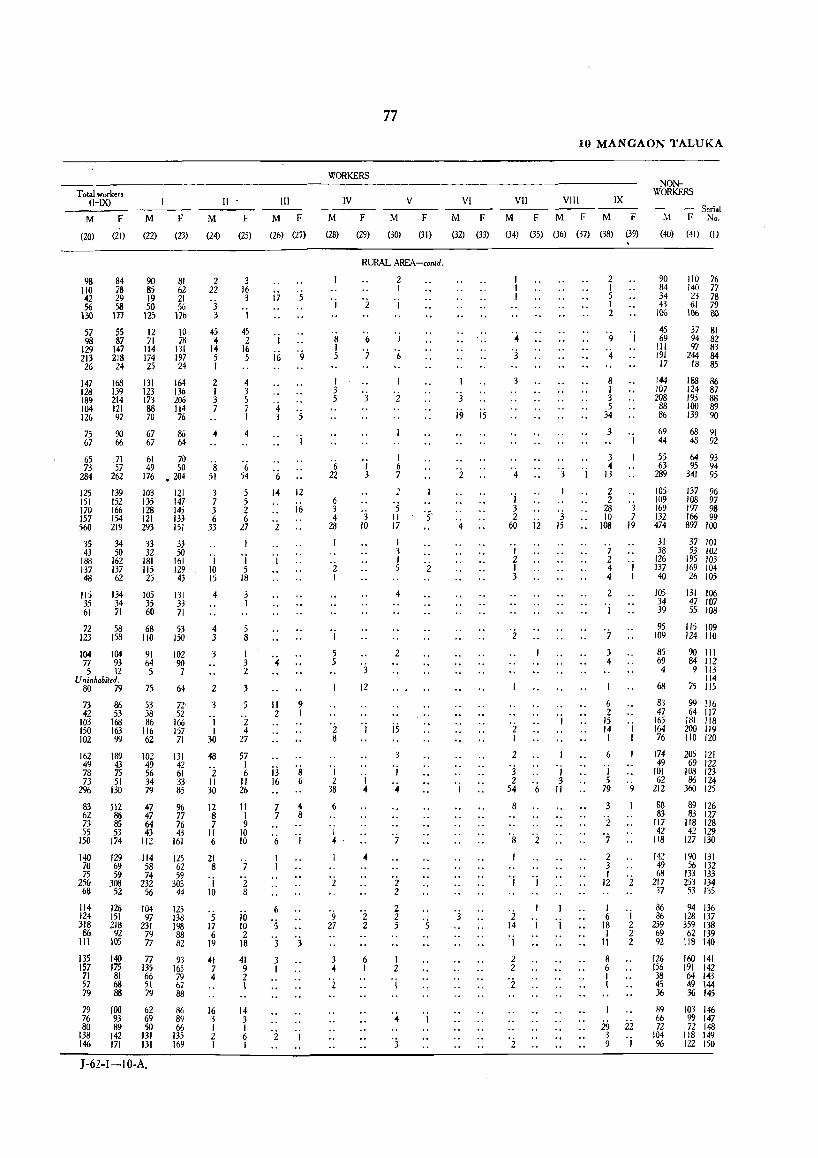
Total workers (!-lX) II
M F M F M F
(20) (21) (22) (23) (24) (25)
98 84 110 78 42 29 56 58
\30 177
57 55 98 87
129 147 213 218 26 24
147 168 128 139 189 214 104 121 126 97
75 67
65 73
284
125 151 170 157 560
35 43
188 137 48
115 35 61
72 123
90 66
.71 57
262
139 152 166 154 219
34 50
162 137 62
134 34 71
58 158
104 104 77 93 5 12
Uninhabited. BO 79
73 86 42 53
103 168 150 163 102 99
162 189 49 43 78 75 73 51
296 130
83 112 62 86 73 85 55 53
150 174
90 81 85 62 19 21 50 56
125 176
12 10 71 78
114 131 174 197 25 24
131 164 123 136 173 206 88 tt4 70 76
67 67
86 64
61 70 49 50
176 • 204
103 121 135 147 128 145 121 133 293 151
33 33 32 50
181 161 115 129 25 43
105 35 60
68 110
91 64 5
75
53 38 86
116 62
102 49 56 34 79
47 47 64 43
112
131 33 71
53 150
102 90 7
64
72 52
166 157
71
131 42 61 33 85
96 77 76 43
161
140 129 114 125 70 69 58 62 75 59 74 59
250 308 232 303 68 52 56 44
114 126 104 124 151 97 318 218 231 86 92 79
III lOS 77
135 157 71 57 79
79 76 80
138 146
140 175 81 68 88
100 93 89
142 171
77 135 66 51 79
62 69 50
131 131
J-6Z-I-IO-A.
125 138 198 88 82
93 165 79 67 88
86 89 66
135 169
2 22
3 3
45 4
14 5 I
2 I 3 7
·s 51
3 7 3 6
33
.j 10 15
4
4 3
3
2
3 .j I
30
48
·2 II 30
12 8 7
II 6
21 8
I 10
·s 17 6
19
41 7 ..
16 3 I 2 I
3 16 3
1
45 2
16 5
4 3 5 7 I
4
6 54
5 5 2 6
27
.j 5
18
5 8
I 3 2
3
5
·2 4
27
57 I 6
II 26
II I 9
10 10
7
2 8
j6 10 2
18
41 9 2 \
14 3 1 6 I
1lI
M F
(26) (27)
17 5
I
16 ·9
6
14
2
4
.j
12
16
II 9 2 I
j3 ·S 16 6
7 4 7 8
6 .j
6
's 3 3
3 I
·2 I
77
WORKERS
IV V
M F M F
(28) (29) (30) (31)
RURAL AREA-con/d.
.j
8 I 5
I 3 5
6 22
6 3 4
28
·2 I
I
5 5
·2 8
.j 2
38
6
2
·9 27
3 .. ·i
(>
·7
3
'j 3
3 10
·3
12
.j 4
·2 z
6 I
2 I
.j
2
I 6 7
2
·5 II 17
2
js
3 .j
..
2 2
2 2 5
I 2
·i
3
2
VI
M F
(32) (33)
"j
19 15
4
10 MANGAON TALUKA
NONWORKERS
VII Vlll IX ------ Serial
M FMFM F MFNo.
(34) (35) (36) (37) (38) (39) (40) (41) (I)
3
.j 3 2
60
I 2 I 3
2 I
2
"3 2
12
54 6
8
8 2
I I
2
.j 15
OJ
I 3 II
14 I 1 .j
2 2
·i
.j
2 I 5 I 2
8 I 3 5
34
3
3 .. 13
2 2
28 10
108
7 2 4 4
2
I
·7 3 4
6 2
15
I
3 7
19
.j I
14 I I I
6
I 5
79 9
3
·2 7
90 110 76 84 140 77 34 23 78 43 61 79
1% 1% 80
45 37 81 69 94 82 III 97 83 191 244 84 17 18 85
144 107 208 88 86
69 44
55 63
289
105 109 169 132 474
31 38
126 137 40
105 34 39
95 109
85 69 4
68
83 47
165 164 76
174 49
101 62
212
80 83
117 42
118
188 86 124 87 195 88 100 89 139 90
68 91 48 92
64 93 95 94
341 95
137 96 108 97 197 98 166 99 897 100
37 101 53 102
195 103 169 104 26 105
131 106 47 107 55 108
115 109 124 110
90 III 84 112 9 113
114 75 115
99 116 64 117
181 118 200 119 110 120
205 121 69 122
108 123 86 124
360 125
89 126 83 127
118 128 42 129
127 130
2 142 190 131 56 132
133 133 zj3 134
3 49 I 68
12 2 217 37
I 86 6 . j 86
18 2 259 I 2 69
II Z 92
8 6 I 1
29 22 3 9 I
126 156 38 45 36
89 66 72
104 96
53 135
94 136 128 137 359 138 62 139
118 140
160 141 191 142 64 143 49 144 36 145
103 146 99 147 72 148
118 149 122 150
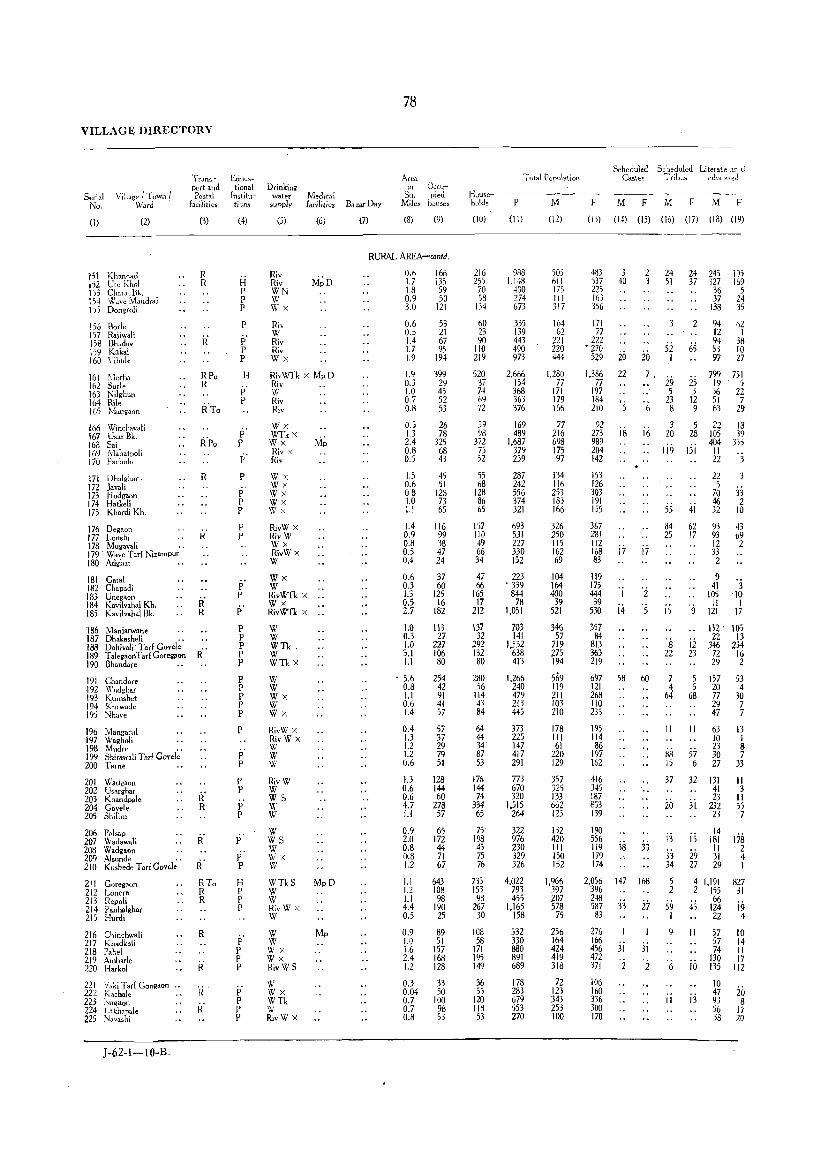
VILLAGE DIRECTORY
Serial No.
Vill£ig~ / Town! \Vard
(1) (2)
i51 Khon<lad 1';2 Ute Kiwi l53 Charai \:lk. 154 ~/ <.l.ve M .. mdraj 15j Dongroli
156 Borle 157 Rajiwali 158 Bhoday 159 Kokal 160 \'il,ule
161 ~tlorba 162 Surle 163 Nilghun 164 Rile 165 Mapgaon
166 Winchavali 167 Usar Bk. 168 Sai 169 Mahatpoli 170 Pachale
171 Dhalghar· 172 Javali 173 Hadgaon 174 Hatkeli 175 Khardi Kh.
Tr:msport and Postal
bcilities
(3)
R R
RPo R
R
176 Degaon 177 Lonshi R 178 Mugavali .. 179 Wave Tarl Nizampur 180 Adghar
181 Garal 182 Ch.padi 183 Unegaon 184 Kavilvahal Kh. R' 185 Kavilyahal Bk. R
186 Manjatwane 187 Dhaka,heli .. 188 Dahivali' Tarl Govele 189 T alegaon T ad Gorellllon R . 190 Bhandare
19'1 Chandore ·192 Wadghar 193 Kumshet 194 Kurwade 195 Nh.ve
196 Mangarul 197 Wagholi 198 Mudr. .. 199 Shira",.]i Tarl Govele 200 Tarne
201 Wadgaon 202 Usarghar 203 Khandpale 204 Covele 205 Shilim
206 P,lsap 207 Wadawali 208 Wadg.on 209 AI,unde .. 210 Kushede TarlGovele
211 Caregaon 212 Lonera 213 Repoli 214 Panhalghar 215 Hurdi
216 C',inchwali 217 Khadkoli 218 Pahel 219 AmharIe 220 Harkol
221 '!aki Tad Gongaon .. 222 Kaohale 223 Nagaon 224 bkhonale 225 Naynshi
1-62-1-1 D-B.
R' R
RTo R R
R
ri R
EQUL<I
tional Institutj.';ns
(4)
i-i p p p
P
p' P P
H
p' P
p' p
p' p
p' P P
p p
p P
P' P P P P P
P P P P P
P
p' P
P P
P P
f p' P
H p p P
P P P P
p P p P
Drinking water Medical
supply facilities
(5)
Riv Riv WN W Wx
Riv W Riv Riv Wx
(6)
Riv \Vfk X Mp D Riv W Riv Riv
Wx WTkx W X M~ Riv>: Riv
Wx Wx Wx wx Wx
RivW X RivW Wx RivWX W
Wx W RivWI"k X •• Wx RivWI"k X ••
W W WTk. W WTkx
W W Wx W Wx
RivW X RivW X W W W
RivW W WS W W
\V WS W 'II; X W
WTkS MpD W W RivW X W
W W Wx Wx RivWS
w Wx WTk W RivW X
78
Area in Occu-
Sq. pied Bazar Day Miles houses
(7) (8) (9)
RURAL AREA-wnld.
0.6 1.7 1.8 0.9 3.0
0.6 0.5 1.4 1.7 1.9
1.9 0.3 1.0 0.7 0.8
0.5 1.3 2.4 0.8 0.5
1.5 0.6 08 1.0 1.1
1.4 0.9 0.8 0.5 0.4
0.6 OJ 1.3 0.5 2.7
1.0 0.3 1.0 3.1 1.1
• 5.6 0.8 1.1 0.6 1.4
0.4 1.3 1.2 1.2 0.6
1.3 0.6 0.6 4.7 1.1
0.9 2.0 0.8 [i..8 1.2
1.1 1.2 1.1 4.4 0.5
0.9 1.0 1.6 2.4 1.2
166 ;35 59 50
121
53 21 67 95
194
399 29 45 52 53
26 78
325 68 43
45 51
128 73 65
116 99 38 47 24
37 60
125 16
182
113 27
2}7 106 80
254 42 91 41 57
57 37 29 79 51
128 144 60
278 57
65 172 44 71 67
643 108 98
190 25
89 51
157 168 128
0.3 33 0.04 50 0.7 100 0.7 98 0.8 53
Househ"lds
(10)
216 255
70 58
134
60 23 90
110 219
520 37 74 69 72
39 98
372 75 52
55 68
128 86 65
157 110 49 66 34
47 66
165 17
212
137 32
292 132 80
280 56
114 43 84
64 44 34 87 53
176 144 74
334 65
75 198 45 75 76
735 153 98
267 30
108 58
171 195 149
36 55
120 118
53
Total Population
P M
(11)
9il8 1,148
400 274 673
335 139 443 490 973
2,666 154 368 363 376
169 489
1,687 379 239
287 242 556 374 321
693 531 227 330 152
223 . 339
844 78
1,051
703 141
1,:32 638 413
1,266 240 479 213 445
373 225 147 417 291
773 670 320
1,515 264
322 976 230 329 326
4,022 793 455
1,165 158
532 330 880 891 689
178 283 679 553 270
(12)
505 611 175 III 317
164 62
221 220 444
1,280 17
171 179 166
77 216 698 175 97
134 116 253 183 166
326 250 115 162 69
104 164 400 39
521
346 57
719 275 194
569 119 211 103 210
178 III 61
220 129
357 325 133 662 IZj
132 420 III 150 152
1,966 397 207 578
75
256 164 424 419 318
72 123 343 253 100
Scheduled Scheduled Literate an d Cast~ T r~bes cduU' .. .-~cd
F M F M F M F
(13) (1~) (Jj) (16) (17) (18) (19)
483 3 2 24 24 245 105 537 40 3 51 37 327 169 225 163 356
171 77
222 , 270
529 20
1,386 77
197 184 210
92 273 989 204 142
22
,. 5
18
iiJ 7.
6
16
52 I
29 5
23 8
3 20
119
2
65
2S 3
12 9
5 28
131
36 5 37 24
138 35
94 12 94 53 97
62 I
38 10 27
799 751 19 5 56 22 51 7 63 29
22 18 105 39 404 35,
11 '3 22 5
70 33
153 126 303 191 ISS 55 .ji
46 2 32 10
367 281 112 168 83
119 175 444 39
530
357 84
813 363 219
697 121 268 110 235
195 114 86
197 t62
416 345 187 853 139
190 556 119 179 174
i7
I
i4
58
38
i7
'2 5
60
33
84 25
is
's 22
11
88 is
37
20
i3 33 34
2,056 147 168 5 396 2 248 587 33 i7 S9
83 I
276 166 456 472 371
106 160 336 300 170
31
2
31
2
9
ii
62 93 43 17 93 69
12 2 33 2
9 41
105 II
121
132'
iz .3~ 23 72
29
5 157 5 20
68 77
II
57 6
32
3t
15
29 27
29 47
63 10 23 30 27
131 41 23
232 23
14 181 II 31 29
3 '10
I 17
105 13
2)4 16 2
53 4
30 7 7
J3 i 8 7
33
11 3
II 55 7
178 2 4 I
4 1,191 827 2 155 31
4S 1~~ i9
11
10
i:i
22 4
57 57 74
130 135
10 14 II 17
112
10 47 20 93 8 56 17 38 20
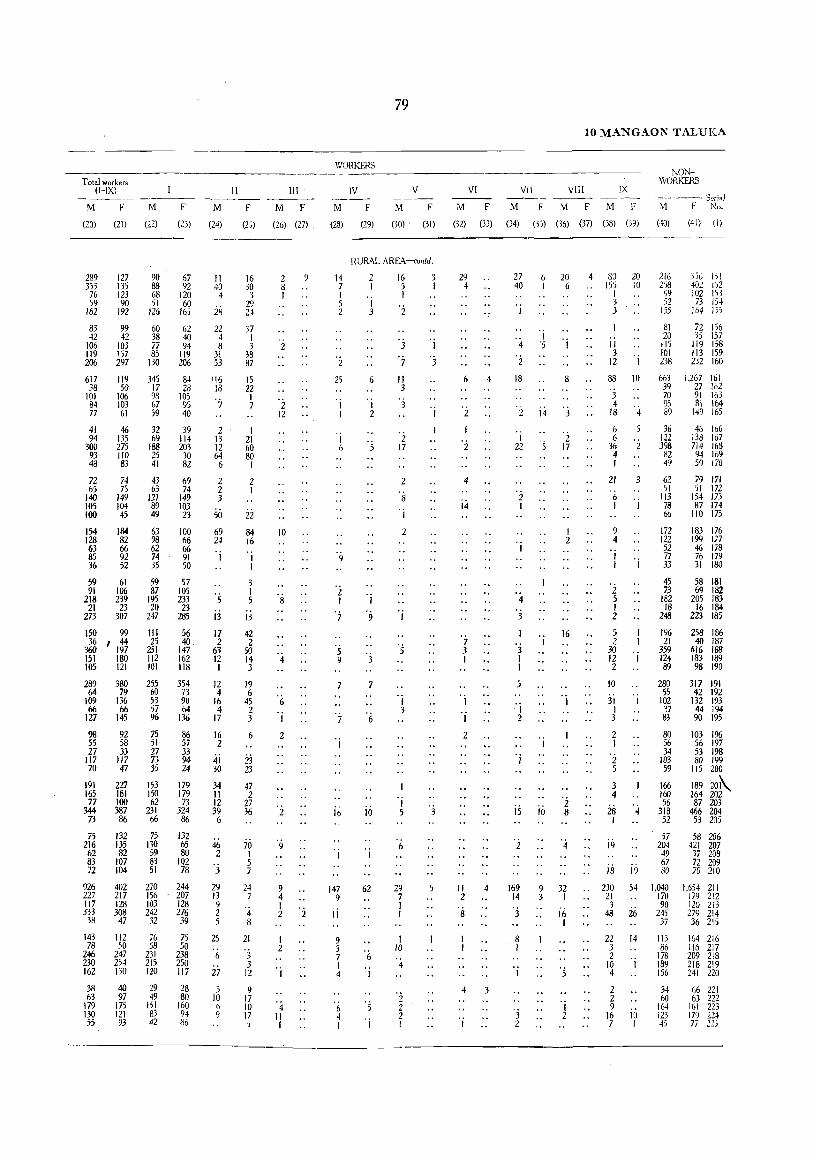
Total workers (i-IX)
M F
(20) (21)
289 353
76 59
162
83 42
106 119 206
617 38
101 84 77
127 135 123 90
192
99 42
103 157 297
119 50
106 103 61
41 46 94 135
300 275 93 110 48 B3
7Z 74 65 75
140 149 105 104 100 45
154 128 63 85 36
184 82 66 92 52
59 61 91 106
218 239 21 23
273 307
150 99 36 I 44
360 197 151 180 105 121
M
(22)
90 88 68 51
126
60 38 77 85
130
345 17 93 67 39
F
(23)
67 9Z
120 60
165
62 40 94
119 206
84 28
105 95 40
32 39 69 114
188 203 25 30 41 82
43 63
121 89 49
63 98 62 74 35
59 87
195 20
247
III 25
251 112 101
69 74
149 103 23
100 66 66 91 50
57 105 233
23 285
56 40,
147 162 118
289 380 255 354 64 79 60 73 I" 1% ~ ~ 66 66 57 64
IV I~ % 1%
98 55 27
117 70
191 165 77
344 73
75 216 62 83 72
926 227 Il7 333
38
92 58 33
117 47
227 181 100 387 86
132 135 82
107 104
402 217 128 30B
47
143 112 78 50
246 247 230 254 162 130
38 63
179 130 55
40 97
175 121 93
75 51 27 73 35
153 150 62
231 66
75 130 59 83 51
270 156 103 242 32
86 57 33 94 24
179 179 73
324 86
132 65 80
102 78
244 207 128 276 39
76 75 58 50
231 238 215 250 120 117
29 49
151 83 42
28 80
160 94 86
I[
M F
(24) (25)
II 40 4
28 22 4 8
31 53
116 18
'';
2 13 12 64 6
2 2 3
50 69 24 OJ
's jj
17 2
63 12 I
12 4
16 4
17
16 2
.ij 30
34 II 12 39 6
46 2
'j
29 13 9 2 5
25 °6 27
3 10 6 9
16 30 3
29 24
37 1 3
3.8 87
15 22 I 7
I 21 60 80 I
2 I
ii 84 16
I I
3 I 5
jj
42 2
50 14 3
19 6
45 2 3
6
23 23
47 2
27 36
70 I 5 7
24 7
'4 8
21
'3 3
12
9 17 10 17 5
III
M F
(26) (27)
2 8 I
2
° 2 12
10
4
6 OJ
2
2
9
9 4 I 2
1 2
'4 II I
9
2
WORKERS
IV
M F
(28) (29)
79
V
M F
(30)' (31)
RURAL AREA-coold,
14 7 I 5 2
25
16
147 9
ij
9 3 7 I 4
2 I
I 3
6
I 2
'j
9
7
6
10
62
'(,
I
16 5 I
'2
°3 0';
II 3
3
2 17
2
8 OJ
2
I 3
OJ
5
6
29 7 I I
1 10
4
2 2 2 !
'j
VI
M
(32)
29 4
6
4
14
7 3 I
I ° j
2
II 2
's
F
(33)
4
4 3
'j
10 MANGAON TALUKA
NONWOI1KERS
VI[ VIII IX ---~Scr;aJ
M
(34)
F M F M F
(35) (36) (37) (38) (39)
:\1 F No,
(40) (41) (1)
27 6 20 40 I 6
4
'2
I '5
18 8
0:2 14 3
I 2 22 '5 17
'2 I
4
3
j I I
5
I 2
';
j.s
2
169 14
'j
8 I
3 2
'j
iiJ
9 3
I 2
16
°2 8
32 I
;6 I
'5
I 2
4 80 20 155 10
I 3 3
II 3
12 'j
88 10
3 4
18 '4
216 258
99 52
155
81 20
115 101 238
036 151 402 152 102 1)3 73 154
164 155
72 156 35 157
119 158 113 159 232 160
663 10267 161 39 27 162 70 91 163 95 81 1M 89 149 165
6 36 46 166 13d 167 714 163
6 122 36 2 398 4 82 94 169
59 170 I 49
21 3 0(,
I I
9 4
l OJ
°2 5 I 2
5 2
30 12 2
10
3i I I 3
2 I
°2 5
3 4
2S '4 I
i9
;8 ;9 .. 230
21 3
48
54
:26
22 14 3 2
to I 4
2 2 9
16 10 7 I
62 51
113 78 66
172 122 52 77 33
45 73
182 18
248
196 21
359 124 89
79 171 51 172
154 m 87 174
110 175
183 176 199 177 46 178 76 179 31 180
58 181 69 182
205 183 16 184
223 185
258 186 40 187
616 188 183 189 98 190
280 317 191 55 42 192
102 132 193 37 44 194 83 90 195
80 56 34
103 59
166 160 56
318 52
57 204 49 67 80
1,040 170 90
245 37
113 86
178 189 156
34 60
164 123 45
103 196 56 197 53 198 80 199
115 200
189 20~ 164 202 87 203
466 204 53 205
58 206 421 207 37 208 72 209 70 210
1,654 211 179 212 120 213 279 214 36 215
164 216 116 217 209 218 218 219 241 220
66 221 63 222
161 223 179 224 77 225
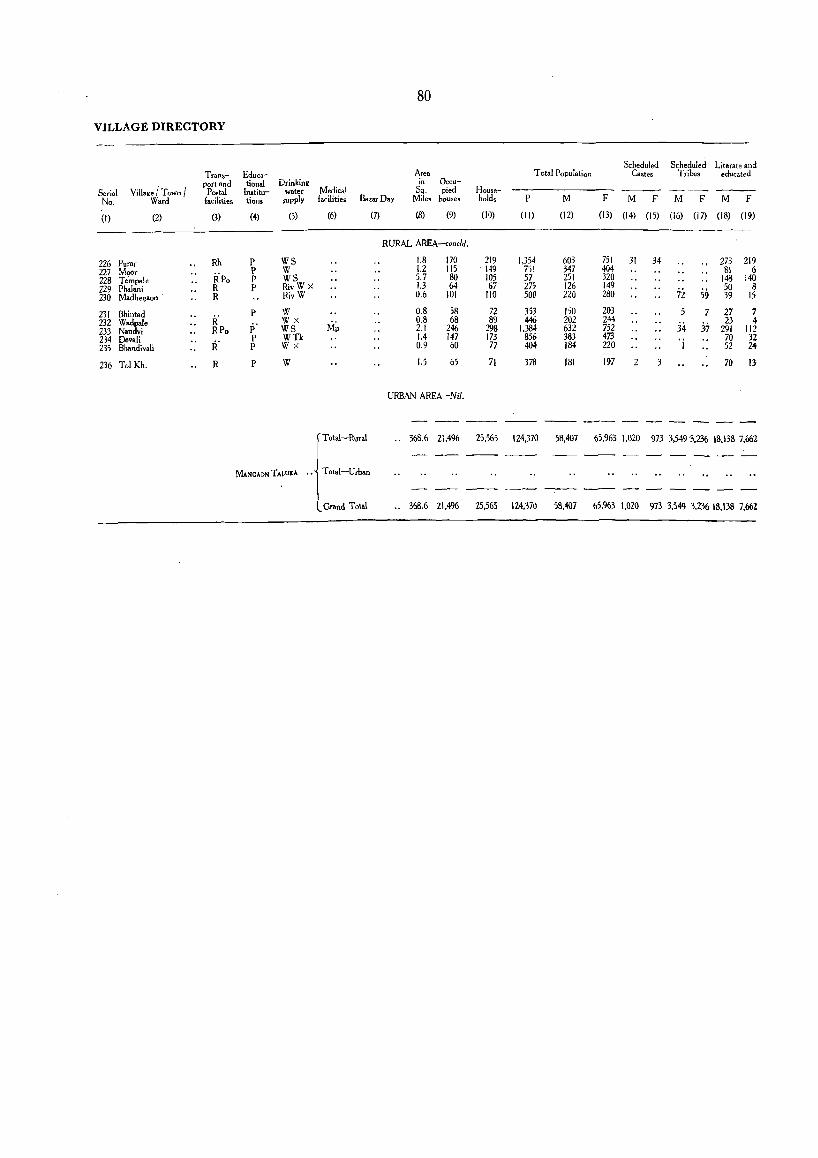
80
VILLAGE DIRECTORY
Scheduled Scheduled Literate and Tra",,- Educa- Area Total Population Castes Tribes educated port and tional Drinking in Occu-
Serial Village I Town I Postal lnstitu- water Medical Sq. pied House-
No. Ward facilities tions ,upply facilities Bazar Day Miles houses hold, P M F M F M F M F
(I) (2) (3) (4) (5) (6) (7) (.'I) (9) (10) (II) (12) (13) (14) (15) (16) (17) (18) (19)
RURAL AREA-cone/d.
226 Purar Rh P WS 1.8 170 219 1,354 603 751 31 34 273 219 227 Moor
RPo p W 1.2 115 149 751 347 404 B1 6
228 Tempale P WS 5.7 80 105 571 251 320 148 140 229 Phal.ni R P RivW>< 1.3 64 67 275 126 149 50 8 230 Madhegaort R RivW 0.6 101 110 500 220 280 72 59 39 15
231 Bhintad P W 0.8 58 72 353 ISO 203 27 7 232 Wadpale R' p' WX
M~ 0.8 6B B9 446 202 244
34 23 4
233 Nandvi RPo WS 2.1 246 298 1,384 632 752 37 291 112 234 Dev.li
R' p wn 1.4 147 173 856 383 473 70 32
235 Bhandivali P Wx 0.9 60 77 404 184 220 I 52 24
236 ToiKh. R P W 1.5 65 71 378 181 197 2 3 70 13
URBAN AREA-Nil.
------------
r~~ .. 368.6 21.496 25.565 124.370 58.407 65.963 1.020 973 3.5493.236 IB.138 7.662
MANGAON TAVlI<A .. Total-Urban
l Grand Total .. 368.6 21.4% 25.565 124.370 58.407 65.%3 1.020 973 3.549 3.23618.138 7.662
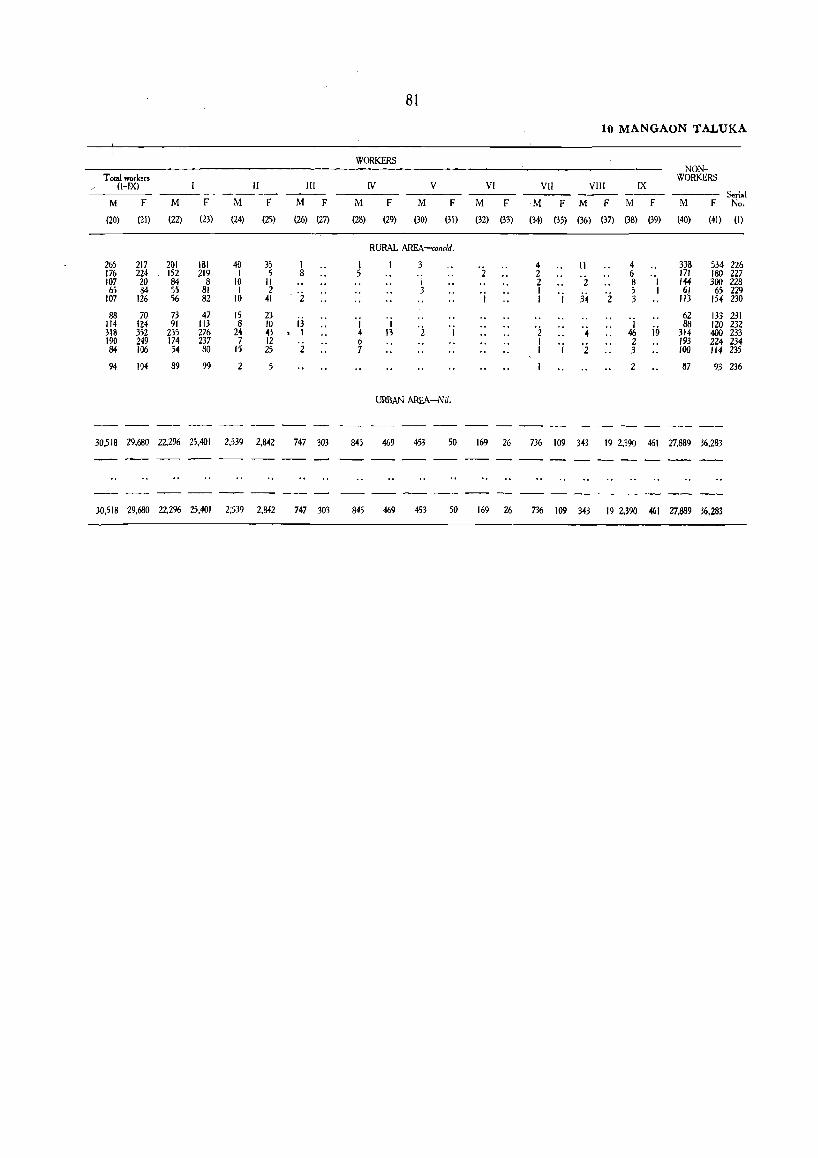
81
10 MANGAON TALUKA
WORKERS NON-
Total Workers WORKERS (I-IX) II III IV V VI VII VIII IX ---- Serial
M F M F M F M F M F M F M F M F M F M F M F No,
(20) (21) (22) (23) (24) (25) (26) (27) (28) (29) (30) (31) (32) (33) (34) (35) (36) (37) (3B) (39) (40) (41) (I)
RURAL AREA--c<>ncld.
265 217 201 181 40 35 I 3 '2 4 II 4 338 534 226 176 224 152 219 1 5 8 2 6 .. 171 ISO 227 107 20 84 8 10 II 1 2 2 8 I 1# 300 228 65 84 55 81 I 2 . '2 3 'j I 'j 34
5 I 61 65 229 107 126 56 82 10 ~I 1 2 3 113 154 230
88 70 73 47 15 23 jj
62 133 231 114 124 91 113 8 10 I I 'i '4 I
i9 88 120 23Z
318 352 235 276 24 43 • I 4 13 1 2 46 314 400 233 190 249 174 237 7 12 6 I 'i 2 193 224 234 84 106 54 80 15 25 2 7 I I 3 100 114 235
94 104 89 99 2 2 H7 93 236
URBAN AREA-Nil,
30.518 29,680 22,296 25,401 2,539 2.842 747 303 845 469 453 50 169 26 736 109 343 19 2,390 461 27,889 36,283
30.518 29,680 22,2% 25.401 2;539 2,842 747 303 845 469 453 50 169 26 736 109 343 19 2,390 461 27.889 36,283

Shrivardhan Mahal
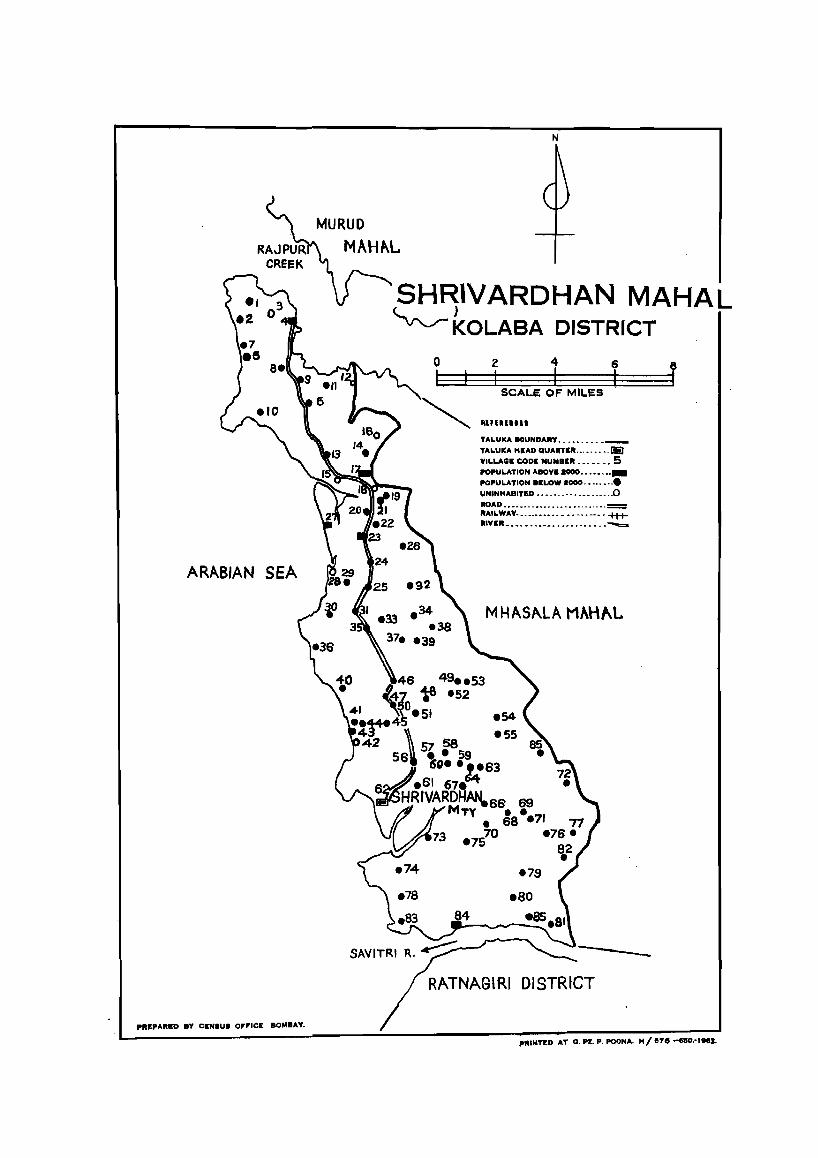
ARABIAN SEA
"REPAItIlD !IV CIINIUI O""ICE BOMBAY.
MURUD
MAHI\L
N
SHRIVARDHAN MAHAL J . ~ KOLASA DISTRICT
o I
Z 4 I I
6
I SCALE OF MILES
'I"UU'" TALUKA IIOUNDAIlY ••.••••••• _ TALUKA Ht:AD QUAIITt:R .•.•.•••. 1iD YILLAGE CODt: NUMBIIt ••••••• S POPULATION ABOVIIOOO •••••.•• _
POPULATION BELOW 1000 •••••••.• UNINHABITt:D •••.• _ •••••••• __ •. .0 ROAD ••••••. _ ••• _. _., •••.••.•• _= IIAILWAY •• _ •.••••• _ -" ••• - ••• +1+ IIIVt:It_ ••• _ "' __ " •••• _ ••••• ........",.
MHAS"LA MAHAt.
T
-
pltlNTED AT G. 1'%. P. POONA. HI 1578 -GIIO.·'"S.
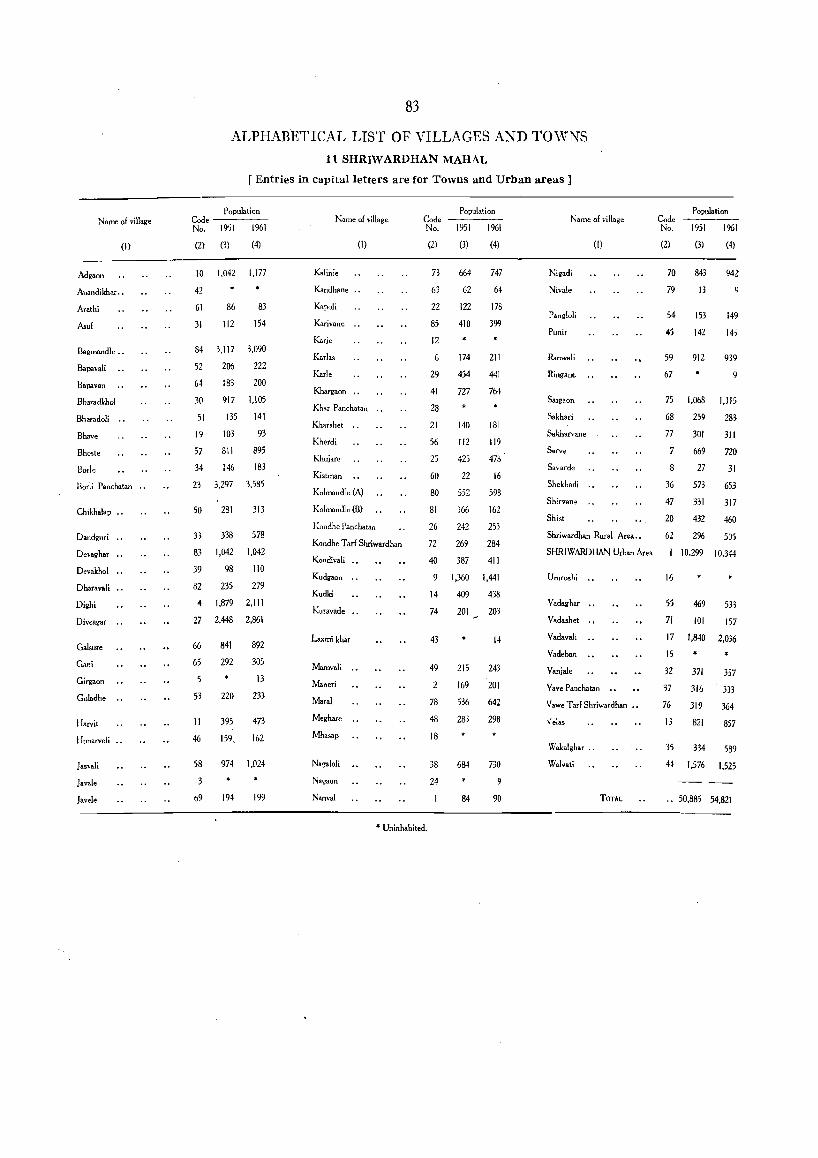
Name 01 village
(I)
Adgaon
Anandikhar .•
Atathi
Asul
Bagmandle .•
Bapavali
Bapavan
BharadkhQI
Bharadoli ..
Bhave
Bhoste
Borle
Barli Panchatan .•
Chikhalap
Dandguri
Devaghar
Devakhol
Dhatavali
Dighi
Diveagar
Galsur.
Gani
Girgaon
Guladhe
Harvit
Hunarveli
lasvali
lavale
lavele
83
ALPHABETICAL LIST OF VILLAGES AND TOWNS
1 t SHRIWARDHAN MAHAL
[ Entries in capital letters are for Towns and Urban areas]
Code No.
Population
1951 1961
(2) (3) (4)
10 1,042 I,m
42
61 86 83
31 112 154
84 3,117 3,090
52 206 222
64
30
183 200
917 1,105
51 135 141
19 103 93
57 811 895
34 146 183
23 3.297 3,585
50 281 313
33 338 578
83 1,042 1,042
39
82
98
235
110
279
4 1,879 2,111
27 2,448 2,861
66
65
5
53
11
46
58
69
841 892
292 305
13
220 233
395 473
159, 162
974 1,024
194 199
Name 01 village
(I)
Kandhane
Kapoli
Karivane ..
KaTje
Karl ..
Karle
Khargaon "
Khar Pancha!.n
Kharshet ..
Kherdi
Khujare
Kistman
Kolmandle (A)
Kolmandle (B)
KOildhe Panchatan
Kondhe Tarl Shriwardhan
Kondivali
Kudgaon
Kudki
Kuravade
Laxmi khar
Mamvali
Maneri
Maral
Meghare .•
Mhasap
Nagaloli
Nagaon
Nanval
Code No.
(2)
73
63
22
85
12
6
29
41
28
21
56
25
60
80
81
26
72
40
Population
1951 1961
(3)
664
62
122
410
174
454
727
140
112
425
22
552
166
242
269
387
(4)
747
64
178
399
211
441
764
181
119
478
16
593
162
253
284
411
9 1,360 1,441
14 409 438
74
43
49
2
78
48
18
38
24
201
215
169
536
283
684
84
203
14
243
201
642
298
730
9
90
• Uninhabited,
Name of village
(I)
Nigadi
Nivale
Pangloli
Punir
Ranwali
Ring-anc
Saigaon
Sakhari
Sakharvane
Sarve
Sa\'arde
Shekhadi .•
Shirvane
Shist
Shriwardhan Rural Area"
SHRIWARDHAN Urban Area
Umroshi
Vadaghar ..
Vadashet
Vadavali
Vadeban
Vanjale
Vave Panchatan
Vawe T arf Shriwardhan ••
l./elas
Wak.lghar .•
Walvati
TOTAL
Code No.
(2)
70
79
54
45
59
67
Population
1951 1961
(3)
843
13
153
142
912
(4)
942
149
14j
939
9
75 1,068 ),115
68
77
7
8
36
47
20
62
16
55
71
259
301
669
27
573
331
432
296
283
311
720
31
653
317
460
505
10,299 10,344
469
101
533
157
17 1,840 2,036
15
32 371 357
37 316 333
76 319 364
13 821 857
35 334 5B?
44 1,576 1,525
.. 50,885 54,821
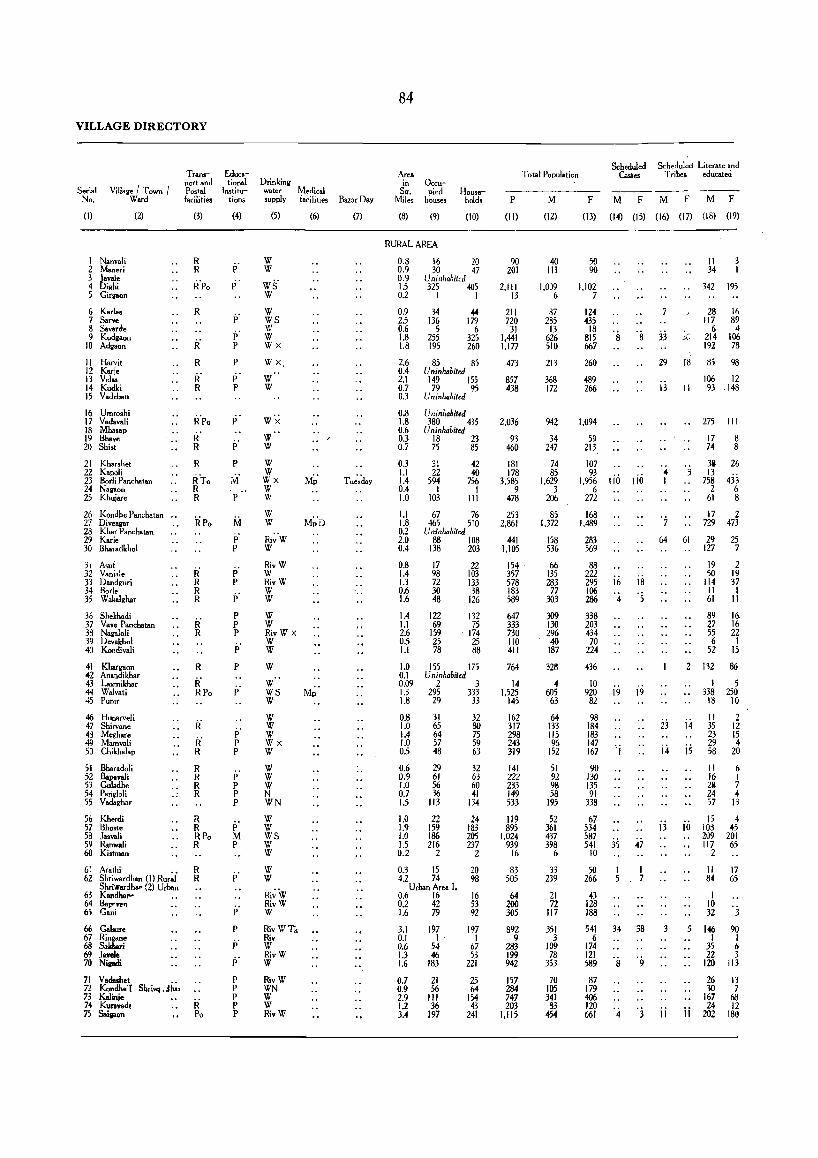
VILLAGE DIRECTORY
Serial No.
Village ! l' own I W.rd
(I)
I Nanvali 2 Maneri 3 Javale 4 Dighi 5 Girgaon
6 Karla, 7 Sarve 8 Savarde 9 Kudll"On
10 Adgaon
II Harvit 12 Karie 13 Velas 14 Kudki 15 Vadeban
16 Umroshi 17 Vada .. li 18 Mh ••• p 19 Bhave 20 Shist
21 Khar.het 22 K.poli
(2)
23 Borli Panchatan 24 Nagaon 25 Khuiare
26 Kondhe Panch.tan .• 27 Diveagar 28 Khar Panchatan 29 Karle 30 Bharadkhol
31 Asuf 32 Vaniale 33 Dandguri 34 Borle 35 WaI..lghar
36 Shekhadi 37 Vave Panchatan 38 Nagaloli 39 DevaI.hol 40 Kondivali
41 Khargaon 42 Anandikhar 43 Laxmikhar 44 Walvati 45 Punir
46 Hunarveli 47 Shirvane 48 Meghare 49 Mamvali 50 Chikhalap
51 Bh.radoli 52 Bapavali 53 Guladhe 54 Pangloli 55 Vadagh.r
56 Kherdi 57 Bho,t. 58 las .. li 59 Ranwali 60 Ki.tman
61 Arathi .• 62 Shriwardhan (Il Rural
Shriwardh"" (2) Urban 63 Kandha... .. 64 Bap"""" 65 Gani
66 Galoure 67 Ringane 68 Sakhari 69 laode 70 Nirodi
71 Vadaohet 72 Kondhe 1 Sh,i"1" Jk, 73 Kalinie 74 Kuravade 75 Saigaon
Transport and Postal facilities
(3)
R
R' R
H' R
H'po
R' R
R
RTo R R
RPo
R' R R R
R' R
R
R' RPo
R' R' R
R R R R
R R RPo R
R R
R Po
Educational
Institutions
(4)
p' p' P
P p' I'
p' P
M' P
M P P
p' P
P' P P P
p'
P
p'
p' P P
p' P P P
P M P
p'
p'
P p' p'
P P P P P
Drinkinll water Medical supply facilities
(5) (6)
w W
WS' W
W WS W W Wx
Wx
W W
W 'x W W
W W Wx W W
W W
Ri~'W W
RivW W RivW W W
W W RivW x W W
W W" WS M~' W
W W W Wx W
W W W N WN
W W WS W W
W W
Ri;'w RivW W
RivWTh Riv W RivW W
RivW WN W W RivW
Bazar Day
(7)
84
Area in
Sq. Miles
(8)
Occupied
house!
(9)
Households
(10)
RURAL AREA
0.8 16 20 0.9 30 47 0.9 Uninhabited 1.5 325 405 0.2 I I
0.9 2.5 0.6 1.8 1.8
2.6 0.4 2.1 0.7 0.3
34 # 136 179
5 6 255 325 195 260
85 85 Uninhabited
149 155 79 95
Uninhabited
0.8 Uninhabited 1.8 380 435 0.6 Uninhabited 0.3 18 23 0.7 75 85
0.3 1.1 1.4 0.4 1.0
31 22
594 I
103
42 40
756 I
III
1.1 67 76 1.8 465 510 0.2 Uninhabited 2.0 88 108 0.4 138 203
0.8 1.4 1.3 0.6 1.6
17 98 72 30 48
22 103 133 38
126
1.4 1.1 2.6 0.5 1.1
122 132 69 75
159 174 25 25 78 88
1.0 0.1 0.09 1.3 1.8
155 175 Uninhabited
2 3 295 333 29 33
0.8 1.0 1.4 1.0 0.5
0.6 0.9 1.0 0.7 1.5
1.0 1.9 1.0 1.5 0.2
31 65 64 57 48
29 61 56 36
113
22 159 186 216
2
0.3 15 4.2 74
Urban Area I. 0.6 16 0.2 42 1.6 79
3.1 197 0.1 I 0.6 54 1.3 46 1.6 183
0.7 0.9 2.9 1.2 3.4
21 56
III 36
197
32 80 75 59 63
32 63 60 41
134
24 183 205 237
2
20 98
16 53 92
197 I
67 53
221
25 64
154 43
241
Total Population Seheduled Scheduled Literate and
Castes Tribes educattd
P M F M F M F M F
(II) (12) (13) (14) (15) (16) (17) (18) (19)
90 201
2.111 13
211 720
31 1.441 I,m
473
857 438
2,036
93 460
181 178
3,585 9
478
253 2.861
441 1.105
154 357 578 183 589
647 333 730 110 411
764
14 1,525
145
162 317 298 243 319
141 222 233 149 533
119 895
1,024 939
16
83 505
64 200 305
892 9
28,3 199 942
157 284 747 203
1.115
40 III
1.009 6
87 285
13 626 510
213
368 172
942
34 247
74 85
1,629 3
206
85 1,372
158 536
66 135 283 77
303
309 130 296 40
187
326
4 605
63
64 133 115 95
152
51 92 98 58
195
52 361 437 398
6
33 239
21 72
117
351 3
ID9 78
353
70 lOS 341 83
454
50 90
1.102 7
124 435
18 815 667
260
.j89 266
1,094
59 213
107 93
's
1.956 110 6
272
168 1,489
283 569
88
lin
222 295 if, is 106 286 '4 '5 338 203 434 70
224
436
10 920
82
98 184 183 147 167
90 130 135 91
338
67 534 587 541
10
50 266
43 128 188
541 6
174 121 589
87 179 406 120 661
19
'i
35
1 5
34
's
4
i9
I 7
38
'9
'j
7
33
29
i3
.~
I
'7 64
23
i4
ij
3
ii
18
II
3
II 34
342 195
28 16 117 89
6 4 214 106 192 78
85 98
106 12 93 .148
275 III
17 8 74 8
32 26 13
758 433 2 6
61 8
17 2 729 473
61 29 25
2
i.j
is
io
5
ii
127 7
19 2 50 19
114 37 II I 61 II
89 16-27 16 55 22 6 I
52 15
132 86
1 5 338 250
18 10
II 35 23 29 58
2 12 15 4
20
II 6 16 I 211 7 24 4 57 13
15 4 103 45 209 201 117 65
2
II 84
I 10 32
146 I
35 22
120
26 30
167 24
202
17 65
3
90 I 6 3
113
13 7
68 12
180
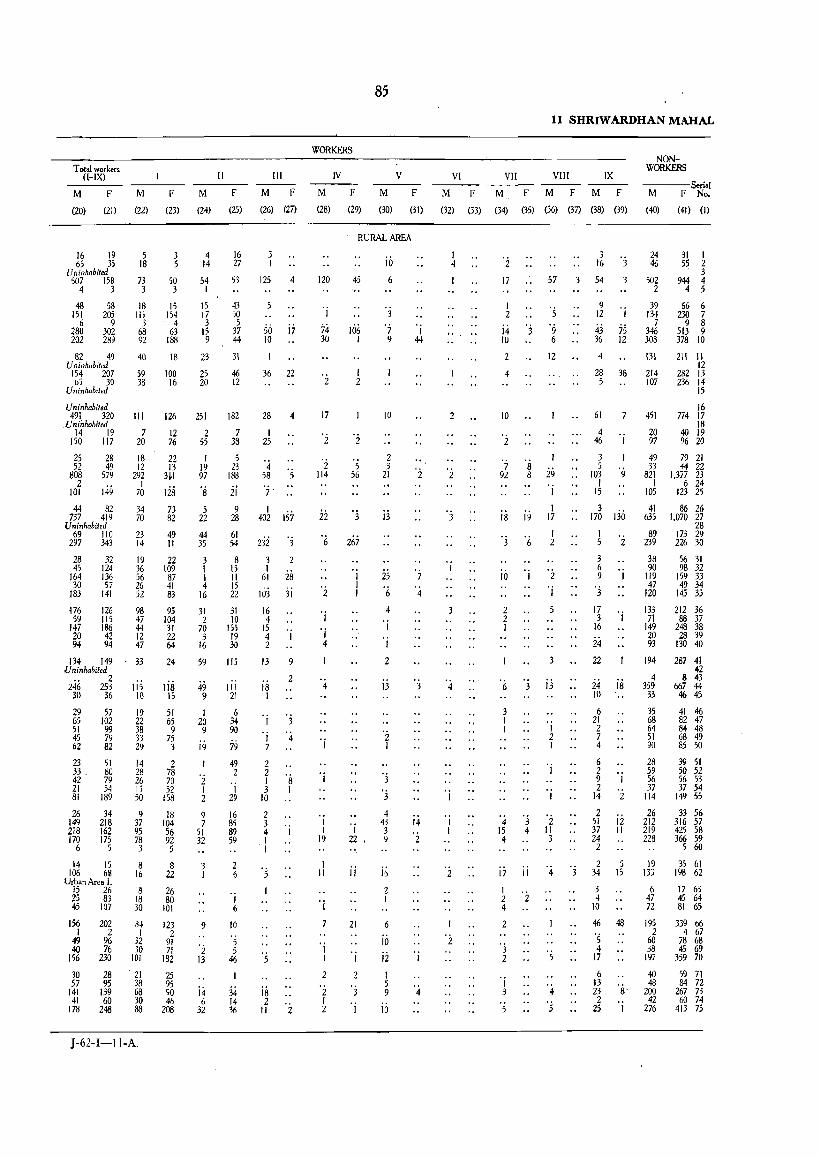
Total workers ((-IX)
M F
(20) (21)
16 19 65 35
Uninhabited 507 158
4 3
48 151
6 280 202
58 205
9 302 289
82 49 Uninhabited
154 207 b5 30
Uninhabited
Uninhabited 491 320
Uninhabited 14 19
150 117
25 28 52 49
'S08 579 2
101 149
44 82 737 419
Uninhabited 69 110
297 343
28 32 45 124
164 136 30 57
183 141
·176 126 59 115
.147 186 20 42 94 94
134 149 Uninhabited
2 246 253 30 36
29 65 51 45 62
57 102 99 79 82
23 51 33 . 80 42 79 21 54 81 189
26 34 149 218 218 162 170 175
6 5
14 15 106 6,~
Urban Are. I. 15 26 25 83 45 107
156 202 I 2
49 96 40 76
156 230
30 28 57 95
141 139 41 60
178 248
M
(22)
5 18
F
(23)
3 5
II
M F
(24) (25)
4 14
16 27
III
M F
(26) (27)
73 3
50 3
54 53 125 4
18 III
3 68 92
40
59 38
15 154
4 63
188
18
100 16
I
15 17 3
15 9
23
25 20
43 50 5
37 44
31
46 12
III 126 251 182
7 12 2 7 20 76 55 38
18 12
292 I
70
34 70
23 14
19 36 56 26 52
98 47 44 12 47
33
115 10
19 22 38 33 29
14 28 26 15 50
9 37 95 78 3
8 16
3 18 30
84 I
32 30
101
22 13
3~1
128 73 82
49 II
22 109 87 41 83
95 104 31 22 64
24
118 15
51 65 9
75 3
2 78 70 52
158
18 104 56 92 5
8 22
26 80
101
123 2
91 71
182
21 25 38 95 68 90 30 46 SS 208
I 19 97
's 5
22
44 35
3 1 I 4
16
31 2
70 3
16
59
49 9
I 20 9
i9
°i I 2
9 7
51 32
3 I
9
°2 13
i4 6
32
5 23
ISS
ii 9
28
61 54
8 15 II 15 22
31 10
155 19 30
115
Iii 21
6 34 90
79
49 2
'j 29
16 85 89 59
2 6
I 6
10
5 5
46
34 14 36
50 i7 10
36 22
28 4
I 25
'4 58 's OJ
I 402 157
232 'j
3 1
61 28
lIij :ii 16. 4
15 4 2
13
18 I
9
2
'j 'j
I °4 7
2 2 I 3
10
2 3 4 I I
is 2
's I
II 2
J-62-I-ll-A.
85
WORKERS
IV v M F M F
(28) (29) (30) (31)
RURAL AREA
120
I
74 30
2
17
2
2 114
22
6
2
'j
'j 4
4
'j
OJ
I I
19
1 II
OJ
I I
2
2 I 2
45
106 I
'5 56
'3
267
I 22 I
ji
21
°i
2
io 6
3
'] 9
10
2 3
21
ij
25 °6 4
'j
I
2
13
°2 I
3
3
4 43 3 9
j6
6
10
ii I 5 9
10
I 44
2
7 °4
3
14
2
VI
M F
(32) (33)
I 4
2
3
3
4
11 SHRIW ARDHAN MAHAL
NONWORKERS
VII VIII IX ----Serial
M F M F M F M F No.
(34) (35) (36) (37) (38) (39) (40) (41) (I)
°2 3 24
16 'j 46 31 I 55 2
3 17 57 3 54 3 502 944 4
1 Os
i.j OJ '9 10 6
2
10
2
7 92
18
'j
10
2 2 I
6
3 I I
4 15 4
8 8
i9
6
3 4
17 i i
1 ° i 4
2
3 2
'j 3
5
12
29 I
I 17
I 2
2 OJ
13
I 2 I
OJ
2 II 3
4
4
's
OJ
9 12 I
43 75 36 12
4
28 38 5
2 4 5
39 66 6 134 230 7
7 9 8 346 513 9 303 378 JO
131
214 107
211 11 12
282 13 236 14
15
61 7 451 16
774 17
4 20 18
40 19 96 20 46 I 97
3 5
103 °9 , 15
3 170 130
3 6
2
9 I OJ
17 3 'j
16
24 22
24 18 10
6 21 2 j 4
6 2 9 2
14
2 51 37 24 2
2
12 II
2 5 34 15
3 4
10
46 48
'5 4
17
49 79 21 33 44 22
821 1.377 23 I 6 24
105 123 25
41 86 26 635 1.070 27
28 89 173 29
239 226 30
38 56 31 90 98 32
119 159 33 47 49 34
120 145 35
133 71
149 20 93
194
4 359
33
35 68 64 51 90
28 59 56 37
114
26 212 219 228
19 133
6 47 72
195 2
60 38
197
212 36 SS 37
248 38 28 39
130 40
287 41 42
8 43 667 44
46 45
41 46 82 47 84 48 68 49 85 50
39 51 50 52 56 53 37 54
149 55
33 56 316 57 425 58 366 59
5 60
35 61 198 62
17 63 45 64 81 65
339 b6 4 67
78 68 45 69
359 70
6 40 59 71 84 72
267 73 13 48 23 8° 200 2 42
25 I 276 60 74
413 75
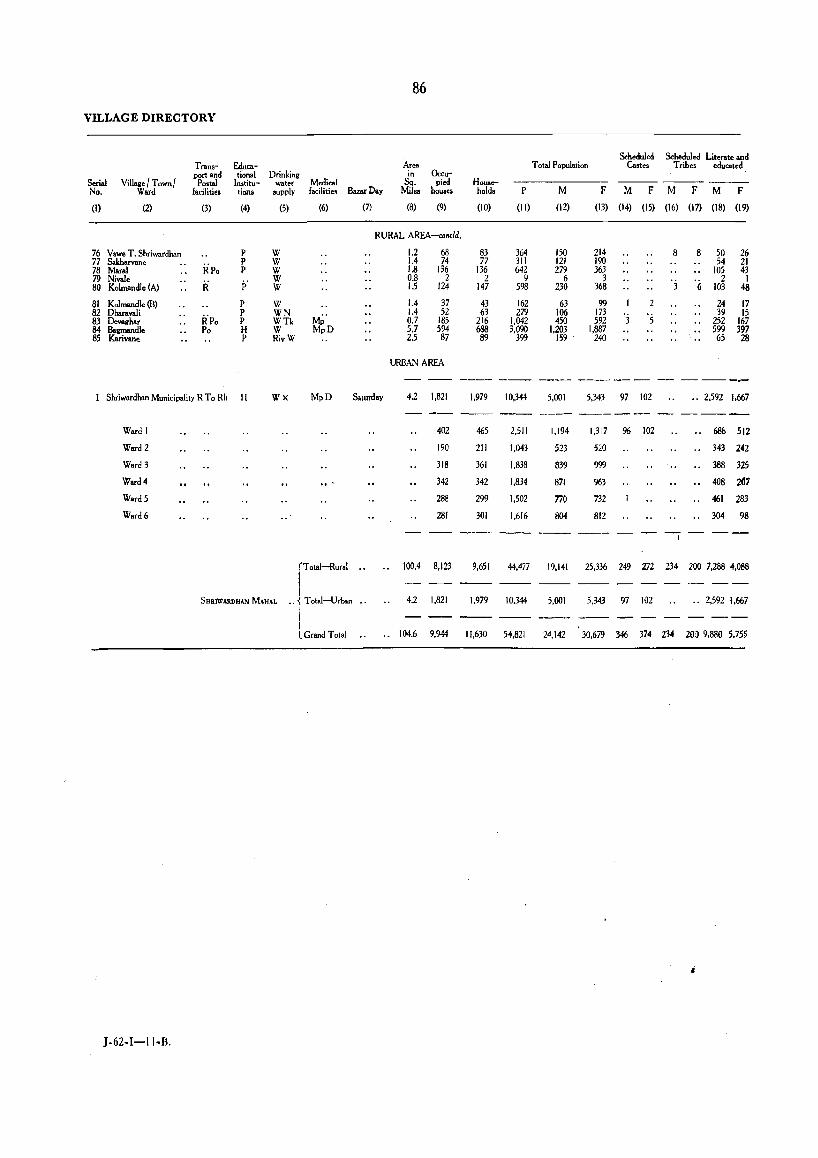
86
VILLAGE DIRECTORY
Area Scheduled Scheduled Literate and
Trans- Educa- Total Population Castes Tribes educated port and tional Drinking in Occu-
Serial Village / Town/ Postal lnstitu- water Medical Sq. pied House- ------ ------ ------No. Ward facilities tions supply facilities Bazar Day Miles houses hold. P M F M F M F M F
(I) (2) (3) (4) (5) (6) (7) (8) (9) (10) (11) (12) (13) (14) (15) (16) (17) (18) (19)
RURAL AREA-concld.
76 Vaw. T. Shriwardhan P W 1.2 68 83 364 150 214 8 8 50 26 77 Sakharvane
RPo P W 1.4 74 77 311 121 190 54 21
78 Maral P W 1.8 136 136 642 279 363 105 43 79 Nival.
R p' W 0.8 2 2 9 6 3 'j 2 1 80 Kolmandl. (A) W 1.5 124 147 598 2;0 368 6 103 48
81 Kolmandl. (B) P W 1.4 37 43 162 63 99 2 24 17 82 Dharavali
H'po P WN
M~' 1.4 52 63 279 106 173 '5 39 15
83 Devaghar P WTk 0.7 185 216 1,042 450 592 3 .. 252 167 84 Bagmandl. Po H W MpD 5,7 594 688 3,090 1,203 1,887 599 397 85 Karivane P RivW 2.5 87 89 399 159 ' 240 .. 65 28
URBAN AREA
------ -- -----Shriwardhan Municipality R To Rh H Wx MpD Saturday 4.2 1,821 1,979 10,344 5,001 5,343 97 102 " 2.592 1.667
------- -- -----Ward I 402 465 2,511 1,194 1,317 % 102 68& 512
Ward 2 190 211 1,043 523 520 343 242
Ward 3 31B 361 1,838 839 999 ' .. 388 325
W.rd4 342 342 1.834 871 963 408 'lI1i Ward 5 288 299 1.502 770 732 461 283
Ward 6 2B1 301 1,616 804 812 .. 304 98
-I
(Total-Rural ., 100.4 8.123 9,651 44.477 19.141 25,336 249 272 234 200 7.288 4.088
I ---SHRIIVARDHAN MAlIAL
I .. i Total-Urban •. 4.2 1,821 1,979 10,344 5,001 5,343 97 102 .. 2,592 1,667
I ---I l Grand T ot.1 .. 104.6 9,944 11,630 54,821 24,142 30,679 346 374 234 200 9,880 5.755
J-62-I-ll-B.
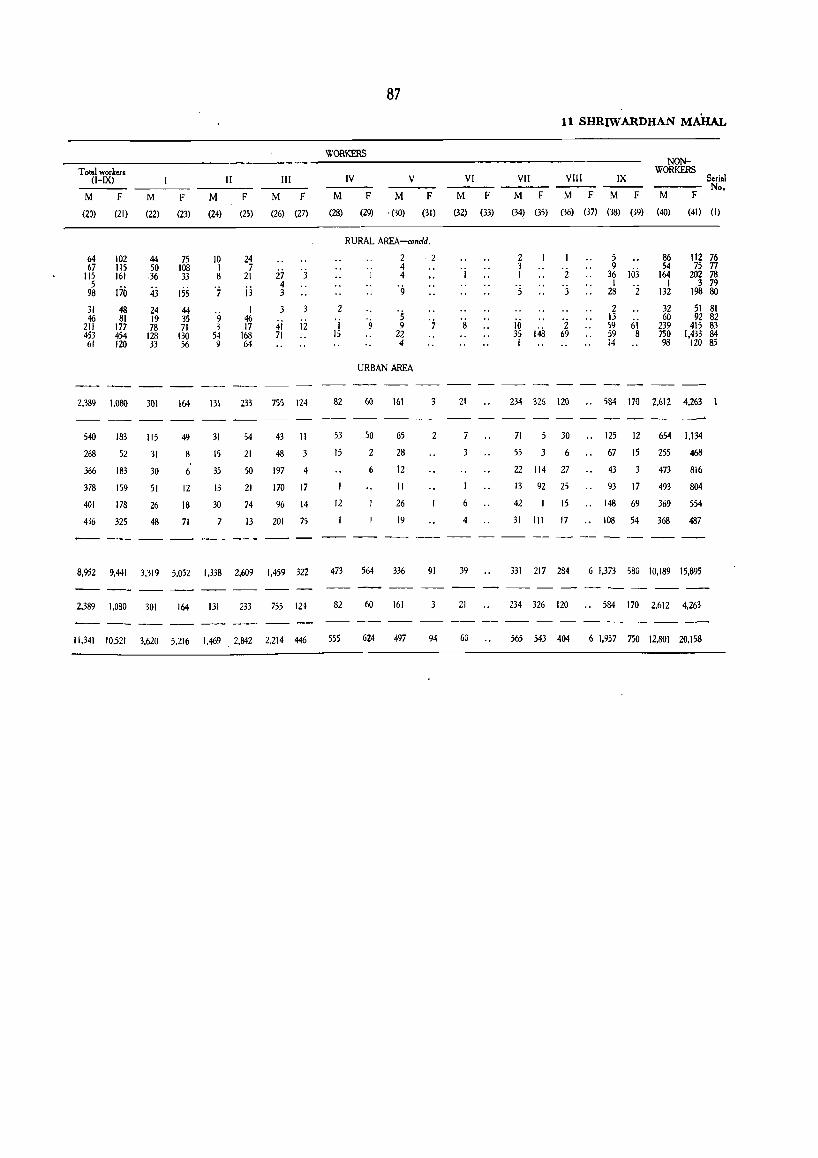
T 01.1 workers (I-1X)
M F
(20) (21)
64 102 67 115
115 161 5
98 170 31 46
211 453
61
48 81
177 454 120
M
(22)
44 50 36
43
24 19 78
128 33
2.389 1,0BO 301
540 183 115
268 52 31
366 183
378 159
401 178
436 325
30
51
26
48
F
(23)
75 108 33
155 44 35 71
130 56
II
M F
(24) (25)
10 I B
'7
9 3
54 9
24 7
21
jj
I 46 17
168 64
III
M F
(26) (27)
27 'j 4 3
3
4i 71
12
164 131 233 7SS 124
49
8
6
12
18
71
31
15
35
13
30
7
54
21
43 II
48
50 197 4
21 170 17
74 96 14
13 201 75
8,952 9,441 3.319 5,052 1,338 2,609 1,459 322
2,389 1,080 301 164 131 233 755 124
11,341 10,521 3.620 5,216 1,469 2.842 2.214 446
87
WORK£Rs
IV V ----M F
(28) (29)
M F
'(30) (31)
RURAL AREA-concld.
2
I 15
82
53
15
12
2 4 4
'9
's 9
22 4
URBAN AREA
60 161
50 65
28
12
II
26
19
473 564 336
82 60 161
555 624 497
2
3
2
91
94
VI
M F
(32) (33)
'j
8
21
7
6
4
39
21
60
11 SHRIW ARDHAN MAHAL
NONWORKERS
VII VIII IX Serial --- --- No.
MF MFMF M F
(34) (35) (36) (37) (38) (39) (40) (41) (I)
2 3 I
'5
I
'2 'j
2 69
5 9
36 J(jj I
28 '2 2
13 59 61 59 8 14
86 112 76 54 75 77
164 202 78 I 3 79
132 198 80
32 51 81 60 92 82
239 415 83 750 1,433 84 98 120 85
234 326 120 .. 584 170 2,612 4,263
71 5 30 .. 125 12 654 1,134
55 3 6 67 15 255 468
22 114 27
13 92 25
43 473 816
93 17 493 804
42 15 .. 148 69 369 554
31 III 17 .• 108 54 368 487
331 217 284 6 1,373 580 10,189 15,895
234 326 120 .. 584 170 2,612 4,263
565 543 404 6 1,937 750 12,801 20,158

Mhasala Mahal
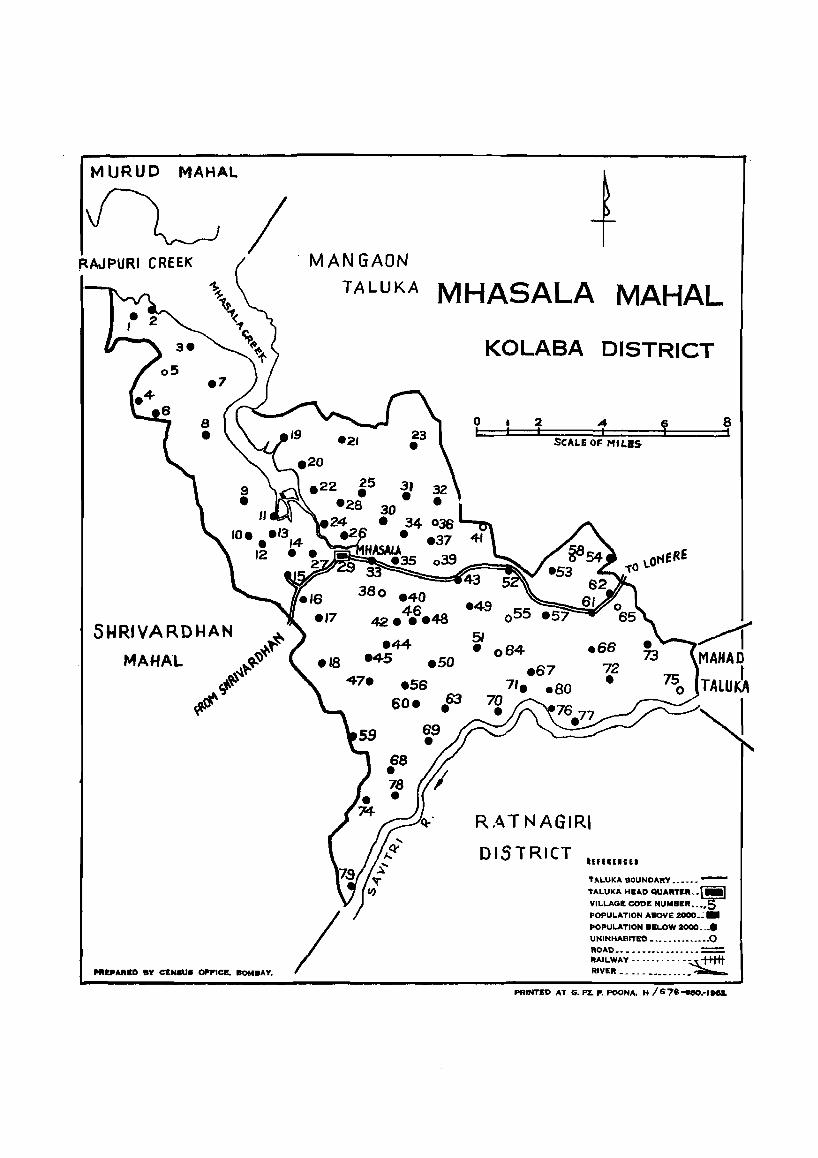
MURUO MAHAL
/
SWRIVAROHAN -i' MAHAl ~~
N.~~ t,+'~
~<t
1'111£""".0 aY CENSUS Ol'I'ICI!. aOMBAV.
MANGAON
TALUKA MHASALA MAHAL
380 .40 46
42 ••• 48
.44 .'8 .45 .SO
47. • 56 60. 83 •
o L
KOLABA DISTRICT
2 A 6 I I +
SCALE 0': MIl.IS
8 t
.49
~ 51 • 064 .86 MAlMO
.67 72 TALU~ 7' • •
70
\ •
RATNAGIRI
DISTRICT TALUKA BOUNDAI'IV •••••• -
TALUKA HEAD QUAIIITltIll •• \-;a1 YILLAGIt CODE NUMBER •• _.
POPULATION ABOVE 2ooo.~_
POPULATION aELOW 2000._. UNINHABITEG • __ ••• ____ •••• 0 ROAD ••• _ •••• __ ••••••• = RAILWAV ........ , .• ~ III RIYER ••••• _. _____ ._
PI'IINTED AT G. PZ. P. POONA. H /S7e--eeo.-11MI3.
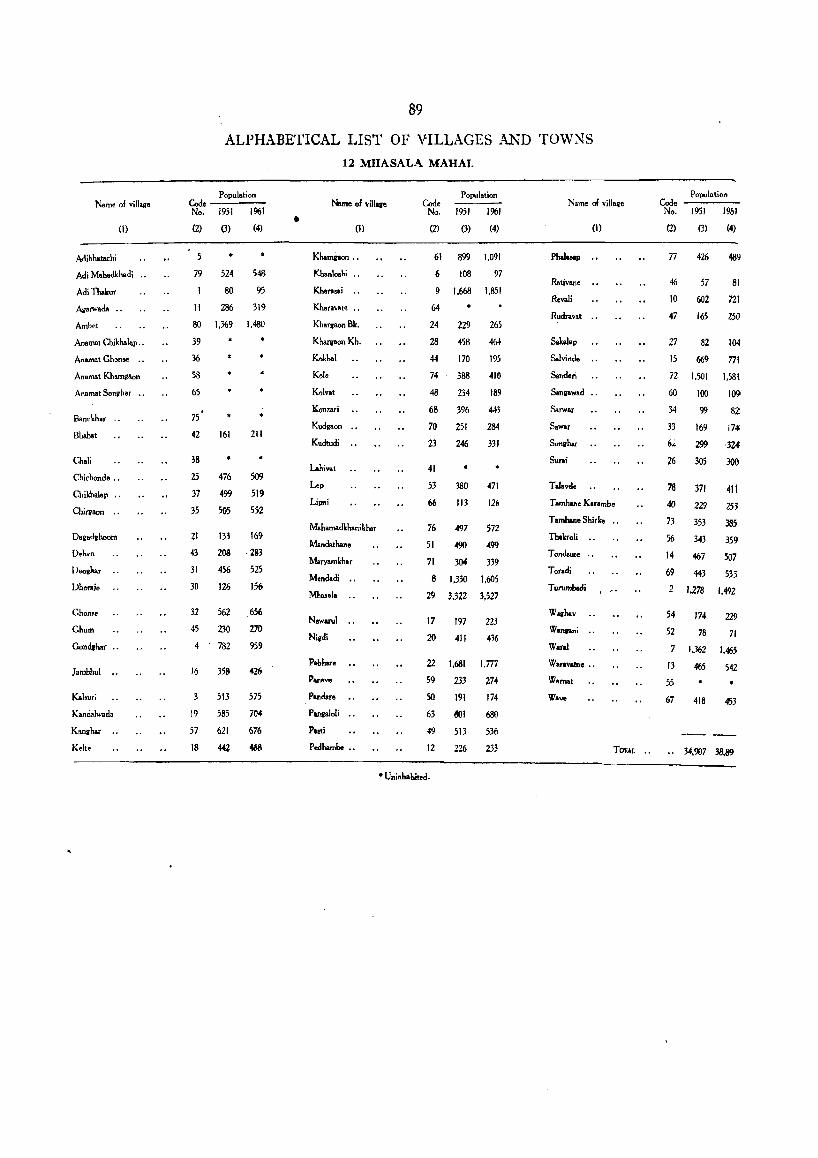
Name 01 village
(I)
Adibhatachi
Adi Mohadkhadi .•
AdiThalrur
Ago""oda ..
Ambet
Anamat Chikhakp .•
Anamat Chonse ..
Anamot Kh'I11lI~on
Anamat Songh.r
Banulchar .•
Bhab.t
Chali
Chichond •.•
Chikhalap ..
Chirgaon .•
Dagad,hoom
Dehen
Deogloar ..
Dh"",j.
Chon ••
Chum
Gondrhar ..
}ambhul ..
Kalsuti
Kandalwa,,"
K_har •.
Kelt.
89
ALPHABETICAL LIST OF VILLAGES AND TOWNS
Code No.
(2)
5
Population
1951 1961
(3) (4)
79 524 548
80 95
II 286 319
80 1,369 1,480
39
36
58
65
75 •
42 161 211
38 * 25 476 509
37 499 519
35 505 552
21 133 169
43 208 283
31 456 525
)0 126 156
32 562 .656
45 230 270
4 782 959
16
19
57
18
358
513
585
621
442
426
575
704
676
~
•
12 MHASALA MAHAL
Name of village
(I)
Kh.miaon ..
Khanloshi ..
Khara.ai ..
Khoravat ••.
Kharraon Bk.
Kharraon Kh.
Kokhal
Kol.
Kolvat
Konzari
Kudgaon ,.
Kudtudi ••
Lahivat
Lop
LiPl1i
Mahamadlchani!.har
M.ndathane
Maryamkhar
Mend.di ••
Ml. ... I.
Newarul ••
Ni,di
Pabhor.
Panave
Panda ..
Panraloli ..
Puti
Pedhambe ••
Code No.
(2)
Population
I 'lSI 1961
(3) (4)
61 899 1,091
6 108 97
9 1,668 1,851
64
24 229 265
28 458 464
44 170 195
74 388
48 234
410
189
68 396 443
70 251 284
23 246 331
41 • 53 380 471
66 113 126
76 497 572
51 490 m 71 304 339
8 1,330 1.605
29 3.322 3,527
17 197 223
20 411 436
22
59
50
63
49
12
1,681
233
191
~I
513
226
1.777
27<t
174
680
536
233
• Uninhabited.
Name of village
(I)
PhalUlP
Rativane .,
RevaJi
Rudravat .,
SakaJap
Salvind.
SarKl.ri
Sanfl&wad
Sa"".r
Sawar
Sonrhar
Surai
ToIavd.
T amha... Kar.mbe
T amhane Shirke ..
Thakroli ••
Tond..". •..
Tor.di
Turuml>adi
W"IIhav
W&nII>ni •.
Waral
Wara_. "
Wamat
Wa,..,
TOTAL ••
Code No.
(2)
77
46
10
47
27
15
Population
1951 1961
(3) (4)
426
57
602
165
82
6()9
489
81
nl 250
104
771
72 1,501 1,581
60 100 109
34 99 82
33 169 174'
6'< 299 324'
26 305 300
78 371 41 t
40 229 253
73 353 38S
56 343 359
14 467 507
69 443 533
2 1,278 1,49Z
54 174 229
52 78 71
7 1,362 1,465
13
55
67
465 542
418 453
34.907 38,89
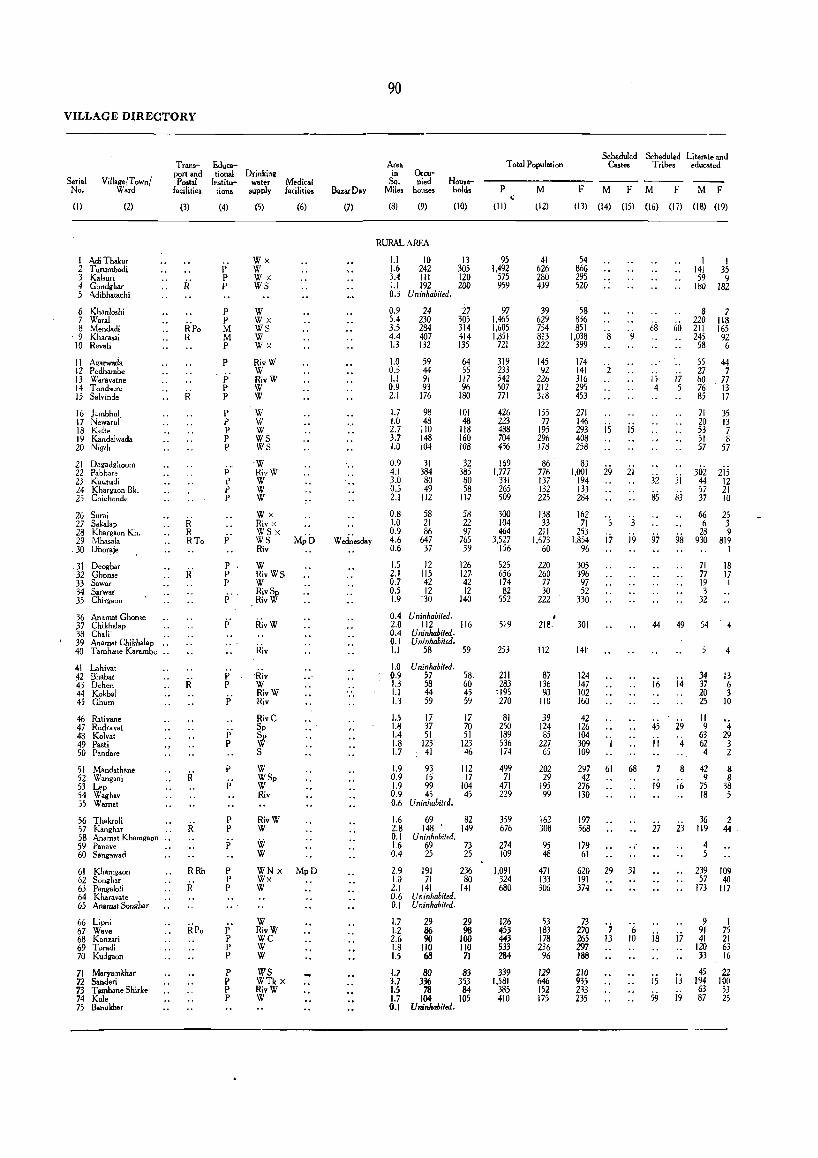
VILLAGE DIRECTORY
Serial No.
(I)
Village/Town/ . Ward
(2)
I Adi Thakur 2 Turumbadi 3 Kalsuri 4 Cortd!fhar S Adibhatachi
6 Khanloshi 7 Waral 8 Mendadi 9 Kharasai
10 Revali
II Agarwada 12 Pedhambe 13 War.valne 14 Tondsure 15 Salvinde
16 Jambhul. 17 Newarul 18 Kelte 19 Kandalwada 20 Nigdi
21 Dagadghoom 22 Pabhare Z; Kudtudi 24 Khargaon Bk. 2i Chichonde
26 Surai 27 S.kalap 28 Khargaon Kh. 29 Mhasala
.30 Dhoraj.
,31 Deogbar 32 Chonse 33 Sawar 34 Sarwar 35 Chirgaon
36 Anamat Chom. P Chikhalap 38 Chali' 39 Anamat Chikhalap 40 Tamh.ne Karambe ..
41 Lahivat 4423 Bhabet
Dehen 44 Kokbal 45 Chum
46 Rativan. 47· Rudravat 48 Kolvat 49 Pasti SO Pandare
51 Mandathane 52 Wong.ni 53 Lep 54 Waghav 55 Warnat
56 Thakroli 57 Kanghar 58 Anamat Khamgaon .. 59 Panave 60 Sangawad
61 Khamgaon 62 Songh.r 63 Pangaloli 64 Kharavate 65 Anamat Songhar
66 Lipni 67 Wave 68 Konzari 69 Toradi 70 Kudgaon
71 Maryamkhar 72 Sanderi 73 T ambane Shirke 74 Kale 75 Banukhat
Transport and Postal
facilities
(3)
R
R' R RTo
R
R
RRh
H'
RPo
Educational
Institu-tions
(4)
P P P
p P M M P
P , i;
P P
P P P P P
p
i' p p
p , p P
p'
P P
p'
p' P
p
p'
P P
p'
P P P
P P P P
P P P P
Drinkinll water
supply Medical facilities
(5)
Wx W Wx WS
W Wx ws W Wx
RivW W RivW W W
W VI W ws ws W RivW W W W
(6)
Wx Riv X WSx ws M~b Riv
W RivWS W RivSp Riv W
Rivw
-Hiv W RivW Riv
Rive Sp Sp W S
W WSp W Riv
RivW W
W W
WN x MpD Wx W
W RivW WC W W
WS WTkx RivW W
Bazar Day
(7)
90
Area in
Sq. Miles
Occupied
houses Households
(8) (9) (10)
RURAL AREA
1.1 10 13 1.6 242 305 3.4 III 120 1.1 192 200 0.3 Uninhabited.
0.9 5.4 3.5 4.4 1.3
1.0 0.5 1.1 0.9 2.1
1.7 1.0 2.7 3.7 1.0
0.9 4.1 3.0 0.5 2.1
0.8 1.0 0.9 4.6 0.6
1.5 2.1 0.7 0.5 1.9
24 230 284 407 132
59 44 91 93
176
98 48
110 148 104
31 384 80 49
112
58 21 86
647 37
112 115 42 12
130
0.4 Uninhabited.
27 305 314 414 135
64 55
117 96
180
101 48
118 160 108
32 385 80 58
117
58 22 97
765 39
126 m 42 12
140
2.0 112 116 0.4 Uninhabited. 0.1 Uninhabited. 1.1 58 59
1.0 Uninhabited. 0,9 57 1.3 58 1.1 44 1.3 59
1.5 17 1.8 37 1.4 51 1.8 123 1,.7 41
58 60 45 59
17 70 51
123 46
1.9 93 112 0.9 15 17 1.9 99 104 0,9 45 45 0,6 Uninhabited.
1,.6 69 82 2.8 148' 149 0, I Uninhabited. 1,.6 69 73 0.4 25 25
2,9 191 236 1.0 71 80 2.1 141 141 0.6 Uninhabited. 0.1 Uninhabited.
1.7 1.2 2.6 1.8 1.5
29
~ 110 68
29 98
100 110
71
1.7 80 83 3.7 336 353 1.5 78 84 1.7 104 105 0.1 Uninhabiled.
T ot.1 Population
P
(II)
95 1,492
575 959
97 1,465 1,605 1,851
721
319 233 542 507 771
~
426 223 488 704 436
169 1,777
331 265 509
300 104 464
3527 156
525 656 174 82
552
519
253
211 283
: 195 270
81 250 189 536 174
499 71
471 229
359 676
274 109
1,091 324 680
126 453 443 533 284
339 1,581
385 410
M
(12)
41 626 280 439
39 629 754 813 322
145 92
226 212 318
155 77
195 296 178
86 . 776 137 J32 225
138 33
211 1,673
60
220 260
77 30
222
218.
112
87 136 9J
110
39 124 85
227 65
202 29
195 99
162 308
95 4Il
471 133 306
53 183 178 236
96
129 646 152 175
•
Scheduled Scheduled Literate and Castes Tribes educated
F M F M F 1\1 F
(13) (14) (15) (16) (17) (18) (19)
54 866 295 520
58 836 851
1,038 399
174 141 316 295 453
271
8
146 293 i5 15 408 258
83 1,001 29 21
68
15 4
194 32 133 284 8S 162
71 ·S 3 253
1,854 i7 i9 97 96
305 396 97 52
330
I I 141 35 59 9
180 182
8 7 220 118
60 211 165
17 5
:ii li3
245 92 58 6
55 44 27 7 80 77 76 13 85 17
71 35 20 13 53 7 51 8 57 57
302 2is 44 12 57 21 37 10
66 6
98 9~~
25 3 9
819 I
71 18 77 17 19 I 3
32
301 4449544
141'
124 147 102 160
42 126 104 309 109
297 61 42
276 130
197 368
179 61
68
620 29 31 191 374
73 270 265 297 188
210 935 233 235
'7 13
6 10
16
45
II
7
i9
27
18
i5 59
I.)
29
4
8
16
i3
i7
13
19
34 37 20 25
II 9
63 62 4
4
13 6 3
10
·4 29 3 2
42 8 9 8
75 38 18 5
36 119
4 5
2 44 .'
239 109 57 40
173 117
9 91 41
120 33
45 194 63 87
I 75 21 63 16
22 100 53 25

T"",lworkers (I-IX)
M F
(20) (21)
18 20 283 271 135 127 241 153
Uninhabited,
14 ·32 288 339 303 282 411 426 138 271
65 40 88 88
149
63 40 97
147 69
62 387
74 82 95
52 13
105 850 24
99 127 41 II
122
65 61 78
121 256
150 79
183 218 110
46 383 61 56
167
103 17
143 307
48
130 185 57 30
194
Uninhabitpd, 88 153
Uninhabited, Uninhabited,
86 I II
Uninhabited, 56 90 68 76 54 67 57 109
31 32 75 68 53 84
107 177 29 73
96 159 15 26 99 145 47 70
Uninhabited,
84 127 123 149
Uninhabited, 37 104 26 43
219 309 59 114
166 87 Uninhabited Uninh.bited,
21 48 85 83 67 127 97 91 36 101
55 liS 300 429
61 118 95 116
U ninhQbit~d,
M
(22)
13 67 97
175
F
(23)
13 96
114 117
3 21 215 321 220 197 303 388 124 266
46 34 26 72
143
34 26 92
121 56
14 221 52 54 42
20 5
77 201
18
80 102 34 II 90
66
85
49 56 54 51
57 43 46 97
227
45 19
177 201 110
46 290
61 40
114
32 15
116 B5 41
110 165 50' 28
184
129
109
80 75 67
lOB
31 32 42 67 50 80 71 168 29 73
73 148 12 24 75 117 47 69
82 79
34 20
120 135
104 41
160 279 53 114 89 74
20 46 64 67 50 113 80 71 35 100
51 115 187, 354 60 116 48 104
II III
M F
(24) (25)
M F
(26) (27)
5 27 14 30
9 5
38 5
5 4 5 7 4
9 10 I
13
58 io 20
28 2 9
50 2
5 3 I
19
I 2
19
I 16
6
33
I 10 9
11
39 iii
7 44 12 34
II 4
32 25 3
5 18 23 24 27
105 60 2
17
78 itS 26
71 I
27 87 7
18 20 4 I 6
23
2
5 I
9 2
28 I
7 13
'i 23
13
2
101 100 18
57 33 7
'j
1
27 18 3 I
i7 I
jj 3
ii
's 'i
'I
... .. 3 3 9
jj 'i 20
8
I
15 I 14 I 20 I
64 ' 'j '5 I
10 '3 'i
91
WORKERS
IV V
M F M F
(28) (29) (30) (31)
RURALARFA
'3 2 7
iii 4 3 3
II
II
I
2 I
'j
IjtS
4
4
12 1 I
I
2
'4 I 2
2
'j
45
'j
12 I
13
3
ii 5
'2 7
9 II
4 7
16
2
'3
'j
'2 2
'j 3
'; iz
VI
M F
(32) (33)
'i 2
2
2
jj
2 II
12 MHASALA MAHAL
VII VIII IX
M F M F M F
(34) (35) (36) (37) OS) (39)
i6 jj 2 'j 7 2
'9 '5 25 48 3 5 II
8 2
5 2
2 I
jj
3
8
'i
jj
27
109 iiJ 75
5 3 3
3 9
33
2 'j 2
2 5 "
';' 'j 'j
4i 30 1 5
41 i.i 16 I 27 5 3
2
16 '9 7 I
14 2 I 6' 9
21 49 'i 8 7 2
4 2 I
10 6 255 74
3
10 2 3
22
I 13
10 ,i
'i
I 15 'i 3 4 'j
22 2 6
6 4 3 I
2 40 '6 ii
2
3 I I
NONWORKERS ____ Serinl M F No,
(40) (41) (I)
23 343 145 198
25 341 391 402 184
80 52
138 124 169
9Z 37 98
149 109
24 389 63 50
130
34 1 595 2 168 3 367 4
S
26 " 497 7 569 & 612 y. 128 10'
109 II 80 12~
238 13 )74 14 197 IS
121 1& 67 17
110 IS: 190 19' 148 20
37 21 618 22 133 23 77 24
117 25
86 59 26 20 54 27
106 110 28 823 1.547 29 36 4S 30
121 133 36 19
100
130
26
31 68
39 53
8 49 32
120 36
106 14 96 52
78 185
58 22
252 74
140
32 98
III 139 60
74 346
91 80
175 31 211 32 40 33 22 34
136 35
36 148 37
38 39
30 40
41 34 42 71 43 35 44 51 45
10 46 58 47 20 48
132 49 36 50
138 51 16 52
131 53 60 54
55
70 56 219 57
58 75 59 18 60
311 61 77 62
287 63 64 65
25 66 187 67 138 68 206 69 87 70
95 71 506 72 115 73 119 74
75
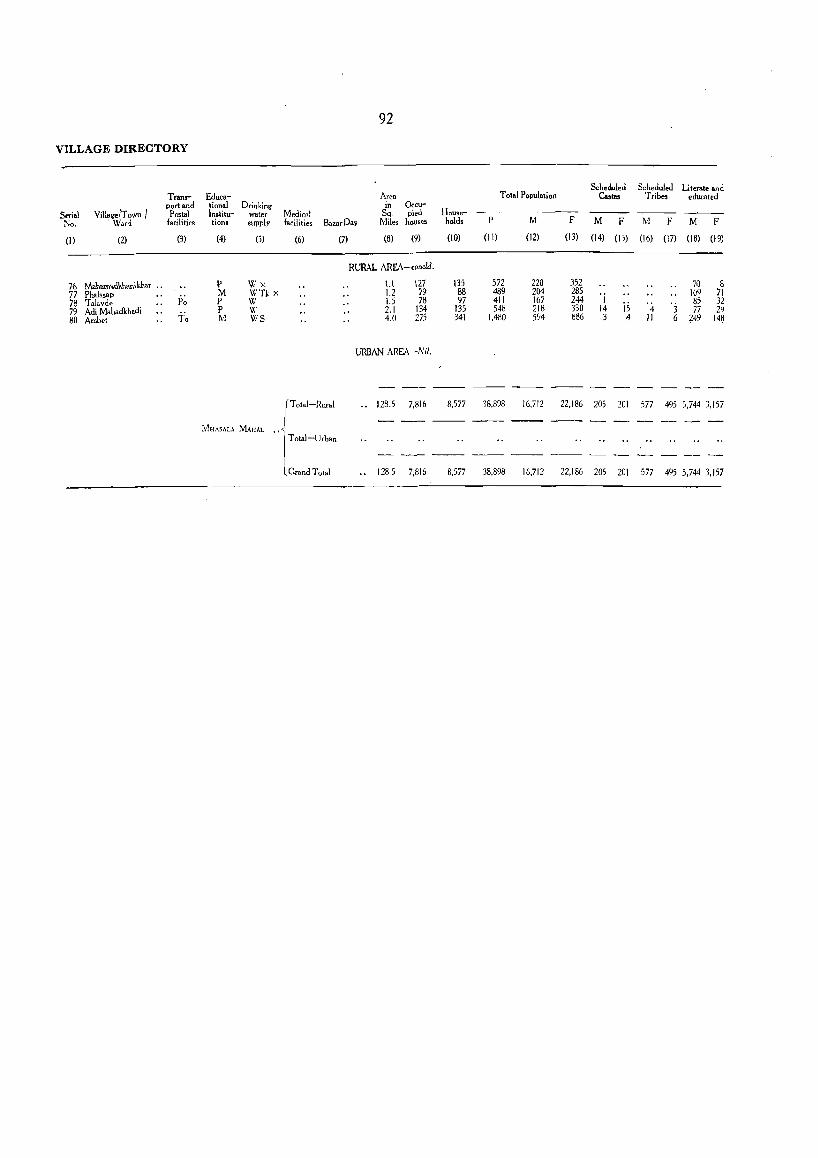
92
VILLAGE DIRECTORY
Scheduled Scheduled Literate and Trans- Educa- Arc. Total Population Caste, Tribes educated port and tional Drinking in Occu-
Serial VmagelT own I Postal lnstitu- water Medical Sq. pied House-
No. . Ward facilities tions supply facilities Ea.arDay Mile. houses holds P M F M F M F M F
(I) (2) (3) (4) (5) (6) (7) (8) (9) (10) (11) (12) (13) (14) (13) (16) (17) (18) (19)
RURAL AREA-concld.
76 Mah.m~dkhan;kha, .. P Wx 1.1 127 135 572 220 352 70 8 77 Phalasap
p~ M WTk X 1.2 79 88 489 204 285 109 71
78 Talavde P W 1.5 78 97 411 167 244 I is 85 32 79 Adi Mahadkhadi
T~ P W 2.1 134 135 548 218 330 14 4 '3 77 29
80 Ambe! M WS 4.0 275 341 1.480 594 ~86 3 4 II 6 249 148
URBAN AREA-Nil.
- - -r T olal-Rw'al .. 128.5 7.816 8,577 38.898 16.712 22.186 205 201 577 495 5.744 3.157
I MH'SALA MAIIAL .. ~
I Total-Urban
l Grand Total .. 1285 7.816 8.577 38.898 16,712 22,186 205 201 577 495 5.744 3.157
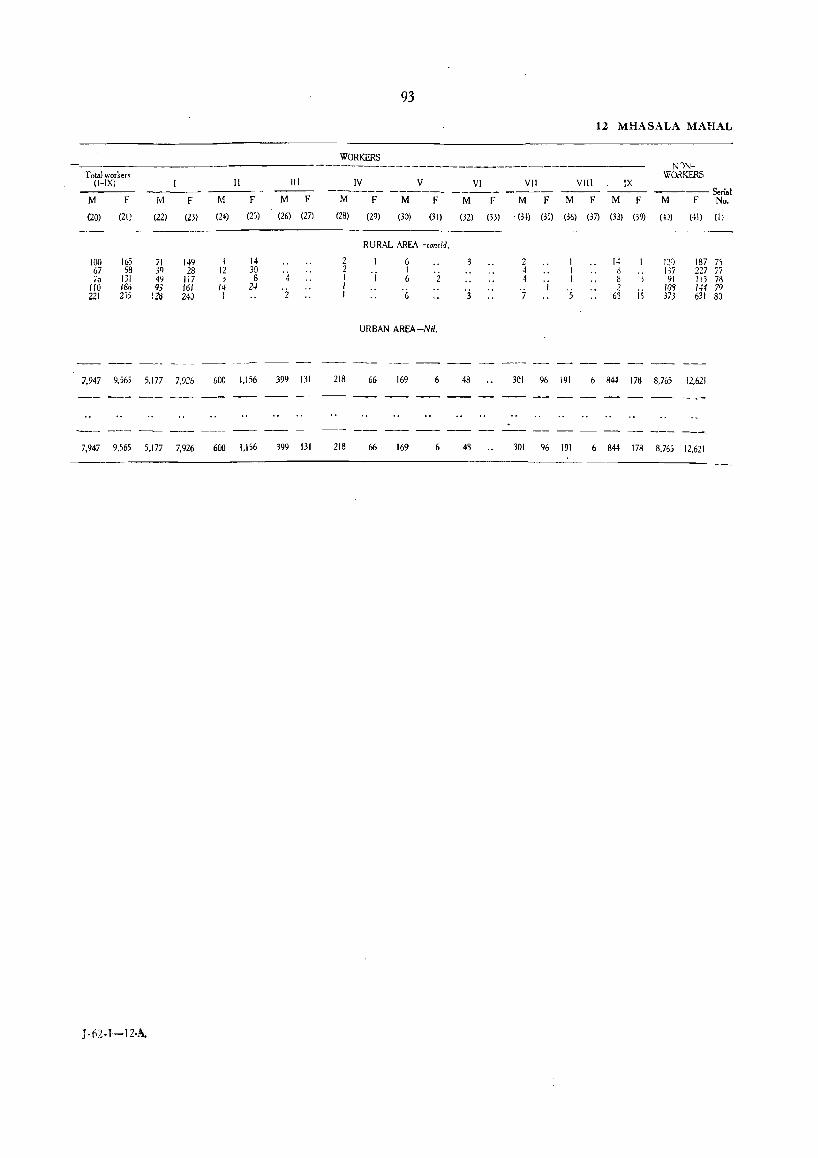
T ota1 worken (I-IX)
M F
(20) (21)
100 165 67 58 70 131
flO 186 221 2»
M F
(22) (23)
71 149 39 28 49 117 93 161
IZij 240
II III
M F M F
(24) (2,) (26) (27)
I 14 12 30 '4 3 8 14 2~ I . i
7,947 9.565 5,177 7.926 600 1,156 399 131
7,947 9.565 5,177 7,926 600 1,156 399 131
J-62-1-12-'\.
93
WORKERS
IV V --._---- -------
M F M F
(28) (29) (30) (31)
RURAL AREA~cont[d.
2 6 2
'j I I 6 2 I I '6
URBAN AREA-Nil.
218 66 169 6
218 66 169 6
12 MHASALA MAHAL
Nl"l-WORKERS
VI VII VIII IX ---- --_- -----Seri.I M F M F M F M F M F No.
(32) (33) (31) (35) (36) Oi) (33) (39) (4) (41) (I)
2 14 121 187 75 4 8 117 227 77 4 8 l 91 113 n
I ? 1M 1~4 79 '3 7 '5 63 is 373 631 83
48 301 96 191 844 178 8,765 12,621
43 301 96 191 6 844 178 8,765 12,621

J-62-1-12 B.

Mahad Taluka
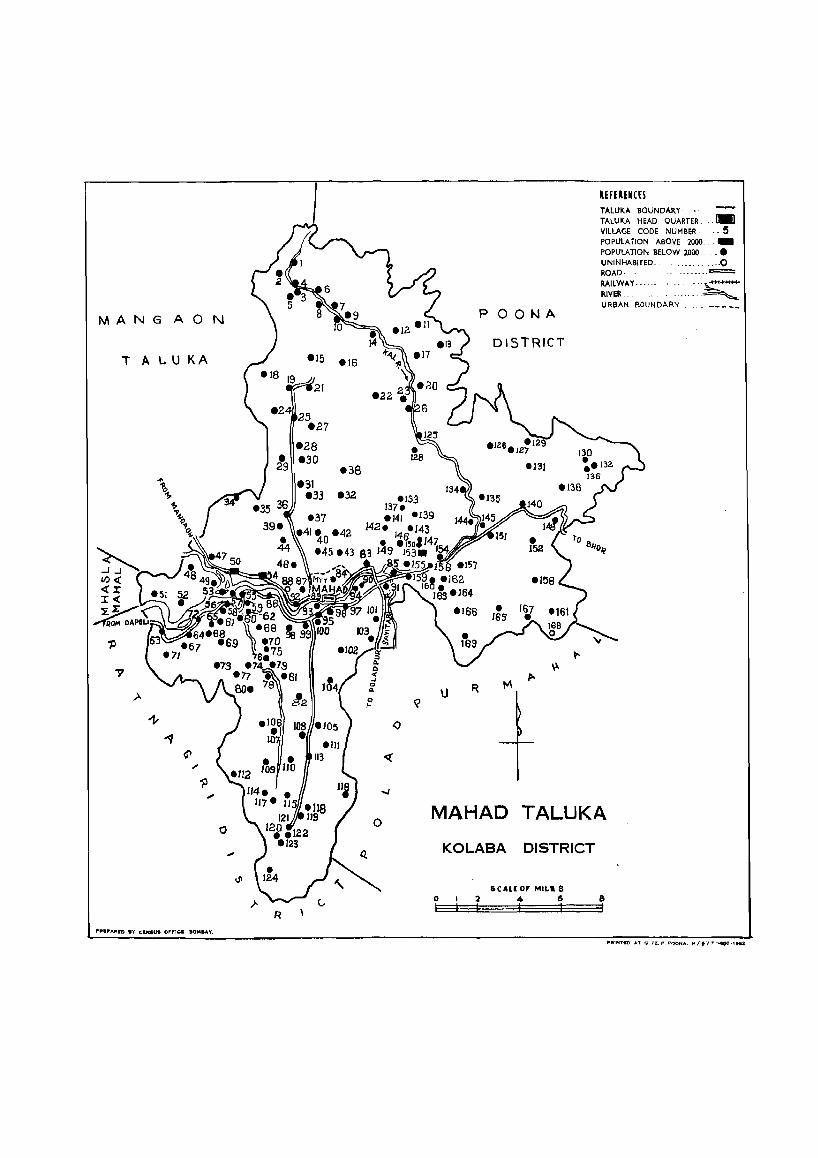
MANGAON
TAL U KA
()
«
o o
p 00 N A
DISTRICT
\J R
REFERENCES TALUKA BOUNDARY· •. TALUKA HEAD QUARTER ... ,_
VILLAGE CODE NUMBER _ - - 5 POPULATION ABOVE 2000 __
POPULATION BELOW 2000 .. __ •
UNINHABITED. """ .. --0 ROAD· -- .. --= RAILWAY·-RIVER, , -: .. :--~ URBAN BOUNDARY ...•• _____ _
MAHAD TALUKA
KOLASA DISTRICT
IC'Ili 01' MILa S o 2 4 &
P.IN'tED AT G PZ. 1'. Pr)CNA. H/f7? ~OO·IH2,
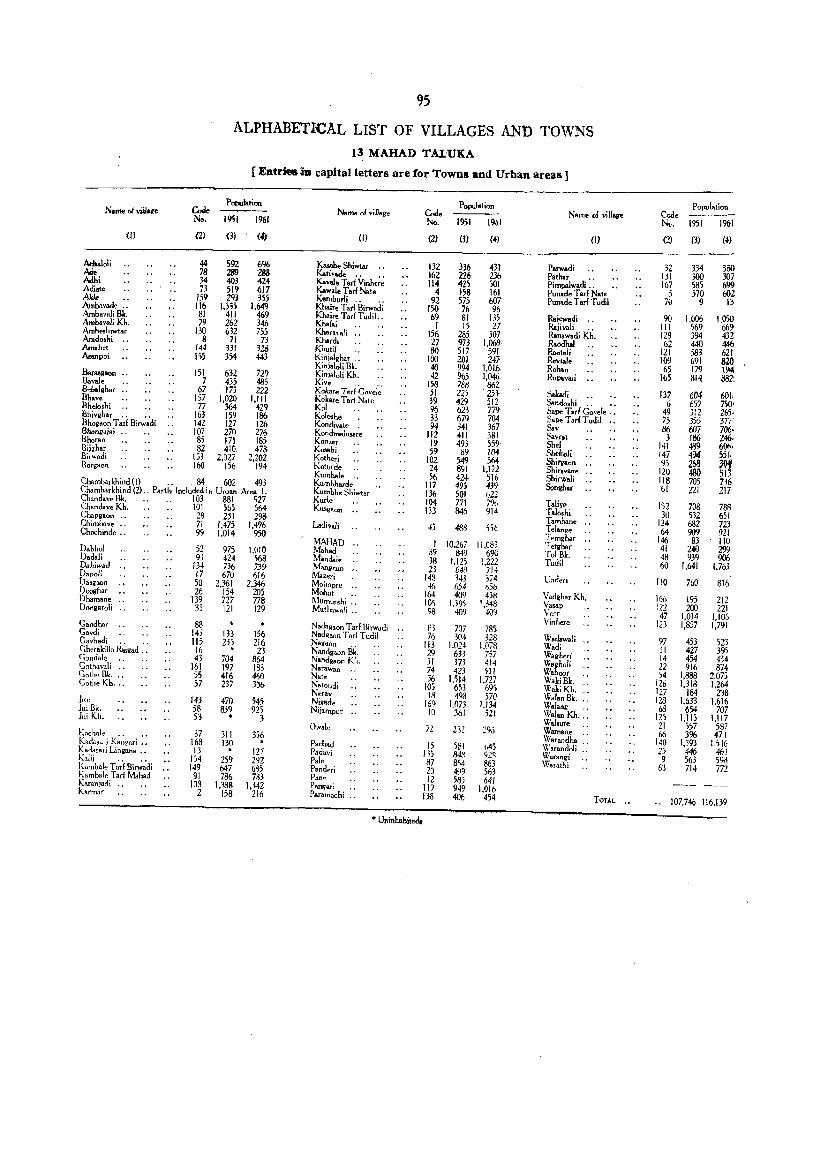
95
ALPHABETICAL LIST OF VILLAGES AND TOWNS 13 MAHAD T AL'UKA
r Entrioea fiD capital letters are for Towns and Urban areas J
Name 01 villal!'e
Aehaloli Arle Adhi Adiste AkJ. •• Ambavade .. Ambavali Bk. Ambavali Kh. Amheshiwtar Arodo.hi .. Am.het A.anpoi
Baraogaon .. Ba..Je fl"hal.har .. Rhave Rh.lo,hi .. .. Bhivihar .. .. Rhogaon T arf Birwadi Bhongai.i .. Bhoroo Bij~har Birwadi Borgao~
Code No.
POIlUIotion
1951 1961
(3) (41
44 592 78 289 34 403 73 51'1
159 29J 116 I,m 81 411 79 262
130 632 8 71
144 331 155 354
151 632 7 435
67 175 157 1,020 77 364
163 159 142 127 107 270 85 171 82 410
153 2,027 160 156
.,96 288 424 617 355
1.649 469 346 755
73 3Zd 443
729 485 222
1,111 429 186 126 276 185 478
2,202 194
Chambarkhind (I) . . . 84 602 493 Chambarkhind(2l .. Partly Included;n Ufoan Area I. Chindav. Bk. 103 881 927 Chandav. Kh. 101 565 564 Chap.aon .. 28 z:; I 298 Chimbave " 71 1,475 1,496 Chochinde ,. 99 1,014 950
Dabhol 52 975 1,010 Dadali 9 j 424 568 D.hiwad . . 134 736 739 Dapoli 17 670 616 Da.g",n 50 2.361 2,346 D.OIIhar 26 154 205 Dbaman. .. 139 727 778 Dongaroli .. 35 121 129
Gandh., Gavdi Gavhadi .. .. Cher.kill. R.igad ., G::mdafe " Gnthavali " Goth. Bk ... Gothe Kh. "
lite lui Bk. lui Kil.
Koch.l. .. .. Kadasurj Kangori ~ ~ Kadasari Lingana .• Kaljj '. .. Kambale T arl Birwadi Kambale Tarl Mah.d Karaniadi " Karma!'
88 143 133 115 235
16 • 43 704
161 197 5S 416 57 237
143 470 58 839 53 •
37 311 168 130 13 •
154 259 149 647
91 786 103 1,,88
2 158
156 216 23
864 183 460 3~6
545 925
3
356 . 127 292 6~5 783
1,442 216
Name 01 villAge
(I)
Kosak Shiwtar .. !Goti.ode .. .. Ka..J. T arf Vinhcre Kawai. T arf Nal. Kemburli .. .. Khaire Tarl Birwadi Khait. Tarl Tudil.. Khalai .. Khara"ali .. Khardi Khulil .. Kinialghar .. Kinialoli Bk. 'Sinialoli Kh. }'\.Ive .• ., Kahre Tarf Govelo Kak"'e Tar! Nate Kol Kolo.h. .. Kondivnte '. Kondmalusare Konzar Kosabi Kotheri Kotllrde Kumhal. .. Kumhhar"e Kurubh.Shiwtar Kurl. KusPon .,
LadivaJi
MAHAD .. Mahad Mandale Mangrun " Maleri Moilopre .. Mohol .. Mumu,.!'i " Muthawali ..
NaJagaon Tad Birwadi Nad~aon Tad T udil Nag-don .. Nandg.o" Bk. Nand.aon Kh. Narawan .. Nate Nalondi Nerav Nif/Ode Nijlltnpul' .,
Ow.le
Pachad Pad.v; Pale Panderi Pane Paneari Paramac.hi ••
• Uninhabited.
(2)
132 162 114
4 92
150 69 I
156 27 80
100 40 42
158 51 39 % 33 94
112 19 59
102 24 56
117 136 104 133
45
1 39 38 23
148 .j,~
164 106 98
~3 76
113 29 31 74 36
105 18
169 10
IS Jl5 87 20 12
119 138
Population
1951 1%1
(3) (4)
336 226 425 158 575 76 81 15
285 973 517 201 994 965 788 225 429 623 679 341 411 493 89
549 891 424' 495 501 771 846
488
10,267 849
1,125 649 343 654 409
1.39\ 409
707 304
1.024 633 373 423
1.514 653 498
1.073 36;
232
581 848 854 499 585 949 406
431 236 501 161 607 96
135 27
307 1,069
591 247-
1,016 1,046 862
. 253 512 779-704 367 381 559 104 564
i .. li2 516 439 622 796 914
556
11,083 690
1.222 j 14 374 656 438
1,348 409
78S 328
1.078 757 414 5lJ
1,727 695 570
1.!34 521
645 92S 863 563 641
1,916 454
Name 01 village
(I)
Parwadi Pathar .. Pimpalwodi .. Punade T .rl Nate Pun.de T arI T udil
Rajewadi ,. Raiivali " Ran.wadi Kh. Raodhal Raotali Revtal. Rohan Rupavali
SaWi Sandoshi.. .. Sap<: Tarf Go,·el. " Sap. Tarl T udil " Sav Savrat She! Sheltoli Shil"gaon ., Shirsvane Shirw.li Songhar
Taliye Talo,hi Tamhane .. Telange Temghar " Tetghar ToIBk. Tudil
Underi
Vadghar Kh. V ... p Veer Vinhere
WadawaJi Wadi Wagher; Wag-holi Wahoor WakiBk. WakiK!' ... WalanBit ... Walang .. IValan Kh ... \X'alsure .. Wamane .. Warandha " \VarandoB Warangi War.thi
TOTAL ..
Code No.
(2l
32 l,ll 167
j 70
90 III 129 62
121 109 65
165
137 6
49 75 B6 3
141 147 9')
120 118 61
152 30
124 64
146 41 48 60
110
166 122
47 123
97 II 14 22 54
126 IZ7 128 68
121 21 66
140 25 9
63
Population
19)1 1961
(3) (4)
334 380 300 307 585 699 570 602
9 U
1,006 1.050 569 669 394 432 440 446 583 621 691 820 179 I~ 814 882:
6fJ4 WI! 657 7S01
312 265· 355 377' 607 706· 186 246. 489 606. 494 551. 268 m 480 i;iJ 705 736 221 217
708 788 532 651 682 723 909 921
83 110 240 299 939 906
1.641 1.763
760 816
195 212 200 221
1.014 tlOG 1,857 1,791
453 523 427 39) 454 434 916 874
1,888 2.075 1,318 1,264
184 238 1,633 1,616
654 707 1,115 1,117
557 587 3% 471
1,393 1,',16 446 461 563 593 714 772
107,746 116,139
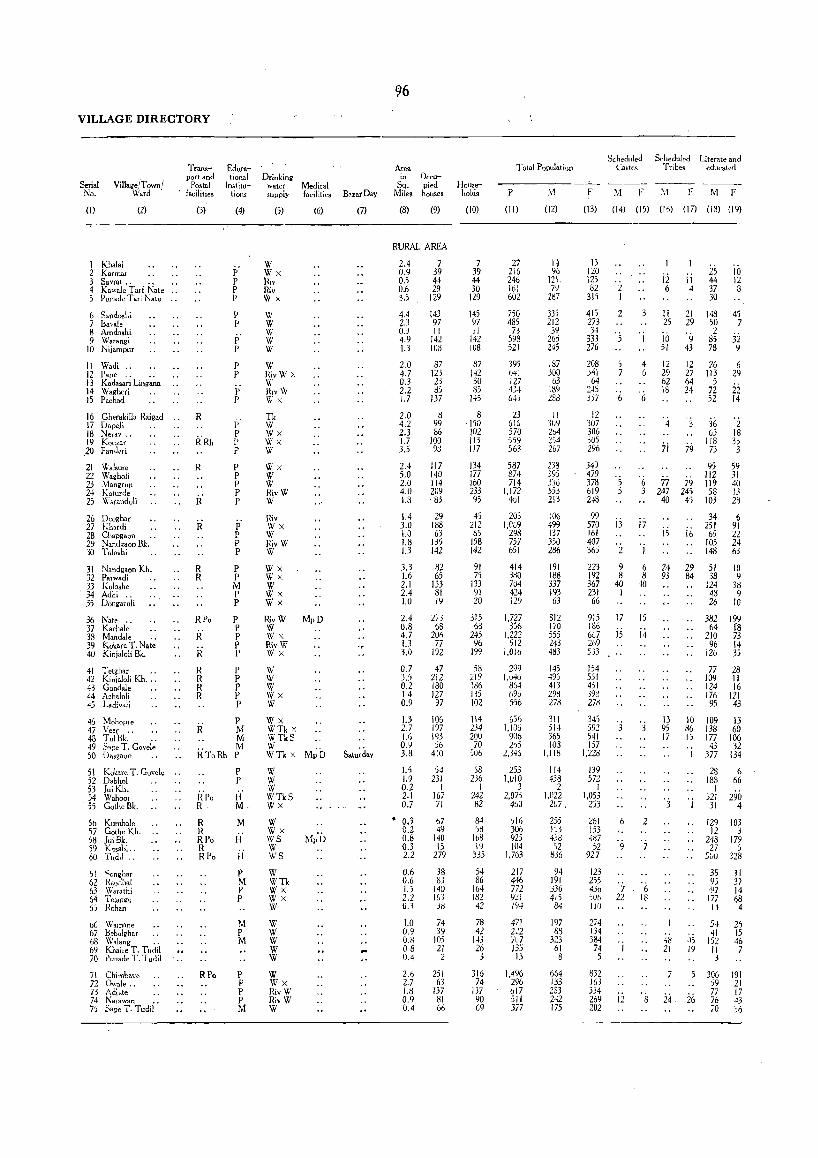
VILLAGE DIRECTORY
Tram,port and
Postal
Educational
Institu-Serial No.
Village/Town! Ward . facilities tions
(I)
Khalai Karmat
(2)
Savrat .. " Kawale Tad Nate .. PunaJe Tar! Nate ..
6 S3.ndosl,i 7 Bava!e 8 Amdo.hi 9 Warangi
10 Nijampllf
II Wadi .. 12 Pane ., .. 13 Kadasari Lingaon 14 Wagheri 15 Pachad
16 Gherakilla Raigad .. 17 Dapoli 18 Nerav .. 19 Konzar
.20 Pandori
21 Wal.ure 22 Wagholi 23 Mangrul1 24 Koturde 25 Warandoli
26 Deoghar 27 Kh.,di 28 ChapgaQn 29 Nandgaon Bk. 30 Talo,hi
31 Nandgaon Kh. 32· Parwadi 33 Kola,he
. 34 Adni " 35 Dangaroli
36 Nate " 37 Kachale 33 Mandale " 39 Kokare T. Nate 40 Kinjaloli Bk.
41 Tetghar .. 42 Kinialoli Kh ... 43 Gondale 44 Arh"loli 45 Ladivali
46 Mohopre 47 Vec(_ .. 48 Toll:1k. .. 49 S'pe T. Govele 50 Da,gaon
51 Kokare T. Gavele .• 52 Dabhnl 53 Jui Kh. 54 Wahoor
. 55 Gothe Bk.
56 Kurnbole 57 Gothe Kh. 58 Jui Bk. 59 Kosabi.. 60 Tudil ..
61 C;onghar 62 Raodh.l 63 War"lhi 64 T'elange 65 Rohan
66 Wamane 67 Bebalghar 68 Walang ., 69 Khai .. T. Tudil 70 Punade T. Tudil
71 Chimbave 72 Owale .. 73 Adiste 74 Narawan .. 75 Sape T. T udil
(3)
R
R
R R
RPo
R R R R
p' P P P
P P
p' P
P P
P P
I" P P P
P P P P P
p P P P
P P M P P
P P P P p
P P P p P
P R M
M M
RToRh P
RPo R
R R RPo R RPo
RPo
p P
~i M
M
H
H P M P P
M P M
P P P P M
Drinking water supply
(5)
W Wx Riv Riv Wx
W W W W W
W RivW X W RivW Wx
Tk W Wx Wx W
Wx W W WvW W
Riv Wx W RivW W
Wx Wx W Wx Wx
M.d'cal facilities
(6)
RivW MpD W WX RivW Wx
W W W Wx W
Wx WTk X WTkS W wn X MpD
W W W WTkS WX
W Wx WS Mp'O W WS
W wn WX Wx W
W W W W W
W WX Riv W Hiv \V W
BazatDay
(7)
96
Area In
Sq. Mile.
(8)
Oc('upied houses
(9)
RURAL AREA
2.4 0.9 OJ 0.6 3.>
4.4 23 0.9 4.9 1.3
2.0 4.7 0.3 2.2 1.7
2.0 4.2 2.3 J.7 3.5
2.4 5.0 2.0 4.0 1.3
1.4 3.0 1.0 1.8 1.3
3.3 1.6 2.1 2.4 1.0
2.4 0.8 4.7 1.3 3.0
0.7 3.5 0.2 1.4 0.9
1.3 2.7 J.()
0.9 3.8
1.5 1.9 0.2 2.1 0.7
• 0.3 0.2 0.8 0.3 2.2
0.6 0.6 J.j 2.2 0.3
1.0 0.9 0.8 08 0.4
2.6 2.7 1.8 0.9 0.4
7 39 44 29
129
143 97 II
142 IUS
87 123 23 ~S
137
8 99 86
100 9{]
117 140 114 209 . tlj
29 188 63
135 142
82 65
J33 81 19
273 68
206 77
192
47 212 180 127 97
106 197 193 56
410
')4 231
I 167 71
67 49
140 15
279
38 83
140 IG3 38
74 39
lOS 21 2
251 63
137 81 66
Households
(10)
7 39 44 30
129
145 97 1I
142 108
87 142 30 8S
145
8 150 102 113 117
134 J77 160 233 95
45 212 65
158 142
91 75
133 91 20
315 68
245 96
199
58 219 186 1.l5 102
114 234 20U
70 506
58 236
I 242 82
84 ')8
168 19
335
54 86
164 182 42
78 42
143 26 3
316 74
137 90 69
T oial Population
P III
(II)
27 216 246 161 602
750 485
73 593 521
395 1)41 127 434 G"*5
23 Glo 570 559 563
587 874 714
1,172 401
205 1.069
298 757 651
414 3~0 704 424 129
1.727 1'>6
1.222 512
1,016
299 l.u46
864 696 556
656 1.105
906 2'J5
2,345
253 I,UIO
3 2,075
4S0
516 306 925 104
1.763
217 446 772 921 194
471 222 IL7 135
13
1.496 296 617 511 377
(12)
11 9"
121. I~ 2~1
335 212 39
26j 245
137 JOO
63 189 288
II 3()9 204 i54 267
233 395 336 553 213
106 499 137 350 286
191 188 337 193 63
B12 170 555 243 483
145 495 413 298 27d
311 51·' 365 103
1,118
1!4 438
2 1,022
2U7.
255 IS3 43d 52
836
94 191 336 415 84
197 88
323 61 8
664 133 283 242 175
Scheduled Ca~tes
M f
Scheduled Literate and Tribes educated
M f M f
(13) (14) (15) (16) (17) (IS) (19)
13 120 125 82
315
415 213 34
333 276
2G8 j41 64
2.\5 551
12 307 306 305 296
2 I
2
5 7
3
4 6
6
ii 6
11 25
10 51
12 29 62 18
4
7i
ii 4
21 29
9 43
12 27 64 24
79
25 44 37 30
143 SO 2
85 78
26 113
5 72 52
36 63
118 73
10 12 8
45 7
:ii 9
6 29
22 14
'i 18 33 3
349 479 378 619 M8
6 77 79 3 247 245
95 liZ 119 58
103
59 31 40 13 23 40 45
99 570 13 17 161 is 407 365 2 I
223 9 6 24 192 8 8 93 367 40 40 231 I 66
915 17 15 186 6(;7 15 i.j 269 533
154 551 451 396 278
345 592 541 157
1,228
139 572
I 1,053
253
261 . 153 4cl7 )2
927
123
6 2
9
255 436 I '(; SOb 22 IS I/O
274 134 384
74 5
832 163 334 269 202
12
13 95 17
48 21
24
34 6 251 91
i6 65 22 105 24 148 63
29 51 10 9
38 9
10
84 38
10 86 15
'j
26
124 48 26
382 199 64 fa
210 73 96 14
126 35
77 28 109 II 124 16 176 121 95 43
109 138 177 43
377
13 60
106 32
134
28 6 188 66
I 521 290 31 4
129 103 12 3
248 179 27 5
suo 328
35 II 9i 31 97 14
177 68 14 4
5~ 41
152 II 3
306 59 77 i6 70
26 15 46 7
191 21 17 43 36
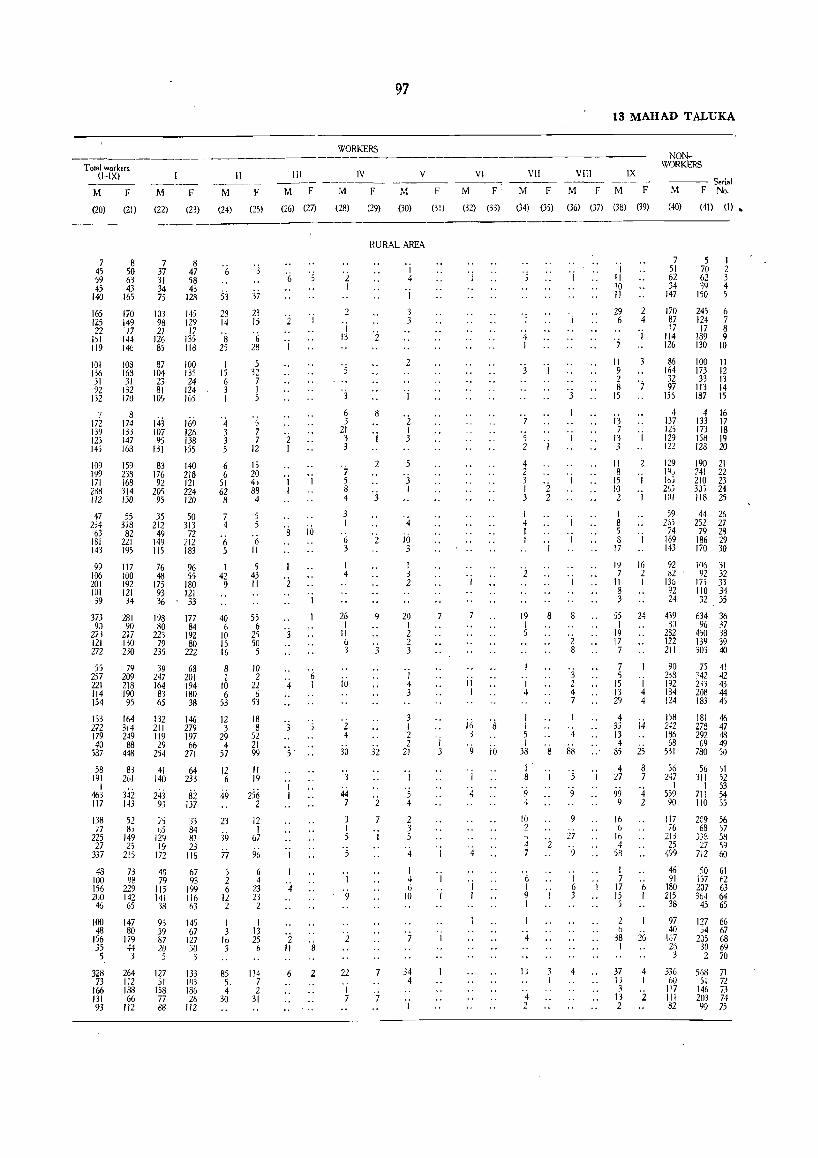
WORKERS
Total workers (I-IX) II III IV
M F . M F M F M F M F
(20) (21) (22) (23) (24) (25) (26) (27) (28) (29)
97
M
(30)
V
F
(31)
VI
M F
(32) (33)
VII
M F
(34) (3)
13 MAHAD TALUKA
VIll IX
M F M F
(36) (37) (38) (39)
NONWORKBRS
--- St'rial M F No.
(40) (41) (I).
------~----------------- ,------~--.-----------
7 45 59 45
140
165 125 22
1)1 119
101 136 31 92
132
7
8 50 63 43
165
170 149 17
144 146
108 163 31
132 170
7 37 31 34 75
103 98 21
126 85
87 104 23 81 10~
8 47 58 43
128
145 129
17 135 118
100 135 24
124 165
172 139 123 145
8 174 143 169 133 107 126 147 95 138 168 131 155
109 199 171 288 112
47 234
63 181 143
99 106 201 101 39
159 238 168 314 130
55 318 82
221 195
117 100 192 121 34
83 176 92
205 95
35 212 49
149 liS
76 48
175 93 36
140 218 121 224 120
50 313
72 212 183
96 55
180 121 33
373 281 198 177 93 90 80 84
273 217 223 192 121 130 79 80 272 230 235 222
55 257 221 114 154
79 209 218 190 95
39 247 164 83 65
68 201 194 180 38
IB 1M In 146 272 314 211 279 179 249 119 197 40 88 29 66
587 448 254 271
58 191
I 463 117
138 77
225 27
337
48 100 156 200
46
83 261
342 143
52 8,
149 25
215
73 98
229 142 65
100 147 48 80
156 179 35 44 5 3
328 264 73 112
166 188 131 66 93 112
41 140
243 93
75 65
129 19
172
40 79
1i5 141 38
9, 39 87 20 5
127 51
158 77 88
64 233
82 137
33 84 81 23
118
67 93
199 116 63
145 67
127 30 3
133 103 186 26
112
6
53 ZS 14
8 25
I 15 6 3 I
'4 3 3 5
6 6
51 62 8
7 4
'6 5
I 42 9
40 6
10 15 16
8 I
10 6
53
12 3
29 4
57
12 6
49
23
39 77 5 2 6
12 2
37 21 15
'6 28
5 32 7 I 5
·5 7 7
12
15 20 45 88 4
6 II
S 43 11
55 6
25 50 5
10 2
22 6
53
18 8
52 21 99
II 19
256 2
12 I
67
96
6 4
23 23 2
I I 3 13
16 25 3 6
85 114 5. 7 4 2
30 31
6 '5
2 I
'j
I I I
's 10
4
3 5
'5' ..
2 II '8
6
2
I 13
3
6 3
21 3 3
';-5 8 4
6 3
I 4
26 I
II 6 3
i6
2 4
30
3
44 7
3 I 5
5
I
9
2
22
'j 7
RURAL AREA
8
2
2
9
32
2
7
I 4
'j
'2 I 3
'j I
4
jo 3
I 3 2
20 I 2 2 3
I 4 3
3 I 2 2
21
I
5 4
2 3 5
4
I 4 6
10
34 4
'j
II I
ji; '8 3
9 10
'j I
4 I
3 I
7
'j
'5 I 2 'j
4 2
f '2 3 2
I 4 I I
19 I 5
'j 4
I i
I
8
I
'j
2 8
3 2 4 7
5 4 I
33 8 88 i 8 I
'9 4
10 2 ~
4 7
6 I 9 I
4
13
4 2
, 5
9
9
27 9
I 6 3
4
'j
'j
I II 10 II
29 6
'7 II 9
2 4
I
~ '7 15
13 7
13 I 3
II 8
15 I 10 2 I
I 8 5 8 I
17
19 16 7 2
II I 8 3
7 5 1 51 70 2 62 62 3 34 ,9 4
147 150 5
170 87 17
114 126
245 6 124 7 17 8
189 9 130 10
85 100 II 164 173 12 32 33 13 97 113 14
155 187 15
4 137 125 129 122
129 IQJ
165 2,j 101
59 265
74 169 143
4 16 133 17 173 18 158 19 128 20
190 21 241 22 210 23 3J; 24 118 25
44 26 252 27
79 28 186 29 170 3D
92 106 31 82 92 32
135 175 33 92 110 34 24 32 35
55 24 439 634 36 I 88 96 37
19 282 450 38 139 39 17 122
7 211 303 40
7 5
15 13 29
I 4 4
4 35 i4 13 4
85 25
4 27
99 9
16 b
16 4
58
I 7
17 15 5
2 6
8 7
'4 2
6 I
38 26 I
37 4 IJ I 3
13 2 2
90 238 192 184 124
75 41 142 42 2,,) 43 208 44 183 45
158 18! 46 242 278 47 186 292 48 68 69 49
531 780 50
56 247
I 5S9 90
117 76
213 25
499
46 91
180 215 38
56 51 311 52
I 53 711 54 110 55
209 56 68 57
3~.<8 58 27 59
712 60
50 61 157 62 207 63 364 M
4-; 65
97 127 66 40 54 67
167 205 68 26 30 69 3 2 70
336 568 71 60 51 72
117 146 73 III 203 74 82 90 75
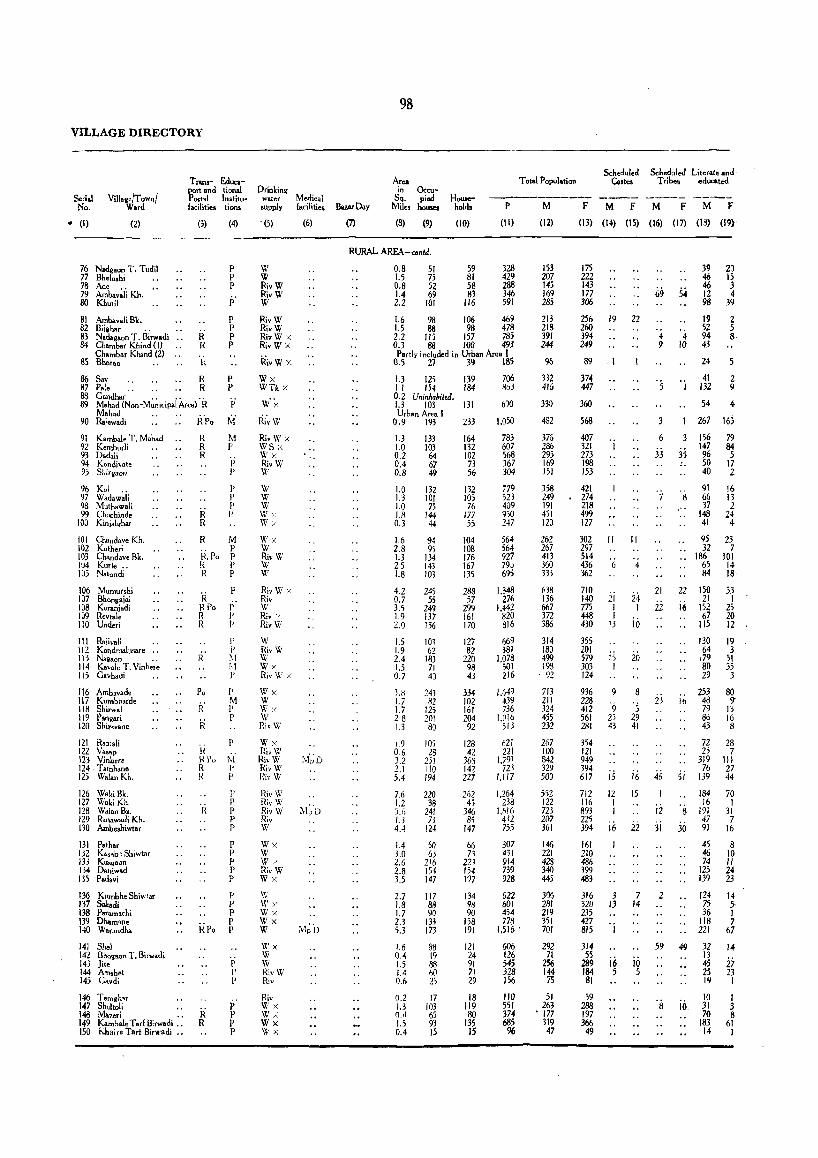
VILLAGE DIRECTORY
Serial No.
• (I)
vmawe!T ownl Ward
(2)
76 Nadgaon T. T uclil 77 Bhelo.hi 78 Ado .. 79 Ambavali Kh. 80 Khutil
81 Ambavali Bk. 82 Biiahar .. 83 N.dagaon T. Birwadi .. 84 Chamb.r Khind (I)
Chambar Kbind (2) .. 85 Bhorao
T 1On.- EducaPOrt and tional Postsl Institu .. facilities tions
(3) (4)
p p P P
86 Say R P P B7 Pal. R
88 Caodhar .. .. .. 89 Mahad (Non-Municipal Areal R
Mahad 90 Ra!ewadi R·po
91 Kambale T. Mahad R 92 K_mburli R 93 Dadali R 94 Kondivate 95 Shirgaon
96 Kol .. 97 Wadawali 98 Muthawali 99 Chochinde
IOJ Kinjal.har
101 Chandave Kh. 102 Kotheri 103 Chandav_ Bk. 104 Kurle .. lOS N.tondi
106 Mumurshi 107 Bhongajai 108 Karaniadi 109 Revtale 110 Underi
111 Rn;ivali 112 Kondmalusare .. 113 NaRaon .. 114 Kaval_ T. Vinhere I is Cavhadi
116 Amb>vad. 117 Kumhharde 118 Shitwal 119 Pangari 120 Shit,va",
121 Rao:ali 122 V.sap 123 Vinher. 124 ,Tamhane 125 Wal.n Kh.
126 Woki ~~. 127 W.k, ;"n,
128 Walan Bk, 129 R.nawadi Kh. 130 Ambe.hiwtar
131 Pathar 132 K".b, Shiwtar 13, KUsR"on 134 Dahiwad 135 Padavi
136 Kumbhe Shiwtar 137 Sakadi 138 Param'lChi 139 Dhamane 140 Warandha
141 Shel 142 BhQllaOn T. Birwadi 143 jit, 144 A'llSh.t 145 Cavdi
146 Ternih~r 147 SheitoH 14il Mazeri •. 149 Karobale T arl B,rwadi .. 150 Kbaire Tart Birwadi ..
R R
P I' P l'
R M P R. Po P
R P R P
R RPo R R
Po
k·
R
P p. )'
l' p P 1'.1 :,1 !'
l' M P P
r .1{ RPu M' R l' H P
R
i< Po
Ii R
p P l' P P
p p p p P
" P P P p
.p r p
p p p p
Drinking water Medical .upply facilities
-(5) (6)
W W RivW RivW W
RivW RivW RivW X RivW X
RivW X
\Vx WHx W·:':
Ri~W
RivW x WSx Wx RivW W
W W W W>: W'/.
W"x W RivW W W
RivW;< Riv WI Riv'/ RivVi
W RivW W Wx RivW x
Wx W W;< WI RivW
Wx Riv'\f,/ RivW RivW l~iv \V
RivW HivW RivW Riv W
Wx W W,( RivW Wx
\V \1'y Wx Wx W
\"I' X W W RivW Riv
Riv Wx Wx Wx Wx
BazarDay
(7)
98
Ar.,. in Oc:cu'"
Sq. pied Miles holl5eS
(8) (9)
Household.
(10)
P
(II)
RURAL AREA-",nld.
0.8 1.5 0.8 1.4 2.2
51 75 52 69
101
59 81 58 83
116
328 429 288 346 591
1.6 98 106 469 1.5 88 98 478 2.2 115 157 78j 0.3 88 100 493 Partly included in Urban Are. I
0.5 27 39 185
1.3 12) I. I 154 0.2 Uninh.biled. 1.3 103 Urban Ar •• 1
0.9 193
1.3 133 1.0 103 0.2 64 0.4 67 O.B 49
1.0 1.3 1.0 1.8 0.3
L6 2.8 1.3 25 1.8
4,2 0.7 3,5 1,9 2.0
1,5 1,9 2.4 1.5 0,7
3.S 1.7 1.7 2,8 U
1,9 0.6 3.2 2.1 5.4
7.6 1.2 ).6 1.3 4.4
1.4 3,0 2,6 2.8 3.5
132 101 75
144 44
94 95
134 143 103
245 55
249 137 136
103 62
183 71 40
243 82
125 '0' -80 10i 28
2;1 JlO 194
220 38
241 73
124
50 63
216 154 147
139 184
131
233
164 132 102 7J 56
132 105 76
177 55
104 108 176 167 135
288 57
299 161 170
127 82
220 98 43
334 102 161 204
92
128 42
363 147 227
262 4;
346 8,
147
66 71
22l 154 197
706 803
6?0
1.050
783 607 568 367 304
i79 523 409 950 247
564 564 927 79'> 695
1.348 276
1.442 820 816
669 381
1.078 501 216
1.649 439 736
1.016 513
621 221
1,;91 721
1.117
1.264 238
1,616 412 m 307 431 914 739 928
622 601 454 778
T atal Populotion
M
(12)
153 207 145 169 285
213 218 391 244
96
332 415
330
482
376 286 295 169 151
358 249 191 451 120
262 267 413 360 333
638 136 667 372 386
314 180 499 198 92
713 211 324 455 232
267 100 842 329 500
552 122 721 207 361
145 221 423 340 445
2.7 I.B 1.7 2.3 5.3
117 88 90
133 173
134 98 90
158 191 1,516 '
306 281 219 3)1 701
),6 o.~ ),5 1,4 0.6
0.2 1.3 n ,I LS 0.4
RB 19 8B 60 25
17 103 65 93 15
121 24 91 71 29
18 119 80
135 15
606 126 545 328 156
110 551 374 685 96
292 71
256 144 75
51 263
·177 319
47
Scheduled Schedllied Literat. and Ca,t"" T rib.. educated
F M F M F M F
(13) (14) (15) (16) (17) (13) (m
175 222 143 177 306
256 260 394 249
89
374 447
360
568
407 321 273 198 153
421 274 218 499 127
19 22
302 If II 297 514 436 6 4 362
710 140 775 448 430
355 201 579 303 124
936 228 412 561 281
354 121 949 394 617
712 116 893 225 394
161 210 486 399 483
316 320 235 427 815
314 55
289 184 81
59 288 197 366
49
ii I I
13
is I
9
9 2; 43
is 12 I 1
i6
3 13
., i6 5
24 I
io
26
8
·5 29 41
;6 15
2i
7 14
io 5
69 54
39 46 46 12 98
2·) 15 3 4
4 9
5
3
6
33
21
22
23
46
ii 3i
2
59
4 10
35
19 52 94 43
24
.41 132
54
267
156 147 96 50 40
39
2 5 8
2 9
4
165
79 84 5
17 2
91 16 ·s 66 13 37 2
148 24 41 4
95 23 32 7
•• 186 101
22
16
16
5i
8
30
65 14 84 18
150 21
152 67
115
130 64
,79 80 29
253 48 79 86 43
72 2;
319 76
139
184 16
191 47 91
33 I
25 20 12
19 3
51 35 3
80 9
13 16 8
28 7
III 27 44
70 I
31 7
16
45 8 46 10 74 If
125 24 139 23
124 75 36
118 221
14 5, I 7
67
49 32 14 13 45 i7
i6
25 23 19 I
10 31 70
183 14
I 3 8
61 I
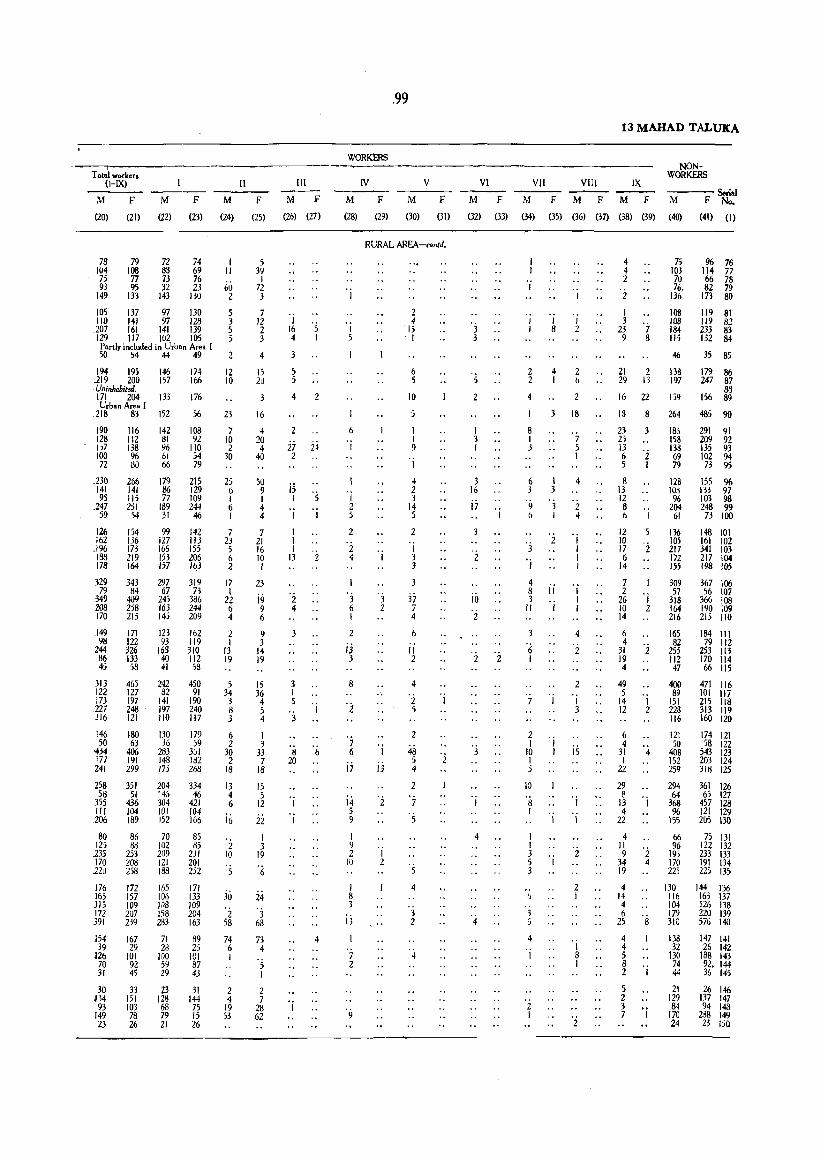
T obll workers (HX) II
M F M F M F
(20) (21) (22) (23) (24) (25)
78 79 72 74 I IU4 lOB 83 69 II 75 77 73 76 93 95 32 23 60
149 133 143 130 2
105 137 97 130 5 110 HI 97 128 3
.207 161 141 139 5 129 117 102 105 ') Partly included in Urban Area I 50 ,4 44 49
194 19j 146 174 166 219 200 157
,Unillhabil<tl, 171 204 133 176
56
108 92
110 54 79
Urban Area I .218 83 152
190 116 142 128 112 81 1)7 138 96 100 96 61 72 80 66
,230 266 179 215 129 109 244
141 141 86 95 115 77
.247 251 189 59 54 31 46
126 154 99 142 113 ISS 206 11\3
162 136 127 ,196 173 166 188 219 153 178 164 157
329 343 79 84
349 409 208 258 170 m
..149 171 98 122
244 326 86 133 45 58
313 122 173 227 J16
146 50
-434 177 241
258 58
355 III
206
80 125
235 170 220
176 165 JI5 172 391
.154 39
126 70 31
30 J'l4 93
149 23
453 127 197 248 121
180 63
406 191 299
351 51
436 104 189
86 88
253 208 258
J72 157 109 207 239
167 29
101 92 45
33 151 103 78 26
297 319 67 73
245 386 163 244 145 209
123 162 93 119
168 310 40 112 41 58
242 82
141 197 110
130 36
283 148 J7j
204 '4,)
304 101 152
70 102 209 121 188
165 106 WB 158 2B3
450 91
190 240 117
179 59
361 182 268
334 46
421 104 166
85 85
231 201 2j2
171 133 109 204 163
71 89 28 25
100 101 59 87 29 43
23 31 128 144 68 75 79 15 21 26
12 10
23
7 10 2
30
25 6 I 6 I
7 23 5 6 2
17 I
22 6 4
2 I
13 19
5 34 3 8 3
6 2
30 2
18
13 4 6
j6
2 10
5
30 'i 58
74 6 1
2 4
19 53
5 39
I 72 3
7 12 2 3
4
15 20
16
4 20 4
40
50 9 I 4 4
7 21 16 10 I
23
i9 9 6
9 3
14 19
15 36 4 5 4
I 3
33 7
18
15 5
12
22
I 3
19 °6
24 3
68
73 4
'5 I
2 7
28 62
III
M F (26) (27)
I 16 5 4 I
4
2
27 ii 2
is I '5 I I
I I I
13 2
3 I 5
'3
8 20
6
4
,99
WORKERS
IV V
M F M F
(28) (29) (30) (31)
RURAL AREA-amid,
6
I
'j 2' 5
2
2 4
3 6 I
2
ij 3
8
'i
'7 6
i7
i4 5 9
I 9 2
IU
I 8 3
j.i
7 2
'j 2
'j
13
2 4
15 I
6 5
10
I I 9
I
4 2 3
14 5
2
I 3 3
37 7 4
6
II 2
4
2 5
2
48 5 4
2
7
'5
'5 4
3 2
4
VI
M F
(32) (33)
3 3
2
3 16
i7
2
io 2
2 '2
3
4
13 MAHAD TALUXA
VII VIII IX
M F M F M F
(34) (35) (36) (37) (38) (39)
'j I
I I I I 8 2
2 2
8 I 3
6 3
'9 b
'3 I
4
4 2 I b
2
18
7 5 I
4
'3 '2 I 4
2 OJ
I I I
8 II I 3 I II I I
4
'6 2 I
2 I
10 I
10
8 I
I I 3 5 3
6
3 6
4
I
'i I
2
I 3
15
'j
I
2 I
'j 8 I
4 4 2
2
I 3
23 7 9 8
21 2 29 13
16 22
13 8
23 25 13 6 '2 5 I
S 13 12 8 6 1
12 10 17 '2 6
14
7 2
26 'i 10 2 14
6 4
31 Z 19 4
49 5
14 I 12 2
6 4
31 4 I
22
29 8
13 'j 4
22
4 II 9 '2
34 4 19
4 14 4 6
25
4 4 5 8 2 'j
5 2
~ OJ
NONWORKERS
----Seri.1 M F No.
(40) (41) (I)
75 96 76 103 114 77 70 66 78 76, 82 79
136 173 80
lOS 119 81 lOB 119 82 184 233 83 115 132 84
46 35 85
138 197
159
264
ISS 158 138 69 79
128 1011 96
204 61
136 105 217 172 155
309 57
318 164 216
165 82
255 Il2 47
400 89
151 228 116
121 50
408 152 259
294 64
368 96
155
66 96
193 170 225
130 116 104 179 310
179 86 247 87
8S 156 89
485 90
291 91 209 92 135 93 102 94 73 95
ISS 96 133 97 103 98 248 99
73 100
148 101 161 102 341 103 217 104 198 105
367 106 56 \07
366 108 190 109 21; 110
184 111 79 112
253 113 170 114 66 115
471 116 101 117 215 118 313 119 160 120
174 121 58 122
543 123 203 124 318 125
361 126 65 127
457 128 121 129 205 no
75 131 122 132 233 133 191 134 m 135
144 136 163 137 126 138 220 139 576 140
138 147 141 32 26 142
130 188 143 74 92. 144 44 36 145
21 26 146 129 137 147 84 94 148
170 238 149 24 23 150
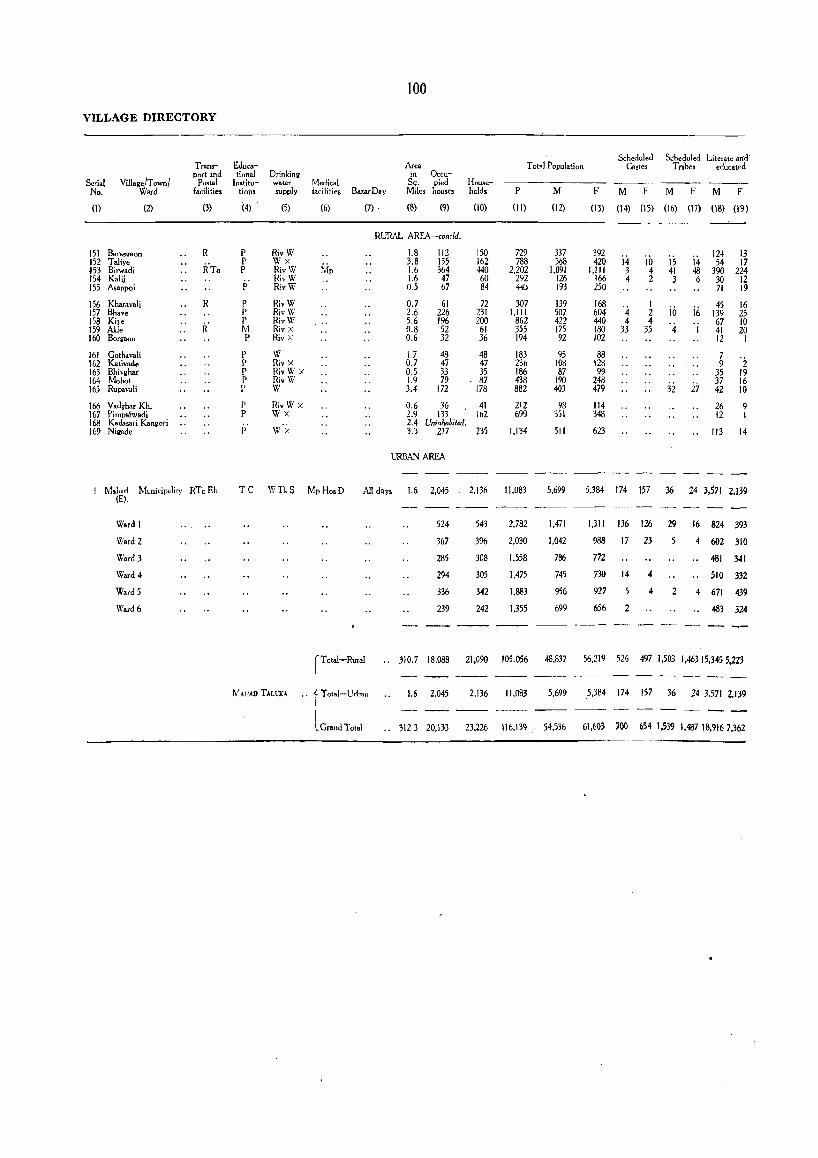
100
VILLAGE DIRECTORY
Scheduled Scbeduled Litera!e and· Trans- £dum- Area Tot.1 Population Castes T ribe. ed~c'ted port and tional Drinking in Occu-
Seri,l Village/T own/ Postal In.titu- water Medical Sq. pied House-No. Ward facilities tions supply facilities BazarDay Miles nauses hold. P M F M F M F M F
(I) (2) (3) (4) (5) (6) (7) (8) (9) (10) (II) (12) (13) (14) (15) (16) (17) (18) (19)
RURAL AREA-concld.
151 Barasgaon R P RivW 1.8 112 150 729 337 392 i4 '10 '15
124 13 152 Taliye
fTo P Wx
~ip 3.8 135 162 788 368 420 14 54 17
153 Birwadi P RivW 1.6 364 440 2,202 1,091 1,111 3 4 41 48 390 224 154 Kalii RivW 1.6 47 60 292 126 166 4 2 3 6 30 12 155 Asanpoi P RivW 0.5 67 84 443 193 250 .. 71 19
156 Kharavali R P RivW 0.7 61 72 307 139 168 '4 I ici
45 16 157 Bhave P RivW 2.6 226 231 1,111 507 604 2 10 139 25 158 Kiye R' P RivW 5.6 196 200 862 422 440 4 4 67 10 159 Akl. M Riv X 0.8 52 61 355 175 180 33 35 4 I 41 20 160 Bergaon P Riv X 0.6 32 36 194 92 102 12 I
161 Gothav.li P W 1.7 48 48 183 95 88 7 '2 162 Kativade P niv X 0.7 47 47 236 108 128 9 163 Bhivgh,r P RivW X 0.5 33 35 186 87 99 35 19 164 Mohot P RivW 1.9 79 87 438 190 248 37 16 165 Rupavali p W 3.4 172 178 882 403 479 32 27 42 10
166 Vadghar Kh, P RivW X 0.6 36 41 212 98 114 26 9 167 Pimpalw.di P Wx 2.9 133 162 699 351 348 12 I 168 KadasaIi Kangori
W'x 2.4 Uninhabited.
169 Nigad. P 3.3 217 235 1.134 SII 623 113 14
URBAN AREA
---M.had MunicipalilY RTo Rh TC W11S
(E). MpHosD All days 1.6 2.045 2.136 11.083 5.699 5.384 174 157 36 24 3.)71 2.139
Ward I 524 543 2.782 1.471 1.311 136 126 29 16 824 393
Ward 2 367 3% 2,030 1,042 988 17 23 5 4 602 310
Ward 3 285 308 1.558 786 772 481 341
Ward 4 294 305 1.475 745 730 14 4 510 332
Ward 5 336 342 1,883 956 927 5 4 2 4 671 439
W.rd6 239 242 1.355 699 656 2 483 324
fTotal-Rut.1 .. 310.7 18.088 21.090 105.056 48.837 56.219 526 497 1.503 '.463 15.345 5.223
----lV AliAD TALtJ(, Total-Urban 1.6 2.045 2.136 11.083 5,699 5,384 174 157 36 24 3.571 2.13')
I
I ---l Grand Total .. 3123 20,133 23.226 116.139 54.536 61.603 700 654 1.539 1.487 18.9167.362
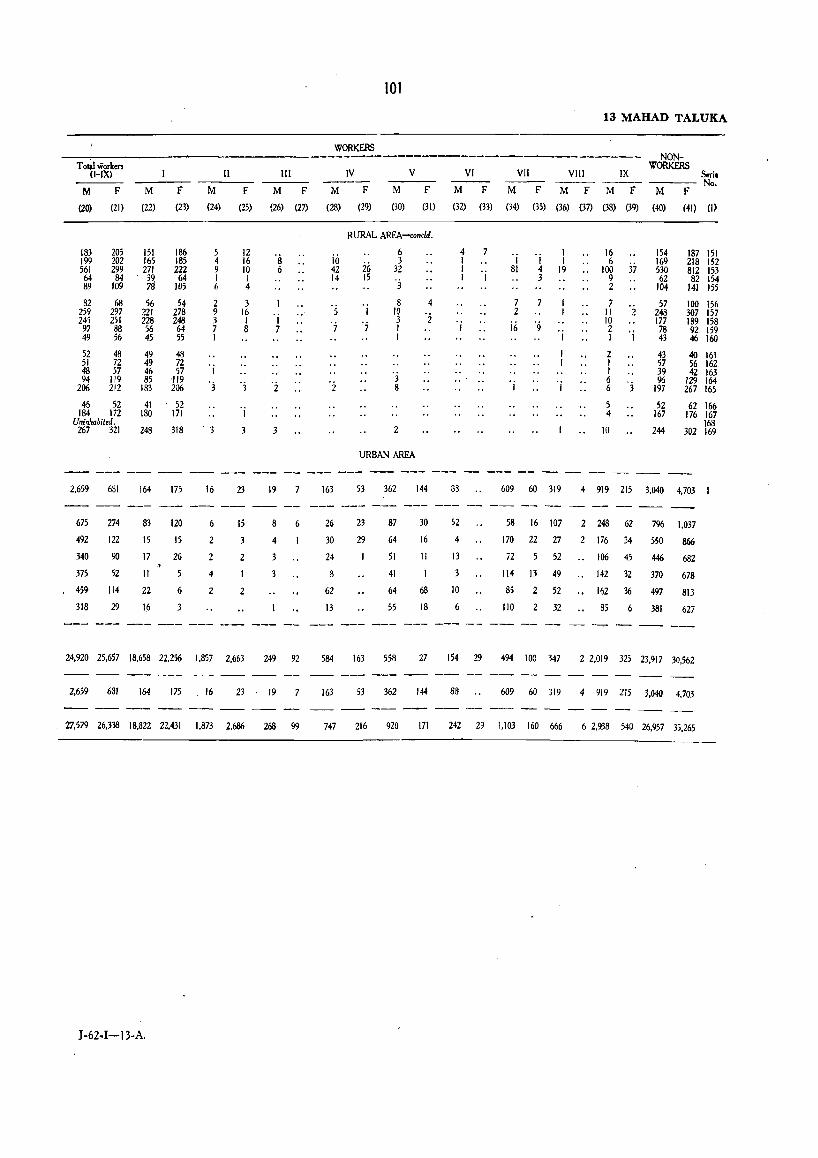
T olal workers (I-DO
M F
(20) (21)
183 205 199 202 561 299
64 84 89 109
82 68 259 297 245 251
97 88 49 56
52 48 51 72 48 57 94 119
206 212
46 52 184 172
Uninhabited. 267 321
2.659 681
675
492
340
375
459
318
274
122
90
52
114
29
M
(22)
F
(23)
151 186 165 185 271 222 39 64 78 105
56 54 221 278 228 248 56 64 45 55
49 48 49 72 46 57 B5 119
183 206
41 . 52 180 171
248 318
164 175
83
15
17
II
22
16
120
15
26
5
6
3
1\1
(24)
5 4 9 I 6
2 9 3 7 I
I
'j
. 3
16
6
2
4
2
II
F
(25)
12 16 10 I 4
3 16 I 8
'j
23
15
3
2
III
M F
(26) (27)
's 6
'j 7
3
19 7
8
4
3
6
24.920 25.657 18.658 22.256 1.857 2.663 249 92
2.659 681 164 175 16 23 ,19 7
27.579 26.338 IB.822 22.431 1.873 2.686 268 99
J-62-I-J3-A.
101
WORKERS
IV V VI
M F M F M F
(28) (29) (30) (31) (32) (33)
i<i 42 14
RURAL AREA-concld.
6
26 15
3 32
3
8 10 3 I I
'j 8
URBAN AREA
4
2
4 I I I
7
VII
M F
(34) (35)
'j 81
7 2
i6
'j 4 3
7
13 MAHAD TALUKA.
NONWORKERS
VIII IX Soria --- No.
M F M F M F
(36) (37) (38) (39) (40)
I I
19
'j
16 6
.. 100 37 9 2
7 II 2 10 2 I 'j
2 I I 6 6 'j
5 4
10
154 169 530 62
104
57 248 177 78 43
43 57 39 96
197
52 167
244
(41) (I)
187 151 218 152 BI2 153 82 154
141 155
100 156 307 157 189 158 92 159 46 160
40 161 56 162 42 163
129 164 267 165
62 166 176 167
168 302 169
--~ --- --- --- -- --- -- -- -- -- - -- ---163
26
30
24
8
62
13
53 362 144
23
29
I
87
64
51
41
64
55
30
16
II
I
68
18
83
52
4
13
3
10
6
609 60 319 4 919 215 3.040 4.703 I
58 16 107 2 248 62 796 1.037
170 22 27 2 176 34 550 866
i2 52 .. 106 45 446 682
114 13 49 .. 142 32 370 678
85 2 52 .. 162 36 497 813
110 2 32 85 6 381 627
584 163 558 27 154 29 494 100 347 2 2.019 J2j 23.917 30.562
163 53 362 144 88 609 60 319 4 919 2Ij 3.040. 4,703
747 216 920 171 242 29 1.103 160 666 6 2.938 540 26.957 35.265

J-62-1-13-B.

Poladpur Mahal
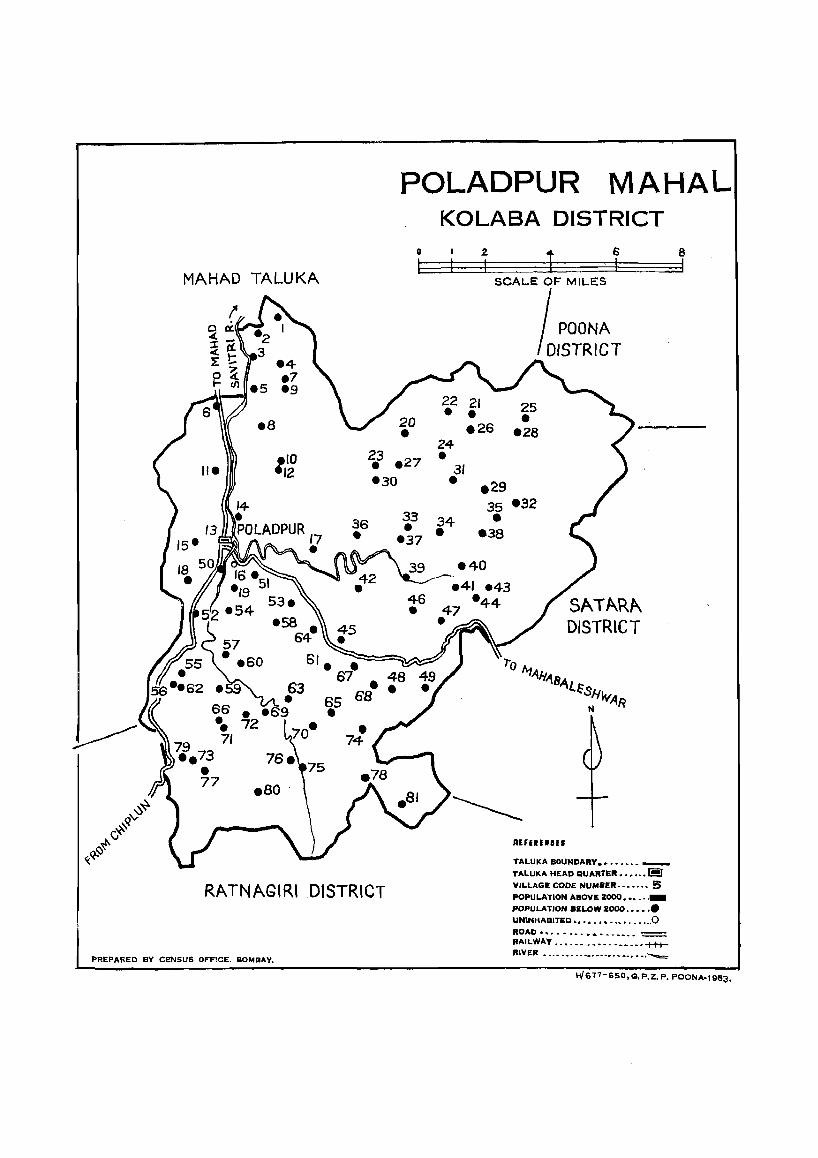
POLADPUR MAHAL
MAHAD TALUKA
66 ••
79 71 •• 73
• 77 .ao·
0
~
20 • 2; _27
-30
RATNAGIRI DISTRICT
PREPARED BY CENSUS OF'FICE. aOMBAY.
KOLASA DISTRICT
22 -24 -31 • 34 •
2 i 6
I I SCAL..E OF MIL..ES
Ir POONA DISTRICT
21 25 - -.26 .28
.29 35 .32 •
.38
AIUIE.,,,
SA.TARI\ DISTRICT
TALUKA BOUNDARy ........ _
TALUKA HEAD QUARTER •••••• I!!!J VILLAGE CODE NUMBER ••••••• 5 POPULATION ABOVE 2000 •••••. _
POPULATION BELOW 2000 ••••••
UNINtiABITED .. " •••••••••••• 0 ROAO ................. = RAILWAY •.••• _ ....... ~ ••• -t+t-RIVER .................. _ ..... ---=
8 I
H/677-S50, G. P.Z. P. POONA.1963.
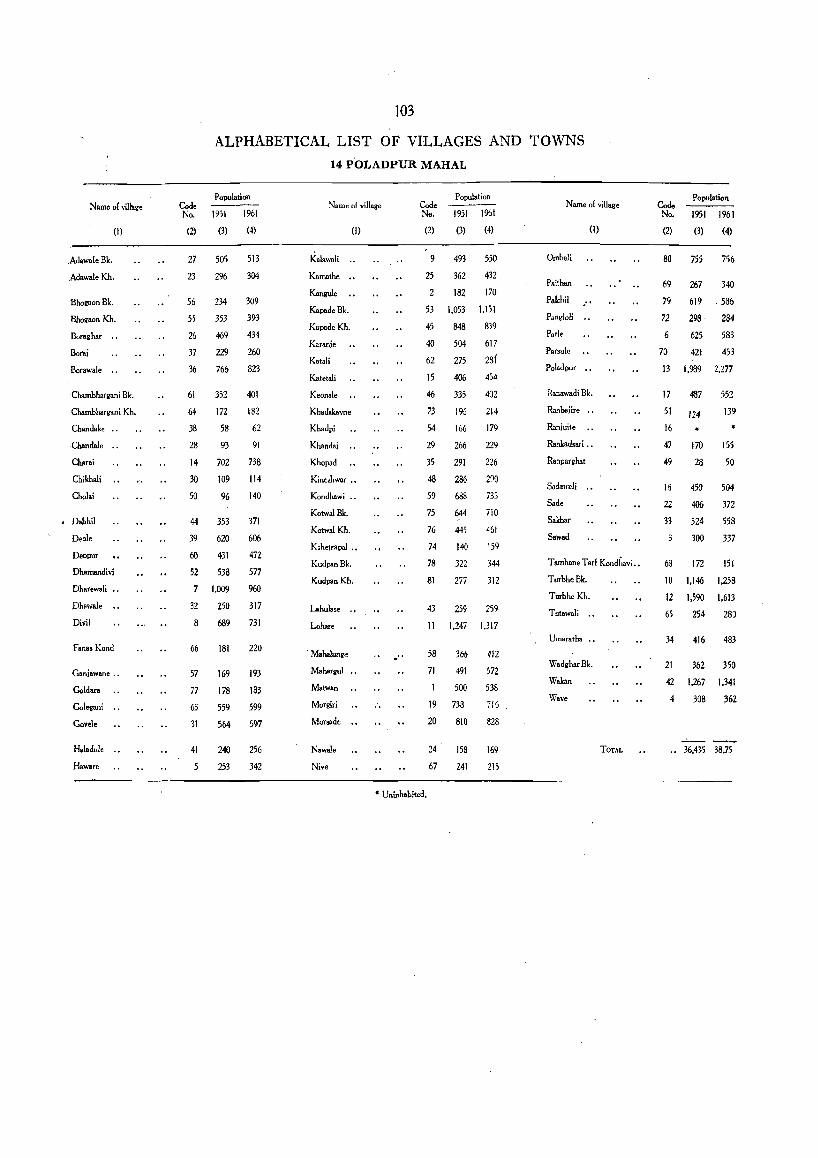
Name of village
(I)
.Adawale Bk.
Adawale Kh.
Sholll'on Bk.
Bhogaon Kh.
Boraghar ..
Boraj
Borawale •.
Chambh.rgani Bk.
Chambhargani Kh.
Chandake ..
Chandale ..
Charai
Chikhali
Cholai
• Dabhil
Deale
Deopur
Dhamandivi
Dharewali ..
Dhawale .•
Divil
fana. Kond
Ganjawane ••
Goldar.
Colegani "
Covele
Hal.clule .•
Hawaro
103
ALPHABETICAL LIST OF VILLAGES AND TOWNS
14 POL AD PUR MAHAL
Population Code ----No. 1951 1961
(2) (3) (4)
27 505 513
23 296 304
56 234 309
55 353 393
26 469 434
37 229 260
36 766 823
61 352 401
64 172 182
38 58 62
28 93 91
14 702 738
30 109 114
50 96 140
44 353 371
39 620 606
60 431 472
52 538 577
1.009 960
32 250 317
8 689 731
66
57
77
63
31
41
5
181
169
178
559
564
240
253
220
193
183
599
597
256
342
Name of village
(I)
Kalawali ..
Kamathe ••
Kanrule KapadeBk.
Kapade Kh.
Karanje
Katali
Katetali
Keonale
Khadakavne
Khadpi
Khandaj •.
Khopad
Kine.hwar ••
Kondhawi ..
Kalwa! Bk.
Kotwal Kh.
K,hetrapai ••
KudpanBk.
Kudpan Kh.
Lahul.,e
Lohare
. Mabalunge
Mahargul
Matwan
Morgiri
Morsade ••
Nawale
Niv.
_"
Population Code -----No. 1951 1%1
(2) (3) (4)
9 493 550
25 362 432
2 182 170
53 1.053 l,151
45 848 839
40 504 617
62 275 2sf
15 406 454
46 335 402
73 196 214
54 166 179
29 266 229
35 291 226
48 286 290
59 688 735
75 644 710
76 445 461
74 140 159
78 322 344
81 277 312
43 259 259
11 1.247 1.317
58 366
71 491
500
19 738
20 810
24
67
158
241
412
572
538
716
828
169
215
• Uninhabited.
Name of village
Ombali
Paithan
Palchil
Panglo]j "
Pari.
(I)
Pa1Sule
Po!adpur ••
Ranawadi Bk.
Ranhaiire ..
Ranjuite ..
Rankadsari .•
Ranparghat
S.d.,,·.li ••
Sad.
Sakhar
S.wad
T amhone Tar! Kondhavj .•
TurbheBk.
Turbh. Kh.
TutawaIi
Umaratho ..
WadgharBk.
Wok.n
Wave
TOTAL
Code No.
(2)
Population
1951 1961
(3) (4)
80 755 756
69 267 340
79 619 . 586
72 298 284
6 625 583
70 421 453
13 1.989 2.277
17 487 552
51 124 139
16 •
47 170 155
49 28 50
18 450 504
22 406 372
33 524 558
300 337
68 172 lSI
10 1.146 1.258
12 1.590 1.613
65 254 28)
34 416 483
21 362 350
42 1.267 1.341
308 362
.• 36.435 38.75
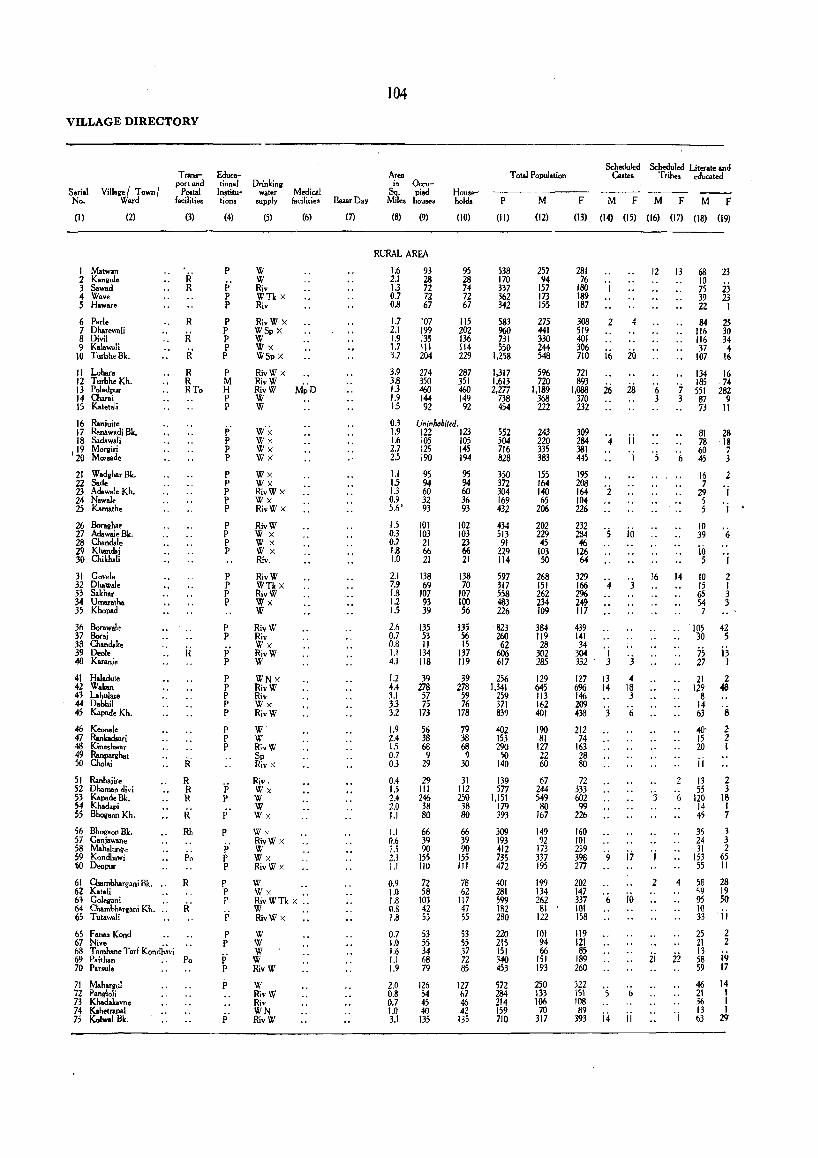
VILLAGE DIRECTORY
Serial No.
Villalle/ Town/ Ward
(I)
1 M.twan 2 Kanvule 3 Sawad 4 Wave 5 Hawar.
6 Parle 7 Dharewoli 8 Divil 9 KalawaIi
(2)
10 Turbhe Bk.
11 Lohare 12 T urbhe Kh. 13 Poladpur 14 Char.i IS Kat.tali
16 Raniuit. 17 Ranowadi Bk. 18 Sadawali
,19 MorKiri 20 Morsad.
21 Wadllhar Bk. 22 Sade 23 Adawale Kh. 24 Nowale 25 Kamath.
26 BofOllhar 27 Adawale Bk. 28 Chandsl. 29 Khandaj 30 Chikhali
31 Govele 32 Dhawale 33 Sakhar 34 UmatlIlha 35 Khopad
36 Boraw.le 37 Bor.i 38 Chondske 39 Deole 40 Karanj.
41 HaI.dule 42 Wokan 43 Lahul ... 44 Dabhi1 45 Kapade Kh.
46 Keonale 47 Rankadsari 48 Kin .. hwar 49 Ranparyhat 50 Cholai
51 Ranbaiir. 52 Dhaman divi S3 Kapad. Bk. 54 Khadapi 55 Bhollaon Kh.
56 Bhagaon Bk. 57 Ganiowan. 58 Mahalun~e 59 Kondhawi 60 Deopur
Transport and
Postal facilities
(3)
R' R
R
R
R' R R RTo
R R R
R' Rh
61 Chambhargani Bk. ., R 6~ Katoli 61 Golegani 64 Chambhargani Kil. R' 65 Tutawali
65 F ana. Kond 67 Nive .. 68 T amhan. Tar! Kondha,·i 69 Paithsn Po 70 Parsule
71 Maharvul 72 Pangloli 73 Khadakavne 74 Kshetrapal 7, Kalwal Bk.
Educational Institutions
(4)
P i; P P
P P P P P
P M H P P
j, p P P
P P P P P
P P P P
P P p P
P P
p' p
P P p P P
p P P
j:i p
p
P p' P P
p P p
p p P
i' P
P
DrinkinK water Medical
supply facilities
(5) (6)
W W Riv WTkx Riv
RivW X WSp X W Wx WSp X
RivW X RivW RivW M~D W W
W'x Wx Wx Wx
Wx Wx RivW X Wx RivW X
RivW Wx Wx Wx Riv.
RivW WTkx RivW Wx W
RivW Riv Wx RivW W
WNx RivW Riv Wx RivW
W W Ri"W Sp Riv X
Riv. Wx W W Wx
W>' RivW X W Wx RivW X
W Wx •. RivWn x .. W RivWx
W W W W RivW
W RivW Riv WN RivW
Ile.zar Day
(7)
104
Area in O<:cu-
Sq. pied Households Mile. houses
(8) (9) (10)
RURAL AREA
1.6 2.1 1.3 0.7 0.8
1.7 2.1 1.9 1.7 3.7
3.9 3.8 1.3 1.9 15
03 1.9 1.6 2.7 25
1.1 15 1.3 0.9 5.6'
15 0.3 0.7 1.8 1.0
2.1 7.9 1.8 1.2 15
2.6 0.7 0.8 1.1 4.1
1.2 4.4 3.1 33 3.2
1.9 2.4 I.S 0.7 0.3
0.4 1.5 2.4 2.0 1.1
1.1 0.6 1.5 2.3 1.1
0.9 1.0 1.8 0.8 1.8
0.7 1.0 1.6 1.1 1.9
2.0 0.8 0.7 1.0 3.1
93 28 72 72 67
107 199 135 111 204
274 350 460 144 92
95 28 74 72 67
115 202 136 114 229
287 351 460 149 92
Vninluzbil,d. 122 123 105 105 125 145 190 194
95 95 94 94 60 60 32 36 93 93
101 103 21 66 21
138 69
107 93 39
135 53 11
134 118
39 278 57 75
173
56 38 68 9
29
29 III 246 38 80
66 39 90
155 110
72 58
103 42 55
53 55 34 68 79
126 54 45 40
135
102 103 23 66 21
138 70
107 100 56
135 56 15
137 Jl9
39 278
59 76
178
79 38 68 9
30
31 112 250 38 80
66 39 90
155 III
78 62
117 47 55
53 55 37 72 85
127 67 46 42
135
Total Population Scheduled Scheduled Literate and
Ca.t.s Tribe. educated
P M F M F M F M F
(14) (15) (16) (17) (18) (i9) (11) (12) (13)
538 170 337 362 342
583 960 731 550
1,258
1,317 1,613 2,277
738 454
552 504 716 828
350 372 304 169 432
434 513 91
229 114
257 94
157 173 155
275 441 330 244 548
5% 720
1,189 368 222
243 220 335 383
155 164 140 65
206
202 229 45
103 50
281 76
180 189 187
308 519 401 306 710
721 893
1,088 370 232
309 284 381 44;
195 208 164 104 226
2
16
;16
4
232 '5' 284 46
126 64
12
4
io
is
ii 1 '5
io
13 68 10 75 39 22
84 116 116 37
107
134 185
'7 551 3 87
6
7}
81 78 60 45
16 7
29 5 5
10 39
io 5
23
23 23 1
2S 3() 34 4
16
16 74
282 9
11
23 18 7 3
2
1
'i
'j
597 317 558 483 226
268 151 262 234 109
329 16 14 10 2
823 260 62
606 617
256 1,341
259 371 839
402 155 290 50
140
139 577
1.151 179 393
309 193 412 735 472
401 281 599 182 280
220 215 151 340 453
572 284 214 159 710
384 119 28
302 285
129 645 113 162 401
190 81
127 22 60
67 244 549 80
167
149 9Z
173 337 195
199 134 262
Bl 122
101 94 66
151 193
250 133 106 70
317
166 4 3 296 249 117
439 141 34
304 . i 332 3 j
127 13 4 6% 14 18 146 3 209 438 "j 6
212 74
163 28 80
72 333 602 "3 99
226
160 101 239 398 9 i7 'j 277
202 147 337 6 101 158
119 121 85
189 260
)22 1,1 '5 108 89
393 i4
2
ii>
ii
6
ii
l5 1 65 3 54 3 7
105 42 ,'30 5
7S i3 27 1
21 2 129 48
8 14 63 8
40' 2 15 2 20 t
ii 2 13 2
55 3 6 120 18
14 1 45 7
35 3 24 3 31 2
153 65 55 11
4 58 28 59 . 19 95 50
1~ ii 25 2 21 2
ii ~~ i9 59 17
46 14 21 I 36 1 13 1 63 29 'i
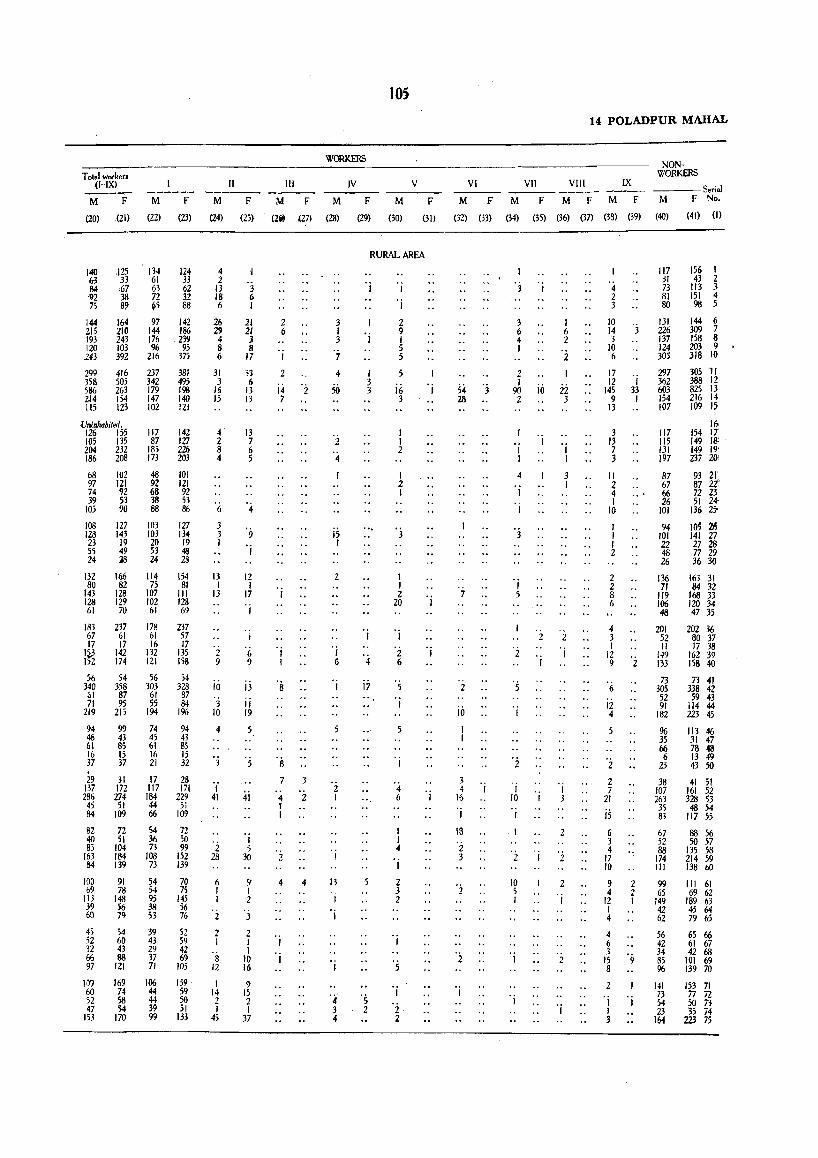
T olal workero (I-IX) II
M F M F M F
(20) (2H (22) (23) (24) (25)
140 125 63 33 B4 ,67 92 38 ,75 89
144 215 193 120 243
299 -358 586 Z14 115
164 210 243 103 392
416 505 263 154 123
Uninhabited. 126 155 105 135 204 232 186 208
68 102 97 121 74 92 39 53
105 90
108 127 128 143 23 19 55 49 24 :is
134 124 61 33 63 62 72 32 ~5 88
97 144 176 96
216
237 342 179 147 102
117 87
185 J73
48 92 68 38 88
103 103 20 53 24
142 186 239
95 J7j
381 495 198 140 123
142 127 226 203
101 121 92 53 86
127 134
19 48 28
132 166 114 154 80 82 75 81
143 128 107 III 128 129 102 128 61 m 61 ~
183 67 17
l~
237 61 17
142 174
56 54 340 358
01 87 71 95
219 m 94 99 46 43 61 85 16 15 37 37
29 31 137 172 286 274 45 51 84 109
82 72 40 51 85 104
163 184 84 139
100 91 69 78
113 148 39 56 60 79
45 54 52 60 32 43 66 88 97 121
178 61 16
132 lZ1
237 57 17
135 158
56 54 303 323
61 87 55 84
194 1%
74 94 45 43 61 85 16 15 21 32
17 28 117 171 184 229 44 51 66 109
S4 72 36 50 73 99
lOB 152 73 139
54 70 S4 75 95 145 38 56 53 76
39 52 43 59 29 42 37 69 71 105
4 2
13 18 6
26 29 4 8 6
31 3
16 15
4 2 8 4
6
3 3 I
13 I
13
2 9
10
3 10
4
3
'j 41
6 I I
'2 2 I
's 12
109 169 106 159, I 60 74 44 59 14 52 58 44 50 2 47 54 39 51 I I~ 1m 99 In ~
"3 Iii J
21 21 3 8
17
33 Ii
13 13
13 7 6 5
9
I
IZ I
17
I
I
'i, 9
i3 II 19
5
41
I 5
30
9 I 2
'3 2 I I
10 16
9 15 2 I
37
m 1\4 F
(2~ (7)
2 6
'j
2
j4 'i 7
'j I
8
7 :3
4 2 I I
4 4
1
'j
105
WORKERS
IV V
M F M F
(28) (29) (30) (31)
RURAL AREA
3 I 3
7
4
50
2
4
is I
2
'j 6
'2 I
13
'j
'j
';f 3 4
'j
I 3 3
'j
4
j7
5
's 2
I
'j
2 9 I 5 5
5
j6 3
I I 2
I 2 I
3
I I 2
20
'j
'2 6
's 1
5
'j
4 6
I I 4
'j
2 3 2
I
'2 2
'i
VI
M F
(32) (33)
2
io
3 4 I
15
I
18
'2 3
14 POLADPUR MAHAL
VII VIII IX
M F M F M F
(34) (35) (36) (37) (3S) (39)
I
'3 I
3 6 4 I
2 I
90 2
I I
4
'j
'j
'3
I 5
I 6 2
'2
io ii 3
2
'j
'j I
3 I
2 'j
I I 10 I 3
I
2
'i I 'i
10 5 I
'j
2
I
2
'4 2 3
10 '3' 14 3
10 6
17 12 I
145 33 9 I
13
3 13 7 3
II 2 4 I
10
I I I 2
2 2 8 6
4 3 I
12 9
6
12 4
5
2
2 7
21
js 6 3 4
2
17 1 10
9 2 4 2
12 1 1 4
4 6 .1
IS '9 8
I I I 3
NONWORKERS
---Serial M F No,
(40) (41) (l)
117 31 73 81 80
131 226 137 124 305
297 362 603 154 107
117 115 131 197
87 67 66 26
101
94 101 22 48 26
156 I 43 2
tI3 3 151 4 98 5
144 6 309 7 158 8 203 9 318 10
305 11 388 12 825 13 216 14 109 15
16 154 17 149 IS: . 149 19' 237 201
93 21 87 2t 72 23 51 24·
136 25-
101 2~ 141 27 27 28 77 29 36 30
136 163 31 ]I 84 32
119 168 33 106 120 34 48 47 35
201 52 II
149 133
202 36 80 37 17 38
162 39 158 40
73 73 41 305 338 42 52 59 43 91 114 44
182 223 45
% 113 46 35 31 47 66 78 48 6 13 49
23 43 50
38 41 51 107 161 52 263 328 53 35 48 54 83 117 55
67 88 56 52 50 57 88 135 58
174 214 59 III 138 60
99 III 61 65 69 62
149 189 63 42 45 64 62 79 65
56 65 66 42 61 67 34 42 68 85 101 69 96 139 70
141 153 11 73 77 72 54 50 73 23 35 74
164 2Z3 75
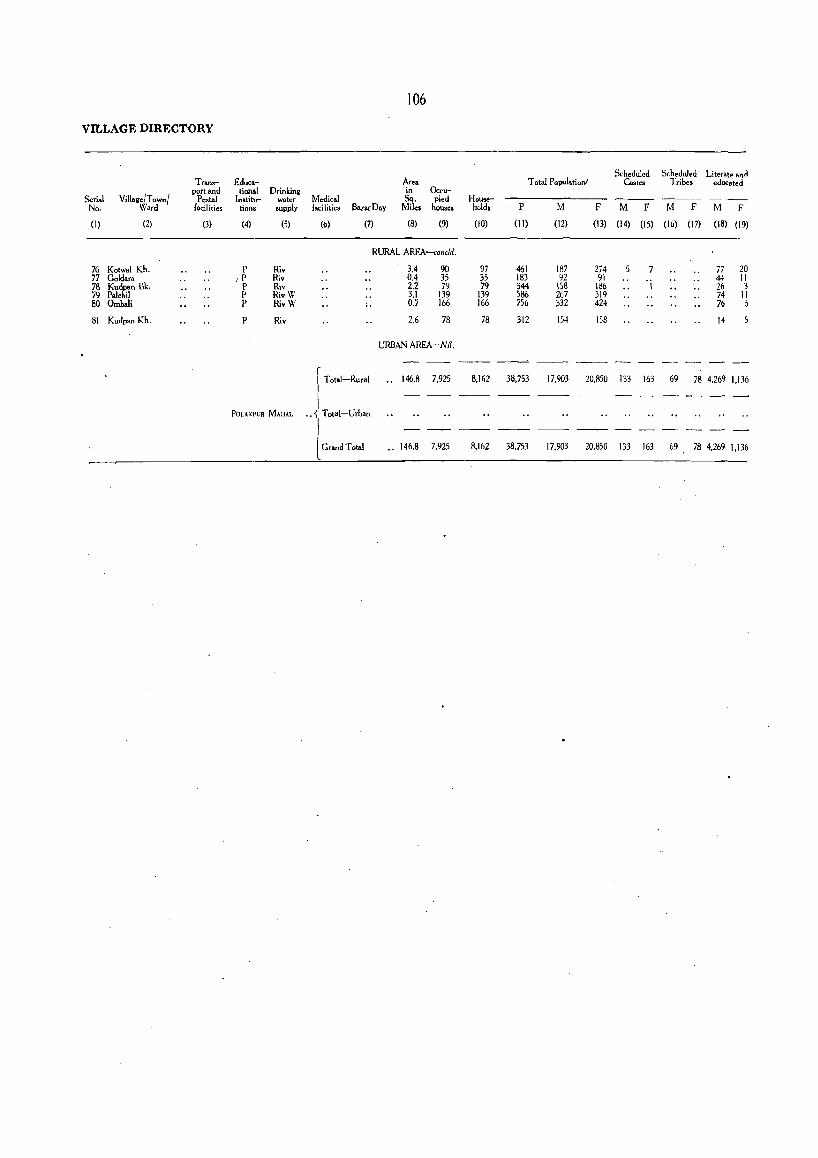
106
VILLAGE DIRECTORY
Scheduled Scheduled' Literate anrl Trans- Educa- Area Total Population! Castes Tribe. edoeated
Village/T own! port and tional Drinking in Ocru-
Serial Pestal lnstitu- water Medical Sq. pied Ho.....-No. Ward facilities - tiona supply facilities s..zarDay Mile. houses holds P M F M F M F M F
(1) (2) (3) (4) (5) (1)) (7) (8) (9) (10) (11) (12) (13) (14) (15) (16) (17) (18) (19)
RURAL AREA-condd,
76 Kotwal Kh. P Riv 3.4 90 97 461 187 2i4 7 77 20 77 Goldara I P Riv 0.4 35 35 183 92 91 44 II 78 Kudpan ilk. P Riv 2.2 79 79 344 158 186 I 26 3 79 Pruchil P RivW 3.1 139 139 S86 267 319 74 II 80 Omboli P RivW .. 0.7 166 166 756 332 424 76 6
81 Kudpan Kh. P Riv 2.6 78 78 312 154 158 14
URBAN AREA-Nil.
r I Total-Rural 146.8 7.925 8.162 38.753 17.903 20.850 133 163 69 78 4.269 1.136 I I I
POLA:;>PVR MAIlAL •• -1' Total-Urban
I I Grand Total .. 146.8 7.925 8.162 38.753 l
17.903 20.850 133 163 69 78 4.269 1.136
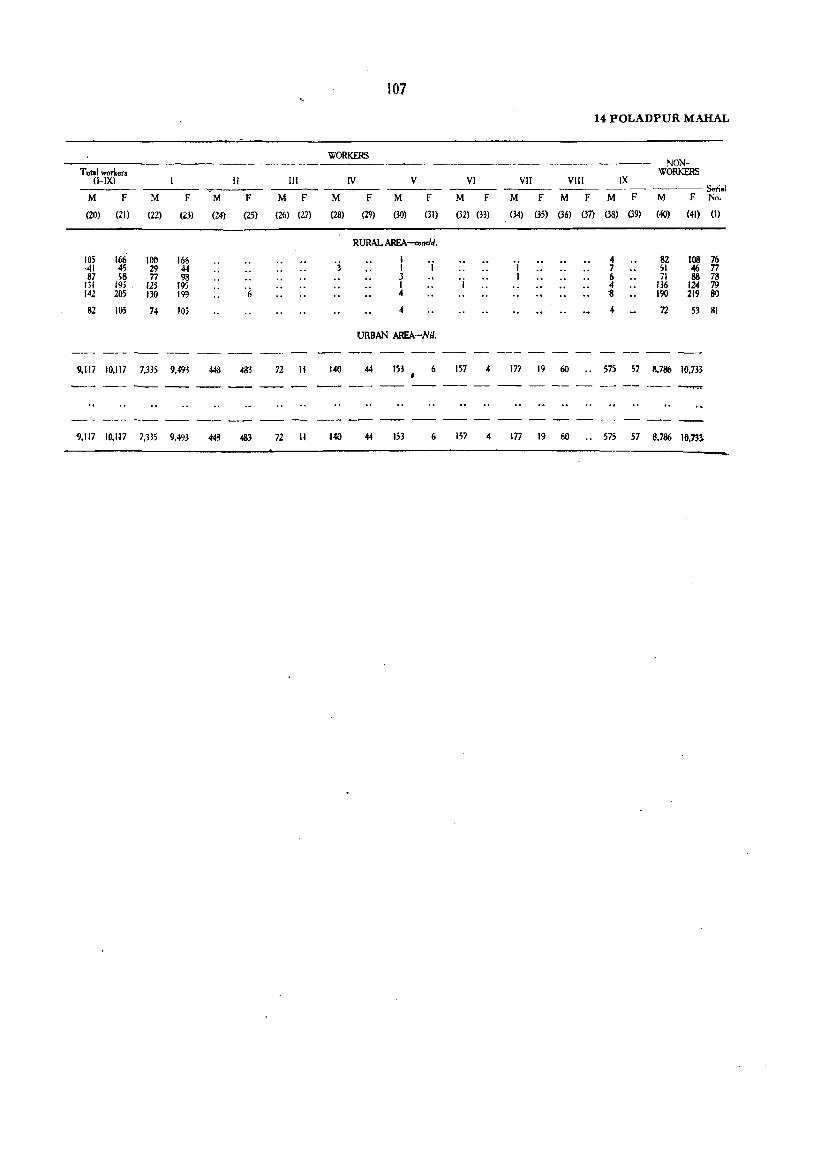
107 ',.
14 POLADPUR MAHAL
WORKERS NON-
Tcml wor~er. WORKERS (I-IX) II III IV V VI VII VIlI IX
",""--- --- --- ---- Serial M F M F M F M F M F M F M F M F M F M F M F No,
(20) (21) (22) (2J) (24) (25) (26) (27) (28) (29) (30) (31) (32) (33) (34) (35) (36) (37) (38) (39) (40) (41) (1)
RURAL AREA_nclcl,
105 166 106 16n 'j I 'j 'j 4 82 108 76 AI 45 29 44 1 7 51 46 77 87 ~ 77 98 3 'j 1 6 71 88 78
131 19:> 125 195 '6 I 4 136 124 79
142 205 130 199 4 11 190 219 80
82 105 74 105 4 4 72 53 81
URBAN AREA-Nil,
---- -_--- -- ----9.117 10,117 7,335 9,493 44B 4tH 72 II 140 44 153 6 157 4 177 19 60 .. 575 57 8,786 10,733
'),117 lo.ll7 7,335 9.493 44B 483 72 II 140 44 153 6 157 4 177 19 60 .. 575 57 8,786 10,731:

PART II
CENSUS TABLES These include GentlTal Population, Economic, Household Economic, Social, Cultural, Housing and other SPecial Tables
J-62-II-14-B (Kolaba.)
Explanatory Note (With Appendices I-III )
A-GENERAL POPULATION TABLES
A-I .. Area, Houses and Population
Appendix I-Statement showing 1951 Territorial Units constituting the present 1961 set-up of the District.
Appendix II-Number of Villages with a population of 5,000 and over and Towns with a population under 5,000.
Appendix Ill-Houseless and Institutional Population.
A-II.. Variation in population during sixty years.
A-III.. Villages classified by population. •.
A-IV.. Towns (and Town-groups) classified by population in 1961 with variation since 1901.
B-ECONOMIC TABLES
(1) General Economic Tables
Primary Census Abstract
B-1 and Workers and Non-workers in Talukas B-II. and Towns classified by sex and by
broad age-groups.
B-I1I. . Industrial classification and non-workers by levels-
of workers educational
Part A-District Total Part B-District Rural
Part C-District Urban Part D-Talukawise Rural only ..
B-IV.. Part A-Industrial classification by sex and class of worker of persons at work at household industry.
Part B-Industrial classification by sex and class of worker of persons at work III non-household industry, trade, business, profession or service.
Part C-Industrial classification by sex and divisions, major groups and minor groups of persons at work other than cultivation.
B-V _. Occupational classification by sex of persons at work other than cultivation.
B-VI. . Occupational divisions of persons at work other than cultivation classified by sex, broad age-groups and educationallevels in Urban areas only.
CONTENTS
PAGE
113
135
136
136
136
137
138
139
140
142
152 152 152 153
156
157
159
166
172
B-ECONOMIC TABLES-concld.
(1) General Economic Tables-concld.
B-VII Part A-Persons working principally (i) as Cultivators, (ii) as Agricultural I abo u 'r e r s or (iii) at Household Industry classified by sex and by secondary work (i) at household industry, (ii) as cultivator or (iii) as agricultural labourer.
Part B-Industrial classification by sex of persons working in non-household industry, trade, business, profession or service who are also engaged in household industry,
B-VIII Part A-Persons unemployed, aged 15 and above, by sex, broad age-groups and educational levels in Urban areas only.
Part B-Persons unemployed aged 15 and above, by sex and educational levels in Rural Areas only.
B-IX Persons not at work classified by sex, broad age-groups and type of activity.
(2) HousehOld Economic Tables
B-X .. Sample Households (i) engaged neither in cultivation nor household industry, (ii) engaged either in cultivation or household industry but not in both and (iii) engaged both in cultivation and household industry;
B-XI .. Sample Households engaged in cultivation classified by interest in land and size of land cultivated.
B-XII.. Sample Households engaged in cultivation only classified by size of land cultivated and number of family workers and hired workers.
B-XIII .. Sample Households engaged both in cultivation and household industry showing size of land cultivated classified by principal household industry.
B-XIV .. Sample Households engaged only in Household Industry classified by principal household industry-
Part A-Households classified by major groups of Principal Household Industry and number of persons engaged.
Part B-Households classified by minor groups of Principal Household Industry.
B-XV .. Sample Households engaged both in cultivation and household industry classified by size of land.
B-XV!. . Sample Principal Household Industry classified by period of working and total number of workers engaged in household industry.
PAGE
174
175
176
176
178
180
181
182
187
188
189
190
196
G-SOCIAL AND CULTURAL TABLES
C-I
C-II
C-III
C-IV
C-V
C-VII
C-VIII
Size and composition of sample households-
Part A-Size of sample households classified by participation in household cultivation or industry.
Part B-Composition of sample households.
Age and Marital Status
Part A-Age, Sex and Education in the District.
Part B-Age, Sex and Education in the District and Talukas Rural.
Part C-Age, Sex and Education in the District Urban.
Single Year Age Returns
Mother-tongue
Religion ••
Part A-Classification by literacy and industrial category of workers and non-workers among Scheduled Castes.
Part B-Classification by literacy and industrial category of workers and non-workers among Scheduled Tribes.
SCT-SPECIAL TABLES FOR SCHEDULED CASTES AND SCHEDULED TRIBES
SCT-I Part A-Industrial classification of persons at work and non-workers by sex for Scheduled Castes for the District and Talukas Rural only.
Part B-Industrial classification of persons at work and non-workers by sex for Scheduled Tribes for the District and Talukas Rural only.
SCT-I1I Part A (i)-Education in Urban Areas only for Scheduled Castes.
Part A (ii) Education in Urban Areas only for Scheduled Tribes.
112
CONTENTS
PAGE
200
200
201
201
202
204
204
205
206
208
208
210
214
218
218
SCT-SPECIAL TABLES FOR SCHEDULED CASTES AND SCHEDULED TRIBES-cone/d.
seT-III Part B (i)-Education in Rural areas only for Scheduled Castes.
Part B (iil-Education in Rural areas onl y for Scheduled Tribes.
SCT-V Part A-Sample households:engagedin cultivatIOn classified by interest in land and size of land cultivated by Scheduled Castes in Rural Lareas only.
Part B-Sample households engaged in cultivation classified by interest in land and size of land cultivated by Scheduled Tribes in Rural areas only.
SC-SPECIAL TABLE FOR SCHEDULED CASTES ONLY
SC-I •• Persons not at work classified by se;x, type of activity and educational levels for Scheduled Castes.
ST-SPECIAL TABLES FOR SCHEDULED TRIBES ONLY
ST-I.. Mother-tongue and Bi-lingualism for Scheduled Tribes.
ST-I1 .. Persons not at work classified by sex and type of activity for Scheduled Tribes.
E-HOUSING 'ABLES
E-I ... Census hOU3es and the uses .to which they are put.
E-II ,. Tenure status of sample censuS households living in Census houses used as dwelling.
E-IV... Distribution of sample households living in Census Houses used wholly or partly as dwellings by.; predominant material of wall and_predominant material of roof.
E-V •• Sample households classified by number of members and by number of rooms occupied.
Number of Establishments and Workers for Industries classified by Minor Groups of Industrial Classification.
PAGE:
218
21&
219-
21 IF
219
22()
222
223
224-
225
226
227
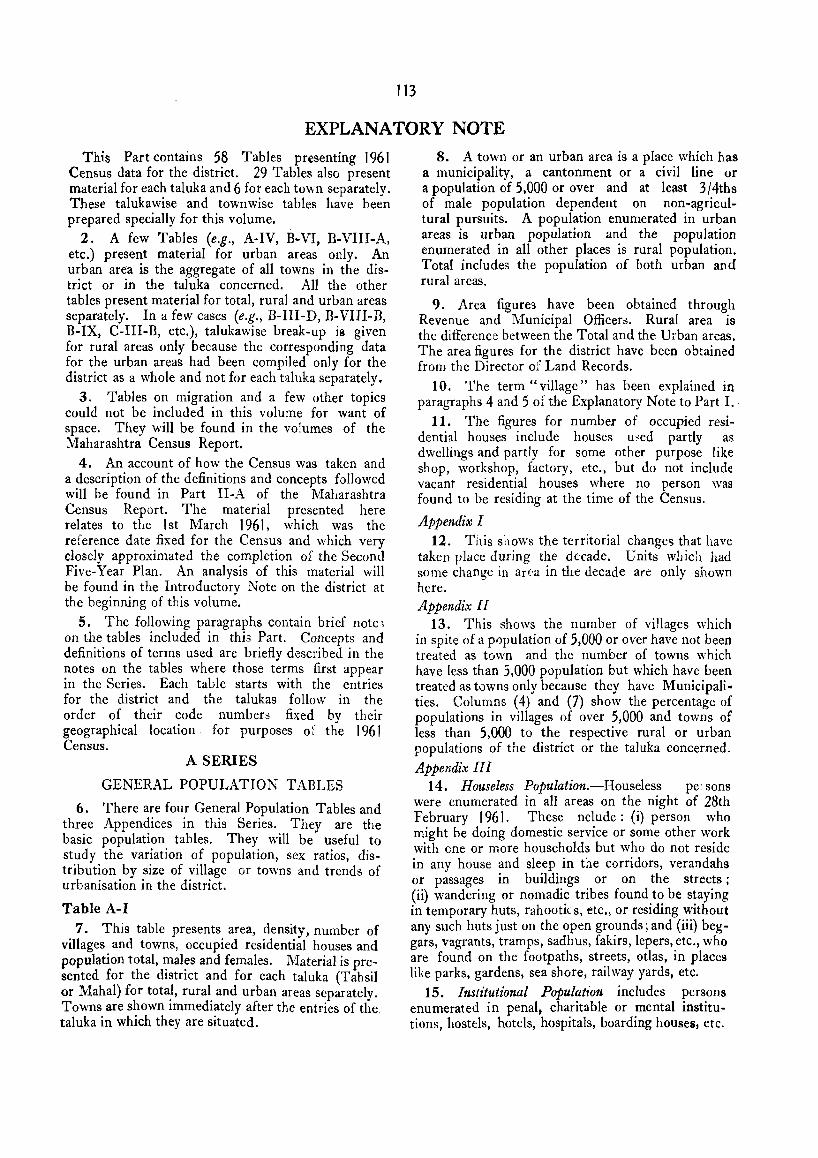
113
EXPLANATORY NOTE
This Part contains 58 Tables presenting 1961 Census data for the district. 29 Tables also present material for each taluka and 6 for each town separately. These talukawise and townwise tables have been prepared specially for this volume.
2. A few Tables (e.g., A-IV, B-VI, B-VIII-A, etc.) present material for urban areas only. An urban area is the aggregate of all towns in the district or in the taluka concerned. All the other tables present material for total, rural and urban areas separately. In a few cases (e.g., B-III-D, B-VIII-B, B-IX, C-III-B, etc.), talukawise break-up is given for rural areas only because the corresponding data for the urban areas had been compiled only for the district as a whole and not for each taluka separately.
3. Tables on migration and a few other topics could not be included in this volume for want of space. They will be found in the volumes of the Maharashtra Census Report.
4. An account of how the Census was taken and a description of the definitions and concepts followed will be found in Part II-A of the Maharashtra Census Report. The material presented here relates to the 1 st March 1961, which was the reference date fixed for the Census and which very closely approximated the completion of the Second Fi ve-Year Plan. An analysis of this material will be found in the Introductorv Note on the district at the beginning of this volum~.
5. The following paragraphs contain brief note; on the tables included in this Part. Concepts and definitions of terms used are briefly described in the notes on the tables where those terms first appear in the Series. Each table starts with the entries for the district and the tal uk as follow in the order of their code numbers fixed by their geographical location. for purposes of the 1961 Census.
A SERIES
GENERAL POPULATION TABLES
6. There are four General Population Tables and three Appendices in this Series. They are the basic population tables. They will be useful to study the variation of population, sex ratios, distribution by size of village or towns and trends of urbanisation in the district.
Table A-I 7. This table presents area, density, number of
villages and towns, occupied residential houses and population total, I?al~s and females. Material is presented for the dlstnct and for each taluka (Tahsil or Mahal) for tota.l, rural. and urban areas separately. Towns are shown ImmedIately after the entries of the. taluka in which they are situated.
8. A town or an urban area is a place which has a municipality, a cantonment or a civil line or a popUlation of 5,000 or over and at least 3/4ths of male popUlation dependent on non-agricultural pursuits. A population enumerated in urban areas is urban population and the population enumerated in all other places is rural population. Total includes the population of both urban and rural areas.
9. Area figures have been obtained through Revenue and Municipal Officer:;. Rural area is the difference between the Total and the Urban areas. The area figures for the district have been obtained from the Director of Land Records.
10. The term "village" has been explained in paragraphs 4 and 5 of the Explanatory Note to Part I.
11. The figures for number of occupied residential houses include houses used partly as dwellings and partly for some other purpose like shop, workshop, factory, etc., but do not include vacant residential houses where no person was found to be residing at the time of the Census.
Appendix I 12. TJlis shows the territorial change,> that have
taken place during the decade. Units which had some change in area in the decade are only shown here. Appendi,x; II
13. This shows the number of villages which in spite of a population of 5,000 or over have not been treated as town and the number of towns which have less than 5,000 population but which have been treated as towns only because they have Municipali. ties. Columns (4) and (7) show the percentage of populations in villages of over 5,000 and towns of less than 5,000 to the respective rural or urban populations of the district or the taluka concerned.
Appendix III 14. HOflseless Population.-Houseless pe· sons
were enumerated in all areas on the night of 28th February 1961. These nelude: (i) person who might be doing domestic service or some other work with cne or more households but who do not reside in any house and sleep in the corridors, verandahs or passages in buildings or on the streets; (ii) wandering or nomadic tribes found to be staying in temporary huts, rahootic s, etc., or residing without any such huts just on the open grounds; and (iii) beg~ gars, vagrants, tramps, sadhus, fakirs, lepers, etc., who are found on the footpaths, streets, otlas, in places like parks, gardens, sea shore, railway yards, etc.
15. Institutional Population includes persons enumerated in penal, charitable or mental institutions, hostels, hotels, hospitals, boarding houses; etc.
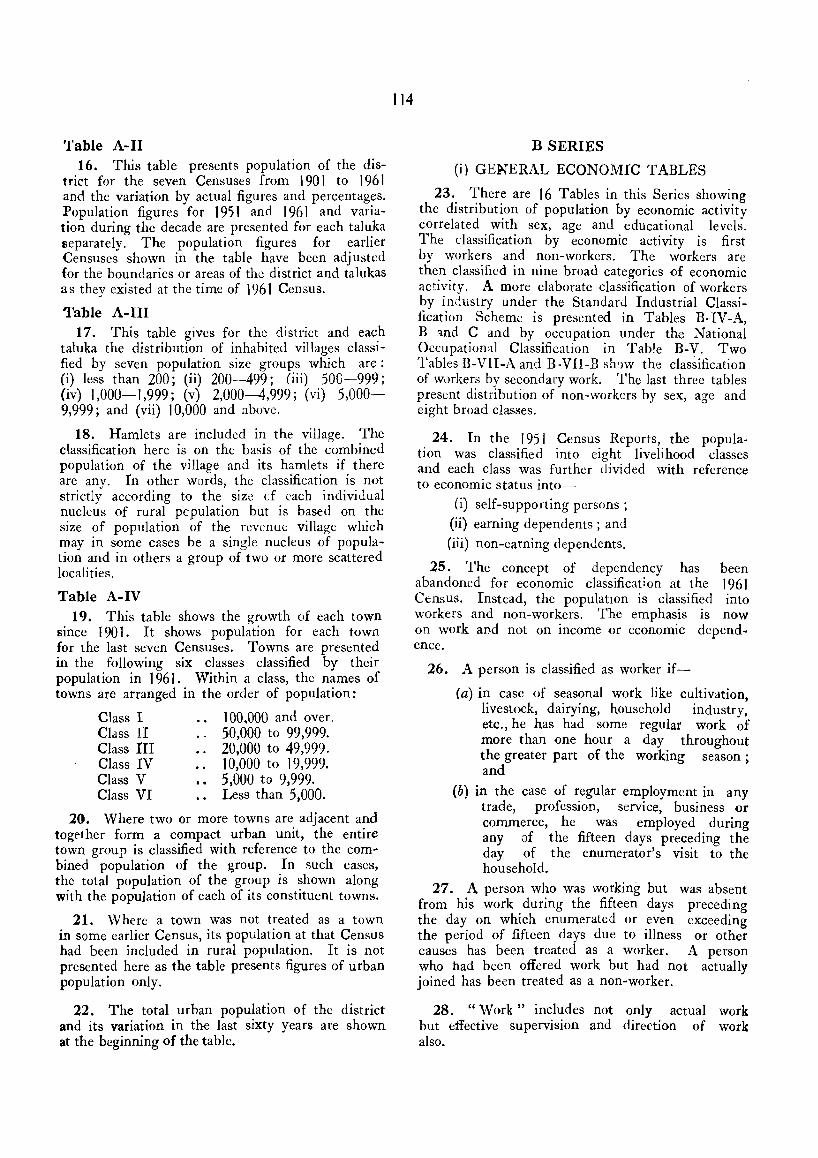
Table A-II 16. This table presents population of the dis
trict for the seven Censuses from 190 1 to 1961 and the variation by actual figures and percentages. Population figures for 1951 and 1961 and variation during the decade are presented for each taluka separately. The population figures for earlier Censuses shown in the table have been adjusted for the boundaries or areas of the district and talukas as they existed at the time of 196) Census.
Table A-III 17. This table gives for the district and each
taluka the distribution of inhabited villages classified by seven population size groups which are: (i) less than 200; (ii) 200-499; (iii) 500-999; (iv) 1,000-1,999; (v) 2,000-4,999; (vi) 5,000-9,999; and (vii) ) 0,000 and above.
18. Hamlets are included in the village. The classification here is on the basis of the combined population of the village and its hamlets if there are any. In other words, the classification is not strictly according to the size cf each individual nucleus of rural pcpulation but is based on the size of population of the revenue village which may in some cases be a single nucleus of population and in others a group of two or more scattered localities.
Table A-IV 19. This table shows the growth of each town
since 1901. It shows population for each town for the last seven Censuses. Towns are presented in the following six classes classified by their population in ) 96) . Within a class, the names of towns are arranged in the order of popUlation:
Class I 100,000 and over. Class II 50,000 to 99,999. Class III 20,000 to 49,999. Class IV 10,000 to 19,999. Class V 5,000 to 9,999. Class VI Less than 5,000.
20. Where two or more towns are adjacent and together form a compact urban unit, the entire town group is classified with reference to the com~ bined population of the group. In such cases, the total population of the group is shown along with the popUlation of each of its constituent towns.
21. Where a town was not treated as a town in some earlier Census, its population at that Census had been included in rural population. It is not presented here as the table presents figures of urban population only.
22. The total urban population of the district and its variation in the last sixty years are shown at the beginning of the table.
) 14
B SERIES
(i) GENERAL ECONOMIC TABLES
23. There are ) 6 Tables in this Series showing the distribution of population by economic activity correlated with sex, age and educational levels. The classification by economic activity is first by workers and non-workers. The workers are then classified in nine broad categories of economic activity. A more elaborate classification of workers by industry under the Standard Industrial Classification Scheme is presented in Tables B·.rV -A, Band C and by occupation under the National Occupational Classification in Table B-V. Two Tables ll-VII-A and B-VII-B sh')w the classification of wvrkers by secondary work. The last three tables present distribution of non-workers by sex, age and eight broad classes.
24. In the 1951 Census Reports, the population was classified into eight livelihood classes and each class was further divided with reference to economic status into-
(i) self-supporting persons; (ii) earning dependents; and
(iii) non-earning dependents.
25. The concept of dependency has been abandoned for economic classification at the 1961 Census. Instead, the populatIOn is classified into workers and non-workers. The emphasis is now on work aDd not on income or economic dependence.
26. A person is classified as worker if-
(a) in case of seasonal work like cultivation, livestock, dairying, household industry, etc., he has had some regular work of more than one hour a day throughout the greater part of the working season; and
(b) in the case of regular employment in any trade, profession, service, business or commerce, he was employed during any vf the fifteen days preceding the day of the enumerator's visit to the household.
27. A person who was working but was absent from his work during the fifteen days preceding the day on which enumerated or eVen exceeding the period of fifteen days due to illness or other causes has been treated as a worker. A person who had been offered work but had not actually joined has been treated as a non-worker.
28. "Work" includes not only actual work but effective supervision and direction of work also.
29. Persuns under trammg as apprentices with ot without stipend or wages are regarded as workers.
30. An adult woman who was engaged in household duties but doing no other productive work to augment the family's resources has not been considered as working. If, however, in ad dition to her household work she engaged herself in work such as rice pounding for sale or wages, or in domestic services for wages for others, in minding cattle or selling firewood or making and selling cowdung cakes, or grass, etc., or any such work she has been treated as a worker.
31. Persons like beggars, pensioners, agricultural or non-agricultural royalty, rent or dividend receivers, who earn an income but who are not participating in any productive work are not treated as workers unless they also work in cultivation, industry, trade, profession, business or commerce.
32. A public or social service worker who is engaged in publIc service actively or a political worker who is actively engaged in furthering the political activity of his party is regarded as a worker.
33. The popUlation classified as workers here is the economically active popUlation including family workers but not including unemployed persons.
34. The Census Questionnaire did not have any question to determine the extent of full employment or under-employment.
35. Classification of workers doing two or more different types of work, has been done on the basis of their principal work, i.e., the work whIch consumes larger portion of their time and not necessarily the work which earns larger portion of their income. Primary Census Abstract
36. This table shows 1961 summary figures for the district and talukas, each for total, rural and urban areas separately. Similar details for each village, town and ward of a town are presented in Part 1.
37. For each unit, the table shows area in square miles, number of occupied houses, number of households, total population, population of Scheduled Castes and Scheduled Tribes, number of literate and educated persons and number of workers and non-workers. The workers are shown further classified for nine categories of economic activity.
38. Column (5) shows the number of households for each unit. The" household" is slightly different from a "family". A" household" is a group of persons who commonly live together in the same house and take their meals from
J 15
a common kitchen unless the exigencies of work prevented any of them from doing so. A domestic servant residing and eating at the employer's house is a member of the household. Similarly, a friend or a guest (related or unrelated) residing and eating with the host during the Census period is treated as a member of the (host) household. On the other hand, a son or a daughter residing in a hostel (may be in the same town) is not treated as a member of the household.
39. Columns (9) to (J 2) of the Primary Census Abstract show population of the Scheduled Castes and Scheduled Tribe, respectively, by males and females. The figures are related only to the two group totals of all Scheduled Castes and all Scheduled Tribes. Their break-up by individual Scheduled Caste or Scheduled Tribe will be found m Table SCT - I.
40. The limitations in coverage of these two groups may be mentioned here. The groups of Scheduled Castes or Scheduled Tribes do not include all backward castes or tribes living in the district. They include only the castes or tribes declared as Scheduled Castes or Scheduled Tribes in the district. In cases where a caste or a tribe is declared as a Scheduled Caste or a Scheduled Tribe for a specified area that caste or tribe has been separately presented only for that specified area and not for any other areas of the district.
41. Columns (13) and (14) show figures for literates and educated persons. A" literate" is a person who can both read and write a simple letter. Persons having higher education are also included in these figures. More material on literacy and education cross tabulated with age-group;is presented in Table C-III.
42. The w)rkers are shown classified by sex and in the following nine categorie3 of economic activity:-
I. As Cultivator. II. As Agr~cu1tural Labourer.
III. In Mining, Quarrying, Live-stock, Forestry, Fishing, Hunting and Plantations, Orchards and allied activities.
IV. At Household Industry. V. In Manufacturing other than Household
VI. VII.
VIII.
Industry. In Construction. In Trade and Commerce. In Transport, Storage and Communica
tions. IX. In other services.
Category I 43. This category includes both the owner
cultivators and tenant cultivators. Along with workers personally doing work on land are also included persons who are engaged in supervision or
direction of cultivation. All persons working in cultivation of land on which they have either ownership or tenancy rights are included ,n this category.
Category II 44. All other persons working on land as
labourers on wages without holding any right upon the land are classified as agricultural labourers and included in the second category.
Category III 45. Workers in mining, quarrying, live-stock,
forestry, fishing, hunting, plantations, orchards and allied activities are included in thi3 category. Category IV
46. A" Household Industry" is defined as an industry conducted by the head of the household himself and/or mainly members of the household at home or within the village in rural areas and only at home in urban areas. A household industry is not run on the scale of a registered factory. Thus, the main criterion for a household industry is the participation of one or more member; of a household in rural areas. In the urban areas, household industry is confined to the house.
47. A household industry relates to production, processing, servicing, repairing or making and selling of goods. I:: does not include professions such as pleader, doctor, barber, waterman or astrologer. Persons working in other person's household industry as paid employees are also treated as workers in household industry.
Category V 48. "Manufacturing" includes all types of pro
duction, processing, servicing or repairing of goods. This category does not include production or processing which may be classified as household industry. Category VI
49. This category includes workers engaged in construction and maintenance of buildings, roads, railways, bridges, telegraph, telephones, waterways, reservoirs, etc. Category VII
50. This category includes workers engaged in any capacity in wholesale or retail trading activ.tyand commercial transaction; relating to imports and exports, real estates and properties, stocks and shares, insurance, moneylending, banking, etc.
Category VIII 51. This category includes workers engaged in
transport activities by air, rail, road or water and in service incidental to transport such as packing, carting, loading, unloading, etc. Workers engaged in storage, warehousing and communication services such as Posts, Telegraph, Telephones, Wireless Signalling, Information and Broadcasting are also included in this category.
116
Category IX 52. This category include, (i) Public utility
services like electricity or gas or water supply, sanitary services; (ii) Central, State or Municipal employees; (iii) Professional services; (iv) Trade or labour associations, Recreation services, etc.
Tables B-1 and B-II 53. This combined table gives break-up of the
Primary Census Abstract distribution of workers in nine industrial categories and non-workers by four broad age-groups. The material is presented for the district and each taluka as well as for total, rural and urban areas separately. Towns are also shown immediately after the entries of the talukas in which they are situated. For talukas which do not have any urban areas, entries are given only for totals which correspond to those for rural areas.
Table B-III 54. This table gives break-up of the Primary
Census Abstract distribution of workers in nine industrial categories and non-workers by educationallevels. Material fc·r the district is presented for total, rural and urban areas separately, while that for the talukas is presented only for rural areas. The classification by educational levels is more elaborate in the case of the urban areas. Clas3ification by educational levels and age-groups will be found in Table C-II .
Industrial Classification 55. Industry of a worker is that branch of eco·
nomic activity in which he is engaged n producing goods or services. Tables B-IV-A, B-IV-B, B-IV-C, B-VII-A and B-VII-B of the present Series and Tables B-XIII, B-XIV-A, B-XIV-B and B-XVI of the following Series show the distribution of workers by industry according to the· Standard Industrial Classification which is reproduced as Appendix I to this note. For want of space it has not been possible to give description of each group of industry in the tables. They are shown only by industry codes in one, two or three digits as the case may be.
56. The nine categories shown in the Primary Census Abstract and Tables B-1, B-II and B-III conform to the industry divisions as follows :-
Category Industry Division I. Cultivator • • . • 1 Minor groups 000, 001, 002,
J 003 and 004 from Division Agricultural Labourer . . O. Mining, Quarrying, etc. Division 0 except minor groups
000 to 004 and Division I.
II. III.
IV. Household Industry Division 0 except minor groups 000 to 004, Divisions 1,2 & 3.
V. VI.
VII. VIII.
IX.
Manufacturing .. Construction .. Trade and Commerce .. Transport, Storage and
Communications. Other Services .•
Divisions 2 and 3. Division 4. Division 6. Division 7.
Divisions S, 8 and ~.
'Table B~lV-A 57. This table gives the distribution of workers
-engaged in household industry by statui of employ~ent and by each divi~ion and major group (Appen.dIX I) of household mdustry separately. Material -is presented only for the district but for total, rural and urban areas separately. Major groups of household industry which do not have any workers in the district are not shown here. Columns (7) and (8) show the workers who work at their own household industry (i.e., who are either employers, single workers or family workers in those household industries). Co'umns (5) and (6) on the other hand show the workers who are working as employees in household
industries not of their own. Table B-IV-B
58. This table presents distribution of all workers (other than these working in categories I, II and I_V) by industry divisions and major groups (AppendIx I) and by employment status. Material is pre'lented for the district only but for total, rural and urban areas separately. Classification of workers by employment status is in four cla'lses "employer", "employee", "single worker" and " family worker " :
An "employer" is a person who employs other persons in order to perform economic activity in which he is engaged.
An " employee" is a person who usually works under some other person for salary, or wages in cash or kind.
. A "single ,,:orker" is a person who works by hImself. He IS not employed by anyone else and in his turn does not employ anyone else, not even members of his household, except casually.
A "family worker" is a member who works, with: out receiving wages, in cash or kind, in any industry business or trade conducted mainly by members of the family and ordinarily does at least one hour of work every day during the working season. Table B-IV-C
59. This is a very important table as it gives the employment position in all sectors of economy in the district. It shows the distribution of all workers (~t~~r than t.hose in categories.I and II) by industry divislOn, major groups and ffimor groups according to the Standard Industrial Classification (Appendix I), The number of workers against each division, major group or minor group is further split up and shown separately for household industry and non-household industry. Material is presented only for the district but for total, rural and urban areas separately. Major or minor groups which do not have any workers in the district are not shown here.
a ccupational Classification 60. Occupation of a worker is the function which
he performs in any branch of economic activity J -62-II-15-A-(Kolaba).
111
~which i~ cal~ed his,.industry). For a clerk working ~n a te~tde mill, the mdustry is textile and occupation IS clencal. For a person working as a driver on a ~ank:s ve?icle, the industry is banking and occupanon IS dnver .
61. Tables B~ V and B-VI show the distribution of workers by occupation according to the National Occupational . Classification Scheme which is reproduced as Appendix II to this note.
Table B-V 62. This table presents the distribution of
workers (other than those engaged in categories I and II) by occupational divisions and groups (Appendix II). For each division or group the workers are shown by ~ c~tegorywise break-up of their industry. The matenalls presented only for the district but for total, rural.and urban areas separately. Occupational groups whIch do not have any workers in the district are not sh.own in the table. For an occupational group whIch has all the workers in only one category of industry, only one line shows the total workers for that group as well as for that category of industry.
Occupational distribution of workers in the 196' Census has been worked out and presented in Maharashtra Cemus Report, Part II-B (ii), even for Occupation~l ~amilies, i.e., up to three digits, For want of ~pace It IS prese!lt,ed here for occupational groups, I.e., up to two dIgIts only.
Table B-VI 63. This table presents the distribution of
workers (other .than c~t~~ories I and II) classified by sex, occupatIOnal d1VlsIOns (Appendix II), broad age-groups and by educational levels. This table is presented only for the total urban area of the district. Table B-VII-A 6~. This t~ble presents workers engaged as
cultIvators, agrIcultural labourers and at household industry classified by the nature of their secondary work. In case a worker is engaged in two or more kind~ o~ work the one wh~ch consumes larger portion of hl~ tl!fle (not r;tecessarily earning a larger portion of hIS mcome) _Is treated as his principal work, another consumIng second larger portion of his ~ime is h~s secondary work. The secondary work IS sh~,,:,n In ~he table classified only in three broad categones, VIZ., IV~Household Industry, I-Cultivator and II-Agricultural labourer. Workers who may be engaged in secondary work in other cate. gories, viz., III, V, VI, VII, VIII and IX are not ~hown in this t~ble. The break-up of principal work In household mdustry by major industrial groups (Appendix I) is shown in column (1). It will enable an~lysis of workers engaged in secondary work by major branches of their principal work at household industry. The material is presented for the district only but for total, rural and urban areas separately.
Table B .. VII .. B 65. This table shows workers engaged in non
household industry categories III and V to IX as principal work and doing some additional work in household industry. The additional work in household industry is classified by industrial divisions (Appendix I) only. Similarly, -the break-up of principal industry in column (1) is also by industrial divisions only. Workers engaged in the industry divisions shown in cloumn (1), but who are doing additional work in any sector other than household industry are not shown in this table. Material is presented for the district only but for total, rural and urban areas separately.
Table B-VIII-A 66. This table presents the distribution of un
employed persons aged 15 and above by agegroups and educational levels. The number of unemployed have been further split up by persons seeking employment for the first time and persons employed before but now out of employment and seeking work. Material is presented only for the total urban area of the district. Such detailed information on the unemployed is compiled for the first time in the 196} Census.
Table B-VIII-B 67. This table present&> the distribution of un
employed aged 15 and above in rural areas of the district by educational levels. The break-up of educational levels is not as elaborate as in Table B-VIII (Part A) and classification by age-groups or by persons seeking employment for the first time, etc., is not shown in this table. As a compensatory factor, the material is presented for the rural area of the district and each taluka, separately. Table B-IX
68. This table presents the distribution bf nonworking population by broad age-groups and eight classes of non-workers. Such if.formation on the non-working population had never been compiled before. The material is presented for the district separately for total, rural and urban areaS and for each taluka for rural areas only.
(ii) HOUSEHOLD ECONOMIC TABLES 69. Tables B-X to B-XVI present the economic
activity of the households as units. They relate to-(i) the size of or interest in land cultivated and
or the household industry conducted by the households; and
(ii) the number of family workers and/or hired workers working in either of the two activities separately or combined in both.
'70. In the case of countries of such economic status as ours where not all the goods produced enter the money market and where much of what is
J 62-I1-15-B-(Kolaba).
116
produced is consumed by the family itself, presenta.· tion of information on economic activity of individuals. alone is likely to be slightly misleading unless that information is supplemented by material relating to-· economic activity of the households as entities. Such information is presented h~e for the first. time. These tables are prepared from the household schedules specially introduced for that purpose as. one of the three Questionnaire forms in the J 961 Census. The tables have been prepared on a 20> per cent sample of all the households in the district drawn for rural and urban areas separately.
71. Cultivation here includes cultivation both as owners and tenants. Size of holding shown is, also of Operational hold~ng, i.e., land actually cultivated and does not include land owned. but not cultivated by the household. .
Table B-X 72. This table presents distribution of sample
households by those-(i) engaged neither in cultivation. nor house-
hold industry; (ii) engaged in cultivation only; . (iii) engaged in household industry only; and (iv) engaged both in cultivation and household
industry. The material is presented for the district and each
taluka for total, rural and urban areas separately.
Table B-XI 73. This is an important table. I t shows the
distribution of sample households engaged in cultivation classified by size of land and interest in land cultivated. Ten size-groups are _ shown horizontally while the interests in land are classifid in three types, viz.-
(a) Entirely owned or held from Government. (b) Entirely held from private persons or
institutions for payment in money, kind or share.
(c) Partly held from Government and partly from private persons or institutions for payment in money, kind or share.
The material is presented separately for total, rural and urban areas of the district and only for rural areas of each tal uka.
Table B-XII 74. This table shows the distribution of sample
households engaged in cultivation classified by size of land cultivated and the total number of family workers and hired workers. The material is present. ed for the district for total, rural and urban areas separately and only for rural areas of ~ach taluka. Table B-XIII
75. This table shows the distribution of sample households engaged both in cultivation and household industry classified by size of land cultivated and
"'by industry division and major group of the household industry (Appendix I). The table shows the :sizes I of cultivation holdings and the branches of household industry for which the two household -economic activities combine in varying degrees. 'The material is presented only for the district but for rural and urban areas separately.
"Table B-XIV-A 76. This table shows the distribution of sample
bouseholds engaged in household industry only by the number of workers engaged and by industry ,division and major groups of the household industry ,(Appendix I). Material is presented for the district only but for total, rural and urban areas separately.
'Table B-XIV-B 77. This table shows the distribution of sample
households engaged in household industry oilly classified by industry minor groups (Appendix I) for the household industry. The industry minor group is shown with a break-up in four-digit codes in column (1). These jour-digit codes are shown in Appendi:A1 III. The material is presented for the district only but for total, rural and urban areas separately.
Table B-XV' 78. This table shows the distribution of sample
households engaged both in cultivation and household industry classified by size of land cultivated and the numher of family workers and hired workers working in the two activities combined. The material is presented for the district for total, rural and urban areas and for -each taluka only 'for rural areas separately.
Table B-XVI 79. This table shows the distribution of sample
households engaged in household industry classified by the period for which the household industry is worked and by industry division and major groups (Appendix I) of the household industry. A further split-up of figures is shown for household industry combined with cultivation and without cultivation. The material is presented for the district only but for total, rural and urban areas separately.
C SERIES
SOCIAL AND CULTURAL TABLES 80. There are 11 Tables in this Series dealing
with Social or Cultural aspects like sizes and composition of households, age, marital status, literacy and education, language, religion, Scheduled Castes and Scheduled Tribes. The first two Tables C-I-A and C-I-B relating to Size and Composition of households are prepared from the household schedules on a 20 per cent sample. All the other-tables are prepared from, individual slips and on a total count.
1.19.
Table C-I-A 81. This table presents distribution of sample
households classified by their size and by economic· activity, i.e., by work in cultivation or household industry. Households working at cultivation are further classified by size of landholding. The material is presented only for the district but separately for total, rural and urban areas. Classification by economic activity as well as by size of landholding is presented only for rural areas and classification by size of the household is alone presented for total and urban areas. This table is prepared from household schedules on a 20 per cent sample. Thil-. table appears as Table B-XVII in Part-III of the Maharashtra Census Report.
82. The classification by size is as one member. small (2 to 3), medium (4 to 6), large (7 to 9) and very large (over 10) households. By definition, a Census household is not the same as a family. The household also includes persons who are not members of the family but who were residing with the family during the Census period. All the same. the table will give a general idea of the family sizes as in the majority of families outsiders are not likely to be present. Table C-I-B
83. This table presents distribution of population of sample households by heads of the households, spouses of heads of households, married relations, never married, widowed or divorced relations and unrelated persons. These details are also shown for sample households classified by economic activity, i.e:, participation in cultivation or household industry. For cultivation, the sample households are further classified by size of landholdings. This table is prepared from the household schedules on a 20 per cent sample. Material is presented for the district only but fvr total, rural and urban areas separately. The classification of households by economic activity and size of landholding is, however, shown for rural areas only. This table is of sociological interest indicating the strength of the joint family system. Table' C-II
84. This table presents distribution of popUlation by sex, age and marital status. Classification of age between 10 and 70 years is by five-year age-groups. The other two groups are 0-9 years and 70 and over. The entire population in 0-9 years age-group has been treated as never married and no further classification by marital status is shown against them. The material is presented only for the district but for total, rural and urban areas separately. From this table it may be ascertained whether proportions in various marital status groups have changed since the last Census. and whether any trend is observed in age of marriage. A corresponding table at the 1951 Census was prepared on a 1.0 per cent sample. This table is, however, prepared on a full count.
Table C-III-A, Band C 85. These three tables present the distribution
by age, sex, literacy and educational levels. Classification by age is by five-year age-groups up to 59 years. Classification by educational levels is the same as in Table B-UI. It is more elaborate in the case of urban areas. Part A presents material only for the district total while Part B presents material for rural areas of the district and of each taluka separately. Part C presents material only for the district urban areas but with more elaborate classification by educational levels.
86. These tables are a measure of the growth of literacy in the total population as well as in the different age-groups since the last Census. They are also likely to furnish information on the spread of adult education. The corresponding table at the 1951 Census was prepared on a 10 per cent sample. These tables have been prepared on a full count.
Table C-IV 87. This table presents distribution of the
district population by single year ages both for males and females separately. Figures presented are based on the actual returns recorded in the Census, i.e., they have not been smoothed or adjusted for preferences for digits 0, 5, etc. The material is presented only for the district total.
88. This is an important demographic table which is used for computing mortality rates. The corresponding table at the J 95 J Census was prepared on a 10 per cent sample. This table has been prepared on a full count.
Table C-V 89. This table presents the distribution of
population by mother-tongues. The figures are presented only for 9 top ranking mother-tongues in the district. Figures for all the other mothertongues have been shown combined in the group " Others". Mother-tongues are arranged in the alphabetical order. Material is presented for total, rural and urban areas for the district and each taluka separately. At the end material is also prescnted- for each town separately. A footnote is added to show the number of speakers in the district for each of the mother-tongues combined in the group" Others".
90. " Mother-tongue U is defined as a language spoken by the person's mother to the person in his childhood or mainly spoken in the house. Dialects have been included in the main languages on the basis of Grierson's Classification.
91. Another Table (C-Vn on bilingualism has , peen prepared in the J 96 J Census. It is not included in this volume and may be found in Part II-C of the Maharashtra Census Report.
J20
Table C-VII 92. This table presents distribution of popula-
tion by religion. Eight main religions have been shown in their alphabetical order. All other religions returned in the Census are combined in the group" Others". Figures for various sects returned as religion during the Census have been combined with the main religions concerned.
Table C-VIII-A 93. This table presents the total population
of Scheduled Castes classified by literacy and by economic activity. Classification by economic activity is the same as in the Primary Census Abstract or Tables B-1 and B-II. Material is 'presented for total, rural and urban areas of the district separately and only for rural areas of ,each taluka separately. Paragraph 40 above, on Primary Census Abstract, may be seen for explanation of the special group treated as Scheduled Cast~s.
Table C-VIII-B 94. This table presents the total population
of SchedUled Tribes classified by literacy and by economic activity. Classification by economic acti vity is the same as in the Primary Census Abstract or Tables B-1 and B-1!. Material is presented for total, rural and urban areas of the district separately and only for rural areas of each taluka. Paragraph 40 aboVe, on Primary Census Abstract, may be seen for explanation of the special group treated as Scheduled Tribes.
SCT, SC & ST SERIES
SPECIAL TABLES FOR SCHEDULED CASTES AND SCHEDULED TRIBES
95. There are 1 J Tables in this Series specially prepared for the population of SchedUled Castes and Scheduled Tribes in the district. These classes of people are declared by the President's orders issued under Articles 34 J and 342 of the Constitution of India as Scheduled Castes Or Scheduled Tribes. Under Article 46 of the Constitution, the State has to promote, with special care, the educational and economic interests of the weaker sections of the people and in particular of the Scheduled Castes and Scheduled Tribes and has to protect them from social injustice and all forms of exploitation. For ensuring adequate representation to these classes, seats are also reserved for them in the House of the People, State LegiSlature and other elective bodies.
96. These special tables have been prepared to furnish data on the present socio-economic conditions of these people to be studied not only as a combined group as in 1951 but also for each Scheduled Caste and Scheduled Tribe separately.
91: These tables relate to economic activity, education, mother-tongue and classification of perSons not at work. Material is presented for each Scheduled Caste and Scheduled Tribe separately. It will be useful information for formulating various schemes for their welfare.
98. Classification by Castes and Tribes is on the basis of returns recorded in response to question 5 ( c) of the 1961 Census Questionnaire. Every person was asked if he belonged to one of the Scheduled Castes or Scheduled Tribes notified for the district and in case he belonged to one of them he was asked the name of his caste or tribe. Paragraph 40 above on the Primary Census Abstract explains the limitations of these castewise or tribewise figures. The population of Scheduled Castes shown here is much less than that for the district in 1951 as many persons from that group have returned their religion as Buddhist or NavBuddha, and under the Constitution, there can be Scheduled Castes only among Hindus and Sikhs and in no other religion.
99. Two more Tables SCT-II and SCT-IV on age, marital status and religion of the Scheduled Castes and Scheduled Tribes prepared in the 1961 Census are not presented here for want of space. They may be seen in Part V-B of Maharashtra Census Report.
Table SCT -I-A 100. This table presents the distribution of
Scheduled Castes population by economic activity. Material is presented for the total of all Scheduled Castes as well as for each Scheduled Caste separately. Scheduled Castes are arranged in the alphabetical order. Classification by economic activity is in the same nine categories as in the Primary Census Abstract and Tables B-1 and B-II. In a way, this table presents castewise break-up of the material presented in Table C-VIII (Part A). The last group of castes "not stated" is of persons who were returned as belonging to Scheduled Castes but in whose case the name of the Scheduled Caste concerned had not been stated in the Census.
101. Columns (28) to (31) present Scheduled Castewise figures of persons engaged in unwholesome occupations like tanning, currying of hides and skins and scavenging. The number of workers ,shown in these occupations as well as in any other category is on the basis of principal work. Persons engaged in cultivation or any other activity as principal work and also engaged in tanning, currying or scavenging as secondary work are not included in the figures of columns (28) to (31).
102. The material is presented for total, rural and urban a~eas of the district separately and only for rural areas for each taluka. .
111
103. There are some more castes declared· as Scheduled Castes for the district. They are not shown in this table because no one belonging to those castes was enumerated in 1961 Census in the district.
Table SCT -I-B 104. This table presents the distribution of
Scheduled Tribes population by economic activityl Material is presented for the total of all Scheduled Tribes as well as for each Scheduled Tribe separately. Scheduled Tribes are arranged in the alphabetical order. Classification by economic activity is in the same nine categories as in the Primary Census Abstract and Tables B-1 and B-II. In a way, this table presents tribewise break-up of the material presented in Table C-VIII (Part B). The last group of tribes" not stated" is of persons who were returned as belonging to Scheduled Tribes but in whose case the name of the Scheduled Tribe concerned had not been stated in the Census.
105. The material is presented for total, rural and urban areas of the district separately and only for rural areas for each taluka.
106. There are some more Scheduled Tribes declared as Scheduled Tribes for the district. They are not shown in this table because no one belonging to those tribes was enumerated in 1961 Census in the district.
Table SCT-III-A (i) 107. This table presents the distribution of
each Scheduled Caste population by sex and educational levels. The table presents material for the district urban area only. The classification of educational levels is the same as in Tables B-III and C-III applicable for urban areas.
Table SCT-III-A (ii) 108. This table presents the distribution of
each Scheduled !Tribe population by sex and educational levels. The table presents material for the district urban area only. The classification of educational levels is the same as in Tables B-III and C-III applicable for urban areas.
Table SCT-III-B (i) 109. This table presents the distribution of
population for each Scheduled Caste by educational levels only for the district rural area. The classification by educational levels is somewhat reduced than that of Table SCT -III (Part A).
Table SCT -I1I-B (ii) 110. This table presents the distribution of
popUlation for each Scheduled Tribe by educational levels only for the district rural area. The classification by educational levels is somewhat reduced than that of Table SCT -III (Part A).
Table SCT-V·A 111. This table presents the distribution of sample
Scheduled Caste households of the district (Rural) by interest in land cultivated and by size of land cultivated. The interests in land cultivated are shown in three categories :-
(i) entirely owned or held from Government; (ii) entirely held from private persons or institu
tionsfor payment in money, kind or share; and
(iii) partly held from Government and partly from private persons, etc.
Classification by size of land cultivated is the same as in the B Series household economic tables. Material here is presented only for the district rural and for all the Scheduled Castes as a group. The table is prepared from the household schedules on a 20 per cent sample. Table SCT-V-B
112. This Table for Scheduled Tribes, (same as Part A) is presented only for the dis.trict rural. The table is prepared from household schedules on a 20 per cent sample. Table SC-I
113. This table presents the total non-working population of all the Scheduled Castes as a group classified by four categories of non.workers, viz.-
(i) full-time students; (ii) persons seeking employment for the first
time; (iii) persons employed before but now out of
employment and seeking work; and (iv) others.
The non-working population is further classified by educational levels. The material is presented for the district only but for total, rural and urban areas separately. Table ST-I
114. This table presents the. distribution of population of each Scheduled Tribe· by mothertongue and the subsidiary languages spoken. Material is presented only for the district but for total, rural and urban areas separately. Scheduled Tribes are arranged in their alphabetical order and mother-tongues when there are more than one for any Scheduled Tribe are also shown in the alphabetical order. The figures for rural areas only are also shown separately for talukas having more than 25 per cent Tribal population. Table ST-I1
115. This table presents the total non-working population of each Scheduled Tribe classified by four categories of non·workers, viz.-
(i) full-time students; (ii) persons seeking employment for the first
time;
122
(iii) persons employed before but now out of employment and seeking work; and
(iv) others. The figures for rural areas only are also shown separately for talukas having more than 25 per cent Tribal popUlation.
The material is presented for the district only but for total, rural and urban ilreas separately.
E SERIES HOUSING TABLES
116. There are five Tabtes in this Series. Four of them relate to housing conditions and . urnish data on the purposes for which the houses are used, the tenures on which they are occupied by the households, material of construction of walls and roofs and the distribution of households by the number of rooms occupied. The last table relates to industries and shows the number of establishments and the number of workers for each industry classified b:y industry division, major group; and minor groups. Another Table (E-III) on industrial establishments prepared from the houselists gives a' break-up by industry and the fuel used cross-tabulated by the size of the establishments. It is not l'resented here for want of space. It may be seen Jfl Part IV of the Maharashtra Census Report.
117. All the five tables of this Series are prepared from the houselists which were prepared at the time of numbering of houses in SeptemberOctober of 1960. Such data on housing conditions are furnished here for the first time.
118. A "house" was defined for purposes of the Census as "a structure or part of a structure inhabited or vacant, a dwelling, a shop, a shop-cumdwelling or a place of business, workshop, school, etc., having a separate entrance. The entrance may be directly on the road, street, or lane or to a common staircase, court-yard or a gate". Table E-I
119. This table presents the distribution of houses classified by uses to which they are put to. The various uses are shown n columns (4) to (16). Houses which were not being used for any purpose at the time of houselisting were treated as vacant. A "workshop" is a place where some kind of production, processing, repairs or servicing of goods, goes on a commercial scale. Manufacturing or processing esta~lishments registered under the Factories Act are treated as factories. When a house was used both as a shop and as a dwelling or workshop and as a dwelling it is treated as ·a shop-cum-dwelling or workshop-cum-dwelling. The houses which were used as schools, offices, factories, or restaurants and also used by some people for residence, have been treated for purposes of this table as schools, offices, factories or restaurants and not as school.cum-dwelling, office-cum· dwelling and so on.
120. The last category of "Others" includes all purposes not included in. columns (4) to (15) prominent among them bemg cattle-sheds. garages, show-rooms, locked houses, etc. Table E-I presents material for the district and each taluka and for total. rural and urban areas separately. The table is prepared from the houselists on a full count.
Table E-U 121. This table presents th€ distribution of
sample households by the tenure of houses occupied by them. Tenure here is of only two kinds, owned or rented. " Rent free" or "Caretaker" occupation is included jn the" Rented" category. The houses occupied under each, tenure are further classified by the nature of uses .such as dwellings, shop-cumdwellings, etc. Tenure of occupati(::m of nonresidential houses such as schools, hospitals, etc., is not shown here.
122. This table is prepared from the houselists and on a 20 per cent sample.
123. Material is presented for the district and each taluka and for total, rural and urban areas separately.
Table E-IV 124 This table preoents distribution of sample
houses used wholly or partly as dwelling by material of wall and material of roof. The material of wall is the material out of which most of the walls of the house are constructed. Where a house has separate portions each of different material, the material of the walls for this table is the one out of which the walls of the main bed-rooms are constructed. Similarly, the material of roof is one out of which most of the roof exposed to weather is constructed. In case of multi-storeyed buildings, the intermediate floor is treated as the roof of the lower storey.
125. Material is presented here for the district and each taluka and for total, rural and urban areas separately. This table is prepared from the houselists on a 20 per cent sample.
Table E-V, 126. This table presents the distribution of
sample households classified by the number of rooms occupied. For each class of households the total number of members of the households is shown by males and females separately. This will help measure congestion or over-crowding particularly in urban areas.
J23
. U7. The table is prepared from the houselists on a 20 per cent sample. The material is presented for the district and each taluka and for total, rural and urban areas separately.
128. The table relates only to the family house~ holds. In3titutional households like hostels, boardings, prisons, etc., are not shown here,
129. A" room" has four walls with a door and a roof overhead and is not less than 6' X 6'. Unenclosed verandah, kitchen, store, garage, ca<tle-shed. etc., though used for residential purposes are not treated as rooms. Households residing in such places are shown in columns (7) to (9) as having no regular room.
Table on Industrial Establishments and Workers
130. This is a very important table and presents the number of establishments and number of workers for each branch of industry classified by industry divisions and minor groups according to the Standard Industrial Classification (Appendix I). For each industry division, minor group figures are shown in the brackets first for the number of establishments and second for the number of workers.
131. The table is prepared from the houselists on a full count. Material is presentesi here for the district and talukas for total, rural and urban areas as well as for each villa.ge and town separately. The presentation is in the run-on style and the villages are shown both by their names and code numbers. These latter will help locate them in the taluka maps included in Part 1. Villages which do not have any industrial establishments are not shown here. Similarly, for any village, town or taluka, the industry minor codes for which there are no establishments are not shown in the table.
132. The material presented here relates to September-October of 1960. Establishments where processing, repairing or servicing of goods is done are also included along with the manufacturing establishments. The number of workers shown here includes the proprietor and/or the other household members if any were working in the industry during the week preceding the enumerator's visit. ...
133. The list of industries presented here may not include some seasonal industries which were not actually working during the period when houselists were prepared, viz., September-October 1960.
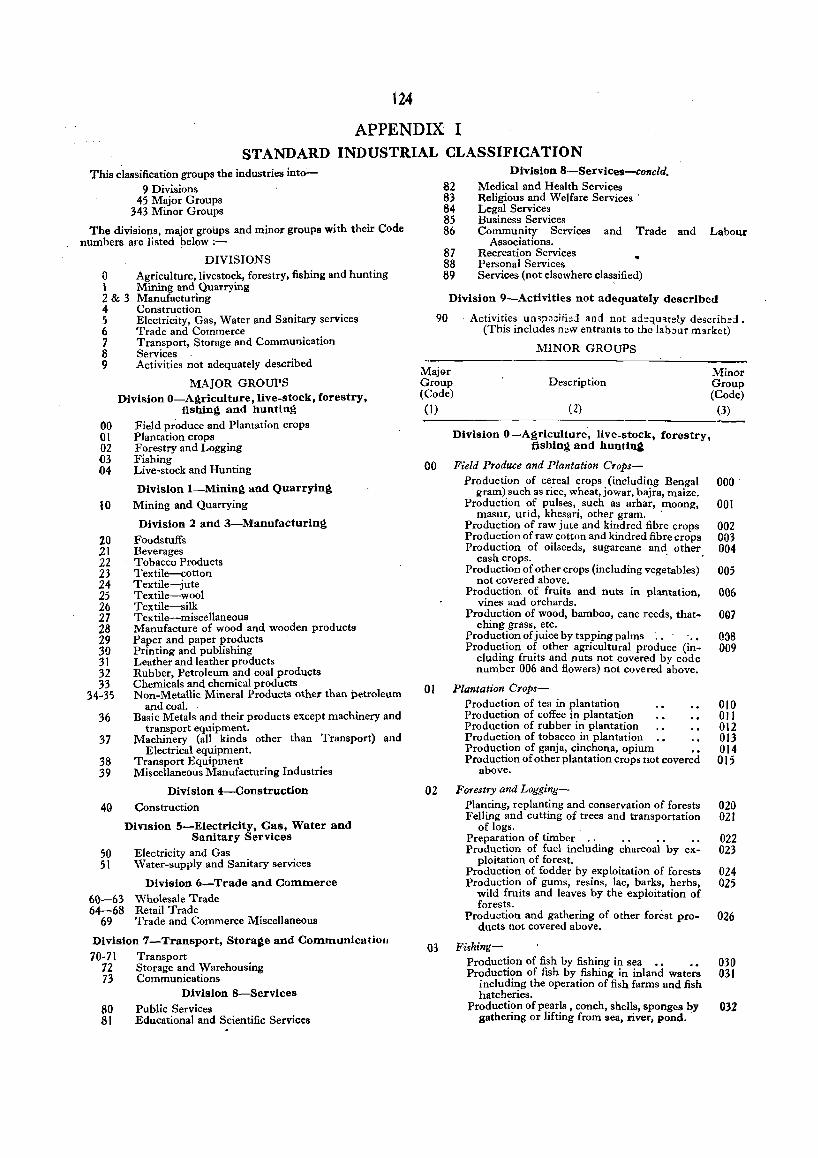
124
APPENDIX I STANDARD INDUSTRIAL CLASSIFICATION
This classification groups the industries into-9 Divisions
45 Major Groups 343 Minor Groups
The divisions, major groups and minor groups with their Code numbers are listed below ;-
DIVISIONS
o \ 2&3 4
Agriculture, livestock, forestry, fishing and hunting Mining and Quarrying Manufacturing Construction
5 6 7 8 9
00 01 02 03 04
10
20 21 22 23 24 25 26 27 28 29 30 31 32 33
34~3S
36
37
38 39
Electricity, Gas, Water and Sanitary services Trade and Commerce Transport, Storage and Communication Services Activities not adequately described
MAJOR GROUPS Division O-Allriculture, live-stock, forestry,
fishing and hunting Field produce and Plantation crops Plantation crops Forestry and Logging Fishing Live-stock and Hunting
Division i-Mining and Quarrying
Mining and Quarrying
Division 2 and 3-Manufacturing
Foodstuffs Beverages Tobacco Products Textile---cotton Textile-jute Textile-wool Textil~ilk Textile-miscellaneous M,lOufacture of wood and wooden products Paper and paper products Printing and publishing Leather and leather products Rubber, Petroleum and coal products Chemicals and chemical products Non-Metallic Mineral Products other than petroleum
andcoa!. Basic Metals and their products except machinery and
transport equipment. Machinery (all kinds other than Transport) and
Electrical equipment. Transport Equipment Miscellaneous Manufacturing Industries
Division 4-Construction
40 Construction
DiVlsion 5-Electricity, Gas, Water and Sanitary Services
50 Electricity and Gas 5 I 'Vater-supply and Sanitary services
Division 6-Trade and Commerce
60-63 Wholesale Trade 64-68 Retail Trade
69 Trade and Commerce Miscellaneous
Division 7-Transport, Storage and Communicatioll
70-71 Transport 72 Storage and Warehousing 73 Communications
Division 8-Services
flO Public Services 81 Educational and Scientific Services
Division 8-Services-C01lcZd. 82 Medical and Health Services 83 Religious and Welfare Sen.ices 84 Legal Services 85 Business Services 86 Community Services and Trade and Labour
Associations. 87 Recreation Services 88 Personal Services 89 Services (not elsewhere classified)
Division 9-Activities not adequately described
90 Activities unspecifid and not ad:!quately describei. (This includes new entrants to the labour market)
MINOR GROUPS
Maj(}r Minor Group Description Group (Code) (Code)
_(1_) _______ (2_) ___ ~ ____ (3)
Division O-A~riculture, live-stock, forestry, fishing and hunting
00 Field Produce and Plantation CTOPS-Production of cereal crops (including, Bengal 000
gram) such as rice, wheat, jowar, bajra, maize. Production of pulses,. such as arhar, moong, 001
masur, und, khesan, other gram. ' Production of raw jute and kindred fibre crops 002 Production of raw cotton and kindred fibre~rops 003 Production of oilseeds, sugarcane and other 004
cash crops. . Production of other crops (including vegetables) 005
not covered above. Production, of fruits and nuts in plantation 006
vines and orchards. ' Production of wood, bamboo, cane reeds that- 01}7
ching grass, etc. ' Production, of juice by tapping palms .. . • 038 Production of other agricultural produce (in- 009
eluding fruits and nuts not covered by code number 006 and flowers) not covered above.
o I Plantation Crops-Production of tea in plantation 0 10 Production of coffee in plantation 0 II Production of rubber in plantation 012 Production of tobacco in plantation . • . • 013 Production of ganja, cinchona, opium •• 014 Production of other plantation crops not covered 015
above.
02 Forestry and Logging-
Planting, replanting and conservation of forests 020 Felling and cutting of trees and transportation 021
of logs. . Preparation of timber ., . • . . . • 022 Production of fuel including charcoal by ex- 023
ploitation of forest. Production of fodder by exploitation of forests 024 Production of gums, resins, lac, barks, herbs, 025
wild fruits and leaves by the exploitation of forests.
Production and gathering of other forest pro- 026 ducts not covered above.
03 Fishing-Production of fish by fishing in sea • • • • 030 Production of fish by fishing in inland waters 031
including the operation of fish farms and fish hatcheries.
Producti?n of p~ar~s , conch, shells, sponges by 032 gathenng or IIftmg from sea, river, pond.
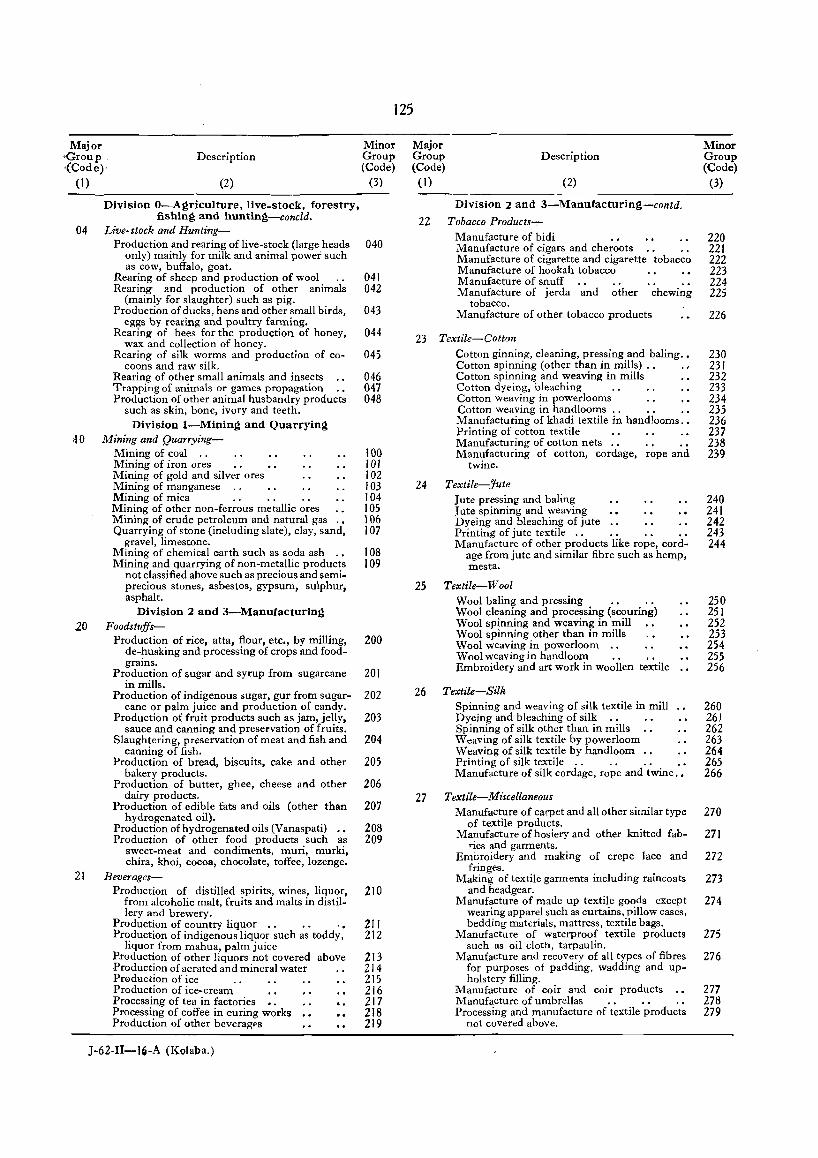
125
Major ,Group, {Code)
Description Minor Group (Code)
(1)
04
·10
20
24
(2)
Division O-Agriculture, live-stock, forestry, fishing and huntin~-concld.
Live-stock and Hunting-
(3)
Production and rearing of live-stock (large heads 040 only) mainly for milk and animal power such as cow, buffalo, goat.
Rearing of sheep and production of wool 041 Rearing and production of other animals 042
(mainly for slaughter) such as pig. Production of ducks, hens and other small birds, 043
eggs by rearing and poultry farming. Rearing of bees for the production of honey, 044
wax and collection of honey. Rearing of silk worms and production of co- 045
coons and raw silk. Rearing of other small animals and insects 046 Trapping of animals or games propagation 047 Production of other animal husbandry products 048
such as skin, bone, ivory and teeth. Division I-Mining and Quarryin~
Mining and Quarrying-Mining of coal I 00 Mining of iron ores I 0 I Mining of gold and silver ores J 02 Mining of manganese J 03 Mining of mica J 04 Mining of other non-ferrous metallic ores J 05 Mining of crude petroleum and natural gas 106 Quarrying of stone (including slate), clay, sand, 107
gravel, limestone. Mining of chemical earth such as soda ash .• I 08 Mining and quarrying of non-metallic products 109
not classified above such as precious and semiprecious stones, asbestos, gypsum, sulphur, asphalt.
Division 2 and 3-Manufacturing Foodstuffs-
Production of rice, atta, flour, etc., by milling, 200 de-husking and processing of crops and food-grains.
Production of sugar and syrup from sugarcane 201 in mills.
Production of indigenous sugar, gur from sugar- 202 cane or palm juice and production of candy.
Production of fruit products such as jam, jelly, 203 sauce and canning and preservation of fruits.
Slaughtering, preservation of meat and fish and 204 canning of fish.
Production of bread, biscuits, cake and other 205 bakery products.
Production of butter, ghee, cheese and other 206 dairy products.
Production of edible fats and oils (other than 207 hydrogenated oil).
Production of hydrogenated oils (Vanaspati) .• 208 Production of other food products such as 209
sweet-meat and condiments, muri, murki, chira, khoi, cocoa, chocolate, toffee, lozenge.
Beverages-Production of distilled spirits, wines, liquor, 210
from alcoholic malt, fruits and malts in distil-lery and brewery.
Production of country liquor .. • . . • 211 Production of indigenous liquor such as toddy, 212
liquor from mahua, palm juice Production of other liquors not covered above 213 Production of aerated and mineral water 214 Production of ice . . 215 Production of ice-cream 2 J 6 Processing of tea in factories 2 J 7 Processing of coffee in curing works 218 Production of other beveragps 219
J-62-I1-14-A (Kolaba.)
Major Group (Code)
(1)
Description
(2)
DivisiOn :2 and 3-Manufacturing-contd.
22 Tobacco Products-:-Manufacture of bidi Manufacture of cigars and cheroots Manufacture of cigarette and cigarette tobacco Manufacture of hookah tobacco Manufacture of snuff Manufacture of jerda and other chewing
tobacco. Manufacture of other tobacco products
23 Textile-Cotton Cotton ginning, cleaning, pressing and baling .• Cotton spinning (other than in mills) .. Cotton spinning and weaving in mills Cotton dyeing, bleaching Cotton weaving in powerlooms Cotton weaving in handlooms .. Manufacturing of khadi textile in handlooms .• Printing of cotton textile Manufacturing of cotton nets .. Manufacturing of cotton, cordage, rope and
twine.
24 Textile-Jute Jute pressing and baling Jute spinning and weaving Dyeing and bleaching of jute Printing of jute textile .. Manufacture of other products like rope, cord
age from jute and similar fibre such as hemp, mesta.
25 Textile-Wool Wool baling and pressing Wool cleaning and processing (scouring) Wool spinning and weaving in mill Wool spinning other than in mills Wool weaving in powerloom .. Wool weaving in handloom Embroidery and art work in woollen textile
26 Textile-Silk Spinning and weaving of silk textile in mill Dyeing and bleaching of silk Spinning of silk other than in mills Weaving of silk textile by powerloom Weaving of silk textile by handloom .• Printing of silk textile .. . . . . . • Manufacture of silk cordage, rope and twine .•
27 Textile-Miscellaneous Manufacture of carpet and all other similar type
of textile products. Manufacture of hosiery and other knitted fab
,.ics and garments. Embroidery and making of crepe lace and
fringes. Making of textile garments including raincoats
and headgear. Manufacture of made up textile goods except
wearing apparel such as curtains, pillow cases, bedding materials, mattress, textile bags.
Manufacture of waterproof textile products such as oil cloth, tarpaulin.
Manufacture and recovery of all types of fibres for purposes of padding. wadding and upholstery filling.
Manufacture of coir and coir products Manufacture of umbrellas Processing and manufacture of textile products
not covered above.
Minor Group (Code)
(3)
220 221 222 223 224 225
226
230 231 232 233 234 235 236 237 238 239
240 241 242 243 244
250 251 252 253 254 255 256
260 261 262 263 264 265 266
270
271
272
273
274
275
276
277 278 279
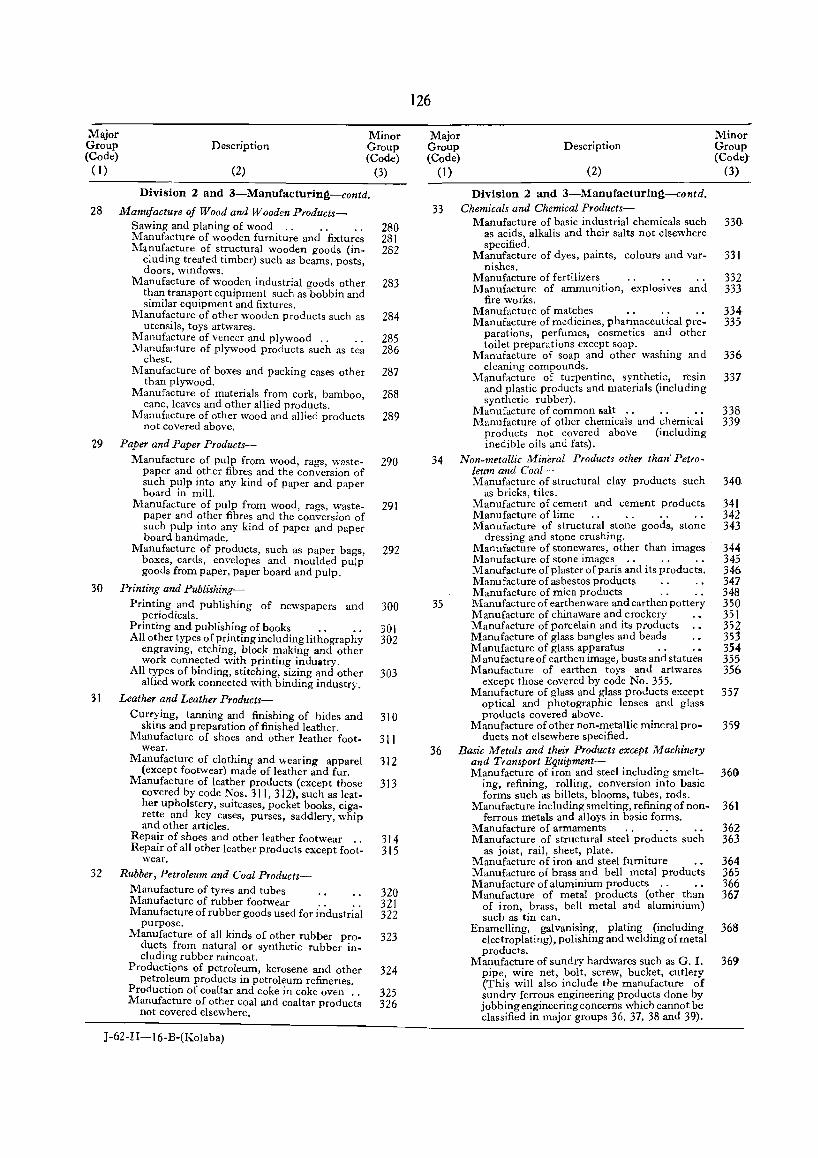
Major Minor Group Description Group (Code) (Code) (I ) (2) (3)
Division 2 and 3-Manufacturing-contd.
28 Manufacture of Wood and Wooden Products-Sawing and planing of wood .. . . :Manufacture of wooden furniture and fixtures Manufacture of structural wooden goods (in-
cluding treated timber) such as beams posts doors, windows. ' ,
Manufacture of wooden industrial goods other than transport equipment such as bobbin and similar equipment and fixtures.
l\!Ianufacture of other wooden products such as utensils, toys artwares.
l\!Ianufacture of veneer and plywood .. . . Manufacture of plywood products such as tea
chest. l'vlanufacture of boxes and packing cases other
than plywood. Manufacture of materials from cork, bamboo,
cane, leaves and other allied products. Manufacture of other wood and allied products
not covered above.
29 Paper and Paper Products-
30
31
32
Manufacture of pulp from wood, rags, wastepaper and other fibres and the conversion of such pulp into any kind of paper and paper board in mill.
Manufacture of pulp from wood, rags, wastepaper and other fibres and the conversion of such pulp into any kind of paper and paper board handmade.
lVlanufacture of products, such as paper bags, boxes, cards, envelopes and moulded pulp goods from paper, paper board and pulp.
Printing and Publishing-
Printing and publishing of newspapers and periodicals.
Printing and publishing of books . . . . All other ~ypes of ~rinting including lithography
engravmg, etchmg, block making and other work conno:cte? with printing indulltry.
All t~pes of bmdmg, stitching, sizing and other allIed work connected with binding industry.
Leather and Leather Products-
Currying, tanning and finishing of hides and skms and preparation of finished leather.
IVlanufacture of shoes and other leather footwear.
Manufacture of clothing and wearing apparel (except footwear) made of leather and fur.
Manufacture of leather products (except those covered by code Nos. 311, 312), such as leather upholstery, suitcases, pocket books, cigarette and key cases, purses, saddlery, whip and other artIcles.
Repa!r of shoes and other leather footwear .. RepaIr of all other leather products except foot
wear.
Rubber, Petroleum and Coal Products-Manufacture of tyres and tubes . . • . lVlanufacture of rubber footwear Manufacture of rubber goods used for i'ddustri;l
purpose. Manufacture of all kinds of other rubber pro
ducts from natural or synthetic rubber including rubber raincoat.
Productions of petroleum, kerosene and other petroleum products in petroleum refineries
Production of coaltar and coke in coke oven :. Manufacture of other coal and coal tar products
not covered elsewhere.
J-62-II-16-B-(Kolaba)
280 281 282
283
284
285 286
287
288
289
290
291
292
300
301 302
303
310
311
312
313
314 315
320 321 322
323
324
325 326
126
Major Description
Minor Group (Code)
Group (Code)
(I)
33
34
35
36
(2) (3)
Division 2 and 3-Manufacturing--contd. Chemicals and Chemical Products-
Manufacture of basic industrial chemicals such 330· as acids, alkalis and their salts not elsewhere specified.
Manufacture of dyes, paints, colours and var- 331 nishes.
Manufacture of fertilizers 332 IVlanufacture of ammunition, explosives and 333.
fire works. Manufacture of matches 334· Manufacture of medicines, pharmaceutical pl'C- 335
parations, perfumes, cosmetics and other toilet preparations except soap.
Manufacture of soap and other washing and 336 cleaning compounds.
Manufacture of turpentine, synthetic, resin 337 and plastic products and materials (including synthetic rubber).
Manufacture of common salt .. 338 IVIanufacture of other chemicals and chemical 339
products not covered above (including inedible oils and fats).
Non-metallic Mineral Products other than' Petroleum and Coal-Manufacture of structural clay products such
as bricks, tiles. Manufacture of cement and cement products Manufacture of lime Manufacture of structural stone goods, stone
dressing and stone crushing. lVlanufacture of stonewares, other than images' Manufacture of stone images Manufacture of plaster of paris and its products. Manufacture of asbestos products Manufacture of mica products l\;Ianufacture of earthenware and earthen pottery Manufacture of chinaware and crockery Manufacture of porcelain and its products Manufacture of glass bangles and beads Manufacture of glass apparatus Manufacture of earthen image, busts and statues Manufacture of earthen toys and artwares
except those covered by code No. 355. Manufacture of glass and glass products except
optical and photographic lenses and glass products covered above.
Manufacture of other non-metallic mineral products not elsewhere specified.
Basic Metals and their Products except Machinery and Transport Equipment-Manufacture of iron and steel including smelt
ing, refining, rolling, conversion into basic forms such as billets, blooms, tubes, rods.
Manufacture including smelting, refining of nonferrous metals and alloys in basic forms.
Manufacture of armaments Manufacture of structural steel products such
as joist, rail, sheet, plate. Manufacture of iron and steel furniture Manufacture of brass and bell metal products Manufacture of aluminium products Manufacture of metal products (other than
of iron, brass, bell metal and aluminium) such as tin can.
Enamelling, galvanising, plating (including electroplating), polishing and welding of metal products.
Manufacture of sundry hardwares such as G. I. pipe, wire net, bolt, screw, bucket, cutlery (This will also include the manufacture of sundry ferrous engineering products done by jobbing engineering concerns which cannot be classified in major groups 36, 37, 38 and 39).
340
341 342 343
344 345 346 347 348 350 351 352 353 354 355 356
357
359
361)
361
362 363
364 365 366 367
368
369
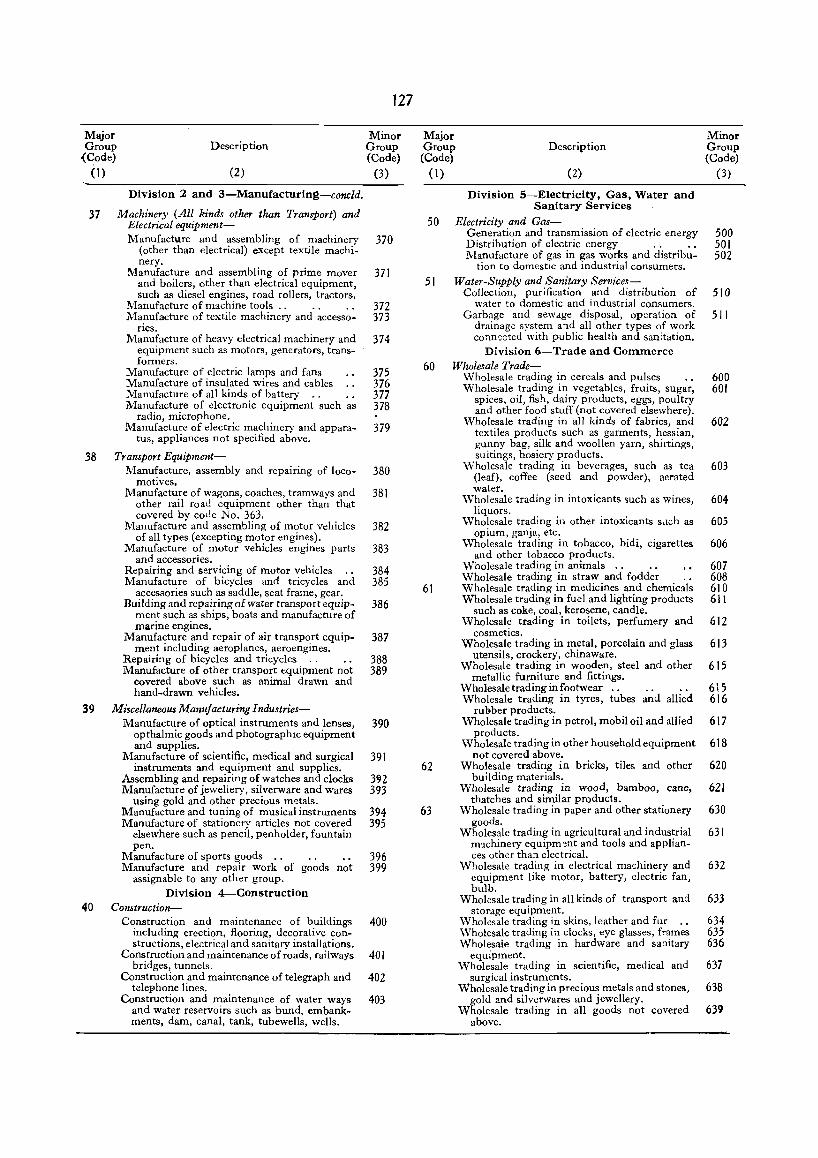
127
Major Minor Group Description Group
{Code) (Code) (1) (2) (3)
Division 2 and 3-Manufacturing-concld.
37 Machinery (All kinds other than Transport) and Electrical equipment-Manufacture and assembling of machinery 370
(other than electrical) except textile machi-nery.
Manufacture and assembling of prime mover 371 and boilers, other than electrical equipment, such as diesel engines, road rollers, tractors.
Manufacture of machine tools .. . . . . 372 Ma~1Ufacture of textile machinery and accesso- 373
nes. Manufacture of heavy electrical machinery and 374
equipment such as motors, generators, transformers.
Manufacture of electric lamps and fans 375 Manufacture of insulated wires and cables 376 Manufacture of all kinds of battery .• 377 :Manufacture of electronic equipment such as 378
radio, microphone. l\hnufacturc of electric machinery and appara- 379
tus, appliances not specified above.
38 Transport Eqllipment-Manufacture, assembly and repairing of loco- 380
motives. l'vlanufacture of wagons, coaches, tramways and 381
other rail road equipment other than that covered by code No. 363.
Manufacture and assembling of motor vehicles 382 of all types (excepting motor engines).
Manufacture of motor vehicles engines parts 383 and accessories.
Repairing and servicing of motor vehicles . . 384 Manufacture of bicycles and tricycles and 385
accessories such as saddle, seat frame, gear. Building and repairing of water transport equip- 386
ment such as ships, boats and manufacture of marine engines.
Manufacture and repair of air transport equip- 387 ment including aeroplanes, aeroengines.
Repairing of bicycles and tricycles 388 Manufacture of other transport equipment not 389
covered above such as animal drawn and hand-drawn vehicles.
39 Miscellaneous Manufacturing Industries-Manufacture of optical instruments and lenses, 390
opthalmic goods and photographiC equipment and supplies.
Manufacture of scientific, medical and surgical 391 instruments and equipment and supplies.
Assembling and repairing of watches and clocks 3'92 Manufacture of jewellery, silverware and wares 393
using gold and other precious m,"tals. Manufacture and tuning of musical instruments 394 Manufacture of stationery articles not covered 395
elsewhere such as pencil, penholder, fountain pen.
Manufacture of sports goods 396 Manufacture and repair work of goods not 399
assignable to any other group. Division 4-Construction
40 Construction-Construction and maintenance of buildings 400
including erection, flooring, decorative constructions, electrical and sanitary installations.
Construction and maintenance of roads, railways 40 I bridges, tunnels.
Construction and maintenance of telegraph and 402 teleflhone lines.
Construction and maintenance of water ways 403 and water reservoirs such as bund, embankments, dam, canal, tank, tubewells, wells.
Major Group (Code)
(1)
Description
(2)
Division 5-Electricity, Gas, Water and Sanitary Services
Minor Group (Code)
(3)
50 Electricity and Gas-Generation and transmission of electric energy 500 Distribution of electric energy . . . . 501 Manufacture of gas in gas works and distribu- 502
tion to domestic and industrial consumers. 51 Water-Supply and Sanitary Services-
Collection, purification and distribution of 510 water to domestic and industrial consumers.
Garbage and sewage disposal, operation of 511 drainage system and all other types of work conn~cted with public health and san:tation.
Division 6-Trade and Commerce 60 Wholesale Trade-
Wholesale trading in cereals and pulses . . 600 Wholesale trading in vegetables, fruits, sugar, 601
spices, oil, fish, dairy products, eggs, poultry and other food stuff (not covered elsewhere).
Wholesale trading in all kinds of fabrics, and 602 textiles products such as garments, hessian, gunny bag, silk and woollen yarn, shirtings, suitings, hosiery products.
Wholesale trading in beverages, such as tea 603 (leaf), coffee (seed and powder), aerated water.
\Vholesale trading in intoxicants such as wines, 604 liquors.
Wholesale trading in other intoxicants such as 605 opium, ganja, etc.
Wholesale trading in tobacco, bidi, cigarettes 606 and other tobacco products.
Wholesale trading in animals .. . . 607 Wholesale trading in straw and fodder . . 608
61 Wholesale trading in medicines and chemicals 610 Wholesale trading in fuel and lighting products 611
such as coke, coal, kerosene, candle. Wholesale trading in toilets, perfumery and 612
cosmetics. Wholesale trading in metal, porcelain and glass 613
utensils, crockery, chinaware. Wholesale trading in wooden, steel and other 6 IS
metallic furniture and fittings. Wholesale trading in footwear .. . . . . 615 Wholesale trading in tyres, tubes and allied 616
rubber products. Wholesale trading in petrol, mobil oil and allied 617
products. Wholesale trading in other household equipment 618
not covered above. 62 Wholesale trading in bricks, tiles and other 620
building materials. Wholesale trading in wood, bamboo, cane, 621
thatches and similar products. 63 Wholesale trading in paper and other stationery 630
goods. Wholesale trading in agricultural and industrial 631
machinery equipm~nt and tools and applian-ces other than electrical.
Wholesale trading in electrical machinery and 632 equipment like motor, battery, electric fan, bulb.
Wholesale trading in all kinds of transport and 633 storage equipment.
\Vholesale trading in skins, leather and fur 634 \Vholesale trading in docks, eye glasses, frames 635 Wholesale trading in hardware and sanitary 636
equipment. Wholesale trading in scientific, medical and 637
surgical instruments. Wholesale trading in precious metals and stones, 638
gold and silverwares and jewellery. Wholesale trading in all goods not covered 639
above.
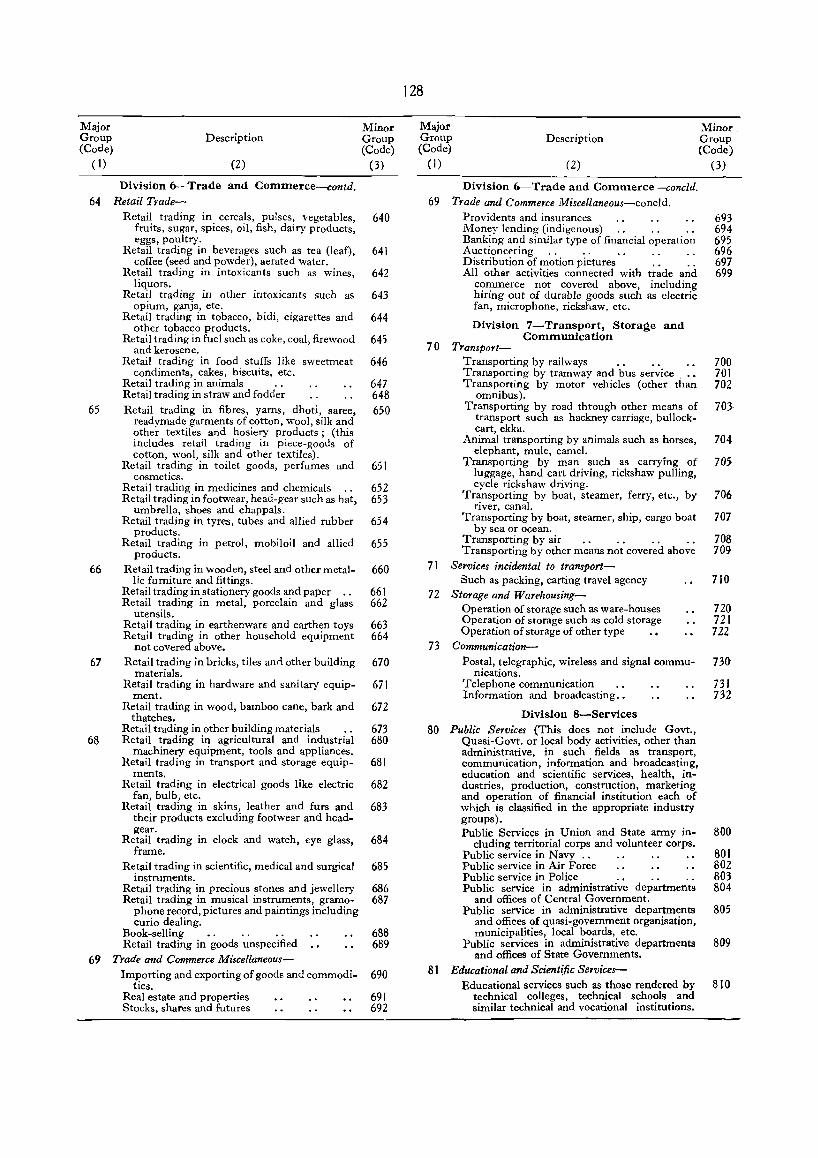
Major Group (Code)
( 1)
Description
(2)
Minor Group (Code)
(3)
Division 6-Trade and Commerce-contd. 64 Retail Trade-
Retail trading in cereals, pulses, vegetables, 640 fruits, sugar, spices, oil, fish, dairy products, eggs, poultry.
Retail trading in beverages such as tea (leaf), 641 coffee (seed and powder), aerated Water.
Retail trading in intoxicants such as wines, 642 liquors.
Retail trading in other intoxicants such as 643 opium, ganja, etc.
Retail trading in tobacco, bidi, cigarettes and 644 other tobacco products.
Retail trading in fuel such as coke, coal, firewood 645 and kerosene.
Retail trading in food stuffs like sweetmeat 646 condiments, cakes, biscuits, etc.
Retail trading in animals 647 Retail trading in straw and fodder 648
65 Retail trading in fibres, yams, dhoti, saree, 650 readymade garments of cotton, wool, silk and other textiles and hosiery products; (this includes retail trading III piece-goods of cotton, wool, silk and other textiles).
Retail trading in toilet goods, perfumes and 651 cosmetics.
Retail trading in medicines and chemicals 652 Retail trading in footwear, head-gear such as hat, 653
umbrella, shoes and chappals. Retail trading in tyres, tubes and allied rubber 654
products. Retail trading in petrol, mobiloil and allied 655
products. 66 Retail trading in wooden, steel and other metal- 660
lic furniture and fittings. Retail trading in stationery goods and paper 661 Retail trading in metal, porcelain and glass 662
utensils. Retail trading in earthenware and earthen toys 663 Retail trading in other household equipment 664
not covered above. 67 Retail trading in bricks, tiles anet other building 670
materials. Retail trading in hardware and sanitary equip- 671
ment. Retail trading in wood, bamboo cane, bark and 672
thatches. Retail trading in other building materials 673
68 Retail trading in agricultural and industrial 680 machinery equipment, tools and appliances.
Retail trading in transport and storage equip- 681 ments.
Retail trading in electrical goods like electric 682 fan, bulb, etc.
Retail trading in skins, leather and furs and 683 their products excluding footwear and head-gear.
Retail trading in clock and watch, eye glass, 684 frame.
Retail trading in scientific, medical and surgical 685 instruments.
Retail trading in precious stones and jewellery 686 Retail trading in musical instruments, gramo- 687
phone record, pictures and paintings including curio dealing.
Book-selling 688 Retail trading in goods unspecified 689
69 Trade and Commerce Miscellaneous-Importing and exporting of goods and commodi- 690
ties. Real estate and properties 691 Stocks, shares and futures 692
128
Major Group (Code)
Description
(I) (2)
Division 6-Trade and Commerce--concld.
69 Trade and Commerce jl1iscellaneous-concld. Providents and insurance!! Money lending (indigenous) Banking and similar type of financial operation Auctioneering Distribution of motion pictures . . . . All other activities connected with trade and
commerce not covered above, including hiring out of durable goods such as electric fan, microphone, rickshaw, etc.
Division 7-Transport, Storage and Communication
7 0 Transport-Transporting by railways . . . . Transporting by tramway and bus service , .• Transporting by motor vehicles (other than
omnibus). Transporting by road through other means of
transport such as hackney carriage, bullockcart, ekka.
Animal transporting by animals such as horses, elephant, mule, camel.
Transporting by man such as carrying of luggage, hand cart driving, rickshaw pulling, cycle rickshaw driving.
Transporting by boat, steamer, ferry, etc., by river, canal.
Transporting by boat, steamer, ship, cargo boat by sea or ocean.
Transporting by air Transporting by other means not covered above
71 Services incidental to transport-Such as packing, carting travel agency
72 Storage and Warehousing-Operation of storage such as ware-houses Operation of storage such as cold storage Operation of storage of other type
73 Communication-Postal, telegraphic, wireless and signal commu
nications. Telephone communication Information and broadcasting .•
Division 8-Services 80 Public Services (This does not include Govt.,
Quasi-Govt. or local body activities, other than administrative, in such fields as transport, communication, information and broadcasting, education and scientific services, health, industries, production, construction, marketing and operation of financial institution each of which is classified in the approprjat~ industry groups). Public Services in Union and State army in-
cluding territorial corps and volunteer corps. Public service in Navy .. Public service in Air Force Public service in Police Public service in administrative departments
and offices of Central Government. Public service in administrative departments
and offices of quasi-government organisation, municipalities, local boards, etc.
Public services in administrative departments and offices of State Governments.
81 Educational and Scientific St1vices-Educational services such as those rendered by
technical colleges, technical schools and similar technical and vocational institutions.
Minor. Group (Code)
(3)
693 694 695 696 697 699
700 701 702
70J
704
70>
706
707
70S 709
710
720 721 722
73fr
731 732
800
801 802 803 804
805
809
810

Major Group (Code)
(f)
Description
(2)
Division 8-SerVices-contd.
Minor Group (Code)
(3)
81 Educational and Scientific Services-coneld. Educational services such as those rendered by 811
colleges, schools and similar other institutions of non-technical type.
Sci~ntific services and research institutions not 812 capable of classification under any individual group.
82 Medical and Health Services-Public health and medical services rendered by 820
organisations and individuals such as by hospitals, sanatoria, nursing homes, mater-nity and child welfare clinic as also by hakimi, unani, ayurvedic, allopathic and homeopathic practitioners.
Veterinary services rendered by organisations 821 and individuals.
83 Religious and Welfare Services-Religious services rendered by religious orga- 830
nisations and their establishments maintained for worship or promotion of religious activities this includes missions, ashrams and other allied organisations.
Religious and allied services rendered by pandit, 831 priest, preceptor, fakir, monk.
Welfare services rendered by organisations 832 operating on a non-profit basis for the promotion of welfare of the community such as relief societies, red-cross organisation for the collection and allocation of contributions for charity.
84 Legal Services-Legal services rendered by barrister, advocate 840
solicitor, mukteer, pleader, mukurie, munshi. Matrimonial services rendered by organisations 841
and individuals.
85 Business Service.<-Engineering services rendered by professional 850
organisations or inividuals. Business services rendered by organisations of 851
accountants, auditors, book-keepers or like individuals.
Business services _rendered by professional or- 852 ganisations or individuals such as those of advertising and publicity agencies.
Business services rendered by professional 853 organisations or individuals such as of those rendered by news-agency, newspaper correspondent, columnist, journalists, editors, authors.
129
Major Group (Code)
(I)
Description
(2)
Division 8-Services-concld.
Minor Group (Code)
(3)
86 Community Services and Trade and Labour Associations-Services rendered by trade associations, cham- 860
bers of commerce, trade unions and similar other organisations.
Services rendered by civic, social, cultural, 861 political and fraternal organisations such as rate payers association, club. library.
Community services such as those rendered by 862 public libraries, museums, botanical and
zoological gardens, etc.
87 Recreation Services-Production of motion picture and allied services 870
such as processing, editing, etc. Recreation servic(>s rendered by cinema houses 871
by exhibition of motion pictures. Recreation services rendered by organisations 872
and individuals such as those of theatres, opera companies, ballet and dancing parties, musicians, exhibitions, circus, carnivals.
Recreation services rendered by indoor and 873 outdoor sports by organisations and individuals including horse, motor, etc., racing.
88 Personal Services-Services rendered to households such as those 880
by domestic servants, cooks. Services rendered to households such as those 881
by governess, tutor, private secretary. Services Fendered by hotels, boarding houses, 882
eating houses, cafes, restaurants and similar other organisations to provide lodging and boarding facilities.
Laundry services rendered by organisations and 883 individuals, this includes all types of cleaning, dyeing, bleaching, dry cleaning, services.
Hair dressing, other services rendered by organi- 884 sation and individuals such as those by barber, hairdressing saloon and beauty shops.
Services rendered by portrait and commercial 885 photographic studios.
89 Services (not elsewhere classified)-Services rendered by organisations or individuals 890
not elsewhere classified.
Division 9-Activities n'Jt adequately described 90 Activities unspecified and not adequately described-
Including activities of such individuals who fail 900 to provide sufficient information about their industrial affiliation to enable them to be classified.
Fresh entrants to the Labour Market 999
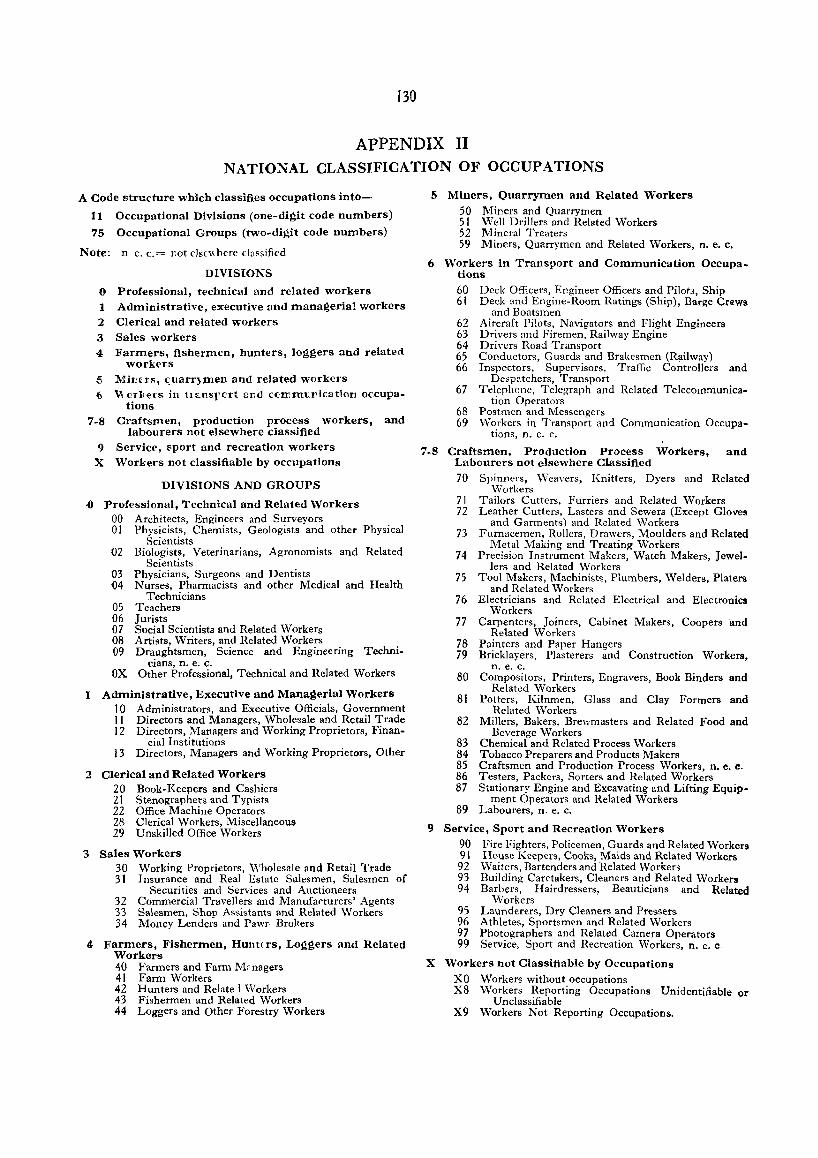
130
APPENDIX II NATIONAL CLASSIFICATION OF OCCUPATIONS
A Code structure which c1assifi.es occupations into-
11 Occupational Divisions (one-digit code numbers)
75 Occupational Groups (two-digit code numbers)
Note: n e. c.= 110t elsc",bere c1r.ssified
DIVISIONS
o Professional, technical and related workers 1 Administrative, executive and managerial workers 2 Clerical and related workers 3 Sales workers 4 Farmers, fishermen, hunters, loggers and related
workers 5 Mir!£rs, <;uarrymen and related workers 6 "crteJ:s in 1u'Cnsrcrt ~J:\d communication occupa
tions 7-8 Craftsmen, production process workers, and
labourers not elsewhere ciassified 9 Service, sport and recreation workers
X Workers not classifiable by occupations
DIVISIONS AND GROUPS
.() Professional, Technical and Related Workers 00 Architects, Engineers and Surveyors 01 Physicists, Chemists, Geologists and other Physical
Scientists .02 Biologists, Veterinarians, Agronomists and Related
Scientists {)3 Physicians, Surgeons and Dentists 04 Nurses, Pharmacists and other Medical and Health
Technicians ·05 Teachers 06 Jurists 07 Social Scientists and Related Workers 08 Artists, Writers, and Related Workers .09 Draughtsmen, Science and Engineering Techni
cians, n. e. c. OX Other Professional, Technical and Related Workers
I Administrative, Executive and Managerial Workers 10 Administrators, and Executive Officials, Government 11 Directors and Managers, Wholesale and Retail Trade 12 Directors, Managers and Working Proprietors, Finan-
cial Institutions 13 Directors, Managers and Working Proprietors, Other
2 Clerical and Related Workers 20 Book-Keepers and Cashiers 21 Stenographers and Typists 22 Office Machine Operators 28 Clerical Workers, Miscellaneous 29 Unskilled Office Workers
3 Sales Workers 30 Working Proprietors, \Vholesale and Retail Trade 31 Insurance and Real Estate Salesmen, Salesmen of
Securities and Services and Auctioneers 32 Commercial Travellers and Manufarturers' Agents 33 Salesmen, Shop Assistants and Related Workers 34 Money Lenders and Pawr Brokers
4, Farmers, Fishermen, HUllt< rs, Loggers and Related Workers 40 Farmers and Farm l'.1?nagers 41 Farm Workers 42 Hunters and Relate 1 vVorkers 43 Fishermen and Related Workers 44 Loggers and Other Forestry Workers
5 Miners, Quarrymen and Related Workers
50 Miners and Quarrymen 51 Well Drillers and Related Workers 52 Mincral Treaters S9 Miners, Quarrymen and Related Workers, n. e. c.
6 Workers in Transport and Communication Occupations
60 Deck Officers, Engineer Officers and PilotJ, Ship 61 Deck and Engine-Room Ratings (Ship), Barge Cr~ws
and Boatsmen 62 Aircraft Pilots, Navigators and Flight Engineers 63 Drivers and Firemen, Railway Engine 64 DriYcrs Road Transport 65 Conductors, Guards and Brakesmen (Railway) 66 Inspectors, Supervisors, Traffic Controllers and
Despatchers, Transport 67 Tderhone, Telegraph and Related Telecommunica
tion Operators 68 Postmen and l\1essengers 69 vVorkers in Transport and Communication Occupa
tions, n. e. c.
7-8 Craftsmen, PrOduction Process Workers, and Labourers not elsewhere Classified
70 Spinners, vVeavers, Knitters, Dyers and Related ·Workers
71 Tailors Cutters, Furriers and Related Workers 72 Leather Cutters, Lasters and Sewers (Except Gloves
and Garments) and Related Workers 73 Furnacemen, Rollers, Drawers, Moulders and Related
Metal Making l!nd Treating ·Workers 74 Precision Instrument Makers, Watch Makers, Jewel
lers and Related Workers 75 Tool Makers, Machinists, Plumbers, \Velders, Platers
and Related Workers 76 Electricians and Related Electrical and Electronics
Workers 77 Carpenters, Joiners, Cubinet Makers, Coopers and
Related Workers 78 Painters and Paper Hangers 79 Bricklayers, Plasterers and Construction Workers,
n. e. c. 80 Compositors, Printers, Engravers, Book Binders and
Related Workers 81 Potters, Kilnmen, Glass and Clay Formers and
Related \Vorkers 82 Millers, Bakers, Brewmasters and Related Food and
Beverage Workers 83 Chemical and Related Process Workers 84 Tobacco Preparers and Products Makers 85 Craftsmen and Production Process Workers, n. e. c. 86 Testers, Packers, Sorters and Related Workers 87 Stationary Engine and Excavating and Lifting Equip
ment Operators and Related Workers 89 Labourers, n. e. c.
9 Service, Sport and Recreation Workers
90 Fire Fighters, Policemen, Guards and Related Workers 91 House Keepers, Cooks, Maids and Related Workers 92 \Naiters, Bartenders and Related Workers 93 Building Caretakers, Cleaners and Related Workers 94 Barbers, Hairdressers, Beauticians and Related
\Vorkers 9) Launderers, Dry Cleaners and Pressers 96 Athletes, Sportsmen and Related vVorkers 97 Photographers and Related Camera Operators 99 Service, Sport and Recreation \Vorkers, n. e. c.
X Workers not Classifiable by Occupations
XO Workers without occupations X8 ·Workers Reporting Occupations Unidentifiable or
Unclassifiable X9 Workers Not Reporting Occupations.
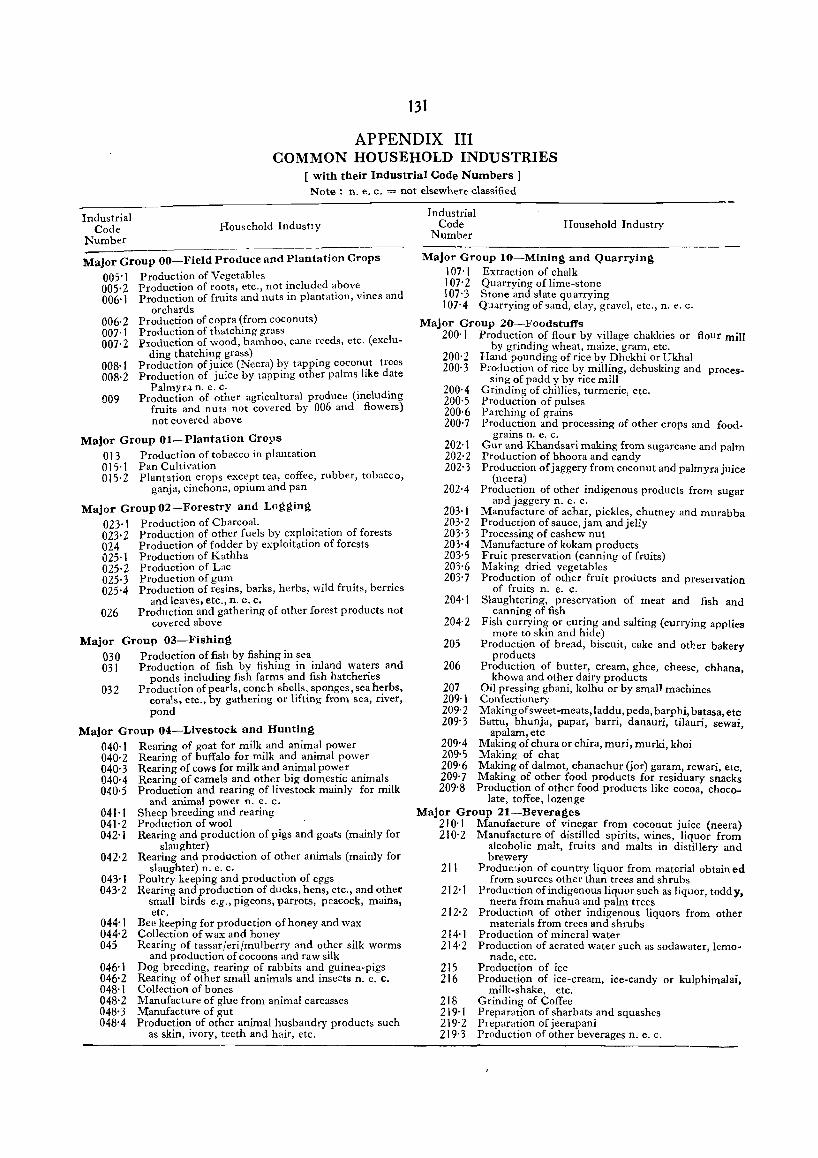
131
APPENDIX III COMMON HOUSEHOLD INDUSTRIES
[ with their Industrial Code Numbers] Note: n. e. c. = not elsewhere classified
Industrial Code
Number Household IndustIy
-------Malo"r Group OO-Field Produce and Plantation Crops
005'1 005·2 006·1
006·2 007·1 001'2
008·1 008·2
009
Production of Vegetables Production of roots, etc., not included above Production of fruits and nuts in plantation, vines and
orchards Production of copra (from coconuts) Production of thatching grass Production of wood, bamboo, cane reeds, etc. (exclu-
ding thatching grass) . Production of juice (Neera) by tappmg coconut trees Production of juice by tapping other palms like date
Palmyra n. e. c. . . Production of other agricultural produce (mcludmg
fruits and nuts not covered by 006 and flowers) not covered above
Major Group Ol-Plantation Crops 013 Production of tobacco in plantation 015·1 Pan Cultivation 015' 2 Plantation crops except tea, coffee, rubber, tobacco,
ganja, cinchona, opium and pan
Major Group 02-Forestry and Logging
023·1 023·2 024 025·1 025·2 025·3 025·4
026
Production of Charcoal. Production of other fuels by exploitation of forests Production of fodder by exploitation of forests Production of Kathha Production of Lac Production of gum Production of resins, barks, herbs, wild fruits, berries
and leaves, etc., n. e. c. Production and gathering of other forest products not
covered above
Major Group 03-Fishing 030 Production of fish by fishing in sea 031 Production of fish by fishing in inland wat~rs and
ponds including fish farms and fish hatchenes 032 Production of pearls, conc h shells. sponges, sea herbs,
corals, etc., by gathering or lifting from sea, river, pond
Major Group 04-Livestock and Hunting 040·1 Rearing of goat for milk and animal power 040'2 Rearing of buffalo for milk and animal power 040'3 Rearing of cows for milk and animal power 040'4 Rearing of camels and other big domestic animals 040'5 Production and rearing of livestock mainly for milk
041'1 041'2 042'1
and animal power n. e. c. Sheep breeding and rearing Production of wool Rearing and production of pigs and goats (mainly for
slaughter) 042'2 Rearing and production of other animals (mainly for
slaughter) n. e. c. 043·1 Poultry keeping and production of eggs 043'2 Rearing and production of ducks, hens, etc., and other
small birds e.g., pigeons, parrots, peacock, maina,
044·1 044'2 045
046·1 046·2 048·1 048·2 048'3 048'4
etc. Bee keeping for production of honey and wax Collection of wax and honey Rearing of tassar/eri/mulbcrry and other silk worms
and production of cocoons and raw silk Dog breeding, rearing of rabbits and guinea-pigs Rearing of other small animals and insects n. e. c. Collection of bones Manufacture of glue from animal carcas~es Manufacture of gut Production of other animal husbandry products such
as skin, ivory, teeth and hair, etc.
Industrial Code
Numb",r Household Industry
Major Group to-Mining and Quarrying 107'1 Extraction of chalk 107' 2 Quarrying of lime-stone 107'3 Stone and slate quarrying 107'4 Quarrying of sand, clay, gravel, etc., n. e. c.
Major Group 20-Foodstuffs 200'1 Production of flour by village chakkies or flour mill
by grinding wheat, maize, gram, etc. 200· 2 Hand pounding of rice by Dhekhi or Ukhal 200· 3 Pl'Oduction of rice by milling, dehusking and proces-
sing of padd y by rice mill Grinding of chillies, turmeric, etc. Production of pulses
200·4 200·5 200·6 200'7
202·1 202·2 202'3
Parching of grains Production and processing of other crops and food.
grams n. e. c. Gur and Khandsari making from sugarcane and palm Production of bhoora and candv Production of jaggery from coc~nut and palmyra juice
(neera) 202'4 Production of other indigenous products from sugar
and jaggery n. e. c. 203·1 203'2 203-3 20304 203'5 20306 203'7
Manufacture of achar, pickles, chutney and murabba Production of sauce, jam and jelly Processing of cashew nut Manufacture of kokam products Fruit preservation (canning of fruits) Making dried vegetables Production of other fruit products and preservation
of fruits n. e. c. 204'1 Slaughtering, preservation of meat and fish and
canning of fish 204'2 Fish currying or curing and salting (currying applies
more to skin and hide) 205
206
207 209·1 209'2 209'3
209-4 209·5 209-6 209'7 209'8
Production of bread, biscuit, cake and oteer bakery products
Production of butter, cream, ghee, cheese, chhana khowa and other dairy products '
Oil pressing ghani, kolhu or by small machines Confectionery Making of sweet-meats, laddu, peda, barphi, batasa, etc Sattu, bhunja, papar, barri, danauri, tilauri, sewai,
apalam,etc Making of chura or chira, muri, murki, khoi Making of chat Making of dalmot, chanachur (jor) garam, rewari, etc. Making of other food products for residuary snacks Production of other food products like cocoa, choco-
late, toffee, lozenge Major Group 21-Beverages
210·1 Manufacture of vinegar from coconut JUIce (neera) 210' 2 Manufacture of distilled spirits, wines, liquor from
alcoholic malt, fruits and malts in distillery and brewery
211 Produc~ion of country liquor from material obtain ed from sources other than trees and shrubs
212'1 Production of indigenous liquor such as liquor, todd y, neera from mahua and palm trees
212· 2 Production of other indigenous liquors from other materials from trees and shrubs
214·1 Production of mineral water 214·2 Production of aerated water such as sodawater, lemo
nade, etc. 215 216
218 219·1 219'2 219'3
Production of ice Production of ice-cream, ice-candy or kulphimalai,
milk-shake, etc. Grinding of Coffee Preparation of sharbats and squashes Preparation of jeerapani Production of other beverages n. e. c.
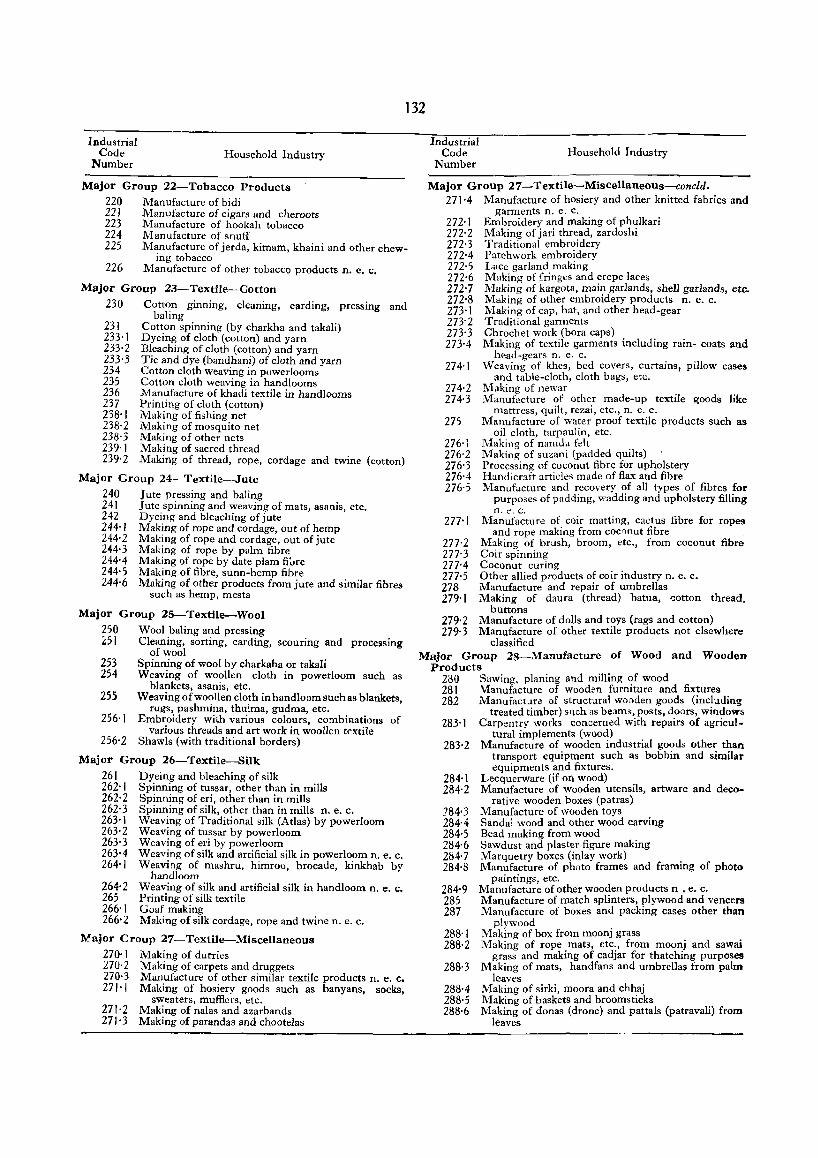
Industrial Code
Number Household Industry
Major Group 22-Tobacco Products 220 Manufacture of bidi 22 J Manufacture of cigars and cheroots 223 Manufacture of hookah tobacco 224 Manufacture of snuff
132
225 Manufacture of jerda, kimam, khaini and other chew-ing tobacco
226 Manufacture of other tobacco products n. e. c.
Major Group 23-Textile-Cotton
230 Cotton ginning, cleaning, carding, pressing and baling
23! 233·J 233·2 233·3 234 235 236 237 238·1 238·2 238·3 239·1 239·2
Cotton spinning (by charkha and taka!i) Dyeing of cloth (cotton) and yarn Bleaching of cloth (cotton) and yarn Tie and dye (bandhani) of cloth and yarn Cotton cloth weaving in puwerlooms Cotton cloth weaving in handlooms Manufacture of khadi textile in handlooms Printing of cloth (cotton) Making of fishing net Making of mosquito net lVIaking of other nets Making of sacred thread Making of thread, rope, cordage and twine (cotton)
Major Group 24-Textile--Jute
240 Jute pressing and baling 241 J ute spinning and weaving of mats, asanis, etc. 242 Dyeing and bleaching of jute 244·' Making of rope and cordage, out of hemp 244·2 Making of rope and cordage, out of jute 244· 3 Making of rope by palm fibre 244·4 Making of rope by date plam fi;"re 244· 5 Making of fibre, sunn-hemp fibre 244·6 Making of other products from jute and similar fibres
such as hemp, mesta
Major Group 25-Textlle-Wool
250 Wool baling and pressing ~51 Cleaning, sorting, carding, scouring and processing
Industrial Code
Number Household Industry
Major Group 27-Textile-Miscellaneous--concld. 271·4 Manufacture of hosiery and other knitted fabrics and
272·1 272·2 272·3 272-4 272·5 272-6 272-7 272-8 273·1 273'2 273·3 273-4
garments n. e. c. Embroidery and making of phulkari Making of jari thread, zardoshi Traditional embroidery Patchwork embroidery Lace garland making Making of fringes and crepe laces Making of kargota, main garlands, shell garlands, etc. Making of other embroidery products n. e. c. Making of cap, hat, and other head-gear Traditional garments Chrochet work (bora caps) Making of textile garments including rain- coats and
head-gears n. e. c. .. 274·1 \Veaving of khes, bed covers, curtams, pillow cases
and table-cloth, cloth bags, etc. 274·2 Making of newar 274·3 Manufacture of other made-up textile goods like
275
276·1 276'2 276·3 276·4 276·5
mattress, quilt, rezai, etc., n. e. c. l\hnufacture of water proof textile products such as
oil cloth, tarpaulin, etc. l\iakin" of namda felt Making of suzani (padded q~ilts) Processing of coconut fibre for upholstery Handicraft articles made of flax and fibre :Manufacture and recovery of all types of fibres for
purposes of padding, 'i'?adding and upholstery filling n. e. c.
277·1 Manufacture of coil' matting, cactus fibre for ropes
277·2 277-3 277-4 277·5 278 279·1
and rope making from COCr)llut fibre Making of brush, broom, etc., from coconut fibre Coir spinning Coconut curing Other allied products of coir industry n. e. c. Manufacture and tepair of umbrellas Making of daura (thread) batua, cotton thread,
buttons 279·2 Manufacture of dolls and toys (rags and cotton) 279·3 Manufacture of other textile products not elsewhere
classified
253 254
of wool Spinning of wool by charkaha or takali
Major Group 28-Manufacture of Wood and Wooden
255
Weaving of woollen cloth in powerloom such as blankets, asanis, etc.
Weaving of woollen cloth in handloom such as blankets, rugs, pashmina, thulma, gudma, etc.
256·1 Embroidery with various colours, combililations of various threads and art work in woollen t('l(tile
256·2 Shawls (with traditional borders)
Major Group 26-Textile-Silk
261 Dyeing and bleaching of silk 262·1 Spinning of tussar, other than in mills 262·2 Spinning of eri, other than in mills 262·3 Spinning of silk, other than in mills n. e. c. 263·1 Weaving of Traditional silk (Atlas) by powerloom 263· 2 Weaving of tussar by powerloom 263·3 Weaving of eri by powerloom 263·4 Weaving of silk and artificial silk in powerloom n. e. c. 264·1 Weaving of mashru, himroo, brocade, kinkhab by
handloom 264·2 265 266·1 266'2
Weaving of silk and artificial silk in handloom n. e. c. Printing of silk textile Goaf making l\laking of silk cordage, rope and twine n. e. c.
Wajor Group 27-Textile-Miscellaneous 270·1 Making of durries 270·2 Making of carpets and druggets 270·3 Manufacture of other similar textile products n. e. c. 271·1 Making of hosiery goods such as banyans, socks,
sweaters, mufflers, etc. 271· 2 Making of nalas and azarbands 27 J. 3 Making of parandas and chootelas
Products 280 Sawing, planing and milling ~f wood 281 M:anufacture of wooden furmture and fixtures 282 Manufacture of structural wooden goods (including
treated timber) sitch as beams, posts, doors, windows 283·1 Carpentry work> concerned with repairs of agricul
tural implements (wood) 283·2 Manufacture of wooden industrial goods other than
transport equipment such as bobbin and similar equipments and fixtures.
284·1 Lecquerware (if on wood) 284· 2 Manufacture of wooden utensils, artware and deco-
784·3 284-4 284·5 284-6 284·7 284·8
284·9 285 287
rative wooden boxes (patras) Manufacture of wooden toys Sandal wood and other wood carving Bead making from wood Sawdust and plaster figure making Marquetry boxes (inlay work) Manufacture of photo frames and framing of photo
paintings, etc. Manufacture of other wooden products n . e. c. Manufacture of match splinters, plywood and veneers Manufacture of boxes and packing cases other than
plywood . 288·1 Making of box from moonJ grass . . 288·2 Making of rope mats, etc., from moonJ and sawal
grass and making of cadjar for thatching purposes 288·3 Making of mats, handfans and umbrellas from palm
288·4 288·5 288·6
leaves Making of sirki, moora and chh.aj Making of baskets and broomsticks . Making of donas (drone) and pattals (patravah) from
leaves
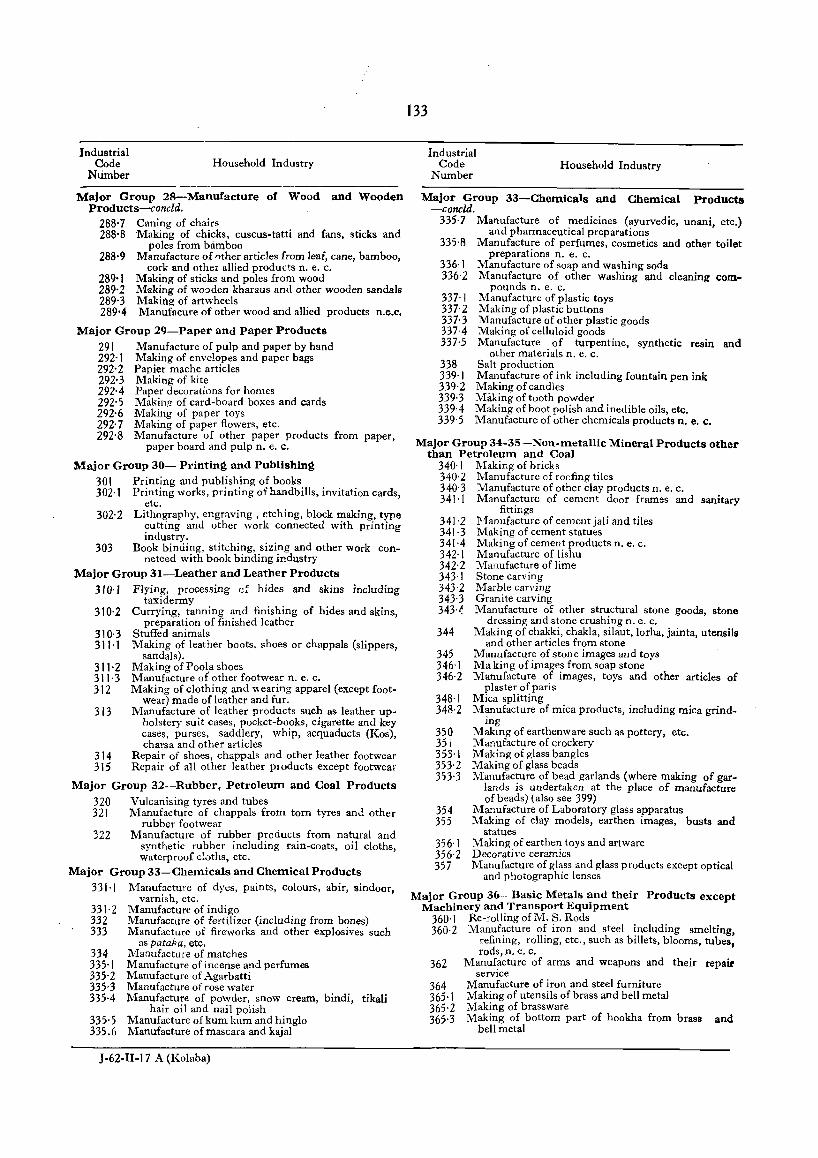
Industrial Code
NUmber Household Industry
Major Group 28-Manufacture of Wood and Wooden Products-concld.
288·7 Caning of chairs 288·8 'Making of chicks, cuscus-tatti and fans, sticks and
poles from bamboo 288·9 Manufacture of ')ther articles from leaf, cane, bamboo,
cork and other allied products n. e. c. 289·1 Making of sticks and poles from wood 289·2 Making of wo:>den kharaus and other wooden sandals 289'3 Making of artwheels 289·4 Manufacure of other wood and allied products n.e.c.
Major Group 29-Paper and Paper Products 291 Manufacture of pulp and paper by hand 292·1 Making of envelopes and paper bags 292' 2 Papier mache articles 292'3 Making of kite 292·4 Paper decorations for homes 292·5 Makin,,! of card-board boxes and cards 292·6 Making of paper toys 292· 7 Making of paper flowers, etc. 292'8 Manufacture 'of other paper products from paper,
paper board and pulp n. e. c.
Major Group 30- Printing and Publishing 301 Printing and publishing of books 302·1 Printing works, printing of handbills, invitation cards,
etc. 302·2 Litho~raphy, engraving, etching, block making, type
~uttmg and other work connected with printing mdustry.
303 Book binding, stitching, sizing and other work connetced with book binding industry
Major Group 31-Leather and Leather Products 310·1 Flying, processing d hides and skins including
taxidermv 310·2 Currying, tanning and finishing of hides and skins,
preparation of finished leather 310· 3 Stuffed animals 311·1 Making of leather boots, shoes or chappals (slippers,
311·2 311·3 312
313
sandals). Making of Pool.a shoes Manufacture of other footwear n. e. c. Making of clothing and wearing apparel (except foot
wear) made ofleather and fur. Manufacture of leather products such as leather up
holstery suit cases, pocket-books, cigarette and key cases, purses, saddlery, whip, acquaducts (Kos) charsa and other articles '
314 Repair of shoes, chappals and other leather footwear 315 Repair of all other leather ploducts except footwear
Major Group 32--Rubber, Petroleum and Coal Products 320 Vukanising tyres and tubes 321 Manufacture of chappals from tom tyres and other
322 rubber footwear
Manufacture of rubber products from natural and synthetic rubber including rain-coats, oil cloths, waterproof c!0ths, etc.
Major Group 33-Chemicals and Chemical Products
331·1
331'2 332 333
334 335·1 335'2 335'3 335-4
335·5 335.6
l\'1anuf~cture of dyes, paints, colours, abir, sincioor, varnish, etc.
Manufacture of indigo Manufacture of fertilizer (including from bones) Manufacture of fireworks and other explosives such
as pata};a, etc. lVlanufacture of matches Manufacture of incense and perfumes Manufacture of Agarbatti Manufacture of rose water Manufacture of powder, snow cream, bindi, tikali
hair oil and nail polish Manufacture of kum kum and hinglo Manufacture of mascara and kajal
J-62-1I-17 A (Kolaba)
133
Industrial Code
Number Household Industry
Major Group 33-Chemicals and Chemical Products -concU.
335· 7 Manufacture of medicines (ayurvedic, unani, etc.) and pharmaceutical preparations
335·8 Manufacture of perfumes, cosmetics and other toilet preparations n. e. c.
336·1 l\'1anufacture of soap and washing soda 336·2 Manufacture of other washing and cleaning com-
337· J 337'2 337·3 337·4 337·5
338 339·1 339·2 339·3 339·4 339·5
pounds n. e. c. Manufacture of plastic toys Making of plastic buttons Manufacture of other plastic goods Making of celluloid goods Manufacture of turpentine, synthetic resin and
other materials n. e. c. Salt production Manufacture of ink including fountain pen ink Making of candles Milking of tooth powder Making of boot polish and inedible oils, etc. Manufacture of other chemicals products n. e. c.
Major Group 34-35-Non-metallic Mineral Products other than Petroleum and Coal
340· 1 Making of bricks 340·2 Manufacture of roofing tiles 340· 3 Manufacture of other clay products n. e. c. 341·1 Manufacture of cement door frames and sanitary
fittings 34J·2 341·3 341·4 342·1 342·2 343·1 343·2 343·3 343·~
344
345 346·1 346·2
l':1:anufacture of cement jali and tiles Making of cement statues Making of cement products n. e. c. Manufacture of lishu l\'1anufacture of lime Stone carving Marble carving Granite carving Manufacture of other structural stone goods stone
dressing and stone crushing n. e. c. ' Making of chakki, chakla, silaut, lorha, jainta utensils
and other articles from stone ' Manufacture of stone images and toys Ma king of images from soap stone Manufacture of images, toys and other articles of
plaster of paris 348·1 Mica splitting 348· 2 M~ufacture of mica products, including mica grind-
350 351 353·1 353-2 353·3
354 355
356·1 356·2 357
wg Making of earthenware such as pottery, etc. l\1anufacture of crockery Making of glass bangles l\tlaking of glass beads Manufacture of bead garlands (where making of gar
lands is undertaken at the place of manufacture of beads) (also see 399)
Manufacture of Laboratory glass apparatus l\,[aking of clay models, earthen images, busts and
statues Making of earthen toys and artware Decorative ceramics Manufacture of glass and glass products except optical
and photographic lenses
Major Group 36-Basic Metals and their Products except Machinery and Transport Equipment
360·1 Re-rolling of M. S. Rods 360·2 Nlanufacture of iron and steel including smelting
refining, rolling, etc., such as billets, blooms, tubes; rods, n. e. c.
362 Manuf~cture of arms and weapons and their repair
364 365·1 365·2 365·3
service Manufacture of iron and steel furniture Making of utensils of brass and bell metal Making of brassware Making of bottom part of hookha from brass and
bell metal
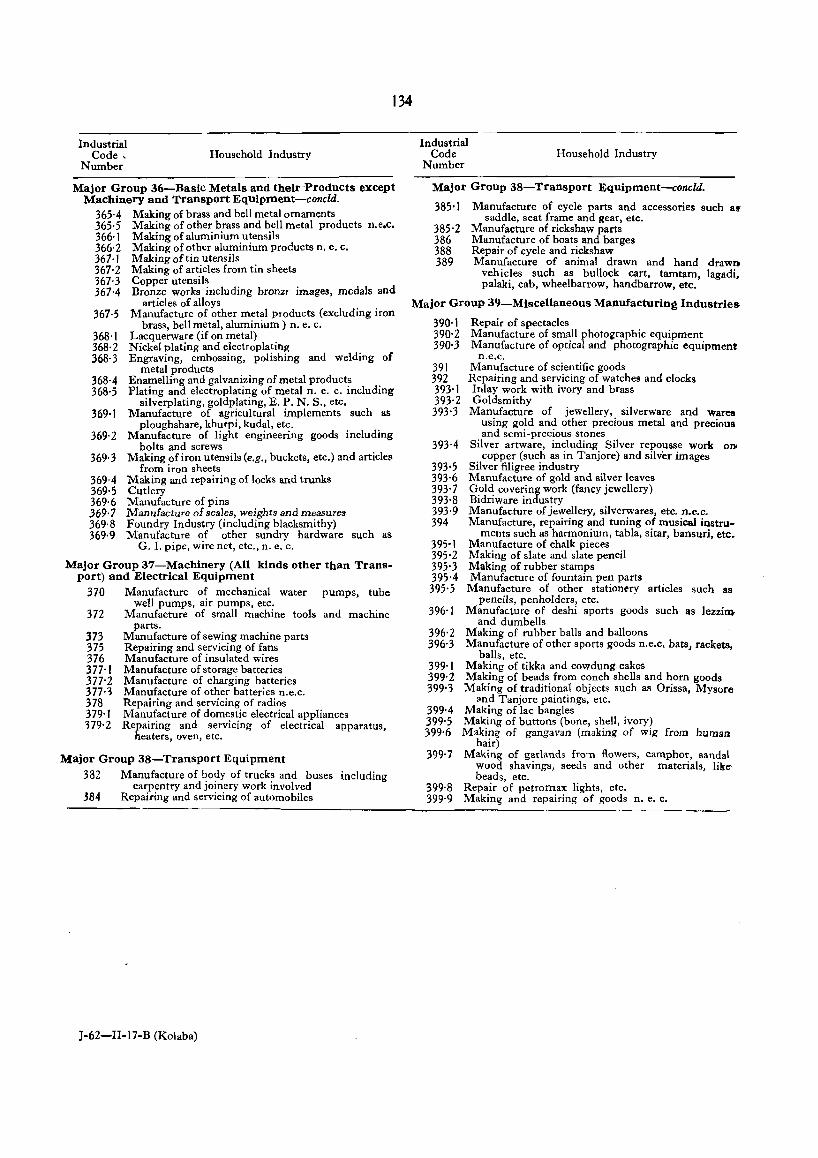
134
Industrial Code,
Number Household Industry
Major Group 36-Basic Metals and their Products except Machinery and Transport Equipment-concld.
365·4 Making of brass and bell metal ornaments 365·5 Making of other brass and bell metal products n.e.c. 366·1 Making of aluminium utensils 366'2 Making of other aluminium products n. e. c. 367·1 Making oft in utensils 367·2 Making of articles from tin sheets 367·3 Copper utensils 367·4 Bronze works including bronze images, medals and
articles of alloys 367·5 Manufacture of other metal I>roducts (excluding iron
368·1 368·2 368·3
brass, bell metal, aluminium) n. e. c. Lacquerware (if on metal) Nickel plating and electroplating Engraving, embossing, polishing and welding of
metal products 368·4 Enamelling and galvanizing of metal products 368·5 Plating and electroplating of metal n. e. c. including
silverplating, goldplating, E. P. N. S., etc. 369·1 Manufacture of agricultural implements such as
ploughshare, khurpi, kudal, etc. 369· 2 Manufacture of light engineering goods including
bolts and screws 369· 3 Making of iron utensils (e.g., buckets, etc.) and articles
369·4 369·5 36% 369·7 369·8 369·9
from iron sheets Making and repairing of lock.s and trunks Cutlery Manufacture of pins Manufacture of scales, weights and measures Foundry Industry (including blacksmithy) Manufacture of other sundry hardware such as
G. 1. pipe, wire net, etc., n. e. C.
Major Group 37-Machinery (All kinds other than Transport) and Electrical Equipment
370 Manufacture of mechanical water pumps, tube
372
373 375 376 377·1 377'2 37Fi 378 379·1 379,2
weI! pumps, air pumps, etc. Manufacture of small machine tools and machine
parts. Manufacture of sewing machine parts Repairing and servicing of fans Manufacture of insulated wires Manufacture of storage batteries Manufacture of charging batteries Manufacture of other batteries n.e.c. Repairing and servicing of radios Manufacture of domestic electrical appliances Repairing and servicing of electrical apparatus,
heaters, oven, etc.
Major Group 38-Transport Equipment 382 Manufacture of body of trucks and buses including
carpentry and joinery work involved 384 Repairing and servicing of automobiles
J-62-II-17-B (Kolaba)
Industrial Code
Number Household Industry
Major Group 38-Transport Equipment-concld.
385·1
385·2 386 388 389
Manufacture of cycle parts and accessories such a~ saddle, seat frame and gear, etc.
Manufacture of rickshaw parts Manufacture of boats and barges Repair of cycle and rickshaw Manufacture of animal drawn and hand drawD
vehicles such as bullock cart, tamtam lagadi, palaki, cab, wheelbarrow, handbarrow, etc.'
Major Group 39-Miscellaneous Manufacturin~ Industries.
390·1 Repair of spectacles 390' 2 Manufacture of small photographic equipment 390·3 Manufacture of optical and photographic equipment
391 392 393·1 393·2 393-3
393·4
393·5 39306 393·7 393-8 393·9 394
395·1 395·2 395·3 395-4 395·5
396·1
396'2 396'3
399·1 399·2 399'3
399-4 399,5 39%
399·7
399·8 399'9
n.e.c. Manufacture of scientific goods , Repairing and servicing of watches and clocks Inlay work with ivory and brass Goldsmithy
Manufacture of jewellery, silverware and wares using gold and other precious metal and precious and semi-precious stones
Silver artware, including Silver repousse work 000
copper (such as in Tanjore) and silver images Silver filigree industry Manufacture of gold and silver leaves Gold covering work (fancy jewellery) Bidriware industry Manufacture of jewellery, silverwares, etc. n.e.c. Manufacture, repairing and tuning of musical instru-
ments such as harmonium, tabla, sitar, bansuri, etc. Manufacture of chalk pieces Making of slate and slate pencil Making of rubber stamps Manufacture of fountain pen parts
Manufacture of other stationery articles such as pencils, penholders, etc.
Manufac.ture of deshi sports goods such as lezzim and dumbells
Making of rubber balls and balloons Manufacture of other sports goods n.e.C. bats} rackets,
balls, etc. Making of tikka and cowdung cakes Making of beads from conch shells and horn goods Making of traditional objects such as Orissa, Mysore-
~,nd Tanjore paintings, etc. Making of lac bangles Making of buttons (bone, shell, ivory) Making of gangavan (making of wig from human
hair) Making of garlands fro":U {lowers, camphor, sandal
wood shavings, seeds and other materials, likebeads, etc.
Repair of petromax lights, etc. Making and repairing of goods n. e. c.
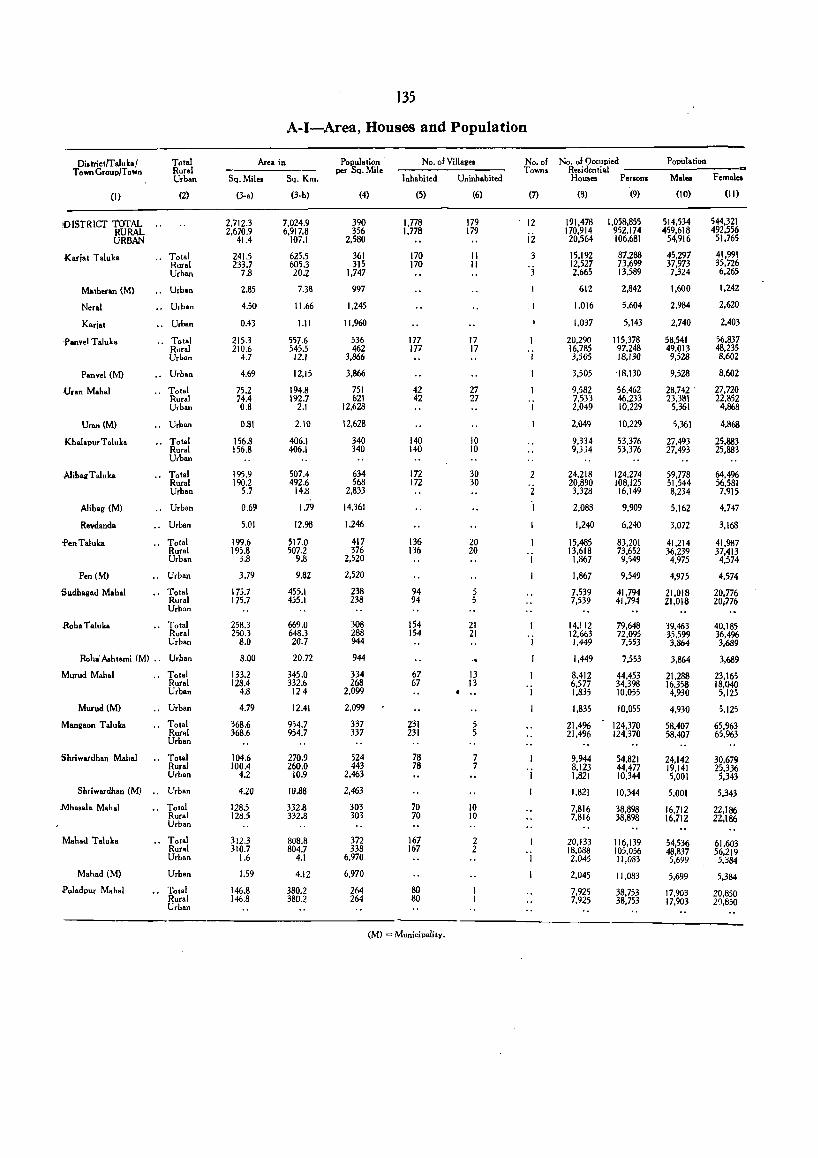
Di.trictrraluka/ Town Group/Town
(I)
oDISTRICT l'OTAL RURAL URBAN
Kariat Taluko
Motheran (M)
N.ral
Kariat
t'anvel T.luka
Ponvel (M)
.(Jran M.h.1
Uran (M)
Kh.l.pur T .Iuk.
Alibag T aluka
Alib.g (M)
Revd.nda
i'enTaluka
Pen(M)
"5udhagad Mohol
.Roha T wuk.
Total Rural Urb.n
(2)
.. Totol Rur.l Urban
•• Urban
.. Urb.n
Urban
.. Total Rural Urb.n
.. Urban
.. Total Rur.1 Urban
., Urban
.. Tot.1 Rural Urban
.. Total Rural Urban
., Urbon
., Urban
.. Total Rur.1 Urban
•. Urban
., Total Rural Urb,n
.. Total Rurol Urban
Rob.: Asbtami (M) ., Urb.n
-Murud M.h.}
Murud (M)
Manllaon Tal uko
Shriwardhan M.h.1
Shriwardhon (M)
Mha.ala Mohol
M.h.d T.luk.
M.had (M)
Poladpur Mahol
.. Total Rural Urban
Urb.n
.. Totol Rural Urban
., Tot.1 Rur.l Urb.n
•• Urban
.. Total Rur.1 Urban
.. Total Rur.1 Urban
Urban
•• Total Rural Urban
135
A-I-Area, Houses and Population
Ar.a in
Sq. Mil.. Sq. Km.
(3-a)
2.712.3 2.670.9
41.4
241.5 233.7
7.8
2.85
4.50
0.43
215.3 210.6
4.7
4.69
75.2 74.4 0.8
0.81
156.8 156.8
195.9 190.2
5.7
0.69
5.01
199.6 195.8
3.8
3.79
175.7 175.7
258.3 250.3
8.0
8.00
133.2 128.4
4.8
4.79
368.6 368.6
104.6 10004
4.2
4.20
128.5 128.5
312.3 310.7
1.6
1.59
14(>.8 146.8
(3-b)
7.024.9 6.917.8
107.1
625.5 605.3 20.2
7.38
11.66
1.11
557.6 545.5
12.1
12.15
194.8 192.7
2.1
2.10
406.1 406.1
507.4 492.6
14.8
1.79
12.98
517.0 507.2
9.8
9.82
455.1 455.1
669.0 648.3 20.7
20.72
345.0 332.6 124
12.41
954.7 954.7
270.9 260.0
10.9
10.88
332.8 332.8
808.8 804.7
4.1
4.12
380.2 380.2
Population per Sq. Mile
No.oIVillag ••
(4)
390 356
2.580
361 315
1,747
997
1,245
11.960
536 462
3,866
3,866
751 621
12,628
12.628
340 340
634 568
2.833
14.361
1,246
417 376
2,520
2,520
238 238
308 288 944
944
334 268
2.099
2.099
337 337
524 443
2,463
2,463
303 303
372 338
6,970
6.970
264 264
Inhabited
(5)
1,778 1,778
170 170
177 177
42 42
140 140
In 172
136 136
94 94
154 154
67 67
231 231
78 78
70 70
167 167
80 80
(M) = Municipality.
Uninhabited
(6)
179 179
11 II
17 17
27 27
10 10
30 30
20 20
5 5
21 21
.. 13 13 . .. 5 5
7 7
10 10
2 2
No. 01 No. 01 Occupied Population Town. Residential ---------
Hous.. Person, M.les F emal ..
(7)
12
ii
2 ';1
'j
'j
191,478 170.914 20,564
15.192 12,527 2,665
612
1.016
1,037
20.290 16,785 3,505
3,505
9,582 7,533 2.049
2,049
9,334 9.334
24.218 20.890 3,328
2.088
1.240
15,485 13,618
1,867
1,867
7.539 7,539
14,112 12.663 1.449
1,449
8,412 6,571 1,835
1.835
21,4% 21,496
9.944 8,123 1,821
1,821
7,816 7,816
20,133 18,088 2,045
2,045
7.925 7.925
(9)
1,058,855 952,174 106,681
87.288 73,699 13,589
2,842
5.604
5,143
115,378 97,248 18.130
18,130
56.462 46,233 10.229
10.229
53.376 53,376
124.274 108.125 16,149
9,909
6,240
83.201 73.652 9,549
9,549
41,794 41,794
79,648 72.095 7,553
7,553
44.453 34,398 10,055
10.055
124.370 124,370
54,821 44.477 10,344
10.344
38,898 38,898
116,139 105,056 11 ,083
11.083
38,753 38,753
(to)
514.534 459,618
54,916
45,297 37,973 7,324
1,600
2,984
2,740
58,541 49.013 9,528
9,528
28.742 . 23,381
5,361
5,361
27,493 27,493
59,778 51,544 8.234
5,162
3,072
41,214 36.239 4.975
4,975
21,018 21,018
39,463 35,599 3,864
3,864
21.288 16.358 4,930
4,930
58,407 58,407
24.142 19,141 5.001
5.001
16,712 16.712
54,536 48.837 5,699
5,699
17.903 17,903
(II)
544,321 492,556 51.765
41,991 35,726 6,265
1.242
2,620
2,403
56,837 48,235 8,602
8.602
27,720 22.852 4,868
4,868
25,883 25,883
64,4% 56.581 7.915
4,747
3,168
41,987 37,413 4.574
4.574
20,776 20;776
40,185 36,4% 3,689
3,689
23,165 18.040 5.125
5,125
65,963 65,%3
30,679 25,336 5,343
5,343
22.186 22.186
61,603 56,219 5,384
5,384
20,850 n850
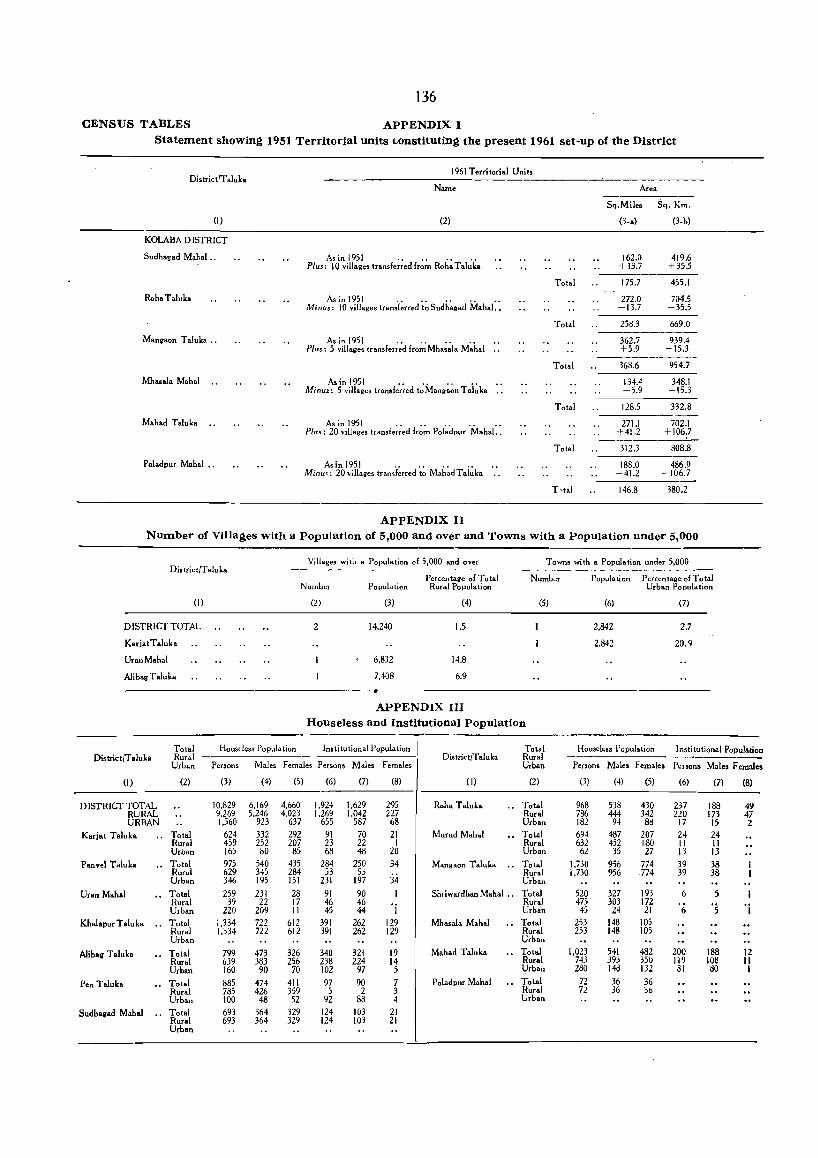
136
CENSUS TABLES APPENDIX I Statement showing 1951 Territorial units LOnstituting the present 1961 set-up of the District
Districtrr .Iuk.
(I)
KOLABA DISTRICT
Sudhagad Mab al ..
RohaTaluka
Manll'aon Taluk •..
Mh .. ala M.h.1
M.h.d T.luka
Poladpur Mah.1 •.
1961 Territori.1 Units
Name
(2)
As in 1951 ...•.... Plus: 10 villages transferred from Roha T aluk.
Total
As in 1951 ......... . Minu,: 10 villages translerred to Sudhag.d Mah.I .•
Total
As in 1951 ....•..• Plus: 5 villa"es translerred IromMhasala Mahal ..
Total
As in 1951 .•...... Minus: 5 villages transferred to Mangaon Taluka
Total
As in 1951 .........• Plus: 20 villages transferred Irom Poladpur Mahal..
Total
Asin 1951 .....•.• Minu': 20 villages tran,Ierred to MahadTaluka
T,tal
APPENDIX II
Area
Sq.Miles Sq. Km.
(3-.) (3-b)
162.0 419.6 +13.7 +35.5
175.7 455.1
272.0 7045 -13.7 -35.5
258.3 669.0
362.7 939.4 +5.9 +15.3
368.6 954.7
134.4 348.1 -5.9 -15.3
128.5 332.8
271.1 702.1 +41.2 +106.7
--------,-312.3 80S.8
----------188.0 486.9
-41.2 -106.7
146.8 380.2
Number of Villages with a Population of 5,000 and over and Towns with a Population under 5,000
District/Taluka
(I)
DISTRICT TOTAL
Karjat T aluka
UranMahal
Alibag Taluka
Villages with a Population of 5,000 and over
Number
(2)
2
Population
(3)
14,240
6,832
7,408
Percentage of Total Rural Population
(4)
1.5
14.S
6.9
APPENDIX III
Towns with a Population under 5,000
Number Population P ercen tage of Total Urban Population
(5) (6) (7)
2,842 2.7
2,842 20.9
Houseless and Institutional Population
Total Houseless Popula tion Institutional Popula.tion Total Houseless Population Institutional Population District/T.luk. Rural District/Taluk. Rural -------
Urban Persons Males Females Persons Males Females Urban Persons Male. Females Persons. Males F emal ••
(l) (2) (3) (4) (5) (6) (7) (8) (I) (2) (3) (4) (5) (6) (7) (8)
DISTRICT TOTAL 10,829 6,169 4,660 1,924 1,629 295 Roha Taluka Total 968 538 430 237 188 49 RURAL 9,269 5,246 4,023 1,269 1.042 227 Rural 786 444 342 220 173 47 URBAN 1,560 923 637 655 587 68 Urban 182 94 8d 17 IS 2
Kariat Taluka .. Total 624 332 292 91 70 21 Murud Mahal Total 694 487 207 24 24 Rural 459 252 207 23 22 1 Rural 632 452 180 11 II Urban 165 80 85 68 48 20 Urban 62 35 27 13 13
Pan vel Taluka Total 975 540 435 284 250 34 Mangaon Taluka Total l,i30 956 774 39 38 Rural 629 345 284 53 53
34 Rural 1,730 956 .774 39 38
Urban 346 195 151 231 197 Urban
Uran Mahal Total 259 231 28 91 90 I Shriwardhan Mahal .• Total 520 327 193 6 :) Rural 39 22 17 46 46 Rural 475 303 172 '5 'j Urban 220 209 II 45 44 I Urban 45 24 21 6
Khalapur Taluka Total 1,334 722 612 391 262 129 Mhosala Mahal Total 253 148 105 Rural 1.334 722 612 391 262 129 Rural 253 148 105 Urban Urban
Alibal! T .Iuka Total 799 473 326 340 321 19 M.h.d T.luk. Total 1,023 541 482 200 188 12 Rural 639 383 256 238 224 14 Rural 743 393 350 119 lOS II Urban 160 90 70 102 97 5 Urban 280 148 132 81 80 I
Pen Talulca .. Total 885 474 411 97 90 7 Poladpur Mahal Total 72 36 36 Rural 785 426 359 5 2 3 Rural 72 36 -'6 Urban 100 48 52 92 88 4 Urban
Sudhallad Mah.1 .. Total 693 364 329 124 103 21 Rural 693 364 329 124 103 21 Urban
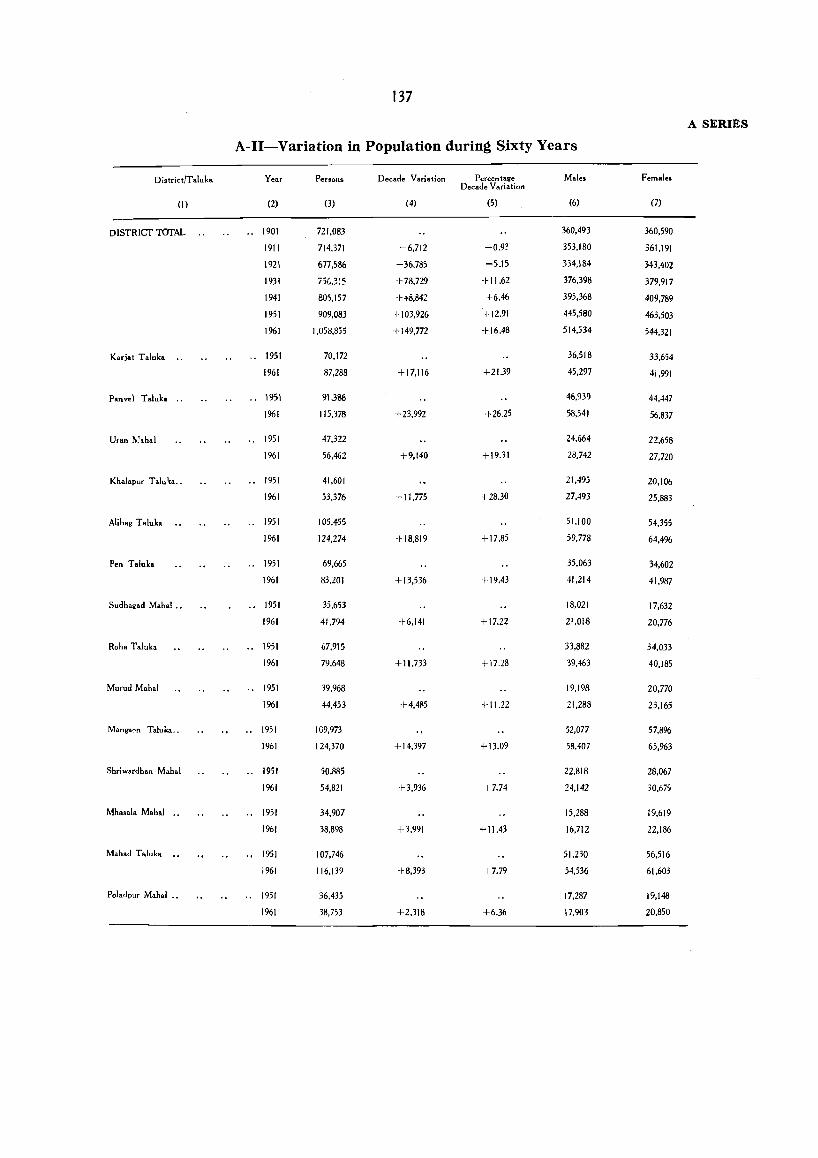
137
A SERIES
A-II-Variation in Population during Sixty Years
District/Taluka Year Persons. Decade Variation Percentage Mal_s Females Decade Variation
(I) (2) (3) (4) (5) (6) (7)
DISTRICT TOTAL .. 1901 721.083 360.493 360.590
1911 714.371 -6.712 -0.9~ 353.180 361.191
1921 677.586 -36.735 -5.15 334.134 343.402
1931 _ .... ']1" tJtI' ...... _ +78.729 +11.62 376.398 379.917
1941 805.157 +40,842 +6.46 395.368 409.789
1951 909.083 + 103.926 '+12.91 445.580 463.503
1961 1.058.855 + 149.772 +16.48 514.534 544.321
Karja! Taluka .. " 1951 70.172 36.518 33.654
1961 87.288 +17.116 +21.39 45.297 41.991
Panv_1 Taluka .. .. 1951 91.386 46.939 44.447
1961 115.378 +23.992 +26.25 58.541 56.837
Uran l\:.hal .. 1951 47.322 24.664 22.658
1961 56.462 +9.140 +19.31 28.742 27.720
Khalapur Ta1u~a .. .. 1951 41.601 21.495 20.106
1961 53.376 +11.775 +28.30 27.493 25.883
A1ibag Taluka .. 1951 105.455 51.100 54.355
1961 124.274 +18.819 +17.85 59.778 64.496
Pen Taluka .. 1951 69.665 35.063 34.602
1961 83.201 +13.536 + 19.43 '11.214 41.987
Sudhagad Mahal .. .. 1951 35.653 18.021 17.632
1961 41.794 +6.141 +17.22 21.018 20.776
Roha Taluka .. 1951 67.915 33.882 34.033
1961 79,648 + 11.733 +17.28 39.463 40.185
Murud Mahal .. 1951 39.968 19.198 20.770
1961 44.453 +4.4~5 +11.22 21.288 23.165
MangaAIl Talu ka .. .. 1951 109.973 52.077 57.896
1961 124.370 +14.397 +13.09 58.407 65.963
Shriwardhan Mahal " 1951 50.885 22.818 28.067
1961 54.821 +3.936 +7.74 24.142 30.67~
Mhasala Mahal .. " 1951 34.907 15.288 19.619
1961 38.898 +3.991 +11.43 16.712 22.186
Mahad Ta1uka .. .. 1951 107.746 51.230 56.516
1961 116.139 +8.393 +7.79 54.536 61.603
Poladpur Mahal .• " 1951 36.435 17.287 19.148
1961 38.753 +2.318 +6.36 17.903 20.850
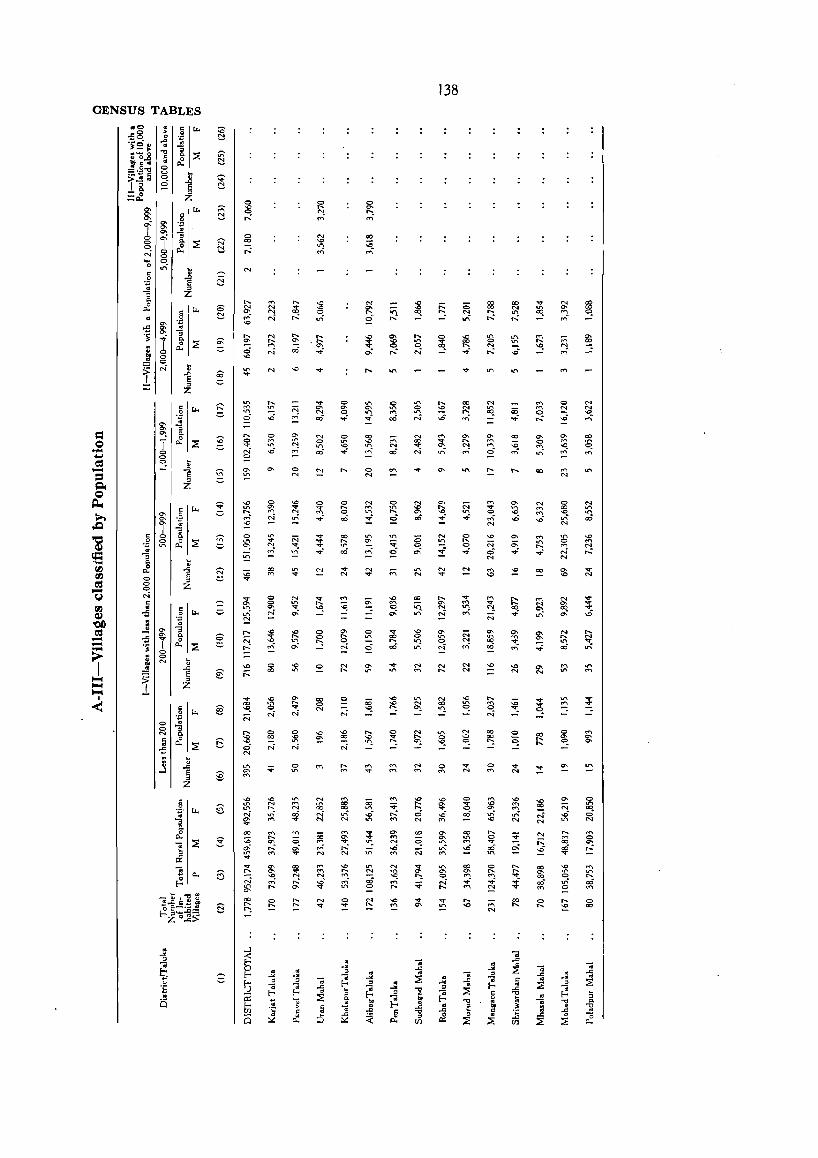
OENSUS TABLES
o co
" N
'" N N N
00
'" .,., ....
o o ~
o
N ....
o '" o ..,
.... N
138
'" N
'" ..,
o ~ o N
o cc
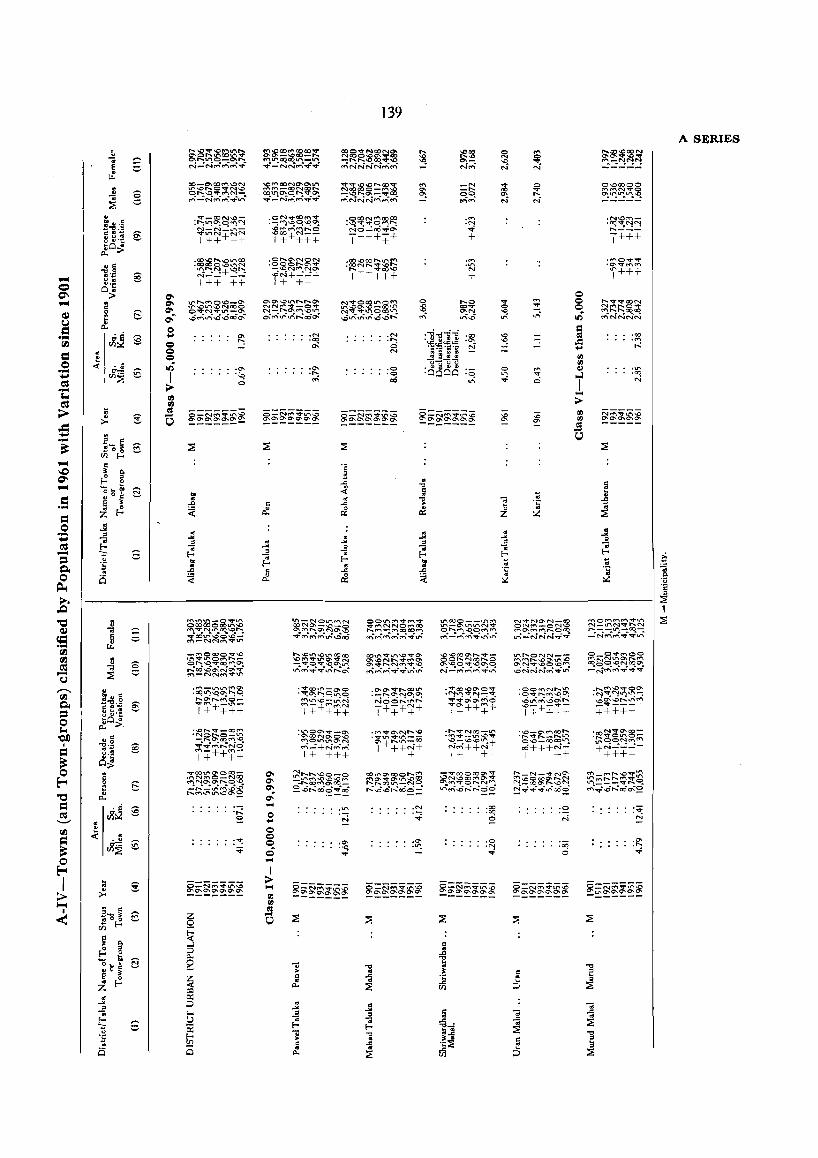
.",
.~
o
c:: .....
.,...: o
I > .... rIl VJ tU
'0
139
~i~~=~~ rr\NNNrr\~M
.'" ......
'"
·~C01.l'\-Q\O • "1"0\ r-.,o\('\o Mll'i..o_:~N
1+++++
.'" .", ....
.N ...... o '"
·0 '0
cci
.N .::;:
.'" '''l
.'" .", N
+
.'" .00
o
.0 • N ..,,:
N~NO\N-CO O(<.J~-ON..,e ('!"\O\~Mr--.Oa::l
"'-\_:NNN~"';
·0
N
:oq o
o o o It)
§ .c: ....
VJ VJ Ql
1 > VJ VJ tU
'0
A SERIES
·N'-D~-.~~~~ t-... __ _
,+++
.", ·00 N
.'" ...... ..,,:
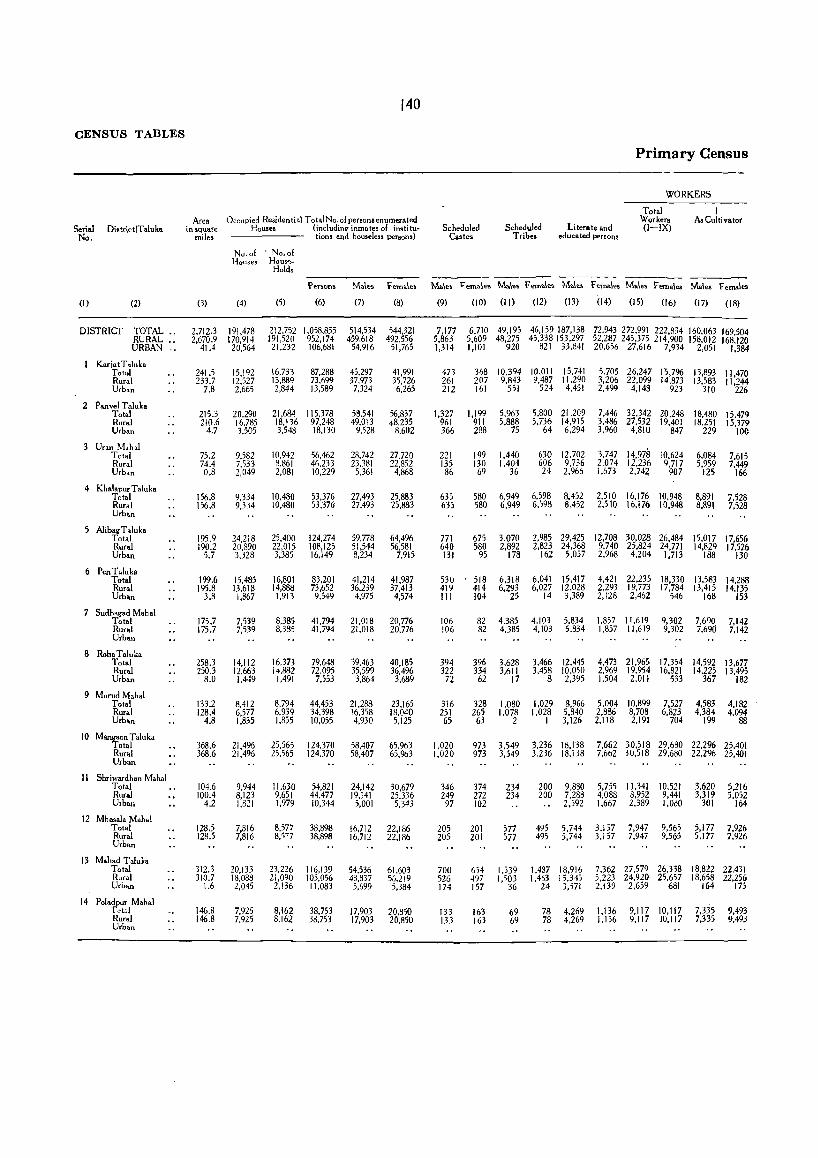
CENSUS TABLES
Serio.! Di.trictiTaluka No.
(I) (2)
DISTRICT TOTAL •. RURAL .. URBAN .•
Karjat l' .Iuka Total. Rural Urban
2 Panvel Taluk. Total Rural Urban
Uran Mahal Total Rural Urban
4 KhalapurTaluh Total Rural Urban
AlibagTaluka Total Rural Urban
6 PenTaluk. Total Rural Urban
7 Sudh.gad Mahal Total Rural Urban
8 RohaTaluka Total Rural Urban
9 Murud Mah.1 Total Rural Urban
10 Mang.on Taluka Totol Rural Urban
II Shriwardhan Mahol Totol Rural Urban
12 Mhasala Mahal Total Rural Urban
13 Mah.d T.1uk. Total Rur.! Urban
14 Poladpur M.h.1 Totd Rural Urban
140
Area Occupie:l Residential TotalNo. of persons enumerated in square Houses (includinv inmates of institu ..
miles tions ana housdess persons)
No.of . No.of Houses Hous~ ...
Holds
Scheduled Castes
Scheduled Literate and Tribes educated persOn:!!
----------
Primary Census
WORKERS
Total Workers (I-IX)
I As Cui ti va tor
Penons Males females Males "emale. Males Females Males Females Males Females Males Females
(3) (4)
2.712.3 191,478 2,670.9 170,914
41.4 20,564
241.5 233.7
7.8
215.3 2106
4.7
75.2 74.4 0.8
15,192 12527 2,665
20,290 16.785 3.505
9,582 7533 2.049
(5) (6)
212.752 1.058,855 191.520 952,174 21.232 106,681
16.733 13.889 2.844
87,288 73.699 13.589
21.684 115.378 18.136 97.248 3,548 18.130
10.942 8.861 2.081
56.462 46.233 10.229
(7)
514,534 459.618
54,916
45.297 37,973 7,324
58.541 49.013
9.528
28.742 23,381
5.361
(8)
544,321 492,556
51,765
41,991 35.726 6,265
56,837 48.235
8.602
27.720 22,852
4.868
156.8 156.8
9,334 10.480 53.376 27,493 25,883 9,334 10.480 53.376 27,493 25,883
195.9 190.2
5.7
199.6 195.8
3.8
175.7 175.7
2583 250.3
8.0
133.2 128.4
4.8
24.218 20.890 3,328
15.485 13,618 1,867
7,539 7,539
14.112 12.663 1,449
8.412 6.577 1.835
25.400 22.015 3,385
16.801 14,888 1,913
124.274 108.125 16,149
83,201 73,652 9,549
59.778 51.544 8,234
41,214 36,239 4.975
64,4% 56,581
7.915
41,987 37,413 4,574
8,385 41.794 21.018 20,776 8.385 41,794 21.018 20.776
16.373 14.882
1,491
8.794 6,939 1,855
79,648 72.095
7,553
44.453 34,398 10.055
39,463 35.599 3,864
21.288 16.358 4.930
40.185 36,4%
3,689
23.165 18.040 5.125
368.6 21,496 25.565 124.370 58.407 65.963 368.6 21.496 25.565 124.370 58.407 65,963
104.6 100.4
4.2
1285 128.5
312.3 310.7
1.6
146.8 146.8
9,944 8,123 1.821
7,816 7,816
20,133 18.038 2,045
7,925 7.925
11,630 9.651 1.979
54.821 44.477 10,344
24,142 19.141
5,001
30,679 25,336 5,343
8,577 38,898 16,712 22,186 8,S'7 38.898 16.712 22,186
23.226 21,090
2.136
116.139 105.056 11.083
54536 43.337
5.599
61.603 56.219 5.384
8,162 38.753 17.903 20.8S0 8.162 38.753 17,903 20,850
(9) (10) (11) (12) (13) (14) (15) (16) (17) (18)
7,177 6.710 49.195 46,159187,138 72.943 272.991 222.834 160,063 169504 5,863 5,609 48,275 45,338153.297 52.287 245.375 214,900 158,012 168:120 1,314 1.101 920 821 33.841 20.656 27.616 7,934 2.051 1,384
473 261 212
1.327 961 366
221 135 86
635 635
771 640 131
530 419 111
106 106
394 322
72
316 251 65
1.020 1.020
346 249 97
205 205
700 526 174
133 133
368 10.394 10.011 15.741 207 9,843 9.487 11.290
5.705 26.247 15,7% 13,893 11,470 3,206 22.099 14.873 13.583 11,244 2.499 4,148 923 310 226 161 551 524 4.451
1.199 911 288
199 130 69
5.963 5.888
75
1,440 1.404
36
5.800 21.209 5.736 14.915
64 6.294
630 12.702 606 9.736 24 2,966
7.446 32342 20.248 18.480 15.479 3,486 27.532 19,401 18.251 15.379 3.960 4.810 847 229 10C
3,747 14,978 10.624 2.074 12.236 9.717 1.673 2.742 907
6.084 5,959
125
7.615 7.449
166
580 6.949 6.598 8.452 2.51016.17610.948 8,891 7.528 580 6.949 6,598 8,452 2.510 16,176 10.948 8,891 7,528
675 3.070 580 2.892
95 178
518 6,318 414 6,293 104 25
2,985 29,425 12,708 30,028 26.484 15.017 17,656 2,823 24,368 9,740 25.824 24,771 14,829 17,526
162 5.057 2.968 4,204 1,713 188 130
6,041 15,417 6,027 12.028
14 3,389
4,421 22.235 18,330 13,583 14.288 2.293 19.773 17,784 13,415 14,135 2,128 2,462 546 168 153
82 4.385 4.103 5.834 1.857 11.619 9.302 7.690 7.142 82 4.385 4,103 5.834 1.857 11.619 9.302 7.690 7.142
396 3.628 334 3,611
62 17
328 265 63
1,080 1.078
2
3.466 12.445 3.458 10.050
8 2,395
1.029 1.028
1
8.966 5.840 3.126
4.473 21.965 17.354 14.592 13.677 2.969 19.954 16.821 14.225 13,495 1,504 2.011 533 367 182
5.004 10.899 2.886 8.708 2,118 2.191
7.527 4,583 4,182 6.823 4,384 4.094
704 199 88
973 3.549 3.236 18.138 7.662 30.518 29,680 22.296 25,401 973 3,549 3.236 18.138 7.662 JO,S18 29.680 22.296 25,401
374 272 102
201 201
6j4 497 157
163 163
234 234
577 577
1,539 1,503
36
69 69
200 9.880 200 7.288
2.592
5,755 11,341 10,521 4.088 8,952 9,441 1,667 2,389 1.0aO
3,620 3.319
301
5.216 5,052
164
495 5.744 3.157 7,947 9,565 5.177 7,926 4955,7443,1577,9479.5655,177 7,926
1.437 18,916 1,453 15.345
24 3,:571
7.362 27.579 26.338 18,822 22.431 5.223 24.920 25.657 18.658 22,256 2.139 2.659 681 164 175
78 4,269 1,136 9.117 10,117 7.335 9,493 78 4.269 1.136 9.117 10.117 7,335 9,493
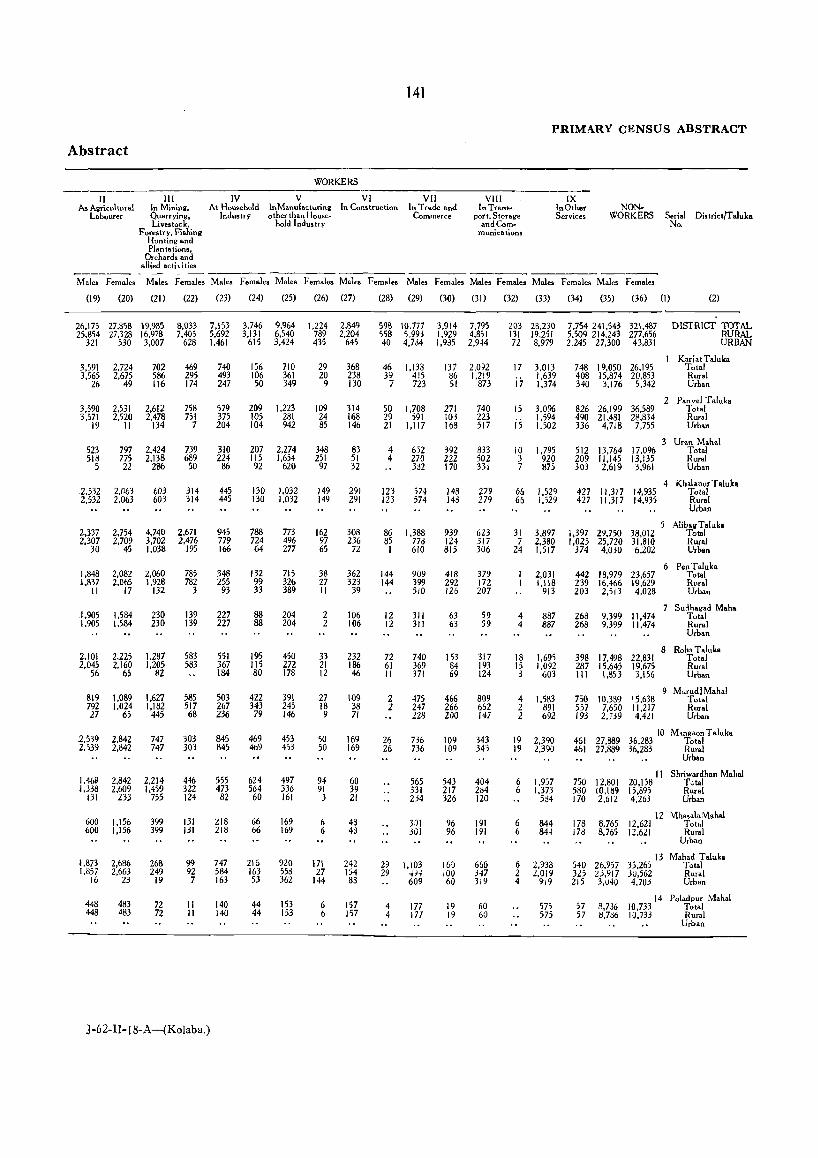
l41
PRIMARY CENSUS ABSTRACT
Abstract
WORKERS
II III IV v VI VII VIII As Agricultural
Labourer In Minln.i, Quarryinll. Livestock,
At Household Industry
In Manufacturing other than House..
hold Indus try
In Construction In Trade and Commerce
In Transport. Storage
and Communications
IX InOther Services
NONWORKERS
Forestry, Fishing Hunting and Plantations,
Orchards and allied acti\ities ------ --------- ----------- ----- ----- ---------
Seri.1 No.
Districtrr aluka
Males Females Males Females Males Females Males Females Males Females Males Females Males Female, Males Females Males Female.
(19) (20) (21) (22) (23) (24) (25) (26) (27)
26.175 27.858 19.9SS 25.854 27.328 16,978
321 530 3.007
3.591 3.565
26
3.590 3,571
19
523 518
5
2,532 2.532
2,337 2,307
30
1,848 1,837
11
2.724 2,675
49
2.531 2.520
II
797 775 22
2,063 2,063
2,754 2.709
45
2.082 2.065
17
1,905 1,584 1,905 1.584
2,101 2,045
56
819 792 27
2.225 2.160
65
1.089 1.024
65
2.539 2,842 2.539 2,842
1.469 2.842 1,338 2,609
131 233
600 1.156 600 1,156
1,873 2.686 I.B57 2,663
16 23
448 448
483 483
702 586 116
2.612 2,478
134
2,424 2.138
286
603 603
4,740 3.702 1,038
2,060 1.928
132
230 230
1.287 1.205
82
1.627 1.182
445
747 747
2,214 1,459
755
399 399
268 249
19
72 72
8.033 7,405
628
469 295 174
758 751
7
739 689 50
314 314
2.671 2.476
195
785 782
3
139 139
583 583
585 517 68
303 303
446 322 124
131 131
99 92 7
II II
J-62-1I-18-A-(Kolaba,)
7.153 5.692 1.461
740 493 247
579 375 204
310 224
86
445 445
945 779 166
348 255
93
227 227
551 367 184
503 267 236
845 845
555 473 82
218 218
747 584 163
140 140
3,746 3.131
615
156 106 50
209 105 104
207 liS 92
130 130
788 724 64
132 99 33
88 88
195 115 80
422 343
79
469 469
624 564 60
66 66
216 163 53
44 44
9.964 6.540 3.424
710 361 349
1.223 281 942
2.274 1.654
620
1,032 1.032
773 496 277
715 326 389
204 204
450 272 178
391 245 146
453 453
497 336 161
169 169
920 558 362
153 153
1,224 2,849 789 2.204 435 645
29 20
9
109 24 85
348 251 97
149 149
162 97 65
38 27 II
2 2
33 21 12
27 18 9
50 50
94 91 3
6 6
171 27
144
6 6
368 238 130
314 168 146
83 51 32
291 291
308 236
72
362 323 39
106 106
232 186 46
109 38 71
169 169
60 39 21
48 4d
242 154 8a
157 157
(28) (29) (0) (31) (2) (33) (34) (5) (36) (I) (2)
59B 10,771 558 5,993 40 4)J4
46 39
7
50 29 21
4 4
123 123
86 85 I
144 144
12 12
72 6] II
2 2
26 26
1,138 415 723
1,708 ;91
1.117
652 270 3:12
574 574
1,388 776 610
909 399 510
311 311
740 369 371
475 247 228
736 736
565 331 234
301 301
29 1,103 29 4H
609
4 4
177 177
3,914 1.929 1.9d5
137 86 51
271 103 168
392 222 170
143 14d
939 124 815
418 292 126
63 63
153 84 69
466 266 200
109 109
543 217 326
96 96
160 iOO 60
19 19
7.79S 4.851 2,944
2,092 1.219
873
740 223 517
833 502 331
279 279
623 317 306
379 172 207
59 59
317 193 124
809 662 147
343 343
404 284 120
191 191
666 347 319
60 60
203 28,2'>0 131 19,251 72 8.979
17
i ;.
IS
is 10 3 7
31 7
24
4 4
18 IS 3
4 2 2
3,013 1,639 1.374
3,0% 1,594 1.502
1.795 920 875
1,529 1,529
3,897 2.380 1.517
2,031 1,118
913
887 887
1.695 1,092
603
1,583 891 692
19 2,390 19 2.390
6 6
6 6
1,957 1,373
5:14
844 84-1
6 2.938 2 2,019 4 919
7,754241,543 321.487 5,509 214,243 277.656 2,245 27.300 43.831
748 19.050 26.195 408 15.874 20.853 340 3.176 5,342
826 26. I 99 36,589 490 21,481 28.834 336 4,718 7.755
512 13.764 17.096 209 11,145 13.135 303 2.619 3.961
427 11.317 14.935 427 11.317 14.935
1,397 29,750 38.012 1.023 25.720 31.810
374 4.030 6.202
442 18,979 23,657 239 16,466 19,629 203 2.513 4.028
268 9.399 11.474 268 9.399 11,474
398 17.498 22.831 287 15.645 19,675 " I 1.853 3.156
750 10,389 15.638 557 7.650 11,2 I 7 193 2,739 4,421
DISTRICT TOTAL RURAL URBAN
KariatTaluka Total Rural Urban
2 Pan vel Taluka Total Rural Urban
3 Uran Mah.l Total Rural Urban
4 KhalapurTaluka Total Rural Urban
Alibali' Taluka Total Rural Urban
6 Pen Taluk. Total Rural Urban
Sudhagad Maho Total Rural Urban
8 Roh. Taluka Total Rural Urban
9 MurudlMohal Total Rural Urban
10 Mongaon Taluka 461 27.889 36,283 Total 461 27.889 36,283 Rural
Urban
11 Shriwardhan Mahal 750 12.801 20.158 Total 580 IO,I~9 15,895 Rural 170 2,612 4,263 Urban
12 Mha"la Mahal 178 8.765 12,621 Total j 7d 8.765 12.621 Rural
Urban
13 Mahad Taluka 540 26,957 35,265 Total 325 23,917 3U,562 Rural 215 3.040 4.703 Urban
14 Poladpur Mahal 57 8,736 10,733 Total 57 1:I,7d6 10,733 Rural
Urban
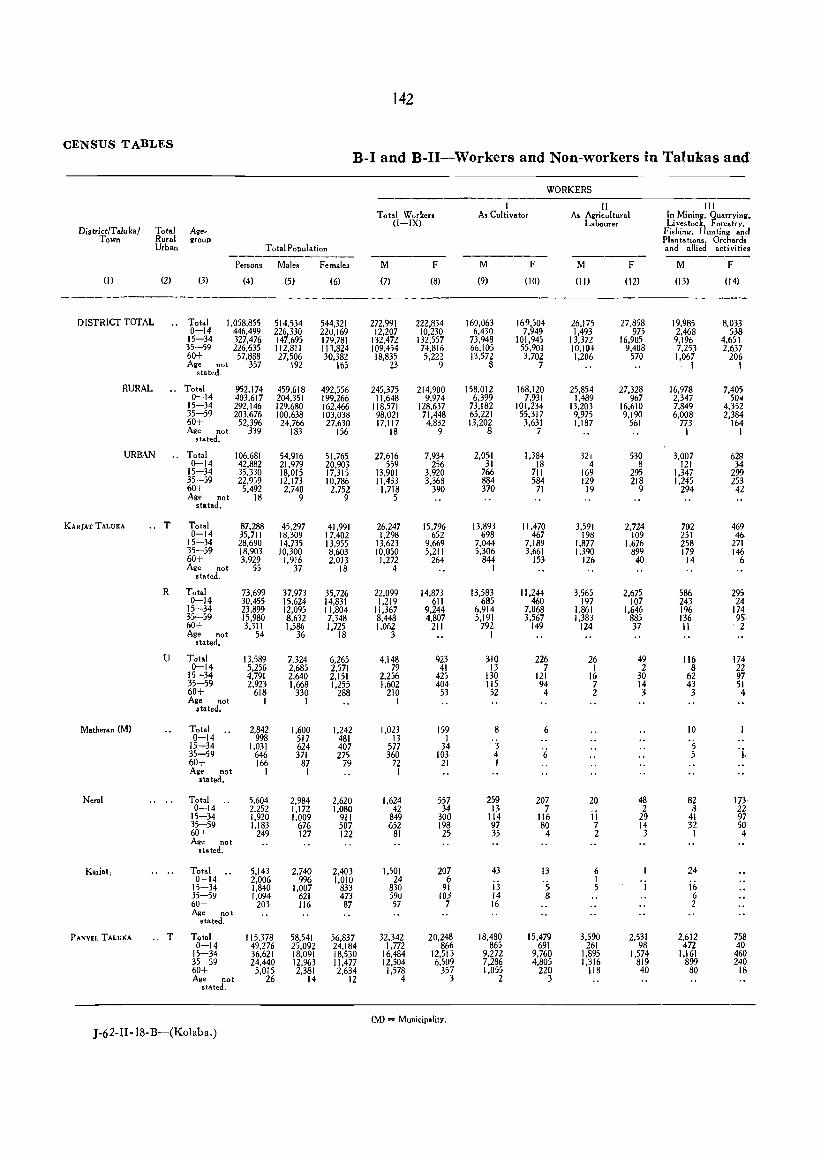
142
CENSUS TABLES B-1 and B-II-Workers and Non-workers in Talukas and
WORKERS
I iI III Total Workers As Cultivator As Agricultural In Mining, Quarrying,..
District/Talukal Total (I-IX) Labourer Livestock. Forestry,
Age- Fishing, Hunting and Town Rural group Plantations. Orchards
Urban Total Population and allied activities ------------- ------- ---------
Persons Males Females M F M F M F M F
(I) (2) (3) (4) (5) (6) (7) (8) (9) (10) (II) (12) (13) (14)
DISTRICT TOTAL .. Total 1,058,855 514,534 544,321 272,991 222.834 160,063 169,504 26,175 27,858 19,985 8,033 0-14 446,499 226,330 220,169 12,207 10,230 6,430 7.949 1,493 975 2,468 538 15-34 327,476 147,695 179,781 132,472 132,557 73,948 101.945 13,372 16,905 9,196 4.651 35-59 226,635 112,811 113,824 109,454 74,816 66,105 55,901 10,104 9,408 7,253 2.637 60+ 57,688 27,506 30,382 18,835 5,222 13,572 3.702 1,206 570 1,067 206 Age not 357 192 165 23 9 8 7 I 1
stated.
RURAL .. Tot.1 952.174 459,618 492.556 245.375 214,900 158.012 168.120 25,854 27,328 16,978 7,405 0-14 403,617 204,351 199.266 11.648 9,974 6.399 7,931 1,489 967 2,347 504
15-34 292,146 129,680 162,466 118,571 128,637 73,182 101,234 13,203 16.610 7,849 4.352 35-59 203,676 100.638 103,038 98,021 71,448 65,221 55,317 9,975 9,190 6.008 2,384 60+ 52,396 24,766 27,630 17.117 4,832 13,202 3.631 1.187 561 773 164 Age not 339 183 156 18 9 8 7 1 1
stated.
URBAN .. Total 106,681 54,916 51.765 27,616 7,934 2,051 1.384 321 530 3,007 62g 0-14 42,882 21.979 20,903 559 256 31 18 4 8 121 34
15-34 35,330 18.015 17,315 13,901 3,920 766 711 169 295 1.347 299 35-59 22,9j9 12,173 10,786 11.433 3.368 8B4 5B4 129 218 1,245 253 60+ 5.492 2.740 2,752 1,71B 390 310 71 19 9 294 42 Age not IB 9 9 5
stated.
KARJAT TALuKA .. T Total 87.288 45,297 41,991 26.247 15,796 13.893 11.470 3.591 2,724 702 469 0-14 35,711 18,309 17,402 1.298 652 698 467 198 109 251 46
15-34 28,690 14.735 13,955 13.623 9,669 7.044 7.189 1.877 1.676 258 271 35-59 18,903 10,300 8,603 10,050 5,211 5,306 3,661 1.390 899 179 146 60+ 3,929 1.916 2,013 1,272 264 844 153 126 40 14 6 Age not 55 37 18 4 I
stated,
R Total 73,699 37.973 35,726 22,099 14.873 13,583 11,244 3.565 2.675 586 295 0-14 30.455 15,624 14,831 1.219 611 685 460 197 107 243 24
15-34 23,899 12.095 11,804 11.367 9,244 6,914 7.068 1.861 1.646 196 174 35-59 15,980 8,632 7.348 8.448 4,807 5.191 3.567 1.383 885 136 95 60+ 3,31 I 1.586 1.725 1,062 211 792 149 124 37 II 2 Age not 54 36 18 3 I
stated.
U Total 13,589 7,324 6,265 4,148 923 310 226 26 49 116 174 0-14 5.256 2.685 2.571 79 41 13 7 I 2 8 22
15-34 4.791 2,640 2.151 2.256 425 130 121 16 30 62 97 35-59 2.923 1.668 1.255 1.602 404 115 94 7 14 43 51 60+ 618 330 288 210 53 52 4 2 3 3 4 Age not I I I
stated.
Matheran (M) Total 2,842 1.600 1.242 1.023 159 8 6 10 0-14 998 517 481 13 I '3 '5 15-34 1,031 624 407 577 34 '6 'j 35-59 646 371 275 360 103 4 5
60+ 166 87 79 72 21 I Age not I I I
stated.
Neral Total 5,604 2,984 2.620 1,624 557 259 207 20 48 82 173 0-14 2,252 1.172 1.080 42 34 13 7
ii 2 8 22
15-34 1.920 1.009 911 849 300 114 116 29 41 97 35-59 1.183 676 507 652 198 97 80 7 14 32 50 60+ 249 127 122 81 25 35 4 2 3 I 4 Age not
stated.
Kariat; Total 5,143 2.740 2.403 1.501 207 43 13 6 24 0-14 2,006 996 1.010 24 6 ·s I
15-34 1,840 1.007 833 830 91 13 5 I 16 35-59 1,094 621 473 590 10J 14 8 6 60+ 203 116 87 57 7 16 2 Age not
stated.
PANVEL TALUJ(A .. T Total 115,378 58,541 56.837 32.342 20,248 18.480 15,479 3.590 2.531 2.612 758 0-14 49.276 25.092 24,184 1.772 866 865 691 261 98 472 40
15-34 36,621 18.091 18.530 16,484 12,513 9,272 9.760 1.895 1.574 1.161 460 35-59 24.440 12,963 11.477 12,504 6,509 7.286 4.805 1,316 819 899 240 60+ 5,015 2,381 2,634 1.578 357 1.055 220 118 40 80 18 Age not 26 14 12 4 3 2 3
Slated.
(M) = Municipality,
J-62-II - 18-B-(Kolaba.)
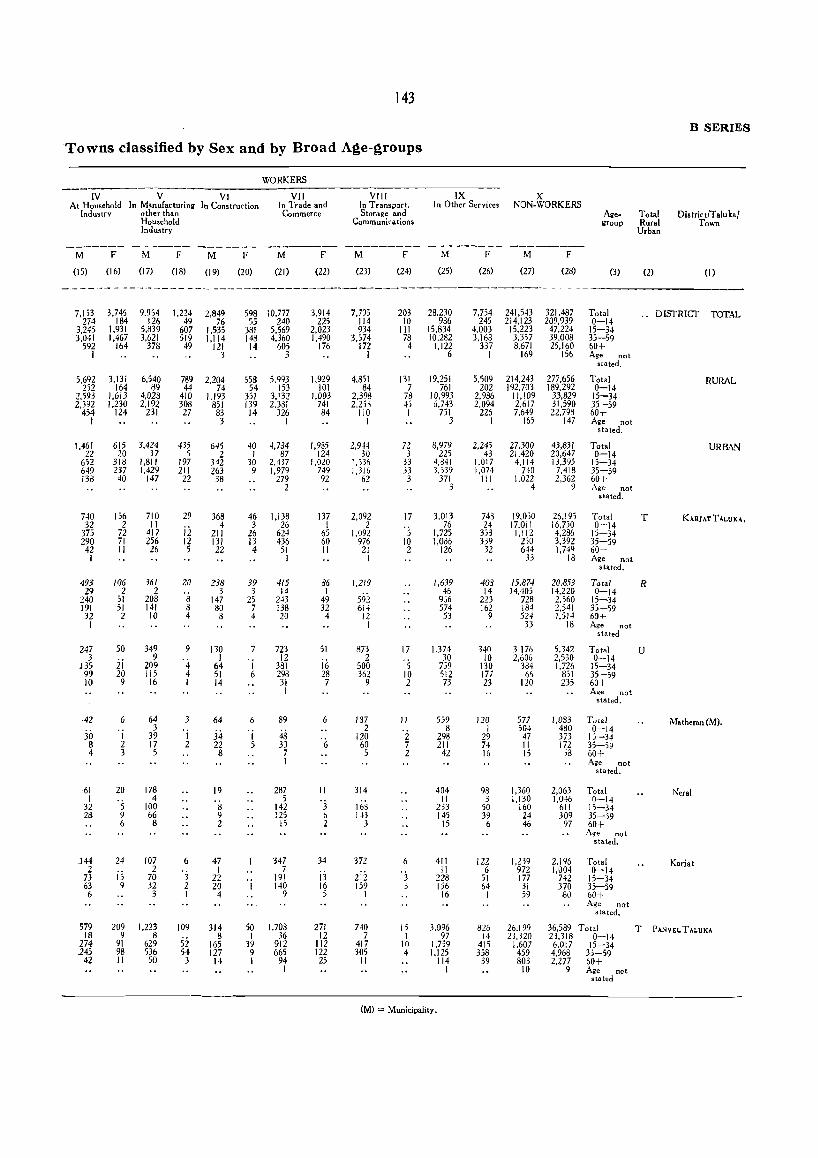
143
B SERIES
Towns classified by Sex and by Broad A~e-~roups
WORKERS
IV V VI VII VIII IX X At Household In Manufacturing In Construction In Trade and In Transport, In Other Services NON·WORKERS
Industry other than Commerce Storage and Age· Total District/Taluka/ Household Communications group Rural Town Industry Urban
------- ------ ------ -------- --------- -------M F M F M F M F M F M F M F
(15) (16) (17) (18) (19) (20) (21) (22) (23) (24) (25) (26) (27) (28) (3) (2) (I)
----------------------7.1 ;3 3.745 9.9S4 1.224 2.849 598 10.777 3.914 7.795 203 28.230 7.754 241.543 321,487 Total .. DISTRICT TOTAL
274 184 126 49 76 55 240 225 114 10 936 245 214.123 209.939 0-14 3.245 1.931 5.839 607 1.535 381 5.569 2.023 934 111 15.834 4.003 15.223 47.224 15-34 3.041 1.467 3.621 519 1.114 148 4.360 1.490 3,574 78 10.282 3.163 3,357 39.008 35-59
592 164 378 49 121 14 605 176 172 4 1.122 337 8.671 25.160 60+ I 3 3 I 6 1 169 156 Age not
stated.
5.692 3.13; 6,540 789 2.204 558 5.993 1.929 4.851 131 19.251 5,509 214.243 277.656 Total RURAL 2)2 164 89 44 74 54 153 101 84 7 761 202 192.703 189.292 0-14
2.593 1,613 4.028 410 1.193 351 3.132 1.003 2,398 76 10.993 2.986 11.109 33.829 15-34 2.392 1.230 2.192 308 851 139 2,331 741 2.2B 4; 6,743 2.094 2.617 31.590 35-59
454 124 231 27 83 14 326 84 1 iO 1 751 226 7.649 22.798 60+ I 3 1 1 3 1 165 147 Age not
stated.
1.46f 615 3.424 435 645 40 4,704 1.935 2.944 7Z 8.979 2.245 27.300 43,831 Total URBAN 22 20 37 5 2 1 87 124 30 3 225 43 21,420 20.647 0-14
652 318 1,811 197 342 30 2.437 1,020 l.j35 33 4.341 1.017 4,114 13.395 15-34 649 237 1.429 211 263 9 1.979 749 1.316 33 3.539 1.074 740 7.418 35-59 138 40 147 22 38 279 92 62 3 371 111 1.022 2.362 60+
2 3 4 9 Age not stated.
740 156 710 29 368 46 1.138 137 2.092 17 3.013 743 19.0jO 26.195 Total T KARJATTALuKA. 32 2 11 4 3 26 1 2 . 5 76 24 17.011 16.];0 0-14
375 72 417 12 211 26 624 65 1.092 1.725 353 1.112 4.286 15-34 290 71 256 12 131 13 436 60 976 10 1.036 339 2,0 3.392 35-59 42 II 26 5 22 4 51 11 21 2 126 32 644 1.74Q 60+ I 1 1 33 18 Age not
st'lted.
493 106 361 20 238 39 415 86 1.219 1,639 408 15,874 20.853 Total R 29 2 2 ·s 3 3 14 1 46 14 14,405 14.220 0-14
240 51 208 147 25 243 49 592 956 223 728 2.560 15-34 191 51 141 8 80 7 138 32 614 574 162 184 2.541 35-59 32 2 10 4 8 4 20 4 12 53 9 524 1.514 60+
1 1 33 18 Age not stated
247 50 349 9 130 7 723 51 873 17 1.374 340 3176 5.342 Total U 3
2i 9 '4 1 12
i6 2 . 5 30 10 2.606 2.530 0-14
.n; 209 64 1 381 500 759 130 304 1.726 15-34 99 20 115 4 51 6 298 28 362 10 512 177 6~ 851 35-59 10 9 16 1 14 31 7 9 2 73 23 120 235 60+
I A,e not stated.
-42 6 64 3 64 6 89 6 187 11 559 120 577 1.083 Total Matheran (M).
.30 3 'j 34 'j 4S 2 '2 8 1 504 4~0 0-14
1 39 '6 120 293 29 47 373 15-34 8 2 17 2 22 5 33 60 7 211 74 11 172 35-59 4 3 5 8 7 5 2 42 16 15 53 60+
I Age not stated.
61 20 178 19 287 11 314 404 9a 1.360 2,063 Total Neral 1 . 5 4 5 11 3 1.130 1.046 0-14
32 100 8 142 3 165 233 50 160 611 15-34 28 9 66 9 125 6 143 145 39 24 309 35-;9
6 8 2 15 2 3 15 6 46 97 60+ Age not
stated.
.144 24 107 6 47 347 34 372 6 411 122 1,239 2.196 Total Kariat 2 is 2 1 7
13 . .3 11 6 972 1.004 0-14 73 70 3 22 191 212 228 51 177 742 15-34 63 9 32 2 20 I 140 16 159 3 156 64 31 370 35-59 6 3 1 4 9 5 1 16 1 59 80 60+
Age nat stated.
579 209 1.223 109 314 50 1.703 271 740 15 3.096 826 26.199 36.589 Tot,1 T PANVEL TALUKA 18 9 8
52 8 1 36 12 7 I 97 i4 23.320 23.318 0-14
274 91 629 165 39 912 112 417 10 1.759 415 1.607 6.017 15-34 245 98 536 54 127 9 665 122 305 4 1.125 358 459 4.968 35-59
42 11 50 3 14 1 94 25 11 114 39 803 2.277 60+ 1 1 10 9 Age not
statE':d
(M) = Municipality.
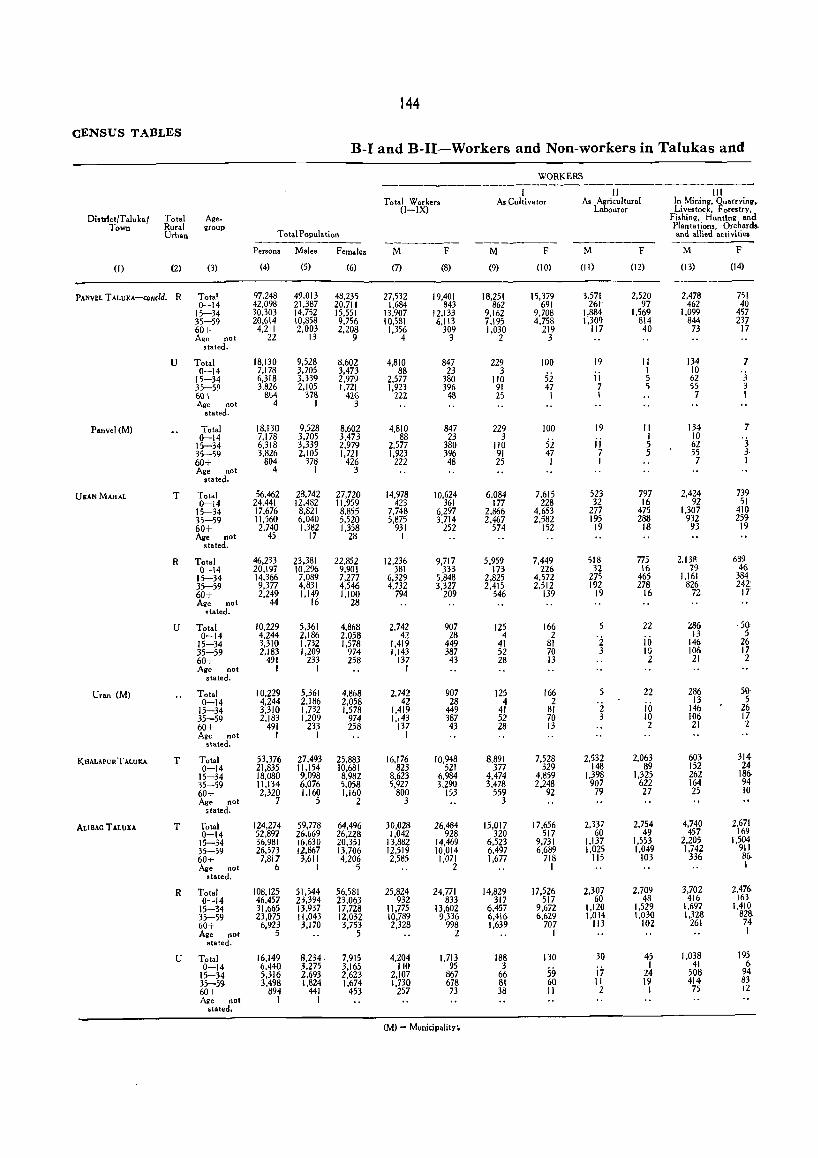
144
CENSUS TABLES B-I and B-II-Workers and Non-workers in Talukas and
WORKERS
I II III Total Workers As Cultivator As A.ricultural In Mining, Quatrying ...
(I-IX) Labourer Livestock, Forestry. Distdct/Taluka/ Total Age. Fi,hing. HuntIng and
Town Rural group Plantations. Orchard .. Urban Total P opul. ti on and allied activities
--------Persons Males Females M F M F M F M F
(I) (2) (3) (4) (5) (6) (7) (8) (9) (10) (11) (12) (13) (14)
l'ANvEL TALuKA-concid. R Tota! 97.248 49.013 48.235 27.532 19,401 18,251 15,379 3,571 2,520 2.478 751 0-14 42.098 21.387 20.711 1.684 843 862 691 261- 97 462 40
15-34 30.303 14.752 15.551 13.907 12.133 9,162 9.708 1,884 1,569 1,099 457 35-59 20,614 10,858 9,756 10,581 6.113 7,195 4,758 1.309 814 844 237 60+ 4,211 2,003 2.208 1,356 309 1.030 219 117 40 73 17 Age not 22 13 9 4 3 2 3
stated.
U Total 18,130 9,528 8.602 4,810 847 229 100 19 11 134 7 0-14 7,178 3,705 3,473 88 23 3
si I 10 'j 15-34 6,318 3,339 2,979 2,577 380 110 11 5 62
35-59 3.826 2.105 1.721 1,923 396 91 47 7 5 55 3 60+ SiJ4 378 426 222 48 25 1 \ 7 I Age not 4 1 3
stated,
Panvel(M) Total 18.130 9,528 8.602 4.810 847 229 100 19 11 134 7 0-14 7.178 3.705 3.473 88 23 3
52 ii 1 10 'j 15-34 6.318 3.339 2.979 2.577 380 110 5 62
35-59 3.826 2,105 1.721 1.923 396 91 47 7 5 55 3 60+ 804 378 426 222 48 25 1 1 7 1 Age not 4 1 3
stated.
URAN MAHAL T Total 56,462 23.742 27.720 14.978 10,624 6.084 7.615 523 797 2.424 739 0-14 24.441 12.482 11.959 423 361 177 228 32 16 92 51
15-34 17.676 8.821 8.855 7.748 6.297 2.866 4.653 277 475 1.307 411} 35-59 11,560 6.040 5.520 5.875 3.714 2.467 2.582 195 288 932 2W 60+ 2.740 1.382 1.358 931 252 574 152 19 18 93 19 Ag. not 45 17 28 1
stated,
R Total 46.233 23.381 22,852 12,236 9,717 5,959 7,449 518 773 2.13g 689 0-14 20.197 10.296 9.901 381 333 173 226 32 16 79 46
15-34 14.366 7.089 7.277 6.329 5.848 2.825 4.572 275 465 1.161 384 35-59 9.377 4,831 4.546 4.732 3.327 2.415 2.512 192 278 826 242 60+ 2.249 1,149 1.100 794 209 546 139 19 16 72 IT Age not 44 16 28
'tated.
U Total 10.229 5.361 4.868 2.742 907 125 166 5 22 286 50 0-14 4.244 2,186 2,058 42 28 4 2 'i 13 5
15-34 3,310 1,732 1,578 1.419 449 41 81 10 146 26 35-59 2,183 1,209 974 1,143 387 52 70 3 IG 106 17 60+ 491 233 258 137 43 28 13 2 21 2 Age not I 1 I
stated.
Uran (M) Total 10.229 5.361 4.868 2.742 907 125 166 22 286 50 0-14 4.244 2.186 2.058 42 28 4 2 'i iil
13 5 15-34 3.310 1.732 1,578 1.419 449 41 81 146 26 35-59 2.183 1.209 974 1.143 387 52 70 3 10 106 17 60+ 491 233 258 137 43 28 13 2 21 2 Age not 1 I 1
.tated.
KIIALAPURTALUKA T Total 53.376 27,493 25.883 16.176 10.948 80891 7,528 2.532 2.063 603 314 0-14 21.835 11.154 10.681 823 521 377 329 148 89 152 24
15-34 18.080 9.098 8.982 8.623 6.984 4.474 4.859 1.398 1.325 262 186-35-59 11.134 6.076 5.058 5.927 3.290 3,478 2.248 907 622 164 94 60+ 2.320 1.160 1.160 800 153 559 92 79 27 25 10 Age not 7 5 2 3 3
stated.
ALI BAG TALUKA T Total 124.274 59.778 64,496 30,028 26,484 15.017 17,656 2.337 2.754 4.740 2.671 0-14 52.897 26.669 26.228 1,042 928 320 517 60 49 457 169
15-34 36.981 16.630 20.351 13.882 14.469 6,523 9.731 1.137 1.553 2.205 1504 35-59 26.573 12,867 13.706 12.519 10.014 6.497 6.689 1.025 1.049 1.742 911 60+ 7.817 3.611 4.206 2,585 1.071 1.677 718 115 103 336 80. Age not 6 1 5 2 1 1
stated.
R Total 108.125 51,544 56.581 25.824 24.771 14,829 17.526 2.307 2.709 3.702 2.476 0-14 46.457 23,394 23,063 932 833 317 517 60 48 416 163
15-34 31.665 13.937 17,728 1\ .775 13,602 6,457 9.672 1.120 1.529 1.697 1.410 35-59 23.075 11.043 12,032 10,789 9,336 6,416 6,629 1.014 1.030 1.328 828-60+ 6,923 3.170 3,753 2,328 998 1.639 707 113 102 261 74 Age oot 5 5 2 1 1
stated.
U Total 16.149 8.234. 7.915 4.204 1,713 188 130 30 45 1.038 195 0-14 6.440 3.275 3.165 110 95 3
59 i7 1 41 6
15-34 5.316 2.693 2.623 2.107 867 66 24 508 94 35-5<} 3.498 1.824 1.674 1,730 678 81 60 II 19 414 83 60+ 894 441 453 257 73 38 11 2 1 75 12 Age not I 1
.tated.
(M) = Municipality'.
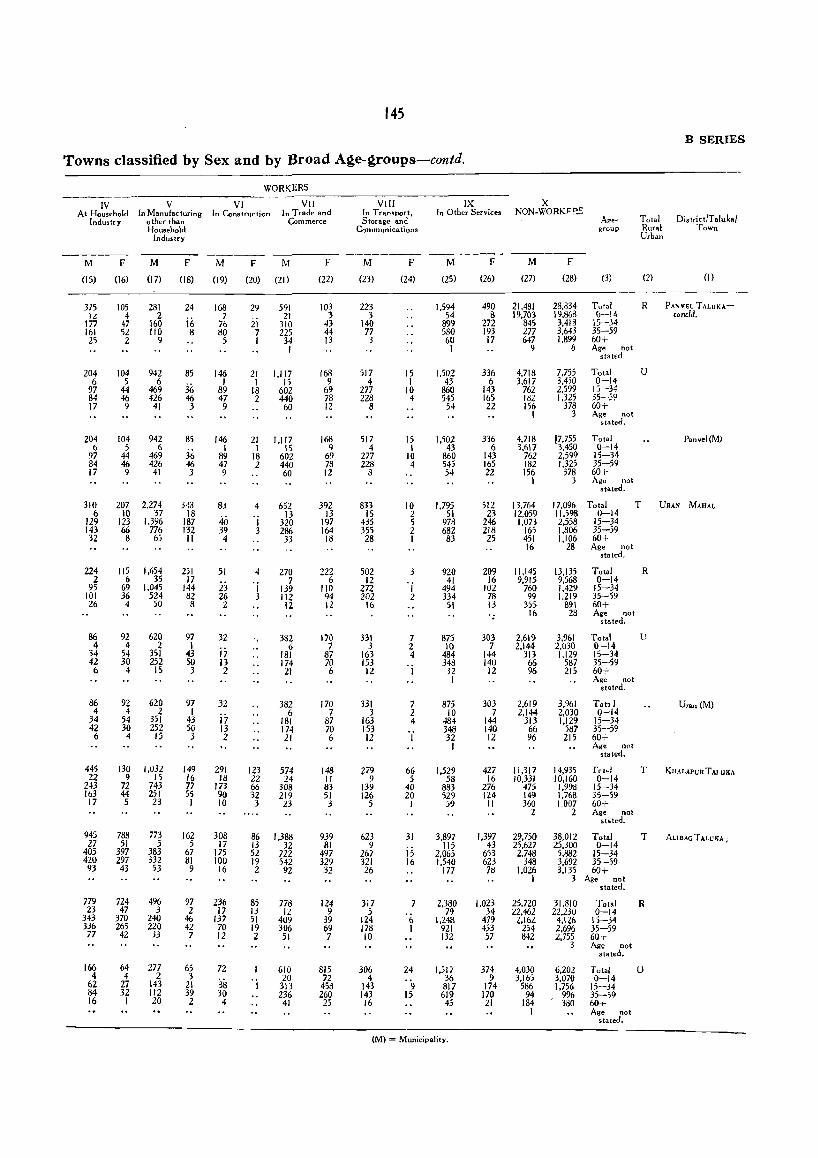
145
B SERIES,
Towns classified by Sex and by Broad A~e-~roups-contd.
WORKERS
IV V VI VII VIII IX X A t Household In Manufacturing In Construction In Trade and In Transport, In Other Services NON-WO RKF!>'::
District/Taluka/ Industry other than Commerce Storage and Age- Total Household Communica tions group Rural Town
Industry Urban
------ --------- -------M F M F M F M F M F M F M F
(15) (16) (17) (18) (19) (20) (21) (22) (23) (24) (25) (26) (27) (28) (3) (2) (I)
375 105 281 24 168 29 591 103 223 1,594 490 21.481 28.834 Total R PANVEL TALUKA-lL 4 2 7 21 3 3 54 B 19.703 19.868 0-14 coneld.
177 47 1(,0 i6 76 ii 310 43 140 899 272 845 3.413 15-34 161 52 liD 8 tiD 7 225 44 77 580 193 277 3.643 35-59 25 2 9 5 I 34 13 3 60 17 647 1.899 60+
I 1 9 6 Age not stated.
204 104 942 85 146 21 1.11 7 168 517 15 1,502 336 4.718 7.755 Total U 6 5 6
36 I I 15 9 4 I 43 6 3.617 3.4iO O-li
97 44 469 89 18 602 69 277 10 860 143 762 2.599 15--34 84 46 426 46 47 2 440 78 228 4 545 165 182 1.325 35-5!' 17 9 41 3 9 60 12 8 54 22 156 378 60-1-
1 3 Age not stated.
204 104 942 85 146 21 1,117 168 517 15 1,502 336 4,718 ,7.755 Total Panvel(M) (> 5 6
36 I I 15 9 4 1 43 6 3,617 3.450 0-14
97 44 469 89 18 602 69 277 10 860 143 762 2.599 15-34 84 46 426 46 47 2 440 78 228 4 545 165 182 1.325 35-59 17 9 41 3 9 60 12 8 54 22 156 378 (,0+
1 3 A"ie not stated.
310 207 2.274 Y.3 8.1 4 652 392 833 10 1,795 512 13.764 17,096 Total T URAN MAHAL 6 10 37 18
40 13 13 15 2 51 23 12.059 II .598 0-14
129 123 1,396 187 I 320 197 435 5 978 246 1.073 2,558 15-34 143 66 776 132 39 3 286 164 355 2 682 218 165 1.806 35-59 32 8 65 II 4 33 18 28 I 83 25 451 1.106 60+
16 28 Age not stated.
224 115 1,654 251 51 4 270 222 502 920 209 11.145 13.135 Total R 2 6 35 17 7 6 12 41 16 9,915 9,568 0-14
95 69 1,Q45 144 23 I 139 110 272 I 494 102 760 1.429 15-34 101 36 524 82 26 3 112 94 202 2 334 78 99 1,219 35-59 26 4 50 8 2 12 12 16 51 13 355 891 60+
. 16 28 Age not stated .
86 92 620 97 32 382 170 331 7 875 303 2.619 3.961 Total II 4 4 2 1
i7 6 7 3 2 10 7 2.144 2.030 0-14 34 54 351 43 181 87 163 4 484 144 313 1,129 15-34 42 30 252 50 13 174 70 153 'i 348 140 66 587 35-59 6 4 IS 3 2 21 6 12 32 12 96 215 60+
I A.e not stated.
86 92 620 97 32 382 170 331 7 875 303 2,619 3,%1 Total Uran(M) 4 4 2 I
i7 6 7 3 2 10 7 2.144 2,030 0-14 34 54 351 43 181 87 163 4 484 144 313 1.129 15-34 42 30 252 50 13 174 70 153 OJ 348 140 66 587 35-59 6 4 15 3 2 21 6 12 32 12 96 215 60+
I A~e not stated.
44S 130 1,032 149 291 123 574 148 279 66 1,529 427 11,317 14,935 T<t,1 T KI1ALAPUR TAl UKA 22 9 15 16 18 22 24 II 9 5 58 16 10,331 10,160 0-14
243 72 743 77 173 66 308 83 139 40 883 276 475 1,993 15-34 163 44 251 55 90 32 219 51 126 20 529 124 149 1.768 35-59 17 5 23 I 10 3 23 3 5 I 59 II 360 1.007 60+
2 2 Age not stated.
945 788 773 162 308 86 1,388 939 623 31 3.897 1.397 29.750 38.012 Total T ALI BAG T ALUKA J 27 51 5 5 17 13 32 81 9 115 43 25.627 25.300 0-14
405 397 383 67 175 52 722 497 267 i5 2.065 653 2.7411 5.882 15-34 420 297 332 81 100 19 542 329 321 16 1.540 623 348 3,692 35-59 93 43 53 9 16 2 92 32 26 177 7t> 1,026 3.135 60+
I 3 Age not stated.
779 724 496 97 236 85 778 124 317 7 2.380 1,023 25,720 31.810 Total R 23 47 3 2 17 13 12 9 5 79 34 £2.462 22.230 0-14
343 370 240 46 137 51 409 39 12,4 .~ 1,248 479 2,162 4,126 I)-54 336 265 220 42 70 19 306 69 178 I 921 453 254 2.696 35-59
77 42 33 7 12 2 51 7 10 132 57 842 V55 60+ 3 Age not
stated.
166 64 277 65 72 610 815 306 24 1.517 374 4,030 6.202 Total U 4 4 2 3
38 20 72 4 36 9 3.165 3,070 0-14 62 27 143 21 1 313 458 143 '9 817 174 586 1.756 15-34 84 32 112 39 30 236 260 143 15 619 170 94 996 35-59 16 I 20 2 4 41 25 16 45 21 184 380 60+
I Age not stated.
(M) = Municipality.
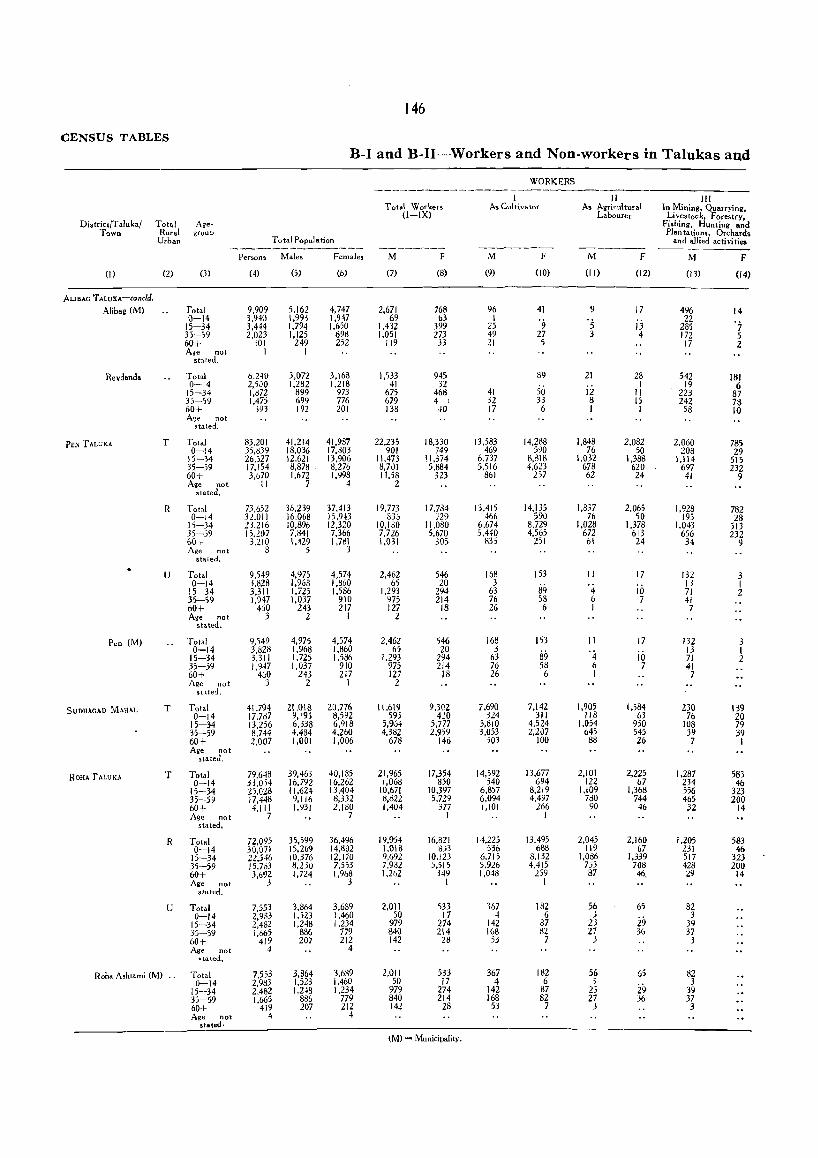
146
CENSUS TABLES
B-1 and B-II-Workers and Non-workers in Talukas and
WORKERS ----------
I II III Total W or ker. As. Cultivator As Agricultural In Mining, Quarrying,
(I-IX) Labourer Livestock, Forestry, District/TaIuka/ Tot.1 Age- Fishing, Hunting and
Town Rura.l grQurJ Plantation!), Orchards Urban Total Population and allied activities
--~------------- -~--~-- ---------Persons Males Females M F M F M F M F
(I) (2) (3) (4) (5) (6) (7) (8) (9) (10) (11) (12) (13) (14)
ALIBAG TALUKA-concld.
Alibag (M) Total 9,909 5,162 4,747 2,671 768 96 41 9 17 496 14 0-14 3,940 1,993 1.947 69 63 I '5 i3
22 15-34 3,444 1,794 1,650 1,432 399 25 9 285 '7 3;-59 2,023 1,125 89B 1,051 273 49 27 3 4 172 5 60+ jO I 249 2j2 119 33 21 5 17 2 Age not I I
stl.ted.
Revdanda Total 6,240 3,072 3,168 1,133 945 89 21 28 542 181 0-14 2,5JO 1,282 1,218 41 32 50 I 19 6
15-34 1,872 899 973 675 468 41 12 II 223 87 3)-59 1,475 699 776 679 4 I 32 33 8 15 242 78 60+ 393 192 201 138 ~O 17 6 I I 58 10 A'Je not
stated.
PEN TALUKA T Total 83,201 41,214 41,987 22,235 18,330 13.583 14,288 1,848 2,082 2,060 785 0-14 35,839 18,036 17,803 901 749 469 590 76 50 208 29
15-34 26,527 12,621 13,906 11,473 11,374 6,737 8,818 1,032 1,388 1.114 515 35-59 17,154 8,878 8,276 8,701 5,884 5,516 4,623 678 620 697 232 60+ 3,670 1,672 1,998 11,58 323 861 257 62 24 41 9 Age not II 7 4 2
stated.
R Total 73,652 36,239 37,413 19,773 17,7a4 13,415 14,135 1,837 2,065 1,928 782 0-14 32,01 I 16,068 15,943 836 729 466 590 76 50 195 28
15-34 23,216 10,896 12,320 10,180 11,080 6,674 8,729 1,028 1,378 1,043 513 35-59 15,107 7,841 7,366 7,726 5,670 5,440 4,565 672 613 656 232 60+ 3,210 1,'129 1,781 1,031 305 835 251 61 24 34 9 Age not 8 5 3
sta.ted.
U Total 9,549 4,975 4,574 2,462 546 168 153 II 17 132 3 0-14 3,828 1,968 1,860 65 20 3
89 '4 io 13 I
15-34 3.311 1,725 1,586 1.293 294 63 71 2 35-59 1,947 1,037 910 '0)75 214 76 53 6 7 41 60+ 460 243 217 127 18 26 6 I 7 Age not 3 2 I 2
sta.ted.
Pen (M) Total 9,549 4,975 4,574 2,462 546 168 153 II 17 132 3 0-14 3,828 1,968 1,860 65 20 3
89 '4 i& 13 I
15-34 3,311 1,725 1,586 1,293 294 63 71 2 35-59 1,947 1,037 910 975 214 76 58 6 7 41 60+ 4':'0 243 217 127 18 26 6 I 7 Age not 3 2 I 2
st:lted,
SUDHAGAD M'HAL T Total 41.794 21.018 20,716 11.619 9,302 7,690 7,142 1,905 1,584 230 139 0-14 17,7d7 9,193 8,592 595 420 324 311 118 63 76 20
15-34 13,2j6 6,338 6,918 5,964 5,777 3,810 4,524 1,054 950 108 79 35-59 8,744 4,434 4,260 4,382 2,959 3,053 2,207 645 545 39 39 60+ 2,007 1.001 1,006 678 146 503 100 88 26 7 I Age not
stated,
ROHA TALUKA T Total 79,6~8 39,463 40,185 21,965 17,354 14,592 13,677 2,101 2,225 1,287 583 0-14 33,014 16,792 16,262 1,068 850 540 694 122 67 234 46
15-34 25,023 11,624 13,404 10,671 10,397 6,857 8,219 1,109 1,368 556 323 35-59 17,448 9,116 8,332 8,822 5,729 6,094 4,4Y7 780 744 465 200 60+ 4,111 1,931 2,100 1,404 377 1,101 266 90 46 32 14 Age not 7 7 I I
stated,
R Tot.1 72,095 35,599 36,496 19,954 16,821 14,225 13,495 2,045 2,160 1,205 583 0-14 30,071 15,269 14,802 1.018 8J3 536 688 119 67 231 46
15-34 22,546 10,376 12,170 9,692 10,123 6,715 8,132 1,086 1,339 517 323 35-59 15,7a3 8,230 7,553 7,932 ',515 5,926 4,415 753 708 428 200 60+ 3,692 1,724 1,968 1,262 349 1,048 259 87 46_ 29 14 Age not 3 3 I I
stated.
U Total 7,553 3,864 3,689 2,011 533 367 182 56 65 82 0-14 2,983 1,523 1,460 50 17 4 6 3
29 3 15-34 2,482 1,248 1,234 979 274 142 87 23 39 }';-59 1,665 886 779 840 214 168 82 '1.7 36 37 60+ 419 207 212 142 28 53 7 3 3 Age not 4 4
<il.tated.
Roha Ashtami (M) .. Total 7,553 3,864 3,639 2,011 533 367 182 56 65 82 0-14 2,983 1,523 1,460 50 17 4 6 3
29 3
15-34 2.482 1,2~8 1,234 979 274 142 87 23 39 3j-59 1,665 886 779 840 214 168 82 27 36 37 60+ 419 207 212 142 28 53 7 3 3 Age not 4 4
stated.
1M) = Municipality,
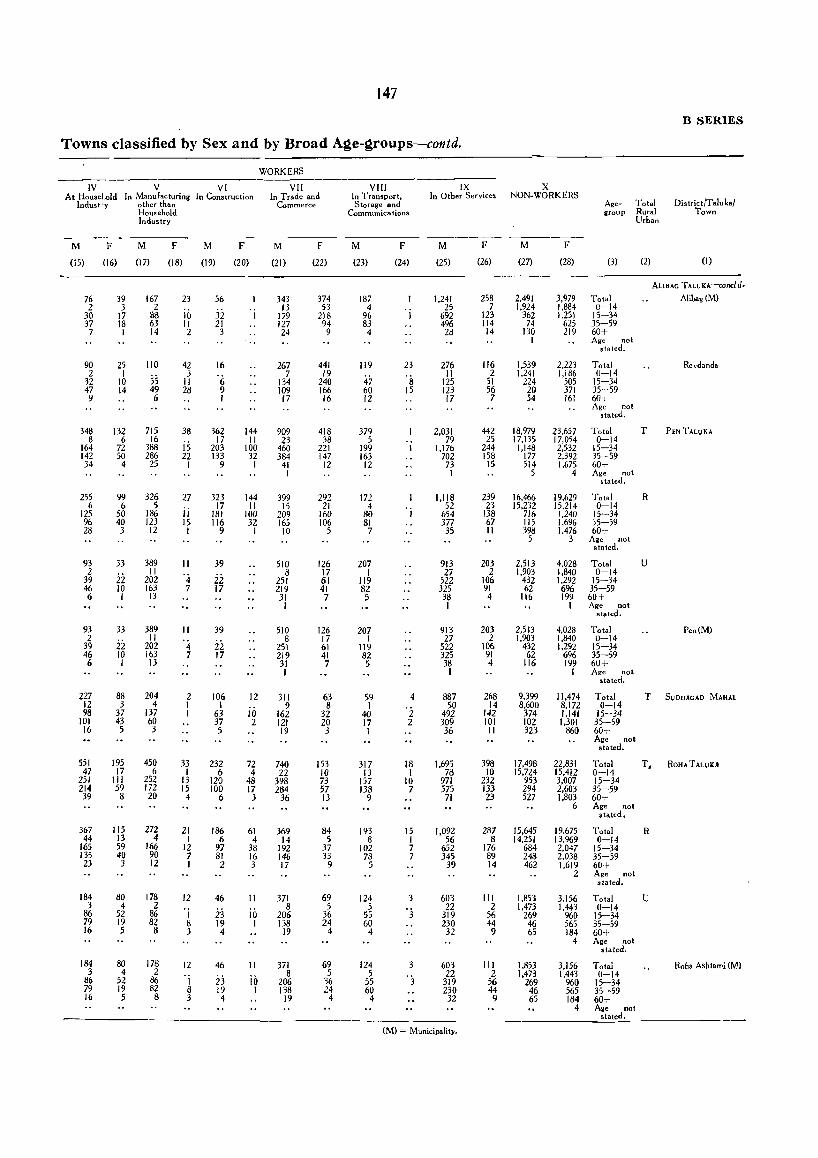
147
B SERIES
Towns classified by Sex and by Broad A~e-~roups-contd.
WORKERS ----IV V VI VII Vlll IX X
At HouseLoid In Manufacturing In Construction In Trade and In Transport, In Other Services NON-WORKERS Indust .y other thlln Commerce Storage and Age- Tot.1 District/T.Iuka/
Household Communications group Rural Town Industry Urban
-----M F M F M F M F M F M F M F
(15) (16) (17) (18) (19) (20) (21) (22) (23) (24) (25) (26) (27) (28) (3) (2) (I)
ALI BAG TALUKA-concl d.
76 39 167 23 56 343 374 187 1,24[ 258 2,491 3,979 Total Alibag(M) 2 3 2
jo 3i 'j [3 53 4 25 7 1.924 1,884 0-14
30 17 88 J79 218 96 J 692 123 362 1,251 15-34 37 18 63 II 21 127 94 83 496 114 74 625 35-59 7 I 14 2 3 24 9 4 28 14 130 219 60+
I Age not stated.
90 25 110 42 16 267 441 1[9 23 276 116 1,539 2,223 Total Revdanda 2 I 55 3 '(, 7 19
47 's II 2 1.241 1,186 0-14 32 10 II 134 240 125 51 224 505 15-34 47 14 49 28 9 109 166 60 15 123 56 20 371 35-59 9 6 I 17 16 12 17 7 54 161 60+
Age not 5tated.
348 13Z 715 38 362 144 909 418 379 2,031 442 18,979 23,657 Total T PEN TALvKA 8 6 16 17 II 23 38 5 79 25 17,135 17,054 0-14
164 72 388 15 203 100 460 221 199 1 1,176 244 1,148 2,532 15-34 142 50 286 22 133 32 384 [47 [63 702 158 177 2,392 35-59 34 4 25 [ 9 [ 4[ 12 12 73 [5 5[4 1,675 60+
1 I 5 4 Age not stated..
255 99 326 27 323 144 399 292 172 1,118 239 16,466 19,629 Total R 6 6 5
ii 17 II [5 21 4 'j 52 23 15,232 15,214 0-14
]25 50 186 181 100 209 160 80 654 138 716 1,240 15-34 96 40 123 15 116 32 165 106 81 377 67 115 1,696 35-59 28 3 12 I 9 I 10 5 7 35 II 39B 1.476 60+
5 3 Age not stated,
93 33 389 II 39 510 126 207 913 203 2,513 4,028 Total U 2 II
'4 ii 8 17 I 27 2 1,903 1,840 0-14
39 22 202 251 61 119 522 106 432 1.292 15-34 46 10 163 7 17 219 41 82 325 91 62 696 35-59 6 I 13 31 7 5 38 4 116 199 60+
I ] I Age not stated.
93 33 389 II 39 510 [26 207 913 203 2.5 13 4,028 Total Pen(M) 2
22 II
'4 ii 8 17 I 27 2 1.903 [,840 U-14 39 202 251 61 )[9 522 106 432 1,292 15-34 46 10 163 7 17 219 41 82 325 91 62 696 35-59 6 I 13 31 7 5 38 4 116 199 60+
I I I Age not stated.
227 88 204 2 106 12 311 63 59 4 887 268 9,399 11,474 Total T SVDHAGAD MAIIU 12 3 4 I I
io 9 8 I 'i 50 14 8,600 8,172 0-14 98 37 137 I 63 162 32 40 492 142 374 1,14' 15-34
101 43 60 37 2 121 20 17 2 309 10] 102 1,301 35-59 16 5 3 5 19 3 1 36 II 323 860 60+
Age not stated.
551 195 450 33 232 72 740 153 317 18 1,695 398 17,49B 22,831 Total T. ROHATALUKII 47 17 6 I 6 4 22 10 13 I 78 10 15,724 15,412 0-14
251 III 252 13 120 48 398 73 157 10 971 232 953 3,007 15-34 214 59 172 15 100 17 284 57 138 7 575 133 294 2,603 35-59 39 8 20 4 6 3 36 13 9 71 23 527 1.803 60+
6 Age not stated.
367 115 272 21 186 61 369 84 193 15 1,092 287 ]5,645 19,675 Total R 44 13 4 I 6 4 14 5 8 I 56 8 14,251 13,%9 0-14
165 59 166 12 97 38 192 37 102 7 652 176 684 2,047 15-34 ]35 40 90 7 81 16 146 33 78 7 345 89 248 2,038 35-59 23 3 12 I 2 3 17 9 5 39 14 462 1,619 60+
2 A,e not stated.
]84 80 178 12 46 II 371 69 124 3 603 III 1.853 3,156 Total U 3 4 2
'j 8 5 5 22 2 1,473 1,443 0-14 86 52 86 23 10 206 36 55 'j 319 56 269 960 15-34 79 19 82 8 19 I 138 24 60 230 44 46 565 35-59 16 5 8 3 4 19 4 4 32 9 65 184 60+
4 Age not stated.
184 80 178 12 46 II 371 69 124 3 603 II] 1,853 3,156 Total Roba Ashtall'; (M~ 3 4 2
'j 8 5 5 22 2 1.473 1.443 0-14 86 52 86 23 jn 206 36 55 ' 3 319 56 269 960 15-34 79 19 82 8 19 I 138 24 60 230 44 46 565 35-59 16 5 8 3 4 19 4 4 32 9 65 184 60+
4 Age not stated.
(M) = Municipality.
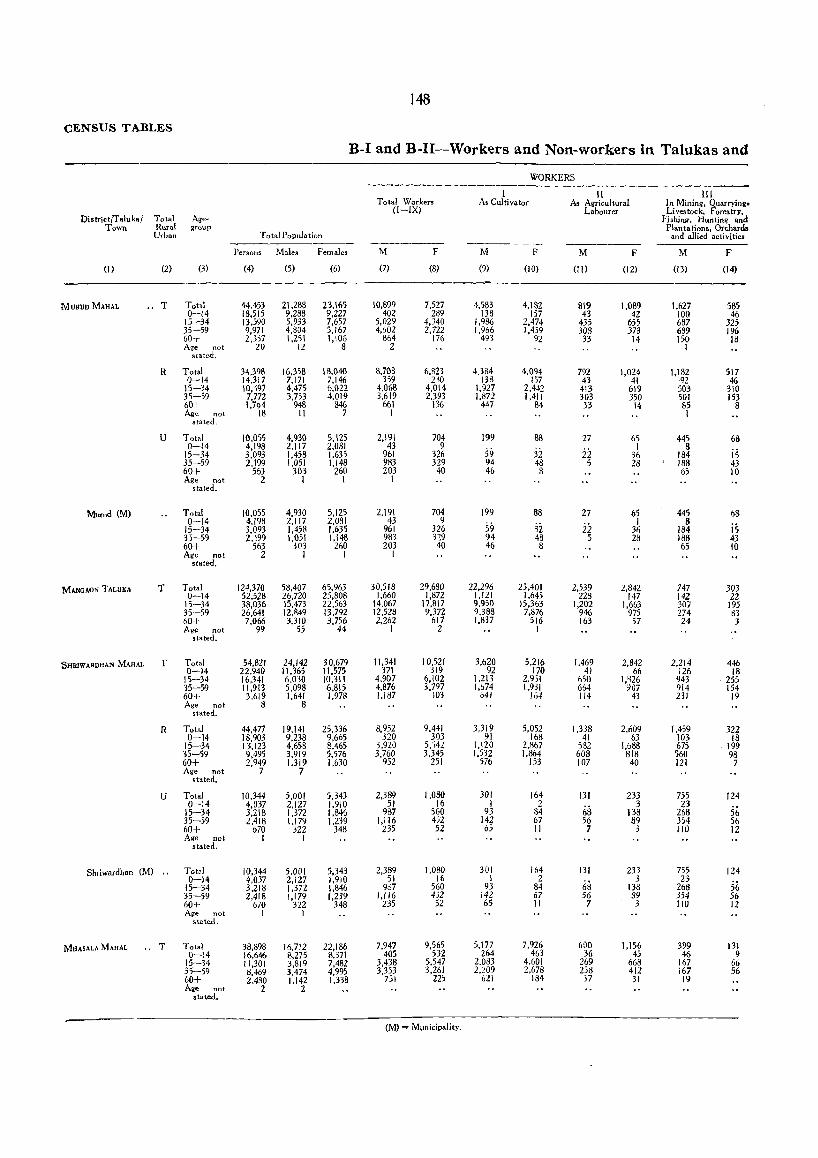
148
CENSUS TABLES
B-I and B-II-Workers and Non-workers in Talukas and
WORKERS
I II III Total Workers A. Cultivator As Agricultural In Mining, Quarrying.
(I-IX) Labourer Livestock, Forestry, DistrictlToluko/ Total Age- Fishing, Hunting and
Town Rural group Plantations, Orcharca Urban Total Population and aUied activities ------
Persons Males Females M F M F M F M F
(1) (2) (3) (4) (5) (6) (7) (8) (9) (10) (11) (12) (13) (14)
MURUDMAHAL .. T Tot.l 44,453 21,288 23,165 10,899 7,527 4,5&3 4,IB2 819 1,089 1,627 585 0-14 18.515 9.288 9.227 402 289 138 i)7 43 42 100 46
15-34 13,590 5,933 7.657 5,029 4,340 1,9ll6 2,474 435 655 637 325 35-59 9,971 4,804 5,167 4,602 2,722 1,9&6 1,439 308 378 689 196 60+ 2,357 1,251 1,106 864 176 493 92 33 14 150 18 Age not 20 12 8 2 I
stated.
R Total 34,39B 16,358 18,040 B,70B 6.~23 4.3S4 4.094 792 1.024 1,182 517 0-14 14,317 7,171 7.146 359 2;0 133 157 43 41 92 46
15-34 10,197 4.475 6,022 4.068 4,014 1.927 2,442 413 619 503 310 35-59 7,772 3,753 4,019 3,619 2,393 1.872 1,411 303 350 501 153 60+ 1,794 948 346 661 136 447 84 33 14 85 8 Age not 18 11 7 I I
stated,
U Total 10,055 4,930 5.125 2,191 704 199 88 27 65 445 68 0-14 4,198 2,117 2,081 43 9
59 32 22 I 8 15-34 3,093 1.458 1,635 961 326 36 184 is 35-59 2,199 1.051 1.148 983 329 94 48 5 28 188 43 60+ 563 303 260 203 40 46 8 65 10 Age not 2 I 1 1
stated.
Mutud (M) Total 10.055 4.930 5,125 2.191 704 199 88 27 65 445 68 O-I~ 4,198 2,117 2,081 43 9
59 ji 22 I 8 15-34 3.093 1.458 1.635 961 326 36 184 is 33-59 2,199 1.051 1.148 983 329 94 48 5 28 188 43 60+ 563 303 260 203 40 46 8 65 10 Age not 2 I I 1
state<l.
MANGAON TALUKA T Total 124,370 58,407 65.963 30,518 29,680 22,296 25,401 2,539 2.842 747 303 0-14 52,528 26,720 25,808 1.660 1,872 1,121 1.645 228 147 142 22
15-34 38,036 15,473 22,563 14,067 17.817 9,950 15,363 1,202 1.663 307 195 35-59 26,641 12,849 13,792 12,528 9.372 9,388 7,876 946 975 274 83 60+ 7,066 3,310 3.756 2.262 617 1.837 516 163 57 24 3 Age not 99 55 44 1 2 1
stated.
SHRIWARDHAN MAHAL r Total 54,821 24,142 30,679 11.341 10,521 3.620 5,216 1,469 2,842 2,214 446 0-14 22,940 11,36) 11575 371 319 92 170 41 66 126 18
15-34 16,341 6,030 10,311 4,907 6.102 1.213 2.9;1 650 I ,'l26 943 255 35-59 11.913 5,098 6.815 4,876 3.797 1.674 1,931 664 907 914 154 60+ 3,619 1.641 1.978 1.187 303 641 16~ 114 43 231 19 Age not 8 8
stated.
R Total 44,477 19,141 2;,336 8.952 9.441 3.319 5,052 1,338 2.609 1,459 322 0-14 18,903 9.238 9,665 320 303 91 168 41 63 103 18
15-34 13.123 4,658 8,465 3,9211 5.142 1,120 2.867 532 1,688 675 . 199 35-59 9,495 3.919 5,576 3,760 3,345 1.532 1.864 608 818 560 98 60+ 2,949 1.319 1,630 952 251 576 153 107 40 121 7 Age not 7 7
stated.
U Total 10,344 5,001 5,343 2,389 I,OBO 301 164 131 233 755 124 0-14 4.037 2.127 1.910 51 16 I 2
66 3 23
56 15-34 3,218 1,372 1,846 987 560 93 84 138 263 35-59 2,418 1,179 1.239 1.116 452 142 67 56 89 354 56 60+ 670 322 348 235 52 05 II 7 3 110 12 Age not I I
stated.
Shriwardhan (M) .. Tot,1 10,344 5,001 5,343 2,389 1,080 301 164 131 233 755 124 0-14 4,037 2,127 1,910 51 16 I 2
63 3 23
56 15-34 3,218 1,372 1,846 9a7 560 93 84 138 268 35-59 2,418 1.179 1,239 1,116 4j2 142 67 56 89 354 56 60+ 670 322 348 235 52 65 II 7 3 110 12 Age not I I
stated.
MHASALA MAHAL .. T Total 38,898 16,712 22,186 7,947 9.565 5.177 7.926 600 \,156 399 131 0-\4 16,646 8,275 8,371 405 532 264 463 36 45 46 9
15-34 11,301 3,819 7.482 3,438 5,547 2,OB3 4.601 269 668 167 66 35-59 8,469 3,474 4.995 3,353 3.261 2,209 2.678 258 412 i67 56 60+ 2,480 1.142 1.338 751 225 621 184 37 31 19 Age not 2 2
stated.
(M) = Municipality.
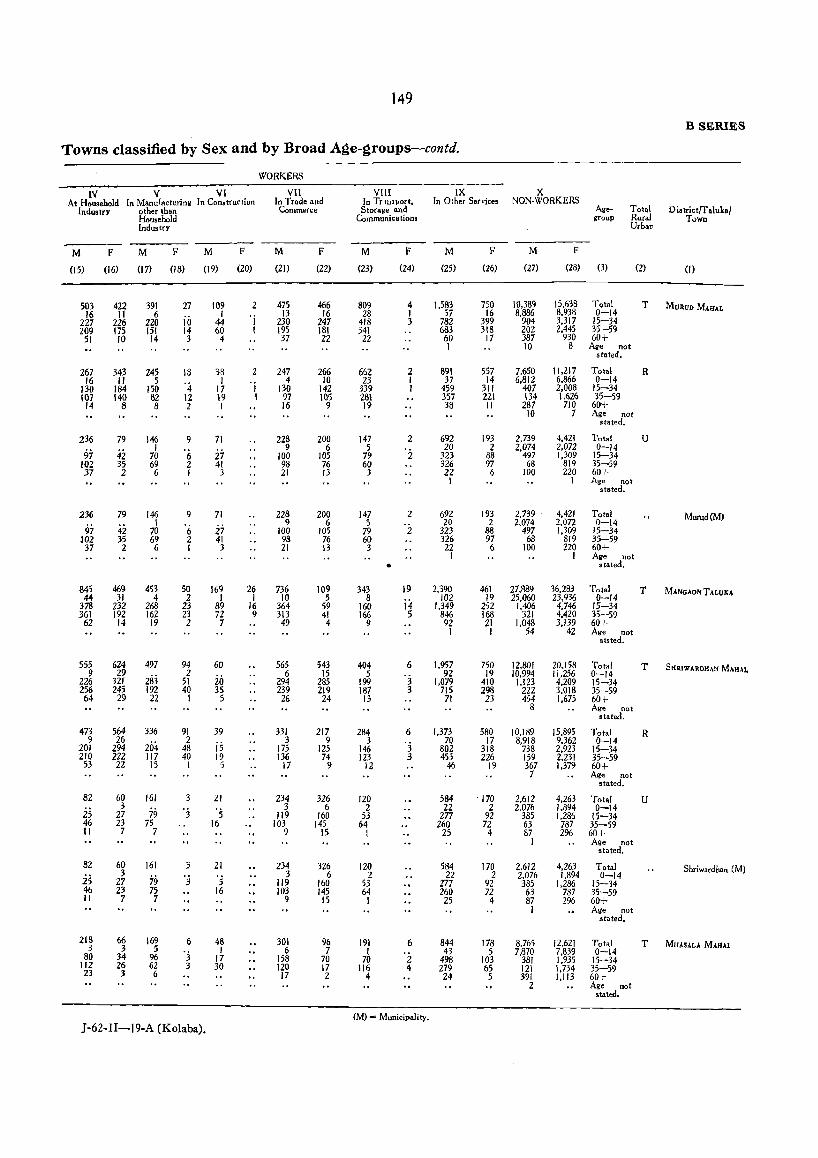
149
B SERIES
Towns classified by Sex and by Broad Age-groups-contd.
WORKERS
IV V VI VII Vlll IX X At Household In Manu1acturinw In Constfu('lion In Trade and In TnnJ'Port. In Other Serdce. NON-WORKERS
Industry other than Commerce Storage and Age- Total D istrict/T aluks' Household Communications group Rural Town Industry Urbar-
M F M F M F M F M F M F M F
(15) (16) (17) (18) (19) (20) (21) (22) (23) (24) (25) (26) (27) (28) (3) (2) (I)
503 422 391 27 109 2 475 466 809 4 1.583 750 10,389 15,638 Total T MVRUO MAHAL 16 11 6 I 'i
13 16 28 I 57 16 8,886 8.938 0-14 227 226 220 iiJ 44 230 247 418 3 782 399 904 3.317 15-34 209 175 151 14 60 I 195 181 341 683 318 202 2.445 35-59
51 10 14 3 4 37 22 22 60 17 387 930 60+ 1 10 8 Ag. not
stated.
267 343 245 18 38 2 247 266 662 2 891 557 7.650 11,217 Total R 16 " 5 '4 I 'j 4 10 23 1 37 14 6.812 6.866 0-14
130 184 150 17 130 142 3311 I 459 311 407 2.008 15-34 107 140 82 12 19 I 97 105 281 357 221 134 1,626 35-59
14 8 8 Z I 16 9 19 38 II 287 710 6~+ 10 7 Age not
stated,
236 79 146 9 71 228 200 147 2 692 193 2.739 4,421 Total U
97 42 I '6 27
9 6 5 20 2 2.074 2,072 0-14 70 100 105 79 2 323 88 497 1.309 15-34
102 35 69 Z 41 98 76 60 326 97 68 819 35-59 37 2 6 I 3 21 13 3 22 6 100 220 60+
I I Age not stated.
236 79 146 9 71 228 200 147 2 692 193 2.739 . 4,421 Total Murud(M) 1 9 6 5 20 2 2.074 2,072 0-14
97 42 70 '6 27 100 105 79 2 323 88 497 I,J09 15-34 J02 35 69 2 41 98 76 60 326 97 68 819 35-59 37 2 6 I 3 21 13 3 22 6 100 220 60+
1 I Age not • stated,
845 469 453 50 169 26 736 109 343 19 2,390 461 27.889 36.283 Total T MANGAON T AtUKA 44 31 4 2 I I 10 5 8
i4 102 19 25.060 23,936 0-14
378 232 268 23 89 16 364 59 160 1.349 252 1.406 4,746 15-34 361 192 162 23 72 9 313 41 166 5 846 168 321 4.420 35-59
62 14 19 2 7 49 4 9 92 21 1.048 3.139 60+ I I 54 42 Age not
ststed.
555 624 497 94 60 565 543 404 6 1.957 750 12.801 20,158 Total T SHItIWARDHAN MAlUI, 9 29 2 6 15 5 92 19 10.994 1I ,256 0-14 226 32! 283 51 20 294 285 199 '3 1.079 410 1.123 4.209 15-34 256 245 192 40 35 239 219 187 3 715 298 222 3,018 35-59
64 29 22 I 5 26 24 13 71 23 454 1,675 60+ 8 Age not
stated,
473 564 336 91 39 331 217 284 6 1.373 580 10.189 15.895 Total R 9 26
204 2
is 3 9 3 '3 70 17 8,918 9.362 0-14
201 294 48 175 125 146 802 318 738 2.923 15-34 210 222 117 40 19 136 74 123 3 455 226 159 2,231 35-59 53 22 15 I 5 17 9 12 46 19 367 1.379 60+
7 Age not stated,
82 60 161 3 21 234 326 120 584 ' 170 2.612 4.263 Total U
25 3
79 '3 '5 3 6 2 22 2 2,076 1.894 0-14 27 1I9 160 53 277 92 385 1.286 15-34
46 23 75 16 103 145 64 260 72 63 787 35-59 II 7 7 9 15 I 25 4 87 296 60+
I Aqe not stated,
82 60 161 3 21 234 326 120 584 170 2,612 4,263 Total Shriwardhan (M)
25 3
79 'j '5 3 6 2 22 2 2.076 1,894 0-14 27 119 160 53 277 92 385 1.286 15-34
46 23 75 16 103 145 64 260 72 63 787 35-59 II 7 7 9 15 1 25 4 87 296 6~+
1 Age not stated.
218 66 169 6 48 301 96 191 6 844 178 8.765 12.621 Total T MHASALA MAIIAL 3 3 5 'j 1 6 7 I 43 5 7.870 7.839 0-14 80 34 96 17 158 70 70 2 498 103 381 1.935 15-34 1I2 26 62 3 30 120 17 116 .. 279 65 121 1.734 35-59 23 3 6 17 2 4 24 5 391 1.113 60+
2 Age not stated.
(M) = Municipality_
J-62-I1-19-A (Kolaba).
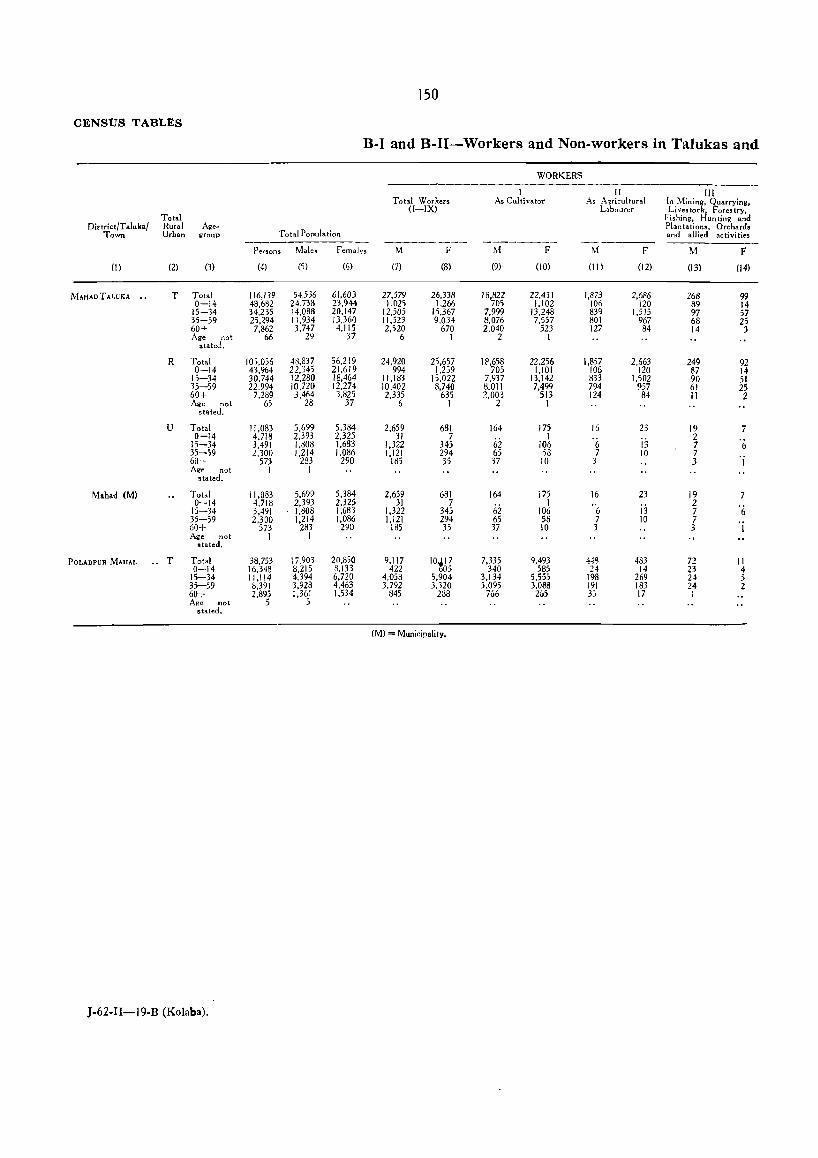
150
CENSUS TABLES
B-1 and B-II-Workers and Non-workers in Talukas and
WORKERS
I II IJI Total Wor kefs As Cui ti va tor As A~ricul tural In Mining, Quarrying,
(I-IX) L'lbourer Livesto('~ Forestry, Total Fishing, I unting and
Di,trict/TaIuka/ Rural Age- Plantations, Orchards Town Urban group Total Population and allied activities -------- ------
Persons Males Females M F M F M F !VI f
(1) (2) (3) (4) (5) (6) (7) (R) (9) (10) (II ) (12) (13) (14)
MAHAoTAWKA T Total 116,139 54,536 61,603 27,579 26,338 18,822 22,431 1,873 2,686 268 99 0-14 48,682 24,738 23,944 1,025 1,266 705 1,102 106 120 89 14
15-34 34,235 14,088 20,147 12,505 15,367 7,999 13,248 839 1,515 97 57 35-59 25,294 11,934 13,360 11,523 9,034 8,076 7,557 801 967 68 25 60+ 7,862 3,747 4,115 2,520 670 2,040 523 127 84 14 3 Age not 66 29 37 6 I 2 I
stated.
R Total 10>,056 48,837 56,219 24,920 25,657 IP,658 22,256 1,857 2,663 249 92 0-14 43,964 22,345 21,619 994 1,259 705 1,101 106 120 87 14
15-34 30,744 12,280 18,464 II ,183 15,022 7,937 13,142 833 1,502 90 51 35-59 22,994 10,720 12,274 10,402 8,740 8,011 7,499 794 957 61 25 60+ 7,289 3,464 3,825 2,335 635 ].,003 513 124 84 11 2 Age not 65 28 37 6 I 2 I
stated.
U Total 11,083 5,699 5,384 2,659 681 164 175 16 23 19 7 0-14 4,718 2,393 2.325 31 7
iii I '6 i3
2 '(, 15-34 3,491 1,808 1,683 1,322 345 106 7
35-59 2,300 1.214 1,086 1,121 294 65 58 7 10 7 60+ 573 233 290 185 35 37 10 3 3 I A~e not I I
stated.
Moh.d (M) Total 11,083 5,699 5,384 2,659 6Bl 164 i75 16 23 19 7 0-14 4,718 2,393 2,325 31 7
iii I ij 2
'6 15-34 3,491 1,808 1,683 1,322 345 106 6 7 35-59 2,300 1,214 1,086 1,121 294 65 58 7 10 7 60+ 573 283 290 185 35 37 10 3 3 I Air" not I I
stated,
POLADPUR MAHAL .. T Total 38,753 17,903 20,850 9,117 l°il7 7,335 9,493 4~8 483 72 II 0-14 16.348 8,215 8,133 422 05 340 585 24 14 23 4
15-34 11,114 4,394 6,720 4,058 5,904 3,134 5,555 198 269 24 5 35-59 8,391 3,928 4,463 3,792 3,120 3,095 3,088 191 183 24 2 60+ 2,895 1,361 1,534 845 288 766 21>5 3:; 17 Age not 5 5
stated.
(M) = Municipality,
J-62-1I-19-B (Kolaba),
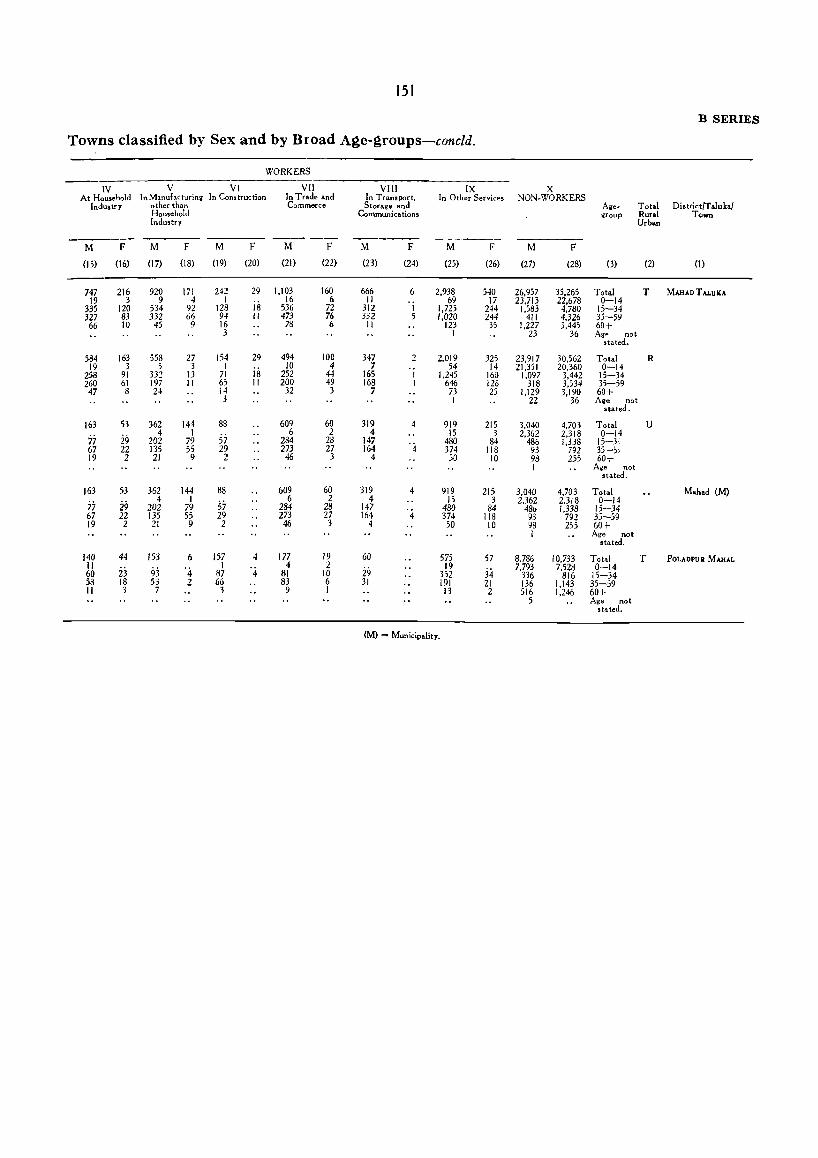
151
B SERIES
Towns classified by Sex and by Broad Age-groups-concld,
WORKERS
IV V VI VII VIII IX X At Household In MJ.nufacturin2' In Construction In Trade and In Transport, In Other Services NON-WORKERS
Industry other than Commerce Storage and Age- Total Districtrr.luka/ Household Communications ~roup Rural Town Indu.try Urban
------M F M F M F M F M F M F M F
(15) (16) (17) (18) (19) (20) (21) (22) (23) (24) (25) (26) (27) (28) (3) (2) (I)
747 216 92Q 171 242 29 1,103 160 666 6 2,938 540 26,957 35,265 Total T MAHADTALU"A 19 3 9 4 I is 16 6 II 'j 69 17 23,713 22,678 0-14
335 120 534 92 128 536 72 312 1,723 244 1.583 4,780 15-34 327 83 332 66 94 II 473 76 332 5 1,020 244 411 4,326 35-59 66 10 45 9 16 78 6 II 123 35 1.227 3,445 60-t-
3 I 23 36 Age not stated.
584 163 558 27 154 29 494 100 347 2 2,019 325 23,917 30,562 Total R 19 3 5 3 I is 10 4 7 54 14 21,351 20,360 0-14
258 91 332 13 71 252 44 165 I 1.245 160 1,097 3,442 15-34 260 61 197 11 6} II 200 49 168 I 646 126 318 3,534 35-59 47 8 24 14 32 3 7 73 25 1,129 3,190 60+
3 I 22 36 A.e not stated.
163 53 362 144 88 609 60 319 4 919 215 3,040 4,703 Total U
29 4 I
57 6 2 4 15 3 2,362 2,318 0-14 ;; 202 79 284 28 147 '4 480 84 48& 1,338 15-3:
67 22 135 55 29 273 27 164 374 118 93 792 35-), 19 2 21 9 2 46 3 4 50 10 98 255 60+
I A~e not stated.
163 53 362 144 88 609 60 319 4 919 215 3,040 4,703 Total Mahad (M) 4 1
57 6 2 4 15 3 2,362 2.318 0-14 ;7 i9 202 79 284 28 147 '4 480 84 48t> 1,338 15-34
67 22 135 55 29 273 27 164 374 118 93 792 35-59 19 2 21 9 2 46 3 4 50 10 98 2S5 60+
I Age not stated.
140 44 153 6 157 4 177 19 60 575 57 8,786 10,733 Total T POLADPUR MAHAL II
23 93 '4 I '4 4 2 29 19 j4 7,793 7,528 0-14
60 87 81 10 352 336 816 15-34 58 18 53 2 66 83 6 31 191 21 136 1,143 35-59 11 3 7 3 9 I 13 2 516 1,246 60+
5 Age not stated.
(M) = Municipality.
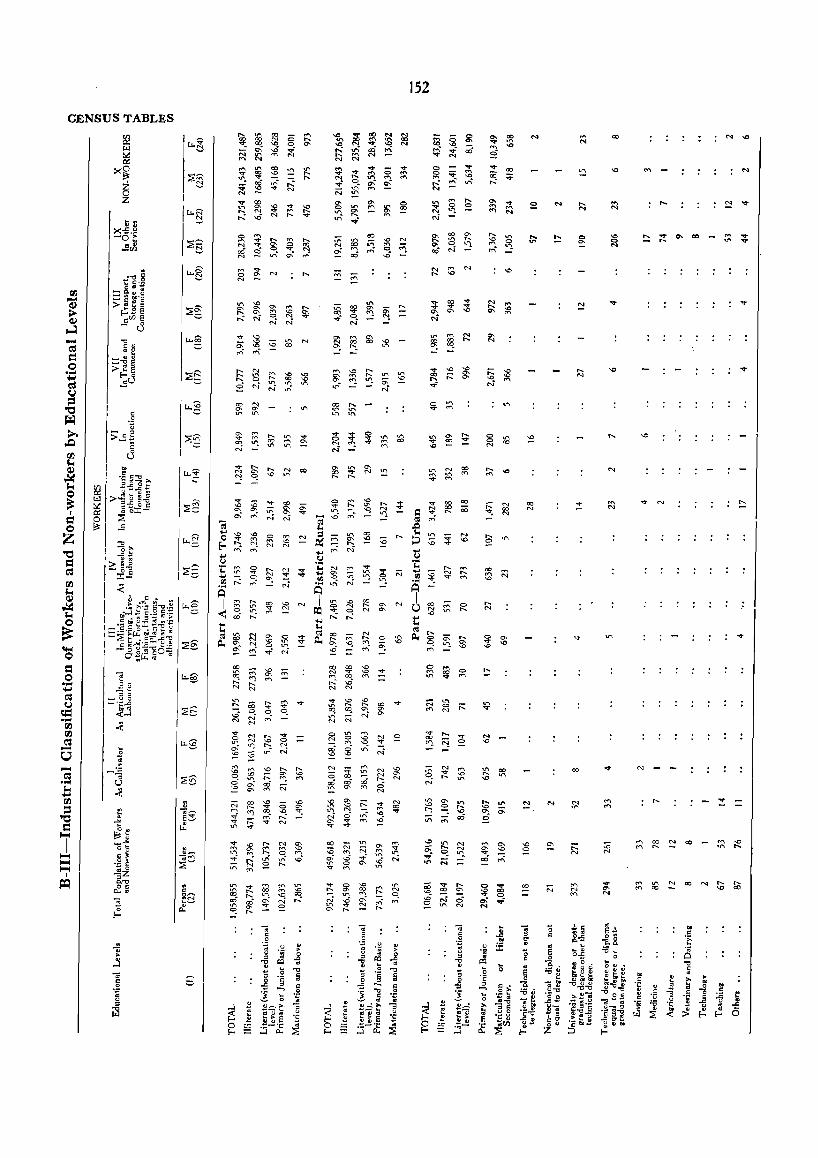
CENSUS TABLES
f:Q
..... o =: o ."" .... ~ c.J = ."" r/J r/J ~
(3
~
~ :><~
~
00 00 "" N -.::r ...0 ~
"" 00 '" r-..~ -.c N N
~ ~ ~ ~ ~ ~gtr\N
152
~ ~ S: cg :;f ~
~ ~ ~ ..,. co
~ ;;:
..... N
N
'"
... '"
co N
N
"" o
N
'"
N
... N
..,.
co
..,.
..,. N
N _ -
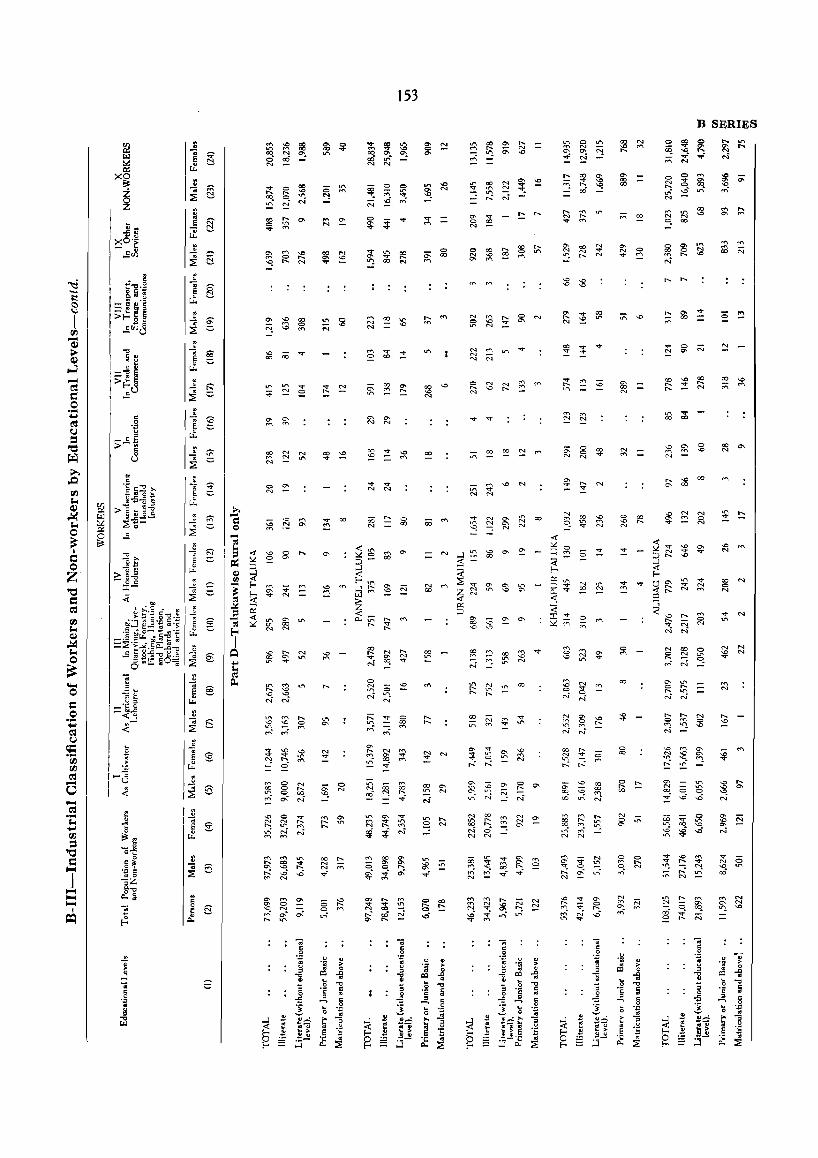
.... o = o .... ~ t<: t.I
q:: ·00 f/J t<: o
~ I .~ 1-;;
I ~
'" .,. ~ N 00
o aN
.... 00
'"
'" aN N
........ N N
153
o 00
~ ~ ~ ~ ~ r-: N
00 :;::00 00
'" '" N N
N
'"
o 00
R 00
B SERIES
~ 3 ~ tr\ ...c wri N
~ N N
..,. N
'"
N N ~ N
'" N
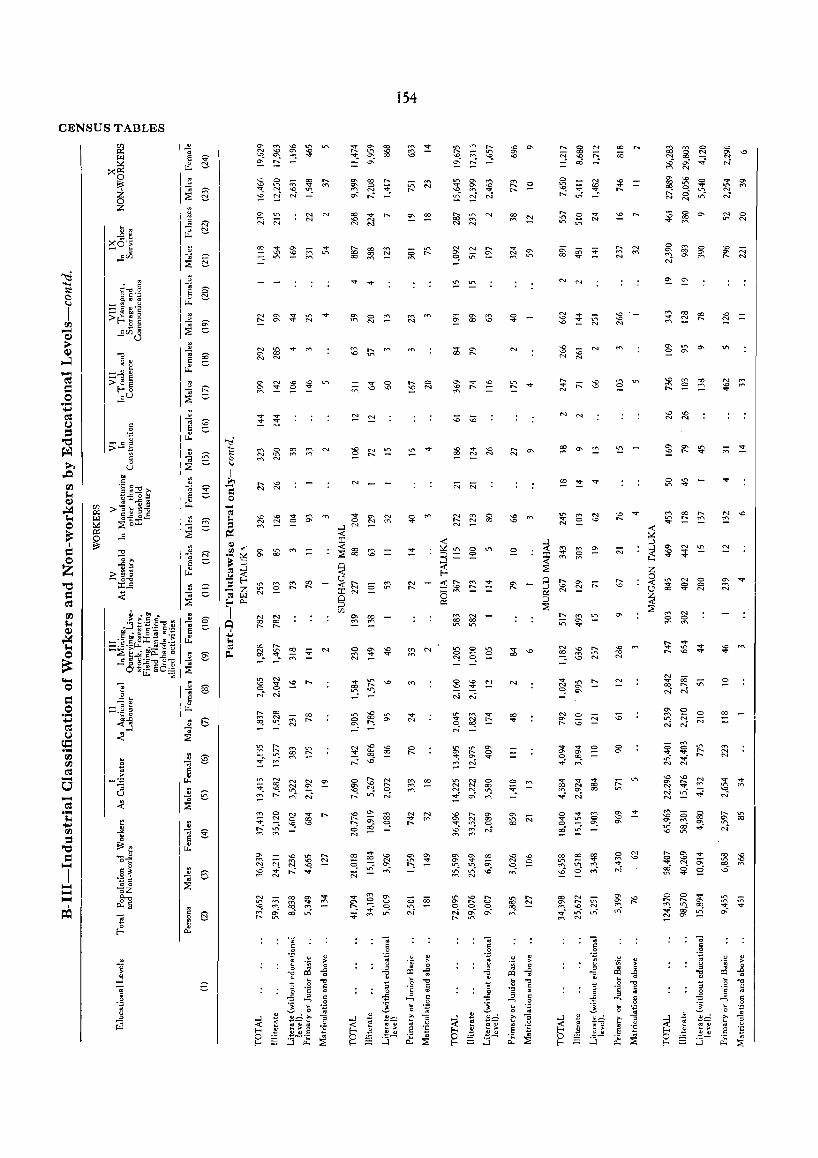
CENSUS TABLES
1Q
-o
= o .... .... ~ C,,) = .... rn rn ~
6 -1!'3
:E rn :=
"0
= -I ---~
~ ::,,:
xc>: ; . ~ _c-I ...
xO·~ 1- ~ I .sell
c .g - c 15 >-~
§ u
N
i54
..... <:> '" N
N N
N
"" ....
N N
N N
..... N
'" '" N
'" <:>
'" "" N
~ ~ ~ ..c 0-.& :;;
'" N
~ ~ ~ ~ ~ ~
....
<:>
'" N N
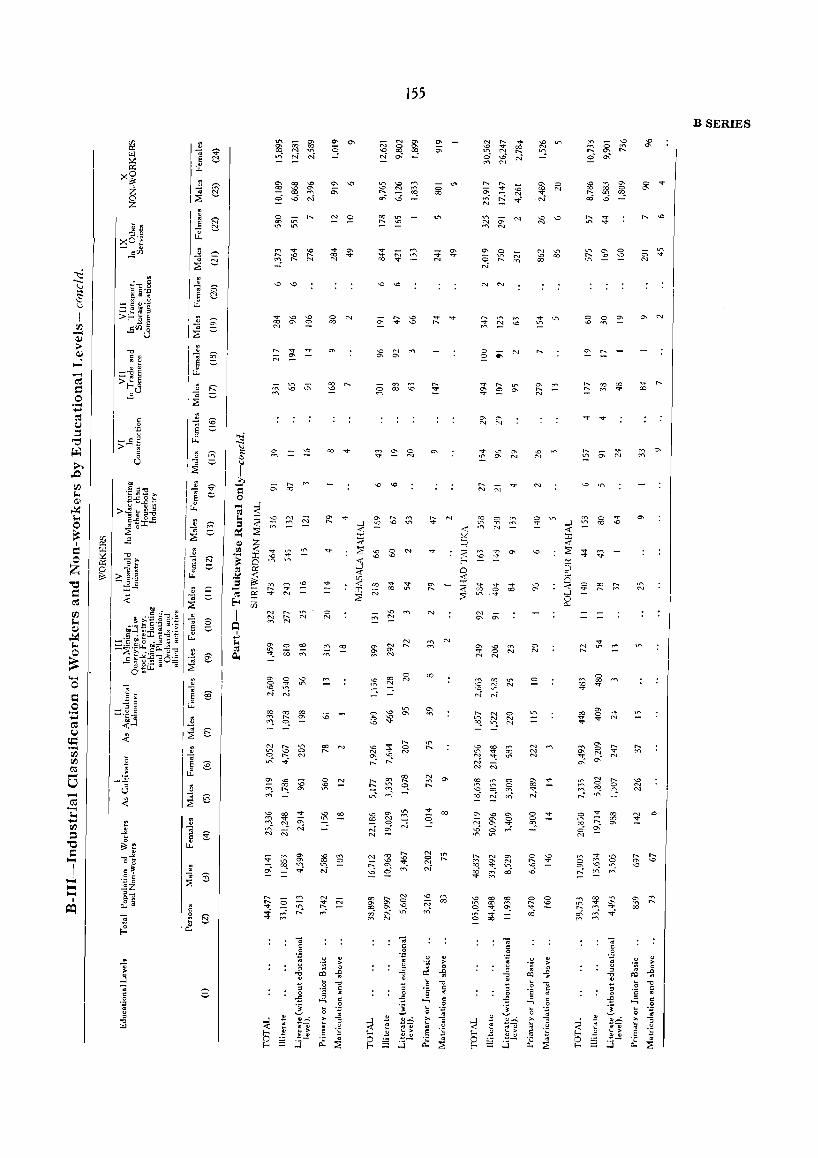
...J
..0:
6 f-<
155
o N
..... ...
.....
.".
N
N N
..... .". N N
'" ..... N
'" N
N
o N
o
N N N
B SERIES
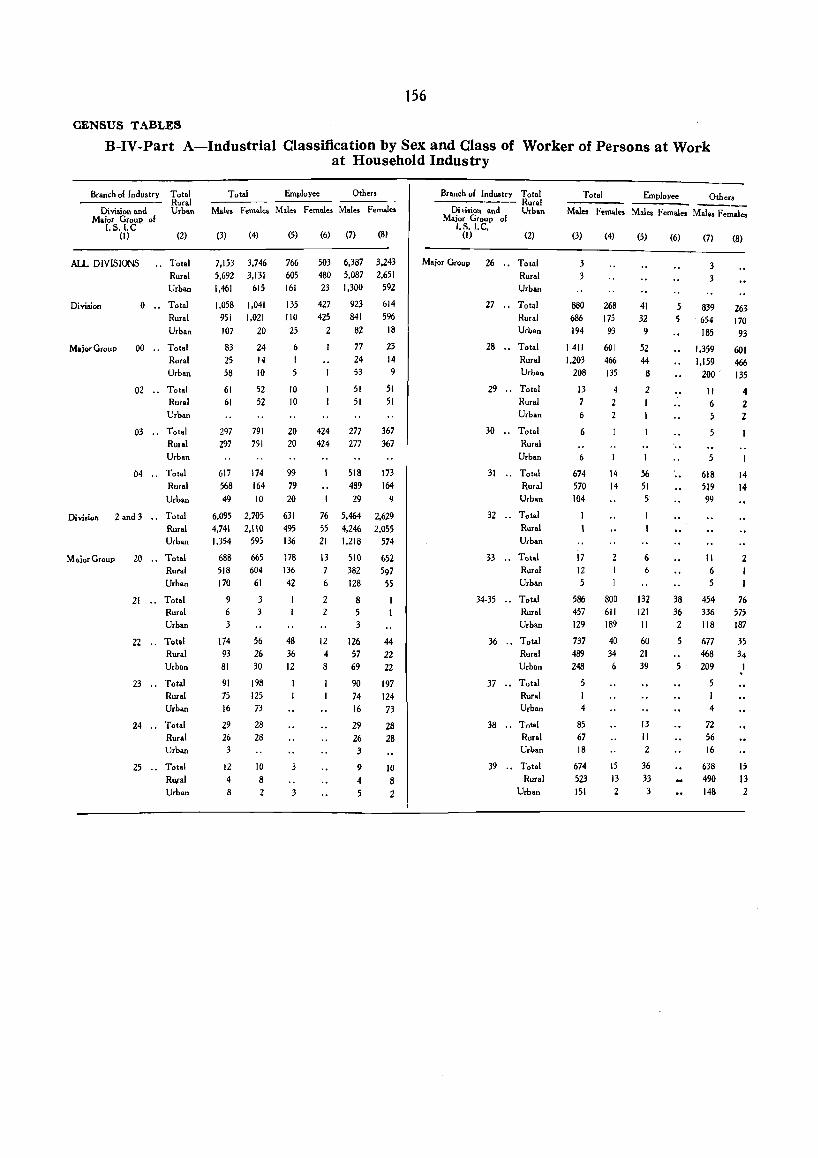
156
CENSUS TABLES
B-IV-Part A-Industrial Classification by Sex and Class of Worker of Persons at Work at Household Industry
Branch 01 Industry
Division and Maior Group 01
I.S.I.C
Total Rural Urban
(I) (2)
AU.. DIVISIONS .• Total
Division
Rural Urban
o " Total Rural
Urban
M.jorGroup 00 .. Total Rural Urban
Division
MaiorGroup
02 .. Total Rural Urban
03 .. Total Rural Urban
04 " Total Rural
Urban
2 and 3 •. Total Rural Urban
20 •• Total Rural Urban
21 .• Total Rural Urban
22 •. Total Rural Urban
23 •• Total Rural Urban
24 •• Total Rural Urban
25 •. Total Ru,ral Urban
Total Employee Othero
Mal.. F emal.. Mal.. F .male. Mal.s F emal ..
(3)
7.153 5.692 1.461
1,058 951 107
83 25 58
61 61
297 297
617 568 49
6,095 4,741 1,354
688 518 170
9 6 3
174 93 81
91 75 16
29 26 3
12 4 8
(4)
3,746 3,131
615
1,041 1,021
20
24 14 10
52 52
791 791
174 164
10
2,705 2,110
595
665 604
61
3 3
56 26 30
198 125 73
28 28
10 8 2
(5)
766 605 161
135 110
25
6 I
10 10
20 20
99 79 20
631 495 136
178 136 42
48 36 12
3
(6) (7)
503 480 23
427 425
2
424 424
76 55 21
13 7 6
2 2
12 4 8
6.387 5,087 1,300
923 841
82
77 24 53
51 51
277 277
518 489 29
5,464 4,246 1,218
510 382 128
8 5
3
126 57 69
90 74 16
29 26 3
9
4 5
(8)
3.243 2,651
592
614 596
18
23 14 9
;1
51
367 367
173 164
9
2,629 2,055
574
652 597
55
44 22 22
197 124 73
28 28
10 8 2
Branch of Industry Total ------- Rural
Di 1(ision a.nd Major Group of
I.S.I.C.
Urban
(I)
Major Group
(2)
26 " Total Rural Urban
27 .. Total Rural Urban
28 .. Total Rural Urban
29 .. Total Rural Urban
30 .. Total Rural
Urban
31 .. Total Rural Urban
32 .. Total Rural Urban
33 .. Total Rural Urban
34·35 .. Total Rural Urban
36 .. Total Rural Urban
37 .. Total Rural Urban
38 .. Total Rural Urban
39 .. Total Rural
Urban
Total Employe. Others
Mal .. Fern,l .. Males Femal •• Mal •• Femal ..
(3)
3 3
880 686 194
1411 1,203
208
13 7 6
6
674 570 104
17 12 5
586 457 129
737 489 248
5
4
85 67 18
674 523 151
(4)
268 J7j
93
601 466 135
4
2
14 14
800 611 189
40 34
15 13 2
(5)
41 32
9
52 44 8
2
I
56 51 5
6 6
132 121 II
60 21 39
13 II 2
36 33 3
(6)
5
38 36 2
5
5
(7)
3 3
839 654 185
1,359 1,159
200
II 6 5
5
618 519 99
11 6 5
454 336 118
677 468 209
5
4
72 56 16
638 490 148
(8)
263 170 93
601 466 135
4 2 2
14 14
2
76 575 187
35 34 I
15 13 2
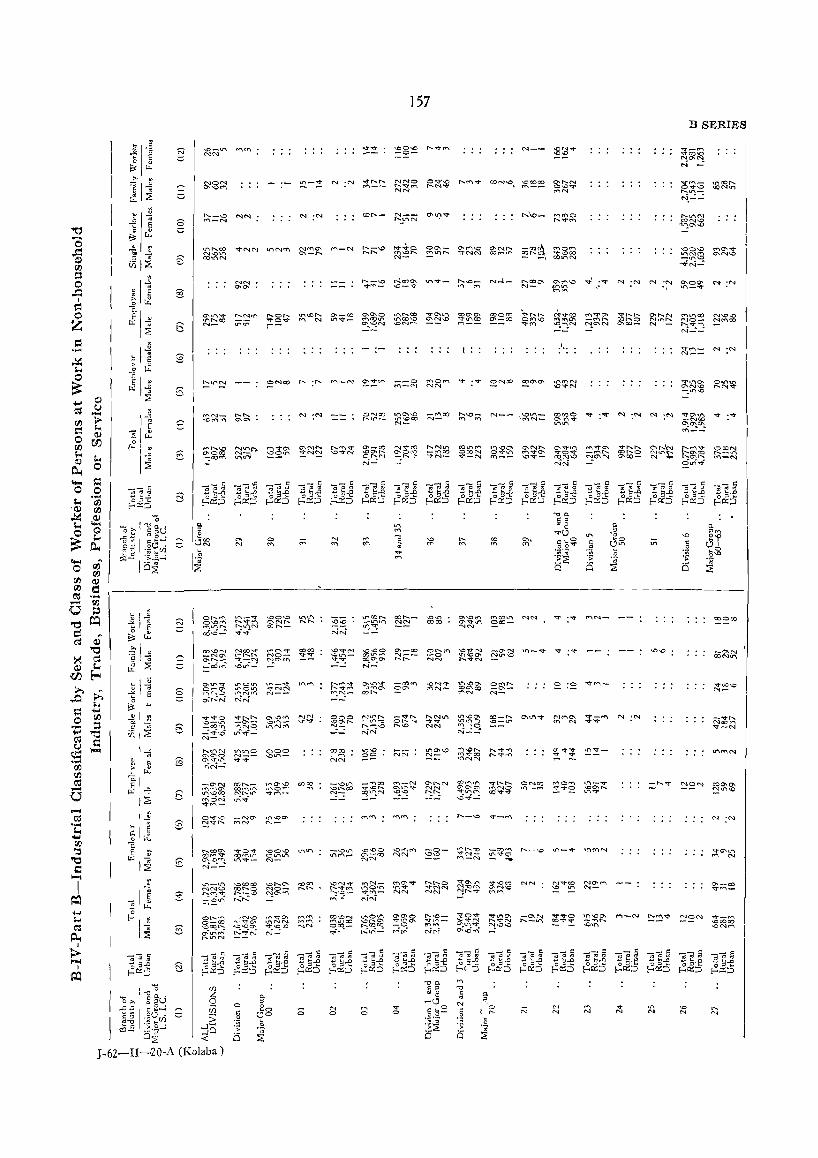
NN
ot--.?Il l.!"\_'"'t -.00'-0 'U"'iU'\ 0>,0('<"\ ""'!'t',,,,\ O'Nr-... r-...r-... MlJ'\f"'oo J"o..tAN cc.r-.._ OO--D-= ...;"¢ ..
~~a! ~~~ ~g;:! 0-['..,_ -T_N ~o-.rr'\ _:ai('f'\ ..t:)tt{....:
Q'"\U'\""1" t..r.O\.('\ , ..... ~~ 0-0" Lf'IOlli ~NN r""'l~":::> V",Nf'I"'I 1:'.1--O\~N NN
! U)
:;: ...J...JQ <r:
J-62-II-20-A (Kolaba )
~~~ CQ~ V('f"!· ...
N <:> "" o
157
"":,,C» 711"100 "'--
N--
"'''''''
N-- '-Ov."\-IC'<"'!N-
lI'I\OO\ 00-['. '-Ot.('\~ ..o-lf". '" '0 N_:":
.' ..
'" N
t't'\t:'\- --
B SERIES
"'''',.. 0\ N '..0
~ :N ':!~~ "<t- :~ "''''".,
'" N
~...:....:
'" N
'"",," '" N
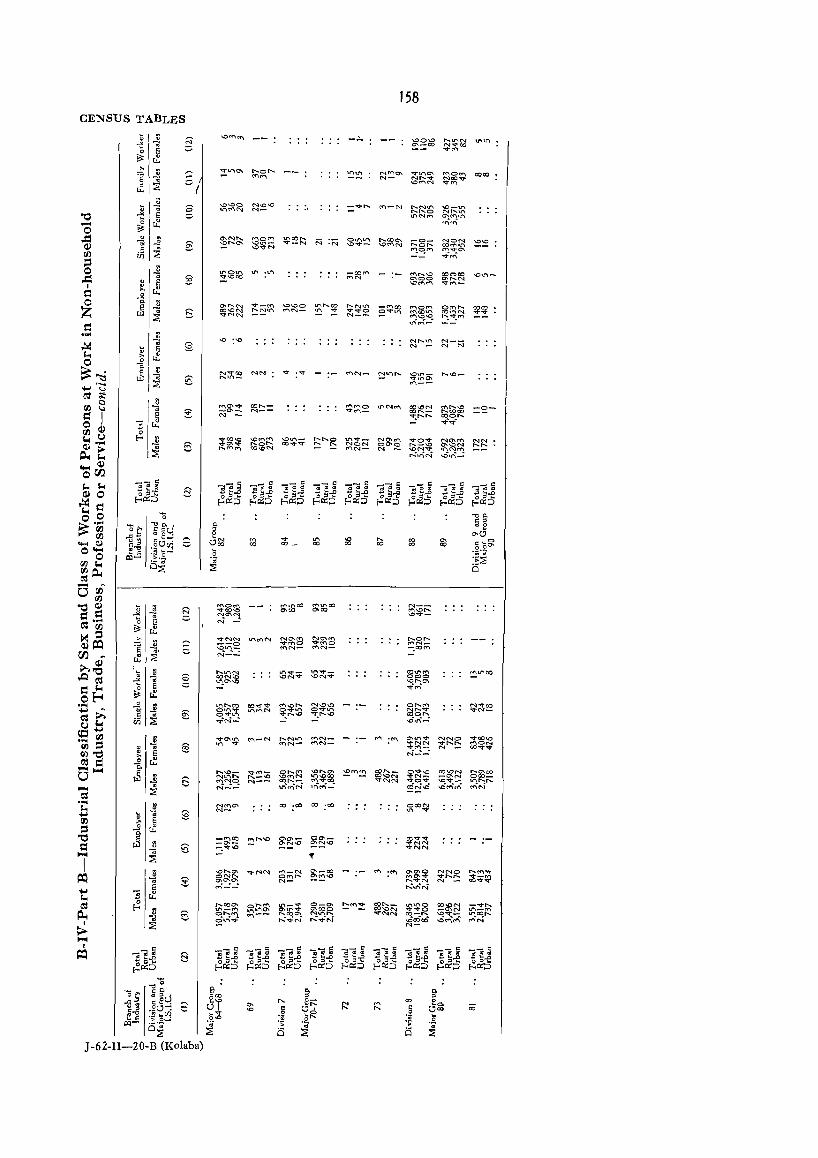
158 CENSUS TABLES
~ I ~ § """'" -- -- ""0"" ..... "'''' ""'''' ~i~ <:1'_00 NV'"
~Ij ... '" '" ~ ~tt'\Q\ ..... 0 .....
"'''' N"'''' :-= otI -;:: ",.,,,,, "'0", 'X)(Xl E -;; "'''' "'- N ........ "'00.".
Li': ~ ;::. """'''' ... '"
~, ~ 8 "'''''0 ",,,,,,, =~r-.. "'-N ..... "'''' ""-'" ~ ~ "''''''' N_ ......... 0 "' .... '" ~ -;: E c "''''''' "''''''' - 01 r1! ~~
0 ~I ..c= ~I~ ~~S': "'0'" "'''' .... N :'N 0",,,, ... 000. -0_ NON ~~ a> §: "''''- ""-N "'.".- """'N ..... 0 .... 00"",,,,
c I ~ "' ... '" rr"lq('l"\ "' ... '" 00 iJj :E ~~
= ~
0 I~ ",0", '" .'" -CO", '- "' .... '" COOoo "''''--= § !:...oa:> "'''' 0-000 a. .... '" ~ E ,'" ... '" "'<">-I r1! e: ...9
0 c. .] "' .... '" "'-'" -<>-<>0 "' .... 00 Z ~ .... "'''' -"'CO "'0'" 0"' .... roro
~ 6 00>.0", ..... Non "''''- :!:! :! "'..,.0 8"¢l('\ """on COll"'IN ..,...,. ... "'''' "'-- ~"'!~ ~~tt'\
e: "''''-.... 11 "" :'" "' .... '" "'--,!:4 I .. § '" - N N ~ E
'"' ~ ~ 0 -a I ~ ~~ "''''co ",N ..,. . ..,.
"'N- "'''' ..... ..ol/"'l-~)~ 0: .... "'- ..,."'''' .... "'-....... "'--.... <.>
ttl ;: ~ 0 "''''''_ "' .... - "',",0 otI"'", 00 I,J -;; "''''''' "' .... '" _0_
~ _0._ N-- "''''- 00 .... - .... 0000 e: I E N - "I:!t .. r....r-.. roo ....
0 -;; r1! -¢-¢
00 a> ~ '"'
t,) .] ",00", ",,,,,,, """'- ......... 0 "',,"- NO'o", "'0'" "",,'" NN Cl)
.... 6 ..,.0. ... ....0 .... 00..,...,. ~ ~ NO'" 0"'0 .... -'" "''''''' ........ ;;.- ]:g ..... "'''' "''0'" "'N-N _
'ON,," "''''''' &lot '"' r--,:'u-\'N ...01.1"\"":
~Q,) 0 00
'"' ~ "';G$ i ]-ej ~"';d ; -;'"; a __ 0
"";"; ; ~_ c ]ej ]~j ]~j -~..o " .. " " "" a> 0 ~~~ :::l _~..o -~..o - ~..o -~..o - t:1..o ~~;.) o ~ ~ o ~ ~ o ~ ~ o~~
~~::5 o ~ ~ 0" ~ ~&::5 ,!:4 f-,P::;:J f-,~;:J f-,~;:J f-,~;:J f-,P::;:J f-,C::;:J I..; = o 0 '"'0 .,,0. " , ~.~ ~~
.." c.. 0. " B gg~ " 0 "'0 Q,) u ~ c .. - '"' "N ~
.... L"I '" .... "" '" .g.g~ ~ c' .~OrJj 000 00 _
00 00 00 "" 00 o~ .. ."
~ C .~ E-.~ ~ "
00 8 CQ- >,_ :~::E
: Pot i5~ :;;: Cl
- 00-0 00 ~ Q,) ~ ~
~ ~g~ , .. ,,"00 ~~e.o N--
" ",00 , .. "" ..... =.S .,. -;; N"'N .0"'-a E N ....! ttl 00 ~ r1! X = .!::; .... "'''' "''''''' "''''''' NO.", .... 0 ....
O.)~ --0 ",,,,0 .... "'0 "''''-'s ~' ;:; ~u:..-:. "'N- "'N- -:_co('t\
00 " N--
;;..,Q,) "" ; ~ "''''-,.Q~ j 8 ..... "'''' "' .... - ~:ga "'''''''' " ~~:g ""N'" ""N,,"
0,0 .... '" = ~ a E ~ ~~
of-! ~ r1! .... ~
J! "' ..... co co",'" "''''' .... ""'''10 0 .... '" "',,"co .... >: .. (5S <;,." .... "''''''' 0,,"'" 0"",,, N ..... "" .... N_
t':l " " 0 .... '" ~r-..\Q ~~t...\C ooor-.. (J ""
iii :E ~r-.i-= ...o~_:
(,t:l '+-' 00 I ~ """'''' "'-'" ..... "'''' "'N_ '" :'" "'VI"" NNO .... ""'" .... ::; VI .... "''''- "'''I- ... NN .............. MON 00 g 11 e:: ... "'_ N - 00 .... ""
0) 'd N-="': ~ d -i1r1! o~ E ~ ..... "'- .... "'- 0 ..... '" 0.0"", ~M~ "'''- 0 ... .., "'o.OM "''''co "''''''' "'-'" """,M "'''''00 00'0",
.... "'- -"'N 000_
bJ ,~ S "''''0 "'-- 00"- "',,"00 .... "'N .... 0 .... "" .... - "'1.l'oAr-... - N-="': U"\~N ~N'\"": ~~~ ..o~M "'''' ~ .... ~ I~ "''''''' 00 .00 00 ,co 0""'" :
'"' '" N- '" .... : .... ::e 00 y :::s ~
~ ~ -",co "' .... '" 00'0_ 0",_ ro..,. ....
= 8 -"'- ~~..o ~~\O .... "'N -:,"'I;J"\O ... NN
I-t ~
I "" ..... '" ...-NN "'_N "'_00 '" :'" ",0'00 ~J:':!R ..... "'''" ~ ..!i ~ oN ..... 0"' .... ~~-.c ~~~ ... -'" E ~ a."'''' "'- N - "" ........
~_:....: r-:~N .... "$ r1! '"' t':l ~ """'" s::~~ "'-.... 0_'" !:::t't"'!~ !~~ ~~g """"'" - ........
:J "'-'" "'''' .... "'COO -"'N "'-'" Pot 6 0 .... '" "'-- ..... 00'" N"' ..... 00-" 0.0 .... _ "'oor-.. -;; Olt"\~ t-:...:fN r-:...;N' ...oeJ5~ ..ort'\rr\ ~N I :;s N-
t> I-t
I
-eej -;;-e 1i 1ej Ci;"c; a co""; ~ ca'C; ; ""a= ; 1~1 jU'""ii ; -c;"iG ; ~ ~
:::l ~&~ _~..o
_ .. ..0 _ .. ..0 - .. ..0 -"..0 ~ ~..o
p~::5 ~&l::5 ~~::5 o ,,~
~~::5 0' " 0" ... 0" ~ 0'_ !-<O:::;:J !-<C):;:J r--C::::J !-<C::;:J !-<O:::;:J
.... .,,0
0. ceo " c. 0. 0. " , , "00 , , ..o~ c~~ ~ ~r 0.
..... e;:::: ~ '" "" eO. u 11
:§~~ ~ 0.0 . § " . .... c "'" 00 :;-0 ~ .... .gR 0 .. c > 0_ 0-0 ·s .~ .g tXI- 0';;- ' ..
~ " ..
:;;: :E Ci :;s i:S :;s J -62-II-20-B (Kolaba)
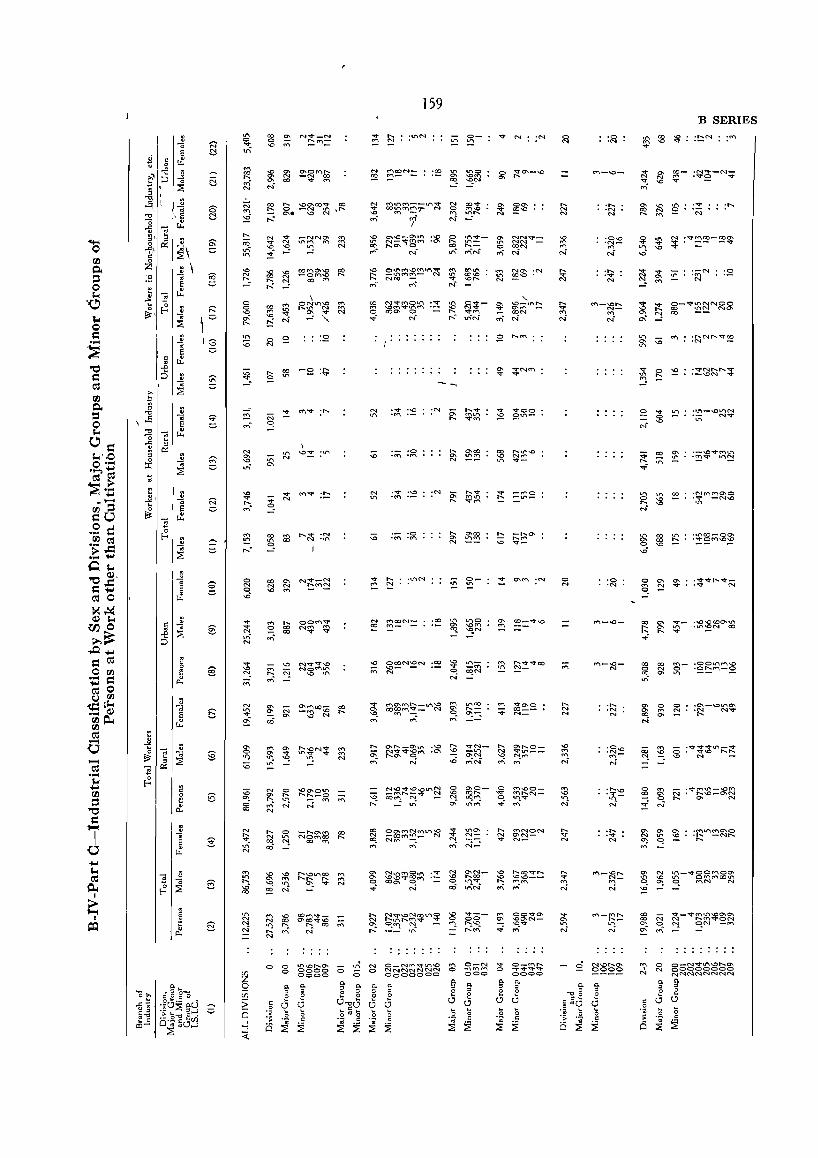
~ ~ ~~~fQ N
~ ~. ::::~(£)~,~ r.:
~ ~ ~~~~
'" ...0 N-.::I"-.::I"...o
~ <q N~~::g
'" ~ N ~~CO~ ~
'" '" '" a5
o 0 U""I...ot--.a. o 0000
0000
159
0-
'" '"
~ ~~~a~ :~ ~ m N~ tr\
~ ~~~~~Lt'\~ ~ m rf'I~ N
8 ~~~~~ ::! ~ ..,.~ N~ ........
. ...,.
.",
- .....
~ ~~~:!=lt"\~
'" '"
~ ~~r"·= o ""'" ('f'\ N
~ ~~- ~ O'I~ ari~ ...f
'" Ntr'I~0ll"'l .-.::1" ~ ~~V~Cf'\ .¢ N
~ ~~- ~ as It'\N' ~
~ ~~~~~\i"\~ a. Or"l"\ N -r-: ..:.....: ~
o N
o '"
.... N N
tf"I-'-O-
..... 'N
'"
~-"'-
C't'\-...oN
. .... 'N
'"
B SERIES
~ rJ ~- :~~-N~
'" ::! N
: ....
~ ~ :;:v~~-~~ -6
'-N .", N
~ § ~ :-.::I"~~=~~ ...; N
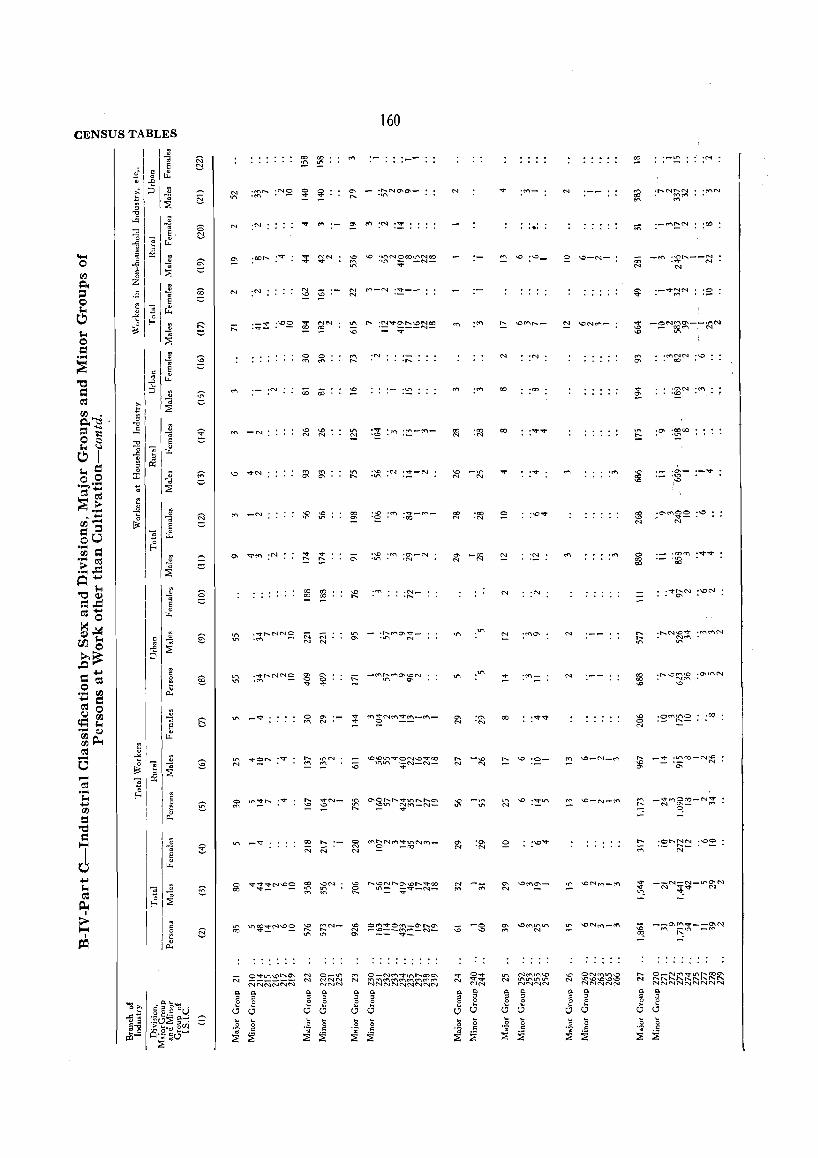
CENSUS TABLES
G c
N
'"
Of'> _"'"
. . . . . . . . . . . .
<:> 0
'" '"
160
tf'\ :_-
:~:t'f"l :~-N"o-
......... . ....... .
:'"
"" 'co N 'N
'~ 'N
..... -'" N N
..,.
o
N
..,.
r--. ...0 '0_
N
:""
.~NN '\0 , co
i
:~- :-~ ~
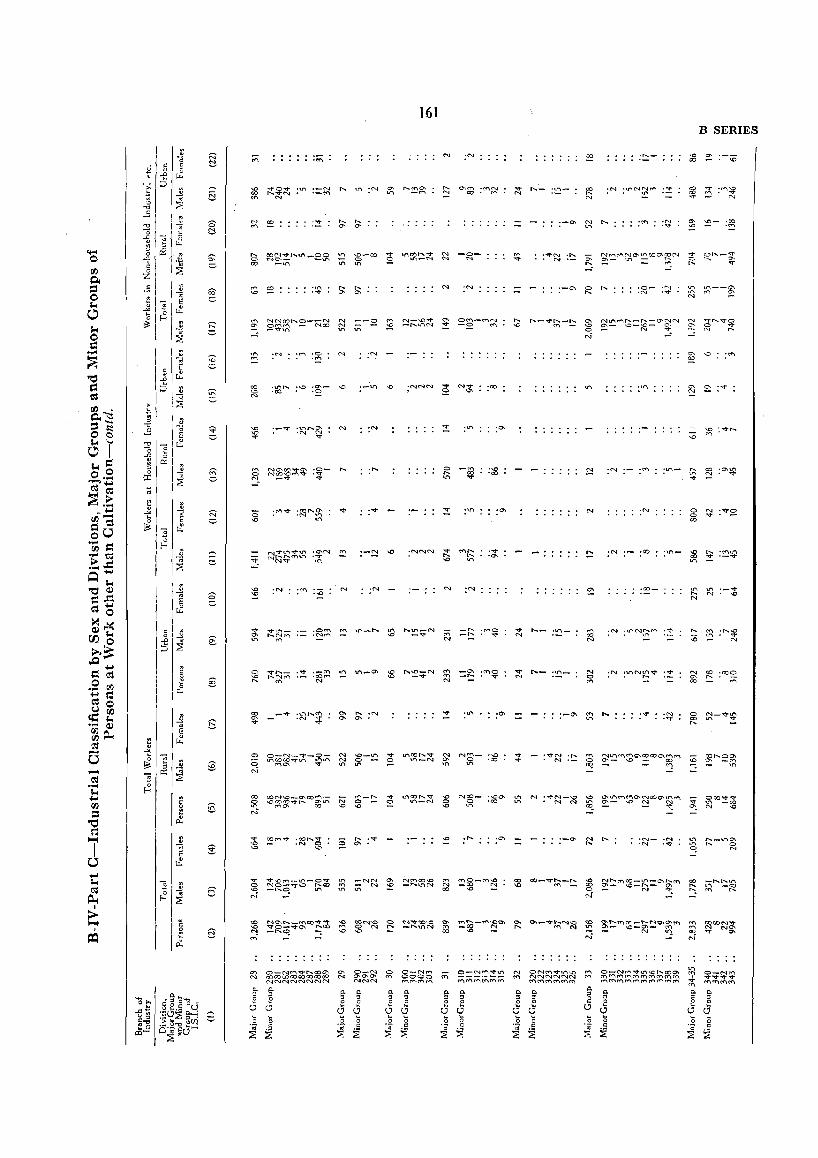
161
~ ~~~~~-N~ ~ ~-£ ~ ~~~~ ~ ~~-~~ ...:
.~ ::Q N
~ Q~~;;~~~;;:; ~ N
~ ~g;!:::;j:~Q;)It~ ('.!_ - ...... q -:.
'"
: .....
:'"
..... . ",
...... .(3)
...... . . . . . .
""!t' ['0._ 01/"1_ N
. .... . . .... .
N
N o '"
B SERIES
.",
:'"
. ..... . . .. . . . .
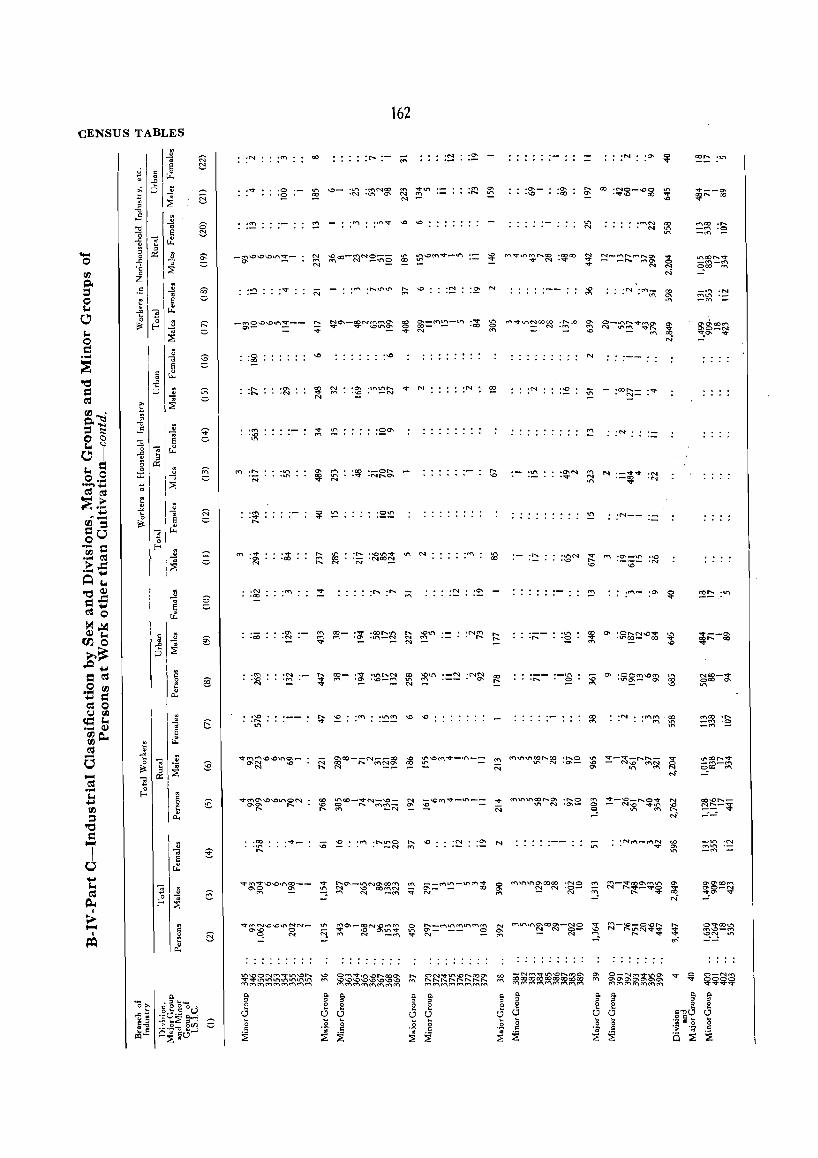
CENSUS TABLES
I I~
I ~ I c II l~ ~
I w I c I ~ l~
N ::::;.
8 ::::;.
·0 • <Xl
'" ..... N
.", . ...,. .....
. ...,. • 0-N
. ...,. '00
:'"
162
: .....
'0\ .\f'\lf'\ ...... "If' N '\0 • -N
. . . . . . . . . . . . . . . .
:£ N
.",
. ...... . . ...... .
'U'\
.....
'U'\ .~
. . . . . . . . . . . . . . . . . .
'" N
N
00
'"
't'f"tN co • N '"
'"
~ :!-~~r-.~~ ~
...... . .....
N
~oo .,.... _rt"I ·0 -<"
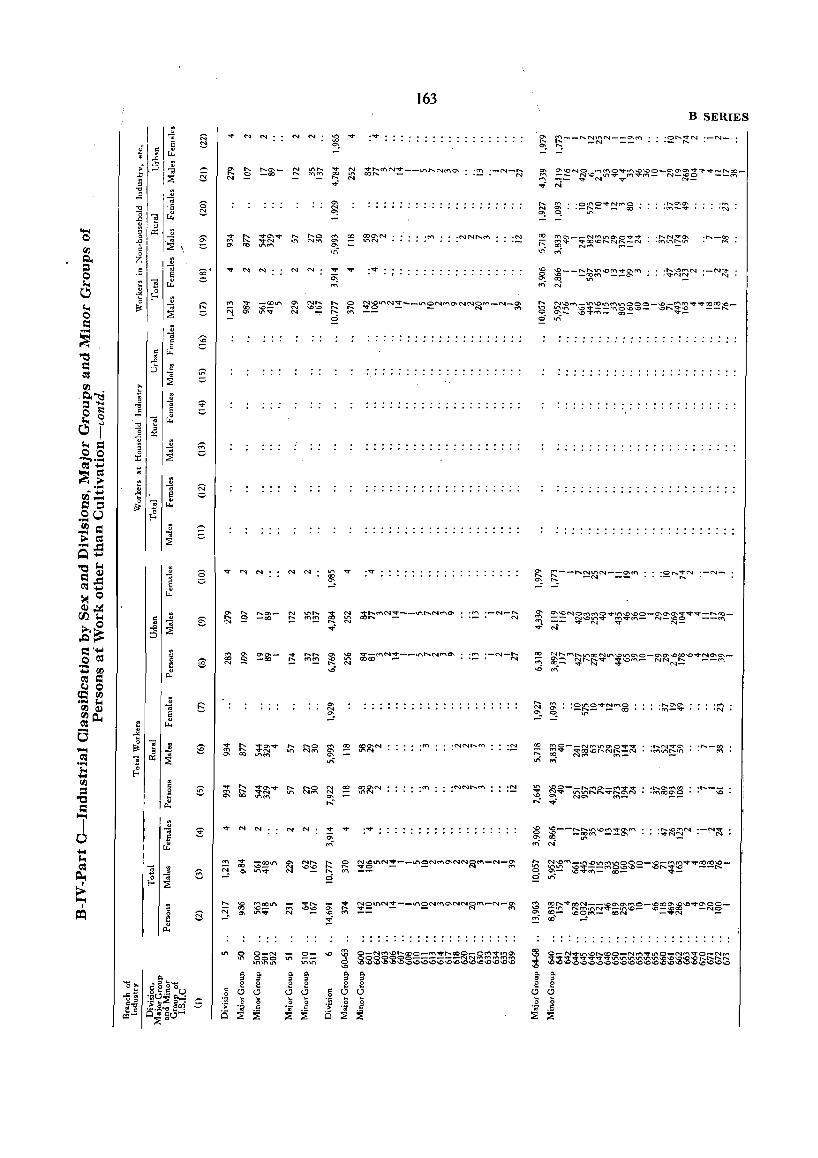
~ v
-;
J
N N
N N
163
....
: ...
~ ~ ~~~N~--~~N~~NN~~_N_~
o
....
~ ~~ re ~ ~~~N~--~~N~~
.... .~ ·-N- .......
• N
........ "''''
~ ~ ~OO~N~--~ ....... N~~ :~ :-N-~
-0
~ ~ ~~~N~-_~~N~~NN~~_N_~
$I
$ ~ ~2~N~--~SNm~NN~~-N-~ :!
. . . . . . . . . . . . . . . . . . . . . . . . . . . . . . . . . . . . . . . .
B SERIES
~ ~~N~~~~~~~~~~-~~~~~~=~~_ ~ N
'Oll"'lO"1t'Nrt"lO .-~- - 00
~ ~-_~~~\O~:!~~ ~ N
."" .",
~ ~~~~~~=~~~~~-~~;~~~~~~-o t.r\
~ ~=M~~~~~~~~~_~~~~~~~~~_ ..D ~
.", 'N
~ ~--!::~~~~:!~~ ~ NO.
~ ~~V~8~~~~~~~-~=~~~~~~~-('1"\ r.r.S ......:
.................. . ................ .
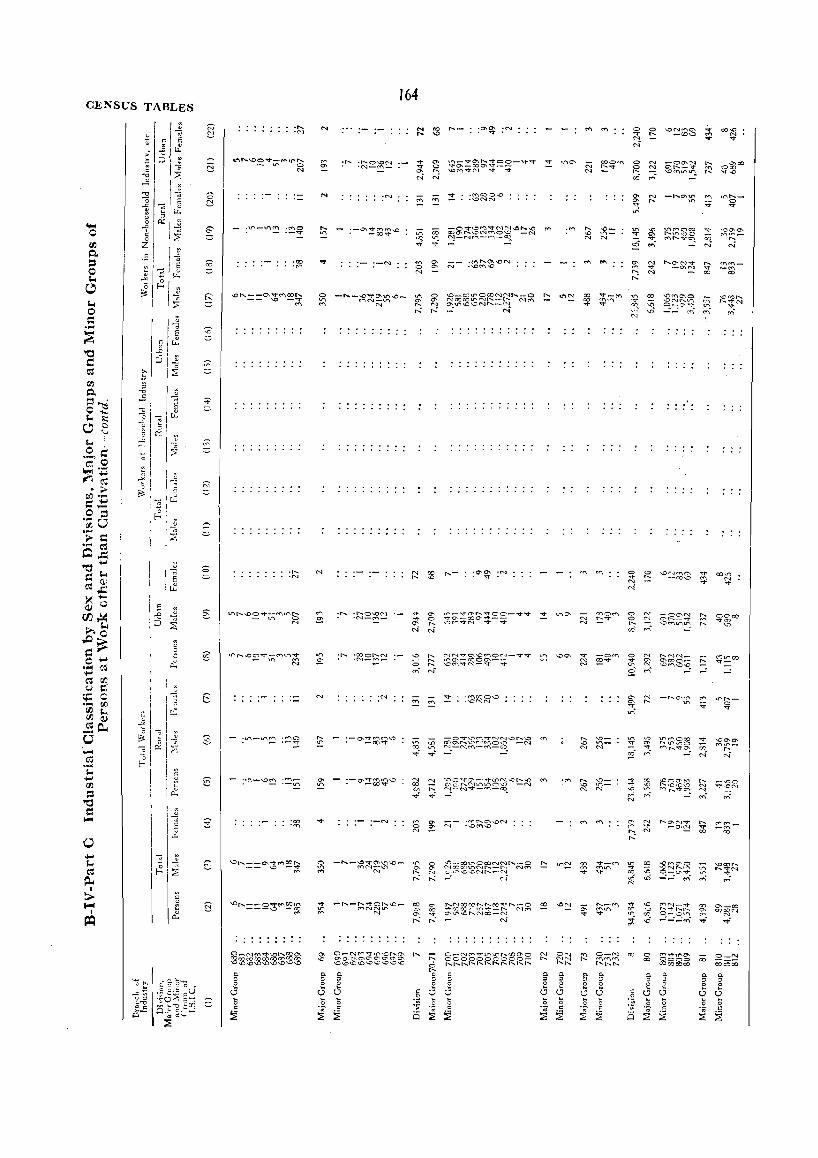
CENSUS TABLES
8 :::;
..... ·N
\O~ __ O"-"","M~t--.. -- \0 -v
'"
'-Or-... __ O"ITMOOll"\ ---\0 -00
'" . . . . . . . . . . . . . . . . . .
164
i R ~~~~~~~~-~~ v "'''' N N
:'"
a ~ N- :~~e6\DN '"
i ~ ~~~~~i2~-~~ ~ "'''' N N
"" :::: ~~::?b~~=S::-'7V o ....... -.ot'(\~N-V v M ~,f
~ N 'gf~~0:Rl;:;:;~~~\.C'~~ 0- ..... ~_:'N'7-N"\-oq_
~ ~
~ -"'-~~~~~- R ~ ...e-OOl.i'"'OCJ:)NN ...... -O r.... NCOcr-JV"'\N ....... _['." N<""'I c,ll1\.O>.CN ....... _N
'"' r' ....: N~
:A -"-~~~!;;\O_ '" N
~ ~ ~~~~~~~;:!r--..N~ 0" l' e--' .. ·,...c ......... <'lOO-N
r-: '"' _' N-
......... . ....... .
~ R -a~t8$ ~ cO~ N
~ ~ \O~~$ ~ N
~ ~ - ....... c,~ ~
'"
0-. ~l ....... o,,~,~ ....... r'1 V .-O'IN "" r-- '" co .--:
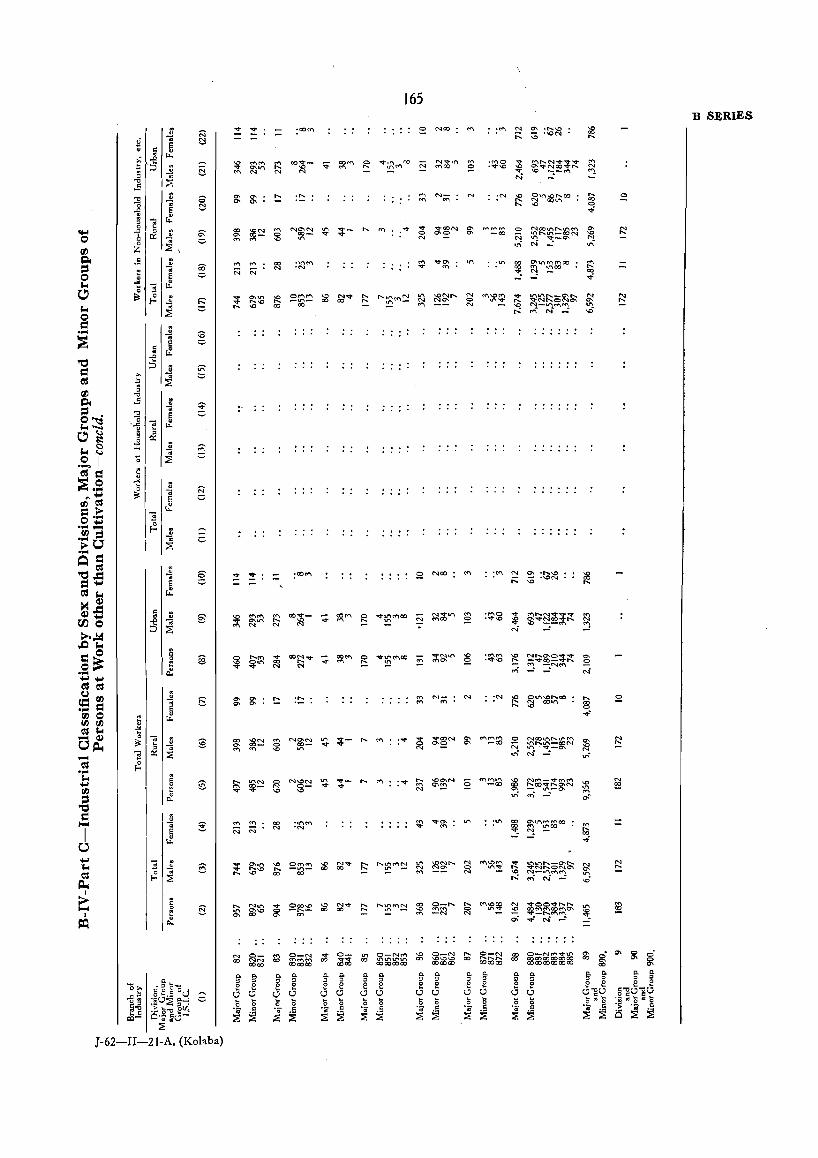
-~ .... '" ~ r1J .g = 1-4
I o
""_ ""
:~
165
~ NOO
N
""'"'' .,.,""
~ ~~~ ~ ~~~=~~ ~ ..n N"' ....: ..n
~ ~~~ ~ ~~~ ~ ~~~~~~ ~ "," ('t'\ !" .. f": ...c
B SERIES
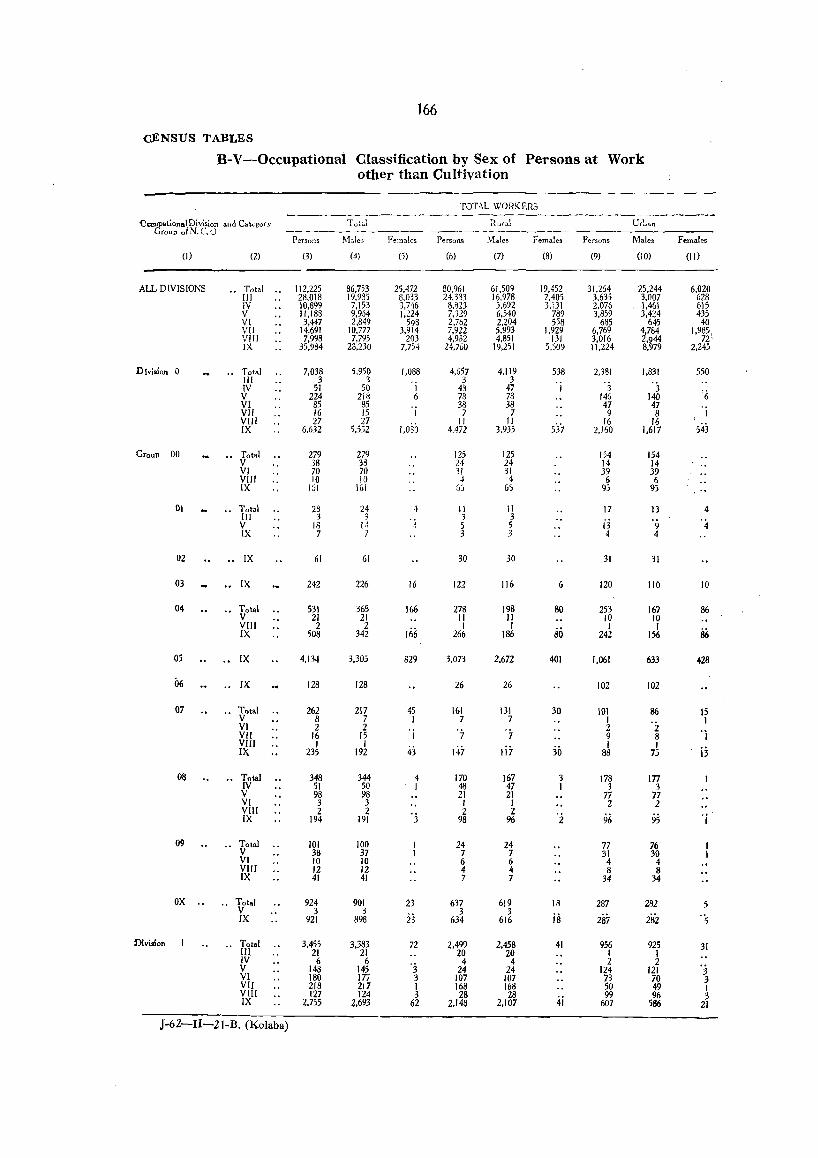
J66
CENSUS TABLES
B-V -Occupational Classification by Sex of Persons at Work other than Cultivation
TOTAL WORKERS
DccupationalDivision and Cat(;.gofY Tu~"\ aural Urban Group 01 N, C. u -------- .-----~- ------~---.-----
PerSO:ls ~,Ue3 Fe!1lalcs Persons Males F'emales Per-sons Males Females
(I) (2) (3) (4) (5) (6) (7) (8) (9) (10) (II)
ALL DIVISIONS .'. Total ,. 112.225 86.753 25.472 30.961 61.509 19.452 31.264 25.244 6.020 III 28.018 19.985 8.033 24.383 16.978 7.405 3.635 3.007 628 IV 10.899 7.153 3.746 8.~23 5.692 3.t31 2.076 1.461 615 V 11.183 9,954 1.224 7,329 6.540 789 3.859 3,424 435 VI 3,447 2,849 5g8 2.762 2.204 558 685 645 40 VII 14.691 10.777 3.914 7.922 5,993 1,929 6,769 4,784 1,985, VIIl 7.998 7.795 203 4.932 4.851 131 3.016 2,944 72' IX 35.984 23.230 7.754 24.760 19.251 5.509 11.224 8.979 2.24>
Division 0 ., Total 7.038 5.950 1.088 4.657 4.119 538 2.381 1.831 550 III 3 3 'j 3 3 '3 '3 IV 51 50 43 47 1
'6 V 224 218 6 78 78 146 140 VI 85 85
'j 38 38 47 47 'j VII 16 15 7 7 9 8 VIII 27 27
1.030 II II
537 16 16 543 IX 6.632 5.5:;2 4.472 3.935 2.160 1,617
Group 00 .. Total 279 279 125 125 154 154 V 38 38 24 24 14 14 VI 70 70 31 31 39 39 VIII 10 10 • 4 6 6 IX 151 161 JS 65 95 95 ., ..
01 .. Total 28 24 4 11 11 17 13 4 III 3 3 3 3
'4 V 18 14 (~ 5 5 13 9 IX 7 7 3 ,3 4 4
02 " IX 61 61 30 30 31 31
03 .. IX 242 226 16 122 116 6 120 110 10
04 .. Total 531 365 166 278 198 80 253 167 86 V 21 21 II II 10 10 VlII 2 2
166 I I
80 I I
86 IX 508 342 266 186 242 156
03 .. IX 4,134 3,305 829 3,073 2.672 401 1,061 633 428
06 .. IX 128 128 26 26 102 102
07 .. Total 262 217 45 161 131 30 101 86 15 V 8 7 I 7 7 I I VI 2 2 'j '7 '7 2 'i 'j VII 16 15 9 8
VIII I I 43 147 li7 30 I I
i3 IX 235 192 88 75
08 .. Total 348 344 4 170 167 3 178 177 IV 51 50 I 48 47 1 3 3 V 98 98 21 21 77 77 VI 3 3 I I 2 2 VIIl 2 2 '3 2 2
96 95 'j IX 194 191 98 96 2
09 .. Total 101 100 24 24 77 76 V 38 37 7 7 31 30 VI 10 10 6 6 4 4 VIII 12 12 4 4 8 8 IX 41 41 7 7 34 34
OX .. .. Total 924 901 23 637 619 18 287 282 5 V 3 3 23
3 3 is IX 921 898 634 616 287 2si 's Division .. Total 3.455 3,383 72 2,499 2.458 41 956 925 31 III 21 21 20 20 1 I
IV 6 6 '3 4 4 2 2 V 148 145 24 24 124 121 'j VI 180 177 3 107 107 73 70 3 VII 218 217 I 168 168 50 49 1 Vl!I 127 124 3 28 28
4i 99 96 3 IX 2.755 2.693 62 2.148 2,107 607 586 21
J-62-II-21-B, (Kolaba)
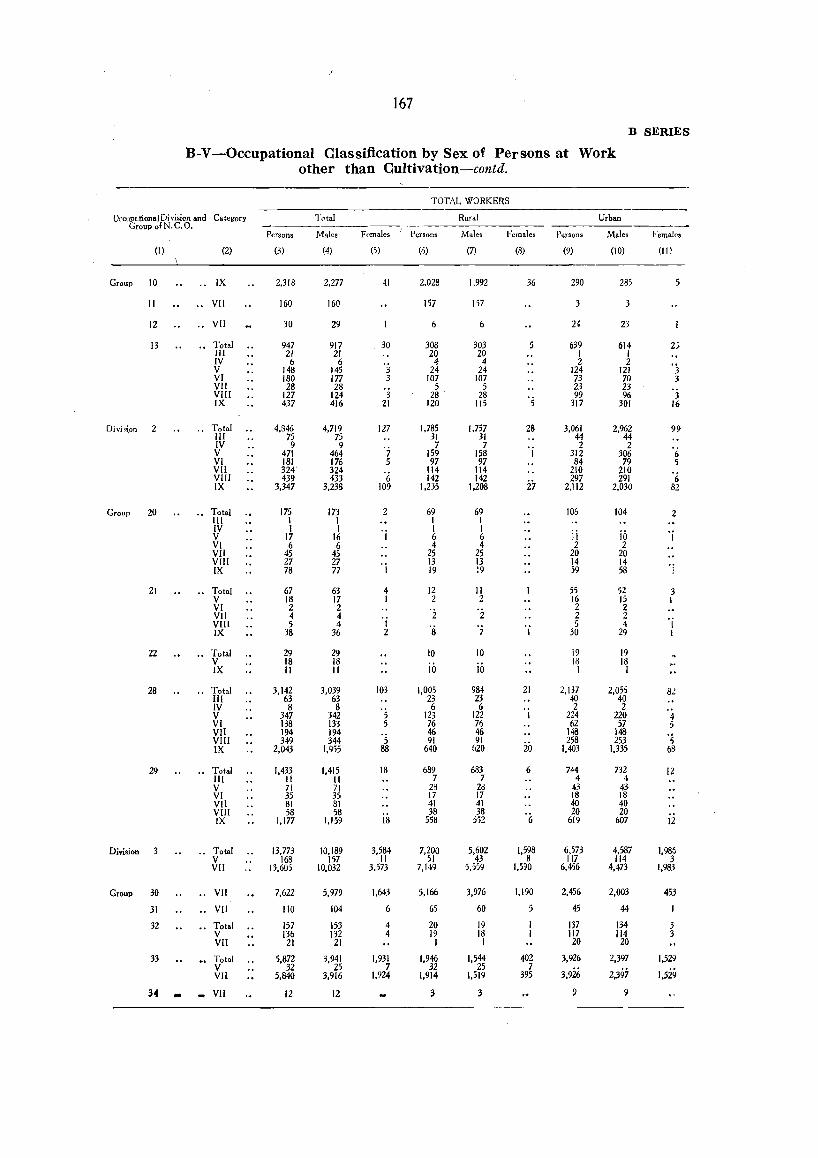
167
B SERIES
B-V -Occupational Classification by Sex of Persons at Work other than Cultivation-contd,
TOTAL WORKERS
OccuPE.rionai Di vision and Categ-ory Total Rural Urban Group of N. C. 0,
Persons Males Females PersQns Males Females Persons Males Females
(I) (2) (3) (4) (5) (6) (7) (8) (9) (10) (II)
Group 10 ,. IX 2.318 2.277 41 2.028 1.992 36 290 285 5
II .. VII 160 160 157 m 3
12 " VII 30 29 6 6 24 23
13 " Total 947 917 30 308 303 5 639 614 2; III 21 21 20 20 I I IV 6 6 4 4 2 2 V 148 145 3 24 24 124 121 3 VI 180 177 3 107 107 73 70 3 VII 28 28 5 5 23 23 VllI 127 124 3 28 28 '5 99 96 3 IX 437 416 21 120 115 317 301 16
Divi5\On 2 ., Total 4.846 4.719 127 1.785 1.757 28 3.061 2.962 99 III 75 75 31 31 44 44 IV 9 9 '7 7 7 'j 2 2 V 471 464 159 158 312 306 I) VI 181 176 5 97 97 84 79 5 VII 324 324 '6 114 114 210 210 VIll 439 433 142 142
i7 297 291 '6
IX 3.347 3.238 109 1.235 1,208 2,112 2.030 82
Group 20 .. Total 175 173 2 69 69 106 104 2 III I I I I IV I I 'j I I
ii io 'j V 17 16 6 6 VI 6 6 4 4 2 2 VII 45 45 25 25 20 20 VIII 27 27 'i 13 13 14 14
'i IX 78 77 19 :9 59 58
21 " Total 67 63 4 12 II 55 52 3 V 18 17 I 2 2 16 15 I VI 2 2 '2 '2 2 2 VII 4 4 'j 2 2 'j VIII 5 4 's '7 'j 5 4 IX 38 36 2 30 29 1
22 .. Total 29 29 10 10 19 19 V 18 18
iii 18 18
IX II II 10 I I
28 " Total 3.142 3.039 103 1.005 984 21 2,137 2,055 82 III 63 63 23 23 40 40 IV 8 8 '5 6 6 'j 2 2 V 347 342 123 122 224 220 4 VI 138 133 5 76 76 62 57 5 VII 194 194 '5 46 46 148 148 '5 VIII 349 344 91 91 258 253 IX 2.043 1.955 88 640 620 20 1,403 1,335 68
29 .. Total 1,433 1.415 18 689 683 6 744 732 12 III II II 7 7 4 4 V 71 71 28 2d 43 43 VI 35 35 17 17 18 18 VII 81 81 41 41 40 40 VIII 58 58 38 38 ';; 20 20 IX 1,177 1.159 18 558 552 619 607 12
Division 3 " Total 13.773 10.189 3.584 7.200 5.602 1,598 6.573 4.587 1,986 V 168 157 11 51 43 8 117 114 3 VII 13.605 10,032 3,573 7.149 5.559 1,590 6,456 4.473 1,983
Group 30 .. VII 7.622 5.979 1.643 5.166 3.976 1,190 2,456 2,003 453
31 " VII 110 104 6 65 60 5 45 44
32 .. Total 157 153 4 20 19 137 134 :5 V 136 132 4 19 18 117 114 3 VII 21 21 I I 20 20
33 ,., Total 5,872 3,941 1,931 1.946 1,544 402 3,926 2,397 1,529 V 32 25 7 32 25 7 3,9i6 2,397 1,529 VII 5,840 3,916 1.924 1,914 1.519 395
34 - _ VII 12 12 3 3 9
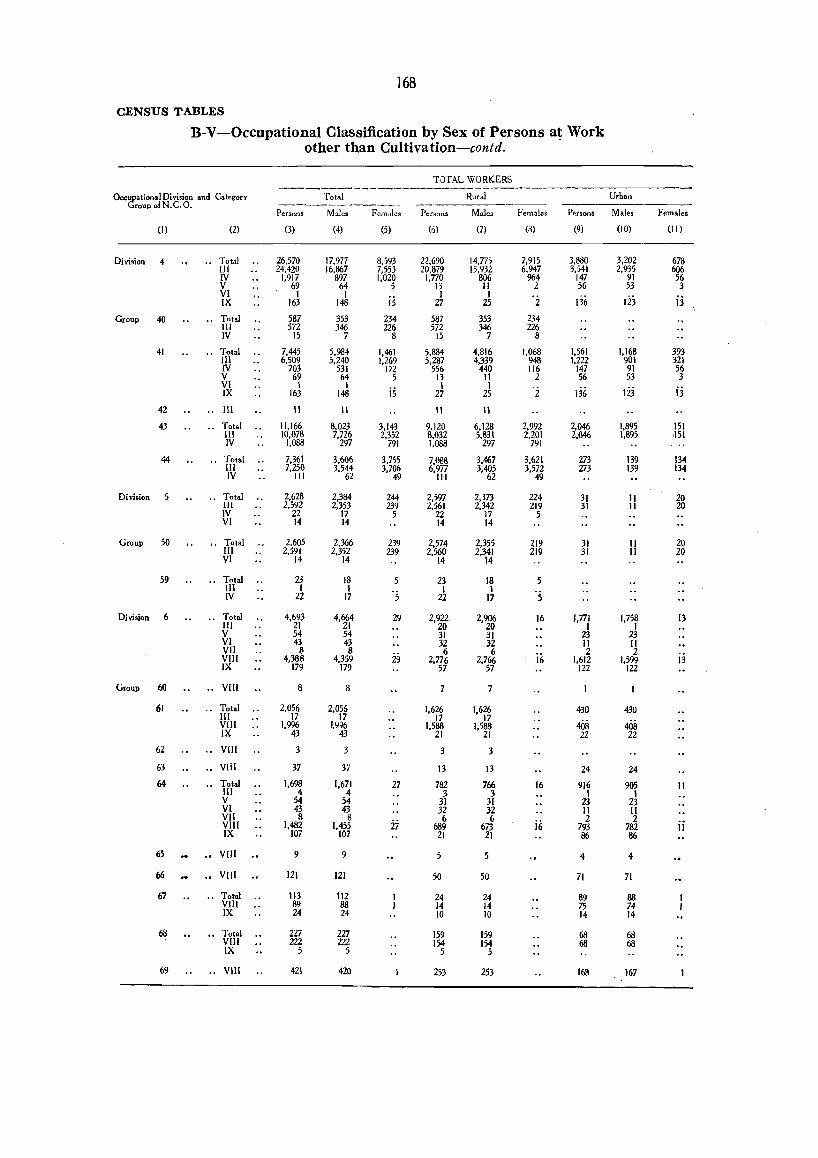
168
CENSUS TABLES
B-V-Occupational Classification by Sex of Persons at Work other than Cultivation-contd.
T0TAL WORKERS --------~---Occupational Division and Category Total Rural Urban
Group oIN.C.O. ----------Persons M,les Females Persons Males Females Petsons Males Females
(1) (2) (3) (4) (5) (6) (7) (3) (9) (10) (II)
Division 4 .• Total 26,570 17.977 8.593 22.690 14.775 7.915 3.880 3.202 678 III 24.420 16.867 7.553 20.879 13.932 6.947 3.541 2.935 606 IV 1.917 897 1.020 1.770 806 964 147 91 56 V 69 64 5 13 11 2 56 53 3 VI 1 1
i5 1 1
'2 136 123 i3 IX 163 148 27 25
Group 40 .• Total 587 353 234 587 353 234 III 572 346 226 572 346 226 IV 15 7 8 15 7 8
41 •. Total 7.445 5.984 1.461 5.884 4.816 1.068 1.561 1.168 393 m 6.509 5.240 1.269 5.287 4.339 948 1.222 901 321 IV 703 531 172 556 440 116 147 91 56 V 69 64 5 13 11 2 56 53 3 VI 1 1
i5 1 1 '2 136 123 jj IX 163 148 27 25
42 .. m II II II 11
43 " Total 11.166 8.023 3.143 9.120 6.128 2.992 2.046 1.895 151 III 10.078 7.726 2.352 8.032 5.831 2.201 2.046 1.895 ;151 IV 1.088 297 791 1.088 297 791
44 .. Total 7.361 3.606 3.755 7.088 3.467 3.621 273 139 p4 1Il 7.250 3.544 3.706 6.977 3,405 3,572 273 139 34 IV III 62 49 III 62 49
Division 5 •• Total 2,628 2,384 244 2,597 2,373 224 31 II 20 III 2,592 2,353 239 2,561 2,342 219 31 II 20 IV 22 17 5 22 17 5 VI 14 14 14 14
Group 50 .. Total 2,605 2,366 239 2,574 2,355 219 31 II 20 III 2,591 2,352 239 2,560 2.341 219 31 II 20 VI 14 14 14 14
59 •• Total 23 18 5 23 18 5 III 1 I ·s I I '5 IV 22 17 22 17
Division 6 •. Total 4,693 4,664 29 2,922 2,906 16 1.771 1.758 13 III 21 21 20 20 I I V 54 54 31 31 23 23 VI 43 43 32 32 II II VII 8 8
iii 6 6 ii;
2 2 VIII 4,388 4,359 2,776 2,766 1,612 1,599 13 IX 179 179 57 57 122 122
Group 60 .. VllJ 8 8 7 7
61 .• Total 2,056 2,056 1,626 1,626 430 430 III 17 17 11 17 VIII 1,996 1,996 1,588 1,583 408 408 IX 43 43 21 21 22 22
62 .. VIII 3 3 3 3
63 .• VlIl 37 3, 13 13 24 24
64 •• Total 1,698 1,671 27 782 766 16 916 905 II III 4 4 3 3 I 1 V 54 54 31 31 23 23 VI 43 43 32 32 II II VII 8 8
27 6 6 i6
2 2 VIII 1,482 1,455 689 673 793 782 ii IX 107 107 21 21 86 86
65 ., VIII 9 9 5 5 4 4
66 •• VIII 121 121 50 50 71 71
67 .. Total 113 112 24 24 89 88 VJII 89 88 14 14 75 74 IX 24 24 10 10 14 14
68 .. Total 227 227 159 159 68 68 VIII 222 222 154 154 68 68 IX 5 5 5 5
69 .. VIII 421 420 253 253 168 167
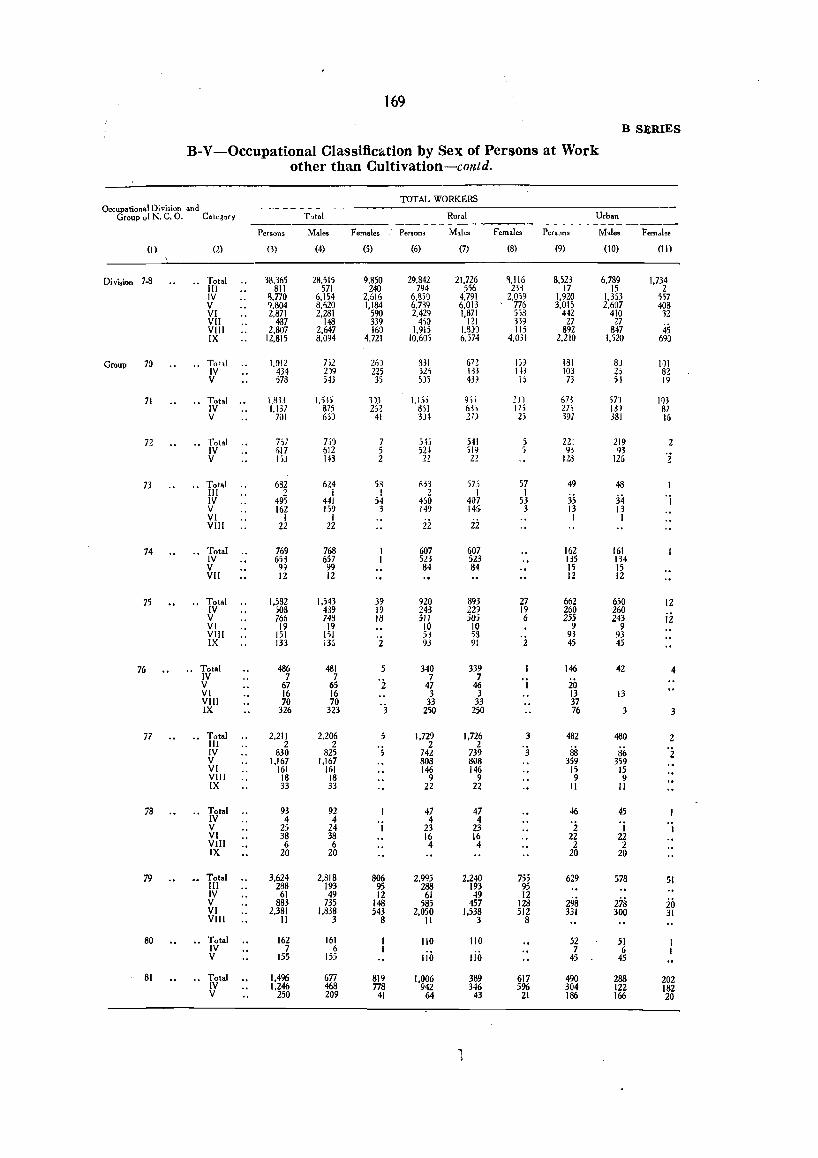
;
169
B SERIES
B-V -Occupational Classification by Sex of Persons at Work other than Cultivation-contd,
TOTAL WORKERS Occupational Division and
Group 01 N, C, 0, Cate~ory Tfltal Rural Urban --------------Persons Males Females PeJ'sons Males Females Pets.)ns M,le. Female~
(I) (2) (3) (4) (5) (6) (7) (8) (9) (10) (II)
Division 7-8 " Total 38,365 28.515 9.850 29.842 21.726 ~.1I6 8.523 6.789 1.734 III 811 571 240 794 556 233 17 15 2 IV 11.770 6.154 2,616 6.8;Q 4.791 2.059 1.920 1,353 557 V 9.804 8.620 1.184 6.739 6.013 776 3.015 2.607 408 VI 2.871 2.281 590 2.429 1.871 553 442 410 32 VII 437 148 339 41) 121 319 27 27
45 VIII 2.807 2.647 160 1.915 1.8)) 115 892 847 IX 12.815 8.094 4.721 10.605 6,574 4.031 2.210 1,520 690
Group 70 .. Total 1.012 752 26~ 331 672 lH 131 8) 101 IV 434 2)9 225 326 m III 103 ?' 82 ., V 578 541 35 5J) 43J I') 73 51 19
71 .. Total .. 1.833 1.5l5 3J3 1.15; 9il ,)) 5H ;]1 103 IV 1.n7 87; m 851 6l, llj 275 13) 87 V 701 6S~ 41 3H 21J 2j 391 381 16
72 .. Total 7j7 m 7 5H 5~1 5 221 219 2 IV (,17 612 5 521 m 5 93 Q3
'2 V 15) 1H 2 22 22 123 126
73 .. Tota! 6g2 624 53 633 575 57 49 48 III 2 1 1 2 1 1
35 34 'j IV 495 441 54 460 407 53 V 162 159 3 149 145 3 13 13 VI 1 1
22 2i I I
VIII 22 22
74 .. Tot.l 769 768 607 607 162 161 IV 653 657 523 523 135 134 V 99 99 84 84 15 IS VII 12 12 12 12
75 •• Tot.1 1,582 1,543 39 920 893 27 662 650 12 IV 508 439 19 243 229 19 260 -260
ii V 766 748 18 511 505 6 255 243 VI 19 19 iO 10 9 9 VIII 151 151 53 53 'i 93 93 IX 133 m 2 93 91 45 45
76 .. Total 486 481 5 340 339 146 42 4 IV 7 7 'i 7 7 'j ib V 67 65 47 46 VI 16 16 3 3 13 13 VIII 70 70 'j 33 33 37 IX 326 323 250 250 76 3 3
17 .. Total 2.211 2.206 5 1.729 1.726 3 482 480 2 III 2 2 '5 2 2
'2 IV 830 825 742 739 3 88 86 V 1,167 1,167 808 808 359 359 VI 161 161 146 146 15 15 VlII 18 18 9 9 9 9 IX 33 33 22 22 11 11
78 .. Total 93 92 47 47 46 45 IV 4 4 4 4 'i 'j V 25 24 1 23 23 1 VI 38 38 16 16 22 22 VIII 6 6 4 4 2 2 IX 20 20 20 20
79 Total 3.624 2.818 806 2.995 2,240 755 629 578 51 III 288 193 95 288 193 95 IV 61 49 12 61 49 12
298 278 V 883 735 148 585 457 128 2b VI 2.381 1.838 543 2,050 1,538 512 331 300 31 VIII 11 3 8 11 3 8
80 ., Total 162 161 110 110 52 51 IV 7 6
Jib lib 7 6
V 155 155 45 45
81 .. Total 1,496 677 819 1.006 389 611 490 288 202 IV 1.246 468 778 942 346 596 304 122 182 V 250 209 41 64 43 21 186 166 20
, I
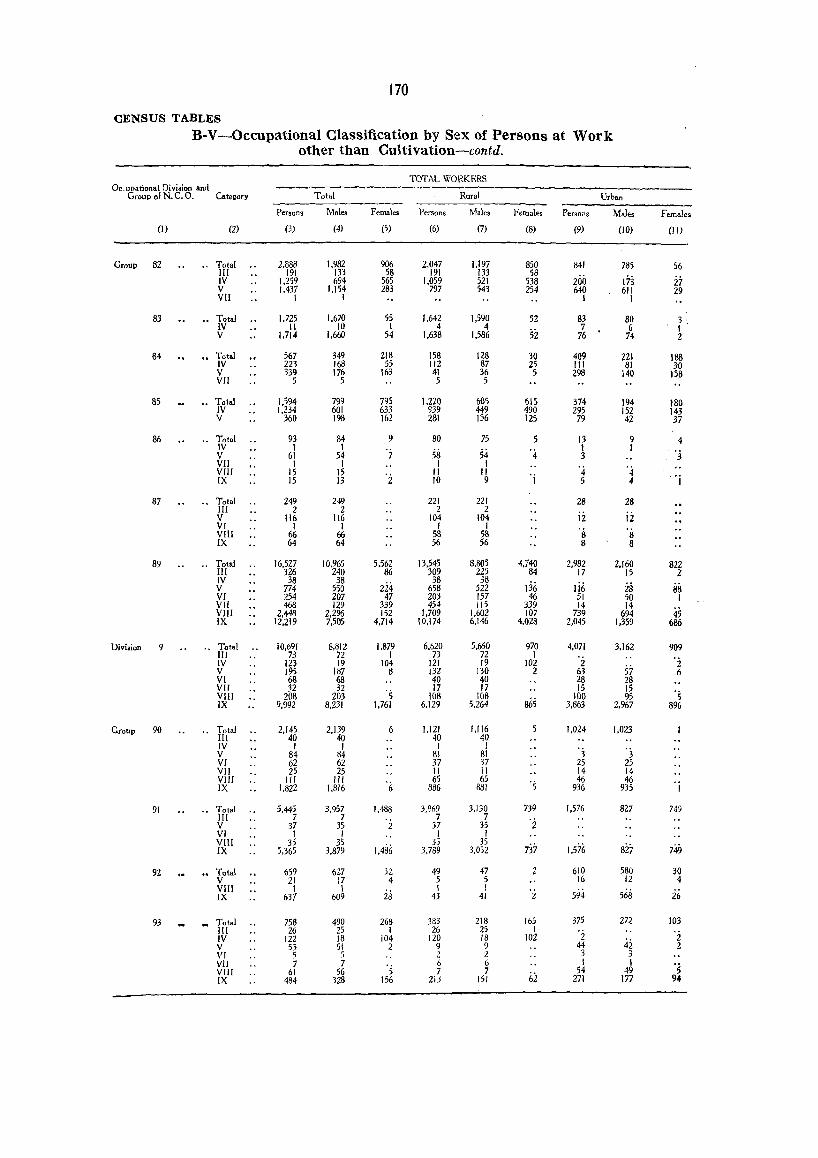
170
CENSUS TABLES
B-V-Occupational Classification by Sex of Persons at Work other than Culti vation-contd.
TOTAL WORKERS Oc.upational Division ann ~--Group 01 N. C. 0, Cateaory Tot.1 Rural Urban
Persons Males Females Persons Males Felllale. Perso,·js Males Females
(1) (2) (3) (4) (S) (6) (7) (8) (9) (10) (II)
Group 82 ., Total 2.888 1.982 906 2.047 1.197 850 841 785 56 III 191 133 58 191 133 58
200 173 IV 1.259 694 565 1.059 521 538 27 V (.437 1.154 283 797 543 254 640 611 29 VII I I 1 1
83 .. Total 1.725 1.670 55 1.642 1.590 52 83 80 3· IV II 10 1 4 4 si 7 6 1 V (.714 1.660 54 1.638 1.586 76 74 2
84 .. Total 567 349 218 158 128 30 409 221 188 IV 223 168 55 112 87 25 III 81 30 V 339 176 163 41 36 5 298 140 158 VII 5 5 5 5
85 .. Total 1,594 799 795 1.220 605 615 374 194 180 IV 1.234 601 633 ~39 449 490 295 152 143 V 360 19B 162 281 156 125 79 42 37
86 .. Total 93 84 9 80 75 5 13 9 4 IV 1 1 '7 58 54 '4 I 1 'j V 61 54 3 VII 1 1 I I
'4 '4 VIII 15 15 'i II II 'j IX 15 13 10 9 I 5 4
87 •• Total 249 249 221 221 28 28 III 2 2 2 2
ii ii V 116 116 104 104 VI I I I I VIII 66 66 58 58 8 8 IX 64 64 56 56 8 8
89 .. Total 16,527 10.%5 5.562 13.545 8.805 4.740 2,982 2,160 822 III 326 240 86 309 225 84 17 15 2 IV 38 38
224 38 38
136 li6 i8 88 V 774 550 658 522 VI 254 207 47 203 157 46 51 50 I VII 468 129 339 454 115 339 14 14
45 VIJI 2.448 2.296 152 1.709 1.602 107 739 694 IX 12.219 7,505 4.714 10.174 6.146 4.028 2.045 1,359 686
Division 9 " Tota! 10.691 8.812 1.879 6.620 5.650 970 4.071 3.162 909 III 73 72 I 73 72 I
'2 IV 123 19 104 121 19 102 2 V 195 187 8 132 130 2 63 57 6 VI 68 6S 40 40 28 28 VII n 32 's 17 17 15 15 's VIII 20S 203 108 lOB
865 100 95
IX 9.992 8.231 1,761 6.129 5.264 3,863 2,967 896
Croup 90 " Total 2.145 2.139 6 1.121 1.116 1.024 1.023 III 40 40 40 40 IV I I I I '3 '3 V 84 84 81 81 VI 62 62 37 37 25 25 VII 25 25 II 11 14 14 VIII III III '6
65 65 's 46 46 IX 1.822 1.816 886 881 936 935 I
91 ., Total 5.445 3.957 1,488 3.869 3,130 739 1,576 827 749 1II 7 7 7 7 '2 V 37 35 2 37 35 VI I I I I VIII 35 35
1.486 35 35
737 1.576 827 749 IX 5.365 3.879 3,789 3.052
92 .. Total 659 627 3Z 49 47 610 580 30 V 21 17 4 5 5 16 12 4 VIII 1 I
28 I I
'2 568 IX 637 609 43 41 594 26
93 N Total 758 490 268 383 218 165 375 272 103 1I! 26 25 I 26 25 I '2 'i IV 122 IS 104 120 18 102
42 V 53 51 2 9 9 44 2 VI ~ 5 2 2 3 3 VII 7 7 '5 6 6 I I ·s VIII 61 56 7 7
62 54 49
IX 484 328 156 213 151 271 177 9 ..
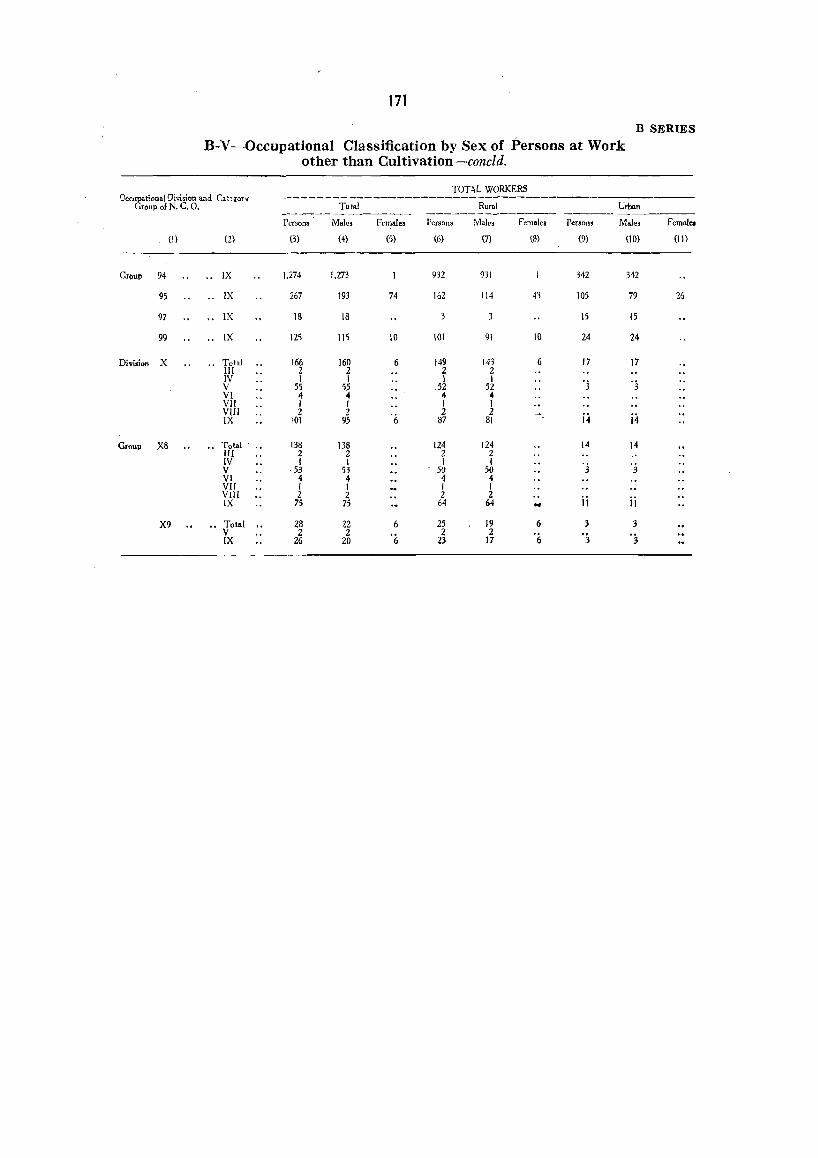
171
B SERIES
B-V -Occupational Classification by Sex of Persons at Work other than Cultivation-concid.
TOTAL WORKERS Oceupation.! Division and Ca,,~ory ~-----------------------~--Group of N. C. O. Total Rural Urb.n
~--------------- ----------------Persons M.le. Female. Persons Male. Female. Persons Male. Femal ..
(1) (2) (3) (4) (S) (6) (7) (6) (9) (10) (\1)
Group 94 .. IX 1.274 1,273 932 931 342 342
95 .. IX 267 193 74 162 114 43 105 79 26
97 .. IX 18 18 15 15
99 .. IX 125 115 10 101 91 10 24 24
Division X .. Total 166 160 6 149 143 6 17 17 III 2 2 2 2 IV I J J J '3 '3 V 55 55 .52 52 VI 4 .. .. 4 VII 1 I I I VIII 2 2
'j, 2 2 "" i~ i4 IX 101 95 87 81
Group X8 .. Total' 138 138 124 124 14 14 III 2 2 2 2 IV 1 1 I 1
'3 V 53 53 50 50 3 VI .. 4 4 .. VII I I I I VII! 2 2 2 2
ii ji IX 75 75 64 64 .. X9 " Total .. 28 22 6 25 19 6 3 3
V 2 2 '(; 2 2 '(; '3 '3 IX 26 20 23 17
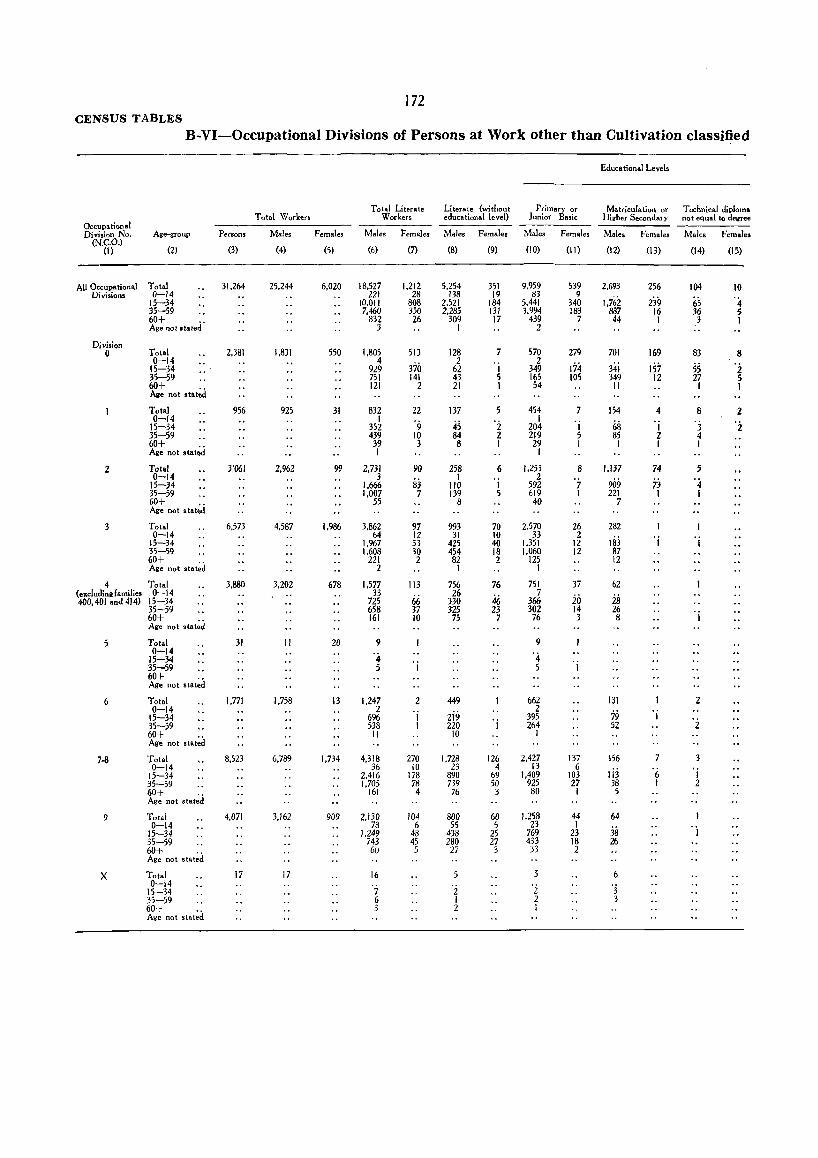
172 CENSUS TABLES
B-VI-Occupational Divisions of Persons at Work other than Cultivation classified
Educational Level.
Total Literate Literate (without Primary or Ma tricula tion or Technical diploma Total Workers Workers educational level) Junior Basic Higher Secondary not equal to deQTee
Occupational Persons M.les Fem.les M.les Females Males Females Males Fem.les M.les Division No. Age-group Females Males Females
(N.C.O.) (2) (3) (4) (5) (6) (7) (I) (8) (9) (10) (II) (12) (13) (14) (15)
All Occupational Total 31.264 25.244 6.020 18.527 1.212 5.254 351 9.959 539 2.693 256 104 10 Divisions 0-14 221 28 138 19 83 9
239 65 15-34 10.011 808 2.521 184 5.441 340 1.762 4 35-59 7.460 350 2.285 131 3.994 183 887 16 36 5 60+ 832 26 309 17 439 7 44 1 3 1 Age not stated' 3 1 2
Division 1.805 570 0 Total 2.381 1.831 550 513 128 7 279 701 169 83 8
0-14 4 370
2 'i
2 174 34i 157 5S 'i 15-34 929 62 349
35--59 751 141 43 5 165 105 349 12 27 5 60+ 121 2 21 1 54 11 1 1 Age not .t.t~d
Total 956 925 31 832 22 137 5 454 154 4 8 2 0-14 1 '9 45 'z 1 'j 68 'j '3 'i 15-34 352 204
35-59 439 10 84 1 ZI9 5 85 1 4 60+ 39 3 8 I 29 1 1 1 1 Age not stat.;d I I
2 Total 3'061 2.962 99 2.731 90 258 6 1.253 8 1.137 74 5 0-14 3 1 'j 2 '7 909 7j '4 15-34 1.666 83 110 592
35-59 1.007 7 139 5 619 1 221 1 1 60+ Age not sta~d
55 8 40 7
3 Total 6,573 4.587 1.986 3.862 97 993 70 2,570 26 282 0-14 64 12 31 10 33 2
lIij 'j 'j 15-34 1.967 53 425 40 1,351 12 35-59 1.608 30 454 18 1.060 12 87 60+ 221 2 82 2 125 12 Age not stat~d 2 1 I
4 Total 3.880 3,202 678 1.577 113 756 76 751 37 62 (excluding families 0-14 33
66 26
46 7
20 is 400.401 and 414) 15-34 725 330 366 35-59 658 37 325 23 302 14 26 'j 60+ 161 10 75 7 76 3 8 Age not stat;.i
5 Total 31 II 20 9 9 0-14 '4 '4 15-34 'j 'j 35-59 5 5
60+ Age not stat~
6 Total 1.771 1.758 13 1.247 2 449 662 131 2 0-14 2 'j 2j9
2 79 'j 15-34 696 395 'i 35-59 538 1 220 1 264 52
60+ Age not st.t~d
II 10 I
7-8 Total 8.523 6.789 1.734 4.318 270 1.728 126 2.427 137 156 7 3 0-14 36 10 23 4 13 6
Ij3 '6 15-34 2.416 178 890 69 1.409 103 1 35-59 1.705 78 739 50 925 27 38 I 2 60+ 161 4 76 3 80 1 5 Age not stat~d
9 Total 4.071 3.162 909 2,130 104 800 60 1.258 44 64 0-14 78 6 55 5 23 I
38 15-34 1.249 48 433 25 769 23 1 35-59 743 45 280 27 433 18 26 60+ 60 5 27 3 33 2 Age not stat;ci
X Total 17 17 16 0-14 '7 '2 '2 '3 \5-34
35-59 6 I 2 3 60+ Age nat st.t~d
3 2 I
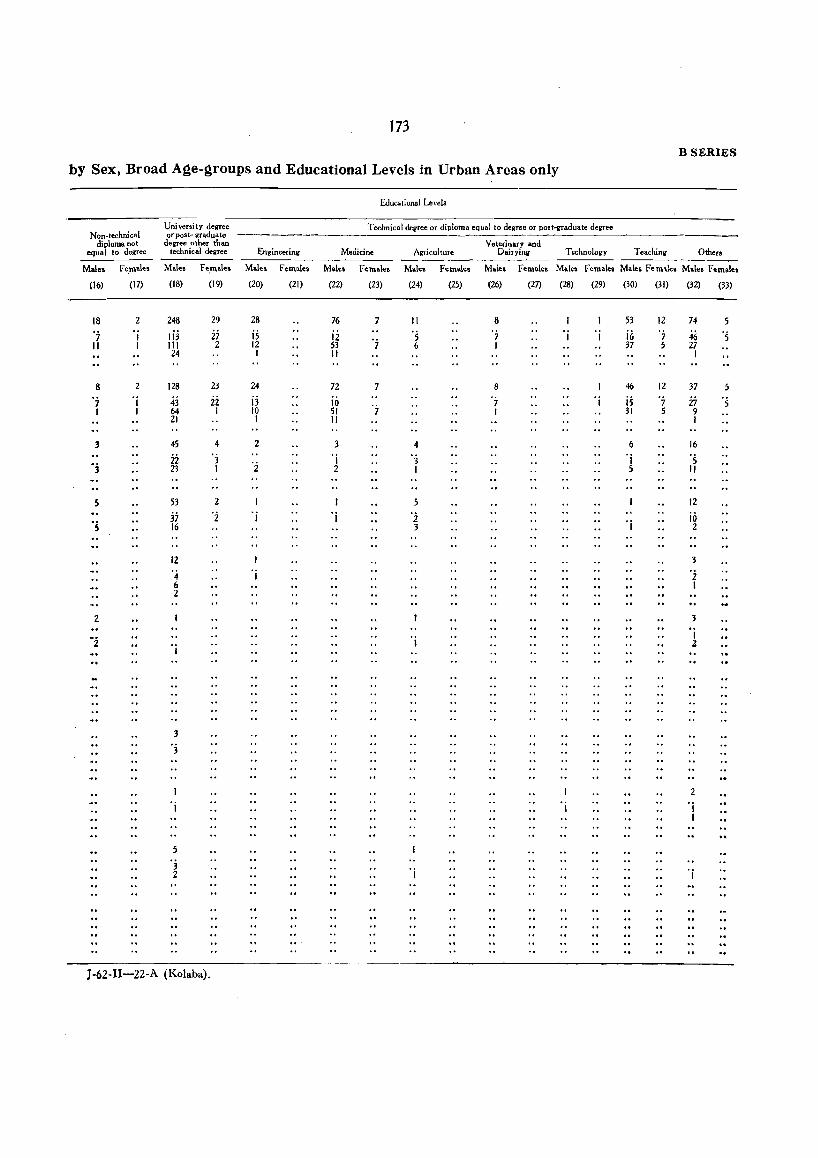
J73
by Sex, Broad Age-groups and Educational Levels in Urban Areas only
Non_technical diploma not
equal to degree
University degree or post- graduate
degree other than technical degree Engineering
Educational Leyel>
Technical degree or diploma equal to degree or p08t~gradu8te degree
Medicine AgticuIture Veterinary and
Dajryj~ Technology
B SERIES
Teaching Others
Male. Fe,mal.. Male. F',rnal.s Males Female. Male. Fernal.. Male. Fernal.. Maie, Female. Mal •• Female. Male. Fern,le. Mal •• Fom.le.
(16) (17) (18) (19) (20) (21) (22) (23) (24) (25) (26) (27) (28) (29) (30) (31) (32) (33)
18 2 248 29 28 76 7 II 8 53 12 74 5
'7 'j Ii:i ij js ii 'j '5 '7 'j 'j j6 7 46 '5
II I III 2 12 53 6 I 37 5 27 24 1 11 I
8 2 128 23 24 72 7 8 46 12 37 5 'j OJ 43 i2 i3 io '7
'7 I is 7 27 '5 I 1 64 1 10 51 1 31 5 9
21 I II 1
3 45 4 2 3 4 6 16
'j ii 'j
'2 'j 3 'j '5
23 I 2 I 5 II
S 53 2 ; 12
's 37 '2 'j 'j '2 'j jo
16 3 2
12
'4 'j 'i 6 I 2
z
"2 I 'j 1 2
3 'j
2 'j 'j 'j
I
5 'j
'j 2 I
J'62-1I-22-A (Kolaba),
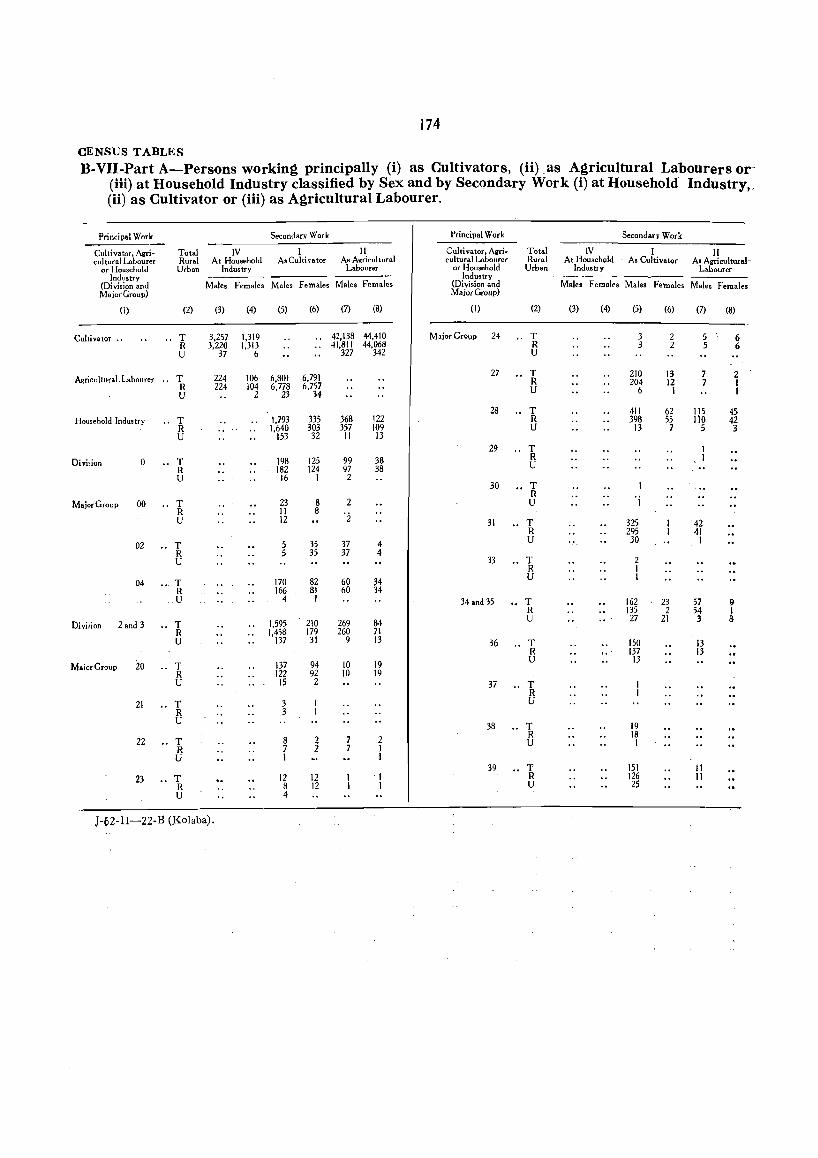
174
CENSUS TABLES
B-VII-Part A-Persons working principally (i) as Cultivators, (ii) as Agricultural La,bourers or-(iii) at Household Industry classified by Sex and by Secondary Work (i) at Household Industry,. (ii) as Cultivator or (iii) as Agricultural Labourer.
Principal Work Secondary Work Principal Work Secondary Work
Cultivator, Agri .. Total IV I II Culti vator, Agri .. Total IV I II cultural Labourer Rural At Household As Cultivator As Agricultural cultural Labourer Rural A t Household As Cultivator As Agricultural-'
or Household Urban Industry Labourer or Household Urban Industry Labourer Industry Industry --_---
(Division and Males Females Males Fem'ales Males Females (Di vision and Males Femal,s Males Females Males Females Major Group) MaiorGroup)
(1) (2) (3) (4) (5) (6) (7) (8) (1) (2) (3) (4) (5) (6) (7) (8)
Cultivator .. .. T 3,257 1,319 .. 42,138 44,410 Major Group 24 .. T 3 2 5 6 R 3,220 1,313 .. 41,811 44,068 R 3 2 5 6 U 37 6 327 342 U
A~ricultural. Labourer T 224 106 6,801 6,791 27 .. T 210 13 7 2 " R 204 12 7 1 R 224 104 6,778 6,757 U 6 1 I U 2 23 34
28 .. T 411 62 115 45 Household Industry .. T 1,793 335 368 122 R 398 55 Ilo 42
R 1,640 303 357 109 U 13 7 5 3 U 153 32 11 13
29 .. T
Division 0 T 198 125 99 38 R R 182 124 97 38 U
U 16 1 2 30 T
R 'j Major Group 00 .. T 23 8 2 U R 11 8 '2 U 12 31 T 325 42
R 295 41
02 T 5 35 37 4 U 30 I R 5 35 37 4 U 33 .. T 2
R I
04 T 170 82 60 34 U 1
R 166 81 60 ~4 U 4 I 34 and 35 T 162 23 57 9
R 135 2 54 I
DiYi~ion 2 and 3 .. T 1,595 210 269 84 U 27 21 3 8 R 1,458 179 260 71 U 137 31 9 13 36 T 150 13
R 137 13
MaiorGroup 20 .. T 137 94 10 19 U 13
R 122 92 10 19 U 15 2 37 T
R 21 T 3 U
R 3 U 38 .. T 19
22 .. T 8 2 7 2 R 18
R 7 2 7 1 U 1
U I I 39 .. T 151 11
23 T 12 12 I R 126 II R 8 12 I U 25 U 4
J-62-1I-22-B CKolaba).
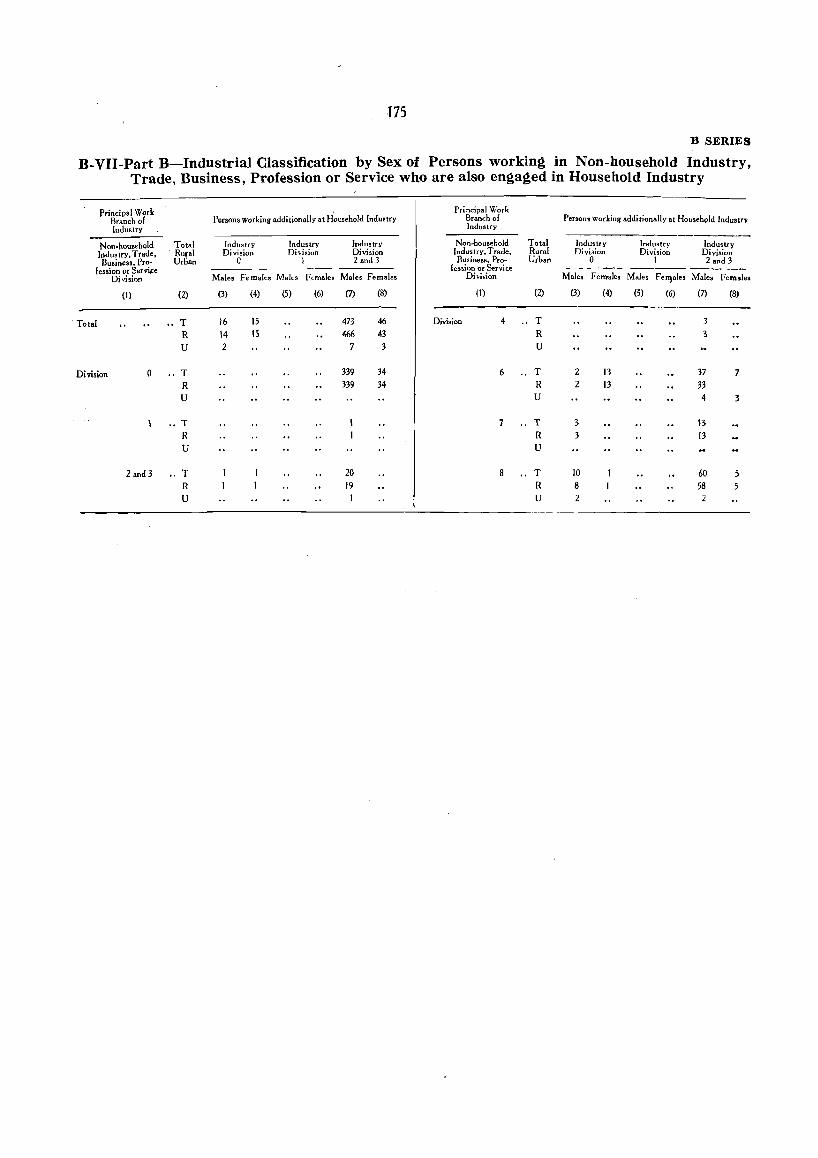
J75
B SERIES
B-VII-Part B-Industrial Classification by Sex of Person.s working in Non-household Industry, Trade, Business, Profession or Service who are also engaged in Household Industry
Principal Work Principal Work Branch 01 Persons working additionally at Household Industry Branch of Persons working additionally at Household Industry Industry Industry
Non-household Total Industry Industry Industry Non-household Total Industry Industry Industry Industry, Trade, Rural Division Division Division Industry, Trade, Rural DiviJion Division Division Business. Pro .. Urban C I 2 and 3 Business. Pro .. Urban 0 I 2 and 3
fession or Ser"i~e {ession or Service ---------Division Males Females Males Females Males Females Division Males Females Males Felljales Males Females
(I) (2) (3) (4) (5) (6) (7) (8) (I) (2) (3) (4) (5) (6) (7) (8)
. Total T 16 15 473 46 Division 4 ., T 3
R 14 15 466 43 R 3 U 2 7 3 U
Division 0 T 339 34 6 .. T 2 13 37 7 R 339 34 R 2 13 33 U U 4 3
T 7 T :> \3 R R 3 13 U U
2 and 3 .. T 20 8 T 10 60 5 R 19 R 8 58 U I U 2
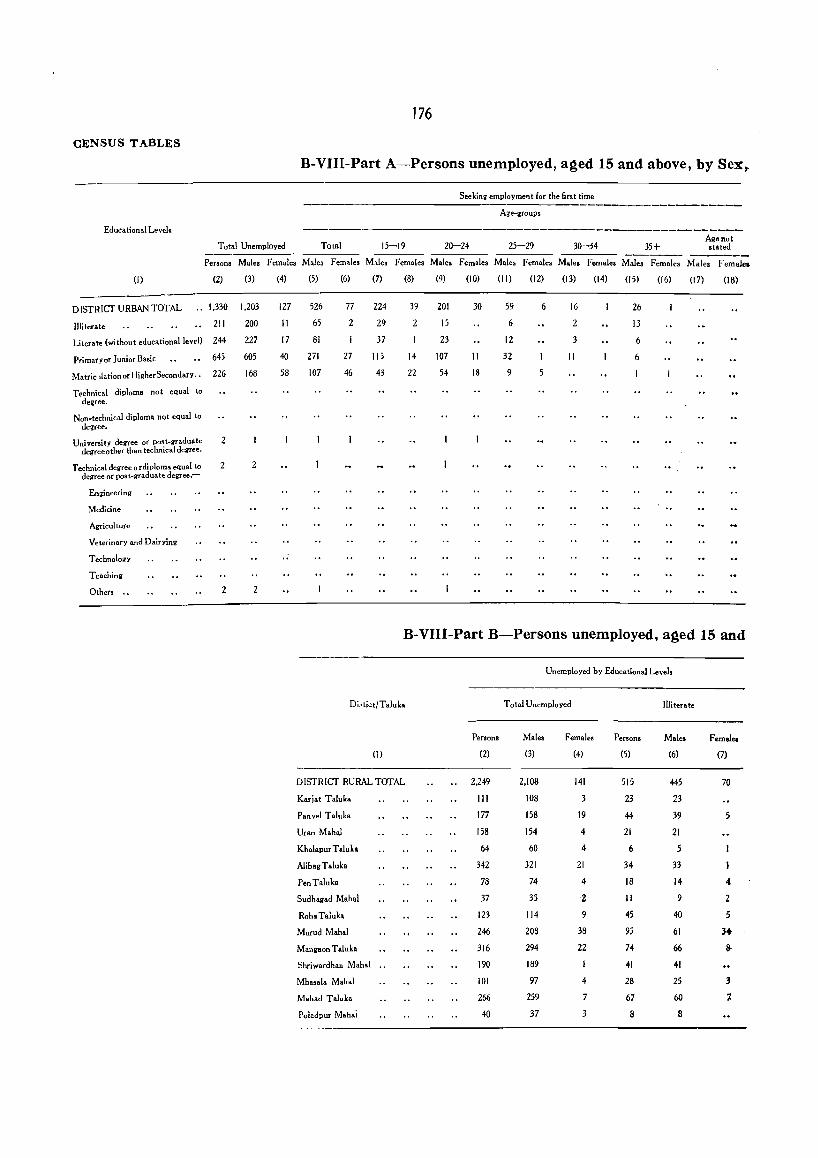
CENSUS TABLES
Educational Levels
(I)
DISTRICf URBAN TOTAL
Illiterate
Litetate (without educational level)
Primary or Junior Basic
Mattie llation or HigherSecondary .•
Technical diploma not equal to degree.
Non-technical diploma not equal to degree.
University degree or po,t_graduate degree other th~n technical degree.
Technical degree 0 rdiploma equal to degree or post .. graduate degree.-
En:lineering
Medicine
Agriculture
Veterinary and Dairying
Technology
Teaching
Others ..
Total Unemployed
176
B-VIII-Part A-Persons unemployed, aged 15 and above, by Sex,.
Seeking employment for the first time -------------------- Age-groups
Total 15-19 Z0-24 25-Z9 30-34 35+ Age not stated
------ ------ -_---Persons Males Female, Males Female, Male, Female, Males Female, Male. Fem.les M.les Female, Males Females Males Female.
(2) (3) (4)
1.330 1.203 127
Zl] 200 II
244 227 17
645 605 40
226 168 58
2
2 2
2 2
(5) (6) (7) (8)
526 77 224 39
65 2 29 2
81 37
271 27 115 14
107 46 43 22
(9)
201
IS
23
107
54
(10)
30
11
(II)
59
6
12
32
18 9
(12)
6
(13)
16
2
3
II
(14) (15)
26
13
6
6
(16) (17) (18)
B-VIII-Part B-Persons unemployed, aged 15 and
Unemployed by Educational Levels
Di"tict/Taluka Total Unemployed Illiterate
Persons Males Females Persons Mal .. Femal ..
(l) (Z) (3) (4) (5) (6) (7)
DISTRICf RURAL TOTAL 2.249 2.108 141 515 445 70
Kariat Taluka III 108 3 23 23
Pan vel Taluko 177 158 19 44 39 5
Uran Mahal 158 154 4 21 21
KhalapurTaluka 64 60 4 6 5
AlibagTaluka 342 321 21 34 33
PenTaluk. 78 74 4 18 14 • Sudhagad Mahal 37 35 2 II 9 2
RohaTaluka 123 114 9 45 40 5
Murud M.h.1 246 208 38 95 61 3+
Mangaon Taluk. 316 294 22 74 66 Ii-
Shriw.rdhan Mohol 190 189 41 41
Mha.al. Mahal 101 97 4 28 25 3
Mah.d T aluk. 266 259 67 60 , Poladpur Mahai 40 37 3 8 8
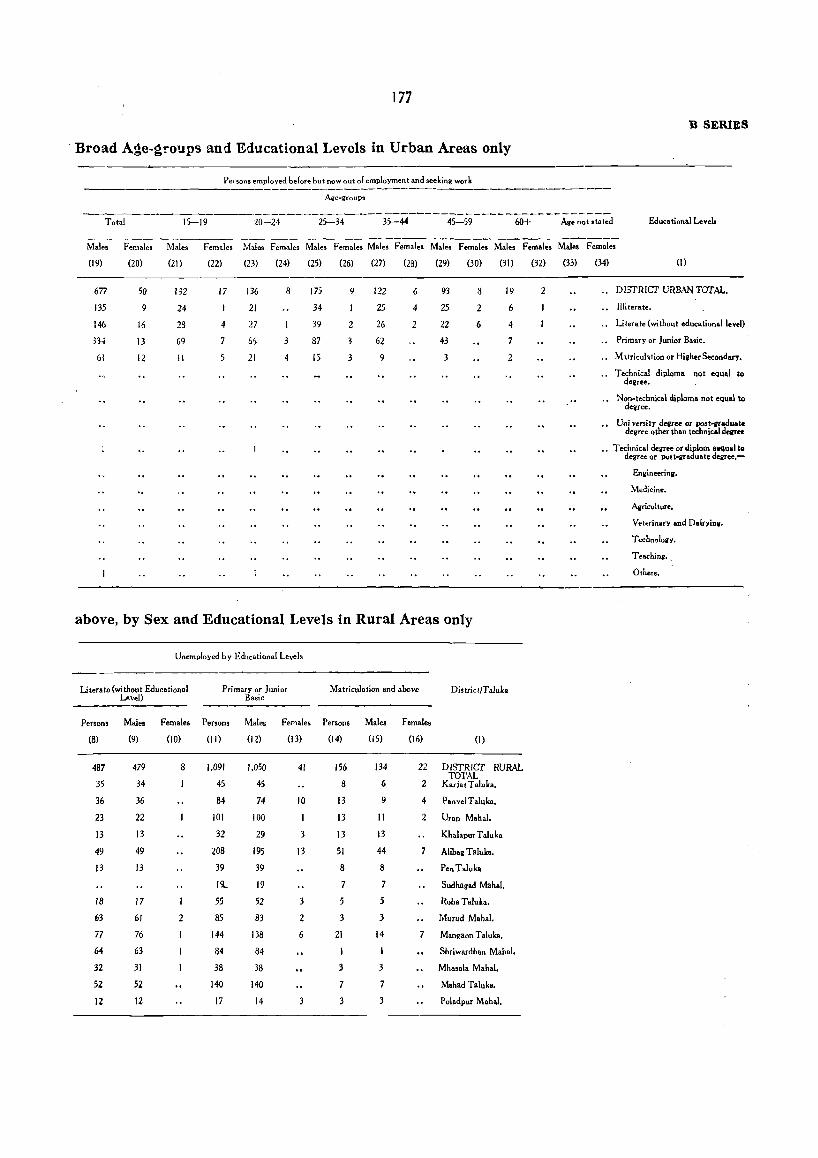
177
B SERIES
. Broad A~e-~roups and Educational Levels in Urban Areas only
Persons employed before but noW out of employment and seeking work
Age-groups
Total 15-19 20-24 25-34 35-44 45-59 60+ Age not stated Educatiobal Level..
Male. Females Males Females Mal ... Females Males Females Males Females Males Females Males Femal •• Males Females
(19) (20)
677 50
135 9
146 16
334 13
61 12
(21)
132
24
23
69
II
(22)
17
4
7
5
(23)
136
21
27
6S
21
(24)
8
3
4
(25)
175
34
39
87
13
(26)
9
2
3
(27)
122
25
26
62
9
(28)
6
4
2
(29)
93
25
22
43
3
(30)
8
2
6
(31)
19
6
4
7
2
above, by Sex and Educational Levels in Rural Areas only
Unemployed by Educational levels
Lilerate(without Educational Primary or Junior Matriculation and above DislrictiT alulca Level) Basic ----------
Persons Males Females Persons Males Females Persons Males Femoles
(8) (9) (10) (II) (12) (13) (14) (IS) (16) (I)
487 479 8 1.091 1.050 41 156 134 22 DISTRICT RURAL TOTAL
35 34 45 45 8 6 2 Kariat Talulca.
36 36 84 74 10 13 9 4 Pan vel Taluk ••
23 22 101 100 13 II 2 Uran Mah.l.
13 13 32 29 3 13 13 Khalapur T.luk.
49 49 208 195 13 51 44 7 Alibag Talulca.
13 13 39 39 8 8 Pen Taluh
I~ 19 7 7 Sudhagad Maha1.
18 17 55 52 3 5 5 Roh. T aluka.
63 61 2 85 83 2 3 3 Murud M.hal.
77 76 144 138 6 21 14 7 Mangaon T aluk ••
64 63 84 84 1 Shriwordhon Mohal.
n 31 38 38 3 3 Mhosolo Mohal.
52 52 140 140 7 Mahad Taluka.
12 12 17 14 3 3 3 Poladpur M.h.l.
(32) (33)
2
(34) (1)
.. DI5TRICT URBAN TOTAL.
.. Illiterate.
Literate (withollt educationolle.ell
Primary or Junior Basic.
.. Matriculation or Hillher Secondary.
.. Technical diploma not equal til de2ree.
Non-technical diploma not equal to dearec.
Vni versity dezree or post ... ,radualc degree other than tecbnical deil'oc
•• Technical degree or diplom a.quo1t.. degree or poOl-graduale degree.-
Ena-ineerinwo
Medicine.
Agriculture.
Veterinary and DairyiDi'.
Technology.
Teaching.
Others.
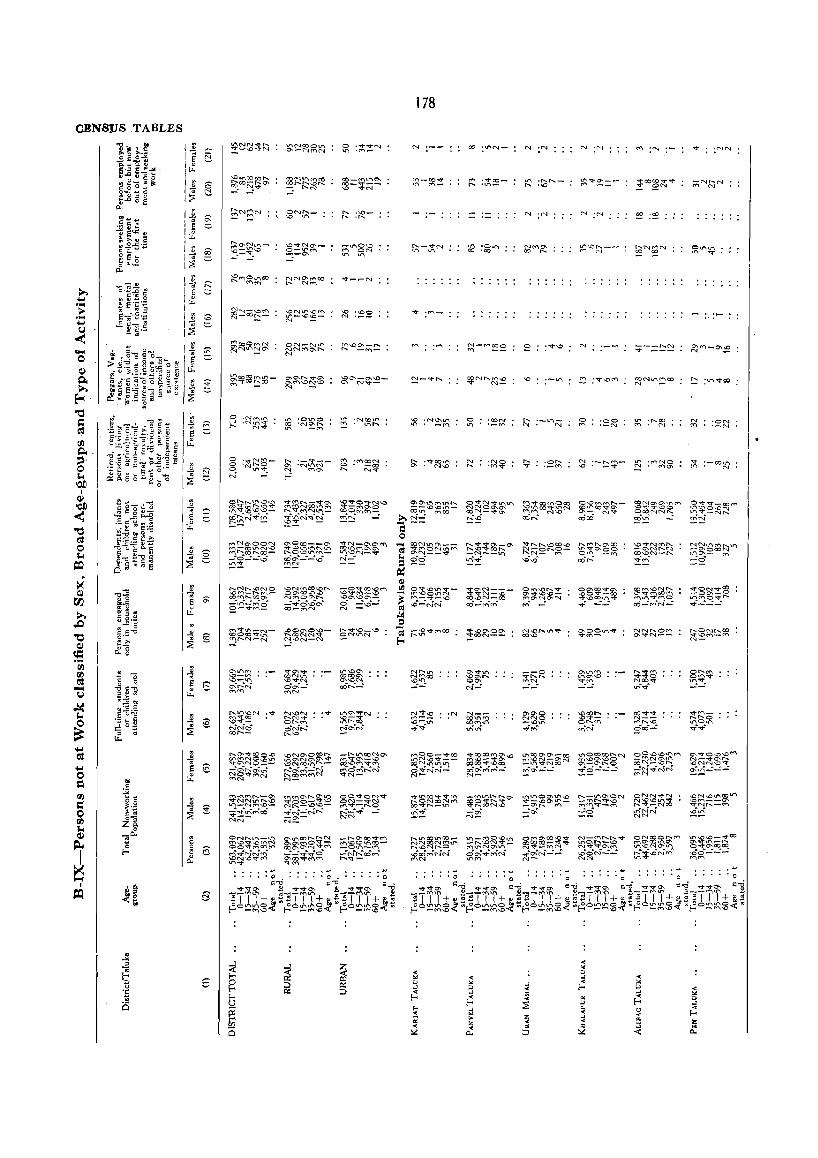
178
CENS11S TABLES
"'=t'-.-N
:v ~~~N N~('f
1:'1"'1 .~oof"oo 'I.r')-
:N ~V::M 00,,",'" ~lI"'I"
N ;{'I
If'\'...o,..... __ ('!"". N
N
o '00 ('() '-("1
---~N ~ ---
-N""'N '" N
~~g~~ ~_:_;_:
I I •
I I
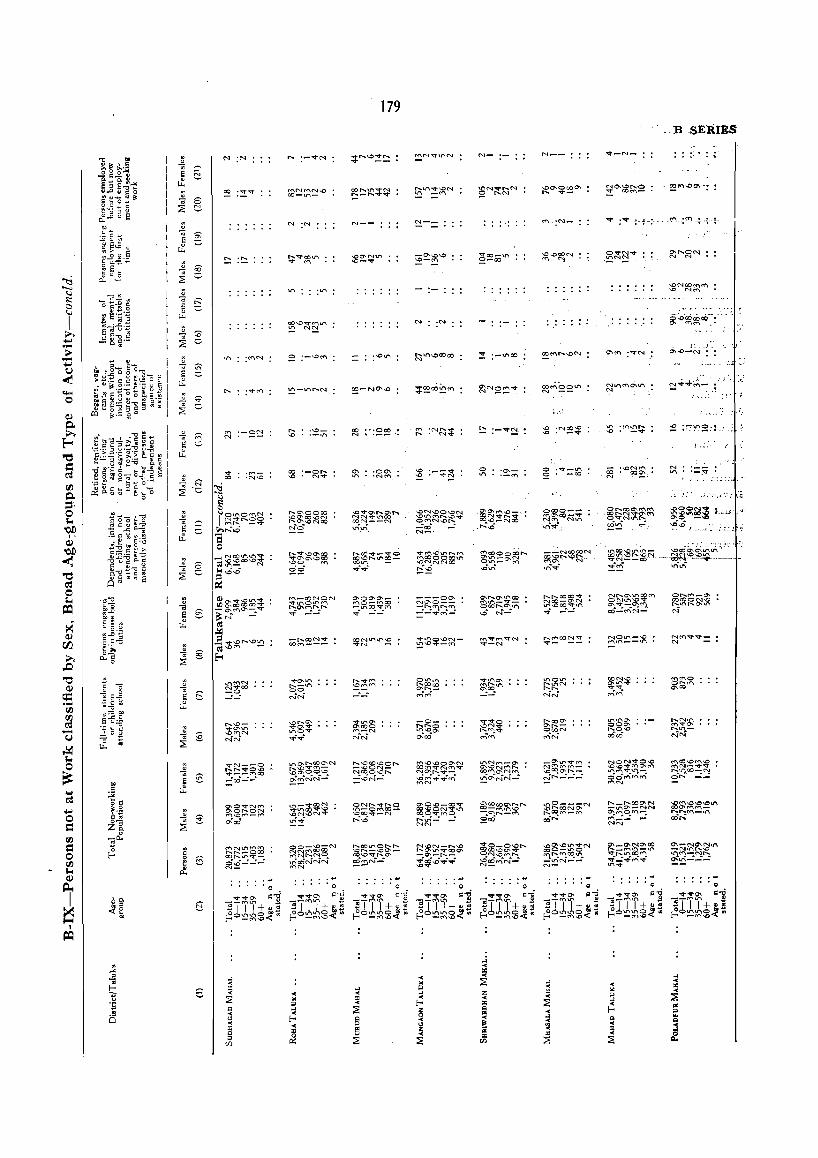
..... o
.",
0\0...".(".1('/"\ 0\ or-.. ON ~~C'f"o-rt"\ a-oo
;"'
~u:\Ci~~ -.oN",NV ~..,;
< .. '" ... <
f-< <
J
179
N--
...... c6..."._<Vo OO..O ...... ""'CO_ 00", _
..¢.¢
N-_
~o~e~iGr--. "'- '" ...o~
ctJ~Oot.n N --
0«:00-M~eo-"If' Nt"("\ (',1\('\
u-\~.:
o "!t'~0\ r:=i
]Til'+u;t ~O~~~~.
~-N_
Nf"ooO'\ll"\COt"("l ONU"'I\C"'t' O\""'1"_O'>{'I'"\ a5_:rr\N"":
.B sEltraS
- .. ; .. :.' .. !
! .•
: ~ .'.' ," ". i. : :,1. .:,:
0 ...... ('1"\_0"1 OOCOON'-D ~ll"\"""Q'\1J"'I N
o .","'1#"0\ =--0
] Til' +U~ ~O~~~~~
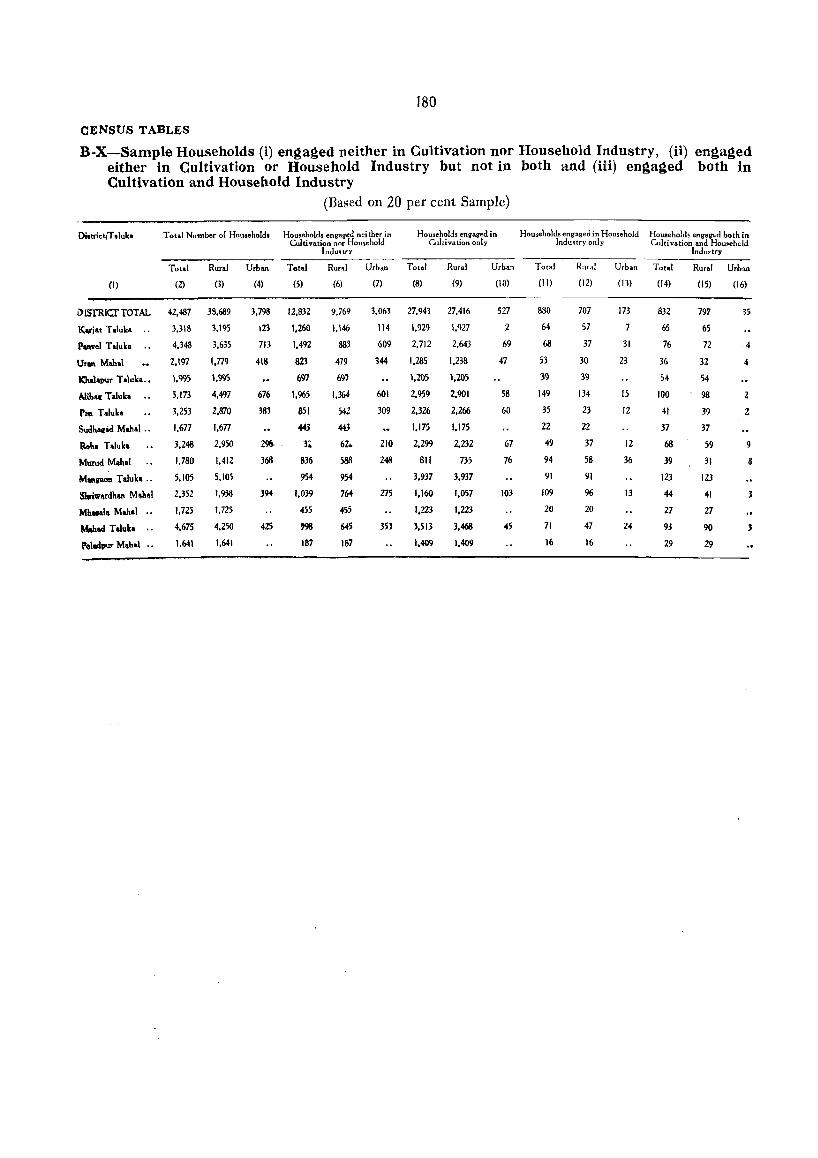
180
CENSUS TABLES
B-X-Sample Households (i) en~aged neither in Cultivation nor Household Industry, (ii) engaged either in Cultivation or Household Industry but not in both and (iii) engaged both in Cultivation and Household Industry
(Based on 20 per cent Sample)
Diotrict/Talulca Total Number of l-tousehoWs Households engaged nei ther in Housebolds engall"d in Households engaged in Household Household, engagf:d both in Cultivation nor Household Cultivation only Indu~try only Culti vatian and Hou!lehcld
Indu<lJtry Indu-:try
Total Rural Urban Total Runl Urban Total Rural Urba~ Total Rural Urban Total Rural Urban
(I) (2) (3) (4) (5) (6) (7) (8) (9) (10) (II) (12) (13) (14) (15) (16)
J)ISTRICTTOTAI... 42,487 3S,689 3,798 12,832 9,769 3,063 27,943 27,416 527 880 707 173 832 797 35
I<",jat T .Iuk. .. 3,318 3,195 123 1,260 1,146 114 l,n9 1,927 2 64 57 65 65
P"""el Talulc. .. 4,348 3,635 113 1,492 883 609 2,712 2,643 69 68 37 31 76 72 4
Uf", M.hal 2.197 1.779 418 823 479 344 1,285 1.238 47 53 30 23 36 32 4
lOta1apur T olu'ka .. 1.995 \,995 697 1,9' 1,20) 1.205 39 39 S4 54
t\l\bac Taluk. " 5,173 4.497 676 1.965 1.364 601 2.959 2.901 58 149 134 15 100 98 2
P ... Taluh 3.253 2.870 383 851 542 309 2.326 2,266 60 35 23 12 41 39 2
SudbacOd Moh.1 ., 1.677 1.677 443 443 1.175 1.175 22 22 37 37
Rob. Taluk. 3.248 2.950 29fI. 3. 6L. 210 2.299 2.232 67 49 37 12 68 59
MUl'Ud Mohal 1.780 1.412 368 836 588 248 811 735 76 94 58 36 39 31 8
M ... ,&OII Teluka .. 5.105 5,105 954 954 3.937 3.937 91 91 123 123
S&riwwlhan M.h~1 2.352 1,958 394 1.039 764 7:15 1.160 1.057 103 109 96 13 44 41 }
MIl.,al. Mohol .. 1,725 1,725 455 455 1.223 1.223 20 20 27 27
~ad Talllk. .. 4.675 4.250 4Z5 998 645 35J 3.513 3.468 45 71 47 24 93 90 }
P"ladpuY' MaI>.1 .. 1.641 1,641 187 187 1.409 1.409 16 16 29 29
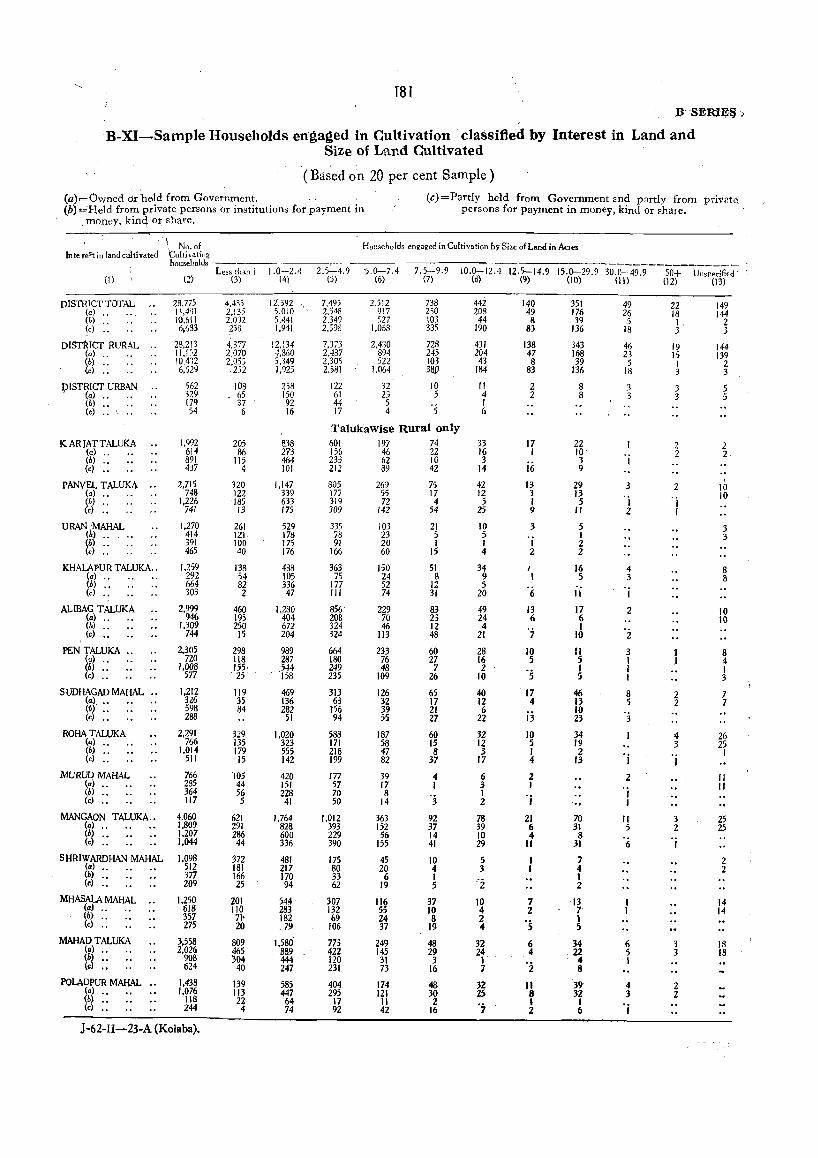
T8t ~SERt~~.>
B-XI-Sample Households engaged in Cultivation classified by Interest in Land and . Size of Land Cultivated
. . . (Based on 20 per cent Sample)
(a):=Owned dr'held from Government. ' , (b) ==Held from private persons or institutions for payment in
, money, klnq or, share.
(c)=Partly held from Government and partly from private. persons for payment in money, kind or share.
Inte reSt in land cuiltivated
(1)
D[STRICT TOTAL (a) " (6) .. (c) .•
DISTRICT RURAL .. (a) .• (6) .. (c) ..
DISTRICT URBAN • (a)
(b).. .. (c) .....
KARJATTALUKA <a) .. <h) " (c) ..
PANVEL T ALUKA .. (a) .. (b) .. (c) ..
URANlMAHAL (b) .. ~b) .• (c) ••
KHALAPUR TALUKA .. (a> •• (b) ., (c) ••
ALIBAG T ALUKA (a) .. (b) .. (c) ..
PEN TALUKA .. <a) .. (h) .. (c) ..
SUDHAGAD MAHAL " (al .. ('iI) .. (c) ..
ROHA T ALUKA (al .. (b) " (c) ..
MURUD MAHAL (a) .. (b) .. (c) ..
MANGAON TALUKA .. (a) .. (b) .. (c) ..
SHRIWARDHAN MAHAL (a).. .. .. (6) .. (c) ..
MHASALA MAHAL ., (a).. . .. (b) .. (c) ..
MAHAD TALUKA (a) .. (h) .. (c) ..
POLAOPUR MAHAL " <al " (6) .. (c) ..
\. No. of Cultivating housebolds
Less than 1 (2) (3)
28,775 II,4S1 10,611 6,633
23,213 n,l '2 10.412 6,529
562 329 179 54
I,Q92 614 89[ 437
2,715 748
1,226 741
1,270 414 391 465
1,259 292 664 303
2,999 946
1,309 744
2,305 720
I,OOB 577
[.212 326 598 288
2,291 766
1.014 511
766 285 364 117
4,060 1.809 1,207 1,044
1,098 512 377 209
1.250 618 357 275
3.558 2.026
90S 624
1.438 1.076
118 244
4,435 2,135 2m2 258
4,377 2,070 2,05:> .2i2
108 65 37 6
205 86
115 4
320 122 185 13
261 121 100 40
[38 54 82 2
460 195 250
15
298 118 155· 25
119 35 84
329 135 179 15
lOS 44 56 5
621 291 286 44
372 181 166 25
j!01 110 71'
,20
809 465 304
40
139 113 22 4
J-62-U-23-A (Kolaba).
1.0-2.4 (4)
2.5~4.9 (5)
12,392 \ 7,495 5,0:0 ' 2,)48 5,441 2,349 1,941 2,598
12,134 7,373 4,860 2.437 5,349 2,305 1,925 2.5BI
258 122 150 61 92 44 16 17
Household, engaged in CultiYation by Size of Land in Acres
5.0-7.4 7.5-9.9 10.0-12.4 12.5-14.9 15.0-29.9 30.C-49.9 (6) (7) (S) (9) (10) (11)
2,512 917 527
1,068
2,430 894 522
1,064
32 23 5 4
738 250 103 335
728 245 103 38.0
10 5
'5
442 20R
44 190
431 204 43
184
II 4 I 6
140 49 8
B3
138 47 8
83
2 2
351 176 39
136
343 168 39
136
8 8
49 26 5
18
46 23 5
18
3 3
Talukawise Rural only 838 273 464 101
1.147 339 633 175
529 176 175 176
488 105 336 47
1,230 404 672 204
989 287 544 158
469 136 282
51
]'020 323 555 142
420 lSI 228
41
1,764 828 600 336
481 217 170 94
544 283 182 .79
[,580 .889 444 247
585 447 64 74
601 156 233 212
805 177 319 309
335 78 91
166
363 75
177 111
856 208 324 324
664 180 249 235
313 63
156 94
58B 171 218 [99
177 57 70 50
1.012 393 229 390
175 80 33 62
307 132 69
106
773 422 120 23[
404 295
17 92
197 46 62 89
269 55 72
142
103 23 20 60
150 24 52 74
229 70 46
113
233 76 4B
[09
126 32 39 55
IB7 58 47 B2
39 17 8
14
363 152 56
155
45 20 6
[9
116 55 24 37
249 145
31 73
174 121
11 42
74 22 10 42
75 17 4
54
21 5 1
15
51 8
12 31
83 23 12 48
60 27 7
26
65 17 21 21
60 [5 B
37
4 1
'3 92 37 14 41
10 4 1 5
37 10 B
19
48 29 3
16
4B 30 2
16
33 16 3
14
42 12 5
25
10 5 I 4
34 9 5
20
49 24 4
21
28 16 2
10
40 12 6
22
32 12 3
17
6 3 I 2
78 39 10 29
5 3
'"z 10 4 2 4
32 24 1 7
32 25
"7
[7 1
i6 13 3 I 9
3
I 2
I I
'6 13 6
'j
10 5
'5 17 4
ij 10 5 I 4
Z I
'j
21 6 4
11
7 2
"5 6 4
"z II 8 1 2
22 10 3 9
29 13
5
" 5 I 2 2
16 S
II
17 6 I
10
II 5 I 5
46 13 10 23
34 19 2
13
70 31
8 31
7 4 1 2
13 7 1 5
34 ,22
4 8
39 32
1 6
'j
3
[
2
4 3 'j
2
2
3 1 I , 8 5
3
'j
2 'j , 11 5
6
6 5 1
4 3 'j
50+ (12)
22 18 I 3
19 15 1 3
3 3
2 2
2 'j I
2 2
4 3 'j
3 2
I
3 3
2 2
Unspecifi,d . (13)
149 144
2 3
144 139
2 3
5 5
2 2
10 10
3 3
8 8
10 10
8 4 I 3
7 7
26 25 I
II [I
25 25
2 2
14 [4
[8 18
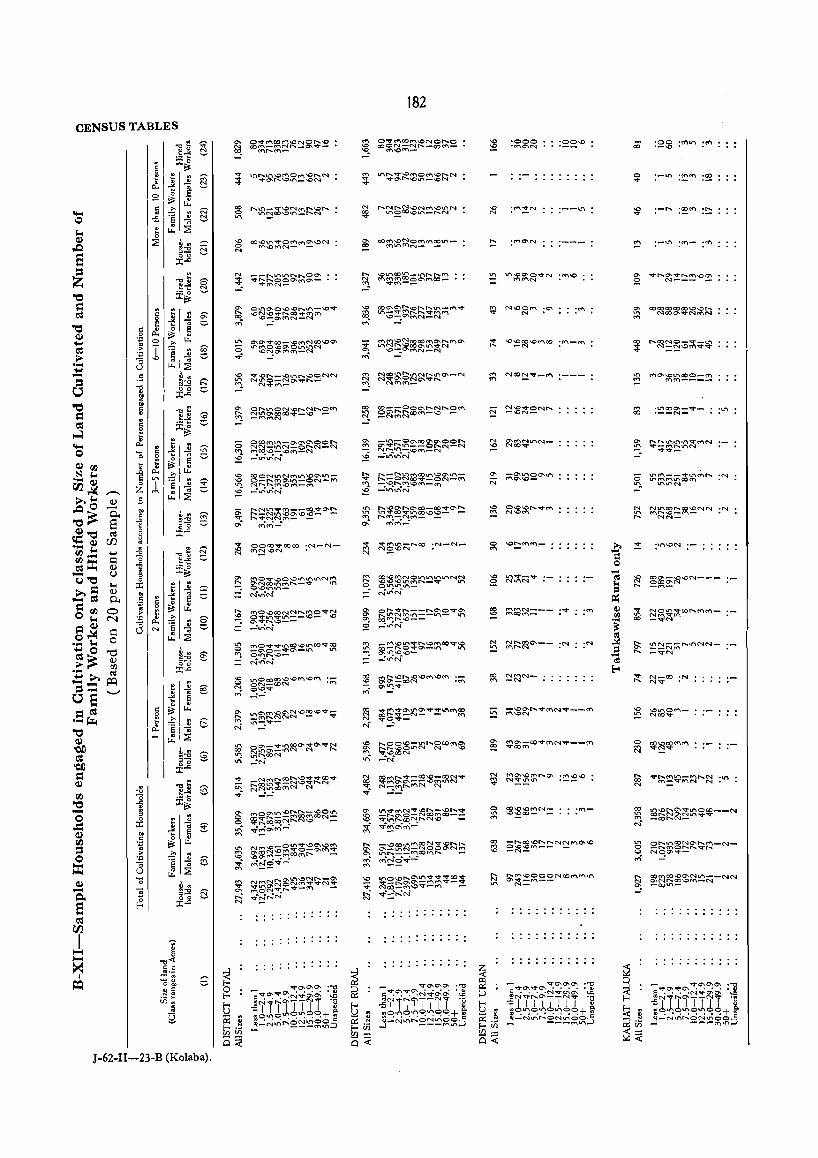
CENSUS TABLES
J-62-II-23-B (Kolaba).
~ ~~~i!5~§\O~-:::a-!::: ~ C'f'\Cf'\_.
~ g~~~~~~~\t"\N~ NU-;N
~ ~;~~~~!:::f2~~~ _:"'C--;
~ ~~~:::~~~~CO~~ <"'1, 0"" ....... \0-
N""N"
182
~ ~~~~~~;a~~~0\
'"
§ ~~~~~~~~~N~ N"lI'\('.f
~ ~~~~~=!:::~:=~~ ~ ....:~N
f£ ~~;~~-.oM\()~ of(\
'"
* ~~~~~~~~CO~$ v\ _:N"
:--'"
·lI"'\OOa-._~_ ·--N- :'"
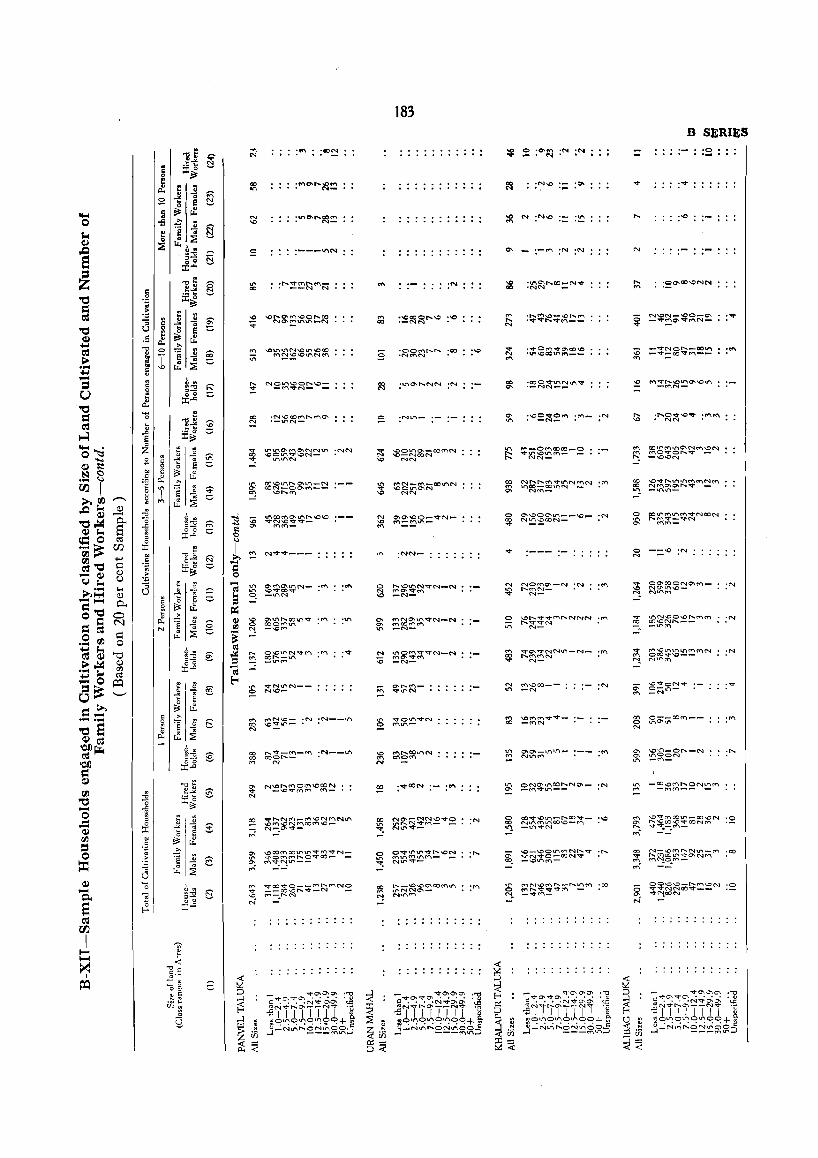
c g
J: ... o
1 z
. ~~ € 00
:r:-"
00
'"
N""i!!""I:t'--_
~ ~~~~~~ :~ ~ -",gf1"'\
~ ~r:e~~~('1"\ :~
-"''''
:'"
.....
:N __ lI"'\
gs ~~t:::~-~ :N-_~ M N
~ N~~~~~\O~~ N
183
~ ~~~~-N:N :~ .... N-
B SERIIl;S . -0·'· .. _ ...
,.... .\.0 o_
N
Ch c£~~R~!::~M _ .. _lr\('f"I
:""
......
a ~~~~«i;;r~~N ·0 0- "1"C'!.CON N
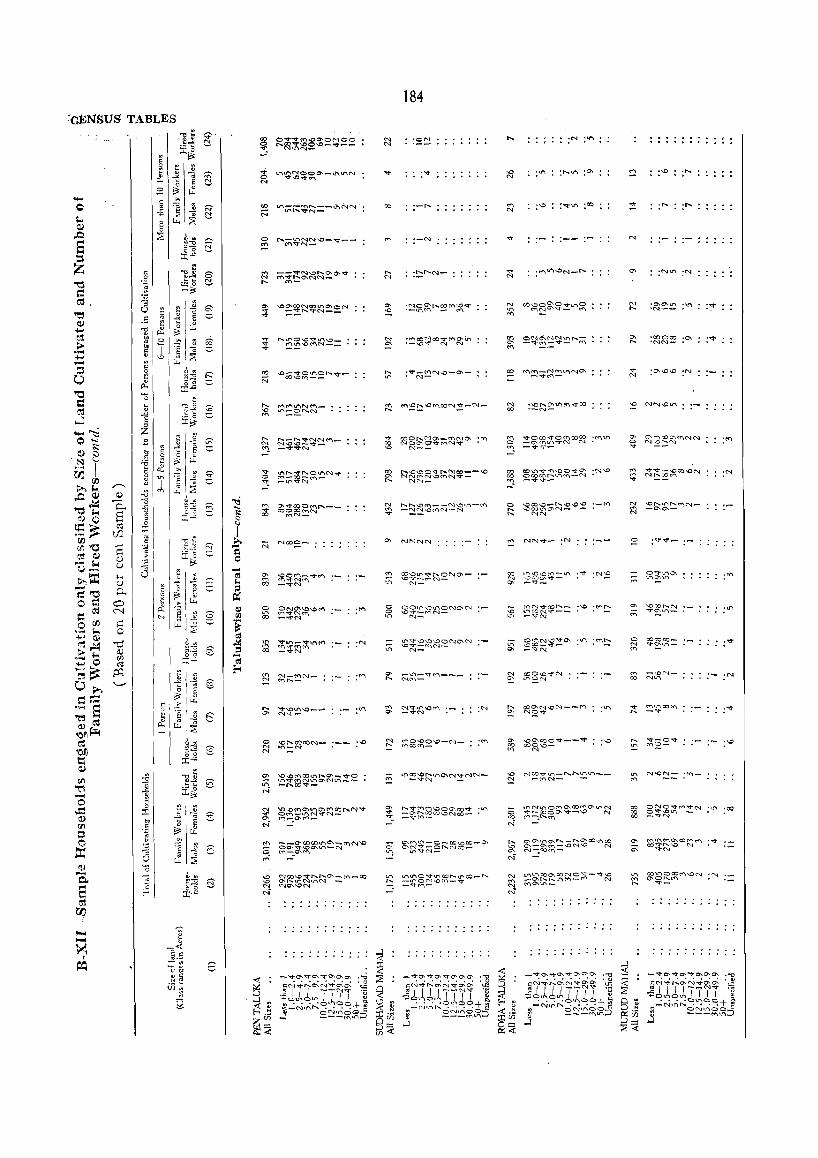
184
.... o
0\ NNNN
(1'1 \O\ON"'oCOlf"l,....Q\_~O
If\ ';!:!lt~~~O"NI.t"\-,_ N
~ ~3~g~~::lf'\ .":j" :N~ 0\ -"q"_
N ~~?2~~~:::;:;:;-~~ q t""'IO'Ill"'\_
N
N
:'"
,.,.
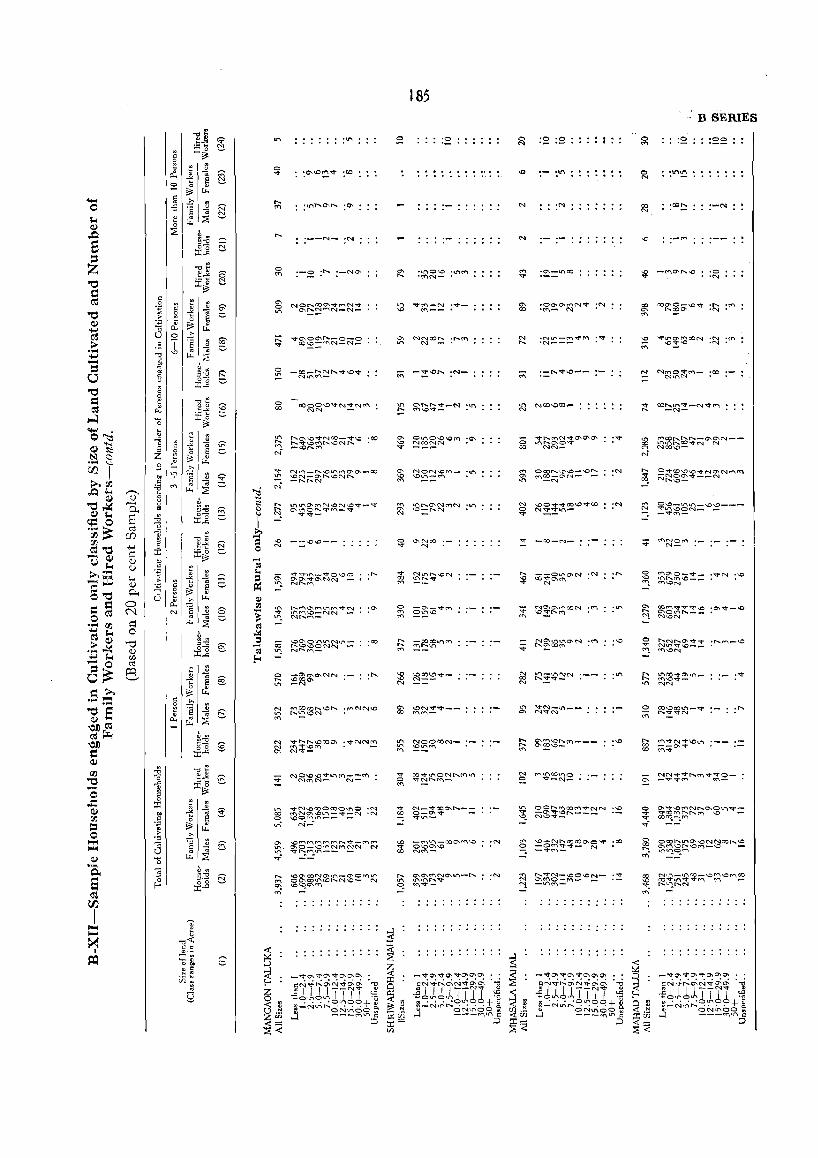
o 00
:'"
~ 8~~~f:!~Ntt'D -CO ",.
~ ~~~Z8~~~~~ :~ o "C0r,'I'-I"'I __ -
1.1"\ N'....:'
J 85
~ ~=~~O\t--..---;. Vtl"l-
~ ~~~~O'\t.t"'I-['." ;N q C1l"1"-
N
-.::r -CO-N-
."
:'"
.""
- B SERIES
~ co~gO\\O~ :~ :('1"\
'"
~ ~~!:::~~No\~N--o Nc.o-.o-N
.....
~ ~~~~f-::!~O\~\f'\~::: ...,. oocq_~f""'I ..;
~ ~~~~~~\O~\O~~
'"
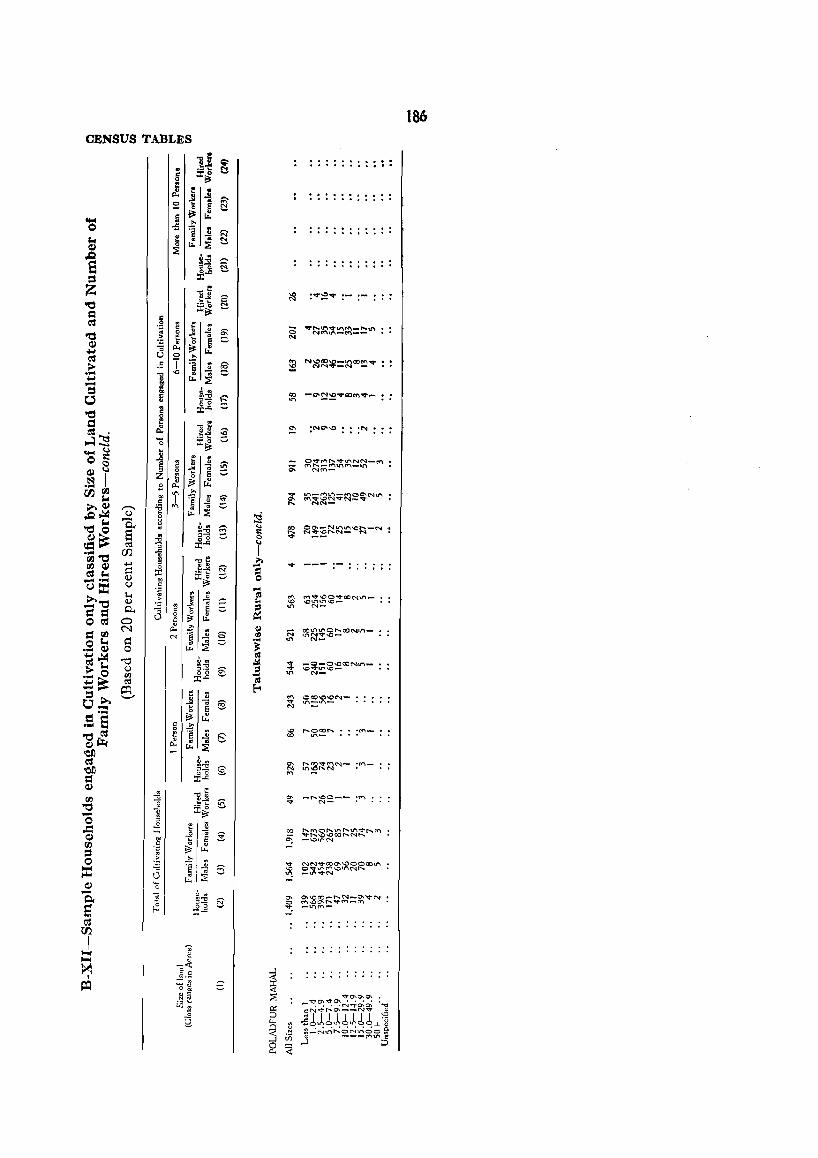
186 CENSUS TABLES
·d ~ . :E~ ~ '" 0
~ j . "*
~ :: ~ s ~ .... ; ~ tZ ;0.
0 .s 1 J! ~ ~ ~ ~
~ ~ ~ 0 Lt.
'8 ~ ...
~~ ,.... 5
= X-" Z ..
."li S ~ :~::2"" f!-"
"0 :e~ C!, 1:1
" ~ .~ ~ ~ .. ..,,\I"\..,.V"'totf'l_ ..... lI\
~ 0 ~ ~ 0 Nct\",_tf"!o __
"0 -;; > t s :::::. N ~ ~
0 c.. e:= tZ ... 0 ~ ;0.
.5 T 1 ~ '" N"'OO\O_lt\(1J~...,. ;>
"* :;: NN<o;:t'_N _ .... "'0 '" = .... ~ Lt. ~ - 1:
= .. ~ .. 00 -go.!::!~VCOM'T_ 0 '" .. ." § ~ :>- '" 00
oe l! ::c..c s:! ~ ..
.,,~
2: :NC7\..o :'" ~"ci - .~~ ~ ~ ....... 0 ::c~ .... u ~ 0 ~ ~ ..
O"l:t'rf'\r-..~lt"\NN_tf'\ C E ~ ~
@ ~ -;; Q; ('f""",-,_rt"Il.r\('t'\_lt"\
~ U " 0 N<"-
I Z \l 0 S toO:I e:= tZ .... .8 c..
00 rI.l ""' ;0.
"3- ~:;;;:$~;;:~~~NU"\ ~ '" I ] ..-;;...l '" "* " NN-,......
1 '" --Q) Lt. ~ ~ ,!:J.~ ..... 'do c.. · .. 8
..., "" ~!~~~~-'O~-N 8 .. ." ;: ~
~::: ~ ,,- e 0 0
C':I. "0 ::c-" I 'riJ "t:1 rn 1 .... ."e ,e> ---rI.l ~ 0 ~ . '"
... ~ ......
== ~ ~ :r :c~ _."", Q)
" ;:; I:)
(J::t (,) c . ~ ~ .. ....
!'''t:1 I-< > j .£ (G
~ M "",...00..,. co NlI"I-
Q)
~ ., " ::::
~ .,gtl""!tl""!\O_
c.. C
~ E ::::. N-
s:! s:! 0 tZ 0 ~ 0 e
= N ~ .?: ., CI N (t)l/"II.I"'\Or...CONtI'\_
rD N .~ .£ <5 rtJ I.t"\N~\O-
0 '"' ~ ~ -- .... '" N_ ... ~ 0 Lt. ~ .... ~ · ~'"' '"0 ~ .. ~ ... _Q_O \0 'XI NIJ"\_ .. ."
E~ Q) ,,- € .:l
.,. \O~ll"'I\O-
(/l 00 '" N-
C':I ::C-C ~
il=l Ij .. £-t =;..., '-" .£ '" OCO\C\QN-o_ S §
.,. "'::tt"'I-I~
N
.~fe tZ c '"
~~ ~ ~ . cg r-.. 0 GO ...... .",-S "'-~ AI -;; c.. Lt. :2: 'OJ) · ~ · .. '" .....CO"'t'MN- :rt"'I_ "'" 'OJ) ,,- e N ll'\;:er-..N
d ~_g '" Q) ..
:S .,,~
'" _",~o __
:'" rD 0
~.,g 6 ... N-"'0 ..c :c~ - ~ 0 " ..
.:::l ~ j .£ 00 ...... MO ...... I.t"\r-..I.t"\Vr-..M Q) "" E 3 ~
~ ...... -'O'-OCOr-..Nt-..
~ -\oU"\N
rD .S t1 = ~ 0 .; .E:: .. .,. NN~OCIO\\OOOOOtr, 's .£ 6 ::= :;
" -0 O""1'll"\("t"'.\OI.t"\N~
U ~I? ""'. -IJ"\~N
Q) ~ 0 · -(:l. -;; · .. ~ '" O"I\Oro_ ..... N_O\~N .. ." ~
,,- ~ 0 M\O"' ..... 'q"N'\-N"I
S 00 ": -1.t"I('t'\-;C-C
~ 00
I ~
"'"' ~
"'"' -0< ~ c c
~ I ~ .... P=I -I)
~ 0", « • c ? "":1"0\0\0\ N ~ . _ '" ~"'vo\ .... rn .. c:: - ••• ·N"':J"O\'" ...,
~ ::> ~nJ!IIJ:I ~ Q ""
~ ~ g;.....:N~.....:ONv-:O~ ~
Ui Q) ---tf'Il..I"IC:
~ ...J ::>

187 B SERIES
B-XIII-Sample Households engaged both in Cultivation and Household Industry showing Size of Land Cultivated classified by Principal Household Industry
(Based on 20 per cent Sample)
CodeNo. Total No. Number of Households by Size in Acres of Land Cultivated of of Hous.,.
1.s.I.C. bolds
Less than I 1.0-2.4 2.5-4.9 5.0-7.4 7.5-9.9 10.0-12.4 12.5-14.9 15.0-29.9 30.0-49.9 50+ Unspecified (I) (2) (3) (4) (5) (6) (7) (8) (9) (10) (11) (12) (13)
DISTRICf RURAL All Industries 797 132 324 197 83 29 16 4 2
Division 0 148 12 44 44 28 10 4 2 3
Maiot GtoliP 00 1
02 1
03 19 6 12
04 127 6 31 44 27 10 3 2 3
Division I
MaiorGroup 10 I
Division 2&3 648 119 280 153 55 19 12 2 6
Major Group 20 47 6 22 8 5 2 2
21 3 3
22 7 5
23 16 3 6 4
27 96 13 35 27 15 4
28 169 38 78 35 7 5 3 2
31 109 22 47 27 10 2
33 6 2 1 2
34 &35 106 19 51 22 8 4
36 38 11 16 9
38 3 I 1
39 48 8 18 17 2 2
DISTRICf URBAN All Industries 35 11 IS 6 2
Division 0 8 4 2
Major Group 04 8 4 2
Division 2 &3 27 10 II 5
Maior GroliP 20 4 I 3
23 2 2
27 2
28 , 31 3 2
34 &35 12 4 6
36 I
38
39
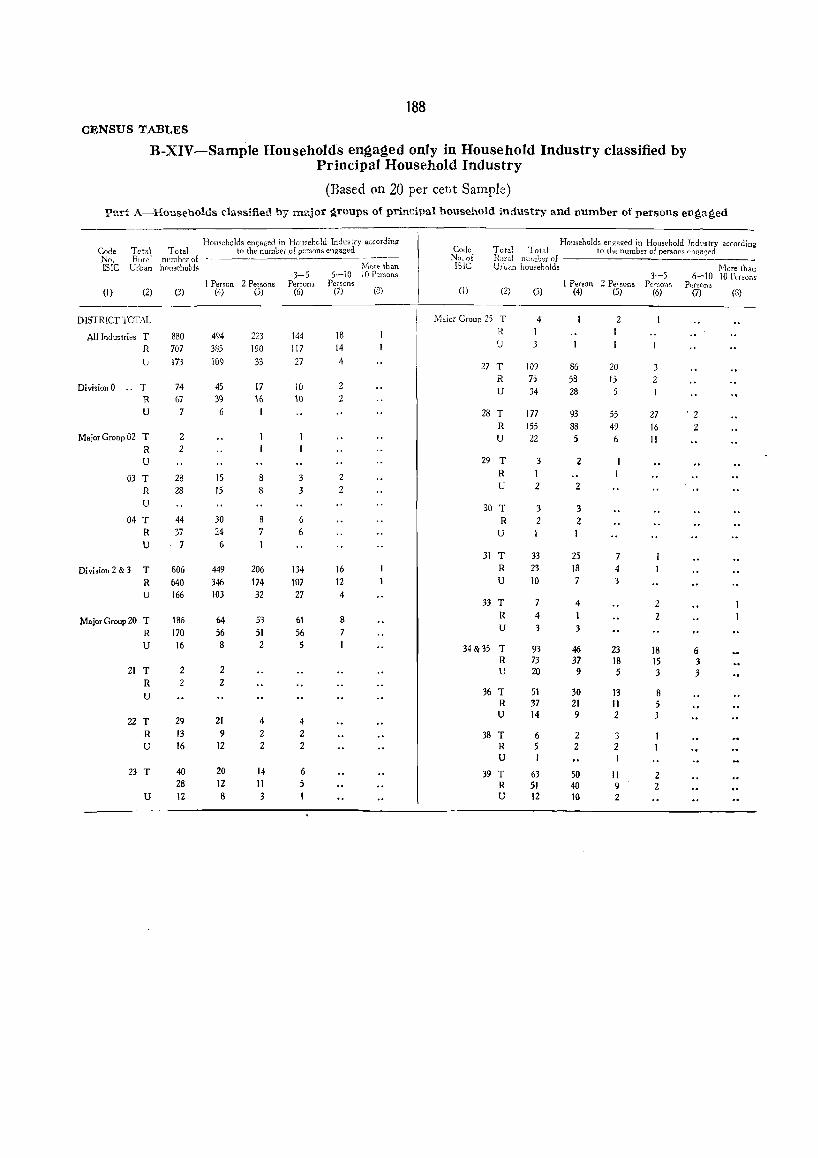
188 CENSUS TABLES
B-XIV-Sample Households engaged only in Household Industry classified by Principal Household Industry
(Based on 20 per cent Sample)
Part A-Households classified by major groups of principal household industry and number of persons engaged
Households engaged in Hou,el:cld Indcs;ry according Code Total
Households engaged in Household Industry according Code Total Total to the number.of persons enga.ged Total to the number of persons enqa!1t'd '" No. Hurd nvrnberof No.of R;~ril.l manb~r of ," ISIC Urban hou,eholds f\llore than ISIC UrrJ<-'.n hou,:;eholds ~1ore than
3-5 5-10 10 PerS0113 3-5 6-10 10 Persons 1 Person 2 PelSon. Per30n3 Persons 1 Por,on 2 Pef'Sons Perw!ls Pef'Jons
(I) (2) (3) (4) (5) (6) (7) (8) (1) (2) (3) (4) (5) (6) (7) (3)
DISTRICT TCTAL Mojor Group 25 T 4 2
All Industries T 880 494 223 144 18 R I I
R 707 385 190 117 14 !J 3
U 173 109 33 27 4 27 T 109 86 20 3
R 7j 58 15 2 Division 0 .. T 74 45 17 10 2 U 34 28 5
R 67 39 16 10 2
U 7 6 28 T 177 93 55 27 ' 2 R 155 88 49 16 2
Major Group 02 T 2 U 22 5 6 11 R 2 U 29 T 3 2
03 T 28 15 8 3 2 R 1
R 28 15 8 3 2 U 2 2
U 30 T 3 3 04 T 44 30 8 6 R 2 2
R 37 24 7 6 U U 7 6
31 T 33 25 7
Division 2 & 3 T 806 449 206 134 16 R 23 18 4
R 640 346 174 107 12 U 10 7 3 U 166 103 32 27 4
33 T 7 4 2
Major Croup 20 T 186 64 53 61 8 R 4 I 2
R 170 56 51 56 U 3 3
U 16 8 2 5 34 &35 T 93 46 23 18 11 R 73 37 18 15 3
21 T 2 2 U 20 9 5 3 3 R 2 2
U 36 T SI 30 13 8 R 37 21 11 5
22 T 29 21 4 4 U 14 9 2 3
R 13 9 2 2 38 T 6 2 3 U 16 12 2 2 R 5 2 2
U I 1
23 T 40 20 14 6 39 T 63 50 II 2 28 12 11 5 R 51 40 9 2
U 12 8 3 U 12 10 2
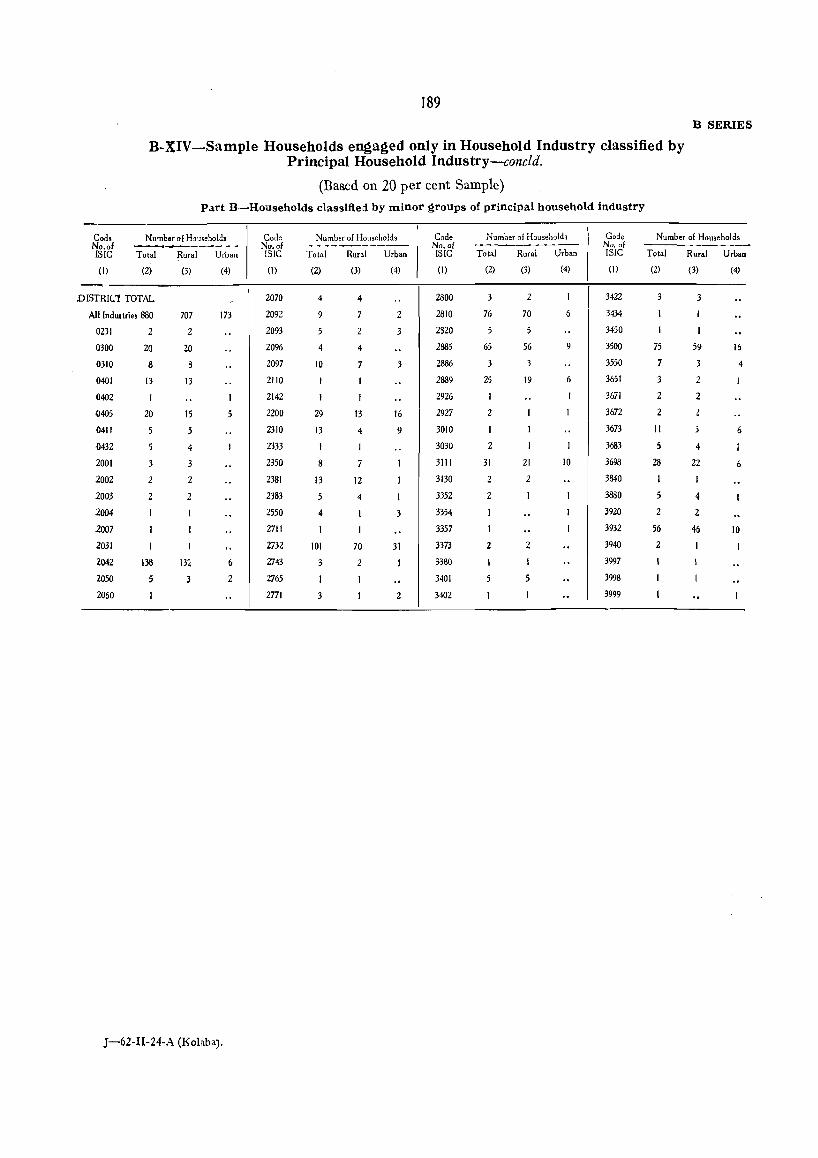
189 B SERIES
B-XIV-Sample Households engaged only in Household Industry classified by Principal Household Industry-concld.
(Based on 20 per cent Sample)
Pat't B-Households classified by minor ~roups of principal household industry
Cod. NU'llber of H,,,se~oll. Code Number of Household. Code Number of Household, Gode Number of Households No.of -------- No. of No. of --------- No. of ISIC Total Rura! Urban ISIC Total Rural Urban ISIC Total Rural Urban ISIC Total Rural Urban
(I) (2) (3) (4) (I) (2) (3) (4) (1) (2) (3) (4) (I) (2) (3) (4)
DISTRI('l TOTAL 2070 4 4 2800 3422 3 3
All Industries 880 707 173 2092 9 2 2810 76 70 6 3434 I
0231 2 2 2093 5 2 2820 5 5 3450
0300 20 20 2096 4 4 2885 65 56 9 3500 75 59 16
0310 8 2097 10 3 2886 3 3 3550 7 3 4
0401 13 13 2110 I 2889 25 19 6 3651 2
0402 I 2142 1 2926 3671 2 2
0405 20 15 2200 29 13 16 2927 2 3672 2
0411 5 2310 13 4 9 3010 3673 II 6
0432 5 4 2333 1 3030 2 3683 5 4
2001 3 2350 8 3111 31 21 10 3698 28 22 6
2002 2 2 2381 13 12 3130 2 2 3840 I I
2003 2 2 2383 5 4 1 3352 2 3680 5 4
2004 2550 4 3 3354 3920 2 2
2007 2711 3357 3932 56 46 10
2031 2732 101 70 31 3373 2 2 3940 2
2042 138 13, 6 2743 3 2 I 3380 3997
2050 5 2 2765 I 3401 5 5 3998
2060 2771 3 2 3402 3999
J-62-Il-24-A (Kohba).
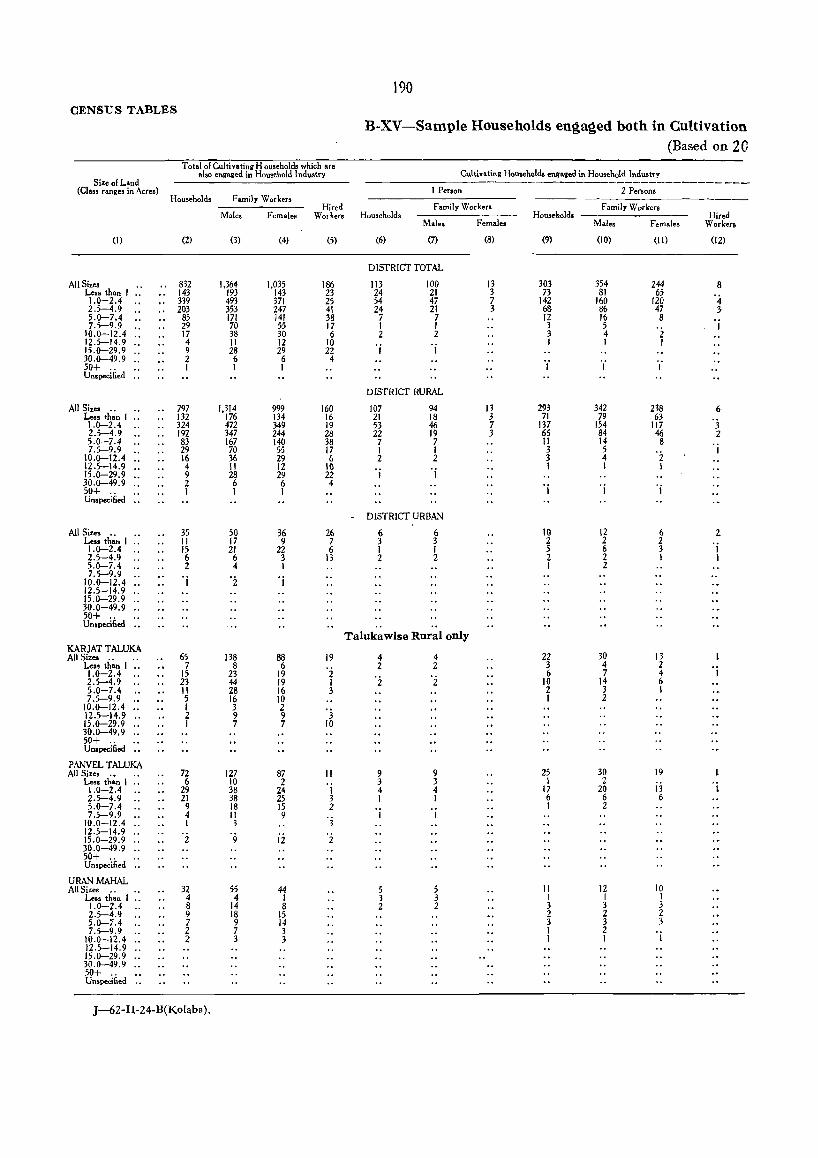
190 CENSUS TABLES
B-XV-Sample Households engaged both in Cultivation (Based on 20
Total ofCultivatini H ou.ehold. which are Cultivating Household. engaged in Household Industry also engaged in Household Industry
Size of Land (Cia .. range, in Acres) I Per$on 2 Persons
Hou.ehold. Family Worker. Hired Family Workers Family Worker.
Mal .. Femaleti Worker. Households Household. Hired Male. Fema.les Males Females Workers
(I) (2) (3) (4) (5) (6) (7) (8) (9) (10) (11) (2)
DISTRICT TOTAL
All Size. 832 1.364 1.035 186 113 100 13 303 354 244 8 Less than I .. 143 193 143 23 24 21 3 73 81 65 '4 1.0-2.4 339 493 371 25 54 47 7 142 160 120 2.5-4.9 203 353 247 41 24 21 3 68 86 47 3-5.0-7.4 85 171 i41 38 7 7 12 16 8 7.5-9.9 29 70 55 17 1 1 3 5 1
10.0-12.4 .. 17 38 30 6 2 2 3 4 2 12.5-14.9 .. 4 II 12 10 'j , j 1 I 1 15.0-29.9 .. 9 28 29 22 30.0-49.9 .. 2 6 6 4 '1 50+ I 1 1 I I Unspecified ..
DISTRICT RURAL
All Sizes 797 1,314 999 160 107 94 13 293 342 238 6 Less th~n I .. 132 176 134 16 21 18 3- 71 79 63 1.0-2.4 324 472 349 19 53 46 7 137 154 117 3 2.5-4.9 J9Z 347 244 28 22 19 3- 66 84 46 2 5.0-7.4 83 167 140 38 7 7 11 14 8 7.5-9.9 29 70 55 17 I 1 3 5 '2 I
10.0-12.4 .. 16 36 29 6 2 2 3 4 12.5-14.9 .. 4 11 12 10 'j 'j 1 I 1 15.0-29.9 .. 9 28 29 22 30.0-49.9 .. 2 6 6 4 'j 'j 'j 50+ I 1 1 Unspecified ..
DISTRICT URBAN
All Sizes 35 SO 36 26 6 6 10 12 6 2 Less th~n 1 .. II 17 9 7 3 3 2 2 2 'j 1.0-2.4 15 21 22 6 I I 5 6 3 2.5-4.9 6 6 3 13 2 2 2 2 I 1 5.0-7.4 2 4 1 1 2 7.S-9.9
'j 'i 'j 10.0-12.4 .. 12.S-14.9 .. 15.0-29.9 .. 30.0-49.9 .. 50+ Unspecified ..
Talukawise Rural only KARJAT TALUKA
30 All Sizes 65 138 88 19 4 4 22 13 Less tj,~n 1 .. 7 8 6 '2 2 2 3 4 2 'j 1.0-2.4 15 23 19 6 7 4 2.5-4.9 23 44 19 I 'i 2 10 14 6 5.0-7.4 11 28 16 3 2 3 I 7.5-9.9 5 16 10 1 2
10.0-12.4 .. I 3 2 12.5-14.9 .. 2 9 9 3 15.0-29.9 .. I 7 7 10 30.0-49.9 .. 50+ UnlPec'ified ..
PANVELTALUKA All Size. 72 127 87 11 9 9 25 30 19
Less th~n 1 " 6 10 2 3 3 1 2 i3 1.0-2.4 29 38 24 1 4 4 17 20 l
2.5-4.9 21 38 25 3 I I 6 6 6 5.0-7.4 9 18 15 2 1 2 7.5-9.9 4 11 9 '3 1 1
10.0-12.4 .. 1 3 12.5-14.9 .. 15.0-29.9 .. 2 9 12 2 30.0-49.9 .. 50+ Unspec'i£;ed ..
URANMAHAL All Sizes 32 55 44 5 5 11 12 10
Less th~n 1 .. 4 4 1 3 3 I I 1 1.0-2.4 8 14 8 2 2 3 3 3 2.S-4.9 9 18 15 2 2 2 5.0-7.4 7 9 14 3 3 3 7.5-9.9 2 7 3 1 2 'i 10.0-12.4 .. 2 3 3 1 I
12.5-14.9 .. 15.(}-29.9 .. 30.0-49.9 .. 50+ uns-ified ..
J-62-II-24-B(Kolaba).
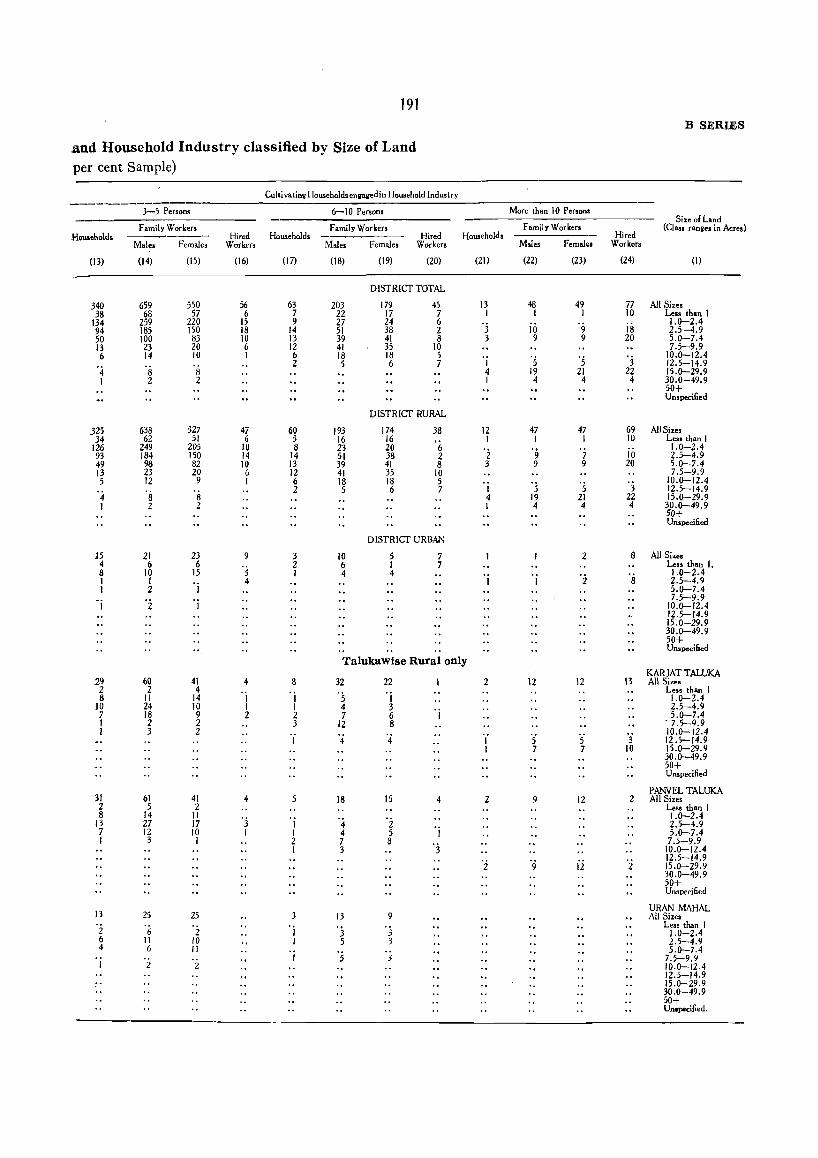
191 B SERIES
and Household Industry classified by Size of Land per cent Sample)
Culti vating Households enllsvedin Household Industry
3-5 Persons 6-10 Persons More than 10 Person. Size of Land
Family Workers Family Workers Family Workers (CI ... ranlles in Acres) Household. Hired Household. Hired Households Hired
Male. Females Workers Males Females Workers Males Females Workers
(13) (14) (15) (16) (17) (18) (19) (20) (21) (22) (23) (24) (I)
DISTRICT TOTAL
340 659 550 56 63 203 179 45 13 48 49 77 All Sizes 38 68 57 6 7 22 17 7 I I I 10 Less than I
134 259 220 15 9 27 24 6 'j io js 1.0-2.4
94 185 150 18 14 51 38 2 9 2.5-4.9 50 100 83 10 13 39 41 8 3 9 9 20 5.0-7.4 13 23 20 6 12 41 35 10 7.5--9.9 6 14 10 I 6 18 18 5 '5 '5 10.0-12.4
'4 's 2 5 6 7 I 3 12.5--14.9 8 4 19 21 22 15.0-29.9
I 2 2 I 4 4 4 30.0-49.9 50+ Unspecified
DISTRICT RURAL
325 638 527 47 60 193 174 38 12 47 47 69 All Size. 34 62 51 6 5 16 16 I I I 10 Less than I
.126 249 205 10 8 23 20 6 '9 1.0-2.4 93 184 150 14 14 51 38 2 2 7 10 2.5-4.9 49 98 82 10 13 39 41 8 3 9 9 20 5.0-7.4 13 23 20 6 12 41 35 10 7.5-9.9 5 12 9 I 6 18 18 5 10.0-12.4
2 5 6 7 I 5 5 3 12.5--14.9 4 8 8 4 19 21 22 15.0-29.9 I 2 2 1 4 4 4 30.0-49.9
50+ Unspecified
DISTRICT URBAN
15 21 23 9 3 10 5 7 2 8 All Size. 4 6 6 2 6 1 7 Less than I. a 10 15 5 1 4 4 ·z ·s 1.0-2.4 I I 4 I 1 2.5--4.9 I 2 I 5.0-7.4
'j 'j 7.5--9.9
2 10.0-12.4 12.5-14.9 15.0-29.9 30.0-49.9 50+ Unspecified
Talukawise Rural only KARJAT TALUKA
29 60 41 4 8 32 22 2 12 12 13 All Siz •• 2 2 4 'j ·s 'j Less than 1 8 II 14 1 1.0-2.4
10 24 10 I I 4 3 2.5-4.9 7 18 9 2 2 7 6 'j 5.0-7.4 I 2 2 3 12 8 . 7.5--9.9 I 3 2 'i '4 'j 10.0-12.4
'4 1 '5 '5 12.5-14.9 1 7 7 10 15.0-29.9
30.0-49.9 50+ Unspecified
31 61 41 4 PANVEL TALUKA
5 18 15 4 2 9 12 2 All Sizes 2 5 2 Less than 1 8 14 II 'j 1.0-2.4
13 27 17 1 '4 2 2.5--4.9 7 12 10 I 1 4 5 I 5.0-7.4 1 3 1 2 7 8 7.5--9.9
I 3 '3 10.0-12.4
'i ii 12.5--14.9
9 2 15.0-29.9 30.0-49.9 50+ Unspecified
B 25 25 3 URAN MAHAL
13 9 All Sizes
2 6 '3 Less than 1 2 1 3 1.0-2.4
6 II 10 1 5 3 2.5-4.9 4 6 II 5.0-7.4
1 I '5 3 7.5-9.9
2 2 10.0-12.4 12.5--14.9 15.0-29.9 30.0-49.9 50+ Unspecified.
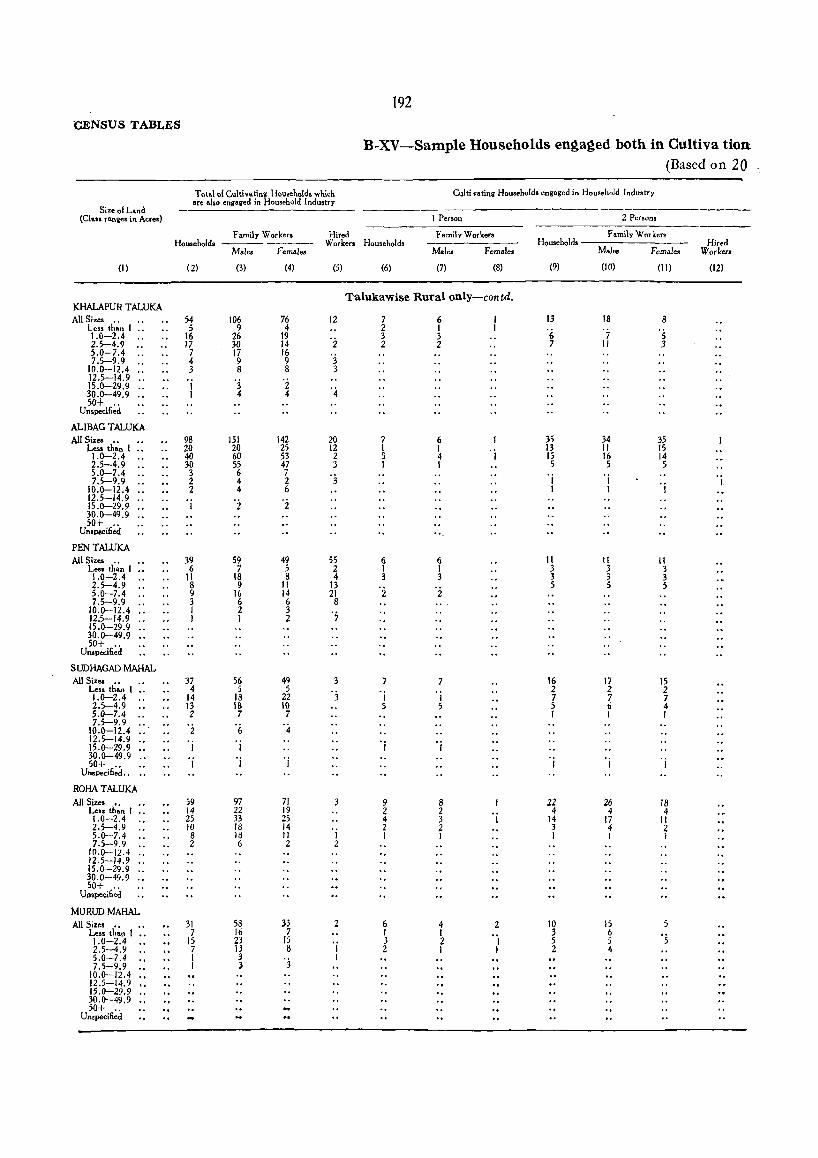
CENSUS TABLES
Size 01 Land (Cl.n ranae. in Acres)
Total 01 Cultivating Household. which are .1.0 engaged in Household Indu.try
Family Workers Hired
192
B-XV-Sample Households en~a~ed both in Cultiva tion (Based on 20
Culti vating Households enga,ed in Household Industry
I Person 2 Persons
Family Worke,. Family Workers Household. W orken Households Households
Mal.. Females Hired
Worker.
(I)
KHALAPUR TALUKA All Sizes ..
Less than I .. 1.0-2.4 2.5-4.9 .• 5.0-7.4 7.5-9.9
10.0-12.4 .. 12.5-14.9 .. 15.0-29.9 .. 30.0-49.9 .. 50+ ..
Unspecified
ALIBAG TALUKA All Sizes ••
Less than 1 •• 1.0-2.4 2.5-4.9 5.0-7.4 7.5-9.9
10.0-12.4 .. 12.5-14.9 •• 15.0-29.9 .. 30.0-49.9 .. 50+ ..
Unspecili.d
PENTALUKA All Sizes ..
Less th.n I .. 1.0-2.4 2.5-4.9 5.0-7.4 7.5-9.9
10.0-12.4 .. 12.5-14.9 .. 15.0-29.9 .. 30.0-49.9 .. 50+ ..
Unspecified
SUDHAGAD MAHAL All Sizes ..
Less than 1 ., 1.0-2.4 2.5-4.9 5.0-7.4 7.5-9.9 ..
10.0-12.4 .. 12.5-14.9 .. 15.0-29.9 .. 30.0-49.9 .. 50+ ..
Unspecified ..
ROHA TALUKA All Si« ...
Less than I .. 1.0-2.4 2.5-4.9 5.0-7.4 7.5-9.9
10.0-12.4 .. 12.5-14.9 .. 15.0-29.9 .. 30.0-49.9 .. 50+ "
Unspecified
MURUDMAHAL All Sizes "
Less than 1 •• 1.0-2.4 2.5-4.9 5.0-7.4 7.5-9.9
10.0-12.4 .. 12.5-14.9 " 15.0-29.9 .. 30.0-49.9 .. 50+ '.
Un,pecified
(2)
54 5
16 17 7 4 3
1 I
98 20 40 30 3 2 2
I
39 6
11 8 9 3 I J
37 4
14 13 2
'i I
I
59 14 25 10 8 2
31 7
15 7 1 J
Males Females
(3)
106 9
26 30 17 9 8
'3 4
lSI 20 60 55 6 4 4
'2
59 7
18 9
16 6 2 I
56 5
18 18 7
'6 'j
I
97 22 33 18 18 6
58 16 23 13 3 3
(4)
76 4
19 14 16 9 8
'i 4
142 25 53 47 7 2 6
'i
49 5 8
II 14 6 3 2
49 5
22 10 7
'4
'j
71 19 25 14 11 2
}3 7
15 8
'3
(5)
12
'2 '3 3
20 12 2 3
'3
55 2 4
13 21 8
'7
3
3
3
1 2
2
Mal.. Female.
(6) (7) (8)
Talukawise Rural onlY-contd.
7 2 3 2
7 I 5 1
6 1 3
'2
7
I S
9 2 4 2 1
6 I 3 2
6 I 3 2
6 1 4 1
6 1 3
2
7
I S
'j
8 2 3 Z I
4 I 2 1
'j
2
I 1
(9)
13
'(, 7
35 13 15 S 'j 1
II 3 3 5
16 2 7 S I
22 4
14 3 1
10 3 5 2
(10)
18
'7 II
34 II 16 5
I I
11 3 3 5
17 Z 7 6 t
'j
26 4
17 4 1
15 6 5 4
(II)
8
·s 3
3S 15 14 5
'j
II 3 3 5
15 2 7 4 I
18 4
II 2 I
. 5
(12)
. i
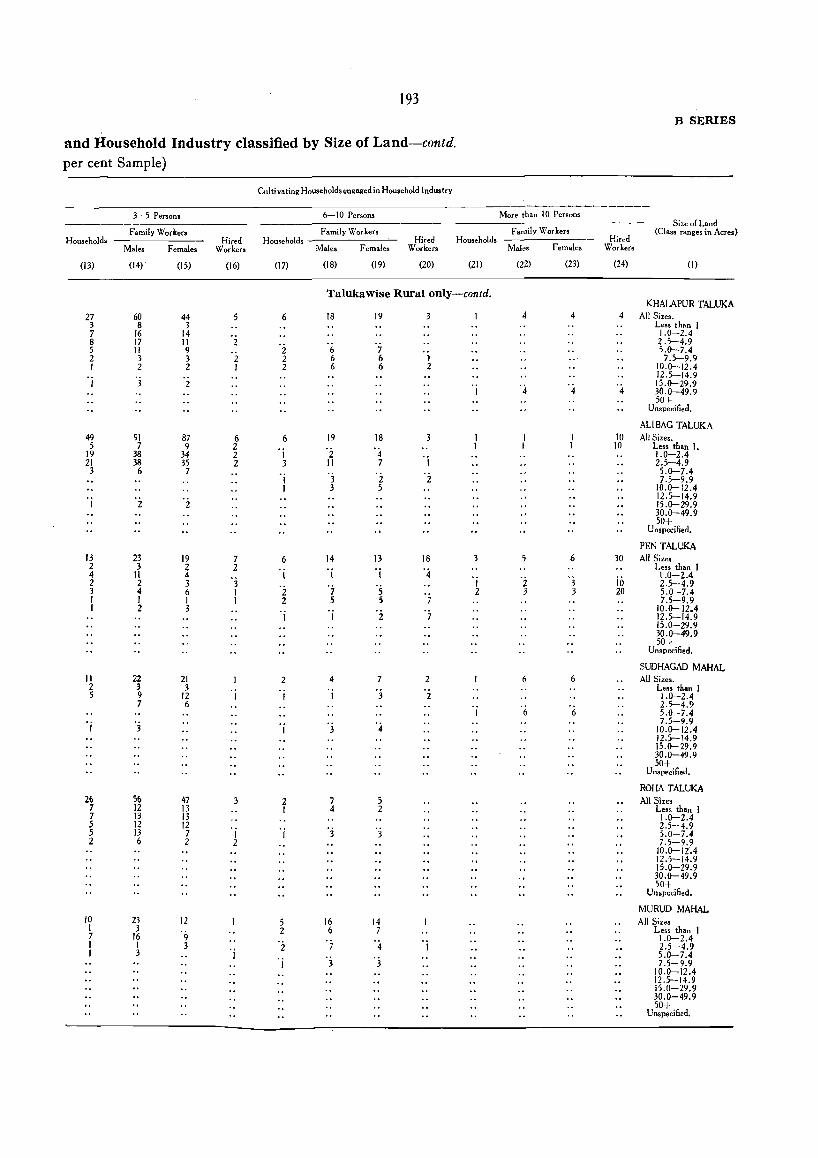
193 B SERIES
and Household Industry cla.ssified by Size of Land-contd. per cent Sample)
Cultivating Households engaged in Household Industry
3-5 Person. 6--10 Persons More than 1 0 Persons
Family Wor kers Size 01 Land
Family Worken Family Workers (Class ranges in Acres) Household. Hired Households Hired Households Hired
Males Females Workers Males Females Workers Males Females Workers
(13) (14) (15) (16) (17) (18) (19) (20) (21) (22) (23) (24) (I)
Talukawise Rural only-cantd. KHALAPUR TALUKA
27 60 44 6 18 19 3 4 4 4 All Sizes. 3 8 3 Less than I 7 16 14 1.0-2.4 8 17 II 2 2.5-4.9 5 II 9 2 6 7 5,0-7.4 2 3 3 2 2 6 6 1 7,5--9,9 1 2 2 1 2 6 6 2 10,0-12,4
12,5--14,9 1 3 2 '4 '4 '4 15,0-29.9
1 30.0-49.9 50+
Unspeeified.
AU BAG TALUKA 49 91 87 6 6 19 18 10 All Sizes. 5 7 9 2 'j '2 '4
10 Less than I. 19 38 34 2 'j 1.0-2.4 21 38 35 2 3 II 7 2.5-4.9 3 6 7 '3 'z ·z 5.0-7.4
I 7.S-9.9 I 3 S 10.0-12.4
'j 2 'z 12.5-14.9 IS.0-29.9 30.0-49.9 SO+
Unspecified.
PENTALUKA 13 23 19 7 6 14 13 18 6 30 All Sizes 2 3 2 2 'j 'j '4 Less than I 4 It 4 'j
'j '3 iiJ \.0-2.4
2 2 3 '3 'z ·7 '5 '2 2,5-4.9
3 4 6 1 '7 2 3 3 20 5.0-7.4 I 1 I I 2 5 5 7.5-9.9 I 2 3 'j '2 '7 10.0-12.4
'j 12.5--14.9 15.0-29.9 30.0-49.9 50+
Unspecified.
SUDHAGAD MAHAL II 22 21 2 4 7 2 6 6 All Sizes. 2 3 3 '3 Less than 1 5 9 12 1 I I 2 1.0-2.4
7 6 'j '6 2.5-4.9 6 5.0-7.4
'j 3 '3 '4 7.5-9.9 1 10.0-12.4
.. 12.5-14.9 15.0-29.9 30.0-49.9 50+
Unspecified.
ROHA TALUKA 26 56 47 3 2 7 J All Sizes
7 12 13 1 4 2 Less than I 7 13 13 1.0-2.4 5 12 12 2.S-4.9 5 13 7 1 'j 'j 'j 5.0-7.4 2 6 2 2 7.S-9.9
10.0-12".4 12.5--14.9 15.0-29.9 30.0-49.9 50+
Unspecified.
MURUD MAHAL 10 23 12 5 16 14 All Sizes 1 3 2 6 7 Less than I 7 16 '9 1.0-2.4 1 I 3 'z '7 '4 'j 2,5-4.9 1 3 1 5.0-7.4
'j '3 '3 7.5-9.9 10.0-12.4 12.5-14.9 15.0-29.9 30.0-49.9 50+
Unspecified.
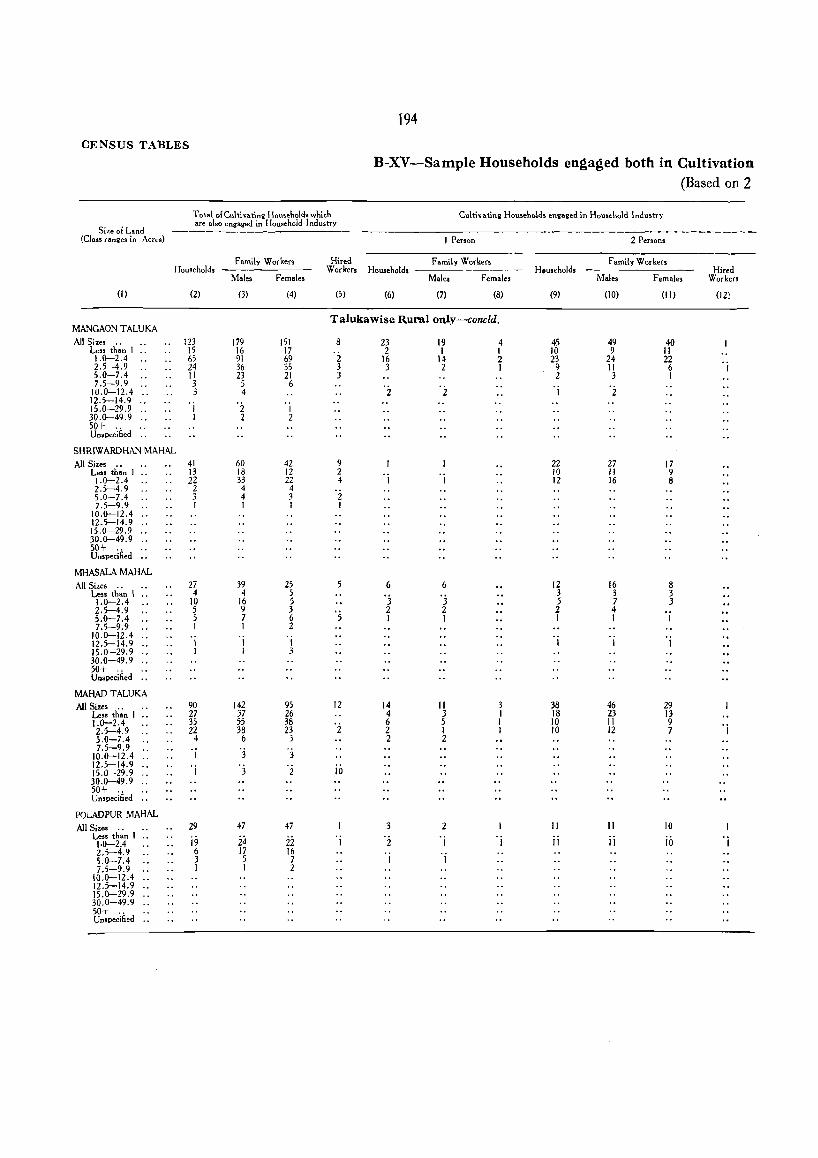
CENSUS TABLES
T94
B-XV-Sample Households en~a~ed both in Cultivation (Based on 2
Size of Land (Class ranges in Acres)
Total of Cultivating Households which are also engaged in Household Industry
Cultivating Households engaged in Household Industry
Households
(I)
MANGAON TALUKA All Sizes ..
Le .. than I .. 1.0-2.4 2.5-4.9 5.0-7.4 7.5-9.9
10.0-12.4 ., 12.5-14.9 .. 15.0-29.9 .. 30.0-49.9 .. 50+ .. Unspecified ..
SHRIWARDHAN MAHAL All Sizes .•
Le .. than I .. 1.0-2.4 2.5-4.9 5.0-7.4 7.5-9.9
10.0-12.4 .. 12.5-14.9 .. 15.0-29.9 .. 30.0-49.9 .. 50+ .. Unspecified ••
MHASALA MAHAL All Sizes ..
Less tban I .. 1.0-2.4 2.5-4.9 5.0-7.4 7.5-9.9
10.0-12.4 .. 12.5-14.9 .. 15.0-29.9 .. 30,0-49.9 .. 50+ .. Umpecified •.
MAHAD TALUKA All Sizes ..
Less than I .. 1.0-2.4 2.5-4.9 5.0-7.4 7.5-9.9
10.0-12.4 .. 12.5-14.9 .. 15.0-29.9 .. 30.0-49.9 .. 50+ .. Unspecified ••
POLADPUR MAHAL All Sizes ..
Less than I .. 1·0-2.4 2.5-4.9 5.0-7.4 7,5-9.9
10.0-12.4 .. 12.5-14.9 .. 15.0-29.9 .. 30.0-49.9 .. 50+ .. Unspecified .•
(2)
123 15 6S 24 II 3 3
I I
41 13 22 2 3 I
27 4
10 5 5 I 'j I
90 27 35 22 4
1
'j
29
j9 6 3 I
Family Worker.
Males Females
(3)
179 16 91 36 23 5 4
'2 2
60 18 33 4 4 I
39 4
16 9 7 1
I I
142 37 55 38 6
3
3
47
:24 17 5 1
(4)
151 17 69 35 21 6
1 2
42 12 22 4 3 I
25 5 5 3 6 2
I 3
95 26 38 23
3
3
2
47
ii 16 7 2
I Person
Hired Family Workers Workers Households ---------
Males Female,
(5) (6) (7) (8)
Ta1ukawise Rural on1:v--concld.
8
'2 3 3
9 2 4
2 I
5
12
2
jo
'j
23 2
16 3
6
'j 2 I
14 4 6 2 2
3
':2 I
19 1
14 2
6
3 2 I
II 3 5 I 2
2 'j
'j
4 I 2 I
'j
Household.
(9)
45 10 23
9 2
'j
22 10 12
12 3 5 2 I
38 18 10 10
11 jj
2 Persons
Family Workers
Males Females
(10)
49 9
24 II 3
2
27 II 16
16 3 7 4 1
46 23 II 12
11 jj
(II)
40 II 22 6 I
17 9 8
8 3 3
'j
'j
29 13 9 7
10
jiJ
Hired Worke"
(l2!
'j
'j
'j
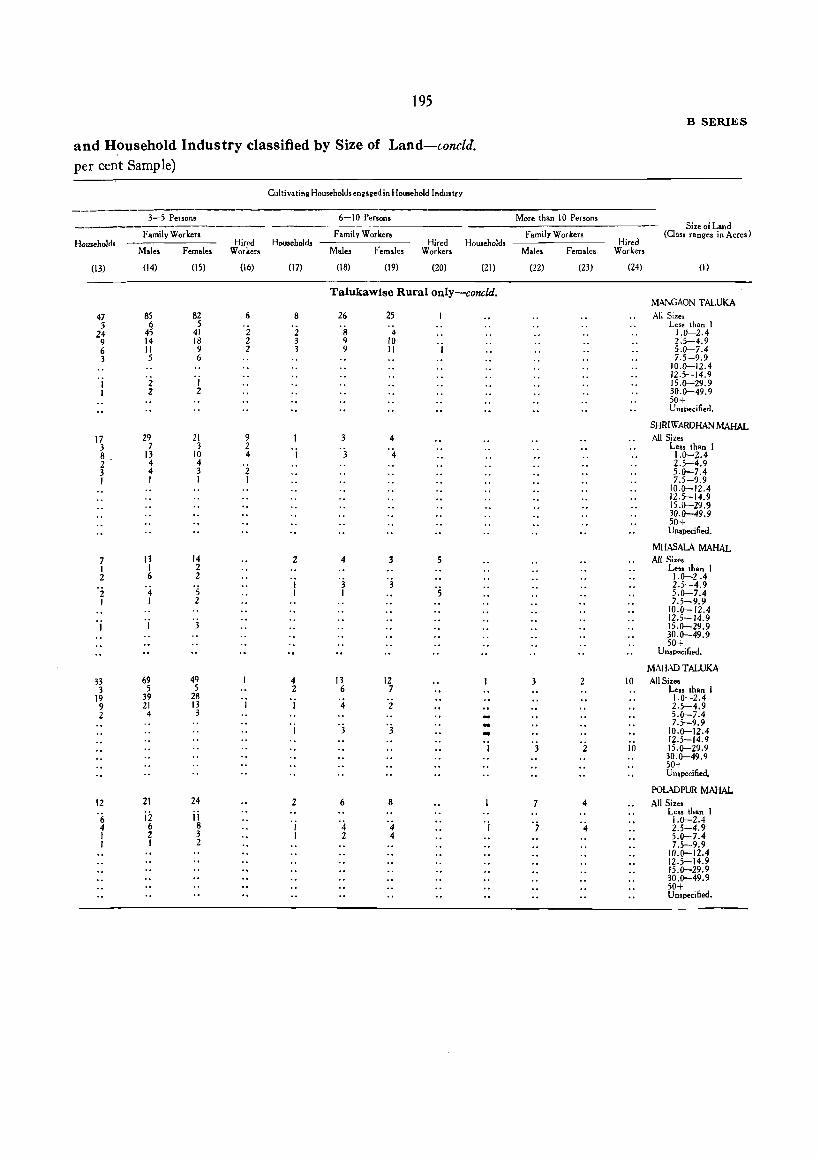
195 B SERIES
and Household Industry classified by Size of Land-wncld. per cent Sample)
Culti vating Household. engaged in Household Indultry
3-5 Person. 6-10 Persons More than 10 Persons ---------------- Size 01 Land Family Workers Family Workers Family Workers (Class ranges in Acres)
Households Hired Household. Hired HouJehold. Hired Males Female. Workers Male. Females Workers Males Females Workers
(13) (14) (15) (16) (17) (18) (19) (20) (21) (22) (23) (24) (I)
Talukawise Rural only-cancU. MANGAON TALUKA
47 85 82 6 8 26 25 All Sizes 3 6 5 Less than I
24 45 41 2 2 8 4 1.0-2.4 9 14 18 2 3 9 10 2.5-4.9 6 II 9 2 3 9 II I 5.0-7.4 3 5 6 7.5-9.9
10.0-12.4 12.5-14.9
1 2 1 15.0-29.9 1 2 2 30.0-49.9
50+ Unspecified.
SHRIWARDHAN MAHAL
17 29 21 9 3 4 All Sizes 3 7 3 2 '3 '4 Less than I 8 13 10 4 I 1.0-2.4 2 4 4 'i 2.S-4.9 3 4 3 5.0-7.4 1 I I I 7.S-9.9
10.0-12.4 12.5-14.9 IS.(}-29.9 30.0-49.9 50+ Unspecified.
MHASALA MAHAL 7 13 14 Z 4 3 5 All Sizes 1 1 2 Le .. than 1 2 6 2 '3 "3 1.0-2.4
'2 '4 . 5 1 ·s 2.5-4.9 1 1 5.0-7.4
I 1 2 7.5-9.9 10.0-12.4
'j 12.5- 14.9 1 I 15.0-29.9
30.0-49.9 SO+
Unspecified.
MAHAn TALUKA
33 69 49 4 13 12 2 10 All Sizes 3 5 5 2 6 7 Les. than 1
19 39 28 1.0-2.4 9 21 13 I I 4 2 2.5-4.9 2 4 3 5.0-7.4
'3 7.5-9.9 I 3 .. 10.0-12.4
io 12.5-14.9 I 3 2 15.0-29.9
30.0-49.9 SO+ Unspecified.
POLADPUR MAHAL 12 21 24 2 6 8 7 4 All Size.
'6 ii ii Less than I 'j '4 '4 1.0-2.4
4 6 8 'j '7 '4 2.5-4.9 1 2 3 1 2 4 5.0-7.4 1 1 2 7.5-9.9
10.0-12.4 12.5-14.9 15.0-29.9 30.0-49.9 50+ Unspecified.

196
CENSUS TABLES
B-XVI-Sample Principal Household Industry classified by Period of Working
(Based on 20
Total Total 1 to 3 months 4 to 6 months CodeNo, Rural
Household Industry Urban Family Workers Family Workers Family Workers (Division and Major (a) With cultivation House .. Hired. House .. Hired House .. Hired
Group only) (b) Without cultivation holds Male. Females Workers hold. Males Females Workers holds Male. Females Workers
(I) (2) (3) (4) (5) (6) (7) (8) (9) (10) (11) (12) (13) (14)
DISTRICT TOTAL All Industries " Total 1,712 2,322 1,572 260 71 95 73 8 257 327 271 54
(a) b32 1,364 1,035 186 50 74 58 7 165 249 204 39 (b) 880 958 537 74 21 21 15 1 92 78 67 15 Rural 1,504 2,090 1,450 204 68 91 71 8 223 295 242 29 (a) 797 1,314 999 160 49 72 57 7 157 241 192 28 (b) 707 776 451 44 19 19 14 I 66 54 50 1 Urban 208 232 122 56 3 4 2 34 32 29 25 (a) 35 50 36 26 1 2 1 8 8 12 11 (b) 173 182 86 30 2 2 1 26 24 17 14
Division 0 .. Total 230 387 300 40 2 3 8 8 10 (a) 156 307 257 37 2 3 4 5 4 (b) 74 80 43 3 'j '2. 'j 4 3 6 Rural 215 369 297 38 7 7 9 (a) 148 296 255 35 I 2 3 3 4 3 (b) 67 73 42 3 4 3 6 Urban 15 18 3 2 1 1 1 (a) 8 11 2 2 1 1 1 (b) 7 7 1
Major Group 00 .. Rural(a) .. 1 I
02 .. Rural 3 5 7 2 3 2 3 4 (a) I 2 3 2 3 ';1 '4 (b) 2 3 4 3
03 .. Rural 47 62 49 (a) 19 31 27
'j (b) 28 31 22 1
04 " Total 179 319 243 40 4 4 4 (aj 135 273 226 37 3 4 3 (b) 44 46 17 3 I '3 1 Rural 164 301 240 38 3 3 (a) 127 262 224 35 2 3 2 (b) 37 39 16 3 I 'j I Urban 15 18 3 2 I I (a) 8 11 2 2 1 1 I (b) 7 7 1
DIVision 1 and Major .. Rural (a) .. Group 10,
Di vision 2 & 3 .. Total 1,481 1,934 1,271 220 70 93 70 8 248 318 26{) 54 (a) 675 1,056 777 149 49 72 55 7 160 243 199 39 (b) 806 878 494 71 21 21 15 1 88 75 61 15 Rural 1,288 1,720 1,152 166 67 89 68 8 215 287 232 29 (a) 648 1,017 743 125 48 70 54 7 153 236 188 28 (b) 640 703 409 41 19 19 14 1 62 51 44 1 Urban 193 214 119 54 3 4 2 33 31 28 25 (a) 27 39 34 24 I 2 1 7 7 11 11 (b) 166 175 85 30 2 2 1 26 24 17 14
Major GrQuP 20 .. Total 237 295 256 40 12 17 15 14 9 13 (a) 51 85 52 19 5 12 8 2 4 2 (b) 186 210 204 21 7 5 7 12 5 11 'i Rural 217 276 243 27 12 17 15 8 6 8 I (a) 47 80 51 15 5 12 8 I 2 1 (b) 170 196 192 12 7 5 7 7 4 7 1 Urban 20 19 13 13 6 3 5 1 (.) 4 5 1 4 I 2 I
OJ (b) 16 14 12 9 5 I 4
21 .. Rural 5 5 2 (a) 3 3 2 (b) 2 2 I I
22 .. Total 36 43 n 2 2 2 (aj 7 II 7 2 I 1 (bj 29 32 10 '2 1 1 'j Rural 20 25 12 I 1 (a) 7 11 7 2 1 I 1 (b) 13 14 5 'j 'j Urban (b) " 16 18 5
23 .. Total 58 66 55 15 8 II 9 2 (a) 18 29 23 15 3 7 4 2 (b) 40 37 32 is 5 4 5 Rural 44 57 41 7 11 8 '2 (a) 16 27 20 15 3 7 4 2 (b) 28 30 21 4 4 4 Urban 14 9 14 I 1 (a) 2 2 3 'j 'j (b) 12 7 11
25 .. Total (b) .. 4 4 4 Rural (u) I 1 'j 1 'j Urban(D) :: 3 3 3 1 3
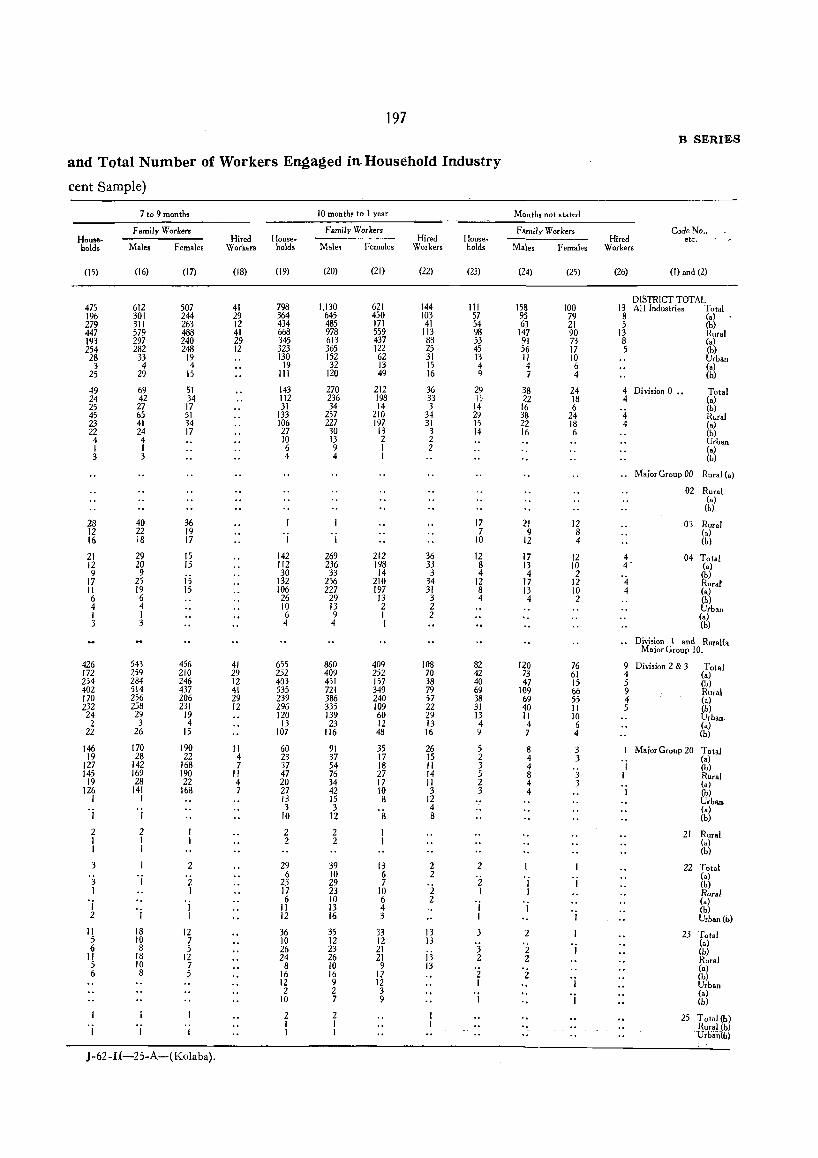
197 B SERIES
and Total Number of Workers Engaged in Household Industry
cent Sample)
7 to 9 months 10 months to I year Months not stated
Family Workers F amil y Wor ken Family Workers CadeNa .. House- Hired House .. Hired House~ Hired etc. bolds Males Females Workers holds Male, Females Workers holds Males Females Workers
(15) (16) (17) (18) (19) (20) (21) (22) (23) (24) (25) (26) (I) and (2)
DISTRICT TOTAL 475 612 507 41 798 1,130 621 144 111 158 100 J3 All Industries Total 196 301 244 29 364 645 450 103 57 95 79 8 (a) 279 311 263 12 434 485 171 41 54 63 21 5 (b) 447 579 488 41 668 978 559 113 98 147 90 13 Rural 193 297 240 29 345 613 437 88 53 91 73 8 (a) 254 282 248 12 323 365 122 25 45 56 17 5 (b) 28 33 19 130 152 62 31 13 11 10 Urban 3 4 4 19 32 13 IS 4 4 6 (a)
25 29 15 111 120 49 16 Q 7 4 (b)
49 69 51 143 270 212 36 29 38 24 4 Division 0 .. Total 24 42 34 112 236 198 33 I:" 22 18 4 (a) 25 27 17 31 34 14 3 14 16 6 (b) 45 65 51 J33 257 210 34 29 38 24 4 Rural 23 41 34 106 227 197 31 IS 22 18 4 <a) 22 24 17 27 30 13 3 14 16 6 (b) 4 4 JO 13 2 2 Urban I I 6 9 I 2 <a) 3 3 4 4 1 <b)
, • Major Group 00 Rural (a)
02 Rural (a) (b)
28 40 36 17 21 12 03 Rural 12 22 19 7 9 8 (a) 16 18 17 I I 10 12 4 (b)
21 29 15 142 269 212 36 12 17 12 4 04 Total 12 20 15 112 236 19B 33 B 13 10 4 . (a) 9 9
is 30 33 14 3 4 4 2 '4 (b)
17 25 132 256 210 34 12 17 12 Rural II 19 15 106 227 197 31 8 13 10 4 (a) 6 6 26 29 13 3 4 4 2 (b) 4 4 10 13 2 2 Urban 1 I 6 9 I 2 (a) 3 3 4 4 I (b)
.. Division I and Rural(.' Major Group 10.
426 543 456 41 655 860 409 108 82 120 76 9 Division 2 & 3 Total 172 259 210 29 252 409 252 70 42 73 61 4 (a) 254 284 246 12 403 451 157 38 40 47 IS 5 (b) 402 514 437 41 535 721 349 79 69 109 66 9 Rural 170 256 206 29 239 386 240 57 38 69 55 4 (a) 232 258 231 12 296 335 109 22 31 40 II 5 (b) 24 29 19 120 139 60 29 13 11 10 Urban. 2 3 4 13 23 12 13 4 4 6 (a)
22 26 15 107 116 48 16 9 7 4 (b)
146 170 190 II 60 91 35 26 5 8 3 Major Group 20 Total 19 28 22 4 23 37 17 15 2 4 3 <a)
127 142 168 7 37 54 18 II 3 4 I (b) 145 169 190 II 47 76 27 14 5 8 3 I Rural
19 28 22 4 20 34 17 II 2 4 3 <a) 126 141 168 7 27 42 10 3 3 4 I (b)
I I 13 15 8 12 Urban 3 3 4 <a)
I I 10 12 8 8 (b)
2 2 2 2 21 Rural 1 I 2 2 (a) I I (b)
3 2 29 39 13 2 2 22 Total 6 JO 6 2 'i (a)
3 I 2 23 29 7 '2 I I (b) 1 I 17 23 10 J I Rura!
6 10 6 2 (a) I I II 13 4 I I <b) 2 I I 12 16 3 I I Urban (b)
II 18 12 36 35 33 13 2 23 Total 5 JO 7 10 12 12 13 -. (a) 6 8 5 26 23 21 ij 3 2 I (b) II 18 12 24 26 21 2 2 Rural 5 10 7 8 10 9 13 'i (a) 6 8 5 16 16 11 2 (b)
12 9 12 I I Urban 2 2 3 'j 'j (a)
JO 7 9 (b)
2 2 25 Total (b) I I RuralJb) I I I I I Urbiin(b)
J-62-II-25-A-(Kolaba),
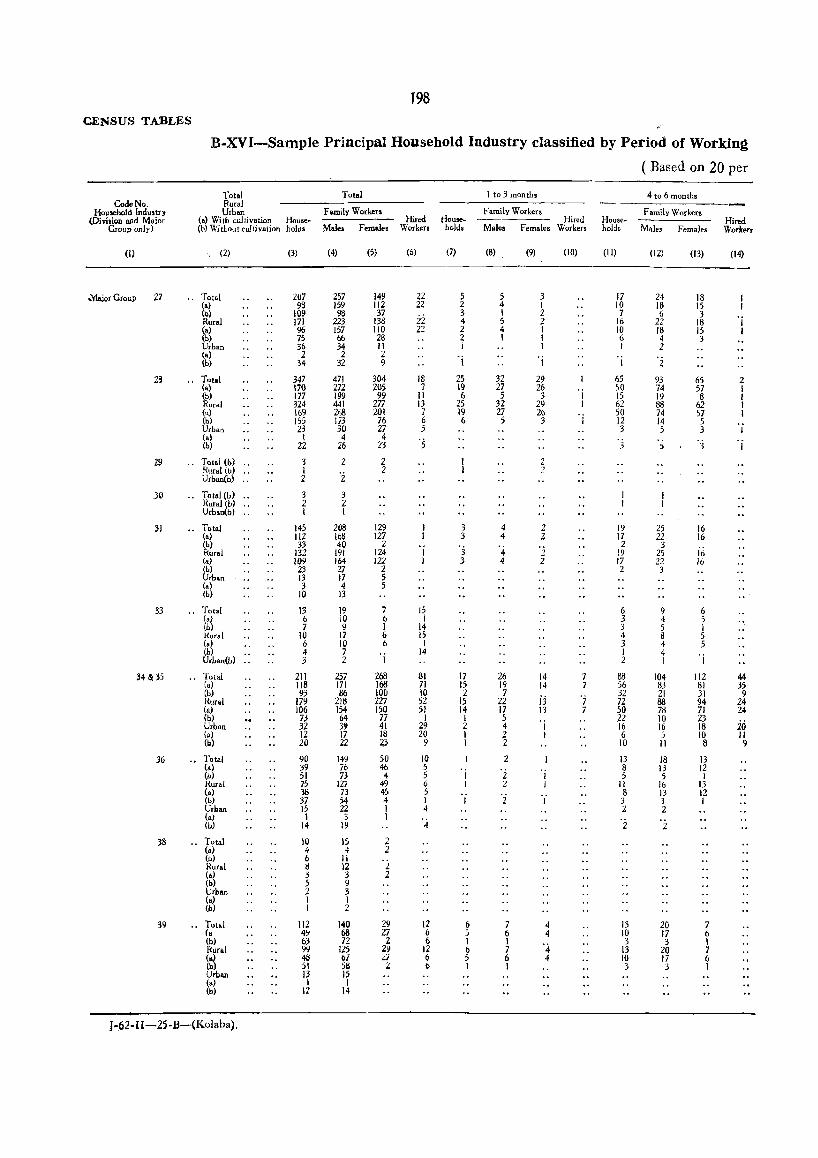
198 CENSUS TABLES
B-XVI-Sample PrIncipal Household Industry classified by Period of Working
( Based on 20 per
Total Total 1 to 3 month. 4 to 6 month. Code No, Rural
Household Industry Urhan Founily Workers House-
Family Worken Family Workers (Division and Maior (a) With cultivation House_.. Hired Hired House .. Hired
Group only) (b) Withou! col ti vation holds Male. Females Work.rs holds Mal •• Females Workers hoJds MaJes Females Workers
(I) , (2) (3) (4) (5) (6) (7) (8) (9) (10) (II) (12) (13) (14)
.!'rla.ior Group 27 " Total 207 257 149 22 5 5 3 17 24 18 (a) 98 159 112 22 2 4 1 10 18 15 (b) 109 98 37
ii 3 I 2 7 6 3
Rural 171 223 138 4 5 2 16 22 18 I (a) 96 157 110 22 2 4 I 10 18 15 1 (h) 75 66 28 2 I 1 6 4 3 Urban 36 34 11 I 1 I 2 (a) 2 2 2 'j 'j 'j (b) 34 32 9 2
28 " Total 347 471 304 18 25 32 29 65 93 65 2 (a) 170 272 205 7 19 27 26 'j 50 74 57 I (1,) 177 199 99 11 6 5 3 15 19 8 1 Rural 324 441 277 13 25 32 29 1 62 88 62 1 (al 169 268 201 7 19 27 26 'j 50 74 57 1 (b) 155 173 76 6 6 5 3 12 14 5 Urban 23 30 27 5 3 5 3 1 (a) 1 4 4 '5 '3 '5 "j 'j (b) 22 26 23
29 " Total (h) " 3 2 2 2 Rural (b) " I '2 2 2 Urban(b) " 2
30 " Total (b) " 3 3 Rural (b) 2 2 Urban(bl " I 1
31 " Total 145 208 129 3 4 2 19 25 16 (a) 112 168 127 3 4 2 17 22 16 (h) 33 40 2 'j '2
2 3 Rural 132 191 124 I 4 19 25 16 (0) 109 164 122 I 3 4 2 17 22 16 (h) 23 27 2 2 3 Urban 13 17 5 (a) 3 4 5 (b) 10 13
33 .. Total 13 19 7 15 6 9 6 (a) 6 10 6 I 3 4 5 (b) 7 9 1 14 3 5 I Hur.l 10 17 6 is 4 8 5 (a) 6 10 6 I 3 4 S (h) 4 7 'j 14 I 4
OJ Urban(b) .. 3 2 2 I
34 & 35 .. Total 211 257 268 81 17 26 14 7 88 104 112 44 (a) 118 171 168 71 15 19 14 7 56 83 8) 35 (b) 93 86 100 10 2 7
i:i 32 21 31 9
I<ural 179 218 227 52 15 22 7 72 88 94 24 (a) 106 154 150 51 14 17 13 7 50 78 71 24 (b) 7:3 64 77 1 I 5 'j 22 10 23
iii Urban 32 39 41 29 2 4 16 16 18 (a) 12 17 )8 2Q I 2 ) 6 5 10 II (h) 20 22 43 9 1 2 10 11 B 9
36 .. Total 90 149 50 10 2 13 18 13 (a) 39 76 46 5 'i 8 13 12 (b) 51 73 4 5 I I 5 5 I Rural 75 127 49 6 I 2 I II 16 13 (a) 38 73 4; ,
'2 8 13 12 (b) 37 )4 4 I 1 I 3 3 I Urban 15 22 1 4 2 2 (a) 1 3 1 °4 '2 '.2 (b) 14 19
38 .. Total 10 IS 2 (a) 4 4 2 (b) 6 II 'i Rural ~ 12 (a) 3 3 2 (b) 5 9 Urban 2 3 (a) I I (b) I 2
39 .. Total 112 140 29 12 6 7 4 13 20 7 (a 4~ 68 27 6 5 6 4 10 17 6 (b) 63 72 Z 6 1 I '4
3 3 I Rural 99 125 29 12 6 7 13 20 7 (a) 48 07 ~1 6 :; 6 4 10 17 6 (b) 51 58 ;: b 1 1 3 3 I Urban 13 15 (01 1 1 (b) 12 14
J-62-1I-25-B-{Kolaba),
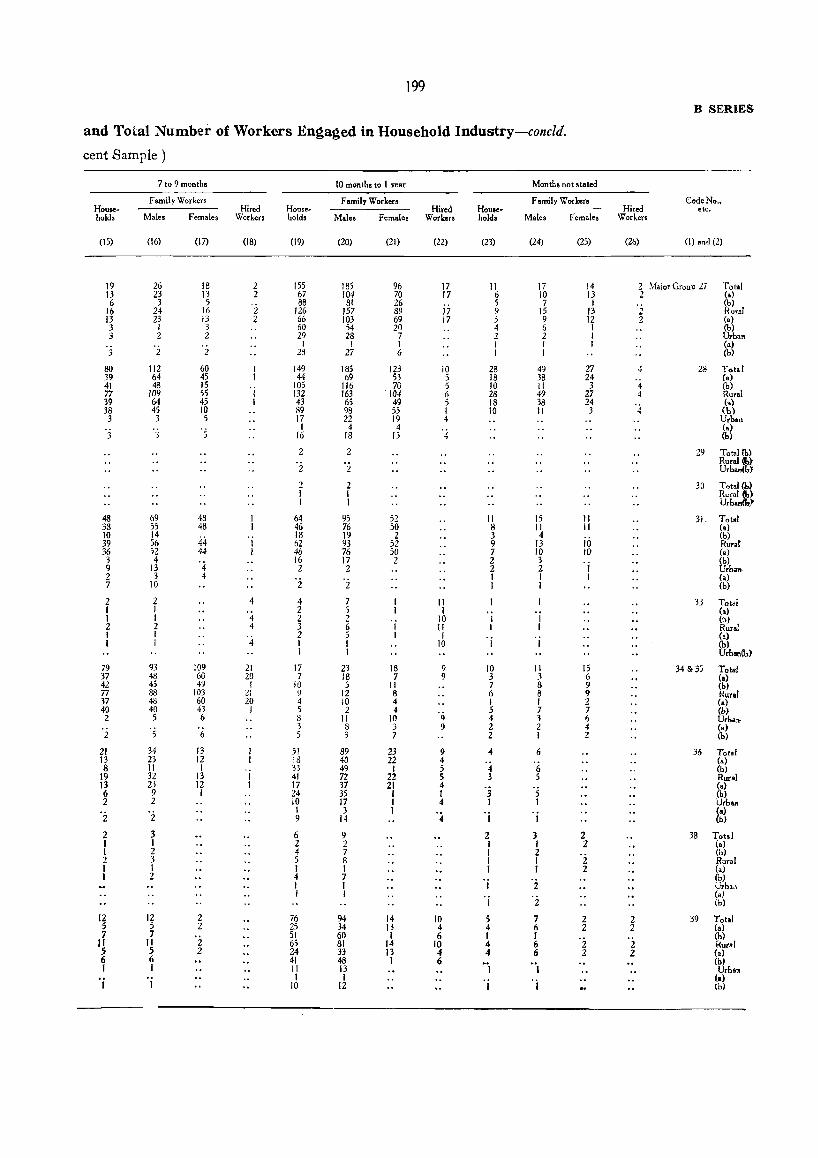
199 B SERIES
and Total Number of Workers Engaged in Household Industry-concld,
cent Sample)
7 to 9 month. 10 month. to 1 year Month. nol,lated
Family Worker. Family Workers Family Workers Code No .• House- Hired House .. Hired Hous.- Hired etc. hold. Mal •• Females Workers hold. Mal., Femal., Worker, hold. Male, Female. Workers
(IS) (16) (17) (18) (19) (20) (21) (22) (23) (24) (2S) (26) (1) and (2)
19 26 18 2 ISS 183 96 17 II 17 14 2 Maior Gr0uP 27 Total 13 23 13 2 67 104 70 17 6 10 13 2 (a) 6 3 5 88 81 26 5 7 1 (b)
16 24 16 2 126 J57 89 J7 9 15 J3 2 Rural 13 23 13 2 66 103 69 17 j 9 12 2 (a) 3 I 3 60 54 20 4 6 I (b) 3 2 2 29 28 7 2 2 I Urban
I J f I I (a) 3 2 2 28 27 6 I (b)
80 112 60 149 185 123 10 28 49 27 28 Total 39 64 45 44 69 53 5 18 38 24 (a) 41 48 15 105 116 70 5 10 II 3 4 (b) 77 J09 55 I 132 163 104 6 28 49 27 4 Rural 39 64 45 I 43 65 49 '; 18 38 24
'4 (a)
38 45 10 89 98 55 I 10 II 3 (b) 3 3 5 17 22 19 4 Urban
's I 4 4 '4 (a)
3 3 16 18 15 (b)
2 2 29 Total (b)
'i Rural (!!,) 2 Urban(b}
2 2 30 Total (.!J I I Rur~ I I Urb .~
48 69 48 64 95 52 II 15 11 31. Tot.! 33 55 48 46 76 50 8 II II (a) 10 14
44 'j 18 19 2 3 4 jo
(b) 39 56 62 93 52 9 13 Rur.r 36 52 44 I 46 76 50 7 10 10 (a) 3 4 16 17 2 2 3 'j (b) 9 13 4 2 2 2 2 Urb." 2 3 4
'2 I I I (a) 7 10 2 1 I (b)
2 2 4 4 7 II 33 Total 1 I 2 5 1 (a) I I 4 2 2 10 I I (b) 2 2 4 3 6 I 11 I I Rural 1 I 2 5 I I (a) 1 I 4 I I 10 1 I (b)
1 1 Urban(b)
79 93 109 21 17 23 18 9 10 II 15 34 &35 Tot.! 37 48 60 20 7 18 7 9 3 3 6 (a) 42 4S 49 I 10 5 II 7 8 9 (b) 77 88 103 21 9 12 8 6 8 9 Rural 37 48 60 20 4 10 4 I I 2 (a) 40 40 43 I 5 2 4 5 7 7 {bi 2 5 6 8 II 10 9 4 3 6 Urba:t-
's 3 8 3 9 2 2 4 (a> 2 6 5 3 7 2 I 2 (b)
21 34 13 51 89 23 9 4 6 36 Total 13 23 12 18 40 22 4 '4 '6 (a) 8 II I 33 49 I 5 (b)
19 32 13 I 41 72 22 5 3 S Rural 13 23 12 1 17 37 21 4 '3 '5 (a) 6 9 I 24 35 I I (b) 2 2 10 17 1 4 1 I UrbOll
'2 I 3 I 'j (a) 2 9 14 4 I (b)
2 3 6 9 2 3 2 38 Total , 1 2 2 1 1 2 (a) 1 2 4 7 I 2 'i (b> 2 3 5 8 1 I Rural , I 1 1 , J 2 (a) , 2 4 7 ·z (b)
1 1 , Urban I I (al
I 2 (b)
12 12 2 76 94 14 10 5 7 2 2 39 To!.! 5 5 2 25 34 13 4 4 6 2 2 (a) 7 7 51 60 I 6 I J (b)
II II 2 65 81 14 10 4 6 2 2 Rural 5 5 2 24 33 13 4 4 6 2 2 (a) 6 6 41 48 I 6 .. , ", (b) , 1 II 13 Urb",.
I I 'j (I) , I 10 12 I (1))
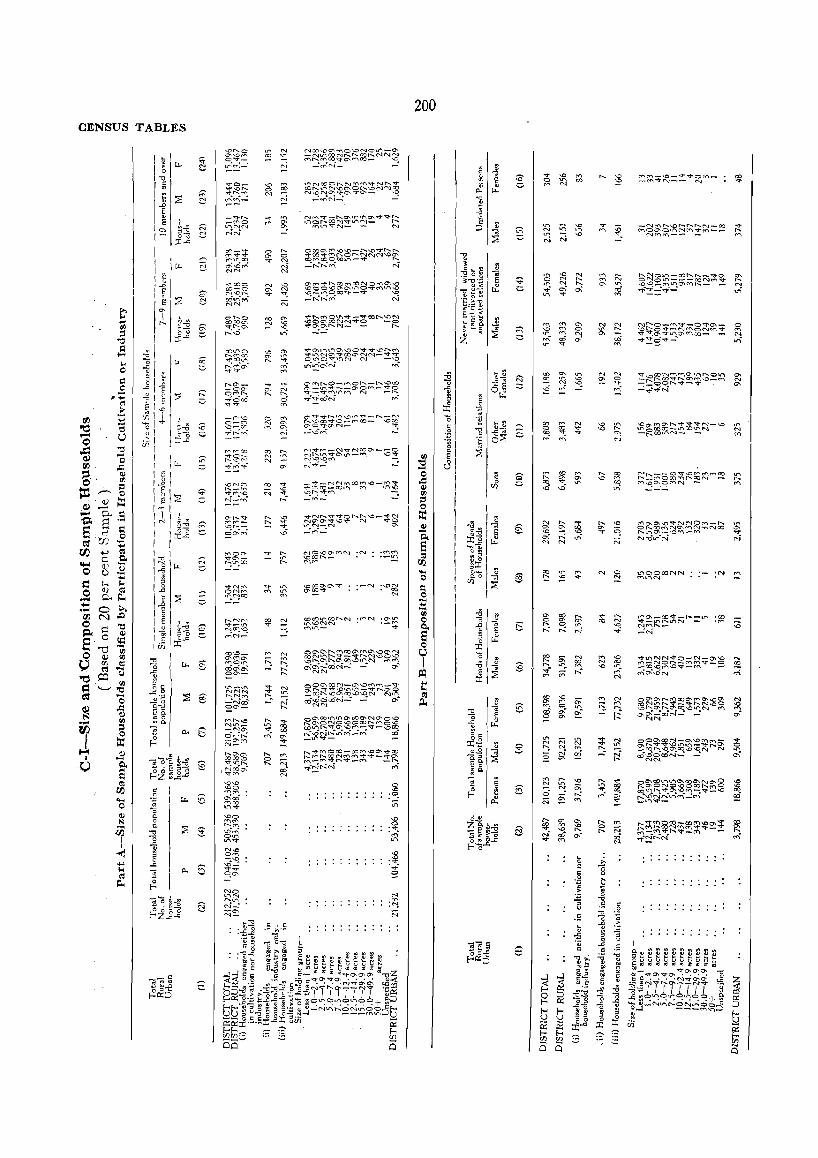
CENSUS TABLES
'"'''0 0"""' 0"'-_ l.I"'~ ~~_:
_~\O c-a \()-ifl
o:r--:~
~"""'Y) .,,-0-t--,\.f.:'(" ~:~...;
\01:'10 ,,-'" ..,."'''' N....:~·
"'-'" ~~~ "":Noc) '20'.-"'''-0 "'''' _ _ NO>
O~...:r-:
-"'''' N-
""'''' 0000-.0
""'" !~~~ ..0-0 "",0
"'''' ~oci "'00 "' .... -00 "'<" .--."' ..o~ 0", "' .... "''''' 0", ->.0 ..6....: ... ..,. C .. O'I
~2~*~~~~~~~R ,,¢~CO"N N"\
~tt~:;:~;,;~~a-.-~~ ~:-.q"S.('Oi ~ N""'- -_"""_NN('I"'oCO(V",...o_M~ ':'f"O\CO-COll"'l (V'\ """"'0 --0('.."'1'"('('\ ~ ....:~_:
·.-N .\.ON • 00
N
200
$ ~ ?g 0\ r...: 11'10-N N
~~g_j~~£:!~~~N~ ~ "'l1"'IO\-...o~-ro"', <o:::t;.
NoOl.('""C"i N
('I"\O\_OO'¢_""_l!"\ -co ~;;::;tQ!::,,",N - .('t'\,:::o _"N
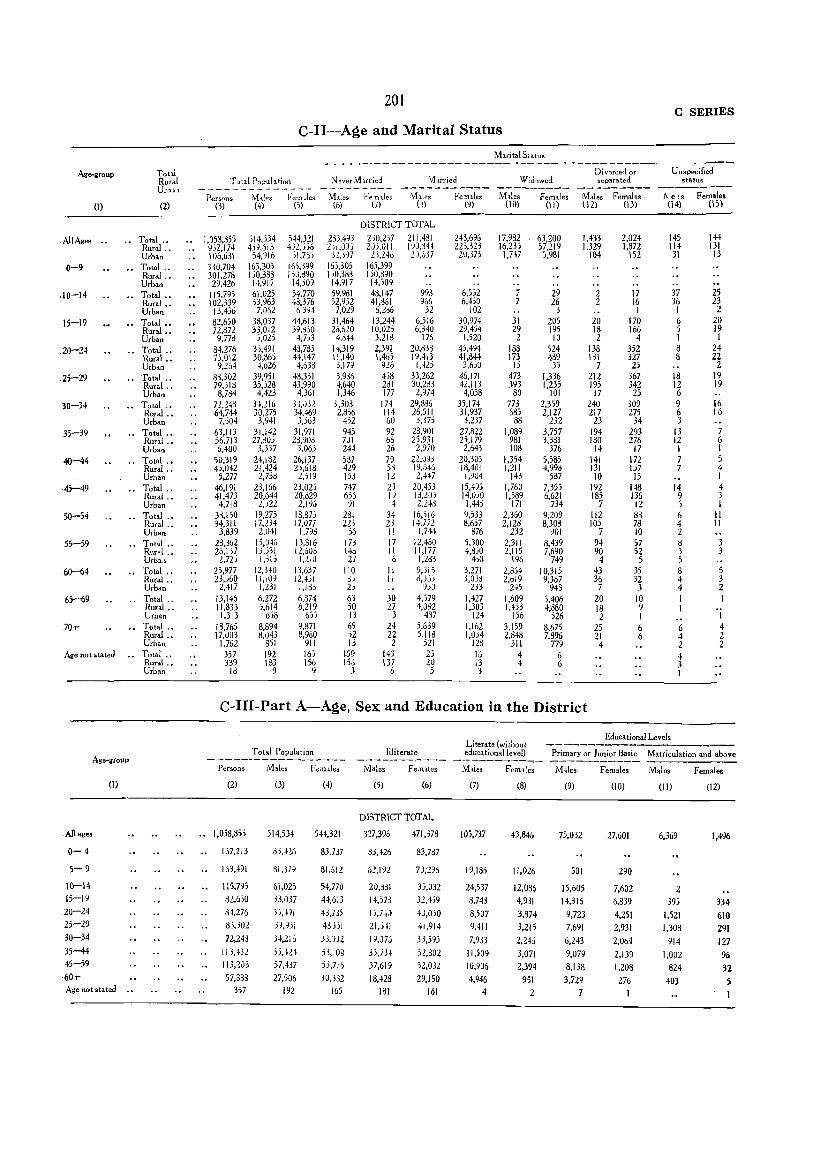
201 C SERIES
C-II-Age and Marital Status
Marital Status - ---------- -------Age-group Total Divorced or Unspecified
Rural Total Po;:mlation Never Mlfried V11rtied W;dowed separated status U{~ll -------------- -------_- _------------- --------- ---------- -------
Persons ]\1')'ies Fero.le. Mlles renlles Mlles Fermle, M,le, Fe,mle, Males Female. JVe (s Females (I) (2) (3) (4) () (6) (I) 0) (9) (10) (11) (12) (13) (14) (15)
DISTRICT TOTAL
AlIAg"" .. .. Total .• 1,053,855 514,534 544,321 233,493 230,257 21 i ,431 243,696 17,982 63.200 1,433 2,024 145 144 Rural .. 9;2,174 45').513 412,»0 2); ,0) 2Ji.OII 190.844 223,323 16,235 57.219 1.329 1,872 114 131 Urban 106,631 54,916 51,7» 32,m 2;.246 M,o}7 ZO,373 1,747 5.981 104 152 31 13
0:""'9 Total .. 330,704 165,305 165,399 165,305 165,399 Rural .. 301,278 150.383 I ;O,~90 1,0,383 150,890 Urban 29,426 14,91 i 14,;09 14.917 14509
,10-14 .. Total .. 115,795 61,025 54,770 59,931 43,147 993 6.552 7 29 2 17 37 25 Rural .. 102,339 53,963 43,376 52,952 41,361 965 6,450 7 26 2 16 36 23 Urban 13,456 7,062 63'4 7,029 6,2d6 32 102 3 I I 2
15-19 .. Total .. 82,650 38,037 44,613 31,464 13,244 65)6 30,974 31 205 20 170 6 20 Rural •• 72,872 33,012 39.d60 20,620 10,026 6,340 29,454 29 195 18 166 5 19 Urban 9,773 5,025 4,7)3 4,044 3,218 176 1,520 2 10 2 4 I I
20-24 .. Total .. 84,276 35,491 43,785 1~,319 2,391 20,833 45,494 188 524 138 352 8 24 Rural .. 7';,012 30,865 44,147 11,140 1,461 19,413 41,8H 173 489 131 327 S 22 Urban 9,264 4,626 4,638 3,179 926 I,W 3,650 15 35 7 25 2
25-29 .. Total .. 83,302 39,951 48,351 5,986 458 33,262 46,171 473 1,336 212 367 18 19 Rural .. 79,518 35,528 43,990 4,640 281 30,283 42,113 393 1,235 195 342 12 19 Urban 8,704 4,423 4,361 1.346 177 2,974 4,058 80 101 17 25 6
30-34 Total .• 72.243 34.116 3J,J32 ),303 174 29,835 35,174 773 2,359 240 309 9 16 Rural .• 64,744 30,275 34,469 2,856 114 26,511 31,937 685 2,127 217 275 6 16 Urban 7,504 3,941 3,563 452 60 3,375 3,237 88 232 23 34 3
35-39 .. Total .. 63,113 31,142 31,971 945 92 28,901 27,822 1,089 3,757 194 293 13 7 Rural •• 56,713 27,00) 2d,~Od 701 66 25,931 25,179 981 3,381 130 276 12 6 Urban 6,400 3,337 3,063 244 26 2,970 2,643 108 376 14 17 I I
40-44 .. Total .• 50,319 24,182 26,137 537 70 non 20,305 1,354 5,JSJ 141 172 7 5 Rural .• 45,042 21,424 2;,618 429 56 19,646 18,401 1,211 4,993 131 157 7 4 Urban 5,277 2,758 2,519 15:3 12 2,447 1,904 143 587 10 15 I
-45-49 .. Total .. 46,191 23,166 23,025 747 23 20,453 15,495 1,760 7,355 192 148 14 4 Rural .. 41,473 20,644 20.029 656 19 13,205 14,0;0 1,589 6,621 185 136 9 3 Urban 4,71d 2,)22 2,1% :11 4 2.Md 1,44j 171 734 7 12 5 I
50-54 .. Total .. 38,150 19,275 18,875 281 34 16.5[6 9,533 2,360 9.209 112 88 6 11 Rural .• 34,311 17,234 17,077 225 2.l 14.772 8.657 2,120 8,308 105 78 4 II Urban 3,839 2,041 1,7:)3 56 I! 1,744 876 232 901 7 10 2
55-59 .. Total .. 23,862 15,046 13,816 m 17 12,460 5,300 2,311 8,439 94 57 8 3 Rural .• 26,137 13,>31 12,606 146 II 11,177 4,8;0 2,115 7,690 90 52 3 3 Urban 2,72; !,';15 I,l,O 21 6 1,283 450 196 749 4 5 5
,60-64 .. Total .. 25,977 12,340 13,637 110 II 9,315 3,271 2,854 10,315 43 35 8 5 Rural., 23,560 II ,ltD 12,451 OJ Ii o,J5j 3,038 2,619 9,367 36 32 4 3 Urban 2,417 1,231 l,ioS 2) 9)0 233 245 943 7 3 4 2
65-69 .. Total .. 13,146 6,272 6,874 63 30 4,579 1,427 1,609 5,406 20 10 I I Rural .. 11,833 5,614 6,219 50 27 4,092 1,303 1,453 4,880 18 9 I 'i Urban 1,313 658 6S5 13 3 487 124 IS6 526 2 I
70+ .. Total .. 18.765 8,894 9,871 65 24 5,639 1,162 3.159 8,675 25 6 6 4 Rural .. 17,003 8,043 8,960 :i2 22 5,118 I,OJ4 2,848 7.896 21 6 4 2 Urban 1,762 851 911 13 2 521 128 311 779 4 2 2
Age not stated .. Total .. 357 192 165 lSi) 143 25 16 4 6 4 Rural .• 339 183 156 156 137 20 13 4 6 3 Urban 18 9 9 3 6 5 3 I
C-III-Part A-Age, Sex and Education in the District
Literate (without Educational Level,
Total Population Illiterate educational level) Primary or Junior Basic Matriculation and above Age-group ------------------ ---_------- ---......... --------:- -----------Persons Males Fem.l.les Males Feclllles Shies Femlles Nllle, Fern,le, Males Females
(I) (2) (3) (4) (5) (6) (7) (8) (9) (10) (II) (12)
DISTRICT TOTAL
,All ages .. 1,053,855 514,534 544,321 317,396 471,378 105,737 43,846 75,032 27,601 6,369 1,496
0-4 157.213 83,426 83,737 83,426 83,737
5-9 1 )3,491 Bun 81.612 62,192 7),2% 19,186 11,026 501 290
10-14 115,795 61,025 54,770 20,831 35.032 24,537 12,065 15,605 7,602 2 15-19 82,650 33.037 44,613 14,313 32.459 8,743 4,931 14,316 6,839 395 334 ~20-24 34,276 3j,,1)1 43.735 1;,74) 4),0;0 8,507 3,874 9,723 4,251 1,521 610 25-29 8U02 3J.:h1 43);1 21541 41,914 9.411 3,215 7,691 2,931 1,308 291 30-34 n,243 34,215 3J,)32 11,J75 33,59; 7,933 2,245 6,243 2,064 914 127 35-44 113,132 5>,324 53,,03 33.134 52,302 11509 3,071 9,079 2,139 1,002 96 45-59 113,203 57,437 5;,716 37,619 52,032 10,906 2,394 8,138 1,208 824 32 60+ 57,833 27,'506 30,332 18,428 29,150 4,946 951 3,729 276 403 5 A~e not stated .. 357 192 165 181 161 4 2 7 I 1
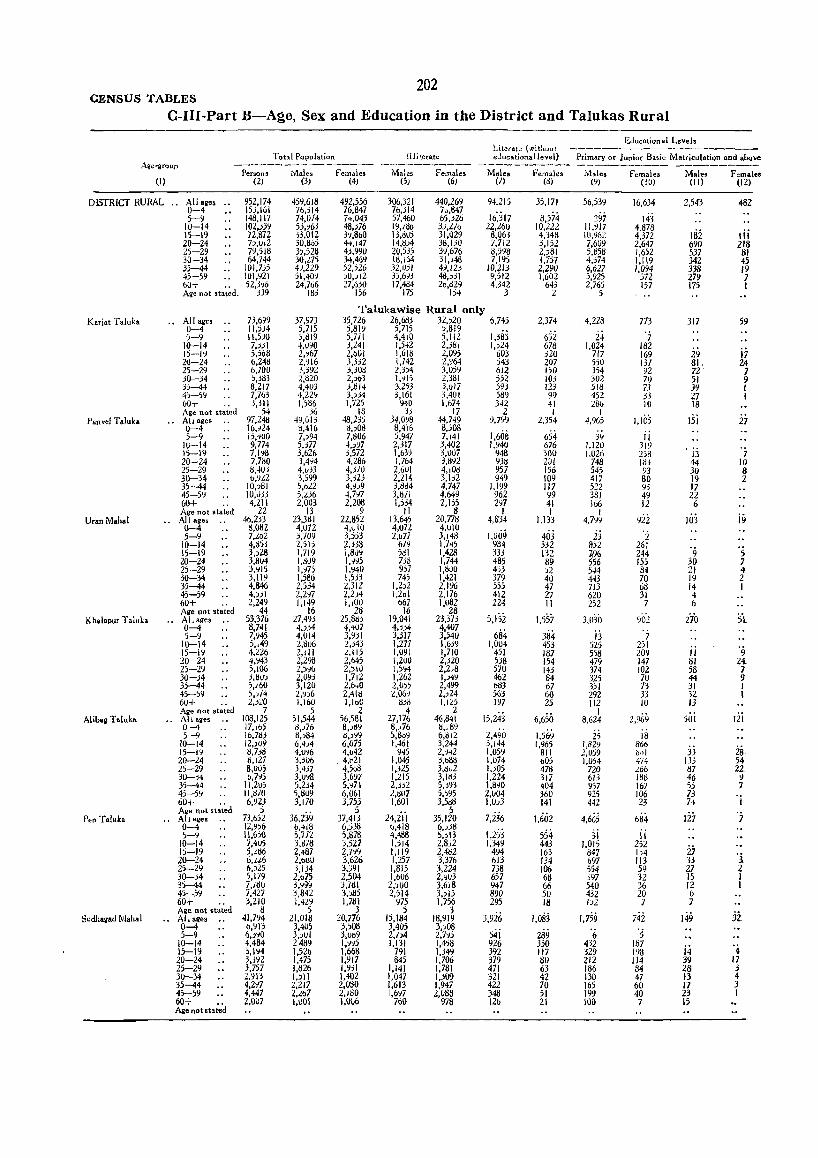
202 CENSUS TABLES
C-I1I-Part B-Age, Sex and Education in the District and Talukas Rural
(I)
DISTRICT RURAL " Alla~es " 0-4
Kariat T aluk.
Pan.eJ T.luk.
UranM.h.l
Khalapur Taluka
Alib&i T.luka
Pen T.luk.
Sudh.llad Mahal
5-9 10-14 15-19 20-24 2S-29 30-34 35-44 45-59 60+ " Ag-e not stated.
" All ~e, " 0-4 5-9
10-14 15-19 20-Z4 25-29 30-34 35-44 45-59 60+ " Age not stated
., All ages .• 0-4 5-9
10-14 15-19 20-24 25-29 30-34 35-44 45-59 60+ " Age not stated
" All ages " 0-4 5-9
10-14 15-19 20-14 25-29 30-34 35-44 45-59 60+ " Age not stated
" AI. ages " 0-4 5-9
10-14 15-19 20-24 25-29 30-}4 35--44 45-59 60+ " Aile not stated
" All ages " 0-4 5-9
10-14 15-19 20-24 25-29 30-J4 35-44 4j-59 60+ " Age not stated
" Allages " 0-4 S-'J
10-14 15-19 20-24 25-29 30-j4 35-44 45-59 60+ " Age not stated
.. AI18ges .. 0-4 5-9
10-14 15-19 20-24 25-29 30-34 35-44 45-59 60+ " Age not stated
Persons (2)
952,174 15>,161 148,117 102,339 72,812 7~,V12 79,518 64,144
101,755 101,921 52,No
339
73,699 1I,5J4 II,S~O 7,JJI 5,568 6,24d 6,70U ;,583 8,217 7,763 3,m
54 97,248 16,,24 b,'1UO 9,774 7,1~B 7,780 8,.U3 b,YlZ
IO,~81 10,O;.! 4,211
22 46,2.>3
(I,G8Z 7,L02 4,ti5; 3,:>28 3,8U4 3,~15 >,t1~ 4,846 4,)51 2,249
44 53,376 8,741 7,945 ),,49 4,226 4,~4:J 5,106 5,8v) 5,/60 S,,/4 2,.)20
7 108,12) 17,165 lb,7d.! 12,)u9 1l,7Jd 8,121 8,u05 6,NS
\ 1,2\)) 11,070 6,Y23
S 73,652 12,~>6 1I,6jO 7,4U5 5,,,86 6,,,L6 6,)25 S,IN 7,1~O 7,427 3,210
6 41,794 6,913 6,j~0 4,484 3,1~4 3,392 3,757 2,~n 4.2Y7 4,447 2,007
Tot.1 Population
Males (3)
459,618 76,>14 74,0/4 5j;,63 33,012 30,865 3),;28 30,aS 4Y,229 51,409 24,766
183
37,973 5,715 5,819 4,v~0 2,%7 2,~16 l392 2:ti20 4,4U3 4,229 1,,86
36 49,013 b,416 7,)94 5,377 3,626 3,4:14 4,lW 3,599 5,022 5,236 2,003
13 23,3dl 4,072 3.109 2,51) 1,719 1,~u9 1,~1:'i 1,5S6 2,534 l,U7 1,149
16 27,4~J 4,)34 4,014 2,tlU6 2,111 2,298 2,~~6 2,W> 3,120 2,Y>6 1,160
:; 51,544 8,J76 8,>84 6,4j4 4,v~6 3,-'06 3,4j7 3,u~8 5,2j4 5.809 3,ll0
36,239 6,418 5,712 3,~J8 2,487 2,t>uO 3,134 2,b7? 3,y9y 3,842 1,429
5 21.018 3,405 3,JUI 2489 1,520 1,475 1,826 1,511 2,217 2,"67 1,001
Educational Levels Literat~ {~.itho:Jt --------------------
Illiterate e:ducationallevel} Primary of Junior Basic Matriculation and above
Females (4)
492,556 76,847 7.,043 48,576 3~,860 4.,l47 43,990 34,469 52,;26 '0,)12 27,630
156
Ma!es Females (S) (6)
306,321 7tJ,514 57,460 19,186 13,M 14,tlj4 20,535 ItI,I64
32,U5I 35,6,3 17,484
175
440,269 7u.847 65,j26 3),210 31,029 38,UO 39.676 31,148 4~,'23 4ll,.HI 20,d29
Jj4
Males Female. (I) (d)
94,215
16',317 22,260
8,063 7,712 8,598 7,195
10,;213 9,512 4,342
3
35,171
8,574 10,222 4,348 3,152 2,)81 1,757 2,290 1.602
643 2
Talukawise Rural only 35,726 26,683 32,)20 6,745
5,81Y 5,715 ),819 5,711 4,410 5,IIZ 3,241 1,542 2,381 2.001 1,61B 2.095 3,332 1,742 2,964 3,J08 2,3:>4 3,U59 2,)03 1,~15 2,381 J,814 3,253 3,017 3,>34 3,161 3,401 1,125 940 1,674
18 3; 17 48,235 34,098 44,749 ~,)08 8,416 8,508 7.806 5,941 7,141 4,)97 2,317 3,402 3,5n 1,639 3,007 4,286 1,764 3,892 4,3}0 2,6tll 4,IOd 3,:$23 2,214 3,b2 4, ~J9 3,804 4,747 4,N7 3,81 I 4,649 2,208 1,534 2,155
9 II 8 22,852 13,645 20,178 4,L 10 4,012 4,uIO 3,553 2,077 3,148 2,138 679 1,745 l,8J~ 5dl 1,428 1,~~5 7Jj 1,744 1,940 957 1,~UO 1,533 745 1,421 2.312 1,2)2 2,196 2,2J4 1,201 2,176 1,100 667 l,u82
28 16 28 25,M> 19,041 23,373 4.qU7 4,J34 4,407 3,931 J,ll7 3,54U 2,j4", 1,277 1,619 L,II) I,U91 1,710 2,645 I,ZUO 2,.>20 2,:> 10 1 ,:>~4 2,208 1,712 1,262 1,)49 2,6.0 Z,O» 2,499 2,418 2,06') 2,;24 1,100 Hj8 1,125
2 4 2 56,581 27,176 46,841 8,)ti9 8,076 ~,"89 ~,)~9 ~,So9 6,812 6,075 1,461 3,244 4,042 945 2,~42
, V21 1,045 3,oM 4508 1,325 3,dv1 3,6~1 1,215 3,Iti3 5,~71 2,:>j2 5,)93 6,061 2,tiU7 5,)95 3,753 1,60 I 3,5dB
5 5 37,413 24,2(1 35,120
6,:;38 6,418 6,)38 '>,878 4,488 5,;13 3527 1,514 2,852 2,7W 1,119 2,4~2 3,626 1,257 3,376 3,391 1,815 3,224 2,504 1,606 2,qU3 3,7~1 2,)UO 3,6i8 3,>85 2,514 3,)15 1,7dl 975 1.756
3 5 3 20,776 15,184 18,919
3,508 3,405 3,008 3,Ud9 2./)4 2.7~5 1.~~5 1,131 1,4:;8 1,668 791 1,;49 1.917 845 1,706 1.931 1,141 1,781 1,402 1,041 1,309 2.0S0 1.613 1,947 2,180 1,6~7 2,(188 1,006 760 978
1,385 1,)24
603 543 612 552 593 589 342
2 9,799
1,608 1,940
948 938 957 949
1.199 962 297
I 4,834
1,009 984 m 485 4SJ 379 555 412 224
5,\52 684
I,OU4 451 538 570 462 683 563 197
15,243
2,490 3,144 1.059 1,014 1,505 1,224 I,S:lO 2,004 1,0)3
7,236 1.253 1,349
494 613 738 657 947 890 295
3,926
54i 926 392 379 471 321 422 348 126
2,374
65i 67S 320 207 150 103 123 99 41 I
2,354
654 676 300 2UI 156 109 117 99 41 I
I,m
40j 332 132 89 :>2 40 47 27 II
1,557 384 453 187 154 143 84 67 60 25
6,650
1,569 1,965
811 605 478 317 404 360 141
1,602
554 443 163 134 106 68 66 50 18
1,083
289 350 117 80 63 42 70 51 21
Males Females (9) (10)
56,539
297 11,917 10.%2 7,609 5,858 4,574 6,627 5,925 2,765
5
4,228
24 1,024 m 5jO 354 31)2 518 452 280
I 4,%5
39 1,120 1,026
748 545 411 522 381 166
I 4,799
23 Ih2 7,9& 556 544 443 713 620 252
3,030 i3
525 558 479 374 325 351 292 112
I 8,624
25 1,829 2,059 1,054
720 613 957 925 442
4,665 3i
1,015 847 697 554 397 540 432 1)2
1,759 '6
432 329 212 186 130 165 199 toO
16,634
143 4,878 4,372 2,647 1,652 1,119 1,094
572 157
773 'j
182 169 137 92 70 73 33 10
1,105
11 319 258 183 Yo SO 95 49 12
922 '2
261 244 155 84 70 68 31 7
9i:iz 7
251 209 147 102 70 73 33 10
2,96Y 18
866 ~"I 474 L66 188 167 106 2,3
684 ii
252 [)4 113 59 32 36 20 7
742 '5
187 I'JB il4 84 47 60 40 7
Mal". Females (II) (12)
2,543
IS2 690 537 342 3J8 279 175
317
29 61 72 51 39 27 18
15i
, ij 44 30 19 17 22 6
Hij
9 30 21 19 14 4 6
i/o
II 81 58 44 31 32 13
50i
3j 133 87 46 55 73 74
127
27 33 27 15 12 I) 7
149
i4 39 28 13 17 23 15
482
Iii 218
81 45 19 7 I
59
i7 24 7 9 I I
27
7 10 8 2
i9
'5 7 4 2 I
'9 24 7 9 1 I
121
28 54 22 9 7
I
7
'i 2 I I
'4 17 3 4 3 I
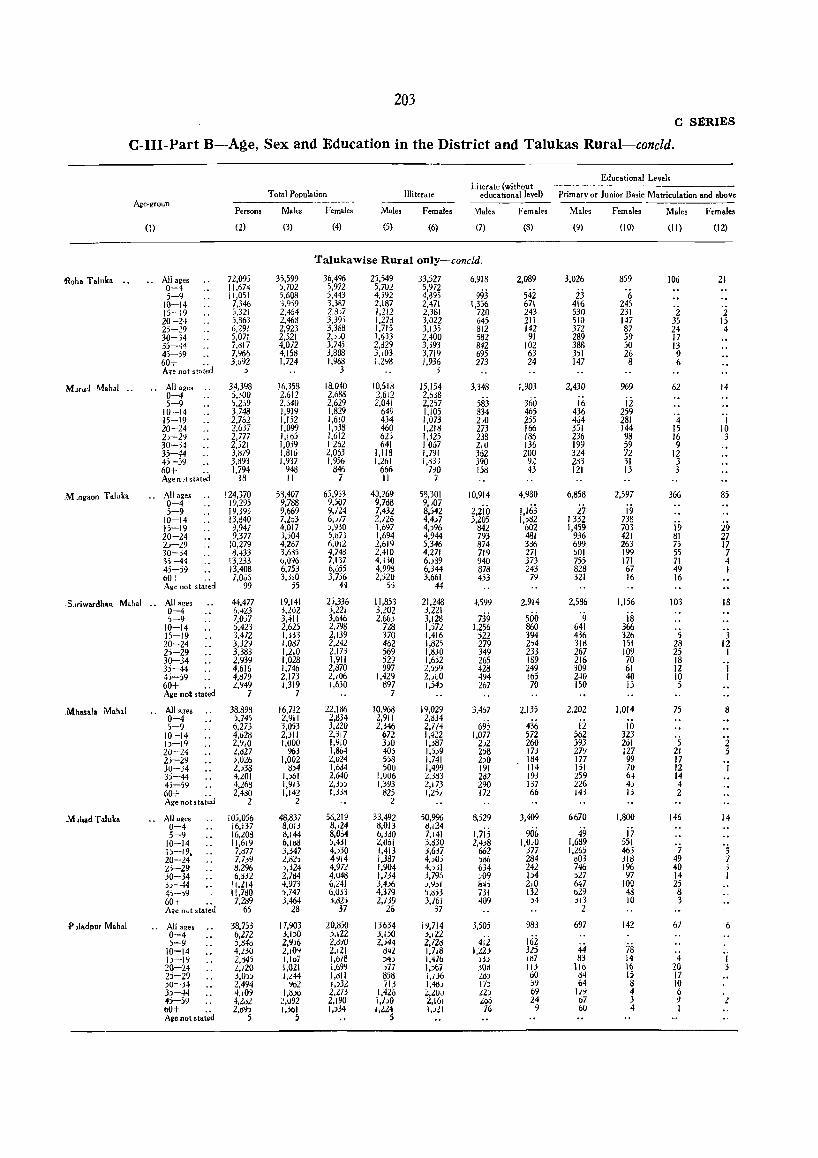
203 C SERIES
C-III-Part B-Age, Sex and Education in the District and Talukas Rural-coneld,
Educational Levels
Total Population Illiterate Literate (without
educational level) Primary or Junior Basic Matriculation and above Age-group
Persons Males Females Males Fem.les M.les Fem.les Males Females M.les Femal ••
(1) (2) (3) (4) (5) (6) (7) (8) (9) (10) (11) (12)
Talukawise Rural only-concld.
<Roh. Taluk. " .. All ages 72,095 35,599 36,496 25,549 33,527 6,918 2,089 3,026 859 106 21 0-4 11,674 5,702 5,972 5,702 5,972
993 542 23 5-9 11,051 5,608 5,443 4,;92 4,d95 6 10-14 7,346 3,959 3,387 2,IS7 2,471 1,356 671 416 245
'2 15-19 5,321 2.464 2,8)7 1,212 2,381 720 243 530 231 2 20-24 5.863 2,463 3,39) 1,27d 3.022 645 211 510 147 35 15 2')-29 6.291 2,923 3,368 1,715 3,135 812 142 372 87 24 4 30-34 5,071 2,521 2,);0 1,633 2.400 582 91 289 59 17 35-44 7,d17 4.072 3,745 2,d29 3,593 842 102 388 50 13 45-59 7,966 4,158 3,808 3.103 3,719 695 63 351 26 9 60+ 3,692 1,724 1,968 1,2~8 i.936 273 24 147 8 6 A'fe not sta;;d j 3 3
M.rud Mahol .. .. All ages .. 34,398 16,358 18,040 10,518 15,154 3,348 1.903 2,430 969 62 14 0-4 5.100 2.612 2.688 2,612 2,668
583 360 ii 5-9 '>.259 2,640 2,629 2.041 2,257 16 10-14 3,748 1,919 1,829 649 1,105 834 465 436 259 '4 'i 15-19 2,762 1,152 1,6:0 434 1,073 2,0 2j5 464 281 20-24 2,637 1,099 1,)38 460 1,218 273 166 351 144 15 10 2j-29 2,777 1,165 1,612 625 1,125 233 186 236 98 16 3 30-34 2.321 1,059 1262 641 1057 2iO 136 19~ 59 9 35-44 3,879 1,816 2.053 1.118 1.791 362 200 324 72 12 4; -:;9 3.d93 1,937 1,950 1,261 I,m 390 9Z 2113 31 3 60+ 1,794 948 846 666 7-;0 158 43 121 13 3 Agew,tstat;,d 18 II 7 11 i
"M ,ngaon T.luk. .. All ages 124,370 53.407 6:;,953 40,269 58,301 10,914 4,980 6,858 2,597 366 85 0-4 19,295 9,788 9,507 9,788 9,)07
2,2io 1,163 5-9 19,393 9,669 9,124 7,432 8.542 27 19 10-14 13,MO 7,2"')3 6,y17 2,726 4,4)7 3,205 1,382 1332 738
i9 ]5-19 9,947 4,017 5,930 1,697 4,)96 842 602 1,459 703 19 20-24 9,377 3,504 5,ti73 1,694 4,944 793 481 936 421 81 27 2j-29 10,279 4,267 6,012 2,619 5,346 874 3ti6 699 263 75 17 30-34 8.133 3,6~5 4,748 2.410 4,271 719 271 501 199 55 7 3;-44 13,233 0,096 7,137 4.330 6,)d9 940 373 755 171 71 4 45-59 13.408 6,753 6,655 4,998 6,344 878 243 828 67 49 I 60+- 7,0';6 3,j10 3,7j6 2,)20 3,661 453 79 321 16 16 A~e not sta·t~d 99 55 44 5:'> 44
:S.lfiwardhao M.b.1 ,. All •• es 44,477 19,141 2),336 11,853 21,248 4599 2,914 2,586 1,156 103 18 0-4 6,423 3,L02 3,221 3.202 3,221
739 500 '9 is 5-9 7,0-'7 3,411 3,646 2.66j 3,128 10-14 5,423 2,625 2.198 728 1,'>72 1,256 860 641 366 ·s 15-19 3,472 I,.W 2.139 370 1,416 522 394 436 326 3 20-24 3,329 I.Od7 2,L42 462 1,825 279 1)4 318 151 28 12 25-29 3,383 1,210 2.173 569 l,diO 349 233 267 109 25 1 30--34 2,939 1,028 1,911 529 1,6)2 265 1~9 216 70 18 'j 35-44 4,616 1.746 2,870 997 2,559 428 249 309 61 12 45-59 4,d79 2.173 2,/06 1,429 2,yuO 494 165 240 40 10 I 60+ 2,949 1,319 1,630 ~97 1,54) 267 70 150 15 5 Age not st.i~ 7 7 7
Milas.l. Mahal .. AlI'les 38.898 16,712 22,186 10,968 19,029 3,467 2,135 2,202 1,014 75 8 0-4 5,745 2,911 2,d34 2,911 2,d34
69j 436 5-9 6,273 3,053 3,m 2,346 2,774 12 10 10-14 4,028 2,311 2,:m 672 1,422 1,077 572 562 323 '2 J:j-Iq 2,Y10 1,000 1,910 3)0 1,)87 2J2 260 .393 201 5 20-24 L,d27 963 1,864 40; 1,5)9 258 J7j 27Y 127 21 5 2j-29 3,026 1,002 2,U24 558 l,741 2)0 IM4 177 99 17 30-34 2,)38 8j4 1,61l4 JOO 1,499 191 114 151 70 12 I 3)-44 4,201 1,)61 2,640 1,1)06 2,jlB 2d2 193 259 64 14 4j-59 4.268 1,913 ~,3jj 1,393 2,173 290 137 226 4j 4 60+ 2,4dO 1,142 l,jJti d25 1,25i 172 66 143 Jj 2 Agenotstat~d 2 2 2
.M .h.d Taluk. .. AlI.ges 105,056 48,837 56,219 33,492 50,9% 8,529 3,409 6670 1.800 146 14 0-4 16.137 8,013 8,124 d.013 d,I24
1,7is 906 49 i7 5-9 16,LOB ti,144 8,004 b,3dO 7,141 10-14 11,619 6,1 tid ),431 ~.06i 3,d30 2,4j8 1,0,·0 1,689 551 '7 'j l'l-19, 7,677 3,347 4,J30 1,413 >.6d7 662 i77 1,265 463 20-24 7,739 2.d25 4914 1,387 4,,05 )d(, 284 ti03 3111 49 7 b-29 8,296 >,324 4,972 1,904 4,,31 634 242 746 196 40 30-34 6,032 2,704 4,U48 1.134 3,795 J09 154 )27 97 14 ,j-44 11.214 4,973 6.241 3,4)6 ).Yil 845 210 647 100 25 4;-)9 11.7dO ;,747 6.U.i3 4,379 J,dH 731 132 029 4d 8 60T 7.289 3.464 5.db 2./39 3,J61 409 )4 513 10 3 A?e n·A st.i~d 65 28 37 26 37 2
jp ,Iadpur M.h.1 .. Ali agea 38,753 17,903 20,8)0 13634 19,714 3,505 983 697 142 67 6 0-4 6,272 :l,bO 3,122 J,150 5,122
4ii 162 5-9 5.840 2.956 2,0'10 2,j44 2,m 44 78 10-14 4.LjO 2,10~ 2,121 d42 1.718 I,lli 325 1)-19 2,045 1,107 1,6/8 )4) l,qJ6 );) 107 83 14 4 I 20-24 L,/20 1,0l1 i,69~ )17 1,)67 jOd \1) 110 16 20 3 25-29 j,O») 1,l44 1,611 tl5t! 1,/j6 Lo) 60 64 15 17 5U-j4 2.494 %2 I,m il3 1,40) 17) j9 64 8 10 3)-44 4.109 1,8j6 2,27; 1,426 ~.LUJ lZ) 69 1/:) 4 6 45-59 4,ldl L,092 2,190 l,lJO 2,161 .100 24 67 3 9 2 60+ Z,o,!j 1,:l61 1,)34 l,lL4 I,)LI J6 9 60 4 I Aile not sta;.,d 5 5 5
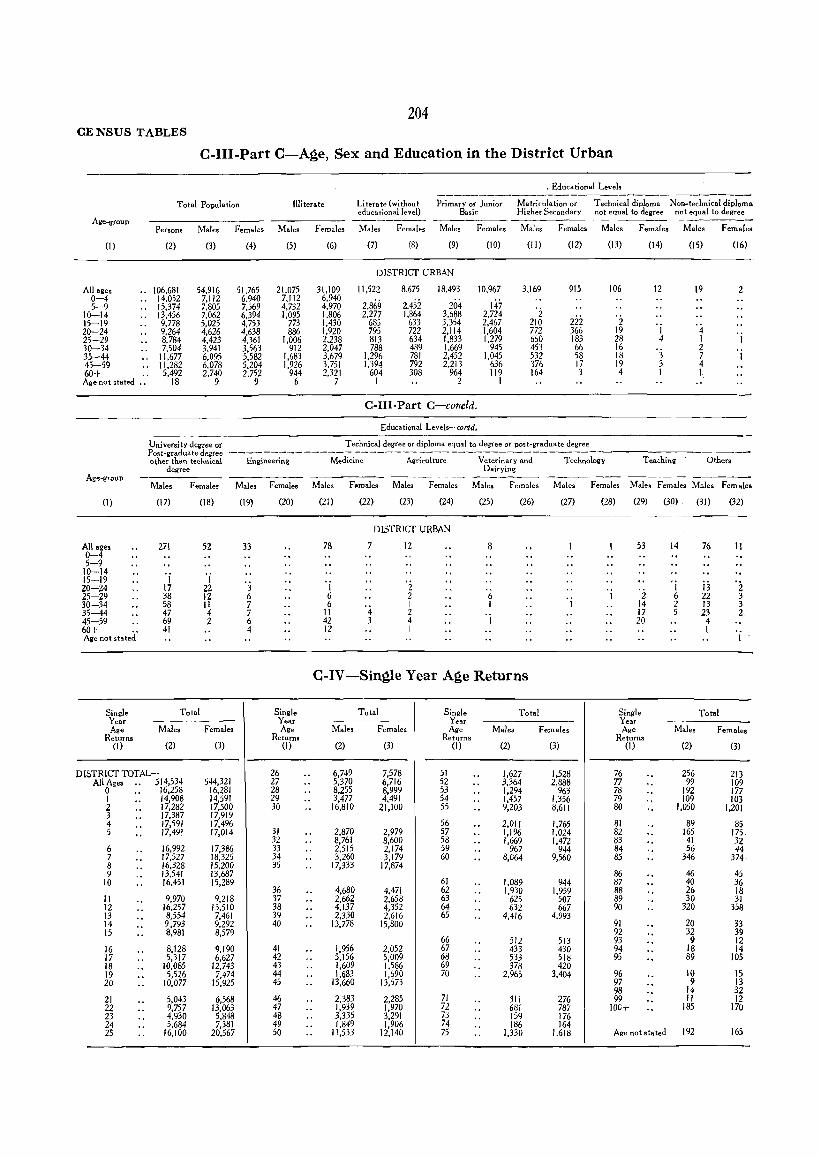
204 CENSUS TABLES
C-III-Part C-Age, Sex and Education in the District Urban
. Educational Levels
Total Population !!literate Literate {without Primary or Junior Matriculation or Technical diploma Non-technical diploma educational level} Basic Higher Secondary not equal to degree not equal to degree
Aile-group Persons Males Females Males Females Males Females Males Females Males Females Males Females Males Female$
(1) (2)
All ages " 106,681 0-4 .. 14,052 5-9 .. 15,374
10-14 .. 13,456 15-19 9,778 20-24 9,264 25-29 8,784 30-34 7,504 35-44 . . 11,677 45-59 . . 11,282 60+ .. 5,492 Age not stated .. 18
(3)
54,916 7,112 7,805 7,062 5,025 4,626 4,423 3,941 6,095 6,078 2,740
9
(4)
51.765 6.940 7,569 6,394 4,753 4,638 4,361 3,563 5,582 5,204 2,752
9
(5)
21,075 7,112 4,732 1,095
773 886
1,006 912
1,683 1,926
944 6
(6)
31,109 6,940 4,970 1,806 1,430 1,920 2,238 2,047 3,679 3,751 2,321
7
(7) (8) (9)
DISTRICT URBAN
11,522
2,869 2,277
685 795 813 788
1,296 1,394
604 I
8,675
2.452 1,864
633 722 634 489 781 792 308
18,493
204 3,688 3,354 2,114 1,833 1,669 2,452 2,213
964 2
C-I1I-Part C-contld.
Educational Levels-contd.
(10)
10,967
147 2,724 2,467 1,604 1,279
945 1,045
636 119
I
(II)
3,169
'2 210 772 660 453 532 376 164
(12)
915
222 366 183 66 58 17 3
(13)
106
2 19 28 16 18 19 4
(14)
12
'j 4
'j 3 I
(15)
19
'4 I 2 7 4 I
(16)
2
'j
I
-------------------------------------
(1)
All,gt> 0-4 5-9 10-14 15-19 20-24 25-29 30-34 35-44 45-59 60+ ., Age not stated
Single Year Age
Returns (I)
University degree or Post-graduate degree other than t«hnical
degree
Males Females
(17)
271
'j 17 38 58 47 69 41
(18)
52
'j 22 12 ]l 4 2
Total
Males Females
(2) (3)
DISTRICT TOTAL-All Ages .. 514,534 544,321
0 .. 16,258 16,281 I .. 14,908 14,591 2 .. 17,282 17,500 3 .. 17,387 17,919 4 .. 17,591 17,496 5 .. 17,49' 17,014
6 .. 16,992 17,386 7 .. 17,527 18,325 8 .. 16,328 15,200 9 .. 13,541 13,687
10 .. 16,451 15,289
II .. 9,970 9,218 12 .. 16,257 13.510 13 .. 8,554 7,461 14 .. 9,793 9,292 15 .. 8,981 8,579
16 .. 8,128 9,190 17 .. 5,317 6,627 18 .. 10,085 12.743 19 .. 5.526 7,474 20 .. 10.077 15,925
21 .. 5,043 6.568 22 .. 9,757 13,063 23 .. 4,930 5.848 24 .. 5,684 7,381 25 .. 16,100 20,567
Engineering
Males Females
(I9)
33
'j 6 7 7 6 4
(20)
Single Year Age
Returnt (I)
26 27 28 29 30
31 32 33 34 35
36 37 38 39 40
41 42 43 44 45
46 47 48 49 50
Technical degree or diploma equal to degree or post-graduate degree
Medicine Agrkulture Veterinary and Dairying
Technology Tea.:.hing
-------- ------ -------Other.
Males Ftt"males Males Females Males Females Males Females Males Females Males Females
.. .. ..
.. ..
.. .. ..
.. ..
.. .. .. ..
..
..
..
..
..
..
.. ..
..
..
..
(21)
78
I 6 6
II 42 12
(22)
7
'4 3
(23) (24)
DISTRICT URBAN
12
2 2 I 2 4 1
(25)
8
6 I
I
(26)
C-IV -Single Year Age Returns
Total Single Total Year
Males Females Age Male. Returns
(2) (3) (I) (2)
-6,749 7,578 51 .. 1,627 5,370 6,716 52 .. 3,364 8,255 8,999 53 .. 1,294 3,477 4,491 54 .. 1,457 16,810 21,100 55 .. 9,203
56 .. 2,011 2,870 2,979 57 .. 1,196 8,761 8,600 58 .. 1,669 2,515 2,174 59 .. 967 3,260 3,179 60 .. 8,064
17,333 17,874
61 .. 1,089 4.680 4,471 62 .. 1,930 2,662 2.658 63 .. 625 4.137 4.352 64 .. 632 2,330 2,616 65 .. 4,416
13,778 15,800
66 .. 512 1,956 2.052 67 .. 433 5,156 5,009 68 .. 533 1,609 1,586 69 .. 378 1.683 1.690 70 .. 2,965
13,660 13,573
2.383 2,285 71 .. 311 1,939 1,970 72 .. 681 3.335 3,291 73 .. 159 1.849 1.906 74 .. 186
11,533 12,140 75 .. 1,330
(27)
'j
Females
(3)
1,528 2,888
963 1,356 8,611
1,765 1,024 1,472
944 9,560
944 1,959
507 667
4.993
513 430 518 420
3,404
276 787 176 164
1.618
(28) (29) (30)
53
2 14 17 20
Single Year Age
Returns (I)
76 77 78 79 80
81 82 83 84 85
86 87 88 89 90
91 92 93 94 95
96 97 98 99
100+
.. .. '. '. "
.. .. .. .. ..
.. ' . .. .. .. .. .. .. .. .. .. .. .. .. ..
Age not stated
14
I 6 2 5
Males
(2)
256 99
192 109
1,050
89 165 41 56
346
46 40 26 30
320
20 32 9
18 89
10 9
14 II
185
192
(31 )
76
ij 22 13 23
4 I
Total
(32)
11
2 3 3 2.
Females
(3)
213 109 177 103
1,201
85 175 32 44
374
45 36 18 31
358
33 39 12 14
105
IS 13 32 12
170
165
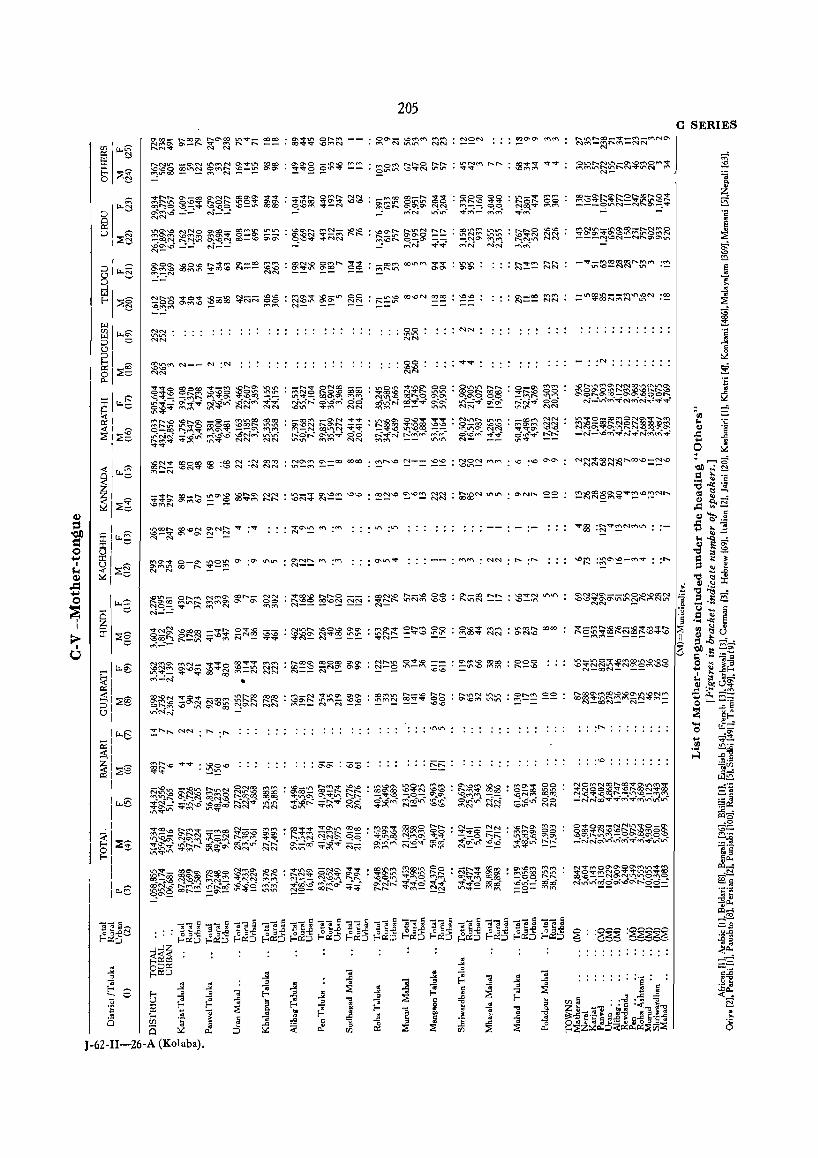
NN
"'''' NN
:'"
205
00 ""'" NN
00 -c-c NN
NN
~oit a8 Na:>"<t' C't'IC't'I ~~
r--..r:-.O \0'-0 \O~N NN I'oNI.I"I NN ~~
0\_00 ~('f'\ N-- NN
~g§ ~~~ EF~~ ~~~ ~~ : ~~~ ~~~ ~~ : ~~~ ~N~ ~~ ~in~ r--..r--.. : ~:!~ Lnlt\
N"":"":
1~6 ....JI
~I::a~ 01 ~
!-<!
I Ic..~ I ~
~~~ ~~~ ~~* ~~~ ~~ ~~~ ~~~ ;; <">--
: : :
....J....JZ ~C1i;i!i ~1e~
~ ~ G ~ ~ E2 r
~ dS 1 ~ .S' .... c :..: ~
}-62-II-26-A (Kolaba),
C SERIES
~~~~i'~=~NC't'INO'< .i Oll"\r--..NlI"'I_O\...o('f'\Off'l~ ~('t\ll"\~,!:!r-..N,¢,LnN t'I"'I
_:;N::;:::: :
:'"
: : :1.0 : : : : : : : :
.... o
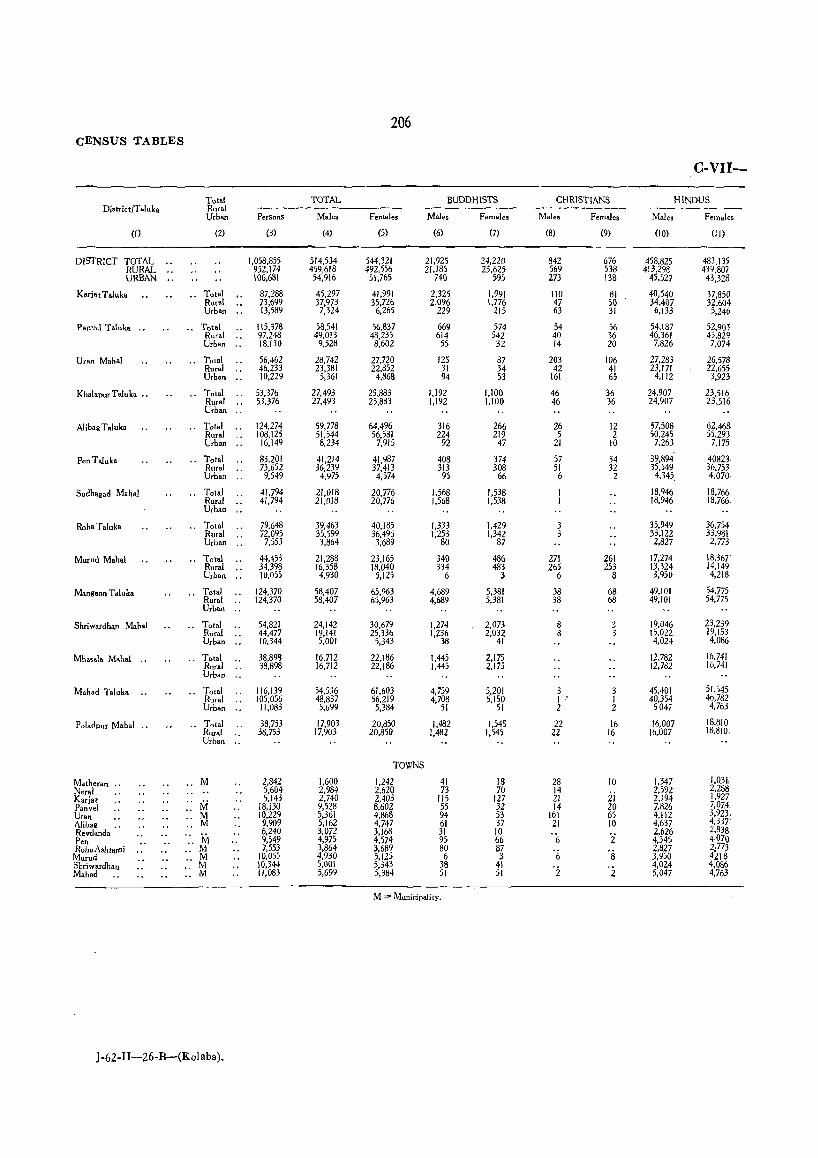
206 cENSUS TABLES
C-VII-
Total TOTAL BUDDHISTS CHRISTIANS HINDUS District/T aluk. Rural ------------------ _--------- ----------- --_--_----
Urban PerSonS Male. Females Males Females Males Females Males Females
(1) (2) (3) (4) (5) (6) (7) (8) (9) (10) (II)
DISTRICT TOTAL .. 1,058,855 514,534 544,321 21,925 24,220 842 676 458.825 483.135 RURAL .. 952,174 459.618 492.556 21.185 23,625 569 538 413.298 439.807 URBAN .. 106.681 54.916 51,765 740 595 273 138 45,527 43,328
Karia( Taluka .. Total 87.288 45.297 41.991 2,325 1.991 110 81 40.540 37.850 Rur,1 .. 73,699 37.973 35,726 2,096 1,776 47 SO 34.407 32,604 Urban .. 13,589 7,324 6,265 229 215 63 31 6,133 5,246
Panvel T.luk, .. .. Total 115,378 58,541 56.837 669 574 54 56 54.187 52,903 Rural .. 97.248 49.013 48.235 614 542 40 36 46.361 45,829 Urban .. 18.130 9.528 8.602 55 32 14 20 7.826 7.074
Uran Mahal .. Total 56,462 28.742 27.720 125 87 203 106 27.283 26.578 Rural .. 46.233 23,381 22.852 31 34 42 41 23.171 22.655 Urban .. 10,229 5,361 4,868 94 53 161 65 4,112 3,923
KhalapurTaluka .. .. Total 53.376 27.493 25,883 1.192 1.100 46 36 24.907 23.516 Rural .. 53.376 27.493 25,883 1.192 1.100 46 36 24,907 23.516 Urban ..
A1ibagTaluka .. Total 124,274 59,778 64,496 316 266 26 12 57,508 62,468 Rural .. 108.125 51.544 56,581 224 219 5 2 50.245 55,293 Urban .. 16.149 8.234 7.915 92 47 21 10 7.263 7,175
Pen TaIuk. .. Total 83.201 41,214 41.987 408 374 57 34 39.894 40823 Rural .. 73.652 36.239 37.413 313 308 51 32 35.549 36.753 Urban .. 9.549 4.975 4.574 95 66 6 2 4.345 4.070·
Sudhagad Mahal " Total 41,794 21.018 20.776 1.568 1,538 18.946 18.766. Rur.1 .. 41.794 21.018 20,776 1.568 1.538 18.946 18,766 Urban ..
Roh. T.luka " Total 79.648 39.463 40.185 1.333 1.429 3 35,949 36.754-Rur.l .. 72.095 35.599 36.496 1,253 1,342 3 33,122 33,981 Urban ., 7.553 3.864 3.689 80 87 2.827 2,773
Murud Mahol .. Total 44.453 21.288 23.165 340 486 271 261 17,274 18.367 Rural .. 34.398 16,358 '~040 334 483 265 253 13.324 14.149 Urban .. 10.055 4.930 .125 6 3 6 8 3.950 4.218·
M.ngaon Taluka .. Total 124,370 58,407 65,963 4,689 5,381 38 68 49.101 54.775 Rural .. 124,370 58,407 65,963 4.689 5.381 38 68 49.101 54.775 Urban ..
Shriwardh'Jl Mah.1 Total 54.821 24.142 30.679 1.274 2.073 8 ~ 19.046 23.239' Rural .. 44,477 19.141 25,336 1.236 2.032 8 3 15,022 19.153 Urban .. 10.344 5.001 5.343 38 41 4.024 4.086
Mhasala Mahal ., .. Total 38.898 16.712 22.186 1,445 2,175 12,782 16.741 Rural .. 38.898 16.712 22,186 1.445 2.m 12.782 16.741 Urban "
Mahad Taluka .. .. Total 116,139 54.536 61.603 4,759 5.201 3 3 45.401 51,545 Rur.1 " 105.056 48.837 56.219 4,708 5,150 1 . I 40.354 46.782. Urban .. 11,083 5,699 5,384 51 51 2 2 5047 4.763
Pol.dpur Mahal ., .. Total 38.753 17,903 20.850 1.482 1545 22 16 16.007 18.810 Rural " 38.753 17.903 20.850 1,482 1,545 22 16 16.007 18.810. Urban "
TOWNS
Math.ran ., M 2.842 1.600 1,242 41 18 28 10 1.347 1,031: Neral 5,604 2.984 2.620 73 70 14
ii 2.592 2.288
Karia' .. M 5,143 2.740 2.403 115 127 21 2.194 1.927
Pan vel 18.130 9,528 8.602 55 32 14 20 7.826 7.074. Uran .. M 10,229 5,361 4.868 94 53 161 65 4.112 3,923. Alibag M 9.909 5,162 4.747 61 37 21 10 4,637 4.337: Revdanda .. M
6,240 3.072 3.168 31 10 .{, 'i 2.626 2.838 Pen .. 9.549 4.975 4.574 95 66 4,345 4.070 Roh. Ashtami .. M 7,553 3.864 3,689 80 87 '(, '8 2,827 2.773 Murud .. M 10,055 4,930 5.125 6 3 3.950 4218 Shriwardh.n M 10.344 5.001 5.343 38 4\ '2 '2
4,024 4,086 M.had :: M 11.083 5,699 5,384 51 51 5,047 4.763
M = Municipality.
J-62-II-26-B-(Kolaba).
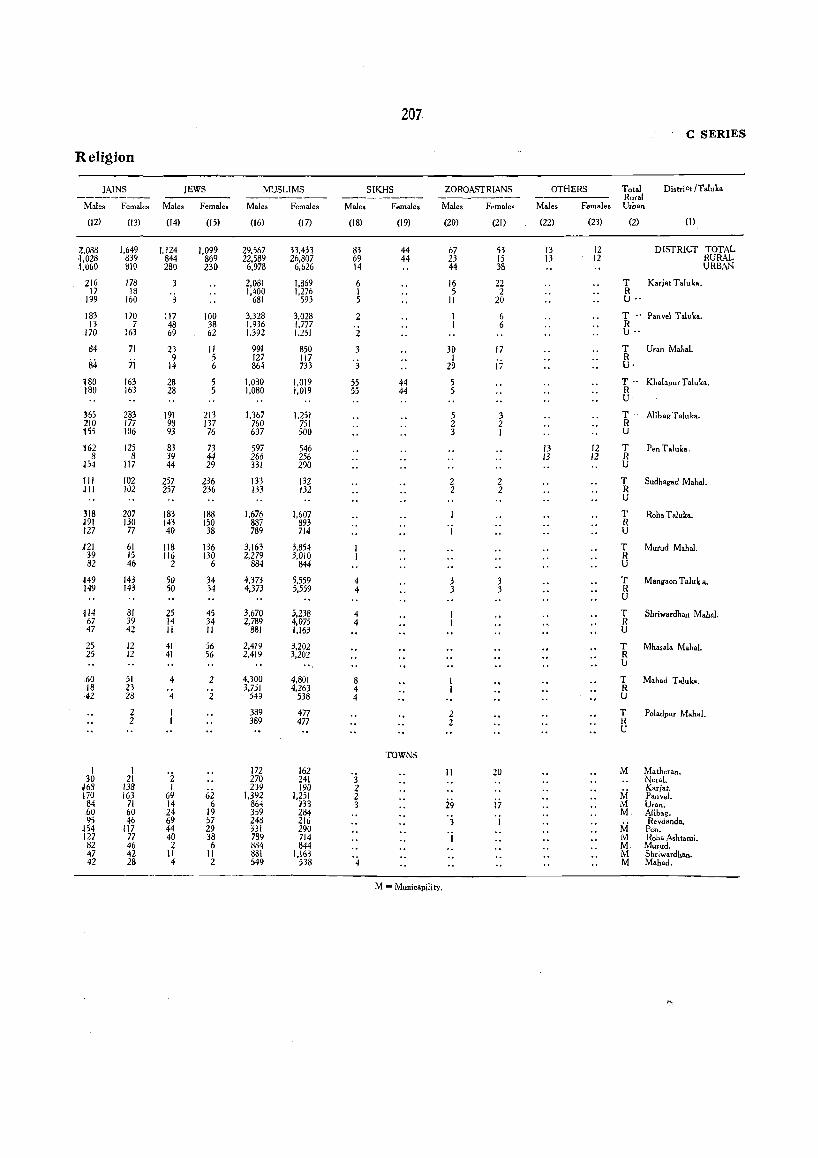
207 C SERIES
Religion
JAINS JEWS MUSLIMS SIKHS ZOROASTRIANS OTHERS Total District ITaluka ----_---- -------- --------- -------- Rural
Males Females Males Females Males Females Males Females Males Female~ Males Females Urban
(I2l (13) {I 4) (15) {I 6) (17) (18) (19) (20) (21) (22) (23) (2) (1)
2.088 1.649 1.124 1.099 29,567 33.433 83 44 67 53 13 12 DISTRICT TOTAL ~.028 839 844 869 22.589 26.807 69 44 23 15 13 12 RURAL 1.060 810 280 230 6.978 6.626 14 44 38 URBAN
216 178 3 2,081 1,869 6 16 22 T Karjat Taluka. 17 18 '3 1,400 1,276 1 5 2 R
199 160 681 593 5 11 20 U "
183 170 117 100 3.328 3,028 2 6 T .. Pan vel Taluka. 13 7 48 38 1,936 1,777 6 R
170 163 69 62 1.392 1.251 2 U"
84 71 23 " 991 850 3 30 17 T Uran Mahal.
84 ;i 9 5 127 117 I R 14 6 864 733 3 29 17 U·
t80 163 28 5 1.080 1,019 55 44 5 T .. KhalapurTaluka. 180 163 28 5 1.080 1.019 55 44 0; R
U
J65 283 191 213 1,367 1.251 5 3 T Alibag Taluka. 210 177 98 I37 760 751 2 2 R 155 106 93 76 607 500 3 I U
162 125 83 73 597 546 13 12 T Pen Taluk •. 8 8 39 44 266 256 13 12 R
J54 117 44 29 331 290 U
111 102 257 236 133 132 2 2 T Sudh'gad M.hal. JII 102 257 236 133 132 2 2 R
U
318 207 183 188 1.676 1.607 T Roh. Tal"k •. J91 130 143 150 887 893 'j R 127 77 40 38 789 714 U
W 61 118 136 3.163 3.854 T Murud Mahal. 39 15 116 130 2.279 3.010 R 82 46 2 6 884 844 U
149 143 50 34 4.373 5,559 4 3 3 T M.ngaon Taluk a. 149 143 50 34 4,373 5,559 4 3 3 R
U
,1I4 81 25 45 3,670 5,238 4 T Shriwardhan Mah.1. 67 39 14 34 2,789 4,075 4 R 47 42 II II 881 1,163 U
25 12 41 56 2,419 3.202 T Mhosal. M.h.1. 25 12 41 56 2.419 3,202 R
U
,60 51 4 2 4.300 4.801 8 T Mahad T oluk •• 18 23 3.751 4.263 4 R 42 28 4 2 549 538 4 U
2 389 477 2 T Poladpur Moho!. 2 389 477 2 R
U
TOWNS
I I 172 162 '3 " 20 M Matheran. 30 21 2 270 241 Nerol.
J68 138 I 6i
239 190 2 M Kariat.
170 163 69 1.392 1,251 2 PanveL 84 71 14 6 864 733 3 i9 i7 M Uran. 60 60 24 19 359 284 M Alibag. 95 46 69 57 248 216 3 'j
M Revdondo.
J54 tI7 44 29 331 290 Pen. 127 77 40 38 789 714 I M Roha A.hlami. .82 46 2 6 884 844 M, Murud. 47 42 II II 881 1.163
'4 M Shriwardhan. 42 28 4 2 549 538 M Mahad.
M = Munic.pility.
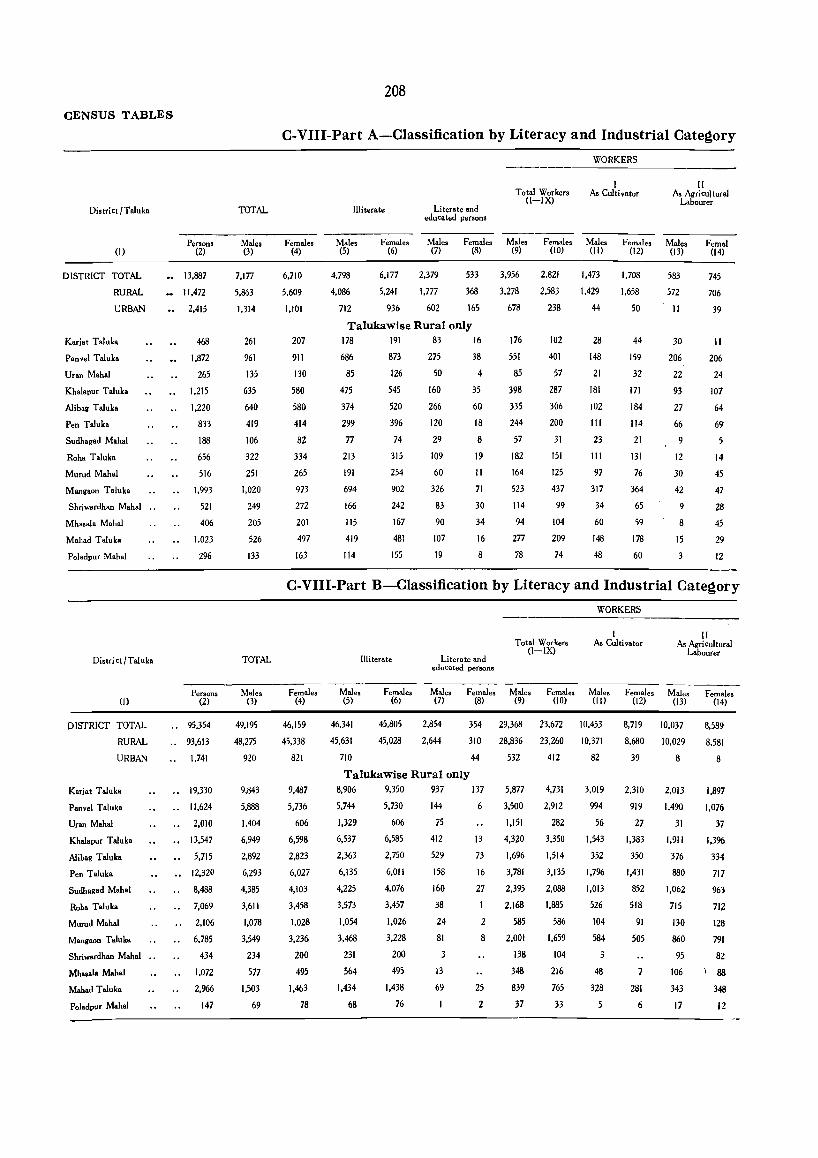
CENSUS TABLES
District I Toluko
(I)
DISTRICT TOTAL
RURAL
URBAN
Kari.t T.luk.
Pan vel T aluk.
Uran Mahal
Khalapur Taluka
A1ib.g Taluka
Pen Taluka
Sudh.gad Mahal
Roh. Taluko
Murud Mah.1
Mangoon T.luk.
Shriwordhan M.h.1 ..
Mhosala Mahal
Mahad Taluk.
Poladpur Mahal
District/Taluka
(I)
DISTRICT TOTAL
RURAL
URBAN
Karjat Taluk.
P.nv.l Taluk.
Uran Mahol
Khalopur Taluka
A1ibag Taluka
Pen Taluka
Sudhagad Mahal
Roha Taluka
Murud Mohal
Mangaon Taluka
Shriwardhan Mahal •.
Mh .. ala Mah.1
Mah.d Taluka
Pol.dpur Mah.l
Persons (2)
•• 13.887
11.472
2.415
468
1.872
265
1.215
1.220
833
188
656
516
1.993
521
406
1.023
296
Persons (2)
•• 95,354
.• 93.613
1,741
•• 19.330
.• 11.624
2.010
.. 13.547
5.715
.. 12.320
8.488
7.069
2.106
6.785
434
1.072
2.966
147
TOTAL
Males (3)
7.177
5.863
1.314
261
961
135
635
640
419
106
322
251
1.020
249
205
526
133
TOTAL
Males (3)
49.195
48.275
920
9.843
5.888
1.404
6.949
2.892
6.293
4.385
3.611
1.078
3.549
234
577
1,503
69
208
C-VIII-Part A-Classification by Literacy and Industrial Category
Females (4)
6.710
5.609
1.101
207
911
130
580
580
414
82
334
265
973
272
201
497
163
WORKERS
I II Total Workers
(I-IX) As Cultivator As Agricul tural
Labourer Illiterate Literate .nd
educated persons
Males (5)
4.798
4.086
712
Females Males (6) (7)
6.177 2.379
5.241 1.777
936 602
-------- ---------Females Males Females Males Females Males
(8) (9) (10) (II) (12) (13)
533 3.956 2.821 1.473 1.708 583
368 3.278 2,583 1.429 1.658 572
165 678 238 44 50 II
Talukawise Rural only 178 191 83 16
686
85
475
374
299
77
213
191
694
166
115
419
114
873
126
545
520
396
74
315
254
902
242
167
481
155
275
50
160
266
120
29
109
60
326
83
90
107
19
38
4
35
60
18
8
19
II
71
30
34
16
8
116
551
85
398
335
244
57
182
164
523
114
94
277
18
102
401
57
287
306
200
31
151
125
437
99
104
209
74
28
148
21
181
102
III
23
III
97
317
34
60
148
48
44
159
32
171
184
114
21
131
76
364
65
59
178
60
30
206
22
93
27
66
9
12
30
42
9
8
15
3
Fernal (14)
745
706
39
II
206
24
107
64
69
5
14
45
47
28
45
29
12
C-VIII-Part B-Classification by Literacy and Industrial Category
Females (4)
46.159
45,338
821
9,487
5.736
606
6.598
2.823
6.027
4.103
3.458
1.028
3.236
200
495
1.463
78
WORKERS
I Total Workers
(I-IX) As Cultivator
II As Agri cultural
L.bourer Illiterate Literate and
educated persons
Males (5)
Female. Males (7)
Females Male. (6) (8) (9)
46.341
45.631
710
45.805
45.028
2.854
2.644
354 29.368
310 28.836
44 532
Talukawise Rural only 8.906 9.350 937 137
5.744 5.730 144 6
1.329 606 i5
6,537 6,585 412 13
2,363 2.750 529 73
6.135
4.225
3.573
1.054
3,468
231
564
1,434
68
6,011
4.076
3.457
1.026
3.228
200
495
1.438
76
158
160
38
24
81
3
13
69
16
27
1
2
8
25
2
5.877
3.500
1.151
4.320
1.696
3.781
2.395
2.168
585
2.001
138
348
839
37
Female. Males (10) (II)
23.672 10.453
23.260 10.371
412 82
4.731
2.912
282
3.350
1.514
3.135
2.088
1.885
586
1.659
104
216
765
33
3.019
994
56
1.543
352
1.796
1.013
526
104
584
3
48
328
5
Females Males (12) (13)
8.719 10.037
8.680 10.029
39 8
2.310
919
27
1.383
350
1.431
852
518
91
505
7
281
6
2.013
1.490
31
1.911
376
880
1.062
715
130
860
95
106
343
17
Females (14)
8.589
8.581
8
1.897
1.076
37
1.3%
334
717
963
712
128
791
82
)88
348
12
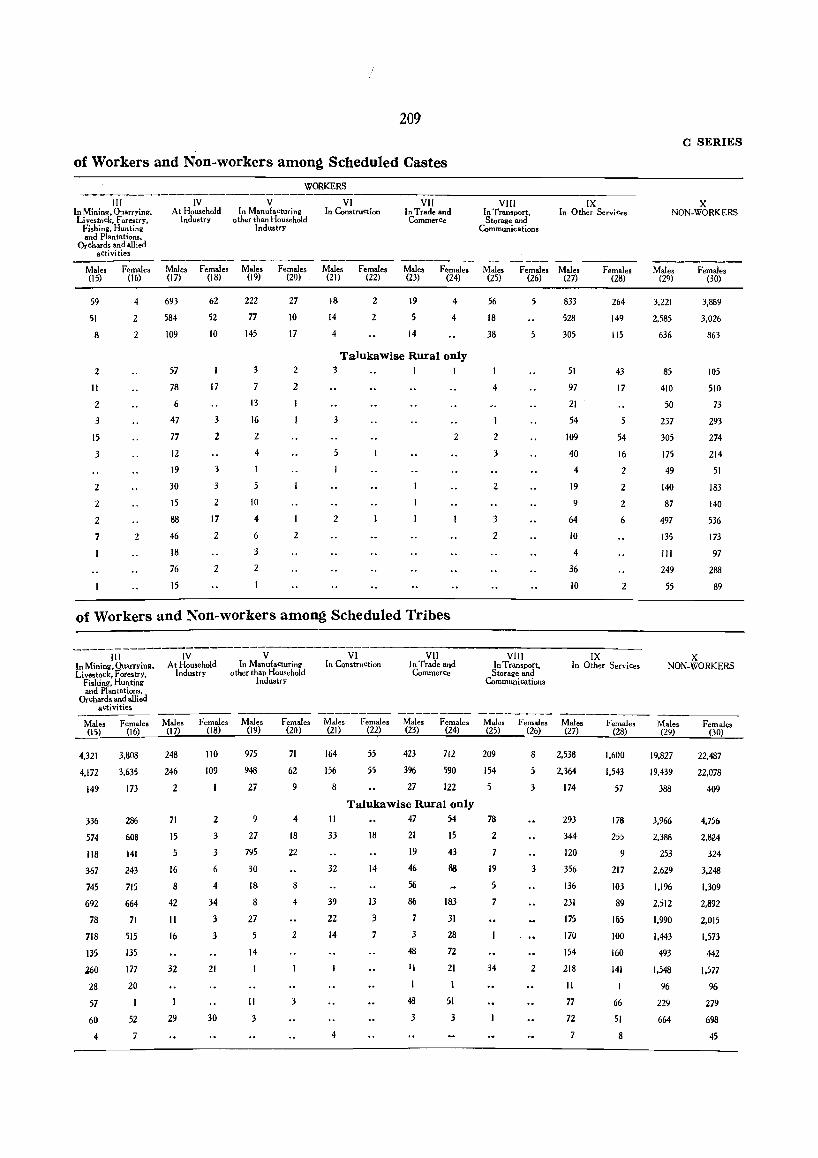
/
209
of Workers and Non-workers among Scheduled Castes
WORKERS
III IV V VI VII Vlll IX In Mining. Quarrying. Livestock. Forestry.
At Household Industry
In Manufacturing other than Household
Industry
In Construction In Trade and CommerCe
In Transport. Storage and
Communications
In Other Services
Fishing, Hunting and Plantations.
Otchards and allied activities
---------- -------Males Females Males Females Males Females Males Females (15) (16) (17) (18) (19) (20) (21) (22)
59 4 693 62 222 27 IS 2
SI 584 52 77 10 14 2
8 2 109 10 145 17 4
Males Females Males Females Males a» a~ ~ a~ an
19 4 56 5 833
5 4 18 528
14 38 305
Talukawise Rural only 2
II
2
3
15
3
2
2
2
7
57
78
6
47
77
12
19
30
IS
88
46
18
76
15
17
3
2
3
3
2
17
2
2
3
7
13
16
2
4
10
4
6
3
2
2
2
2
3 I
3
5
I
2
of Workers and Non-workers among Scheduled Tribes
----iu-------,v---------V--- VI VII
2
4
2
3
2
3
2
VIII
51
97
21
54
109
40
4
19
9
64
10
4
36
10
IX
Females (28)
264
149
115
43
17
54
16
2
2
2
6
2
In Construction In Mining. Quarrying. At Household In Manufacturing Livestock. Forestry. Industry other than Household
In Trade and Commerce
In Transport, Storage and
Communications
In Other Services
Fishing. Hunting Industry and Plantations.
Otchards and allied activities
C SERIES
X NON.WORKERS
Males (29)
3.221
2.585
636
85
410
50
237
305
175
49
140
87
497
135
III
249
55
Females (30)
3.889
3.026
863
105
510
73
293
274
214
51
183
140
536
173
97
288
89
X NON.WORKERS
Males Females Males Females Males Females Males Females Males Females Males Females Males Females lVIales Females ~(~15~) __ ~(I~6)~ ____ ~(I~7)~~(~18~) __ ~(~19~) __ ~(2~O)~ __ ~(2~1) __ ~(~22~) __ ~(2~3)~~(~24~) __ ~(~25~) ___ (2~6)~~(2~7~) ____ ~(2~8~) ____ ~(2~9)~ __ ~(3~O)~_
4,321 3.808 248
4.172 3.635 246
149 173 2
336
574
118
367
745
692
78
718
I3S
260
28
57
60
4
286
608
141
243
715
664
71
515
135
177
20
I
52
71
15
5
16
8
42
II
16
32
29
110 975
109 948
2
3
3
6
4
34
3
3
21
30
27
9
27
795
30
18
8
27
5
14
II
3
71 164 55 423 712 209
62 156 55 396 590 154
9 8 27 122 ;
Talukawise Rural only 4
18
II 47 54 78
8
4
2
3
33
32
39
22
14
4
18
14
13
3
7
21
19
46
56
86
7
3
48
II
48
3
15
43
88
183
31
28
72
21
I
51
3
2
7
19
5
7
34
8 2,538
5 2.364
3 174
3
2
293
344
120
356
136
231
175
170
154
218
II
77
72
7
1.600
1,543
57
178
255
9
217
103
89
165
100
160
141
66
51
8
19.827
19,439
388
3.966
2.388
253
2.629
1.196
2.512
1.990
1.443
493
1.548
96
229
664
22.487
22.078
409
4.756
2.824
324
3.248
1.309
2.892
2.015
1.573
442
1.577
96
279
698
45
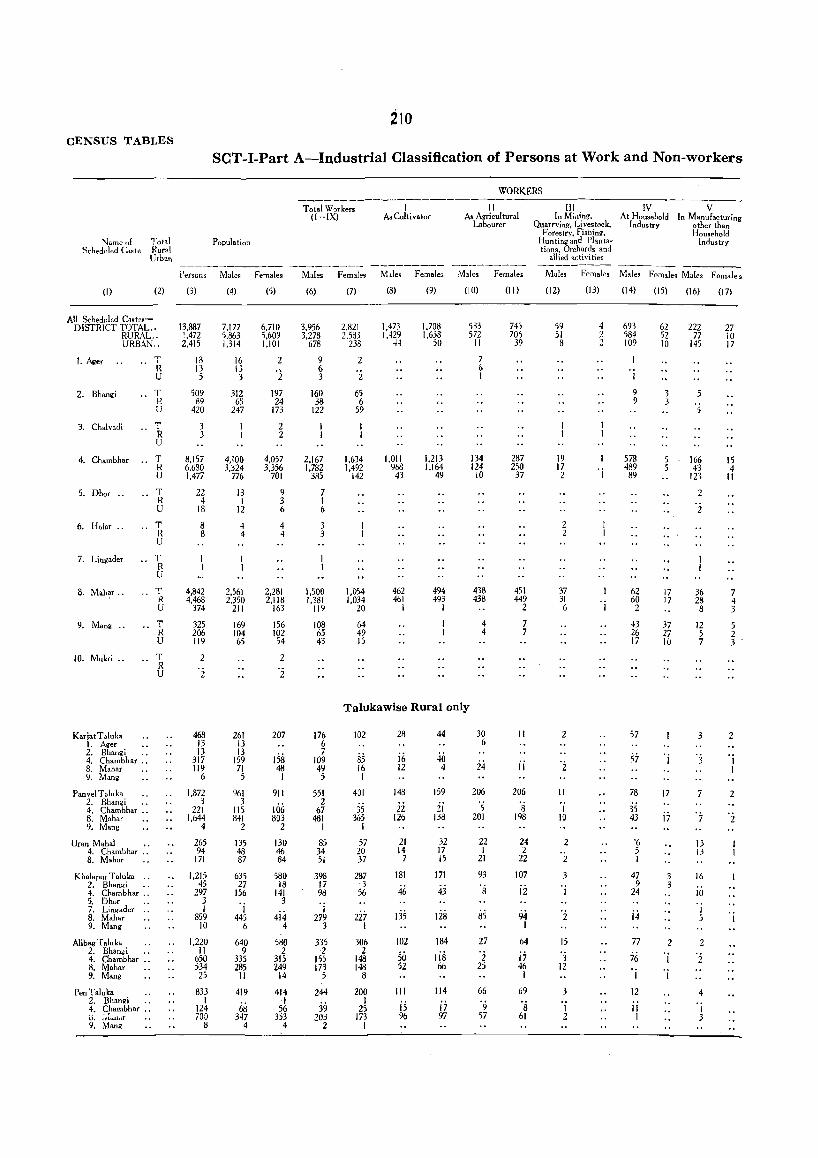
CENSUS TABLES
Name of Scheduled Caste
(1)
Total Rural Urban
(2)
All Seheduled Coste,DISTRICT TOTAL..
RURAL .. URBAN ..
~
LAger .. 1
2. Bha1llli
R U
T R U
3. Chalvadi .. T R U
4. Chambhar T R U
5. Dhor .. .. T R U
6. Hol.r .. .. T R U
7. Lingader .. T R U
8. M.h~r .. .. T R U
9. Mang ..
10. Mukri ..
KariatTalub 1. Ager 2. Bhangi .. 4. Chambhar .. 8. Mahar 9. Mang
Panvel T.luka 2. Bhangi .. 4. Chambhar .. 8. Mahar 9. Maog
Uran Mahal •. 4. Chambhar .. 8. Mahar
Khal.pur T.luk. .. 2. Bhangi .. 4. Ch.mbhar .. 5. Dhor 7. Lingader .. 8. Mahar 9. Mang
Alibag T.luka 2. Bhangi .. 4. Chambhar .. 8. Mahar 9. Mang
Pen Taluka 2. Bhang; .. f. Cfambhar .• U. ~YJ.<.Hl<1r 9. Mang
T R U
T R U
2to
seT -I-Part A-Industrial Classification of Persons at Work and Non-workers
Population
Persons Males Females
(3)
13,887 I !,472 2,415
13 13 5
509 89
420
3 3
8,157 6.680 1,477
22 4
18
8 8
4,842 4,468
374
325 206 119
2
'2
468 13 13
317 119
6
1.872 3
221 1,644
4
265 94
171
1,215 45
297 3 1
859 10
1,220 11
650 534 25
833 1
124 70J
II
(4)
7,177 5,863 1,314
16 13 3
312 65
247
4,100 3,324
776
13 I
12
4 4
2,561 2,350
211
169 104 65
261 13 13
159 71 5
961 3
115 841
2
135 48 87
635 27
156
'i 445
6
640 9
335 285
11
419
68 347
4
(5)
6,710 5,609 1,101
2
2
197 24
173
2 2
4,057 3,356
701
9 3 6
4 4
2,281 2,118
163
156 102 54
2
'i
207
158 48 1
911
Hi6 803
2
130 46 84
580 18
141 3
4i4 4
580 2
315 249
14
414 '1 56
353 4
WORKERS
Total Workers (I-IX)
I As Cultivator
II As Agricultural
Labourer
Males Females Miles Female, ilhles Fem.les
(6)
3,956 3,278
678
9 6 3
160 38
122
2,167 1,782
385
7 1 6
3 3
1,500 1,3$1
119
108 65 43
176 6 7
109 49 5
551 2
67 481
1
85 34 51
398 17 98
'i 279
3
335 2
155 173
5
244
39 203
2
(7)
2.821 2,533
233
2
2
65 6
59
1,634 1,492
142
1,054 1,034
20
64 49 15
(8)
1,473 I,m
44
1,011 968
43
462 461
I
(9)
1.708 1,6)8'
50
1.213 1,164
49
494 493
)
(10)
533 572
11
7 6 I
134 124
10
438 438
4 4
Talukawise Rural only
102
35 16 I
401
3S 365
I
57 20 37
287 3
56
2i7 1
306 2
148 148
8
200 I
25 173
I
28
i6 12
148
22 126
21 14
7
181
46
102
50 52
111
is 96
44
46 4
159
21 138
32 17 15
171
43
184
lis 66
114
17 97
30 o
24
206
'5 201
22 I
21
93
's S5
27
'2 25
66
'9 57
(11)
745 706
39
287 250 37
451 449
2
7 7
11
ii
206
8 198
24 2
22
107
ii
94 1
64
i7 46 1
69
8 61
III In Mining,
Quarrying, Livestock. Forestry, Fishing,
Huntingand Planta. tions. Orchards and
allied acti vi ties
IV At Household
Industry
V In Manufacturing
other than Household
Industry
Males Females Males F em.les Males Female s
(12)
59 51 8
19 17 2
2 2
37 31 6
11
1 10
2
2
3
'j
2
15
'j 12
3
1 2
(13)
4 2 2
'i
(14)
693 584 109
1
9 9
578 489 89
62 60 2
43 26 17
57
57
78
35 43
'6 5 1
47 9
24
i.j
77
76 'i 12
11 1
(15)
62 52 10
17 17
37 27 10
17
i7
3 3
2 'j
1
(16)
222 77
145
166 43
123
2
'2
36 28 8
12 5 7
3
'7
13 13
16
10
I 5
2
'2
4
'i 3
(17)
27 lO 17
15 4
11
7 4 3
5 2 3
2
2
'2
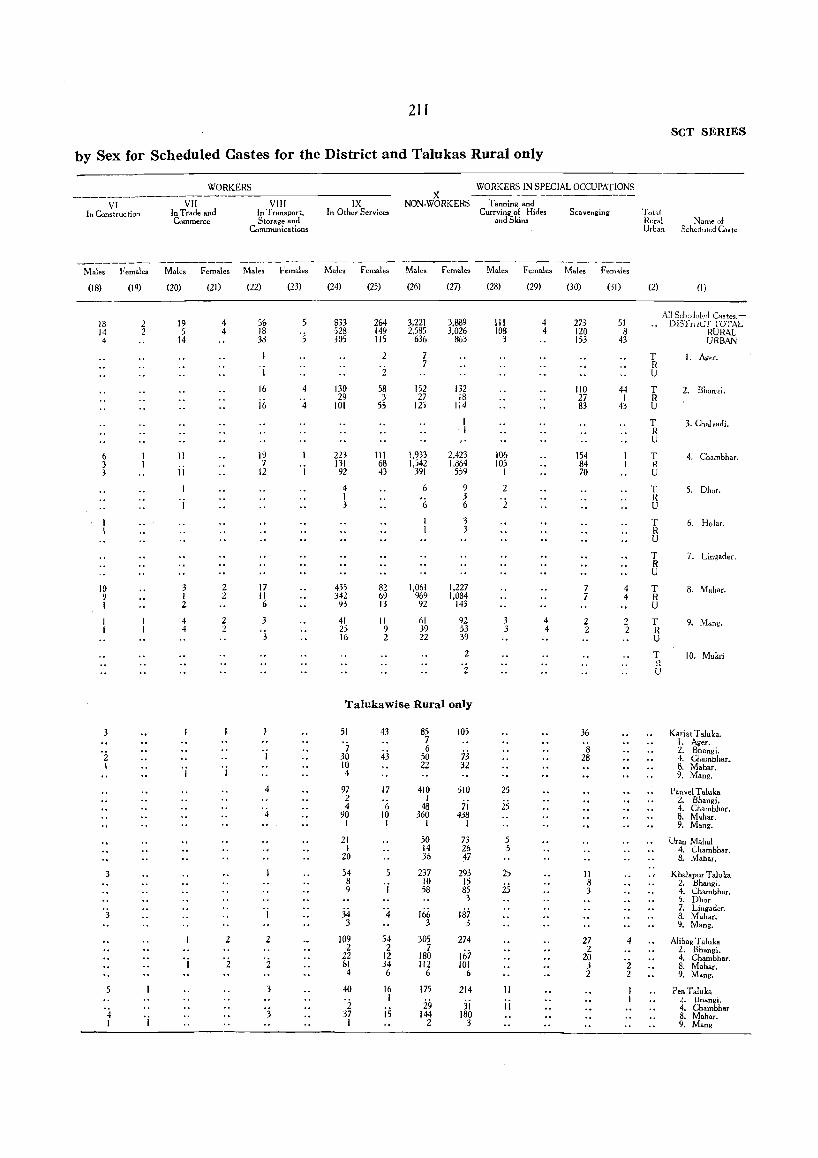
211 seT SERIES
by Sex for Scheduled Castes for the District and Talukas Rural only
WORKERS WORKERS IN SPECIAL OCCUPATIONS X
VI VII VIII IX NON-WORKERS Tanning and In Cons true tion In Trade and In Transport. In Other Services Currying of Hides Scavenging Total
Commerce Storage and and Skins Rural Name of Communications Urban Scheduled Caste
--------- ----_--- --~----- _-_---- ------ ------_ Males Females Males Females Males Females Males Females Males Females Males Females M.les Females
(18) (19) (20) (21) (22) (23) (24) (25) (26) (27) (28) (29) (30) (1) (2) (I)
56 5 833 3,221 3,889 111 4 All Sohcdded Castes. -
18 2 19 4 264 273 51 DISTldCTTOTAL 14 2 5 4 18 ·s 528 149 2,585 3,026 108 4 120 8 RURAL 4 14 38 305 115 636 863 3 153 43 URBAN
2 7 T I. Ager.
'i '2 7 R U
16 4 130 58 152 132 110 44 T 2, Bhan"{i.
i6 '4 29 3 27 18 27 I R 101 55 125 114 83 43 U
1 T 3. Chal vadi. 1 R
U
6 11 19 223 111 1,933 2,423 106 154 T 4. Cn.mbhar. 3 ii
7 'j 131 68 1,542 1.864 105 84 ~ 3 12 92 43 391 5'>9 I 70 U
4 6 9 2 T 5. Ohor.
'i 1 3 '2 R 3 6 6 U
3 T 6. Holar. 3 R
U
T 7. Lingader. R U
10 3 2 17 435 82 1,061 1,227 7 4 T 8. Mahar. 9 I 2 11 342 69 969 1,084 7 4 R 1 2 6 93 13 92 143 U
4 2 41 11 61 92 3 4 2 2 T 9. Mang. 4 2 25 9 39 53 3 4 2 2 R
3 16 2 22 39 U
2 T 10. Mukri n
Z U
Talukawise Rural only
51 43 85 105 36 Karia! Taluka. 7 I. Ager.
7 6 73 8 2. Bhangi.
2 1 30 43 50 28 4. Chambhar. 1 10 22 32 8. Manar.
I I 4 9. Mang.
4 97 17 410 510 25 Panvel T a1uka 2 I
25 Z. Bbangi. 4 6 48 71 4. Chambhar.
4 90 10 360 438 8. Mahar. 1 I I I 9. Mang.
21 50 73 5 Uran Mahal 1 14 26 5 4. C.hambhar.
20 36 47 8. Mdhor.
3 54 5 237 293 25 11 Khalapur Taluka 8 'j 10 15
25 8 2. llhangi. 9 58 85 3 4. Chambhar.
3 5. Dhor
'3 'i 34 '4 166 Hi7 7. Lingader. 8. Mahar.
3 3 3 9. Mang.
2 2 109 54 305 274 27 4 Alibag Taluka 2 2 7
167 2 l. Bhangi.
'i 22 12 180 20 '2 4. Chambhar. 1 2 81 34 112 101 3 8. Mahar.
4 6 6 6 2 2 9. Mang.
5 40 16 175 214 11 PenT.luka 1
29 ". tlhangi.
'j 2 is 31 II 4. Chambhar
4 37 144 180 8. Mahar. I 1 I 2 3 9. Mang
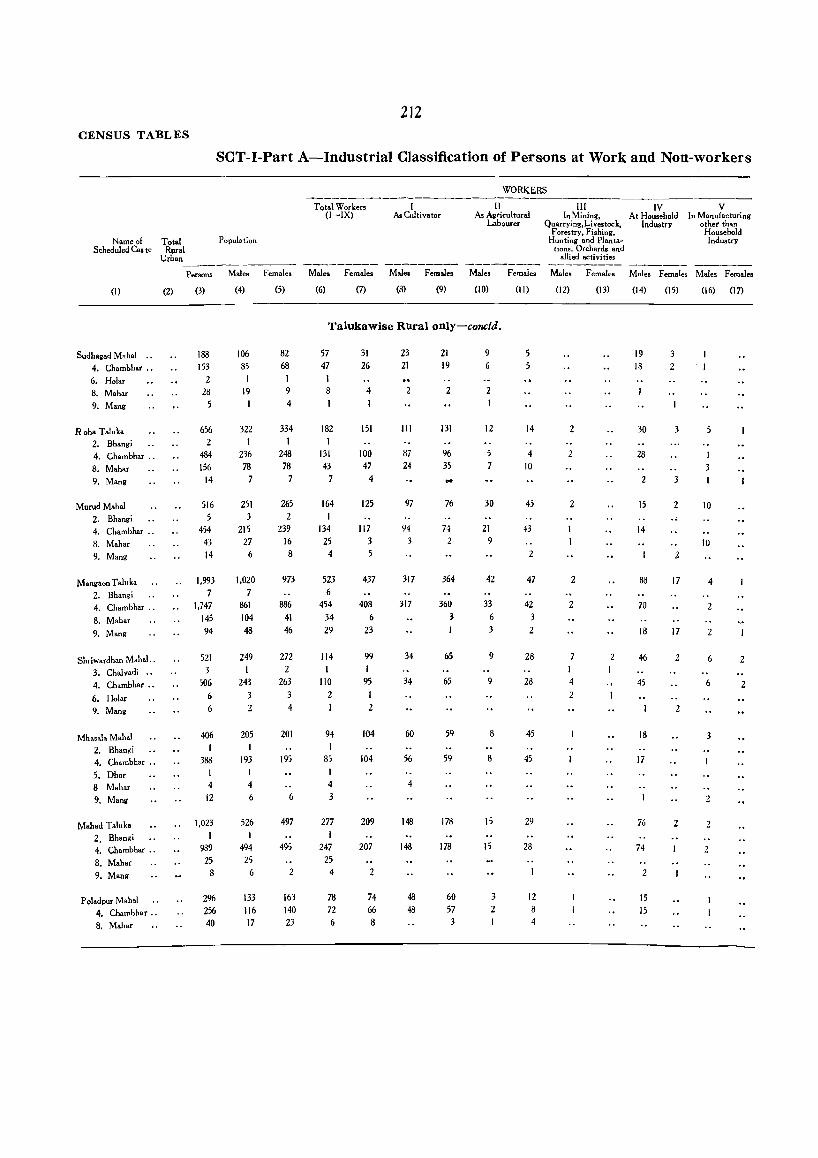
CENSUS T ABL ES
Name of Scheduled Cas te
Total Rural
Urban
212
SCT-I-Part A-Industrial Classification of Persons at Work and Non-workers
Population
Total Wor kers (I-IX)
I As Cultivator
WORKERS
II As Agricultural
Labourer
III In Mining,
Quarrying,Livestock, Forestry, Fishing,
Hunting and Planta~ tions, Orchards and
allied activities
IV A t Household
Industry
V In Manufacturing
other than Household Industry
Persons Males Females Males Females Male. Females Males Femaies Males Females Males Females Males Femal ..
(I)
Sudhagad Mahol .. 4. Chambhar •• 6. Holor 8. Mahar 9. Mang
R oho Taluka 2. Bhangi 4. Ch.mbhar .. 8. Mahar 9. M.ng
Murud Mahal 2. Bhangi 4. Chambhar .. 8. Mahar 9. Mang
Mangaon Taluka 2. Bhangi 4. Chamhhar ..
8. Mahar
9. Mang
Shriwardhan Mahal .. 3. Chal vadi .. 4. Chambhar ..
6. Holar 9. Mang
Mhasala Mahal 2. Bhangi 4. Chambhar ..
5. Dhor 8 Mahar 9. Mang
Mahad Taluka 2. Bhangi 4. Chambhar •.
8. Mahar 9. Mang
Pol.dpur Mahol 4. Chombhar .. 8. Mahar
(2) (3)
188 153
2 28
5
656 2
484 156
14
516 5
454 43 14
1,993 7
1,747 145 94
521 3
506 6 6
406 1
388 1 4
12
1,023 1
989 25
8
296 256 40
(4)
106 85
1 19 1
322
236 78
7
251 3
215 27
6
1,020 7
861 104 48
249
243
3 2
205
193 I 4 6
526
494 25
6
133 116 17
(5)
82 68
9 4
334 I
248 78
7
265 2
239 16 8
973
886 41 46
272 2
263
3 4
201
195
6
497
495
2
163 140 23
(6) (7) (8) (9) (10)
Talukawise RUral only-cQncld.
57 47
8
182
131 43
7
164
134 25
4
523 6
454 34 29
114 I
110 2
94 1
85
4 3
277
247 25
4
78 72 6
31 26
4
151
100 47
4
125
117 3 5
437
408 6
23
99
95
2
104
104
209
207
2
74 66 8
23 21
111
87 24
97
94
317
317
34
34
60
56
4
148
148
48 48
21 19
2
131
96 35
76
74 2
364
360
3
65
59
59
178
178
60 57 3
9
6
2
12
5 7
30
21 9
42
33
6 3
9
9
8
8
15
15
3 2
(11)
5 5
14
4 10
45
43
2
47
42 3 2
28
28
45
45
29
28
12 8 4
(12)
2
2
2
2
2
4
2
(13)
2
(14)
19 18
30
28
2
15
14
83
70
18
46
45
18
17
76
74
2
15 15
(15)
2
3
3
2
2
17
17
2
2
(16) (17)
5
10
10
4
2
2
6 2
6 2
3
2
2
2
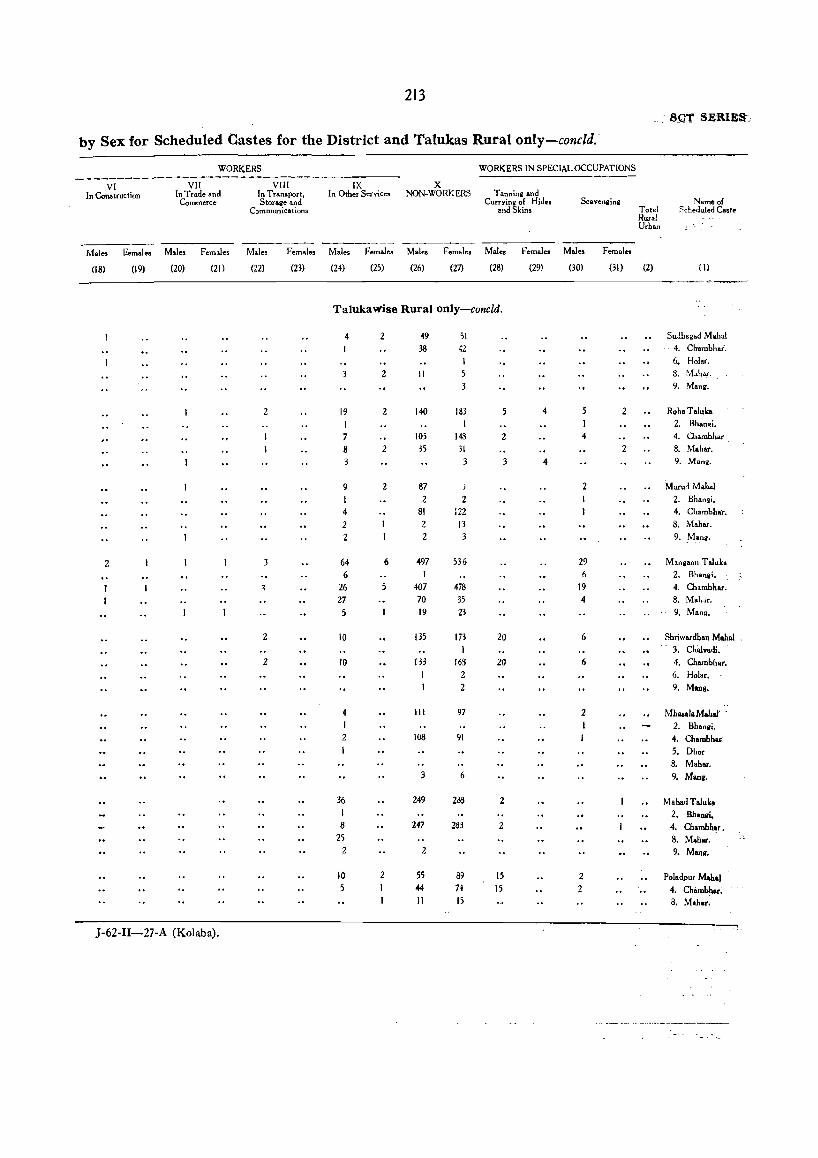
213
by Sex for Scheduled Castes for the District and Talukas Rural only-concld.
WORKERS ----------------~
VI In Construction
VII In Trade and
Commerce
VIII In Transport, Storage and
Communications
WORKERS IN SPECIAL OCCUPATIONS
IX X In Other Service. NON.WORKERS Tannin~ and
Currying of Hide. end Skin.
Scavenrin2
Mal.. F-emale. Males Fem.les Male. Females. Males Females Mal.. Female. Mal.. Female. Males Femal ..
(18) (19) (20) (21) (22) (23) (24) (25) (26) (27) (28) (29) (30) (31)
Total Rural Urban
(2)
. S_QT SERI:&:tJ
Na_of Scheduled Cas'e
(1)
--------------------------------------------------------------------~. ------
2
2 3
2
2
Talukawise Rural onJy-concld.
4
19
8 3
9
1 4 2 2
64 6
26 27
5
10
10
4 I 2
I
36
8 25
2
10 5
2
6
2
87
2 81 2 2
497 I
407 70 19
135
133 I
111
108
3
249
247
2
55 44 11
)
2 122
13
536
478 35 23
173
163 2 2
97
91
6
208
283
89 74 15
20
20
2
2
15 15
4
4
4
2
29 6
19 4
6
6
2
2
2
2
2
Su:lhagad Mah.1 . 4. Clmmbb.i.
6. Holar. 8. ~,Ihbar .. , 9. Mang.
Roh. Taluka 2. Shan.i. 4. Chanobhar
8. Mahar. 9. Mang.
Murud M.hol 2. Bhan~i.
4. Chambhar.
8. Mahar.
9 .. Mana.
Mangaon T aluka 2. Bhanlli. 4. Ch.mbbar.
8. Malur. 9. Mang.
Shriwardhan Mah.1 3. Chary,di. 4, Chambh.r. 6. Hol.t. 9. Mang,
Mhasal.M.hal' . 2. Bhanlli. 4. Chambhu:
5. Dhor 8. M.har. 9. Mani.
M.h.d Taluka 2. Bhanai. 4. Ch.mbh~r.
8. Mahar. 9. Mang.
Poladpur M.hal 4. Chaml.har; 8. Mah.r.
--~~~~~~------------------------------------------~ J-62-1I-27-A (Kolaba).
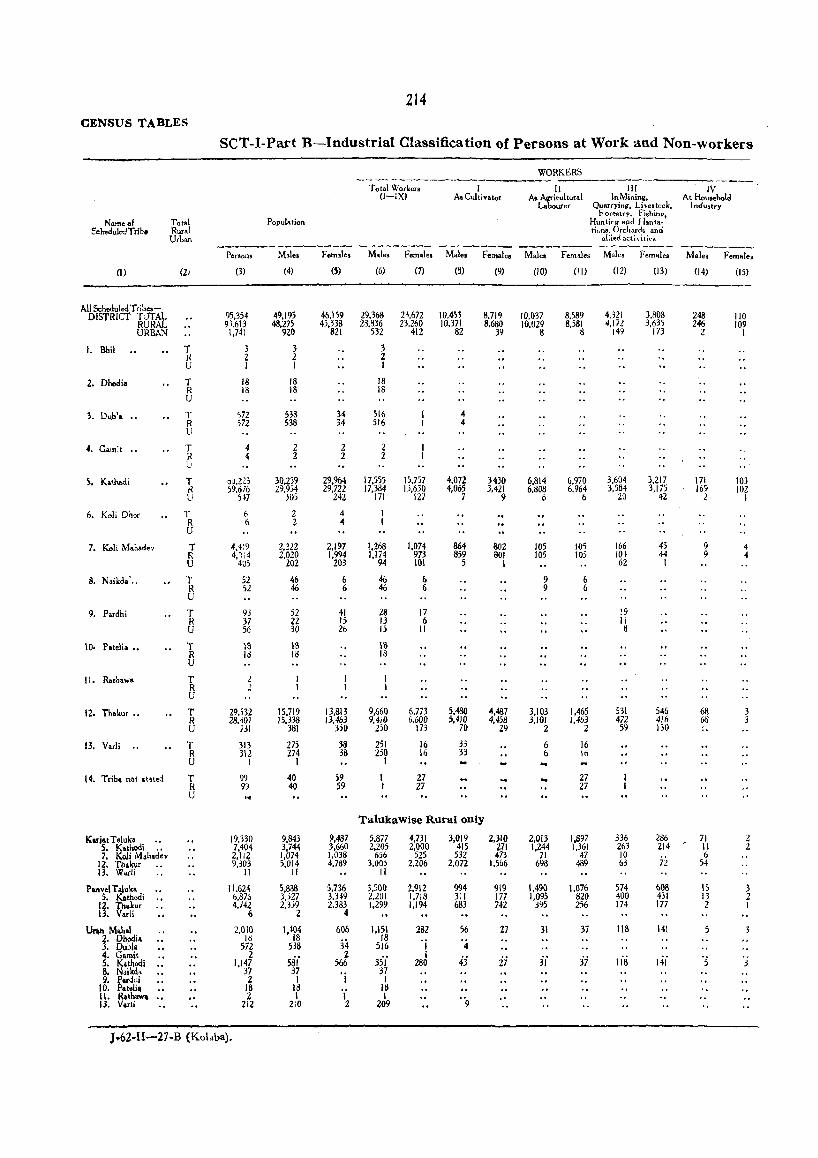
214 CENSUS TABLES
seT-I-Pa:rt B-Industrial Classification of Persons at Work and Non-workers
WORKERS --Total Work." I II III IV (I-IX) As Cultivator As ~cultural In Mininw, At Houtehold
La urer Quartyinll. Livestcck. Industry
Name of Total Population Forestry. Fishinp,
Huntirg and f lanta .. !:chedulcd T rib. Rural tir;os. Orchards and
Urban aHied activitle:. -------------- ------.--- ------- ---_--- ----- -----_. Persons M.le, Fehlll •• Male. Female. Mal., female. Male. Fem.les M.les Femal •• Mal •• Female"
0) (2) (3) (4) (5) (6) (7) (8) (9) (10) (II) (12) (13) (14) (15)
AII5eheduled Trib •• -95.354 49.195 46.159 29.368 2'.672 10.453 8.719 4.321 3.808 DISTRICT TOTAL 10.037 8,589 248 110
RURAL 91.613 48.275 4i.338 28.836 23.260 10.371 8.680 10.029 8,581 4.172 3.635 246 109 URBAN 1.741 920 821 532 412 82 39 8 8 149 173 2 1
I. Bhil T 3 3 3 H 2 2 2 U I I I
Z. Dhodia T 18 18 18 " R 18 18 13 U
3. Dub'. " or 572 538 34 516 <4 R 572 538 34 516 4 U
4. Cam:t " T 4 2 2 2 R 4 2 2 2 LJ
S. Kalhodi T o~,U3 30.2;9 29.964 17,5:;5 15.757 4.072 3430 6.814 6,970 3.604 3.217 171 103 K 59,616 29,954 29.722 17.384 1).630 4.065 3.421 6.808 6,964 3.584 3,175 169 102 U :)17 305 242 171 127 7 9 () 6 20 42 2 )
6. Koli Dh?r T 6 2 4 R 6 Z .. U
7. Koli Mah.dev T 4.1:9 2.222 2.197 1.268 1,074 864 802 105 105 166 4S 9 4 R 4,);4 2,020 1.994 1.174 973 859 801 105 105 i04 44 9 4 U 40S 202 203 94 101 5 1 62 1
S. N.ikda'" T 52 46 6 46 Ii 9 6 R 52 46 6 46 6 9 6 U
9. Pardhi T 93 52 41 28 17 !9 R 37 2l 15 13 6 )j
U 56 30 26 15 II B
10. Pateli ... T 18 IS \8 R 18 18 18 U
II. R.thawa T 2 R 2 U
12- Thakur .. T 29.532 15.719 13.813 9.660 6.773 5.480 4.487 3.103 1.465 531 546 68 3 R 28.,,0) )5.338 13.463 9.4;0 6.600 5.410 4.458 3,101 1.463 472 416 68 3 U 731 381 3,0 2,0 173 70 29 2 2 59 130 "
13. Varli T 313 275 38 251 16 33 6 16 R 312 274 38 250 16 33 6 16 U I I 1
14. Tri~ n .. t stated T 99 40 59 27 27 R 97 40 59 27 27 U
Talukawise R.ural only
Kariat Taluk. .. 19.330 9,843 9.487 5.877 4,731 3.019 2.310 2.013 1,897 336 286 71 2 5. K~thodi .• 7,404 3,744 3.660 2.205 2.QOQ 415 271 1.244 1.361 263 214 11 Z 7. Koli M.hadev 2.11<1 1.074 1,038 656 525 532 473 71 47 10 6
12. Th&1ror 9,303 5.014 4.789 3.00) 2.206 2.072 1.566 698 489 63 72 54 13. Wadi II II II
Pllnv.! T a1uk. 11.624 5.8BS 5.736 3500 2.912 994 919 1,490 1.076 574 608 15 3 5. K.thodi " 6.875 3.m 3.349 2.201 1.718 31 I 177 1.095 820 400 431 13 2
IJ. tbakur 4.742 2.3j9 2.383 1.299 1.194 683 742 395 256 174 177 2 I (. arli 6 2 4
U.-.n Moh.! 2.010 1,104 606 1.151 282 56 27 31 37 118 141 5 3 2. Dhodia 16 18
34 18 'j '.j 3. Dub!. 572 538 516
4. Gamit 2 58!' Z 35!' i 43 if :31' jj 118 141 '5 5. Kathod; .. 1.147 566 280 3 8. N.ikd, 37 37 37 9. Perdn; 2 I I I
10. P.telj~ 18 1~ 18 II. Rath_ .. 2 1 I 1
"9 13. Var!; 2i2 2iO 2 209
J .. 62-II-27-B (Kolaba).
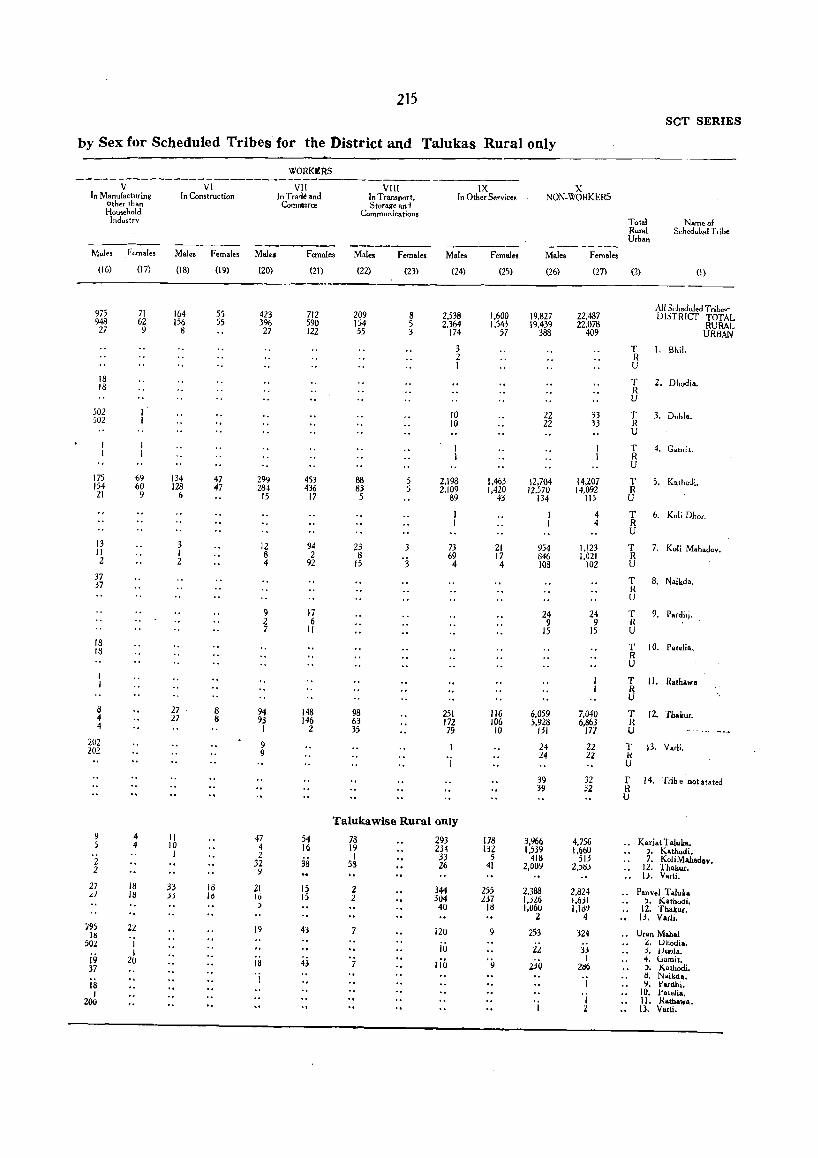
215 seT SERIES
by Sex for Scheduled Tribes for tbe District and Talukas Rural only
WORK~RS ---~--------------------------V VI VII VIII IX X
In Manufacturing In Construction In Tra,M and In Transport, In Other Service, NON·WORKERS Other than Commerce Storage ani Household Communications
Industry Total Name of Rural Scheduled Tribe Urban -----_- ------ ----------- --------- ......... ---------
M.les Females Male. Females Mal .. Female. Males Females Male. Femal •• Males Femal.,
(16) (17) (18) (19) (20) (21) (22) (23) (24) (25) (26) (27) (2) (I)
All Scheduled Tribe.' 975 71 164 55 423 712 209 8 2,538 1,600 19,827 22,487 DISTRICf TOTAL 948 62 15(> 55 396 590 154 5 2,364 1,543 19,439 22,078 RURAL 27 9 8 27 122 55 3 174 57 388 409 URBAN
3 T I. Bhi!. 2 R I U
18 T 2. Dhodia. 18 R U
502 10 22 33 T 3. Dubl., 502 10 22 33 R U
T 4. Gamit. R U
175 69 134 47 299 453 88 5 2.198 1.463 12.704 14.207 T 5. K.thodi. 154 60 128 47 284 436 83 5 2,109 1,420 12,570 14,092 R 21 9 6 15 17 5 89 43 134 115 U
4 T 6, Koli 0101. 4 R
U 13 3 12 94 23 3 73 21 954 1.123 T 7. Koli M.h.dev. II I 8 2 S 69 17 846 1,021 R 2 2 4 92 IS '3 4 4 103 102 U 37 T 8. Naikd •. 37 R
U
9 17 24 24 T 9. Pard;';. 2 6 9 9 R 7 II 15 15 U
18 T 10. Pat.li •.. IB R U
T II. Rathawl R U
8 27 8 94 148 98 251 116 6,059 7.040 T 12. Thakur. 4 27 8 93 146 63 172 106 ,.928 6.863 R 4 I 2 35 79 10 131 177 U ----, .. -._ 202 9 24 22 T 13. Varli. 202 9 24 22 I< 'j U
39 32 T 14. Trib e Dot stated 39 32 R
U
Talukawise Rural only 9 4 II 47 54 78 293 178 3.966 4.756 .. Karjat Taluka. :; 4 10 4 16 19 234 132 1.J39 1.660 ). Kathodi. 1 2 I 33 5 41B 513 7. KoliMahadev. 2 32 38 58 26 41 2,009 2.5dj 12. Thakur. 2 9 U. Varli.
27 18 33 i8 21 15 2 344 255 2.388 2.824 .. Panvel Taluka ~l 18 jj 10 16 15 2 304 ~37 1.326 1.6il ). Kathodi. ) 40 18 1,060 1.lo~ 12. Thakur. 2 4 13. Varli.
795 22 19 43 120 \) 253 324 Uran Mah.1 IH 2. I.)hodi •• 502 1 10 U. 3j j. I.)ubla.
i9 I 43 1 4. (.jamit. 20 18 7 Jib 9 2;Q ztj() ~. Kothodi. 37
H. Naikda. 1 1 ~. I'ardhi. 18 10. PateJia. J 'j II. Hath.wo. 200
1 2 n. V •• li.
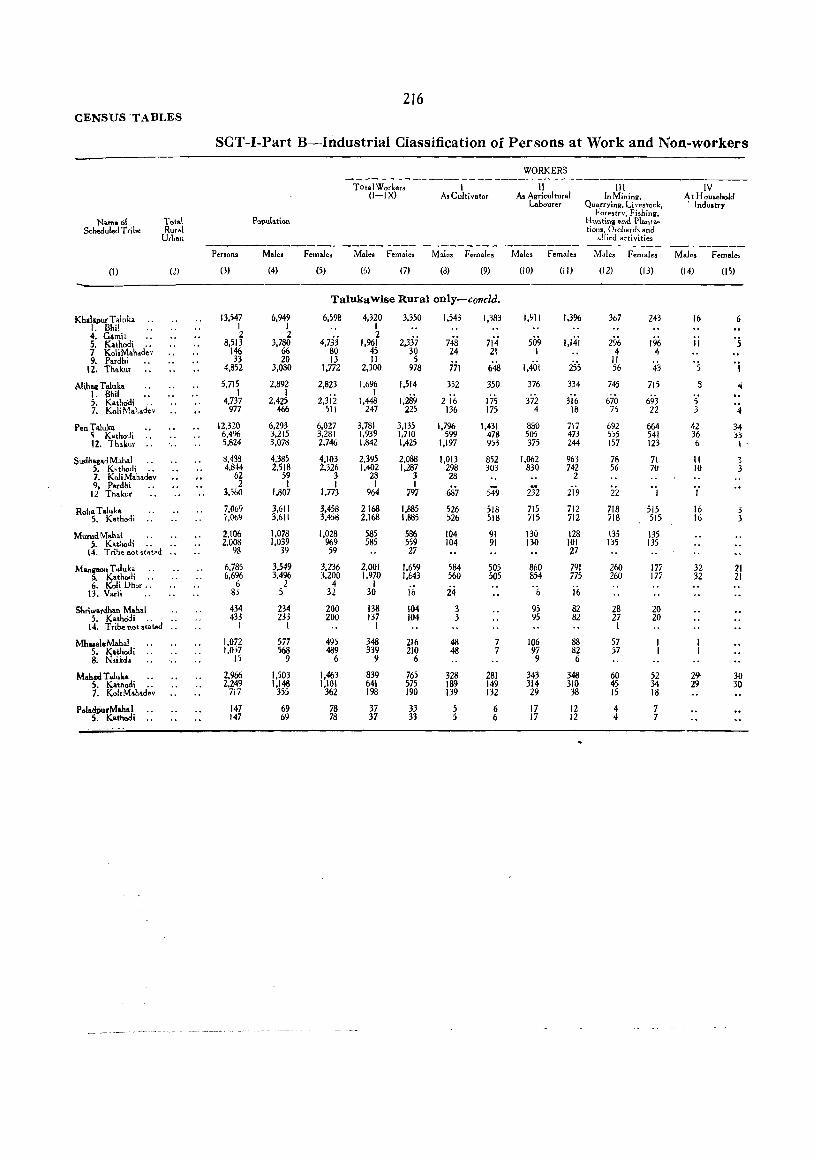
CENSUS TABLES
Nam.o{ Scheduled Tribe
(I)
Khalll>urTaluh I. Bhil 4. Gamit 5. Kathodi .• 7 KoliMah.de, 9. Pordhi
12. Thakur
AlibacTaluka \. Bhil 5. Kathadi .. 7. KoliM.hadev
Pen Taluka ~ Kathocli .• 12. Th.",,,,. ..
Sudb.asr.dM~hal 5. K.tnodi .. 7, KoliMahadev 9. P.rdhi
12 Thakur
Rona Taluka S. Kathodi
Murud Mah.l 5. Kathodi ..
Total Rural
Urban
(2)
14. Tribe not stat,d ..
Manll80lt T atuka .. So Kathodi .. 6. Koti Uhor ..
13. Vorli
5hriwardhan M.h.l 5. Kathadi ' .
14. Tribenotstat.d ..
Mhasala;Mahal 5. Ie_thadi .. 8. N.ikd.
Mahad T alub S. Kathodi .. 7. KoliM.h.clev
P"taclliurMah.t •• 5. Katitodi
216
seT -I-Part B-lridustrial Classification of Persons at Work and Non-workers
Persons
(3)
13,547 I 2
8,513 146 33
4.852
5,715 I
4.737 977
12.320 6,4% 5.824
8,43S 4.844
62 2
3,560
7.069 1.004
2.106 2.00$
98
6.785 6.696
6 83
434 433
I
1.072 1.0)7
15
2.966 2.249
717
147 147
Population
Males
(4)
6,949 I 2
3,780 66 20
3,080
2.892 I
2.425 466
6.293 j.215 3,07$
4,385 2,518
59 I
1,807
3.611 3.611
1,078 1,039
39
3.549 3.496
2 5
234 233
I
577 568
9
1.503 1,148
355
69 69
TOtal Workers (I-IX)
I A.Cultivator
WORKERS
II A. Agricultural
Labourer
1ll In Mining,
Quarrying. Livestock. Forestry, Fishing,
Huntina and Plantations, Orchards and
allied activities
IV At Household , Industry
Females Males Females Males Female. Male, Female. M.le. Females Males Females
(5) (6) (7) (d) (9)
Talukawise Rural only-concld.
6,598
4.7:33 80 13
1.772
2,823
2,3ii 511
6,027 3.281 2,746
4,103 2.326
3 I
1,773
3,458 3,4St;
1,028 %9 59
3,236 3.200
4 32
200 200
495 489
6
1,463 1.101
362
78 78
4,320 I 2
1,961 45 II
2,300
1,696 I
1,448 247
3,781 1.939 1.842
2.395 1,402
28 I
964
2168 2.168
585 585
2.001 1.970
I 30
138 137
I
348 339
9
839 641 198
37 37
3.350
2.337 30 5
978
1,514
1,289 225
3,135 1,710 1,425
2,088 1.287
3 I
797
1.885 1.885
586 559 27
1,659 1.643
iii 104 104
216 210
6
765 575 190
33 33
1,543
748 24
771
352
2 i6 136
1,7% 599
1,197
1,013 298 28
687 526 ~26
104 104
584 560
24 3 3
48 48
328 189 139
5 :;
1,383
71'4 21
648 350
175 175
1,431 478 953
852 303
549 518 518
91 91
505 505
7 7
281 149 132
6 6
(10)
1,911
509 I
1,401
376
372 4
880 505 375
1.062 830
232
715 115
130 130
860 854
'6 95 95
106 97 9
343 314 29
17 17
(11)
1,3%
i5'5
334
3'16 18
717 473 244
963 742
2
219
712 712
128 101 27
791 775
i6 82 82
88 82 6
348 310 38
12 12
(12)
367
296 4
II 56
745
670 7S
692 5j5 157
78 56
22
718 jl8
135 US
260 260
28 27 I
57 57
60 45 15
4 4
(13)
243
196 4
43 715
693 22
664 541 123
71 70
I
515 515
I3S 135
177 177
20 20
52 34 18
7 7
(14)
16
ii
's' 3
42 36 6
11 10
I
16 16
32 32
29 29
(15)
6
'j
4
34 jj , . 3 3
3 3
21 21
.,
30 30
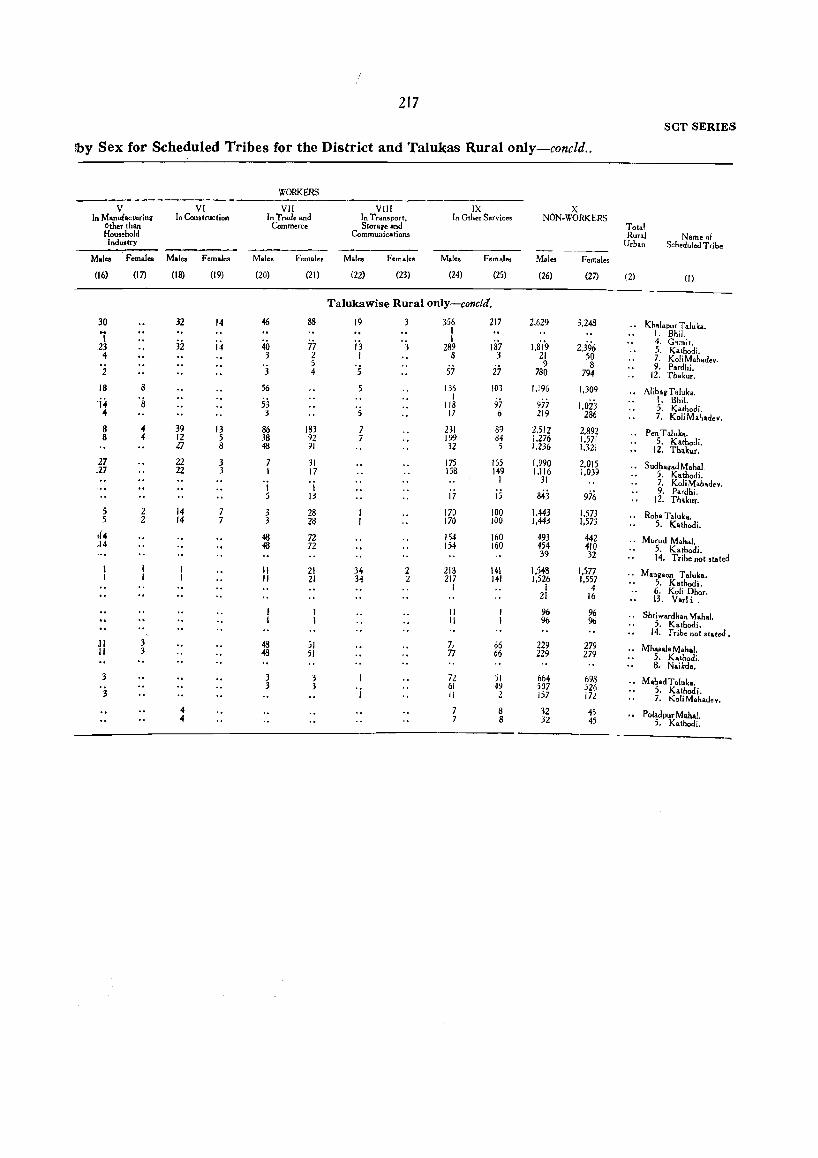
217
seT SERIES
lby Sex for Scheduled Tribes for the District and Talukas Rural only-concld ..
WORKERS ---------------_-----------------------------V VI VII VIII IX X
In Manufacturinr In Construction In Trade and In T ran~poTt. In Other Services NON·WORKERS other than Commerce Storage and Tot.1 Household Communications Rural Name of Industry Urban Scheduled Tribe
Male. F.mal .. Mal.s Femal •• Mal., Femalee Mal., Females Mo.I •• Fern"'., M.I .. F.m.les
(16) (17) (18) (19) (20) (21) (22) (23) (24) (25) (26) (27) (2) (J)
Talukawise Rural only-concld.
30 32 14 46 88 19 3 356 217 2.629 3.248 .. Khal.pur Taluk ••
1 I J. Bhil.
3i 40 ij 1 Iii? 1.819 2.3% 4. G.",it.
23 14 77 3 289 5. Kathodi.
" 3 2 I 8 3 21 SO 7. KoliM.hadev. 5 '5 57 27 9 8 9. Pardhi. 2 3 4 780 794 12. Thakur.
18 8 56 136 103 1.196 1.309 AlibagT.luka. -14 53
I 97 977 I.oi; I. Bhil. 8 liS 5. Kathodi. 4 3 5 17 6 219 286 7. KoliMah.dev.
8 4 39 13 86 183 7 231 89 2.512 2.892 .. PenT.luka . 8 4 12 5 38 92 7 199 64 1.276 1.571 5. Kathodi. 27 8 48 91 32 5 1.236 1.321 12. Thakur. 27 22 3 7 31 175 165 1.990 2.01S Sudh.iadMah.1 .27 22 3 1 17 158 149 1.116 1.039 5. Kathodi. I 31 7. KoliMahadev. 1 1
i7 is 843 976 9. Pardhi. 5 13 12. Thakur. 5 2 14 28 170 100 1.443 1.573 .. Roha Taluk •. 5 2 14 28 170 100 1.443 1.573 5. Kathodi.
d4 48 72 154 160 493 442 Murud M.h.I. ,14 48 72 154 160 454 410 5. K.thodi. 39 32 14. Tribe not Silted II 21 34 2 216 141 1.548 1.577 .. Mongoon T.luk •• II 21 34 2 217 141 1.526 1.557 5. Kathodi. I I 4 6. Koli Dhar. 21 16 13. V.r1 i .
II 96 % Shriw.rdh.n Mohal. II % 96 5. Kathadi. 14. Tribe not stoted.
.II 3 48 51 7, 66 229 279 MhosalaMohai. II 3 48 51 77 66 229 279 S. K.thodi. 8. N.i_da.
3 3 3 72 51 664 698 M.h.d T.luk •. 3 3 'j 61 49 507 526 5. Kathodi. 3 II 2 157 172 7. KoliM.h.dev. 4 8 32 45 Pol.dpur Moh.1. 4 .. 8 32 45 5. Kothodi .
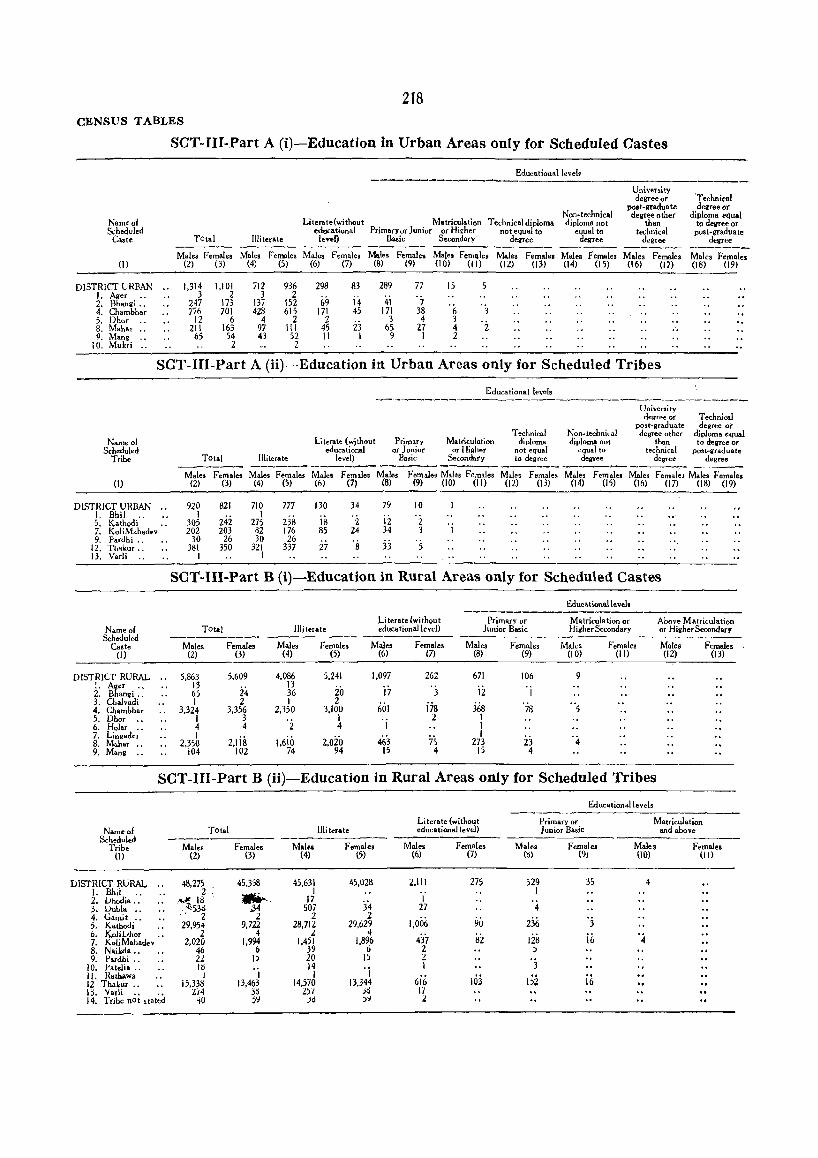
218 CENSUS TABLES
Name of Scheduled
Caste
(I)
DISTRICT URBAN ., I. Ager •. 2. Bhang; .. 4. Chambhar 5. Dhor 8. Mahar .. 9. Mang .•
10, Mukri ..
SCT-III-Part A (i)-Education in Urban Areas only for Scheduled Castes
TOtal Illiterate
Literate{without ~tion.1
level)
Education.llevel.
Non-technical Matriculation Technicaldiploma diploma not
Primaryo( Junior or Higher not equal to equal to Basic Secondary degree degree
Univeraity degree or
po. t-gradua te degree other
than technical degre~
'Technical degree or
diploma "<lual to degree or
post-graduate degree
Males Female. Males Females Males Female. Moles Females MaJes Female. Males Female. Males Female. Males Females Males Females (2) (3) (4) (5) (6) (7) (8) (9) (10) (11) (12) (13) (14) (15) (16) (17) (18) (19)
1.314 3
247 776
12 211
65
1,101 2
173 701
6 163 54 2
712 3
137 428
4 97 43
936 2
152 615
2 III 52 2
298
69 171
2 45 II
83
;4 4S
i3 I
289
4i 171
3 6S
9
77 • '1 38 4
27 1
15
'(, 3 4 2
SeT-III-Part A (ii)~Education in Urban Areas only for Scheduled Tribes
Name 01 Scheduled
Tribe
(I)
DISTRICT URBAN I. Bhil .. 5. KathQdi 7. KoliMahadev 9. Pardhi ..
12. Thakur .. 13. Varli
Name of Scheduled
Caste (I)
DISTRICT RURAL :. Ager " 2. Bhangi .• 3. Chalvadi 4. Chambhar 5. Dhor .. 6. Holar .. 7. Ling.der S. Mahar .. 9. Mana "
TOtal Illiterate
Literate (wjthout educational
level)
Primary or Junior
Bl\~ic
Educational levels
Matticulation or Highet
Sec~nd.ry
Technical diploma
not equal to degree
Non .. technical diploma not
equal to degree
University degree of
post-graduate degree other
than technical
degree
Technical degree or
diploma equal to degree or
post-gradua te deRree
--------- -----~ ----- ------ ------Males Females Male. Females Males Female. Males
(2) (3) (4) (5) (6) (7) (8) Female, Male. Fe:n,I •• Males Fem.Ie. Males Fem.le, Males Femal~, Males Females
(9) (10) (II) (12) (13) (14) (15) (16) (17) (18) (19)
920 821 710 777 130 34 79 10 I
242 I
238 i8 . i ii 305 275 2 202 203 82 176 85 24 34 3 1
30 26 30 26 's 33 . 5 ", 381 350 321 337 27
1 1 ..
SeT-III-Part B (i)-Education in Rural Areas only for Scheduled Castes
TOtal
Males Females (2) (3)
5,863 13 65 I
3,324 1 4 I
2,350 104
5,609
24 2
3,356 3 4
2,Iis 102
Illiterate
Males Females (4) (5)
4,086 13 36 I
2,350
'2 1,6;0
74
5.241
20 2
3,100 I 4
2,020 94
Literate (without educatiot1.llevel)
Moles Females (6) (7)
1,097
i7 601
'i 463
15
262 'j
ji8 2
75 4
Primary or lunior Basic
Moles Females (8) (9)
671
ii 36s
I I 1
273 15
106
'j
'78
23 4
Education.llevel.
Matriculation or Higher Secondary
Males Females (10) (II)
9
'4
Above Matriculation or Higher Secondary
Males F ernale. (12) (13)
SeT-III-Part B (H)-Education in Rural Areas only for Scheduled Tribes
Educational levels
Literate (without Primary or Matriculation Name of Tot.l Illiterate education.IIevel) .J unior Basic and above
Scheduled Females Males Female. Male. Females Male. Females Males Females Tribe Males
(1) (2) (3) (4) (5) (6) (7) (ti) (9) (10) (II)
DISTRICT RURAL 48,275 45,338 45,631 45,028 2.111 275 529 35 4 I. Bbil 2 _. ... ,
1 I 2, I.Jhodia:: .,.,~ 18 17 34
1 '4 3, Uubl • .. "'538 .34 507 27 4. Camit .. " 2 2 2 2
1,006 90 'j 5. Kathodi 29,954 9,722 28,712 29,629 236 6, I<.oIiVhor 2 4 2 4
4j] liil i6 '4 7, KoJiM.hadev 2,020 1.994 1,451 1.896 112 8. NaiJ,da .. 46 6 39 6 2 )
9. Pardhi " U I) 20 15 2 '3 10, Patelia .. l~ 'j 14 'j I II. Hathawa 1 I
6i6 HiJ 1;2 if> 12 Thakur .. 15,338 13,463 14,570 13,344 13. v"li 274 3~ l51 jt! Ii 14. Tribe noi 'tat~d ~O 5Y jd )~ l
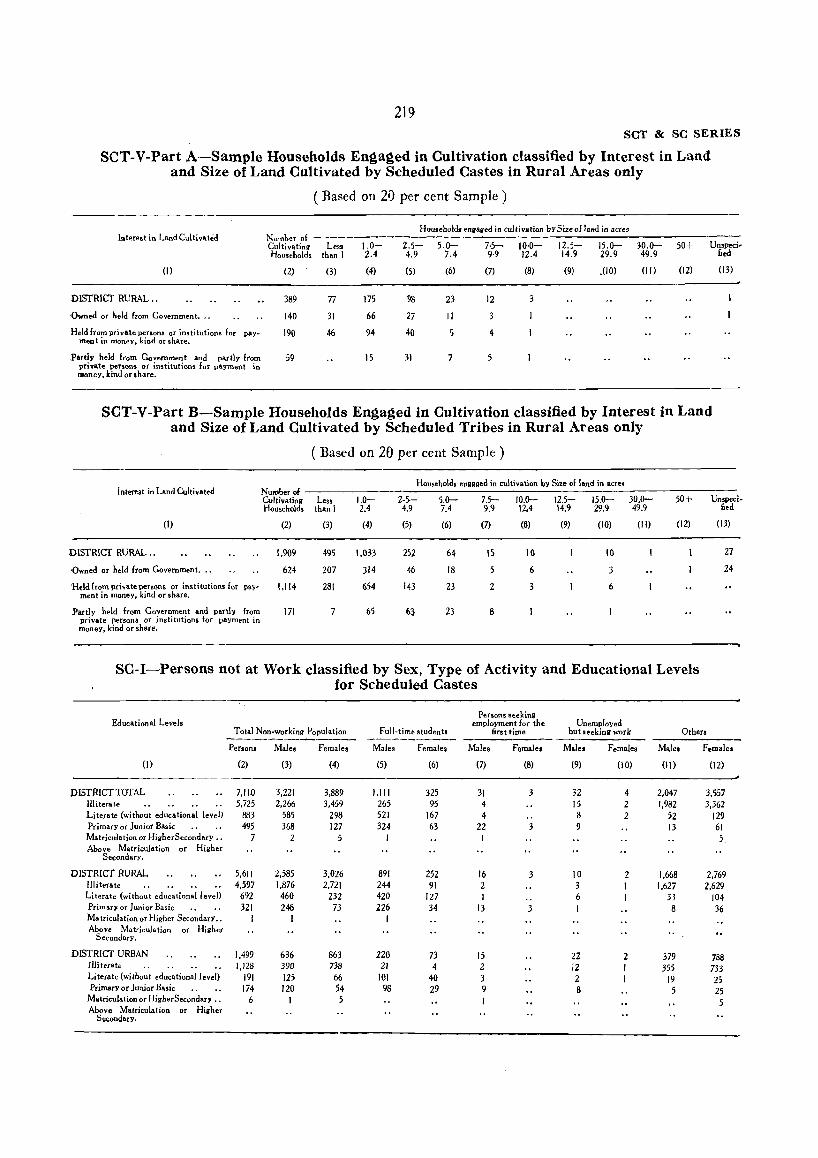
219 SCT & SC SERIES
SCT-V-Part A-Sample Households En~a~ed in Cultivation classified by Interest in Land and Size of Land Cultivated by Scheduled Castes in Rural Areas only
( Based on 20 per cent Sample)
Hou.ehold .. nllaged in cultivation bySizeofland in acres Intere.t in Land Cultivated Nu.,..ber of -----
CultivatirtR' Less 1.0- 2.5- 5.0- 7·5-- 10·0- 12.5- 15.0- 30.0- 50+ Unspecj ... tied Households than I 2.4 4.9 7.4 9·9 12.4 14.9 29.9 49.9
(I) (2) (3) (4) (5) (6) (7) (8) (9) ,(10) (Ill (12) (l3)
DISTRICT RURAL •• 389 77 175 98 23 12 3
·Owned or hel.! from Government •.. 140 31 66 27 II 3
Held from private persons oT institutions far men t in IDQney,. kind or share.
pay .. 190 46 94 40 4
Partly held from Government and partly Irom 59 15 31 7 5 pri..,ate ~rsons or institutions for payment in money. kind or share.
SCT-V-Part B-Sample Households Engaged in Cultivation classified by Interest in Land and Size of Land Cultivated by Scheduled Tribes in Rural Areas only
int"",.t in Land Cultivated NUlOber of Cultivating Households
(I) (2)
DISTRICT RURAL .. 1.909
'Owned or held from Government. .. 624
Held from private persons or institutions for pay- 1.114 ment in money, kind or share.
Partly held from Government and partly from private persons or institutions for payment in
111
money, kind or share.
( Based on 20 per cent Sample)
Household. enugged in cultivation by Size of land in acres
Less 1.0- 2-5- 5.0- 7.5- 10.0- 12.5- 15.0-than I 2.4 4.9 7.4 9.9 12.4 14.9 29.9
(3) (4) (5) (6) (7) (8) (9) (IO)
495 1.033 2S2 64 15 10 10
207 314 46 18 5 6 3
281 654 143 23 2 6
6S 6.3 23 8
30.0-49.9
(II)
50+ Unspeci-fied
(12) (13)
27
24
SC-I-Persons not at Work classified by Sex, Type of Activity and Educational Levels for Scheduled Castes
Persons seeking Educational Level. employment for the Unemployed
Total Non-working Population Full-time students 6rst time but seeking work Others -----~--------- --~-_.-----Persons Male, Female. Male. Female. Male. Female. Male. Female. Male. Females
(I) (2) (3) (4) (5) (6) (7) (8) (9) (10) (l1) (l2)
DISTRICT TOTAL 7.11.0 3.221 3.889 1.111 325 31 32 4 2,047 3,557 Illiterate 5.725 2.266 3.459 265 95 4 15 2 1.982 3.362 Literate (without educational level) 883 585 298 521 167 4 8 2 52 129 Ptimaryor lunior Basic 495 368 127 324 63 22 9 13 61 Matriculation or HigherSecondatY ., 7 2 5 I I 5 Above Matriculation or Higher
Secondary.
DISTRICT RURAL 5.611 2.585 3.026 891 252 16 10 2 1.668 2.769 Illiterate 4.597 1.876 2.721 244 91 2 3 I 1.627 2.629 Literate (without educational level) 692 460 232 420 127 I 6 33 104 Primary or Junior Basic 321 248 73 226 34 13 I 8 36 Matriculation or Higher SecondarY .• I I I Above Matriculation
Secondary, or Higher
DISTRICT URBAN 1.499 636 863 220 73 15 22 2 379 788 illiterate 1.128 390 738 21 4 2 12 I 355 733 Lilerate (without educational level) 191 125 66 101 40 3 2 I 19 25 Primary or Junior Basic 174 120 54 98 29 9 8 5 25
Matriculation or HigherSecondary " 6 I 5 I 5 Above Matriculation or Higher
Secondary.

220 CENSUS TABLES
ST -I-Mother-ton~ue and Bilin~ualism for Scheduled Tribes
Mother .. tonllue : Total
Total persons returned as apeak
Name of Scheduled iog a lana'uage sub.i-Tribe Rural diary to tbat shown
Urban Total Speakers horizontally
Subsidiary Lanvuaao
M.les Females Males Fema.les
(I) (2) (3) (4) (5) (6) (7)
Marathi
I. Bhil Total 2 Hindi (Male. I). Rural 2 Hindi (Male. I). Urban
Rajasthani
Total Rural Urban I
Gujarati
2. Dhadi. Total 18 Rural 18 Urb ...
Cuiarali
~. Dubl. Total 5~8 34 7 Hindi (Males 2), Marathi (Mal .. 5). Rural 538 34 7 Hindi (Male. 2), Marathi (Mal •• 5). Urban
Cujarati
4. Gamit Total 2 2 Hindi (Male. I). Rural 2 2 Hindi (Male. I). Urban
Kathodi
5. Kathodi .. .. Total 34 Rural 34 Urban
Katkari
Total 1,476 1,978 598 627 Marathi (Males598, Females 627) Rural 1,475 1,975 598 627 Marathi (Males 598, Females 627). Urban I 3
Marathi
Total .. 28,782 27,952 146 40 EllIrli.h (Males 1), Hindi (Males 57, Femal •• 1), Katkari (Mal •• 82, Femll .. 39}" Kathodi (M.le.4),Urdu (Mal .. 2).
Rural .. 28,478 27,713 1+4 39 £Oafish (Males I), Hindi (Maleo 55), Katkari (Mal •• S2, F.mal •• ~9), Kathodi(M.I .. 4), Urdu (M.I.s2).
Urban 304 2~9 2 Hindi (Males 2, Females I).
r.lulu
Total Marathi (Mal .. I). Rural Marathi (Male. I). Urban
Marathi
6. KaliDhor .. .. Total 2 4 2 Hindi (F .male. 2). Rural 2 4 2 Hindi (Female. 2). Urban
Marathi
7. Koli Mahade. .. Total 2,221 2,190 63 3 Gujarati(Male. 3), Hin~i(Male. 50, F.male. 3), Enlllish(MaI .. 9). Kannad.(Male. 1). Rural 2,020 1,994 46 3 Gujarati(Maiesm Hindi(Mal .. 43, Femal .. 3)., Urban 201 196 17 Hindi (M.les 7), En~li.h (Males 9), Konnad. (Mal •• I).
T<lUlu Total 7 2 Enilis~ (Female. 1), Hindi (Female. I), Konnad. (Mol .. I). Rural 'j '2 En~li.h '(Female, I), Hindi (Femal •• I), Kannada (Males ll. Urban 7 I
Gujarati
8. N.ikd. Total 37 Rural 37 Urban
Marathi Total 9 6 Rural 9 6 Urban
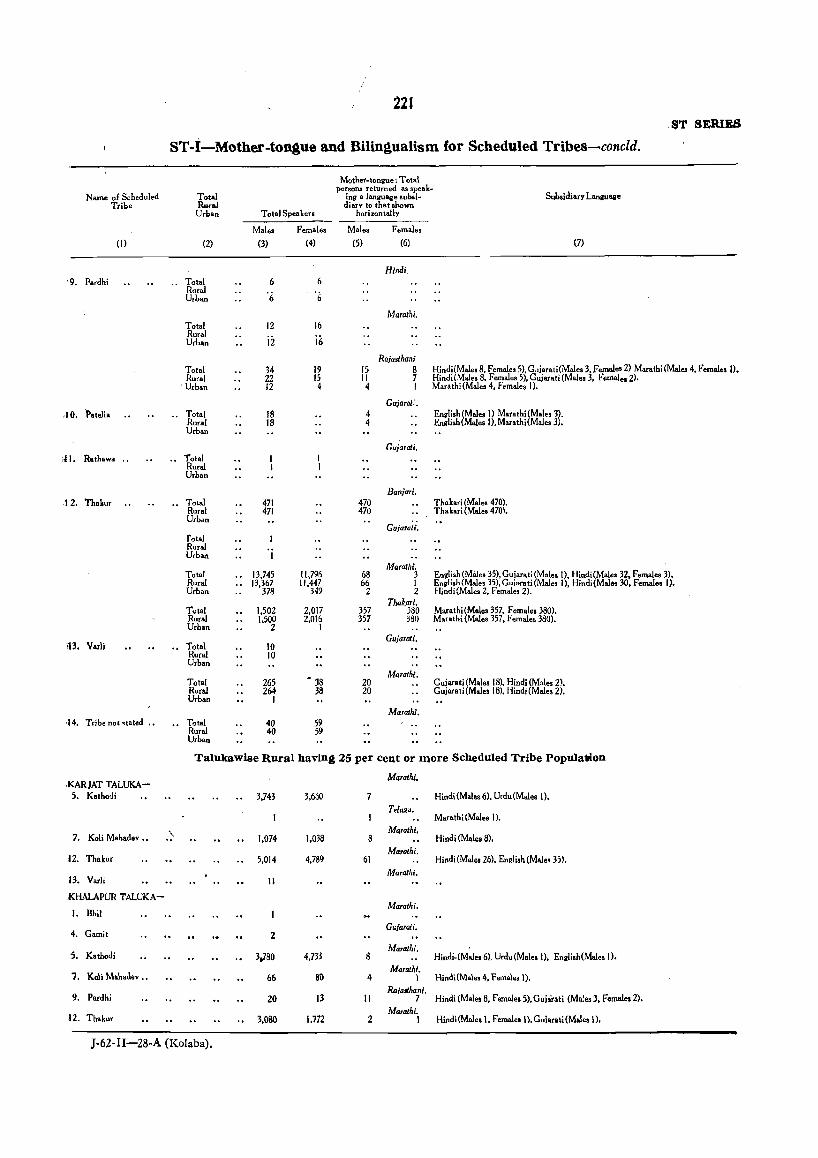
Name of Scheduled Tribe
(I)
'9. Pardhi
. 10. Patelia
Ill. Rathawa ..
.12. Thakur
\13. VarJi
,14. Tribe not .tated ..
,KARJAT TALUKA-5. Kathodi
7. Koli Mahade •••
U. Thakur
13. Vorlj
KHALAPUR TALUKA-
I. Bhil
4. Gamit
5. Kathodi
i. Koli Mah.aev ••
9. Pardbi
12. Thakur
221 .ST SERIES
sT-i-Mother-tonaue and Bilinaualism for Scheduled Tribes-concld.
Mother-tongue: Total persons returned as speak ..
Subsidiary LanllUllile Total ing a Ianguaee sub5i .. Rural diary to that shown Urban Total Speakers horizontany
Males Females Males Females
(2) (3) (4) (5) (6) (7)
Hindi. .. Total 6 6
Rural '6 '1; Urban
Marathi. Total 12 16 Rural
ii i6 Urban
Rajasthan; Total 34 19 15 8 Hindi(Male. 8. Females 5). Coiarati(Males 3. Fernal.s 2) Marathi (Mal .. 4. Femal.s I). Rural 22 15 II 7 Hindi (Males 8. Females 5). Cuiarati (Male. 3. Fe"'.les 2).
. Urban 12 4 4 I Marathi{Maie. 4. Females I).
Gujarol: • .. Total 18 4 English(Maiesn Marathi(Males 3).
Rural 18 4 English (Males I). MarathHMaie. 3). Urban
Gujarali. .. Total
Rural Urban
Banjori. Total 471 470 Thakari{Maies 470). Rural 471 470 Thakari (Males 4701. Urban
GUjaraii. fotal Rural Urban I
Marathi. Total 13.745 11,796 68 3 Engli.h(M9.les 35),Cuiarati(Maies n. Hindi(Males 32, Females 3). Rural 13,~% " .447 66 I En~lish(Males 35).Cujarati(Maies I), Hindi(Maleo 30. Females I). Urban 349 2 2 Hindi (Males 2. Females 2).
Total Thal(ari.
Mar,thi(M.les 357. Females 380). 1.502 2.017 357 380 Rural 1.500 2,016 357 380 Marathi (Male. 357. Female. 380l. Urban 2 I
Total Gujarati.
10 Rural 10 Urban
Total 265 • 38 Marathi .
20 Cuiarati (Males 18). Hindi (Males 2). Rural 264 38 20 Guiarati(Mal.sI8J. Hindi (Males 2). Urban I
Marathi. Total 40 59 Rural 40 59 Urban
Talukawise Rural havin~ 25 per cent or more Scheduled Tribe PopUlation
Marathi.
3.743 3,660 Hindi (Mal .. 6). Urdu(Maies I).
Telug •• Mar.thi (Mal.s I).
"- Marathi. 1.074 1,038 8 Hindi (Males 8).
Maralhi. 5.014 4.789 61 Hindi (Mal.s 26l. English (Male. 35).
Marathi. II
Marathi.
Gujarati. 2
Maralhi, 3.780 4,733 8 Hindi.(Mal .. 6), Urdu (Males I), Engli.h(Males I).
Marathi. 66 SO 4 1 Hindi(Males 4, Females 1).
20 13 II Ra;alllhani.
7 Hindi (Males 8, Females 5l.Gujarati (Males 3. F • ..,ales 2l. Marathi.
3.080 1,712 2 I Hindi (Males I. Females I). Guiarati (Males I).
J·62-II-28·A (Kolaba).
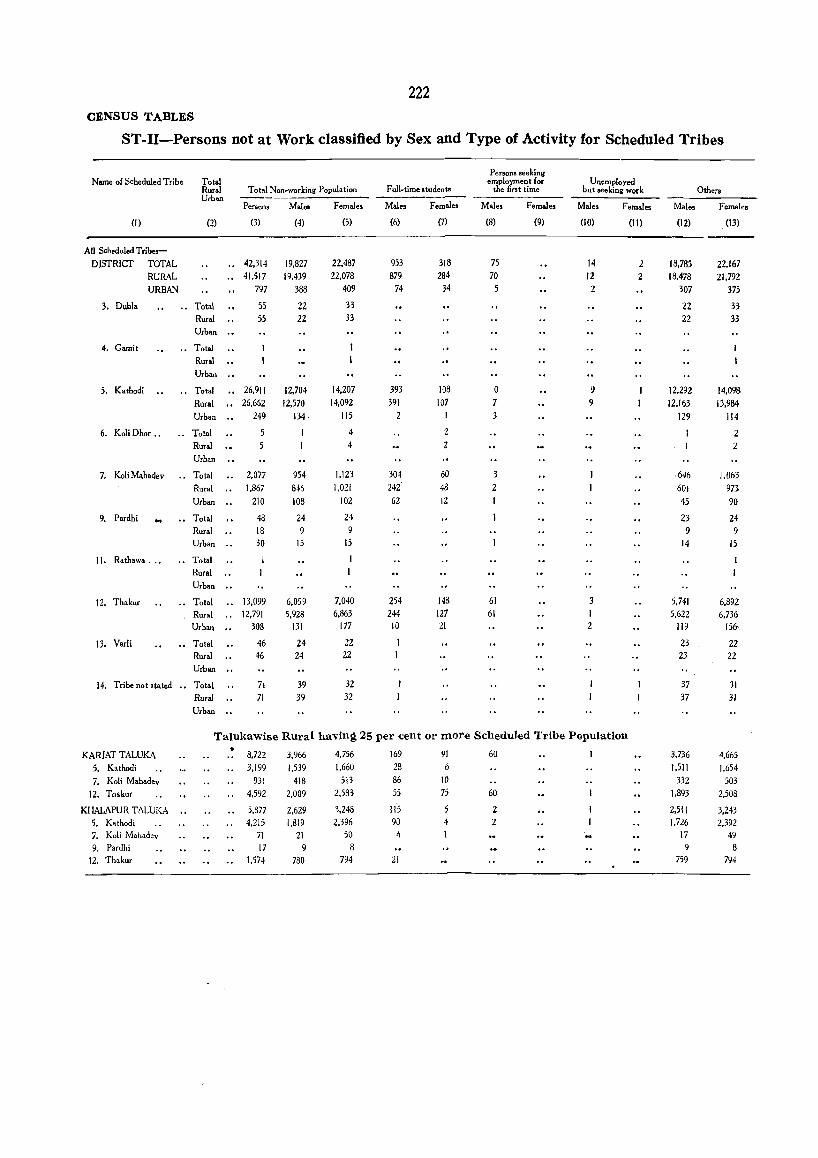
222 CENSUS TABLES
ST -II-Persons not at Work classified by Sex and Type of Activity for Scheduled Tribes
Persons seeking Name of Scheduled Tribe Total employment for Unemployed
Rural Total Non-working Population Full-time students the first time but seeking work Others Urban --------
Person, Males Females Males Females Males Fernales Males Fernales Males Females
(I) (2) (3) (4) (5) (6) (7) (8) (9) (10) (II) (12) (13)
All Scheduled Tribes-
DISTRICT TOTAL .. 42.314 19.827 22.487 953 318 75 14 2 18.785 22.167 RURAL .. 41,517 19.439 22.078 879 284 70 12 2 18.478 21.792 URBAN 797 388 409 74 H 5 2 307 375
3. Dubla •• Total 55 22 33 22 33 Rural 55 22 33 22 33 Urban ..
4. Gamit .. Total Rural Urban ..
5. Kathodi •• Total .. 26.911 12.704 14.207 393 108 0 9 12.292 14.098 Rural .. 26.652 12.570 14.092 391 107 7 9 12.163 13.984 Urban .. 249 134 115 2 3 129 114
6. KoliDhor .. .. Total 5 4 2 2 Rural 4 2 2 Urban ..
7. Koli Mahadev .. Total 2,077 954 1.123 304 60 3 646 1.063 Rural 1.867 846 1.021 242 48 2 601 973-
Urban .. 210 108 102 62 12 45 90
9. Pardhi •• Tot.1 48 24 24 23 24 Rural 18 9 9 9 9 Urb.n .. 30 15 15 14 15
11. R.th.w .... •• Total Rural Urban ..
12. Thakur .. Total .. 13.099 6.059 7.040 254 148 61 3 5.741 6.892 Rural .. 12.791 5.928 6.863 244 127 61 1 5.622 6.736 Ur!>an .. 308 131 177 10 21 2 119 156,
13. Varli .. Total 46 24 22 23 22 Rural 46 24 22 23 22 Urban ..
14. Tribe not ,tated .. Total 71 39 32 37 31 Rural 71 39 32 37 31 Urban ..
Talukawise Rural having 25 per cent or more Scheduled Tribe Population
KARJAT TALUKA 8.722 3.966 4.756 169 91 60 I 3.736 4.665
5. K.thodi 3.199 1.539 1.660 28 6 1.511 1.654 7. Koli Mahadev 931 418 513 86 10 332 503
12. Thakur 4.592 2.009 2.583 55 75 60 1.893 2,508
KHALAPUR TALUKA .. 5.877 2.629 3.248 115 5 Z 2.511 3.243 5. Kathodi 4.215 1.819 2.396 9D 4 2 1.726 2.392 7. Koli Mahadev 71 21 50 4 17 49
9. Pardhi 17 9 8 9 8
12. Thakur 1.574 780 794 21 759 794
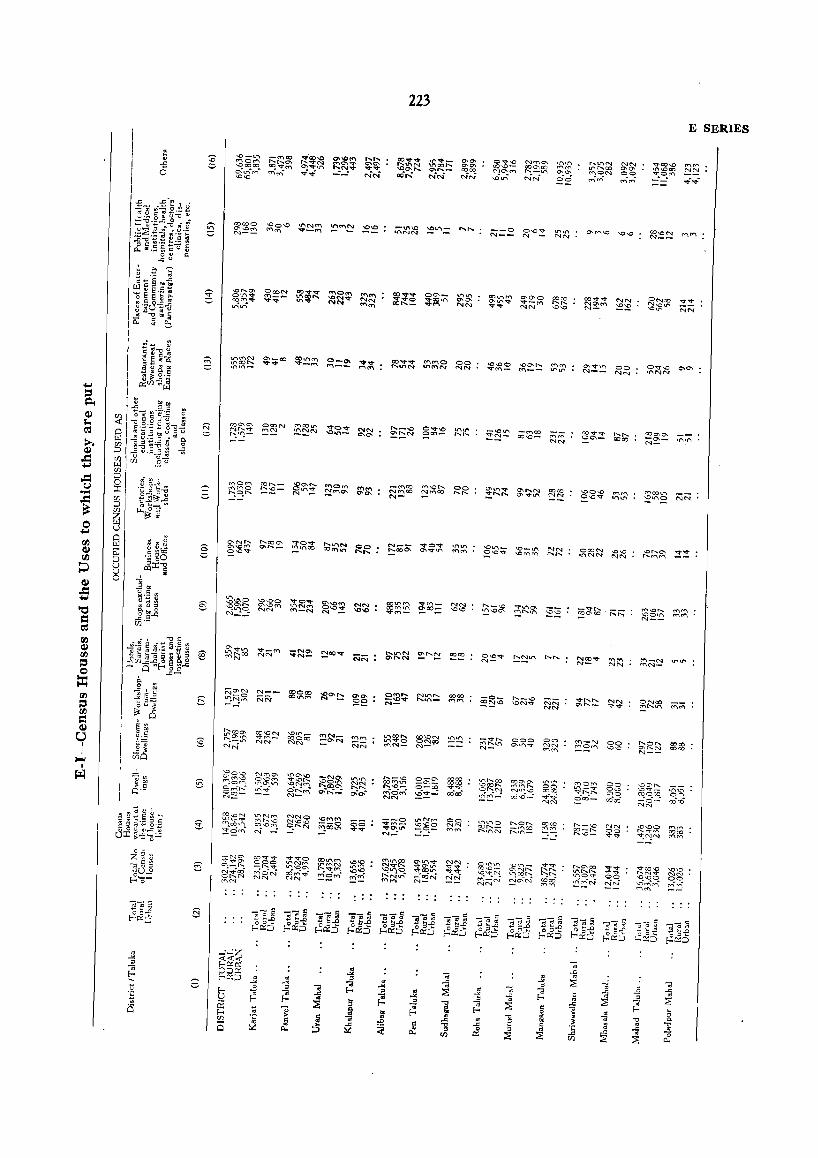
tJ .~
i:5
"IN
"''''
"'''' . "'N· ........ 0\0"0'"
. :
223
00 NN
00 .... "
coco
coo:>
"""
--0 N __
.... "
NN NN
00 NN
"''''
['..If''IN <"IN lI"I"""CO 0\0\ ('1"'\ON 00
ff'\~ M~
OOON ",NN
00 NN
"" COco
~H~~
E SERIES
..,. .... NN
NN
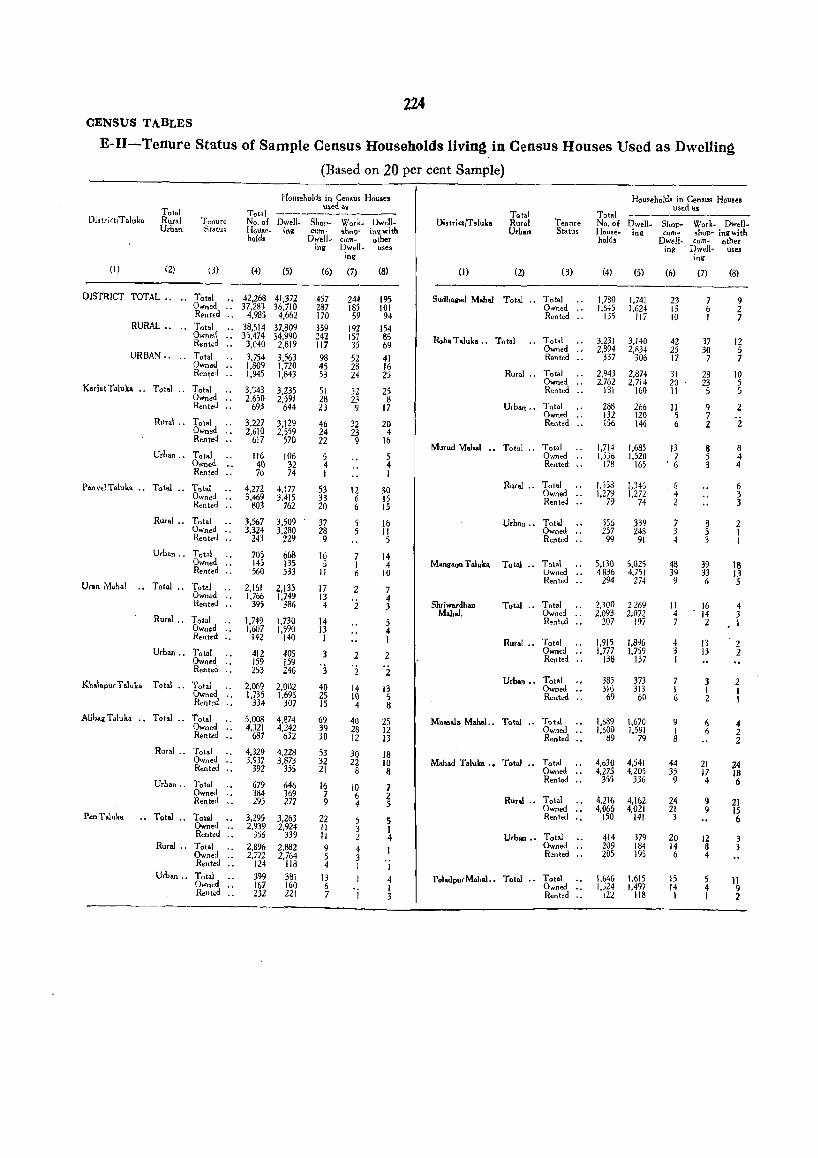
224 CENSUS TABLES
E-II-Tenure Status of Sample Census Households livin~ in Census Houses Used as Dwelling
(Based on 20 per cent Sample)
Households in Census Houses u~ed a,
D;strict/Taluka Total Rural Urban
Total -----------Tenure Statui
No. of Dwell_ Shop- Work- Dwell-Hous.e- in~ cutn.- !.n()p" inq: with hold, Dwell_ cum- other
(I) (2) (3) (4) (5)
DISTRICT TOTAL.. .. Total .• 42,268 Owned .. 37.283 Rented " 4,985
41,372 36,710
4,662 RURAL.. .• Total.. 38,514
Owned .• 35.474 Ren ted 3.040
37,809 34.990 2,819
URBAN.. .. Total 3,754 Owned . . 1,809
3,563 1,720 1,843 Rented .. 1,945
KariatTaluka .. Total .. Total 3,343 Owned ., 2,650
3.235 2.591
Rented " 693
Rural .. Total 3,227 Owned " 2,610 Rented 617
Urban.. Total 116 Owned.. 40 Rented ., 76
644
3.129 2.559
570
106 32 74
l'anvelTaluk ... Tot.1 .. Totat 4,272 Owned 3,469
4.177 3,415
762 Rented 803
Rural.. Total Owned " Rented ..
Urban ., T ot.1 Owned " Rented "
Urln Mahol .. Total .. Total
Khalapur T aluka
Owned " Rented ..
Rurol .. Total Owned " Rented "
Urban.. Total Owned Rented .,
Totol .. Total Owned " Rented "
AlibagT.luka .. Total .. Total Owned " Rented "
Rural .. Total Owned " Rented "
Urban.. Total Owned " Rented
Pen Taluka .. Total .. Total Owned " Rented ..
Rural .. To tal Owned Rented
Urban .. Total Owned " Rented ..
3,567 3,324
243
705 145 560
2,161 1,766
395
1,749 1,607
142
412 159 253
2,069 1,735
334
3,509 3,280
229
668 135 533
2,135 1,749
386
1,730 1,590
140
405 159 246
2,002 1,695
307
5,008 4.874 4,321 4.242
687 632
4,329 4,228 3,931 3,873
392 355
679 646 384 369 295 277
3,295 3,263 2,939 2,924
356 339 2,896 2,882 2,772 2,764
124 118 399 167 232
381 160 221
inll Dwell.. uses ing
(6) (7)
457 287 170 359 242 117 98 45 53
51 28 23
46 24 22
5 4 I
S3 33 20
37 28 9
16 5
II
17 13 4
14 13 I
3
'3 40 25 15
69 39 30
53 32 21
16 7 9
22 II 11 9 5 4
13 6 7
244 185 59
192 157 35 52 28 24
32 23 9
32 23 9
12 6 6
7 I 6
2
2
2
'2 14 10 4
40 28 12
30 22 8
iO 6 4
j 3 2
(8)
195 101 94
154 85 69 41 16 25
25 8
17
20 4
16
5 4 I
30 15 15
16 11 5
14 4
10
7 4 3
5 4 I
2
'2 13 5 8
25 12 13
18 10 8
7 2 5
5 I 4
I
I
4 I 3
Households in Censu, Hou,es used as
Total -----------District/Taluka
Total Rural Urb ...
Tenure No. of Dwell_ Shop- Work. Dwell_ Status House- jn~ cum... shop ... ingwith
(I) (2) (3)
Sudhag.d Mobol Total .. Total Owned .. Rented .,
Roha Taluka ., Total Total Owned Rented .,
Rural .. To tal Owned ., Rented ..
Urban .. Total Owned ., Rented ..
Murud MaJ.oI .. Total .. Total Owned .. Rented .,
Rural .. Total Owned Rented
Urb,," .. Total Owned ., Rented "
Mangaon Taluka Total.. Tot.1 Owned ,. Rented .•
Shriw_.-dhan Mabal.
Total ., Total Owned Rented .,
Rural . , Total Owned ., Rented
Urban .. Total Owned .• Rented ,.
Mh .. ala Mabal .. Total .. Totat Owned .. Rented .,
Mabad ToIuka •• Total .. Total Owned ., Renled "
Rural ., T ot.1 Owned ,. Rented ..
Urban .. Total Owned ., Renled
PoladpurMahal •• Total .. Total Owned .. Rented "
hold. Dwell. cum- other
(4)
1,780 1.645
135
3.231 2.894
337
2,943 2.762
lSI
288 132 156
1,714 1,536
178
1.)58 1,279
79
355 257 99
5,130 4836
294
2.300 2,093
207
1,915 1,777
138
385 316 69
1,689 1,600
~9
4,630 4,275
355
4.216 4,066
150
414 209 205
(5)
1.741 1.624
117
3,140 2.834
306
2.874 2.714
160
266 120 146
1,685 1.520
165
1,346 1,272
74
339 248
91
5,025 4,751
274
2269 2,072
197
1,8~6 1,759
137
373 313 60
1,670 1,591
79
4,541 4,205
336
4.162 4,021
141
379 184 195
1,646 1.615 1.524 1.497
122 118
ing Dwell- u,es jng
(6)
23 13 10
42 25 17
31 20 11
II 5 6
13 7
. 6
6 4 2
7 3 4
48 39 9
II 4 7
4 3 I
7 I 6
9 I 8
44 35 9
24 21 3
20 14 6
15 14 I
(7)
7 6 I
37 30 7
28 23 5
9 7 2
8 5 3
8 5 3
39 33 6
16 14 2
13 13
3 I 2
6 6
21 17 4
9 9
12 8 4
5 4 I
(8)
9 2 7
12 5 7
10 5 5
2
'2
8 4 4
6 3 3
2 1 I
18 )3 5
4 3 I
'2 2
2 I I
4 2 2
24 IB 6
21 15 6
3 3
11 9 2
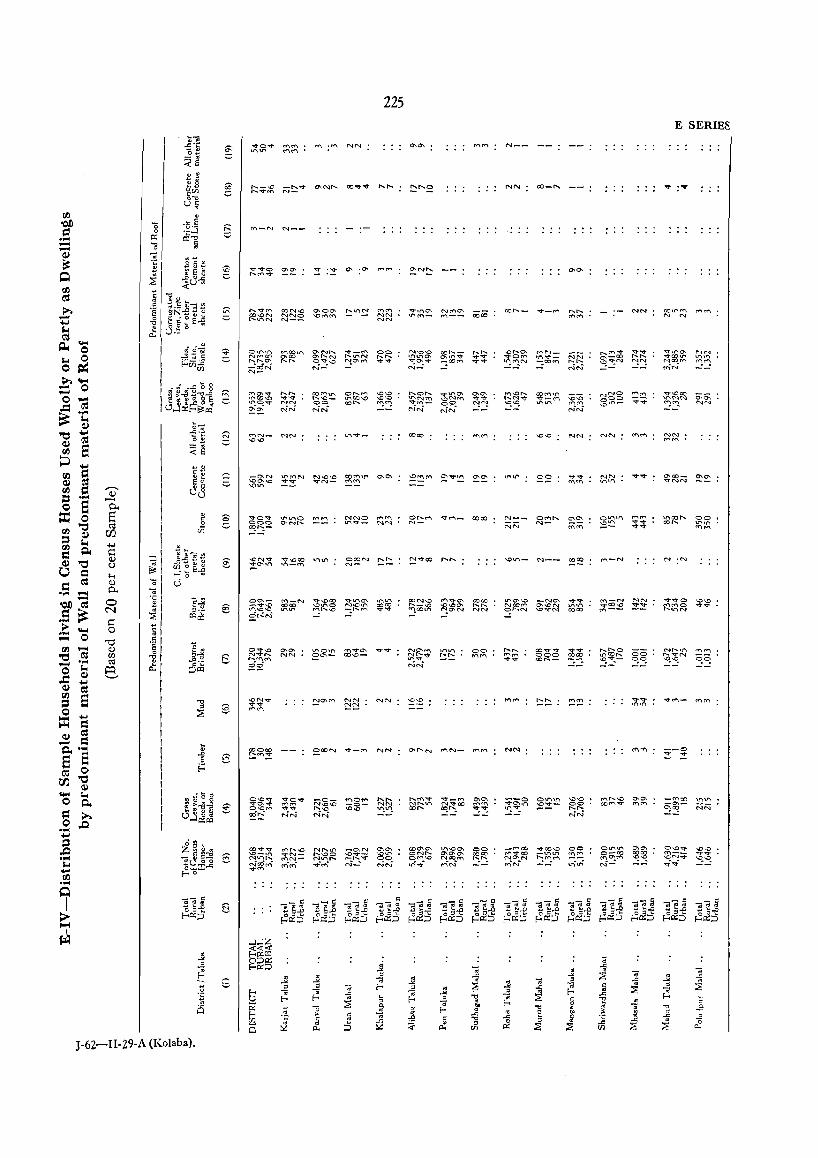
CI} CI) CI}
= ~
CI}
= CI}
== CI)
o == .... --'OJ) tIS
.S ~
.~ .... _ 0
g cr: "0
I I
_I 71 es:! ~I .;: ! ~r ~I iii 1
.5 ! g, 111 .tl ,
1
! , I I , ! I I , I , I !
J-6Z-II-29-A (Kolaba).
~-N N-_
225
"'''' NN NN
00 .......... ."..".
dO 00
M __ _ _
NN
NN
00_""" __
..,. .... "'''' 0000
<'IN
NN "''''
NN
E SERIES
"""'-"'0\ NN V ('Cll.n If"HI''\ ~~rf"\ ~~ ",N
N :~
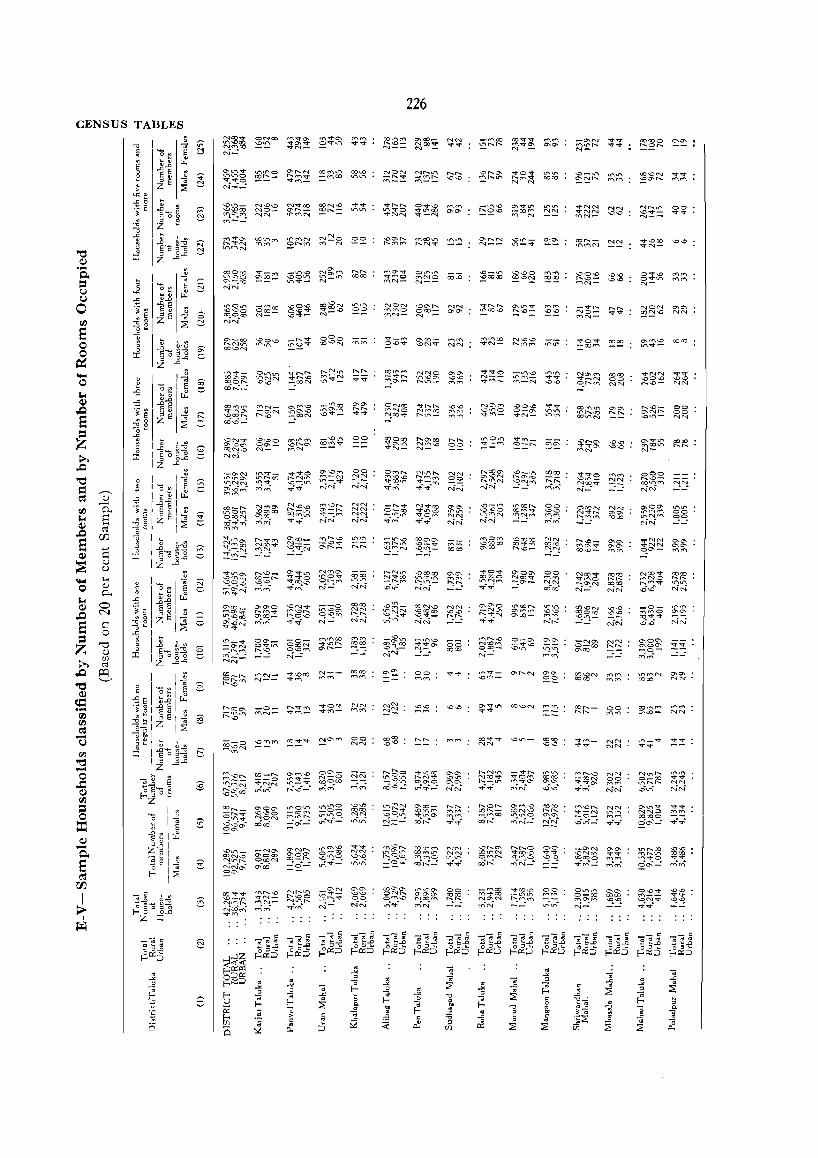
CENSUS TABLES
00-'"
"''''''' OOON ro";~
"'''' ~~~ i;:::
ct:J "o::t -.0-", (',1.'1, ......
N05~ ..,.'"
"'0'" -00'" "''''.-... :::~_:
..,...,. "''''
00
"IN NN NN NN
226
~nOCJoo tr'10'.-f"'I
"''''-N~
1.<""'\'00'\ ""~a("l~~
~N
NN ..,..,.
........
-.0..0
""",-.0 o:",,'D If'\\.t''\O M~N""":
"'.-...0 ~OC)'.o
"''''0 (v)~N"":
"''''.-... ""-N -0-...0 ..... ,-:
NN
-.0-.0 ..0..0
.-..." .... .".
a...!","'3'" NNO 00000 O~...:
00 .... .,.
"'''' NN
00 00 NN
..,..,.
"'''' NN
"'''' ..,..". "IN NN

227 E SERIES
Number of Establishments and Workers for Industries classified by Minor Groups of Industrial Classification
NOTE-(1) For description of Code, see Appendix I to the Explanatory Note. (2) The first figure in the bracket is of number of Establishments, the second is for number of workers.
KOLABA DISTRICT KARJAT TALUKA-concld.
Total.-Division 2 & 3 (3,245-7,104).-200 (380-1266), 202 (2-4),204
(4-34),205 (73-208),207 (81-101), 209 (69-139),210 (2-4), 214 (28-54),215(2-4),216 (1-1),220 (48-305), 231 (14-14), 232 (17-34),234 (2-26),235 (16-24), 243 (1-10), 255 (7-14), 273 (771-961), 274 (1-1),278 (4-5),279 (1-1),280 (22-59), 281 (32-89), 282 (4-6), 284 (6-10), 287 (4-8), 288 (85-192), 289 (45-105), 290 (4-96), 301 (4-31), 302 (10-32), 310 (24-48), 311 (203-241), 313 (66-85), 314 (65-67), 315 (7-8), 320 (2-6), 326 (1-1), 330 (4-92), 335 (5-219), 336 (5-11), 337 (1-12), 339 (I H2), 341 (1-20), 342 (I-I), 343 (4-42), 344 (2-120), 350 (65-106), 351 (7-15), 355 (10-34), 356 (22-130)', 360 (22-40), 364 (5-7), 365 (34-79), 367 (39-133), 368 (95-157), 369 (174-295), 370 (11-33), 371 (HOO), 372 (6-8), 377 (4-5), 379 (8-149), 380 (1-3), 383 (1-6),384 (23-162), 385 (1-1), 386 (1-20), 388 (89-127), 389 (1-2), 391 (I-I), 392 (23-26), 393 (394-502), 394 (5-7), 399 (60-113).
Rura1.-200 (249-681), 202 (2-4), 204 (2-32), 205 (34-85), 207 (78-96), 209 (40-84), 210 (2-4), 214 (12-17), 220 (15-28), 231 (14-14), 232 (17-34), 235 (I H2), 243 (1-10), 273 (539-648), 278 (3-3), 279 (1-1), 280 (10-21), 281 (22-70), 282 (4-6),287 (3-5),288 (61-146),289 (43-103),290 (4-96), 301 (1-2), 302 (3-6), 310 (23-47), 311 (178-202), 313 (59-75), 314 (33-33), 315 (7-8), 320 (2-6), 326 (I-I), 330 (4-92), 335 (3-117), 337 (1-12), 339 (5-25), 341 (1-20), 343 (4-42),350 (64)-104),351 (7-15),355 (1-1),356 (12-16), 360 (22-40) 364 (5-7), 365 (12-18), 367 (2-2), 368 (89-149), 369 (117-184), 370 (11-33), 371 (1-100), 372 (6-8), 377 (H), 379 (6-139), 380 (1-3), 384 (13-31),386(1-20), 388 (26-32), 389 (1-2). 391 (1-1),392 (6-6), 393 (302-385), 394 (2-2), 399 (44-89).
Urban.-200 (131-585), 204 (2-2), 205 (39-123), 207 (3-5), 209 (29-55),214 (16-37),215 (2-4),216 (1-1),220 (33-277), 234 (2-26), 235 (5-12), 255 (7-14), 273 (232-313), 274 (I-I), 278 (1-2), 280 (12-38), 281 (10-19), 284 (6-10), 287 (1-3), 288 (24-46), 289 (2-2), 30 I (3-29), 302 (7-26), 310 (I-I), 311 (25-39), 313 (7-10), 314 (32-34), 335 (2-102), 336 (5-11), 339 (6-7), 342 (H), 344 (2-120), 350 (1-2), 355 (9-33), 356 (10-114), 365 (22-61), 367 (37-131), 368 (6-8), 369 (57-111), 377 (3-4), 379 (2-10), 383 (1-6),384-(10 131), 385 (1-1), 388 (63-95), 392 (17-20), 393 (92-117), 394 (3-5), 399 (16-24).
KARJAT TALUKA Total.-
Division 2 & 3 (388-7825).-200 (36-116), 204 (4-34), 205 (5-6),207 (9-20),209 (7-15),210 (2-4),220 (3-4),235 (1-2), 273 (134-152) 278 (1-1),281 (1-1),289 (21-38),310 (1-10), 313 (35-42), 314 (30-30), 343 (1-10), 350(5-17), 356 (12-16), 360 (2-11),368 (10-16),369 (1-1),379 (5-119),384 (1-10), 386 (1-20), 388 (4-5), 389 (1-2), 393 (39-43), 399 (16-37).
Rura1.-200 (35-114), 204 (2-32), 205 (3-3), 207 (9-20), 209 (7-15), 210 (2-4), 220 (3-4), 235 (1-2), 273 (132-150), 278 (1-1), 281 (1-1), 289 (21-38), 310 (1-10),313 (35-42), 314 (30-30), 343 (1-10), 350 (5-17), 356 (12-16), 360 (2-11), 368 (10-16) 369 (H), 379 (5-119),384 (1-10),386 (1-20) 388 (4-5), 389 (1-2), 393 (34-38), 399 (16-37).
Urban.-200 (1-2), 204 (2-2), 205 (2-3), 273 (2-2), 393 (5-5). VILLAGES
(10) Kalamb.-200 (1-21), 273 (6-6), 289 (1-6), 343 (1-10), 393 (16-16), 399 (2-9).
(13) Maniwali.-273 (1-1). (18) Varai Tarf Varedi.-289 (1-2). (19) Poshir.-273 (2-2), 289 (1-2), 313 (3-3). (20) Vare.-200 (1-2),205 (3-3), 273 (1-1),289 (2-4),313 (4-4). (22) Avasare.-273 (1-1), 289 (1-2). (23) Birdole.-273 (I-I) 289 (1-2). (25) Malegaon Tarf Varedi.-273 (2-2), 393 (I-I).
VILLAGES-Concld.
(26) Dahiwali Tarf Varedi.-200 (I-I), 273 (1-1), 313 (2-2), 393 (1-0.
(27) Khandas.-273 (4-4), 313 (2-2). (36) Bandivali.-289 (I-I). (37) Bhadwal.-289 (7-9).
*(42) Neral.-200 (7-15),210 (2-4), 273 (15-24), 289 (I-I), 310 (1-10), 313 (8-8), 379 (5-119),393 (3-3),399 (5-19).
(55) Eksal.-289 (1-1). (59) Chinchavali.-200 (1-1), 209 (1-1), 273 (4-4), 393 (1-1).
(60) Ukrul.-289 (1-2). (65) Vawe.-200 (1-1). (69) Sugwe.-207 (3-6), 235 (1-2), 350 (2-6), 389 (1-2). (76) Boriwali.~369 (1-1). (78) Dhotre.-207 (1-7). ~79) Shingdhol.-207 (2-2). (81) Kashele.-200 (1-2),207 (1-2), 273 (2-2), 2e9 (1-2)
360 (2-11). (84) Tembhare.-273 (1-1). (89) Kothimbe.-273 (3-3), 313 (3-3), 350 (2-7), 393 (1-1). (90) Ambiwali Tad Kothalkhalati.-313 (I-I). (91) Jambrung.-313 (1-1). (97) Sawale. -273 (6-6). (98) Hedawali.-273 (2-2). (99) Mandavane.-200 (1-1),273 (1-1).
(100) Humgaon.-200 (3-9), 273 (25-25),384 (1-10), 393(1 -I). (102) Nasrapur.-313 (1-1).
(107) Chandhai.-273 (1-1). (108).Kadav-200 (3-7), 207 (I-I), 209 (3-», 273 (4-4), 271>
(I-I), 314 (9-9), 368 (4-4), 386 (1-20). (115) Ambot.~273 (2-2). (116) Bhaliwadi.~200 (1-1), 207 (1-2), 273 (3-3) 313 (3-3)
314 (5-5). ' ,
(119) Potal.-273 (1-1), 350 (1-4). (123) Pall Tad Kothal Khalati.-273 (4-4), 313 (2-2) 356
(12-16). ' (144) Halivali.-368 (1-1). (146) Tiware.-368 (1-1). (148) Bhisegaon.-200 (3-13), 209 (3-11), 220 (3-4), 36B
(4-10),399 (8-8). *(149) Karjat.-200 (6-22), 273 (36-45),281 (1-1),313 (5-12),
314 (4-4),388 (3-3),393 (10-14). (152) Dahiwali Tad Need.-200 (4-17), 204 (2-32) 273.
(3-3),289 (1-2),399 (1-1). ' (157) Vengaon.~289 (1-2),314 (2-2). (168) Khandpe.-200 (1-1),388 (1-2). (176) Kondiwade.-314 (10-10).
URBAN
Matheran Municipality.-200 (1-2), 204 (2-2), 205 (2-3) 273 (2-2), 393 (5-5).
PANVEL TALUKA Total.-
Division 2 & 3 (294-751).-200 (86-321), 205 (5-13), 209 (14-26), 214 (2-10), 215 (1-3), 220 (2-4), 235 (1-1), 273 (67-83),280 (3-12),281 (3-5),284(4-8),287 (1-3),289(1-1), 301 (2-11), 311 (6-7), 314 (I-I), 335 (2-102), 336 (2-2), 339 (3-3), 343 (I-I), 350 (1-2), 365 (2-3), 367 (2-2), 368 (3-4), 369 (38-59), 377 (1-1), 383 (1-6), 384 U-13), 388 (8-10), 392 (2-2), 393 (22-26), 394 (1-1), 399 (3-5).
• Subsequently included in Urban area in Population Tables. J-62-II-30-A. (Kolaba).
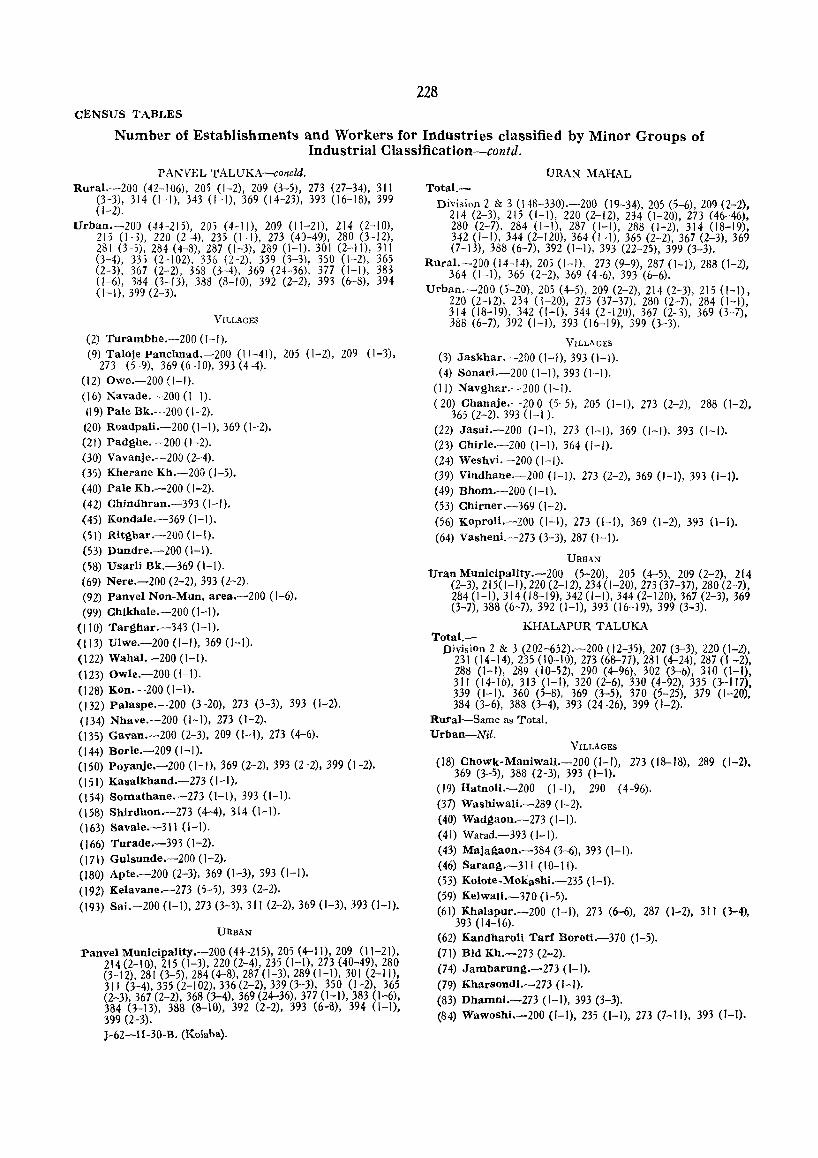
228 CENSUS TABLES
Number of Establishments and Workers for Industries classified by Minor Groups of Industrial Classification-contd.
PANVEL TALUKA-concld. Rural.-200 (42-106), 205 (1-2), 209 (3-5), 273 (27-34), 311
(3-3), 314 (I-I), 343 (1-1), 369 (14-23), 393 (16-18), 399 (1-2).
Urban.-200 (44-215), 205 (4-11), 209 (11-21), 214 (2-10), 215 (1-3), 220 (2-4), 235 (I-I), 273 (4~-49), 280 (3-12), 281 (3-5), 284 (4-8), 287 (1-3), 289 (1-1), 301 (2-11), 311 (3-4), 333 (2-102), 336 (2-2), 339 (3-3), 350 (1-2), 365 (2-3), 367 (2-2), 363 (3-4), 369 (24-36), 377 (1-1), 383 (1-6), 384 (3-13), 388 (8-10), 392 (2-2), 393 (6-8), 394 {H), 399 (2-3).
VILLAGES
(2) Turambhe.-200 (I-I). (9) Taloje Panchnad.-200 (11-41), 205 (1-2), 209 (1-3),
273 (5-9), 369 (6-10), 393 (4-4). (12) Owe.-200 (I-I). (16) Navade.-200 (1-1). (9) Pale Bk.-200 (1-2). (20) Roadpali.-200 (1-1),369 (1-2). (21) Padghe.-200 (1-2). (30) Vavanje.-200 (2-4). (35) Kherane Kh.-200 (1-5). (40) Pale Kh.-200 (H).
(42) Chindhran.-393 (1-1). (45) Kondale.-369 (1-1).
(51) Ritghar.-200 (1-1).
(53) Dundre.-200 (1-1).
(58) Usarli Bk.-369 (I-I). (69) Nere.-200 (2-2), 393 (2-2). (92) Panvel Non-Mun. area.-200 (1-6). (99) Chikhale.-200 (H).
(110) Targhar.-343 (1-1).
(113) Ulwe.-200 (1-1),369 (1-1). (122) Wahal.-200 (1-1).
(123) Owle.-200 (1-1).
(128) Kon.-200 (1-1). (132) Palaspe.-200 (3-20), 273 (3-3), 393 (1-2). (134) Nhave.-200 (1-1), 273 (1-2). (135) Gavan.-200 (2-3), 209 (1-1), 213 (4-6). (144) Borle.-209 (1-1). (150) Poyanje.-200 (1-1),369 (2-2),393 (2-2), 399 (1-2). (151) Kasalkhand.-273 (1-1). (154) Somathane.-273 (1-1),393 (1-I).
(158) Shirdhon.-273 (4-4), 314 (1-1). (163) Savale.-311 (1-1).
(166) Turade.-393 (1-2). (171) Gulsunde.-200 (1-2). (180) Apte.-200 (2-3), 369 (1-3), 393 (1-1).
(192) Kelavane.-273 (5-5), 393 (2-2). (193) Sai.-200 (1-1),273 (3-3), 311 (2-2),369 (1-3),393 (I-I).
URBAN
Panvel Municipality.-200 (44-215),205 (H 1),209 (11-21), 214(2-10) 215 (1-3),220 (2-4),235 (1-1),273 (40-49),280 (3-12) 28i 0-5), 284 (4-8),281 (1-3),289 (1-1),301 (2-11), 311 (:3-4),335 (2-102), 336 (2-2),339 (3-3), 350 (1-2), 365 (2-3),361 (2-2), 368 (3-4), 369 (24-36),377 (1-1), 383 (1-6), 384 (3-13), 388 (8-10), 392 (2-2), 393 (6-8), 394 (I-I), 399 (2-3). J-62-1I-30-B. (Kolaba).
URAN MAHAL Total.-
Division 2 & 3 (I 48-330).--200 (19-34), 205 (5-6), 209 (2-2), 214 (2-3), 215 (I-I), 220 (2-12), 234 (1-20), 273 (46-46), 280 (2-7), 284 (1-1), 287 (H), 288 (1-2), 314 (18-19), 342 (1-1),344 (2-120),364 (1-1),365 (2-2),367 (2-3),369 (7-13),388 (6-7), 392 (H), 393 (22-25), 399 (3-3).
Rura1.-200 (14-14),205 (I-I), 273 (9-9),281 (1-1),288 (1-2), 364 (I-I), 365 (2-2), 369 (4-6), 393 (6-6).
Urban.-200 (5-20),205 (4-5),209 (2-2),214 (2-3),215 (1-1), 220 (2-12), 234 (1-20), 273 (37-37), 280 (2-7), 284 (1-1), 314 (18-19), 342 (1-1), 344 (2-120), 367 (2-3), 369 (3-7), 388 (6-7), 392 (I-I), 393 (16-19), 399 (3-3).
VILLAGES
(3) Jaskhar.-200 (1-1), 393 (1-1). (4) Sonari.-200 (1-1), 393 (1-1).
(II) Navghl'.r.-200 (I-I). (20) Chanaje.-20 0 (5-5), 205 (I-I), 273 (2-2), 288 (1-2),
365 (2-2), 393 (1-1). (22) JasaL-200 (1-1), 273 (1-1), 369 (1-1), 393 (I-I). (23) Chirle.-200 (I-I), 364 (1-1). (24) Weshvi.-200 (1-1). (39) Vindhane.-200 (H), 273 (2-2), 369 (1-1), 393 (I-I). (49) Bhom.-200 (1-1). (53) Chirner.-369 (1-2). (56) Koproli.-200 (1-1), 273 (1-1), 369 (1-2), 393 (1-1). (64) Vasheni.-273 (3-3), 287 (1-1).
URBAN
Uran Municipality.-200 (5-20), 205 (4-5), 209 (2-2), 214 (2-3),215(1-1),220 (2-12),234 (1-20),273 (37-37),280 (2-7), 284 (1-1),314 (18-19),342 (1-1),344 (2-120), 367 (2-3), 369 (3-7),388 (6-7), 392 (I-I), 393 (16-19), 399 (3-3).
KHALAPUR TALUKA Total.-
DivisiOn 2 & 3 (202-652).-200 (12-35), 207 (3-3), 220 (1-2), 231 (14-14), 235 (10-10),273 (68-77), 281 (4-24), 287 (I -2), 288 (1-1), 289 (10-52), 290 (4-96), 302 (3-6), 310 (I-I), 311 (14-16),313 (I-I), 320 (2-6),330 (4-92),335 (3-117), 339 (I-I), 360 (5-8), 369 (3-5), 370 (5-25), 379 (1-20), 384 (3-6), 388 (3-4), 393 (24-26), 399 (1-2).
Rural-Same as Total. Urban-Nil.
VILLAGES
(18) Chowk-ManiwaIi.-200 (I-I), 273 (18-18), 289 (1-2). 369 (3-5), 388 (2-3), 393 (1-1).
(19) Hatnoli.-200 (I-I), 290 (4-96). (37) Washiwali.-289 (1-2). (40) Wadgaoll.-273 (I-I). (41) Warad.-393 (I-I). (43) Majagaon.-384 (3-6),393 (1-1). (46) Sarang.-311 (10-11). (53) Kolote-Mokashi.-235 (1-1). (59) Kelwali.-370 (1-5). (61) Khalapur.-200 (1-1),273 (6-6),287 (1-2),311 (3-4),
393 (14-16). (62) Kandharoli Tan Boreti.-370 (1-5). (71) Bid Kh.-273 (2-2). (74) Jambarung.-273 (I-I). (79) Kharsondi.-273 (I-I). (83) Dhamni.-273 (I-I), 393 (3-3). (84) Wawoshi.-200 (1-1),235 (I-I), 273 (7-11), 393 (I-I).
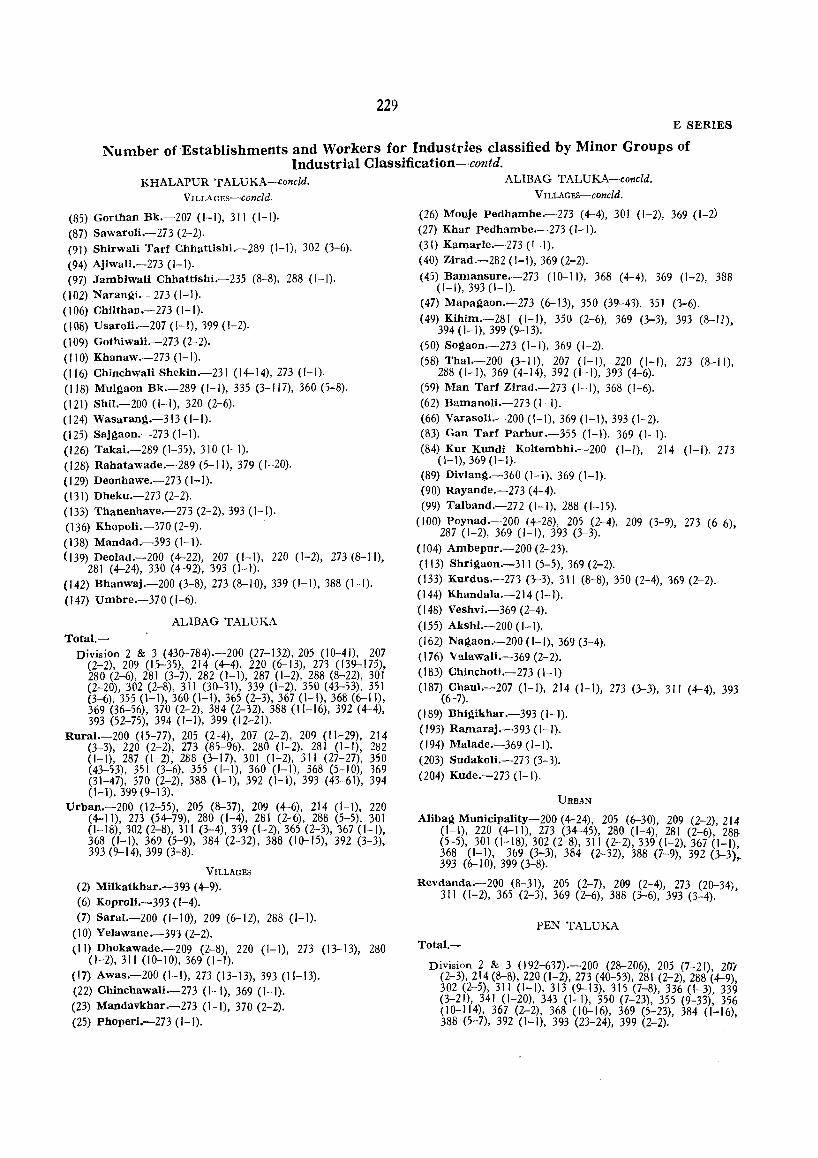
229 E SERIES
Number of Establishments and Workers for Industries classified by Minor Groups of Industrial Classification-contd.
KHALAPUR TALUKA--eonc[d. VILLAGES-Coneld.
(85) Gorthan Bk.-207 (I-I), 31 I (I-I). (87) Sawaroli.-273 (2-2). (91) ShirwaU Tart Chhattishi.-289 (1-1), 302 (3-6). (94) Ajiwali.-273 (I-I). (97) Jambiwali Chhattishi.-235 (8-8), 288 (I-I).
(102) Narangi.-273 (1-1). (106) Chilthan.-273 (1-1). (108) Usaroli.-207 (1-1), 399 (1-2). (109) Gothiwali.-273 (Z-2). (110) Khanaw.-Z73 (1-1). (116) Chinchwali Shekin.-231 (14-14),273 (1-1). (118) Mulgaon Bk.-289 (I-I), 335 (3-117), 360 (5-8). (121) Shil.-200 (I-I), 320 (2-6). (124) Wasarang.-313 (1-1).
(125) Sajgaon.-273 (1-1). (126) Takai.-289 (1-35),310 (1-1). (128) Rahatawade.-289 (5-11),379 (1-20). (129) Deonhawe.-273 (1-1). (131) Dheku.-273 (2-2). (133) Thanenhave.-273 (2-2),393 (1-1).
(136) Khopoli.-370 (2-9). (138) Mandad.-393 (1-1). (139) Deolad.-200 (4-22), 207 (I-I), 220 (1-2), 273 (8-11),
281 (4-24), 330 (4-92), 393 (1-1). (142) Bhanwaj.-200 (3-8),273 (8-10), 339 (1-1), 388 (1-1). (147) Umbre.-370 (1-6).
ALIBAG TALUKA Total.-
Division 2 & 3 (430-784).-200 (27-132),205 (10-41), 207 (2-2), 209 (15-35), 214 (4-4), 220 (6-13), 273 (139-175), 280 (2-6), 281 (3-7), 282 (1-1), 287 (1-2), 288 (8-22), 301 (2-20),302 (2-8),311 (30-31),339 (1-2),350 (43-53),351 (3-6),355 (1-1),360 (1-1), 365 (2-3),367 (1-1),368 (6-11), 369 (36-56), 370 (2-2), 384 (2-32), 388 (11-16), 392 (4-4), 393 (52-75), 394 (I-I), 399 (12-21).
Rural.-200 (15-77), 205 (2-4), 207 (2-2), 209 (11-29), 214 (3-3), 220 (2-2), 273 (85-96), 280 (1-2), 281 (1-1), 282 (1-1), 287 (1-2), 288 (3-17), 301 (1-2), 311 (27-27), 350 (43-53), 351 (3-6), 355 (1-1), 360 (1-1), 368 (5-10), 369 (31-47), 370 (2-2), 388 (1-1), 392 (1-1), 393 (43-61), 394 (1-1),399 (9-13).
Urban.-200 (12-55), 205 (8-37), 209 (4-6), 214 (1-1), 220 (4-11), 273 (54-79), 280 (1-4), 281 (2-6), 288 (5-5), 301 (1-18),302 (2-8),311 (3-4),339 (1-2),365 (2-3), 367 (1-1), 368 (1-1), 369 (5-9), 384 (2-32), 388 (1(}-15), 392 (3-3), 393 (9-14), 399 (3-8).
VILLAGES
(2) Milkatkhar.-393 (4-9). (6) Koproli.-393 (1-4). (7) Saral.-200 (1-10), 209 (6-12), 288 (I-I).
(10) Yelawane.-393 (2-2). (11) DhOkawade.-209 (2-8), 220 (I-I), 273 (13-13), 280
(1-2),311 (10-10),369 (1-1).
(17) Awas.-200 (1-1),273 (13-13),393 (11-13). (22) Chinchawali.-273 (1-1), 369 (1-1). (23) Mandavkhar.-273 (1-1), 370 (2-2). (25) Phoperi.-273 (I-I).
ALIBAG TALUKA-concld. V ILLAGES-Concld.
(26) Mouje Pedhambe.-273 (4-4), 301 (1-2), 369 (1-2) (27) Khar pedhambe.-273 (1-1). (31) Kamarle.-273 (1-1). (40) Zirad.-282 (1-1),369 (2-2). (45) Bamansure.-273 (10-11), 368 (4-4), 369 (1-2), 388
(1-1),393 (1-1). (47) Mapagaon.-273 (6-13), 350 (39-43), 351 (3-6). (49) Kihim.-281 (1-1), 350 (2-6), 369 (3-3), 393 (8-12)
394 (1-1), 399 (9-13). >
(50) Sogaon.-273 (1-1), 369 (1-2). (58) Thal.-200 (3-1 I), 207 (1- I), 220 (I-I), 273 (8-11),
288 (I-I), 369 (4-14), 392 (1-1),393 (4-6). (59) Man Tarf Zirad.-273 (1-1), 368 (1-6). (62) Bamanoli.-273 (I-I). (66) Varasoli.-200 (1-1), 369 (1-1),393 (1-2). (83) Gan Tad Parhur.-355 (1-1). 369 (1-1). (84) Kur Kundi Koltembhi.-200 (1-1), 214 (1-1). 273
(1-1),369 (1-1). (89) Divlang.-360 (1-1), 369 (I-I). (90) Rayande.-273 (4-4). (99) Talband.-272 (I-I), 288 (1-15).
(100) Poynad.-200 (4-28), 205 (2-4), 209 (3-9), 273 (6-6), 287 (1-2), 369 (1-1), 393 (3-3).
(104) Ambepur.-200 (2-23). (113) Shrigaon.-311 (5-5), 369 (2-2). (133) Kurdus.-273 (3-3), 311 (8-8), 350 (2-4), 369 (2-2). (144) Khandala.-214 (1-1). (148) Veshvi.-369 (2-4). (155) Akshi.-200 (1-1). (162) Nagaon.-200 (1-1), 369 (3-4). (176) Valawali.-369 (2-2). (183) Chinchoti.-273 (1-1) (187) Chau1.-207 (1-1), 214 (1-1), 273 (3-3) 311 (4-4) 393
(6-7). " (189) Bhigikhar.-393 (1-1). (193) Ramaraj.-393 (I-I). (194) Malade.-369 (1-0. (203) Sudakoli.-273 (3-3). (204) Kude.-273 (1-1).
URBAN
Alibag Municipality-200 (4-24), 205 (6-30), 209 (2-2),214 (1-1), 220 (4-11), 273 (34-45), 280 (1-4), 281 (2-6), 28& (5-5), 301 (1-18), 302 (2-8),311 (2-2),339 (1-2),367 (1-1) 368 (I-I), 369 (3-3), 384 (2-32), 388 (7-9) 392 (3-3)' 393 (6-10), 399 (3-8). "
Revdanda.-200 (8-31), 205 (2-7), 209 (2-4), 273 (20-34) 311 (1-2),365 (2-3),369 (2-6),388 (3-6),393 (3-4). >
PEN TALUKA
Total.-
Division 2 & 3 (192-637).-200 (28-206), 205 (7-21), 20) (2-3),214 (8-8),220 (1-2),273 (40-53),281 (2-2) 288 (4-9) 302 (2-5), 311 (I-I), 313 (9-13), 315 (7-8), 336' (1-3), 339 (3-21), 341 (1-20), 343 (I-I), 350 (7-23), 355 (9-33), 356 (10-114), 367 (2-2), 368 (10-16), 369 (5-23), 384 (1-16) 388 (5-7), 392 (I-I), 393 (23-24), 399 (2-2). '
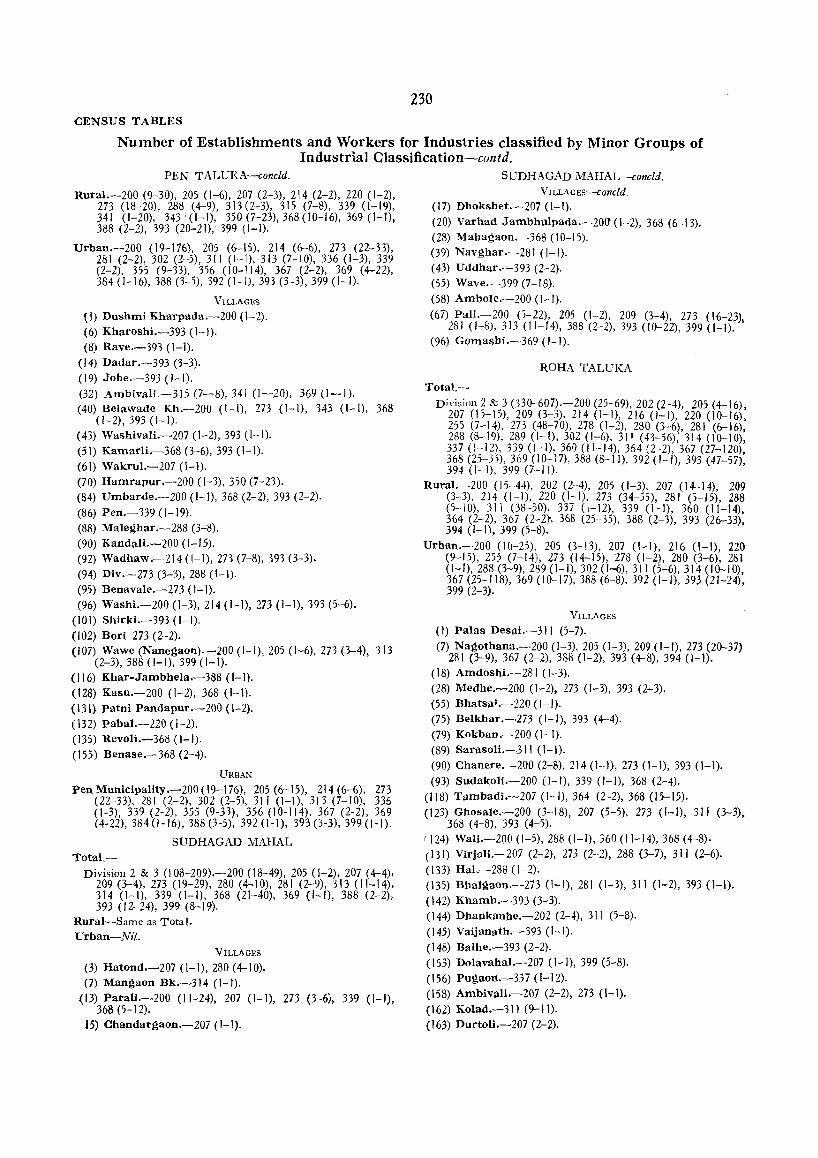
230 CENSUS TABLES
Number of Establishments and Workers for Industries classified by Minor Groups of Industrial Classification-contd.
PEN TALUKA-concld.
Rural.-200 (9-30), 205 (1-6), 207 (2-3), 214 (2-2), 220 (1-2), 273 (18-20), 288 (4-9), 313 (2-3), 315 (7-8), 339 (1-19), 341 (1-20), 343 (1-1), 350 (7-23), 368 (10--16), 369 (I-I), 388 (2-2), 393 (20-21), 399 (1-1).
Urban.-200 (19-176), 205 (6-15), 214 (6-6), 273 (22-33), 281 (2-2), 302 (2-5), 311 (1-1), 313 (7-10), 336 (1-3), 339 (2-2), 355 (9-33), 356 (10-114), 367 (2-2), 369 (4--22), 384 (1-16),388 (3-5),392 (1-1),393 (3-3), 399 (I-I).
VILLAGES
{I) Dushmi Kharpada.-200 (1-2). (6) Kharoshi.-393 (I-I). (8) Rave.-393 (1-1).
(14) Dadar.-393 (3-3). (19) Johe.-393 (1-1). (32) Ambivali.-315 (7-8), 341 (1-20), 369 (I-I). (40) Belawade Kh.-200 (1-1), 273 (1-1), 343 (1-1), 368
(1-2), 393 (1-1). (43) Washivali.-Z07 (1-2),393 (1-1). (51) Kamarli.-368 (3-6), 393 (I-I). (61) Wakrul.-207 (1-1). (70) Hamrapur.-200 (1-3), 350 (7-23). (84) Umbarde.-200 (1-1),368 (2-2),393 (2-2). (86) Pen.-339 (1-19). (88) Maleghar.-288 (3-8). (90) Kandali.-200 (1-15). (92) Wadhaw.-214 (H), 273 (7-8),393 (3-3). (94) Div.-273 (3-3),288 (I-I). (95) Benavale.-273 (1-1).
(96) Washi.-200 (1-3), 214 (1-1), 273 (1-1), 393 (5-6). (101) Shirki.-393 (1-1). (102) Bori 273 (2-2). (107) Wawe (Nanegaon).-200 (1-1),205 (1-6),273 (3-4), 313
(2-3),388 (1-1),399 (I-I). (116) Khar-Jambhela.-388 (I-I). (128) Kasu.-200 (1-2), 368 (1-1). (131) Patni Pandapur.-200 (1-2). (132) pabal.-220 (1-2). (135) Revoli.-368 (I-I). (155) Benase.-368 (2-4).
URBAN
Pen Municipality.-200(19-176), 205(6-15), 214(6-6), 273 (22-33), 281 (2-2), 302 (2-5), 311 (1-1), 313 (7-10), 336 (1-3), 339 (2-2), 355 (9-33), 356 (10-114), 367 (2-2), 369 (4-22),384(1-16),388 (3-5),392 (1-1),393 (3-3),399 (I-I).
SUDHAGAD MAHAL Total.-
Division 2 & 3 (108-209).-200 (18-49), 205 (1-2), 207 (4-4), 209 (3-4), 273 (19-29), 280 (4-10), 281 (2-9), 313 (11-14), 314 (1-1), 339 (I-I), 368 (21-40), 369 (I-I), 388 (2-2), 393 (12-24), 399 (8-19).
Rural-Same as Total. Urban-Nil.
VILLAGES
(3) Hatond.-207 (I-I), 280 (4-10). (7) Mangaon Bk.-314 (I-I).
(13) Parali.-200 (11-24), 207 (1- 1), 273 (3-6), 339 (1-1), 368 (5-12).
,15) Chandargaon.-207 (1- I).
SUDHAGAD MAHAL-concld. VnLAGES-Concld_
(17) Dhokshet.-207 (1-0. (20) Varhad Jambhulpada.-20(J (1-2), 368 (6-13). (28) Mahagaon.-368 (10-15). (39) Navghar.-281 (1-1). (43) Uddhar.--393 (2-2). (55) Wave.-399 (7-18). (58) Ambole.-200 (1-1).
(67) PalL-ZOO (5-22), 205 (1-2), 209 (3-4), 273 (16-23), 281 (1-8), 313 (11-14),388 (2-2),393 (10-22), 399 (1-1).
(96) Gomashi.-369 (1-1).
ROHA TALUKA
Total.-Division 2 & 3 (330-607).-200 (25-69),202 (2-4), 205 (4-16),
207 (15-15), 209 (3-3), 214 (1-1), 216 (1-1) 220 (10-16) 255 (7-14), 273 (48-70), 278 (1-2), 280 (3-6) 281 (6--16)' 288 (8-19),289 (1-1),302 (1-6),311 (43-56{314 (10-10): 337 (1-12), 339 (1-1),360 (11-14),364 (2-2) 367 (27-120) 368 (25-35),369 (10-17),388 (8-11), 392 (I-i) 393 (47-57)' 394 (1-1), 399 (7-11). "
Rural.-200 (15-44), 202 (2-4), 205 (1-3), 207 (14-14), 209 (3-3), 214 (1-1), 220 (1-1), 273 (34-55), 281 (5-15), 288 (5-10), 311 (38-50), 337 (H2), 339 (I-I), 360 (11-14), 364 (2-2), 367 (2-2)', 368 (25-35), 388 (2-3), 393 (26-33) 394 (I-I), 399 (5-8). '
Urhan.-200 (I (J-25), 205 (:H3), 207 (1-1), 216 (1-1), 220 (9-15), 255 (7-14), 273 (14-15), 278 (1-2), 280 (3-6), 281 (1-1),288 (3-9),289 (1-1),302 (1-6),311 (j-6), 314 (10-10), 367 (25-118),369 (10-17),388 (6-8),392 (1-1),393 (21-24) 3~(~~. '
V1LLAGES
(I) Palas Deslli.-31 I (5-7). (7) Nagothana.-200 (1-3), 205 (1-3), 209 (I-I), 273 (20-37)
281 (3-9), 367 (2-2), 388 (1-2),393 (4-8),394 (1-1). (18) Amdoshi.-281 (1-3). (28) Medhe.-200 (1-2), 273 (1-3), 393 (2-3). (55) Bhatsa; .. -220 (H). (75) Belkhar .-273 (I-I), 393 (4-4). (79) Kokban.-200 (I-I). (89) Sarasoli.-311 (1-1). (90) Chanere.-200 (2-8), 214 (1-1), 273 (1-1),393 (1-1). (93) Sudakoli.-200 (1- I), 339 (1-1), 368 (2-4).
(118) Tambadi.--207 (I-I), 364 (2-2), 368 (15-15). (123) Ghosale.-200 0-18), 207 (5-5), 273 (I-I), 311 (3-3),
368 (4-8), 393 (4-5). (124) Wali.-200 (1-5),288 (1-1), 360 (11-14),368 (4-8). (131) Virjoli.-207 (2-2), 273 (2-2), 288 (3-7), 311 (2-6). (133) Hal.-288 (1-2). (135) Bhalgaon.-273 (1-1),281 (1-3),311 (1-2), 393 (1-1). (142) Khamb.~393 (3-3). (144) Dhankanhe.-202 (2-4), 3 II (5-8). (145) Vaijanath.-393 (I-I). (148) Balhe.-393 (2-2). (153) Dolavahal.-207 (1-1), 399 (5-8). (156) Pugaon.-337 (1-12). (158) Amhivali.-207 (2-2), 273 (1-1). (162) Kolad.~311 (9-11). (163) Durtoli.-207 (2-2).
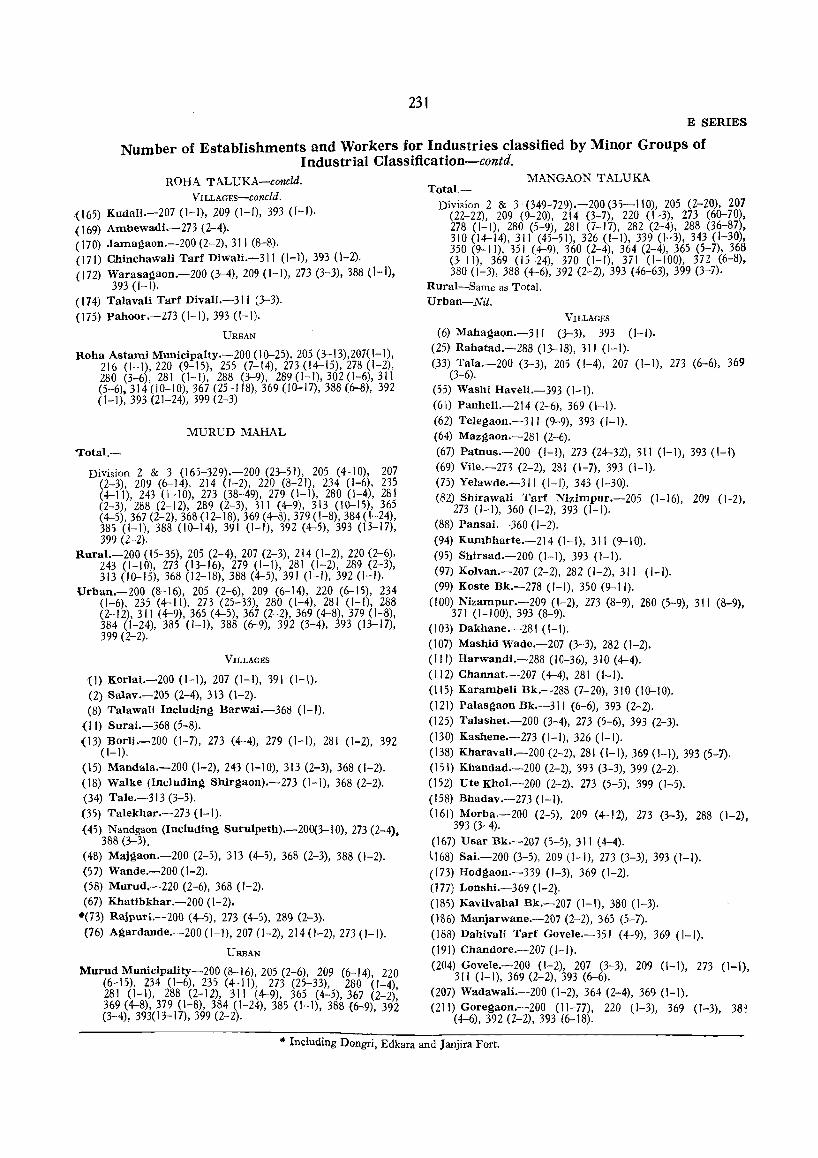
231 E SERIES
Number of Establishments and Workers for Industries classified by Minor Groups of Industrial Classification-contd.
ROHA TALUKA-concld. VILLAGES-Concld.
(165) Kudali.-207 (1-1), 209 (1-1), 393 (1-1). (169) Ambewadi.-273 (2-4). (170) Jama~aon.-200 (2-2),311 (8-8). (171) Chinchawali Tarf Diwali.-311 (1-1),393 (1-2). (172) Warasagaon.-200 (3-4),209 (1-1),273 (3-3), 388 (1-1),
393 (I-I). (174) Talavali Tarf Divali.-311 (3-3). (175) Pahoor.-Z73 (1-1),393 (1-1).
URBAN
Roha Astami Municipalty.-200 (10-25).205 (3-13),207(1-1), 216 (1-1),220 (9-15), 255 (7-14), 273 (14-15),278 (1-2), 280 (3-6), 281 (I-I), 288 (3-9),289(1-1),302(1-6),311 (5-6),314 (10-10),367 (25-118),369 (10-17),388 (6--8), 392 (I-I), 393 (21-24), 399 (2-3)
MURUD MAHAL
'Total.-
Division 2 & 3 (165-329).-200 (23-51), 205 (4-10), 207 (2-3), 209 (6-14), 214 (1-2), 220 (8-21), 234 (1-6), 235 (4-11), 243 (1-10), 273 (38-49), 279 (I-I), 280 (1-4), 281 (2-3), 288 (2-12), 289 (2-3), 311 (4-9), 313 (10-15), 365 (4-5),367 (2-2),368(12-18),369 (4-8),379(1-8),384(1-24), 385 (I-I), 388 (10-14), 391 (I-I), 392 (4-5), 393 (13-17), 399 (2-2).
Rural.-200 (15-35), 205 (2-4), 207 (2-3), 214 (1-2), 220 (2-6), 243 (1-10), 273 (13-16), 279 (1-1), 281 (1-2), 289 (2-3), 313 (10-15), 368 (12-18),388 (4-5),391 (I-I), 392 (I-I).
Urban.-ZOO (8-16), Z05 (2-6), 209 (6-14), 220 (6--15), 234 (1-6), 235 (4-11), 273 (Z5-33), Z80 (1-4), 281 (I-I), 288 (2-12),311 (4-9), 365 (4-5), 367 (2-2), 369 (4-8),379 (1-8), 384 (1-24), 385 (I-I), 388 (6-9), 392 (3-4), 393 (13-17), 399 (2-2).
VILLAGES
(I) Korlai.-200 (1-1), 207 (1-1), 391 (1-1). (2) Salav.-205 (2-4), 313 (1-2). (8) Talawali Including Barwai.-368 (I-I).
(II) Surai.-368 (5-8). (13) Borli.-ZOO (1-7), 273 (4-4), 279 (1-1), 281 (1-2), 392
(I-I). (15) Mandala.-200 (1-2),243 (1-10),313 (2-3),368 (1-2). (18) Walke (Includin~ Shir~aon).-273 (1-1), 368 (2-2). (34) Tale.-313 (3-5). (35) Talekhar.-273 (I-I). (45) Nandgaon (InclUding Surulpeth).-200(3-10), 273 (2-4),
388 (3-3). (48) Maj~aon.-200 (2-5), 313 (4-5), 368 (2-3), 388 (1-2). (57) Wande.-200 (1-2). (58) Murud.-220 (2-6), 368 (1-2). (67) Khatibkhar.-200 (1-2).
-(73) Rajpuri.-20() (4-5), 273 (4-5), 289 (2-3). (76) Agardande.-200 (1-1),207 (1-2),214 (1-2),273 (I-I).
URBAN
Murud Municipality-200 (8-16),205 (2-6), 209 (6-14), 220 (6-15), 234 (1-6), 235 (4-11), 273 (25-33), 280 (1-4) 281 (I-I), 288 (2-12), 311 (4-9), 365 (4-5),367 (2-2)' 369 (4-8),379 (1-8), 384 (1-24), 385 (I-I), 388 (6-9) 392 (3-4), 393(13-17),399 (2-2). '
MANGAON TALUKA Total.-
Division 2 & 3 (349-729).-200 (35-110), 205 (2-20), 207 (22-22), 209 (9-20), 214 (3-7), 220 (1-3), 273 (60-70), 278 (1-1), 280 (5-9), 281 (7-17), 282 (2-4), 288 (36-87), 310 (14-14),311 (45-51),326 (1-1),339 (1-3),343 (1-30). 350 (9-11), 351 (4-9), 360 (2-4), 364 (2-4), 365 (5-7), 368 (3-11), 369 (15-24), 370 (I-I), 371 (1-100), 372 (6-8), 380 (1-3), 388 (4-6), 392 (2-2), 393 (46-63), 399 (3-7).
Rural-Same as Total. Urban-Nil.
VILLAGES
(6) Mahagaon.-311 (3-3), 393 (1-1). (25) Rahatad.-288 (13-18),311 (I-I). (33) Tala.-200 (3-3), 205 (1-4), 207 (I-I), 273 (6-6), 369
(3-6). (55) Washi Haveli.-393 (I-I). (61) Panheli.-214 (2-6), 369 (I-I). (62) Telegaon.-311 (9-9), 393 (I-I). (64) Mazgaon.-281 (2-6). (67) Patnus.-200 (I-I), 273 (24-32), 311 (1-1), 393 (I-I) (69) Vile.-273 (2-2), 281 (1-7), 393 (I-I). (75) Yelawde.-311 (I-I), 343 (1-30). (82) Shirawali Tarf Nizimpur.-205 (1-16), 209 (1-2),
273 (I-I), 360 (1-2), 393 (I-I). (88) Pansai.-360 (1-2). (94) Kumbharte.-214 (1-1),311 (9-10). (95) Shirsad.-200 (I-I), 393 (1-1). (97) Kolvan.-207 (2-2),282 (1-2), 311 (I-I). (99) Koste Bk.-278 (I-I), 350 (9-1 I).
(100) Nizampur.-209 (1-2), 273 (8-9), 280 (5-9), 311 (8-9), 371 (1-100), 393 (8-9).
(103) Dakhane.-281 (I-I). (107) Mashid Wade.-207 (3-3), 282 (1-2). (II I) Harwandi.-288 (10-36),310 (4-4). (112) Channat.-207 (4-4), 281 (I-I). (115) Karambeli Bk.-288 (7-20), 310 (10-10). (121) Palasgaon Bk.-311 (6-6), 393 (2-2). (125) Talashet.-200 (3-4), 273 (5-6), 393 (2-3). (130) Kashene.-273 (1-1),326 (I-I). (138) Kharavali.-200 (2-2),281 (1-1),369 (1-1),393 (5-7). (151) Khandad.-200 (2-2), 393 (3-3), 399 (2-2). (152) Ute Khol.-200 (2-2), 273 (5-5), 399 (1-5). (158) Bhadav.-273 (1-1). (161) Morba.-200 (2-5), 209 (4-12), 273 (3-3), 288. (1-2),
393 (3-4). (167) Usar Bk.-207 (5-5), 311 (4-4). (168) Sai.-200 (3-5), 209 (I-I), 273 (3-3),393 (I-I). (173) Hodgaon.-339 (1-3), 369 (1-2). (177) Lonshi.-369 (1-21. (185) Kavilvahal Bk.-207 (I-I), 380 (1-3). (186) Manjarwane.-207 (2-2), 36; (5-7). (188) Dahivali Tarf Govele.-351 (4-9), 369 (I-I). (191) Chandore.-207 (I-I). (204) Govele.-200 (1-2), 207 (3-3), 209 (I-I), 273 (1-1),
311 (1-1),369 (2-2),393 (6-6). (207) Wadawali.-200 (1-2), 364 (2-4), 369 (I-I). (211) Gore~aon.-200 (11-77), 220 (1-3), 369 (1-3), 38~
(4-6), 392 (2-2), 393 (6-18).
'*' Including Dongri, Edkara and Janjira Fort.

232 CENSUS TABLES
Number of Establishments and Workers for Industries classified by Minor Groups of Industrial Class.ification-contd.
MANGAON TALUKA-co7lcld. V ILL'l.GES-Concld.
(2J2) Lonera.-200 (1-1),209 (1-2),369 (1-2). (223) Nagaon.-368 (3-11), 369 (I-I). (228) Tempale.-200 (1-2), 370 (I-I). (233) Nandvi.-200 (I-I), 288 (1-2), 311 (1-5),393 (3-3). (235) Bhandivali.-369 (1-2), 372 (6-8). (236) Tol Kh.-281 (1-1), 288 (4-9).
SHRIWARDHAN MAHAL Total.-
Division 2 & 3 (199-371).-200 (21-39), 205, (16-37),207 (9-13), 209 (I-I), 214 (3-4), 220 (9-26), 232 (17-34), 273 (29-56), 28 (1-1), 288 (9-17), 289 (1-1), 310 (7-22), 311 (3-5),314 (4-5),360 (1-2),365 (9-14), 367 (I-I), 368 (4-5), 369 (16-28), 370 (3-5), 377 (I-I), 384 (4-8), 388 (7-16), 392 (I-I), 393 (19-25),399 (3-4).
Rura1.-Z00 (12-20), 205 (14-28), 207 (7-9), 209 (1-1), 214(2-2), 220 (3-6), 232 (17-34), 273 (20-31), 282 (I-I), 288 (9-17), 289 (I-I), 310 (7-22), 360 (1-2), 365 (5-9), 368 (3-3), 369 (13-23),370 (3-5),384 (4-8),388 (3-3),393 (10-16).
Urban.-200 (9-19),205 (2-9),207 (2-4),214 (1-2),220 (6-20). 273 (9-25), 311 (3-5), 314 (4-5), 365 (4-5), 367 (I-I), 368 (1-2), 369 (3-5), 377 (1-1), 388 (4-13), 392 (1-1), 393 (9-9), 399 (3-4).
VILLAGES
(4) Dighi.-200 (1-5), 205 (1-2). (7) Sarve.-369 (1-2). (9) Kudgaon.-200 (1- I), 273 (1-1).
(17) Vadavali.-200 (1-5), 205 (1-2), 207 (2-2), 369 (3-6). (23) Borli Panchatan.-200 (2-2), 205 (9-14), 207 (3-4),
220 (3-6), 232 (14-26), 273 (6-14), 368 (2-2), 369 (I-I), 384 (2--5), 388 (3-3), 393 (7-9).
(27) Diveagar.-200 (I-I), 273 (9-12), 288 (3-6), 360 (1-2), 369 (1-2).
(33) Dandguri.-207 (1-1), 370 0-5). (38 )Nagaloli.-365 (Z-4), 369 (I-I). (44) Walvati.-200 (I-I). (50) Chikhalap.-282 (I-I), 369 (1-2). (58) Jasvali.-ZOO (I-I), 209 (I-I). (59) Ranwali.-200 (I-I), 369 (1-2), 393 (3-7). (62) Shriwardhan.-232 (1-3), 288 (5-9). (66) Galsure.-200 (1-1), 207 (1-2), 232 (1-2), 365 (3-5),
368 (I-I). (68) Sakhari.-214 (2-2), 369 (3-6). (71) Vadashet.-200 (I-I), 288 (1-2), 310 (4-16). (78) Maral.-205 (2-8), 289 (I-I), 310 (2-5), 369 (I-I), 384
(2-3). (83) Devaghar.-232 (1-3). (84) Bagmandle.-200 (I-I), 205 (1-2), 273 (4-4), 310
(I-I). URBAN
Shriwardhan Municipality.-200 (9-19),205 (2-9),207 (2-4), 214 (1-2),220 (6-20) 273 (9-25),311 (3-5), 314 (4-5), 365 (4-5), 367 (I-I), 368 (1-2), 369 (3-5), 377 (1-1), 388 (4-13), 392 (i-I), 393 (9-9), 399 (3-4).
MHASALA MAHAL Total.-
Division 2 & 3 (95- 129).-200 (10-19),205 (3-4),207 (11-13), 209 (2-6),220 (1-2),273 (19-23),278 (1-1),281 (I-I), 288 (2-3), 311 (14-15), 369 (5-9), 384 (1-2), 388 (I-I), 392 (2-2), 393 (22-28).
Rural.-Same as Total. Urban.-Nil.
MHASALA MAHAL-concld. VILLAGES-Co7lcld
(8) Mendadi.-200 (1-2), 288 (1-2), 369 (1-3). (18) Kelte.-311 (8-8), 393 (3-3). (22) pabhare.-200 (1-2), 393 (3-3). (26) Surai.-393 (3-5). (28) Khargaon Kh.-369 (I-I). (29) Mhasala.-200 (4-10),205 (3-4),207 (10-12), 209 (2-6)'
220 (1-2), 273 (19-23), 278 (I-I), 288 (I-I), 311 (6-7)' 369 (2-4), 384 (1-2), 388 (I-I), 392 (2-2), 393 (J 3-17).
(61) Khamgaon.-200 (1-1). (67) Wave.-200 (1-2). (72) Sanderi.-ZOO (I-I). (76) Mahamadkhanikhar.-369 (I-I). (78) Talavade.-207 (1-1). (80) Ambet.-200 (1-1),281 (I-I).
MAHAD TALUKA
Total.-Division 2 & 3 (293-734).-200 (37-82), 205 (11-32), 207,
(1-2), 209 (6-12), 214 (4-15), 220 (4-200), 273 (51-65), 274 (1-1), 280 (2-5), 281 (1-4), 284 (1-1), 28$ (14-20), 289 (9-9), 302 (2-7), 310 (1-1) 31 I (35-42), 336 (2-6), 365 (10-45), 367 (2-2), 368 (I-I), 369 (28-42), 377 (1-2), 379 (1-2),384 (7-51), 388 (20-28),392 (5-7),393 (34-46), 394 (2-4)
Rural.-200 (14-25), 205 (3-8), 207 (1-2), 273 (22-25), 289 (9-9), 311 (29-32), 369 (24-35), 384 (4-5), 393 (24-28).
,-r:-Urban.-200 (23-57), 205 (8-24), 209 (6-12), 214 (4-15),
220 (4-200), 273 (29-40), 274 (1-1), 280 (2-5), 281 (1-4)~ 284 (1-1), 288 (14-20), 302 (2-7), 310 (I-I), 311 (6-10), 336 (2-6), 365 (10-45), 367 (2-2), 368 (H), 369 (4-7), 377 (1-2), 379 (1-2), 384 (3-46), 388 (20-28), 392 (5-7), 393 (10-18), 394 (2-4). .
VILI-AGES (3) Savrat.-369 (I-I)
(19) Konzar.-369 (1-1).
(22) Wagholi.-393 (6-6). (26) Deoghar.-369 (I-I). (33) KoloShe.-369 (I-I). (36) Nate.-273 (6-6), 384 (I-I). (43) Gondale.-311 (2-2). (47) Veer.-31 1(6-6),369(1-1),393(2-4). (48) Tol Bk.-369 (2-4). (50) Dasgaon.-200 (1-1), 205 (3-8), 311 (6-6), 384 (3-4)~
393 (2-2). (54) Wahoor.-200 (I-I), 369 (1-1). (55) GQthe Bk.-369 (I-I). (56) Kumbale.-311 (1-1). (59) Kosabi.-311 (2-2). (60) Tudil.-200 (H). (71) Chimbave.-200 (2-6), (73) Adiste.-207 (1-2), 369 (H). (75) Sape Tarf Tudil.-369 (1-2). (90) Rajewadi.-393 (I-I). (93) Dadali.-273 (1-1). ~94) Kondivate.-200 (1-1).
(103) Chandave Bk.-369 (1-1),393 (I-I). (108) Karanjadi.-369 (2-2). (120) Shirsvane.-311 (9-12).
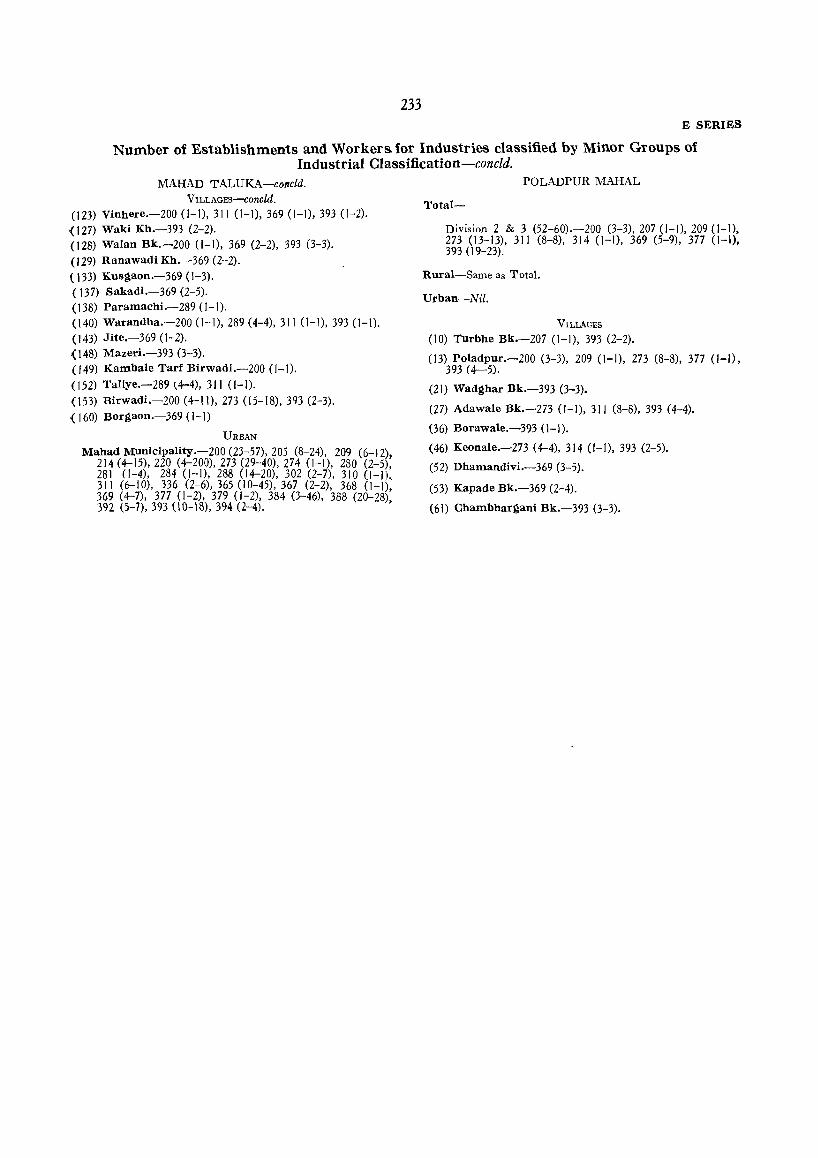
233 E SERIES
Number of Establishments and Workers. for Industries classified by Minor Groups of Industrial Classification-concld.
MAHAD TALUKA-concld. VILLAGES--Concid.
(123) Vinhere.-200 (1-1),31 I (I-J), 369 (H), 393 (1-2). '( 127) Waki Kh.-393 (2-2). (128) Walan Bk.-200 (1-1), 369 (2-2), 393 (3-3). (129) Ranawadi Kh.-369 (2-2). (133) Kusgaon .-369 (1-3). ( 137) Sakadi.-369 (2-5). (138) Paramachi.-289 (H). (140) Warandha.-200 (1-1),289 (4-4),31 I (1-1),393 (1-1). (143) Jite.-369 (1-2).
(148) Mazeri.-393 (3-3). (149) Kambale Tad Birwadi.-200 (1-1).
(152) Taliye.-289 t4-4), 311 (1-1).
(153) Birwadi.-200 (4-11),273 (15-18), 393 (2-3). '( 160) Borgaon.-369 (1-1)
URBAN
Mahad MunicipaIity.-200 (23-57),205 (8-24), 209 (6--12), 214 (4-15),220 (4-200),273 (29-40), 274 (1-1), 280 (2-5), 281 (1-4), 284 (1-1), 288 (14-20), 302 (2-7), 310 (I-I) 3 11 (6--10), 336 (2-6), 365 (10--45), 367 (2-2), 368 (I-I): 369 (4--7), 377 (1-2), 379 (1-2), 384 (3-46), 388 (20-28) 392 (5-7),393 (l0-18), 394 (2-4). '
POLADPUR MAHAL
Total-
Division 2 & 3 (52-60).-200 (3-3),207 (1-1),209 (I-I), 273 (13-13), 31 I (8-8), 314 (1-1), 369 (5-9), 377 (1-1), 393 (19-23).
Rural-Same as Total.
Urban-Nil.
VILLAGES
(10) Turbhe Bk.-207 (I-I), 393 (2-2).
(13) Poladpur.-200 (3-3), 209 (I-I), 273 (8-8), 377 (I-I), 393 (4-5).
(21) Wadghar Bk.-393 (3-3).
(27) Adawale Bk.-273 (1-1), 31 I (8-8),393 (4-4).
(36) Borawale.-393 (I-I).
(46) Keonale.-273 (4-4),314 (I-I), 393 (2-5).
(52) Dhamandivi.-369 (3-5).
(53) Kapade Bk.-369 (2-4).
(61) Chambhargani Bk.-393 (3-3).

J-6Z·III-31-A.-Kolaba.
PART III
OTHER OFFICIAL S'f ATISTICS These include Statistics on Climau: and Rainfall, Agriculture, Industry, EducatUm, Health and few other aspec",
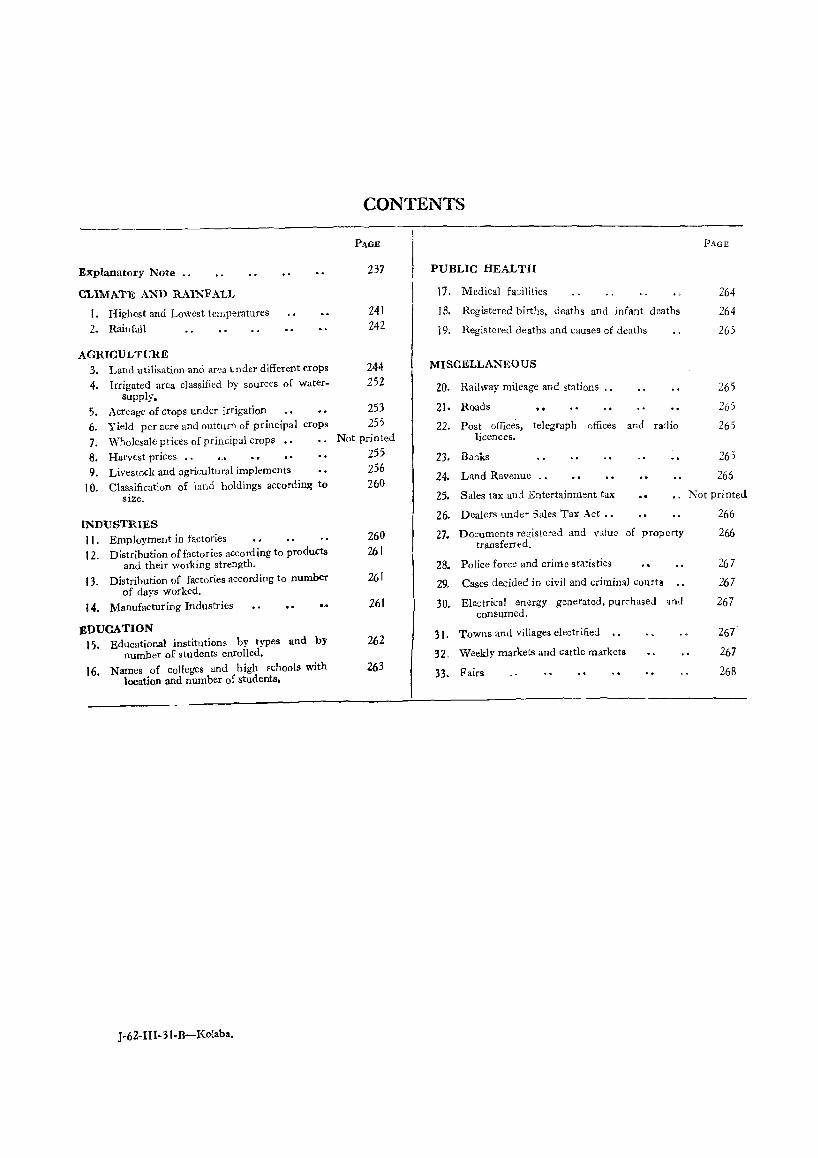
Explanatory Note ..
CLIMATE AND RAINFALL
I. Highest and Lowest temperatures
2. Rainfall
AGRICULTURE 3. Land utilisation and area under different c.rops 4. Irrigated area classified by sources of water-
supply. S. Acreage of crops under irrigation 6. Yield per acre and outturn of principal crops
7. Wholesale prices of principal crops .,
8. Harvest prices ., 9. Livestock and agricultural implements
10. Classification of land holdings accordin~ to size.
lNDUSTRIES 11. Employment in factories 12. Distribution of factories according to products
and their working strength. 13. Distribution of factories according to number
of days worked. 14. Manufacturing Industries
:£DUCATION 1 '}. Educational institutions by types and by
number of students enrolled. 16. Names of colleges and high schools with
location and number of students.
J-62-II1-31-B-Kolaba.
CONTENTS
237
241 242
244 252
253 255
Not printed 2'})
256 26()
260 261
261
261
262
263
PUBLIC HEALTH
17. Medical fa:ilities
18. Registered births, deaths and infant deaths
J 9. Registered deaths and causes of deaths
MISCELLANEOUS
20. Railway mileage and stations
21. Roads
22. Post office~, telegraph offices licences.
23. Banks
24. Land Revenue
25. Sales tax and Entertainment tax
26. Dealers under Sales Tax Act .•
and radio
27. Documents registered and value of prOj)erty transferred.
28. Police force and crime statistics
29. Cases decided in civil and criminal courts
30. Electrical energy geoerated, purchased 'lod consumed.
31. Towns and villages electrified
32. Weekly markets and cattle markets
33. Fairs
PAGE
264
264
265
265
265
265
265
266
Not printed
266
266
267
267
267
267
267
268
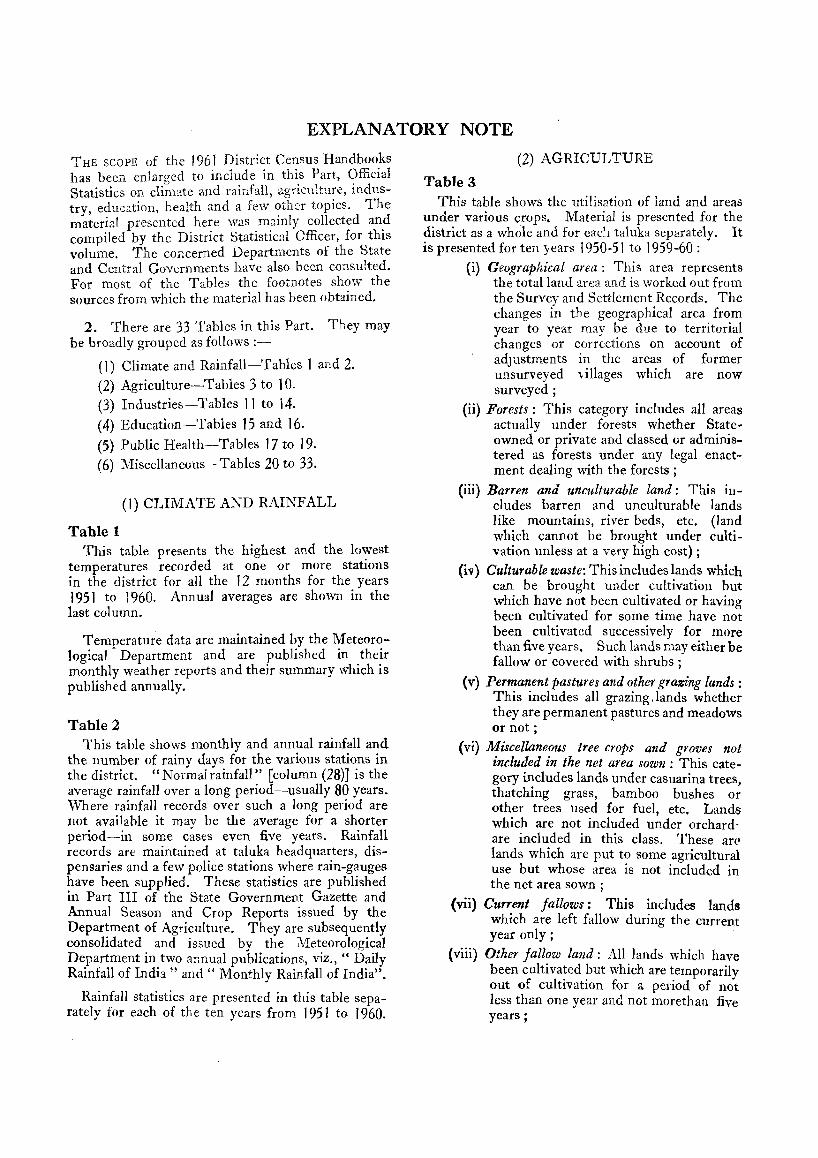
EXPLANATORY NOTE
THE SCOPE of the 1961 District Census Handboo.ks has been enlarged to include in thi.s Part, <?fficlaI Statistics on climate and rainfall, agnculture, llldustry, educ:.tion, health and a few ?ther topics. The material presented here was mamly collected an.d compiled by the District Statistical Officer, for thIs volume. The concerned Departments of the State and Central Governments have also been consulted. For most of the Tables the foo~notes show the sources from which the material has been obtained.
2. There are 33 Tables in this Part. They may be broadly grouped as follows :-
(1) Climate and Rainfall-Tables 1 and 2. (2) Agriculture-Tables 3 to 10. (3) Industries-Tables 11 to 14. (4) Education-Tables 15 and 16. (5) Public Health-Tables 17 to 19. (6 ) Miscellaneous-Tables 20 to 33.
(1) CLIMATE AND RAINFALL
Table 1 This table presents the highest and the lo,:,",est
temperatures recorded at one or more statIOns in the district for all the 12 months for the years 1951 to J960. Annual averages are shown in the last column.
Temperature data are maintained by the Meteorological' Department and are published in their monthly weather reports and their summary which is published annually.
Table 2 This table shows monthly and annual rainfall and
the number of rainy days for the various stations in the district. " Normai rainfall " [column (28)] is the average rainfall over a long period-usually 80 years. vVhere rainfall records OVer such a long period are not available it may be the average for a shorter period-in some cases even five years. Rainfall records are maintained at taluka headquarters, dispensaries and a few police stations where rain-gauges have been supplied. These statistics are published in Part III of the State Government Gazette and Annual Season and Crop Reports issued by the Department of Agriculture. They are subsequently consolidated and issued by the Meteorological Department in two annual publications, viz., " Daily Rainfall of India" and" Monthly Rainfall of India".
Rainfall statistics are presented in this table separately for each of the ten years from 1951 to 1960.
(2) AGRICULTURE
Table 3 This table shows the utilisation of land and areas
under various crops, Material is presented for the district as a whole and for eac~ taluka separately. It is presented for ten years 1950-51 to 1959-60 :
(i) Geographical area: This area represents the total land area and is worked out from the Survey and Settlement Records. The changes in the geographical area from year to year may be due to territorial changes or corrections on account of adjustments in the areas of former unsurveyed villages which are now surveyed;
(ii) Forests: This category includes all areas actually under forests whether Stateowned or private and classed or administered as forests under any legal enactment dealing with the forests;
(iii) Barren and unculturable land: This iucludes barren and unculturable lands like mountains, river beds, etc. (land which cannot be brought under cultivation unless at a very high cost) ;
(iv) Culturable waste: This includes lands which can be brought under cultivation but which have not been cultivated or having been cultivated for some time have not been cultivated successively for more than five years. Such lands may either be fallow or covered with shrubs;
(v) Permanent pastures and other grazing lands: This includes all grazing .lands whether they are permanent pastures and meadows or not;
(vi) Miscellaneous tree crops and groves not included in the net area sown: This category includes lands under casuarina trees, thatching grass, bamboo bushes or other trees used for fuel, etc. Lands which are not included under orchard' are included in this class. These ar(' lands which are put to some agricultural Use but whose area is not included in the net area sown ;
(vii) Current fallows: This includes lands which are left fallow during the current year only;
(viii) Other fallow land: All lands which have been cultivated but which are temporarily out of cultivation for a period of not less than one year and not morethan five years;
(ix) Net area sown: The net area sown is the actual area under crops counting areas sown more than once in the Same year only once;
(x) Gross cropped area: This is the sum of areas under all crops and represents the sum of net area sown and area sown more than once in the year.
After the land utilisation statistics under section A in column (1) the table presents in section B the detdls of areas under different crops. The crops are classified in two main groups, viz., foodcrops and non-foodcrops. Foodcrops are further grouped by " cereals, pulses and others". Non-foodcrops are similarly shown under " oilseeds and others".
The data on land utilisation and areas under crops lire primarily prepared by the village officials of the Revenue Department. They are subsequently consolidated by the Agriculture Department.
Talukawise land utilisation and crop statistics are being presented for the first time in this volume. They have not been published so far anywhere else.
TallIe 4 This table presents gross and net irrigated areaS
and the distribution of net irrigated area by sources of irrigation. To facilitate comparison, the gross cropped area is also shown in column (3). The data are presented for three years, viz., 1950-5 I, 1955-56 and 1959-60. Presentation is for the district as a whole and for each taluka separately.
Table 5 This table shows the acreages of various crops
under irrigation for each year from 1950-51 to 1959-60. 'Io facilitate comparison, the gross cropped area, and the gross irrigated area, are presented in the beginning. This is followed by acreages under irrigation for each crop.
The material is presented for the district as a whole and for each taluka separately.
Sources for the district and talukawise material are different and there may, therefore, be a few small discrepancies between the two sets of figures.
Table 6 This table presents the outturn and average
yields per acre of principal crops in the district. The crops presented are foodcrops like rice, wheat, jowar, bajri, ragi, maize, tur, gram and sugarcane and nonfoodcrops like groundnut, sesamum, cotton and tobacco. Crops which are locally important are only $hown in this table.
The outturn figures are in hundred tons while average yields are shown in pounds per acre.
238
The estimates of average yields and production in respect of rice, bajri (kharif and rabi), jowar, wheat, gram, cotton, groundnut, tobacco, ragi an d tur are
. based on the results of crop estimation surveys conducted annually by the Agriculture Department. The estimates of yields for other remaining crops are based on the anna valuation figures an d normal yields reported by the Revenue Officers. The figures relate to the years 1950-51 to J 959-60.
Table 7 This table presents wholesale prices of prbcipal
crops. The material is presented for previous years by monthly averages and for the last year separately for each month. The prices shown 'Jre for the places having regulated markets or for the District Headquarters. (However, this table is not pre~ented for this district as the Data are not available.)
Table 8 This tablt presents harvest prices of principal
crops. The" harvest price" is the averilge wholesale price at which the commodity is disposed of by the producer to the trader at the village site during the specified harvest period. These prices are published in the Season and Crop Reports. The figures relate to the years 1950-51 to 1959-60. .
'Table 9 This table presents figures for livestock and agri
cultural implements for the district and each taluka separately for three years: 1951, 1956 an d 1961. The material is obtained from the three Livestock Censuses conducted in those years. The reference date to which the data relate is the J 5th April of the .concerned year.
"Poultry" in section B of the table includes hens, ,cocks, chicken, ducks, drakes and ducklets.
Section C presents statistics for agricultural implements. The figures for carts shown in the table are in respect of carts used for agricultural purposes only.
The number of tractors is inclusive of those owned by the Government and those owned by private persons.
The materi:JI IS presented tor the district as a whole and for each talllka separately.
Table 10 This table pres·ents the distribution of the number
of land hol~ings and their areas by size of holdings. The matenal has been taken from the census of agricultural holdings conducted in the year 1952-53 or 1953-54 in different parts of the State.
The figures presented here are for ownership holdings and the area figures are in terms of converted dry acres, i.e., calculated after giving due weightage for irrigated lands.
Where the distriCt has unc.crgone major changes because of the reorganisation of States in J 956 or 1960, the material relates to the area of the district as it existed in the year J 952-53 or J 953-54.
(3) IND USTRIES Table Ii
This table presents, for each industry, the total number of working factories, the number of mandays for which they worked during the year and the average daily number of workers employed classified by adults (18 years and above), adolescents (15 to 17 years) and children (14 or less). Statistics presented in columns (3) to (11) relate only to the reporting factories. The number of nOll-reporting factories and their estimated average daily number ~f workers are shown in columns (12) and (13). These details of factories are further split up by the type of industry shown under column (I) both by industry code and a brief description. The industry codes shown here (as well as in Table 12) are those used for compilation of data by the Chief Inspector of Factories. They are different from the Standard Industrial Classification used in the
. Census Tables and reproduced in Appendix I to the Explanatory Note to Part II.
The material is presented only for the district as a whole and only for one year, viz., 1961.
The word" factories" here includes only the registered factories. They are of three types :-
(i) Factories using no power but employing 20 or more workers;
(ii) Factories using power and employing 10 or more workers, and
(iii) Factories not covered by (i) and (ii) above but notified by the Government as covered by the Factories Act.
'The material presented in this table is for all the three types combined.
'Table 12 This table presents the distribution of factories
for each type of industry by size of employment. For each size group, the number of facl:ories and their total working strength are shown for each industry separately. The material is presented only for the district as a whole and only for one year, viz., 1961.
'Table 13 This table presents the distribution of factories
for each type of industry by the number of days worked during the year. The material is shown for each industry and the number of factories and their total workers are shown for each group of working periods. This will show the seasonal or perennial pattern of employment in industries in the district. Material is presented only for the distric~ as a whole
,and relates to the year t 96 t.
239
Table 14 This table presents a summary of data regarding
the manufacturing industries as obtained through the annual Census of Manufacturing Industries conducted during the year 1958.
The 1958 Census had covered only 29 important industries. It moreover covered only the factories using power and employing 20 or more workers.
The figures for capital, etc" relate to 31 st December 1958. " Vahle" added by manufacture denotes the increase in the total value of com!llodities as calculated by deducting the cost of materials, supplies, containers, fuel, electric energy and depreciation of fixed assets from the total value of the products.
The table presents only thf' combined figures for the 29 industries covered in the 1958 Census.
(4) EDUCATION Table 15
This table shows the number of different types of educational institutions in the district and the total number of pupils (boys and girls) and teachers for each type for the years 1951, 1956 and 1961. 1 he material is presented for the district as a whole and for each taluka separately.
The number of institutions relates to the academic year ending June and the number of pupils IS
as on 31 st March of the respective years.
Table 16 This table presents a list of colleges and high
schools in the district with their locations. The material relates to 31 st March J 961, and does not include institutions started after that date.
Lists are presented talukawise.
(5) PUBLIC HEALTH Table 17
This table shows medical facilities available in the district. The material is presented for three years 1950, 1955 and 1960 and shows the number of hospitals, maternity homes, dispensaries, rural health centres, doctors, nurses, beds available and indoor and outdoor patients treated.
Material is presented for each taluka separately. The material presented here includes only civil
hospitals and Government dispensaries, Local or Municipal Funds institutions, private-aided or Railway dispensaries. It does not cover private unaided institutions run by individuals or associa. tions. Similarly, the number of doctors, nurses or patients shown in this table does not inclilde that relating to unaided hospitals, dispensaries or private practitioners.
Table 18
This table shows data about births, deaths and infant deaths for the years 1951 to 1960. Wherever possible, figures for e8ch taluka are also shown separately. For the districts of Aurangabad and Nagpur divisions, material is availabe and presented only for the years 1957 and onwards.
The figures of infant deaths relate to deaths of children below one year.
The coverage and reporting on births, deaths and epidemic diseases in the rural areas are incomplete in many respects. The material presented in Tables 18 and 19 should not, therefore, be treated as any accurate representation of actual conditions in the district and should be used only after allowing a margin for those limitations. The Department of Public Health is working on many schemes to improve the present position in respect of vital statistics.
Table 19 This table shows the number of deaths due to
principal causes in the district for the 10 years 1951 to 1960. The caUses of deaths shown are cholera, smallpox, plague, dysentery and diarrhoea, fever, respiratory diseases and other causes. The figures of fevers include deaths due to enteric fever, cerebro-spinal fever, malaria, influenza, typhus, etc. Respiratory diseases include pneumonia, pulmonary tuberculosis, whooping cough, etc. In the other causes are included diphtheria, chicken-pox, poliomyelitis, leprosy, cancer, deaths from child birth, etc.
240
(6) MISCELLANEOUS Tables 20 to 31
Tables 20 to 31 are self-explanatory and need no further clarification.
Table 32 This table presents talukawise lists of weekly
markets. The table also shows the day on which the weekly bazar is held. Places where cattle bazars are held are also indicated. The list is based on the information collected from the Mamlatdar's offices ~nd the Census enumerators' reports, prepared 111 September-October 1960.
Table 33 . This table. ~ives a talukawise list of villages where
dIfferent rehglOus or cultural fairs are held. The· l~st includes only those fairs which ha"e a congregatlOn of 1,000 or more. Information regarding-
(i) Location Code Number, (ii) the name of the village in which the fair
is held, (iii) distance from Railway station and S. T.
Bus stop, (iv) name of the fair, and month and date of the
fair, and (v) average congregation
is furnished for each fair separately.
The list is prepared on the basis of information collected from the District Superintendents of Police Municipalities and the Census enumerators' reports: The number of people gathering at the fair is based on eye estimates and should be treated as a· broad' approximation.
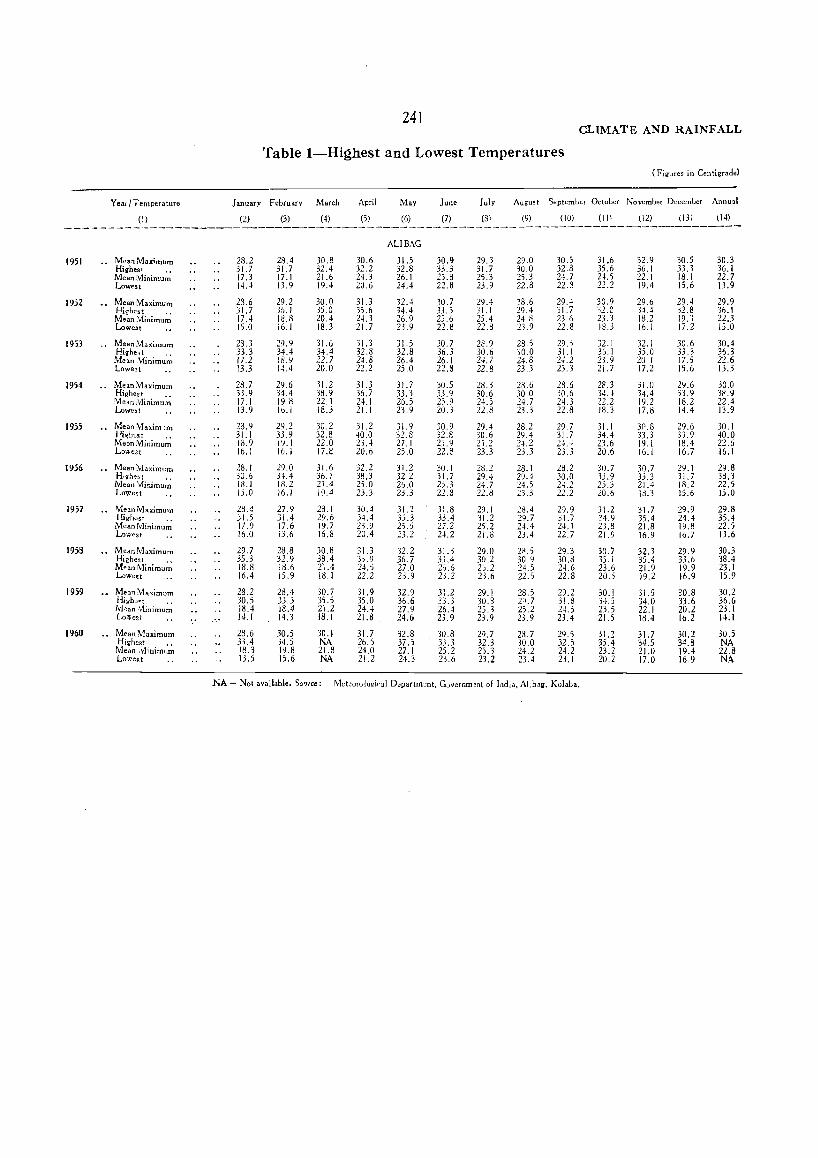
241 CLIMATE AND RAINFALL
Table 1-Highest and Lowest Temperatures (Figures in Centigrade)
Yeal/Temperature January Februarv March April May June July August September OctoLer November Decembe1 Annusl
(I) (2) (3) (4) (5) (6) (7) (8) (9) (10) (Ill (12) (13) (14)
------------------------------------------------------_--------------------------AU BAG
1951 Mean Max1mum 28.2 28.4 30.8 30.6 31.5 30.9 29.3 29.0 30.5 31.6 32.9 30.5 30.3 Highest 31.7 31.7 32.4 32.2 32.8 33.3 31.7 30.0 32.8 35.6 36.1 33.3 36.1 MeanMjnimu~ 17.3 17.1 21.6 24.3 26.1 25.8 25.3 25.3 24.7 2U 22.1 18.1 22.7 Lowest 14.4 13.9 19.4 20.6 24.4 22.8 23.9 22.8 22.S 22.2 19.4 15.6 13.9
1952 Mean Maximum 23.6 29.2 30.0 31.3 32.4 30.7 29.4 38.6 29.4 30.9 29.6 29.4 29.9 Highest j1.7 36.1 35.0 35.6 34.4 33.3 31.1 29.4 31.7 32.8 34.4 32.8 36.1 Mean Minimu~ 17.4 18.8 20.4 24.3 26.9 25.6 25.4 24.8 23.6 23.3 18.2 19.3 22.3 LoWest 15.0 16.1 18.3 21.7 23.9 22.8 22.S 23.9 22.8 18.3 16.1 17.2 15.0
1953 .. Mean ."v1aximum 28.3 29.9 31.6 31.3 31.5 30.7 28.9 28.5 29.5 32.1 32.1 30.6 30.4 High.5t 33.3 34.4 34.4 32.S 32.8 36.3 30.6 30.0 31.1 36.1 35.0 33.3 36.3 Mean l\1inimu~ 17.2 18.9 22.7 24.8 26.4 26.1 24.i 24.8 2-1.2 23.9 20 1 i7.5 22.6 Lowe::!t 13.3 J4.4 20.0 22.2 25.0 22.S 22.8 23.3 23.3 21.7 17.2 15.6 13.3
1954 MeanMaximum 28.7 29.6 31.2 31.3 31.7 30.5 28.3 23.6 28.6 28.3 31.0 29.6 30.0 Highest .• 33.9 34.4 38.9 36.7 33.3 33.9 30.6 30.0 30.6 34.4 34.4 33.9 38.9 Mean Nlinimu.n 17.1 19.8 22.1 24.1 26.5 25.9 24.5 24.7 24.3 22.2 19.2 18.2 22.4 Lowest 13.9 16. i 18.3 21.1 23.9 20.3 22.8 23.3 22.8 18.3 17.8 14.4 13.9
1955 l\1ean Maxim"lm 23.9 29.2 30.2 31.2 31.9 30.9 29.4 28.2 29.7 31.1 30.8 29.6 30.1 Hi~hest 31.1 33.9 32.8 -10.0 32.S 32.R 30.6 29.4 31.7 34.4 33.3 33.9 40.0 Me()nMinimu~ 18.9 19.1 22.0 23.4 27.1 25.9 25.2 IU 2'-4 23.6 19.1 18.4 22.6 Loweot 16.1 16.1 17.e '20.6 25.0 22.8 23.3 23.3 23.3 20.6 16.1 16.7 16.1
1956 Mean rvlaximum 2S.1 29.0 31.6 32.2 31.2 30.1 28.2 28.1 28.2 30.7 30.7 29.1 29.8 HtFhE'~t 30.6 34.4 36.1 38.3 32.2 31.7 29 .• 29.4 30.0 33.9 33.3 31.7 3S.3 Mean :Viinirnu~ 18.1 18.2 21.4 25.0 26.0 25.3 24.7 24.5 24.2 25.3 21.4 18.2 22.5 Lowest Li.O 16.1 19.4 23.3 23.3 22.S 22.8 23.3 22.2 20.6 10.3 15.6 15.0
1957 .. Mean MaximuTil 28.4 27.9 28.1 30.4 31.2 31.8 29.1 28.4 29.9 31.2 31.7 29.9 29.8 Highest 31.5 31.4 29.6 34.4 35.3 33.4 31.2 29.7 31.7 34.9 35.4 24.4 35.4
Mean Minimu~ 17.9 17.6 19.7 2>.9 25.5 27.2 25.2 24.4 24.1 23.8 21.S 19.8 22.S LOW0'st 16.0 13.6 16.8 20.4 23.2 24.2 21.8 23.4 22.7 21.9 16.9 16.7 13.6
1959 Mean~1aximum 29.7 28.8 30.8 31.3 32.2 31.3 29.0 22.5 29.3 30.7 32.3 29.9 30.3 Hi.he" 35.3 32.9 38.4 33.9 36.7 33.4 30.2 30.9 30.8 35.1 35.4 33.6 38.4 Mf'an ~linimu~ 18.8 18.6 21.4 24.5 27.0 ')' f 2,.2 24.5 24.6 23.6 21.9 19.9 23.1 ,,-Q.O
Loweu 16.4 15.9 18.1 22.2 23.9 23.2 23.6 22.5 22.8 20.5 19.2 16.9 15.9
1959 Mea., :"vIa 1:.i mum 28.2 28.4 30.7 31.9 32.9 31.2 29.1 28.5 29.2 30.1 31.5 :::0.8 30.2 High,<t 30.5 33.3 35.5 35.0 36.6 33.3 30.S 2{).7 3! .8 3-1.5 34.0 33.6 36.6 Nl"!an 'V1inimu~ 18.4 18.4 21.2 24.4 27.9 26.4 25. , 25.2 2~ .5 23.5 22.1 20.2 23.1 L.o~e::!t 14.1 14.3 IS.1 21.8 24.6 23.9 23.9 23.9 23.4 21.) 18.4 16.2 14.1
1960 Mf'an \tlaximum 23.6 30.5 30.1 31.7 32.8 30.8 29.7 23.7 29.5 31.2 31.7 30.2 30.5 Highest 3;.4 34.5 NA 26.5 37.5 33.3 32.3 30.0 32.5 35.4 34.5 34.8 NA Mean ,Vliniml~~ 18.3 19.8 21.8 24.0 27.1 25.2 25.3 24.2 24.2 23.2 21.0 19.4 22.8 LOWel'.t 13.5 15.6 NA 21.2 24.3 23.6 23.2 23.4 23.1 20.2 17.0 16.9 NA
NA ~ Not available. Sowce: Met'OIologir.1 D,partment, Government of India. Al;ba!l. Kolaba.
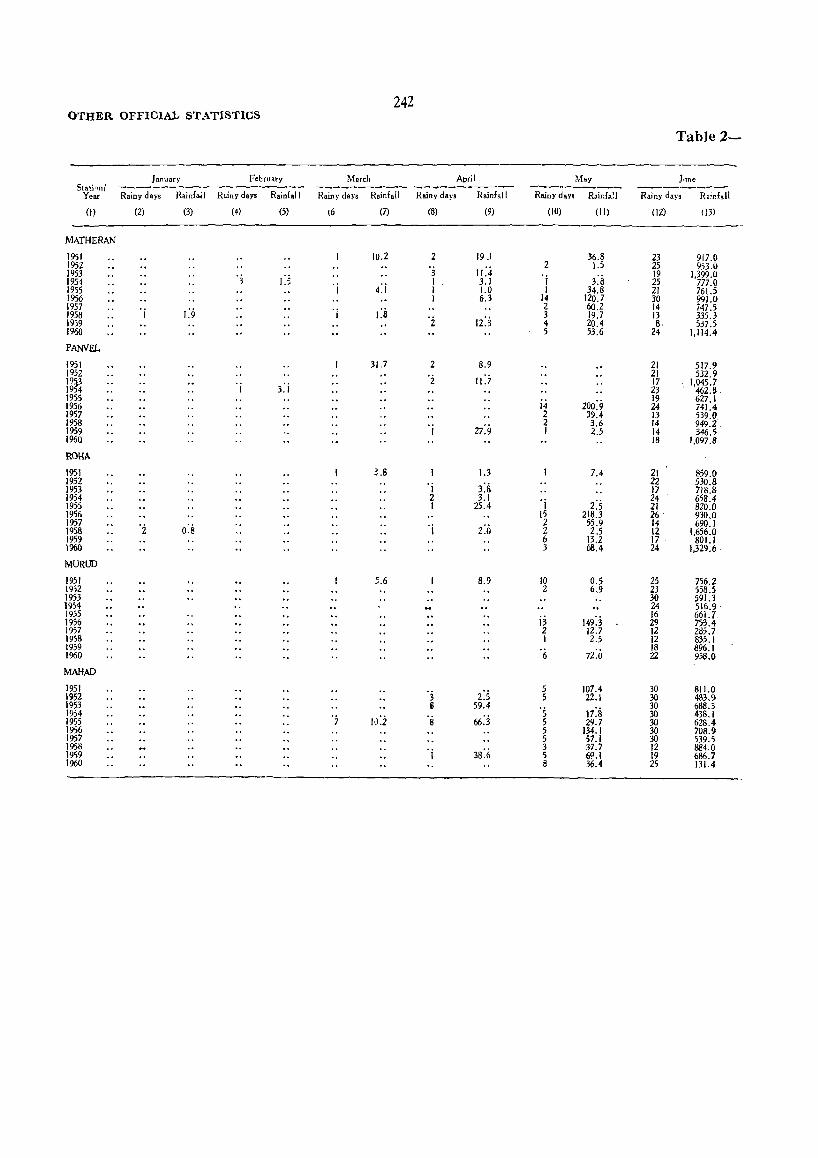
242 OTHER OFFICIAL STATlSTICS
Table 2-
January February March April May lIme Stati,",n/ -_-_ ...... _----- --------------- ------------ _...-__ .-_--.--_--- -------- -------_.
Year Rainy days Rainf"l R.iny day, Rainfall Rainy days Rainfall Rainy days Rainfall Rainy daYS R.ir.f •. !l Rainy days R.'nf.ll
(1) (2) (3) (4) (5) 16 (7) (8) (9) (10) (II) (12) (13)
MATHERAN
1951 10.2 2 19.1 36.8 23 917.0 1952 'j 11 :4 2 1.5 25 953.0 1953 'j d 'j 3:8
19 1.399.0 1954 'j 4:j
I 3. J 25 777.0 1955 I 1.0 1 34.8 21 761.5 1956 I 6.3 14 120.7 30 991.0 1957 'j (9 'j l:a 2 60.2 14 i47.5 1958 'i lz:3
3 19.7 13 335.3 1959 4 20.4 B 5375 1960 5 53.6 24 1.114.4
PANVEL
1951 31.7 2 8.9 21 517.9 1952 '2 11:7 21 532.9 19p 'j 3:i
17 . 1.045.7 194 23 . 462.8 1955
200:9 19 627.1
1956 14 24 741.4 1957 2 39.4 13 539.0. 1958
27:9 2 3.6 14 949.2
1959 I I 2.5 14 346.5 1960 18 1.097.8
ROHA 1951 3.8 1.3 7.4 21 859.0 1952 'j 3:8
22 530.8 1953 17 718.8 1954 2 3.1 'j is 24 658.4 1955 1 25.4 21 820.0 1956 15 218.3 26 930.0 1957 'i 0:8 'j 2:0
2 55.9 14 690.1 1958 2 2.5 lZ 1.656.0 1959 6 13.2 17 801.1 1%0 3 68.4 24 1.329.6
MURUD
1951 5.6 B.9 10 0.5 25 756.2 1952 2 6.9 23 558.5 1953 30 591.3 1%4 24 516.9 1955 ;3 149:3
16 661.7 1956 29 753.4 1957 2 12.7 12 285.7 1958 1 2.5 12 835.1 1959
72:0 18 896.1
1960 6 22 95S.Q
MAHAD
1951 'j 2:5 5 107.4 30 811.0
1952 5 22.1 30 483.9 1953 S 59.4 ·s 17:8
30 688.3 19;4 '] 10:2 ·s 66:3
30 438.1 1955 5 29.7 30 628.4 1956 5 134.1 30 708.9 1957 5 57.1 30 539.5 1958
'j 38:6 3 37.7 12 884.0
1959 5 60 .1 19 686.7 1960 B 36.4 2S 131.4
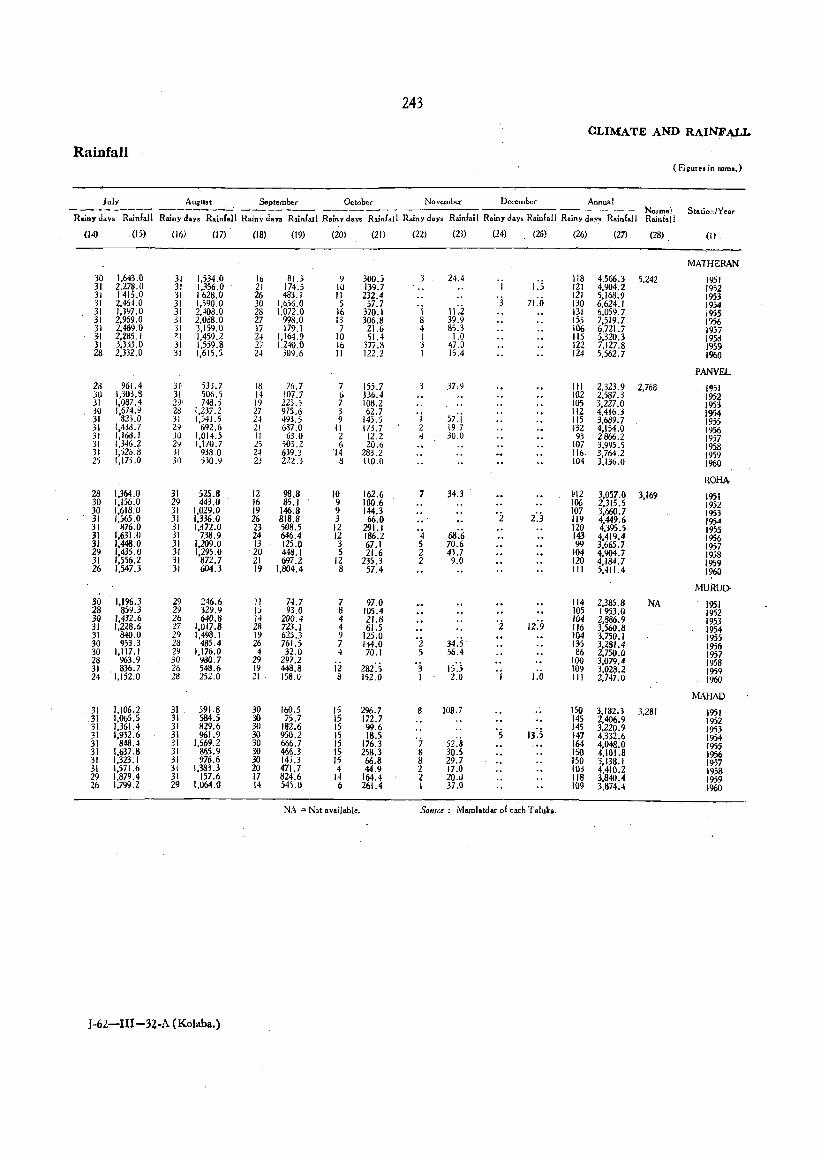
243
CLIMATE AND RAINFALL
Rainfall (Fiiures in Dlms.)
july August September October November December Annual ----_---- -------- ------ Norma} Statio:1/¥ear
Rainy day. Rainfall Rainy days Rainfall Rainy days RainEal1 Rainy days Rainfall Rainy days Rainfall Rainy days Rainfall Rainy da., Rainfall RainEaIl
(14) ,(15) (16) (17) (18) (19) (20) (21) (22) (23) (24) (25) (26) (27) (28) (I)
MA1HERAN 30 1,643.0 31 1,534.0 16 81.3 9 300.5 3 24.4
1:5 118 4.566.3 5.242 1951
31 2,m.O 31 1,356.0 21 174.5 10 139.7 I 121 4.904.2 1952 31 1411.0 31 1628.0 26 483.1 II 232.4 '3 71 :0
121 5,168.9 1953 31 2,46 .0 31 1,590.0 30 1,656.0 5 57.7 'i 11:2
130 6,624.1 1954 31 1,397.0 31 2,~O3.0 28 1.072.0 16 370.1 131 6,059.7 1955 31 2,969.0 31 2,088.0 27 998.0 13 306.8 8 39.9 155 7,519.7 1956 31 2,469.0 31 3,159.0 17 179.1 7 21.6 4 85.3 106 6,721.7 1957 31 2,td5.1 ~I 1,459.2 2~ 1,164.9 10 SI.4 I 1.0 115 5,320.3 1958 31 3,3j~.0 31 1,559.8 27 1.240.0 16 377.8 3 47.0 112 7,127.8 1959 28 2,33Z.0 31 1,615.5 24 309.6 II 122.2 1 15.4 124 5,562.7 1%0
PANVEL 2B 961.4 31 533.7 18 76.7 7 155.7 3 3709 Itl 2,323.9 2,768 1~51 3\) 1,303.8 31 506.5 14 107.7 6 .139.4 102 2,587.3 1952 31 1,087.4 29' 748.5 19 225.5 7 108.2 105 3,227.0 1953 30 1,674.9 2& 1,231.2 27 975.6 :> 62.7
57:i 112 4,4163 1954
31 82;.0 31 1,541.5 24 493.5 9 143.5 I 115 3,689.7 1955 31 1,43d.7 29 !l92.6 21 687.0 II 173.7 Z 19 7 1-32 4,154.0 1956 31 1,168.1 30 1,014.5 II 63.0 2 12.2 4 30.0 93 2866.2 1957 31 1,346.2 29 1,170.7 25 505.2 6 20.6 107 3,995.5 1958 31 1,526.8 31 933.0 24 639.3 14 283.2 116· 3,764.2 1959 25 1,175.0 30 530.9 23 222.3 8 110.0 104 3,136.0 1960
ROHA
28 1,364.0 31 525.8 12 98.8 10 162.6 7 34.3 1'12 3,057.0 3,169 1951 30 1,156.0 29 443.0 16 85.1 9 100.6 106 2,315.5 1952 30 1,618.0 31 1,029.0 19 146.8 9 144.3 '2 2:3
107 3,660.7 1953 31 1,565.0 31 1,336.0 26 818.8 3 66.0 119 4,449.6 1954 31 876.0 31 l,d72.0 23 508.5 12 291.1 '4 68:;; 120 4,395.5 1955 31 1,631.0 31 738.9 24 646.4 12 186.2 143 4,419.4 1956 31 1.448.0 31 1.209.0 13 125.0 3 67.1 5 70.6 99 3,665,7 1957 29 1,435.0 31 1,295.0 20 448.1 5 21.6 2 43.7 104 4,904.7 1958 31 1,556.2 31 872.7 21 697.2 12 235.3 2 9.0 120 4,184.7 1959 26 1,547.3 31 604.3 19 1,804.4 8 57.4 III 5,411.4 1%0
MURU[}
30 1,196.3 29 246,6 II 74.7 7 97.0 114 2,385.8 NA 1951 28 859.3 29 329.9 15 93.0 8 105.4 105 1953.0 1952 30 1,432.6 26 640.8 14 ZOO.4 4 21.8 'i 12:9
104 2,1186.9 1953 31 1,228.6 27 1,017,8 28 723.1 4 61.5 116 3,560.8 1954 31 840.0 29 1,498.1 19 625,3 9 125.0 'i 34:5
104 3,750.1 1955 30 953.3 28 485.4 26 761.5 7 144.0 135 3,281.4 1956 30 1,117.1 29 1,176.0 4 32.0 4 70.1 5 56.4 86 2,750.0 1957 28 963.9 30 980.7 29 297.2
ii 282:5 'j IS·.S 100 3,079.4 1958
31 . 836.7 26 548.6 19 448.8 'j ,:0 109 3,028.2 1959 24 1,152.0 28 252.0 21 158.0 8 IS2.0 I 2.0 III 2,747.0 1960
MAHAD 31 1,106.2 31 591.8 30 160.5 IS 296.7 8 108.7 150 3.182,3 3,281 1951 31 I.ObS.5 31 584.5 30 75.7 IS 172.7 145 2,406.9 1952 31 1,361.4 31 829.6 30 182.6 15 99.6 '5 13:5
145 3,220.9 1953 31 1,932.6 31 961.9 30 950.2 15 18.5 '7 52:8
141 4,332.6 1954 31 848.4 31 1,569.2 30 666.7 IS 176.3 164 4,048.0 1955 31 1,637.8 31 865.9 30 466.3 15 258.3 8 30.5 .ISO 4,101.8 1956 31 1,323.1 31 976.6 30 145.3 15 66.8 8 29.7 150 3,138.1 1957 31 1,571.6 31 1,383.3 20 471.7 4 44.9 2 17.0 103 4,410.2 1958 29 1,879.4 31 157.6 17 824.6 14 164.4 2 20.,) 118 3,840.4 1959 26 1,799.2 29 1.064.0 14 545.0 6 261.4 1 37.0 109 3,874.4 1%0
NA = Nat available, SOUTC<: Mamlatdar of each T sluk •.
J-6Z-nI-n-A (Kolaba,)
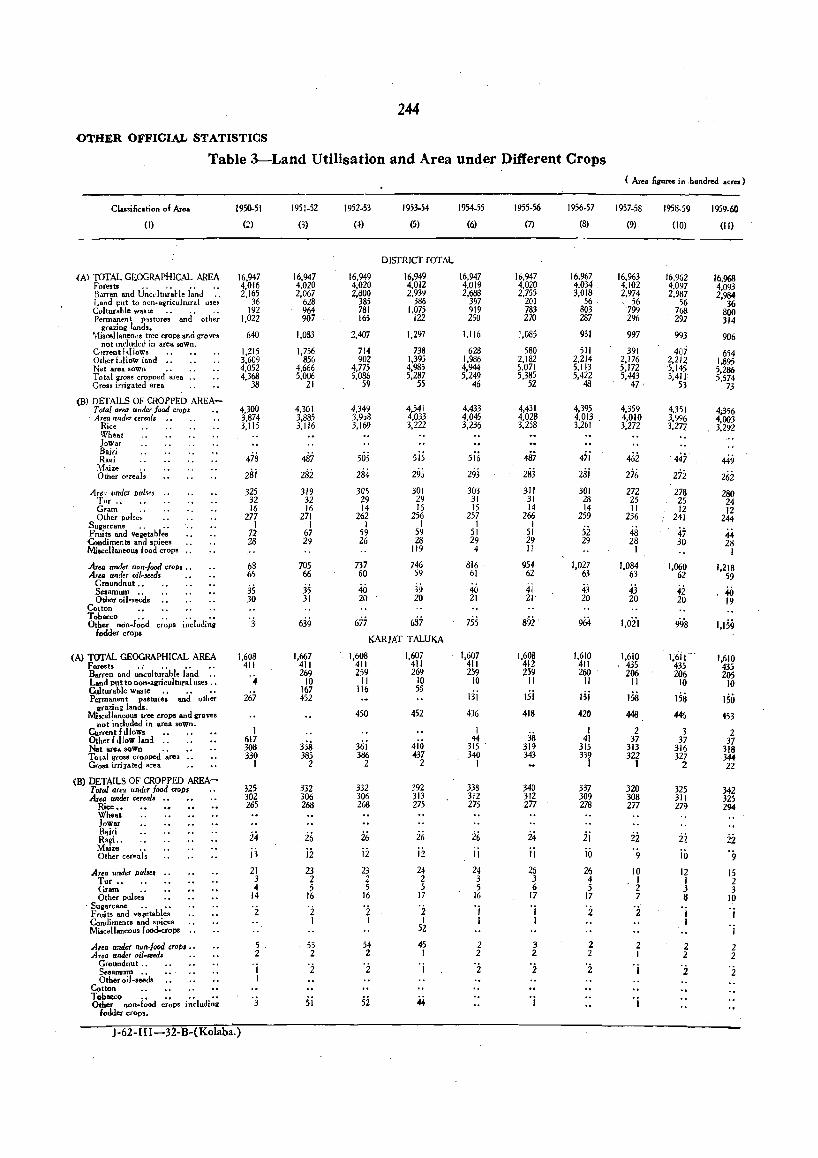
244
OTHER OFFICIAL STATISTICS
Table 3-Land Utilisation and Area under Different Crops
Clu,ilicat;on 01 Arca
(i)
(A) TOTAL GEOGRAPI1ICAL AREA Forests .. .. •• .• BdITen and Uncdtur.He l.nd .• Land put to non~agricultural uses Culturable waste .. .. .. Permanent p:iStures and tither
grazing land •• \1iscellaneous tree crops and groves
not mrluded in area soWn. c.,rrent bIlows .. Other hllow land •• Net area sOWn •• Total gross cropDed area .. Gros! irrigated area
(B) DETAILS OF CROPPED AREA-T oial area lInder food crops .• Area under cereals ; .
Rice Wheat lownr Bairi RaSli
Maize .. Other cereals
ATe" undeT /Julses .• Tur .. Gram ., Other pu I,., ..
Sugarcane .. .• Fruits and vegetables Condiments and spices Miscellaneous food crop. ••
Area under non-food crop, •. Area undet oil-seeJs
Groundnut .. S.lamum .. Other oil-secds
Colton Tobacco .. ...• Other non.-food crops including
fodeler cropo
(A) TOTAL GEOGRAPHICAL AREA Forests ... " .. .. Barren and unculturabl. land .. Land put to non.agricultural uses .. Culturable waste . , PermlUlent pasture, and other
srra'?:ing lands. Miscellaneous tree crops and groves
not included in area SoWn. Curren tf tllow. • • Otherf ,llow land .. Net area sOWn .• Total g(OSS cropped area •. Gross irrh'ated area
(B) DETAILS OF CROPPED AREA-Total area under food crops •• Area under cereal. ••
Rice •• Wheat Jowar Sairi Ralli .• Maize " Other cereals
.Area u!'Ider pulse. . . Tur •• Gram .• Other pulses
Sugarcane .. .. Fruits and ve~tables Condiments and spices Miseellaneou. food-crops
Are. under non-food croP' •• Area under oil .. seeds
Groundnut .. Sesamum .. Other o;I-seeds
Cotlon Tobacco •• " .. •• Other non-food crop. includinw
fodder crops.
1950-51
(~)
16.947 4,016 2,165
36 192
1,022
640
1,215 3,609 4,052 4.368
38
4,300 3.874 3,115
478 2sj
325 32 16
277 I
72 28
6S 65
35 30
1,608 411
':' 267
I 617 308 330
I
325 302 265
:.14
13
21 3 4
14
'2
5 2 'j I
'3
J-62-III 32-B-(Kolaba.)
1951_52
(3)
16,947 4,020 2,067
628 964 907
1,083
1,756 856
4.666 5,006
21
4,301 3,885 3,116
487
282 319 32 16
271 I
67 29
705 66
35 31
1,667 411 269
10 167 452
358 385
2
332 306 268
26 ii 23 2 5
16
'2 I
53 2
'i
si
1952-53
(4)
16,949 4,020 2,800
385 781 165
2.407
714 902
4,775 5,086
59
4,349 3,958 3,169
505 284 305 29 14
262 1
59 26
1953-54
(5)
DISTRICfTOTAL
16,949 4,012 2,939
386 1,075
122
1,297
738 1,395 4985 5:287
55
4,541 4,033 3,222
5is 295 301 29 16
256 I
59 28
119
737 746 60 59
40 39 20 20
677 637 KARJAT TALUKA
1,60B 411 259
II 116
450
36i 386
2
332 306 268
26 ii 23 2 5
16
·z 1
54 2
'2
si
1,607 411 269
10 55
452
410 437
2
392 313 275
i6 12
24 2 5
17
'i I
52
45 I
'j
1954-55
(6)
16,947 4,019 2,688
397 919 250
1,116
628 1.986 4944 5:249
46
4,433 4,045 3,236
5ii,
29j 303
31 15
257 I
51 29 4
816 61
40 21
1,607 411 259
10
di 436
1 '14
315 . 340
I
338 312 275
26 ii 24 3 5
16
'j I
2 2
'2
1955-56
(7)
16,947 4,020 2,755
201 783 270
1,085
580 2,182 5,071 5,385
52
4,431 4,028 3,258
487 283 311
31 14
266 I
51 29 II
954 62
4i 21
892
1,608 412 259
II
lsi 418
38 319 343
340 312 277
24 ii 26 3 6
17
'j I
3 2
'2
16.967 4.034 3,018
56 803 287
931
511 2,214 5,113 5,422
48
4,395 4.013 , 3.261
4ti 28;
301 28 14
259
52 29
1,027 63
43 20
1,610 411 260
II
i5i 426
1 41
315 339
1
337 309 278
ij
iii 26 4 5
17
'2
2 2
'2
( Area Jig ..... in .bundred acres)
1957-58
(9)
16,963 4.102 2,974 , 56 799 296
997
391 2,176 5.172 5,443
47·
4.359 4,010 3,272
462
276 272 25 11
236
48 28
I
I,OB4 63
43 20
1,610 435 206
II
IS8 448
2 37
313 322
I
320 308 277
i2 9
10 I 2 7
'2
2 I
'j
'j
1958-59
(10)
16,962 4.097 2.987
56 768
, 29]
993
401 2,212 5,145 5,411'.
53
4.351 3,996 3,277
, 447 272
278 25 12
241
47 30
1,060 62
42 20
1.611 435 206
10
158 446
3 37
316 327
2
325 31I 279
i2 io 12 I 3 B
I I
2 2
'2
1959.611
(II)
16,968 4,093 2.984
36 800 314
906
654 1,895 5,286 5,574
73
4;356 4,003 3.292
449 262 280 24 12
244
44 28
I
1,218 59
40 19
1,159
1,610 435 205
10
150
453
2 37
318 3# 22
342 325 294
2i 9
15 2 3
10 OJ
'j
2 2
'2
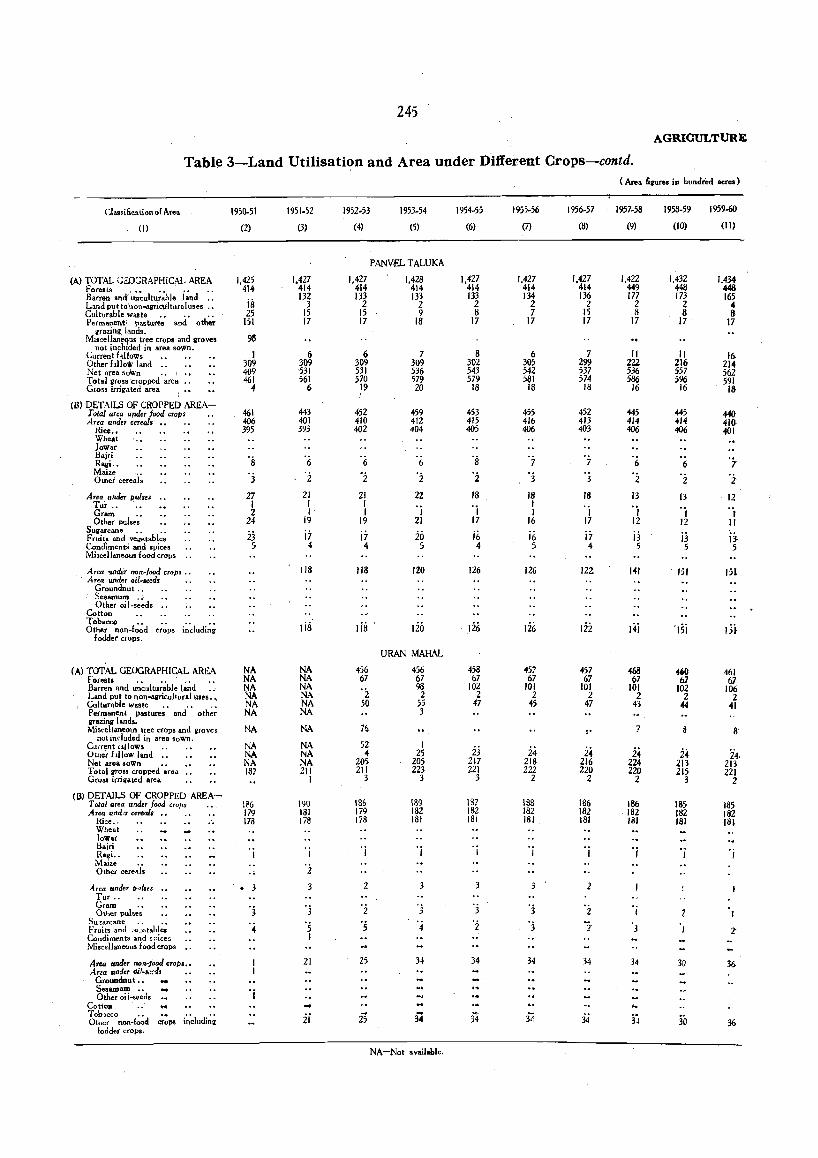
245
AGRICULTURE
Table 3-Land Utilisation and Area under Different Crops-contd,
CI .. ,ilication 01 Area
(I)
(A) TOTAL GEOGRAPHICAL AREA Fore.t~ I, •• •• •• ••
Barren anc!' unculturable land .. Land put to'non...agrieulturaluses .• Cult"rable waste .• ., .. Permanent I pastures and other
grazing J',ands. Miscellanequs tree Cfops and groves
not inclUded in area sown. Current hllows •• Other hllo", land .• Net area soWn .• ~ Total gross 'Cropped are. Gross irrigated area
(B) DETAILS OF CROPPED AREATotal area under food CTOP' Area under ctTeais •• • •
Hice •• Whe.t Jowar Hajti Ragi .• Maize .. Other cereals
Area. under pul .. , .• Tur .• Gram .. Other pulses
Sugarcane .• .• Fruits and vegetables Cond~mentS and spices Mi3cellaneow5 food crops .•
Area !lnde'r non-lood crops .• . Area under oil·seeds •.
Gtoundnut .• Sesamum " Other oi I·seeds
Cotton Tobacco.. ...• Other non-food crops including
f odder crops.
(Al TotAL GEOGRAPHICAL AREA Foresto .•. .• ., Barren and uncuiturable land .• Land put to non-iliricult.1.1ra.1 uses .• Culturable waste . . . . . : Permanent pastures and other If"zing land$. Miscellaneous tree crops and groves
not included in area soWn. Cal"rent uHows .. Otiler f .How land •• Net area soWn •• Total wross cropped area •• GrQS$ itrigated area
(8) DETAILS OF CROPPED AREA-T oIal area under food crops •• Area und!T ceretU'
Hice .. Wheat 10Wa( Bajri Ragi •• Maize •• Other cere-Jl:ls
Area under tJtllses Tur .• Gram ., Other pulses
Suzarcane .• .• Fruits and ~·e",etabJe, Condiments and s;:>ices Miscellaneous food crops
Area under JUJn-jood crop ••• Afla under ";1 •• ,,;1,
Groundnut •• Sesamarn •• Other 0; i-seeds
Cotto" Tob,cco .. .•.• Other non-Iood crops includinq
fodder crops.
1950-51
(2)
1,425 414
iii 25
151
98
J 309 409 461 .. 461 406 395
's 3
27 I 2
24
ij 5
NA NA NA NA NA NA
NA
NA NA NA 187
1~6 179 178
.. • 3
'3 4
'j
1951-52
(3)
1,427 414 132
3 15 17
6 .309 ~I 561
6
443 401 393
6
'2 21 I I
19
i7 4
118
lis
NA NA NA NA NA NA
NA
NA NA NA 211
I
190 181 178
'j
'2
. 3 '5 I
21
ii
1952-53
(4)
1.427 414 133
2 15 17
6 309 531 570
19
452 410 402
'6 '2 21 I I
19
i7 4
118
456 67
'2 so
71;,
52 4
205 211
3
186 179 liB
'j
2
2
'5
25
1953-54
(5)
P ANva TALUKA
1.428 414 133
2 9
18
7 309 536 579 20
459 412 404
6
'2 22
°i 21
iii 5
120
lio
URAN MAHAL
456 67 98 2
55 3
I 25
205 223
3
189 182 181
'j
3
'j
4
34
NA-Not avoilable.
1954-55
(6)
1.427 414 133
2 8
17
8 302 543 579
18
453 415 405
's '2 18
'j 17
ii; 4
126
12i;
458 67
102 2
47
ij 217 221
3
'j
3
34
1955-56
(7)
1.427 414 134
2 7
17
6 305 542 581
18
455 416 406
'7 '3 18 I I
16
jf, 5
126
Iii;
457 67
101 2
45
24 218 222
2
188 182 181
'j
3
'j
3
34
1956-57
(8)
1.427 414 136
2 15 17
7 299 537 574
18
452 413 403
'7 3
18
"1 17
i7 4
122
Iii
457 67
101 2
47
2.j 216 220
2
186 182 181
'j
2
34
34
(Area IillUre. in hundred acre.)
1957-58
(9)
1.422 449 177
2 8
17
II 222 536 586
16
445 414 406
6
'2 13
"I 12
ij 5
141
14;
468 67
101 2
43
24 224 220
2
186 182 181
'j
34
1958-59
(10)
1,432 448 173
2 8
17
II 216 557 596
16
445 414 406
6
2
13 '°1 12
i3 5
151
'15i
~,o
67 102
2 44
2~ 213 215
3
185 182 161
'j
30
1959-60
(II)
1.434 448 165
4 a
17
16 214 562 591
18
440 410 401
12 Of II
jj. 5
151
461 67
106. 2
41
24. 213 221
2
185 182 181
'j
36
36
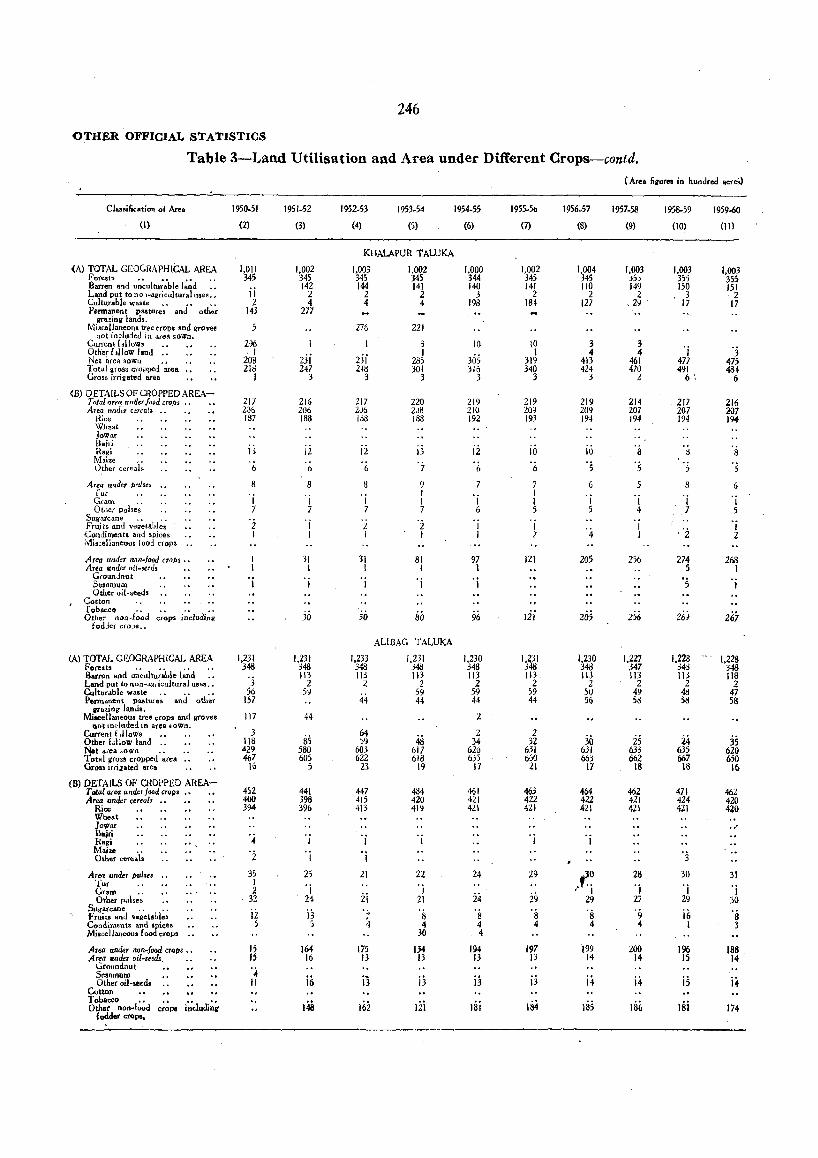
246
OTHER OFFICIAL STATISTICS
Table 3-Land Utilisation and Area under Different Crops-cQntd.
Classi&cat;on 01 Area
(l)
(A) TOTAL GEOGRAPHICAL AREA Fore$1:; •• •• •• Batren and unculturable land " Land put to nOt .. aiti.culturalllses .• Culturable waste " " " Permanent p .. tures and other
grazing lands, Miscellaneous tree crops and groves
not included ·in area sOWn. Current! ,Bows , • Otherf"low land ,. Net area soWn •• Total gros.s clopped area Gross irrigated area
(B) DETAILS OF CROPPED AREA-Total area untler fOCld crops .• Area under cerca[3
);{ice Wheat lowar Ba;ri Ragi Mlize " Other cereals
Area under ".u .. , Cur
Gram ., Otner Pul,.s ' ,
SUQ'arcane .• .• Fruits and vegetahles Condiments and spices Mi"ellaneau. 100:1 crop.
Are. under nan-food eroM '. Area under I){{ .. seeds
GrounJnut Sesamum Other oil-seods
Cotton Tobaec.. " '. '. " Othe:- nonAood crops includiog
fodJ.r erO;>ll,.
(A.I TOTAL GEOGRAPHICAL AREA Forest!! .• •• •• Barren and unculturable land , • Land put to non-ag(icultural. uses •• Culturable W35te ,. " Permanent pastures and other
vtQ.zing lands. Miscellaneous tree <rO»$ and 111'0"'.
not mducted in .area !lown. Current f ,1I0Ws ,. Olher fallow land ,. Net &((!a EOWIl •• Total ira,. cropped ar •• Gros. irtilated area
(B) DETAILS OF CROPPED AREA-T DIal are« under food cr.p. " •• Ar .. under cereal,
Rice Wheat Jowar Bajri Hagi Maize " Other cereals
Area under pul", Tur Gram .. Other pulses , •
Sugatcane .• •• F rui Is and .eget.ble. Condiment.s and $pices Mjseellaneou, food crops
Ar .. under 1I1Jn-food crops •• Area under ail-seeds
Groundnui Sesamum Other oil-seed.
Cotton Tobacco.. .••• Oth.r non-Iood crops including
fodder ctol'$.
1950.51
(2)
1,011 34:;
ii 2
143
5
Z'l6 I
208 21$
1
211 2J6 187
i1 '6 8
'j 7
'z I
'j
1,2.31 348
'j 56
1S7
117
3 118 429 467
16
452 400 394
'.4 '2 35 I 2
32
ii 5
15
" ' .. II
1951-52
(3)
1,002 345 142
2 4
277
z3i 247
3
21~ 206 188
ii ,(,
8
'j 7
'j 1
31 1
I
30
1,231 348 113
2 59
44
85 580 605
5
441 398 396
I
1
25 'j 24
i3 5
164 16
i6
148
1952-53
(4)
1953-54
(5)
KHALAPUR TALUKA
1,003 34) 144
2 4
276
I
23i 2~tl
3
217 21)6 1d8
ii 6
8
'j 7
2 I
31 I
I
30
1,233 348 ILl
2
44
64 )9
603 622
23
447 415 413
'j
1
21
ii
175 13
i3
1,002 345 141
2 4
221
3 1
283 :>01
3
220 2JB 188
i3 '7 9 I 1 7
'z I
81 I
'i
80
ALlBAG TALUKA
1,231 348 113
2 59 44
48 617 618
19
484 420 41':1
22
! 21
'il 4
30
134 13
i3
Iii
1954-55
(6)
1,000 344 140
3 198
10
305 316
3
219 210 192
ii 6
7
'j 6
I I
97 I
'i
il6
1,230 348 113
2 59 44
2
2 34
626 655
17
¥.il 421 421
24
24 '8 4 4
194 J3
ij
1955-56
(7)
1,002 345 J41
2 18~
10 I
319 340
3
219 20'1 193
10
'j,
7 I I 5
I 1
121
1,431 348 113
2 59 44
2 32
631 660
21
463 422 421
2,}
29 's 4
197 13
jj
1956.57
(8)
1,004 34) 110
2 127
3 4
413 424
3
219 209 194
iii 's 6
'j 5
20;
205
1,230 348 113
2 50 56
30 631 663
17
464 422 421
'j
f~~ " I
29
's 4
199 14
i4
(Area hgnr"" in hu"drtd acre;.)
1957-58
(9)
3 4
461 470
2
214 207 194
's '5 5
1 4
I I
2)6
256
1,227 347 113
2 49 58
:15 633 662
18
462 421 421
28 'j 27
'9 ~
200 14
i4
136
1958-59
(10)
1.003 355 150
3 17
'j 477 491
6 "
.217 207 194
5
8
1 7
274 5
'5
1,228 34~ 11>
2 4d 58
i4 635 667
18
471 424 421
'j
30
'i 29
i6 I
196 15
lsi
1959-60
(11)
1,003 355 151
2 17
'j 475 48'
6
216 207 194
6
'j 5
1 2
268 1
I
267
1,228 348 118
2 47 58
35 620 650
16
462 420 420
31
'i 30
's 3
188 . 14
i4
174
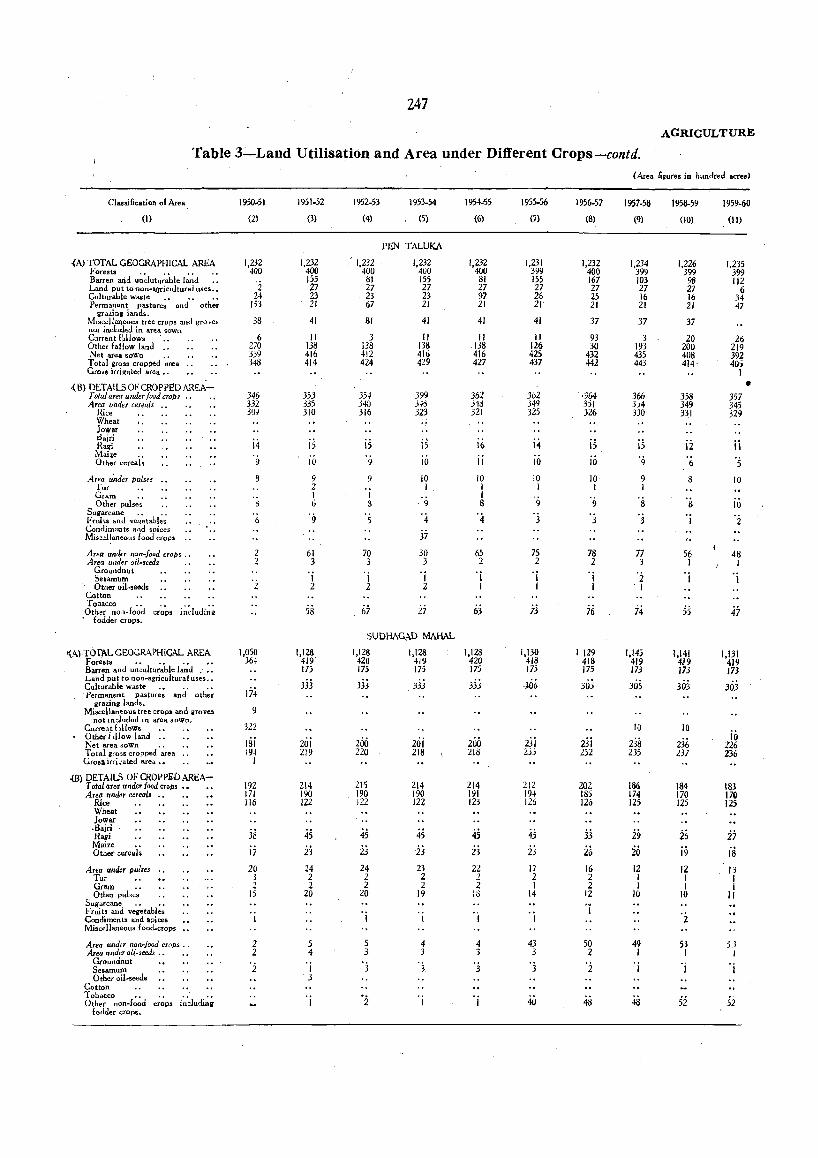
247
,AGRICULTURE
Table 3-Land Utilisation and Area under Different Crops-contd,
Classification of Are.
.(A) TOTAL CEOGRAPHICAL AREA Forests .• •• •• Barren and uncluturable land " " Land put to non-agricultural uses •• Culturable waste " , " " " " Permanept pastures and other
gra'z.in, lands. Miscellaneous tree crops and groves not indi.lded. in area sown Current f~lIows .• Other fallow land " " Net area ,soWn •• Total gross croppe:d area .• GfOS$ iuigated area ..
-< B) DETAILS OF CROPPED A.,{EATotal area under food crops Area under cereals
Hice Wheat JoWar ):Iajri Ralli Maize "" Other cereals
Area u"nder puls~s fur
Gram ., Other pulses
Sugarcane .• .. F-ruits a.nd vegeta.bles Condiments a,ld spices Mis:::..!lIaneous food crops
Area under lJon~Jood crops .• Area under ail-seeds
Groundnut Sesamum Other oil-seeds
Cotton Tobacco"" """" Other no.-food crops indudin2
" fodder crops.
,(,t.,,) TOTi\L GSOGRAPHiCAL AREA Forests " "' "" ., Bacren and unculturable land .. "' Land put to non.-agricultural uses •• CulturabJe waste •• . • . • , Permanent pastures and other
grazing lands. Miscellaneous tree ctops and groves
not In.:::luded in area soWn. Curre,t hllows ., Other i<llow l.nd ". Net area soWn •. .Total geoss cropped area .• Gross i([i .:ated area. ••
.(8) DETAILS OF CROPPED AREA-T ofai area under/oad crops " , , Are(! under cereals
Rice Wheat Jawor ,Bajri Ragi Maize "' Otaer' cereals
Area under pulses " • Tur Gram "" Other pulses .•
Sugarcane •• •• Frujts and vegetables Condiments and spices Miscellaneous food-crops
Area under non-food cr(l!Js •. Area under oil-seeds ••
Groundnut Sesamum Other oil-seed.
Cotton Tobacco eo _ ••••
Other non-food crops includinll fodder crops.
1950.51
(2)
1,232 400
2 24
153
38
6 270 339 348
346 332 309
14
9
2 2
1,050 364
174 9
322
lsi 194
I
192 171 116
38 i7 20
3 2
15
2 2
"2
1951.52
{3}
1,232 400 155 27 23 21
41
II 138 416 414
353 335 310
is 10
9 2 1 6
"9
61 3
I 2
58
1,128 419 175
333
20j 219
214 190 122
45 ij 24 2 2
20
5 4
"i 3
"j
1952-53
(4)
1232 '400
81 27 23 67
81
3 138 412 424
354 J4D 316
is ')
9
I 8
" 5
70 3
I 2
67
1953.54
(S)
PEN TALUKA
1,232 400 155 27 23 21
41
II 138 416 429
399 ,>111 323
is 10
10 1
9
"4 37
30 3
"j 2
27
SUDHAGAD MAHAL
1,128 420 175
lH
200 220
215 190 122
45 23 24 2 :2
20
"i
5 3
3
1,128 419 175
3jj
20j 218
214 190 122
45 ij 23 2 2
19
4 3
" 3.
"j
1954-55
(6)
1,232 400
81 27 97 21
41
II 138 416 427
362 ,4d 321
16
ji 10 1 I 8
"4
65 2
"j I
63
1,128 420 175
3jj
200 218
214 191 123
45 2j
22 2 2
18
4 3
"j
"j
1955-56
(7)
1,231 399 155 27 26 21'
41
II 126 425 437
362 ,49 325
14 10
10 1
"9 " 3
75 2
"j 1
73
1,130 418 175
-:>06
2ji 2))
212 I9~ 126
.jj
ij 17 2 1
14
43 3
"j
1956-57
(8)
1,232 400 167 27 25 21
37
93 30
432 442
. "364 3)1 326
is 10
10 I
9
"j
78 2
"j I
76
I 129 418 175
30';
2,ii 2')2
202 185 126
j3
26 16 2 2
12
"I
50 2
"2
48
(Area haure. in hundred acres)
1957-58
(9)
1,234 399 103 27 16 21
37
3 193 435 443
366 3)4 330
is "9 9 1
S
"j
77 3
"i I
j.j
1,145 419 173
305
I,)
238 235
186 174 125
,29 20 12 I I
10
49 I
I
48
1958-59
(10)
1,226 399
98 27 16 21
37
20 200 408 414"
358 349 331
ji '6 8
S
I
56 I
"j
55
1,141 4J9 173
303
10
236 237
184 170 125
,26 j9 12 I I
10
53 I
"j
si
I 959-6{l
(II)
1,235 399 112
6 34 47
26 219 392 405
I
357 345 329
ii "5 10
10
"i
48 I
I
1,131 419 m 303
io 226 236
183 178 125
ij
is 13 I 1
II
53 I
'j
•
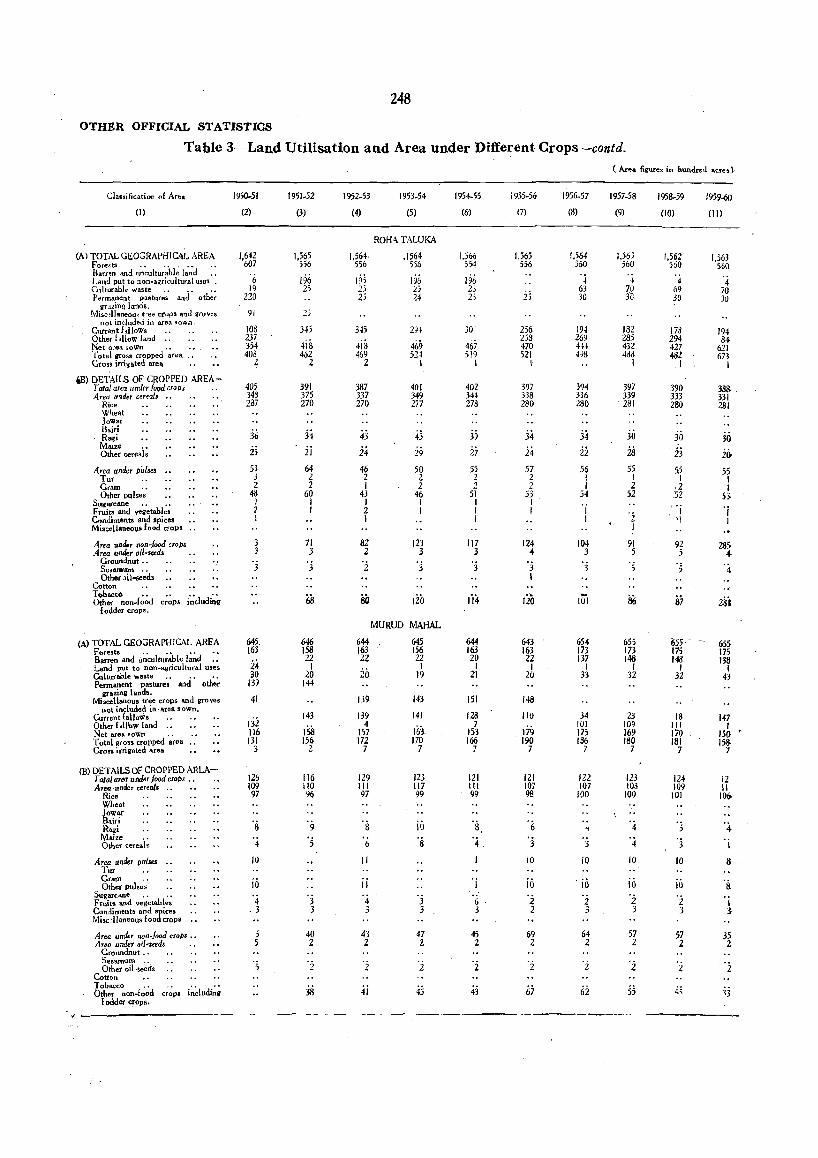
248
OTHER OFFICIAL STATISTICS
Table 3-Land Utilisation and Area under Different Crops-contd,
Classification of Area
(I)
(A) TOTAL GEO::;RAPHlCAJJ AREA Fore3ts .• .." .. Barten and unculturahle land .• Land put to non .. a~(ficultural uses • Culturabl. waste , , , , , , Permanent pastures and othet
grazing lands, !Vtisc~lIaneou::, t:ee crops Si'ld groves
not included in area sown. Cutrent hIlows " Othe, hllow I.nd " Net o:ca soWn •• • .. Total gross cropped area ., Gross irrigated" area
tBl DSTAILS OF CROPPED AREA-Total area under food crop, " Area v..,der ceTf!'2ls ••
Rice Wheat Jaw"' Bajri Ragi Maize " Other cereals
Area under pulses " Tu, G,am " Other pulses
Sugarcane .• .• F cuits aod vegetable. Condiments and $pices Miacellaneou, food crops ..
Area under non-lood :rop, Area under oil-... d.
Groundnut, , Ses.taum .. Oth.r oil....,.d,
Cotton Tobacco" ,,', Othet non_lood c,op' including
f odder crops,
(A) TOTAL GEOGRAPHICAL AREA F()rests •• •• •• ~ .. Barren and linculturable land , , Land put to non-agricultural uses <:...Iturable waste " , , ' , Permanent pastures and other
grazinll lands, Miscellanou5 tree crops and groves
not include.d. in-area soWn. CurrentfaUows ,. ,. Other hll'ow land " Net area sown . • • • Total gross cropped area " Gross irrigated area
(B) DETAILS Or CROPPED ARLA-Total area under food croP' " ' , Alec ,unde,. ctreals ..
Rice Wheat }owar Bajri Ragi Maiz. " Other cereals
A ". under pulses , , Tur Cram .. Other pulses , ,
Sugarcane ., .• F 1'llits and vegetab16 Condirnenb and spices Mi,dlaneou, food crops
Area IInckr nofl-food crops ~ • Area under oil-seeds
Groundnut ., Sesamum .. Other oil-seed.
Cotton lobacco ., .... Other non-food crops including
f odder crops,
1950-51
(2)
I,~~~ ,(, 19
220
91
lOS 237 354 408
2
405 343 287
36 25 53 3 2
48 I ? I
'j
645. 163
2.i 30
139
41
13i lib 131
3
126 109 97
's 4
10
iii 4
- 3
5 5
1951-52
(3)
1.565 556
196 25
345
4is 462
2
391 375 270
j~
2i 64 2 2
60 I I
71 :3 'j
646 158 22
I 20
144
143
lsa 156
2
116 110 96
'j 3
40 2
38
1952-53
(4)
1,564 556
195 2:; 25
345
413 469
2
387 337 270
43 24 46 2 I
43 I 2 I
82 Z
'Z
80
644 163 22
20
139
139 4
157 172
7
129 III 97
's I)
II
ij 4 3
43 2
41
1953-54
(5)
ROIH TALUKA
.1564 5S6
196 25 24
29~
469 524
I
401 349 2i7
43 29 50 2 2
46 I I
123 3
MURUD MAHAL
645 156 22
I 19
143
141
163 170
7
123 117 99
io 8
3 3
47 Z
45
1954-55
(6)
1.566 5>4
196 23 25
301
4&7 519
1
402 344 278
39 27 55 2 2
51 I I I
II7 3
3
644 163 20
I 21
151
128 7
153 166
7
121 III 99
's 4.
'i Ii 3
45 2
43
1955-56
(7)
1,565 556
j: _J
256 253 470 521
I
397 338 280
34 24 57 2 2
53 I I
124 of 'j I
lib
643 163 22
1 20
148
110
179 190
7
121 107 98
'6 , 3
10
io 'i 2
69 2
67
1956-57
(8)
1.564 550
'4 63 30
194 269 4H 498
394 336 280
34 22 56
I I
54
I I
104 3 'j
65 .. 173 137
I 33
34 101 17) 186
7
122 107
100
4 , .3
10
io 2 3
64 2
Iii
( Are. figllr •• in hundred ac,e.).
1957-58
(9)
1.563 560
'4 70 3D-
182 285 432 4dd
I
397 339 281
jo
2S 55
I 2
52
'2 I
91 5
's
655 173 148
I 32
23 109 169 180
7
123 103
100
'4 '4 10
iii '2 3
57 2
55
1958-59
(10)
1,562 560 , 4 69 30
178 294 427 482
I
390 331 280
30 ij 55
I ,2 52
I 'I
92 5
87
655 175 148
I 32
18 III 170 181
7
124 109 101
'5 '3 10
io 2 3
57 2
1959-60
(Ill
1,563 56ll
4 70 30
194 84
621 673
I
388 331 281
30 io,
55 I I
5J.
'j I
285-.. 4
65> 175 138
I 43
147 I
IS!} • 15S
1
12 II 10~
'. I 8
'a 'i 3
35 2
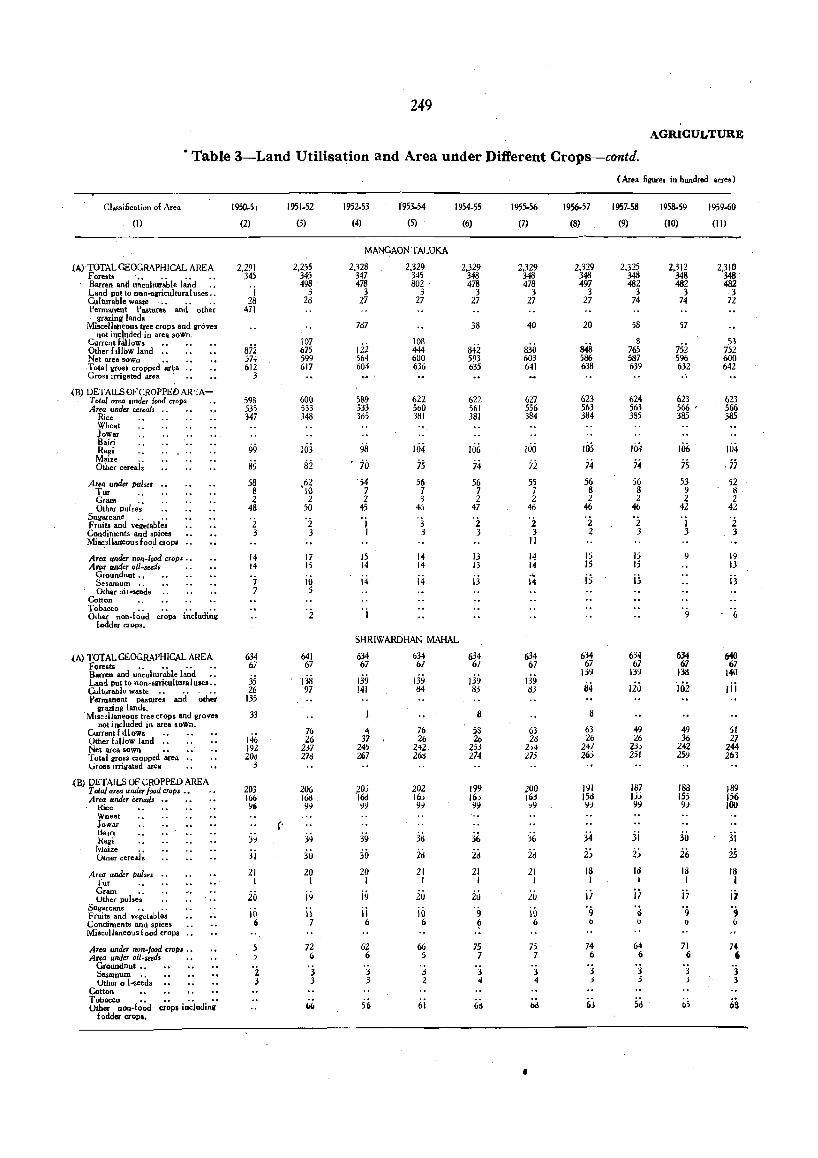
249
AGRICULTURE
• Table 3-Land Utilisation and Area under Different Crops-contd.
Classification of Area
(I)
!A) TOTAL GEOGRAPHICAL AREA Forests •• .• .. Barren and u~culturable land .. Land put to n,,"-IIIri<:ultural uses .. Culturable waste . . . . . . . Perman"'!t Pasture. and other
grazing land. Miscellaneous tree crops and groves
not iDc~uded in area soWn. Currentfallows •• .• .. Other hllow land •• Net area SPWn ••
-Total IlfQ'~ cropped ar." Gross irrig~ted area . .
{B) DETAILS OF CROPPED AR :cATotal ana unclu {Dod crop. Area uncin, cereai$ • • • •
Rice Wheat Jowar Ba.iri Ragi
Maize " Other cereals
Area under />ulses Tnr Gram " Other pulses
Sugarcane . . . • Fruits and velletables Condiments and spices Miac,llarteous food crop.
Area under non-food crop, .• Area und.r oil-seed. . .
G(oundnut .• Sesamurn Other oi l-seod.
Cotton Tobacco.. .•.• Other non-Iood crops includini
fodder crops.
{A) rOTALGEOGRAPHICALAREA Foresll " " .• •• Barren and unculturable land .• Land put to non-Illricultural uses •• Culturable waste . • . • •• Permanent pastures and other
l17azinll lands . . Mlscd!aneQus tree crops and groves
not included in area soWn. Current hit ow. . . Other f .How land " Net area sown •• Total 1170.' cropped arca uross Irrigated area
(B) DETAILS OF CROPPED AREA T otai area under food crop • •• Area under cereal.
i{ice Wheat JORar Hajri }<ag; IVlaize •• Utner cerea.l s
Area under pulses rut
Gram " Uther pulses
Sagarcane . • . • Fruits and vegetable, Condiments and spices l'v1iscellaneo!Js food crops
Area under non_lood ero" ••• Area un"'r oil-sud. • •
Groundnut " ~ .. amum " UtIler oJ ... eed.
Cotton Tobacco " •• .• Other non-food crops includinw
fodder erQP"
1950.51
(2)
2.291 345 'j 28
471
872 574 612
3
598 535 347
99 89 58 8 2
48
·z 3
14 14
7 7
634 67
35 26
J35
33
146 192 20.
3
203 166 Y6
3; jj
21 I
26 in 6
'z 3
1951-52
(3)
2.255 345 498 .
3 28
107 675 599
, 617
600 533 348
103 li2
,62 10 2
50
'2 3
17 15
10 5
641 67
138 97
76 26
237 27d
206 16tI 'J'i
3~
3U 20
I
iii ii 7
72 6
3 3
1952-53
(4)
1953-54
(5)
MANGAON TALUKA
2,328 347 478
3 27
787
122 564 604
589 533 365
98 70 54 7 2
45 'j I
15 14
14
'j
2.329 345 802 .
3 27
108 444 600 636
622 560 381
104 75 56 7 3
4&
3 3
14 14
14
1954-55
(6)
2,329 348 478
3 27
38
&ii 593 635
622 561 381
106 74 56
7 2
47
'2 3
13 13
13
SHRIWARDHAN MAHAL
634 634 67 67
139 139 141 &I
4 76 37 26
245 242 267 26::s
39 30 20
I
i9 ii 6
62 6
:3 :3
56
202 165 ":J
3~
iil 21
I
20 10 6
66 5
3 2
61
634 61
d~ 63
8
53 26
253 274
199 16j 99
36 2d 21 I
20 '9 6
75 7
'3 4
60
1955-56
(7)
2.329 348 478
3 27
40
830 603 641
627 556 384
100 72 55 7 2
46
2 3
II
14 14 .!.
14
634 67
139 II:'
63 2(1
Z,4 27j
ZOO 163 ~9
•
:;6 iil 21
I
20
iil 6
75 7
j
4
1956-57
(8)
2.329 348 497
3 27
20
s48 586 638
623 563 384
105 74 56 8 2
46
'2 2
15 15
is
634 67
139
84
8
63 26
241 265
191 15d YJ
34 ij 13 I
ii '9 b
74 6
3 J
(Area fillUte. in hundred acre.)
1957-58
(9)
2.325 348 482
3 74
58
3 765 587 639
624 563 385
104 74 56 8 2
46
·z 3
15 15
i5
634 67
139
Ji0
49 26
23_j 251
187 Ijj 99
ji ij Id 1
ii cl o
64 6
3 3
1958-59
(10)
2.312 348 482
3 74
57
7si S96 632
623 566 385
106 75 53 9 2
42 'j :3
9
9
634 67
138
uii
49 36
24l 259
188 IS, 9:}
30 i6 Id I
i7 '9 o
71 6
3 3
1959-60
(II)
2,310 348 482
3 72
53 752 600 642
623 566 385
104 77 52 8 2
42
·z 3
19 13
i3
'6
6040 67
140
Iii
51 27
244 263
189 156 100
3i 25 18 I
i1 '; 6
74 6
3 3
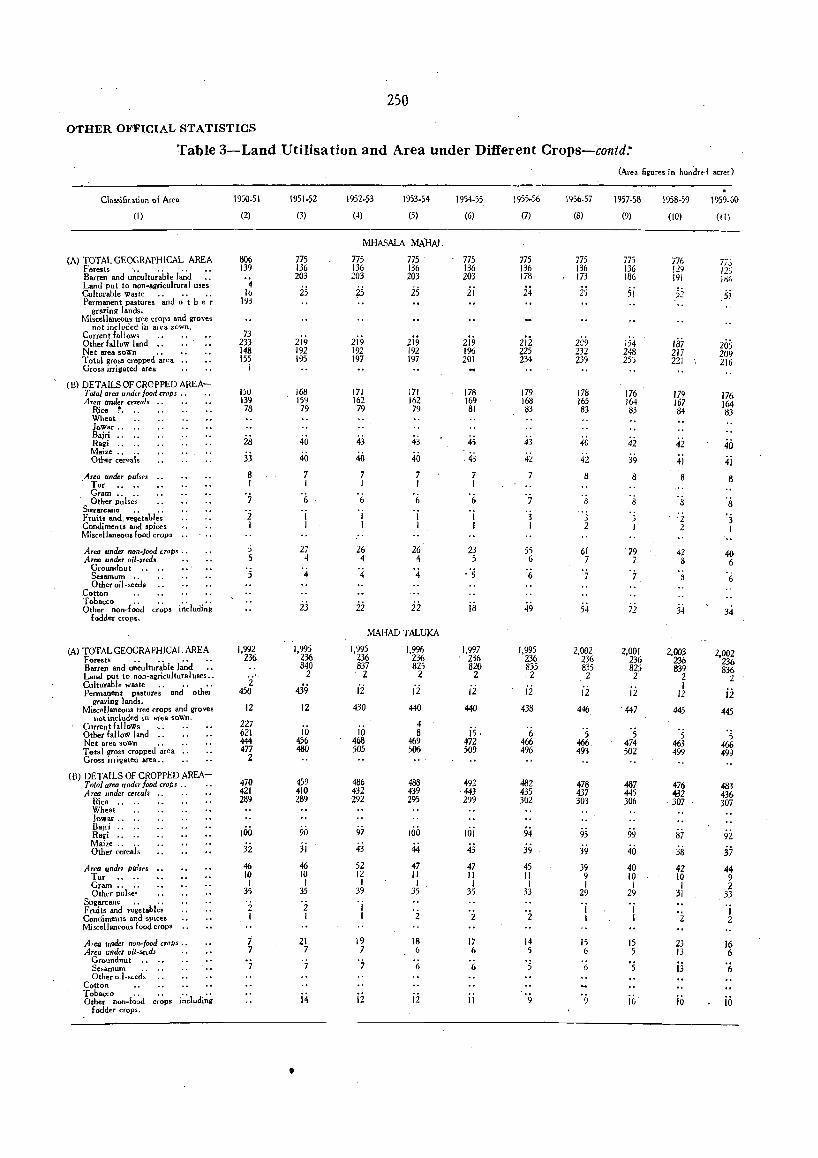
250
OTHER OFFICIAL STATISTICS
Table 3-Land Utilisation and Area under Different Crops-contd,·
Classification of Area
(I)
(A) TOTALGEOCRAPH[CAL AREA Forests '.. .. ., Barren and unculturable land .. Land put to non.agricultural uses Culturable waste .. .• •. Permanent pastures and 0 the r
grazing lands. Miscellaneous tree crop'S and groves
not inrillded in alea sown. Current fallows ,. . . Other fallow land •. Net area soWn •• " Total gross cTopped area •• Gross irrigated area
(8) DETAILS OF CRCPPED AREAT oIal aTea u ndeT food crops " Are,! un~~ cereals ..
R,ce " .. Wheat lowar.. .. Sairi .... Ragi ., ..
Maize .• " Other cereals
Area under tJuises . Tur .. "
Gram .. " Other pulses
Sugarcane •• •. Fruits and. vegetables Condiments and spices Miscellaneoualood crops
Area under non.JcQd CTOpS ••
Area under oil .. seed, Groundnut •• Sesamum •. Other oil-seeds
.Cotton Tobacco.. ..•. Other non~£ood crops including
fodder crops,
(Al TOTAL GEOGRAPHICAL AREA Forests .. .. ., Barren and unculturable land • , Land· put to. non ... aericultural uses •• Culturable waste " " ., Permanent pastures and other
grazing lands, l\1iscelJaneous tree crops and groves
not includ.ed. in area soWn, Current fallows -" Other fallow land , , Net area soWn •• Total gross cropped area .. Gross inigated area ..
(B) DETAILS OF CROPPED AREA-Total aTea under food crops, , ' • Area under cfuais ..
Rice .. .. Wheat Jawor, , Bajri " Ragi .... Maize" " Other cereals
Area under pUrses Tur " .. Gram .... Other pulse'
Sugarcane •. .• Fruits and vegetable, Concliments and ~pice'S Mhcellaneousfood crops ..
A,,,,, under non-food crops,. Area under oil~ie,ds
Groundnut " Sesamum ..., Other oJ-seeds
Cotton Tobacco.. .. .. Other non .. food crops including
f odder crops.
1950-51
(2)
806 139
4 16
193
73 233 148 155
I
150 139 78
2S 33 8 I
7
'2 I
5 5
'5
1,992 236
'i 450
12
227 621 444 477
2
470 421 289
100 J2
46 10 I
35
2 1
7 7
'7
1951-52
(3)
•
775 136 203
25
2i9 192 195
168 159 79
40 40 7 I
'6
I I
27 4
4
23
1,995 236 840
2
439 12
10 45(> 480
459 410 289
90
ji
46 10 I
35
'2 I
21 7
7
i4
1952-53
(4)
1953-54
(5)
MHASALA MAHAL
775 136 203
is
2i9 192 197
171 162 79
43 40 7 I
'6 I I
26 4
'4
ii
775 . 136 203
25
Zi9 192 197
171 162 79
43 40 7 I
6
I I
26 4
'4
22
MAHAD TALUKA
1,995 236 837
2
Ii 430
10 468 505
486 432 292
97
43
52 12 I
39
I I
19 7
'7
ii
1,996 236 825
2
ii 440
4 8
469 ·)06
488 439 295
100 44 47 II I
35
18 6
6
ii
1954-55
(6)
775 136 203
2;
219 196 201
178 169 81
45
.43 7 I
'6 I I
23 5
, '5
i8
1,997 236 820
2
ii 440
is, 472 509
492 ·443 299
Hii 43 47 II I
35
2
17 6
6
11
1955-56
(7)
775 136 178
24
ziz 225 234
179 168 83
43 42
'j
'j I
55 6
6
49
1,995 Z36 835 .2
i2 438
'6 466 496
482 435 302
94 39
45 II 1
33
14 5
5
9
1956-57
(8)
775 136 173
2S
209 232 239
178 165. 83.
40
42
8
8
'3 2
61 7
'7
54
2,002 236 835 2
ii 446
'5 466 493
478 437 303
95 39 39 9 I
29
'i I
15 6
9
(Area ligures in hundr.·J acre,)
1957-58
(9)
775 136 186
sj
154 248 255
176 164 83
42
39 8
8
3 I
79 7
'7
7)
2,~~~ 825 2
ii , 447
's 474 502
487 445 306
99 40 40 10 I
29
I I
15 5
'5
10
1958-59
(10)
776 129 191
52
IBl 217 221
179 167 84
4i 41
8
42 8
34
2,003 236 839
2 I
12
445
'5 463 499
476 432 307
87 38 42 [0 I
31
23 13
i3
io
1959.6()
(11)
7;J t2S itih
.5i
205 209 216
176 164 83
40 .ji 8
8
'3 I
40 6
6
34
2,002 236 836
'1
ji
445
'5 466 499
483 436 307
92 37
44 9 2
33
'j 2
16 6
'6
;0
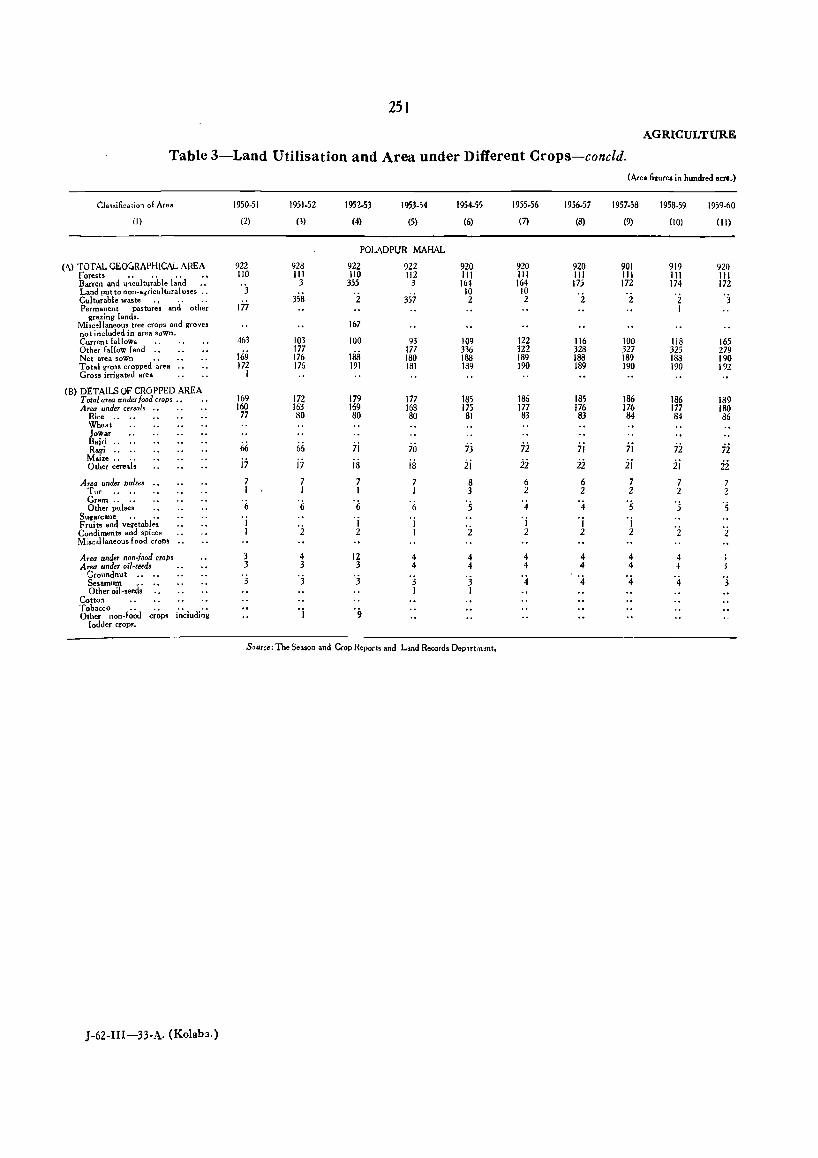
2S1
AGRICULTURE
Table 3-Land Utilisation and Area under Different Crops-concld.
Classi6.catio, of Area
(I)
(A) TOTAL GEOc..RAPHICAL AREA Forests .• .. .. Barren and u,cultllrable land .• Land put to non-agricultural uses .. Culturable waste . , . . . . Permanent pastures and other
grazing lands. Miscellaneous tree crops and groves not included in area soWn. Current fallows " Other {.lfow fand " Net area soWn •• Total gross cropped area Gross irrigated area
(S) DETAILS OF CROPPED AREA Total area under food crops. . . . Area under cereals ..
Rice .. .. Wheat Jowar Bajti .. Rag; ..
Maize ... , Other cereals
Area under pulse! Tur .• ., Gram .... Other pulses
Suwarcane .. .. Fruits and vegetables Condiments and spices Miso.llaneolls food crops
A"a under non· food crop, Area under oil.seed.
Croundnut " Sesamum ... " Other oil.seed,
Cotto~ ., Tobacco" "., Other non·food crops including
fodder crop,.
]-62-III-33-A, (Kolaba,)
1950·51
(2)
922 110
'3 177
463
169 172
I
169 160 77
66 i7 7 I
'(;
'i I
3 3
'3
1951.52
(3)
928 III
3
358
103 f77 176 176
172 163 SO
(,6 i7
'i
4 3
'3
'j
1952-53
(4)
1953.54
(5)
POL.ADPUR MAHAL
922 110
355
'2
167
100
His 191
179 169 80
7i i8 7 I
'6 'i 2
12 3
'3
922 112
3
3S7
93 177 180 181
177 168 80
70 i8 7 I
'(,
I I
4 4
'3 I
1954-55
(6)
920 III 164
10 2
109 336 188 189
185 175
81
73 ii 8 3
'5
2
4 4
'j I
SOU".: The S ••• on and Crop Report, and Land Records Departl1l'llt.
1955.56
(7)
920 III 164
10 2
122 322 189 190
186 177 83
72 22 6 2
'4 'i 2
4 4
'4
1956.57
(8)
920 111 175
'i
116 328 188 189
185 176 83
7j
ii 6 2
'4 'j 2
4 4
'4
(Area hgures in hundred acre,)
1957-58
(9)
901 III 172
'2
100 327 189 190
186 176 84
7i ii 7 2
'5 'j 2
4 4
'4
1958.59
(10)
919 111 174
'2 1
118 325 188 190
186 177 84
72 ii 7 2
'5
19';9.60
(II)
920 III 172
'j
165 279 190 192
189 180 86
ii 22 7 2
'j
'3
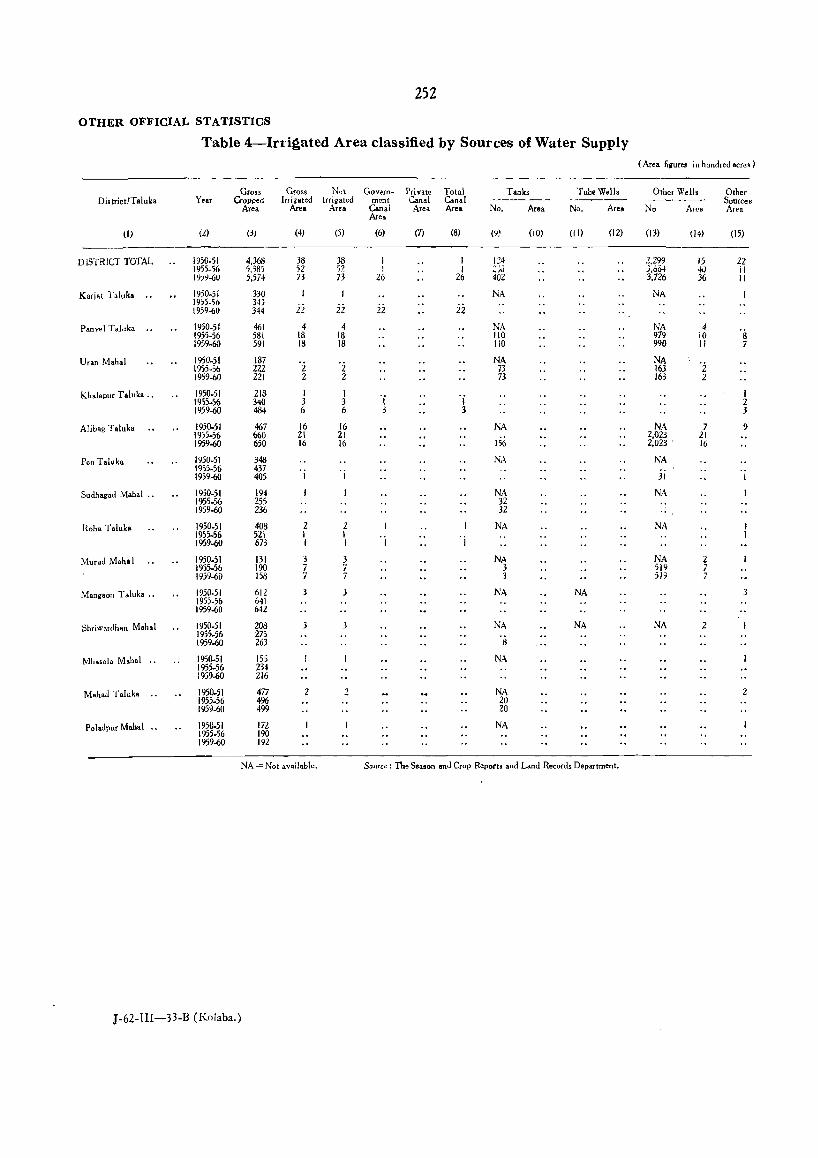
252
OTHER OFFICIAL STATISTICS
Table 4-Irri~ated Area classified by Sources of Water Supply (Area filluret in hundred acre. )
Gross Gross Net Govern ... Private Total Tanks Tube Wells Other Wells Other DistrictlTaluka Year Cropped Irrigated irrigated ment Canal Canal ------ ----- ----- Sources.
Area Area Area Canal Area Area No, Area No, Area No Area Area Area
m (2) (3) (4) (5) (6) (l) (8) (9) (10) (II) (12) (13) (14) (15)
DISTRICT TOTAL 1950-51 4,368 38 38 I 124 2,299 15 22 1955-56 5.3R5 52 'i? I 2~ ~N 3,6&1 -it) il 1~}~-60 5,574 73 73 26 402 3,726 36 II
Kariat Tal uk • .. 1950-51 330 NA NA 1955-56 3H :22 ii ii 1959-60 344 22
Panvel Taluka .. 1950-51 461 4 4 NA NA 4 1955-56 581 18 18 110 979 10 8 1959-60 591 18 18 110 990 II 7
Uran Moh.1 1950-51 187 '2 'i NA NA 'i 1955-56 222 13 163 1959-60 221 2 2 13 163 2
Khal.pur T.luk. " 1950-51 218 I I , i I 1955.56 3~O 3 3 I 2 1959-60 484 6 6 3 3 3
Alibag T.luka 1950.51 467 16 16 NA NA 7 9 19;5·56 660 21 21 2,023 21 1959-60 650 16 16 156 2,023 ' 16
Pen Toluk. 1950-51 348 NA NA 1955-56 437 1959-60 405 I I 31 I
Sudhagad Mahol '. 1950-51 194 NA NA 1955-56 255 32 1959-60 236 32 ",
Roh. T.luk. 1950.51 408 2 2 NA NA 195~56 521 I I 'j 'j 1959-60 673 I I
Murud Mob.1 1950-51 131 3 3 NA NA 2 1955.56 190 7 7 3 519 7 1959-60 158 7 7 3 519 7
Mangoon T aluka " 1950-51 612 3 NA NA 3 195).56 641 1959-60 6 .. 2
Shriwardhan M.h.1 1950-51 208 3 3 NA NA NA 2 195~56 275 's 1959-60 263
Mh.,ala Mob.1 .. 1950-51 ISS NA 1955-56 234 1959-60 216
Mobad Taluk • .. 1950-51 477 2 2 NA 2 1955.56 496 20 1959-60 499 20
Polaclpur Mob_I .. 1950.51 172 NA 1955-56 190 1959-60 192
NA = Not avail.ble, S"trce; The Season .nd Crop Report. and Land Records Department,
J-62-I1I-33-B (Kolaba,)
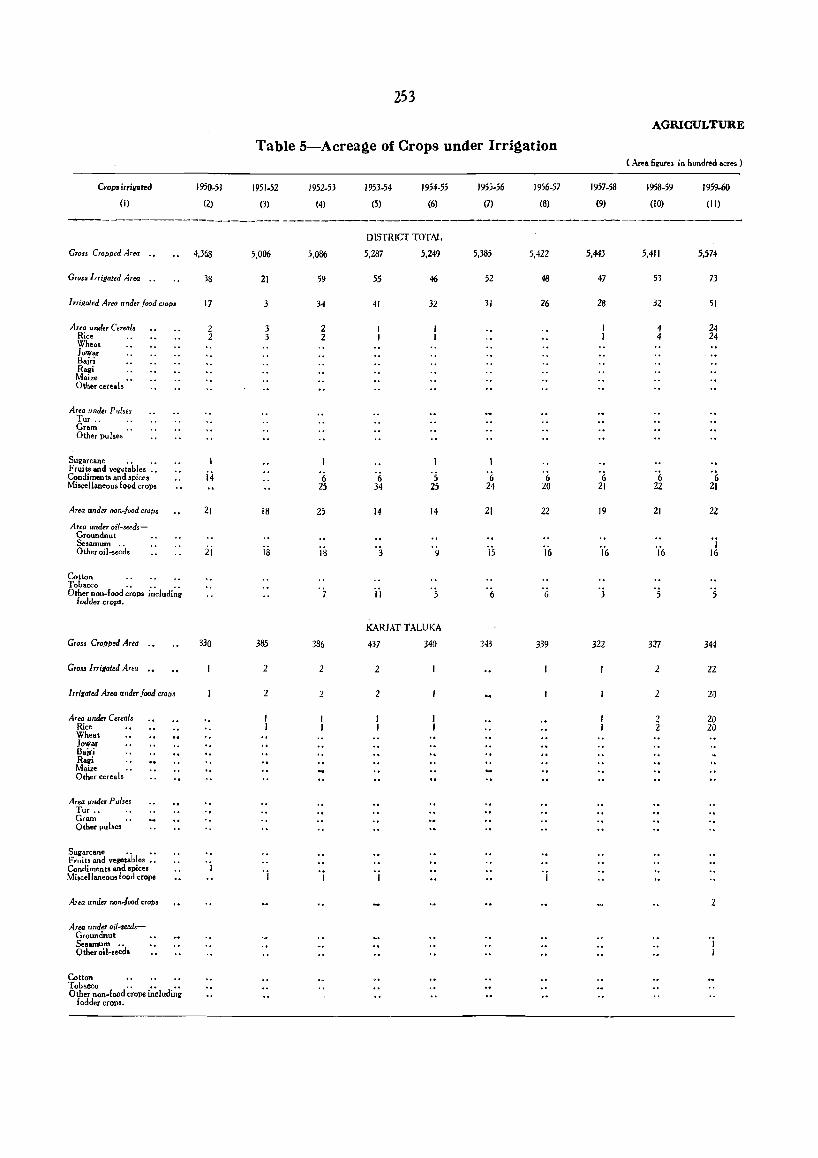
253
Table 5-Acrea~e of Crops under Irri~ation
Cropo irrigated
(I)
1950-51
m 1951-52
(3)
----------------- ...... ---~------
Gr." Cropped Area
Gross J rdgaled Area
Irrigated Area under food ClOPS
Area under Cereals Rice Whe.t Jowar Bajri Ragi Maize Other cere.I.
Area under Pulses Tur .. Gram Other pu I ses
Sugarcane .• .• Fruits and vegetables •. Condiments and spices Miscellaneous food crops
Area under non~food crops
Area under oil~seedsGroundnut Sesamum o. Otheroil-seeds
Cotton Tobacco ..... . Other non .. food crops including
fodder cropo.
Gross Cro.oped Area
GroS! Irrigated Area
Irrigated Area under food ero.o.
Area under Cereals Rice Wheat Jawor Bairi Ragi Maize Other cereals
Area under P alses Tur .. Gram Other pulses
Sugarcane .. o. F rui Is and vegetables .. Condimen t8 and spices Miscellaneous food crops
Area under non-food CTO»'
Area u nd" oil-seedsGroundnut Sesanrum .. Other oil-s.eds
Cotton Tobaeco ...... Oth.r non-food crops including
f odder crop ••
4.368
38
17
2 2
i4
21
ii
330
'j
5,006
21
3
3 3
i8
is
385
2
2
'j
1952-53
(4)
5,086
59
34
2 2
.;' 25
25
is
386
2
2
1953-54
(5)
1954-55
(6)
DISTRICT TOTAL
5,287
55
41
'6 34
'3
II
5,249
46
'5 25
14
9
KARJAT TALUKA
437 340
2
2
1955-56
(7)
5,385
52
31
';' 24
21
is
'6
343
1956-57
(8)
5,422
48
26
6 20
22
16
6
339
1957_58
(9)
5,443
47
28
';' 21
19
16
3
322
AGRICULTURE
(Area fillUre, in hundred acres )
1958-59
(10)
5,411
53
4 4
'6 22
21
327
2
2
2 2
1959-60
(II)
5,574
73
51
24 24
'6 21
22
I 16
5
344
22
20
20 20
2
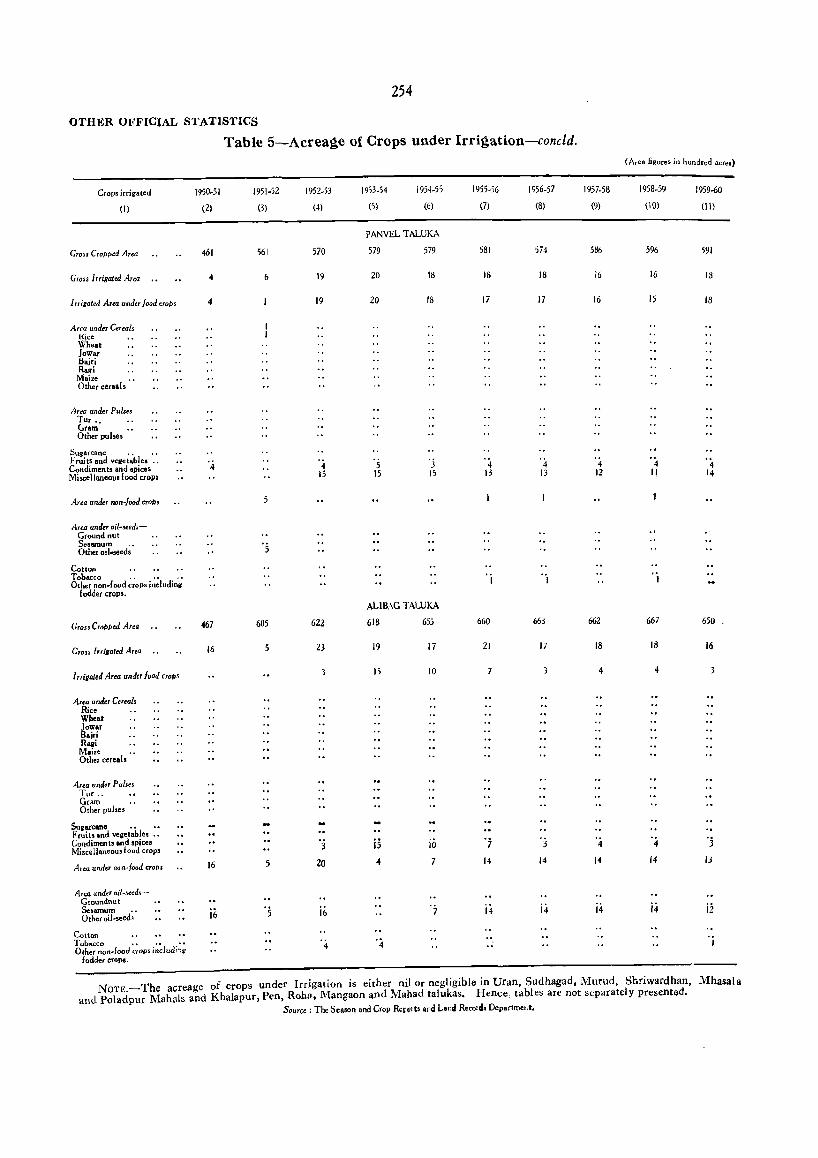
254
OTHER OFFICIAL ST.ATISTICS
Table 5-Acreage of Crops under Irrigation-concld,
Crops irrigated
(I)
Gross Cropped Area
Gross Irrigated Are.
I rrig"ted A, .. under food croPs
Area under Cereals «ice Wh.at lowar Bajri Ragi
Maize Other •• r •• ls
Areo under Pulses 'fur, , Gram Other pulse.
Sugarcane •• Fruits and veaetable. " Condimen t5 and spices Mi ... llaneou.food croPs
Area under non-food crop.
Area under oil"!eedsGround nut Sesamum .• Olher oil-seed.
Cotton Tobacco ".... Other non-food crops includina
fodder CfOP',
Gross CraMed Atea
Gross [rrilated Area
I rrigaJed Area unde, food croP'
Area under Cereals Rice Wheat Jowar Haiti R8IIi Maize Other cereal.
Area under Puls~s Tur .. Gram Other pulses
Sugarcane .. .. F ruils and ve«etable •. , Condiments and .pices Miscellaneou.food crop.
Area under no(l~food crops
Area under oi/,secdsGroundnut Sesamum •• Oth., oil-seed,
Cotton Tobacco •••••• Other non .. food crops includi'lg
fodder crops,
1950-51
(2)
461
4
4
4
467
16
16
16
1951-52
(3)
561
6
'5
605
5
1952-53
(j)
570
19
19
4 15
622
23
'3 20
i6
4
1953-54
(i)
1954-55
(6)
PANVEL TALUKA
579
20
20
5 15
579
18
18
'j 15
ALIBAC TALUKA
618
19
I')
is
"
'4
655
17
10
io 7
7
I 955-i6
(7)
581
18
17
4 13
'j
660
21
7
'j
14
i4
1956-57
(8)
574
18
17
'4 13
663
17
3
'j
14
;4
1957-58
(9)
586
16
16
4 12
662
18
4
'4 14
;4
(Area figures in hundred acres)
1958-59
(IO)
596
16
15
4 II
, i
667
18
4
'4 14
i4
1959-60
(II)
591
18
18
'4 14
650
16
3
'j
13
ii
NOTE,-The acreage of crops under Irrigation is either nil or negligible in Uran, Sudhagad, Murud, Shriwardhan, Mhasala and Poladpur Mah~\ls and Khalapur, Pen, Roha, Mangaon and Mahad talukas. Hence, tables are not separately presented,
Source: The Season and Crop Rorel" ard Lar.d Record. Department,
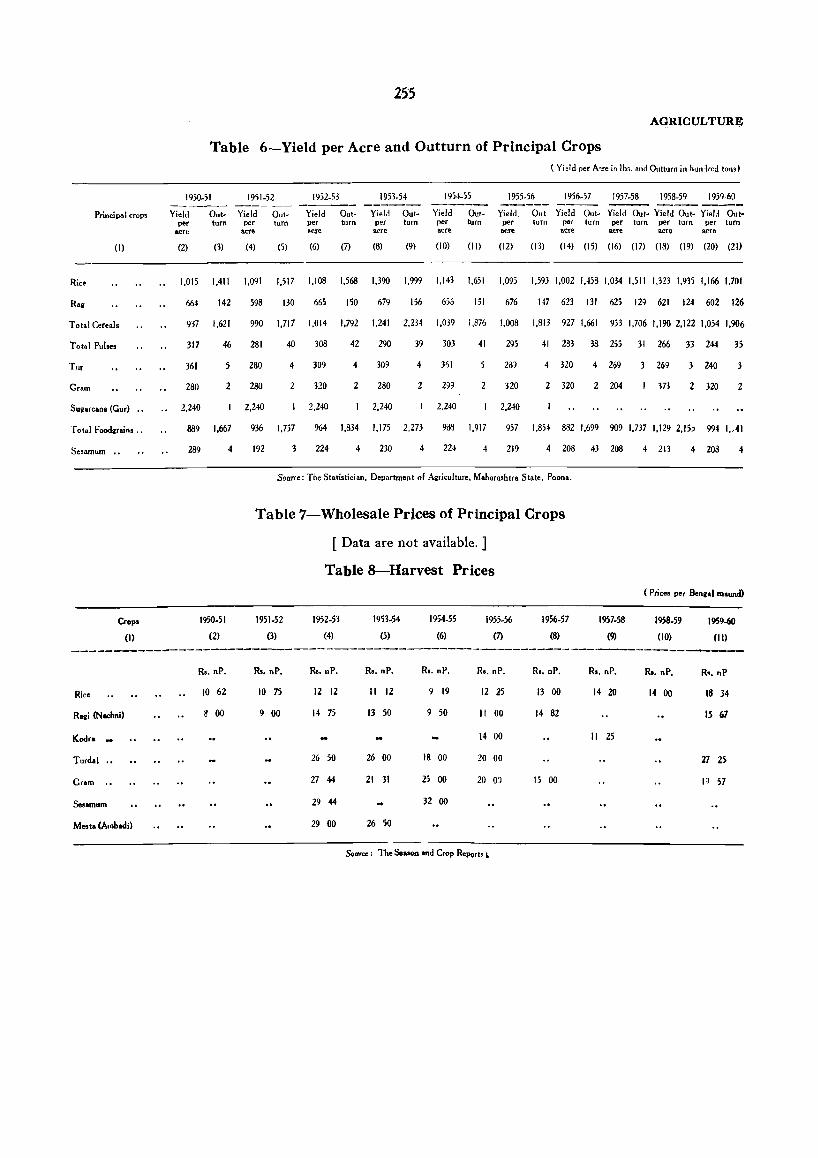
Principal crops
(I)
Rice
Total Cereals
Tot.1 Pul •••
Cram
Sugarcane (Gur) ..
T ot.1 Foodllr.in •..
Se!amum ••
Crop.
(I)
255
AGRICULTURE
Table 6-Yield per Acre and Outturn of Principal Crops ( Yi,ld per A:re in Ib,. and Outturn in hunl"d ton,)
1950-51 1951-52 1953-54 1954-55 1955-56 1956-57 1957-58 1958-59
Yield Out- Yield Out- Yield Out- Yield Out- Yield Out- Yield Out Yield Out- Yield Out- Yield Out- Yiel,~ Out-per
oore turn per turn per turn per turn per turn per turn pet turn per tum per turn per tum
acre 2:cre acre acre acre acre aere acre acre
(2) (3) (4) (5) (6) (7) (8) (9) {I 0) (II) (12) (13) (14) (15) (16) (17) (18) (19) (20) (21)
1.015 1.411 1.091 1,517 1.108 1,568 1.390 1.999 1.143 1.651 1.095 1,593 1.002 1.458 1.034 1,511 1.323 1.935 1,166 1.701
664 142
937 1.621
317 46
361
280
2.240
5
2
889 1,667
289
1950.51
(2)
4
598 130 665 150 679 156 656 151 676 147 623 131 625 m 621 124 602 126
990 1,717 1.014 1,792 1.241 2.m 1,039 1.876 1.008 1,813 927 1.661 953 1.706 1,190 2.122 1,054 1,906
281 40 308 42 290 39 303 41 295 41 283 38 255 31 266 33 244 35
280 4 309
280 320
2.240 2.240
4
2
309
280
2,240
4
2
361 23?
299 2 320
2.240 2,240
4 320
2 320
4 269
2 204
269
373
240
2 320
3
2
936 1,757 964 1,834 1.175 2.213 938 1,917 957 1.854 882 1,699 909 1.737 1,129 2.15) 994 I.AI
192 3 224 4 230 4 224 4 219 4 208 43 208
Source: The Statistician, Departrnent of Agriculture, Moharashlra State. Poon •.
Table 7-Wholesale Prices of Principal Crops
[ Data are not available. ]
1951.52
0)
Table 8-Harvest Prices
1952-53
(4)
1953.54
(5)
1954-55
(6)
1955-56
(7)
1956-57
(8)
1957.58
(9)
4 213 " 208 4
( Price. per Benllal mound)
1958-59
(10)
1959-60
(II)
----------------------------------------------------------------------------------
Rice
R&ii eNochn;)
Kodro
Turd.l ..
Cram .•
s..amum
Meota (AmJ,odi)
R •. nP.
10 62
8 00
Ro. nP.
10 75
9 00
Ro. nP.
12 12
14 7;
26 50
27 44
29 44
29 00
R •• nP.
II 12
13 50
26 00
21 31
26 50
R •. nP.
9 19
9 50
18 00
25 00
32 00
R •. nP.
12 25
II 00
14 00
20 00
20 01
Source: The Season and Crop Report< ~
R •• nP.
13 00
14 82
15 00
R •. nP.
14 20
II 25
Ro. nP.
14 00
R •• nP
18 34
15 61
27 25
1~ 57
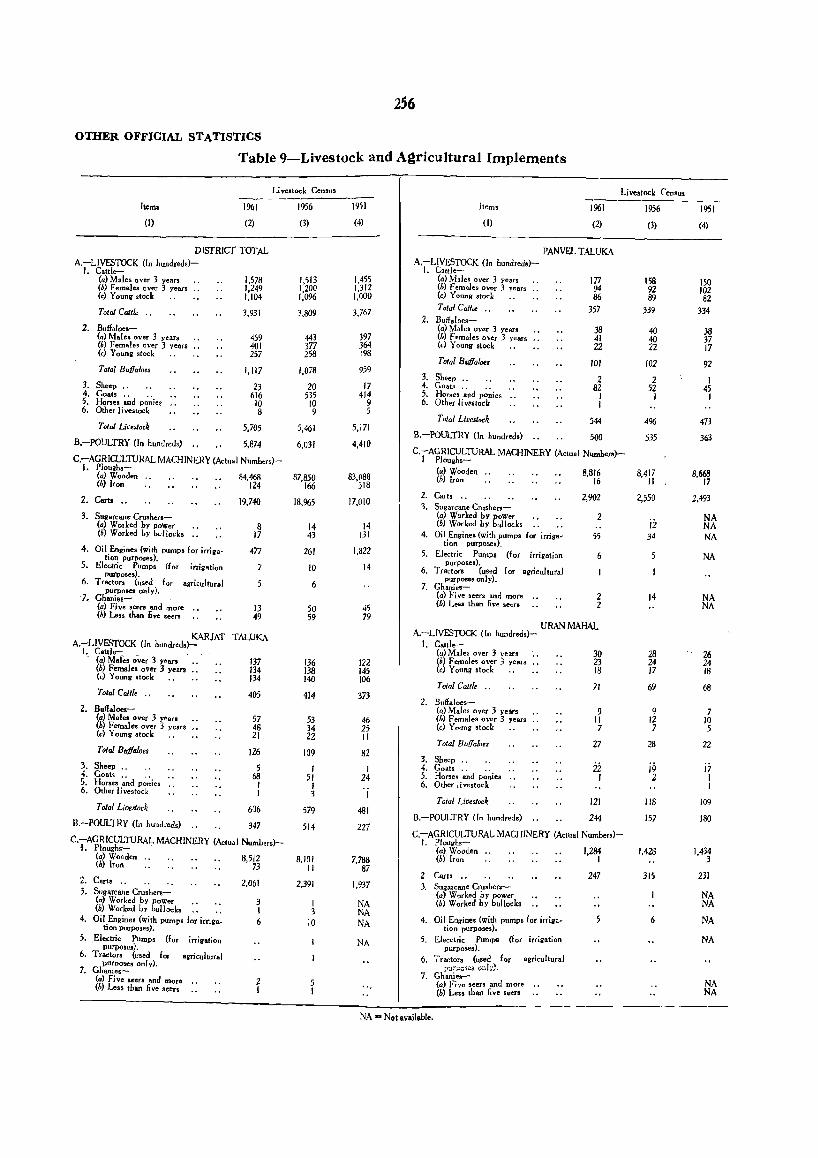
OTHER OFFICIAL STATISTICS
Table 9-Livestock and Agricultural Implements
Li vestock Census Livestock Cen,us
lterm 1%1 1956 1951 Item, 1%1 1956 1951 (I) (2) (3) (4) (I) (2) (3) (4)
DISTRICT TOTAL PANVEL TALUKA A.-LIVESTOCK (In hundred,)-
I. Cattle-A.-LIVESTOCK (In hundredol-
I. Cattle-(a) Males over 3 years 1,578 1,513 1.455 (a) .iVhles over 3 years 177 158 150 (b) Females over 3 years .. 1,249 1,200 1,312 (b) Females O~r 3 years .. 94 92 102 (c) Young stock 1,104 1,096 1,000 (c) Young stock 86 89 82 Total Cattle 3,931 3,809 3,767 Total Cali,. .. 357 339 334 ..
2. Bu/hloes-2. Bulfal .. s- (a) Males oyer 3 years 38 40 38
(a) Males over 3 years 459 443 397 (b) Females over 3 years 41 40 37 (b) Females over 3 year. 401 377 364 (c) Young stock 22 22 17 (c) Young stock 257 258 198
Total BuffalMoB 101 102 92 . Total Buffaloes 1,117 1,078 959 3. Sheep .. 2 2 I 3. Sheep .. 23 20 17 4. Goats .. 82 52 45 4. Goats .. 616 535 414 5. Horses and p~~ies .. I I I 5. Horses Bnd p~~ies 10 JO 9 6. Other Ii vo.tock I 6. Other livestock 8 9 5
Tolal Livestock 544 4% 473 Total Lit,.stock 5,705 5,461 5,171 B.-POULTRY (In hundreds) 500 535 363 B,-POULTRY (In hundred,) 5,874 6.031 4,410 C.-AGRICULTURAL MACHINERY (Actu.1 Numbers)-
C.-AGRICULTURAL MACHINERY (Actual Numbers)- I Ploughs-I. Plough.- (a) Wooden .. 8,816 8,417 8,668 (a) Wooden 84,468 87,850 83,088 (b) Iron 16 II 17 (h) Iron 124 166 318
2. Carts 17,010 2. CaIts " 2,902 2,550 2,493 .. 19,740 18,%5 3 . Sugarcane Crushers-
3. SUllatcane Crushers- (a) Worked by power 2 ii NA
(a) Worked by poWer 8 14 14 (h) Worked by bullocks NA (iI) Worked by bullocks 17 43 131 4. Oil Engines (with pumps for irrilla" 55 34 NA
4. Oil Engines (with pumps lor irriga-tion purposes),
4n 261 1,822 5. Electric Pumps (for irrigation NA tion purposes). purposes). 5. Electric Pumps (for irrigation 10 14 6. Tractors (used for 81lricultural purposes). purposes only). 6. Tractors (used for agricultural 6 7. Ghanies-
7 •. purposes only).
(a) Fi ve seers and more 2 14 NA Ghanie,- .. (a) Fi ve seen and more 13 50 45 (b) Less than five ,ettO 2 NA (h) Less than live seers 49 59 79
URANMAHAL KARJAT TALUI<A A.-LIVESTOCK (In hundreds)-
A.-LIVESTOCK {In hundredsl- I. Cattle-I. C.ttle- _ . . (a) M.les over 3 years 30 28 26
- (a) Males Over 3 year. 137 136 122 (b) Females over 3 yearS 23 24 24 (h) Femal •• over 3 ye ... 134 138 145 (c) Young stock 18 17 18 (c) Young stock 134 140 106
Tolal Caltle .. 71 69 68 Tolal Cattle .. 405 414 373
2. Buffaloes-2. Bulfaloes- (a) Males over 3 years 9 9 7
(a) Males over 3 yean 57 53 46 (b) Females over 3 years .. II 12 10 (h) Females over 3 years 48 34 25 (c) Young stock 7 7 5 (c) Young stock 21 22 II
Total Buffaloes 27 28 22 Tolal Buffaloes 126 109 82
Sheep .. 3. iz i9 j; 3. Sheep .. 5 I I 4. Goats . .
4. Goah .. 68 51 24 5. Horses and p~~es .. I Z I 5. Horses and p~~ies I I 6. Other 1 i vestock I 6. Other livestock I 3 'j
T alai Liv£31ock Tolal Livestock 121 118 109
606 579 481 B.-POULTRY (In hundreds)
B.-POULTRY (In hundreds) 244 157 180 347 514 227
C.-AGRICULTURAL MACHINERY (Actual Numbers)-C.-AGRICULTURAL MACHINERY (Actual Numbers)-
I. Ploughs-t. Ploughs- (a) Wooden .. 1,284 1,428 ),431 (a) Wooden 8,512 8,101 7,788 (b) Iron I (b) Iron 73 II 87
2. Carts 2 CarIS .. 247 315 231 " 2,061 2,391 1,937 3. Sugarcane Crushers-3. Svgarcane Crushen- (a) Worked by PoWer NA (a) Worked by poWer 3 I NA (b) Worked by bullocks NA (b) Worked by bullocks I 3 NA
4. Oil Engine. (with pumps for irrig~~ 6 10 NA 4. Oil Engine. (with pump. for irriga- 5 NA tion purposes). tion purposes).
5. Electric Pumps (for irrigation NA 5, Elecctric Pumps (for irrigation NA purposes). pli.TPOses).
6. T ractor. (~sed for IllIricultural 6. Tractor. (used for agricultural 7.
PUfposes only), parpos:::,s o ... }:,.·). Ghanies-7. Ghani .. -(a) Fi ve seers and more 2 5 {a} Five seers and more NA (h) Less than five see,. I I (b) Less than five seer. NA
NA - Not available.
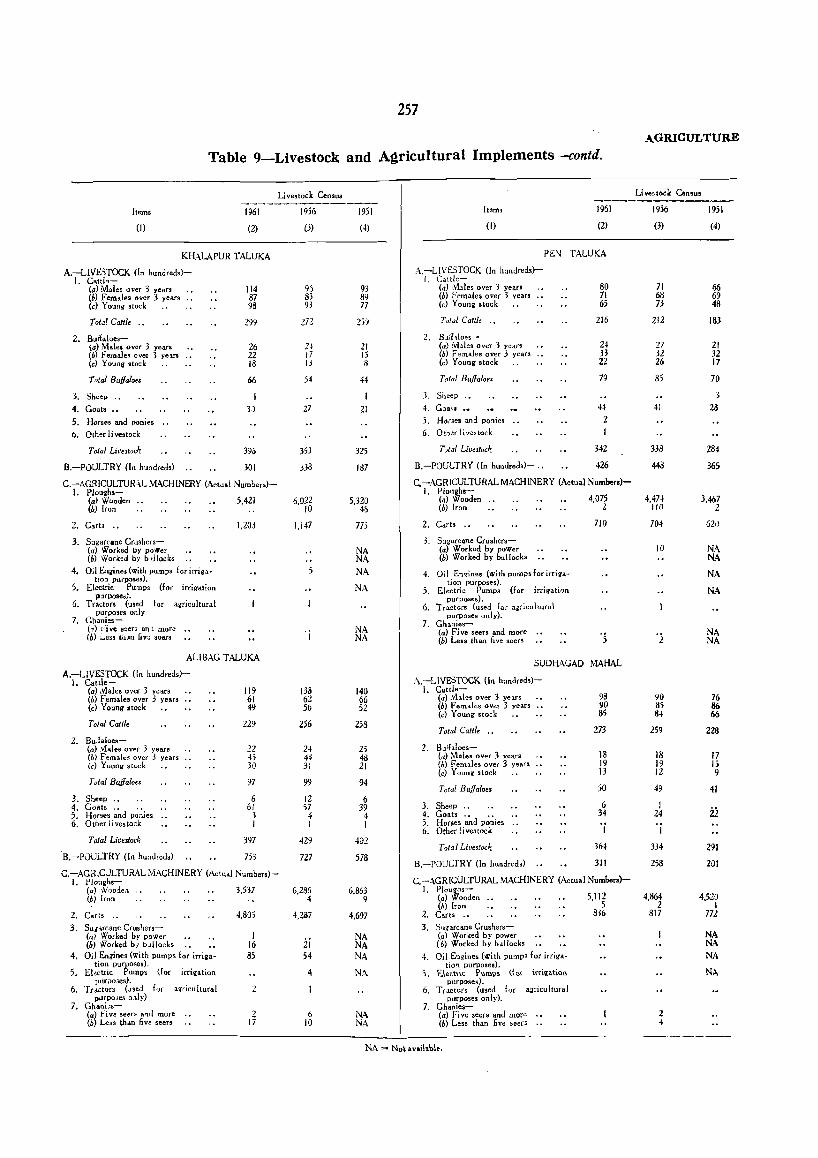
257
A.GRICULTURE
Table 9-Livestock and A~ricultural Implements-contd.
Livestock Census Uvestock Census -~--------------
Items 1961 1956 1951 iteml 1961 1956 1951
(I) (2) (3) (4) (I) (2) (3) (4)
KHALAPUR TALUKA PEN TALUKA
A.-LlVE'iTOCK (In hundreds)- A.-LIVS5TOCK (In hundreds)-1. Cattlo- I. Cattle-
(a) Males over 3 years 114 95 93 (aJ >\hlo. over 3 year' 80 71 66 (6) Fem,les over 3 year. 87 8> 89 (b) Females over 3 years 71 68 69 (c) Y oun~ stock 98 93 77 (c) Young stock .• 65 73 48
Total Calile .. 299 272 2SJ Tolal CallIe .. 216 212 183
2. Buff.loe,- 2. B_tfflloes-(a) Maleo "yer 3 years 26 2~ 21 (a) Males over 3 yearS 24 27 21 (b) FelDales ovel 3 yem 22 17 15 (b) Females oYer 3 years 33 32 32 (c) Y OUIlIl stock 18 13 8 (c) Young .tock .. 22 26 17
r Dial Buffaloes 66 54 44 Tofal Buffaloes 79 85 70
3. Sheep .. 3. Sheep .. 3
4. Go.ts .• 3J 27 21 4. Goats .. H 41 28
5. Horses and poni es 5. Horses and pO:1ies 2
6. Other 1 i vestock 6. Ot:1er liv~stock
Tolal Lieestack 395 353 325 Totai Liveslock 342 333 284
B.-POULTRY (In hundreds) 301 338 187 B.-POULTRY {In hundreds}- .• 426 448 365
C.-AGR[CULTUR~L MACH[NERY (Actual Numbers)- C. -AGR[CULTURAL MACHINERY (Actual Numbers)-I. Ploughs- I. Plough.-
(a) Wooden 5.421 6.022 5.320 (a) Wooden 4.075 4.4n 3.467 (bJ [ron 10 46 (b) [ron 2 110 2
2. Cart, .. 1.203 1.147 77j 2. Carts .. 710 704 621)
3. SUiarcane Crushers- 3. Su:rarcane Crushers-(a) Worked by power NA (a) Worked by poWer 10 NA (b) Worked by b .• llock, NA (b) Worked by bullocks NA
4. Oil En~ines (with pumps for irriga- NA 4. Oil E'Vlines (with pumps for irriga- NA t10,1 pu(Poses). 5. Electric PUlnps (for irriQ'ation NA
tion purposes).
purpose3;. 5. Electric Pumps (for irrigation NA
6. Tractors (used for agricultural purposes).
purposes only 6. "Tractors (used for agricultural
7. Gbani",,-purposes only),
(1'1) r'ivc seers anj more NA 7. Ghanies-
'j (a) Fi ve seers and mote NA (b) i.e .. t~.n five seers NA (b) Less than five seers '5 'i NA
ALIBAG TALUKA SUDHAGAD MAHAL
A.-LIVESTOCK ([n hundreds)-A.-LIVESTOCl( (In hundred,)-I. Cattle-
(a) ,vla[es over 3 years 119 133 [40 l. Cattle-(b) Females over 3 years 61 62 66 (a) 1\1ales over 3 years 98 90 76 (c) Young .cock .. 49 56 52 (h) Females over 3 years .. 90 85 86
(c) Young sto:k 85 8~ 66 Total Cattl. 229 25~ 253
Tolal Callie .. 273 259 228 2. Bu.faloes-
(a) .,tales over 3 years 22 24 25 2. Bu!hloe,-(b) Females over 3 years 45 44 43 (a) Males over 3 years 18 18 17 (e) Young stock 30 31 21 (b) Femlles over 3 years 19 19 15
(c) Young stock .. 13 12 9 Tola/ Buffa/oes 97 99 94
Total Buffal.es 50 49 41 3. Sheep .• 6 12 6 4. Goats 61 57 39 3. Sheep .. 6 I 5. Horses ~~d p~~jes 3 4 4 4. Goats 34 24 ii 6. Other livestock I I I 5. Horses ~~d p~~les ..
6. Other livestock I I Tolal Livestock 397 429 402
Tolal LiV"loc~ 364 334 291 B,-POULTRY {In hundreds} 753 727 578
B.-POULTRY (In hundreds) 311 258 201 C.-AGR;CJLTURAL MACH[NERY (Actual Numbers)-
C.-AGR[CULTURAL MAcH [NERY (Actual Numbers)-I. Plough,-(a) W' oode., .. 3.537 6.286 6.853 l. P[oughs-(b) [ro~ 4 9 (a) Wooden .. 5.112 4.864 4.520
(b) [ron 5 2 I 2. Carts .. 4.805 4.287 4.697 2. Carts .. 836 817 m 3. SUj'J.fcane Grushers- 3. Sugarcane Crushers-
(al Worked by power I ii
NA (a) Worked by power NA (6) IVorked b! bullocks 16 NA (b) Worked by bullocks NA
4. Oil Engines (with pumps for irriga- 85 54 NA 4. Oil Enline. (with pump' for irrilla- NA tion purposes). tio!1 purposes).
5. El<ctlic Pumps (for irrigation 4 NA. 5. £.lectfic Pllmp, ({Of irri'llltiQ\) NA. PUTi>o.Jes). purposes).
6. Tractors (.Jsed for a'l(icuitural 2 6. Tractors (used for a:tricultural
7. purpo;es o.lly) purposes only}.
Ghoni,,- 7. Ghanies-(a) fi v~ $eers and mote 2 6 NA (a) Fi ve seers and more 2 (b) Less than five seers 17 10 NA (b) Less than five seers 4
NA = Not available.
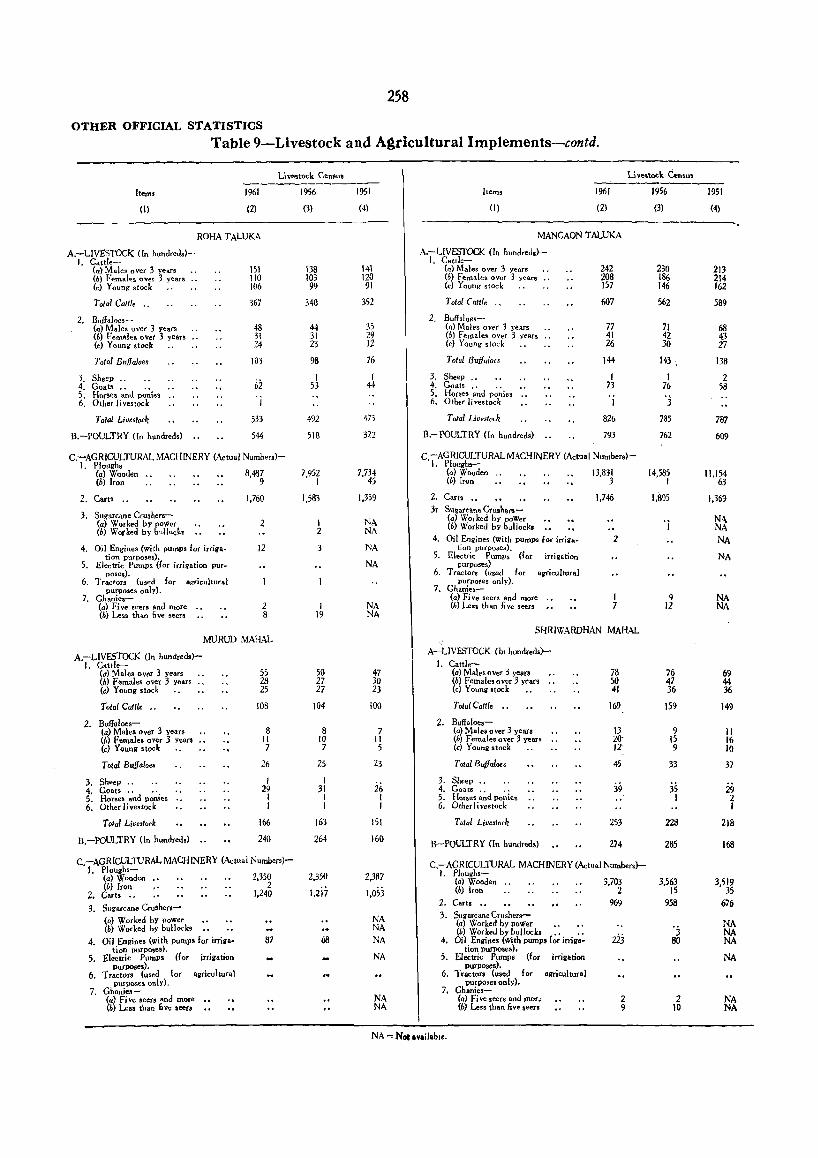
258
OTlIER OFFICIAL STATISTICS
Table 9-Livestock and Agricultural Implements-contd.
Livestock Ct:ntoU"
Item.
(1)
1961
(2)
ROHA TALUKA
A.-LIVBSTOCk (In hundredsl-1. Cattle-
(a) Males over 3 years (6) Females over 3 year. (c) Young stock ..
Total Cattle "
2. Bud.loes-(a) Males over 3 years (b) Female. over 3 years .. (c) Young stock ..
Total Buffaloes
3. Sheep .. 4. Gosts .. .• 5. H"j"Oe. and ponies 6. Other livestock
Total Livestock
B.-POULTRY (In hundreds)
151 110 106
367
48 31 24
103
i>2
1
533
544
C.-AGRICULTURAL MACHINERY (Actual Numbers)-1. Ploughs
(a) Wooden 8,487 (h) Iron 9
2. Carts ..
3. Sugarcane Crushen(a) Worked by pOWer (h) Worked by b"lIacks
4. Oi1 Engines (with pumps for irrigation purposes).
5. Electric Pumps (lor irrigation pur .. poses).
6. Tractors (used lor agricultural pIJrposes only).
7. Ghanies-(a) Fi ve seers and more (hI Leas than five seers
1,760
2
12
2 8
MURUD MAHAL
A.-LIVESTOCK (In hundreds)-1. C.ttle-
(a) Males over 3 year. (b) Females over 3 years (c) Young stock ..
Total Cattle ..
2. Buffaloes-(a) Males over 3 years (b) Females over 3 Yean (c) Young stock
Tolal Bulfalo ..
3. Sheep .. 4. Goats.. .. S. Horses and lloni~s 6. Other livestock
Total Liveslock
B.-J>OULTRY (In hundreds)
55 28 25
108
8 II 7
26
J 29
I 1
166
240
C.-AGRICULTURAL MACHINERY (Actual Numbers)-1. Ploughs-
(a) Wooden ., 2,350 (h) Iron 2
2. Cart. ., 1,240 3. Sugarcane Crushets
(a) Worked by power (b) Worked by bullocks
4. Oil Engines (with pumps lor irriga- 87 tion purposes).
5. electric Pumps (for irrigation purposes).
6. 1 ractors (used for agricultural purposes onlY).
7. Ghanies-(a) Fi ve seer. and more (b) Less than live seers
1956
(3)
138 103 99
340
44 31 23
98
I 53
492
518
7.952 I
1,583
1 2
3
I 19
50 27 27
104
8 10 7
25
J 31
I J
163
264
2,350
1,2i7
68
1951
(4)
141 120 91
352
31 29 12
76
1 44
473
322
7,734 45
1,359
NA NA NA
NA
NA NA
47 30 23
100
7 II 5
23
26 I I
lSI
160
2,387
1,053
NA NA
NA
NA
NA NA
Items
(I)
1961
(2)
MANGAON TALUKA
A.-LIVESTOCK (In hundred.)-I. Cattle-
(a) Males over 3 years (b) Females OVer '3 years (c) Young stock ..
Totol (attle ..
2. Bull,loes~ (a) Males over 3 years (b) Females OVer 3 years (c) Young stock
Total Buffaloes
3. Sheep ., 4. Goats .' .. 5. Hones and ponies 6. Other livestock
T olal Lil.lestoLk
B.-POULTRY (In hundreds)
242 208 157
607
77 41 26
144
I 73
826
793
C -AGRICULTURAL MACHINERY (Actual Numbers)'1. Ploughs-
(a) Wooden 13,831 (h) Iron 3
2. Carts .•
3r Sugarcane Crush. ro-(a) Worked by poWer (h) Worked by b"llock.
4. Oil Engines (with pumps for irrigation purposes).
5. Electric Pumps ({or irrigation purposes)
6. Tractors (used for agricultural purposes only),
7. Ghanies-(a) Five seers and more (b) Less than live seers
1,746
2
I 7
SHRIWARDHAN MAHAL
A-LIVESTOCK (In hundreds)-
I. Cattle-(a) Males over 3 year. (b) F ernales 0 ver 3 years (c) Young stock
Total Cattle ••
2. Bull.loes-(a) M.les oVer 3 years (6) Females over 3 years (c) Young stock
Total Bu;tfaloes
3. Sheep " 4. Goats " ., 5. Horses and ponies 6. Otherliv.stock
Total LiVeslock
B-POULTRY (In bundreds)
78 50 41
169
13 20' 12'
45
39
253
274
C.-AGRICUL1lJRAL MACHINERY <Actu.1 Numbe"j-l. Ploughs-
(a) Wooden 3,703 (6) Iron 2
2. Carts '0 969 3. Sugarcane Crushers-
(a) Worked by pOWer .. .. (6) Worked by bullock. .' .,
4. Oil Engines (with pump,lor irrigs- 2ij tion pUrposes).
5. Electric Pumps (for irrigation purposes).
6. Tractors (used lor agricultural purposes only).
7. Ghanies-<a) Five seers and mor, 2 (b) Less than live seers 9
NA = Not available.
1956
(3)
230 186 146
562
71 42 30
143
I 76
'3 785
762
14,585 I
1,805
9 12
76 47 36
159
9 15 9
33
35 I
228
285
3,563 15
958
0
3 80
2 10
1951
(4)
~.
213 214 162
589
68 43 27
138
2 58
787
609
1l,1S4 63
1.369
NA NA
NA
NA
NA NA
69 44 36
149
II 16 10
37
29 2 1
218
168
3,519 35
676
NA NA NA
NA
NA NA
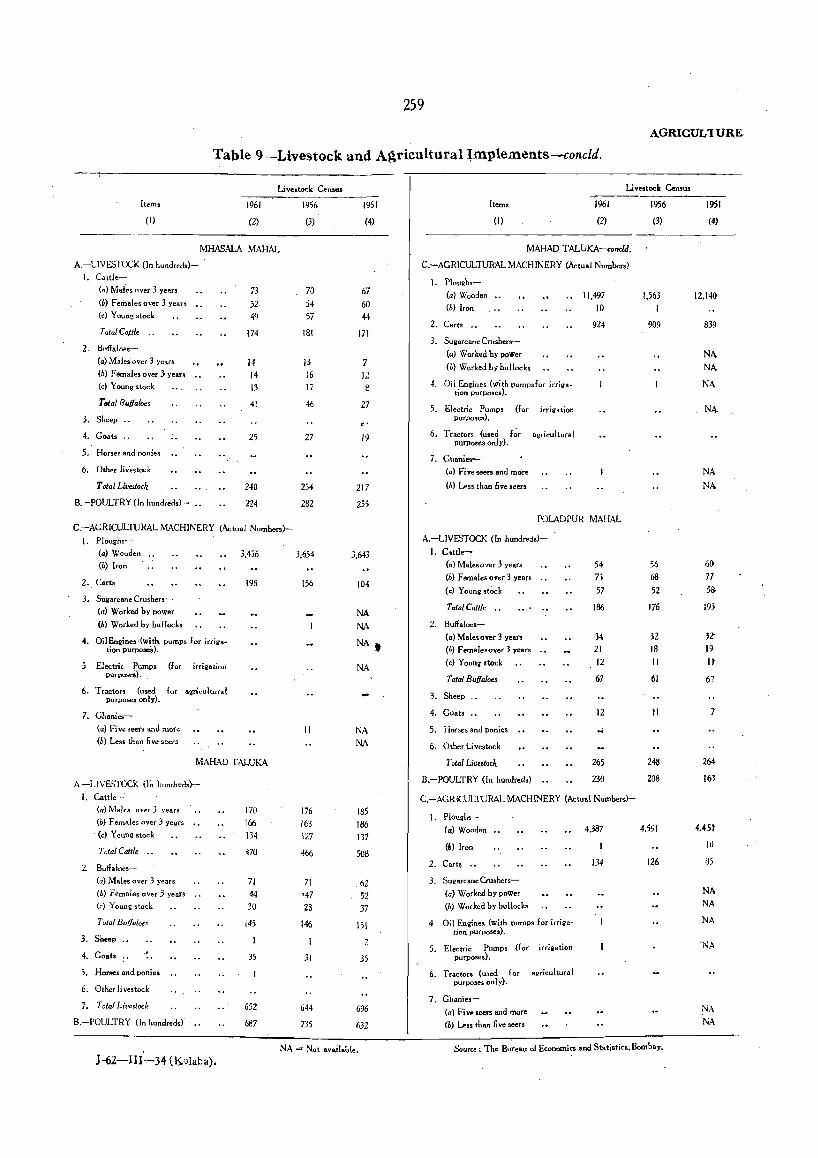
2)9
AGRlCUL'I UR,E.
Table 9-Livestock and A~ricultural ~mplements-concld.
Livestock Census
Items
(I)
1961
(2)
MI-IA'lALA MAHAL
A.-LIVESTOCK (In hundreds)-
I. C.ttle-
(a) Mates over 3 years
(b) Females over 3 years
(c) Young stock
Tolal Calli. ••
2. Buffaloe,-
(a) Male. over 3 years
(b) Females over 3 years
(c) Young stock
T oIal Budaloos
3. Sheep
4. Goats
5. Horses and ponies
6. Other liveslock
T alai Livestock
B.-POULTRY (In hundreds)-
..
73
52 49
174
14 14 13
41
25
240
224
C.-AGRICULTURAL MACHINERY (Actual Numbers)
I. Ploughs-
(a) Wooden
(b) Iron
2 •. Carts
3. Sugarcane Crushers
(a) Worked by power
(b) Worked by bullocks
4. OiIErliPnes'(with pumps lor irrigation purposes).
5 Electric. Pumps (for irrigation purposes).
6. Tractors (used for agricultural purposes only).
7. Ghanies-
(a) Fiveseen and more
(b) Less than five seers
3.456
198
MAHAD T ALUKA
A -LIVESTOCK (l~ hundreds)-
I. Cattle__:
(a) Males over 3 years
(h) Females over 3 years
(c) Young stoe k
Tolal Cattle
2. Buffaloe,-
(a) Ms.les over 3 years
(b) Females over 3 years
(c) Young stock
,Total Bltffaloe~
3~ Sheep
4. Goats
5. Hones and poniel
6. Otherli voslock
7. Tolal Liveslock
B.-POULTRY (In hundreds)
170 166
134
470
71 44 ;0
145
35
652
687
1956
(3)
70
54 57
181
13 16 jj
46
27
254
282
3.654
156
II
176 163 12i
466
71
'47 28
146
31
644
735
1951
(4)
67
60 44
171
7 12
27
19
217
255
3.643
104
NA
NA
NA t
NA
NA NA
185
186 131
sos
62 52 37
151
2
35
696
632
NA = Not available.
J-62-1II-34 (Kolaba).
Li veslock Cen,us
Items
(I)
1961
(2)
MAHAD TALUKA-condd.
C.-AGRICULTURAL MACHINERY (Actual Numbers)
1. Ploughs-
(al Wooden
(b) Iron
2. Carts .•
3. Sugarcane Crushers-
(al Worked by power
(b) Worked by bullocks
4. Oil Engines (with pumps for irrigation purposes).
5. Electric Pumps (for irrigation putposes).
6. Tractors (used f~r agricultural purposes only).
7. Ghani .. -
(a) Five seers and more
(b) Less than live seers
11.497 10
924
POLADPUR MAHAL
A.-LIVESTOCK (In hundreds)-
1. C.ttle-
(al M.l.s 0 ver 3 yea"
(b) Females over 3 years
(c) Young stock
Total Catlle
2. Buffaloes-
(al Malesover 3 years
(b) Females over 3 years
(c) Young <tock
Total Buffaloes
3. Sheep
4. Goats
5. Horses and ponies
6. Other Livestock
Total Liv<3tock
B.-POULTRY {In hundredsl
54 73
57
186
34 21 12
67
12
...
265
230
C.-AGRICULTURAL MACHINERY (Actual Numbers)-
1. Plough.
(.) Wooden
(f,) Iron
2. Cart~ ..
3. . Sugarcane Ctushers
(a) Worked by power
(bl Worked by bullocks
4 Oil Engines (with pumps for irrigation purposes).
5. Electric Pumps (tor irrigation purposes).
6. Tractors (uJed for agricultural purposes only).
7. Ghanies-
(a) Five seers and more
(b) Less than five seers
4.387
134
1956
(3)
1563
I
909
56 68
52
176
32 18 II
61
II
248
208
4,591
126
Source: The B.:reau of Economics and Statistics. Bombay.
1951
(4)
12.140
839
NA NA
NA
NA
NA
NA
61)
77
5~
19j
n 19
It
6?
7
264
163
4.451
10
85
NA NA
NA
'NA
NA
NA

260
OTHER OFFICIAL STATIS.TICS
Table lO-Classification of Land Holdings according to Size
Size of holdinlll' Number of Percentage Area Size of holding! (Acres) holdings of holding! owned (Acres)
(I) (2) (3) (4) (I)
Up to 1 acre 55.972 30.99 33.542 Exceeding 40 but not 45 Exceeding 1 but not 2.50 47,603 26.36 82.281 Exceeding 45 but not 50 ElICeeding,2.50 but not 5, 33,959 18.80 1,24,810 Exceeding 50 but not 60 ElICeeding5 but not 7.50 15,758 8.72 97,797 Exceeding 60 but not 75 ElLCeeding 7.50 but not 10 8,647 4.79 74,690 Exceeding 75 but not 100 Exceeding 10 but not 12.50 4.975 2.75 55,931 Exceeding 100 but not,I5e 'Exceeding 12.50 bu t not 15 3,373 1.88 45,714 Exceeding 150 but not 200 ' Exceeding 15 but not 17.50 2,304 1.28 37,397 Exceeding 200 but not 300 Exceeding 17.50 but not 20 1,464 0.81 28.774 Exceeding 300 but not 500 Exceeding 20 but not 25 2.085 ),)5 47,065 Exceedinl1500 but not 1.000 Exceeding 25 but not 3!l 1.192 0.66 33.033 Exceeding 1,000 acres Exceeding 30 bu t no t 35 803 0.44 25.918 Exceeding 3~ hut not 40 518 0.29 19.480 Total
Source: The Cen.u. 01 Agricultural Holdings in the State of Bombay as in 1952-53.
Table l1~Employment in Factories
Average daily num,er of workers employed Code No. Nam"er of Num'>er of
Number of working man-day. working factories worked fa.ctories submitting during
r----------.A. _____ -, and
Description of Industry Adult. Adolescents Children
(I)
205 Manufacture of grain mill product.(b) Rice mills
209 Manufacture of miscellaneous food preparations-
(h) Slit refin"ies
220 Tobacco manufactures(a) Bidi
231 Spinning. weaving and finishing of textiles-
(a) Cotton mills
271 Pulp. pa"er and paoer-board mills(b) Paper .. .. " .. (c) Paper-board and straW-board .,
280 Printing, book-binding. etc.-(a) Letterpress
319 Manufacture of miscellaneous chemical products-
(a) Fine and pharmaceutical chemicals.
339
350
U) Others
Manufacture ot non-metallic mineral products not eisewhefe classi6ed-
(a) Stone dressing and crushing .• (d) Others
Manufacture of metal productS (except machinery and transport equipment)
(b) Cutlery. locks, etc. (h) Others .. ..
370 Electrical mach; nery-(d) Electric fans. radiators and
othet ~ccessorie ••
384 Repair 01 motor vehicles and cycles-(a) JV!otor Vehides .• " _
399 Manufacturinll industries no c1assified-
(il C,lluloid .rticles .. (I) Others
511 Electriclight and power ..
elsewhere
Total
(2)
19
21
I 3
2'
5 2
4
I 2
6
76
returns the year
(3)
18
18
2
I , 3
3
(4)
60,098
83.615
40,706
90,885 35,106'
6,859
2 114.547
3
I 2
4
18.036
I 26,ii6
3.450 34.884
3.020
20.160
7,600 25.U23
71.589
64 748,435
Men
(5)
214
396
31
4
235 116
321
54
15 72
8
87
25 83
225
2,2.34
Women Males Females
(6)
17
109
14 41
23
4)
.42
2
293
(8)
Boys
(9)
NOTE.-Column (4) relates only to those Factorie. submitting figures for number of days for which the factor, Was Working.
Column, (5) to (II) rohte to working Facto.ies submitting returns.
Somee: The Chief Inspector 01 F actorie ••
Girls
(10)
Number of holdings
(2)
375 257 333 30B 248 178 74
102 53 28
6 ----180.615
Total
(II)
231
396
140
4
249 157
23
335
54
IS 114
10
87 I
25 83
225
2,582
(ATea in Acres)
Percentage Area of holding! owned
(3) (4}
0.21 15.932 0.14 12,624 0.18 18,223 0.17 20,697 0.14 21,724 0.10 21,814 0.04 12,873 0.06 24.563 0.03, 20.361 0.01 20,807
7.732 ----100,00 903,782
Working factories not submitting returns
No.
, (12)
, I
2
12
Estimated average daily
No. of workers employed
(13)
16
173
21
52
361

261 INDUSTRIES
Table 12-Distribution of Factories according to Products and their Working Strength
10 or more 200T more SOOT more 100 or more 500 or more 1,000 or more 5,000 Less than butl ... than but less than butle .. than bu t I ess than but less than but less than or more
CodeNo, 10 workers 20 workers 50 worker, 100 workers 500 workers 1,000 5,000 workers and workers workers
Description Q{ Industry ---- ---- -~--- ---- ------ ----- ------A B A B A B A B A B A B A B A B
(I) (2) (3) (4) (5) (6) (7) (8) (9) (10) (II) (12) (13) (14) (15) (16) (17)
20 F Dod ex~e~t beverages II 64 14 186 10 309 68
22 T~bacco 2 140
,23 Textiles 4
27 Pap~r· and paper p~oducts •. 17 2 140 249
28 Printing'~ publishing, and allied industries 23
31 Chemicals and Chemical Product, 54 2 355
33 ~on .. metalljc mineral products (except products 23 391 of petrdleum and coall.
35 Metal prod acts (exceptl mg_c!Un~ry and transport 15 114
equipmen"U.
37 Eiectrical'machinery. apparatus. appliances and 10 suppiies.
38 Transport' equipment 3 87 "
39 Miscellam:ous indm:tries 3 1(18
51 Electricity, ga.:i and steam 8 35 68 114
Total 16 99 17 228 IS 562 4,0 6 1,223
A = Numo=t of Factories submitting returns. B = Avc:age numbe~ ot workers employed daily. Source: The Chief Inspector of F' actories.
Table 13-Distribution of Factories according to Number of Days Worked
More than More than Number of 60 but not 120 but not M ore than 18C More than 240
Code No. days not 60 day, more than more than but not more but not more More than 300 and stated 01 less 12G day, ItlO days than 240 days than 300 days days
DestriPtion of --,--- ----- --_-- ----- -----Industry. A B A B A .B A B A e A B A B
(I) (2) (3) (4) (5) (6) (7) (8) (9) {I 0) (II) (l2) {I 3) {I 4) (15)
20 F cOd. except beverage! 14 5 21 19 391 7 78 7 118 22 Tob""co 2 140
23 Textiles 4
27 Paoer and paper products •• 17 74 2 315 28 Printin~, publishing and allied industri •• ., 2 15 8
31 Chemicals and chemical products 3 409 33 Non-metallic mineral PIoducts (except products 2 414
of petroleum and c()&.D~
35 lVletal prodacts (except machinery and transport 15 114 equipment) .
37 Electrical machinery, apparatus, appliance, and 10 I' supp.les.
38 Transport equipment 27 2 60
39 Miscellaneous industries 108
51 Electricity, gas and steam .. 4 225
Total 3 45 5 17 21 21 480 II 233 26 1,781
A = Number of Factories submitting returns. B ~ Average number of workers employed daily. SouTce : The Chief Inspector of Factories.
Table 14-Manufacturing Industries
Number of Working Number of Number of Other than Total Fixed Working Total Total Value added by Factories Reporting Workers Workers Employment Capital Capital Productive Value of Manufacture
Factories Capital Production Rs. Rs, Rs. Rs. Rs,
(I) (2) (3) (4) (5) (6) (7) (S) (9) {I 0)
2 451 74 525 31,56,000 33,93,000 65,49,OJO 60,00,000 16,87,000
Source: Statistical Abstract of 1960-61 MaharashtraState,
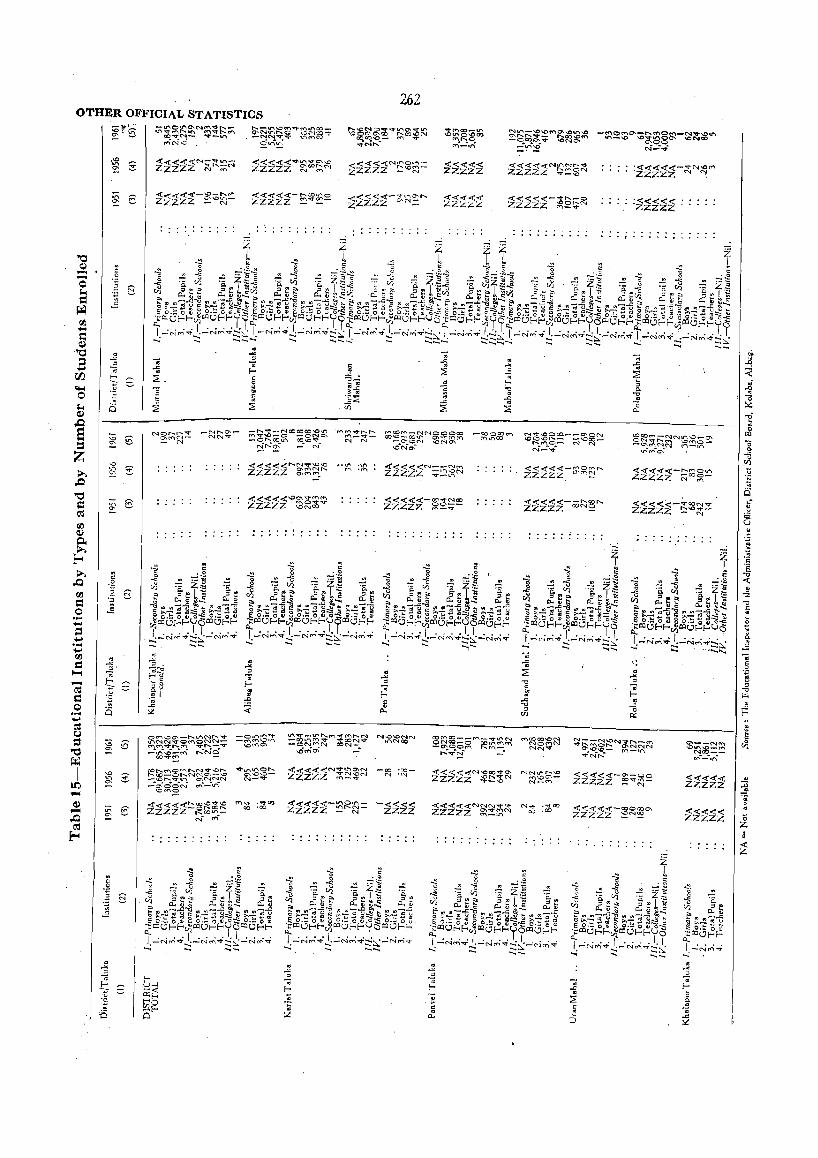
262 OTHER OFFICIAL STATISTICS
-11>' -U"IOl.f'lo-.Nt'I'\~,...._ r-...- ....... -'O('l"\""t)-M.r-.OO_ t:ocg~~~q.~~:b~ ~~(X)~:£ ~·6 lr1'o:::1"'~""'''''' f'I"'I"¢'''tI''''I ~~~t;:Sf ~~~~'T C1'\Ro ~'q",~- ~-V"I o::.CO'O_ f"I"\ '0:1"
~N>.C Sl(\~ "';Nt'-..'" f'f"\"'_".r::
.~ :i:i;fHN~;!;;;;C;; :i:i:i:i:i~~;;;~~ ~«<<t:Nl(',O'~-
~~:i:i:i ~ ::!- ZZZZZ !::"'1Q-
:;:; :i;!':i:i:i-~~RJ~ :2:i:i:i:i-~~:@:2 "'<C':(-<:C<C<t:-"¢.""C"r-.... 11111 ~ ~ zZzzz C'",;::
~
.1 ... ~
~ = ~ ~ -.. .. C ... -.. -'" ... ~ 2: ; = ..c b 1::: 2: " .."...:
'" 0
~~ ~ . ~ ~
." . '] " ;:: a ]~ '" ~ -" ~
2: z: z: is :2: en
:0 ~ c'
'" ~ ~
6' ~
'" ~ ~.
~, ~ ... --,; " .. .. t!g .. -" = 1; k 0 ...
b u ::;; 11 ::
~ ~ c '" u -" :it p.. ~
OM\OO"-_ ....... lJ"o,Nt-..'¢' -O>.l"ltr>~ It'''t'''_V'''Ir-..f'I'''\~~I'.N N\,Q\ONN COrt"\OO-_f'I"\_'":1"O.n~ -t;""\r""'\\Ol,{"\ -OOI.t"'\M~ ""'00('.1-.:1" "'''''0 ONCiO ..... O CC)lAtf"\(1'\ :0 6 ~~~ .. ;t~~",~~ .. ~~ .. ;; -CNI"I"'IN OON_ -~~~~ "f'I"\-~ OC"'''' ...o~o\ _: a-.
-l.f'I~-M r-..NO COv~ -
cO)'.,f"I"\O("t"lr-..N~""r--. ''If'~$~!:::: <f.~<C~<f.N~K)$~ -00 '00_ <c..a:<C<:(<tN'OOO~o. 00 N .", zzzzz ~!::~'" ~ I"-oOO-Or-...NNo-.-\O N-"" ZZZZ2. "'-..-~ _\Or--.~lf"'\ ",NNN -"O:OON'" f't'\''''':tr\
\OM::::
:i:i:i:i:i~R~~~ "''t • ... 00 :i:i:i:ir:BR~:: -<C<C«<c :i-<-<<(<(N~'O!~N :;:; 6 '" ."" zzzz zzzz "'_'" 0- N ~~
:
'" ~ .1 ~ ~ = -;; ... ~ 1:; U.....l ~ -«
·V ~ <>: ...
~ !t °E "'0 k (; .!3 ~f-. ~ n c Cl.,
('t"IOOCO'<ON NO('('\('.I N"' ....
NN\I"\r......o M\OO"-N-""
COl..,. :05'" 00
-tI''''IQrt'\(3).-r-..('(''\Ort''\_N'III!''\OIJ'\ 11'\-\0 \Q~:S80'\ \ONce
N-"~
~~~~~N~~~~ O'---Nf'f"I -.oV'\-.o_~
.. ~"' .. - C"I"\-I.t"\ Nco __ ""Nt-. t't'{'_.",
-<-<-<<(<(-00-<;;>0 zzzzz ~""N- :i:i:i~:i
-«<1"««-00000'" zzzzz ::::N~ :i:i:i~:i
. ..<:: . 2: " ~
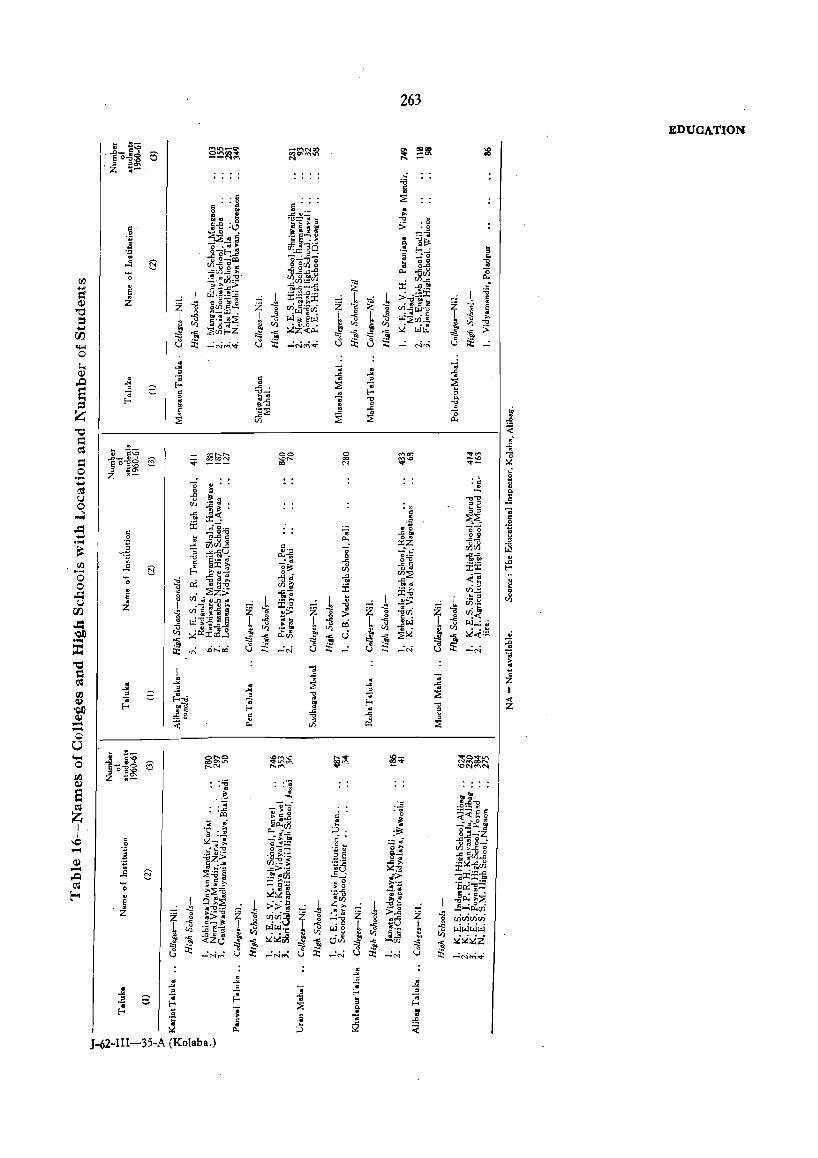
263
EDUCATION ~ :1-
~"'-Qt. ~ C'" ;;~~~ ~ ~~ :g . i'o~~ 0 S?~~~ N
" "'" Z ~-
i : ~ ::;;:
5 = " '" ~GJ:': ~ Q '" ~
i~ ;J ~=g~a ..., > .0
c ·0
.~ 3::E..!!5 Il<";" ~~ ._ S"""'l GJ .
.~ o • at >- ~ ~i;5 ~ -g~ .. .]of-..,J! .. !Xl 0 _ .5" f-o...: " " '0-=-13'0 "';0 '" ,.!; 8 tilj-o~ 00 ...,
0 0 00 0 a o..c: " '0
-",,l1j,, ..c_g..aoJ: "- ""'eX ~ rtJ l1. II1 J5:g . tilJj.~cX cX..." ... S f!;~?: ..g.L::r:~ ~ ::z:: ..c:" ~ c: I t.JJ ..... -...c I :E:":~i i {
. .~:E t " u_ • -;-;i >:i~; ia ~ z Z -5 co bel 0 i -5 u) ~.~ . z 1 ~ ·c ~ "1.:1 0 ~:;~-: ~ .w~~ h
0 U'l..ct,LI-o 0
k "" L w" S~ ~ ~ ..!~o1.~ ..., ,.,
::I rX 5·cr..!!::;;: rX ..., ~
U) ~z~p.;
. .. > .... ::;;:Jl,:!i :1 "" "" ~ wt:.. :1 i', if) -!! i', ~ :::: '" d .~ d .~ 0 .... :t: _:N~~ oj ::t: ":C'im .. oj ::t: ::t: ...: N~ u :t: ...: 0 .... .j -;; "
-;; ~ " ~
.... -; ,.Q " -;; c " ::E -" ~ f-o " ::;;: -;; e " ..e
!3 ";; ~ " -0"':
" f-o 0 Ii " -: 11 c.
::s f-o " ,,-; -:l '" " ..c: ~ Z g ]::;;: ..c ~ -0
::;;: Ul ::E "- ~
"1.:1 :;;: 1=1 .. (l$ ~ ~- ~
~ ='" "'" .... 00 0 ",en .... '" -0 s:: eo~d 6 :;;: CO<aN -0 ..... '" ~-o --0 :.: co N .... -0 ::l .E~ i z .-..... : . , .... -0 ~
. c ~ " (l$ 0 " -. j ..." U u " " ...,-0
0 Ul .~ " : !l " " ~ .. ll~ "ii ....:l i'. ,,< ::;;:.~ .~ :t ::r:...: -5
~ ar 0 .... "ii " 0 '0'0 c _ 0-0 ...,,'" 00 ..... .~ ; ~..." C "- 0" ..e..c u .... rJicXj "'z " -" c JlJl -0
~ ~~ -; .... -"u Q.~ -0 ...:,: I.IJ ..., .~:E i ,,--" 0 0·- ..g~ ~
i~ ..c 0"
rJ1 ..s c eX ..eta iii ..c
8 ~ t-< - >-IJ..!. _g. Jl::;;: ..t"§ 0 - ~E~ .;. 0
0 ~ ".: ~i i .;." ." ~ ~ . ::;;:2:>
._ .. Ul_:: = ~ e 8 .. " ... I
;I;..., Ji.~ ,}j u "
U) ai Q,I..Q cd { .- " .1 Q ..!!> .k I vil H 5 ::r::-s! .." -5 if) z i i " i " i ·Ii
l ~> 0 > ...,vi 0 ~< tJ~~lj ~ ~
0 " . ~ -= ~; cO ~ ~~ trJ •• _" ;,dc:!:2cd..3 ~ ·c ~ ~
U) to f. ~..:::;, 'CD ""
-!! "" "-Ul
~ U "" ::;;::.:
~ ..., ~ .... "0 .~ ::::: 'i ~ ~ ~ ~
0
::t:: .,.; ...or..:ai u ::r: -=N u u ""':N u ::r: "':N ~
"1.:1 > -;l
. = I ~
~ • 0 (l$ " " z • ....
" ::;;: .... "'ii .... " -" ~ I 00 .2 ~ ~~ " 11 "ii ::E ...: ~ ~ "ii ~ f-o -d Z 'CD " ~ f-o .J:l os " ~ ~8 c .., ..c ~
< ~ ~ ~ ::E - "- Ul -0 0
j ~~ .... 0"'0 ~~~ ........ ~~ ~~;J;~ 0 6: co""" ~'" e-~o ",N \O('\JC'f"\N "o,,~
JI'J Z -=_ :i Qj :': e .i!: ~ d." ~ .7
Q; "j'i .:..a ,..c .... CI:I
Z ·18 5 ·11 ~< eg > "..a ~ I . ~ ~ . fii~cX ::'5 ..: .. .,e ; .. :i3: ." ~a:~ 8]_;z ~ ._
c" -.0 ~ ~-:. ~S ..t:: 0') 0 ..
0 g';fi 0 ... til" 0-'1""4
:~ .. ~"'O '; e "'..., 0
.~ ":> '"5~:5- go"";; .g ;JL.g ~ -gz .... tf).oo+ >- ·~a """ :2:':';'cX - ..5
a:I .;._ ..c:>.~ ~:-s! 8 2:;; ~ .~ «IdS c . ..... ,...r:
,.Q ~o .;> ~~;I;.!!: ~ '0 ~;>. :r: ;-; . ., ... _
~Q::;1j:I: .. ::;;:,; ." " > 0 ..!!.~ E-- :.:~ li 'P"5 "e. ~~ ~:E ~ { c5 ~:E osUl >0"
I »~ .k z'" I -ol:: ..s-;c:evi (If"'C''''''' .~ " z f
> .... -0 i ~ •• ..c:
f ."!;
f ~ >..c: i ~ 0 ">,, 0 U:U:j g _..., ; "..c: 0 ";";";01
"5 .S • .!! L J! "5 . ~ ~u 0
..!t.lt.l..! U) III WI.IJ.~ 1.IJ8 r)j ~] ..,
..c ~ " U) r)j ~ ..c • " :t. ;,d~~ ~
dJi !t ~ -!! ~ <Z'-' ..ll
~ :1 ..,
d ~ -'Ul ::!l
~ ::.i~::.ii
d ::r: d d .~ d _:N~ -=N~ ::r: -=N -=N ....:NNi~
" -'" " "
, os ...
"ii • ..... " -;; ..... .... " 7 f-o ~
.2 ~ "ii f-o ~ II -;;
• ~ f-o 2 ~ f-o
f-o ';j "i c 7 :r ·il ~
os ~ ~ ::'5 52 :;;:
J-62-I1I-35-A (Kolaba.)
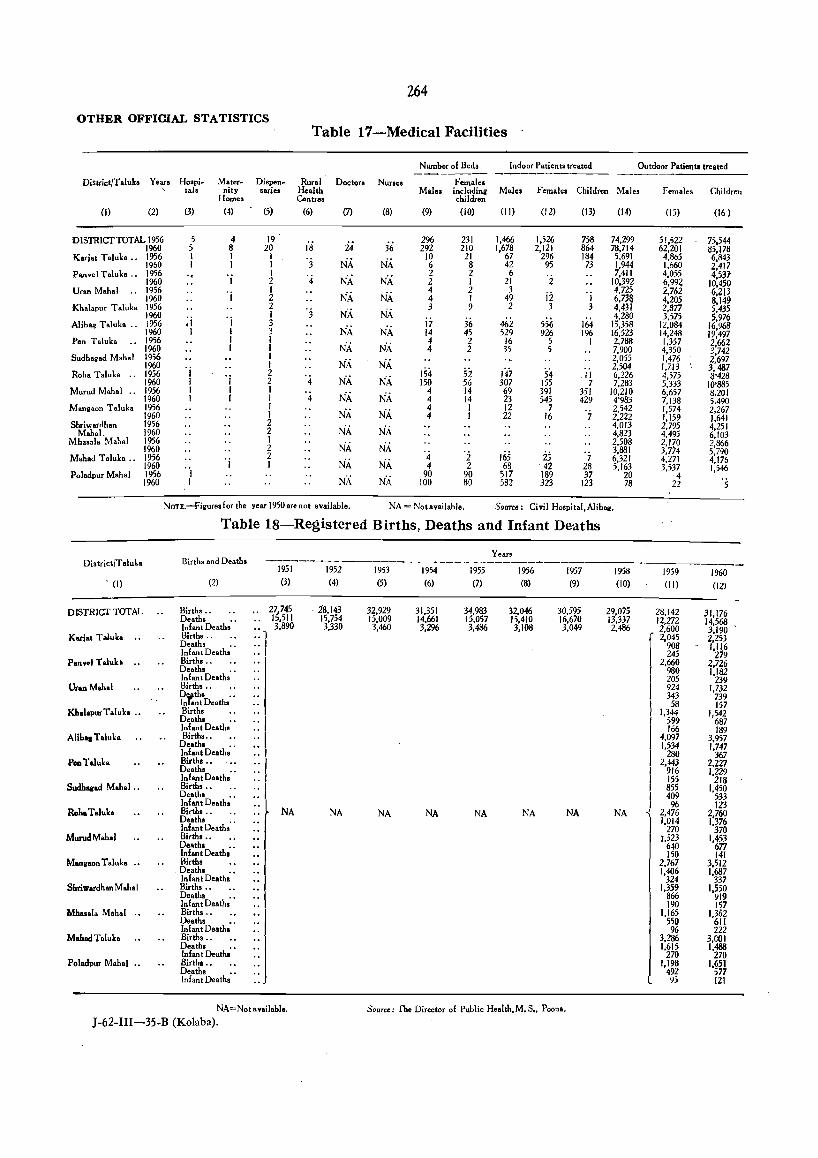
264
OTHER OFFICIAL STATISTICS Table 17-Medical Facilities
Number of Bed. Indoor Patients treated Ou tdoor Patiellto treated -------- -----------District/Taluka Years Hospi- Mater- Diapen- Rur.l Doctors Nurses Females , t.l. oity sariel Health Males includinll M.l •• Female. Children M.les Females Children
Homes Centr •• children (I) (2) (3) (4) (5) (6) (7) (8) (9) (10) (II) (12) (13) (14) (15) (16)
DISTRICfTOTAL 1956 5 4 19 I'S 24 36
296 231 1,466 1,526 758 74,299 51,~22 75,544 1%0 5 8 20 292 210 1,618 2,121 864 78,714 62,201 85,178
Kari.t T.luk ••. 1956 1 I I '3 NA NA 10 21 67 296 184 5,691 4,865 6,843 1960 I I I 6 8 42 95 73 1,944 1,660 2,417
Panvel T.luka " 1956 'j I '4 NA NA 2 2 6 'i 7,411 4,055 4,53;
1%0 2 2 1 21 10,392 6,9n 10,450 Uran M.h.l 1956 'j I NA NA
4 2 3 ji
4,725 2,762 6,213 1960 2 4 I 49 I 6,738 4,205 8,149
Khalapur T.Iuka 1956 2 "3 NA NA 3 9 2 3 3 4,431 2,877 5,435
1960 ;j 'j I
36 556 4,280 3,575 5,976
Alib~ Taluk. " 1956 3 NA NA 17 462 164 15,358 12,084 16,968 1960 I 1 3 14 45 529 926 196 16,523 14,248 19,497
Pen Taluka " 1956 1 1
NA NA 4 2 16 5 I 2,788 1,357 2,662
1960 I 1 4 2 35 5 7,900 4,350 ~,742 Sudhagad Mahal 1956 1 NA NA
2,055 1,476 2,697 1960 'j I
154 52 147- 54 2,504 1,7.13 3,487
Roh. Taluka ,. 1956 'j 2 '4 NA NA " 6,226 4,575 3'428 1960 I 2 150 56 307 155 7 7,283 5,333 10'885
Murud Mah.1 " 1956 I I I NA. NA 4 14 69 391 351 10,210 6,657 8,201 1960 I I I 4 4 14 23 545 429 4'983 7,138 5,490
Mangoon Taluka 1956 I NA NA
4 I 12 7 2,542 1,574 2,267 1960 I 4 I 22 16 7 2,222 1,159 1,641
Shriwardhan 1956 2 NA NA 4,013 2,795 4,251 Mahol. 1960 2 4,823 4,495 6,103
Mhasal. Mahal 1956 I NA NA 2.508 2,170 2,866
1960 2 '4 'i 165 25 '7 3,881 3,7~4 5,790
Mahad Taluka " 1956 'j 2 NA NA 6,321 4,271 4,176 1960
"1 I 4 2 68 42 28 5,163 3,537 1,546
Poladpur Mahal 1956 NA NA
90 90 517 189 37 20 4 1960 I 100 80 582 323 123 78 22 's
NOTE,-Figuresfor the year 1950 are not available. NA = Not available, Sour .. : Civil Hospital,Alibag,
Table 18-Registered Births, Deaths and Infant Deaths
Yean District/Taluka Birth. and Death. ---------------------------------~ 1951 1952 1953 1954 1955 1956 1957 1958 1959 1960
, (I) (2) (3) (4) (5) (6) (7) (8) (9) (10) (II) (12)
DISTRICT TOTAL Births, , .. 2~745 .28,143 32,929 31,351 34,983 32.046 30,595 29,075 28,142 31,176 Death. I ,511 15,754 15,009 14,661 15,057 15,410 16,670 13,337 12,272 14,568 Infant Death; • :: 1
3,890 3,330 3,460 3,296 3,486 3,108 3,049 2,486 2,600 3,190 Kariat Tal .... ,. Birth. " r 2,045 2.253
De.ths ,.1 908 1,116 Infant Death; , '. I 245 279 Panvell'aluh "
Birth. " 2,660 2,726 Death. 980 1,182 Infan t Deaths" 205 239 UranMah.1 Birth. '. 924 1,732
Dr.thl :: 343 739 In ant Deaths 58 157
KhalapurTaluka ,. Births :: , 1,344 1,542 Deaths '. 599 687 Infant Death. 166 189
AlibagTaluka Birth., • "I 4,097 3,957 Deaths 1,534 1,747 Infant Death; . :: I 280 367
PeoTaluk. Birth ••• .. , 2.443 2,221 Death. .. I 916 1,229 Infant Death. " I
1 155 218
Sudb8llad Mahol ., Birth. " .. I 855 1,450 Death. •• 1 I 409 533 Infant Death; •
" ~ ~ 96 123 RohaTaluka Birth. '. NA NA NA NA NA NA NA NA 2,476 2,760
Death. " "I I 1.014 1,376 Infant Death.
" 270 370 MurudMahal Birth ••• },523 1,453
Death. 640 677 Infan t Death,' , 150 141
Mangaon Taluka ,. Birth. 2.767 3,512 . Deaths 1,406 1.687 Infant Deaths' • 324 337
SbriwardhanMahal Births .. 1,359 1.550 Deaths
I 866 919 Infant Death" • 190 157
Mhosala Mohal .. Birth. " 1,165 1,362 Deaths
1 550 611
Infant Death; . 96 222 MahadTaluka Births ,.
I 3,286 3,COI Deaths 1,615 1,488 Infant Death," 270 270
Polaclpur Mohol '. Birth. " ! 1,198 1,651 Deaths ::J 492 577 Infant Death;' 95 121
NA=Not availabl., Source, The Director of Public Health, M. S .. Poona,
J-62-IlI-3S-B (Kolaba).
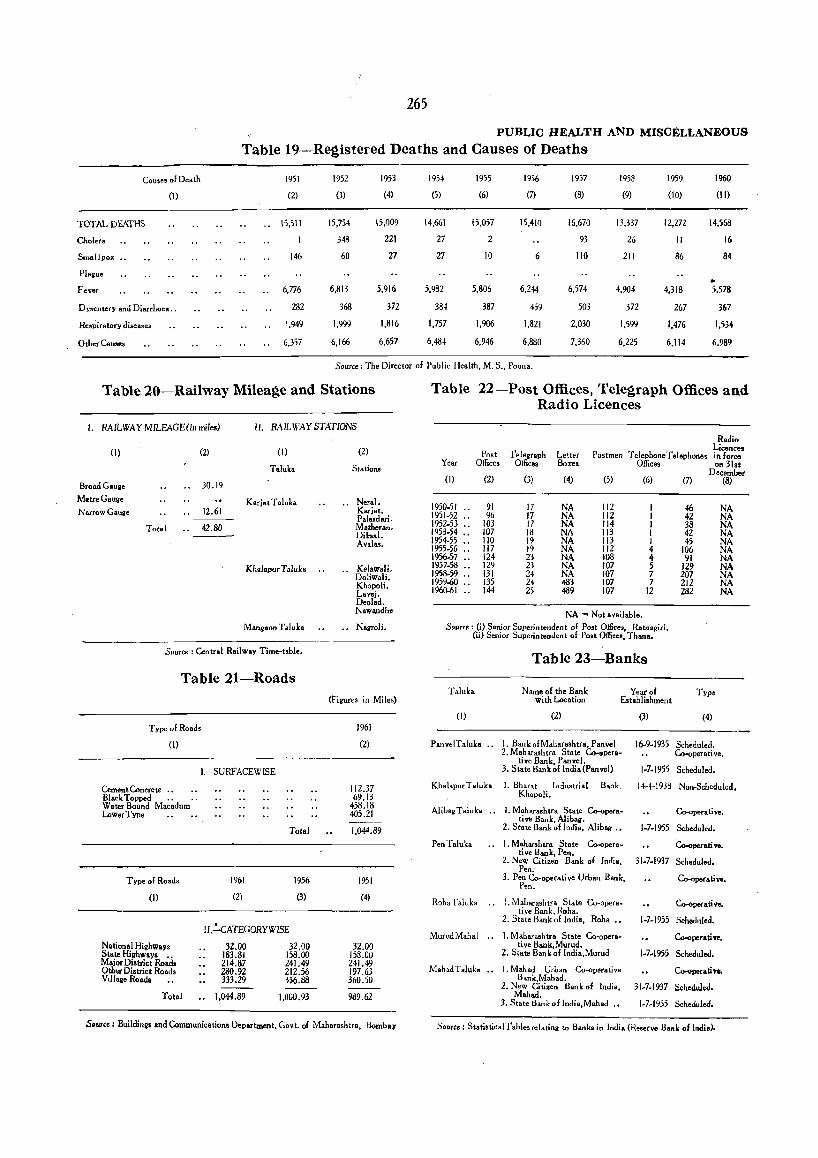
265
PUBLIC HEALTH AND MISCELLANEOUS
Table 19-Registered Deaths and Causes of Deaths
Cauo.s of D.ath 1951 1952 1953 1954 1955 1956 1957 195a 1959 1960
(I) (2) (3) (4) (5) (6) (7) (8) (9) (10) (II)
TOTAL DEATHS 15,511 15,754 15,009 14,661 15,057 15,410 16,670 13,337 12,272 14,568
Choler. 1 348 221 27 2 93 26 11 16
Smallpox •• 146 60 27 27 10 6 110 211 86 84
Plague .. Fever 6,776 6.813 5,916 5,932 5,806 6,244 6,574 4.904 4.318 5.578
Dysentery and Diarrhoea .. 282 368 372 384 387 459 503 372 267 367
Respiratory diseases 1.949 1.999 1,816 1.757 1.906 1,821 2.030 1.599 1.476 1,534
Other Cau,es 6,357 6,166 6,657 6,484 6,946 6,880 7.360 6,225 6.114 6.989
Source: The Director of Public Health. M.S., Poona.
Table 20-Railway Mileage and Stations
I. RAILWAY MILEAGE (In mil",,) II. RAILWAY STATIONS
(I) (2) (1)
Taluka
Broad Gauge 30.19
Metre Gauge Karjat T aluka Narrow Gauge 12.61
Total 42.80 ----
Khalapur Taluks
Mangaon T.lulca
Source: Central Railway Time-table.
Table 21-Roads
Type 01 Roads
(I)
I.-SURFACEWISE
Cement Concrete •• • • BlackTopped .. .. Water Bound Macadum Lower Type
Type of Roads
(1)
National Highways Stale Highways .. Major District Roads Other District Roads Village Road.
Total
Total
1961 1956
(2) (3)
1I • ..:.cATEGORYWISE
32,00 32.00 183.81 158.00 214.87 241.49 280.92 212.56 333,29 356.88 ---
1.044,89 1,000,93
(2)
Stations
Neral. Karjat. Palasdari. Matheran. Dil.al. Aval •••
Kelawali. Doliwali. Khopoli. Lavej. Deolad. Nawandh.
NagToJi.
(Figures in Miles)
1961
(2)
112.37 69.13
458.18 405.21
1.044.89
1951
(4)
32.00 158.00 241.49 197.63 360.50
989.62
Source: BuildinllS and Communications Department. GOyt. 01 Maharashtra. Bombay
Table 22-Post Offices, Teleg,raph Offices and Radio Licences
Radio Licences
Post Telegraph Letter Postmen Telephone Telephone. in fotce Year Offices Ollices Boxes Offices
(I) (2) (3) (4) (5) (6)
1950.51 91 17 NA 112 I 1951.52 96 17 NA 112 1 1952.53 .. 103 17 NA 114 1 1953-54 107 18 NA JI3 I 1954-55 110 19 NA 113 1 1955-56 .. 117 19 NA 112 4 1956-57 124 23 NA lOS 4 1957.58 129 23 NA 107 5 1958-59 131 24 NA 107 7 1959-60 .. 135 24 483 107 7 1960-61 144 25 489 107 12
NA - Notavailable. Source: (j) Seniot Superjntendent of Post Offices, Ratnagiri.
(ii) Senior Superintendent of Post Office., Thana.
Table 23-Banks
Taluka Name of the Bank wi th Location
Year of Establishment
(1) (Z)
PanvelTaluka .• 1. Bank ofMohara.htra. Panvel 2. Maharashtra State Co.opera.
tive Bank, Panvel. 3. State Bank of India (Panvel)
KhalapurTaluka 1. Bhar.t lnlustrial Bank. Khopoli.
AlibaiTaluka .. 1. Mah.rashtra State Co-opera. tive Bank, Alibag.
2. State Bank of India, Alibag ••
Pen Taluka 1. Mabarshtra Stat. Co-opera-tive Bank, Pen.
2. New Citizen Bank of India. Pen.
3. Pen Co-operative Urban Bank. Pen.
Roha Taluka .• I. Maharashtra State Co-opera. ti ve Bank, Roha.
2. State Bank of India. Roha .•
MurudMahal .. I, Maharashtra State Co-operati ve Bank.Murud.
Z. State Bank of India.Murud
M.had Taluk. .. 1. Mahad Urban Co-operati ye Bank,Mahad.
2. New Citizen Bank of India. Mahad.
3. State Bank of India,Mahad ..
(3)
16-9-1935
1.7.1955
14-4-1933
1·7.1955
31-7.1937
1·7.1955
1-7.1955
31-7-1937
1-7-1955
on31st December
(7) (8)
46 NA 42 NA 38 NA 42 NA 45 NA
106 NA 91 NA
129 NA 207 NA 212 NA 282 NA
Type
(4)
Scheduled. Co-operati ve.
Scheduled.
Non·Scheduled.
Co..operative.
Scheduled.
Co..operati Ye.
Scheduled.
Co-operative.
Co-operatitle.
Scheduled.
Co-oper.ti .....
Scheduled.
Co-oper.tiva.
Scheduled.
Scheduled.
Source: StatisticalT abies relating to Banks in India (Reserve Bank of India).
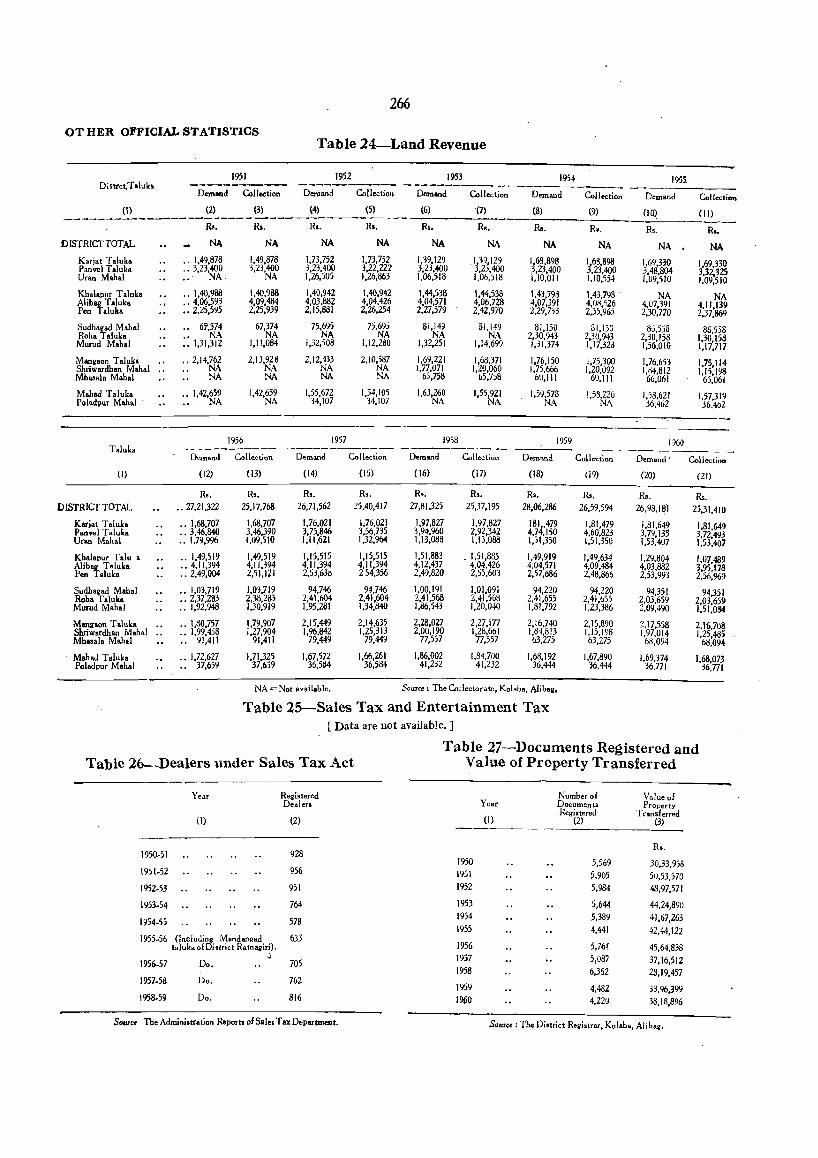
266
OT HER OFFICIAL STATISTICS Table 24-Land Revenue
1951 1952 1953 1954 DisttctITaluka ----------- -------- -------------Demand Collection Demand Collection Demand Collection Demand
(I) (2) 0) (4) (5) (6) (7) (8) -_ ........ _ ........ _-------------DISTRICT TOTAL
Karia! T aluka Panvel Taluk. Uran Mob.1
Kh.l.pur T aluk. Aliblli T.luk. Pen T.luk.
Sudh.gad Moh.l Roha Taluk. Murud Mah.1
Mangaon T .Iuk. Shriwardhon Mohol .. Mh ... la Mob.1
Mobad Toluka Pol&dpur Mohal
T.luka
(I)
DISTRICT TOTAL
Karia, T aluk. Panvel Taluka Uran M.h.1
Khalapur T .Iu • Alibag Taluka Pen Taluka
Sudhagad Mahal Roha Taluh Murud Mahal
Mangaon Talu,," Shriwardhan Mobol .. Mba •• I. Mobal
. Mahad T .Iulca Poladpur M.h.1
JU. JU. R •• R •• Rs. R •• JU. NA NA NA NA NA NA NA
., 1.49,878 1.49.878 1.73.752 1.73,752 1,39.129 .1.39,129 Il9.898
.. 3,23,400 3,23,400 3,23.400 3,22.222 3,23,400 3,23.400 .23,400 . NA NA 1,26.505 1.26,863 1,06,518 1.06,518 1,10.011
•. 1.40,988 1,40.988 1,40,942 1,40,942 1.44,538 1.44,538 1,43,798 .,4,06,593 4.09.484 4,03.882 4,04,426 4.04,571 4,06.728 4.07.391 ., 2,25.595 2,25,939 2,15,881 2,26,254 2.27,579 2,42,910 2,29,733
.. 61',374 67,374 75.695 75.695 81.14, 81,149 81.150 NA NA NA NA NA NA 2.30.943
:: 1,31,312 1.11.084 1.32.508 1.12.2dO 1,32.251 1.14,699 1.31,374
•• 2.14,762 2.13,928 2,12.433 2,10,587 1,69.221 1,68,371 1.76.150 NA NA NA NA 1,17,071 1,20,060 1,75.666 NA NA NA NA 65.758 65,7)8 6il,III
.. 1,42.659 1.42,659 1.55,672 1,54,105 1,63,260 1,55,921 1,59.578 NA NA 34,107 34,107 NA NA NA
1956 1957 1958 1959 -------- ----------- -----------Demand
(12)
Ro. .. 27.21.322
.. 1,68,707
.,3,46,840 .. 1,79,996
.. 1,49,519
.. 4,11,394
.. 2,49,004
.. 1,03,719
.. 2,37.2'03
.. 1,92.948
.. 1,80.757
.. 1.99,458
.. 91,411
.. 1.72,627
., 37,659
Collection Demand Collection Demand Collection Demand
(13) (14) (15) ( 16) (17) (18)
R •• Rs. R •. R •. Rs, R •• 25.17.768 26,71.562 25.40,417 27,81.325 25,37,195 28.06,286
1,68,707 1,76,021 1,76.021 1.97,827 1,97.827 181 .. 479 3,46,390 3,75.846 3,56,735 3.94,960 2,92,342 4,74,150 1,09,510 1,11.621 1.32,964 1,13,088 1,13,088 1,51.350
1.49,519 1,15,515 1.15,515 1.51,88} . 1,51,883 1,49,919 4.11.394 4,11.394 4,11.394 4,12.437 4,04.426 4,04,571 2,51.121 2,53,63(1 254,356 2,49.820 2,55,603 2.57,686
1,03.719 94,746 94.746 1,00.191 1.01.091 94,220 2,38,283 2,41,604 2,41.604 2.41.568 2.41,568 2,41,655 1,30,919 1,95,281 1,34,840 1,86,543 1,20,040 1.81.792
1,79,907 2.15.449 2,14,635 2,28.027 2,27,177 2.16,740 1,27,904 1,%,842 1,25,313 2,00,190 1,28,661 1,84,813
91.411 79.449 79,449 17,557 17,557 63.275
1,71,325 37,659
1,67.572 36,534
1,66,261 36,584
1.86,002 41.232
1,84,700 41,232
1,68,192 36,444
NA = Not available. Source: The Collectorate, Kolab., Niball.
Table 25-Sales Tax and Entertainment Tax [ Data are not available. ]
1955-
Collection Demand Collection (9) (lO~ ( II)
R •. Rs. lli.
NA NA NA
1.68.898 1,69,330 1,69.330 3,23,400 3.48,804 3.32,325 1,10.554 I,U9,51O 1,09,510
1,43,798 NA NA 4.08,526 4,07.391 4,11.139 2,35,965 2,30,770 2.37,869
31,150 85,538 86.558 2,3U.943 2.30,158 1,30,158 1,17,320 1,56,010 1,17,717
1,75,300 1,76,653 1.75.114 1,20.092 1,84,812 1,15,198
60,111 66,061 65,061
!,58.226 1,58,621 1.57,319 NA 36,462 36.402
1960
CollectIon Demand' Collectio ..
(19) (20) (21)
R •• R •. Ro. 26,59,594 26,98,18'1 25.31,410
1.81,479 1,81,649 1.81,649 4,60,823 3,79.139 3.72.493 1,51,350 1,53,407 1,53,407
1,49.634 1:29.804 1.07.489 4,09.484 4,03.882 3.9>,178 2,48.866 2,53.993 2.56,96~
94,220 94,351 94,351 2,41.655 2,03,659 2.03.659 1.23.386 2,09.490 1,51,084
2,15,890 2.17,558 2,16,708 1,15.198 1.97,014 1,25.485 63,275 68,094 68,094
1,67.890 1,69,374 1.68,073 36,444 36,771 36,771
Table 26--Dealers under Sales Tax Act Table 27-Documents Registered and
Value of Property Transferred
Year
(I)
1950-51
1951·52
1952-53
1953·54
1954.55
1955.56 (Including Mandangad taluk. of District Ratnagiri) .
.0 1956.57 Do.
1957.58 Do.
1958.59 Do.
Registered Dealers
(2)
928
956
951
764
578
633
705
762
816
Source The Administration Reports of Sales Tax Departmellt.
1950 1951 1952
1953 1954 1955
1956 1957 1958
1959 1960
Number of Value of Year Documents Property
(I) Registered . Transferred
(2) (3)
R •.
5.569 30,33,958 5,905 50,53,570 5.984 48,97.571
5.644 44.24,890 5,389 41.67,263 4,441 42,44,122
5.7M 45,64.838 5,087 37,16,512 6,362 23,19.457
4,482 33.96,399 4,220 38.18,896
Source: The District Registrar, Koloha, Aliball.
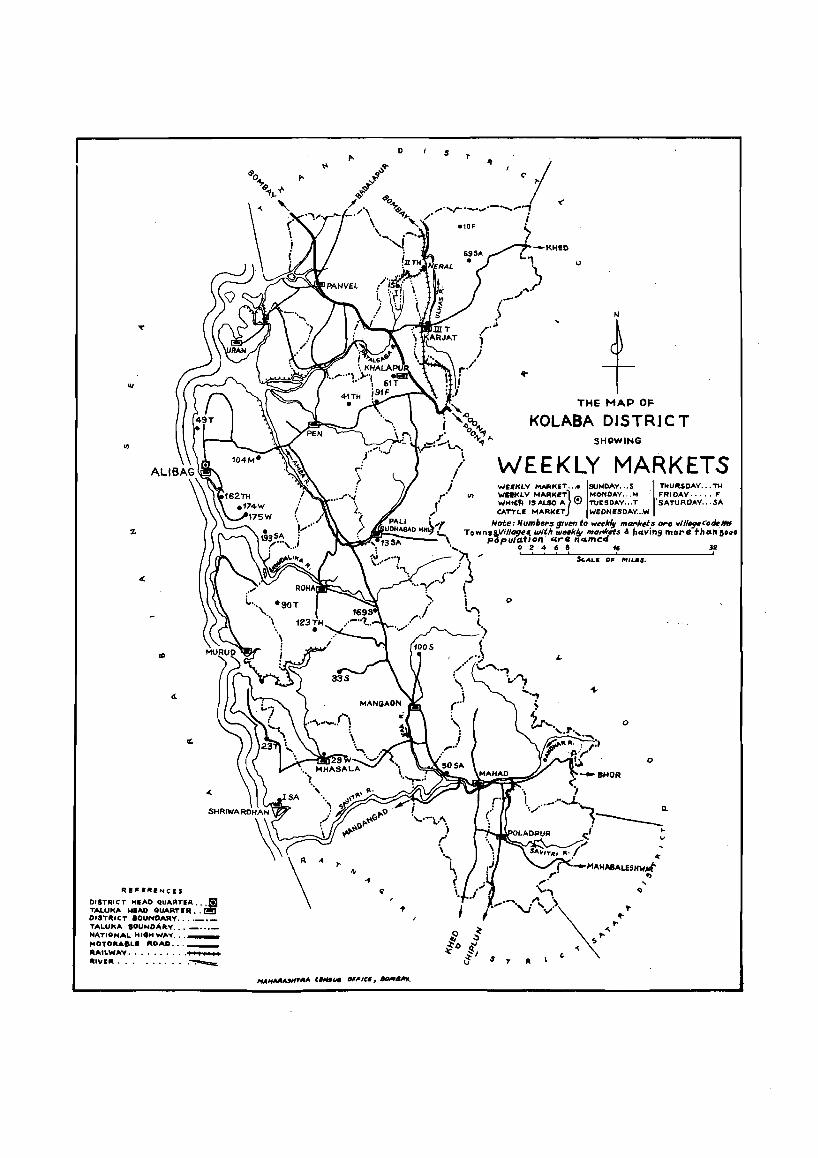
'"
REF.IIt.NeIS
DISTRICT 11,"'0 QUARTSR .•• m TALUK... ....AD ~UART." •. !!!!i DI.TllleT BOUNDA"Y •••• _._ TALUKA BOUNDARY ••. _"'_ NATIONAL HltiHWAY ... _ MOTOR ... eu ROAD ••. _ 1l ... 'LWAV •••••••.•. _ RIVIR .•••••.••• ~
D s .,.
II>
u
N
+ THE MAP OF
KOLABA DISTRJC T SHOWING
WEEKLY MARKETS W£IiHLY _K'T ...• 'SUNDAY .•. S I THURSDAY .•. n! W_LY MARKET}"" MONDAY .. M FRIDAY .•.•. F WH"fI IS ALSO A 6 TUUDAY .•. T 'SATURDAY .•. SA CATTLIi MARKET WEiDNESDAY ..• W
32
o
o
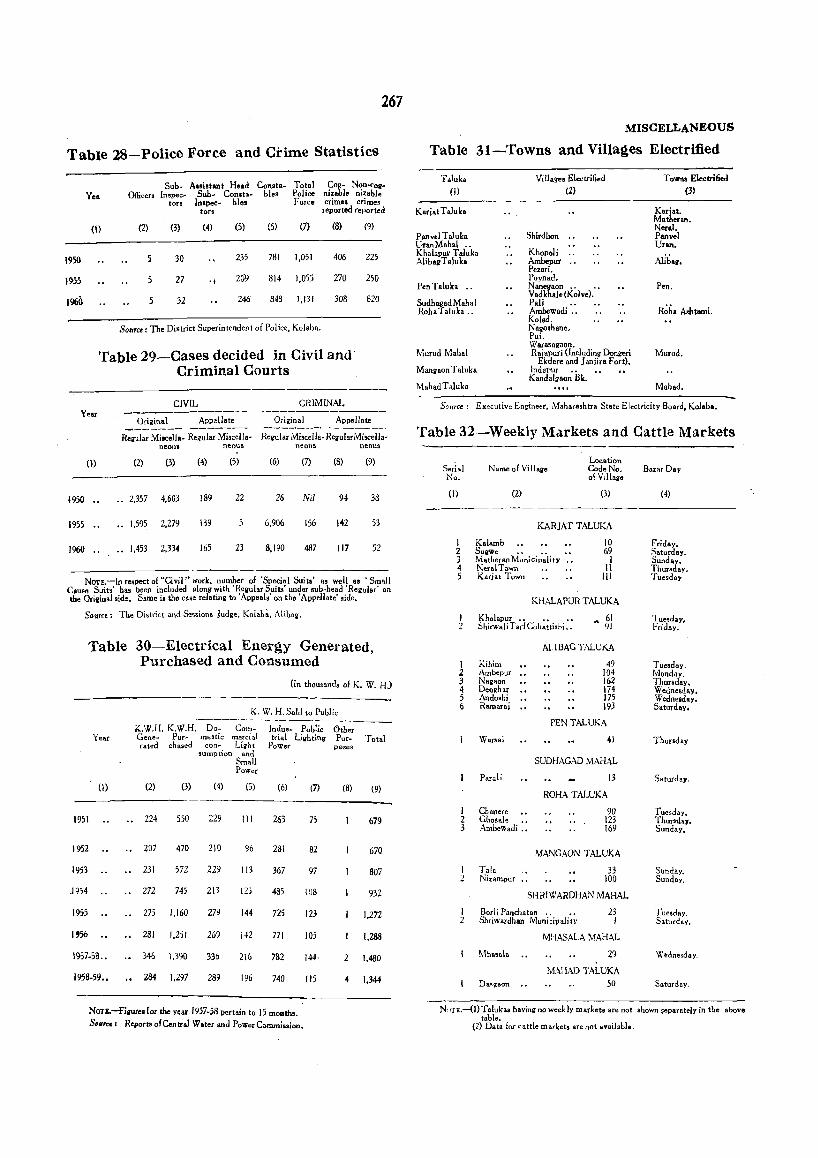
267
Table 28-Police Force and Ci-ime Statistics
1950
1955
1960
Yea
(I)
Sub- A •• i.tllnl Head Con.ta- Total Co¥- Non"'og_ ()fIicers In,pec- Sub- Conota- bles Police nizable nizable
tOT! Inapee.. hIes F ofce crimes crimes tors reported reported
(2)
5
5
5
(3) (4)
30
27 .j
32
(5)
235
209
246
(6) (7)
781 1,051
814 1,055
848 1,131
SOUTe.: 'The District Superintendent of Police, Kolaba.
(8) (9)
406 225
270 250
308 820
Table 29-Cases decided in Civil and' Criminal Courts
CIVIL CRIMINAL Year
Original Appellate Original Appellate
Regular Milcella- Regular MiscelJa- Reiular MisceIla-ReyularMiscella-neoU1i neous neous neous
(I) (2) (3) (4) (5) (6) (7) (8) (9)
1950 2,357 4,603 189 22 26 Nil 94 38
1955 1,595 2,279 139 5 6,906 156 142 53
1960 1,453 2,334 165 23 8,190 487 117 52
NOTE.-In respect of "Civil" work, number of 'Speci.1 Suits' a. well a. 'Small Cau"" Suit. has been included .Ionirwith 'RegularSuits' under sub-head ·Regul., on the Orillinalside. Same i. the case relatini to 'Appeal" on the 'Appellate' side.
Soure<: The District and Sessions Judge, Kalab .. , Alibl\i.
Table 30-Electrical Energy Generated, Purchased and Consumed
(In thousands of K. W. HJ
K. W. H. Sold to Public
Year
(l)
1951
1952
1953
.1954
1955
1957-58 .•
1958-59 ••
K.W.H. K.W.H. 00- ComGene- Pur.. mestic merciaJ rated chased con- Light
(2) (3)
224 550
207 470
231 572
272 745
275 1,160
281 1,251
346 1,390
284 1,297
sumption and Small Power
(4) (0)
229 111
210 96
229 113
213 125
279 144
267 142
336 216
289 196
Indus- Public trial Liihting
Power
(6)
263
281
367
485
725
771
782
740
75
82
97
108
123
105
144·
115
NOTE,-fiiure,for the year 1957-58 pertain to 15 mORth ••
S.IITee: Reports of Central Water and PowerCommi.,ion.
Other Pur
pases
(8)
Total
(9)
679
670
807
932
1,272
1,288
2 1,480
4 1,344
MISCELLANEOUS
Table 31-Towns and Vi1la~es Electrified
T.luk. (I)
Karjat T wuka
Pan vel Taluka UtaniVlahal ., Khal.pur Taluka Aliball T aluka
Pen Taluka •.
SudhagadMahal Roha Taluk •..
Murud Mah.1
Mangaon Taluka
Mahad T aluka
Village, Electrified (2)
Shirdhon
Khopoli .. Ambepur Pezari. Poynad. Nanegaon .. .• V.dkh.l. (Kolve). Pali •. Ambewadi •. Kolad. N.gothane. Pui. 'X'arasagaon .. Rajapuri (Including DonllOri
Ekdare and janjira Fort). Ind.pur ., Kandalgaon Bk,
T oWrt. Electrified (3)
Kariat. Matheran. Neral. Panvel Urlln,
Allbag.
Pen.
R~h. Ashtami.
Murud.
Mobad.
Source: Executive Engineer', M'aharashtra State Electricity Board, Kolaba.
Table 32-Weekly Markets and Cattle Markets
Serial No.
Name 01 Villaae Location CodeNo, 01 V,llago
(I) (2) (3)
KARJAT TALUKA
I 2 3 4 5
Kalamb 10 SUgWe •••• 69 Matheran Municipality I Neral Town II Kariat Town III
KHALAPUR TALUKA
1 Khalapur.. .. .. " 61 91 2 Shirwali Tad Chhatti,hi .•
I Kihim Z Ambepur 3 Nagaon 4 Deoghar 5 Andoshi 6 Ham.raj
\Varsai
Parali
I Chanere Z Ghos.l. .• 3 Ambewadi .•
I Tala 2 Nizampur
All BAG T ALUKA
49 104 162 174 175 193
PENTALUKA
41
SUDHAGAD MAHAL
13
ROHA TALUKA
90 123 169
MANGAON TALUKA
33 100
SHRIWARDHAN MAHAL
I Borl i Panchatan . . .. 23 I 2 ShrilVardhan Municipality
Mha.al.
Da!\'i{8.on
MHASALA MAHAL
29
MAHAD TALUKA 50
Bazar Day
(4)
Friday. S.turday. Sunday. Thursday. Tuesday
Tuesday, Friday.
Tuesday. Monday. Thursday, Wednesday, Wednesday, S.turday,
Thursday
Saturday.
Tuesd.y, Thur>day, Sunday,
Sunday. Sunday .
Tuesday. Saturd.y.
W.dnesday.
Sa.turday,
Nc'fE.-(1) Talukas h.ving no weekly markets are not shown ,eparately in tbe above table.
(2) D.ta for cattle markets are not avail.bl •.
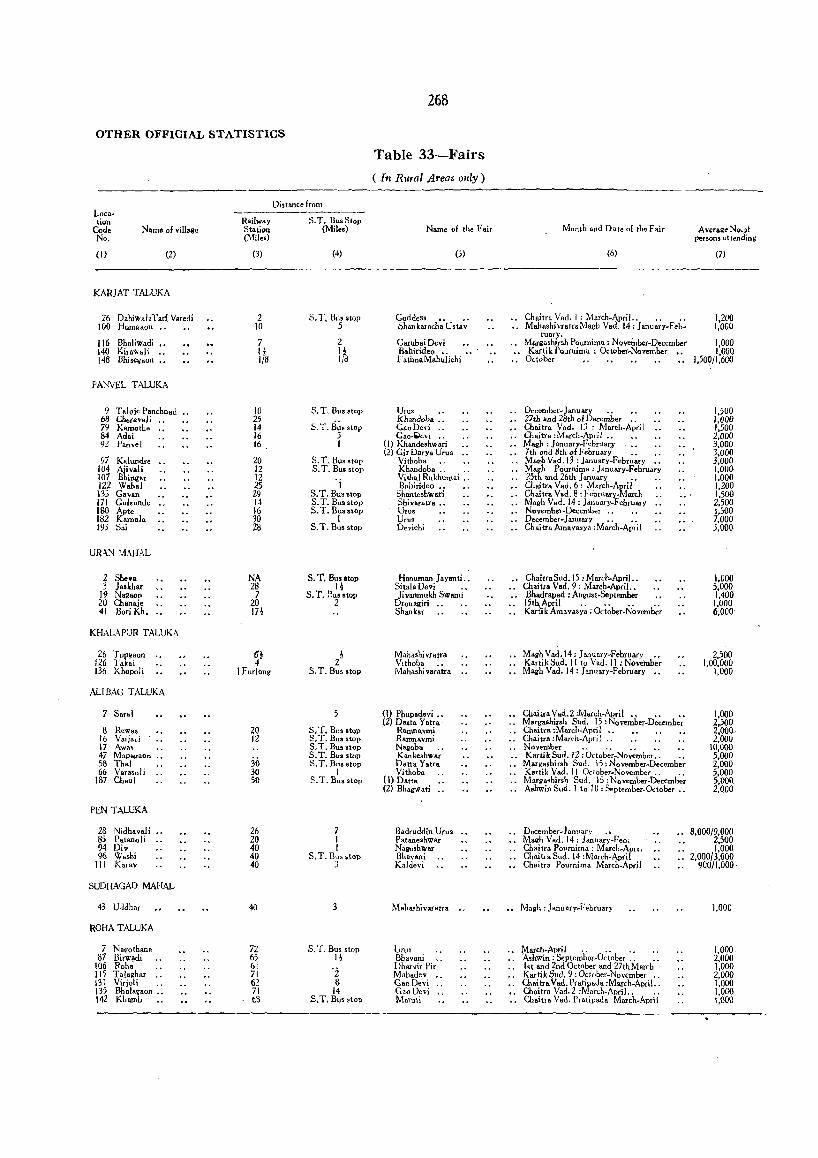
OTHER OFFICIAL STATISTICS
Location
Code No.
N~m. of .illage
(I) (2)
KARJAT TALUKA
26 DahiwaliTarf V.redi 100 Hum •• on
116 Bhaliwadi 140 Kirawali 148 Bhisogoon
PA"VEL TALUKA
9 T aloj. Panchnad 6B Cheral'ali 79 KamotlJe 84 Ad.i 92 Panvel
97 Kalundre 104 Aiivali 107 BlUng"r 122 Wah.l 135 Cavan 171 Gulsunde 180 Apte 182 Kamala 193 Sai
UR"'N :vtAHC\L
2 She.a 3 Jaslchar
19 Nagaon 20 a.anaie 41 Bori Kh.
KHALAPUR TALUKA
26 Tup~aon 126 Takai 136 Khopoli
ALI BAC T ALUKA
7 Saral
8 Rew.s 16 Vaijali 17 Aw .. 47 Mapagaon 58 Ih.1 66 V.r .. oli
187 Chaul
PEN TALUKA
28 Nidhaval j 85 Patanoli 94 Oil' 96 Washi
III Kara.
SUDHAGAD MAHAL
43 Uddh.r
ROHA TALUKA
7 Nagothane 87 Birw!l<li
106 Roh. .. 115 Talaghar .. 131 Virioli 135 Bhalagaon •• 142 Khamb
Railway Station (Mile.)
(3)
2 10
7 I ~ 1/8
10 25 14 16 16
20 12 12 25 29 14 16 30 28
NA 28 7
20 m
6~ 4
I Furlong
20 12
30 30 SO
26 20 40 40 40
40
72 65 61 71 62 71 t8
Distance from
S.T. BusStop (Miles)
(4)
S. T. Bus stop 5
2 11 1/8
S. T. Bu. stop
S. T.Ii~s stop 3 I
S. T. Bus stop S. T. Bus stop
'j S. T. Bus stop S. T. Bus stop S. T. Busstop
I S.T. Bus stop
S. T. Bus atop H s. T. ~u!J stop 2
2~ S. T. Bus stop
S, T. Bus stoP S. T. Bus stop s:1'. Bu. stop S. T. Bus stop S. T. Bus stop
I S.T. Bus stop
7 1 I
S. T. Bus .top 3
S. T. Bus stop n
'2 8
14 S. T, Bus stop
268
Table 33-Fairs
( In Rural Areas only)
Name of the Fair
(5)
Goddess ,. .. Shankaracha Usta.
Garubai Devi Bahirideo •. F atimaMahulichi
Urus .• Khandoba •. CaoDevi .. Cao-lOie,j ..
(I) Khandeshwari (2) Cir Darn Urus
Vithoba " Khaodoba .. .. Vi thaI Rukhumai .. Bahirideo •.
Shanteshwari Shivaratra •. Urus Urus Devicbi
Hanuman Jayanti .• SitalaDevi .. Ji vanmukh Swami
Dronagiri Shankar
Maha.hivratr. Vithoba .• Mah .. hi varalra
(I) Phupadevi •• (2) Datta Yatra
Ramnavmi Ramnavmi Nagob. .. Kankeshwar Dalta Yatr. Vithoba
(1) Datta .. (2) Bhagwati ..
Badruddin Uru. Pataneshwar N.geshwar Bhavani Kaldevi
Mahashivaratra .•
Urus Bhavani .. Dharvir Pir Mahadev Gao Devi Gao Devi MnTuti
Month and Date of the Fair
(6)
Chaitra Vad. I ; March.April.. .. .• MahashivratraMagh Vad. 14: January·Feb.
ruat}". Margashirsh Pournima : November·December
'. Karlik PQurnima ; October-November " October
December .. January .• 27th and 28th 01 December .. Chaitra Vad. 13 , March-April Chaitr. :March-April.. .. Magh : J.nuary-February 7th and 8th 01 F ebruari .. .. Magh Vad. I3 : January-February .. Magh Pournima: January-February 25th and 26th January •. Chaitra Vad. 6, March.April Cb.itra Vad. 8: February.March Magh Vad. 14: January-February November ~DecelJ)ber " December -January . . . . Chaitra Amavasyo :March-April
ChailraSud.15 : March.April .. Chai tra Vad. 9 : March.April.. Bhadrapad : August.September .• ISth,April .. .. .. .. Kartik Amavasya; October.November
M'gh Vad, 14: January-February .• Kartik Sud. II to Vad. 11 : November Magh Vad. 14: January-February ••
Cnaltra Vad. 2 :March-April.. .. •• Marg •• hirsh Sud. 15: November-December Chaitr. : March-ApriI .. Chaitra :March·April .. November •. .• •• •. " Kartik Sud. 12: October-November.. ..
Marga.hirsh Sud. 15: November-December Kartik Vaa. II October.November.. " Margashirsh Sud. 15, November-December Ashwin Sud. I to 10 : September.October "
December .. lam1ary . 'Ii Magh Vad. 14 : January-Feo, Chaitra Poumima : Marcb .. Apnl ChaitroSuJ.14 : March-April Chaitra Pournima March .. April
,.. Magh, J anuary.F ebruary
March-April . . . . . . Ashwin : September-October .. • . 1st and 2nd October and 27th March Kartik Sud. 9: October.November .. Chaitra Vad. Pratipad. :March.ApriL. Chaitr. V.d.2 :March-April.. .. Chaitra Vad. Pr.tipad. March-April
Average No.of persons attending
(7)
1,200 1,000
1.000 I ,GOO
1.500/1,600
1,500 1,000 1,500 2,000 3.000 3.000 3.000 1.000 1.000 1.200 1.500 2,500 1.500 7.000 3.000
1,000 5,000 1,400 1.000 6.000
2.500 1,00,000
1.000
1.()(}0 2,500 2,000, 2,000
10,000 5,000 2,000 5,000 5,000, 2.000
8,000/9.000 2.500 1.000
2,000/3,000 900/l,000
1,000
1,000· 2,000 1,000 2,000 1,000 1,000 1,000
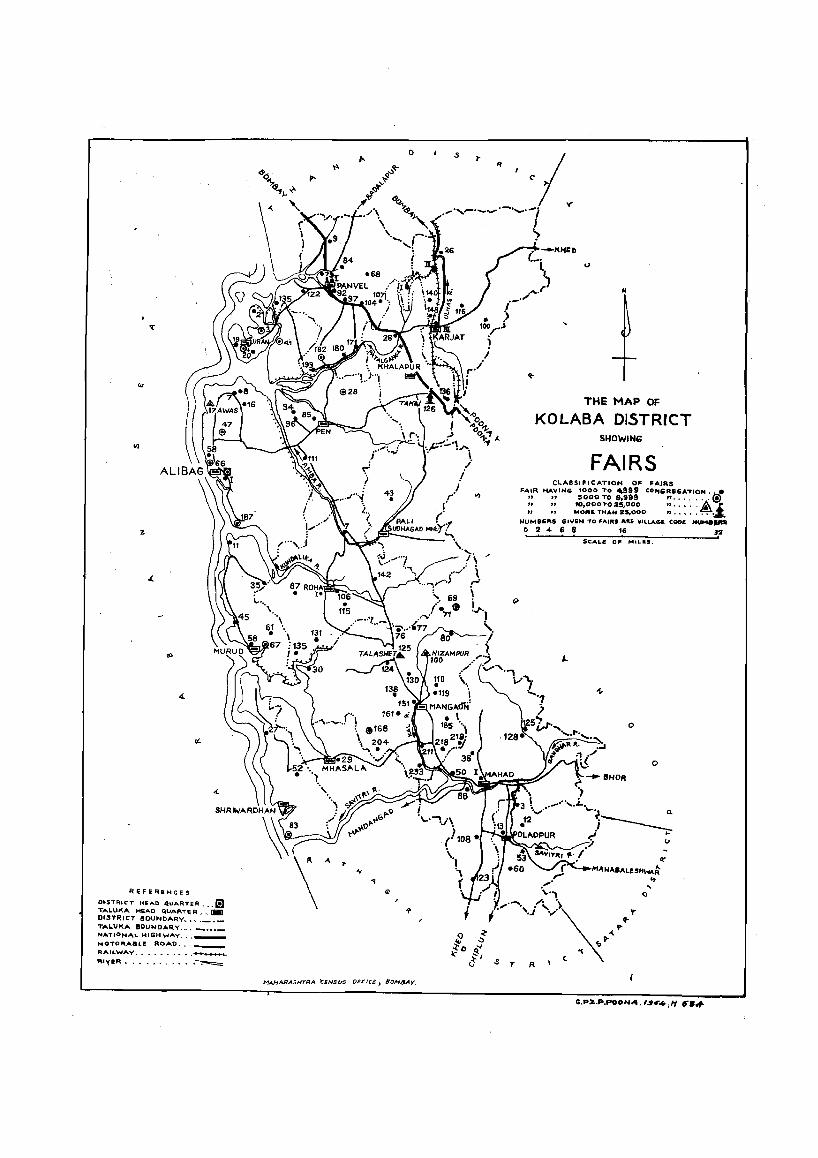
~EFERI!NC.ES
OISTRICT HEAD Q:UARTER .•• B TALUKA HEAD QUAf'," E ~ .. ~ lIE D'''TII'CT BOUNDARY." ._._ TAL.UK.A 80UND"'~Y .... _ ••• _ NATIONA,L HIGHWAy ••• _
MOTO" .... LE ROAD •.. __
RAILWAy ••.••••••• ~
... 'VE .... " .• "." ••• ~
o s
MAHARASHTRA 'cENSUS O~nCE) 80/lfllAY.
N
THE MAP OF
KO LABA DISTRICT SHOWING
FAIRS CLASSIFICATION OF FAIRS
~~~R H~~rN" ~~:~~: ::i:: CONG~~~~~I~~: ®_. " " to,OOOTO 25,000 " •• ~ •. &1 " " MOlltE TfiAN 25,.000 u ..••...•
NUMB&R5 ~1"IiN TO FAIRS AAi ""'.LAGE CODe: HUM8JRS o 2 4 ,. 8 16 J2
S T P.
SCALI' Oil MILas.
o
" Q
o
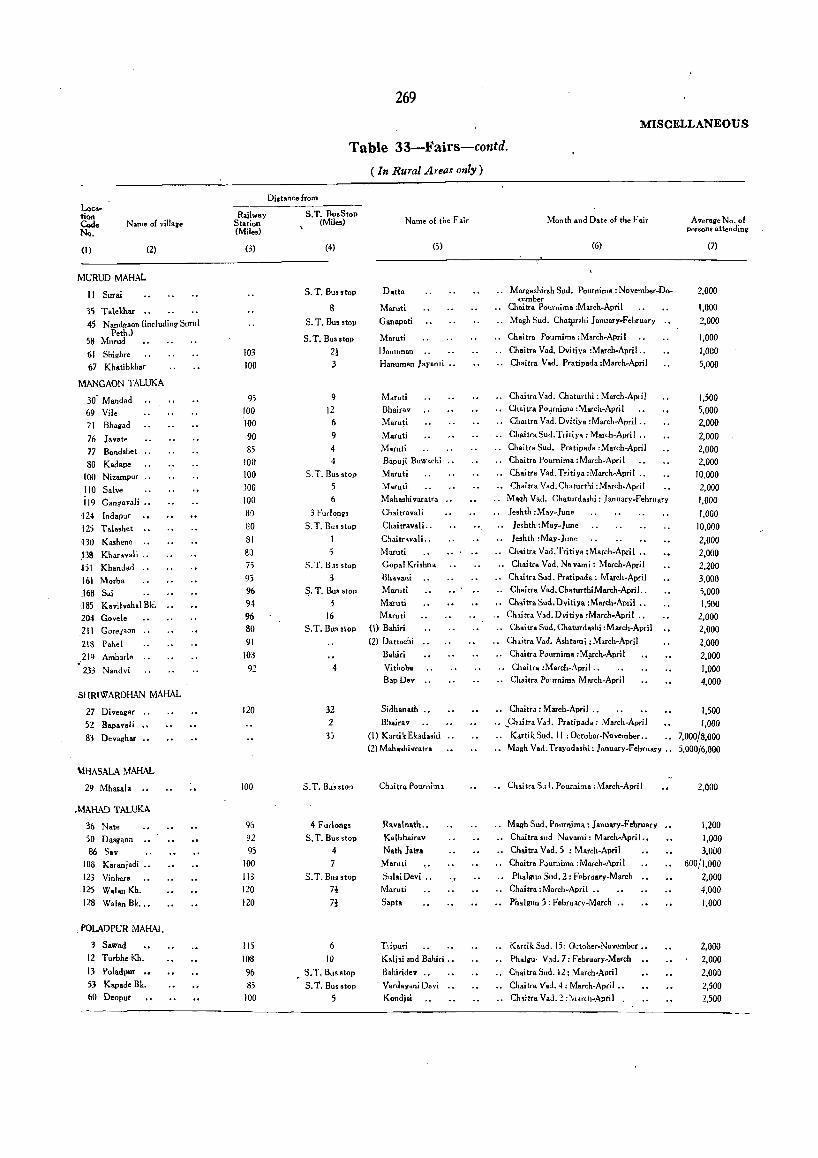
Location Cod. N<:.,
Name of vill.,e
(I) (2)
MURUD MAHAL
II Surai
3S Talekhar
45 Nandgaon (including Surul Peth.)
58 Murud
61 Shighre
67 Khatibkh.r
MANGAON TALUKA
30 M.nd.d
69 Vile
71 Bhag.d
76 lavate
77 Bond.het
80 Kadape
100 Nizampur
110 Salve
119 Gang-avaH
'124 Ind.pur
125 Tala.het
HO K •• hene
. 138 Kharavali .•
,J5] Khand.d
.161 Morba
.168 Sai
ISS Kavilvah.1 Bk.
204 Govele
211 Gorel1aon
218 Pahel
219 Ambarle
233 Nandvi
.SHRIWARDHAN MAHAL
27 Diveagar
52 Bapavali
83 Dev.ghar
\1HASALA MAHAL
29 Mhasal.
,MAHAD TALUKA
36 Nate
50 Dasgaon
86 Sav
IQ8 Karanjadi
123 Vinber. 125 Walan Kb.
128 Walan Bk ...
• POLADPUR MAHAL
3 Sawad 12 Turbhe Kh.
13 Poladpur ..• 53 Kapad. Bk.
60 Deopur
Railway Station (Mile.)
(3)
103 100
95 100 100
90 85
100 100 .100 100 8a
80
81
80 75
95 96
9~
96 80 91
103
92
120
100
96 92 95
100
113 120
120
115 108 96 85
100
269
MISCELLANEOUS
Table 33-Fairs-contd.
Distance from
S.T. Bu.Stop (Miles)
(4)
S. T. Bu •• top
S
S. T. Bus stop
S. T. Bu •• top
2!
9 12
6
9 4 4
S. T. Bussto"
5 6
3 Furlong,
S. T. Bus ,top
I
5 S. T. B,. stop
3 $. T. Bus stop
3 16
S,T. Bus stop
4
32 2
35
S. T. B •• sto~
4 Furlongs
S. T. Bus stop
4 7
S. T. Bus stop
7! 7!
6 10
• S.T. Bu,stop
S. T. Bus stop
5
( In Rural Areas only)
Name of the Fair
(5)
Datta
Maruti
Ganapati
Maruti
Hanuman
Hanuman J ayan ti ..
Maruti
Bhairav
Maruti
Maruti
Maruti Bapuji Buwachi
Maruti
Matuti Mahashivaratra
Chaitravali
Chaitravali ..
C!1aitravali ..
Maruti
Gopal Kri.hna
Bh.vani
Maruti
Maruti
Maruti
(\) Bahirl
(2) Da ttachi
Bahiri
Vithoba
BapDev
Sidhanath .•
B!,.irav
(I) KartikEkadashi
(2) Mahashi vratra
Ch,itra Pournim.
Rav.lnath ..
K.lbhairav
Nath latra
Maruti
SulaiDevi .• 'J Maruti
Sapta
Tripud K.liai and Bahiri ..
B,hiridev .. . Vardaytlni Devi
Kondj.i
Month and Date of the Fair
(6)
Margashirsh Sud. Pournima: November-De_ cember
Cbaitra Pournima :March-April
.. Magh Sud. Ch.tprthi Ianuary-February
Chaitr& Pournima : March ... April
.. Cbaitra Vad. Dvitiya :March-April ..
.. Chaitra Vad. Pratipada :March-April
.. Chaitra Vad. Chaturthi ,March-April
.. Chaitra Po1._-tfni01a :March .. April .. Chaitr. Vad. Dvitiya :March-April ..
.. Ch.itra Sud. Tritiya : March-Apri I .. Chaitr. Sud. Pratipada : March-April
., Chaitra Pournima : March ... April
.. Chaitra Vad. Tritiya : March-Apri I .. Chaitr. V.d.Chaturthi : March-April
Magh Vad. Chaturdashi: January-February
I.shth :May-Iune
.. Ieshth :May-Iune
.. Ie.hth ,May-June
Chaitra Vad. Tritiya :March-April ..
.. Chaitra Vad. Nav.mi: March-April
Chaitr. Sud. Pr.tipad.: March-April
.. Chaitra Vad.ChaturthiMarch-April..
" Chaitra Sud. Dvitiya : March-April "
Ch,itra V.d.Dvitiya :March-April .•
., Chaitra Sud. Chaturdashi : Match-April
Chaitra Vad. Ashtami ; March-April
.. Ch.itra Pournim. :M~rch-April
.. Chaitr. :March-April ..
.. Chaitra Pournima March-April
• • Chaitra: March-April .•
.• ,CJuitra V.J. Pratipada: March-April
.. Kartik Sud. II ; October-November ..
.. Maoh Vad. Trayodashi: January-February ..
.• Ch.i". S,1, Pournima : :vIarch-Apri I
Maah Sud. Pournima: January-February
Chaitra sud Nav.mi: March-April,.
Chaitra V.d. 5 : March-April
., Chaitra Pournima ; March-Apri I
., Phalgun Sud. 2: February-March
Chaitr.: March-April ..
Phalgun 5: February-March .•
.. Kartik Sud. I): October-November ..
Phalgu· Vad. 7 : February-March
ehaitra Sud. 12: March·April
Chaitra V.d. 4; March-April ..
.. Ch,itra Vad. 2 :!\ldrcn-April .
Average No. of persons altendinQ'
(7)
2,000
1,000
2,000
1,000
1,000 5,000
1,500 5,000 2,000
2,000 2,000 2,000
10.000 2,000 1,000
1,000 10,000
2,000 2,000 2,200 3,000 5,000 1,500
2,000 2,000
2,000 2,000 1,000 4,000
1,500 1,000
7,000/8,000 5,000/6,000
2,000
1,200 1,000 3,000
800/1,000
2,000 4,000
1,000
2,000 2,000
2.000 2,500 2,500
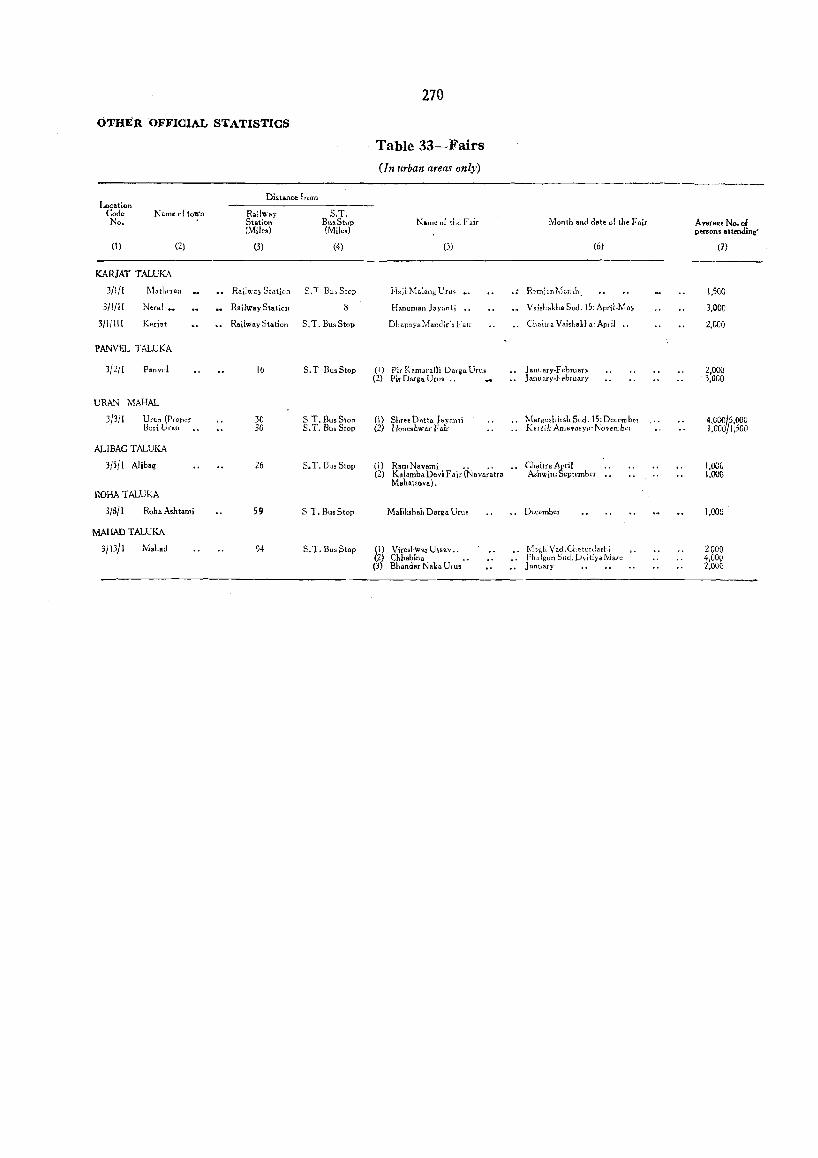
OTHER OFFICIAL STATISTICS
Location Code No.
~amc of town
(I) (2)
KAR1AT TALUKA
31l/l Matheran
3/1/l1
3/1/111
Nera] _
Karjat
PANVEL TALUKA
3/2/1 Par-wi
URAN MAHAL
3j31I Uran (Proper Bori Uran
ALIBAG TALUKA
3/5/ I Alibag
ROHA TALUKA
3/S!! Roh. A,ht.TIli
MAHAO TALUKA
3/13j! M.h.d
Dista:lce from
Rail"Fay Station (Miles)
(3)
S.T. Eu.Stop (Miles)
(4)
Rai~wc:.y Sta.ticn ~. ~ R..Is Step
Railway Statien 8
Railway Station S. T. Bus Stop
16
30 30
26
59
94
S. T BusSlop
ST. Bus Stop S. T. Bus Stop
S. T. Bus Stop
S T, Bus SloP
S, T, Bus Stop
270
Table 33-Fairs
(In urban areas only)
Name of th~ Fair
(j)
l·bji i\1&;cng Urm
Hanuman Jayanti
Dhapaya!\/Ianclir's FaIr
(I) Pir Kama,..lli DaTi". Urus (2) Pit Darga Un" "
(1) Shr •• Datta Jay"nli (2) Hones/'IVal' Fai,
(I) R.mNavami .. .. (2) K.lamba Devi F .ir(N .varatra
M.h.\sova).
Maliksh.h D.r~a Urus
(1) Vires!,Way Ulsa, .. (2) ehh.bina (3) Bhand.r Nah Urus
Month "ltd date of the Fair
(6)
•• Ram~ar.!\'kI.th
Vaishalh.Sud.15;April.M.y
.. Chaitr. Vai,h.Ha; April ..
J anuary~F ebru8Y'Y lanuar~'~February
l"large,hirsh Sud. IS; December Karti.k AmaVilsYIl·r-.,-oven:bcl
Chaitr. April Ashwin: September
•• Dectmbe.f
r":<:'t,h·Vad, C~~ tUHluhi Fhulgun Sud. D"itlyaIVlarc January
A verage No. of persons attendine"
(7)
1,5GO
3,000
2,000
2,000 . 3,OGO
4,CooIS,OOG ! , OGOi 1,500
1,000 I ,COO
1,000 '
2000 4,OO~' 2,OOG
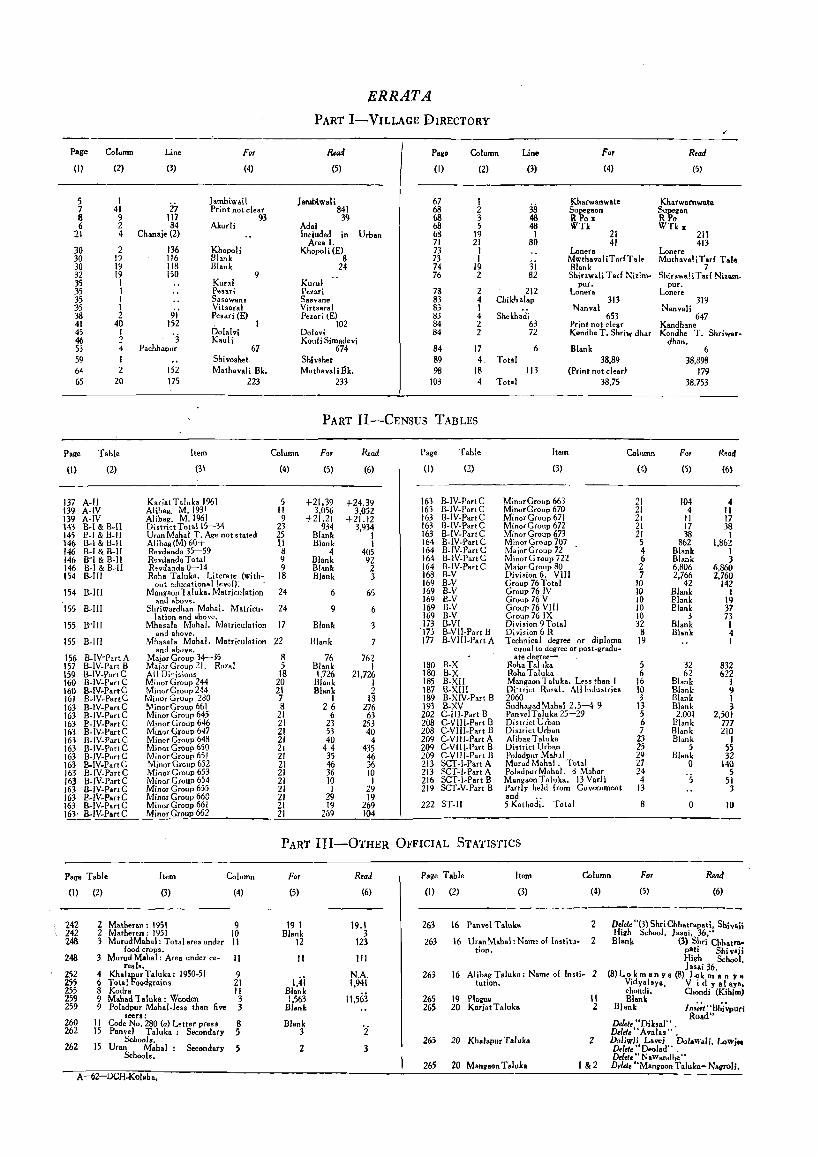
ERRATA PART I-VILLAGE DIRECTORY
,-
Page Column Line Fo, Rerul Page Column Line F., Road
(I) (2) (3) (4) (5) (I) (2) (3) (4) (5)
5 1 2'7
J.mbiw.il Jambiwali 67 1 Kharwanwate Kharwarnwate 7 41 Print not clear 841 68 2 38 Supell80n Supegan 8 9 117 93 39 68 3 48 R Po x R Po 6 2 84 Akurli Adal 68 5 48 WTk WTk"
21 4 Chanaje (2) lnduded in Urban 68 19 I 21 211 Area I. 71 21 80 41 413
30 2 136 Khopoli Khopoli(E) 73 I Lonera Lonere 30 D 116 Blank 8 73 I
3i MwtbavaliTarlTale MuthavaliTarl Tal.
30 19 118 Blank 24 74 19 Blank 7 32 19 150 9 76 2 82 Shir.waH Tar! Nizim- Shir .... !iTar! Nizam-35 I Kural Kurul pur. pur. 35 1 Pesa:ri Pezari. 7B 2 212 Lonera LoneTe 35 I Sasawans Sasvane 83 4 Chikh.lap 313 319 35 1 Vitsaral Virtsaral 83 I l\I.nval Nanvali 38 2 91 Pesari (E) Pez.ri (El 83 4 Shekhadi 653 647 41 40 152
Dol.lvi 102 84 2 63 Print not dear K.ndhane
45 I 'j Dolavi 84 2 72 Kondhe T. Shriw dhar Kondbe T. Shriwar. 46 :! Kauli Koul i Simadev; dban. 53 4 Pachhaput 67 674 84 17 6 Blank 6 59 I Shivoshet Shivshet 89 4. Total 38,89 38,898 64 2 152 Mathavali Bk. Muth.vali Bk. 98 18 113 (Print not cle.r) 179 65 20 175 223 233 103 4 Total 38,75 3S.753
PART II-CENSUS TABLES
Page
(1)
Table
(2)
137 A-II 139 A-IV 139 A-IV 143 B-1 & B-ll 145 P-I & B-ll 146 B-1 & B-II 146 B-1 & B-II 146 B-1 & B-I1 146 B·I & B·ll 154 B-IIl
154 B.IIl
155 B-IlI
155 B-1lI
155 B-IIl
156 B-IV-Part A 157 B·IV-Part B 159 B-IV-PartC 160 B-IV-Part C 160 B-IV.PartC 161 B-IV-P.rtC 163 B-IV-PartC 163 B-IV-PartC 163 B-IV·PartC 163 B-IV-PartC 163 B·IV·Part C 163 B-IV.P.rt C 163 B-IV-Part C 163 B-lV-PartC 163 B-IV-P.rt C 163 B-IV·PartC 163 B-IV-PartC 163 H-IV-PartC 163 B-IV-PartC 163' B-IV-Parte
Item Column
(3\ (4)
Kari.tTaluka 1961 5 Aliba •. M.193 1 I I Aliba •. M.1961 9 District Tot.1 15-34 23 UranMah.1 T. Age not stated 25 AI ib •• (M) 60+ 1.1 Revdand. 35-59 8 Revdand. Tot.l 9 R,vd.nda 0-14 9 Roha Taluka. Literate (with- 18
out educationallevel)~ Mang.on 1 aluk •. Matriculation 24
and &bov~. Shriwardhan Mahal. M.tricu- 24
lation and above. Mhasala Mahal. Matriculation 17
ani above. Mhos.la Maha!. Matriculation 22
and above. M.jor GrouP 34-35 8 M.jor Groun 21. Rural 5 All Di"isio;'s 18 Minor Group 244 20 Minor Group 244 21 Minor Group 2aO 7 l'v'inorGroup 661 8 Minor Group 645 21 Minor Group 646 21 Minor Group 647 21 Miner Group 648 21 Minor Group 650 21 Minor GrGup 651 21 Minor Grcup 652 21 Minor Group 653 21 Minor Group 654 21 Minor Group 655 21 Minor Group 660 21 Minor Group 661 21 Minor Group 662 21
For
(5)
+21.39 3.056
+21.21 934
BI.nk Blank
4 Blank Blank Blank
6
9
Blank
Blank
76 Blank 1.726
Blank Blank
I 26
6 23 53 40
44 35 46 36 10 1
29 19
269
Read
(6)
+24.39 3.052
+21.12 3,934
1 1
405 92 2 3
65
6
762 I
21,726 I 2
13 276 63
253 40
4 435
46 36 10 I
29 19
269 104
Page T.ble
(I) (2)
163 B-IV.PartC 163 B-lV-P.rtC 163 B-IV-P.rt C 163 B-IV-PartC 163 B-IV-PartC 164 B-IV-PartC 164 B-IV-Part C 164 B-IV-PartC 164 B-IV-PartC 168 B.V 169 BN 169 BN 169 aN 169 B-V 169 B-V 173 B-VI
'17; B-Vll-P.rt B 177 B-VIll-Part A
180 B-X 180 B-X ISS B-XII 187 B-XlII 189 B-XIV.Parl B 193 B·XV 202 C·III·Part B 208 C-VIII.P.rl B 208 C-VIII.Parl B 209 C-VIII.Parl A 209 C-V[[!-P.rt B 209 C-VIII·Part B 213 SCT-I.Part A 213 SCT-I-Par! A 216 SCT-I.Part B 219 SCT·V·P.rt B
222 ST.II
Item
(3)
MinorGroup 663 MinorGroup 670 Minor Group 671 Minor Group 672 Minor Group 673 Minor Group 707 M.jor Group 72 Minor Group 722 M.ior Group SO Division 6. VIII Group 76 Total Group 76 IV Group 76 V Group 76 Vlll Group 76 IX Division 9 Total Division 6 R Technical degree of diploma
equal to degree or post .. gradu .. ate degree-
Roha Taluka Roha T.luka Mangaon 1 aluka. Less than I Di'trict Rural. All Industries 2060 Sudhag.dMahal 2.5-4 9 PanvelTaluka 25-29 District Urban District Urban Alib •• T.luka Di'3trlct Urban Poladpur Mah,1 Murud M.h.l. Total Pol.dpur M.hal. 8 Mahar Mangaon Taluka. 13 Varli Partly held Irom Government and " 5 Kathodi. Total
Column
(4)
21 21 21 21 21 5 4 6 2 7
10 10 10 10 10 32
8 19
5 6
16 10 3
13 5 6 7
23 25 29 27 24 4
13
8
For
(5)
104 4
II 17 38
862 Blank Blank 6.806 2,766
42 Blank Blank Plank
3 Blank Blank
32 62
BI.nk BI.nk Blank Blank 2.001
Blank Blank Blank
5 Blank
o 'j
o
(6)
4 II 17 38 I
1.862 I 3
6.860 2.760
142 I
19 37 73 I 4 I
832 622
1 9 I 3
2,501 777 210
I 55 32
140 5
51 3
10
PART III-OTHER OFFICIAL STATISTICS
Page Table Item Column
(I) (2) (3) (4)
242 242 24a
248
252 255 255 259 259
260 262
262
2 M.tberan: 1951 9 2 M.theron: 1951 10 3 Muru&Mahal: Total area under II
food crops. 3 Murud Mab.l: Area under ce· II
reals. 4 Khalap_urTaluka: 1950.51 9 6 Tota! f'oadgrain> 21 8 Kodr. II 9 Mahad 1.Iuka: Wooden 3 9 Poladpur Mah.I-less than fi~ 3
seers : II Code No. 280 (a) Letter press 8 15 Pan vel Taluka: Secondary 5
Schools. 15 Uran Mohal Second.ry 5
Schools.
A 62 DCH-Kolaba.
For
(5)
19 I Blank
12
11
1,4i Blank 1,563
Blank
BI.nk 3
2
(6)
19.1 3
123
111
N.A. 1.941
11,563
'j
3
Item Column Fo, Read
(1) (2) (3) (4)
263
263
263
265 265
265
265
16 Pan vel Taluka 2
16 Ur.nMahaI: N.m, 01 lnstitu· 2 tion.
16 Alib'll Taluka: N.me 01 Insti· 2 tution~
19 Plague 20 Karjat Taluka
20 Kh.lapur T.luka
20 Mongaon T .Iuk.
II Z
2
1&2
(5) (6)
D.I.t. "(3) Shri Chh.trapali, Shivaii Hillh School, lasai, 36." Blank (3) Shri Chbalra-
poti Shi v.ji Hillh School, lasai 36.
(8) L 0 k m • n yo (8) Lok m 0 n ya Vidya!aya, V i d y a I aya. <hond.. Chondi (Kihim) Blank
Blank In'~;I"Bhi~uri Ro.d"
Delet. "Diksal" . Delete" A •• I ... • • Doliwli Lovei DoI_wali. Lowjee Delet • .. Dealad" . DeI.t." N.w.ndhe" Delefe "M.nllaon T.luh- N.groli.