District Census Handbook, Jaisalmer, Rajasthan
246
CENSUS OF INDIA 1961 RAJASTHAN DISTRICT CENSUS HANDBOOK JAISALMER DISTRICT c. S. GUPTA OF THB INDIAN ADMINISTRATIVE SERVICE Superintendent of CensU$ Operations. Rajasthan
-
Upload
khangminh22 -
Category
Documents
-
view
1 -
download
0
Transcript of District Census Handbook, Jaisalmer, Rajasthan
CENSUS OF INDIA 1961
RAJASTHAN
DISTRICT CENSUS HANDBOOK
JAISALMER DISTRICT
c. S. GUPTA OF THB INDIAN ADMINISTRATIVE SERVICE
Superintendent of CensU$ Operations. Rajasthan

Printed by Maratla] Z. Gandhi. at Nayan Printing Press. Ahmedabad-I.
FOREWORD
The Census data has always been considered as indispensable for day to day administration. It is increasingly being considered now as the foundation stone of all regional planning. The publication of this series of District Census Handbooks wherein census - statistics is made available for smaller territorial units is, therefore, a significant occasion for it fills many existing gaps in statistics at the lower levels. Many interesting details have been revealed by the Census 1961 and I hope persons engaged in the administration of the State and public in general will appreciate the value and the effort that has gone into the production of such a standard book of reference.
I congratulate the Superintendent of Census Operations, Rajasthan, Shri C. S. Gupta I. A. S. and his colleagu,es who have done a good job with skill and perseverence.
JAIPUR,
1st Alarch. 1966.
B. MEHTA Chief Secretary
to the Government of Rajasthan-

PRft'ACE
The District Census Handbooks, to which series the present volume belongs, are the gifts of the Census of India and were first introduced in 1951. The 1961 series of District Census Handbooks are more elaborate than their counter-part in 1951 and present all important census data alongwith such other basic information as is very z:elevant for an understanding of the district. A wide variety of information which the Census 1961 collected has already been released in several parts as mentioned elsewhere in this book. The information contained in the present volume will be found useful by the Government, the district administration, persons engaged in regional planning, social workers and scholars in the field of humanities. Unfortunately these Handbooks became available to the users rather late in the decade. This was due to difficulties in printing. The Government Press Jodhpur, to whom this work was assigned by the State Government, had a heavy backlog of printing and found it impossible to print all the books in the series itself. Arrangements had therefore to be made to get these printed through a private press. I trust a more expeditious method for printing of such valuable matter in time will be devised in future.
I am grateful to Sllri Asok Mitra, Registrar Gcaeral, India for his guidance in this work from time to time. I am greatly beholden to the State Government for their kindly agreeing, as they also did in 1951, to get this series published at their cost.
I
Dr. U. B. Mathur, Dy. Superintendent Census Operations, Rajasthan assisted me in editing this series. Tabulation Officer Shri S. R. Luhadia assiduously worked for compilation of the information presented in the book and has seen it through the press. Many of the facts and figures incorporated in the book were built up after scrutiny of II. lot of raw material and by personal contacts. This task was admirably done by Shri Ram Autar Gupta, Statistical Assistant. Without their sincere cooperation and the assistance rendered by various members of the staff, mentioned overleaf, who were associated with this work, it would have been hardly possible to present the information which is the subject matter of tbis book. I tbank tbem a11.
JAIPUR. 15th August, 1966.
C. S. GUPTA Superintendent.
Census OperatiOns, Rajasthan.
OTHER MEMBERS OF 'THE STAFF ASSOCIATED WITH THIS WORK
Shri Wali Haider CompuTor
Shri R. N. Verma Computor
Shri T. C. Patni Compiler
Shri B. B. Dave Compiler
Shri D. L. Badiwal Compiler
Shri M. L. Kumawat Draftsman
Shri D. L. Verma Asstt. Draftsman
Shri M. M. Goyal .oM Proof Reader
Shri O. P. Avasthy ... Proof Reader
FOREWORD
PREFACE
SECI10N I
INTRODUCTION
SECI'lON n
PRIMARY CENSUS ABSTRACT
CONTENTS
(i) DISTRICT }>RIMARY CENSUS ABSTRACT
(ii) RURA.L PRIMARY CENSUS ABSTRACT
Ramgarh TehsiI
, , ..Nachna Tehsil
laisalmer Tehsil
Pokaran Tehsil
Sam Tehsil
Fatehgarh Tehsil
(Hi) URBAN PRIMARY CENSUS ABSTRACT
OTHER CENSUS TABLES
A-SERIES-GENERAL POPULATION TABLES
NOTE
.. ,
PAGE
iii
v
(i)
(iii)
1
3
8
12
12
12
14
18
22
28
34
37
39
TARLE A-I Area, Houses and Population 41
APPENDIX-I Statement showing 1951 territorial units constituting the present set-up of the district ••• 42
ANNEXURE TO APPENDIX-I: List of villages affected in the transfers 43'
APPENDIX-II Villages with a population of 5,000 and over and towns with a population under 5,000 45
APPENDIX-Ill Houseless and Institutional Population 46
vii
TABLE A-II
APPENDIX
TABLE A-III
TABLE A-IV
Variation in population during sixty years (1901-1961)
Statement showing 1951 population according to their territorial jurisdiction in 1951, changes itt area and the population involved in those changes
Villages classified by population
Towns classified by population jn 1961 with variation since 1901 ._
B-,SERIES-ECONOMIC TABLES
NOTE
APPENDIX
TABLE B-1
TABLE B-III
PART A
PART B
TABLE B-IV
PART A
PART B
PART C
TABLE B-V
APPENDIX
FLY LEAF
TABLE 8·VI
Standard Industrial Classification
Workers and non-workers classified by sex and broad age-groups
Industrial classification of workers and non-workers by educational levels in urban areas on]y
Industrial classification of workers and non-workers by educational levels in rural areas only
Industrial classification by sex and class of worker of persons at w&-k at household industry
Industrial classification by sex and class of worker of persons at work in non-household industry, trade, business, profession or service
Industrial classification by sex and divisions, major groups and minor groups of persons at work other than cultivation
ApPENDIX TO TABLE B-IV PART C
SUPPLEMENTARY TABLE TO TABLE B-IV PART C : Tehsilwise industrial classification by sex and divisions of persons at work other than cultivation in rural areas only
Occupational classification by sex of persons at work other than cultivation
Occupational divisions of persons at work other than cultivation classified by sex, broad agewgroups and educational levels in urban areas only .•.
viii
46
47
48
50
51
55
64
68
70
so
81
83
102
103
104
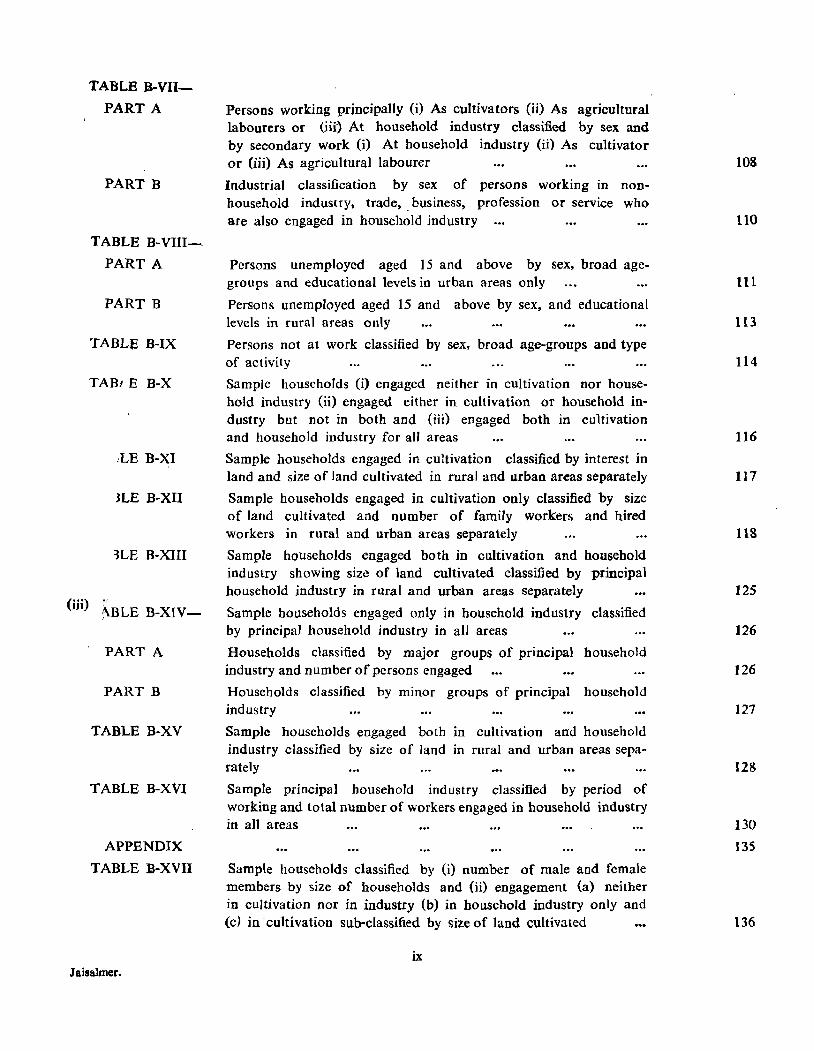
TABLE B-VII
PART A
PART B
TABLE B-VIII
PART A
PART B
TABLE B-IX
TABl E B-X
)LE B-XII
3LE B-XIII
(iii) ., ;\BLE B-XIV-
PART A
PART B
TABLE B-XV
TABLE B-XVI
APPENDIX
TABLE la-XVII
Jaisalmer.
Persons working principally (i) As cultivators (ii) As agricultural labourers or (iii) At household industry classified by sex and by secondary work (i) At household industry (ii) As cultivator or (iii) As agricultural labourer
Industrial classification by sex of persons working in Donhousehold industry, trade" business, profession or service who are also engaged in household industry
Persons unemployed aged 15 and above by sex, broad agegroups and educational levels in urban areas only
Persons unemployed aged 15 and above by sex, and educational levels in rural areas only
Persons not at work classified by sex, broad age-groups and type of activity
Sample households (i) engaged neither in cultivation nor household industry (ii) engaged either in cultivation or household industry but not in both and (iii) engaged both in cultivation and household industry for all areas
Sample households engaged in cultivation classified by interest in land and size of land cultivated in rural and urban areas separately
Sample households engaged in cultivation only classified by size of land cultivated and number of family workers and hired workers in rural and urban areas separately
Sample households engaged both in cultivation and household industry showing size of land cultivated classified by principal household industry in rural and urban areas separately
Sample households engaged only in household industry classified by principal household industry in all areas
Households classified by major groups of principal household industry and number of persons engaged
Households classjfied by minor groups of principal household industry
Sample households engaged both in cultivation and household industry classified by size of land in rural and urban areas separately
Sample principal household industry classified by period of working and total number of workers engaged in household industry in all areas
Sample households classified by (i) number of male and female members by size of households and (ii) engagement (a) neither in cultivation nor in industry (b) in household industry only and (c) in' cultivation sub-classified by size of land cultivated
Lx
108
110
111
113
114
116
117
118
125
126
126
127
128
130
13S
136
C-SERIES--SOCIAL AND CULTU:RAL TABLES
NOTE
TABLE C-J
TABLE C-Il
TABLE C-III
PART A
PART B
PART C
TABLE CIV
TABLE C-v TABLE C-VII
TABLE C-VIU
PART A
PART n
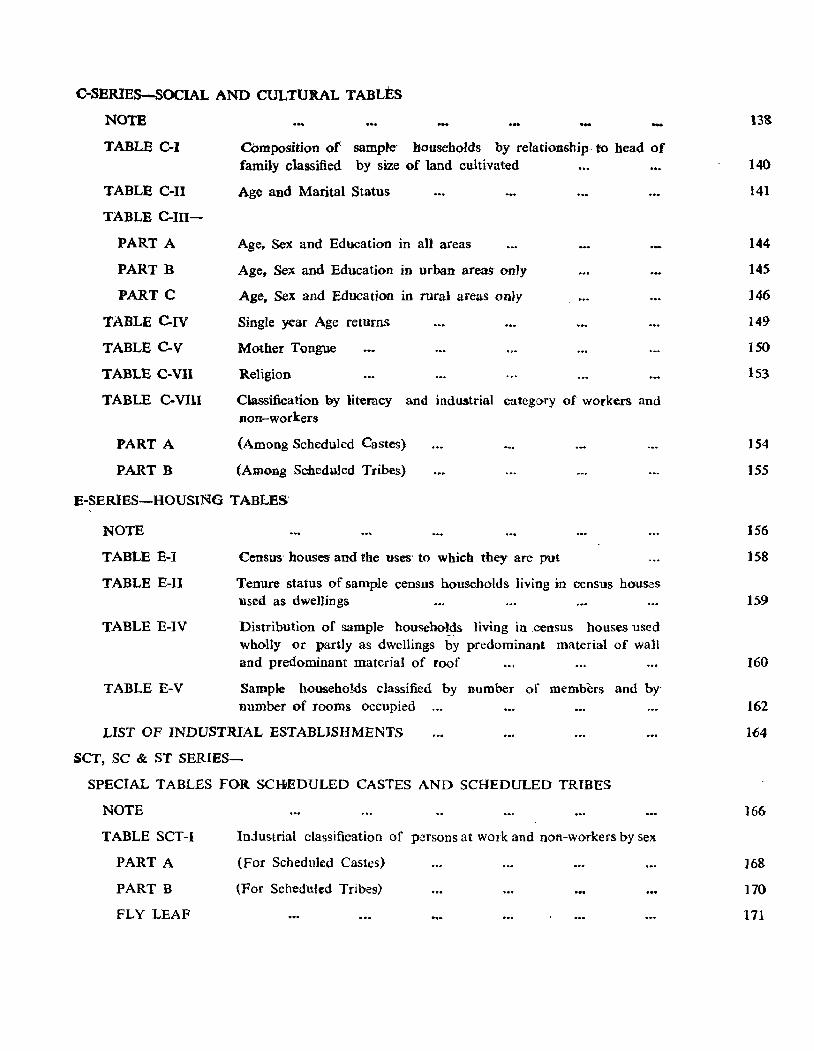
Composition or sampk households by reJationshipe to head of family classified by size of land cultivated
Age and Marital Status
Age. Sex and Education in aU areas
Age, Sex and Education in urban areas on1y
Age, Sex and Education in rural areas only
Single year Age returns
Mother Tongue
Religion
Classification by literacy and indus.trial category of workers and non-workers
(Among Scheduled Castes)
(Among Scheduled Tribes)
E-SERIES-HOUSIN6 TABLES'
NOTE
TABLE E-I
TABLE E-1I
TABLE E-IV
TABLE E-V
Census houses' and the uses to which: they are put
Tenure status of sample census households living in census houses used as dwe1Jings
Distribution of sample househo~9s living in .census houses used wholly or partly as dwellings by predominant material of wall and predominant material of roof
Sample househo!ds classified by Dumber of members and by' number of rooms occupied
LIST OF INDUSTRIAL ESTABLISHMENTS
SCT, SC & ST SERIES-
SPECIAL TABLES FOR SCHEDULED CASTES AND SCHEDULED TRIBES
NOTE
TABLE SCT-I
PART A
PART B
FLY LEAF
Injustrial classification of persons at work and non-workers by sex
(For Scbeduled Castes)
(For Scheduled Tribes)
13&
140
141
144
145
146
149
ISO
IS3
]54
155
156
158
159
160
162
164
166
]68
170
171
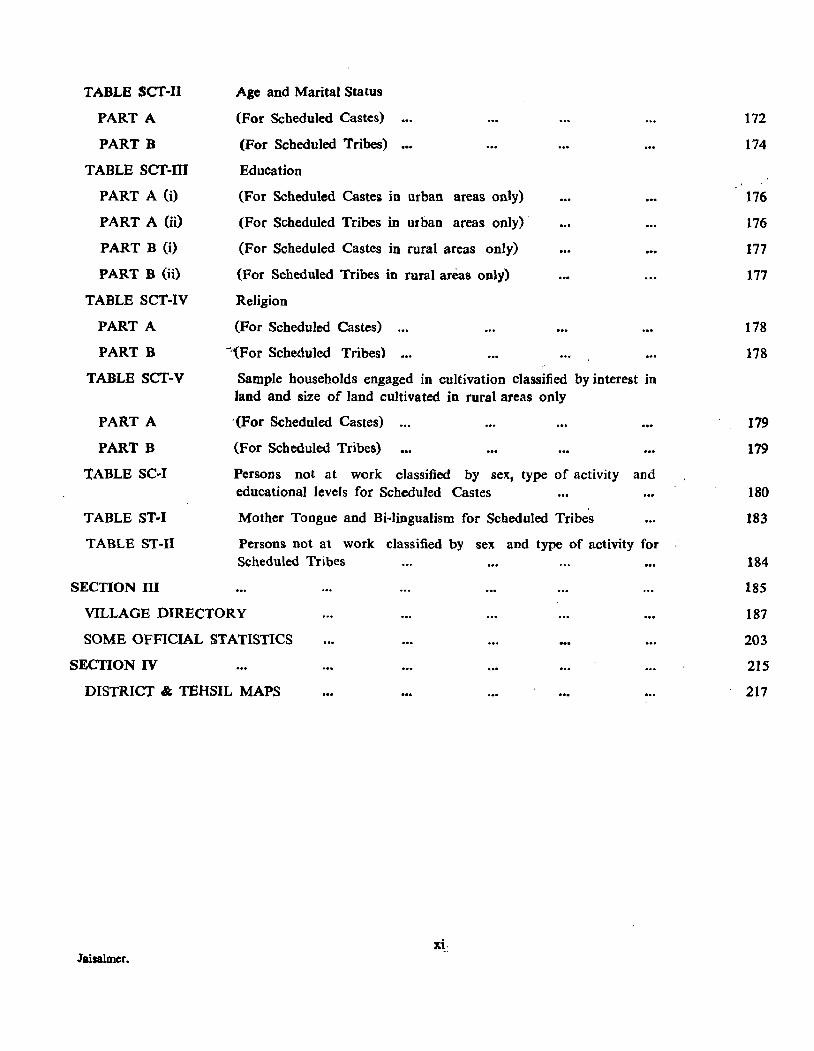
TABLE SCf-II
PART A
PARTB
TABLE SCf-nI
PART A (i)
PART A (ii)
PART B (i)
PART B (ii)
TABLE SCT-IV
PART A
PART B
TABLE SCT-V
PART A
PART B
TABLE SC-I
TABLE ST-I
TABLE ST-I1
SECTION HI
Age and Marital Slatus
(For Scheduled Castes)
(For Scheduled Tribes)
Education
(For Scheduled Castes in urban areas only)
(For Scheduled Tribes in urban areas only)·
(For Scheduled Castes in rural areas only)
(For Scheduled Tribes in rural areas only)
Religion
(For Scheduled Castes)
-iFor Scheduled Tribes)
Sample households engaged in cultivation classified by interest in land and size of land cultivated in rural areas only
. (For Scheduled Castes)
(For Scheduled Tribes)
Persons not at work classified by sex, type of activity and educational levels for Scheduled Castes
Mother Tongue and Bi-lingualism for Scheduled Tribes
Persons not at work classified by sex and type of activity for Scheduled Tribes •••
VILLAGE DIRECTORY
SOME OFFICIAL STATISTICS
SECTION IV
DISTRICT" TEHSIL MAPS
Jaisaimer.
172
174
176
176
171
177
178
178
J79
179
180
183
184
185
187
203
215
217
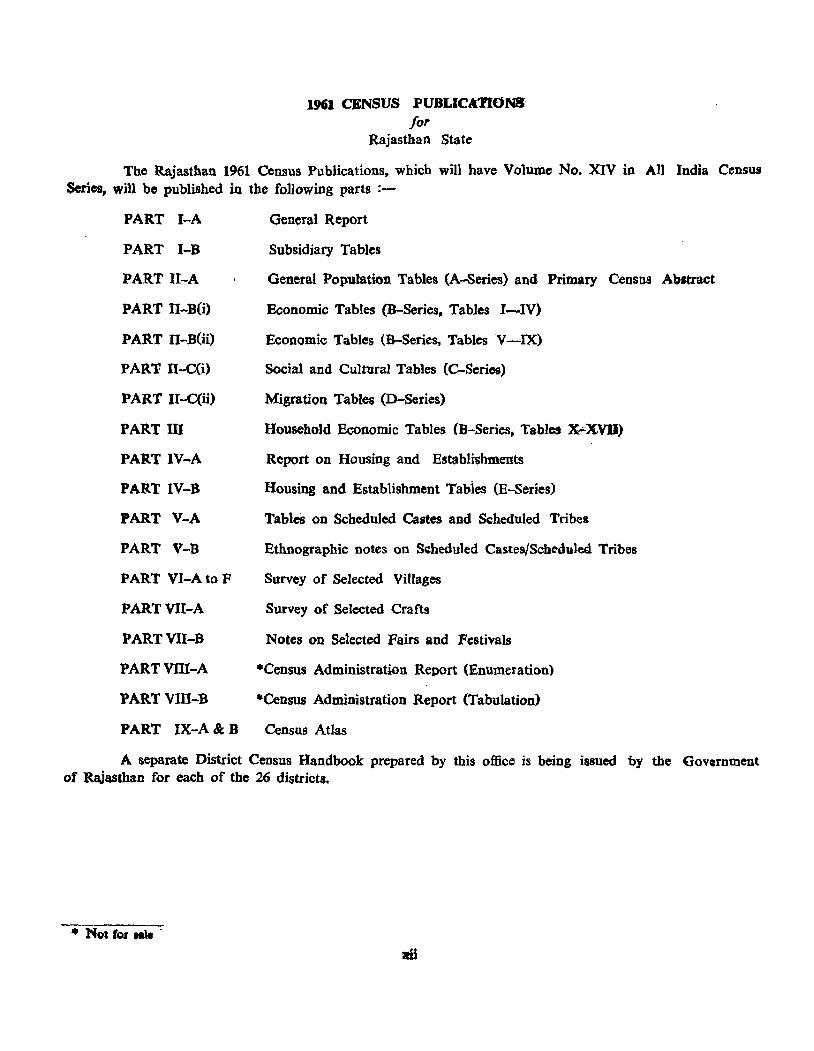
1961 CENSUS PUBLICA-nONS' for
Rajasthan State
The Rajasthan 1961 Census Publications, which will have Volume No. XIV in All India Census Series, wjl} be published in the following parts :-
PART I-A General Report
PART I-B Subsidiary Tables
PART II-A General Population Tables (A-Series) and Primary Census Abstract
PART n-BCi) Economic Tables (B-Series, Tables I-IV)
PART II-B(ii) Economic Tables (B-Series, Tables V-IX)
PART II-C(i) Social and Cultural Tables (C-Series)
PART Il-C(ii) Migration Tables (D-Series)
PART m Household Economic Tables CB-Series, Tables x..X.VU)
PART IV-A Report on Housing and Establiihments
PART IV-B Housing and Establishment Tabies (E-Series)
PART V-A Tables on Scheduled Castes and Scheduled Tribes
PART V-B Ethnographic notes on Saheduled Castes/Scheduled Tribes
PART VI-A to F Survey of Selected Villages
PART VU-A Survey of Selected Crafts
PART VII-B Notes on Selected Fairs and Festivals
PART VID-A ·Census Administration Report (Enumeration)
PART VIII-B *Census Administration Report (Tabulation)
PART IX-A & B Census Atlas
A separate District Census Handbook prepared by this office is being issued 'by the Government of Rajasthan for each of the 26 districts.
• NOlfor .... -
SECI10N I
INTRODUcnON

INTRODUCTION
The territory, now known as district Jaisalmer. used to be a princely State which merged into the United States of Greater Rajasthan in the year 1949. A separate district was formed in October, 1949 but in 1953 it was reduced to the status of a sub-division of Jodhpur district. In 1954 it was again made a separate district which continues up-to-date.
Location and Formation
2. District Jaisalmer is situated in the western portion of Rajasthan and lies between 26°4' and 28°8' north latitudes and 69°30' and 72°20' east longitudes. It is bounded on the north and west by Pakistan, on the south and east by Jodhpur and Barmer districts and on the north-east by Bikaner district.
3. The area of the district as reported by the Surveyor General of India is 14,847 Sq. miles and according to village papers it is 14,994.7 Sq. miles or 38,836.3 Sq. Kms. The district Covers 11.4 % of the total area of the State and is the largest in area amongst the other districts of the State.
4. The district is composed of six tehsils viz. Ramgarb, Jaisalmer, Sam, Fatehgarb, Pokaran and Nachna. The first four of these tehsils continue their name and form ever since the formation of the district while the last two tehsils were newly constituted during the inter-censal period. The Pokaran tehsiI was constituted with 47 villages and Pokaran town transferred from Phalodi tehsH and 17 villages from Shergarh tehsil of Jodhpur district and 9 villages from Jaisalmer tehsil and 8 villages taken out from Fatebgarb tehsil of this district. Nacbna tehsil was constituted with the help of 42 villages from the former Bap tehsil of this district and 4 villages from Jaisalmer tehsil. Some inter-district transfers of territories also took place in the district during the inter-censal period. 43 villages and 3 hamlets of this district were transferred to Kolayat tehsil of Bikaner district and 33 villages to Phalodi tehsil of Jodhpur district. All these villages belonged to the former Bap tehsil. During the inter-ceosal period 12
villages were also transferred from 'Jaisalmer tehsil to Fatehgarh (Vinjorai) tehsil.
Topography
5. The district is composed of the dreary and desolate arid region known as the Thar-The great Indian desert, The general condition of the district is of an interminable sea of sand hills of different shapes varying from 20 ft. to 200 ft. in height and at sometimes two or three miles in length. However, near Jaisalmer town and within a oircuit of about 40 miles, the soil is very stony and various low rocky ridges and hard undulating plains occur which are covered in places to the south with smooth pebbles. Shifting sands, which are given a local name 'Dhrians', are common especially in the west near village Shahgarh (Sam tehsil) where their surface is continuously changing and as such these are very difficult to cross. There are small hills within a circuit of 40 miles of Jaisalmer town from where the water accumulates at various low lying places during the rainy season which are locally called 'Kharins'. Kakni Nala rises in the district near the village Kotri (Fatehgarh tehsil) seventeen miles south of Jaisalmer town. Water is found at about 250 ft. deep or even more. Most of the area of the district is covered by sandy soil and some parts of tehsil Pokaran is rocky.
Climate
6. The climate of the district is dry and extreme. Humidity is very low. The weather is dominated by bot winds and saQd; storms in summer. The district lies in the belt having an average minimum temperature ranging from 12°.5C to 15°.0C and 15°.0C to 17°.5C and an average maximum temperature of 32°.5C. The normal annual rainfall of the district is only 17.91 ems. and occurs from July to September.
Geology and Minerals
7. The surface of th,e district is mostly covered with sand dunes of transverse type. Rocks of Jurassic age
(iv)
are found which have been divided into several groups. Limestone. sand stone and marble are found near laisalmer town. The lime stone has been famous for a long period and is said to have been used in the inlay work at the Taj Mahat. Gypsum is found at tire surface near Lakha in Fatehgarh tebsil and at Mobangarb and Hamir-ki-Nadi in Jaisalmer tehsil. Lignite is taken out from the earth near village Lakha (Fatebgarb tmsil). There are deposits of fuller's earth at Modha (Fatehgarh tehsil). Bentonite is also found in Jaisalmer tehsil.
Forest, Flora and Fauna
8. During 1960-61 only 0.5% of the total area was under forests according to village papers. Due to the desert conditions prevailing in the district. vegetation is very scarce. Bis trees are rare and even dwarf trees
~ are few and far between. The various trees found in the district are Kbejra (Prospis spicigera). Rohera (TecomeUa uodulata), Ker (Cappa-ris decidua), Phog (Calligonum polygonoides), Ak (Calotropis procera), Jal or Pilu (Salvadora perllica and Oleoides). Ber (Zizyphus jujuba). Bardia (Zizyphus totundifolia) etc. These trees provide mainly fuel aDd fodder, however. the tree of Rohera (Tecomelta undulata) also provides the wood for making doors and furniture. Some other trees lik.e the Nim (Azadirachta indica). Pipal (Ficus religiosa) and Farasb (Tamrix articulata) are found growing on the banki of the village ponds. Among the shrubs and grasses found in the region, the important ones are Dhaman (Pemisetum oenchroices), Bharut (Cenchrus catharticus) and Lomp -(Aristida depressa). Sewan (Elionurus hirsutus) grass alllO grows in abundance. A large number of 'Chinkara' the Indian gazelle are found in the forest area. Other wild animals such as jackal, wild dog, desert fox, antelope etc. are alllO found in the district.
9. There are Forest Guards in addition to a Forester in the district which are wader the jurisdiction of Range Forest Officer; Jodhpur.
General Administration
10. For the purposes of administration, the district )s divided into two sub-divisions and six tehsils as mentioned below:-
Name of Sub-division
1 Jaisalmer
2' Pokaran
Name of Tehsil
1 Jaisalmer 2 Fatehgarh 3 Ramgarh 4 Sam
1 POkaran 2 Nachna
11. The Collector is the administrative chief of the district who is also tbe District Magistrate. Each Sub-division is under the charge of a SUb-divisional Magistrate who is vested with 1st Class magisterial powers while each tehsil is under the charge and supervision of a Tehsildar, who is vested with 2nd or 3rd Class magisterial powers as the case may be. Besides Collector. Sub-divisional Officers and Tehsildars who exercise criminal powers, there is a court of Muosif Magistrate at Jaisalmer. A court of District & Sessions Judge functions at Jodhpur for this district also.
12. With the advent of democratic decentralisation, 3 Paochayat Samities have been formed out of which 2 are Community Development Blocks. The Pan~ chayat Samities are guided by the Zita Parishad under the Chairmanship of the Pramukh and supervised 'by the Collector of the district who is also the District Development Officer. The Rajasthan Panchayat Samities and Zila Parishads Act. 1959 devolves on these Panchayat Samities the complete charge of the administration of the Block including the implementation of the Community Development Programmes. For imparting the technical gUidance to the villagers the Government has deputed its representatives from various departments to the Blocks, so tbat an all round progress may be achieved. The ultimate aim of the Government is to make these Panchayat Samities the sole agency of all developmental activities at the Block level.
13. There ia a _b-jail at Jail8lrner which is under the supervision of the Sub-divisional Magistrate. Tile office of the Superintendent of Police is located at Jaisa1mer while that of Deputy Superintendent of Police at laisalmer and Pokaran. 9 Police stations and 18 outposts functioned in the district during tbe year 1960-61.
LaDd Use
14. The classification of the land use in tbe district during 1960-61 was as follows :-
(v)
Classification of land
I, Forests 2 Land put to non-agricultural use 3 Barren and uncultivated land 4 Other uncultivated land excluding
fallow land 5 CulturabJe waste 6 Fallow land
Percent
0.5 1.2
42.1
2.6 41.9 8.0
7 Net area sown 3.7
Total 100.0
Crop Pattern
15. Out of the total area under crops during 1960-61, over 90.8% was utilised for cereals and the rest for growing pulses, oil seeds and other crops. Bajra is the main agricultural produce of the district. The district ranked 13th in tbe production of bajra of the State and contributed 1.9% of the total production of bajra in the State during 1960-61.
Irrigation
16. Water is found at very low levels. However, wells are the only source of irrigation in the district. Rainfall is always scanty. In case where the soil is harder and the surroundings hilly and rocky, especially near laisalmer town, irrigation is possible from 'Kharins' or shallow depressions into wbich the rain water accumulates. 'Kharin' is the typical mode of agriculture in the dlstnct. It is a method of dry cultivation.
17. During 1960-61, about two hundred acres of area was irrigated in the district of whicQ nearly 66% was irrigated in Pokaran tehsil alone. All the irrigated area of the district was utilised for food crops. In Sam, Fatehgarh and: Ramgarh tehsils not a single acre of area was irrigated during the year.
Animal Husbandry
18. Animal husbandry is the main occupation of the people living in the district. Tbarparkar breed of cows is found in the district. The total livestock popula-
tion in the district was over 988 thousand heads according to the Livestock Census of 1961 as compared to around 850 thousand in 1956. Out of the total livestock during 1961, 47.2% were sheep, 29.7% cattle, 18.8% goats, 2.9% camels and the rest comprised of donkeys, buffaloes, horses, ponies and mules. The total poultry in the district during 1961 was a little over 1.3 thousand which mostly consisted of fowls'-
19. There are veterinary hospitals at laisalmer and Pokaran and dispensaries at Ramgarh and Nachila. A mobile unit also functions at laisalmer and a sheep breeding farm runs at Pokaran. Sheep and Wool Extension Centres are run at laisalmer, Nachna, Ramgarh, Sam, Lathi (Pokaran tehsil), Mohangarh (J aisalmer tebsil) and Devikot (Fatehgarh tehsil). One such centre also functions at Pokaran under Community Development Block. A sum of Rs. 1.18 lakhs was spent over the development of animal husbandry in the district during the second five year plan.
Agricultural Implements
20. Tbere wer~ about 23.6 thousand ploughs, 2.7 thousand bullock-carts, 28 persian wheels, 26 'Gbanies', 3 tractors and 2 electric pumps in the district accordinl to the Livestock Ce~sus of 1961.
Agricultural Improvements
21. During the second five year plan a sum of Rs. 8.56 lakhs was spent in the district on agriculture sector. During this period over 7 hundred Mds. of improved seeds, one ton of fertilizers and about 2.6 thousand improved agricultural implements were distributed to the farmers under various schemes of tbe Agriculture Department. Besides, 17 manure pits were dug.
Industries and Labour
22. In the year 1961 there was only one registered factory in the district viz. Rajasthan State Electricity Board, Power House at JaisaJmer. It provided employment to 22 persons during the year.
23. The main small-scale and cottage industries of the district are 'Ghee' making, rope and carpet
(vi)
making, weaving of woollen -and eotton oloth, w.ool grading, dyeing and printing, manufacturing of tbe articles from -sheep hair t and making of articles from marble -and stone. There is a Khadi -Oramodyoga Parishad in the distrrct functioning since the year 1961 which has opened several centres for dyeing, .soap making and preparing articles from leather.
24. The District Industries Officer posted at Barmer looks after the development of industries in this district. The Industries Department has started a scheme of aiding small-scale industries by advancing loans to the parties. It granted a loan of Rs. 26 thousand to 32 parties during the year 1959-60 and 1960-61.
25. A sum of Rs. 24 thousand was spent on industrial development during the second five year plan comprising of loans to Co-operative Societies, subsidies, rlfba tes etc.
26. The district has no separate employment exchange but the work is looked after by the Employment Officer, Jodhpur.
, Power
27. There is a power house at Jaisalmer town in the district which was established in the year 19~9 with 82 Kwb. Two new sets were added during the years 1948 and 1958 with 62 Kwh. and 32 Kwh. respectively. During the second five year plan a sum of Rs. 34 thousand was spent on the development of power resources in this district.
Trade and Commerce
28. The articles that are exported out of this district consist of wool, woollen articles, 'Ghee', camels, cattle, sheep, hides, fuller's earth etc. while grain, cotton, sugar, tobacco, oil, electric goods, medicines and other articles of general merchandise are imported into the district.
29. Jaisalmer, Pokaran, -Ramgarh are the important commercial places in the district. Facilities of local markets exist in certain villages which have been shown in the Primary Census Abstract elsewhere in this book.
3.0. The State Bank of ,:Bibner \Ltd. bas got its branch at Jaisalmer town.
61. There were 4 shops deailiog in :country liquor and 3 in hemp drugs at the various ,places in the district during 1960-61.
32. There was one temporary cinema 'house at Jaisalmer town in the district during 1960.
Education
33. During 1956-57 there was one High School. 5 Middle Schools, 51 Primary Schools and 6 Schools for Special education. The number increased to 2 Highl Higher Secondary Schools, 11 Middle Schools, 82 Primary Schools and 9 Schools were for Special education in 1960-61. Besides, 16 Junior Basic Schools were also functioning in the district. The total number of scholars in all type of institutions during 1960-61 was about 5.4 thousand. A sum of Rs. 4.97 lakhs was spent on educational facilities in the district during the second five year plan.
Medical and Public Health
34. During 1950-51, there was one allopathic bospital at laisalmer with 6 beds. By the end of the year 1960 there were 6 Government Public Hospitals and dispensaries with J 2 beds.
35. Out of 5 small pox vaccination centres in the district, one is under Government control and the rest are under the ·Panchayat Samities. Two Primary Health Centres also function at Pokaran and Nachna.
36. There were 13 Government Ayurvedic and Vnani dispensaries in the district during 1960-61 as compared to only one during 1950-51. Rs. 1.92 lakhs and Rs. 53 thousand were spent on Medical and Public Health and Ayurvedic facilities in the district respectively during the second plan period.
Drinking Water Facilities
37. A water supply scheme started in the year 1948 was not able to cope with the requirements of the
(vii)
town as its capacity was only 12 thollsaod -gallons .per .day. People had to supplement their supplies ftom the Gharsisar tank for their drinking water ,requirements. A scheme for drinking water supply was completed during the second five year plan over which about Rs.93 thousand were spent. Under this scheme, wells have been dqg near village Dabla of 1aisalmer tehsil and connected with 1aisalmer town by a pipe ,line 9 miles in length.
Housing
38. The Low Income Group Housing Scheme was initially introduced in the district during 1958-59. During the second five year plan a sum of Rs. 16 thousand was disbursed to the public under this scheme for the construction of houses in Jaisalmer town as a result of which 6 houses were constructed.
Transport and COIIIIIWnicatioD
39. In March 1961 the district had 380 miles of roads. 51.8% of the roads in the district were fair weather and dressed up tracks, 27.1% gravelled and the rest consisted of painted, metalled and cement concrete. 3 roads were completed and a sum of Rs. 17.29 lakhs was spent on road development works in the district dunng the second plan period.
40. There were 126 motor vehicles on road in 1954 which increased to 181 in 1-961.
41. The district is connected by the Metre-gauge branch line (10dhpur-Pokaran) of the Northern ,Railway. There is a metalled road connecting 1aisalmer town with Pokaran town the length of which is about 65 miles. Regular bus services ply between these two places. The total length of the railway line in the district duriQg 1961 was about 31 kilometres. There are Dak Bungalows at 1aisalmer and P.okaran towns and a . rest house at village Lathi (Pokaran tehsil). During 1960-61 there ,were 11 Post Offices, 2 Telegraph Offices, 2 Ielt;phone Exchanges and one Public Call Office in the district.
Local Bodies and Co-operatioD
42. There are Municipal Boards in the district at laisalmer and Pokaran. The main sources of revenue of
tbe Munidpalities are fees, fairs, taxes, sale of landand grants provided by the Government.
43. There is a Zila Parishad comprising of 3 Panchayat Samities and 100 Gram Pancbayats in the district.
44. In June, 1961 there were 132 Co_:operative Societies of various categories in the district with a total membership of about 4.9 thousand. The working capital of these societies was around Rs. 4.83 lakh and the share capital was Rs. 1.53 lakh. A loan of Rs. 1.22lakh approximately was advanced by the Government. The depe~ sits and borrowings during the period was around Rs. 15 thousand and Rs. 314 'thousand respectively white the total liabilities amounted to Rs. 564 thousand approxima.: tely. In all 67 societies were functioning at profit, 17 at loss and 48 societies were functioning on no profit no loss basis. During the second five year plan a sum of Rs. 96 thousand was spent on Co-operation in the district.
COIIIlIDOnity . Development
45. The Community Development programme was started in the district .during 1954-55 by establishing a block at Sakea (Pokaran tehsil). Another block was also established at Jaisalmer during 1959-60. Thus by the end of the year 1961, there were two blocks functioning in the district.
46. During the year 1961, over 1.5 thousand Mds. of seeds and around 2 hundred agricultural implements were distributed to the farmers and 26 agricultural demonstrations were held in the various Panchayat Samities of the district. 4 wells were constructed for irrigation and another 22 for drinking purposes. 75 adult literacy centres were opened and over one hundred persons were I¥ade literate. 8 Youth Clubs were started and one reading room was opened.
Social Welfare
47. An Inspector of Social Welfare Department posted at Barmer also looks after the welfare activities connected with the uplift of the backward classes in the district.
48. There is a Government hostel at laiialmer and a training-cum-production centre at Pokaran where
(viii)
training is imparted in the art of shoe-making. Scholarships are also awarded to the students belonging to the Scheduled Castes.
49. The Government has also opened a 'Sanskar Kendra' at Jaisalmer town for the development of cultural and religious activities of the Scheduled Castes. Rs. 24 thousand were spent for social welfare and welfare of backward classes in the district during the second five year plan.
Fairs and Festivals
50. Some of the important fairs held in the district are as foHows ;-
(i) Shri Ram Deora-ka-Mela
A fair is held at village Ram Deora in Pokaran tehsil twice a year viz. on Bhadra Pada Sudi 2 to Bhadra Pada Sudi 14 (Aug.-Sept.) and Magba Sudi 2 to Magha Sudi 14 (Jan.-Feb.). The main attraction
. is the shrine of Ramdeoji. The Samadhi is located in a big hall where replica of the horse, which was a favourite of the warrior saint, are offered to the deity. A life size image of that horse stands in the hall. Behind the Samadhi there are some l't sepulchres. About 2 lakhs of people (both Hindus & Muslims) assemble in the fair from far and near places to pay homage to the deity. The people offer sweets, coconuts etc. as prasad. Ram Deora is a railway station. It is also connected by a metalled road with Jodhpl!r town.
(ii) Vaisakhi-ka-Mela
This fair is held near village Varamsar in Jaisalmer tehsil which is located at a distance of about 10 miles from Jaisalmer town. There are certain kunds (reservoirs) where water percolates throughout the year. About 20,000 people congregate in the fair and take a dip in these holy 'Kunds'.
(iii) Swangiyoji Fair
A fair of some significance is held at Bhadariya near village Lathi ( Pokaran tehsil). There is a temple dedicated to Swangiyoji, the main Goddess of the Bhati
Rajputs. This fair takes place twice in a year on Bhadrapada Sudi 6 (Aug.-Sept.) and Magha Sudi 6 (Jan.-Feb.). About 1,000 people congregate in each of the fairs.
(iv) Gangaur
This fair is held at Gharsisar tank near Jaisalmer town on Chaitra Sudi 4 (March-April) every year. About 12,000 people assemble in the fair.
(v) Gandhi Mela
A fair is held at village Sakra (Pokaran tehsil) which was started only a few years ago in order to persuade the people to lead an ideal life. It is held on the auspicious occasion of the birthday of Mahatama Gandhi and is called 'Gandhi Mela'. It lasts for two days. Pokaran is the nearest railway station from where the village is connected by a kachha road of about 32 miles.
51. The main festivals among Hindus are Holi, Deewali. Raksha-Bandhan, Dashera, Ram Navmi, Makar Sakranti and Ganesh Chaturthi while Muslims observe Moharrum, Idulfitre, Idul Zuha and Barawafat.
Places of Historical " Archaeological Importance
52. Following places are of great interest in the district.
Jaisalmer
Jaisalmer town has a population of about 8.4 thousand which constitutes 61.3% of the district's urban population. It is situated at 260 65' north latitude and 700 55' east longitude. The town, 113 Kms. (70 miles) by road from Pokaran, is the terminus of the JodhpurPokaran line of the Northern Railway, and 158 Kms. (98 miles) from Barmer town. The town stands at the sourthern end of a low range of hills and is surrounded by a stone wall about three miles long, ten to fifteen ft. high, five to seven ft. thick having many bastions and corner towers. The town has two main entrances viz; Amarsagar gate on the west and the Gharsisar gate on the east. Between these two gates is tbe principal
(b)
thorough fare on which the main market is located. Other streets of the town are narrow. The Mandir Palace which is the residence of the former ruler has some exquisite stone carvings and a beautiful canopy over it. The Patwa's HaveJi containing beautiful and rare carvings and Deewan Salam Singh's House having six storeys and much ornamentation are attractions in the town.
The Fort
To the south, on a hill overlooking the town, is the fort, perhaps the oldest fort after Chitorgarh in Rajasthan. Its foundation was laid by Rawal Jaisal in 1156 A. D. The Maharawal's Palace which is 957 ft. above the sea surmounts the main entrance and has an imposing pile crowned by huge umbrella of metal mounted on a stone shaft regarded as a solid emblem of dignity by the Bhati Chiefs. The hill on which the fort stands is entirely covered by buildings and defences and the base is surrounded by a buttress wall of solid blocks of stone above which the hill projects and supports the ramparts. The view from the ramparts is not attractive as the foreground presents a succession of sterile, ridges and bushes.
The Temples
Witbin tbe fort there are several Vaishnav and Jain temples. Of the former mention may be made of Ad Narain's or Teekamji's temple which is said to have been built by Rawal Jaisal in the 12th century. The other is Laxmi Nathji temple ascribed to Rawal Lakhan which is remarkable for possessing gold and silver plated shutters. The impressive Jain temples are decorated with sculptures of gods and goddesses, dancing figures and mythological scenes. Of the Jain temples, those dedicated to Parasnath have exquisite stone carvings. It is beHeved that the oldest of tbese was built 'about 1332 A.D. Other temples in the fort are of Sambhavnath, Sheetlanath, Shantinatb. Ashatpad, Rikhabdeo, Mahavir Swami and Chandra Prabbu Swami. Besides, Gaj Mandir near Gbarsisar tank and the temple of Adlshwar at Amarsagar, are also places of great attraction.
Gyan Bhandar or Store oj Knowledge
Established as a part of the Jain temples, the Jin Bhadra Suri Gyan Bhandar has an invaluable collection
of some of the oldest manuscripts known in the countr.~ It contains over one thousand palm-leaf manuscripts anq around 2 thousand paper mllnuscripts, a few dating back to the early twelfth century. This shows that calligraphy was prevalent at that time. The' longest and . but preserved palm-leaf manuscript, which is written in black ink, is O.9m. (38.S inches) long. The painted wooden covers in which the manuscripts are preserved are also of great interest. B~ides ,\he Jai~ religious texts, this Bhandar also has manuscripts on varioUi!I branches of Indian philosophy, works of poetry, drama and rhetoric. Fragments of a commentary on Kautilya's Arthashastra, belonging probably to the fourteenth century, is a valuable document. All these books are of great antiquity and have been classified.
Gardens
The important gardens in the district are Bada Bagh, Amarsagar and Moolsagar. Of these, the first is about 6 miles from Jaisalmer town and contains the cenotaphs of the former rulers. There is a dam called Jait Bund near this garden which was constructed in the time of Maharawal Jet Singh. In the other gardens fruits and vegetables are grown. These gardens contain buildings having some beautiful stone carvings.
Tanot
It is a small village in Ramgarh tehsil which lies in the north-west corner at a distance of about 75 miles from J aisalmer town and has a fortress and a temple dating the eighth century. The place is famous for it was the first desert capital of the Bhatis.
Laudrava
It is located at about 16 Kms. (10 miles) north-west of laisalmer town and was the Bhati capital from the end of the tenth to the middle of the twelfth century. It is said to have been taken by Rawal Deoraj from the Lodhra Rajputs. It has the ruins of a few lain temples.
Electoral Participation and Preferences
53. During the first general elections in the year 1952, the district formed only one constituency with a
(x)
voting population of about S4 thousand persons and one seat in the State Vidhan Sabba. 27.7 percent voters exercised their right of franchise. The seat was captured by an independent candidate. No separate seat was allotted to tbe district in the House of the People for it was combined with Jodhpur district for tbis purpose.
54. During the second general elections in the year 1957 the district which constituted one assembly
constituency with a voting population over 60 thousand per~ons, had one seat in tbe State Vidhan Sabba. 34.4% voters (45.1 % of men and 21.3% of women) exercised their right of franchise. At this time too, the seat waS won by a candidate who was an independent. The district bad no separate seat in the House of tbe People and it was combined with Barmer district, and Phalodi, Shergarh tebsils and parts of Osian tehsil of Jodhpur district to form a parliamentary constituency.
SECTION n
PRIMARY CENSUS ABSTRACT
" OTHER CENSUS TABLES


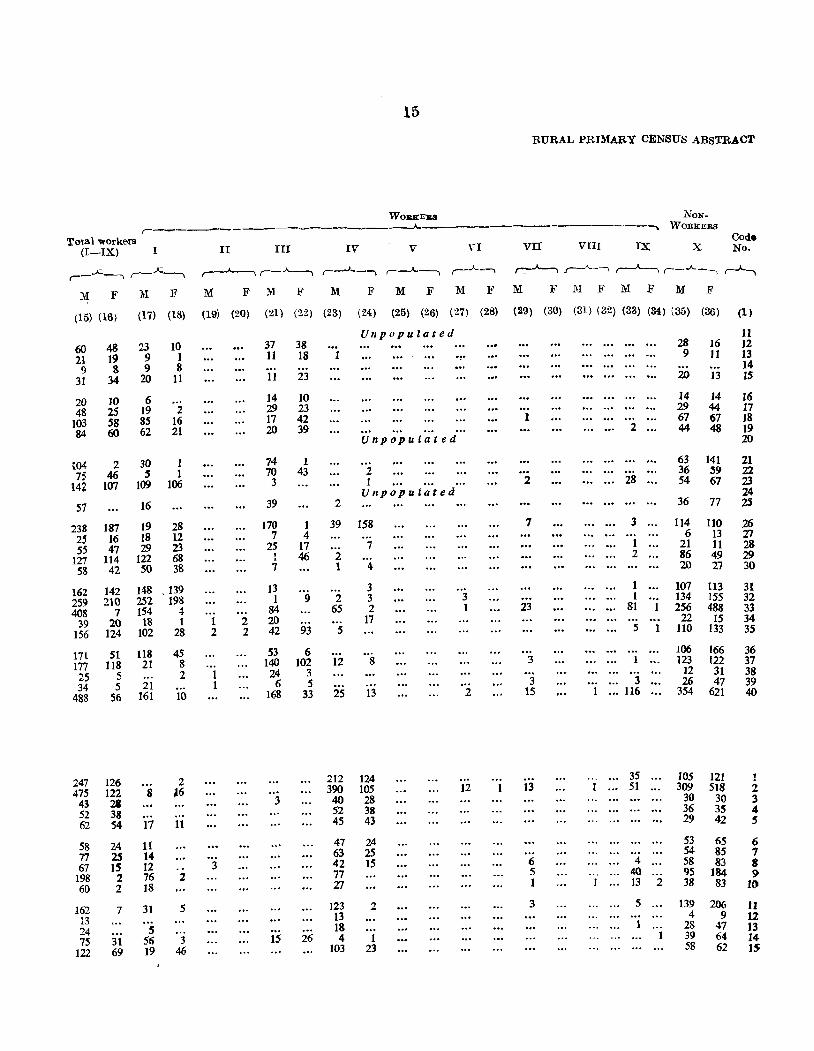
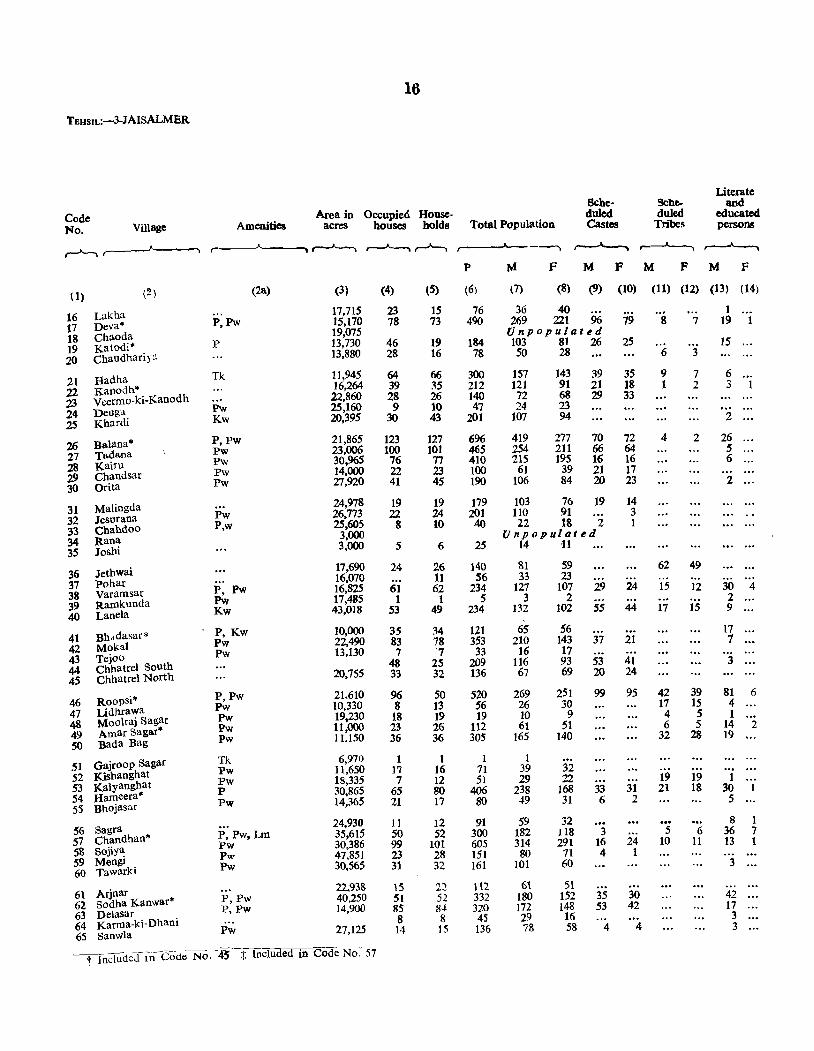
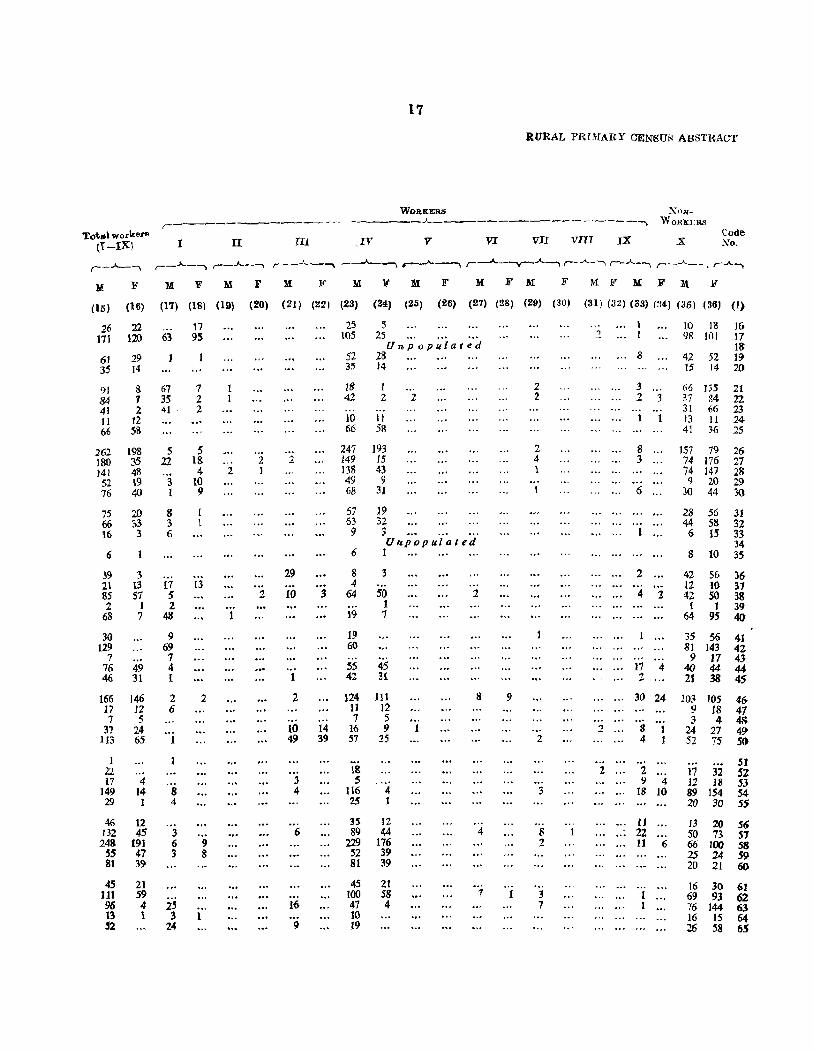
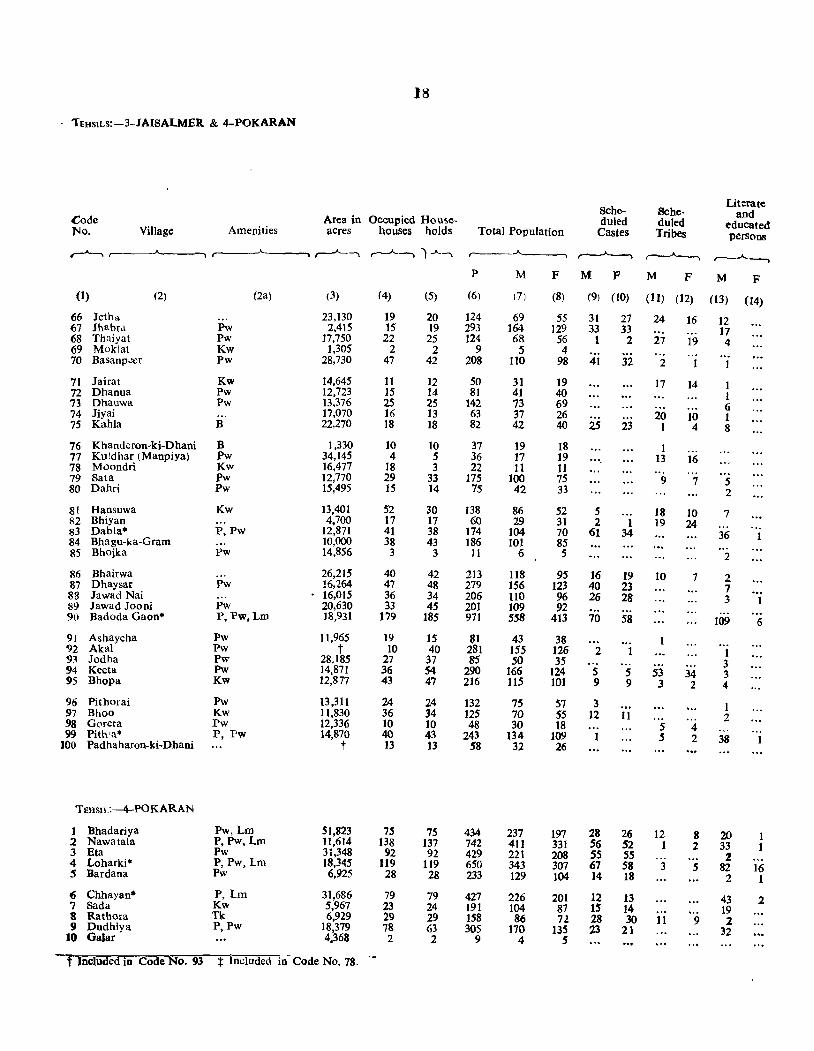
PRIMARY CENSUS ABSTRACf

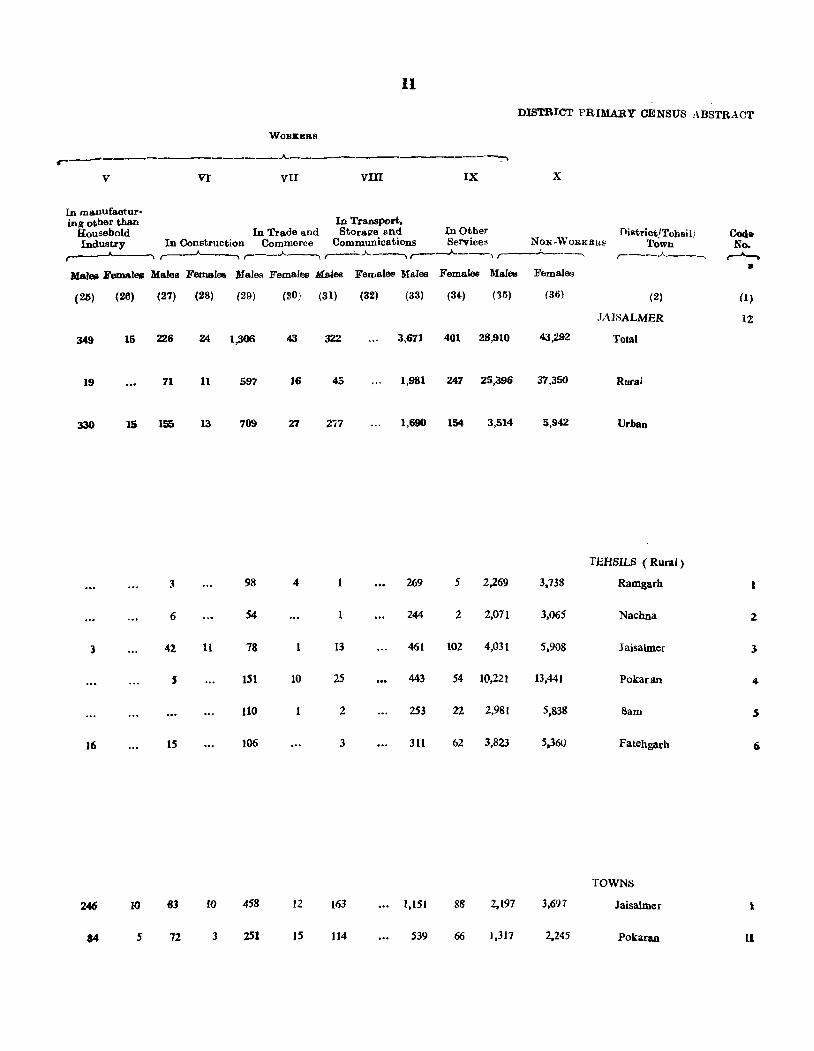
PRIMARY CENSUS ABSTRACT
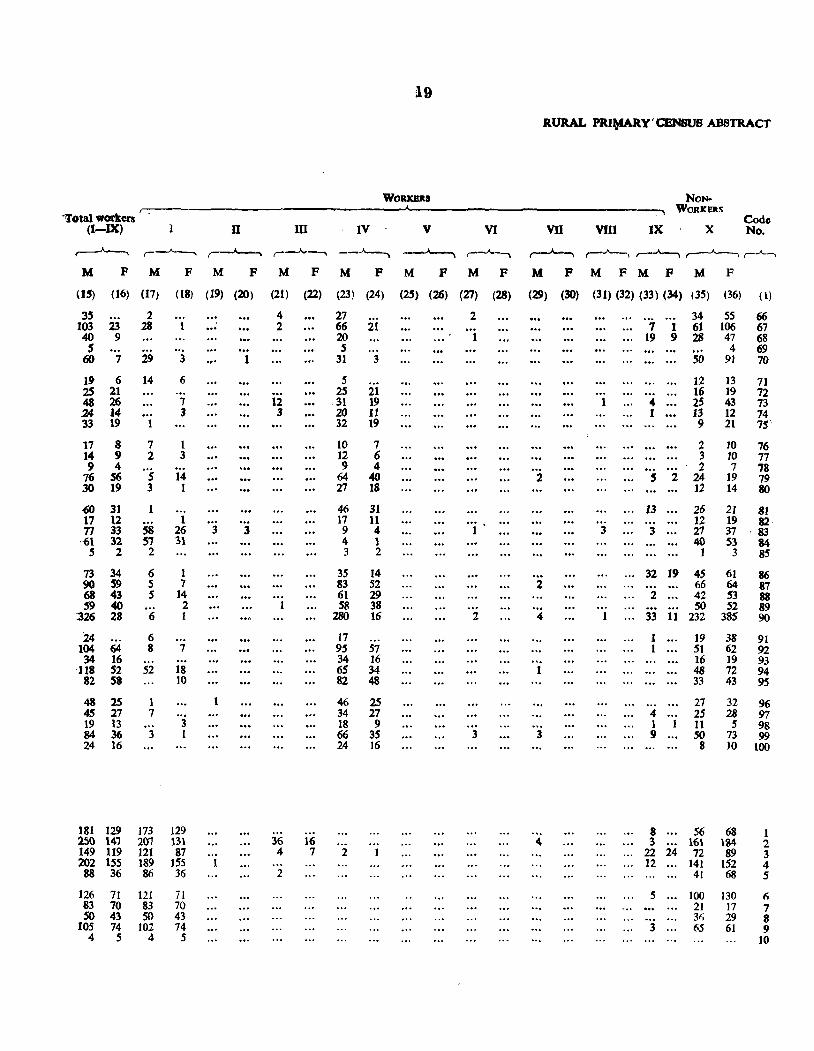
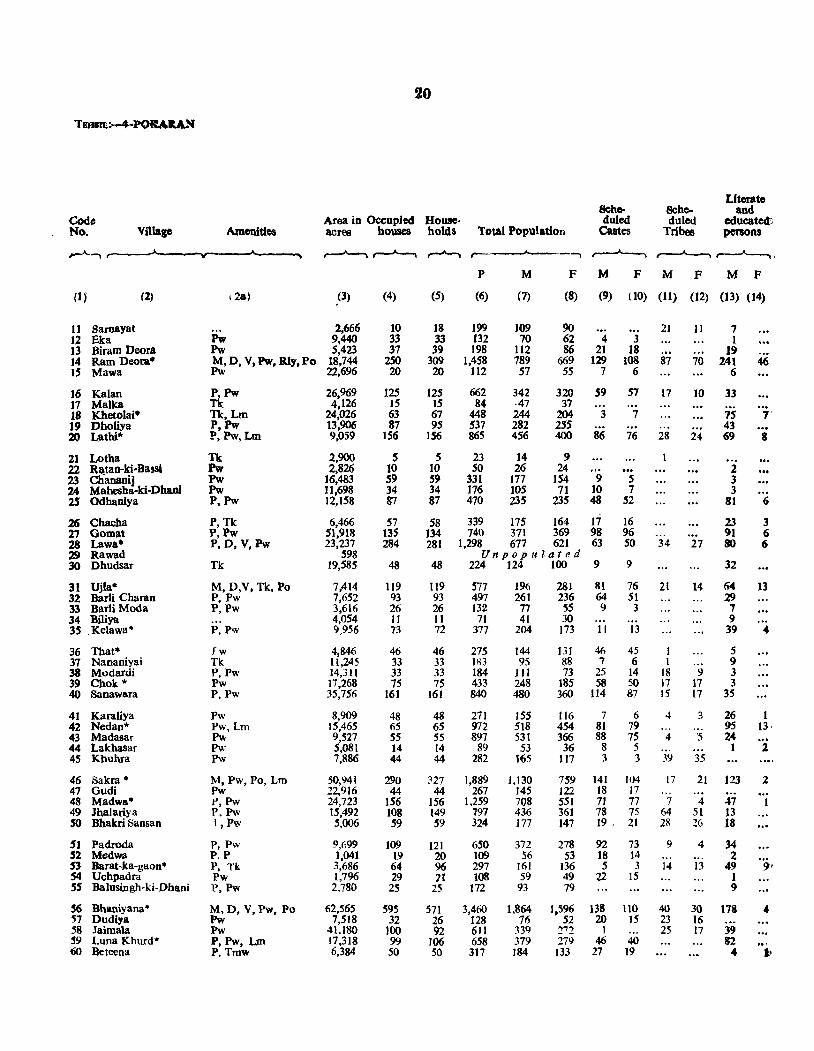
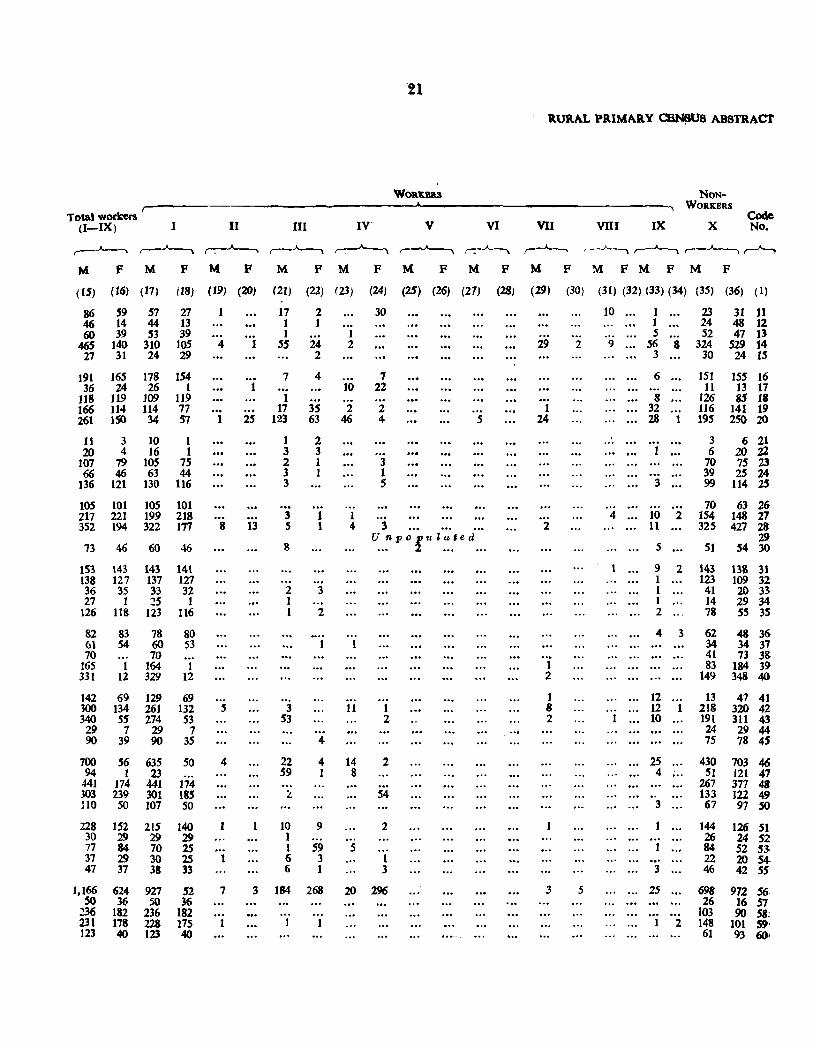
The Primary Census Abstract furnishes the population figures for 1961 Census and is presented in three parts viz. District, Rural and Urban Primary Census Abstracts. These abstracts contain the data in respect of area, number of occupied residential houses and households, total population and its break up by sex, literacy, Scheduled Castes and Scheduled Tribes, workers and non-workers. The workers have further been classified into following nine industrial categories:-
I As Cultivator, II As Agricultural Labourer,
lIT In Mining, Quarrying, Livestock, Forestry, Fishing, Hunting and Plantations, Orchards and allied activities,
IV At Household Industry, V In Manufaoturing other than Household
Industry, VI In Construction,
VII In Trade and Commerce, VIII In Transport, Storage and Communioat.ions and
IX In Other Services.
2. The Distriot Primary Census Abstract furnishes the data fol' the district total, rural and urban areas, each rural tehsil and for each town separately. The Rural Primary Census Abstract presents the data for the villages while Urban Primary Census Abstract furnishes information for the municipal wards of all the towns in the district.
3. A Revenue Mauza (including its hamlets) is treated as a village while a town is a place having either a Munici. pality or Cantonment or satisfying the following factors:-
(a) having a minimum population of 5,000 and (b) having three.fourth of its male adul~ population
engaged in non-agricultural pursuits, or (c) having a density of approximately 1,000 persons
per sq. mile.
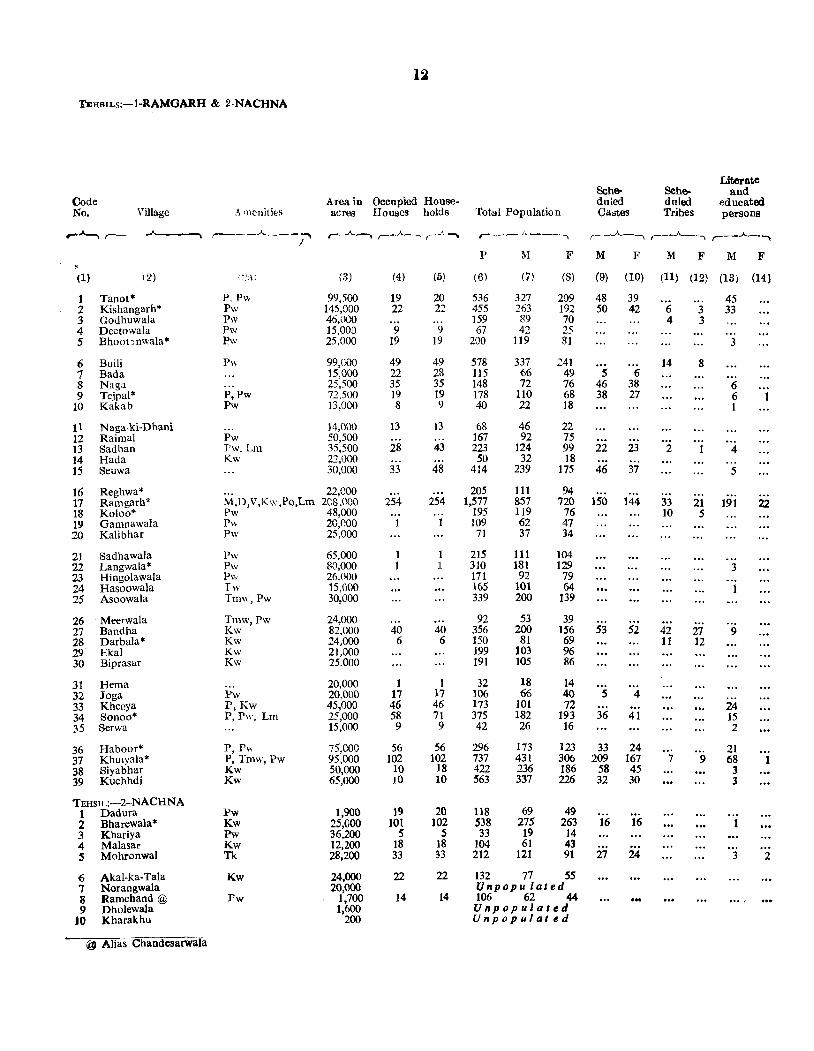
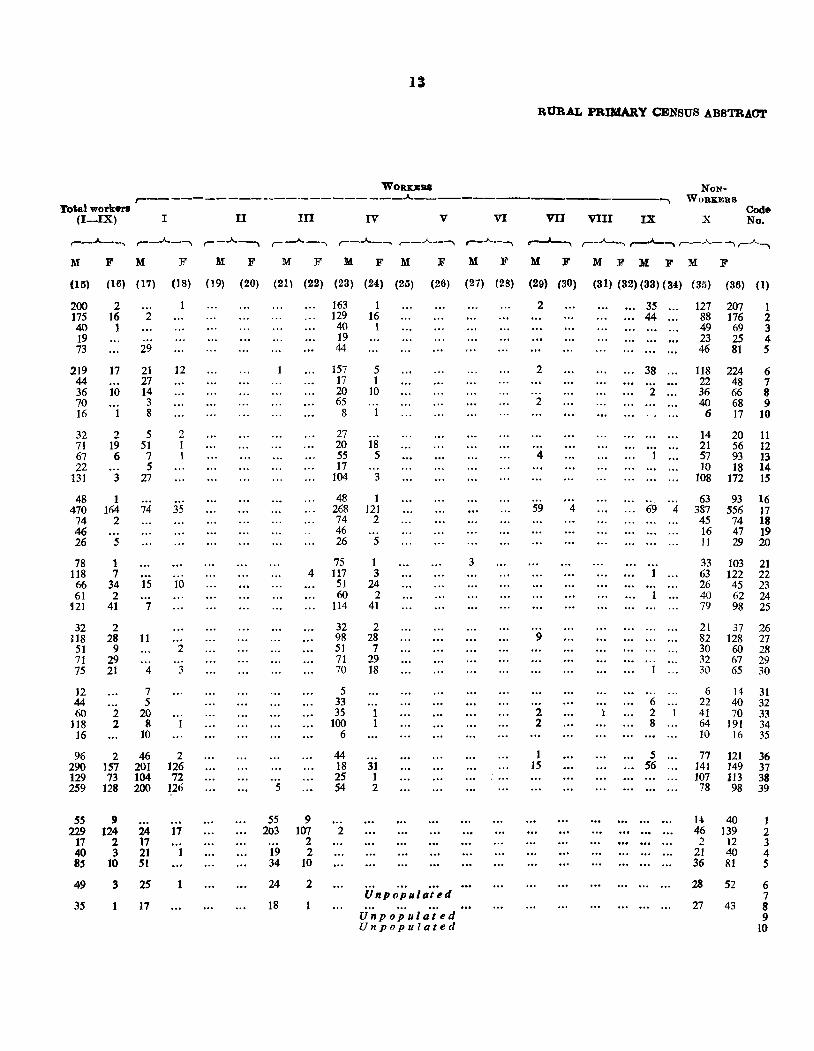
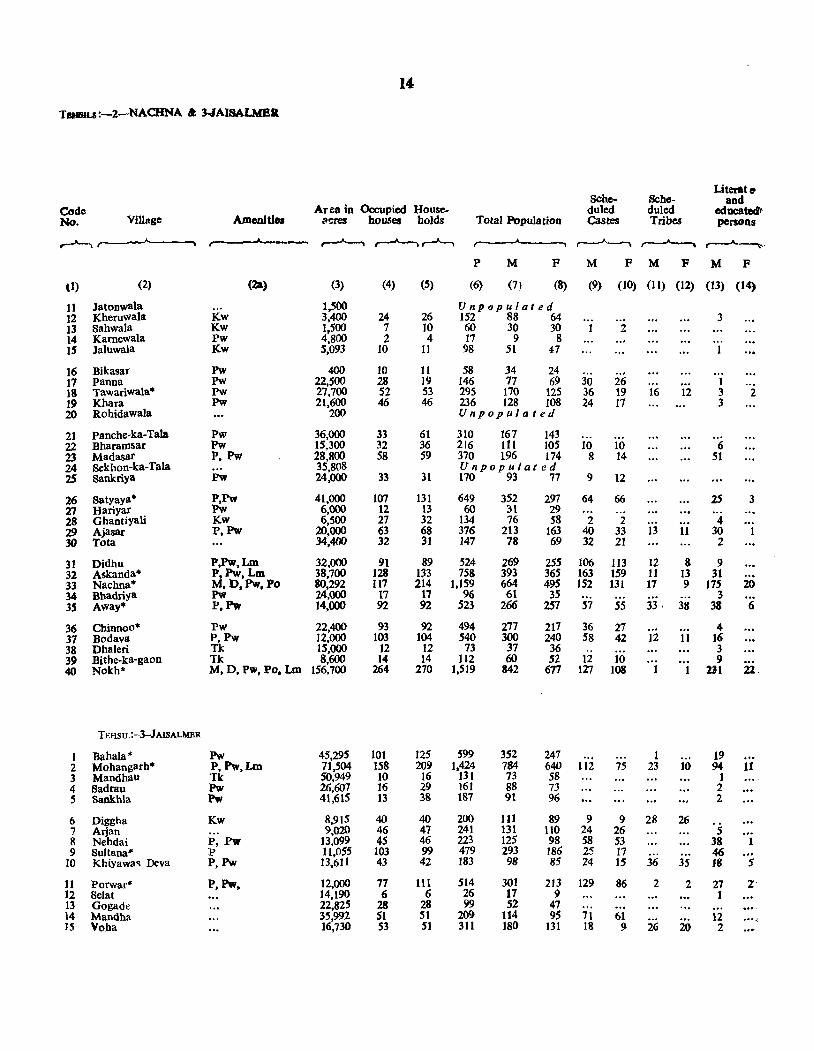
Hamlets falling into the revenue areas of the towns but not administered by the municipality are treated as the non-municipal area of the town. The villages in the Rural Primary Census Abstract are presented tehsilwise and within a tahsil in order of their Census location code numbers.
4. In the Urban Primary Census Abstract, the data has been presented for each municipal ward of the towns. The blockwiBe figures for towns could not be presented
here for want of space. This information, however, i. available in the office of the Superint,;ndent, Census Operations, Rajasthan. The data for non-municipal &reM attached to a town has been shown just after the wards while for special charges the figures have generally been included in the respective wards.
5. A special column (2a) in the Rural Primary Census Abstract has boon provided for showing some of the basic amenities which existed in the villages. These amenities have been shown by means of symbols as under: ...
P-Primary School M-Middle School H-HighJHigber Secondary School C-College D-Dispensary
Hos-Hospital Tmw-Trained Midwife
V -Veterinary Hospital) Dispensary Pw-Pucca well Kw-Kutcha well Tk-Tank B-Baori (stcpped well)
Rly-Railway Station Po-Post Office To-Telegraph Office
Lm-Local Market
6. Village marked with an asterisk (*). indicates the location of a Gram Panchayat.
7. The area figures shown in column (3) of the Rural Primary Census Abstract are coll'~cted from the Revenue Authorities while this column of the Urban Primary Census AbstI;act has been left blank as area figures for the wards are not available.
8. Column (4) of the Abstract includos houses used as dwellings or partly us dwellings.
9. Column (5) shows the number of households. A "household" has been defined as a group of persons who commonly live together in the same house and take their meals from a common kitchen. A servant, friend or a guest (related or unrelated) residing and eating with the household during the census period has been treated &8
a member of the household. On the other hand, a SOD
or a daughter residing in a hostel is not treated as a member of the household.
10. Columns (6) to (8) of the Abstract show the total population a.nd. its sex-wise breakup. This also includes houselMS and institutional population. Houseless person ha.s heen defined as (i) a person who might be doing domestic service or some other work with one or more households but who does not reside in any house a.nd sleeps in the corridors, verandahs or passages in buildings or on the streets; (ii) wandering or nomadic tribes found to be staying in temporary huts, etc. or residing without any such huts just on the open ground; and (iii) beggar, vagrant, tramp, sadhu, fakir, etc. who is found in the foot-paths, streets, in places like parks, gardens, railway yards, etc. Institutional population includes persons enumerated. in penal, charitable or mental institutions, hostels, hotels, hospitals, boarding houses, etc.
11. Columns (9) to (12) of the Abstract show the population of Scheduled Castes and S0hed.uled Tribes and their sex-wise breakups. The further breakups of individual Scheduled Castes/Tribes are dven in Table SOT-I.
12. Columns (13) & (14) of the Abstract give the number of literate and educated persons. A "literate" is defined as a person who knows both reading and writing. This also includes the persons having higher education. Detailed information on educational levels has been given in Table B~III and O-III.
13. Columns (15) & (16) give the total number of male and female workers. A perdon is classified as "worker" if in case of seasonal work like cultivation, livestock, dairying, household industry, etc. he has had some regular work of more than one hour a day throughout the greater part of the working season. In the case of regular employment in any trade. profession, service, business or commerce, he was employed during any of the fifteen days preceding the day of the enumerator's visit to the household. A person who waB working but was absent from his work during the fifteen days preceding the day on which enumerated or even exceeding the period of fifteen days due to illness or other causes has been treated a.s a worker. A person who had been offered work but had not actually joined has been treated as non-worker. "Work" includes not only actual work but effective supervision and direction of work also.
6
Persons under training as apprentices with or without stipend or wages are regarded. as workers. An adult woman who was engaged in household duties but doing no other productive work to augment the family's resourc;,s has not been considered as working. If, however, in addition to her household work she engaged herself in work such as rice pounding for sale or wages, or in domf"'Jtic services for wages for others, in minding cattle or selling firewood or making and selling cowdung cakes, or grass, or any such work she has been treated as 8
worker. Similarly persons like begga.rs, pensioners, agricultural or non-agricultural royalty, rent or dividend receivflrs, who earn un income but who are not participating in any productive work are not treated as workers
unless they also work in cultivation, industry, trade, prof. ession. business or commerce. A publio or social service worker who is engaged in public service aotively or a political worker who is actively engaged in furthering the political activity of his party is regarded as a worker.
The population classified as workers here is the economically active population including family workers but not including unemployed persons.
14. Columns (17) to (34) furnishes the sex-wise distribution of workers into nine industrial categories. The explanations for these categories are given below:-
Oategory I
This category includes both the owner cultivators and tenant cultivators. Along with workers personally doing work in land are also included persons who are engaged in supervision or direction of cultivation. The term 'culti. vation'involves ploughing, sowing and harvesting and does not include fruit growing or keeping orchards or groves or working for plantations.
Oategory n
All other persons working on land as labourers on wages without exercising any supervision or direction and without holding any right upon the land are classified as agricultural labourers and are included in this category.
Category m
Workers in mining, quarrying, livestock, forestry, fishing, hunting, plantations, orchards and allied activities are included in this category.
Category IV
A "Household Industry" is an industry conducted by the head of the household himself and/or mainly by the members of the household at home or within the village in rural areas and only at home in urban areas. The industry should not be run on the scale of a registered factory but may use machinery and employ power like steam engine or oil engine or electricity to drive the machinery. Thus, in a rural area, the household industry oan be located either at home or within the village but in urban area the household industry or at lea.st the major part of its work must be located at home. A household industry relates to prod~ction, processing, servicing or repairing and includes making and selling of goods bu'" should not be confined simply to buying and selling. It does not include profession such as pleader, doctor, barber, waterman or astrologer, etc. Persons working in other person's household industry as paid employees are also treated as workers in household industry.
Category V
'Manufacturing'includes all t.ypes of production, proceesing, servicing or repairing of goods which does not
:include production or processing under oategory IV.
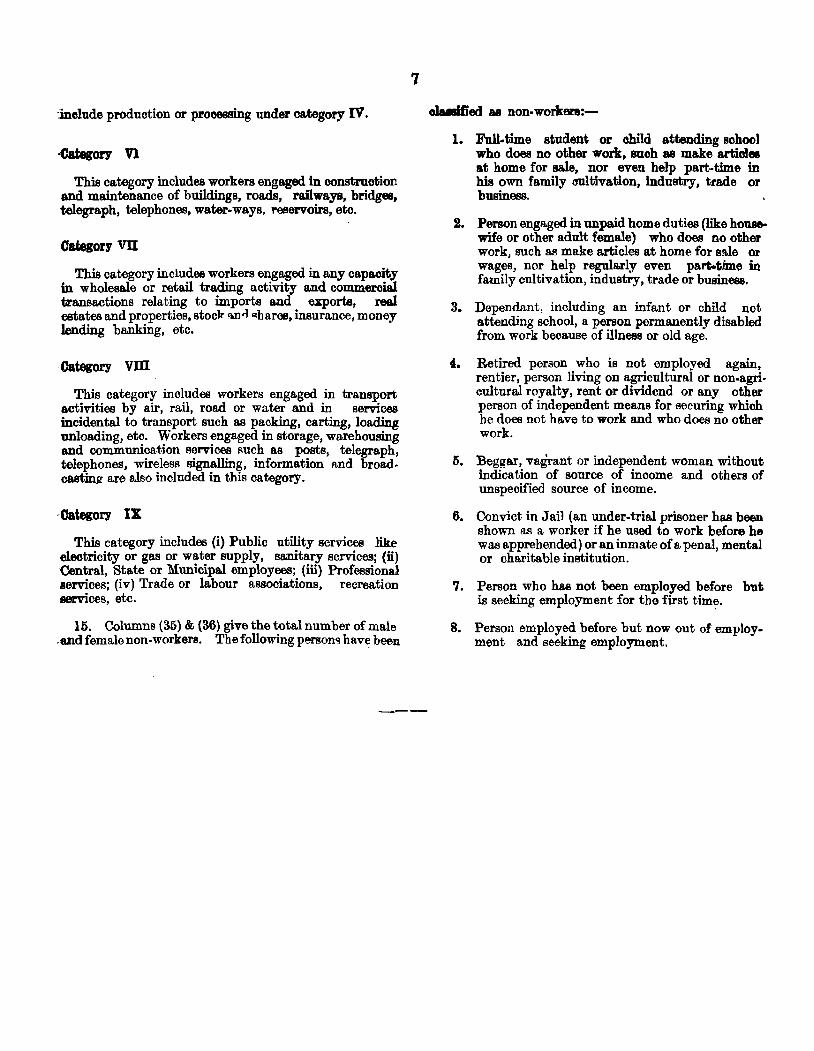
.categOry Vl
This category includes workers engaged in construotion and maintenance of buildings, roads, railways, bridges. telegraph, telephones, water-ways, reservoirs, etc.
Category vn
This category includes workers engaged in any capacity in wholesale or retail trading activity and commeroial transactions relating to imports and exports, real estates and properties, stoclT Il.n.-l qb ares, insurance, money lending banking, etc.
-CategOry vm
This category includes workers engaged in trans~ort activities by air, rail, road or water and in servIces incidental to transport such as packing, carting, loading unI9ading, etc. Workers engaged in storage, warehousing and communication services such as posts, telegraph, telephones, wireless signalling, information and broadcastin.e: are also included in this category.
·categOry IX
This category includes (i) Public utility services like ~tricity or gas or water supply, sanitary services; (li) 'Central, State or Municipal employees; (iii) Professional services; (iv) Trade or labour associations, recreation services, etc.
16. Columns (35) & (36) give the tota.l number of male .'8nd female non· workers. The following person~ have been
'1
oJa.If'jed as non.workere:-
1. Full.time student or child attending school who does no other work. Baoh as make articles at home for sale, nor even help part.time in his own family oultivation, Industry, trade or business.
2. Person engaged in unpaid home duties (like housewife or other adult female) who does no other work, such as make articles at home for sMe or wages, nor help regularly even part-time in family cultivation, industry, trade or busineee.
3. Dependant, including an infant or child not attending school, a person permanently disabled from work because of illness or old age.
4. Retired person who is not employed again, rentier, person living on agricultural or non-agri. cultural royalty, rent or dividend or any other person of independent means for securing which he does not have to work and who does no other work.
O. Beggar, vagrant or independent woman without indication of source of income and others of unspecified source of income.
6. Convict in JaiJ (an under-trial prisoner has been shown as a worker if he used to work before he was apprehended) or an inmate of a penal, mental or charitable institution.
7. Person who has not been employed before but is seeking employment for the first tim~.
S. Person employed before but now out of employment and seeking employment.
8
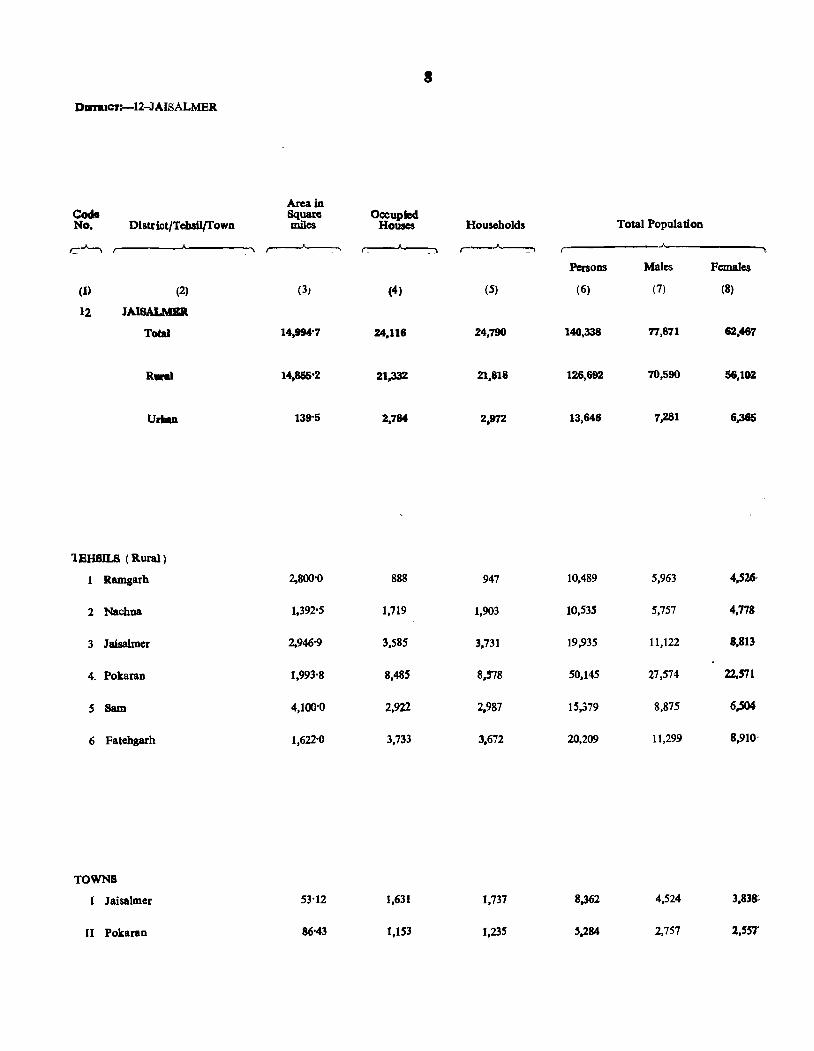
DJlftICl'!-12-JAISALMER
Area in Co6o Square Occupied No. Distrlct/TebsU{fown miles Houses Households Total Population
~ ,....--A----. ~ ,--~
Persons Males Females
(1) (2) (3) (4) (5) (6) (7) (8)
12 JAlBALMBll
Total 14,994'7 24,116 24,790 140,338 Tl,871 62,467
Rural 14,855·2 21,332 21,818 126,692 70,590 56,102
UrllaD 139'5 2,784 2,972 13,646 7,281 6,365
lEHSILS (Rural)
1 Ramgarh 2,800'0 888 947 10,489 5,963 4,526,
2 Nachna 1,392'5 1,719 1,903 10,535 5,757 4,778
3 Jaisalmer 2,946-9 3,585 3,731 19,935 11,122 8,813
4. Pokaran 1,993'8 8,485 8,578 50,145 27,574 22,571
5 Sam 4,100'0 2,922 2,987 15,379 8,875 6,504
6 Fatehgarh 1,622'0 3,733 3,672 20,209 11,299 8,910'
TOWNS
I Jaisalmer 53'12 1,631 1,737 8,362 4,524
II Pokaran 86'43 1,153 1,235 2,757 2,5ST
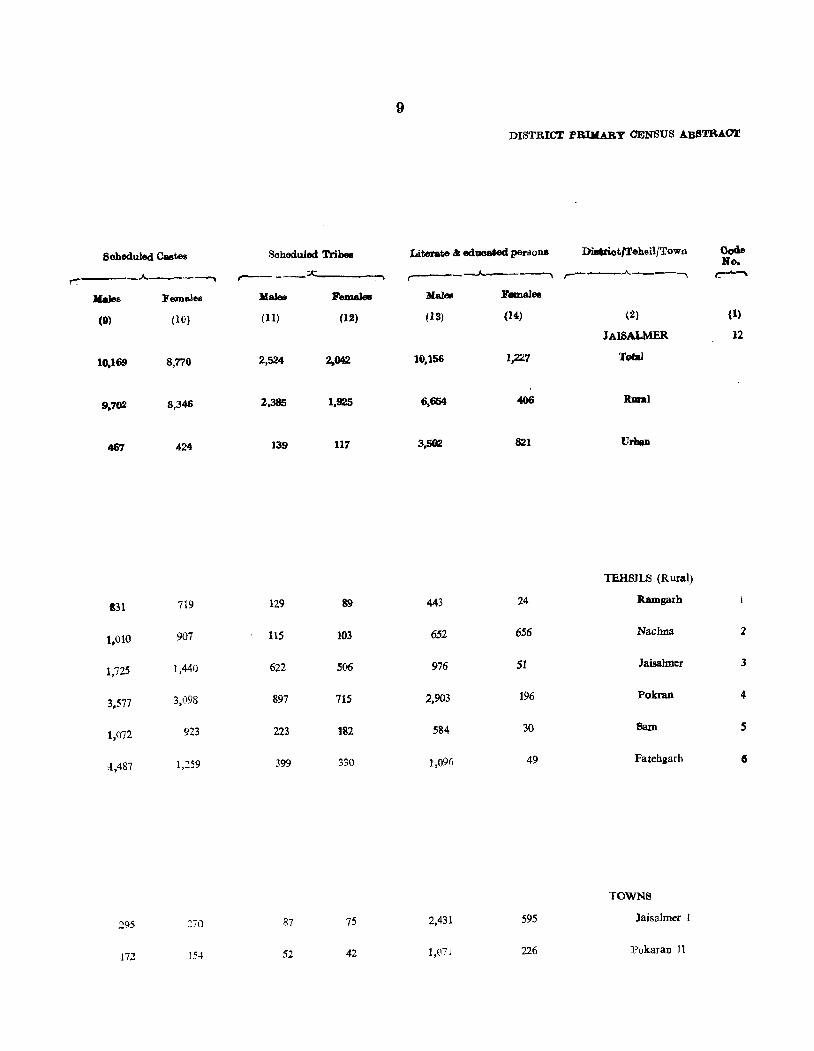
9
DISTRIC'l' PRIMARY CENSUS ABSTRACT
Sobeduled Castes Sobeduled Tribelt Literate &; edlloated persons DilIViotl'!'ehsi1jTown Oode No.
'1"": .A._---. ,------~-:"""t -.A.--~ ,--__ ..A.~-"""'\
~
lIales Females Males Females Malee Females
(9) (10) (11) (1.2) (13) (14) (.2) (1)
JAISALMER 12
10,169 8,770 2,524 2.042 10,156 1,227 Total
9,702 8,346 2.385 1.925 6,654 406 Rural
467 424 139 117 3,502 821 UrbeD
TEHSILS (R ural)
131 719 129 89 443 24 Ramgarh
1.010 907 115 103 652 656 Nachna 2
1,725 1,440 622 506 976 51 Jaisalmer 3
3,577 3,098 897 715 2,903 196 Pokran 4
1,072 923 223 ]S2 584 30 Sam 5
\.(,487 1,259 399 330 1,096 49 Fatehgarb 6
TOWNS
.295 270 87 75 2,431 595 Jaisalmer I
.172 154 52 42 1,(171 226 Pokaran 11
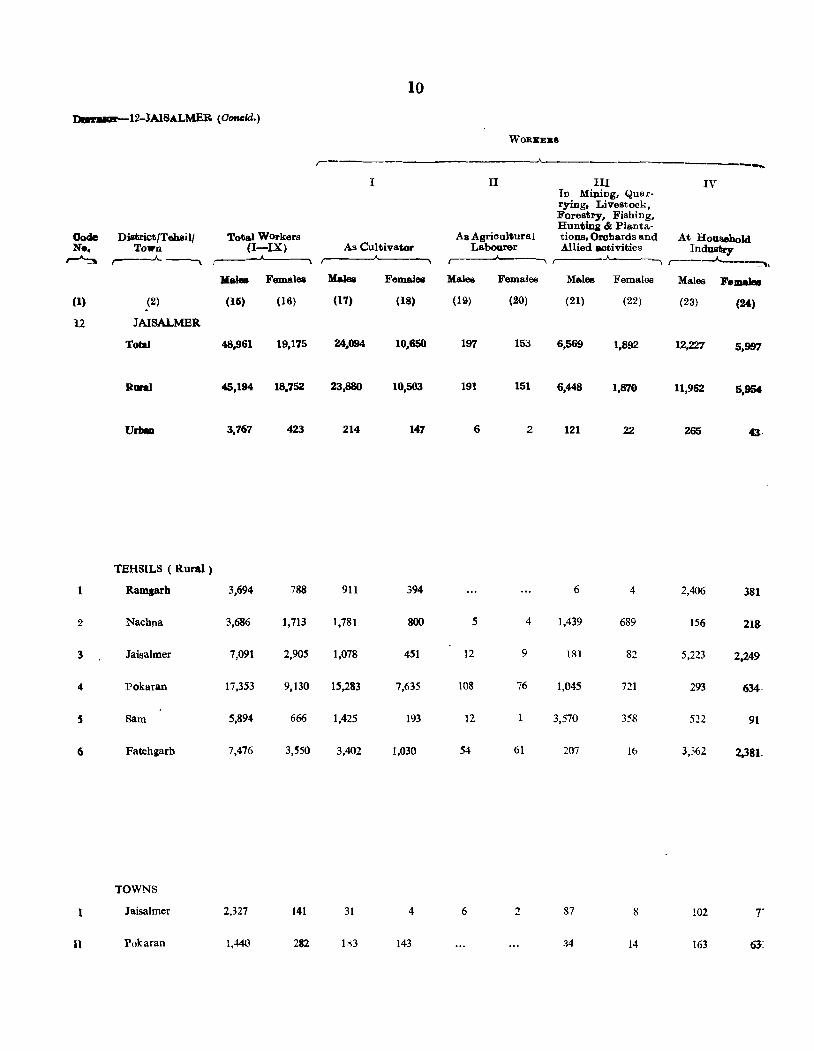
10
DIaT_-12-JAISALMER (Ooncld.)
WORKERII
.A- ..... I II III IV
In Mining, Quar-rying, Livestock, Forestry, Fishing, HuntinJI: & Planta-
Code Dietrict/Tehsil/ Total Workers As Agricultural tions, Orchards and At Hon_bold N •• Town (I-IX) As Cultivator La.bourer Allied activities Industry ~ ,---.A..~ r::--~-' ,..-----A---, -"----, r----J...-_~
Males Femalea Males Female. Ma.Jes Females Males Females Males F.JDa1ee (1. (2) (15) (16) (17) (18) (19) (20) (21) (22) (23) (240)
12 JAISALMER
Total 48,961 19,175 24,094 10,650 197 153 6,569 1,892 12,227 5,997
Rural 45,194 18,752 23,880 10,503 191 151 6,448 1,870 11,962 5,95f
Urbu 3,767 423 214 147 6 2 121 22 265 43
TEHSILS ( Rural)
1 Ramprb 3,694 788 911 394 6 4 2,406 381
2 Nachna 3,686 1,713 1,781 800 5 4 1,439 689 156 21S
3 Jaisalmer 7,091 2,905 1,078 451 12 9 181 8Z 5,223 2,249
4 Pokaran 17,353 9,130 15,283 7,635 108 76 1,045 7Z1 293 634
S Sam 5,894 666 1,425 193 12 1 3,570 358 522 91
6 Fateh"arb 7,476 3,550 3,402 1,030 54 61 207 16 3,362 2,381-
TOWNS
I Jaisalmer 2,327 141 31 4 6 87 8 102 T
II Pokaran 1,440 282 183 143 14 163 6l:
II
DISTRICT PRIMARY CENSUS ABSTRACT
WOB]UBS
r_--------------------"--V VI VII vm IX x
In manufactur-inj!; other than In Transport.
Household In Trade a.nd Storalle Elnd In Other District!Tebsil/ Cod. Industry In Construction Commerce Communications Services NOllil-WORK.8JRI> Town No.
r A.. _ __, ,-~ ,-_-"-__ , ,-";;"-"----, r----.A.---, ,--";---~ , __ .A.. __ -. ,.........__ Males Females Males Fema~ Males Females
.. Males Females Femalee Males Females Males
(2lS) (26) (27) (28) (29) (30) (31) (32) (33) (34,) (35) (36) (2) (1)
JAISALMER 12
349 15 226 24 1,306 43 322 3,671 401 28,910 43,2.92 Total
19 71 11 597 16 45 1,981 247 25,396 37,350 Rural
330 15 155 13 709 27 277 1,690 154 3,514 5,942 Urban
TEHSILS (Rural)
3 98 4 269 5 2,269 3.738 Ramgarh 1
6 54 244 2 2,071 3,065 Nachna 2
3 41 11 78 1 13 461 102 4,031 5,908 Jaisalmer 3
, 151 10 25 443 54 lQ,221 13,441 Pokaran 4
UO 2 253 22 2,981 5,838 Sam S
16 IS 106 3 311 62 3,823 5,3(1) Fatehgarh ,
TOWNS
10 83 to 458 12 163 1,151 88 2.[97 3,697 Jaisalmer i
5 12 3 251 IS 114 539 66 1,317 2,245 Pokarao 11
l~
l'EHSILS:-I-RAMGARH & 2·NACHNA
Literate 8che- Sche- and
Code Area in Occupied House- duled duled educated No. Village A 'llenities acres Houses holds Total Population Cadtes Tribes persons
,.. ............ r------"----""' r-_A~ ,--..A--" f-_"\._~ r----_)'----, ,_.A.-, ,-_.A.._, ,_.A..-""'r I
P M F M .F M F M F
(1) 12) (~a) (3) (4) (5) (6) (7) (8) (9) (10) (11) (12) (13) (14}
1 Tanot* p, p\v 99,500 19 20 536 327 209 48 39 45 2 Kishangarh* Pw 145,000 22 22 455 263 192 50 42 6 3 33 3 Godhuwala Pw 46,000 159 89 70 4 3 4 Deetowala Pw 15,000 9 9 67 42 25 5 BhootJnwala* Pw 25,000 19 19 200 119 81 3
6 Buili Pw 99,000 49 49 578 337 241 14 8 7 Bada 15.000 22 28 115 66 49 5 6 8 Naga 25;500 35 35 148 72 76 46 38 6 9 Tejpal* P,Pw 72.500 19 19 178 110 68 38 27 6
10 Kakab Pw 13,000 8 9 40 22 18 I
11 Naga-ki-Dhani 14,000 13 13 68 46 22 12 Raimal Pw 50,500 167 92 75 13 Sad han l'w.Lm 35,500 28 43 223 124 99 22 23 2 4 14 Hada Kw 22,000 50 32 18 15 Seuwa 30,000 33 48 414 239 175 46 37 5
16 Reghwa* 22,000 205 111 94 17 Ramgarh* M.D,V,Kw,Po,Lm 208.000 254 254 1,577 857 720 150 144 33 21 191 22 18 Koloo* Pw 48,000 195 119 76 10 5 19 Gamnawala p", 20,0.00 109 62 47 20 Kalibhar Pw 25,000 71 37 34
21 Sadhawala Pw 65,000 1 I 215 111 104 22 Langwala* Pw 80,000 1 1 310 181 129 3 23 Hingolawala Pw 26,000 171 92 79 24 Hasoowala fw 15,000 165 101 64 25 Asoowala Tmw,Pw 30,000 339 200 139
26 . Meerwala Tmw,Pw 24,000 92 53 39 27 Bandha Kw 82,000 40 40 356 200 156 53 52 42 27 9 28 Darbala* Kw 24,000 6 6 150 81 69 11 12 29 Ekal Kw 21,000 199 103 96 30 Biprasar Kw 25.000 ]91 105 86
31 Hema 20,000 1 1 32 18 14 32 Joga Pw 20,000 17 17 106 66 40 5 4 33 Kheeya P,Kw 45,000 46 46 173 101 72 24 34 80noo* P,P\\', Lm 25,000 58 71 375 182 ]93 36 41 15 35 Serwa 15,000 9 9 42 26 16 2
36 Haboor* P, p\\ 75,000 56 56 296 173 123 33 24 21 37 KhUlyala* P, Tmw, Pw 95,000 102 102 737 431 300 209 167 7 9 68 38 8iyabhar Kw 50,000 10 18 422 236 ]86 58 45 3 39 Kuchhdi Kw 65,000 10 10 563 337 226 32 30 3
TEHSIL:-2-NACHNA 1 Dadura Pw 1,900 )9 20 118 69 49 2 Bharewala* Kw 25,000 101 102 538 275 263 16 16 3 Khariya Pw 36,200 S S 33 19 14 4 Malasar Kw 12,200 18 18 104 61 43 5 Mohronwal Tk 28,200 33 33 212 121 91 27 24 3 2
6 Akal-ka-Tala Kw 24,000 22 22 132 77 55 7 Norangwala 20,000 Unpopu lated 8 Ramchand @ Pw 1,700 14 14 106 62 44 9 Dholewala 1,600 Unpopulated
to Kharakhu 200 Unpopulated
@ Alias Chandesarwala
13
RURAL PRIMARY CENSUS ABSTRACT
WORICBBS NON-,.-____ - _______ ---_______ -A __ - _______
~ WORKERS Total workers Code
(I_IX) I II In IV V VI VII VIII IX X No.
,_.A._-. ,-_.A._~ ,--A.._~ ,---A._ . .., ,-_.A. __ r--...A.._, ,..._.A.._~ r--"---.. ,--"---., ,.-.-A-, ,._.A.--, ,.A., M F M F M F M F M F M F M F M F M F M F M F
(15) (16) (17) (18) (19) (20) (21) (22) (23) (24) (25) (26) (27) (28) (29) (30) (31) (32) (33) (34) (35) (36) (1)
200 2 163 1 2 35 127 207 1 175 16 2 129 16 44 88 176 2 40 1 40 1 49 69 3 19 19 23 25 4 73 29 44 46 81 5
219 17 21 12 157 5 2 38 118 224 6 44 27 17 1 22 48 7 36 10 14 20 10 2 36 66 8 70 3 65 2 40 68 9 16 8 8 6 17 10
32 2 5 2 27 14 20 11 71 19 51 1 20 18 21 56 ]2 67 6 7 1 55 5 4 57 93 13 22 5 17 10 18 14
131 3 27 104 3 108 172 15
48 1 48 1 63 93 16 470 164 74 35 268 121 59 4 69 4 387 556 ]7 74 2 74 2 45 74 18 46 46 16 47 19 26 5 26 5 II 29 20
78 1 75 1 3 33 103 21 118 7 4 117 3 63 ]22 22
66 34 15 10 51 24 26 45 23 61 2 60 2 40 62 24
121 41 7 114 41 79 98 25
32 2 32 2 21 37 26 118 28 11 98 28 9 82 128 27
51 9 2 51 7 30 60 28 71 29 71 29 32 67 29 75 21 4 3 70 18 30 65 30
12 7 5 6 14 31 44 5 33 6 22 40 32 60 2 20 35 2 2 41 70 33
118 2 8 100 2 8 64 191 34 16 10 6 10 16 35
96 2 46 2 44 1 5 77 121 36 290 157 201 ]26 18 31 15 56 141 ]49 37 129 73 104 72 25 1 107 113 38 259 128 :200 126 5 54 2 78 98 39
5S 9 55 9 a 40 I 229 124 24 17 203 107 2 46 139 2
17 2 17 2 2 12 3 40 3 21 19 2 21 40 4 85 10 51 34 10 36 81 5
49 3 25 24 2 28 52 6 U"populat~d 7
35 17 18 27 43 8 Unpopulated 9 Unpopulated 10
14:
TIIIIllILS :-2-NACHNA a UAISALMBIl
Literate Sche- 8che- and
Code Area in Occupied House. duled duled oducated~ No. Village AmenJtJes Mrcs houses holds Total Population Castes Tribes persons
".......,_, . - ~ r--A--. r--A-. r----"----I ~ r t u ,
p M F M F M F M F
(I) (2) (2a) (3) (4) (5) (6) (7) (8) (9) (10) (11) (12) (13) (14)
11 Jatonwala 1,500 Unpopulated 12 Kheruwala Kw 3,400 24 26 152 88 64 3 J3 Sahwala Kw 1,500 7 10 60 30 30 2 14 Karnewala Pw 4,800 2 4 17 9 8 15 Jaluwala Kw 5,093 10 11 98 51 47
16 Bikasar Pw 400 10 11 58 34 24 17 Panna Pw 22,500 28 ]9 ]46 17 69 30 26 ]
18 Tawariwala* Pw 27,700 52 53 295 170 125 36 19 16 12 3 2 19 Khara Pw 21,600 46 46 236 128 108 24 17 3 20 Rohidawala 200 Unpopulated
21 Panche-ka-Tala Pw 36,000 33 61 310 167 143 22 Bharamsar Pw 15,300 32 36 216 III 105 10 10 6 23 Madasar P,Pw 28,800 58 59 370 196 174 8 14 51 24 Sekhon-ka-Tala 35,808 Unpopulated 2S Sankriya Pw 24,000 33 31 170 93 77 9 12
26 Satyaya'" P,PW 41,000 107 131 649 352 297 64 66 25 3 21 Hariyar Pw 6,000 12 13 60 31 29 28 Ghantiyali Kw 6,500 27 32 134 76 58 2 2 4 29 Ajasar p.Pw 20,000 63 68 376 213 163 40 33 13 11 30 30 Tota 34,400 32 31 147 78 69 32 21 2
31 Didhu P,Pw,Lm 32,000 91 89 524 269 255 106 113 12 8 9 32 Askanda* P.Pw,Lm 38,700 128 133 758 393 365 163 159 11 13 31 33 Nachna'" M.D,Pw,Po 80,292 117 214 1.159 664 495 152 131 17 9 175 20 34 Bhadriya Pw 24,000 17 17 96 61 35 3 3S Away'" P,Pw 14,000 92 92 523 266 257 57 55 33· 38 38 6
36 Chinnoo* Pw 22,400 93 92 494 277 217 36 27 4 37 Bodava P,Pw 12,000 103 104 540 300 240 58 42 12 11 16 38 Dhaleri Tk 15,000 12 12 73 37 36 3 39 Bithe-ka-gaon Tk 8,600 14 14 H2 60 52 12 10 9 40 Nokh* M, D, Pw, Po, Lm 156,700 264 270 1,519 842 677 127 108 1 231 22.
TEHSIL:-3-JAISALMER
1 Bahala'" Pw 45,295 101 ]25 599 352 247 1 19 2 Mohangarh'" P,Pw,Lm 71,504 158 209 1,424 ' 784 640 112 75 23 10 9-t U 3 Mandhau Tk: 50,949 10 16 131 73 58 1 4 Sadrau Pw 26,607 16 29 161 88 73 2 S Sankhla Pw 41,615 13 38 187 91 96 2
6 Diggha Kw 8,915 40 40 200 III 89 9 9 28 26 7 Arjan 9,020 46 47 241 131 110 24 26 ·s ... 8 Nehdai P, Pw 13,099 45 46 223 125 98 58 53 38 1 9 Sultana· P 11,055 103 99 479 293 186 25 17 46
10 Khiyawas !)eva P,PW 13,611 43 42 J83 98 85 24 IS 36 35 18 5
11 Porwar'" P,Pw, 12,000 77 111 514 30t 213 129 86 2 2 21 2' 12 Selat 14,190 6 6 26 17 9 1 13 Gogade 22,825 28 28 99 52 47 14 Mandha 35,992 51 51 200 114 95 71 61 12 15 Voba 16,730 53 51 311 180 131 18 9 26 20 2
15
RURAL PRIMARY CENSUS ABSTRACT
WOBKEBS NON-, ________ -_-____ ---A- ----------. WORKERS
Tot8.1 'Worket'll Cod.
(I-IX) I II In IV V VI VII VIII IX X No.
,-_.A._--.. ,_A_--.. ,-_..A..---., ,-_-"----.. ,__..)--~ ,_..A..---., ,.--..A.._, ~ ,--'--, ~,,--"--, ,..A..,
14 F M F M F M F M F M F 1\1 F 1\1 F III F 1\1 F M F
(15) (16) (17) (IS) (19) (20) (21) (22) (23) (24) (25) (26) (27) (28) (29) (30) (31) (32) (33) (34) (35) (36) (1)
Unpopulated 11
60 48 23 10 37 38 28 16 12 21 19 9 1 11 18 1 9 11 13
9 8 9 8 14 31 34 20 11 11 23 20 13 15
20 10 6 14 10 14 14 16 48 25 19 2 29 23 29 44 17
103 58 8S 16 17 42 1 67 67 18 84 60 62 21 20 39 2 44 48 19
Unpopulated 20
.04 2 30 1 74 1 63 141 21
7~ 46 S 1 70 43 2 36 59 22
142 107 109 106 3 1 2 28 54 67 23 UnpopuZated 24
57 16 39 2 36 77 2S
238 187 19 28 170 1 39 158 7 3 114 110 26 25 16 18 12 7 4 6 13 27 5S 47 29 23 2S 17 7 1 21 11 28
127 114 122 68 46 2 2 86 49 29 58 42 50 38 7 1 4 20 27 30
162 142 148 ,139 13 3 1 107 113 31 259 210 252 198 1 9 2 3 3 I 134 155 32 408 7 154 4 84 65 2 1 23 81 1 256 488 33
39 20 18 1 1 2 20 17 '" 22 15 34 156 124 102 28 2 2 42 93 5 5 1 110 133 35
171 51 118 45 53 6 ... 106 166 36 177 118 21 8 140 102 12 8 3 1 123 122 37 25 5 2 1 24 3 12 31 38 34 5 21 1 6 5 3 3 26 47 39
488 56 161 10 168 33 2S 13 2 15 ... 116 354 621 40
247 126 2 212 124 35 105 121 475 122 8 ~6 390 105 12 13 51 309 518 2
43 28 3 40 28 30 30 3 52 38 52 38 36 3S 4
62 54 17 11 45 43 29 42 5
58 24 11 47 24 53 65 6 77 2S 14 63 25 54 85 7 67 15 12 .. 3 42 15 6 4 58 83 8
198 2 76 2 77 5 40 95 184 9 60 2 18 27 1 13 2 38 83 10
162 7 31 .5 123 2 3 5 139 206 II 13 13 4 9 12 24 5 18 1 28 47 13 75 31 56 3 1.5 26 4 1 39 64 14
122 69 19 46 103 23 58 62 IS
16
TEHSIL:-3-JAISALMER
Literate Sche- Selle- and
Code Area in Occupie& House- duled duled educated
No. Village Amenities acres houses bolds Total Population Castes Tribes persons
~ ,..-..J--., ..---"----",...-A---, ,------A----..., ~ r- .. ~
P :rd F M F M F M F
0) (~) (2a) (3) (4) (5) (6) (7) (8) (9) (10) (11) (12) (13) (14)
16 Lakha 17,715 23 15 76 36 40 1
11 Deva* P,Pw 15,170 78 73 490 269 221 96 79 8 7 19
18 Chaoda 19,075 Unpopulated
19 Katodi* P 13,730 46 19 ]84 103 8] 26 25 ]5
20 Chaudhariy~\ 13,880 28 16 78 50 28 6 3
21 Hadha Tk ]],945 64 66 300 157 143 39 35 9 7 6
22 Kallodh* ]6,264 39 ~S 212 121 91 21 18 1 2 3
23 Veermo-ki-I{anodh 22,860 28 26 140 72 68 29 33
24 Deuga Pw 25,160 9 10 47 24 23
25 Khardi Kw 20,395 30 43 201 107 94 2
26 Balana'" P,pw 21,865 123 127 696 419 277 70 72 4 2 26
27 Tadana Pw 23,006 100 101 465 254 211 66 64 5
28 Kairu Pw 30,965 76 77 410 215 195 16 16 6
29 Chandsar Pw 14,000 22 23 100 61 39 21 17
30 Orita Pw 27,920 41 45 190 106 84 20 23 2
31 Malingda 24,978 19 19 179 103 76 19 14
32 Jesurana Pw 26,773 22 24 201 110 91 3
33 Chahdoo P,w 25,605 8 10 40 22 18 2 1
34 Rana 3,000 Unpopulated
35 Joshi 3,000 5 6 25 14 H
36 Jethwai 17,690 24 26 140 81 59 62 49
37 pohar 16,070 11 56 33 23
38 Varamsar P, Pw 16,825 61 62 234 127 107 29 24 15 12 30 4
39 RaDlkunda Pw 17,485 1 1 5 3 2 2
40 Lanela Kw 43,018 53 49 234 132 102 Ss 44 17 15 9
41 Bh"dasar* P, Kw 10,000 35 34 121 65 56 17
42 Moleal Pw 22,490 83 78 353 210 143 37 21 7
43 Tejoo Pw 13,130 7 7 33 16 17
44 Chhatrel South 48 25 209 116 93 53 41 3
45 Chhatrel North 20,755 33 32 136 67 69 20 24
46 Roopsi* P,Pw 21,610 96 SO 520 269 251 99 95 42 39 81 6
47 Lidbrawa Pw 10,330 8 13 56 26 30 17 15 4
48 Moolraj Sagar Pw 19,230 18 19 19 10 9 4 5 1
49 Amar Saga.r'" Pw 11,000 23 26 112 61 51 6 5 14 2
50 Bada Bag Pw 11.150 36 36 305 165 140 32 28 19
51 Gajroop Sagar Tk 6,970 1 1 1 1
52 Kishanghat Pw 11,650 17 16 71 39 32
53 Kalyanghat Pw 18,335 7 12 51 29 22 19 19 1
54 Hameera'" P 30,865 65 80 406 238 168 33 31 21 18 30
55 Bbojasar Pw 14,365 21 17 80 49 31 6 2 5
56 Sagra 24,930 11 12 91 59 32 8 1
57 Chandhan* P, Pw,Lm 35,615 SO 52 300 182 118 3 5 6 36 7
58 sojiya Pw 30,386 99 101 605 314 291 16 24 10 11 13 1
59 Mengi pw 47,851 23 28 151 80 7I 4 1
60 Tawarki Pw 30,565 31 32 161 101 60 3
61 Arjnar 22.93& 15 22 1\2 61 51
62 Sodha Kanwar* P,Pw 40.250 51 52 332 180 152 35 30 42
63 Delasar P,Pw 14,900 85 8.J. 320 172 148 53 42 17
64 Kanna-ki-Dbani 8 8 4S 29 16 3
65 Sanwla Pw 27,125 14 15 136 78 58 4 4 3
tTncludeJ lU Code No. 45 :j: Included in Code 1'10.- 57
l7
RURAL PRCMARY CENSUf< ABSTRACT
WOltKERS l'\ON-
,---------------- - _____ .A. __________ -------, WORRJ:R.~
Tot.i workers lode (t-IXl I II III IV V VI VII VIn IX x No_
r-.A..-, ,_.A.._, r-A.--, r- - _--'---, -_..Iy_----, ,...--"----., ,-A_--v-_.A.-, r-.A.-, r--A --.. ,---'-- - \ r.A.,
M F M F M F H F !iii F M F ?of F M F M F M F M F
(15) (16) (17) (18) (UI) (20) (21 ) (22) (23) (24) (25) (26) (27) (28) (29) (:30) (31) (32) (33) (34) (35) (:l6) (I)
26 22 17 1S 5 -" 10 18 15 171 120 63 95 lOS 25 2 98 WI 17
Unpopulated 18 61 29 52 28 8 42 52 1~ 35 14 35 14 15 14 2()
91 S 67 7 18 1 ... 2 3 66 135 21 84 1 35 2 42 2 2 2 2 3 37 84 22 41 2 41 2 31 66 23 11 12 10 11 13 II 24 66 S8 66 58 41 36 25
262 198 5 5 247 193 2 8 157 79 26 180 35 22 18 2 2 149 15 4 3 74 176 21 141 48 4 2 I 138 43 1 74 147 28
52 19 3 10 49 9 .. , 9 20 29 76 40 1 9 68 31 t 6 30 44 30
75 20 8 67 19 28 56 31 66 33 3 63 32 44 58 32 16 3 6 9 .3 6 15 33
Unpopulated 34 (; 6 1 S 10 35
39 '3 29 8 3 2 42 56 :>6 21 13 17 13 4 12 10 37 85 57 5 2 10 3 64 SO 2 4 2 42 SO 38 2 1 2 1 I I 39
68 7 4S 1 19 7 64 95 40-
30 9 19 35 56 41 129 69 60 81 143 42
7 7 9 17 4.1 76 49 4 55 45 17 4 4Q 44 44-46 31 1 1 42 31 2 2f 38 45
166 146 2 2 2 124 III 8 9 30 24 103 105 46-17 12 6 11 12 9 18 41 7 5 7 5 3 4 4S
37 24 10 14 16 9 2 8 1 24 27 49 113 65 1 49 39 57 25 2 4 1 52 75 5()
1 51 22 1& 2 2 17 32 52 17 4 3 5 9 4 12 J8 53
149 14 8 4 116 4 .3 18 10 89 154 54 '}9 1 4 25 t 20 30 55
46 12 15 12 J1 13 20 56 132 45 3 6 89 44 4 8 ... 22 50 73 57 248 191 6 9 229 176 2 11 6 66 100 58
55 47 3 8 52 39 25 24 S9 8) 39 81 39 20 21 60
45 21 45 21 16 30 61 111 59 100 58 7 3 69 93 62 96 4 2.5 16 47 4 7 76 144 63 13 1 3 10 16 15 64 32 24 9 19 26 58 65
)8
. "EHsILs:-3-JAISALMER & 4-POKARAN
Sche- Sche-Literate
and Code Area in Occupied House- duled duled educated No. Village Amenities acres houses holds Total Population Castes Tribes persons
,--A---. r----A--__ ,..-.-A----, ")-"-__ .A ~ ,.---A---., ,--.A.--,
P M F M F M F M F (I) (2) (2a) (3) (4) (5) (6) 17) (8) (9) (10) (1I) (12) (13) (14)
66 Jetha 23,130 19 20 124 69 55 31 27 24 16 12 67 Jhabr.l Pw 2,415 15 19 293 164 129 33 33 17 68 Thaiyat Pw 17,750 22 25 124 68 56 1 2 27 19 4 69 Moklat Kw 1,305 2 2 9 5 4 70 Basanpeer Pw 28,730 47 42 208 110 98 41 32 2
71 Jairat Kw 14,645 11 12 50 31 19 17 14 1 72 Dhanua Pw 12,723 15 14 81 41 40 I 73 Dhauwa Pw 13,376 25 25 142 73 69 6 74 Jiyai 17,070 16 13 63 37 26 20 10 1 75 KaMa B 22,270 18 18 82 42 40 25 23 I 4 8
76 Khanderon-ki-Dhani B 1,330 10 10 37 19 18 1 77 Kuldhar (Manpiya) Pw 34,145 4 5 36 17 19 13 16 78 Moondri Kw 16,477 18 3 22 11 II 79 Sata Pw 12,770 29 33 175 100 75 9 7 5 80 Dahri Pw 15,495 15 14 75 42 33 2
81 Hansuwa Kw 13,401 52 30 138 86 52 5 18 10 7 82 Bhiyan 4,700 17 17 60 29 31 2 1 19 24 83 Dabla· P,Pw 12,871 41 38 174 104 70 61 34 36 84 Bhagu-ka-Gram 10,000 38 43 186 101 85 85 Bhojka pw 14,856 3 3 11 6 5 2
86 Bhairwa 26,215 40 42 213 118 95 16 19 10 7 2 87 Dhaysar Pw 16,264 47 48 279 156 123 40 23 7 88 Jawad Nai 16,015 36 34 206 110 96 26 28 3 89 Jawad Jooni Pw 20,630 33 45 201 109 92 90 Badoda Gaon· P,Pw,Lm 18,931 179 185 971 558 413 70 58 109 6
91 Ashaycha Pw 1l,965 ]9 15 81 43 38 92 Akal Pw t 10 40 281 ISS 126 2 1 93 Jodha Pw 28,185 27 37 85 50 35 3 94 Keeta Pw 14,871 36 54 290 166 124 S 5 53 34 3 95 Bhopa Kw 12,877 43 47 216 115 101 9 9 3 2 4
96 Pithorai Pw 13,311 24 24 132 75 57 3 1 97 Bhoo Kw 11,830 36 34 125 70 55 12 Jl 2 98 Gorera Pw 12,336 10 10 48 30 18 5 4 99 Pith'a* P, Pw 14,870 40 43 243 134 109 .s 2 38 100 Padhaharon-ki-Dhani t 13 13 58 32 26
TEHSIL:--4-POKARAN
1 Bhadariya Pw,Lm 51,823 7S 75 434 237 197 28 26 12 8 20 1 2 Nawatala P,Pw,Lm 11,614 138 137 742 411 331 56 52 1 2 33 1 3 Eta Pw 31,348 92 92 429 221 208 55 55 2 4 Loharki* P, Pw, Lm 18,345 119 119 650 343 307 67 58 3 S 82 16 5 Bardana Pw 6,925 28 28 233 129 104 14 18 2 1 (j Chhe.yan· P, lm 31,686 79 79 427 226 201 12 13 43 2 7 Sada Kw 5,967 23 24 191 ]04 87 15 14 19 8 Rathora Tk 6,929 29 29 158 86 71. 28 30 11 9 2 9 Dudhlya P,Pw 18,379 78 63 305 170 135 23 21 32 10 Galar 4,368 2 2 9 4 5
f Included in Code No. 93 :j: Included in-Code No. 78.
19
RURAL PlU~Y' CENSUS ABSTRACT
WORKl!RS NON-WORKERS
"Total workers Code (I-IX) I n III IV V VI VII VIII IX X No.
,---"----. ,--"----- ,-_' ,--"------.. __ .A..---. ,--.A._, r-"---. ,---"---.. ,-....._, ~ ,-"----,
M F M F M F M F M F M F M F M F M F M F M F
{I'> (16) (17) (18) (19) (20) (21) (22) (23) (24) (25) (26) (27) (28) (29) (30) (31) (32) (33) (34) (35) (36) ( 1)
35 2 ... 4 27 2 34 5S 66 103 23 28 1 2 66 21 7 I 61 106 67 40 9 20 1 19 9 28 47 68
S 5 4 69 60 7 29 3 1 31 3 SO 91 70
19 6 14 6 5 12 13 71 2S 21 2S 21 16 19 72 48 26 7 12 " 31 19 1 4 2S 43 73 24 14 ... 3 3 20 H I 13 12 74 33 19 1 32 19 9 21 75'
17 8 7 1 10 7 2 ]0 76 14 9 2 3 12 6 3 10 77 9 4 "s 9 4 2 7 78
76 56 14 64 40 2 5 2 24 19 79 30 19 3 1 27 18 12 14 80
60 31 46 31 13 26 21 81 17 12 58 1 17 11 ..... 12 19 82 77 33 26 3 3 9 4 I 3 3 27 37 ,83
,-61 32 57 31 4 1 4(} S3 84 5 2 2 3 2 1 3 85
73 34 6 1 3S 14 32 19 45 61 86 90 59 S 7 83 52 2 66 64 87 68 43 5 14 61 29 2 42 53 88 S9 40 2 1 58 38 ... SO 52 89
326 28 6 1 280 16 2 4 1 33 11 232 38S 90
24 6 17 1 19 38 91 104 64 8 7 95 57 1 51 62 92
34 16 34 16 16 19 93 '118 52 52 18 6S 34 48 72 94
82 58 10 82 48 33 43 9S
48 15 1 46 2S 27 32 96 4S 27 7 34 27 4 25 28 97 19 13 3 18 9 1 1 11 5 98 84 36 3 1 66 35 3 3 9 SO 73 99 24 16 24 16 8 10 100
181 129 173 129 8 S6 68 1 .2.50 141 207 131 36 16 ... . .. 4 3 161 184 2 149 119 121 87 4 7 2 1 22 24 72 89 3 202 155 189 ISS -.. 12 141 152 4 88 36 86 36 2 41 68 5
126 71 121 71 5 100 130 t'\ 83 70 83 70 21 17 7 SO 43 50 43 3fl 29 8
105 74 102 74 3 65 61 9 4 5 4 5 10
20
Literate SchOo Sche- and
'Code Area in Occupied House- duled duled educatect No. VUlap Amenities acres houses holds Total Population castes Tribes persons
,-A-, r--"--\ r .. --, ...-.-. -, .....--'---.~,
P M F M F M F M F
(I j (2) ,2a) ,(3) (4) (5) (6) (1) (8) (9) ( 10) (11) (12) (13) (14)
11 Sarnayat 2,666 10 18 199 109 90 21 11 1 12 Eka Pw 9,440 33 33 132 70 62 4 3 1 13 Biram Deora Pw 5,423 37 39 198 112 86 21 18 J9 14 Ram Deora- M, D, V, Pw, Rly, Po 18,744 2SO 309 1,458 789 669 129 108 87 70 241 46 IS Mawa Pw 22,696 20 20 112 57 5S 7 6 6
16 Kalan P,PW 26,969 125 125 662 342 320 S9 51 17 10 33 17 MaIka TIc 4,126 15 IS 84 ,47 37 18 Khetolai· Tk,Lm 24,026 63 61 448 244 204 3 7 1S 7' 19 Dholiya P,PW 13,906 87 95 537 282 2S5 43 20 ~thi* P, Pw,Lm 9,059 156 156 865 456 400 86 76 28 24 69 g
21 Lotha Tk 2,900 S 5 23 14 9 22 Rlltan-ki-Bassl Pw 2,826 10 10 SO 26 24 2 2l Chananij Pw 16,483 59 59 331 177 154 9 5 3 24 Mahesha-ki-Dhaol Pw I1,698 34 34 176 105 71 10 7 3 2S Odhaniya P,Pw 12,158 87 87 470 235 235 48 52 81 6
26 Chacha P,Tk 6,466 57 58 339 175 164 17 16 23 3 27 Gomat P,Pw 51,918 135 134 740 371 369 98 96 91 6 28 Lawa· P,D, V,Pw 23,237 284 281 1,298 677 621 63 50 34 27 80 6 29 Rawad 598 Unpopulated 30 Dhudsar Tk 19,585 48 48 224 ]24 100 9 9 32
31 Ujla'" M, D,V, Tk, Po 7,414 119 119 577 196 281 81 76 21 14 (i4 13 32 Barli Charan P,Pw 7,652 93 93 497 261 236 64 51 29 33 Barli Moda P, Pw 3,616 26 26 132 77 55 9 3 1 34 Biliya 4,054 II 11 71 41 30 9 35 ,Kelawa" P,PW 9,956 73 72 377 204 173 11 13 39 .. 36 Tbat'" fw 4,846 46 46 275 144 131 46 45 I 5 37 Nananiyai Tk 1l,245 33 33 183 95 88 7 6 1 9 38 Modardi P,Pw 14,311 33 33 184 III 73 25 14 18 9 3 39 Cbok* Pw 17,268 75 75 433 248 185 58 50 17 17 3 40 Sanawara P,Pw 35,756 161 161 840 480 360 114 87 15 17 35
41 Karaliya Pw 8,909 48 48 271 155 116 7 6 4 3 26 1 42 Nedan* Pw,Lm 15,465 65 65 972 518 454 81 79 95 tl, 43 Madasar PvI- 9,527 55 55 897 531 366 88 75 4 '5 24 44 Lakhasar Pw 5,08 ( 14 14 89 53 36 8 5 1 2 45 Kbuhra Pw 7,886 44 44 282 165 117 3 3 39 35
46 Sakra .. M,Pw,Po, Lm 50,941 290 ?-27 1,889 1,130 759 141 104 17 21 123 2 47 Gudi Pw 22,916 44 44 267 145 122 18 17 48 Madwa'" t',Pw 24,723 156 156 1,259 708 551 71 77 7 4 47 49 Jhalariya P,PW 15,492 108 149 797 436 361 78 75 64 51 13 SO Bhakri Saosan I,Pw 5,006 S9 59 324 177 147 19 ' 21 28 26 18
51 Padroda P, Pw 9,699 109 121 650 372 278 92 73 9 4 34 52 Medwa P,P ],04] 19 20 ]09 56 53 18 14 2 .;, 53 Barat-ka-gaon· p. Tk 3,686 64 96 297 161 136 5 3 14 13 49 54 Uchpadra Pw 1,796 29 11 108 59 49 22 15 1 55 Balusingh-ki-Dhani P,Pw 2,780 2S 25 172 93 79 9
56 Bhaniyana· M, D, V, Pw, Po 62,565 595 571 3,460 1,864 1,596 138 ltO 40 30 178 .. 57 Dudiya Pw 7,518 32 26 128 76 52 20 15 23 16 58 Jaimala Pw 41,180 100 92 611 339 2'72 I 25 17 39 S9 Luna Khurd* P,Pw, Lm 17,318 99 106 658 379 279 46 40 82 tiO lkteena P,Tmw 6,384 50 50 317 184 133 27 19 .. .'
21
, R.URAL PRIMAR.Y CBNBUB ABBTR.ACI'
Wonus NON-WORKllRS
Total workers COde (I-IX) I II m IV V VI VII VIII IX X No.
,-A---,. r-~ ,-:--A----. ~ ~ ,~ r-::--"-... ,--"---. ,---'--~ ,-~ ,---"----..,~
M F M F M F M F M F M F M F M F M F M F M F
( IS) (16) (17) (18) (19) (20) (21) (22) (23) (24) (25) (26) (27) (28) (29) (30) (31) (32) (33) (34) (35) (36) ( 1)
86 59 57 27 17 2 30 10 1 23 31 11 46 14 44 13 1 1 1 24 48 12 60 39 53 39 1 1 ... 5 52 47 13
46S 140 310 lOS 4 1 55 24 2 29 2 9 56 8 324 529 14 27 31 24 29 2 3 30 24 15
191 165 178 154 7 4 1 6 151 155 16 36 24 26 1 1 10 22 11 13 17
liS 119 109 119 1 8 126 8S 18 166 114 114 77 17 35 2 2 ... 1 32 116 141 19 261 ISO 34 57 1 25 123 63 46 4 5 24 28 1 195 250 20
11 3 10 1 1 2 ." 3 6 21 20 4 16 1 3 3 6 20 22
107 79 105 7S 2 1 3 70 75 23 66 46 63 44 3 1 1 39 25 24
136 121 130 116 3 5 3 99 114 2S
lOS 101 105 101 70 63 26 217 221 199 218 3 1 4 10 2 154 148 27 352 194 322 171 8 13 5 4 3 2 11 325 427 28
~.~ po 1 u l ~.' e d ••• 29
73 46 60 46 8 5 51 54 30
153 143 143 141 9 2 143 138 31 138 127 137 127 1 123 109 32 36 35 33 32 2 3 1 41 20 33 27 1 2S 1 1 1 14 29 34
126 H8 123 116 I 2 2 '" 78 55 35
82 83 78 80 ... 4 3 62 48 36 61 54 60 53 1 1 34 34 37 70 70 41 73 3&
165 1 164 I 1 83 184 39 331 12 329 12 2 149 348 40
142 69 129 69 1 12 13 47 41 300 134 261 132 5 3 11 1 8 12 218 320 42 340 5S 274 53 53 2 2 10 191 311 43 29 1 29 1 •• j 24 29 44 90 39 90 3S 4 75 78 45
700 56 635 50 4 22 4 14 2 25 430 703 46 94 I 23 59 1 8 4 51 121 47
441 174 441 114 ... 267 377 48 303 239 301 185 ~ 54 133 122 49 110 SO 107 SO 3 67 97 SO
228 152 215 140 I 10 9 2 144 126 51 30 29 29 29 1 26 24 52 77 84 70 25 1 59 5 84 52 .n 37 29 30 25 1 6 3 1 ... 22 20 S4-47 37 38 33 6 I 3 3 46 42 55
1,166 624 927 52 7 3 184 268 20 296 3 5 25 698 972 56 SO * 50 * 26 16 57
236 182 236 182 ... . .. 103 90 58: 231 178 228 175 1 1 I 1 2 148 101 59' 123 40 123 40 61 93 60>
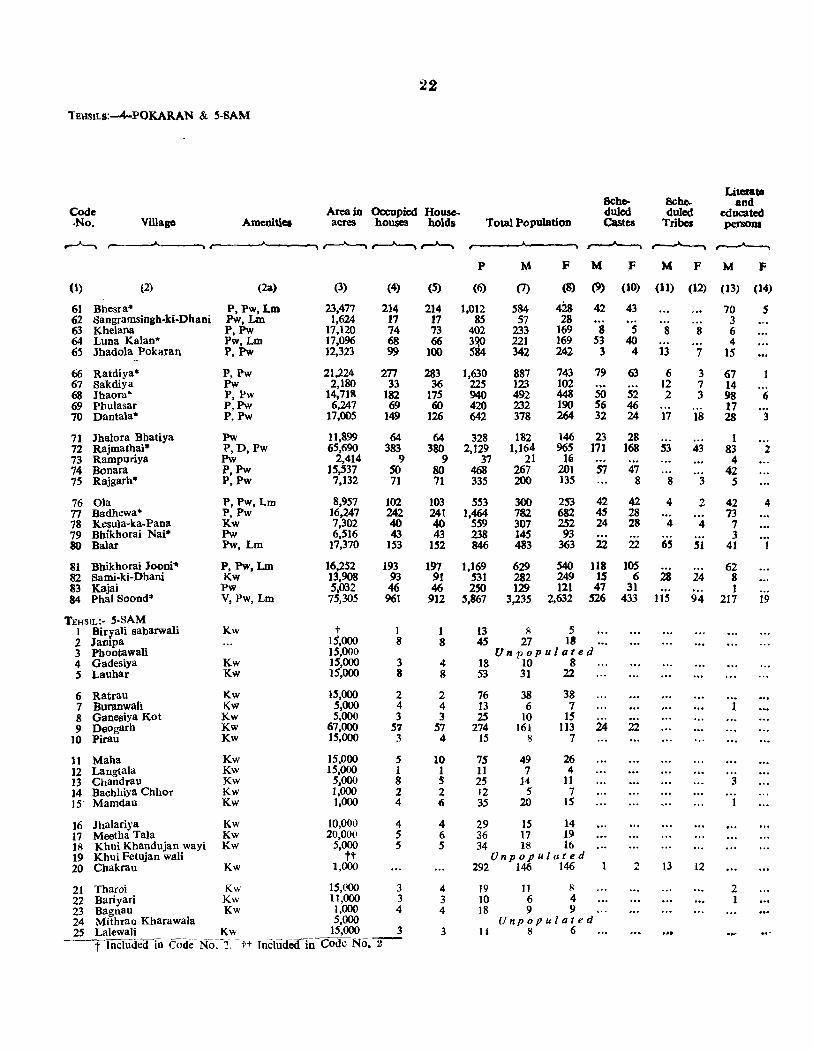
22
TEHSIU:--4-POKARAN & S-SAM
Literate ache- ache- and
Code Area in Occupied House- duJed duled educated ·No. Village AmenitiCi acres houses holds Total Population Castes Tribes pefSOllI
~ -A.. ,.--A---,. t \ r--"--. ... ~ ~ P M F M ,F M F M F
(1) (2) (2a) (3) (4) (5) (6) (1) (8) (9) (10) (11) (12) (J3) (14)
61 Bhesra* P,Pw,Lm 23,477 214 214 1,012 584 428 42 43 70 5 62 Sangramsingh-ki.Dhani PW,Lm 1,624 17 17 85 57 28 3 63 Khelana P,PW 17,120 74 73 402 233 169 8 5 8 8 6 64 Luna Kalan* Pw,Lm 17,096 68 66 3f 221 169 53 40 4 65 Jhadola Pokaran P,PW 12,323 99 100 54 342 242 3 4 13 7 15
66 Ratdiya* P,Pw 21,224 Zl7 283 1,630 887 743 79 63 6 3 67 67 Sakdiya Pw 2,180 33 36 225 123 102 12 7 14 68 Jhaora" P, Pw 14,718 182 175 940 492 448 SO 52 2 3 98 6 69 Phulasar P,Pw 6,247 69 60 420 232 190 56 46 17 70 Dantala" P,Pw 17,005 149 126 642 378 264 32 24 17 18 28 :;
71 Jhalora Bbatiya Pw 11,899 64 64 328 182 146 23 28 1 72 Rajmathai* P,D,Pw 65,690 383 380 2,129 1,164 965 171 168 53 43 83 2 73 Rampuriya Pw 2,414 9 9 37 21 Ui 4 74 Bonara P,Pw 15,537 SO 80 468 267 201 57 47 42 75 Rajgarh* P,PW 7,132 71 71 335 200 135 8 8 3 5
76 Ola P,Pw,Lm 8,957 102 103 553 300 253 42 42 4 2 42 4 77 Badhewa* P,Pw 16,247 242 24t 1,464 782 682 45 28 73 78 Kesula-ka-Pana Kw 7,302 40 40 559 307 252 24 28 4 4 7 79 Bhikhorai Nai* Pw 6,516 43 43 238 145 93 3 80 Balar Pw, Lm 17,370 153 152 846 483 363 22 22 65 51 41
81 Bbikhorai Jooni'" P, PW,Lm 16,252 193 197 1,169 629 540 118 lOS 62 82 Sarni-ki-Dhani Kw 13,908 93 91 531 282 249 IS 6 28 24 8 83 Kajai Pw 5,032 46 46 250 129 121 47 31 1 84 PhalSoond* V, Pw, Lm 75,305 961 912 5,867 3,235 2,632 526 433 115 94 217 19
TEHSIL:- 5-SAM 1 Birrali sabarwali Kw t 1 1 13 8 5 2 Jantpa 15,000 8 8 45 27 18 3 Pbootawali 15,000 Unpopulated 4 Gadesiya Kw 15,000 3 4 18 10 8 5 Lauhar Kw 15,000 8 8 53 31 22
6 Ratrau Kw 15,000 2 2 76 38 38 7 Buranwali Kw 5,000 4 4 13 6 7 8 Ganesiya Kot Kw 5,000 3 3 25 10 15 9 Deogarh Kw 67,000 57 57 274 161 113 24 22
10 Pirau Kw 15,000 3 4 15 8 7
11 Maba Kw 15,000 5 10 75 49 26 12 Langtala Kw 15,000 1 1 I1 7 4 13 Chandrau Kw 5,000 8 S 25 14 11 3 14 Bachhiya Chhor Kw 1,000 2 2 12 5 7 ]5 Mamdau Kw 1,000 4 6 35 20 15
]6 Jhalariya Kw 10,000 4 4 29 15 14 17 Meetha Tala Kw 20,000 5 6 36 17 ]9 18 Khui Khandujan wayi Kw 5,000 5 5 34 18 16 19 Khui Fetujan wali tt Unpopulated 20 Chakrau Kw 1,000 292 146 146 2 13 12
21 Tharoi Kw 15,000 3 4 19 11 8 2 22 Bariyari Kw 11,000 3 3 10 6 4 23 Bagnau Kw 1,000 4 4 18 9 9 24 Mithrau Kharawala 5,000 Unpopulated 25 Lalewali Kw 15,000 3 3 14 8 6
t Includeii in Code No~2_ -i--, [neluded in Code NO.2
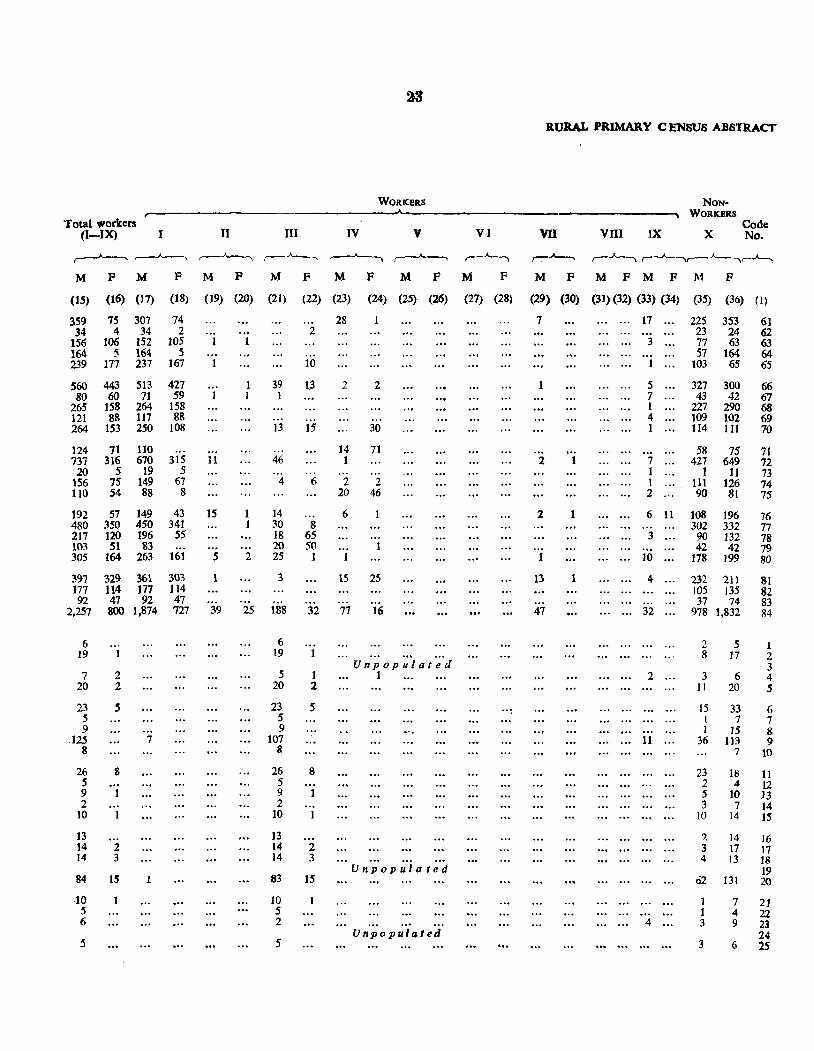
RURAL PRIMARY CENSUS ABSTRACT
WORKERS NON-WORKERS
Total workers Code (I-IX) I II III IV V VI VII VllI IX X No.
,.--"---. ~ ,-~ ,~--"-----. ,---A----, ~---, ,.-_.A._, ~.Jo-..... r-J--, ,---"-,,.-_A..._-v-.A.-..,
M F M F M F M F M F M F M F M F M F M F M F
(IS) (16) (17) (18) (19) (20) (21) (22) (23) (24) (2j) (26) (27) (28) (29) (30) (31) (32) (33) (34) (35) (36) (1)
3S9 7S 307 74 28 7 17 225 353 61 34 4 34 2 2 23 24 62
156 106 152 105 3 77 63 63 164 S 164 5 57 164 64 239 177 237 167 10 103 65 65
560 443 S13 427 1 39 13 2 2 5 327 300 66 80 60 71 59 1 1 7 43 42 67
265 158 264 158 1 227 290 68 121 88 117 88 4 109 102 69 264 153 250 108 13 15 30 1 114 III 70
124 71 110 14 71 58 75 71 737 316 670 315 11 46 1 2 7 427 649 72
20 5 19 5 1 1 II 73 156 75 149 67 4 6 2 2 1 111 126 74 110 54 88 8 20 46 2 90 81 75
192 57 149 43 15 1 14 6 2 6 11 108 196 76 480 350 450 341 1 30 8 302 332 77 217 120 196 55 18 65 3 90 132 78 103 51 83 ... 20 50 . .. 42 42 79 305 164 263 161 5 2 25 1 1 10 178 199 80
397 329 361 303 1 3 15 25 13 1 4 232 211 81 177 114 177 114 105 J35 82 92 47 92 47 37 74 83
2,257 800 1,874 727 39 25 188 32 77 16 47 32 978 1,832 84
6 6 2 5 1 19 19 8 17 2
Unpopulated 3 7 2 5 1 1 2 3 6 4
20 2 20 2 11 20 5
23 5 23 5 15 33 6 5 5 I 7 7 9 9 1 15 8
125 7 107 11 36 113 9 8 8 7 10
26 8 26 8 23 18 11 5 5 2 4 12 9 9 1 5 10 13 2 2 ... 3 7 14
10 10 1 JO 14 15
13 13 ? ]4 16 14 2 14 2 3 17 17 14 3 14 3 4 13 18
Unpopulated 19 84 15 1 83 15 02 131 20
10 10 1 7 21 5 5 I 4 22 6 2 4 3 9 23
Unpo pulated 24 5 5 3 6 2S
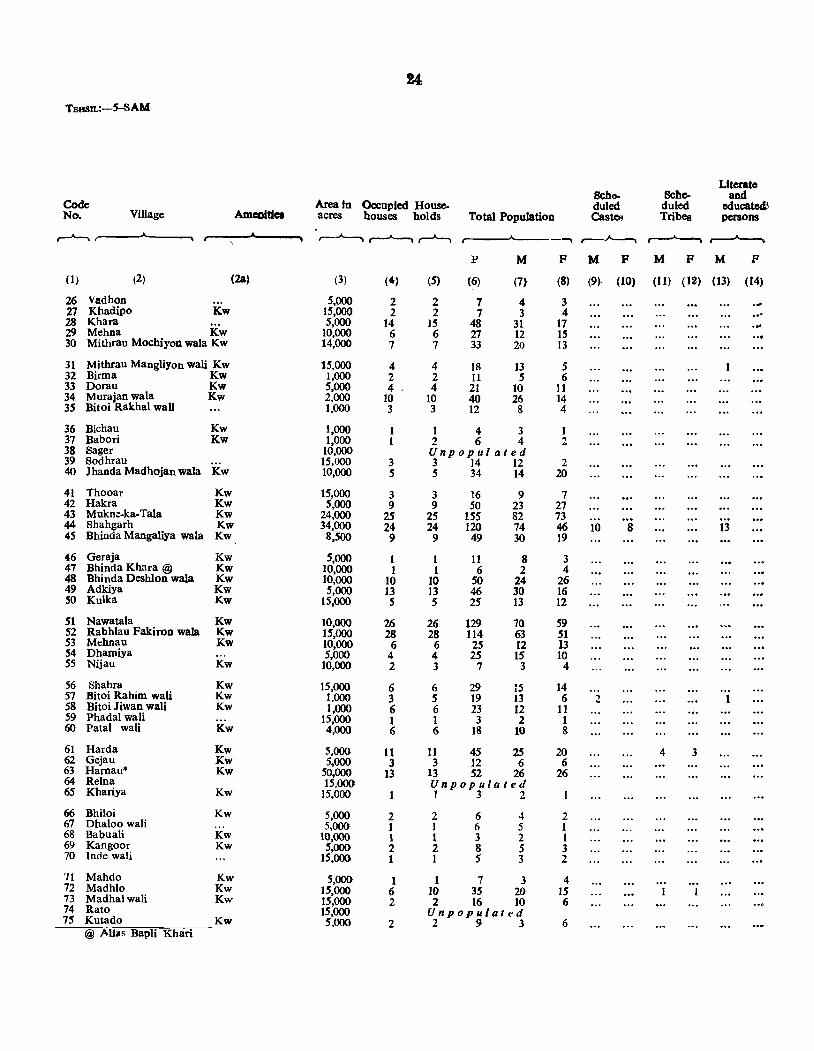
TBHSJL:-S-SAM
Llterato Sche- Sche- and
Code Area tn Occupied House- duled duled educated'-No. Village AmcnlUea acres houses holds Total PopuJation Castes Tribes persons
,--"--, ~ r---'---. ,-J'-, -. ,--~ ~~ P M F M F M F M F
(1) (2) (2a) (3) (4) (5) (6) (7) (8) (9). (10) (11) (12) (13) (14)
26 Vadhon 5,000 2 2 7 4 3 ... 27 Khadipo Kw 15,000 2 2 7 3 4 .. -28 Khara 5,000 14 IS 48 31 17 ... 29 Mehna Kw 10,000 6 6 27 12 15 30 Mithrau Mochiyon wala Kw 14,000 7 7 33 20 13
31 Mithrau MangliYon wall Kw 15,000 4 4 18 13 5 32 Birma Kw 1,000 2 2 11 5 6 33 Dorau Kw 5,000 4 4 21 10 II 34 Murajan wala Kw 2,000 10 10 40 26 14 35 Bitoi Rakhal waH 1,000 3 3 12 8 4
36 Bichau Kw 1,000 1 4 3 1 37 Babori Kw 1,000 1 2 6 4 2 38 Sager 10,000 Unpopulated 39 Sodhrau 15,000 3 3 14 12 2 40 Jhanda Madhojan wala Kw 10,000 5 5 34 14 20
41 Thooar Kw 15,000 3 3 16 9 7 42 Hakra Kw 5,000 9 9 50 23 27 43 Mukne-ka-Tala Kw 24,000 2S 25 155 82 73 44 Shahgarh Kw 34,000 24 24 120 74 46 10 8 13 45 Bhinda Mangaliya wala Kw 8,500 9 9 49 30 19
4.6 Geraja Kw 5,000 1 1 11 8 3 47 Bhinda Khara @ Kw 10,000 1 1 6 2 4 48 Bhinda Deshlon wala Kw 10,000 10 10 50 24 26 49 Adkiya Kw 5,000 ]3 13 46 30 ]6 50 Kulka Kw 15,000 5 5 25 13 12
51 Nawatala Kw 10,000 26 26 129 70 S9 52 Rabhlau FakiroD wala Kw 15,000 28 28 114 63 51 53 Mehnau Kw 10,000 6 6 25 12 13 54 Dhamiya 5,000 4 4 25 15 10 S5 Nijau Kw 10,000 2 3 7 3 4
56 Shahra Kw 15,000 6 6 29 15 14 57 Bitoi Rahim wall Kw 1,000 3 S 19 13 6 2 58 Bitoi Jiwan waH Kw 1,000 6 6 23 12 11 S9 Phadal wali 15,000 1 1 3 2 1 60 Patal wali Kw 4,000 6 6 18 10 8
61 Harda Kw 5,000 11 II 45 2S 20 4 3 62 Gejau Kw 5,000 3 3 12 6 6 63 Harnau* Kw 50,000 13 13 52 26 26 64 ReIna 15,000 Unpopulated 65 Khariya Kw ]5,000 1 3 2
66 Bhiloi Kw 5,000 2 2 6 4 2 67 Dhaloo waH 5,000 1 1 6 5 1 68 Babuali Kw 10,000 1 1 3 2 t 69 Kangoor Kw 5,000 2 2 8 5 3 70 lnde wali 15,000 1 1 S 3 2
'/1 Mahdo Kw 5,000 1 1 7 3 4 72 Madhlo Kw 15,000 6 10 35 20 15 73 Madhal waH Kw 15,000 2 2 16 10 6 74 Rato 15,000 Unpopulated 7S Kutado Kw 5,000 2 2 9 3 6
@ AUlIs Bapli Khari
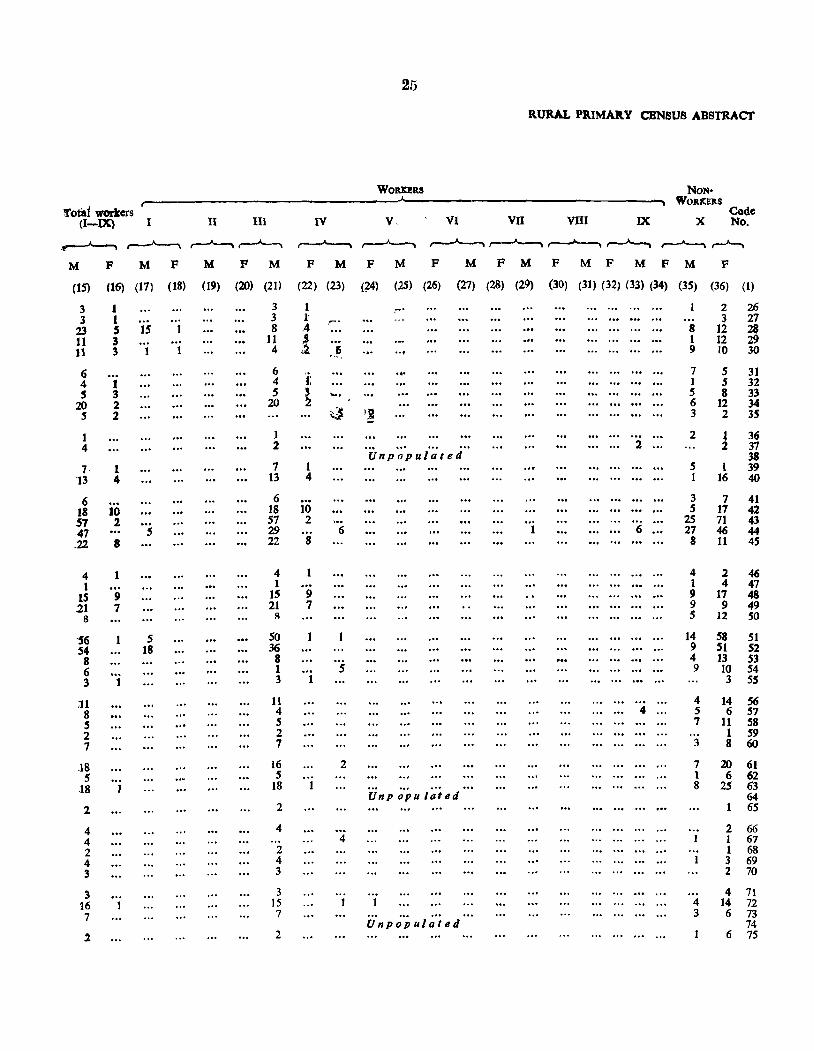
25
RURAL PRIMAR.Y CENSUS ABSTRACf
WORlC!R.S NON-WORKERS
!fotal WOlters Code (I-IX) I II III IV V, VI VII VIII IX X No,
~~ ~ ,.-..-A---, ~ ,..---"--""" ~~, .. , ,.......A...-..; ,......_.A...-. ~
M P M P M F M P M F M F M F M F M F M F M F
(15) (16) (17) (18) (19) (20) (21) (22) (23) (74) (25) (26) (27) (28) (29) (30) (31) (32) (33) (34) (35) (36) (1)
3 1 3 1 ,~, 2 26 3 1 3 l'
~ . 3 27 23 S 15 8 . 4 8 12 28 11 3 .. ' 11 Ii 1 12 29 11 3 1 1 4 II .. ' .. , 9 10 30 "-. 6 6
'i: '.' 7 5 31 4 1 4 ... , 1 5 32 5 3 5 ~ "-' 5 8 33
20 2 20 6 12 34 5 2 ;;} t~ 3 2 35
1 1 2 t 36 4 2
'Unpopulated 2 2 37
38 7· 1 7 1 5 1 39
'13 4 13 4 1 16 40
6 6 , .. 3 7 41 18 10 18 10 S 17 42 57 2 57 2 ... 25 71 43 47 S 29 6 1 6 27 46 44 .22 8 22 8 8 11 4S
4 4 4 2 46 1 1 1 4 47
IS 9 15 9 9 17 48 21 , 21 7 9 9 49
8 8 5 12 50
'56 1 5 50 14 58 51 S4 18 36 9 51 52
8 8 4 13 53 6 1 5 9 10 54 3 1 3 1 3 55
11 11 4 14 56 8 4 4 5 6 57 5 S 7 11 58 2 2 1 59 7 7 3 8 60
.18 16 2 7 20 61 5 5 1 6 62
18 1 18 Unp ~'pu la';ed
8 25 63 64
2 2 65
4 4 ... 2 66 4 4 I 1 67 2 2 ... 1 68 4 4 1 3 69 3 3 2 70
3 3 '" 4 71 16 15 1 1 4 14 72 7 7 3 6 73
Unpopulated 74 2 2 6 7S
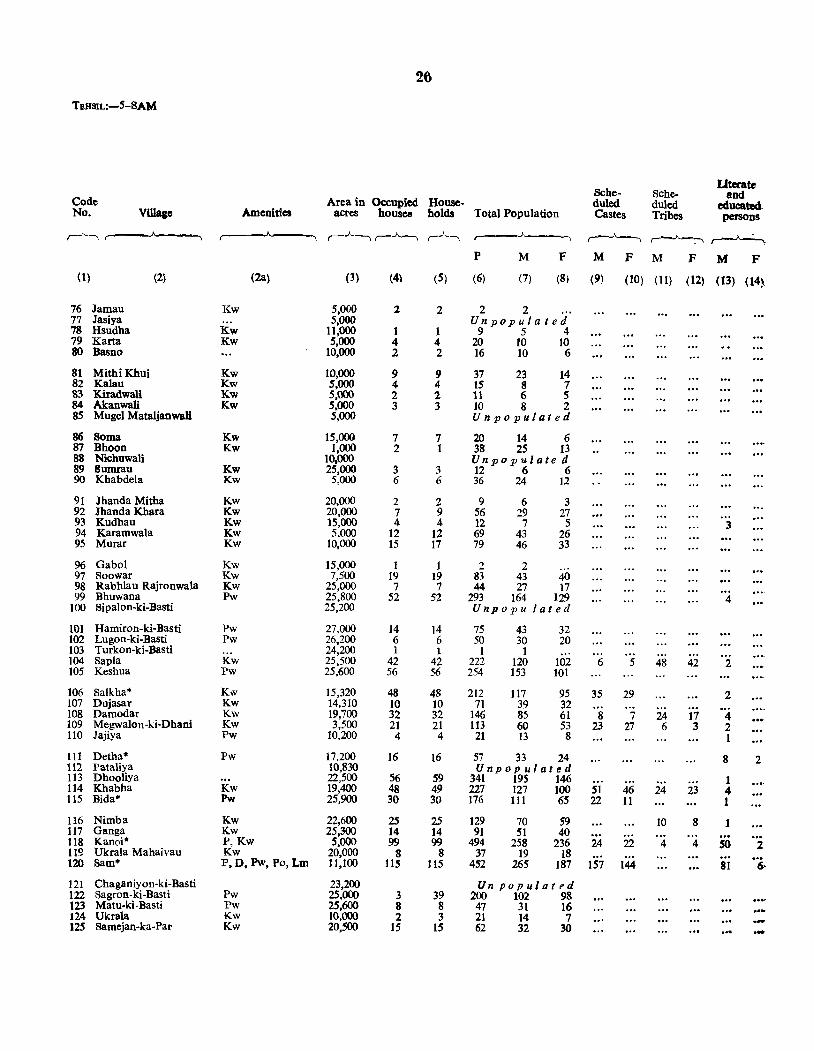
26
TEHSIL:-5-SAM
Literate Scbe- Sche- and
Code Area in Occupied House- duled duled educated No. Village Amenities acres housc:a bolds Total Population Castes Tribes persons
,J..., ,-.A.--, r--"---.. ,,.)~, ,- ,--..1-.-, ,--"---., ~.
P M F M F M F M F (1) (2) (2a) (3) (4) (5) (6) (7) (81 (9) (10) (11) (12) (13) (14)
76 lamau Kw 5,000 2 2 2 2 77 lasiya 5,000 Unpopula ted 78 Hsudha Kw 11,000 1 1 954 79 Karta Kw 5,000 4 4 20 10 10 80 Basno 10,000 2 2 16 10 6
81 MithiKhui Kw 10,000 9 9 37 23 14 82 Kalau Kw 5,000 4 4 15 8 7 83 KiradwaU Kw 5,000 2 2 11 6 5 84 Akanwali Kw 5,000 3 3 10 8 2 85 Mugel Mataljanwali 5,000 Unpopulated
86 Soma Kw 15,000 7 7 20 14 6 87 Bhoon Kw 1,000 2 1 38 25 13 88 Nichuwali 10,000 Unpopulated 89 Sumrau Kw 25,000 3 3 12 6 6 90 Khabdela Kw 5,000 6 6 36 24 12
91 Ihanda Mitha Kw 20,000 2 2 9 6 3 92 Ihanda Khara Kw 20,000 7 9 56 29 27 93 Kudhau Kw 15,000 4 4 12 7 5 3 94 Karamwala Kw 5,000 12 12 69 43 26 95 Murar Kw 10,000 15 17 79 46 33
96 Gabol Kw 15,000 1 1 2 2 97 Soowar Kw 7,500 19 19 83 43 40 98 Rabhlau Rajronwala Kw 25,000 7 7 44 27 17 99 Bhuwana Pw 25,800 52 52 293 164 129 4
100 Sipalon-ki-Basti 25,200 Unpopu fated
101 Hamiron-ki-Basti Pw 27,000 14 14 75 43 32 102 Lugon-ki-Basti Pw 26,200 6 6 50 30 20 103 Turkon-ki-Basti 24,200 1 1 1 1 104 SapIa Kw 25,500 42 42 222 120 102 6 5 48 42 2 105 Keshua Pw 25,600 56 56 254 153 101
106 SaIkha* Kw 15,320 48 48 212 117 95 35 29 2 107 Dujasar Kw 14,310 10 to 71 39 32 ... 108 Damodar Kw 19,700 32 32 146 85 61 8 7 24 17 4 109 Megwalon-ki-Dhani Kw 3,500 21 21 113 60 53 23 27 6 3 2 110 Jajiya Pw 10,200 4 4 21 13 8 1
111 Detha* Pw 17,200 16 16 57 33 24 8 2 112 Pataliya 10,830 Unpopulated 113 Dhooliya 22,500 56 59 341 195 146 1 114 Khabha Kw 19,400 48 49 227 127 100 51 46 24 23 4 115 Bida* Pw 25,900 30 30 176 III 65 22 11 1
116 Nimba Kw 22,600 25 25 129 70 59 10 8 1 117 Ganga Kw 25,300 14 14 91 51 40 1I8 Kanoi* P,Kw 5,000 99 99 494 258 236 24 22 4 4 SO 2 119 Ukrala Mahaivau Kw 20,000 8 8 37 19 18 ... 120 Sam· P,D, Pw, Po, Lm 11,100 tI5 115 452 265 187 157 144 81 6-
121 Chaganiyon-ki-Basti 23,200 Un popuiatPd 122 Sagron-ki-Basti Pw 25,000 3 39 200 102 98 123 Matu-ki -Basti Pw 25,600 8 8 47 31 16 124 Ukrala Kw 10,000 2 3 21 14 7 125 Samejan-ka-Par Kw 20.500 15 15 62 32 30 .-
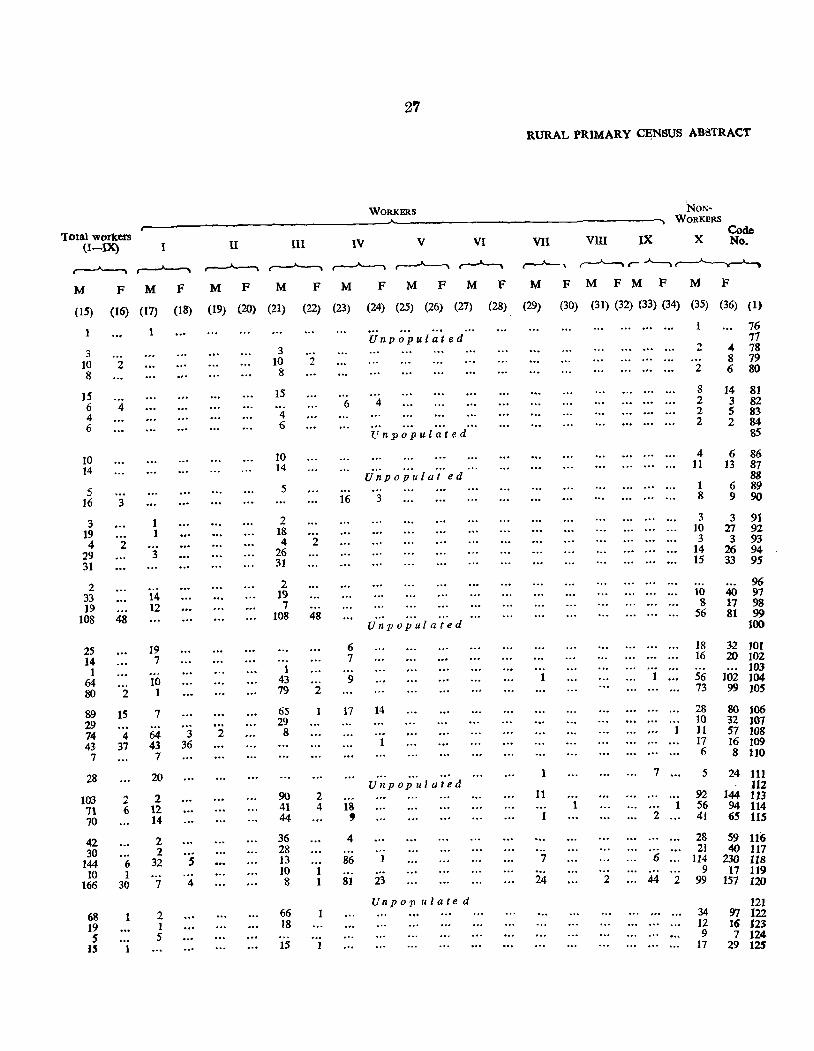
27
RURAL PRIMARY Cf;NSUS ABSTRACT
WORKERS NON-WORKERS
'Iota} workers Code
(I-IX) I II III IV V VI VII VIII IX X No.
r--"----I ~ ~ ~ ~ ~ ~ ~r-~~
M F M F M F M F M F M F M F M F M F M F M F
(15) (16) (17) (18) (19) (20) (21) (22) (23) (24) (25) (26) (27) (28) (29) (30) (31) (32) (33) (34) (35) (36) (1)
1 76 Unpopulated 77
3 3 2 4 78 10 2 10 2 8 79
8 8 2 6 80
15 15 8 14 81
6 4 6 4 2 3 82
4 4 2 5 83
6 6 2 2 84 Unpopulated 85
10 10 4 6 86 14 14 11 13 87
Unpopuiat ed 88
5 5 1 6 89
16 3 16 3 8 9 90
3 1 2 3 3 91
19 1 18 10 27 92 4 2 4 2 3 3 93
29 3 26 14 26 94 31 31 15 33 9$
2 2 96 33 14 19 10 40 97 19 12 7 8 17 98
108 48 108 48 56 81 99 Unpopulated 100
25 19 6 18 32 101 14 7 7 16 20 102
1 1 103 64 10 43 9 1 56 102 104 80 2 1 79 2 73 99 lOS
89 15 7 65 17 14 28 80 106
29 29 10 32 107 74 4 64 3 2 8 II 57 108
43 37 43 36 17 16 109 7 7 6 8 110
28 20 1 7 5 24 111 Unpopulated 112
103 2 2 90 2 11 92 144 113 11 6 12 41 4 18 1 1 56 94 114 70 14 44 , 2 41 65 liS
42 2 36 4 28 59 116 30 2 28 ... 21 40 117
144 6 32 5 13 86 1 7 6 114 230 118 10 1 10 9 17 119
166 30 7 4 8 81 23 24 2 44 2 99 157 120
Unpopulated 121 68 2 66 34 97 122 19 1 18 12 16 123 5 5 9 7 124
JS I 15 1 17 29 125
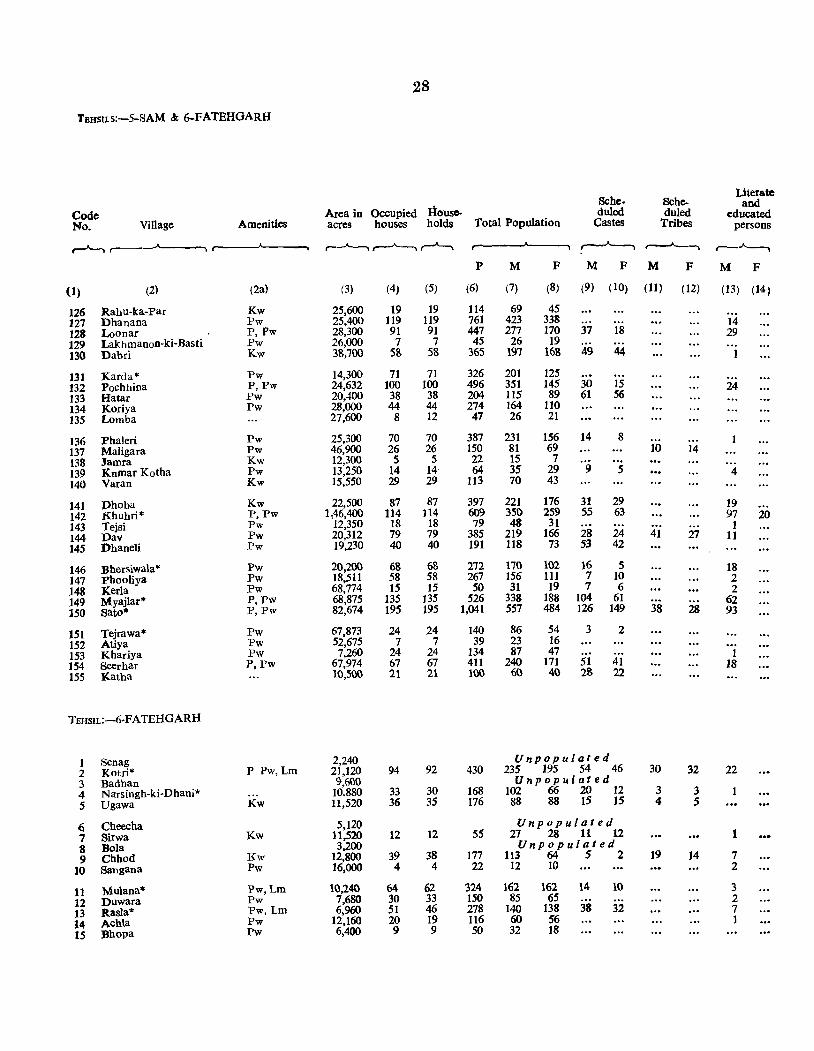
28
TEHSILS:-5-SAM &; 6-FATEHGARH
Sche. Sche-Literate
House-and
Code Area in Occupied duled duled educated No. Village Amenities acres houses holds Total Population Castes Tribes persons
,...-'--, r-~ r--'-----. r-"--> ~ ~. r--""----,
P M F M F M F M F
(1) (2) (2a) (3) (4) (5) (6) (7) (8) (9) (10) (11) (12) (13) (14)
126 Rahu-ka-par Kw 25,600 19 19 114 69 45 127 Dhanana Pw 25,400 119 119 761 423 338 14 128 Loonar P,Pw 28,300 91 91 447 277 170 37 18 29 129 Lakhmanon-ki-Basti Pw 26,000 7 7 45 26 19
130 Dabri Kw 38,700 58 58 365 197 168 49 44
131 Karda* Pw 14,300 71 71 326 201 125 132 Pochhina P,Pw 24,632 100 100 496 351 145 30 15 24 133 Hatar Pw 20,400 38 38 204 115 89 61 56 134 Koriya Pw 28,000 44 44 274 164 110 135 Lomba 27,600 8 12 47 26 21
136 Phaleri Pw 25,300 70 70 387 231 156 14 8
137 MaJigara Pw 46,900 26 26 150 81 69 10 14 138 Jamra Kw 12,300 5 5 22 15 7
139 Kumar Kotha Pw 13,250 14 14 64 35 29 9 5 4 140 Varan Kw 15,550 29 29 113 70 43
141 Phoba Kw 22,500 87 87 397 221 176 31 29 19 142 J{huhri* P,Pw 1,46,400 114 114 609 350 259 55 63 97 20 143 Tejsi Pw 12,350 18 18 79 48 31 1 144 Dav Pw 20,312 79 79 385 219 166 28 24 41 27 11 145 Phaneli Pw 19,230 40 40 191 118 73 53 42
146 Bhersiwala* Pw 20,200 68 68 212 170 102 16 5 18 147 rhooliya Pw 18,511 58 58 267 156 111 7 10 2 148 Keda Pw 68,774 15 15 50 31 19 7 6 2 149 Myajlar* P,Pw 68,875 135 135 526 338 188 104 61 62 150 sato* P,Pw 82,674 195 195 1,041 557 484 126 149 38 28 93
151 Tejrawa* Pw 67,873 24 24 140 86 54 3 2
152 .Atiya Pw 52,675 7 7 39 23 16
153 Khariya Pw 7,260 24 24 134 87 47 1 154 Seerhar P,Pw 67,974 67 67 411 240 171 51 41 18 155 Katha 10,500 21 21 100 60 40 28 22
TEHsIL:-6-FATEHGARH
1 Senag 2,240 Unpopulated 2 Kotri* P Pw, Lm 21,120 94 92 430 235 195 54 46 30 32 22 3 Badban 9,600 Unpopulated 4 Narsingh-ki-Dhani* 10.880 33 30 168 102 66 20 12 3 3 5 Ugawa Kw 11,520 36 35 176 88 88 15 15 4 5
Q Cheecha 5,120 Unpopulated 7 Sirwa Kw 11,520 12 12 5S 27 28 11 12 1 8 Bola 3,200 Unpopulated 9 Chhod Kw 12,800 39 38 177 113 64 5 2 19 14 7
10 Sangana Pw 16,000 4 4 22 12 10 2
11 Mulana* Pw,Lm 10,240 64 62 324 162 162 14 10 3
12 Duwara Pw 7,680 30 33 150 85 6S 2
13 Jtasla* Pw,Lm 6,960 51 46 278 140 138 38 32 7
14 Achla Pw 12,160 20 19 116 60 56 1
15 Bhopa Pw 6,400 9 9 50 32 18
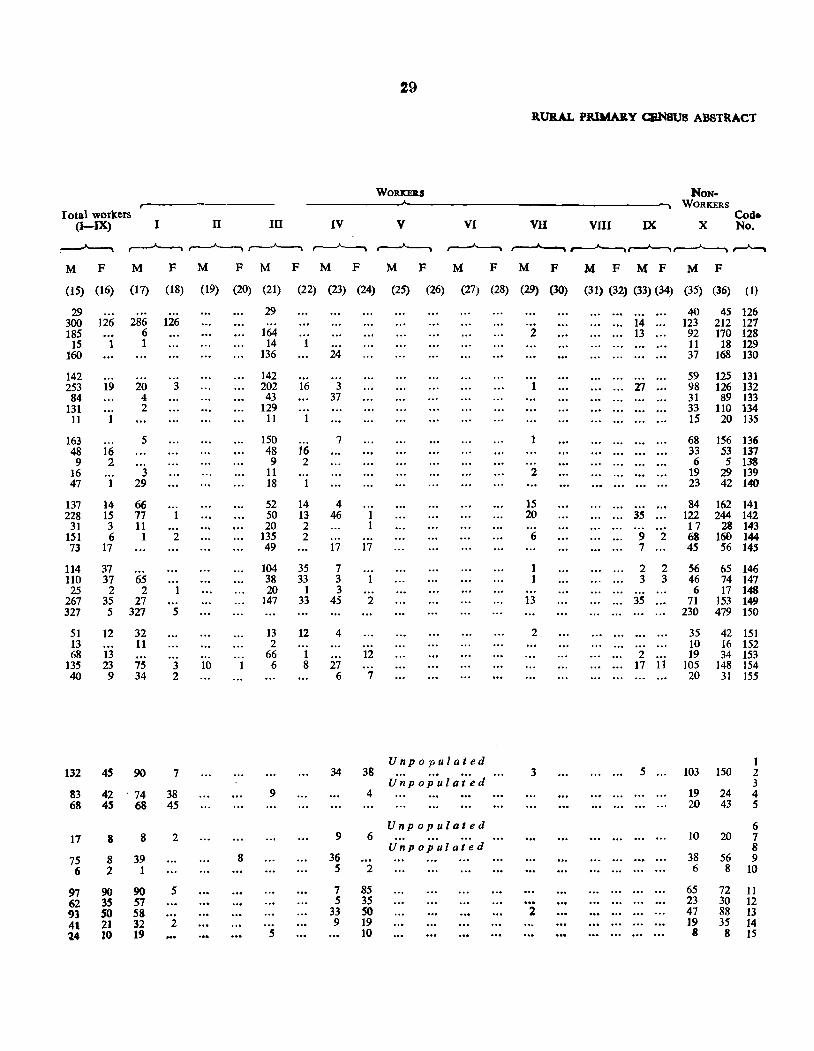
29
RURAL PRlMAll.Y CBNSUS ABSTRACT
WORD!JlS NON-WORKERS
Iotal workers Cod. (I-IX) I IT III IV V VI VII VIII IX X No.
~ r---"'----. ~ ~ ~ r----'--, r--"------. ,~~~~
M F M F M F M F M F M F M F M F M F M F M F
(15) (16) (17) (18) (19) (20) (21) (22) (23) (24) (25) (26) (27) (28) (29) (30) (31) (32) (33) (34) (35) (36) (1)
29 29 40 45 126 300 126 286 126 14 123 212 127 185 6 164 2 13 92 170 128
15 1 1 14 11 18 129 160 136 24 37 168 130
142 142 59 125 131 253 19 20 3 202 16 3 1 27 98 126 132 84 4 43 37 31 89 J33
131 ... 2 129 33 110 134 11 I 11 15 20 135
163 5 150 7 1 68 ]56 136 48 16 48 16 33 53 137 9 2 9 2 6 5 138
16 3 11 2 19 29 139 47 29 18 23 42 140
137 14 66 52 ]4 4 15 84 162 141 228 15 77 50 13 46 20 35 122 244 142
31 3 11 20 2 17 28 143 151 6 1 2 135 2 6 9 2 68 160 144 73 17 49 17 17 7 45 56 145
114 37 104 35 7 1 2 2 56 65 146 110 37 65 38 33 3 1 3 3 46 74 147 25 2 2 20 I 3 6 17 148
267 35 27 147 33 45 2 13 35 71 153 149 327 5 327 5 230 479 150
51 12 32 13 12 4 2 35 42 151 13 11 2 10 16 152 68 13 66 1 12 2 19 34 153
135 23 75 3 10 6 8 27 17 11 105 148 154 40 9 34 2 6 7 20 31 155
Unpopulated 1 _132 45 90 7 34 38
U~ p 0 p~ I a i··e d 3 5 103 150 2
3 83 42 74 38 9 4 19 24 4 68 4S 68 45 20 43 5
Unpopulated 6 17 8 8 2 9 6 10 20 7
Unpopulated 8 7S 8 39 8 36 38 56 9 6 2 1 5 2 6 8 10
97 90 90 S 7 85 65 72 II 62 35 57 S 3S 23 30 12 93 SO 58 33 50 2 47 88 13 41 21 32 2 9 19 19 35 14 14 10 19 5 10 8 8 15
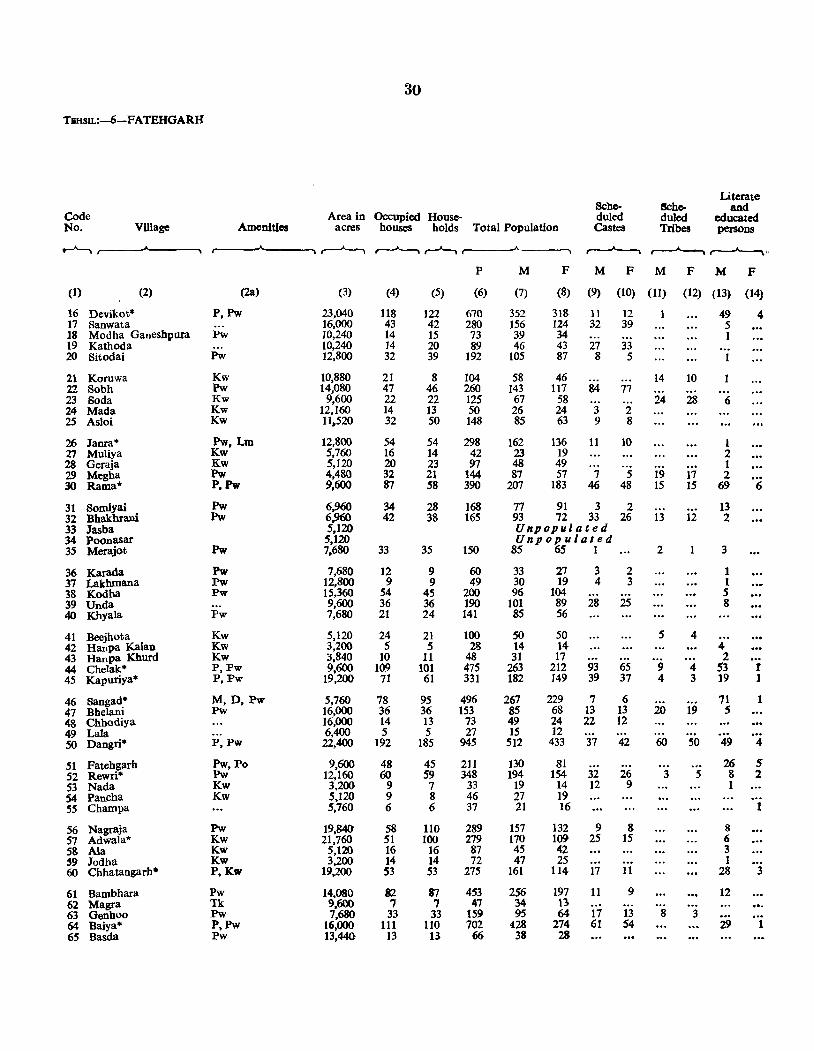
30
TJlHSIL:-6-FATEHGARH
Literate Scbe- I5che- and
Code Area in Occupied House- doled duled educated No. Village Amenities acres houses holds Total Population Castes Tribes persons
~ ,.------'---, ~r-'-t r---"---. ~~,.
P M F M F M F M F
(1) (2) (2a) (3) (4) (5) (6) (7) (8) (9) (10) (11) (12) (13) (14)
16 Devikot'" P,PW 23,040 118 ]22 670 352 3]8 11 12 49 4 ]7 Sanwata 16,000 43 42 280 156 124 32 39 5 18 Modha Ganeshpura Pw 10,240 ]4 15 73 39 34 1 19 Kathoda 10,240 14 20 89 46 43 27 33 20 Sitodai Pw 12,800 32 39 ]92 ]05 87 8 5
21 Koruwa Kw 10,880 21 8 104 58 46 14 10 22 Sobh Pw 14,080 47 46 260 143 117 84 77 23 Soda Kw 9,600 22 22 125 67 58 24 28 6 24 Mada Kw 12,160 14 ]3 50 26 24 3 2 25 Asloi Kw 11,520 32 50 148 85 63 9 8
26 Jama'" Pw,Lm 12,800 54 54 298 162 136 11 10 1 27 MuUya Kw 5,760 ]6 14 42 23 ]9 2 28 Geraja Kw 5,]20 20 23 97 48 49 1 29 Megba Pw 4,480 32 21 144 87 57 7 5 19 17 2 30 Rama* P,PW 9,600 87 58 390 207 183 46 48 15 15 69 6
31 Somlyai Pw 6,960 34 28 168 77 91 3 2 13 32 Bhakhrani Pw 6,960 42 38 165 93 72 33 26 13 12 2 33 Jasba 5,120 Unpopul ate d 34 Poonasar 5,120 Unpopulated 35 Merajot Pw 7.680 33 35 150 85 65 1 2 3
36 Karada Pw 7,680 12 9 60 33 27 3 2 1 37 Lakhmana Pw 12,800 9 9 49 30 19 4 3 I 38 Kodba Pw 15,360 54 45 200 96 104 5 39 Unda 9,600 36 36 190 101 89 28 25 8 40 Kbyala Pw 7,680 21 24 141 85 56
41 Beejhota Kw 5,120 24 21 100 SO 50 5 4 42 Hanpa Kalan Kw 3,200 5 5 28 14 14 4 43 Hanpa Khurd Kw 3,840 10 11 48 31 17 2 44 Chelak* P,Pw 9,600 109 101 475 263 212 93 65 9 4 53 I 45 Kapuriya'" P,Pw 19,200 71 61 331 182 149 39 37 4 3 19 1
46 Sangad'" M,D,Pw 5,760 78 95 496 267 229 7 6 11 1 47 Bhelani Pw 16,000 36 36 153 85 68 13 13 20 19 5 48 Chhodiya 16,000 14 13 73 49 24 22 12 49 Lala 6,400 5 5 27 15 ]2 50 Dangri- P,Pw 22,400 192 185 945 512 433 37 42 60 50 49 4
51 Fatehgarh PW,Po 9,600 48 45 211 130 81 26 5 52 Rewri- Pw 12,160 60 59 348 194 154 32 26 3 5 8 2 S3 Nada Kw 3,200 9 7 33 19 14 12 9 1 S4 Paneha Kw 5,120 9 8 46 27 19 55 Champa 5,760 6 6 37 21 16 1
56 Nagraja Pw 19,840 58 110 289 157 132 9 8 8 57 Adwala* Kw 21,760 51 100 279 170 109 25 15 6 58 Ala Kw 5,120 16 16 87 45 42 3 '9 Jodha Kw 3,200 14 14 72 47 25 I 60 Chhatangarh· P,Kw 19,200 53 53 275 161 114 17 11 28 3
61 Bambhara Pw 14.080 82 87 4S3 256 197 11 9 12 62 Magra Tk 9,600 ., ., 47 34 1l 63 Genhoo Pw 7,680 33 33 159 95 64 17 13 8 3 64 Baiya* P,Pw 16,000 HI 110 702 428 274 61 54 29 1 65 Basda Pw 13,440 13 13 66 38 28
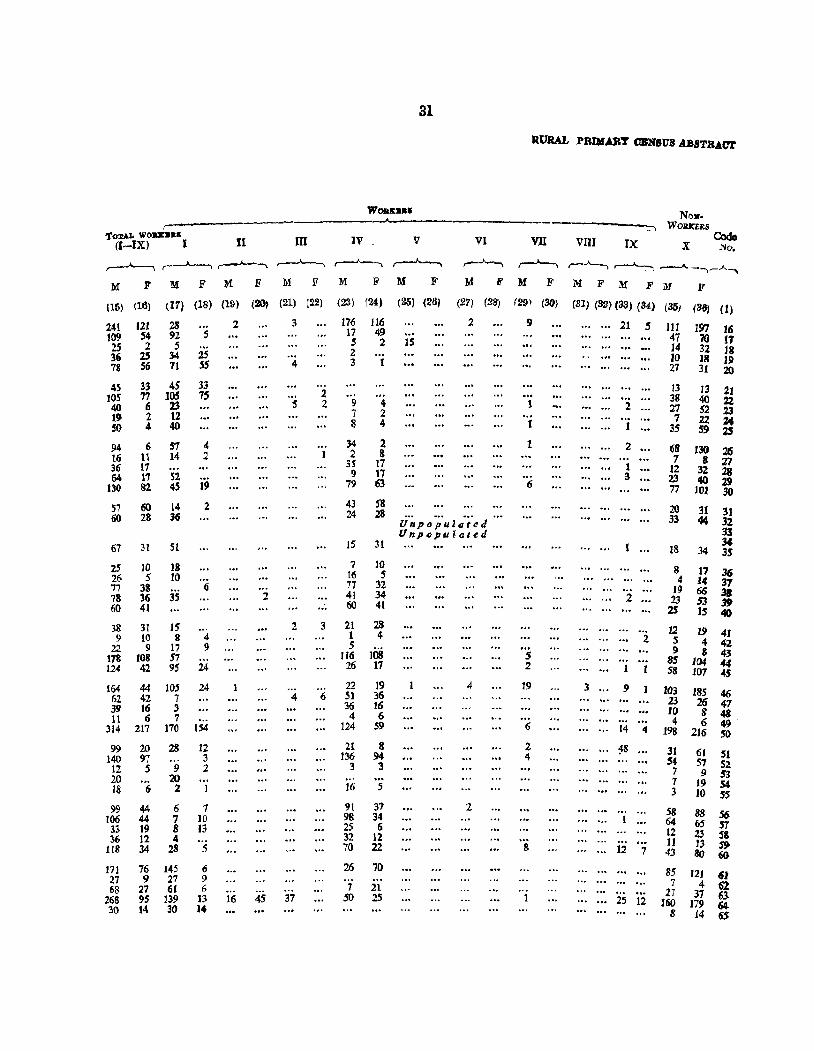
81
RURAL PRDUJ\T CBNStTB A.B8TBAC'1'
WOBltUI No •• --.A.
WORkERS 'l'or ... lo WOKJDltll
II m IV V VI VJI VIII IX Code
(I-IX) [ X .No.
,.--~ ,-.A.--., ~-.. ,.--~ ,---J'-, r---A---. ,--J--., r-J--.. r-J.,_-, ~ ....--A -,,..-A-,
M F M .F M P M F M F M F M F M F M F M F M F
(16) (16) (17) (18) (19) (20) (21) (22) (23) (24) (25) (26) (27) (28) (29) (OO} (81) (82) (33) (34) (35, (86) (1)
241 121 28 '2. 3 176 116 2 9 21 5 III 197 1& 109 54 92 S 17 49 47 70 11
2S '2. S 5 2 15 J4 32 18 36 25 34 2S 2 JO J8 19 78 56 71 55 4 3 1 27 3{ 20
45 33 45 33 13 13 21 105 77 lOS 75 2 ... 38 40 22 40 6 23 5 2 9 4 1 2 27 52 23 19 '2. 12 7 2 7 22 14 50 4 40 8 4 35 59 2S 94 6 51 <I 34 2 1 2 68 130 26 16 11 14 2 2 8 7 8 Z1 36 17 3S 17 1 J2 32 28 64 I'J 5'2. 9 17 .3 23 40 29 130 82 4S 19 79 63 6 77 101 30 57 60 14 2 43 58 20 31 31 60 28 36 24 28 ..... ...... .. ... 33 44 32 Unpopulated
UnpopuZated 33 34 67 31 51 15 31 18 34 3S
25 10 18 7 ]0 8 17 36 26 S l() 16 S 4 14 31 '7 38 6 77 32 19 65 38 78 36 3S '2. 41 34 2 23 53 39 60 41 60 41 2S 15 40 38 31 15 2 3 21 28 12 19 41 9 10 8 <I 1 4 2 S 4 42 22 9 17 9 5
108 9 8 43 178 108 57 116 5 85 104 44 124 42 9S 24 26 17 2 58 107 4S
164 44 lOS 24 22 19 4 19 3 9 103 ISS 46 62 42 7 4 6 51 36 23 25 47 39 16 3 36 16 10 S 4B 11 6 7 4 6 4 6 49 ' 314 217 170 154 124 59 6 14 " 198 216 SO 99 20 28 12 21 8 2 18 31 61 51 140 97 3 136 94 4 54 57 52 12 S 9 2 3 3 7 9 53 20 20 ... 7 19 S4. 18 6 2 1 16 5 3 10 SS 99 44 6 1 91 37 2 58 88 56 106 44 7 10 98 34 64 65 57 33 19 8 13 25 6 12 23 S& 36 12 4 32 12 ... II 13 ~ 118 34 28 5 70 22 8 12 7 43 80 6G
171 76 145 6 26 70 85 J2J 61 27 9 27 9 7 4 62 68 27 61 6 7 21 27 37 63 268 95 139 13 16 45 37 50 2S 25 12 160 179 (j4, 30 14 30 14 8 14 6S
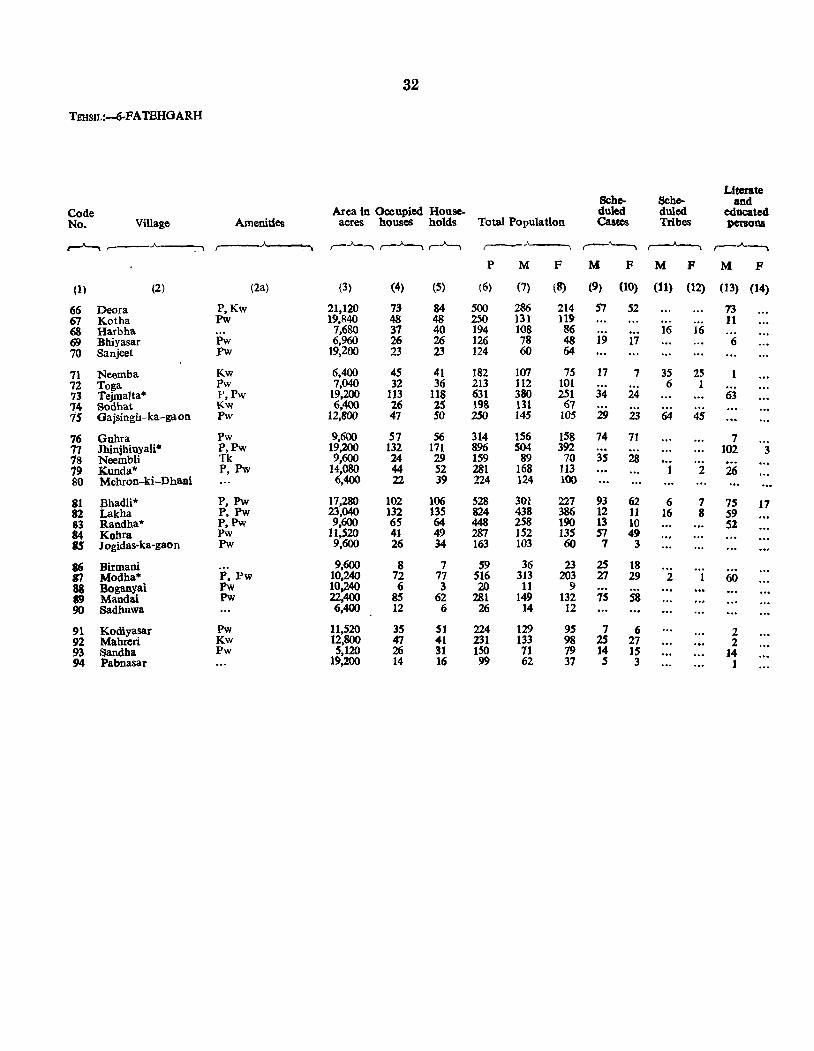
32
TI!HSIL:--6-FATEHGARH
Literate Scho- Scho- and
Code Area in Occupied House- duled duled educated No. Village AmenitiCll acres houses holds Total POpulation Castes Tribes persons
,..._....._, _;. - _\ ,--'-, r-~ ,-"---, r-- ~ ~ ,--~
P M F M F M F M F
(1 ) (2) (2a) (3) (4) (5) (6) (7) (8) (9) (10) (ll) (12) (13) (14)
66 Deora P,Kw 21,120 73 84 500 286 214 57 52 73 67 Kotha Pw 19,840 48 48 250 131 119 11 68 Harbha 7,680 37 40 194 108 86 16 16 69 Bhiyasar Pw 6,960 26 26 126 78 48 19 17 6 70 Sanjeet Pw 19,200 23 23 124 60 64
71 Neemba Kw 6,400 45 41 182 107 75 17 7 35 25 1 72 Toga Pw 7,040 32 36 213 112 101 6 1 73 Tejmalta* P,Pw 19,200 113 118 631 380 251 34 24 63 14 Sodhat Kw 6,400 26 1S 198 131 67 15 Gajsingh-ka-gaon Pw 12,800 47 50 250 145 105 29 23 64 45
76 Guhra Pw 9,600 57 56 314 156 158 74 71 7 77 JhinjhinyaU· P,Pw 19,200 132 171 896 504 392 102 3 18 Neembli Tk 9,600 24 29 159 89 70 3S 28 19 Kunda* P, Pw 14,080 44 52 281 168 113 2 26 SO Mehron-ki-Dbani 6,400 22 39 224 124 100
~ Bhadli* P, Pw 17,280 102 106 528 30l 227 93 62 6 7 7S 17 Lakha P, Pw 23,040 132 135 824 438 386 12 11 16 8 59
83 Randha* P,Pw 9,600 65 64 448 258 190 13 10 51 84 Kobra Pw 11,520 41 49 287 152 135 57 49 IS Jogidas-ka-gaon Pw 9,600 26 34 163 103 60 7 3
86 Birmani 9,600 8 7 59 36 23 25 18 B7 Modha* P,Pw 10,240 72 77 516 313 203 27 29 2 60 88 Boganyai Pw 10,240 6 3 20 11 9 89 Mandai Pw 22,400 IS 62 281 149 132 75 58 90 Sadhuwa 6,400 12 6 26 14 12
9l Kodiyasar Pw 11,520 35 51 224 129 9S 7 6 2 92 Mahreri Kw 12,800 47 41 231 133 98 2S 27 2 93 Sandha Pw 5,120 26 31 150 71 79 14 15 14 94 Pabnasar 19,200 14 16 99 62 37 5 3 1
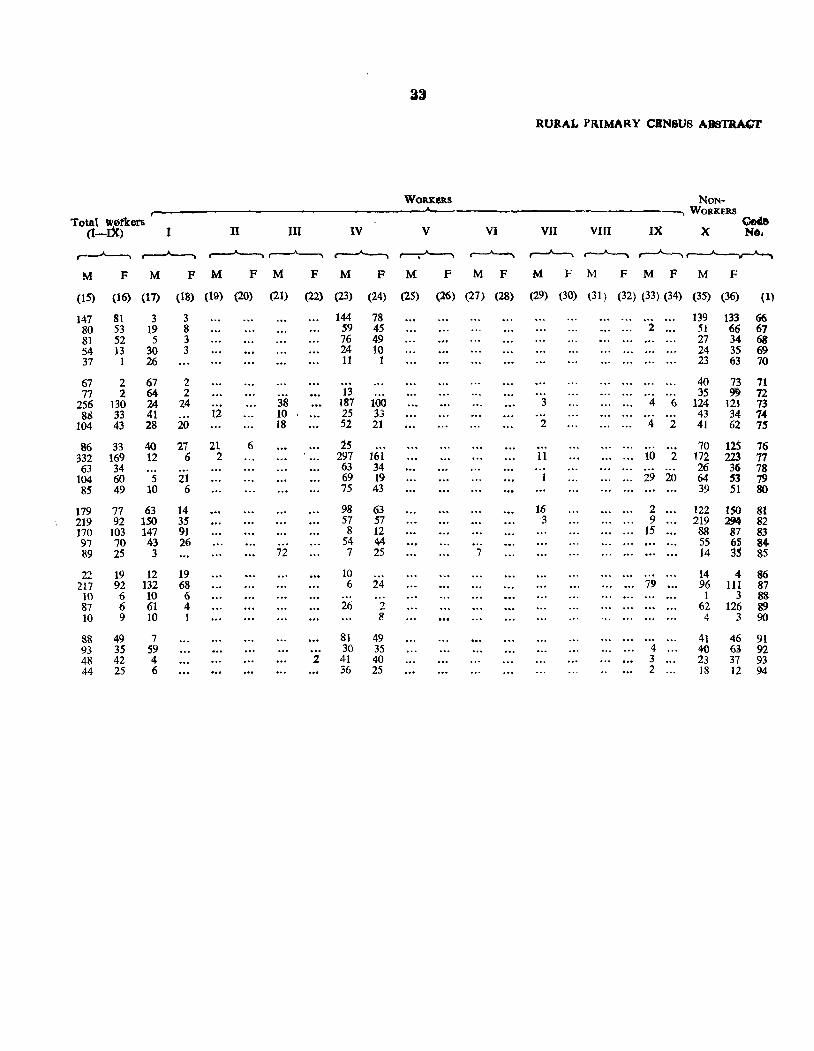
33
RURAL PRIMARY CBN8US ABSTRA&r
WORKJ!llS NON-WORKERS
Totat ~~tkers eM& a-I 1 II III IV V VI VII VIJI IX X NO •
r---"--> ,----'--.. ....----'--.~ r--"----, ~ ~ r--"---. ~ ~~
M F M F M F M F M F M F M F M F M F M F M F
(15) (16) (17) (18) (19) (20) (21) (22) (23) (24) (25) (26) (27) (28) (29) (30) t31) (32) (33) (34) (35) (36) (I)
147 81 3 3 144 78 139 133 66 80 53 19 8 59 45 2 51 66 67 81 52 5 3 76 49 27 34 68 54 13 30 3 24 10 24 35 69 37 1 26 11 1 23 63 70
67 2 67 2 40 73 71 77 2 64 2 13 35 99 72
256 130 24 24 38 187 100 3 4 6 124 121 73 86 33 41 12 10 25 33 .,. . .. 43 34 74
104 43 28 20 18 52 21 2 4 2 41 62 75
86 33 40 27 21 6 15 70 125 76 332 169 12 6 2 297 161 11 10 2 172 223 77 63 34 63 34 .. , 26 36 78
104 60 5 21 69 19 1 29 20 64 53 79 85 49 10 6 75 43 39 51 80
179 77 63 14 98 63 16 2 122 150 81 219 92 150 35 57 57 3 9 219 2M 82 170 103 147 91 8 12 15 88 87 83 97 70 43 26 54 44 ... 55 6S 84 89 25 3 72 7 25 7 14 j~ 85
22 19 12 19 10 14 4 86 217 92 132 68 6 24 79 96 III 87 10 6 10 6 1 3 88 87 6 61 4 26 2 62 126 89 10 9 10 1 8 4 3 90
88 49 7 81 49 41 46 91 93 35 59 30 35 4 40 6] 92 48 42 4 2 41 40 3 23 37 93 44 25 6 36 25 2 18 12 94
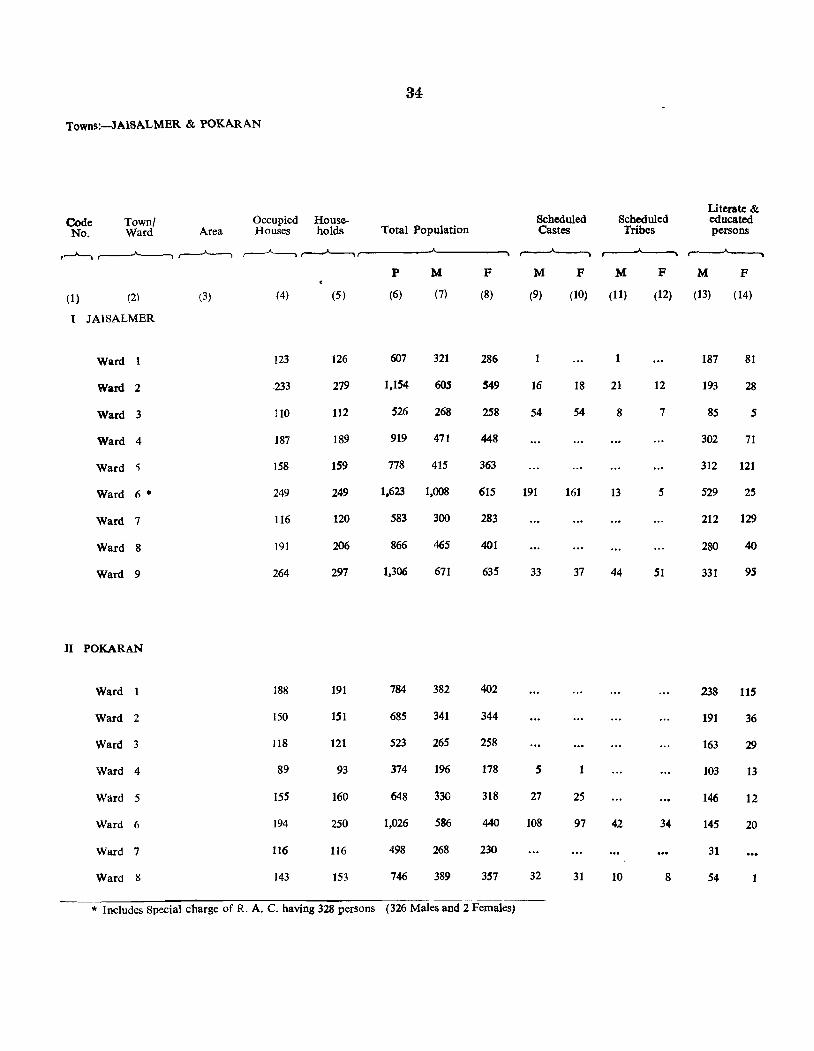
34
Towns:-JAISALMER & POKARAN
Literate & Code Town! Occupied House- Scheduled Scheduled educated No. Ward Area Houses holds Total Population Castes Tribes persons
,__..__, ~,-~ r--"---.~ ~ r----"----. r---"-----,
P M F M F M F M F
(1) (21 (3) (4) (5) (6) (7) (8) (9) (10) (11) (12) (13) (14)
I JAISALMER
Wa.rd 123 126 607 321 286 187 81
Wa.rd 2 -233 279 1,154 605 549 16 18 21 12 193 28
Ward 3 110 112 526 268 258 54 54 8 7 85 5
Ward 4 187 189 919 471 448 302 71
Ward ') 158 159 778 415 363 312 121
Ward 6 • 249 249 1,623 1,008 615 191 161 13 5 529 25
Ward 7 116 120 583 300 283 212 129
Ward 8 191 206 866 465 401 280 40
Ward 9 264 297 1,306 671 635 33 37 44 51 331 95
II POKARAN
Ward 188 191 784 382 402 238 115
Ward 2 150 151 685 341 344 191 36
Ward 3 118 121 523 265 258 163 29
Ward 4 89 93 374 196 178 5 1 103 13
Ward 5 155 160 648 330 318 27 25 146 12
Ward 6 194 250 1,026 586 440 108 97 42 34 145 20
Ward 7 116 116 498 268 230 31
Ward 8 143 153 746 389 357 32 31 10 8 54
* Includes Special charge of R. A. C. having 328 persons (326 Males and 2 Females)
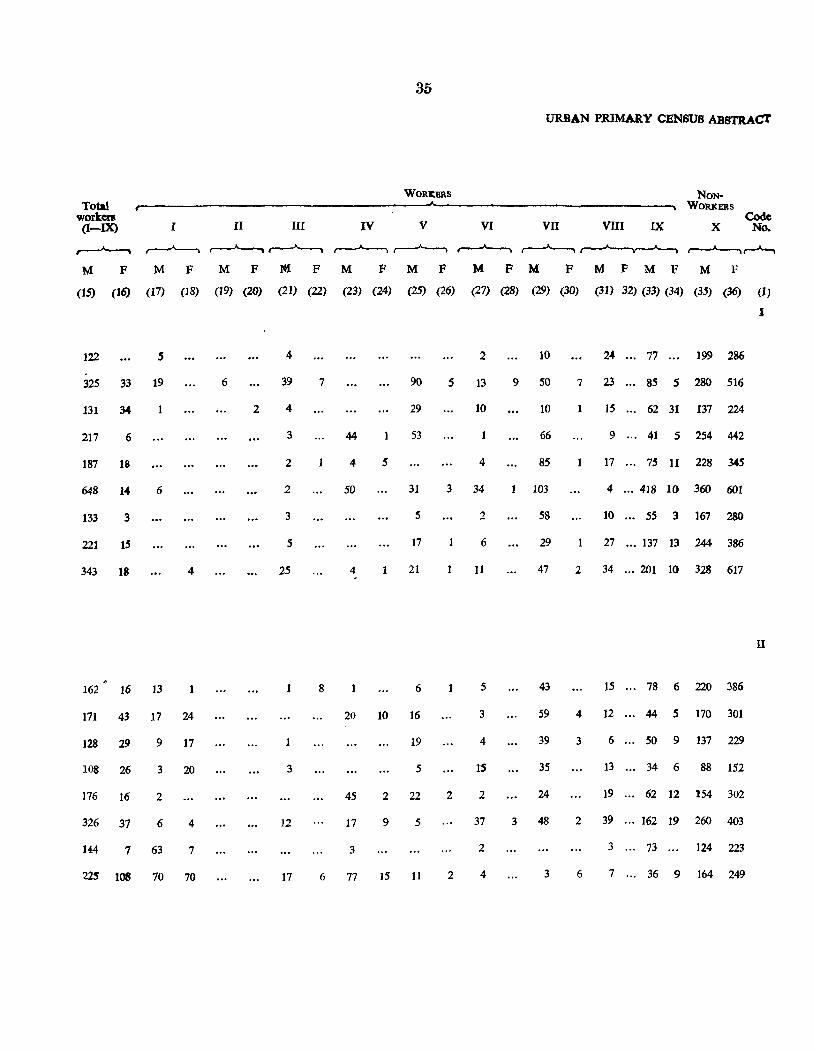
35
URBAN PRIMARY CENSUS ABSTRACt
WOR:DlltS NON-Total WORKERS
worten Code (I-IX) I II III IV V VI VII VIII IX X No.
~ ~ ~ ~ ~ ~ r--"'----, ,...---'--., ~ r---A----,,........_,
M F M F M F Nt. F M F M F M FM F MFMF M F
(15) (16) (17) (18) (19) (20) (21) (22) (23) (24) (25) (26) (27) (28) (29) (30) (31) 32) (33) (34) (35) (36) (1)
I
122 5 4 2 10 24 77 199 286
325 33 19 6 39 7 90 5 13 9 50 7 23 85 S 280 516
131 34 2 4 29 10 10 1 15 62 31 137 224
217 6 3 44 53 66 9 41 S 254 442
187 IS 2 4 5 4 85 17 75 11 228 345
648 14 6 2 50 31 3 34 103 4 ..• 418 10 360 601
133 3 3 5 2 58 10 .•. 5S 3 167 280
221 15 5 17 6 29 27 •.• 137 13 244 386
343 18 4 25 4 21 11 47 2 34 ... 201 10 328 617
II
162 16 13 8 6 5 43 15 78 6 220 386
171 43 17 24 20 10 16 3 59 4 12 44 5 170 301
128 29 9 17 19 4 39 3 6 50 9 137 229
108 26 3 20 3 5 15 35 13 34 6 88 152
176 16 2 45 2 22 2 2 24 19 62 12 154 302
326 37 6 4 12 17 9 5 37 3 48 2 39... 162 19 260 403
144 7 63 7 3 2 3 73 124 223
~2S JOS 70 70 17 6 77 15 11 2 4 3 6 7 36 9 164 249

OTHER CENSUS TABLES
Jais. 1

GENERAL POPULATION TABLES
(No¥! Oil A-Series)
There are four Tables and five Appendices in this series. These tables, being the basic population tables, furnish information about area, sexwise population and' its variation during sixty years, classification of villages and towns by population and the trends of urbanisation in the district.
Table A-I
2. This is the basic population table showing area, density, number of villages and towns, occupied residential houses and population by persons, males and females. The data has been presented for the district as well as for each tehsil for total, rural and urban areas separately. The town figures have been shown immediately after the entries of the tehsil in which they are situated. The abbrev~ation just after the name of the town has been used t~ denote that the particular town has a Municipality or a Cantonment.
3. It may be noted that in the previous censuses the density of population and other urban break-ups upto tho town level were not mentioned in this table which have been shown separately now for 1961 Census besides furnishing the number of inhabited and uninhabited villages in each tehsil.
4. The area figures both for rural and municipai towns have been obtained from the State revenue authorities. Though the area figures have been collected originally in acres yet these figures have been shown in Sq. miles and Sq. Km. in columns 3 (a) and 3 (b) respectively after converting them into the respective units. Further, the area figures have been given upto one decimal place in case of the district as well as for each tehsil but such. presentation is made upto two decimal places in ease· of towns.
5. The density of persons has been worked out according to the area shown under column 3 (a) and has been presented separately for the district and for each of the tehsils and towns under column 4.
6. A village and a town has already been defined in para 3 of the note on Primary Census Abstract.
his. I-A
7. For the purpose of 1961 Census. a 'House' is a structure o.r part of a structure inhabited or vacant, or a dwelling, a shop, a shop-cum.dwelling or a place of business, workshop, school etc., giving out on the road or a common staircase or a common courtyard leading to a main gate or enjoying a separate entrance. 'Occupied residential houses' are those houses which are used wholly or partly for the purpose of residence by one or more households. .
8. In addition to this main table, there are three. appendices which were not prepared in the last censuses.
Appendix 1
9. This appendix is helpful in finding out the growth of the district to the present area since the last census. The appendix shows the territorial changes that have taken place during the last decade. A brief description of gain and loss of territory in those tehsils which had changes in area during the period is also shown in this appendix. A list of Such transferred areas has been given in the annexure to this appendix.
Appendix II
10. One of the criteria for a place to be .declared as town is that it should normally have a popUlation of 5,000 and above. For various reasons, several places with a population of 5,000 and over have not been recognised as towns. This appendix gives the tehsilwise number of such places with their population. Further, it also shows the percentage contribution of total rural population of the district of such places.
Appendix /II
11. This appendix shows the sexwise figures . for houseless and institutional population for the district and each tehsil for total, rural and urban areas separately. Houseless and Institutional popUlation has already been defined in para 10 of the note on Primary Census Abstract.
TabJe A-II
12. This table compares population figures of the district as ascertained at the 1961 Census with the corresponding figures for the six previous censuses. The
40
figures presented for the six previous cenSuses in the table, have been adjusted after taking into consideration the territorial changes taken place in the district so as to afford a correct basis for comparison. This is an important table as it gives the growth of population from decade to decade. It further provides a basis for estimating the population especially in the absence of reliable data for vital statistics. The main change in this table over 1951 Census is that the percentage variation has also been mentioned from decade to decade.
13. The appendix attached to this table shows the population for the district as well as for each tehsil according to their territorial jurisdiction in 1951 besides furnishing the changes in area and the population involved in those changes that have taken place during the last decade. The details of transfers of areas and population in every case have been given in the footnote separately.
Table A-ill
14. This table furnishes the sexwise total rural population together with the number of inhabited villages for the district as well as for each tehsil arranged into seven population size groups viz., less than 200, 200-499, 500-999, 1,000-1,999, 2,000-4,999, 5,000-9,999 and 10,900 and above.
15. The main changes in this table over 1951 Census are (i) the group less than 500 has now been split up into two groups viz., less than 200 and 200-499 and (ii) it relates only to villages while in 1951 Census it related to villages and towns both.
Table A-IV
16. This table shows the growth of each town in the district since 1901 together with its sexwise population. It further furnishes the information regarding decade variation in popUlation and its percentage. For the purpose
of this table aU the towns have been classified into the following six classes according to population:-
Class I 1,00,000 and above Class II 50,000 - 99,999 Class III 20,000 - 49,999 Class IV 10,000 - 19,999 Class V 5,000 - 9,999 Class VI Less than 5,000
17. The district totals for II class have been given followed by the various towns in that particular Class. Column No. 2 of the table presents the name of the town and just under it the area of that town has been given both in Sq. miles and Sq. Km. The status of the town is separately shown in column No. 3 in an abbieviated form.
18. The main object of this table as indicated above is to show the growth of towns as towns and not how certain places have been converted into towns from villages as such the figures against towns have been shown for those decades only in which they were recognised as towns. The district population for all classes dlllring the previous decades has been arrived at after adding the population of those places which were treated as towns in the corresponding decade but now declassified. As such if a town had not been treated as town in all the previous censuses, it is indicated as declassified in those particular censuses. Towns treated for the first time iu 1951 Census have been asterisked*.
19. The change in this table over 1951 Census is that the areas of towns as well as the percentage of decade variations of total population of the towns have been additionally shown in the present census.
20. A separate volume-Part II-A incorporating the General Population Tables for the State and the districts I:l.ave been issued in which the concepts used have also bBen discussed.
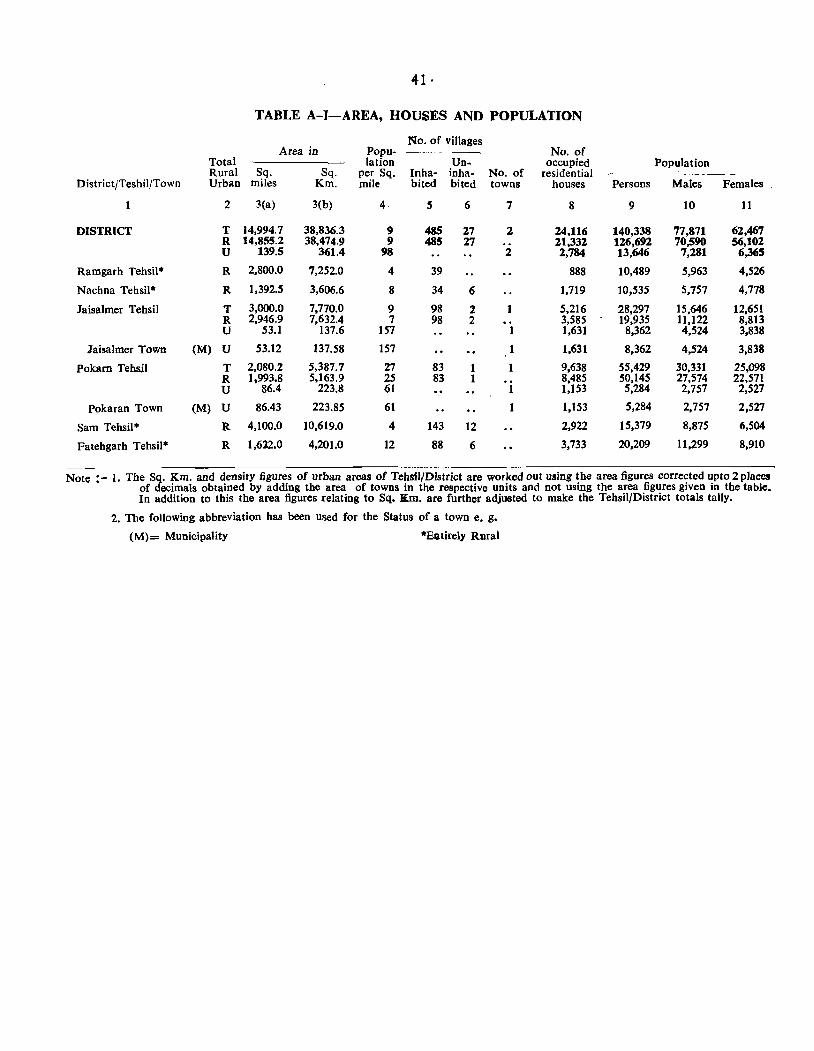
41·
TABLE A-I-AREA, HOUSES AND POPULATION
Area in No. of villages
Popu- No. of Total lation Un- occupied Population Rural Sq. Sq. per Sq. Inha- inha- No. of residential
DistrictjTeshil/Town Urban miles Km. mile bited bited towns houses Persons Males Females
2 3(a) 3(b) 4- 5 6 7 8 9 10 11
DISTRICT T 14,994.7 38,836.3 9 485 27 2 24,116 140,338 77,871 62,467 R 14,855.2 38,474.9 9 485 27 21,332 126,692 70,590 56,102 U 139.5 361.4 98 2 2,784 13,646 7,281 6,365
Ramgarh Tehsil* R 2,800.0 7,252.0 4 39 888 10,489 5,963 4,526
Nachna Tehsil* R 1,392.5 3,606.6 8 34 6 1,719 10,535 5,757 4,778
laisalmer Tehsil T 3.000.0 7,770.0 9 98 :! 1 5,216 28,297 15,646 12,651 R 2,946.9 7,632.4 7 98 2 3,585 19,935 11,122 8,813 U 53.1 137.6 157 1,631 8,362 4,524 3,838
laisalrner Town (M) U 53.12 137.58 157 1,631 8,362 4,524 3,838
Pokam Tehsil T 2,080.2 5,387.7 27 83 1 9,638 55,429 30,331 25,098 R 1,993.8 5.163.9 25 83 1 8,485 50,145 27,574 22,571 U 86.4 223.8 61 1,153 5,284 2,757 2,527
Pokaran Town (M) U 86.43 223.85 61 1 1,153 5,284 2,757 2,527
Sam Tehsil* R 4,100.0 10,619.0 4 143 12 2,922 15,379 8,875 6,504
Fatehgarh Tehsil* R 1,612.0 4,201.0 12 88 6 3,733 20,209 11,299 8,910
Note : - 1. The Sq. Km. and density figures of urban areas of Tehsll{Dlstrict are worked out using the area figures corrected upto 2 places of decimals obtained by adding the area of towns in the respective units and not using the area figures given in the table. In addition to this the area figures relating to Sq. K.m. are further adjusted to make the Tehsil/District totals tally.
2. The following abbreviation has been used for the Status of a town e. g.
(M)= Municipality *Eratirely Rural
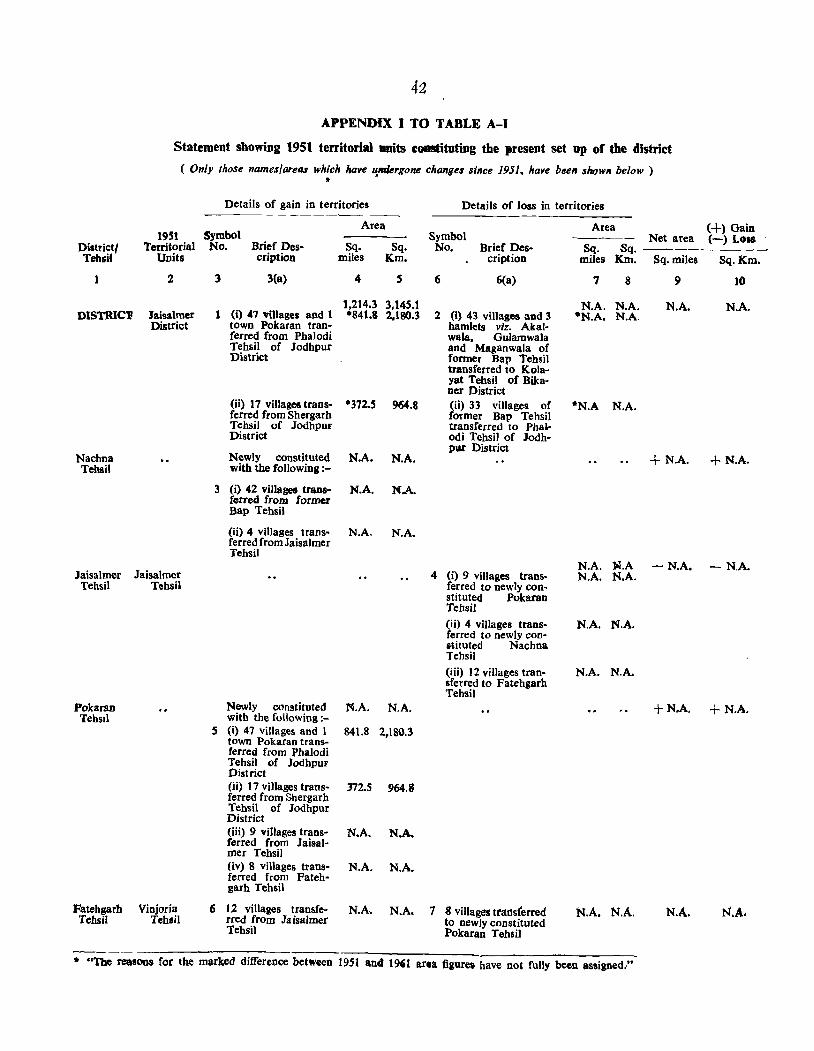
42
APPENDIX I TO TABLE A-I
Statement showing 1951 territorial IlDits eGllStitoting the present set QP of the district
( Only those names/areas which have u.mlergone changes since 1951, have been shown below)
District/ Tehsil
DISTRIC'P
Nachna Tehsil
1951 Territorial
Units
2
laisalmer District
Jaisalmer Jaisalmer Tehsil Tehsil
Pokarau Tebsil
Fatehgarb ViDjoria Tehsil Tehsil
• Details of gain in territories Details of loss in territories
Area Symbol No. Brief Des-
cription Sq. Sq.
miles Km.
3 3(a) 4 5
1,214.3 3,145.1 1 (i) 41 villages aDd 1 ·841.8 2,180.3
town Pokaran tran-ferred from Phalodi Tehsil of Jodhpur District
Oi) 17 villages trans- ·372.5 964.8 ferred from Shergarh Tehsil of Jodhpur District
Newly constituted N.A. N.A. with the following:-
3 (i) 42 villages trans- M.A. M.A. lerred from formu Bap Tehsil
(ii) 4 villages trans- N.A. N.A. ferred from Jaisalmer Tehsil
Newly constituted N.A. N.A. with the following :-
5 (i) 47 villages and 1 841.8 2.180.3 town Pokaran trans-ferred from Phalodi Tehsil of Jodhpur District Oi) 17 vi11ages trans- 372.5 964,8 ferred from Shergarb Tehsil of Jodhpur District (iii) 9 villages trans- N.A. NA ferred from Jaisal-mer Tehsil (iv) 8 villages trans- N.A. N.A. ferred from Fateh-garh Tebsil
Symbol No. Brief Des
cription
6 6(a)
2 (I) 43 villages and 3 hamlets viz. Akalwala, Gulamwala and Maganwala of former Bap Tehsil transferred to Kolayat Tehsil of Bibner District (ii) 33 villages of former Bap Tehsil transferred to Pha.lodi TehsiJ of Jodhpur District
4 (i) 9 villages trans· ferred to newly constituted Pokaran Tehsil (ii) 4 villages transferred to newly CODatituted Nachna Tehsil (iii) 12 villages transferred to Fatehgarb Tehsil
6 12 villages transf~ rred from laisalmer Tehsil
N.A. N.A. 7 8 villages trat1sferred to newly constituted Pokaran Tehsil
Area
Sq. Sq.
(+) Gain Net area (-) LoIS
miles Km. Sq. miles Sq.Km.
10 7 8
N.A. N.A. ·N.A. N.A,
*N.A N,A.
9
N.A.
+N.A.
N.A.
+N.A.
N.A. W.A - N.A. - N,A. N.A. N.A.
N.A. N.A.
N.A. N.A.
+N.A. + N.A.
N.A. N.A. N.A.
* "The reasoos for the marked difference between 1951 and 1961 arta figurC$ have not fully been assigned!'
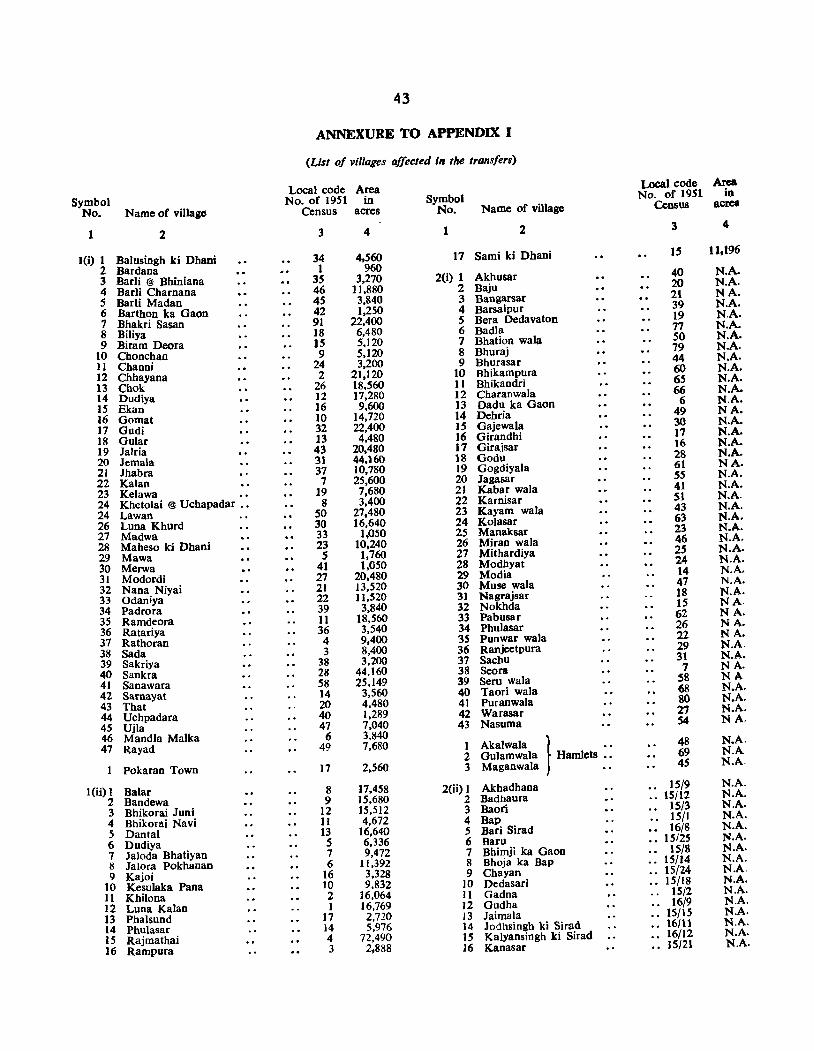
Symbol No. Name of village
2 t
I(i) 1 Balusingb ki Dhani 2 Bardana 3 Barli @ Bhiniana 4 Barli Charnana 5 Barli Madan 6 Barthon ka Gaon 7 Bhakri Sasan 8 Biliya 9 Biram Deora
10 Chonchan II Channi 12 Chhayana 13 Chok 14 Dudiya 15 Ekan 16 Gomat 17 Gudi 18 Gular 19 Jalria 20 lemala 21 Jhabra 22 Kalan 23 Kelawa 24 Khetolai @ Uchapadar ., 24 Lawan 26 Luna Khurd 27 Madwa 28 Maheso ki Dhani 29 Mawa 30 Merwa 31 Modordi 32 Nana Niyai 33 Odaniya 34 Padrora 35 Ramdeora 36 Ratariya 37 Rathoran 38 Sada 39 Sakriya 40 Sankra 41 Sanawara 42 Samayat 43 That 44 Uchpadara 45 Ujla 46 Mandla Maika 47 Rayad
Pokaran Town
1 (ii) 1 Balar 2 Bandewa 3 Bhikorai Juni 4 Bhikorai Navi 5 Dantal 6 Dudiya 7 Jaloda Bhatiyan Il Jalora Pokhanan 9 Kajoi
10 Kesulaka Pana II Khilona 12 Luna Kalan 13 Phalsund 14 Phulasar 15 Rajmathai 16 Rampura
43
ANNEXURE TO APPENDIX I
(List of villages affected in the transfers)
Loca} code Area No. of 1951 in
Census acres
3
34 1
35 46 45 42 91 18 15 9
24 2
26 12 16 ]0 32 13 43 31 37 7
19 8
50 30 33 23 5
41 27 21 22 39 11 36 4 3
38 28 58 ]4 20 40 47
6 49
17
8 9
12 11 13 5 7 6
16 10 2 1
J7 14 4 J
4
4,560 960
3,270 11,880 3,840 1,250
22,400 6,480 5,120 5,120 3,200
21,120 18.560 17,280
9.600 14,720 22,400 4,480
20,480 44,160 10,780 25,600 7,680 3,400
27,480 16,640
1,050 10,240
1,760 1,050
20,480 13,520 11,520
3,840 18,560 3,540 9,400 8,400 3,200
44.160 25,149
3,560 4,480 1,289 7,040 3,840 7,680
2,560
]7,458 15,680 15,512 4,672
16,640 6,336 9,472
11,392 3,328 9,832
]6,064 16.769
2,720 5,976
72,490 2,888
Symbol No. Name of village
2 1
17 Sami ki Dhani
2(i) 1 Akhusar 2 Baju 3 Bangarsar 4 Barsalpur 5 Bera Dedavaton 6 BadIa 7 Bhation wala 8 Bhuraj 9 Bhurasar
10 8hikampura 1 t Bhikandri 12 Charanwala 13 Dadu ka Gaon 14 Dehria 15 Gajewala 16 Girandbi 17 Girajsar lS Godu 19 Gogdiyala 20 Jagasar 21 Kabar wala 22 Karnisar 23 Kayam wala 24 Kolasar 25 Manaksar 26 Miran wala 27 Mithardiya 28 Modhyat 29 Modia 30 Muse wala 31 Nagrajsar 32 Nokbda 33 Pabusar 34 Phulasar 35 Punwar wala 36 Ranjeetpura 37 Sachu 38 Seora 39 Sem wala 40 Taori wala 41 Puranwala 42 Warasar 43 Nasuma
1 Akalwala I .. 2 Gulamwala Hamlets •• 3 Maganwala ••
2(ii) I Akhadhana 2 Badhaura 3 Baori 4 Bap 5 Bari Sirad 6 Baru 7 Bhimji ka Gaon 8 Bhoja ka Sap 9 Cbayan
10 Dedasari 11 Gadna 12 Gudha 13 Jaimala 14 Jodhsingh ki Sirad 15 Kalyansingh ki Sirad 16 Kanasar
Local code No. of 1951
Census
3
15
40 20 21 39 19 77 50 79 44 60 65 66
6 49 30 17 16 28 61 5S 41 51 43 63 23 46 25 24 14 47 18 15 62 26 22 29 31
7 58 68 80 27 54
48 69 45
•• 15/9 .. 15/12 .• 15/3 •. 15/1 •• 16/8
15/25 15/8
.. 15/14 " 15/24 •• 15/18 .. 15/2 .• 16/9
15/15 16/11 16/12 15/21
Area in
acrea
4
11,196
N.A. N.A. NA. N.A. N.A. N.A. N.A. N.A. N.A. N.A. N.A. N.A. N.A. NA. N.A. N.A. N.A. N.A. NA. N.A. N.A. N.A. N.A. N.A. N.A. N.A. N.A. N.A. N.A. N.A. N.A. NA. NA. NA. N A. N.A. N.A. NA. NA N.A. N.A. N.A. NA.
N.A. N.A N.A.
N.A. N.A . N.A. N.A. N.A. N.A. N.A. N.A. N.A. N.A . N.A. N.A. N.A. N.A. N.A. N.A.

44
ANNEXURE TO APPENDIX I .. Concld.
(List of vilhlges affected in the transfers)
Local code Area Local code Area Symbol No. of 1951 in Symbol No. of 1951 in
No. Name of village Census acres No. Name of village Census acres
1 2 3 4 2 3 4
17 Khakhuri 15/19 N.A. 36 Inawala 16/38 N.A. 18 Kherwa 15/13 N.A. 37 Bhesituk 16/42 N.A. 19 Malamsingh ji ki Sirad •• 16/13 N.A. 38 Jarkhadi 16/52 N.A. 20 Manchitiya •• 1515 N.A. 39 Modhio 16/56 N.A. 21 Modkia 15/17 N.A. 40 Narainsar 16/64 N.A. 22 Mondli 16/4 NA. 41 Vixkasar 16/65 N.A. 23 Nayagaon 15/4 N.A. 42 Anayat wala 16/71 N.A. 24 Padamsingh ki Sirad 16/10 N.A. 25 Raneri ]5/20 N.A. 3(ii) 1 Ajasar 24 NA. 26 Raora 15/7 N.A. 1. Askandra 22 N.A. 27 Sanguri J5/1O N,A. 3 Oidhoo 23 N.A. 28 Sanwaragaon 16/5 N.A. 4 Tota 25 N.A. 29 Sekbasar 15/11 N.A. 30 Sihado 15/22 N.A. 4(i) 1 Bhadaria 21 N.A. 31 Tekra Bhari Bbak 15/23 N.A. 2 Oholia 2 N.A. 32 Tepu 15/16 N.A. 3 Eta 32 N.A. 33 Lubhani 15/6 N.A. 4 Keralia 5 N.A.
5 Lathi 1 N.A. 3(i) 1 Akal ka Bera 15/34 N.A. 6 Loharki 20 N.A.
2 Avai 15/38 N.A. 7 Loheta 3 N.A. 3 Bera Oadura 15/30 NA. 8 Nawa Tala 18 N.A. 4 Bhandariya 15/37 NA. 9 Ratan ki Basti 4 N.A. 5 Bharamsar 16/73 NA. 6 Bhera wala 15/28 N.A. 4(ii) As against 3(ii) 7 Bodana 16/74 N.A. 8 Chandesar wala 16/35 N.A. 4(iii)1 Asloi 49 N.A. 9 Chinu 16/76 N.A. 2 Janro 48 N.A.
IO Dhaleri 16/2 N.A. :3 Koruwa 46 N.A. H Ghatiyali 15/36 N.A. 4 Kotri 53 N.A. 12 Kampu wala 16/70 N.A. 5 Mada 51 N.A. 13 Khara 16/69 N.A. 6 Narsingh ki Dhani 44 N.A. 14 Kharakhu 16/33 N.A. 7 Sangana 22 N.A. 15 Khariya 15/40 N.A. 8 Sobh 47 N.A. 16 Kheru wala 1/72 N.A. 9 Soda 50 N.A. 17 Madasar 16/75 N.A. 10 Ugawa 32 N.A. 18 Malasar ]5/39 NA. 11 Wadhan 45 N.A. 19 Mohar wala 15/32 N.A. 12 Senang 37 N.A. 20 Nachana 15/26 N.A. 21 Nokh 16/1 N.A. 5(i) As against 1 (i) 22 Norang wala 16/34 N.A. 5(ii) Ai against 1 (ii) 23 Panche ka Tala 15/33 N.A. 5(iii) As against 4(i) 24 Panna 16/67 N.A. 25 Sakari 15/27 N.A. S(iv) 1 Betina 15 N.A. 26 Satiyaya 15/35 N.A. 1. Bhesada 13 N.A. 27 Sekhon ka Tala 15/31 N.A. :3 Donara 17 N.A. 28 Tuwero wala 16/53 N.A. 4 Lakhasar 20 N.A. 22 Vitaka Gaon 16/3 N.A. 5 Madasar 21 N.A. 30 Hariyar 15{29 N.A. 6 Nedan 22 N.A. 31 Rohidon wala 15/41 N.A. 7 Ola 38 N.A. 32 Kalron wala 16/32 N.A. 8 Rajgarh 17 N.A. 33 Baradhola 16/33 N.A. 34 Jalu wala 16/36 N.A. 6 As against 4(iii) 35 Kama wala 16/37 N.A. 7 As against S(iv)
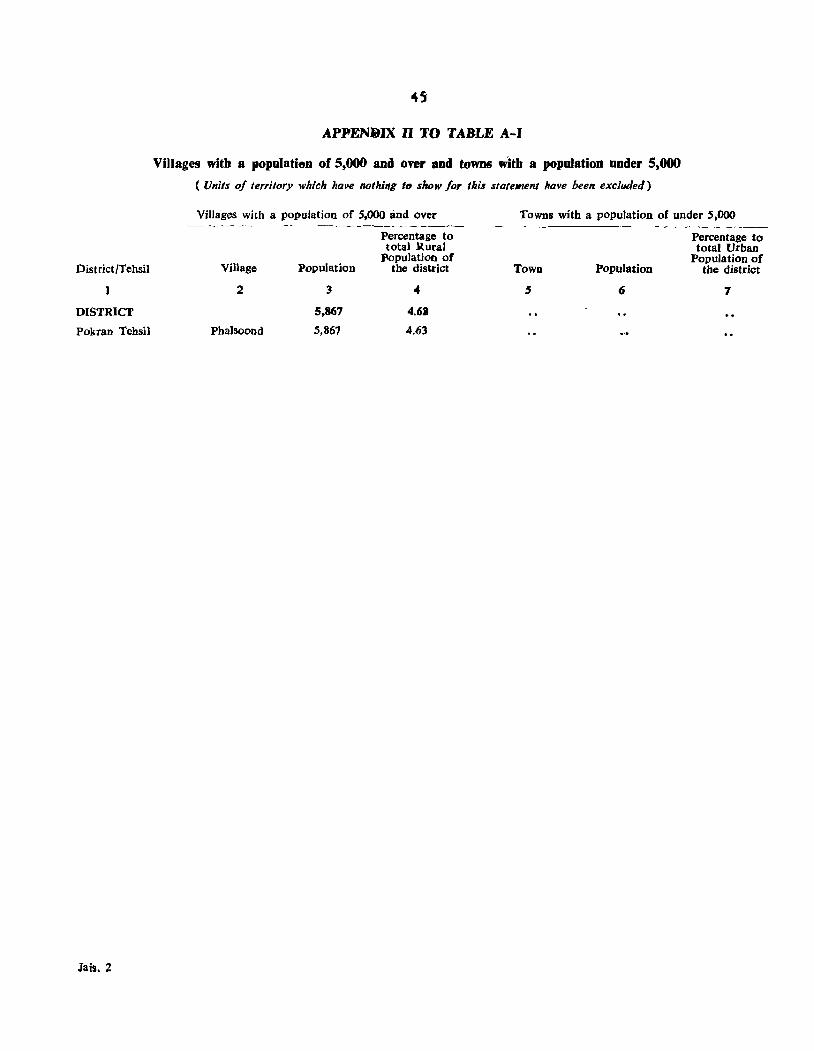
District/Tehsil
DISTRICT
Pokran Tehail
Jais.2
45
APPENJiUX n TO TABLE A-I
Villages witb a populatifJn of 5,000 and over and towns witb a population under 5,000
( Units of territory which have nothing ttJ show for tllis s(afelnent have been excluded)
Villages with a population of 5,000 and over Towns with a population of under 5,000 ----
Village Population
2 3
5,867
Phalsoond 5,867
Percentage to total R.ural
Population of the district
.. 4.63
4.63
TOWQ Population
5 6
Percentage to total Urban
Population of tbe district
7
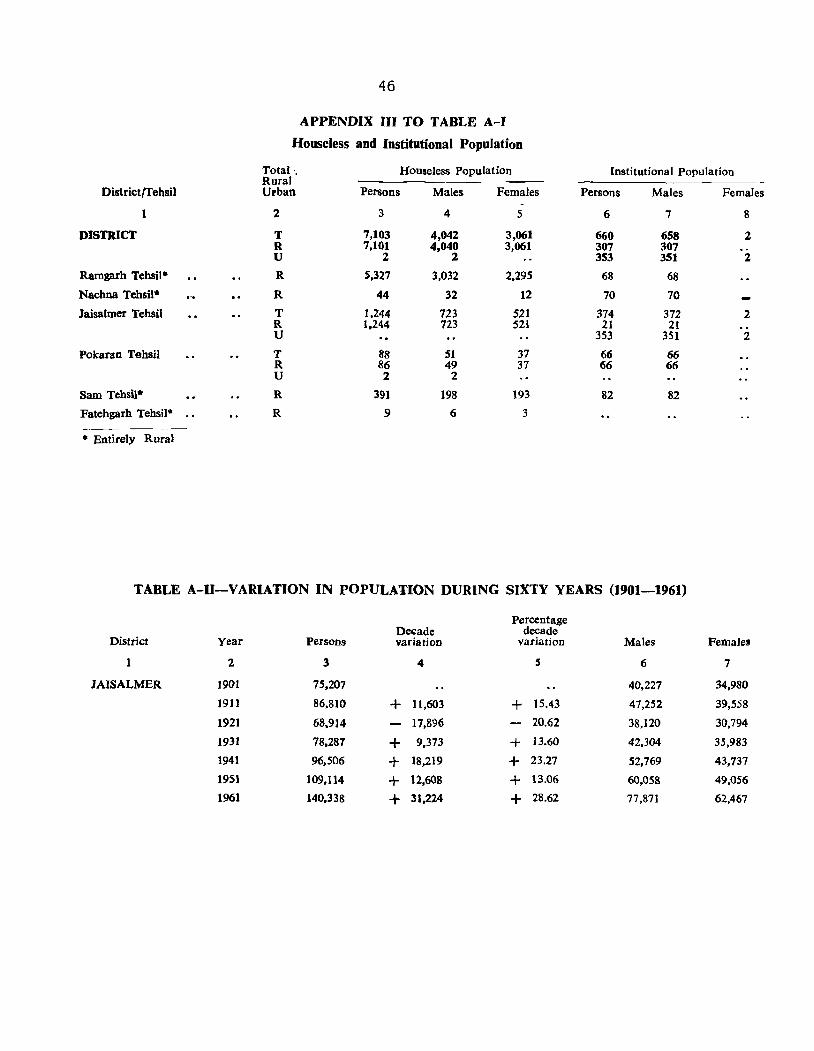
46
APPENDIX III TO TABLE A-I
Houseless and Institutional Population
Total-. Houseless Population Institutional Population Rural
District/Tehsil Urban Persons Males Females Persons Males Females
1 2 3 4 5 6 7 8
DISTRICT T 7,103 4,042 3,061 660 658 :2 R 7,101 4,040 3,061 307 307 U :2 :2 353 351 :2
Ramgarh Tehsil* R 5,327 3,032 2,295 68 68
Nachna Tehsil* R 44 32 12 70 70
Jaisalmer Tehsil T 1,244 723 521 374 372 2 R 1.244 723 521 21 21 U 353 351 2
Pokaran Tehsil T 88 51 37 66 66 R 86 49 37 66 66 U 2 2
Sam Tebsil* R 391 198 193 82 82
Fatebgarh Tehsil* R 9 6 3
* Entirely Rural
TABLE A-II-VARIATION IN POPULATION DURING SIXTY YEARS (1901-1961)
Percentage De~ade decade
District Year Persons variation variation Males Females
1 2 3 4 5 6 7
JAISALMER 1901 75,207 40,227 34,980
1911 86,810 + 11,603 + 15.43 47,252 39,558
1921 68.914 17,896 20.62 38,120 30,794
1931 78,287 + 9.373 + 13.60 42,304 35,983
1941 96,506 + 18,219 + 23.27 52,769 43,737
1951 109,114 + 12,608 + 13.06 60,058 49,056
1961 140,338 + 31,224 + 28.62 77,871 62,467
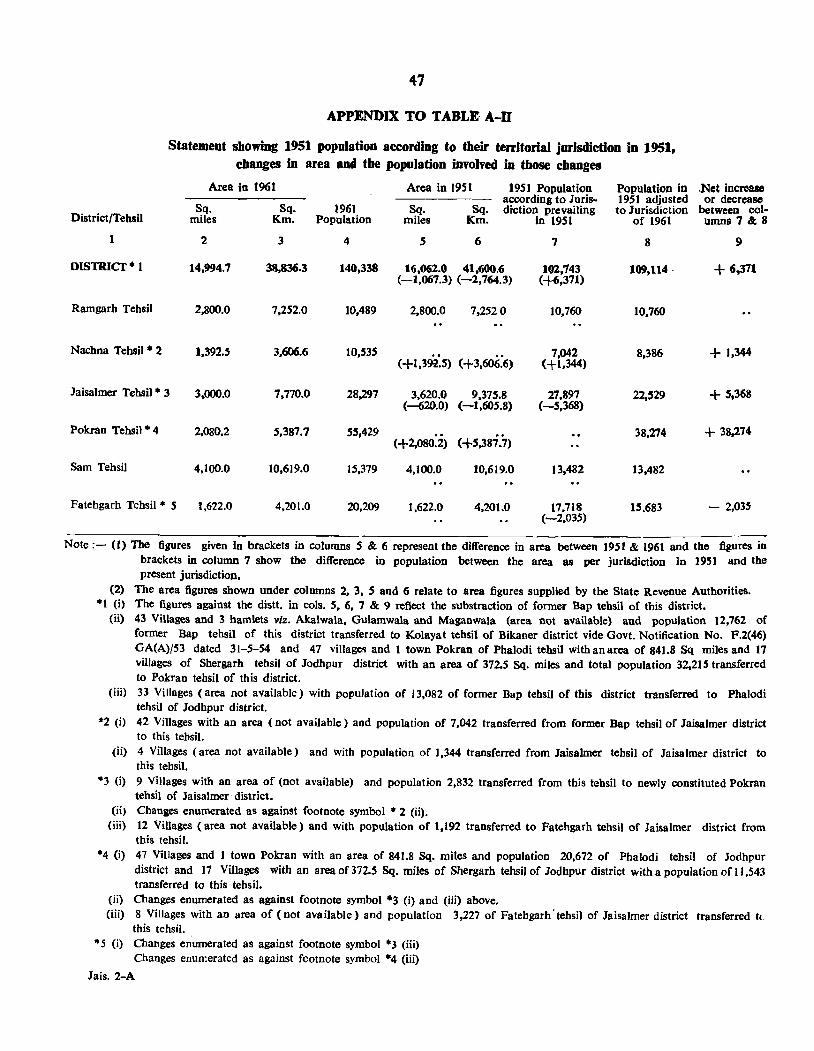
47
APPENDIX TO TABLE A-H
Statement showing 1951 population aecording to their territorial jurisdiction in 1951, changes in area and the population involved in those changes
Area in 1961 Area in 19S1 19S1 Population Population in .Net increase according to Juris- 1951 adjusted or decrease
Sq. Sq. 1961 Sq. Sq. diction prevailing to Jurisdiction between col-District/Tehsil miles Km. Population miles Km. in 1951 of 1961 umns7&8
1 2 3 4 5 6 7 8 9
DISTRICT· 1 14,994.7 38,836.3 140,338 16,062.0 41,600.6 102,743 109,114 - + 6.371 (-1,067.3) (-2,764.3) (-J-(;,371)
Ramgarh Tehsil 2,800.0 7,252.0 10,489 2,800.0 7,2520 10,760 10,760
Nachoa Tebsil * 2 1,392.5 3.606.6 10,535 . . .. 7,042 8,386 + 1,344 (+1,39i!.5) (+3,606.6) (+1,344)
Jaisalmer Tehsil· 3 3,000.0 7,770.0 28,297 3,620.0 9,375.8 27,897 22,529 + 5.368 (-620.0) (-1,605.8) (-5,368)
Pokrao Tebsil * 4 2,080.2 5,387.7 55,429 38,274 + 38,174 <+2,080.2) <+5,387.7)
Sam TehsiI 4,100.0 10,619.0 15,379 4,100.0 10,619.0 13.482 13.482
Fatehgarh Tehsil * 5 1,622.0 4,201.0 20,209 1,622.0 4,201.0 17.718 15.683 - 2,035 (-2,035)
Note :- (I) The figures given in brackets in columns 5 & 6 represent the difference in area between 1951 & 1961 and the figures in brackets in column 7 show the difference in population between the area as per jurisdiction in 1951 and the present jurisdiction.
(2) The area figures shown under columns 2, 3, 5 and 6 relate to area figures supplied by the State Revenue Authorities. *1 (i) The figures against the distt. in cols. 5, 6, 7 & 9 reflect the substraction of former Bap tehsil of this district.
(ii) 43 Villages and 3 hamlets viz. Akalwala, Gulamwala and Maganwala (area not available) and population 12,762 of former Bap tehsil of this district transferred to Kolayat tehsil of Bikaner district vide Govt. Notification No. F.2(46) GA(A)/53 dated 31-5-54 and 47 villages and 1 town Pokran of Phalodi tehsil withanarea of 841.8 Sq miles and 17 villages of Shergarh tehsil of Jodhpur district with an area of 372.5 Sq. miles and total population 32,215 transferred to Pokran tehsil of this district.
(iii) 33 Villages (area not available) with population of 13,082 of former Bap tehsil of this district transferred to Phalodi tehsil of Jodhpur district.
*2 (i) 42 Villages with an area (not available) and population of 7,042 transferred from former Bap tehsil of Jaisalmer district to this tehsil.
(ii) 4 Villages (area not available) and with population of 1.344 transferred from Jaisalmer tehsil of Jaisalmer district to this tehsil.
·3 (i) 9 Villages with an area of (not available) and population 2,832 transferred from this tehsil to newly constituted Pokran tehsil of Jaisalmer· district.
(ii) Changes enumerated as against footnote symbol * 2 (ii). (iii) 12 Villages (area not available) and with population of 1.192 transferred to Fatehgarh tehsil of Jaisalmer district from
this tehsil. *4 (i) 47 Villages and 1 town Pokran with an area of 841.8 Sq. miles and population 20,672 of Phalodi tehsil of Jodhpur
district and 17 Villages with an area of 372.5 Sq. miles of Shergarh tehsil of Jodhpur district with a population of 11,543 transferred to this tehsiI.
(ii) Changes enumerated as against footnote symbol *3 (i) and (iii) above. (iii) 8 Villages with an area of (not available) and population 3,227 of Fatehgarh' tehsil of Jaisalmer district transferred it
this tehsil. ·5 (i) Changes enumerated as against footnote symbol *3 (iii)
Changes eouILeratcd as against footnote symbol *4 (iii)
Jais.2-A
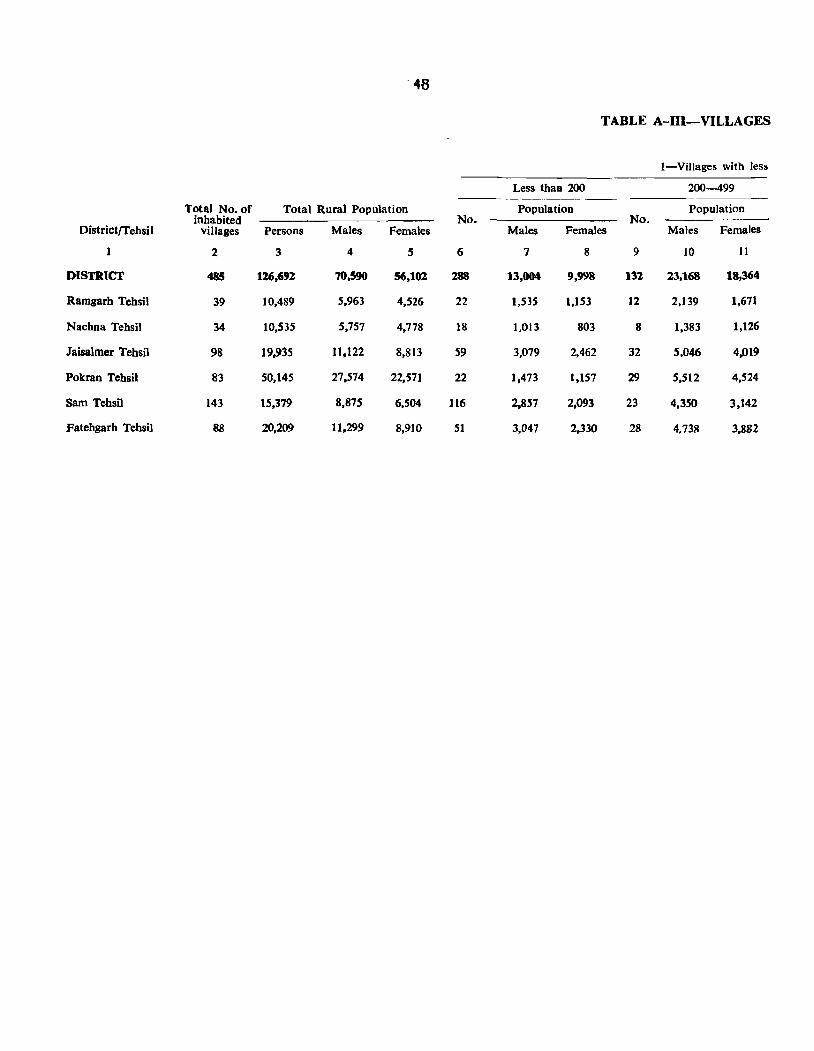
'48
TABLE A-nI-VILLAGES
I-Villages with less
Less thaD 200 200-499
Total No. of Total Rural Population Population Population inhabited No. No.
District/Tehsi I villages Persons Males Females Males Females Males Females
2 3 4 5 6 7 8 9 10 11
DISTRICT 485 126,692 70,590 56,102 288 13,OM 9,998 132 23,168 18,364
Ramgarh Tehsil 39 J0,489 5,963 4,526 22 1,535 1,153 12 2,139 1,671
Nachna Tehsil 34 10,535 5,757 4,778 18 J,013 803 8 1,383 1,126
Jaisalmer Tehsil 98 19.935 1 ],122 8,813 S9 3,079 2,462 32 5,046 4.019
Pokran Tehsi1 83 50,145 27,574 22,571 22 1,473 1,157 29 5,512 4,524
Sam Tehsil 143 15,379 8,87S 6,504 116 2,857 2,093 23 4,350 3,142
Fatehgarh Tehsi] 88 20,209 1l.299 8,910 51 3,047 2.330 28 4.73R 3,882
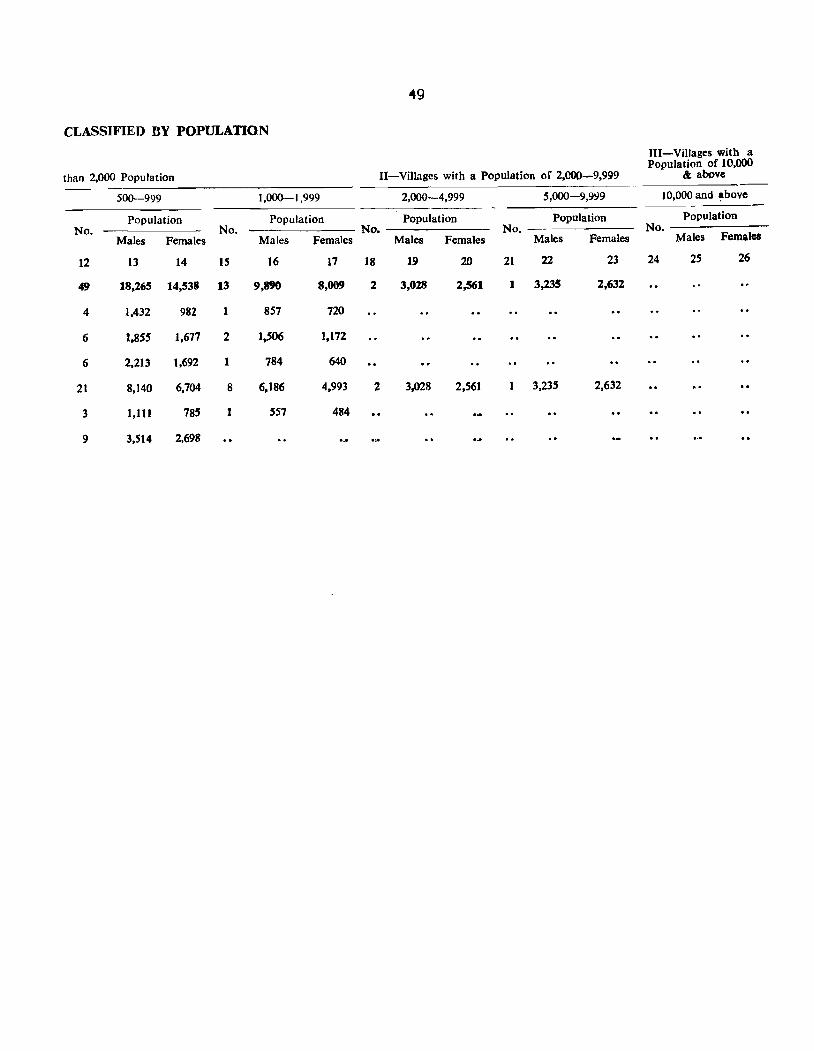
49
CLASSIFIED BY POPULATION
JII-ViJlages with a
than 2,000 Population Population of 10,000
II-Villages with a Population of 2,000-9,999 & above
500-999 1,000-1,999 2,000-4,999 5,000-9,999 10,000 and ~bove
Population Population Population Population Population No. No. No. No. No.
Males Females Males Females Males Females Males Females Males Females
12 13 14 15 16 17 18 19 20 21 22 23 24 25 26
49 18,265 14,538 13 9,890 8,009 2 3,028 2,561 1 3,235 2,632
4 1,432 982 1 857 720
6 1,855 1,677 2 1,506 J,172
6 2,213 1,692 1 784 640
21 8,140 6,704 8 6,186 4,993 2 3,028 2,561 3,235 2,632
3 1,111 78S 1 557 484
9 3,514 2,698
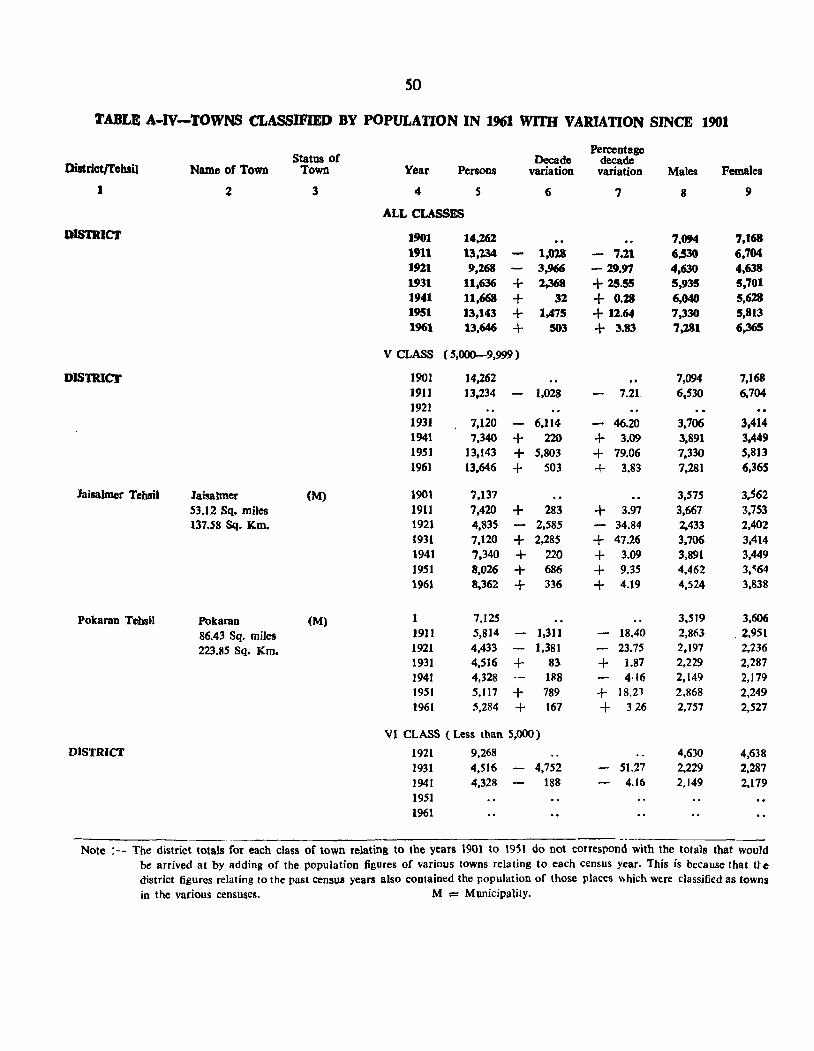
50
rABLE A-IV-TOWNS CLASSIFIED BY POPULATION IN 1961 WITH VARIATION SINCE 1901
Status of Decade Percentage
Districtrrchsil decade
Name of Town Town Year Persons variation variation Males Females
1 2 3 4 5 6 '7 8 9
ALL CLASSES
DISTRICT 1901 14,262 7,0t4 7,168 1911 13,l34 1,018 7.l1 6,530 6,704 1921 9,268 3,966 - 29.97 4,630 4,638 1931 11,636 + 2,368 + 25.55 5,935 5,701 1941 11,668 + 32 + 0.28 6,040 5,628 1951 13,143 + 1,475 + 12.64 7,330 5,813 1961 13,646 + 503 + 3.83 7,281 6,365
V CLASS ( 5,000--9,999 )
DISTRlCJ' 190] ]4,262 7,094 7,168 1911 13,234 1,Q28 7.21 6,530 6,704 1921 1931 7,120 6,114 46.20 3,706 3.414 1941 7,340 + 220 + 3.09 3,891 3.449 1951 13,143 + 5.803 + 79.06 7,330 5,813 1961 13.646 + 503 + 3.83 7,281 6,365
Jaisalmcr Tebsil Jaisalmer (M) 1901 7.137 3,575 3,562 53.12 Sq. miles 1911 7,420 + 283 + 3.97 3,667 3,753 137.58 Sq. Km. 1921 4,835 2,585 34.84 2,433 2,402
1931 7,120 + 2,285 + 47.26 3,706 3,414 1941 7,340 + 220 + 3.09 3,891 3.449 1951 8,026 + 686 + 9.35 4.462 3.~64
1961 8,362 + 336 + 4.19 4,524 3,838
Pokaran Tebsil Pokaran (M) 1 7.125 3,519 3,606
86.43 Sq. miles 1911 5,814 1,311 18.40 2,863 . 2,951
223.85 Sq. Km. 1921 4,433 1,381 23.75 2,197 2,236 1931 4,516 + 83 + 1.87 2,229 2.287 1941 4.328 1118 4·16 2,149 2.179 1951 5.117 + 789 + 18.23 2,868 2,249 1961 5.284 + 167 + 326 2.757 2.527
VI CLASS ( Less than 5,000)
DISTRICT 1921 9.268 4,630 4,638 1931 4,516 4,752 51.27 2,229 2,287 1941 4,328 188 4.16 2,149 2,179 1951 1961
Note :- The district totals for each class of town relating to the years 190\ to 195\ do not correspond with the totals that would be arrived at by adding of the population figures of various towns relating to each census year. This is because that tte district figures relating to the past census years also contained the population of those places which were classified as towns in the various censuses. M = Municipality.
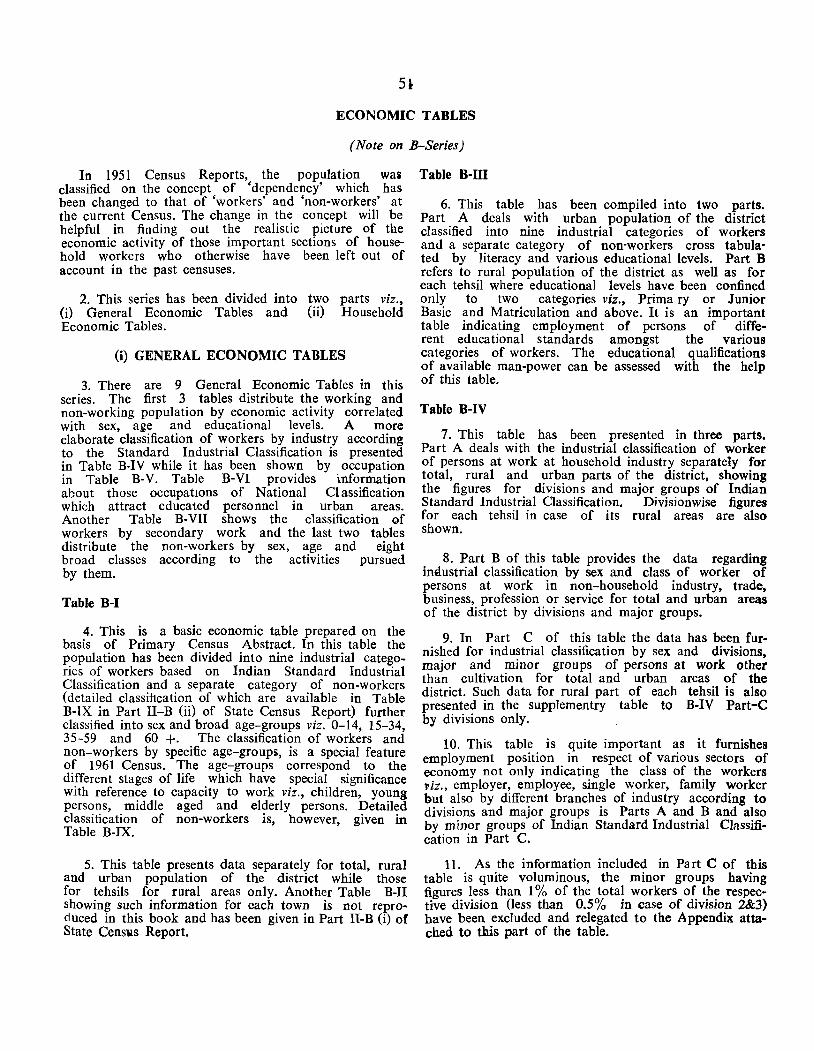
Sl
ECONOMIC TABLES
(Note on B-Series)
In 1951 Census Reports, the population was classified on the concept of 'dependency' which has been changed to that of 'workers' and 'non-workers' at the current Census. The change in the concept will be helpful in finding out the realistic picture of the economic activity of those important sections of household workers who otherwise have been left out of account in the past censuses.
2. This series has been divided into two parts viz., (i) General Economic Tables and (ii) Household Economic Tables.
(i) GENERAL ECONOMIC TABLES
3. There are 9 General Economic Tables in this series. The first 3 tables distribute the working and non-working population by economic activity correlated with sex, age and educational levels. A more elaborate classification of workers by industry according to the Standard Industrial Classification is presented in Table B-IV while it has been shown by occupation in Table B-V. Table B-VI provides information about those occupations of National CI assification which attract educated personnel in urban areas. Another Table B-VII shows the classification of workers by secondary work and the last two tables distribute the non-workers by sex, age and eight broad classes according to the activities pursued by them.
Table B-1
4. This is a basic economic table prepared on the basis of Primary Census Abstract. In this table the population has been divided into nine industrial categories of workers based on Indian Standard Industrial Classification and a separate category of non-workers (detailed classification of which are available in Table B-IX in Part II-B (ii) of State Census Report) further classified into sex and broad age-groups viz. 0-14, 15-34, 35-59 and 60 +. The classification of workers and non-workers by specific age-groups, is a special feature of 1961 Census. The age-groups correspond to the different stages of life which have special significance with reference to capacity to work viz., children, young persons, middle aged and elderly persons. Detailed classification of non-workers is, however, given in Table B-IX.
5. This table presents data separately for total, rural and urban popUlation of the district while those for tehsils for rural areas only. Another Table B-Il showing such information for each town is not reproduced in this book and has been given in Part H-B (i) of State Cens\ls Report.
Table B-m
6. This table has been compiled into two parts. Part A deals with urban population of the district classified into nine industrial categories of workers and a separate category of non-workers cross tabulated by literacy and various educational levels. Part B refers to rural popUlation of the district as well as for each tehsil where educational levels have been confined only to two categories viz., Prima ry or Junior Basic and Matriculation and above. It is an important table indicating employment of persons of different educational standards amongst the various categories of workers. The educational qualifications of available man-power can be assessed with the help of this table.
Table B-IV
7. This table has been presented in three parts. Part A deals with the industrial classification of worker of persons at work at household industry separately for total, rural and urban parts of the district, showing the figures for divisions and major groups of Indian Standard Industrial Classification. Divisionwise figures for each tehsil in case of its rural areas are also shown.
8. Part B of this table provides the data regarding imlustrial classification by sex and class of worker of persons at work in non-household industry, trade, business, profession or service for total and urban areas of the district by divisions and major groups.
9. In Part C of this table the data has been furnished for industrial classification by sex and divisions, major and minor groups of persons at work other than cultivation for total and urban areas of the district. Such data for rural part of each tehsil is also presented in the supplementry table to B-IV Part-C by divisions only.
10. This table is quite important as it furnishes employment position in respect of various sectors of economy not only indicating the class of the workers l1iz., employer, employee, single worker, family worker but also by different branches of industry according to divisions and major groups is Parts A and B and also by minor groups of Indian Standard Industrial Classification in Part C.
11. As the information included in Pa rt C of this table is quite voluminous, the minor groups having figures less than 1 % of the total workers of the respective division (less than 0.5% in case of division 2&3) have been excluded and relegated to the A ppendix attached to this part of the table.
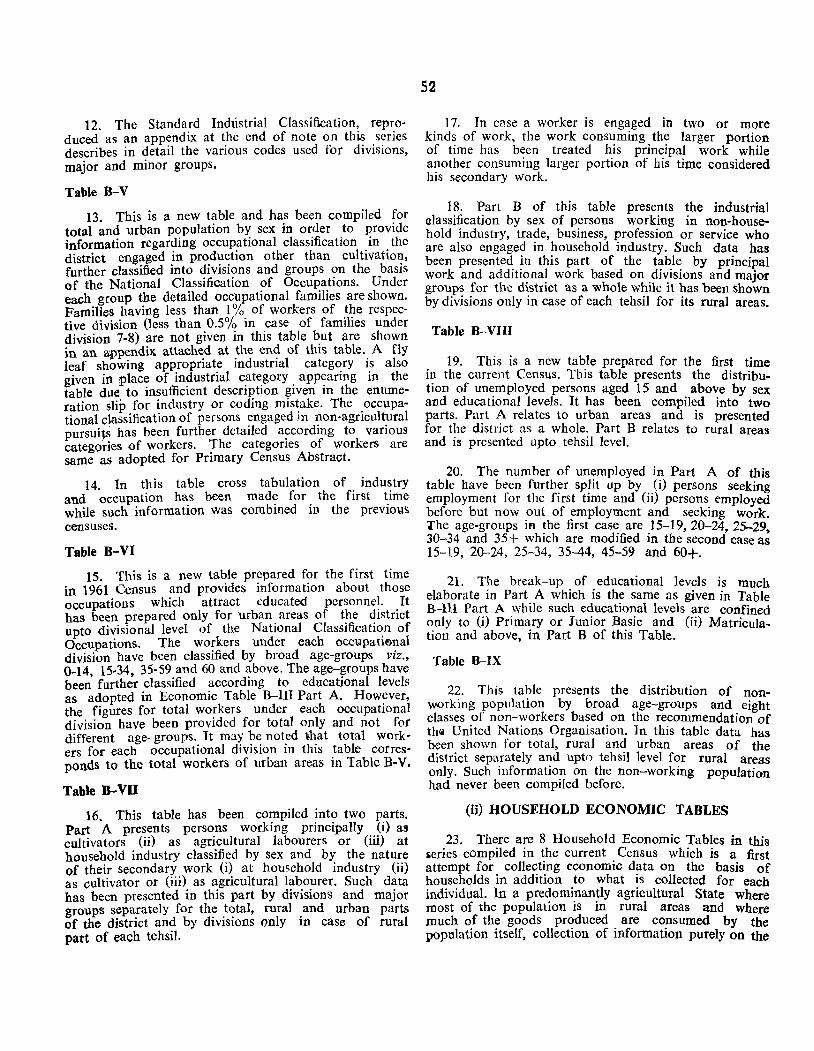
12. The Standard Industrial Classification, reproduced as an appendix at the end of note on this series describes in detail the various codes used for divisions, major and minor groups.
Table B-V
13. This is a new table and has been compiled for total and urban population by sex in order to provide information regarding occupational classification in the district engaged in production other than cultivation, further classified into divisions and groups on the basis of the National Classification of Occupations. Under each grouP the detailed occupational families are shown. Families having less than 1 % of workers of the respective division (less than 0.5% in case of families under division 7-8) are not given in this table but are shown in an appendix. attach~d at .the en~ of this table .. A fly leaf showing appropnate Industnal category lS also given in place of industrial category appearing in the table dud to insufficient description given in the enumeration slip for industry or coding mistake. The occupational classification of persons engaged in non-agricultural pur sui,s has been further detailed according to various categories of workers. The categories of workers are same as adopted for Primary Census Abstract.
14. In this table cross tabulation of industry and occupation has been made for the first time while s~ch information was combined in the previous censuseS.
Table B-VI
IS. This is a new table prepared for the first time in 1961 Census and provides information about those occupations which attract educated personnel. It has been prepared only for urban areas of the district upto divisional level of the National Classification of Occupations. The workers under each occlapaticnal division have been classified by broad age-groups viz., 0-14, 15-34, 35·59 and 60 and above. The age-groups have been further classified according to edtlcational levels as adopted in Economic Table B-Ill Part A. However, the figures for total workers under each occupational division have been provided for total only and not for different age-groups. It may be noted ~hat total workers for each occupational division in this table corresponds to the total workers of urban areas in Table B-Y.
Table B-VII
16. This table has been compiled into two parts. Part A presents persons working principally (i) as cultivators (ii) as agricultural labourers or (iii) at household industry classified by sex and by the nature of their secondary work (0 at household industry (ii) as cultivator or (iii) as agricultural labourer. Such data has been presented in this part by divisions and major groups separately for the total, rural and urban parts of the district and by divisions only in case of rural part of each tehsil.
52
17. In case a worker is engaged in two or more kind~ of work, the work cons~ming. th~ larger portion of hme has b~en treated hiS prIncipal work while another consumIng larger portion of his time considered his secondary work.
18. Part B of this table presents the industrial aIassiflcation by sex of persons working in non-household industry, trade, business, profession or service who are also engaged in household industry. Such data has been presented in this part of the table by principal work and additional work based on divisions and major groups for the district as a whole while it has been shown by divisions only in case of each tehsil for its rural areas.
Table B-VIII
19. This is a new table prepared for the first time in the current Census. This table presents the distribution of un~mployed persons aged 15 and above by sex and educatIOnal levels. It bas been compiled into two parts. Pa~t ~ relates to urban areas and is presented for the dIstnct as a whole. Part B relates to rural areas and is presented upto tehsil level.
20. The num ber of unemployed in Part A of this table have been further split up by (i) persons seeking employment for the first time and (ij) persons employed before but now .out of employment and seeking work. The age-groups III the first case are 15-19,20-24 25-29 30-34 and 35+ which are modified in the second case a~ 15-19, 20-24, 25-34, 35-44, 45-59 and 60+.
21. The break-up of educational levels is much elaborate in Part A which is the same as given in Table B-III Part A while such educational levels are confined only to (i) Primary or Junior Basic and (ii) Matriculation and above, in Part B of this Table.
Table 8-1X
22. This table presents the distribution of nonworking population by broad age-groups and eight classes of non-workers based on the recommendation of thli United Nations Organisation. In this table data has been shown for total, rural and urban areas of the district separately and upto tehsil level for rural areas only. Such information on the non-working population had never been compiled before.
(ii) HOUSEHOLD ECONOMIC TABLES
23. There are 8 Household Economic Tables in this ,eries compiled in the current Census which is a first attempt for collecting economic data On the basis of households in addition to what is collected for each individual. In a predominantly agricultural State Where most of the population is in rural areas and where much of the goods produced are consumed by the population itself, collection of information purely on the
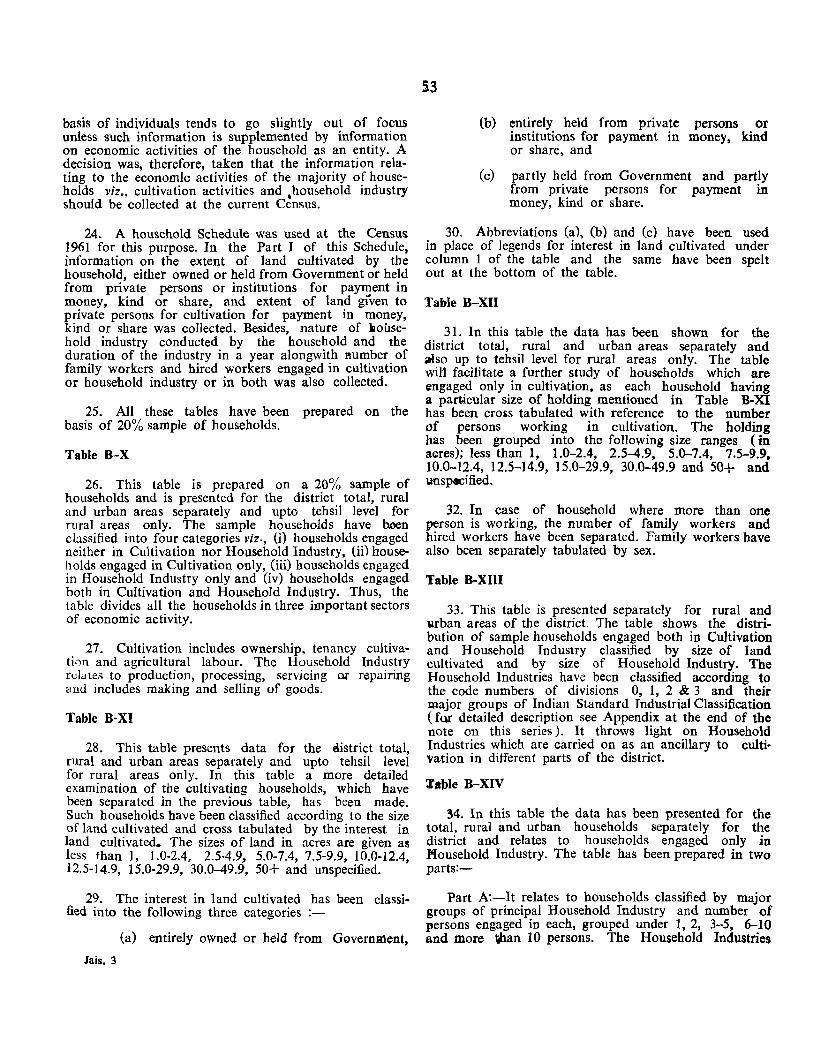
basis of individuals tends to go slightly out of focus unless such information is supplemented by information on economic activities of the household as an entity. A decision was, therefore, taken that the information relating to the economIc activities of the majority of households viz., cultivation activities and .household industry should be collected at the current Census.
24. A household Schedule was used at the Census 1961 for this purpose. In the Part I of this Schedule, information on the extent of land cultivated by the household, either owned or held from Government or held from private persons or institutions for payment in money, kind or share, and extent of land given to private persons for cultivation for payment in money, kind or share was collected. Besides, nature of sousehold industry conducted by the household and the duration of the industry in a year a10ngwith Plumber of family workers and hired workers engaged in cultivation or household industry or in both was also collected.
25. All these tables have been prepared on the basis of 20% sample of households.
Table B-X
26. This table is prepared on a 20% sample of households and is presented for the district total, rural and urban areas separately and upto tehsil level for rural areas only. The sample households have b.oen classified into four categories viz., (i) households engaged neither in Cultivation nor Household Industry, (ii) households engaged in Cultivation only, (iii) households engaged in Household Industry only and (iv) households engaged both in Cultivation and Household Industry. Thus, the table divides all the households in three important sectors of economic activity.
27. Cultivation includes ownership, tenancy cu1tivatil)n and agricultural labour. The Household Industry rdu les to production, processing, servicing or repairing and includes making and selling of goods.
Table B-Xl
28. This table presents data for the district total, rural and urban areas separately and upto tehsil level for rural areas only. In this table a more detailed examination of the cultivating households, which have been separated in the previous table, has been made. Such households have been classified according to the size of i<l.lld cultivated and cross tabulated by the interest in land cultivated. The sizes of land in acres are given as less than I, 1.0-2.4, 2.5-4.9, 5.0-7.4, 7.5-9.9, 10.0-12.4, 12.5-14.9, 15.0-29.9, 30.0-49.9, 50+ and unspecified.
29. The interest in land cultivated has geen classified into the following three categories :-
(a) entirely owned or held from GovernRlent,
Jais. 3
53
(b) entirely held from private persons or institutions for payment in money, kind or share, and
(c) partly held from Government and partly from private persons for payment in money, kind or share.
30. Abbreviations (a), (b) and (c) have been used in place of legends for interest in land cultivated under column 1 of the table and the same have been spelt out at the bottom of the table.
Table B-XII
31. In this table the data has been shown for the district total, rural and urban areas separately and also up to tehsil level for rural areas only. The table will facilitate a further study of households which are engaged only in cultivation, as each household having a particular size of holding mentioned in Table B-XI has been crolis tabulated with reference to the number of persons working in cultivation. The holding has been grouped into the following size ranges ( in acres); less than 1, 1.0-2.4, 2.5-4.9, 5.0-7.4, 7.5-9.9. 10.0-12.4, 12.5-14.9, 15.0-29.9, 30.0-49.9 and 50+ and \HlsplCified.
32. In case of household where more than one person is working, the number of family workers and hired workers have been separated. Family workers have also been separately tabulated by sex.
Table B-XIII
33. This table is presented separately for rural and urban areas of the district. The table shows the distribution of sample households engaged both in Cultivation and Household Industry classified by size of land cultivated and by size of Household Industry. The Household Industries have been classified according to the code numbers of divisions 0, 1, 2 & 3 and their major groups of Indian Standard Industrial Classification (for detailed delicription see Appendix at the end of the note on this series). It throws light on Household Industries which are carried on as an ancillary to cultivation in different parts of the district.
:rll'ble B-XIV
34. In this table the data has been presented for the total, rural and urban households separately for the district and relates to households engaged only in Household Industry. The table has been prepared in two parts:-
Part A:-It relates to households classified by major groups of principal Household Industry and number of l'ersons engaged in each, grouped under 1, 2, 3-5, 6-10 and more tban 10 persons. The Household Industries
54
have been classified according to the code number of divisions 0, I, 2 & 3 and their major groups of Indian Standard Industrial Classification (for detailed description of code numbers see Appendix at the end of the note on this series).
Part B:-It relates to households classified by minor groups of principal Household Industry. In cases where there are more than one Household Industry under a minor group, sub-minor group numbers in four digits have been given.
Table B·XV
35. This table has been prepared for households engaged both in Cultivation and Household Industry. The data has been shown separately for total, rural and urban areas of the district. Tehsilwise break-ups for rural areas only could not be given here due to short of space, however, the same is available in Part III of State Census Report. In this table, an analysis has been made of persons working in these households with reference to size of holding. In cases where more than one person is employed, the number of family workers and hired workers are separately given. Similar data in respect of households engaged in Cultivation only has already been given in Table B.XII. A comparison between this table and Table B-XII will show how the combination of Household Industry with Cultivation effects the employment position. This table helps to establish a co-relation between the Household Industry and the scale of Cultivation.
Table B-XVI
36. This table is confined only to Household Industry and the data has been presented separately for the district total, rural and urban areas. The data in respect of Households engaged in Household Industry only or both in Household Industry and Cultivation are gowen separately. Household Industry is classified according to period of working of the industry grouped under 1-3 months, 4-6 months, 7-9 months and 10 months to one
year and under each category number of households number of family workers and number of hired workers are given. This table thus, furnishes important data on the seasonality of various household industries and yields inferences on the seasonality of Household Industry wkh seasonality of Cultivation.
37. The major groups of Household Industry having less than 10% of the figures of the respective division which have been omitted from the table are shown in the Appendix at the end of the table. For detailed description of divisions and major groups of Household Industry see Appendix at the end of the note on this set:'ies.
TabJe B-XVII
38. The data in this table has been presented separately for the district total, rural and urban areas. The family sizes of sample households have been classified according to single member, 2-3 members, 4-6 members, 7-9 members and to members and over. It may be noted that although the 'Census Household' is not exactly the same as <Family' to the extent that it may also include unrelated persons residing with the family during the census count, yet this table gives a general idea of the family sizes as in the majority of families outsiders are likely to be insignificant.
39. The sample households have also been classified by ecoo.omic activity by work in cultivation or household industry. Ho.useholds engaged in cultivation have been further classified by size of land holding. Classification by economic activity as wen as by size of land holding is presented only for rural areas while classification by size of households is presented for total and urban areas.
40. Separate volumes Part II-B (i) & (ii) for General EGonomic Tables and Part III for Household Economic Tables have been issued in which the various concepts used, have been discussed in detail.
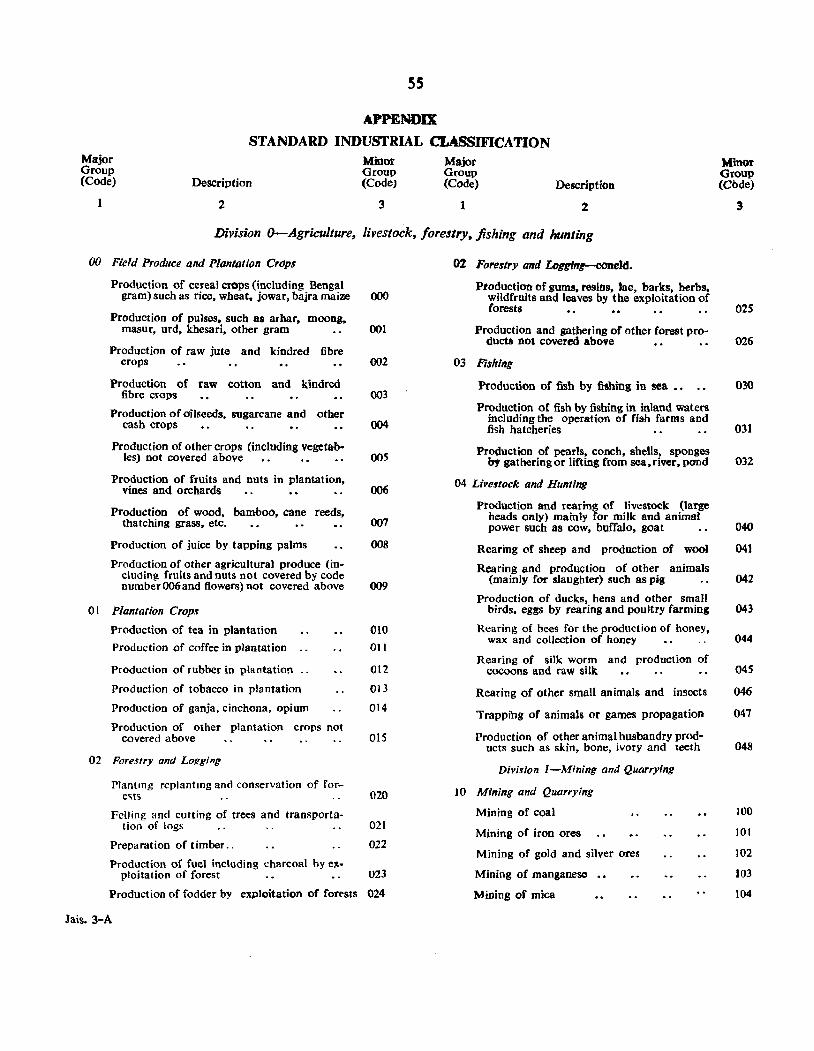
55
APPENDIX
STANDARD INDUSTRIAL CLASSIFICATION Major Group (Code) Description
2
Minor Group (CodeJ
3
Major Group (Code)
1
Description
2
Division V-Agriculture, livestock, forestry, fishing and hunting
00 Field Produce and Plantation Crops
Production of cereal crops (including Bengal gram) such as rice. wheat, jowar, bajra maize
Production of pulses. such as arhar. moong. masur, urd. khesari, other gram
Production of raw jute and kindred fibre crops
Production of raw cotton and kindred fibre crops
Production of oilseeds, sugarcane and other cash crops
Production of other crops (including vegeta·b· les) not covered above
Production of fruits and nuts in plantation, vines and orchards
Production of wood, bamboo, cane reeds, thatching grass. etc.
Production of juice by tapping palms
Production of other agricultural produce (including fruits and nuts not covered by code number 006 and flowers) not covered above
01 Plantation Crops
Production of tea in plantation
Production of coffee in plantation
Production of rubber in plantation
Production of tobacco in plantation
Production of ganja, cinchona, opium
Production of other p1antation crops not covered above
02 Forestry and LOflging
Plantmg replantmg and conservation of fore<;ts
Felling and cutting of trees and transporta-
000
001
002
003
004
005
006
007
008
009
010
011
Ot2
013
014
015
020
tion of logs 021
Preparation of timber. . 022
Production of fuel including ~harcoal byex-ploitation of forest U23
Production of fodder by exploitation of forests 024
Jais.3-A
02 Forestry and Loggint-OODcld.
Ptoduction of gums, resins. lae. barks, herbs. wildfruits and leaves by the exploitation of forests •. •• .• •.
Production and gathering of other forest products not covered above
03 Fishing
Production of fish by timing in sea ••
Production of fish by fishing in inland waters including the operation of fish farms and fish hatcheries
Production of pearls. conch. shells, sponges by gathering or lifting from sea, river, pond
04 Livestock and Hunting
Ptoduction and rearing of livestock (large heads only) mainly for milk and animal power such as cow, buffalo, goat
Rearing of sheep and production of wool
Rearing and production of other animals (mainly fOl' slaughter) such as pig ..
Production of ducks, hens and other small birds. eggs by rearing and poultry farming
Rearing of bees for the production of honey, wax and collection of honey • . . .
Rearing of silk worm and production of cocoons and raw silk
Rearing of other small animals and insects
Trapping of animals or games propagation
Production of other animal husbandry prod-!Jcts such as skin. bone, ivory and teeth
Division I-Mining and Quarrying
JO Mining and Quarrying
Mining of coal
Mining of iron ores
Mining of gold and silver ores
Mining of manganese
Mining of mica
Minor Group (Code)
3
025
026
030
OJI
032
040
041
042
043
044
045
046
047
048
100
101
102
103
104
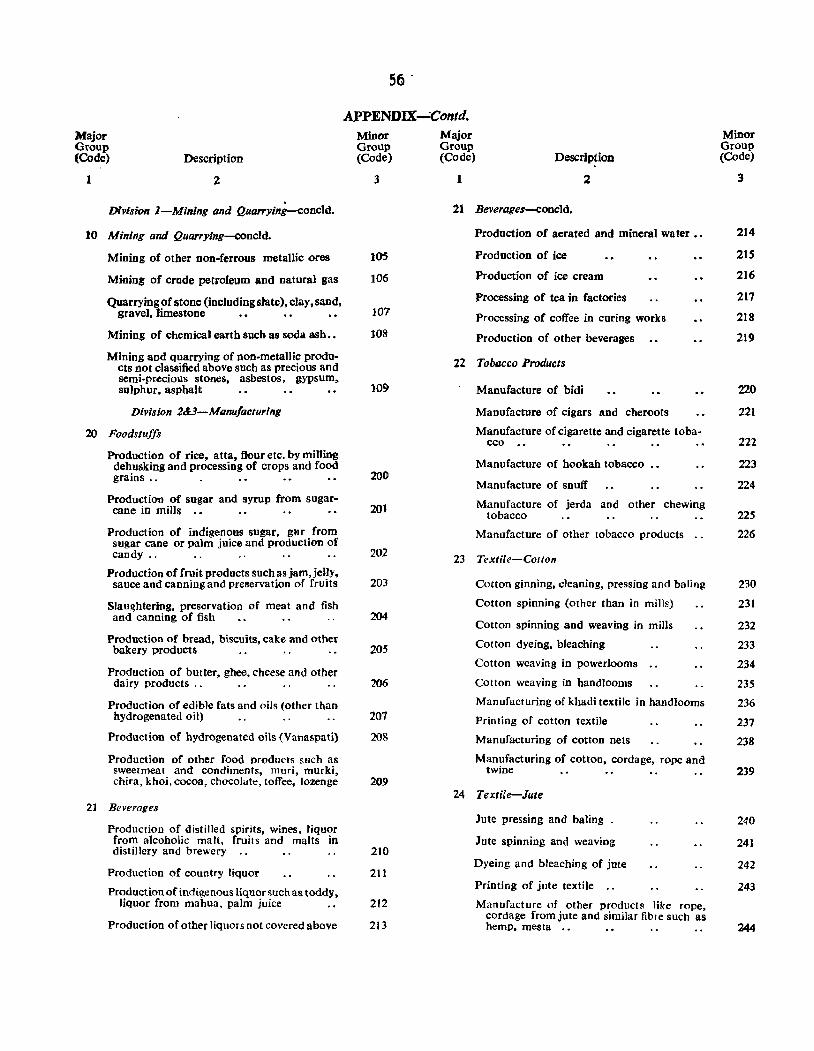
Major Group (Code) Description
I 2
Division l-Mi"ing and QUQ"YinMoncld.
10 Mining and Quarrying-concld.
Mining of other Don-ferrous metallic ores
Mining of crude petroleum and natural gas
Quarrying of stone (including slate), clay. sand, gravel, limestone
Mining of chemical earth such as soda ash ••
Mining and quarrying of non-metallic products not classified above such as precious and semi-precious stones, asbestos, gypsum, sulphUr, asphalt
Division 2&J-ManuJactllring
20 Foodstuffs
Production of rice, atta, flour etc. by mining dehusking and processing of crops and food grains ..
Production of sugar and syrup from sugarcane in mills .•
PrOduction of indigenous sugar, gur from sugar cane or palm juice and production of candy ..
Production of fruit products such as jam, jelly. sauce and canning and preservation of fruits
Slaughtering, preservation of meat and fish and canning of fish
Production of bread, biscuits, cake and other bakery products
Production of butter, ghee, cheese and other dairy products ..
Production of edible fats and oils (other than hydrogenated oil)
Production of hydrogenated oils (Vanaspali)
Production of other food products such as sweetmeat and condiments, muri, murki, chira, khoi. cocoa, chocolate, toffee, lozenge
2] Beverages
Production of distilled spirits, wines. liquor from alcoholic malt, fruits and malts in distillery and brewery
Production of country liquor
Production of indigenous liquor such as toddy, liquor from mabua, palm juice
Production of other liquors not covered above
APPENDIX-Contd. Minor Group (Code)
3
lOS
106
101
108
109
zoo
201
202
203
204
20S
206
207
208
209
210
211
212
213
Major Group (Code) DescriptioD
2 1
21 Beverages-concld.
Production of aerated and mineral water ••
Production of ice
Production of ice cream
Processing of tea in factories
Processing of coffee in curing works
Production of other beverages
22 Tobocco Products
Manufacture of bidi
Manufacture of cigars and cheroots
Manufacture of cigarette and cigarette tobacco .•
Manufacture of hookah tobacco
Manufacture of snuff
Manufacture of jerda and other chewing tobacco
Manufacture of other tobacco products
23 Textile-Cotton
Cotton ginning, cleaning, pressing and baling
Cotton spinning (other than in mills)
Cotton spinning and weaving in mills
Cotton dyeing, bleaching
Cotton weaving in powerlooms
Cotton weaving in handlooms
Manufacturing of khadi textile in hand looms
Printing of cotton textile
Manufacturing of cotton nets
Manufacturing of cotton, cordage, rope and twine
24 Textile-Jute
Jute pressing and baling
Jute spinning and weaving
Dyeing and bleaching of jute
Printing of jute textile ..
Manufacture of other products like rope, cordage from jute and similar fibre such as hemp, mesta .•
Minor Group (Code)
3
214
21S
216
217
218
219
220
221
222
223
224
225
226
230
231
232
233
234
235
236
237
238
239
240
241
242
243
244
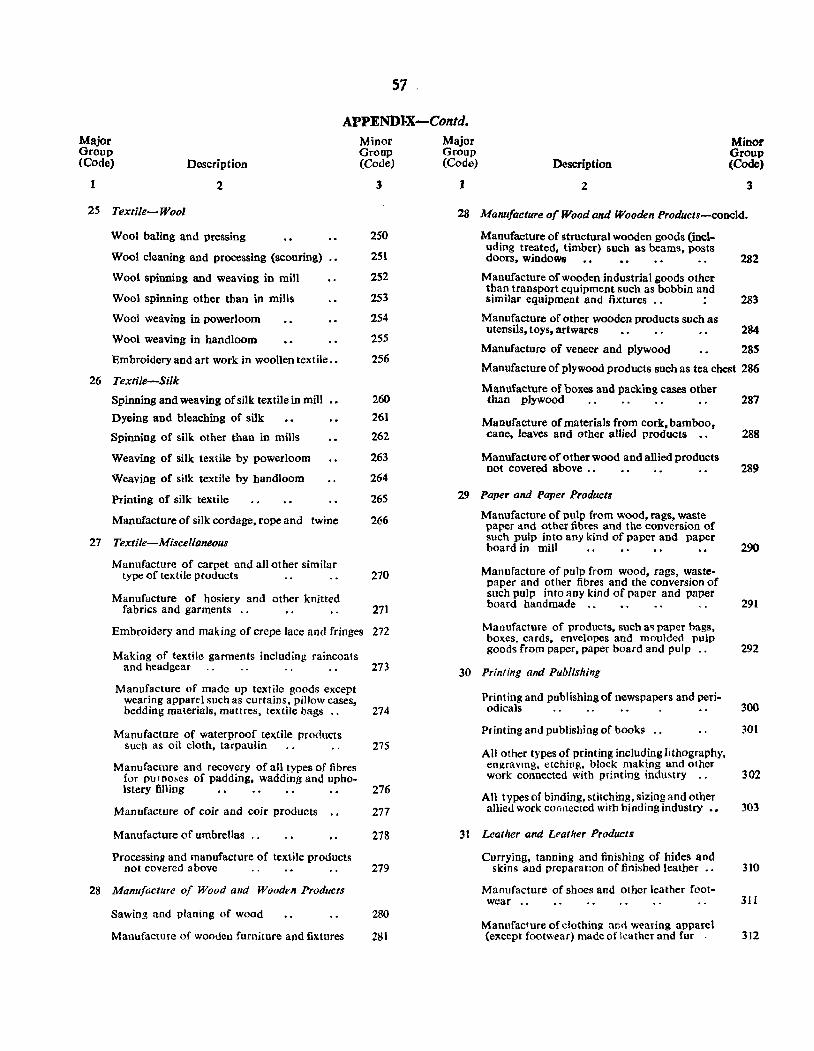
57
APPENDJ.X-Contd. Major Group (Code) Description
1 2
25 Textile-Wool
Wool baling and pressing
Wool cleaning and processing (scouring)
Wool spinning and weaving in mill
Woo) spinning other than in mills
Wool weaving in powerloom
Wool weaving in handloom
Embroidery and art work in woollen textile .•
26 Textile-Silk
Spinning and weaving of silk textile in mill
Dyeing and bleaching of silk
Spinning of silk other than in mills
Weaving of silk textile by powerloom
Weaving of silk textile by handloom
Printing of silk textile
Manufacture of silk cordage, rope and twine
27 Textile-Miscellaneous
Manufacture of carpet and all other similar type of textile products
Manufacture of hosiery and other knitted fabrics and garments ..
Minor Group (Code)
3
250
251
252
253
254
255
256
260 261
262
263
264
265
266
270
271
Embroidery and making of crepe lace and fringes 272
Making of textile garments including raincoats and headgear 273
Manufacture of made up textile goods except wearing apparel such as curtains, pillow cases, bedding materials, mattres, textile bags •• 274
Manufacture of waterproof textile products such as oil cloth, tarpaulin 275
Manufacture and recovery of all types of fibres for pu rlloses of padding, wadding and upho-lstery filling • • • • . • • • 276
Manufacture of coir and coir products 277
Manufacture of umbrellas ..
Processing and manufacture of textile products not covered above
28 Manufacture of Wood and Wooden Products
Sawing and planing of wood
Manufacture of woodell furniture and fixtures
278
279
280
281
Major Group (Code)
1
Description
2
Minor Group (Code)
3
28 Manufacture of Wood and Wooden Products-condd.
Manufacture of structural wooden goods (incl-uding treated, timber) such as beams, posts doors, windows
Manufacture of wooden industrial goods other than transport equipment such as bobbin and similar equipment and fixtures ..
Manufacture of otber wooden products such as
282
283
utensils, toys, artwares 284
Manufacture of veneer and plywood 28S
Manufacture of plywood products such as tea chest 286
Manufacture of boxes and packing cases other than plywood
Manufacture of materials from cork, bamboo, cane, leaves and other allied products .'
Manufacture of other wood and allied products not covered above .•
29 Paper and Paper Products
Manufacture of pulp from wood, rags, waste paper and other fibres and the conversion of such pulp into any kind of paper and paper board in mill
Manufacture of pulp from wood, rags, wastepaper and other fibres and the conversion of such pulp into any kind of paper and paper board handmade ..
Manufacture of products, such a~ paper bags, boxes, cards, envelopes and moulded pulp goods from paper, paper board and pulp
30 Printing and Publishing
Printing and publishing of newspapers and peri-
287
288
289
290
291
292
odicals 300
Printing and publishing of books .. 301
All other types of printing including lithography, engravlDg, etching, block making and other work connected with printing industry .. 302
All types of binding, stitching, sizing and other allied work connected with binding industry 303
3t Leather and Leather Products
Currying, tanning and finishing of hides and skins and preparation of finished leather ••
Manufacture of shoes and other leather footwear .,
Manufacture of clothing aoel wearing apparel (except footwear) made of leather and fur
310
311
312
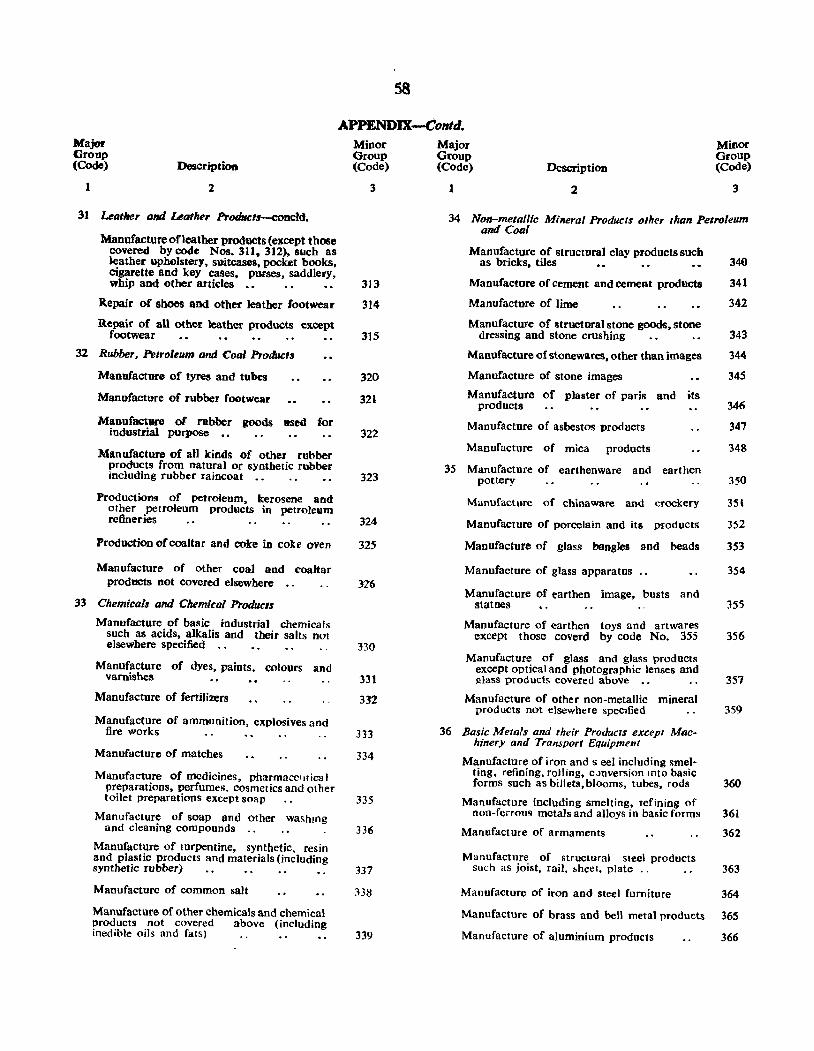
Major Group (Code) Description
1 2
~1 Leather and Leather Prodrtcl8-eOflCld.
Manufacture ofleather products (except those covered by code Nos. 311, 312), such as leather upholstery. suitcases, pocket books, cigarette and key cases, purses, saddlery, whip and other articles ••
R.epair of shoes aDd other leather footwear
Repair of all other leather products ex.cept footwear •• •• •• ••
32 Rubber, Petroleum and Coal Products
Manufacture of tyres and tubes
Manufacture of rubber footwear
Manufacture of rubber goods used for industrial purpose ••
Manufacture of all kinds of other rubber products from natural or synthetic rubber including rubber raincoat ..
Productions of petroleam, kerosene and other petroleum products in petroleum refineries .. .....•
Production of coaItar and coke in cole oven
Manufacture of other coal and roahar products not covered elsewhere
33 Chemicals and Chemical Products
Manufacture of basic industria1 chemicals such as acids, alkalis and their salts not elsewhere specified
Manufacture of dyes. paints. colours and varnishes
Manufacture ef fertilizers
Manufacture of ammunition, explosives and fire works
Manufacture of matches
Manufacture of medicines, pharmacc1ltica I preparations, perfumes. cosmetics and other toilet preparations except soap
Manufacture ef soap and other washmg and cleaning compounds ..
Manufacture of turpentine, synthetic, resin and plastic products and materials (including synthetic rubber) . . . . • . • .
Manufacture ef common salt
Manufacture of other chemicals and chemical products not covered above (including inedible oils and fats)
58
APPENDIX-Contd. Minor Group (Code)
3
3J3
314
315
320
321
322
323
324
325
316
330
331
332
333
334
335
336
337
338
339
Major Minor Group Group (Code) Description (Code)
1 2 3
34 NtHI-metallic Mineral Products other than Petroleum anti Coal
Manufacture of structural clay products such as blicks. tiles • • • • • •
Manufacture of Cement aJld cement products
Manufacture of lime
Manufacture of structural stone goods, stone dressing and stone crushing
Manufacture of stonewares, other than images
Manufacture of stone images
Manufacture of plaster of paris and its products
340
341
342
343
344
34S
346
Manufacture of asbestos products 347
Manufacture of mica products 348
35 Manufacture of earthenware and earthen pottery 350
Manufacturc of chinaware and crockery 3S1
Manufacture of porcelain and its products 352
Manufacture ef glass bangles and beads 353
Manufacture of glass apparatus 354
Manufacture of earthen image, busts and statues 355
Manufacture of earthen toys and artwares except those coverd by cede No. 355 356
Manufacture of glass and glass products except optical and photographic lenses and glass products covered above . . 357
Manufacture of other non-metallic mineral products not elsewhere speclfied 359
36 Basic Metals and their Products excepl Mac-hinery and Transport Equipment
Manufacture of iron and s eel including smel-ting, refining, rolling, ct>nversion mto basic forms such as billets, blooms, tubes, rods 360
Manufacture including smelting, refining of non-ferrous metals and alloys in basic forms 361
Manufacture of armaments 362
Manufacture of structural steel products such as joist, rail. loheet, plate .. 363
Manufacture of iron and steel furniture 364
Manufacture of brass and bell metal products 365
Manufacture of aluminium products 366
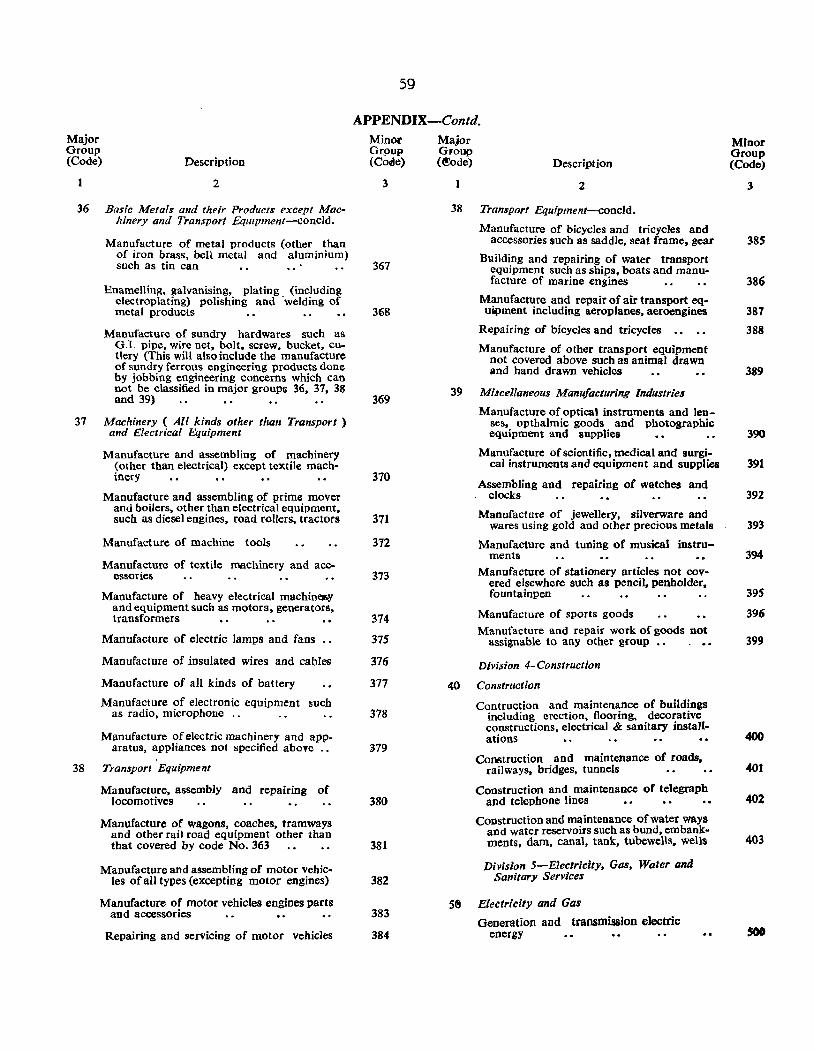
Major Group (Code) Description
1 2
36 Basic Metals and their Products except Machinery and Transport EqUipment-concld.
Manufacture of metal products (other than of iron brass, bell metal and aluminium) such as tin can
Enamelling, galvanising, plating (including electroplating) polishing and -welding of metal products
Manufacture of sundry hardwares such as G.1_ pipe, wire net, bolt, screw. bucket, cutlery (This will also include the manufacture of sundry ferrous engineering products done by jobbing engi.neering concerns which can not be classified in major groups 36, 37, 38 and 39)
37 Machinery ( All kinds other than Transport) and Electrical Equipment
Manufacture and assembling of machinery (other than electrical) except textile machinery
Manufacture and assembling of prime mover and boilers, other than electrical equipment, such as diesel engines, road rollers, tractors
Manufacture of machine tools
Manufacture of textile mechinery and accessories
Manufacture of heavy electrical machin~ and equipment such as motors. generators, transformers
Manufacture of electric lamps and fans ..
Manufacture of insulated wires aod cables
Manufacture of all kinds of battery
Manufacture of electronic equipment such as radio, microphone ..
Manufacture of electric maChinery and apparatus, appliances not specified aboye
38 Transport Equipment
Manufacture, assembly and repairing of locomotives
Manufacture of wagons, coaches, tramways and other rail road equipment other than that covered by code No. 363
Manufacture and assembling of motor vehicles of all types (excepting motor engines)
Manufacture of motor vehicles engines parts and accessories
Repairing and servicing of motor vehicles
S9
APPENDIX-Con/d. MinOl' Grpup (Coe1e)
3
367
368
369
370
371
312
373
374
375
376
377
378
379
380
381
382
383
384
Major Group (i!ode) Description
2
38 Transport Equ;pment-concld.
Manufacture of bicycles and tricycles and accessories such as saddle, seat frame, gear
Building and repairing of water transport equipment such as ships, boats and manufacture of marine engines
Manufacture and repair of air transport equipment including aeroplanes, aeroengines
Repairing of bicycles and tricycles
Manufacture of other transport equipment not covered above such as animal drawn and hand drawn vehicles
39 Miscellaneous Manufacturing Industries
Manufacture of optica1 instruments and lenses, opthalmic goods and photographic equipment and supplies
Manufacture of scientific, medical and surgical instruments and equipment and supplies
Assembling and repairing of watches and clocks
Manufacture of jewellery, silverware and wares using gold and other precious metals
Manufacture and tuning of musical instruments
Manufacture of stationery articles not covered elsewhere such as pencil, penholder, fountainpen
Manufacture of sports goods Manufacture and repair work of goods not
assignable to any other group
Division 4- Construction
40 Construction
Contruction and maintenance of buildings including erection, flooring, decorative constructions, electrical & sanitary installations
Coostruction and maintenance of roads, railways, bridges, tunnels
Construction and maintenance of telegraph and telephone lines
Construction and maintenance of water ways and water reservoirs such as bund, embankments, dam, canal, tank, tubewells. wells
Division 5-Electricity, Gas, Water and Savitary Services
S8 Electricity and Gas
Generation and transmission electric energy
Minor Group (Code)
3
385
386
387
388
389
390
391
392
393
394
395
396
399
400
401
402
403
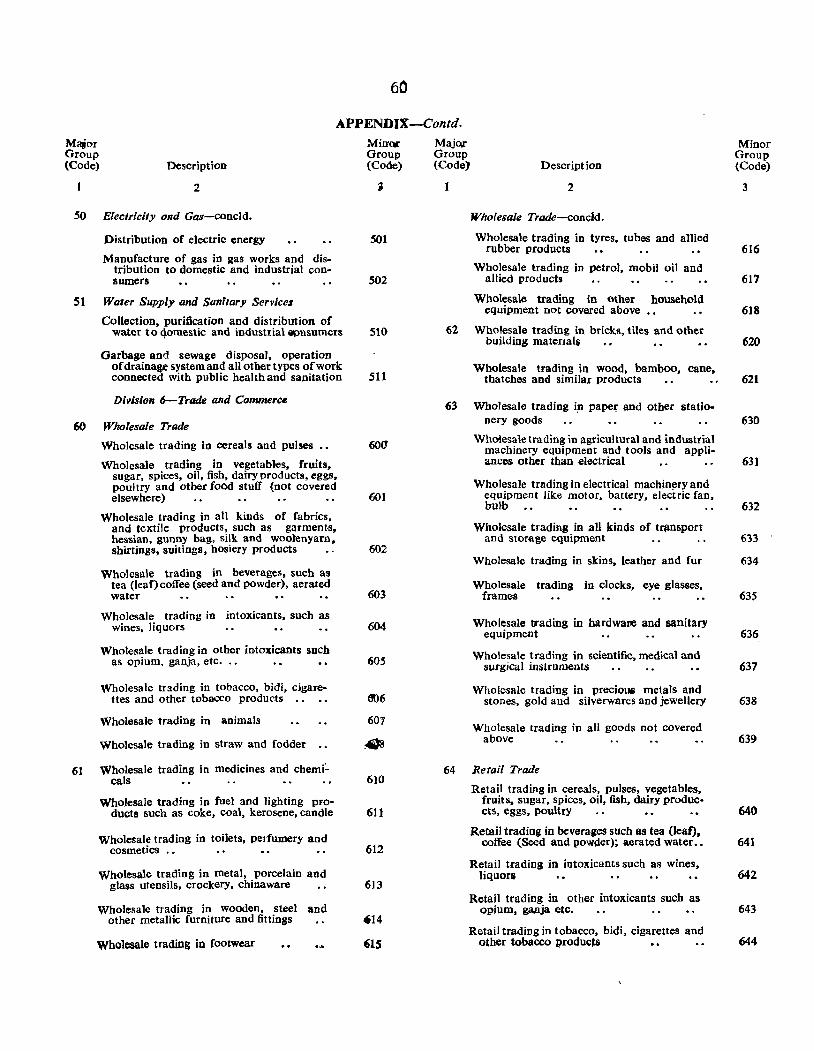
60
APPENDIX-Contd.
Malor Group (Code) Description
2
50 Electricity ond Gas-concld.
Distribution of electric energy
Manufacture of gas in gas works and distribution to domestic and industrial consumers
51 Water Supply and Sanitary Services
Collection, purification and distribution of water to <J,omestic and industrialliPnsumers
Garbage and sewage disposal, operation of drainage system and all other types of work connected with public health and sanitation
Division 6-Trade and Commerce
60 Wholesale Trade
Wholesale trading in cereals and pulses
Wholesale trading in vegetables, Cruits, sugar, spices, oil, fish, dairy products, eggs, poultry and other food stuff (not covered elsewhere)
Wholesale trading in all kinds of fabrics, and textile products, such as garment.s, hessian, gunny bag, silk and woolenyarn. shirtings, suitings, hosiery products
Wholesale trading in beverages, such as tea (leaf) coffee (seed and powder), aerated water
Wholesale trading in intoxicants, such as wines, liquors
Wholesale trading in other intoxicants sucb as opium, ganja, etc ...
Wholesale trading in tobacco, bidi, cigarettes and other tobacco products
Wholesale trading in animals
Wholesale trading in straw and fodder
61 Wholesale trading in medicines and chemi~ cals
Wholesale trading in fuel and lighting products such as coke, coal, kerosene, candle
Wholesale trading in toilets, perfumery and cosmetics .•
Wholesale trading in metal, porcelain and glass utensils, crockery, chinaware
Wholesale trading in wooden, steel and other metallic furniture and fittings
Wbolesale trading in footwear
Minor Group (Code)
~
501
502
510
511
600
60J
602
603
604
60S
606
601
610
611
612
613
~14
615
Majo,r Group (Code)
1
Description
2
Wholesale Trade-concld.
Wholesale trading in tyres, tubes and allied rubber products
Wholesale trading in petrol, mobil oil and allied products
Wholesale trading in other household equipment not covered above
62 Wholesale trading in bricks, tiles and other building materJali
Wholesale trading in wood, bamboo. cane, thatchos and similar products
63 Wholesale trading in paper and other stationery goods
Wholesaletradiog in agricultural and ind~trial machinery equipment and tools and appliances other than electrical
Wholesale trading in electrical machinery and equipment like motor, battery, electric fan, bulb
Wholesale trading in all kinds of trllnsport and storage equipment
Minor Group (Code)
3
616
617
618
620
621
630
631
632
6'33
Wholesale trading in skins, leather and fur 634
Wholesale trading in clocks, eye glasses. frames
Wholesale tJ'ading in hardware and sanitary equipment
Wholesale trading in scientific, medical and surgical instruments
Wholesale trading in precioUi metals and stones, gold and silverwares and jewellery
Wholesale trading in all goods not covered above
64 Re tail Trade
Retail trading in cereals, pulses, vegetables, fruits, sugar, spices, oil, fish, dairy produccts, eggs, poultry
Retail trading in beverages sqch as tea (leaf). coffee (Seed and powder); aerated water •.
Retail trading in intoxicants such as wines, liquors
Retail trading in other intoxicants such as opium, gallja etc.
Retail trading in tobacco, bidi, cigarettes and other tobacco producJs
635
636
637
638
639
640
641
642
643
644
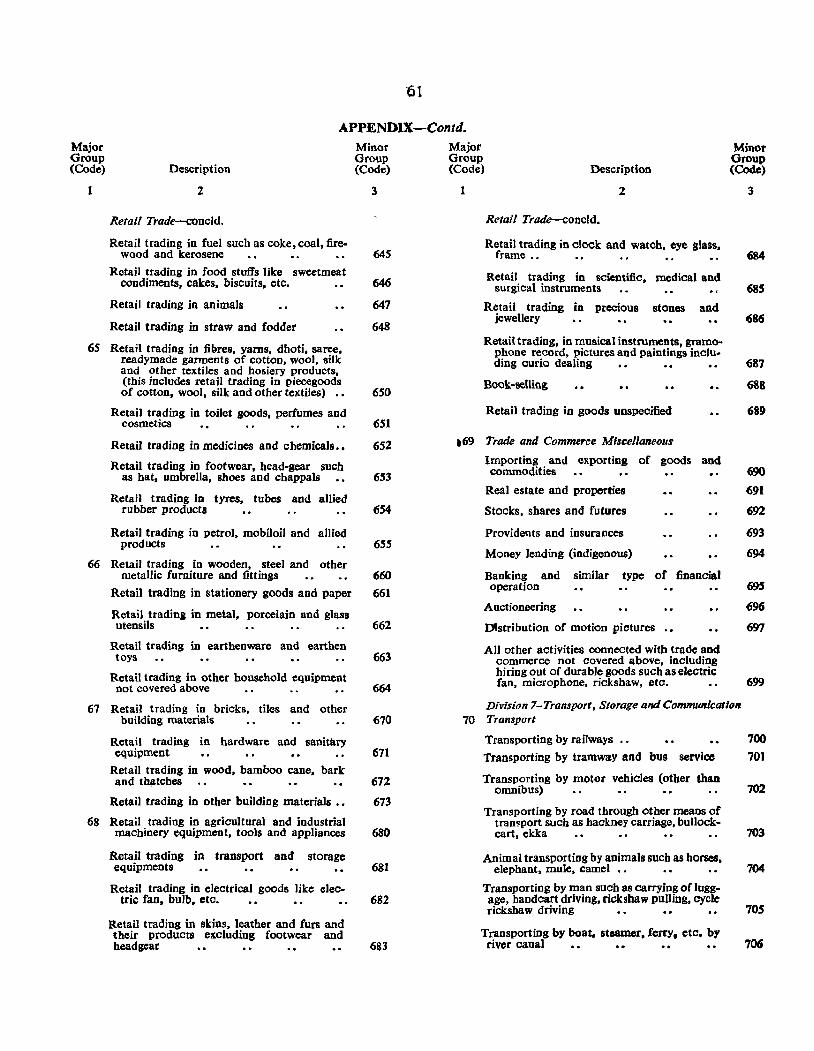
61
APPENDIX-Contd. Major Group (Code)
1
Description
2
Retail Trade--concld.
Retail trading in fuel such as coke, coal, firewood and kerosene
Retail trading in food stuffs like sweetmeat condiments, cakes, biscuits, etc.
Retail trading in animals
Retail trading in straw and fodder
65 Retail trading in fi~res, yams, dhoti, saree, readymade garments of cotton, wool, silk and other textiles and hosiery products, (this includes retail trading in piecegoods of cotton, wool, silk and other textiles) ••
Retail trading in toilet goods, perfumes and cosmetics
Retail trading in medicines and chemicals ••
Retail trading in footwear, head-gear such as hat, umbrella, shoes and cbappals
Retail trading in tyres, tubes and allied rubber products
Retail trading in petrol, mobiloil and allied products
66 Retail trading in wooden, steel and other metallic furniture and fittings
Retail trading in stationery goods and paper
Retail trading in metal, porcelain and glass utensils
Retail trading in earthenware and earthen toys
Retail trading in other housebold equipment not covered above
67 Retail trading in bricks, tiles and other building materials
Retail trading in hardware and sanitary equipment
Retail trading in wood, bamboo cane, bark and thlltches
Retail trading in other building materials ••
68 Retail trading in agricultural and industrial machinery equipment, tools and appliances
Retail trading in transport and storage equipments
Retail trading in electrical goods like electric fan, bulb, etc.
Retail trading in skins, leather and furs and their products excluding footwear and headgear
Minor Group (Code)
3
64S
646
647
648
650
651
652
653
654
6SS
660 661
662
663
664
670
671
672
673
680
681
682
683
Major Group (Code) Description
1 2
Retail Trade-concld.
Retail trading in clock and watcb, eye glass, frame .•
Retail trading in scientific, medical and surgical instruments
Retail trading in precious stones and jewellery
Retail trading, in musical instruments, gramophone record, pictures and paintings including curio dealing • • • • • •
Book-selliBg
Retail trading io goods unspecified
,69 Trade and Commerce Miscellaneous
Importing and exporting of goods and commodities
Real estate and properties
Stocks, shares and futures
Providents and insurances
Money lending (indigenous)
Banking and similar type of financial operation
Auctioneering
Dtstribution of motion pictures
All other activities connected with trade and commerce not covered above, including biring out of durable goods such as electric fan, microphone, rickshaw, etc.
Minor Group (Code)
3
684
68S
~86
687
6S8
689
690
691
692
693
694
695
696
697
699
Division 7-Transport, Storage and Communication 70 Transport
Transporting by railways ••
Transporting by tramway and bus service
Transporting by motor vehicles (other than omnibus)
Transporting by road through other means of tran!'port such as hackney carriage, bullockcart, ekka
Animal transporting by animals such as horses, elephant, mule, camel ••
Transporting by man such as carrying of luggage, handcart driving, rickshaw pulling, cycle rickshaw driving
Transporting by boat. steamer, ferry. etc. by river canal
700 70J
702
703
704
70S
706
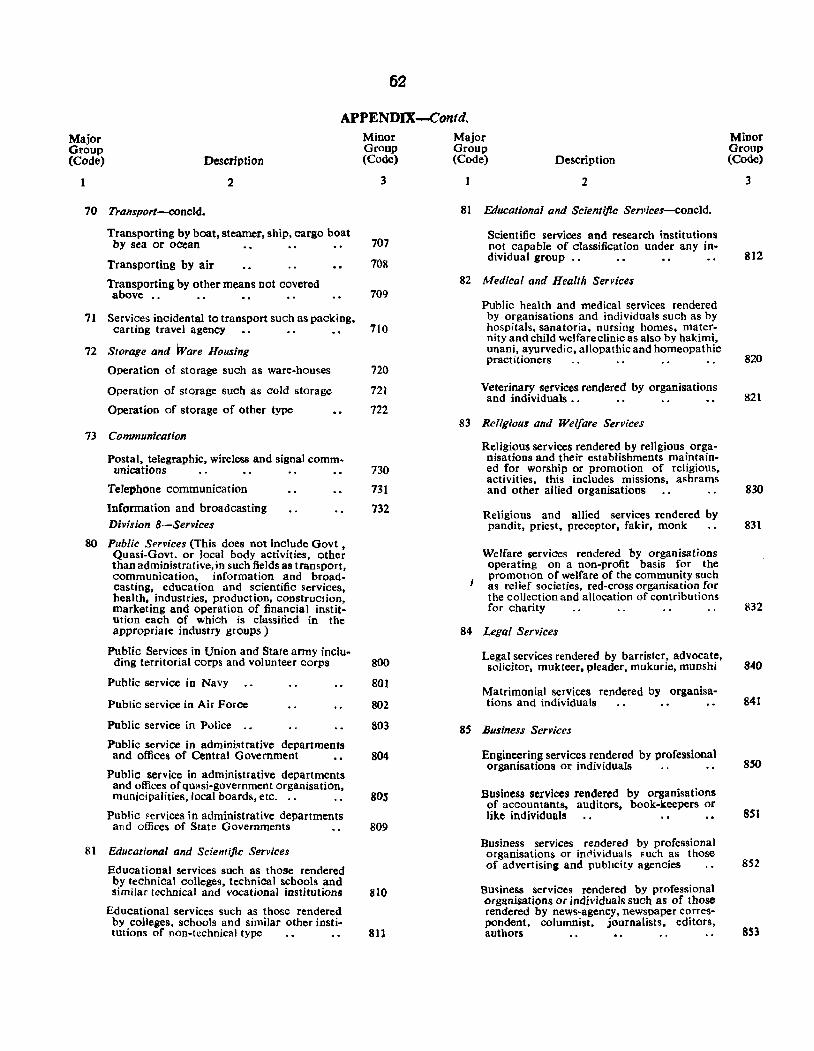
62
APPENDIX--contd. Major Group (Code)
1
Description
2
70 Transporl-concld.
Transporting by boat, steamer, ship, cargo boat by sea or ocean
Transporting by air
Transporting by other means not covered above ..
71 Services incidental to transport such as packing,
Minor Group (Code)
3
707
708
709
carting travel agency 710
72 Storage and Ware Housing
Operation of storage such as ware-houses 720
Operation of storage such as cold storage 721
Operation of storage of other type 722
73 Communication
Postal, telegraphic, wireless and signal comm-unications
Telephone communication
Information and broadcasting Division 8-Services
80 Public Sprvices (This does not include Govt , Quasi·Govt. or local body activities, other than administrative, in such fields as transport, communication, information and broadcasting, education and scientific services, health. industries, production, construction, marketing and operation of financial institution each of which is classiried in the appropriate industry groups)
Public Services in Union and State army inclu-ding territorial corps and volunteer corps
Public service in Navy
Public service in Air Force
Public service in Police
Public service in administrative departments and offices of Central Government
Public service in administrative departments and offices of quasi-government organisation, municipalities, local boards, etc. ..
Public ~ervices in administrative departments ar,d offices of State Governments
81 Educational and Scientiftc Services
Educational services such as those rendered by technical colleges, technical schools and similar technical and vocational institutions
Educational services such as those rendered b~ colleges, schools and similar other institutions of non-technical type
730
731
732
800
801
802
803
804
80S
809
810
811
Major Group (Code) Description
2
81 Educational and Scientific Services-coneld.
Scientific services and research institutions not capable of classification under any individual group .•
82 Medical and Health Services
Public health and medical services rendered by organisations and individuals such as by hospitals, sanatoria, nursing homes, maternity and child welfare clinic as also by hakimi, unani, ayurvedic, allopathic and homeopathic practitioners
Veterinary services rendered by organisations and individuals ..
83 Religious and Welfare Services
Religious services rendered by religious organisations and their establishments maintained for worship or promotion of religious, activities, this includes missions, a!'hrams and other allied organisations
Religious and allied services rendered by pandit, priest, preceptor, fakir, monk
Welfare services rendered by organisations operating on a non-profit basis for the promotIon of welfare of the community such as relief societies, red-cross organisation for the collection and allocation of contributions for charity
84 Legal Services
Legal services rendered by barrister, advocate, solicitor, mukteer, pleader, mukurie, munshi
Matrimonial services rendered by organisations and individuals
85 Business Services
Engineering services rendered by professional organisations or individuals
Business services rendered by organisations of accountants, auditors, book-keepers or like individuals
Business services rendered by professional organisations or in(lividuals FUch as those of advertisina and pubhcity agencies
Bu"iness services rendered by professional organisations or individuals such as of those rendered by news-agency, newspaper correspondent, columnist, journalists, editors, authors
Minor Group (Code)
3
812
820
821
830
831
832
840
841
850
8S1
852
853
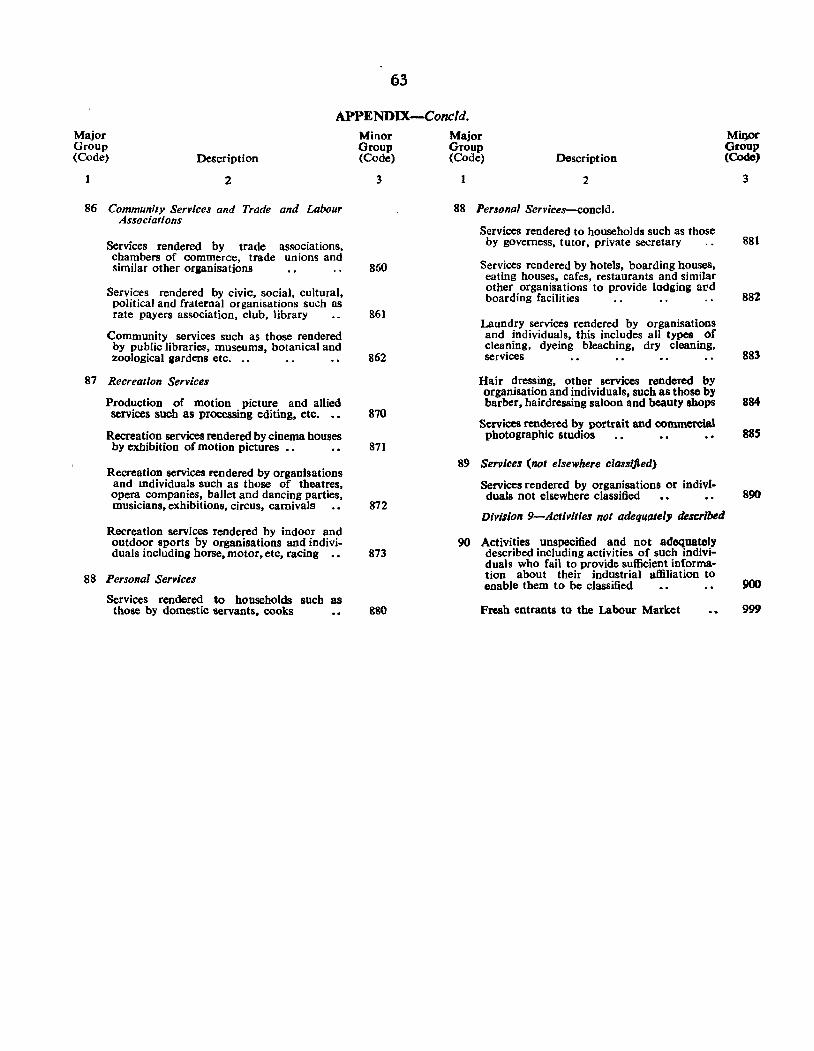
63
APPENDIX-Concld. Major Group (Code) Description
2
86 Community Services and Trade and Labour Associations
Services rendered by trade associations, chambers of commerce, trade unions and similar other organisations
Services rendered by civic, social, cultural, political and fraternal organisations such as rate payers association, club, library
Community services such as those rendered by public libraries, museums, botanical and zoological gardens etc.
87 Recreation Services
Production of motion picture and allied services such as processing editing, etc. • •
Recreation services rendered by cinema houses by exhibition of motion pictures .• • •
Recreation services rendered by organisations and mdividuals such as those of theatres, opera companies, ballet and dancing parties, musicians, exhibitions, circus, carnivals
Recreation services rendered by indoor and outdoor sports by organisations and individuals including horse, motor, etc, racing ••
88 Personal Services
Services rendered to households such as those by domestic servants. cooks
Minor Group (Code)
3
860
861
862
870
871
872
873
&80
Major Group (Code) Description
1 2
88 Personal Services---concld.
Services rendered to households such as those by governess, tutor, private secretary
Services rendered by hotels, boarding houses. eating houses, cafes, restaurants and similar other organisations to provide lodging alld boarding facilities
Laundry services rendered by organisations and individuals, this includes all types of cleaning, dyeing bleaching, dry cleaning, services
Hair dresSing, other services rendered by organisation and individuals, such as those by barber, hairdressing saloon and beauty shops
Services rendered by portrait and commercial photographic studios
89 Services (not elsewhere classi,fted)
Services rendered by organisations or individuals not elsewhere classified
Migor Group (Code)
3
881
882
883
884
885
890
Division 9-Activities not adequately descr/~d
90 Activities unspecified and not adequately described including activities of such individuals who fail to provide sufficient information about their industrial affiliation to enable them to be classified
Fresh entrants to the Labour Market 999
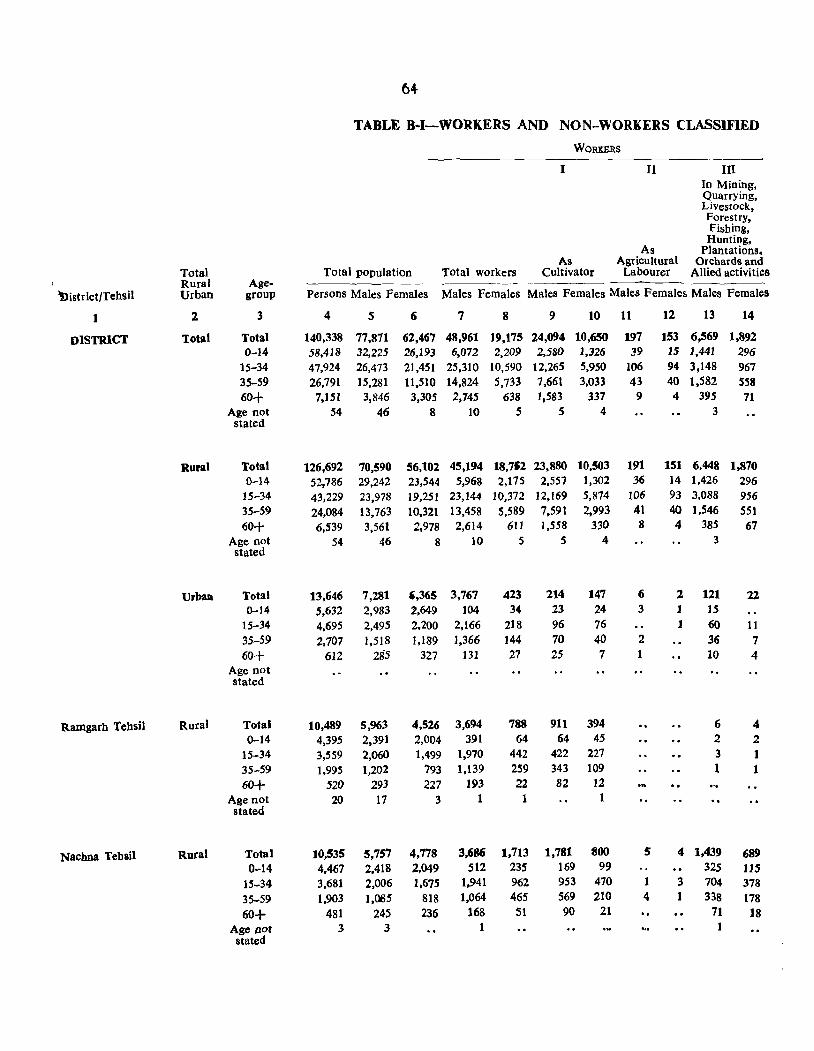
M
TABLE B·I-WORKERS AND NON-WORKERS CLASSIFIED
WORKERS
I II III In Mining, Quarrying, Livestock, Forestry, Fishing,
As Hunting,
Plantations, As Agricultural Orchards and
Total Total population Total workers Cultivator Labourer Allied activities Rural Age-
»istrict/Tehsil Urban group Persons Males Females Males Females Males Females Males Females Males Females
1 2 3 4 S 6 7 8 9 10 11 12 13 14
DISTRICT Total Total 140,338 77,871 62,467 48,961 19,175 24,094 10,650 197 153 6,569 1.892 0-14 58,418 32,225 26,193 6,072 2,209 2,580 1,326 39 15 1,441 296
15-34 47,924 26,473 21,451 25,310 10,590 12,265 5,950 106 94 3,148 967 35-59 26,791 15,281 11,510 14,824 5,733 7,661 3,033 43 40 1,582 S58 60+ 7,151 3,846 3,305 2,745 638 1,583 337 9 4 395 71
Age not 54 46 8 10 5 5 4 3 Slated
Rural Total 126,692 70,590 56,102 45,194 18,752 2.'3,880 10,503 191 151 6,448 1,870 0-14 52,786 29,242 23,544 5,968 2,175 2,557 1,302 36 14 1,426 296
15-34 43,229 23,978 19,251 23,144 10,372 12,169 5,874 106 93 3,088 956 35-59 24,084 13,763 10,321 13,458 5,589 7,591 2,993 41 40 1,546 551 60+ 6,539 3,561 2,978 2,614 611 1,558 330 8 4 385 67
Age not 54 46 8 10 5 5 4 3 stated
Urban Total 13,646 7,281 ',365 3,767 423 214 147 6 2 121 22 0-14 5,632 2,983 2,649 104 34 23 24 3 1 ]5
15-34 4,695 2,495 2.200 2,166 218 96 76 1 60 11 35-59 2.707 1,518 1,189 1,366 144 70 40 2 36 7 60+ 612 285 327 131 27 25 7 10 4
Age not stated
Ramgarh Tehsil Rural Total 10,489 5,963 4,526 3,694 788 911 394 6 4 0-14 4,395 2,391 2,004 391 64 64 45 2 2
15-34 3,559 2,060 1,499 1,970 442 422 227 3 1 35-59 1,995 1,202 793 1,139 259 343 109 1 1 60+ 52() 293 227 193 22 82 12
Age not 20 17 3 1 1 stated
Nachna Tehail Rural Total 10,535 5,7S7 4,778 3,686 1,713 1,781 800 5 4 1,439 689 0-14 4,467 2,418 2,049 512 235 169 99 325 115
15-34 3,681 2,006 1,675 1,941 962 953 470 1 3 704 378
35-59 1,903 1,065 818 1,064 465 569 210 4 1 338 178
60+ 481 245 236 168 51 90 21 71 18 Age Dot stated
3 3
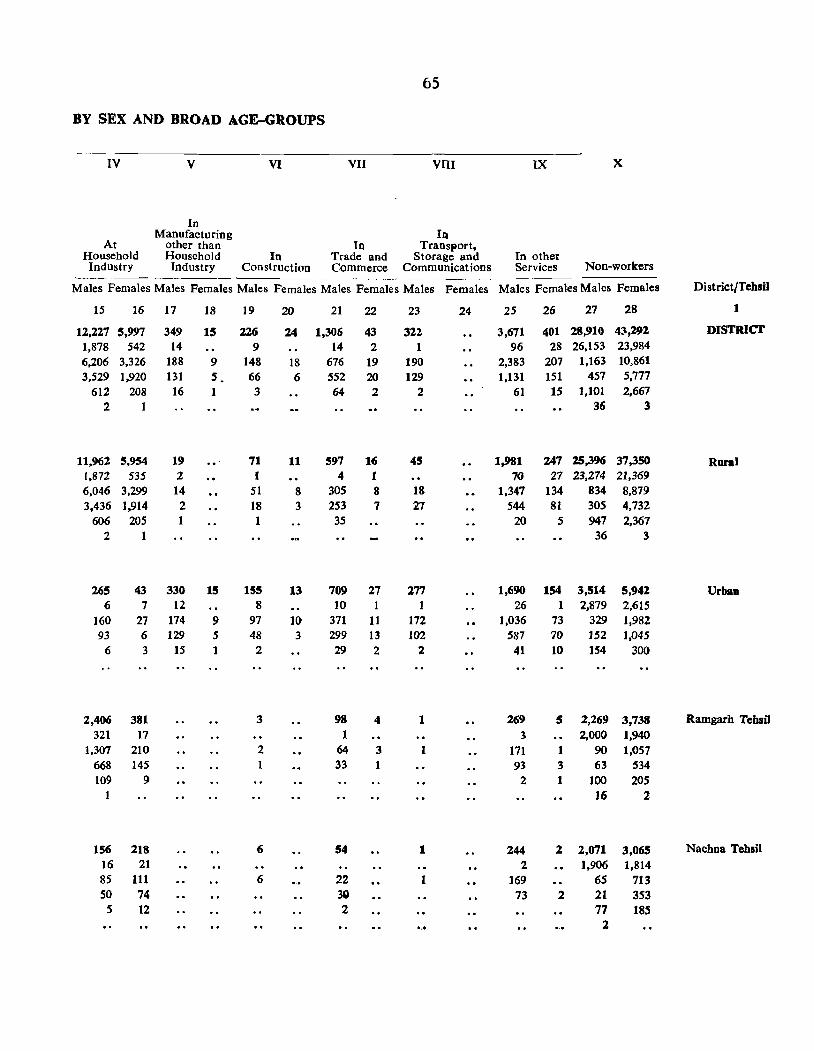
65
BY SEX AND BROAD AGE-GROUPS
IV V VI VII VIII
In Manufacturing IQ
At other than In Transport. Household Household In Trade and Storage and Industry Industry Construction Commerce Communications
Males Females Males Females Males Females Males Females Males Females
15
12,227 1,878 6,206 3,529
612 2
11,962 1,872 6,046 3,436
606 2
265 6
160 93
6
2,406 321
1,307 668 109
1
156 16 85 50
5
16 17 18
5,997 349 15 542 14
3,326 188 9 1,920 131 5.
208 16 1 1
5,954 19 .. 535 2
3,299 14 1,914 2
205 1
43 330 15 7 12
27 174 9 6 129 5 3 15 1
381 17
210 145
9
218 21
III 74 12
19
226 9
148 66 3
71 I
51 18 1
155 8
97 48
2
3
2
6
6
20
24
18 6
11
8 3
13
10 3
21 22
1,306 43 14 2
676 19 552 20 64 2
597 16 4 1
305 8 253 7 35
709 27 10
371 11 299 13 29 2
98 4 1
64 3 33
54
22 3Q
2
23
322 1
190 129
2
45
18 27
277
172 102
2
1
1
1
1
24
IX x
In other Services Non-workers
Males Females Males Females District/Tehsil
2S 26 27 28 1
3,671 401 28,910 43,292 DlSTRlcr 96 28 26,153 23,984
2,383 207 1,163 10,861 1,131 151 457 5,777
61 15 1,101 2,667 36 3
1,981 247 25,396 37,350 Rural 70 27 23,274 2l,369
1,347 134 834 8,879 544 81 30S 4,732
20 5 947 2,367 36 3
1,690 154 3,514 5,942 Urban 26 1 2,879 2,615
1,036 73 329 1,982 587 70 152 1,045
41 10 154 300
269 5 2,269 3,738 Ramgarh Tehsil 3 2,000 1,940
171 1 90 1,057 93 3 63 534
2 1 100 205 16 2
244 2 2,071 3,065 Nachna Tehail 2 1,906 1,814
169 65 713 73 2 21 353
77 18S '}.
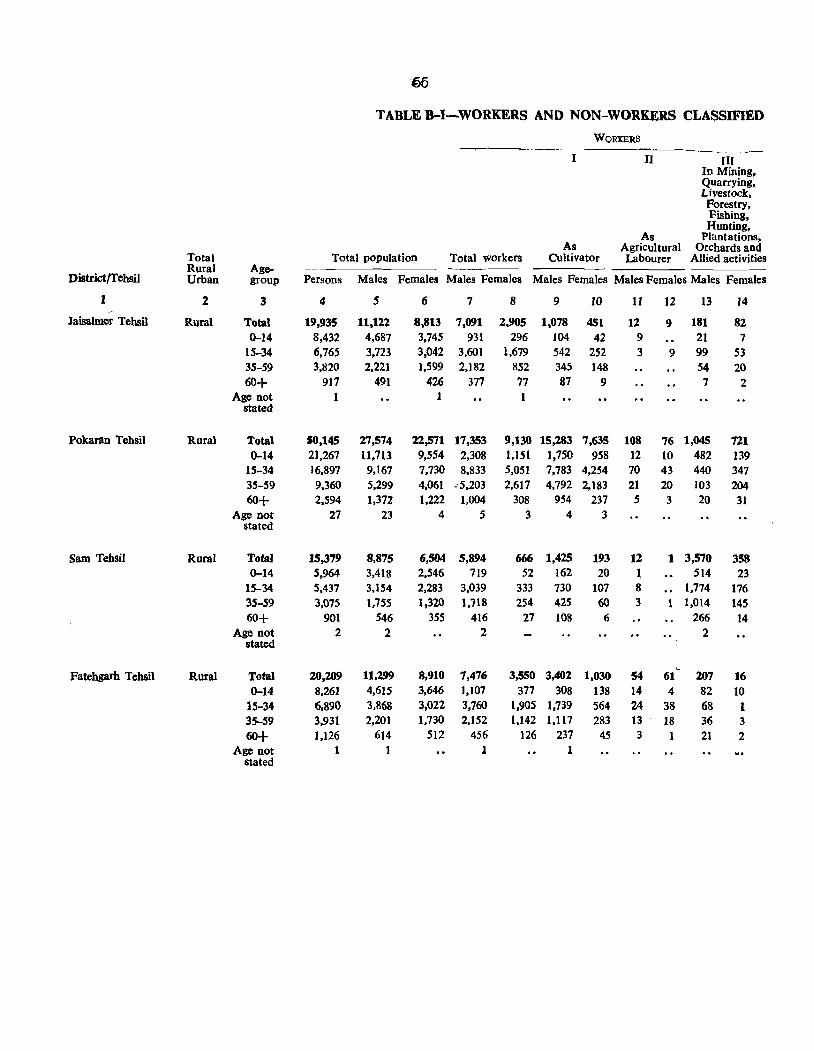
·e6
TABLE B-I-WORKERS AND NON-WORKERS CLASSIFIED
WORXERS
I II III In Mining, QUarrying, Livestock, Forestry, Fishing, Hunting,
As Plantations, As Agricultural Orchards and
Total Total population Total workers Cultivator LabOurer Allied activities Rural Age-
District/Teh$il Urban group Persons Males Females Males Females Males Females Males Females Males Females
I 2 3 4 5 6 7 8 9 10 11 12 13 14 .'
Jaisalmer Tehsil Rural Total 19,935 11,122 8,813 7,091 2,905 1,078 451 12 9 181 82 0-14 8,432 4,687 3,745 931 296 104 42 9 21 7
15-34 6,765 3,723 3,042 3,601 1,679 542 252 3 9 99 53 35-59 3,820 2,221 1,599 2,182 8S2 345 148 54 20
60+ 917 491 426 377 77 87 9 7 2 Age not 1
stated
Pokaran Tehsil Rural Total 10,145 27,574 22,571 17,353 9,130 15,283 7,635 108 76 1,045 721 0-14 21,267 11,713 9,554 2,308 1,151 1,750 958 12 10 482 139
15-34 16,897 9,167 7,730 8,833 5,051 7,783 4,254 70 43 440 347 35-59 9,360 5,299 4,061 ,,5,203 2.617 4,792 2,183 21 20 103 204
60+ 2,S94 1,372 1,222 1,004 308 954 237 5 3 20 31 Age not 27 23 4 5 3 4 3
stated
Sam Tehsil Rural Total 15,379 8,875 6,504 5,894 666 1,425 193 12 1 3,570 358 0-14 5,964 3,418 2,546 719 52 162 20 ~ 514 23
15-34 5,437 3,IS4 2,283 3,039 333 730 107 8 .. 1,774 176 35-59 3,075 1,755 1,320 1,718 254 425 60 3 1 1,014 145 60+ 901 546 35S 416 27 108 6 266 14
Age not 2 2 2 2 stated
~
Fatehgarh Tehsil Rural Total 20,209 11,299 8,910 7,476 3,550 3,402 1,030 54 61 207 16 0-14 8,261 4,615 3,646 ],107 377 308 138 14 4 82 10
15-34 6,890 3,868 3,022 3,760 1,905 1,739 564 24 38 68 1 35-59 3,931 2,201 1,730 2,152 1,142 1,117 283 13 18 36 3
60+ 1,126 614 512 456 126 237 45 3 1 21 2 Age not 1 1 1 1
stated
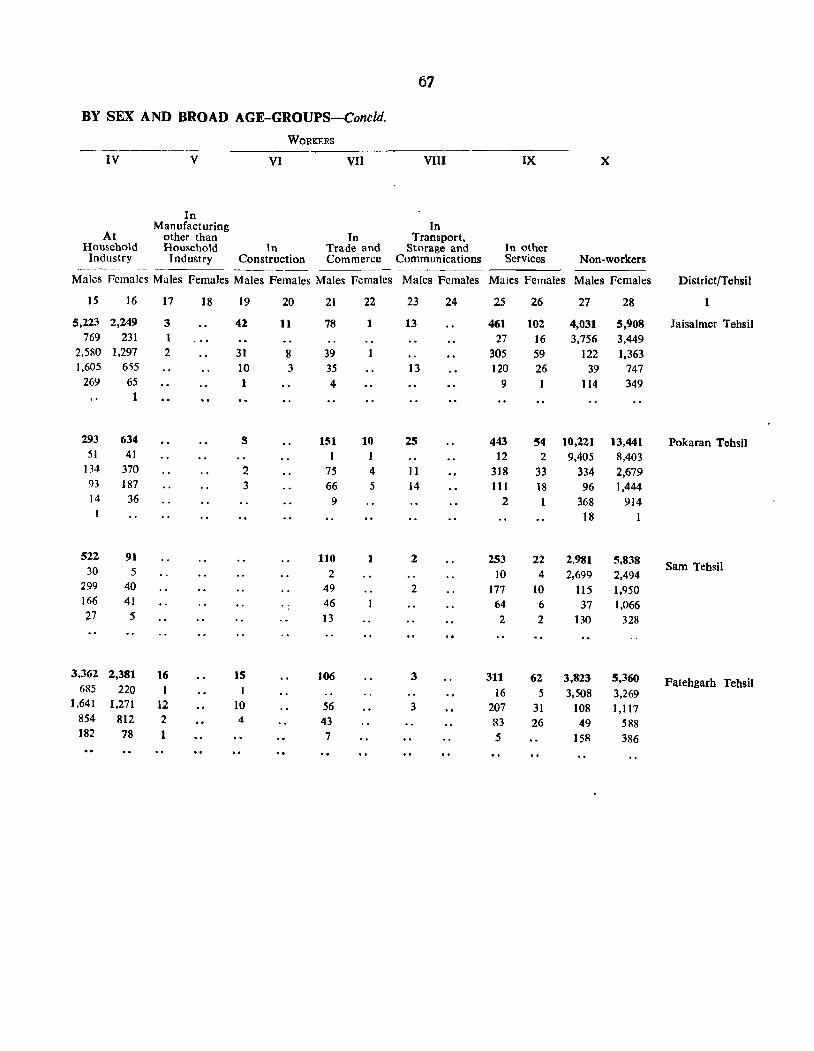
67
BY SEX AND BROAD AGE-GROUPS-Concld.
WORKERS
IV V VI VII VIII IX X
In Manufacturing In
At other than Tn Transport, Household Household In Trade and Storage and In other Industry Industry Construction Commerce Communications Services Non-workers
---- -----~--- ------- ~---~~-
Males Females Males Females Males Females Males Females Males Females Males Females Males Females District/Tehsll
15 16 17 18 19 20 21 22 23 24 2S 26 27 28 1
5,223 2,249 3 42 11 78 1 13 461 102 4,031 5,908 Jaisalmer Tehsil 769 231 1 27 16 3,756 3,449
2,580 1,297 2 31 8 39 305 59 122 1,363 1,605 655 10 3 35 13 120 26 39 747
269 65 I 4 9 114 349 1
293 634 S 151 10 2S 443 54 10,221 13,441 Pokaran Tebsil 51 41 I 1 12 2 9,405 8,403
134 370 2 75 4 11 318 33 334 2,679 93 187 3 66 5 14 III 18 96 1,444 14 36 9 2 1 368 914
18
522 91 110 1 2 253 22 2,981 5,838 Sam Tehsil 30 5 2 10 4 2,699 2,494
299 40 49 2 177 10 115 1,950 166 41 46 64 6 37 1,066 27 5 13 2 2 130 328
3,362 2,381 16 IS 106 3 311 62 3,823 5,3(;0 Fatehgarh Tehsil 685 220 1 I 16 5 3,508 3,269 1.641 1,271 12 10 56 3 207 31 108 1,117
854 812 2 4 43 83 26 49 588 182 78 1 7 S 15R 386
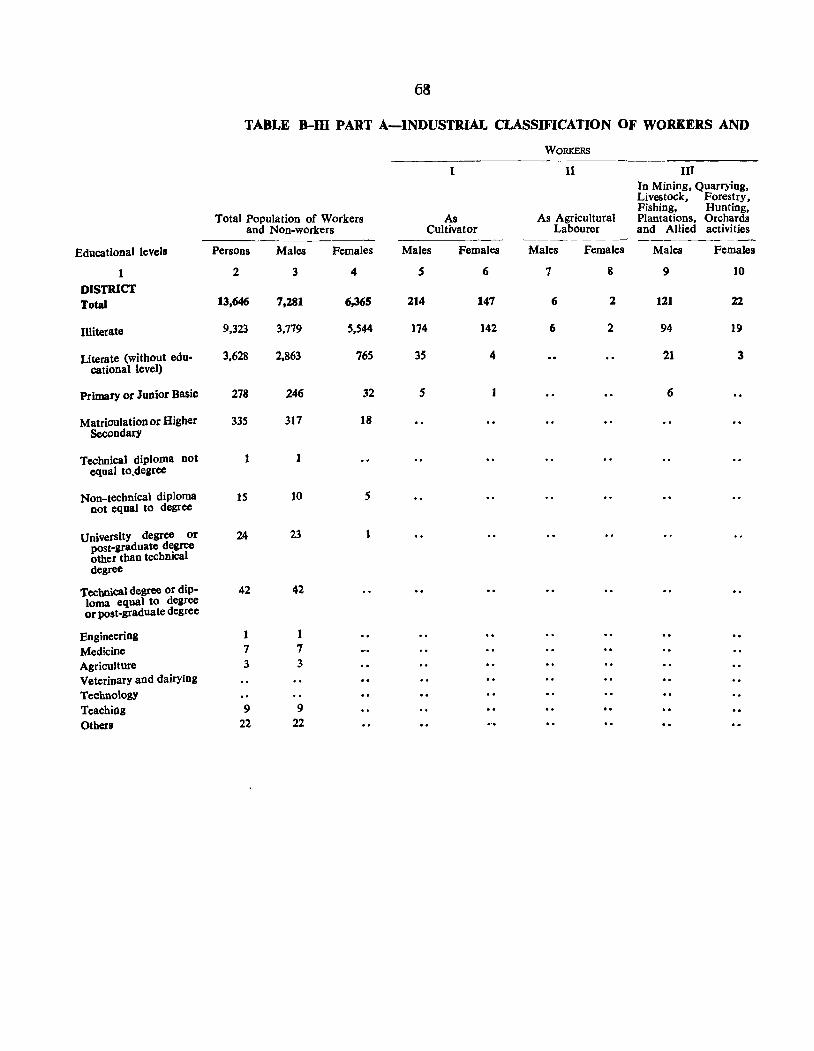
6S
TABLE B-m PART A-INDUSTRIAL CLASSIFICATION OF WORKERS AND
WORKERS
1 n III In Mining, Quarrying, Livestock, Forestry,
Total Population of Workers and Non-workers
Fishing, Hunting, As As Agricultural Plantations, Orchards
Cultivator Labourer and Allied activities
Educational levels Persons Males Females Males Females Males Females Males Females
1 2 3 4 5 6 7 8 9 10
DISTRICt Total 13,646 7,2.81 6,365 214 147 6 2 121 22
Illiterate 9,323 3.779 5,544 174 142 6 2 94 19
Literate (without edu- 3.628 2,863 765 35 4 21 3 cational level)
Primary or Junior Basic 278 246 32 5 6
Matriculation or Higher 335 317 18 Secondary
Technical diploma not 1 equal to.degree
Non-technical diploma not equal to degree
15 10 5
University degree or 24 23 post~graduate degree other than technical degree
Technical degree or dip- 42 42 loma equal to degree or post-graduate degree
Engineering 1 1
Medicine 7 7 Agriculture 3 3 Veterinary and dairying Technology Teaching 9 9
Others 22 22
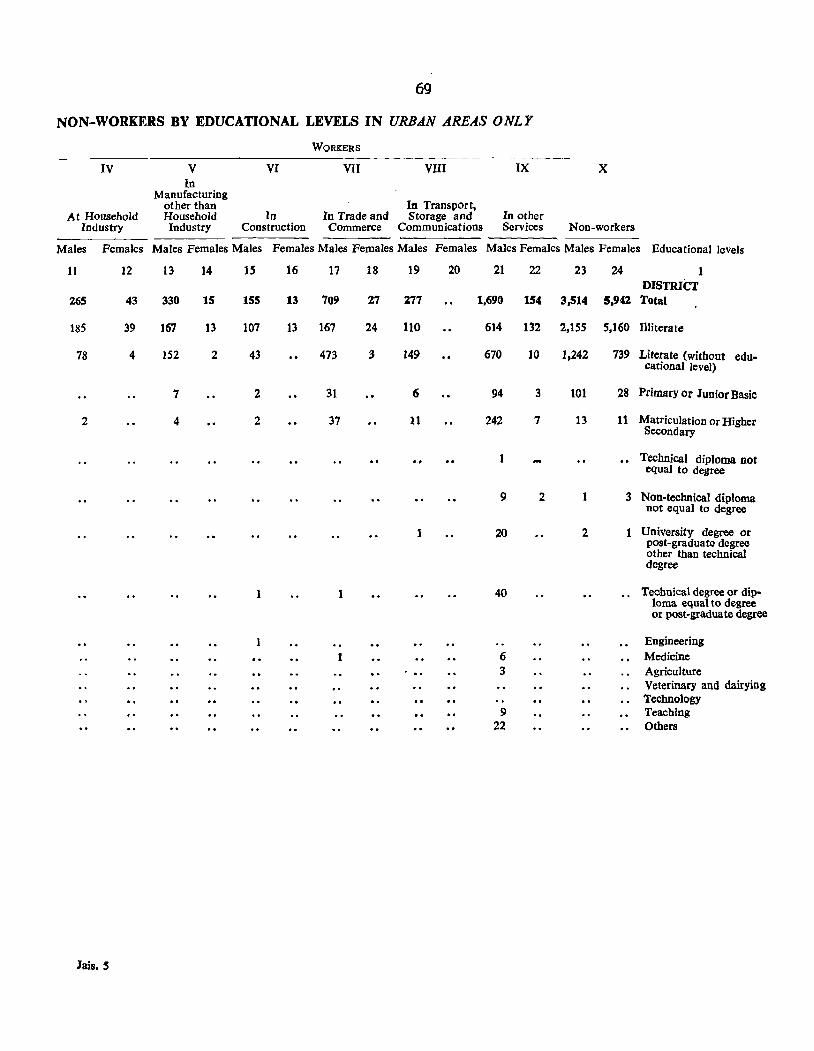
69
NON-WORKERS BY EDUCATIONAL LEVELS IN URBAN AREAS ONLY
WORKERS
IV V VI VII VIII IX X In
Manufacturing other than In Transport,
At Household Household In In Trade and Storage and In other Industry Industry Construction Commerce Communications Services Non-workers
Males Females Males Females Males Females Males Females Males Females Males Females Males Females Educational levels
11 12 13 14 15 16 17 18 19 20 21 22 23 24 1 DISTRICT
265 43 330 15 155 13 709 27 277 1,690 154 3,514 5,942 Total
185 39 167 13 107 13 167 24 110 614 132 2,155 5,160 Illiterate
78 4 152 2 43 473 3 149 670 10 1,242 739 Literate (without edu-cational level)
7 2 31 6 94 3 101 28 Primary Or Junior Basic
2 4 2 37 11 242 7 13 11 Matriculation or Higher Secondary
Technical diploma not equal to degree
9 2 3 Non-technical diploma not equal to degree
1 20 2 1 University degree or post-graduate degree other than technical degree
1 40 Technical degree or dip-loma equal to degree or post-graduate degree
1 Engineering
1 6 Medicine 3 Agriculture
Veterinary and dairying Technology
9 Teaching 22 Others
Iais. S
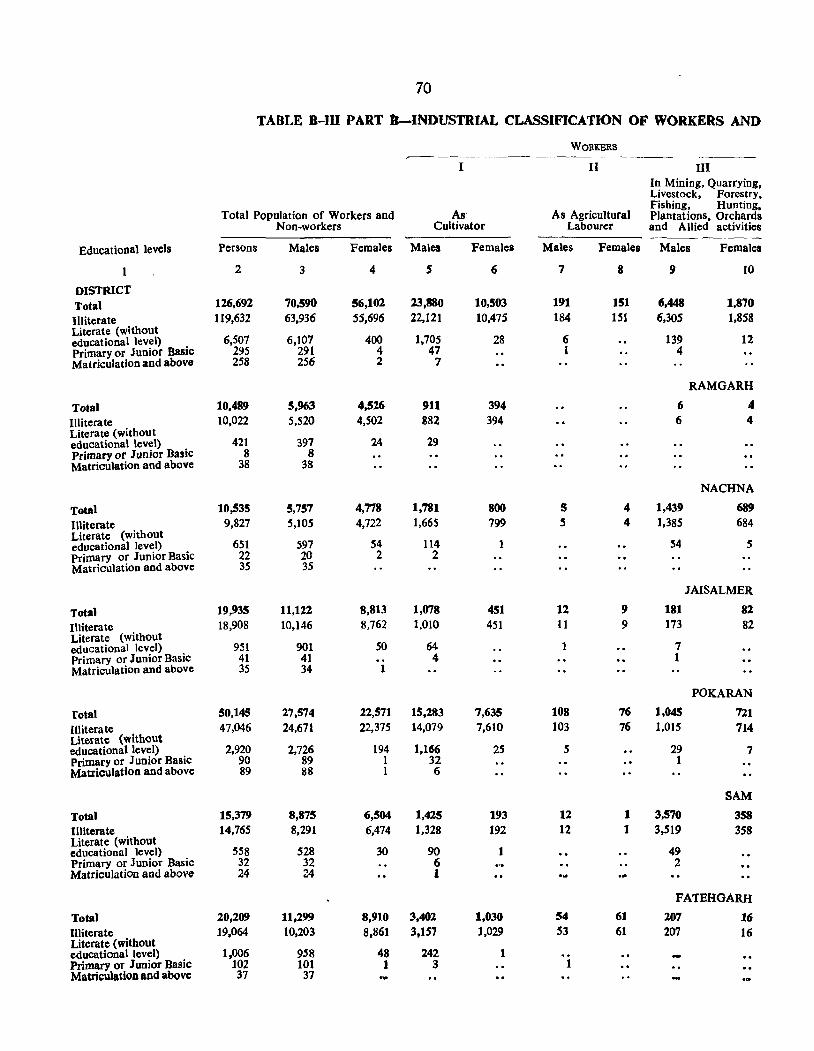
70
TABLE 8-In PART B-lNDUSTRIAL CLASSIFICATION OF WORKERS AND
WORKERS
I II III In Mining, QuarrYing, Livestock, Forestry,
Total Population of Workers and As' As Agricultural Fishing, Hunting, Plantations, Orchards
Non-workers Cultivator Labourer and Allied activities
Educational levels Persons Males Females Males Females Males Females Males Females
2 3 4 5 6 7 8 9 to
DISTRICT Total 126,692 70,590 56,102 23,880 10,503 191 151 6,448 1,870
Illiterate 119,632 63,936 55,696 22,121 10,475 184 151 6,305 1,858 Literate (without
6,507 6,107 400 1,705 28 6 139 12 educational level) Primary or Junior Basic 295 291 4 47 I 4 Matriculation and above 258 256 2 7
RAMGARH
Total 10.489 5,963 4,526 911 394 6 4
llliterate 10,022 5,520 4,502 882 394 6 4 Literate (without
421 397 24 29 educational level) Primary or Junior Basic 8 8 Matriculation and above 38 38
NACHNA
Total 10,535 5,757 4,778 1,781 800 5 4 1,439 689
Illiterate 9,827 5,105 4,722 1,665 799 5 4 1,385 684 Literate (without
651 591 54 114 54 educational level) 1 5 Prixnary or Junior Basic 22 2(} 2 2 Matriculation and above 35 35
JAISALMER
Total 19,935 11,122 8,813 1,078 451 12 9 181 82
Illiterate 18,908 10,146 8,762 1,010 451 11 9 173 82 Literate (without
50 educational level) 951 901 64 1 7 Primary or Junior Basic 41 41 4 1 Matriculation and above 35 34 1
POKARAN
Total 50,145 27,574 22,571 15,283 7,635 108 76 1.045 721
llliterate 47,046 24,671 22,375 14,079 7,610 103 76 1.015 714 Literate (without educational level) 2,920 2,726 194 1,166 25 5 29 7 Primary or Junior Basic 90 89 1 32 1 Matriculation and above 89 88 1 6
SAM
Total 15,379 8,875 6,504 1,425 193 12 1 3,570 358 Illiterate 14,765 8,291 6,474 1,328 192 12 t 3,519 358 Literate (without educational level) 558 528 30 90 1 49 Primary or Junior Basic 32 32 6 2 Matriculation and above 24 24 1
FATEHGARH
Total 20,209 11,299 8,910 3,402 1,030 54 61 207 16 Illiterate 19.064 10,203 8.861 3.157 1,029 53 61 207 16 Literate (without educational level) 1,006 958 48 242 1 Primary or Junior Basic 102 101 1 3 1 Matriculation and above 37 37
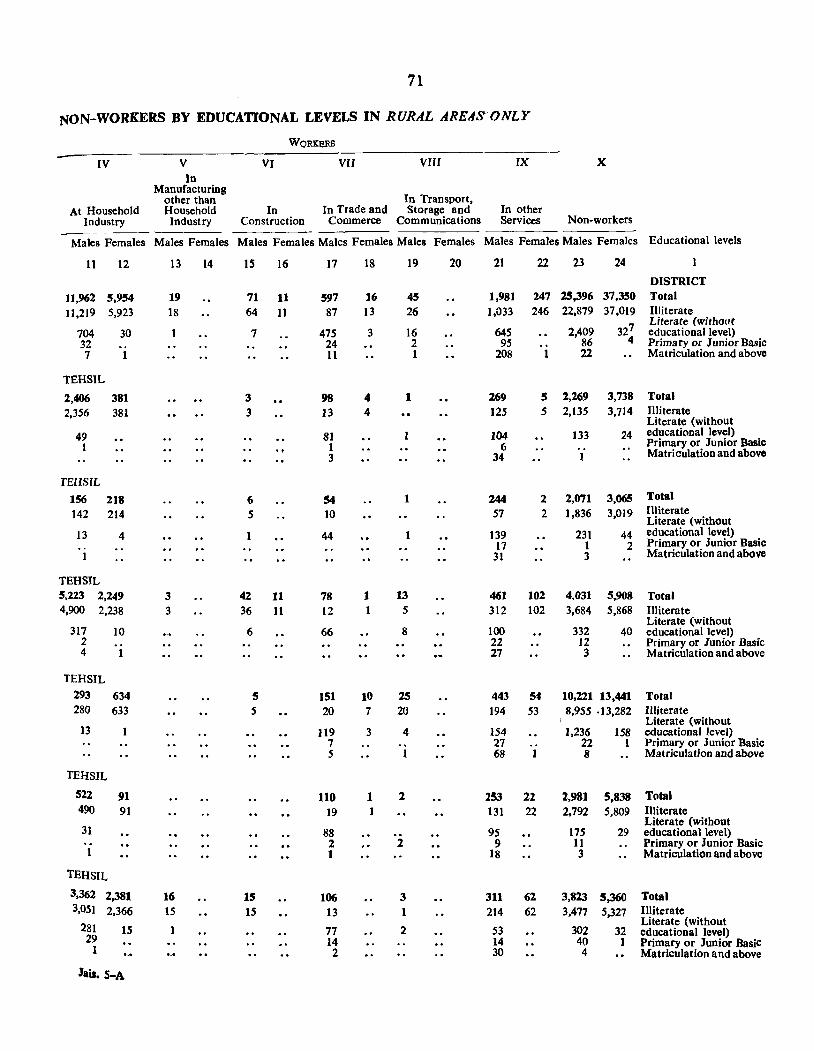
71
NON-WORKERS BY EDUCATIONAL LEVELS IN RURA.L AREAS ONLY
WORKERS
IV V VI vn VIII IX X In
Manufacturing other than In Transport,
At Household Household In In Trade and Storage and In other Industry Industry Construction Commerce Communications Services Non-workers
Males Females Males Females Males Females Males Females Males Females Males Females Males Females Educational levels
II 12 13 14 IS 16 17 18 19 20 21 22 23 24
DISTRICT
11,962 5,954 19 71 II 597 16 45 1,981 247 25,396 37,350 Total
11,219 5,923 18 64 11 87 13 26 1,033 246 22,879 37,019 Illiterate
327 Literate (without
704 30 7 475 3 16 645 2,409 educational level) 32 24 2 95 86 4 Primary or Junior Basic 7 11 1 208 22 Matriculation and above
TEHSIL
2,406 381 3 98 4 1 269 5 2,269 3,738 Total
2,356 381 3 13 4 125 5 2,135 3,714 Illiterate Literate (without
49 81 104 133 24 educational level) 1 ., 1 6 Primary or Junior Basic
3 34 Matriculation and above
TEHSlL
156 218 6 54 1 244 2 2,071 3,065 Total
142 214 5 IO 57 2 1,836 3,019 Illiterate Literate (without
13 4 1 44 139 231 44 educational level) 17 1 2 Primary or Junior Basic
31 3 Matriculation and above
TEHSIL 5,223 2,249 3 42 11 78 1 13 461 102 4,031 5,908 Total 4,900 2,238 3 36 11 12 5 312 102 3,684 5,868 Illiterate
317 10 6 66 8 100 Literate (without
332 40 educational level) 2 2Z IZ Primary or Junior Basic 4 27 3 Matriculation and above
TEHSIL 293 634 5 151 10 2S 443 54 10,221 13,441 Total 280 633 5 20 7 20 194 53 8,955 ·13,282 Illiterate
13 4 Literate (without
119 3 J54 1,236 158 educational level) 7 27 22 1 Primary or Junior Basic 5 68 8 Matriculation and above
TEHSIL
522 91 110 1 2 253 22 2,981 5,838 Total 490 91 19 131 22 2.792 5,809 Illiterate
31 Literate (without
88 95 175 29 educational level) 2 2 9 11 Primary or Junior Basic
1 1 18 3 Matriculation and above
TEHSIL
3,362 2,381 16 15 106 3 311 62 3,823 5,360 Total 3,051 2,366 15 15 13 1 214 62 3,477 5,327 Illiterate
281 IS 77 2 53 302 Literate (without
32 educational level) 29 14 14 40 1 Primary or Junior BasiC
1 2 30 4 Matriculation and above
.Jais. S-A
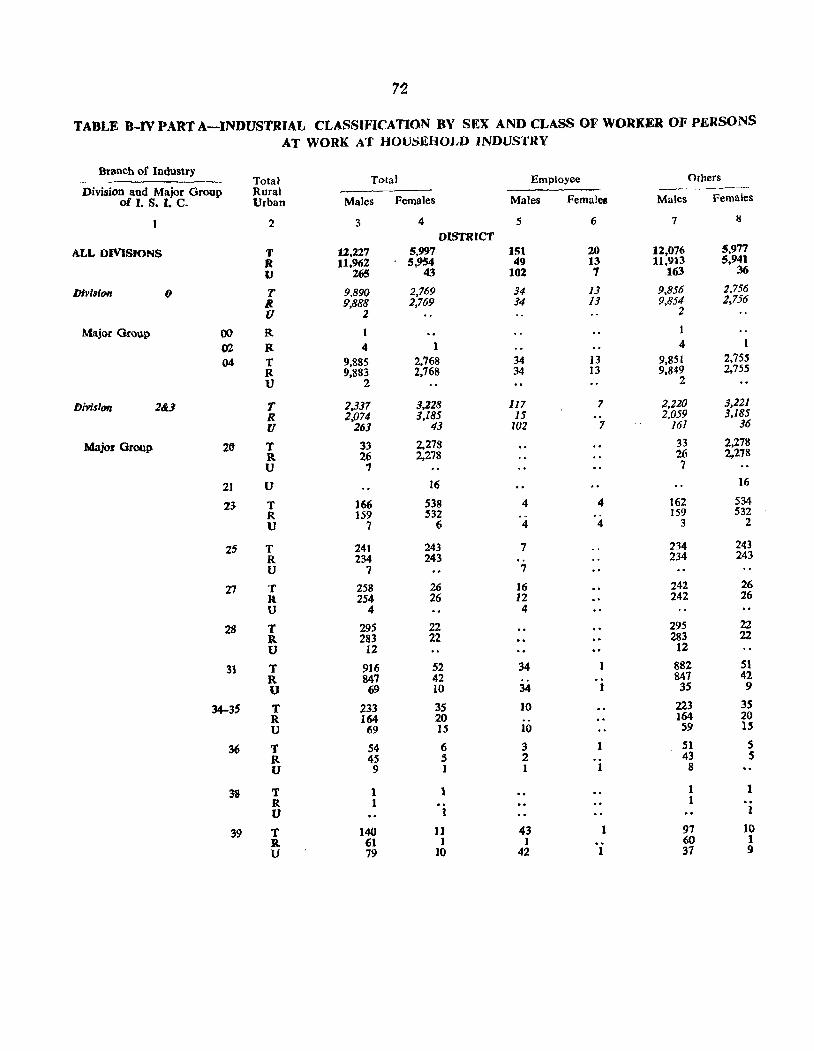
72
TABLE B-IV PART A-INDUSTRIAL CLASSIFICATION BY SEX AND CLASS OF WORKER OF PERSONS AT WORK AT HOUSEHOLD INDUSTRY
Branch of Industry Tota} Total Employee Others
Division and Major Group Rural of I. S. I. C. Urban Males Females Males Female. Males Females
2 3 4 5 6 7 Ij
DISTRICT ALL DIVISIONS T 12,227 5,997 1St 20 12,076 5,977
R 11,962 5,954 49 13 11,913 5,941
V 265 43 102 7 163 36
Dfvinon 0 T 9.890 2,769 34 13 9,856 2,756
R 9,888 2,769 34 13 9,854 2,756
U 2 Z
Major GrQUp ()() R 1 1
OZ R 4 1 4
04 T 9,885 2,768 34 13 9,851 2,755
R 9,883 2,768 34 13 9,849 2,755
U 2 2
Dmsi"" 2&3 T 2,337 3,228 117 7 2.220 3,221 R 2,074 3,185 15 2,059 3,185
U 263 43 102 7 161 36
Major Group 20 T 33 2,278 33 2,278 R 26 2,278 26 2,278
U 7 7
21 U 16 16
23 T 166 538 4 4 162 534 R 159 532 159 532
U 7 6 4 4 3 2
25 T 241 243 7 234 243 R 234 243 234 243
U 7 7
27 T 258 26 16 242 26 R 254 26 12 242 26 U 4 4
28 T 295 22 295 22
It 283 22 283 22 U 12 12
31 T 916 52 34 1 882 51 R 847 42 .. 847 42
U 69 10 34 J 35 9
34-35 T 233 35 10 223 3S R ]64 20 ]64 20 U 69 15 10 59 lS
T 54 6 3 1 51 5 R 45 5 2 43 S U 9 1 1 1 8
38 T 1 1 1 1 R 1 1 U 1
39 T 140 11 43 1 97 10 R. 61 1 1 60 1
U 79 10 42 1 37 9
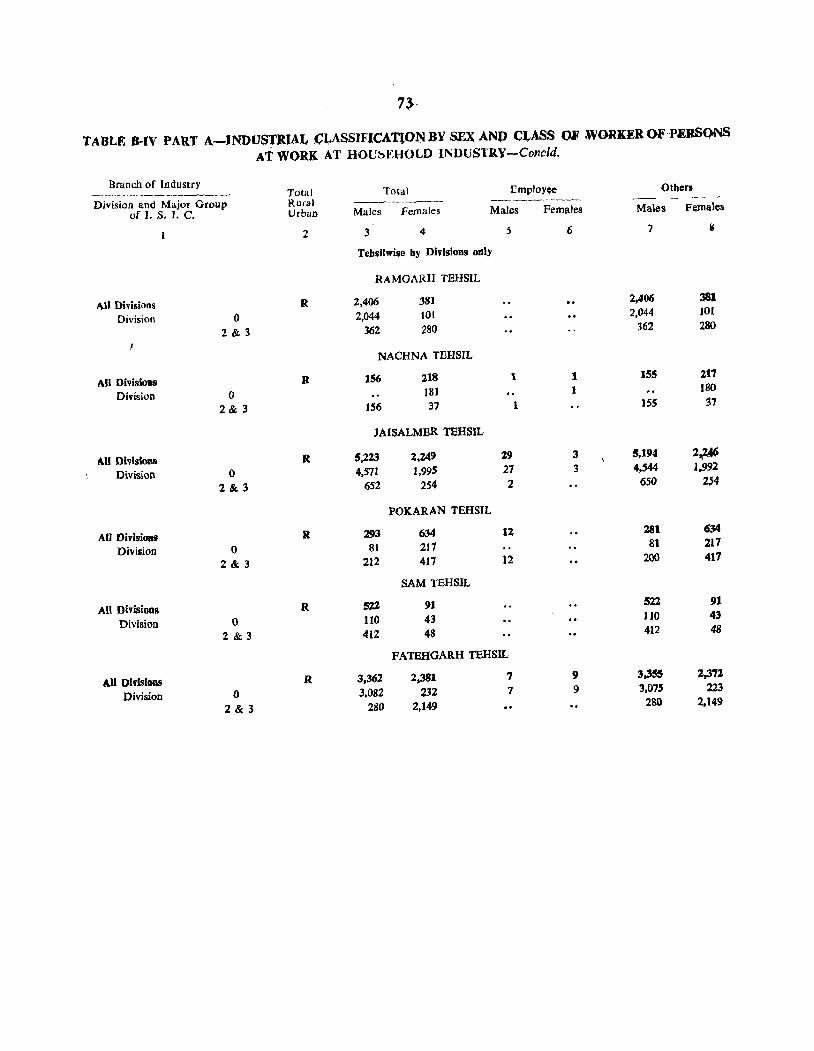
1:}·
TABLE 8.IV PART A-INDUSTlUA~ .~J,ASSIFICAnOl'JBY SEX AND CLASS OF WORKEROF,PI!:BSOOS AT WORK AT HOV~EHOLD {l'<DUSl'RY-C01lcld.
Branch of Industry ------~-~- Total Total EmploYQe Others
Division and Major Group Rural ----- --- -~ -of I. S. I. C. Urban Males Females Males Females Males F~rna}cs
2 3 4 5 6 7 II
TehsiIwise by Divisions onl)
RAMGARH TEHSIL
All Dhisions R 2,406 381 2,406 381
Division 0 2,044 tOl 2,044 101
2 &: 3 36Z 280 362 280
NACHNA TEHSIL
All Divisions R 156 218 1 1 155 211
Division 0 181 1 180
2 & 3 156 37 1 ISS 37
JAISALMER TEHSIL
,..11 Divisions R 5,223 2,249 29 3 5,194 2~
Division 0 4,571 1,995 27 3 4,544 1,992
2&3 652 254 2 650 254
POKARAN TEHSIL
An DivisiOllll R 293 634 12 281 634
Division 0 81 217 81 217
2 & 3 212 417 12 200 417
SAM TEHSIL
All Divisions R 52Z 91 522 91
Division 0 110 43 110 43
2&3 412 48 412 48
FATEHGARH TEHSIL
All Diflsious R 3,362 2,381 7 9 3,355 2,372
Division 0 3.082 232 7 9 3,075 223
2&3 280 2,149 280 2,149
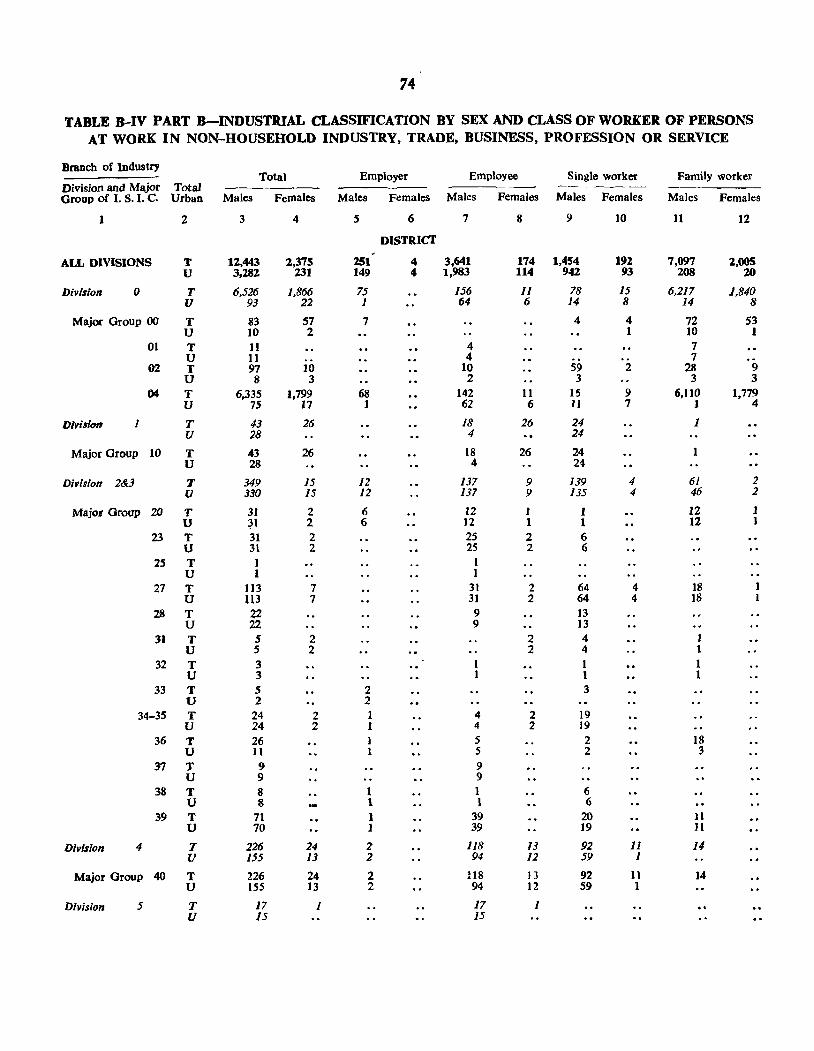
74
TABLE B-IV PART B-INDUSTRIAL CLASSIFICATION BY SEX AND CLASS OF WORKER OF PERSONS AT WORK IN NON-HOUSEHOLD INDUSTRY, TRADE, BUSINESS, PROFESSION OR SERVICE
Branch of Industry Total Employer Employee Single worker Family worker
Division and Major Total Group of I. S. I. C. Urban Males Females Males Females Males Females Males Females Males Females
1 2 3 4 5 6 7 8 9 10 11 12
DISTRICf
ALL DIVISIONS T 12,443 2,375 251 4 3,641 174 1,454 192 7,097 2,005 U 3,282 231 149 4 1,983 114 942 93 208 20
Division 0 T 6.526 1.866 75 156 11 78 15 6.217 1.840 U 93 22 1 64 6 14 8 14 8
Major Group 00 T 83 57 7 4 4 72 53 U 10 2 1 10 1
01 T 11 4 7 U 11 4 7
0'2 T 97 10 10 S9 2 28 9 U 8 3 2 3 3 3
04 T 6,335 1.799 68 142 11 15 9 6,110 1,779 U 75 17 1 62 6 Jl 7 J 4
DiYisitm I T 43 26 18 26 24 1 U 28 4 24
Major Group 10 T 43 26 18 26 24 1 U 28 4 24
Division 2&3 T 349 IS 12 137 9 /39 4 61 2 V 330 15 12 137 9 135 4 46 2
Major Group 20 T 31 2 6 12 I I 12 1 U ~l 2 6 12 1 1 12 1
23 T 31 2 25 2 6 U 31 2 25 2 6
25 T 1 I U 1 1
27 T 113 7 31 2 64 4 18 U 113 7 31 2 64 4 18
28 T 22 9 13 U 22 9 13
3) T 5 2 2 4 1 U 5 2 2 4 1
32 T 3 1 1 1 U 3 1 1 1
33 T 5 2 3 U 2 2
34-35 T 24 2 1 4 2 19 V 24 2 I 4 2 19
36 T 26 1 5 2 18 U It 1 5 2 3
37 T 9 9 U 9 9
38 T 8 1 1 6 U 8 1 1 6
39 T 71 1 39 20 11 U 70 1 39 19 11
Division 4 T 226 24 2 lI8 13 92 11 14 U 155 /3 2 94 12 59 1
Major Group 40 T 226 24 2 118 1) 92 11 14 V 155 13 2 94 12 59 1
Division 5 T 17 1 17 1 U 15 15
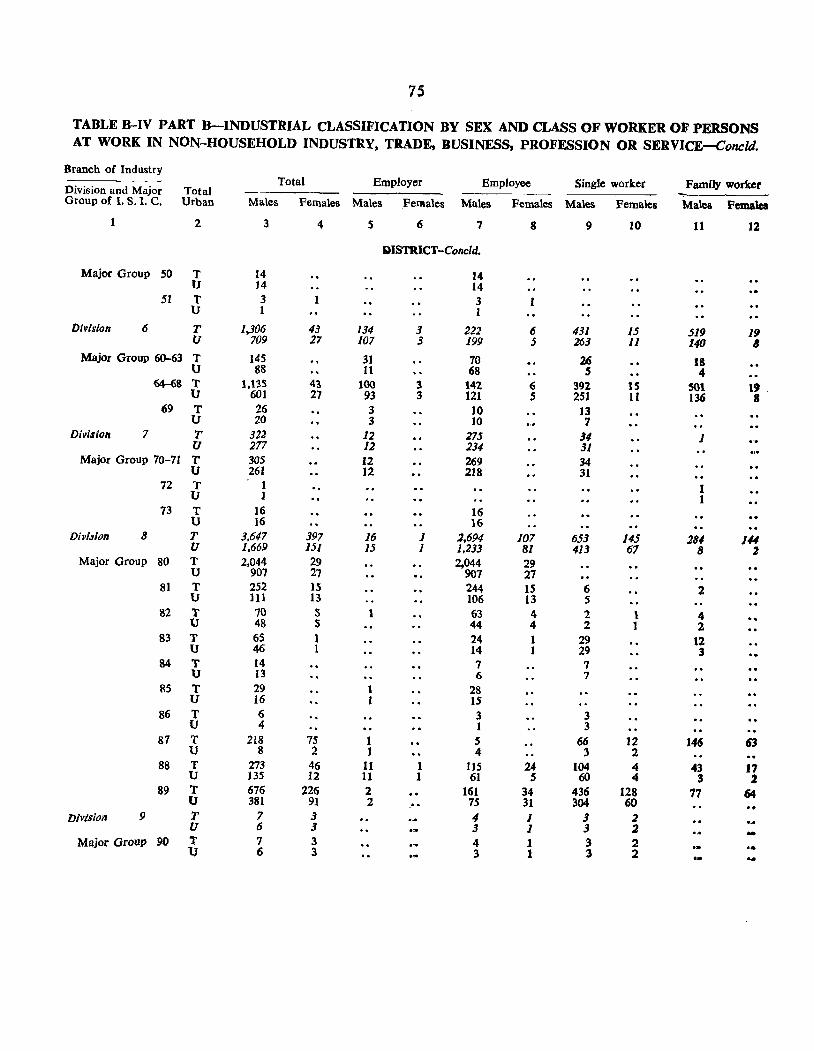
75
TABLE B-IV PART B-INDUSTRIAL CLASSIFICATION BY SEX AND CLASS OF WORKER OF PERSONS AT WORK IN NON-HOUSEHOLD INDUSTRY, TRADE, BUSINESS, PROFESSION OR SERVICE-Concld.
Branch of Industry Total Employer Employee Single worker Family worker Division and Major Total
Group of I. S. 1. C. Urban Males Females Males _Felllaies Males Females Males Females Males Femalea
2 3 4 S 6 7 8 9 10 11 12
QISTRICT -Conc1d.
Major Group SO T 14 14 U 14 14
51 T 3 3 U 1 1
Division 6 T 1,306 43 134 3 222 6 431 15 519 19 U 709 27 107 3 199 5 263 11 14(J IJ
Major Group 60-63 T 145 31 70 26 18 U 88 11 68 5 4
E4--68 T 1,13S 43 100 3 142 6 392 15 SOl 19 . U 601 27 93 3 121 5 251 11 136 8 69 T 26 3 10 13
U 20 3 10 7 Division 7 T 322 12 275 34 1
U 277 12 234 31 Major Group 70-71 T 305 12 269 34
U 261 12 218 31 72 T 1 1 U 1 1 73 T 16 16
U 16 16 Divis;()n 8 T 3.647 397 16 J 2,694 107 653 145 284 IN
U 1,669 151 15 1 1,233 81 413 67 8 2 Major Group 80 T 2,044 29 2,044 29
U 907 27 907 27 81 T 252 IS 244 15 6 2
U 111 13 106 13 5 82 T 70 S 1 63 4 2 \ 4
tJ 48 S 44 4 2 1 2 83 T 65 1 24 1 29 12
U 46 1 14 1 29 3 84 T 14 7 7
U 13 6 7 85 T 29 1 28
U 16 1 IS 86 T 6 3 3
U 4 1 3 81 T 218 7S 1 S 66 12 J46 63
U 8 2 1 4 3 2 88 T 273 46 11 1 115 24 104 4 43 17
U 135 12 11 I 61 5 60 4 3 2 89 T 676 226 2 161 34 436 128 77 64
U 381 91 2 . . 7S 31 304 60 .. Division 9 T 7 3 " J 3 2
U 6 3 3 1 3 2 -Major Group 90 T 7 3 4 1 3 2 •• U 6 3 3 1 3 2 ..
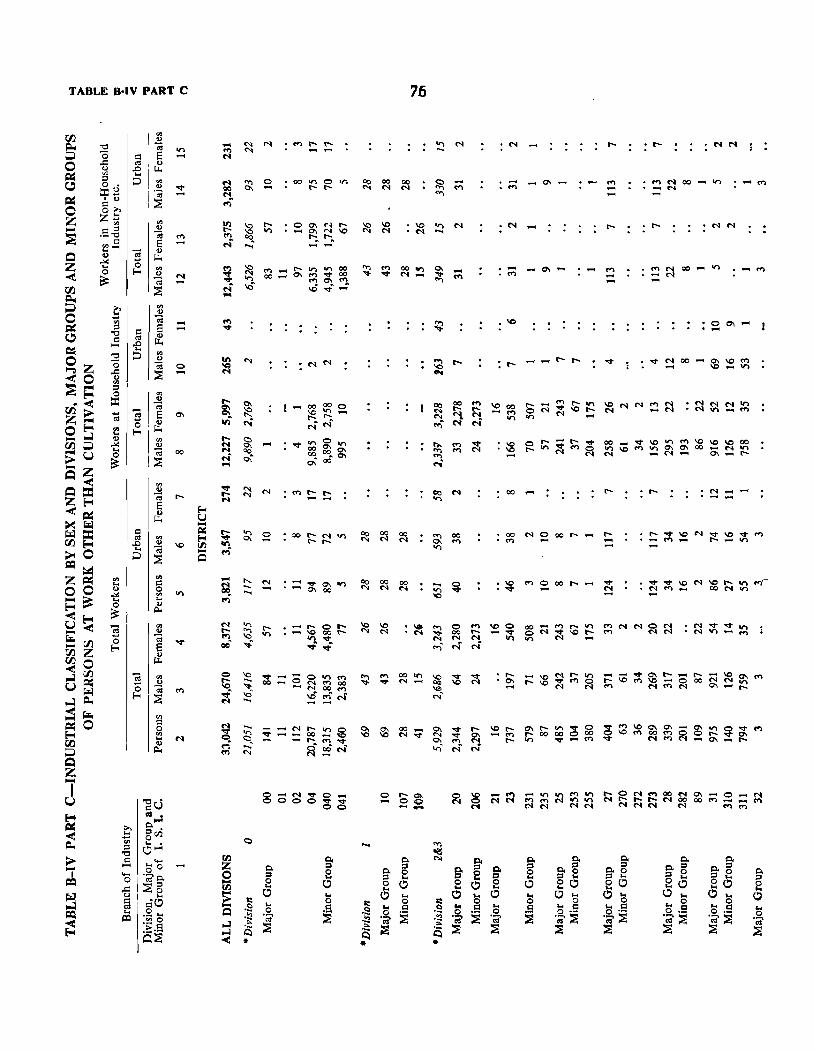
TABLE B·IV PART C
I I~
;::J
N ....
.... ....
o ....
0\
00
76
00"1 <'1-
~~~.,...~~~
00 _
..... ...,.
o r-- Cl> .... 00 --
\(!> ","
N ....
N ....
\0 eo ..... .,...
00 .....
..... .... ....
<'1<'1
<'I .... ....
. . ,
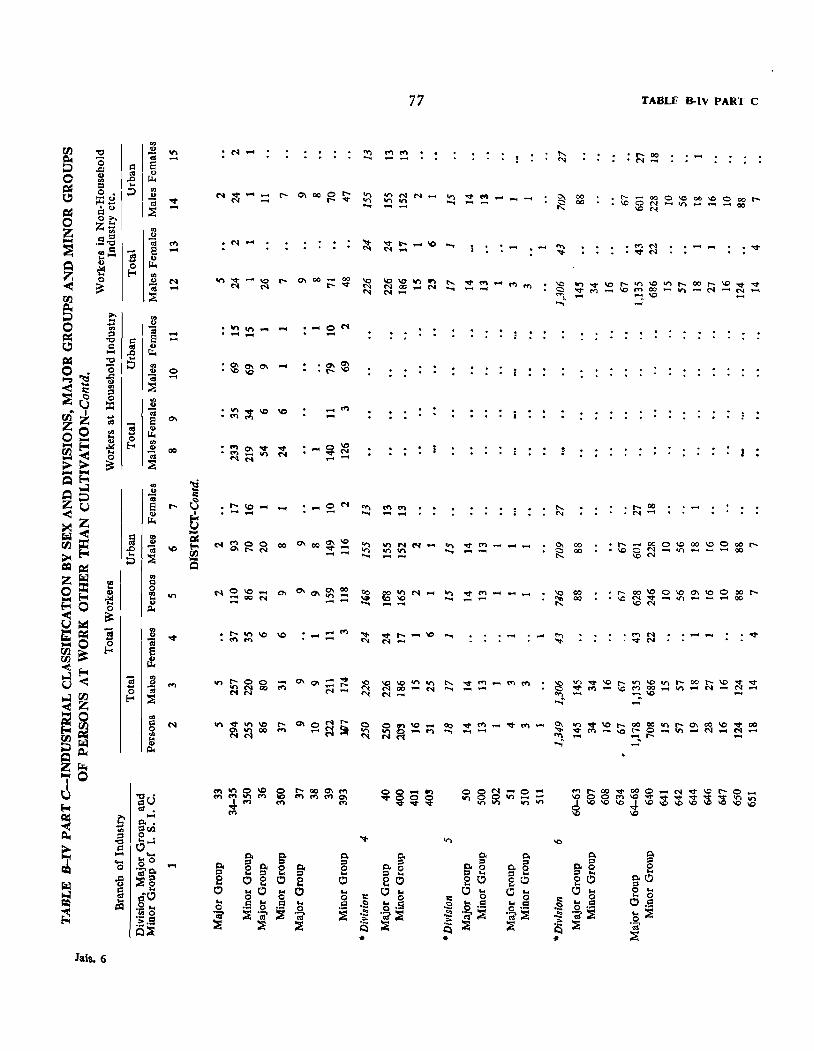
.,.. ....
-o ....
....
Jais. 6
N-
$$0'\ ....
_ .... ....
-~~ ........
77 TABU' B-IV PART C
.... ....
- .... -........ -
........
~ ~~\O~~~~~oo~~~~ "r - """:. \0 ...; .....
~ ~~\c~~~""&:;~~\c~OO <'f') ""'" ..-:.. r--. ...; .....
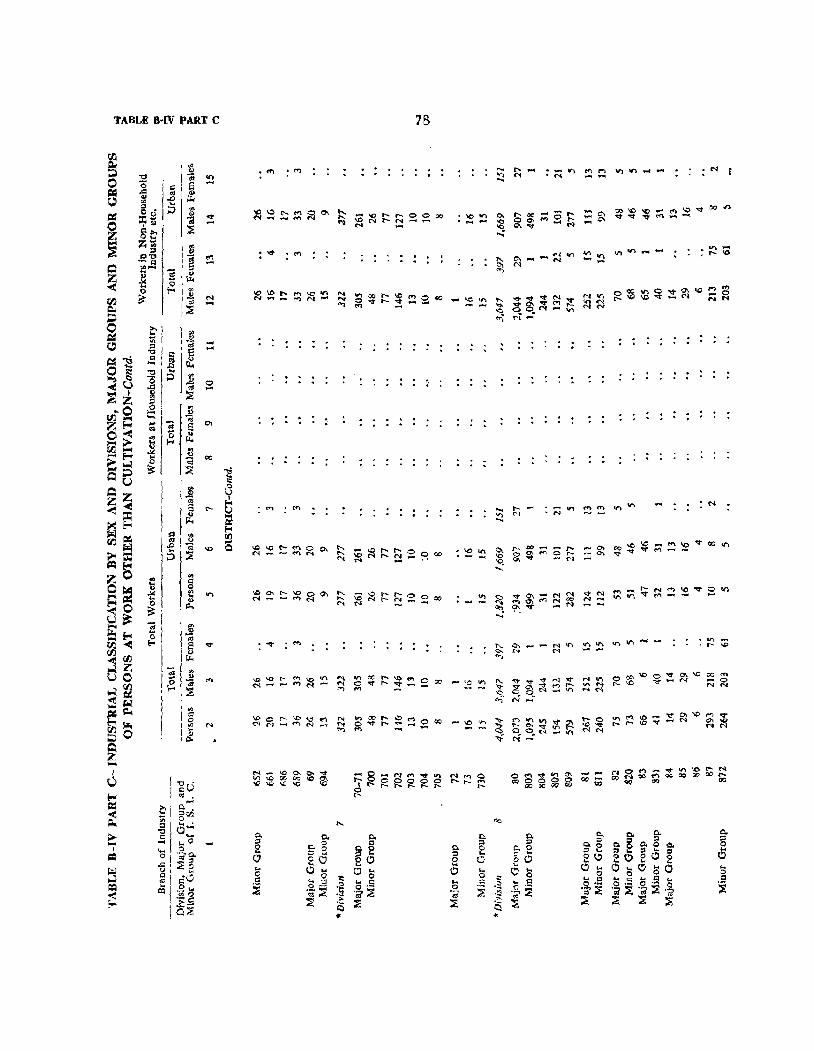
TABLE B·IV PART C
:""
'" . . . .
78
M E
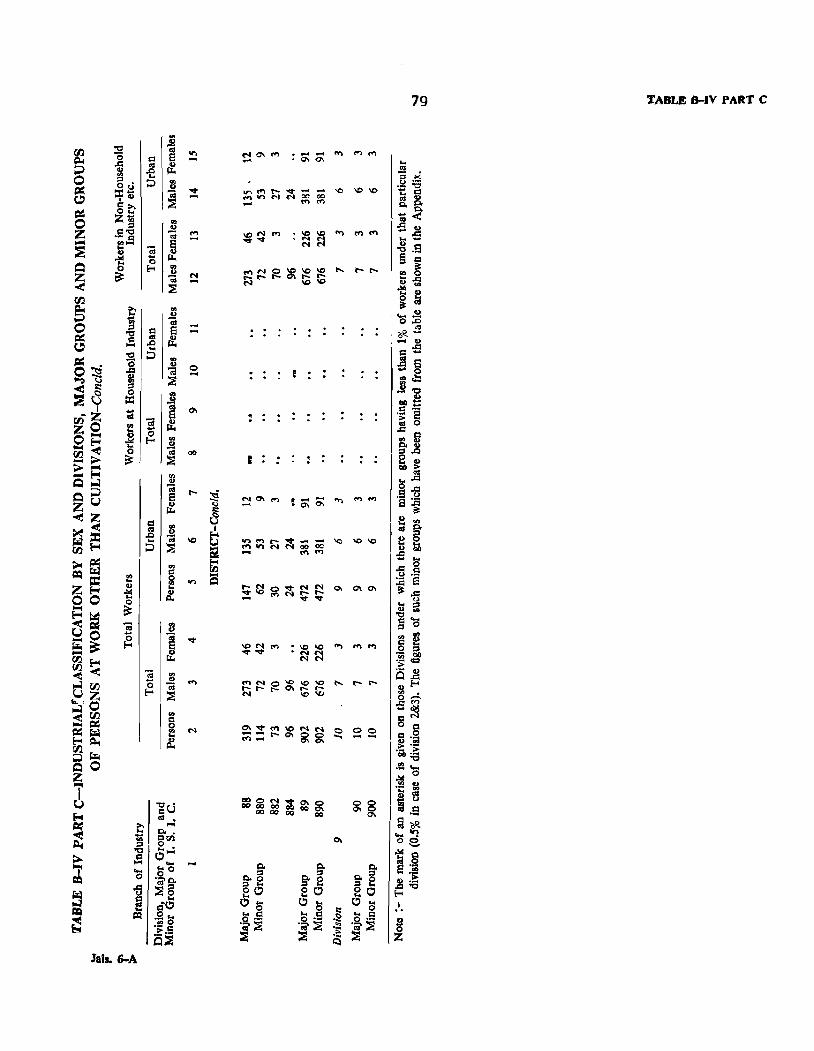
Jall.6-A
N -
:
79 TABLE 8-IV PART C
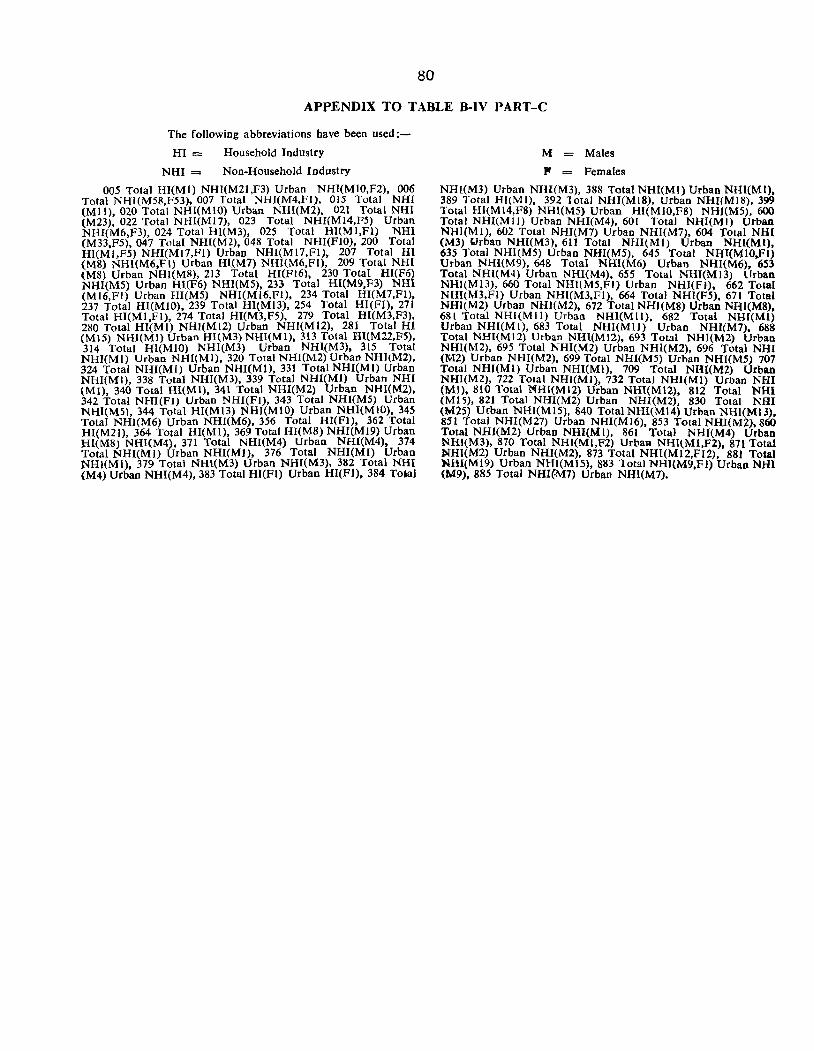
80
APPENDIX TO TABLE B-IV PART-C
The following abbreviations have been used:
HI = Household Industry
NHI = Non-Household Industry
005 Total HI(MI) NHI(M21,F3) Urban NHI(MI0,F2), 006 Total NHI(M58,F53), 007 rotal NHI(M4.Fl), 015 Total NHI (Mll), 020 Total NRI(MIO) Urban NHI(M2), 021 Total NHI (M23), 022 Total NHI(MI7), 023 Total NHI(MI4,F5) Urban NHl(M6,F3), 024 Total Hl(M3), 025 Total Hl(Ml,Fl) NHI (M33,F5), 047 Total NHl(M2). 048 Total NHI(FIO), 200 Total Hl(MI,F5) NHI(MI7,Fl) Urban NHI(MI7,Fl), 207 Total HI (M8) NHI(M6,FI) Urban HI.(M7) NHI(M6.Fl). 209 Total NHI (M8) Urban NHI(M8), 213 Total HI(FI6), 230 Total Hl(F6) NHI(MS) Urban Hl(F6) NRl(MS). 233 Total HI(M9,F3) NHI (MI6,FI) Urban HI(M5) NHl(MI6,FI). 234 Total Hl(M7,Fl), 237 Total HI(MIO), 239 Total HI(MI3), 254 Total HI(Fl), 271 Total HI(Ml,Fl), 274 Total HI(M3,F5). 279 Total HI(M3,F3). 280 Total HI(MI) NHI(MI2) Urban NHI(M12), 281 Total HI (MI5) NHl(Ml) Urban RI(M3) NHl(Ml), 313 Total HI(M22,F5), 314 Total Hl(MlO) NRI(M3) Urban NHI(M3). 315 Total NHI(Ml) Urban NHI(Ml). 320 Total NHI(M2) Urban NHllM2). 324 Total NHI(MI) Urban NHI(Ml). 331 Total NHI(MI) Urban NHI(Ml), 338 Total NHI(M3), 339 Total NHI(MI) Urban NHI (MI), 340 Total RI(MI), 341 Total NHI(M2) Urban NHl(M2), 342 Total NHI(FI) Urban NHI(FI), 343 Total NHI(M5) Urban NHI(M5), 344 Total HI(MI3) NHI(MIO) Urban NHl(MIO), 345 Total NHI(M6) Urban NHI(M6), 356 Total HI(Fl), 362 Total HI(M21), 364 Total HI(M1), 369 Total HI(M8) NHI(MI9) Urban HleM8) NHI(M4), 371 Total NHI(M4) Urban NHI(M4), 374 Total NHI(Ml) Urban NHI(Ml), 376 Total NHI(MI) Urban NHl(MI), 379 Total NHI(M3) Urban NHl(M3), 382 Total NHI (M4) Urban NHI(M4), 383 Total HI(FI) Urban HI(FJ), 384 To~1
M = Males
P = Females
NHl(M3) Urban NIII(M3), 388 Total NHI(MI) Urban NHI(MI), 389 Total HI(MI). 392 Total NHI(MI8), Urban NHI(MI8), 399 Total HI(MI4,F8) NHI(MS) Urban HI(MlO,F8) NHJ(M5), 600 Total NHI(MII) Urban NHI(M4). 601 Total NHI(MI) Urban NHI(MI), 602 Total NHI(M7) Urban NHI(M7), 604 Total NHI (M3) (Jrban NHI(M3). 611 Total NHI(MI) Urban NH!(MI), 635 Total NHI(M5) Urban NHI(M5), 645 Total NHJ(MIO,FI) Urban NHI(M9), 64& Total NHI(M6) Urban NHI(M6), 653 Total NHI(M4) Urban NHI(M4), 655 Total NHI(MI3) Urban NHI(MI3), 660 Total NHl(M5,Fl) Urban NHI(Fl), 662 Total NHI(M3,FI) Urban NHI(M3,FI). 664 Total NHJ(F5). 671 Total NHI(M2) Urban NHI(M2), 672 Total NHI(M8) Urban NHI(M8). 681 Total NHr(M11) Urban NHI(Mll), 682 Total NHf(MI) Urban NHI(Ml), 683 Total NHI(MJI) Urban NHI(M7). 688 Total NHI(MI2) Urban NHI(M12), 693 Total NHI(M2) Urban NHI(M2). 695 Total NHI(M2) Urban NHI(M2), 696 Total NHI (M2) Urban NHI(M2), 699 Total NHI(M5) Urban NHJ(M5) 707 Total NHI(MI) Urban NHI(MI), 709 Total NHl(M2) Urban NHI(MZ), 722 Total NHI(MI}. 732 Tota) NHI(MI) Urban NHI (MI), 810 Total NHI(MI2) Urban NHl(M12), 812 Total NHt (MlS). 821 Total NHI(M2) Urban NHI(M2), 830 Total NHI (M25) Urban NHI(MI5). 840 Total NHI(MI4) Urban NH1(MI3), 851 Total NHI(M27) Urban NHI(MI6), 853 Total NHI(M2), 860 Total NHI(M2) Urban NHI(M I), 861 Total NHI(M4) Urban NHI(M3), 870 Total NHI(Ml,F2) Urban NHl{Ml,F2), 871 Total NHI(M2) Urban NHl(M2), 873 Total NHI(MI2,FI2). 881 Total NHI(M19) Urban NHI(MI5), 883 Total NHI(M9,FJ) Urban NHI (M9), 885 Total NHI(M7) Urban NHI(M7).
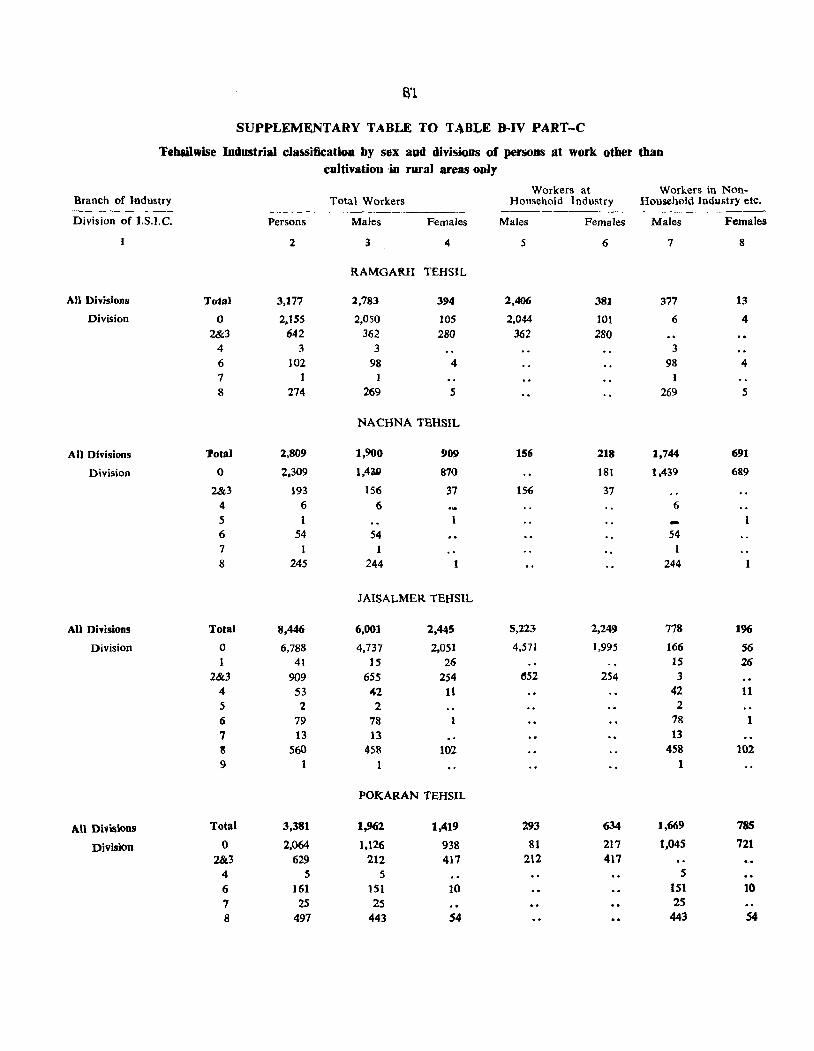
8'1
SUPPLEMF:NTARY TABLE TO T40BLE B-IV PART-C
TebUlwise Industrial cla~ificatioa by sex aDd divisions of persons at work other than cultivation in rural areas onJy
Workers at Workers in Non-Branch of Industry Total Workers Household T ndustry Household Industry etc.
Division of I.S.I.C. Persons Males Females Males Females Males Females
2 3 4 5 6 7 8
RAMGARH TEHSIL
AU Divisions Total 3,177 2,783 394 2,406 381 377 13
Division 0 2.155 2,050 105 2,044 101 6 4 2&3 642 362 280 362 280
4 3 3 3 6 102 98 4 98 4 7 1 I I 8 274 269 5 269 5
NACHNA TEHSIL
All Divisions 'lotal 2,809 1,900 909 156 218 1,744 691
Division 0 2.309 1,4~ 870 181 1,439 689
2&3 193 156 37 1% 37 4 6 6 6 5 1 -6 54 54 54 7 1 1 1 8 245 244 244
JAISALMER TEHSIL
All Divisions Total 8,446 6,001 2,445 5,223 2,249 778 196
Division 0 6,788 4,737 2,051 4,571 1,995 166 S6 1 41 IS 26 15 26
2&3 909 655 254 ~52 254 3 4 53 -42 11 42 11 5 2 2 2
6 79 78 78 1
7 13 13 13
3 560 458 102 458 102 9 1
POKARAN TEHSIL
AU Dhisions Total 3,381 1,962 1,419 293 634 1,669 785
Division 0 2,064 1,126 938 81 217 1,045 721 2&3 629 212 417 212 411
4 5 5 5 6 161 151 10 lSI 10 7 25 25 25 8 497 443 54 443 54
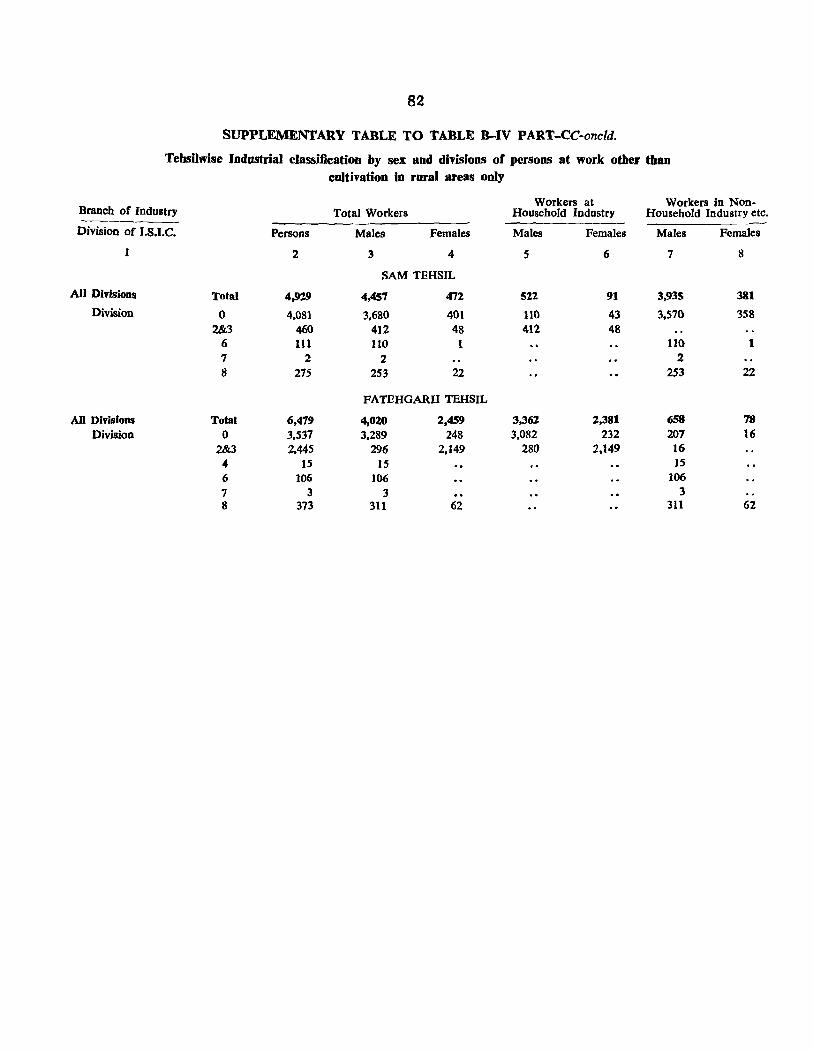
82
SUPPLEMENTARY TABLE TO TABLE B-IV PART-CC·oncld.
Tehsilwise Industrial classification by sex and divisions or persons at work other than cultivation in rural areas only
Workers at Workers in Non-Branch of Industry Total Workers Household Industry Household Industry etc.
DivisioQ of I.S.I.C. Persons Males Females Males Females Males Females
2 3 4 5 6 7 8
SAM TEHSIL
All Divisions Total 4,92.9 4.457 472 522 91 3,93S 381 Division 0 4,081 3,680 401 110 43 3,570 358
2&3 460 412 48 412 48 6 111 110 1 110 1 7 2 2 2 8 275 253 22 253 22
FATEHGARH TEHSIL
AU Divisions Total 6,411) 4,020 2,451) 3,362 2,381 658 78
Division 0 3,537 3,289 248 3,082 232 207 16 2&3 2,445 296 2,149 280 2,149 16
<4 15 15 15 6 106 106 106
7 3 3 3 8 373 311 62 311 62
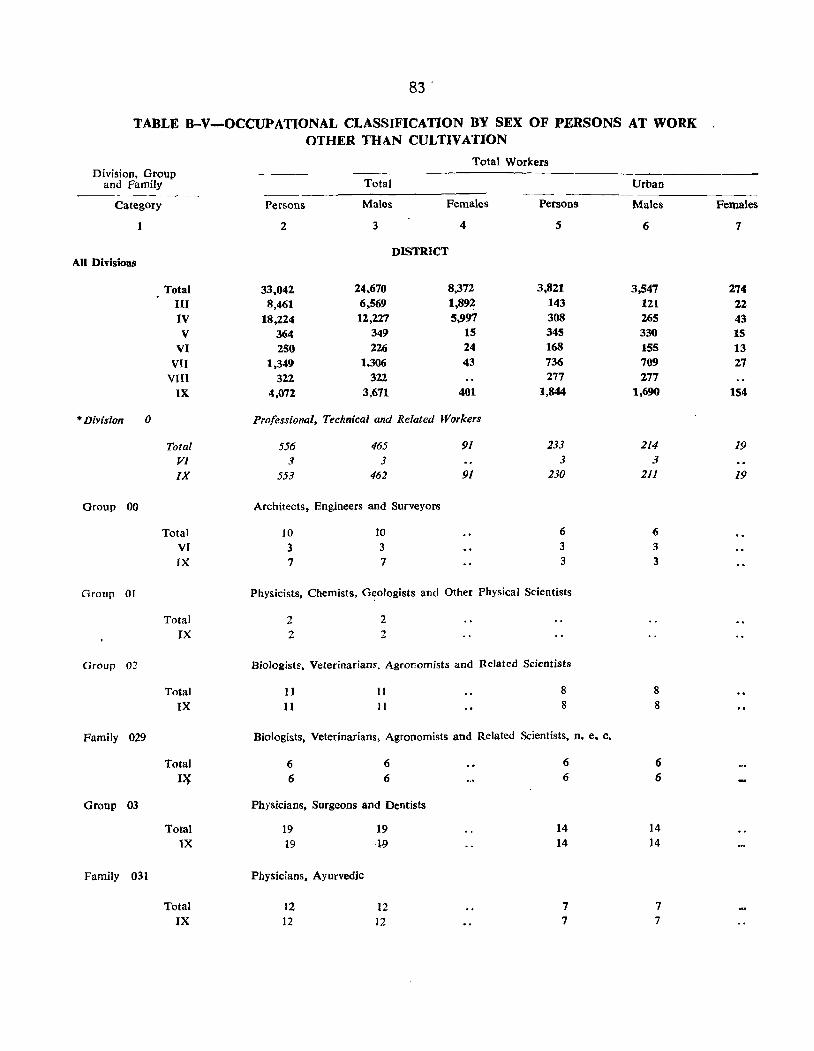
83 .
TABLE B-V-OCCUPATIONAL CLASSIFICATION BY SEX OF PERSONS AT WORK OTHER THAN CULTIVATION
Total Workers Division, Group
and Family Total Urban
Category Persons Males Females Persons Males Females
2 3 4 5 6 7
DISTRICT All Divisions
Total 33,042 24.670 8,372 3,821 3,547 274 III 8,461 6,569 1,892 143 121 22 IV 18,224 12,227 5,997 308 265 43 V 364 349 15 345 330 15
VI 250 226 24 168 155 13 VII 1.349 1,306 43 736 709 27
VIII 322 322 277 277
IX 4,072 3,671 401 1,844 1,690 154
'" Division 0 Professional, Technical and Related Workers
Total 556 465 91 233 214 19 VI 3 3 3 3
IX 553 462 91 230 211 19
Group 00 Architects, Engineers and Surveyors
Total JO JO 6 6
VI 3 3 3 3 IX 7 7 3 3
Group 01 Physicists, Chemists. Geologists and Other Physical Scientists
Total 2 2 IX 2 2
Group 02 Biologist~. Veterinarians, Agronomists and Related Scientists
Total 11 11 8 8
IX 11 II 8 8
Family 029 Biologists, Veterinarians, Agronomists and Related Scientists, n. e. c.
Total 6 6 6 6
I~ 6 6 6 6
Group 03 Physicians, Surgeons and Dentists
Total 19 19 14 14 lX 19 '~9 14 14
Family 031 Physicians, Ayurvedic
Total 12 12 7 7
IX 12 12 7 7
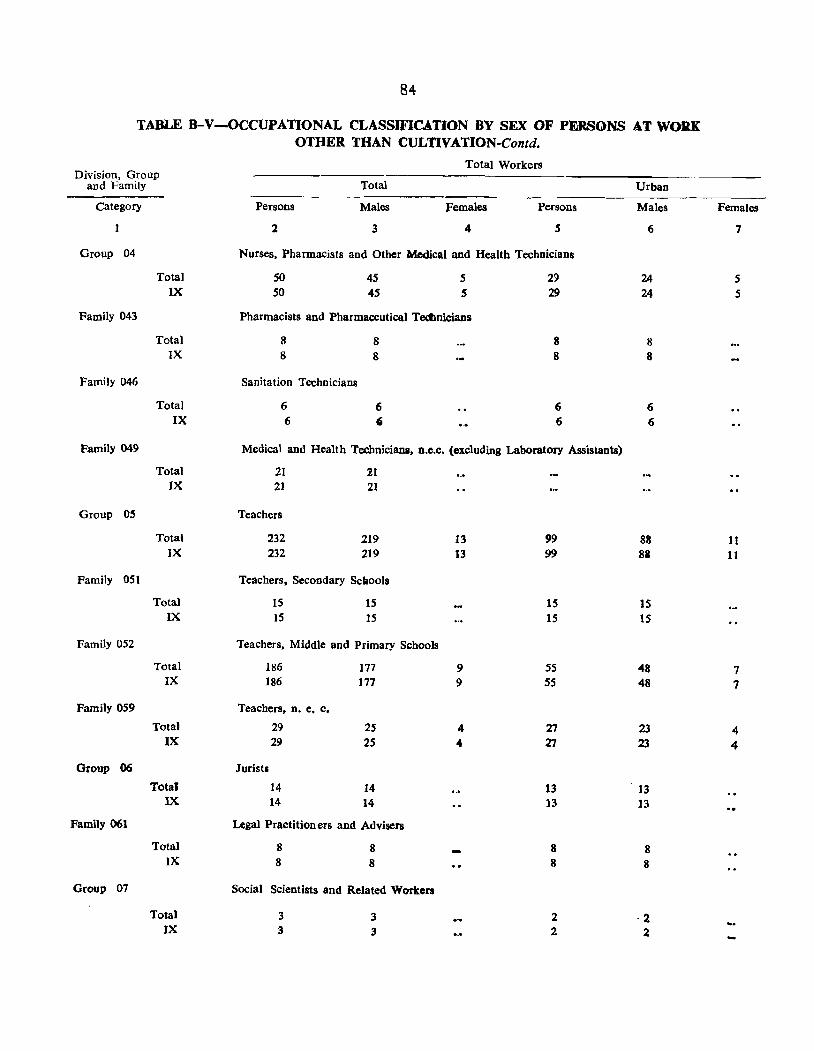
84
TABLE B-V-OCCUPATIONAL CLASSIFICATION BY SEX OF PERSONS AT WORK OTHER THAN CULTIVATION-Contd.
Total Workers Division, Group
and Family Total Urban
Category Persons Males Females Persons Males Females
2 3 4 5 6 7
Group 04 Nurses, PharmaCists and Other Medical and Health Technicians
Total 50 45 5 29 24 5 IX 50 4S S 29 24 S
Family 043 Pharmacists and Pharmaceutical Teclmicians
Total 8 8 8 8 IX 8 8 8 8
Family 046 Sanitation Teehnicians
Total 6 6 6 6 IX 6 , 6 6
Family 049 Medical and Health Technician., n.e.c. (excluding Laboratory Assistants)
Total 21 21 IX 21 21
Group 05 Teachers
Total 232 219 13 99 88 11 IX 232 219 13 99 81 11
Family 051 Teachers, Secondary Sckools
Total 15 15 15 15 IX 15 15 15 15
Family 052 Teachers, Middle and Primary Schools
Total 186 177 9 55 48 7 IX 186 177 9 55 48 7
Family 059 Teachers, D. e. c.
Total 29 2S 4 27 23 4 IX 29 2S 4 27 23 4
Group 06 Jurists
Total 14 14 13 13 IX 14 14 13 13
Family 061 Legal Practition ers and Advisers
Total 8 8 8 8 IX 8 8 8 8
Group 07 Social Scientists and Related Workers
Total 3 3 2 ·2 IX 3 3 2 2
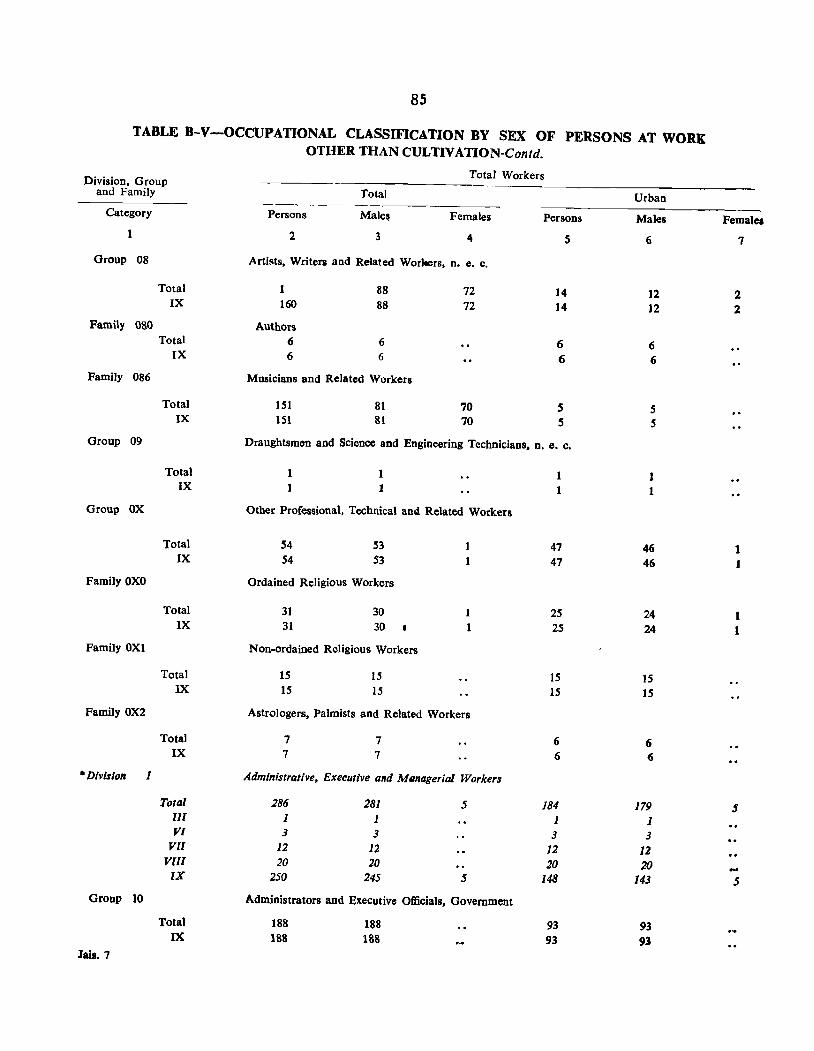
85
TABLE B-V-OCCUPATIONAL CLASSIFICATION BY SEX OF PERSONS AT WORK OTHER THAN CULTIVATION-Contd.
Division, Group Total Workers and Family Total Urban
Category Persons Male~ Females Persons Males Females 1 2 3 4 S 6 7
Group 08 Artists, Writers and Related Worlters, n. e. c.
Total 1 88 72 14 12 2 IX 160 88 72 14 12 2 Family 080 Authors
Total 6 6 6 6 IX 6 6 6 6
Family 086 Musicians and Related Workers
Total 151 81 70 S 5 IX 151 81 70 S S
Group 09 Draughtsmen aod Science and Engineering Technicians. D. e. c.
Total 1 1 1 IX 1 1 1
Group OX Other Professional. Technical an4 Related Workers
Total S4 53 47 46 1 IX S4 S3 47 46
Family OXO Ordained Religious Workers
Total 31 30 1 25 24 1 IX 31 30 1 25 24 1
Family OXl Non-ordained Religious Workers
Total 15 15 15 15 IX 15 15 15 15
Family OX2 Astrologers, Palmists and Related Workers
Total 7 7 6 6 IX 7 7 6 6
-Division 1 Administrative, Executive and Milnagerial Workers
Total 286 281 5 184 179 5 III 1 1 1 1 YI 3 3 3 3
YII 12 12 12 12 Ylll 20 20 20 20
IX 250 245 5 148 143 5 Group 10 Administrators and Executive Officials, Government
Total 188 188 93 93 IX 188 188 93 93
Jais. 7
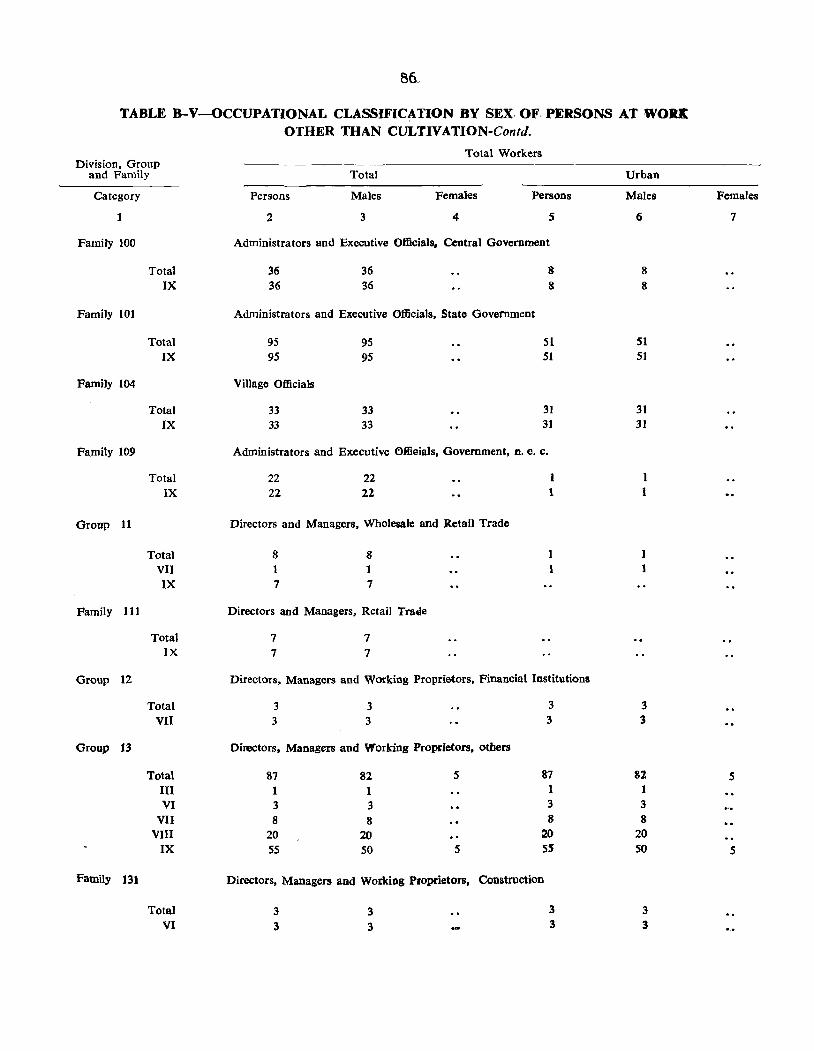
TABLE B-V-OCCUPATIONAL CLASSIFICATION BY SEX. OF· PERSONS AT WORK OTHER THAN CULTIVATION-Contd.
Total Workers Division, Group
and Family Total Urban
Category Persons Males Females Persons Males Females
1 2 3 4 5 6 7
Family 100 Administrators and Executive Ofiicials. Central Government
Total 36 36 8 8 IX 36 36 8 8
Family 101 Administrators and Executive Officials, State Government
Total 95 95 51 51 IX 95 95 51 51
Fami1y 104 Village Officials
Total 33 33 31 31 IX 33 33 31 31
Family 109 Administrators and Executive 6Bieials, Government, n. e. c.
Total 22 22 1 IX 22 22 1 1
Group 11 Directors and Managers, Wholesale and Retail Trade
Total 8 8 1 VII 1 1 1 IX 7 7
Family 111 Directors and Managers, Retail Tra4e
Total 7 7 IX 7 7
Group 12 Directors, Managers and Working Proprietors, Financial Institutions
Total 3 3 3 3 Vll 3 3 3 3
Group t3 Directors, Managers and Working Proprietors, others
Total 87 82 5 87 82 5 III 1 1 1 1 VI 3 3 3 3
VII 8 8 8 8 VII1 20 20 20 20
IX 55 50 5 55 50 5
Family 131 Directors, Managers and Working Proprietors, Construction
Total 3 3 3 3 VI 3 3 3 3
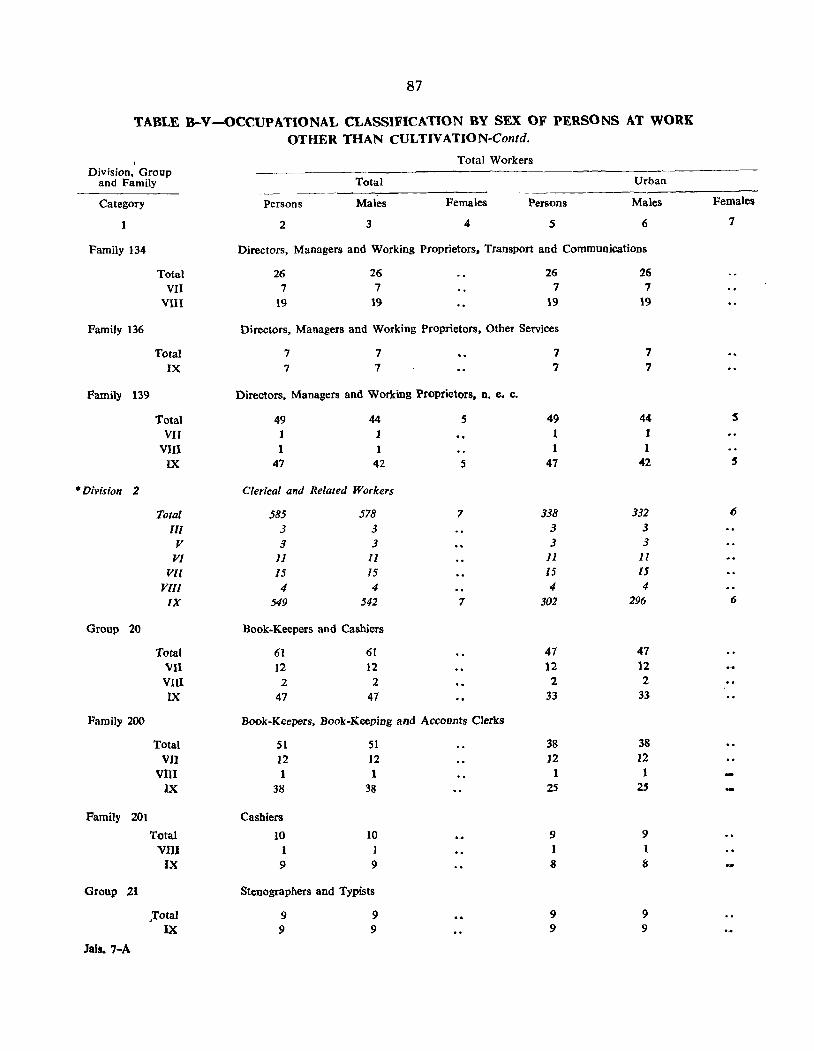
87
TABLE B-V-OCCUPATIONAL CLASSIFICATION BY SEX OF PERSONS AT WORK OTHER THAN CULTIVATION~Contd.
, Total Workers Division, Group
and Family Total Urban
Category Persons Males Females Persons Males Females
2 3 4 5 6 7
Family 134 Directors, Managers and Working Proprietors, Transport and Communications
Total 26 26 26 26 VII 7 7 7 7
VIl1 19 19 19 19
Family 136 Directors, Managers and Working Proprietors, Other Services
Total 7 7 7 7 IX 7 7 7 7
Family 139 Directors, Managers and Working Proprietors, n. e. c.
Total 49 44 5 49 44 5
VII J 1 1
VIII 1 1 1
IX 47 42 5 47 42 5
• Division 2 Clerical and Related Workers
Total 585 578 ., 338 332 6
III 3 3 3 3
V 3 3 3 3
VI 11 11 11 11
Vll 15 15 15 15 Vlll 4 4 4 4
[X 549 542 ., 302 296 6
Group 20 Book~Keepers and Cashiers
Total 61 61 47 47 VII 12 12 12 12 VIII 2 2 2 2 IX 47 47 33 33
Family 200 Book·Keepers, Book-Keeping and Accounts Clerks
Total SI 51 38 38
VB 12 12 12 12 VIII 1 1 1 1 IX 38 38 25 25
Family 201 Cashiers
Total 10 10 9 9
VllI 1 1 1 1
IX 9 9 8 8
Group 21 Stenographers and Typists
.Total 9 9 9 9
IX 9 9 9 9
Jais.7-A
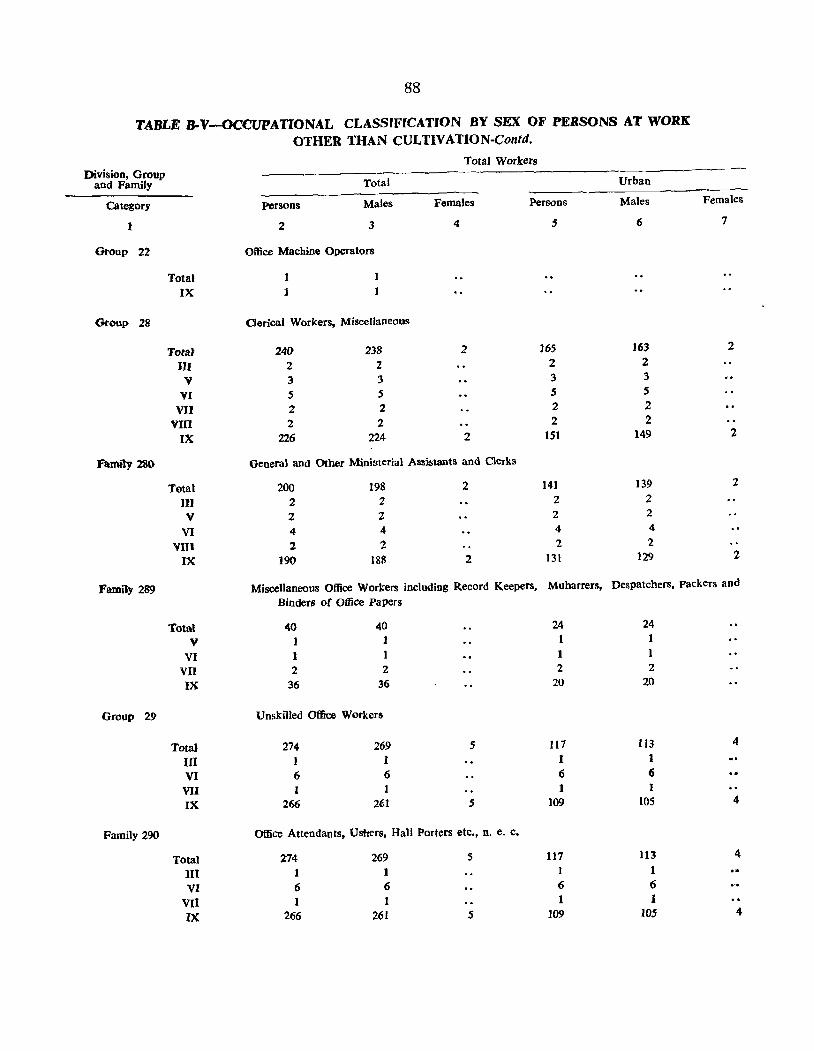
88
TABLE lJ..V-OCCUPATIONAL CLASSIFICATION BY SEX OF PERSONS AT WORK OTHER THAN CULTlV ATION-Contd.
Total Workers Division, Group
and Family Total Urban
category Persons Males Females Persons Males Females
I 2 3 4 5 6 7
Group 22 Office Machine Operators
Total 1
IX 1 1
Group 28 Clerical Workers, Miscellaneous
Total 240 238 2 165 J63 2
111 2 2 2 2
V 3 3 3 3
VI 5 5 5 5
VIl 2 2 2 2
VIII 2 2 2 2
IX 226 224 2 151 149 2
Family 28& General and Other Ministerial Assistants and Clerks
Total 200 198 2 141 139 Z
III 2 2 2 2
V 2 2 2 2
VI 4 4 4 4
'flU 2 2 2 2
IX 190 188 2 131 129 2
Family 289 Miscellaneous Office Workers including Record Keepers, Muharrers, Despatchers, Packers and
Binders of Office Papers
Total 40 40 24 24
V 1 1 VI 1 1 1
vn 2 2 2 2
IX 36 36 20 20
Group 29 Unskilled Office Workers
Total 274 269 5 117 113 4
III 1 1 1 1
VI 6 6 6 6
VII I 1 1 1
IX 266 261 5 109 105 4
Family 290 Office Attendants, UShers, Hall Porters etc., n. e. c.
Total 274 269 5 117 113 4
III 1 1 1 1
VI 6 6 6 6
VII 1 1 1 1
IX 266 261 5 109 105 4
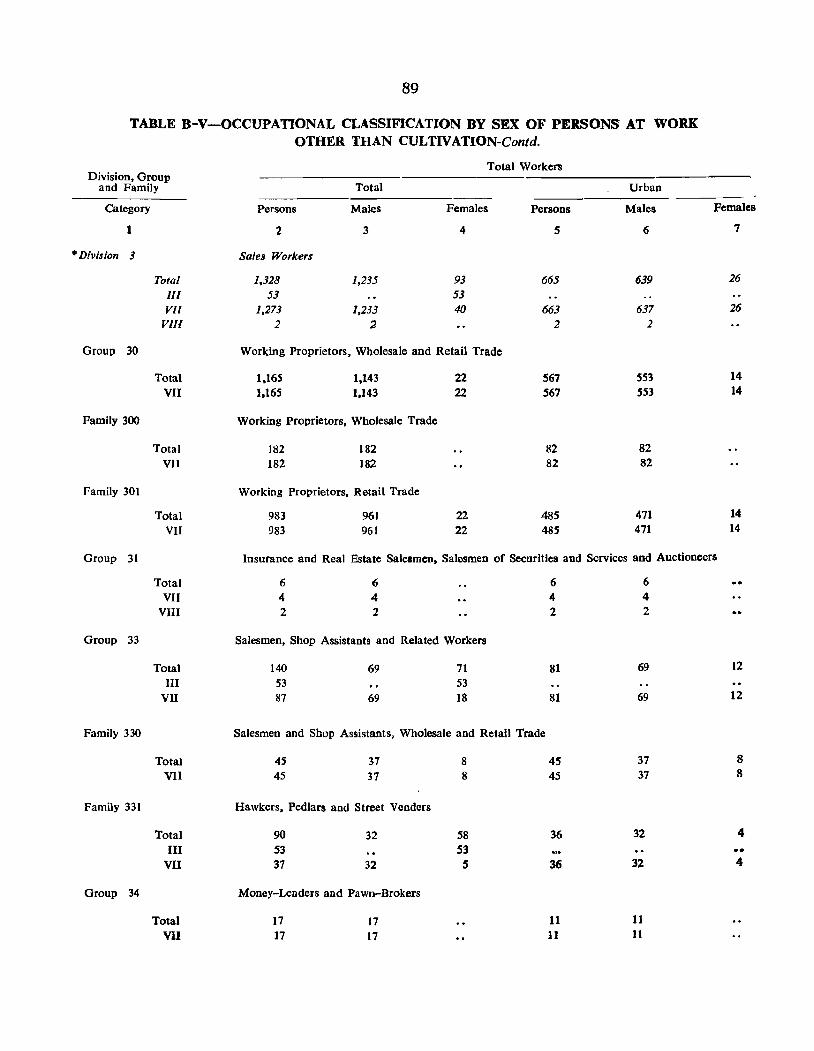
89
TABLE B-V-OCCUPATIONAL CLASSIFICATION BY SEX OF PERSONS AT WORK OTHER THAN CULTIVATION-Contd.
Total Workers Division, Group
and Family Total Urban
Category Persons Males Females Persons Males Females
1 2 3 4 5 6 7
• Division 3 Sales Workers
Total 1,328 1,235 93 665 639 26
1Il 53 53 Vll 1,273 1,233 40 663 637 26
Vlll 2 2 2 2
Group 30 Working Proprietors, Wholesale and Retail Trade
Total 1.165 1,143 22 567 553 14
VII 1,165 1,143 22 567 553 14
Family 300 Working Proprietors. Wholesale Trade
Total 182 182 82 82 vn 182 ]82 82 82
Family 30] Working Proprietors. Retail Trade
Total 983 961 22 485 471 14
VII 983 961 22 485 471 14
Group 31 Insurance and Real Estate Salesmen, Salesmen of Securities and Services and Auctioneers
Total 6 6 6 6
VII 4 4 4 4 VIII 2 2 2 2
Group 33 Salesmen, Shop Assistants and Related Workers
Total 140 69 71 81 69 12
III 53 53 VII 87 69 18 81 69 12
Family 330 Salesmen and Shop Assistants, Wholesale and Retail Trade
Total 45 37 8 45 37 8
VII 45 37 8 45 37 8
Family 331 Hawkers, Pedlars and Street Venders
Total 90 32 58 36 32 4 III S3 53
VII 37 32 S 36 32 4
Group 34 Money-Lenders and Pawn-Brokers
Total 17 17 11 11
VII 17 17 11 11
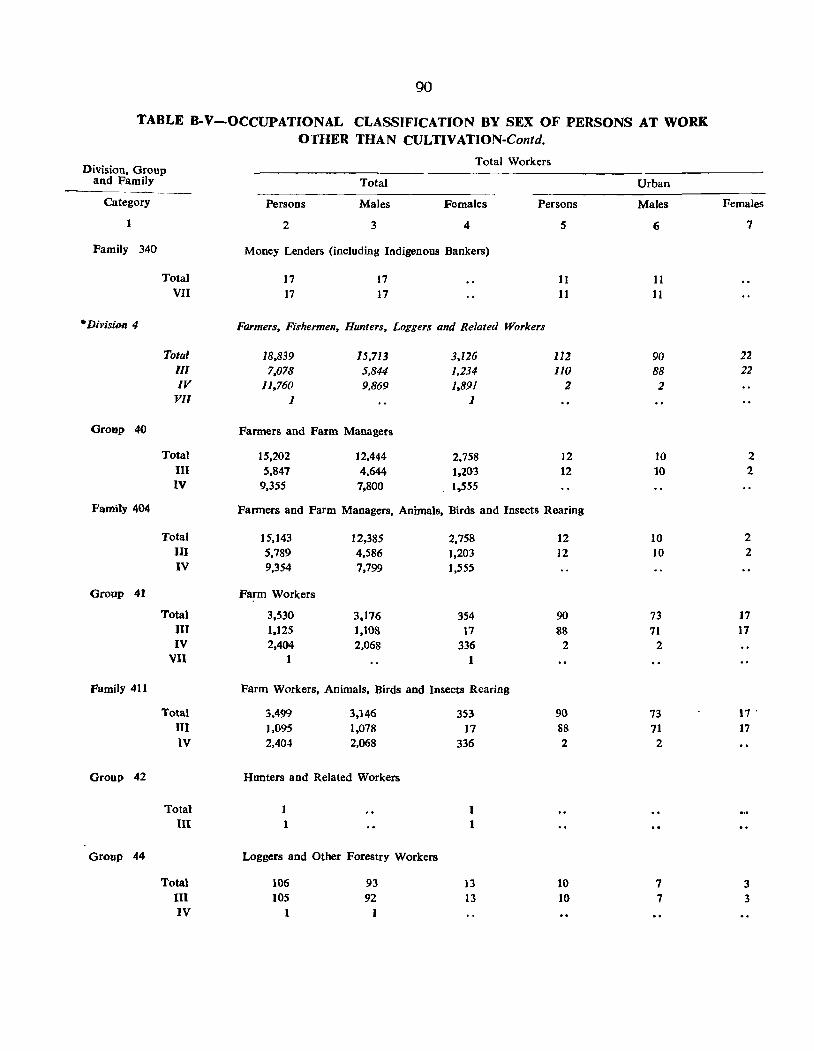
90
TABLE B-V-OCCUPATIONAL CLASSIFICATION BY SEX OF PERSONS AT WORK OTHER THAN CULTIVATION-Contd.
Division, Group Total Workers
and Family Total Urban
Category Persons Males Females Persons Males Females
I 2 3 4 5 6 7
Family 340 Money Lenders (including Indigenous Bankers)
Total 17 17 11 11 VII 17 17 11 11
·Division 4 Farmers, Fishermen, Hunters, Loggers and Related Workers
Total 18,839 15,713 3,126 112 90 22 III 7,078 5,844 1,234 no 88 22 IV 11,760 9.869 1,891 2 2
VI1 1 1
Group 40 Farmers and Farm Managers
Total 15,202 ]2,444 2,758 12 ]0 2 III 5,847 4,644 1,203 12 10 2 IV 9,355 7,800 1,555
Family 404 Farmers and Farm Managers, Animals, Birds and Insects Rearing
Total 15,143 12,385 2,758 12 ]0 2 III 5,789 4,586 1,203 12 10 2 IV 9,354 7,799 ],555
Group 41 Farm Workers
Total 3,530 3,176 354 90 73 17 III ],125 ],108 17 88 71 17 IV 2,404 2,068 336 2 2
VII 1 1
Family 411 Farm Workers, Animals, Birds and Insects Rearing
Total 3,499 3,146 353 90 73 17 . III 1,095 1,078 17 88 71 17 IV 2,404 2,068 336 2 2
Group 42 Hunters and Related Workers
Total 1 III 1 1
Group 44 Loggers and Other Forestry Workers
Total 106 93 13 10 7 3 III 105 92 13 10 7 3 IV 1 1
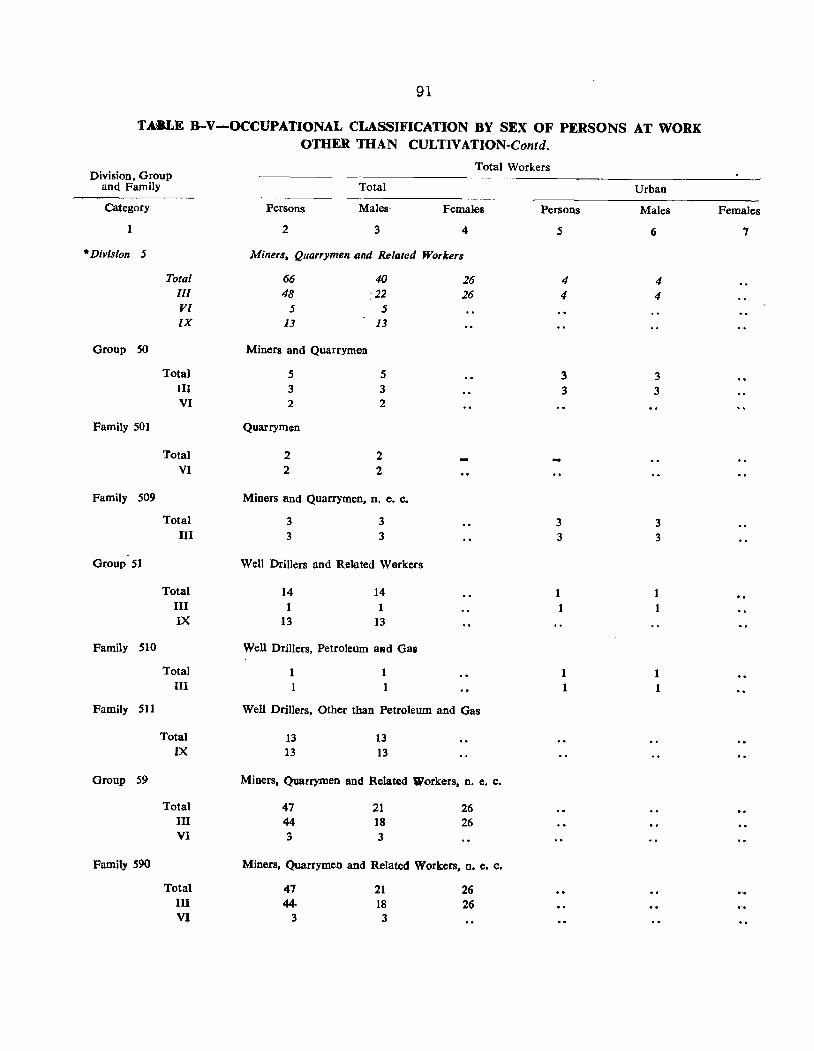
91
TASLE B-V-OCCUPATIONAL CLASSIFICATION BY SEX OF PERSONS AT WORK OTHER THAN CULTIV ATION-Contd.
Division, Group and Family
Category
I
*Division 5
Total III VI rx
Group 50
Total III VI
Family 501
Total VI
Family 509
Total III
Group 51
Total III IX
Family 510
Total III
Family 511
Total IX
Group 59
Total III VI
Family 590
Total III VI
Total Workers
Total
Persons Males- Females
2 3 4
Miners. Quarrymen and Related Workers
66 40 48 ,'22
5 5 13 13
Mincrs and Quarrymen
S S 3 3 2 2
Quarrymen
2 2 2 2
Miners and Quarrymen, n, c. C.
3 3 3 3
Well Drillers and Related Warkers
14 1
13
14 1
13
Well Drillers. Petroleum aRd Gas
1 1
1
26 26
Well Drillers, Other than Petroleum and Gas
13 13
13 13
Miners, Quarrymen and Related Workers. n. e. c.
47 44 3
21 18 3
26 26
Miners, Quarrymen and Related Workers. n. e. c.
47 44-
3
21 18
3
26 26
Persons
5
4 4
3 3
3 3
1 1
I I
Urban
Males
6
4 4
3 3
3 3
1 1
1
Females
7
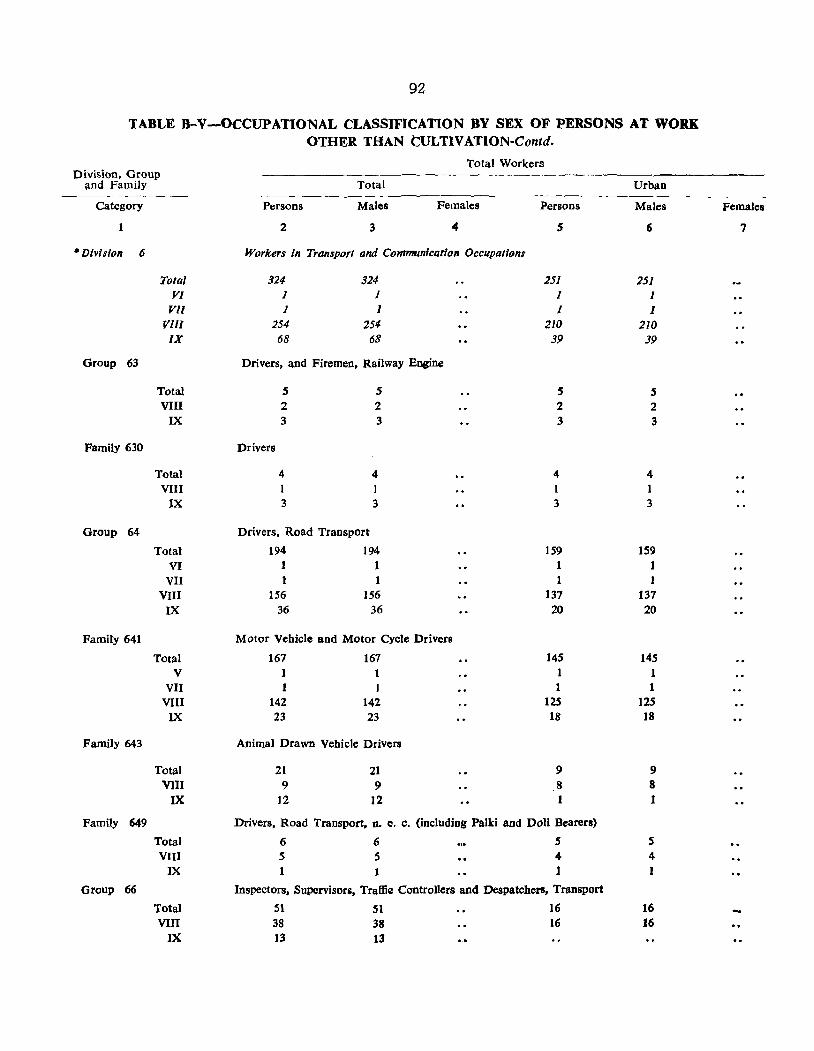
92
TABLE B-V-OCCUPATIONAL CLASSIFICATION BY SEX OF PERSONS AT WORK OTHER THAN tULTIVATION-Contd.
Total Workers Division, Group
and Family Total Urban
Category Persons Males Females Persons Males Females
2 3 4 S 6 7
• Division 6 Workers in Transport and Communication Occupations
Total 324 324 251 251 VI 1 1 I 1
Vll 1 1 J 1 VllI 254 254 210 210
IX 68 68 39 39
Group 63 Drivers, and Firemen, Railway Engine
Total S S S 5 VIII 2 2 2 2
IX 3 3 3 3
Family 630 Drivers
Total 4 4 4 4 VIII 1 1 1 1
IX 3 3 3 3
Group 64 Drivers, Road Transport
Total 194 194 159 159 VI 1 1 1 1
VII 1 1 1 1 VIII 156 156 137 137
IX 36 36 20 20
Family 641 Motor Vehicle and Motor Cycle Drivers
Total 167 167 145 14S V 1 1 1 1
VlI 1 1 1 1 VIII 142 142 125 125
IX 23 23 18 18
Family 643 Animal Drawn Vehicle Drivers
Total 21 21 9 9 VIlI 9 9 8 8
IX 12 12 1 1
Family 649 Drivers, Road Transport, n. e. c. (including Palki and Doli Bearers)
Total 6 6 5 5 VIII 5 5 4 4
IX 1 1 1 1
Group 66 Inspectors, Supervisors, Traffie Controllers and Despatchers, Transport
Total 51 51 16 16 VIn 38 38 16 16
IX 13 13
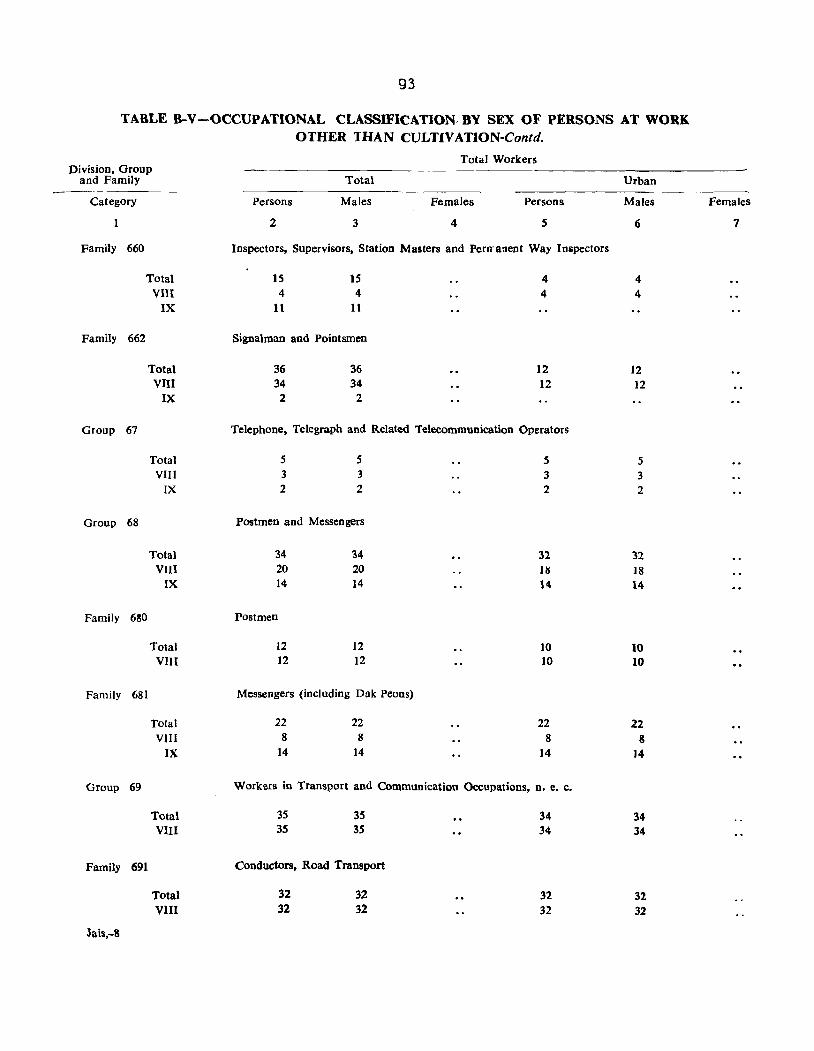
93
TABLE B-V-OCCUPATIONAL CLASSIFICATION" BY SEX OF PERSONS AT WORK OTHER THAN CULTlVATJON-Contd.
Division, Group and Family
Category
Family 660
Total VIII
IX
Family 662
Total VIII
IX
Group 67
Total VIII
IX
Group 68
Total VIII
IX
Family 6~0
Total VIII
Family 681
Total VIII
IX
Group 69
Total VIII
Family 691
Total VlII
Jais,-8
Total Workers
Total
Persons Males Females Persons
2 3 4 S
Inspectors, Supervisors, Station Masters and PerrraDent Way Inspectors
15 4
11
15 4
11
Signalman and Pointsmen
36 34
2
36 34 2
4 4
12 12
Telephone, Telegraph and Related Telecommunication Operators
5 3 2
5 3 2
Postmen and Messengers
34 20 14
Postmen
12 12
34 20 14
12 12
Messengers (including Dak Peons)
22 8
14
22 8
14
5 3 2
32 III 14
10 10
22 8
14
Workers in Transport and Communication Occupations, n. e. c.
35 3S
3S 35
Conductors, Road Transport
32 32
32 32
34 34
32 32
Urban
Males
6
4 4
12 12
5 3 2
32 18 14
10 10
22 8
]4
34 34
32 32
Females
7
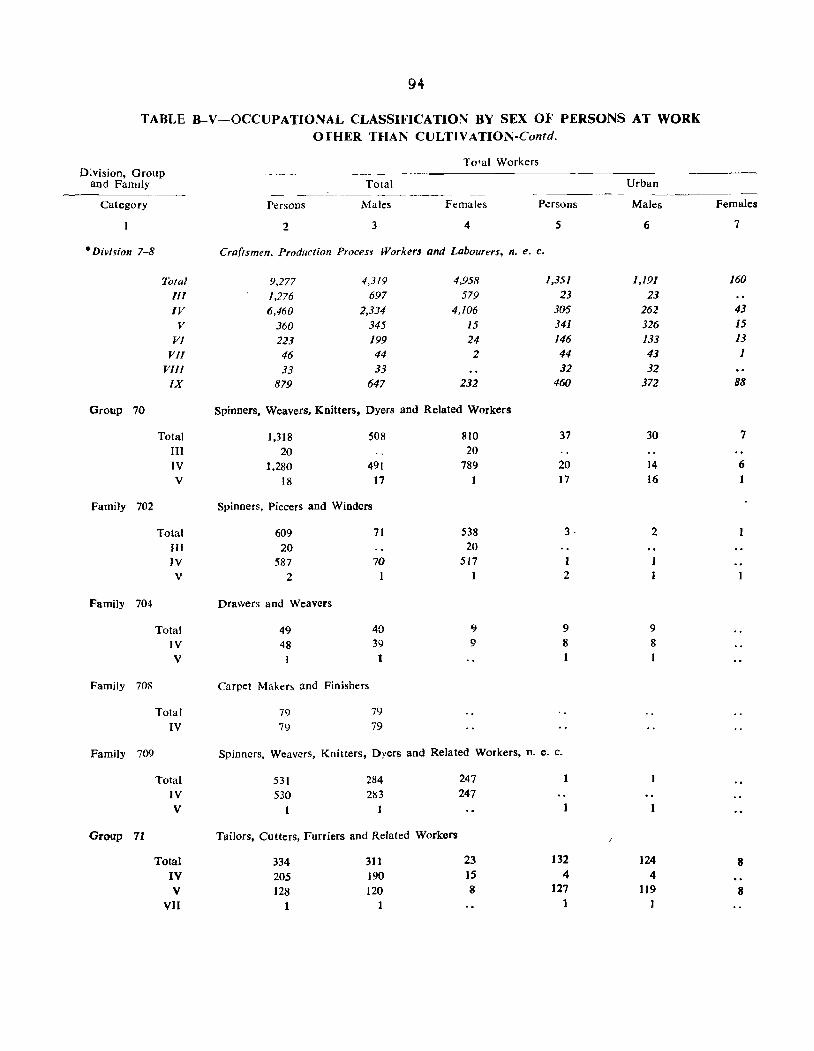
94
TABLE B-V-OCCUPATIONAL CLASSIFICATION BY SEX OF PERSONS AT WORK
Division, Group and Family
Category
• Division 7-8
Total III IV V
VI VI/
VIll IX
Group 70
Total III IV V
Family 702
Total III IV V
Family 704
Total IV V
Family 70S
Total IV
Family 709
Total lV V
Group 7J
Total IV V
VII
Of HER THAN CULTIVATION-Contd.
Total Workers
Total -_-----
Persons Males Ft:males Persons
2 3 4
Craftsmen, Production Process Workers and Labourers, n. e. c.
9,277 4,319 4,958
1,276 697 579 6,460 2,3]4 4.106
360 345 15 223 199 24 46 44 2 33 33
879 647 232
Spinners, Weavers, Knitters, Dyers and Related Workers
1,318 508 20
1,280 491 18 17
Spinners, Piecers and Winders
609 20
587 2
Drawers and Weavers
49 48 1
Carpet Makers and Finishers
79 79
71
70 1
40 39 1
79 79
810 20
789
538 20
517
Ii)
9
5
1,35/ 23
305 341 146 44 32
460
37
20 17
3·
1 2
9 8
Spinners, Weavers, Knitters, Dyers and Related Workers, n. e. c.
53) 284 247
530 283 247
1
Tailors, Cutters, Furriers and Related Workers
334 311 23 132
205 190 15 4
128 120 8 127
1 1
Urban
Males
6
1,/91
23 262 326 133 43 32
372
30
14 16
2
9 8
124 4
119 1
Females
7
160
43 15 13 1
88
7
6
1
8
8
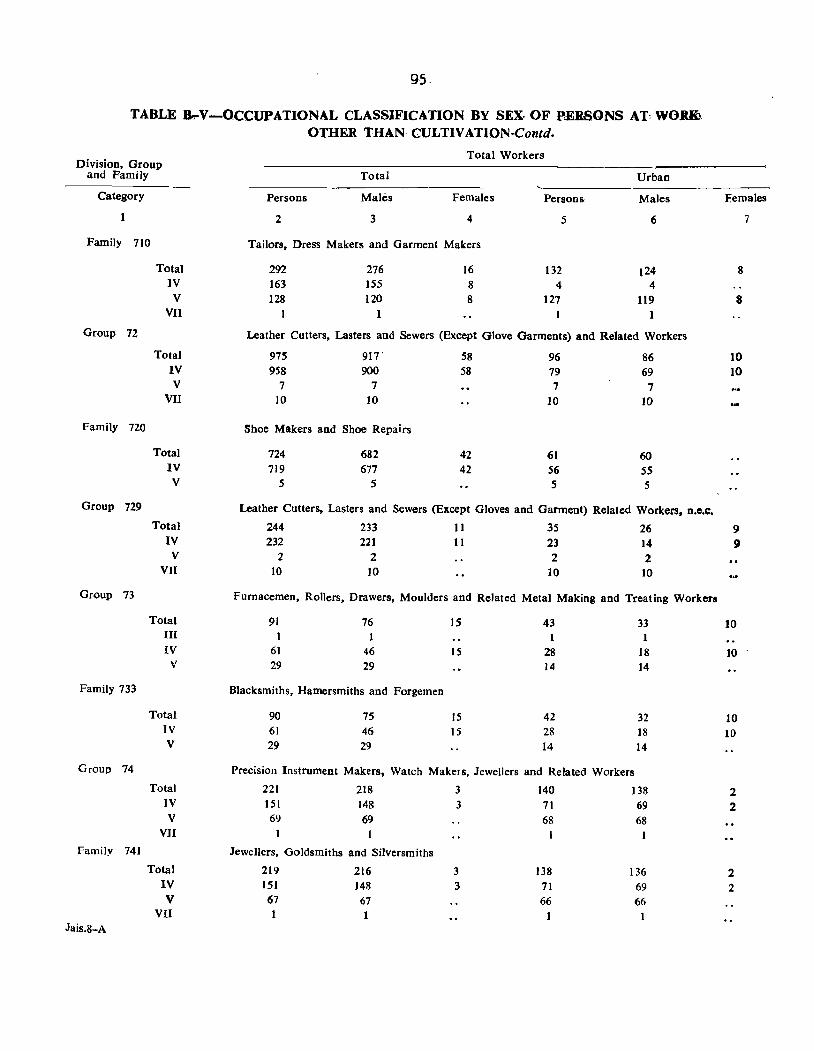
95.
TABLE B,-V-OCCUPATIONAL CLASSIFICATION BY SEX- OF P<ERSONS AT, WO.R& OTHER THAN CULTIVATION-Contd.
Total Workers Division, Group
and Family Total Urban
Category Persons Males Females Persons Males Females
2 3 4 5 6 7
Family 710 Tailors, Dress Makers and Garment Makers
Total 292 276 16 132 124 8 IV 163 ISS 8 4 4 V 128 120 8 127 119 8
VII 1 1
Group 72 Leather Cutters, Lasters and Sewers (Except Glove Garments) and Related Workers
Total 975 917 58 96 86 10 IV 958 900 58 79 69 10 V 7 7 7 7
VII 10 10 10 10
Family no Shoe Makers and Shoe Repairs
Total 724 682 42 61 60 IV 719 677 42 56 55 V 5 5 5 5
Group 729 Leather Cutters, Lasters and Sewers (Except Gloves and Garment) Related Workers, n.e.c.
Total 244 233 11 35 26 9 IV 232 221 11 23 14 9
V 2 2 2 2 VII 10 10 10 10
Group 73 Furnacemen, Rollers, Drawers, Moulders and Related Metal Making and Treating Workers
Total 91 76 IS 43 33 10 III 1 1 1 IV 61 46 IS 28 18 10 V 29 29 14 14
Family 733 Blacksmiths, Hamersmiths and Forgemen
Total 90 75 IS 42 32 10 IV 61 46 IS 28 18 10 V 29 29 14 14
Group 74 Precision Instrument Makers, Watch Makers, JeweJlers and Related Workers
Total 221 218 3 140 138 2 IV 151 148 3 71 69 2 V 69 69 68 68
VII 1 1 Family 741 Jewellers, Goldsmiths and Silversmiths
Total 219 216 3 138 136 2 IV 151 )48 3 71 69 2 V 67 67 66 66
VII 1 Jais.8-A
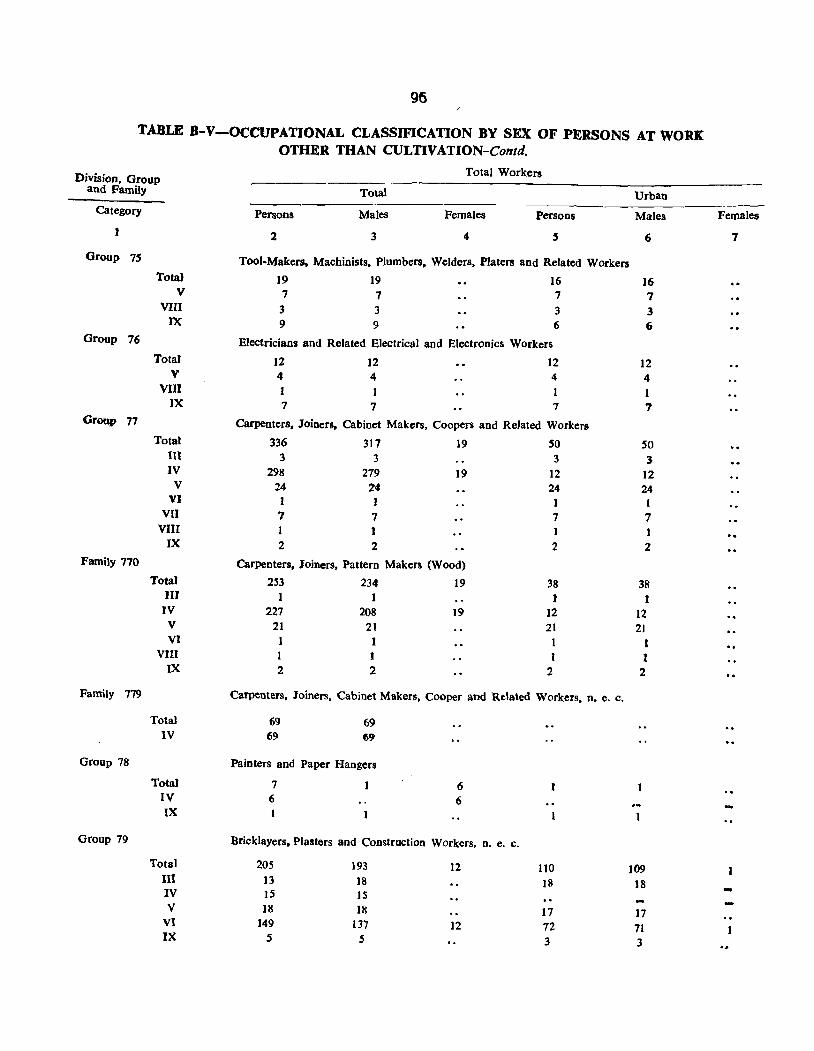
96
TABLE B-V-OCCUPATIONAL CLASSIFICATION BY SEX OF PERSONS AT WORK OTHER THAN CULTIVATION-Contd.
Total Workers Division, Group and Family Total Urban
Category Persons Males Females Persons Males Females
2 3 4 5 6 7
Group 7S Tool-Makers, Machinists, Plumbers, Welders, Platers and Related Workers Total 19 19 16 16
V 7 7 7 7 VIII 3 3 3 3
IX 9 9 6 6 Group 76 Electricians and Related Electrical and Electronics Workers
Total 12 12 12 12 V 4 4 4 4
VIII 1 IX 7 7 7 7
Group 77 Carpenters, Joiners. Cabinet Makers, Coopers and Related Workers Total 336 317 19 50 50
III 3 3 3 3 IV 298 279 19 12 12
V 24 24 24 24 VI 1 1 1
VII 7 7 7 7 VIII 1 1 I 1
IX 2 2 2 2 Family 770 Carpenters, Joiners. Pattern Makers (Wood)
Total 2S3 234 19 38 38 III 1 1 IV 227 208 19 12 12
V 21 21 21 21 VI 1 I
VIII I 1 1 I IX 2 2 2 2
Family 779 Carpenters. Joiners, Cabinet Makers, Cooper and Related Workers, n. e. c.
Total 69 69 IV 69 69
Group 78 Painters and Paper Hangers
Total 7 6 IV 6 6 IX
Group 79 Bricklayers. Plasters and Construction Workers, n. e. c.
Total 205 193 ]2 )to 109 III 13 18 18 18 -IV ]5 IS V ]8 18 17 17
VI 149 137 12 72 71 IX 5 5 3 3
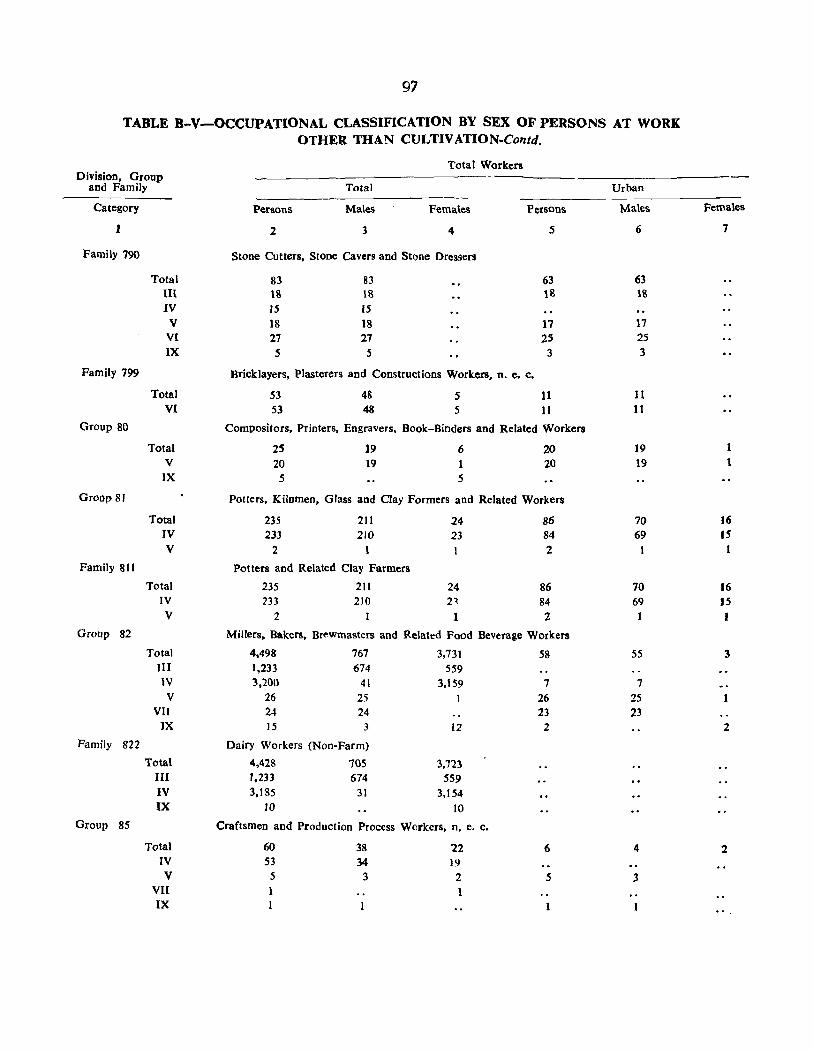
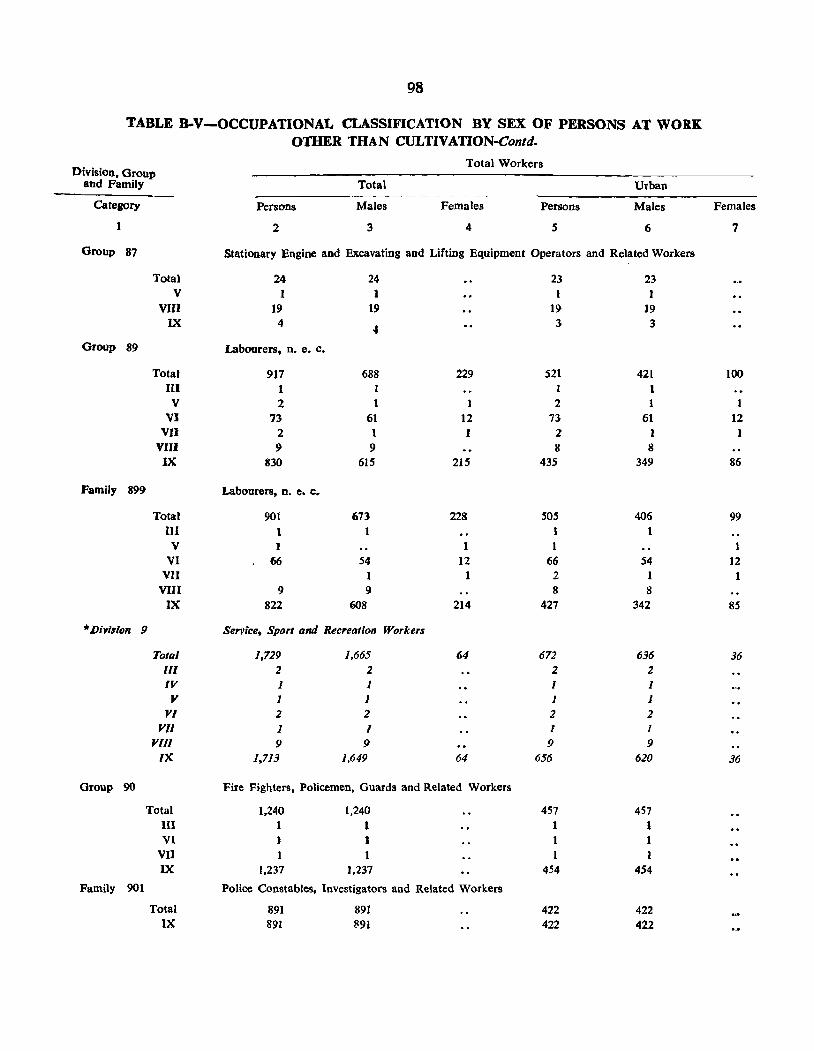
98
TABLE B-V-OCCUPATIONAL CLASSIFICATION BY SEX OF PERSONS AT WORK OTHER THAN CULTIVATION-Contd.
Total Workers Division, Group
and Family Total Urban
Category Persons Males Females Persons Males Females
1 2 3 4 5 6 7
Group 87 Stationary Engine and Excavating and Lifting Equipment Operators and Related Workers
Total 24 24 23 23 V I 1 1
VIII 19 19 19 19 IX 4
4 3 3
Group 89 Labourers, D. e. c.
Total 917 688 229 521 421 100 III 1 I I 1 V 2 1 2 1
Vl 73 61 12 73 61 12 VIl 2 2 1
VIIJ 9 9 8 8 IX 830 615 215 435 349 86
Family 899 Labourers. D. e. c.
Total 901 673 228 505 406 99 III 1 1 1 V J 1 1
VI 66 54 12 66 54 12 VII 1 1 2 1
VIII 9 9 8 8 IX 822 608 214 427 342 85
*Division 9 Service, Spor' and Recreation Workers
Total 1,729 1,665 64 672 636 36 III 2 2 2 2 IV 1 1 1 J Y 1 J 1 1
PI 2 2 2 2 Yll 1 1 1 1
Ylll 9 9 9 9 IX 1.713 1.649 64 656 620 36
Group 90 Fire Fighters. Policemen, Guards and Related Workers
Total 1,240 1.240 457 457 III 1 1 1 1 VI J I
VII 1 IX 1,237 1,237 454 454
Family 901 Police Constables, Investigators and Related Workers
Total 891 891 422 422 IX 891 891 422 422
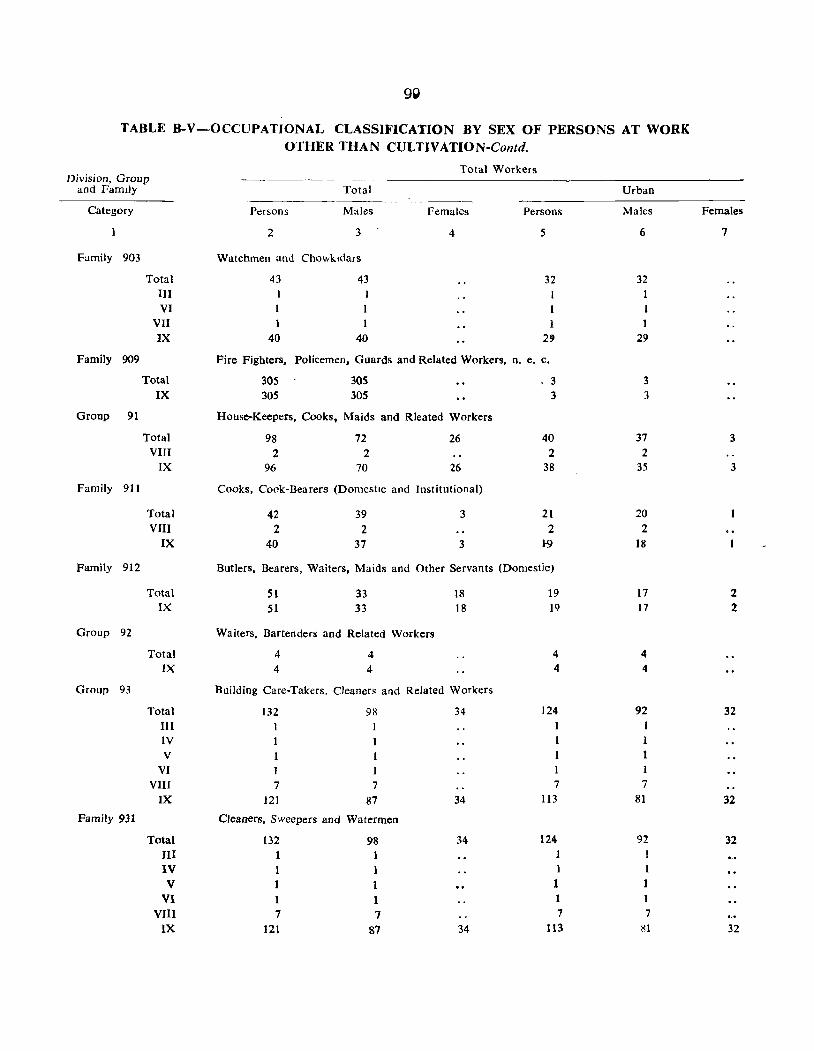
g~
TABLE B-V-OCCUPATIONAL CLASSIFICATION BY SEX OF PERSO NS AT WORK OTHER THAN CULTIVATION-Contd.
Total Workers Division, Group -------- _----
and Family Total Urban
Category Persons Males Females Persons Males Females
2 3 4 5 6 7
Family 903 Watchmen and Chowkldars
Total 43 43 32 32 III 1 VI 1
VII 1 1 1 IX 40 40 2' 29
Family 909 Fire Fighters, Policemen, Guards and Related Workers, n. e. c.
Total 305 30S 3 3 IX 305 305 3 3
Group 91 House-Keepers, Cooks, Maids and Rleated Workers
Total 98 72 26 40 37 3 VIII 2 2 2 2
IX 96 70 26 38 35 3
Family 911 Cooks, Cook-Bearers (Domestic and Institutional)
Total 42 39 3 21 20 VIII 2 2 2 2
IX 40 37 3 1-9 18
Family 912 Butlers, Bearers, Waiters. Maids and Other Servants (Domestic)
Total SI 33 18 19 17 2 IX 51 33 18 19 17 2
Group 92 Waiters, Bartenders aod Related Workers
Total 4 4 4 4 IX 4 4 4 4
Group 93 Building Care-Takers, Cleaners and Refated Workers
Total 132 98 34 124 92 32 III IV V
VI ]
VIIl 7 7 7 7 IX 121 87 34 113 81 32
Family 931 Cleaners, Sweepers and Watermen
Total 132 98 34 124 92 32 JII 1 !
IV 1 1 1
V 1 1 1 VI 1 1 1
VIII 7 7 7 7 IX 121 87 34 113 ~l 32
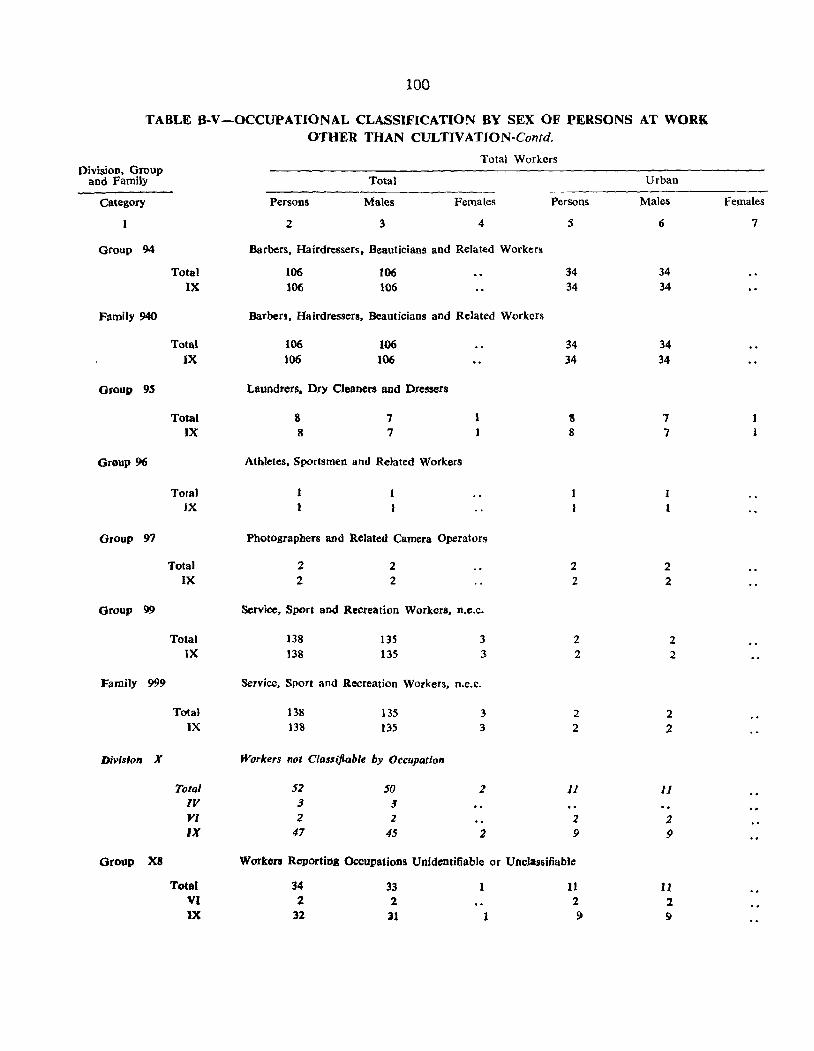
100
TABLE B-V-OCCUPATIONAL CLASSIFICATION BY SEX OF PERSONS AT WORK OTHER THAN CULTIVATION-Con/d.
Total Workers Division, Group
and Family Total Urban
Category Persons Males Females Persons Males Females
2 3 4 5 6 7
Group 94 Barbers, Hairdressers, Beauticians and Related Workers
Total 106 106 34 34 IX 106 106 34 34
Family 940 Barben, Hairdressers, Beauticians and Related Workers
Total 106 106 34 34
IX 106 106 34 34
Group 95 Laundrers. Dry Qeaners and Dressers
Tota) S 7 1 S 7 1 IX 8 7 8 7 1
Group 96 Athletes, Sportsmen and Related Workers
Total I JX 1
Group 97 Photographers and Related Camera Operators
Total 2 2 2 2 IX 2 2 2 2
Group 99 Service, Sport and Recreation Workers, D.e.C.
Total 138 135 3 2 2 IX 138 135 3 2 2
Family 999 Service, Sport and Recreation Workers, n.e.c.
Total 138 135 3 2 2 IX 138 135 3 2 2
Division X Workers not Classifiable by Occupation
Total 52 50 2 11 11 IV 3 J Yl 2 2 2 2 IX 47 45 2 9 9
Group X8 Worton Reportiog Occupations Unidentifiable or UnclassifiabJe
Total 34 33 1 11 U VI 2 2 2 2 IX 32 II 1 5) 9
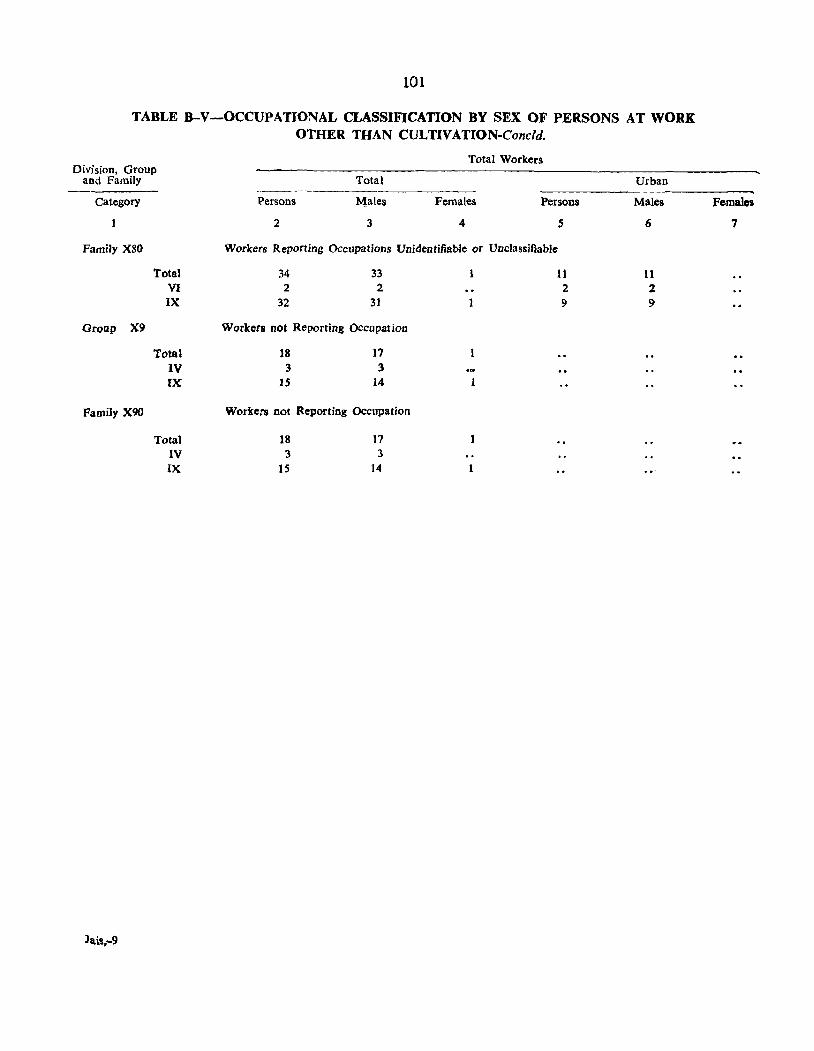
101
TABLE B-V-OCCUPATIONAL CLASSIFICATION BY SEX OF PERSONS AT WORK OTHER THAN CULTIVATION-Concld.
Division, Group and Family
Category
Family X80
Total VI IX
Group X9
Total IV [X
Family X90
Total IV IX
Jais,-9
Total Workers
Total ._------
{'ersons Males Females Persons
2 3 4 5
Workers Reporting Occupations Unidentifiable or Unclassifiable
34 2
32
33 2
31
Workers Dot Reporting Occupation
18 3
15
17 3
14
Workers not Reporting Occupation
18 3
15
17 3
14
1
1
11 2 9
Urban
Males
6
11 2 9
Females
7
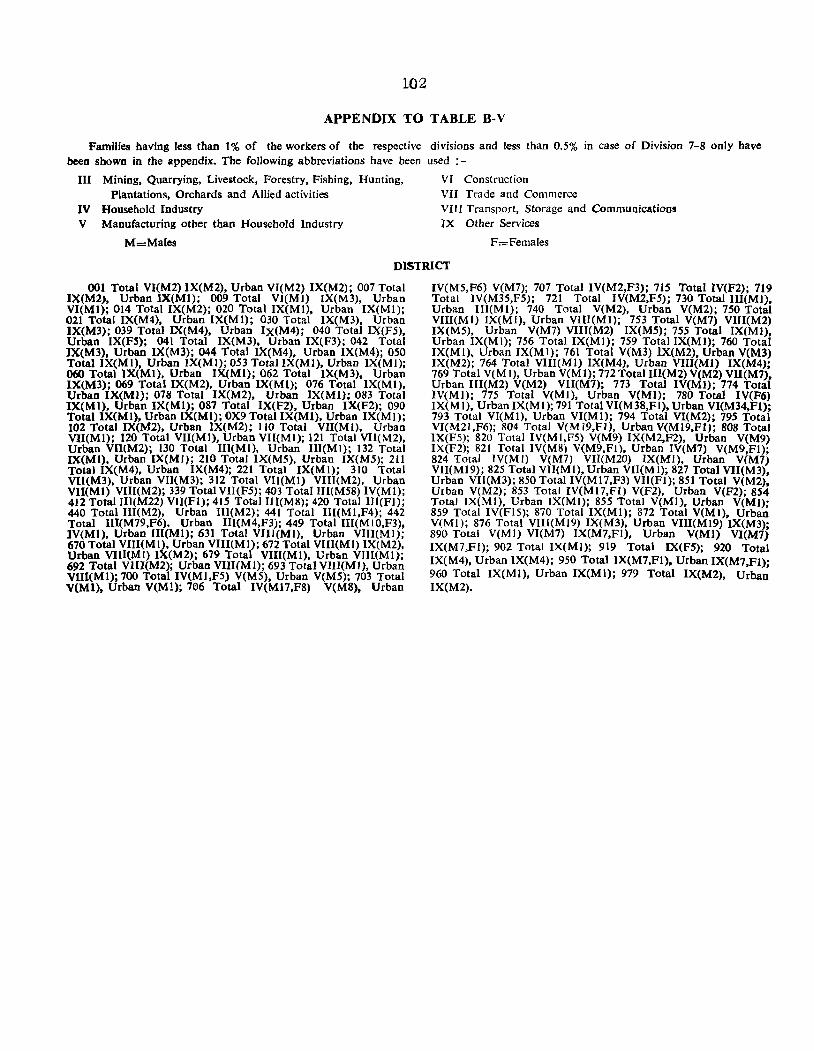
102
APPENDIX TO TABLE B·V
Families having less than 1% of the workers of the respective divisions and less than 0.5% in case of Division 7-8 only have been shown in the appendix. The following abbreviations have been used :-
III Mining, Quarrying, Liveiltock, Forestry, Fishing, Hunting, Plantations, Orchards and Allied activities
IV Household Industry V Manufacturing other than Household Industry
M=Males
VI Construction VII Trade and Commerce VIII Transport, Storage and Communications IX Other Services
F=Females
DISTRICT
001 Total VI(M2) IX(M2). Urban VI(M2) IX(M2); 007 Total IX(M2), Urban IX(Ml); 009 Total VI(Ml) lX(M3). Urban VI(Ml); 014 Total IX(M2); 020 Total IX(Ml). Urban IX(Ml); 021 Total IX(M4), Urban IX(Ml); 030 Total IX(M3), Urban IX(M3); 039 Total IX(M4), Urban IX(M4); 040 Total IX(F5), Urban IX(FS); 041 Total IX(M3), Urban IX(F3); 042 Total IX(M3), Urban IX(M3); 044 Total IX(M4), Urban IX(M4); 050 Total IX(MI), Urban IX(Ml); 053 Total IX(Ml), Urban IX(MI); 060 Total IX(MI), Urban IX(Ml); 062 Total IX(M3), Urban IX(M3); 069 Total IX(M2), Urban IX(MI); 076 Total IX(Ml), Urban IX(Ml); 078 Total IX(M2), Urban IX(MI}; 083 Total lX(Ml), Urban IX(Ml); 087 Total IX(F2), Urban IX(F2); 090 Total IX(MI), Urban lX(Ml); OX9 Total IX(Ml), Urban IX(Ml); 102 Total IX(M2), Urban IX(M2): 110 Total VII(Ml), Urban VI1(Ml); 120 Total VII(Ml). Urban VU(M1); 121 Total VII(M2). Urban VII(M2); 130 Total m(Ml), Urban IlI(Ml); 132 Total IX(Ml), Urban IX(MI); 210 Total IX(M5), Urban IX(MS); 211 Total IX(M4), Urban IX(M4); 221 Total IX(MI); 310 Total Vll(M3), Urban VII(M3); 312 Total VIl(Ml) VIlJ{M2), Urban VII(Ml) VIII(M2); 339 Total VII(F5); 403 Total IIl(M58) IV(Ml); 412 Total I1I(M22) VII(Fl); 415 Total III(M8); 420 Total I1I(FI); 440 Total IlI(M2), Urban III(M2); 441 Total III(Ml,F4); 442 Total IlI(M79,F6), Urban 1II(M4,F3); 449 Total III(MIO,F3), IV(Ml), Urban III(Ml); 631 Total VIIJ(MI}, Urban VIII(MI); 670 Total VIII(MI), Urban VIIIlMI); 672 Total VlII(MI) IX(M2), Urban VIII(MI) IX(M2); 679 Total VIII(Ml), Urb&n VlII(Ml); 692 Total VlII(M2); Urban VIII(Ml); 693 Total VllI(Ml), Urban VII1(Ml); 700 Total IV(Ml,F5) V(M5), Urban V(M5); 703 Total V(Ml). Urban V(Ml); 766 Total IV(M17,F8) V(M8), Urban
IV(M5,F6) V(M7); 707 Total IV(M2,F3); 715 Total IV(F2); 719 Total IV(M35,F5); 721 Total IV(M2,F5); 730 Total III(MJ), Urban IlI(MI); 740 Total V(M2), Urban V(M2); 750 Total VIII(MI) IX(MI), Urban VIII(MI); 753 Total V(M7) VIII(M2) IX(M5), Urban V(M7) VIII(M2) IX(M5); 755 Total IX(Ml), Urban IX(Ml); 756 Total IX(MI); 759 TotaIIX(Ml); 760 Total IX(MI), Urban IX(MI); 761 Total V(M3) IX(M2), Urban V(M3) IX(M2); 764 Total VIII(MI) IX(M4), Urban VIII(Ml) IX(M4); 769 Total V(M I), Urban V(M I); 772 Total UI(M2) V(M2) VII(M7). Urban III(M2) V(M2) VlI(M7); 773 Total IV(Ml); 774 Total IV(MI); 775 Total V(Ml), Urban V(Ml); 780 Total IV(F6) IX(Ml), Urban IX(Ml); 791 Total VI(M38,FI), Urban VI(M34,Fl); 793 Total VI(Ml), Urban VI(MI); 794 Total VI(M2); 795 Total VI(M21,F6); 804 Total V(MI9,FI), Urban V(MI9,Fl); 808 Total lX(FS); 820 Total IV(Ml,F5) V(M9) IX(M2,F2), Urban V(M9) IX(F2); 821 Total IV(M8) V(M9,FI). Urban IV(M7) V(M9,Fl); 824 Total IV(M I) V(M7) VII(M20) lX(MI), Urban v(M7) VII(MI9); 825 Total VIl(Ml), Urban VII(MI); 827 Total VII(M3), Urban VU(M3); 850 Total IV(MI7,F3) VII(FI); 851 Total V(M2). Urban V(M2); 853 Total IV(MI7,Fl) V(F2), Urban V(F2); 854 Total IX(MI), Urban IX(MI); 855 Total V(Ml), Urban V(Ml); 859 Total IV(FI5); 870 Total IX(Ml); 872 Total V(Ml). Urban V(MI); 876 Total VIII(MI9) IX(M3), Urban VIII(MI9) IX(M3); 890 Total V(MI) VI(M7) IX(M7,FI), Urban V(Ml) VI(M7) IX(M7,FI); 902 Total IX(Ml); 919 Total IX(FS); 920 Total IX(M4), Urban IX(M4); 950 Total IX(M7,Fl). Urban IX(M7,Fl); 960 Total IX(Ml), Urban IX(Ml); 979 Total IX(M2), Urban IX(M2).
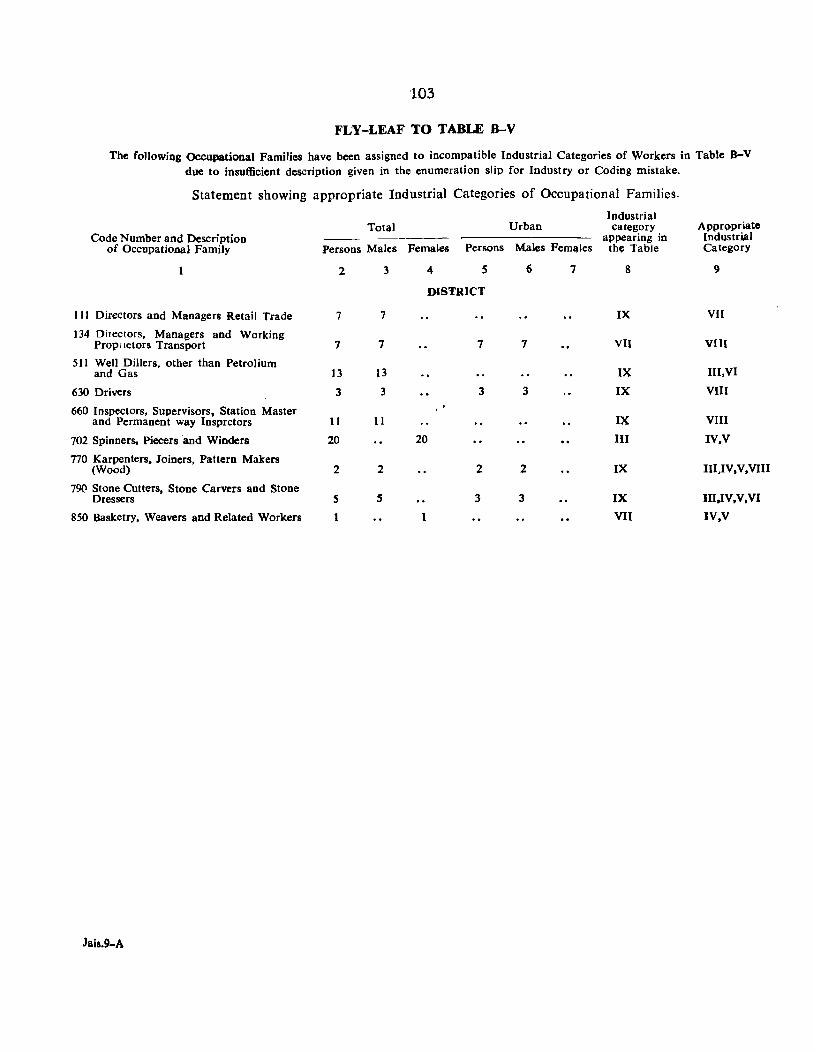
103
FLY-LEAF TO TABLE B-V
The following Occupational Families have been assigned to incompatible Industrial Categories of Workers in Table B-V due to insufficient description given in the enumeration slip for Industry or Coding mistake.
Statement showing appropriate Industrial Categories of Occupational Families.
Code Number and Description of Occupational Family
111 Directors and Managers Retail Trade
134 Directors, Managers and Prop'letors Transport
Working
511 Well Diliers. other than Petrolium and Gas
630 Drivers
660 Inspectors, Supervisors. Station Master and Permanent way Insprctors
702 Spinners, Piecers 'and Winders
770 Karpenters, Joiners, Pattern Makers (Wood)
79(1 Stone Cutters, Stone Carvers and Stooe Dressers
850 Basketry, Weavers and Related Workers
Jais.9-A
Total
Persons Males
2 3
7 7
7 7
13 13
3 3
11 11
20
2 2
5 5
Industrial Urban category
appearing in Females Persons Males Femll.les the Table
4 5 6 7 8
DISTRICT
IX
7 7 VII
IX 3 3 IX
' . IX
20 III
2 2 IX
3 3 IX VII
A ppr()priate Industrial Category
9
VII
VIII
I1I,VI VIII
VIII IV,V
IIIJV,V,VIII
III.IV,V,VI IV.V
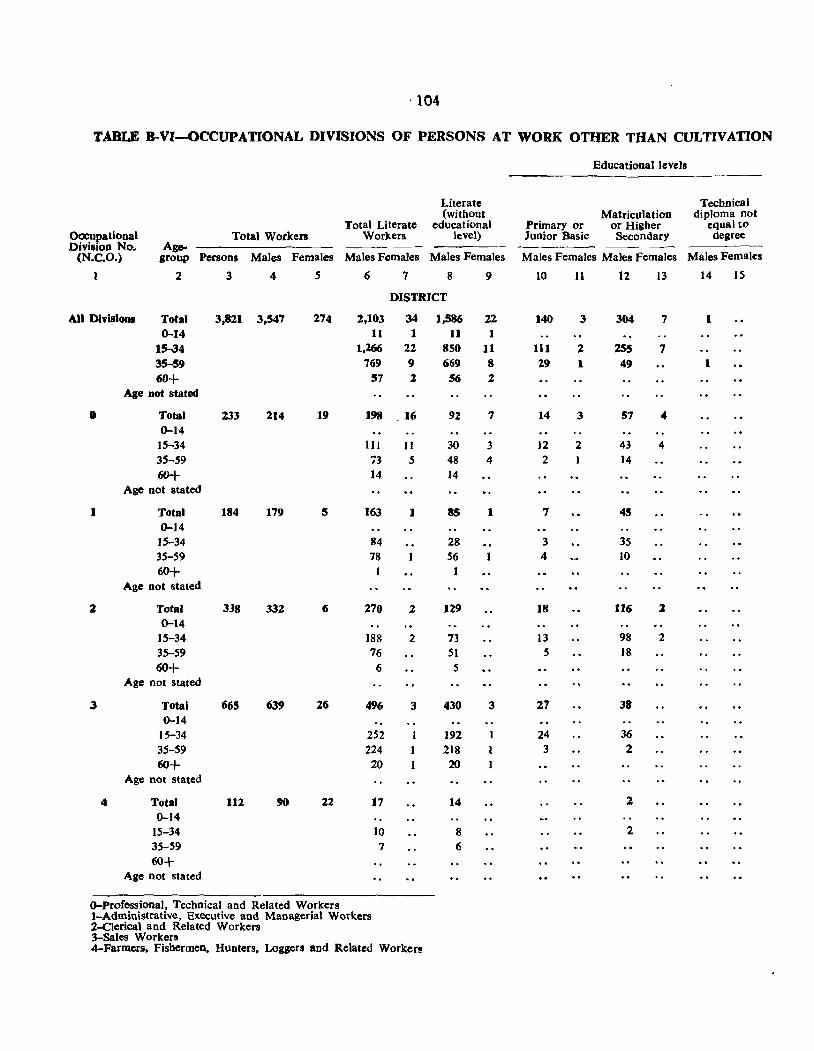
·104
TABLE B-VI-OCCUPATIONAL DIVISIONS OF PERSONS AT WORK OTHER THAN CULTIVATION
Educational levels
Literate Technical (without Matriculation diploma not
Total Literate educational Primary or or Higher equal to Occupational Total Worken Workers level) Junior Basic Secondary degree Division No. Age-
(N.C.O.) group Persons Males Females Males Females Males Females Males Females Males females Males Females
2 3 4 5 6 7 8 9 10 11 12 13 14 IS
DISTRICT
All DivislOBl Total 3.8:U 3,547 274 2,103 34 1.586 22 140 3 304 7 1 0-14 11 1 11 1
15-34 1,266 22 8S0 11 III 2 25S 7 35-59 769 9 669 8 29 1 49 1 60+ 57 2 56 2
Age Dot stated
0 Total Z33 214 19 198 16 92 7 14 3 57 " 0-14 15-34 III 11 30 3 ]2 2 43 4 35-59 73 5 48 4 2 14
60+ 14 14 Age not stated
1 Total 184 179 5 163 1 85 1 7 45 0-14
15-34 84 28 3 35 35-59 78 56 4 10 60+
Age not stated
2 Total 338 332 270 2 129 18 116 1 0-14
15-34 188 2 73 13 98 2 35-59 76 51 5 18 60+ 6 5
Age not stated
3 Total 665 639 26 496 3 430 3 27 38 0-14
15-34 252 192 24 36 35-59 224 218 3 2 60+ 20 20
Age not stated
4 Total 112 90 22 17 14 2. 0-14
15-34 10 8 2 35-59 7 6 60+
Age not stated
O-Professional, Technical and Related Workers I-Administrative, Executive and Managerial Workers 2-Clerical and Related Workers 3-Sales Workers 4-Farmcrll. Fishermen. HUnters, Loggers and Related Worker!
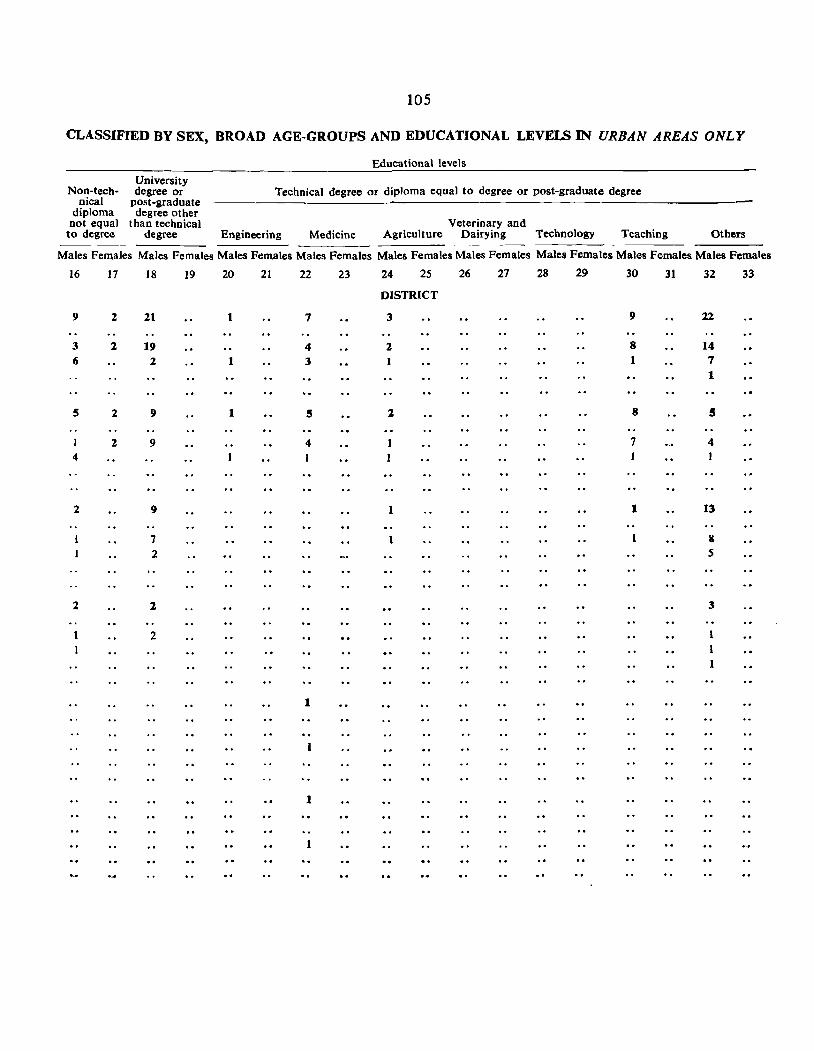
105
CLASSIFIED BY SEXt BROAD AGE-GROUPS AND EDUCATIONAL LEVELS IN URBAN AREAS ONLY
Non-tech-nical
diploma not equal to degree
University degree or
post-graduate degree other
than technical degree
Educational levels
Technical degree or diploma equal to degree or post-graduate degree
Engineering Medicine Veterinary and
Agriculture Dairying Technology Teaching Others
Males FemaJes Males Females Males Females Males Females Males Females Males Females Males Females Males Females Males Females
16
9
3 6
5
1 4
2
2
17
2
2
2
2
18
21
19 2
9
9
7
2
2
2
19 20 21 22 23
1 7
4 1 3
1 S
4
1
1
24 25 26 27 28 29
DISTRICT
3
2 I
2
1
1
30 31
9
8 1
8
7
1
32
22
14 7 1
S
4 1
13
& S
3
1 1 1
33
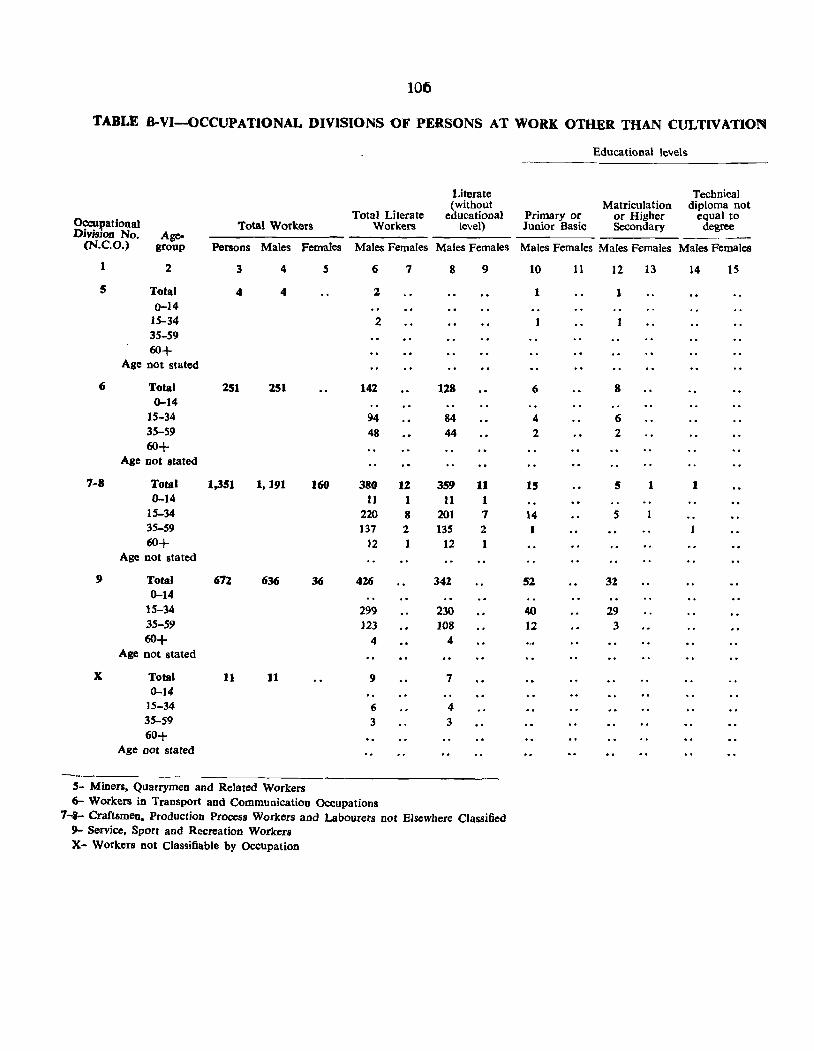
106
TABLE B-VI-OCCUPATIONAL DIVISIONS OF PERSONS AT WORK OTHER THAN CULTIVATION
Total Workers Total Literate
Workers
Literate (without
educational level)
Educational levels
Matriculation Primary or or Higher Junior Basic Secondary
Technical diploma not
equal to degree Occupational
Division No. (N.C.O.)
Agegroup Persons Males Females Males Females Males Females Males Females Males Females Males Females
1
5
(j
7-8
x
2
Total 0-14
IS-34 3S-S9 60+
Age not stated
Total 0-14
15-34 3S-59 60+
Age not stated
Total 0-14
15-34 35-59
60+ Age not stated
Total 0-14
15-34 35-59 60+
Age not stated
Total 0-14
15-34 35-59 60+
Age Dot stated
3
4
251
1,351
67Z
11
4
4
251
1, ]91
636
11
S- Miners, Quarrymen and Related Workers
5
160
36
6
2
2
142
94 48
7
380 12 11 1
220 8 137
J2
426
299 123
4
9
6 3
2 1
6- Workers in Transport and Communication Occupations
8
128
84 44
359 11
201 135
12
342
230 108
4
7
4
3
9
11 1 7 2 1
7-8- Craftsmen. Production Process Workers and Labourers not Elsewhere Classified 9- Service, Sport and Recreation Workers X- Workers not Classifiable by Occupation
10
1
6
4 2
15
14 1
52
40 12
11 12
1
8
6 2
5
5
32
29 3
13 14 15
1 1
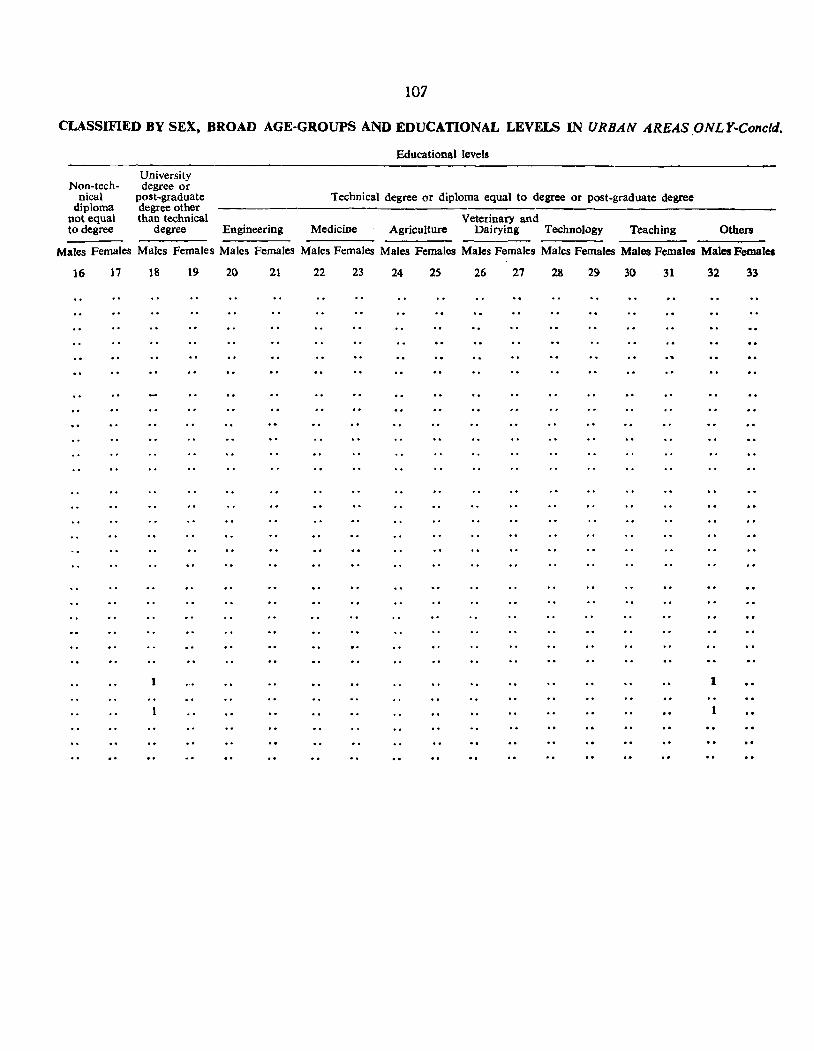
107
CLASSIFIED BY SEX, BROAD AGE-GROUPS AND EDUCATIONAL LEVELS IN URBAN AREASONLY-Concld.
Non-technical
diploma not equal to degree
University degree or
post-graduate degree other than technical
degree Engineering
Educational levels
Technical degree or diploma equal to degree or post-graduate degree
Veterinary and Medicine Agriculture Dairying Technology Teaching Others
Males Females Males Females Males Females Males Females Males Females Males Females Males Females Males Females Males Females
16 17 18 19 20 21 22 23 24 25 26 27 28 29 30 31 32 33
1 1
1
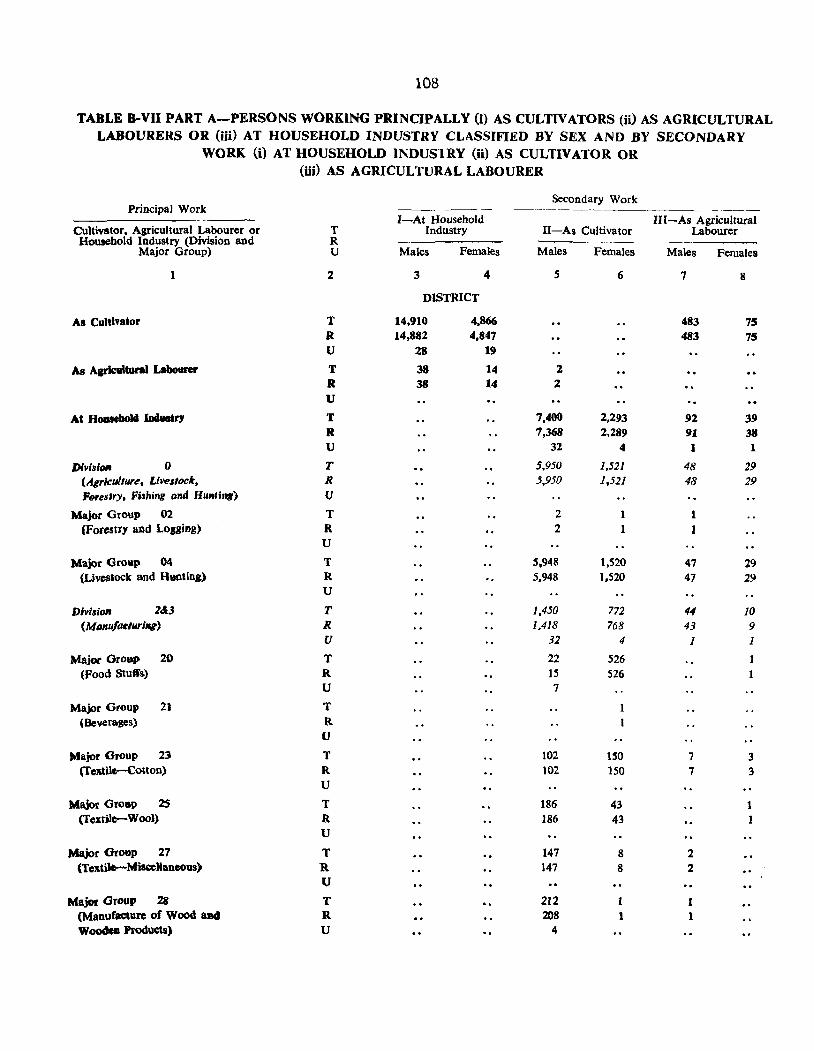
108
TABLE 8-VII PART A-PERSONS WORKING PRINCIPALLY (1) AS CULTIVATORS (U) AS AGRICULTURAL LABOURERS OR (iii) AT HOUSEHOLD INDUSTRY CLASSIFIED BY SEX AND BY SECONDARY
WORK (i) AT HOUSEHOLD lNDUSlRY (ii) AS CULTIVATOR OR (iii) AS AGRICULTURAL LABOURER
Secondary Work Principal Work
I-At Household III-As Agricultural Cultivator. Agricultural Labourer or T Industry II-As Cultivator Labourer
HOUl(lboid Industry (Division and R Major Group) U Males Females Males Females Males Females
2 3 4 S 6 7 8
DISTRICT
As Cultivator T 14,910 4.866 483 75 R 14,882 4.847 483 7S U 28 19
As Apicultural Labourer T 38 14 2 R 38 14 2 U
At HouseboW WusttY T 7.400 2,293 92 39 R 7,368 2,289 91 38 U 32 4 1 1
Div/fli_ 0 T 5,950 1,521 48 29 (Agricu/lure, Livestock. R 5,950 1,521 48 29 Forestry, Fbhing and Humi'W) U
Major Group 02 T 2 1 (Forestry and Logging) R 2 1
U
Major Group 04 T 5,948 1,520 47 29 (Livestock and Hunting) R 5,948 1,520 47 29
U
Divi.sio" 2&.3 T 1.450 772 44 10 (Manu/ae/llrilf6) R 1.418 768 43 9
U 32 4 1 1
Major Gropp 20 T 22 526 (Food Stuffs) R 15 526
U 7
Major Group 21 T 1
'Beverages) R 1 U
Major Group 23 T 102 150 7 3 (felrti1e-Couon) R 102 150 7 3
U
Major Group 25 T 186 43 1 (Textile-Woo}) R 186 43 1
U
Major Group 27 T 147 8 2 (Textilo-MilK:e)laneous) R 147 8 2
U
Major Group 28 T 212 1 I (Manufacture of Wood alld R 208 1 1 WoodeD Products) U 4
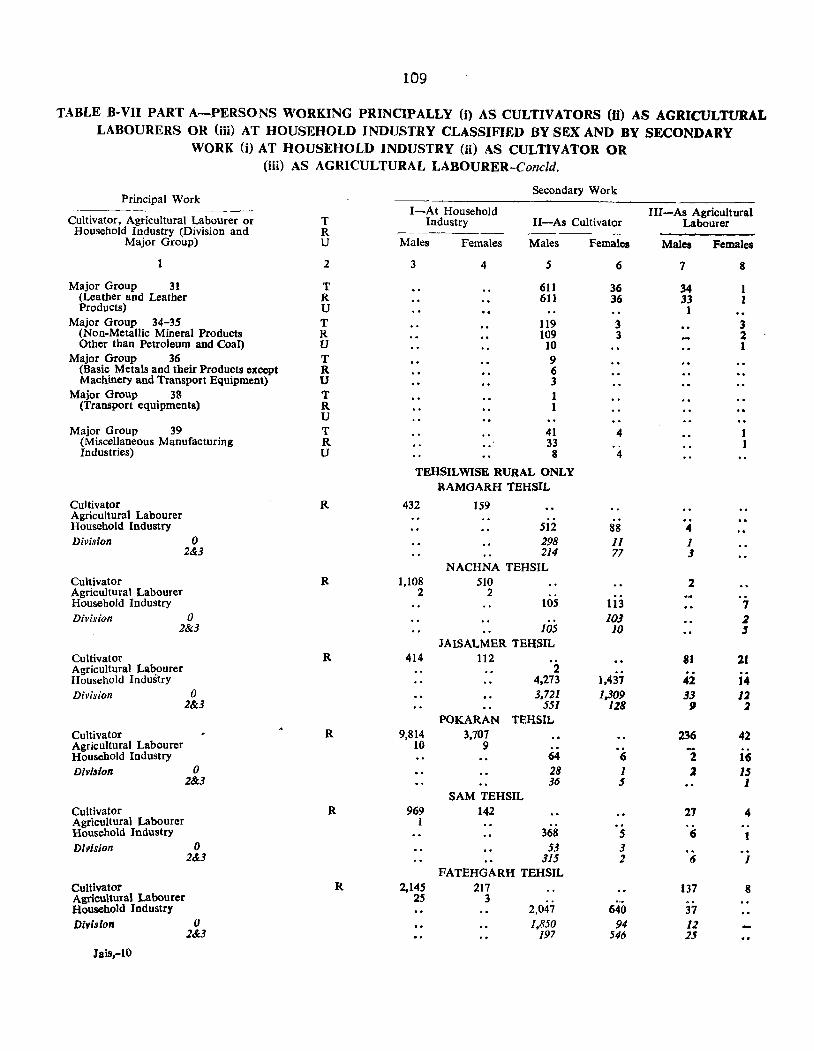
109
TABLE B-VII PART A-PERSONS WORKING PRINCIPALLY (i) AS CULTIVATORS (ij) AS AGRICULTURAL LABOURERS OR (iii) AT HOUSEHOLD INDUSTRY CLASSIFIED BY SEX AND BY SECONDARY
WORK (i) AT HOUSEHOLD INDUSTRY (ii) AS CULTIVATOR OR (iii) AS AGRICULTURAL LABOURER-Conc1d.
Principal Work Secondary Work
I-At Household III-As Agricultural Cultivator, Agricultural Labourer or T Industry II-As Cultivator Labourer
Household Industry (Division and R Major Group) U Males Females Males Females Males Females
1 2 3 4 5 6 7 8
Major Group 31 T 611 36 34 1 (Leather and Leather R 611 36 33 1 Products) U 1
Major Group 34-35 T 119 3 3 (Non-Metallic Mineral Products R 109 3 2 Other than Petroleum and Coal) U 10 1
Major Group 36 T 9 (Basic Metals and their Products except R 6 Machinery and Transport Equipment) U 3
Major Group 38 T 1 (Transport equipments) R 1
U Major Group 39 T 41 4 1
(Miscellaneous Manufacturing R 33 1 Industries) U 8 4
TEHSILWISE RURAL ONLY RAMGARH TEHSIL
Cultivator R 432 159 Agricultural Labourer Household Industry 512 88 4 Division 0 298 Jl 1
2&3 214 77 3 NACHNA TEHSIL
Cultivator R 1,108 510 2 Agricultural Labourer 2 2 Household Industry lOS 113 7 Division 0 10J 2
2&3 105 10 .5 JAISALMER TEHSIL
Cultivator R 414 112 81 21 Agricultural Labpurer 2 Household Industry 4,273 1,437 42 14 Division 0 3.721 1,309 33 12
2&3 551 128 9 2 POKARAN TEHSIL
Cultivator R 9,814 3,707 236 42 Agricultural Labourer 10 9 -Household Industry 64 (j 2 16 Division 0 28 1 :z IS
2&3 36 S 1 SAM TEHSIL
Cultivator R 969 142 27 4 Agricultural Labourer 1 Household Industry 368 5 6 I Division 0 53 3
2&.3 315 2 6 1 FATEHGARH TEHSIL
Cultivator R 2,145 217 137 8 Agricultural Labourer 25 3 Household Industry 2,047 640 37 Division 0 1,850 94 12
2&3 197 546 25
Jais.-l0
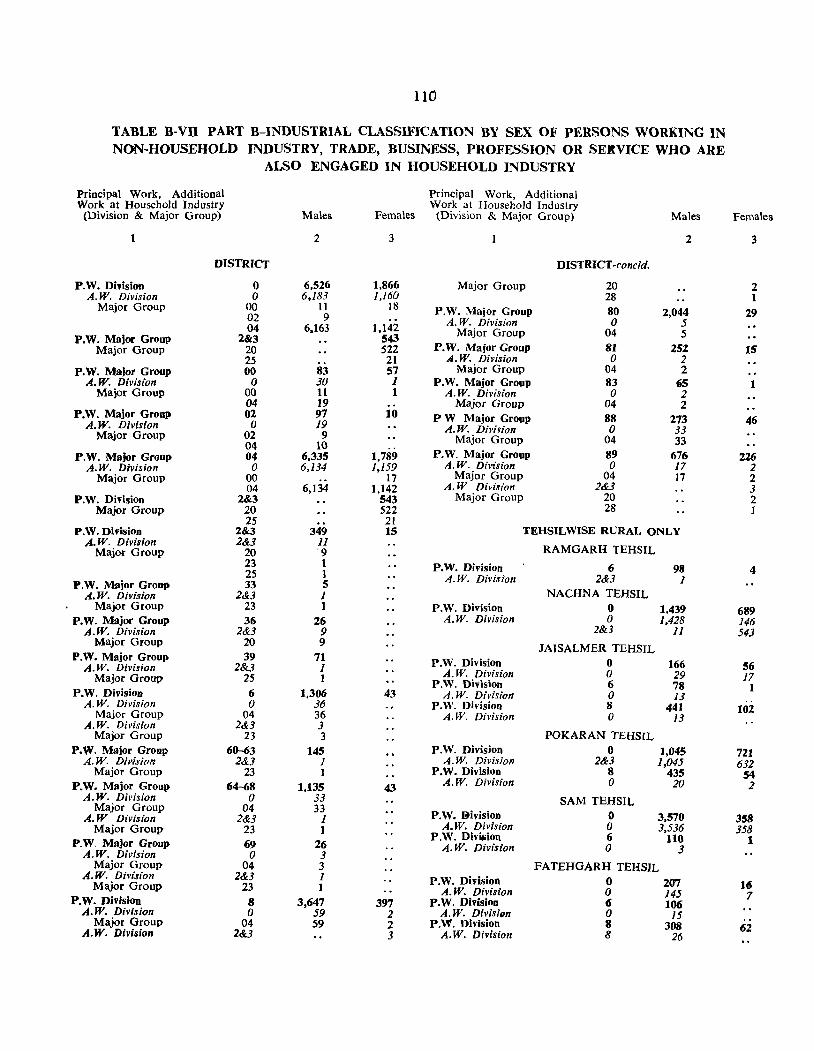
110
TABLE B-VII PART B-INDUSTRIAL CLASSIFICATION BY SEX OF PERSONS WORKING IN NON-HOUSEHOLD INDUSTRY, TRADE, BUSINESS, PROFESSION OR SEll VICE WHO ARE
ALSO ENGAGED IN HOUSEHOLD INDUSTRY
Principal Work, Additional Work at Household Industry
(Division & Major Group)
P.W. Division
DISTRICT
o A. W. Division
Major Group
P.W. Major Group Major Group
P.W. Major Group A.W. Division
Maior Group
P.W. Major Group A. W. Division
Major Group
P.W. Major Group A. W. Division
Major Group
P.W. Division Major Group
P.W. Division A. W. Division
Major Group
P.W. Major Group A. W. Division
Major Group P.W. Major Group
A.W. Division Major Group
P.W. Major Group A. W. Division
Major GrOll{)
P.W. Division A. W. Division
Major Group A. W. Division
Major Group P.W. Major Group
A. W. Division Major Group
P.W. Major Group A. W. Division
Major Group A.W Division
Major Group P.W. Major Group
A.W. Division Major Group
A.W. Division Major Group
P. W. Division A. W. Division
Major Group A.W. Division
o 00 02 04
2&3 20 25 00 o
00 04 02 o
02 04 04 o
00 04
2&3 20 25
2&3 2&3
20 23 25 33
2&3 23 36
2&3 20 39
2&3 25
6 o
04 2&3
23 60-63
2&3 23
64-68 o
04 2&3
23 69 o
04 2&3
23 8 o
04 2&3
Males
2
6,526 6,183
11 9
6.163
83 30 11 19 97 19
9 10
6,335 6,134
6,134
349 11 '9 1 1 5 1 1
26 9 9
71 1 1
1,306 36 36 3 3
145 1 1
1,135 33 33
1 1
26 3 3 1 I
3,647 59 59
Females
3
1,866 1,160
18
1,142 543 522 21 57 1 I
10
.. 1,789 1,159
17 1,142
543 522
21 15
4.3
43
397 2 2 3
Principal Work, Additional Work at Household Industry
(Division & Major Group) Males
Major Group
P.W. Major Group A. W. Division
Major Group P.W. Major Group
A. W. Division Major Group
P.W. Major Group A. W. Division
Major Group P W Major Group
A. W. Division Major Group
P.W. Major Group A. W. Division
Major Group A.W Didsion
Major Group
DISTRICT-rancid.
20 28 80 o
04 81 o
04 83 o
04 88 o
04 89 o
04 2&3
20 28
2
2,044 5 5
252 2 2
CiS 2 2
273 33 33
676 17 17
TEHSILWISE RURAL ONLY
RAMGARH TEHSIL
P.W. Division A.W. Division
P.W. Division A.W. Division
P.W. Division A. W. Division
P.W. Division A. W. Division
P.W. Division A. W. Division
P.W. Division A.W. Db'Ision
P.W. Division A. W. Division
P.W. Division A. W. Division
P.W. Diviiion A. W. Division
P.W. Division A. W. Division
P.W. Division A. W. Divisitm
P.W. Division A.W. Division
6 2&3
NACHNA TEHSIL o o
2&3
JAISALMER TEHSIL o o 6 o 8 o
POKARAN TEHSIL o
2&3 8 o
SAM TEHSIL o o 6 o
98 1
1,439 1,428
11
166 29 78 13
441 13
1,045 1,045
435 20
3,570 3,536
no 3
FATEHGARH TEHSIL
o 207 o 145 6 106 o 15 8 J08 8 26
Females
3
2 1
29
15
1
46
226 2 2 3 2 1
4
689 146 543
56 17
1
102
721 632
54 2
358 358
1
16 7
62
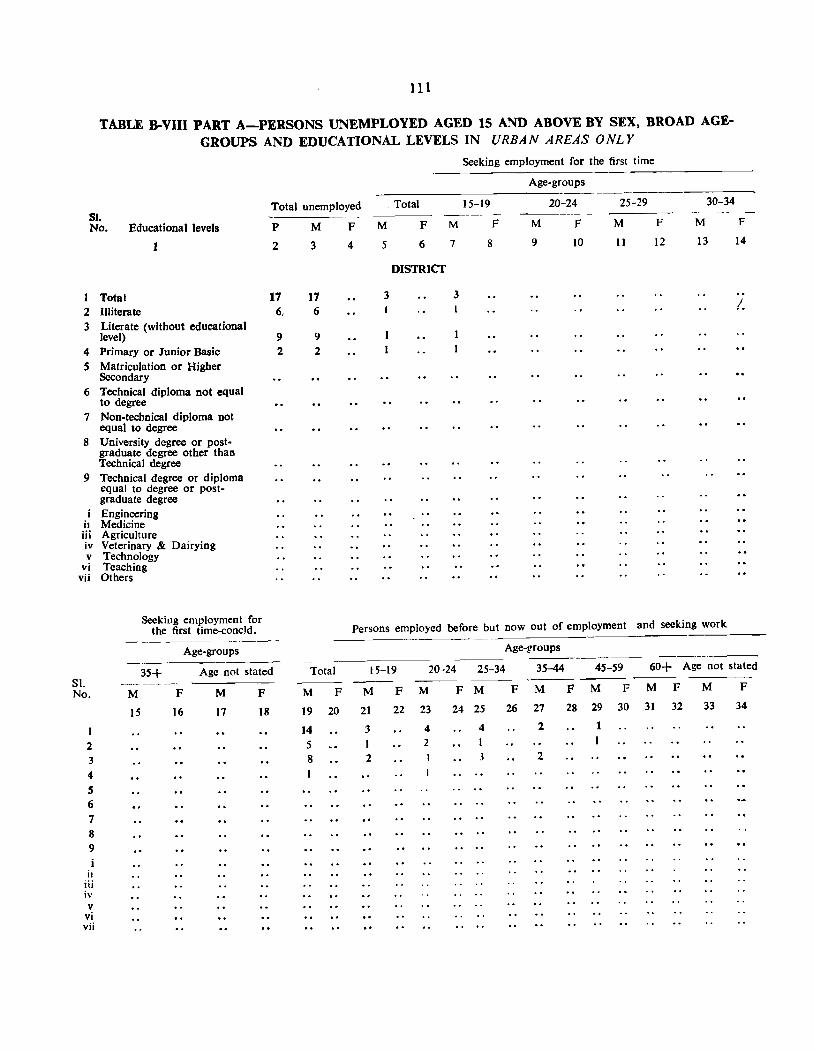
111
TABLE B-VIII PART A-PERSONS UNEMPLOYED AGED 15 AND ABOVE BY SEX, BROAD AGEGROUPS AND EDUCATIONAL LEVELS IN URBAN AREAS ONLY
Seeking employment for the first time ----------------Age-groups
Total unemployed _ Total 15-19 20-24 25-29 30-34 Sl. ~
F M F M F M F M F No. Educational levels P
2 3
4 S
6
7
8
9
il iii iv v
vi vii
SI. No.
1 2 3
4 5 6 7 8 9
11
iii iv v
vi vii
1
Total Illiterate Literate (without educational level) Primary or Junior Basic Matriculation or Higher Secondary Technical diploma not equal to degree Non-technical diploma Dot equal to degree University degree or post. graduate degree other thaD Technical degree Technical degree or diploma equal to degree or post-graduate degree Engineering Medicine Agriculture Veterinary & Dairying Technology Teaching Others
Seeking employment for the first time-concld.
Age-groups
2
17 6,
9 2
-------------35+ Age not stated
M F
15 16
M
17
F
18
M
3
17 6
9 2
Total
M F
19 20
14 5 8
F M
4 5 6 7 8 9 10 11 12 13 14
DISTRICf
3 3 I.
Persons employed before but now out of employment and seeking work
Age-groups
15-19 20-24 25-34 35-44 45-59 60+ Age not stated --- -----
M F M F M F M F M F M F M F
21 22 23 24 25 26 27 28 29 30 31 32 33 34
3 4 4 2 1
1 2 1 1
2 2

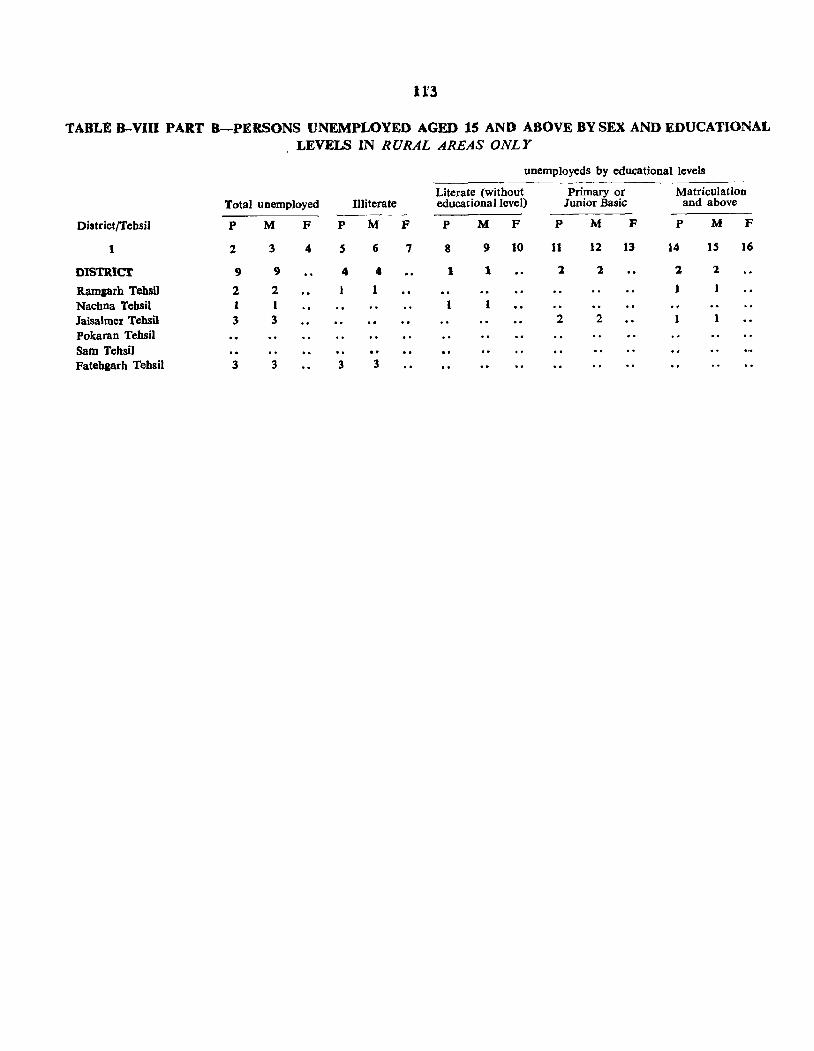
11'3
TABLE B-VIII PART B-PERSONS UNEMPLOYED AGED 15 AND ABOVE BY SEX AND EDUCATIONAL LEVELS IN RURAL AREAS ONLY
unemp]oyeds by educational levels
Literate (without Primary or Matriculation Total unemployed TIJiterate educational level) Junior Basic and above
Dilltrictrrehsil P M F P M F P M F P M F P M F
1 2 3 4 S 6 7 8 9 10 11 12 13 14 IS 16
DISTRiCt 9 9 4 4 1 1 1. 1. 1 1
Ramprh Tehsil 2 2 Nachoa Tebllil 1 1 1 1
Jaisalmer TehsiJ 3 3 2 2 1 1
Pokaran Tehsil Sam Tehsil Fatebgarh Tehsil 3 3 3 3
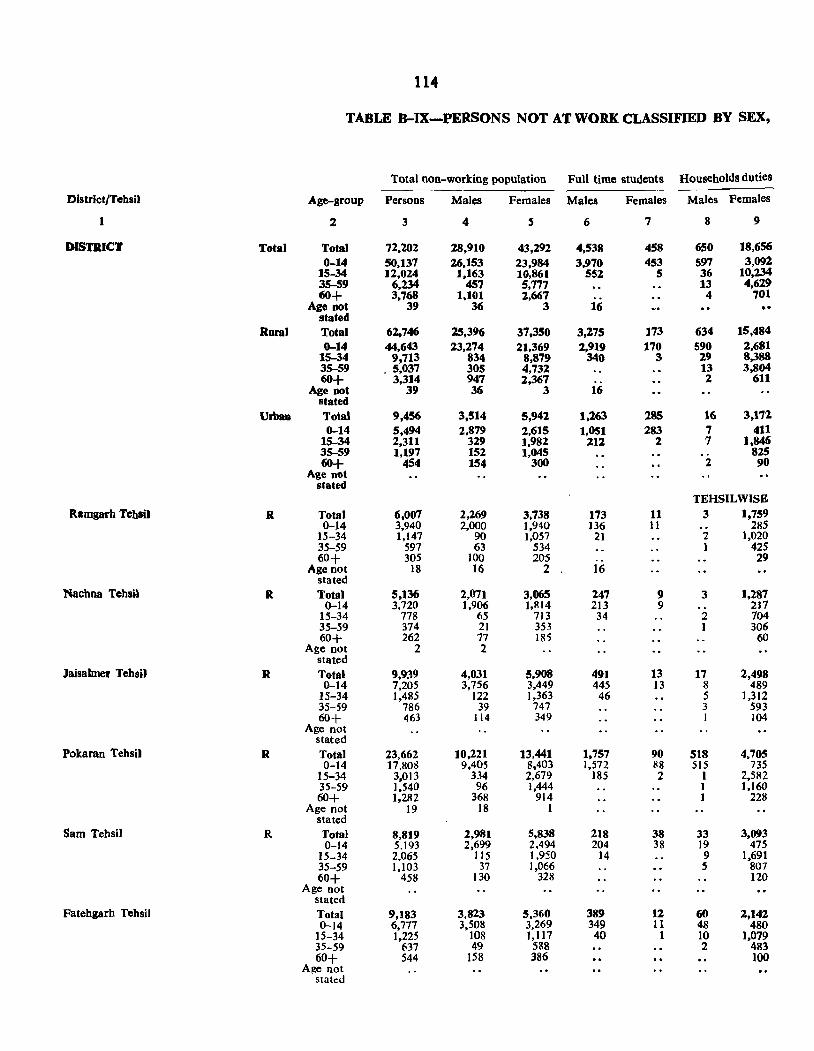
114
TABLE B-IX-PERSONS NOT AT WORK CLASSIFIED BY SEX,
Total non-working population Full time students Households duties
District/Tebsil Age-sroup Persons Males Females Males Females Males Females
I 2 3 4 S 6 7 8 9
DISTRICT Total Total 72,202 28,910 43,292 4,538 458 650 18,656
0-14 50,137 Z6,153 23,984 3,970 453 S97 3,092 15-34 ]2,024 1,163 10,861 552 5 36 10,234 35-59 6,234 457 5,777 13 4,629 60+ 3,768 1,101 2,667 4 701
Age not 39 36 3 16 .. stated
Rural Total 62.746 25,396 37,350 3,275 173 634 15,484
0--14 44,643 23,274 21,369 2,919 170 590 2,681 15-34 9,713 834 8,879 340 3 29 8,388 35-59 . 5,037 305 4,732 13 3,804 60+ 3,314 947 2,367 2 611
Age not 39 36 3 16 stated
UrbaD Total 9,456 3,514 5,942 1,163 285 16 3,172 0--14 5,494 2,879 2,615 1,051 283 7 411
15-34 2,311 329 ],982 212 2 7 1.846 35-59 1,197 152 1,045 825 60+ 454 154 300 2 90
Age not stated
TEHSILWISE Ramgarh Tchsi) R Total 6,007 2,269 3,738 173 11 3 1,759
0-14 3,940 2,000 1,940 136 11 285 15-34 ],147 90 1,057 21 2 1,020 35-59 597 63 534 1 425 60+ 305 100 205 " 29
Age not 18 16 2 16 stated
Nachoa Tehsi) R Total 5,136 2,071 3,065 247 9 3 1,287 0-14 3,720 1,906 1,1I14 213 9 2J7
15-34 778 65 713 34 2 704 35-59 374 21 353 1 306 60+ 262 77 185 60
Age not 2 2 stated
JaisalIner Tehsn R Total 9,939 4,031 5,908 491 13 17 2,498 0-14 7,205 3,756 3,449 445 13 8 489
15-34 1,41cl5 122 1,363 46 5 1,312 35-59 786 39 747 3 593 60+
Age not 463 114 349 I 104
stated Pokaran Tehsil R Total 23,662 10,221 13.441 1,757 90 518 4,705
0-14 17,8011 9,405 8,403 1,572 88 515 735 15-34 3,013 334 2.679 185 2 1 2,51<2 35-59 1,540 96 1,444 1 1,160 60+ 1,2R2 368 914 1 228
Age not 19 18 1 stated
Sam Tehsil R Total 8,819 2,981 5,838 218 38 33 3.093 0-14 5.193 2,699 2.494 204 38 19 475
15-34 2,065 J 15 1,950 ]4 9 1.691 35-59 1,103 37 1,066 5 807 60+ 458 130 328 120
Age not stated
Fatehgarh Tehsil Total 9,183 3,823 5,360 389 12 60 2,142 0-14 6,777 3,508 3,269 349 11 48 480
J5-34 1,225 108 ), t 17 40 1 10 1,079 35-59 637 49 588 2 483 60+ 544 158 386 100
A~e not stated
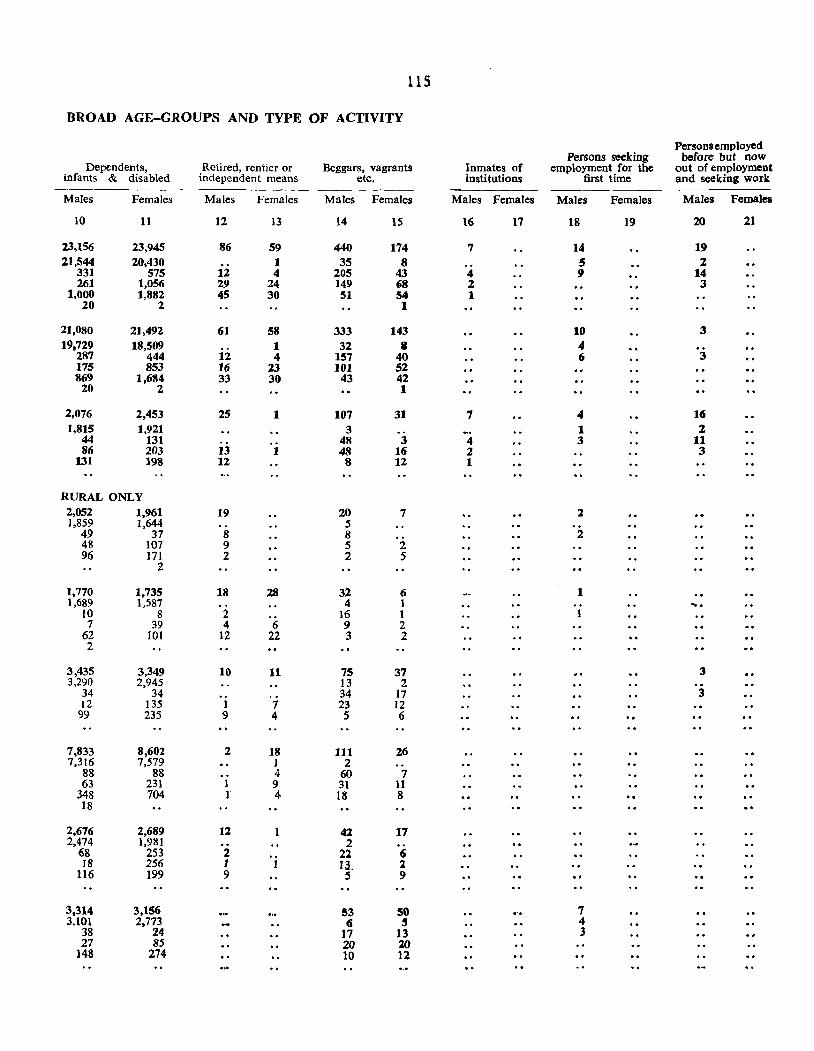
115
BROAD AGE-GROUPS AND TYPE OF ACTIVITY
Persons employed Persons seeking before but now
Dependents, Retired, rentier or Beggars, vagrants Inmates of employment for the out of employment infants & disabled independent means etc. institutions first time and seeking work
Males Females Males Females Males Females Males Females Males Females Males Females
10 11 12 13 14 15 16 17 18 19 20 21
23.156 23,945 86 59 440 174 7 14 19 21,544 20,430 1 35 8 5 2
331 575 12 4 205 43 4 9 14 261 1,056 29 24 149 68 2 3
1,000 1,882 45 30 51 54 1 20 2 1
21,080 21,492 61 58 333 143 10 3 19,729 18,509 1 32 II ..
287 444 12 4 157 40 6 3 175 853 16 lJ 101 52 869 1,684 33 30 43 42
20 2 1
2,076 2,453 25 1 107 31 7 4 16 1,815 1,921 3 1 2.
44 131 48 3 4 3 11 86 203 13 1 48 16 2 3
131 198 12 8 12 1
RURAL ONLY 2,052 1,961 19 20 7 2 1,859 1,644 5
49 37 8 8 2 48 107 9 5 2 96 171 2 2 5
2
1,770 1,735 18 28 32 6 1 1,689 1,587 4 1 ....
10 8 2 16 1 7 39 4 6 9 2
62 101 12 22 3 2 2
3,435 3,349 10 11 75 37 3 3,290 2,945 13 2
34 34 34 17 3 12 135 1 7 23 ]2
99 235 9 4 5 6
7,833 8,602 2 18 111 26 7,316 7,579 1 2
88 88 4 60 7 63 231 1 9 31 11
348 704 r 4 18 8 18
2,676 2,689 12 42 17 2,474 1,981 2
68 253 2 21 6 18 256 1 Il. l
116 199 9 5 9
3,314 3,156 53 50 7 3.101 2,773 (I 5 4
38 24 17 13 3 27 85 20 lO
148 274 10 12
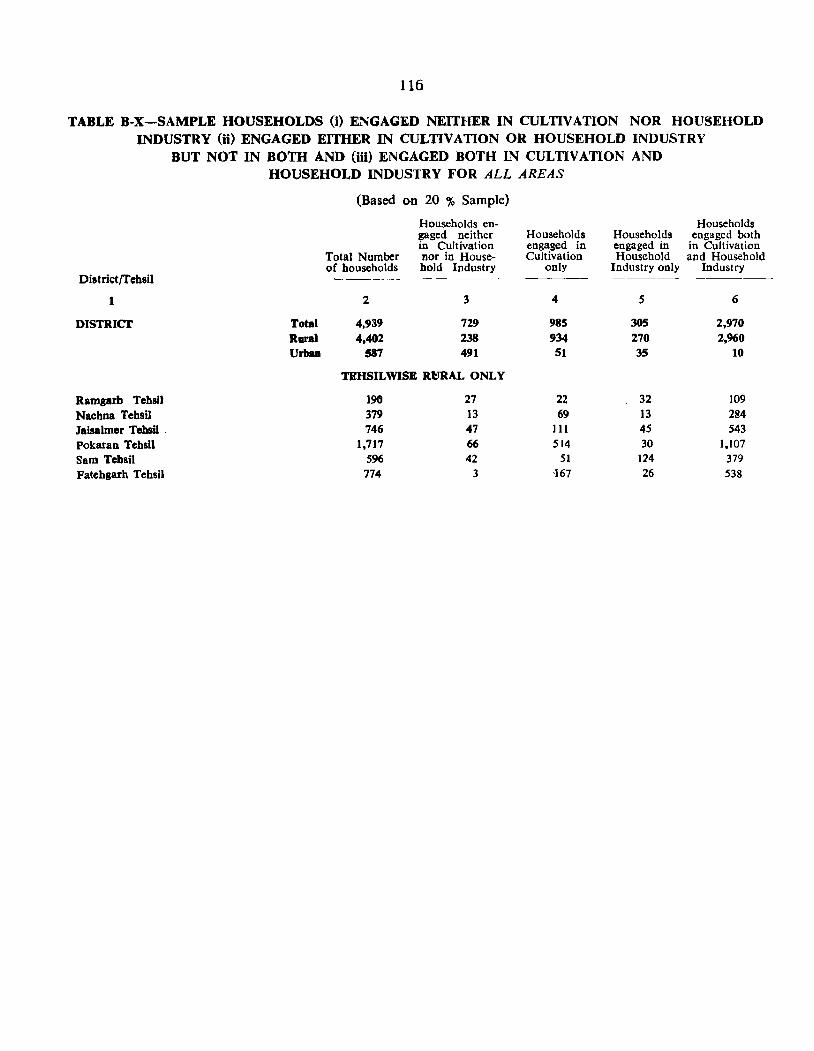
116
TABLE B-X-SAMPLE HOUSEHOLDS (i) ENGAGED NEITHER IN CULTIVATION NOR HOUSEHOLD INDUSTRY (it) ENGAGED EITHER IN CULTIVATION OR HOUSEHOLD INDUSTRY
Districtrrehsil
1
DISTRIct
Ram,arb Tebsil Nachoa Tehsil Jaisalmer TehsU . Pokaran Tehsil Sam Tehai1 Fatehgarh Tehsil
BUT NOT IN BOTH AND (iii) ENGAGED BOTH IN CULTIVATION AND HOUSEHOLD INDUSTRY FOR ALL AREAS
(Based on 20 % Sample)
Households en-gaged neither Households Households in Cultivation engaged in engaged in
Total Number nor in House- Cultivation Household of households hold Industry only Industry only ------ ----- ----_
2 3 4 5
Total 4,939 729 985 305 Rural 4,402 238 934 270 Urbu 587 491 51 35
TRHSILWISE RtJRAL ONLY
190 27 22 32 379 13 69 13 746 47 111 45
1,717 66 514 30 596 42 51 124
774 3 '167 26
Households engaged both in Cultivation and Household
Industry -----_
6
2,970 2,960
10
109 284 543
I,ID7 379 538
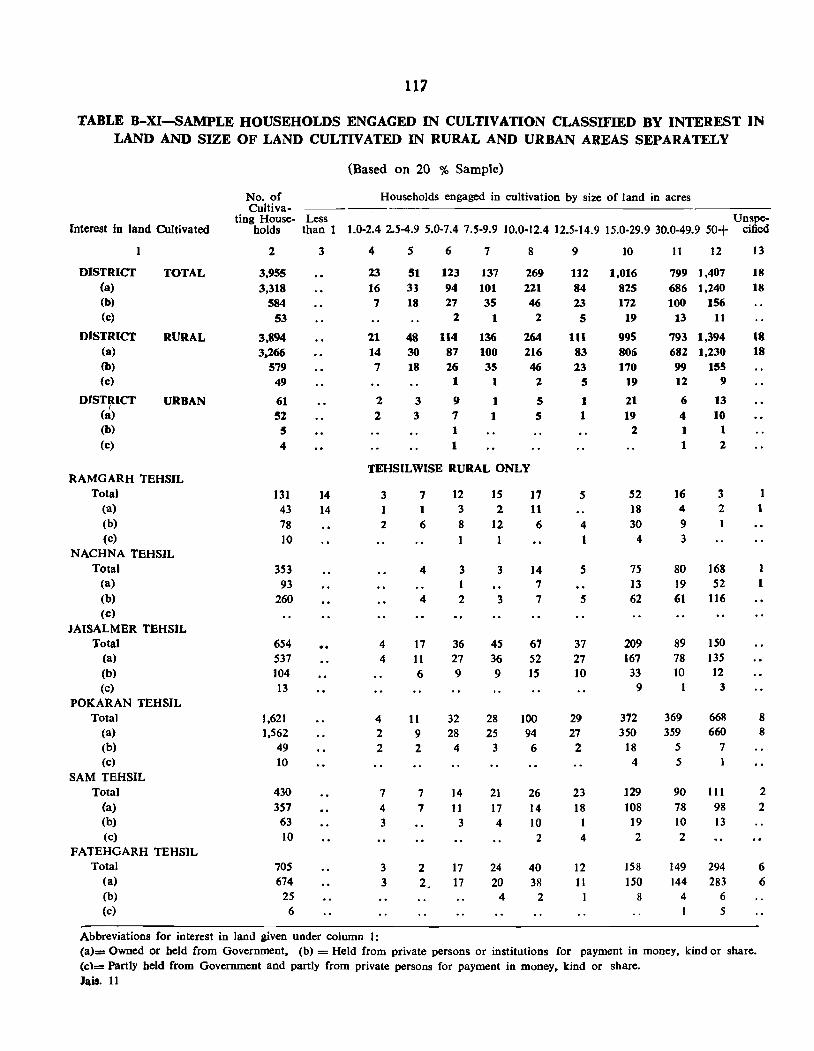
117
TABLE B-XI-SAMPLE HOUSEHOLDS ENGAGED IN CULTIVATION CLASSIFIED BY INTEREST IN LAND AND SIZE OF LAND CULTIVATED IN RURAL AND URBAN AREAS SEPARATELY
Interest in land Cultivated
DISTRICT (a) (b)
(c)
DISTRICT (8)
(b)
(c)
DISTRICT I
(a)
(b)
(c)
TOTAL
RURAL
URBAN
RAMGARH TEHSIL Total
(a)
(b)
(c)
NACHNA TEHSIL Total
(a)
(b)
(c)
JAISALMER TEHSIL Total
(a)
(b) (c)
POKARAN TEHSIL Total
(a) (b)
(c)
SAM TEHSIL Total
(a) (b)
(c)
FATEHGARH TEHSIL Total
(a)
(b)
(c)
(Based on 20 % Sample)
No. of Households engaged in cultivation by size of land in acres Cultiva- --- -----
ting House- Less Unspe-holds than 1 1.0-2.4 2.5-4.9 5.0-7.4 7.5-9.9 10.0-12.4 12.5-14.9 15.0-29.9 30.0-49.9 50+ cified
2
3,955 3,318
584 53
3.894 3,266
579 49
61 52
5 4
131 43 78 10
353 93
260
654 537 104 13
],621 1,562
49 10
430 357
63 10
705 674
25 6
3
14 14
4
23 16 7
21 14 7
2 2
5 6 7
51 123 137 33 94 101 18 27 3S
2 1
48 114 136 30 87 100 18 26 35
1 I
391 371
1
1
8
269 221 46
2
264 216 46
2
5 S
TEHSILWISE RURAL ONLY
3
2
4 4
4 2 2
7 4 3
3 3
7 1 6
4
4
17 11 6
12 3 8
1
3 1 2
36 27 9
11 32 9 28 2 4
7 14 7 11
3
2 17 2, 17
15 2
12 1
3
3
45 36 9
17 11 6
14 7 7
67 52 15
28 ]00 25 94
3 6
21 26 17 14 4 10
2
24 40 20 38
4 2
9 10 11 12
112 1,016 799 1,407 686 1,240 84 825
23 172 100 156 5 19 13 II
111 995 793 1,394 682 1,230 83 80ti
23 170 99 155 5 19 12 9
I 21 6 13 1 19 4 10
5
4 1
5
5
37 27 10
29 27 2
23 18
4
12 II
2
52 18 30
4
75 13 62
209 167
33 9
1 1 1 2
16 4 9 3
3 2
80 168 19 52 61 116
89 150 78 135 10 12
3
372 369 668 350 359 660
18 5 7 4 5
129 90 III 108 78 98 19 10 13 2 2
158 149 294 150 144 283
8 4 6
I 5
13
18
18
18 18
1
I
8 8
2
2
6 6
Abbreviations for interest in land given under column I: (a)= Owned or held from Government, (b) = Held from private persons or institutions for payment in money, kind or share. (c)= Partly held from Government and partly from private persons for payment in money. kind or share. Jais. 11
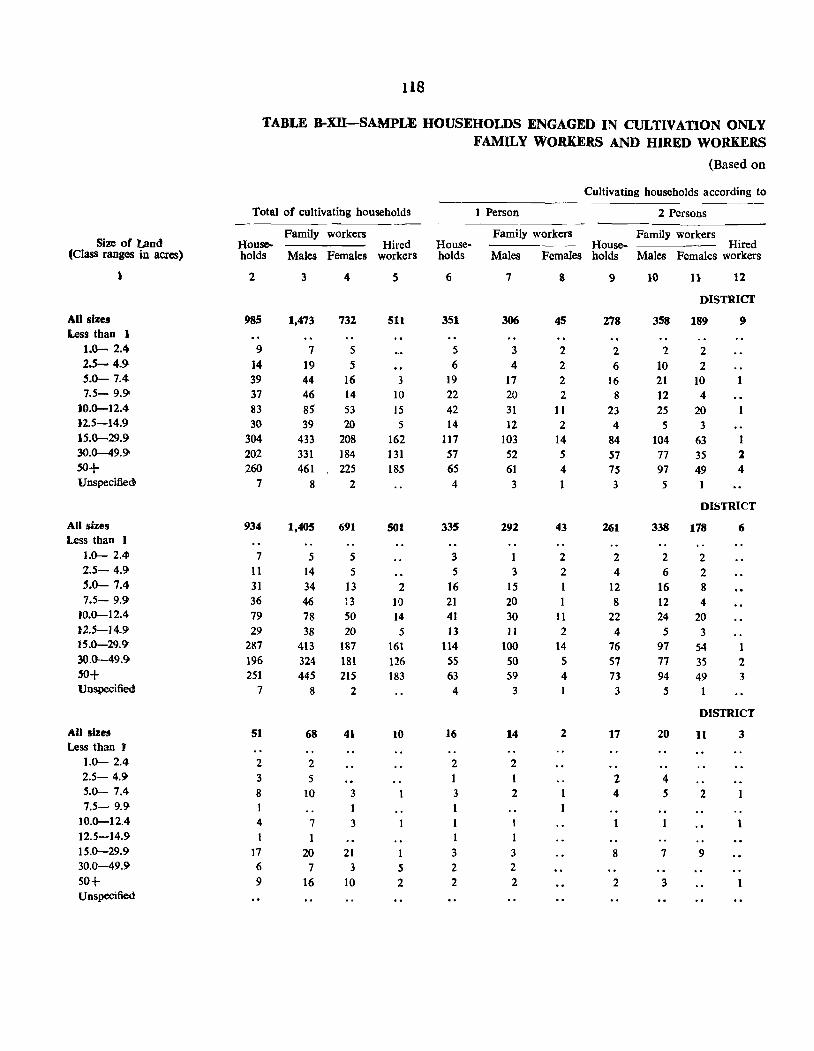
Size of Land (Class ranges in acres)
I
All sizes Less than Ii
1.0- 2.4 2.5- 4.9-5.0-7.4 7.5- 9.90
)0.0-12.4 }2.5-14.9 15.0-29.9-30.0-49.9
50+ Unspecified
All sizes Less than I
1.0- 2.4 2.5- 4.9 5.0- 7.4 7.5- 9.9
rO.0-12.4 }2.5-14.9 15.0-29.9 30.0-49.9
50+ Unspecified
All lizes Less than I
1.0- 2.4 2.5- 4.9 5.0- 7.4 7.5- 9.9
10.0-12.4 12.5-14.9 15.0-29.9 30.0-49.9 50+ Unspecified
118
TABLE .o-Xll-SAMPLE HOUSEHOLDS ENGAGED IN CULTIVATION ONLY FAMILY WORKERS AND HIRED WORKERS
Total of CUltivating households
Family workers Households
2
98S
9 14 39 37 83 30
304 202 260
7
934
7
11 31 36 79 29
287 196 251
7
51
2
3 8 I 4
17 6 9
Hired Males Females workers
3
1,473
7
19 44 46 85' 39
433 331
461 8
1,405
5 14 34 46 78 38
413
324 445
8
68
2 5
10
7
1 20
7
16
4
732
5 5
16 14 53 20
208 184 225
2
691
5 5
13 13
50
20 187 181 215
2
41
3
3
21 3
10
5
511
3 10
15 5
162 131 185
SOl
2 10 14 5
161 126 183
10
5 2
Households
6
351
5 6
19
22 42 14
117 57 65
4
335
3 5
16 21 41 13
114 55 63 4
16
2
3
1
I
3
2
2
(Based on
Cultivating households according to
I Person 2 Persons
Family workers Family workers House- ---
Males Females holds Hired
Males Females workers
7
306
3
4 17 20 31
12 103 52 61 3
292
3 15
20 30 11
100 50 59
3
14
2
2
3 2
2
8
45
2 2 2 2
11 2
14 5 4
43
2
2 1
11
2
14 5 4
2
9
278
2 6
16 8
23 4
84 57 75 3
261
2
4 12 8
22
4 76 57 73 3
17
2 4
8
2
10 11 12
DISTRICT
358 189 9
2 10 21 12 25 5
104 77 97 5
2 2
10 4
20 3
63
35
49
1 4
DISTRICT
338 178 6
2 6
16 12 24 5
97 77 94 5
20
4 5
7
3
2 2 8 4
20 3
54
35 49
2 3
DISTRICT
11 3
2
9
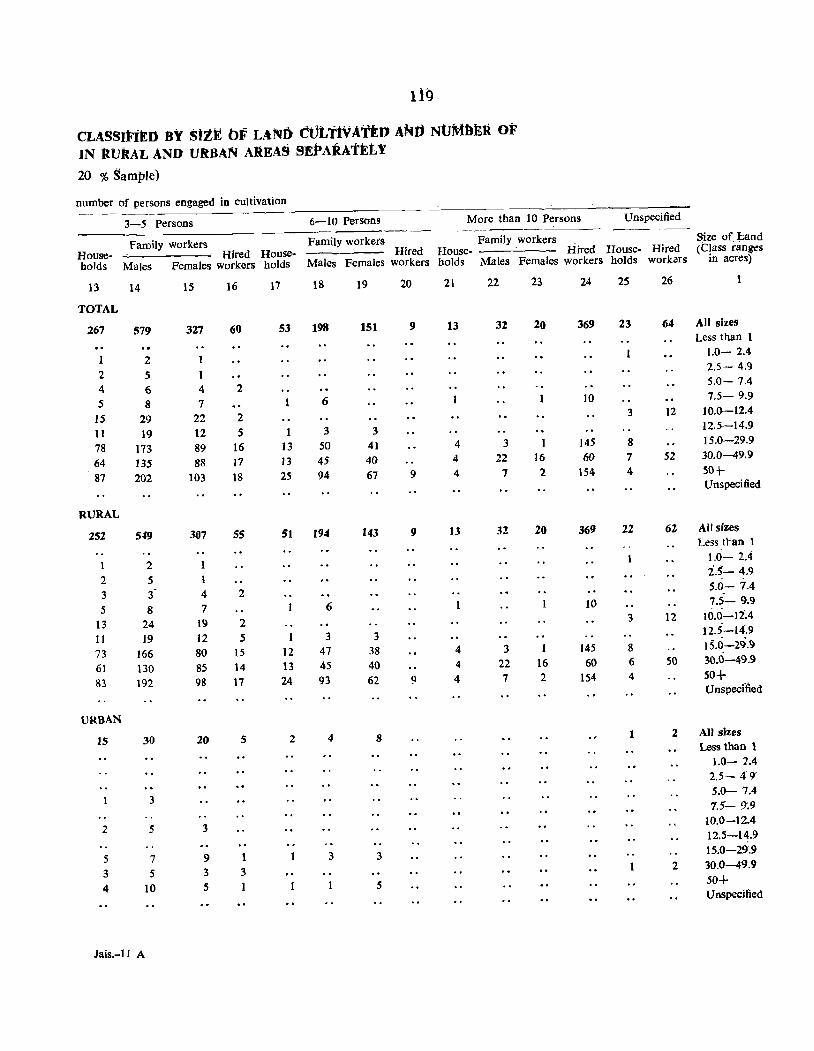
119
CLASSIFiED BY stzit bF LAM) CUtttvAttD AND NtJMIlER OF IN lUJRAL AND VRBAfol AREAS SEt-ARAntY
20 % Sample)
number of persons engaged in cultivation
3-5 Persons 6-10 Persons More than 10 Persons Unspecified
Family workers Family workers Family workers Hired
~ze of~nd
House- Hired House- Hired House- House- Hired <qass r~nges
holds Males Females workers holds Males Females workers holds Males Females workers holds work<:rs III acres)
13 14 15 16 17 18 19 20 21 22 23 24 25 26
TOTAL
267 579 327 60 53 198 151 9 13 3Z 20 369 23 64 All sizes Less than 1
1 2 1.0- 2.4
2 5 1 2.5- 4.9
4 6 4 2 5.0- 7.4
5 8 7 6 10 7.5- 9.9
15 29 22 2 3 12 10.0-12.4
11 19 12 5 3 3 12.5-14.9
78 173 89 16 13 50 41 4 3 145 8 15.0-29.9
64 135 88 17 J3 45 40 4 22 16 60 7 52 30.0-49.9
87 202 103 18 2S 94 67 9 4 7 2 154 4 50-\-Unspecified
RURAL
252 519 307 55 51 194 143 9 13 32 20 369 22 62 All sizes Less tran 1
1 2 1 1.0- 2,4
2 5 1 2.5- 4.9
3 3 - 4 2 5.0- 7.4
5 8 7 6 10 7.5- 9.9
13 24 19 2 3 12 10.0-12,4
11 19 12 5 3 3 12.5-14.9
73 166 80 15 12 47 38 4 3 145 8 15.0-29.9
61 130 85 14 13 45 40 4 22 16 60 6 SO 30.0-49.9
83 192 98 17 24 93 62 9 4 7 2 154 4 50+ Unspecffled
URBAN
15 30 20 5 2 4 8 1 2 All sizes Less than 1
1.0- 2.4 2.5- 4' 9' 5.0- 7.4
3 75- g.9
2 5 3 10.0-12.4 125-14.9
5 7 9 1 3 3 15.0-29.9
3 5 3 3 1 2 30.0-49.9
4 10 5 1 5 50+ Unspecified
Jais.-l1 A
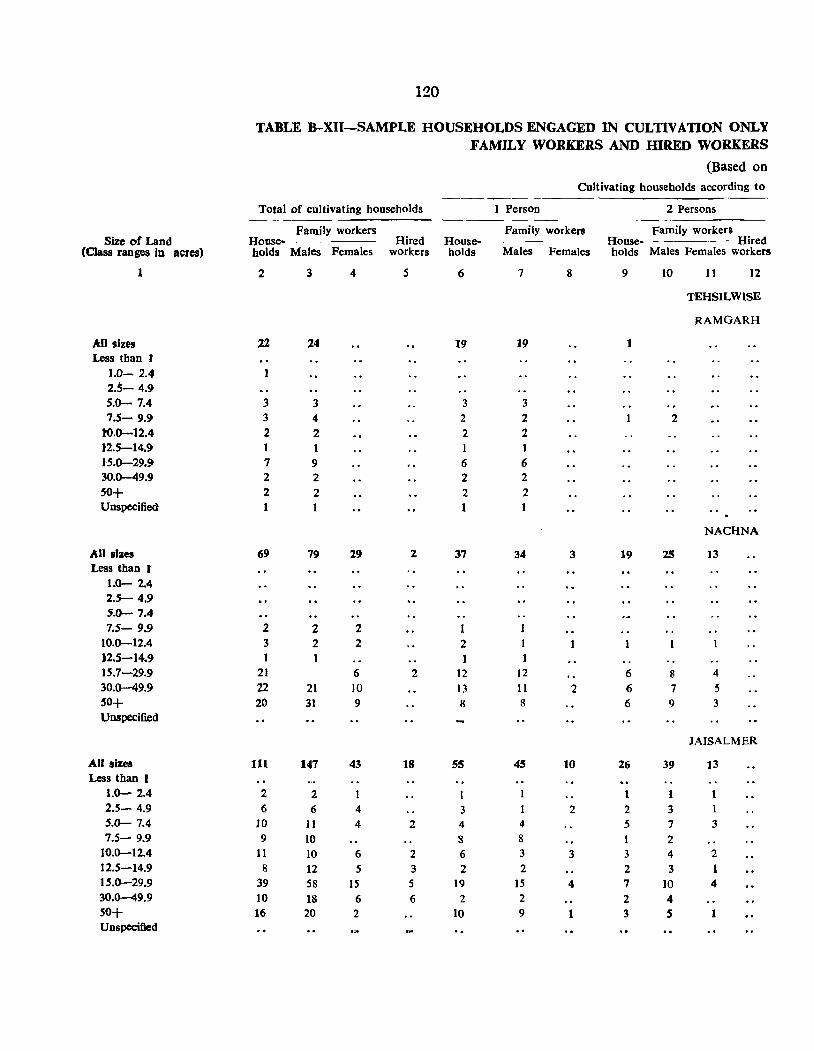
120
TABLE B-XII-SAMPLE HOUSEHOLDS ENGAGED IN CULTIVATION ONLY FAMILY WORKERS AND IDRED WORKERS
(Based on Cultivating households according to
Total of cultivating households 1 Person 2 Persons
Family workers Family workers Family workers Size of Land House- Hired House- House- Hired
(Class ranges in acres) holds Males Females workers holds Males Females holds Males Females workers
1 2 3 4 5 6 7 8 9 10 11 12
TEHSILWISE
RAMGARH
All sizes 22 24 19 19 1 Less than I
1.0- 2.4 2.5- 4.!> S.O- 7.4 3 3 3 3 7.5- 9.!> 3 4 2 2 2
to.0-12.4 2 2 2 2 12.5-t4.!> 1 1 1 1 J-S.0-29.!> 7 9 6 6 30.0-49.9 2 2 2 2
50+ 2 2 2 2 Unspecified 1 1
NACHNA
All sizes 69 79 29 2 37 ~4 3 19 25 13 Less than I
1.0- 2.4 2.S- 4.9 S.O- 7.4 7.5- 9.9 2 2 2
10.0-12.4 3 2 2 2 1 12.5-14.9 1 1 1 15.7-29.9 21 6 2 12 12 6 8 4 30.0-49.9 22 21 10 13 11 2 6 7 5 SO+ 20 31 9 8 8 6 9 3 Unspecified
JAISALMER
All sizes 111 147 43 18 S5 4S 10 26 39 13 Less than 1
1.0- 2.4 2 2 1 1 1 2.5- 4.9 6 6 4 3 2 2 3 5.0- 7.4 10 JI 4 2 4 4 5 7 3 7.S- 9.9 9 10 8 8 1 2
10.0-12.4 11 10 6 2 6 3 3 3 4 2 12.5-14.9 8 12 5 3 2 2 2 3 1 15.0-29.9 39 58 15 5 19 15 4 7 10 4 30.()-49.9 10 18 6 6 2 2 2 4 50+ 16 20 2 10 9 1 3 S 1 Unspecified
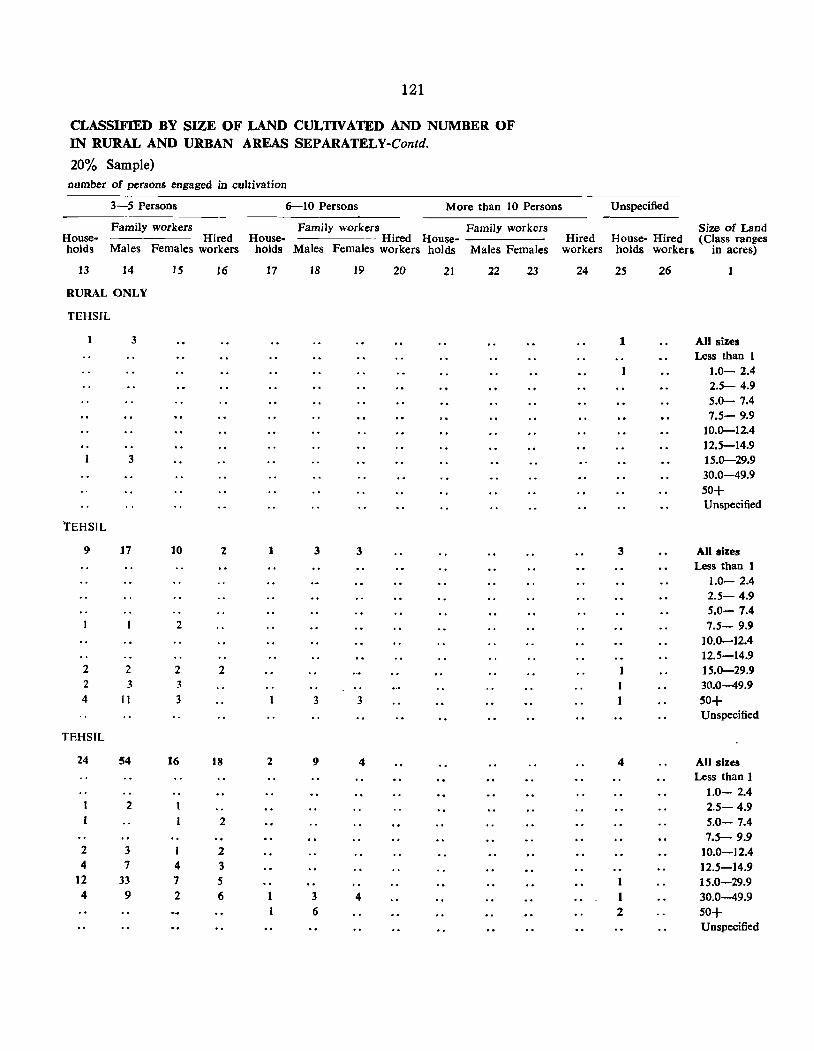
121
CLASSIFIED BY SIZE OF LAND CULTIVATED AND NUMBER OF IN RURAL AND URBAN AREAS SEPARATELY-Contd.
20% Sample) number of persons engaged in cultivation
3-5 Persons 6-10 Persons More than 10 Persons Unspecified
Family workers Family workers Family workers Size of Land House- Hired House- - Hired House- Hired House- Hired (Class ranges holds Males Females workers holds Males Females workers holds Males Females workers holds workers in acres)
13 14 15 16 17 18 J9 20 21 J2 23 24 25 26
RURAL ONLY
TEHSJL
1 3 1 All sizes Less than 1
1.0- 2.4 2.5- 4.9 5.0- 7.4 7.5- 9.9
10.0-12.4 12.5-14.9
3 15.0-29.9 30.0-49.9 50+ Unspecified
TEHSIL
9 17 10 2 1 3 3 3 All sizes Less than 1
1.0- 2.4 2.5- 4.9 5.0- 7.4
2 7.5- 9.9 10.0--12.4 12.5-14.9
2 2 2 2 15.0-29.9 2 3 .3 30.0-49.9 4 II 3 3 3 50+
Unspecified
TEHSIL
24 54 16 18 2 9 4 4 All sizes Less than 1
1.0- 2.4 2 t 2.5- 4.9
1 2 5.0- 7.4 7.5- 9.9
2 3 1 2 10.0-12.4 4 7 4 3 12.5-14.9
12 33 7 5 15.0-29.9 4 9 2 6 3 4 I 30.0-49.9
6 2 50+ Unspecified
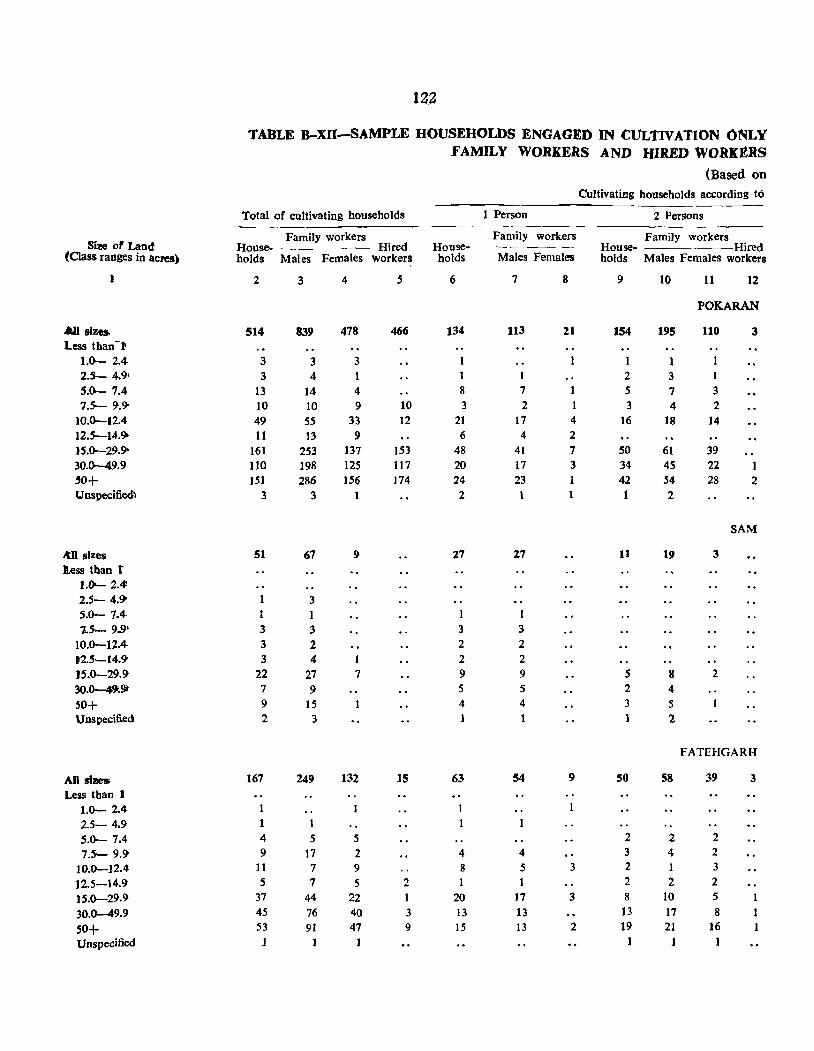
12~
TABLE B-XII-SAMPLE HOUSEHOLDS ENGAGED IN CULTIVATION ONLY FAMILY WORKERS AND HIRED WORKItRS
(Based on Cultivating households according to
Total of cultivating households 1 Person 2 Persons
Family workers Family workers Family workers S'12!e of Land House- Hired House- House- Hired
(Oass ranges in acres) holds Males Females workers holds Males Females hOlds Males Females workers
) 2 3 4 5 6 7 8 9 10 11 12
POKARAN
.&II 5iZe8i 514 839 478 466 134 113 21 154 195 110 3 Less than-I
t.0- 2.4 3 3 3 I 2.S- 4.91 3 4 1 1 2 3 1 5.0- 7.4 13 14 4 8 7 5 7 3 7.'5- !).9' 10 10 9 10 3 2 3 4 2
10.0-12.4 49 55 33 12 21 17 4 16 18 14 12.5-14.9- 11 13 9 6 4 2 }S.0-2!).9- 161 253 137 153 48 41 7 50 61 39 30.()-49.9 110 198 125 117 20 17 3 34 45 22
.50+ 151 286 156 174 24 23 1 42 54 28 2 lJnspecifi~ 3 3 1 2 1 1 1 2
SAM
AD sizes 51 67 9 27 27 11 19 3
less than r l.()- 2.4 2.S- 4.9- 1 3 S.O- 7.4 1 1 1
1.5- 9.91 3 3 3 3 10.0-12.4 3 2 2 2 )2.S~14.9 3 4 I 2 2 15.0-29.9 22 27 7 9 9 5 8 2 3O.Q--49I.9t 7 9 5 5 2 4
50+ 9 15 4 4 3 5 Unspecified 2 3 1 2
FATEHGARH
ADsl7leSi 167 249 132 15 63 54 9 50 58 39 3
Less than I 1.0- 2.4 1 1 1
2.5- 4.9 1 1 1
5.0- 7.4 4 5 5 2 2 2
7.S- 9.9 9 17 2 4 4 3 4 2
10.0-12.4 ]] 7 9 8 5 3 2 I 3
12.5-14.9 5 7 5 2 2 2 2
15.0-29.9 37 44 22 I 20 17 3 8 10 5
30.0-49.9 45 76 40 3 13 13 13 17 8 1
50+ 53 91 47 9 15 13 2 19 21 16 1
Unspecified 1 1 1 1
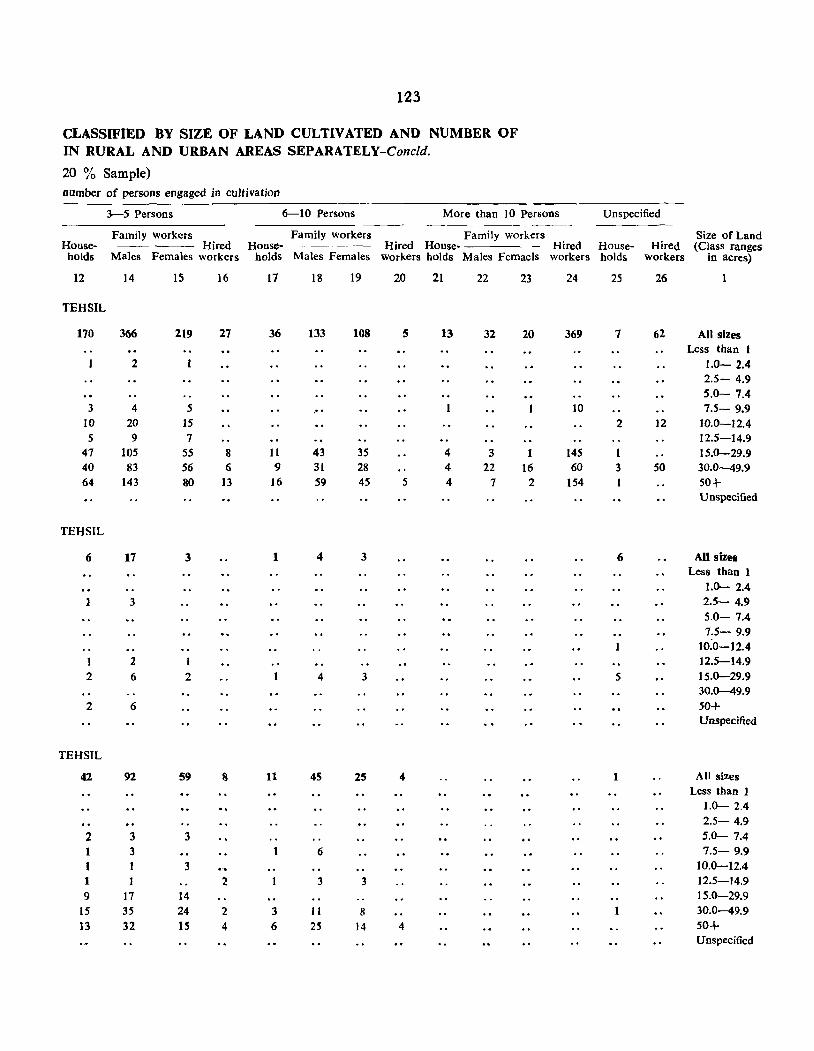
123
CLASSIFIED BY SIZE OF LAND CULTIVATED AND NUMBER OF IN RURAL AND URBAN AREAS SEPARATELY-Concld.
20 % Sample) number of persons engaged in cultivation
3-5 Persons 6-10 Persons More than 10 Persons Unspecified
Family workers Family workers Family workers Size of Land House- Hired House- --~-- Hired House· Hired House- Hired (Class raDges
holds Males Females workers holds Males Females workers holds Males Femaels workers holds workers in acres)
12 14 15 16 17 18 19 20 21 22 23 24 25 26
TEHSIL
170 366 219 27 36 133 108 5 13 32 20 369 7 62 All sizes Less than I
2 1.0- 2.4 2.5- 4.9 5.0- 7.4
3 4 5 ." 1 10 7.5- 9.9 10 20 15 2 12 10.0-12.4 5 9 7 12.5-14.9
47 105 S5 8 11 43 35 4 3 145 15.0-29.9 40 83 S6 6 9 31 28 4 22 16 60 3 50 30.0-49.9 64 143 80 13 16 59 45 5 4 7 2 154 50+
Unspecified
TEHSIL
6 17 3 1 4 3 6 All sizea Less than 1
1.0-- 2.4 1 3 2.5- 4.9
5.0- 7.4 7.5- 9.9
10.0-12.4 1 2 1 12.5-14.9 2 6 2 4 3 5 15.0--29.9
30.0-49.9 2 6 50+
Unspecified
TEHSIL
42 92 59 8 11 45 25 4 1 All sizes Less than 1
1.0- 2.4 2.5- 4.9
2 3 3 5.0- 7.4 1 3 1 6 7.5- 9.9
I I 3 10.0-12.4 1 2 3 3 12.5-14.9
9 17 14 15.0-29.9 15 35 24 2 3 II 8 30.0-49.9
13 32 IS 4 6 2~ 14 4 50+ Unspecified

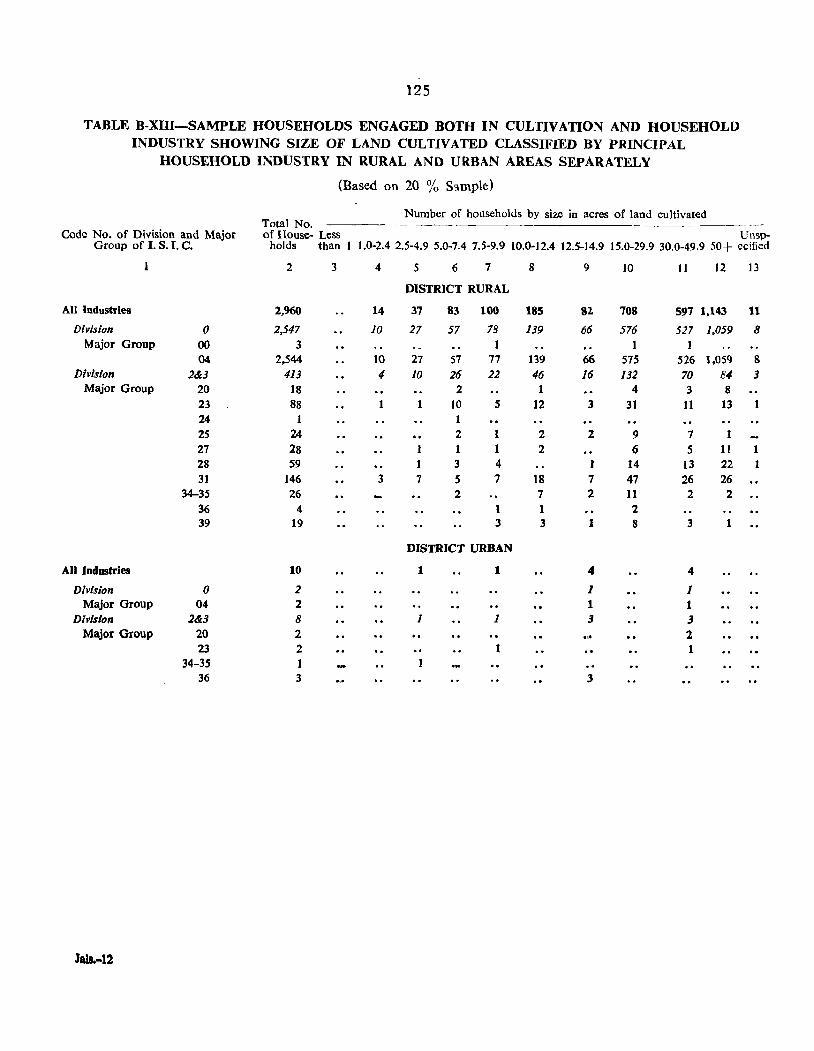
125
TABLE B-XIll-SAMPLE lIOUSEHOLDS ENGAGED BOTH IN CULTIVATION AND HOUSEHOLD INDUSTRY SHOWING SIZE OF LAND CULTIVATED CLASSIFIED BY PRINCIPAL
HOUSEHOLD INDUSTRY IN RURAL AND URBAN AREAS SEPARATELY
(Based on 20 % S3mple)
Total No. Number of households by size in acres of land cultivated
Code No. of Division and Major of House- Less Unsp-Group of I. S. I. c. holds than I 1.0-2.42.5-4.9 5.0-7.47.5-9.9 10.0-12.4 12.5-14.9 15.0-29.9 30.0-49.9 50+ ecified
2 3 4 5 6 7 8 9 10 11 12 13
DISTRICT RURAL
All Industries 2,960 14 37 83 100 185 82 70S 597 1,143 11
Division 0 2,547 10 27 57 78 139 66 576 527 1,059 8 Major Group 00 3 1 1 1
04 2,544 10 27 57 77 139 66 575 526 1,059 8 Division 2&3 413 4 10 26 22 46 16 132 70 e4 3
Major Group 20 18 2 4 3 8 23 88 1 10 5 12 3 31 11 13 24 1 25 24 2 1 2 2 9 7 1 27 28 1 1 1 2 6 5 11 28 59 1 3 4 ) 14 13 22 31 146 3 7 5 7 18 7 47 26 26
34-35 26 2 7 2 11 2 2 36 4 1 1 2 39 19 3 3 1 8 3 1
DISTRICT URBAN
All Industries 10 1 1 4 4
Division 0 2 1 1 Major Group 04 2 1 1
Division 2&3 8 1 1 3 3 Major Group 20 2 2
23 2 1 34-35 1
36 3 3
JaIs.-12
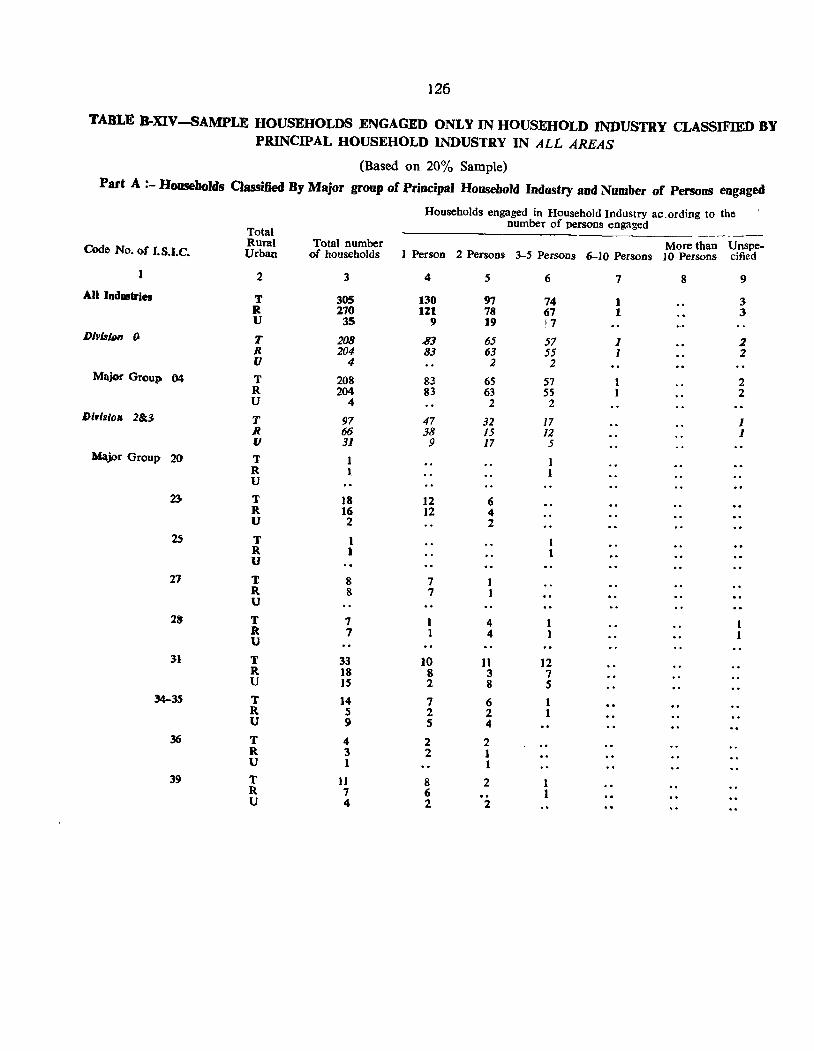
126
TABLE B-XIV-SAMPLE HOUSEHOLDS ENGAGED ONLY IN HOUSEHOLD INDUSTRY CLASSIFIED BY PRINCIPAL HOUSEHOLD INDUSTRY IN ALL AREAS
(Based on 20% Sample)
Part A :- Households Classified By Major group of PrincipaJ Household Industry and Number of Persons engaged
Households engaged in Household Industry ac.ording to the number of persons engaged
Total _._---Rural Total number More than Unspe-Code No. of I.S.I.C. Urban of households 1 Person 2 Persons 3-5 Persons 6-10 Persons 10 Persons cified
1 2 3 4 5 6 7 8 9 All Industries T 305 130 97 74 1 3
R 270 121 78 67 1 3 U 3S 9 19 !7
Dlvl3/1H1 0 T 208 K3 65 57 I 2 R 204 83 63 55 1 2 U 4 2 2
Major Group 04 T 208 83 65 57 1 2 R 204 83 63 55 1 2 U 4 2 2
D(v(stoll 2&3 T 97 47 32 17 1 R 66 38 15 12 J U 31 9 17 5
Major Group 2() T 1 R 1 U
2) T 18 12 6 R 16 12 4 U 2 2
2S T 1 I R 1 1 U
27 T 8 7 1 R 8 7 1 U
2& T 7 I 4 I R 7 I 4 1 U
31 T 33 )0 11 )2 R 18 8 3 7 U 15 2 8 5
34-35 T 14 7 6 1 R 5 2 2 1 U 9 5 4
T 4 2 2 R 3 2 1 U 1 1
39 T 11 8 2 1 R 7 6 .. 1 U 4 2 2
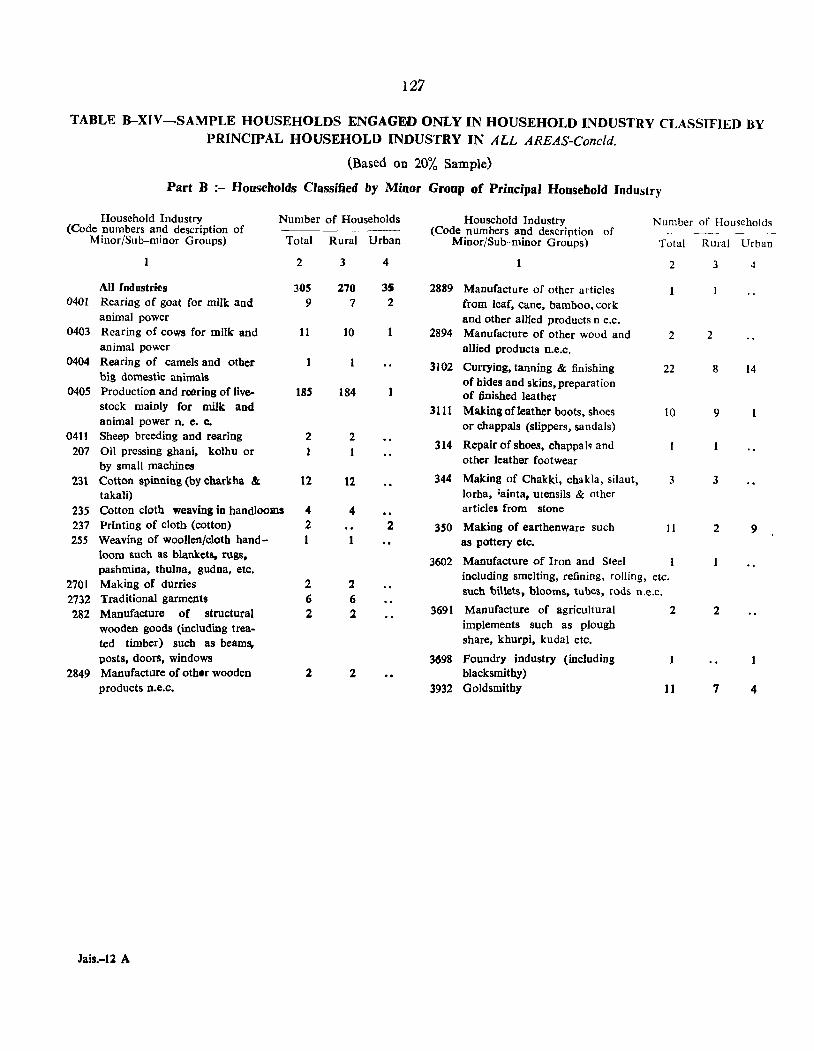
127
TABLE B-XIV-SAMPLE HOUSEHOLDS ENGAGED ONLY IN HOUSEHOLD INDUSTRY CLASSIFIED BY PRINCIPAL HOUSEHOLD INDUSTRY IN ALL AREAS-Cone/d.
(Based on 20% Sample)
Part B :- Households Classified by Minor Group of Principal Household Industry
Household Industry (Code numbers and description of
Minor/Sub-minor Groups)
Number of Households
Total Rural Urban
All Industries 040l Rearing of goat for milk and
animal power 0403 Rearing of cows for milk and
animal power 0404 Rearing of camels and other
big domestic animals
2
305 9
11
0405 Production and rooring of live- 185 stock mainly for milk and animal power n. e. Co
0411 Sheep breeding and rearing 2 207 on pressing ghani, kolhu or
by small machines 231 Cotton spinning (by charkha & 12
takali) 235 Cotton cloth weaving in handlooRls 4 237 Printing of cloth (cotton) 2 255 Weaving of woollen/cloth hand- 1
loom such as blankets, rugs, pashmina, thulna, gudna, etc.
270 I Making of durries 2 2732 Traditional garments 6 282 Manufacture of structural 2
wooden goods (including trea-ted timber) such as beams, posts, doors, windows
2849 Manufacture of other wooden 2 products o.e.c.
Jais.-Il A
3
270 7
10
184
2
12
4
1 6 2
2
4
35 2
1
2
Household Industry (Code numbers and description of
Minor/Sub-minor Groups)
Number of Households
Total Rural Urban
1
2889 Manufacture of other articles from leaf, cane, bamboo, cork and other alHed products n e.c.
2894 Manufacture of other wood and allied products n.e.c.
2
2
3102 Currying, tanning & finishing 22 of hides and skins, preparation of finished leather
3111 Making of leather boots, shoes 10 or chappals (slippers, sandals)
314 Repair of shoes, chappalg and other leather footwear
344 Making of Chakki, chakla, sHaut, 3 lorha, ;ainta, utensils & other articles from stone
350 Making of earthenware such 11 as pottery etc.
3602 Manufacture of Iron and Steel including smelting, refining, rolling, etc. such billets, bloom!!, tubes, rods. n.e.c.
3691 Manufacture of agricultural 2 implements such as plough share, khurpi, kudal etc.
3698 Foundry industry (including blacksmithy)
3932 Goldsmithy 11
3
2
8 14
9
3
2 9
2
7 4
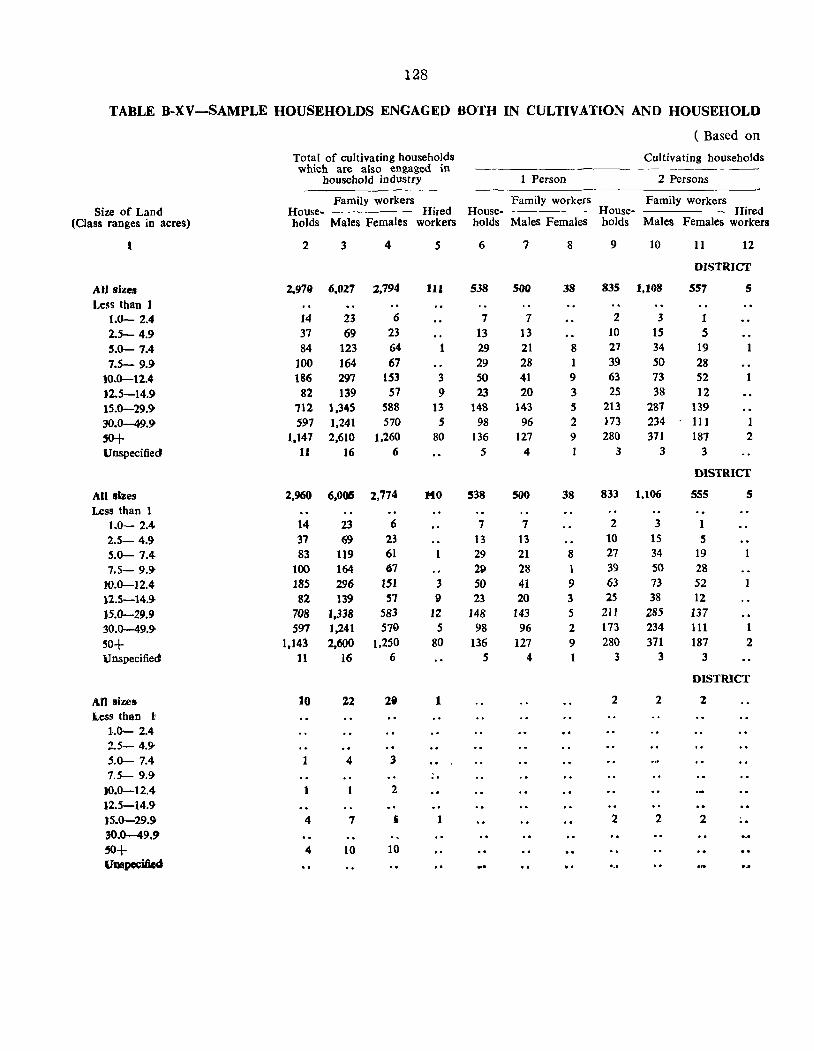
128
TABLE B-XV-SAMPLE HOUSEHOLDS ENGAGED BOTH IN CULTIVATION AND HOUSEHOLD
( Based on
Total of cultivating households Cultivating households which are also engaged in
household industry 1 Person 2 Persons
Family workers Family workers Family workers Size of Land House- Hired House- - House- Hired
(Class ranges in acres) holds Males Females workers holds Males Females holds Males Females workers
1 2 3 4 5 6 7 8 9 10 11 12
DISTRICT
AU sizes 2.979 6,027 2,794 111 538 SOO 38 835 1,108 557 5 Less than I
UJ- 2.4 14 23 6 7 7 2 :3 1
2.5- 4.9 37 69 23 13 13 10 15 5 5.0- 7.4 84 123 64 1 29 21 8 27 34 19 1
7.5- 9.9 100 164 67 29 28 39 50 28 10.0-12.4 186 297 153 3 50 41 9 63 73 52 1
12.5-14.9 82 139 57 9 23 20 3 25 38 12 15.0-29.9- 712 1,345 588 13 148 143 5 213 287 139
30.0-49.9- 597 1,241 570 5 98 96 2 173 234 III
SO+ 1,147 2,610 1.260 80 136 127 9 280 371 187 2 Unspecified 11 16 6 5 4 3 3 3
mSTRICT
All sizes 2,960 6,006 2,774 140 538 500 38 833 1,106 55S 5
Less than 1 1.0- 2.4 14 23 6 7 7 2 3 1 2.5- 4.9 37 69 23 13 13 10 15 5
5.0- 7.4 83 119 61 29 21 8 27 34 19 7.5- 9.9- 100 164 67 21) 28 1 39 50 28
1'0.0-12.4 185 296 151 :3 SO 41 9 63 73 52 12.5-14.9- 82 139 57 9 23 20 3 as 38 12 J5.0-29.9 708 J.338 583 JZ J48 143 5 Zll 285 137 30.0-49.9- 597 1.241 57Q 5 98 96 2 173 234 III 1 50+ 1.143 2.600 1,250 80 136 127 9 280 371 187 2 U nspecifiett 11 16 6 5 4 3 3 3
DISTRICT
An sizes 10 22 28 1 2 2 2 Less than ~
1.0- 2.4 2.5- 4.9-5.0- 7.4 1 4 3 7.5- 9.g. ..
W.0-12.4 1 2 12.5-14.9-)5.0-29.9 4 7 i 1 2 2 2 30.0-49.9 50+ 4 10 10 VDSl)C':iticd
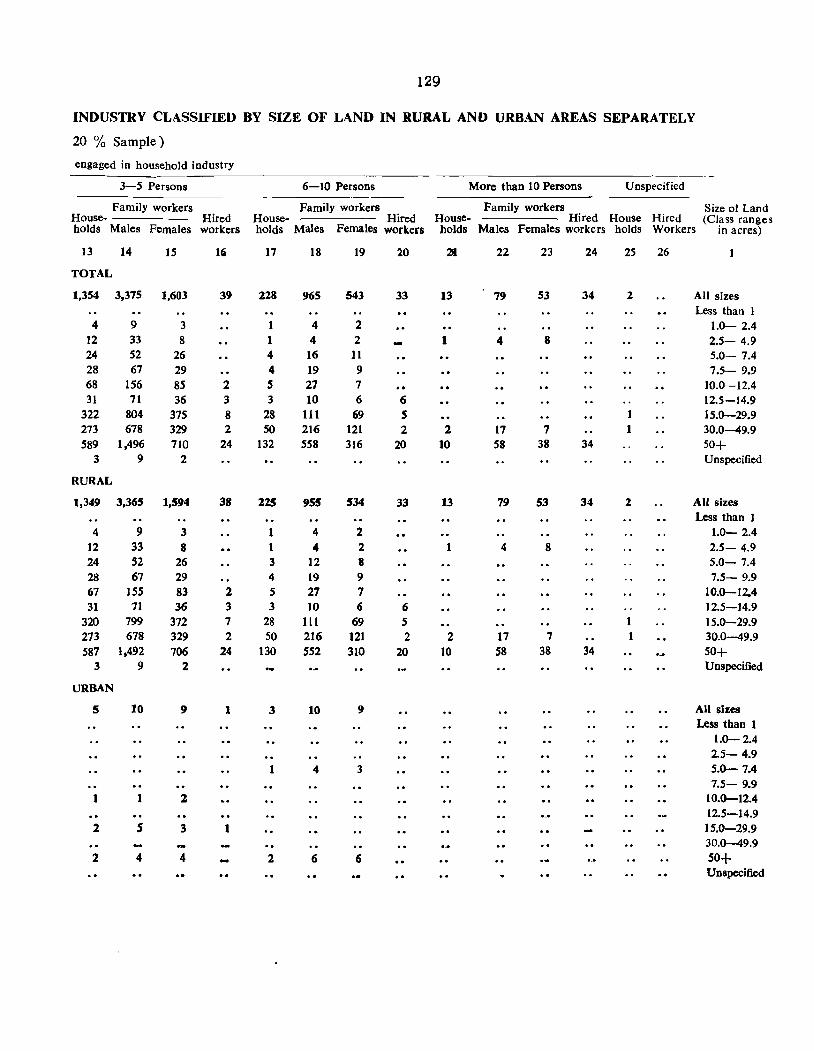
129
INDUSTRY CLASSIFIED BY SIZE OF LAND IN RURAL AND URBAN AREAS SEPARATELY
20 % Sample)
engaged in household industry
3-5 Persons 6-10 Persons More than 10 Persons Unspecified
Family workers Family workers Family workers Size of Land House- Hired House- Hired House- Hired House Hired (Class ranges holds Males Females workers holds Males Females workers holds Males Females workers holds Workers in acres)
J3 14 IS Hi 17 18 19 20 211 22 23 24 25 26
TOTAL
1,354 3,375 1,603 39 228 965 543 33 13 79 S3 34 2 All sizes Less than 1
4 9 3 4 2 1.0- 2.4 12 33 8 I 4 2 1 4 8 2.5- 4.9 24 52 26 4 16 11 5.0- 7.4 28 67 29 4 19 9 7.5- 9.9 68 156 8S 2 5 27 7 10.0-12.4 31 71 36 3 3 10 6 6 12.5-14.9
322 804 375 8 28 111 69 S 15.0-29.9 273 678 329 2 SO 216 121 2 2 17 7 I 30.0-49.9 589 1,496 710 24 132 558 316 20 10 58 38 34 50+
3 9 2 Unspecified
RURAL
1,349 3,365 1,594 38 225 955 534 33 13 79 53 34 2 All sizes Less than 1
4 9 3 4 2 1.0- 2.4 12 33 8 4 2 1 4 8 2.5- 4.9 24 52 26 3 12 8 5.0- 7.4 28 67 29 4 19 9 7.5- 9.9 67 15S 83 2 5 27 7 10.0-12.4 31 71 36 3 3 10 6 6 12.5-]4.9
320 799 372 7 28 III 69 5 1 15.0-29.9 273 678 329 2 50 216 121 2 2 17 7 1 30.0-49.9 587 1,492 706 24 130 552 310 20 10 58 38 34 50+
3 9 2 Unspecified
URBAN
5 10 9 1 3 10 9 All sizes Less than 1
1.0- 2.4 2.5- 4.9
I 4 3 5.0- 7.4 7.5- 9.9
I I 2 10.0-12.4 12.5-14.9
2 5 3 I 15.0-29.9 30.0-49.9
2 4 4 2 6 6 50+ Unspecified
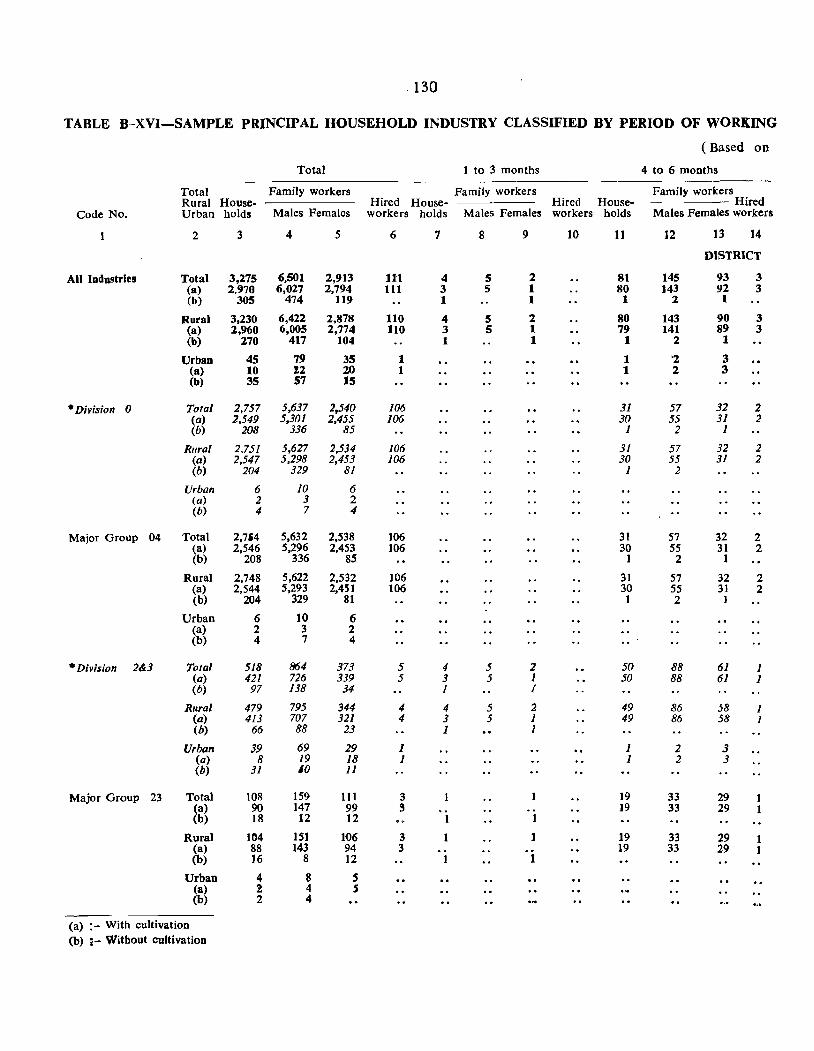
.130
TABLE B-XVI-SAMPLE PRINCIPAL HOUSEHOLD INDUSTRY CLASSIFIED BY PERIOD OF WORKING
( Based on
Total I to 3 months 4 to 6 months
Total Family workers Family workers Family workers Rural House- Hired House- Hired House- Hired
Code No. Urban holds Males Females workers holds Males Females workers holds Males Females workers
2 3 4 5 6 7 8 9 10 11 12 13 14
DISTRICT
All Industries Total 3,275 6,501 2,913 111 4 5 2 81 145 93 3 (a) 2,970 6,027 2,794 111 3 5 1 80 143 92 3 (b) 305 474 119 1 I 1 2 1
Rural 3,230 6,422 2,878 110 4 5 2 80 143 90 3 (a) 2,960 6,005 2,774 110 3 5 1 79 141 89 3 (b) 270 417 104 1 1 1 2 1
Urban 45 79 35 1 1 '2 3 (a) 10 12 20 1 1 2 3 (b) 35 57 15
• Division 0 Total 2.757 5,637 2,540 106 31 57 32 2 (a) 2.549 5.301 2.455 106 30 55 31 2 (b) 208 336 85 1 2 I
Rural 2,751 5,627 2,534 106 31 57 32 2 (a) 2,547 5,298 2,453 106 30 55 31 2 (b) 204 329 8/ 1 2
Urban 6 10 6 (a) 2 3 2 (b) 4 7 4
Major Group 04 Total 2,7.4 5,632 2,538 106 31 57 32 2 (a) 2.546 5,296 2,453 106 30 55 31 2 (b) 208 336 85 I 2 1
Rural 2.748 5,622 2,532 106 31 57 32 2 (a) 2.544 5,293 2,451 106 30 55 31 2 (b) 204 329 81 1 2 1
Urban 6 10 6 (a) 2 3 2 (b) 4 7 4
• Division 2&3 Total 518 864 373 5 4 5 2 50 88 61 1 (a) 421 726 339 5 3 5 1 50 88 61 1 (b) 97 138 34 I J
Rural 479 795 344 4 4 5 2 49 86 58 1 (a) 413 707 321 4 3 5 1 49 86 58 1 (h) 66 88 23 1 1
Urban 39 69 29 I 1 2 3 (a) 8 19 18 I 1 2 3 (b) 31 10 11
Major Group 23 Total 108 159 111 3 19 33 29 1 (a) 90 147 99 3 19 33 29 1 (b) 18 12 12
Rural 104 lSI 106 3 1 19 33 29 1 (a) 88 143 94 3 19 33 29 1 (b) ]6 8 12 1
Urban 4 8 5 (a) Z 4 S (b) 2 4
(a) :- With cultivation (b) ,- Without cultivation
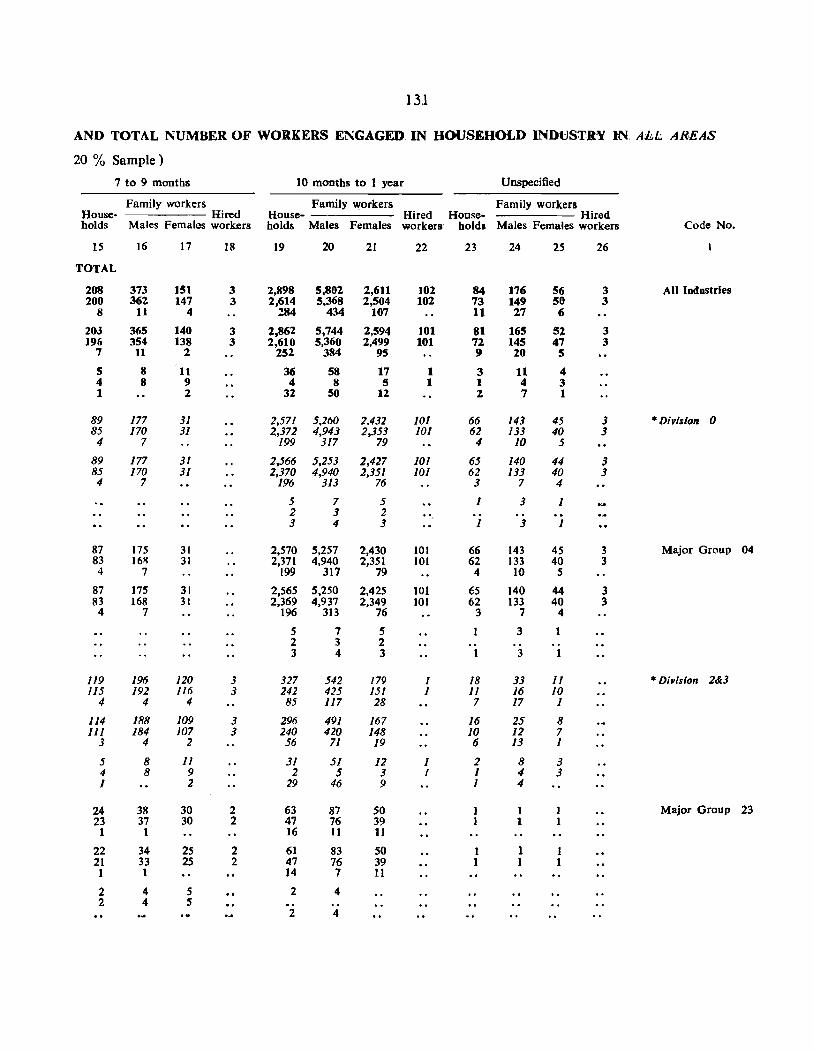
131
AND TOTAL NUMBER OF WORKERS ENGAGED IN HOUSEHOLD INDUS:rRY IN ALL:. AREAS
20 % Sample)
7 to 9 months 10 months to 1 year Unspecified
Family workers Family workers Family workers House- Hired House- Hired House- Hired holds Males Females workers holds Males Females workers' holds Males Females workers Code No.
15 16 17 18 19 20 21 22 23 24 25 26
TOTAL
208 373 151 3 2,898 5,802 2,611 )02 84 176 56 3 All Iodustries 200 362 147 3 2,614 5.368 2,504 102 73 149 50 3
8 11 4 Z84 434 107 11 27 6
203 365 140 3 2,862 5,744 2,594 101 81 165 52 3 196 354 138 3 2,610 5,360 2,499 101 12 145 47 3
7 11 2 252 384 95 9 20 5
5 8 11 36 58 17 1 3 11 4 4 8 9 4 8 5 1 1 4 3 1 :1 32 50 12 2 7 1
89 177 31 2,571 5.160 1.432 101 66 143 45 3 ·Divislon 0 85 170 31 2,372 4,943 2,353 101 62 133 40 3
4 7 199 317 79 " 10 5
89 177 31 2,566 5,253 2,427 101 65 140 44 3 85 170 31 2,370 4,940 2,351 101 62 133 40 3 4 7 196 313 76 3 7 4
5 7 5 1 3 1 2 3 2 ., 3 4 3 1 3 1
87 175 31 2,570 5,257 2,430 101 66 143 45 3 Major Group 04 83 16R 31 2,371 4,940 2,351 101 62 133 40 3
4 7 199 317 79 4 10 5
87 175 31 2,565 5,250 2,425 101 6S 140 44 3 83 168 31 2,369 4,937 2,349 101 62 133 40 3
4 7 196 313 76 3 7 4
S 7 5 1 3 1 2 3 2 .. 3 4 3 1 3 1
Jl9 196 120 3 327 542 179 1 18 33 11 • Division 2&3 115 192 116 3 242 425 151 1 11 16 10
4 4 4 85 117 28 7 17 1
114 188 109 3 296 491 167 16 25 8 111 184 107 3 240 420 148 10 12 7
3 4 2 56 71 19 6 13 1
5 8 11 31 51 12 1 2 8 3 4 8 9 2 5 3 I 1 4 3 1 2 29 46 9 I 4
24 38 30 2 63 87 50 I 1 Major Group 23 23 37 30 2 47 76 39 1 1 1 1 16 11 11
22 34 2S 2 61 83 50 1 1 1 21 33 2S 2 47 76 39 1 1 1 1 1 14 7 11
2 4 5 2 4 2 4 5
2 4
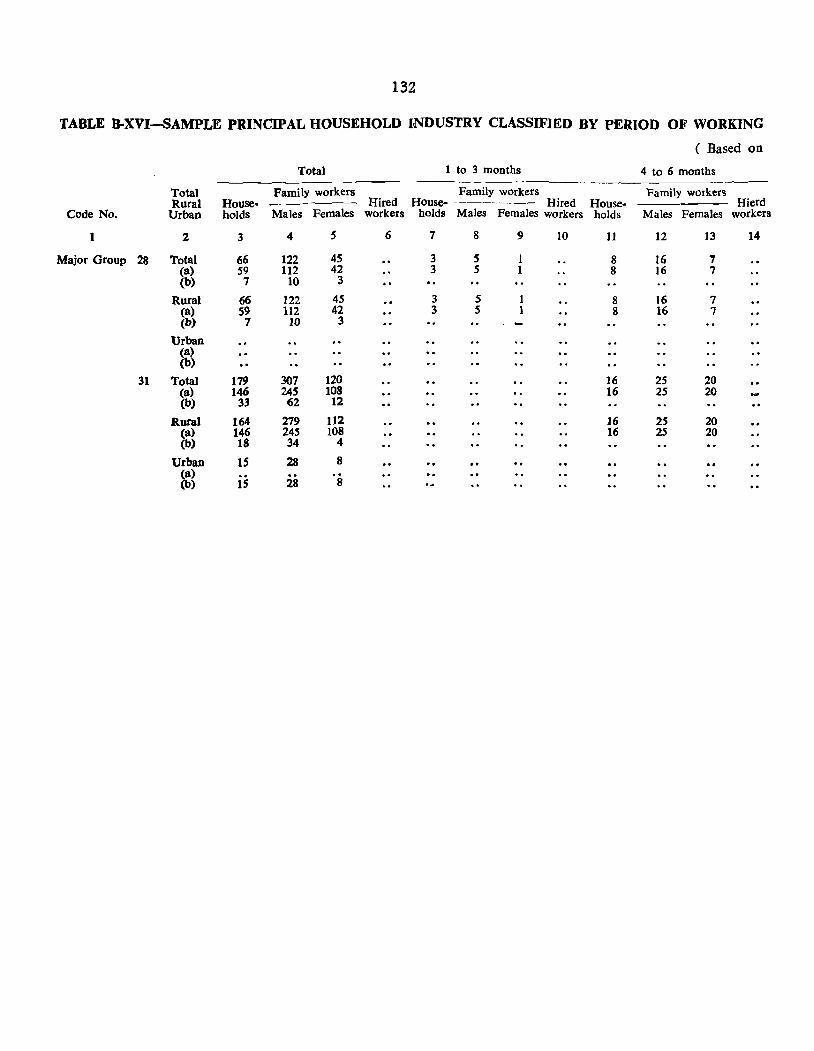
132
TABLE IJ..XVI-SAMPLE PRINCIPAL HOUSEHOLD INDUSTRY CLASSIFIED BY PERIOD OF WORKING
( Based on
Total 1 to 3 months 4 to 6 months
Total Family workers Family workers Family workers Rural House- Hired House- ----- Hired House- Hierd
Code No. Urban holds Males Females workers holds Males Females workers holds Males Females workers
1 2 3 4 5 6 7 8 9 10 11 12 13 14
Major Group 28 Total 66 122 45 3 5 1 8 16 , (a) 59 112 42 3 5 1 8 16 7 (b) 7 10 3
Rural 66 122 45 3 5 8 16 7 (a) 59 112 42 3 5 8 16 7 (b) 7 10 3
Urban (a) (b)
31 Total 179 307 120 16 25 20 (a) 146 245 108 16 2S 20 (b) 33 62 12
Rural 164 279 112 16 25 20 (a) 146 245 108 16 25 20 (b) 18 34 4
Urban 15 28 8 (a) . . .. (b) 15 28 8
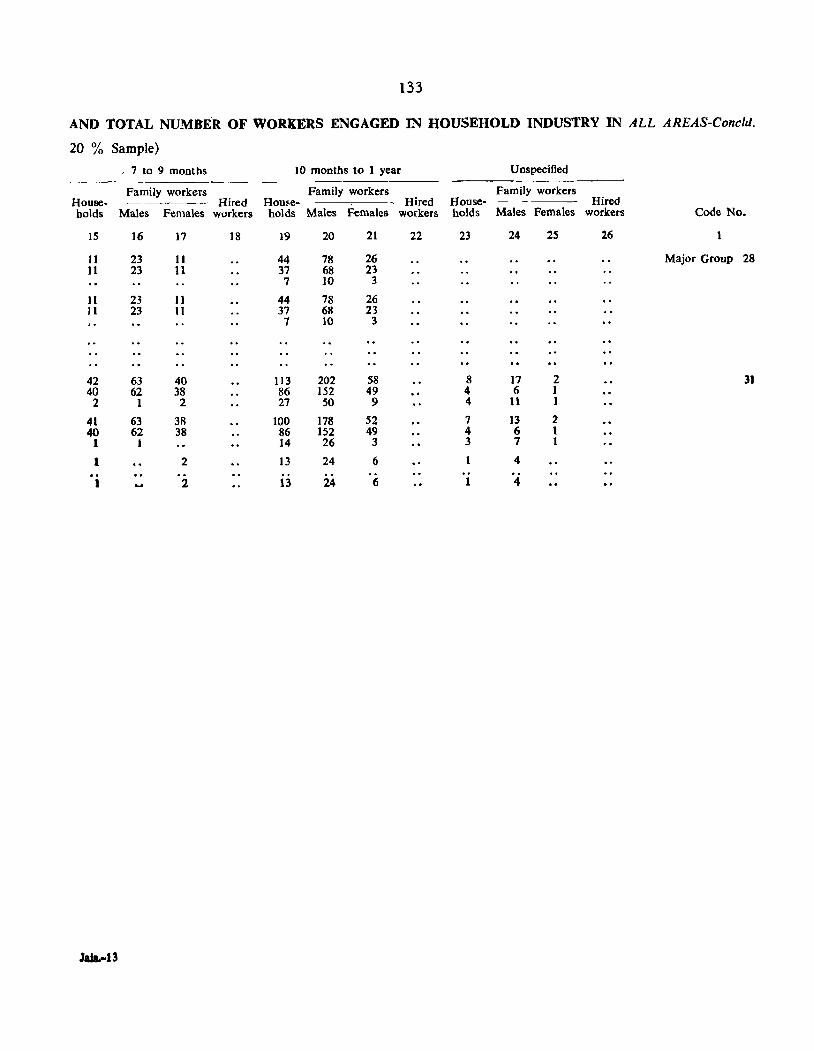
133
AND TOTAL NUMBE'R OF WORKERS ENGAGED IN HOUSEHOLD INDUSTRY IN ALL AREAS-Concld.
20 % Sample)
" 7 to 9 months 10 months to 1 year Unspecified
Family workers Family workers Family workers House- Hired Home- - Hired House- Hired holds Males Females workers holds Males Females workers holds Males Females workers Code No.
15 16 17 18 19 20 21 22 23 24 25 26
II 23 11 44 78 26 Major Group 28 11 23 11 37 68 23
7 10 3
11 23 II 44 78 26 II 23 11 37 68 23
7 10 3
42 63 40 113 202 58 8 17 2 31 40 62 38 86 152 49 4 6 1
2 1 2 27 50 9 4 11 1
41 63 3R 100 178 52 7 13 2 40 62 38 86 152 49 4 6 1
1 I 14 26 3 3 7 1
1 2 13 24 6 4 .. 1 2 13 24 6 1 4
JaJa.-13

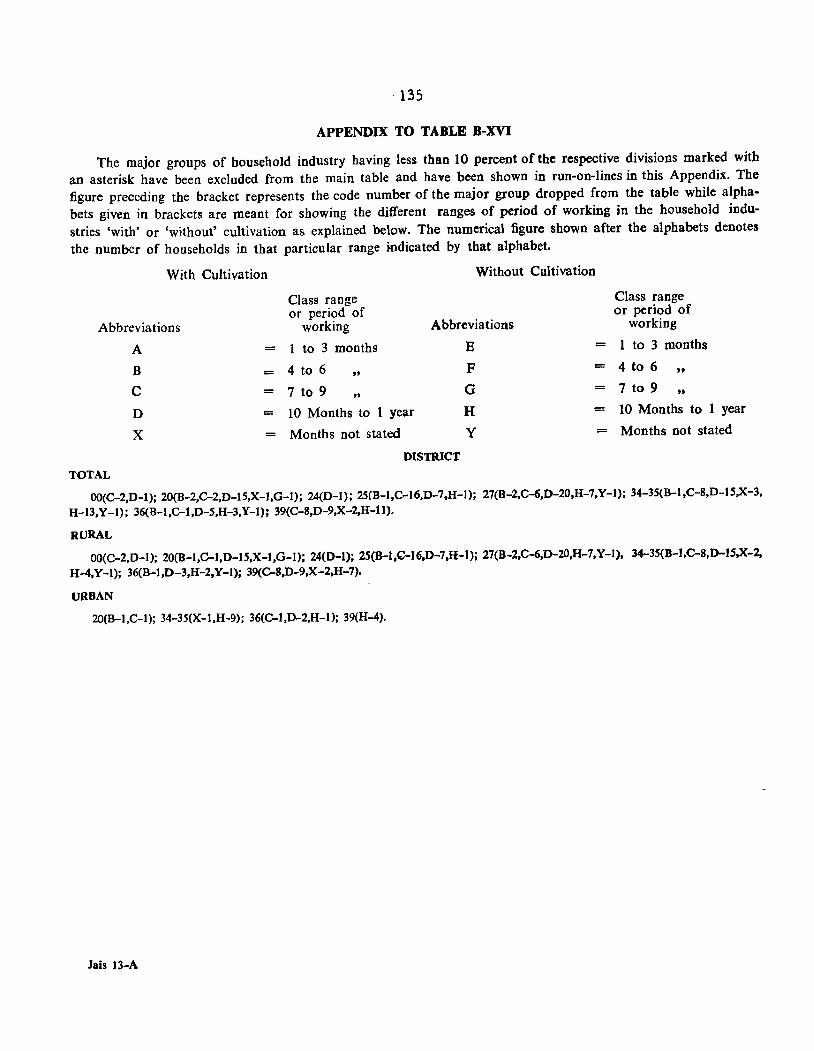
'135
APPENDIX TO TABLE B-XVI
The major groups of household industry having less than 10 percent of the respective divisions marked with an asterisk have been excluded from the main table and have been shown in run-on-lines in this Appendix. The figure preceding the bracket represents the code number of the major group dropped from the table while alphabets given in brackets are meant for showing the different ranges of period of working in the household industries 'with' or 'without' cultivation as explained below. The numerical figure shown after the alphabets denotes the number of households in that particular range indicated by that alphabet.
With Cultivation
Abbreviations
TOTAL
A
B
C
o X
= = =
=
Without Cultivation
Class range or period of
working Abbreviations
1 to 3 months E = 4 to 6 "
F = 7 to 9 "
G -10 Months to 1 year H -
Months not stated y = DISTRICT
Class range or period of
working
1 to 3 months
4 to 6 " 7 to 9 " 10 Months to 1 year
Months not stated
OO(C-2,D-l); 20(B-2,C-2,D-15,X-l,G-I); 24(D-I); 25(B-I,C-16,D-7,H-J); 27(B-2,C-6,O-20.H-7.Y-I); 34-3S(B-I,C-8,D-lS,X-3.
H-13,Y -1); 36(B-I,C-l.D-S,H-3,Y-l); 39(C-8,D-9,X-2,H-ll).
RURAL
OO(C-2,O-1); 20(B-I,C-I,O-lS,X-1,G-1); 24(D-I): 2S(B-l,C-16.0-7.H-I): 27(B-2,C-6,D-20,H-7,Y-l), 34-3S(B-I,C-8,D-lS,x-2, H-4,Y-I); 36(B-I,D-3,H-2,Y-l): 39(C-8,D-9,X-2.H-7).
URBAN
20(B-I,C-I); 34-3S(X-I,H-9); 36(C-l,D-2,H-I); 39(H-4).
Jais 13-A
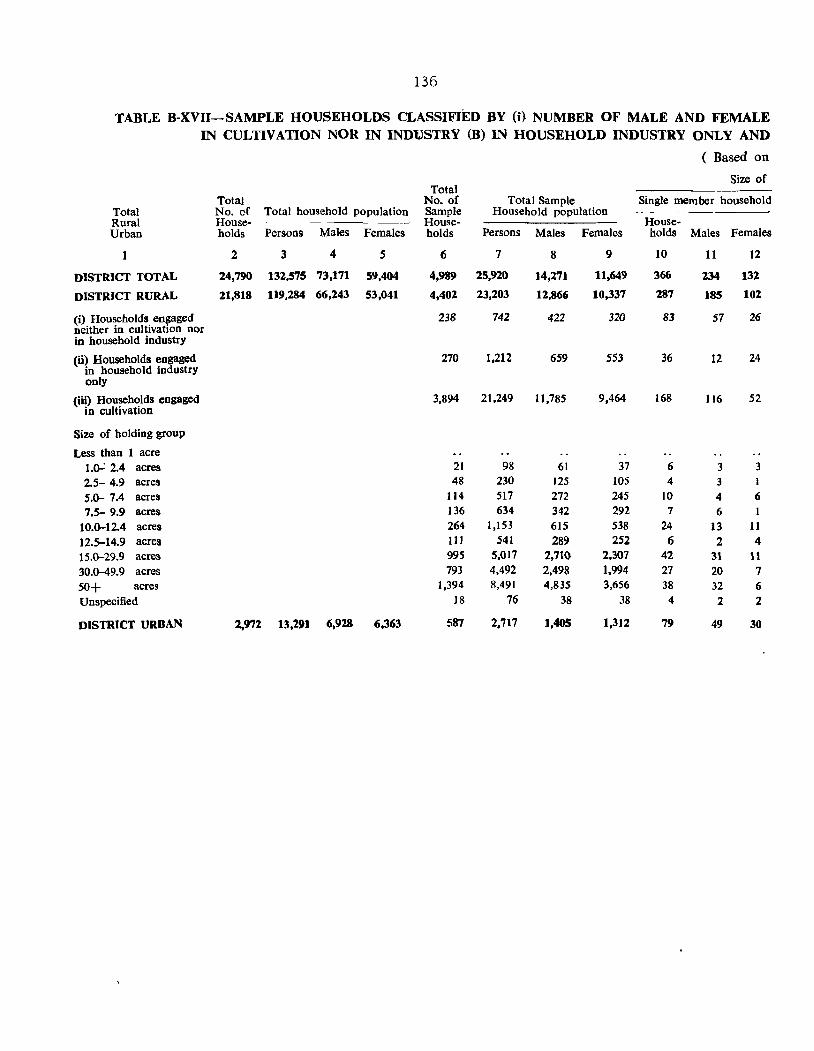
136
TABLE B-XVII-SAMPLE HOUSEHOLDS CLASSIFIED BY (i) NUMBER OF MALE AND FEMALE IN CULTIVATION NOR IN INDlJSTRY (B) IN HOUSEHOLD INDUSTRY ONLY AND
( Based on
Size of Total
Total No. of Total Sample Single member household Total No. of Total household population Sample Household population Rural House- House- House-Urban holds Persons Males Females holds Persons Males Females holds Males Females
1 2 3 4 5 (i 7 8 9 10 11 12
DISTRICT TOTAL 24,790 132,575 73,171 59,404 4,989 25,920 ]4,271 11,649 366 234 132
DISTRICT RURAL 21,818 119.284 66,243 53,041 4,402 23,203 12,866 10,337 287 185 ]02
(i) Households engaged 238 742 422 320 83 57 26 neither in cultivation nor in household industry
(ii) Households engaged 270 1,212 659 553 36 12 24 in household industry only
(iii) Households engaged 3,894 21,249 11,785 9,464 168 116 52 in cultivation
Size of holding group
Less than 1 acre 1.0..: 2.4 acres 21 98 61 37 6 3 3
2.5- 4.9 acres 48 230 125 105 4 3 I
5.0- 7.4 acres 114 517 272 245 10 4 6
7.5- 9.9 acres 136 634 342 292 7 6 1
10.0-12.4 acres 264 1,153 615 538 24 13 11 12.5-14.9 acres III 541 289 252 6 2 4 15.0-29.9 acres 995 5,017 2,710 2,307 42 31 11 30.0-49.9 acres 793 4,492 2,498 ],994 27 20 7
50+ acres ],394 8,491 4,835 3,656 38 32 6
Unspecified ]8 76 38 38 4 2 2
DISTRICT URBAN 2,972 13,291 6,928 6,363 587 2,717 1,405 1,312 79 49 30
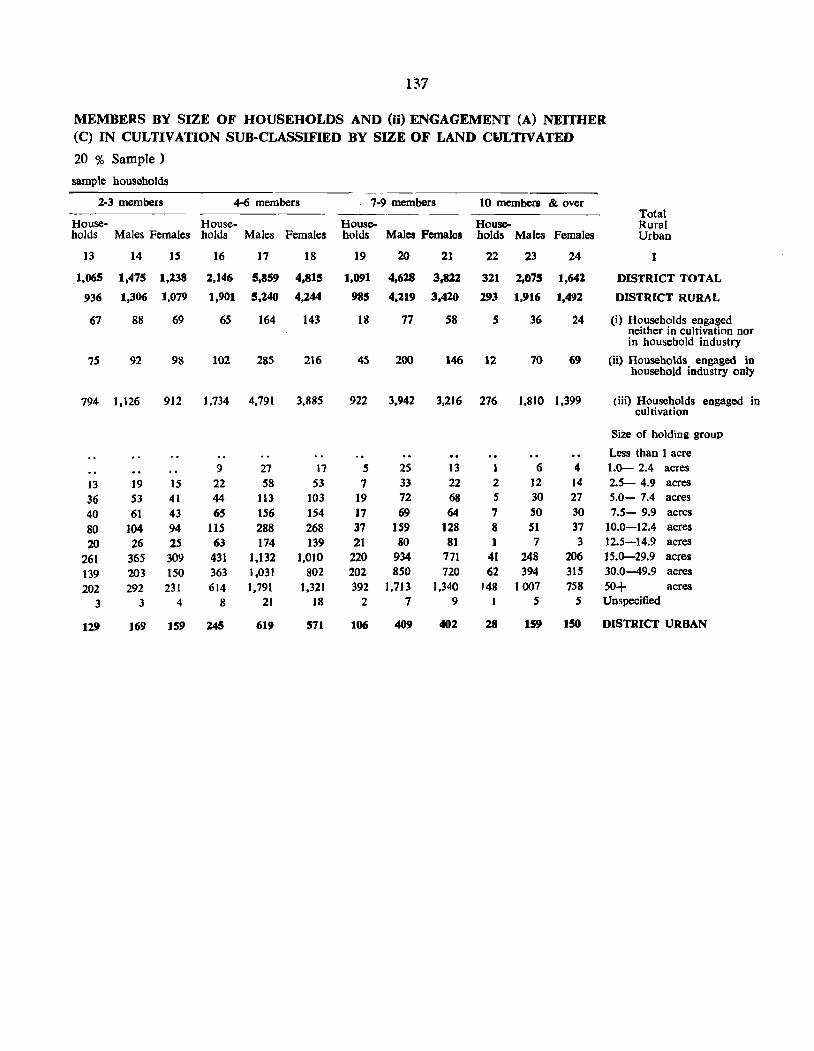
137
MEMBERS BY SIZE OF HOUSEHOLDS AND (ij) ENGAGEMENT (A) NEITHER (C) IN CULTIVATION SUB-CLASSIFIED BY SIZE OF LAND CQLTIVATED
20 % Sample)
sample households
2-3 members 4-6 members 7-9 members 10 members & over Total
House- House- House- House- Rural holds Males Females holds Males Females holds Males Females holds Males Females Urban
13 14 15 16 17 18 19 20 21 22 23 24 1
1,065 1,475 1,238 2,146 5,359 4,815 1,091 4,628 3,822 321 2,075 1,642 DISTRICT TOTAL
936 1,306 1,079 1,901 5,240 4,244 985 4.Zl9 3,420 293 1,916 1,492 DISTRrCT RURAL
67 88 69 65 164 143 18 77 58 5 36 24 (i) Households engaged neither in cultivation nor in housebold industry
75 92 98 102 285 216 45 200 146 12 70 69 (ii) Households engaged in household industry only
794 1,126 912 1.734 4,791 3,885 922 3.942 3,216 276 1,810 1,399 (iii) Households engaged in cultivation
Size of holding group
Less than 1 acre 9 27 17 5 25 13 1 6 4 1.0- 2.4 acres
13 19 15 22 58 53 7 33 22 2 12 14 2.5- 4.9 acres
36 53 41 44 113 103 19 72 68 5 30 27 5.0- 7.4 acres
40 61 43 65 156 154 17 69 64 7 SO 30 7.5- 9.9 acres
80 104 94 115 288 268 37 159 128 8 51 37 10.0-12.4 acres
20 26 25 63 174 139 21 80 81 1 7 3 12.5-14.9 acres
261 365 309 431 1,132 1,010 220 934 771 41 248 206 15.0-29.9 acres
139 203 150 363 1,031 802 202 850 720 62 394 315 30.0-49.9 acres
202 292 231 614 1.791 1,321 392 1.713 1.340 148 1007 758 50+ acres
3 3 4 8 21 18 2 7 9 S 5 Unspecified
129 169 159 245 619 571 106 409 402 28 159 150 DISTRICT URBAN
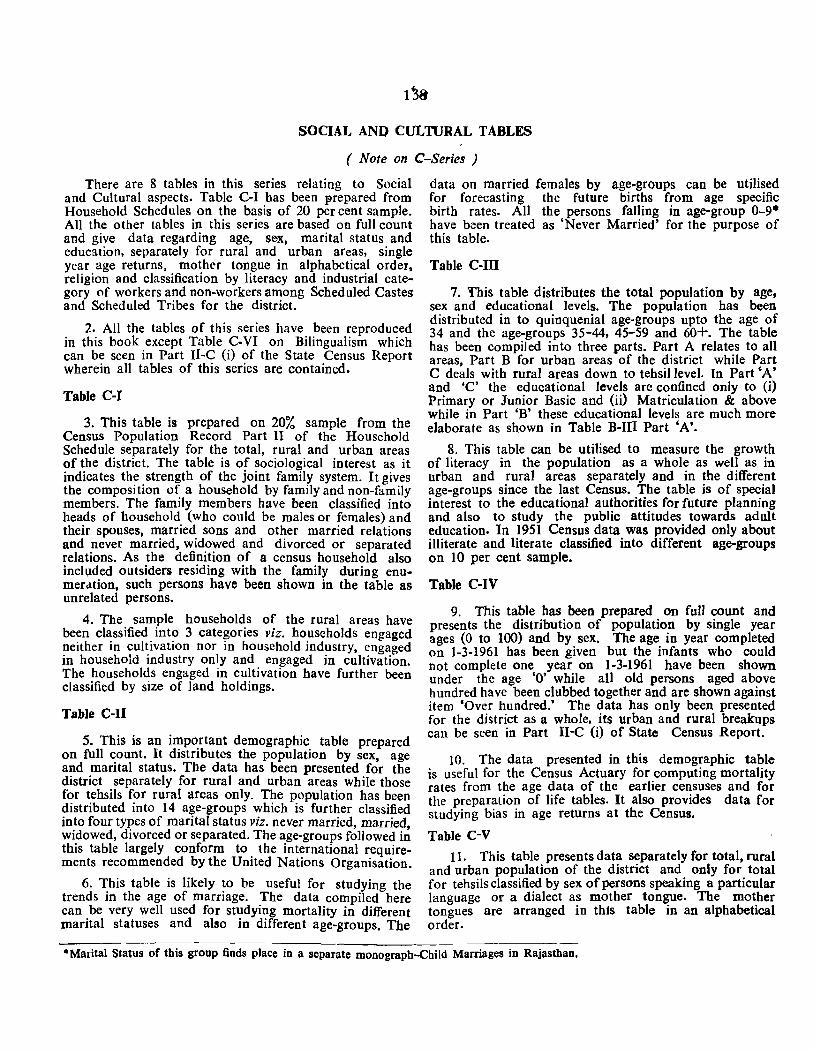
SOCIAL AND CULTIJRAL TABLES
( Note on C-Series )
There are 8 tables in this series relating to Social and Cultural aspects. Table C-I has been prepared from Household Schedules on the basis of 20 per cent sample. All the other tables in this series are based on full count and give data regarding age, sex, marital status and education. separately for rural and urban areas. single year age returns, mother tongue in alphabetical order, religion and classification by literacy and industrial category of workers and non-workers among Scheduled Castes and Scheduled Tribes for the district.
2. All the tables of this series have been reproduced in this book except Table C-VI on Bilingualism which can be seen in Part I1-C (i) of the State Census Report wherein all tables of this series are contained.
Table C-I
3. This table is prepared on 20% sample from the Census Population Record Part II of the Household Schedule separately for the total, rural and urban areas of the district. The table is of SOCiological interest as it indicates the strength of the joint family system. It gives the composition of a household by family and non-family members. The family members have been classified into heads of household (who could be males or females) and their spouses, married sons and other married relations and never married, widowed and divorced or separated relations. As the definition of a census household also included outsiders residing with the family during enumeration, such persons have been shown in the table as unrelated persons.
4. The sample households of the rural areas have been classified into 3 categories viz. households engaged neither in cultivation nor in household industry, engaged in household industry only and engaged in cultivation. The households engaged in cultivation have further been classified by size of land holdings.
Table C-JI
s. This is an important demographic table prepared on full count. It distributes the population by sex, age and marital status. The data has been presented for the district separately fOf rural and urban areas while those for tehsils for fural areas only. The population has been distributed into 14 age-groups which is further classified into four types of marital status viz. never married, married, widowed, divorced or separated. The age-groups followed in this table largely conform to the international requirements recommended by the United Nations Organisation.
6. This table is likely to be useful for studying the trends in the age of marriage. The data compiled here can be very well used for studying mortality in different marital statuses and also in different age-groups. The
data on married females by age-groups can be utilised for forecasting the future births from age specific birth rates. All the persons falling in age-group 0-9· have been treated as 'Never Married' for the purpose of this table.
Table C-ill
7. 'fhis table distributes the total population by age, sex and educational levels. The population has heen distributed in to quinquenial age-groups upto the age of 34 and the age-groups 35-44, 45-59 and 60+. The table has been compiled into three parts. Part A relates to all areas, Part B for urban areas of the district while Part C deals with rural areas down to tehsillevel. In Part 'A' and 'C' the educational levels are confined only to (i) Primary or Junior Basic and (ii) Matriculation & above while in Part 'B' these educational levels are much more elaborate as shown in Table B-III Part 'A'.
8. This table can be utilised to measure the growth of literacy in the population as a whole as well as in urban and rural areas separately and in the different age-groups since the last Census. The table is of special interest to the educational authorities for future planning and also to study the public attitudes towards adult education. In 1951 Census data was provided only about illiterate and literate classified into different age-groups on 10 per cent sample.
Table C-JV
9. This table has been prepared on fuU count and presents the distribution of popUlation by single year ages (0 to 100) and by sex. The age in year completed on 1-3-1961 has been given but the infants who could not complete one year on 1-3-1961 have been shown under the age '0' while all old persons aged above hundred have been clubbed together and are shown against item 'Over hundred.' The data has only been presented for the district as a whole. its urban aod rural breakups can be seen in Part II-C (i) of State Census Report.
10. The data presented in this demographic table is useful for the Census Actuary for computing mortality rates from the age data of the earlier censuses and for the preparation of life tables. It also provides data for studying bias in age returns at the Census.
Table C-V
11. This table presents data separately for total, rural and urban popUlation of the district and only for total for tehsilsclassified by sex of persons speaking a particular language or a dialect as mother tongue. The mother tongues are arranged in this table in an alphabetical order.
-Marital Status of this group finds place in a separate monograph-Child Marriages in Rajasthan.
139
12. According to Census 1961 'Mother Tongue' is the language or dialect spoken in childhood by the person's mother to the person or mainly spoken in the housebold.
13. This table is of great interest to philologists in view of a large variety of languages and dialects spoken in the district and will be of great assistance for ensuring the implementation of the various safeguards granted to the linguistic minorities under the constitution.
Table C-VII
14. In this table the population has been distributed in six main religions and the figures of all other religions including the figures of those having 'Indefinite belief' such as Atheists and Agnostics have been clubbed together and noted under headilng 'Other Religions and Persuasions'. Separate heading'Religion not stated' has also been Provid@d for those who do not follow any religion and have given out only their nationalities such as Goans, Israelists, Italians etc.
15. The data of this important sociological table has been presented separately for total, rural and urban areas of the district and also for each tehsiI.
Table c-vrn
16. This is a new table compiled in the 1961 Census and presents data separately for total, rural and urban areas of the district and further upto tehsil level for rural areas only. It has been prepared into two parts A & B. Part A presents the data of Scheduled Castes and Part B of Scheduled Tribes.
17. It gives the distribution of population by literacy classification of workers into differeDt industrial categories based on the Standard Industrial Classification 'and non-workers. Literacy figures of these communi ties given for the first time in the present Census.
18. In 1951 Census data for Scheduled Castes and Scheduled Tribes was provided only about total number of persons belonging to Scheduled Castes and Scheduled Tribes classified by sex for the districts and upto sub-division.
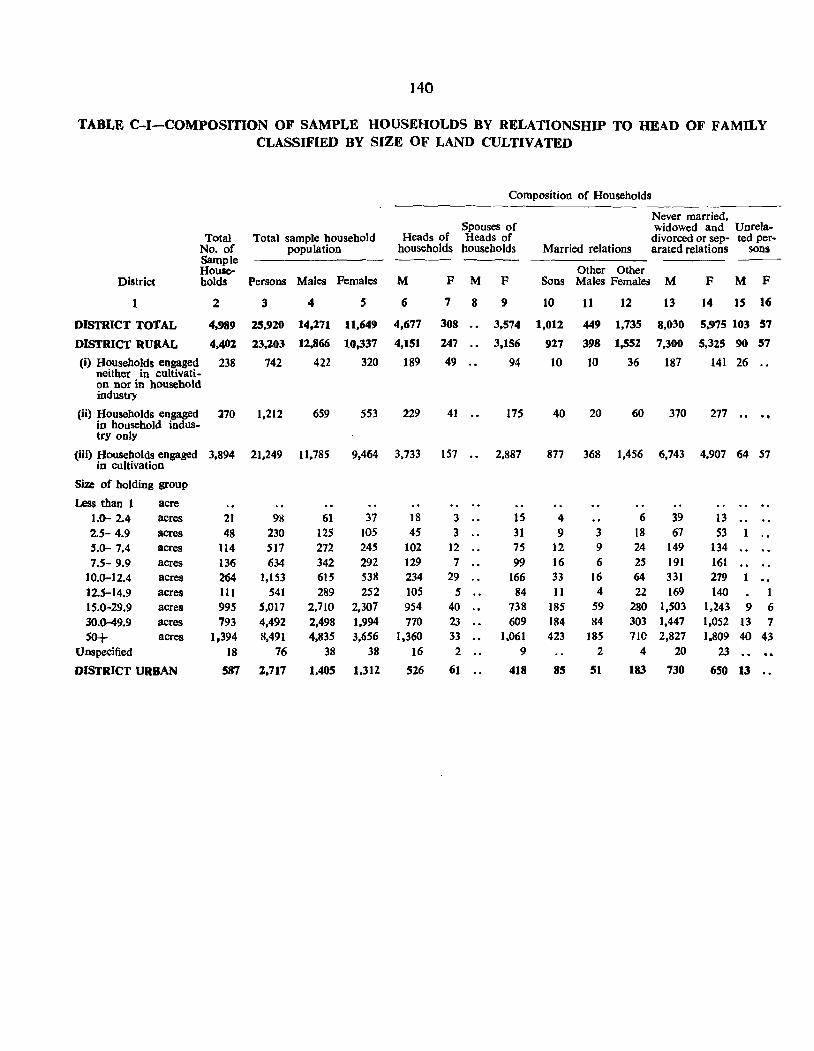
140
TABLE C-I-COMPOSITION OF SAMPLE HOUSEHOLDS BY RELATIONSHIP TO HEAD OF FAMILY CLASSIFIED BY SIZE OF LAND CULTIVATED
Composition of Households
Never married, Spouses of widowed and Unrela-
Total Total sample household Heads of Heads of divorced or sep- ted per-No. of population households households Married relations arated relations sons Sample Houle- Other Other
District holds Persons Males Females M F M F Sons Males Females M F M F
2 3 4 5 6 7 8 9 10 11 12 13 14 15 16
DISTRICT TOTAL 4,989 25,920 14,271 11,649 4,677 308 .. 3,574 1,012 449 1,735 8,030 5,975 103 57
DISTRICT RURAL 4,402 23,203 12,866 10,337 4,151 247 3,156 927 398 1,552 7,300 5,325 90 57
(i) Households engaged neither in cultivati-
238 742 422 320 189 49 .. 94 10 10 36 187 141 26
on nor in household industry
(ii) Households engaged in household indus-
l70 1,212 659 553 229 41 .. 175 40 20 60 370 277 .. try only
(iii) Households engaged 3,894 21,249 11.785 9,464 3,733 157 .. 2,887 817 368 1,456 6,743 4,907 64 57 in cultivation
Size of holding group
Less than 1 acre . , .. .. l.{)- 2.4 acres 21 98 61 37 18 3 .. 15 4 6 39 13 .. 2.5- 4.9 acres 48 230 125 105 45 3 .. 31 9 3 18 67 53 1 .. 5.0- 7.4 acres 114 517 272 245 102 12 .. 75 12 9 24 149 134 7.5- 9.9 acres 136 634 342 292 129 7 .. 99 16 6 25 191 161
10.0-12.4 acres 264 1,153 615 538 234 29 .. 166 33 16 64 331 279 12.5-14.9 acres HI 541 289 252 105 5 .. 84 11 4 22 169 140 1 15.0-29.9 acres 995 5,017 2,710 2,307 954 40 .. 738 185 59 280 1,503 1,243 9 6 30.0-49.9 acres 793 4,492 2,498 1,994 770 23 .. 609 184 84 303 1,447 1,052 13 7
SO+ acres 1,394 8,491 4,835 3,656 1,360 33 1,061 423 185 71C 2,827 1.809 40 43 Unspecified 18 76 38 38 16 2 .. 9 2 4 20 23
DISTRICT URBAN 587 2,717 1,405 1.312 526 61 .. 418 85 51 183 730 650 13
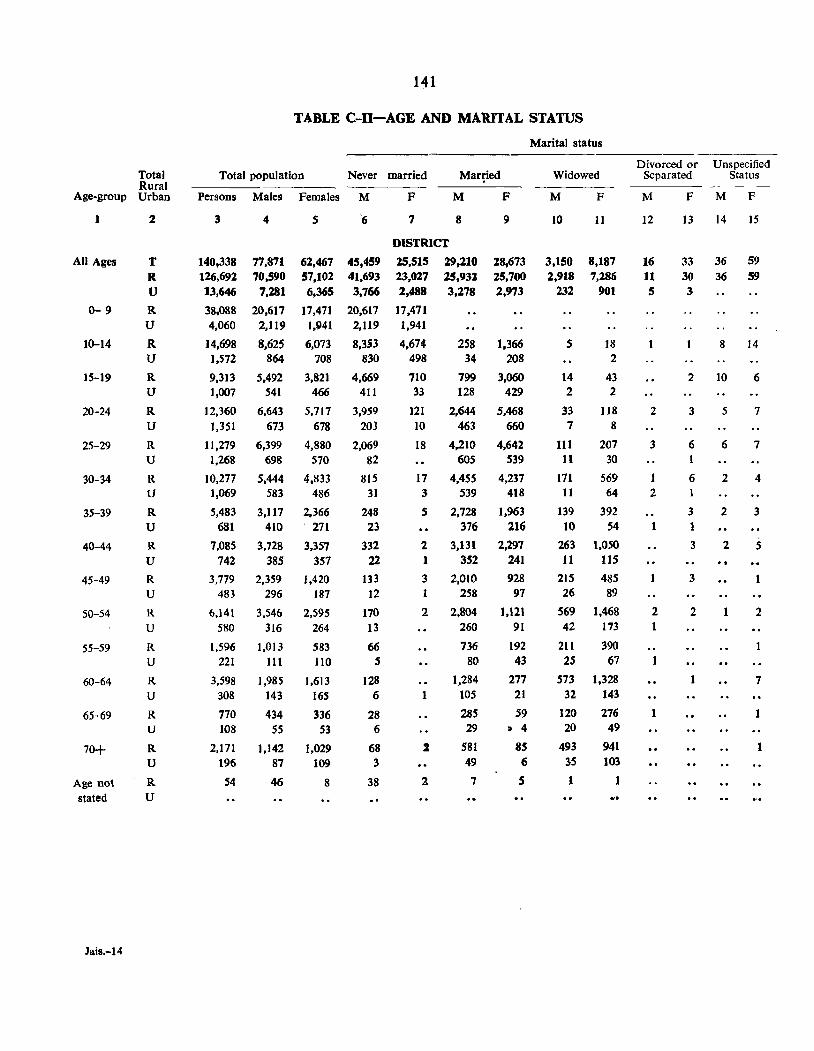
141
TABLE C-n-AGE AND MARITAL STATUS
Marital status
Divorced or Unspecified Total Rural
Total population Never married Mar~ied Widowed Separated Status
Age-group Urban Persons Males Females M F M F M F M F M F
1 2 3 4 5 (; 7 8 9 10 11 12 13 14 15
DISTRICT
All Ages T 140,338 71,871 62,467 45,459 25,515 29,210 18,673 3,150 8,187 16 33 36 59
R 126,692 70,590 57,102 41,693 23,027 25,931 25,700 2,918 7,286 11 30 36 59 U 13,646 7,281 6,365 3,766 2,488 3,278 2,973 232 901 5 3
0-9 R 38,088 20,617 17,471 20,617 17,471 U 4,060 2,119 1,~41 2,119 1,941
10-14 R 14,698 8,625 6,073 8,353 4,674- 258 1,366 5 18 8 14 U 1,572 864 708 830 498 34 208 2
15-19 R 9,313 5,492 3,821 4,669 710 799 3,060 14 43 2 10 6 U 1,007 541 466 411 33 128 429 2 2
20-24 R 12,360 6,643 5,717 3,959 121 2,644 5,468 33 118 2 3 5 7 U 1,351 673 678 203 10 463 660 7 8
25-29 R 11,279 6,399 4,880 2,069 18 4,210 4,642 111 207 3 6 6 7 U 1,268 698 570 82 605 539 11 30
30-34 R 10,217 5,444 4,833 815 17 4,455 4,237 171 569 1 6 2 4 U 1,069 583 486 31 3 539 418 II 64 2
35-39 R 5,483 3,117 2,366 248 5 2,728 1,963 139 392 3 2 3 U 681 410 . 271 23 376 216 10 S4 1
40-44 R 7,085 3,728 3,357 332 2 3,131 2,297 263 1,050 3 2 5 U 742 385 357 22 1 352 241 11 115
45-49 R 3,779 2,359 1,420 133 3 2,010 928 215 485 3 U 483 296 187 12 1 258 97 26 89
50-54 R (>,141 3,546 2,595 170 2 2,804 1,121 569 1,468 2 2 2 U 580 316 264 13 260 91 42 173
55-59 R 1,596 1,013 583 66 736 192 211 390
U 221 HI 110 S 80 43 2S 67
60-64 R 3,598 1,985 1,613 128 1,284 277 573 1,328 7 U 308 143 165 6 1 105 21 32 143
65-69 R 770 434 336 28 285 59 120 276 U 108 SS 53 6 29 It 4 20 49
70+ R 2,171 1,142 1,029 68 2 581 85 493 941 1 U 196 87 109 3 49 6 35 103
Age not R 54 46 8 38 2. 7 5 1 1
stated U
Jais.-14
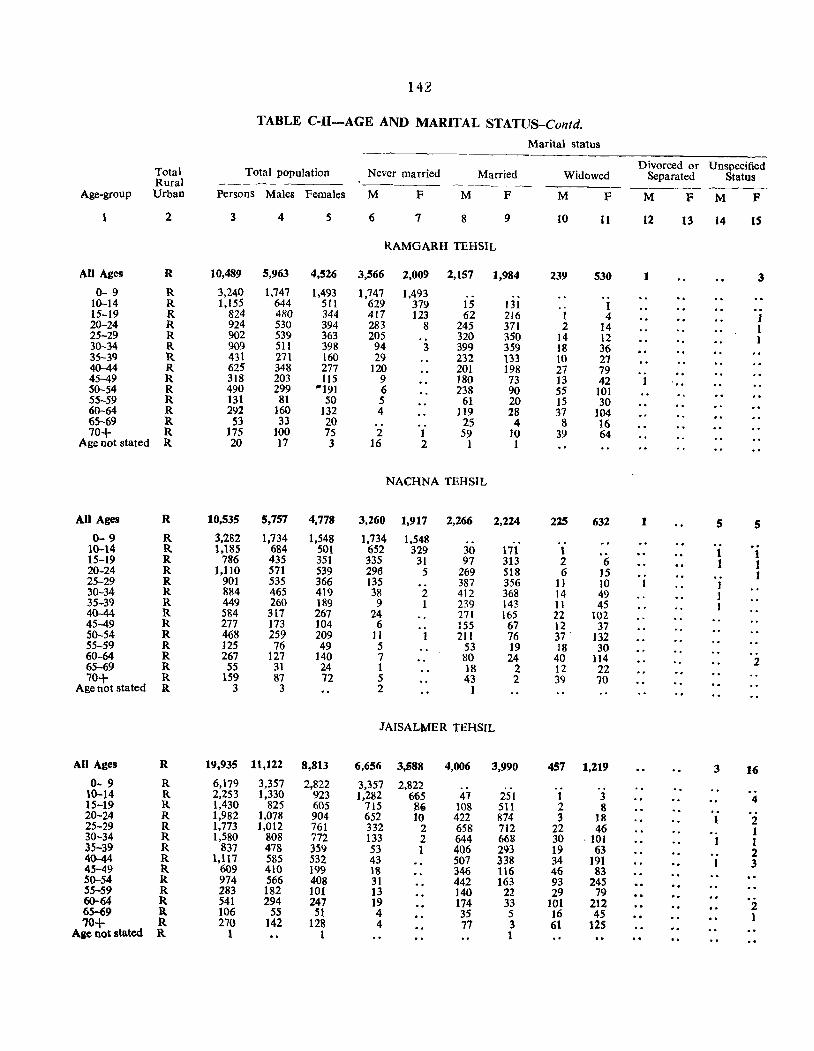
14~
TABLE C-II-AGE AND MARITAL STATUS-Contd.
Marital status
Divorced or Unspecified Total Total population Never married Married Widowed Separated Status Rural ~~----
Age-group Urban Persons Males Females M F M F M F M F M F
1 2 3 4 5 6 7 8 9 10 II 12 13 14 15
RAMGARH TEHSIL
All Ages R 10,489 5,963 4,526 3,566 2,009 2,157 1,984 239 530 1 3 0-9 R 3,240 1,747 1,493 1,747 1,493
10-14 R 1,155 644 511 629 379 15 131 1 15-19 R 824 480 344 417 123 62 216 1 4 I 20-24 R 924 530 394 283 8 245 371 2 14 1 25-29 R 902 539 363 205 320 350 14 12 1 30-34 R 909 511 398 94 3 399 359 ]8 36 35--39 R 431 271 160 29 232 133 10 27 40-44 R 625 348 277 120 201 198 27 79 45-49 R 318 203 115 9 180 73 13 42 50-54 R 490 299 "191 6 238 90 55 ]01 55-59 R 131 81 50 5 61 20 15 30 60-64 R 292 160 132 4 119 28 37 104 65--69 R 53 33 20 2S 4 8 16 70+ R 175 100 75 2 I 59 10 39 64
Age not stated R 20 17 3 16 2 1 1
NACHNA TEHSIL
All Ages R 10,535 5,757 4,778 3,260 1,917 2,266 2,224 225 632 1 5 5 0-9 R 3,282 1,734 1,548 1,734 1,548
10-14 R 1,185 684 501 652 329 30 171 1 1 1 15-19 R 786 435 351 335 31 97 313 2 6 1 1 20-24 R ],110 571 539 296 5 269 518 6 15 J 25-29 R 901 535 366 135 387 356 11 to 1 30-34 R 884 465 419 38 2 412 368 14 49 1 35-39 R 449 260 189 9 1 239 143 II 45 I 40-44 R 584 317 267 24 271 165 22 102 45-49 R 277 173 J04 6 155 67 12 37 SO-54 R 468 259 209 11 1 211 76 37 ' 132 55-59 R ]25 76 49 5 53 19 18 30 60-64 R 267 127 140 7 80 24 40 114 2 65-69 R 55 31 24 1 18 2 12 22 70+ R 159 87 72 5 43 2 39 70
Age not stated R 3 3 2 1
JAISALMER TEHSIL
All Ages R 19,935 11,122 8,813 6,656 3,588 4,006 3,990 457 1,219 3 16 0- 9 R 6,179 3,357 2,822 3,357 2,822 ..
10-14 R 2,253 1,330 923 1,282 665 47 251 I 3 4 15-19 R 1,430 825 605 715 8{) 108 511 2 8 20-24 R 1,982 1,078 904 652 10 422 874 3 18 2 25-29 R 1,773 1,012 761 332 2 658 712 22 46 1 30-34 R 1,580 808 772 133 2 644 662 30 . tOl 1 1 35-39 R 837 478 359 53 1 406 293 19 63 2 40-44 R 1,117 585 532 43 507 338 34 191 1 3 45-49 R 609 410 199 18 346 116 46 83 50-54 R 974 566 408 31 442 163 93 245 55-59 R 283 182 101 13 140 22 29 79 60-64 R 541 294 247 19 174 33 101 212 2 65-69 a. 106 55 51 4 35 5 16 45 1 70+ R 270 142 128 4 77 3 61 125
Age not stated R. 1 1 1
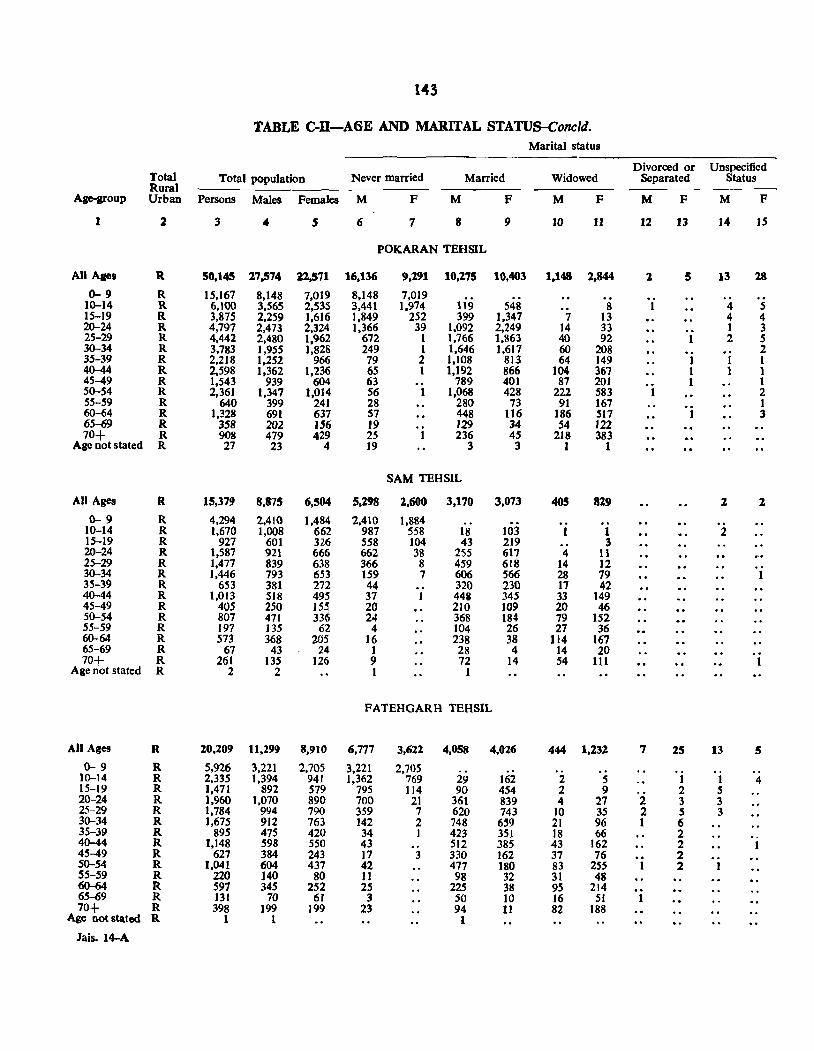
143
TABLE C-D-A6E AND MARITAL STATUS-Coneld. Marital status
Divorced or Unspecified Total Total population Never married Married Widowed Separated Status Rural
Age-group Urban Persons Males Females M F M F M F M F M F
J 2 3 4 5 6 7 8 9 10 Jl J2 J3 14 J5
POKARAN TBHSIL
All Ages R 50,145 27.574 n,571 16,136 9,191 10,275 10,403 1.148 2,S44 2 5 13 28
0-9 R 15,J67 8,148 7,019 8,148 7,019 10-14 R 6,100 3,565 2,535 3,441 1,974 119 548 8 4 5 15-19 R 3,875 2,259 1.616 ],849 252 399 1,347 7 13 4 4 20-24 R 4,797 2,473 2,324 1,366 39 1,092 2,249 14 33 ] 3 25-29 R 4,442 2,480 1,962 672 1 1,766 1,863 40 92 1 2 5 30-34 R 3,783 1,955 1,828 249 1 1,646 1,617 60 208 2 35-39 R 2,218 1,252 966 19 2 1,108 813 64 149 1 1 1 40-44 R 2,598 1,362 1,236 65 1 },192 866 104 367 I 1 1 45-49 R 1,543 939 604 63 789 401 87 201 1 1 50-54 R 2,361 1,347 1,014 56 ] ],068 428 222 583 2 55-59 R 640 399 241 28 280 73 91 167 ] 60-64 R ],328 691 637 57 448 116 186 517 1 3 65-69 R 358 202 156 19 129 34 54 122 70+ R 908 479 429 25 1 236 45 218 383
Age not stated R 27 23 4 19 3 3 1 1
SAM TEHSIL
All Ages R 15,379 8,875 6,504 5.298 2,600 3.170 3,073 405 829 1 2
0-9 R 4,294 2,4\0 1,484 2,410 1.884 10-14 R 1.670 1,008 662 987 558 18 103 I 2 15-19 R 927 601 326 558 104 43 219 3 20-24 R 1,587 921 666 662 38 255 617 4 11 25-29 R 1,477 839 638 366 8 459 618 14 12 30-34 R 1,446 793 653 159 7 606 566 28 79 I 35-39 R 653 381 272 44 .. 320 230 17 42 40-44 R ].013 518 495 37 I 4411 345 33 149 45-49 R 405 250 15~ 20 210 ]09 20 46 50-54 R 807 471 33 24 368 184 79 152 55-59 R 197 135 62 4 104 26 27 36 60-64 R 573 368 205 16 238 38 114 167 65-69 R 67 43 24 ] 28 4 ]4 20 70+ R 261 ]35 ]26 9 72 14 54 111
Age not stated R 2 2 1 1
FATEHGARH TEHSIL
All Ages R 20,209 11,299 8,910 6,777 3,622 4,058 4,026 444 1,232 7 2S 13 S 0-9 R 5.926 3,221 2,705 3,221 2,705
10-14 R 2,335 1,394 941 1,362 769 29 162 2 5 1 1 4 15-19 R 1,471 892 579 795 114 90 454 2 9 2 5 20-24 R 1,960 1,070 890 700 21 361 839 4 27 2 3 3 25-29 R 1,784 994 790 359 7 620 743 10 35 2 S 3 30-34 R ],675 912 763 142 2 748 639 21 96 I 6 35-39 R 895 475 420 34 I 423 351 ]8 66 2 40-44 R 1,148 598 550 43 512 385 43 162 2 1 45-49 R 627 384 243 17 3 330 ]62 37 76 2 50-54 R 1,041 604 437 42 477 180 83 2SS 2 1 55-59 R 220 140 80 11 98 32 31 48 60-64 R 597 345 252 25 225 38 95 214 65-69 R J31 70 61 3 SO 10 16 51 70+ R 398 199 199 23 94 11 82 188
Age not stated R 1 1 1 Jais. 14-A
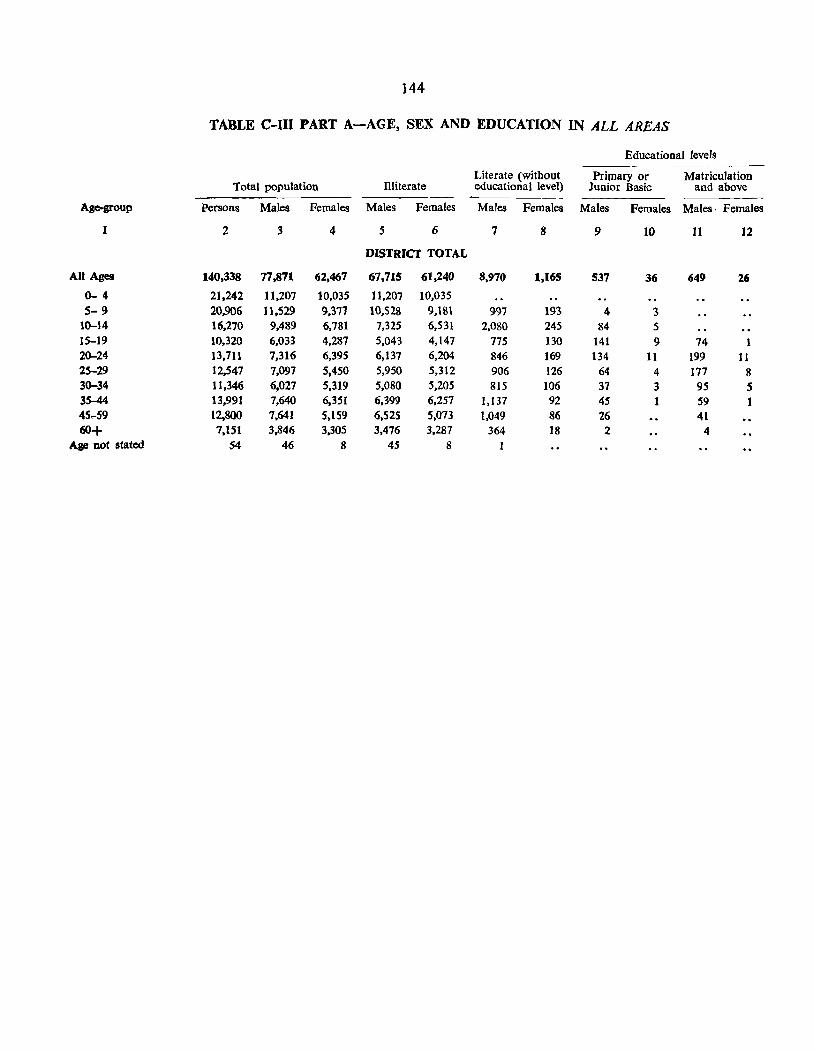
144
TABLE C-I1I PART A-AGE, SEX AND EDUCATION IN ALL AREAS
Educational levels
Literate (without Primary or Matriculation Total population ntiterate educational level) Junior Basic and above
Age-group Persons Males Females Males Females Males Females Males Females Males· Females
1 2 3 4 5 6 7 8 9 10 11 12
DISTRICT TOTAL
All Ages 140.338 77,871 62.467 67.715 61,240 8,970 1,165 537 36 649 Z6
0- 4 21.242 11,207 10,035 11,207 10,035 5- 9 20,906 11,529 9,371 10,528 9,181 997 193 4 3
10-14 16,270 9,489 6,781 7,325 6,531 2,080 245 84 5 15-19 10,320 6,033 4,287 5,043 4,147 775 130 141 9 74 1 20-24 13,711 7,316 6,395 6,137 6,204 846 169 134 11 199 11 25-29 12,547 7,097 5,450 5,950 5,312 906 126 64 4 177 8 30-34 11.346 6,027 5,319 5,080 5,205 815 106 37 3 95 S 35-44 13.991 7,640 6.351 6,399 6,257 1,137 92 45 59 1 45 ... 59 12,800 7,641 5,159 6,525 5,073 1,049 86 26 41 60+ 7,151 3,846 3,305 3,476 3,287 364 18 2 4
Age Dot stated S4 46 8 45 8
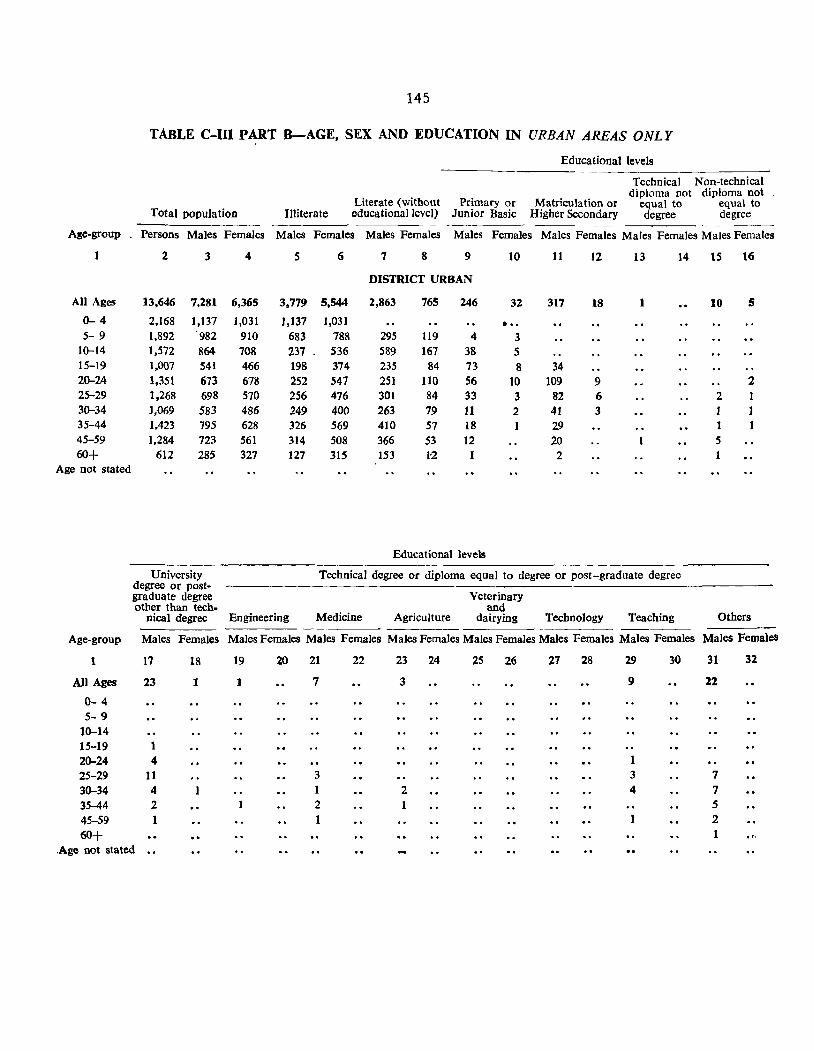
Age-group
All Ages
0- 4 5- 9
10-14 15-19 20-24 25-29 30-34 35-44 45-59 60+
Age not stated
145
TABLE C-In PART B-AGE, SEX AND EDUCATION IN URBAN AREAS ONLY
Educational levels
Technical Non-technical
Literate (without Primary or Matriculation or diploma not diploma not
equal to equal to Total population Illiterate educational level) Junior Basic Higher Secondary degree degree
Persons Males Females Males Females Males Females Males Females Males Females Males Females Males Females
2 3 4 5 6 7 8 9 10 11 12 13 14 15 16
DISTRICT URBAN
13,646 7,281 6,365 3,779 5,544 2,863 765 246 32 317 18 1 10 5
2,168 1,137 1,031 J,137 1,031 •.. 1,892 '982 910 683 788 295 119 4 3 1,572 864 708 237 . 536 589 167 38 5 1,007 541 466 198 374 235 84 73 8 34 1,351 673 678 252 547 251 110 56 10 109 9 2 1,268 698 570 256 476 301 84 33 3 82 6 2 1 1,069 583 486 249 400 263 79 11 2 41 3 1 1 1.423 795 628 326 569 410 57 18 29 1,284 723 561 314 508 366 53 12 20 5
612 285 327 127 315 153 1'2 1 2 1
Educational levels ------------.------------- -------------------------------------------
University degree or postgraduate degree other than tech-
nical degree Engineering
Technical degree or diploma equal to degree or post-graduate degree
Medicine
Veterinary and
Agriculture dairying Technology Teaching Others
Age-group Males Females Males Females Males Females Males Females Males Females Males Females Males Females Males Females
1 17 18 19 20 21 22 23 24 25 26 27 28 29 30 31 32
All Ages 23 1 1 7 3 9 22
0- 4 5- 9
10-14 15-19 1 20-24 4 1 25-29 11 3 3 7 30-34 4 2 4 7 35-44 2 2 5 45-59 1 1 2
60+ 1 .. ' .Age not stated
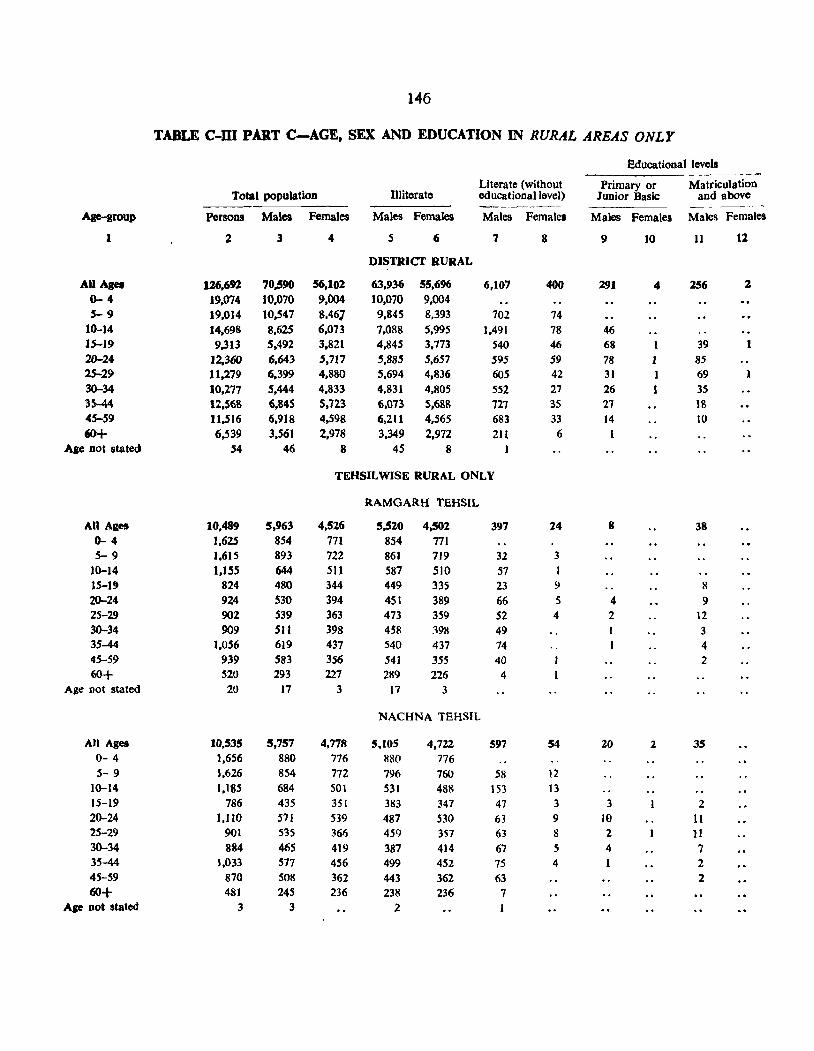
146
TABLE C-ID PART C-AGE, SEX AND EDUCATION IN RURAL AREAS ONLY
Educational levels -----
Literate (without Primary or Matriculation Total population Illiterate educational level) Junior Basic and above
Age-group Persons Males Females Males Females Males Females Males Females Males Females
1 2 3 4 5 6 7 8 9 10 11 12
DISTRICT RURAL
AU Agee 126,692 70,590 56,101 63,936 55,696 6,107 400 291 4 256 2 0-4 19.074 10,070 9,004 10,070 9,004 5-9 19,014 10,547 8,461 9,845 8,393 702 74
10-14 14,698 8.625 6,073 7,088 5.995 1,491 78 46 15-19 9,313 5,492 3,821 4,845 3,773 540 46 68 I 39 20-24 12,360 6,643 5,717 5,885 5,657 595 59 78 1 85 25-29 11,279 6,399 4,880 5,694 4,836 60S 42 31 1 69 1 30-34 10,277 5,444 4,833 4,831 4,805 552 27 26 35 35-44 12.56& 6,845 S.723 ti,073 5,688 727 35 27 18 45-59 11,516 6,918 4,598 6,211 4,565 683 33 14 10
60+ 6,539 3,561 2,978 3.349 2.972 211 6 ABC not stated 54 46 8 45 8
TEHSILWISE RURAL ONLY
RAMGARH TEHSIL
All Ages 10,489 5,963 4,526 5,520 4,502 397 24 8 38 0-4 1,625 854 771 854 771 5-9 1.615 893 722 861 719 32 3
10-14 1,155 644 511 587 510 57 I 15-1' 824 480 344 449 335 23 9 8 20-24 924 530 394 451 389 66 5 4 9 25-29 902 539 363 473 359 52 4 2 12 30-34 909 51 I 398 458 ~98 49 3 35-44 1,056 619 437 540 437 74 4 45-59 939 583 356 541 355 40 2
60+ 520 293 221 289 226 4 Age Dot stated 20 17 3 17 3
NACHNA TEHSIL
All Ages 10,535 5,757 4.778 5.105 4,722 597 54 20 2 3S 0- 4 1,656 880 776 880 776 5- 9 1,626 854 772 796 760 58 12
10-14 1,185 684 501 531 488 153 13 15-19 786 435 3S1 383 347 47 3 3 2 20-24 J,Il0 511 539 487 530 63 9 10 II 25-29 901 535 366 459 357 63 8 2 11 30-34 884 465 419 387 414 67 5 4 7 35-44 1,033 517 456 499 452 75 4 1 2 45-59 870 508 362 443 362 63 2 60+ 481 245 236 238 236 7
Age Dot stated 3 3 2 J
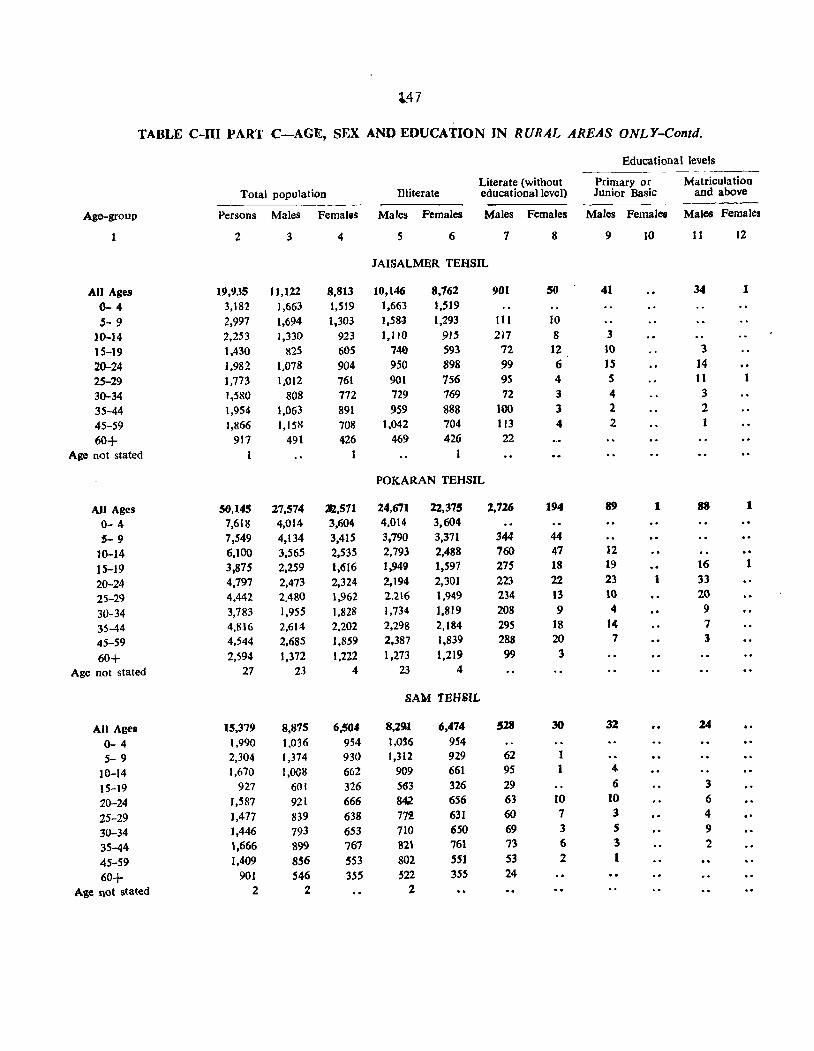
.. 47
TABLE C-III PART C-AGE, SEX AND EDUCATION IN RURAL AREAS ONLY-Contd.
Educational levels
Literate (without Primary or Matriculation Total population Illiterate educational level) Junior Basic and above
Age-group Persons Males Females Males Females Males Females Males Females MaleS Females
1 2 3 4 5 6 7 8 9 10 11 12
JAISALMER TEHSIL
All Ages 19,9J5 11,122 8,813 10,146 8,762 901 50 41 34 1
0-4 3,182 1,663 1,519 1,663 1,519
5- 9 2,997 1,694 1,303 1,583 1,293 HI 10
JO-14 2.253 J,330 923 1,110 915 217 8 3
15-19 1,430 825 605 740 593 72 12 10 3
20-24 1.982 1,078 904 950 898 99 6 15 14
25-29 1,773 1,012 761 901 756 95 4 5 11
30-34 I,S80 808 772 729 769 72 3 4 3
35-44 1,954 1,063 891 959 888 100 3 2 2
45-59 1,866 1,158 708 ),042 704 113 4 2 1
60+ 917 491 426 469 426 22
Age not stated 1 1
POKARAN TEHSIL
All Ages 50,145 27,574 ~,S11 24,671 22,375 2,726 194 89 1 88 1
0-4 7,618 4,014 3,604 4.014 3,604
'5- 9 7,549 4,134 3,415 3,790 3,371 344 44
10-14 6,100 3,565 2,535 2.793 2,488 760 47 12
15-19 3,875 2,259 1,616 1,949 1,597 275 18 19 16 1
20-24 4,797 2,473 2,324 2,194 2,301 223 22 23 1 33
25-29 4,442 2,480 1,962 2,216 1.949 234 13 10 20
30-34 3,783 1,955 1.828 1,734 1,819 208 9 4 9
35-44 4,816 2,614 2.202 2,298 2,184 295 18 14 7
45-59 4.544 2,685 1.859 2,387 1.839 288 20 7 3
60+ 2,S94 1,372 1,222 1,273 1.219 99 3
Age not stated 27 23 4 23 4
SAM fEH,sIL
All Ages 15,379 8,875 6,504 8,29J. 6,474 528 30 31 24
0-4 1,990 1,036 954 1,()36 954
5- 9 2,304 1,374 930 1,312 929 62 1
10-)4 1,670 1,008 662 909 661 95 1 4
15-19 927 601 326 563 326 29 6 3
20-24 1,587 921 666 842 656 63 10 10 6
25-29 1,417 839 638 772 631 60 7 3 4
30-34 ],446 793 653 710 650 69 3 5 9
35-44 1,666 899 767 821 761 73 6 3 2
45-59 1,409 856 553 802 S51 53 2 I
60+ 901 546 355 522 355 24 Age not stated 2 2 2
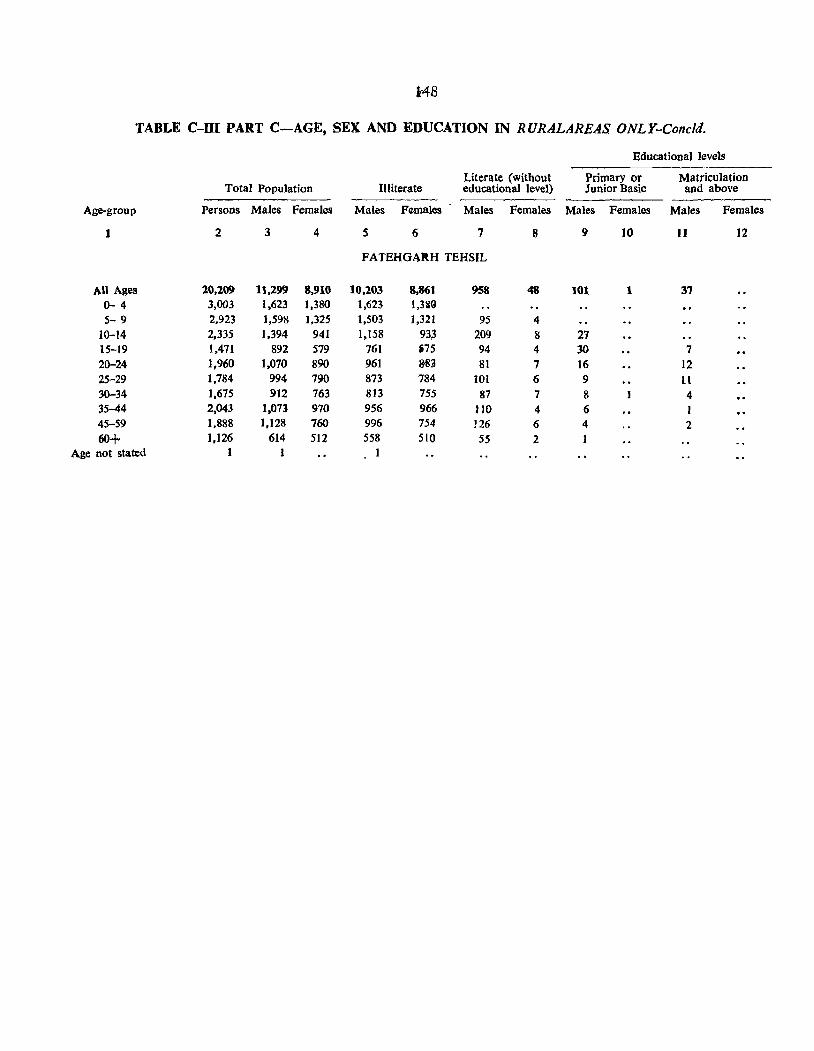
148
TABLE C-ill PART C-AGE, SEX AND EDUCATION IN RURALAREAS ONLY-Concld.
Educational levels
Literate (without Primary or Matriculation Total Population Illiterate educational level) Junior Basic and above
Age-group Persons Males Females Males Females Males Females Males Females Males Females
1 2 3 4 5 6 7 8 9 10 II 12
FATEHGAltH TEHSIL
AU Ages 10,209 11,299 8,910 10,203 8,861 958 48 101 1 37 0-4 3,003 1,623 1,380 1,623 1,389 5- 9 2,923 1,598 1,325 1,503 1,321 95 4
10-14 2,335 1,394 941 1,158 93~ 209 8 21 15-19 1,471 892 579 761 .75 94 4 30 7 20-24 1,960 1,070 890 961 &83 81 7 16 ]2
25-29 1,784 994 790 873 784 101 6 9 II 30-34 1,675 912 763 813 755 87 7 8 4 35-44 2,043 1,073 970 956 966 ) 10 4 6 I 45-59 1,888 1,128 760 996 754 126 6 4 2 60+ 1,126 614 512 558 510 55 2
Age not stated 1
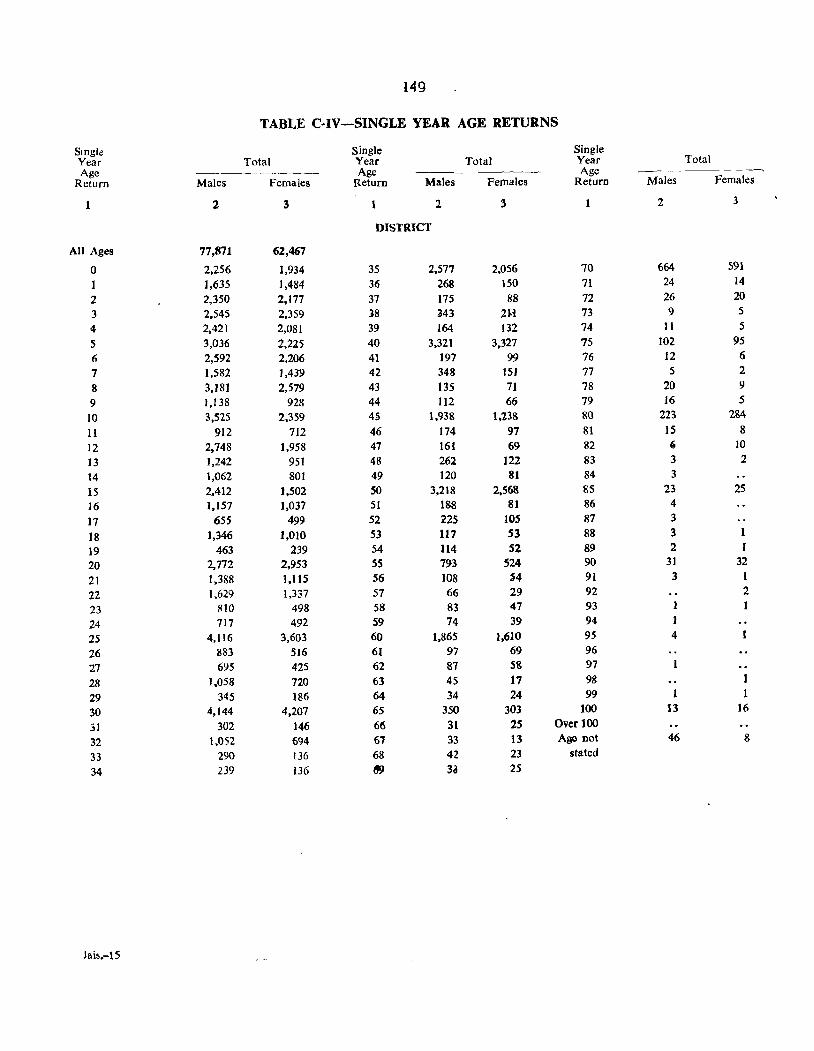
149
TABLE C~IV-SINGLE YEAR AGE RETURNS
Single Single Single Year Total Year Total Year Total Age ----~--- Age Age
Return Males Females Return Males Females Return Males Females
1 2 3 2 3 2 3
DISTRICT
All Ages 77,871 62,467
0 2,256 ],934 35 2,577 2,056 70 664 591
1 1,635 1,484 36 268 150 71 24 14
2 2,350 2,177 37 175 88 72 26 20
3 2,545 2,359 ~8 343 2M 73 9 5
4 2,421 2,081 39 164 132 74 11 5
5 3,036 2,225 40 3,321 3,327 75 102 95
6 2,592 2,206 41 197 99 76 12 6
7 1,582 ],439 42 348 151 77 5 2
8 3,181 2,579 43 135 71 78 20 9
9 1,138 928 44 112 66 79 16 5
10 3,525 2,359 45 1,938 1,238 80 223 284
II 912 712 46 174 97 81 15 8
12 2,748 1,958 47 161 69 82 , 10
13 1,242 951 48 262 122 83 3 2
14 1,062 801 49 120 81 84 3
15 2.412 1,502 50 3,218 2,568 85 23 25
16 1,157 1,037 51 188 81 86 4
17 655 499 52 225 lOS 87 3
18 1,346 1,010 53 117 53 88 3 1
19 463 239 54 114 52 89 2 1
20 2,772 2,953 5S 793 524 90 31 32
21 1,388 1,1l5 56 108 S4 91 3 1
22 1,629 1,337 57 66 29 92 2
23 810 498 58 83 41 93
24 717 492 59 74 39 94
25 4,116 3,603 60 1,865 1,610 95 4
26 883 516 61 97 69 96
27 695 425 62 87 58 97 1
28 1,058 720 63 45 17 98 1
29 345 ]86 64 34 24 99 1 1
30 4,144 4,207 6S 350 303 100 13 16
:51 302 146 66 31 25 Over 100
32 1,052 694 67 33 13 Age not 46 8
33 290 136 68 42 23 stated
34 239 136 (1) 3a 25
lais.-15
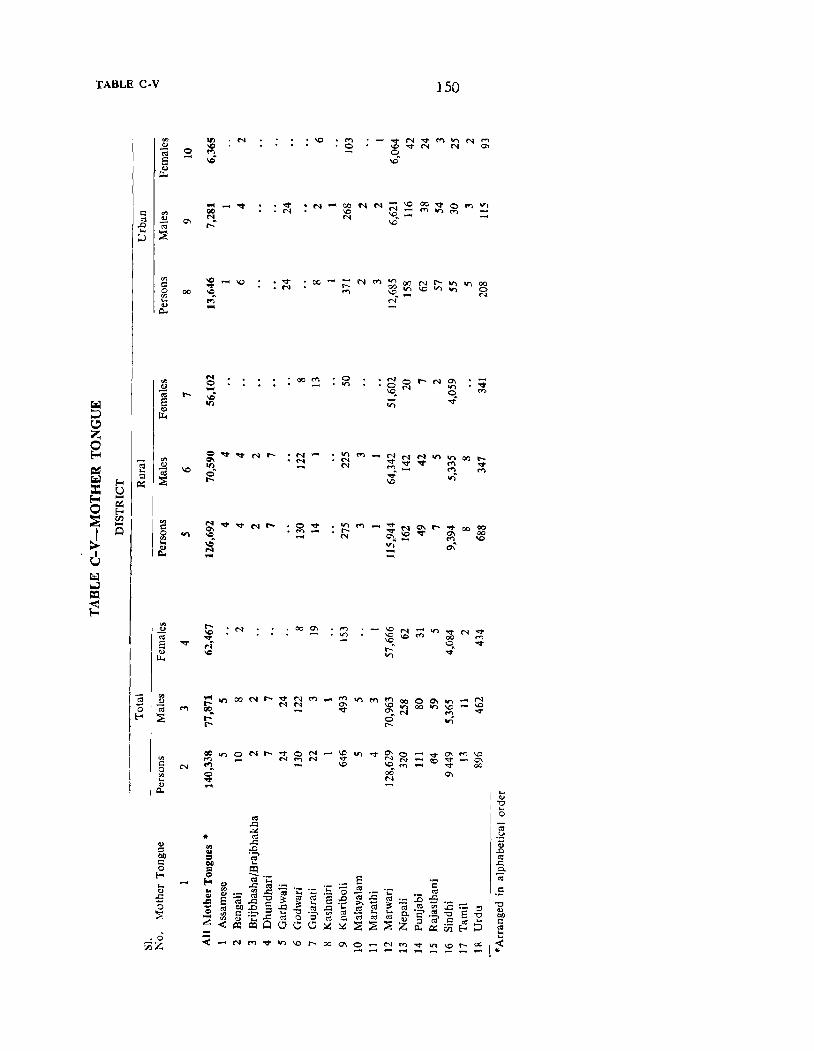
TABLE C·V
'" <U C; S ., ....
I':: '" ~ .,
.J:j 0:; ... ~ ::>
'" c:: 0
'" .... ., Il<
. 0 ViZ
III \CO
~ f'\
I#S
... OC> N
0\ r--~
\CO
""" 00 \CO ..;--
.....
N
'<:I' '<t - N
..... ID "3" N
\0
• N
N N
00
0'<1"
'" -
-
-
~ 0
00 \0 N
r-~
o on
150
.". N '<:I' <"I ..., N ..., \0 .". N N a. 0 \C"
N N - ~ 00 "3" 0 .... I#) f'I ~ "'. 10 "... = '"
N <"I "'00 N r-- II) It) aa ~on 10 It) ..., 0
N e";
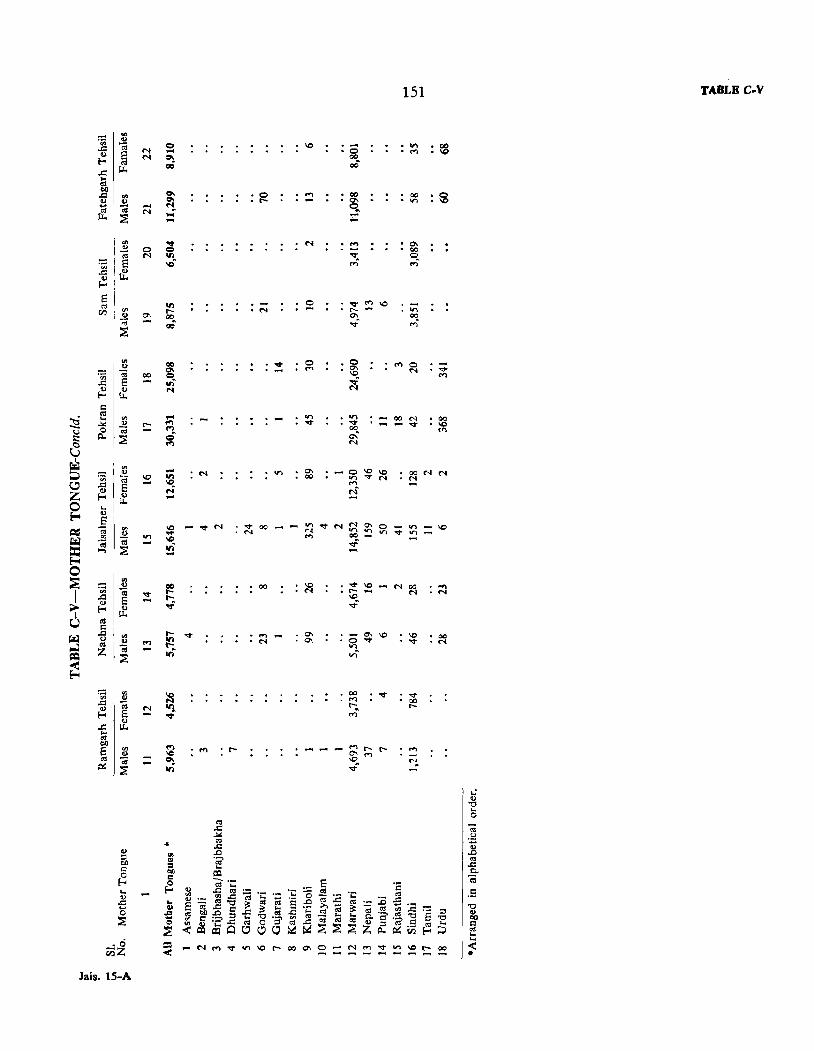
• ci F;.iZ
lais. 15-A
N N
-N
o N
\C) -
N
~ -...
* '" .. ::0 OIl C
~
151 TABLE C.V
00 . ."
o N -
00

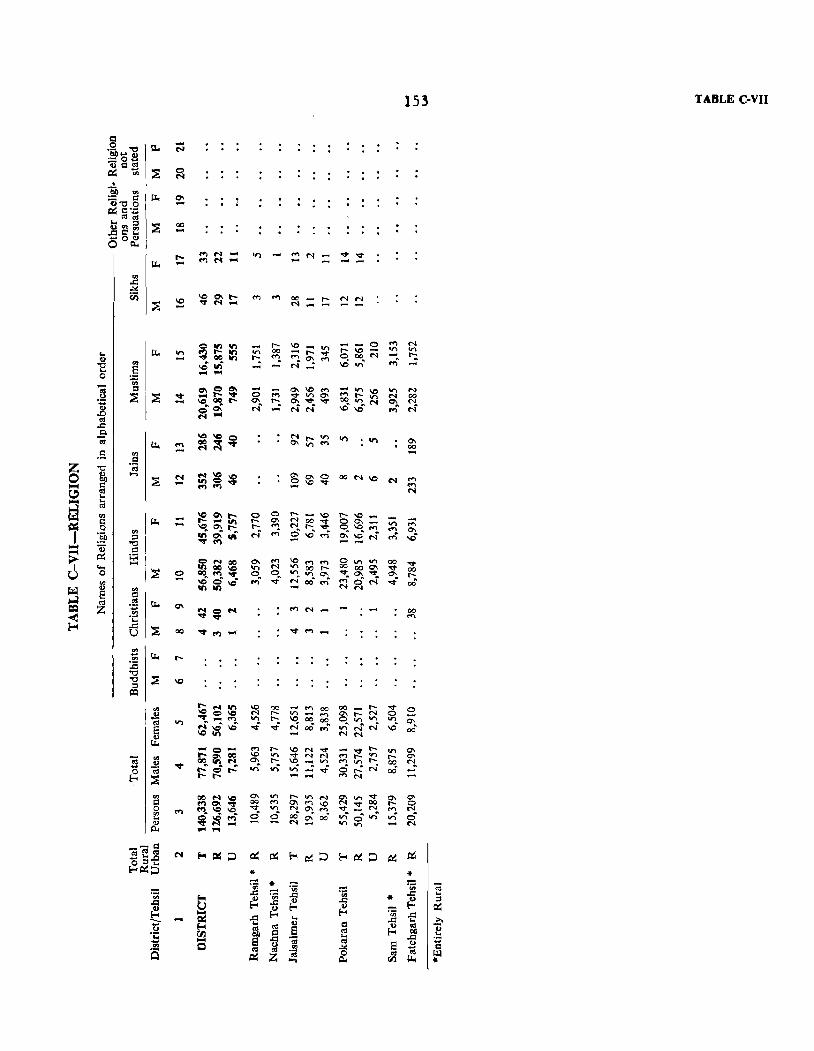
153 TABLE C-VII
CI ,2 .., p.. N ·~o8 OQ5
~ ~ ~ '" . '60 II)
ll. ;:::: 1:1 ~ v"o 0
~lr~ t(ll~ ::?J 00 ,.Qc:!~ .... Oo~
" ..., N - on "" N ~ ~
ll. - ..., ~ .... II)
.s::
..l<I C;S
~ \C 0\ " ""
.., co !::: N N ::?J ~ ~ .... N
Q III on .... ..... \C .... ... 0 ..., N
ll. 11"1 ..., ..... 11'1 V) 00 - ..... V) ..... \C - V) on .... ..,. 0011'1 t-:. "l 1"'\ '<T q 00 N r-:. «)
'" N ~ "" .,; ..; ... "0 ,§ ~ on ..... \C .... .... .... 0 'Uj
] ::I 0\ Q 0\ .... 0\ \0 "" .... .,.,
\C ..... N ~ ::g ::!; .... r- ..,. 0 ...., '<T '" '" "" ..... N 00
\C~ ~ r- ~ t-:. 0- ..,. ...,. ~"1.~ 0). N '0 N .... N N \C\J:) .., N .0 ~-01 .s:: 0. \C \C N on t;; = ..... on on 0\ ll. .., ~
..,. ..,. C\ V) "" N 00
. 9 '" .....
1:1 Z "0 'a 0 ~ ..... ::g N ~ \C
~ C\ a- e 00 N\O ,., - .... = 0 \0 "'" N
~ 1:1 f') ..., - .., to!) 01 N .... ~ .... ~ 01
r.l '" \0 Q\ l"'- e 0 ..... - \J:) I- \C 1:1 ll. 1- .... 111 .... a- N 00..,. 0 '" on ...
~ 0 \00\1- I- "" N t-.. ~ 0 \0 ,.,
'" ..; ~ "" ..., 0). 'So ::s .,j",,,, N \0 ,., 0\ v:) N ..; \0
~ 'tl ""M ..... ~ ... t:l ;;.- ~ ~ = N 00 '" "" \0 ..., 0", .,.. 00 '" """ I ..... 11'1 00 \0 on N ..... 00 ...... 0000 0\ .... 00 U 0 ::g ~ 00 :;} 'Of" e 0.
.,.. V) a- ""'"0\ .... a- ....
V> ~ v:) ..; ...,. N 00' ",' ...,' O' N ..,.' 00 liIil «) en til III NN
S 8 CI C<S ,~ ll. 0'\ Z t; N = ~ .... N 00
~ 'C ..,. ..,. ....
..c:: ~ ..,.
U 00 ..,. ..., .... "" :t1 ,l!l ll. ...... .s:: "0 ::;a "0 \0 :l III
I II) l- N on \0 00 ...., 00 00 r-""'" S I'; '" = 10 N ..... '" "" 0- r- N e ..,. .... .., V) I- 10 00 00 0 "1-
.,.. on
'" on N \D- lIS ..; ..; N 00' ..,' .,; N v:) E "" 00 ., \0 .... N N ll. ..., ..... -0 - ..... 10 N ...,. .... '<t on 0-
t;; '" 1"'-0'1 CO '" on
""'" N N ...,
l- V) r- '" 2 ~"l. N 0\ ..... \C ..... V) ...., In ..... 00 "i
;§ ..,. ...: .,; .,; .,; ..; 0 r-: .... ,j 00 C<S ..... e
~ r-r- - ..., N
'" 00 N \C '" .,.. t- or. N a- ." """ 0'\ 0-
1:1 ..., 0\ ..,. 00 M 0- t'> \0 M ~ 00 ..... ?:l 0 ..... "I. "l 10 ...,. .,.. N "'. ..... ""'"
_N ..., '" ..; ;i ~ 00 00- .,; 6"; .,; 6' .... ~ \0 a-." N .... N - I(") on N c.. ... ...
<aS~ N ~ '" :;:J ~ ~ E-< ~ ::> E-< ~ :;:J ~ tx: -:l.o
~~:5 * * - • .- -.;; .- '" :::: ';; Oi
';; ~ ..c:: '/E ..Q '" *
.s:: .... .s:: ~ ..Q
., .s:: ~ :l
~ U
~ Eo< ~ r- ~ .... ..c:: '" oS tf - !¥ .... .s:: >. Eo< ...
C<S ." d ~
o;S ~ 'C rIJ g!. I::l S C<S OIl .!:i .... .s:: .... 8 ..c:: <a C<S 1;; Q ~ S
., c is C<S '" ..l<I ~
'" Z ';; 0 C<S UJ ... c.. C'Il 10. -II
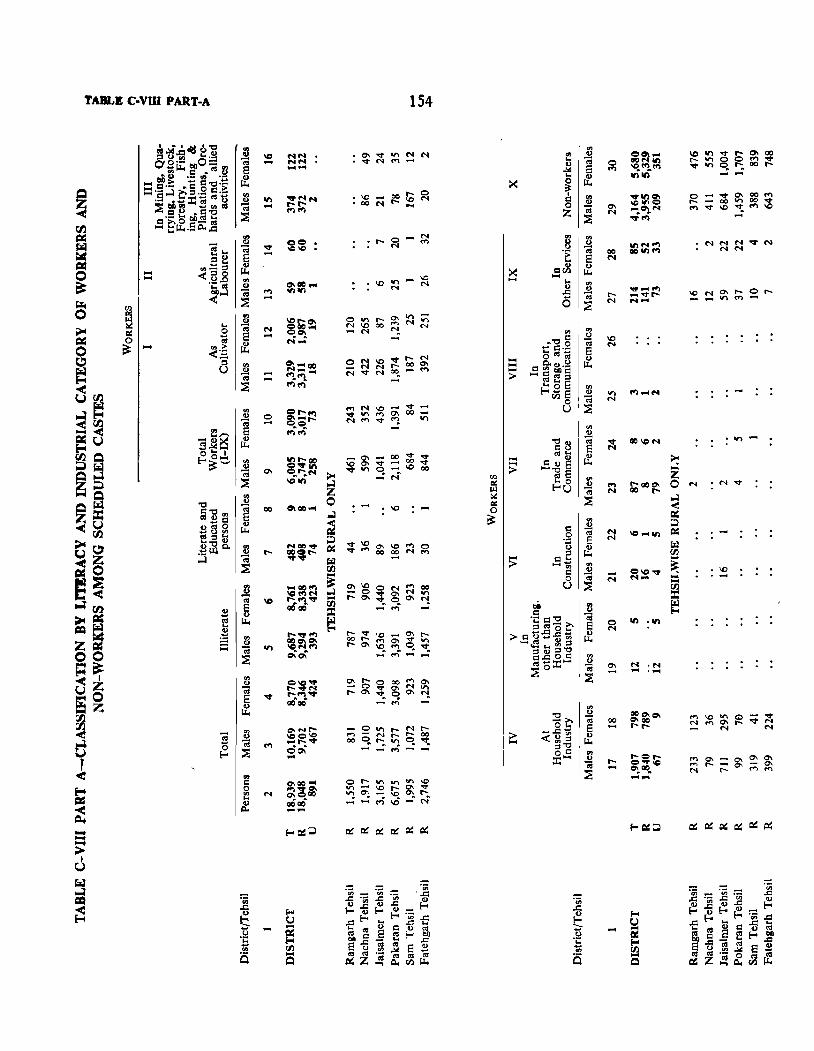
TAJILE C·VIU PAJlT-A
\0 -on -~ -
N ...
--
N
NN NN _ ...
154
\0 N
o~~~~~ NVN~""f\'l -
=b~g:;~~ ~- 0\ ~ q 0\ rt
- M
.... .... .... >
.... ..... >
12= I
I~ '~
o ...
0\ N
00 N
\0 N
N N
-N
0\ -
00
I"-
N .N -.,...
o ~O\OO ...
:;:;~~~~~ -
on -
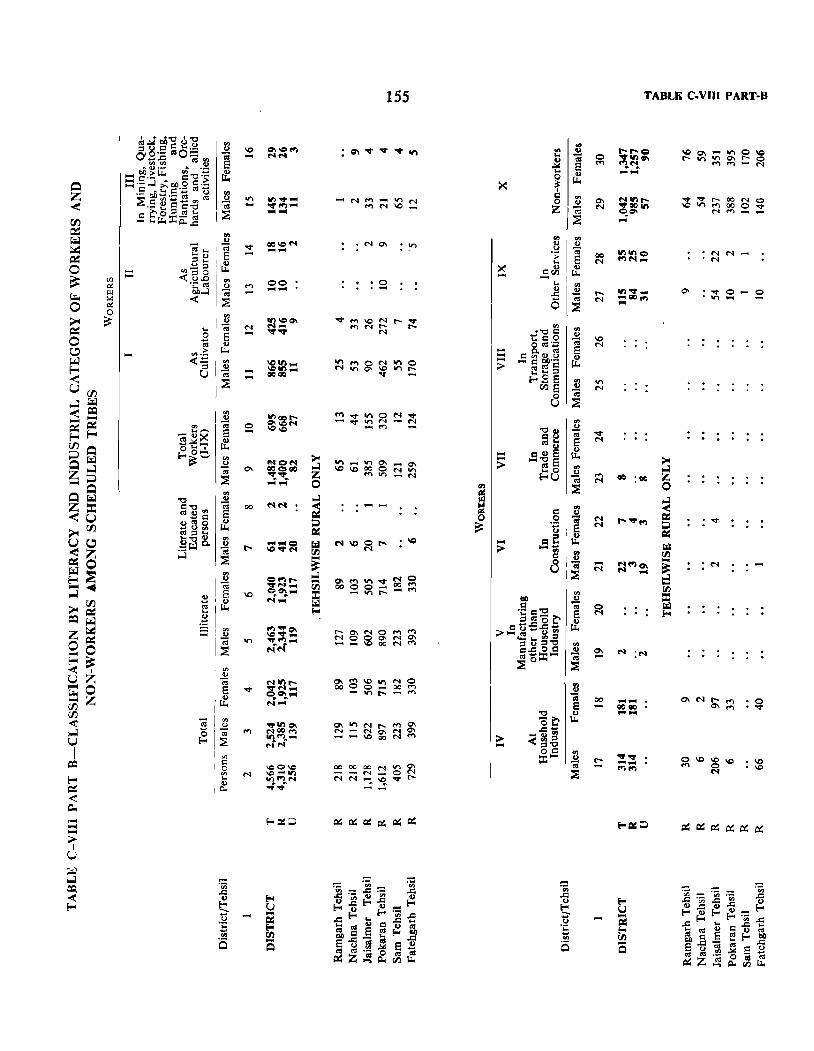
..... .....
I~ '6 1° I~ I~
I'"
I~ ~
'" ,e I~
l~
00 ......
155
NO\ :~
><: ....
-.... .... :>
.... >
:> ....
.., 8 0;;: ...
o~ ....
'" 'U I~
I~
o ....
00
r-
TABLI~ C.VIll PART-B
QO :QO
...... QO QO ......
...,.0 VI ...
o -
1$6
HOUSING TABLES
(Note on E-Series)
There are five tables in this series prepared for the first time in this census which have been extracted from the House List prepared at the time of house numbering and house listing operations in 1960. Out of these, four tables viz. E-I, E-II, E-IV. E-V relate to housing conditions and furnish data for the purposes for which the houses are used, the tenure on which they are occupied by the households, material of construction of walls and roofs and the households classified by number of members and by number of rooms occupied by them. The data in these tables has been shown for the district as well as for each tehsil separately for total, rural and urban areas.
2. Another table (E-III) on industrial establishments also prepared from the house lists gives a break-up by industry and the fuel used cross-tabulated by the size of establishments, is not presented here for want of space and can be seen in Part IV-B of the State Census Report which presents an the tables of this series. However, the data regarding number of establishments contained in this table is separately compiled down to village level which bas been presented in a separate list of industrial establishments.
Table E-I
3. This table bas been prepared on fuJI count and furnishes figures of census houses separately for total. rural and urban areas of the district and tehsils classified into different categories according to the uses to which they are put. The houses which were found vacant at the time of house listing have also been shown separately as such. The following are the various types of houses into which occupied houses have been classified:-
Dwellings, shop-cum-dwellings, workshop-cum-dwellings, hotels, hostels, sarais, dharamshalas, tourist homes and inspection houses, shops excluding eating houses, business houses and offices, factories registered under the Factories Act and worksheds and workshops not so registered, schools and other educational institutions including training classes, coaching and shop classes, restaurants, sweetmeat shops and eating places, places of entertainment and community gathering (Panchayat Ghar), public health and medical institutions, hospitals, health centres, doctors clinics, dispensaries, etc.
4. Occupied census houses which do not fall in any of the above categories have been classed as 'Others', e.g. temple, mosque, church, cow shed, motor garage, water-hut, engine room, store room, grass shed.
S. The concepts and definitions of the terms occuring in the table are given below:-
A "Census house" is a structure or part of a structure inhabited or vacant, or a dwelling, a shop, a shop-
cum-dwelling, or a place of business, workshop, school, etc. with a separate entrance.
A "Census household" is a group of persons who commonly live together in the same census house and take their meals from a common mess unless the exigencies of work prevent them from doing so.
A "shop" or a "workshed" is a place where articles are sold for cash or for credIt.
A "Workshop" is a place where some kind of produc· tion, processing, repair or servicing such as paper-making, shoe-making tailoring, cycle-repairing, motor-servicing, halwai's shop, pottery-making, goldsmithy, blacksmithy, etc., are undertaken or where goods or articles are made and sold, and Is not a factory registered under the Factories Act.
A "Factory" is a large workshop which has been registered under the Indian Factories Act.
"Business houses" are those p~emises where transactjons jn money or other articles take place such as banks etc.
Table E-II
6. This table has been prepared on the basis of 20 per cent sample of households used as dwellings, shopcum-dwellings, workshop-cum-dwellings and dwellings with other uses. Shop-cum-dwellings and workshop-cumdwellings are census houses which are partly used for residential or dwelling purposes and partly used as a shop or workshop. Dwellings with other uses are census houses sych as offices, schools, temples, mosques etc. which are partly used for residential purposes by watchmen or attendents. The total number of househOlds given in column 4 of this table gives the total of such samples claSSified into the aforementioned four categories of dwellings, which have been further classified according to their tenure status. whether owned or rented, separately for the total, rural and urban areas of the district and also for tehsils.
7. The following concepts alld definition have been used in respect of tenure status;-
The term 'owned' was considered to be a situation when a household was living in its own house or a house duty mortagaged to it by some of its debtor.
The term 'rented' meant a situation when a household was found living in a house taken on rent from a landlord or in a house that was taken on lease or in a house for which no rent was being paid with the consent of the landlord.
Table E-IV
8. This table has been prepared on 20 per cent sample of households used as dwellings, shop-cum-dwellings, workshop-cum-c1wdlings and dwellings with other uses.
The total number of houses given in column 3 of this table gives the totals of all such sampled household. The material out of which most of the walls are made or where a house consists of separate structures, each made of different materials, the material oLU of which the walls of the main bedrooms, are made has been classified into the following nine categories:-
(1) Grass, leaves, reeds or bamboo (2) Timber (3) Mud (4) Unburnt bricks (5) Burnt bricks (6) C. I. Sheets or other metal sheets (7) Stone (8) Cement concrete (9) All other material
9. The material out of which most of the outer roof exposed to the weather is made, i.e., tiles thatch, corrugated Iron, zinc or asbestos cemeni sheets or concrete, etc., or in the case of multistoreyed building, the material out of which the intermediate floor or floors is made, has been classified into the following seven categories:-
(1) Grass, leaves, reeds thatch, wood or bamboo (2) Tiles, slate, shingle (3) Corrugated iron, zinc or other metal sheets (4) Asbestos cement sheets (5) Brick and lime (6) Concrete and stone slabs (7) All other material
10. This table has been presented separately for total, rural and urban areas of the district and also for tehsils.
Table E-V
11. This table has been prepared on 20 percent sample of households used as dwellings, shop-cumdwellings, workshop~cum-dwellnigs and dwellin~ with other uses. The figures given in column 3 of this table are the totals of all such sampled households. The sex break-up of the total number of members occupying such sampled households have been further classified into the following six categories showing the number of
Jals.-16
households and number of occupants by sex in each category:-
(i) no regular room (ii) one room
(iii) two rooms (iv) three rooms (v) four rooms
(vi) five rooms or more 12. This table has been prepared separately for the
total, rural and urban areas of the district and also for tehsils.
List of Industrial Establishments
13., This table gives the number of establishments and the number of workers in each branch of industry classified by minor groups of Indian Standard Industrial Classification (for detailed description see appendix to the Explanatory Note on B-Series). The data is presented in the ascending order of the minor groups showing the figures in the brackets first for the number of establishments and' second for the number of workers employed. The information has been extracted from the house list prepared at the time of honse.numbering and house listing operations in 1960.
14. The data is presented for the district and each tebsil for total, rural and urban areas as well as for each village and town separately. A summary of number of industrial establishmems by workers employed has beea given separately for the district. tehsils and towns in the begining of this table. The table' has been presented in run'!On-lines and the villages are shown both by their names and COde·numbers. The Code number of the villages will be helpfUl in findiBg out the locatioB of the village in the tehsil maps. Villages which do not have any indu .. Itrial establishments as well as those industry minor ,roups for wbim there are no figures in village or town or tehsil have been excluded from the list.
15. The data for some seasonal industries which were not actually working during the period of house listing has not been included. The number of workers also includes the proprietor and the other household members who were working: in the j.n~ustry during the week prec:eeding the enumerators' VISIt.
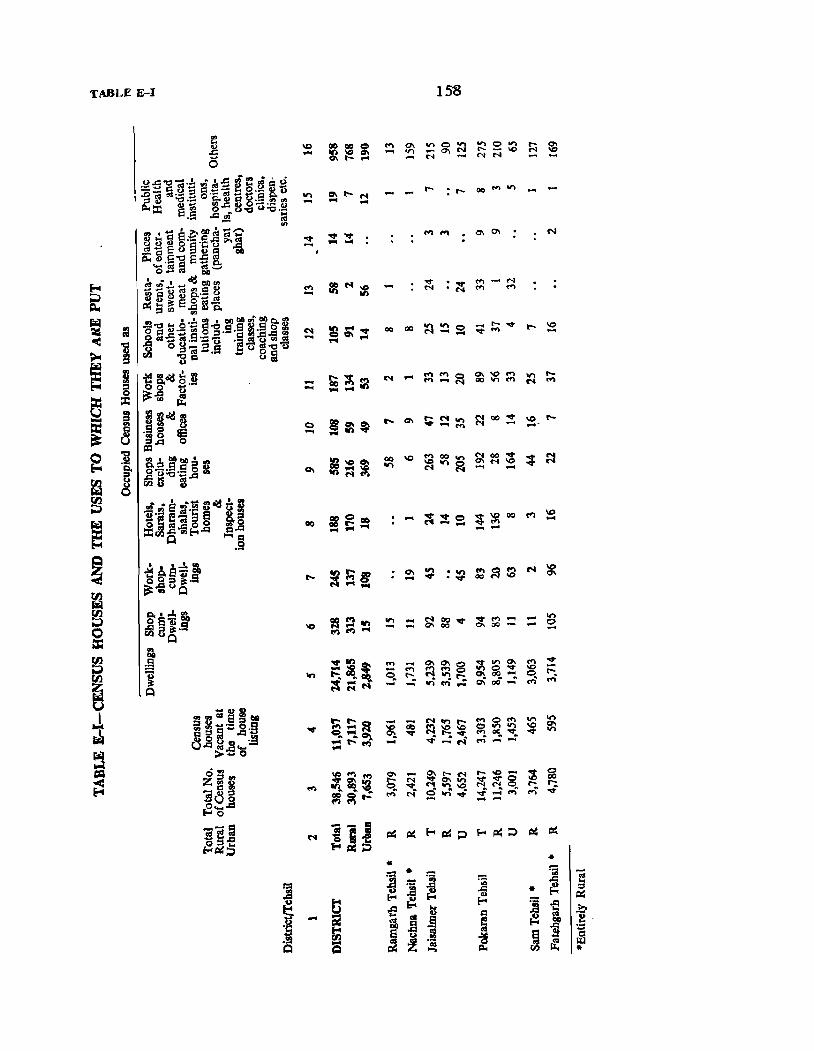
Tt\BLE E-J 1$8
C ~ \D
~~ C .... 0\ II'> 0 on '" ~ .,.. r- $ ... ~ on N 0'1 N t- ID rI
0 ... ('t N .... ....
• ~.d~ ...... .!. .,t Js.s i e fi = ti ::0 ~ fJ.~:S is·<;: Cd ~ g._ 8. u '" ~ .... - - r- r- oo ... '" - ....
l::s ." .<;: A Q) Q g.S '" '" N .... ... ... ~ ~ ~ ~ ~ "'. 8 ." U :a .!! ..... .c ~ :;
'" rI> l .... e:»eI)~~C 8 ~ fl o'-a·S -5 ..... ! ..,. ...,. ...,.
ttl "" 0'10\ N
.... ... ... ~"-Eo=t>c=
\ ~!.~] e-s ~ • 0- ~ ......
~ Jt";.,!._~011'"
::l ~ N ... "'" :~ .... .... N
~ fi ans s.~ ~ \0 N .... .... ~
."
=: ... ~e.8"'-::1 m ... Q)Q.
IiIiI =
.,~ .... c·.L a . CQcorit:lOo.O'l ~ '0 Q.8·z ti 0 -g .9.S WI.S ,2 ~ ('.l ~ .... .., 00 GO on :!l 0 :;;: ..... "'" r- ~ M .... < 0", '" C._ C "'..c: ... .... ...0'1 ... ...
'0 .c ~ u"-"u ";.!! () filS
~ ~ ~ °.gi3.9 !=u 8]U
m ::s ; ~a~~~ f;;;~~ ('.l ... .... ....
~ 0'1 '0 ..,
VI .... ::s o 0 ~._ - .... 00 on .... N .... 0 ~.c '" - .......
g ~ ... '" ~ !;~8 ~ Non N "'"
~ III> 0 ~~~ .... 0\ co \D .... a . ~ is IS
.... .... N .... _-... i..c: 0
... e :i ab~~:s~ ~\Oi
co \0 .... 00 on NCO .., .., M
! on \0 .,..
~ O'IM \0
""" N
o-u:.o'';:,2 ... 0\ ."r::; M .... .... ~ ~~ 8
fg ~ ~8 =~.i ~lIdu B B';e-!38 u
= =GO .... ~~~ ~~ co .... \D
~ 0&3"''''0 0 ~o GO -::t: .c.;jEo<.Q c.Q ... :::; ... -...
Q .... 1;1
.9
~ ~Ae~r It)f;i§ 0\ on .", ~~!2 N \0
~ 0 Q;. .... .... ...,. . ...,. 0\
~"iluQ ~ ...... ~ ~ Q. • .J. ~
o~'O ~ Cf)
II) ~ M 00 ..,. ~ .... - ....
0 ~ EI:.5! '0 ... 0\ 00 co 0 .... .... ... -
= Q ~
~ ;§ """'01 .... ;;:; ~~g "",11'>0'1 .... "'" i
.... ;g .... - ono .... \Q -e In to:. .GO 0.. r--;. Monr- 0\00- ~
r-;s - .. .n~,,: c;.oO-= .-)
Q NN .... -
-CI)~
..L "'gCII§:::s1il8 ~~2 N,"I'- ... 0"'" .... ::s ..... 09 - co on
~ ... ° 6 ... "' ..... ..,.
~ .... '0\0 o on"" \0 0\
1:1 0 .19 ~~O\ ..... Nt- .... "l. oc. ""'. """ VI
t3.c"',8 .... - ........ . - ..;...:« ....... -~
> .... 0 ... ....
c:Q d~ ... ""<'Ift) ~ - ~""M ..... \0- ~ 0
~ :z;~~ ""~rn N .... "'on ~~~ 00
ft) 111) ... 0\ ~ 0.. ~ g~~ r-- r;
-a=' M .... .f! 0 ~~ .... M ""' ......... O .... ..cI
... .... Eo< 0
--5 ..... a Eo<~;J Eo<~:J = ~ .f!~.o N o~-! ~ ~
~~:5 i-Icr::J • ...
::::: • ~ ~ -]
<I> - ~ ~ ~ .Q ] ..cI op
~ "5 • =' Eo< ~
~ t3 r:! ... Eo< j ~ ..c: :a .! - E
.. .., G) C
~ ,g 8 ~ ~ co e "i i
._ . ii ! ~
... ~ 1 ~
c Q 25 ~ J:tI
til •
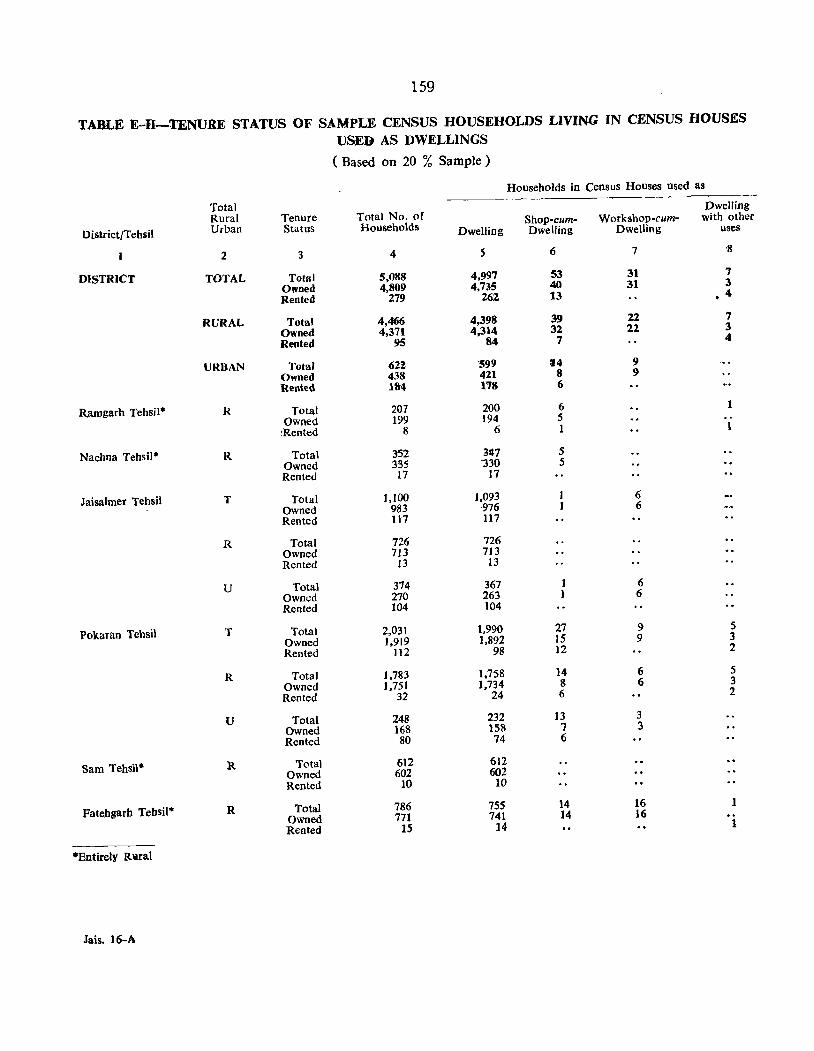
159
TABLE E-U-TENURE STATUS OF SAMPLE CENSUS HOUSEHOLDS LIVING IN CENSUS HOUSES USED AS DWELLINGS
(Based on 20 % Sample)
Households in Census Houses used as
Total Dwelling Rural Tenure Total No. of Shop-cum- Workshop-cum- with other
DistrictjTehsil Urban Status Households Dwelling Dwelling Dwelling uses
2 3 4 5 6 7 '8
DISTRICT TOTAL Total 5,088 4,997 53 31 7
Owned 4,809 4,735 40 31 3
Rented 2.79 262 13 • 4
RURAL Total 4,466 4,398 39 22 7
Owned 4,371 4,314 32 22 3
Rented 95 84 7 4
URBAN Total 62Z '599 !J4 9 Owned 438 421 8 9 Rented 1S4 178 6
R.arogarh Tehsil* R Total 2Q7 200 6 Owned 199 J94 5 :Rented 8 6 1 1
Nachna Tehsil* R Total 3'52 ;1J7 5 Owned 335 330 5 Rented 17 17
Jaisalmer Tehsil T Total 1,100 ],093 6 Owned 983 '976 6 Rented 117 117
R Total 726 726 Owned 713 713 Rented 13 13
U Total 374 367 1 6 Owned 270 263 1 6 Rented 104 104
Pokaran Tehsil T Total 2,031 1,990 27 9 5 Owned 1,919 1,892 15 9 3 Rented 1I2 98 12 2
R Total 1,783 1,758 14 6 5 Owned ],751 1,734 8 6 3 Rented 32 24 6 2
U Total 248 232 13 3 Owned 168 158 7 3 Rented 80 74 6
Sam Tehsil'" R Total 612 612 Owned 602 602 Rented 10 10
Fatebgarh Tehsil* R Total 786 755 14 16 1
Owned 771 741 14 16 Rented 15 14 1
*Entirely R~ral
Jais. 16-A
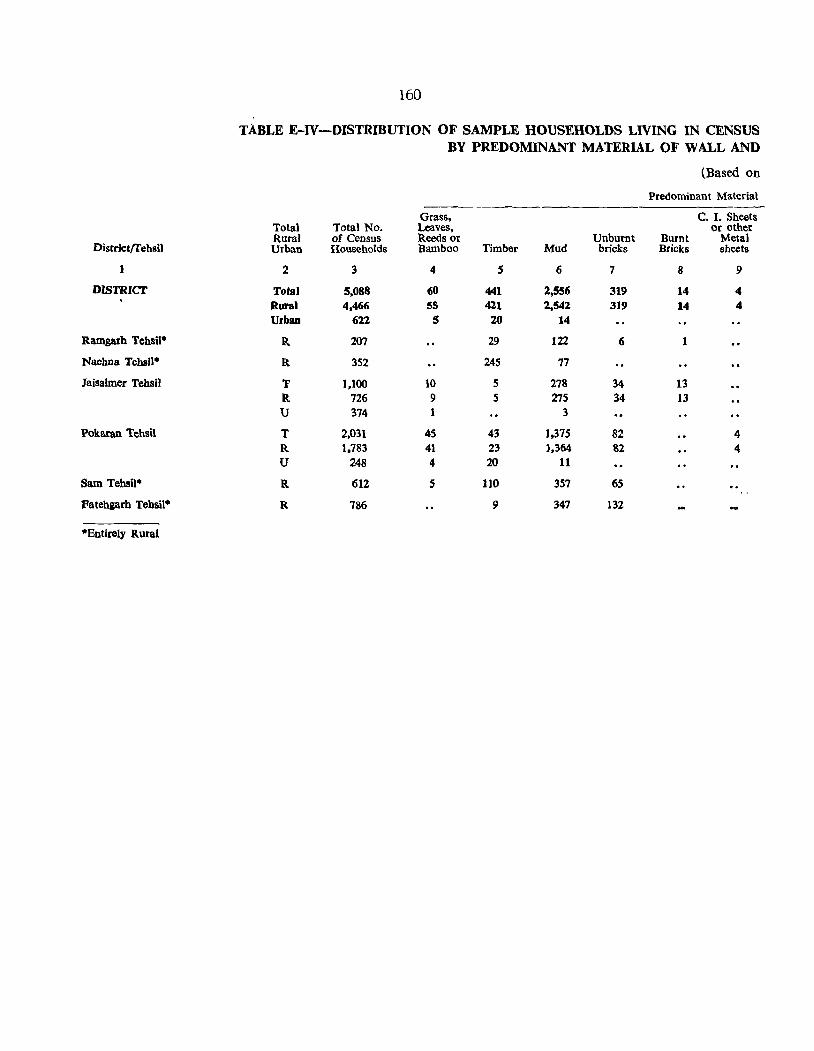
160
TABLE E-IV-OISTRIBUTION OF SAMPLE HOUSEHOLDS LIVING IN CENSUS BY PREDOMINANT MATERIAL OF WALL AND
(Based on
Predominant Material
Grass. C. I. Sheets Total Total No. Leaves, or other Rural of Census Reeds or Unburnt Burnt Metal
District/Tehsil Urban Households Bamboo Timber Mud bricks Bricks sheets
J 2 3 4 5 6 7 8 9
DISTRICT Total 5,088 60 441 2,556 319 14 4 Rural 4.466 5S 421 2,542 319 14 4 Urban 622 5 20 14
Ramgarh TehsU* R 207 29 122 6 1
Nachna Tehsil* R 352 245 77
Jaisalmer Tehsil T J.loo 10 S 278 34 13 R 726 9 5 275 34 13 U 374 1 3
pokaran Tehsil T 2.031 45 43 1.375 82 4 R 1.783 41 23 1.364 82 4 U 248 4 20 11
Sam Tehsil* R 612 5 110 357 65
Fatebgarh TehsU* R 186 9 347 132
*Entirely Rural
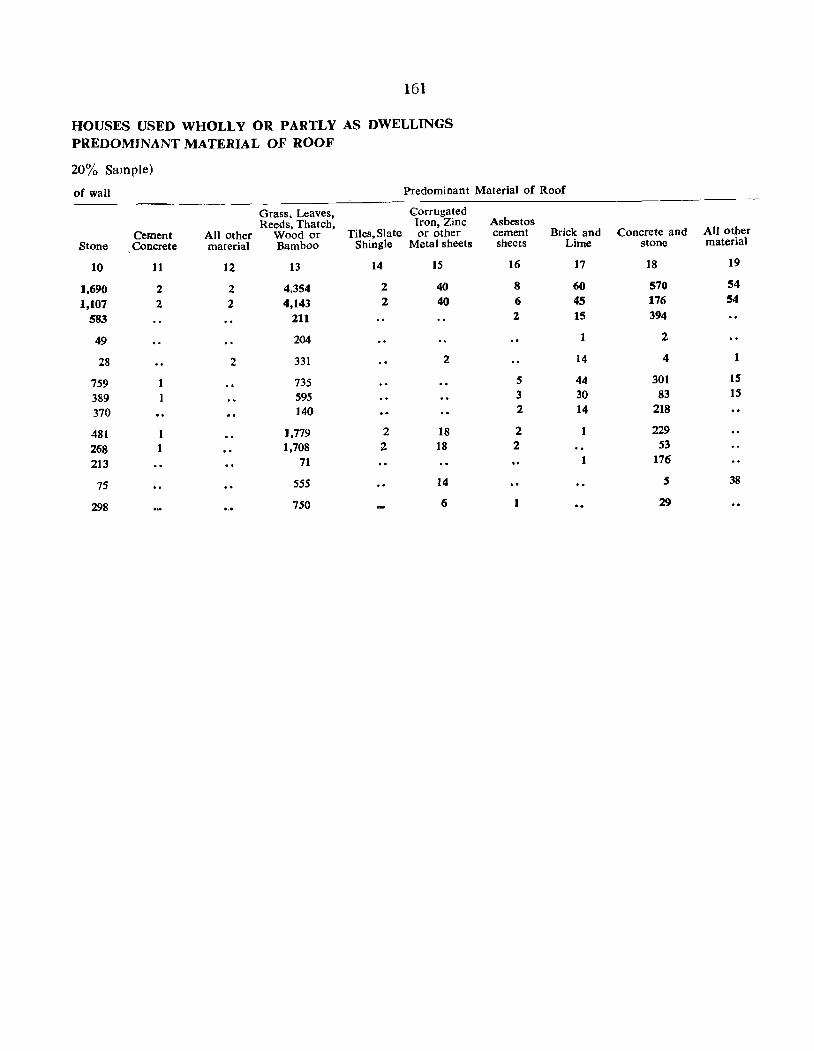
161
HOUSES USED WHOLLY OR PARTLY AS DWELLINGS PREDOMINANT MATERIAL OF ROOF
20% Sample)
of wall Predominant Material of Roof
Grass. Leaves, Corrugated Reeds, Thatch, Iron, Zinc Asbestos
Cement All other Wood or Tiles, Slate or other cement Brick and Concrete and AU other Stone Concrete marerial Bamboo Shingle Metal sheets sheets Lime stone material
10 11 J2 13 14 15 16 17 18 19
],690 2 2 4.354 2 40 8 60 570 54
1,107 2 2 4,143 2 40 6 45 176 54
583 211 2 15 394
49 204 1 2
28 2 331 2 14 4 1
759 735 5 44 301 IS
389 S95 3 30 83 IS
370 140 2 14 218
481 1 J,779 2 18 2 229
268 1 1,708 2 18 2 53
213 71 1 176
75 555 14 5 38
298 750 6 1 29
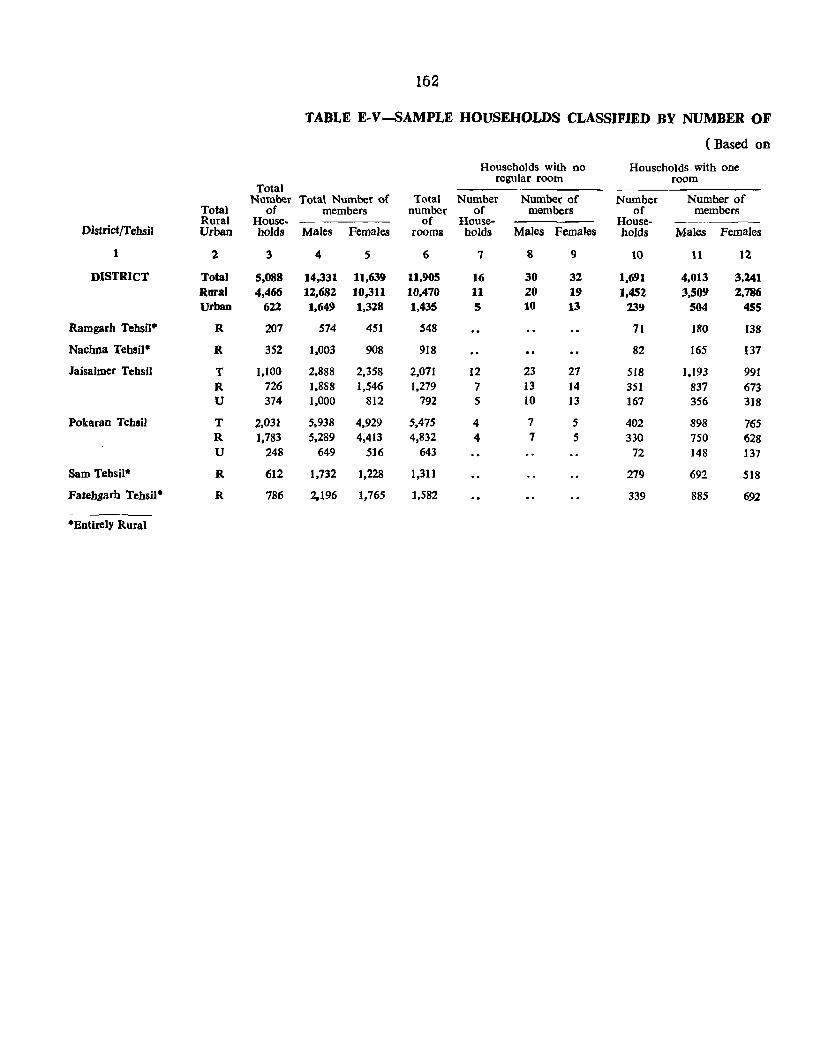
162
TABLE E-V-SAMPLE HOUSEHOLDS CLASSIFffiD BY NUMBER OF
( Based on
Households with no Households with one regular room room
Total Number Total Number of Total Number Number of Number Number of
Total of members number of members of members Rural House- of House. House-
District/Tehsil Urban holds Males Females rooms holds Males Females holds Males Females
1 2 3 4 5 6 7 8 9 10 11 12
DISTRICT Total 5,088 14,331 1),639 11,905 16 30 32 1,691 4,013 3,241 Rural 4,466 12,682 10.311 10,470 11 20 19 1,452 3,509 2,786 Urban 622 1,649 1,328 1,435 5 10 13 239 504 455
Ramgarh Tehsil· R 207 574 451 548 71 180 138
Nachna Tehsil· R 352 1,003 908 918 82 165 137
Jaisalmer Tehsil T 1.100 2,888 2,358 2,071 12 23 27 518 1,193 991 R 726 1,888 I,S46 1,279 7 13 14 351 837 673 U 374 1,000 812 792 5 10 13 167 356 318
Pokaran Tehsil T 2.031 5,938 4,929 5,475 4 7 5 402 898 765 R 1,783 5,289 4,413 4,832 4 7 5 330 750 628 U 248 649 516 643 72 148 137
Sam T.ebsU* R 612 1,732 1,228 1.311 279 692 S18
Fatehgarh Tehsj)· R 786 2,196 1,765 1,582 339 885 692
-Entirely Rural
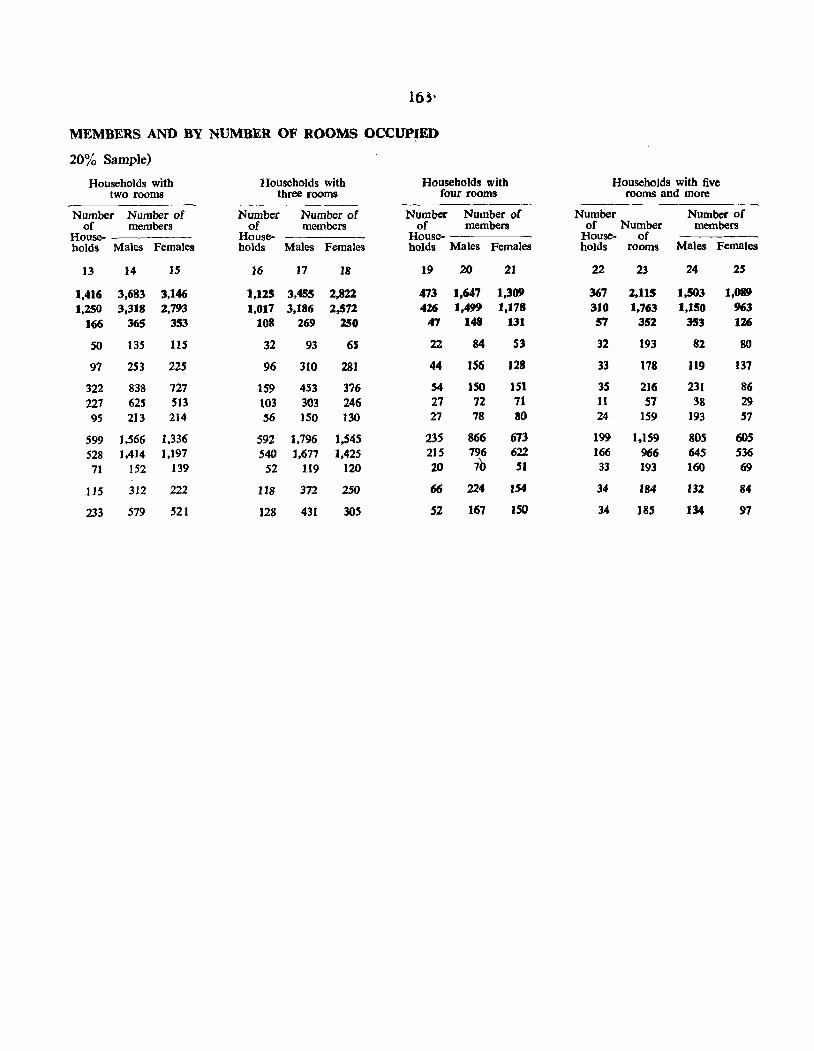
16)'
MEMBERS AND BY NUMBER OF ROOMS OCCUPIED
20% Sample)
Households with Households with Households with Households with five two rooms three rooms four rooms rooms and more
Number Number of Number Number of Number Number of Number Number of of members of members of members of Number members
House- House- House- House- of holds Males Females holds Males Females holds Males Females holds rooms Males Females
13 14 15 16 17 18 19 20 21 22 23 24 25
1,416 3,683 3,146 1,125 3.455 2.822 473 1,647 1,309 367 2.115 1,so3 1,089 1,250 3,318 2,793 1,017 3.186 2,572 4%6 1.499 1,178 310 1.763 1.150 963
166 365 353 108 269 250 47 148 131 57 352 353 1%6
50 135 115 32 93 6S 22 84 53 32 193 82 80
97 253 225 96 310 281 44 156 128 33 178 119 137
322 838 727 159 453 376 54 ISO 151 35 216 231 86 227 625 513 103 303 246 27 72 71 11 57 38 29 95 213 214 S6 150 130 27 78 80 24 IS9 193 57
599 1,566 1.336 592 1,796 1,545 235 866 673 199 1,159 80S 60S 528 1,414 1.197 540 1.677 1,425 215 796 622 166 966 64S 536 71 !52 139 52 119 120 20 7'0 51 33 193 160 69
115 3J2 222 118 372 250 66 224 154 34 184 132 84
233 579 521 128 431 30S S2 167 150 34 185 134 97
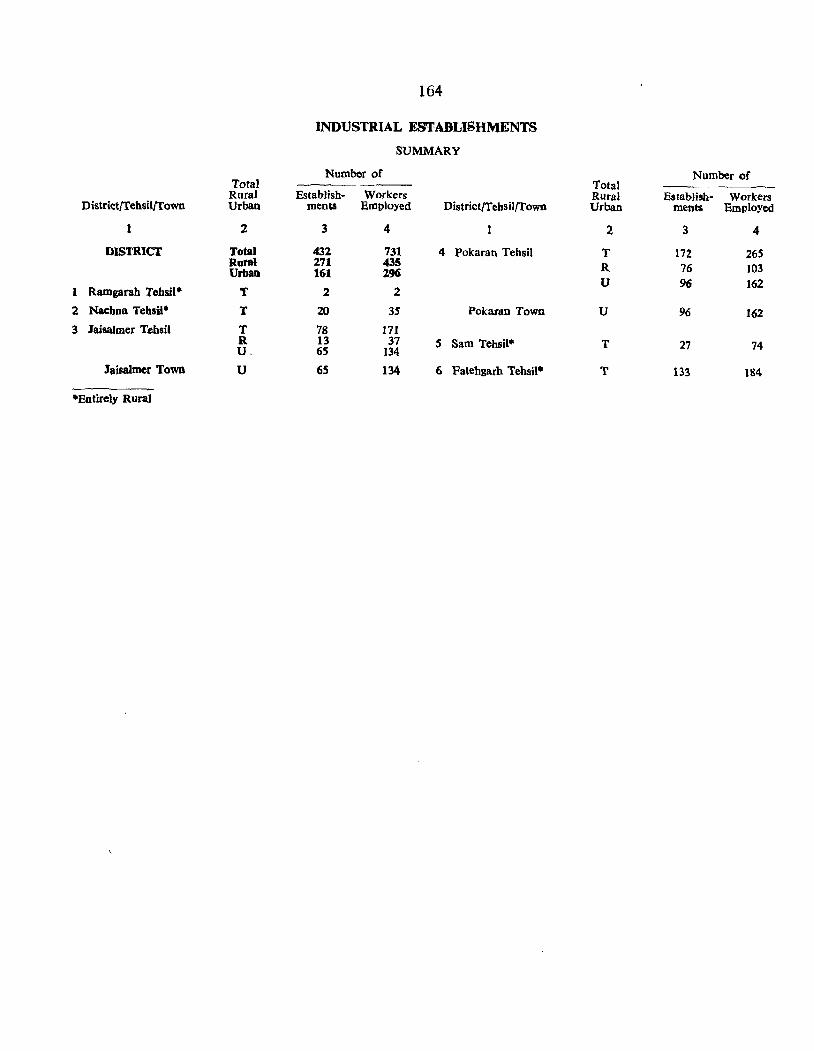
164
INDUSTRIAL ESTABLISHMENTS
SUMMARY
Number of Number of Tota! Total
Rural Establish- Workers Rural Establish- Workers Districtrrehsilrrown Urban ments Employed District/Tehsil/Town Urban ments Employed
1 2 3 4 2 3 4
DISTRICT Total 432 731 4 Pokaran Tehsil T In 265 Rural 271 435 R 76 103 Urban 161 296
U 96 162 1 Ramgarah Tebsil· ,. 2 2
2 Nachna Tehan· T 20 35 Pokaran Town U 96 162 3 Jaisalmer Tcbsil T 78 171
R 13 37 S Sam Tehsil· T 27 74 U, 65 134
Jaisalmer Town U 6S 134 6 Fatehgarh TehsU· T 133 184
·Entirely Rural
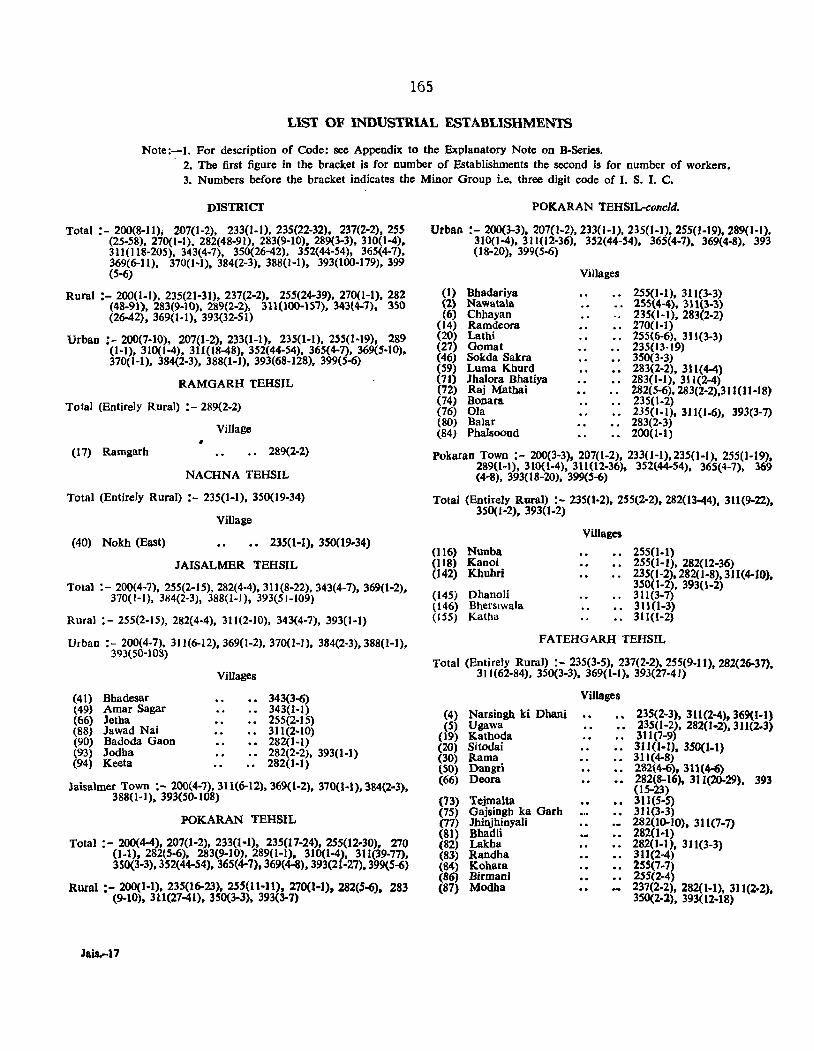
165
LIST OF INDUSTRIAL ESTABLISHMENTS
Note:-I. For description of Code: see Appendix to the Explanatory Note on B-Serics. . 2. The first figure in the bracket is for number of Establishments the second is for number of workers.
3. Numbers before the bracket indicates the Minor Group i.e. three digit code of I. S. I. C.
DlSTRICf
Total :- 200(8-11); 207(1-2), 233(1-1), 235(22-32), 237(2-2), 255 (25-58), 270(1-1). 282(48-91), 283(9-10), 289(3-3), 310(1-4). 311(118-205), 343(4-7), 350(26-42), 352(44-54), 365(4-7). 369(6-11), 370(1-1). 384(2-3), 388(1-1), 393(100-179), 399 (5-6)
Rural :- 200(1-1), 235(21-31), 237(2-2), 255(24-39), 270(1-1), 282 (48-91), 283(9-10), 289(2-2), 311(100-157), 343(4-7), 350 (26-42), 369(1-1), 393(32-51)
Urban :- 200(7-10), 207(1-2), 233(1-1), 235(1-1). 255(1-19), 289 (I-I), 310(1-4), 311(18-48), 352(44-54), 365{4-7), 369(5-10), 370(1-1), 384(2-3), 388(1-1), 393(68-128), 399(5-6)
RAMGARH TEHSIL
Total (Entirely Rural) :- 289(2-2)
Village •
(17) Ramgarh •• 289(2-2)
NACHNA TEHSIL
Total (Entirely Rural) :- 235(1-1), 350(19-34)
Village
(40) Nokh (East) 235(1-1), 350(19-34)
JAISALMER TEHSIL
Total :- 200(4-7), 255(2-15).282(4-4), 311 (8-22), 343(4-7),369(1-2), 370(1-1). 384(2-3), 388(1-1),393(51-109)
Rural :- 255(2-15), 282(4-4). 311(2-10), 343(4-7). 393(1-1)
Urban :- 200(4-7), 311(6-12),369(1-2),370(1-1), 384(2-3),388(1-1), 393(50-103)
(41) Bhadesar (49) Amar Sagar (66) Jetha (88) Jawad Nai (90) Badoda Gaon (93) Jodba (94) Keeta
ViIlages
343(3-6) •• 343(1-1)
255(2-15) 311(2-10) 282(1-1) 282(2-2), 393(1-1) 282(1-1)
laisalmer Town :- 200(4-7).311(6-12),369(1-2), 370(1-1),384(2-3), 388(1-1), 393(50-108)
POKARAN TBHSIL
Total :- 200(4-4), 207(1-2), 233(1-1), 235(17-24),255(12·30), 270 (I-I), 282(5-6), 283(9·10). 289(1-1), 310(1-4), 311(39-77), 350(3-3),352(44-54), 365(4-7),369(4-8),393(21-27),399(5-6)
Rural :- 200(1-1), 235(16-23). 255(11-11). 270(1-1), 282(5-6). 283 (9-10), 311(27-41), 350(3-3), 393(3-7)
Jais.-17
POKARAN TBHSIL-conc1d.
Urban :- 200(3-3), 207(1-2),233(1-1), 235(1-1).255(1-19),289(1-1), 310(1-4). 31102-36), 352(44-54), 365(4-7), 369(4-8), 393 (18-20), 399(5-6)
(I) Dhadariya (2) Nawata\a (6) Chbayan
(14) Ramdeora (20) Lathi (27) Gomat (46) Sokda Sakra (59) Lurna Kburd (7)) Jhalora Bhatiya ('2) Raj Mathai (74) Donara (76) 01a (80) Dalar (84) Pba)soond
Villages
255(1-1). 311(3-3) 255(4-4), 311(3-3}
-.. 235(1-1), 283(2-2) 270(1-1)
• . 255{6-6). 311(3-3) 235(13-19) 350(3-3) 283(2-2), 311(4-4) 283(1-1), 311(2-4) 282{5-6),283(2-2),311(11-18) 235(1-2)
•• 235(1-1), 311(1-6), 393(3-7) 283(2-3) 200(1-1)
Pokaran Town :- 200(3-3). 207(1-2), 233{I-J),235(l-I), 255(1-19), 289(1-1), 310(1-4), 311(12-36), 352(44-54). 365(4-7), 369 (4-8). 393(18-20), 399(5-6)
Total (Entirely Rural) :- 235(1-2), 255(2-2),282(13-44), 311(9-22), 350( 1-2), 393(1-2)
(116) Nunba (118) Kanoi (142) Khubri
(145j Dhanoli (146) Bherslwala (ISS) Katha
Villages
255(1-1) 255(1-1), 282(12-36) 235(1-2),282(1-8),311(4-10), 350(1-2), 393(1-2) 311(3-7) 311(1-3)
• • 311{1-2)
FATBHGARH TEHSIL
Total (Entirely Rural) :- 235(3-5), 237(2-2),255(9-1 1).282(26-37). 311(62-84). 350(3-3), 369(1-1), 393(27-41)
(4) Narsingh ki Dhani (5) Ugawa
(19) Kathoda (20) Sitodai (30) Rama (SO) Dangri (66) Deora
(73) TejmaJta (75) Gajsingb ka Garb (77) Jhinjhinyali (81) Bhadli (82) Lakha (83) Randha (84) Kohara (86) Birmani (87) Modha
Villages
235(2-3), 311 (2-4), 369(1-1) 235(1-2), 282(1-2),311(2-3) 311(7-9) 311(1-1), 350(1-1) 311(4-8) 282(4-6), 311(4-6) 282(8-16), 311(20-29), 393 (15-23) 311(5-5) 311(3-3) 282(10-10), 311(7-7) 282(1-1) 282(1-1), 311(3-3) 311(2-4) 255(7-7) 255(2-4) 237(2-2), 282(1-1), 311(2-2), 350(2-2), 393(12-18)
1€>6
SPECIAL TABLES FOR SCHEDULED CASTES AND SCHEDULED TRIBES
(Note on SeT, SC and ST Series)
There are 8 Tables in this series specially prepared for the population of Scheduled Castes and Scheduled Tribes in the district. No special table was prepared for these classes during 1951 Census. The only information collected at that time was the aggregate strength of Scheduled Castes and Scheduled Tribes for the district and sub-divisions. However. together more information for these communities which have been safeguarded in the constitution, special tables have been devised and presented in this series. Part V-A of the State Census Report gives information for the State on this subject.
Table SCT-I
2. This table presents the industrial classification of persons of Scheduled Castes and Scheduled Tribes at work and non-workers by sex. In other words, this table presents caste/tribe wise (arranged in alphabetical order) break-up of the data shown in Table C-VIII. This table has been compiled in two parts. Part A deals with the Scheduled Caste population showing the data for each Scheduled Caste separately in rural and urban areas of the district.
3. Special study regarding the number of persons of Scheduled Castes engaged in unwholesome occupations like tanning, currying of hides and skins, scavenging is also conducted. The number of workers shown in these occupations as well as in other industrial categories is on the basis of their principal work.
4. Part B of this table refers to Scheduled Tribes population and presents the data for each Scheduled Tribe separately in rural and urban areas of the district.
5. A fly-leaf showing the sexwise break-up for Scheduled Castes and Scheduled Tribes in the district as well as for each tehsil is also attached which presents data separately for total, rural and urban areas. Figures of such Scheduled Castes and Scheduled Tribes have also been given for each village and town in the Primary Census Abstract.
Table SCT-II
6. This table distributes the population of Scheduled Castes and Scheduled Tribes according to theiJ: marital status of never married, married, widowed, divorced or separated and unspecified status under the age-groups of 0-14, 15-44 and 45+. The total popUlation of these classes acccording to their marital ,tatus is also shown separately of all age-groups.
7. This table has been presented in two parts. Part A gives such information for each Scheduled Caste and Part B relates to each Scheduled Tribe providing such information for the district.
8. This is an important demographic table. The age marital status data in the case of Scheduled Tribes give an indication whether the tribal population is decreasing, stable or increasing.
Table SCI-III
9. This table presents the distribution of the population of Scheduled Castes and Scheduled Tribes by sex and educational levels. The table has been compiled in two parts. Part A has been further classified in two parts. Part A (i) provides such type of data for each Scheduled Caste in urban areas only while Part A (ij) presents similar data for urban areas for each Scheduled Tribe.
10. Part B of this table provides the similar information as in Part A for rural areas only, being classified in two parts. Part B (i) deals with Scheduled Castes while Part B (ii) refers to Scheduled Tribes.
11. [n case of urban areas the data has been given for educational standards as in Table B-Ill Part A while such data has been shown for mere literate primary or junior basic and matriculation and above in case of rural areas as in Table B-Ill Part B.
12. This is an important table, the data of which can be proved very useful for the education department as it throws light on the spread of education among these communities in the rural and urban areas separately. The data will also be helpful to the department for awarding scholarships to the members of these communities.
Table SeT-IV
13. This table presents a distribution of the population of Scheduled ~astes and Scheduled Tribes according to their religion. This table is compiled in two parts. Part A provides religionwise data for each Scheduled Caste in the district showing the rural and urban figures together. Similar type of information has been presented for Scheduled Tribes in Part B of this table. It may be noted that tbe members of Scheduled Castes can be either Hindus or Sikhs while members of Scheduled Tribes may profess different religions.
Table SCT-V
14. This table presents a detailed examination of the tural cultivating households of the Scheduled Castes and Scheduled Tribes and is based on 20% sample. Such households have been classified in various groups according to the size of land cultivated and cross tabulated by the interest in land cultivated.
15. This table is similar to that of household economic table B-XI and is compiled in two parts. Part A presents such data for Scheduled Castes while Part B provides such information for Scheduled Tribes.
167
Table'SC-I
16. This table presents data for students and unemployed persons in non-working population of Scheduled Castes. This is further classified according to the broad educational levels consisting of literates, primary or junior basic and matriculation and above.
17. The data has been shown separately for the district total. rural and urban areas and further down to tehsil level in case of rural areas only. It is very useful table at it indicates the numerical strength of students and unemployed persons among the Scheduled Castes.
Table ST-I 18. Scheduled Tribes have their own peculiar langua
ges and dialects. This is due to the fact that this table is prepared showing the number of speakers of that
Jais. l1-A
subsidiary 'language of those members of Scheduled Tribes who have moved out of their homes and as a result of contact with the local persons speak some other subsidiary language to the mother tongue. The number of persons speaking such subsidiary languages have been shown sex-wise in run-on-lines. The data has been presented separately for the district total, rural and urban areas for the each Scheduled Tribe.
Table ST-II
19. This table presents data for students and unemployed persons in the non-working population for each individual Scheduled Tribe. The data has been shown separately for district total, rural and urban areas. This table is an important one as it throws light on the progress of education and the unemployment position for each individual tribe.
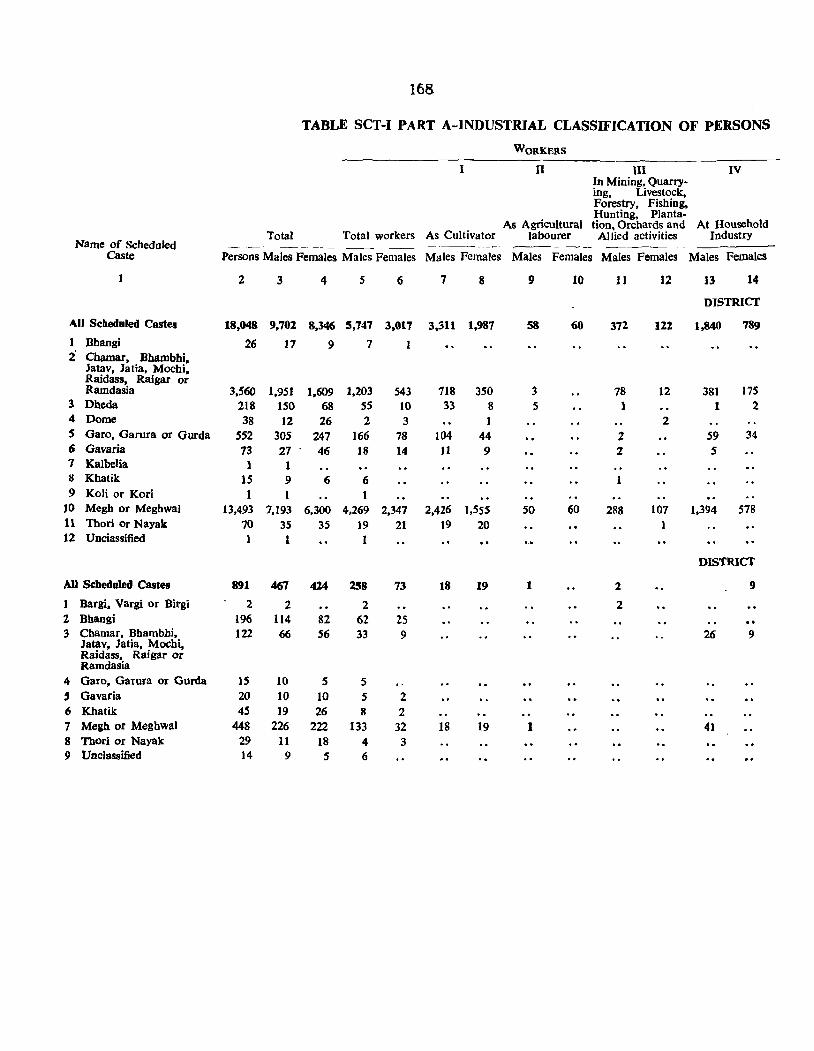
168
TABLE SCT-I PART A-INDUSTRIAL CLASSIFICATION OF PERSONS
WORKERS
I II III IV In Mining, Quarry-ing, Livestock, Forestry, Fishing, Hunting, Planta-
As Agricultural tion, Orchards and At Household Total Total workers As Cultivator labourer Allied activities Industry
Name of Scheduled ----_ Caste Persons Males Females Males Females Males Females Males Females Males Females Males Females
2 3 4 5 6 7 8 9 10 11 12 13 14
DISTRICf
All Scheduled Castes 18,048 9,702 8,346 5,747 3,017 3,311 1,987 58 60 372 122 1,840 789
1 Bhangi 26 17 9 7 1 2' Chamar, Bhambhi,
Jatav, Jatia, Mochi, Raidass, Raigar or Ramdasia 3,560 1.951 1.609 1.203 543 718 350 3 78 12 381 175
3 Dheda 218 ISO 68 55 10 33 8 5 1 1 2 4 Dome 38 12 26 2 3 1 2 5 Garo, Garura or Gurda 552 30S 247 166 78 104 44 2 59 34 6 Gavaria 73 27 46 18 14 II 9 2 5 7 Kalbelia 1 1 II Khatik IS 9 6 6 1 9 Koli or Kori 1 1
10 Megh or Megbwa] 13,493 7,193 6,300 4,269 2,347 2.426 1.555 50 60 288 107 1,394 578 11 Thori or Nayak 70 35 35 19 21 19 20 1 12 Unclassified 1 1 1
DISTRICT
All Scbeduled Castes 891 467 424 258 73 18 19 1 2 9
1 Bargi, Vargi or Birgi 2 2 2 2 2 Bhangi 196 114 82 62 2S 3 Cbamar, Bbambbi, 122 66 56 33 9 26 9
Jatav, Jatia, Mochi, Raidass, Raigar or Ramdasia
4 Garo, Garura or Gurda 15 10 5 5 , Gavaria 20 10 10 5 2 6 Khatik 45 19 26 8 2 7 Megh or Meghwal 448 226 222 133 32 18 19 1 41 8 Thod or Nayak 29 11 18 4 3 9 Unclassified 14 9 5 6
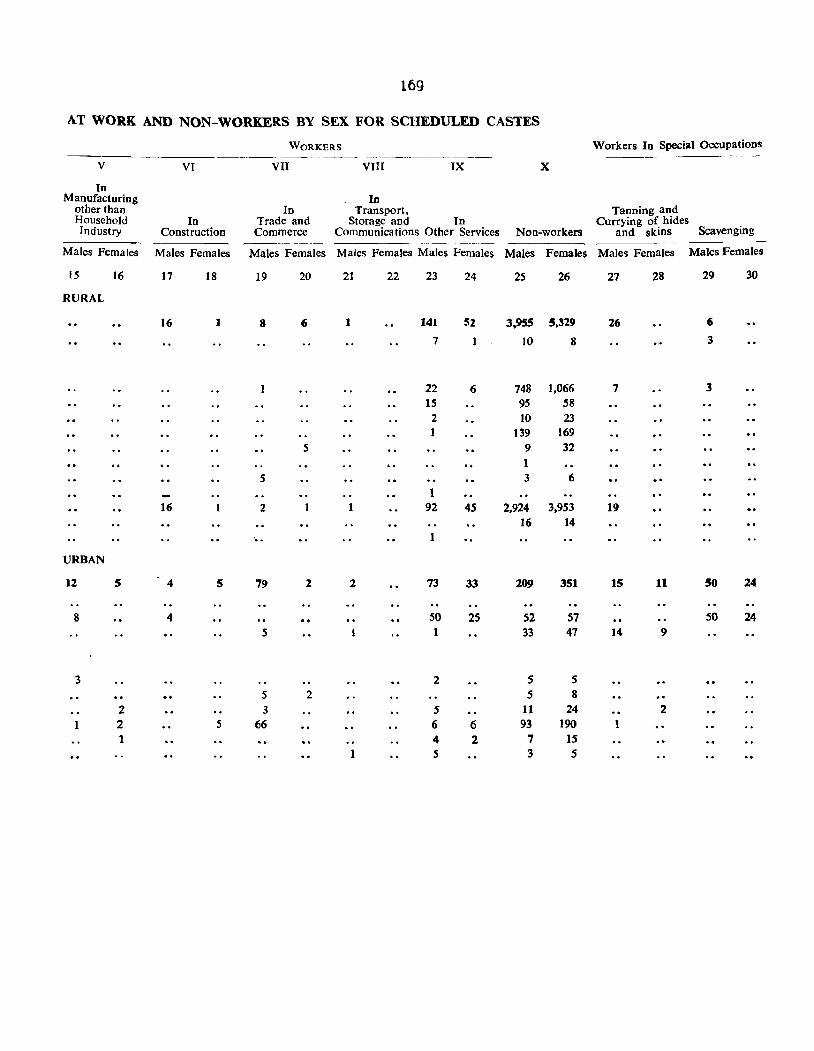
169
AT WORK AND NON-WORKERS BY SEX FOR SCHEDULED CASTES
WORKERS Workers In Special Occupations -----------~--
V VI VII VIII IX X
In Manufacturing In
other than In Transport, Tanning and Household In Trade and Storage and In Currying of hides Industry Construction Commerce Communications Other Services Non-workers and skins Scavenging
Males Females Males Females Males Females Males Females Males Females Males Females Males Females Males Females
15 16 17 18 19 20 21 22 23 24 25 26 27 28 29 30
RURAL
16 1 8 6 1 141 52 3,955 5.329 26 6
7 I 10 8 3
22 6 748 1,066 7 3 15 95 58 2 10 23
139 169 5 9 32
1 5 3 6
16 2 92 45 2,924 3,953 19 16 14
o. J
URBAN
12 5 4 5 79 2 2 73 33 209 351 15 11 50 24
8 4 50 25 52 57 50 24 5 1 33 47 14 9
3 2 5 5 5 2 5 8
2 3 5 11 24 2 1 2 5 66 6 6 93 190
1 4 2 7 15 5 3 5
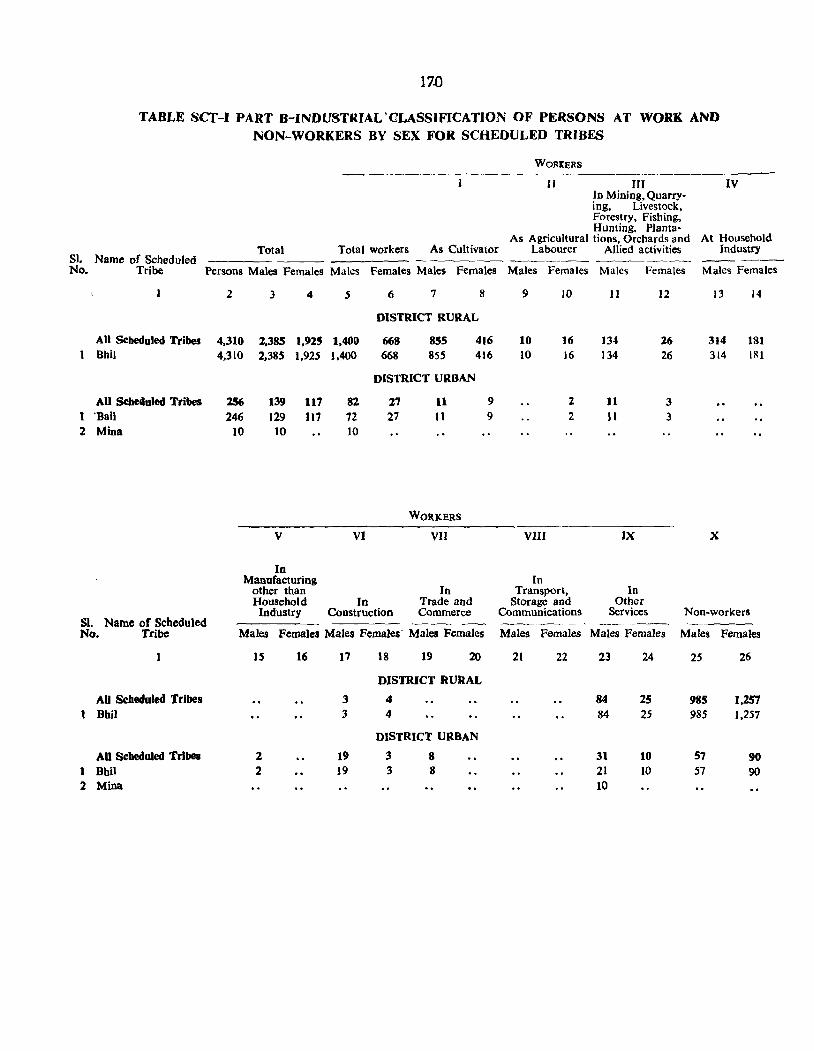
SI. No.
1 2
S1.
17.0
TABLE SCf-1 PART B-INDUSTRIAL 'CLASSIFICATION OF PERSONS AT WORK AND NON-WORKERS BY SEX FOR SCHEDULED TRIBES
WORl:ERS
1 II III IV In Mining, Quarry-ing, Livestock, Forestry, Fishing, Hunting. Plant,,-
As Agricultural tions, Orchards and At Household Total Total workers As Cultivator Labourer Allied activities Industry
Name of Scheduled ------Tribe Persons Males Females Males Females Males Females Males Females Males Females Male~ Females
2 3 4 5 6 7 8 9 10 11 12 J3 14
DISTRICT RURAL
All Sebeduled Tribes 4,310 2,385 1,925 1,400 668 8SS 4)6 10 16 134 26 314 181 Rhil 4,310 2,385 1,925 1,400 668 855 416 10 16 134 26 314 1111
DISTRICT URBAN
All Scheduled Tribes 256 139 117 82 27 11 9 2 11 3 'Bail 246 129 117 72 27 Jl 9 2 11 3 Mina 10 10 10
WO~KERS
V VI VII VIII IX X
In Manufacturing In
other than In Transport, In Household In Trade and Storage and Other
Industry Construction Commerce Communications Services Non-workers Name of Scheduled
No. Tribe Males Females Males Females Males Females Males Females Males Females Males Females
15 16 17 18 19 20 21 22 23 24 25 26
DISTRICT' RURAL
AU Scbeduled Tribes 3 4 84 2S 985 1,257 t Bhil 3 4 84 25 985 1,257
DISTRICT URBAN
All Scheduled Tribes 2 19 3 8 31 10 57 90 1 Bhil 2 19 3 8 21 10 57 90 2 Mina 10
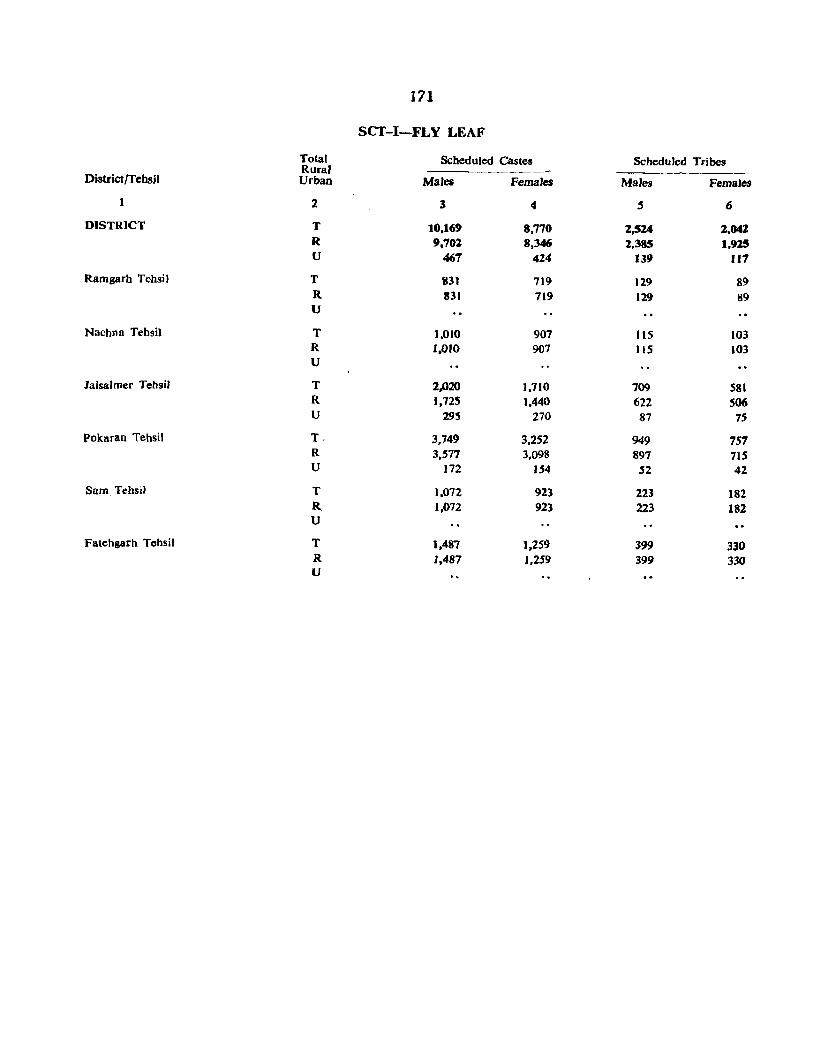
171
seT-I-FLY LEAF
Total Scheduled Castes Scheduled Tribe!l Rural
District/Tehsii Urban Males FemaJes Males Females
2 3 4 oS 6
DISTRICT T 10,169 8,770 Z,524 2.042 R 9,701 8,346 2,385 1,925 U 467 424 139 111
Ramgarh Tehsil T 831 719 129 89 R 831 719 129 89 U
Nachna Tebsil T 1,010 907 115 103 R J,OIO 907 115 103 U
laisalmer Tehsil T 2.020 1,710 709 581 R 1,725 1.440 622 506 U 29:5 270 87 75
Pokaran Tehsil T- 3,749 3.252 949 757 R 3.577 3.098 897 715 U 172 154 52 42
Sam. Tehsil T 1.072 923 223 182 R 1,072 923 223 182 U
Fatehgarh Tehsil T 1,487 1,259 399 330 R 1.487 1,259 399 330 U
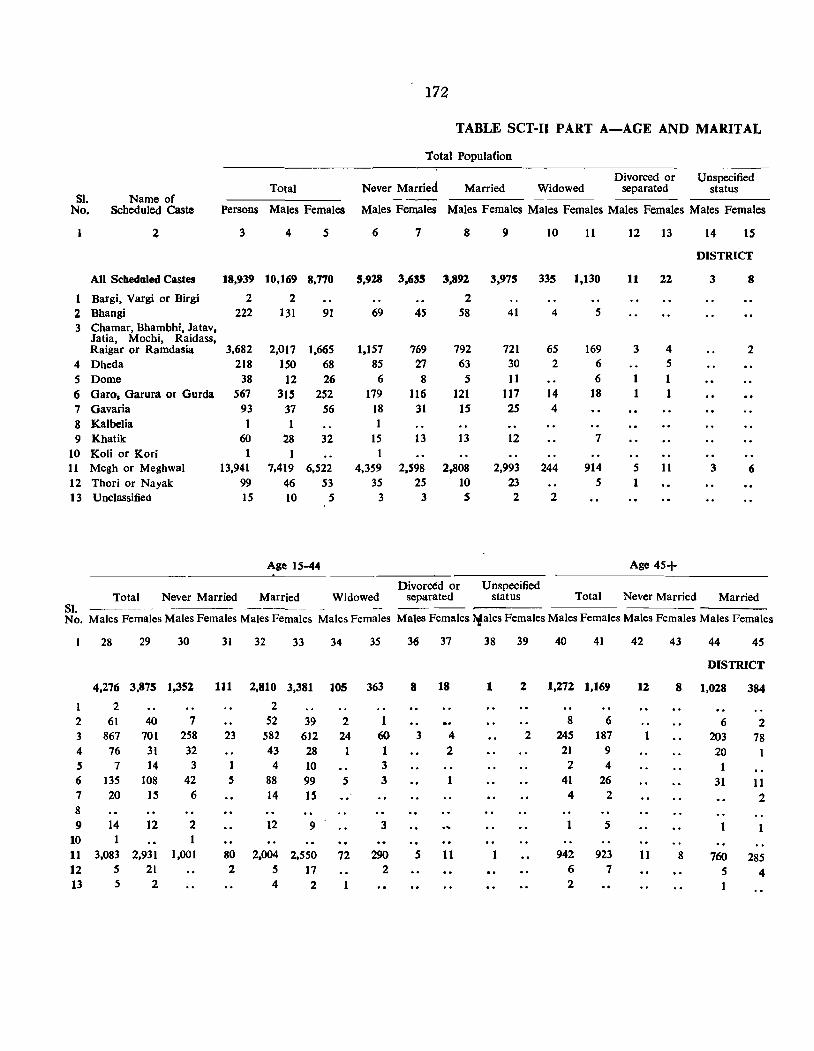
Sl. No.
Name of Scheduled Caste
2
All Scbeduled Castes
1 Bargi, Vargi or Birgi 2 Bhangi 3 Chamar, Bhambhi, Jatav,
Jatia, Mochi, Raidass, Raigar or Ramdasia
4 Dheda 5 Dome 6 Garo, Garura or Gurda 7 Gavaria 8 Kalbelia 9 Khatik
10 Koli or Kori 11 Megh or Meghwal 12 Thori or Nayak 13 Unclassified
Total
172
TABLE SeT-II PART A-AGE AND MARITAL
Total Population
Never Married Married Widowed Divorced or
separated Unspecified
status
Persons Males Females Males Females Males Females Males Females Males Females Males Females
3 4 5
18,939 10,169 8.770
2 2 222 131 91
3,682 2,017 1,665 218 150 68
38 12 26 567 315 252
93 37 56 1 1
60 1
13,941 99 15
28 32 1
7.419 6,522 46 53 10 5
Age 15-44
6
5,928
69
1,157 85 6
179 18
1
15 1
4,359 35
3
7
3,635
45
769 27 8
116 31
13
2,598 25
3
8
3,892
2 58
792 63
5 121
IS
13
2,808 10 S
Divorced or
9
3,975
41
721 30 11
117 25
12
2,993 23 2
10
335
4
65 2
14 4
244
2
11
1,130
5
169 6 6
18
7
914 5
12
11
3
1 1
5 1
13
22
4 5 1 1
11
Age 45+
14 15
DISTRICf
3 8
2
3 6
Total Never Married Married Widowed separated Unspecified
status Total Never Married Married SI. ----- ----~-- ----No. Males Females Males Females Males Females Males Females Males Females 1'1ales Females Males Females Males Females Males Females
28 29 30
1 2
4,276 3,875 1,352
2 61
3 867 4 76 5 7 6 135 7 20 8 9 14
40 701
31 14
108 15
12
7 258 32 3
42 6
2 10 1 11 3,083 2,931 1,001 12 5 21 13 5 2
31
111
23
1 5
32 33
2,810 3,381
2 52 39
34
105
2 582 43 4
88 14
612 24 28 10 99 5 IS
12 9
80 2.004 2,550 72 2 5 17
4 2
35
363
1 60 1 3 3
3
290 2
36
8
3
s
37
18
4 2
11
38 39
1
2
40 41
1,272 1,169
8 6 245
21 2
41 4
187 9 4
26 2
5
942 923 6 7 2
42
12
11
43
8
8
44 45
DISTRICT
1,028
6 203 20 1
31
384
2 78
11
2
1
760 285 5 4
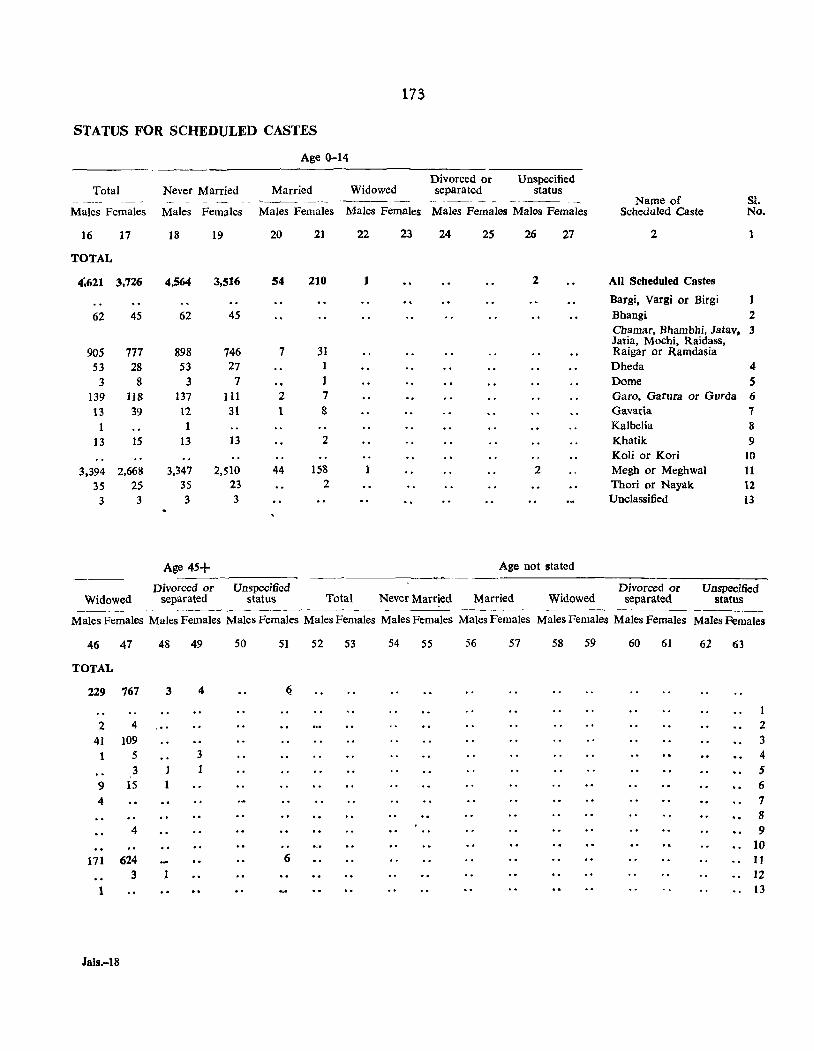
173
STATUS FOR SCHEDULED CASTES
Age 0-14
Divorced or Unspecified Total Never Married Married Widowed separated status
-.- --_-- -.~
Males Females Males Females Males Females Males Females Males Females Males Females
16 17 18 19 20 21 22 23 24 2S 26 27
TOTAL
4~621 3.726 4,564 3,516 54 210 1 2
62 45 62 45
905 777 898 746 7 31 53 28 53 27 I
3 8 3 7 1 139 118 137 III 2 7 13 39 12 31 1 8
1 13 15 13 13 2
3,394 2,668 3,347 2,510 44 158 2 35 25 35 23 2
3 3 3 3
Age 45+ Age not stated
Divorced or Unspecified Widowed separated status Total Never Married Married Widowed
Name of St. Scheduled Caste No.
2 1
All Scheduled Castes
Bargi, Vargi or Birgi Bhangi 2 Chamar, Bhambhi, Jatav, 3 Jatia, Mochi, Raidass, Raigar or Ramdasia Dheda 4 Dome S Garo, Garura or Gurda 6 Gavaria 7 Kalbelia 8 Khatik 9 Koli or Kori 10 Megh or Meghwal 11 Thori or Nayak 12 Unclassified 13
Divorced or separated
Unspecified status
Males Females Males Females Males Females Males Females Males Females Males Females Males Females Males Females Males Females
62 63
Jais.-18
2 3 4 5 6 7 8 9
10 11 12 13
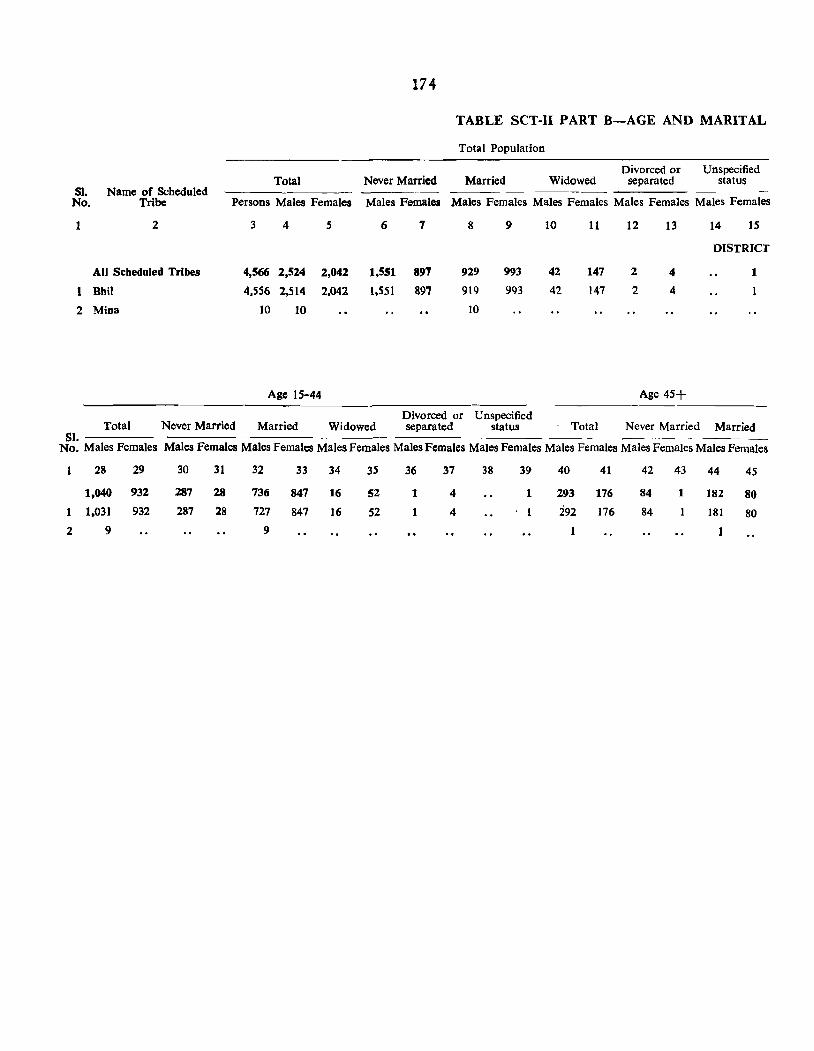
174
TABLE seT-II PART B-AGE AND MARITAL
Total Population
Divorced or Unspecified Total Never Married Married Widowed separated status
Sl. Name of Scheduled --_--No. Tribe Persons Males Females Males Females Males Females Males Females Males Females Males Females
1 2 3 4 5 6 7 8 9 10 11 12 13 14 15
DISTRICT
All Scheduled Tribes 4,566 2,524 2,042 1,551 89'7 929 993 42 147 2 4 1
Bhil 4,556 2,514 2,042 1,551 897 919 993 42 147 2 4 1
2 Mina 10 10 IO
Age 15-44 Age 45+
Divorced or Unspecified Total Never Married Married Widowed separated status Total Never Married Married
SI. No. Males Females Males Females Males Females Males Females Males Females Males Females Males Females Males Females Males Females
1 28 29 30 31 32 33 34 3S 36 37 38 39 40 41 42 43 44 45
1,040 932 287 28 736 847 16 52 1 4 1 293 176 84 1 182 80
1 1.031 932 287 28 727 847 J6 52 1 4 292 176 84 J81 80
2 9 9 1 1
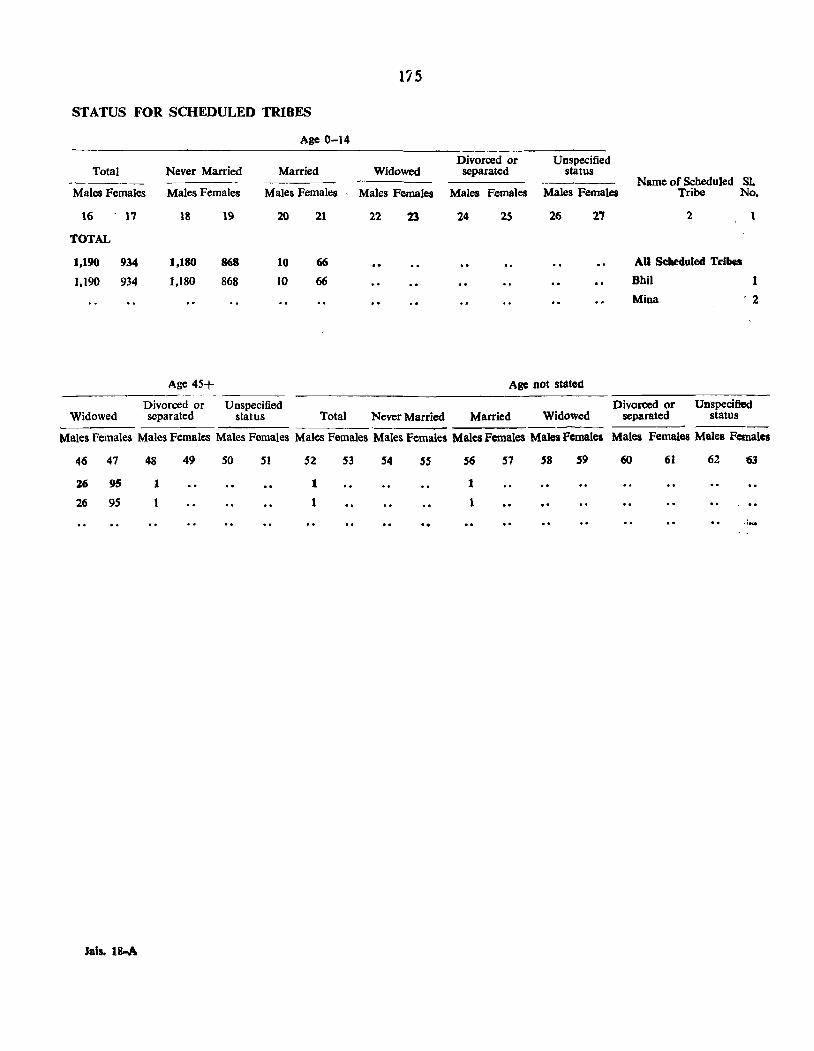
STATUS FOR SCHEDULED TRIBES
Total
Males Females
16
TOTAL
17
1,190 934
1,190 934
Never Married
Males Females
18
1,180
1,180
Age 45+
19
868
868
Age 0-14
Married
Males Females
20
10
10
21
66
66
Divorced or Unspecified Widowed separated status Total
175
Divorced or Unspecified Widowed separated status
Name of Scheduled Sl. Males Females Males Females Males Females Tribe No.
22 24 2S 26 27 2 1
All ScIroeduled Tribes
Bhil I
Mina 2
Age not stated
Divorced or Unspecified Never Married Married Widowed separated status
Males Females Males Females Males Females Males Females Males Females Males Females Males Females Males Females Males Females
46 47
26 95
26 9S
Jals. 1s..A
48
1
49 50 51 52
1
1
53 S4 ss 56
1
1
57 58 59 60 61 62 63
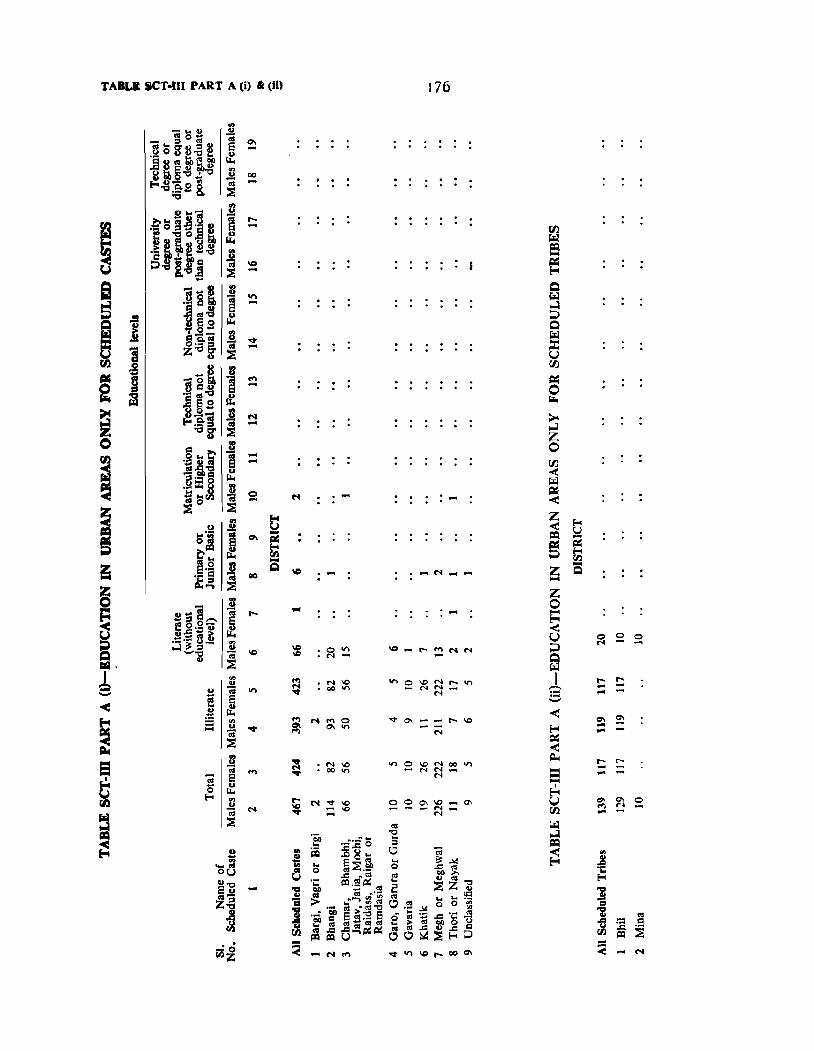
TABU jCT-1II PART A (i) "(Ii)
. . . .
176
.-
:-
r- r-:: ::
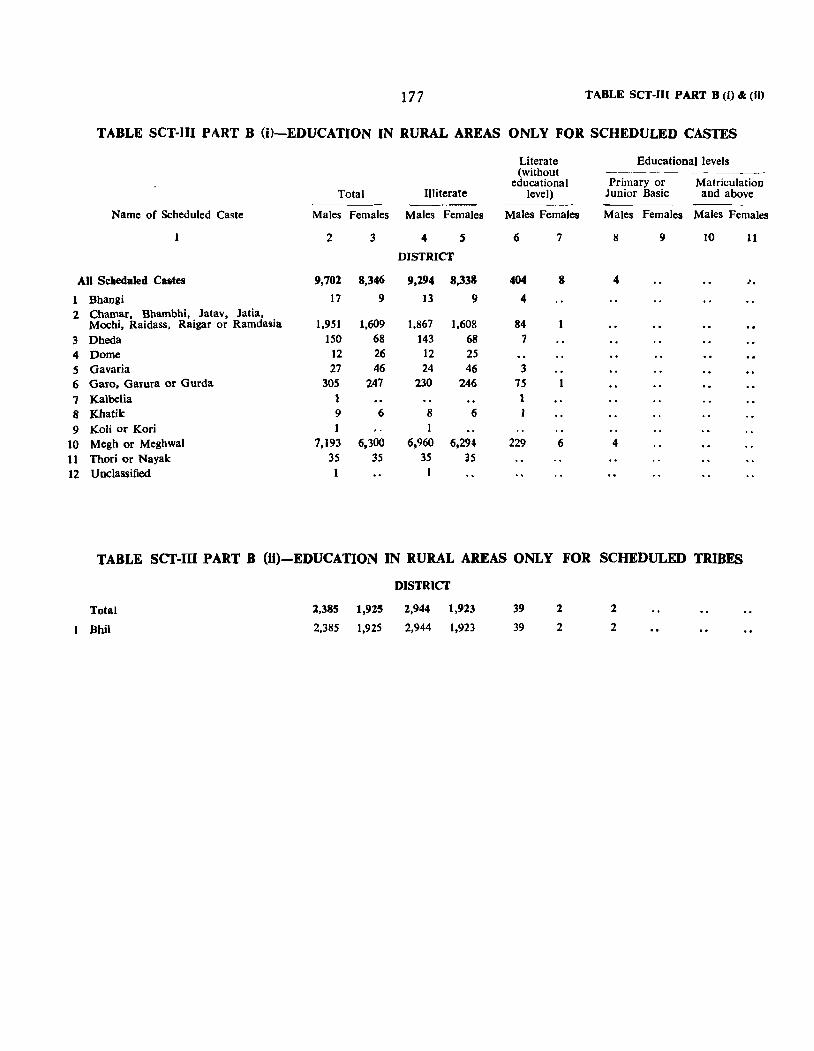
177 TABLE SCT-Ill PART B (I) &: (Ii)
TABLE SCT-III PART B (i)-EDUCATION IN RURAL AREAS ONLY FOR SCHEDULED CASTES
Literate Educational levels (without ----------
educational Primary or Matriculation Total Illiterate level) Junior Basic and above
------Name of Scheduled Caste Males Females Males Females Males Females Males Females Males Females
2 3 4 S 6 7 8 9 10 11
DISTRICT
All Scheduled Calltes 9,702 8,346 9,294 8,338 404 8 4 .'. 1 2
3 4 5 6 7 8 9
10 11 12
Bhangi 17 9 13 9 4 Chamar, Bhambhi, Jatav, Jatia, Mochi, Raidass, Raigar or Ramdasia 1,951 1,609 1,867 1.608 84 Dheda 150 68 143 68 7 Dome 12 26 12 25 Gavaria 27 46 24 46 3 Garo. Garura or Gurda 305 247 230 246 75 Kalbelia 1 1 Khatik 9 6 8 6 Koli or Kori 1
Megh or Meghwal 7,193 6,300 6,960 6,294 229 6 4 Thod or Nayak 35 35 35 35 Unclassified 1
TABLE Scr-llI PART B (ii)-EDUCATION IN RURAL AREAS ONLY FOR SCHEDULED TRIBES
Total
Bbil
2,385 1,925
2,385 1,925
DISTRICT
2,944 1,923
2.944 1,923
39
39
2
2
2
2
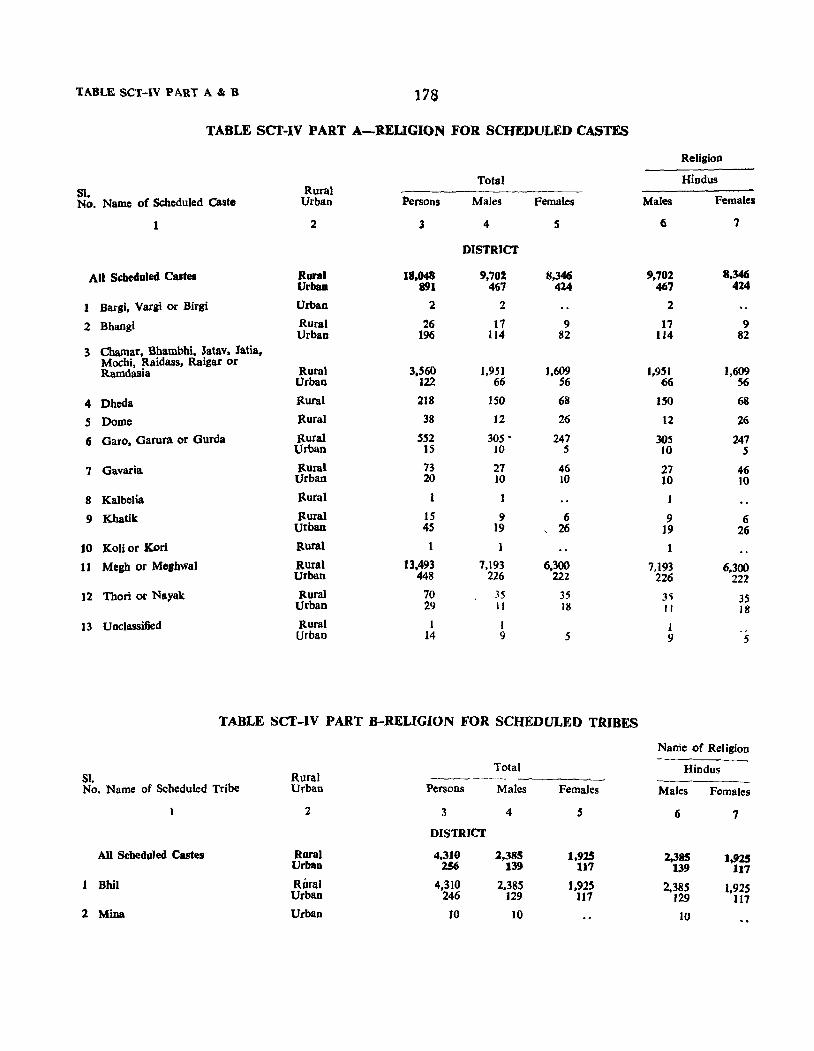
TABLE seT-IV PART A & B 176
TABLE SCI-IV PART A-RELIGION FOR SCHmULED CASTES
Religion
Total Hindus 51. Rural No. Name of Scheduled Caste Urban Persons Males Females Males Females
1 2 3 4 S 6 7
DISTRICJ'
All Scheduled Castel Rural 18,048 9,701 8,346 9,702 8,346 Urban 891 467 424 467 424
1 Bargi, Vargi or Birgi Urban 2 2 2
2 Bhangi Rural 26 17 9 17 9 Urban 196 114 82 114 82
3 Chamar, Bbambhi, Jatav, Jatia, Machi, Raidass, Raigar or
Rural 3.560 1,951 J,609 1,951 1,609 Ramdasia Orban 122 66 S6 66 56
4 Dheda Rural 218 150 68 ISO 68
5 Dome Rural 38 12 26 12 26
«I Garo, Gacura or Gurda Rural 552 305 • 247 305 247 Orban 15 10 5 10 5
7 Gavaria Rural 73 27 46 27 46 Urban 20 10 to 10 10
8 Kalbelia Itural 1 I
9 Khatik Rural 15 9 6 9 6 urban 45 19 , 26 19 26
10 Kolior ICori Rural 1 1
11 Megh or Me,hwal Rural 13.493 7,193 6,300 7,193 6,300 Urban 448 226 222 226 222
12 Thod or Nayak Rural 70 35 35 3'i 35 Orban 29 11 18 II 18
13 Unclassified Rural I I 1 Urban 14 9 5 9 5
TABLE SCT-IV PART B-RELIGION FOR SCHEDULED TRIBES
Name of Religion
Total Hindus Sl. Rura) No. Name of Scheduled Tribe Urban Persons Males Females Males Females
2 3 4 5 6 7
DISTRICT
AU ScbeduJed Castes Rural 4,310 1,385 1,925 2,385 1,925 Urban 2.56 139 117 139 117
Bbil Rural 4,310 2.385 1,925 2,385 1,925 Urban 246 129 117 J29 117
2 Mina Urban to 10 10
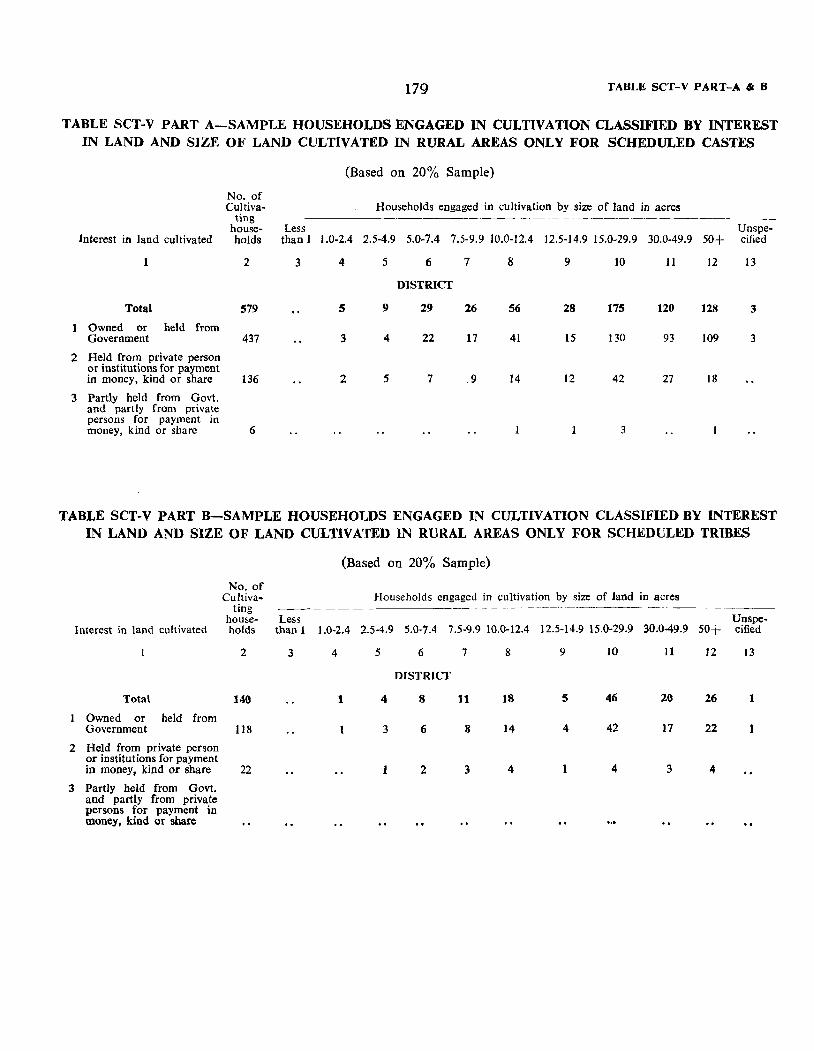
179 TABLE SCT-V PART-A" B
TABLE SCT-V PART A-SAMPLE HOUSEHOLDS ENGAGED IN CULTIVATION CLASSIFIED BY INTEREST IN LAND AND SIZE OF LAND CULTIVATED IN RURAL AREAS ONLY FOR SCHEDULED CASTES
(Based on 20% Sample)
No. of Cultiva- Households engaged in cultivation by size of land in acres
ting -- ~- -- - - - ~----- ---~
house- Less Unspe-Interest in land cultivated holds than 1 1.0-2.4 2.5-4.9 5.0-7.4 7.5-9.9 10.0-12.4 12.5-14.9 15.0-29.9 30.0-49.9 50+ cified
2 3 4 5 6 7 8 9 10 11 12 13
DISTRICT
Total 579 5 9 29 26 56 28 175 120 128 3
Owned or held from Government 437 3 4 22 17 41 15 130 93 109 3
2 Held from private person or institutions for payment in money. kind or share 136 2 5 7 ,9 14 12 42 27 18
3 Partly held from Govt. and partly from private persons for payment in money, kind or share 6 3
TABLE SCT-V PART B-SAMPLE HOUSEHOLDS ENGAGED IN CULTIVATION CLASSIFIED BY INTEREST IN LAND AND SIZE OF LAND CULTIVATED IN RURAL AREAS ONLY FOR SCHEDULED TRIBES
Interest in land cultivated
Total
Owned or held from Government
2 Held from private person or institutions for payment in money, kind or share
3 Partly held from Govt. and partly from private persons for payment in money. kind or share
No. of Cultiva
tin" hous~- Less holds than 1
2 3
140
118
22
(Based on 20% Sample)
Households engaged in cultivation by size of land in acres - ~-~-~- --~ -~---~--~- ~--------~ ---------
1.0-2.4 2.5-4.9 5.0-7.4 7.5-9.9 10.0-12.4 12.5-14.9 15.0-29.9 30.0-49.9 50+
4 5 6 7 8 9 10 11 12
DISTRICT
1 4 8 11 18 5 46 20 26
3 6 8 14 4 42 17 22
1 2 3 4 4 3 4
Unspecified
13
1
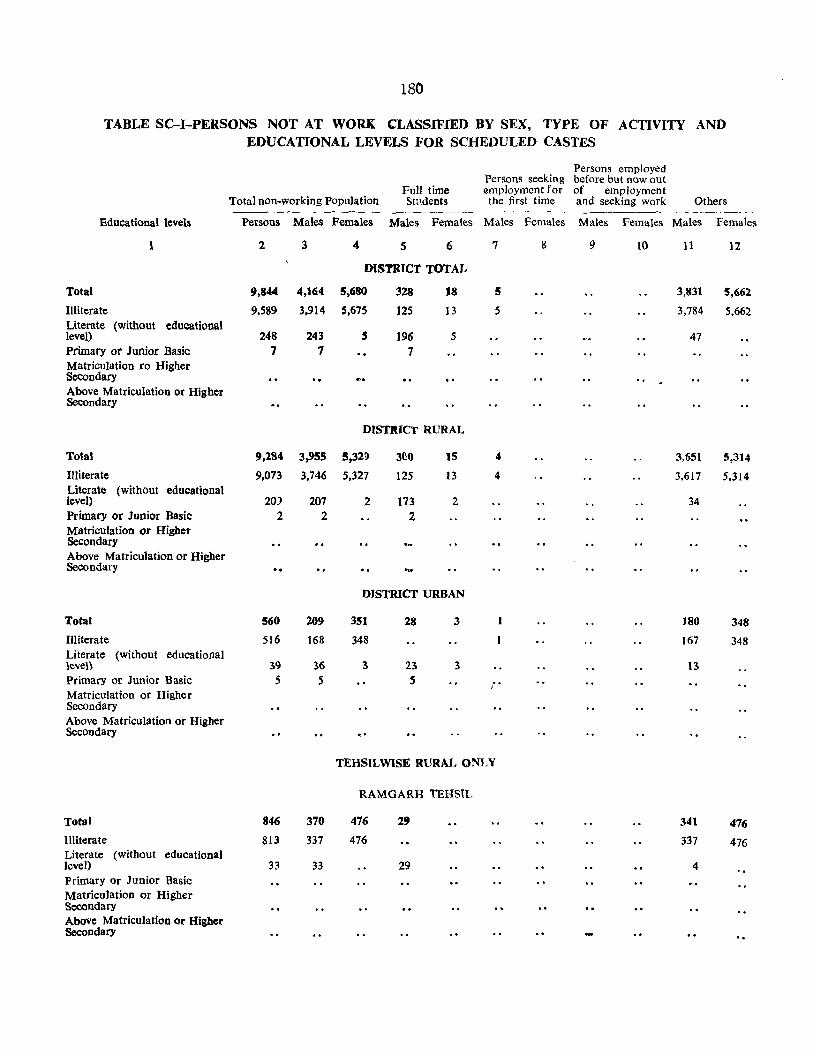
180
TABLE SC-I-PERSONS NOT AT WORK CLASSIFIED BY SEX, TYPE OF ACTIVITY AND EDUCATIONAL LEVELS FOR SCHEDULED CASTES
Educational levels
Total
Illiterate Literate (without level)
educational
Primary or Junior Basic Matriculation ro Higher Secondary Above Matriculation or Higher Secondary
Total
Illiterate Literate (without educational level) Primary or Junior Basic Matriculation or Higher Secondary Above Matriculation or Higher Secondary
Total
Illiterate Literate (without educational level) Primary or Junior Basic Matriculation or Higher Secondary Above Matriculation or Higher Secondary
Total
Illiterate Literate (without educational level) Primary or Junior Basic Matriculation or Higher Secondary Above Matriculation or Higher Secondary
Total non-working Population Full time Students
Persons employed Persons seeking before but now out employment for of employment the first time and seeking work Others
Persons Males Females Males Females Males Females Males Females Males Females
2
9,844
9.589
248 7
9,284
9,073
20) 2
"
560
516
39 5
846
813
33
3
4,164
3,914
243 7
3,955
3,746
207 2
209
168
36 5
370
337
33
4 5 6 7
mSTRICT TOTAL
5,680 328 18 5
5,675 125 13 5
S 196 5 7
DISTinCT RURAL
5,32!> 360 ]S 4
5,327 125 13 4
2 173 2 2
DISTRICT URBAN
351 28 3 1
348
3 23 3 5
J"
"
TEHSILWISE RURAL ONI~Y
RAMGARH TEHSTL
476
476
29
29
g 9 10 11 12
3,831 5,662
3,784 5,662
47
3,651
3,617
34
180
167
13
341
337
4
5,314
5,314
348
348
476
476
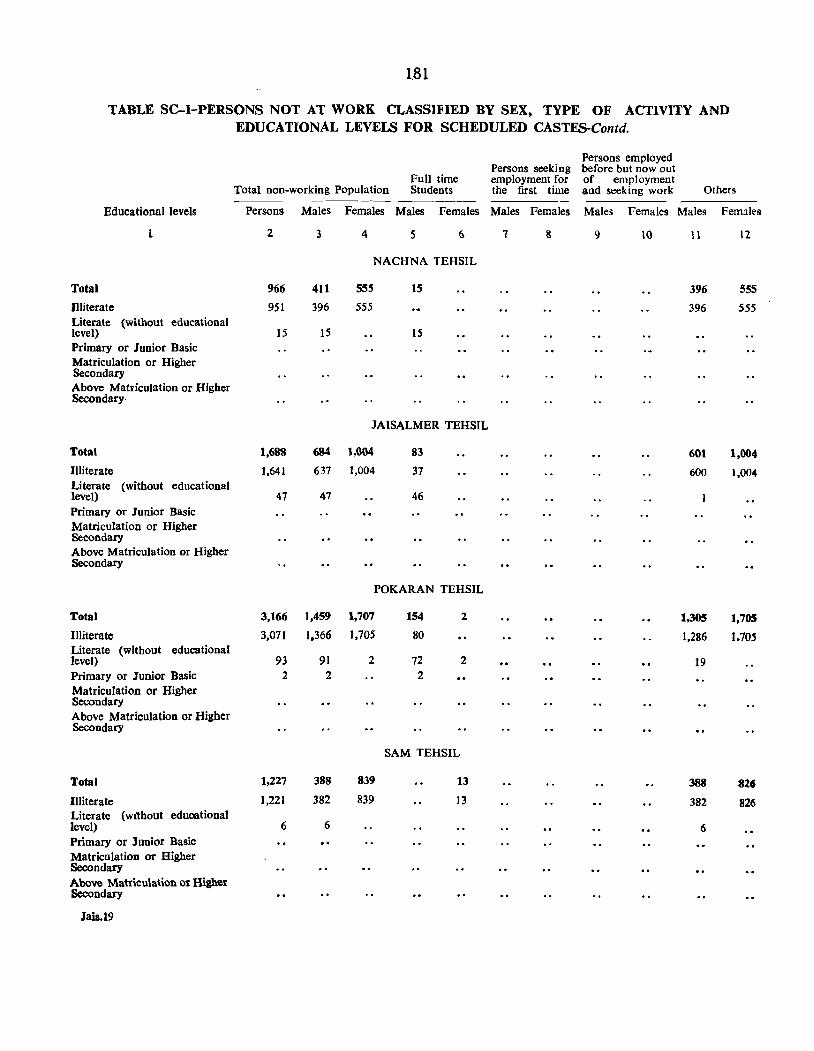
181
TABLE SC-I-PERSONS NOT AT WORK CLASSIFIED BY SEX, TYPE OF ACTIVITY AND EDUCATIONAL LEVELS FOR SCHEDULED CASTES-Contd.
Persons employed Persons seeking before but now out
Full time employment for of employment Total non-working Population Students the first time and seeking work Others
Educational levels Persons Males Females Males Females Males Females Males Females Males Females
1 2 3 4 5 6 7 8 9 10 \l 12
NACHNA TEHSIL
Total 966 411 555 15 396 555
Illiterate 951 396 555 396 555 Literate (without educational level) 15 15 15 Primary or Junior Basic Matriculation or Higher Secondary Above Matriculation or Higher Secondary·
JAISALMER TEHSIL
Total 1,688 684 1,004 83 601 1,004
Illiterate 1,641 637 1,004 37 600 1,004 Literate (without educational level) 47 47 46 Primary or Junior Basic Matriculation or Higher Secondary Above Matriculation or Higher Secondary
POKARAN TEHSIL
Total 3,166 1,459 1,707 154 2 1,305 1,705
Illiterate 3,071 1.366 1,705 80 1,286 1.70S Literate (without educational level) 93 91 2 72 2 19 Primary or Junior Basic 2 2 2
Matriculation or Higber Secondary Above Matriculation or Higber Secondary
SAM TEHSIL
Total 1,227 388 839 13 388 826
Illiterate 1,221 382 839 13 382 826 Literate (witbout eduoational level) 6 6 6 Primary or Junior Basic Matriculation or Higher Secondary Above Matriculation or Higher Secondary
Jais.19
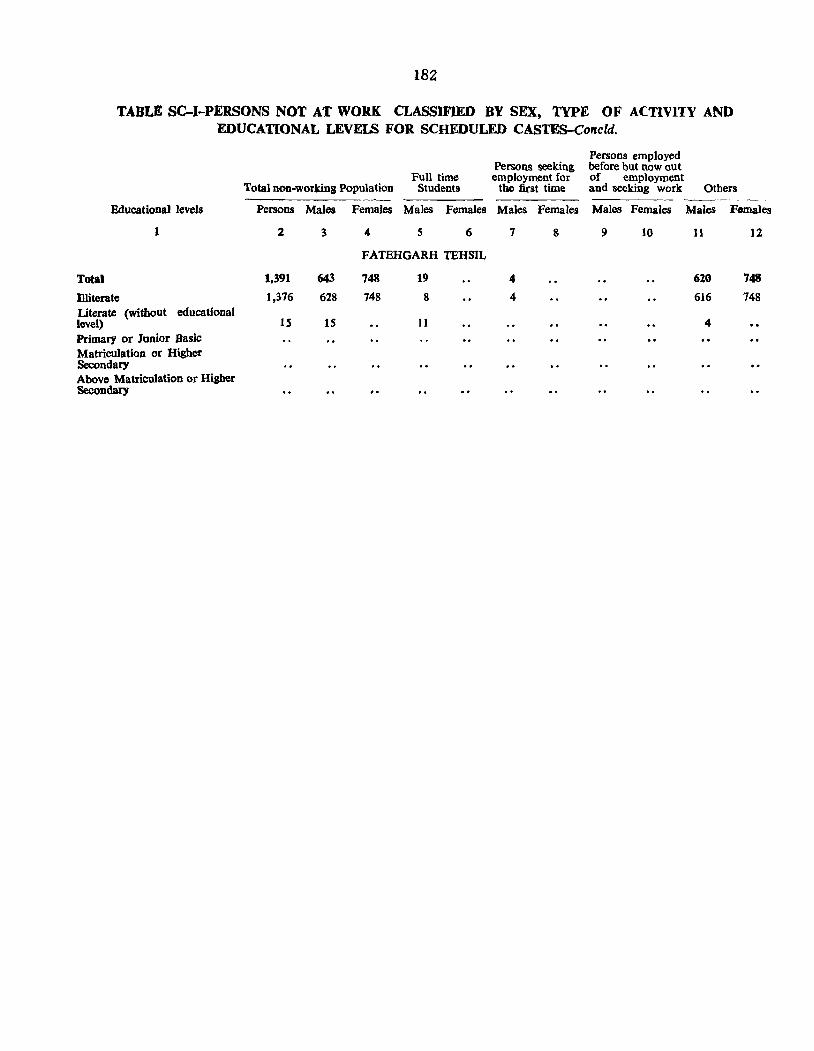
IB2
TABLE SC-I-PERSONS NOT AT WORK CLASSIFIED BY SEX, TYPE OF ACTIVITY AND EDUCATIONAL LEVELS FOR SCHEDULED CASTES-Concld.
Educational levels
Total
miterate
1
Literate (without educational level) Primar)' or Junior Basic Matriculation or Higher Secondary Above Matriculation or Higher Secondary
Full time Total non-working Population Students
Persons Males Females Males Females
2 3 4 S 6
FATEHGARH TEHSIL
1,391
1,376
IS
643
628
15
748 748
19
8
11
Persons seeking employment for
the first time
Males
7
4
4
Females
8
Persons employed before but now out of employment and seeking work
Males FeI114les
9 10
Others
Males Fomales
II 12
620
616
4
748
748
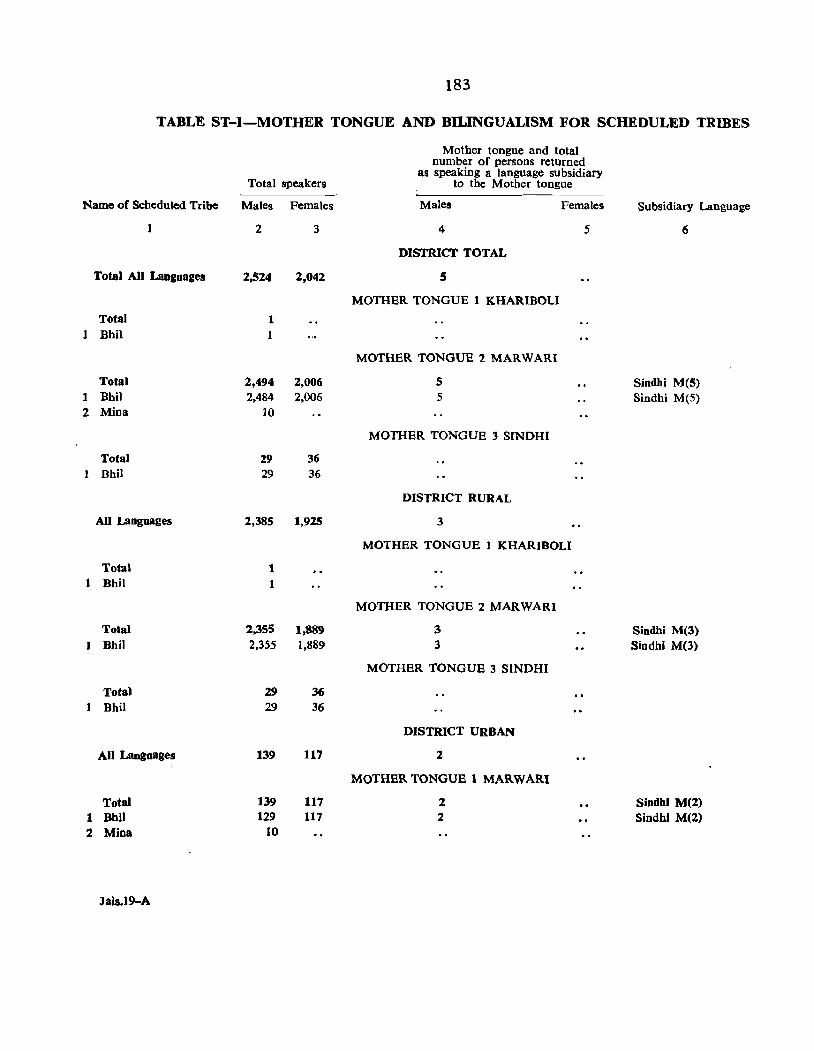
183
TABLE ST-I-MOTHER TONGUE AND BILINGUALISM FOR SCHEDULED TRIBES
Mother tongue and total
Total speakers
number of persons returned as speaking a language subsidiary
to the Mother tongue
Name of Scheduled Tribe Males Females Males Females Subsidiary Language
2 3 4 5 6
DlSTRICI' TOTAL
Total All Languages 2,524 2,042 5
MOTHER TONGUE 1 KHARIBOLI
Total I 1 Bhi! 1
MOTHER TONGUE 2 MARWARI
Total 2,494 2,006 5 Sindhi M(5) 1 Bhil 2,484 2,006 5 Sind hi M(S) 2 Mioa 10
MOTHER TONGUE 3 SINDHI
Total 29 36 Shil 29 36
DISTRICT RURAL
All Languages 2,385 1,925 3
MOTHER TONGUE 1 KHARIBOLI
Total 1 Bhit
MOTHER TONGUE 2 MARWARI
Total 2,355 1,889 3 Sindhi M(3) Bhil 2,355 1,889 3 Sind hi M(3)
MOTHER TONGUE 3 SINDHI
Total 29 36 Bhi! 29 36
DISTRICT URBAN
All Languages 139 117 2
MQTHBRTONGUE 1 MARWARI
Total 139 117 2. Sindhi M(2) 1 BhU 129 117 2 Sindhi M(2) 2 Mina 10
Jais.19-A
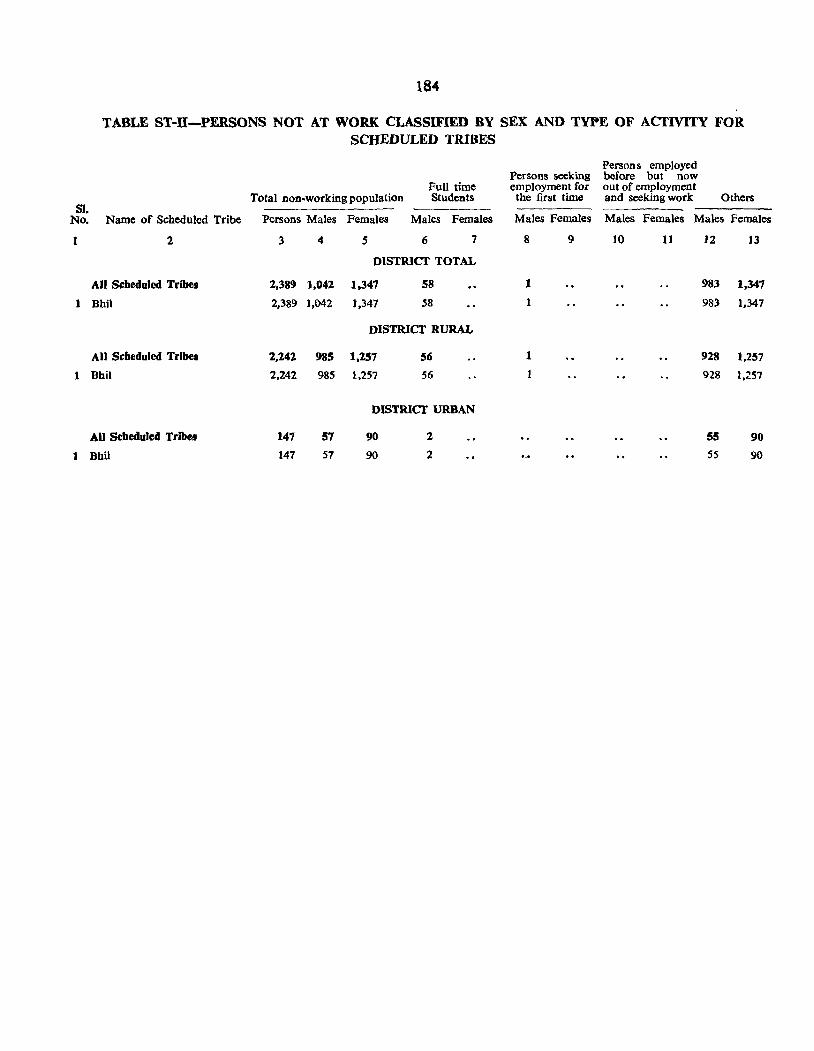
184
TABLE ST-ll-PERSONS NOT AT WORK CLASSIFIED BY SEX AND TYPE OF ACTIVITY FOR SCHEDULED TRIBES
Persons employed Persons seeking before but now
Full time employment for out of employment Total non-working population Students tbe first time and seeking work Others
SI. No. Name of Scheduled Tribe Persons Males Females Males Females Males Females Males Females Males Females
1 2 3 4 5 6 7 8 9 10 11 12 13
DISTRICT TOTAL
All Scheduled Tribes 2,389 1,042 1,347 58 1 983 1,347
1 Bhil 2,389 1,042 1,347 58 1 98) 1,347
DISTRICT RURAL
AU Scbeduled Tribes 2,242 985 1,257 56 1 928 1,257
1 Bbi! 2,242 985 1,257 56 928 1,257
DISTRICT URBAN
AU Scbeduled Tribes 147 57 90 2 5S 90
1 BhU 147 57 90 2 55 90
SECTION III
VILLAGE DmECTORY
&
SOME OFFICIAL STATISTICS


VILLAGE DIRECIORY

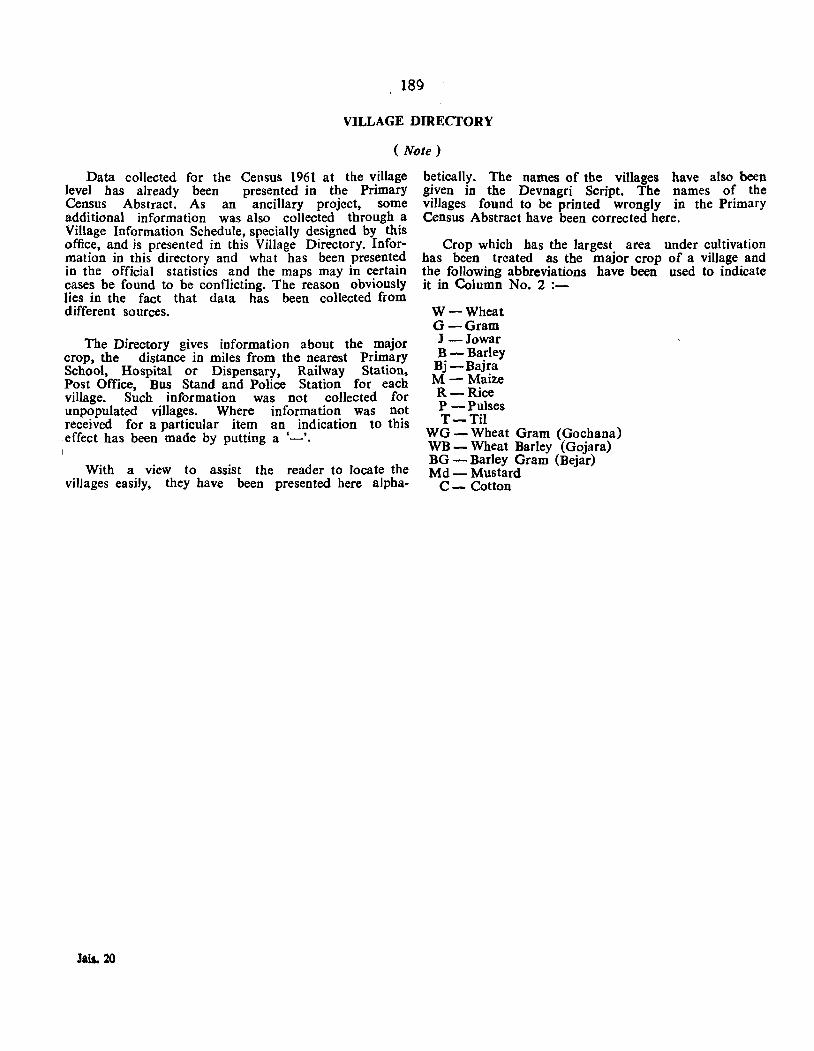
189
VILLAGE DIRECTORV
( Note)
Data collected for the Census 1961 at the village level has already been presented in the Primary Census Abstract. As an ancillary project, some additional information was also collected through a Village Information Schedule, specially designed by this office, and is presented in this Village Directory. Information in this directory and what has been presented in the official statistics and the maps may in certain cases be found to be conflicting. The reason obviously lies in the fact that data has been collected from different sources.
The Directory gives information about the major crop, the distance in miles from the nearest Primary School, Hospital or Dispensary, Railway Station, Post Office, Bus Stand and Police Station for each village. Such information was not collected for unpopUlated villages. Where information was not received for a particular item an indication to this . effect has been made by putting a '_'. I
With a view to assist the reader to locate the villages easily, they have been presented here alpha-
Jab. 20
betically. The names of the villages have also been given in the Devnagri Script. The names of the villages found to be printed wrongly in the Primary Census Abstract have been corrected here.
Crop which has the largest area under cultivation has been treated as the major crop of a village and the following abbreviations have been used to indicate it in Column No. 2 :-
W-Wheat G-Gram J -Jowar B-Barley Bj-Bajra M- Maize R-Rice P -Pulses T-Til
WG - Wheat Gram (Gochana) WB - Wheat Barley (Gojara) BO - Barley Gram (Bejar) Md-Mustard C- Cotton
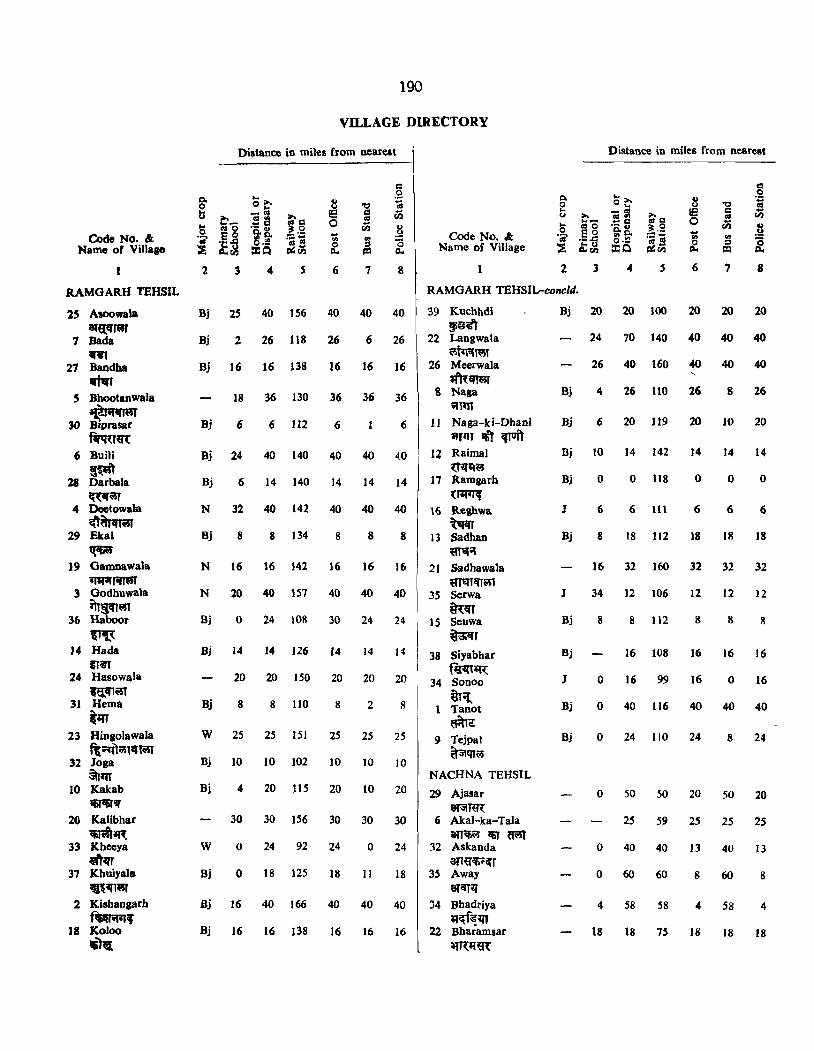
Code No. & Name of Village
RAMGARH TEHSIL
25 Asoowala ,,~
7 Bada W1
27 Bandba ~
5 Bhootanwala
~""I(4r 30 Blprasal
firroU{ 6 Buili
~~ 28 Darbala ~WT
4 Deetowala ~~
29 Eltal
~ 19 Gamnawala
iRr-Ij'ifJ(4f 3 Godbuwala
itt§l't~ 36 Haboor
~ J4 Hada
Ir~ 24 Hasowa]a
~101 31 Hema
tm 23 HingoJawala
f1:~)Ci'll"mt 32 Joaa
~r;rf 10 Kakab
1ifiT06J1fI' 20 Kalibbat
li1lit~ 33 Kheeya
(fr~ 37 Khuiyala
.~1Jlti5T
2 Kishangarh f • .,q,
18 Koloo 15)~
190
VILLAGE DIRECTORY
Distance in miles from ncareat
.. is o
5 6 7 8
Bj 2 26 118 26 6 26
Bj 16 16 138 16 16 16
18 36 130 36 36 36
Bj 6 6 112 6 6
Bj 24 40 140 40 40 40
Bj 6 14 140 14 14 14
Bj 8 8 134 8 8 8
N 16 16 142 16 16 16
N 20 40 157 40 40 40
Bj 0 24 108 30 24 24
Bj 14 14 126 14 14 H
20 20 150 20 20 20
Bj 8 8 110 8 2 8
W 25 25 151 25 25 25
Bj 10 10 102 10 10 10
Bj 4 20 liS 20 10 20
30 30 156 30 30 30
W 0 24 92 24 0 24
Bj 0 18 125 18 11 18
Bj 16 40 166 40 40 40
Bj 16 16 138 16 16 16
Code No. " Name of Village
1 2 3
Distance in miles from nearest
5 6 8
RAMGARH TEHSIL-concld.
39 Kucbbdi ,g~
22 Langwa!a Ci'l~l\lSt
26 Meerwala 1{Rf.JTWr
S Naga .,1;rf
11 Naga-ki-Dbanl ;JrflT ~ 'fTUi)
1Z Raimal '{t1Jq~
17 Ramgarb (r~
\6 Reghwa ~lfr
13 Sadban ~ ..
21 Sadhawala ~NT<n~
35 Serwa mr
IS Seuwa ~r
38 Siyabbat f~~
34 Sonoo {trot.
1 Tanot 6~<!
9 Tejpal ~qrw
NACHNA TEHSIL
29 Ajasar 8f3JTm:
6 Akal-ka-Tala an~ <6T 6Wt
32 Askanda an«<F~
35 Away el<ll<l
34 Bhadriya ~1{f:g1JJ
22 Bbaiamsar ~(qm
Bj 20 20 100 20 20 20
24 70 140 40 40 40
26 40 160 40 40 40
Bj 4 26 110 26 8 26
Bj 6 20 Jl9 20 )0 20
Bj 10 14 142 ]4 14 14
Bj 0 0 118 0 0 0
J 6 6111 666
Bj 8 18 112 18 18 18
16 32 160 32 32 32
J 34 ]2 106 12 12 12
Bj 8 8 112 8 8 8
Bj 16 108 16 16 16
J 0 16 99 16 0 16
Bj 0 40 116 40 40 40
Bj 0 24 110 24 8 24
o 50 50 20 50 20
25 59 2S 25 25
o 40 40 13 40 13
o 60 60 g 60 8
4 58 58 4 58 4
18 18 75 18 18 18
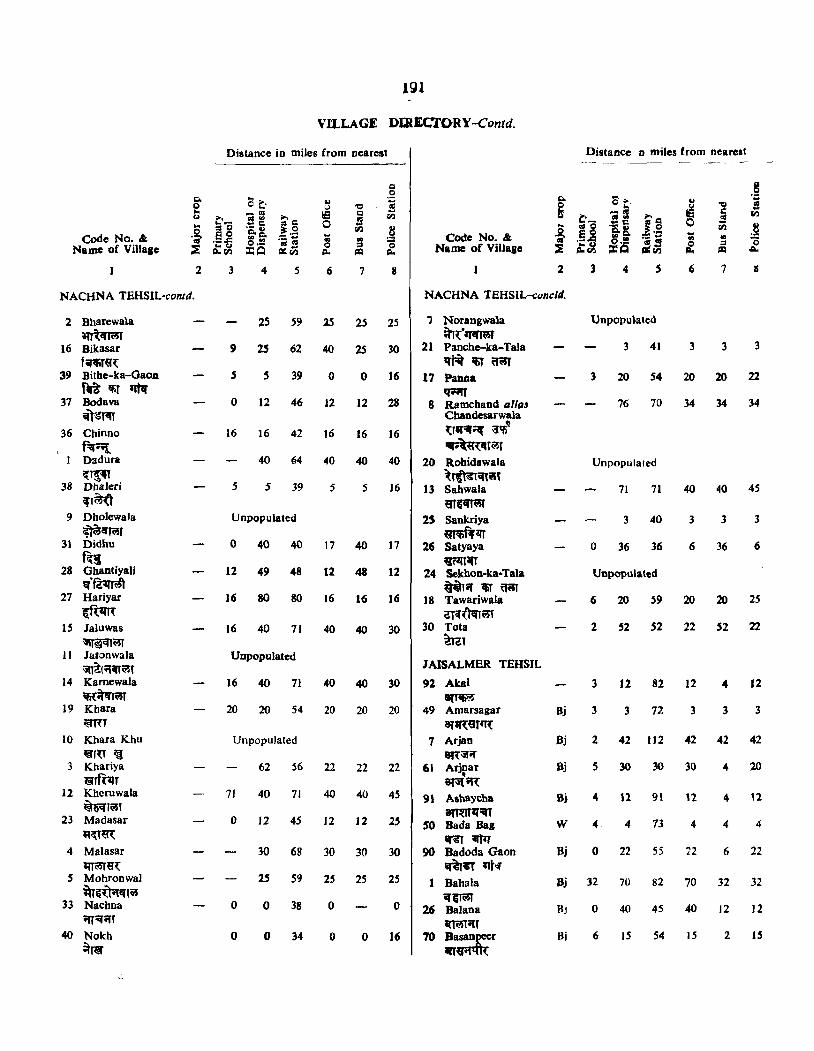
Code No. & Name of Village
NACHNA TEHSIL-contd.
2 Bharewa\a ~iiJWT
16 Bikasar fi(15f«~
39 Bithe-ka-OaoJl M''6T11tfr
37 Bodava Oi(t~r~
36 Chinno f:q"t_ Dadura i!(1~
38 Dllaleri ~T~
9 Dholewala ~Cf~r
31 Didhu
ffl:i 28 Ghaotiyali ~.~
27 Hariyar ~f(1lR
15 Jaluwas ~~~
J 1 JatonwaJa ~~("lil(ti!5T
14 Kamewala 'Ii~WT
19 Kbara ~m
10 KhaTa Khu
"'IU ~ 3 Khariya
li,f~r 12 Kheruwala
~~<rl~T 23 Madasar
~r{T~
4 Malasar ~~~
5 Mohronwal m~U"l'H~
33 Nachna ;n"'"lT
40 Nokh ~r@
2
191
VILLAGE DIllEClORY-Contd.
Distance in miles from nearest
3
.. III o p..
6 8
2S 59 lS 25 2S
9 25 62 40 2S 30
5 5 39 0 0 16
o 12 46 12 12 28
16 16 42 16 16 16
40 ~4 40 40 40
5 5 39 :5 :5 J6
Unpopulated
o 40 40 17 40 17
12 49 48 12 48 12
16 80 80 16 16 16
16 40 71 40 40 30
Unpopulated
16 40 71 40 40 30
20 20 S4 20 20 20
Unpopulated
62 S6 22 22 22
71 40 71 40 40 4S
o 12 45 12 J2 25
30 68 30 30 30
25 59 25 25 25
o 0 38 o o
o 0 34 o 0 16
Code No. & Name of Village
1 2
Distance D miles from nearest
3
NACHNA TEHSIL-concld.
') Norangwala ~1{·1fIIm'
21 Panche-ka-Tala IIA ~ (I~
17 Palla. tp;ff
8 Rlimchand alias Chandesarwala ~IA~ :al:fi~ ~{ltr~r
20 Robidawala :tf(meuiSt
U Sahwala «TC~
2S Sankriya ~~
26 Satyaya iIi:W-ItarT
24 Sekhon-ka-Tala q@T"l 'fiT ~
18 Tawariwala ~~~~T
30 Tota ~al
lAISALMER TEHSIL
92 Akal 1(1~
\Jnpopu}.ated
3 41 333
3 20 54 20 20 22
76 70 34 34 34
Unpopulated
71 71 40 40 45
3 40 3 3 3
o 36 36 6 36 6
Unpopulated
6 20 59 20 20 2S
2 52 52 22 52 22
3 12 82 12 4 12
49 Amarsagar OJ 3 3 11. 3 3 3 aJ1R91''l{
7 Arjan aR'5Iif
61 Arj~ar 8t;j{~
91 Asbaycba
anm'·n SO Bada Bag ~~
90 Badoda Gaon ;Rr~ ~t'"
1 Bahala if"~
26 Balana artift"lT
70 Basanpeer lfT~tft{
Bj 2 42 112 42 42 42
Bj 5 30 30 30 4 20
Bi 4 12 9\ 12 4 11
W 4 4 73 444
Bj 0 22 55 22 6 22
Bj 32 70 82 70 32 32
OJ 0 40 45 40 12 12
Oi 6 15 54 1 S 2 15
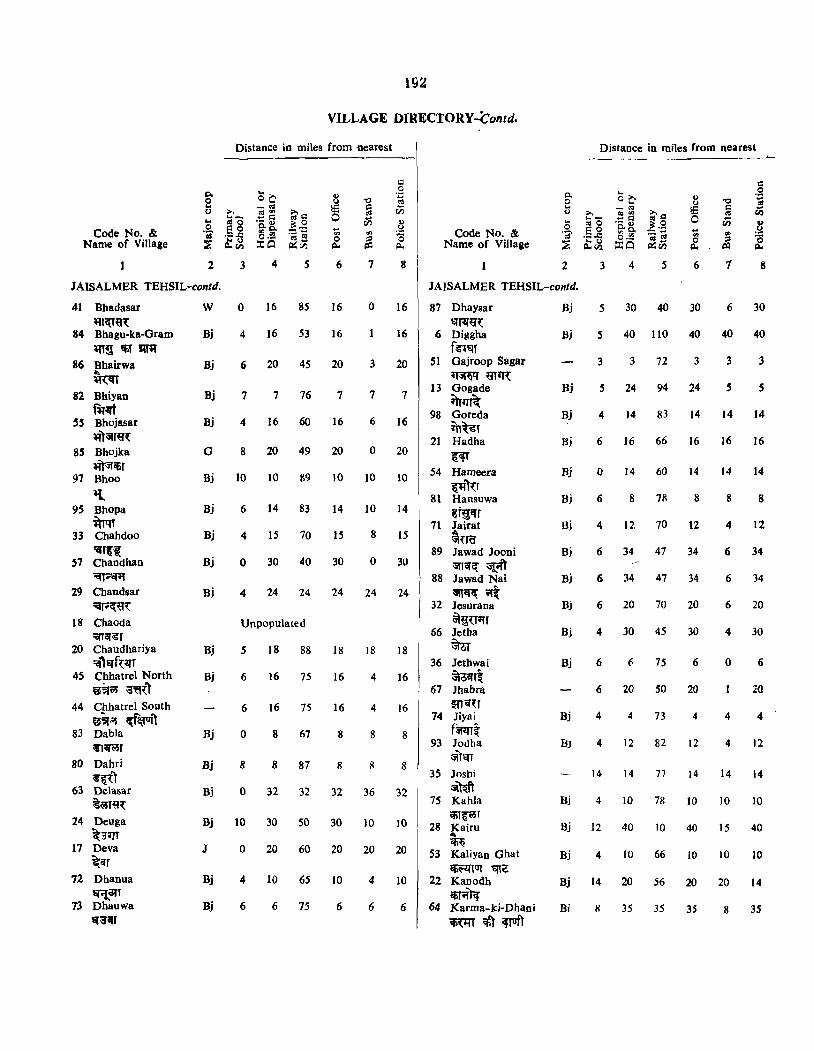
Code No. &. Name of Villaae
2
JAISALMER TEHSIL-conld.
41 Bhadasar W llr({T{{(
84 Bhagu-ka-Gram Bj m~ ~ I((;{
86 Bhairwa ~qy
82 Bhiyan f~:,rt
" Bhojasar ~)\5Ire~
8S Bhojka ~)\5Ii1ir
97 Bhoo
~
Bj
Bj
Bi
G
Bj
9S Bhopa Bj mqT
33 Chahdoo Bj :qr~~
57 Chandhan Bj ~ ..
29 Chandsar Bi :qF~{{(
18 Chacda :;;rrcr6'T
20 Chaudhariya Bj :q"hlf(~T
45 Chhatrel North Bj iJ§{w a~(1
44 Chhatrel South uSr~ I(f~on
83 Dabla Bj :&1;;;rwT
80 Dahri Bj ~~"t
63 Delasar Bj ~~Hl(
24 Dellga Bj ~3"m
17 Deva J
~'H 72 Dhanua Bj
I:"f.icn 73 Dhauwa Bj
'Iit~~T
192
VILLAGE DIRECTORY-Contd.
Distance in miles from -nearest
3 4 5
o 16 8S
4 16 53
6 20 4S
7 7 76
4 16 60
8 20 49
10 10 89
6 14 83
4 15 70
o 30 40
4 24 24
Unpopulated
5 18 88
6 16 75
6 16 75
o 8 67
8 8 87
o 32 32
10 30 50
o 20 60
4 10 65
6 6 75
8 !£3 o
6
16
16
20
7
16
20
10
14
15
30
24
18
16
16
8
8
32
30
20
10
6
7
o
3
7
6
o
10
10
8
o
24
18
4
4
8
36
]0
20
4
6
8
16
16
20
7
16
20
10
14
15
30
24
18
16
16
8
8
32
10
20
10
6
Code No. &. Name of Village
2
JAISALMER TEHSIL-contd.
87 DhaYllar Bi 'Iit~~(
6 Diggha Bi f~'ElT
51 Gajroop Sagar
~ ~r"( 13 Gogade Bj
i'trq~ 98 Goreda Bj
m~T 21 Hadha 8j
~ 54 Hameera Bj
~;r'l(r 81 Hansuwa Hj
~f~.n 71 Jairat Bj
~mr 89 Jawad Jooni Bj
Gllcr~ ~;ft 88 Jawad Nai Bi ~~ .. t
32 Jesurana Bj 6'I~u .. r
66 Jetha Bj ~
36 Jethwai Bj ~6crTt
67 Jhabra ®iI'U
74 Jiyai Bj f~~
93 Jodha BJ \5I)m
3S Joshi a!~
75 Kahla Bj <liT~wr
28 fairu Bj <Ii~
53 Kaliyan Ghat Bj <Ii~l{rG! 'q{<;
22 Kanodh Bj lifit~~
64 Karma-ki-Dhan; Bi
~~~
Distance in miles from nearest
3 4 5 6 8
5 30 40 30 6 30
5 40 llO 40 40 40
3 3 72 3 3 3
5 24 94 24 s s
4 14 83 14 14 14
6 16 66 16 16 16
o 14 60 14 14 14
6 8 7R 8 8 8
4 12. 70 12 4 12
6 34 47 34 6 34
6 34 47 34 6 34
6 20 70 20 6 20
4 30 45 30 4 30
6 75 6 o 6
6 20 50 20 20
4 4 73 4 4 4
4 12 82 12 4 12
14 14 77 14 14 14
4 10 78 10 10 10
12 40 10 40 15 40
4 10 66 10 10 10
14 20 56 20 20 14
8 35 35 35 8 35
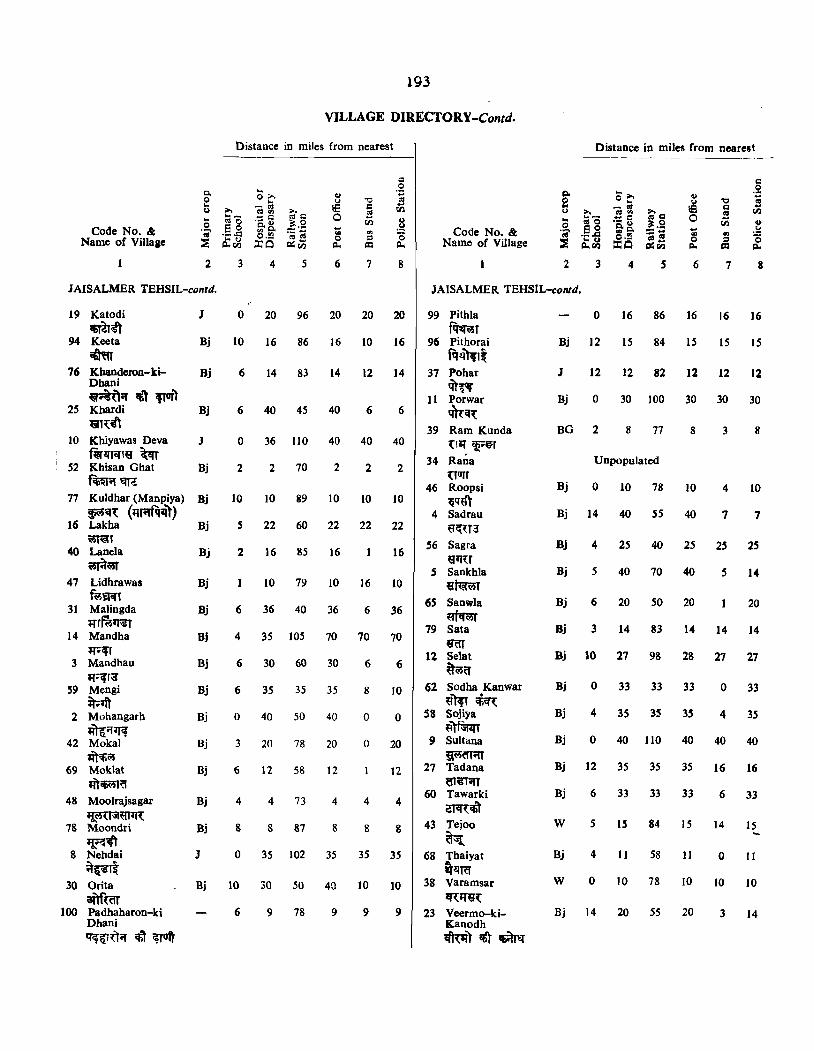
193
VILLAGE DIRECTORY-Contd.
Code No. & Name of Village
2
JAISALMER TEHSIL-contd.
19 Katodi J ~~
94 Keeta Bj ~
Distance in miles from nearest
3 4 5 6 7 8
o 20 96 20 20 20
10 16 86 16 10 16
76 Kbanderon-ki- Bj 6 14 83 14 12 14 Dbani ~;r .1 yror1
25 Kbardi Bj 6 40 45 40 6 6 lIt~C\
10 Khiyawas Deva J 0 36 110 40 40 40 f~~rqT~ ~
i 52 Kbisan Ghat Bj 2 2 70 2 2 2 f<tilttOf'EIR:
77 Kuldhar (Manpiya) Bj 10 10 119 10 10 10 ~1iI~ (;jr;rfq~)
16 Lakha Bj 5 22 60 22 22 22 VSNf
40 Lanela Bj 2 16 85 16 16 ~(l5f
47 Lidhrawas Bj 10 79 10 16 10 fw~t
31 Malingda Bj 6 36 40 36 6 36 JTf~iT~r
14 Mandha Bj 4 35 105 70 70 70 JT;;;;r
3 Mandhau Bj 6 30 60 30 6 6 ,,;;;r~
59 Mengi Bj 6 35 35 35 8 10 ir.-;tl
2 Mohangarh Bj 0 40 50 40 0 0 iJm:O{~
42 Mokal Bj 3 20 78 20 0 20 ")"fiw
69 Moklat Bj 6 12 58 12 12
'"<tiwl~ 48 Moolrajsagar Bj 4 4 73 4 4 4
~~~iT~ 78 Moondri Bj 8 8 87 8 8 8
~~~ 8 Nehdai J 0 35 102 35 35 35
~~T~ 30 Orita Bj 10 30 50 40 10 10
ar)f{ffi" 100 Padhaharon-ki 6 9 78 9 9 9
Dhani q;;&IUif 'li1 ~ott
Code No. & Name of Village
2
Distance in miles from nearest
3
~g ~.-:;3 rJ:fI.l
5 6 7 8
JAISALMER TEHSIL-contd.
99 Pithla fq~wT
96 Pithorai fq~~T~
37 Pohar ~~
Jl Porwar
qR"~ 39 Ram Kunda
~1a:r ~~r
34 Rana ~Tllfr
46 Roopsi liq~
4 Sadrau tr({U3"
56 Sagra ~iTU
5 Sankhla UraWT
65 Sanwla ~
79 Sata m
12 Selat ~wa
62 Sodha Kanwar ~)1fr <t~
58 Sojiya ~i)t~~T
9 Sultana ~(fTifT
27 Tadana ~
60 Tawarki cncRc61
43 Tejoo
~ 68 Thaiyat
~~m 38 Varamsar
'RJfU~
23 Veermo-kiK.anodh ~~,,) ctft m
o 16 86 J6 16 16
Bj 12 15 84 15 15 15
J 12 12 82 12 12 12
Bj 0 30 100 30 30 30
BG 2 8 77 S 3 8
Unpopulated
Bj 0 10 78 10 4 10
Bj 14 40 55 40 7 7
Bj 4 25 40 25 25 25
Bj 5 40 70 40 5 14
Bj 6 20 50 20 20
Bj 3 14 83 14 14 14
Bj 10 27 98 28 27 27
Bj 0 33 33 33 0 33
Bj 4 35 3S 35 4 35
Bj 0 40 110 40 40 40
Bj 12 35 35 35 16 16
ru 6 " " " 6 D
W 5 15 84 15 14 15 -Bj 4 11 58 11 0 II
W 0 10 78 IO 10 10
Bj 14 20 55 20 3 14
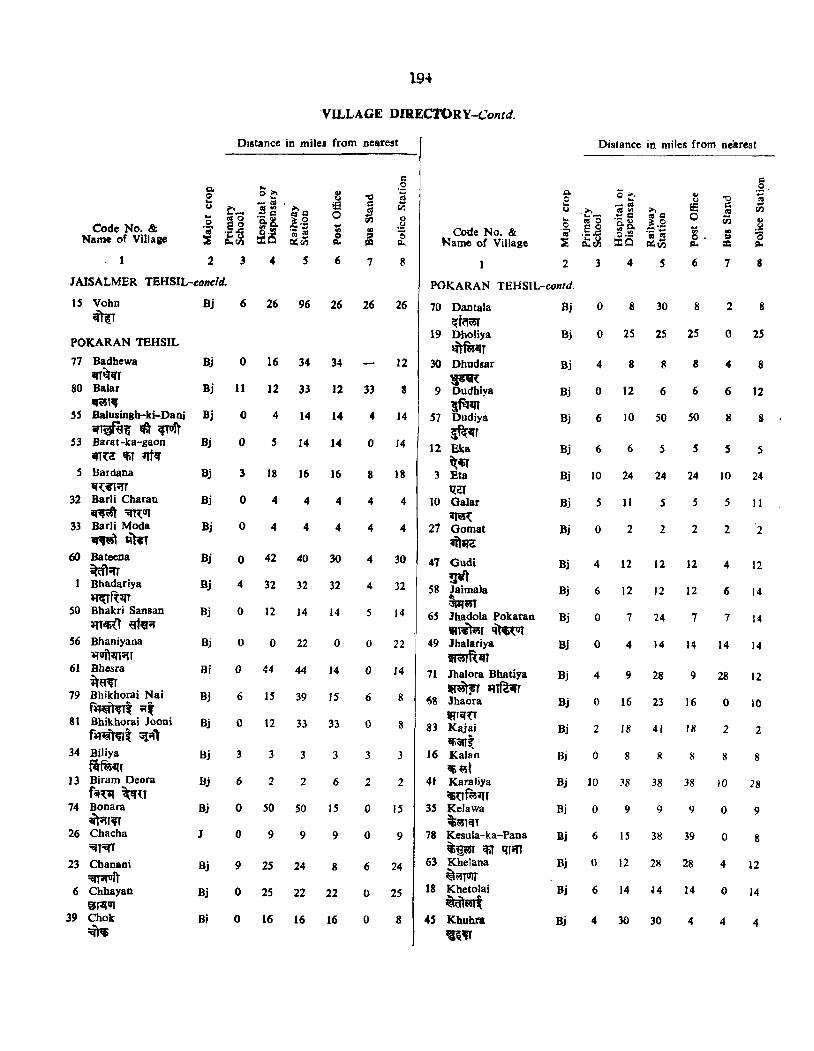
Code No. & Name of Village
1 2
JAISALMBR TBHSIL-eoncld.
15 Vohn Bj ci'Il:T
POKARAN TEHSIL
77 Badbewa Bj ifi~lfr
80 Baiar Bj
~I' S5 Balusingb-ki-Dani Bj ;r~~ ~ ;pun
53 Barat-ka-gaon Bj il'Tt<! !.fiT tftlf
5 Bardana Hj Irt.n;rr
32 Barli Charan Bj ~~U(
33 Barli Moda Bj ~1 "~T
60 Bateena Bj ~1;rr Bhadariya Bj ~f{~f
50 Bhakri Sansan Bj +rl~'l ~tq;r
56 Bhaniyana Bj llufi~t;rt
61 Bhesra Bi itrn
79 Bhikhorai Nai 8j f~~Tt "{
81 Bhikhorai Jooni Bj f~~m{ '"lil'
34 Biliya Bj ~~(
J 3 Biram Deora Bj f4il~ ~U
74 Bonara Bj ~;rr~r
26 Chacha J ::qr"ff
23 Cbanani 8j ~'t
6 Chhayan Bj Uf~U(
39 Chok Bi :citlIi
lfH
VILLAGE DIRECT'ORY-Contd.
DIstance in miles from nearest
3 6 7 8
6 26 96 26 26 26
o 16 34 34 12
II 12 33 12 33 8
o 4 14 14 4 14
o , 14 14 0 14
3 18 16 16 8 18
o 4 4 444
o 4 444 4
o 42 40 30 4 30
4 32 32 32 4 32
o 12 14 14 5 14
o 0 22 0 0 22
o 44 44 14 0 14
6 IS 39 IS 6 8
o 12 33 33 0 8
33333 3
62262 2
o 50 SO IS 0 15
09990 9
9 25 24 8 6 24
o 25 22 22 0 25
o 16 16 16 0 8
Distance in miles from nearest
Code No. & Name of Village
-GO o· p..
2
POKARAN TEHSIL-contd.
3 6
70 Dantala ~fowr
19 Dholiya ~fCilS~r
30 Dhudsar
8ft~ 9 Dudhil'a
!f}t~ 57 Dudiya
~r 12 Eka
~~ 3 Eta ~a
10 Galar ~
21 Oomat ~a
47 Oudi
~ 58 Jaima!a
~CilSr 6S lhadola Pokaran "l~r~
49 Jhalariya ~~T
71 Jhalora Bhadya ff~ 3tT~r
68 lhaora IRrCfn
83 Kajai Ofi~~
J6 Kalan Oil) {1St
41 KaraJiya ';fiuft;5~t
35 Kelawa itili51CfT
78 Kesula-ka-Pana ~~ <liT qron
63 Khelana ig~
18 Khetolai ~CilSTt
45 Khuhra 'iQ~
Bj 0 8 30 8 2
Bj 0 25 25 25 0
~ 4 8 884
Bj 0 12 6 6 6
Bj 6 10 50 SO 8
Bj 6 6 5 5 5
Bj 10 24 24 24 JO
Bj 5 11 5 5 5
~ 0 2 222
Bj 4 12 12 12 4
Bj 6 12 12 12 6
Bj 0 7 24 7 7
Bi 0 4 14 14 14
Bj 4 9 28 9 28
~ 0 16 n 16 0
Bj 2 18 41 18 2
~ 0 8 8 8 8
Bj JO JS 38 38 10
Bj 0 9 9 9 0
Bj 6 15 38 39 0
Bj 0 12 2R 28 4
Bj 6 14 J4 14 0
Bj 4 30 30 4 4
8
8
2S
8
12
8
5
24
11
2
12
14
14
14
12
10
2
8
28
9
8
12
J4
4
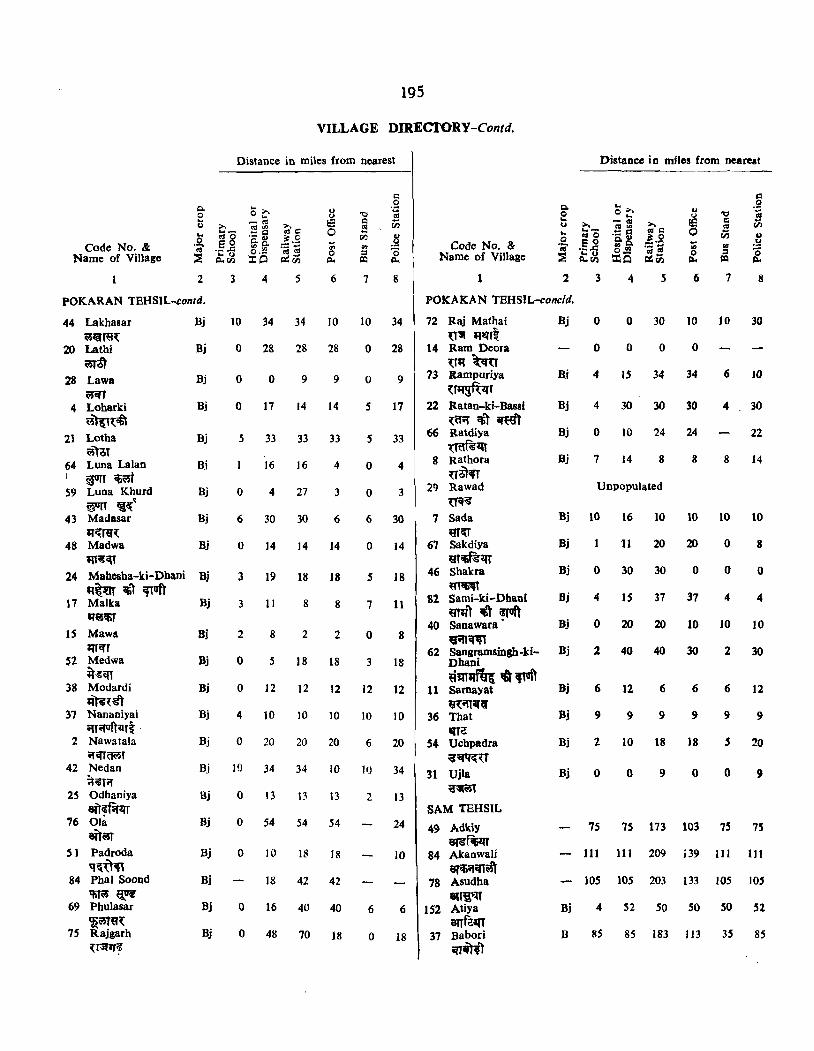
Code No. & Name of Village
2
POKARAN TEHSIL-contd.
44 Lakhaaar Bj Ci5~fQ,(
20 Lathi Bj ld
28 Lawa Bj CiSifT
4 Leharki Bj Ci5~~<€t
21 Letha Bj aToT
64 Luna Lalan B.i I, ijOlT 'fiCiSr S9 Luna Khurd Bj
~r <i~~ 43 Madasar Bj
q~re'(
48 Madwa Bj ~<n
24 Mabesha-ki-Dhani Bi q~ ~1 <flUJ1
17 MaIka Bj qa~
15 Mawa 8j JfTifT
52 Medwa Bj ~~<n
38 Modardi Bj q~~;tt
37 Nananiyai Bj ilTi{Qft~fl '
2 Nawatala Bj ififTowT
42 Nedan Bj ~~Ti(
25 Odhaniya Bj aUCZMijT
76 oli Bj eUCi5T
5 1 Padroda Bj q~~~
84 Pha} Soond Bj IfiTtlS ~
69 Phulasar Bj ~~9,(
75 Rajgarh Bj U3JIJ~
195
VILLAGE DIRECfORY-Contd.
Distance in miles from nearest
~ o
3 4 5 6
10 34 34 10
o 28 28 28
o o 9 9
o 17 14 14
5 33 33 33
16 16 4
o 4 27 3
6 30 30 6
o 14 14 14
3 19 18 18
3 11 8 8
2 8 2 2
o 5 18 18
o 12 12 12
4 10 10 10
o 20 20 20
10 34 34 10
o 13 13 13
o 54 54 54
o 10 18 18
18 42 42
o 16 40 40
o 48 70 18
7 8
10 34
o 28
o 9
5 17
5 33
o 4
o 3
6 30
o 14
5 18
7 11
o 8
3 18
12 12
10 10
6 20
10 34
2 13
24
10
6 6
o 18
Code No. & Name of Village
1 2
POKAKAN TEHSIL-concld.
72 Raj Mathai '(1'31 II~~
14 Ram Deora '(rq ~cru
73 Rampuriya '(~~f
22 Ratan-ki-Bassi ,(({if 'fi1 ~1
66 Ratdiya \TQfu~
8 Rathora
U~'" 29 Rawad
Uit~
7 Sada mt{r
67 Sakdiya ;gr~
46 Shakra
"l~ 82 Sami-ki-Dbani
mil) <tt i!TvIt 40 Sanawara· ~cm
62 Sangramsingh-kiDhani ijJm1tlr{ t';TUft
11 Samayat 9{i(f~'
36 That 'IT'!
54 Uchpadra :a-:cm:U
31 Ujla :a-~
SAM TEHSIL
49 Adkiy 8ff~
84 Akanwali at'iilifl~
78 Asudha .n~t:4{
152 Atiya et1f<!~{
37 Babori ilT-n,1
Bj
Bi
Bj
Bj
Bj
Bj
Bj
Bj
Bj
Bj
Bj
Bj
Bj
Bj
Hj
Bj
B
Distance in miles from nearest
3 4 5 6 7 8
o 0 30 10 10 30
o 0 0 o
4 15 34 34 6
4 30 30 30 4 30
o 10 24 24 22
7 14 8 8 8 14
Unpopulated
10 16 10 10 10 10
11 20 20 o 8
o 30 30 o o o
4 IS 37 37 4 4
o 20 20 10 10 10
2 40 40 30 2 30
6 12 6 6 6 12
999 9 9 9
2 10 18 18 5 20
009 o o 9
7S 75 173 103 75 75
111 111 209 i39 111 III
105 105 203 133 105 lOS
4 52 50 so 50 52
!IS 85 183 113 35 8S
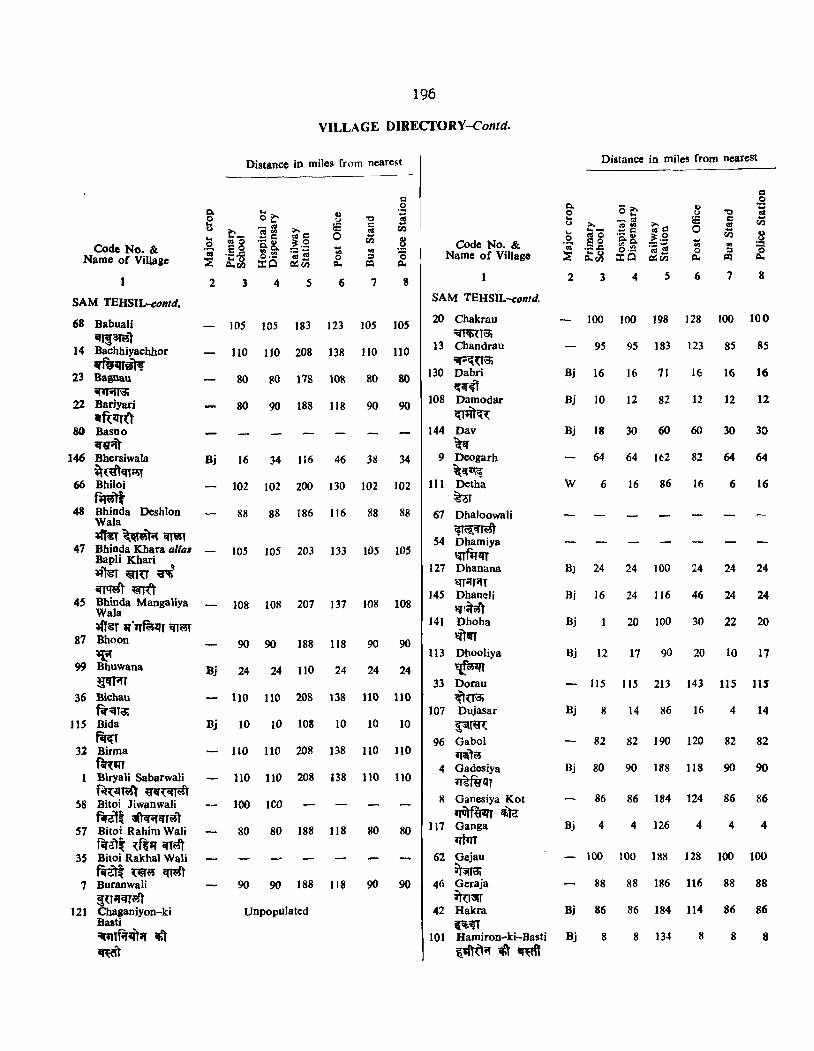
Code No. & Name of Village
SAM TEHSIL-conld.
68 BabuaJi ~am1
14 Bachbiyachhor 1ffiJ;rr~
23 Bagnau ~:a;
22 BariYari IIft~f(t
80 Basno il'VilT
146 Bhersiwala
~{~"'~ 66 Bhiloi f~
48 Bhinda Deshlon Wala ~~<m'St
47 Bhinda Khara alia:r Bapli Khari ~1\fi ~U 'fi iI'~~Rt
4S Bhinda Mangaliya WaJa ~~ "',,f<;s~r <1TwT
87 Bhoon
~ 99 Bhuwana
~T 36 Bichau
f.r~~ 11S Bida
~T 32 Birma
~qT Biryali Sabarwali f~~'A5' ~~
58 Bitoi Jiwanwali f~l~ ~crr~1
57 Bitoi Rahim Wali firlt~ d(1J ifT~
3S Bitoi Rakhal Wali f.;ft{ ~~ crmt
7 Buranwali
~U"<iT~ 121 Chaganiyon-ki
Basti =IPIlfoJ~'f ~ ~"t
2
Bj
Bj
Bj
196
VILLAGE DIRECTOR\'-Contd.
Distance in miles from neare~t
3
lOS 105 183
110 110 208
80 SO 178
80 90 188
)6 34 116
102 102 200
88 88 186
105 105 203
108 108 207
90 90 188
24 24 110
110 110 208
10 10 103
110 110 208
110 110 208
100 lCO
80 80 188
90 90 188
Unpopulated
8 !S o
6
123
138
108
118
46
130
116
133
137
118
24
138
10
138
138
118
118
7 8
105 105
ltO 110
80 80
90 90
34
102 102
88 88
105 105
108 108
90 90
24 24
110 110
10 10
110 110
110 110
80 80
90
Code No. & Name of Village
SAM TEHSIL-contd.
20 Chakrau :;fi<Jini3i
13 Chandrau ~Ui3i
130 Dabri ~if~l
108 Damodar
~ 144 Dav ~
9 Deogarh ~q~
III Detha ~r
67 Dha)oowali <;I~~
54 Dhamiya "lTflJlfT
127 Dhanana IifT"'TifT
145 Dhaneli Ifr~~
141 Dhoba 11lTiI'T
113 Dhooliya
~iR 33 Dorau
~u:a; 107 Dujasar
~T~~ 96 Gabol
"iII)~ 4 Gadesiya ~mQT
II Ganesiya Kot ~~~)G
117 Gaoga 'ftm
62 Gejau ;r3lSi
46 Geraja iro~
42 Hakra ~.~
101 Hamiron-ki-Basti ~~l", ~ ~
Do o -
Distance in miles from nearest
() :>. ... -_ o "'0 . .., .§_8 ~ cl:~
-'" o 1:1..
2 3 4 5 6 7 8
100 100 198 128 )()() 100
95 95 183 123 85 85
8j 16 16 71 )6 16 16
Bj 10 12 82 12 12 12
Bj 18 30 60 60 30 30
W 6 16 86 16 6 16
BJ 24 24 100 24 24 24
Bj 16 24 116 46 24 2~
Bj 20 100 30 22 20
Bj 12 17 90 20 10 17
115 115 213 143 115 lIS
Bj 8 14 86 16 4 14
82 82 190 120 82 82
Bj 80 90 188 118 90 90
86 86 184 124 86 86
Bj 4 4 126 4 4 4
100 100 188 128 100 100
88 88 186 116 88 88
Bj 86 86 184 114 86 86
Bj 8 8 134 8 8 8
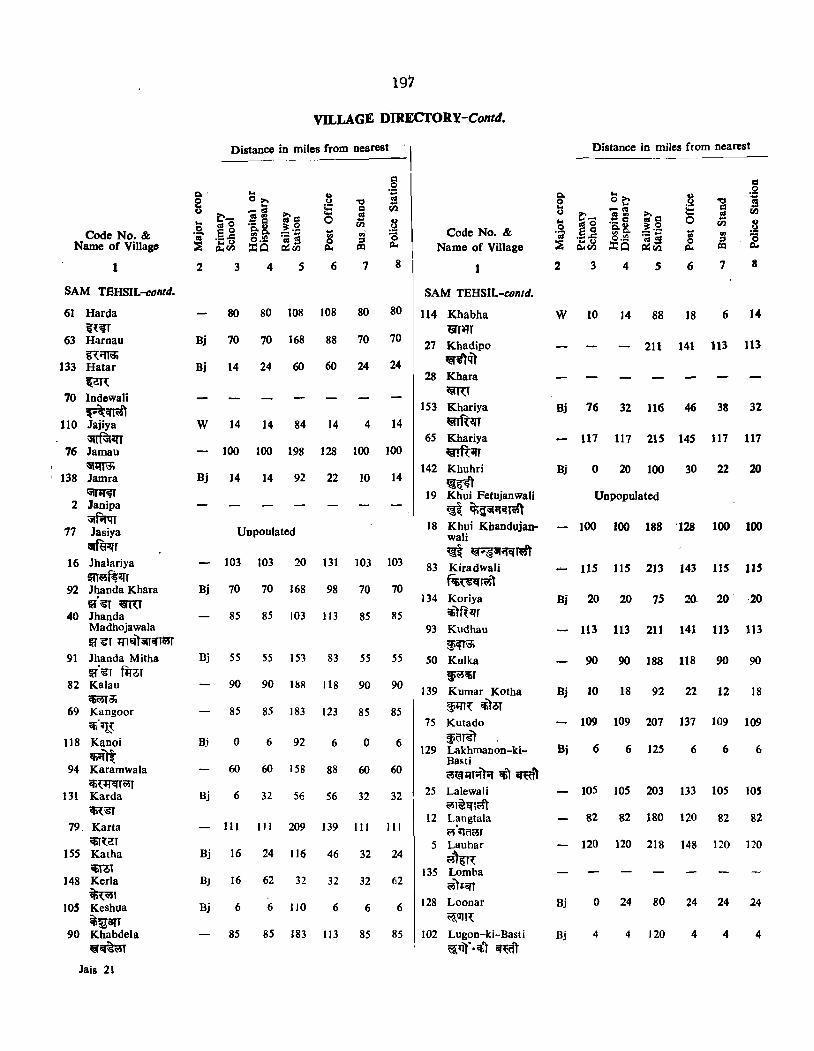
Code No. & Name oC Villago
1
SAM TEHSIL-ct.lntd.
61 Harda
&~'T 63 Harnau
~ifTij; 133 Hatar
&eT, 70 Indewali
~~<rtW1 110 Jajiya
~tftI~, 76 Jamau ~~
I 138 Jamra
~ 2 Janipa
~f;rqy 77 Jasiya
~~r 16 lhalariya mwf~
92 Jhanda Khara ii~ ~ro
40 Jhanda Madhojawala H ~T Jfll:l)'3UCflCi5T
91 lhanda Mitha ~. '61 nroT
82 Kalau ~~
69 Kangoor <ii'~
118 Kanoi 'fiiiTt
94 Karamwala CIi\JlCrrwr
131 Karda *\"6T
79, Karta CliI~i!T
ISS Katha <IiTOl
148 Kerla t~l
lOS Keshua ifl~SJT
90 Khabdela ~mt
Jais 21
197
VILLAGE DIRECI'ORY-Cont4.
2
Bj
Bj
w
Bj
Bj
Distance in miles Crom nearest' I
3 4 5
80 80 108
70 70 168
14 24 60
14 14 84
100 100 198
14 14 92
Unpoulated
103 103 20
70 70 168
85 85 103
8 8 o
6
108
88
60
14
128
22
131
98
113
7
80
70
24
4
100
10
103
70
85
.g f! rn
8 ~
8
80
70
24
14
100
14
103
70
85
Bj 55 55 153 83 55 55
90 90 188 118 90 90
85 85 183 123 85 85
B,i 0 6 92 6 0 6
60 60 158 88 60 60
Bj 6 32 56 56 32 32
111 III 209 139 III III
Bj 16 24 116 46 32 24
BJ 16 62 32 32 32 62
Bj 6 6 110 6 6 6
85 85 ]83 113 85 85
Code No. & Name oC Village
1
SAM TEHSIL-contd.
114 Khabba lir~T
27 Khadipo '«~~
28 Khara i9T\l
153 Khariya ~rR~
65 Khariya '«!R~
142 Khuhri
'@~ 19 Khui Fetujanwali ~ itSl~O{qr~
18 Khui Khandujan. wali
~ ~"'ifCI'RWft 83 Kiradwali
f<6~Cf~1 134 Koriya
'Ii)'f{llT 93 Kudhau
~;;ri3;
2
w
Bj
Bj
Bj
Distance in miles Crom nearest
3 6 8
10 14 88 18 6 14
211 141 113 113
76 32 116 46 38 32
117 117 215 145 117 117
o 20 100 30 22 20
Unpopulated
100 100 188 '128 100 100
115 115 213 143 I1S liS
20 20 75 :!()_ 20' '20
113 113 211 141 113 113
50 Kulka 90 90 188 118 90 90 ~wiir
J 39 Kumar Kotha Bj 10 18 92 22 12 18 ~m( 'Ii)'~
75 Kutado 109 109 207 137 109 109 ~('I~)
129 Lakhmanon-ki- Bj 6 6 125 6 6 6 Basti w~"r",,)'", ifi') Offit1
25 Lalewali 105 105 203 133 105 lOS al~cn~'t
12 Langtala 82 82 180 120 82 82 a'qo~r
5 Lauhar 120 120 218 148 120 120
~~~R US Lomba
wTt.O!t 128 Loonar Bj 0 24 80 24 24 24
W;OJ1,
102 Lugon-ki-Basti Bj 4 4 120 4 4 4 W;i1)" • 'b't if~i;'I')'
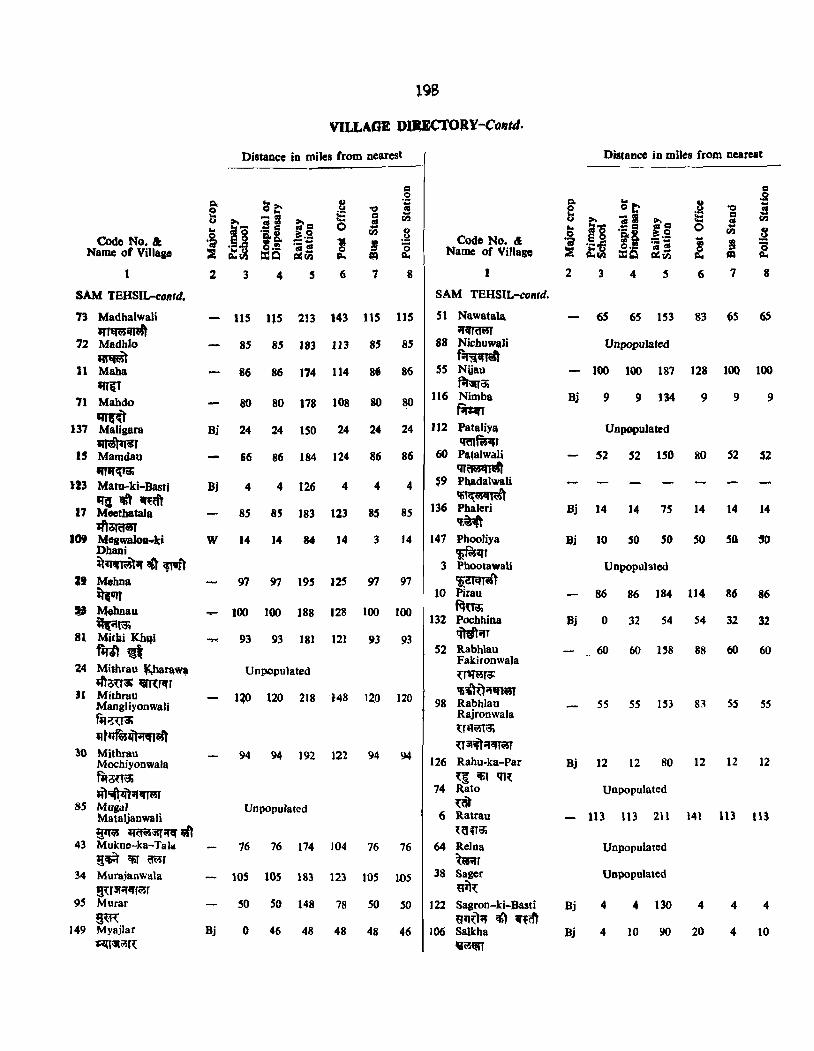
Code No. &: Name of Village
SAM TEHSIL-contd.
73 Madbalwali
""'I:1WiIAft 72 MadbJo
IIf'iIiit 11 Maha
IIT(T
71 Mahdo 'IT(~
137 Maligara 11161·I~r
.5 Mamdau
~ 123 Matu-ki-Basti
IIQ ~ ~~ 17 Moetbatala
JftomaT lot MogwaJoa...ki
Dhani ~mmsr.t oft ~"t
31 MohDa qUJf
» M.,bDau ~f$
8. Mitki Khqi f~~
24 Mithrau l'.hara~ lfToU''' "Rlcn
JJ Mithrau Mangliyonwali fi:!~ IIt~~I~
10 Mithrau Mochiyonwala tIi;06i ai):oft~)"1f~
85 Mugul Mataljanwali ijlRJ a«I0~~ wt
43 Mukne-ka-Tala ij<R CfiT ~r
34 Murajanwala 8Ullotcrr01
95 Murar
5~ 149 Myajlar
~~~~f{
19B
VILLAGE OluerORY-CQ",d.
Distance in miles from nearest
~e.. =t
'1.1 tcQ
4 5
.~ t: o
l 6
115 115 213 143
85 85 J83 J13
86 86 174 114
80 80 178 108
Bj 24 24 150 24
66 86 184 124
Bj 4 4 126 4
85 85 183 1~3
W 14 14 84 14
97 97 195 125
..... 100 100 188 128
93 93 181 121
Unpopulated
1~ 120 218 148
94 94 192 122
Unpopulated
76 76 174 104
105 105 183 123
50 50 148 78
Bj 0 46 48 48
115
86
80
24
86
4
85
3
97
100
93
I~O
94
76
lOS
50
48
8
115
85
86
80
24
86
4
85
14
97
100
93
120
94
76
)'05
so
46
Code No. 41 Name of Villap
1
SAM TEHSIL-contd.
51 Nawatala ~crr~
88 NicbuwaJi
~ 55 Nijau
ftf~a; 116 Nimba f~
]]2 Pataliya qm~r
60 PatalwaJi qr~
$9 Pb,adalwali 'fil~~
136 Phaleri 'f.~
147 Phooliya ~~T
3 PhootawaU 'i~Ti5'l
10 Pitau fqu~
132 Pochhina .mitot,
S2 Rabblau Fakironwala ~r~ra:
'Ifi'i1U",,~ 98 Rabhlau
Rajronwala ~rq;;na;
U~ot<m5r 126 Rahu-ka-Par
~~ 'it ql{ 74 Rato ~
6 Ratrau {ana;
64 ReIna ~Wirr
38 Sager ~{
J 22 Sagron-ki-Basti ~~U~ <i) ~,~
106 Salkha v\lSQlr
Distance in miles from nearest
.~ t: o
! 6 8
65 65 153 83 65 65
Unpopulated
100 100 187 128 100 100
Bj 9 9 134 9 9 9
UnpOpulated
Bj 14 14 75 14 14 14
Bj 10 SO 50 SO SO "
UDpopuhted
86 86 184 114 86 86
Bj 0 32 54 S4 32 32
S5 55 153 83 55 SS
Bj 12 12 80 12 12 12
Unpopulated
113 113 211 141 113 113
Unpopulated
Unpopulated
Bj 4 4 130 4 4 4
Bi 4 10 90 20 4 10
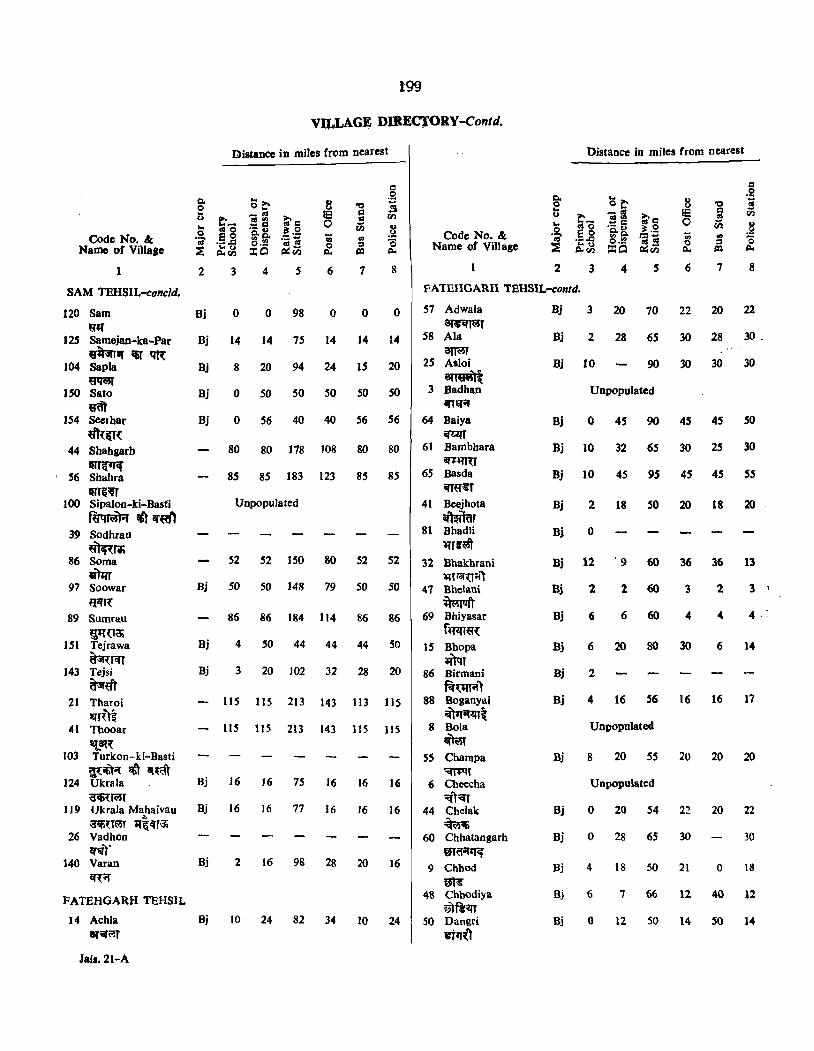
t99
VIJ"LAG~ DlltECJORY-Contd.
Code No. &; Name of Villaae
1
SAM TEHSIL-conc/d.
120 Sam
"'f 125 Samejan-ka-Par
vit:snll' lif tm: 104 SapIa ~
150 Sato v<'it
154 SeeJhar ~{{T(
44 Shahgarh
f8'J'&fJ~ , 56 Shahra
f8'flI'Yr 100 Sipalon-ki-Basti ~ !fit ifE<f1
39 Sodhrau ~~fii
86 Soma vTm
97 Soowar
a·m: 89 Sumrau
~1f{1i3i 151 Tejrawa
~rcH 143 Tejsi
~it
Distance in miles from nearest
2 3 4 5
.... .. ~ 6
Bj 0 0 98 0
Bj 14 14 75 14
Bj 8 20 94 24
Bj 0 50 50 SO
Bj 0 56 40 40
80 80 178 108
85 85 183 123
Unpopulated
52 52 150 80
Hj SO SO 148 79
'0 !=: tIS
til .. ::s ~
1 8
o 0
14 14
15 20
SO 50
56 56
80 80
85 8S
52 52
SO SO
86 86 184 114 86 86
Bj 4 SO 44 44 44 50
Bj 3 20 J02 32 28 20
21 Tharoi 115 115 213 143 113 115 I!lrit~
41 Thooar liS 115 213 143 115 115
'1..8H: 103 Turkon-ki-Basti
~~i{ ~ ilmft 124 Ukrala Bj]6]6 75 16 16 ]6
~{(i5T 119 UkraJa Mahaivau Bj 16 16 77 16 16 16 ...
~{Twr II&: crr;,j 26 Vadhon
l(!;lT'
140 Varan Bj 2 16 98 28 20 16 l({Of
FATEHGARH TEHSIL
14 Achla 8f",~r
Jais.21-A
Bj 10 24 82 34 10 24
Code No. &; Name of Village
Distance in miles from nearest
2
fATEHGARH TEHSIL-contd.
3 4 5 6 7 8
S7 AdwaJa aJfllWT
58 Ala
arrwr 25 Asloi
atT~ 3 Badhan
I(Jl:Tif
64 Baiya ~
61 Bambhara il'i~
6S Basda ifT~~f
41 Beejhota oftWar
81 Bhadli ~nr~
32 Bbakhrani ~TlOf~il1
47 Bbelani i\'~f!Jft
69 Bhiyasar fi'RT{l'~
15 Bhopa ~)qr
86 Birmani f.mn'iI)
88 Boganyai ~ .. ~nt
8 Bola ~
S5 Champa ~T
6 Cheecha :q'l:qr
44 Chelak ~~
60 Chhatangarh m6il~
9 Chhod m;g
48 ChbOdiya ~~~
SO Dangri .. tq()
Bj
Bj
Bj
Bj
Bj
Bj
Bj
Bj
Bj
Bj
Bj
Bj
Bj
3 20 70 22
2 28 65 30
10 90 30
Unpopulated
o 4S 90 45
10 32 65 30
10 45 95 45
2 18 50 20
o
12 . 9 60 36
2 2 60 3
6 6 60 4
6 20 80 30
2
20 22
28 30 .
30 30
45 so
25 30
45 55
18 20
36 13
2 3 1
4 4,:
6 14
Bj 4 16 56 16 16 17
Unpopulated
Bj 8 20 SS 20 20 20
Unpopulated
Bj 0 20 S4 2:! 20 22
Bj 0 28 65 30 30
Bj 4 18 50 21 0 18
Bj 6 7 66 12 40 12
Bj o 12 SO 14 SO 14
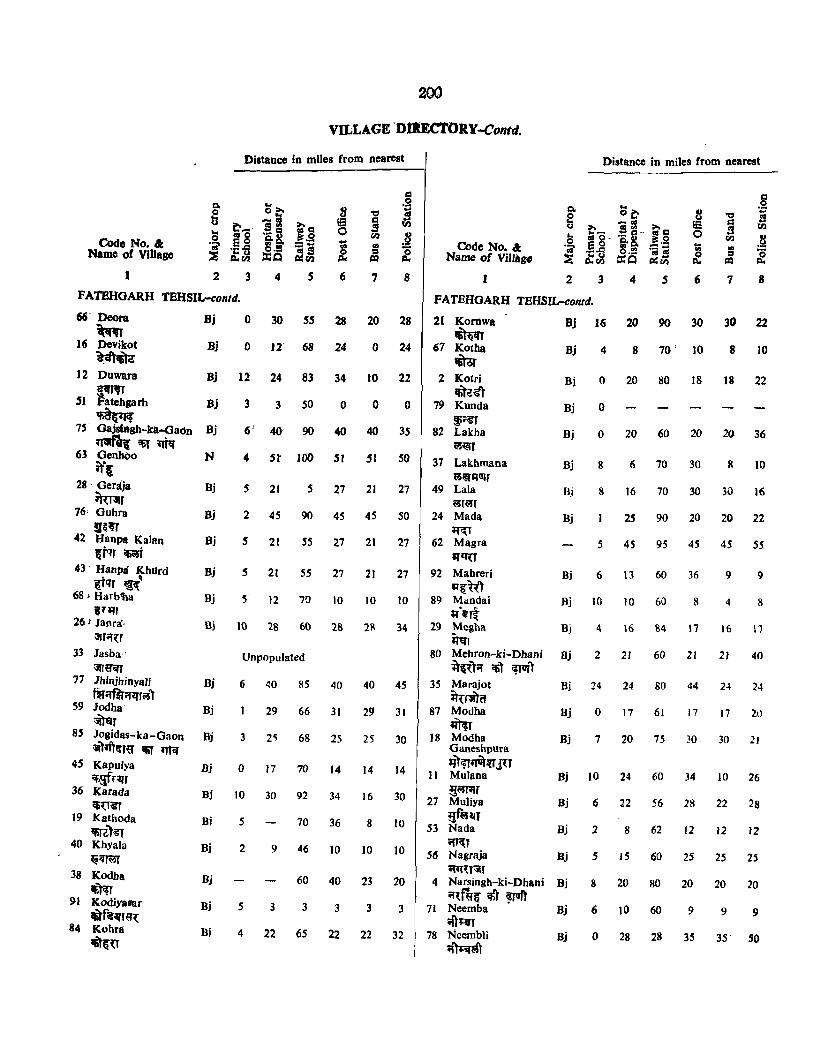
VILLAGE'DllEC'tORY-Contd.
Distance in miles from nearest Distance in miles from nearest
Code No. &: Name of Village
2 1
FATBHGARH
66-Deora mr
TEHSIL-contd.
16 Devikot ~~i!
12 Duwara
51 ra:garh 'fi8~
Bj
Bi
Bj
Bj
75 Ga_gh-ka-Gaon Bj
~ ~ tri<t 63 OenbOo
it;: N
28 Gerlija Bj ~~
76,' Guhra Bj
I~~ 42 Hanpa Kalan Bj
(T'lr ;af 43 - Hanp. Khdrd Bj
WIn ~' 68 ' Harblla Bj
InfJ 26 J Janrli' Bj
;jjTf'fU 33 Jasba"
;jjraorr 77 Jhinjlrinyali Bj
mctfiliP-JfiiS1 S9 Jodha' Bj ~T
85 Jogidas-ka-Gaon Bj ~)lfiltr« 'liT qfq-
45 Kapulya Hj iif.${~,
36 Karada Bj 'Ii~;g-,
19 Kathoda Bi 'IiT~,gJ
40 Khyala Bj ~~~
38 Kodha Bj Itm
9) Kodiyasar Bj Ititnr;rrGt
84 Kohra Bj
"'{U
o 30 55
o J2 68
12 24 83
3 3 50
6' 40' 90
4 51' 100
5 21 5
2 45 90
5 21 5S
5 21 5S
5' 12 70
10 28 60
Unpopulated
6 40 R5
29 66
3 2~ 68
o 17 70
10 30 92
5 70
2 9 46
60
533
4 22 65
28
24
34
o
40
51
27
45
27
27
10
28
40
31
25
14
34
36
10
40
3
22
Code No. &: Name of Village
7 8 I 2 3 4 5 6 7 8
FATEHGARH TEHSIL-contd.
20 28 2( Korowa Bj 16 20 'Ii~
30 22 90 30
o 24 67 Kotha Bj 4 8 m 70 ' 10 8 10
10 22 2 Kotri Bi 0 20 80 18 18 22 'fit<!~
o o 79 Kunda Bj 0
40 35 i~
82 Lakha Bj 0 20 60 20 20 36 w~,
51 so 37 Lakhmana Bj 8 6 70 30 8 10 0~qCJlf
21 27 49 La)a Bj 8 16 70 30 30 16 iiSfiiSf
45 50 24 Mada Bj 25 90 20 20 22 ~t
21 27 62 MagTa 5 4S 9S 4S 45 5S Il"U
21 27 92 Mabreri Hj 6 13 60 36 9 9 A&W
10 89 Mandai Hj)O 10 60 8 4 8 Il'~rt
10
211 29 Megha Bj 4 16 84 17 16 17 it~1
34
80 Mehron-ki-Dbani Bj 2 21 60 21 21 40 ~tUif 'Ii) <;lQJ1
40 3S Marajot Bj 24 24 80 44 24 24
~f~" 4S
29 87 MOdha Bj 0 17 61 17 17 20 Ift<;T
31
25 18 Modha Bj 7 20 75 30 30 21 Oaneshpura
30
14 q)ifl<Jit~JU
11 Muhma Bj 10 24 60 34 10 26 14
16
8
~r 27 Muliya Bj 6 22 56 28 22 28
ijr~lI' 53 Nada Hj 2 8 62 12 12 12
30
10
10 ~Ti'(l
56 Nagraja Bj 5 15 60 25 25 25 10
iPlU~f 23 20
3
4 Narsingh-ki-Dhani Bj 8 20 80 20 20 20 iu:flr( lJft ~
71 Neemba Bj 6 }O 60 9 9 9 ;(};.r
3
22 32 78 Neembli Bj 0 28 28 35 3S' SO ",,",toft
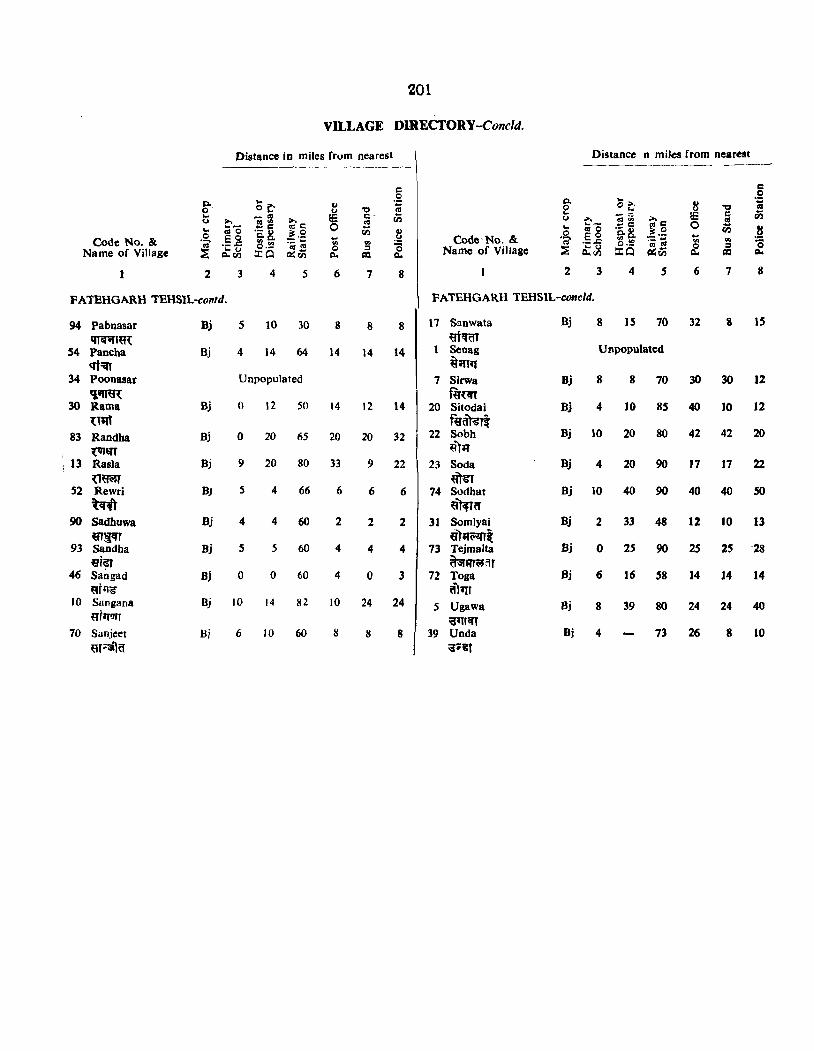
201
VILLAGE DlRECfORY-Concld.
Distance in miles frum nearest Distance n miles from nearest -----~~------- _---
j::; .g o~
.S2 g. ... g. u co o t, 8 '1:1 co 0 u '1j .. _'" 15 c- ril .. - '" !E I: ri5 u ;... os'" ;... os u "" «I'" ""c: 5 «Ie 0 .. - .~ 5 0 .. ... - :~ 5 ri5 .. tUO ~.:: en .§ «1O ~.g U 0 0 EO e.e. ... u Code'No. & EO Poe. ...
Code No. & .(;' ~.~ '" '" ~ ';;' ._ .c: ~.!! 0::.,..
'" ",
'0 ._ .c: tUtU 0 ::s Name of Village ~ "u <IS'" ~
::s Name of Village ::E ... u ::to o=:ril c..(Il ::to ~ri5 = c.. Q..(Il a.. = a..
1 2 3 4 S 6 7 8 2 3 4 5 6 7 8
FATEHGARH TEHSIL-contd. FATEHGARH TEHSIL-concld.
94 Pabnasar Bj 5 10 30 8 8 8 17 Sanwata Bj 8 IS 70 32 8 15
1JTiI'iI1~ ij'f"l'fflT 54 Pancha Bj 4 14 64 14 14 14 Senag Unpopulated
qf'ifr ~;JHl 34 Poonasar Unpopulated 7 Sirwa Bj 8 8 70 30 30 12
q;u~ m{iIl 30 Rama Bj 0 12 SO 14 12 14 20 Sitodai Bj 4 10 85 40 10 12
~lqt fVftm{ 83 Randha Bj 0 20 65 20 20 32 22 Sobh Bj 10 20 80 42 42 20
I {VI1ilT ~T~ " 13 Rasia Bj 9 20 80 33 9 22 23 Soda Bj 4 20 90 J7 17 22
~~ ~ 52 Rewri BJ 5 4 66 6 6 6 74 Sodhat Bj 10 40 90 40 40 50 ~ ~mCf
90 Sadhuwa Bj 4 4 60 2 2 2 31 Somlyaj Bj 2 33 48 12 to 13
93 eTWfr Sandha Bj 5 5 60 4 4 4
~lIr(i:lJlt 73 Tejmalta Bj 0 2S 90 2S 25 28
~j~ ~~;JAr 46 San gad Bj 0 0 60 4 0 3 72 Toga Pj 6 16 58 14 14 14
~tl1;g- tfl;rr JO Sangana Bj 10 14 82 10 24 24 5 Ugawa Bj 8 39 80 24 24 40
qrlTwr :otlr<{T 70 Sanjeet Bj 6 10 60 8 8 8 39 Unda Bj 4 73 26 8 10
erra10 ~;Cf


SOME OFFICIAL STATISTICS

205
SOME OFFICIAL STATISTICS
(Note)
Presented in this section are some tables relating to statistics collected from various official agencies~ They cover subjects like rainfalI, land utilisation, area and production under crops, irrigational facilities, livestock, agricultural implements and power. Information about consumption of intoxicants, educational and medical
Jail. 22
facilities, motor vehicles, progress of co-operative societies, development blocks and panchayat samities is also given in this section. A Jist of fairs celebrated in the district and the data relating to the electoral participa. tion and preferences for the first two general elections also form a part of this section.
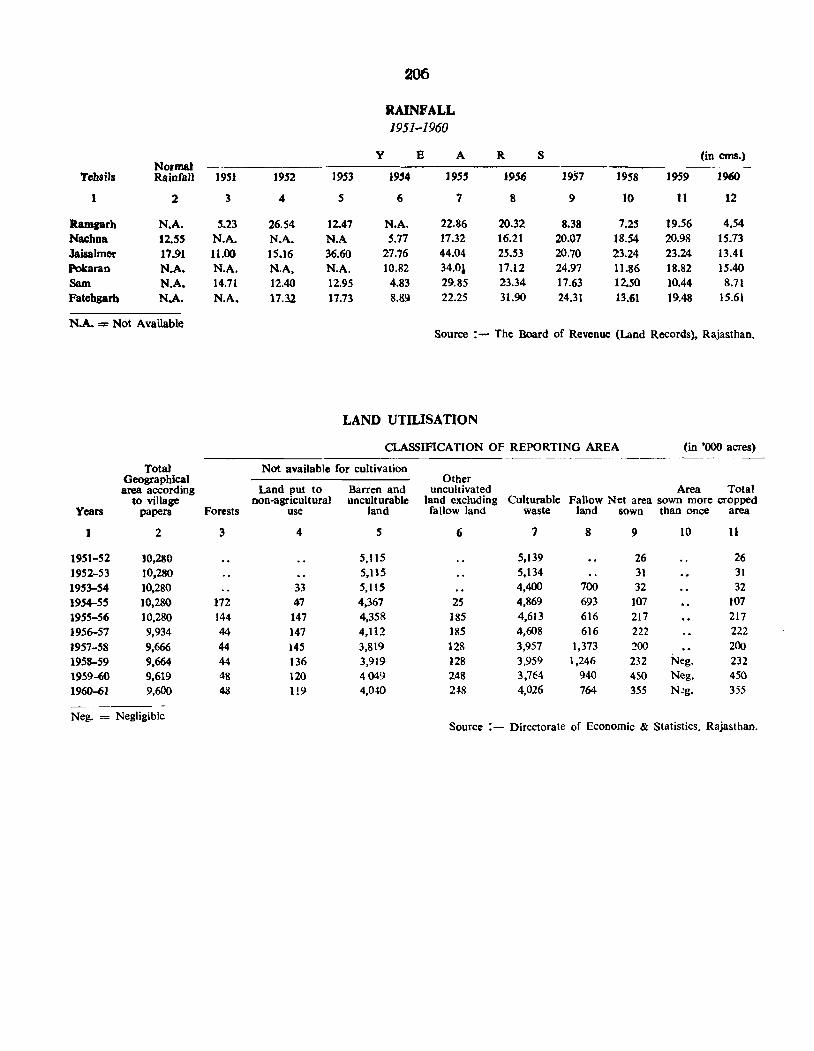
206
RAINFALL /951-1960
Y B A R S (in ems.) Normal
Tehsils RainfalJ 1951 1952 1953 19'4 1955 1956 1957 1958 1959 1960
I 2 3 4 5 6 7 8 9 10 11 12
Ramgarh N.A. S.23 26.54 12.47 N.A. 22.86 20.32 8.38 7.25 19.56 4.54
Nacbna 12.55 N.A. N.A. N.A 5.77 17.32 16.21 20.07 18.54 20.98 IS.73 Jaisalmer 17.91 11.00 15.J6 36.60 27.76 44.04 25.53 20.70 23.24 23.24 13.41
Pokaran N.A. N.A. N.A, N.A. 10.82 34.01 17.12 24.97 11.86 18.82 15.40
Sam N.A. 14.71 12.40 12.95 4.83 29.85 23.34 17.63 12.5() 10.44 S.7l Fatebgarb N.A. N.A. 17.3.2 17.73 8.89 22.25 31.90 24.31 13.61 19.48 15.61
N.A. = Not Available Source :- The Board of Revenue (Land Records), Rajasthan.
LAND UTILISATION
CLASSIFICATION OF REPORTING AREA (in '000 acres)
Total Not available for cultivation Geographical Other area according Land put to Barren and uncultivated Area Total
to viIlage non-agricultural unculturable land excluding Culturable Fallow Net area sown more cropped Years papers Forests use land fallow land waste land sown than once area
I 2 3 4 5 6 7 8 9 10 11
1951-52 10,280 5,115 5,139 26 26
1952-53 JO,280 5,1l5 5,134 31 31
1953-54 10,280 33 5,115 4,400 700 32 32
1954-55 JO,280 172 47 4,367 25 4,869 693 107 107
1955-56 10,280 144 147 4,358 185 4,613 616 217 217
1956-57 9,934 44 147 4,112 IR5 4.608 616 222 222
1957-58 9,666 44 145 3,819 128 3,957 1,373 200 200
1958-59 9,664 44 136 3,919 128 3,959 1,246 232 Neg. 232
1959-60 9,619 48 120 4049 248 3,7E4 940 450 Neg. 450
1960-61 9,600 48 1!9 4,O.w 2-l8 4,026 764 355 N~g. 355
Neg. = Negligible Source :- Directorate of Economic & Statistics, Rajasthan.
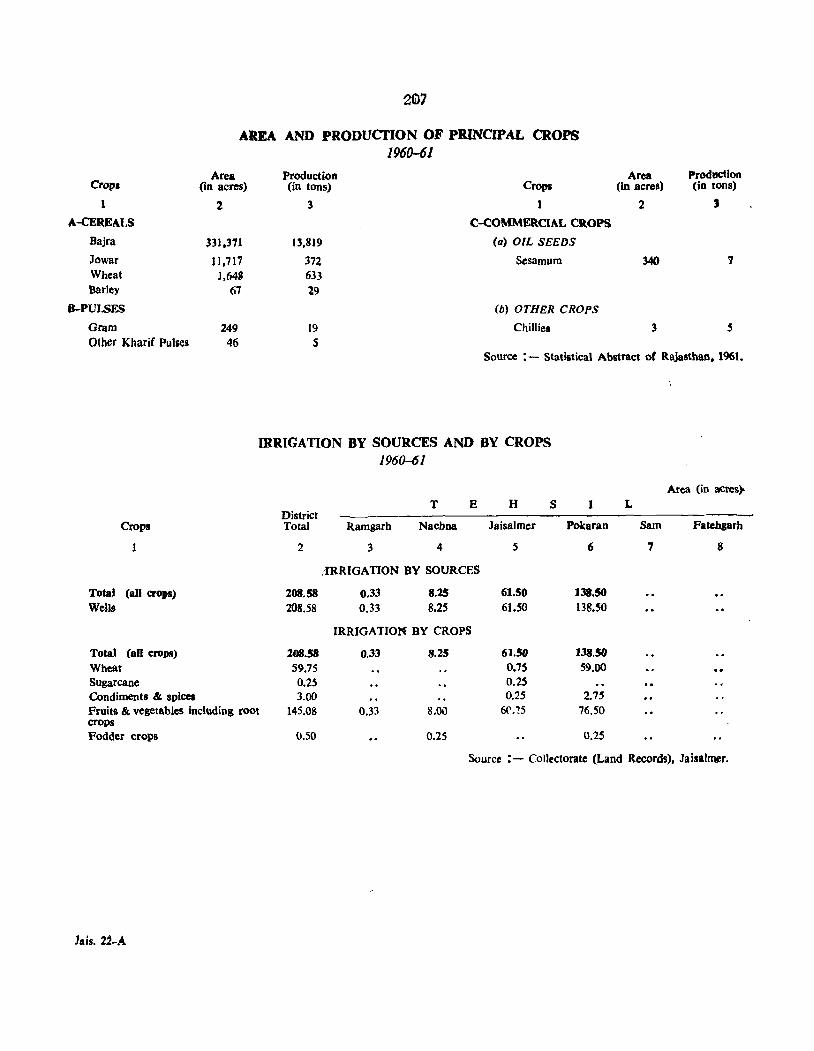
Crop.
1
A-CEREALS
Bajra
Jowar Wheat Barley
B-PULSES
Gram Other Kharif Pulses
AREA AND PRODUCI'ION OF PRINCIPAL CROPS 1960-61
Area Production (in acres) (in tons) Crops
2 3 1
C-COMMERCIAL CR.OPS
)3] .311 ]3,819 (a) OIL SEEDS
n,711 372 Sesamum 1,648 633
67 29 (b) OTHER CROPS
249 19 Chilliel 46 S
Area Production (in acres) (in tons)
2 ,
340 7
3 5
Source :- Statistical Abstract of Rajasthan. 1961.
IRRIGA nON BY SOURCES AND BY CROPS 1960-61
Crops
1
Total <all crops)
Well'
Total (an croJIR) Wheat Sugarcane Condiments '" spices Fruits & vegetables including roOt crops Fodder crops
District Total
2
208.58 208.58
208.58 59.75 0.25 3.00
145.08
0.50
T E
Ramgarh Nacbna
3 4
,iRRIGATION BY SOURCES
0.33 0.33
8.25 8.25
IRRIGATIOM BY CROPS
0.33 8.25
0.33 8.00
0.25
H S
Jaisalmer
5
61.50
61.50
6].50 0.75 0.25 0.25
6{'. '25
Area (in acres)-
I L
Pokaran Sam Fatehgarh
6 7 8
138.50 138.50
138.50 59.00
2.75 76.50
0.25
Source :- Collectorate (Land Records), Jaisallller.
Jais. 2.2-A
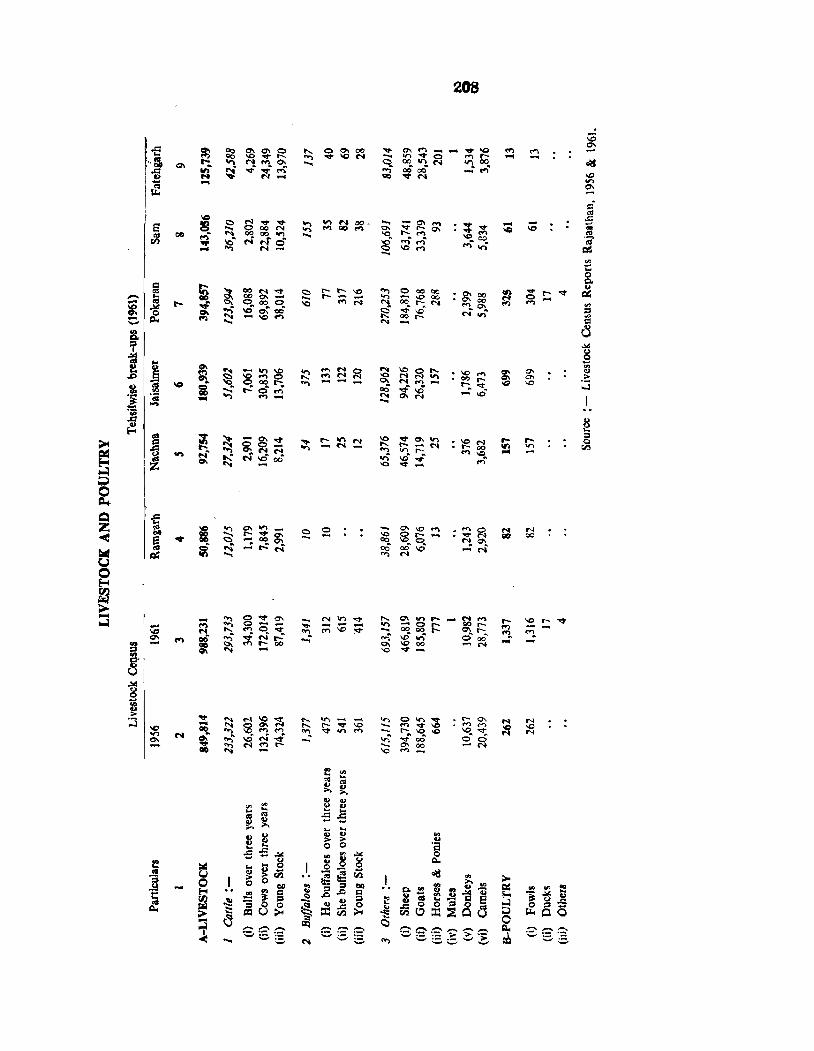
c
j
I .~ ....
-~ -
\CO on 0\ -
I ..
....
.!l "3 IX!
on ..... co o ....
c ....
..., --.,) -'0
208
-\0
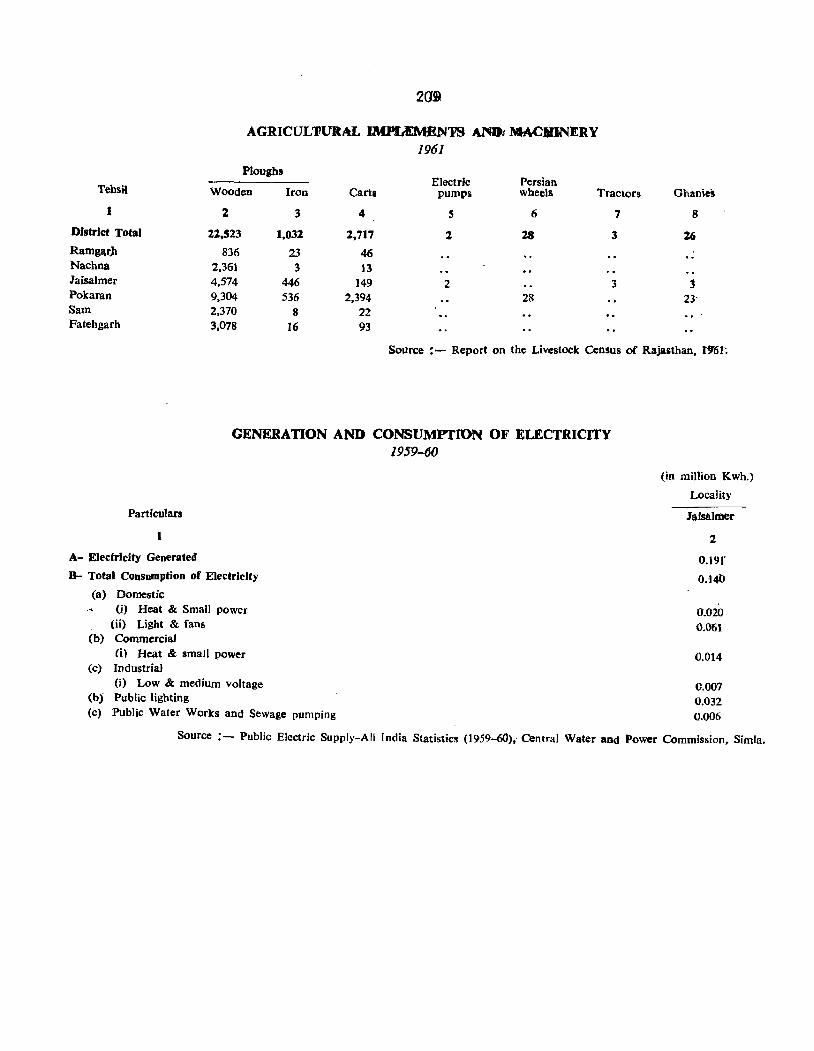
20J
AGRICUL'PUltAL 1l\IPM:M.RN'PS A.ND; MACIIINJ!:RY 1961
Ploughs Electric Persian
Tehsil Wooden Iron Carts pumps wheels Tractors Ghanics
1 2 3 4 S 6 7 8
District Total 22,523 1,032 2,717 1 28 3 26 Ramgllrp 836 23 46 Nachna 2,361 3 13 Jaisalmer 4,574 446 149 2 3 l Pokaran 9,304 536 2,394 28 23-Sam 2,370 8 22 Fatehgarh 3,078 16 93
Source :- Report on the Livestock Census of Rajasthan, f9'61:
Particulars
I
A- Electricity Generated
GENERATION AND CONSUMPTION OF ELECTRICITY 1959-60
B- Total Consumption of Electricity
(a) Domestic (i) Heat & Small power
(ii) Light & fans (b) Commercial
(i) Heat & small power (c) Industrial
(i) Low & medium voltage (b) Public lighting (c) Public Water Works and Sewage pumping
(in million Kwh.)
Locality
Jaisalmer
2
0.19r
0.140
0.020 0.061
0.014
0.007 0.032 0.006
Source :- Public Electric Supply-All India Statistics (1959-60), Central Water and Power Commission, Simla.
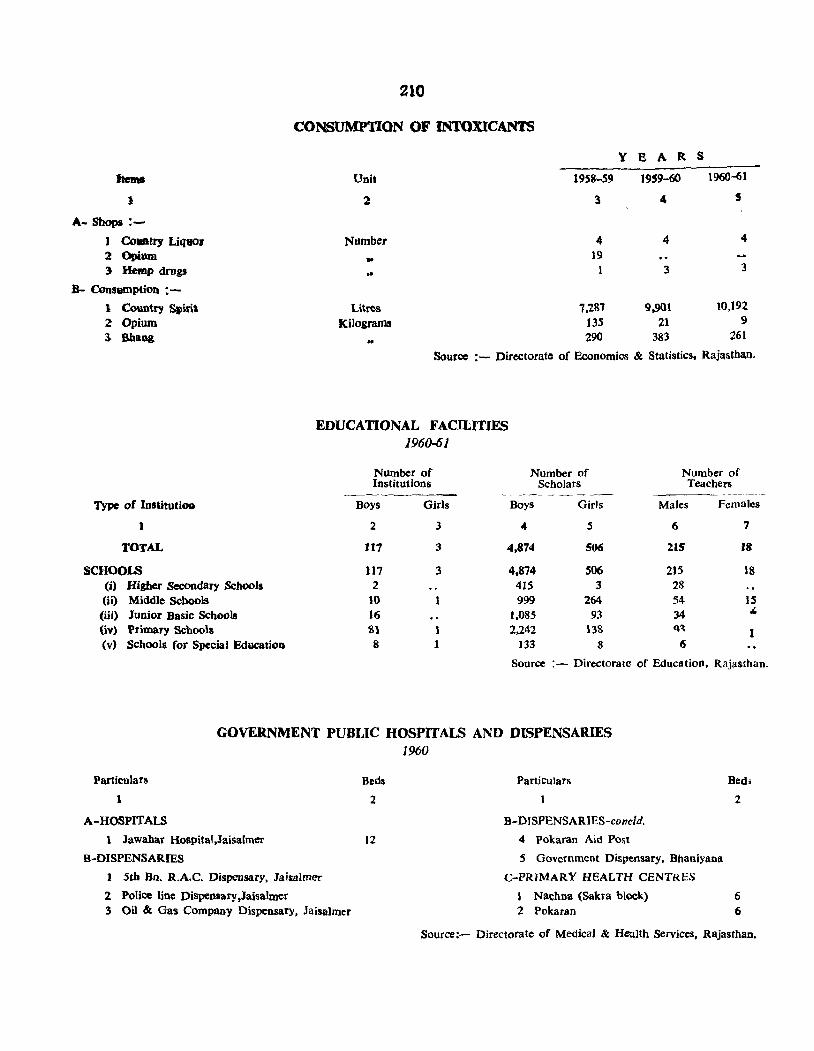
Items
I
A- Shops :-
I Co_try LiqtlO' 2 Opilllll 3 Hemp drugs
B- Cons8l1lption :-
1 Country Spml 2 Opium 3- Bhang
Type of InstitutiOD
1
TOTAL
SCHOOLS (i) Higher Secondary Schools (ii) Middle &;bools (iii) Junior Basic Schools (iv) Primary Schools (v) Schools for Special Education
210
CONSUMPTION OF INTOXICANTS
y B A R S
Unit 1958-59 1959-60 1960-61
2 3 4 5
Number 4 4 4 .. 19 3 3 ..
Litres 1.28'7 9,901 10,192
Kilograms J35 21 9
.. 290 383 261
Source :- Directorate of Economics & Statistics. Rajasthan.
EDUCATIONAL FACILITIES 196()..6}
Number of Institutions
Boys Girls
2
Number of Scholars
Boys Girls
.. S
U7
3
3 4,874 506
117 2
]0
16 81 8
3
1 1
4,874 506 415 3 999 264
1.085 93 2.242 138
133 8
Number of Teachers
---~.----
Males Females
6 7
215 18
215 18 28 54 15 34 " Q' I
6
Source :- Directorate of Education, Rajasthan.
GOVERNMENT PUBliC HOSPITALS AND DISPENSARIES 1960
Particulars
I
A-HOSPITALS
1 Jawahar HospitaI.Jaisatmer
B-DISPENSARIES
1 Sth Bn. R.A.C. Dispensary, Jai$llimer
2 Police line Dispensary,Jaisalmer 3 Oil &; Gas Company Dispensary, JaisaJmer
Beds
2
12
Particulars
B-DISPENSARIES-conc/d.
4 pokaran Aid Post
5 Government Dispensary, Bhaniyana
C-PRJMARY HEALTH CENTRES
I Nachos (Sakra block) 2 Pokaran
Bedi
2
6 6
Source:- Directorate of Medical & Health Services, Rajasthan.
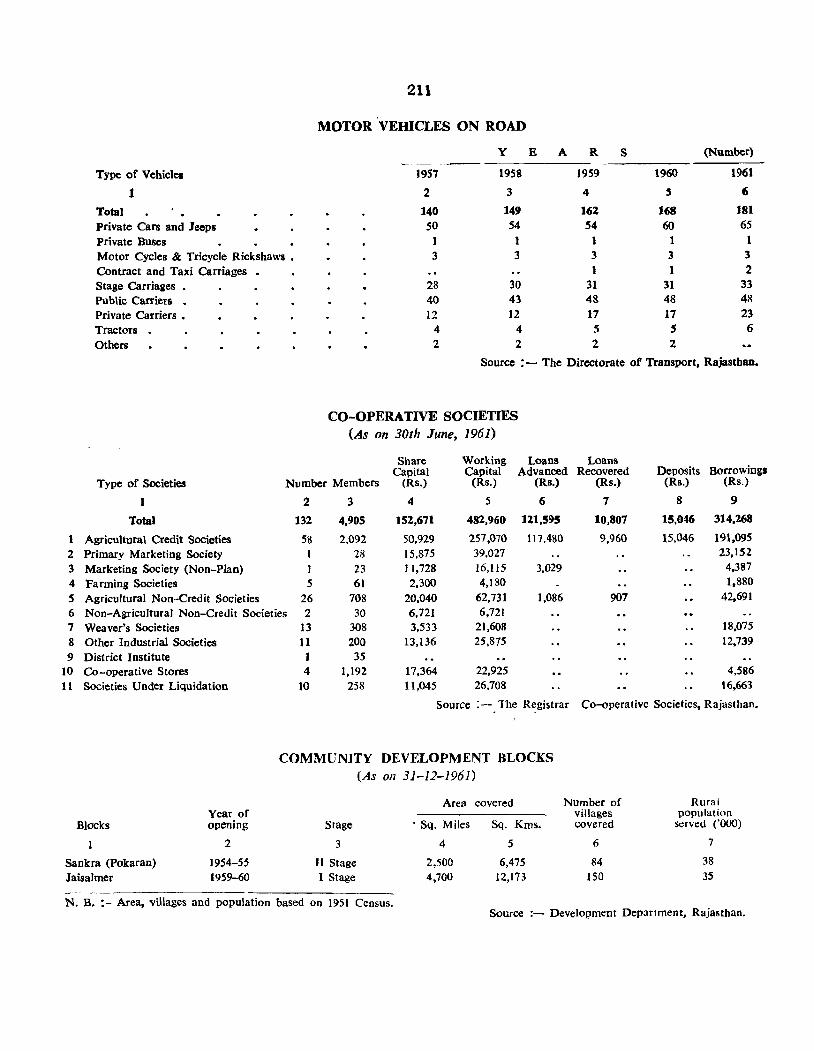
Type of Vehicles
1 Total Private Cars and Jeeps Private Buses Motor Cycles & Tricycle Rickshaws • Contract and Taxi Carriages Stage Carria&es • Public Carriers • Private Carriers • Tractors Othera
211
MOTOR VEHICLES ON ROAD
y B
J957 1958
2 3
140 149
50 54
1 1 3 3
28 30
40 43
12 12
4 4 2 2
A R S (Number)
1959 1960 1961
4 :; ., 162 168 181
54 60 65
1 1 1 3 3 3
1 1 2
31 31 33 48 48 48
17 17 23 5 S 6
2 2
Source : - The Directorate of Transport, Rajasthan.
1 2 3 4 5 6 7 8 9
10 11
CO-OPERATIVE SOCIETIES (As on 30th June, 1961)
Share Working Loans Capital Capital Advanced
Type of Societies Number Members (Rs.) (Rs.) (Rs.)
1 2 3 4 5 6
Total 132 4,905 152,671 482,960 121,595
Agricultural Credit Societies 58 2,092 50,929 257,Qi0 117.480
Primary Marketing Society 28 15,875 39.027
Marketiog Society (Noo-Plan) I 23 ] 1,728 16,115 3,029
Farming Societies 5 61 2,300 4,180
Agricultural Non-Credit Societies 26 708 20,040 62.731 1,086
Non-Agricultural Non-Credit Societies 2 30 6,721 6,721
Weaver's Societies Other Industrial Societies District Institute Co-operative Stores Societies Under Liquidation
13 308 3,533 21,608
11 200 13,136 25,875
1 35 4 1.192 17,364 22,925
10 258 11,045 26,708
Source : - . The R~gistrar
COMMUNITY DEVELOPMENT BLOCKS (As on 31-12-1961)
Loans Recovered Deposits Borrowings
(Rs.) (Rs.) (Rs.)
7 8 9
10,807 15,046 314,268
9,960 15,046 191.095 23,152
4,387 1,880
907 42.691
18,075
12.739
4,586 16,663
Co-operative Societies, Rajasthan.
Area covered Number of Rural
Blocks
1
Saokra (Pokaran) Jaisalmer
Year of opening
2
1954-55 1959-60
Stage
3
II Stage I Stage
N. B. :- Area, villages and population based 00 1951 Census.
. Sq. Miles
4
2,500 4,700
Sq. Kms.
5
6,475 12,173
villages covered
6
84 150
population served ('000)
7
38 3S
Source :- Development Department, Rajasthan.
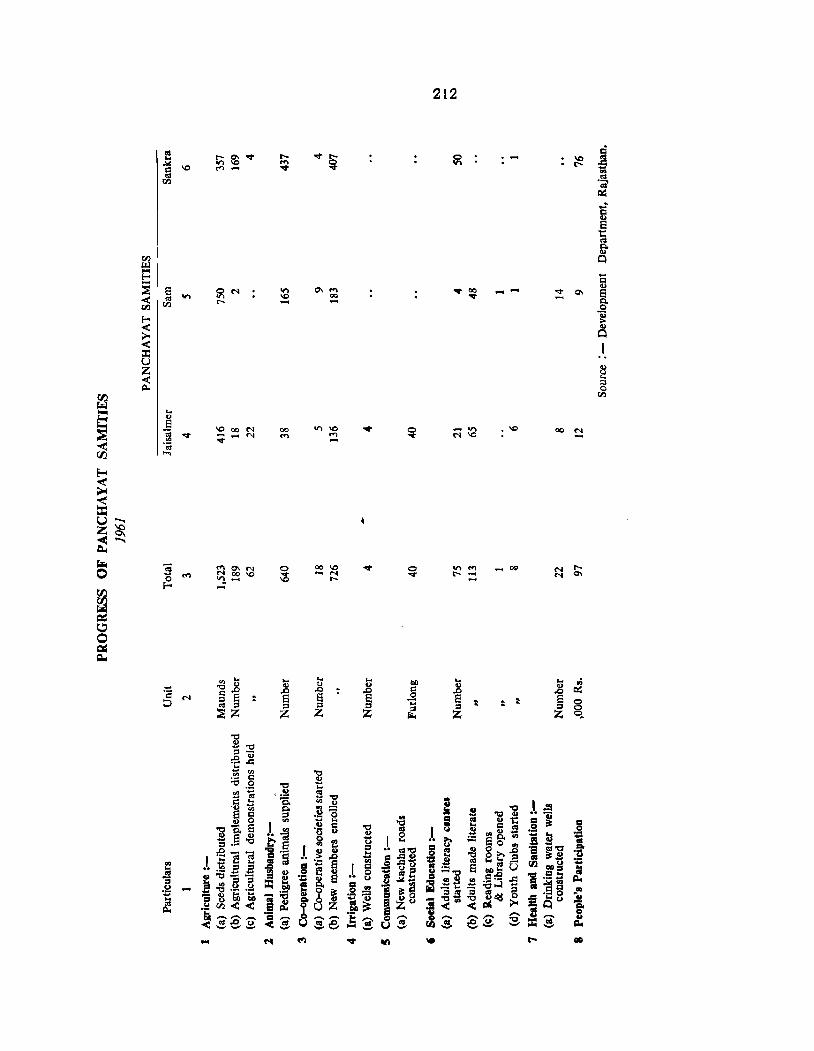
.,., \0 -
~ =' Z
00 IC -~ r--
....
212
--
00 ~ -
..
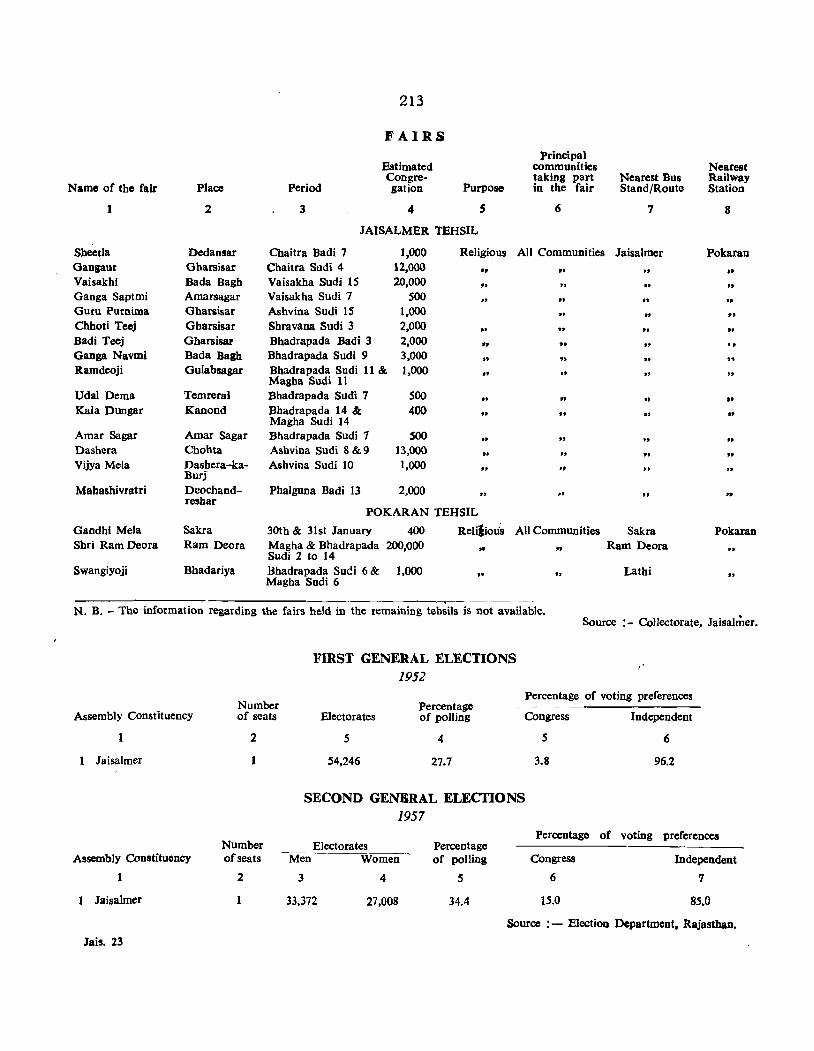
213
FAIRS Principal
Estimated communities Nearest Congre- taking part Nearest Bus Railway
Name of the fair Place Period gat ion Purpose in the fair Stand/Route StatioD
1 2 3 4 5 6 7 8
JAISALMER TEHSIL
Sheeda Dedansar Chaitra Badi 7 1,000 Religious AU Communities Jaisalmer Pokaran Gangaur Gharsisar Chaitra Sudi 4 12,000 . , .. .. .. Vaisakhi Bada Bagh Vaisakha Sudi 15 20,000
" " .. .. Ganga Saptmi Amarsagar Vaisakha Sudi 7 500 .. .. Guru Purnima Ghart.isar Ashvina Sudi IS 1.000 .. " .. Chhoti Teej Gharsisar Shravana Sudi 3 2,000 .. ., .. to
Badi Teej Gharsisar Bhadrapada Badi 3 2,000 . , , . " ..
Ganga Navmi Bada Bagb Bhadrapada Sudi 9 3,000 .. " .. ,. Ramdeoji Gulabsagar Bhadrapada Sudi 11 &
Magha Sudi 11 1,000 .. .. "
Udal Dema Tcmrerai Bhadrapada Sudi 7 500 .. .. , . II
Kala Dungar Kanond Bhadrapada 14 & 400 " .. " .. Magha Sudi 14
Amar Sagar Amar Sagar Bhadrapada Sudi 7 500 " t, .. Dashera Cbohta Ashvina Sudi 8 & 9 13,000 .. .. " " Vijya Mela Dashera-ka-
Burj Ashvina Sudi 10 1,000
" .. Mahashivratri Deochand- Phalguna Badi 13 2,000
reshar .. .. .. , .
POKARAN TEHSIL
Gandhi Mela Sakra 30th & 31st January 400 Relilious All Communities Sakra Pokaran Sbri Ram Deora Ram Deora Magha & Bhadrapada
Sudi 2 to 14 200,000 " " Ram Deora
Swangiyoji Bhadariya Bhadrapada SucH 6 & 1.000 Magha Sudi 6 " " Lathi ••
N. B. - The information regarding the fairs held in the remaining tehsils is not available. Source :- Collectorate. Jaisalmer.
Assembly Constituency
1
1 !aisalmer
Assembly Constituency
1
1 Jaisalmer
Jais. 23
Number of seats
2
Number of seats
2
1
FIRST GENERAL ELECTIONS 1952
Percentage of voting preferences
Electorates Percentage of polling Congress Independent
5
54.246
4
27.7
SECOND GENERAL ELECTIONS 1957
Electorates ~en VVODlen
3
33,372
4
27,008
Percentage of polling
5
34.4
5
3.8
6
96.2
Percentage of voting preferences
Congress
6
15.0
Independent
7
85.0
Source : - Election Department, Rajasthan.

SECTION IV
DISTRICT" TEHSIL MAPS

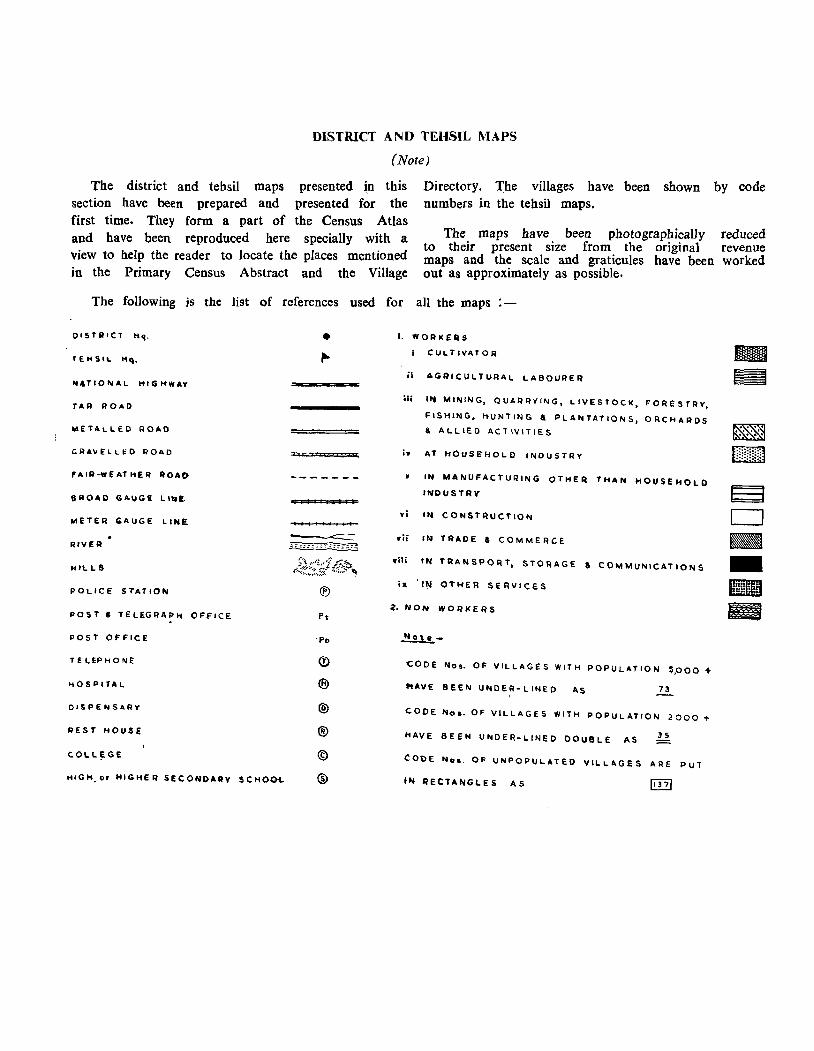
DISTRICT AND TEHSIL MAPS
(Note)
The district and tehsil maps presented in this section have been prepared and presented for the first time. They form a part of the Census Atlas and have been reproduced here specially with a view to help the reader to locate the places mentioned in the Primary Census Abstract and the Village
Directory. 'rhe villages have been shown by code numbers in the tehsil maps.
The maps have been photographicaUy reduced to their present size from the original revenue maps and the scale and graticules have been worked out as approximately as possible.
The following is the list of references used for all the maps
DISTRICT 1'1'1.
TEHSIL Hq.
",,,TIONAL HIGHWAY
TAR ROAD
METAI.LED ROAD
GRAVELLED ROAD
fAIA-WEATI1ER ROAl)
aAOAD GAUGE LUt!.
METER GAUGE LINE.
RIVER
HILLS
POLICE STATIO'"
POST I TELEGRAPH OFFICE
POST OFFICE
T E LEP HONE
1i0SPITAL
DISPEIIISARy
REST HOUSE
COLL~GE
HIGH.or HIGHEII SECOffOARV SCHOOi.
•
®
Pt
'Po
@)
®
©
®
I. WOAKEQS
CULT IVATOR
;1 AGRICULTURAL LABOURER
iii ' .. MINING, QUA-RRYING, LIVESTOCK, FORESTRY,
FISHING, HUNTING & PLAIIITATIOIIIS, ORCHARDS
& ALLIED ACTIVITIES
i. 4 T If 0 uS Eo'" 0 L D I III 0 U S TRY
• IN MA NUFAC T UR IN GOT HER T HA N HOUSE Ii 0 L 0
INDUSTRY
vi ,,. CONSTRUCTION
vii IN TRADE & COMMERCE
,Ui TN TRANSPORT, STORAGE a COMMUNICATIONS
ill HI OTHER SERVICES
~. NON WORKE RS
NOle _
'CODE Nos. OF VILLAGES WITH POPULATION ~.OOO +
.. AVE BEEN UNDER-LINED AS 73
(;OOE 111o •• OF VILLAGES WITH POPULATION 2000 +
HAVE 8EEN UNDER-LINED DOUBLE AS JS
CODE foiIos. OF UNPOPULATED VILLAGES ARE PUT
'''' RECTANGI.ES AS
E3 c=J ". .. Imnmll III
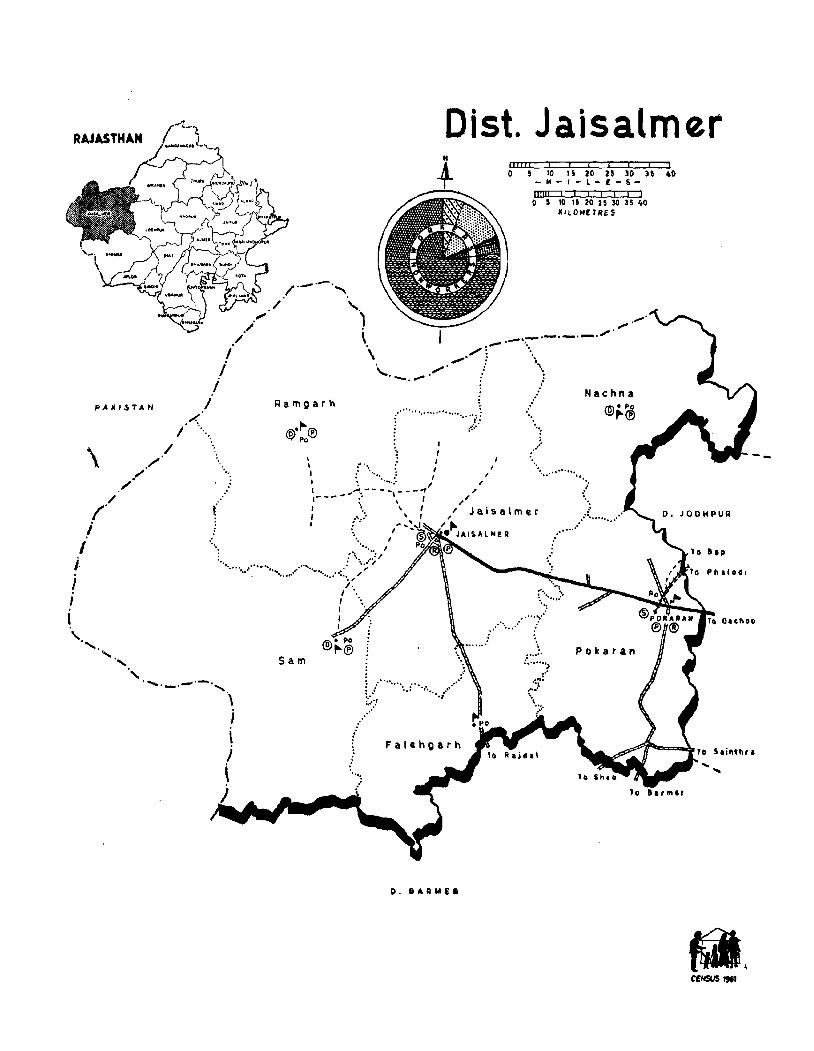
RAJASTHAN
PAKI$TAN
\
I i
.I /
"
/ ./
.;
/'_'-'" /' \.~
Dist. Jaisalmer
+ b""~ 1~ IS 20 U 30 n :0 -M-I-L-E-S-Olli! i I I I I I I o 5 10 15 20 25 30 3S 40
KILOMETRES
') \ _,...,.,_.- ....... _." . _. '.
Ramgarh
I \ 1
• I ,---, I •
\ /:. . ,_,: \ '- "",,' \ .......... "",-. ,:
.................. ........ .0: •• /.: "
": .,'
,.'
Nachna n;,' Po ~~®
I I I I I
, I'
............. ..... " ,/
" Jaisalmer
,,"" • JAISALMER .'
,/ .... l ... : ........... . .....
:\ ...... :::" I
.........•.......•.. ,. : ....• , .............................. ::. ","
I I
' . ...... ,,' "
......... -.~.-.,
" i \ I \ j
Sam
., /.
I • I I I ,
Fatehgarh
O. eARN,.
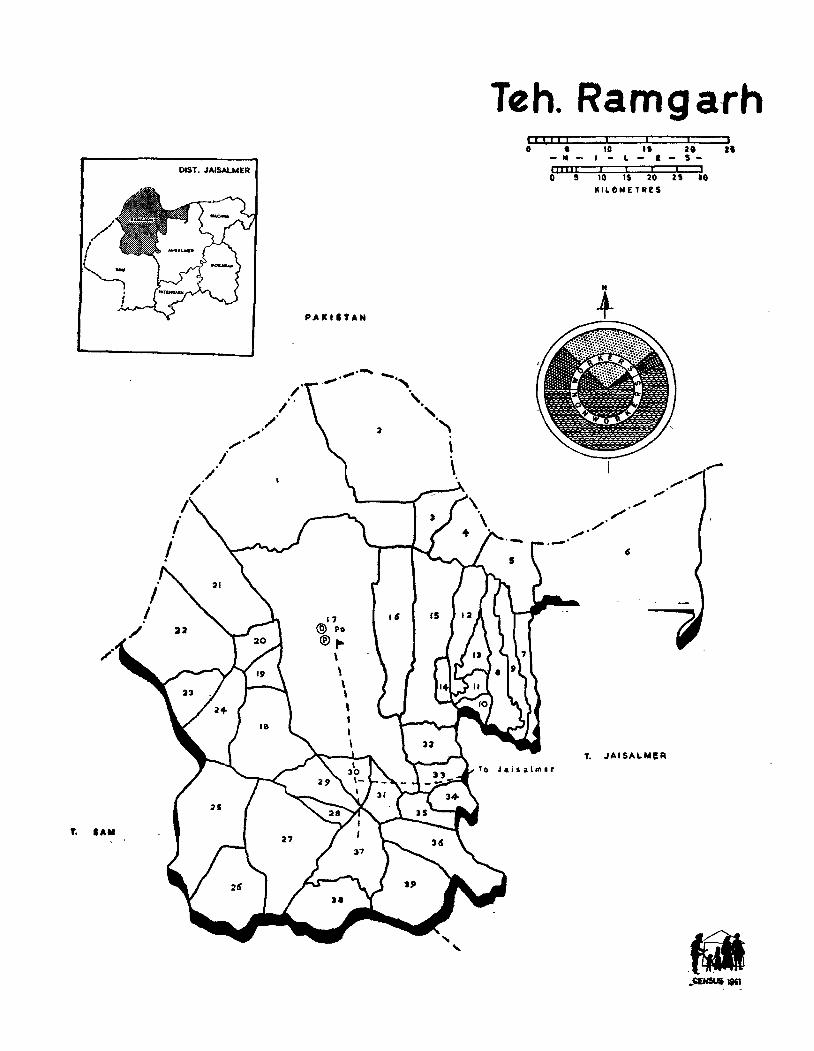
f. lAM
DlST. JAISALMER
I I
/
_,.' _,.' /
/ /
/' /. /"
PAICII'AN
Teh. Ramg arh « i , II I I I 0 • 10 " at It - 14 - f . L - I $ -
111111 I I I I 1 0 5 10 IS 20 25 '0
KILfll4E TAES
T. JAI$AI.MeR
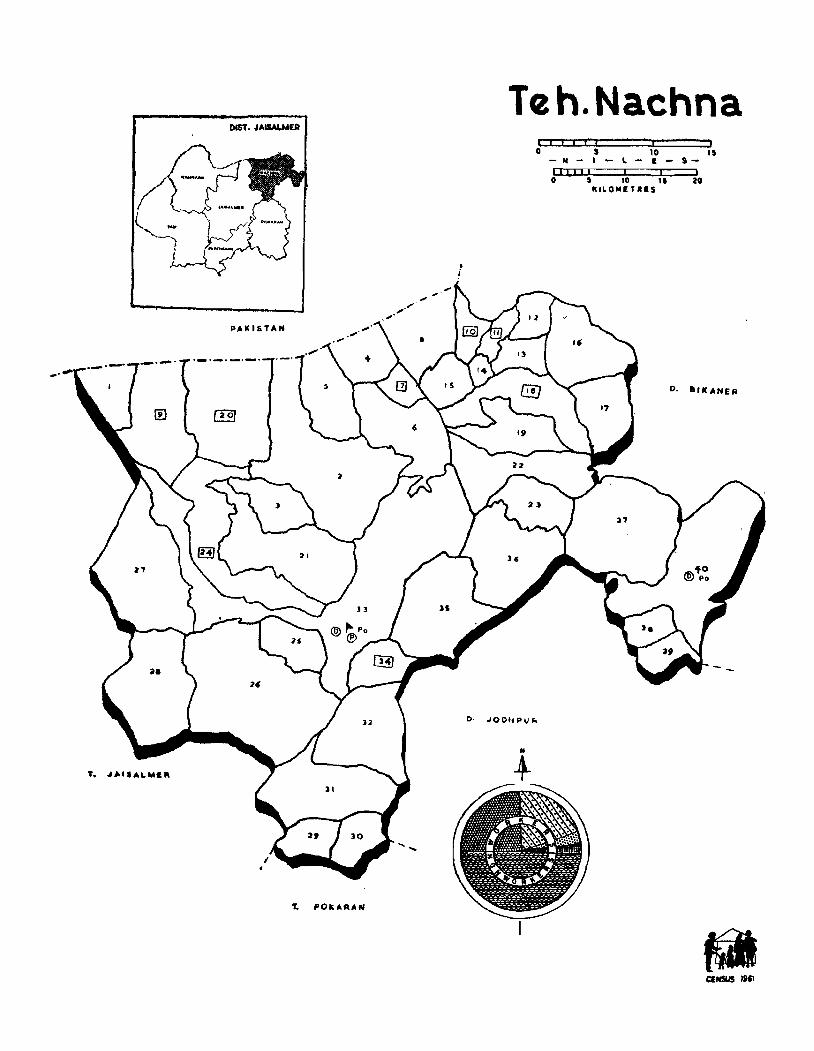
Teh.Nachna DIST. JAISA&.MER
5-I1I1 j, i. o I 10 I' 20
kiLOMETRES
• i
PAICISTAN
O •• 'IeANER
.lOOIiPVh
T. "AIIALMa"
....
T. POkAAAN
aNSUS lifl
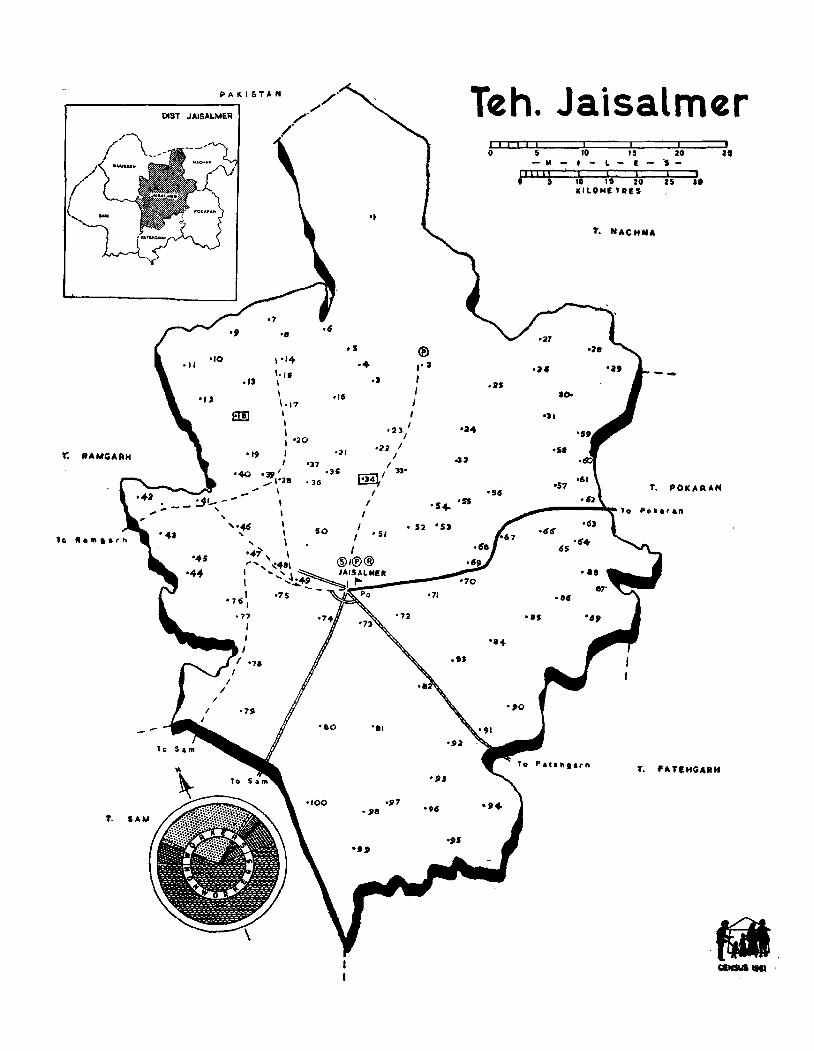
RAMGAAIi
'eo lI.ftI •• rh
f.
PAKISTAN
DlST JAiSALMER
"0
"2
",
of,
"
\".
1"5 \
\
1'17 , I I I '20
I I 'J7
-.tS
'40 ';Jp I '35 ..,., ,'3, • 36
\
I I I I \
50
'80
-'00
Teh. Jaisalmer
.5
'1
® -. ,,2
,J ,
I I I
'23 I I
-~2 I I
Emf I :n'
'24
.,a
'54- 'SS
'52 • S3 , 5,
-7,
,tiS
'I'
'9J
-97 • ,gl '9'
,,5 ·9,
o 5 -M
,.11 " o s
.as
'1'
oS,
'57
' .. -85
' ..
to 15 • - L - !
10 15 20 II!LOME TRES
1', HACHNA
20
a,
T. POKAR'"
1'. f'ATlHC;ltIlH
·Kdt.
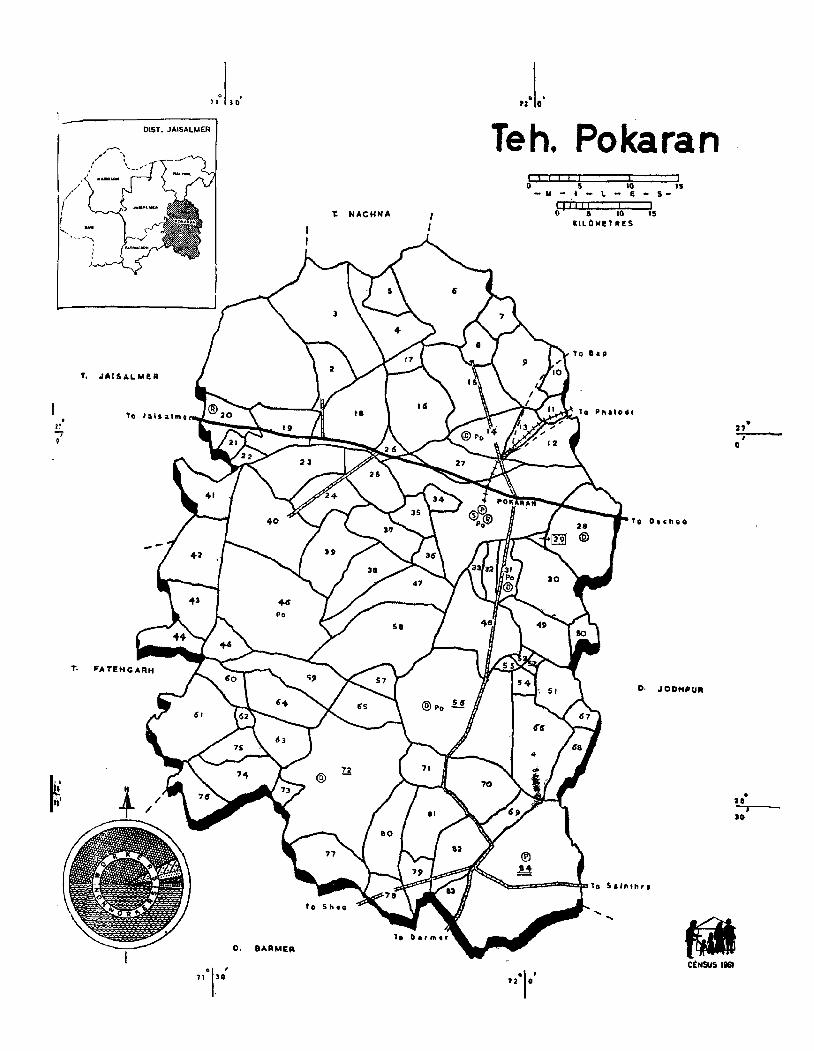
, 17
'(
h,' ftl
T.
DIST. JAISALMER
T. JAISALMI!R
D. lIAAM£R
't NACHNA 1 I
.1. 'a 0
Teh. Pokaran o 5 10 15 -1oI-~-L-E-S-
I I i I I I I o 5 10 15
IIILOMI!TIt!S
O. JODHPUR
• 27 I
o
• ae J
'0
fWI C£NSUS ••
12 0 ·1'
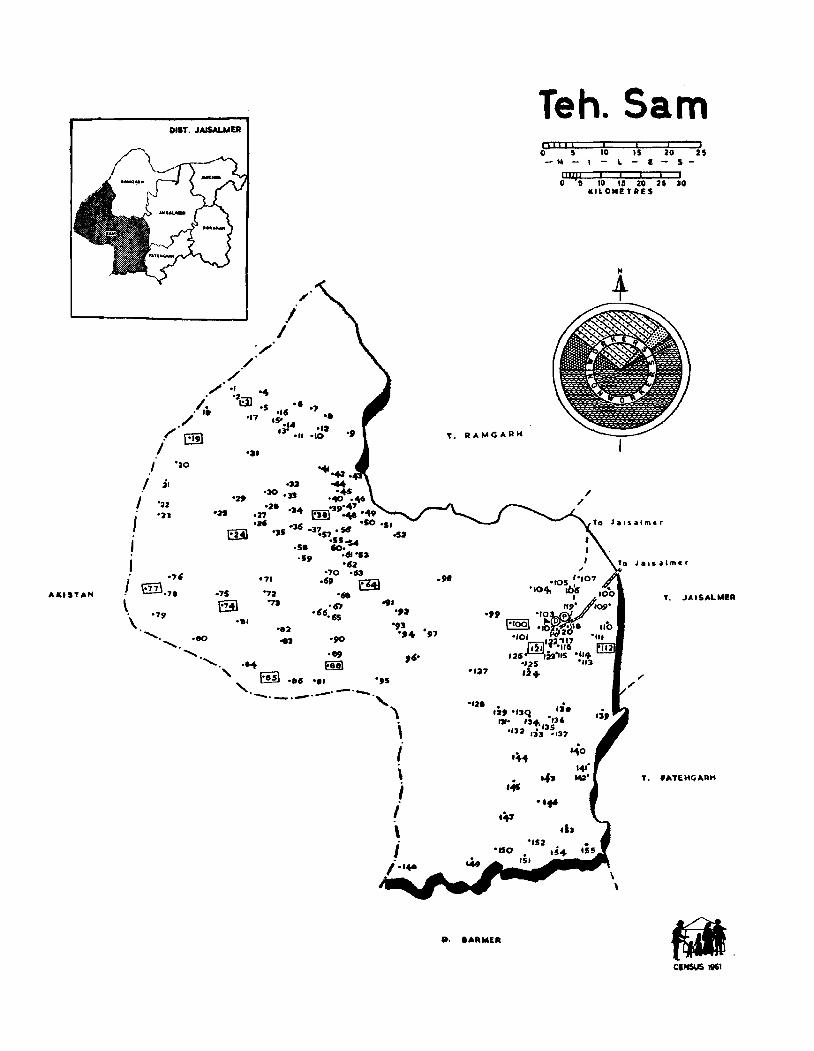
I J I I ! \. \
J /
OIST. JAISALMER
'20
21
'22 .~
'21
••• ·110
........ . ' .....
'7'
.I I
/'
'6 '16 ., IS' •• til" '12
'11 -10
'72 "71
-82 .. , , ffil
'-. '86 '8' ',5 -._. __ . ...,.._.....-- ........
" "' \ I \ j i \ j
/""-
Teh. Sam o !S 10 -M I -
1111) I I I i o 5 10 111 20 25 '0
IIILOMEtRES
T. RAMGARH
·'27
"2' ." "3Q ,i. ",. "+' ','6
.132 13~3~137
.++
...... .h
O •• AAMER
T. JAISALM£A
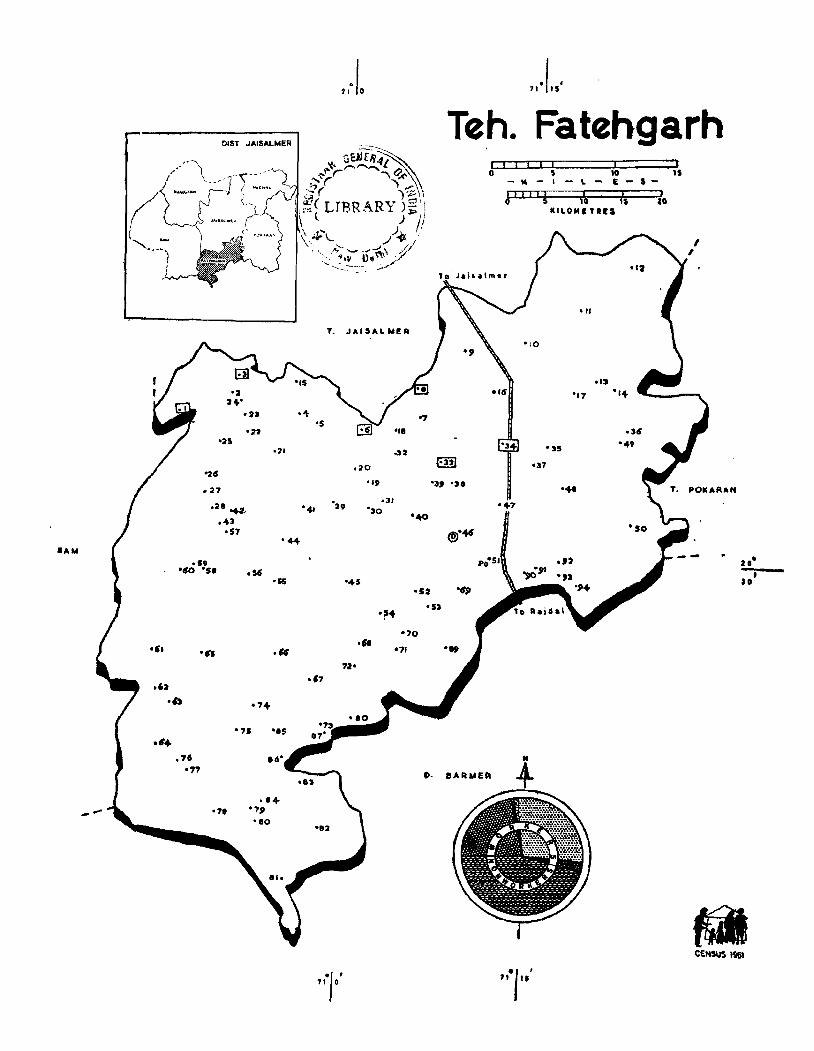
_-
'2 2+'
,23 .+ '5
. ., '22 '1'
'25 .21 -32
'2~ .20
@!l
.27 '1, '3' .,.
.28 o+a', '41 '29
.43
.3' "0
'40
'5' '44
$'44
'~O59 '5.
... , 'n
." ,ft
.f'",
.7' . ." '7'
,54 .$5
."
,'+
"5 "5
•• + . ." '80
• ... 5 ·52 '$
.~+ 'S,
"0 .,. . ." ." .
• '7
o· .ARMER
'82
71 0 '1 '
$-- I. - ': 1$
IIILOM"" 1$ .. REl 10 I 10
."
.,.,
• '5
" II ./'