District Census Handbook, Madak - Linguistic Survey Of India
Upload
khangminh22Category
view
0download
0
"ll\a' "1' \iAtrol'11 1981
CENSUS OF INDIA 1981
SERIES-II
... ~,.;'" S.R'tr
MADHYA PRADESH
1tT1TIV-ffi
PART IV-A
SOCIAL AND CULTURAL TABLES
'Ii" ~,,, ~. '"
'In:a-rzr 5f9fT~frrif, i'icrT
frr~wCfi :ififlJl1T<Jr qf<::qr~rr I 11"1.f !,;f~w
K. C. DUBEY
of the Indian Administrative Service Director of Census Operations, Madhya Pradt!sh
STTiifili'irr
FOREWORD
ST~Tcr;:rT
PREFACE
CONTENTS
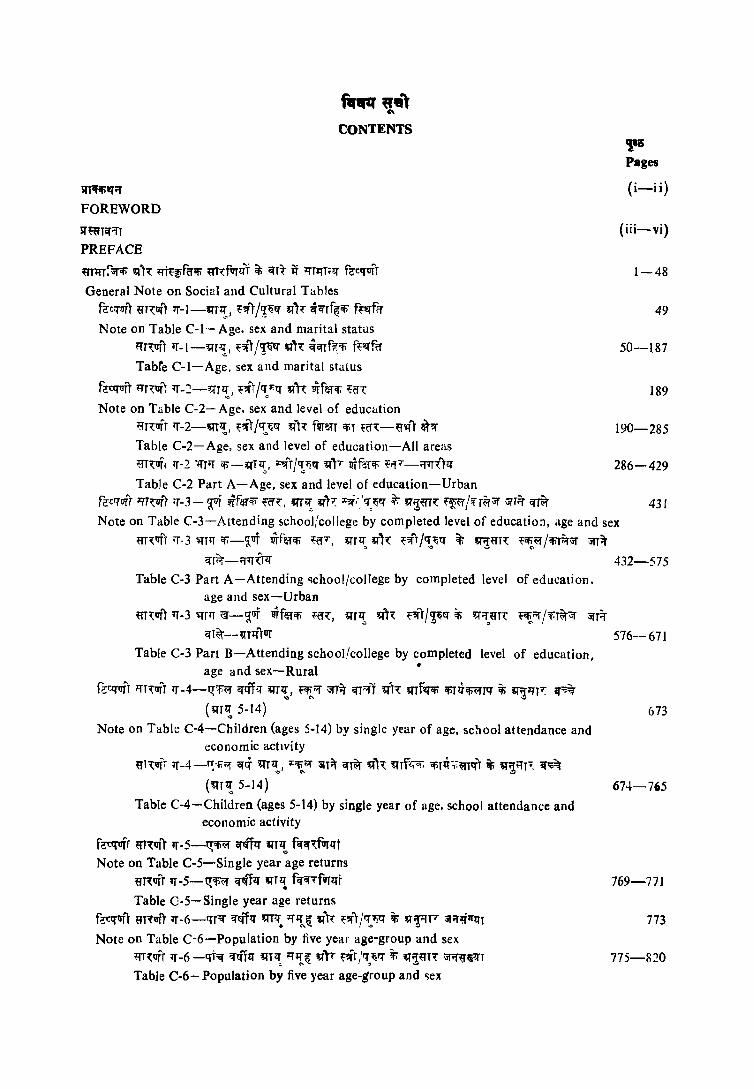
~T1fT:~ ~T~ llt~!ifffifi ~T~fvrlfT ~ <fTT it llT1fT;:1:f fctqufr
General Note on Social and Cultural Tables fct-qI1TT ij'r~urT 7f-I-ilJT<!., 1:'!fT Irrfif'( :trlr ~qTf~ifi ff~fff Note on Table C-I- Age. sex and marital status
~m:llfr 7J'-I-!tTT~, f'!Jr/~f'( ilJh c1crrf~"fi ft~fil Tabre C-I-Age. sex and marital status
fcC!f1lTT llT<:IIfT 7J'-:2-~Tl!' f"!!'Tjrt"F.'q !tTl~ -9ifeTif. 1:0-<:
Note on Table C-2- Age, sex and level of education ~nufr 7J'-2-!tTTzr, t"!!'T/q'f.f!{ !tTl, fllTan CfiT t(f<:-ij'~r Ill"!!' .. '" Table C-2-Age, sex and level of education-All areas
'l'iS Pages
(i-ii)
(iii-vi)
1-48
49
50-187
189
190-285
~rn:ufl 7J'-2 +rT7J' iifl-qT~, ~"}{Th"if!{ !tTl' llif~ifi ti'f'-;:f7J'"<:T!i 286-429
Table C-2 Part A-Age, sex and level of education-Urban f;:-c'1uTr 7:m::urr 'T-3-~ wfercn ~ff~, ilJr~ qr': ~i.-,'r.r;~.q it ~~~m: ~'f<?f/'H~Jf JfT~ qJ'~ 431
Note on Table C-3-Attending school/college by completed level of education, age and sex
ij'T<:IIfT 'T -3 ~JlT 'Ii -~uT m-f'elCfi taT, ~r ~ !tTl, t"!!'T /'t'f,q it. !tT~~T<: ~~~ /Cfi'Tr.r;;r ;;rTif
crr~-rriffTzr 432-575 Table C-3 Part A-Attending '1chool/college by completed level of education.
age and sex-Urban
~T<:IIfT 7J'-3 ~flT l3-!J.:uT QjfeTCfi ~ff,{, 'R'r~ qj'{ t"!!'T/~f!{ i'o ~~~T<: t~"f!,.f.T~;;r ;;rrif
crT~--~T1fTIIf 576-- 671 Table C-3 Pan B-Attending school/college by completed level of education,
age and sex-Rural •
f;:;r.qQ'fT llT,ufr 7J' -4-~'f,~ crqrq ilJrzr, fCfi''1 mit crr'1) ~T~ ilJrfq-Cfi' ilirij-'li~ru; ~ !tT~llV if=;;9-~ ~ -
(ilJT~ 5-14)
Note on Table C-4-Children (ages 5-14) by single year of age, sc!tool attendance and economic acttvity
ij"l~vf' 7J' -4 -TT-f,i1 cflf 'l;fTtT I :IO'!t}<1 ~T~ crT~ 'l;fT~ 'l;(TP::;or; ;PT~;:;\iJTqT ~ !tTrI''lF, <f;;~ • \:) C' ~
('I;(T~ 5-14)
Table C-4-Children (ages 5-14) by single year of age. school attendance and economic activity
fetlfvTr ij"T~O'fT 7J' -5-t:!;~ crrfflf q'T~ fcrcr~fllfqt Note on Table C-5-Single year age returns
'IHvfr if -5-~~ <Pf'flf q'T zr fcrq-.fQ'ftTT . Table C-5-Single year age returns
f;:;cq-IIfT ij"r~IIfT 7J'-6-Qr:q <rrff'1 m~ ll'f._~ !tTTr 121f1r/r.r..,fiff ~ !tT~fT ~;:r~"lIT Note on Table C-6-Population by five year age-group and sex
~r~O'fT if -6 -qt:cr <rqrzr q'Tll', ll'f-Q: 'l;fl. 12fr /'l}ir:r lr. !tT~ij"T~ ;;rrrnllT
Table C-6- Population by five year age-group and ~ex
673
674-765
769-771
773
775-8~0

~~ ~uS' it, I981 ifiT iir;:rrrurilT ifir ~r(urT;fi~ur qT\ifi'£T ~ 'lrrr 4-ifi 'fiT m~fufl:rj, ~rqfff lfeq
sr~!lT ~Tiiq 'fi"t ~mHf~Cf) ~'h: ~f~iif6ifi ~T1furlff, sr~Q 1f1T qf ~ I ~if ~n:fUflfT it 'q'T~, ~'fT/'1li.~ :ql~ ci"qTf~Gfi' f~rqfa iii; "I1~n: \if"~I9lfT, t:!;ifi~ cr~ i[~, if!ff'fi ~6~ m~ ~~ \ifTif crT~T ~ 'q't'fi~T <tlT
\ifT"'fiT~T G:T 4ff ~ I ~il ~n~furtrT 'fiT lTslf sr~!ff ~Tiilf 'fiT ~ilqUfilT 'fi"t tfi'~c~ q~ ~ij"Tf!-l'a 20% ij-~Cf~
;;lI'f~ffrra- Cff:qtr1 ~ 'q'T!-l'H Cf~ tltrT~ fifilfT 4fll'T & I ~T [fr 0 q~lfifT~, \iff f'fi 7 'q'~sr~, 1977 iI' 6 'q'~.~, 1983 6'fi ~J~Q if; lf~\fm=~T~ ~l~ iOfillfUJifT ~!.fa if, if; if~q it ~T~~~ f'fit:!; lft:!; I
1981 'fiT iif,i'flfUfifT if; e1'fTlI" Gfi'rli' ~ qf~UJTlf~lfCf ~r 1I~ STlfiTlffif a-lIr~ flfitrT 4flfr ~ I 15fT if;o ~To \if in~r lfElf sR!lT ~riilf it sr~r f!lT~ffi ij- ! 981 lfiT \ifi'£lflJTifr lfi~crT~ 4ff I 'fmr ~ qfflTTif q~f\if~
15fT qTot:!;~o qlfT it; lfT~~if it ~ij' «4fOif it I981 'fir \if;;4fUfifT 'fiT ~n~fUJlI'T 'fiT If'fnn~ srtrf1rcr ifi~it
'fiT ~~ ~lIT ~ I
oqf<fa'rrff qf:qlfT it; f~ifiTi ~ ifiTfs-rr q-h ij'~tfr~i'£ ~T ~jifi' srfcrflSi! ~ ifirli' 'fir ~~~" ar9f
qur;:rr f~rezr, lf~"'lf ~Ill' , 'lNTtII' it fifilfT iflfT I a~q~~ fij'~q f~~, srnrTfifif, lfi~c~"{ ~
CfT~fCfifi ~ij'Taif, tfi'~C~i!~T~;:r ij'RfUJlfT <tiT «crTm, fG'cq'fVIl1l 'fir f~~if 'fit <tiTli' m~ VlIS' Cfi) 1Jfre ifiUl't cit ~T ~~ mil' ~ ifiTq <tiT oqCf~"T m~ij ~ lf~f~~~ it; 'fiTlf~lf aTU 'fiT 4ff I
~ij' 'SI'ifiT'{ lI"~ VlIS' ~rrOif ~ 'q't1:ffitifi tfi'l{-fiflSo ~fa'fiTf~lfT 'fir z,)q if; qftl5flf ;;p"t q'f~urfa ~ I ~uS' it ~"rifNTcr it; ifiT~ur ~T\;:r it; 1f~T~f~~~ ~ fqf~i'i'£ 'SI"fTlfT if ifi"Tq~;:r ~if ij''fT 'q'fi:rCfi'rf~T !fiT
~~ <1i~;:n ~~cr ;:r~T ~ f~i'Q)if ~~ @US' ;;PT fcrf~;:if ~ff~T q'~ ~IS~ ~qi'£T ~tr ij'~lf)if fG:lfT a'fTN,
trTifif ij'mS'il sr'fTrr iii; 'q'f!-l'~Tf~qT P..TT t:!;~ot:!;ifo :q~;G:T, ij'~ifQ fi'£iro!fi ('q'f;;p~ ij'~T!-l'i'£), 15fT it;om~o
\3'r<fT, ~~iffi filitW'fi (SfTIlPf), ~T t:!; 0 ij'if ~cff, ~~ifQ fi'£~!lT1f) (i[tifi~ ljij"Ta'if) ~j~ ij"cf'-'fT
~To ~o lf~roT, crTocrTo ~Tor, "in:oqTo ~t~, sr~Ttf ~~"{r qj~ fEl:lfTCfi~, i3"q' filiroCfiT if; i'fTlfT !fiT
i3"~~~ fifilfT GrTffi ~ ~lJrf!.f; ~;:~Tit fcrfifrrr ~cr"{T tf~ 'q't'f~ srfcrflSZ ~1'( ~~rai'( it; ifirzl" ~ ~~mi'( if m'lifilf ij"~lJ)rrf1{lfT I Q:lf if!lTif~ ~O:Cfi~~f?:Cf) ~rc"{, rr~ fG:~~r \l;fj~ ~T\ifrr~ ifi~t~z~ if;;::jf, :qUgT~ iiiij- 'q'i'lI"
ij'1TQiIT iii; ~T "I'Tm"{') ~ f~;::~lil ifi~C~~ ~fcran!; ~q~;a ifi"{crT~ I
ar"l'1TUfifT srmrr it ~T\farll"r Ofi"t *r1!ffT lfi~if ~l'{ ~~ ~ifiTlffrr ;;PT fzcqforqf fflf~ iifi~CfTif 'fiT T'i' ~~G:Tfll';:cr "I'tfif 3iq'"{ ftwrlfr 'q'1~ lf~ <il"T zI" lI_;fT1:!;if 0 ~Tq '{rer, ij'~lfifi lf~~f~"{ 'q"~ 15f"t lf~;:r fij'~, qf"{6Q
'q'~;fSTil 'q'fuifiT~') ~ m~G:wrr ij ~;;qcrfp:rcr \'f~T~ ~ fifilfT 4flJT I ~~ OfiTQ if i3"~ ~T 4f~!lT ~T~, ~~lflfi f~!lTCfi \ifrrifUfifT 'fiTzr if ij'~lf)if f~lfT I iOfrrlJUfifT fif~!lTT~lI', ;relf 'ST~, ~)tfT~ ij 15fT t:!;qot:!;~o '!lTqi,
"3"q" frr~!IT;;P Griff( 1lf"T CfiTzr ql'( i3"rr~ ~~1:f)flflJl if ~T"{ forlfT ;;PT fcr~QT,"{ ~ ij'crTm 'fiT I
15f) ~lSurr;f~ ciff, qf~ISO fEl:rG:T qfS'ifiHT q"~ i3"ifit; ij'~qffqllT if ~ij"'iiT f~;::G:T iliqT~ fifim' J
S!il' .ft o'1T 0 ;:;1<1", ~~rlfCfi fi{~WCfi qj"{ ~ifor srqnT if CfiTzr"{ff \3'<I"~ ~~lI'Tfrrll"T if ~;UJT~lf it ~ij' flug if;
~ifur it WTi'fT ij'~lffrrf~lI"T I ~ij' ifiTzl" ~ erfflSO ~Cf iI' ljsr4: +!.ijlfr~lf t ~~r "I"firifiTftlfT 'q'R ;;pq:qrf(zTf
ifi i'(Tlf q~q ij- ~1:!; q~ ~ I
;:rf fG:~~T
18 f«ff~if~, 1986
( i )
~q" "''I q,q 'l~~ it; ij'~iffl lf~m.~~

FOREWORD
This volume presents tables in Part IV-A of the Tabulation Plan of 1981 Census VIZ •• the Social and Cultural Tables covering age. sex and marital status composition of the population. single year age returns, educational level and school attendance in respect of Madhya Pradesh State. These tables have been generated on the basis of computerised processing of 20 per cent sample of individual slips of Madhya Pradesh State. The publication is the culmination of the process which started with field operations of 1981 Census under the inspiring leadership of Shri P. Padmanabha, who was the Registrar General and Census Commissioner, India during the period from 7th October 1977 to 6th October, 1983. The 1981 Census of India was ably conducted in the State of Madhya Pradesh by Shri K. C· Dubey. This organisation has, under the guidance of Shri V.S. Verma, the present' Registrar General, India set for itself the goal of publishing the tables of 1981 Census as expeditiously as possible.
The work of coding and editing of the individual slip records as well as the data entry was completed in the Directorate of Census Operations, Madhya Pradesh, Bhopal. Thereafter, the further processes of system design, programming, actual processing o~ the computer, scrutiny of the computerised tables, writing up of the notes and arranging the printing of the volume was taken over and seen through by the office of the Registrar General, India.
This volume is thus a product of labour of a team of highly dedicated officers in this organisation. Constraints of space preclude a mention of all officers at various levels in the different divisions of the office of the Registrar General, India who saw this project through its various stages but mention can be made of Shri S.N. Chaturvedi, Joint Director (Data Processing), Shri K.R. Unni, Ioint Director (Programme). Shri A. Sen Gupta, Joint Director (Data Processing), S/Shri B.K. Maratha, V.V. Rao, R.P. Gupta, Pradeep Mehra and Himakar, Deputy Directors in the D.P. Division and other officers who saw through the work of data entry and processing at various stages. We are grateful to organisations like National Informatics Centre. New Delhi. Regional Computer Centre. Chandigarh and others who have provided computer facilities to us.
The Census Division had taken over the responsibility of overall 'scrutiny of the taldes and preparation of notes of this publication, and this work was very ably carried out under the supervision of Shd N. Rama Rao, Assistant Registrar General and Shri Madan Singh, Senior Research Officer assisted by Shri Ganesh Das, Assistant Director of Census Operations. In the Census Directorat~, Madhya ~radesh, Bhopal. Shri M.L. Sharma, Deputy Direc~or of Census Operations and his colleagues have also scrutinised the tables in detail.
Shri K.N. Pant, Senior Hindi Officer and his colleagues did the Hindi translation. In printing this volume. Shri B.P. Jain. Assistant Director and his colJeagues in the Printing Division have helped in seeing the volume through the press. The names of officers and staff at the headquarters who were closely associated with the work are given separately.
New Delhi Septembtr 18, 1986
( ii )
V.P. PANDEY Joint Registrar General, India

SI'H,iq.,i
~ q-~i1!'T :qiiT~1.: ~ ~fcr; 1981 it ~T1.:a- 'fiT ;;rrr<rur.,T ~ ({hrrr ~ifif'!fa- ilicr;~T 'fiT ~~T9"rr
~~)frrcr; 'fi~c~~ q-~ f'fill'r <rll'T I iiI'~a- iT cr;l1 'firl1 ~~a--~T9"rr (cr;li'"ITf1.:lI'T) n~T f'fill'T <rll'T I lI'~
r.fiP:f 'IT srT'ffl1cr; iil'rr<rurrrr ~r~, '1f~iiTT~ ~ ~f~lI'r ~ 9"~ ~ ~~r~ qf~iiTH cr;T iil'rr~~T :q1~ qf~iiTH it ~ijll'ff: iiI')~T iil'Ti't cTT~r 'lfIfr iiIi ~~m~ q-f1.:iiTr~ cr;T \ifrr~lSlI'r ~ ~~.jfaa m~r 'fir ~~rarr I ~rn-~Tarr !lRr 'SI'f1'f!1T;;f 3frar~ 'l"~ fcr;lI'T <TlI'T I 1981 'fir ;;riilTurifr if oll"fCfa-<r1'f 'l":qT ~ 'I'rE:lf'l' ~ ~cr;f':fa ~tifi~T <fiT ~q- 'l"~ f;;rll'T <rln , fq:l1T"f'l 'SI'it!lT, \if~~ :q1, lfilqh:, lffur,!~, lr'tfT"1l1' , rrFiTeyfo:s, f~fCfOjilf ~'h: ~,!~r:oT~
~Tt ~T\i'lI'T ~1~ ij"~T «'Cf ~FlI' e)'5fT it; ~Tor.~T or.t 100 srfa-!1TCf t'l" '1~ f~lfr <rlfr iil'iiI'for. ~r~ ~ T\i'lI' ;;f~ if~ 'T\i'lI'T ~ 20 srffl!1Ta ~;'l"~ <rurrrT i~Tif.) if; 3fT'fi:sT if.) ~q- 'l"~ f~lTT <rll"T I if.t:C1J:H H ~~ 'SI'if.H
«ij"'fffre" mifi~ iI_;!9l1"a: srT~flfcr; ;;rrrtT1ITrrT ijH it sror.rf9Ta- 'icoioriaT mCfisT if; ~'l" ~t ~ ikfer.rr ~urTlf\
cHi{ ~ ~nur lI"TtT it ~)~T iT@ff 3f"ff~ ~) ~<fim ~ I
'Hf {gUs it a:p;:r:r sr~!1T ciT <r-~'{g;;rr ciT ijgfurllt sr~~;;f 'fiT tT~ ~ furrr'ir ~r~, ~"jft/!J.<'if!f ~1,
~iiTrfffor. f~~fff i 31"il9H \ifrrulS:r:rT, ~91~ iiTl'{ 3fT<I_;, !!1feT91 ~a~ ~'r~ ~~\jfT ;l efTm i" '>rtGf.~ f~li <r~ ~ I
~T~farll"T 91) 'l"~i{ it 'l"~~ :a-'llfr<rT srrtf~91 '1Toll" ffTlflAT ~'l"'lia 91~Ti{ 91T ~flSc ~ ~'ll1 ~T~furlfT ~ ifT~ .' . it ~Cfi ~T;::r:r fcC'1UfT ;;r1<: srflr91 ~HurT iii; ifT~ ~ ;;r<>r<r-'I;{i1!'<r f~C'l"Ufr ~r <r~ ~ I
lf~ ~l(lA ifiT.r ;;r"tTur=rT f~li P;;fr cj'; 0 ir 0 ~~ it; 'I'Tl'T({Qj-rr it f91ll'T <rlfT ~T 3fa: ~~Cffr
~q;~ 'liT 'a<:T ~lI" '3";:~ ~r ~ ~ff."rr ~ij" {gUs "fiT sTij" it; f~~ cfll'T-: '17-:i't ~ '1~~ ~T ~;:~ fCfiij"T 'I;{;:lI'
llQ:f<roaut frrl!f1.fil r.r~ "lrii ~ f,.1~ ~~ ~<rorr 'fit ~)~"'T '1~T I
ft ~r 'l"r 0 'l"~l1rrT'll, ~Fff if; f"iiTa-i1rrr l1l!Ff;;r~~T<: ;;r1-: p.;rT efT o~~o (fl1t, ~Fff ~ efcfllTrr
l1~Ff\jf~~n: "fiT :a-rrir. or~~~i l(Ti{~Qj-., ~ f~~ 'I;{~lf;:<:f 3fT'llt<:r ~ I if ';(~ srcmFf CfiT ij l1l1" 'l"~ srrmflUa
'Ii~~ 1.r ~ ~ff-: en: ({I <r~ iTg~~;;r ij"~lI'ffT ~ ~1~ P;;fT f"f;;rq 'l"T<>r 'l"Tui I lfT,ff ~ ~~Cfff l(~T,f\if~~<::,
arrCfi~ ~m!:1rr fiiTlTFT in 3ffer'fiTf,lI'T, P;;fT ~rro ~TJI' ~Tq, ij"Q:Tzr'fi Jfq:T-:f;;r~~T~, ".iT q~ f~~, eff-:l'io
">r~~erT" 'l;{fer~rir, l:ir ~1l. ·fT'11'1" r..f,uri I crf~l'io 'I;{"!,~'qH 3ff.1 'fiT~Y ar). ~Fr<rur.,T 'ST'>fT<r if ~.,~
q~)flflfT ~T orT or1T <> ;;f"1, ~~T<:fCfi fif~~~ ( 13irUf j 3fl~ 'l~'f it; lfQ:n:f;;r~n: ~ CfiTlI"T~<:i ~ ar"lI'
~falfiTf'lI'T CfiT mlTn::T ~ I
13~ ;;r'l::r CfiTlI"Ti;'fll" ~ ~T ~l1<> \if To l(T~"(T~, qQ:Tl:f'fi f"it~or. q ~.,ip ~q:lI'T~r P;;fT fq~JI' f~~ ir 'a,T ij"~lI':rT fq'1T f>r;:~T~ frrlioT'J:;f'li r;ci q~"ff iT CfiTli" f91zrr I i~ 'lint ~ 'Cff'llSo ~'1 ~ ~;:iif;;r ~~
frrit~r;;rll" ~ ifill;;rrf~lI"T t i'f~lf ~<>rlf ~ f~u: ;;rT'~ ~ I m'li~ srf'lli:r:rT in 'fiTli" lfil ~1ff11 frr'(T~'fUf
~cf"-lT n: 0 \if! 0 '>rT'Ii il~T P;;fT 0i'?T 0 r;q 0 ~Ti1", q~rzr"fi f.,itlll'if.T aTU f'fizrT <fll'T I -;g-rr qiiT91T ft ~,:rnH~T ~ I
'IT'l"H,
18 fij"il'f~iiI'"f, 1986
( ii j )
~o~o ~qf
~r:r frr~IlI'Cfi, 'if'llTurrrT qf<:::q'f'lOf I
lfe:r:r sritlll'
PREFACE
It is for the first time that the processing of the data collected during the 1981 Census of India has been done on the electronic computer except for some minimum manual tabulation relating to Primary Census Abstract, data on household population by religion of the head of household and household population by language mainly spoken in the household. The manual compilation was on cent per cent basis. The data collec.ted through the Individual Slip in the 1981 Census Operations. have been taken on tape. For small States like Himachal Pradesh, Jammu and Kashmir, Manipur, Meghalaya, Nagaland, Sikkim and Tripura and all the Union Territories, 100 per cent taping of the data was done whereas for bigger States, like ours, it has been done for 20% sample of the enumeration blocks. The data thus processed on computer broadly conform to th~ relevant figures published in the Primary Census Abstract but there may be some marginal differences in totals due to rounding off.
The tables presented in this volume are tile C-Series tables of Madhya Pradesh State covering age. sex and marital status composition of population, single year age·returns. educational level and school attendance. A general note on aU the tables and a separate note in respect of each table are given, so as to provide useful preliminary readlDg before one goes to the tables.
The Director of Census Operations Shri K.C. Dubey under whose guidance the entire operations were carried out deserves all credit for its success, but he had to Ii~ave the organisation for taking up some other important assignment before this volume could be made
for the press.
I must record my deepest sense of gratitude to Sbri P. Padmanabha, ex-Registrar -General, India and Shri V·S. Verma, present Registrar General, India for their valuable
, guidance. I am grateful to Shri V.P. Pandey, Joint Registrar General, India, the officers in the Data Processing Division, Shri N. Rama Rao. Assistant Registrar General, Shrt Madan Singh, Senior Research Officer. Shri M. Gopal Kini. Senior Research Officer and his colleagues in the Census Division, Shri B.P. Jain, Assistant Director (Printing) and other -officers of the office of the Registrar General, India for their valuable help to us at every stage in bringing out this publication in time.
In my own office, I received all help from Shri M.G. Mohril. Assistant Director assisted by Sitri Vishram Singh. Investigator who worked diligently with devotion. The names of staff of this Directorate closely associated with this work are giVen separately. On the data entry side. the work was ably supervised by S/Shri A.G. Oak and V S. Joshi. Auistant Directors of Census Operations. I am thankful to all of them.
Bltopal September 18. 1986
( iv)
M. L.SHARMA Deputy Director of Census Operations,
Madhya Pratlesh

"TmUfiRf ~ror ~ ~r{f~ 'll'T ~fw1:r
1. IIJfj 'In: 0 ~i'f 0 ~ ... r 2. ,....f~ llififfll' 'if1o Ifni'ff
3. 1ISI"11f~f iIi1'rffi 'R"i{)'lfT
4 ~,,~ fir~ fiil''=~
1. IISI"J ifj 0 11;Vf 0 Girr 2. '!.IT ~iiI' '1Ti'f
3. IISI"T ~"ciw sr~Ti{ 0
4. .,fT lAT~o ~~ 0 ~~
s. I51'T fJTfo ~"'t 0 wlff 6. IISI"T ~rr 0 ~o ~J1iI'~
7. IISI"j Q;«" 1R'f{ 0 ~nT
8. IISI"T '"if STifinT
9. IISI"T «(lI' STif;TW
10. IISI"j~" If To ~~
1. P.1T (£T 0 11;« 0 l:TC{(f
2. P.1T ~n: 0 If) 0 ,..)q-~T
3. P.1T ~ifo It;o IR'~)~T
4. l!.Tr ifT~o dro if~w
I. l'_;fT'I'fcr fcp::r~ 1R''A'fTti
2. ssrr~;q- 0 11-::[" ~" rrEf<.fr
3. f!1r ~ 0 1fT 0 'q"s::;rwr
4. J>ir Ul=(" ;;rT~ ~Ef~;:rr
5. ssrr;Q1 rrr~ lifi"Nf"crgr
6. ssrr rp=r.... <fi 0 fl1">rT
7 . ssrr ;Q~1Jf ~T:q-:;P~
8. I!.TTl1f~ qfrri;fT ~-1')qH:cr~
9. '!" IR''fr;q-T ~~If
10. :!i 0 fTiiI'<.fTrfT 'H;rTi'f
II. ~" ij4:vtT i'fT~-;:
l;f~iIi
Ut~i6TiJ u~
JftftJI1ifiTlI' ~if;
l1tf.lfifiTlI' uqrll'~
U~TiJi(; fi'f~"'ifi
Zfi!!'Tlf"fi f.:r~'fi"
U~TlI'ifi fift.rar;
qTlflifi fi'(~Wifi
~lfifi f~wif,'
q~Hrar; f~;;r,
U~llfEfi fiRw'fi
;q-~n:rEfi fi'fbr~
ilfi!!'Tlf'fi" fi'fitw:;r.
;q-~TlI'Efi f~wEfi
fi!ri{T -rf'ElifiTl:)
qf"{tio f~;:i{T ;Q~ri{iifi ;rfttio fi!ri{T ~<rri{Efi
;;rf'{lSo f~;:cfr 'R":!::rr~Efi
srq; iT~'{ '"
",,","Ul'",,' foR~l~Q", "<:Q" sr~~
;q-tf~lf"Cfirlf" ~i
A CKNOWLEDGENmNTS
OFFICE OF THB REGISTRAR GENERAL, INDIA
Census Dil"ision
1. Shri R.N. Chhabra 2. Smt. Kavita G. Thandani 3. Smt. Kanta Malhotra 4. Shri Anoop Singh Disht
Data Processing Division
I- Shri B.L. Jain 2· Shri SUraj Bhan 3. Shri Raghuvansh Prasad 4. Sbri R·L. Puri 5. Shri Y.D. Sharma 6. Shri N.K. Rawal 7. Shri S.R. Garg 8. Shri Gyan Prakash 9. Shri Satya Prakash
10. Shri A.P. Gupta
Hindi Division
1. Shri P.S. Rawat 2. Shri R.P. Chopra 3. Shri N .K. Arora 4. Shri R.C. Bansal
Printing Division
Shri B.K. Madan
Investigator Statistical Assistant StatIstical Assistant Statistical Assistant
Assistant Director Assistant Director Assistant Director Assistant Director Assistant Director Assistant Director Assistant Director Assistant Director Assistant Director Assistant Director
Hindi Officer Sr. Hindi Translator Sr. Hindi Translator Sr. Hindi Translator
Proof Reader
DIRECTORATE OF CENSUS OPERATIONS, MADHYA PRADESH
1. Smt. Vimla Agrawal 2. Shri S. M. A. Naqvi 3. Shri J.P. Chandravanshi 4. Shri Rambabu Saxena S. Shri Anand KaItari 6. Shri S. K. Mishra 7. Shri Arun Raikar 8. Smt. Anita Srivastava 9. Ku. Anisa Begam
10. Ku. Rijwana Parveen 11. Ku. Manjula Nagar
( vi )
Statistical Assistant Statistical Assistant Statistical Assistant Statistical Assistant Statistical Assistant Printing Inspector Computor Assistant Compiler Assistant Compiler Assistant Compiler Lower Di vision Clerk

~fI+t If",. SR''R ~~~ m\fvJIri
SOCIAL AND CULTURAL TABLES

'lir~~T:q' ~;:rqUfiJT it 'H1=n:Jqo olr If"( 'IT«I"Tlf iifo'!"ij'\ClI'f 'ti1 ~fTlHf~;r. ~l"( ~t~fo'ti fcrmTIA'T it; iIT~ it IA'TOfii ~'ti~~ fli~ ~rff ~ I qrlfrf;;rOfi m~ ij't~!ifo'ti fcr~E:TTsrT ~1=if;:&'1 ij'T~fQJlft 1981 'tiT ~'FT1J[ifT it sr~'Ii G1::ff.to
iii f;.;rt:!; 'filT qf o~fiffl'i)'o ~ ~ 3fTtlflf ~ ~~~ f~ iTtt ;q-f~"f ~ 3fMn:(f & I
~9 liQ~ i:j- fij;iJf~fliij' «Tlf) f~Cf. ;q-R ~iif('f'fi ~lnfUf~t sr~tf 'f;~1 iT~ ~ :
If -1 : ~p:!, ~;r1 /'2'f!!f 31h ~CfTf~'Ii f~v:rfu
If-2: ~r~, ~;rT/~ 'Rh fllT~T 'liT ~(f,
If-2 'lifiJ' 'ti : ;q-T~, 'f;;rT/~!if 'R"l~ fllT~T l!iT ~aT-iI~T~
if-3 'liTq cp : 'luT Wf~Ofi ~iJT, 'R"r~ m, ~'J{T/~!if ~ ~~ ~iifJ.~/CfiT;.;r~ ~Tif CfT~- if~)lf
if-3 ~i)' ~ ; 'lot wflfl'll ~'J~, ~r~ ~'h: -':'fT/~~ i!i ~:!ij'r, ~iifJ.~/Cfir;.;r'if 'ifTif crWr-i"n:r"tvr
If -4 : ~~ 'R"~ crIST I ~"!.~ ;;rrif crT~ 'R"R: 'RTN'ti m'li~l ~ ,,"~ij"R if~ ('R"Tl! 5-14)
If -5 : U;cp;.;r ~ Cft'fflf fcrcl"\fUflfT ~
1981 Cfi'r ;;riflfQJifT it ~'liT ~q 'Tii7.T 1Il'l!'f m~ f~qT:q~ sr~~, ;;r;1! 'R"T~ 'til!'''T" it~r~~, f~fif'tilf, ;;rm~Q:S,
lffQJ~, m~ f.ir,!"(r ii?~ ~~-~)~ U'illl ~ ~ if ~ 'fORr i ;q'II1T, cr~ lr ;q'rCf,~ ~mfi1;:r fCfit:!; iTt!; ~ I ~ ~ii7.TT, ~ij" ~T'ilf ij"f~if i f~t:!; mCf,~ 20% ~;q~ ~ i 'R"m, cr, ~mf!ffi fifitt iftt ~ I ~crij"r~ lT~ ~~crf~if ~fu cr,
ttcp fccq1lTT crf,f~-III ii ~1 'ifT '(~ ~ I
198) opT '3fiJlflJA'T i ql'Cfi~T CfiT q11m;:r ~) ~a,T cr~ g)aT ~ sr~qrl': srNfq'f. "fiJlfUf'l r ;rg ~ f~tt 'ti~:;rrf"(<IT
in,r lITrI' !.If'f!iT('I' m~UfT'fi'Uf qh ~«~ Cfi;~~,( cr~ ~ij'T&';::r 1 Cfi;C¥, It<: ~nlTfa('f cra-~nOf «T~fUfliT crt ~l1rlf)f"fo fCfilfT iTlfT <:'frf'fi :of'Cf<:'f ~lIT)~;::r lifi,'I1 ;q'fcp~ srTfI:I'fli'ti "f;::riTQfifT-ij"T, ~ If~~ i qjCfi6'T <t1 ~~cr ~) ~ro: I arC!": ~) ~~<iT ~ fii l:f);r "T'lfT lfTlfNfT If Ift~~ 1t<'f if ~tt arT' i3'i{ii ~~ ~TqTfir:r'f. 3P:;'l, ~T I
c;qfifC!"q;:r If'lT (<<J'lIT;:~) 31'T,( c;lIflfffiJ'tf If:qT·(~) i if~it qfd~~~-I f.f f<=:n; iT~ ~ I ~;r IifQ~ If ij'JTfUflfj
~llH ~,if i f~tt arflfi? ttn cp'\lf it lP.niT it ~~ iff arcm~QfTarT 81"1, sr~T 'Ii") ;;rlJlJit iJiT ~f~r ~ \i'it~l!'~ ~
<':!ff1f('fi)'('f qf;irlfr ~ l11=iff.-a-tf sr~T ~ :a~, f,'tiri ctiTit .r, f;;rtt sriTur~T Cfi) 31' i~lIT q-f'{f!lTlSl"-lI it f~t:l; iTtt t J
2

GENERAL NOTE ON SOCIAL & CULTURAL TABLES
Traditionally. the Indian Census has been collecting data on the social and cultural characteristics of the lndian population. The tables on social and cultural characteristics are based on the data collected through Individual Slips canvassed for each individual in 1981 Census.
The following social and cultural tables are presented in this volume:
Col : Age. Sex and Marital Status
C-2: Age. Sex and Level of Education
C-2 Part A: Age. Sex and Level of Education-Urban
C-3 Pa.rt A : Attending School/College by Completed Level of Education, Age and Sex-Urban
C-3 Part B : Attending School/College by Completed Level of Education, Age and Sex-Rural
C-4: Children (Ages 5-14) by Single Year of Age, School Attendance and Economic Activity
C-5 : Singal Year Age Returns
C-6 : Population by Five Year Age Groups and Sex.
In 1981 Cen~us, these data have been processed on a full count basis in respect of all the Union Territories and sroaner States like Himachal Pradesh, Jammu & Kashmir. Meghalaya, Sikkim. NagaJand. Manipur and Tripura. For the rest of the States, including this State the data were processed on 20% area sample. A note on sampling procedure is appended as Appendix 111.
The processing of the 1981 Census data consisted of two stages-first hundred percent manual tabulation for the P.C.A. and later, on the Computer. The present tables processed on the Computer were adjusted so as to conform to the earlier p.e.A. figures by applying a suitable correction factor. The totals may. therefore, not tally in all the cases and there may be some marginal differences.
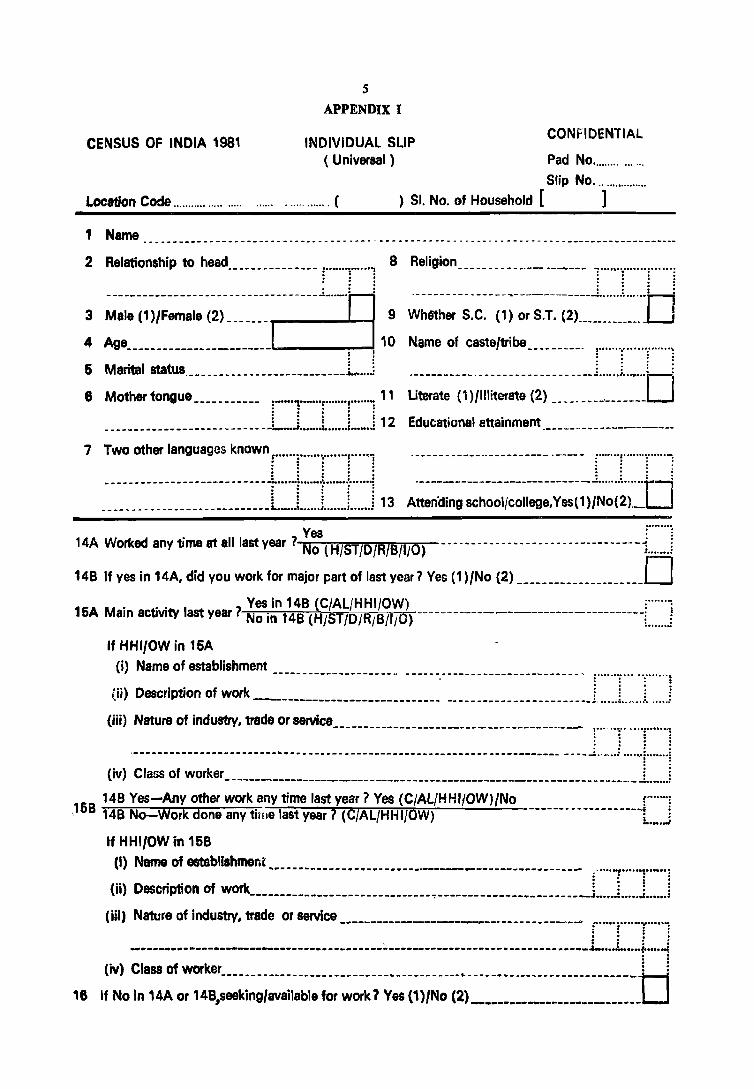
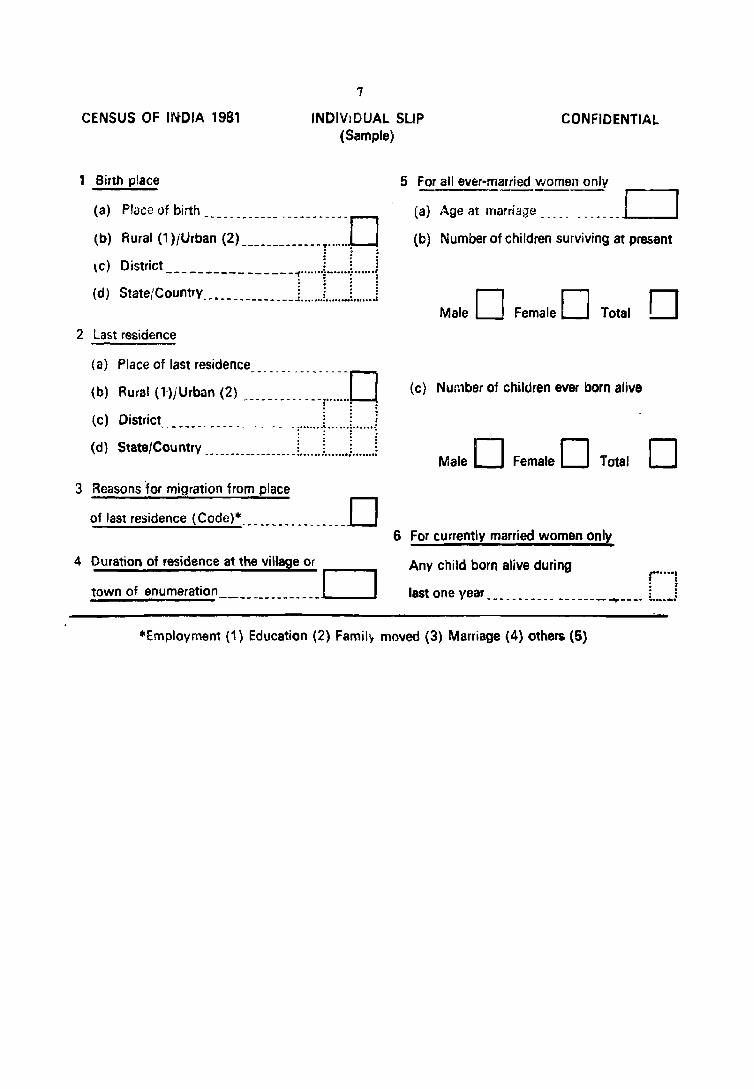
The specimens of Individual Slip (Universal) and Individual Slip (Sample) are reproduced in Appendix-I. In order to facilitate the understanding of the concepts and the questions used in collecting the data for preparation of tables in this volume. the instructions to enumerators for recording the answers to the concerned questions of the Individual Slips are reproduced in Appendix-II.
~ <F.T JI""j(lJi1j 1981 ",44 fft.,'Ii1 cAf (11m ~'!!) iii; f~)
) qfr~;ror If.'If ~o I 'fll{ .... ----.- ----- . -- .... ~ .. -_ ..... -_ .......... _ ................................. _ ............ --_ ......... --_ ........... _- ............ __ .. -.. _---_ ..
2 qf7"<n1: ~ ~T ~ ~"1'--. ---- ... ----- ------ B "l'li---- •••• ----------------- --- -- - --. ---------.. -.. _ ......... -. ---_ .... __ -- _ ... ---- .- .. ___ ..... n····· i .••• '1 ----- .. ----- .. -.. ------- ......... ------- ............ ,- . 'i·· .. ~
: ~;.~-1-)-~~.~ .. (-2! ._-~-_-__ --~---=o 9 5 ":.rTf~ f'~:r--- .. ______ c==J 10
w ~o '0\1'0 ( 1) 'A~T : ... • J .. • J ..... ,;
~o ;;£0 ;;rTo (2) it; ~<ml t ----------------0 :;nf':r!;;r;r;;rTfif !!iT 'fn:r.-------------------
6 llT',!-'l11tfl ----. - - ---
~TIi1'{ (1 )if~~H: (2)-------------:.,-'-:·-··'d 1~ ~f (f'fi tm;r Inf t----------------------
- - - -- --- . - -- -- - -- - . - -- - . - ~ .... -.... -._ ..... , ." ". 1 1
7
l:ff-: 15;ro ir 'no ~o }'I;I'O <f,To :
(i) lIf<ttoT'f ;P;T OJ n:r- - -- --- -- -- - -- --.- - - - - -- -- --- - -- -- - -- - --- - -- - - -- - - --- - -- -- ------------
I,i) .qf,,'f it; ;roTI{ 'fir fq~ ------- -- - ---- - -------------~- - -------------------------: -- " .. " _ ... , ... '" t ___ 1. __ ! . .. i
(III) j'l'lllf, aqrqn:: lH WIT ltiT f'f~------------------------------------------------ _________________________ ,,--. ___ .. --_ ••• __ ......... - ••••• _. __ .- •• - .. 0. ------r' .. r··"- .... .
: : ( IV) or.lzr H~ qTi't 2fiT qq - - -- . - - . - - .. -- - . - - - --- - - -- - .... -. ... - .... " _ ................ ,- ............ ~
:. ... ,.; 14l;1'i!f'-lliHq f'f'1r 1fT -llflp;rrtr ~;ji ;P;lll f;P;~T? ~ (;P;To /~o"'o /CfTQ =;> if;f. ;roTo ) l'lI,:
15. 141lf ''f~' -lTif qli f;r..rT 1fT ~a:rq -.rr !ffll fof.lfT ~T ? (;P;T. /~o 110 /<ffo -a./q. 'fiTo )
~ ... "':
'" ...... ----! . , _.-.... 1
zrf~ 151lf ir '!10 "3'. /f;fo if:To .
(r) ~fCltOT'f ;P;T 'f111--·--------------------------·- -------.---------------.------------
( II) Oll'fom- if, ;r.Tlf 'fiTfC{q~ur .---,,---------.-. -.--- .. ------.--------.- ------ .--.-;''''--:' •.• ; :
(ilr) '3''l'lTIT,UITm r.rr 'rqT If.f ~:nrq-.----------------.---------- -- .... - -.. -• _ ............... _,0 ••• ___ ~.-.-- ••••••• --_.--- .. --._ ...... -._--_ ..... -------, .. , ..
( IV) ~ TI{ If,r;J ql1!r 1fT qq- - - - - -- - - . - -- -. . -- - -- -- - -- - - -- - -- -. - --. -... --- .. - .-
5
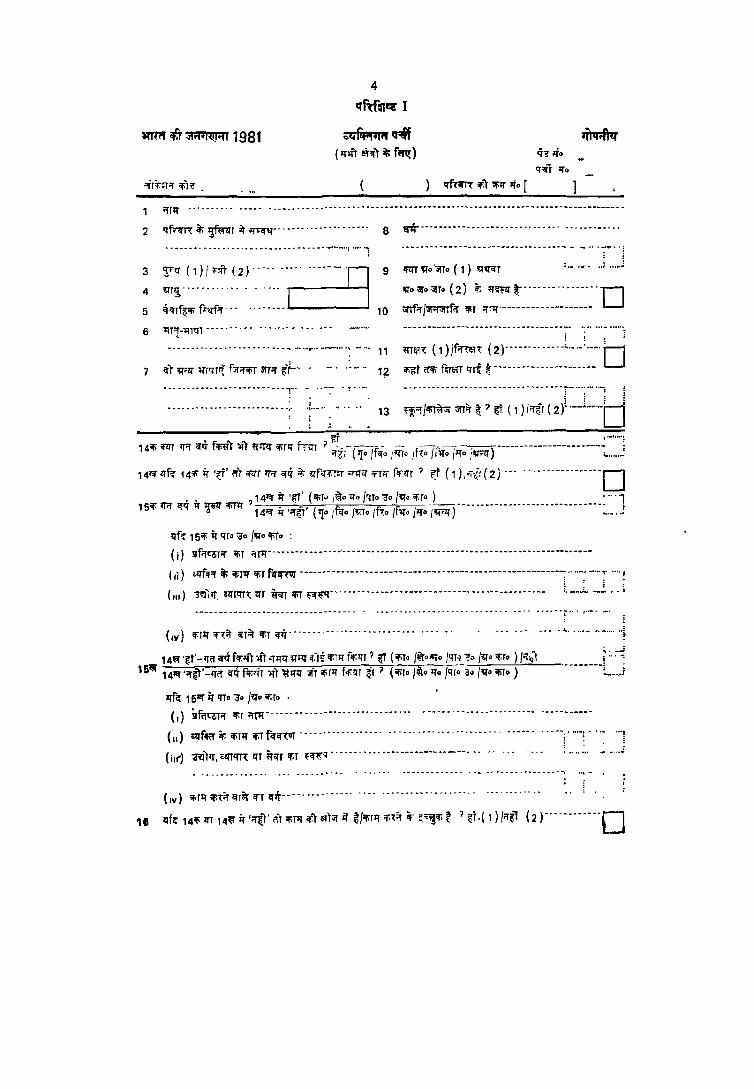
APPENDIX I
CENSUS OF INDIA 1981 INDIVIDUAL SLIP CONFIDENTIAL
( Universal) Pad No ............ '"
Slip No ................ .
Location Code ........... ..... ..... ...... . ............ ( ) 51. No. of Household [ ]
1 Name .... ___________________________________________ . ___ . _ . _____ . ___________________________ __
2 Relationship to head. ______________ r ..... T ...... ! 8
3 ~~~~~;~;;~~;;)-_-~_-~_-~~[------L.-~ ~ 9
4 Age_______________________ 10 I I
6 Marital status .. _________________________ L ... J
Religion ___________ .-- ------ T ..... r ..... T ..... : .- --.-. ----------·-----------...: .. ·· .. ·:..·· .. 0: :
Whether S.C. (1) or S.T. (2).. __________ .
6 Mothertongu9 ___________ :-._.' .. _ ... r ....... ' ...... -: 11 .. . . .. ..
Name of caste/tribe __________ ! ....... : ....... : ....... ~ . : . :
~~~-;~;I;;I~~~~ -(;)-::: ~-~::~:~"~~:·:b 1 ~ i :,' i 12 Educat,'onal atta'lnment _______________________ - __ - __ .J ...... .c................ . __________________ _
7 Two other languages known : ...... ~ ............... , .... '" . --- - _ ... -----~.---- ... ----- ._---- : ........ !.~ ....... =- ...... -: . ~ . , !
--- --- -- ------------------+·+-t···-t-····! 13 ... ___ ... ___ ......... _ .. ___ ... ___________ L._ ••• i ...... i ....... i ...... :
: : : ----------------------------..: ...... L· .. ··
O' :
AttenCling school/college. Yesl1 )/No( 2). __
14A Worked any time at all last year 7 Yes - - - --- - - - - - - - - - - - - - -- - ------ -----1' ...... 1 No (H/ST/D/R/B/I/O) : ....... :
14B If yes in 14A, did you work for major part of last year 7 Yes (1 )lNo (2) __________________ ---D . . . Yes in 148 (C/Al/HHI/OW) : ...... ~
16A Mam activity last year? No in 14B (HjST/O/R,S/I/O) ------------~-------------------L .... J If HHI/OW in 16A
(i) Name of establishment -------------------- .. -----------------------------, r .... 'f ..... ; ....... ! Oi) Description of work _____________________________ -___________________ • ___ 1 ..... 1. .. , ... 1 ...... ;
(iii) Nature of industry, trade or service -------------------------------------.--- 1 .... "r .. ·r ...... l .------ -- --- -- .. -.... -.... -_ .. -'- ......... -_ .......... ------ .. -- --- .. -- --- ........... ----------.. _ .. --~., ..... : ··· ...... i···· .. ··i
(iv) Class of worker ______________________________________________________ -------.. _._l ...... J
15 148 Yes-Any other work anv time last year? Yes (C/Al/HHI/OW)/No r· .... ·!
, B 148 No-Work done any time last year 7 (C/AL/HHI/OW) __ nn __ -u-uu----L .. j If HHI/OW in 168
(I) Name of estabIl8hrneril. ____________ ~-. ____ •• ______ .______________________ ..... _, ............. 1
(ii) Description of work ______________________________ ., ________________________ L .... L. .. J.. ... J (iii) Nature of industry, trade or service _________________ ~-~ __ . ____________ ............... y ..... "
i ! : : : : : : . . . . . _ .. ---_ .. -------------_ .. _----_ .. -~-----------------.---- ........ -------- .. ----~-.... ~ ..... ( ..... ..(
16 I:: ~n~: ;::~;~;:~;~~I~;~~;-~.-:;~;~~~;;~~=:==~~_~~~_~~~~~~.I j

6
• iIP'f~
(If» ;;r;JJ 'I1T ~---------------•• ---.
~:~ =.~.~! .. ~.~-~!.~~~~~~~--p (11J) ~/~---··-········-·-··T"~··;·-···1·····:
z i! f.AnJ ~ L ............ ; ..... .
(~) ~ ~ Iti1' f;r;mr ~ •. - .... -.-.. -.. .
~:; =.~~!-.~.-~~!.-..... -... -..... -~~~~q (If) ~/~ .. ····-·--·-·-··-··~ .... ·f .. "'1'''' .-
,.?!~pm~ -rt~ ....... ~.: Df'Jit
(m), ···· .... ·· .. · .. ···· .. ····· .. · .... 0 ~ """" iii IlTIr If! ;rm if f.lmT if) q1 I 6 iRot :r-r ~ iii f~ :;ft rn '"'1f fimfP f
fRI' ~ ri t !!iTt ;;i'rfim ~ em gvr' .... : ! ~ .. ...
CENSUS OF INDIA 1981
7
INDIVIDUAL SLIP (Sample)
CONFIDENTIAL
1 Birth place 5 For all ever-married women only
(a) Place of birth
(b) Rural (1 )/Urb~~-;~;~~~~~~~~~~~~_-:.~.~.~O \c) District l [ I --- ------- ------"'! ....... : ....... : ....... ~ (d) State/Country. _. __________ __ l ...... .L ..... .L. .... i
(a) Age at m~;riage~~-= __ . D (b) Number of children surviving at pressnt
Male D Female D Total 0 2 Last residence
(a) Place of last residence
(b) Rural (l)/Urban (2) -~~~~~~:-·.-~~~.:.-.. -.~.D (c) Number of children ever born alive
(c) District ~ ~ 1 . -----_. --------------; .......... ~ ...... ~ .... "0: (d) State/Country ... _. ___________ . -L.. ... L .... L. .. .J
Male 0 Female 0 Total 0 3 Reasons 'for migration from place
of last residence (Code)· ___ . _______ . ____ -D 6 For currently married women only
4 Duration of residence a1 the village Or
town of enumeration. _______________ D Any child born alive during ,. ..... , ! !
last one year ___ ... _____________ ---- L . ..!
*Employment (1) Education (2) Famil" moved (3) Marriage (4) others (5)

mJl'Tfiiflfi 1Iit~ "Tf!if(flfi ~furllT ~ "l:iff~"" srm ~ ~~ ~ m ~ f~ srll"litil '" •
sr," 3 : ~~q (1 )/~'" (2)
n sr'Qif it; ~rltit f~n; ~n; l!fTit it '1~ it. f-=rU; "1" q-"~ ~"I') it; f.'I'U: />2" f-=ri I f~~~"'i m~ 'lf~'1T ~ f"ll.:
~~ it "1" f~ I ~r iiR~~r f~'liTi, \rT~-II ij; i!fir~ 2 q-lt 3 if ifi) ;rf srfcr~1if ij; "T~ iifT'tf 'i~ I ~fVzn' ~ ,,~at'q ill) ~ 'fiT~ it lf~ f;:rf!!'q('f ~) ~TU;lTr f'fi ~Tqif ~'!fr ~l\ '!~" ifi) oT'fi ~iif fifiliT ~ I
llf;r 4: Iff,!
~~ 'fiT~lt it ozrf'ffi' ifiT fuJ.i:r ;or-If f~"!' ifi) tr~ ~'T Cftfl it ~;;f 'fi~ I Sl'Tlf: zr6: ~!fT ~lI'T ~ fifi Pf)~ ~~ Cflf1 ifiT m~ ifi) ~~ifi\ "'iJ~ ~i!) ~~" cr.) i1'ffTff ~ I q~;:~ I;ITqifiT q-r~ "~~ qt!I'l" if i!r ~ ifi~;:ft ~ I f;or"!' fu~s;rT cr.T
s;rT~ "fUA'T it ~if ffifi U;iifi qtf it ifilf WT -arr'fiT ~ '0' i{,* ifi'i liflflfifi ~ nr ~'fi cr" it; "'Wl ~ ~ I IATlfliiT "~Ti'fT it q-~ 1{~ 'f~) 'Ii~;fT ~ I ._, . .
sr~ 5 : ~'l'Tfe:1Ifi f~fR
ie' sr~ ij; ':3"~, it; fu~ f~"!'f~f!fij' ~f&iC{l' ~~T ifiT srlfTIT ifi~ :-
!I0-f~ifiT atifT ffifi mi{1 'fit §l ~, !ITT 0 -~) ~ij" ij"lfll' "CJTf~ifi f~~fff it ~ I
f~ 0 - f~uif; I f-;(uifir qf(f Iq~iJ) ifi) '!(~ f!) '!'fi) ~),
~ ofil'o -Ul=orrs fir:;;~ q-"CfT ff9Tifi~i{T I
~ij" Sll-r if. :a-~<:: it f"'~iff-=rfl!fij' ff<::Tit; ij' srf<r~ lti) ;orTl!; :-
(<ti) f;;r~ azrfifff "if.) 'fiq) 'tr mr "'~ ~f ~) ;.;uil; frfU; "fo" fPfj I
(Ii) Q;Q' all'flf(f if. f~u: "!!TTo" fri 13fT ~'" Ultll' "<rTf~ifi f~qfi:l it t ~ ~"i!fiT q~~T fqqT~ ~) 1fT ~"~T '.:il, 'TVT"fT if. UJI'lf ~uClir l;.;u'Ifr qfff /q'MJ ~)f~cr t I Q;Jt oll'flfi:lllT if. f~u: 1fT "!ITT 0" f,,1i \iTT
fw:;r lIT ~JI'r;or if; ;-n:r !!Tr~T~T ltTif ~Ta ~ q-R ;or) ;:"nrr m ~ ~~ii: ~J:lff'6' ifil' ij'~ ~a- ~1 I
lff~ fCf.n~ fcrC!"llT~qi{ \rr ~ ~f'li" ~;orf;:~ff ~~ lfT ~'!f') lf~ if.{ f'li CI ~ mi{')~T t lI'T f'fTlf) ffR q'{ q~C!ff: i{~qf~ it ~ it <::il'ffT 6" ift ~it. f;;rn: W "!ITT,," ft;N I
(IT) ~9' 6Qfl!fo f;;r"if. q'fff/q~"!,') 'fir ~;;~ ~T ~<tiT t. 'All: f;;ru~ frT ... lT fqcnt "'~'"f f'lilfT ~ ~~iIi fflQ; "f<ro" f;;rli I
('Ef) l£f~ 'liTt ~~Ii m P.fJ, q-q;:(T [j"i!'i'!) zrT !Rqit qf(f a :q;;nr '{~ ,(~T ~ lfT \~ \~I' ~ q-"'{ f;;mifiT :qq-r)
q'i:"!'T <rT ;qq~ q'fii if. ~T~ ,~~ 'fiT iijiTf iilTf~~ 'Hfi{T ;r~1 ~ trT fCliu) i'llllJT~lf i~r lJT ~) sr:;ffi;r;:r mJl'Tf~1ifi ZTT mr~ Sl'tlT if. ~Tn o'1T!f; f'f'1 '!iijiT i!T q-)'{ ~~T ~ IQ'NI' ~ ~ ~:o~ fuQ; "~DfcrD" f'1V I
(g:) ~ifff'" \Ell ~ '{~it <frill' ff:!{lJT iiji) crcr1fi{'fi ffQJfi'i qi{T fQ it if« arcr~Tl{ I
~~ sr'if ifit ~or) ozrfcfozrl ~ m if 'q'~;;T ~ :qr~ ~ fltidt '1"1 ~T~ t ~l I ~Tt if;;'!fT t fiNlJ if lfi( qoT
~)ffr &) ~ fli ~ qf2(crTfj{iT iti'r, fqj\ qT 1"f'1ifiT ';'crTf&ifi ff"fa- if, ~t it ~~ <til s;rfCJllTiiji srfcrf6C iiji~ I
8

APPENDIX II
INSTRUcnONS TO ENUMERATORS FOR RECORDING THE ANSWERS TO THE CONCERNED QUESTIONS RELATING TO SOCIAL AND CULTURAL TABLES
Q. 3. : Male (l)Female (2)
For male, write '1' and for female, write '2' in the box provided against this question. For eunuchs and hermaphrodites, write '1' in the box. Verify with reference to the name and relationship to head recorded under columns 2 and 3 respectively of the Population Record that you have noted the sex correctly.
Q. 4: Age
Record the age of the person in total years completed last birth-day in the rectangle provided against this question. The age should be recorded in international numerals. Very often. there is a tendency on the pan of ir:dividuaJs to return 'years running' rather than 'years completed'. Make sure that only the actual number ('~ "~ars completed is recorded. In respect of infants who might not I. 'lve completed one year by the day 0f enumeration, their age in comp!eted years must be shown as'v as they have not yet completed one year of age. Makt" sure that infants even if one da.y old are invariably enumerated. You should not enter the age in months. The age of an infant who has not"' et completed one year should invariably be noted as '0' only.
Q. 5: Marital Status
In answering this question use the following abbreviations:
For never-married, write For currently married, write For widowed, write For divorced or separated, write
The entry is to be made in the manner iadicated below.
'NM' 'M' 'W' 'S'
(a) For a person who has never been married at any time before write 'NM'.
(b) For a person currently married. whether for the first or another time and whose marriage is subsisting at the time of enumeration with the spouse living, write'M'. Write 'M' also for persons who are recognised by custom or society as married and for the persons in stable de facto union. Even if a marriage is disputed in the locality, write 'M' if the person co~cerned says he or she is married or is in stable de facto union.
(c) For a widowed persop whose husband or wile is dead, and who has not been married again, write ·W'.
(d) For a person who has b<!en sep:trated from wife or hushand and is living apart with no apparent intenti0!1 of living together again or who has been divorced either by decree of a law court or by an acc!!pted social or religious custom but who has not fe-married, write'S'.
(e) For an independent woman return her marital status as declared by her.
This question must be answered for all persons irrespective of age. For very young children, though we may know that they are not married, the appropriate abbreviation must be entered.
9
10
i3f) t« «q'lI' cfqTfi{'fi fp:rfcr if ~, ~"if; f.'T!1; "~rr 0" f~li I t« ij'q'lI' clqrf~'fi f~~fcr 'fiT ~ti ~i.i ~T it f<r'.fTfii:Cf (if" f"'fTf~Cf) ij" "if fi.iTIH ~T~, '«'fil 3f~ if;cr~ lf~1 ~ fiJi ~ij' Q'q'q fcrorTf~ (,=:r;qclf) i3fTCJif olfaTCT "R:it Cf~ I ~I~~or if; fi.iT!1;, fifi«T illffiifcr 'fiT m~ ~Jf Jfl1lf 80 <rfi ~ ",1~ f;;yqit 50 Oft'{ If~~ f'fqT~ fifilfT ~) ~h :a-Q'iJiT
IHifT "''liT 'liT .... 1f2l'Er ~ arh <r~ 1:)ifT !1;iIi .n~ ~f.ff ~ Er) ~~~ t« ij'lilf cjOfTf~'fi f~fCf it IfTifT iifr; I
~CfTf~cp f~f;:; it ~)i:r if; fi.iTt!; ~<f lf~ ~ f"ll ~~ qh ~'l(T ~)ifT ;;rrf'f(f ~ ",'h; ~ ~\l1 f.rtlIfT~~' fqinf~6'
~ ~lII"iq: ~iliT !;fi.iT'fi lfT l'I";iI"~1:i fq~1: if~T g'qT ~ I filflH lfQ: rrTc ~ fifi f<r<ITt1, 'fiT?;if 'liT l1f6c ij" 1fTi'll' ~ lfT
if~T, ~«ij" ~IfT~T 'lil( 1I'i:fi.iil' <fF.T ~ I
:a-q-~TiifCf srfCff~cll'f ~TH q-~ ~i;f ifii iifiTl.ic'fi if rrgT I
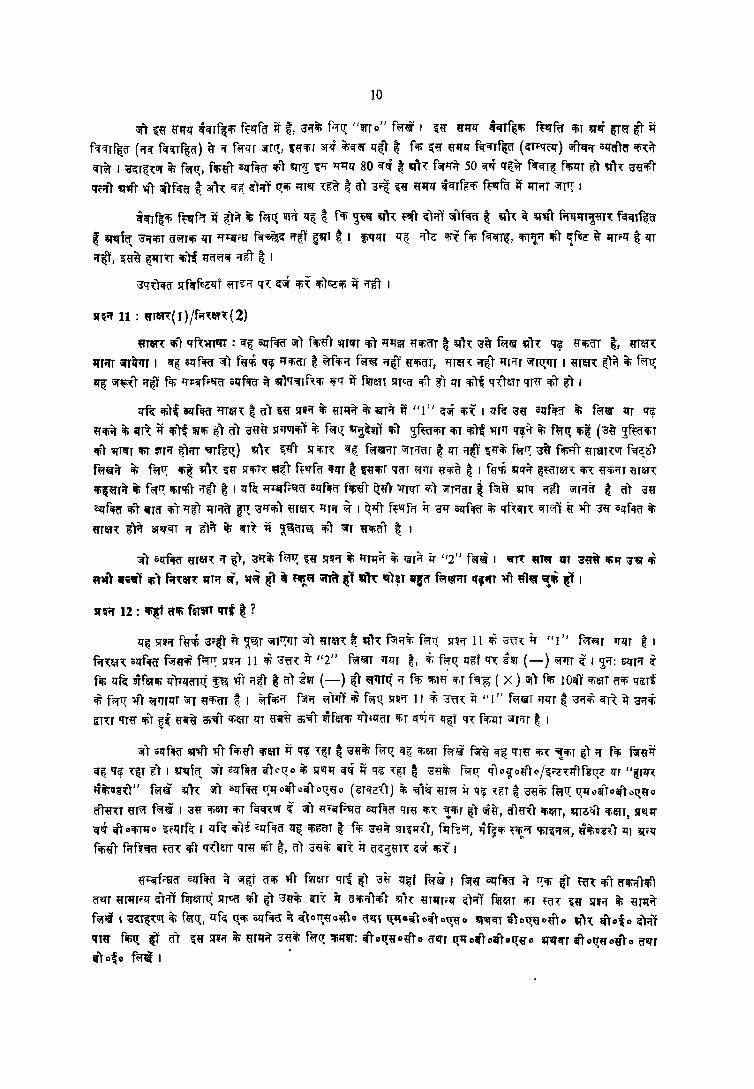
sr~ ... 11 : ij'T~~( 1 ) /fif~~~ (2)
ij'T~~ llir qf~~TI!IT : 'f~ 6zrfifCf iif) fif,«r 'ifT"T iJi) Ifliill ~iifiCfT ~ "'h :a-~ f~l9 "'h q-~ ~CfiErT ~, meH IfTi'fT ...-rjJqT I 2I'~ olTfiffi" iif) f«i If~ Ifilicrr ~ ~f<fii{ fi.il..<f <fj!T «ilicrT, 1fTen i{~T ilNT i3fT!1;'TT I «Te:J~ ~T~ il; fi.iTq;
~ ~,1 <f~T f<fi l'I"l=iI'f;:l:T!;f o!:ff'fo it irl'T'tI'rhiifi ~q- if fwen srrCiJ iifiT ~) IH iJi)~ !J<:Te:Jr qT~ <fir ~) I
<rf~ 'fi)~ c<rfiifo ~re:J~ ~ oT ~ij' sr~i{ if; ~Tlfif if; 19T~ if /I]ll ~;;f 'fit I tlf;::a-« il!:ffiif=:l" if; fi.iT~ tiT q~
«ifiil' if; iin~ it ifi~ W'fi ~) (f) :a-~~ srql!JifiT il; fi.il:!; ~1t~T lflT ~f~lflr 'fiT lfl~ 'liTq ~~ if; fi.i!1; 'fi~ (:a-e- ~f~('fiifiT lflT 'liIllT ifiT ~Tif ~)i'fT 'EfTf~!1;) qh: ~T sr'f;T, Of~ fi.il9<fT iifTifiJT ~ <rT <f~ ~fI"if, flPl'n; ~ fifil'l"T 1JTaT~l!J f'EfC::oT
flPl'liif il; fi.iTn; Ifi~!ifh: ~ij' 5TiliT~ ~~T fp~fi:f iifll'T ~ ~«IfiT !foT (if'llr Q'iJia- ~ I f«i !ifqit &~('fTel' iIi~ «'f.<fT ij Te:!",
ifiili.iTit ifi fi.1n; iliTIJiT if6"T ~ I lI'f~ q;arfrl:TCf ozrfiif(f flfl«1" it~) ~TQ'T if.) iifTif(fT ~ f;;j i:r qTlf if~ ;;YTif~ e 6) :a-«
~ll'fifff ifiT 'ITEr ifi) qtT Ifrifa- ~ :a-Iflfl) ij're:J~ lITi{ ~ I ~l'I"T ft"ifif if ~ olffifil ill qf~qr"\ qT(.j'y « ~r ~ o!Jfiifq ill
«Tel"\ ~)~ ar~qT iI iIi\' ill il'r~ It ~~tr~ "'T iifT «"iff') ~ I
:sr) Oll'fiffi" Q'T~~ if ~t, ;a-qif; fffil; ~~ srll<f if, qrqij- if; liTi:t ir "2" f~{j I .... ~ ~n" qT ;a'~ If>q ;a'~ ~
~~T .;;~T ifi) f.I~~~ "Til 'i, 'l{~ i!' ~ ~"!." ;ffit ~l ,,'h: q)~T it§o f~QA'T q,ffT ~1 ~lQT ,iii ~ll
sr~rr 12 : Ifill Cflf> f~~T 'ITt ~ ?
lfQ sr~if f~i \3"~~1 ~ ~T :srTn;'TT ~) ~He:J~ ~ il'h f'Jf<f~ f<=r1Z sr~if]] cf. :am i:r "]" f<'fl<lT 'T~T ~ I
f;:,,~, ozrfifEr f:sr~ f;;rn; srH ]] i ';3'~H it "2" f~1..<fT q~r ~, ;_f; f<'TtJ; lI~j q"~ iw' (-) ~qT ~ I ~if: sqr<f ~
flfi lTR wfe:J1fi lTTtll'oTti ~ -.:rl" ~~T ~ 0) iw (-) ~T ~qT1t or f"li 'lim' Cf.T f:q~ ( X) \if) fiJi ] OiilT if.a1T oiji qG"Ti
<Ji' f;;rtJ; ~T i.iqrzrr ~T ~'fi(fT ~ I ~fiifirr f~ (if'Tm i f(if'~ sr~'f 11 i- ~~H iT "I" f~"T lJ'lJT ~ ~cf. orR it ~<f;f; ll:HT '1l~ lfir ~~ ~if~ Oi'tl'T <foelT lI'T «ar~ Oi'tl'T wfellfi tr)llfor Cf.T quIi'f zr~f IH f'f.lI"T ~NT ~ I
:sr) ozrflfiJ q-.:rT 'liT flfl~T ifie:JT if !f~ '~r ~ :a-«ifi f~tJ; q~ lfie:Jr f<=r1# f;;re- q~ qm ifi, ,"!iliT ~) if fili f;;r1Jif
Cffi q~ ,&T f.') I !if¥:J'iq: ;;rT ~lfflfo GfTctJ;o if; ST¥:fq orli it !fiE '{i[T ~ '3'tl'ifi f<'T1:!; q-r0Iil:0~ft"/~~e"\qlf5!1;e IH "i!r~
4'itilJs~r" fi.iT~ !if"'~ iif) olTfif(f ~()iI"TCill"o~~o (6TifcfT) ~ 'Efi~ ~T(if' il' q~ ~~T ~ ';3'~~ f<=r~ q;q<>iToifTott«o
!;fT~T «T<'T f<=r1# I :a-1J lfle'll lflT fqq-,vr ~ ;;r) ~·iI'F'ETiJ olff'liJ rrT« iH '!'fir li) ;;fe-, cr')«~T 'fielT, !iTTo~1" if.e:JT, srlQ li
q~ orToifiTqo ~~ll'Tf~ I lI"f~ lfllt ClI"fifo zr~ ifig;:rT ~ fif. :a-tl'~ srr;qJ[,{T, fqfs;;r, lif?'if. ~",r:r q;r~<f~ ~if;1J6ft til qi'll 'f." ,
f'fi«T riffll'tl'Er ~Cf,( 'fiT q\l~T qT~ ciT ~, ill ~~if; il'Tt if o't~~T~ ~'* <fii I
~t:iI'f;:tlCf c~fifi:f if \jj~t (fiji 'liT fwen qr~ ~)' :a~ lI'~f f(if'~ I f;;y~ illffifCf if n;iji ~I" ffi"\ ifiT o'liorTlfil
iJ"iT Q'TIfTi'lT ti:TifT fWIIH~ srTCiJ 'fiT &) :a-1Jifi il'T~ i:r CI'f;ilT'fir 9;Jh ij'TliT~lI' <=:)ifT fWIIH lflT HH ~ij' SllIif if; ~T1iit
f~1i , '3'<I;t~,11'( if; f~~, l;ff~ ~'" G!:l"fCil~ ~ qrot;«o~fto <:t:q{ ~~.iifoi[·\'c.~Q'o 'q''lCf'l i[To~~o«To q)"( i[10~0 ~l'i'1T
!fT« fifi!1; ~ <:tT ~«STIli!' ifi «Tlfit "3'ij'lf; fi.1~ ~1I'1lT: or1ott«0~TO Er~r ttqoarroil"TDq;«O q''l'CfT arrott«o«To ErITT
iTTo~o f;;;r~ I .
11
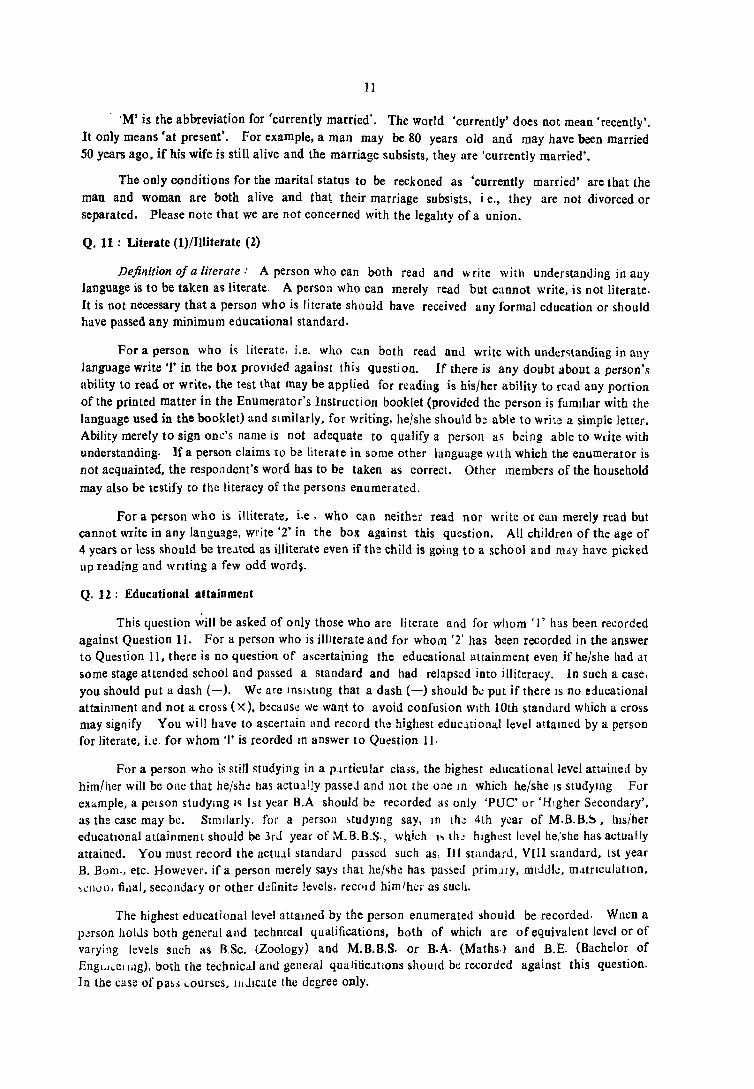
'M' is the ab breviation for' currently married'. The world 'currently' does not mean' recently'.
It only means 'at present'. For example, a man may be 80 years old and may have been married SO years ago, if his wife is still alive and the marriage subsists, they are 'currently married'.
The only conditions for the marital status to be reckoned as 'currently married' are that the man and woman are both alive and tha~ their marriage subsists, i e., they are not divorced or separated. Please note that we are not concerned with the legality of a union.
Q. 11 : Literate (l)/Illiterate (2)
Definition of a literate.' A person who can both read and write with understanding in any language is to be taken as literate. A person who can merely read but cannot write, is not literate. It is not necessary that a person who is literate should have received any formal education or should have passed any minimum educational standard.
For a person who i~ literate. i.e. who can both read and writc with undcr~tanding in any language write 'I' in the box provided against this question. If there is any doubt about a person's ability to read or write, the test that may be applied for reading is his/her ability to r~itd any portion of the printed matter in the Enumerator's InstructioJl booklet (provided the person is farDihar with the language used in the booklet) and Similarly, for writing, he/she should b;! able to write it simple letter. Ability merely to sign one's name is not adequate to qualify a person as being able to wdte with understanding. If a person claims to be literate in some other language wuh which the enumerator is not acquainted, the respondent's word has to be taken as correct. Other members of the household
may also be testify to the literacy of the persons enumerated.
For a person who is illiterate, i.e. who can neither read nor write or can merely read but cannot write in any language. write '2' in the bolt against t!lis question. All children of the age of 4 years or less should be treJ.ted as illiterate even if the child is going to a school and mdY have picked up reading and WrIting a few odd word~.
Q. 12: Educational attainment
This queslion will be asked of only those Who are literate and for whom 'I' has been reGorded against Question 11. For a person who is illlterate and for whom '2' has been recorded in the answer to Question II, there is no question of ascertaining the educational attainment even if he/she had at some stage attended school and passed a standard and had relapsed into illiteracy. In such a case. you should put a dash (-). We arc Insl~tlllg that a dash (-) should hi: put if there IS no educational attainment and not a cross (x), becaus\! we want to avoid confusion With 10th standard which a cross may signify You will have to ascertain and record the highest educ.ltional level attalDcd by a person for literate, i.e. for whom 'I' is reorded ID answer to Question 11.
For a person who is still studying in a puticular class, the highest educational level attained by him/her will be one that he/sh.: lIas actu~!!y passel and 110t the one In which he/she IS studyll1g For example, a pelson studymg I~ 1st year B.A should b.: recorded as only 'PUC' or 'Higher S<!condary', as the case may be. SImilarly. for a p<:rsol1 ~tudylng say, III th..: 4th year of M.B.B.~, his/her educatIOnal attainment should be 3rJ year of M.B.B.S., which I' th: hlghl!st level he/slle has actually attained. You must record the uctll.ll standard passed such as. III srandard. Vlll standard, 1st year B. Bam., etc. However. if a person merely says that he/'ihl! has pas~ed prinulY, mlJdl..:, mJtflculatlOn, ~':Jlvll. tidal, secondary or other d:!finit:;; levels. rcc('ld him/her as SUch.
The highest educational level attalDed by the person enumerated should be recorded. Wm:n a p.!rson holJs both general and tcchDlcal qualifications, both of which are of equivalent level or of varying levels such as B.Sc. (Zoology) and M.B.B.S. or B.A. (Maths.) and B.E. (Bachelor of Engl.l~ellllg). both the technic.!l and general qualilicJtlons should be recorded against this question. In the case of PIl~S I.ourses. lliJlcate the degree only.
12
fifi!IT if') fiJTffifi 1fT t:rrrffifiTtrt fW&lT cpT fff't~"" ifi\ff ij"JI'1f ~1I' fCllfll' ~ij', il"To~goij"')o (ilm), '1l1'o~o (9;fI!jWT~'I'), ~lI'oQ;ij"oij"')o (ar)c;;T), ii£T0U;ij"Oij"To (liN) ~TfG: f~li I Q;~ ~f<;r ;:rrll' i;J)' ij"rqr;:lfff; STlI'Tif
;:ri:!1 f'fiu; i;Jra- ~, if f~i I ~ij"') G:WT it f:AT :1fT f:sc(:fTJI'T "PT IJ;tT iJTlI' f~1i I \gG"T&:tUf ~ f~~, ~oU;o (fi:!~<iT) ~1t ~TlI'qy"'-u ij"T~tI' it f:sci'if)'JI'T :1fT 0;1100;0 (ij"I1Ji;Jl!TTt:'lf) ~"t ~iiI''t ft~w;:r it f:st~TlI'r qrfG: IW I CAl it <l>Tq;T ~~mr
f<{liT iTlI'T ~ qff: ~ftT f~fq_cr fJlt ij'~T-ij'~T ~fIllifi l1Tn rcrr G:\;f 'Iii I lI"6: ijfTiJifiRr 'if;:r-wfiRr lI"~<I"r if; f;,;rQ; ~~lI'<'6'
1Ji:!ccr~1Jj ~ ~tl; ~rlJ ~~ ~T<rt:TT'fTc;{;f'li d 'fi~ I
sr~rr 13 : ~'ff.:{:f fCfi~ ~T~ ~ ? ~ (I) lif~l (2 )
"SI'!1iJ 12 'fir ~"'t ~ 'liti:r if il"TG: qTIJ'fiT lI"i:! q"(n '{it;:rT ~ fCfi fijfij' clJfiffi' 'fiT ~Tq iJVJ;:rT 'fit t~ ~ Cfll'T ~ f'li~ft ~~i'if lI"T "'T~~ ;r ijfTQT ~ lfT ;:r~ I lff~ '3"~'t "~r" ~) crr l:iM- it "1" ~:;f "li~ I zrfo: '3"~'t "ifQ:T" ~l aT l:iTi:r
;r "2" G:'* 'fi't I !i"lIT lI~ "Ie II\~ fll\ frr~~ (Sf~ II q ")i' "2") 1tT ~~" lilA ;;n~ ~ ~'fia' , ;;rn-. lf~
ST'!1rr ~T ij' ~ I
iiij' "SI!I<I" 1.f,T ~m <(;;f 'fita- ij''!"zr ~fl:",F"'cr e:lfR<:f ij' tr&: ;;rrrr~ iliT lTrq-'!1l!''fitrT rr~ ~ f'li f~ij' f'fi<'f j<f,T~, 'iT '" if q& err; t~r ~ ~ I1r<'1.Ja-T-!fTCcr ~ zrr ~r I lI'f<{ 'fi)~ ClI'fifQ" q~:qTt ~lJ!fiJl' if; qr~,," ij- ~ 't~r~) zrT <JlfTcr«yfil"f
q-r<!!.lI'~JI' lI'T sr)~ fl!Ta:t"T CPY7T"fil!" if, ~;:o*J fwen 11fi.1IJ Cfit t&T &) ~h FPj iji) t9J.<'f /'liTiiriil" jJ liifi1" cn\1T iTo 101 ~i, QI cra:~~nt fiT "SIl'1 iii ij'T'I"~ .-f.t if 'ifiT6 "1" G:~ 'fi-( I
IR'RI!fIfi !nrr
1981 Cf>t i;J;:r~1IJ;:rT if ~qru \3"~it~ \1Trff 'lit ;q"fM-CP iTfcrf<rftrfT ~ arrl: it fqfCIn: ~ 'iIT'ICfil'"T U;C!i'"J 'fi~
'fiT ~ mfq; ~if :JJT!firr if "5fI;fTifi:JT~r cpT qtf~Cf 'ilTiJ<f>T'\T fJf~ ij"~ J iR"Tfl!fiifi 5Tllil frf1:;:rf;;rfliO ~ ;-
I "5fll<l" 14iji" lillY iTa- qq fiifi~r \11 ~JI'lf 'fiT'!" fCfill"T ? ~Tff ( ~ I If; J(: I· I _ . ifll" ~ollq" lTTo ~o l'1o/~o g;rrlf
"5fll't 14li lff~ 14'li if u&:t" crt ifl:fT iTer qf{ ~ ~fa-'fli'!II" ~qll' 'fiTJI' f;r;lfT ? ~ (1) (iT~l (2)
• it ? 14lS if 'Q"f' (;r;ror~Oq"/qTo~"If(oSPTo) II 51"11<1" 15'li lTi'f q" ~~1f 'fiTI1 . J4~ it 'iJ{r' (,!oJfqoJg;rTo/fto/f'1o/{jo/~.lf)
14~ '~t' -lTCf q~ f<fiat '1f ij'I1Q IT;:lI' <!ill 'fiTJI' fif.:IfT ?
~t (;r.To/'i{foJl'o/rrTo\3"o/'lJO'/fiTO )/iJ&T SPliT 1511 -'-4lSf--o"'''I-:iT'-iJ'CI' ql{ fsptl'r 'IlT ij''!"lf ;;r-r !fiTq f'fillY it ?
(<['T 0 /'i{f 0,,"0 (erTo '3"0 /ff" '/fiT 0 )
!I"~rr 1411\ ~1t1 ~ P' ill~ "'tt Cf~ "';;"'1~) ql ~'T 1A'1~ ~~!fiT \J"I,\ 31CI''llf C{;f flfitfT \ill~ I ijf&:t 0"'Ii
~rl:f ST'!1i'J) "PT ij"l=iiTiS" ~ ~ ~~1 ?r ~iJ. "jffrt fiil"iI' If't ~ ~TlJ_ Q"Ti'r iiI I
it "SIlliJ "!"rlfT BT~r iTO" crli it f'lio; iTU; 'foTl!" q;T fqq~1Jf \1~if it forU; ~ I 3;J'Cf: ~~ I '!fiTXI" CfiT IJftmI!JT
~l-.:: 'l'it'4" iR"orf!:T 'fiT ~Jf~ ~"r i;J~~T & I
1(i1'l"!fiT qft~l
filiij'') 'IT olTf<lff fqQrq inn iR"rl!"~iTT if f~1:!; f<f>lIT tJlJT wr'tfn-!Ii liT Jl'Ti'fmiifi CPT2i" -'fi~Tq- "!fiTJf"
<f>~i'ifTO"T ~ I 'fiT;r l:i it.Cfi?[ 'f>r;r 'fitiJT ~r ;:ri?:T iR"TCfT ~ iitfC-ifi if;TlI' 'fiT STqTCfI q q~&lur ~lt fil'~i'J 'IlT '!1TTf~ ~ I
~i{li lR';rr~
~\Tr S£lliJT it. f~v, ~k4 trqTht iTVTo:TT 'liT aT~Ttcr ~ Q;>;f; qi Ii&~ iifiT ~ I ~ i1iTlI'~?r fiifi !tiT" ~n ;:r~ij"l=iiTf;S"er qrftlfTf~Cfi :a~)if Gi~, ~~ il"i'JTiJT, q~ m: zrr f'liij"T ~Hi l=f1«'1" it:lfT q!i' ~ fCfiij'T 'lT1T it ~i'J'hr qf,ff'lffO"lfT it. ~~«Tt f'liU; \iIl~ ~ I ~~ lUJf~T it i:!lI'T"U oqf\lSTTl!' 1JUfi'JT ij' ~ ir"tij- qjij"\;T cr~ ij' ~ I

13
In recording the educational level of a graduate or a post-graduate, the major subject such as B.Sc. (Maths.), M.A. <Economics), M.Sc. (Botany), B.Sc. (Agriculture), etc. should be noted. You
should not use abbreviations which are not in common uSe. In such cases, the degree or diploma should be spelt out fully. For example, M.A. <Hindi> and Diploma in Library Science or M.A. (Soc.) and Diploma in Labour Relations. Adequate space has been provided in the slip and you are urged
to record the qualification accurately and in sufficient detail. This information is vital for manpower planning and should receive your careful attention.
Q. 13 : Attending school/college, Yes (1)/No/(2)
After you have recorded the ans'ver to Question 12, you have further to ask whether the person whom you are enumerating is attending any School or college. If the answer is 'Yes', you have to record' I' in the box providtld against thIS question. If the answer is 'No', you should record '2' in the box. Please note that illiterates (code 2 agaiust Question 11) can be found attending school. Therefore, this question should be asked of all persons, including elderly men and women.
In recording answers to this question you are not required to ascertain whether the school/ college being attended by the person enumerated is a recognised or unrecognised institution. The choic: ~hould be left to the respondent as to whether the person is attending school/college. Thus, if a perSOll is receiving education through a correspondece course or attending some vocational course or attending the Adult Education Programme and returns himself as attending school/college. he/she will be entered as such and code 'I' will b.: recorded in the box against thi!: question.
ECONOMIC QUESTIO!lolS
In the 1981 Census we intend collecting i'lformation regarding the economic activity of the
people in great detail so that those who use these data have the type of information they want. The economic questions consist of the following:
I Q. 14A Worked any time at allla~t year?
Yes No (H/ST/D/R!B!I/O
Q. 14B If yes in 14A. did you work for major part of last year? Yes (I II No (2) II Q. 15A Main activity last year?
Yes in 14B (C/AL/HHI/OW) No in J4B (f:J.7ST7D/R:,B/lri5)
Q 15B 14B Yes-Any other~_ork any time last y~l!r? Yes {C(AL(HHI/OW/No. . 14B No-Work done (~ny time last year? (C/AL/HHI/OW)
These questions must be canvassed for every person, irrespective of age or sex· Every person must b· asked Question l4A, including the very young or very old and the answer to this question must be filled ill. The other questions will have to be filled in the case of those to whom they are applicable. The instructions for filling these questions follow.
These questions are meant to get details of the work done by the people with reference to last year. We may, then fore, first consider what is meant by 'work' and what the 'reference period' IS.
Definition of work
Work may be defined as participation in any economically productive activity. Such participation may be physical or mental in nature. \-Vork involves not only actual work but also effective supervision and direction of work.
Reference period
In all the questions, the reference period is the one year preceding the date of enumeration. Certain types of work such as agriculture. household industry like. gul' making. etc.. are carried on either throughout the year or only during certain seasons or parts of the year. depending on the local circumstances. In such cases what we are concerned with is the broad time span of the agricultural seasons preceding the enumclation.

14
~;r Sf~;:(f it; lfT6lJlf ~ i1:ij 'fiTlf lp<;;!t qT~ iilJfifCl'lJT ifiT ~ ~~!:IT iFT G'err ifi<:ijT ~ I =<t fiF i!i111 Cfil:;!t qT~1
~ ifiTf~ifi (Full time) lIT If)ij"ifr (Seasonal) lIT ij"Tififerifi (Marginal) ~r ij"ifiCl'T ~, ~er: ~ij" iIT~ if ~fiF~l ifiT ((~ ifio::;rr q"T,""lJifi ~ fi>T;r~ q~crfqifi f~q-fer ifiT qerT :q~ ij"it; I Sfl1i'f I 4'fi. srl1;r I 4'if. Sfl1;r I Sifi m-.: srlfif ISIS'
ij ~~r 5TifiT~ ifir i>TT;rifiT-.:r G"i 9fT ;;rT;r) ~ I
Sl'li:; 14'fi if. Im:T ll"i[ q'<fT iF,;:rT ~ fifi ifl:fT olff'fCl' ~ 'Ier qlf fiFm +£r «lIll" <f,)~ ifiTlf fifillT lJ'T ;:r~T 1 Zlfe:
'3'~ ifi)~ 'l1T ifiTlf Ofl?:T f;r'lJT ~) err '3'«it ~q'rrT !J1111 ern ~ro f'F1U? f:srq olJfcrn it; f~1T, 5Tliij 14ifi it "~" ~;;j ~T '3'ij'~ 14~ if ~ qOT ~lJTijr ~ fc!; iflfT '3'~ cr~ it ;pfa-ifit~ ij"+rlf iT ifiT+!" fifilfT 6' ? crt{ ~ q"f&~ ij"l1lf ~ ~~sr ~ 183 lJT '3'ij"~ ~faifi f~ lIT ~ij'~ WiGT ij 6 l1i!ri'r lfT '3'IJ~ ~fuifi !Jl1lf I f;;Ji'~T~ 183 f~;r ZIT ~!J« ~ft:Tifi ij"iflf ifiTlf flfiOrT. '3'ifit f~~ ~;r 1419 if "~T" ill)\, ~,~ ij on);s "1" if;;f ifi<:iiT ~ ~f'F;r fiifi'i[Ti!t 6 ifl?:Tii" liT 183 f~il
~ ifi1f IJ+!"lf Ifil1I' fifilfT '3'ififi f\ill:!; 'S'IJ Sl'11;r ij "i'f~r" ~'\o:: Sl'l1if if; IJTll~ if; VTii it ifi);s "2" f\ilV""T ~ I Sfl1if 15iF ij
'3'''1' <fiT+!" ifi<:ii <[T\ilT if; ~lelf ifiTzr-ifi\iTrq ~ if~ ij iiTTifIfiTO::) 1T,ifif'll'er ifi~ifr~, fi>TiI'if; f\iTn; S[!lil' 1419 if ifi);S "1" G"~ ~ I ~!Jif; fqtf'{f;:r f;;Jrf om'fOll"T Eli f~U; Sl'l1if 1419 ij ifiT€" "2" ~~fq. ""I"6T" G";;f fil'ilIT 'IZlT~) a-rrit ~~lf ifiTzr
ifi\ilTq' 'fiT +£1 'fCl'T :q~lJT I
~r !J'f.<fT ~ f~T allflfer it ~ifi « afuifi ifiPf-lifi~rqT if ~\il fiJ\iTTifi<: 6 ~fit lJT 183 f~"I"!iT a-IJ« ~faCfi ~J:f'lf oifi ifiT+r filill"T Q:T I i:t~f f~~fFf ir fi>Tl1 cpTzT-ifi\iTT1f it '3'~il ~f'Cjcptw +rlllf \iliI'TlI"T ~) a-ij- ~"t i3t1'ifiT ~lJ ""Pi
lIT"T :srTt!;'IT I '3'<ng:,Uf it; f\iTt:J;. lffG" fifi!JT cll'f'fer :r al'" +r~y;r ifimflfTfT, ~ifi 'f~~";JT ~~ sr;rTii il1'{ '!T~ 11~, ii i:rfi'l~<:
+rj[~<: Eli ~q if 'f.T+r fifill'T ~) err '3'~ifiT ~l§lf 'fiTII ifil11i;JifiT<:"f ~TTfT I lI~ tu ~GT~~Uf 1t i[fCl'~~ +r:J;i<: if; ~q it ,jT
;;rT;:r ltir~ if.T+r f'jill"T tT crT lft! ~~ q~ f;:r'li"~ ~ fer: ~F. ~.,iI ~ ~'lrtT ~lPlI" crt+r f",~ ifFr~H ~ I fi>Trt!til" srl1rt 14~
it ";rgyl' G;;f <fj<crTlfT ~ !q~f1' f;;r;:f,Ti'r fq-f3.~ q-q. 6 lt~r;r liT 183 f<l:" ~ 'PIJ if.T+r fifilfT 9Ai\ f:srrrEli f~t!; I.iT;>r ij
'fih" "2" ~.r fifilfT 'IlJ"T ~ ~;:~ lJ~ ifCl'FfT ~ fili 'flfT ~ ~lfer: ~~-ifiTlf if Ci!:lH ~ lI'T f<f~mH ~ <IT ifTP.:;r~ IlT f'{eT!:Ii
:Sll'fiffi" !~f;:ell"~ liT f'ir19J7T ~ liT ~~~~rr qf~<fTT if 7~ff it ~r.: lIf~ ~ iilfflf'1 ~'fiJ f<f.ir s.:Mr ir ;;~T ~T€t ~ ~r Sf1!"f
15'f. if "3"i'fif; f~ "~i'lI"" f;;rlj I
!:I":iii 1511 ~'tUf <foT+!" (Secondary) lI"T lfrlltfi'lifi (Marginal) <foTff CfiT i~l<:r 'ij",{iI'T ~ I f;;>;r~Ti't crq. il;
~fa'f.tw l1ff"lT 9:TIJ f'f.lIT ~T ~~fC'[. fi>T"I"il'i f~~ 5111;r 14'ji if 2f.)s "1" ~;;f f'jill'T :srrerT ~, ~rrif; ~ijlf CfiTff <fiT ~qlU
Slllif 15;;r. if ~~T i>TT "'!'f.T ~ I ~i'fit ",T~ ir srvrr 1519 iT ~lUf if.TIJ, IlfG Gf~~ ~t, i:rT '3"+rif.T ~qlU il:rrT ~ I fGTi'Q:)~ crt{
fr- iff!:fif.t!!f ~fflf if.T~ ifiT+!" 'J~J f'fil:fT ~ arh fi>TiI'if; fi'1n; 511!r[ 1419 if "2" ~;;f fif.lfT 'lilT ~ "3;:~Ti't arcr"QlI' ~J ifiif
'TrifTfo-Of, ifiT+!" f'filfT gY'IT ~l' ":3""Tif.T ~lfhT !HiI' 15~ ir ~;;f <foHT g ~q- 1I~ ~TCfli!lif. i?:llJT f-:r. qN rOT S!11iI' if.T lT~)
j'iH sneer if.~it it f;;r~ 'I~U~ ~ lfvrr '<{~ I
~CI': ';TTQ il:~ir fifi ;:srTf~'f. Q~'2~T if; it 5Plil ~11 !:flf.H <iiJPJ: 'In; ~ fifi ~iI'ij- frtlJ"flrcr lfT +rl!JlJT, !J~T 'fiTif
if.~:r OINT i!f1~ ifiTlt rr~r ifi~;r cH"rT GY<iT 'fiJ iTOTi'fT ifiT nHltl ~ qQ~ if; n;ifi <Iii it ifiTIi-<foi9JQT 'fiT qcrT \iT1"J iiTTGT
~ I l("~ 'ell'Trr it"l"T ;;r~~y ~ fif\" SI'!I" 14<fj, I4{!f, 15iii" ;;rh ISI.i it ori'fT~ iT~ i!fqfq 'fiT llCfi'lif iJUfifr ~ 1T,;p ~-i qQ~
<fjf ';Tqfa- q ~ I ~11 5TifiT\, lI'fG ~~ ~<fT if fif.lfr ollf'fcr it CPT!l(jif.T~, irfi;J&\ ~;:;r~'{ ZIT fif.~J a-~Tq if if>q\iT t!;ifi
IJ)l111 if ifiT+r fifill"T ~ <lTlfT"!_, 6 +r~Ti:r/I83 f~ ~ if.if ifiT+!" fif.lIT BY 7d"ij- 5Ilrr 1411 'Ii" f\il~ 'liTIl" 'fi"~ii crT\ilT ;r&T ltT"I"T
1rrn;rIT I "3".q-~ iIlTf'ilfi <fjTli-ifi~T'i Sl"lirr 1519 if fGO: ;;rT1J;iT I ~cr: sr~rr 140fi <it ~T;'T' i:i fGTi'f~ f\ilq "~:f"~, Sl'11i'f 141S'
tiT 5I"liif 1511 liT ~-T;ff if "3"ii;f. fi'Tt:!; "ili" f,,'fVT ;;rTtJ:ifT I
15
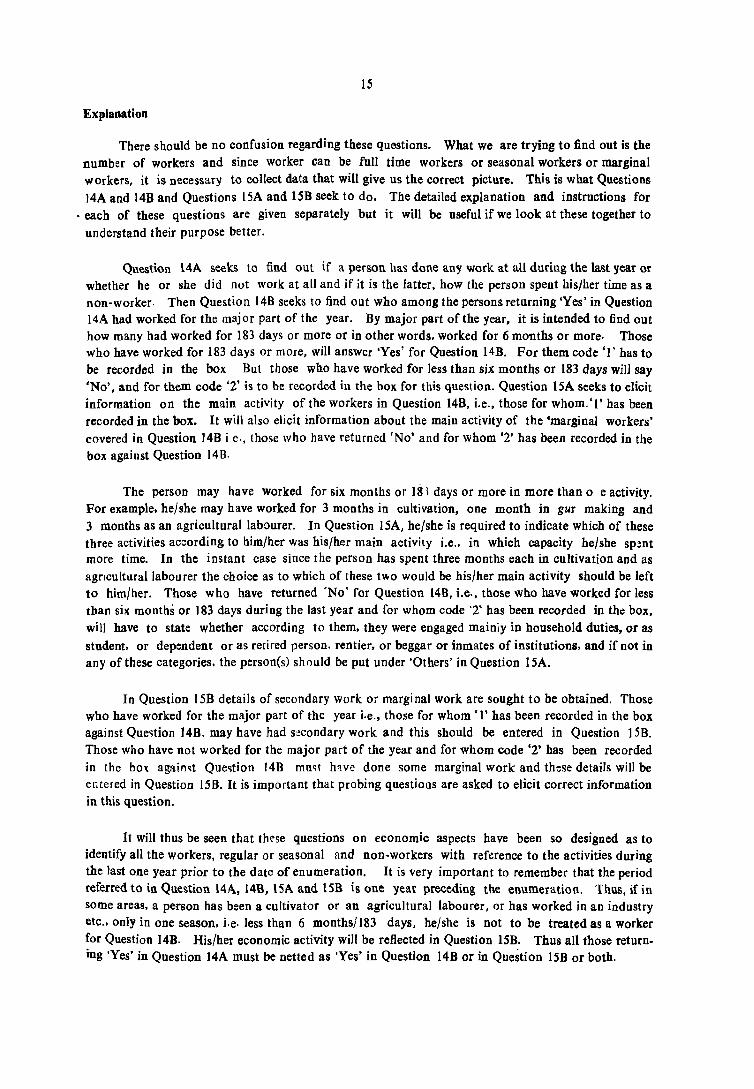
Explanation
There should be no confusion regarding these questions. What we are trying to find out is the number of workers and since worker can be full time workers or seasonal workers or marginal workers, it is necessary to collect data that will give us the correct picture. This is what Questions 14A and 148 and Questions ISA and 158 seek to do. The detailed explanation and instructions for
. each of these questions are given separately but it will be useful if we look at these together to
understand their purpose better.
Question 14A seeks to find out if a person has done any work at aU during the last year or whether he or she did not work at all and if it is the latter, how the person spent his/her time as a non-worker. Then Question 148 seeks to find out who among the personsreturning 'Yes' in Question 14A had worked for the major part of the year. 8y major part of the year. it is intended to find out how many had worked for 183 days or more or in other words. worked for 6 months or more· Those who have worked for 183 days or more, will answer 'Yes' for Question 148. For them code '1' has to be recorded in the box But those who have worked for less than six months or 183 days will say 'No', and for them code '2' is to be recorded in the boll. for this question. Question 15A seeks to elicit information on the main activity of the workers in Question 14B, i.e., those for whom.'I' has been recorded in the box. It will also elicit information about the main activity of the 'marginal workers' covered in Question ]4B i C" those who have returned 'No' and for whom '2' has been recorded in the boll. against Question 148.
The person may have worked for six months or 181 days or more in more than 0 e activity. For example, he/she may have worked for 3 months in cultivation, one month in gur making and 3 months as an agricultural labourer. In Question 15A, he/she is required to indicate which of these three activities according to him/her was his/her main activity i.e., in which capacity he/she sp~nt more time. In the instant case since the person has spent three months each in cultivation and as agClculturallabourer the choice as to which of these t~o would be his/her main activity should be left to him/her. Those who have returned 'No' for Question 14B, i.e., those who have worked for Jess than six months or 183 days during the last year and for whom code '2' has been recorded in the box, will have to state whether according to them, they were engaged mainiy in household duties, or as
student, or dependent or as retired person, rentier, or beggar or inmates of institutions, and if not in any of these categories. the person(s) should be put under 'Others' in Question] SA.
In Question 158 details of secondary work or margi nal work are sought to be obtained. Those who have worked for the major part of the year i.e., those for whom < I' has been recorded in the box against Que~tion 14B. may have had s;!condary work and this should be entered in Question 15B. Those who have not worked for the major part of the year and for whom code '2' has been recorded in the box again~t Que~tion 14B mu~1 hwe done some marginal work and these detaHs will be entered in Question 15B. It is important that probing questions are asked to elicit correct information in this question.
It will thus be seen that these questions on economic aspects have been so designed as to identify all the workers, regular or seasonal and non-workers with reference to the activities during the last one year prior to the date of enumeration. It is very important to remember that the period referred to i.n Question 14A, 14B, 15A and ISB is one year preceding the enumeration. Thus, if in some areas. a person has been a cultivator or an agricultural labourer, or has worked in an industry etc .• only in one season. i.e. less than 6 months/183 days, he/she is not to be treated as a worker for Question 14B. His/her economic activity will be reflected in Question 15B. Thus all those returning 'Yes' in Question 14A must be netted as 'Yes' in Question 148 or in Question 158 or both.

16
frr~f~f.ff ~ iI'~c~uf ifTffT q-~ fqWt;r ::Jf)~ ~rrT !ll'T'flllT!f. ~ :
(i) ~1Il 0llf~ 'GfT ~Tll'rrllff: !f.Tlf ifi~oT ~ ~fifi;:r 'fi~i w;rfF:T ~ i{j-{-Tif .rrll'n:T, llT'lfT ~T, ~v:rTllT ~lifirGIC,
~~ 'm'R <t11f;T~UJ iifiril' ~ a:r~lff~v:rff ~~ ~, ~~ !f.Ttl~ff ~ "fT"fT :;n'f~~ 2flltf'li ll~ q~ ~~ sr~ a~e:rrf ffl~ ~ ~qf~O' ifi(T ~i(ffT 0) iiliTiI' 'liW ,\~T I
(ii) srf~~ (9;fq-tfi'~) ;;f~ srflll'~urTF:TTif OllflffillT ifi) ""~ a-~ q"!'Tllir llT 'll;;r~ fll~T ~) llT ifi!T, 'liT'll
'ti~i't anm il'TrrT "fJl:!; I
(iii) Q;~ ollfCfff 'ti) f;;r~ <ll<fi~T ~ ft'lQ; iert'l 'ST~<lTer ~~ f~llT lTlI'T ~ ~f<firr .m:<lCf ii' '3'~it i;TiT i;TGfi 'IiT~ arRl='q if f!f.llT ~T 'iT ~ 'liTlf~ff if@ ;rrifT ;;rr;:rr :qrf~ I
(iv) CfiT( ~1i1!f lfT ~T \if) ~liill<l: 9;fqit ,,~~ <fiTl{ <fi~ ~l ~~T~ur ~ ft'll!;, VfifT iTifTifT lI'r ~ ~ WlI'
ifiT'll, ~~ <fiJiI' iIi'(it ern'fT if~T m;:rr ;;rrl!;ttT I ~r'i ~T lI'f~ ifi"'t( (:f~if.T lI'T ~'CfiT "f) ~Q: fq~l
~) 9;f1~ qTf~f,(1ifi :RTf'i<fi trfofqf~ ;r ~ iTcTffT ~), ~fCfiif ~uiIifiTf~!f. cmr 'fi'(it qr~ <l>T ~ rrt.l' 6) 'iij- Sl'llif 14{f ~ f.;;rl!; 'fiT'!' m qTffi' if~ ij'l{Wfr :qrr&~ ,,~ ~) ~~it Sl'lfo'I' 14i1i ~ 'ffl~ ;r "~" ~ Cfi'{CfTlfT ~) I ~ij',\) '11'1'" lI'f~ ;y;){ ;;lffiRr ert{ OfiT 9;ffF:TOfitlll' !Ilerf'!:l it ~~: f~T ~v:rOfi trfuferfu"
;r .Olffir ~~ ~) :J!h ~~~ ij"T~ -~T~ if~~ 'fip:f '1'1' ~ffT ~~ ~) ~ ~ElIT1IiT\;Trr 'fi~:qI ilTf~ V. '1T
"!'TO'T ~iIT if) a) ~~ srlll'f 14~ ~ f~~ '!'~ ~q ~ !f.T'll ~i\' CfTt'lT 'llTrrT iifTrrr :;rrfi!l:!; il"1~ <r« Sl'llrr '"
15'fi ;r O'~ erm~ff 'fi'\rrT .... Tf~l!; I
(v) Q;ij"T ollfCfQ f;;r~ ~qt'l 31rll Sl'Ttff ~)<l) ~t ;;f~, flifi~TlI'T ~it CfT<ilT llT q:!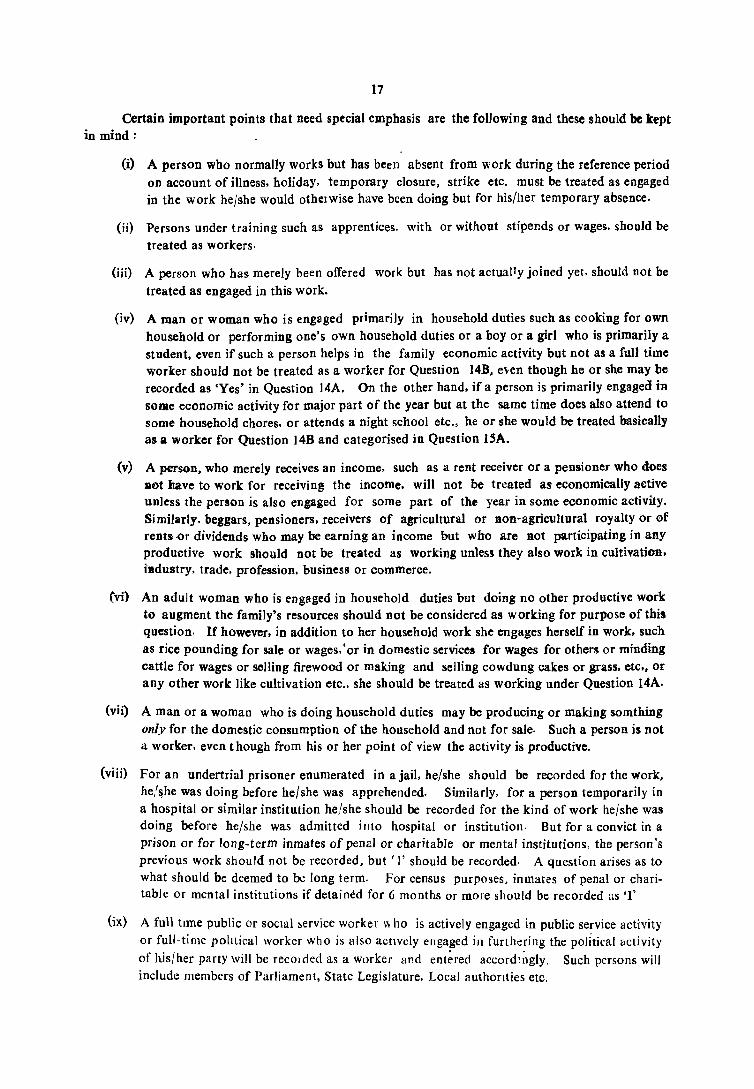
17
Certain important points that need special emphasis are the following and these should be kept in mind:
(i) A person wbo normally works but has been absent from work during the reference period on account of illness, holiday, temporary closure, strike etc. must be treated as engaged in the work he/she would othelwise have bcen doing but for his/her temporary absence.
(ij) Persons under training such as apprentices. with or without stipends or wages, should be
treated as workers·
(iii) A person who has merely been offered work but has not actually joined yet. should not be
treated as engaged in this work.
(iv) A man or woman who is engaged primarily in household duties such as cooking for own household or performing one's own household duties or a boy or a girl who is primarily a student, even if such a person helps in the family economic activity but not as a full time worker should not be treated as a worker for Question 14B, e"en though he or she may be recorded as 'Yes' in Question l4A. On the other hand. if a person is primarily engaged in some economic activity for major part of the year but at the same time does also attend to some household chores, or attends a night school etc., he or she would be treated basically as a worker for Question l4B and categorised in Question 15A.
(v) A person, who merely receives an income. such as a rent receiver or a pensioner who does Dot have to work for receiving the income. will not be treated as economically active unless the person is also engaged for some part of the year in some economic activity. Similarly. beggars, pensioners, receivers of agricultural or non-agricultural royalty or ef rents -or dividends who may be earning an income but who are 110t participating in any productive work should not be treated as working unless they also work in cultivation. iRdustry. trade, profession. business or commerce.
(vi) An adult woman who is engaged in household duties but doing no other productive work to augment the family's resources should not be considered as working for purpose of this question. If however, in addition to her household work she engages herself in work, such as rice pounding for sale or wages.' or in domestic services for wages for others or minding cattle for wages or selling firewood or making and selling cowdung cakes or grass. etc •• or any other work like cultivation etc .. she should be treated as working under Question 14A.
(vii) A man or a woman who is doing household duties may be producing or making somthing only for the domestic consumption of the household and not for sale. Such a person is not a worker, even though from his or her point of view the activity is productive.
(viii) For an undertrial prisoner enumerated in a jail. he/she should be recorded for the work, he/~he was doing before he/she was apprehended. Similarly, for a person temporarily in a hospital or similar institution he/she should be recorded for the kind of work he/she was doing before he/she was admitted i lito hospital or institution. But for a convict in a prison or for long-term inmates of penal or charitable or mental institutions, the person's previous work should not be recorded, but'!, should be recorded. A question arises as to what should be deemed to be long term· For census purposes. inmates of penal or charitable or mental institutions if detained for 6 months or more should be recorded as 'I'
(ix) A full time public or SOCIal &ervice worker \\ ho is actively engaged in public service activity or full-time polItical worker who is also actively engaged in furthaing the political activity
of his/her party will be recolded as a worker and ent~red accordl;,gly. Such persons will include members of Parliament, State Legislature, Local authonties etc.

qf~ III
1981 iliT ;;r"~lJ)'rr' it ~lJ)'rrT it; lCa~ H il'T~ ~T"{IJ)'T~IJ)' it; f(f"{ !H ~;:If~ If;jifu iliT ;q-qrrTlI'T ~lI'T I ~;1JT
it; ~T~rif il'T~t:r sr~!!T, fil'~H, ~:iITra, ~f\lI'TIJ)'T, iJirriG'iji", it;\~, ~~lI' sr~!!T, ~Tm, .r;;rTiI' , ~T;;rlC\!lTrr, erf~~T~ '{("h: ~n'~ !f{~ ~r.:rG(r it STJf'f'fcIT :JT)~ Jl'iilHf ~~~ft 5[~rr 20% ai:lf ~~!ffl it ~t lfir I ~PG( ~;:f), ~r.:rli) :JTl~ ~'fi( ~T~
~:;ff it ll"~ JfTiflliHT «I1T orrfCferll'T iJ ~'Ii~oT 'fiT if~ I 1:!;iji"fOfcr fiji"n: ~l:!; J;ft'fi~T it; m"{OJriji"~or i!i"T 'fiTl!- 20% ~Of i+:q~ it; ;q-T!fn: q"{ f'F!H qzn ~ ;;r~t ~~If~ Iff'f'lt lT~T ITlI'T 'fl I il"QmlS~ ;q-T<:: qflfiillf .rlTT~ ~~l[T it ~r~orl'fi~or 'fiT iliTl!
tflrrrrr ;~I"i!i"T it; 20% alSl' €~!f\>l' iliT 'fIJif iifi'(it; fiifilfT mil ~ I ;q-;:IJ {flTT '{r\ilfT ;q-T,( ~'Cf ,(T\ill' ~srl it ~T~uftiifi~or !fiT !firlf 1j;rT~ q~fcr iliT ~~~ ~ fil'ifT ~T fifiIJT qJ;JT ~ I
f;;rif ~IJfr(T i~T'fi) it €;:q-~ q:;ff "11« ~f ~, :a'iI* 'f!fif it; f~l:!; "Ii~ ~ {f~~ ~(n:Tiifi~ur fi!ffs- iifiT !l!t)~
f'FIJr ITllT ~ I ~h!f~ ~ if!frr 1ti II''lTH it; f<il'~ SH:!rifi fJf~ iliT f;'fl:iff~flier erT" :a-Cf~'T) it il'feT ~llT :-
:a''fer f(f\T iifir frrahor qtiji"~ sr~er Cfi"tlf it; fer(;: il'1""{ q'tiji"~ l:!;iifisr iifi"{lf it; f~l:!; f~ lTl:!; srwmfi'fifi
5J.~.n q'~ ~mllf~er 'fT I
ii«r fiji" If~~ ~T il'erT!fT \ifT ifiifir ~ fiifi 1j;:q~ ;~Tiji") it; :iiPlif i¥i f~~ !H~iIi srifr~if ~CfiT~ it ~lJ)'ifr i~r'li) .. ifiT 1:!;iifi qi'1T il'ifTll'T ~1:fT I lf~ iferfifT f<fl'flf ~ ifrQ:~ iI~l ~)lfT fiji" ijfr~TIJ)' alOf) it "WTOJrrr i~r'fi il"ifri?r if; f~~, mq
'fr~ il'T<rr~ Q_T !JT'~~ q'rsrr~ QT, ~lTT iji") :q'r;;f '(f:>rfG'"{ it "Iiil"-qT"{ ~;;f f'li!JT tf1:fT J;f'h ;;rifli~qT it; iI'?;~H llTifT
it ~ 1TrflTOJifr ;;: ;rr'fi ""rrTO; ~o: I n;ifi ifT;;f it IJ'lT1 i(1TifiT <tiT "Iiil" -~r'( iI-;G!""{ fc=:o; ~o; I fifilT CfiT~ ;q-riil"l<{f ~T~ i~T'fiT
(tricrl) ili"T ~T~'fi"{ 300 ~ 'fill, 300-499, 500-749 er4T 750 ;q-h \1~U ;q-fg;;p- 'fiT ii[rr~~lfT qT~ ii'HCfi) 'fiT ~fi'f!i~!JT
~th "I')~!lfrr 'fih iti ~'J~IH ~T ~ifTcrg 9lTi:"lffrr'tl rr;:iI'"{ a-'li,( U;:If~ i¥i 'tlfif i¥i f~'Q; liif ii!l'J'( fili"lfT q1:fT I sr:qI~rr
:Z:iifiT~ if; f~o; qQ~T qlJ)'rrT ;~T'-fi t~:S1T ferfg ~n:T iiflf it; iil"T<{ ,,!if ~~ i~r'tl 'fir ifi'r~frr'F "lilt ~19lfr it q-t:q ;;rT~'tl,
i;IlT~T i\1T'Ii ~rrij q~ I sr~if ~'fiT{ iF ;;;ffliji" 'liT "lilt ~1S!I'T fiT qT~(fq if ~)~rr Cj1Ts rrJ:H ~ I ~)if;!!Tif 'fiTs iI')~ {fiilifer'fi ~ ~lfT 'liT IT{<{ ~ H;:q-~ s~T'liT 'liT "tifTq Cfi~i?r q'"{ ~lTT ~T'liT ~ ~Ta- er if~ Q~T'liT 'liT ~T"Tif ~!f a :qIJ;:r f'filTT ~!JT I UlTT SI'ifT~rr ~'fiT~T it l1Pl) 'fiT 11T "Iiil"-qT"{ rr;:iiI"~ f~~ tTo; ~ I ~ ;:rJ:iiI", erQ:~R lfT :a-~iti ~il"¥lJ
~'FTf ~ :a'ffi:T-q-fi'fITT ~)~ ~ srTH11 ~TiIi"~ lTl~)ft1lfi ~t1trrcrr iliT ~!Hi'{ it '(W ~o; «lffiiliT, ijft~ ~ ~fe:l'or-'Iq 'tiT 'IT, if~ij 'lilT it f~o; ~o; I i>fif«rn ~ fQUTiI' ij' V'T'Il if 'ITf'fCJ; :qh ;q'r11 ;q-TCfilfiili ·~fcrmil'T it ~;:CR: ~ ~: i~iJil ifi) iiTiI'f1ITifT a:rr~ ij- lill'CfR:'fij i'fi'(~ t ~)! 1fT ii' "1" ~ril"l lti"t ff~T ij,T~ ij- srferfi:rfiJcq flf~T i>f)fCfi flli~l "T
U~IT a-Cfiilll1i CfiT ~qi..r ~fia' , I.
18
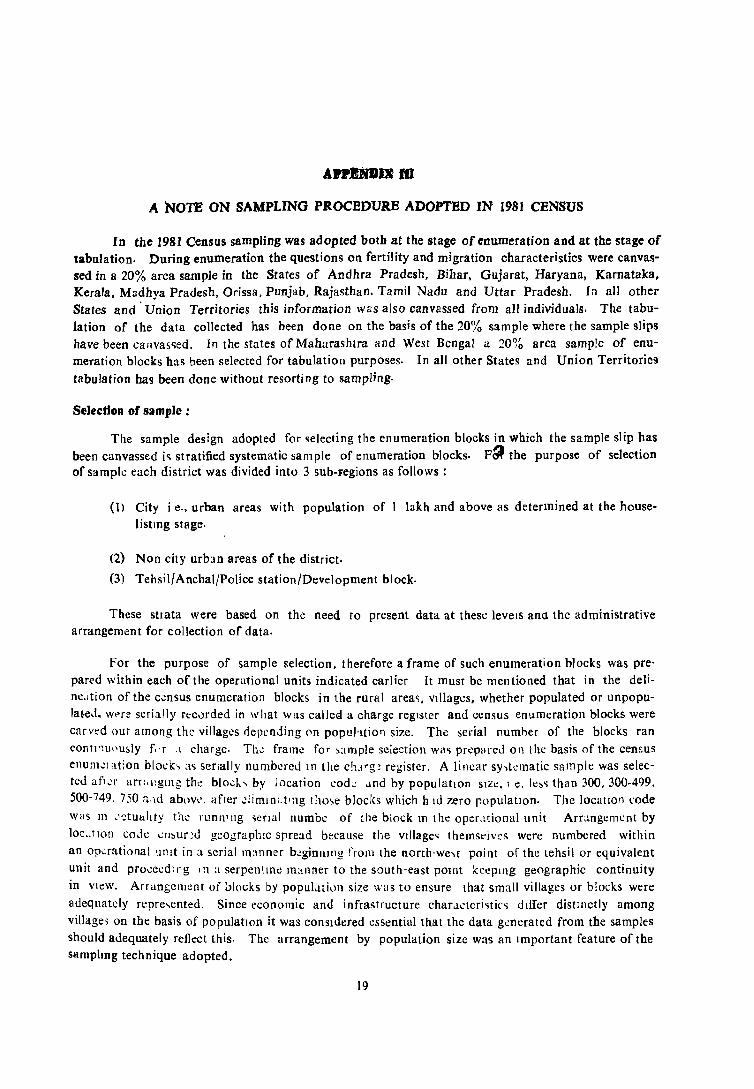
A NOTE ON SAMPLING PROCEDURB ADOPTBD IN 1981 CENSUS
In the 1981 Census sampling was adopted both at the stage of enumeration and at the stage of tabulation. During enumeration the questions on fertility and migration characteristics were canvassed in a 20% area sample in the States of Andhra Pradesh, Bihar, Gujarat, Haryana, Karnataka, Kerala, Madhya Pradesh, Orissa, Punjab, Rajasthan. Tamil Nadu and Uttar Pradesh. In all other States and' Union Territories this information W8S also canvassed from all individuals. The tabulation of the data collected has been done on the basis of the 20% sample where the sample slips
have been canvas-;ed. In the states of Maharashtra and West Bengal a 20% area sample of enumeration blocks h:1S been selected for tabulation purposes. In all other States and Union Territories
tabulation has been done without resorting to sampling.
Selection of sample:
The sample design adopted for selecting the enumeration blocks in which the sample slip has been canvassed i<; stratified systematic sample of enumeration blocks. F~ the purpose of selection of sample each district was divided into 3 sub-Fegions as follows:
(1) City i e., urban areas with population of I lakh and above as determined at the houselistmg stage.
(2) Non city urb~tn areas of the district.
(3) Tehsil/ Anchal/Police station/Development block.
These s1lata were based on the need to present data at these levelS anC! the administrative arrangement for collection of data.
For the purpose of sample selection, therefore a frame of such enumeration blocks was pre' pared within each of the operational units indicated earlier It must be mentioned that in the deline.ltion of the c.::nsus enumeration blocks in the rural area~. vIllages, whether populated or unpopulated. wt>re serially rt:c0rded in what was callea a charge regIster and census enumeration blocks were carvt'd oui among the viIIagl!s depending ()fl popuhtiot1 size. The serial numher of the blocks ran contl'1U"u~ly f,'r ,I charge. Th-: frame for ~;Imple selection was pr:-.:parcd on the basis of the census enum':l ation block, as senally nu mbered I n the c!u~g ~ register. A Ii Ilcar sy,t':l11atic sam pit: was selected afl':1' arr;,ngll1g th~ blo.;l,~ by location cod:: .!Od by population SIl!.:.l C. k:.<; than 300, 300-499,
500·749. 750 a'Hi ablwl', after .:iimln,.t'ng !;lO~e blocks which hid zero populatIOn. The locallon code
was 1I1 .',::tuahty the runn'lIg ,erial numbc of the biock In the oper.!tional unit Arr,mgcmcnt by
loc .. llO!l co,ic cll~ur:d geographIC spread because the vilIage~ themsdvcs were numbered within
an op...:rational ~Init in a serial m:mner b.:ginlllllg from the norrh'we~t point of the tehsil or equivalent unit and pro,;c:.:d:l'g ,n a serpen~lI1t: manner to the south-east pOInt kceplllg geographic continuity
in vIew. Arranf;em:.:nt of ::'Iocks by popul.lli,Jl1 size was to ensure that small villages or blocks were
adequately repre\ented. Since economic and infrastructure char .. lI;tcri~tic~ dIffer distinctly among village, on the basis of populatIOn it was consIdered essential that the data g.:ncrated from the samples should adequately reflect this. The arrangement by population sizc was an Important feature of the samphng technique adopted.
19
20
ilq~')lI "h) q SI'ifr~if ~ifirt ~ ~r(ijnr) ifiT f;lITrr it '\W Q"t:t if1JfilT i~Tifil 'liT «'hrtifiil ~U sr'flH f'fl!l"T
fTl.fT fili 600 ~ 750 iliT ;or;:rUijl1T crr~ ~fTl1'fT ~ifi ;of« ~r;r;H: 'l> ·iifJifi ..-it I ~a-: iffR:TIf ~'!fl it; ~~ 'iflR ~ q~
\iI";r~ijQ"T 3TTifiJl iii il"itfTl 'lUJilr i~Tifi) 'flT crffTifilQ)" il~l ti;pliT 'TIU I
20% ~ ... ~~q~ iF f\1~ mqa- iI"~ a ~J:..-f;:sa- =o.i['{1II' il"l\1iififj-l if fc;~ ~ ~ I ~;:r ~) ~ '1'~~I' ~f'{l~ "')<: qfT-q1f oim~ '{T::illY if 'ifT tfrlUJT~ it; f~~ 'TUJifr it;T~ iF 20% ~J:~ <tq :qq;r fifiliT
'TlrPfT I
~;tffi CilifcRrrra Qf'if111 ~ \f!H\"fiT;r{ «gfUfl:rr ifil fcrnrT\ ifi~q; If[ic:r'f «n:fVTlJ"j fflin:: 1fT 'T'( ~ I ~vi ifllJ"i(T ~ irmn: q-'{ ~qT~ fifiif 'Tit srr'ffq-ifi ;oriflfUJifT «J\ if q~~ ~T «r~Hcrr il"R mf'fifi iffc:rfcrfip.r) if; '1'2fll: '"Iif
~Iit{f ~ 'l;fJ"fi~ f~iI" '"Ir "ifi ~ I SlzrTif if ~1~ ifl:!;: ~UJifir it; fGfCfiItf ~ f~~ ~;:n:T;:'('f 5lf'lfilil 1fT c;) f;:mm if srm
fi1ilfr qlil ~ (fffifi ",f;:aq- 1f)'T it; il"fi1i~ r'f qQ)'ifr it; il"Ta'T\ H \fllH f"fit:t ifq SI'T 0 ii!'0Ul' ° if; :mifi~) Q-. it« un! I
~~T ifi) ~RT Cfj,it it; f~Q: 1I"1f1'f 'liT if~ !f"fa- ~if.il'Ii-2 it ~T iflft t I il:lf~ a oq-frgt( «T~lft SR~lti~' ~
Q1T it <F1fi-': ifi) ~f • I

21
In urban areas, however, the enumeration blocks were demarcated taking into account opera: tional field conditions and were more or less uniform in size with. a population ranging between 600 to 750. Therefore in the urban areas the enumeration blocb' were not arranged according to the population size before selection of the sample.
Relevant extracts from the detail¢d instructions for selection of the 20% area sample are reproduced at Annexure I. In the States of Maharashtra and West Bengal also a 20% sample of enumeration blocks were selected as per these instructions for tabulation.
Estimation procedure :
The tables prepared from the sample individual slips have been inflated to give the estimated tables. The total population classified by literacy and economic characteristics were already available from the Primary Census Abstract .prepared on a fulJ count basis. A two way iterative procedure has been used to develop the multipliers used for inflating the sample figures so that the final totals will tally with the full count PCA figures. The procedure used to develop the multipliers is given in Annexure II. The estimation of the final table from the sample has b~en independently done in each
, of the strata.
~~vr ~;:q-~ :qllif iti 'STlITi>fif iti f~~ 'ST~'Ii fi>f~ 'liT ifi'f'li ~T it orkr i>fT~tTT I ~ij~ ~ij'
'STCfiT~ ~T~:-
(1) ~np: ifq'rq: ~{t aT'S!" fi>fi'f'lir i>fif#lSlIT ~'liTif ~:qrCfi1:ur ~ ~~l[ t!;i.!i <'fm lH ~B;; c~"l-n; RQif',cr 'liT fJ( ~);
(2) W~\T it; 'q"~T<rT f~ iti iJ~p:·h.J el"l' 'q"q'Tq_ f~ ~ Jj-,·~r iffJ\rl[ ill'S!"; 'q"R
~;:q-~ i~r'liT ~ 'ifll'rr it; f~t!; sr~Cfi ~Q:"{ t!;i.!i ~'fCfi sr'ifT~<r iCfiTl ~)fJr I l!f~ fCfi~r filf~ it ~) lJT ilfaCfi
~~'{ ~, 6'1 srcit'li ~\ 'liT ~'Ii ~q''Ii ST'ifT(ifrr ~'liTf ~TifT i>f~ f;["~ ~'Ii WF it ~q''Ii ~;:q-~ i~T'Ii ~tl' ;;rrtt~ I'
lfft fifi'~j- iff(,j-ll' ~1!~ apr ;or;rdlSlfT 100,000 1lf'R '{~~ «fu''Ii ~T 6') ~~q\1' 'iflfrr it; snr'ti>fi'f it; f\1'l:!; \3"~ 1lI'~,
~ i>fft!;fJT ,
w~\l apT ~T~~ f~ if; Wlf iffJ{tll' 1ff'l!!1' apT t!;'Ii ~1l~ g)lfT I 1f& ~frrfll'ifff 'Ii\~ it; f~~ f'li 'Ii~ 'ifti£fJ\Tlf ~'S!" ~;;T rr~ ~, rrfJ\Tlf if"fT it i.!i~ifT 'fiT (W~<:'T CfiT ~~ifi\) ~)~!ffrr op)~ iti ifj~T\ BlrciffplRr ap-':iJT m-.: ~iI; iIT~ OffiTl:!; tfl:!; 'q"jij"T"{ ~~q\1' "fiT 'iftrrt ifi\iI'T {()trr I ~~ q~ it 'q"rif qT~ i'flJ"{rlf ~~~ it ~ft:~fmr if~-fqCfimT. 'liT rrtf\rll' mifT i>fJt1;tfT I
l:l"~ ~frrh'ifCf 'Ii<:~ if; f\1'r; fifi ;;:;rT'liT 'liT 'iflfrr ij"~T ilJ ~ ~), srcit'li sr:q<n.{ {"iTt' iii; f(ift!; frr1.J;:;;rvt ~Ta
frraTf-.:cr apT JTf ~ "{fCfi fqf~;:;; ~Cf.:r if ~p:r~ "fll';:r 'fiT q~fCf f~'rr-f'iT'" ~ ifCf: frrl("fUJ IlI'Tc ij:; !:fiT<:.it;: it 'iTf
f'iT~rrCfT ~ I !:fiTl'i-l !ff~<:'1. !:fiTI{ -2 ifl:: 1lI'Q_-';:T ;:m-':Tlf 'q",\""{ q:;Tl'i-3 'lT~fUf al'"fT ill; f~r; ~ I '{rr fifll''SI"Uf IlI'T;;T 'liT ~T
srfcrrrr ~HrrT ~ I ~'Ii srf('l' f.:r~~'Ii ;r.r'lQJifT !filll !fiT ~\iI'r \il'TQ'TT ~h ~~p:r srfa- 'lTqrUf al'S!"T if; f[Tq~T it "fr~ 'q"fa'f."T"{T iIT~T if'\"<:' rrrr-flll" al'5fT it f\if~T i>f;:rliUJ;:rT iff'!:lifi") ~n:T "{'Sf ilfT1J;lJT I l1T~~T ~ li.rfaCf frrli"fUJ l1Tf~ !ff~"{
i>f<TlJUJ;;rT ;q-fu'liTft ilHT "\lSr ~Tt!;ljT I
~'f ~~WT it 11Q: ifCfTl1T :;rr~rrT fop 1lI'~"\r it ~;q(if i~T'f. f'F~ SI"'liT\ ~ "Lit TTl!" I sr~i:r'li w~"\ 1.1;
l1rJT~ it fifli'5fUJ WTC: qrr;f -I 'fiT \3"!fllTIf f'flTT ;;rTt!;lfT I
w~<:l if t!;'f. ~ 'q"fEl'li "fTiS{ QT 1ii'fiff ~ 'q"l-.: sr~i:rCfi "ff;;f if 'Ii~ lJllfifT i~T'Ii" Q:T ~OPff ~ I l:l"~ ~f<rf~"'cr 'Ii\~ iii; f~t!; f'li ;(ifT'F ~ orgy ~ 'q",\", w~<: it ij-t:qf~rr ~lJTCfT"\ ~lT it t, "llq"liT ~~ f~fli'l(lIl "W')~ (Q;TU -1) 'iT,"'T fJTliT I
qf'fT;:r fqq~IIfT iii; 9;ffcrf<:ifff frrli'!f1lT WTa- it me cti(~q t I
22

ANNEXURE I TO APPENDIX III
INSTRUCTIONS FOR SELECTION OF 20% SAMPLE OF ENUMERATION BLOCKS
.part I-General Instructions
Stratification :-For the purpose of sample selection each district will be divided into a number of strata. The strata will be :-
(D City i.e. areas with population one hundred thousand and above as determined in the Houselisting operation.
(ji) Urban areas other than cities within a district i.e. non-city urban areas of the district; and
(iii) 'TehsiI/Taluk/Circle/Police Station/Development Block etc., i.e. the rural charge.
Each city will be a separate operational unit for selection of sample blocks. If in a district, there .are two or more cities, then each city will be treated as a separate operational unit and the sample blocks will be selected separately in each of the cities· If an 'urban agglomeration' has a 'population, of 100,000 and above it will be treated as a 'city' for the purpose of sample selection.
Urban areas other than cities in a district together will constitute one stratum. To ensure that no urban area is omitted, it will be necessary to arrange the towns in the urban areas (other than cities) by location code number and then select the sample as indicated later. Outgrowths included in an urban agglomeration faIling in this category will be treated as urban. .
In case of rural areas, each tehsil/taluk/circle/police station/development block would constitute an operational unit.
To ensure that the systematic selection of blocks proceeds accurately. control sheets have been prescribed for each of the operational units. As the procedure of sample selection differs in different strata. the format of the control sheet also differs. Form I relates to cities. Form II to non-city urban and Form III to the rural areas. These control sheets have to be filled in duplicate. One copy will be sent ·to the office of the Director of Census Operations and the other retained by the charge officer in case of rural areas and by the District Census Officer in ca5e of urban areas. The control sheet relating to cities will be retained by the city census officer.
Part II-Instructions for selection of sample in a city (including U.A.)
These instructions indicate the way in which the sample blocks will be identified in the case of cities. In the case of each city the control sheet Form I will have to be used.
In cities there may be more than one charge. each consisting of a number of enumeration blocks. To make sure that blocks are not omitted and to ensure that the sampling is continuous within the city. you have to fill up a control ~heet (Form I). Besides identification particulars, tho -control sheet consists of eight columns.
23

24
1q'~A fill'CR:url' it mcr'1i't l::TiiIf, f~r o'1T l!T~ 'fiT ij"Jlf ml:: ~~ 1Ii)T ;::r~ ~ f~if =qyf~~ l
mf~1Ii liT;:~1iIi' ;:r~iI', (t~q ~m:) 1 ~1\ 5 ~ iff,... 'fiT( aflli ~rn f\ilt \ifittJ'ur;:rr cnli fifm III'rQifjT iffiTttir I
~« i{~if"( iii) ~rq qjTI{ ~ «iI'« ;m, srr~f-':'lI1Ii ~,\f~ifi ;:r;Gi1: ~ «q~ ~iO[ ifi~ I tr~ ;:r~iI" ;0« tJ'Ufi{T ~Tifi
;:r~iI'"{ CPT ifol~tJ'T f\if«~ ~lq' ~~q~ ;~rrlili'l llil :;;rll'i{ ~ lIi~ii I ~« tJ'1l'f;;T ~Tcp ~ ~ "I\',i!; I q~ ;mT~ tJ'q ff{,)iiI;
it; !R':!«r"{ :;;rzror ~qif41 itJ' ij' fifill'T ~tJ'T I
!til"" 1 : ",Tit llil ;n" ~T ~-lIir~q 1 'it ~ 'fiT ;:r~iI'\ ~~ ifi~ I lj'f~ «~~ ~"( zrT iJlR"')'zr
«~i[ ~"Ii' :qriO[ ~ oT ~~CfiT ;;TIi ~;;f 'fi~ I lf~ l!T~ if ~"Ii' ~ ~f!f"l\' :qT;;f ~, oT ~ ~~ :qriiT 'fir 'fTll' lfT 'f~iI'"{ ~ iIi~ I ~«~ :qf;;f iliT iffq lfT ;;~;r"{ ~« ifiT~ it 011'1 ~i fifilfT \ifr~lfT \if'" q~~ :;;rr'>i iifiT ~~'lf~lf iifiTlf ~T ~) \ifT~tTT I
Ifl.lTfili ~tq'fiT ~srli ~r qoT :q« \ifTtttJ'I' fili sr~IiIi';;rr::;f iii; f~~ ,..-i{1iIi' m~;t ;oq'lfttJ' it ~rrt \ift'f1 ~ $f5: iifiI' olili' ~
"'Tiii' if· ~h!ff~tJ' iIlpf 'an ;:r~T ~T \ifr6'T, 6'if 0"1\' ~«~ :qr;;f ifiT ;:rTl{ lJT ;:r~ ... "{ ~ rr iti~ I
1I\'t\=A 2 : 'IifT;;J if ;mllill1ft p ~.,ql-"li'T~ 2 if lI'qrf~fo l!Tl!:'/~r;;j if, i~rc!il'fi') ~~ ~~T ~;;f ifi~ ;,f'ti' lf~ ~1iIi' q~~<r~of \ifrrriliT,T ~ f;fo: i~Tifi) OJif f« ~liilfT ~T «mritT ~ §f;:r~ 'fiT \iflq I
"""" 3 : ~qn • I~ 'liT ;::rnr'(-~l{ 3 if f~lI'T tTlI'T trr~f:;;~1iIi' it~i('\ f~_ I ~i{ ;:r1:i(1j ~1:q.~
'iflJ~ !if. sm:fnrili rifi t I Iff~ f~r ... ~~ iiIiT ~r<ifa-o lfT~f;;~"I\' ;:r1=iI'"{ 4 • ot tJ'1IT;:rr .~T"Ii' ;:f. 4 If~T ~~a
i«TI!) ~ I
~ 4 : .tim 'l"l'ifT &I1IIiT llil "T-"l\'T~q 3 it zrr~f'i.~1iIi' i=f1:if"{ ~ ur6T 'fi"{it; ;O«;;NA ~ IIJTil ... &
l'~iIi' m.cr ~ "liT "iflfi( ~ oili 'ifi"{ff \ifTifT t \ifi(' oili :;rT;;f if ~rifil iliT 'iij' SliIi'A "liT "iI'zrif Ulilt(!' if~l {t ~mn e{I~1f it; f~~ zrf{ iiIiT'f1f 3 it IfT~f~~ ;:r~~ 4 ~ 0) III'Tlfiti) ii'fT'fi rr~Gf'{ .04, 9, 1.04, 19 'TTnt ItiT :;rzr<f iifi'tifT II II'~ ~~ ~Ti If 112 ~TiiIi t m iflfrrT ""iii ~ 1 09 tI'~ ""flier .i.iT~ ~ I W1lt;m1tff t ffX« if>1~1f 4
it a iI1~ I .,"fel{j (~ STiliTl..a \ll ~l6gT ~ :
[ 4, 9, 14, 19, 241
f2~: .. ~.~~ .~~~.:~~~ ~ iiliTWl{ if fll'aofT WT'ii=fl IliT ~T'n~lfiaT QT ~;:r1 'fiT STlfrr fifill'T '3frq I ~ iiIiT"l{ it ~iif ;~Tifi :orR
~i~;mili f I
Ifil\II1f 5 : ~~IR( if a;rnff 1fIl ~ -iJir~l{ 4 if «'1T ~~q~ ;~TiJil 'fiT ~ iti,i{ ct1 ifR ~~q\i[ it iWfilil
ifiT «~ ~T tJ'Uf;;T ifi~ m"{~« . ~~lfT it; /fTif iii) ifiT~~ 5 it~;;f "Ii''t I ~~q-~ ;~rifff ili'T f~ «~T ;o~ ~~lIT it;
«riil'~ t)tJ'l GT) llit.,q 2 it ~ f~ tJ'~ ;~rij;T ilil fW U-§!JT it 5 q '1TfJ' iti\' q-'{ fffiliWoS ~ I lff~ iliffiq 2 it ~* ~ifff iliS f« ~ill'T if 5 !fiT 'WT 'l'T-'f{T if~ \ifT6'T ~ oT "li'T~ 5 if~;;f 4-1=1£« ~rifi lili'f ~'lfr f;;1= ... fiiJf~cr it>:
~T" '!)QT:-
(Cfi) ['ifri if iffiCfiT CfiT f~ ~roJ WISf!fit ~~ ~
5
lfT
(~) ['ifT;;f if i~r'fiT 'fiT i11=iT{ ] "liit ~~ ii ~h -------- 'l1TIftI)(f if I \if)~ ~
5
lffa: ~ STn:f~Cfi i~TIiIi' iii if1=if'( ~ Cfilt ~:qaT ~ 5T 4-1=q-~ i~TCfiT 'fiT CfT~fq'fi ~ijlj'T q~ ~e:\1l'f ~
f;:rCfiT\=fS JT{ ~ij'-IT ~ <i~i"'"{ ~)lfT I q'\i'1: lffG' ~1'iI' l1r~ f~'q'fi i~f'fi i1l=iT, ~ iT"{TiT~ lff ;O~~ ~terifi ~ 0) 'ifflfo i~TiifiT
'fiT ~1,gzrr ~ift ~a:r~ur ~ fi1ifi~T ~ ~lSll'T if; iT~ror"{ ~)lfT ~'-fTq_ m~tO~ if I ;;rT~~ if; ifT<f ;;r) ti~lI'T, fi1ifi~ , ;o~if, iRTiiR ijTij'T I

In "Identification particulars" you· must write ~he name ,of the state, .district and the city and their code numbers. The random start will be a number between 1 and 5 will be indicated to you by the Director of Census Operations. Enter this number against "random start' at the top of the form. This number indicates the number of enumeration' block from which you will start selection of the sample blocks. Starting from this enumeration block. selection will be done systematically as explained further-
Col. I : Name of Charge or Number-Enter the charge number in col. I. If the entire city or U.A. is treated as one charge then enter the name. If the city has more than one charge, then enter the narn.! or number of the first charge here. The name or number of the second charge will be
entered in this col. only after the sampling operation with respect to tlte first charge is over. Since. as you will see later, you may be using quite a few lines for each charge, do not enter the name or. number of the second charge unless the sampling operation in the first charge is completed.
Col. 2: Total Number of blocks in the charge-Enter here the total number of blocks in the city/charge as the case may be. Since this is important information this has to be ascertained carefully.
Col. 3: No. of the first block selected-Write down the random number which is assigned here. This indicates the starting point for sample selection. If the random number allotted for the city is 4, and first sample block will be enumeration block Nv. 4.
Col. 4: List of Enumeration blocks selected-Starting with the random number in col. 3, select every 5th block till you can not select only further block in the charge. For example, if the random number In col. 3 is 4. you must select block number 4, 9. 14, 19 etc. If in this charge there are 112 blocks, the last block selected will be the enumeration block number 109. All the block numbers should be entered in column 4. The entries can be made as :-
[4, 9. 14. 19. 24]
[29, 34, 39, 44. 49]
[ .................. etc.]
Use as many lines as needed in this column. Blocks listed in this column arc the sample blocks for the charge.
Col. S: No. of blocks in the sample-After listing all the sample blocks in column 4, count the number of blocks in the sample and enter this total number in column 5. The number of blocks in blocks, the sample should be equal to the number of blocks in the cbarge entered in col. 2 divided by 5. If the number of blocks in col. 2 is not exactly divisible by five then the number of sample blocks in co]. 5 will be equal to :
(a) [
The number of bSloCkS in the charge ]. . Ignoflng the remainder
OR
(b) [The number of bl~cks in the charge ] ignoring the remainder + I
The actual number of blocks in the sample will be equal to the former if the remainder is less than the starting block number. If the remainder is equal to or greate'r than the starting block Dumber. ~he number of blocks selected will be equal to the latter i.e. the quotient plus one.
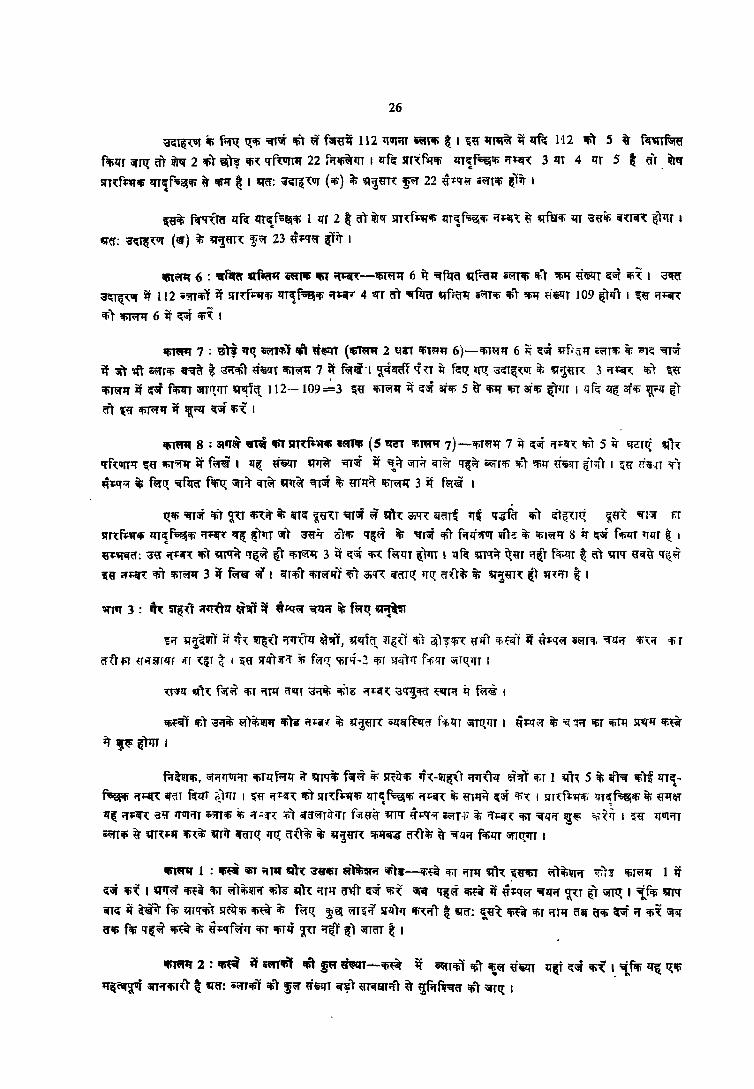
26
~T~ iii f~ Q;iIi ",r;of iii) "f\1f~it 112 <tllTiIT ""J1ti ~ 1 'i~ :q~ it ~ 1 '12 iliT 5 ~ f<i'tTf-;m
fililiT '5fTl{ aT ~ 2 CifiT ~1l iii, qf~ 22 frrlfi~<tT I zrf~ srr~N'ii zrT1f~'" rr~~ 3 liT 4 liT 5 l ar iitl'if srn:f~!Ii lfT~fr;~ili ij' IIil'I' ~ 1 iq'ff: ~~~ (ili) ~ "''jij'r~ ~ 22 ~tqiiT .~Tiif ~Tit I
c
~ Rlfircr lfR lfT~f;;~lfi 1 liT 2 & ffi itl'if 51nf~'ifiti lIT1f;;~lf. rr~iI1: ~ "ffsif, lIT ~«if; ar,llR QI<tr I
.q-cr: =il{rQ~OT (lif) it; ~'j~IH ~~ 23 ~+qiiT' (Tir I
161'\=(1'{ 6 : ra:Rm Gf~ ~fIti IIIiT ~-ilimSf 6 it ",flfij 'I'f~o:q i~r'li it7\' "!if{ ~@JT <=:..r iJi~ 1 a<Rr
=i~ if 112 i:;fTiJiT if srT~f+1f1fi zrT1~'Ii Wlq7 4 ~r ;:ft "'flra qfriJ11 ~;p iJiT '!fi'IJ ('I"illT 109 Qr;rT I ~ij' it.,""
if, T \fiTiiT'1f 6 it ~ iI\'~ I
1fitt=Pf 7 : ""' tilt it=IT'1I11Ii\' tflFlT (lfi'ItII"( 2 u.~ lfiT~" 6)-lfiHill 6 li G:;;i- ~f; all i\=fTif. ir. iI1<.i ,,";;i
it ~ 'itT iiiT'T'fi iI"~ ~ :a;r'f'T ~liiQ"T ""~ 7 il fiiT'~"1 ~cfiffi1 ~ <:T if fq:Q; rrQ; a~~,1f[ if. ""'~ij'g 3 rr~ 'li"T \ij'
'liTiiT'Sf if ~iif fifi1fT iiITrtlfT 'I''fiq_ 112 -- 109 ' 3 ~« lfiJ~'IJ it <=:i;'[ aTOfi 5 ij' iliSf 'liT at'fi ~)i{r I <:j fG" lf~ aT'fi Wlf ~T aT '(iii" i!iT~q it 't(~lf ~;i iti"i I
~ 8 : 81q~ """ IIiT sm:f~lt!li al'll11fi (5 'Ef~ "'RIr'f 7) -ifiTiiT'Sf 7 it c::iii" ii+iI"~ 'lir 5 it EfcJt{ ilh qf~"rfll ~ij' ~'iiIlI' if f;.;ri I ll~ ~ ~ ,,"'if if '!~ GIT~ "r~ ~~ i~IH; 'foT "Ii11 riil.TT ~t:rT I Witr <ii".n 'ifl ~\:q::r it; f\ifll; 'ifflfiJ f'fit1; \1fT~ orr~ 'I'tT~ ~ if. ij'fliit ififiiT'Sf 3 it f~~ I
((ifi 'ifr:i 'tiT CJ:U ~it t ilTC:: ~ij"{T 'ifTi;'[ ~ ~l~ o;tf<: aH=rrf trt q:[fa- ifiT q:)~Tt:t ~fft 'qT~ foJ
srn:f1:1f'fi zrr1f~'fi i1+ar{ ~ i!Tm;;it i3'ij"ij- oT'fi If~~ ~ "Iri 'fiT f~zi"f1lJ :WT:!" if; CfiI~11 S if ~i f<filfT f[IH ~ I
~",.Hf: i3'« iff-iJ, iliT 'q'f'f;r 'fQ:~ ~T OfiTiiT'~ 3 it <(;of 'fi, f~lIT ~)<tT I tlf~ mcf.r Q;«J iT~r f<r.llJ ~ e1 ~:nq ij'iI"ij- q~~ ~« iJ~~ ifiT 'fiJ~q 3 if fen- ~ I il"T"ft ifiT~ql iIi't =3jq'1;" il"ffTtl; 1fO: air~ iff 'iii«J~ ~r 'i(i{1 t I
1fT" 3: ah 9~~1 ~ ~m if i+Cf\if rqtIfi if; f~q ~
!'i l{i~:W) it ~\ ~1;"1 iitTihr ~!Ifl, ~~Tcr. WQ<:T 'ill ~T~'Il\ ij"llT <f.~~ft if ij-J.q,;; iiffTlf. "flli{ ilJi"\ii 'fi"T
aU fOr UolHflff >ff (~r ~ I ~« Sl'q)lf'l if; f';;lJ; qjf!i-~ 'fiT 5flfTlT f'fi'fJ ~Tll;m I
lti~iI") cr.) ~i'(~ ~)~:qri{ ifir. i'(l:~~ if; ~'i«rt olfqf~ff fof.lfT iOf~"r I ~t=qr.:r ~ "1 ~WI 'tiT ifiHI sr~1i ~
it ~ ilTm I
f.:r~WiIi, iil"iiqvr;:rT iliTlffiiJlJ it 'I'T"f~ fijf~ ~ STcil"ifi q~-:qr~T iitT1;"Tlf el'Sl"T cr.J I ill, 5 if. il"T'ii ifiT~ lfTC:: ~ c
~ ii+i[( are! r f~zrr ~ 11fT I '{iii" i1~sr, !fi) srr,ft='ififi lfT1 ~ifi rrf.iI1: if; «J'fit c::i>f 1fi1;" I llT<:f+'l1i!f> 'U;;-~ifi iI; «'f~
li{ WI+~ aij" lfOTiiJ i?lTifi if; ;:r ;:~( :0) il"ff<.1ritlfr f;jfij"~ ~N ~hq-.vr io;H if; 'ft=;r~ "lir 'if<Jii ~~ ~~~ I ~« 1fur'fT
iiiT'TiF ij- m~~'f 'ti~ii; il'riT mo: q~ nUi!; ij; !R",!m ~Sfil":[ m:T~ ij- "fl:f'f fifizrT \iTTt1;tTT I
Ifi~ 1 : ~ iiiT ~Tq qh ;a-«ifiT a)t$lii Ofi)V-if,fit ifiT i'(TI1 $ft~ ~~ifiT ~iI;llJif t;.h 'tir~q 1 if G:iii 1Ii'( I ~~ 'fi~it ifiT iiT'T~!ffii ifiR" ql~ 'iTIi ff'ifT G::i 'f't i5fil" q~~ ilift if ~~qiiT' 'iillif 'iI;~r ~T \iTT(( I ;'f'fi ~ i(fC:: if it~iT f'li qrCfifiT sr(lr'fi m ~ f~Q; ~~ <.1r~;f Sfl:f)q iifi1:rrT ~ mT: ~ff~ m ifiJ iirif Cfil" ij'fi ~ WI 'til iifOf
aap fili q~~ ~ it ~1=qf~q 'fiT !firli ~ 'fill' i!) \iTJm ~ 1
~ 2 : m if .~,I!fil "" p nrn-~ it i\lfTlfiT iliT ~~ ~~ tI~t <{:.if It'i~ I. '\flt'i ~ Q;'fi
'f~~~ ~'fapr~T ~ Va: iiiT'T;pT iliT J\if ~lizrr il~T IirTCJSTilT ~ ~f.lfil'iia 'fiT arrt1; I

27
For example, let us consider a charge which has 112 enumeration blocks. In this case, if 112 is divided by 5. the result would be 22 leavi:Qg a remainder of 2· If the random start is 3 or 4 or 5. the remainder is less than the random start and. therefore. we would have 22 sample blocks as indicated in (a).
On the other hand. if the random start is 1 or 2, the remainder would be greater than' or equal to the random start and. therefore, we would have 23 sample blocks as indicated in (b).
Col. 6: No. of the last block selected-Enter here the serial number of the last block selected. In the above example, with 112 blocks if the random start were 4. the serial number of the last block selected would be 109. This number should be entered in col. 6.
Col. 7: No. of blocks left (Jut Col. 2-Col. 6-The total number of blocks romaining in the charge after the last block listed in col. 6 should be entered here. In the example discussed in previous para. the number 3 should be entered here <112-109 =3). The number entered,in this column
, will be less than five. In case this number is zero, enter zero in this column.
Col. 8: Starting block of the next charge 5-Col. 7-Subtract the entry in col. 7 from the number 5. and enter the result in this column. This number will be the serial number of the first block to be selected in the next charge. This number should also be copied in col. 3 against the next charge for which sample selection has now to be commenced.
After completing this charge. take up the next charge and repeat the above operations. Instead of using a' fresh random start you will have to use the number indicated in col. 8 in the entry relating to the immediate previous charge as the starting point in sample selection. You would have already copied this number in col. 3 in each case. If you have not done so. do it now. The other columns will be filled up as before.
Part 1I1-lnstructions for selection of sample blocks in the nOD-city urban areas
These instructions indicate the WfAy in which the sample blocks will be identified in non-city urban areas, in other words, in all towns excluding cities. Form II wiJI be used for this purpose.
Write the name of the state and district and their code numbers in the appropriate space.
Towns will be arranged according to their location code numbers. The sample selection will start from the first town.
FaT each non-city urban area of a district, a random number between 1 and 5 would have been communicated to you by the Director of Census Operations. Enter this number against the random start· This number against the random start indicates the number of the enumeration block from which you will start the selection of the sample blocks. Commencing with this enumeration block. selection will be done systematically as explained further.
Col. 1 : Name of TOWIJ and its location cocle-Enter the name of the town and its location code in col. I. The name and the location code of the next town will be entered only after completing the sample selection in the first town entered. Since. as you will see later, you may be using quite a few lines for each town. do not enter the name of the second town unless the sampling operation relating to the first town is completed.
Col. 2 " Total Nllmber of blocks in the town·-Enter the totall'lumber of blocks in the town here. Since this is important information this has to be ascertained carefully.

28
~ : 3 ... m q~ ~T'" "" "~.'-iJT~,!, 3 if f~lIl trlfT lfT~~1ti ~if, f\;"v I lfi["'~ QPf'l'
;;rl(Wf 'liT lfriN;r; ~ ~ I lI'f~ f;r;~1' Jj"\ -W~tl' rrqtl'lI' n ifiT l1T~f~ifi il+iiR 4 t iJr I'f'IJTi'fT ~ifi;f 0 4 1J~1 ~~t:T ii;rcfi Q:rm I
~ 4 : ",fltft IfUTrrT i~Tl'fir ","-CfiT~1l 3 it lfT~f~'Ii if;;r, f\';Vi!' ~ ifT~:a-« i{~or, ~ ~ .. &
lf~Cfi ~ it:TTCfi CfiT "I'lI''f iJiT iJCfi ~~ iiIFI'T ~ \ifiT iJCfi ifi{=it ii it:TTifiT <fiT ~« srifiP: 'liT 'i{lI'i{ «~ntij' 'f~ 6:1 ;;rnn I \ro~~ ~ f~ lift ~ 3 it lI'T~f~ifi "';if' 4 t iJr q-rlJ'lir,iffilfi il+iT1:4, 9, 14, 19 mfi{ 'fiT "'lilIIR"fT
t I lff~ ~« ~~ it 112 iC?fT'fi ~ of tf1ITorT ~T<fi orR!"{ 109 ~f;:o;r :qflfiJ iC?fTOfi 6:)trT I nr i~TCfi) ~ i{;iT'{ ~'l
4 it Cl'ar Cfii I srfq f6ClfT r;« srifiT'{ Cfi) \iTT ij"CfiaT ~ I
( 4, 9, 14, 19, 24] [29, 34, 39, 44, 491 [ ............... ~tll'Tfi{1
~ij' ipT<lfll' tr f:jfiJi{1' mw ipr q-TCftlJifiiJT~) aiJrr) ~lJlf)1r if C?fT~ I ~« If.T~lI' if {~ i<lfTif ~ ~
~ ;1fC?f iffiifi ~ I
lfitp 5 : ~"" if itlrllfiT iliT (f~-EfiTfI1I' 4 if 161ft ~PfC?f imifil ifi) ~ ifi1:~ ~ iTT~ ~;q-iif it .miff
lIfT ~'lf'T lIfT tfUTifT 'Ii~ ifl, i~ ~~r if;' lI'Tq 'fiT cmJlI' 5 it ~;;f 'fii I ~;IJC?f iiiifrfl CfiT ~ijlfT :a-« ~~lfT ~ if,{T~
()it) ;it ~lI' 2 if if" f~ m!; Iiii' iffiifiT 'liT ~iiI' ~ilrr it 5 ~ "'rtf ~ If( f.r'fiiil'iJl' t I lf~ ifiT\WTij- 2 if if;;f -mifiT ifT 'iiiii' ~I9<JT if 5 'fiT 'IlTtf Cf'T-r\T i{~ iifTiJT t iJ1" ifiH1l1' 5 it if;;f €;q-<lf i9TCfi 'fiT fi~r fi{;i{f;;;rf;,giJ
if; ~Tif1: ~)tr) I
(Cfi ) ['iITi it ~ifil ifi1 Cfliil' ~AT ] ~ 'fi) ~)~ ~ I
5
. lfT
(1'8) [~~ ii i~~ Cfi) ~ilfT]
5
Wcr ifi) ~r~ ~ "ih 'fIq'li~ if 1 ijf)~ ~ I
lff~ Wl!I' Sl'Hfl='Illfo i;;rTlfi ~ i{~iT, q 'lill' iT:qiJT ~ ijr ~;l(:f i<1TifiT 'iiI' q)'{=iJr.rifi' ~ij!:(T lJ~ik :a'i{T~,UJ ~ frrifiTit tr~
tfli'lfT it ~\ Erl1rl IJ~S If f~ WIlT srr\f;"'ifi iiifTifi if;if, it; aRliT'{ t liT :a-«« "ifUCfi ~ 6) :crflfiJ i~TCfiT ifil tfGlfT
J;«l ~UJ q f"llfll* ~ ij'~l:I'T if; "RTif{ QNl "i~iq_ "'mqj~ if 1 '"I'T?it ir. iTT~ ijfT ~l§lfT fi{ifi~ :a-u~
if'{ iii"{ ~)1ft I
~~r~,UJ ~ fiil'Q; ~'!l ~ <fiT ~ fiif«it 112 qUJ'fr .~T1fi ~ I ~u lI'T~ it qf~ 112 ifiT 5 ~ fcr'lTfijfij
fifilfT iifr~ 6) ~l!I' 2 q;) ~r~ f~r.rr ;;rT~tfT m~ IJf~v(TlI' 22 frr~tfT I lfk sn~f~ lfT~f:;:£%ifi ;:r;or~ 3 lfT 4 lfT 5 t ('1') vN lfT~f;:\Tlfl ~~f'Tj~q; ~ cpr ~ I ifij: ~TQ~UJ (ifi) ~ "i¥T<: ~iiI' 22 ~;qi; ii1Tifi ~)q I
~u~ fcr'R:Ta lf~ lfTif~'fi I lI'T 2 ~ crT iq !:fn::f;\lCfi "';:iiT~ ~T ;q-f~q; lfT ;a'{1<r. ifUir, ~)rrr I "fcr;
. ~T~~v( (v) it' '1'~~m ~~ 23 «;:q<1 ;~TCfi ~)q I
1IiJ"''I' 6 : 'iifft:m "fiff'!' i\lfTifi 'fiT or~iT~ -ifiTiifif 6 if ",flfa q-f;6if ii<1Tq; <fiT ~ ~ilfJ C{~ <fi~ I :a-ifiJ
~T~v( it 112 i7fTifiT ij srT~f~\TCfi lIr<~f;;~q; i{~~ 4 ~T iJ) .... Pm '1'f;:iJ'I' iC?fTifi ifiT 'IR ~~ I 09 ~)1J1 I ~u rr;if1:
ifi) ifiTiifll' 6 it c:i ifi~ I
lliTiiI''I' 7 : "" ~ i\ltTiiillf>i "'1m (~2 sm 15T~'l 6) -IfiTiif'l 6 it ~ "f;=a1r iiif~ ~ iTT!:
~ it arT ..,-1 i7ffif; iT'ifa- ~ ,,"'Ii')-;:iillT ifiT~~ 7 it f~ti I ;aq'1!' ifff q'=t it f~ q~ rn{'UJ ~ lEllin, 3 ;r~ ifiT
;q~ IIifflq it ~~ fifilfT.\iTT~qT "i"'f~ 112-109=3 ;qU ifi'T~ it i{'3( ajCfi 5 ~ cpr ifiT ~)'IT, qf~ ~ .'Ii ~ ,1 ('1') ~u ifiT\lq it lI!ill' ~ iifi~ I
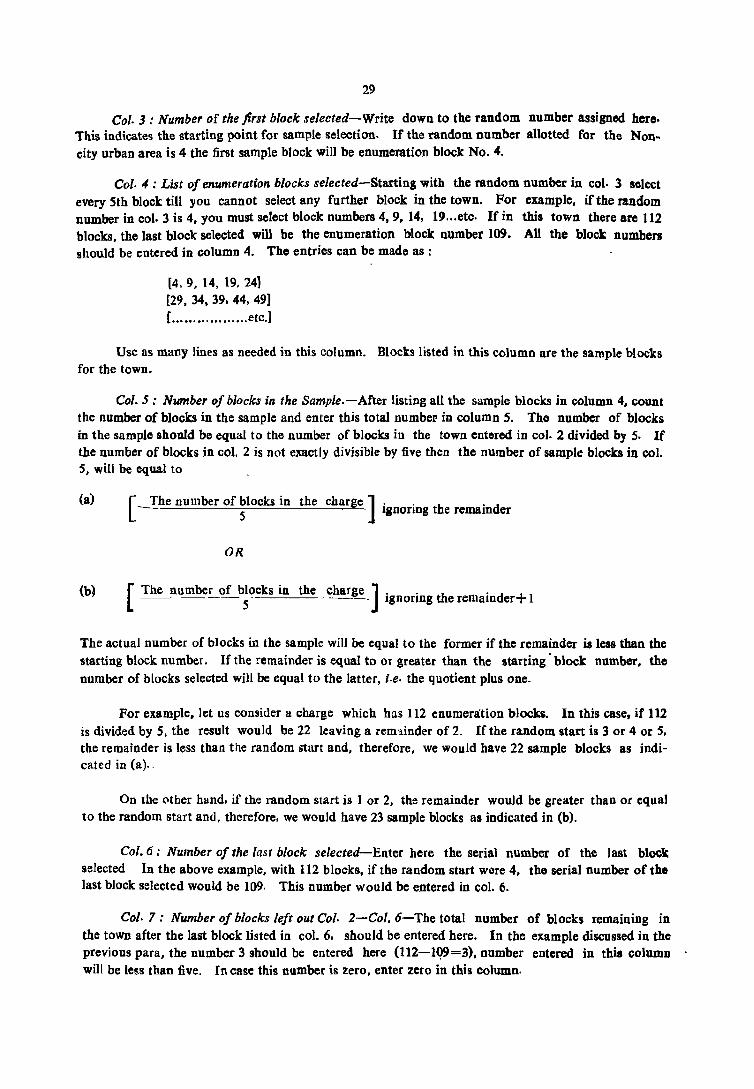
29
Col. 3 : Number of the first block selected-Write down to the random number assigned here. This indicates the starting point for sample selection. If the random number allotted for the Noncity urban area is 4 the first sample block will be enumeration block No.4.
Col. 4 : List of enumeration blocks selected-Starting with the random number in col. 3 select every 5th block till :you cannot select any further block in the town. For example, if the random number in col. 3 is 4, you must select block numbers 4,9. 14, 19 ... etc. If in this town there are 112 blocks. the last block selected will be the enumeration block number 109. All the block numbers should be entered in column 4. The entries can be made as :
[4,9, 14, 19.241 [29. 34,39.44. 49] {. ...... , .......... etc.]
Use as many lines as needed in this column. Blocks listed in this column are the sample blocks for the town.
Col. 5 : Number of blocks in the Sample.-After listing all the sample blocks in column 4, count the number of blocks in the sample and enter this total numbei' in column 5. The number of blocks in the sample should be equal to the number of blocks ill the town entered in col. 2 divided by 5. If the number of blocks in col. 2 is not exactly divisible by five then the number of sample blocks in col. 5, will be equal to
(a) [
_!he number of bSIOCkS in the Charge]. . h . d IgnorlDg t e remaID er
OR
(b) [
The numb~!__~b5l<)CkS in the charge ] . . th . d + --=---'---'---'-- ----- 19nonng e remaIn er I
The actual number of blocks in the sample will be equal to the former if the remainder is less than the starting block number. If the remainder is equal to or greater than the starting' block number. the number of blocks selected will be equal to the latter, i.e. the quotient plus one.
For example. let us consider a charge which has 112 enumeration blocks. In this case, if 112 is divided by 5, the result would be 22 leaving a rem':l.inder of 2. If the random start is 3 or 4 or 5, the remainder is less than the random start and, therefore, we would have 22 sample blocks as indicated in (a).-
On the other hand. if the random start is 1 or 2, the remainder would be greater than Ot equal to the random start and, therefore, we would have 23 sample blocks as indicated in (b).
Col. 6: Number of the last block selected-Enter here the serial number of the last block selected In the above example. with 112 blocks, if the random start were 4, the serial number of the last block selected would be 109. This number would be entered in col. 6.
Col. 7 : Number of blocks left out Col. 2-Col. 6-The total number of blocks remamIDg in the town after the last block listed in col. 6. should be entered here. In the example discussed in the previous para, the number 3 should be entered here (112-1Q9=3), number entered in this columo will be less than five. In case this number is zero, enter zero in this column.

30
"""" 8: IA~ lfi'. "" srt~f1:1flfi i\lfl'ifi (5 "RI !fiT\Il'1i 7) -ljiT~q 7 it ~;;f ;;1=~ iifi) 5 it 'Ii!:Ttt 'Iii'Ri "f~UlTq ~~ iifir~'f if f~ I tr~ «,1fT :q'1f~ iifi~ it ;,i\' iOfT;r GfT~ I{~ ii~rlji 'fiT "Ii11' «iitil' ~)~T I ~ij' «'SlI'r op)
ql='{\Il' iii fiirQ; :;;rflffi f'ifi~ .... r~ Cfl'lli' q'lT~ Cjifit ~ ~T11'~ CjiT~1f 3 if 'liT fiirri ,
tt'fi iiIi~ lji) ~ ~ ~ ifr~ ~~T ~iij'T if q'R Oif(\ ilCfTW fJ{ trQfi:r lji) ~Q:~Ttt I ;;~~ ~ !fiT
:ndi:'It!fi lIT~f~Q ifHR ,,~ tt:)m iOIT a-ij'~ ~lt\' If~ if; ~ 'fir It\'~)\Il' ~')z if; It\'T~ 8 if ri flt\'lI'T ~lI'T t I U1=\Tcffi: •
a-u ;fif~ It\'T IANi\' ~llr ~T ~ 3 it tiif ~ f~1IT ~ I ~f{ q'Tq-;r Q:ij'T ;;~ fifill'T taT 'SITI{ ij'iI'ij- If~ i;ij' ;:jil'~ ifiT
opT~q 3 if f~~ ~ I ifrClif 'IlT~) Clif m~ iRI'nt IT({ Q'~f~ it; "¥TTt ~T 'R;;T t I
lftIT 4 : VT'fjur tR'JIT if i1="~ ;fQ.,. it f~~ CIfo!~
'i;; :q-p) it 5RitCii ~TIfTvr "fT;f if \i;q'~ ii~ifi if; ::q1I';; ifil I{~:f~ ij'llmt iJ!T~r I mliTIIf ~""T it ~~\; i~rifil if; :;;rlrif if; f~ q;p:r -J" CjiJ ;cJ"lfll'TIT fifi'lfr .... r~~T I '(ij' q;TIT 'fiT 'GfTGf ~fiif~~ it ~ \1fTifiifiTtT m ~r iiTTQ;tTT I
ifimlJ I : Ijfiq n'l11-;pj'~ I if ;rvr;;r ii~rCjil iii fu~f~ ;;;cr, f~ iil'rT:t~ I 5Ji'~ ;rvr;;T ~rifi
if; f~~ ll:'Il 1A'1~ ~~if ;cJ"lflI'm it ~~ .... rl:!;~T I
IfiTfPf 2 : wr~ «~-'GfTif if «r<f>~) Cji) I:!;<ti if; erN 'i:u~r ~ iifi~ I qf~ ;cJ"ifi:fiT ifi)~ ifTIi (liT ifl'iI'~)
~T (IT \1r~ "'T ~t fri I
IfiTiI''f 3 : "i.lfiT w)m m-lfiTil'f 3 if me{ ~ ~)~~;; "lilt!' fQf~ I
~ 4 : i9IllIi ., - <tiTQfIf 4 if iiQfI'li ;:jif~ ~ ifi~ I lI'fit ~VfifT if; 'Sl"ltlUfif if; f\lt'll: f<fi«T me{ if I:!;ifi ~ crfS'iifi ii';fTiifi ~ cr)' srtitifi ii~rifi if; f~~ IA~IT ~ ~~ifl ~ \1lflJJrr Ofi~ I Sl'titiifi:orT'ii' if; "iOlicr i~TiJ\';:jaR fij'\It'
f{fllrifr~ ~i{r :;;rrfQ:1{ I lI'~ ;:j'~ lfVfifJ 'lir~ if; f~ tf~ filiI{ m~ :;;rT;;f ~f""f~ it !JC'irifi rrl1frrT ~T!fl ifiT f~T "liT
mtl
if>'T'hf 5, 6, 8, 10 'til, 12 : ;(;{«UT ~ ~Q'n ;vm;lll>T mf:il-lfifiR ~"fT <rifTa ij'lllf ii~cp Gfl1 ftfutfto ilfiT qt "",9'@J.I'T cpT ~«"o "liTCiJ'I' if t;;i' Ofi~ I trft iimifi it ifi1t ~;Hiijllr ;; ~T a) 'liT~1l 5 it '(fll' (0) ~~
ifi~ I lI'f~ iiCi!ifi <fiT .... rr«.tIl' 300 « ifij:f zrr 300 f;Il~ 499 if; ifr:or zrT 500 'iTR 749 if, 1I"T"I" lI'T 750 ~ IAfacti ~ aT ifiT~\T 6, 8, 10 lI'T 12 it, lI'v.rrffv.rfcr, qJfift"<fcp ar-r«lilfT ~;;j- ilfi~ I STclrifi ii'1T'1l ilfiT ~if Ift"f ifiT~\Tl if opififf I:!;ilfi QT ilfiT~1f it srfiff~ (ltft I I{ilfi iiiffTifi if; fcr;;r{IIfT Cjir ~;;f Cfi~i\' ~ err ~ ~ij"t ii~rlfi $ f<r<r~!IJ T ifiT c::ii ilfi~ ;r"~ "S:ij'T
a(~ mit crnt :il'Ttt I
ilfiT~" 7. 9, 11 aft" 13 : "tirnf ... -1i Of~'H-"T;;j- q; ij'-,ft iqrlfiT if 'J";f;f "Iirli '!i'{ ~~ ;r. <rT~. CfiT'11f 7
9, II q-"'{ 13 'IT,;r ~ I ilfiTiffll 7 it ii::rtilfiT iJ\'T iff 'lfilf ~~;:H ~",T ~ I 'fir\lt'lf 6 it 'liT ~ Sl'v.r11' ;:rf"f6C ifiT ifiTiffll' 7 ij
;fiT'( 1 f;Il, ~«~T srf"f~ iJ\') ;fif~ 2 q-Tf~ f~lI'T ;:;rT~r I OfiTi1j:f 6 <fiT U'iff Sl'fqf~f ~T ~l \il'Ti't t ifTt ifiTQfIf 9 ij
1fT 'lfi'f «.lI'T e;;rr ;rRT ,,~I a-i{f~'{ur it; f\lt'Q; lI'ft f<tiflr "fT;;f if 51 i~Ofi Q:« ~ fiiTififif ~T 300 ~ 0fiIf ~ aT
ifi1lftI' 7 ii' .;rFa'f ;far~ 51 ~m 1A1't ilfiT\It'1f 8 qir STill" 5I'f"fl!ic it; ~Iff iifiTVl'lI' 9 it 'lfilf ~~T 52 ~;;f 'fiT
;;{Tt!;trT I ~ij'T SI'iifi~ ifiT\It''f 9 t ~'{r ~T \il'Ti\' it; iI'~ <fiTifflf 11 ij vh: iifiT~ II i{T ,r ;rf.t ~ il'Tt iifiTVl'lI' 13 it "Ii11'
~ilfT ~i'ft ~ I trfc:: :qy'* if fiff~l!i~ «r~\iI' ;f; ~ ifiT ilfiT( ifflifi ~l ~ 0) ~«lJa iJ\'T~'f if ilfi)( 'ff Sl'fcrf~ ;;ilT ~)1T11 ;cJ"lUj{'{vr ~ f~ trR ~ it ifilt 'fT ~«T i~rilfi if~l ~ f;ornlfi'l' ar-r«i!JT 750 ~ih:~" -~fif"li t aT IIIM1J 12 ~,.~ 13 'IT~'l' ,~ I ~ij' ~~T ifA,{ ~i\' it iJ\'Tzr if; ",",0 it, Sl'C'.ifi lTlIf;;T iiOJTiifi "liT iifiT~1l' 7 ~ 9 lit 11 ~ 13 it i ~ilfi iifiTnf;;iifi ;;;aR ~IJT I

31
Col. 8 " Starting block of the next town 5-Col. 7-.Subtract the entry in col. 7 from the number 5 and write the result in this column. The number will be the serial number of the first block to be selected in the next town. This number should also be copied in col. 3 against the next town for which s.lmple selection has now to be commenced.
After completing this town, take up the next town and repeat the above operations. Instead of using a fresh random start you will have to use the number indicated in col. 8 in the entry relating to the immediate previous town as the starting point in sample selection. You would have already copied this number in col. 3 in eHch case. If you have not done so, do it now· The other columns will be filled up :IS before.
Pllrt IV-Instructions for sample selection in rural areas
These instructions indicate the way in which the sample block! will be selected in each rural chul ge. Form III will be used for selection of sample blocks in rural areas. This form will be filled by extracting information contained in the cbJ.rge register itself.
The names of the state, district and JUral charge will have to be written in the appropriate spaces along with their locatIOn code numbers.
Coil,' Serial number-This IS a ruuning serial number of the enumeration blocks. For each enumt:latJOn block a separate lint: WIll be used.
Col. 2 : Circle numbel'-The circles in the charge should be entered one after another. If tbey have any name (or numb.:r) enter them here.
Col. 3: Location ('ode of the village-W rile the location code of the village.
Col 4,' Block number - The block number is entered in column 4. In case a particular village has more than one b:ock for the purpose of enumeration, then separate lines should be used for each block The block number should be continuous within each charge. This number is the number aSSigned to each enumeration block in the charge register prepared for the enumeration operations.
CvI. 5, 6,8, 10 and 12,' Size of block by populatioll-Enter the population of the block as determined at the houselisting operations in the relevant column. If the block does not have any ropu1atifln, enter 0 under column 5. If the population of the block is less than 300 or between 300 and 499 or between 500 and 749 or above 750. enter the ul'tuul population IU columns 6, 8, 10 or 12, as the case may be. Each block wllillave an entry in only one of these five columns. After enterIng the particulars for a block eater the particulars for the next block aDd sO on.
C()/. 7, 9, II lInd,IJ iVotional numbers-Aft;or you havp. exh:.usted all the blocks in your charge, you must now go to columns 7, 9, 11 and 13. Starting with column 7, you must allot a fresh serial number te> the blocks. Thus. the first entry in column 6 will get number I in column 7 and the second entry number 2 and so on· After you have exhausted all the entries in column 6, continue the serial numbering in column 9 also. Fqr example, if you have 51 blocks with population less tban 300 in the particular charge, the last number in column 7 wJlI be 51 and again'st the first entry in column 8 you will have to record the serial number 52 in column 9. Similarly, after exhausting column 9, you .,h mId continue the serial numb:r in column II and column 13 respectively. In case you do not have a block of a particular size group in the charge, there will be no entry in the relevant column. For example. if in your charge, there are no blocks of population 750 and above then column 12 and 11 11':" "" },lank. At the end of this re-numbering operation, each enumeration block will have a notional number given in column 7 or 9 or 11 or 13.
32
~J:q~ im~ if\T 'iI'~;:r-5H~iIi 'CI'Tiif ifiT 1 ill~ 5 if; ~T'CI' i!i1t 1:!;:iIi zrT~f~.. ;:r;~~ ~;:rrrvr;:rT iiJiTq
f;:r~~iIi) if ~ffT fitlU ~tqt I ;;~Til~CIf~~q q-rlfili f;jf~r ~;:rqClf;:rT q-ftfiiJir~T am 4 if;iiR: f~T qliT ~ , ~a: 4 •. 9.
l4, 19' ~~!Hfi{ ~T~lff<{'li ;:r;iI'~ iilT~ .i;TIfi) 'liT .... 1:£;:r f~lfT ~T1:!;:lTT I ~6qil lfiTi;q it iiJi"T\"qR'fi ;:r;~~ iiJi"t \OfTi; iifij'~ ~ <I'n if; ~~<{, ,lifT JTTQ;lTT I lfiT(fq 4 it CRQqrrrT ;;;i;rili ;f~, iiJi"T q-T \OfTi; q:fij'~ q <ID' it ~li'T ~r1:!;:m I ii{~ if;
iR'r(l';T(I' if; ~ ~ ~ij' 'CI'~ II; ~hq'\'f i~TIfi iiITi!" I
lf~ !R'inzr f>lfTif it ~li'r ~T~ f'li f~;:r ii;TiIiT it ~;:r«~ij!H ;:rQT~. ;a'iflfiT 'CI'lf'l rr~l flfilfT ~T1:!;: I ~ srlifiT~
it; qClf'IT ii;T;r;1 iiJi"T i\OfTiIi *,~ ifiTPfq 4 if rrte flfilfT i;fl~ ~h ilifflll' 5 it IIflf (0) f\OflS~ ~ ~ffr ~ 'iTT1:!;:rn' fili
I(iI' i~T;r;1 if ;;Jrr4i.l:IT if~ ~ I ~fipif lfil 611rif ~~ rip {ij' srij)f~ iii itlTIfiT it>T ili"TRRlJ> "Iiq nqT it:;;j it>~if it; f~
~( it>Ti>('1!' if~r ~ I ~ij''t ~ffl it. 4~\'I' i\'I'Tip tenr ;;if qurifT i~Tiifff if ~ ~T "!~ ;;JT~ f;;rrrif f~ if ~ ;;rrr
nllT Q:t I
5lfT;:r itif CfT~) iij',T q~(~ il'm zril ~ fip 2fiT\Of1!' 7. 9, 11 ill, 13 it <(:;;j f'fi1:t \ifTof crr~ CfiT\"q'fiflfi
;til't it;cr\Of f;q'\Of iiPITitiT iliT ~"Trr iti,;i' it; fijf~ ~ I If, ;t~ f4ittT oql IPIf sr ,,"\if;:r it, f~~ ~qq)1T if if \lfl1lT
iI~ I «~~ i~TopT it; f,ifiTi if iIi'fR{ Iff,crR 1ffi:CI'r, i'llf'Rfrra- q'~ qi' ~fh: 1f.lf ~~) n:'liti it it ... " ~if\ t Wt$!W'( • ;i~ ~T ~ fi!i~ ~Tt:i I
'11111' 5 : !IPIl ~
f~~ iiPlTiiilliliT 'CI'l(;:r ifgg ~;ft ~ fiRr ;;rr~ I ~ i~iIi) ifi ifT~ it ~ifrrur;:rT ftiliTi it ~t ~Ifi'T"U ~qT ;at ~T 1ff&'~ ij'r~TiI'4 f'lilfT i;fl1:trrT tih: !R'rf¥.f'li 1iliTli'-ii1i'~If. sr~<{rrm, Sfinij' m~ ij' Hojf~il ~go q~~ tt"furlfl ii1i't ificr~ '{if ~~\Of iffi'lfiT ~ 1fT&''' q, ffliH fililiT 'iTT~T I '{~« WG:T"IT qfrrtlfT iiIl ij'i!i(fT t f'li' ~ >;flJif iIiT fiiJi'OifT II'tW' t 'A'6: ~~ iIiT 'iJlJif \Jf'ilt oit> ~qcr (t ql fi!i~ \JIT~ I lfil crorrrr iT ,,~a~CCf'ri' t f'fi d'~\'I' ~rii1i'l ij t)'1Ifi'fT iiI'~ (fili ~'fCI'~) oT~ ilT ij' opT iiI'J'~ "'~ 'lilt 1fT olffiffi' 1fTfif rrClfifT « ;:r ~ ii(f~ I
~\'I' 'Cflfif it ~ en) ~ Ft ~ij' ifT(T iIiT f>l(rif ,. fop m ,,"rqifit ~~ fcr"q- it ii1i'Ji llifo.rri ~t ilt
qyq fif:ij'.l'iJ fiil'~ ij['if'qUTifT ~rEl'iIiT~T 'IR fimrifi' iIfif1TUfifT iliTzrt\'l'lf « ~ ij'!flfi ~rftrO' i!i~' I iihll flti q'~ iRTTlfT ill 'i,'IiT Q. ~~ ifflitiT it ij'rlfPlf m ~~ ~iJT ~ olfmrlTQ qf'Cl'lft 1RT
~~ I ~~ -~~ ~'fI1 if it;~ ij'T~;:lf ilffCfa1Rl' Q'Cfl 1t~T 'il'rl:t~ft I Q¥.fTflf, If( 5lfT;:r ~ fifi q;r~cm: ~:;ft ~ arn q~-~ ~Rl ~ iffi'iIil it q-(t ~l ~v:rnt W ~!fT q'fumj t f\"f1:t 'RT ilT~ I ~T-Iffl iffi'~ it ~ iiI'T;f ifl'\Wft izrfcffirra" qf:qzrt if~ ~q'1 II .
33
Selection of Sample Blocks-For each charge a random number between 1 and S will have been communicat d by the state Director of Census Operation's office. For example let us assume 4 as the random numb~r given to you by your District Census Officer. Therefore, blocks, having the notional numb~r 4, 9. 14, 19 etc ..... will be selected. The notional numbers in the relevant columns will be circled in red pencil. The corresponding block number in column 4 will also be circled with red pencil. The circled blocks will be the sample blocks in this charge.
It must be noted that the blocks with no population will not be selected. The enumeration block number of such blocks win be noted in col 4 and the fact that they have no population will also be noted in col. .5 with the entry '0'. but it will be noticed that there is -no column for the notional serial number in the case of such blocks. In other words, the sample blocks will be selected only from among those enumeration blocks which have some population.
Another very important point to be noted is that the notional number in cols. 7. 9, 11 and 13 are only meant to identify the sample blocks. This number MUST NOT BE USED FOR ANY OTHER PURPOSE. In the records of the sample blocks sucb as the Household Schedules, Individual Slip Pad§ and in aU other records the numb~r that must be used is ONLY THE LOCATION CODE NUMBER OF THE BLOCK.
Part V -Other matters
The selection of the sample blocks m'lst be made very carefully. The information in the census records of these blocks will be used for a major part of tabulation and most of the very important tables relating to economic activity. fertility, migration, etc. are going to be obtained only on the basis of these sample blocks· It will. therefore, be realised how very important it is that the selection of the sample is as perfect as possible- Incidentally. it will also be noted how very important it is for us to ensure that the quality and coverage of tIte enumeration in the sample blocks is also as perfect as possible:
In view of the importance of the sample selection, please note that if you have any difficulty at all in this matter. you must unhesitatingly get ill touch with the District Census Officer and the, Director of Census Operations.
As mentioned earlier, in the sample blocks both the Universal and Sample Individual Slip will be canvassed. In the non-sam"le blocks only the Universal Individual Slip will be cavassed .. However, ple3.s~ n)ta that tb.~ Houseb.old S~hedule will be canvas'iCd in both the sample and non-sample blocks i.e. it win b~ c.l.nv lssel for all bousenolds. Tlte individual slips to be canvassed in the sample blocks are printed in blue.

34
.. ~-I
~1IIIi~"'T,1981
i~q~ ;m'f'l iii 'f'R ~ ~ fij'li~ ~la:-~u ~~ .................. . f\1l"~r"""''''''''''''''''''''''''''''''''
~ ............. ..
.... !"if 'm' ~if 'if tim !f~~ 'ifflf;;r lfUTrrT d1=!f~ if 'ifflf;;r ~)~ 'l'Q; i~rlfiT m 'iffiii' ltiT
;;111 m ~TIIiT<ft iVfTlti itiT iffllliTcm- imltiT IlI'fifl';r 'fiT ~~lfT sm::f~qifi
;;;iR lfi~ ~lSlIT ;;~ liJ.:;ft 'fiT trill'r i~T'fi (If.r~;r 2 'ifeT i~cp (5 srer .. IIiT ;f 0 lfiT;:;f;r 6) crnr;r 7)
2 3 4 5 6 7 8 ------- _-- ------------- -- --- ------------- -_-
.. ~-1I
ltmf !lit' tRlfUfiff I 1981
Pr\ll' emlliT iii ,,!;;r~ iii f"'l{ r ... rt""", tftc-ir~ ~~~"'t ;;IfUZT ~;;zr' ...... ............... f:sr~T"" .............. ,., • I •
~ .................. . 5ITd'rcp lIT({f~"'''''''''''' " . " ,
'ifflla' !f~ .... flftT 'fGIij'T ij-~~ if :;rl'q;;r ~~ ~ ;qrylfiT !q'lf~ lfi~ itiT
~'ti 'tiT ~ifiTifiT ~riiiT !q'fr;;r;r 'fir ~ilTT 5ITtf1r'fi
i'l'on: ~~ iifiT ~Tcp (lfiT~;r 2 'ElCT iiPl'Tlfi (5 'ifeT
ij'.'H 'tir ;:f 0 ~'l 6) iifim;r 7)
2 3 s 6 7 8
'160 ij'Ii!lIT ............ .. .. ~-III
""t~tI' lilt 'f;f'l'VPl'T I 1981
i", ... iWrllif iii "!ifTII' ~ f~Q; f;;Ii'!f'1JT ma--VT,,"hT Uiilj .... · ..................... .. f;;rm· .... · .. ••· .. · ...... • ..........
~ m~ qjer CPT iiPl'Tlfi ;:;r;:railiT <t1 ~~ij'R ~r'fi) itiT Iff,(1IT1f Q;tf ~f;r'fi ;far\
VilIT ;fo tnm ;to ----------------,-,---;------------lfifg W;:II
'" 300 ij- "fi'l 300- "fiq 500- "fi1I' 750~ "fi1I'
<Jill' ij'o 499 ~o 749 ~o srfirlti ~o
-----------------
1 2 3 4 5 6 7 8 9 10 11 12 13

35
Form I Page No ......... .
CENSUS OF INDIA 1981
Control sheet for the selection of sample blocks--City
State •• , .............................. . District •••...............•..••••••...
City ••••••••••• ' ••.•• ~ ••••• I ••••••••• Random start .................... .
Name of the Charge or Number
Total Number of blocks in the charge
2
No. of the first block selected
3
List of Enumeration blocks selected
4
Form II
No. of blocks in the sample
j
CENSUS OF INDIA 1931
No. of the last block selected
6
No. of blocks left out Col. 2-Col. 6
7
Starting block of the next charge 5-Co1. 7
8
Page No .•••••.•••••••••
Conuol sheet for the selection of sample blocks-Non-city orb ..
State ............................... .. District ••.••••••••••..••.•.••••.•••.•
Town ............................... .
Name of town and its location code
I
Total Number of blocks in the town
2
Number of the first block selected
3
Randomstart .................... .
List of Enumeration block selected
4
Number of blocks in the sample
5
Number of the last block selected
6
Form III
CENSUS OF INDIA 1981
Number of blocks left Starting block out Col. 2- of the next Col. 6 town 5-Col. i
7 8
Page No ........ ~ ..... ..
Control sheet for selection of sample blocks-Rural
State ...... tea •••••••••••••••••••••••••••••• District ••.••.••••••••.••.•....••..••••••••• Tehsil/Taluk/P.S./Development Block ............................ .. Random stat't ......................... ..
--- --- ----_ .. _-----._--------------------Location Size of block by population and notional number Code
SI. Circle of the Block Less than S. S. S. 750& S. No. No. village No. Zero 300 No. 300-499 No. 500-749 No. above No.
------1 2 3 4 5 6 7 8 9 10 11 12 13
, ,
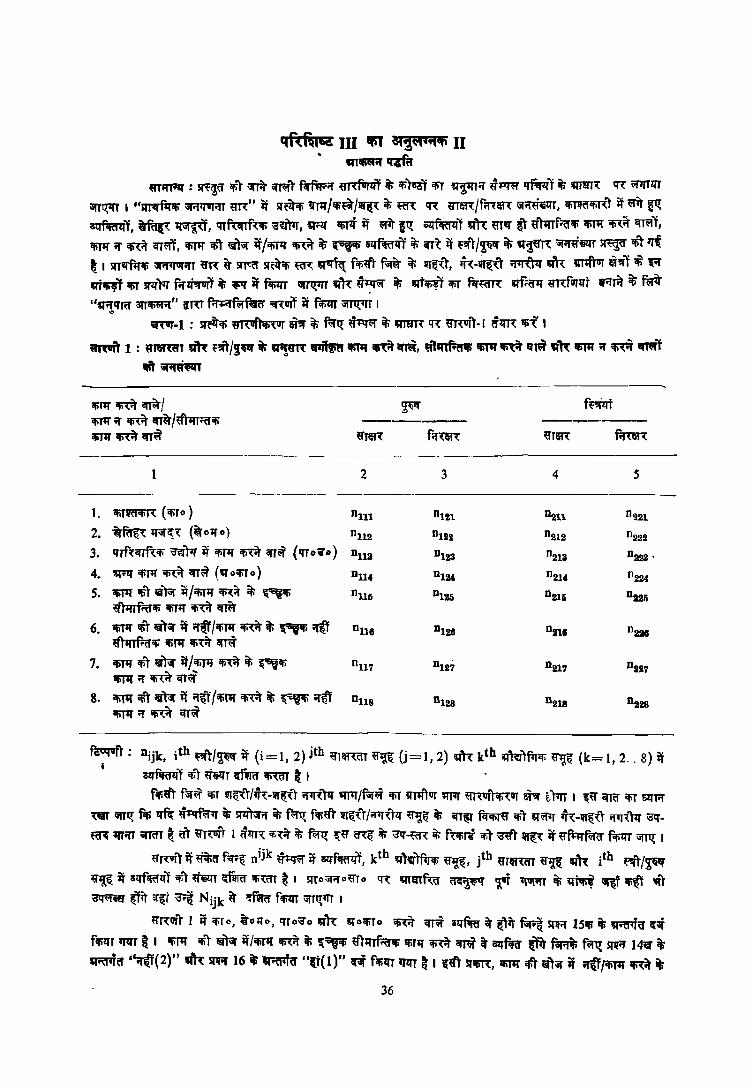
qftft1q III Ifi1 ~¥t.~ II • ,"~qfCl
mrn'lf : sr~CJ;CI' lfi'r ,{R ~r f'ffoq;:;:r m-dUTif ~ 'fi)8QJ 'fiT ~;:r dJ:lf~ qf;:p:rl ~ mI!TT1.: ~ ~mllT
\iIT~ I "srrll'f~ifi' ;;r;:rrrufOlT ~m:" if sr~ 'Vlff/ifi~/~ if; ~ en: m~/f,"m: iilml:fT, ~CI'm1 it ~ ~ Ql:fflffflfT, Wf~~ 1iiiI'~, qrf"(Cflf~1fi ~m, WlI' ifil~ it ~ it!; ;;lI'fiRrll'T m ij'fvr ~ ij'ilrTf.olfi lfi1ll' ~ir ~l, ififlf or ~it crrm, ififIf ctl' liliil it/ifi'frr m it; ~ ilIfiRflfl ~ iIT=t if ""1/~ iti ~~ m~ ~ arrl Iff t I srrll'frr'li "I'f~;:rT ij'R ~ ~ sr~itifi' ~ ~fq f~ fq if; ~~1, ~~-~'\" ~i1f ,,'h: VT'fTur P;l~T ~ '{if .n~ arrr !l<fPr fif~ if; ~ it f~ \ilTt1;'Tr ~ ~~ iti m~ arrr fcr~ IIffrij'J{ m~fUflft .-orA iti f~ ""'OIlim arr~" ilRT f;:r~OIft;rfe "",VTl it flfil1T iiIT~ I ,.
"""'-1 : ~itlfi ~ '"'If if; f~t!; ~~ if; iATm q'\ ij'RUf1·( ti~~ arr'i I
wn..n 1 : "'fIRtH' m ~'"/'J" $ 1A'~m'{' ~ IfiTq m~, ~1,"f'tflli Ifil" m '1M ,," IfiTq' if m II'Ml
""~~
ifi'Tlfm~1 ~ f~~ ifiTIf if rn ifT~/t\IfT;:CI'ifi' ------- --_-lIiTlf ~~ ;n~ ij'J1fR f;:r~ ij'T~ mlH"~
2 3 4 5
----I. iIiT~ ('liTO ) D111 nUl D211. n~2l
2. it~ ~~~ (~01f0) n112 DU2 n212 D222
3. IfTf«nf'{ifi -:aw)q if ifiTJf ifi~it ifT~ (1fT" i' 0 ) D113 D123 "213 DlI2ll •
4. ~;:l:f ifiTlf ~it ifT~ (q oifiT 0 ) D114 D1:U n 214 n224
5. iliTlf arrr v)iil' it / iliTlf ~it if; ~'fi n 115 0125 D211i 02211 ~rfi'(fifi ifiTlf rn crrir
6. i1iT1f llir mil it ;:r'(f/lfiTlf ~ ~ ~ i'[~ D116 0 126 DOG n 226 ~fhlTf..crifi lli1ll' 'Ii~ ifT~
7. ifi11J 'li1 m if / CfjTJf ~it if; ~'evCfi 1tiTl( ;r Iifi~ qr\i
n 117 D127 D217 DlI27
S. ifitlI ~ VR it i'[~l/i6tl{ iIi~it it; ~:;;'iIi if~ ifitlI if m crr~
DU8 D128 D218 D228
f~: Djjk, ith ~'\"/~ if (i=l, 2) jth ij'lm:crr ij'~ (j=l, 2) ~h kth ~~)fi[Cf; ~ (k= 1,2 .. 8) it ¥ clffcm'lr"f iliT ~ilfT mro ~ t I .
fifi~ f;;r~ ilif 'QT~T/~'{-'Qf~'\" i!1R1l:f q-pr/f;;r~ 'fir 111l1'1Q]' 'IN «RUfTIfi~Uf ~ (I'm I ~ij' iq"fCl' 'liT szrrrr
'(VI' \ilTt!; fit; q~ ~q it; ~ it; f~ filiij'1 'QT~~r/rrfT"'\"lf ij'~~ it; iil'Tl!l fcr'filij' 'Ii) ~~ ~~-w~1 i{1J,1q ~~ qrifr iiI'TaT ~ <IT ij'T~1ITT I ~lIT<: ;f,~it if; ~t!; i:ij' CI"{~ ~ ~.~ if; f'{iliri ;r;)' m ~ it ij'~ f.t;;;rr iiITt1; I
ij'T~r if ~if;CI' f'<fi'~ nijk ~~ if GlI'fri, kth qlw)fuif> ij'~, jth ij'TIfffiIl ij'~ q'R jth ~"t/~ ij'~ it Ql:ffiRl'l:fTlf.1 mr ~ llIi~aT ~ I 5fTo:;r.=rom-o !f~ qrl!TTf~ a<:~ 'r'i 't1ITiIT iii t(ftt;~ ~ 'Ii~ ",1 ~cS' ~it q(t ~ N ijk ~ ;:mcr fif>lIT ;orTt!;trT I
ij'r~Uf'\" I it iliTo, VO;fo, !fro"o ~,.~ ~olifiTo iIi~ CfT;f ctrfiRr if ~it f~ sr~if 15111 if; ~a- I{if fif>lfT 1NT ~ I ifiTIf 'fi1 lil~ it /'fill{ ~ if; i:~ ~lfrf~1Ii 'liTIi m cn~ if BlJm ~ mif; f~ ~or 14v iJ ma '~(2)" m 5IToI 16 ~ 't;r~a "(1'{1)" ~ fllilfJ W ~ I ~t\ srifiT'{, lfiTt{ iii'\" 1Il~ it iI{f/ifi11i m it;
36

General:
ANNEXURE II TO APPENDIX III
ESTIMATION PROCEDURE
• The values of various cells to be presented will be estimated from the sample slips. The
'Primary Census Abstract' (PCA) presents for each village/town/city. the population oC literatesl illiterates. persons engaged in cultivation (C), agricultural labour (AL). household industry (Hm), other work (OW) as well as marginal workers. non-workers. persons seeking/available for work by sex. These totals for each stratum i.e. city. non-city urban and rural areas of a district derived from peA will be used as controls and the data from the sample will be expanded into these groups by means of 'ratio estimation'. The estimation will be done in dif'£erent steps explained below :-
Step-I; Prepare table 1, based on the sample for each tabu1atiOD area.
Table 1: Workers. marginal workers and non-worke~s classified by literacy and sex
Workers/non-workeD! marginal workers
Cultivators (C)
Agricultural labourers (AL)
Workers in housebold industry (HHI)
Other workers (OW)
Marginal workers seeking/available for work
Marsinal workers not seeking!not available for work
NOD-~orkers seeking/available for work
Non-workers not seekinll/not ava able for work
Males r----'---~
Literate Illiterate
2 3
nll1 ·Ul
nlll nll2
al1l Rttl
au, 81s'
DIU Dlli
all, alII
nn? 1i11I7
n118 DlI,
Female. I----Jt-- -. Literate Illiterate
4 S
IItJ.I • .. 1
11111 D. alII a_
all, iii",
8115 a,..
alii DII•
811, BlI17
DIl8 nile
Note: nijk deDotes the number of penons in the i th sex (i=1.2). jth literacy group (i0=1.2) and II:th
industry group (k= 1.2 ... 8)
The tabulation area will be city/non-city urban part of a district/rural part of a district. It should be noted that if the outgrowth of a city/urban agglomeration have been treated as a separate non-city urban sub-stratum for the purpose of sampling, the records of such a sub-stratum should be pooled with that of the city to prepare table 1.
In the table the notation nijk denotes the number of persons in the sample, in the ktb
industry
group. lb literacy group and jtb sex group. The corresponding full count values wherever available
based on peA. will be denoted by N ijlc
In table 1. C, AL, HHI and OW will be based on answers recorded under Q. lSA. Margin a)
workers seeking/available for work will be those for whom 'No (2)' has been recorded UDder Q. 14-B and ·Yes (I)' has been recorded under Q 16. SimilarlY marginal workers not seeking/not available
37
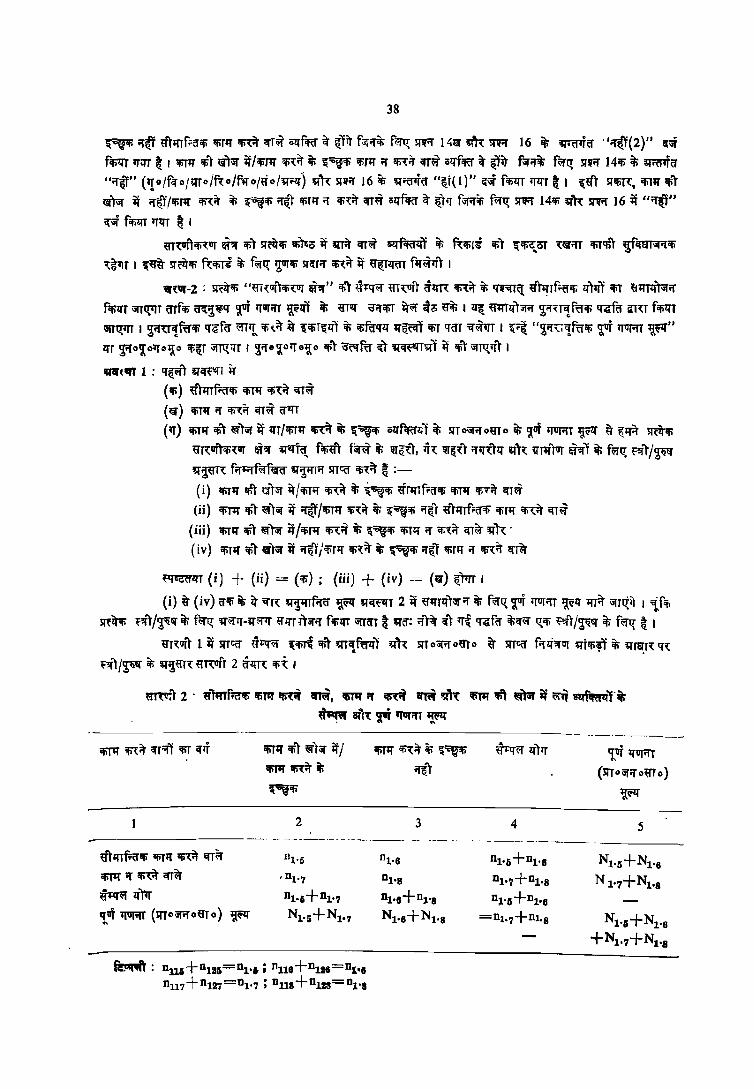
38
~ if~ ij"hnf;a'ifi OfiTIl ifi~ crT~ ozrftffi ~ ~Til' f;:;rifq; f~ Sl'llif 14lS""" Sl'll"I' 16 it; WfftTa' "if~(2)" q;;f
filillT 'T1:IT ~ I iliTI1 ifi') V)~ it/'firll 'fi,;r it; ~~'fi ifir1J if ~.r crr~ o<rf'ffi ~ ~~ fi>l';A; f~~ Sfllif 14ifi it; ~rcmiI "if~:I' ('qo/fero/flTo/f"o/f'ffo/«o/J;f'ilf) J;f1" Slllif 16 if; J;f;;fftTiI "Q:t(I)" 1:'Jf f'filfT q!n ~ I ~«t Sf'fiR, 'fiT'!' ifiT
1iT~ it if~T/'fir" ~it iii ~;;i'fi if~') 'fiTi{ ~ 'Ii,;r crT~ ozrflffi ~ ~)If f~iti f~ Sl'll"I' 14ifi q-"~ SI"llif 16 it "if~1J q~ f'filir qlfT ~ I
m~ur')'Ii'ur ~ "fi) Sl'clt"fi q;~o it q'f;r crr~ IlilffiRl'lIT it; R"firi 'fi) ~'Ii~OT ,vorr 'liTI:jiT ~f<MT;;r;:r'fi
<;:~t1T I ~~ SI'~ifi R'liTi it; f;:;r~ T'T'Ii SI'~rif ~;r it ~ f"~'TT I
"f~"-2 : Sl'ti'tifi "~rHurT'Ii~ur ~'JI''' <fiT ~hqiii' m~urT 6'lfT~ ifi<;:;r if; 't1;;nt[ ~'hrTf;'a'"fi If)qr 'liT ~1JM~if
filii" ~~T iITfifi ~l.q -rt quriIT ~!lT if; m~ ~iflliT iriii' ofo ~i6 I ll~ ~lf)'jf'if 2;;r~T,!f~'fi qi:fiI iiHT fifilfT
\jfJ'~m I ~i1~r,!Rr'fi q;:rfa' m~ ifi(if ~ ~'liT~lf) it; ififiICflf '!'~ IliT lia'r :q~qT I ~~ "~rr";<rfff'li -rt qurifT ~" liT ~0'I0lJ'0lJ:0 Ofi~T ~';fT , ~rro~..,q0l!0 ~ 'at'fRr ;it 'q'~r;orT it ifiT ~Tl:!;qT I
~('IT 1 : 'l6:\11 q-<rf~r i:(
('Ii) ~11JTf;:a'1fi lfiT'!' 'Ii~;r <IT~
( V ) ifiT" if Ofil:ir qT~ iI~T (q) 'liT1i 'fi) {!f)~ it lfT/IliT1J ~if it; ~~ olfflRfllT it; Sl'To~omo iii; 'loT iJ'ur;:TT ~~ ~ i!1Jif Sl'ti'tlfi
~~ur)lIi,ur 1ft''JI' t;I'~Tq_ f'fi~1 f~~ i6 w~r. oT,{ lI'Tii"') ifq,,)!l lijl'{ ~T'!'1ur ~T it; ftwr~ 'f'ft/~
t;l'lm fifWf'fiii'fW' 'l'l'ITif srTCO iifi"(if ~ :-
( i ) 'IiT'!'"fiT I1T:>T it I 'fiTi{ ifi~iI' i6 ~~'Ii ~r;n f;;cr'li "fiT'l' Cfi.iI' crr~
(ii) Ofin:r ifiT ~TiiT it ~T /OfiT'l' Ofi~iI' it; ~~'ti if~) ~1'!'Tf;:iI'Ii OfiT" ifi<;:iI' crr~
(iii) IIilIi 'liT ~~ it /iliT'l' ~;i t i!(~ifi IliT;:r if Cfi'(it crT~ q-T" .
( i v ) ifiT'!' ifi) lii)iiT it if~l / 'fiT'!' 'Ii~if i6 ~ifi if~l Ofirll if Ofi'{it Cfr~
~lfT (i) + (ii) = ('Ii); (iii) + (iv) = (Iii) il1<rT ,
(i) iJ (iv) iI'Ii if; i't ~H q-illrfifa' ~ q-~T 2 it ~IlTlf)~ if iii; f~1:!; ~ quri'fT 'J:~lf '!'TiI' iiTr~it I '{fer. sr~ifoI; 'f'!fT/~1if it; fC!f1:!; q'.;;rIJ-q-~ ~iTnT:orif f'filfT iiTTffT ~ q'ff: ifT'ir ~r q~ lii."fff it;criii' I:!;Ofi ~:ft/~Iif i6 f\1~ ~ I
~T~urT 1 it mecr ij-Pfiii' ~ifiT~ aJf\' q-TCI,;f'tl'lfT m~ Sl'r o\jfif o~o ~ srTCij fifliorar q-tCfi?T i6 q'ra:r~ q~ ~",,\ I~ if; t;I'~m~ ~l~ufT 2 c:rlfn: itii: I
ml~T 2 . wmf;olli lfiT1f m ~, 1Imr;:r m erM "R''' !til'!'!.fi1 Qf);r ij ~q ;;tlf~1l1·it;
~ 8T1~ TIl 'lVTi'lT ~
Cfi1''l iii) \Cr);sr it / ~~itili
~1Ii
2 3 ----------- - -------_._-- -- -.---- --
~TIlTf;:;;r'li ifiTIt rn c:rT~ 111 '5
IIiT'f 'if 1Ii~ crr~ ,°1,,,
~q~ If)'q °1.,+°1'"
'lui" tfVI'iIf (srro iiTif 0 EfT 0) ~ N1' S+N1' 7
~: 0U,+Olli=OI'i; ° 118+°116=°1'8
0117+ n127=D1' 7 ; Dll8+01ZS=D1·•
111'6
°1'8
°1'8+°1'8
N 1•6+N1·8
4
D1'6 + 01-8
°1·.,+°1'8
°1'6+°1'6
=nl'7+01'8
qvr qurrrT "
(srrOiiT'ifoIDo)
~
5
N1•5+N1•6
N 1·.,+N1'8
NN+N1 '6
+ Nlo7+N1'8
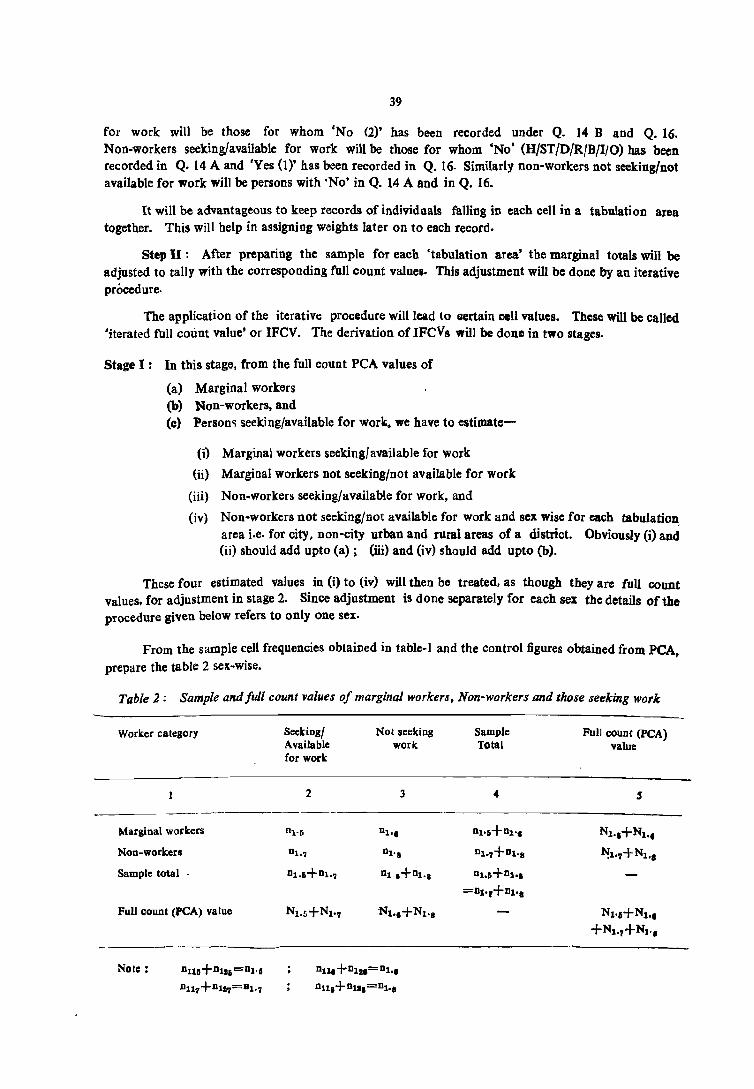
39
for work will be those for whom 'No (2)' has been recorded under Q. ]4 Band Q. 16. Non-workers seeking/available for work will be those for whom 'No' (H/ST/D/R/B/I/O) has been recorded in Q. 14 A and 'Yes (1)' has been recorded in Q. 16. Similarly non-workers not seeking/not available for work will be persons with 'No' in Q. 14 A and in Q. 16.
It will be advantageous to keep records of individuals falling in each cell in a tabulation area together. This will help in assigning weights later on to each record.
Step II: After preparing the sample for each 'tabulation area' the marginal totals will be adjusted to tally with the corresponding full count values. This adjustment will be done by an iterative procedure.
The application of the iterative procedure will lead to scrtain cell values. These will be called 'iterated full count value' or IFCV. The derivation of IFCVs will be done in two stages.
Stage I: In this stage, from the full count PCA values of
(a) Marginal workers (b) Non-workers, and (c) Person~ seeking/available for work. we have to estimate-
(i) Marginal workers seeking/available for work
(ii) Marginal workers not seeking/not available for work
(iii) Non-workers seeking/available for work, and
(iv) Non-workers not seeking/not available for work and sex wise for each tabulation, area i.e. for city, non-city urban and rural areas of a district. Obviously (i) and (ii) should add upto (a); (iii) and (iv) should add upto (b).
These four estimated values in (i) to (iv) will then be treated. as though they are full count values, for adjustment in stage 2. Since adjustment is done separately for each sex the details of the procedure given below refers to only one sex.
From the sample cell frequencies obtained in table-l and the control figures obtained from PCA, prepare the table 2 sex.-wise.
Table 2: Sample and full count values of marginal workers, Non-workers and those seeking work
Note: n110+ nI16=Dl'6
D117+ DI17=81'7
Dn.+D12l=Dl ••
D11,+Dll.=Dl·8
Full count (peA) value
5
N1 .• +N1.,
~1'7+Nl ••
Nl·,+N1.,
+N1•7+N1 ••
40
~ ~urrrT (srroor;:y0 llr0 ) ,,!~lf ~f;:('I'1f 'liTr:P:r ~ih: ~f;:crll ~rH if f<:"Q; ~~ ~ I ~T1frf;:cr'li 'liT1f!fi~
CfT~T ~R 'liT" ;:y "R:it ",r~T 'fiT ~ij!fT SIT oijf"l' o~T 0 if !l;l'Hnrr) ij' \3~iia- ~ I iliT1f iIi'T 'iTiiI' if ;:y@/CfiT1f iIi'\it it; ~
;:y~l ilffiFl'll'T ifi'T q!9!:fT ~r1frf;:cr'l!i 'fiT1f 'fi~ CfT~ ~h 'fiT1f ;:y 'fi,\~ "rr~ clfflRflfT ~ \Jf~ if ij' 'IiT1f 'fiT (gT\if it /!fiT1f
'fi\~ ~ ~"ii~'fi clffifcrlfT 'fiT ~l!ilfr 'CICT 'Ii\ srTCcr 'liT \ifTCl'T ~ I
«J:q'~ ~~!.Tl <tiT l.f~T1'lTcr IIIIP.i):;r;:r Cfi~ ffif<ti ~J;'f'-"T ~Tl;:r ii; lfT~ ~~;:y it; m1fit \3'f~(1f~ ~0Ji ~vrrrr
~lf ~ it;:;r 'iT ri iA'~fq_ c;{1lT ~r if ~Tmf;:cr<ti CfiTlf 'fi~ qT~l ifiT ~ilfT
r 1 = t~ -it IITIfTfrocl; -cini ~ii .mn ~f 9'eQ'T
~h iliT'!' 'fiT'iT\Jf if/<fiT1f "''\~ ~ ~Cfi (nl'S) qh: 'liTlI CfiT vT;or it rrijl/'IiT'li 'li\it ii; '(~'fi rr~T lOI.o)
IITlfTf;:('I'Cfi '{iT'll Cfi~~ "'~ 'fir Q'lilfT ifit q~~ it r 1 ~ ~IJfT 'fi~ I ~IIr q'ajiT"{
c;t:uf ~T if lfi1lI' rr ~ ifT(ij) 'fiT ~ll'r r 2 c:= ~~QI' it <fiT1f ;:y "R:~ <i1''-"TT 'li1 ~~
aIT,{ 'fiT'!' 'fiT.);;r ij/<fiT'!' 'fi'\it if; \""Wii (n1•7] m\ if.T'f 'fir IiT;;Y if ;:y~l/'fir'!' 'fi'{it if; ~""V'fi ;:yq:r (01'8) ifiTJf if
'fif.:l' ifT\WIl if; ilti'ifi,?T if» r 2 ~ TIT 'fit I
'!'TrrT \!I srifi'n: srrco (Cf,r~ ~i."lf D1-5(I,O), n1•6(J,0), 111-7(1,0), 01'8(1,0) ~fiil'i'fit <ti)llO'ifi' if ~1 ~~ 1
m'\ 0 ilir ~~Jt ~qw: llQ' ~cr 'ifi'\tfr ~ fili ~ifi' iIT'\ l;{;:;r ij-~cr;_;r l;{~lf iii) ~i'fu,!f'ff<fi ~ iTU ~Ilf)fa-cr fifi'lfT ~lfT ~
t;ffi ~ll'T::;r;r ~~ it; ~T,{ f~ 'flfT ~ I ~l{'RI' srr~ ~ll'T 'fiT crnr'!'-c{T,{ \Jf~ 'fi,\ ilt:!; 'IiT\iI''!' ~ !il'f Sl'Itft 'fit I
'IiT;:;r1{ ~ l:I')tr lIiTlf iii1 '!i)ijf if /ifi'T1f m it. ~~'fi 'qj~ if.T1f '!fiT vr;;r if ;;~ /'lfiT1f Cfi'{~ it. ~~ <i'~T ollflRf1.JT '!fiT
q-~1{Tf"l'ff ~ilIT 1ffQfff ifi{cr ~ I t"I';pr c;{1IT ~~rrT (5TT o;;j'i'folIr 0) ~"T it ID'''f ir~ fifizrr ;;rr~ I ~«~ f(1~ C1 ~'h: C2
ifir tJ1ITi'fT Cfit ijf~t
_ c;t:uttrarrrr it; q'~~H ifiT1f ifiT IiTiiI" it I ajiT1f ifi'{it if; ~'Ii ilffifcrl:l'T ifiT ~1SzrT C
1 - --q;ylf-ili'fv)~-ifiifiiif ifiii't if; ~iIi olfRo~'f-ifiT ~r.r('l' ~~T
c;t:ut 1JUIOfT Ir; 'q'l~'\ lIiTlI 'liT 'lTiiI" it rr~r /'liT1f ifi~ Ir; t~ ;:y~r olfflfa'lI'r ifi) ~1ilfT C2 =:-c: ifillf 'li1 ~)iiI" it Yf&T /ifiT,!, ifi,\i't if; ~:;;Yii ;:Yl!1 olff<f'JlJ'l IliT "~JI'Tf.m ~1ilfT
ifiT~ 1 :.ft iI~ srferf~trl iii) c! ijo!l;l'R: ifiT\il'Jf 2 ifi'T 'l~ 5Tfqf~'l ifi) ce ~ ~IJfT 1Ii~ q-"ff~ D1'6 (1,0) ~ n1' 7 (I,O) ifi') c1 ij' iq'j~ n1' 6 (1,0) q-h:: D1' 8 (1,0) iii) c2 ~ ~urr ifit I ~i'f ~zrT iii) D1'6 (1,1), D1'6 (1,1), D1. 7 (1, I) ~T~ n1-8 (1 J I) ilii2T iil'T~ I ~it;Q f"'''ij (1,1) lit{ ;a-mcr m:crr ~ . fifi iffi~ ~j,\ ifiT~l ~Ti'fl 'fit t:!;ifi
t:!;'fi ilH 'f"TzrTf~ff f;r.>.:rr 'fliT ~ I
\3'iJff ij' 'srrca ~(>lIl 'fiT q' fiJff ifT,\ ijfT~ ~T ijff;;r ifi~ f". CfQ'T if sr T oiil"Yf ° ~T C) it "!.i."lfT ij' ~ 'irit ~ I If~ ir~ lila- ~ (f) ~Yf\T"{f'ff ,{)'Ii ~ q-;:zrlllr \;:y l;{Hll1i) q~~ fCfiir ~if q'~~T,\ q'fifff erJ\ ~qp:J)fijf('l' ifi=( f~ fifi
% srra;;rrroij'T 0 ~ q'f'fCl'C{" "!.~l(1 ~ ~ 'iTJt I ~« ij'1{fzr)'iifYf if; ~"'f~ lI'~ ~ ifi~ fifi ifiT;:;r1J if; 'l~ ij'1fJt!Tmr ll)lT
srr o iJYf 0 «To it; ~lfT it; ij'Tti ir~ lira- ~ I lI'f1{ ~ irQl' ;:r~ 'iTff crT ifir~"qT,\ ~"Tlf)fi5Rl' iIi~ I ~ ~qTt!TiiI'rrT it q f<feforT{ crl!fT 'fir .;:r"arr~ t:!;ifi ~ <rN ~I!i ~;:y'\r,!f'tf ferflil' ~ ~'YiT~lf1 if; "!~ ~lf 5TTC~~) ijfTttit ijf) q fiRfiirT\ ailT
ifi'TQI''lqf, srr oiJ"I' o«T ° ii; ~zrT e- Jt;:;r l.iT!l;if I
'3'Cffi' q'~f(J ~ «!mfr(!iIi ifiT'!' 'fi'\ir crr~ q-h ifiT'!' if.T ~ it/if.T,!, ifi''\;r it ~~'li q-1\ 'fiTlt 'fiT VTijf
it "I'~/ifiTlI m it ~ifi ;:y~l 'liT1I;:Y cti{~ err~l ifiT 'f'Jfr/~'Cf it; "'i~R "'lfIT"1 ifiT m ~'lT I ~ q-~JfTif F-;rrf "2:fU"!Rrifi ~ QUfiTT ~i."i:j" (~oi°tro~o) 'liQT illfT ~ q'CfflfJ 2 if q-Tit ~0'l0Qo~o m 1fi'~ if; fqr~ firm ~ ~q- it srlfTtr fifi~ ijfJ~ I
pm 1: ifiT o, @o,!,o, q'Ja'\3'o, q'o!fiTo, ~Tm:, f"l',\~\ it ~ IfUIin' ~ilf m\ f;rT/~ ~ q-l«R
ifil1l' ifir IiTiiI" it/ifiTl1 ifi\if ;i ~ii ~h: ifiTJf ifiT V);;r if rrw.l/ifiTlI ifi~ ci ~~ ~, ~fiij'iifi ifiI1I' m ifT;:;rT
ql'{ ifiTlf ;:r 'Ii'\it erT~l if; ~0't otrol;{o ~ifif"l'Q 'lit I ~;U1ta' ~0'i0Qo~o 5T'f1r ~"fT ij- ~it (lit I lI'f{ ~Ti'f "\~ fifi 5fro::;r;ro~To ~ tq~ «mf.ffifi iifirll ifi\it cmr, IliI1l' "I' rn <rr~ mt ifiA IliT. if/ifiT1I m <ti ~ifi ilfflf(l'!IT iliT tfffr ",(;lifT cr"fT nflill' 1 ~ ~rJfTf.a'ifi IIiT1I' lIi1:it crrm: CIR ifiTq It rn ifT\iI'l1t ij' IIiT1I' IliT .niil' ifl iliT" ii'\i% it; ~'ii illff,,;rzrl 'liT tfffT 'f~ I
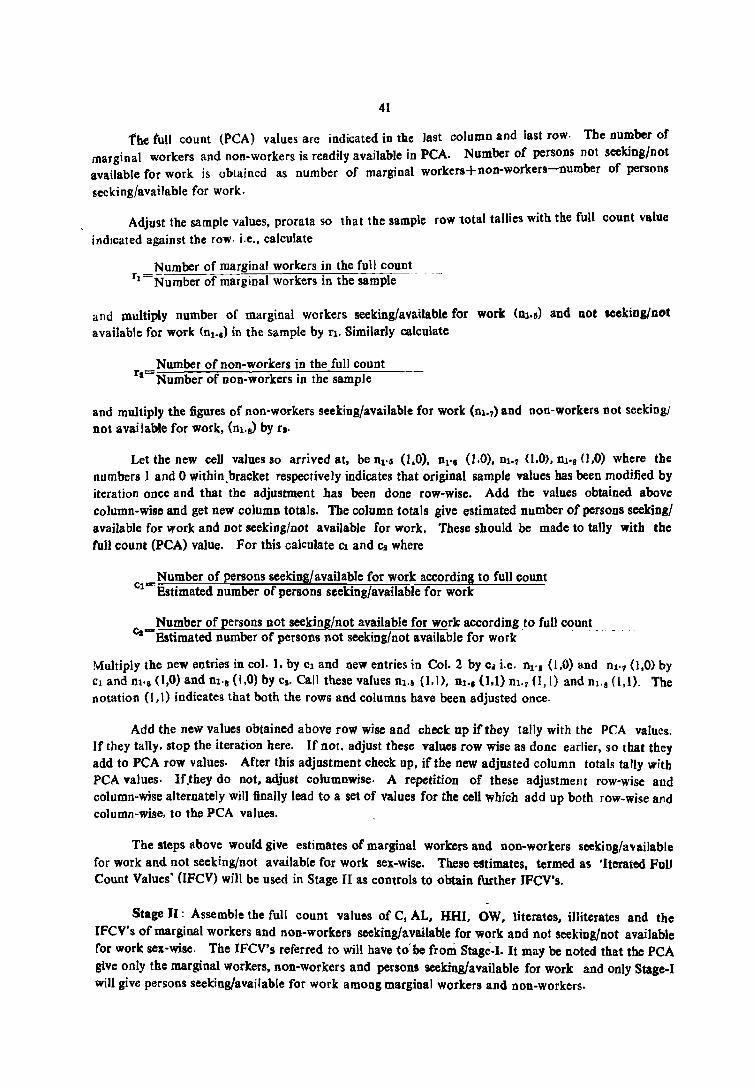
41
fhe full count (PCA) values are indicated in tile last column and last row· The Dumber of marginal workers and non-workers is readily available in PCA. Number of persons not seeking/not available for work is obtained as number of marginal workers+non-workers-number of persons
seeking/available for work.
Adjust the sample values, pro rata so that the sample row 10tal tallies with the full count value
indicated against the row· i.e., calculate
Number of marginal workers in the full count fl =Number of marginal workers in the sample
and multiply number of marginal workers seeking/ava\lable for work (01.6) and nOl leeking/not available for work (n1") in the sample by n. Similarly calculate
Number of non-workers in the full count r. Number of non-workers in the sample
and multiply the figures of non-workers seeking/available for work (n1'7) and non-workers not seekingl not available for work, (nl.J by r"
Let the new ce]) values So arrived at, be n1"5 (1,0), Orl (1.0), 01'1 0.0). Dl.8 (J ,0) where the numbers 1 and ° within.bracket respectively indicates that original sample values has been modified by iteration once and that the adjustment has been done row-wise. Add the values obtained above column-wise and get new column totals. The column totals give estimated number of persons seeking! available for work and not seeking/not available for work. These should be made to tally with the full count (peA) value. For this calculate Cl and CI where
Number of persons seeking/available for work according to full count cl=Estimated number of persons seeking/available for work
Number of persons not seeking/not available for work according to full count C.-Estimated number of persons not seeking/not available for work ------ - --------
Multiply the new entries in col. 1. by c} and new entries in Col. 2 by Cl i.e, nl'6 (1,0) and nl·7 (1.0) by Cl and n1" (1,0) and n1'8 (1,0) by Cs· Call these values nlo5 (I.1), nl .• (1.1) n1·7 (1, I) and Dl.8 (1,1). The notation (I, 1) indicates that both the rows and columns have been adjusted once·
Add the new values obtained above row wise and check up if they tally with the peA values. If they tally, stop the iteration here. If not, adjust these values row wise as done earlier, so that they add to PCA row values, After this adjustment check uP. if the new adjusted column totals tally with PCA values. If.tbey do not. adjust columnwise· A repetition of these adjustment row-wise and column-wise alternately will finally lead to a set of values for the cell which add up both row-wise and column-wise, to the PCA values.
The steps above would give estimates of marginal workers and non-workers seeking/available for work and not seeking/not available for work sex-wise. These estimates, termed as 'Iterated FulJ Count Values' (lFCV) will be used in Stage II as controls to obtain further IFCV's,
Stage II: Assemble the full count values of C, AL. HHI, OW, literates. illiterates and the [FCV's of marginal workers and non-workers seeking/available for work and not seeking/not available for work sex-wise. The [FCV's referred to will have to'be from Stag~-I. It may be Doted that the PCA give only the marginal workers, non-workers and persons seeking/available for work and ooly Stage-I will give persons seeking/available for work among marginal workers and non-workers.
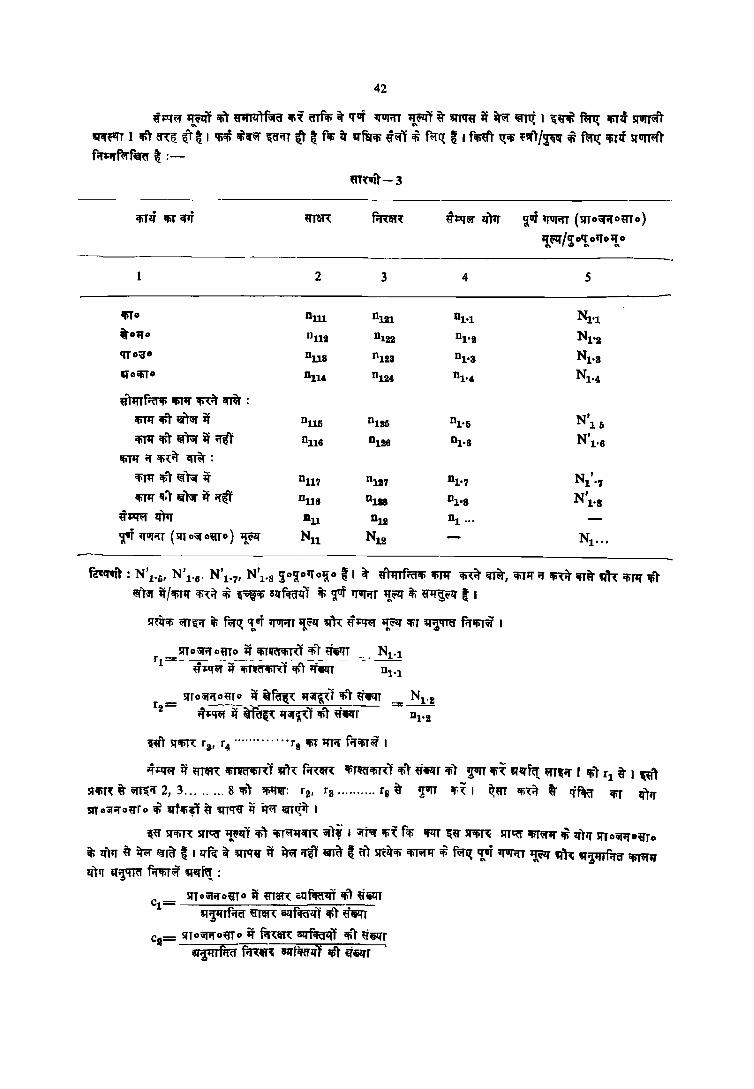
42
~Pf~ It~ ~ 'I1(Jtf)fiiTtl' 1Ii~ mf~ ~ 'fur ~ur.rr ~ ~ mtI'~ ;r ~ ~,lt I ~~<t f~ IliTlf srvrrm ~ ~
,,",PTT I ctl" ffi:{f Q:T ~ I q;;t ~<1'~ ~iJT 'lr t fiii it q-fitill \l~l '41 f~C{ t I rilld'!' ttill ~~1/~ Ii r~ ~T~ srvm:ft fi'f1=if~fQ ~;-
m~VJ'-3
~d 1!iI'iI1f mm: m$~ ~~qr qFr ~ ~QJ'fI' ('SIT a;;r;:r a goT a )
1f_~/~a,! atJolf_a
2 3 4 5
"",0 Om 0121 01'1 N1'1 .,oqo DU2 0122 °1'2 Nrs q'Jo~. DU8 D123 D1'3 N 1'3
'io1!il'o °U4 n12• nl ·, N1.,
goi"ItTf;:tf~ wm1f CIi1:i\' iif1ir ; ifilq ill' ~ it DU5 DU5 D1•0 N'15
~ iIlT 'ifJ;;r it i'ft\' DU6 DUG 0 1'6 N'l" ltlT'!' Of 'Ii~i\' ~:
~J1f Cfir 1fI~ ;r D117 11117 01'7 N I " 7 ~ <r:t l!ITiOI' it ;:r~ °U8 °128 °1'8 N'l •S
ij'~~ lJ)~ DU 011 0 1 ...
-rT ~lIf~r (5fT o\jf am 0 ) ~~ Nll Nu N1 •••
f!tIl1lT' : N'l"lil N'l'G' N'1-71 N'l'S !ia'l0~o~o t I ~ ~'h:nf;:aop iIiJ1I' m cffir, 'iilq OJ 'filii" 1iIT~ 'IR 'iir1f lliT
t§')~ ij/~Tff Cfi,i\' '41 ~. olJfiffllJT ~ flT 'TlIfi'I'r ~t"lI' iii ~\"lJ ~ I
5f~'ii m~ iF; R:rC{ tlJj ~T ~~lJ:qR ~~~ ~lI' lliT ~ f;:rIli'T~ I
_ 'SITo\jfif omo it ""~) ~1 mr _ .. N1'1 r 1 - ~J:q~- ij--nifi~·'(..n it~ -- - 01-1
5I'ra~OJoij'ro ij .,~, q~'T ~T ~"T Nl'2 [2= .r~qqfif~ It"'"~) 'liT ~~r- = 01'2
'~T STapf, r S. r, ............. T 8 apf ~if f;:rCfiT~ I
4";:~ ij mllR ~mfilir~T ~1( f;:r(1IR 'lir!ffi'~T ifi'r ~~r 'Ii) ~T!fi~ lI'ffq_ ~ .. ;:r I lli'l (1 i' I wl srifiT~ ~ IiTT~Of 2, 3 ........ 8~) ~; r2' fa .......... f8 i' ~lIfT Ifr~ I ~m ifi\~ '" tiflffi "" ~IJ' srro~OJo~ro ~ q-fl!li~) ~ q-rlf~ if ir~ ISITltit I
~~ 5fifi'R srrtQ ~~lI'l 'ii) ifi'f~1i"T~ ;;r), I ;orj':;r ifi~ f'li iflIT q:~ sr;m 'SITtQ EfiTW'I' ~ lJ)q SIT o\lfO'J 0 ij'J'o ~ <rIll' q ~ lira- t I lI'~ ~ mergo ij q~ Oft\' .m ~ tf) STti:t~ ~q 'Ii f~C{ ~ tJUl';fT ~ IIJR lIJ:rrrfOftf IfiTWIf
q)1J' ~fI'lO f.rCfiT~ iIf"l'~ :
!fT0i5l'OJoij'f O it goT$\ olififfl<rT !fiT ~ilfT cl = --q-W'---"rr.:-Ofa-ij'J'-m:-o-l:["'fiRl'll'---=ff::-· -;ifiT-:-~~
clI= srr o\lfi'l' om 0 it f.R1R~ ol~flRflif ilir ~,qT ~ffffi f'Rut Iil'fifCflll ilir {j~r
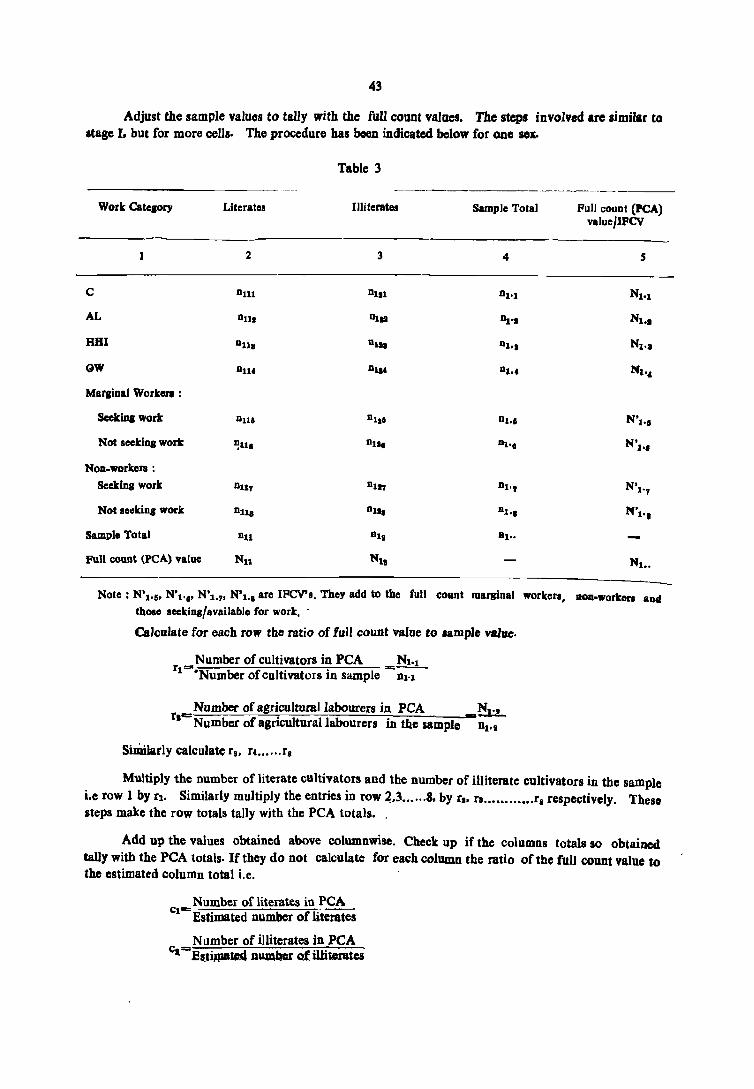
43
Adjust the sample values to tally with the full count values. The steps involved are similar to aage I. but for more cells. The procedure has boen indicated below fOf one sex.
Table 3
--------------------------------------------Work Catqory
C
AL
HBI
QW
Marginal Worken :
Seeking work
Not seeking work
Non-workera :
Seeking work
Not seeking work
Sample Total
Full count (PC A) value
Literates
2
nll1
nUl
Dlli
Dll'
nU6
I!UI
nl17
nllB
nu
Nll
IIIi terates
3
nl11
nlll
n1l1
n1l4
nl16
nllt
nll'l
nll8
n1s
NIl
Sample Total
4
Full count (PCA) valuc/IFCV
s
Note: N·I •5• N't .•• N'l.,. N'l., are IFCV'a. They add to tbe full count marlinal worleen, lIOn-worker. an" those seeking/available for work. -
Calculate for each row the ratio of full count value to sample value.
Number of cultivators in peA Nt'1 r- =---1-'Number of cultivators in sample n1-1
Number of agricultural labourers in peA N1., f'-Number of agricultural labourers in t.be sample nl'.
Sinlilarly calculate r,. r ....... r.
Multiply the number of literate CUltivators and the number of illiterate cultivators in the sample i.e row 1 by rl. Similarly multiply the entries in row ~.3 •..... 8. by r •• r ............. r. respectively. Theso steps make the row totals tally with the peA totals. ,
Add up the values obtained above columnwise. Check up if the columns totals so obtained tally with the peA totals· If they do not calculate for each column the ratio of the full count value to the estimated column total i.e.
Number of literates in peA cl=Estimated number of literates
Number of illiterates in peA cl Es_tiJllll~ number Qf Witoratcs
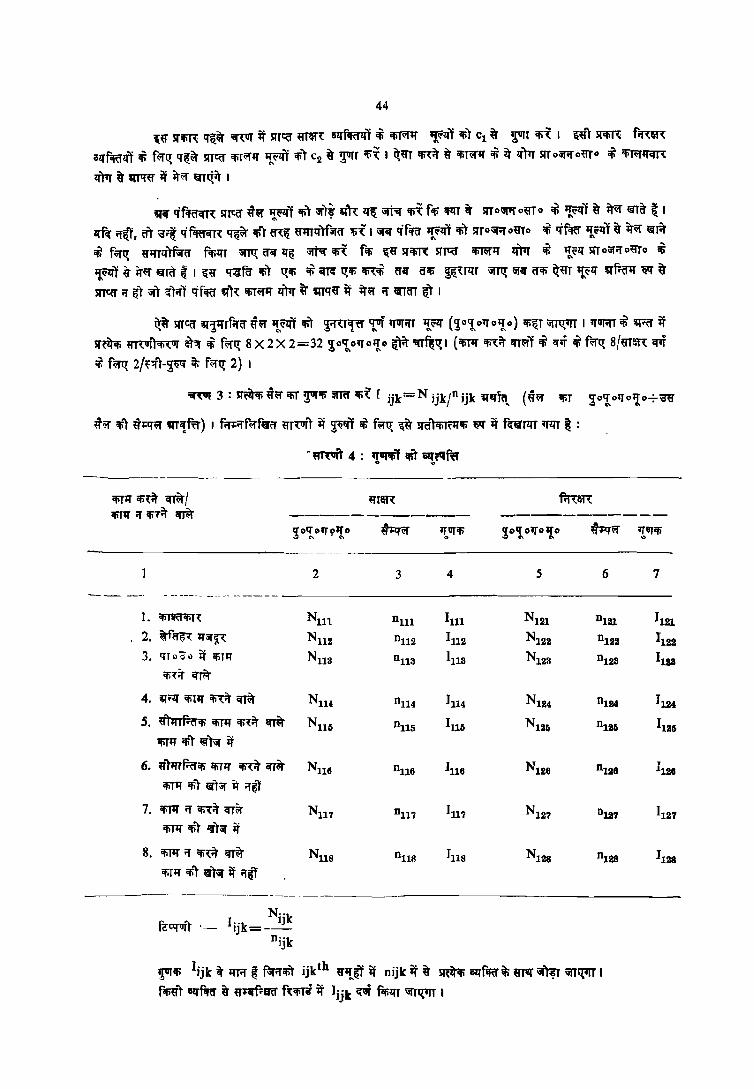
44
lij' sr~~ If~~ :q~ur it srTCO ij'f~~ olfflfiJlI'T ~ iIiffl'f ~lI'T ltiT c1 ij' ~T Iti~ I wr srm fi'f1:~ alfflfa'lfT ~ f~~ If~~ srTCO ~~II' "'i~lIT ~T c2 ij' ~r ~=( I ~ij'T lfi,it ~ ltiT~II' ~ ~ lI'r'l' 5!'Toiij'ifom'0 ~ 'liT~~ lI'T'I' ij' qtq'ij' if 1r<1" lITt:tiT I
q~ tfflfo<m: srTtiJ ~hr lJ~lI'T ~r \jfT~ q-1~ lf~ \jff:q lfi=( f~ !fll'T if SlT0i5fl'l'oij'fo ~ "~T ~ if\; @la- ~ I ZJR if~, iJr :o~ tff'RfCf(, IfQ~ ~r ~ ~TlI'rf\1fiJ 1ii I \jfif qfifCf ~lI"l !fiT srro\jfifoij'To i tff'RT "'i~lI"T ij' if\; IiR cfi f~Q; ij''l'fQTf,;riJ flfill"T ~ iJif lI"Q ;;rt:q lfi~ flfi ~ sr~~ srTtiJ 'IiT\;'f lI'Pr i "~lf srT o\1fif om'o ci lJ~ ~ if\; fi'Ta- ~ I ~ij' q'~fu ~r ~!fi ~ ifTil Q;lfi 'R~ iJ~ iJlfi ~ii'UlJT '3I'l1:t \jfif iJlfi Q;ij"f ~~lf ~fi'ijlf qq' ij'
SlTtiJ if ~T ;it ~Tifl tffiffi q-1, 'liT~q- If)l'f ij' mqij' if ifiR' if vr«T ~T I
~ srrCiJ ~¥rfifiJ i~ '!..~) ~T ~TCf'a' ttvi 'l'uri'l'T l!.~ ('!o'! 0'1' 0ll 0) lfiiiT iil'J"Q;tJT I "T1IfifT ~ ~;:iJ it sr~ifi m"{1J(r~ ~~ ~ f~Q; 8 X 2 X 2=32 ~o~ot)'0llo q:Ti't ~Q;I (Iti'" lfi"it 'fTiR'T ~ "q ~ f\;1:!; 8/ij'f~~ qof
of. f~ 2lf-:rr-~ if; f<1"1:!; 2) I
~ 3: sr~~:~hflfiT T"lfi ma' lilii [ ijk=N ijkrijk ","'f~tI~ (~iR' lfiT ~o,!olJo~o+~
«<1" ifir ~i:If~ iIlTCfRr) I fifi:iffiil'ffi'1'I' ij'T'{1JTT it ~~1iIT cfi f~Q; ~ srcr"'rliliff"liIi ~ it f~TlI'T t)'lfT ~ :
• ~ 4: 'l'1IRil!lft aqt'lf'ft' . ~
----_------ ---
'liT" q;,it ~I ~Tm: f.j,m: ifiT" if 1ili7i't crr~ ----------- ----------
io~ofT!'''o ~~ ~lJfifi '!oq'ot)'Oll'o «~~ ... ...
2 3 4 5 6
--- --- - -- --- - - - -- -- -- ---- - - --
I. ifiT~ifiT, NUl DUI 1111 Nl21 DI21
2. ~fo6' If:;r;;1: " N1l2 °112 1112 Nl22 D122
3. 'HQ~Q if ifiTIi N1l3 DU3 1113 N 123 °123 ·n~ ifR
4. q-;:lf !fiTII' 'Hit ifT~ NU4 n114 1114 Nl24 D124
S. ij'OOf;:1'I'!fi~" !fi~if ifT~ N115 °115 1115 N l25 D125 ~lf 'tiT ~T\jf it
6. «'hrrfrcr'ti ifiT'l ~it ifT~ NU6 DU6 1116 N 126 DU6
~1f ~T lST\jf it if~
7. 'tiT'l' if ~it <niir NU? DU7 1117 N127 °127 ~'f 'tiT IiT\jf it
8, ~1f <r 'ti~ ifT~ NU8 nU8 JU8 NU8 nl28
ififli 'tiT ~TiiI' it i'l'ijT
------ -------------- -----_--N.o
k f~CtflJfT '- J '-k 1J IJ =--
nijk
~'ti Ijjk ~ "A ~ f\jfif'fi) ijkth ij'~~ if nijk it ij- SRitor; CilIflRl'if; mvr iifm iiJTl'{tIT I
f~~T lq-fitiJ U «1:arf;:W f,!fiTi it Jijk~;;i f~lI"T \1TTlfIT I
IJlJfifi ..
7
1121
1122
1113
1124
1136
1126
1127
1128

45
MUltiply the column values for literates obtained in step earlier by Cl' Similarly mUltiply colwnn values for illiterates obtained earlier by CII. This should make the column totals tally with PCA totals
column-wise.
Now add the cell values obtained above row-wise and check up if they tally with PCA values. If not adjust row-wise again as earlier. When row values are adjusted to tally with PCA row values check up if column totals of the values so obtained tally with peA values. This procenure hall to be alternated so that we get a set of values finally in which both row and column totals tally.
The estimated cell values obtained will be called Iterated Full Count Value (IFCV). At the end of the calculation we should have 8X2X 2=32 IFCV values for each tabulation area. (8 for workers category/2 for literacy category/2 for sex.).
Step III : Calculate, for each cell the inflation factor JUk = N ijkl nijk i.e.(lFCV for a ceU+sample
frequency of that cell). The following table shows this symboIicaJ1y for maJes.
l.
2.
3.
4.
S.
6.
7·
8.
Workers! Non-worken
Cultivators
Agricultural labourers
Workers In RRI
Other worIcers
Marginal workers seekiDI work
Marginal workers not seeking work
NOD-workers seeking work
Non-workers not seeking work
Njjk Note: I··k=--
IJ nijk
Table 4 : Derivation of Inflation factor
Literate ,------J,..,-.----~ IFCV Sample Inflation
factor
2 3 4
Nlll Out Ill!
NUl DUa 1111
NU8 nna In3
Nut D114 1114
NUl °U6 Ius
Nlle nu, 1111
NU7 n1l7 1117
NU8 nU8 IU8
Illiterate ,-----J,..,-. _____ -" IFCV Sample Inflation
factor
S 6 7
NIl! DlaI 'tal
:fijI. OIU 1111
NIl. 0188 1113
N]24 nil, 1]_
N125 °115 1125
Nue 111.1 Ina
NII7 n]27 1127
Nll8 nU8 1118
The inflation factor Ijjk's are the weights to be attached to each of the nijk persons in the ijktb group·
In the record corresponding to a person Ijjk win be entered.
46
~ 4 : aqflRflfa' f~Ti IIiT 1fT"
IfTiI """CI' ~ 6 atan a'!Ifi ~ I fifiU'\' ~ iii'\' u.n ~r iii) U1f1'ir 'l'TiI' fimqr I \!itT6:00-r qlli ij'f~crftiRlIf ~lIf it m:r'\' ij'f~~ ~ 'Ii) {l':rrA JfT;r' fJl'iitlft I Jrtlrlfi ftifiTi it; U11r~ JlTif ~ fiifi1.lT iiIl'qm' I ~fifi SRiti!i azrfiM !fi) aql{ifa' .U~ it Q' flliij') 'I:tIIi U~~ if ~uftq flfizrT GffrI1 t mI': mlfi allflfa' t u;arfiaa Rifiri IliT P
iI'~ 'q1i'f.~ ~ I
...:vr 5 : G~q \~ IIit GTII\IPr
U$f) azrf~l iti fil'q «il'fifffl ;y,'T1li ifi) ~ ~ iii m fifftr~ iii 1iflI' ~ ~ fifi1:t IJQ;
'"if Q' ~~"'fiRl' ij'T,uf't \f1fR q;,\, iiIT~ I f'4II1 .. a rw1 if q-ft:riiJ'W1mrr iii ~m: a:) Sl'1fiT\ iii fcrf\rnr ~ ~11T'( ?~ iti lTT~ UTIA' !!fr~it I
"" """" : f~nt: 1TA flll'1n ~ flli ~ 15-19 ~ i!ft' ~ ~( 'Ii'\' fcrcn'f{a f~) iii'\' ~i7n iWTff iRi'fT :;;r~ r I W C{) 'iR:uiT it 'ffi11T flfi'w ~qT I
(i) ~)-~, ~ ~ ~ ffiffJ ftlrftr iii ~ f~Ji iii)" ~fZ I 1fJ'if f\illn iiIlq fiti r.t;~ ~R!'~ if 15-19 CJfi iti III'T~ ufl if f.AT~ f~llli) 66W In' ~ I
(ii) 15-19 crlSj it; ~T~-~ 11ft ~ In' fcmf~ ~'lfzrl it; fil'q 1TA \if~' I {UQ' 15-19 i{tf iii ~ij'lf_t{ it fcr<fT~ w..mlli'\' ~f.rcr ~ ifJff ~q) I
freihl """" : qfurcf;mTtlRfT : zrK !!fT"t~T $' ~ ~~ fifitrT ij'~ it ~ ifTt olffCf6'lfr iii)
tj"" ~ iii Q'Rrma p 15-19 eN iii ~11-~ !fiT w ij'1flJ ~~ f~ftr iii) mrzrl it 1li1f) 1f) q~ Iq ~ 4i'\' ~~~ !tiT ~iqri'f ;;nnOfT ~~ ~ ffi ~ f~ft;rfQ ~ ~m if fifilfT ~'TT :
(i) 15-19 q-1Sj iii Q'11-~~ iii) {q ij'1I'lJ fcmf~ ~'fftr !til lT~iI'TlII'l iti f'(m ct>1 ~ I
(i i) iij' Ul!~ ifi) 5I'~lrifi lff~iI'T iti fil'q, a'ij' lf~iI'T {r ifi'if) 1f) q~T it!; ar;.:ql ifi) ~ilIT it; ~ fifiq tTtf If Til' {r TIT iIi'( ql, ~ I ~ Sl'1IiT~ srr~ lIl1r {r m 'if) .f~T ~q ~l ifi'\' ~Tf.Rr ffilzrr i'Rr
Fr)' ~;:zr ~a' fVQ {r ith ~hr it jtb 8t!fiRr {r iti\1) ",,\, q't'r ~ ~l 1!)'\' ~'ilTT f.r+ir. fl'{f~~) :
X=Iij X Xii iiI'~t ith ~FT ~ jtb ~fiM' it; f~ ~ \TTl 'ij ~) ~ll;
Xij =!ff,{<Rf;nr)t;ij'T ~T '!.~lf Q''ifC! ifi'\TT "') .feu ~~ i('i:;;rT1Jft' mr I

47
Step IV: Assigning the weights to individual records
The weights will be retained to six decimal digits. All the slips in a group wiU receive the same weight. For example aU male literate cultivators in a tabulation area will get the same weight. The weight has to be entered against each record. Since every person has to be necessarily categorised into one of the above groups, each record relating to an individual must contain a weight.
Step V: Estimation of final values
After recording the inflation factor for aU the persons estimated tables may be prepared by referring to the value of the characteristics and the weight recorded. Two cases will arise according as whether we want to estimate attributes or variables.
Case I : Attributes : Suppose we want to estimate the number of females in the age group 15-19 who are married. This will be achieved in two steps.
(i) Sort the records according to the sex. age group and marital status. Suppose there are 'n' married females in the age group 15-19 in the sample.
(in Add the weights for all the 'n' married females falling in the age group 15-19. Tilia Sivcl the estimated number of married females in the age group 15-19
Case II: Variables: If in addition to estimating the frequency i.e. number of persons falling in a group etc. we want to estimate the number of children ever born to currently married WOmeD ia the age group 15-19. This will be done in two steps as follows:
(i) Sort out the records relating to currently married woman in the age group 15-19
(ii) For each woman in this group multiply the number of children ever born by the weight recorded for that woman and add. The sum of products 80 obtained would be the estimated number of chiJdren ever born. In the simple notation. the estimated number of children ever born for the J.th persons in the .th cell would be X=I" xx ,.where I .. is the
J IJ J IJ
weight recorded for jth persons in jth cell and Xij =the value of the variate i.e., (numbe.r
of children ever born) for that perSODI.

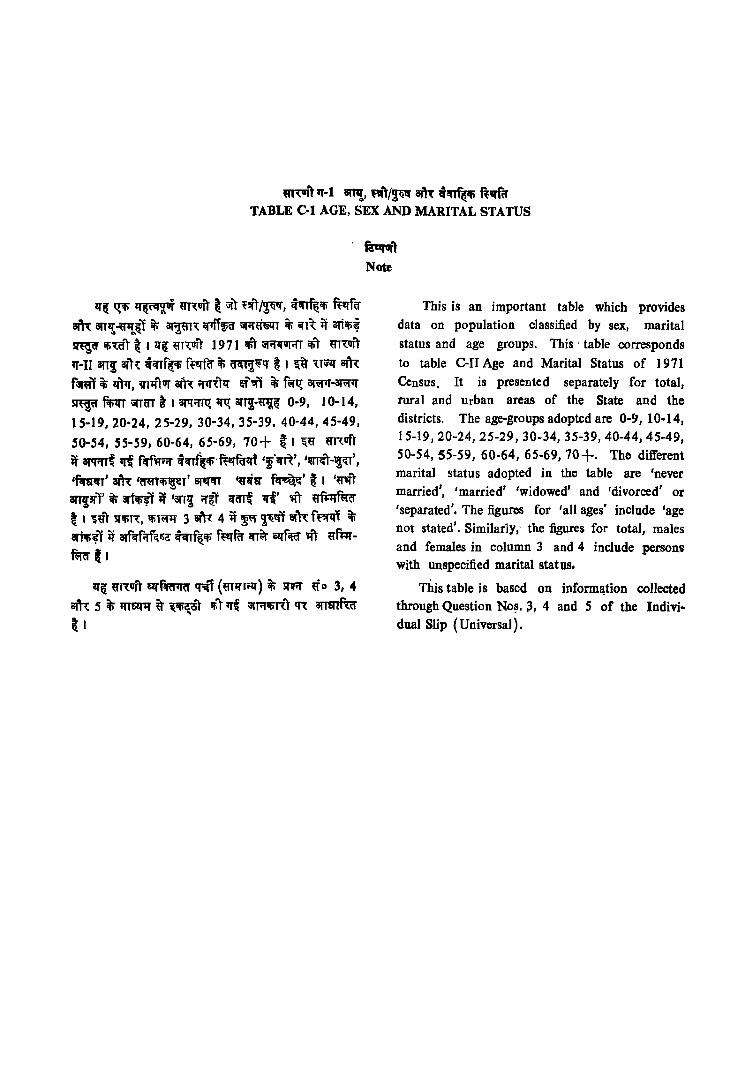
m~l q-I 8T~, "l/~ silt hTf{!1fi ".rR TABLE C-I AGE, SEX AND MARITAL STATUS
lI'q t.!;1fi ~ mvrl"l ;;r) ~!lfT~, <lcnf~'Ii R'ifff m 8Tr,!~Q.T it ~n:: CJ1T1ii'ff ;;rrr«ijlfJ it int iT 8Ti'li~ 5Ilgff lIi~ffT t I lI'~ ij'n:uft 197 1 ifIl \iA1JVfifJ 'liT m~T ~T-II arr,; ar"~ hTf~'Ii ff'ff(l' ifi ~1fq' ~ I ~~ 'UilI' 8111:
ri5[~ ifi lIllr, ~;nlflvr 8T)~ iJ1I',\TlI' ~~ iii f~t.!; BJ\II1T-~IT m:p f.r;1rr ;rrm ~ I a:rt{rrro; ITt.!; 8T11-~~ 0·9, I 0-'14,
15-19,20·24,25-29,30-34,35-39,40-44,45-49,
SO-54, 55-59, 60·64, 65-69, 70+ t I ~ij' ij'n:vrT iT 8fA'T~ '1ft rcrf'lli'if <lifTt~;p· fterfall'i ',{cr~', '~I"-tgiU" 'AAT' ~ 'ff~T'Ii~T' ar.:r<rr '~.ra- f~' ~ I '~'TT arr';3J'l' it artlfi,l if 'an,; rr~l iJ~ ~' '1"1" mRff~[ ~ I ~~T srlli~, ifil~ 3 ~ 4 if ~ Ij"litfT 81"11: f~l it; arr.t;~l iT 8Tfcrf.rr'=.lSZ cl.nf~1fi ff'ffff cn~ Gl{fiffi' '1"T ~fi:Irft;ff t I
lI'~ m~vrl" Glff.RrQff 't'if1 (mIfJi'iI') t SITrI' tio 3, 4 81""~ 5 it IfTr;lI1f ~ ~'liZOT !f.T ~ ;;(A'Ii"T If,\ arrmfur ... ~ I
f~l Note
This is an important table which provides data on population classified by sex, marital status and age groups. This' table corresponds
to table C-I1 Age and Marital Status of 1971 Census. It is presented separately for total, rural and urban areas of the State and the districts. The age-groups adoptcd are 0-!1, 10-14, 15-19,20-24,25-29,30-34, 35-39, 40-44, 45-49, 50-54,55-59, 60-64, 65-69,70+. The different marital status adopted in the table are 'never married', 'married' 'widowed' and 'divorced' or 'separated'. The figures for 'all ages' include 'age not stated', SimilarlY,' the figures for total, males and females in column 3 and 4 include persons with unspecified marital stat us.
This table is bascd on informll;tion collected through Question No~. 3, 4 and 5 of the Individual Slip (Universal).

50
'I-I 811!, ""/~ Col AGE, SEX AND
~ Wer/Marital StatuB ---!"f ~r ~ ..
lfTrr}lrrlftvr I Total Population Never Married ~~ ----------Total/R.ural} afTIpr~ ~" mf ~ ffa<rt Urban Age-group Males Females Males Females
1 2 3 4. 5 6
qsq-MADHYA PRADESH
q)1r ~nft 8Tllf. 26,886,303 . 2S,292,537 13,923,863 11,052,1»69
rTOTAL All aleB
0-9 7,457,980 7,266,863 1,457,980 7,266,863
10-14 3,581,747 3,195,853 3,390,400. 2,171,609
]$-19 2,580,453 2,239,387 1,909,714 822,968
20--24 2,154,137 2,147,980 729,796 138,871
25-29 1,954,521 1,843,011 204,659 24,338
30-34 1,613,337 1,601,912 611,022 7,490
35-39 ],539,S42 1,437,961 31.682 3,745
40-44 1,392,831 1,268,588 32,784 3,lOI
45-49 1,196,391 1,063,760 22,514 1,901
50-54 ],071,!i68 887,337 ·21,226 1,495
55-59 623,511 600,912 11,161 601
60-64 700,590 698,498 13,025 892
65-69 352,041 379,717 5,926 32~
70+ 584,585 648,259 9,634 1,5H
.mftwr ij''Ift arT'{ 21,266,319 20,326,062 . 10,788,508 8,655,264
llUR.AL All ases 0-9 «1,080,775 5,924,243 6,080,775 5,924,243
10-14 2,874,025 2,550,178 2,689,490 2,1S6,08!
15-19 1,953,237 1,725,086 1,347,197 of
511,07!
20-24 1,572,363 ],655,299 388,172 49,42~
25-29 1,496,123 1,436,700 108,242 8,90!
30-34 1,289,531 1,218,689 45,264 3,52~
35-39 1,202,159 1,143,831 28,816 2,031
40-44 1,086,115 1,034,194 26,149 1,83: 45-49 948,810 873,884 18,216 1,039 50-54 871,299 '135,426 17,396 971 55-59 507,686 504,893 9,230 377 60-64 585,219 586,363 10,987 623 65-69 294,463 321,390 4,957 241 70+ 493,043 547,788 7,876 1,118
f!aIuft :--:( I) '~arTl!' it 'C!ITI! ~ if~' it' ~ ~ ~ I ---_
NQt~ :- FilPJfes of Aile not stated are included in 'All aces',
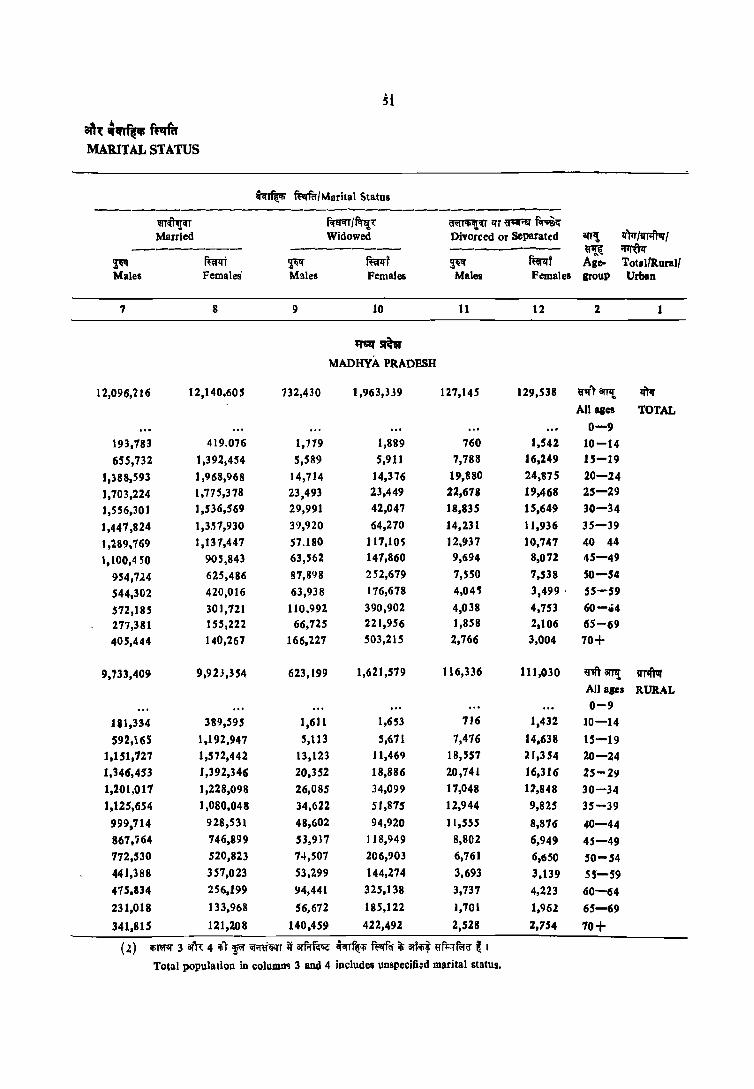
51
~'{ ~,,",. f~ MARITAL STATUS
hrfWli ft1rfcr/Marital Status -------------------------------------
mifrmT ~/~'l: i'tm1li1!<:r I1T «~ fir;i~ Married Widowed Divorced or Separated anl! If)trI~1
,-------- -------- -------- ~ 'I1I'UI1 ~ fuRl ~ mt F' ~t Age- Tot.I'Rurall Males Females' Males Females Males Females grouP Urban
7 8 9 10 11 12 2 1
'I'af mr MADHYA PRADESH
12,096,216 12,140.605 732,430 1,963,339 127,145 129,S38 «'I"f arTl{ m All ales TOTAL
0-9
193,783 419.076 1,779 1,889 760 1,542 10-14
6SS,732 1,392,454 S,589 5,911 7,788 16,249 1S-19
1,188,593 1,968,968 14,714 14,376 19,880 24,875 20-24
1,703,224 1,775,378 23,493 23,449 22,611 19,468 25-29
1,556,301 1,536,569 29,991 42,047 18,835 IS,649 30-l4
1,447,824 1 ,3.~7,930 3'),920 64,270 14,231 11,936 3S-39
1,'2.89.769 1,137,447 57.180 117,JOS 12,937 10,747 40 44
1,100,450 905,843 63,562 147,860 9,694 8,072 45-49
954,724 625,486 87,898 252,679 7,550 7,538 SO-54
544,302 420,016 63,938 176,678 4,04' 3,499· 55-59
572,185 301,721 110.992 390,902 4,038 4,753 60-04
277,381 155,222 66,725 221,956 1,858 2,106 65-69
405,444 140,267 166,227 503,215 2,766 3,004 70+
9,733,409 9,923,354 623,199 1,621,579 116,336 11],030 ij"1ft~ ITTIftvr All ages RURAL 0-9
181,334 389,595 1,611 1,653 716 1,432 10-14
592,16S 1,192,947 5,\13 5,671 7,476 14,638 15-19 1,151,727 1,572,442 13,123 J 1,469 18,551 21,354 20-24
1,346,453 J ,392,346 20,352 18,886 20,141 16,316 25-29 1,201,017 1,228,098 26,085 34,099 17,048 17,848 30-34
1,125,654 1,080,048 34,622 51,875 12,944 9,825 3.5-39
999,714 928,531 48,602 94,920 11,555 8,876 40-44 867,164 146,899 .5l,937 118,949 8,802 6,949 45-49 772,S30 520,823 74,507 206,903 6,761 6,6.50 .50-.54 441,388 357,023 53,299 144,274 3,693 3,139 55'-S9
475,834 256,199 94,441 32S,138 3,731 4,223 60-64
231,018 133,968 56,612 18S,122 ),701 1.962 65-69
341,815 121,208 140,459 422,492 2,S28 2,754 70+
(2) iliTOfll" 3 ijfR 4 'tI')- ~ iil'inililfT it arfljf~~ hTf~'li ft:;qfQ iii iSf~~ ~f;'lr.('(r ~ I Total population in Qolumn'l 3 and 4 includes unspecifi:d marital status.

52
,,-1 ani, "'/~ C.I AGE, SEX AND
~~r cfq~ ftvffcr/Marital Status
-----------lfi<m
~:m/VT,ft1Jr/ Total Population Never Married i!1R1<r -------------- --------------'f otal/R urall arT1! ""~ ~~ ffip:rt ~'{l'f f~<rf
Urban Age-group Males Females Males Females
2 3 4 5 6
~Slfm
MADHYA PRADESH
~ ~ arfl! 5.619,983 4,966,475 3,135,354 2,387,405
URBAN All ages
0-9 1,377,205 1,341,620 1,377,205 1,342,620
10-14 713,722 645,(175 700,910 615,524
15-19 627,216 514,301 562,511 3] 1,893
20-24 581,774 492,681 341,624 89,445 25-29' 458,398 406,310 95,416 15,433
30-34 383,806 323.223 22,758 3.964 35-39 - 33'7,683 294,130 8,866 1,106
40-44 306,715 234,394 6,()35 1,369
4S-i9 247,581 189,875 4,298 868
50-54 200,269 151,911 3,830 524 55-59 115,885 96,020 1,931 229
60-64 115,311 1IZ,135 2,039 268 65-69 57,578 58,326 969 84
70+ 91,541 100,411 1.758 392 ... ~""
MORENA
~ em arT!! 710,142 592,411 384,138 252,194
TOTAL All ages
0-9 212,239 183,497 212,239 183,497
10-14 97,374 70,992 91,844 S8,IH 15-19 68,303 52,230 43,498 9,253 20-24 56,8S3 52,257 J 4,192 890 25-29 50,801 42,790 5,429 81 30-34 42,493 37,290 3,270 30 35-39 36,977 32,094 2,679 15 40-44 35,809 28,038 2,627 46 45-49 27,314 23,804 1,943 5 50-54 28,024 20,674 2,089 26 55--59 15,650 13,998 1,210 10 60-64 18,134 15,991 1,414 27
65-69 8,058 7,050 58l 10
70+ 12,208 11,537 816 25

S~
aftt1i~~ MARITAL STATUS
;fcr~ mrfcrfMa~ital Status ._-------------------------------~pt~ fcrtm/f.r~' ~~~ 1fT ~~ f.r;3i{
Married Widowed Divorced or Separated arT,! Ifflr(lI11ftvr f ------------ -------- , ---------- ~ ~ ~ ffil"lfi ~ ffil"lff ~~ f~t Age- Total/Rural/ Males Females Males Females Males Females group . Urban
7 8 9 10 11 12 2
~m MADHYA PRADESH
2,362,807 2,217,250 109,232 341,761 10,809 IB,SOB ~ arT,! ~"tlf
All ages URBAN 0-9
12,450 29,481 168 236 44 110 10-14
63.567 199,508 476 840 312 1,611 15-19
236,B66 396,526 1,591 2,907 1,323 3,521 20-24
356,172 383,0}2 3,141 4,563 J.931 3,152 25-29
355,284 308,471 3.906 7,948 1.781 2,801 30-34
322,169 2'17,882 5,297 12,395 1,287 2,112 35-39
290,055 2118.916 8,578 22,185 ], i3 2 1,812 40-44
232,686 1.58,944 9,625 28,911 892 1,126 45-19
] 82,194 104,663 13,391 45.776 789 889 50-54
102,914 62,994 10,638 32,404 352 361 55-59
96.352 45,522 ] 6,551 65,164 301 530 60-64
46.363 2].254 10,053 36,834 158 144 65-69
63,629 19,059 25,761 80,723 239 251 70+ .. ~;n
MORENA
299,605 297,170 26,260 42.526 555 372 "rarT,!; liN All ages TOTAL 0-9
5.4117 12,745 25 51 10 10-14
24,603 42,788 157 iOI 21 26 lS-19
41,978 50,928 628 362 12 47 20-24
44,339 42,132 930 531 93 36 25-29
37,814 36,1 S4 1,323 1,045 86 51 30-34
32,537 30,107 1,124 1,342 3S 21 35-39
30,694 25,057 2,398 2,888 76 47 40-44
22,920 :0,802 2,400 2,960 40 36 45-49
22,522 14,177 3,343 6,394 56 57 SO-54 11,969 10,178 2,436 3,784 30 15 55-59
12.677 6,236 4,003 9,717 10 5 60-64 5,205 3,051 2,255 3,989 5 65-69 6,707 2,129 4,630 9,346 30 21 70+

54
q·t an~1 fIR II'" C-t AGE, SEX AND
~~ ft:vffir/Marital St .. ·dls...
!Of \lI;ffl~r -- \"'I{ ----j ~/'lTI'il'vr! Total Population Never Married ~ -------------- -------------Total/Rurall arTl{ ~i[ ~ f~t ~~ f~' Urban Age-group Males Females Males Females
2 3 4 5 6
!ton MORENA
!I11ft1r ~~ 613,185 511,778 3Z9,741 214,394
RURAL All ases 0-9 18 5,202 159,392 185,202 ]59,392
10-14 84,026 60,697 71,804 48,701
15- ]9 57,302 44,231 34,895 5,728
20-24 47,101 44,573 l O,S3!! 314
25-29 43,271 36,545 4,602 28
10-34 36,479 32,163 1,018 21
35-39 31,806 27,540 2,500 II
40-44 11 ,011 24,319 2,412 37
45-49 23,720 20,992 1,&50 5
SO-54 24,898 111,291 1,966 21
55-59 13,922 12,H2 1,146 10
60-64 16,301 14.060 1,318 27
65-69 7,044 6,229 544 5
70 ... 10,761 10,227 748 10
~ liT"" iII'P! 97,S 57 80,693 54,398 37,800
URBAN All ages 0-9 2',037 24,105 27,037 24,105
10 -14 13,348 10,294 13,040 9,454
15-19 11,001 7,999 8,603 3,526 20-24 9,782 7,684 3,657 576 25-29 7,530 6,245 827 53
30-34 6.014 5.127 253 9
35-39 5,171 4,554 179 4
40-44 4,798 3,120 214 II
45-411 3,593 2,812 94
50-54 3,126 2,383 123 4
55-59 1,728 1,646 63
60-64 ],833 1,931 96
65-69 1,014 821 39 5
70+ 1,446 1,309 68 U
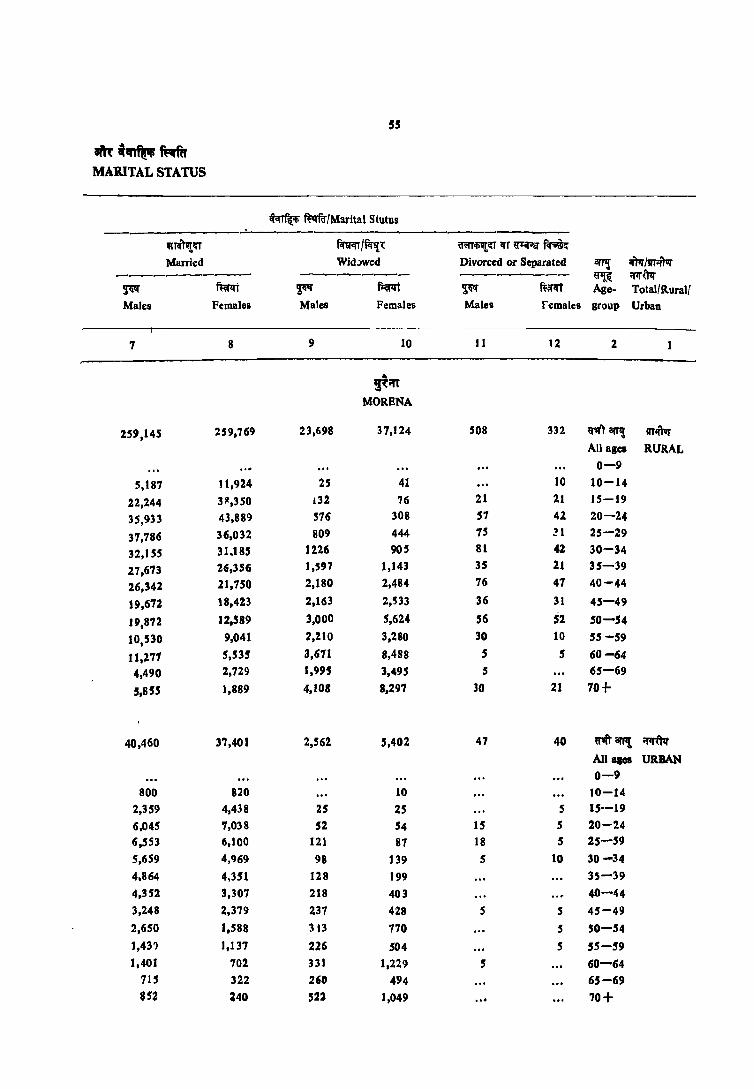
55
lilt __ ft:dr
MARITAL STATUS
~ ~fMarital Stutus -----
WTG:~<IT ~/f<r~p: a.rr~~ Iff ~ flr;;~ Married Wid.>wed Divorced or Separated arrrr zr)Ir Itmftvr .. --------- ------ -------- ~ ;:rIT(N
~ mt ~ ~i ~ mrlft Age- TotalfRuralf Males Females Males Females Males females group Urban
7 8 9 10 11 12 2
'" ~;n
MORENA
259,145 259,769 23,698 37,124 508 332 ~'I'l arflJ Iff,"", .. All agea RURAL
0-9
5,187 11,924 25 41 10 10-14
22,244 311,350 132 76 21 21 15-19
35,933 43,889 576 308 57 41 20-24
37,186 36,032 809 444 75 ~I 25-29
32,1 SS 31.185 1226 90S 81 42 30-34
27,673 26,356 1,597 1,143 35 21 35-39
26,342 21,750 2,180 2,484 76 47 40-44
19,672 18,423 2,163 2,533 36 31 45-49
19,872 12.589 3,000 5,624 56 52 SO-54
10,530 9,041 7,210 3,280 30 10 55-59
11,271 5,53! 3,671 8,488 5 5 60-64
4,490 2,729 1,99' 3,495 5 65-69
5.BSS 1,889 4,108 8,297 30 21 70+
40,460 37,401 2,56% 5,402 47 40 ritaTPt ;m'tIr
All alOB URBAN 0-9
800 820 10 10-14
2,359 4,438 25 25 5 1S--19
6.045 1,038 5% 54 15 5 %0-24
6,553 6,100 121 87 18 5 25-59
5,659 4,969 98 139 5 10 30 -34
4,864 4,351 128 199 35-39
4,352 3,307 218 403 40-44
3,248 2,379 237 428 5 5 45-49
2,650 1.588 313 170 5 50-54
1,43') 1,137 226 504 5 55-59 1,401 702 331 1,229 5 60-64
715 322 260 494 65-69 852 240 522 1,049 70+

51S
'1·1 lilT!, """t/~ C-t AGE, SEX AND
~C(r~ ~/MaIital Status ---
p~m ~ lI'ffl /'lJ1l"1vr / Total Population Never Muried ~flI' ------------ ------------Total/Rural/ arJ'l!~i! ~ mrll't ~ mt Urban Age-group Males Females Males Females
2 3 4 5 6
foqq BHIND
m- ~ orr,! 532,969 440,847 288,885 181,924
TOTAL All ales 0-9 151,924 128,674 151,924 128,674
10 -14 75,123 52.143 72,~06 45,710 15-19 52,910 39,014 36,887 6,713 20 -24 40,715 38,488 10,716 475 25-29 35,393 31,943 3,865 SO 30-34 28,877 26,548 2,260 35 35-39 26,541 24,781 1,839 24 40-44 27,667 22,989 2,00) 23 45-49 22,316 19,485 1,481 5 50-54 23,159 16,843 1,540 11 55-59 ·13,224 11,537 932 60-64 16;471 J2,590 1,178 10 65-69 '1,217 5,905 530 10 70+ 11,018 9,637 757 30
'l~ ~iIl'l1! 441,626 365,978 238,538 148,210 R.UR.AL All ales
0-9 127,286 106,863 127,186 106,863 10-14 62,526 42,765 60,506 37,072 15-19 42,742 31,833 29,000 3,911 20-24 32,657 3J,924 7,525 98 25-29 28,967 26,505 3,072 27 30-34 23,451 21,910 1,958 25 35-39 21,690 20,353 1,599 10 40-44 22,828 19,290 1,706 23 45-49 18,686 16,438 .,341 5 50-54 19,554 14.340 1,330 12 55-59 11.224 9,931 806 60-64 14,276 10,572 1,081 5 65-69 6,208 5,034 486 10 70+ 9,3lS 8,026 714 30

57
mei .... ~ MAlUTAL STATUS
~ mrftr/Marital Status -----------------~r:r fcraciT/~ ~r:rJfT~~ Married Widowed Divorced or Separated iII'P! Jf)'lr /!I11ftvr/
-------- ----- ------ ~~ ~ ~~ fuRt ~1!1' ffiRt ~~ ~t Age. Total/R.ura11 Males. Females Males Pemales Males Females sroup Urban
7 8 9 10 11 12 Z 1
f1fq
BHlND
218,867 223,931 24,186 34,635 25>6 211 ~~ IfN AUqcs TOTAL
0-9
2,268 6,393 . 44 20 S 10-14
15,882 32,133 120 114 5 5 15-19
29,S73 37,619 381 331 36 43 20-24
30,133 31,398 751 464 35 2S 25-29
25,533 25,652 1,044 835 40 21 30-34
23,231 23,715 1,436 1,015 36 28 35-39
23,230 20,410 2,374 2,532 55 14 40-44
18,508 16,890 2,286 2,561 20 29 45-49
18,226 11,632 3,358 5,186 25 8 50-54
9,935 8,603 2,342 2,928 10 5 55-59
11,225 5,201 4,043 7,3SS 15 19 60-64
4,660 2,525 2,018 3,365 5 65-69
5,695 1,674 4.513 1,908 19 5 70+
181,221 188,200 21,493 29,301 266 146 ~'Ift'8I'I"t .. , All aaes RURAL
0-9
1,981 5;658 39 20 S 10-14
13,633 27,759 94 109 5 ,. 15-19 24,751 31,499 328 283 36 24 20-24
25,190 26,056 661 402 35 15 25-29
20,528 21,128 930 737 35 15 30-34
18,324 19,512 1,241 816 26 15 35-39
18,991 17,108 2,075 2,140 45 14 40-44
15,292 14,253 2,023 2,163 20 16 45-49
15,273 9.SS0 2.927 4,435 20 8 50-54 8;363 7,412 2,040 2,514 10 5 55-59 9,649 4,359 3,521 6,189 15 13 60-64
3,902 2.124 1,809 2,895 5 65-69
4,161 1,388 3,191 6,587 l? $ 7()+
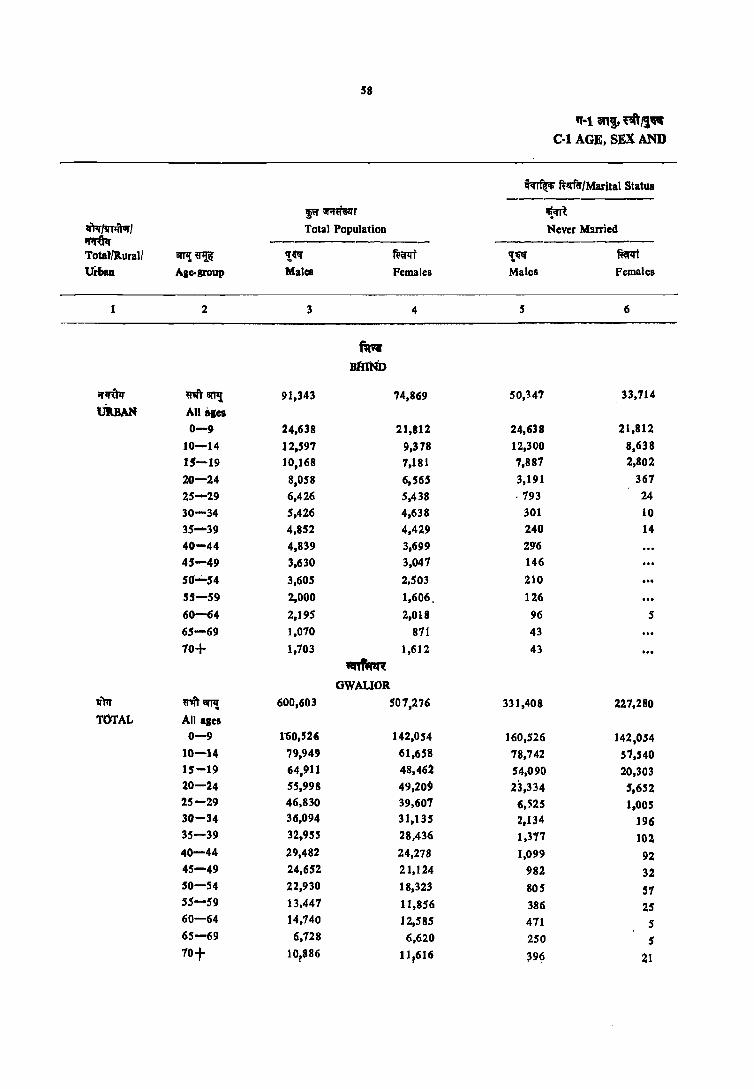
58
q·1 an" "'IJ'" C-I AGE, SEX AND
~ R,,{ffl/Marital Status
p~r ~m lI'Fr/llMar/ Total Population Never Mmicd ~ -------~--- -------------TotallRural/ 8TTl! ~ '!(If fi'er.rt 't,{If mm Uiban Age-group Malee Females Males Females
1 2 3 4 5 6
fiIq
BtUND
;rom mit arrzr 91,343 74,869 SO,l47 33,714 .. ukBAN All BlcS
0-9 24,638 21,812 24,638 21,812
10-14 12,591 9,378 12,300 8,638 15-19 ]0,]68 7,181 1,881 2,802
20-24 8,058 6,565 3,191 361
25-29 6,426 5,438 .193 24
30-34 5,426 4,638 301 10 35-39 4,852 4,429 240 14
40-44 4,839 3,699 29"6 45-49 3,630 3,041 146
50"--54 3,605 2,503 210
55-59 2,000 1,606. 126
60-64 2,195 2,018 96 5 65-69 1,070 871 43
70+ 1,703 1,612 43
~ GWAUOR.
If)lr mfrarJ'l! 600,603 507,276 331,408 221.280 TOTAL All agcs
0-9 l60,52' ]42,054 ]60,526 142,054 10-14 79,949 61,658 78,742 5'7,540 ]5-]9 64,91 ] 48,462 54,090 20,303 20-24 55,998 49,209 23,334 5,652 25-29 46,830 39,607 6,525 ].005 30-34 36,094 31.135 2,134 196 35-39 32,955 28,436 ],11'7 102 40-44 29,482 24,278 1,099 92 45-49 24,652 2 ],124 982 32 SO-54 22,930 18,323 805 57 55-59 13,441 11,856 386 25 60-64 14,740 12,585 471 5 65-69 6,728 6,620 250 5 70t 10,886 11 p6]6 ~9~ 21
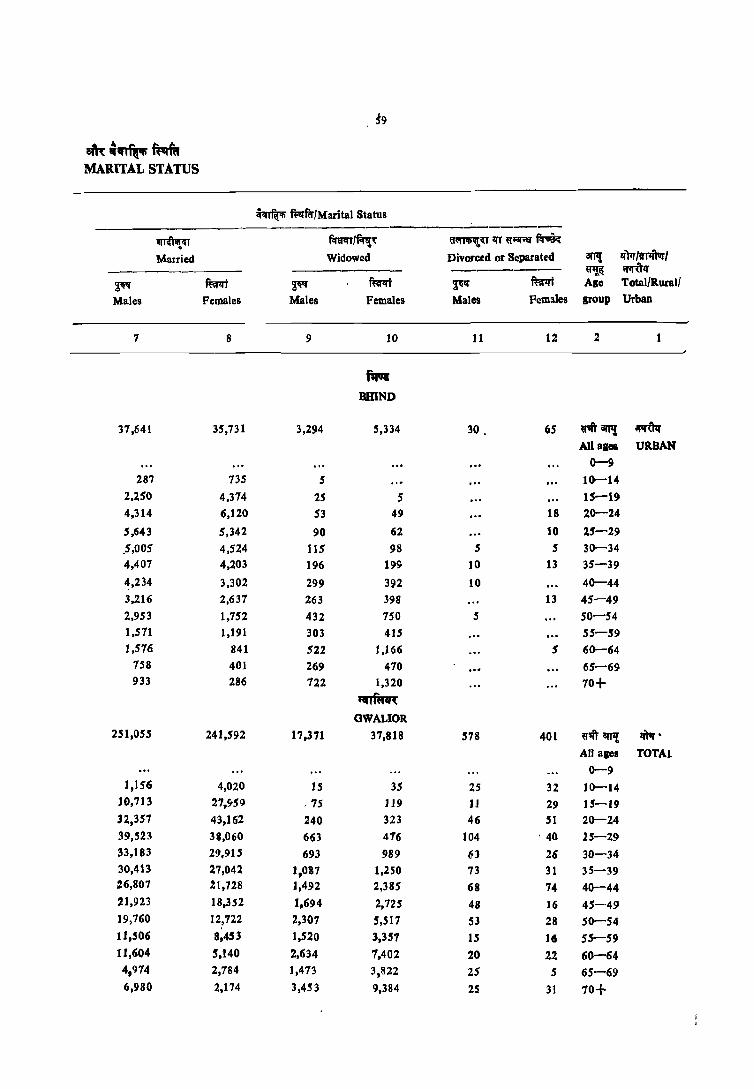
~9
~.~~ MARITAL STATUS
~ ~ftr'Marital Status ----------------------------------
~ifI flnm'~"{' 6~iIJ:q'r~~~
Married Widowed Divorced or Separated 8111! :q'Fr tvPitvr I _--------- -------- --------- ~ ~Il'
~ f~ ~ mt ~1If mt Agc Total/Rural'
Males Females Males Females Males Fem:l1es group Urban
1 8 9 10 11 12 2
f1rq
BRIND
37,641 35,731 3,294 5,334 30. 65 ril"arJ1! ~ All alCi URBAN
0-9 287 735 5 10-14
2,250 4,374 25 5 15-19
4,314 6,120 53 49 18 20--24
5,643 5,342 90 62 10 25-29
.5,005 4,524 Il5 98 5 5 30-34 4,407 4,203 196 1990 10 13 35-39
4,234 3,302 299 392 10 40--44 3,216 2,631 263 398 13 4$-49
2,953 1,752 432 150 5 SO-54 1,511 1,191 303 415 55-59 1,516 841 522 1,166 5 60-64
158 401 269 410 65-69 933 286 722 1,320 70+
~ GWALIOR
251,055 241,592 17,371 37,818 578 401 ~'ii't 8fI1! lIN" All ages TOTAL
0--9 1,156 4,020 15 35 25 32 10--14
10,713 27,!f59 .75 119 11 29 15-19 32,357 43,162 240 323 46 51 20-24 39,523 38,060 663 416 104 . 40 25-29 33,183 29,915 693 989 63 26 30-34 30,413 27,042 1,087 1,250 73 31 35-39 26,807 .21,728 1,492 2,385 68 74 40-44 21,923 18,352 1,694 2,725 48 16 45-49 19,760 ]2,122 2,307 5,517 53 28 SO-54 1l,S06 8,453 1,520 3,351 15 .6 55-59 11,604 5,140 2,634 1,402 20 22 60-64 4,914 2,184 1,413 3,822 25 5 65-69 6,980 2,174 3,453 9,384 25 31 70+
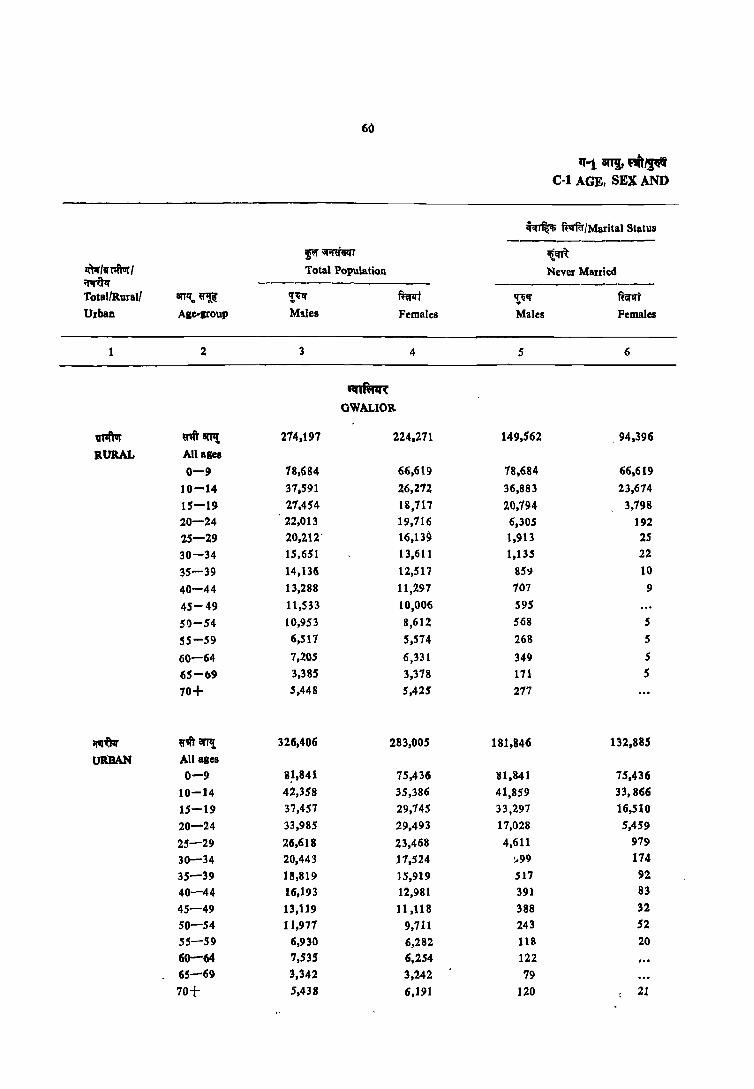
60
11'"1. IfI1, ~~ C-I AGE, SEX AND
~ fttffir/Marital Status ----f"I' \iAlim iilfm
~Ivt'lft'arl Total Population Never Msuied ~ Total/Rurall arrqo~ 'l"ilf mm 't"ilf mm U,ban AIe-I1'OUP Mllel Females Males Females
1 2 3 4 5 6
~ GWALIOR.
VlIftar ~an'Il 274,197 224,271 149,562 .94,396
RURAL All aSCI 0-9 18,~84 66,619 18,684 66,619
]0-14 37,591 26,212 36,883 23,674
15-19 27,454 18,717 20,194 3,798 20-24 22,013 19,116 6,305 192 25-29 20,212" 16,139 1,913 25
30-34 15,651 13,611 1,135 22
35-39 14,135 12,517 85~ 10
40-44 13,288 11,297 107 9
45-49 11,533 10,006 595
50-54 10,953 8,612 568 5
55-59 6,511 5,574 268 5
60-64 7,205 6,331 349 5
65-e.9 3,385 3,378 171 5
70+ 5,448 5,425 217
;pI'(R ~'Iit Bi'TIl 326,406 283,005 181,846 132,88S
UlUlAN All ases 0-9 8~,841 75,436 81,841 75,436
10-14 42,358 35,386 41,859 33,866
15-19 37,457 29,145 33,297 16,510
20-24 33,985 29,493 17,028 5,459
25-29 26,618 23,468 4,611 979
30-34 20,443 17,524 ~99 174
35-39 18,819 ] 5,919 517 92
40-44 16,193 12,981 391 83
45-49 13,119 11,118 388 32
50-54 11,971 9,711 243 52
55-59 6,930 6,282 118 20
60-64 7,535 6,254 122 65-69 3,342 3,242 79
70+ 5,438 6,J91 120 21

6 • . ~~~ MARITAL STATUS
~ ft:trftrIMarital Status -----~ifI f.m11~~ ~ifll1T~~
Married Widowed Divorced or Separated an'!. If)trlvT1ftar1
~~ l!1I~
!IW ~lI'j !IW ~lft ~ ~lfj Age- lotBl/Rurall
Males FemaleS Males Females Males Females group Urban
7 8 9 10 11 12 2 1
nr1'ft:nn GWALIOR.
113,816 lIO,9!;1 10,418 18,691 381 111 ~~ ~ All Bges RUaAL
0-9
688 2,564 5 14 10 5 10-14
6,619 14,829 30 10 5 5 15-19
15,556 19,368 122 121 30 29 20-24
17,789 15,919 422 168 87 15 25-29
14,044 13,018 431 502 35 30-24 12,599 11,954 636 547 42 6 35-3!:
11,570 9,923 959 1,341 52 25 40-44
9,822 8,615 1,085 1,392 32 45-49
8,928 5,881 ],426 2,714 37 ]2 ·0-54
5,304 4,042 930 1,516 15 10 55-59
5,275 2.428 1.566 3,892 15 60-64
2,346 1,444 858 1,925 10 65-69
3,224 936 1,932 4,480 10 10 70+
131,239 130,601 6,952 19,122 197 284 9''IIT artI! • ;prfr1r
All Bles URBAN 0-9
469 1,455 10 21 15 27 10-14
4,094 13,130 44 49 6 23 15-19 16,801 23,794 118 202 16 22 20-24
21,734 22.140 241 308 16 2S 25-29
19,139 16,836 262 487 21 26 30-34
17,814 15,088 451 703 31 25 35-39
15,237 11,805 533 1,044 11 50 40-44 12,101 9,737 608 1,334 11 16 4S-4~
10,832 6,841 880 2,802 16 16 50-54 6,202 4,411 590 1,840 5 55-59
6,330 2,711 1,068 3,510 s' 22 60-64 2,628 1,340 615 1,891 15 5 65-69 3,156 1,238 1,521 4,905 15 21 10+

6i
"-1 an!, ""~ C-I AGE, SEX. AND
~lfi ft'ffer/Marltal Status -----------
fOT ;;r;:ffiiliT ~m lfPr If J"ftvr I Total Population Never Married ~ -------------- ------------Total/Rural/ arT'! ~ 'tq~ mt ~QlI' mom Urban Age-group Males Femjiles Males Females
2 3 4 5 6
~ DAnA
~ ~milf1'l! 168,305 143,588 89,523 59,064 TOTAL, All ages
0-9 47,567 41,754 47,567 41,754 10-14 23,085 16,624 22,434 14,519 15-19 16,158 12.218 12,136 2,408 20-24 13,355 12.084 3,463 214 25-29 11,685 9,839 1,081 42 30-34- Q,615 8,942 549 15 35-39 9,155 8,162 419 13 40-44 8,805 7,842 49~ 10 4S-49 7,249 6,471 242 50-S4 1,443 6,048 326
5S-S9 4,065 3,605 213 60-64 4,129 4,310 262
65-69 1,981 2,251 137
70+ 2,651 3,288 93 26
'A'l1ft'ur ~ilf1'l! 135,786 115,116 10,833 46,406
RURAL All agel
0-9 38,547 34,106 38,541 34,106
10-14 18;858 13,002 18,260 11,106
15-19 12,849 9,419 11,714 1,091
20-24 10,255 9,660 :,066 9 25-29 9,547 7,857 781 IS
30-34 7,795 7,236 457 ... 35-39 1,530 6,415 358 9 40-44 1,094 6,294 441 10 45-49 5,881 5,456 227 SO-54 6,285 4,931 259
55-59 ~,371 2,904 182
60-64 3,9'33 3,414 250
65-69 1,593 1,711 122
70+ 2,100 2,636 83 15

63
aft'(,_~~
MAlUTAL STATUS
~ f'fv.rfu/Marital Status ----------------------------------
~cmriU mr<rr/f<nJ;,"I: ~iU 1fT ~1=if"a" f.r;SCI' Married Widowed Divorced or Sepuatcd 8lTI! 1f)frlllr.frrJrt ----------- ------- --------- ~ :mtq
~ fum ~ ffim ~ ~t Age- TotalfRural, Males Females Males Females Males females lIloup Urban
7 8 9 10 11 12 2 I
~ DAnA
72,258 71.453 6.200 12,)45 294 96 "''1ft' arr!f m '" All ages TOTAL
0-9 637 2,069 5 ~1 5 10-14
4,569 9,760 44 41 4 4 15-19 9.613 11,763 145 90 73 4 20-24
10,284 9,668 257 96 57 33 25-29 8,137 8,698 295 222 34 8 30-34 8,251 7,841 433 308 52 35-39 7,720 6,983 558 841 27 9 40-44 6,241 5,583 16.6 869 19 45-49 6,241 4,047 860 1.992 15 9 SO-54 3,214 2,33S 613 1,270 25 55-59 3,536 1,484 916 2.881 5 5 60-64 1,372 781 471 1,410 65-69 1,738 422 826 2,840 ... 70+
59,430 58,307 5,228 10,309 265 74 ""arTII tmiI1r All ales RURAL 0-9
584 1,865 5 21 5 10-14 4,087 8,2113 40 35 4 4 15-19 8,000 9,588 125 44 64 4 20-24 8,477 7,731 226 91 57 19 25-29 7.019 7,011 285 165 34 30-34 6.743 6,183 391 224 38 35-39 6,171 5,651 456 624 27 9 40-44 5.033 4,714 621 723 19 45-49 5,280 3.287 731 1,640 15 9 SO-54 2,655 1,854 520 1,050 20 55-59 2,909 1,173 '09 2,236 5 5 60-64 1,100 577 372 1,140 65-69 1,3;29 309 688 2,412 70+

64
'I-I an" ""/~ C-l AGE, SEX AND
tcr~ ~/Marital Status -----------
p ;;r;ni$l'r Ili,m 'I1T1r/lfm/ Total Population Never Married ~ ------------- -----------Total/Rural/ 8!'1"!~ 1f~1J .. ~ ~IJ mr Urban Age-group Males Females Males Females
1 2 3 4 5 6
mnn DATIA
~ Wfft'arJ'Il 32,519 28,472 18,690 12,658
URBAN AU ages 0-9 9.020 7,648 9.020 7,648
10-14 4,227 3,622 4,174 3,413 15-19 3,909 2,799 3,422 1,311
20-24 3,100 2,424 1,397 204
25-29 2,138 1,982 300 27
30-34 1,820 1,707 92 15
35-39 1,625 1,747 61 5 40-44 1,711 1,548 59
45-49 1,367 1,015 15 50-54 1,158 1;111 61
55-59 689 701 31
60-64 796 957 12 65-69 388 534 16
70+ 557 652 11 10
~ SHIVPURI
lfA' ~arl"I 466,817 399.053 248,661 168.036 TOTAL AlJages
0-9 135,903 123.784 135.903 123,784 10-14 60,953 44,659 58,716 37,329 15-19 42,150 31,811 29.;01 5.144 20-24 36.249 33.161 10,751 767
25-29 34,294 28.102 3,938 141
30-34 29.016 15.004 2,495 44
35-39 27,217 23,196 1,688 25
40-44 26,148 20,051 1,711 21
45-49 19.769 16,820 1,141 IS
50-54 19,718 15,249 964 15
55-59 10,sS5 9.834 484
60-64 12,785 12,788 542
65-69 4,840 5,092 207
10+ 7,010 8.102 224 5

(is
m"~Rqftr MARITAL STATUS
<fifTf{<ti ~/Marital Status ------------------
-.rm'!il.'T f.nm/~ ~il.'Tl!'T~~
Married Widowed Divorced or Separated arT!! zmr /Vpft1!r I ----------- ------- -------- ~ ~ i~ mrlti' ~ mt ~ mt Age- Total/Jlural/ Males Females Males Females 1IIIaies Females I1'OUp Urban
7 8 9 10 11 12 2 1
~ DATIA
12,328 13,146 972 2,636 29 22 ij'iftBl'flt iI1rttzr All Bles URBAN 0-9
53 204 10-14
483 1,417 5 6 15-19
1,673 2,147 20 46 9 20-24 1,307 1,937 31 ,5 13 25-29
1,718 1,627 10 58 8 30-34 1,509 1,658 42 84 14 35-39
1,550 1,332 103 217 40-44
1,208 869 145 146 45-49
962 759 129 352 SO-54 560 481 93 220 5 55-59
627 311 157 646 60-64
272 204 99 330 65-69 409 114 138 528 70+
~ SHIVPURI
199,377 191,343 17,572 33,096 1,206 454 ~'Ift' CII'P\ ~ ,All aces TOTAL 0-9
2,203 1,300 20 10 5 10-14 12,285 25,935 109 62 40 29 15-19 24,955 32,787 390 147 149 51 20-24 29,310 28,174 810 312 :'116 58 25-29 ' 25,254 24,338 1,059 550 218 67 30-34 23,992 22,289 1,388 852 149 31 35-39 22,412 17,883 1,873 2,016 140 65 40-44 16,595 14,256 1,916 2,508 116 36 45-49 16,102 9,970 2,545 5,222 102 42 50-54
8,486 6,779 1,550 3,023 35 20 55-59 9,602 4,390 2,589 8,344 46 44 60-64 3,521 1,880 1,091 3,197 16 S 65-69 4,534 1,304 2,227 6,788 1$ 5 70+
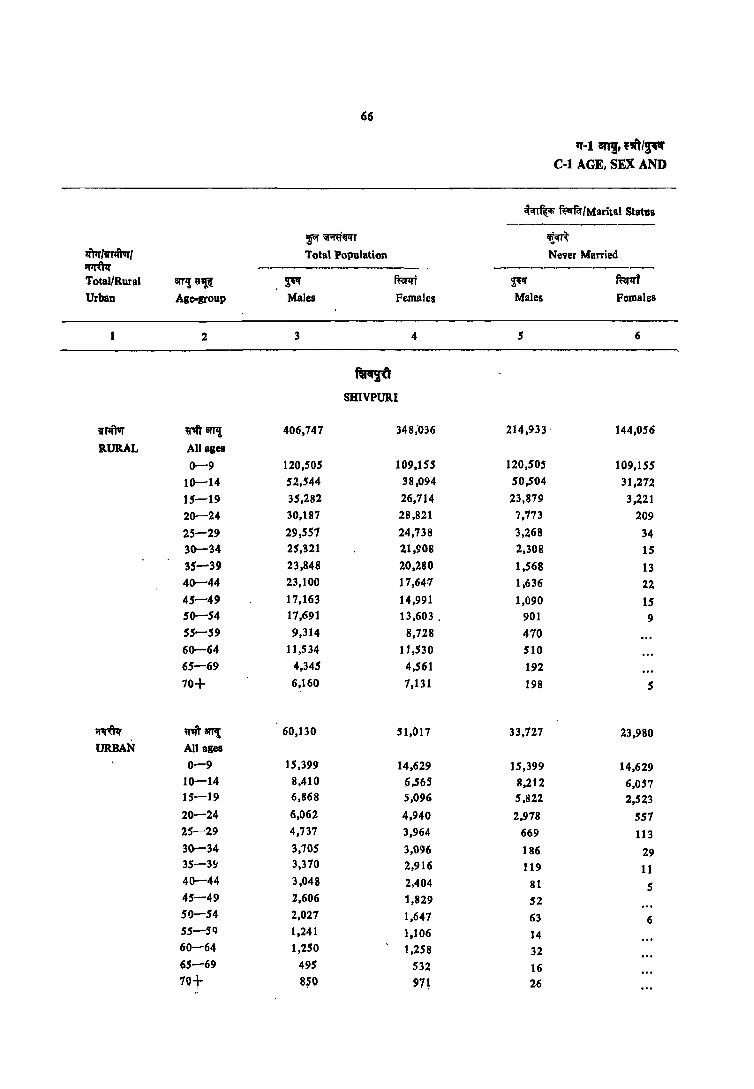
66
'1'-1 an'!, ,,"IS" C-l AGE, SEX AND
~ ~(Marital StatuI ----------
7j<'mm ~ ~)lr~.{ Total POpUlation Never Married ~ ----------- -----------Total/Rural arTl! :a~ ~ mm ~ f~1I1
Urban Age-group Males Females Males Females
2 3 4 5 6
~ SHIVPURI
vpfivr ~"'" SIP! 406,747 348;036 214,933 ' 144,056
RURAL All alea
0-9 120,505 109,155 120,505 109,155
10-14 52,544 38,094 50,504 31,272
15-19 35,282 26,714 23,879 3,221 20-24 30,187 28,821 7,773 209
25-29 29,5S7 24,738 3,268 34 30-34 25,321 21,908 2,308 15 35-39 23,848 20,280 1,568 13 40-44 23,100 17,641 1,636 22 45-49 17,163 14,991 1,090 15 50-54 17,691 13,603 . 901 9 55-59 9,314 8,728 470 60-64 11,534 11,530 510 65-69 4,345 4,561 192
70+ 6,160 7,131 198 5
~ ~arrJ; 60,130 51,017 33,727 23,980 URBAN All ages
0-9 15,399 14,629 15,399 14,629 10-14 8,410 6,565 8,212 6,057 15-19 6,868 5,096 5,822 2,523 20-24 6,062 4,940 2,978 S57 25-29 4,737 3,964 669 113 30-34 3,705 3,096 186 29 35-3~ 3,310 2,916 119 11 40-44 3,048 2.404 81 5 45-49 2,606 1,829 52 51)-54 2,027 1,647 63 6 55-51) 1,241 1,106 14 60-64 1,250 1,258 32 65-69 495 532 16 7(,1t 8~0 9n 26
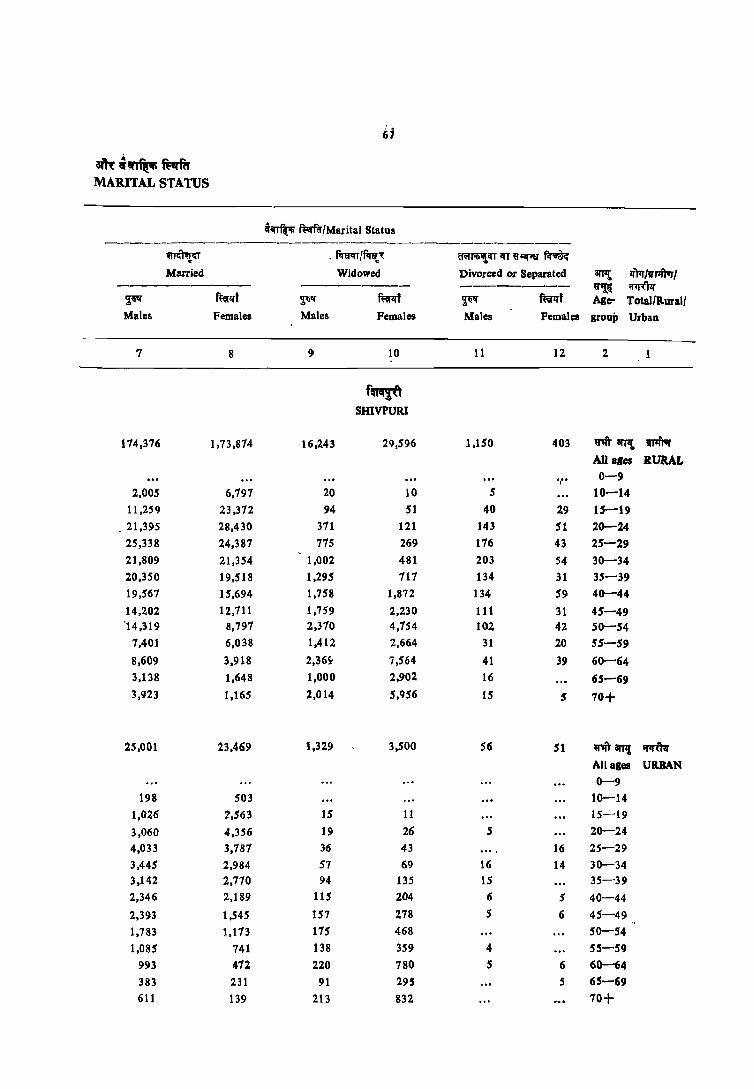
67
aiR ~~~ "'(fir MARITAL STATUS
-. ~/MaJ'ital Status ------------------------------------
~~ . mro/f.nt~ CM~~IfT~~ Married Widowed Divorced OJ' Separated 3rfl!. lfPr/flrfrvr/
---------- --------- --------- ~ ~ ~ ~t ~ ffirlft ~ mf Age- Total/Rural1 Males Females Males Females Males Females group Urban
7 8 9 10 11 12 2
f~ SHIVPURI
114,376 1,73,814 16,243 29,596 1,150 403 ~1it awt ~ All ales .RURAL
·t· 0-9
2,005 6,197 20 10 5 10-14
11,259 23,312 94 51 40 29 15-19
. 21,395 28,430 311 121 143 51 20-24 25,338 24,387 775 269 176 43 25-29
21,809 21,354 1,002 481 203 54 30-34
20,350 19,518 1,295 111 134 31 35-39
19,561 lS,694 1,758 1,872 134 59 40-44
14,202 12,711 1,759 2,230 111 31 45-49 '14,319 8,797 2,370 4,754 102 42 SO-54
7,401 6,038 1,412 2,664 31 20 55-59
8,609 3,918 2,365> ;,564 41 39 60-64 3,138 1,648 1,000 2,902 16 65-69 3,923 1,165 2,014 5,956 15 5 10+
25,001 23,469 1,329 3,500 56 51 U1ft arTli ~ All ages URBAN 0-9
198 503 10-14
1,026 2,563 15 11 15-19
3,060 4,356 19 26 5 20-24
4,033 3,787 36 43 16 25-29
3,445 2,984 57 69 16 14 30-34 3,142 2,170 94 135 15 35-39
2,346 2,189 115 204 6 5 40-44
2,393 1,545 157 278 5 6 45-49
1,783 1,113 175 468 SO-54
1,085 741 138 359 4 55-59
993 412 220 780 S 6 60-64
383 231 91 295 5 65-69
611 139 213 832 70+

~8
~.1 "'!, f1R1~ C-l AGE, SEX AND
4<rr%-P fftlftf/Marital Status
----------pornTm ~ lWr /IlRtvr I Total Population Never Married ~lf ------------ ------------TotallRural/ iTT,! ~~ ~ ffirq-f Ti" ffifll'f Urban Ale-group Males FemaJes Males Females
1 2 3 4 5 6
~ GUNA
~ ~an'I! 532,345 469,640 276,190 207,717 TOTAL AJI ages
0-9 154,056 148,014 154,056 148,014 10-14 11,355 55,542 68.541 47,135 15-19 48,343 40,871 32,943 8,888
20-24 43,427 41,115 10,527 1,621
25-29 31,364 32.968 3,104 504
30-34 33,220 28,940 1,835 377
35-39 29,546 25,452 1,160 338
40-44 21,611 21,138 1,209 336
45-49 21,888 18,469 795 ISS
SO-54 21.572 15,964 732 13 55-59 11,850 11 ,061 309 48
60-64 14,704 12,865 360 22
65-69 6,319 6,125 119 2.6
10+ 10,118 10,299 245 20
~ ~"t;rr, 457,124- 403,262 235,137 116,013 RURAL All ages
0-9 135,366 129,340 135,366 129,340 10-14 61,060 46,819 58,404 38,1)33
15-19 39,543 33,848 25,411 5,224 20-24 35,672 34,402 7,161 689
25-29 31,367 28.021 2,308 443 30-34 28,561 25,037 1,660 342 35-39 25,705 21,962 1,101 316 40-44 23,920 18,847 1,128 319 45-49 18,899 15,961 153 143 SO-54 18,838 13,721 668 69 55-59 10,15S 9,520 2SQ 48 60-64 12,838 11,284 330 22 65-69 5,419 5,359 160 26 70+ 9,414 9,001 231 14

69
am~~~ MARITAL STATUS
~~ fi:lI'fcrlMarital Status ----
~~ f.nrol~~ ~;n' Iff ~ ~~~
Married Widowed Divorced or Separllted arJ1f. If'Trr /vr;ftvr J ----------- --------- ~ ~ F" mt ~ ffirll"T ~ mt Age- Total/Rural{ Males Females Males females Males Females &roup Urban
7 8 !J 10 11 12 2
!"R OUNA
234,079 229,103 20,754 31,822 1,234 903 ntCll'll If'm All ages TOTAL 0-9
2,143 8,325 3S 2S 20 22 10-14 15,204 31,844 145 80 41 39 15-19 32,369 39,198 395 191 126 85 20-24
33,434 32,099 643 288 183 71 25-29 30,100 27,9a2 1,0(}2 582 188 74 30-34 26,724 24,146 1,551 913 102 51 35-39 24,020 19,617 2,268 1,665 115 60 40-44 19,057 16,233 1,897. 1,979 126 101 45-49 17,382 11,432 2,889 4,344 70 115 50-54 9,186 8,046 1,668 2,891 86 75 55-59
11,345 5,197 2,899 7,556 75 80 60-64 4,541 2,605 1,564 3,430 29 63 65-69 6,721 2,345 3,684 7,868 68 62 10+
201,999 198,110 11,170 27,567 1,151 853 ~m art"{, fflfi1Jr All ages RURAL 0-9
2,591 1,816 35 25 20 15 10-14 13,941 28,516 140 69 35 29 15-19 28,1105 33,468 3n 152 Il6 85 20-24 28,299 27,269 SS8 248 172 62 25-29 25,713 24,095 996 526 188 74 30-34 23,046 20,840 1,451 159 102 41 35-39 20,627 17,000 2,076 1,412 90 56 40-44 16,356 14,OS8 1,614 1,660 111 101 45-49 15,507 9,856 2,593 3,681 70 115 50-54
8,321 6,972 1,461 2,425 75 75 55-59 9,313 4,475 2,606 6,701 7S 1S 60-64 3,329 2,286 1,401 2,984 29 63 65-69 5,336 2,071 3,340 6,855 68 62 70+

10
'1-1 aTT!, ~/~ C-l AGE, SEX AND
~ ff'l'fir/Marilal Status --,__--~------
f"I' or;Wl§lfT ~ ~/!I'J'lftur/ Total Population Never Married ~ -------------- -------------Total/Kural/ atTI! ~ ~~ mi ~ m..lfi Urban Age-group Males' Females Males Females
2 3 4 5 6
wrr OUNA
~ n"t CIT11! 75,221 66,378 41,053 31,104 URBAN All llges
0-9 18,690 18,734 18,690 18,734 10 -14 10,295 8,722 10,143 8,202 15-19 8,800 7,023 7,526 3,664 20-24 7,155 6,112 3,366 932 25-29 5,997 4,947 796 62 30-34 4,659 3,902 175 35 3$-39 3,841 3,490 59 21 40-44 3,690 2,891 81 17 4$-49 2,988 2,501 42 13 SO-54 2,134 2,243 64 4 55-59 1,692 1,541 20 60-64 1,866 J,580 30 65-69 900 765 19 70+ 1,243 1,298 15 5
~. TIKAMOARH
1M ~8fI1! 391,471 345,510 200,974 142,946 TOTAL All ages
0-9 113,749 104,873 113,749 104,873 10-14 53,109 41,613 49,716 32,709 15-19 38,282 30,632 22,006 4,691 20-24 29,024 27,646 6,096 422 25-29 25,571 23,348 2,374 55 30-34 23,522 20,541 1,619 29 35-39 21,130 18,028 1,271 17 40-44 19,449 16,651 1,145 40 45-49 16,372 14,766 843 50-54 16,920 13,142 794 13 55":'_59 9,477 9,645 399 60-64 11,349 10,964 474 15 65-69 5,718 5,672 254 S 70+ 7,734 7,913 205 30
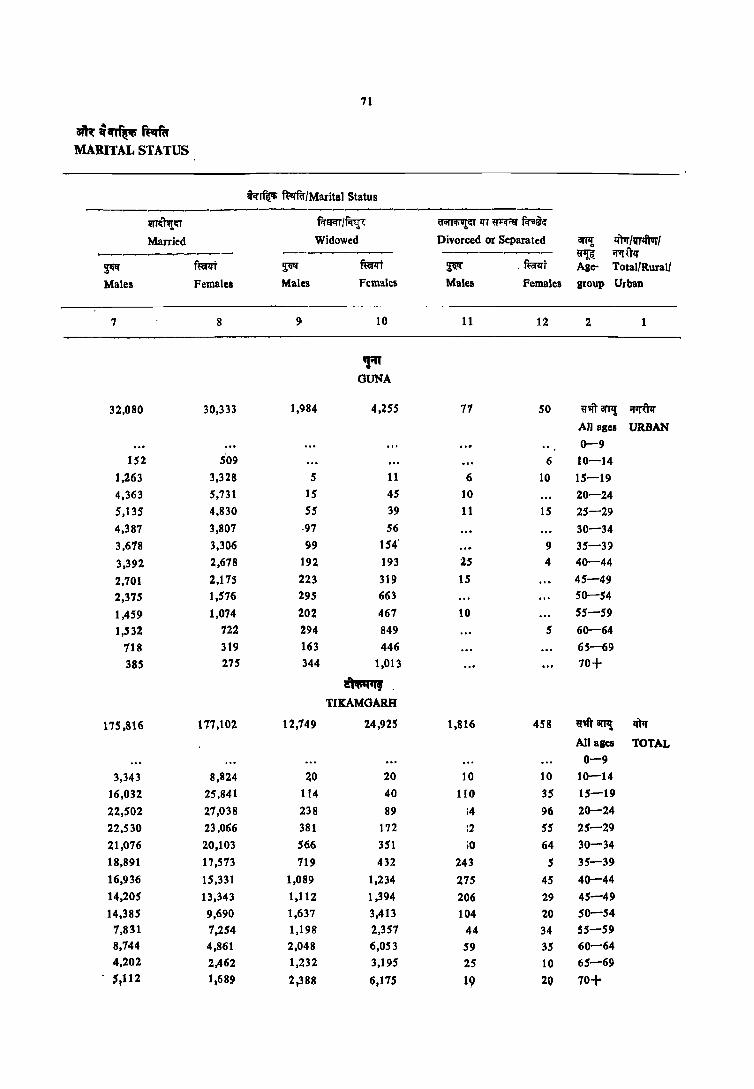
71
~;i~~ MARITAL STATUS
«~ ft:vrnr/Marital Status ----------------------------
m'T1f!~ Ffaq'T I~< ~~ lI'T ~;r;:1:1' fcr;;~~
Married Widowed Divorced or Separated BI'fI! litIr/vr4R1 ----------- -------- -------- ~ il1I'l.TIf
~ f~ ~ mt ~ , fu:rlI't Age- Total/Rural/
Males Females Males Females Males Females sroup Urban
7 8 9 10 11 12 2
'fIT OUNA
32,080 30,333 1,984 4,255 77 SO ij'mill'Tl! <I'm AJI ages URBAN
0--9 152 5'09 6 10-14
1,263 3,328 5 11 6 10 15-19
4,363 5,731 15 45 10 20-24
5,135 4,830 55 39 11 15 25-29
4,387 3,807 -97 56 30-34
3,678 3,306 99 154' 9 35-39
3,392 2,678 192 193 :Z5 4 40-44
2,701 2,175 223 319 15 45-49
2,375 1,576 295 663 SO-54
1,459 1,074 202 467 10 55-59
1,532 122 294 849 5 60-64
718 319 163 446 65-69
385 275 344 1,013 70+
~-TIKAMOARH
175,816 117,102 12,749 24,925 1,816 458 ~qT amt l{N
All ages TOTAL 0-9
3,343 8,824 ~O 20 10 10 10-14
16,032 25,841 114 40 1I0 35 15-19
22,502 27,038 238 89 14 96 20--24
22,530 23,066 381 172 12 55 25-29
21,076 20,103 566 351 iO 64 30-34
18,891 17,573 719 432 243 5 35-39
16,936 15,331 1,089 1,234 275 45 40--44
14,205 13,343 1,112 1,394 206 29 45-49
14,385 9,690 1,637 3,413 104 20 SO-54 7,831 7,254 1,198 2,357 44 34 55-59 8,144 4,861 2,048 6,053 59 3S 60-64 4,202 2,462 1,232 3,195 25 10 65-69
5,112 1.689 2,388 6,175 19 20 70+
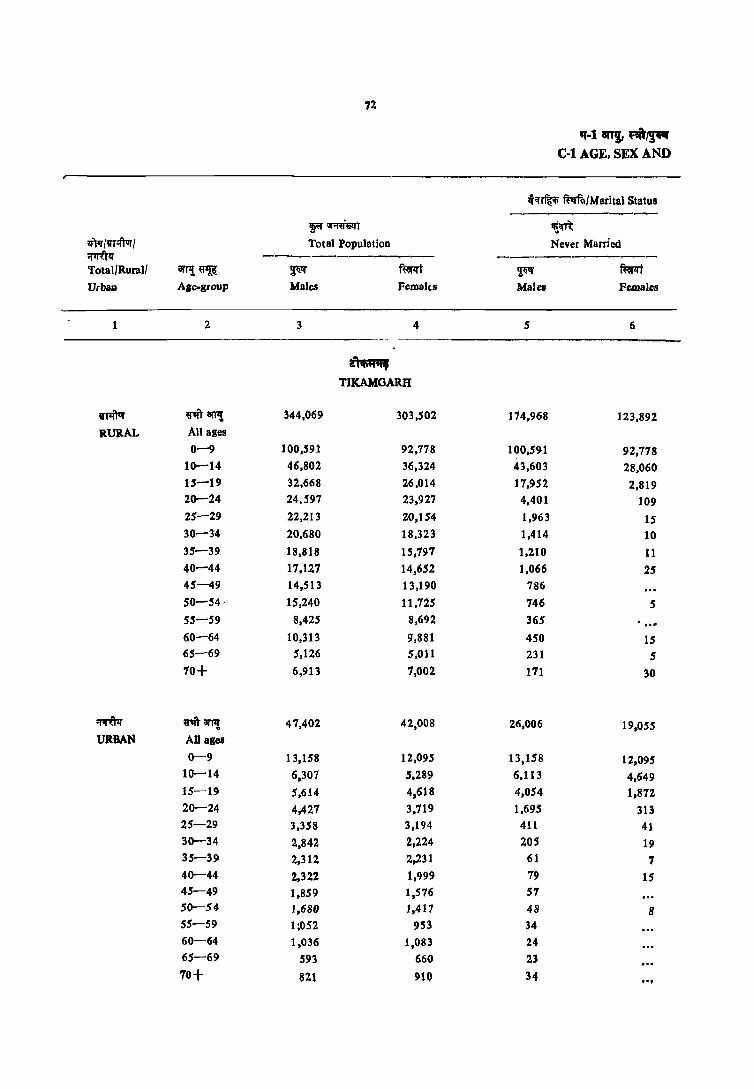
72
IF-I an!, ""IP' C-I AGE, SEX AND
h~ Wq'fa/Marital Status
~m&llT 'lim lfW /trr:frJr / Total Population Never Married ;:pn:flf ----------- -------------Total/Rural I arl'l!~ ~ ~t ~ ffir<t UrbaD A,e-glO11p Males Femalu Males Females
1 2 3 4 5 6
~'" T1KAMGARH
v~ ~arP! 344,069 303,502 174,968 123,892 R.URAL All ages
0-9 100,591 92,778 100,591 92,778 10-14 46,802 36,324 43,603 28,060 15-19 32,668 26,014 17,952 2,819 20-24 24,597 23,927 4,401 109 25-29 22,213 20,154 1,963 15 30-34 20,680 18,323 1.414 10 35-39 18,818 15,797 1,210 11 40-44 17,127 14,652 1,066 25 45-49 14,513 13,190 786 50-54, 15,240 11,725 746 5 55-59 8,425 8,692 365 ... 60-64 10,313 9,881 450 15 65-69 5,126 5,011 231 5 10+ 6,913 7,002 111 30
~ ~'ii't 3l'l'I! 47,402 42,008 26,006 19.055 URBAN All age.
0-9 13,158 12,095 13,158 12,095 10-14 6,307 5,289 6,113 4,649 15-19 5,614 4,618 4,054 1,812 20-24 4,427 3,719 1,695 313 25-29 3,358 3,194 411 41 30-34 2,842 2,224 205 19 35-39 2,312 2,231 61 7 40-44 2,322 1,999 79 15 45-49 1,859 1,576 57 50-54 1,680 1,411 48 8 55-59 1;052 953 34 60-64 1,036 1,083 24 65-69 593 660 23
70+ 821 910 34 ,.,

73
am:~~~~ MARITAL STATUS
~ ft-'if~/MaritILI Status ---------------------------------
m<{l1!,CIT fur<.n' !f'l'F!' ~CIT'!.'n~~~
Married Widowed Divorced or Separated 8W! lI1tr IVTIftur I ---------- -------- ------- ~ ~~ ~~ fufzrt 2;1i'1f fI.;~t ~ R:a-tI't Age- Total/Rural/
Males Females Males Females Males Females groUP Urban
7 8 9 1'1 11 12 2 1
m", TlKAMOARH
155,622 157,148 11,633 21,983 1,149 421 ~'iiT 8W! ",PiA All asCi RURAL 0-9
3,149 8,205 20 15 10 10 10-14
14,482 23,106 114 34 105 35 15-19
19,793 23,666 214 19 184 73 20-24
19,639 19,910 351 119 256 SO 25-29
18,479 17,962 542 287 245 64 30-34
16,585 15,390 686 392 232 5 35-39
14,809 13,487 978 1,095 l70 45 40-44
12,471 11,944 1,044 1,222 206 25 45-49 .
12,928 8,657 1,467 3,038 99 20 SO-54 6,935 6,598 1,076 2,065 44 29 S~-59
7,901 4,428 1,883 5,403 59 35 60-64
3,778 2,209 1,087 2,788 25 10 65-69
4,558 1,508 2,165 5.444 10 20 70+
20,194 19,954 1,116 2,942 67 37 ~'Iij- Bl'TI! "f1R:PJ All aiel URBAN 0-9
194 619 30 5 10-14
1,550 2,735 5 5 15-19
2,709 3,372 24 10 23 20-24
2,891 3,096 30 53 26 4 25-29
2,59'1 2,141 24 64 15 30-34
2,207 2,183 33 41 11 35-39
2,127 1 ,845 110 139 5 40-44
1,734 1,400 68 172 4 45-49
1,457 1,034 171 375 5 50-54
896 656 123 291 5 55-59
843 434 164 650 60-64
425 253 145 407 65-69
5~4 lSO 224 7~0 ." 70+
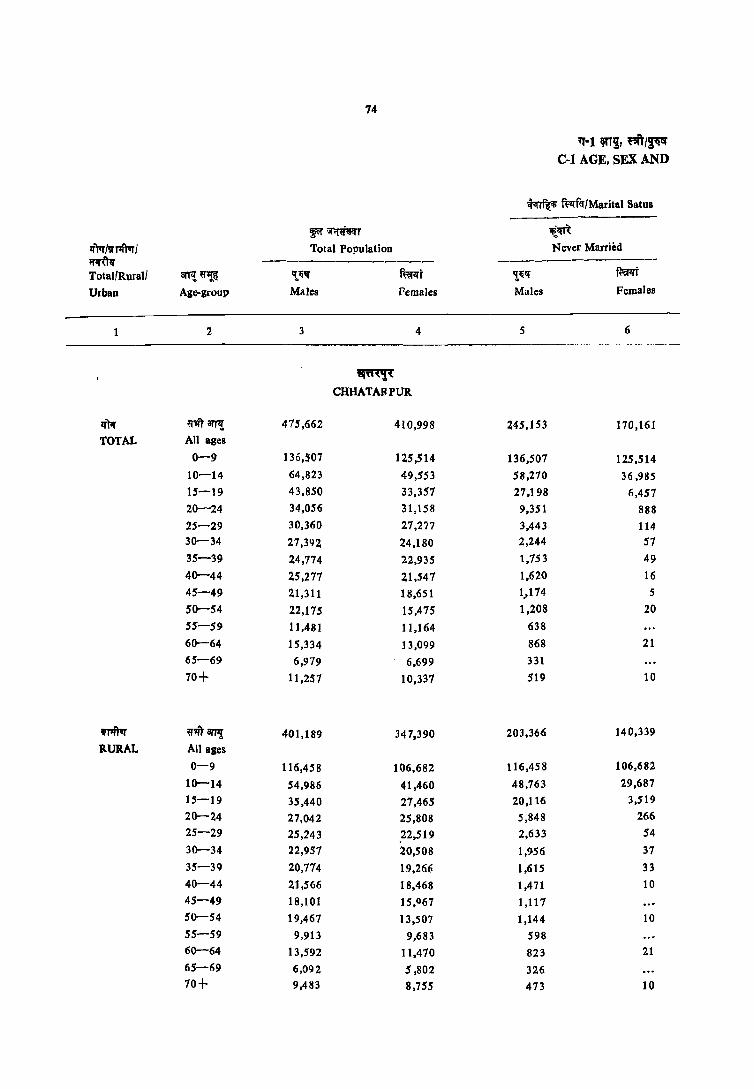
74
'H~~,"iJ~ C-l AGE, SEX AND
~ f~fi'f/Marital Satus ------------
~~liIfr 'tim 1f"\1f /'1 fl'iTor / Total Population N ever Married ~ -------------- -----------Total/RuralJ ~~~ 't,lilt fuRt 'ililt f~
Urban Age-group Males Females Males Females
1 2 3 4 5 6
~ CHHATABPUR
1f"\1f ~'4t GI'I7! 415,662 410,998 245,153 170,161 TOTAL All ages
0-9 136,507 125,514 136,507 125,514 10-14 64,823 49,553 58,270 36,985 15-19 43,850 33,351 21,198 6,457 20-24 34,056 31,158 9,351 888 25-29 30,360 21,217 3,.443 114 30-34 27,392 24,180 2,244 51
35-39 24,174 22,935 1,153 49
40-44 25,211 21,541 1,620 16
45-49 21,311 18,651 1.,114 5
50-54 22,115 15,415 1,208 20
55-59 11,481 11,164 638
60-64 15,334 13,099 868 21
65-69 6,979 6,699 331
70+ 11,251 10,337 519 10
~ ij"~ arTl! 401,189 347,390 203,366 140,339
RURAL All ages
0-9 116,458 106,682 116,458 106,682
10-14 54,986 41,460 48,163 29,681
15-19 35,440 21,465 20,116 3,519
20-24 27,042 25,808 5,848 266
25-29 25,243 .22,519 2,633 S4
30--34 22,951 20,508 1,956 31
35-39 20,174 19,266 1,615 33 40-44 21,566 18,468 1,471 10 45-49 18,101 15,Q61 1,117 50-54 19,467 13,507 1,144 10 55-59 9,913 9,683 598 60-64 13,592 11,410 823 21 65-69 6,092 5,802 326 10+ 9,483 8,755 473 10
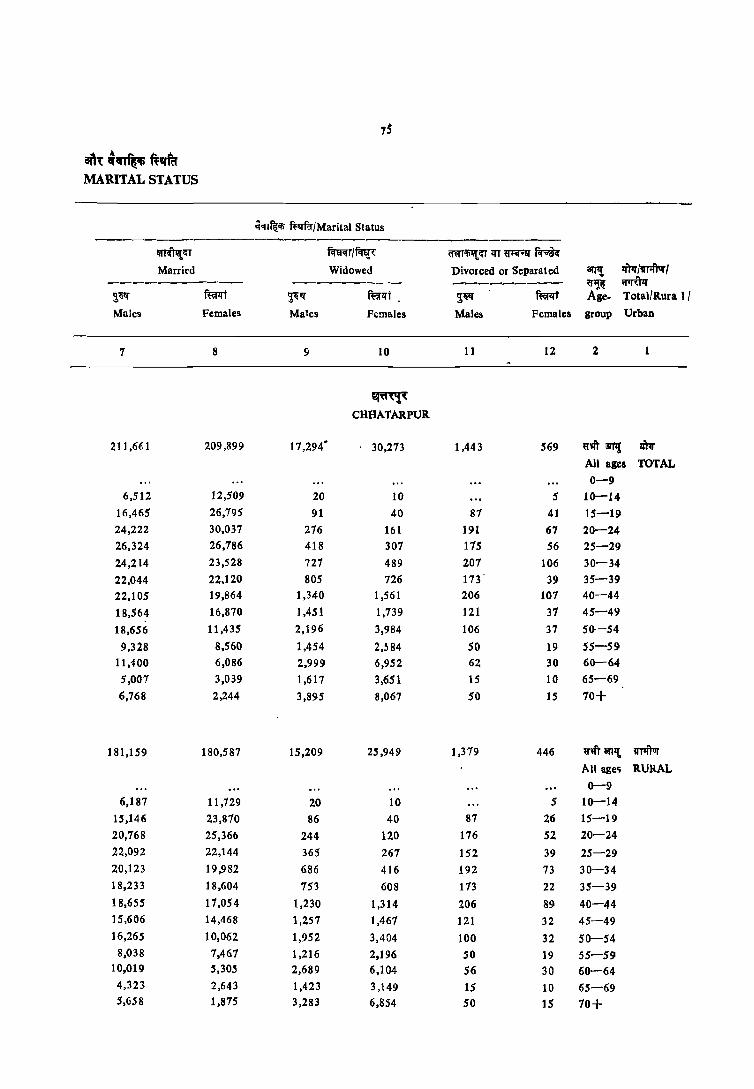
7$
aft;: cim~ ft:'fm MARITAL STATUS
~ifi ft;¥ffcr/Marital Status -----------------------------------
m:Pr.~ fcrl:rcrr /~<: ij"(;T'I'ill<rr <rr ~ ~i{ Married Widowed Divorced or Separated 01TI! lfPr /fTliA' I
---------- -------- ------- ~ ~ 2,l51!f mt ~!f ffirlft 9;l51!f ffir<rt Age. Total/Rura 1/
Males Females Males Females Males Females group Urban
7 8 9 10 11 12 2
~'(
CHHATARPUR
211,6f.l 209,899 17,294· 30,213 1,443 569 e:m 3I'P! ~ All ages TOTAL
0-9 6,512 12,509 20 10 5 10-14
16,465 26,195 91 40 81 41 15-19
24,222 30,037 216 161 191 61 20-24 26,324 26,186 418 301 115 56 25-29
24,214 23,528 721 489 201 106 30-34
22,044 22,120 80S 726 113 - 39 35-39
22,105 19,864 1,340 1,561 206 101 40-44
18,564 16,870 1,451 1,139 121 31 45-49
18,656 11,435 2,196 3,984 106 37 SO-54
9,328 8,560 1,454 2,!J84 SO 19 55-59
11,400 6,086 2,999 6,952 62 30 60-64
5,001 3,039 1,617 3,651 15 10 65-69
6,768 2,244 3,895 8,067 50 15 10+
181,159 180,587 15,209 25,949 1,319 446 e:'lT <IT1l(, I"pfivr
An age~ RURAL
0-9
6,187 11,129 20 10 5 10-14
15,146 23,810 86 40 81 26 15-19
20,768 25,366 244 120 176 52 20-24
22,092 22,144 365 261 152 39 25-29 20,123 19,982 686 416 192 73 30-34 18,233 18,604 753 608 113 22 35-39
18,655 11,054 1,230 1,314 206 89 40-44 15,606 14,468 1,257 1,461 121 32 45-49 16,265 10,062 1,952 3,404 100 32 50-54
8,038 1,467 1,216 2,196 50 19 55-59 10,019 5,305 2,689 6,104 56 30 60-64
4,323 2,643 1,423 3,149 15 10 65-69 5,658 1,815 3,283 6,854 50 15 10+

16
"'-1 an!, ni I~~ C-l AGE, SEX AND
ffi%'Ii ft .. qf~fMarital Status -----------
~;;r;t~~T ~ l'fPr I~T+ftor f Total Population Never Married ~ ----------- _------------TotalfRurall 6TI1!~ 'Iii" ft>iI1ff 'i1i" ~
Urban Age-group Males Females Males Females
1 2 3 4 5 6
~'t CHHATARPUR
;:prU1J ~'" 6l'J1! 74,47 3 63,608 41,787 29,822
URBAN All ages
0-9 20,048 18,832 20,048 18,832
10-14 9,837 8,093 9,501 7,298
15-19 8,410 5,892 7,082 2,938 20-24 7,014 5,350 3,503 622
25-29 5,117 4,159 810 60
30-34 4,435 3,673 288 21
35-39 4,000 3,668 138 16
40-44 3,111 3,019 149 5
45-49 3,210 2,685 57 5
SO-54 2,108 1,968 63 11
55-59 1,568 1,481 41
60-64 1,742 1,630 45
65-69 887 897 5
70+ 1,774 1,582 46
IRT PANN'A
l'fA' ~m arJ''! 282,242 257,136 141,989 106,518
TOTAL All ages
0-9 81,419 16,355 81,479 76,355
10-14 38,911 32,828 34,718 25,400
l.$-19 26,596 21,604 15,602 4,113
20-24 21,411 21,474 4,636 456
25-29 19,857 19,345 1,619 68
30-34 17,158 16,775 865 20 35-39 15,816 14,536 662 5 40-44 14,866 13,325 593 35
45-49 11,701 10,296 467 11 50-54 11,158 9,404 429 11
55-59 6,272 5,956 178 6C-64 7,547 7,029 236 12
65-69 3,535 3,259 133 5
70+ 5,776 5,511 2S7 11

17
aftt~_~
MARITAL STATUS
~ ~fu/Marital Status -------------------- ----~ flnT<rr /mr: om~~ lIT ~Ef R~
Married Widowed Divorced or Separated BlJ'I! If)1J' /'IJ n:i)1Ir /
----------- --------- -------- ~~ 'fII"'" ~ rnp:ri ~ mf':ri' ~ fuTlfi Age- l olal/ Rural/
Males FemaleS Males Females Males Females group Urban
7 8 9 10 11 12 2
~~
CHHATARPUR
30,502 29.312 2,085 4,323 65 123 ij''ii) arl''! ~lf
All ages URBAN 0-9
325 781 10-14
1,319 2,926 5 15 15-19
3,454 4,671 32 42 15 15 20-24
4,233 4,642 53 41 22 11 25-29
4,091 3,546 41 13 15 33 30-34
3,811 3,517 51 118 17 35-39
3,451 2,810 111 246 17 40-44
2,958 2,403 194 271 5 45-49
2,391 1,373 244 581 6 4 50-54
1,189 1,093 238 388 55-59
1,381 181 310 849 6 60-64
684 39S 194 502 65-69
1,111 369 613 1,213 10+
IFn PANNA
131,012 131,633 8,486 18,991 126 454 llm 0l'TIi If)lr
All ages TOTAL ~-9
4,152 1,318 25 15 5 5 10-14
10,899 17,315 5S 25 35 5 15-19
16,511 20,841 168 121 97 44 20-24
11,910 19,031 236 192 92 48 25-29
15,729 16,279 453 413 101 64 30-34
14,591 13,840 456 627 101 65 35-29
13,570. 12,035 609 1,196 9S S9 40-44
10,463 8,192 725 1,441 51 40 45-49
9,675 6,540 891 2,810 (;2 43 50-54
5,329 4,159 730 1,186 35 11 55-59
5,335 2,925 1,450 4,056 21 36 60-64
2,741 1,324 650 1,920 5 10 65-69
3,563 1,099 1,932 4,372 19 24 10+
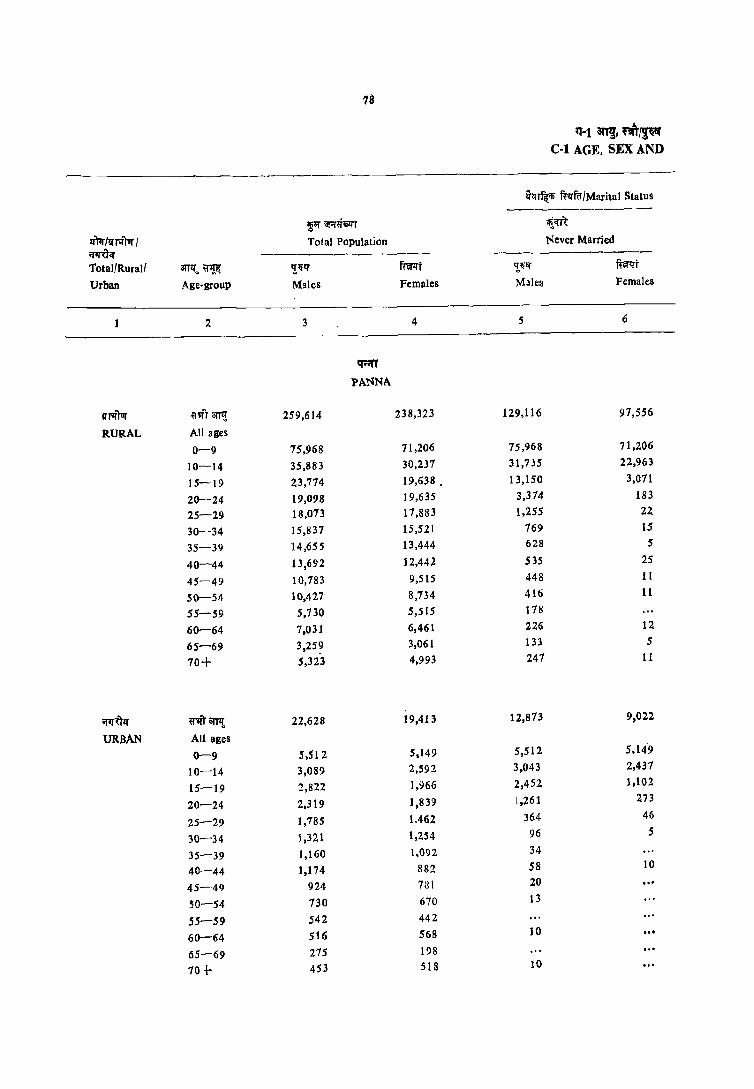
1a
q·t ani, ~/~ .. C-I AGE, SEX AND
-._------_. ~'i~ ft~fu'JMarital Status
----------------'101' '3r.iQi1l'f lflcrit
zrN/l1JlfIvr / Total Population 'Never Married ;r;rUlI' --------_----- -------------Total/Rural! aTTl(~ ~ ~~q f;er:rt ,!~l'f furq-t
Urban Age-group M3les Females r.llles Females
2 3 4 5 6
q;;n
PANNA
Ifl'lflvr ~'liT 3fI?! 259,614 238,323 129,116 97,556
RURAL All ages
0-9 75,968 71,206 75,968 71,206
10-14 35,883 30,2)7 31,7)5 22,963
15-19 23,774 19,638 _ 13,150 3,011
20-24 19,098 19,635 3,374 183
25-29 18,073 17,883 1,255 22
30-34 15,837 15,521 169 15
35-39 14,655 13,444 628 5
40-44 13,692 12,442 535 25
45-49 10,183 9,515 448 11
50-54 10,427 8,734 416 11
55-59 5,730 5,SlS 118
60-64 7,031 6,461 226 12
65-69 3,25? 3,061 133 5
10+ 5,323 4,993 241 11
;r!T\TI.f ~'i{t anI! 22,628 19,413 12,813 9,022
URBAN All ages
0-9 5,512 5,149 5,512 5,149
10-14 3,089 2,592 3,043 2,437
15-19 2,822 1,966 2,452 1,102
20-24 2,319 1,839 1,261 273
25--29 1,785 1.462 364 46
30-34 1,321 1,254 96 5
35-39 1,160 1.092 34
40-44 1,174 882 58 10
45-49 924 781 20
50-54 130 670 13
55-59 542 442
60-64 516 568 10
65-69 215 198
10 t- 453 518 10
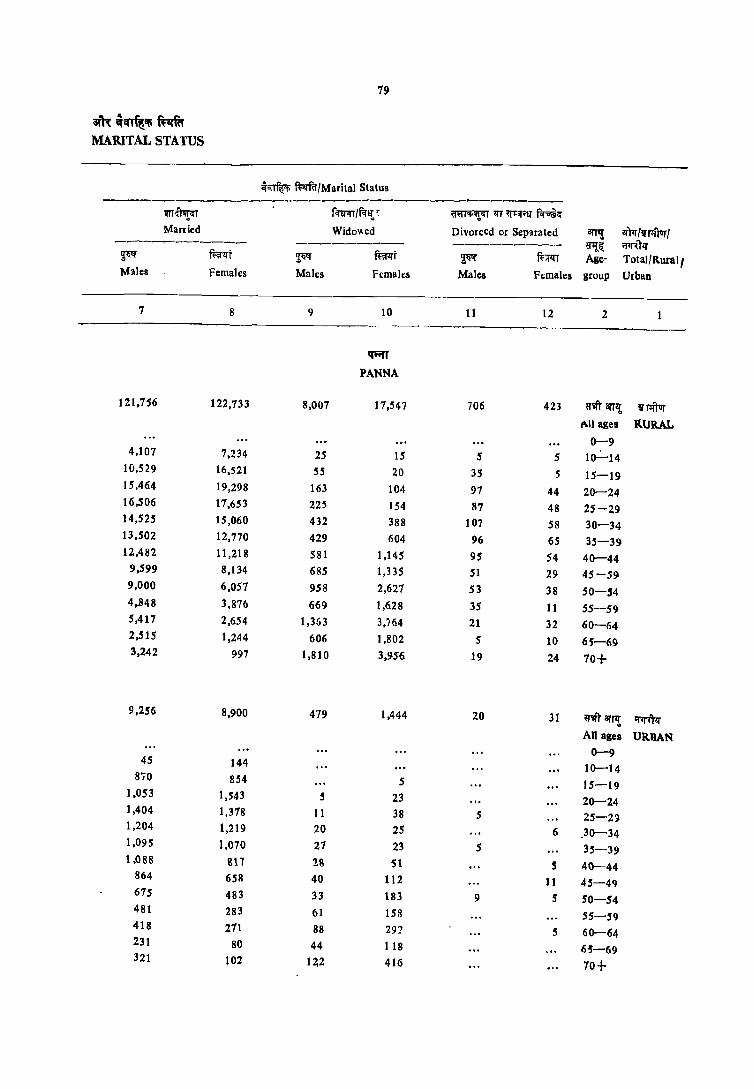
79
~~~~I!i~ MARITAL STATUS
;f~ f~iI'/Marital Stalus ------------------------------~-------
m~Gr f<nr<rr/f'ltt ~ ~1!!GT lIT ~l';f'!i ~G
Married Widoy,ed Divorced or Seplfaled anl! If)rr/~Fftvr/ ------------ ---------- --------- ij"l!.it ;rl]<.rq
~ ffi:rlTt ~ fu:r<rt ~ ff~ Age- Total/Rural/ Males Females Males Females Males Females group Urban
7 8 9 10 11 12 2
IFIT PANNA
121,7S6 122,733 8,007 17,547 706 423 ij'lft arrl! 1I' r.f\1Jr t\1l ages RURAL
0-9 4,107 7.234 25 15 S 5 10"':""'14
10,529 16.521 55 20 35 5 15-19 15,464 19,298 163 104 97 44 20-24 16,506 17.653 225 154 87 48 25-29 14,525 15,060 432 388 107 58 30-34 13,502 12,770 429 604 96 65 35-39 12,482 11 ,218 581 1,145 95 54 40-44
9,599 8,134 685 1,335 51 29 45-59 9,000 6,057 958 2,621 53 38 50-S4 4,.848 3,87b 669 1,628 35 11 55--59 5,411 2,654 1,363 3,/64 21 32 60-64 2,515 1,244 606 1,802 5 10 65-69 3,242 997 1,810 3,956 19 24 70+
9,256 8,900 479 1,444 20 31 ~'q'r an,! ~ All ages URBAN
0-9 45 144 10-14
SiO 854 5 15-19 1,053 1,543 5 23 20-24 1,404 1,378 II 38 5 25-2~ 1,204 1,219 20 25 6 .30-34 1,095 1,070 21 23 5 35-39 1,088 817 28 51 5 4()--44
864 658 40 112 11 45-49 675 483 33 183 9 5 SO-54 481 283 61 158 55-59 418 211 88 291 5 60-64 231 80 44 118 65-69 321 102 1Z2 416 70+

80
f(-l an~, rol~ C-I AGE, SEX AND
;t.r~ ft:'ffa-/Marital Status ____ ,..,J.... _______
T'" ~~T !lim ll'"m /n:ft1lr / Total Population Never Married ~ --------------- -------------Total/Rural/ 8W!~~ q'~~ .. ffir:rt ,!~I'f ffir:rt Urban Age-group Males Females Males Females
1 2 3 4 5 6
m1N
SAGAR
II"TrI ~<II'l1! 699,510 623,562 371,321 274,737
TOTAL All ages
0-9 198,569 185,463 198,569 185,463
10-14 95,122 78,572 93,428 69.664
15-19 10,181 58,617 54,168 15,734
20-24 63,907 57,578 20,137 2,998 25-29 50,538 42,134 4,677 419 30-34 39,864 35,818 1,819 105 35-39 35,440 32,511 1,039 66 40-44 33,054 29,528 1,031 50 45-49 28,O! 1 24,408 614 56 50-54 25,316 21,847 ~8S 40 55-59 15,933 15,21 S 341 10 60-64 18,150 17,159 346 30 65-69 9,369 9,169 111 10
70+ 15,293 15,424 312 66
!ITIftur """I' OTTl!, 502,553 451.974 264,729 191,598 RURAL AU agcs
0-9 149,920 138634 149,920 138,634 10-14 68,013 54,978 66,573 47,076 15-19 47,964 39,960 33,297 5,372 20-24 42,032 40,776 8,,245 364
25-29 35,277 30,134 2,022 39 30-34 28,088 26,089 1,161 19 35-39 24,965 23,112 812 9 40-44 23,258 21,633 790 10 45-49 20,005 17,497 497
SO-54 18,179 16,257 449 10
55-59 11,798 11,442 261 5 60-64 13,791 13,043 282 5
65-69 1,325 6,931 133
70+ 11,853 11,463 231 SO

81
am'~fmcr MARITAL STATUS
~~ ~fu/Marital Status
~ f,f!:TCrr'~ Cl<'TTili~GT lIT t[l'itiQ' f~
Married Widowed Divorced or Separated an., II'N/'lRl1lf / ----------- -------- -------- ~ ~
~ f~lft ~~ ffiI1rt ~If mt Age Total/Rural/
Males Females Males Females Males Fem:lles group Urban
7 8 9 10 11 12 2
:m'R SAGAR
298,520 300,786 20,889 46,283 2,119 1,565 61rl arJ'!i zftIr All asoa TOTAD
0-9
1,620 8,820 30 10 10 10-14
16,403 42,541 124 135 62 144 15-19
42,995 53,955 370 324 389 292 . 20-24
44,516 40,906 803 545 537 245 25-29
36,574 34,533 1,037 994 433 242 30-34
32,978 30,995 1,129 1,308 294 142 35-39
29,830 26,486 1,869 2,848 -319 139 40-44
25,370 ' 20,911 1,826 3,332 242 110 45-49
22,308 15,866 2,316 5,838 157 92 50-54
13,574 10,842 1,897 4,327 120 31 55-59
14,724 7,653 3,015 9,4(:8 65 63 60-64
7,080 3,834 2,060 5,294 59 30 65-69
10,508 3,413 4,413 11,916 44 25 70+
219,070 225,521 16,212 33,480 2,441 1,211 61r1arrlt vPilar All ales RURAL 0-9
1,376 7,837 20 10 10 10-14
14,486 34,320 105 110 62 128 15-19
33,125 39,961 288 20S 365 241 20-24
32,159 29,495 626 396 465 190 25--29
25,666 25,228 850 638 411 204 30-34
22,992 22,123 915 885 245 94 35-39
20,796 19,565 1,377 1,945 295 113 40-44
17,873 15,111 1,421 2,291 214 82 45-49
15,805 11,873 1,780 4,299 135 76 SO-54
9,957 8,339 1,471 3,072 109 25 $5-59
11,103 5,945 2,347 7,036 59 52 60-64 5,541 3,033 1,597 3,868 54 30 65-69 8,162 2,671 3,416 8,712 ~4 2~ 10+
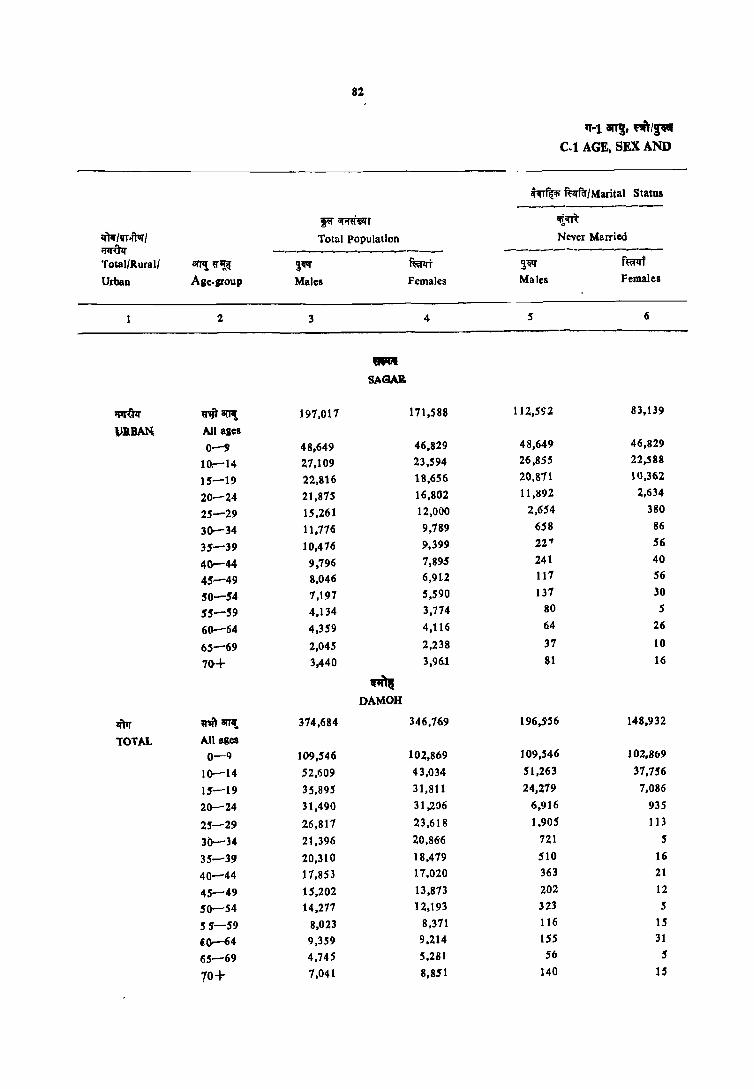
82
"-1 arJ!, ~/I'" C-l AGE, SEX AND
~ fumy/Marital Status ---------~~r "i~
I{N/vr.ft1ll'/ Total population Never Married ~ -------------- ------------'f oUlIl R ura II 8I'J1{ ~~ ~~ fi:;;rq-t ~;w f~f
Urban Age-group Males Females Males Females
2 3 4 5 6
WR
SAGAR.
~ ~tjt I(Pt 197,017 171,588 112,5S2 83,139
\SaBAN. All ages 0-9 48,649 46,829 48,649 46,829
10:-14 27,109 23,594 26,855 22,588
15-19 22,816 18,656 20,871 10,362
20-24 21,875 16,802 11,892 2,634
25-29 15,261 12,000 2,654 380
30--34 11,776 9,789 658 86
35-39 10,476 9,399 22" 56
40-44 9,796 7,895 241 40
45-49 8,046 6,912 117 56
50-54 7,197 5,590 131 30
51-59 4,134 3,774 80 5
6(1-64 4,359 4,116 64 26
65-69 2,045 2,238 37 10
70+ 3,440 3,96.1 81 16
~ DAMOH
~ ~arr~ 374,684 346,169 196,j56 148,932
tOTAL All ages O-Q 109,546 102,869 109,546 102,8b9
10-14 52,609 43,034 51,263 31,156
15-19 35,895 31,811 24,279 7,086
20-24 31,490 31,206 6,916 935
25-29 26,817 23,618 1,905 113
30-34 21,396 20,866 721 5
35-39 20,310 18,419 510 16
40-44 17,853 11,020 363 21
45-49 15,202 13,873 202 12
SO-54 14,277 12,193 323 5
55-59 8,023 8,311 116 B
'0--64 9,359 9,214 155 31
65-69 4,745 5,281 56 5
70+ 7,041 8,851 140 15
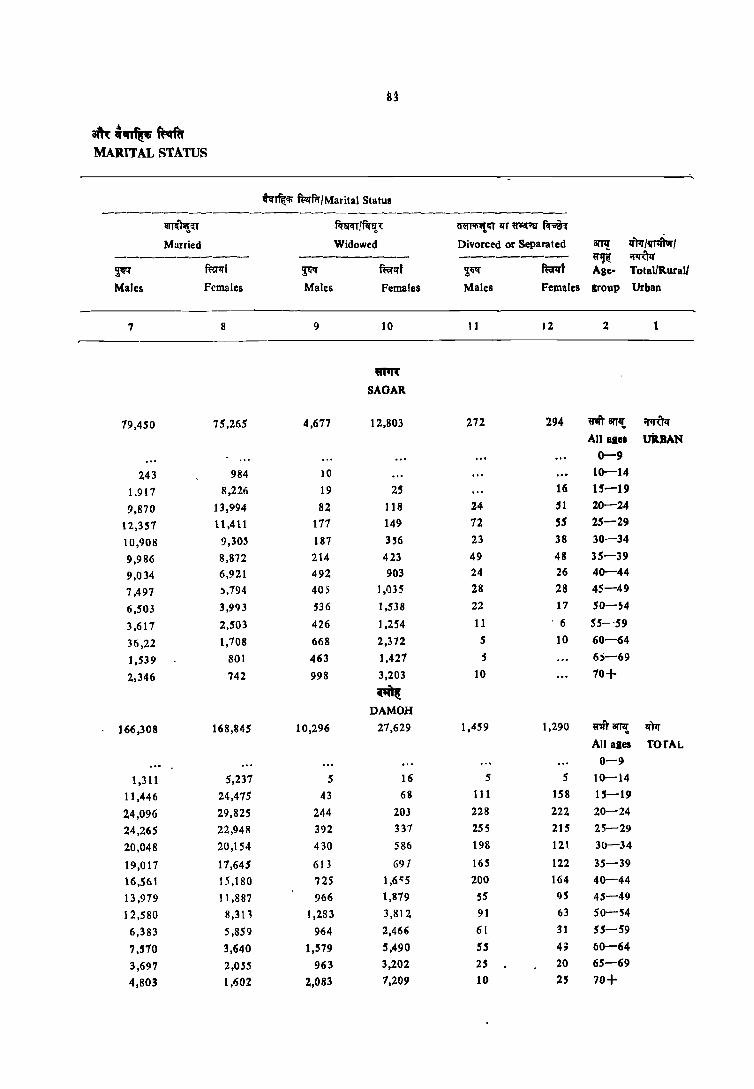
8~
am:~~~ MARITAL STATUS
;tq~q; ~fii'Marital Status ------------------~--------------
~pt~ f.nm lfiff!'t ~,"II'T~~
Mllrried Widowed Divorced or Separated iITTl! lTTlr/., ----------~-- --------- ------ ~ ~ ~ f'w:ri ~ ffirll'f ~~ furll'f Age- Total/Rural/
Males Females Males Females Males Females group Urban
7 8 9 10 II 12 2
~
SAGAR
19,450 75,265 4,671 12,803 272 294 ~arrl{. ~lf
All alcI uRBAN 0-9
243 984 10 10-14
1.917 8,226 19 25 16 15-19
9,870 13,994 8Z 118 24 '1 20-24
12,357 11,411 171 149 72 55 25-29
10,908 9,305 181 356 23 38 30-34
9,986 8,872 214 423 49 48 35-39
9,034 6,921 492 903 24 26 40-44
7,491 :l,194 405 1,035 28 28 45-49
6,503 3,9C) 3 536 I,S38 22 17 50-~4
3,617 2,503 426 1.254 11 ' 6 SS-S9
36,22 1,708 668 2,312 5 10 60-64
1,539 801 463 ] ,421 :s 6:;-69
2,346 742 998 3,203 10 70+
~ DAMOH
166,308 168,845 10,296 27,629 1.459 1,290 Wlfr arTl! 11')11'
All ales TOTAL
0-9
1,311 5,237 5 16 5 5 10-14
11 ,446 24,475 43 68 111 158 15-19
24,096 29,825 244 203 228 222 20-24
24,265 22,948 392 331 255 215 25-29
20,048 20,154 430 586 198 121 30-34
19,011 17,645 613 691 165 122 35-39
16,561 15,180 72S 1,6<;5 200 164 40-44
13,979 11,887 966 1,819 55 95 4S-49
12,580 8,311 1,283 3,812 91 63 SO-54
6,383 5,859 964 2,466 61 31 55-59
7,570 3,640 1,579 5,490 S5 4; 60-64
3,697 2,055 963 3,202 25 20 65-69
4,803 1,1502 2,083 7,209 10 25 70+

84
""l ~I~/~ C-l AGE, SEX AND
~ H"I'Rr/Marital Status --------------
!OI' ~lff '(m ~/!I'1lftvr1 Total Population Never Married ~ -----------_ ---~-------
Total/Rural/ 0lTlr .. ~ ,!~'f mm ,!'q'f fter:rt Urban Age-group Males Females Males Females
2 3 4 5 6
"'" DAMOH
VFI~ Wift 81" 319,168 297,660 164,844 125,119 RURAL All ages
0-9 95,444 89,614 95,444 89,614 10-14 44,946 36,328 43,662 31,351 15-19 29,669 26,512 18,105 3,862 20-24 25,808 26,336 3,821 165 25-29 22,528 20,167 1,014 35 30-34 18,197 18,111 532 5 35-39 11,330 15,683 425 10 40-44 IS,209 14,728 310 15 45-49 12,844 11,914 112 6 50-54 12,378 10,584 275 5 55-59 6,868 1,271 106 15 60-64 8,266 7,892 140 31 65-69 4.051 4.616 51 5 70+ 6,130 7,703 13S 10
~ fi"vIT am{ 54,916 49,109 31,112 23,753 URBAN All ages
0-9 14,102 13,255 14,102 13,255 10-14 7,663 6,706 7,601 6,398 15-19 6,226 5,238 5,575 3,225 20-24 5,682 4,870 3,095 771 25-29 4,289 3,451 890 77 30-34 3,200 2,749 189
35-39 2,980 2,796 85 6 40-44 2,644 2,292 52 6 45-49 2,358 1,899 30 6 SO-54 1,899 1,609 48 55-59 1,IB 1,100 10 60-64 1,093 1,322 15 65-69 695 665 5
70+ 911 1,148 S S
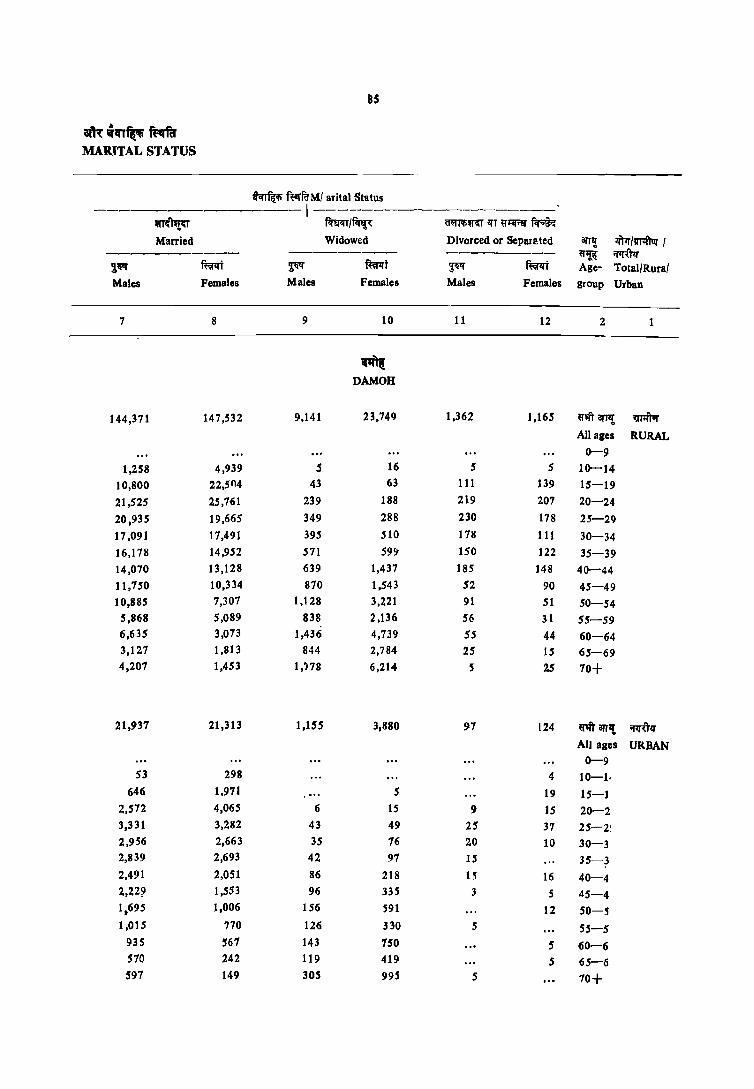
8$
am: qllT~ fttmr MARITAL STATUS
~if;' f~fuMI arital Status --------------1 ------------------
wr~'P!~ f.f~/~ MrJ'iriW~ liT ~l'i[ilf ~
Married Widowed Divorced or Separp.ted arr,! ziFrlliRtvr I --------- -------- --------- ~ 'J1f<."PT ,,1Pf ffiill't ~ m-t ~ ffim Age- Total/Rural Males Females Males Females Males Females group Urban
7 8 9 10 11 12 2 1
~ DAMOH
144,371 147,532 9,141 23,749 1,362 1,165 ~1iT al'l'l! ~ All ages RURAL
0-9
1,258 4,939 S 16 5 5 10-14
10,800 22,504 43 63 111 139 15-19
21,525 25,761 239 188 219 207 20-24
20,935 19,665 349 288 230 178 25-29
17,091 17,491 395 510 178 111 30-34 16,178 14,952 571 59!1 150 122 35-39 14,070 13,128 639 1,437 185 148 40~44
11,750 10,334 870 1,543 52 90 45-49 10,885 7,301 1,128 3,221 91 51 50-54 5,868 5,089 838 2,136 56 31 55-59 6,635 3,013 1,436 4,739 55 44 60-64 3,121 1,813 844 2,784 25 15 65-69 4,207 1,453 1, ')78 6,214 5 25 10+
21,937 21,313 1,155 3,880 97 124 ~ 0ITl{ ~ All ages URBAN 0-9
53 298 4 10-1. 646 1,971 5 19 IS-I
2,572 4,065 6 15 9 IS 20-2 3,331 3,282 43 49 25 37 25-2~
2,956 2,663 35 76 20 10 30-3 2,839 2,693 42 97 IS 35-3 2,491 2,051 86 218 15 16 40-4 2,229 1,553 96 335 3 5 45-4 1,695 1,006 156 S91 12 50-5 1,015 770 126 330 5 5S-5
935 567 143 750 5 60-6 570 242 119 419 5 65-6 597 149 305 995 5 10+

84
'I-I an!, ~!~ Col AGE, SEX AND
<lcr~ mrnr/Marital Status _---------J\'I ~il.rT 'lim
~ /1X1lftvr / Total Population Never Married O!~ ------------ -------------Total/RuH.)! 3iJll ~ ~ ffiflff ~ ~
Urban Age-group Males Females Males Females
2 3 4 5 6
""'" ~ATNA
!I'm mTIarP! 595,753 557,634 283,760 223,530
TOTAL All ages
0-9 166,941 159,145 166,941 15<l,145
10-)·1 83,118 72.816 69,832 52,106 15-}9 59,687 51,083 29,178 10,264 20-24 44,765 46,309 8,889 l,os3 25-,29 40,42 7 39,236 2,808 145
30-34 34,808 35,594 1110 60
35-3~ 34,045 32,206 930 25 40-44 31,130 2~,383 849 15
45-49 26,681 2',710 676 00
50-5·1 22,749 19,349 611 IS
55--59 13 ,513 12,704 297 05
60-64 16,044 15 805 376 05
65-69 8,402 7,827 188 OS 70+ 13,229 12,215 318 20
Qpftllf ~"tarT'!:, 494,982 4 71,668 232,091 184,561
RURAL All ages
0-9 140,66(1 134,575 140,660 134,575
10-14 69,552 61,886 57,184 42,778
15-19 49,264 43,005 22,280 6,635
20-24 35,810 38,504 5,224 394 25-29 32,505 32,415 1,892 52 30-34 27,808 29,923 956 34
35-39 27,848 27,118 814 14
40-44 25,463 24,89~ 75S 10
4$-49 22,340 20,432 616
SO-54 19,279 16,613 555 15
55-59 11,607 12,138 271 5
60-64 13,757 13,727 346 5
65-69 7,367 ~6,858 168
70+ 11,549 10,620 298 '5

87
am:~~~ MARITAL STATUS
<i<fTf{oli WITff/M:Uital Stutus -------------------------------------
"'Ta'P!~ fcr!Tc!T If<rl!\ ~<fl' lfT ~~fl fcr;;~<:"
Married WidJw,d Divorced or Separated arJ1! lfPr/llT.irJT --------- --------- --------- trl!"q: <flT(tq
~ f~t ~ mt ~ mrlfi Age- T \)tall Rurall
Males Females Males Females Males remales gll)UP Urban
7 8 9 10 II 12 2
~
SA.TNA
290,889 292,821 19,670 40,260 1,339 973 ~;JfPl;, 1Il1F
All ages TOTAL 0-9
13,172 20,029 95 61 10 10 10-14 29,530 . 40,531 272 201 91 61 15-19 35,250 44,770 416 336 201 140 20-24 36,734 38,542 653 454 232 90 25-29 32,569 34,470 830 926 230 132 30-34 31,821 30,4)2 1,108 1,597 180 91 35-19 28,775 26,550 1,425 2,670 81 149 40-44 24,392 20,537 1,517 3,156 95 77 45-49 20,003 13,845 2,Cl90 5,391 45 98 50-54 11,370 9,202 1,816 3,467 20 30 55-59 12,579 1,565 2,990 8,174 84 61 60-1i4 6,338 3,449 1,847 4,36~ 25 5 65-69 8,244 2,781 4,611 9,438 41 30 70+
244,100 251,760 17,493 34,487 1.238 825 WlftarTl{ vr·ftur All ages. RU~ 0-9
12,264 18,826 84 61 10 10 10-14 26,637 36,127 257 173 79 55 1S-19 30,049 37,706 377 283 164 III 20-24 29,787 31,918 612 311 214 73 25-29 25,906 28,981 726 792 215 116 30-34 25,858 25,731 1,006 1,341 17J 91 35-39 23,402 22,529 1,231 2,24.5 76 110 40-44 20,301 17,783 1,33-2 2,590 90 60 45-49 16,825 11 ,966 1,855 4,545 45 87 50-54 9,683 8,050 1,628 3,058 20 25 55-59
10,691 6,615 2,626 7,052 84 55 60-64 5,504 3,040 1,670 3,B 13 25 S 65-69 7,107 2,446 4,089 8,144 41 25 70+

88
'I-I 811,. ""IP C-l AGE, SEX AND
~ ~/Marjtal Satus
f"I' ;;r;rn'ilfT '(ifR 1J)1r /IlJ1ftvr / Tolal Population Never M"rried ~ -------------Total/Rural/ arJl! ij'~ "~lf ~j ,!~lf mj
Urban Age-group. Males Females Males Females
2 3 4 5 6
WCAT SATNA
ifIrt)l.r marr~ 100,711 85,966 51,669 38,969
UltBAN A.ll ages
0-'-9 26,281 24,570 26,281 24,570
10--14 13,566 11,130 12,648 9,928 15-19 10,423 8,018 7,498 3,629
20-24 8,946 1,805 3,665 659
25-29 7,922 6,821 916 93
30-34 1,000 5,611 214 26
35-39 6,191 5,028 117 11
40-44 5,661 4,489 94 5
45-49 4,341 3,338 59
50-54 3,410 2,735 56
55-59 . 1,906 1,561 25
60-64 2,281 2,078 30
65-69 1,035 910 20 5
10+ 1,680 1,6" 20 IS
~ REWA
~ ~'Ift' orr,! 613,226 594,357 299,009 236,215
'TO't'A.L A.ll ages
0-9 119,590 112,383 119,590 172,383 10-14 89,931 78,142 14,061 54,431
15-19 62,604 52,010 29,098 8,212 20-24 44,681 ' 48,815 8,641 895
25-29 38,112 41,095 2,134 88
30-34 32,429 37.680 1,064 28
H-39 31,834 35,569 819 II
40-44 31,300 32,496 759 25
45-49 25,936 24,581 583 20
SO-54 23,854 21,387 527 15 55-59 13,142 13,412 387 5 60-64 16,747 16,491 535 15 6S-69 8,450 1,360 26'1 5 10+ 13,751 12,120 41? ,
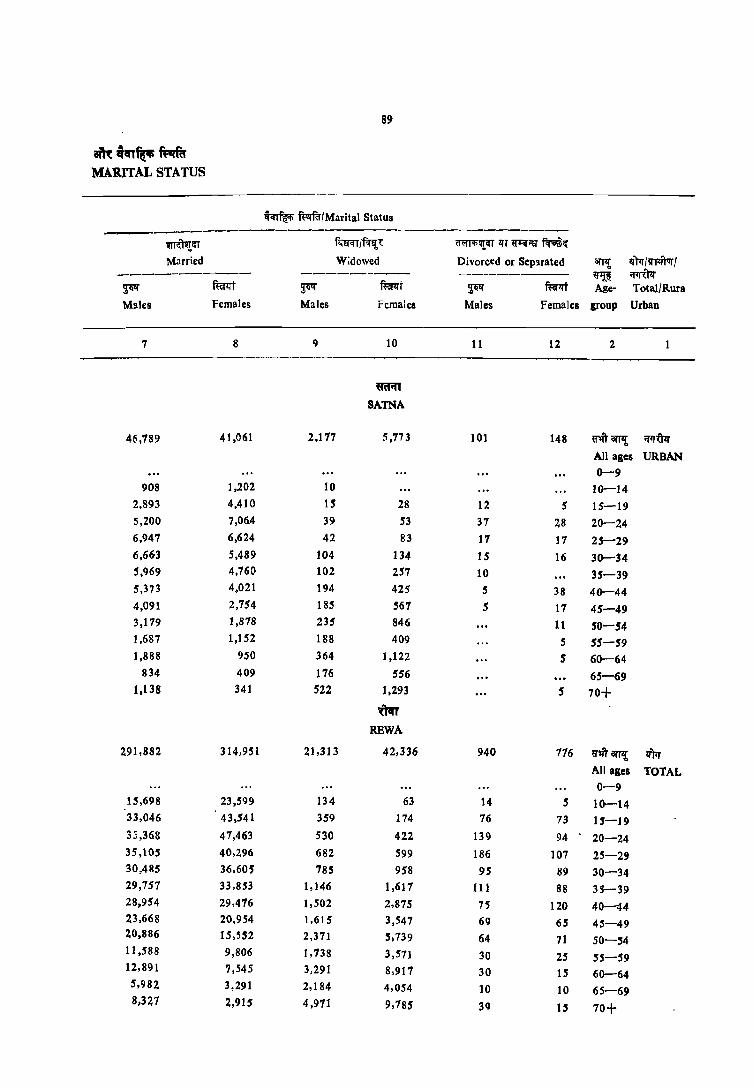
89
amf..,.~~ MARITAL STATUS
~ wmrlMarital Status
~crr f<;lfCIT /f.T!!'l: ~!!!crr liT ~i'l:J ~~
Married W;dowed Divorced or Sepuated OW! lJ)lr /ITFfrrr { ----------- ----------- ---------- ~ ~ ~ mt ~ ~t ~ m:rlft Age- Total/Rura
Males Females Males Females Males Females group Urban
7 8 9 10 11 12 2
!fRAT
SATNA
46,789 41,061 2,177 5,773 101 148 ~OW! 'f1J"61r
All ages UR.BAN 0-9
908 1,202 10 10-14 2,893 4,410 15 28 12 5 15-19 5,200 7,06.4 39 53 37 28 20-24 6,947 6,624 42 83 17 17 25-29 6,663 5,489 104 134 15 16 30-34 5,969 4,760 102 257 10 35-39 5,3'13 4.021 194 425 5 38 40-44 4,091 2,754 185 567 5 17 45-49 3,179 1,878 235 846 11 SO-54 1,687 1,152 188 409 5 55-59 1,888 950 364 1,122 5 60-64
834 409 176 556 65-69 1,138 341 522 1,293 5 70+
'(\1n
REWA
291,882 314,951 21,313 42,3'36 940 776 ~mlll'l7! lim All ages TOTAL 0-9
15,698 23,599 134 63 14 5 10-14 33,046 43,541 359 174 76 73 15-19 33,368 47,463 530 422 139 94 20-24 35,105 40,296 682 599 186 107 25-29 30,485 36,605 785 958 95 89 30-34 29,757 33,853 1,146 1,617 III 88 lS-39 28,954 29,476 1,502 2,875 75 120 40-44 23,668 20,954 1,615 3,547 69 65 45-49 20,886 15,552 2,371 5,739 64 71 SO-54 11,588 9,806 1,738 3,571 30 25 55-59 12,891 7,545 3,291 8,917 30 15 60-64 5,982 3,291 2,184 4,054 10 10 65-69 8.327 2,915 4,971 9,785 39 15 70+

90
'1-1 errg, ~/~ C-l AGE, SEX AND
ffi~ ~IMarital Status ----~ ",<Ri~::rT ~
If''''~! 10lal Population Ney~r Married ~ -.------------- -------------TotallRural1 arTlt ~~ ~ ~r ~ f~
Urban Age-group Males Females Males Felllales
2 3 4 5 f
tm REWA
VJlftIIf ~aJT1! 527,198 522,726 254,803 204,842
RURAL All ages
0-9 158,871 H2,790 158,871 152,790
10-14 77,889 68,554 62,997 46,314
15-19 51,165 45,192 21,237 .5,336 20-24 36.045 42,298 5,340 229 25-29 31,924 36,109 1,448 21 30-34 26,917 32,853 881 13 35-39 26,815 31,123 709 11 40-44 26,511 28,411 669 15
45-49 22,116 21,492 510 20
SO-54 20,661 19,009 485 15
55-59 12,216 11,964 377
60-64 15,012 14,683 510 15
6'-69 7,651 6,728 252
70+ 12,447 11,389 404 5
rrrftlf ~,ft 8fT,! 86,028 71,631 44,206 31,373
URBAN All ggeS
0-9 20,719 19,593 20,119 19,593
10-14 12,042 9.587 11,064 8,116
15-19 10,839 6,818 7,861 2,876
20-24 8,637 6,571 3,301 666
H-21 6,188 4,986 686 61
30-34 .'i,511 4,827 183 14
3-.5-39 4,:)59 4,446 110
40-44 4,730 4,085 90 10
45-49 3,820 3,095 73
SO-54 3,193 2,318 43
55-59 1,526 1,44R 10 S
60-64 1,136 1,908 2~
65-69 800 631 16 .5
70+ 1,309 1,331 1, , ..

91
am ~.n~ '"fa' MARITAL STATUS
~ fP-lfa-/Marilal Slatus ----------_.--------------------_------
m~ill~ fcreqT/fq~~ ~~ 1fT ij+iI";:!:7 ~<::
Married Widowed Divorced or Separated CIfI1! Ifm /lITl'i\vr / ----------~- ----~----- --------- ~ ~ ~~ mi ~If ffirlfi 'I~ mt Age- Total/Rural/
Males Females Males Females Males Females grOUP Urban
7 8 9 10 11 12 2
'{m REWA
251,939 279,S!t6 19,602 37,296 795 673 ~ 0I'Tl! qr.iTur All ages RURAL 0-9
14,739 22.,139 124 51 So 5 10-14
30,112 39,610 341 163 66 73 IS-19
30,076 41,651 499 363 129 55 20-2.4
29,704 35,4S~ 633 511 134 87 25-29
25,229 31.932 733 827 7,~ 80 30-34
25,032 29,579 1,034 1,450 1(;0 83 35-39
24,475 25,820 1,361 2,472 5S 104 40-44
20,017 18,400 1,525 3,016 64 56 45-49
18,028 13,894 ,,079 5,024 64 71 SO-54
10,284 8,819 1,525 3,115 30 25 55-59
11 ,388 6,786 3,094 7,867 20 15 60-64
5,351 3,019 2,032 3,700 10 10 65-69
7,386 2,658 4,618 8,717 39 9 70+
39,943 35,105 1,711 5,040 145 103 ~~r aw.r. ~TII'
All ages URBAN 0-9
959 1,461 10 5 .4 10-14
2,934 3,931 19 11 11 15-19
5,291 5,813 30 60 9 39 20-24
5,402 4,811 4) 89 52 19 25'--29
5,256 4,672 52 131 21 9 34-34
4,726 4,274 111 168 12 5 35-39
4,418 3,657 141 402 20 16 45-44
3,651 2,554 91 532 5 10 45-49
2,359 1,658 2'>2 715 50-54
1,304 987 213 456 55-59
1,503 759 198 1,049 10 60-~4
631 272 153 354 65-69
941 256 353 1,068 6 10+

91
'l-I i1'T!i, ~~~ C-I AGE, SEX AND
~ ft~f6'/Marital Status ------------
~ \iA~liiI1T 'lim lfm I~Tlftvt I Total Population Never Married ~ ------------ -------~-------
Total/Rural1 0Tfl! ~~ 'I'll{ f~~t '!,liq' mt Urban Age-group Males Females Males Females
----------2 3 4 5 6
~ SHAHDOL
lI't<r ~mamt 690,395 654,730 309,739 259,516
TOTAL All ages
0-9 188,912 186,911 188,912 186,911
10-14 89,030 81,'161 75,250 59,219
15-19 62,101 55,992 30,741 11,595
20-24 51,498 54,733 9,085 1,250
2~-29 53,224 49,283 2,HS 192
30-34 44.918 44,654 989 59
35-39 45,789 40,085 608 35
40-44 38,121 35,617 526 25
45-49 34,623 29,126 282 31
50-54 28,399 22,438 ".13 19
55-59 15,862 14,455 44 17
60-64 16,131 16,087 168 10
65-69 8,175 9,054 66
70+ 12,599 14,237 101 10
t.111ft'ur ritarTlf, 561,416 544,093 246,031 209,361
RURAL All ages
0-9 155,689 153,889 155,689 153,889
10-14 12,321 61,844 59,599 41,139
15-19 49,961 46,054 21,595 1,549
20-24 40,078 44,590 5,049 479
25-29 42,213 39,903 1,520 48
30-34 35,605 36,390 715 42
35-39 36,160 32,999 48(\ 30 40-44 30,255 30,384 447 20 45-49 28,363 25,204 235 26 50-54 24,070 19,625 164 15 55-59 13,800 12,709 135 11
'60-64 14,221 13,893 154 10 65-69 7,195 7,778 66
70+ 11,213 12,610 86
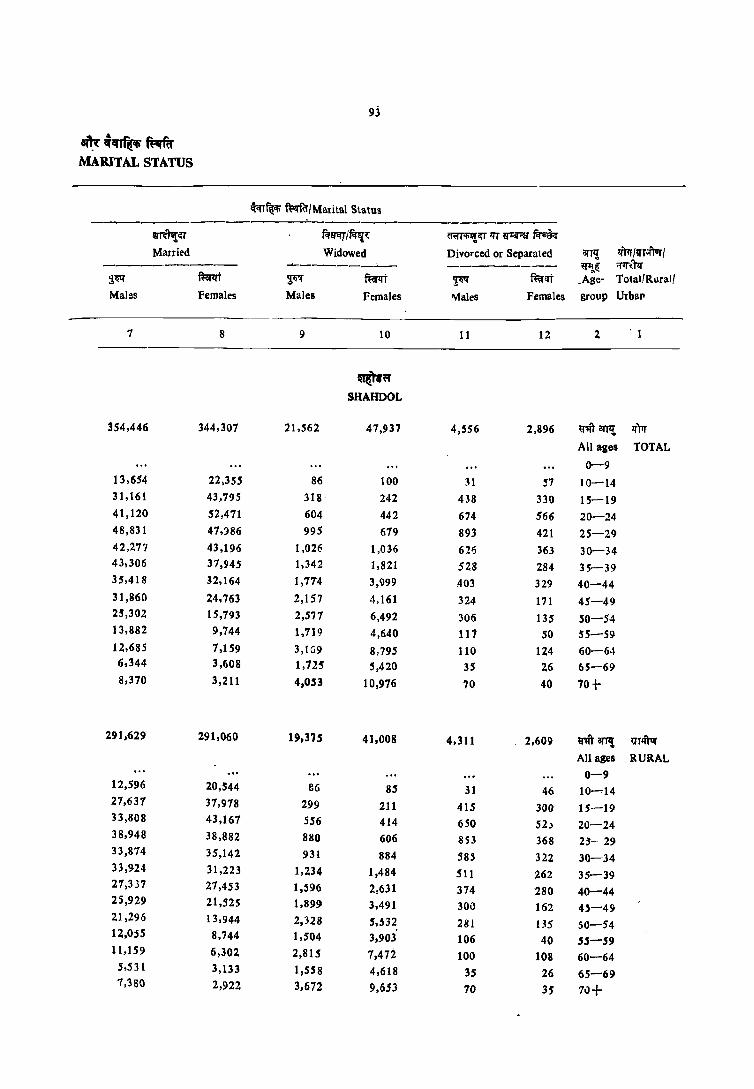
93
~~.~ MARITAL STATUS
ffi~ ~{I/Marital Status ------------------=-------------------
wrmrlU frt!f1fJ I~'t cr.rr~iIT liT U"Hf"ll ~
Married Widowed Divorced or Separated orTl! If)rr 't'r.;ft1lr / ---------- ----____ ...1--_ --------- «~i!: i11r.JlI'
:JQlf fuil"lI'T ~ fuil"lTT ~ fuiI"!fT . Age- Total/Rllral/
Males Females Males Females avlales Females group UrbaJl
7 8 9 10 11 12 2 ' 1
$\If SHAHDOL
354,446 344,307 21,562 47,937 4,556 2,896 ij',ft arr'!, ll"l1r All ages TOTAL
0--9 13,654 22,355 86 100 31 ~7 10-14 31,161 43,795 318' 242 438 330 15-19 41,120 52,471 604 442 674 566 20-24 48,831 41,:)86 995 619 89.3 421 25-29 42,27'1 43,196 1,026 1,036 62/j 363 30-34 43,306 37,945 1,342 1,821 528 284 35-39 35,418 32,164 1,7'1'4 3,999 .103 329 40-44 31,860 24,763 2,157 4,161 324 171 45-49 25,302 15,793 2,571 6,492 306 135 SO-54 13,882 9,744 1,719 4,640 117 50 55-59 12,685 1,159 3,IG9 8,795 110 124 60-64 6,344 3,608 1,725 5,420 3S 26 65-69 8,370 3,211 4,053 10,976 70 40 70+
291,629 291,060 19.375 41.008 4,311 2,609 rit orTI{ VT;ft1Ir
All ages RURAL
0-9 12,596 20,544 86 85 31 46 10-.14 27,631 31,918 299 211 415 300 is-19 33,808 43,161 556 414 650 52" 20-24 38,948 38,882 880 606 853 368 23-29 33,814 35,142 931 884 585 322 30-34 33,914 31,223 1,234 1,484 511 262 35-39 27,337 27,453 1,596 2,631 314 280 40-44 25,929 21,525 1,899 3,491 301) 162 0-49 21,296 13,944 2,328 5,532 281 05 SO-54 12,0)5 8,744 1,504 3,903 106 40 55-59 11,159 6,302 2,815 1,472 100 108 60-64
5.531 3,133 1,558 4,618 35 26 65-69 7,3S0 2,922 3,672 9,653 70 3$ 1u+
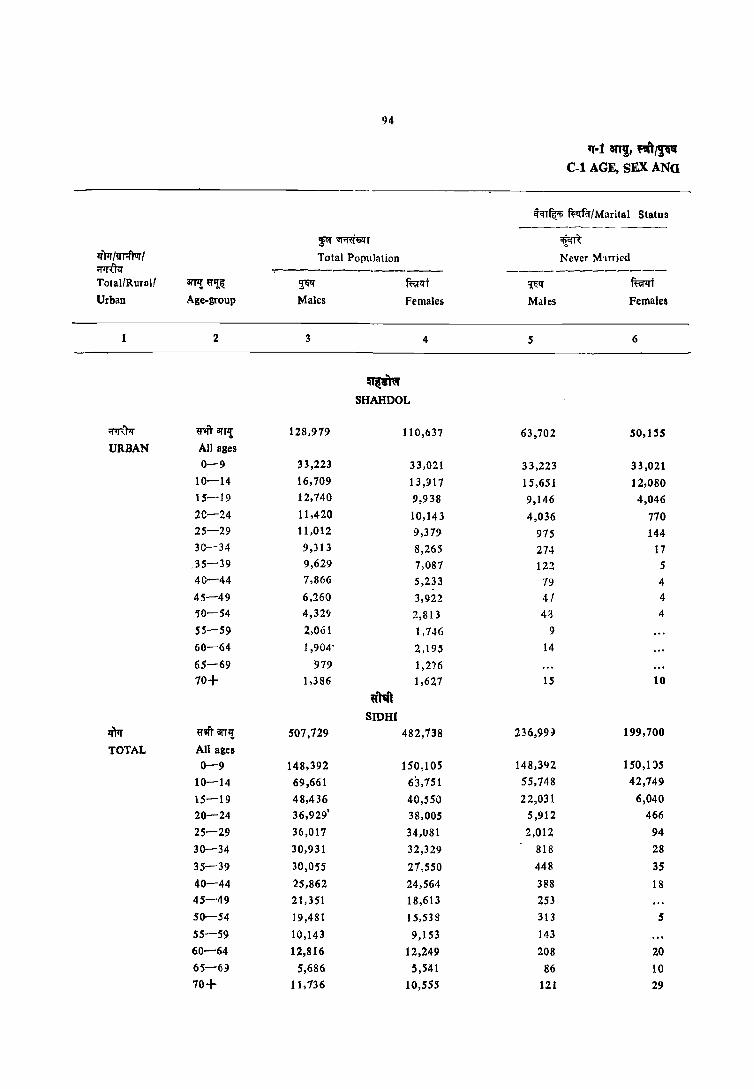
94
'1'-1 811!J1 ~~ C-l AGE. SEX ANa
;f"T~ R=l1ffcr/Marital Status
~ ;;r;m'I;lH ~Tt lI"mlllR'\1Jrl Total Population Never Muried ;m:'hf ~-------------- -------------TOlaIlRurall an'I! iQ'IJ:il: ~ fuill"t ~!f mf Urban Age-group Males Females Males Females
2 3 4 5 6
~ SHAHDOL
il'mTlI" rn an,! 128,979 110,a37 63,702 50,155
URBAN All ages 0-9 33,223 33,021 33,223 33,021
10-14 16,709 13,917 15,651 12,080 15--19 12,740 9,938 9,146 4,046 2C-24 11,420 10,143 4,036 770 25-29 11,012 9,379 975 144 3C-34 9,313 8,265 274 17
.35-39 9,629 7,087 122 5 40-44 7,866 5,233 79 4 45-49 6,260 3,922 41 4
50-54 4,32Cj 2,813 43 4
55-59 2,061 1 ,7~G 9
60-64 1,904- 2,195 14
65-69 979 1,n6
70+ 1,386 1,627 15 10
~",1
SIDHI
m iQ'm arrl! 507,729 482,738 236,99~ 199,700
TOTAL All ages 0-9 148,392 150,105 148,3112 150,1)5
10-14 69,661 6'3,151 55,148 42,149
15-19 48,436 40,550 22,031 6,040
20-24 36,929' 38,005 5,912 466
25-29 36,017 34,(J81 2,012 94
30-34 30,931 32,329 818 28
35-39 30,055 21,550 448 35
40-44 25,862 24,564 388 18 45-49 21,351 18,613 253
SO-54 19,481 15,538 313 5
55-59 10,143 9,153 143
60-64 12,816 12,249 208 20 65-6~ 5,686 5,541 86 10
10+ 11,136 10,555 121 29
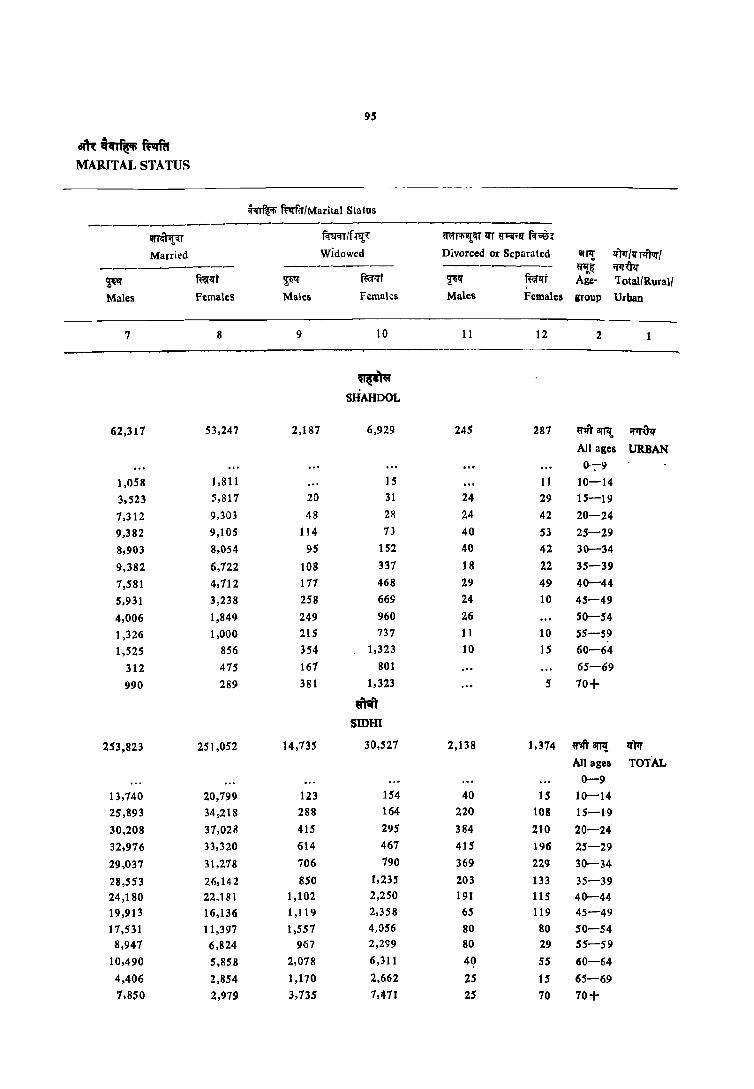
95
~~~~ MARITAL STATUS
ffi~ ~(f/Marital Status ----------------------------------
~~ f.ruqr If.ff!~ m'fr~~ liT ij"1'if;:a f.r~.t
Married Widowed Divorced or Separated aU1{ If)1r /tl r4tar/ ----------- -------- --------- ~~ ij'1J<.'Pi
~ fuillft ~q' fi:(r'lT ~q' f~l[t Age- 1otal/Rural/
Males Females Males females Males Females grOUP Urban
7 8 9 10 11 12 2
~ SHAHDOL
62,317 53,247 2,187 6,929 245 287 mamt ;:m,'h;r
All ages URBAN 0--;--9
1,058 1,811 15 11 10-14
3,523 5,817 20 31 24 29 15-19
7,312 9,303 48 28 24 42 20-24
9,382 9,105 114 7) 40 53 25-29
8,903 8,054 95 152 40 42 30-34
9,382 6,722 108 337 18 22 35-39
7,581 4,712 171 468 29 49 40-44
5,931 3,238 258 669 24 10 45-49
4,006 1,849 249 960 26 SO-54
1,326 1,000 215 737 11 10 55-59
1,525 856 354 1,323 10 15 60-64
312 475 161 801 65-69
990 289 381 1,323 5 10+
~1
SIDHI
253,823 251,052 14,135 30,521 2,138 1,314 marTl! 1i)1r
All ages TOTAL 0-9
13,740 20,799 123 154 40 15 10-14
25,893 34,218 288 164 220 108 15-19
30,208 37,028 415 295 384 210 20-24
32,976 33,320 614 467 415 196 25-29
29,037 31,278 706 790 369 229 30-34
28,553 26,142 850 1,:Z3S 203 133 35-39
24,180 22.181 1,102 2,250 191 115 40-44
19,913 16,136 1,119 2,358 65 119 45-49
17,531 11,397 1,557 4,056 80 80 SO-54
8,947 6,824 967 2,299 80 29 55-59
10,490 5,858 2,078 6,311 49 55 60-64
4,406 2,854 1,170 2,662 25 15 65-69
7,850 2,979 3,735 1,411 25 10 70+
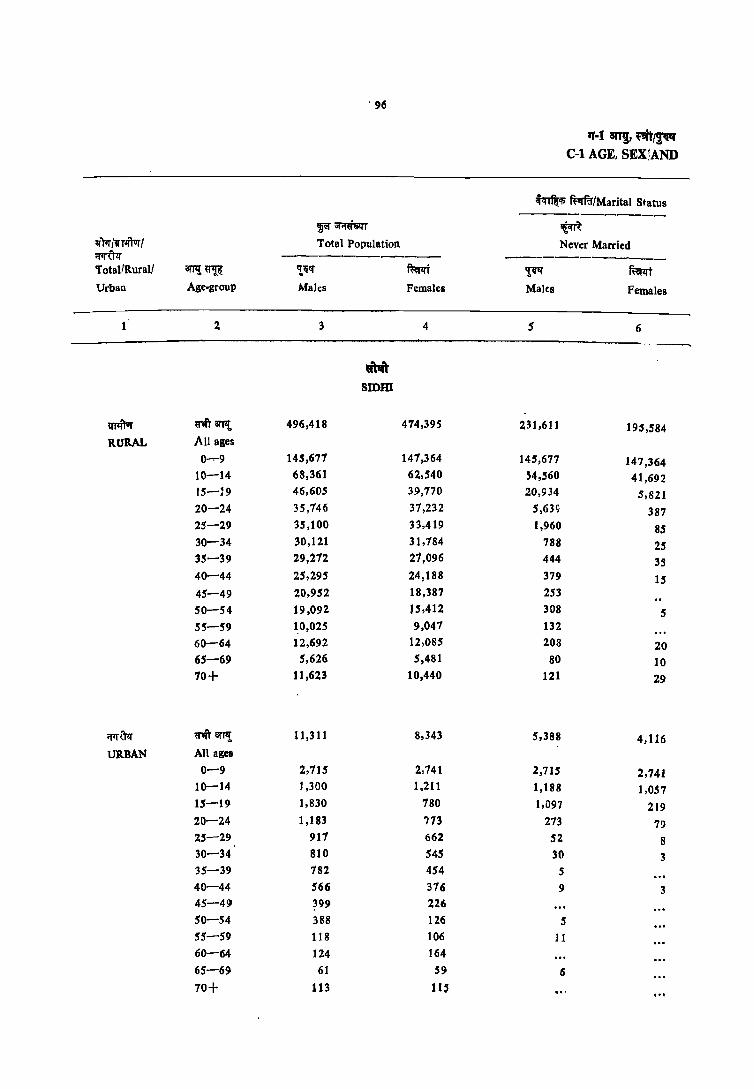
, 96
IT·1 81'I'!l, m/~ C-l AGE, SEX!AND
~ R='ffu/Marital Status ----------
~~T IIlm lim /wpfrJr I Total Population Never Married i!1R"tlr ------------ ------------,. otal/Rurall i!IT1! ~ 'illi1' mt ,!lli1' ffirlft Urban Age-group Mal(s Females Males Females
1 2 3 4 5 6
~ slDm
wr4\1rr rit8lTl{. 496,418 474,395 231,611 195,584 RURAL All ages
0-.9 145,677 147,364 145,677 147,364 10-14 68,361 62,540 S4,560 41,692 15-:9 46,605 39,710 20,934 5,821 20-24 35,146 31,232 5,6H 381 25-29 35,100 33,419 1,960 85 30-34 30,121 31,184 788 25 35-39 29,272 21,096 444 35 40-44 25,295 24,188 319 15 45-49 20,952 18,387 253
SO-54 19,092 J 5 ,412 308 5 55-59 ~0,025 9,041 132
60-64 12,692 12,085 208 20 65-69 5,626 5,481 80 10 70+ 11,623 10,440 121 29
i!1RW ro 3ff!! 11,311 8,343 5,388 4,116 URBAN All ages
0-9 2,715 2,741 2,715 2,741 10-14 1,300 1,211 1,188 1,OS7 15-19 1,830 780 1,097 219 20-24 1,183 773 273 79 25-29 917 662 52 8 30-34 810 545 30 3 35-39 182 454 S 40-44 566 376 9 3 45-49 399 226 SO-54 388 126 5 55-59 118 106 11 60-64 124 164
65-69 61 59 6
70+ 113 11' .. ' ,.,

97
lilt .;~ ftvrftr MARITAL STATUS
~~ ~/Marital Status -------------------~rrr f.rrn/~ ~UllT~~
Married Widowed Divorced or Separated EII'fI! ~/~I ---------- --------- -------- ~ i!1I<Pf ~ mt ~ mt ~I!{ mt Age- Total/Rural/
Males Females Males Females Males Females group Urban
7 8 9 10 11 12 2 1
"illli SIDW
248,037 247,240 14,607 30,127 . 2,134 1,359 ntiilTl! lfI1ftvr . All ages Rt1ItAL
0-9 13,627 20,654 123 144 40 15 10-14 25,164 33.660 288 164 220 105 15-19 29,308 36,337 405 295 384 208 20-24 32 ,125 32,674 605 462 411 193 25-29 28,269 30,748 695 771 369 229 30-34 27,780 25,'102 845 1,224 203 130 35-39 23,628 21,844 1,098 2,213 191 115 40-44 19,524 15,981 1,110 2,292 65 114 45-49 17,168 11,310 1,537 4,017 80 80 50-54 8,840 6,754 961 2,264 80 29 55-59
10,381 5,785 2,063 6,220 40 55 60-64 4,361 2,827 1,161 2,629 25 15 65-69 7,111 2,925 3,101 7,411 25 10 70+
5,786 3,812 128 400 15 ~marJ'll' .. ~ All ages URBAN
0-9 113 144 10 10-14 729 5S8 3 15-19 900 691 11 ... 3 20-24 8S1 646 9 5 5 3 25-29 768 530 12 13 30-34 773 440 5 11 3 35-39 553 337 5 37 40-44 390 ISS 9 66 4 45-49 364 87 20 39 SO-54 107 70 36 55-59 109 73 14 91 60-64. 45 26 9 33 65-(i9 79 ~5 34 60 ,,, 10+

98
IT-I an!, ,,"/~ C-I AGE, SEX AND
cFrTft-i; ~ft./Marital StatuI ----------p....rn~ ~
If''tlf /V'J1ftur I Total Population Never Married ~ ------------- -------------Total/Rurall anlJ:~~ ~ mr ~ mt Urban Age-ll'ouP Males FemalUl Males Females
1 2 3 4 5 6
FcRlR MI\NDSAUR
liN ~'Ift arl'li 651,011 612,388 315,780 248,832
TOTAL All alea 0-9 180,711 176,214 180,717 176,214
10-14 81,694 75,058 71,820 54,713 15-19 62,161 56,459 39,417 15,189
20-24 51,859 55,256 15,261 1,990 25-29 41,195 45,251 3,485 282 30-34 40,150 31,988 1,238 92 35-39 36,390 34,581 806 26 40-44 34,241 30,194 682 63
45-49 21,167 24,589 590 31 5Q-S4 25,055 20,877 472 11 55-59 14,129 14,106 363 11 60-64 17,895 16,851 391 10 65-69 10,025 9,468 165 10+ 15,528 15,3'4 237 41
~ ~'" 8ITI! 517,482 489,991 243,129 191,762 RURAL All aBes
0-9 146,981 142,905 146,981 142,905
10-14 64,548 59,107 . 55,191 40,261
15-19 46,914 42,851 26,523 1,188
20-24 43,841 43,262 8,484 511
25-29 37,496 36,124 2,064 102
30-34 31,849 31,146 828 55
35-39 29,509 21,916 611 16
40-44 27,612 24,391 533 36
45-49 21,440 19,623 485 IS
SO-54 20,264 11,084 388 55-59 11,225 11,583 301 5 60-64 14,889 13,863 317 5
65-69 8,157 1,746 140
10+ 12,608 12,320 188 20
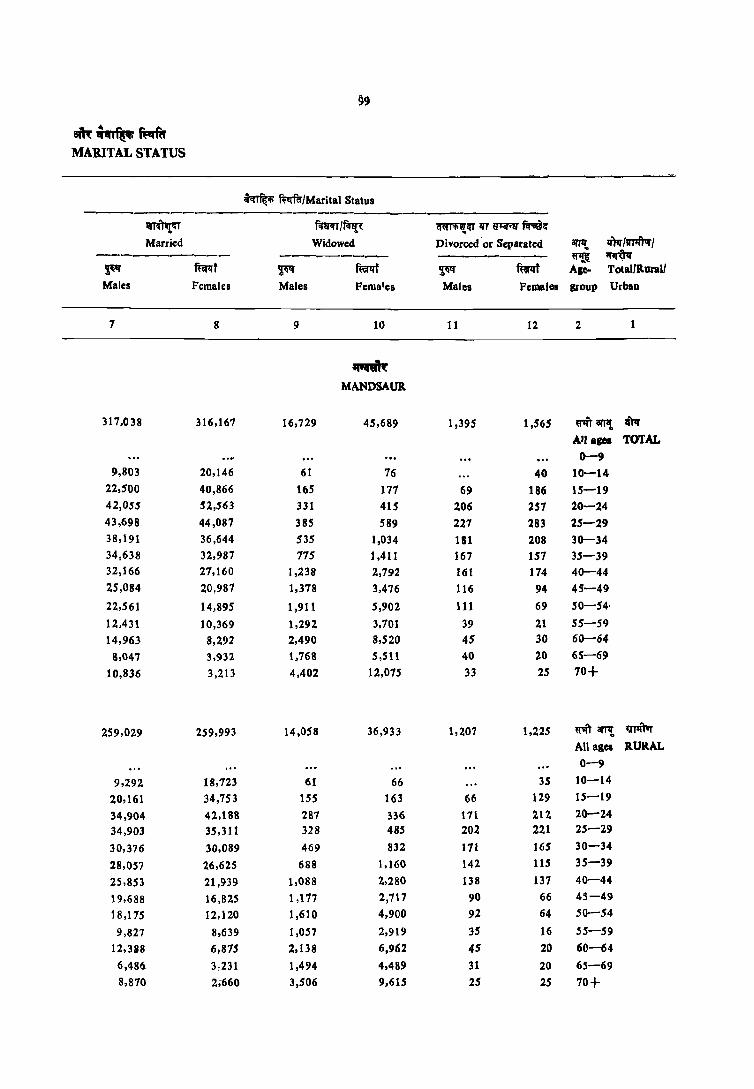
99
am.r~~ MARITAL STATUS
~if1 ~/Marital Status ---------------------------
~<rr mm/mr\ ~<rr lIT ~ fif;8if Married Widowed Divorced 'or Separated 8fTIt IfN/IFftrJr/
----------- ---_---- ~ ~ ~ mt ~ ~f ~ mt Age- Total/Rural/ Males Females Males Females Males Females &roup Urban
7 8 9 10 11 12 2
~ MANDSAUR
317,038 316,167 16,729 45,689 1,395 1,565 ritarl1! ~ All ages TOTAL 0-9
9,803 20,146 61 76 40 10-14 22,500 40,866 165 177 69 186 15-19 42,055 52,563 331 415 206 257 20-24 43,698 44,087 385 589 227 283 25-29 38,191 36,644 535 1,034 181 208 30-34 34,638 32,987 175 1,411 167 151 35-39 32,166 21,160 1,238 2,792 161 174 40-44 25,084 20,987 1,378 3,476 116 94 45-49
22,561 14,895 1,911 5,902 111 69 SO-54'
12,431 10,369 1,292 3,701 39 21 55-59
14,963 8,292 2,490 8,520 45 30 60-64
8,047 3,932 1,768 5,511 40 20 65-69
10,836 3,213 4,402 12,075 33 25 70+
259,029 259,993 14.058 36,933 1,207 1,225 trIf) lIn?{ ~
All ages RURAL 0-9
9,292 18,723 61 66 35 10-14
20,161 34,753 ISS 163 66 129 15-19
34.904 42,188 287 336 171 212 20-24 34,903 35.311 328 485 202 221 25-29
30,376 30,089 469 832 111 165 30-34
28,057 26,625 688 1,160 142 115 35-39
25,853 21,939 1,088 2,280 138 137 40-44
19,688 16,825 1,117 2,717 90 66 45-49
18,175 12,120 1,610 4,900 92 64 50-54
9,827 8.639 1,057 2,919 35 16 55-59
12.3118 6,875 2,138 6,962 45 20 60-64
6,486 3,231 1,494 4,489 31 20 65-69
8,810 2,660 3,506 9,61S 25 25 70+

100
11'-1 8fT!, m/~ C-l AGE, SEX AND
~ ~ff/Marital Status -----------
~~ ~ tim /v11ftvr / Total Population Never Married ;prUlI' -------------- ------------TotalfRural/ arr,!~ ~ mY ~l mt Urban Age-group Males Females Males Females
2 3 4 5 6
~ MANDSAUR.
~ ~awt 133,529 122,397 72,651 51,070
URBAN All ages
0-9 33,736 33,309 33,736 33,309 10-14 17,146 15,951 16,630 14.512 15-19 15,247 13,602 12,894 7,402 20-24 14,012 11,994 6,783 1,473 25-29 10,299 9,133 1,422 180 3C-34 8,301 6,842 410 37 35-39 6,881 6,665 188 11
40-44 6,635 5,803 149 32 45-49 5,727 4,965 105 16
SO-54 4,791 3,793 85 11
55-59 2,904 2,523 61 5
60-64 3,006 2,994 74 5 65-69 1,868 1,723 25
70+ 2,920 3,034 50 21
~
R.ATLAM
liN w4't an?! 401,883 380,846 206,024 164,518
TOTAL All ages
0-9 108,115 101,803 108,115 107,803 10-14 52.548 48,110 48,262 3 !),49 0 15-19 40,405 36,365 29,712 13,936 20-24 35,248 33,018 13,196 2,484 25-29 28,414 28,091 3,416 488 3(l-34 25,078 23,554 972 105 35-39 23,448 22.969 563 52 40-44 22,298 19,221 514 49 45-49 18,366 15,209 346 30 SO-54 15,545 12.535 335 20 55-59 7,683 7,515 106 5 60-64 10,301 10,519 159 20 65-69 5,269 5,846 143 5 70+ 9,093 9,978 160 10
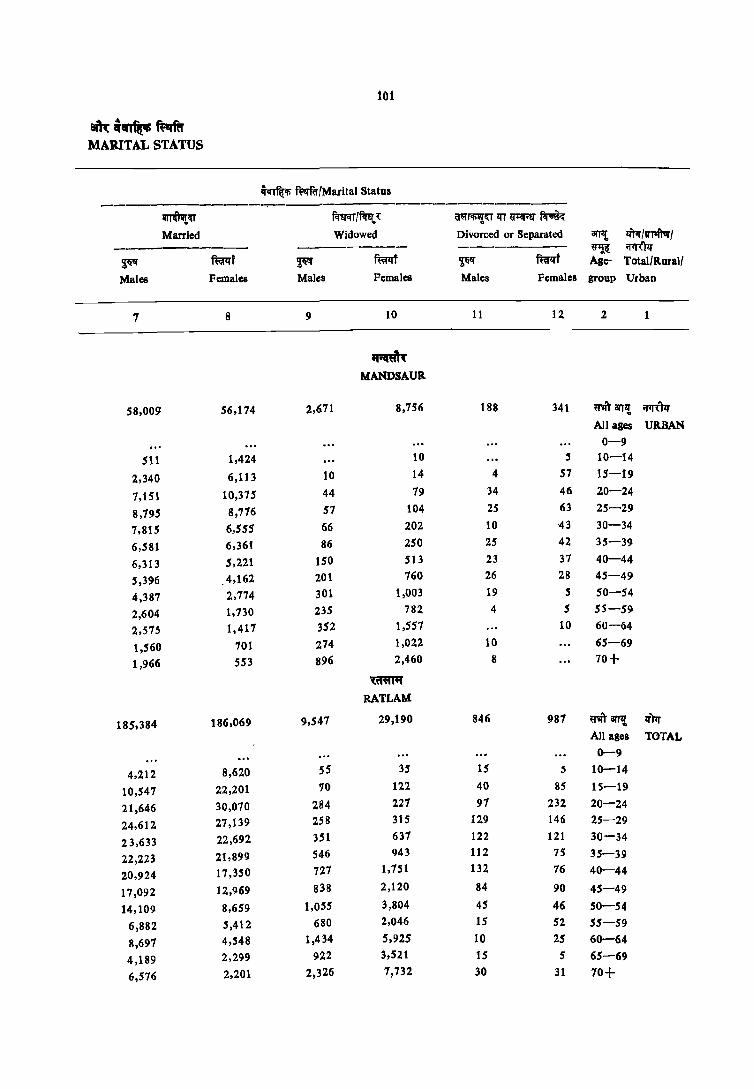
101
am:.~~ftr MARITAL STATUS
~ ~fMarital Status
~u FnT<rr ffcrft' QoTmr~ 1fT ~+iI';:a' f.riIk Married Widowed Divorced or Separated art'lt lI'Pr f'lT'ftvrf
---------- --------- -------- ~ ;rll\TlI'
~ ffiflI'T ~ ffiflI't ~If ffirlrt Age- TotalfRuralf
Males Females Males Females Males Females group Urban
1 8 9 10 11 12 2
~ MANDSAUa.
58,009 56,174 2,611 8,156 188 341 mft alTZr .. ;rm:TIf All ages URBAN
0-9
511 1,424 10 5 10-14
2,340 6,113 10 14 4 57 15-19
7,1S1 10,375 44 19 34 46 20-24
8,195 8,776 57 104 25 63 25-29
7,815 6,555 66 202 10 -43 30-34
6,581 6,361 86 250 25 42 35-39
6,313 5,221 150 513 23 37 40-44
5,396 4,162 201 760 26 28 45-49
4,387 2,774 301 1,003 19 5 SO-54
2,604 1,730 235 782 4 5 55-59
2,575 1,411 352 1,551 10 60-64
1,560 701 274 1,022 10 65-69
1,966 553 896 2,460 8 70+
~
RATLAM
185,384 186,069 9,541 29,190 846 981 mftamt lI'm All ages TOTAL
0-9
4,212 8,620 55 35 15 :; 10-14
10,541 22,201 10 122 40 85 15-19
21,646 30,070 284 227 91 232 20-24
24,612 27,139 258 315 129 146 25-29
23,633 22,692 351 637 122 121 30-34
22,223 21,899 546 943 112 75 35-39
20,924 17,350 721 1,751 132 16 40-44
17,092 12,969 838 2,120 84 90 45-49
14,109 8,659 1,055 3,804 45 46 SO-54
6,882 5,412 680 2,046 15 52 55-59
8,697 4,548 1,434 5,925 10 25 60-64
4,189 2,299 922 3,521 15 5 65-69
6,576 2,201 2,326 7,732 30 31 70+

102
'-1 81T!J, "'/~ C-l AGE, SEX AND
~rfW!; n"f'l'/Marital Status ------------
~ ;;r:niGll'T 1If,<m Il)lr /fflfrrr I Total Population Never Married ~ -------------- ------------Total/Rural! 3!11! ~~ '!,1i1!f mrrt ~~ fmi Urban Age-group Males Females Males Females
2 3 4 5 6
~
RA1l.AM
1JTliA ~ arTl! 277,111 265,060 136,918 110,007
RURAL All ages
0-9 78,928 18,186 18,928 78,186 10-14 36,245 32,892 32,324 25,136 15-19 26,106 23,534 16,781 5,984 20-24 22,532 21,962 5,472 501 25-29 18,976 19,212 1,483 91 30-34 11,164 16,500 554 38 35-39 16,371 15,643 350 10 40-44 15,016 13,462 325 25 45-49 12,203 10,202 191 5 SO-54 10,571 8,709 213 5 55-59 4,932 5,381 72
60-64 7,579 7,727 106 5 (15-69 3,851 4,199 71 5
70+ 6,649 7,422 92 5
~ ~arrt 124,106 115,786 69,046 54,511
URBAN AlIagcs
0-9 29,181 29,61'1 29,187 29,617
10-14 16,303 15,278 15,931 14,354
15-19 14,299 12.,831 12,931 7,952
20-24 12,716 11.055 7,724 1,983
25-29 9,438 8,885 1,933 397
30-34 7,914 7,054 418 67
35-39 7,071 7,326 213 42
40-44 1,281 5,765 189 24
45-49 6,162 5,008 148 2S
50-54 4,961 3,826 122 IS
5S-59 2,751 2,134 35 5
60-64 2,722 2,791 53 IS 65-69 1,418 1,647 71
70+ 2,444 2,551 69 5
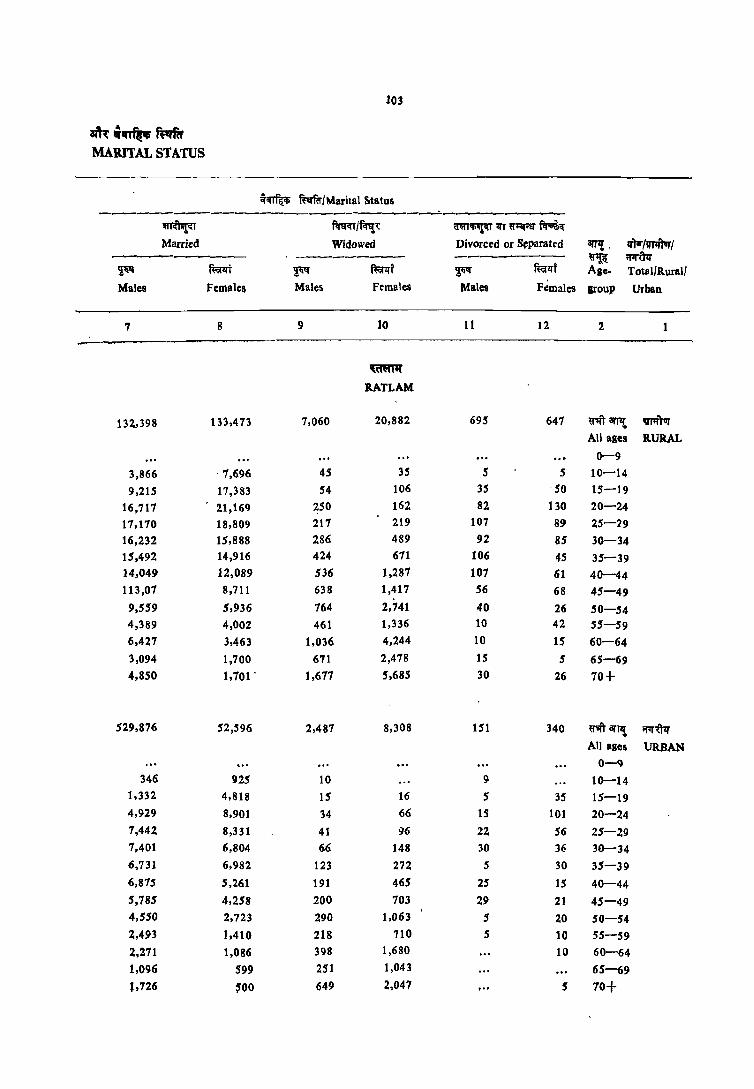
103
a1t~ i~ .. fAftr MARITAL STATUS
~~ mmr/Marital Status --------------------------~-------
m~ f.rq;rr/~~ am~;u Zl'r Q'~ ~q: Married Widowed Divorced or St:paratfd arr,! ' rftIr/r.mftvr I
-~------ ------- ------- ~ ;prUzr
~ ~ ~ ~T ~ fuJlI"t Age- Totili/Rural/ Males Females Males Females Males F"males &roup Urban
7 8 9 10 11 12 2
~
llATLAM
132,398 133,473 7,060 20,882 695 641 Q',ft arTI{. VPf)G)'
All agcs R.URAL
0-9
3,866 . 7,696 45 35 5 5 10-14
9,215 17,383 54 106 35 -50 15-19
16,717 21,169 250 162 82 130 20-24
11,110 18,809 217 219 107 89 25-29
16,232 15,888 286 489 91. 85 30-34 15,492 14,916 424 671 106 45 35-39 14.049 12,089 536 1,281 101 61 40-44 113,07 8,711 638 1,417 56 68 45-49
9,559 5,936 764 2,141 40 26 50-54 4,389 4,002 461 1,336 10 42 55-59 6,427 3,463 1,036 4,244 10 15 60-64
3,094 1,700 671 2,478 15 5 65-69 4,850 1,701 . 1,617 5,685 30 26 10+
529,816 52,596 2,487 8,308 151 340 ~an1l' ;:pr'U1I" .. All ages URBAN
0-1)
346 925 10 9 10-14 1,332 4,818 15 16 5 35 15-19 4,929 8,901 34 66 15 101 20-24 1,442 8,331 41 96 22 56 25-29 7,401 6,804 66 148 30 36 30-34 6,731 6,982 123 272 5 30 35-39
6,815 5,261 191 465 25 15 40-44 5,785 4,258 200 703 29 21 45-49 4,550 2,723 290 1,063 5 20 50-54 2,493 1,410 218 710 5 10 55-59
2,271 1,086 398 1,680 10 60-64
1,096 599 251 1,043 65-69
',726 $00 649 2,047 5 10+

104
q·l 8IT!, ''"/~ C-I AGE, SEX AND
~ ~fir/Marital Status ------------
p~lillT '(<t'~
1f)1r /II'Tlftur / Total Population Never Married ~ -------------- _-----------Total/Rural 81T1! ~~. ~ ~t ~ f~t
Urban Age-group Males Females Males Pemales
2 3 4 5 6
.. ~If
UJJAIN
1f)1r "TBTPt 579,850 537,152 298,460 221,045
:rOTAL All lIgcs
0-9 1S3,497 149,979 153,497 149,979
10-14 17,039 68,651 71,818 54,499 15-19 56,663 50,048 42,255 17,235 20-24 51;788 46,843 19,923 3,861 25-29 42,778 39,545 5,122 739 30-34 36,364 33,058 1,624 179 35-39 32,508 30,547 796 119 40-44 30,647 26,317 976 108 45-49 23,799 20,957 495 54 50-54 23,141 19,213 663 42 55-59 11,868 11,014 296 10 60-64 16,512 16,180 366 31 65-69 7,946 7,876 144 10
70+ 14,962 16,709 258 45
1I'J1fivr ,,"'Ift'iIWi 359,752 338,578 177,079 133,334 RURAL All ages
0-9 100,283 98,341 100,283 98,341 10-14 48,871 42,373 44,092 29,657 15-19 33,015 28,700 20,846 4,796
20-24 28,406 27,246 6,666 324 25-29 25,167 23,523 1,885 80 30-34 21,904 20,912 835 10 35-39 19,985 19,096 505 22 40-44 19,188 16,580 574 32 45-49 14,589 13,511 302 5 50-54 14,741 12,818 363 15 55-59 7,166 7,220 138 60-64 11,117 10,990 240 65-69 5,036 5,374 104 70+ 10,173 11,810 112 14

10$
~.~ft!dI MAlUTAL STATUS
~ ~'Marital Status
~~ f<nm'~ ~~IJT~"IiI'~
Married Widowed Divorced or Separated anl{ IJJq Iw 11iTur I -------- ~ ;rq'6'q
~ ~lft ~ ft:a'l:rt ~ ft:a'l:rt Age- lolaI/Rural' Males FemaleS Males Females Males Females group Urban
7 8 9 10 11 12 2
Ml1 UJJAIN
265,518 262,684 14,423 45,814 1,247 1,448 mitill'pt liN All ages TOTAL 0-9
5,181 14,003 30 19 15 10-14
14,250 32,441 103 224 30 119 15-19
31,405 42,349 276 361 158 235 20-24
31,030 31,915 408 518 203 308 25-29
34,109 31,136 463 961 168 182 30-34
30,815 28,768 657 1,512 174 148 35-39
28.427 23.232 1,097 2.191 142 174 40-44
21,998 11,749 1,162 3,068 139 80 45-4!)
20,625 13,462 1,735 5,613 108 96 50-54
10,464 7,775 1.073 3,209 30 15 55-59
13,889 6,863 2.254 9,235 41 31 60-64
6,381 3,125 1,396 4,132 15 !) 65-69
10,894 3,205 3,767 13,423 38 25 10+
172,091 172,165 9,107 31,596 823 784 mit arrzr VFIfrvr .. All .. R.URAL 0-9
4.145 12,614 30 47 10 10-14
12,036 23,661 98 162 25 63 15-19
21,421 26,544 201 2S5 107 112 20-24
22,885 22,891 238 413 149 134 25-29
20,645 20,120 315 661 109 121 30-34
18,908 11,913 450 1.081 122 74 35-39
17,760 14,494 771 1.942 84 112 4().:-44
13,385 11 ,377 794 2,092 104 36 45-4~
11,070 9,012 1,245 3,125 64 66 50-54
6,311 5,149 692 2,056 25 10 55-59
9,350 4,612 1,504 6,336 15 37 60-64
4,041 2,167 882 3,202 5 5 65-69
7,$06 2?17~ 2,480 9,60~ 15 5 70+
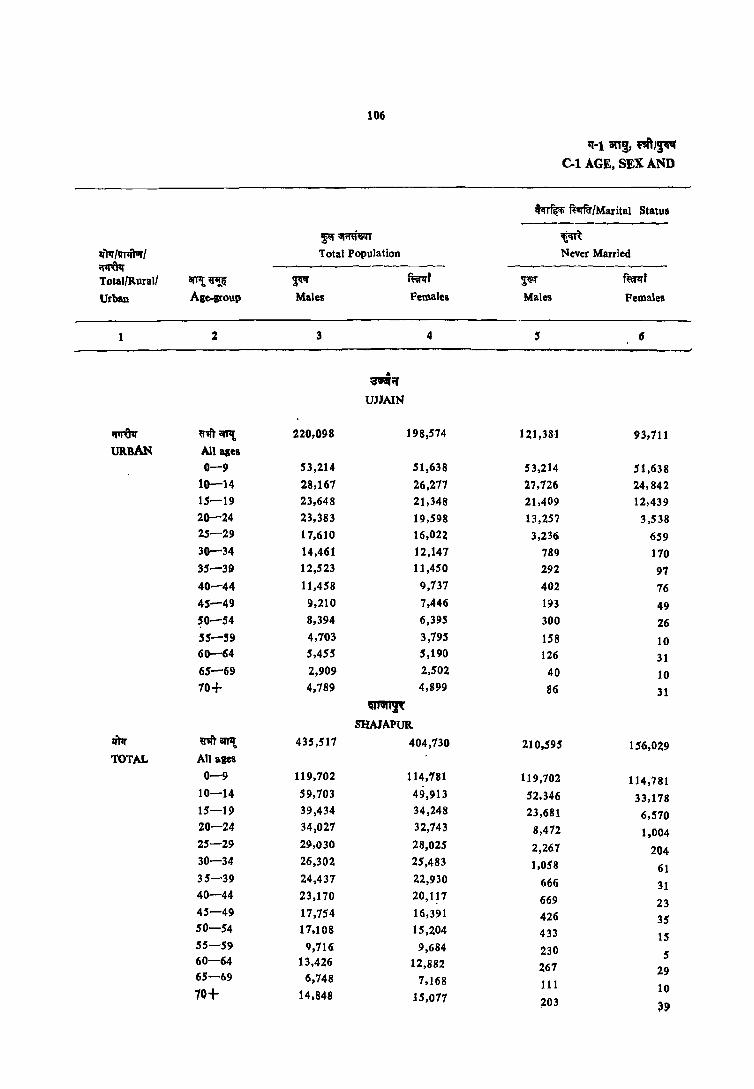
106
"-1 an" ",/~ C-l AGE, SEX AND
"'"'~ ~/Marital Status
?1''SI~T ~ 3fPr ItITIftur I 'Total Population Never Married ~ -~~------ -------------Total!Rurall arrl{~ ~ fi;nf ~ f~f
Urban Age-pou\) Males Females Males Females
2 3 4 ~ 6
.. \ii\1Iif
UJJAIN
II'I'(N 9''I/'l' arJ1{. 220,098 198,574 121,381 93,711
URBAN All agel
0-9 53,214 51,638 53,214 51,638 10-14 28,167 26,277 27,726 24,842 15-19 23,648 21,348 21,409 12,439 20-24 23,383 19,598 13,257 3,538 25-29 17,610 16,022 3,236 659 30-34 14,461 12,147 789 170 35-39 12,523 11,450 292 97 40-44 11,458 9,737 402 76 45-49 9,210 7,446 193 49 50-54 8,394 6,395 300 26 55-59 4,703 3,795 158 10 60-64 5,455 5,190 126 31 65-69 2,909 2,502 40 10 70+ 4,789 4,899 86 31
~ SHAIAPUR
zmr U'lft'8JI'I{, 435,517 404,730 210,595 156,029 TOTAL All ages
0-9 119,702 114,'181 119,702 114,781 10-14 59,103 49,913 52.346 33,178 15-19 39,434 34,248 23,681 6,570 20-24 34,027 32,143 8,472 1,004 25-29 29,030 28,025 2,267 204 30-34 26,302 25,483 1,058 61 35-39 24,437 22,930 666 31 40-44 23,170 20,1! 7 669 23 45-49 17,754 16,391 426 35 SO-54 17,108 15,204 433 15 55-59 9,716 9,684 230 5 60-64 13,426 12,882 267 29 65-69 6,748 7,168 111 10 70+ 14,848 15,077 ~03 ~9
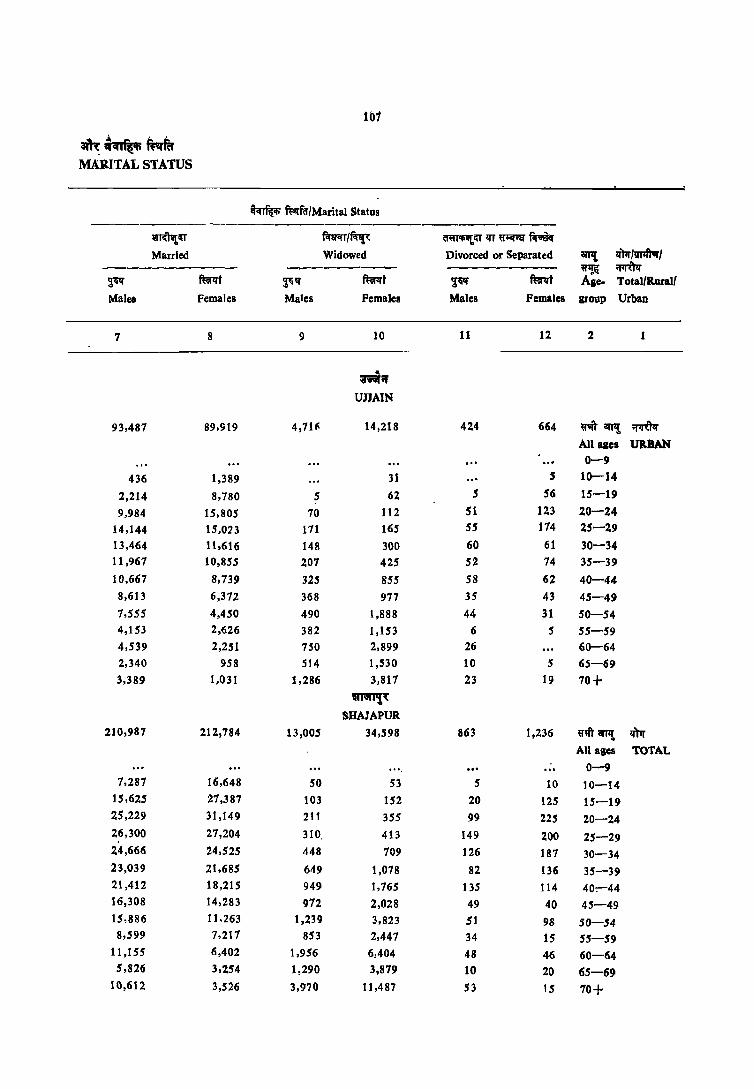
101
~~~~ftr MAlUTAL STATUS
~ llv.!'fa'/Marital Statu9
~1U f.m"r/~ ~iO'lJr~~
Married Widowed Divorced or Separated il1'I1{ IJ)J(' /V'rIfrvr I ---------_ ----- ------ ~ ~ ~qtf ffirlJt ~q' mt ';qtf fum Age. Total/Rural' Males Females Males Females Males Females grOUP Urban
7 8 9 10 tl 12 2
.. ilftl'lt
UJJAIN
93,481 89,919 4,716 14,218 424 664 ritlllP{ ~ All ages URBAN 0-9
436 1,389 31 S 10-14
2,214 8,780 5 62 5 56 15-19
9,984 15,805 70 112 51 123 20-24
14,144 15,023 171 165 55 114 25-29
13,464 11,616 148 300 60 61 30-34 11,961 10,855 207 425 52 14 35-39
10,667 8,739 325 8SS 58 62 40-44 8,613 6,372 368 977 35 43 45-49 7,555 4,450 490 1,888 44 31 SO-54 4,153 2,626 382 1,153 6 5 55-59 4,539 2,251 750 2,899 26 60-64 2,340 958 514 1,530 10 5 65-69
3,389 1,031 1,286 3,811 23 19 10+ ~,
SHAJAPUR 210,981 212,784 13,005 34,598 863 1,236 ij"9IT lIIP{ 1f)1r
All ages TOTAL .... ... 0-9
1,281 16,648 50 53 5 10 10-14 15,625 21,387 103 152 20 125 15-19 25,229 31,149 211 355 99 225 20-24 26,300 21,204 310. 413 149 200 25-29 24,666 24,525 448 109 126 181 30-34 23,039 21,685 649 1,078 82 136 35-39 21,412 18,215 949 1,165 135 114 40:--44 16,308 14,283 912 2,028 49 40 45-49 15,886 11,263 1,239 3,823 51 98 SO-54 8,599 7,211 853 2,441 34 15 55-59
11,155 6,402 1,956 6,404 48 46 60-64 5,826 3,254 1,290 3,819 10 20 65-69
10,612 3,526 3,970 11 ,487 53 15 10+
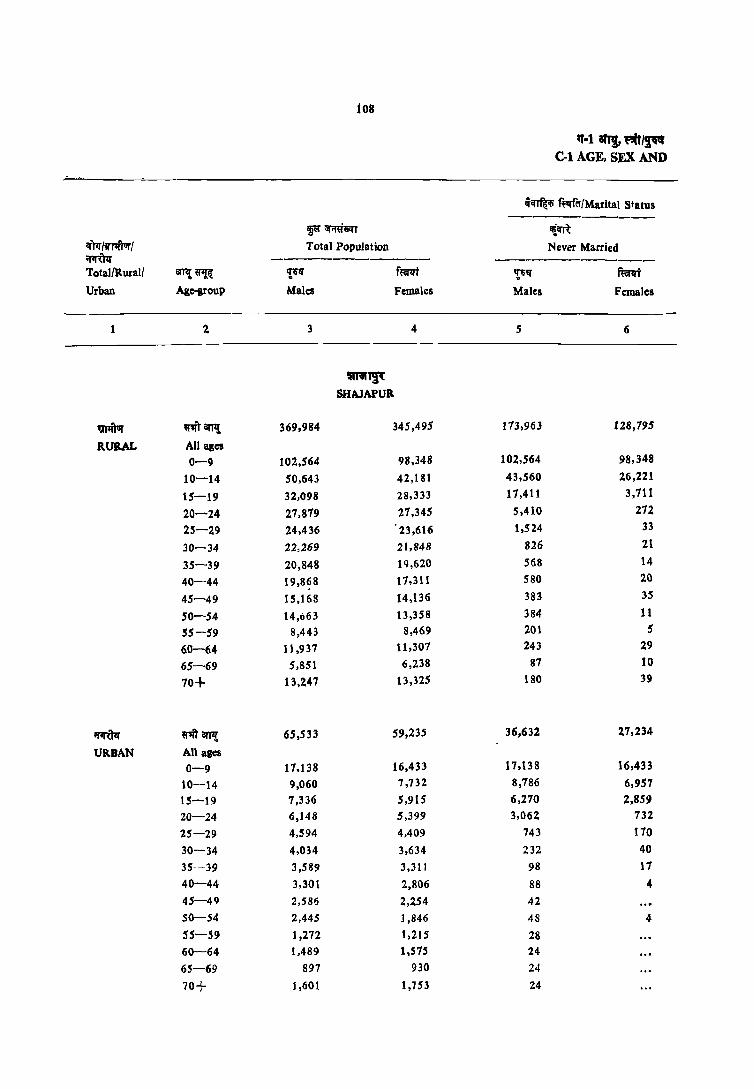
108
*f-l aft!, ""/~ C-l AGE. SEX AND
~ ft;qfer{Marital Status
-----------~~ lI!~R:
lfPr if'pfrrIr { Total Population Never Married ~ ------------ ------------Total{Rural/ 1Im!~ '!;tli ~i ,!l" ffirtrt Urban Age-group Males Females Males Females
1 2 3 4 5 6
'""1!t SHAJAPUR
~ ~~ 369,984 345,495 173,963 128,195
RURAL All alCl
0-9 102,564 98,348 102,564 98,348
10-14 50,643 42,181 43,560 26,221
15-19 32,098 28,333 17,411 3,711
20-24 27,879 27,345 5,410 272
25-29 24,436 23,616 1,524 33
30-34 22,269 21,848 826 21
35-39 20,848 19,620 568 14
40-44 19,8~8 11,311 580 20
45-49 15,168 14,136 383 35
50-54 14,663 13,358 384 11
55-59 8,443 8,469 201 5
60-64 11,937 11,307 243 29
65-69 5,851 6,238 81 10
70+ 13,247 13,325 180 39
~ ~8FPi 65,533 59,235 36,632 27,234
URBAN All ages 0-9 17,138 16,433 17,138 16,433
10-14 9,060 7,732 8,786 6,957
15-19 7,336 5,915 6,210 2,859
20-24 6,148 5,399 3,062 132
25-29 4,594 4,409 743 110
30-34 4,034 3,634 232 40
35-39 3,539 3,311 98 17
40-44 3,301 2,806 88 4 45-49 2,586 2,254 42 SO-54 2,445 1,846 48 4 55-59 1,272 1,215 28 60-64 1,489 1,575 24
65-69 897 930 24
70+ 1,601 1,753 24

109
am.~~ MARITAL STATUS
~~ ~if/Marita1 Status
~ f.fa<!T/~ ~<::r q'T ~ fir-aW~
Married Widowed Divorced or Separated aTJII fi'rql'flrlftvrl --------- --------- --------- ~~ ~ :!~ ~ ~ ~ ~ mt Age- Total/Rllrall Males Females Males Females 'Vlales Females group Urba(l
7 8 9 10 11- 12 2
~~
SHAJAPUR
183,664 185,465 11,548 . 30,163 756 1,013 ~an't Vl'o1)1Jr
All ages RURAL
0-9
7,023 15 ,881 45 45 5 10 10-14
14,518 24,394 84 117 20 106 15-19
22,118 26,578 197 318 85 171 20-24
22,491 23,040 287 370- 134 161 25-29
20,891 21,048 430 609 116 110 30-34
19,609 18,552 591 947 73 107 35-39
18,320 15,651 831 1,563 131 71 40-44
13,936 12,334 829 1,733 20 35 45-49
13,158 9,910 1,016 3,342 44 90 SO-54
7,480 6,402 733 2,041 29 15 55-59
9,889 5,650 1,766 5,598 38 31 60-64
4,597 2,812 1,147 3,332 10 21> 65-69
9,489 3,121 3,520 10,138 49 15 70+
21,323 27,319 1,451 4,435 101 223 ~<IfI1! iflR:1!f
All ages URBAN 0-9
264 767 5 8 10-14
1,047 2,993 19 34 20 15-19
3,052 4,511 14 38 14 53 20-24
3,809 4,164 23 42 14 33 25-29
3,774 3,471 18 100 10 , 11 30-34
3,430 3,133 52 131 9 29 35-39
3,091 2,563 117 202 4 31 40-44
2,312 1,949 143 296 29 5 45-49
2,228 1,353 162 481 7 8 SO-54
1,119 815 120 400 5 55-59
1,266 152 190 806 9 16 60-64
729 383 143 548 65-69
1,123 399 450 1,348 4 70+
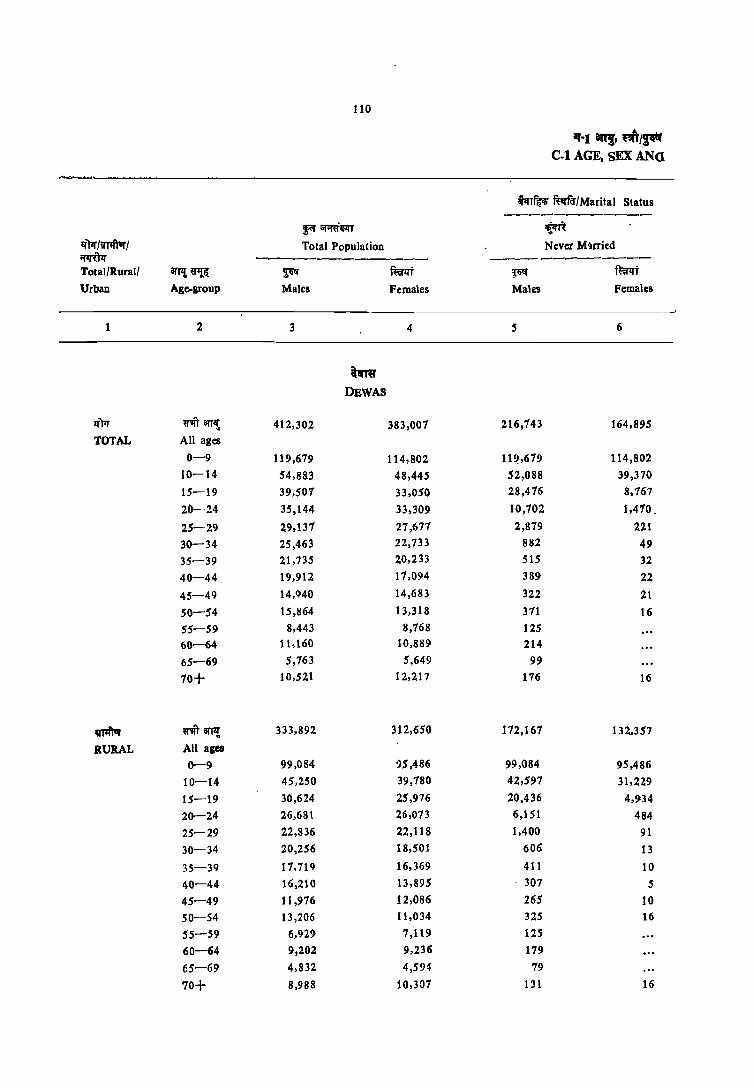
110
q-1 iIR!, ~/pr C.l AGE, SEX ANa
hT~ ffvna-/Marital Stalus ------------~~m ~
1:I')1r/~/ Total Population Never M~rried ~ ----------- -------------Total/Rural/ arJ'1!~ ~ f~!it ~ fmt Urban Age.group Malts Females Males Pemales
1 2 3 4 5 6
ttm DEWAS
lfm ~'Ii't arr~ 412,302 383,001 216,143 164,895
TOTAL All ages 0-9 119,619 114,802 11~,679 114,802
10-14 54,883 48,445 52,088 39,370
15-19 39,501 33,050 28,416 8,767
20-24 35,144 33,309 10,102 1,410.
25-29 29,137 27,677 2,879 221
30-34 25,463 22,733 882 49
35-39 21,735 20,233 515 32
40-44 19,912 11,094 389 22
45-49 14,940 14,683 322 21
SO-54 15,864 13,318 311 16
55-59 8,443 8,768 125
60-64 11,160 10,889 214
65-69 5,763 5,649 99
10+ 10,521 12,217 176 16
vm ~arP! 333,892 312,650 172,167 132,357
RURAL All ages
0-9 99,084 ')5,486 99,084 95,486
10-14 45,250 39,780 42.591 31,229
15-19 30,624 25,976 20,436 4,934
20-24 26,681 26,013 6,151 484
25-29 22,836 22,118 1,400 91
30-34 20,256 18,501 606 13
35-39 11,719 16,369 411 10
40-44 16,210 13,895 . 307 5
45-49 11,916 12,086 265 10
SO-54 13,206 11,034 325 16
55-59 6,929 1,119 125
60-64 9,202 9,236 179
fS-69 4,832 4,594 79
70+ 8,988 10,301 131 16

lit
am: .'"~ ft:v:rftr MARITAL STATUS
~~ ~6'/MaritaJ Status -------------------------------------
~<rr f~/f.r'\'t ~u lfT ~P!i ~i:'
Married WidoweJ Divorced or Sep'lrated 8IP{ lIW(vTlfttirI ---------- -------- -------- ~ lflrtPf ~ ~lft ~ mm ~ fi:ef!rt Age- Total/Rura M'lles Females Males Females Males Females I1'Oup Urban
7 8 9 10 11 12 2
"'"' DBWAS
184,424 186,492 9,926 30,216 1,159 1,293 ~'q'r amt If)lr
All agel TOTAL 0-9
2,750 8,999 20 20 10 30 10-14
10,894 23,971 45 101 82 175 15-19
24,011 31,379 226 214 205 235 2C.-24
26,074 26,917 311 334 174 200 25-29
24,069 21,978 308 513 204 193 30-34
20,683 19,324 41S 783 112 94 3S-39
18,791 15,277 627 1,675 lOS 121 40-44
13,847 12,823 692 1,779 79 60 45-49
14,155 9,671 1,234 3,569 103 52 SO-54
7,429 6,319 858 2,425 30 19 55-59
9,323 4,920 1,608 5,923 10 47 60-64
4,736 2,374 908 3,250 H 15 65-69
7,636 2.514 2,673 9,630 26 52 70+
152,402 154,559 8,247 24,544 1,041 1,089 ~iral'T1!: ~ All ages RURAL 0-9
26,13 8,480 20 15 10 30 lQ-14
10,060 20,782 40 8" 82 150 15-19
20,145 25,214 196 178 190 191 20-24
21,014 21,620 214 239 n8 16'2 25-29
19,200 17,916 268 416 183 156 30-34
16,822 15,694 369 582 107 83 35-39
15,290 12,453 519 1,349 94 88 40-44
11,108 10,575 529 1,446 74 55 45-49
11,179 8.062 1,014 2,893 88 52 50-54
6,069 5,219 704 1,876 30 19 55-59
7,711 4,295 1,292 4,905 10 36 60-64
3,980 2,021 7£4 2,542 9 15 6S-69
Ci,518 2,212 2,259 8,021 16 S2 70+
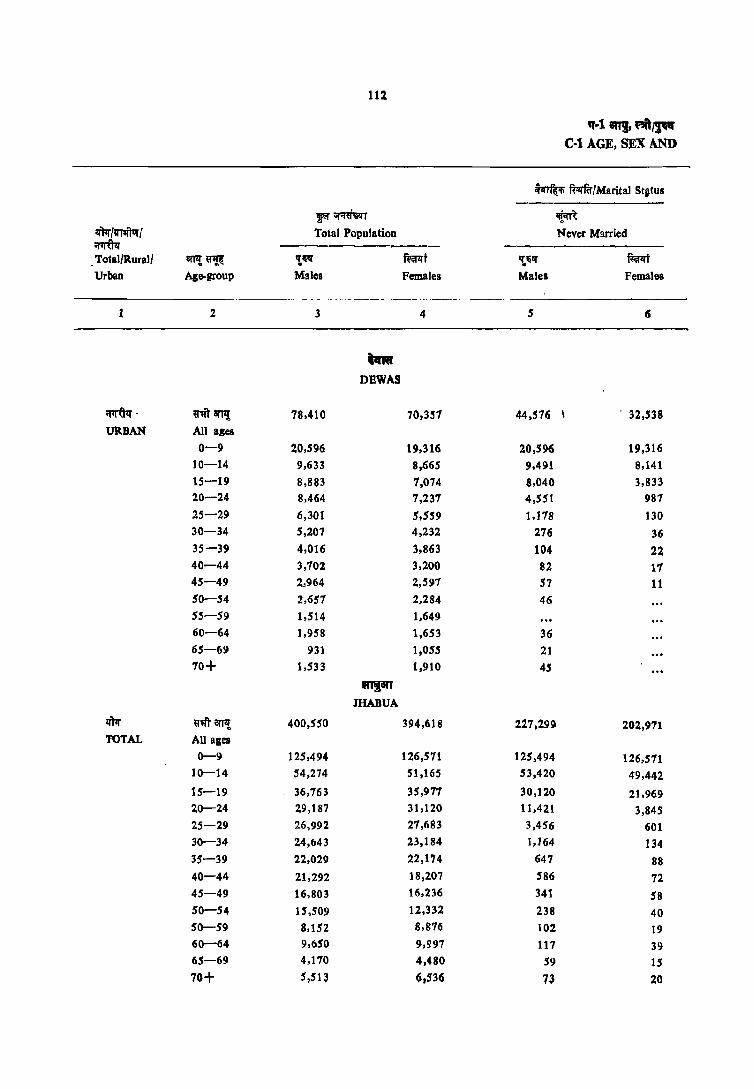
112
If-1 an" ~~ c-t AGE, SEX AND
~ R:'fftr/Marital Stftus
pr~~ ~ IiWfwftulf Total Population Never M!lrried ~ ----------Total/Rural/ BTPi~ 'tlilf RiiI'ltt 't1i1f ~
Urban Age-group Males Females Males Females
2 3 4 5 CS
ftnI OBWAS
~- ~'Ift&m{ 78,410 70,3S1 44,516 \ . 32,538
URBAN AU ages
0"""9 20,596 19,316 20,S96 19,316 10-14 9,633 8,665 9,491 8,141 15-19 8,883 1,074 8,040 3,833 20-24 8,464 1,237 4,551 981 25-29 6,301 5,sS9 1,178 130 30-34 5,207 4,232 216 36 35-39 4,016 3,863 104 22 40-44 3,702 3,200 82 17 45-49 2,964 2,597 57 11 50-54 2,657 2,284 46 55-59 1,514 1,649 60-64 1,958 1,653 36 65-69 931 1,055 21 70+ 1,533 1,910 45
R1P' JHABUA
IiW U~ arfl! 400,550 394,618 227,299 202,971 TOTAL All ages
0-9 125,494 126,571 125,494 126,571 10-14 54,274 51,165 53,420 49,442 15-19 36,763 35,977 30,120 21,969 20-24 29,187 31,120 11,421 3,845 25-29 26,992 27,683 3,456 601 30-34 24,643 23,184 1,164 134 35-39 22,029 22,174 647 88 40-44 21,292 18,207 586 72 45-49 16,803 16,236 341 58 SO-54 15,509 12,332 238 40 SO-59 8,152 8,876 102 19 60-64 9,650 9,S97 117 39 65-69 4,170 4,480 59 15 70+ 5,513 (i,S36 1~ 20

113
~~~ MARITAL STATUS
;fcn%1fi' ~fu'Marital Status --- ---QI'R~~ fcnr<n" fflff!\ ~~IiT~~
Married Widowed Divorced or Separated anI! IiNf'fmfturf
---------- -------- --------- ~ ~
~ ffirn ~ ~l!f ~ ~t Age· TotalfR.ural/
Males Females Males Females Males Females group Urban
7 8 9 10 11 12 2 1
... t'mI'
DBWAS
32,022 31,933 1,679 5,672 118 204 ~ilTl1l ~ All agel tiRUAN
0-9
137 519 5 10-14
R34 3,190 5 21 26 15-19
3,366 6,165 31 36 15 44 20-24
5,061 5,297 36 9S 26 38 25-29
4,369 4,062 41 96 21 37 30-34
3,861 3,631 46 201 5 10 35-39
3,501 2,824 108 326 10 34 40-44
2,739 2,248 163 333 5 5 45-49
2,376 1,608 220 676 15 50-54
1,360 1,100 154 549 55-59
1,606 624 316 1,017 11 60-64
755 347 145 708 10 65-69
1,058 302 414 1,609 10 70+
lI'RarI . JHABUA
162,279 167,506 9,409 23,029 1,436 976 ~'Ift' arT!! IIW All ales TOTAL
0-9
824 1,678 15 IS 5 10-14
6,426 13,842 81 19 87 116 15-19
17,360 26,9S!l 151 79 229 212 20-24
23,055 26,710 238 183 227 179 25-29
22,799 22,493 4-66 462 214 86 30-34
20,694 21,417 521 604 168 60 35-39
19,591 16,528 941 1,540 159 67 40-44
15,420 14,409 910 1,724 133 39 45-49
13,856 8,899 1,332 3,306 83 86 SO-54
7,152 6,804 848 2,002 SO 46 55-59
7,888 4,181 1,620 56,95 25 67 60-64
3,294 1,892 792 2,568 20 5 65-69
~,91~ 1,674 1,503 4,831 24 6 70+
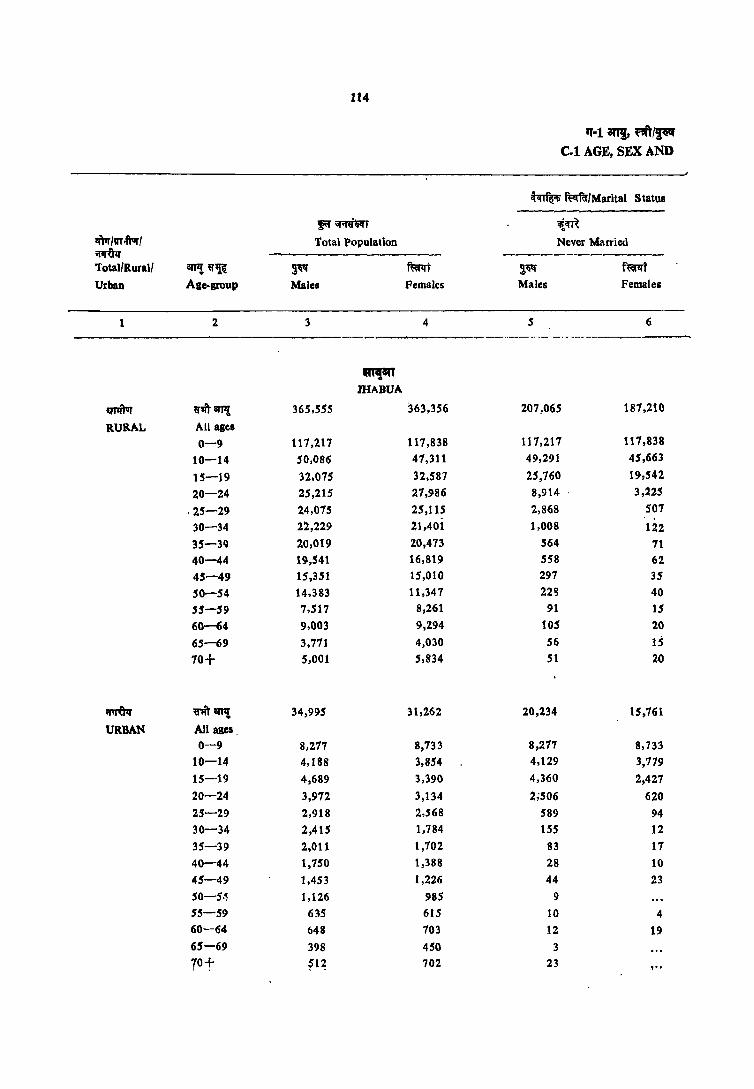
m/VT.ft1Ir/ ~ Total/Rural/
Urban
1
flIlil'ar RURAL
if1J"Uq
URBAN
GlT'l ~~ Age-group
2
~..rr al'l11 All ages 0-9
10-14
15-19
20-24
.25-29 30-34
35-39 40-44 45-49 SO-54 55-59
60-64
65--69
70+
~atT1! All ages. 0-9
10-14
15-19
20-24
25-29 30-34
35-39
40-44
45-49
50-5·~
55-.59 60-64
65-69
rot
114
F' ;;r;rmr Total Population
~~
Males
3
365,55S
117,217 50,086
32,075
25,21S
24,07.5 22,229
20,019 19,541
15,351 14,383 7,517
9,003
3,771 5,001
34,995
8,277
4,188
4,689
3,912
2,918
2,415
2,011
1,750 1,453
1,126
635
648
398
~1~
~ mABUA
~lft
Females
4
363,3.56
117,838 47,311
32,587
21,986
25,11.5 21,401
20,473 16,819 15,010
11,347 8,261
9,294
4,030 5,834
31,262
8,733 3,854
3,390
3,134 2,568 1,784
1,702
1,388
1,226
9B5 615
703
450 702
If-1 an'!, ""~ C.l AGE, SEX AND
~ ~fu/Marital Status
lli,m Never Married
~ Males
5
207,06.5
117,217 49,291
2.5,760 8,914
2,868 1,008
564 .558 297
22'3 91
lOS 56
51
20,234
8,277 4,129
4,360
2;506
589 155
83
28 44
9
10
12
3 23
f~' Females
6
187,210
117,838
45,663
19,542
3,225
507
122
71 62 J5 40
15 20
15
20
15,761
8,733
3,779
2,427
620
94 12
17
10 23
4
19
,0,
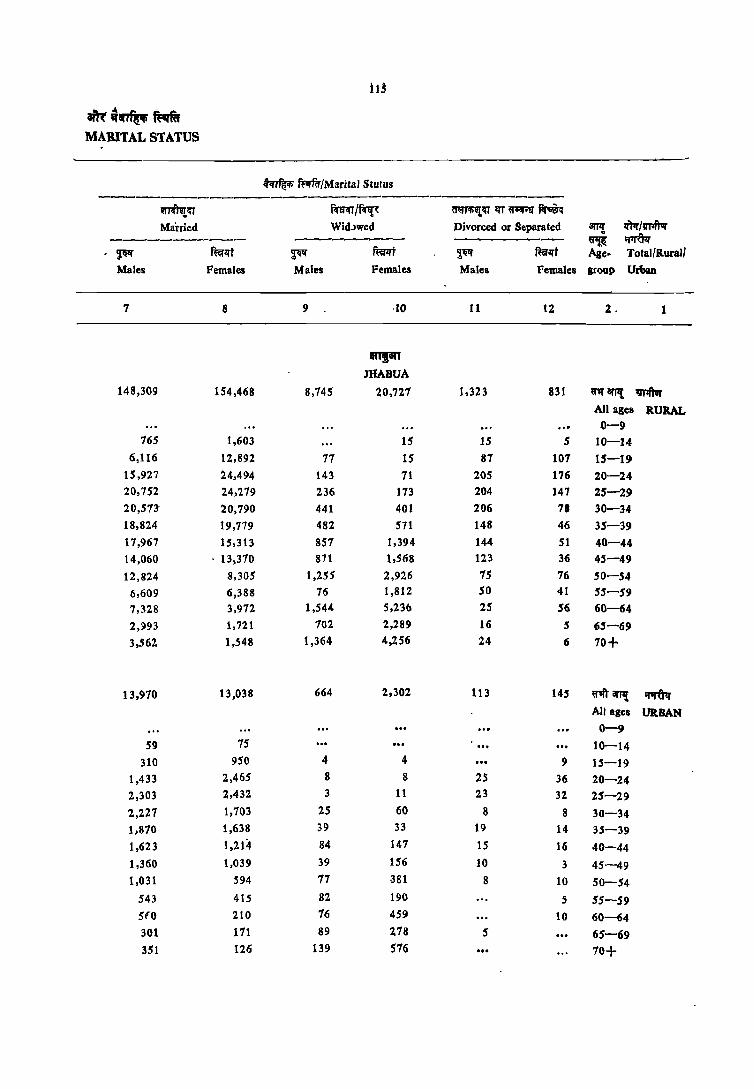
iH
~~~~ MARITAL STATUS
~'Ii tf1rfir/Msrital Stulus --------------------------------------
wrmr<u mm/~ m~<U1IT~~
Mai:ried Wid.)wed Divorced or Separated ~ ~N/vMar ----------- ~ ~ ~ ffirlft ~ ffiA"t ~ ffif~t Ale- Totallilurall Males Females Males Females Males Females group Urban
7 8 9 ·10 11 12 2. 1
R1J8fI JHABUA
148,309 154,468 8.145 20,721 1.323 831 "CIfP.! t.mft'ar All ages aURAL 0-9
165 1,603 15 15 5 10-14 6,116 12,892 71 15 87 107 15-19
15,927 24,494 143 71 205 176 20-24 20,752 24,279 236 173 204 147 25-29 20,513- 20,190 441 401 206 78 30-34
18,824 19,179 482 571 148 46 35-39 17,967 15,313 851 1,394 144 51 40-44 14,060 . 13,370 871 1,568 123 36 45-49 12,824 8,305 1,2SS 2,926 15 76 SO-54
6,609 6,388 76 1,812 50 41 55-59 7,328 3,972 1.544 5,236 25 56 60-64 2,993 1,721 102 2,289 16 5 65-69 3,562 1,548 1,364 4,256 24 6 70+
13,910 13,038 664 2,302 113 145 Wift"arTIJ; ~ All agel lJR.BAN 0-9
59 7S 10-14 310 950 4 4 9 15-19
1,433 2.465 8 8 25 36 20-24 2,303 2,432 3 11 23 32 25-29 2,227 1,703 25 60 8 8 30-34 1,810 1,638 39 33 19 14 35-39 1,623 1,214- 84 141 IS 16 40-44 1,360 1,039 39 156 10 3 45-49 1,031 594 11 381 8 10 SO-54
543 415 82 190 5 55-59 5fO 210 16 459 10 60-64 301 111 89 2.18 5 65-69 351 126 139 516 70+

116
'T-l an" m~ C-l AGE, SEX AND
~ ffvff;;rI,Marital Satus
p ;;r;ffi'q'T 11!.<m lim Iv!lITur I Total Population N ever Married ~ -----------------TotalfRural1 arPl~ 't,1I1'f ~t '!,1I1'f fiwrt
Urban Age-group Males Females Md.les Females
2 3 4 5 6
~
DRAR
~ ~nrr art'l! 537,783 519,686 295,224 247,864
TOTAL All aglls 0-9 161,871 162,146 161,871 162,146
10-14 72,497 66,636 70,903 61,\97 15-19 49,580 46,443 40,103 20.627 20-24 41,983" 42,017 14,949 3,009 25-29 35,510 35,405 3,528 371 30-34 33,317 32,142 1,237 159 35-39 29,667 28,590 648 76 40-44 27,992 24,6H 528 58 45-49 21,762 19,843 321 11 SO-54 20,880 17,423 318 20 55-5~ 10,603 12,125 22Q 16-60-64 14,987 13,724 261 26 65-69 6,630 7,052 143 20 70+ 10,368 11,318 95 16
VI'lft1Jr tr4t arTl{ 468,348 456,141 255,234 216,851 aURAL All ages
0-9 144,526 144,786 144,526 144,786 10-14 63,165 58,099 61,E36 52,896 15-19 41,801 40,233 32,883 16,754 20-24 35,094 35,956 10,590 1,832 25-29 30,655 30,474 2,485 202
30-34 28,586 28,102 979 105 35-39 25,726 24,723 503 55 40-44 24,094 21,773 437 47
45-49 18,826 17,797 248 11 50-54 18,487 15,308 267 15 55-59 9,218 10,742 203 10 60-64 13,234 12,085 225 21 65-69 5,788 6,135 117 20
70+ 9,037 9,801 65 16
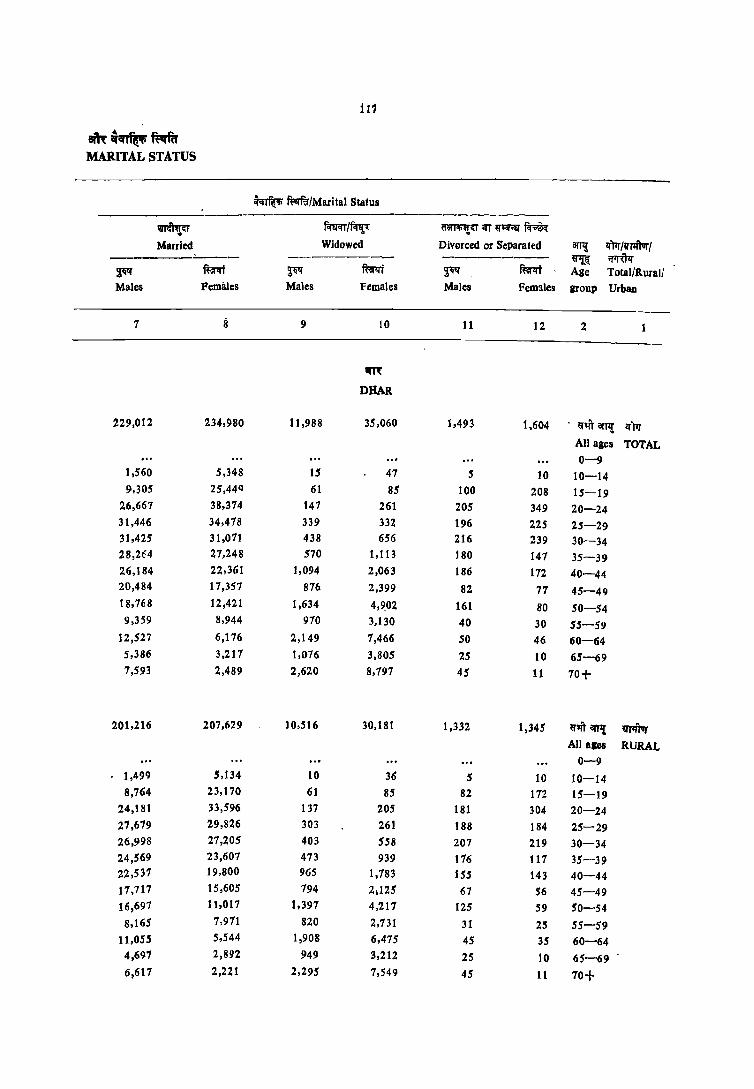
111
m~~ftsqftr MARITAL STATUS
~~ troa'/Marital Status
~ mm/mr: ~~lJTQ'~~
Married Widowed Divorced or Separated 6Tni lI:l1r/vTlft1lJ'I ------- ----- ------- ~ ~ ~ mm ~ ffirrt ~ ffiflfi Age Total/Rural/ Males Females Males Females Males Females grOUP Urbaa
7 8 9 10 11 12 2
1ITt
DRAR
229,012 234,980 11,988 35,060 1,493 1,604 - Q''lT ai'll! lfTtr All ages TOTAL 0-9
1,560 5,348 15 47 5 10 10-14 9,305 25,44Q 61 85 100 208 15-19
26,667 38,374 147 261 205 349 20-24 31,446 34,418 339 332 196 225 25-29 31,425 31,071 438 656 216 239 30-34 28,2~4 21,248 570 1,113 180 147 35-39 26,184 22,361 1,094 2,063 186 172 40-44 20,484 17,357 876 2,399 82 77 45-49 18,768 12,421 1,634 4,9.02 161 80 50-54 9,359 8,944 970 3,130 40 30 55-59
12,527 6,176 2,149 7,466 50 46 60-64 5,386 3,211 1,076 3,805 25 10 65-69 7,593 2,489 2,620 8,197 45 11 70+
201,216 207.629 10,516 30,181 1,332 1,345 Q''lT ar'Ill VTIlTur All ages RURAL
0-9 1,499 5,134 10 36 5 10 10-14 8,764 23,170 61 85 82 172 15-19
24,181 33,596 137 205 181 304 20-24 27,679 29,826 303 261 188 184 25-29 26,998 21,205 403 558 207 219 30-34 24,569 23,607 473 939 116 117 35-39 22,537 19,800 965 1,783 155 143 40-44 17,717 15,605 794 21125 67 56 45-49 16,697 11,017 1,397 4,217 125 59 SO-54 8,165 7,971 820 2,731 31 25 55-59
11,055 5,544 1,908 6,475 45 35 60-64 4,697 2,892 949 3,212 25 10 65-69 6,617 2,221 2,295 7,549 45 11 70+
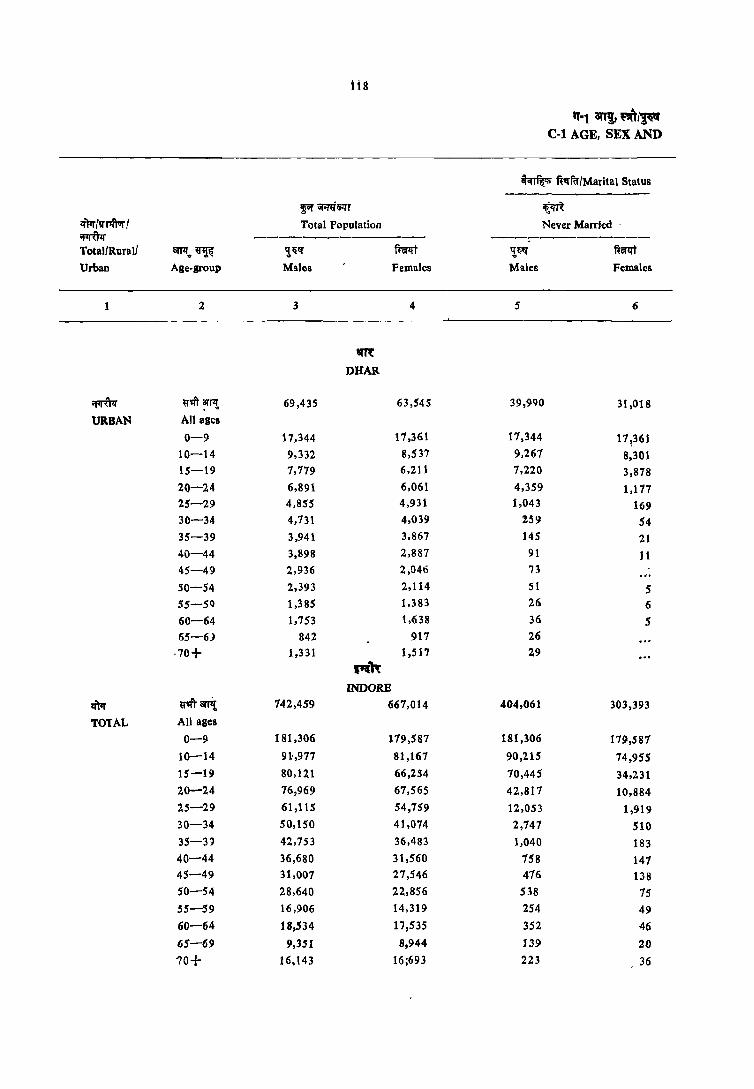
ti8
q-t an~ ,,"/~ C-I AGE, SEX AND
~ w.rfu/Marital Status ----------
~ iifini5lTr ifim lfN/lI'T'Ift1Jr / Total Population 'Never Married . ~ -------------- --------_ ... _---Total/Rural/ arr!l' .. ~ ,!qlf fterrt 'Ililf ftenrt Urban Age-group Males Females Males Females
2 3 4 5 6
em: DHAR
~ ~,ft arr:r . ~ 69,435 63,545 39,990 31,018
UR.BAN All ages
0-9 17,344 17,361 17,344 171361 10-14 9,332 8,537 9,267 8,301 15-19 7,779 6,211 7,220 3,878 20-24 6,891 6,061 4,359 1,177 25-29 4,855 4,931 1,043 169 30-34 4,731 4,039 259 54 35-39 3,941 3,867 145 21 40-44 3,898 2,887 91 11 45-49 2,936 2,046 73
50-54 2,393 2,114 51 5 55-5Q 1,385 1,383 26 6
60-64 1,753 1,638 36 5 65-6) 842 917 26
-70+ 1,331 1,517 29
RR INDORB
l()tr ~'ft arrit 742,459 667,014 404,061 303,393
TOTAL All ages
0-9 181,306 179,587 181,306 179,587
10-14 91-,977 81,167 90,215 74,955 15-19 80,121 66,254 70,445 34,231
20-24 76,969 67,565 42,817 10,884 25-29 61,115 54,759 12,053 1,919 30-34 50,150 41,074 2,747 510 35-3~ 42,753 36,483 1,040 183 40-44 36,680 31,560 758 147 45-49 31,007 27,546 476 138 50-54 28,640 22,856 538 75 55-59 16,906 14,319 254 49
60-64 18,534 17,535 352 46
65-69 9,351 8,944 139 20
10+ 16, t 43 16;693 223 36
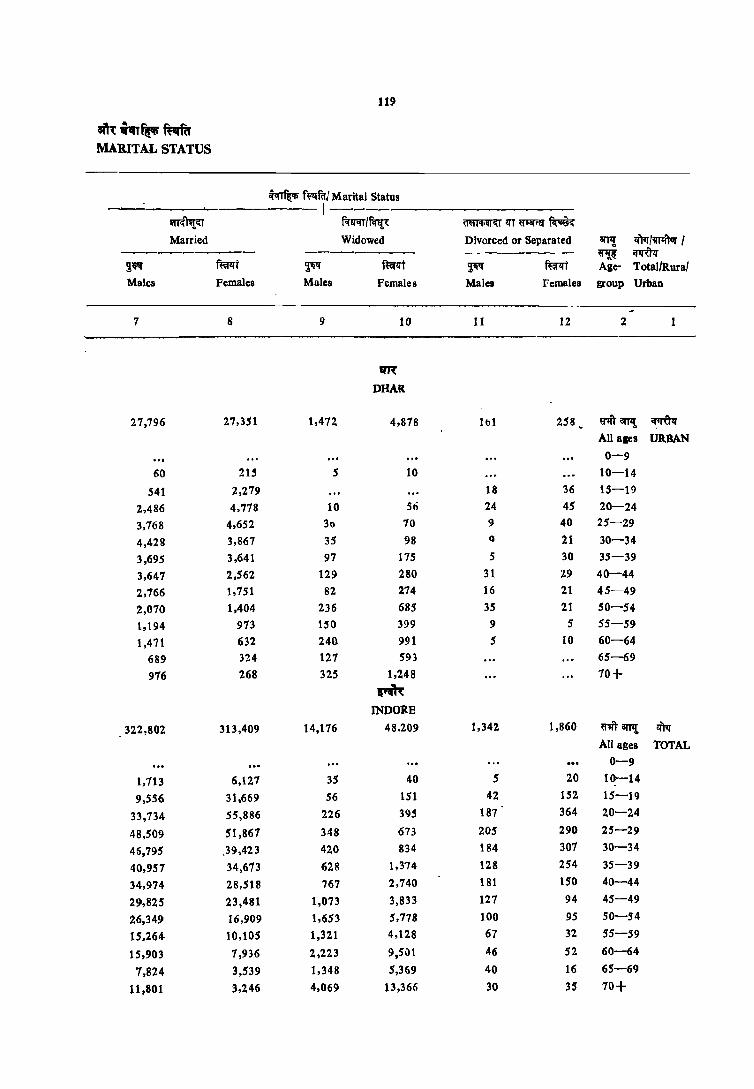
119
aft~iqy~~ MARITAL STATUS
~ f~q'fdJ Marital Status -- 1--m:'nt~ f<f~/~ ~~Il'T~Ii~
Married Widowed Divorced or Separated <IfTlf llW/~ / .. ----------- ~ ij1f~
~~ ~t ~ ~Il't ~ mrlJt Age- Total/Rural
Males Females Males Females Males Females group Urban
7 8 9 10 11 12 2
IfR
DHAR
27,196 27,351 1,472 4,878 hI 258 mowt ~ All ages URBAN
0-9
60 215 5 10 10-14
541 2,279 18 36 15-19
2,486 4,718 10 56 24 45 20-24
3,768 4,652 30 10 9 40 25-29
4,428 3,867 35 98 Q 21 30-34
3,695 3,641 97 175 5 30 35-39
3,641 2,562 129 280 31 29 40-44
2,766 1,751 82 274 16 21 45-49
2,010 1,404 236 685 35 21 50-54
1,194 913 150 399 9 5 55-59
1,471 632 24Q 991 5 10 60-64
689 324 121 593 65-69
976 268 325 1,248 70+
~ INDORE
322,802 313,409 14,176 48.209 1,342 1,860 mftowt lJ)'q
All ages TOTAL 0-9
1,713 6,127 35 40 5 20 10-14
9,556 31,669 56 151 42 152 15-19
33,734 55,886 226 395 187 364 20-24
48,509 51,861 348 613 205 290 25-29
45,795 .39,423 420 834 184 307 30-34
40,951 34,673 628 1,374 128 254 35-39
34,974 28,518 767 2,740 181 150 40-44
29,825 23,481 1,073 3,833 127 94 45-49
26,349 16,909 1,653 5,178 100 95 SO-54
15,264- 10,105 1,321 4,128 61 32 55-59
15,903 7,936 2,223 9,501 46 52 60-64
7,824 3,539 1,348 5,369 40 16 65-69
p,801 3,246 4,069 13,366 30 3$ 70+

120
"-I 8n!, !1ft J~ C-l AGE, SEX AND
~ mrftr/Marital Status -------
~~ ~ zrm/~/ Total Population Never Married ~~ -------------Total/Rural/ an1l~ 1t" ffinrt ~ ~t
Urban Age.group Males Females Males Females
2 3 4 5 6
~ INDORE
VPftvr ~'"' arJ1{. 248,783 231,262 129,173 95,997 RURAL All ages
0-9 69,349 67,710 69,349 61,710 10-14 33,721 28,345 32,513 23,130 15-19 25,011 19,834 18,675 3.844 20-24 21,052 20,337 5,921 401 25-29 18,256 16,621 1,253 98 30-34 14,989 13.804 352 36 35-39 13,205 12,500 211 IS 40-44 12,218 11,325 226
45-49 9,184 9,419 132 19 50-54 9,960 8,502 195 11 55-59 5,177 5,026 66 60-64 6,400 7,189 16 5 65-69 3,417 3,413 21
70+ 6,113 6,978 46 5
~ ~'"' anzr 493,676 435,752 274,888 207,396 . URBAN All ages
0-9 111 ,957 111,811 111,957 111,817 10-14 58,251 52,823 57,642 51,225 15-19 55,104 46,420 51,710 30,387 20-24 55,\117 47,228 36,896 10,477 25-29 42,859 38,139 10,800 1,821 30-34 35,161 27,270 2,395 474 35-39 29,548 23,983 829 168 40-44 24,462 20,235 532 147 45-49 21,222 18,068 344 119 50-54 18,679 14,355 343 64 55-59 11,729 9,294 188 49 60-64 12,134 10,346 276 41 65-69 5,933 5,471 118 20 70+ 10,030 9,71$ 118 H
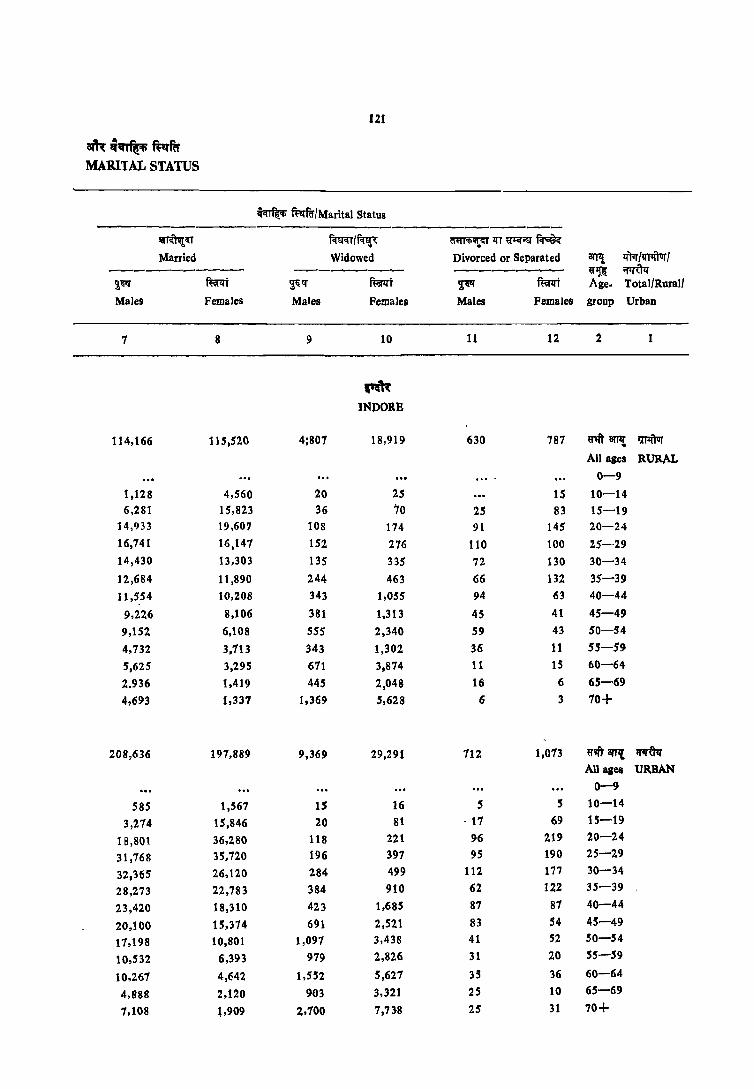
121
am:q~~ftr MARITAL STATUS
~ ~/Marital Status
~<rr mm/~'l; ~<rrlfT~Pt:r~
Married Widowed Divorced or Separated arf!! lfFr Imtft'or I ----------- ------ -------- ~~ ~ 2,m mt ~I!f ft:ilrlft ~lI!f ~t Age. Total/Rural/
MaleS Females Males Females Males Females groUP Urban
7 8 9 10 11 12 2
~ INDORE
114,166 115,520 4;807 18,919 630 787 mftSWi ~ All ages RUR/.L
0-9
1,128 4,560 20 25 15 10-14 6,281 15,823 36 70 25 83 15-19
14,933 19,607 108 174 91 145 20-24
16,141 16,147 152 276 110 100 25-29 14,430 13,303 135 335 72 130 30-34
12,684 11,890 244 463 66 132 35-39
11,554 10,208 343 1,055 94 63 40-44
9,226 8,106 381 1.313 45 41 45-49
9,152 6,108 555 2,340 59 43 50-54
4,132 3,713 343 1,302 36 11 55-59
S,625 3,295 671 3,874 11 15 60-64
2.936 1,419 445 2,048 16 6 65-69
4,693 1,337 1,369 5,628 6 3 70+
208,636 197,889 9,369 29,291 712 1,073 ~'fft ant iNfI"q
All asel URB/.N
0-9
58S 1,567 15 16 5 5 10-14
3,274 15,846 20 81 . 17 69 15-19
18,801 36,2S0 118 221 96 219 20-24
31,768 35,720 196 397 95 190 25-29
32,365 26,120 284 499 112 177 30-34
28,273 22,783 384 910 62 122 35-39
23,420 18,310 423 1,685 87 87 40-44
20,100 15,374 691 2,521 83 54 45-49
11,198 10,801 1,097 3,438 41 52 SO-54
10,532 6,393 979 2,826 31 20 55-59
10,267 4,642 1,552 5,627 35 36 60-64
4,888 2,120 903 3,321 25 10 65-69
7,10S 1,909 2,700 7,nS 25 31 70+

122
'1-1 8l1!J, ~,~ C-l AGE, SEX AND
ffi~ ~¥ffu/Marital Status
~ tlf;fflljl(l 'Ifqft ~/~! Total Population Never Married ~ ------------- ------------TotallRural/ iIfTl{.~i{ ~ ~, ~ f~lff
Urban Age-group Males Females Males Females
2 3 4 IS
qf~~ WEST NIMAR ,1,.-(
l£)1r ~Wr 3fT!! 834.646 796,297 466,026 387,853
TOTAL All ales
0-9 252,113 253,921 252,173 253,921
10-14 114,489 104,835 112,842 99,201
15-19 17,361 66,634 64,369 29,421
20-24 69,096 66,123 25,813 3,981
25-29 59,130 56,682 5,972 603
30-34 51,642 47,825 1,895 255
3S-3~ 44,386 41,514 720 82
40-44 39,140 34,927 594 60
45-49 31,899 30,S07 362 20
50-54 29,031 24,714 333 26
55-59 16,431 18;5n 166 20
60-64 20,696 19,694 240 10
65-69 11,856 11,802 113 5
70+ 16,999 18,278 191 46
Vm ~Wr 8fp! 708,200 681,561 391,031 330;892
RURAL All ages
0-9 220,945 221,929 220,945 221,929
10-14 98,046 89,235 96,483 84,042
IS-19 62,211 55,031 49,997 21,829
20-24 54,391 55,881 16,168 2,319
2S-29 49,598 47,978 3,825 339
30-34 43,605 40,831 1,370 135
3S-39 37,475 35,196 548 50
40-44 32,946 29,700 449 41
45-49 26,716 26,415 296 15
SO-54 25,101 20,898 247 26
SS-S9 14,063 16,253 125 20
60-64 18,089 16,733 186 10
65-69 10,214 10,026 80 5
70+ 14,488 1$ ,325 127 26
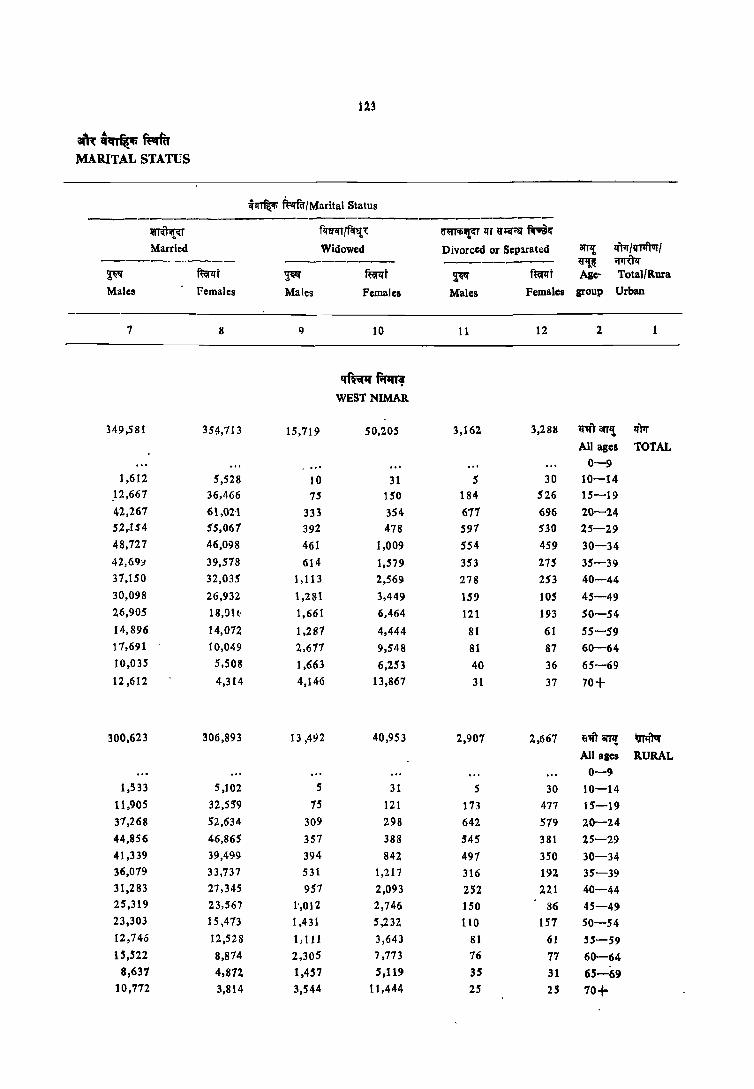
U~
am:q",~ ~ MARITAL STATUS
~~ ~/Marital Status ------------------------------------
~iU fcr~/fq'!'l: tfffiili~ II'T ~RI';:1:1 fcri9~
Married Widowed Divorced or Sepnated al'Tl!; li'tlf /'lTtft1lf / --------- -------- ------- ~ ~ ~ mt ~ mt ~ f~t Age- Total/Rura
Males Females Males Females Males females sroup Urban
7 8 9 10 11 12 2 1
qf~~ WEST NIMAR
349,581 354,713 15,719 50,205 3,162 3,288 ~'I{T arr,! ifPI' All ages TOTAL
0-9 1,612 5,528 10 31 5 30 10-14
l2,667 36,466 75 150 184 526 15-19
42,267 61,02'1 333 354 677 696 20-24 52,.154 55,067 392 478 597 530 25-29 48,727 46,098 461 1,009 554 459 30-34 42,69:;1 39,578 614 1,579 353 275 35-39 31,150 32,035 1,113 2,569 278 253 40-44 30,098 26,932 1,281 3,449 159 105 45-49 26,905 IS,OIl, 1,661 6,464 121 193 50-54 14,896 14,012 1,281 4,444 81 61 55-59 11,691 10,049 2,611 9.548 81 87 60-64 10,035 5,508 1,663 6,253 40 36 65-69
12,612 4,314 4,146 13,867 31 37 70+
300,623 306,893 13,492 40,953 2,907 2,667 ij'lft arT1! i;rr;ft'ar
All ases RURAL
0-9 1,533 5,102 5 31 5 30 10-14
11,905 32,559 75 121 173 477 15-19
37,268 52,634 309 298 642 579 20-24
44,856 46,865 357 388 545 381 25-29
41,339 39,499 394 842 491 350 30-34 36,019 33,737 531 1,217 316 192 35-39 31,283 27,345 957 2,093 252 221 40-44 25,319 23,567 1',012 2,746 150 86 45-49 23,303 15,473 1,431 5,232 110 157 SO-54 12,746 12,528 1,111 3,643 81 61 55-59 15,522 8,814 2,30S 7,773 76 77 60-64
8,637 4,8n 1,457 5,119 35 31 65-69 10,712 3,814 3,544 11,444 25 2S 70+

124
'H an~, "'/~ C.l AGE, SEX ANa
;jifT~ ft:¥1fu/Marital Status --_ J<'f ;;r;mi!l'T ~
~'"pr/~/ Total Population Never Muried ~ ------------- -------------Total/Rural/ an,! ~1J~ ~ ffifl1t ~~ mt Urban Age.group Males Females Males Females
2 3 4 5 6
qf~~,
WEST NIMAR
ifl1fri «~ ilfll! 126,446 114,730 74,995 56,961 URBAN All ages
0-9 31,229 31,992 31,229 31,992 10-14 16,443 15,601 16,359 1 '),159 15-19 15,149 11,603 14,372 7,593 20-24 14,104 10,242 9,646 1,662 25-29 'l,532 8,105 2,148 264 30-34 8,038 6,995 525 120 35-39 6,911 6,318 172 32 40-44 6,194 5,227 145 19 45-49 5,123 4,092 65 6 SO-54 3,929 3,816 86 55-59 2,368 2,345 41 60-64 2,607 2,961 S4 65-69 1,642 1;i76 33 70+ 2,511 2,954 64 20
'" f~, 2~ EASTNIMAR lfPr ~~~ 594,843 558,737 328,262 2S7,903 TOTAL All ages
0-9 167,285 160,354 161,285 160,354 10-14 79,287 71,460 78,532 68,122 15-19 58,202 49,197 51,677 23,043 20-24 48,698 48,699 21,685 4,819 25-29 43,207 40,208 5,292 771 30-34 36,001 34,106 1,340 259 35-39 32,527 30,922 587 122 40-44 28,682 26,925 481 132 45-49 26,113 23,389 380 68 SO-54 21,967 19,915 292 1.1 H-59 14,132 14,086 145 20 60-64 15,300 14,791 180 18 65-69 9,256 10,094 89 10 70+ 13,406 14,455 183 26
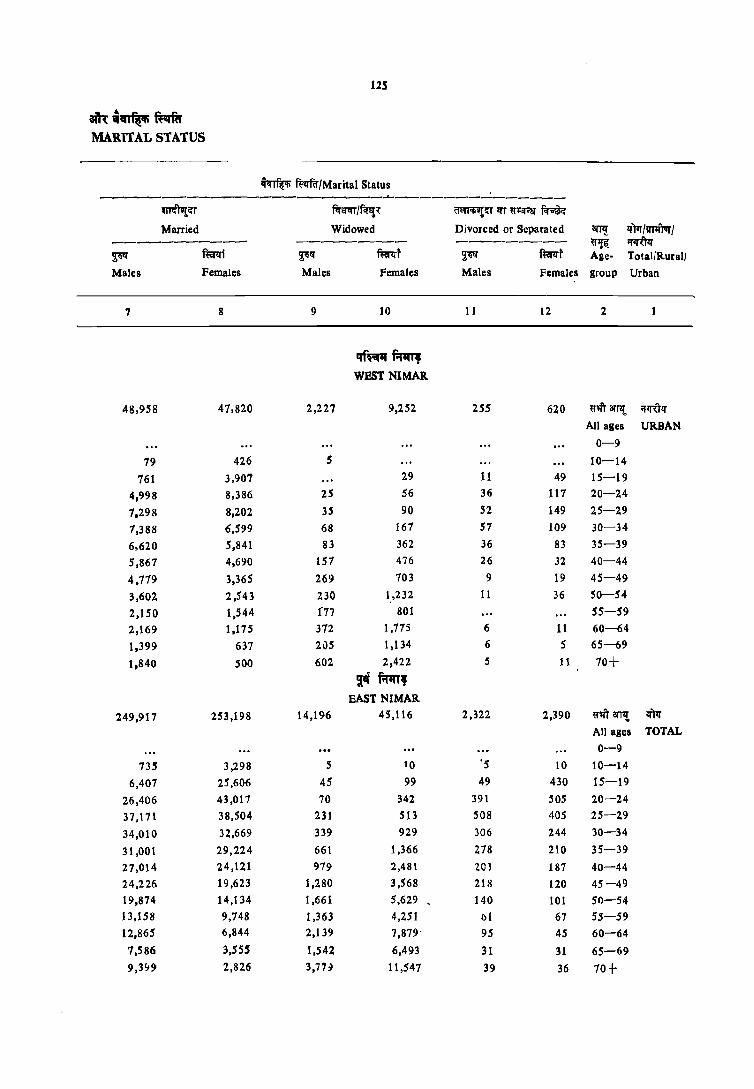
12S
am: ~~ ft:vnR MARITAL STATUS
<1<rr%'li mrfir/Marital Status ----------------------~--------------
~ll!,~T fcr"~ /fcr"f!"{ 6<'Tl~~ 1fT ij"l'VW ~
Married Widowed Divorced or Separated orr,! lJ'm /!I1lft"ur / ---------- ---------- ------- ij"~ ~ ~ mi ~1!1' ~ll"f ~tI!I' f~r Age- Total/Rurall
Males Females Males females Males Females group Urban
7 8 9 10 II 12 2
qf~ f.m'¥ WEST NIMAR
48,958 47,820 2,227 9,252 255 620 ij"m OTTlf. ijlJ"{Tq
All ages URBAN
0-9
79 426 5 10-14
761 3,907 29 11 49 15-19
4,998 8,386 25 56 36 117 20-24
7.298 8,202 35 90 52 149 25-29
7,388 6,599 68 161 51 109 30-34
6,620 5,841 83 362 36 83 35-39
5,867 4,690 151 476 26 32 40-44
4,779 3,365 269 103 9 19 45-49
3,602 2,543 230 1,.232 11 36 SO-54
2,150 1,544 1"17 801 55-59
2,169 1,115 312 1,115 6 11 60-64
1.399 637 205 1,134 6 5 65-69
1,840 500 602 2,422 S 11 10+
~~ form, EAST NIMAR
249,917 253,198 14,196 45,116 2,322 2,390 ij"'liT 8TTl{. lJ'TlJ'
All ages TOTAL
0-9
73!1 3,298 S 10 '5 10 10-14
6,401 25,6<M 45 99 49 430 15-19
26,406 43,017 70 342 391 50S 20-24
37,171 38,504 231 513 508 405 25-29
34,010 32,669 339 929 306 244 30-34
31,001 29,224 661 1,366 278 210 35-39
27,014 24,121 979 2,481 ~G3 187 40-44
24,226 19,623 1,280 3,568 218 120 45-49
19,814 14,134 1,661 5,629 140 101 SO-54
13,158 9,748 1,363 4,251 ()1 67 55-59
12,865 6,844 2,139 7,879 95 45 60-64
7,586 3,555 1,542 6,493 31 31 65-69
9,H9 2,826 3,7H 11,547 39 36 70+

126
If-I 8T1'!, '~1J'l' C-I AGE. SEX AND
<l<fm:'!i ~fQ/Marital Status ------------
~;;r;:ffi~T 'ti<n't lfw/~1 Total Population Never Married ~lJ'U<r _------------TotaIlRural! 3l11l ~ ~tf f~t ~~ ~f
Urban Age-group Males Females Males Females
2 3 4 5 6
'" ~, EAST NIMAR
~r+ftvr {l'll'f or~ 434,481 409,893 233,358 184,133 RURAL All ages
0-9 126,837 121,785 126,837 121,78' to--14 58,268 51,817 57,623 48,796
15-19 39,621 33,154 33,734 11,857 20-H 32,697 34,001 10,669 1,284 25-29 30,996 29,208 2,291 162 30-34 26,132 24,742 671 47 35-39 23,891 21,900 333 46 40-44 20,397 19,485 298 51 45-49 18,854 17,510 242 16 50-54 16,234 14,813 196 16 55-59 10,956 11,110 'l9 10 60-64 11;,29 11 ;381 12')
(,5-69 1,384 7,937 55 5 10+ 10,358 10,1;62 130 10
;:pr(Jl!' ~'ii't 0fTlL 160,356 148,844 94,904 13,110 URBAN All ages
0-9 40,448 38,569 40A48 38,569 10-14 21,019 19,643 20,909 19,326 15-19 18,581 16,043 17,9,43 11,186 20-24 16,001 14,697 11,016 3,535 25-29 12,211 11,000 3,001 609 30-'4 9,896 9,364 669 212 )5-39 8,635 9,022 254 11 40-44 8,28:> 1,440 183 81 45-49 7,258 5,879 137 52 50-54 5,734 5,t02 96 26 55-59 1,716 2,976 S9 11 60-64 3,571 3,409 60 18 65-69 1,872 2,157 33 S 70+ 3,048 3,494 53 16

127
aft'( qcn'" "",m MARITAL STATUS
~~ f~a/Marital Status --------
I!l'R~'U Rrn/~, i'r.IT'f>I!l''U ll'T lT~CT ~G
Married Widowed Divorced or Separated anI! If''ttrI~1 ---------- ------- --------- lT~ iI1lW:r ~.r ~t ~ rnr:rt ~ ft:orlft Age- Total/Rural Males Females Males Females Males Females grOUP Urban
7 8 9 10 11 12 2 1 --1iif~
EASTNIMAR
188,599 190,599 10,429 33,314 1,995 1,687 ~r arTI{ lI'TllTor
All ages RURAL 0-9
630 2,991 5 10 5 10 10-14
5,778 20,356 40 83 49 339 15-19
21,462 32,136 156 231 368 341 20-24
28,103 28,419 185 336 417 275 25-29
24,966 23,847 241 69S 248 148 30-34 22,828 20,773_ 511 959 219 123' 35-39 19,223 17,550 703 1,736 167 147 40-44 17,511 14,862 906 2,542 195 85 45-49 14,726 10,663 1,186 4,048 126 81 SO-54 9,895 1,884 909 3,154 61 62 55-59 9,978 5,564 1,535 5,783 86 30 60-64 6,898 2,781 1,190 5,130 31 15 65-69 7,338 2,243 2,861 8,657 24 31 70+
61,318 62,599 3,767 11,742 327 703 lT1iT~ ~ All ages URBAN
0-9 104 307 10-14 629 4,750 :> 16 91 15-19
4,944 10,881 14 111 23 164 20-24 9,068 10,084 47 117 90 129 25-29 9,044 8,823 98 234 57 96 30-34 8,172 8,451 150 407 59 88 35-39 7,791 6,570 276 745 36 40 40-44 6,71S 4,762 374 1,025 22 35 45-49 5,148 3,471 475 1,580 1 ~ 20 50-54 3,263 1,863 454 1,097 5 55-59 2,887 1,280 604 2,096 10 15 60-64 1,488 774 351 1,363 15 65-69 2,060 583 919 2,890 15 5 70+
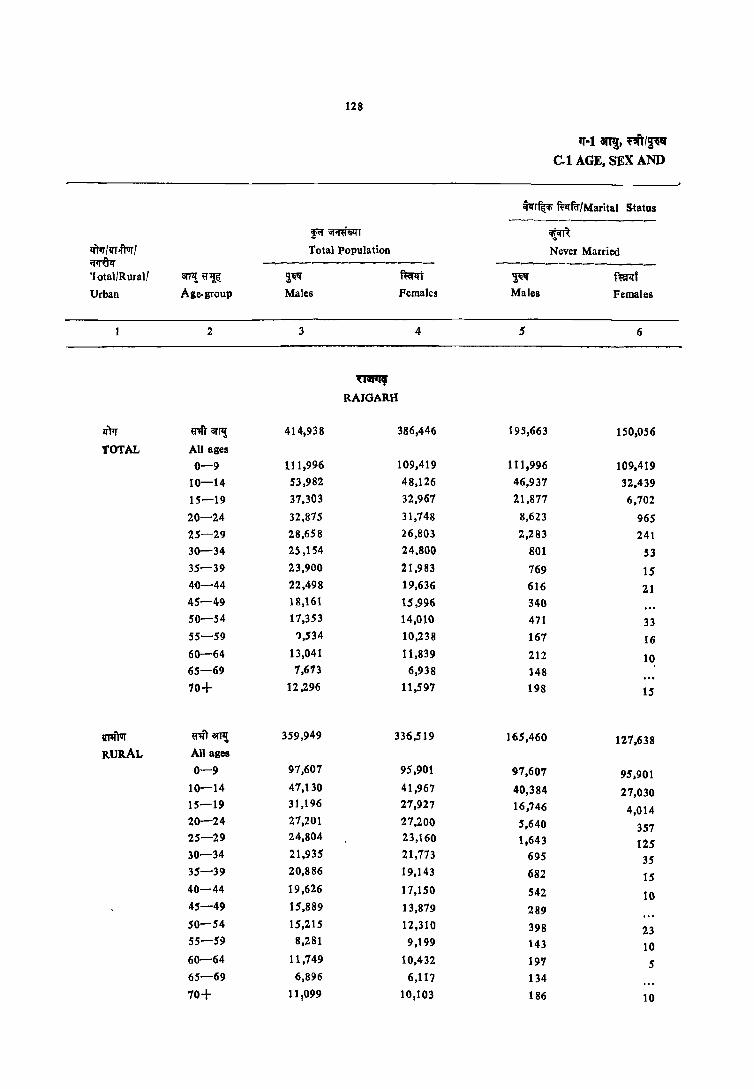
128
'H aJl!, ~Ii~ C.l AGE, SEX AND
;!f;rr~ ~fu/Marital Status ----------
f"r~r ~m lfPr 1'lT.frvr / Total Population Never Married ~ ------------- ------ .. _-----'( otal/R ural/ arTl! '1~ !!q1{ ffiflfT ~ fmt Urban Age·group Males Females Males Females
2 3 4 5 6
~ RAJGARH
lfFr «'Iff arfl! 414,938 386,446 195,663 150,056
TOTAL All ages
0-9 111,996 109,419 111.996 109,419
10-14 53,982 48,126 46,937 32,439
15-19 37,303 32,967 21,877 6,702
20-24 32,875 31,748 8,623 965 25-29 28,658 26,803 2,283 241 30-34 25,154 24,800 801 53 35-39 23,900 21,983 769 15 41>-44 22,498 19,636 616 21 45-49 18,161 15,996 340 SO-54 17,353 14,010 471 33 55-59 '),534 10,238 167 16 60-64 13,041 11,839 212 10 65-69 7,613 6,938 148
70+ 12,296 11,597 198 15
V11I'fur 'I"" ar~ 359,949 336,519 165,460 127,638 RURAL All ages
0-9 91,607 95,901 97,607 95,901 10-14 47,130 41,967 40,384 27,030 15-19 31,196 27,927 16,746 4,014 20-24 27,201 27,200 5,640 357 25-29 24,804 23,160 1,643 125 30-34 21,935 21,113 695 35 35-39 20,886 19,143 682 15 40-44 19,626 17,150 542 10 45-49 15,889 13,879 289 SO-54 15,215 12,310 398 23 55-59 8,281 9,199 143 10 60-64 11,749 10,432 197 5 65-69 6,896 6,117 134
70+ 11,099 10,103 186 10
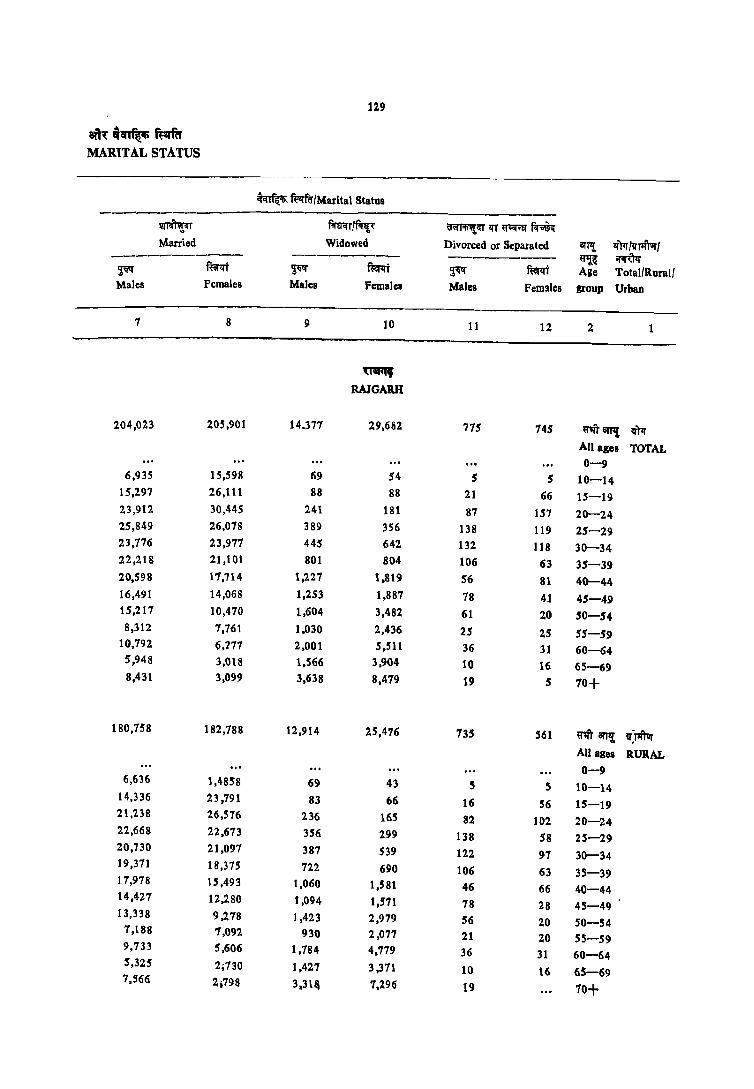
129
sft~ q~ ~ftr MARIT AL STATUS
~. ~/Marital Status
---------------------------------------~ mrcrT/~ ~~I{f~~f~ Married Widowed Divorced or Separated arT!! 11m /lrT1frir / ---------- ------_ ------- ~ ~
~ f~ ~ mm ~Ii ffim Age Total/Rural/ Males Females Males females Males Fem3les grOUP Urban
7 8 9 10 11 12 2 1
mIIIl RAJGARH
204,023 20S ,901 14.377 29,682 775 745 ~1iIFi q-m All ages TOTAL 0-9
6,935 15,598 69 54 5 5 10-14 15,297 26,111 88 88 21 66 15-19 23,912 30,445 241 181 87 157 20-24 25,849 26,078 389 356 138 119 25-29 23,776 23,977 445 642 132 118 30-34 22,218 21,101 801 804 106 63 35-39 20,598 11,714 1,227 1,819 56 81 40-44 16,491 14,068 1,253 1,887 78 41 45-49 15,217 10,470 1,604 3,482 61 20 50-54 8,312 1,761 1,030 2,436 25 25 55-59
10,192 6,771 2,001 5,511 36 31 60-64 5,948 3,018 1,566 3,904 10 16 65-69 8,431 3,099 3,638 8,479 19 5 70+
180,758 182,788 12,914 25,476 735 561 ~111'111 lI'~~ All ages RURAL 0-9
6,636 1,4858 69 43 5 S 10-14 14,336 23,191 83 66 16 56 15-19 21,238 26,576 236 165 82 102 20-24 22,668 22,613 356 299 138 58 25-29 20,730 21,091 387 539 122 97 30-34 19,311 18,375 722 690 106 63 35-39 17,918 15,493 1,060 1,581 46 66 40-44 14,427 12,280 t ,094 1,571 78 28 45-49 13,338 9,278 1,423 2,979 56 20 SO-54
7,188 1,Q92 930 2,077 21 20 55-59 9,733 5,606 1,784 4,779 36 31 60-64 5,325 2;730 1,427 3,371 10 16 65-69 7,566 2;798 313111 7,296 19 70+

130
If-I an~ ~/~ C-l AGE, SEX AND
cm~ ~~ff/Marital Satus -----------
p ;;r;mli'l'r ~m !iNti fIftvr / TOlal Population Never Married ~ ------------- -------------Total/Rurat/ 81Tl! ~~ 'tl "
~t Ifl" .. fi>i:flit Urban AIColfouP Males Females Males Females
2 3 4 5 6
mrq RAJOARH
~ ~uft anI{ 54,989 49,921 30,204 22,418 URBAN All ages
0-9 14,389 13,519 14,389 13,519 10-14 6,852 6,159 6,553 5,408 15-19 6,101 5,039 5,130 2,687 20-24 5,673 4,548 2,983 607 25-29 3.854 3,643 639 116 30-34 3,219 3,027 105 24 35-39 3,014 2,840 87 40-44 2,872 2,485 74 11 45-49 2,272 2,117 50 50-54 2,138 1,700 13 5 55-59 1,253 1,039 25 6 60-64 1,291 1,407 15 5 65-69 717 821 14
70+ 1,197 1,494 12 5
fcfcmt VIDJSHA
liN ~'ff1<111"\ 416,356 366,742 222,616 160,640
TOTAL All ages
0-9 123,278 115,930 123,278 115,930 10-14 54,313 42,899 53,183 36,578 15-19 36,743 30,551 28,401 6,516 20-24 33,680 31,998 10,683 1 ;197 25-29 29,336 26,550 2,731 199 30-34 24,870 23,031 1,183 60 35-39 23,356 20,157 837 7 40-44 20,869 17,654 692 30 45-49 17,443 14,444 480 29
50-54 15,817 12,3.39 480 14
55-59 9;571 8,167 210
61)-64 11,562 9,771 172
65-69 5,549 4,584 65
70+ 9,397 8.481 133 14
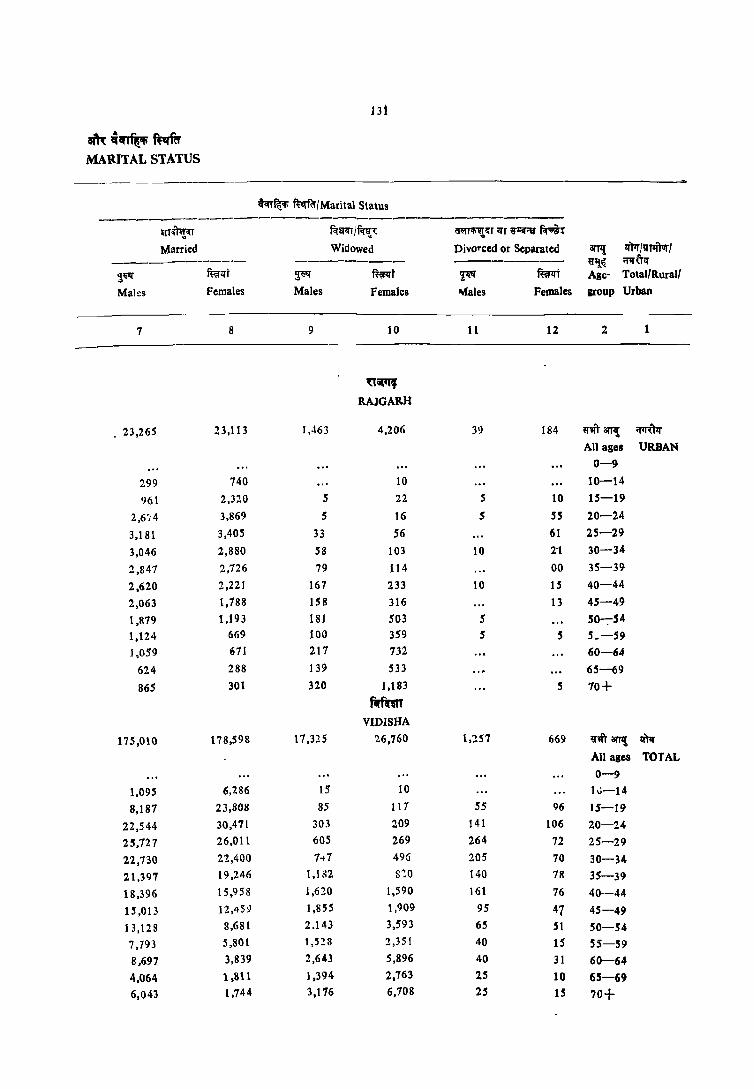
am~~~ MARITAL STATUS
Hi
<lqr~ ~fil/Marital Status ------------------------------------
~r~'"I~ f<!~ If.nirl: 6<U~~T zrT ~ f.r;;i~
Married Widowed Divorced or Separated ----------- -------- ---------$~ fmqj ~ my ~ fmzrt Males Females Males Females ~ales Females
7 8 9 10 11 12
'a'~
RAJGARH
. 23,265 23,113 1,.163 4,206 39 184
299 740 10
961 2,320 5 22 5 10
2,6',4 3,869 5 16 5 55
3,181 3,405 33 S6 61
3,046 2,880 58 103 10 2'1
1,841 2,126 79 114 00
2,620 2,221 167 233 10 15
2,063 1,188 158 316 13
1,879 1,193 181 503 5
1,124 669 100 359 5 5
1,059 611 217 732
624 288 139 533
865 301 320 1,183 5
Rmn VIDISHA
175,010 178,598 17,325 26,760 1,257 669
1,095 6,286 15 10
8,187 23,808 85 117 S5 96
22,544 30,471 303 209 141 106
25,727 26,011 605 269 264 72
22,730 22,400 1 ... 7 496 205 70
21,397 19,246 1,132 s~o 140 78
18,396 15,958 1,620 1,590 161 76
15,013 12,45;) 1,855 1,909 9S 47
13,128 8,681 2.143 3,S,}3 65 51
7,193 5,801 t ,528 2,35 I 40 15
8,697 3,839 2,643 5,896 40 31
4.064 1,811 1,394 2,763 25 10
6,043 1,744 3,176 6,108 2S 15
arfl! lWr /v11fr:Jr' ~~~ ;;QUq
Age- Total/Rural'
&rOUP Urban
2
'I'm OW! iftfUlI' All ages URBAN
0-9
10-14
15-19
20-24
25-29
30-34
35-39
40-44
45-49
50-:-54 5_-59
60-64
65-69
70+
~m arT!! ~ All ages TOTAL 0-9
IJ-14
15-19
20-24
25-29
30-34
35-39
40-44
45-49
50-54
55-59
60-64
65-69
70+

131
If-t 8ll!, ","IJ~ C-l AGE, SEX AND
~ ft.1!fffl"/Marital Status -----------
~ l;A~ilfT ~ ll'tif 'JTTIfIuJ I Total Population Never Married ~ ----------TotalfRurall BITll: ~ ,!'q' noro tt'lill' ft.?rrj Urban Age-group Males Females Males Females
1· 2 3 4 5 6
f.mrr VIDlsHA
vp:r')qr IJ~ arl'l! 345,243 304,950 180,669 130,929 RURAL All ages
0-9 104,426 98,656 104,426 98,656 10-14 45,170 34,874 44,126 28,951 15-19 28,467 24,390 20,718 2,947 20-'].4 25,903 25,861 5,851 233 25-'].9 24,145 21,108 1,781 37 30-34 20,456 19,382 1,001 26 35-39 19,965 19,886 732 40-44 17,87S 14,667 613 20 45-49 14,566 11,884 427 15 SO-54 13,204 10,407 403 14 55-59 8",166 6,930 200 60-64 9,990 8,302 162 65-69 4,740 3,875 S5 70+ 7,938 7,021 86 S
~ ~8TfIt 71,113 61.192 42,007 29,111 URBAN All ages
0-9 18.852 17.274 18,852 17.'2.74 10-14 9,143 8,024 2,057 7,628 15-19 8,216 6,167 1;683 3,569 20-24 7,777 6;131 4,826 964 25-29 5,191 4,84'2. 949 161 30-34 4,414 3,649 182 34 35-39 3,591 3,210 lOS t 40-44 2,994 2,986 78 10 45-49 '1.,877 2,560 S3 14 50-54 2,613 1,933 77 55-59 1,405 1,238 10 60-64 1,513 1,469 10 65-69 809 709 10 70+ 1,459 1,454 48 9

133
SlR ~qrf~ ft:~f~ MARITAL STATUS
~m:'fi fNf~/M:lrital Stutus ----------------------------~-------------
1!T~T~~r Ft'bT9T IN~\ G"\1T'lll1L<n IlT ~~;:~ ~~
Married WidJwed Divorced or Separated anI! !fFr /lJlliTvr ------------ --------- -------- Bli~ 'flliT'l' ~ f~i;!l(t ~ f~iP:rt ~~ f~l(t Age- Total/Rural!
Males Females Males Females Males Females group Urban
7 8 9 10 11 12 2
fCf~~ VIDISHA
147,892 151,128 15,416 22,291 1,156 541 ij"~r arr1! il"Fffur
All ages RURAL
0-9 1,009 5,889 15 10 10-14
7,609 21,250 80 91 50 16 15-19
19,621 25,388 288 160 136 70 20-24
21,600 21,400 522 214 231 51 25-29
18,600 18,887 668 413 186 55 30-34
17,960 16,134 1,139 669 135 78 35-39
15,616 13,240 1,499 1,347 146 61 40-44
12,355 10,321 1,699 1,511 86 36 45-49 10,809 7,326 1,932 3,021 60 46 SO-54 6,581 4,983 1,344 1,932 35 15, 55-59 7,435 3,240 2,341 5,041 40 21 60-64
3,435 1,550 1,224 2,314 25 10 65-;-69 5,132 1,465 2,690 5,542 20 15 70+
27,118 27,470 1,849 4,469 101 128 ij"~T Olfl! ;r]'U!f
All ages URBAN 0-9
86 397 10-14
578 2,558 5 21 5 20 15-19
2,922 5,083 15 49 5 36 20-24
4,127 4,611 82 55 21 15 25-29
4,130 3; 512 78 83 20 15 30-34
3,437 3,112 43 151 5 35-39 2,799 2,718 121 243 15 15 40-44
2,659 2,138 156 397 10 11 45-49' 2,320 1,355 212 572 5 5 50-54 1,206 819 184 419 5 55-59 1,262 599 296 855 11 60-64
629 260 170 449 65-69 911 279 486 1,165 5 70+
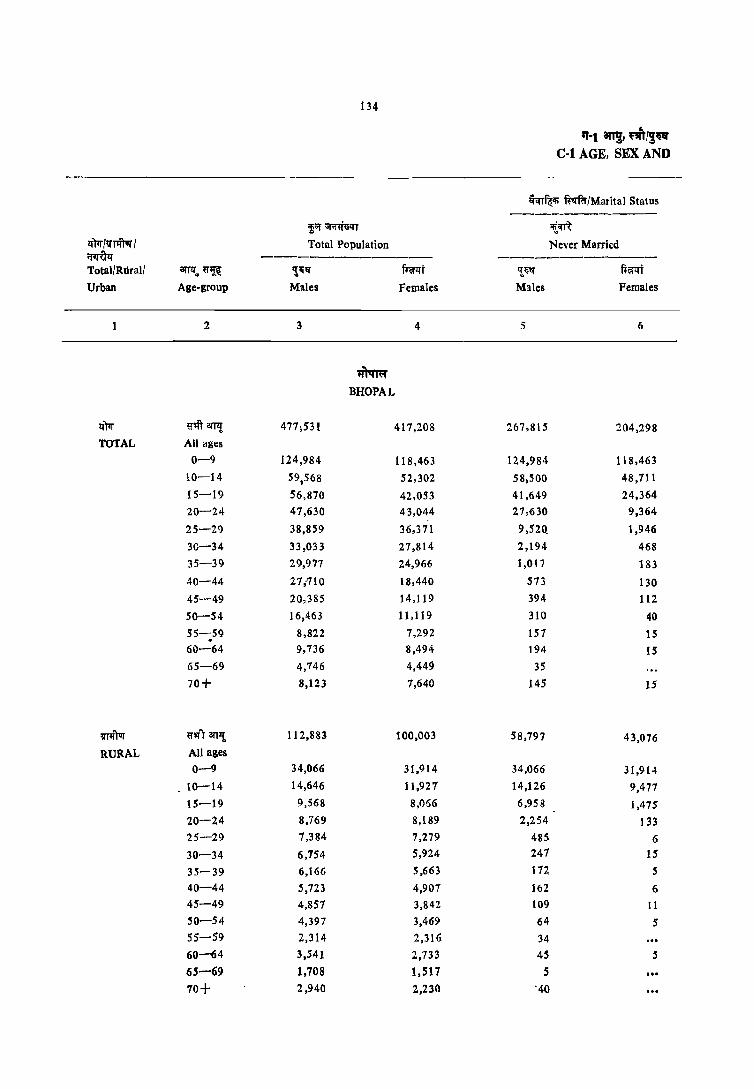
134
If-t 31111 ~/~" Cot AGE. SEX AND
hm'li ftv:rfu/Marital Status --------------
~\'T~ij~T ~m lfFr/l111ftur / Total Population Never Married ~ -------------- -------------Total/Rural! arr~ .. ij"~ ,!1i1!f mt ~1i1!f ftrn Urban Age-group Males Females Males Females
2 3 4 5 6
~ BHOPAL
If)lr ij"'Ift OTT!! 477;531 417,208 267,815 204,298
TOTAL All ages
0-9 124,984 118,463 124,98'~ 118,463
10-14 59,568 52,302 58,500 48,711
15-19 56,870 42,053 41,649 24,364
20-24 47,630 43,044 27,630 9,364
25-29 38,859 36,371 9,520. 1,946
3C-34 33,033 27,814 2,194 468
35-39 29,977 24,966 1,017 183
40-44 27;-710 18,440 573 130
45-49 20,385 14,119 394 112
50-54 16,463 11,119 310 40
55-59 8,822 7,292 151 15 . 60-64 9,736 8,494- 194 15 65-69 4,746 4,449 35
70+ 8,123 1,640 145 15
m'PT ij"'qT anI! 112,883 100,003 58,797 43,076
RURAL All ages
0-9 34,066 3 [,914 34,066 3[,914
10-14 14,646 11,927 14,126 9,477
15-19 9,568 8,066 6,958 1,475
20-24 8,769 8,189 2,254 133 25-29 7,384 7,279 485 6 30-34 6,754 5,924 247 15
35-39 6,166 5,663 112 5
40-44 5,723 4,907 162 6 45-49 4,851 3,842 109 11 50-54 4,397 3,469 64 5' 55-59 2,314 2,316 34 60-64 3,541 2,733 45 5
65-69 1,708 1,517 5
70+ 2,940 2,230 -40

13$
~'~ft:dt MARITAL STATUS
~ ~<f/Marital Status
~iIT f<!<r;rr I~<: ~!U liT ~;:cr f.r~:{
Married Widowed Divorced or Separated aIT,! lim Iv Tiftvi'I ---------~--- -------- -------- ~I{ ;.pJ~
~<r fuirlfT ~!f ffirq-t 2:11'1' ffirlft Age- l alail Rurall
Males Females Males Females Males Females group Urban
7 8 9 10 11 12 2
~
BHOPAL
200,031 187,594 8,910 24,536 609 711 u'II1 arTl{ lfPr All ages TOTAL 0-9
1,021 3,552 15 20 10-14
S ,1,48 17,509 50 86 76 15-19
19,752 33,358 153 172 69 135 20-2,4
28,982 33,973 248 307 99 140 25-29
30,462 26,688 256 554 111 105 30-34
28,400 23,799 475 893 74 91 35-39
26,293 16,566 751 1,712 88 31 40-44
19,181 11,858 754 2,103 SO 40 45-49
15,035 7,995 1,065 3,060 48 2S 50-"4
7,873 4,843 759 2,410 32 . 23 55-59
8,077 3,757 1,425 4707 19 15 60-64
3,361 1,8~4 840 2,540 10 15 65-69
5,845 1,674 2,114 5,936 9 9 70+
50,202 49,837 3,566 6,857 313' 228 rnarTlt 'If rIftvr All ages RURAL 0-9
SIS 2,450 5 10-14
2,580 6,556 30 19 10 15-19
6,404 7,968 76 49 35 39 20-24
6,767 7,179 85 54 47 40 25-29
6.375 5.730 83 144 50 34 30-34
5,789 5,418 171 215 34 25 35-39 5,200 4,429 306 461 55 11 40-44 4,404 3,299 319 517 25 15 45-49 3,376 2,612 432 838 25 14 SO-54 1,983 1.687 278 624 20 5 55-59 2,875 1,283 602 1,434 15 10 60-64
1,308 678 390 823 5 15 65-69
1,106 542 789 1,678 S- 9 70+
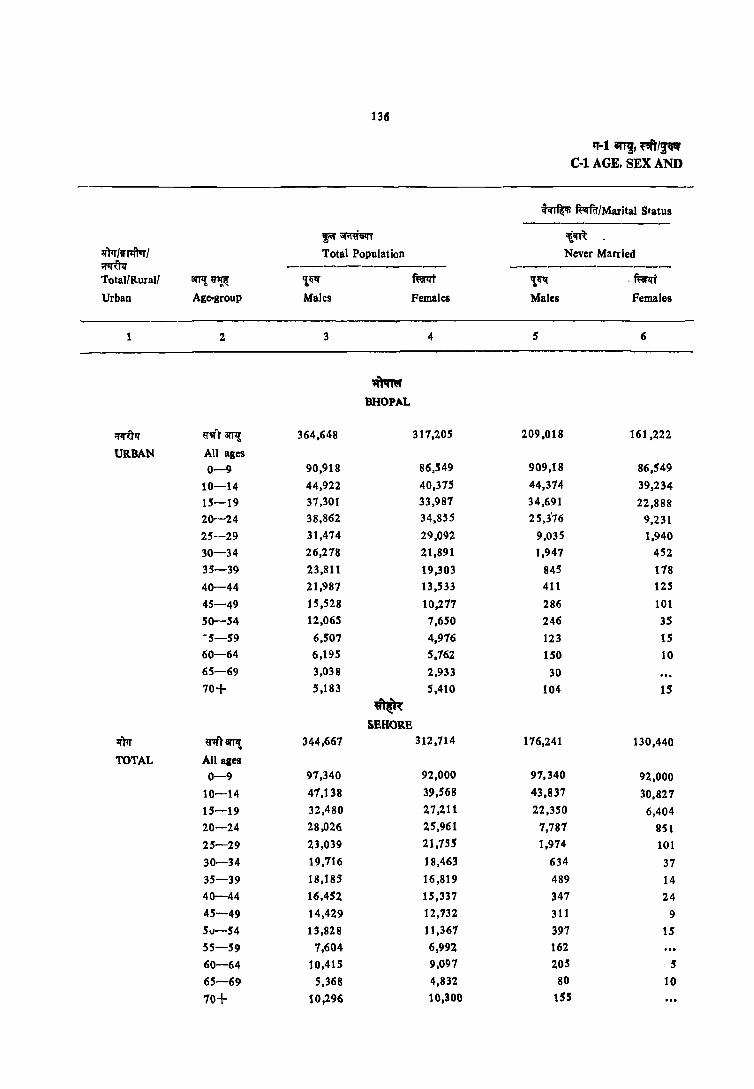
1315
"-1 an!, ~f~ C-l AGE, SEX AND
~ mmrfMarital Status ------------
~~lilI'r \m lfPr/iflfrrrf Total Population Never Manied ~ ----------- ------------Total{Rural/ arTl! ~~ '!,qq' ~ 'tqli( .mt Urban Age-group Males Females Males Females
2 3 4 5 6
""'"" BHOPIoL
~lf ~'1ft amt 364,648 311,205 209,018 161,222
URBAN All ages
0-9 90,918 86,S49 909,18 86,549
10-14 44,922 40,375 44,374 39,234
15-19 37,301 33,981 34,691 22,888 20--24 38,862 34,855 25,3'76 9,231 25-29 31,414 29,092 9,035 1,940
30-34 26,278 21,891 1,947 452
35-39 23,811 19,303 845 118
40-44 21,987 13,533 411 125
45-49 15,528 10,217 286 101
SO-54 12,065 1,650 246 35 ·5-59 6,507 4,916 123 15 60-64 6,195 5,162 150 10 65-69 3,Q38 2,933 30
70+ 5,183 5,410 104 15
~ SEHOllB
lfPr ~'lftamt 344,667 312,114 176,241 130,440
TOTAL All ages
0-9 91,340 92,000 91,340 92,000
10-14 41,138 39,568 43,837 30,821
15-19 32,480 27,211 22,350 6,404 20-24 28,026 25,961 1,781 851
25-29 23,039 21,155 1,914 101
30-34 19,716 18,463 634 37
35-39 18,185 16,819 489 14 40-44 16,452 15,337 347 24 45-49 14,429 12,132 311 9 511-54 13,828 11,361 391 15 55-59 1,604 6,992 162
60-64 10,415 9,091 205 5
65-69 5,368 4,832 80 10
70+ to,296 10,300 155
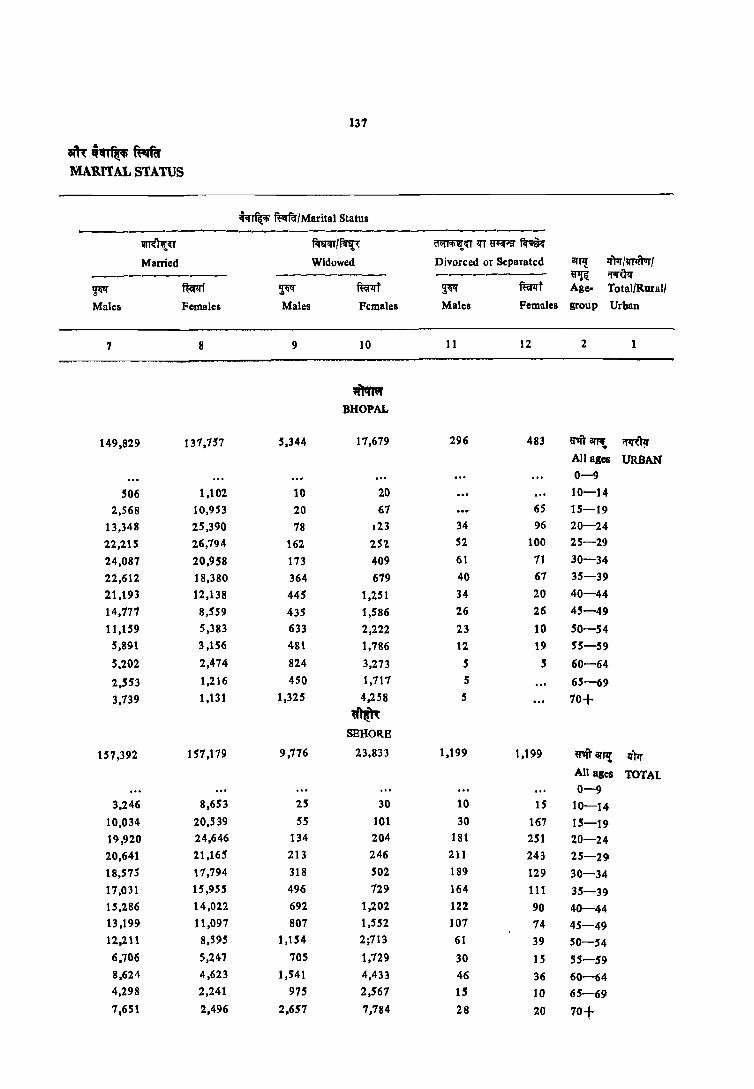
137
mi~~ MARITAL STATUS
~~ ~IMarital Status ------------------------Q1R~;rr m.rrlf?f~ ~;rr 1fT ~P!I ~
Married Widowed Divorced or Separated an,! 1f"trr/~1 --------- ------- ------- ~ if1RN ~ ffiflfi ~ mnrt ~~ ~t Age- Total/RuralJ
Males Females Males Females Males Pemales group Urban
7 8 9 10 11 12 2 1
~ BHOPAL
149,829 131,757 5,344 11,679 296 483 ~arJ1t ~~ All ages URBAN 0-9
506 1,102 10 20 10-14
2,568 10,953 20 67 65 15-19
13,348 25,390 78 123 34 96 20-24
22,215 26,794 162 252 52 100 25-29
24,087 20,958 173 409 61 71 30-34
22,612 18,380 364 679 40 61 35-39
21,193 12,138 445 1,251 34 20 40-44
14,177 8,SS9 435 1,586 26 26 45-49
11,159 5,383 633 2,222 23 10 50-54 5,8!H 3,156 481 1,786 12 19 55-59
5,202 2,474 824 3,273 5 5 60-64
2,553 1,216 450 1,717 5 65-69
3,739 1,131 1,325 4,258 S 70+
W~ SBHORE
157,392 157,179 9,776 23,833 1,199 1,199 ~aTl'; 1f)1r
All ages TOTAL 0-9
3,246 8,653 25 30 10 15 10-14
10,034 20,539 55 101 30 167 15-19
19,920 24,646 134 204 181 251 20-24
20,641 21,165 213 246 211 243 25-29
18,575 17,794 318 502 189 129 30-34
17,031 15,955 496 729 164 111 35-39 15,286 14,022 692 1,202 122 90 40-44 13,199 11,097 807 1,552 107 74 45-49 12,211 8,595 1,154 2;713 61 39 50-54 6,706 5,247 705 1,729 30 15 55-59 8,624 4,623 1,541 4,433 46 36 60-64 4,298 2,241 975 2,567 15 10 65-69 7,651 2,496 2,657 7,784 28 20 70t
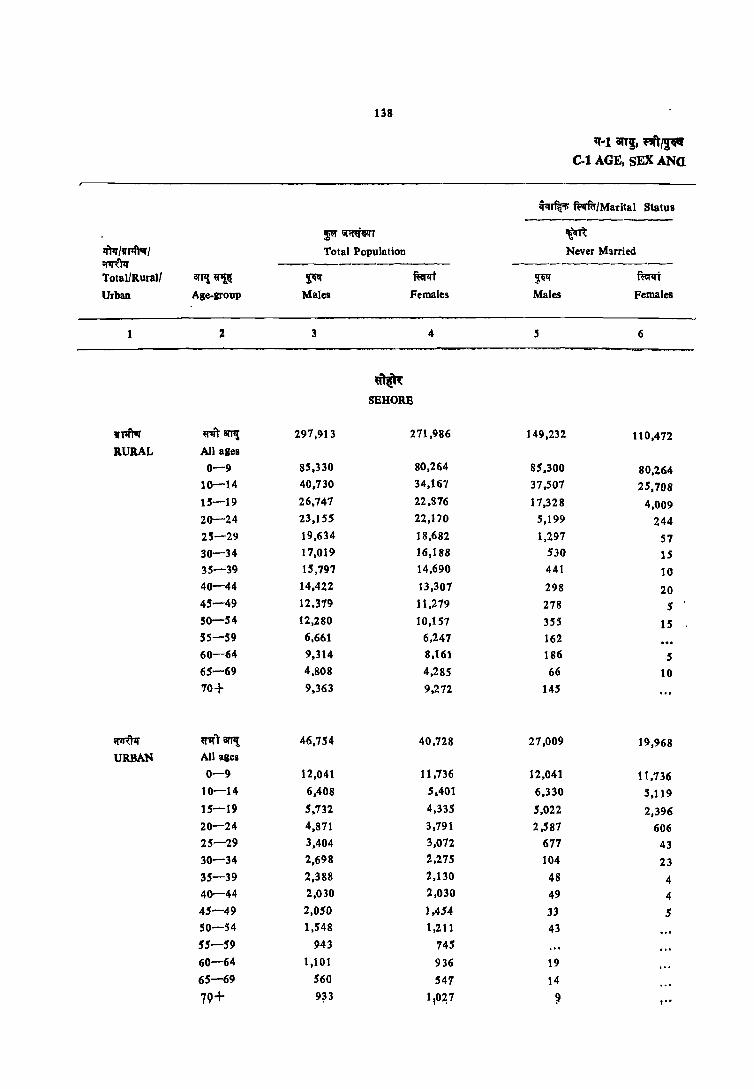
138
'T-l ani, "'"~ C.l AGE, sEX ANa
hTfQ:!; ~/Marital Status -------p iiI'lni~T ~
~)Ir /lTA'PT / Total Population Never M'lrried ~"tlf ----- -------------Total/Rural/ ai'll! ~i{ ~ ftw:rt ~~ ~t
Urban Age.group Males Females Males Females
Z 3 4 6
~ SEHORB
IT'PrTur ""arT!! 297,913 271,986 149,232 110,472 RURAL All ages
0-9 85,330 80,264 85,300 80,264 10-14 40,730 34,167 37,507 25,708 15-19 26,741 22,876 17,328 4,009 20-24 23,155 22,170 5,199 244 25-29 19,634 18,682 1,297 57 30-34 17,019 16,188 530 15 35-39 15,797 14,690 441 10 40-44 14,422 13,307 298 20 45-49 12.379 11,279 218 5 50-54 12,280 10,157 355 15 55-59 6.661 6,247 162 60-64 9,314 8,161 186 5 65-69 4,808 4,285 66 10 10+ 9,363 9,272 145
~ ~'II'1 arfl! 46,754 40,728 27,009 19,968 URBAN All ales
0-9 12,041 11,736 12,041 11,736 10-14 6,408 5,401 6,330 S,119
15-19 5,732 4,335 5,022 2,396 20-24 4,811 3,191 2,587 606 25-29 3,404 3,012 671 43 30-34 2,698 2,275 104 23 35-39 2,388 2,130 48 4 40-44 2,030 2,030 49 4 45-49 2,050 1,454 33 5 50-54 1,548 1,211 43 55-59 943 145
60-64 1,101 936 19
65-69 560 547 14
7Q+ 9~3 1!0~1 ? '"
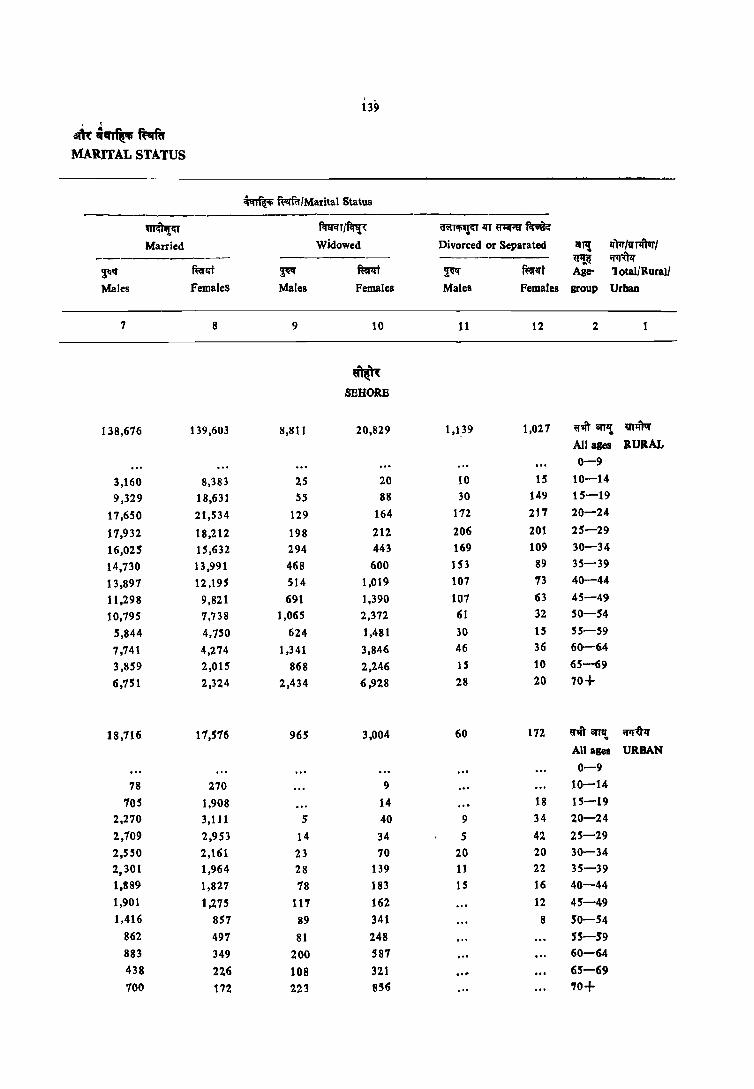
, 139
, ~a~~ MARITAL STATUS
~ ~IMarital Status
mmru mT/~ ~UIfT~~
Married Widowed Divorced or Separated illTI! liP, IV' Tlfrvrl --------~-- ---~---- ~ ;;IJ-(R
~ mrzrt ~ ~ ~ ffiflff Age- lotal/Rural/
Males FemaleS Males Females Males Females group Urban
7 8 9 10 11 12 2 1
~ SBHORB
138,676 139,603 8,811 20,829 1,1_39 1,027 ~m an" vr~ All ages RURAL 0-9
3,160 8,383 25 20 10 15 10-14
9,329 18,631 55 88 30 149 15-19
17,650 21,534 129 164 172 217 20-24
17,932 18,212 198 212 206 201 25-29
16,025 15,632 294 443 169 109 30-34
14,730 13,991 468 600 153 89 35-39
13,897 12,195 514 1,019 107 13 40-44
11,298 9,821 691 ],390 107 63 45-49
10,795 7,738 1,065 2,372 61 32 50-54
5,844 4,150 624 1,48] 30 ]5 55-59
7,741 4,274 1,341 3,846 46 36 60-64
3,859 2,015 868 2,246 15 10 65-69
6,151 2,324 2,434 6,928 28 20 70+
18,116 11,576 965 3,004 60 172 ~'Ift" art'!{, ;;q-"6"lf
All aBes UR.BAN 0-9
78 270 9 10-14
70S 1,908 14 18 15-19
2,270 3,111 5' 40 9 34 20-24
2,109 2,953 14 34 5 42 25-29
2,550 2,161 23 70 20 20 30-34
2,301 1,964 28 139 11 22 35-39
1,889 1,827 78 183 15 16 40-44
1,901 1,275 111 162 12 45-49
1,416 857 89 341 8 SO-54
862 491 81 248 55-59
883 349 200 581 60-64
438 226 108 321 ". 65-69 100 172 223 856 '10+
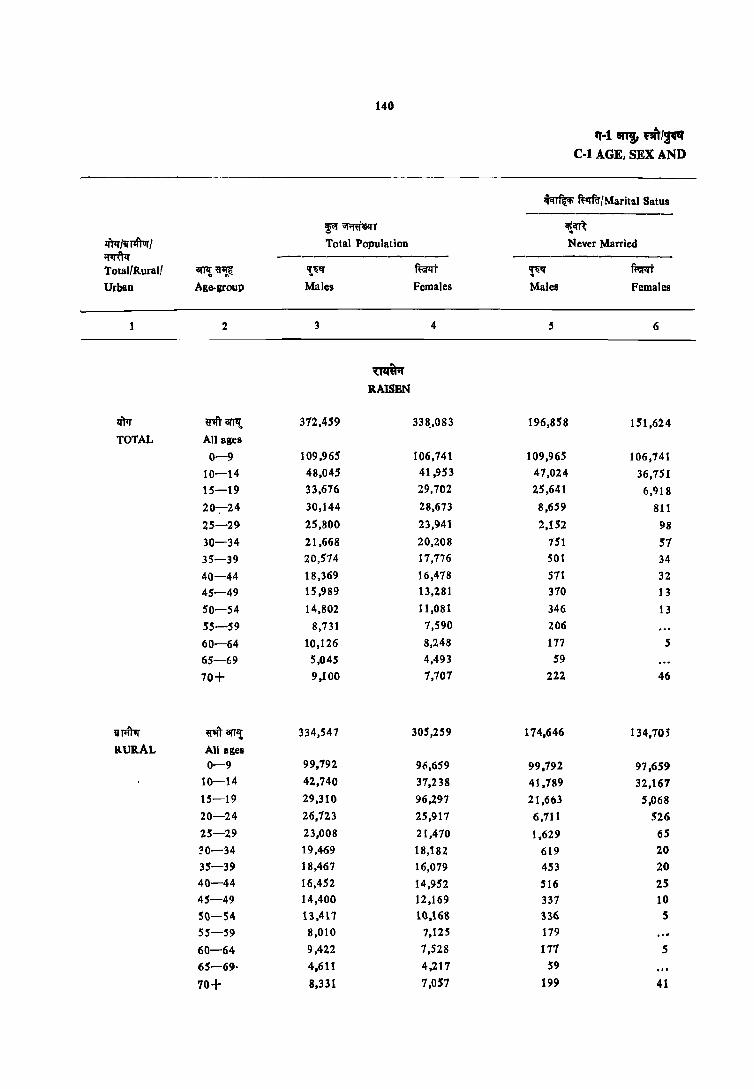
140
,,·1 an" ""'!~ Col AGE, SEX AND
~ ~"ffu!Marital Satus -----------
f<'I' ;;r;rnij!l" T 'l!m lim IV" J'Iftvr I Total Population Never Married ~ Total!Rural! arJ!i «~ 1,"i'l' mt 'I'''i'l' .. mt Urban Age-group Males Females Males Females
2 3 4 S 6
~ RAlSEN
If)lr ~'Ift Ofll{, 312.459 338 .• 083 196.858 151.624
TOTAL All ageB
0-9 109.965 106.741 109,965 106,741
10-14 48,045 41,953 47,024 36,151 15-19 33,676 29,702 25,641 6,918
20-;-24 30,144 28.673 8,659 811
25-29 25,800 23,941 2,152 98
30-34 21,668 20,208 751 57
35-39 20,514 17,176 501 34
40-44 18,369 16,418 511 32 45-49 15,989 13,281 310 13
SO-54 14,802 11,081 346 13
55-59 8,731 1,590 206
60-64 10,126 8,248 177 S
65-69 5,045 4,493 S9
70+ 9,100 1,707 222 46
iFftvr ~ClTTI! 334,547 305,259 174,646 134,10;
RURAL All agel 0-9 99,792 96,659 99,792 97,659
10-14 42,740 37,238 41,789 32,167 15-19 29,310 96,297 21,663 5,068 20-24 26,123 25,917 6,711 526
25-29 23,008 21,410 1.629 65
~0-34 19,469 18,182 619 20 35-39 18,467 16,079 453 20 40-44 16,452 14,952 516 25 45-49 14,400 12,169 337 10
SO-54 13,417 10,168 336 5 55-59 8,010 7,125 179
60-64 9,422 7,528 177 S
65-69· 4,611 4,217 S9 .. , 70+ 8,331 7,057 199 41

141
am:_~~
MARITAL STATUS
~ ft:vlfu/M3rital Stulus
-m'nIe:r fct1ro 1Wc!1; tr.IT~e:r lIT ~!iT ~e: Married WidJwed Divorced or Separated C1'Tl! l<Fr/~l1If --------- --~--- ----- ~ ~
~ ffiriit ~ ~t ~ ffif<rt Age- Total/Rural/ Males Females Males Females Males Females group Urban
7 8 9 10 11 12 2
~ RAISEN
161,01l 162,158 12.,473 22,922 2,051 1,310 ~lIT 3fT1{ qrlf
All agel TOTAL 0-9
981 5,120 20 13 5 39 10-14 7,929 22,412 40 92 66 206 15-19
21,049 27,335 181 234 244 219 20-24 22,940 23,350 325 306 377 187 25-29 20,139 19,524 497 454 281 113 30-34 19,178 16,930 673 727 221 86 35-39 16,513 14,964 1,063 1,385 223 93 40-44 14,266 11,401 1,145 1,775 203 92 45-49 12,726 8,104 1,532 2,896 194 68 ;0-54 7,455 5,462 1,002 2,108 63 20 55-59 8,071 3,197 1,795 4,402 69 39 60-64 3,762 1,859 I,lL 2,634 40 65-69 5,796 1,736 3,003 5,896 65 29 70+
146,228 148,329 11,617 20,942 2,003 1,214 «1fT 0fT1! II"flI'Tor
All ages RURAL 0-9
917 4,993 15 10 5' 39 10-14 7,546 20,942 40 84 61 187 15-19
19,589 24,922 179 212 239 241 20-24 20,697 20,949 307 274 369 183 25-29 18,101 17,592 472 419 277 lSI 30-34 17,168 15,323 629 658 217 78 35-39 14,722 13,576 1,004 1,254 210 93 40-44 12,812 10,514 1,042 1,554 203 92 45-49 11,469 7,466 1,418 2,629 194 68 50-54 6,841 5,141 931 1,964 54 20 55-59 7,484 3,494 1,682 3.985 69 39 60-64 3.397 1.735 1,116 2,482 40 65-69 5,282 1,516 2.777 5,416 65 25 70+
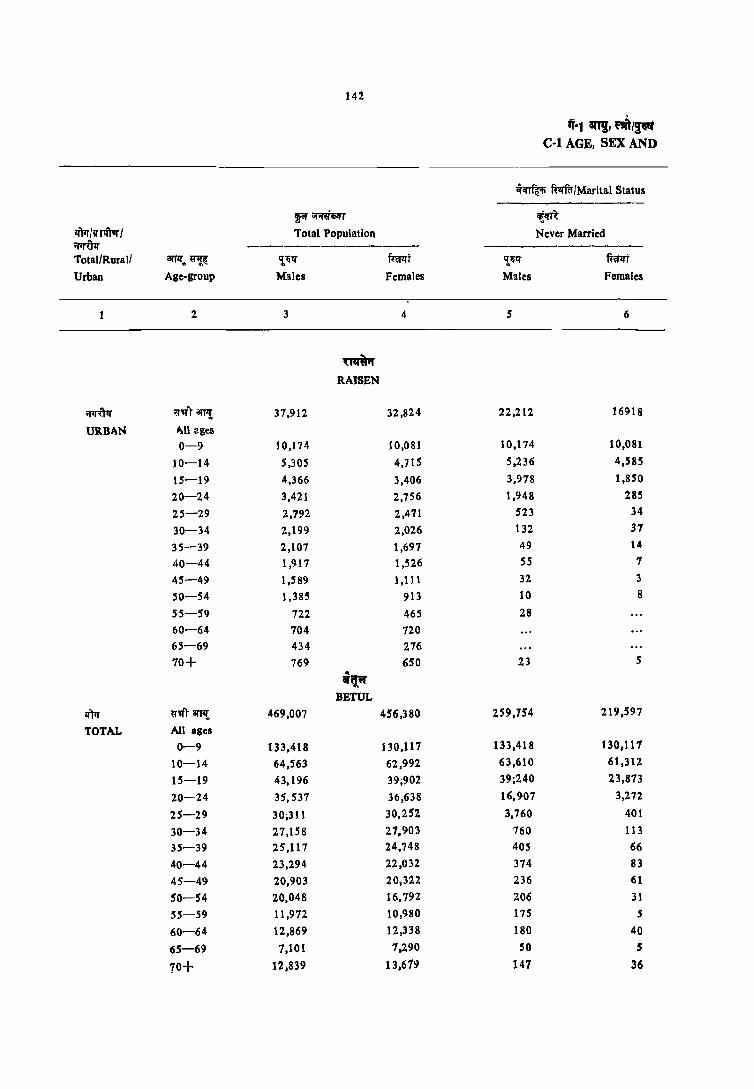
142
if-1 1Il!, ~/~ Col AGE, SEX AND
cfq~ wmr/Marital Status -------------
~~m lI!m ~/1I'nft"ar/ Total 'Population Never Married 'I1rUtr ------------- -------------Total/Rural/ arrlf .. ~ '!,1i1!f mt ,!~Q' fti:t'lft
Urban Age-group M!les Females M!les Females
2 3 4 5 6
~ RAISEN
~If 'I"'Il'r awt 37,912 32,824 22,212 16918
URBAN All ages
0-9 10,174 10,081 10,174 10,081
10-14 5,305 4,715 5,236 4,585
15-19 4,366 3,406 3,978 1,850
20-24 3,421 2,756 1,948 285
25-29 2,792 2,471 523 34
30-34 2,199 2,026 132 37
35-39 2,107 1,697 49 14
40-44 1,917 1,526 55 1
45-49 1,589 1,111 32 3
SO-54 1,385 913 10 8
55-59 722 465 28
60-64 704 120 65-69 434 276
70+ 769 650 23 5 .-il'i!"
BETUL
IfTlf ij''lfr arP{, 469,007 456,380 259,754 219,597
TOTAL All ages
0-9 133,418 130,111 133,418 130,111
10-14 64,563 62,992 63,610 61,312
15-19 43,196 39;902 39;240 23,873
20-24 35,537 36,638 16,907 3,272
25-29 30;311 30,252 3,760 401
30-34 27,158 21,903 160 113
35-39 25,117 24,748 405 66
40-44 23,294 22,032 374 83
45-49 20,903 20,322 236 61
SO-54 20,048 16,792 206 31
55-59 11,972 10,980 175 5
60-64 12,869 12,338 180 40
65-69 7,101 1.290 50 5
10+ 12,839 13.619 141 36
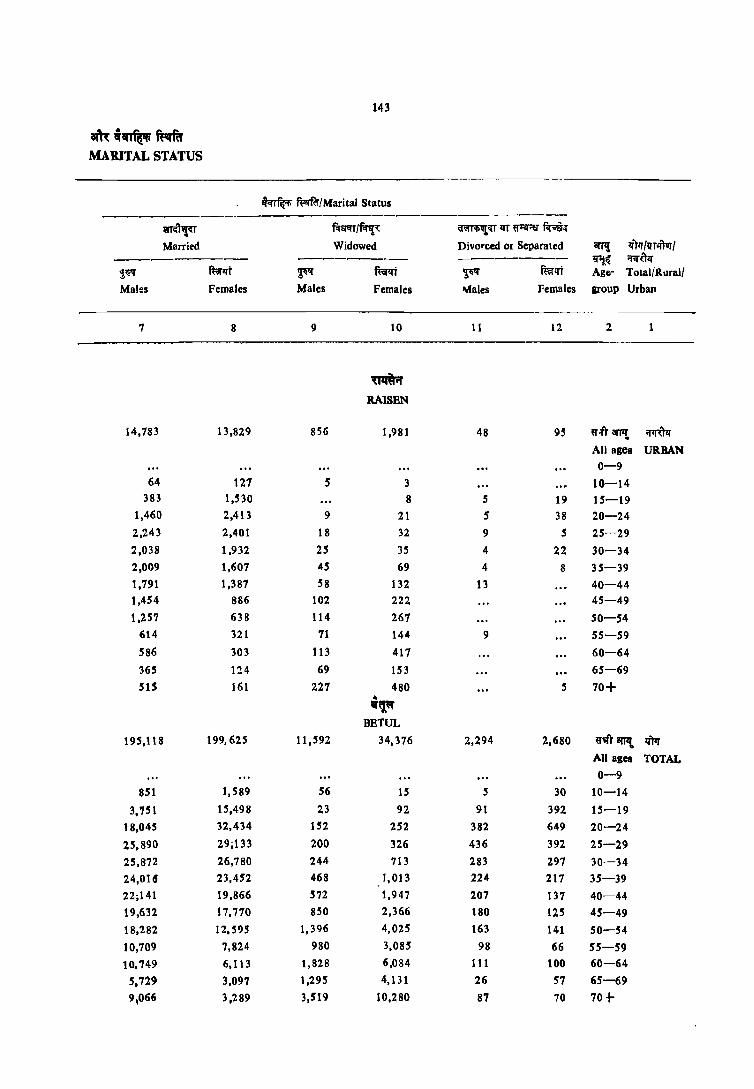
143
ama~~ MARITAL STATUS
Ii<rr~ Wa-!Marital Status --------------------------------
~ilT fiffNI/~~ ~ilTlfT~~i{
Married Widowed Divorced or Separated arr,! If)lf/vr4'rl1f/ ----------- -------- -------- ~~ i!'lrUlf
1~ mrlft ~ ffirIfj ~ mrrrt Age- Total/R&lral/
Males Females Males Females ~ales Females group Urball
7 8 9 10 11 12 2
~ RAISEN
14,783 13,829 856 1,981 48 9S nr arJ1t ~ All agcs URBAN
0-9
64 127 5 3 10-14 383 1,530 8 5 19 15-19
1,460 2,413 9 21 5 38 20-24
2,243 2,401 18 32 9 5 25-29
2,038 1,932 25 35 4 22 30-34
2,009 1,601 4S 69 4 8 35-39
1,191 1,387 58 132 13 40-44 1,454 886 102 222 45-49
1,257 638 114 267 50-54
614 321 71 144 9 55-59
586 303 113 411 60-64
365 1:!4 69 153 65-69
5IS 161 221 480 5 70+ .. "~\II'
BETUL 195,118 199,625 11.592 34.316 2,294 2,680 {f'l!'r iIfII{. lfN
All ages TOTAL
0-9
851 1,589 56 15 5 30 10-14
3, '151 15.498 23 92 91 392 15-19
18,045 32,434 152 252 382 649 20-24
25,890 29;133 200 326 436 392 25-29
25,872 26,780 244 713 283 297 30-34
24,016 23,452 468 1,013 224 211 35-39
22;141 19,866 5?2 1,947 201 137 40-44
19,632 17,770 850 2,366 180 125 45-49
18,282 12,595 1,396 4,025 163 141 50-54
10,109 7,824 980 3,085 98 66 55-59
10,749 6,113 1,828 6,084 111 100 60-64
5.729 3,097 1.295 4,131 26 57 65-69
9,066 3.289 3,519 10.280 87 70 70 -r
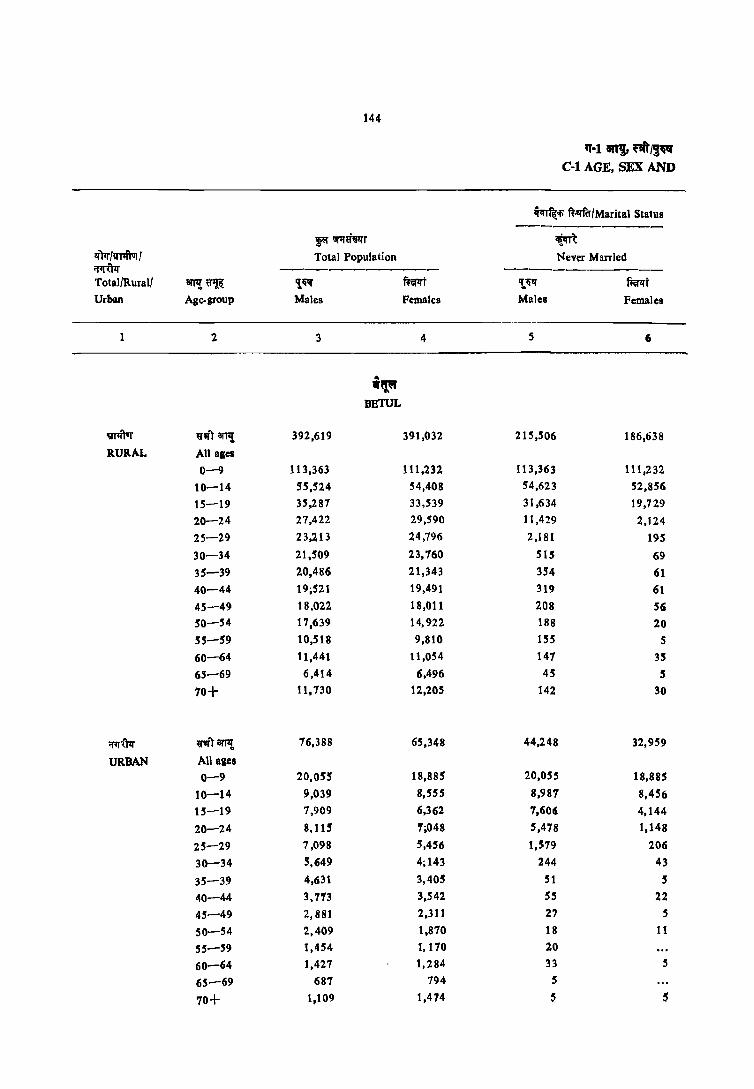
144
'1'-1 IRT" ~/~~ C-l AGE, SEX AND
~ofi R-f:(ffi/Marital Status
~"",,~'ll'T ~ IfR/V11ftuI/ Total Population Never Married ~ ------------Total/Rural/ 8TTl!~ '!'il!!' ftlWl"t 'f."il!!' ffiRj Urban Age-group Males Females Males Females
2. 3 4 5 6
''1'' BETUL
~ ~'II"T anI{ 392,619 391,032 215,506 186,638
RURAL All ages
0-9 113,363 111,232 113,363 111,232
10-14 55,524 54,408 54,623 52,856
15-19 35,287 33,539 31,634 19,729
20-24 27,422 29,590 11,429 2,124
25-29 23,:1.13 24,796 2,181 195
30-34 21,509 23,760 SIS 69
35-39 20,486 21,343 354 61
40-44 19;521 19,491 319 61
45-49 18,022 18,011 208 56
SO-54 17,639 14,922 188 20
55-59 10,518 9,810 155 5
60-64 11,441 11,054 147 35
65-69 6,414 6,496 45 5
70+ 11,730 12,205 142 30
:rtfUlr nTIIl'TI! 76,388 65,348 44,248 32,959
URBAN All ages 0-9 20,055 18,885 20,055 18,885
10-14 9,039 8,555 8,981 8,456
15-19 7,909 6,362 7,606 4,144
20-24 8,115 1;048 5,478 1,148
25-29 7,098 5,456 1,579 206
30-34 5,649 4;143 244 43
35-39 4,631 3,405 51 5
40-44 3,773 3,542 55 22
45-49 2,881 2,311 27 5
50-54 2,409 1,870 18 11
55-59 1,454 1,170 20
60-64 1,427 1,284 33 5
65-69 687 794 5
70+ 1,109 1,474 5 S
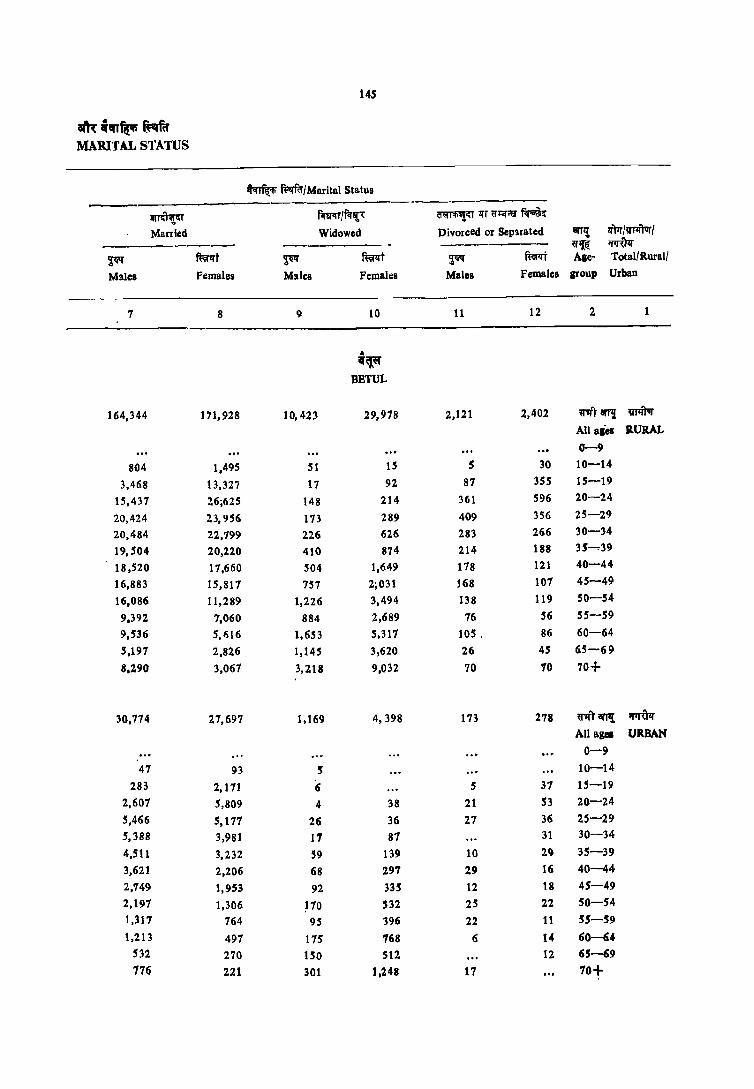
145
am: aanfp ft:qfif MARITAL STATUS
~ ~/Marital Status
~u flllro /f.r'tl: ~l1!ifI lH ~f1:~;:a- ~1{
Married Widowed Divorced or Sep'uated 8IT1! lfm/wr;frlr/ ij'~ ii1Wf
~ mt ~ mt ~ ffir:rt Age- Total/Rural/
Males Females Males Females Males Females sroup Urban
7 8 9 10 11 12 2 1
.. 'l'Cl"
BBTUL
164,344 J71,928 10,423 29,978 2,121 2,402 ~'II'r~ ~
All aies aURAL
0-9
804 1,495 51 15 S 30 10-14
3,468 13,321 17 92 87 355 15-19
15,437 26;625 148 214 361 596 20-24
20,424 23,956 173 289 409 356 25-29
20,484 22.799 226 626 283 266 30-34
19,504 20,220 410 874 214 188 3S ....... 39
18,520 11,660 504 1,649 178 121 40-44
16,883 15,811 757 2;031 168 107 45-49
16,086 11,289 1,226 3,494 138 119 SO-54
9,392 7,060 884 2,689 76 56 55-59
9,536 5,616 1.653 5,317 105 , 86 60-64
5,197 2,826 1,145 3,620 26 45 65-69
8,290 3.067 3.218 9,032 10 7'0 70+
30,774 27,697 1.169 4,398 173 278 6''II'r<ll'111 ~
All ages URBAN 0-9
47 93 S 10-14
283 2,111 (; 5 31 15-19
2,601 5,809 4 38 21 53 20-24
5,466 5,171 26 36 27 36 25-29
5,388 3,981 11 81 31 30-34
4,511 3,232 59 139 10 29 35-39
3,621 2,206 68 297 29 16 40-44
2,749 1,953 92 335 12 18 45-49
2,191 1,306 pO 532 2S 22 SO-54
1,317 764 9S 396 22 11 55-59
1,213 491 115 168 6 14 60-64
532 270 150 512 12 65-69
176 221 301 1,248 17 70+

146
'1'~l arT!, ~/!", C·l AGE, SEX AND
~ ft:vrftr/Marital Status -------~~r ~
1Illr/Q1~1 Total Population Never Married ~ -------~------ ----_ ... _------'fotal/Rurall 0fl'Il ~~ $qI'f ~t $qI'f ffirlrt Urban Age-gro~p Males Females Males Females
1 2 3 4 5 6
tm'I"IiIR HOSHANOABAD
If)lr ~'I(T 8IT1{ 526,273 471,666 286,362 211,804
TOTAL All ages
0-9 142,395 132,821 142,395 132,821
10-14 70,427 62,290 69,344 58,354
15-19, 52,676 42,983 45,837 16,622
20-24 44,245 41,350 19,758 2,841
25-19 37,696 33,64'J 4,869 370
30-34 31,298 28,340 1,354 130
35-39 27,4"11 26,?0 601 75
40~44 26,359 23,806 547 72
45-49 23,206 20,615 450 53
SO-54 20,826 17,918 351 58
55-59 14,111 11 ,683 179 26
60-64 14,211 12,950 205 16
65-69 1,995 8,018 103
10+ 12,111 13,950 121 62
Vf1ft'ar ~'II'r iIfTI! 391,317 360,478 207,96? 154,947
RURAL All ages 0-9 t 10,643 102,580 110,643 102,580
10-14 52,941 46,329 52,063 42,731 15-19 36,866 30,408 30,626 8,406
20-24 29,898 29,913 9,945 180 25-29 26,611 24,410 2,080 117
30-34 22,313 21,184 708 36
35-39 19,847 20,125 342- 20
40-44 19,506 18,441 405 25
45-49 17,295 15,847 345 10 SO-54 16,242 13,999 262 25 55-59 JO,899 9,204 U3 10 60-64 11 ,312 10,337 123 10 65-69 ' 6,453 6,355 64
70t ~0,102 10,934 93 ~O

14'
aft'(~~~ MARITAL STATUS
cR~ ft:v:rfu'/Marital Status
~ mm/f.rt{, o~<n'IiT~~
Married Widowed Divorted or Separated arTI{ IiN/,J'lftvrI ----_.---- ------- ------- ~ ~
~ f~lft ~ ~ ~ ~ Age Total/Ilurall Males Females Males Females Males Fem~les grOUP Urban
7 8 9 10 11 12 2
~~. HOSHANGABAD
222,573 223,334 15,328 40,660 1,813 1,171 ~'i1r amt zm All ages TOTAL 0-9
1,012 3,824 31 15 10 21 10-14
6,723 26,('52 21 78 64 205 15-19
24,004 31,831 246 263 222 410 20-24
32,255 32,465 234 543 318 266 25-29
29,] 86 27,137 453 809 300 259 30-34
2;,823 25,286 719 1,213 263 138 35-39
24,504 2] ,372 1,082 2,203 22] 151 40-44
21,426 11,546 1,153 2,953 171 63 45-49
180517 12,429 ] ,825 5,331 122 100 SO-54
12,219 1,951 1,609 3,691 50 15 55-59
11,552 5,660 2,375 1,210 19 65 60-64
6,198 2,766 1,615 5,216 15 35 65-69
8,687 2,758 3,873 11,082 30 39 70+
169,365 172,915 12,333 31,122 1,604 1,425 ~,,') OTJ'It Vfiftur All ages RURAL 0-9
830 3,543 15 15 10 21 10-14
6,142 21,731 10 72 64 178 15-19
19,533 28,630 217 171 193 322 20-24
24,022 23,714 217 376 272 204 25-29
20,962 20,340 376 609 262 ]94 30-34
18,655 19,178 617 834 228 93 35-39
18,06'i 16,603 887 1,680 182 123 40-44
15,897 13,683 90S 2,'08 143 46 45-49
14,389 9,920 1,498 3,969 89 8S 50-54
9,494 6,383 1,243 2,796 39 15 55-59
9,231 4,586 1,885 5,676 73 65 60-64
5,015 2,261 1,354 4,058 15 35 65-69
6,85'5 2,103 3,12S 8,731 30 39 10+

148
If-I an!, ""'{~ CI AGE, SEX AND
~~ ft.qf<r/Marital StaluS -----
~",~T ~ l'iFT/~! 10tal Population Never Married ~ ------_------ -------------Total/Rural/ ilJ'Tl!~1r ~ ~t ~ ~f
Urban Age-group Males Females Males Females
2 3 4 s
"Iii., i.lCi
HOSHANGABAD
;mWr ~nr) arJ1! 134,896 111,188 78,395 56,857
U~BAN All ages
0-9 31,752 30,240 31,752 30,240
10-14 17,486 15,962 17,281 15,663
15-19 15,810 12,575 15,211 8,216
20-24 14,347 11,437 9,814 2,062
25-29 lJ,085 9,179 2,789 253
30-34 8,984 7,156 64i 94
35-39 7,564 6,586 259 55
40-44 6,853 5,365 142 46
45-49 5,911 4,748 106 44
50-54 4,583 3,919 90 33
55-59 3,218 2,479 56 17
60-64 2,905 2,613 83 5
65-69 1,543 1,663 39
70+ 2,609 3,011 28 11
~ JABALPUR
lI'f<r ~rarJl! 1,149,050 1,019,693 607,179 415,418
TOTAL All ages
0-9 295,512 289;135 295,512 289,13-5
10-14 152,321 141,335 144,399 125,869 15-19 121,851 101,703 96,214 45,071 20-24 106,099 96.874 47,065 11,051 25-29 88,705 78,743 14,929 1,963
30-34 74,548 66,077 4,045 500 35-39 67,395 57,769 1,557 242 40-44 59,686 51,346 1,089 118 45-49 50,044 43,274 742 118 SO-54 43,847 36,137 542 83 55-59 27,612 22,716 348 34 60-64 26,092 26,024 286 20 65-69 13,579 13,923 143 10 70+ 20,705 23,123 302 101

149
am.~ ffqftr MARITAL STATUS
~ fi:'I'Rr/Marital Status _---------------------~<:T f<Nc;rTJ~'1: ~<:TIiT~~ .. Married Widowed Divorced or Separated iITl1! lim 1VTlft'ar I -------- ------ ----- trljl ~
2.~ ffiflit ~!i fmt 2;q!f f@rt Age- Total/Rural/ Males Females Males Females Males Females group Urban
7 8 9 10 II 12 2
~"i.i4 HOSHANGABAD
53,208 50,419 2,995 9,538 26\1 346 ij'~T arT!! iITI'&:r All ages URBAN 0-9
183 282 17 10-14 582 4,321 11 6 28 15-19
4,471 9,201 28 86 29 88 20-24 8,233 8,691 18 167 45 63 25-29 8,224 6,797 77 200 38 65 30-34 7,168 6,108 102 379 35 44 3;-39 6,438 4,769 234 523 39 27 40-44 5,529 3,863 248 845 28 16 45-49 4,128 2,509 327 1,362 33 15 SO-54 2,785 1,568 367 895 11 55-59 2,320 1,074 490 1,534 5 60-64 1,182 50S 321 1,158 65-69 1,832 655 749 2,351 70+
~ lABALPUR
512,030 493,7]5 l6,036 76,963 2,983 3,376 ~0lTI{. lim All ages TOTAL 0-9
7,829 1S,289 48 92 15 24 10-14 25,)81 56,132 220 244 171 204 15-19 57,IiGO 84,495 620 612 403 616 20-24 72,878 75,218 925 1,049 458 492 25-29 68,851 63,440 J ,121 1,660 S:zO 477 30-34 64,082 54,692 1,440 2,543 306 287 35-39 56,295 45,935 2.021 4,871 281 357 40-44 46,831 36,406 2,232 6,531 229 219 45-49 40,060 25,443 3,012 10,397 228 214 SO-54 24,724 15,644 2,426 7,016 J09 71 55-59 21,837 10,741 3,873 15,079 81 180 60-64 10,941 5,302 2,413 8,535 16 76 65-69 14,642 4,621 5,645 18,281 106 95 70+

150
,,·1 an!!, m/~ C-I AGE. SEX AND
~ R;¥:(faIMarital Status ------------
~;;r;:rn'i!l'T ~R
liN IlJ'Pftor I Total Population Never Married
~ ------------- --------------Total/Rulal/ a.1'l! ~"!~ ,!ljq' ffir:rt ,!ljq' " ffirlli
Urban Age-group Males" Females Males Females
2 3 4 5 6
iil'iI~~
JADALPUR
!I11ftvr ~nr' arTl!, 615,352 592,899 310,344 248,013
RURAL All ages
0-9 173,762 167,743 173,762 167,143
10-14 86,602 79,313 79,677 66,001
15-19 61,958 53,926 41,064 13,133
20--24 49,390 50,771 10,134 662
25-29 43,322 40,616 2,405 126
30-34 35,057 H,984 942 95
35-39 32,729 31,986 510 34
40-44 29,891 30,624 50\ 45
45-49 27,018 25,362 333 5
50-54 23,°69 22,0!> 1 261 20
55-59 14,914 13,789 163
60-64 15,155 16,969 153
65-69 8,366 9,257 87 5
70+ 12,879 14,219 159 45
~ ~m arTI! S3~,698 456,794 297,435 227,40S
URBAN All ages
0-9 121,751 121,992 121,7$1 121,992
10-14" 65,720 62,022 64,722 59,868
15-19 59,899 47,777 55,IS 1 31,938
20-24 56,708 46,103 36,930 10,396
25-29 45,384 38,126 12,524 1,837
30-34 39,491 30,093 3,103 405
35-39 34,665 25,784 1,047 208
40-44 29,795 20,722 588 133
45":"'49 23,026 17,913 409 113
SO-54 19,879 14,086 281 63
55-59 12,698 11,987 185 34
60-64 10,937 9,055 133 20
65-69 S,212 !I, 666 56 5
70+ 7,825 8,904 143 56

1St
am:icn~~ MARITAL STATUS
~if f~f~1 Marital Status ----------------------------
m-Tlt~ f.m;rrl~~ ~~!fT~!if~
Married Widowed Divorced or Separated 8lTI! lIFrllmftur I ---------- ------- --------- ~~ ;:rq~ ~~ mt ~li'f ffirlrt ~ f~lft Age- TotallRural/ Males Females Males Females Males Females group Urban
7 8 9 10 11 12 2
~~ JABALPUR
285,511 293,850 17,227 48,743 2,220 2,223 ~'II"T arrJt ~ All ages RURAL
0-9
6,865 13,189 44 82 5 11 10-14
20,507 40,451 220 175 147 152 15-19
38,471 49,347 450 345 329 413 20-24
39,922 39,569 654 617 341 :'05 25-29
33,008 34.654 753 938 349 297 30-34
30,996 30,180 976. 1,5S2 Z48 189 35-39
27,908 27,360 1,279 2,978 203 241 40-44
24,966 21,288 1,547 3,933 172 136 45-49
21,512 15,344 2,022 6,518 168 169 SO-54
13,228 9,262 1,453 4,461 70 61 55--59
12,441 6,738 2,496 10,107 65 124 60-64
6,578 3,583 1,~45 5,613 56 56 65-69
8,97J 2,726 3,677 11,362 67 70 70+
226,519 199,865 8,809 282,210 163 J,153 "'" 3lTI!
;pritlt
All ages URBAN 0-9
964 2,100 5 10 10 13 10-14 4,674 15.681 29 69 24 53 15--19
19,489 35',148 169 267 14 264 20-24 32,456 35,649 271 432 117 188 25-29
35,843 28,786 368 722 17L 179 30 -34 33,086 24.512 463 961 58 98 35-39 28,387 18,57S 743 1,893 78 116 40-44 21,865 15,118 685 2,598 57 83 45-49 18,548 10,100 990 3,879 60 44 50-54 11,496 6,383 973 2,555 39 10 55-59 9,396 4,003 1,378 4,972 15' SS 60-64 4,363 1,719 768 2,922 21 20 65-69 5,671 1,894 1,967 6,918 39 25 70+
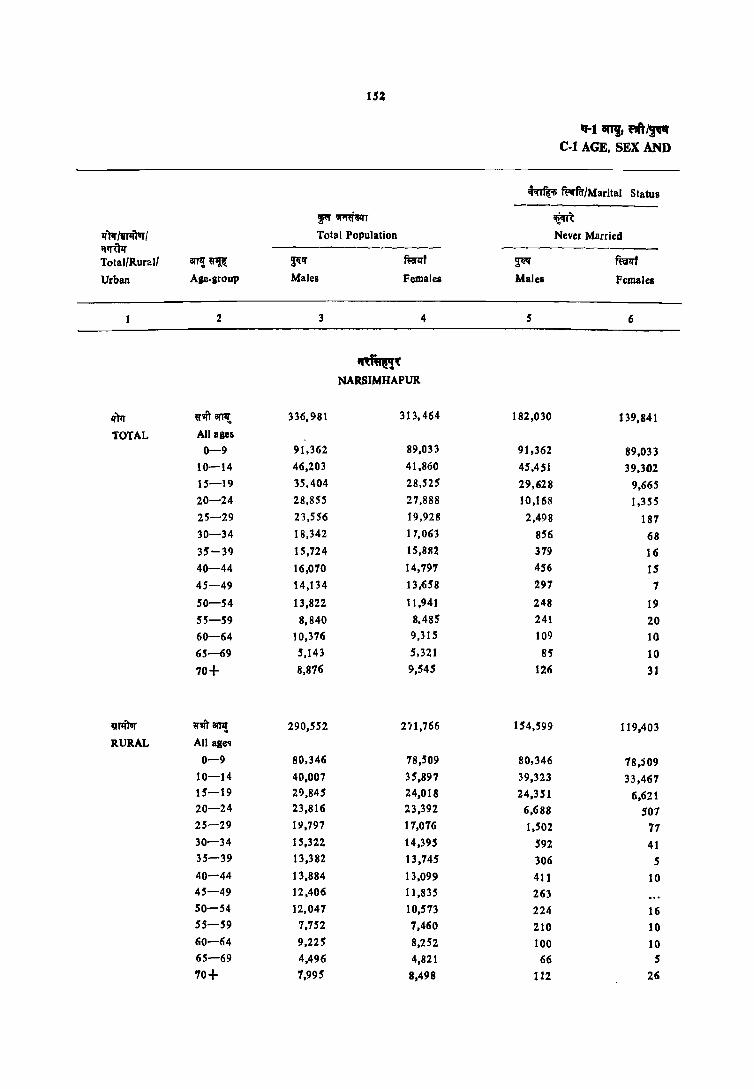
152
If-I an!, "'" ~ Col AGE, SEX AND
~ ~fuJMarital Status ---~~T ~
liN JI'Pft1IJ i Total Population Never Married lltrUll' Total/Rurali arTI!~ ~II' ffa1l'f ~ mf Urban Ase-group Males Female' Males Females
2 3 4 5 6
.,l NARSIMHAPUR
q)q ~'Ift arJ'I{ 336,981 313,464 182,030 139,841
TOTAL All ases 0-9 91,362 89,033 91,362 89,033
10-14 46,203 41,860 45,451 39,302 15-19 35,404 28,525 29,628 9,665 20-24 28,855 27,888 10,168 1,355 25-29 23,556 19,928 2,498 187 30-34 18,342 17,063 856 68 35-39 15,724 15,882 379 16 40-44 16,010 14,791 456 15 45-49 14,134 13,658 291 7
SO-54 13,822 11,941 248 19
55-59 8,840 8,485 241 20 60-64 10,316 9,315 109 10
65-69 5,143 5,321 8S 10
70+ 8,816 9,545 126 31
u11im "''1ft am:t 290,552 2'11,766 154,599 119,403 RURAL All age<!
0-9 80,346 78,509 80,346 78,j09 10-14 40,007 35,897 39,323 33,461 15-19 29,845 24,018 24,351 6,621 20-24 23,816 23,392 6,688 501 25-29 19,797 17,076 1,502 71 30-34 15,322 14,395 592 41 35-39 13,382 13,145 306 5 40-44 13,884 13,099 411 10 45-49 12,406 11,835 263 50-54 12,047 10,5'73 224 16 55-59 7,752 7,460 210 10 60-64 9,2lS 8,252 100 10 65-69 4,496 4,821 66 S
70+ 7,995 8,498 112 26

153
a1tt~~f~ MARITAL STATUS
~ ~/Marital Status ------------------------------~ mm/fcnt<: 'ffOI'T~ lfT ~;:& f~<{
Married Widowed Divorced or Separated arJ"'! lfPr/~1 ----------- ------- ------- ~ ~ $~ r<;;{lfl 'J.qt'{ ~t ~ ~I{f Age- Tot,l/R\1tal/
Males Females Males Females Males Pemales SIouP Urban
7 8 9 10 11 12 2
~~ NARSIMHAPUR.
143,663 146,871 9,129 24,873 1,468 1,792- ij"'Ift amt. lIltr All aSeB TOTAL 0-9
116 2,493 5 5 30 10-14
S,706 18,636 25 76 35 123 15-19
18,323 26,033 136 135 :'123 350 20-24
20,S51 19,215 254 244 254 282 25-29
16,928 16,388 331 381 216 226 30-34
14,824 IS,US 385 556 136 196 35-39
14,766 13,348 65B 1,292 190 142 40-44
12,812 12,034 811 1,496 143 121 45-49
12,850 8,951 1,095 2,8S0 124 122 SO-54
1,S78 6,2BO 977 2,113 4S 67 SS-59
8,542 4,187 1,652 5,027 67 89 60-64
4,181 2,271 861 3,027 10 13 65-69
6,181 1,827 2,517 7,661 25 20 70+
125,94S 129,001 8,611 2 t ,16S 1,332 1,55t ij"1IT8l'J'!! Ill'Iftvr
All ages RURAL 0-9
6S4 2,391 5 5 24 10-14
5,434 17,192 20 76 35 115 15-19
16,796 22,451 131 131 196 281 20-24
17,844 16,S39 216 2"3 234 251 25-29
14,249 13,859 291 308 191 187 30-34
12,595 13,127 350 451 131 156 35-39
12,124 11,866 580 1,110 169 113 40-44
10,335 10,429 677 1,290 126 116 45-49
10,727 7,981 976 2,460 115 111 50-54
6,627 5,609 815 1,783 40 51 55-59
1,586 3,739 1,474 4,416 60 86 60-64
3,679 2,087 141 2,719 10 10 65-69
5,519 1,649 2,264 6.197 2, 20 70+
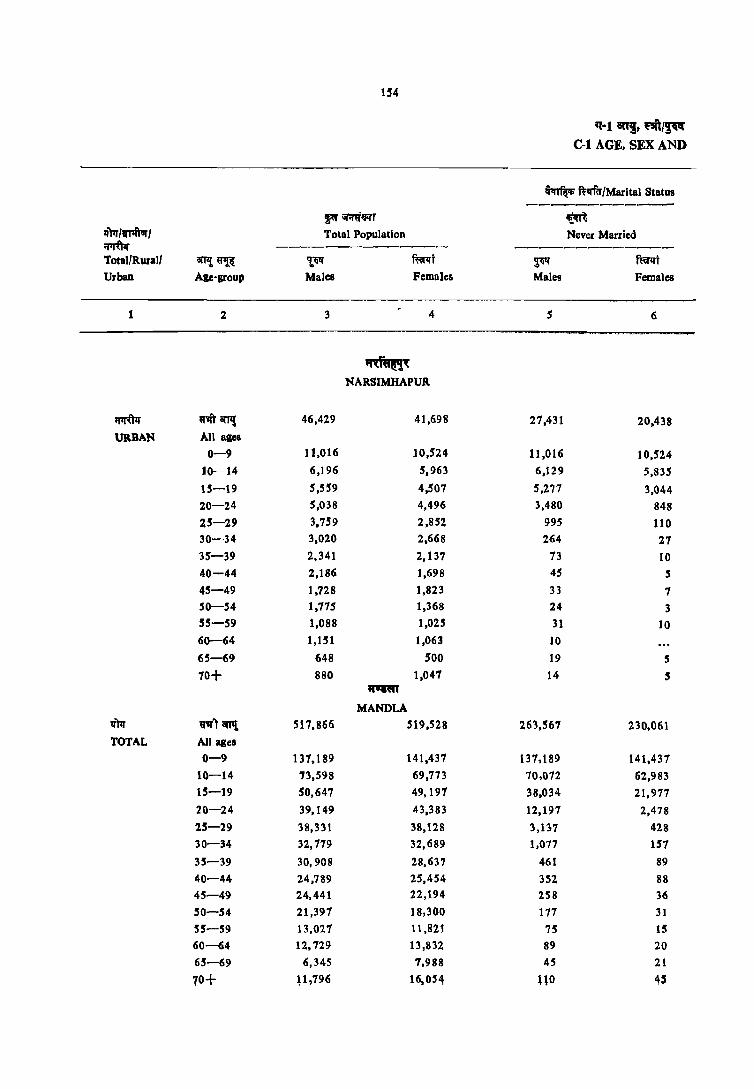
154
q·l~~,~I~ C-l AGE, SEX AND
~ ~'fftr/Marital Status ----------
!Pfm~r ~ JlN/'T'IfTar/ Total Population Never Married ~ ---------- -----------Total/Rurall ~~ l{.1ilf ~t ~ mm Urban Ale-group Males Females Males Females
1 2 3 4 5' 6
"d'e"~ NARSIMHAPUR
~ ,'1ft an,; 46,429 41,698 27,431 20,438 URBAN All asel
0-9 11,016 10,524 11,016 10,524 10-14 6,196 5,963 6,129 5,835
15-19 5,559 4,501 5,2'11 3,044 20-24 5,038 4,496 3,480 848 25-29 3,159 2.852 995 110 30-34 3,020 2,668 264 21 35-39 2,341 2,137 73 10 40-44 2,186 1,698 45 5
45-49 1.728 1.823 33 7 SO-54 1,775 1,368 24 3 55-59 1,088 1,025 31 10 60-64 1,151 1,063 JO
65-69 648 500 19 5
70+ 880 1,047 14 S ~
MANDLA
1:1'N '1'11''1' 0J1'If. 517.866 519,528 263.567 230,061 TOTAL All aseS
0-9 137.189 141.437 137,189 141.431 10-14 73,598 69,773 70,012 62,983 15-19 50,647 49,197 38,034 21,977
20-24 39,149 43,383 12,197 2,478
25-29 38,331 38,128 3,1l7 428 30-34 32,779 32,689 1,077 157
35-39 30,908 28,637 461 89
40-44 24,789 25,454 352 88 45-49 24,441 22,194 258 36
SO-54 21,397 18,300 177 31 55-59 13,027 11,821 75 15 60-64 12,729 13,832 89 20
65-69 6,345 7,988 45 21
70+ ~1,796 16,OS4 HO 4'
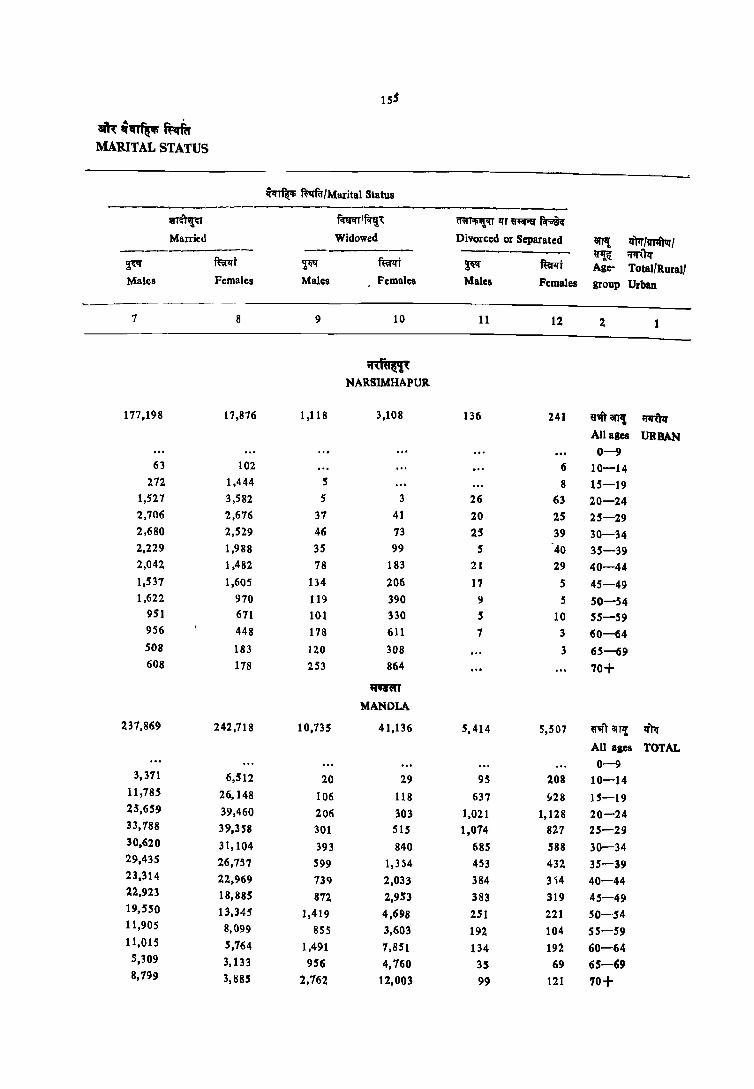
15$
am:q~~ MARITAL STATUS
cl<r~ ~/Marital Status
~~ mmIR,!' tm~lI'r~~
Married Widowed Divorced or Separated OW! m/lmftvrl ----------- --------- -------- ~ '1'111.~ ~ mt ~ mt ~ ftwrt Age- Total!Rural! Males Females Males Females Males Females group Urban
7 8 9 10 11 12 2 1
" (ffl",!( NARSlMHAPUR
177,198 17,876 1,118 3,108 136 241 ij'mOW! ~ All ages URBAN 0-9
63 102 6 10-14 272 1,444 S 8 15-19
1,527 3,582 5 3 26 63 20-24 2,706 2,616 31 41 20 25 25-29 2,680 2,529 46 73 25 39 30-34 2,229 1,988 35 99 5 40 35-39 2,042 1,482 78 183 21 29 40-44 1,537 1,605 134 206 17 5 45-49 1,622 970 119 390 9 5 SO-54
951 671 l().l 330 S 10 55-59 956 448 178 611 7 3 60-64 508 183 120 308 3 65-69 608 178 253 864 70+
~
MANDLA
237,869 242,718 10,735 41,136 5,414 5,507 nr al1~ lI'Pr
All ages TOTAL
0-9 3,371 6,512 20 29 95 208 10-14
11,785 26,148 106 118 637 !l28 15-19 25,659 39,460 206 303 1,021 1,128 20-24 33,188 39,358 301 SIS 1,014 827 25-29 30,620 31,104 393 840 685 588 30-34 29,435 26,757 599 1,3S4 453 432 35-39 23,314 22,969 139 2,033 384 3~4 40-44 22,923 18,885 872 2,953 383 319 45-49 19,550 13,345 1,419 4,698 251 221 SO-54 11,905 8,099 855 3,603 192 104 55-59 11,015 5,764 1,491 7,851 134 192 60-64 5,309 3,133 956 4,160 35 69 65-69 8,799 3,885 2,762 12,003 99 121 70+

15<1
tr-1 81'11, "'/! .... C-I AGE, SEX AND
~ ~/Marital Status ---------_._-fOI'~ ~
~/«1*ftvr I Total Population Never Married ;rroli --or------_______ ---------------Total/Rural! arrl!~ ~ ftw.rf ~!f fuJlif Urban Age-group Males Females Males Females
1 2 3 4 5 6
~
tdANDLA
I1TllTar tr'lfT awr. 479,881 484,328 241,164 212,338 RURAL All ages
0-9 128,154 132,219 128,154 132,219 10-14 68,726 64,975 65,237 58,341 15-19 46,032 45,213 33,631 19,139 20-24 35,110 40,141 9;277 1,698 25-29 35,227 35,4~9 2,315 278 30-34 30,369 30,663 890 132 35-39 28,864 26,547 369 68 40-44 22,974 23,950 319 67 45-49 22,737 20,674 229 31 50-54 19,933 16,961 165 26 55-59 12,083 11,035 70 15 60-64 11,892 13,014 84 20 65-69 5,927 7,519 40 21 10+ 11,155 15,350 110 45
;:r~ tr'lfT anI{, 37,979 35,200 22,403 17,723 URBAN All ages
0-9 9,034 9,217 9,034 9,217 10-14 4,872 4,798 4,835 4,642 15-19 4,615 3,984 4,403 2,838 20-24 4,039 3,243 2,919 780 25-29 3,103 2,660 822 150 30-34 2,410 2,026 186 24 35-39 2,044 2,091 92 21 40-44- 1,815 1,505 33 21 45-49 1,104 1,519 29 S 50-54 1,464 1,339 12 5 55-59 944 786 5 60-64 838 818 5 65-69 418 469 S 70+ 640 704

H1
1ft'( q,,~ ~ MARITAL STATUS
~'Ii ",lim/Marital Status ------------------------------------
~'" f.nT<rr /mr. <: cr.I~1{T lIT ~""a- fc!'OI§1{
Married Widowed Divorced or Separated arJl! lfR/IT11ftvT1 --------- -------- --------- ~"iJ: i!1l"{Tzr
FI' fwd ~ f@<r ~ ffirzrf Age- Total/Rural!
Males Females Males Females Males Females group Urban
7 8 9 10 11 12 2
~
MANDLA
223,160 228,147 9,941 34,413 5,364 5,334 ~'lfT IITl'l!; ~
All ages RURAL 0-9
3,334 6,361 20 29 95 208 10-14
11,587 25,002 106 118 633 928 15-19
24,550 37,046 202 285 1,021 1,096 20-24
31,521 33,920 287 468 1,074 803 25-29
28,420 29,177 373 793 681 561 30-34
27,519 24,807 575 1,262 396 409 3;)-39
21,586 21,659 689 1,890 380 334 40-44
21,359 17,621 773 2,721 376 301 45-49 18,238 12,475 1,288 4,243 242 212 SO-54 11,082 7,593 746 3,328 185 100 55-59 10,274 5,456 1,406 7,345 128 187 60-64 4,947 2,972 905 4,452 35 69 65-69 8,358 3,774 2,563 J 1,409 99 121 70+
14,710 14,571 788 2,724 50 172 lJm aTTI! i'flJUlf
All ages URBAN 0-9
31 150 10-14 198 L 146 5 15-19
1,110 2,414 5 17 32 20-24 2,267 2,437 14 48 24 25-29 2,200 1,927 19 48 5 27 30-34 1,917 1,950 24 92 1 23 35-39 1,728 1,310 50 J43 4 30 40-44 1,565 1,263 99 233 7 J9 45-49 1,312 870 131 455 10 9 SO-54
823 506 110 276 7 4 55-59 741 308 86 506 6 5 60-64 362 161 51 308 65-69 442 111 198 594 70+

1S8
ir-l iIfll, ''''/P. C-I AGE, SEX AND
~ ~fa'{Marital Status -----------_
~ ;;r;nf~T "i'fT't lfm{~r;ft1Jr/ Total Population Never Married ~ ------------- -------------Total/Rural arT!! ~~ ~ f~t ~ f~f
Urban Age-group Males Females Males Females
2 3 4 5 6
f'iij.CCCl.,. CHHINDWARA
If)tr ~1JT OfT!! 627,538 605,593 349,896 291,446
TOTAL All ages
0-9 173,265 114,164 113,265 174,164
10-14 87,052 84,248 86,061 82,129
15-19 59,840 53,656 54,118 29,911
20-24 48,605 47,109 25,526 3,841 25-29 42,258 41,202 6,554 602
30-34 37,256 35,511 1,347 244
35-39 34,199 32,925 610 108
40-44 31,534 30,421 462 103
45-49 29,208 26,288 320 31
50-54 26,461 21,494 298 26
55-59 16,770 13,856 131 10
60-64 16,450 16,671 145 30
65-69 8,731 9,503 70 20
70+ 15,398 18,114 136 74
Vl1ftar ~ arTI{ 489,998 481,966 268,980 229,104
RURAL All ages 0-9 139,495 140,716 139,495 140,716
10-14 69,208 66,857 68,350 65,029
15-19 44,436 40,566 39,939 20,222
20-24 34,584 35,439 15,151 1,698
25-29 31,690 31,652 3,524 300
30-34 27,842 27,935 738 122
35-39 26,122 25,849 399 77
40-44 24,293 24,724 359 65
45-49 22,772 21,318 213 20
50-54 21,463 D,581 213 20
55-59 13,583 11 ,625 101 10
60-64 13,623 13,818 125 30
65-69 7,326 8,130 56 20
70+ 13,221 15,538 116 14

1$9
am-.~ ft:dr MARITAL STATUS
~~ ft:vffu/Marital Status -----
~~r:T fira<n"/forf{"( ~r:T l:I'T ~~ fc;roW<{
Married Widowed Divorced or Separated 3lT1f. l:I'N liTIftvr I ----------- --------- --------- ~ ~ ~ mf ~ fi:erl:l't ~ mt Age- Total/Rurall
Males Female. Males Penla1es Males Females group Urban
7 8 9 10 11 12 2
r'iij.(tiii,r CHHINDWARA
260,004 261,362 14,264 49,362 2,978 3,272 ~arf'l\ q)~
All ales TOTAL
0-9
900 2,060 20 25 10 10-14
4,856 23,199 50 110 74 380 15-19
22,438 42,170 184 285 354 184 20-24
34,816 39,495 273 524 590 570 25-29
34,944 33,865 473 1,011 472 451 30-34
32,729 30,993 575 1,480 290 345 35-39
29,767 27,420 889 2,725 402 173 40-44
27,533 22,497 1,094 3,573 250 187 45-49
24,190 15,628 1,141 5,658 228 182 SO-54
15,061 9,220 1,466 4,578 106 48 55-59
13,968 7,179 2,200 9,386 126 62 60-64
7,193 3.834 1,443 5,619 2:> 2S 65-69
11,365 3,647 3,847 14,327 50 65 70+
206,118 210,126 11.864 40,001 2,748 2.624 ~ arTl{ I'~
AU ages RURAL
0-9
772 1,783 20 20 10 10-14
4,556 19,293 50 100 69 304 15-19
18,866 32,943 162 181 334 601 20-24
27,389 30,498 213 381 5S5 463 25-29
26,288 26,723 386 747 420 343 30-34
24,982 24,331 476 1,160 265 281 35-39
22,841 22,341 737 2,155 356 163 40-44
21,407 18,437 896 2,699 244 162 45-49
19,581 12,870 1,461 4,549 208 141 SO-54
12,161 7,957 1,230 3,618 91 39 55-59
11,573 6,142 1,793 j,SSS 12] 52 60-64
6,029 3,433 1,216 4,647 25 25 65-69
9,835 3,289 3,:UO 12,12$ SO SO 70+

160
'J-I an'!, ""{~ C-I AGE, SEX AND
ffift-ii ft:lqfb{Marital Status -----------
~ \ififtiIiI1T ~ lfN{v11i'tur { . Total Population Never Married ~ -------------Total{Rurall BTTl! ~ ~ ~t ~ ~t
Urban Age-group Males Femalts Males Females
2 3 4 5 6
f~ CllHINDWARA
it1TUlf rit arTI{, 137,540 123,627 80,916 62,342
URBAN All ages
0-9 33,770 33,447 33,770 33,447
10-14 17,844 17,391 17,716 17.100
15-19 15,404 13,091 14,779 9,089
20-24 14,021 11,670 10,369 2.142
25--29 10,567 9.550 3,030 302
30-34 9,414 7,637 609 122
35-39 8,077 7,076 200 31
40-44 7,240 5,697 103 38
45-49 6,436 4,970 107 10
50-54 4.998 3,913 85 5
55-59 3,187 2,231 36
60-64 2,827 2,853 20
65-69 1,405 1,374 14
10+ 2,117 2,576 20
ftA;ft SEON!
:q-N 'I''lfT arr,! 408,441 401,272 221,071 185,676
TOTAL All ages
0-9 113,519 113,897 113,579 113,897
10-14 58,130 54,188 57,317 52,364
15-19 39,090 34,185 33,881 16,934
20-24 29,865 32.,156 11,184 1,868
25-29 28,677 26.641 2,757 220
30-34 23,176 24,594 790 81
35-39 22,697 21,822 359 58
40-44 20,156 20,580 218 25
45-49 19.497 17,958 258 J5
SO-54 16,431 14,835 257 11
55-59 10,865 9,840 91 15
60-64 10,537 11,296 71 10
65-69 5,769 6,697 6S 4
70+ 9,223 11,955 66 3S

161
am.~ft!dI MARITAL STATUS
~ ~/Marital Status --~Iq fem<rT/fln!\ ~Iq liT «~.!l ~
Married Widowed Divorced or Separated iIlT'{ IlWfiJiftur / ------ ------- ~ ~ ~~ ~t ~li' mt ~~ ffirlrt Age. Total/Rural' Males Females Males Females Males Females group Urban
7 8 9 10 11 12 2 1
RIl""I,1 CHHINDWARA
53,886 51,236 2,400 9,361 230 648 «'If) iIITI! iIm'llr AU agel URBAN 0-9
128 216 5 10-14 601 3,906 10 ,. 76 15-19
3,572 9,227 22 103 21 183 20-24 7,428 8,997 61 143 34 107 25-29 8,656 7,142 81 264 52 108 30-34 1,747 6,662 99 320 25 64 35-39 6,925 5,078 152 570 41 10 40-44 6,126 4,060 198 815 5 25 45-49 4,609 2,758 219 1,109 20 41 50-54 2,900 1,263 236 960 15 9 55-59 2,395 1,037 407 ,1,801 5 10 60-64 1,164 401 '121 912 6'-69 1,530 359 621 2,202 15 10+
~ SooNI
113,002 117,992 11,015 34,174 2,954 3,101 ~~OI'P{. liTlr
AU alea TOTAL 0-9
153 1,778 15 10-14 4,986 16,888 81 57 86 291 15-19
18,027 29,509 164 115 455 605 20-24 25,041 25,579 291 336 573 507 25-29 21,711 23,540 284 616 381 357 30-34 21,521 20,349 516' 1,029 296 380 ~5-39 18,793 18,366 719 1,900 367 289 40-44 11,983 15,258 1,072 2,504 193 181 45-49 14,706 10,505 1,289 4,178 189 141 50-S4 9,506 6,460 1,162 3,254 106 111 55-59 8,781 4,694 1,548 6,476 137 111 60-64 4,441 2,457 1,177 4,174 81 62 65-69 6,527 2,445 2,612 9,414 79 56 70+

162
tr-l an"m/~ C-l AGE, SEX AND
~ ~ftr'Marital Status -----------
~ iiPIli'liIfl ;iifR ~"N'!f11ftur , Total Population Never Married ~ ---------- ------------Total/Rural/ aJ'P{ ~ ,!~I!f ffim ,!~I!f ffim Urban Age-sroup Males Females Males Females
2 3 4 5 6
ftIcI;ft
SEONI
~ rirarT't 375,415 371,594 200,918 170,471
RURAL All agel
0-9 105,772 106,268 105,772 106,268
10-14 5'3,603 49,787 52,841 48,030 15-19 35,138 31,053 30,059 14,536 20-24 26,381 29,519 8,486 1,221 25-29 26,189 24,364 1,881 124 30-34 20,983 22,753 561 45 35-39 20,832 20,102 268 30 40-44 18,455 19,232 1 '4 20 45-49 18,047 16,704 219 15 SO-54 15,299 13,881 222 11 55-59 10,035 9,209 76 10
60-64 9,880 10,581 71 5 65-69 5,388 6,249 65
70+ 8,778 11,314 57 35
~ IN'l' arT't 33,026 29,678 20,153 15,205
URBAN All ages 0-9 7,807 7,629 7,807 1,629
10-14 4,521 4,401 4,476 4,334 15-19 3,952 3,133 3,822 2,398 20-24 3,484 2,631 2,698 647 25-29 2,488 2,28Z 876 96
30-34 2,194 1,841 229 37
35-39 1,865 1,720 91 28 40-44 1,701 1,348 44 4 45-49 1,449 1,254 29
SO-54 1,132 954 25
55-59 830 631 15 5
60-64 657 715 5
65-69 381 448 4
70+ ~15 64} P ,.,

, 163
aih:q~~ MARlTAL STATUS
~ ft:¥:mr(Marital Status -----------------
~;u mro/~ ~;u lIT ~ fcr;;iR
Married Widowed Divorc:e~ or Separated arJ'I! lim~f -------- ~ ;ffiW
~ f~ ~ mi ~ ~ Age Total(Rural/
Males Females Males Females Males Pemsles group Urban
7 8 9 10 11 12 2
ftR;ft
SEONI
160,181 166,004 10,432 31,860 2,895 2,934 momr I01frGr .. Ail ages RURAL
0-9
102 1,717 is 5 10 10-14
4,861 16,171 76 55 86 275 15-19
17,262 27,568 149 155 450 576 20-24
23,444 23,414 276 331 513 490 25-29
19,761 21,807 219 571 371 330 30-34
19,187 18,149 491 917 281 341 35-39
11,196 17,19S 727 1,753 358 265 40-44 16,632 14,217 1,008 2,300 189 112 45-49
13,675 9,847 1,223 3,882 119 141 SO-54
8,756 6,055 1,103 3,038 101 106 55-59
8,199 4,440 1,473 6,020 131 111 60-64
4,143 2,328 1,094 3,859 81 62 65-69 (.;,148 2,349 2,493 8,869 19 56 70+
12,221 11,988 583 2,314 58 166 "'''" arJl!
1I"IT'6zr All ages URBAN 0-9
51 62 10-14 125 718 5 2 16 15-19
765 1,941 15 20 5 30 20-24
1,527 2,165 15 5 17 25-29
1,950 1,732 5 45 10 21 30-34
1,734 1,600 25 53 15 39 35-39
1,596 1,172 52 148 9 24 40-44
1,351 1,041 64 204 5 10 45-49
1,031 657 66 296 10 50-54
751 405 59 21S 5 5 55-59
583 254 15 456 60-64 298 129 83 315 ... 65-69 379 96 119 54' 70+
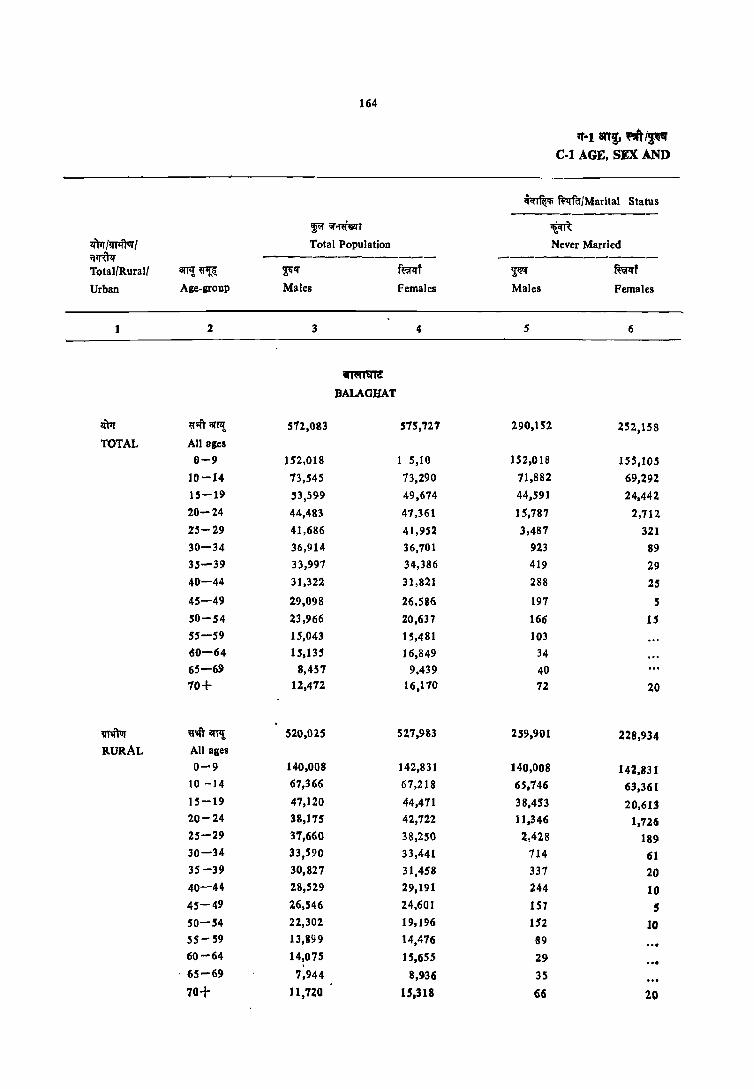
164
"'-I arr~ "'" ~ C-I AGE, SEX AND
~ Wl'fiMarital Status
~~T ~ lftrri~1 Total Population Never Married OJIJ'U<r Total{Rural/ arTl! ~il: ~1'f f~f ~ fWff
Urban Age-group Males Females Males Females
2 3 4 5 6
ammnz BALAGHAT
lI1tt ll'lft al'fI! 512,083 575,721 290,152 252,158
TOTAL All ages
9-9 152,018 I 5,10 152,018 155,105
10-14 73,545 73,290 71,882 69,292 15-19 53,599 49,674 44.591 24.442 20-24 44,483 47,361 15,787 2,712 25-29 41,686 41,952 3,487 321 30-34 36,914 36,101 923 89 3.5-39 33,997 34,386 419 29 40-44 31,322 31,821 288 25
45-49 29,098 26,516 197 5 SO-54 23,966 20,637 166 15 55-59 15,043 15,481 103 60-64 is.13S 16.849 34 65-69 8,457 9,439 40 70+ I.Z.412 16,170 n 20
~ liI'It)" ilfT1!. 520,025 527.983 259.901 228.934 RURAL All ages
0-9 140,008 142,831 140,008 142.831 10 -14 67,366 67,218 65,746 63,361 15-19 47.120 44,471 38,453 20,613 20-24 38,175 42,722 11,346 1.726 25-29 37,660 38,250 2,4'2.8 189 30-34 33,590 33,441 714 61 35-39 30.827 31,458 337 20 40-44 28,529 29,191 244 10 45-49 26,546 24.601 157 5 SO-54 22,302 19,196 152 10 55- 59 13,899 14,476 89 60-64 14.075 15.655 29 ,
, 65-69 7,944 8,936 3S
70+ Il,no 15.318 66 20
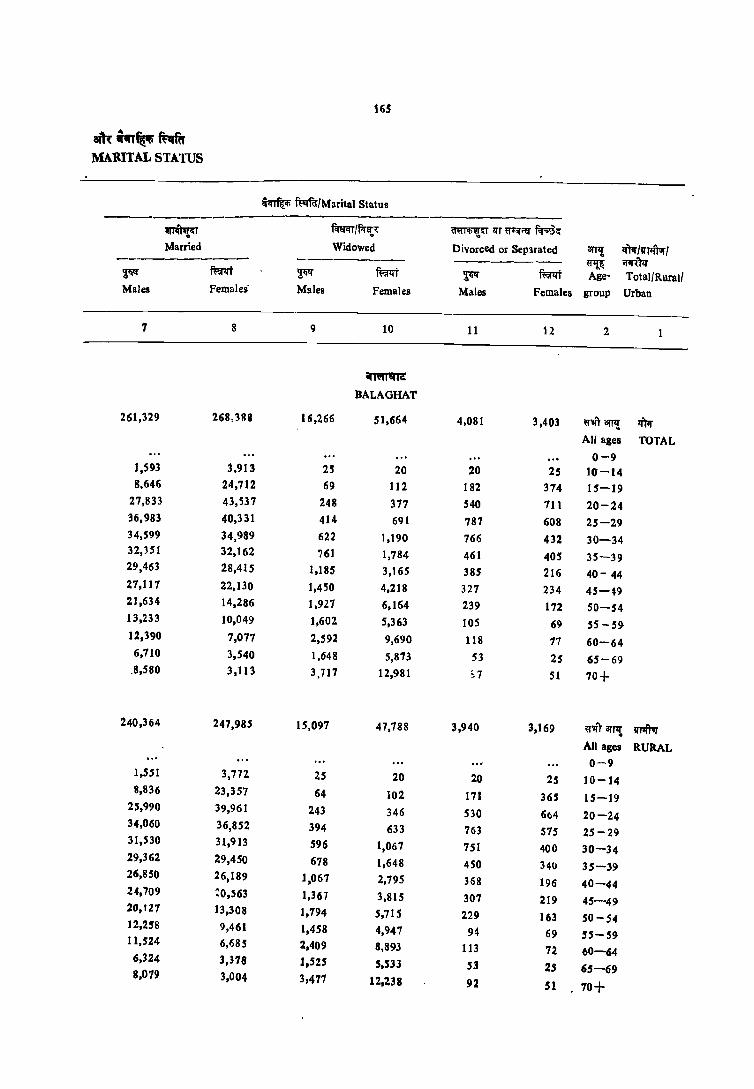
16$
am:.,"~~ MARITAL STATUS
~ W;ri'alMarital Status
~u f.nm1fll'1'{,1; ~u lI'T ~lI'"ll ~<f Married Widowed Divorced or Sep:uated 0ITl! ~I!I"11ftor1 --------- --------- --------- ~ ifln.Tzr
~ fl:a'1Tt ~ mt ~ mt Age- TotallRural1 Males Females' Males Females Males Females group Urban
7 8 9 10 11 12 2
~
BALAGHAT
261,329 268,388 16,266 51,664 4,081 3,403 ij"'lft arf1! If)lr
AU ages TOTAL 0-9
1,593 j,913 25 20 20 25 10-14 8.646 24,712 69 112 182 314 IS-19
27,833 43,537 248 377 540 111 20-24 36,983 40,331 414 691 787 608 25-29 34,599 34,989 622 1,190 766 432 30-34 32,3S1 32,162 761 1,784 461 405 35-39 29,463 28,415 1,185 3,165 385 216 40- 44 27,117 22,130 1,450 4,218 327 234 45-'9 21,634 14,286 1,927 6,164 239 112 SO-54 13,233 10,049 1,602 5,363 105 69 55 - 51) 12,390 7,077 2,592 9,690 118 17 60-64 6,110 3,540 1,648 5,873 53 25 65-69
.8,580 3,113 3,717 12,981 S7 51 70+
240,364 247,985 1S,097 47,788 3,940 3,169 ~"r arr~ ~ All ages RURAL 0-9
1,551 3,772 25 20 20 25 10-14 8,836 23,357 64 102 171 365 15-19
25,990 39,961 243 346 530 664 20-24 34,060 36,852 394 633 763 S75 25-29 31,SJO 31,913 596 1,067 751 400 30-34 29,362 29,450 678 1,648 450 3411 35-39 26,850 26,189 1,067 2,795 368 196 40-44 24,709 :0,563 1,367 3,815 307 219 45-49 20,127 13,308 1,794 5,715 229 163 SO-54 12,258 9,461 1,458 4,947 94 69 55-59 11,524 6,685 2,409 8,893 113 72 60-64 6,324 3,378 1.525 5.533 S3 25 65-69 8,079 3.004 3,477 12.238 92 51 70+
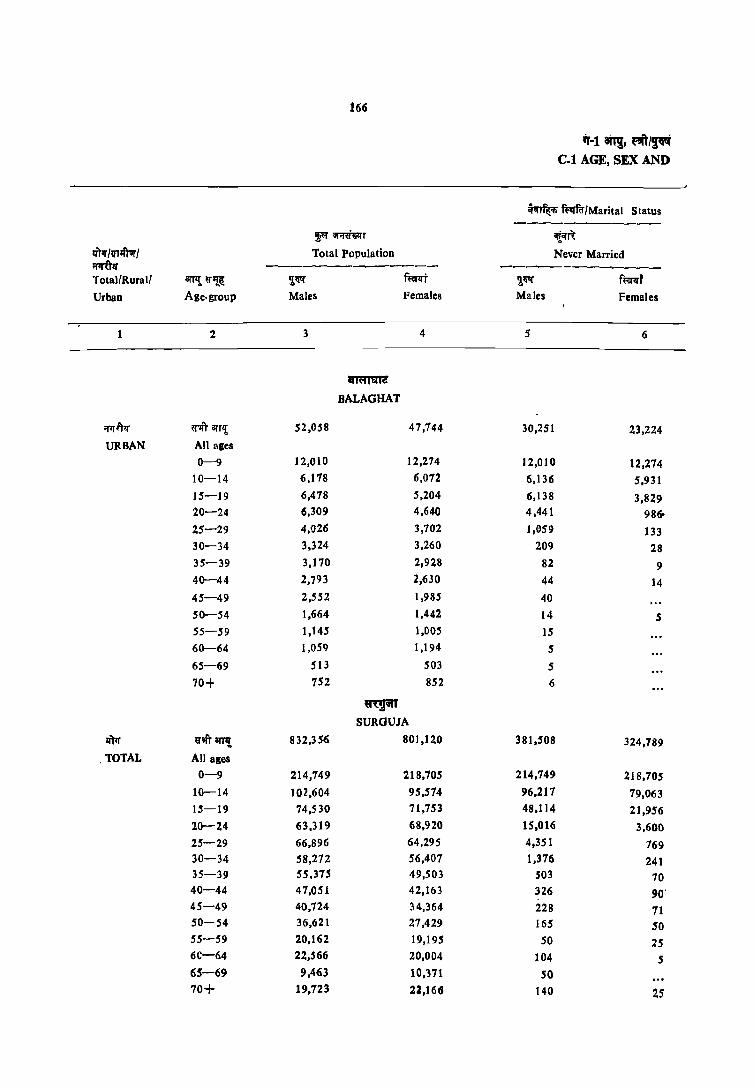
166
iF-t aTr!, ,,"/~ C.t AGE, SEX AND
~ m:rfir/Marital Status -----------
~ ;;r;rn~T "i<r~ trTql'll~1 Total Population Never Married ;mU1;f ----------- ------------'f otal/R ura II ar!l!. ~ 'Ii! ~~ ~t 2.~ f~' Urban Age.group Males Females Males Females
2 3 4 5 6
~
BALAGHAT
'fII'ltlf ~'IiT anI! 52,058 47,744 30,251 23,224 URBAN All ages
0-9 12,010 12,274 12,010 12,274 10-14 6,178 6,072 6,136 5,931 15-19 6,478 5,204 6,138 3,829 20-24 6,309 4,640 4,441 986-25-29 4,()26 3,702 1,059 133 30-34 3,324 3,260 209 28 35-39 3,170 2,928 82 9 40-44 2,793 2,630 44 14 45-49 2,552 1,985 40
SO-54 1,664 1,442 14 S 55-59 1,145 1,005 15
60-64 1,059 1,194 5
65-69 513 503 5
70+ 752 852 6
~ SURGUJA
IIW ~'Ift anI{ 832,356 801,120 381,508 324,189
. TOTAL All ages
0-9 214,749 218,705 214,749 218,705 10-14 102,604 95,514 96,211 79,063 15-19 74,S 30 71,753 48,114 21,956 20-24 63,319 68,920 15,016 3,600 25-29 66,896 64,295 4,351 169 30-34 58,212 56,401 1,316 241 35-39 55,375 49,503 503 70 40-44 47,051 42,163 326 90' 45-49 40,724 34,364 228 71 50-54 36,621 27,429 165 SO 55-59 20,162 19,195 SO 25 6C-64 22,566 20,004 104 5 65-69 9,463 10,371 50 70+ 19,723 22,166 140 25
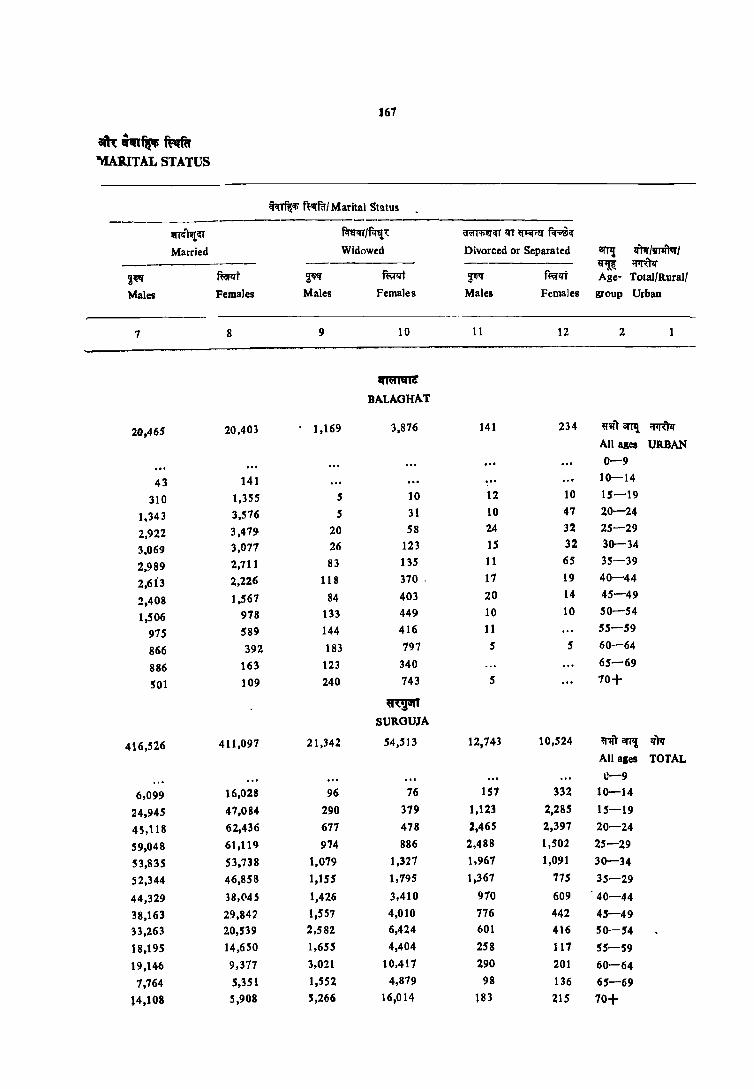
167
8itt i~", ft.m. '"rIARITAL STATUS
~'li f~V{rCl/ Marital Status
~lTift"'l<:T f.rwrr/~l; ~<:TlI'T~Cl""<:'
Married Widowed Divorced or Separated 1II'Tl! lI'm/~1
--------- --------- ~ ~ ~~ ffirIl"t ~ ffi;rl:rt ~ H:;;rlli Age- Total/Rural!
Males Females Males Females Males Females group Urban
7 8 9 10 11 12 2
~
BALAGHAT
20,465 20,403 1,169 3,876 141 234 «'Il1111'11l ~If All ales URBAN
0-9
43 141 ... 10-14
310 1,355 5 10 12 10 15-19
1.343 3,576 5 31 10 47 20-24
2,922 3,479 20 58 24 32 25-29
3,069 3,077 26 123 15 32 30-34
2,989 2,711 83 135 11 65 35-39
2,6i3 2,226 118 370 . 11 19 40-44
2,408 1,567 84 403 20 14 45-49
1,506 918 133 449 10 10 SO-54
975 589 144 416 11 55-59
866 392 183 797 5 5 60-64
886 163 123 340 65-69
501 109 240 743 5 70+
~ SURGUJA
416,526 411,097 21,342 54,513 12,743 10,524 ~'Ilr arT?f lI'm
All ales TOrAL U-9
6,099 16,028 96 16 157 332 10-14
24,945 47.084 290 319 1,123 2,285 15-19
45,118 62,436 671 478 2,465 2,397 20-24
59,048 61,119 974 886 2,488 1,502 25-29
53,835 53,738 1,079 1.327 1,967 1.091 30-34
52,344 46,858 1,155 1,795 1,367 715 35-29
44,329 38,(14 S 1,426 3,410 910 609 40-44
38,163 29.847 1,557 4,010 176 442 45-49
33,263 20,539 2,582 6,424 601 416 SO-54
18,195 14,650 1,655 4,404 258 117 55-59
19,146 9,377 3,021 10,411 290 201 60-64
7,764 5,351 1,552 4,879 98 136 65-69
14,108 5,908 5,266 16,014 183 215 10+

168
'1-1 atTI, ""/~ Col AGE, SEX AND
;jqr~ ~/Marital Status ---------~ ;;r~ilI"T ~R
IJmlVl1iA! Total Population Never Married ~ ---- ------------TOlal/Rural/ i!lll{.~~ ~ ~r ~ ffirlft Urban Age-group Males Females Males Females
2 3 4 5 6
~iiIt SURGUJA
wpftar ~an'I! 756,114 735,394 342.300 292,213 RURAL All "ages
0-9 196,934 200,399 196,934 200,399
10-14 93,845 87,593 87,618 71,458 15-19 66,317 63,862 40,994 17,175 20-24 55,070 62,227 10,939 2,149 25-29 60,122 58,499 3,280 522 30-34 52,893 51,488 1,117 165 35-39 49,733 44,951 451 31 40-44 42,003 38,976 260 S5 45-49 36,526 32,364 187 49 50-54 33,838 25,902 139 50 55-59 18,912 18,420 45 25 60-64 21,505 19,041 80 65-69 9,058 9,957 40 70+ 19,077 21,468 105 25
;rtl~ rirar!l! 76,242 65,726 39,208 32,576 URBAN All ages
0-9 17,815 18.306 17,815 18,306 10-14 8,739 7,981 8,599 7,605 15-19 8,213 7,891 7,120 4,782 20-24 8,250 6,693 4,077 1,451 25-29 6,774 5,796 1,070 247 30-34 5,379 4,920 259 77 35-39 5,542 4,552 51 33 40-44 5,048 3,188 66 35 45-49 4,191 2,001 40 21 SO-54 2,783 1,527 26
55-59 1,250 776 5 60-64 1,062 963 24 5 65-69 405 414 10
70+ 646 699 35 'oo

1419
am:.~~ MARITAL STATUS
;f.irr%'Ii ~a-/M:!rital Stutus
--~G:T f.mcn/~ ~G:T If! ~!il ~~
Married WidJwed Divorced or Separated OfT!! lfN/1l'Jlft1IJ' ------ ------- -------- ~ 'I'IrtN ~ fi:;;rlfT ~ ~j FI' fliiI'lfT Age- Total/Rural/
Males Females Males Females Males Females group Urban
7 8 9 10 11 12 2
~ SUROUIA
380,89.5 381,398 20,147 .51,.50.5 12,.559 10,094 ~'Ift ar!l! lfJlft1r AU ages RURAL
0-9 .5,946 15,661 90 71 157 328 1()-14
23,882 44,003 210 379 1,113 2,261 15-19 41,014 .57,317 643 440 2,443 2,310 20-24
53,412 5S.691 ns 823 2,460 1,448 25-29
48,81.5 49,038 995 1,245 1.950 1,035 30-34
46,329 42,554 1,108 1,657 1,346 698 35-39
39,500 3.5,188 1,3] 8 3,144 925 519 40-44
34,134 28,155 1,439 3,748 765 411 45-49
30,107 ]9,469 2,396 5,998 585 385 50-54
17,052 14,197 1,563 4,091 247 106 55-59 18,239 9,044, 2,894 9,802 286 191 60-64
7,443 5,223 1,418 4,598 98 131 65-69
13,160 5,739 5,009 1.5,494 183 205 10+
3.5,631 29,699 11,945 3,008 184 430 ~'$ft arP{ ~ All ages URBAN 0-9
153 367 'i 5 4 10-14 1,063 3,081 20 10 2~ 15-19 4,104 5,118 34 37 22 87 20-24 .5,636 5,428 39 63 29 54 25-29 5,020 4,700 84 82 11 51 30-34 "",515 4,304 48 137 21 78 35-39 4,828 2,857 108 266 45 30 40-44 4,029 1,687 118 261 11 31 45-49 2,556 1,070 186 426 16 30 50-54
1.142 453 93 313 10 10 55-59
906 333 127 615 4 10 60-64
321 121 74 282 5 65-69 348 t69 257 5~0 ... ~O 70+
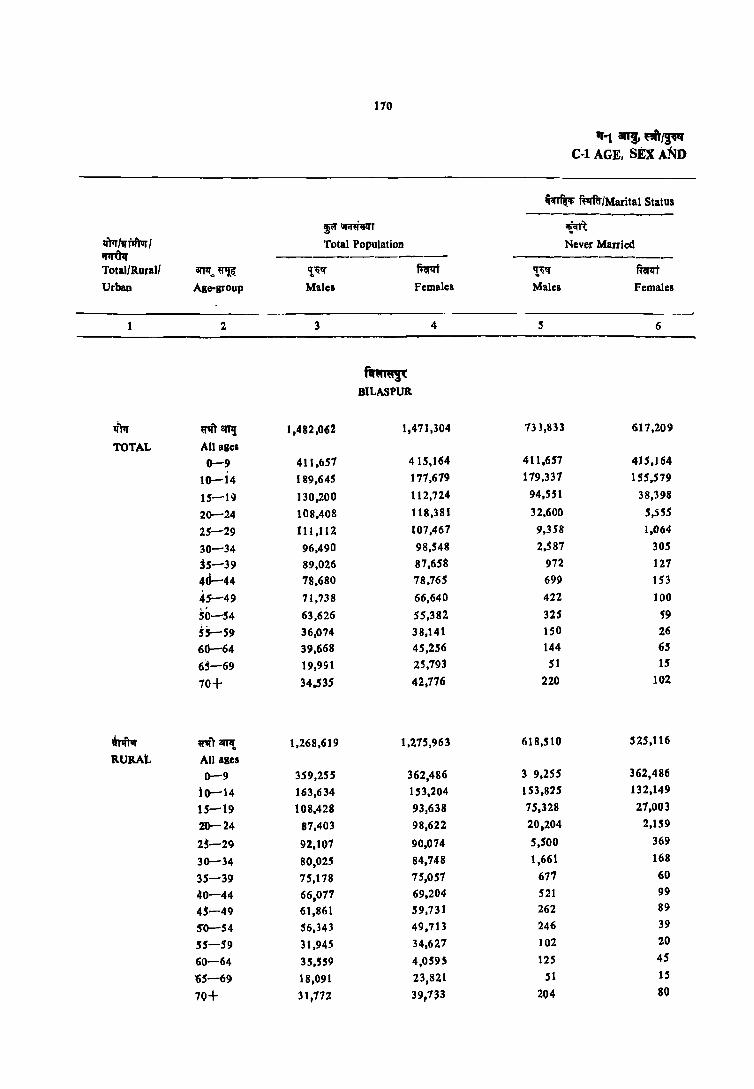
110
""1 8ft!, ""'~ C-l AGE, sEx AND
~ ~/Marital Status
~~VlfT ~ m/trl'lft'ar/ Total Population Never Married ~ ------------Total/Rurall arrlf .. ~ '111
" mt ,!~q' ftilrlft
Urban Ale-grouP M~lel Females Males Females
1 2 3 4 ~ 6
"""'i< BILASPUR
1(')1r ~8lTr{ 1,482,0(;2 1,471,304 731,833 617,209
TOTAL All aBel
0-9 411,657 415,164 411.657 415,164
10-14 189,645 177,679 119,331 155,579
15-19 130.200 112,724 94,551 38,398
20-24 108,408 118,381 32,600 ~,5S5
25-29 Hl,II2 107,467 9,358 1,0(;4
30-34 96,490 98,548 2,~87 305
35-39 89,026 87,658 972 127
4d-44 78,680 78,765 699 153
45-49 71,738 66,640 422 100
SO-54 63,626 55,382 325 59
55-59 36,074 38,141 150 26
60-64 39,668 45,256 144 65
65--69 19,951 25,793 51 15
70+ 34.535 42,776 220 102
~ "Tam{ 1,268,619 1,275,963 618,510 525,116
RURAL All ales 0-9 359,255 362,486 3 9,255 362,486
10-14 163,634 153,204 153,875 132,149
15-19 108,428 93,638 75,328 27,003
%0-24 87,403 98,622 20)204 2,159
25-29 92,107 90,074 5,500 369
30-34 80,025 84,748 1,661 168
35-39 75,178 75,057 677 60
40-44 66,077 69,204 521 99
45-49 61,861 59,731 262 89
5'0-54 56.343 49.713 246 39
55-59 31,945 34,627 102 20
60-64 35,559 4,059S 125 45
'65-69 18,091 23,821 51 15
7Q+ 31,772 39,733 204 80

., i
am~~~ MARITAL STATUS
~ ~{Marital Stalus
~~r mr'~ ~Ull1~fcr.
Married Widowed Divorced or Sepatated all',! 'fPr tv rrftIJf I -------- ~ ~(t?,r
~ ffiflit ~ ffi;p.rt ~ ffif'lI't Age- lotal/&urall Males FemaleS Males Females Males Females 8I'oup Urban
7 8 9 10 11 12 2 1
ftr~ BILASPUR
700,048 707,8~9 37,908 133,835 10,027 12,144 ritamt !Wr All ages TOTAL
0-9 10,143 21.697 84 178 56 117 10-14 34,302 72,346 455 285 BI8 1,596 15-19
7l,298 109,620 955 939 1,527 2,236 20-24
98,S47 103,105 1,627 1,573 I,H3 1,721 25-29
90,&47 94,1)56 1,561 2,924 1,486 1,258 30-34
84,800 81,252 2,114 5,073 1,124 1,207 35-39
74,295 69,460 2,688 8,122 998 1,029 40 44
67,266 54,949 3,279 10,787 766 798 45-49
58,072 37,328 4,566 17,184 648 811 SO-54
32,452 25,304 3,164 12,399 308 412 55-59
33,717 18, ~S6 5.434 26,271 338 359 60-u4 16,404 10,377 3,370 15,119 166 271 65-69
25,483 9,449 8,587 32,912 241 312 70+
606,119 619,110 34,519 120,445 9,285 11,060 ij''Ifi arJI{ 1I'~ All aps RURAL 0-9
9,649 20,665 84 173 56 112 10-14
31,801 64,800 444 251 7S8 1,508 IS-I 9 64,879 93,534 890 860 1,415 2,045 20-24
83,651 86,737 1,504 1,404 1,435 1,558 25-2'.1
75,611 80,9lS 1,41)0 2,522 1,341 1,137 30-34 71,553 69,539 1,906 4,198 1,027 1,061 35-39
62,185 61,071 2,456 7,135 915 899 40-44 57,901 49,379 2,967 9,S31 726 721 45-49 51,325 33,S69 4,148 J 5,383 609 722 50-54 28,759 23,197 2,801 11,027 283 383 55-59 30,189 16,853 4,920 23,353 300 339 60-64
14,845 9,719 3,042 13,115 153 261 65-69
23,395 8,827 7,932 30,528 l36 298 70 t

172
Ife. an,. """~ C-l AGE, SEX ANa
"qT~ ~/Marital Status
~~T ~ ~ 11ll1ftvr/ Total Population Never M'uried ~ ------------ -----------Total/Rural' iIl11! ~~ ~ mrlfT ~ ~
Urban Age-group Males Females Males Females
2 3 4 5 6
~'( BILASPUR
~ ~T OW{. 213,443 195,341 11 5,32.3 91,093
URBAN All ages
0-9 52,401 52,618 52,401 52,678
10-14 26,011 24,475 2$,512 23,429
15-19 21,712 19,086 19,223 11,396
20-24 21,004 19,158 12,396 3,396
25-29 19,005 11,393 3,858 694
30-34 I6,~65 13,800 926 137
35-39 13,849 12,601 295 61 -
40-44 12,603 9,562 177 54
45-49 9,811 6,909 160 11
50-54 7,283 5,669 79 19
55-59 4,129 3,513 49 6 60-64 4,109 4,661 19 19 65-69 1,900 1,972
70+ 2,763 3,043 IS 22
l"I1fIll' RAIGARH
lJ)lr ij''IlT arT,! 719,613 123,584 358,116 315,637 TOTAL All ages
0-9 175,959 180,831 115,959 180,837
10-14 92,7513 90,854 91,256 88,225
15-19 70,779 64,162 61,511 38,085
20-24 51,732 57,913 2,0601 5,431 25-29 55,494 55,460 5,640 1,502 30-34 49,426 51,340 1,523 S96 35-39 41,562 43,946 670 331 40-44 38,471 38,650 4';3 98
45-49 35,760 34,214 280 118 SO-54 31,823 28,041 190 104 55-59 19,823 20,184 104 30 60-64 21,131 22,169 105 44 65-69 10,011 12,500 30 9 70+ 18,501 22,377 122 60
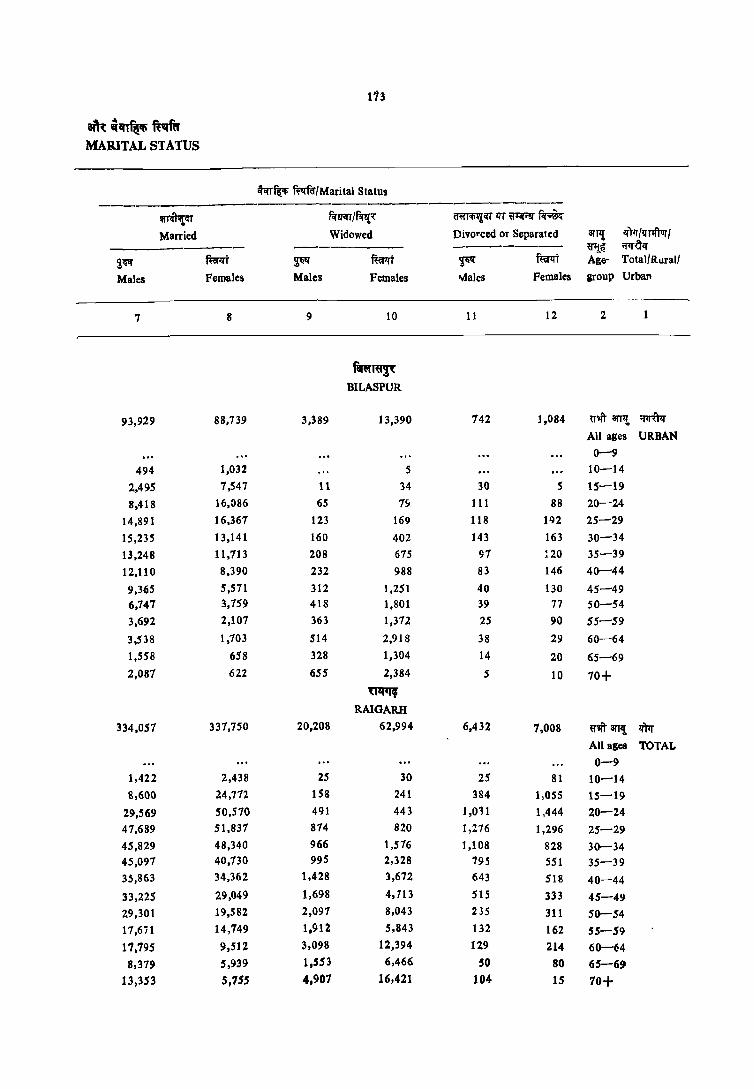
113
~~~~ MARITAL STATUS
ffi~ ~/Marital Status -----------------------------------
~~ f.rrn If<rf{'{ ~<:T lfT ij'Jif"!i' ~
Married Widowed Divorced or Separated anI! lfTIf Ill!lftvr I _----- ------- ------- ~~ ~
~~ fu;prt ~ ft:wrt ~ fualfT Age- Total/RLIral/
Males Females Males Females rvlales Females group Urban
7 8 9 10 11 12 2
h~ BILASPUR
93,929 88,739 3,389 13,390 142 1,084 ~,ftarrlL ~
All ages URBAN 0-9
494 1,032 5 10-14
2,495 7,547 11 34 30 5 15-19
8,418 16,086 65 1~ 111 88 20-24
14,891 16,361 123 169 118 192 25-29
15,235 13,141 160 402 143 163 30-34
13,248 11,113 208 675 97 120 35-39
12,110 8,390 232 988 83 146 40-44
9,365 5,511 312 1,251 40 130 45-49 6,747 3,759 418 1,801 39 77 50-54
3,692 2,107 363 1,312 25 90 55-59
3,538 1,703 514 2,918 38 29 60-64
1,558 658 328 1,304 14 20 65-69
2,081 622 655 2,384 5 10 70+
~ RAIGARH
334,057 337,750 20,208 62,994 6,432 7,008 e-,ft :arT1{ Ifttr All ages TOTAL 0-9
1,422 2,438 25 30 25 81 10-14
8,600 24,772 158 241 384 1,055 15-19
29,569 50,570 491 443 J ,011 1,444 20-24
47,689 51,831 814 820 1,276 1,296 25-29
45,829 48,340 966 1,576 1,108 828 30-34 45,097 40,730 995 2,328 795 551 35-39 35,863 34,362 1,428 3,672 643 518 40-44
33,225 29,049 1,698 4,713 515 333 45-49
29,301 19,582 2,097 8,043 235 311 50-54 17,6;1 14,749 1,912 5,843 132 162 55-59
17,795 9,512 3,098 12,394 129 214 60-~4
8,379 5,939 1,553 6,466 SO 80 65-69
13,353 5,755 4,901 16,421 104 15 70+

114
"'-1 an" ~/~ C-I AGE, SEX AND
t<m~ f~f.'f/Marital Satus
~~r IfLm ~/1I~1 Total Population Never Married ~ ------------ -------------Tota1(Rural/ arPi~ 't,'Illf ffirl"t ,!1i1f ~
Urban Age-group Males Females Milles Females
1 2 3 4 5 6
mllJ RAIGARH
QT1ftur ~"tow! 655,840 666,224 323,278 288,264
,RURAL All ages
0-9 H2,626 6,,985 162,626 165,985 10-14 84,844 83,427 83,420 80,947 15-19 62.880 58,664 54,123 34,288 20-24 44,211 52,375 15,629 4,38'1 25-29 50,023 50,373 . 4,527 1,284 30-34 44,584 47,216 1,192 512 35-39 43,384 40,252 543 295 40-44 34,983 35,888 403 78 45-49 32,919 31,885 214 108 50-54 29,499 26,151 174 94 55-59 18,566 19,549 80 25 60-64 19,808 20,606 80 44 65-69 9,451 11,949 25 9
70+ 17,661 21,577 74 S4
~ ~'¥it 0fl'I! 63,113 57,360 35,438 27,313
URBAN All agel
0-9 13,333 14,852 13.333 14,852 10-14 1,914 7,428 1,836 1,278
15-19 1,899 5,499 7,447 3,796
20-24 7,520 5,531 4,972 1,044
2;-H 5,471 50,87 1,112 218 30-34 4,842 4,124 331 84 35-39 4,178 3,694 121 43 40-44 3,435 2,762 71 20 45-49 2,841 2,329 66 11 50-54 2,324 1,890 16 11 55-59 1,258 1,234 24 5
60-64 1,324 1,563 25 65-69 560 551 5 70+ 840 799 ~8 5

175
8ft'( hI'" mm, MARITAL STAtuS
~ ft1rfu/Marital Status --------------- ----Q1R~l(T m<rrffil''!;1: ~l(Tlfr~~
Married Widowed Divorced or Separated CITTl! IfFr/Il'fli\'olrI -------- ------- ~ ~
~ ~i ~ ~r ~Q!f f~f Age- Total/Rural I Males Females Males Females Males Females group Urban
7 8 9 10 11 12 2
~ RAIOARH
307,250 312,631 189,278 58,532 6,213 6,601 ~m arT!! !TTIft1Jr All ages RURAL 0-9
1,343 2,294 25 30 25 81 10-14
1,164 23,015 141 215 384 1,025 15-19
27,1147 46,147 475 408 1,020 1,409 20-24
43,432 47,133 831 753 1,228 1,191 25-29
41,446 44,497 900 1,449 1,046 157 30-34
41,131 31,284 925 2,148 714 525 35-39
32,621 31,917 1,32Z 3,361 627 466 40-44
30,644 21,187 1,582 4,278 474 313 45-49
27,143 18,431 1,958 7,356 225 270 SO-54
16,583 14,058 1,171 5,310 127 151 55-59
16,691 9,020 2,908 11,339 129 197 60-64
7,941 5,754 1,441 6,106 45 75 65-69
12,835 5,62<> 4,633 15,768 104 130 70+
16,807 25,113 1,280 4,462 219 407 ~i' amt ~ All ales URBAN
0-9
79 144 10-14
436 1,647 11 26· 30 15-19
2,522 4,423 16 36 11 34 20-24
4,2S7 4,704 44 66 48 99 25-29
4,383 3,843 66 127 62 71 30-34
3,960 3,446 70 180 21 26 35-39
3,242 2,384 106 304 16 52 40-44
2,6tZ 1,862 116 435 41 20 45-49
2,158 1,151 139 681 10 41 50-54
1,088 691 136 533 5 5 55-59
1,104 492 190 I,OS5 17 60--64
438 185 112 360 5 5 65-69
518 136 274 653 5 70 +

176
11-1 anJ, ""/~~ C-l AGE, SEX AND
~ifi' ~/Marital Status ------------
~~~~r ~ ~/1I11iTat / Total Population Never Mlnoied ~ ~---------- ------------Total/R.ural/ 3l17! ~~ '!,lil!l" RiiI1rt ,\~I!I" mt Urban Age-sroup Males Females Males Females
2 3 4 5 6
~I\ii" 14" I. RAJNANDOAON
IfPr U-lIT an,! 571,896 589,605 289,216 250,362
TOTAL All ales
0-9 162,653 161,997 162,653 161,997
10-14 81,381 76,178 73,493 64,114
15-19 54,732 51,515 36.668 20,276 20-24 42,070 45,757 11,259 2,901 25-29 40,049 41,026 3,073 548 30-34 35,333 37,092 898 170 35-39 33,089 33,573 275 18 40-44 29,494 30,463 271 58 45-49 28,347 26,503 159 21 SO-54 22,411 21, t 65 105 46 55-59 14,174 15,541 51 60-64 13.288 18,593 70 34 65-69 1.739 11,286 29
70+ 12,746 18,163 90 35
;-~ rnarJ'lt 503,711 519,532 247,144 217,605
RURAL All ages
0-9 144,416 144,823 144.416 144,823
10-14 72,099 67,924 64,362 5S,604 15-19 46,352 44,415 29,005 1S,300 20-24 34,6lS 39,325 6,348 1,336 25-29 34,348 35,309 J,528 203
30-34 30,!..27 32,173 502 89
35-39 28,678 29,015 225 42 40-44 25,355 26,839 203 31 45-49 24,760 23,287 J09 22
SO-54 19,581 18,692 86 36 H--59 12,597 13,840 41 60-64 I1,S5' 16,683 01 24
65-69 6,970 10,289 IS 70+ 11,719 16,'94 76 30

177
am:_~""'m MARITAL STATUS
~ ~fMarital Status
~Rt!IT fcrl:Iqr ff<rf!, ~!ITlI"r~~
Married Widowed Divorced or Separated OWl lI"PrJ'IJ'Tfftvr/ ----------_ ------ -------- ~ ~ ~~ fuir:rt ~" fWrt ~qq' fum Age- Total/RUralf
Males Females Males Females Males Females group Urban
7 8 9 10 11 12 2
(iGi"IC;ilct
RAJNANDGAON
269,369 277,135 12.726 54,891 5,974 7,089 ~"" ~ ~ All ages TOTAL 0-9
1,320 12,568 30 41 24 26 10-14
17,573 30,309 B5 107 372 769 15-19
29,544 41,262 231 307 I,O:U 1,277 20-24 35,569 38,917 396 528 1,001 1,023 25-29
33,226 34,997 429 1,004 770 9IS 30-34
31,501 31,361 644 1,496 663 63B ~5-39
27,773 27,408 860 2,491 590 502 40-44
26,644 21,770 1,050 4,IB4 494 518 45-49
20,373 14,021 1,574 6,611 359 487 50-54
12,319 9,553 1,282 5,738 216 256 55-59
Il,Z09 7,239 1,173 10,961 220 355 60-64 6,408 4,048 1,217 7,090 85 147 65-69
9,357 3,630 3,157 14,317 143 176 70+
239,S69 247,012 11,358 48,430 5,560 6,371 ~on't vrftar All age. RURAL 0-9
7,673 12,223 30 41 24 26 10-14
16,871 28,245 80 107 366 713 15-19
27,081 36,575 220 244 955 1,160 20-24
31 .. 529 33,663 341 417 941 966 25-29 28,514 30,410 380 8Cil) 720 809 30-34 27,269 27,148 591 1,273 587 552 35-39
22,852 24,276 714 2,127 '25 401 40-44 23,259 19,188 918 3,621 473 452 45-49 17,818 12,$86 1,354 5,639 324 431 50-54 11 ,231 8,153 1,124 4,863 201 224 55-59 10,014 6,669 1,570 9,660 210 324 60-64 5,774 3,763 1,096 6,383 85 143 65-69 8,633 3,468 2,879 13,120 131 171 70+
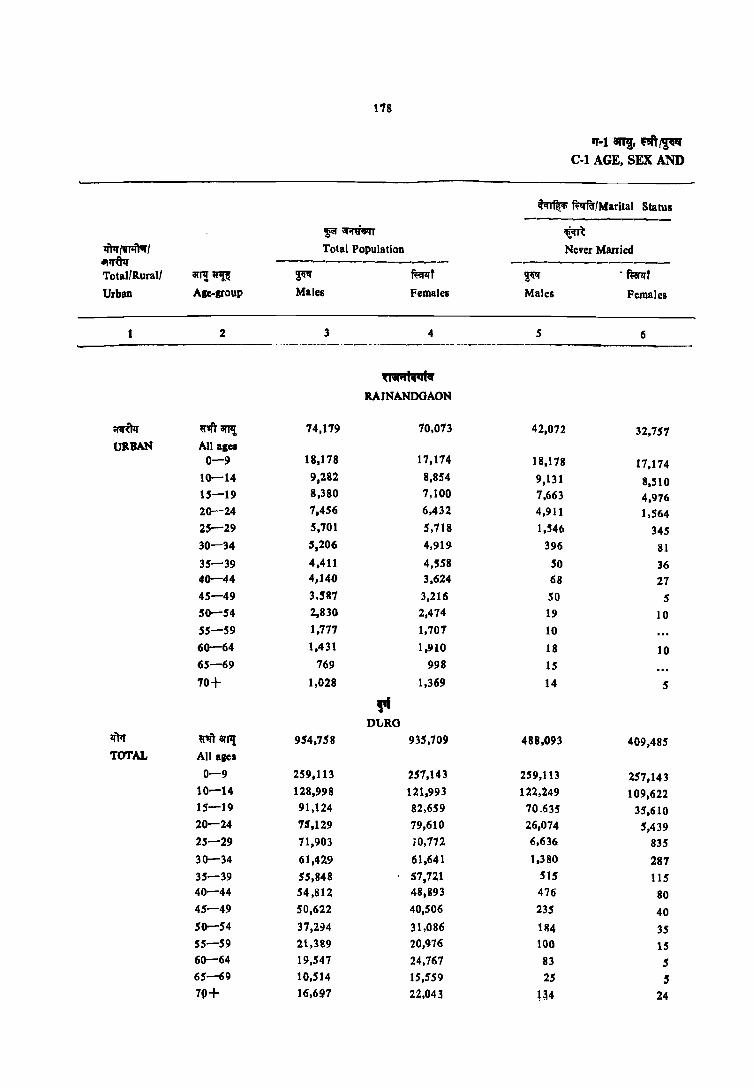
1'78
if-18fT!, ""pt C-I AGE, SEX AND
~ ~ftr'Marital Status ---~ ~1iIIT ~
tiA'~, Total Population Never Married ~1J'Uzr ------------TotallR.ural/ :arJ'l!~ ~" mf ~ om' Urban Age..group Males Females Males Females
1 2 3 4 5 6
(1 .. .,1 .. ·1161 RAJNANOOAON
~ ~~:at"'! 74,179 10,013 42,012 32,151 URBAN All ages
0-9 18,118 11,114 18,118 11,114 10-14 9,281 8,854 9,131 8,510 15-19 8,380 1,100 7,663 4.976 20-24 1,456 6,432 4,911 1,564 25-29 5,701 5,118 1,546 345 30-34 ',206 4,919 396 81 35-39 4,411 4,558 50 36 40-44 4,140 3,624 68 27 45-49 3,!81 3,216 SO 5 SO-54 2,830- 2,474 19 10 55-59 1.717 1,701 10
60-64 1.431 1.910 18 10 65-69 769 998 15
70+ 1,028 1,369 14 5
" D1.JRO ~)1r ~8I'p! 954,758 935,109 488,093 409,485 TOTAL All ages
0-9 259,113 257,143 259,113 257,143 10-14 128,998 121,993 122,249 109,622 15-19 91,124 82,659 70.635 35,610 20-24 75.129 19,610 26,074 5,439 25-29 11,903 ;0,172 6,636 835
30-34 61,429 61,641 1,380 281 35-39 55,848 57,121 515 115 40-44 54,812 48,893 476 80 45-49 50,622 40,506 235 40 50-54 31,294 31,086 1114 35 55-59 21,389 20,976 100 15 60-64 19,547 24,167 83 5 65-69 10,514 15,559 25 , 7()+ 16,697 22,043 l~4 24
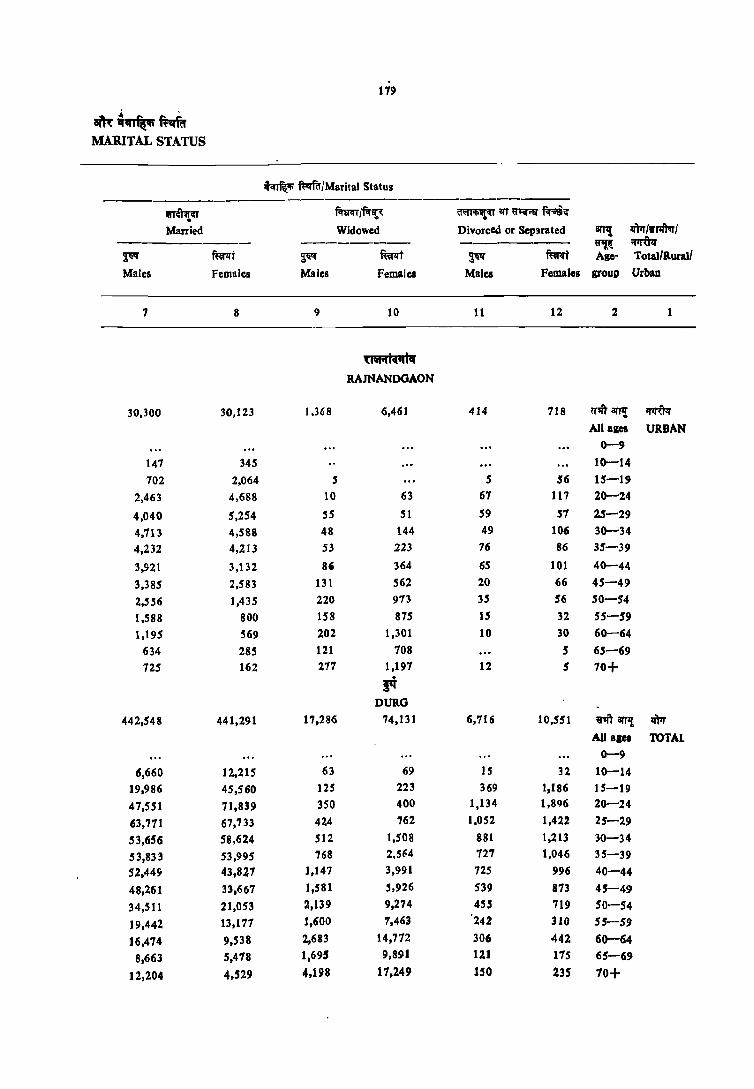
179
.. -~ -"'~ ft:.qftr MARITAL STATUS
~ ftv:rfu/Marital Status ------------------------------------
~u f<nfIIT lfiilt<: ~ lIT ~q;:a' f.r;9;r
Married Widowed Divorced or Sep:uated arTl! IiPr IvPilvr I ---------- -------- ~ ~ ~ mt ~ mt ~ ffiAt Age- Total/Rural/
Males Females Males Females Males Females group Urban
7 8 9 10 11 12 2 1
(i"'fi ... ilii
aAJNANDGAON
30,300 30,123 1.368 6,461 414 118 «'" arT!! ~ All ages URBAN
0-9
141 345 10-14
702 2,064 5 5 56 1S-19
2,463 4,688 10 63 67 117 20--24
4,040 5,254 55 51 59 51 25-29
4,113 4,588 48 144 49 106 30--34
4,232 4,213 53 223 16 86 35-39
3,9-21 3,132 8(i 364 65 101 40-44
3,385 2,583 131 562 20 66 45-49
2,556 1,435 220 913 35 56 SO-54
1,588 800 158 815 IS 32 55-59
1,195 569 202 1,301 10 30 60-64
634 285 121 108 5 65-69
125 162 211 1,191 12 5 10+
rt DURO
442,548 441,291 17,286 74,131 6,716 10,551 ~ arT!! IftIr AU aIel TOTAL
0-9
6,660 12,215 63 69 IS 32 10-14
19,986 45,560 125 223 369 1,186 15-19
47,551 71.839 350 400 1,134 1,896 20-24
63,771 67,733 424 762 1,052 1,422 25-29
53,6S6 58,624 512 1,508 881 1,213 30-34
53,833 53,995 768 2,5(:4 127 1,046 35-39
52,44!i 43,8Z7 1,147 3,991 725 996 40-44
48,261 33.667 1,581 5,926 539 873 45-49
34,511 21,053 2,139 9,274 4.55 719 50-54
19,442 13,171 1,600 1,463 242 310 55-59
16,474 9,538 2,683 14,772 306 442 60-64
8,663 5,418 1,695 9,891 121 I1S 65-69
12,204 4,529 4,198 11,249 ISO 235 70+

llTrr{m~! iJ1l1.Tcr TotaJ(Rural{
Urban
~ RURAL
I!1lUlr URBAN
i!fTl{ ij"1!.~
Age-group
2
ij"'Ift 8TTI! All ages
O-~
]0-14
]5-19
20-24
. 25-29 30-34
35-39
40-44
45-49 5:)-54
55-59
60-64
65-69
70+
ij"'I{T arrlJ. All ages
0-9
10-]4
15-19 20-24
25-29 30-34
35-39 40-44
45-49
50-54 55-59 60-64
65-69
70+
180
~ \il'ifflCll'T
Total Population
~ Males
3
6H.488
179,120
89,024
58,730 46,411
44,231 37,335
33,411
30,685
32,301
27,309
16,797
16,504
9,116
14,313
319,270
79,993
33,974
32,394
28,717
26,671
24,094
, 22,438 24,127
18,321
9,~85
4,592 3,043
1,398
2,384
~ DURO
Females
4
653,875
178,377
84,375
55,931 51,970 44,9]9
38,872
35,870
35,166
31,789
25,724
17,660
20,864
13,421
18,730
281,834
78.766
37,618
26,728
27,640
25,854 22,769
21,851 13,727
8,717 5,362
3,316 3,903
2,138
3,313
ft-i an!, ~/~ Cl AGE, SEX AND
ffi~ ~{Marital Status
~~
Males
5
316,177
179.120
82,930
41,323 9,714 1,780
396
213
183
86
82
61
56
20
100
171,916
79,993
39,319
29,312
16,360
4,856
985
303
293
149
103
39 27
5
35
~ Never Married
Females
6
272,970
178,377
73,372
19,202 1,499
174 66
45
30
21
30
15
S
10
136,515
78,766
36,250
16.408
3.940 660
221
69 49
19
5
5
IS
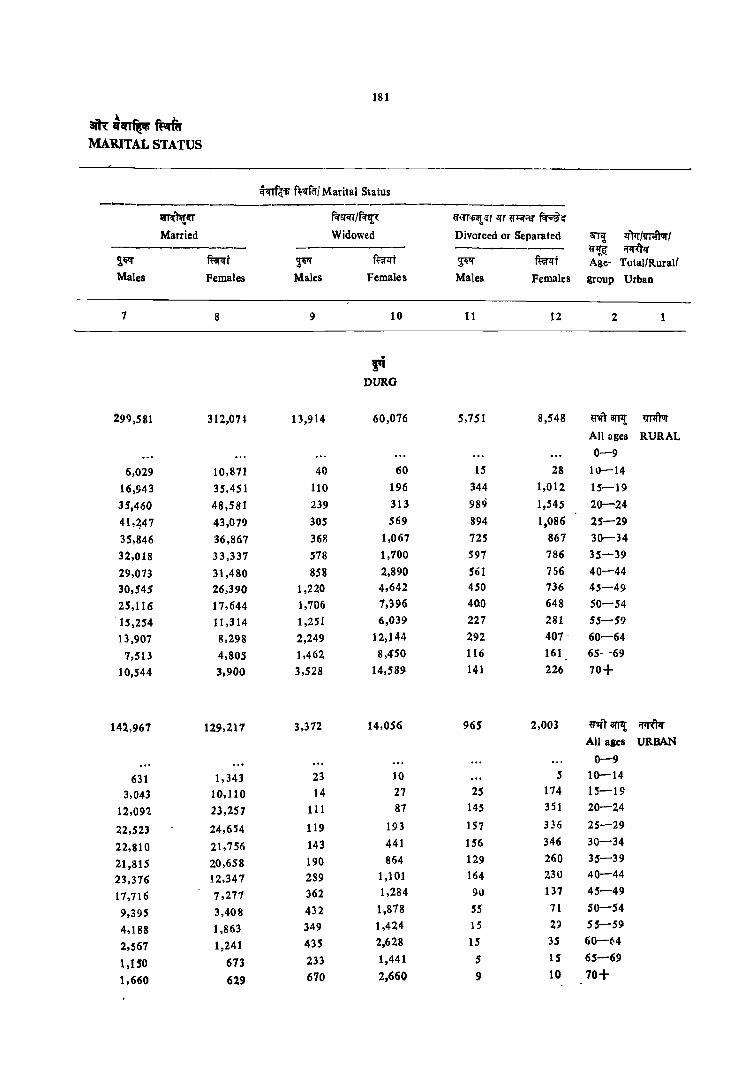
181
aIn~CI1~M MARITAL STATUS
~-n f~'-Tfcrl Marital Status -----------------------------------
~'nJ;i{f f.r~/~ a'<~~r ~r ~l'iI';oer ~~
Married Widowed Divorced or Separated 8lTl! lfm/~1 ---------- ~~ ~lf ~~ mt 2;~ f\?zrt ~ ffirzrt Age- Total(Rural/ Males Females Males Females Males Females group Urban
7 8 9 10 11 12 2 1
fi DURO
299,581 312,OH 13,914 60,076 5,751 8,548 ij"'Ift 0l1l! ~ All ages RURAL
0-9
6,029 10,871 40 60 15 28 10-14
16,!}43 35.451 110 196 344 1,012 15-19
35,460 48,581 239 313 989 1,545 20-24
41,~47 43,079 305 569 894 1,086 25-29
35,846 36,861 368 1,067 725 867 30-34
32,OJ8 33,337 578 1,700 597 186 35-39
29,073 31,480 858 2,890 561 756 40-44
30,545 26,390 1,220 4,642 450 736 45-49
25,116 17,644 1,706 7,396 40:0 648 SO-54
15,254 11 ,314 1,25J 6,039 227 281 55-59
13,907 8,298 2,249 12,144 292 407 - 60-64
7,513 4,805 ],462 8,4'50 116 161 65-69
10,544 3,900 3,528 14,589 141 226 70+
142,967 129,217 3,372 14,056 965 2,003 ij"'llT at'I7! ifIR"tIf All ages URBAN
0-9
631 1,343 23 10 5 10-14
3,043 10,110 14 21 2S 174 15-19
12,09'2 23,257 III 81 145 351 20-24
22,523 24,654 119 193 157 336 25--29
22,810 21,756 143 441 156 346 30-34
21,815 20,658 190 864 129 260 35-39
23,376 12,347 289 1,101 164 230 40-44
17,716 7,277 362 1,284 90 137 45-49
9,395 3,408 432 1.878 5S 71 SO-54
4,188 1,863 349 1,424 15 21 55-59
2,567 1,241 435 2.628 15 35 60-64
1,1S0 673 233 1,441 5 IS 65-69
1,660 629 670 2,660 9 10 70+
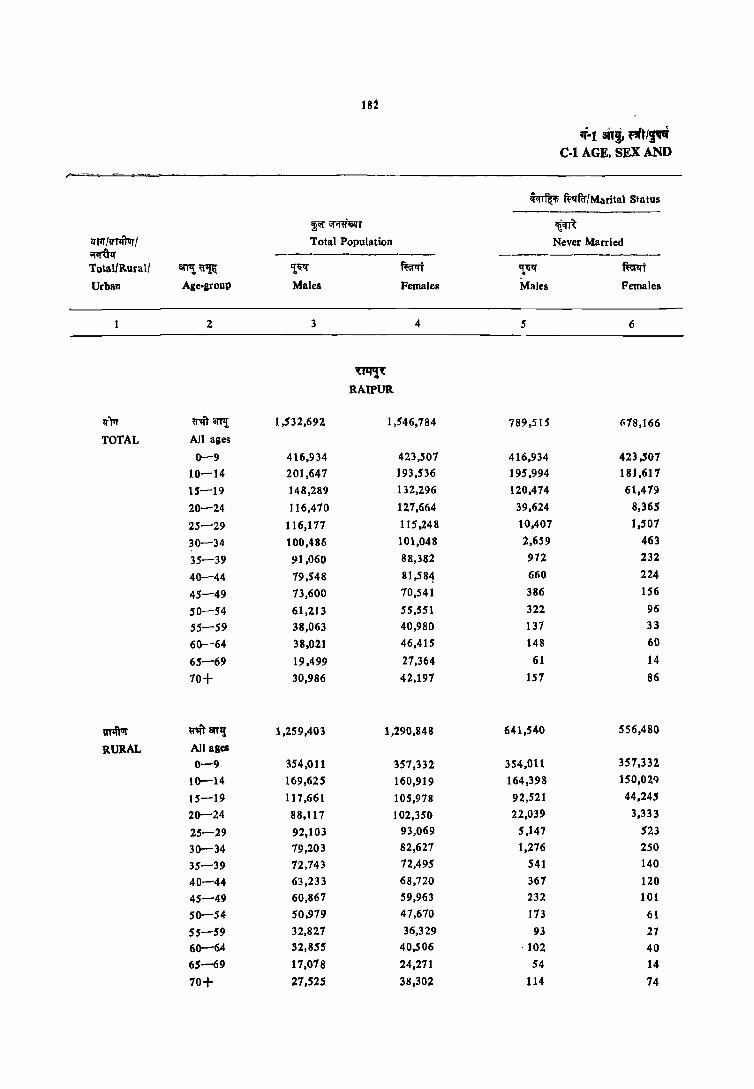
182
If-I aiTi ~t/~ C-I AGE, SEX AND
~ ...
~ ft:'fftf/Marital Status -----------
~ ~lilfr If!lfR lltrr /!fTli'rvr / Total Population Never Married ~lf ------------- ------------Total/Rural/ ~~Q 'l'.'li" ~t '!'lil{ ftw:rt Urban Age-group Males Females Males Females
1 2. 3 4 5 6
~'{
RAIPUR
lfPr ~'" <IfTI! 1,532,692 1,546,184 789,515 618,166
TOTAL All ages
0-9 416,934 423,501 416,934 423,501
10-14 201,641 193,536 195,994 181,611
15-19 148,289 132,296 120,474 61,419
20-24 116,410 121,664 39,624 8,365
25-29 116,177 115,248 10,407 1,507
30-34 100,486 101,048 2,659 463
35-39 91,060 88,382 972 232
40-44 79,548 81,584 660 224
45-49 73,600 10,541 386 156
50-54 61,213 55,551 322 96
55-59 38,063 40,980 137 33
60-64 38,021 46,415 148 60
65-69 19,499 21,364 61 14
70+ 30,986 42,191 151 86
VTIf')1Jr 10m SlTI! 1,259,403 1,290,848 641,540 556,480
RURAL All ages
0-9 354,011 351,332 354,011 351,332
10-14 169,62.5 160,919 164,398 lSO,02Q
15-19 117,661 105,978 92,521 44,245
20-24 88,111 102,350 22,039 3,333
25-29 92,103 93,069 5,147 523
30-34 79,203 82,627 1,276 250
35-39 72,143 12,495 541 140
40-44 63,233 68,720 367 120
45-49 60,867 59,963 232 101
SO-54 50,979 47,670 173 61
55-59 32,821 36,329 93 27
60-64 32,855 40,506 . 102 40
65-69 17,078 24,271 S4 14
70+ 27,525 38,302 114 74

183
am:.~~ MARITAL STATUS
~ ~fu/Marital Status
------WRnri{1' f.nm/~ ~i{1'lIT~~
Married Widowed Divorced or Separated arJ7! l1Fr ~TIfrur I _---------- _------ ~ ~ ~ f~!ft ~ ffir:rt ~ ~1Ji' Age Total/Ruralt
Males Females Males Females Males Females group Urban
7 8 9 10 11 12 2
~ RAIPUR
697,810 712,021 33,431 t 31),879 11,6~'9 16,217 ~arllL l1Fr All ageB TOTAL
0-9
5,514 11 ,651 73 87 33 66 10-14
26,917 68,891 275 202 562 1,570 15-19
74,306 11 S,f23 662 937 1,786 2,654 20-24
102,776 109,903 1,047 1,617 1,941 2,187 25-29
94,737 95,599 1,464 3,092 1,620 1,887 30-34 86,953 81,904 1,713 4,630 1,421 1,610 35-31) .
75,264 71,590 2,344 8,362 1,279 1,402 40-44
69,452 57,597 2,819 11,525 943 1,242 45-49 56,487 36,899 3,773 11,374 625 1,114 SO-54
34,234 26,401 3,203 13,866 490 667 55-59 32,514 17,655 4,968 27,839 378 848 60-64
16,016 9,812 3,110 17,131 306 400 65-69 22,546 8,406 1,960 33,189 309 482 70+
519,344 599,918 28,401 120,548 9,940 13,504 «"" arJ'Il !II1ftar All ages ltuRAL
0-9
5,101 10,657 66 73 33 53 10-14
24,334 60,131 232 170 514 1,325 15-19 63,846 95,968 605 719 1,579 2,276 20-24 84,600 89,373 817 1,415 1,532 1,124 25-H
75,448 78,505 1,175 2,519 1,297 1,346 30-34
69,631 67,093 1,385 3,940 1,186 1,322 35-~9
59,938 60,803 1,826 6,686 1,102 1,11 2 40-44
57,401 49,160 2,412 9,596 822 1,085 45-49 47,226 32,163 3,088 14,397 493 1,049 SO-54 29,421 23,667 2,843 12,037 469 585 55-59 28,061 15,506 4,350 24,176 334 711 60-64 13,992 9,019 2,743 14,847 282 386 65-69 20,258 7,803 6,BSI 29,946 ~89 445 70+

184
If-I ~t m/~ C.I AGE, SEX AND
~~ ftv.rfu/Maritai Status
~~~T ~m ll'llT/!Il~1 Total Population Never Married ~ -------------'( otallRuralf arfl! ~~ ~~ mt ~ f~
Urban Age-group Males Females Males Females
1 • 2 3 4 5 6
~~ RAIPUR.
l'f1)'~J<:r man, 273.289 255,936 141,975 121,685
UR.BAN All ages 0-9 62,924 66,115 62,924 66,175
10-14 32,022 32,616 31,5"6 31,589
15-19 30,629 26,318 27,954 17,234
20-24 28,353 25,314 17,584 5.032
25-29 24,074 22,i 7~ 5,259 983
30-34 21,283 18,421 1,383 213
35-39 18,317 15',887 432 92
40-44 16,315 12,864 293 104
4'5-49 1.2,733 10,518 154 5S 50-54 10,234 7,881 149 36
55-59 5,236 4,651 44 6
bO-64 5,166 5,909 46 ]9
65-69 2,421 3,092 6
'10+ 3,461 3,895 43 12
~
BASTAR
<rffl ~'Ift arT!! 920,321 922,533 484,341 434,132
TOTAL All ages
0-9 254,873 263,035 254,873 263,035
10-14 119,224 1] 5,458 116,548 110.204
15-19 8S,OtS 87,024 '11,228 49,21a
20-2'1 63,421 74,960 25,159 8,651)
25-29, 75,580 74,217 9,967 1,721
30-34 65,131 65,072 2,811 474
35-39 62,7'8 57,634 1,190 261
40-44 49,127 45.97i'i 687 15'1
45-49 44,636 35,908 419 91
SO-54 33,5-:'5 28,448 244 85
55-59 19,278 19,032 126 29
60-64 19,526 22,213 149 46
65-69 10,045 12,084 SO 9
70+ 11,797 21,302 111) '6
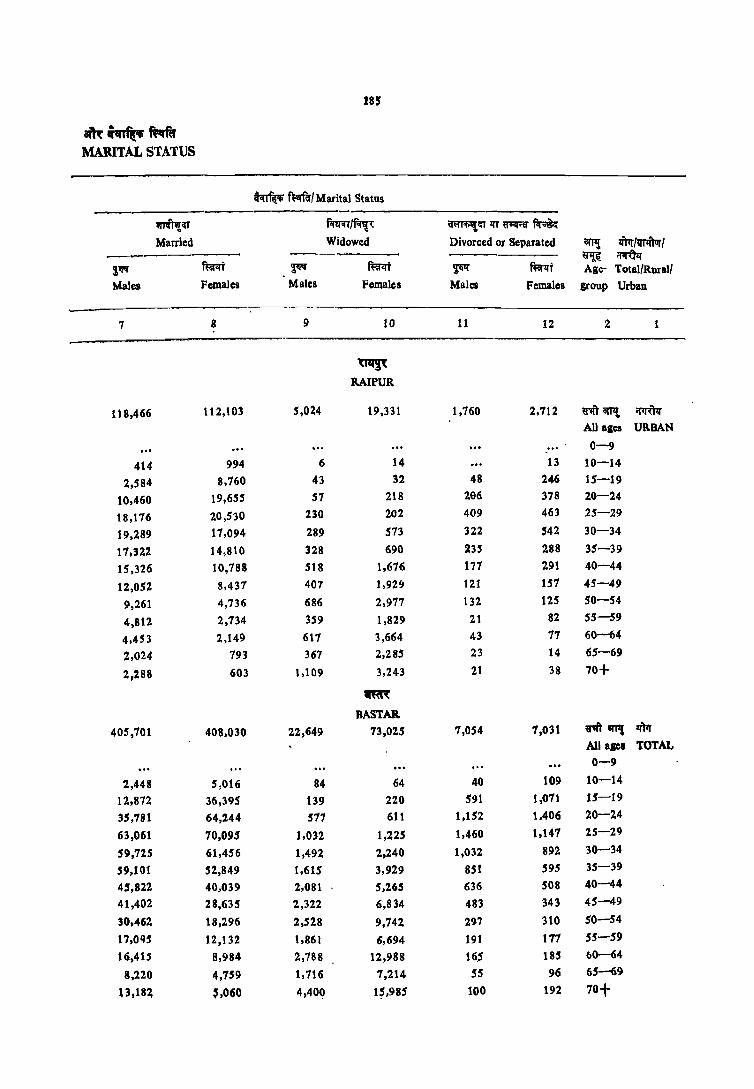
185
aiR .II'T", fAfir MARITAL STATUS
~ f~f(f/ Marital Status
1Ii<l''A!~ mm/~ ~~lfr~Fi1~
Married Widowed Divorced or Separated an,,! lIFr/vm/ -------- -------- ~ ~ ~-.r ~t ~ rnm ~ ffiflft Age- Total/Rural/ Males Females Males Females Males Females group Urban
7 8 9 10 11 12 2 1
~ RAIPUR
118,466 112,103 5,024 19,331 1,760 2,712 mftCllTl! iflRN All ages URBAN
... 0-9
414 994 6 14 13 10-14
1,584 8,760 43 32 48 246 15-19
10,460 19,655 57 218 186 378 20-24
18,176 10,530 230 202 409 463 25-29
19,289 17,094 289 573 322 542 30-34
17,322 14,810 328 690 235 288 35-39
15,326 10,788 518 1,676 177 291 40-44
12,052 8,431 407 1,929 121 157 45-49
9,261 4,736 686 2,971 132 125 SO-54
4,812 2,734 359 1,829 21 82 55-59
4,453 2,149 611 3,664 43 17 60-64
2,024 793 367 2,285 23 14 65-69
2,288 603 1,109 3,243 21 38 70+
~
BASTAR.
405,701 408,030 22,649 73,025 7,054 7,031 ~arPJ; m All ages TOTAL 0-9
2,448 5,016 84 64 40 109 10-14
12,872 36,395 139 210 591 1,071 15-19
35,'181 64,244 511 611 1,152 1,406 20-24
63,061 70,095 1,032 1,225 1,460 1,147 25-29
59,725 61,456 1,492 2,240 1,032 892 30-34
59,101 52,849 1,615 3,929 851 595 35-39
4',822 40,039 2,081 5,265 636 508 40-44
41,402 28,635 2,322 6,834 483 343 45-49
30,462 18,296 2,528 9,142 297 310 50-54
17,OCJS 12,132 1,861 6',694 191 171 55-59
16,415 8,984 2,788 12,988 16.5 185 60-64
8,220 4,759 1,716 7,214 55 96 65-69
l3,18~ ,,060 4,40q 1~,985 100 192 10+

186
''1-1 an" m I~ C·I AGE, SEX AND
~fWt; ~IMarital Status ----~ :;r;rn'~r IIi<rR ..
q'N/li11ft'ar I Total Population Never Married ~ --------- -----------TotallRural1 8I'I'It tr1J.~ ~ ~t ~ ~f
Urban Ale·group Males Females Males Females
1 2 3 4 S 6
~
BASTAR.
v~ ~ arrn 861,848 869,300 4S1,8n 408,225 RURAL All ales
0-9 240,036 248,967 240,036 248,967 10-14 112,360 109,041 109,738 103,922 15-19 79,134 81,176 65,723 45,351 20-24 58,064 69,354 22,425 7,402 25-29 70,016 68,972 8,598 1,485 30-34 60,294 60,844 2,628 358 35-39 58,496 54,376 1,062 217 40-44 45,859 43,429 608 153 45-49 41,777 34,187 380 70 SO-.54 31,705 27,060 220 85 55-59 18,408 18,410 111 25 60-64 18,568 21,100 120 46 65-69 9,636 11,613 SO 5 70+ 17,271 20,613 96 66
~ "" 8l'J'I! 58,473 53,233 32,449 25,907 UR.BAN All alea
0-9 14,837 14,067 14,837 14,067 10-14 6,864 6,417 6,810 6,2112 15-19 5,881 5,848 5,506 3,862 10-24 5,357 5,606 3,334 1,248 25-29 5,564 5,245 1,369 2]6 30-34 4,837 4,228 249 116 35-39 4,282 3,251 128 43 40-44 3,367 2,541 79 5 45-49 2,859 1,721 40 21 SO-54 1,840 1,388 24 55-59 870 622 15 5 60-64 959 1,114 29 65-69 409 471 5 1Qt 527 689 ,4 .. ,

i81
~~~~~ MAllITAL STATUS
------~ ~/Marital Status
------------------------:-----------~ f.rt:l'lTff.r~~ iI\'1'Ailr~ liT ~ f.r;i1{ .. Married Widowed Divorced or Separated 8i'Pl lfTlf {Jr. { --------_- --------- ~
.~
~ ffirll"r ~ mr ~ mt Age- Total/Ruralt Males Females Males Females Males Females aroup UrbaD
7 8 I) 10 11 12 2 1
~
BASTAR
380,631 384,862 21,872 69,489 6,!l02 6,423 ij",,"" 0fI'I! Jr'Pftvr All agel RURAL
0--9 2,399 4,885 19 64 40 lOS 10--14
12,503 34,470 139 220 58S 1,011 15-19 33,193 60,045 564 592 1,142 1,210 20-24 58,919 65,248 1,020 1,140 1,424 1,015 25-29 55,225 57,513 1,440 2,151 1,001 811 30-34 55,009 49,885 1,573 3,745 831 529 35-3!. 42,674· 37,866 1,970 4,985 601 425 40-44 38,693 27,353 2,223 6,431 412 322 45-49 28,750 17,539 2,433 9,145 292 275 ~0-54
16,835 11,813 1,115 6,406 182 166 55-59 15,584 8,584 2,688 12,299 165 160 60-64
7,878 4,651 1,649 6,854 55 92 65-69 12,765 4,935 4,304 15,430 100 183 10+
25,064 23,168 111 3,536 152 608 ~-rr art'1! ~ All ages UR.BAN 0-9
49 131 5 5 10-14 369 1,926 5 60 15-19
1,988 4,199 13 19 10 136 20--24 41,42 4,848 12 85 36 72 25-29 4,500 3,943 52 82 31 81 30-34 4,092 2,964 42 184 14 66 35-39 3,149 2,113 111 280 29 83 40--44 2,709 1,282 99 397 11 21 45-49 1,112 151 96 596 5 35 SO-54
'159 319 86 288 10 10 55-59 830 400 99 689 24 60-64 342 102 61 360 5 65-69 417 125 96 555 9 70+

~R:," '1-2 31',~, ~/~~ am: N'~" ~'( TABLE C-2 AGE, SEX AND LEVE.L OF EDUCATION
f!tqvft
Note
~ muft it ~ aiR ~')j'J;~~ if; 01':!a-f1: GfrI'd'~l(r if; ~flfl"il; ~ if; ~ ~a- f~Q; IlQ; ~ I iT art~~ 5, 6, 7, 8
aiR 9 if; ~~~. 31'~ <1''' afr~ 0-4, 5-9, 10-14, 15-19,. 20-24, 25-29, 30-34, 35-39 ar1~ 60 -I- ~ '3f~ «~~ if; f~ ~ f.I;t:t ~re- ~ I "ij'm ar~if" ~ 3ficI;~T ~ "01'l1 ~ ~~ 1ft" if; art~, m ij'f;qf~Cf & I "~ if~ ~ ~"if; ~ fcrf<Trrr 3fn! -ij'1l~ if; ii!l1 'fiT "ij'm
~ ij'~" t tfTIl it ij' '<fer ~ srft~ rF: ~ ~ ~ I ij''li') ~ iti ~ ~ Il-2 it ar1~ ifll-uzr~;ff if; ~ ij'f1:uft Il-2 ~~. it "SI~ f~ IlQ; ~ I m~ Il-2 it. :m~Iif~ ~&l'Ii ~T iti ilr1: it IAfm-or ~;ff if; art<ti~ ij'~r ~or) if; ~~ it ij' iflJUzr arrli~ ~crifn: SfftCf fq;Q; "IT m ~ I ~ZJ 01'11: ~"f t f~Q; m-:forzrt ar~Il -~Il ~Cf '1ft 1ft t I
~ muft 1971 '1ft ~ '1ft ~n-:or') Il-Ill if; ~q~ I muft Il-2 ~r IH~ it; ft;~ met'li ~ it ~ :( 1) m&n: ( 2) ij'r~~ (ar~iT ~f~ ~~ m~cr filiff mlWfi flfiij') m if;) f~ arlit ar1q-:qrf~ ar1-: arifh'ifrf~ it fcrmfi5lCf f.I;lrr 'Tlff (3) srr~lf-:r (4) f~ (5) ~~ Iff ~ifi1J6~') (6) ~f1H ij'iusur~·z~IfTfuQ;z/f"Sl-~qrm (7) ~-alfi;:ftct,i- fe"cl;Prr Iff "SIlfjUf !p.f "1") f«1 if; ij'1flfi4T if ~ (8) aifi<ft~,) fuc~1ff Ifr Sflfior q-~ "1") fulfr ~ ij1fifi~ if ~ (9) rna~ ar1~ ~ arf~ I mvr') q 2 lfTIl ~~o,tRtzr tR'JI'
~ij' m1f iFr ij'~ itiq~ if'T<:rzr Iit;r"f ij' ~ aih ~ij'
muft it ~flWfi ~ if; ~~ ~cr fc1iQ; ;;rre- t ~if;r ~·iRf (1) ij' (8) Olfi ar"h: f;;;;:rf~f~a ~'( ij'f~cr ~ : ( 9) QOIiift~ fulAI ij' f'liiif ~lfi fevr, (10) ~') mr'l « f<T"if \'iffOlfift:r\ fevr, (11) fu'1A') lfT \'ifr~ mr if; ~ ~ filAr Ifr
f~11T f~ f.rlifT:!m~ dIN Cflff'lia fq;zrr ;;rIOT ~ :
(lfi) ~';;frf~~Il aiR srnitflJ'Ift (~) f'ifflfi~ ~ (tr) mamiu~1J ( 'f{ ) 'ilj!; -f:qf~ffiT
( & ) arolfNPf 31'"h: ('if) arrzr
tr-2 ar1-: Il-2 <Tr'T 'lfi' mfiJrzr) lfi) ~ ~
(ij'llffi'lf) if; ~ «~!:rT 3,4, 11, 12, 13 if; ~~ ~ ~~o') . ~ fff ~r~r ifi' amm: ~ ~~ft;a fq;zrr 'Tlff ~ I
This table presents educational level of the population by age and sex. Date are presented for the single year ages 5, 6, 7, 8 and 9 and the age groups 0-4, 5-9, 10-14, 15-19, 20-24, 25-29, 30-34, 35-39 and 60+. Figures for 'all ages' include those of' age not stated' also. The figures for 'age not stated" can be derived by subtracting the sum of various age-groups from the total of 'all ages'. The data for all areas are presented in Tables C-2 and for urban areas in Table C-2 Part A. The data for rur.ll areas for educational levels mentioned in Table C-2 could be obtained by subtracting the urban figures' from all areas. The tables are presented for the State and the districts separately. This table corresponds to Table C-nI of 1911 Census.
The educational levels for Table C-2-All Areas are: (i) Illiterate (ii) Literate (without educational livel, including educational level not classifiable) further divided into formal and non-formal (iii) Primary (iv) Middle (v) Matriculation or Secondary (vi) Higher SecondaryjJntermediatejPre-Univel'sity (vii) Non-technical diploma or certificate not equal to degree (viii) Technical diploma or certificate not equal to degree Ox) Graduate and above.
Table C-2 Part A- Urban Areas This part relates to urban areas only and the
educationallevds for which data are presented in this table include (i) tc? (viii) above and the following levels:
(ix) Graduate degree other than technical degree, (x) Post-graduate degre.;: other than technical degree,
(xi) Technical degree or diploma equal to degree or post-graduate degree which is further classified as indicated below :
(a) Engineering and technology
(b) Medicine
(c) Agriculture and dairying
(d) Veterinary
(e) Teaching and
(f) Others -
These tables C-2, and C-2 Part 'A' have been com-piled on the basis of information collected through question numbers 3,4, 11, 12, 13 of the Individual Slip (Universal).

190
!f'I' \t~I.I'T Total Population
---------------arTl! iillJ:il: ~ mI' Age group Males Females
2
q~ ri'v MADHYA PRADESH
iilmanq 26,886,303 25,292,537
An ages
0-4 3,555,396 . 3,515,341
5 860,438 805,461
6 852,948 828,203
7 690,757 679,874
8 939,537 883,891
9 558,904 555,092
5-9 3,902,584 3,751,522
10-14 3,587,747 3,195,853
15-19 2,580,453 2,239,387
20-24 2,154,137 2,147,980
25-29 1,954,521 1,843,011
30-34 1,673,337 1,601,912
35-59 5,824,202 . 5,258,551
60+ ],637,21.6 ],726,473
* 8TiW~ nlli m ij' iill'iI'f.:ao 8TT'!i~ ~ ~ I
Includes Figures for Educational Levels not Classifiable.
~ : 'm 8TT1{,' if 'aTTI! ifit ~' iii arI\ii~ m~ ~ I Note: Figures of 'Age not Staled' are included in 'All ages',
'1-2 an~, "'ll'~ ~ C-2 AGE, SEX AND LEVEL OF
f~!\n: Illiterate
-----------_._--~ mrl.l'T Males Females
4 5
16,269,002 20,365,271
3555,396 3,515,341 825,748 780,491 737,699 752,930 510,591 566,984 599,036 697,479 268,691 386,546
2,941,765 3,184,430 1,488,909 2,205,06fi 1,054,923 1,600,74,
856,674 1,621,836 836,370 1,454,335 792,172 1,343,465
3,533,993 4,768,773 1,202,360 1,663,580

191
fm1T If\1 m-~ IIhr EDUCATION-ALL AREAS
wfilA;' m/Educationallevel ---------
mllr: (wfilA;' ~a< it; far.rr*) Literate (without educational level)
----------~----------~---ClfifR~ a{'\tr:;nfu; ~ Non-Formal Formal Primary
---..--------- ------------ ---------~"
ffirlrt ~ ft<irl1f ~ mr am{~~
Males Females Mdcs F:malea Males Females Age group
6 7 8 9 10 11
~m MADHYA PRADESH
293,169 93,622 4,236,558 1,706,784 2,887,037 1,107,516 Wlftam{
All ages
0-4
2,991 1,979 31,699 21,991 5
6,921 3,945 108,328 71,329 6
7,025 3,548 173,142 109,343 7
9,546 4,213 330,955 182,199 8
5,551 2,756 273,801 157,351 10,861 8,438 9
32,034 16,440 917,925 542,213 10,861 8,438 5-9
31,145 13,338 1,154,081 518,084 795,642 383,103 JO-14
24,199 11,004 295,566 134,145 558,164 219,841 15-19
26,153 10,037 237,774 109,752 383,945 162,348 20-24
26,772 8,919 224,643 91,131 318,134 118,990 25-29
24,5J5 6,713 210,515 75,118 221,303 76,687 30-34
97,957 20,571 948,894 197,836 504,04) 123,945 35-59
28,625 5,141 242,542 35.071 87,nO 13,570 60+
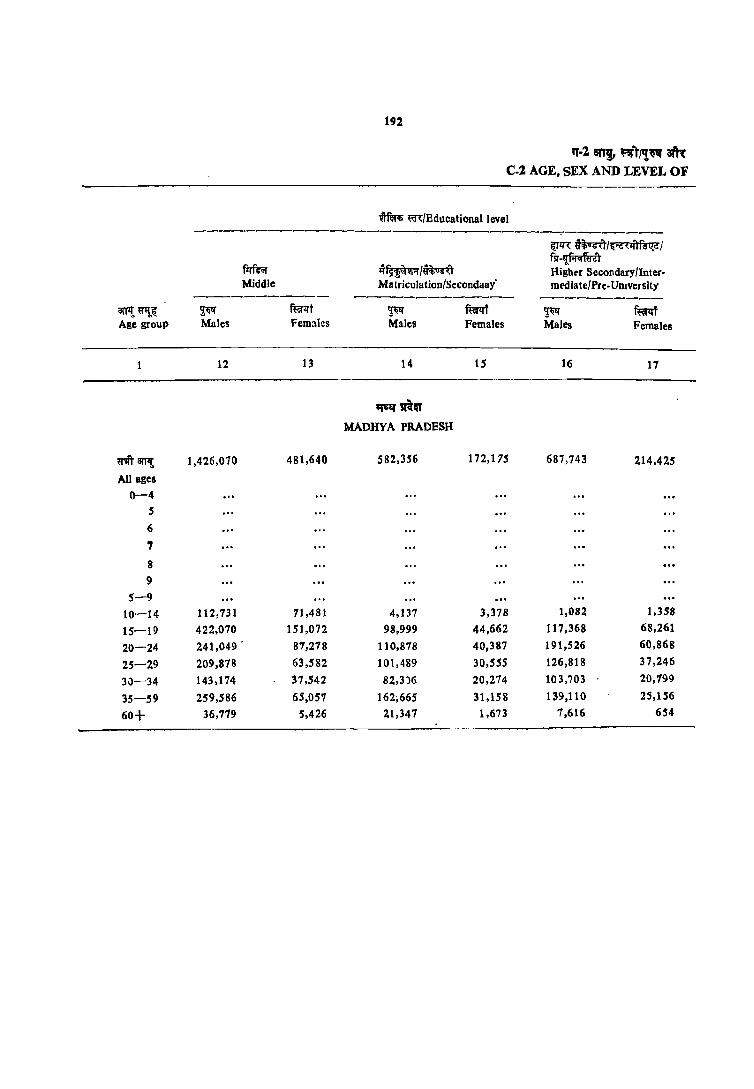
192
'1-2 an" nrT/,!~ aft'( C-2 AGE, SEX AND LEVEL OF
~ ~/Bducational level ------------------------------:-'--------
il:r1l'~ ~r/~~'{~~1
fmr.r ~~/~~ fll" -'!f.r<rfu'iT Highrr Secondary/Inter-
Middle Ma triculation/Secondaay' mediate/Pre-UDlversity ---------- --------------~ -----------
0lTI!. ~il: ~ ffii<rt ~ fuRt ~ ~<rf Age group Males Females Males Females Males Females
12 13 14 15 16 17
~sR'n MADHYA PRADESH
rit81F! 1,426,070 481,640 582,356 172,175 687,743 214,425
All ages
0-4 5
6
7
8 9
5-9
10·-14 112,731 71,481 4,137 3,378 1,082 1,358
15-19 422,070 151,072 98,999 44,662 117,368 68,261
20-24 241,049 . 87,278 110,818 40,387 191,526 60,868
25-29 209,878 63,582 101,489 30,555 126,818 37,246
30-34 143,114 37,542 82,3)6 20,274 103,703 20,799
35-59 259,586 65,05'1 162,665 31,158 139,110 25,156
60+ 36,779 $,426 21,347 1,673 7,616 654

193
mm !til ~-"m fl EDUCATION-ALL AREAS
~ mlEducationallevel ------------------------------------mit it; amlW't' ~.~ mIT iii ilRfJ[R ~r ~"t1rr 1fT ll1fIUJ'..o:reI' fut<;rf;n' 1fT ll1fIUJ'..o:reI' Non·Technical diploma or Technical diploma or certi. ~ am: m arfu;; certificate Dot equal to degree ficate not equal to degree Graduate and above ----------- ------------ -----------~~ mr ~ mr!'ft ~ m.-zrr iIlTI! ~ Males Female8 Males Females Males Females Ale group
18 19 20 21 2Z 23 1
'lsq'sRu MADHYA PRADESH
1,198 610 44,324 2,004 458,845 148,491 q'lft Bl'p!
All aIel 0-4
5 6
7
8 9
S-9 15 29 5 15 10-14
164 69 1,451 133 7.549 9,452 15-19 256 108 10,190 406 95,692 54,960 20-24 160 78 8,753 414 101,506 37,160 25-29 127 64 7,050 364 82,411 20,887 30-34 366 226 15,992 628 161,593 25,206 35-59 106 30 807 44 9,514 672 60+
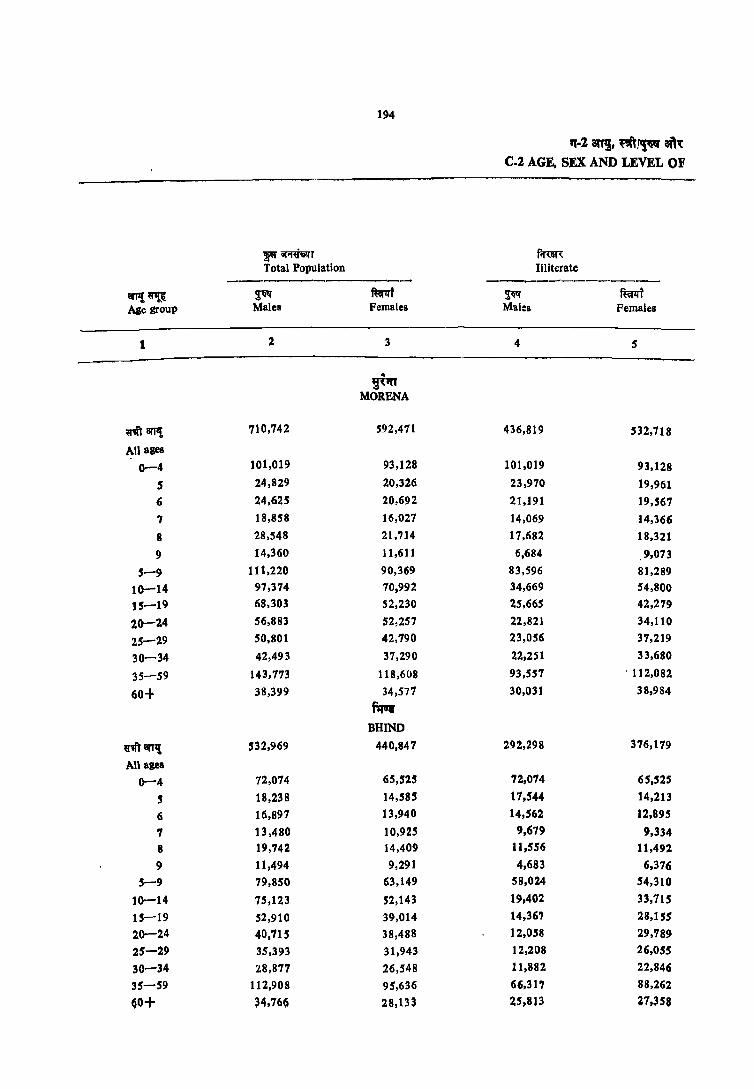
194
~~ Total Population
--------------arT7! ~ ~~ ~t Age group Males Females
1 2 3
.. ~ifT
MORENA
uitBl'fl! 110,742 592,471
AU ages
0-4 101,019 93,128
5 24,829 20,326
6 24,625 20,692
7 18,858 16,027
8 28,548 21,714
9 14,360 11,611
5-9 11 1,220 90,369
10-14 97,374 70,992
15-19 68,303 52,230
20-14 56,883 52,257
25-29 50,801 42,790
30-34 42,493 37,290
35-59 143,773 118,608
60+ 38,399 34,577
f~
BHIND
ij''Ii\' an,! 532,969 440,847
All ages 0-4 72,074 65,525
5 18,238 14,585
6 16,897 13,940
1 13,480 10,925
8 19,742 14,409
9 11,494 9,291
5-9 79,850 63,149
10-14 75,123 52,143
15-19 52,910 39,014
20-24 40,115 38,488
25-29 35,393 31,943
30-34 28,877 26,548
35-59 112,908 95,636
60+ H,76~ 28,133
'1.2, an!, ~,,~ a1l~ C.l AGE, SEX AND LEVEL OF
f.mR lIliterate
---------------~ ft:er:rf Males Females
4 5
436,819 532,718
101,019 9],128
23,970 19,961 21,191 19,561
14,069 14,366 17,682 18,321
6,684 ,9,073 83,596 81,289 34,669 54,800 25,665 42,279
22,821 34,110 23,056 37,219
22,251 33,680
93,557 ' 112,082
30,031 38,984
2n,298 376,179
72,074 65,525
17,544 14,213
14,562 12,895
9,679 9,334 11,556 11,492 4,683 6,376
58,024 54,310
19,402 33,715 14,367 28,155 12,058 29,'189 12,208 26,055
11,882 22,846
66,317 88,262
25,813 27,]58
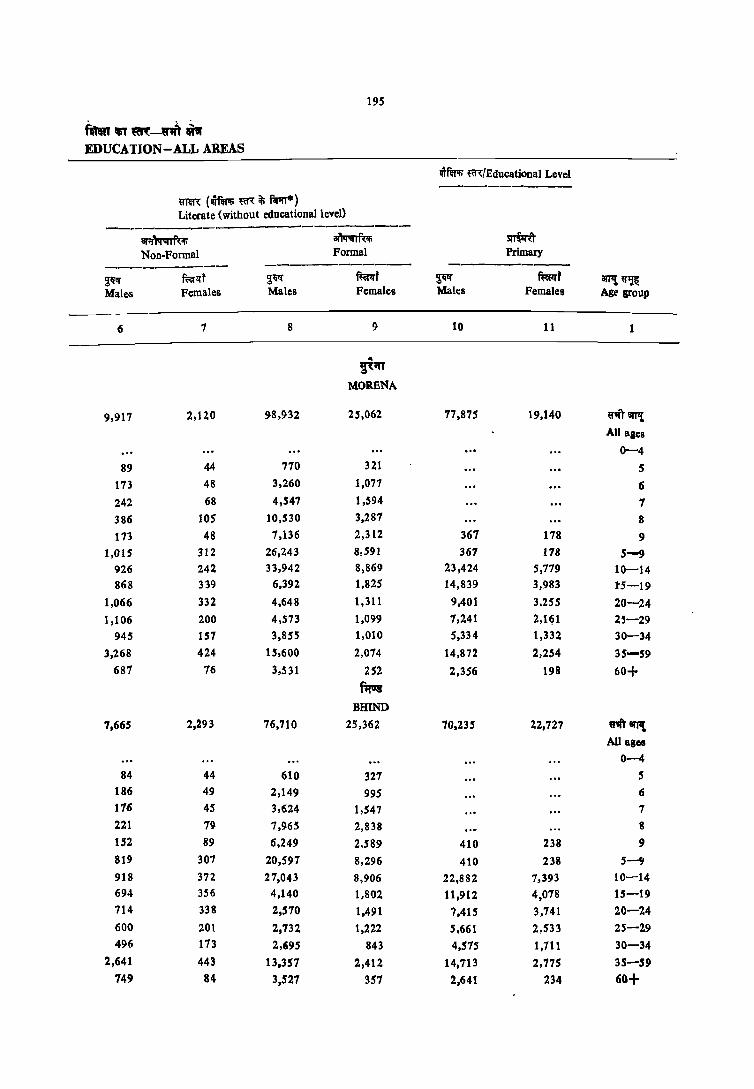
195
fm ., ~-W1ft ~ EDUCATION -ALL AREAS
1li'Nr!; fflfEducational Level
---------~Nn: (1Ii'f!n"Ii ~, it; ril';rr*) Literate (without educational level) --... -------------------
aril'''''~ ~ ~ Non-Formal Formal Primary
---------- ------------ ---------~Ii!f fufll't ~~ furlrt ~ furlrf arJ'I! ~~ Males Females Males Females Males Females Age grOUP
6 7 8 9 10 11 1
.. ~'"
MORENA
9,917 2,120 98,932 25,062 17,875 19,140 ~'iI'r arT!! All ages
0-4
89 44 770 321 5
173 48 3,260 1,071 6
242 68 4,547 1,594 7 386 105 10,S30 3,287 8
173 48 7,136 2,312 367 178 9 l,OlS 312 26,243 8,591 361 118 5-9
926 242 33,942 8,869 23,424 5,779 10-14 868 339 6,392 1,825 14,839 3,983 1'5-19
1,066 332 4.648 1,311 9,401 3,255 20-24
1,106 200 4,573 1,099 7,241 2,1~1 2~-29
945 157 3,855 1,010 5,334 1,332 30-34
3,268 424 15,600 2,074 14,872 2,254 35-59
687 76 3,531 252 2,356 198 60+ f;rq
BHIND
7,665 2,293 76,710 25,362 70,235 22,127 WfITiYPl All ages
0-4
84 44 610 327 5 186 49 2,149 995 6 176 45 3,624 1,547 7 221 79 7,965 2,838 8
152 89 6,249 2,589 410 238 9
819 307 20,597 8,296 410 238 5-9
918 372 27,043 8,906 22,882 7,393 10-14 694 356 4,140 1,8Q2 11,912 4,078 IS-19 714 338 2,570 1,491 1,415 3,741 20-24
600 201 2,732 1,222 5,661 2,533 25-29 496 173 2,695 843 4,575 1,711 30-34
2,641 443 13,357 2,412 14,713 2,775 35-59 749 84 3,527 357 2,641 234 60+

196
11·2 atTIt ~~ ... am: C.2 AGE, SEX AND LEVEL OF
wma.. m/Bducational level ----------------------------------
~~/~~/
~~/~V6U fir-l!fir<rlW:r
mmr H.igher SecondarY/Inter' Middle Matriculation/Secondal"Y medIate/Pre-University
---------- ________ o_ ----------ilP\~ ~ f@rf ~ ffiJqf ~ ffiIclt Age group Males Females Males Females Males Females
1 12 13 14 15 16 17
.. ~
MORENA
~arJ1t 47,422 8,221 5,673 900 24,439 2,967
Aliases 0-4 .0.
S 6
7
8
9
5-9
10-14 4,213 1,184 128 78 82 39 15-19 14,581 2,495 1,293 228 4,458 913 20-24 8,386 1,630 1,186 175 6,965 907
25-29 6,665 1,184 993 162 5,\)40 493 30-34 3,948 609 600 78 3,833 264 35-59 8,145 1,071 1,283 164 3,949 348 60+ 1,458 40 191 15 88 3
fqq BHlND
~"""amt 46,995 9,192 5,227 794 25,143 3,257 All agel
0-4
5
6
7
8
9
5-9
10-14 4,638 1,615 144 83 91 69 "15-19 14,928 2,987 1,459 289 5,217 1,233 20-24 8,196 1,671 1,050 185 6,926 845 25-29 6,401 1,176 930 118 5,031 445 30-34 3,624 607 489 39 3,677 203 35-59 7,476 1,035 1,009 76 4,039 4SS 60+ 1,712 90 147 S 116 S

19;
mar lIT ~-ni' ". EDUCATION-ALL AREAS
w!m; ~if(/Educational level -------------------------------------fft"l ~ Bm1ITif ~~ifo'f1'l>r mrr~~~r ~ liT sr-rrur om- ~)1rr I<T lIlfI1IT om-Non-Technical diploma C"r Technical diploma or certi- ~ffi'li' 3I'n: m arf!T<li certificate not equal to degree ficate not equal to degree Graduate and above ---------- ------ ------ ------------~ mr~r ~ ~I:ff ~If mr~r all'l! ij"~ii: Males F:males Males Females Males Females Age group
-----_ J8 19 20 21 22 23
.. !t;n MORENA
5 310 9,340 1,343 ij",ft arr! All ages
0-4 5 6 1
8
9 S-9
10-14 5 202 168 15-19
99 2,310 531 20-24 61 2,066 212 25-29 30 1,700 161 30-34
5 120 2,974 190 35-59 5 53 10 60+
f1Iq
BHIND 40 476 8,180 1,043 ~31'1'1!
All ages
0-4 5 6 1 8
9
5-9 S 10-=14
15 ~t.' "~~.l> S6 123 114 15-19
10 129 1,647 428 20-24 85 1,745 193 25-29
5 36 1,399 126 30-34 5 165 ],186 117 35-59
5 S6 60+
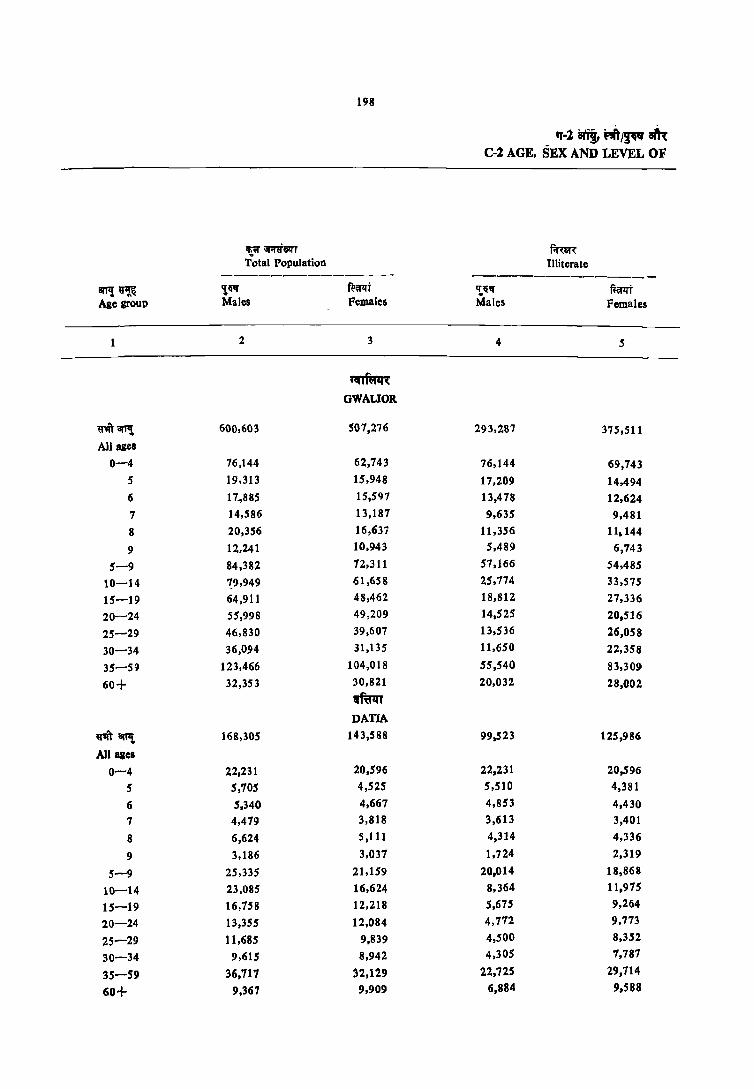
198
q·l an" "'/~ ath: C-l AGE, SEX AND LEVEL OF
lfi't; ;;r;nrI!iIl'T flmR T'"otal Population Illiterate
-------------- -------------- -arP!~ 'i~1!f w;;r:rt 'L~1!f mt Age group Males Females Males Females
2 3 4 5
~ GWALIOR
~~ arll! 600,603 501,276 293,287 375,511 All ages
0-4 76,144 62,743 76,144 69,743 5 19,313 15,948 17,209 14,494
6 17.,885 15,597 13,478 12,624
7 14,586 13,187 9,635 9,481
8 20,356 16,637 11,356 11,144
9 12,241 10,943 5,489 6,743
5-9 84,382 12,311 57,166 54,485
10-14 ~9,949 61,658 25,774 33,575
15-19 64,911 48,462 18,812 27,336
20-24 55,998 49,209 14,525 20,516
25-29 46,830 39,607 13,536 26,058
30-34 36,094 31,135 11,650 22,358
35-59 123.466 104,018 55,540 83,309
60+ 32,353 30,821 20,032 28,C02
~
DATIA
~awt 168,305 143,588 99,523 125,986
A1lll1e8
0-4 22,231 20,596 22,231 20,596
5 5,705 4,525 5,510 4,381
6 5,340 4,667 4,853 4,430
7 4,479 3,818 3,613 3,401
8 6,624 5,111 4,314 4,336
9 3,186 3,037 1,724 2,319
5-9 25,335 21,159 2Q,014 18,868
10-14 23,085 16,624 8,364 11,915
15-19 16,758 12,218 5,675 9,264
20-24 13,355 12,084 4,172 9,773
25-29 11,685 9,839 4,500 8,352
30-34 9,615 8,942 4,305 7,781
35-59 36,711 32,129 22,725 29,114
60+ 9,367 9,909 6,884 9,588
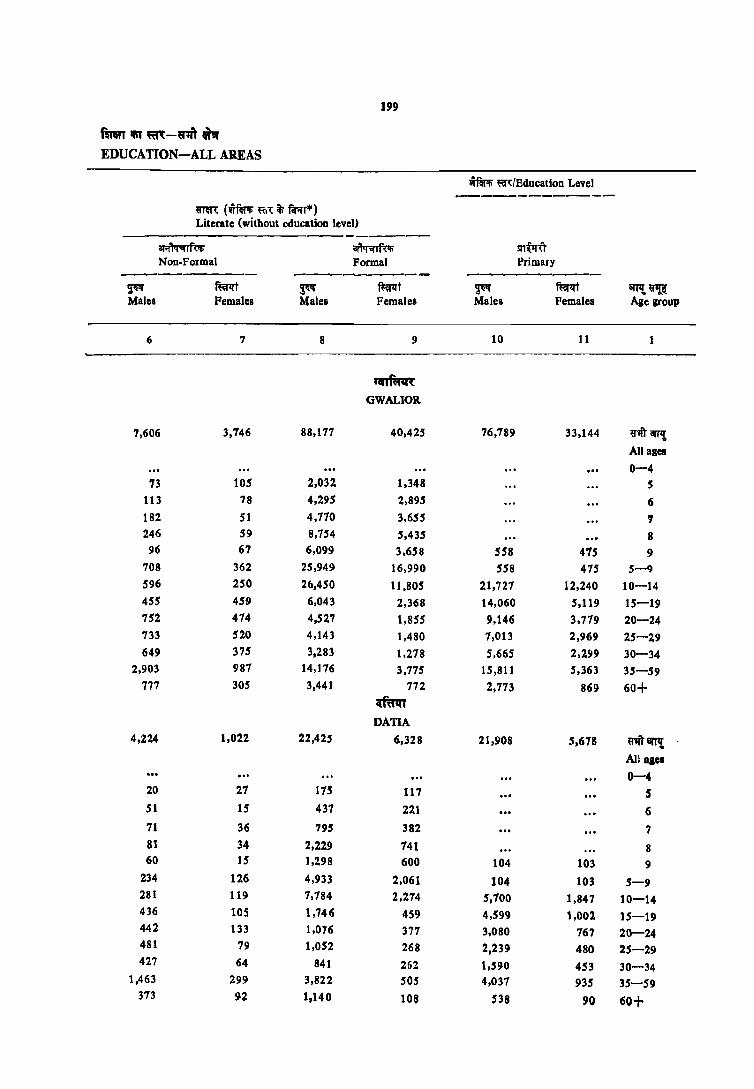
199
ftmT !fiT ~-~ ." EDUCATION-ALL AREAS
~ mlEducation Level -------------
mn: (WRA; ~I"{ it; foAr*) Literate (without education level)
-------ar;:r'lo:Rrfu; iIl'~ sn~u Non-Formal Formal Primary
--------- ---------- -------~ mt ~ mt ~ fi:erll't 1Il'TI!~ Males Females Males Females Males Females Age group
6 7 8 9 10 11
Uii r"l4 (
GWALIOR
7,606 3,746 88,177 40,425 76,789 33,144 «1ft lII'TIl All ages
... 0-4 73 105 2,032. 1,348 S
113 78 4,295 2,895 6 182 51 4,710 3,655 , 246 59 8,754 5,435 8 96 67 6,099 3,658 558 475 9
708 362 25,949 16,990 558 415 5-9 596 250 26,450 11,805 21,727 12,240 10-14 455 459 6,043 2,368 14,060 5,119 15-19 752 414 4,527 1,855 9,146 3,719 20-24 733 520 4,143 1,480 7,013 2,969 25-29 649 375 3,283 1,218 5,665 2,299 30-34
2,903 987 14,176 3,775 15,811 5,363 35-59 777 305 3,441 772 2,713 869 60+
mm DATIA
4,224 1,022 22,425 6,328 21,908 5,618 UlitIllTl! Aliases 0-4
20 27 175 117 5 51 15 437 221 6 71 36 795 382 7 81 34 2,229 141 8 60 15 1,298 600 104 103 9
234 126 4,933 2,061 104 103 5-9 281 119 1,784 2,274 5,700 1,847 10-14 436 lOS 1,146 459 4,599 1,002 15-19 442 133 1,076 377 3,080 767 20-24 481 79 1,052 268 2,239 480 25-29 427 64 841 262 1,590 453 30-34
1,463 299 3,822 505 4,031 935 35-59 373 92 1,140 108 538 90 60+
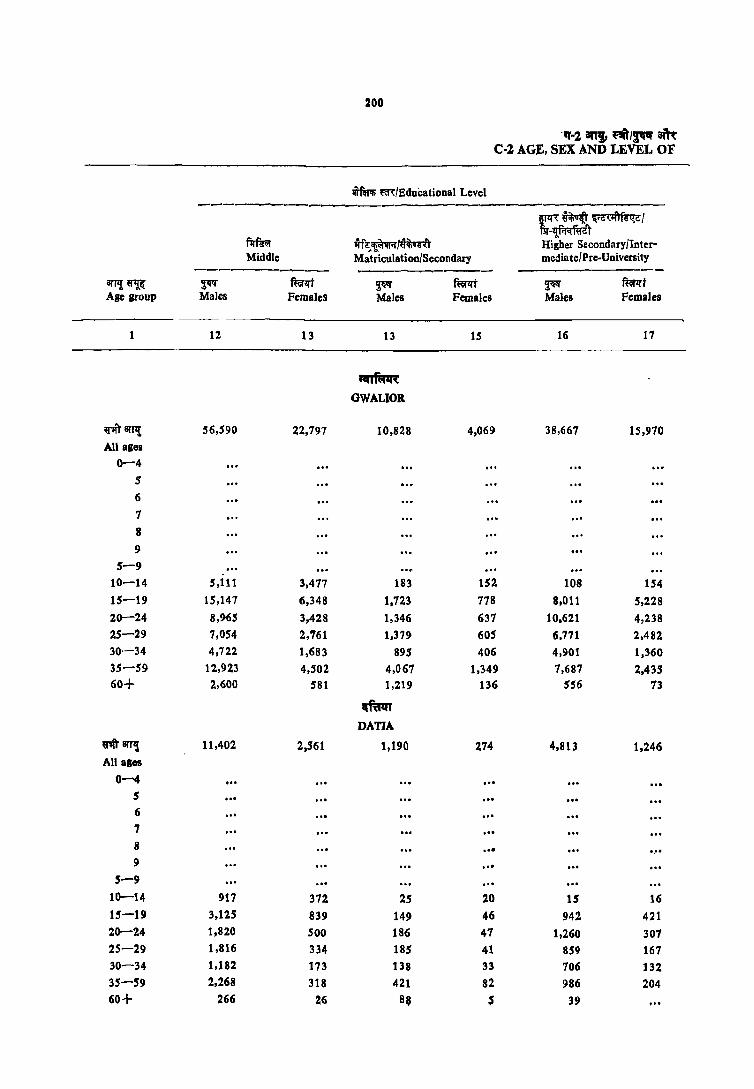
200
-'1-2 an~ "'/P' aftt C-2 AGE, SEX AND LEVEL OF
.rfiwl; m/Educational Level -----------------------------~ ~ ~.wilfii!'{i!/
1{f.rqfuer fim'<;r l{fe.~/~ Higher Secondary/Inter-Middle Matriculation/Secondary mediate/Pre-University
-------- --------ai'l"l!~~ ~ ffifqt ~ mt ~ mt Age group Males Females Males Females Males Females
12 13 13 15 16 17
nnftr1R GWALIOB.
~en1f. 56,590 22,797 10,828 4,069 38,667 15,970 All ages
0-4 ." 5
6
7
8 ". 9 .. ,
5-9
10-14 5,111 3,477 183 152 108 154 15-19 15,147 6,348 1.723 778 8,011 5,228 20-24 8,965 3,428 1,346 637 10.621 4,238 25-29 7,054 2, '161 1,379 605 6.771 2,482 30-34 4,722 1,683 895 406 4,901 1.360 35-59 12,923 4,502 4,061 1,349 7,687 2,435 60+ 2,600 581 1,219 136 556 73
mm DATJA
~arJ'll 11,402 2,561 1,190 274 4,813 1,246 All ales
0-4 .. , 5 ... 6 ... ... 7 ... 8 .. - .... 9 ",
5-9 ... 10-14 917 372 25 20 15 16 15-19 3,125 839 149 46 942 421 20-24 1,820 SOD 186 47 1,260 307 25-29 1,816 334 185 41 859 167 30-34 1,182 173 138 33 706 132 35-59 2,268 318 421 82 986 204 60+ 266 26 8e $ 39 ,,,

201
ftmT IfiT m-tnft " EDUCATION-ALL AREAS
lITNriifi' m/Educational level -----------------------------------fWl"iti~m~l R"w1 ili iIffil{]if ~ ~)1nIl'T5I1I'f'II'~ R"~1lT II'T 5I1I'f'II'-1fif Non-Technical diploma or Technic!!l diploma or certi- ~'Ii am: ~ arW<Ii certificate not equal to degree ficate not equal to degree Graduate and above ------------ --------
2.~ mt ~" ~t ~ fum 111'11~ Males females Males females Males females Age group
11) 19 20 21 22 23
~ GWALlOR
17 43 1,315 126 27,268 11,444 W1IT&rPl All agcs ... 0-4
5 6 1
8
9 5-9
5 10-14 II S 48 S 601 816 IS-19
S S 311 16 5,191 4,261 20-24
216 42 5,985 2,691 25-29
203 5 4,126 1,372 30-34 27 522 $3 9,836 2,217 3S-S9
5 63 892 7'1 60+
~ DATIA
90 5 2,730 488 W1IT8lfI1 AU elcs
0-4 ... ... S
6 ... '1 8
9 5-9
10-14 10 14 84 15-19
41 678 180 20-24 5 5 549 114 25-29
14 410 39 30-34 19 975 11 35-59
," .. , ,,, •• ! ~, , . ~ 60+
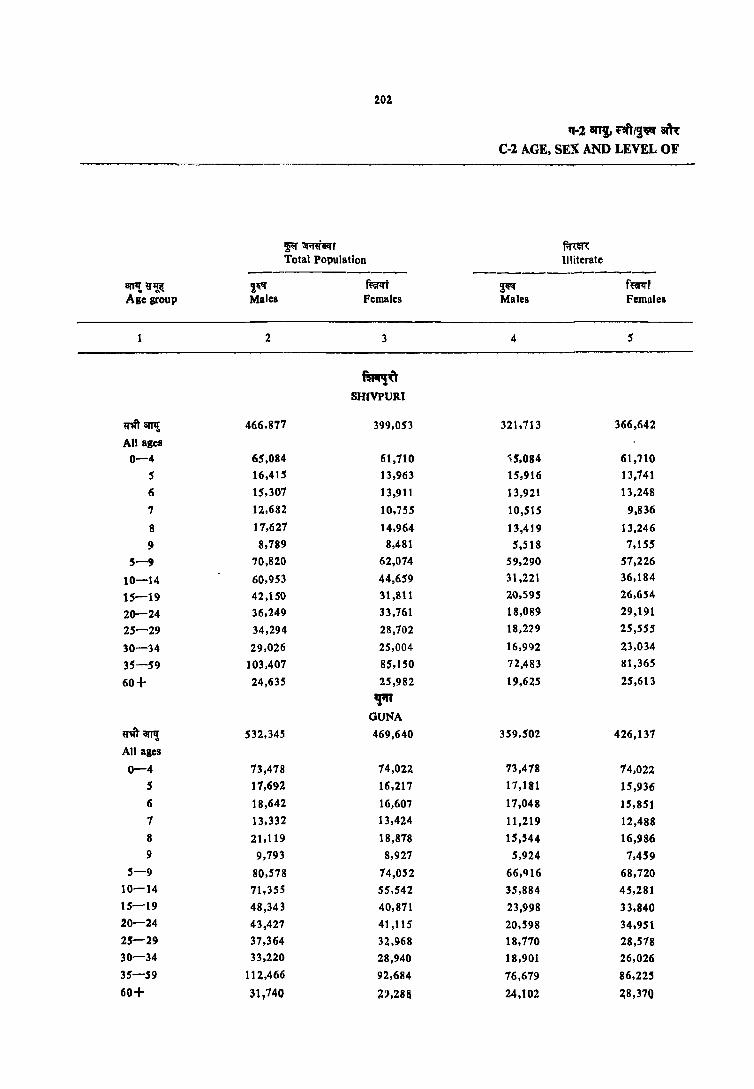
202
~~r Total Population
arP! ~~ ~~ mt Age group Males females
2 3
m,U SHIVPURl
mTIarIl! 466,877 399,053
All ages 0-4 65,084 61,110
5 16,415 13,963
6 15,301 13,911
7 12,682 10,755
8 11,627 14,964
9 8,189 8,481
5-9 70,820 62,014
10-14 60,953 44,659
IS-19 42,150 31,811
20-24 36,249 33,161
25-29 34,294 28,702
30-34 29,026 25,004
35-59 103,401 85,150
60+ 24,635 25,982
'f" GUNA
~1ft arJ1! 5)2,345 469,640
All ages
0-4 13,418 74,022
5 17,692 16,217
6 18,642 16,607
7 13,332 13,424
8 21,119 18,878 9 9,193 8,927
5-9 80,578 74,052 10-14 71,355 55,542 15-19 48,343 40,871 20-24 43,427 41,11S
25-29 37,364 32,968 30-34 33,220 28,940
35-59 112,466 92,684
60+ ~1,740 :t>,28a
'1-2 iII'I'!I, ~ f~'" aiR C-l AGE, SEX AND LEVEL OF
f.mR Illiterate -----------
~ f~f Males Females
4 5
321,113 366,642
'\5,084 61,710
15,916 13,141
13.921 13.248
10,515 9,836
13,4 J 9 13,246
5,518 1,155
59,290 51,226
31,221 36,184
20,S9S 26,654
18,089 29,191
18,229 25,SSS
16,992 23,034
72,483 81,365
19,625 25,613
359,502 426,131
73,418 14,022 11,181 15,936
11,048 15,851
11,219 12,488
15,544 16,986
5,924 1,459
66,'116 68,720
35,884 45,281
23,998 33,840
20,598 34,951
18,170 28,518
18,901 26,026
16,679 86,225
24,102 ~8,37Q

203
.
fmn '" ~~-""" "'" EDUCATION-ALL AREAS
ifWl; m/Educational Level ------------mm: (wmili ~( iii f.I;;r") LIterate (without educational level)
---------------------..,.."qiij,f<'I> ar~ili ~ Non-Formal Formal PrimarY
----------~ mi ~ ffiflft ~ mt 3fTI!~ Males Females Males Females Males Females Age group
6 1 8 9 10 11
~,
SHIVPURI
8,588 1,654 S3,6lS 12,149 43,293 9,616 U''ll an~ All aBel
0-4
53 10 446 212. 5
96 36 1,290 621 6
132 31 2,035 882 7
218 87 3,990 1,631 8
105 55 2,951 1,160 215 112 9
604 225 10,711 4,512 2\5 112 5-9
830 218 17,030 4,01)4 10,308 3,364 10-14
902 165 4,316 838 8,436 1,773 15-19
961 209 3,387 618 5,145 1,360 20-24
998 124 3,277 564 4,789 1,081 25-29
801 142 2,966 410 3,520 650 30-34
2,829 452 9,987 941 8,725 1,111 35-59
622 80 1,871 129 1,539 101 60+
~ OUNA
9493 1,519 66,051 15,G32 52,437 13,217 U''ll arIll All ages
0-4
51 12 460 269 5
118 51 1,477 705 6
97 49 2,017 886 1
231 52 5,345 1,840 8
107 16 3,568 1,330 195 122 9
603 179 12,865 5,030 195 122 5-9
827 217 21,'H6 5,011 11 ,691 4,009 10-14
841 223 5,270 1,000 9,697 2,447 15-19
1,089 304 4,480 900 7,665 1,652 20-24
1,026 119 3,907 680 5,879 1,328 25-29
950 111 3,648 494 4,259 903 30-34
3,237 266 11,705 1,504 10,752 2,433 35-59
857 81 2,884 402 2,291 322 60+
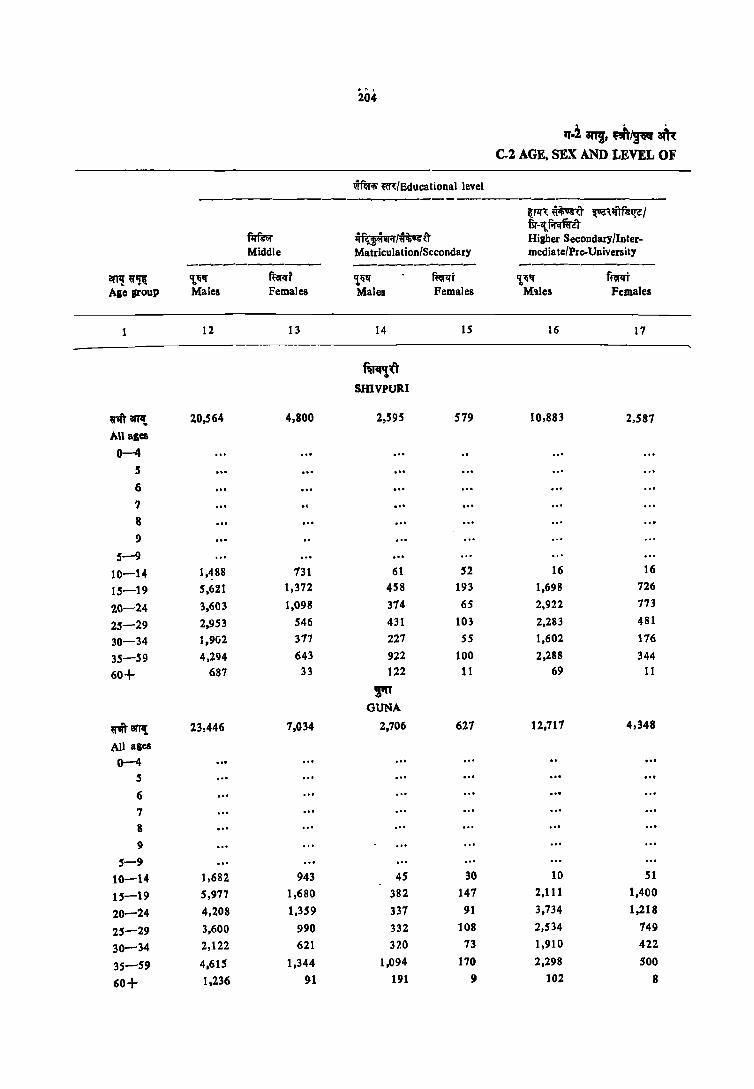
• 0 ,
204
".2 8R!, ~IP' ~ Col AGE, SEX AND LEVEL OF
wmifi ~"{IEducational level -------------------
~m~~~~1
firmr ~~/~~a-fir-tt~ Higher Secondary/Inter-
Middle MatriculationlSccondary media telPre-University --------- -------- ----------
~~~ tt1i" f~i 'l1i1ll' mt 'l1il!f mt Age group Males Females Males Females Males Females
12 13 14 IS 16 17
ftrcIq" • SHlVPUIlI
u1fl'~ 20,564 4,800 2,595 579 10,883 2,587
All asCII
0-4
5
6 7 ."
8 .. , !)
5-9
10-14 1,488 731 61 52 16 16
15-19 5,621 1,372 458 193 1,698 726
20-14 3,603 1,098 374 65 2,922 773
25-19 2,953 546 431 103 2,283 481
30-34 1,902 377 227 55 1,602 176
35-59 4,294 643 922 100 2,288 344
60+ 687 33 122 11 69 11
~ GUNA
~'Ift' 8f11{ 23,446 7,034 2,706 627 12,717 4,348
All ages
0-4 5
6
7 8
9
5-9
10-14 1,682 943 4S 30 10 51
15-19 5,977 1,6BO 382 147 2,111 1,400
20-24 4,208 1,359 337 91 3,734 1,218
25-29 3,600 990 332 108 2,534 749
30-34 2,122 621 no 73 1,910 422
35-59 4,615 1,344 1,094 170 2,29B 500
60+ 1,236 91 191 9 102 8

205
ftm, ., ~-~ Ii", EDUCATION-ALL AREAS
~Rfol; ~\IEducational level ---------------- ------------ -mrr it; ~ ~-6'!i';;'fq;l NlTr it; ~ ~'liiIT'til ~ liT 5I1l1UI'..qa- ~.ofl;rr ~ snnur-'111
Non-Technical diploma or Technical diploma or certi- mff!fi om :.;ffit arfFErli certificate Dot equal to degree ticate not equal to degree Graduate and above _--------- ----------- --------
'!~ fuRt ~'f ffil'lff ~ ~lIi" illTq .. ~ Males Females Males Females Males Females Ale &roup
18 19 20 21 22 23
inq'(l . SHIVPURI
11 173 10 5,442 1,076 fl1IT 0lTI! All agos
0-4 5
6 7
8
9 5-9
10-14 20 6 104 85 15-19 70 1,098 448 20-24
5 17 5 1,313 245 25-29 17 999 159 30-34
5 49 1,824 135 35-59 93 5 60+
~ GUNA
15 36 293 10 5,680 1,620 ~amt All ales
0-4 5 6
7
8
9 5-9
10-14 26 43 135 15-19
10 61 5 1,245 634 20-24 74 1,242 356 25-29
4 25 1,086 286 30-34 S 32 97 4 1,983 204 35-59
15 61 4 60+
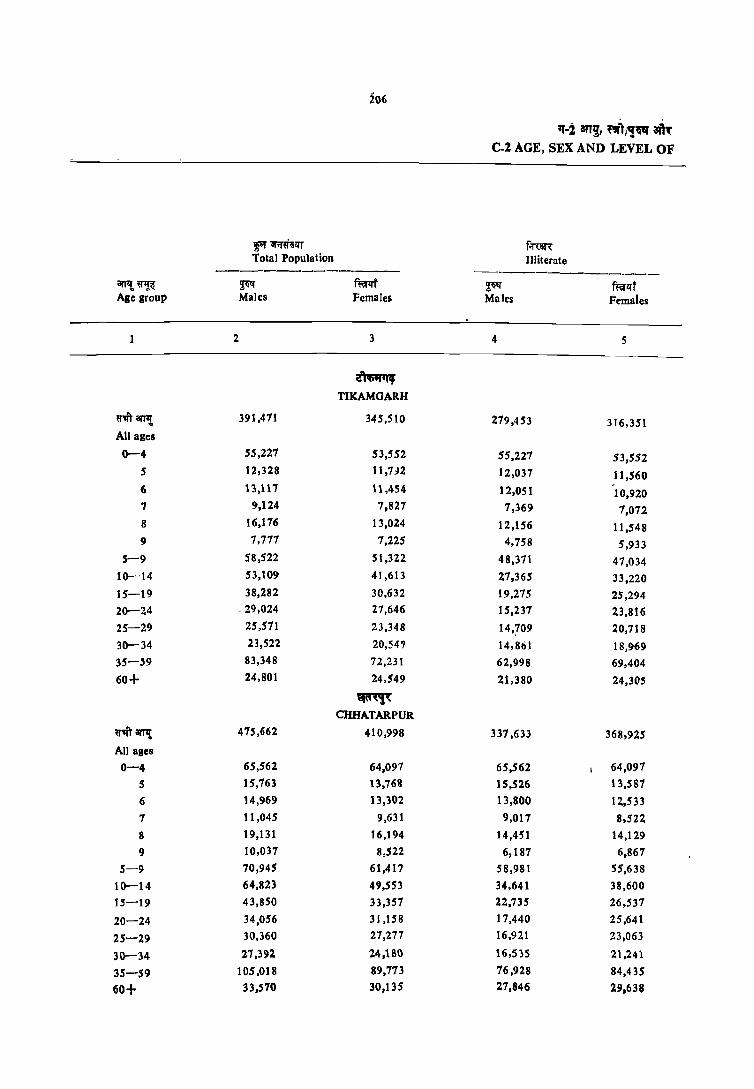
· . "-2 ani. ~jl'~ aitl
Col AGE, SEX AND LEVEL OF
~ ;;r;r~!fT f,,~ Total Population JIIiterate
------------- -----------------arJ1t ~ ~ ft;)rqf ~ ft:erzrf Age group Males Females Males Females
2 3 4 5
~'" TIKAMGARH
'I'm anI! 391,471 345,510 279,453 316,351 All ages
0-4 55,227 53,552 55,227 53,552 5 12,328 11,7:)2 12,037 11,560 6 13,117 11,454 12,05 I 10,920 7 9,124 7,827 7,369 1,072 8 16,176 13,024 12,156 11,548 9 7,771 7,225 4,758 5,933
$-9 58,522 51,322 48,311 47,034 10-14 53,109 41,613 27,365 33,220 15-19 38,282 30,632 19,275 25,294 20-24 ·29,024 27,646 15,231 23,816 25-29 25,571 23,348 14,709 20,718
30-34 23,522 20,54? 14,861 18,969 35-59 83,348 72,231 62,998 69,404
60+ 24,801 24.549 21,380 24,305
~'{
CHHATARPUR
~"" III'Tlt 475,662 410,998 337,633 368,925
All ages
0-4 65,562 64,097 65,562 64,097
5 15,763 13,768 15,526 13,587
6 14,969 13,302 13,800 12,533
7 11,045 9,631 9,017 8,522
8 19,131 16,194 14,4S'1 14,129
9 10,037 8,522 6,181 6,867
5-9 70,945 61,417 58,981 55,638
10-14 64,823 49,553 34,641 38,600
15-19 43,850 33,357 22,735 26,537
20-24 34,056 31,158 17,440 25,641
25-29 30,360 27,271 16,921 23,063
30-34 27,392 24,180 16,5)5 21,241
35-59 105,018 89,773 76,928 84,435
60+ 33,570 30,135 27,846 29,638

207
f~IWiT~-~ ~
EDUCATION-ALL AREAS
"I'm; ~/Bducational Level ---------
mm (ifu<li mit; f;r;rr*) Literate (without educational level)
-----------------_.-------.--ar.iW"I'l'fu; aj'lq;nfu!; ~ Non-Formal Formal Primary
---------- ----------- ----------~ mf ~ f~lit ~ mf 3I'p{ fr"~ Males Females Mldes F~males Males Female. Ale groUP
6 7 8 9 10 11
~ TIKAMGARH
17.299 4,420 30,524 8,710 32,144 8,971 q1ft 3I'11{
All agel
0-4
102 75 189 158 5
314 213 752 321 6
375 161 1,379 588 7
960 286 3,061 1,189 8
562 212 2,252 1,015 175 66 9
2.343 952 7,633 3,270 175 66 5-9
4,024 1,248 12,050 3,346 8,182 3,102 10-14
2,033 625 2.193 601 7,206 1,796 15-19
1,559 509 1,353 362 4,118 1,396 20-24
1,121 333 1,006 276 3,392 967 25-29
1,146 187 917 230 2,585 575 30-34
3,990 416 4,223 533 5,664 1,012 35-59
1,082 74 1,123 76 811 56 60+
~'(
CHHATARPUR
15,109 4,714 41,005 12,949 37,141 12,904 "''1ft 3I'pt All ages 0-4
56 55 171 126 5
290 246 879 522 6
369 178 1,65'8 931 1
691 316 3,989 1,689 8
416 189 3,217 1,358 211 108 9
1,832 1.044 9,914 4,626 217 108 5-9
1,862 1,101 14.455' 4.768 11,194 4,331 10-14
1,571 572 2,618 828 7,970 2,520 15-19
1,360 448 1,865 668 4,414 1,790 20-24
1,145 349 1,503 450 3,688 1,537 25-29
1.164 299 1,503 424 2,479 925 30-34
4,244 174 6,848 996 6,088 1,567 35-59
l,S21 U8 2,28, 189 1.024 US 60+
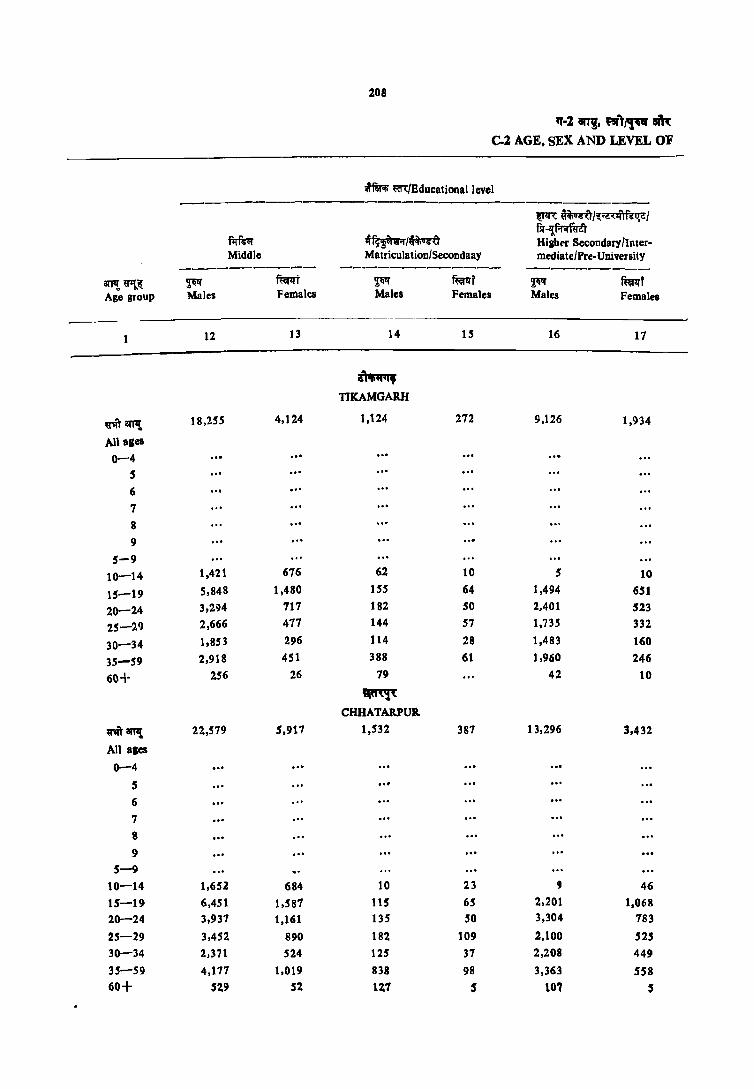
208
,,·1 wr" ",,1/," aik C.2 AGE, SEX AND LEVEL OF
Wm<f; m/Educationallevel
~ ~/~:-a<iIOfcttal
firfr.r ~~/~ fll' -l{f.r.rfuft Higbrr Secondary/Inter-
Middle Matriculation/Secondaay media tel Pre-University --------~- -------------- ----------
an"! "''t~ ~ mt ~ mr.f ~ mt Age group Males Females Males Females Males Females
12 13 14 l' 16 17
~ TIKAMGARH
~ 8Tfl! 18,255 4,124 1,124 272 9,126 1,934
All ages
0-4 ."
5 6 .. , 7
8
9
5-9
10-14 1,421 676 62 10 5 10
15--19 5,848 1,480 155 64 1,494 651
20-24 3,294 717 182 50 2.401 523
25-29 2,666 477 144 57 1,735 332
30-34 1,853 296 114 28 1,483 160
35-59 2.918 451 388 61 1,960 246
60-\- 256 26 79 42 10
~ CHHATARPUB.
riraTPt 22,579 5,917 1,532 387 13.296 3,432
All aICS
0-4
5 ... 6
7
8
9 5-9
10-14 1,652 684 10 23 9 46
15-19 6,451 1,581 115 65 2.201 1,068
20-24 3,937 1.161 135 50 3,304 783
25-29 3,452 890 182 109 2,100 525
30-34 2.371 524 125 37 2,208 449
35-59 4,177 1.019 838 98 3,363 S58 60+ 519 52 lZ1 S 107 ,

209
fat IfI'T ~-w~ " ... EDUCATION-ALL AREAS
IITNrr mfEducationallevel -------------------------------------fftl it; ~J'if llT-aIfi~T fftl it; aRf1rR (A»ffar;T ~T lfT srmvr 'fa' n-c;;'t;rr lTT SI1TJ1IT 'fa' Non-Technical diploma I'r Technical diploma or certi· ~rn'ifi' arn: m arfiriI; certificate not equal to degree ficale not equal to degree Graduate and above ---------- ----------- ------------~ ffirll"f ~ mrll"T ~ ffirll"t <1111l ij"1}.~ Males Females Males Females Males Females ABe group
18 19 20 21 22 73 1
~,
TlKAMGARH
211 10 3,330 118 ij'..rr err,; All ales
0-4
5
." 6
7 8 9
5-9 10-14
5 72 122 15-19 46 10 833 261 20-24 40 758 188 25-29 57 507 100 30-34
S 57 1,144 41 35-59 6 16 60+
~'(
CHHATARPUR
45 539 17 6,182 1,152 ij"Ift"lI1'IIl All alea
0-4
5 6
7
&
9
5-9 10-14
5 60 125 180 15-19 15 100 7 1,427 610 20-24 10 69 1,289 355 25-29 5 98 905 282 30-34
10 207 11 2,316 316 35-59 II' 5 ,.! 120 S 60t

210
lI!"I'~ilfr Total Population
-------------arJ'I! ~ I!,~" ~ Age group Males Females
2 3
q;;n
PANNA
Q''I'''t arTlt 282,242 257,136
All ages
0-4 40,336 38,358
5 9,135 8,292
6 8,451 8,451
7 6,939 6,331
8 10,198 9,546
9 5,813 5,311
5-9 41,143 31,998
10-14 38,971 312,828
15-19 26,596 21,604
20-24 21,417 21,474
25-29 19,851 19,345
30-34 17,158 16,775
35-59 59,818 53,517
60+ 16,858 15,799
mlR SAGAR
~'Ift arTl! 699,570 623,562
All aBel
0-4 102,125 96,022
5 20,924 18,519
6 22,700 20,668
7 15,550 14,976
8 22,887 20,969
9 14,382 14,309
5-9 96,443 89,441
10-14 95,122 78,572
15-19 70,781 58,611
20-24 63,907 57,578
25-29 50,538 42,134
30-34 39,864 35,878
35-59 137,855 123,510
6Q+ 42,8U 4~,7S2
"-2 it1!, ~p am: c-z AGE, SEX AND LEVEL OF
f.mn: JIliterale
-------------- -~~q' mt Males Females
4 5
199,201 235,419
40,336 38,358
8,992 8,187
1,769 8,112
5,136 5,836
8,326 8,545
3,606 4,372
34,428 35,053
20,669 26,522
13,747 18,028
10,848 18,232
10,931 16,949
10,521 15,424
43,948 51,264
13,762. 15,552.
377,941 491,921
102,125 96,012
20,252 17,966
19,178 18,121
10,356 11,233
12,274 14,298
5,481 8,016
67,541 69,634
29,011 43,617
22,310 36,182
18,896 39,906
16,491 30,841
15,779 28,643
76,092 107,641
29,520 39,402
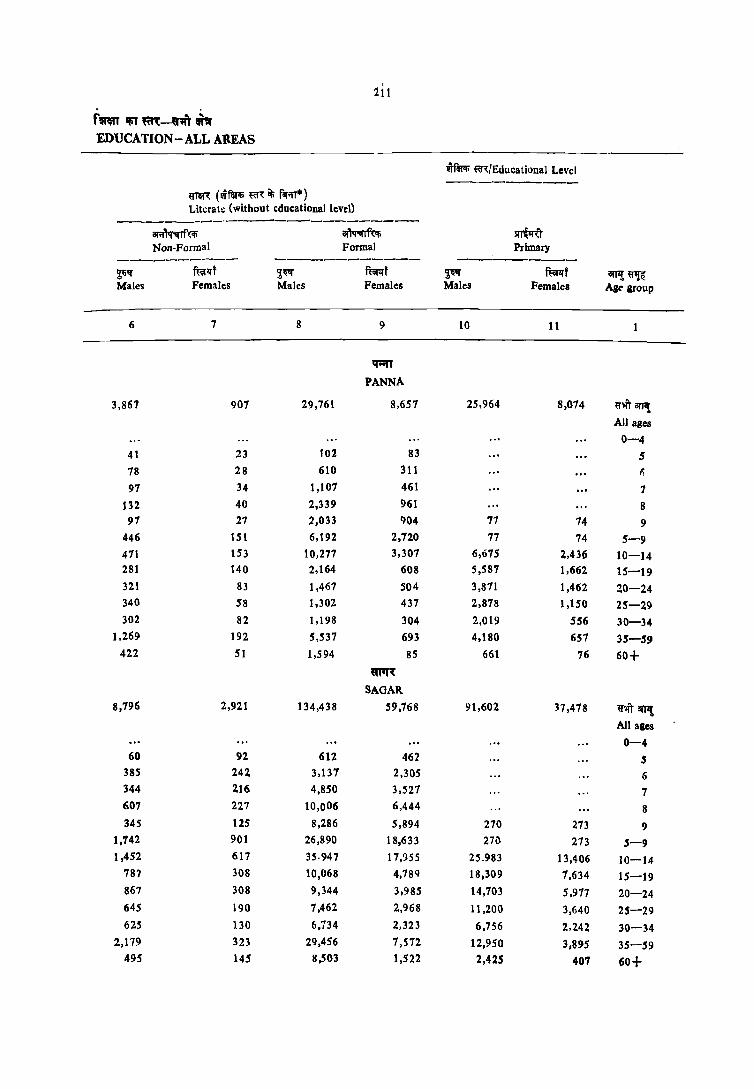
211
- . f~ iii' ~-,"" n EDUCATION - ALL AREAS
-wfm; f(f~IEducational Level -----------
~~ (lIifllT'fi ~n: ~ fif;;r·) Literate (without educational levrl)
--------------------------i!f~~ i!f~ ~ Non-Formal Formal Primary
---------- ------------ ---------~Ii" fu;t~t ~~ ~t ~ Rwft iIfP! ~~ Males Females Males Females Males Females Age group
6 7 8 9 10 11
q;;n
PANNA
3,867 907 29,761 8,651 25,964 8,014 ~,ft iIfP! All ages
0-4 41 23 102 83 5 78 28 610 311 (,
91 34 1,101 461 7
132 40 2,339 961 8 91 27 ',033 904 77 14 9
446 151 6,192 2,120 77 74 5-9 471 153 10,277 3,307 6,675 2,436 10-14 281 140 2,164 608 5,581 1,662 15-19 321 83 1,467 504 3,871 1,462 20-24 340 58 1,302 437 2,878 1,150 25-29 302 82 1,198 304 2,019 556 30-34
1.269 192 5.537 693 4,180 657 35-59 422 51 1,594 85 661 76 60+
m~
SAGAR
8,196 2,921 134,438 59,768 91,602 37.478 wanl!; All ases
0-4 60 92 612 462 5
385 242 3.137 2,305 6 344 216 4,850 3.527 7 607 227 10,006 6,444 8 345 US 8,286 5,894 270 273 9
1,742 901 26,890 18,633 27~ 273 5-9 1,452 617 35.947 17,')55 25.983 13,406 10-14
787 308 10,068 4,7SQ IS,309 7,634 15-19 867 308 9,344 3.985 14,103 5,917 20-24 645 190 7,462 2,968 11,200 3,640 25-29 625 130 6,734 2,323 6,756 2,242 30-34
2,179 323 29,456 7,572 12,950 3,895 35-59 495 145 8,503 1,522 2,425 407 60+

2d
iT-2 ani ~/~ am: C-l AGE, SEX AND LEVEL OF
wfWf; m/Educational Level ----~~~~I fir~1
f1;fr.r Ilf~~fi~ Higher SecondaryfInter-Middle MatriculationfSecordary mediate/Pre-University
--------8I'T! ~ ~ mrlft ~ mt ~ mt Age group Males FemaleS Males Females Males Females
12 13 13 15 16 17
""" PANNA
w4T arr'! 13,489 2,652 778 133 6,583 1,365 All ages
0-4 5 6
1 8 9
5-9
10-14 869 400 5 11 5 15-19 3,842 768 111 7 809 352 20-24 2;530 539 90 21 1,687 460 25-29 2,326 345 117 11 1,396 244 30-34 1,462 164 106 34 1,159 160 35-59 2,186 405 290 55 1,463 143 60+ 269 31 63 60
mt SAGAR
WfitarP{ 43,743 16,998 13,412 4,754 16,256 5,097 All ages
0-4
5
6
7
8
9
5-9
10-14 3,563 2,911 85 41 16 26
15-19 14,111 5,938 1,641 1,174 3,256 2,290
20-24 8,459 2,972 3,038 1,133 5,451 1,416
25-29 6,569 1,968 2,341 934 2,8~9 657
30-34 3,725 1,040 1,978 594 1,$91 332
35-59 6,359 2,001 3,815 814 2,566 361
60+ 947 169 514 62 137 15

213
ftmT "" ~-,"", ~ EDUCATION.-ALL AREAS
wfilR;' m/Educational level -------------------------------------mrit'am~~.~r miT it' am;rr;r (I'ili"ft'liT ~);rT liT 5TlI1!1J'~ fu't<;r)lrr liT 5TlI1!IJ'..rrer Non.Technical diploma or Technical diploma or certi. fil'ffilI1 am: ~ arfu<l; certificate not equal to degree licate not equal to degree Graduate and above ----------- ------------ -----------
!j;llf mr ~ R=er!l'T ~ R=er!l't arJ1! ~ Males Females Males Females Males Females Age group
18 19 20 21 22 23
q;;n
PANNA
26 12S' 2,442 51.1 ij'1ftill'11!
All ages
0-4
5 6
1
8 9
5-9 10-14
11 11 33 39 15-19 11 42 550 113 20-24 5 27 535 151 25-29
11 374 51 30-34 33 912 108 35-59
27 5 60+ ~~
SAGAR
37 15 810 101 12,535 4,509 ij'1ft artl{
All ages
0-4
5 6 7
8
9 5-9
10-14 10 15 5 214 296 15-19
5 5 240 7 2,904 1,869 20-24 16 135 S 2,850 931 25-29
156 15 2,119 558 30-34 5 S 259 68 4,175 823 35-59
5 5 268 26 60+

214
ft=r ;;r;nilPfT Total Population
----------------ar11! ~~ iW fuf<lf Age group Males Females
1 2 3
q~ DAMOH
'!Tm arTl! 374,684 346,769
All ages
0-4 55,517 52,354
5 11,238 10,298
6 12,721 12,111
7 8,607 7,941
8 13,361 12,388
9 8,042 1,176
5-9 53,969 50,514
10-14 52,609 43,034
15-19 35,895 31,811
20-24 31,490 31,206
25-29 26,817 23,618
30-34 21,396 20,866
35-59 75,665 6'),')36
60+ 21,146 23,346
.~
SATNA
rit arpt 595,753 557,634
All ages
0-4 80,639 78,612
5 19,386 17,547
6 18,188 17,555
7 14,862 13,880
8 20,996 19,715
9 12,871 11,836
5-9 86,302 80,532
10-14 83,118 72,816
15-19 59,687 51.083
20-24 44,765 46,309
25-29 40,427 39,236
30-34 34,808 35,594
35-59 128,118 117,412
60+ 37,675 35,901
"-2 ani, ~''!~ ~ C-2 AGE, SEX AND LEVEL OF
f.run: Illiterate
---------_._---~ fum M'd~s Females
4 5
215,622 289,473
55,571 52,354
10,985 10,106
11,011 11,070
5,853 6,274
7,420 9,051
3,105 4,783
38,373 41,285
17,701 27,128
13,192 22,425
11,960 23,631
10,555 18,792
9,450 17,633
44,345 63,705
14,406 22,455
36D,154 483,682
80,639 78,612
18,756 17,217
16,207 16,419
11,311 12,132
13,576 16,122
5,960 8,677
65,869 70,566
31,469 52,170
22,325 38,277
17,100 36,096
17,610 32,309
17,657 31,225
79,989 109,314
27,401 34,95)

21S
fmn It\1 ~ --~ 1Il~
EDUCATION-ALL AREAS
~ mlEducation Level -------------mn: (vfu!l; ~,;; ili f~;H·)
Literate (without education leveU
-----------------------aJ'iI~ B1W'frf1:l!i m~ Non-Formal Formal i'rimary
-----~-- -------- -------~ mfl:rt ~ f;emt ~ ffil<rt arfI{ ~~ Males Females Males Females Males Females Age grQUp
6 7 8 9 10 11
~ DAMOH
2,159 655 79,821 30,690 43,263 15,348 fl"Will'l7! All ages
0-4 30 21 224 172
S 133 80 1,577 960 6 108 25 2,645 1,642 1 153 107 5,789 3,230 8
31 20 4,753 2,878 103 95 9 506 253 14,987 8,881 103 95 5-9 423 150 21,290 9.350 H.8ll 5,410 10-14 174 55 5,925 2,750 9,091 3,258 15-19 165 58 5,611 2,403 6,080 2.509 20-24 171 19 4,761 1,602 5,589 1,540 25-29 113 20 3,910 1,222 3,548 1,102 30-34 470 76 18,316 3,791 6,016 1,298 35-59 130 25 5,010 671 993 137 60+
aa.n SATNA
7,340 1,825 76,sSS 19,450 67,827 26,485 ritan, AU ages
0-4 30 14 600 316 S 59 38 1,922 1,097 6 54 34 3,436 1,714 7 59 53 7,361 3,539 8 74 44 6.649 2,974 188 141 9
276 184 19,969 9,640 188 143 5-9 321 218 25,833 10,914 22,708 8,338 10-14 514 272 4,355 2,211 14,049 6,015 15-19 547 244 2,893 1,575 7,644 4,414 20-24 640 191 2.5'62 1,187 5,835 2,806 25-29 599 10 ~ 2,403 1,046 3,712 1,693 30-34
3,162 44 . 13,749 2,433 11,373 2,792 35-59 \.251 16 . 4.761 425 2"~\l8 27Q 60+

2Ui
q·2 an!, m/,~ am C-2 AGE, SEX AND LEVEL OF
~'Ii ffi~/Educational level -------------------- ---------
zyR ~/$ .. i!(f'lftlt(C1
~ ~~I~ fir -l!f.r;{fuz'r Higher Secondary/Inter-
Middle Matr\culation/Secolldary mediate/ Pre-University ----------- -------"- ---------
iIfTl{ ~ ~ m' ~~ mY ~ m' Age group Males Females Males Females Males Females
1 12 13 14 15 16 17
~ DAMOH
~aITI{ 18,714 6,121 6,618 2,213 4,435 1.196 All ages
0-4
5 6
7
8 9"
5-9
10-14 1,327 977 31 10 10 15-19 5,986 2,118 749 652 738 487 20-24 3,939 1,213 1,571 599 1,243 368 25-29 2,696 775 1;319 415 840 174 30-34 1,885 438 917 235 104 81 35-59 2,582 560 1,820 283 857 76 60+ 348 40 146 19 54
non SATNA
~ alT,! 34,722 8,686 15,450 2,127 23,237 3,109 All ages
0-4
5 ."
6
7
8 ... 9
5-9
10-14 2,512 1,053 167 lOS 48 17 15-19 15,235 2,458 4,278 624 3,755 1,100 20-24 5,468 2,035 2,131 391 6,016 970 25-29 4,777 1,273 2,418 306 4,409 690 30-34 3,400 660 1,620 206 3,852 417 35-59 7,210 1,154 3,766 474 4,261 502
60+ 1,046 52 454 19 185 9

217
"'''' IIiT m-~ '" EDUCATION-ALL AREAS
wf~ m/Educational Level --------------------------------mr iii; 8ffi1'fA' lh:..g!firm.r tnr iii; 81tI1'!'A WIi'ift<1i1 ~ Il"T SIm1II' tRr fut<;rnrr Il"T J:IlIT'UT q'Cf
Non.Technical diploma t"r Technical diploma or certi· ~ 81" :amt affirIi certificate not equal to degree ficate not equal to degree Graduate and above ---------- ----------- ----_-.;;..------~If mrll"f 2:mT mrilt ~ mf 81Tl! ~iI: Males F::maJes Males Females Males Females Age group
18 19 20 21 22 :13 1
~ DANOH
5 355 15 3,633 1,056 ~1IlPl All Illes
0-4 5 6 7 8 ,
s-, 5 10-14
IS 5 26 61 15-19 121 799 425 20-24 S9 10 829 290 25-29 S7 754 134 30-34 93 1,166 146 35-59
5 5 50 60+ ifRAT
SATNA 21 648 10 9,793· 1,660 ~&ml
All alol
0-4 5 6 ... 7 8 9
5-9
10 20 10-14
5 146 126 15-19 17S 2,180 584 20-24 151 2,026 413 25-29 106 1,457 240 12 30-34 181 10 3,110 226 ,0, ,. t~ 35-59
~68 9 60t
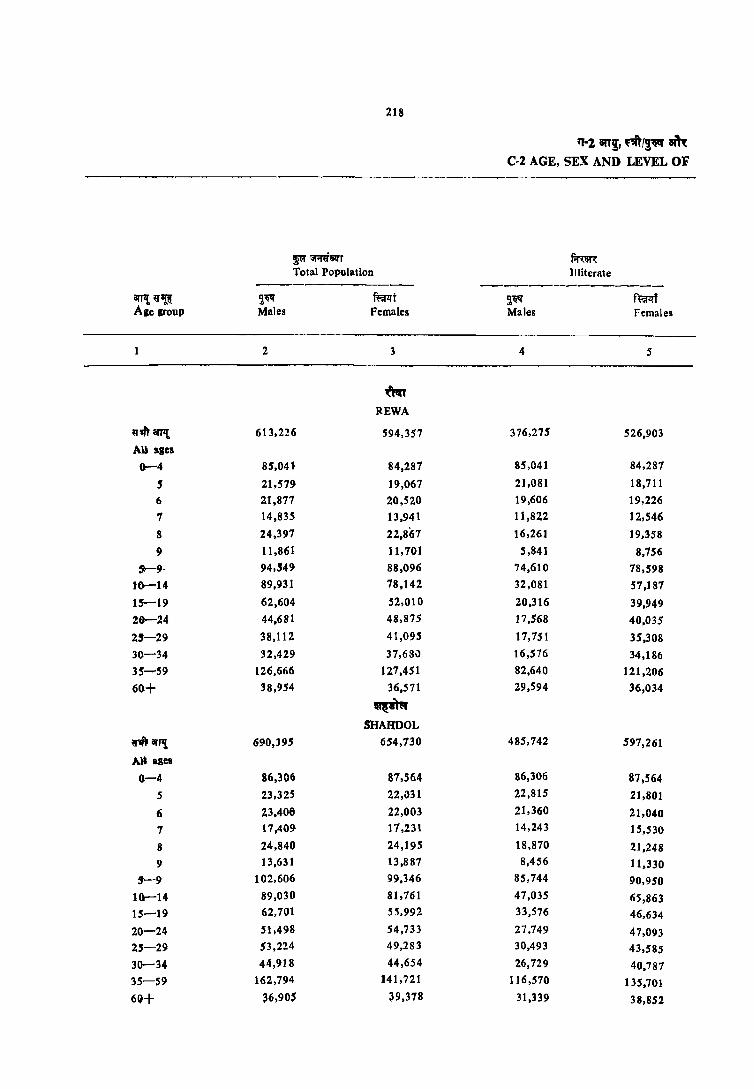
218
'1'-2 an!, "",~~ am: C-2 AGE, SEX AND LEVEL OF
~~~r f.roIR Total Population Illiterate -------_--------
arJ1f. ij"~ ~'" ffir:rt ~ f~' Age group Males Females Males Females
2 3 4 5
~ REWA
ij"1ft' aJrl{. 613,226 594,357 376,275 526,903
All ages
0-4 85,041 84,287 85,041 84,287
S 21,579 19,067 21,081 18,711
6 21,871 20,520 19,606 19,226
7 14,835 13,941 11,822 12,546
8 24,397 22,867 16,261 19,358
9 11,861 11,701 5,841 8,756
""""9- 94,549 88,096 74,610 78,598
16-14 89,931 78,142 32,081 51,181
1S-19 62,604 52,010 20,316 39,949
26-24 44,681 48,875 17,568 40,035
2'-29 38,112 41,095 17,751 35,308
30-34 32,429 37,68':> 16,516 34,186
35-59 126,666 127,451 82,640 121,206
60+ 38,954 36,571 29,594 36,034
~ SHAHDOL
.~ ""P! 690,395 654,730 485,742 591,261
A)' agel
0-4 86,306 87,564 86,306 87,564
5 23,325 22,\)31 22,815 21,801
6 23,406 22,003 21,360 21,040
1 17,409- 17,231 14,243 15,530
8 24,840 24,195 18,870 21,248
9 13,631 13,887 8,456 11,330
'-9 102,606 99.346 85,744 90,950
16-14 89,030 81,761 41,035 65,863 15-19 62,701 55,992 33,576 46,634
20-24 51,498 54,733 27,149 47,093 25-29 53,224 49,283 30,493 43,585
30-34 44,918 44,654 26,729 40,787 35-59 162,794 141,721 116,570 135,701
6 Ii) + 36,905 ~9,378 31,339 38,852

219
men ;riT m-nt p EDUCATION - ALL AREAS
1ITfm; ~/Educational Level ----------
lJtm: (tfm; m it; filfllT*) Literate (without educationalleveI)
-------~---------------<>imq:qlf('Il ~!j; ~ Non-Formal Formal Primary
---------- ------------- ----------2;lil{ fu;{~f 2;ql{ mr ~ ~ ~~ Males Females Males Females Males Females A~ group
6 7 8 9 10 11
""" REWA
~,619 2,692 70,066 26,566 58,704 21,849 rnillll! All ages
~-4
34 19 463 338 .5 92 42 2,179 1,251 6
88 28 2,926 1,366 7
132 100 8,004 3,40') 8 78 61 5,636 2,729 30S 154 9
424 251 19,209 9,094 305 154 5-9
694 338 27,02) 10,474 24,597 8,372 10-14
682 453 3,938 1,806 10,667 4,633 15-19
867 394 1,997 1,526 4,904 3,281 20-24
795 325 1,828 98.! 3,729 2,277 25-29
851 201 1,630 689 2,831 1,239 30-34
3,626 642 10,510 1,747 9,664 1,756 35-59
1,648 75 3,861 235 1,987 137 60+
.'" SHAHDOL
8,076 1,897 75,887 '13,717 59,251 18,~OO rn au'! All ages
0-4
15 5 495 225 5
65 35 1,975 928 6
55 10 3,110 1,6·~0 7
40 55 5,930 2,891 8
70 40 4,875 2,393 231 12 J 9
246 146 16,385 8,1~7 231 123 5-9
419 168 23,091 8,293 16,2S7 6,323 10-14
674 326 5,082 1,636 11,302 3,7132 15-19
715 185 3,749 1,467 7,413 2,807 20-24
1,053 '181 4,285 1,201 6,960 1,919 25-2'1
844 223 4,207 932 5,001 1,434 30-34 3,379 461 15,890 1,763 11,075 1,927 35-S!)
719 81 3,126 252 911 119 60+

22tl
~·2 an!, ~r,!~ ~ C-2 AGE, SEX AND LEVEL OF
IIi'fWI; m/Education:lI Level . -------------------------------------
iWf{~/~~/
~~/~ flr-l{~T
filfr.r Higber Secondary/Inter-Middle Matriculation/Secondary mediate/ Pre-University ---------- ---------- ---------
awt~ ~ fmrt ~ fi:crqt ~ fuRf Age group Males Females Males Females Males Females
12 13 ]4 15 16 17
'61n REWA
~1111'! 3e,193 9,096 11,382 1,689 30,]94 3,681 Aliases
0-4 5 6
7
8
9
5-9 '" 10-14 5,159 1,623 314 97 58 51 15-19 13,503 3,001 5,797 630 7,268 1,391 20-24 4,817 1 ,831 3,139 272 8,440 818 25-29 4,104 1,045 2,637 200 4,847 548 30-34 ~,941 614 1,684 166 4,201 359 35-59 7,214 895 3,408 318 5,154 454 60+ 1,049 84 390 212
~ SHAHDOL
~it arT,! 2.5,242 6,826 11,495 2,069 16,224 3,136 All ages
0-4 ... 5
6 ...
1
8
9
5-9
10-14 2,103 992 88 84 30 38 15-19 6,916 1,949 2,352 65{ 2,605 9.52 20-24 3,937 1,313 2,102 483 4,089 913 25-29 3,628 1,:)33 1,8~5 280 3,181 571 lO-34 2,562 589 1,4\1 214 2,687 272 35-59 5,671 896 3,399 351 3,533 385 60+ 413 54 %44 5 79 S
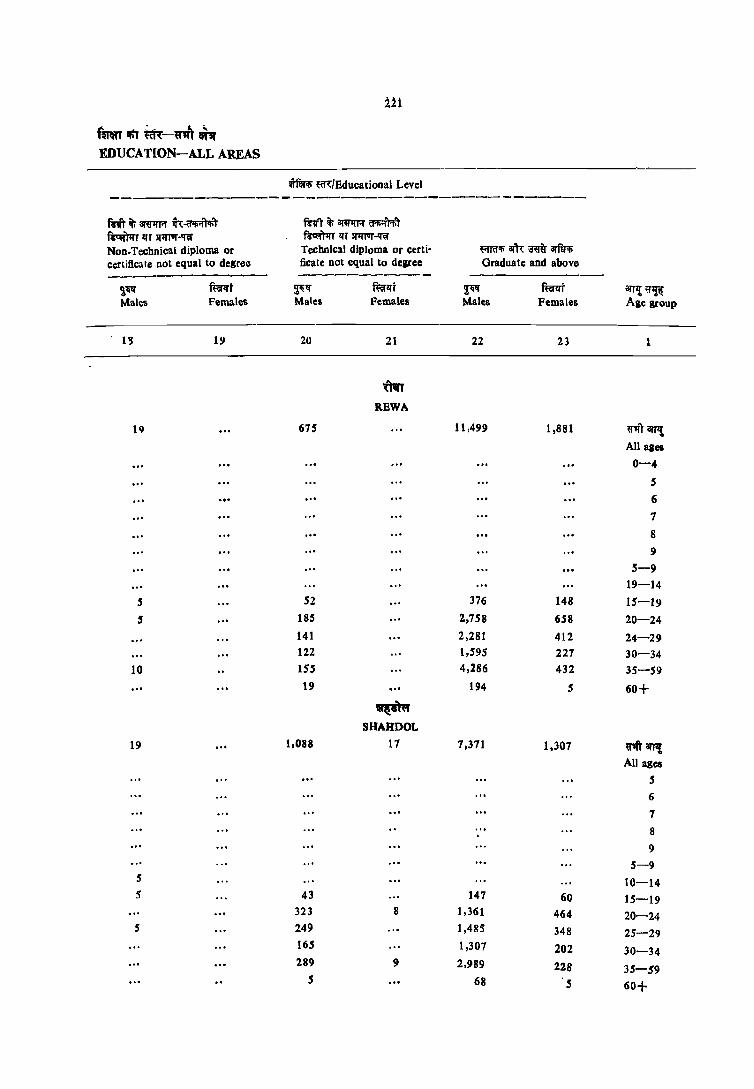
221
fmtT ~ ictt-~ 1li1l' EDUCATION-ALL AREAS
ff~ ~/Educational Level --------------------------------------miT iii 0RI'1l'R ~~ mrlit;~~T ~)1rr 1fT lPJ11IT-'Rf ~T1l'T311I1"IT-'«ir
Non-Technical diploma or Technic!1 diploma or certi- ~"Ii am '3"" arfirt; certificate not equal to degree ficate not equal to degree Graduate and above ---------- ---------- ---------~~ mr ~~ ft:1irlft ~~ ft:;;rzrt arT,! ,,~ Males Females Males Females Males Females Age group
lIJ 19 20 21 22 23 1
mn REWA
19 675 11,499 1,881 ij"'fT arp!
All ages
0-4
S
6
7
8 9
5-9 19-14
5 52 376 148 IS-19 5 185 2,758 658 20-24
141 2,281 412 24-29 122 1,595 227 30-34
10 ISS 4,286 432 35-S9 19 , .. 194 S 60+
~ SHAHDOL
19 1.088 17 7,371 1,307 ij''Ift'an, All ages
5 6
7
8 9
5-9 5 10-14 5 43 147 60 15-19
323 8 1,361 464 20-24 5 249 1,485 348 25-29
165 1,307 202 30-34 289 9 2,989 228 35-S9
S 68 5 60+

222
~ <r.f~q-T Total Population
----------_.--arJ1f. ~~ ~ mr Ase group Males Females
2 3
u)\ft
~lDm
{T'J[1' arJ1f. 501,729 482,738
All ageS
0-4 67.672 70,158
5 17,994 J 7,033
6 18,396 18,19:}
7 12;768 12,572
8 21,849 20,824
9 9.113 10,727
5-9 80,720 19,946
10-14 69,661 63,751
15- ]9 48,436 40,550
20-24 36,929 38,005
25-29 36,017 34,081
30-34 30,931 32,32'>
35-59 106,890 95,417
6<'+ 30,238 28,345
~ MANDSAUR
ij'.tt arT1! 651,011 6] 2,388
All ages 0-4 85,492 83,547
5 22,130 20,649
6 19,971 19,692
7 11,334 17,137
8 23,461 21,817
9 12,329 12,773
5-9 95,225 92,668 10-14 81,694 75,058
15--19 62,161 56,459
20-24 57,8S~ 55,256
25-29 47,7':15 45,257
30-34 40,150 37,988
35-59 136,989 124,346
60+ 43,447 41,680
11'.2 8tl!I, ~'I,!~ ~ C.2 AGE, SEX AND LEVEL OF
fiRm JIIiterate
--------------~ fi:erllT MJles Females
4 5
382,663 459,592
61,672 70.158 17,662 16,879 17,195 18.291 11,124 11.864 17,647 19,513
6.808 9,518
70,436 76,126
42,987 56,638
28,358 36,931
22,081 35,015
22,291 31,825
20,760 30,998
81,821 93,635
26,135 28,15S
348,271 520,135
85.492 83,5'47
21,086 19,992
17,128 18,052
12,488 15,197
14,055 17,678
5,051 9,045
69,808 79,965 26,388 52,407
19,795 40,989
18,605 42,743
15,640 36.397 15.479 31,892
68,848 112,101
28,151 40,059

223
fRT "" ~-.. 1ft IP EDUCATION-ALL AREAS
-------WfWI; m/Education:lI Level
ml1t1: (~fWl; m it; fiRT.) Literate (without educational level)
-------------------------iI(.MqlR<P afIq'i4'Tft;j; ~ Non.Pormal Formal Primary
----------- _ .. ------------~I!f fu;rlrf ~ f~ll"f ~ f{q!ff arJ'I! ij"~ Males Females Mdles f;males Milies Females Age group
6 7 8 9 10 11
~ SIDHI
6,903 1,147 47,204 11,064 32.652 7,255 ~~ at'Tl! All ages
... 0-4 9 4 322 ISO 5
19 4 1,182 495 6 19 31 1,625 676 7 47 13 4,156 1,298 8 38 17 2.758 1,099 109 32 9
132 70 10.044 3,718 109 32 5-9 401 129 15,966 4,211 8,919 2,450 10-14 547 172 3,811 930 7,428 1,569 15-19 752 184 2,307 764 4,266 1,139 20-24 798 145 2,459 469 3,512 909 25-29 736 155 1,948 301 2,380 500 30-34
2,630 226 8,348 563 5,453 616 35-59 869 .5"1 2,212 80 566 26 60+
~ MANDSAUR
6,074 1,907 124,207 40,822 90,855 27,203 ~'lfr iIIJ1! All ages
0-4 109 54 935 604 5 233 n 2,610 1,567 Ii 282 107 4,565 2,433 7 297 136 9,109 4,002 8 131 14 6.837 3,456 310 197 9
1,052 443 24,055 12,062 310 191 5-9 716 353 31,486 11,972 20,504 8,624 10-14 458 J69 9,106 3,450 17,084 5,619 15-19 440 20S 7,947 2,776 13,299 3,916 20-24 462 137 6,957 2,150 10,256 2,892 25-29 457 92 6,474 1,971 7,39Z 1,943 30-34
1,761 335 29,171 5,409 18,335 3,653 35-059 637 I'll 8,938 '77 3,665 3H 60+

224
q-2, i11J1 ~/~ am: C·l AGE, SEX AND LEVEL OF
ifil;.!; ~"(/Educatlonal Level
ii:m~/~~1
.q%~/~) fir~~
fil"fu<;r Higher Secondary/Inler-Middle Matriculation/Secondary mediate/Pre. University ---------- ------ ---------
arrl! ~ 'l~'" ff«lJt ,!~lf mrrt 'l~lf mt Age group Males Females Males Females Mlles Females
1 ]2 13 14 IS 16 17
~ SIDHI
w4'tarJll 15,965 1,980 1,666 519 10,633 813 All ages
0-4
S
6
7
8
9
5-9
10-14 1,287 293 91 26 9 4 15-19 4.662 571 2,034 128 1,594 218 20-24 2,389 451 1,622 109 2,806 242 25-29 2,319 344 1,428 138 2,213 162 30-34 1,570 134 879 S3 1,866 102 35--59 3,525 169 1,535 56 2,108 84
60+ 268 18 71 9 37
~ MANDSAUR
'I''IiT arJ1! 43,912 12,634 3,397 715 22,249 6,383 All ages
0-4
S
6
7
8 9
5-9
10-14 2,466 1,643 44 19 26 35 15-19 11,616 3,999 195 129 3,726 1,962 20-24 8,449 2,631 252 114 6,234 ],934 25-29 7,054 1,728 413 122 4,229 1,185 30-34 4,592 976 320 73 3,505 678 35-59 8,302 ] ,556 1,834 244 4,368 568 6Q+ 1,428 91 339 14 155 IS
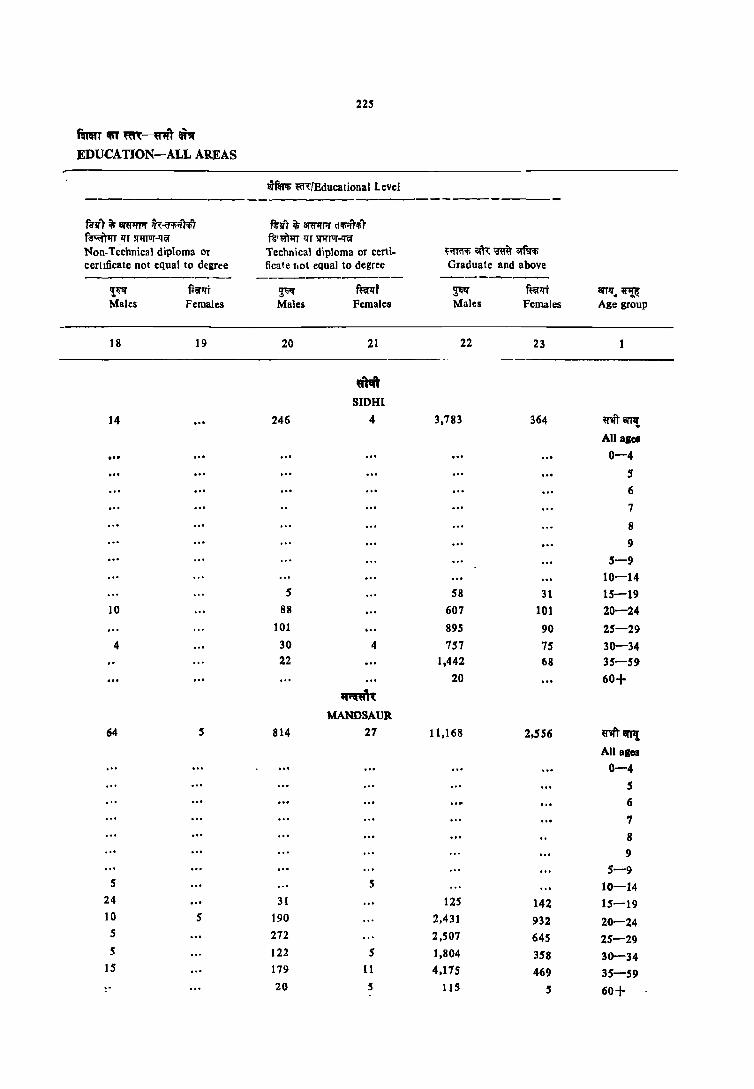
225
~ IfiT ~-~1ft ~'J(
EDUCATION-ALL AREAS
l!T~ fO't{Educationallevel -------------
R-If) it; 0RflfPf ~-(I'fi'lAiT R-If) it; 1lfflII'I'f drn'f»
f~ _1fT ST'If1IT..q eI" fu'ml'lT lfT lfIfl11f-'IiiT Non.Technical diploma OT Technical diploma or certi- ~iffiI'Ii am: ~ arfif<I; cerlificate not equal to degree ficate flot equal to degree Graduate and above
------------ --------'!lilSf fiel"lft ~1Sf R:nt ~ mrlft arTlfe ~~ Males Females Males Females Males Females Age group
18 19 20 21 22 23
WNt SIDHI
14 246 4 3,783 364 rnamt All aSCI ... 0-4
5 6 7
8 9
5-9 10-14
5 58 31 15-19 10 88 607 101 20-24
101 895 90 25-29 4 30 4 757 75 30-34
22 1,442 68 35-59 20 60+
~ MANDSAUR
64 814 27 11,168 2,5S6 ij''If'l' arr~
All ales
0-4 5 6 7
8 9
5-9 5 S 10-14
24 31 125 142 15-19 10 5 190 2,431 932 20-24 5 272 2,507 645 25-29 5 122 5 1,804 358 30-34
15 179 11 4,115 469 35-59 ,. 20 5 115 5 60+
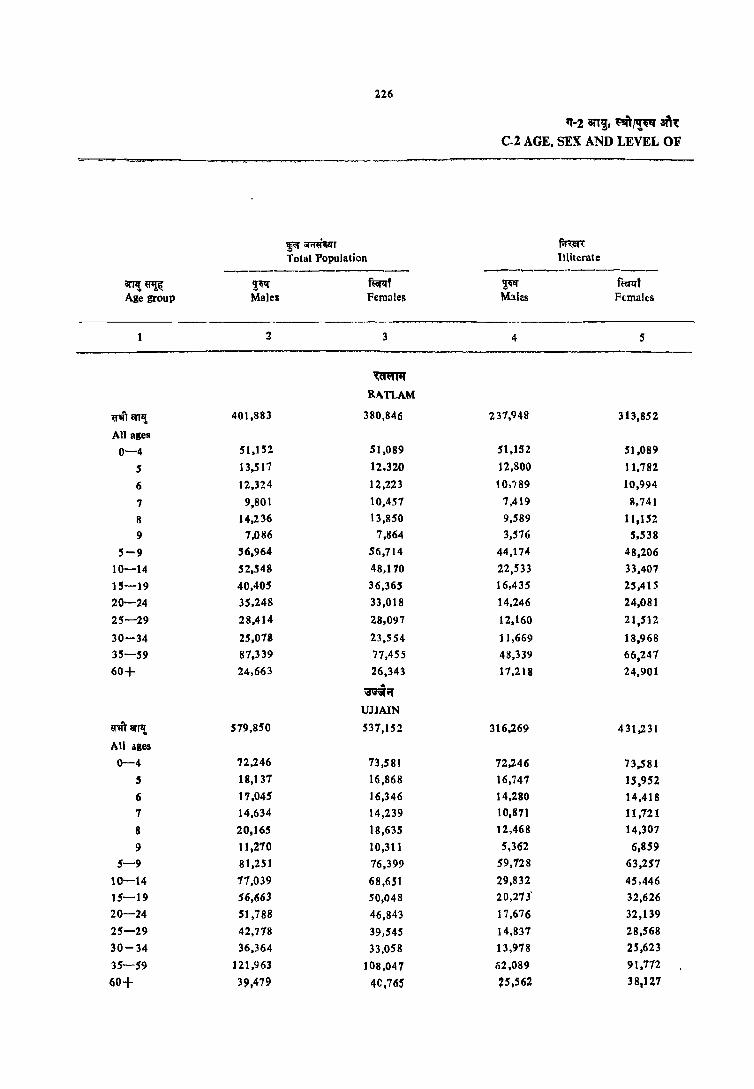
226
'1'-2 ani, ~~ an..: C-2 AGE, SEX AND LEVEL OF
~~T f.mR Total Population Illiterate
--------------- ----------_ .. _---arP!~ ~1iI'{ ffiRf ~ mf Age group Males Females M:lI::s Females
2 3 4 5
~
RATLAM
~m 811'!, 401,883 380,846 237,948 313,852
All ages
0-4 51,152 51,089 51,152 51,089
5 13,517 12,320 12,800 11,782
6 12,324 12,223 10,"/89 10,994
7 9,801 10,457 7,419 8,741
8 14,236 13,850 9,589 11.152
9 7.086 7,864 3,576 5,538
5-9 56,964 56,714 44,174 48,206
10-14 52,548 48,170 22,533 33,407
15-19 40,405 36,365 16,435 25,415
20-24 35,248 33,018 14,246 24,081
25-29 28,414 28,097 12,160 21,512
30-34 25,078 23,554 11,669 18,968
35-59 87,339 77,455 48,339 66,247
60+ 24,663 26,343 17,218 24,901 .. ~ ...
UJJAIN
~marf'l! 579,850 537,152 316,269 431,231
All ages 0-4 72,246 73,581 72,246 73,581
5 18,137 16,868 16,747 15,952
6 17,045 16,346 14,280 14,418
7 14,634 14,239 10,871 11,121
8 20,165 18,635 12,468 14,307
9 11,270 10,311 5,362 6,859
5-9 81,251 76,399 59,728 63,257
10-14 77,039 68,6.51 29,832 45,446
15-19 56,663 50,048 20,273" 32,626
20-24 51,788 46,843 17,676 32,139
25-29 42,778 39,545 14,837 28,568
30-34 36,364 33,058 13,978 25,623
35-59 121,963 108,047 62,089 91,772
60+ 39,479 4C.76S ~5,562 38,127

227
fmrr I4iT fat-tilt) el~ EDUCATION-ALL AREAS
wm~ mlEducational Level ---------------
mm (vrm'Ji Hr>: iii filifT*) lIterate (without educational level)
-------------------------~f1:oI; ~ srR:~ Non-Formal Formal Primary
----------- ~----------- -----------~ ~<ri ~ fu:rtrt ~ fu:rl.ft orfl! ~ Males Females Males Females Males Fameles Age group
6 7 8 9 10 11
~
RAT LAM -
4,673 2,065 ,57,766 24.146 48,099 19,519 ~ll) orr! All ages ... 0-4
71 47 646 492 ... S 106 72 1,429 1,156 ... 6 101 56 2,281 1,661 ... , 190 57 4,456 2,642 8
70 42 1,392 2,113 248 171 9
539 273 12,003 B,064 24B 171 5-9
499 205 15,932 6,391 11,589 6,530 10-14
285 194 4,373 1,675 9,567 3,663 15-19
375 219 3.553 1,414 6,620 2,389 20-24
378 207 2,823 1,238 4,893 1,775 25-29
355 142 2,793 1,056 3,726 1,366 30-34
1,635 600 12,B07 3,581 10,137 3,259 35-59
557 219 3,457 721 1,919 ~61 60+ ...
~~
UJJA1N
7,476 2,379 90,349 37,204 76,607 30,305 ~Ift orTl!, All ages
0-4
Bl 46 1,309 871 5 191 79 2,575 1,849 6
140 54 3,623 2,463 7
354 127 7,343 4,201 8
140 60 5,222 2,941 546 448 9
906 366 20,072 12,3,!7 546 448 5-9
1,003 337 24,294 10,225 18,630 9,,882 10-14
538 187 6,322 2,695 13.826 5,462 15-19
574 203 5,167 2,252 10,167 3,731 20-24 565 272 4,601 1,934 7.649 2,826 25-29 583 195 4,453 1,467 5,999 2,117 30-34
2,361 570 19,244 4,911 16,176 5,148 35-59
902 238 6,049 1,310 3,585 666 6Q+

228
'1.1 an!, "' J1!~ ~ C.l AGE, SEX AND LEVEL OF
"fWI; m/Educational Level
--------------------------------------~'l; ~iI;v~T/,.e:'l;'Ofc"<al
P!mr ~~/~'l;T fir -'{f.:rqfuit Highrf Secondary/Inter.
Middle Matriculation/Secondaay mediate/Pre-UDIversity ---------- ---------------- ----------
CIl1"!~~ ~ fuRl ~ ~r ~ mrl1r Age grouP Males Females Males Females Males Females
12 13 14 15 16 17
~~
RATLAM
~ arTl£ 26,003 11,045 2,896 817 13,851 6,066
All aBeB
_0-4
S
6
7
8
9
5-9
10-14 -1,960 1,596 25 21 10 21
15-19 7,047 3,257 85 53 2,415 1,848
20-24 4,761 1,929 134 129 3,633 1,657
25-29 3,432 1,334 201 104 2,318 1,039
30-34 2,602 877 311 104 1.937 596
35-59 5,415 1,970 1,782 385 3,349 890
60+ 770 83 356 21 190 16 .. ~;:r
UJJAIN
IDI'TiIfll! 42,540 16,772 4,928 1,724 24,268 11,092
All ages
0-4
5
6 ... 7
8
9 5-9
10-14 3.177 2,609 57 73 47 73
15-19 10,698 5,058 289 270 4,381 3,372
20-24 8,189 2,831 385 187 6,3411 3,282
2'-29 6,210 2,J42 sso 297 4,631 1,880
30-34 4,024 1,408 390 212 3,583 1,075
35-59 8,493 2,441 2,310 612 4,954 1,368
60+ 1,737 283 886 14 324 41
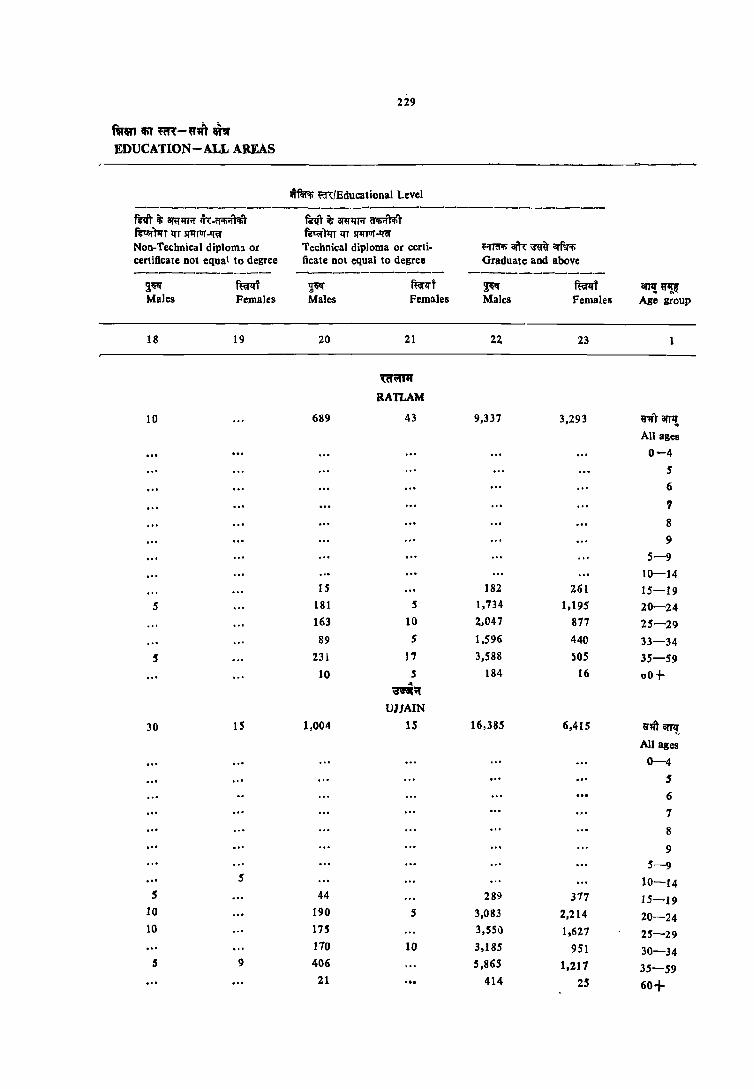
229
f'$fm !fiT ~-"lft Ithr EDUCATION-ALL AREAS
litf~ mfEducational level ------------------------------------mIT Ii; aml'lTrl' ij,:.~ifi;f\''h'T mrT ~ am~1'f ~ifiifr.r.l ~)lrT 1fT SI1l'1Uf..tTer ~m lfI SI1l'TUf..tTer Non-Technical diploml or Technical diploma or certi· ~:rrnifi am: ~ arfu'ifi certificate Dot equal to degree ficate Dot equal to degree Graduate aDd above
----------- -.......----.. ------- -----------~qIf ft:<aIfi ~ ffirlfi ~ mY aTfl! ~ Males Females Males Females Males Females ABc group
18 19 20 21 22 23
~
RATLAM
10 689 43 9,337 3,293 ~'iI"r iITT'!, All ages
0-4 5 6
?
8
9
5-9 10-14
IS 182 261 15-19 5 181 5 1,734 1,195 20-24
163 10 2,047 817 25-29 89 S 1,596 440 33-34
5 231 17 3.588 505 35-59 10 5 184 16 00t-..
;m('f
UJJAIN
30 15 1,004 15 16,385 6,415 ~nft arT!! All ages
0-4
5
6
7 8
9
5-9 S 10-14
S 44 289 317 15-19 10 190 S 3,083 2,214 20-24 10 115 3,5S() 1,621 25-29
110 10 3,185 951 30-34 5 9 406 5,865 1,211 35-59
21 414 2S 60+
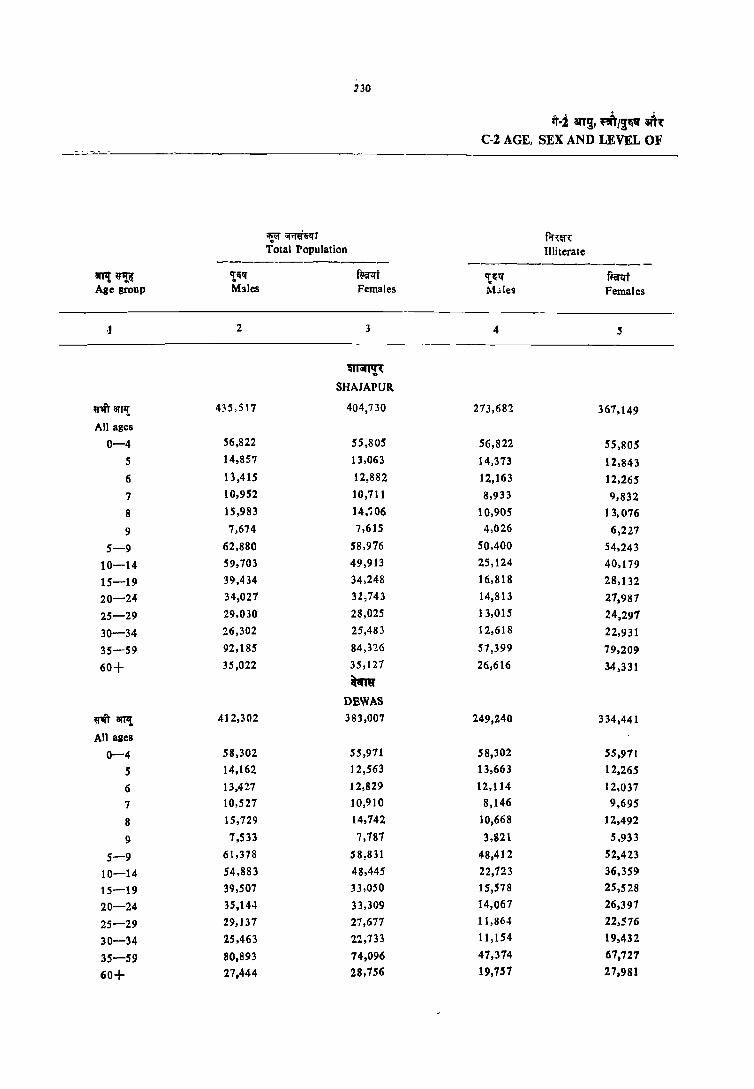
130
"!" ~~T Total Population
-------------8fTI{ u-~ 'Iii. f~~t Age group Males Females
·1 2 3
~'(
SHAJAPUR
u-m afll{ 435,517 40'1,730
All ages
0-4 56,822 5S,805
5 14,8S7 13,063
6 13,415 12,882
7 10,952 10,111
8 15,983 14,i06
9 7,674 7,615
5-9 62.880 58.916
10-14 ~9, 703 49.913
15-19 39.434 34.248
20-24 34,021 32,743
25-29 29,030 28.025
30-34 26,302 25,483
35-59 92,185 84.326
60+ 35,022 35,127
~
DE-WAS
U"'IftilfTli 412,302 383,007
All agel
0-4 58,302 55,971
5 14,162 12,563
6 13,427 12,829
7 10,527 10.910
8 15,729 14,742
9 7,533 7,787
5-9 61,378 58,831
10-14 54,883 48,445
15-19 39,507 33,050
20-24 35,14'+ 33,309
25-29 29,137 27,677
30-34 25.463 22,733
35-59 80,893 14,096
60+ 27,444 28,756
if-i arr~, ~/~'iq aft'( C-2 AGE, SEX AND LEVEL OF
fif"{~ Illiterate
-------------- -tt1i"l' f~ MJles Females
4 S
273,681 361,149
56,822 5S,805 14,373 12,843 12,163 12,265 8,933 9,832
10,905 13,076 4,026 6,227
50,400 54,243 25,124 40,179 16,818 28,132 14,813 27,987 13,015 24,297 12,618 22,931 57,399 79.209 26,616 34,331
249,240 334,441
58,302 55,911 13,663 12.265 12,114 12.037
8,146 9.695 10,668 12.492
3,821 5,933
48,412 52,423
22,123 36.359 15,578 25,528
14,067 26,397 11,864 22,576 11,154 19,432
47,374 67,727
19,757 27,981
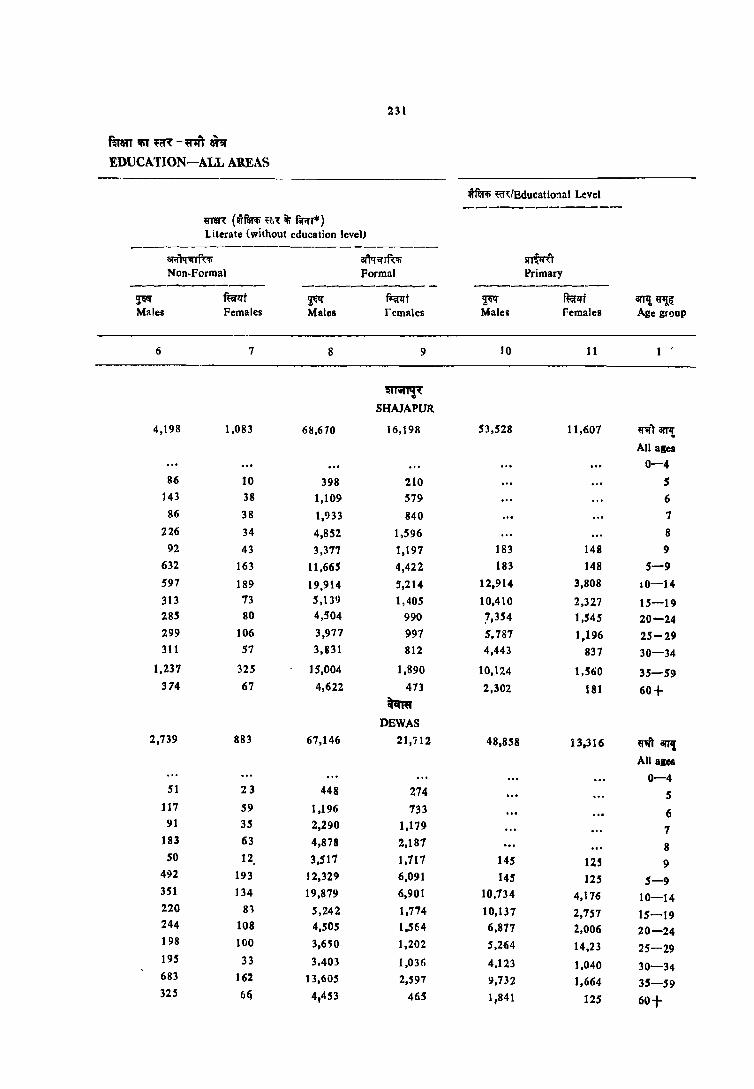
231
~I$T~-~~Tm
EDUCATION-ALL AREAS
~ mlEducatio:lal Level -------------
meR (wfW!; ~~, ~ iii fiAT.) Literate (without education level)
------------------------ar~ ar'\q;;rrfu; snW"t Non·Formal Formal l'rimary
----------- ---------- ----------~ mrll't 2;W f~t ~ fferlTi arfl! ~~ Males Females Males rcmales Malu Females Age group
6 7 8 9 10 11 1
~~ SHAJAPUR
4,198 1,083 68,670 16,198 53,s28 11,607 nrawt All aSes
0-4
86 10 398 210 5 143 38 1,109 579 6
86 38 1,933 840 7
226 34 4,852 1,596 8 92 43 3,317 1,197 183 148 9
632 163 11,665 4,422 183 148 5-9
597 189 19,914 ',214 12.914 3,808 ,0-14
313 73 5,139 1,405 10,410 2,327 is-t9 285 80 4,504 990 7,354 1,545 20-24 299 106 3,977 997 5,787 1.196 25-29 311 57 3,B31 812 4,443 837 30-34
1.237 325 15,004 1,890 10,124 1,560 35-59 374 67 4,622 473 2,302 181 60+
~ DEWAS
2,739 883 67,146 21,712 48,858 13.316 rn~ All ales
0-4 51 23 448 274 5
117 59 1,196 133 6 91 35 2,290 1,179 7
183 63 4,878 2,181 8 SO 12 3,517 1.711 145 125 9
492 193 12,329 6,091 145 125 5-9 351 134 19,879 6,901 10,734 4.176 10-14 220 81 5,242 1,774 10,137 2,157 15-19 244 108 4,505 1,564 6.877 2,006 20-24 198 100 3,6';0 1,202 5,264 14,23 25-29 195 33 3,403 1,036 4.123 1,040 30-34 683 162 13,605 2,597 9,732 1,664 35-59 325 6(j 4,453 465 1,841 125 60+
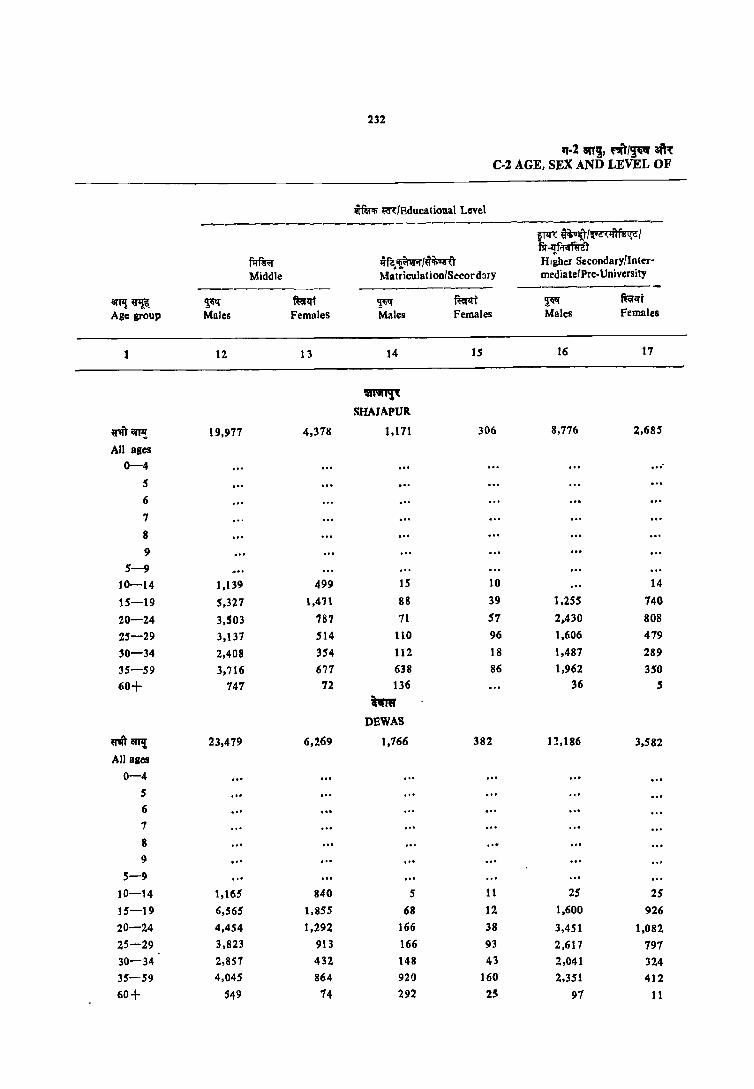
232
q-2 an~, ",I~ ait~ C-2 AGE, SEX AND LEVEL OF
~ mlEducational Level -----------------------------------
qTl1( ~(tI~~1 fir -ljf.;.mra-'t
f1fmr l{fa.~I~~ Higher SecondarylInter-
Middle MatriculationlSecordary mediatelPre-University
--------- -------- ------------OIfI! ~~ ~ ~:qt ~ ffirqt ~ ftei'lff Age group Males Females Males Females Males Females
1 12 13 14 15 16 17
~ SHAJAPUR
ritClJP! 19,977 4,378 1,171 306 8,716 2,685
All ages
0-4 .... 5
6
1
8 9
5-9
10-14 1,139 499 IS 10 14
15-19 5,327 ] ,471 88 39 1,255 740
20-24 3,503 787 7] 57 2.430 808
25-29 3,] 37 514 110 96 1,606 479
30-34 2,408 354 112 18 1,487 289
35-59 3,716 671 638 86 1,962 350
60+ 741 72 136 36 5
hm nBWAS
~arJ'I{ 23,479 6,269 1,766 382 12,186 3,582
All ages
0-4
5 .. , 6
7
8
9 ", 5-9
10-14 1,165 840 5 11 25 25
15-19 6,565 1,855 68 12 1,600 926
20-24 4,454 1,292 166 38 3,451 1,082
25-29 3,823 913 166 93 2,617 797 30-34 2,857 432 148 43 2,041 324
35-59 4,045 864 921) 160 2,351 412
60+ S49 14 292 25 97 11
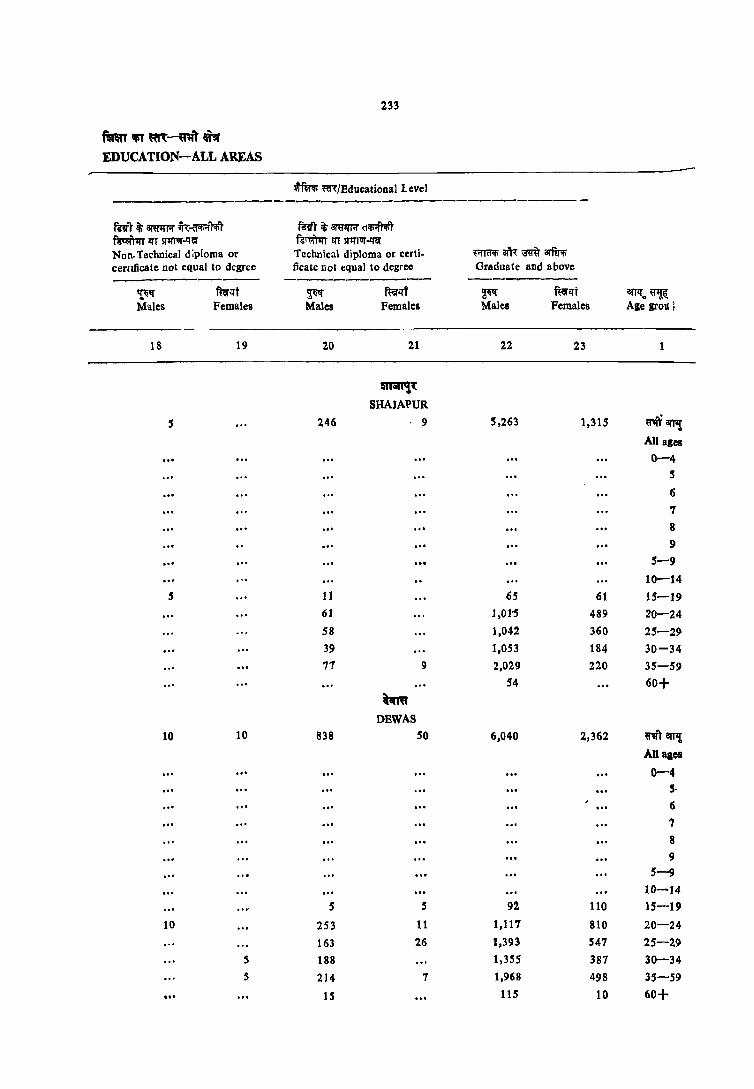
233
ftmT~~-~n EDUCATION-ALL AREAS
wfm; ~~/BducatiODallevel -----------------
mrr~~~~<rm miT it' armrr.r d~ ~I:I"TS(lI'I1lT..qiil' fur.mrr 1fT 5Ill'1111'..q'iil'
Non- Technical d ip[oma or Technical diploma or certi- ro<flIi ~ m ana<li cerufieate Dot equal to degree fieate not equal to degree Graduate and above ------------ ------------ --------
'!.~lf ftiil'lft ~ ~!fT ~ mrlft ilfTlf .. ~ Males Females Males Females Males Females Age grou i
18 19 20 21 22 23 1
~'(
SHAJAPUR
5 246 9 S,26l 1,315 riiill'Pl All ages .. , 0-4
5
6
7 8 .. , 9
5-9
10-14 5 11 65 61 15-19
61 1,01'S 489 20-24 58 1,04.2 360 25-29 39 1,053 184 30-34 71 9 2,029 220 35-59
54 60+ ~
DBWAS
10 10 838 50 6,040 2,362 Wfrl iIfTll All aaes
0-4 5-
6
7
8 9
5-9 10-14
5 S 92 110 15-19
10 253 11 1,117 810 20-24
163 26 1,393 547 25-29 S 188 1,355 387 30--34 S 214 7 1,968 498 35-59 .. , 15 115 10 60+
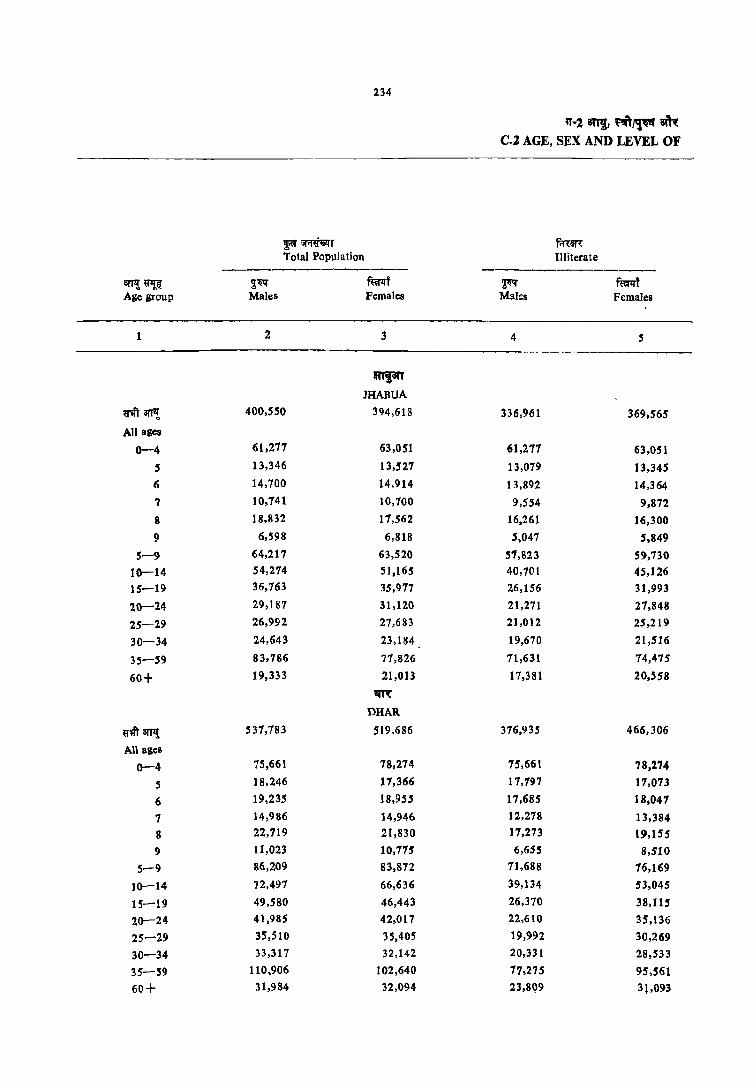
234
~ Of'iRiIill'T Total Population
---------------arP!~ ~~ mt Age group Males Females
2 3
RTp1' JHABUA
WIil'arP! 400,550 394,618
All ages
0-4 61,277 63,OSI
5 13,346 13,527
6 14,700 14,914 ., 10,741 10,700
8 18,832 17,562
9 6,598 6,818
5-9 64,217 63,520
10-14 54,274 51,165
15-19 36,763 35,977
20-'24 29,187 31,120
25-29 26,992 27,683
30-34 24,643 23,184
35-59 83,786 77,826
60+ 19,333 21,013
I!IR
DHAR
ij'm arT,! 537,783 519,686
All ages
0-4 75,661 78,274
5 18,246 17,366
6 19,235 18,955
7 14,986 14,946
8 22,719 21,830
9 11,023 10,775
5-9 86,209 83,872
10-14 72,497 66,636
15-19 49,580 46,443
20-24 41,985 42,017
25-29 35,510 35,405
30-34 33,317 32,142
35-59 110,906 102,640
60+ 31,984 32,094
ff-l 8TTi, ~J1l~ ~'( C.2 AGE, SEX AND LEVEL OF
m:eT{ Illiterate
---------------~ f~t M!ll:s Females
4 5
336,961 369.565
61,277 63,051
13,079 13,345
13,892 14,364
9,554 9,872
16,261 16,300
5,047 5,849
57,823 59,730 40,701 45,126 26,156 31,993
21,271 27,848 21,012 25,219
19,670 21,516
71,631 74,475
17,381 20,558
376,935 466,306
75,661 78,274 17,797 17,073
17,685 18,047 12,278 13,384 17,273 19,155 6,655 8,510
71,688 76,169 39,134 53,045
26,370 38,115 22,610 35,136 19,992 30,269 20,331 28,533
77,275 95.561 23,8Q9 3l,093

235
fmlT ~ ~-,",T P EDUCATION-ALL AREAS
wmifi \'i;R/Educational Level --------------- --
IilTIlR {Wf6:rifi {'eft it; R'IT*) Ltterate (without educational level)
------------------------ar;r~fTot; ar~ifi ~ Non-Formal Formal Primary
--~-------- -----------~ mi ~ ffiIlrf ~ ft:erlii i!lr,!~ Males Females Males Females Males Fameles Age group
6 7 8 9 10 11
""!atT JHABUA
1,019 362 23,675 10,262 17,183 7,220 ~'ifr 3JTlf,
All ages
0-4 33 20 233 161 5 48 45 760 504 6 14 40 1,183 787 7 73 25 2,499 1,237 8 39 15 ] ,426 878 86 76 9
208 147 6,101 3,568 86 76 5-9 183 36 7,449 3,100 5,328 2,443 10-14
73 10 1,834 539 4,066 1,442 15-19 44 26 1,205 582 2,106 843 20-24 92 21 961 430 1,549 738 25-29 69 15 927 372 1,149 575 30-34
292 72 4,175 J ,380 2,957 987 35-59 40 20 1,004 282 543 116 60+
'fR
DHAR
3,922 974 62,708 23,280 50,398 16,055 mITarJ'l! All ages
0-4 34 19 415 274 5 67 33 1,483 875 6
120 45 2,589 1,517 - 7 140 49 5,306 2,626 8
86 23 4,012 2,077 270 165 9 447 169 13,805 7,369 270 165 5-Y 510 152 17,611 6,793 13,592 5,645 10-14 363 88 3,596 1,642 10,670 3,193 15-19 340 80 3,282 1,493 6,765 2,030 20-24 336 96 3,032 1,285 4,925 1,574 25-29 340 74 2,889 1,028 3,859 1,207 30-34
1,233 242 13,782 3,048 8,442 1,996 35-59 343 Ci8 4,578 580 1,867 245 60+

236
'1-2 SlT!I, ~/~ aft~ C-2 AGE, SEX AND LEVEL OF
w~ ~/Educalional Level ---------------------------------
gm ij-~~/iti'l(lftfel{~/ fir-~fuiT
fi:rm:r li"fa;.~/~~) Higher Secondary/Inter-Middle Matriculation/Secorday mediate/Pre-University
----------- ---------- ------------aUI! ~ ~ ~l1't ~ mt ~ fufl1't Age group Males Females Males Females Males Females
12 13 14 15 16 17
mpT JHABUA
"''1ft art'! 9,869 3,770 729 205 6,570 2,258
All ages
0-4
5 (;
7
8
9
5-9 10-14 60S 451 5 5 5 5 15-19 3,636 1,139 20 20 890 740 20_:_'24 1,615 699 100 20 1,965 687 25-29 1,190 626 75 60 1,347 384 30-34 957 323 73 29 1,036 233 35-53 1.546 499 390 11 1,317 '0S 60+ 271 28 6S 10 5
"1'R
DHAR tr,ft arr~ 23,211 7,003 1,275 249 12,361 4,030 All ages
0-4
S
6
7 8
9 5-9
10-14 1,617 961 5 5 29 35 15-19 6,651 2,015 30 14 1,708 1,217 20-24 3,915 1,373 40 45 3,405 1,180 25-29 3,451 1,029 111 43 2,356 711 30-34 2,439 566 l12 35 2,013 425 35-59 4,261 966 751 101 2,510 451
60+ 867 93 226 5 176 5
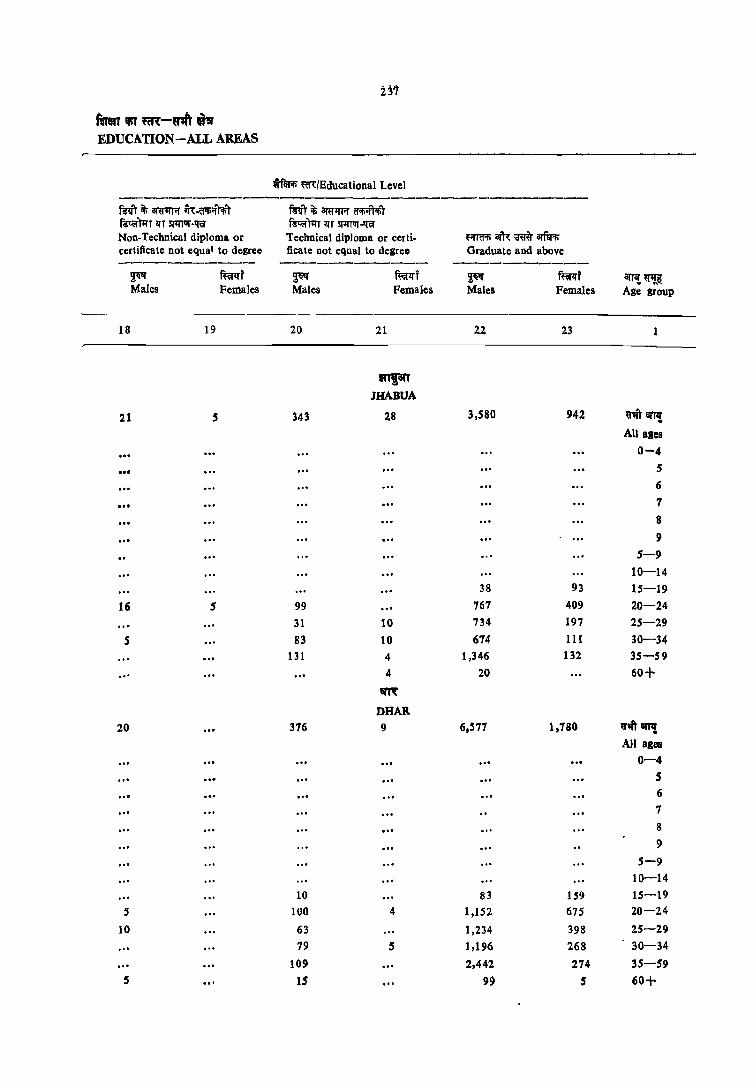
H't
fUm 'lIT ~-m '"' EDUCATION-ALL AREAS
wfllRi m/Educationallevei
---------mrr it; am~ m:~if');;r mrr it; am~ cr'liift;pr ~)'q-T lTT Si1J1UT-qa" ~TI!'r l1T ~..qa-Non-Technical diploma or Technical diploma or certi- ~arnmarfiJ'li" certificate not equal to degree fieate not equal to degree Graduate and above ----------- ------------ -----------~~ 1Wrf ~ ffiflfr ~~ ffirzrf 81Tl! ~ Males Females Males Females Males Females Age grOUP
18 19 20 21 22 23 1
II1pT JHABUA
21 5 343 28 3,580 942 rit amI' . All ales
0-4 ... 5 6
... 7
8 9
5-9 10-14
38 93 15-19
16 5 99 767 409 20-24 31 10 734 197 25-29
5 83 10 674 III 30-34 131 4 1,346 132 35-59
.. ' 4 20 60+
em DRAB.
20 376 9 6,S77 1,780 ~'" 11m! All ages
0-4
... S 6
7 8 9
5-9 10-14
10 83 159 15-19 5 100 4 1,152 675 20-24
10 63 1,234 398 25-29 79 5 1,196 268 30-34
109 2,442 214 35-59 S 15 99 5 60+

~ :;r'1«~r Total Population
--------------8fT!! ij'~ 'iqit ~rn Age group Males Females
2 3
rom INDORB
~~ arfI! 742,459 661,014
All agCII
0-4 87,453 88,678
5 21,038 19,456
6 19,718 19,794
7 16,883 16,614
8 22,857 21,638
9 13,358 13,407
5-9 93,853 90,909
10-14 -91,917 81,167
15-19 80,121 66,254
20-24 76,969 67,5f,5
25-29 61,115 54,759
30-34 50,150 41,074
35-59 155,985 132,766
60+ 44,02S 43,173
qf~A1m.
WBSTNlMAR
9'~ 31f1! 134,646 196,291
AlI.ges
0-4 121,231 124,113
S 28,316 76,878
6 30,,08 30,151
7 21,949 22,569
S 33,299 33,146
9 16,870 17,063
5-9 130,942 129,808
10-14 114,489 104,83S
15-19 77,361 66,634
20-24 69,096 66,123
25-29 59,130 56,682
30-34 51,642 47,825
35-59 160,88'1 150,258
60+ 49.550 49,775
IT-1 8tT!{, ~/'~ at'R C-2 AGE, SEX AND LEVEL OF
fif<:~ llliterate
--------------~'ljl!f ~<rt Males Females
4 5
296,471 422,343
87,45'3 88,678 11,860 16,810 13,537 14,649
8,965 10,170
9,535 11,817
3,709 5,708 53,606 59,154
21,500 33,390 17,796 28,107
15,702 31,485 13,031 27,333
12,024 23,661
54,211 93,237
21,038 31,199
556,743 699,254
121,231 124,113 27,390 26,223 21.121 27,990 17,112 19,479
23,519 27,751 9,330 12,716
104,532 114,160 57,862 78,859 31,983 51,499 33,895 54,226 31,331 47,72 !I 29,043 41,840
104,307 138,483 36.480 48.245

239
fQT !fiT m-'f;rr i'Jil' EDUCATION-ALL AREAS
Wfm; mlEducational Level -------------
trrm: (wfm; «. ~ it; fiAT*) Literate (without education level)
-----------------------at~q ... IF(ifi am.rrfui srrflrtt Non-Formal Formal Primary
---------- ---------- -~ mrll't ~ f~t ~ ffirll't amt~ Males Females Males females Males Females Age group
6 7 8 9 10 11
rom INDORE
1,673 4,031 130,368 82,454 113,164 63,350 fj"wIT arTl! All ages
0-" 292 201 2,886 . 2,444 ,. 324 181 5,857 4,963 IS JF4 107 7,734 6,337 7 144 121 13,178 9,700 8 89 50 8,845 6,870 715 779 9
1,032 661 38,500 30,315 715 779 5-9 493 395 33,040 20,703 30,678 21,214 10-14 570 436 7,755 4,861 20,693 10,727 15-19 626 335 6,469 4,554 14,733 7,923 20-24 661 356 5,351 3,971 10,113 6,256 25-29 532 317 4,706 3,045 7,919 4,493 30-34
2,609 I,B8 25,158 11,721 23,218 10,450 35-59 1,026 329 8,945 2,816 5,025 1,487 60+
1IfuA~ WEST NIMAR
5,147 1,845 120,230 48,458 85,370 28,065 fl'wIT CIfTI!
AJl ages
0-4 SS 10 872 645 5
106 86 3,281 2,075 6 112 62 4,725 3,029 7 116 66 9,604 5,329 8
61 21 7,131 4,114 348 212 9 448 245 25,613 15,191 348 212 5-9 373 208 31,413 14,509 22,592 9,969 10-14 367 150 7,916 3,772 17,005 5,715 15-19 468 151 7,725 3,200 11,715 3,918 20-24 453 201 6,819 2,727 9,287 2,6S'1 25-29 358 148 6.254 2,090 6,986 1,977 30-34
1,890 583 25,921 5,863 14,890 3,280 35-59 720 119 8,409 1,012 2,502 283 60+
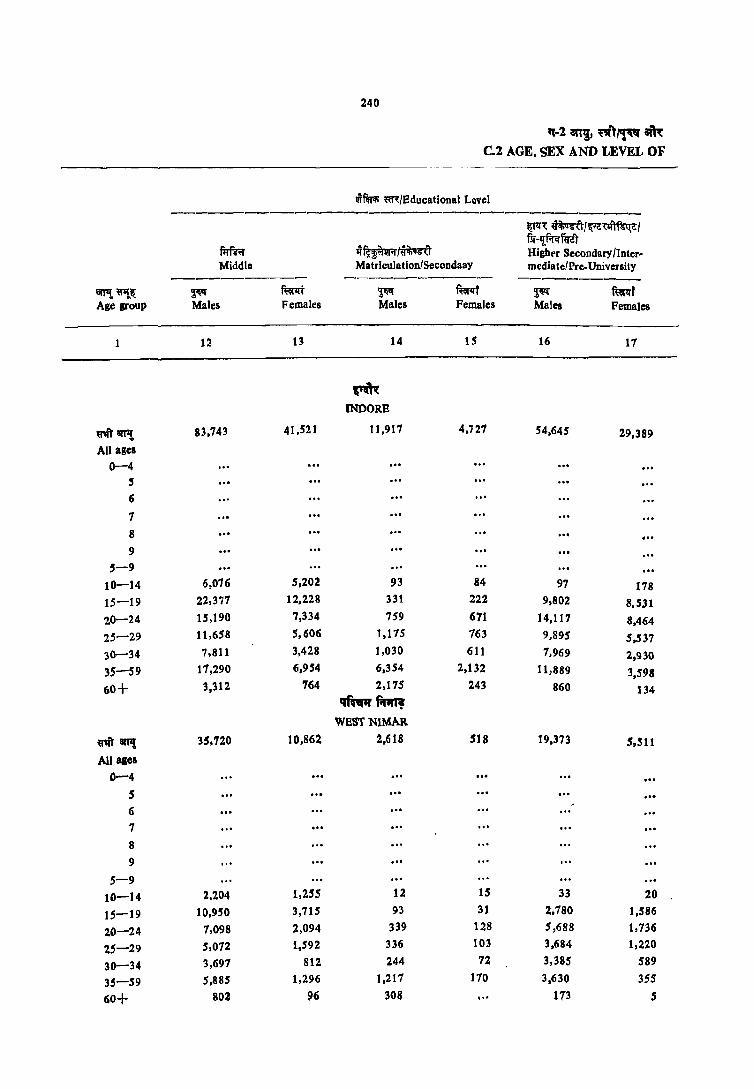
240
q-l ani, ~'11"" am: C.2 AGE. SEX AND LEVEL OF
lii'fu'!!; m/Educational Level --------------------------------------
Frmr ~~/~~r
~q'{ ~"'t/~~~I fJT ·'{f.rcrfuit Higbrr Secondary/Inter-
Middle Matriculation/Secondaay media tel Pre.University ---------- -----~------ ----------
fItTI! ~i!: ~ ffirlrt ~ ~f ~ mt Age group Males Females Males Females Males Females
1 12 13 14 15 16 11
~ INDORE
~arP! 83,743 41,521 11,911 4.727 54,645 29,389
All ages
0-4 , 6
7
8
9 5-9
10-14 6,076 ',202 93 84 97 178 15-19 22,371 12,228 331 222 9,802 8,S31
20-24 15,190 7,334 759 671 14,117 8,464 25-29 11,658 5,606 1,115 163 9,895 5,537
30-34 7,811 3,428 1,030 611 1.969 2,930 35-59 11,290 6,954 6,354 2,132 11,889 3,598
60+ 3,312 764 2,175 243 860 134 ~A1m.
WEST NIMAR.
ntawt 35.720 10,862 2,618 518 19,373 5,511
.All aces
0-4
S 6
7 .,. 8
9
5-9
10-14 2,204 1,255 12 15 33 20
15-19 10,950 3,715 93 31 2,180 I.S86
20-24 7,098 2,094 339 128 5,688 1,736
25-29 5,072 1,592 336 103 3,684 1,220
30-34 3,691 812 244 72 3,385 589
35-59 5,885 1,296 1,217 110 3,630 355
60+ 802 96 308 , .. 113 5

241
fnr 'fiT m:-~' n mUCATION-ALL AREAS
~ mfBducational Level -----------------------------
fWrit;~~~T ~'li" ~ ~ i3'!iifti!\l ~ 1fT lI1!l'lT-tT;a ~c;i'tllT ITT STmur-q'ef
Non.Techr.ical diploma or Tcchnic:il dipluma or certi· ~~ arn: m arfWt; certificate not equal to degree ficate not equal to degree Graduate and above
--------- ----------2.~ ~t ~q' ~t 2:~ m-t arTl! ~~ Males Females Males Females Males Females Age grOUP
H 19 20 21 22 23
~ INDORE
128 32 2,359 101 41,991 19,066 9"IftarJ1i All ages
0-4
5 6
7
8 9
5-9
10-14
10 99 15 698 1,116 15-19
27 5 546 16 8,800 6,778 20-24
24 461 5 8,745 4,932 25-29
24 439 20 7,697 2,569 30-34
47 1.7 714 30 14,481 3,471 35-59
5 ,,, 100 15 1,541 185 60+
~f.IqR,
WBSTNIMAR
S 10 692 28 8,148 1,751 9"Ift 811'1" .. All ases
0-4
5 6
7
8 9
5-9
10-14 34 7 172 100 15-19
271 1,897 671 20-24 S 111 7 2,035 449 25-29
106 1,569 298 30-34 5 137 10 2,946 218 35-59
'" 33 5 124 10 60-1-
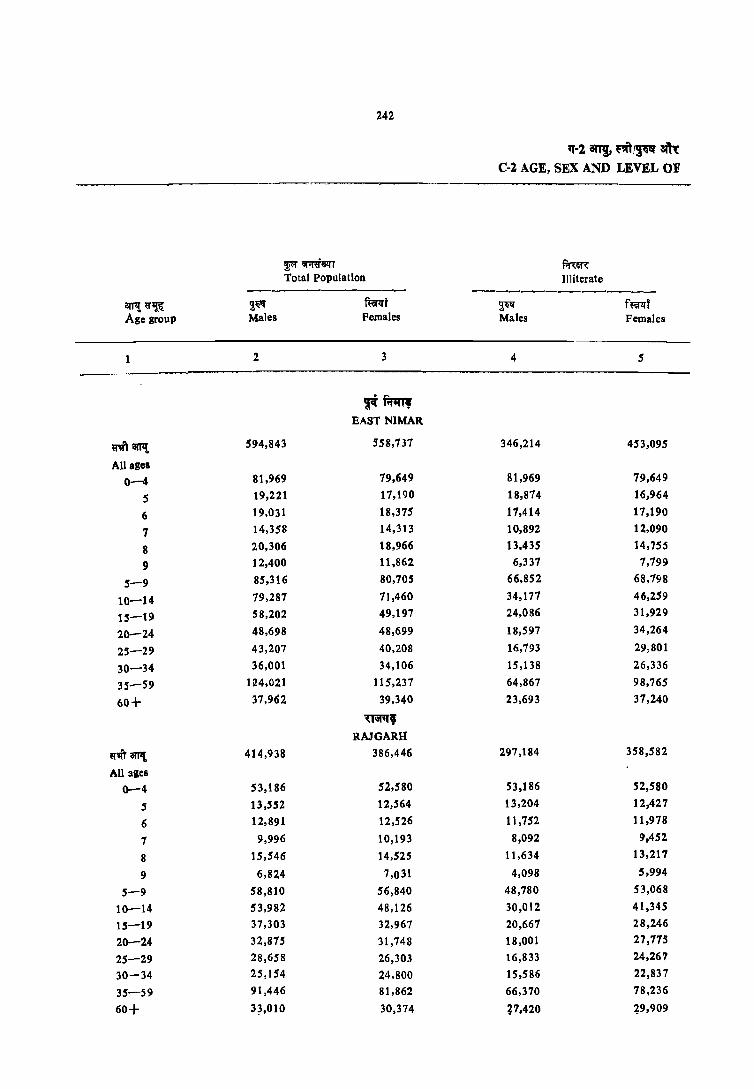
242
"-2 an~. "lf~~ am: C-2 AGE, SEX AND LEVEL OF
~~liIl'r f,r{~ Total population Illiterate ------------- -------------
i!l'P! ~~ 2;~ mt ~ f~f Age group Males Pemales Males Females
1 2 3 4 5
" f.t1n, EAST NIMAR
mftarrt 594,843 558,737 346,214 453,095
All ages
0-4 81,969 79,649 81,969 79,649
5 19,221 17,190 18,874 16,964
6 19,031 18,375 17,414 17,190
7 14,358 14,313 10,892 12,090
8 20,306 18,966 13,435 14,755
9 12,400 11,862 6,337 7,799
5-9 85,316 80,705 66,852 68,798
10-14 79,287 71,460 34,177 46,259
15-19 58,202 49,197 24,086 31,929
20-24 48,698 48,699 18,597 34,264
25-29 43,207 40,208 16,793 29,801
30-34 36,001 34,106 15,138 26,336
35-59 124,021 115,231 64,867 98,765
60+ 37,962 39,340 23,693 37,240 UiItf, RAJGARH
,,"maTP{, 414,938 386,446 291,184 358,582
All ages
0-4 53,186 5.z,s80 53,186 52,580
5 13,552 12,564 13,204 12,427
6 12,891 12,526 11,752 11,978
7 9,996 10,193 8,092 9,452
8 15,546 14,525 11,634 13,217
9 6,824 7,031 4,098 5,994
5-9 58,810 56,840 48,780 53,068
10-14 53,982 48,126 30,012 41,345
15-19 37,303 32,967 20,667 28,246
20-24 32,875 31,748 18,001 27,775
25-29 28,658 26,303 16,833 24,267
30-34 25,154 24,800 15,586 22,837
35-59 91,446 81,862 66,370 78,236
60+ 33,010 30,374 ~7.420 ~9,909
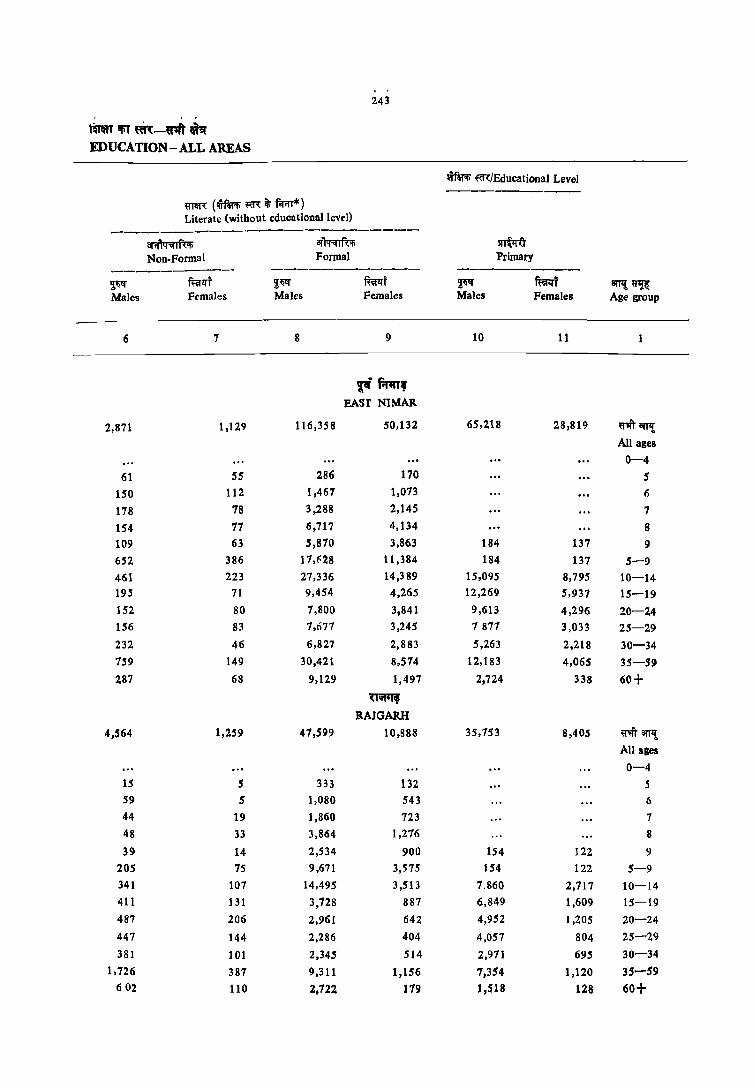
243
1m ItiT ~-wit IP EDUCATION - ALL AREAS
wftTol; mJEducational Level ---------
mn: (~A:A; m it; form*) Literate {without educationallevrl}
-------------------------ar;i\tr;nf~ Cf~ ~ Non-Formal Formal Primary
---------- ------------ ----------~~ fuirll'r ~~ mr ~ mY arTl! ij'~ Males Females Males Females Males Females Age group
6 7 8 9 10 11
'Ii f.f1n, EASr NIMAR
2,871 1,129 116,358 50,132 65,218 28,819 ij''Ift CfIl! All ages
0-4
61 55 286 170 5
150 112 1,467 1,073 6
178 78 3,288 2,145 7
154 77 6,717 4,134 8
109 63 5,870 3,863 184 137 9
652 386 17,~28 11 ,384 184 137 5-9
461 223 27,336 14,389 15,095 8,795 10-14 195 71 9,454 4,265 12,269 5,937 15-19
152 80 7,800 3,841 9,613 4,296 20-24 156 83 7,677 3,245 1871 3,033 25-29
232 46 6,827 2,883 5,263 2,218 30-34
159 149 30,421 8,514 12,183 4,065 35-59
287 68 9,129 1,497 2,724 338 60+
~~
RAJGARH
4,564 1,259 41,599 10,888 35,153 8,405 mft err!! All ages
0-4
15 5 333 132 5 59 5 1,080 543 6
44 19 1,860 723 7
48 33 3,864 1,276 8
39 14 2,534 900 154 122 9
205 75 9,671 3,575 154 122 5-9
341 107 14,495 3,513 1.860 2,717 10-14
411 131 3,728 887 6,849 1,609 15-19
487 206 2,961 642 4,952 1,205 20-24
447 144 2,286 404 4,051 804 25-29
381 101 2,345 5J4 2,971 695 30-34
1,726 387 9,311 1,156 7,354 1,120 35-59
602 110 2.722 179 1,518 128 60+
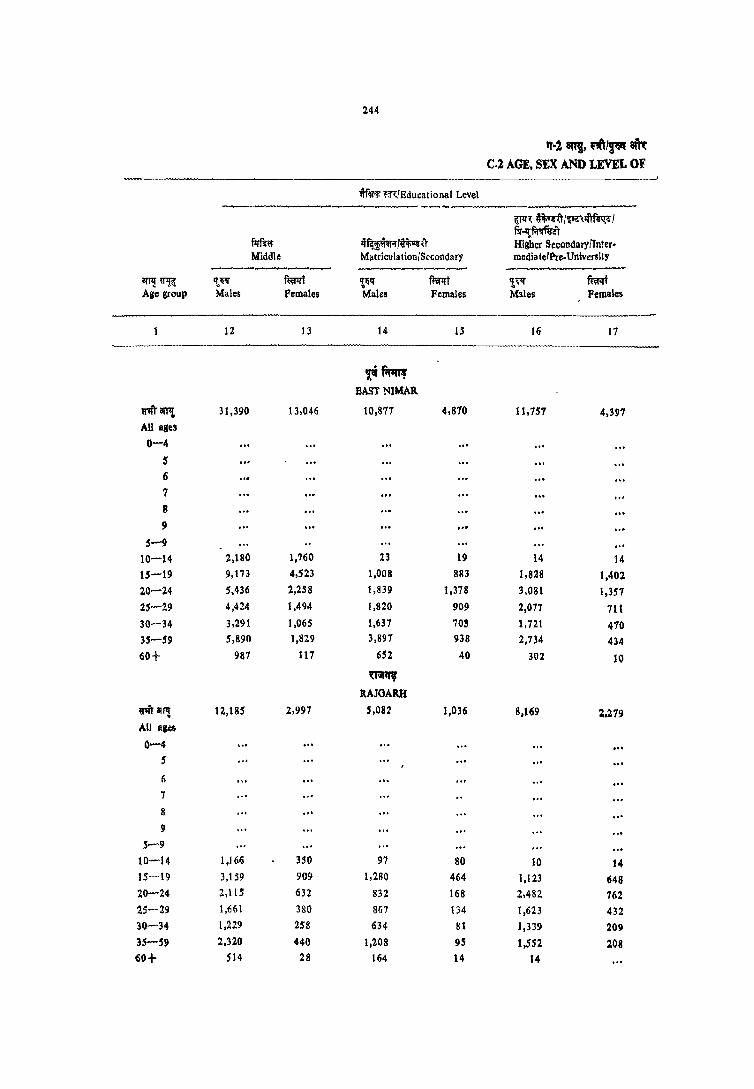
144
"-1 '"', ~'1"" 8t~ C.2 AGE. SEX AND LEVEL Of
lTf41ii' ~:!\JEducational Level
--------------~,~/V'n~1
qf'?~;r/~tft fir-l!:.~
firml Higher Secondary/Inter-Middle Matriculation/Secondary mediate/Pre.University -------- -------- --------
<IT!!! iJ'R 't,1i'lf f~f ~1i'lf fl'Qll"t lj;;;1!f mt Age group Males Females Males Females Males Females
12 13 14 1.5 16 17
~~ BASTNlMAR
U'lftq 31,390 13,046 10.877 4.810 11.7S7 4.397
All alles 0-4
S 6
7
8
9
5-9 10-14 2,180 1,760 23 19 14 ]4
15-19 9,173 4,523 1,008 883 1,828 1,402
20-24 5,436 2,258 1,839 1.378 3,081 1,357 25-29 4,424 1,494 1,820 909 2,077 711 30-34 3,291 1,065 1.637 705 1,721 470 35-59 5,890 1,829 3,897 938 2,734 434 60+ 981 111 652 40 302 10
~,
RAJGARH
",,1Ifl! 12,185 2,991 5,082 1,036 8.169 2.279 All ages
0-4
5
6
1
8
9
S-9 10-14 1,166 350 97 80 10 14 lS-19 3,159 909 1,280 464 1,123 648 20-24 2,115 632 832 168 2,482 762
25-29 1,<i6\ 380 867 134 1,623 432 30-34 1,229 258 634 81 ),339 209
3S-59 2.320 440 1,208 9S 1,552 208
60+ 514 28 164 14 14

24$
fmnlllTf!R-~~ EDUCATION~ALL AREAS
*tm; fiR/Educational Levd ------ -----mrl " i!ffiJI1if ~\-lI .. ;ft;J.1 mit iI1 amlfr.I (1'11;;i1-1;1
~1irll1l'J'Ql''fiI' ~)lrr Iff !llfPT 'l1f Non.fechnical diPlotna C"r Technical diploma or certi· ~~~6'it. certificate not equal 10 degree ficale nOI equal to degree Graduate and abo,'c
------ ------- ----------~ mr<rf ~ 1b"~1 !i'lf ffir'l'l 0!fl{~1l~ Males F:males Ma!es Females Males Females Age group
18 19 20 21 22 73
x'~" BAST NlMAR
10 II 1,332 11 8,816 3,161 1iil1~ All ages
0-4 S 41
1 &
9
S-9
10-14 {iii S 124- 183 15-19
S 4:14 9 1,142 1,215 20-24
5 23S 16 2,144 916 2S-29
239 1,651 385' 3(1--34
II 333 36 2,937 436 H-59
24 5 213 2$ 60+ mPtJ
RAIGARH
19 120 T 4,263 993 m~ All 3,es
(1--4
5 6
1
8
9
S-9
10-14 86 14 15-19
10 IS 1,020 m 20-24 5 51 828 238 1.5-29 , 24 690 lOS 30-34
2S 1,582 220 35-59
5 51 s 60+
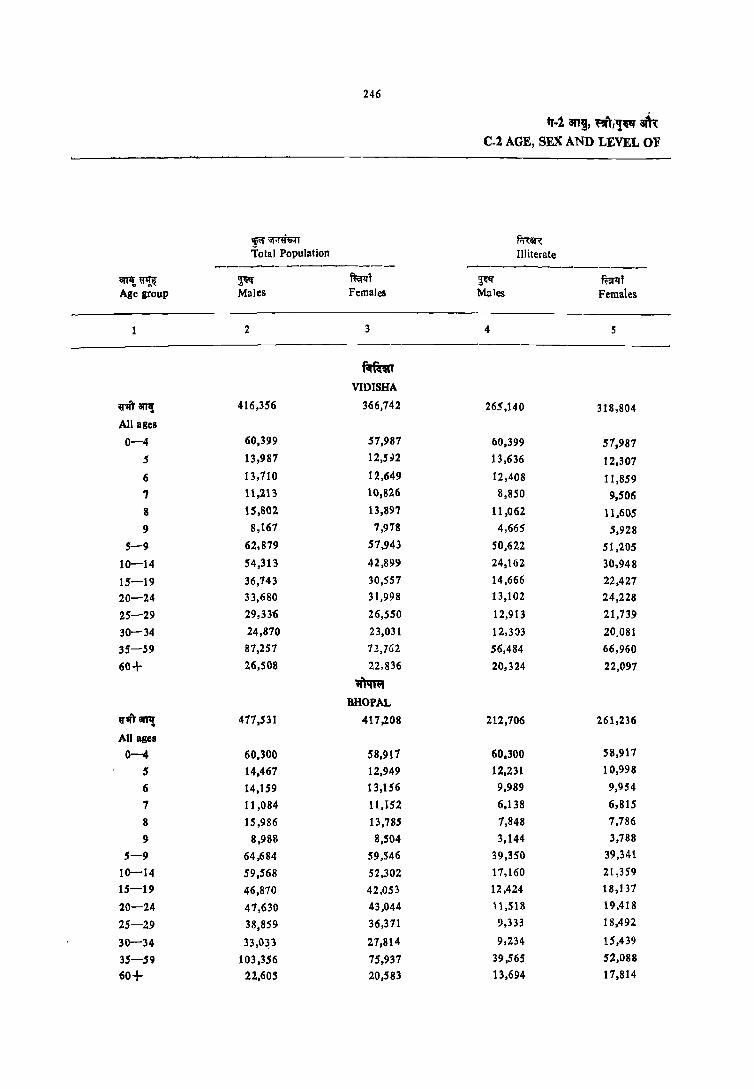
246
~~!fT Total Population
--------------arl1t ~ ~ fu;rlrl Age group Males Females
2 3
Mm VIDISHA
IJm arfl! 416,356 366,742
All ages
0-4 60,399 57,987
5 13,987 12,H2
6 13,710 12,649 ., 11,213 10,826
8 IS,802 13,897
9 8,167 7,978
5-9 62,879 57,943
10-14 54,313 42,899
15-19 36,743 30,557
20-24 33,680 31,998
25-29 29,33"6 26,550
30-34 24,870 23,031
35-59 87,257 12,762
60+ 26,508 22,836
1ITcnW BHOPAL
IJ'IrT 8I'Tl!: 417,531 417,208
AU ages
0-4 60,300 58,917
5 14,467 12,949
6 14,159 13,156
7 11,084 11,152
8 15,986 13,785
9 8,988 8,504
5-9 64,684 59,546
10-14 59,568 52,302 15-19 46,870 42,os3
20-24 47,630 43,044
25-29 38,859 36,371
30-34 33,O~3 27,814
35-59 103,356 75,937
60+ 22,605 20,583
tr-l an~, ~ji'~ ~ C-2 AGE, SEX AND LEVEL OF
fii\1I11: lIIiterale
------------~ R=erIl'T Males Females
4 5
265,140 318,804
60,399 51,987 13,636 12,307 12,408 11,859 8,850 9,506
11,062 11,605 4,665 5,928
50,622 51,205 24,162 30,948 14,666 22,427 13,102 24,228
12,913 21,739
12,3:13 20,081
56,484 66,960
20,324 22,097
212,106 261,236
60,300 58,917
12,231 10,998
9,989 9,954
6,138 6,815
7,848 1,786
3,144 3,788
39,350 39,341
11,160 21,359
12,424 18,131
11,518 19,418
9,333 18,492
9,234 15,439
39,565 52,088
13,694 17,814

241
fmn "" m-~m ~ EDUCATION-ALL AREAS
WftrI; ~a1:/Bducational Level ------------mm (~~ m it; r.r.rr*)
Literate (without educational level) --------------------------
ay;;~ i!I~.m,,,, ~ Non-Formal Formal Primary
----------- ----------~ mt ~ ffiil'lft ~ mf i!fTI!~ Males Females Males F!males Males Females Age group
6 7 8 9 10 11
Prfm VIDISHA
5,318 1,695 62,132 21,289 46,597 13,036 ~ an,!
All agel
0-4 9 350 276 5
35 1,261 790 6 25 30 2,338 1,290 7
30 10 4,710 2,282 8 20 15 3,342 1,907 140 129 9
110 64 12,008 6,545 140 129 5-f/ 256 129 18,633 7,012 10,081 3,825 10-14 311 211 5,t51 2,117 9,154 2,685 15-19 440 211 4,276 1,429 7,341 2,192 20-24 591 173 3,671 1,201 5,560 1.311 25-29 538 162 3,712 792 3,924 959 30-34
2,256 571 11,871 1,801 8,767 1,755 35-59 736 175 2,734 318 1,585 157 60+
~ BHOPAL
7,893 4,744 65,949 43,461 55,214 34,021 rnilW! All ages
0-4 75 55 2,161 1.896 5 45 40 4,125 3,162 6 30 25 4,916 4,311 7
72 50 8,066 5,949 8 15 15 5,362 4,243 466 458 9
236 186 24,632 19,562 466 458 5-9
256 305 19,161 12,649 17,927 13,451 10-14
751 624 3,969 2,063 9,443 5,175 15-19
1.032 668 3,009 1,555 6,725 4,000 20-24
919 640 2,359 1,500 4,684 3,119 25-29
644 456 1,985 1,319 3,545 2,305 30-34
3,076 1,455 8,210 3,611 10,739 4,671 35-59
863 366 1,7Q8 90S 1,710 1116 60+

248
q--2 arT!, ~/,~ am C.l AGE, SEX AND LEVEL OF
w~ m/Educational Level ----------------------------------
~ ~/N<r4r<l1t<'1
li~~'~ flJ -If, fifc!fue"t
fi:rfst;r Higber Secondary/Inter. Middle Matriculation/Secondary mediate/Pre· University
--------- ------_"- ---------arF! IJ~ ~ fum ~ ~lI"f ~ fuRf Age group Males Females Males Females Males Females
12 13 14 15 16 17
Mm VIDISHA
~arJ1{, 13,954 4,785 5,803 1,764 10,359 3;562
All alcs 0-4
5 6
7
8
9
5-9
10-14 1,046 112 119 184 9 28
15-19 3,762 1,236 1,664 655 1,861 1,072
20-24 2,546 911 1,144 324 3,009 1,003
25-29 2,033 710 980 218 2,081 696
30-34 1,169 342 497 107 1,527 369
35-59 2,771 807 1,149 270 1,740 376
60+ 613 67 241 5 117 18
~ BHOPAL
U'itarJ1{, 34,881 20,482 22,6S6 12.680 38,162 22,989
All ages
0-4
5 ... 6
7 ."
8
9 5-9
10-14 3,966 3,814 434 552 64 173
15--19 8,561 4,946 4,513 3,307 6,546 6,769
20-24 5,848 3,243 3,264 2,126 9,075 5.933
25-29 4,177 2,624 2,788 1.643 6.648 4,122
30-34 3,216 1,779 2,313 1.483 5,831 2,468
35-59 1,918 3,722 7,184 3,366 9,180 3,435
60+ 1,179 344 1,573 194 79$ 8$

249
ftmT 'liT ~-w;ft '"' EDUCATION-ALL AREAS
~ m/Bducational Level -----------------------------------fm' it; 8AI'Ifr-I' ~-<Ai't'T-!>'t fhlit;amm;r~ ~lfr~.qQ ~l!T lI1'I'J1II'-'RI'
Non-Technical diploma or Technical diploma or certi- ~Ifi~m~ certificate not equal to degree ficate not equal to dellee Graduate and above ----------- --------
7.~ mrlfT ~1!f ~t 2;~ mt arJI!~ Males Females Males Female. Malea Females A,e grOUP
III 19 20 21 22 23 1
flrfnrr VIDISHA
23 29 432 5 6,598 1,773 ""art"! All BICI ... 0-4
_ .. . .. , (j
7
8
9 5-9
lo-t4 5 9 24 139 146 1S-19
153 1,670 698 20-24 8 10 81 1,417 492 25-29
5 38 5 1,163 209 30-34 5 5 126 2,081 215 35-" 5 10 92 60+
1INTw BHOPAL
197 201 6,830 366 32,944 17.028 ~iII'I1 All alOl
... ... 0-4
... ... S ... (;
... . .. 7 ... 8 9 ... 5-9
10-14 10 20 82 53 564 961 15-19 10 21 918 R6 6,231 5,994 20-24 S 3S 915 55 6,970 4;141 25-29 5 20 886 78 5,372 2,467 30-34
102 84 3,953 94 12,823 3,409 35-59 bS ~C) (is .. - 9H ~5 60+

250
~~T Total Population
-----------CIIT'! lf~ 2.~ ~t Age group Males Females
2 3
~ SEHORE
~an,! 344,667 312,714 All ages 0-4 47,251 45,293
5 11 ,193 10,390
6 11,230 10,134 7 8,609 8,400
8 12,871 11,636
9 6,181 6,147
5-9 50,089 46,707
10-14 47,138 39,568
15-19 32,480 27,211
20-24 28,026 25,961
25-29 23,039 21,755
30-34 19,716 18,463
35-59 70,497 63,249
60+ 26,079 24,229
~ RAISEN
9''Ift' Gfl'I! 372,459 338,083
"'II ages
0-4 54,419 53,684
5 11,895 11,368 6· 12,173 11,802 7· 10,456 9,972
8 13,82.5 12,653
9 7,187 7,261
5-9 55,547 53,056 10-14 48,045 41,953
15-19 33,676 29,102
20-24 30,144 28,673
25-29 25,800 23,941
30-34 21,668 20,208
35-59 78,465 66,206
~Q+ ~4,~7l ~0,449
IT-2. an~ ~/~~ ail't C-2 AGE, SEX AND LEVEL OF
man: Illiterate ------.-------
~~ f~' Males Female.
4 5
222,223 282,136
47,251 45,293
10,865 10,230
10,349 9,514
1,046 7,621
9,370 10,244
3,351 4,925
40,981 42,593
20,4211 31,703
13,426 21,994
12,162 21,789
10,333 18,774
10,085 16,444
46,441 59,482
20,922 23,824
247,853 299,163
54,419 53,684
11,707 11,234
11,423 11,322
8,760 8,888
10,114 10,948
4.030 5,633
46,094 48,025
21,722 30,930
14,630 22,833
13,097 23,280
11,941 20,171
11,685 11,735
54,528 62,293
~9,551 ~O,OS4

251
t~~ .. , ~-,"", ~ EDUCATION - ALL AREAS
IITfWIi ~IEducational Level -----------
«~ (m~ m ~ fii;rr·) Literate (without educationallevr1)
-------------------------ar~ ~ ~ Non-Formal Formal Primary
---------_.- -------------~'ilil" ffiilfT ~~ ffirlff ~ ffiilft arPi ~~ Males - Females Males Females Males Females Agr group
6 7 8 9 10 11
~ SBHORE
4,,88 1,352 50,188 13,357 37,921 8,514 rnarJl! All ages
... 0-4 29 9 299 151 5 33 28 848 532 6 29 14 1,534 765 7 44 33 3.463 1,360 8 30 14 2.740 1,141 79 66 9
145 99 8,884 3,949 79 66 5-9 255 219 11,462 4,584 8,236 2,541 10-14 316 160 4.218 1,249 8,130 1,833 15-J9 504 131 3,117 857 5,654 1,298 20-24 471 152 2,626 105 4,257 860 25-29 417 158 2,223 540 3,322 664 30-34
1.839 360 9,137 1,254 6,810 J,124 35-59 621 61 2,458 2ll 1,393 103 60+
~
RAISEN 4,255 1,186 50,705 19,238 38,961 11,807 ,,~~
AJ. ageB
0-4 15 5 172 129 5 35 16 716 465 6 25 26 1,681 1,059 7 60 36 3,591 1,669 8 25 10 3,063 J .511 70 46 9
UO 93 9,222 4,fS92 70 46 5-9 231 134 16,229 6,826 8,833 3,614 10-14 345 135 4,116 2,131 8,038 2,620 15-19 383 153 3,405 1,600 6,297 1,918 20-24 384 165 3,125 1,041 4,506 1,446 25-29 405 92 2,685 852 3,086 812 30-34
1,767 326 9,490 1,668 6,687 1,182 35":""59 . 508 72 2,383 189 1,377 98 60+

, Z5Z
'1'·1 "'I, """'P ~ C-2 AGE, SEX AND LEVEL OF
Wft ~IEducatiollal Level ---------_
~nn:~/~~~1
f1rmr 1W:~'ftq"{T fSr"i~ Higher Secondary lInter-
Middle Matricula tion/Secondary mediate!Pre.University ---------- ---------lIlT'! ~~ ttl" ~f '!~ ~
'iq
" mi
Ale group Males Females Males Females M!lles Females
1 12 13 14 15 16 17
-SBHORB
8''''' arlit 13,040 3,133 5,119 1,023 1.722 2.340
.Mal" 0--4 ... ."
5 ... ." 6 .. ' ." 7 ." 8 .. , .. , 9' .. , .. ,
5-9
10-14 691 459 62 33 5 23
15-19 3,838 918 1,333 346 1.171 642
20-24 2,473 572 1,091 250 2,102 709
2'-29 2,120 412 811 122 1,571 480 30-34 1,301 290 523 112 1,235 180 35-59 2,174 462 1,126 157 1,594 296 60+ 432 21 173 J 28 5
~ &AlSEN
~iWf. 13,095 3,103 5,881 1,034 8,400 2,020
All ages
0-4 ."
5
6
7 8
9
5-9 10-14 977 401 43 36 10 5 lS-U 4,059 981 1,543 382 911 584 20-24 2,576 594 1,322 252 2,391 624
25-29 2,084 434 1,089 128 ],932 395
30-34 1,168 338 607 106 1,421 203
3S-S9 1,972 323 1,152 119 1,669 208
60+ 238 26 131 10 40

• • 't
253
rat lilt ~-W1ft ~ EDUCATION-AU AREAS
tim; ~Edueational Level -----------------------------.-----fQl it; arnr.r "~-tflIi~r fhr' it; iIRI1!'r.r ~ ~ 1fT lPI1"I" W fI'qr)1rr Iff SI1fTUf ~
Non- Te«:hnical diploma (Or Tc«:hni«:al diploma or «:crti· ~ ar'R m arffi certificate not equal to degree flcate not equal to degree Graduate and above --------- ------------ ------------~ ffillI"t ~ ftall"f ~ ffirlfr atp{ ij"'~ Males F:males Males Females Males Females Age group
18 19 20 21 22 :13
~ SBHORB
15 211 4 3,640 SS5 ~'" arT,! All ages
0-4 5 6
1
8 9
5-9 10-14
9 39 71 15-19 64 859 349 20-24
5 29 809 250 25-29 5 49 556 76 30-34 5 49 4 1,321 110 35-59
10 42 60+
~ llA~SBN
15 12 173 3 3,112 514 ~ar~ All 8ICS
0-4 5 6 1
8 9
·5-9 10-14
15 11 30 15-19 36 638 191 20-24
5 14 724 150 25-29 5 49 563 65 30-34
10 5 49 3 1,141 78 35-59 , 9 29 60+
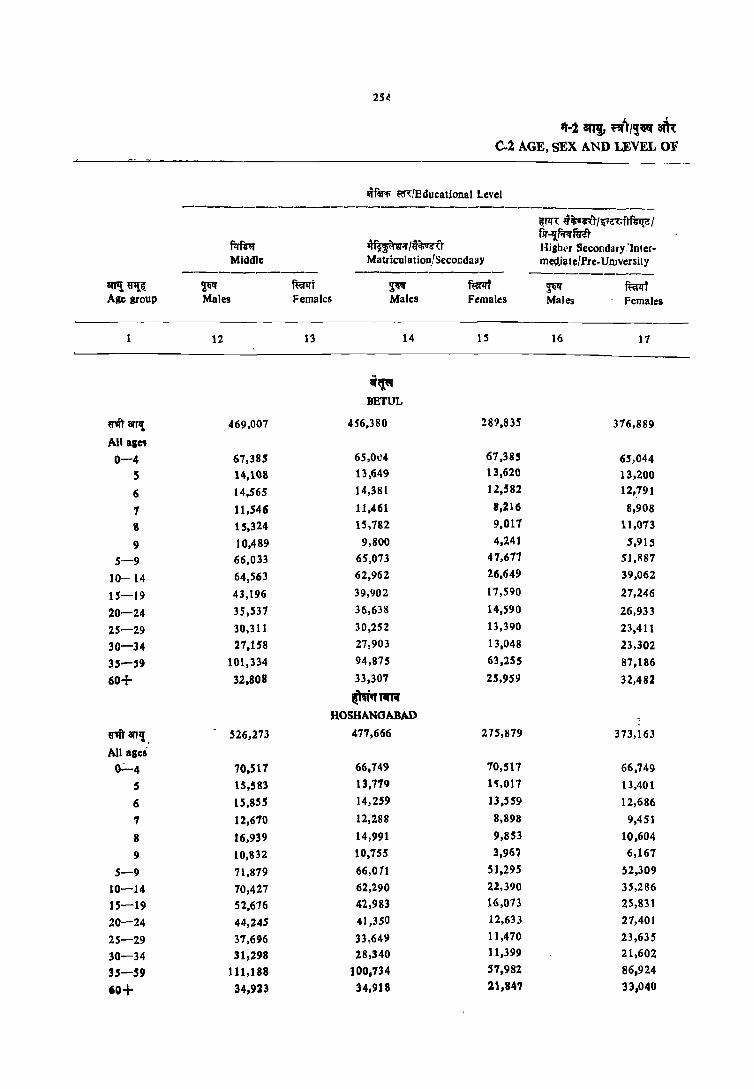
1
~arr'!. All age.
0-4 S
6
1 8
9 5-9
10-14
IS-19
20-24
25-29
30-34
35-59
60+
81ft' anI{
All asei 0":"'4
S
6
7
8 9
5-9
10-14
15-19
20-24
25-29
30-34
H-S9 60+
q·2 811!J, "1/,~ ~ C.2 AGE, SEX AND LEVEL OF
~flH'li Rf\/Educational Level
-------------------------------------
Mr.t Middle
~ Males
12
469,007
67,385 14,108
14,565
11,546
15,324
10,489 66,033
64,563
43,196
35,537
30,311
27,158
101,334
32,808
526,273
70,517
15,583
IS,8SS
12,670
16,939
10,832
71,819
70,427 52,676
44,245
37,696 31,298
111,188 34,923
llfWm::r/ij-~r Matriculation_lSecondaay
~j
Females ~ Males
13
i({" BETUL
456,380
65,01)4
13,649
14,381
11,461
15,182
9,800 65,073
62,962
39,902
36,638
30,252
27,903
94,87S
33,307
14
~RR HOSHANGABAD
477,666
66,749
13,779
14,259
12,288
14,991
10,755
66,011
62,290
42,983
41,350
33,64\1 28,340
100,734
34,918
~ Females
IS
289,835
67,385 13,620
12,582
8,216
9,017
4,241 47,677
26,649
17,590
14,590
13,390
13,048
63,255
25,959
275,879
70,517
1'1,017
13,559
8,898
9,853
3,967
5 J,295
22,390 16,073
12,633
11,470 11,399
51,982
21,847
~Ill'~ 4'it;v~Tlvrr.flmti!"/ fll'-I{f.RRm' High('r Secondary:lnterm~)ateIPre.Uruversity
~ ffirlrl Males Females
16 17
376,889
65,044 13,200 12,.191
8,908
11,073
5,915 51,887
39,062
27,246
26,933
23,411
23,302
87,186
32,482
373,163
66,749
13,401
12,686
9,451
10,604 6,161
52,309
35,286 25,831
27,40J
23,635 21,602
86,924
33,040

2H
fn-r IIir m -m " EDUCATION-ALL AREAS
~~ m/Educational Level ----------mm: (~~ m it; Won.) Literate (without educational level)
---------------------------ar.r~~ aAq"il"lfu; ~ Non-Formal Formal Primary
---------- -_--- ---------~ mf ~ fi:w11f ~ mf iIlT1i Q1{~ Males Females Mdles Fmtales Males Females Age group
6 7 8- 9 10 11
.. -il\iil'
BETUL
2,767 1,022 82,243 39,362 49,041 23,470 marl'll All asea
0-4
20 35 468 414 5
34 25 1,949 1,565 6
15 30 3,315 2,523 7
20 20 6,281 4,689 8
35 30 6,086 3,744 128 111 9
124 140 18,104 12,935 128 111 5-9
233 136 21,719 13,245 14,207 9,098 10-14
168 116 5,804 3,076 9,508 5,063 15-19
384 97 4,897 2,253 6,511 3,417 20-24
325 61 3,916 1,1)92 5,061 2,369 25-29
194 90 3,872 1,551 3,915 1,398 30-34
1,017 282 19,202 3,767 8,349 1,858 35-59
283 95 4,608 482 1,215 141 60+
~1ITm HOSHANGABAD
3,898 1,885 103,490 50,550 65,946 21,183 ij''Ifi arT!! All ales
0-4
53 31 512 341 5
82 51 2,214 1,522 6
41 40 3,731 2,797 7
44 38 7,042 4,350 8
25 21 6,712 4,448 121 119 9
245 186 20,212 13,457 127 119 _5-9
166 154 21,841 15,648 17,534 9,531 10-14
212 251 7,688 4,330 14,239 5,680 15-19
547 199 5,637 3,534 10,041 4,281 20-24
500 211 5,041 2,972 1,042 2,715 25-:-29
391 203 4,567 2,482 4,651 1,804 30-34
1,398 495 24,295 6,840 9,895 3,235 35-59
398 lSS 8,081 1,195 2,332 319 60+
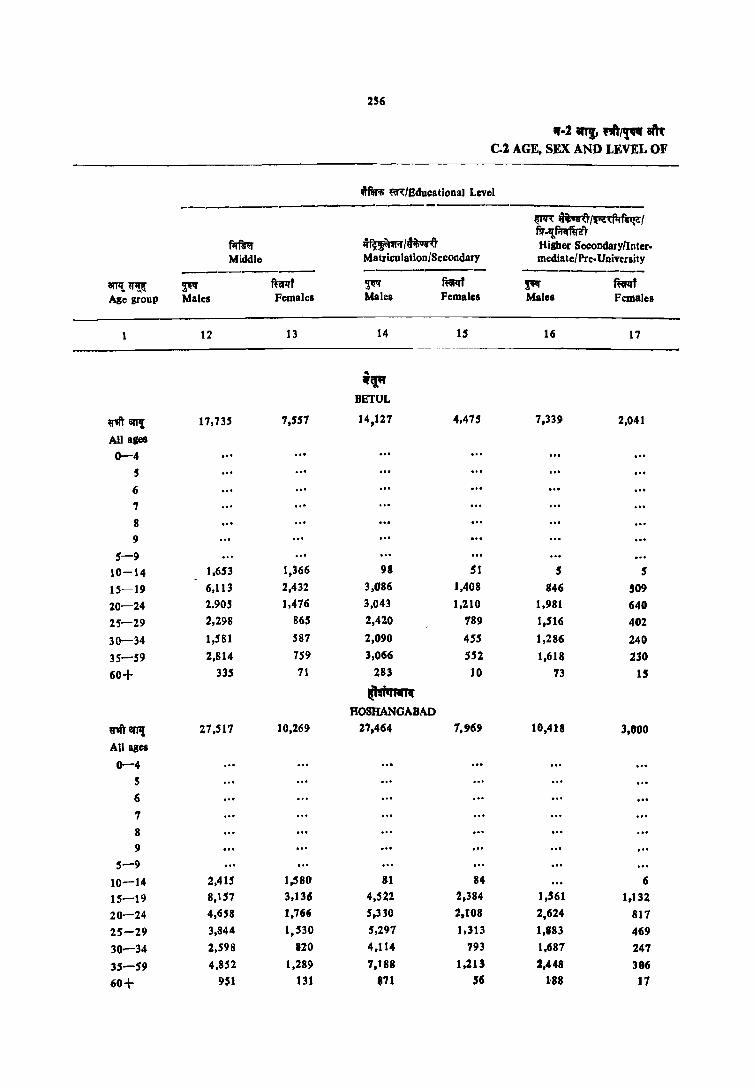
256
,,·2 Iff!, .ttl'!" lilt C.2 AGE, SEX AND LEVEL OF
~ mfEducational Level _---- -----------
~ ~/';:a(fiff.l.(ef
~/~ fir.'l~
fiI1Tor Higher SecondaryfInler. Middle Matriculation/Secondary mediate/ Pre-University
-------- ------_ .. _ IfTl! ~ ~ fflRt ~ ftnf ~ ffiRt Age group Males Females Males Females Males Females
12 13 14 15 16 17
• • p BETUL
U1ft'arJI! 17,735 1,557 14,127 4,475 7,339 2,041
Alla&e& 0-4
5 6 7
8
9
5-9 10-14 1,653 1,366 98 $1 .5 .5
15-19 6,113 2,432 3,086 1,408 846 509
20-24 2,905 1,476 3,043 1,210 1,981 640
2S-29 2,298 865 2,420 189 1,516 402
30-34 1,581 587 2,090 455 1,286 240
35-59 2,814 759 3,066 552 1,618 230
60+ 335 71 283 10 73 15
~ftrTt HOSHANGABAD
"" 81'Pl 27,517 10,269 27,464 7,969 19,418 3,000
All ages
0-4
5 6
7
8 9 , ..
5-9
10-14 2,415 1,580 II 84 6
15-19 8,157 3,136 4,522 2,384 1,561 1~132
20-24 4,658 1,766 5,330 2,r08 2,624 817
lS-29 3,844 1,530 5,297 1,313 1,183 469
30-34 2,598 120 4.114 793 1,687 247
35-59 4,852 1,289 7,t88 1,213 2,448 306
60+ 951 131 811 56 U8 17

257
men 1fT ftI''( -,"" ",.
EDUCATION-ALL AREAS
tiTfm; ~fEducational Level ----------------
fflrlit;~~~~ fflr)it;~d~ ~ 1fT lI1II'lT..!jill' ntm'IT !ir SIlrTUJ'..qilJ Non. Technical diploma or Technical diploma or certi- r.mfiIi am: wt arftR; cenficate not equal to degree ficale Ilot equal to degree Graduate and above ------
't~ Rilflft ~ f~lft ~ mt amr.~ Males Females Males Females Males Females Age grou}
18 19 20 21 22 23 1
it" BBTUL
10 11 745 16 5.159 1,537 ""ifill All ages
0-4 ", 5
'" 6
7
8 , .. 9
5-, 10-14
5 20 57 52 15-19 11 186 11 972 591 20-24
S 195 1,186 364 :25-29 124 S 1,049 210 30-34 194 1,821 240 35-59
15 38 10 60+
~1'IR HOSHANGABAD
21 1,290 30 10,344 3,016 wit.." AIIalU '0-4
." 5 ,., 6
,.' 7 8 .. , ... g
5-9 10-14
5 34 184 238 15-19 11 369 6 2,395 1,238 20-24 S 193 14 2,421 125 25-29 6 181 11 1,104 377 30-34
467 3,395 432 35-59 ,., tt 41 .. , 213 6 60+
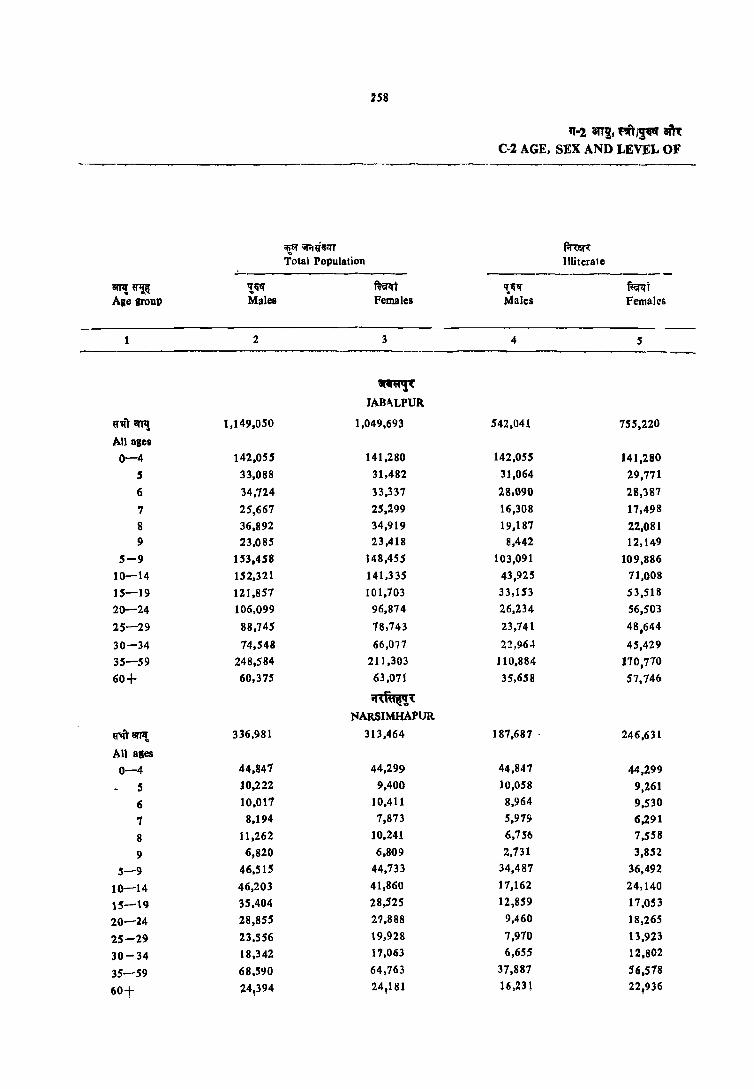
H8
~~~eltT Total Population -- -----
8m!~ ,!lil!f mm Age group Males Females
2 3
~'(
JAB'&'LPUR
~'i(r 8Il'!, 1,149,050 1,049,693
All agea
0-4 142,055 141,280
5 33,088 31,482
6 34,724 33,337
7 25,667 25,299
8 36,892 34,919
9 23.085 23,418
5-9 153,458 148,455
10-14 152,321 141,335
15-19 121,857 101,703
20-24 106,099 96,874
25-29 88,745 78,743
30-34 74,548 66,077
35-59 248,584 211,303
60+ 60,375 63,071
~'{ NARSIMHAPUR
~arTIt 336,981 313,464
All aleS
0-4 44,847 44,299
S 10,222 9,400
6 10,017 10,411
7 8,194 7,873
8 11,262 10,241
9 6,820 6,809
5-9 46,515 44,733
10-14 46,203 41,860
15-19 35,404 28,525
20-24 28,855 27,888
25-29 23.556 19,928
30-34 18,342 17.063
35--59 68.590 64,763
60+ 24,394 24,181
'1-2 ang, ~ ~ ai\'t C-2 AGE, SEX AND LEVEL OF
f.r~ Illiterate
--------------If'ljl!f mi Males Females
4 5
542,041 755,220
142,055 141,280 31,064 29,771
28,090 28,387
16,308 17,498
19,187 22,081 8,442 12,149
103,091 109,886 43,925 71,008
33,153 53,518 26,234 56,503
23,141 48,644
22,96.1 45,429 110,884 110,710 35,658 57,746
187,687 . 246,631
44,841 44,299 10,058 9,261 8,964 9,530 5,97!f 6,291 6,756 7,558 2,131 3,852
34,487 36,492 11,162 24,140 12,859 17.os3
9,460 18,265
7,970 13,923 6,655 12,802
37,887 56,518 16,23l 22,936

259
f~m ~ ~-trfl'T ~:.t EDUCATION-ALL AREAS
l11feri{i ~/Educational Level -----------------
man: (wferi{i l;;;n: if; f.I'fT*) literate (without educational leve 1)
-------------------------ar'l'N'ifTfui ar~i{i ~T Non-Formal Formal Primary
----------- ------------ -----------~ fur:l"i Till ffiF:rr ~~ ffif<rr arTl! ~ Males Females Males Females Males Fameles Age group
6 7 8 9 10 11
~~~ .. JABALPUR
1,106 3,185 2.12,1l6 113.517 150,468 79,421 ij""1"T arr~ All ages
0-4 169 71 1,855 1,639 5 298 156 6,337 4,795 6 209 105 9,150 7,696 ." , 253 115 11,453 12,723 8 154 90 14,001 10,679 489 501 9
1,082 537 48,795 37,532 489 501 5-9
821 448 56,278 33,501 43,600 29,282 10--14
587 440 14,886 8,236 28,321 14,336 15-19
496 283 11.617 6,325 19,750 10,784 20-24
566 198 9,623 5,190 15,628 8,224 25-29
553 174 9,280 4,749 10,801 5,451 30-34 2,389 700 49,023 15,124 26,896 9,481 35-59
626 329 12,329 2,666 4,875 1,283 60+
.m~tR .",
NARSIMHAP UR
2,751 1,045 60,794 30,134 42,234 21,812 ij"m aTTl!,
All ages
0-4 55 10 109 129 5 55 30 998 851 6 56 15 2,159 1,566 7
61 35 4,445 2,649 8 66 55 3,944 2,822 80 79 9
294 145 11,654 f,017 80 79 5--9
285 156 15,988 9,190 11,104 7,152 10-14 254 130 4,356 2,569 8,265 4,586 15-19 313 129 3,259 2,206 6,651 3,845 20-24 245 89 2,642 1,469 4,711 2,363 25-29 219 60 2,498 1,510 3,051 1,393 30-34 856 231 14,978 4,309 6,691 2,146 35-59 269 95 5,379 824 1.649 229 60+

260
.,.28ft!, ""/pi aft..: C-2 AGE, SEX AND LEVEL OF
WRf;t; ~/Educalional Level
~::;~~\iWi1f6t{a/ flI1T.r lif~~/~ Higher Secondary/lnter-Middle Matriculation/Secor.dary mediate/Pre-University -----------
3JT1! ~ ~ fuitlft ~ mt ~ mt Age group Males Females Males Females Males Females
12 13 14 15 16 17
~'(
JABALPUR
~CII'!t! 81,248 38,547 76,906 2.9,701 34,49S 13,2,29
All as-&-4
5
6
1 8 ."
9 5-9
10-14 7,222 6,625 399 425 76 46
15-19 2.4,900 11,668 13,318 8,086 6,102 4,531
20-24 13,520 6,169 1 5,099 6,762 10.686 3,198 25-29 11,261 4,537 13,132 5,469 5,312 2,201 30-34 7,455 3,015 10,634 3,434 4,481 1,255 35-59 15,065 5,919 21,204 5,178 7,039 1,354 60+ 1,768 588 3,037 326 742 38
~-.: fO
NAaSIMHAPUB.
riillffl! 18,S94 7,049 14,892 4,265 4,661 1,)73 All agel
0-4 ... 5 6
7
8
9
5-9 10-14 1,576 1,159 88 64
15-19 S,893 2,395 2,888 1,298 827 435 20-24 3,274 1,299 3,404 1.193 1,396 395 25-29 2,698 857 3,137 723 839 240 30-34 1,81Z 446 2,203 548 709 119 35-59 :a,908 824 2.840 405 820 85 60+ 413 64 306 33 69
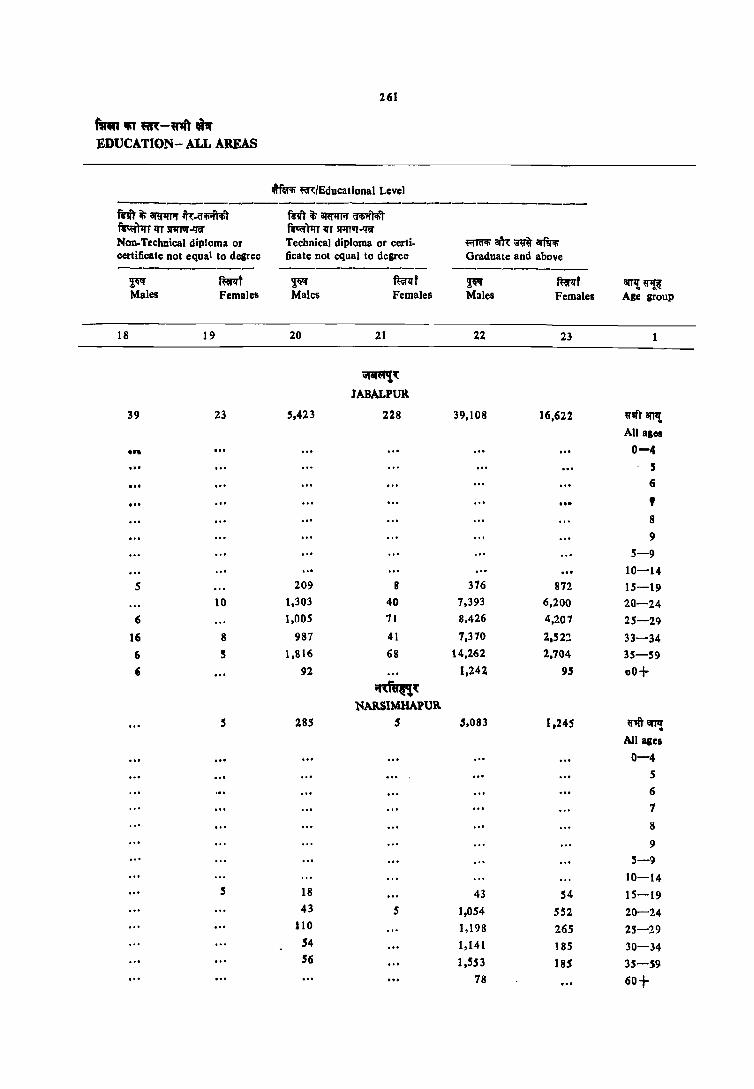
261
mWillfiTfiR-~p EDUCATION-ALL AREAS
ffm; m/Educational Level -------------------------------------mrr t CIRAA ~-6'~) fA) it; amm;r ti'1fiir);;l ~T 1fT SI1TJ1IT 4 fttor"tlrr 1fT lI1fTvr~ Non-Technical diploma or Technical diploma or certi- ~ am: m arfirl!i certificate not equal to degree ficate nol equal to degrec Graduate and abovc ----------- ------------ -----------~ ~t ~ ~qt ~ ~1Tf am{ ij1{~ Males Females Males Females Males Females Age group
18 19 20 21 22 23 1
~,
JABALPUll
39 23 ',423 228 39,108 16,622 ~T'lT) iIfTIt All ales
0" 0-4 5 ... (;
... ... f
8 9
5-9 10-14
5 209 8 376 872 15-19 10 1,303 40 7,393 6,200 20-24
6 l,OOS 71 8,426 4,207 25-29 Ifi 8 987 41 7,370 2,52~ 33-34 6 5 1,816 68 14,262 2.704 35-59 , 92 1,242 95 00+
~,
NAllSIMHAPUll 5 285 5 5,083 1,245 Q''Ift' arTl!
All ages
0-4 5 6 7
8
9
5-9 10-14
5 18 43 54 15-19 43 5 1,054 552 20-24
110 1,198 265 25-29 54 1,141 18S 30-34 56 1,553 185 35-S9
18 60t
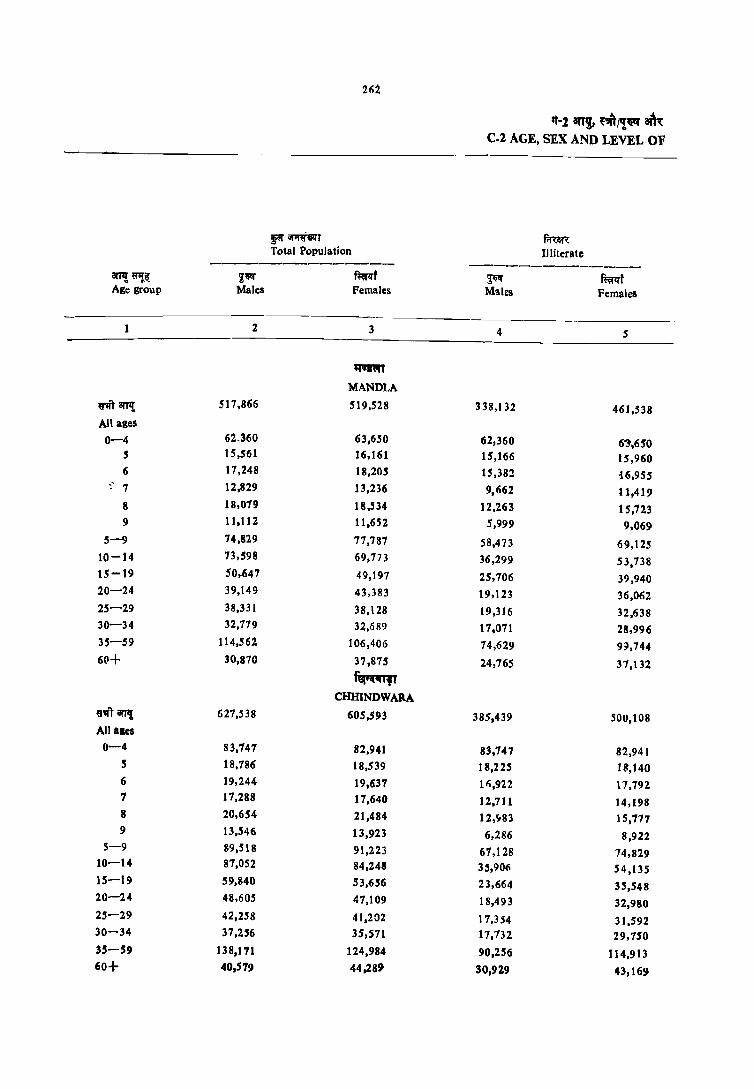
P ;;rotill'T Total Population
---------------arIl! ~I!: ~~ f~r Age group Males Females
2 3
qvnn
MANDLA
"1 arIl! 517,866 519,528
All ages
0-4 62.360 63,650 5 15,561 16,161
6 17,248 18,205 .. ' 7 12,829 13,236
8 18,079 18,534
9 11,112 11,652
5-9 74,829 77,787
10-14 73,598 69,773
15-19 50.647 49,197 20-24 39,149 43,383 25-29 38,331 38,128 30-34 32,779 32,689 35-59 114,562 106,406
6(1+ 30,870 37,875
~,
CHHINDWARA
~"rl ant{ 627,538 605,593 All ales 0-4 83,747 82,941
5 18,786 18,539 6 J9,244 19,637 7 J 7,288 17,640 8 20,654 21,484 9 13,546 13,923
5-9 89,518 91,223 10-14 87,052 84,248 15--19 59,840 53,656 20-24 48,605 47,109 25-29 42,258 41,2:12 30-34 37,256 35,571 35-59 138,111 124,984 60+ 40.579 44.28!J
"'-2 an!, ~/'~ atl~ C.2 AGE, SEX AND LEVEL OF
f,mrI: Illiterate
---------_ .. _---~ ~t Mal:l Females
4 5
338,132 461,538
62,360 6~.6S0 15,166 15,960 15,382 i6,955 9,662 11,419
12,263 15,723 5,999 9,069
58,473 69,125 36,299 53,738 25,706 39,940 19,123 36,062 19,316 32,638 17,071 28,996
74,629 9~,744
24,765 37,132
385.439 500,108
83,747 82,94 t 18,225 1If,140
1",922 17,792
12,711 14,198 12,~83 15,777 6,286 8,922
67,128 74,829 35,906 54,135 23,664 35,548 18,493 32,980 17,354 31,592 17,732 29,750
90,256 114,913
30.929 43,169

263
fR1~~-~i1r EDUCATlON--ALL AREAS
~ m/Bducational Level -------------
~rm: (.-rNr<li ~,~ ifi ftr.:rr*) Literate (without education level)
-----------------------8l'I~m'li 1IT"'r'if~ ~~T Non-Formal Formal Primary -------- --------- ----------
F' ffirq-j ~ mt ~ ffil'q-j 8fT!! ~ Males Females Males Females Males Females Age group
6 7 8 9 10 11
~
MANDLA
3,688 1,001 82,083 27,767 51,711 17,201 "'Ii')- IITl'l! All agel
0-4
59 33 336 168 S 78 61 1,787 1,189 6
128 61 3,039 1,156 1 141 56 5,675 2,755 8
49 52 4,897 2,444 168 88 9 455 262 15,735 8,311 168 88 5-9 474 ] 26 20,9~2 8,623 14,306 6,369 10-14 415 144 5,643 2,110 10,018 3,466 15-19
309 85 4,562 1,612 6,833 2,551 20-24 324 47 4,768 1,559 6,512 2,026 25-29 294 71 4,680 1,319 4,801 1,151 30-34
1,160 201 21,385 3,631 7,988 1,421 35-59
]98 56 4,179 532 1,025 106 60+ ~,
CHHINDWARA
3,743 I,H5 108,263 51,903 62,929 28,693 ~ilflll All ages
0-4
53 34 501 365 5 145 88 2,171 1,158 6 102 98 4,475 3,344 7 lSI 88 7,520 5,618 8
83 48 7,034 4,778 144 175 9 533 356 21,114 15,863 144 175 5-9 418 202 30,857 17,791 11,618 10,139 10-14 201 167 8,817 4,568 13,355 6,784 15-19 290 94 6,130 3,602 9.536 4,597 20-24 317 96 5,350 2,811 6,864 2,968 25-29 383 102 4,811 2,100 4,927 1,671 30-34
1,249 235 23,834 5,385 8,901 2,130 35-59 297 64 6,671 744 1,539 193 60+

;§4
'1-2 1fT!, ~/~ am C.2 AGE. SEX AND LEVEL OF
lt~ ~\/Educational Level ---------------~mi~/~~/
flrlr.r ~R:~/~ fir~f.rcrfirtt Higher SecondarY/Inter.
Middle Matriculation/Secondary mediate'Pre-Universi~y -------- -------- -------arrl!~ ''iiI!!' ffirit '!,'lil!l' ~ II(~I!I' fum Ale &roup Males Females M.II~s Females Male. Females
12 13 14 15 16 17
""'" MANDLA
~ arTI{ 18,930 6,044 12.220 3,358 5.420 1,434 All agel
0-4 5
6
7
8 , .. 9
5-9
10-14 1,465 861 58 51 5
15-19 5,677 1,921 2,380 1,085 729 437
20-24 2,949 1,212 2.548 855 1.603 460
25-29 2,788 772 2,171 585 979 275
30-34 2,077 518 . 1,969 319 829 151 35--59 3,631 727 2,823 434 1,192 106
60+ 303 18 242 24 72 5
ftijiiCiiil,' CHHINDWARA
w4tarTl! 27,510 10,884 23,129 7,549 8,220 2,011
All agel
0-4
5
6 ."
7 8 9
5-9
10-14 2,174 1,199 81) 158
15-19 8,415 3,621 4,069 2,162 1,198 668
20-24 5,058 2.196 4,631 2,241 2,S03 590
25-29 4;031 1,412 4 • .542 1,384 1,645 381
30-34 2,970 671 3,604 809 1,210 200
35-.59 4,497 1,071 5,671 780 1,527 161
60+ 391 94 489 1$ n7 10
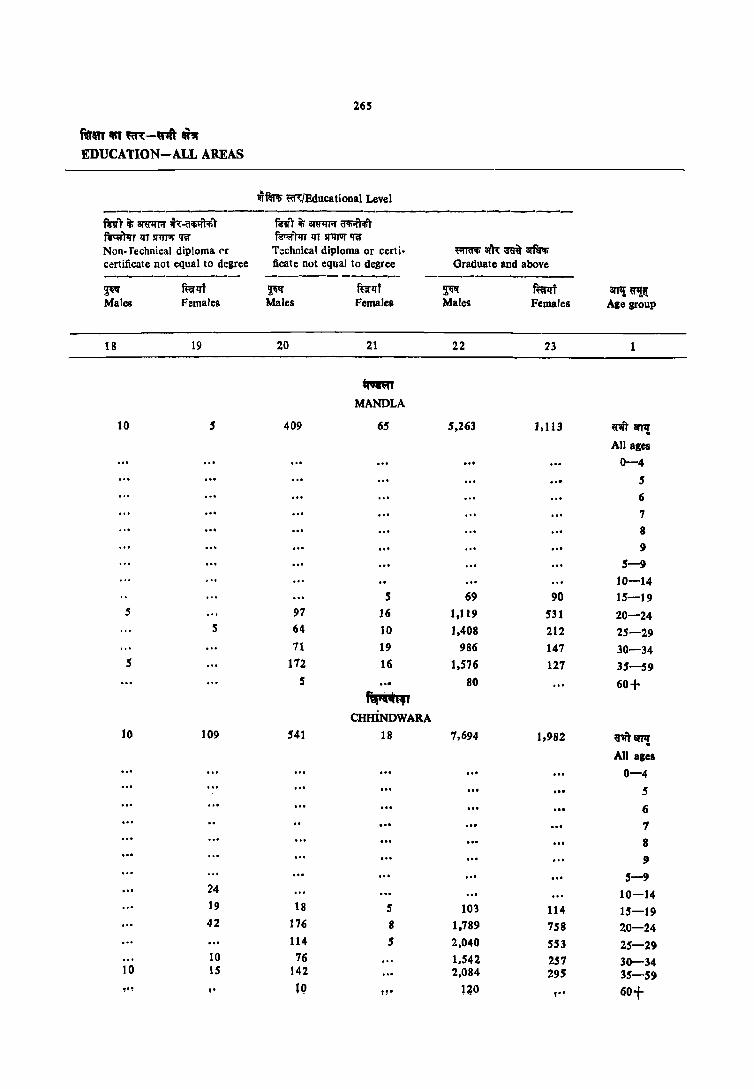
265
f\'rm "" m -u1ft '" EDUCATION-ALL AREAS
-rfllRi m/Educational Level -------------------------------tnT it; 81'Q'lITif IT"{~~T meT it; om1ITiI' tAi'ifT'II'l' ~rlfrlf1111ll'om Worm 1fT SI1fI1II' IRI' Non- fechnical diploma ('r Tl::chnical diploma or certi- ~ OfR m arfiA; certificate not equal to degree ficate not equal to degree Graduate and above --------- ---------~ fuirqf ~ ffiTqf ~ mt atN. ~i!: Males Females Males Females Males Females Ale group
18 19 20 21 22 23 1
~
MANDLA
10 5 409 65 5,263 J,113 marJ1l All ages
0-4 5 6 7
8 9
5-9 10-14
5 69 90 15-19 5 97 16 1,119 531 20-24
5 64 10 J,408 212 25-29 71 19 986 147 30-34
5 112 16 1,576 121 35-59 5' 80 60+
rq.'''',i CHHiNOWARA
10 109 541 18 1,694 1,982 nl'8fTIl . All agel
0-4 5 6 ... 1 8
9
5-9 24 10-14 19 18 5 103 114 15-19 42 176 8 1.189 758 20-24
114 5 2,040 553 25-29 10 76 1.542 257 30-34
10 IS 142 2,084 295 35-59 'f'l ~ ,- 10 n- nO ,-- 60t
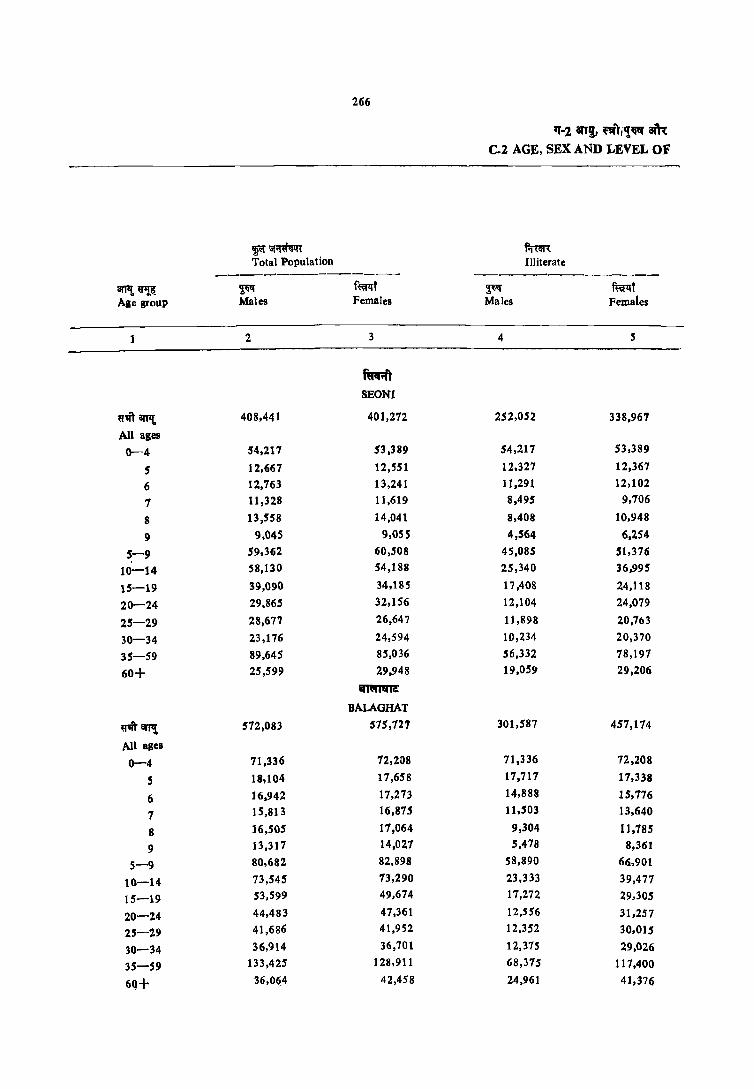
266
'1-2 arr~, ~ri'~ am: C.2 AGE, SEX AND LEVEL Of
'§'Ot'O!~ f;rnr( Total Population Illiterate
-------------- --------------arPt~ ~ ffirrt ~ ~l:I' Age group Males Females Males Females
2 3 4 5
ftIcr.ft SEONI
8'm amt 408,441 401,272 252,052 338.967
All ages
0-4 54,217 53.389 54,217 53,389
5 12,667 12,551 12,327 12,367
6 12,763 13,241 11,291 12,102
7 11,328 11.619 8,495 9,706
8 13,558 14,041 8,408 10,948
9 9,045 9,055 4,564 6.254
5-9 59,362 60,508 45,085 :11,376
10-14 58,130 54,188 25,340 36,995
15-19 39,090 34,185 17.408 24,118
20-24 29,865 32,156 12,104 24,079
25-29 28,617 26,647 11,898 20,763
30-34 23,176 24,594 10,234 20,370
35-59 89,645 85,036 56,332 78,197
60+ 25,599 29,948 19,059 29,206
&fT~
BALAGHAT
~ar., 572,083 515,727 301,587 457,174
All ages
0-4 71,336 72,208 71,336 72,208
5 18,104 17,658 17,717 17,338
6 16,942 17,273 14,888 15,776
1 15,813 16,875 11,503 13,640
8 16,505 17,064 9,304 11,785
9 13,317 14,021 5,478 8,361
5-9 80,682 82,898 58,890 66.901
10-14 73,545 73,290 23,333 39,477
15-19 53,599 49,674 17,272 29,305
20-24 44,483 47,361 12,556 31,257
25-29 41,686 41,952 12,352 30,015
30-34 36,914 36,701 12,375 29,026
35-59 133,425 128.911 68,31S 117,400
6Q+ 36,O~4 42,458 24,961 41,376
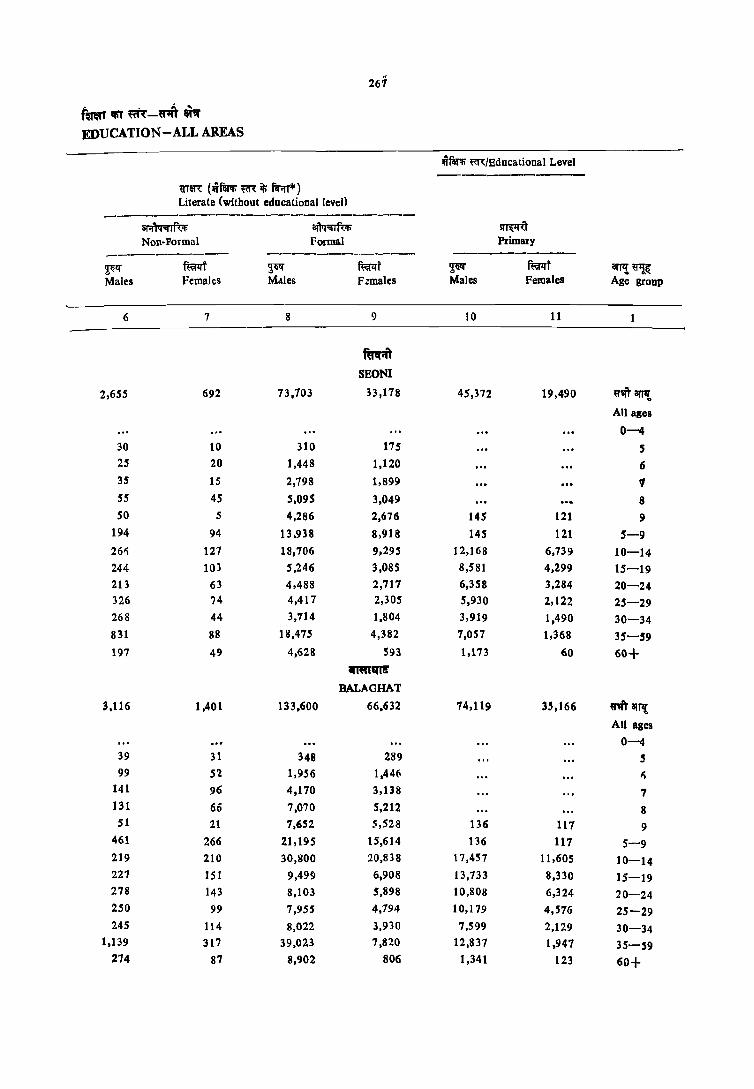
267
tmn 'liT m-rit " EDUCATION-ALL AREAS
wfWf;" ~/Educational Level
m'1lR (wlW!; ~ it; w.rr*) Literate (without educational level)
------------------------~fu; arrt"l'l'fu; ~ Non-Formal Formal Primary
---------- _ .. ----------- --------~!f f@<t ~ mr ~ mt iIf'Tl! ~l!i{ Males Females Males F;:males Males Females Age group
6 7 8 9 10 11
~ SBONI
2,655 692 73,703 33,178 45,372 19,490 ~nft amt All ages
0-4 30 to 310 175 5 25 20 1,448 1,120 6 35 15 2,798 1,899 , 55 45 5,095 3,049 8 SO 5 4,286 2,676 145 121 9
194 94 13.938 8,918 145 121 5-9
2M 127 18,706 9,295 12,168 6,739 10-14 244 10} 5,246 3,085 8,581 4,299 15-19 213 63 4,488 2,717 6,358 3,284 20-24 326 74 4,417 2,305 5,930 2,122 25-29 268 44 3,714 1,804 3,919 1,490 30-34 831 88 18,475 4,382 7,057 1,368 35-59 197 49 4,628 593 1,173 60 60+
~~
BALAGHAT
3,116 1,401 133,600 66,632 74,119 35,166 ~'II'''t 811'1{
All ages
0-4 39 31 348 289 5 99 5l 1,956 1,446 I)
141 96 4,170 3,138 7 131 66 7,070 5,212 8 51 21 7,652 5,528 136 117 9
461 266 21,195 15,614 136 117 5-9 2]9 210 30,800 20,838 17,457 11,605 10-14 227 ]5 I 9,499 6,908 13,133 8,330 15-19 278 143 8,103 5,898 10,808 6,324 20-24 250 99 7,955 4,194 10,179 4,576 25-29 245 114 8,022 3,930 7,599 2,129 30-34
1,139 317 39,023 7,820 12,837 1,947 35-59 274 87 8,902 806 1,341 123 60+
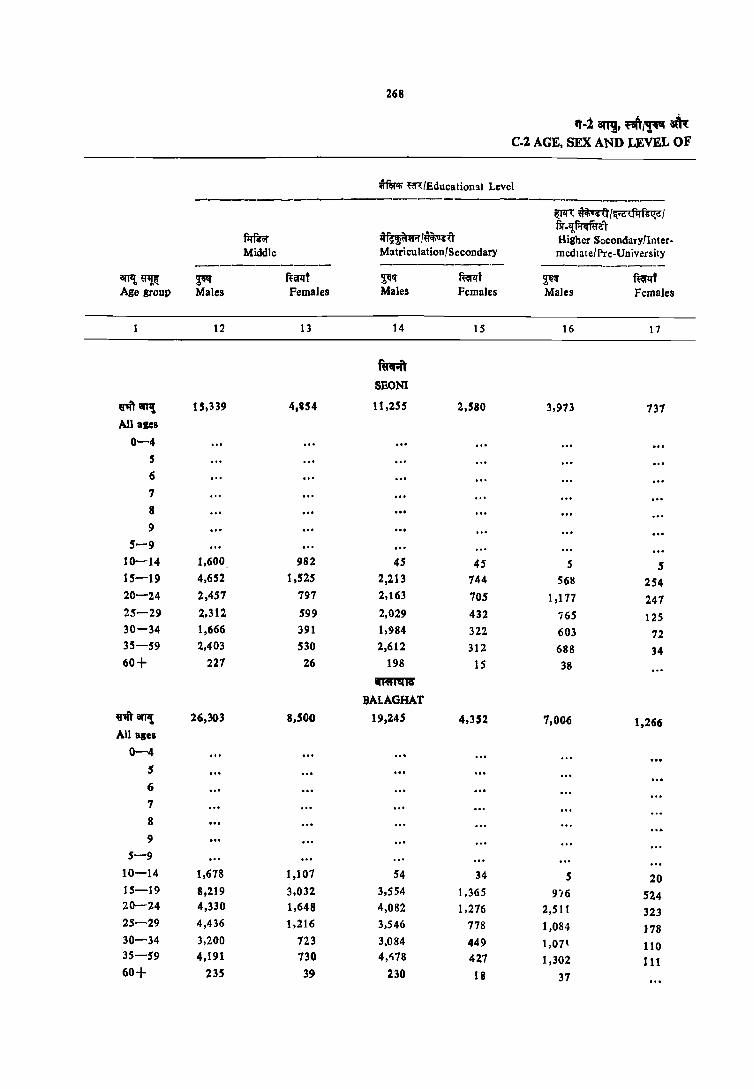
268
'1-2 ~, ~J1!~ ~ C-2 AGE, SEX AND LEVEL OF
wm~ ~/£ducation:ll Level -------------------------------------
~ wro/~·c:(f'1fei{c:1
~~/~i'U 6r -'If.rcrfuc:.'r
f3rlr.r Higher Socondary/Inter-Middle Matricu lation/Secondary mediate/Pre-University
----------- -----------CITJI! ~ ~ ftiil'lif ~ fm-f ~ ftiil'lrt Age grOUP Males Females Males Females Males Females
12 13 14 15 16 17
ftR;ft
SEON!
~1IITIt 15,339 4,"4 11,255 2,580 3,973 137 All ages
0-4
5
6
7
8
9
5-9
10-14 1,600 982 45 4S 5 5 15-19 4,652 1,525 2,213 744 568 254 20-24 2,457 797 2,163 705 1,177 247 25-29 2,312 599 2,029 432 765 125 30-34 1,666 391 1,984 322 603 72 35-59 2,403 530 2,612 312 688 34 60+ 227 26 198 IS 38
mt"I1fR BALAGHAT
v1ft iII11l 26,303 8,500 19,245 4,352 7,006 1,266 All ages
0-4
5
6
7
8
9
5-9 10-14 1,678 1,107 54 34 5 20 15-19 8,219 3,032 3,554 1,365 916 524 20-24 4,330 1,648 4,082 1,276 2,511 323 25-29 4,436 1,216 3,546 778 1,084 J78 30-34 3,200 723 3.084 449 1,071 110 35-59 4,191 730 4,1l78 427 1,302 111 60+ 235 39 230 18 37

fmn trY m-nt "" EDUCATION-ALL AREAS
R"m-it;~lh:~ ~ Q'r srJrIT-'RI' Non-Technical diploma or certificate not equal to degree
~~ mi Males Females
111 19
15
10
24
5
5
S
10
~ mlBducational Level
292
10
84
74 51 63
10
900
34 248 297
113
199
9
R"!I:t ~ om;rr;r ~;ft;t,i ~ Q'r srJrIT-'RI'
Technic!!1 diploma or certificate not equal to degree
~1f Males
20
ffeTql
Females
21
fn;ft
SEONI
5
5
~
BALAGHAT S6
.. '
36
~~ am: a~ arfu<I; Graduate and above
~~ Males
22
3,785
58
815
926
738 1,174
69
6,183
85
1,565
ffeTql
Females
769
58
263
226 102 119
1,180
59 456
23
1,582 294 5 1,202 216
14 1,669 145 76 10
~ij'~ Age grOUP
ij''IT'f iIfTI! All ages
0-4
5
6
7
8
9
5-9 10-14 15-19
20-24
25-29 30-34 35-59
60+
~'If\ iII'Pl All allCS 0-4
5 6
7
8
9
5-9
10-14 15-19 20-24
25-29
30-34
35-59
60+
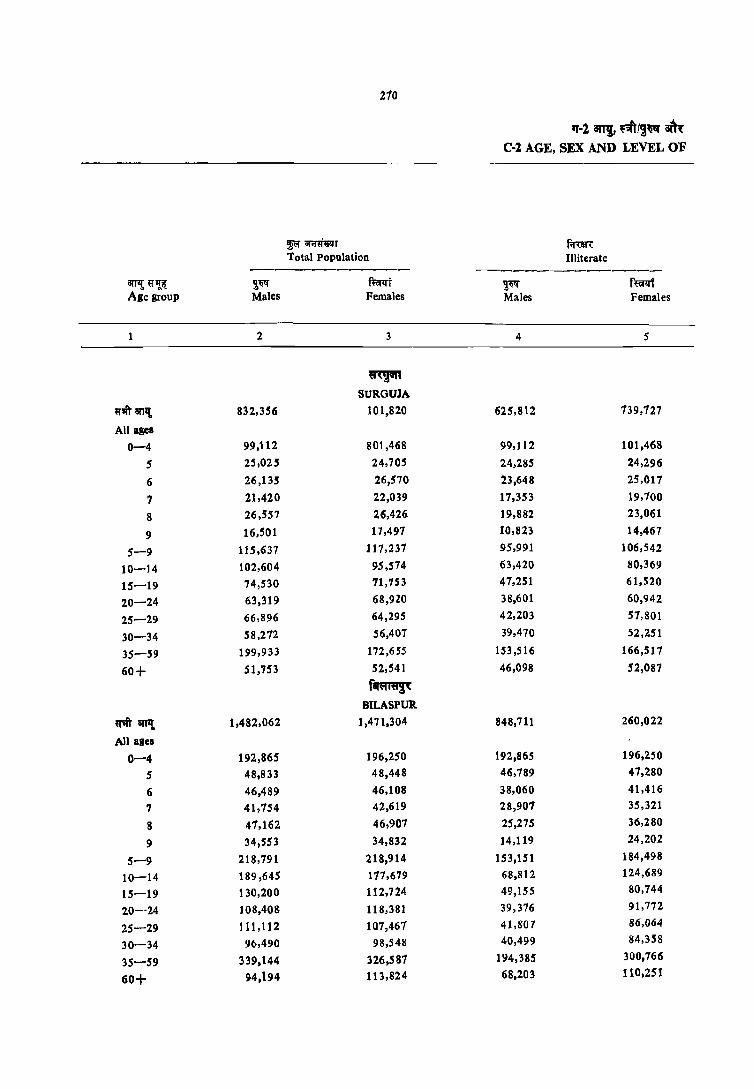
210
~ ;;r;rmr Total Population
------------<I!TI! I;r~ 2.~ ~t Age group Males Females
2 3
~ SURGUJA
~"" anJt 832,356 101,820
All ages
0-4 99,112 801,468
5 25,025 24,705
6 26,135 26,570
7 21,420 22,039
8 26,S57 26,426
9 16,501 17,491
5-9 115,637 117,231
10-14 102,604 95,514
15-19 74,530 71,753
20-24 63,319 68,920
25-29 66,896 64,295
30-34 58,272 56,407
35-59 199,933 172,6055
60+ 51,753 52,541
f~ BILASPUR.
~8JfIt 1,482,062 1,471.304
All aleB
0-4 192,865 196,250
5 48,833 48,448
6 46,489 46,108
7 41,154 42,619
8 47,162 46,901
9 34,553 34,832
5-9 218,791 218,914
10-14 189,645 171,679
15-19 130,200 112,724
20--24 108,408 118,381
25-29 111,112 101,461
30-34 9(>,490 98,548
35-59 339,144 326,581
60+ 94,194 113,824
",-1 an!, ~!~~ ~ C-2 AGE, SE..X AND LEVEL OF
f.:mn: Illiterate
--------------~ f~f Males Females
4 5
625,8' 2 739,727
99,112 101,468
24,285 24,296
23,648 25,017
11,353 19,100
19,882 23,061
10,823 14,467
95,991 106,542
63,420 80,369
41,251 61,520
38,601 60,942
42,203 57,801
39,470 52,251
153,516 166,511
46,098 52,087
848,711 260,022
192,865 196,250
46,789 47,280
38,060 41,416
28,901 35,321
25,275 36,280
14,119 24,202
153,151 184,498
68,812 124,689
49,155 80,744
39,316 91,772
41,807 86,064
40,499 84,358
194,385 300,766
68,203 110,251

211
mm iii' ~~-,"" IIPr EDUCATION - ALL AREAS
wftA; m/Educational Level -----------
~m;: (wfiw!; m t ~.) Literate {without tducationallevel} --... ---------------------
ar.r~ ~ ~ Non-Formal Formal Primary
--_,...._------ -~------------- ----------~Ii" ffi;rlft ~~ mt ~ ~d arTll ~ Males Females Males Females Males Females Age group
6 7 8 9 10 11
~ SURGUJA
4,832 1,374 84,800 27,126 51,690 17,956 "''lJl arT,! All agel
0-4
37 33 703 376 5
119 84 2,368 1,468 6
lOS 44 3,961 2,295 7
196 82 6,479 3,282 8
65 29 5,389 2,831 223 170 9
522 273 18,901 10,253 223 170 5-9
322 149 22,854 7,851 14,438 6,234 10-14
274 152 5,74':" 1,879 11,318 3,572 15-19 391 171 4,619 1,601 7,642 2,579 20 -24 588 146 5,108 1,641 7,555 2,271 25-29
482 117 4.7B9 1,312 5,195 1,368 30-34 1,932 335 19,319 2,322 10,179 1,659 35-59
315 29 3,408 249 1,115 87 60+ r.h'llfij<
BlLASPUR
12,012 3,118 297,062 106,377 156,991 58,132 ffi iIJT'l AU ales
0-4 148 14 1,897 1,094 S 353 122 8,075 4,570 6 326 171 12,522 7,128 7 300 128 21,587 10,499 8 222 88 19,766 10,165 446 376 9
1,348 583 63,847 33,457 446 376 5-9 792 437 66,394 28,509 47,310 20,579 10-14 808 278 -19,168 8,688 26,016 10,902 IS-19 900 :161 17,059 1,772 17,809 8,559 20-24
1,210 330 18,866 6,910 18,"84 6,732 25-29 1,173 236 18,129 5,547 12,795 3,989 30-34 4,S53 -714 76,314 13,191 28,572 6,084 35-59 1,145 231 16,863 Z,097 5,366 869 60+

171
"-2 an!, rol'!"'" am C.2 AGE, sEX AND LEVEL OF
lIi'fiIA; m/Educational Level ----------------------------------
~rl!1: ~r/~c~/
fiIfur 1l~/~~ fll"~fuit Higbl"r Secondary /Inter·
Middle MatriculationlSecondaay mediate/Pre· University ---------- ----------- ----------arJ1! «1{~ ~ ffirzrt ~ ~ ~ ftall'f Age group Males Females Males Females Males Females
12 13 14 15 16 17
~;n
SURGUJA
~'Iit arT!! 25,143 6,745 13,557 2,784 13,316 3,895
All aIel
0-4
5 6 ." 7
8 .. , 9
5-9 ... .. , 10-14 1,459 919 85 43 25 9
15-19 5,910 2,104 2,350 801 1,531 1,639
20-24 4,091 1,223 2,727 729 3,744 1,078
25-29 4,337 983 2,463 510 2,802 525
30-34 3,258 541 1,619 255 2,100 321
35-59 5,588 902 4,025 432 2,968 318
60+ 411 69 218 15 129
r.\i(itii< BILASPUR
~arTl{ 61,086 20,144 54,626 12,832 23,057 4,344
All ales
0-4 .. , .. , S .,. ."
6 ," ." 7 .,. S
9 .. ' 5-9
10-14 5,990 3,294 333 158 15 IS
]5-19 21,321 6,636 9,244 3,702 4,016 1.353
20-24 10,087 3,687 11,429 3,053 7.246 l,t96
25-29 10,604 2,62] 11,136 2,507 3,867 141
30-34 5,559 1,725 8,883 1,425 3,355 489
35-59 10.587 2,557 12,510 1,906 4,214 518
60+ 899 2U 1.031 81 259 32

273
fmn '" ~-U1ft n EDUCATION-ALL AREAS
wfm;' m/Educational Level -------------------------
mft'it;~~~ fc'v'tit;~~ ~ 1fT 5I1f!VT~ ~ 1fT SI1fTVT~ Non-Technical diploma or Technical diploma or certi- ~ am mr arf'i.Ai certifu:ate not equal to degree ficate not equal to degree Graduate and above ---- -------- --------_
~~ ~i ~" ~j ,;~ mm iIITI£~ Males Females Males females Males Females Age grOUP
19 19 20 21 22 23
~ SURGUJA
2.1 8 824 25 6,361 1,480 ~8TT' All Bgel ... 0-4 .. , S
6
7 ... 8 9 ... S-9
10-14 6 82 86 15-19
16 176 4 1,311 593 20-24 200 1,641 412 25-29
5 8 124 8 1,171 226 30-34 313 13 2,093 158 35-59
5 53 ~ 60+ f.~'{
BILASPUR
55 10 2.328 44 20,134 5,681 ~-m amt All ages 0-4
,,, 5 6
7 8
." 9 .. , 5-9 10-14
4 -!.- 60 402 423 15-19 11 4SS 4,035 2,081 20-24 10 5 549 20 4,479 1,538 25-29 10 428 15 3,661 765 30-34 20 5 811 5 7,119 833 35-59 ,. ft! 1~ S 414 37 69+
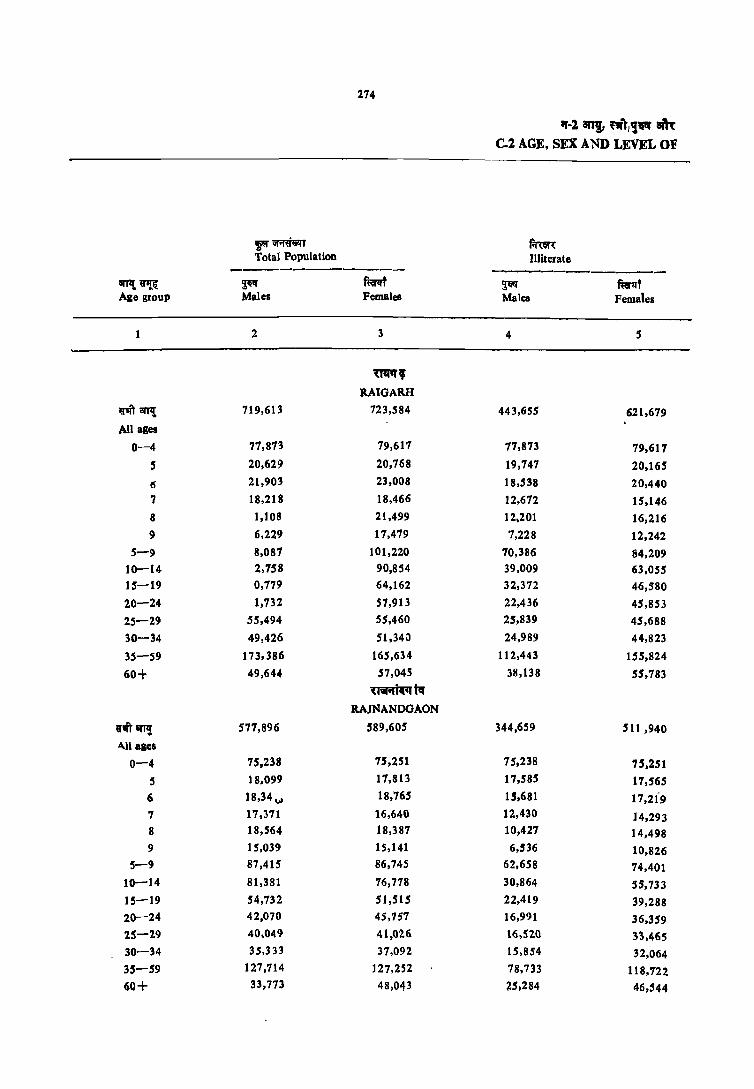
274
p~ Total Population
-------------amt~ ~ ~ Ale group Males Females
1 2 3
mwr, RAIGARH
\t1ftt!r11! 719,613 723,584
All agel
0-4 77,873 79,617
5 20,629 20,768
IS 21,903 23,008 ., 18,218 18,466
8 1,108 21,499
9 6,229 17,479
5-9 8,081 101,220
10-14 2,758 90,854
15-19 0,179 64,162
20-24 1,732 51,913
25-29 55,494 55,460
30-]4 49,426 51,341)
35-59 173,]86 165,634
60+ 49,644 57,045
(i\il.tiC·iR
RAJNANDGAON
~WtT 8I'T'! 577,896 589,605
"11 ages 0-4 75,238 75,251
5 18,099 17,813
6 18,]4", 18,765
7 17,371 16,640
8 18,564 18,387
9 15,0]9 15,141
5-9 87,415 86,745
10-14 81,381 76,778
15-19 54,732 51,515
20--24 42,070 45,757
25-29 40,049 41,026
30-34 35,333 37,092
35-59 127.714 127,252
60+ 33,713 48,043
11'-2 an!, ""i'!1I!r am C-2 AGE, SEX AND LEVEL OF
f;n:en: Illiterate -----------
~ mrlft Males Females
4 5
443,655 621,679
77,873 79,617
19,747 20,165
18,538 20,440
12,672 15,146 12,201 16,216 7,228 12,242
70,386 84,209 39,009 6],055 32,372 46,580 22,436 45,853 25,8]9 45,688 24,989 44,823
112,443 155,824 ]8,138 55,783
344,659 511 ,940
75,238 75,251 17,585 17,565 15,681 17,2i9 12,430 14,293 10,427 14,498 6,536 10,826
62,658 74,401 30,864 SS,7] 3 22,419 39,288 16,991 36,359 16,520 33,46S IS,854 32,064 78,7]3 118,122 25,284 46,544
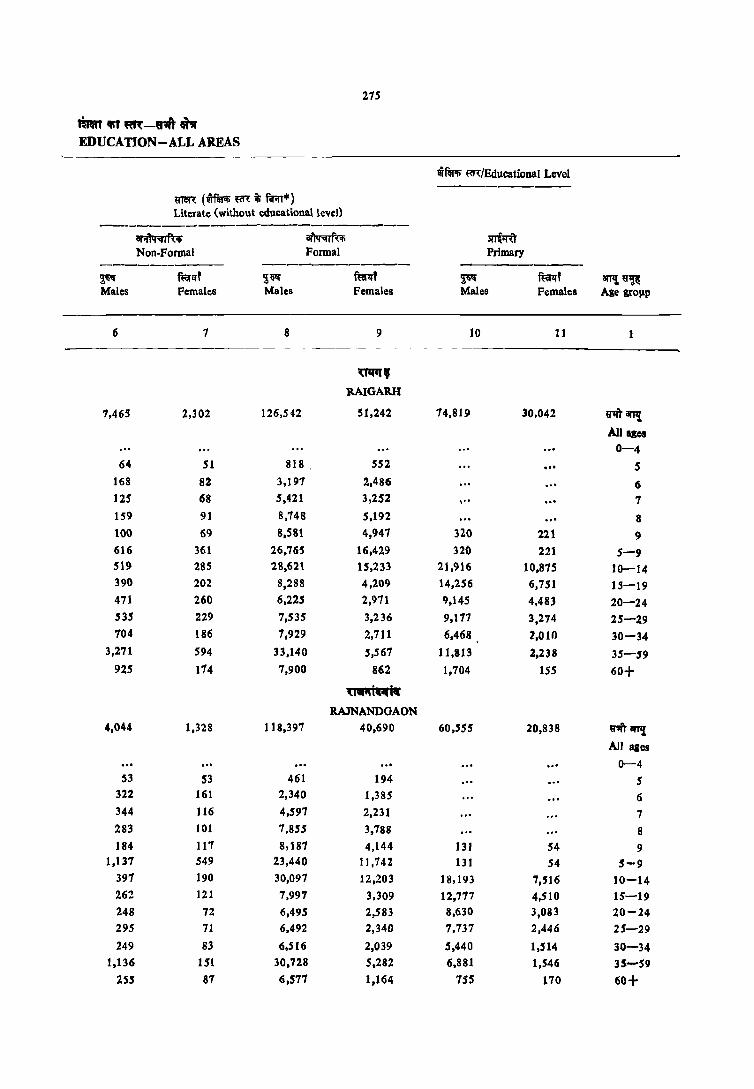
215
tmn iii' m-81R " EDUCATION-ALL AREAS
fftrl; m/Educational Level -----------
~ (~ m i6 frn*) Literate (without educationalleveJ)
-------------------------dj '114 .. " f'('Il CIf~ ~ Non-Fonnal Formal Primary
---------- ------------ --------~~ fuirlfr !l;m fu;r.rf ~ mf aTI'lt u~ Males Females Males Females Males Females A~ gro'!1P
6 7 8 9 10 11
~,
RAIGARH
1,465 2,302 126,542 51,242 14,819 30,042 UlITiIfrI! All lies 0-4
64 51 818 552 ... 5 168 82 3,197 2,486 6 125 68 5,421 3,252 ,,, .. , 1 159 91 8,748 5,192 8 100 69 8,581 4,947 320 221 9 616 361 26,'165 16,429 320 221 5-1} 519 285 28,621 15,233 21,916 10.875 10-14 390 202 8,288 4,209 14,256 6,751 15-19 471 260 6,215 2,971 9,145 4,483 20-24 535 229 7,535 3,236 9,117 3,214 25-29 104 186 1,929 2,711 6,468 1,010 30-34
3,271 594 33,140 5,567 11,813 2,238 35-59 925 114 7,I}00 862 1,704 1S5 60+
(iil"ICliW RAlNANDOAON
4,044 1,328 118,397 40,690 60,555 20,838 ~IITI! All ages
0-4 53 53 461 194 5
322 161 2,340 1,385 6 344 116 4,597 2,231 7 283 101 7,855 3,788 8 184 117 8,187 4,144 131 54 9
1,131 549 23,440 11,742 131 54 5-9 397 190 30,097 12,203 18,193 7,5'16 10-14 262 121 7,991 3,309 12,717 4,510 15-19 248 72 6,495 2,583 8,630 3,083 20-24 295 71 6,492 2,340 1,737 2,446 25-29
249 83 6.516 2,039 5,440 1,514 30-34 1,136 151 30,'128 5,282 6,881 1,546 3S-59
255 81 6,571 1,164 755 170 60+

116
'1-2 "'i, ""'/1"" am C-2 AGE, SEX AND LEVEL OF
~ ~/Educational Level ------------------------------------
~ ~/'Pi!<Ptf.sl(e/
Il~/~ fir-'{f.r;rfu"e't
fl:rmr Higher Secondary/lnter-Middle Matriculation/Secondary mediate/Pre- University
---------- ---------- -----------aT11t ~ ~ ffiflrr ~1If f@rf ~ ft:erqt Age group Males Females Males Females Males Females
12 13 14 15 16 17
U1I'f, RAIGARH
rit an,; 30,340 9,817 18,500 S,Z50 11.295 1,874 All agel
0-4 ... .., 5 .. , 6 7 ... 8
9 5-9
10-14 2,559 1,326 119 79 15 15-19 9,763 3,835 3,529 1,881 1,988 618 20-24 4,156 1,714 4,018 1,415 3,649 625 25-29 4,910 1,254 3,778 980 2,067 370 30-34 3,426 760 2,863 491 1,577 168 35-51 4.990 863 3,870 325 1,915 89 60+ 501 55 298 10 74
nil" I •• ~ RAJNA NDGA-ON
mrr an'!, 25,809 8,094 11,655 3,63'7 6,689 1.404 Ail ages 0-4-
5 .. , ... 6
7 ... 8
9 5-9 ...
10--:-14 1,801 1,111 14 25 U 15-19 8,649 2,817 1,465 792 1,021 548 20-24 3,927 1,540 2,347 1,040 1,991 390 25-29 4,259 1.229 2,074 839 1,203 238 30-34 2,870 595 2,205 441 1,064 152 35-59 3,828 733 3,260 491 1,327 75 60+ 468 68 290 10 57
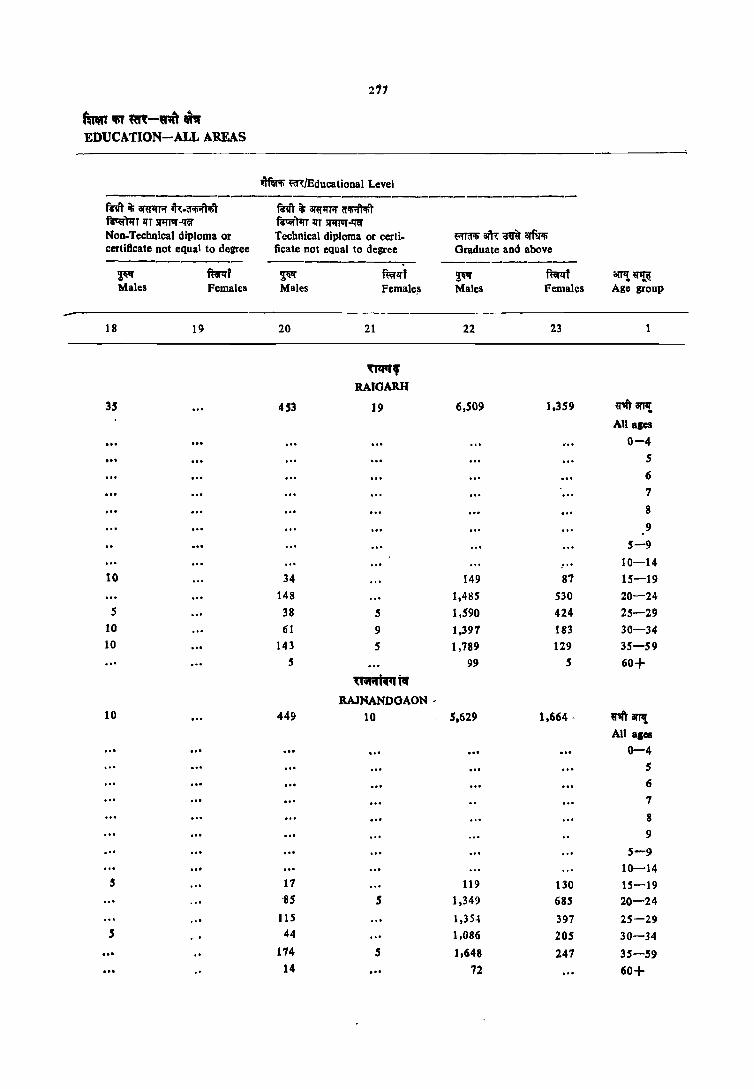
2'11
fat lIiT M-u;it •• EDUCATION-ALL AREAS
~ m/Educational Level --------------------------------------mit ~ amlfA ~.a~ mrr ~ am11rl' a~'T ~TI:rrSl1lJ1ll'-IW ~Ar lIT Si1IT1Jt-IW Non.Technical diploma or Technical diploma or certi. t=mJiIi aiR m arfili!i certificate not equal to degree ficate not equal to degree Graduate and above
----------- ------------ -----------F' mf ~ f~lI'f ~ mt ctTl! ~ Males Females Males Female~ Males Females Age group
18 19 20 21 22 23 1
uqq, RAIGARH
35 453 19 6,509 1.359 ~an'i AU ales
0-4 ... 5 6 7
8 9
5-9 ... 10-14
10 34 149 87 15-19 148 1,485 530 20-24
S 38 S 1,590 424 2S-2g
10 61 9 1,397 183 30-34 10 141 5 1,789 129 35-59 ... 5 99 5 60+
'(161" 1,,-1 taf RAJNANDGAON .
10 449 10 5.629 1,664 - ~~ All ales
0-4 5 6
7 8 9
... 5-9 10-14
5 17 119 130 15-19 -85 5 1,349 685 20-24
115 1,35-1 397 25-29 5 .. 44 1,086 205 30-34
174 5 1,648 247 35-59 14 72 60+
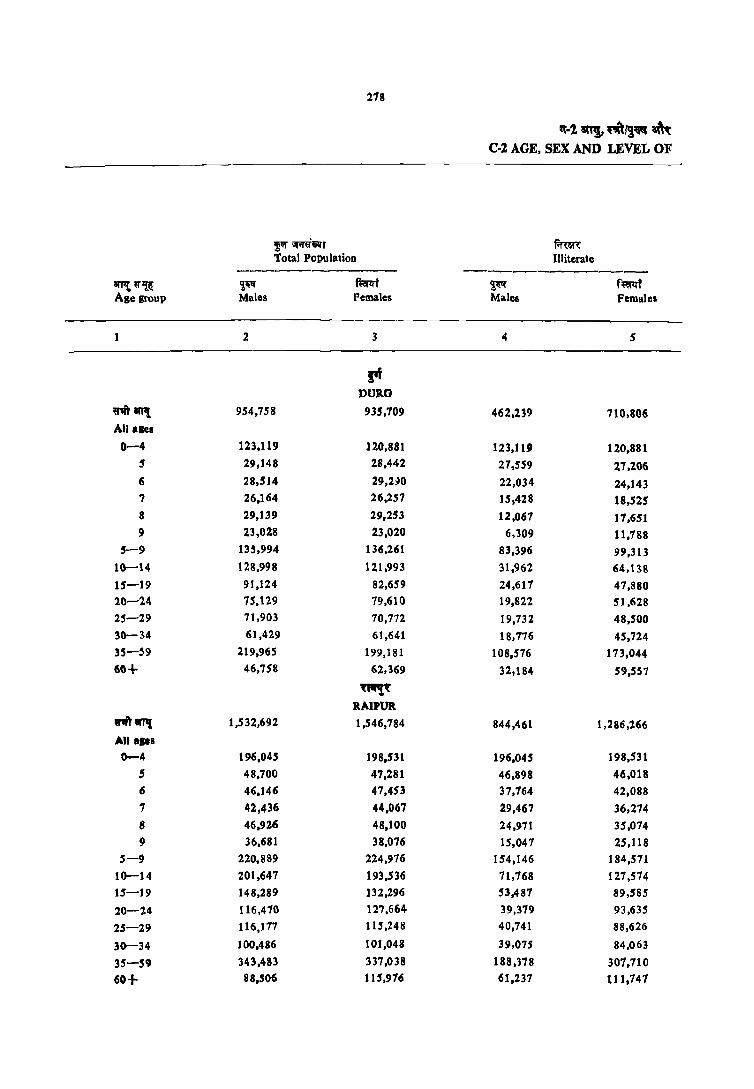
118
f<' ;;r;rn''''J Total Population
------------il'P{ ~~ '!~ mt Age group Males Pemales
2 3
rt DUllO
'""801! 954,758 935,709
All aiel
0-4 123,119 120,881
5 29,148 28,442
(; 28,S 14 29,HO
7 26,164 26,257
8 29,139 29,253
9 23,028 23,020
5-9 135,994 134,261
10-14 128,998 121,993
15-19 91,124 82,659
20-'2.4 15,1'1.9 79,610
25-29 71,903 70,772
30-34 61,429 61,641
35-59 219,965 199,181
60+ 46,158 62,369
'fl'f'lt RAIPUR.
,,~ IR'l 1,532,692 1,546,184
All ap. 0-4 196,045 198,531 ,. 48,700 47,281
6 46,146 47,453
7 42,436 44,067
8 46,926 48,100
9 36,681 38,016
5-9 220,889 224,976
10-14 201,647 193,536
15-19 148,289 132,296
20-24 116,470 127,664-
25-29 116,177 115,248
30-34 100,486 101,048
35-59 343,483 337,038
60+ 88,506 115,976
1t·1~",~ ... ~ C-2 AGE, SEX AND LEVEL OF
f.mn: Illiterate -----------
~ f~' Males females
4 5
462,239 710,806
123,119 120,881 27,559 27,206 22,034 24,143 15,428 18,525 12,061 17,651
6,309 11,188 83,396 99,313 31,962 64,138 24,611 47,880 19,822 51,628
19,732 48,500
18,116 45,724
108,516 173,044
32,184 59,557
844,461 1,286,166
196,045 198,531
46,898 46,018
37,764 42,088
29,467 36,274
24,971 35,014
15,047 25,118
154,146 184,571
71,768 127,514
53,481 89,585
39,379 93,635 40,141 88,626
39,075 84,063
188,378 301,710 61,237 111,741
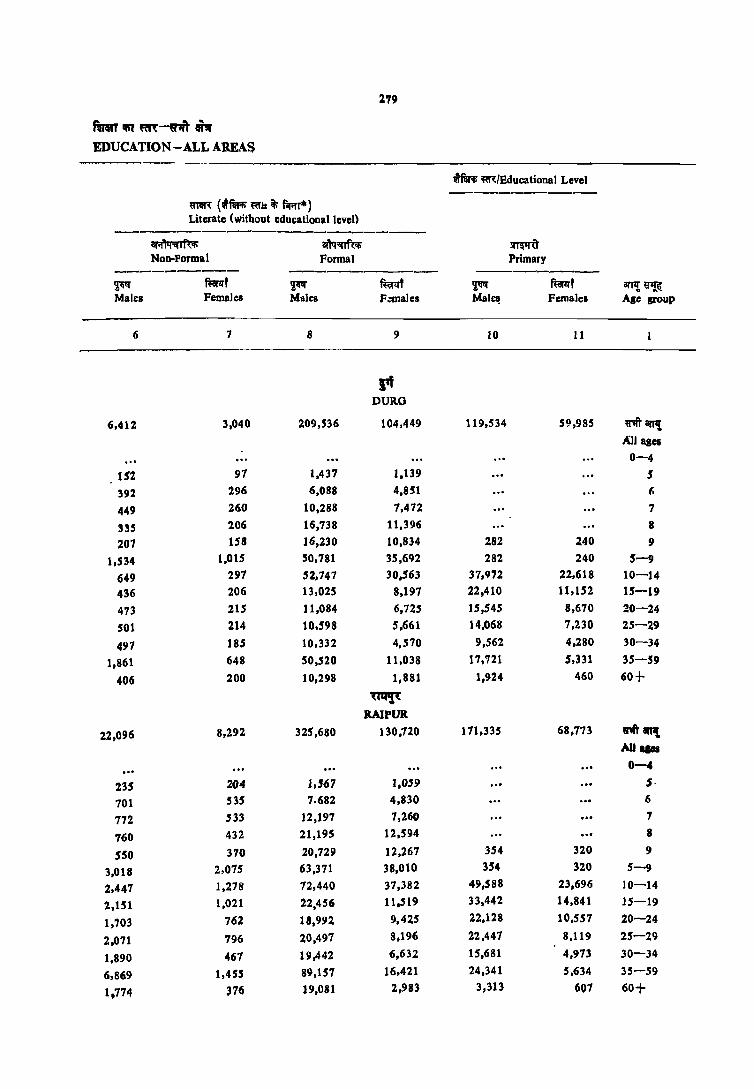
279
rnr "" m-&'lft' "" EDUCATION -ALL AREAS
Wfm; m/Bducational Level -----------
~ (wffi'~.It it; mT*) Literate {without educational level}
-----------------------ar"'q .... f'<;t; aftq~ ~ Non-Formal Formal Primary
---------- ---------- ---------~ mt ~ fuirlff ~ ffi;rzrt 8I'TIl i~ Males Females Males F.::malea MaJe~ Femalea A,e sroup
6 7 8 9 10 11
I" DURO
6,412 3,040 209,536 104,449 119,534 59,985 ~111'11 All aiel
0-4
152 97 1,437 1,139 5
392 196 6,088 4,851 (;
449 260 10,288 7,472 7
33S 106 16,738 11,396 8
207 158 16,230 10,834 282 240 9
1,534 1,015 50,781 35,692 282 240 5-9
649 297 52,747 30,563 37,972 22,618 10-14
436 206 13,025 8,197 22,410 11,152 15-19
473 215 11,084 6,725 15,545 8,670 20-24
501 214 10,598 5,661 14,068 7,230 25-29
497 185 10,332 4,570 9,562 4,280 30-34
1,861 648 50,520 11,038 17,121 5,331 35-59
406 200 10,298 1,881 1,924 460 60+
~ RAIPUR
22,096 8,292 325,680 130,120 171,335 68,773 rit art't AD ... 0-4
235 204 1,567 1,059 5-
701 535 7.682 4,830 6
772 533 12,197 7,260 7
760 432 21,195 12,594 8
550 370 20,729 12,267 354 320 9
3,018 2,075 63,371 38,010 354 320 5-9
2,447 1,278 12,440 37,382 49,588 23,696 10-14
2,151 1,021 12,456 11,519 33,442 14.841 15-19
1,703 762 18,992 9,425 22,128 10,557 20-24
2,071 796 20.491 8,196 22.441 8,119 25-29
1,890 467 19,442 6,632 15,681 4,973 30-34
6,869 1,455 89,157 16,421 24,341 5,634 35-59
1,774 n6 19,081 2,983 3,313 601 60+
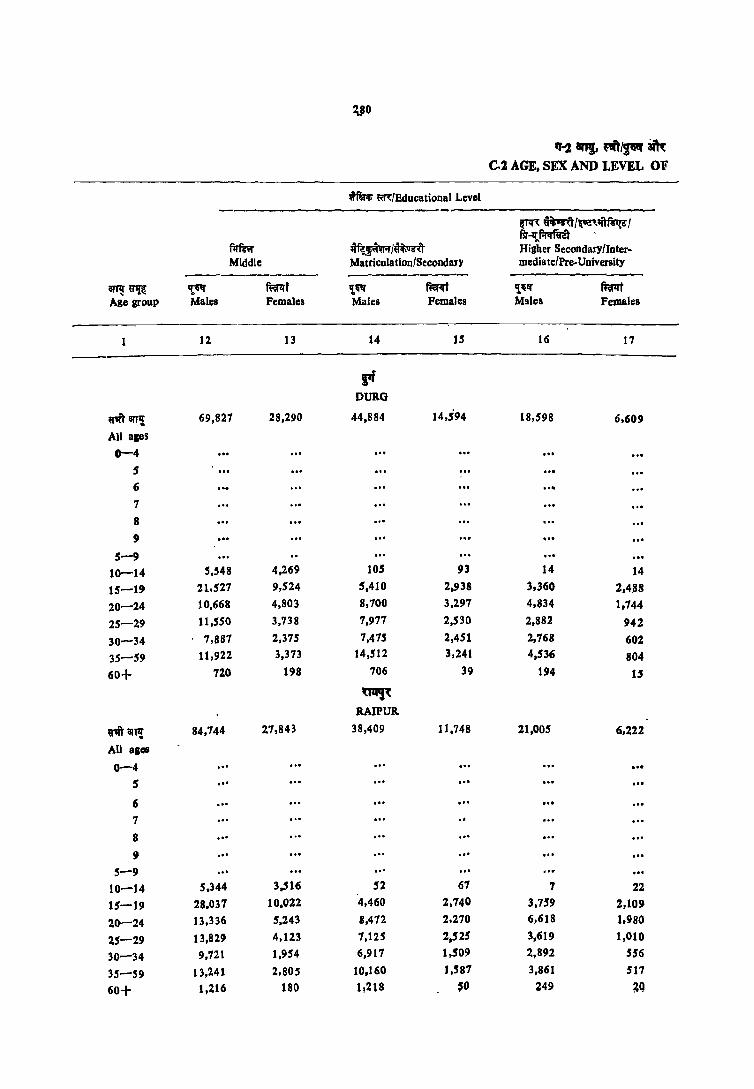
UO
"-2 anJ, f!ftl~ am: C.Z AGE. SE..'X AND LEVEL OF
~ mlEducational Level ----
~Tlr~ i~I~~1
~ ~p/~ fiT~~ , Higher Secondaryllnter-
Middle Matricula lion/Secondary media te/Pre-University --------- ---
arT!! ~ 'tt'!' ffiT7.Tf 't~ flriRt ,!'i'!' mt Age group Males Females Milles Females Males Females
12. 13 14 15 16 17
fi DURO
~arr! 69,827 28,2.90 44,884 14,594 18,598 6,609
All ages 0-4
5 ... 6
7
8
9
5-9 10-14 S,S48 4,2.69 105 93 14 14
15-19 21,52.7 9,524 5.410 2,938 3.360 2.4,88
20-24 10,668 4,803 8,700 3,2.97 4,834 1,744
25-29 11,550 3,738 1.977 2.530 2,882 942
30-34 1,887 2.375 7,475 2,451 2,168 602
35-59 11,922 3.373 14,512 3,241 4,536 804
60+ 120 198 106 39 194 15
~ RAIPUR.
U1ft' illTIJ: 84,744 27,843 38,409 11.748 21,005 6,222
All ages
0-4 .. , ... 5 .. , ., . ... 6 ... 7
8 .. , 9 .. , .. ,
5-9 .. , 10-14 5.344 3,516 52 67 7 22
15-19 28.037 10.022 4,460 2,740 3.759 2,109
20-24 13,336 5,243 8,472 2,270 6,618 1.980
25-29 13,829 4,123 7,125 2,525 3,619 1,010
30-34 9,721 1.954 6.917 1,509 2,892 556
35-59 13,2.41 2,80S 10,160 1.581 3,861 511
60+ 1,216 180 11218 $0 ~4!) ~Q
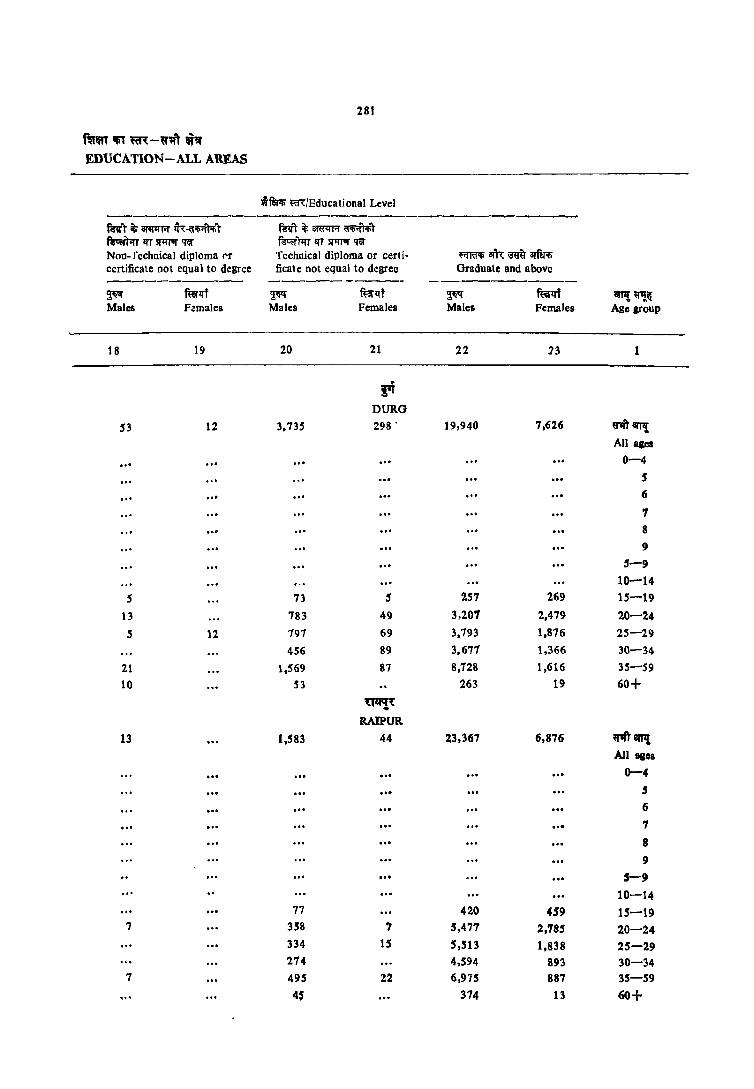
28t
f~m ltiT ~-wlli ~'Jf EDUCATION-ALL AREAS
w!m; m/Educational Level -----fft'l' ~ ~r.r tT~~"'~'l' mrr ~ are+l'R ~'l' ~ lTT 3Jlll1IT 'Rf ~mlTT5f'Il1'UT'l'ef NOD- fechnical diploma ('r Technical diploma or certi· f'fffilli am: m arfa<li certificate not equal to degree ficate not equal to degree Graduate and above ---------- -------- ------------~ mrtrt ~ mt!lt ~ mrtrf ~~~ Males F:males Males Females Males Females Age group
18 19 20 21 22 23 1
. i'f
DURO
S3 12 3.735 298 . 19,940 7,626 ~1II'l1I All ages
.. , 0-4
S
.. ' ... .. , 6
7
8 9
5-9 10-14
S 73 5 157 269 15-19
13 783 49 3,207 2.479 20-24
S 12 791 69 3,193 1,876 25-29 4S6 89 3.671 1,366 30-34
21 1,569 87 8,128 1,616 35--59 10 53 263 19 60+
Uqq"{ •
RAIPUR
13 1,583 44 23,367 6,876 ~'l' 8IT't All agos
0-4 S 6
7
8 9
5-9
10-14 77 420 459 15-19
? 358 7 5,477 2,785 20-24 334 15 5,513 1,838 25-29 274 4,594 893 30-34
7 495 22 6,975 887 35-59 4$ 374 13 60+
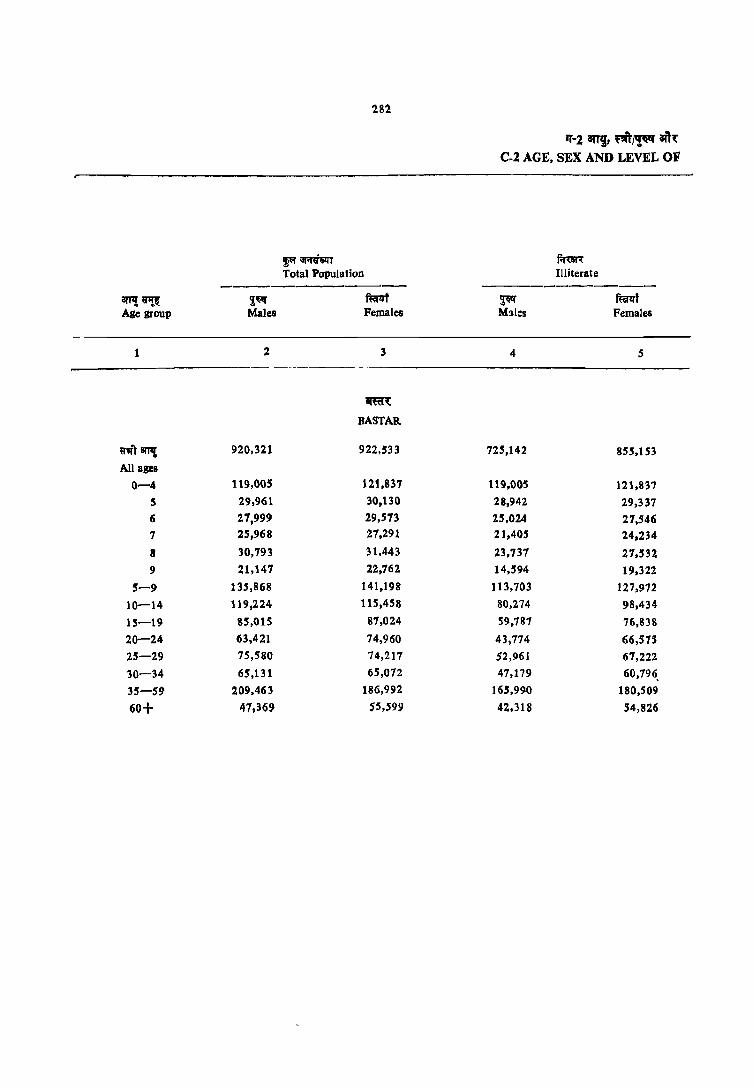
281
!",~T Total Population
---------------arTI! ~ iW ~,
Age grOUP Males Females
1 2 3
amn: BASTAR
~nr' Bm! 920,321 922,533
All ages
0-4 119,00S 121,837
S 29,961 30,130
6 27,999 29,S73
7 25,968 27,291
8 30,793 31,443
9 21,147 22,762
5-9 135,868 141,198
10-14 119,224 115,458
15-19 8S,015 87,024
20-24 63,421 74,960
25-29 75,580 74,217
30-34 65,131 65,072
35-59 209,463 186,992
60+ 41,369 $5,599
11'-2 ani, f'Il~ aft~ C.2 AGE, SEX AND LEVEL OF
~ Illiterate
~ mt M~l::s Females
4 5
725,142 855,153
119,005 121,837
28,942 29,337 25,024 27,546 21,405 24,234
23,737 27,532 14,594 19,322
113,703 127,972
80,274 98,434
59,787 76,838
43,774 66,57S
52,961 67,222
47,179 60,796, 165,990 180,509
42.318 54,826
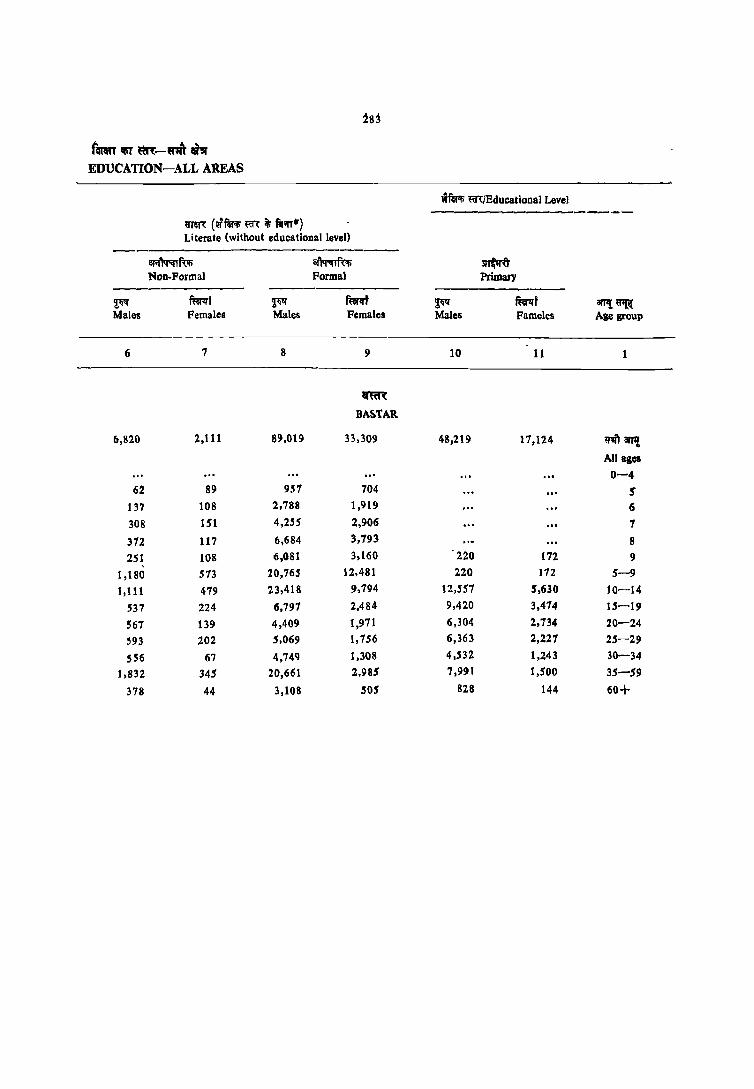
:!83
tmn !liT ~-m Ii~ EDUCATION-ALL AREAS
wffl' m}Educational Level ----m~ (wffl' m: it; fiI;;r*') Literate (without educational level)
-----------------------~ful; ~ sr$(t Non-Formal Formal Primary
-----------~ furl:1'i ~ mm ~ furl:1't arTIl ~ Males Females Males Females Males Fameles Age group
6 7 8 9 10 11
qm
BASTAR
6,820 2.111 89,019 33,309 48,219 17,124 'I'lfilll'P!
All ages
0-4 62 89 957 704 J
137 108 2,788 1,919 6
308 151 4,255 2,906 7
372 117 6,684 3,793 8
2S1 108 6,081 3,160 220 172 9
1,180 573 20,765 12,481 220 112 5-9
1,111 479 23,418 9,794 12,55'7 5,630 10-14
537 224 6,197 2.484 9,420 3,474 15-19
567 139 4,409 1,971 6,304 2,734 20-24
593 202 5,069 1,756 6,363 2,227 25-29
556 67 4,749 1,308 4,532 1,243 30-34
1,832 345 20,661 2.985 1,991 1,500 35-59
318 44 3,108 505 828 144 60+

284
".1 an!, ~,/,~ ~ C-2 AGE, SEX AND LEVEL OF
~ m/Bducaliona\ level
I!:Tlf1: ~~1"';:;Z1;;r"lf6Q;e /
rnmr 1l~/~ fir -,!f.rlI'firit Higbl'r Secondary lInter·
Midd\e Matriculation/Secondaay mediate/Pre-UDIversily ----------- ----------- _---------
BfTI! Wii!: ~ mt ~ fur;rf ~ fta"lff Age group Males Females Males Females Males Females
12 13 14 15 16 17
~
BASTAR
~aTTI! 24,906 7,597 11,652 3,626 6,750 1,825
All ages
0-4 ",
5 6
7
8
9 5-9
10-14 1,810 1,072 50 37 5 9
15-19 6,430 2,564 1,276 774 625 542
20-24 3,509 1,405 2,052 972 1,666 527
25-29 4,162 1,167 2,448 770 1,666 361
30-34 3,067 644 2,1)92 533 1 ,197 ]90
35-59 5,509 707 3,559 516 1,480 196
60+ 408 37 164 23 108
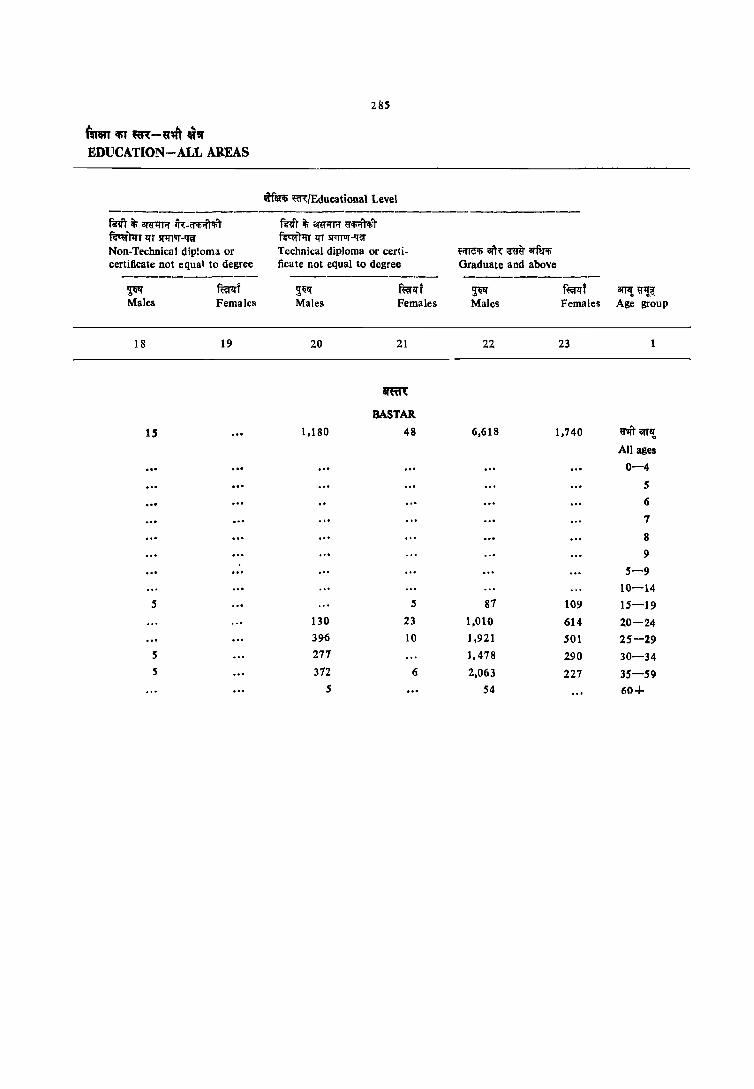
ftmT '" ffl-~m -'" EDUCATION-ALL AREAS
mrr it; anr~ ~-~~if' RGr'PI'T lfT l(1!1'Uf-'rn"
Non-Technical diploma or certificate not equal to degree -----------~ fuilfT Males Fema)cs
18 19
IS
5
5 5
285
ritf~ mlEdueational Level
mrrit;am~~~r ~);rr lfT SI+fTOT-'fef
Technical diploma or certi-ficate not equal to degree ------------
~li!{ ffiflfr Males Females
20 21
~
BASTAR
1,180 48
5 130 23 396 10 271
312 6 5
Frm'li ali~ i3W art'Q"Ii Graduate and above -----------~ ffeflff 0lTl! ~I!~ Males Females Age group
22 23
6,618 1,740 tnfr iIlT,! All ages
0-4
5 6
7
8 9
5-9 10-14
87 109 15-19 1,010 614 20-24 1,921 501 25-29 1,478 290 30-34 2,063 227 35-59
54 60+

286
,,·2 1I11t iii q, ~Tf'" C-2 PART A AGE, SEX AND
mllR (wflfi"li m it; fiAT"') Literate (without educational level)
~~~T Total Population
f.1~ Illiterate
ar.f~ Non-Formal
arr,! ~ Age group
1
«m arT!! All ages
0-4
5
6
7
8
9
5-9 10-14
15-19
20-24
25-29
30-34
35-59
60+
~ Males
2
5,619,983
665,734 159,380
152,553
123,258
167,288
108,992
711,470
713,722
627,216
581,774
458,398
383,806 1,208,133
264,491
mrlfr Females
3
4,966,475
659,351
146,959
]48,480
123,267
157,247
107,315
683,269 645,675
514,301
492,681
406,310
323,223 966,329
270,932
~ Males
4
q1:ZJ m MADHYA PRADESH
2,000,389
665,734
137,747
101,967
58,150
58,294
23,795
310,954 122,822
100,595
88,634
80,001
78,374 368,338
114,~81
"'iR'l'~'1I' lQ-fWl; m « ~ ar~ «fl'lffOftr ~ I
Includes figures for Educational Levels not classifiable.
~ :-'~'lft arr'!.' if 'arT'!, ~i' <r~rt' if ~ ~~tr ~ I
Note :-Pigures of' Age not sta ted' are included in 'All ~ges'.
rntlff Females
5
2,867,458
659,351
129,886
105,551 65,299
68,442
34,141
403,320
190,889
170,776
199,213
188,911
173,895 649,863
229,786
~ Males
6
56,568
1,385
],922
1,224
1,586
188
6.90'7
3,911 4,314
5,228
4,992
4,383 20,018
6,221
mrlfT Frmales
7
37,350
1,000
1,436
854
1.114
118 5,182
3,725 4,248
3,193
4,016
2,823 10,107
3,085
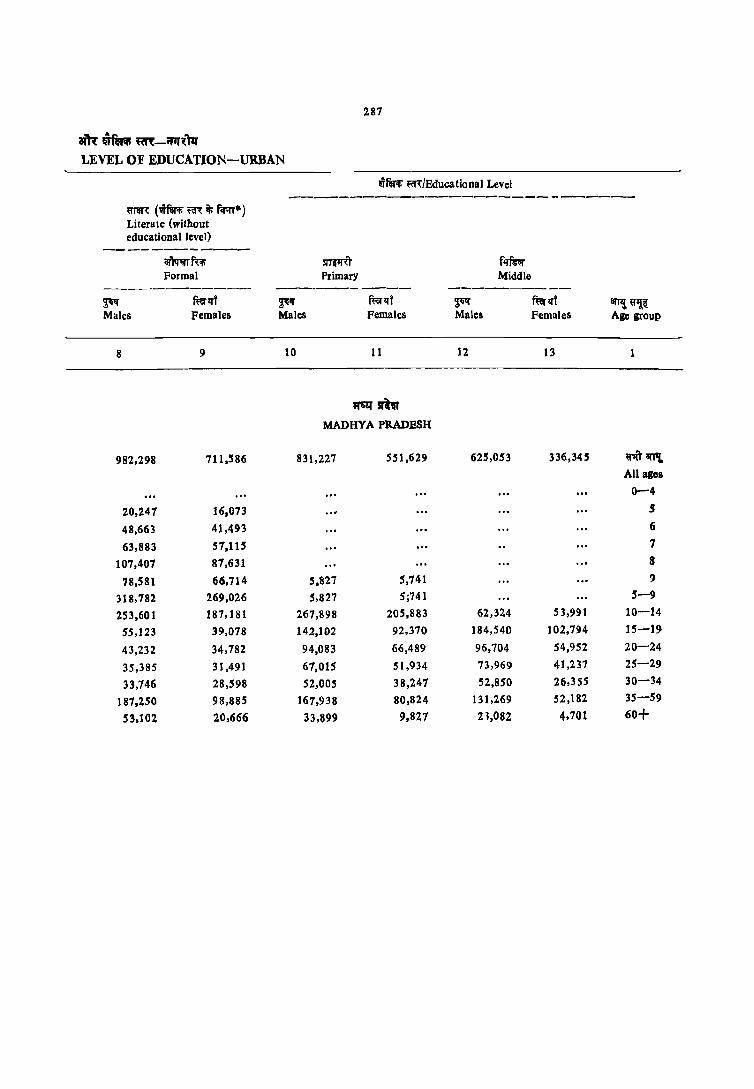
aiR u~ ~-;w'Il~N LEVEL OF EDUCATION-URBAN
~
~nm (WfWf; ~~ it; f;r:rr*) Literate (without educational level)
armrfu; Formal
mrq-f ~"
5IT~ PrimarY
287
wfWf; ~il'~/Educationa) Level
mrq-i ~
f~ Middle
Males Females Males Females Males
8 9 10 11 12
qar sR~
MADHYA PRADESH
982,298 711,S86 831,227 551,629 625,053
20,241 16,073
48,663 41,493
63,883 51,115
107,401 81,631
78,581 66,714 5,827 5,741
318,782 269,026 5,827 5;741
253,601 187,181 267,898 205,883 62,324
55,123 39,078 142,102 92,370 184,540
43,232 34,782 94,083 66,489 96,704
35,385 31,491 67,015 5 I ,934 73,969
33,746 28,598 52,005 38,247 52,850
187,250 98,885 161,938 80,824 t 31 ,269
53,102 20,666 33,899 9,821 21,082
mrq-f Females
13
336,345
53,991
102,794
54,952
41,237
26,355
52,182
4,701
iIlTI! «Il~ Age group
1
~arT\ All agcl
0-4
5
6
7
S !)
5-9
10-14
15-19
20-24
25-29
30-34
35-59
60+
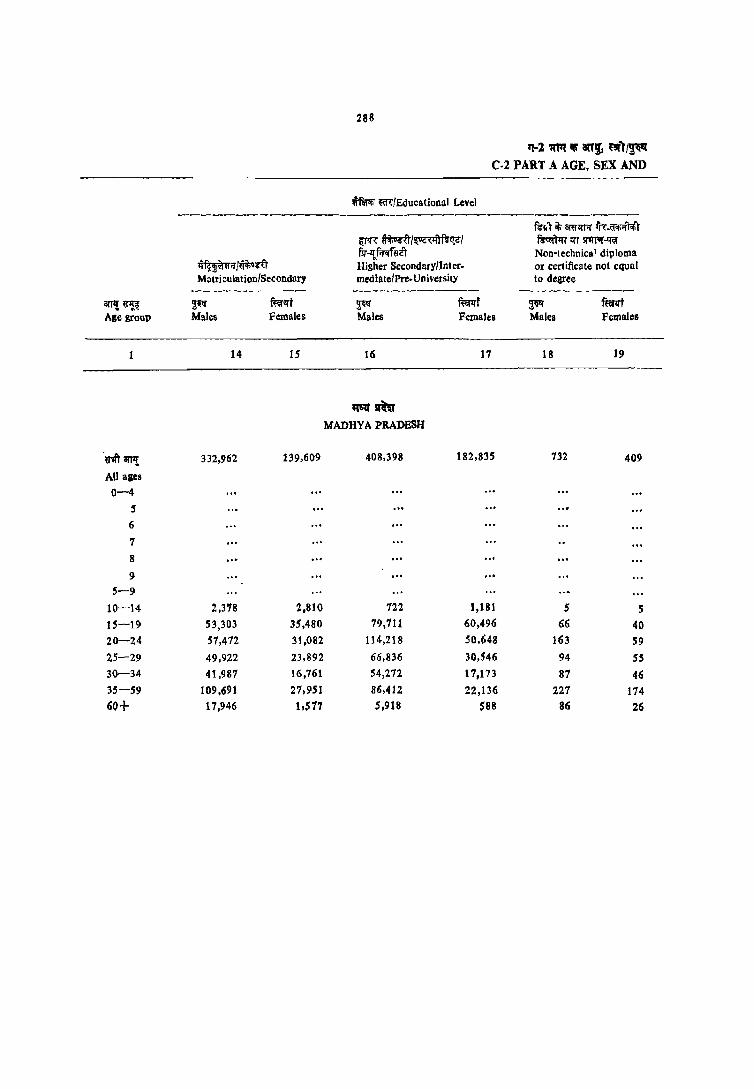
i!fTI!~ Age grOUP
omIT OTP! All ages 0-4
5
6
7
8
9
5-9 10-14
15-19
20-24
25-29
30-34
35-59
60+
"4fWm;r/~rlt MOlri:ulation/Secondnry
~ Males
14
332,962
2,378
53,303
57,472
49,922
41,987
109,691
17,946
~qt
Females
IS
139,609
2,810
35.480
31,082
23,892
16,761
21,951
1,577
288
'1-1 mrr Ifi ani, ~'/~ C-2 PART A AGE, SEX AND
1Iif~ m/EducatioDal Level
fj)''R ~iit/~~/ fl:r -qJiflffij iT Higher Secondary/Intermediate/Pre. University
$W Males
fuI1ff Females
16 17
~smr MADHYA PRADESH
408,398 182,835
722 1,181
79,711 60,496
114,218 50,648
66,836 30,546
54,272 17,173
86,412 22,136 5,918 588
m:r ii; ilf«1Wf ~_a<!iift'li"t ~lfr~..qer Non-technical diploma or certificate not equal to degree
Fi Males
18
132
5
66
163
94
87
227 86
%rift Females
19
409
5 40
59
SS 46
174 26

289
am: .tr~ ,~-~ LEVEL OF EDUCATION-URBAN
Jfi'fll'f'li' m/Educational Level -----------------------------------fi'vrii;~~~T fS"tor)1:rr liT sr;rrur-qr,r ij'ifiifJ'liT fglft Q- f1r;:;r ij'ifi;ft"ifl'l" fn7 ~ fir"!' Technical diploma or ~R"it ~mR"it certificate not equal Graduate degree other Post-graduate deg{ee other to degree than technical desree than technical degree ------ ----- ----------- -----------~ ft:~nr ~ f~lff ~ mrll"f arT!~ Males Females Males Females Males Females Age group
20 21 22 23 24 25 I
~n" MADHYA PRADESH
35,289 1,754 202,491 82,826 96,057 31,673 ~8lT'1 All agea
0-4
S ... 6 .. , 1 8 ,
5-9 10 10-14
1,217 123 5,539 7,870 381 846 15-19 7,665 341 54,IS7 34,003 15,767 13,696 20-24 6,507 340 43,124 19,227 22,610 10,290 25-29 5,590 306 33,320 9,983 17,675 5,620 30-34
13,587 590 61,294 11,403 37,450 7,031 35-59 672. 44 4,885 285 2,054 143 60+
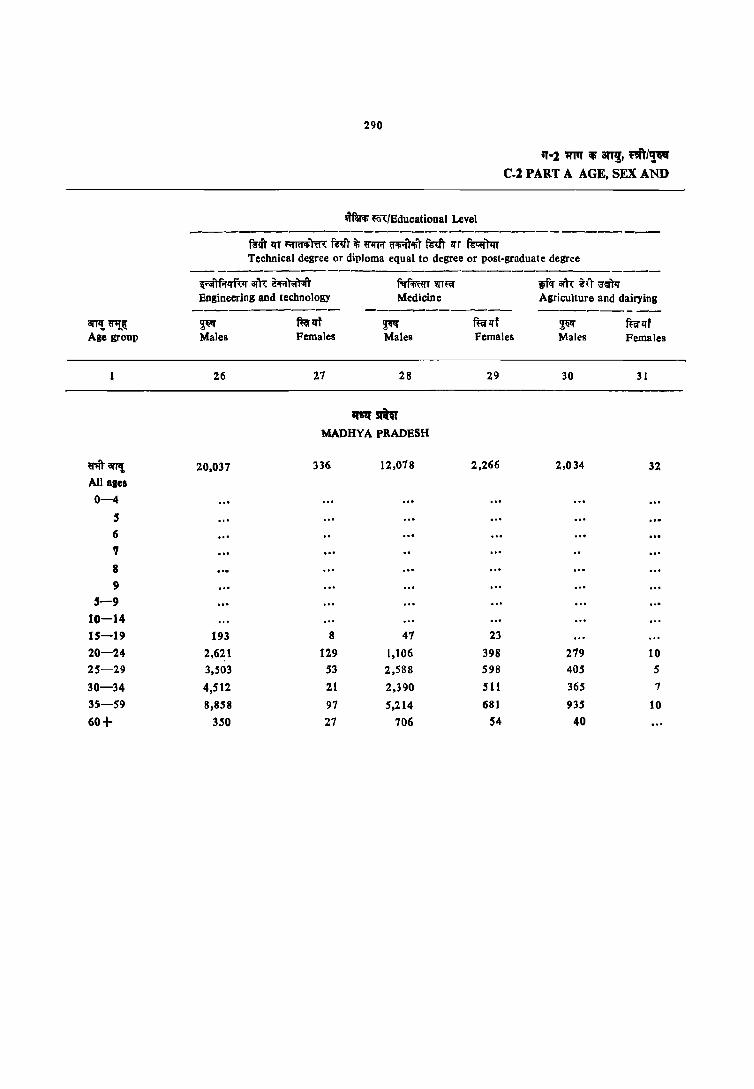
anI{ ~~ Age group
ri"arJ'l! All ages
0-4
5 6 'I
8 9
5-9 10-14 15-19
20-24 25-29
30-34 3S-59
60+
290
~ ~~/Educational Level
"-2 """ ~ an!, "''\'/'1" C-2 PART A AGE, SEX AND
R"IIT 1fT ~rm R"vr it; ~ ~ifir R"m 1fT f6t<;r)l:rr Technical degree or diploma equal to degree or post-graduate degree
--- -----------------------------------,;:;;ft'fifQm- iIl'R Z<A~ Rf1v~r 1ITf« wflf anl: ~lr '3''lIPr Engineering and technology Medicine Agriculture and dairying ------------ ----------- ----------~ ~lft ~ ~lft ~If mp:rt Males Females Males Females Males Females
26 27 28 29 30 31
If\1f m MADHYA PRADESH
20,037 336 12,078 2,266 2,034 32
193 8 47 23
2,621 129 1,106 398 279 10 3,S03 53 2,588 598 405 5
4,512 21 2,390 511 365 7
8,858 97 5,214 681 935 10 350 27 706 S4 40

am: "MIi ~-"'~ LEVEL OF EDUCATION-URBAN
;rm~ m/Educational Level ---------------------------- -------
Technical degree or diploma equal to degree or post-sraduate degree ------------------------------------
'Ill fqf.t;("<rT Veterinary
«ill.r( Males
32
469
21
70 63
310
5
f~d Females
33
Teaching
Till: Males
34
f~lti Females
3S
If'.1f Slbl' MADHYA PRADESH
13,194 14,355
18 148 411 3,082
1,361 3,714
2,160 2,819
9,294 4,388 534 123
CIf'rlI' Others
---------~ Males
36
101
5
13
10
21 41
5
mrlrl ~"«l!.~ Females Age grOUP
37 1
11 i'ft8ll11 All ageB
0-4 5 IS 1 8
9
5-9
10--14 15-19
5 20-24 25-29 30-34
6 35-59 60+

~ ;;r;rmr Total Population
-------ar"!~ ~ mp:rf Age group Males Females
2 3
~"" arT,! 97,557 80,693 All ages
0-4 13,041 1,2,298
5 3,151 2,727
6 2,933 2,641
7 2,439 2,026
8 3,409 2,660
9 2,063 1,753
5-9 13,996 11,807
10-14 13,348 10,294
15-19 11,001 7,9"9 20-24 9,782 7,684
25-29 7,530 6,245
30-34 6,014 5,127
35-59 18,416 15,114
60+ 4,293 4,061
Vlh all''f. 91,343 74,869
All ages
0-4 11,685 Il,022 5 3,033 2,447 6 2,655 2,447
7 2,251 1,961
8 3,064 2,280
9 1,943 1,654
5-9 12,953 10,789
10-14 12,591 9,318
15-19 10,168 7,181
20-24 8,059 6,565 25-29 6,426 5,438
30-34 5,426 4,638
35-59 18,926 15,284
60+ 4.968 4,500
f~~ Illiterate
-------~ ~i;P;fT
Males Feffi'\les
4 5
.. ~1;l'I'T
MORENA 39,712 54,738
13,041 12,298
2,780 2,476
2,055 2,058
1,328 1,295
1,441 1,390
619 716
8,323 7,935
3,044 4,130
2,113 3,678
] ,824 4,124
1,523 3,713
],437 3,419
6,361 11,700
2,113 3,712
f~
BHlND
38,391 51,132
11,685 11,022
2,136 2,288
2,020 1,991
1,180 1,276
] ,258 1,278
453 695
7,647 7,527
2,146 3.314
1,160 3,360
1,156 3.662
1,497 3,390
1,421 3,212
7,103 12,074
2,736 4,148
'£-2 m Ifi an~1 ~'Jl!~ C-2 PART A AGE, SEX AND
.nm (wfWli ~ it; fiM) Literate (without educational level)* -------
aTif~ Non-Formal ------------
~ ~!ff Males Females
6 7
1,025 424
19 2S
29 S
43 45
67 20
29 10
188 103
114 57
101 25
113 64
73 30
85 25
276 98
76 24
817 382
25 S 25 10
15 30 I5
20 S 116 35
SO SO 54 40
69 35
54 30
32 35 339 144
97 10

293
.m~~~-~'lI' LEVEL OF EDUCATION-URBAN
wfllf'fi Hf"{/Educational Level -----------------------------
~rm: (wflft"li \,(f~ ~ fififT) Literate <without educational level)*
------------a:r~rR'Ii ~ fqf~ Formal Primary Middle
----------- --.-------- ----------~ flii'fll"f ~If mrllT ~ f~ll"f ~~~ Males Females Males Females Malell Females Age group
8 9 10 11 12 13
.. ,~;:rr
MORENA
14,127 8,596 13,215 7,549 12,343 5,015 ~_il'fI! All ages
0-4 351 226 5 846 579 6
1,068 681 1 1,902 1,25 I 8
1,213 916 143 111 9 5,442 3,658 143 III 5-9 4,124 2,497 4,611 2,665 1,384 837 10-14
668 391 1,942 1,212 3,760 1,521 15-19
399 418 ],887 931 1,715 823 20-24 476 287 948 826 1,341 646 2;-29
369 295 810 566 902 413 30-34 ],940 887 2,979 1.112 2,658 131 35-59
659 142 645 126 578 30 60+
f'fPl' BHJND
13,053 7,175 13,013 7,036 10,910 4,667 arm arP{.
All ales
0-4 272 154 5 610 447 6
1,062 685 7 1,775 987 8 1,271 811 199 144 9 4,990 ),083 199 144 5-9
3,863 2,083 4,711 2,795 1,722 1,036 10-14
603 342 1,721 884 3,312 1,317 15-19
305 280 1,106 846 1,364 678 20-24 301 223 926 645 1,054 563 25-29
385 223 811 537 683 346 30-34 1,916 757 2,894 1,091 2,011 642 35-$9
680 168 623 89 634 7S 60+

~94
q-l ';('Pf '" atT~, ~,"/~ C-2 PART A AGE, SEX AND
IITfmr m/Educationa) Level -----.. --------------------------~-------
~Ift' it; arwn;r lT~-iji!i;fT'li) ~ ~uro/~~,)f~1 f'sr.rnn 1fT SIlTT'Il'..qa-fu-'!f.Rfirit Non-technical diploma
~~.~(~ Higher Second:ny/lnt..:r- Or certificate not equal MatriculationlSecondary media tel Pre-University to degree ----------- ---------- ---------
aTTl{ ~llil: ~ fuil"lft ~ ft7;~f ~ fua'lfT Age group Males Females Males Female'! Males Females
14 15 16 17 18 . 19
.. ~orr
MORENA ij'lftamt 1,998 752 9,405 2,394 All ages
0-4 5
6
7 8 9
5-9 10-14 38 69 32 39 15-19 431 185 1,852 813 20-24 327 142 2,728 669 25-29 274 139 1,748 367 30-34 171 73 1,228 200 35-59 623 129 1,735 293 60+ 134 15 57 3
f'IA RHINO
~8TTIi 1,474 540 8,660 2,383 5 All ages
0-4 S (;
7 8 9
5-9 10-14 61 69 38 32 15-19 403 200 :2,139 935 20-24 181 lJl :2,200 556 25-29 157 67 1,462 350 30-34 126 25 1,093 154 5 35-59 459 63 1,623 340 60+ 87 5 65 5

295
am: ~flR'li m-~q' LEVEL EDUCATION-URBAN
~~ m/Bducational Level -------------_...------------------------
mr"t 'li affii!l'f Cf'li'fTif> "t ~lfr liT ll'1I'J'UT-IJil a<f;;rT<f>T fu"liJ ij' o'li'fT'fil fi'Al ij' f'lT"l' Technical diploma or N;:;r ~<:r'Ii f51ft 'fim!"IiTm ftlft certificate not equal Graduate degree other Post·Graduate degree other
to degree than technical degree than technical degree ----------- ----------- -----------~ fta"<rl ~ ft;nt ~ ftnt atTlf. ~~ Males Females Males Females Males Females Age group
20 21 22 23 24 25
.. ~;n
MORE~A
254 3,480 808 1,377 367 nrarJ11 All ages 0-4
5 (;
7
8
9 5-9
10-14 5 120 148 10 20 15-19
77 1,036 35Q 326 132 20-24 39 756 159 232 75 25-29 25 640 77 220 45 30-34
104 910 60 575 91 35-59 5 10 5 10 60+
f1li'l' BHIND
311 2,695 652 1,353 256 U''ll arJ1{.
All ages
0-4 ... 5 ... 6
7 8
9 5-9
10-:-14 45 71 86 14 15-19
101 724 280 210 111 20-24 38 598 88 200 73 25-29
20 504 78 254 20 30-34
102 768 115 663 39 35-59
$ ,., lO ,0, 20 ... 60+
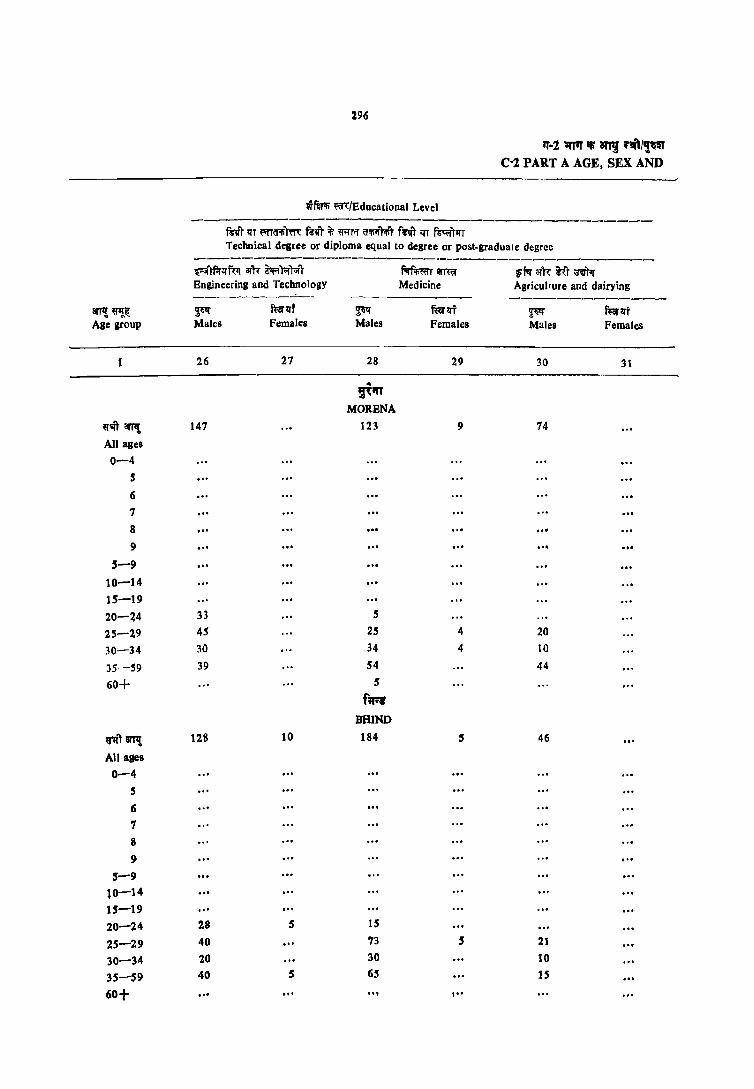
296
"-2 1n'T iii' 811! ,9ftJ,!~ Co2 PART A AGE, SEX AND
wf~ m/Educational Level --------------------------------------
R-iT liT ~CT'Ii~ R"IIT ~ ~Tif iI''!i;rR;T r!'1IT lI'T ~lfr Technical degree or diploma equal to degree or post-graduate degree
---------------------._------------------~"tm"m a!h" m~r.rT fiqf'lmlT IIIT~ iN or'\<: i'l.T ~ Engineering and Technology Medicine Agriculture and dairying ----------!.--- ---------- ------~-------
arT'! ~~ ~ mrll'f ~ m.r1fr ~ m.zrt Age group Males Females Males Females Males Females
26 27 28 29 30 31
... ~;n
MORENA
~-.ft' iIITIl 147 123 9 74
All ages
0-4
5
6
7
8 ... 9
5-9
10-14
15-19
20-Z4 33 5
25-29 4S 25 4 20
30-34 30 34 4 10
35-59 39 54 44
60+ 5
r .. BHIND
q'II'T81'T'!, 128 10 184 5 46
All ages
0-4
5
6
7
8
9
5-9
10-14
15-19 .. ' 20-24 28 5 IS
25-29 40 73 5 21
30-34 20 30 10
35-59 40 5 65 15
60+ ... ,,, .. , , ..

29'1
am~,,",~-~ LEVEL OF EDUCATION-URBAN
w!Wf; m/Educationa) Level ----------------------------------
miT II'T ~m<lim ftv't it; nr.r ~'t fttit II'T f~1fT Tec:bnical degree or diploma equal to degree or pOll-graduate degree ---------------------------
'"t~T arArr.f ar"I' Veterinary Tcachinl Othen ------- --------
~ mt ~ mt ~ ffim iIfI'!~ Males Females Males Females Males Females Ale &roup
32 33 34 35 36 37
.. !t;n
MORENA
5 212 41 U"IT'tarJII All ages
0-4 .. , 5 (j
7 8 !)
5-9 10-14 15-1!)
13 13 20-24 28 25-29
5 49 10 30-34 118 13 35-59
3 S ." 60+ fA'
BHIND 15 272 33 U '""8I'Pl
Allqes
0-4 5 ... . .. .., 6
." .. , ... 7 8 9
5-9 10-14
5 15-19
20-24 5 5 25-29
5 25 10 30-34 10 242 14 15 35-59 ,-, .t· ,., to, ,,, t·' 60+
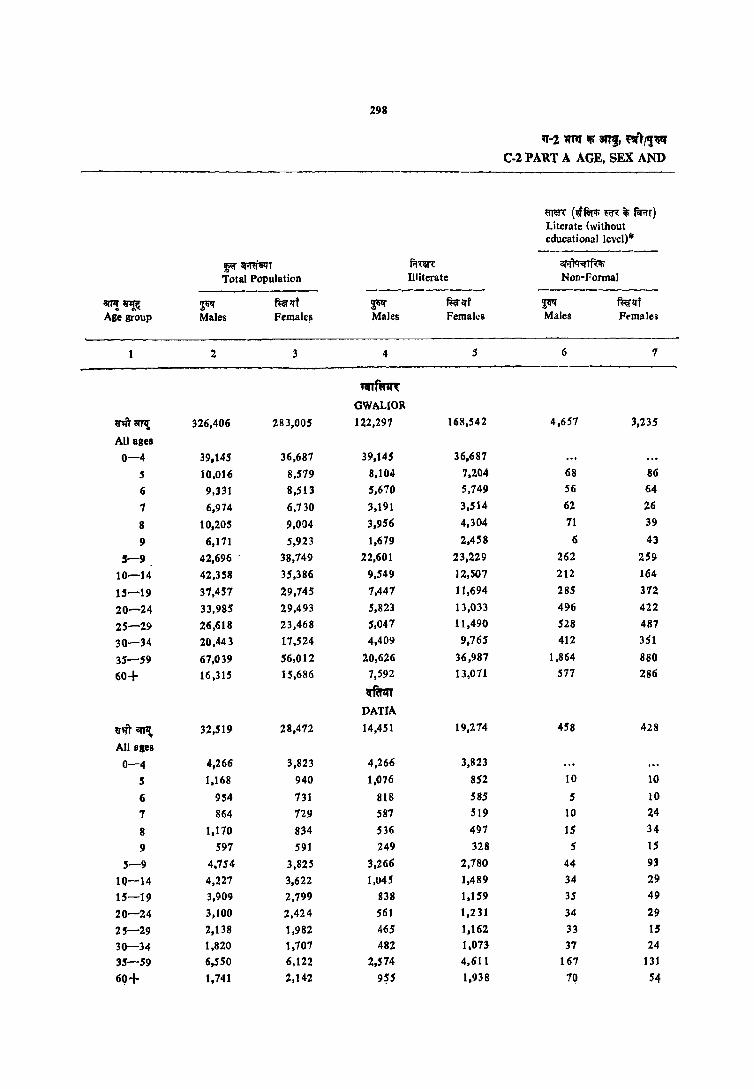
~~r Total Population
--------arTI!~ ~ mrd Age group Males Female~
2 3
n'Tamt 326,406 283,005
All ages
0-4 39,145 36,687
5 10.016 8.519
6 9,331 8,513
7 6,974 6,730
8 10,205 9,004
9 6,171 5,923
5-9 42,696 - 38,749
10-14 42,358 35,386
1.5-19 31,457 29,745
20-24 33,985 29,493
25-29 26,618 23,468
30-H 20,44] 17,524
35-59 67,039 56,012
60+ 16,315 15,686
Q'~ arJIt 32,519 28,4n
All ages
0-4 4,266 3,823
5 1,168 940
6 954 131
7 864 729
8 1,170 834
9 597 591
5-9 4.754 3,825
10-14 4,227 3,622
15-19 3,909 2,799
20-24 3,100 2,424
25-29 2,138 1,982
30-34 1.820 1,107
:3$-59 6,550 6,122
6Q+ 1,741 2,t42
298
f.!~ Illiterate --------
~ fta" 1ft Males Females
4 5
~ OWALlOR 122,291 168,542
39,145 36,687
8.104 1,204
5,610 5,749
3,191 3,514
3,956 4,304
1,679 2,458
22,601 23,229
9.549 12,507
1,447 11,694
5,823 13,033
5,047 11,490
4,409 9,765
20,626 36,987
7,592 13,071
mm DATIA 14,451 19,214
4,266 3,823
1,076 852
818 585
587 519
536 497
249 328
3,266 2,180
1,045 1,489
838 1,15'9
561 1,231
465 1,162
482 1,073
2,574 4,611
9$5 1.938
'l'-2 111'1 iii' an,. ~l,,!~ C-l PART A AGE, SEX AND
mm (wfil:rl; m iF fiAr) Literate <without educational level)*
----------ar~)tr;rrft'li
Non-Formal
----------Ff fuiill'f Males Ff'males
6 7
4,651 3,235
68 86 56 64
62 26
71 39
6 43
262 259
212 164
285 312
496 422
528 487
412 351
1,864 880 517 286
458 428
10 10
5 10
10 24
15 34
5 15
44 93
34 29
35 49
34 29
33 15 37 24
167 131
10 54

299
all'( !il~ m-~~N LEVEL OF EDUCATION-URBAN
wfm; ~<n:/Educational Level ----------------------------
~ (wflff;p' m ~ fiil'iIT) Literate (without educationallcve1)*'
------------~if\'f; srr~ fqfT.r Forma) Primary Middle
--------.----- --_._------- ----------~'i rnf/:rt ~If ft:Q<rt ~ ft:a" <rt ilITl! 91!~ M.lles Fem;!lcs M.lles Females Males Females Age group
8 9 10 II 12 13
~ GWALIOR
48,654 31,924 43,021 27,319 39,827 21,051 UlITilITl! All ages 0-4
1,844 1,289 5 3,605 2,100 6 3,720 3,190 7 6,177 4,661 8 4,004 3,005 483 416 9
19,350 14,845 483 416 5-9 13,733 8,632 14,323 10,539 4,265 3,258 10-14
2,600 I,HS 1,142 3,897 10,761 5,758 lS-19 1,902 1,193 4,498 2,848 5,715 3,038 20-24 1,586 1,045 3,151 2,296 4,312 2,525 25-29
1,296 901 2,841 1,860 3,072 1,561 30-34
6,Z21 3,153 8,950 4,649 9,606 4,339 35-59
1,828 689 1,611 781 2,054 562 60+
~
DATIA
3,644 2,294 4,439 2,834 3,917 1,852 ~ilITl! All ages
0-4
82 78 5
131 137 6
267 185 7
620 303 8
286 190 58 59 9
1,386 893 58 5') 5-9
1,062 751 1,566 1,006 486 327 10-14
227 119 872 411 1,141 589 15-19
113 100 463 293 526 295 20-24
96 81 221 216 381 201 25-29
84 61 204 225 331 134 30-34
468 205 848 552 812 285 35-59
203 57 195 73 168 15 60+

300
1(-2 111'1 • at'f!, '~/~ C-2 PAllT A AGE. SEX AND
.r~ m/Educational Level ------------------------------------
B'IIT ~ amsmr 1i1;~'" ~~f~~~1 ~ 1fT srqrqr..lfef
~~~f~ fir -,!f.rffuiT Non.technical diploma Risher Secondary/Inter- or certificate Dot equal
Matriculation/Secondary mediate/Pre·University to degree --------- -------_--- -~-
iIfTl!~ ~ ~1ft ~ ffi:lqt ~ ~1ft Age group Males Females Males Female~ Males Females
1 14 IS 16 17 18 19
nnrlllln GWALlOIl
W'Ift anI! 9,171 3,917 32,429 1 S,S 35 11 43
All alcI
0-4
5 C;
7 .. ' ... 8 ... 9 ...
5-9
10-14 1'3 138 103 144
15-19 1,381 1Z4 7,135 5,121 11 5
20-24 1,016 627 8,902 4,014 .5 5
25-29 1,050 H7 5,3S9 2,402
30-34 722 396 3,834 1,331
3$-.59 3,609 1,345 6.475 2,390 21
60+ 1,197 136 519 73 .5 mr DAnA
nlBmI 710 249 2,790 1,079
All aaes
0-4
5
6
7 .,. 8 ." 9 .,.
5-9 ." 10-14 19 1.5 IS 5
15-19 102 34 639 353
20-l4 90 39 778 257
25-29 91 41 441 152
30-34 80 33 322 111
35-59 305 82 560 195 ."
60+ u 5 29 .. ,

j01
aftt ~m. 'tR~ LEVEL OF EDUCATION-URBAN
~ m/Educatiooal Level
-----------------------mrltQIfT"'~ ~tOI'\'1n' lIT lAfIIr-'!'if <rI"I'Ri"t fn"t it' f\r;:;r a"Ii;:ft'lil fa-lIT ~ f1t;:;r Technical diploma or ~fm ~~m~1IT certificate not equal Graduate degree other Post-graduate degree other to degree than technical degree thaD technical degree
-----------~ ff«lff ~ fuflff ~ mrqt 311!~ Males Females Males Fcm:lles Males Females Age group
20 21 22 23 24 25
~ OWALIOR
1,291 126 15,199 6,917 6,961 3,639 nr orJ1! All ages
0-4 .5
6 1
8
9 5-9
.5 10-14 48 5 529 709 36 96 15-19
217 16 3,860 2,816 974 1,218 20-24 210 42 3,303 1,584 1,430 895 25-29
197 .5 2,25'1 140 1,009 .524 30-34 491 5'3 4,113 1,102 3,215 815' 3.5-.59 57 .521 26 231 21 60+
tim DATIA
68 1,313 283 490 160 U''lj arpt
All aac. .,. 0-4
5 6 1
8 9
5-9 10-14
.5 45 74 .5 10 15-19 25 403 117 104 63 20-24
.5 264 65 79 34 25-29
14 188 9 53 21 30-34 19 399 19 231 32 3.5-59
·14 19 ... 60+

jQ2
q-i mrr iii 811! '''''11-C-2 PART A AGE, SEX AND
lliffi ~~,'Educational Level ----------------------------------------
~~ liT 'i'tld'l1t'd( f.p.ft iii ~ Q'i;;ft~i" mrr 1fT ~t"T Technical degree or diploma equal to degree or post-graduate degree ------------_ .... _-----_ .. _-----------------
~l{fut arlt ~i" MiIifflT ~~ if N aft;: i1.i" :aVrrr EnSineerins and Technoiosy Medicine Agricul'ure and dairYing ---------- ---------- ______ a _______
arlll ~ii: ~ f~lIf ~ ~lft ~ ~lit Ase group Males Females Males Females Males Females
1 26 27 28 29 30 31
~ OWAUOR.
«111 iITt'{ 954 31 1,269 223 290 5 All ages
0-4 05 .. , 6 1 .. , 8
9 5-9
10-14 15-19 5 11 20-24 185 S 231 57 83 S 2S-29 1705 S 389 S5 27 30-34 176 5 159 36 22 35-59 393 5 394 72 152 60+ 21 10 80 4 5
~
DAnA «-IT att"t 2.4 58 4 All aleS
0-4
5
6
1
8 I)
5-9
10-14 105-19 20-24 25-29 10 29 4 30-34 14 35-059 14 10 5 60+ 5 ...
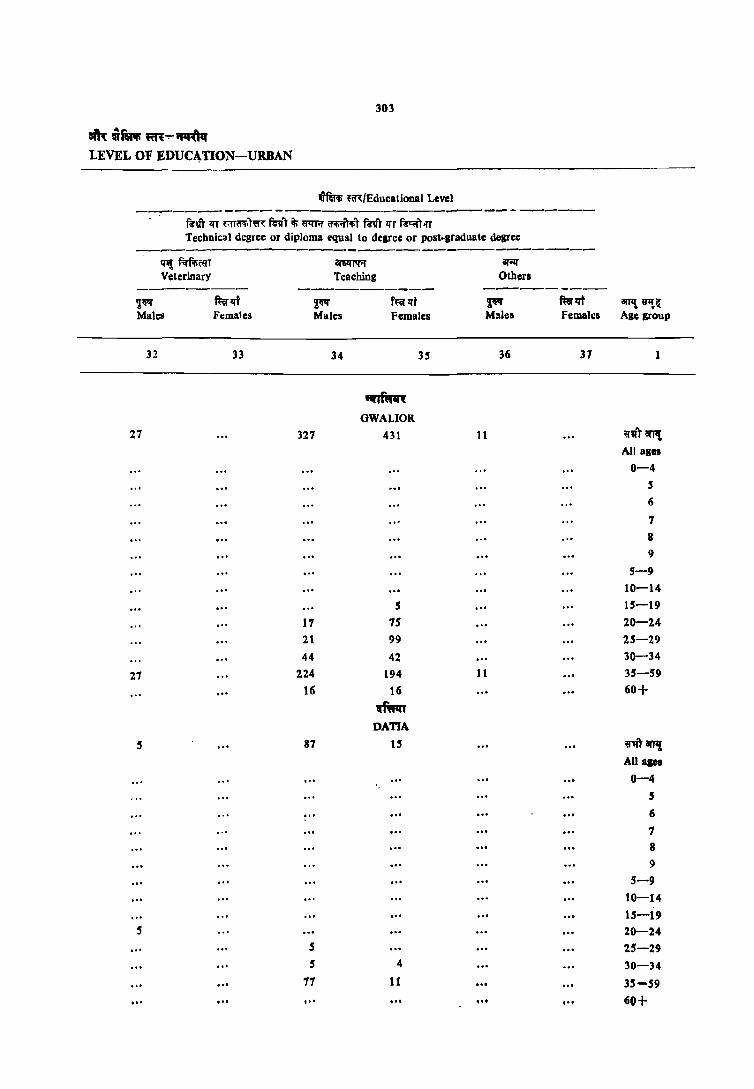
303
siku_~..,..~
LEVEL OF :EDUCt\TION-URBAN
-'I'm; ~i'fl:/Educational Level ------ - -----------------_..,---- - _-----Technical degree or diploma equal to degree or post-Braduate degree
CI1l AAffiT Veterinary
~~ Males
32
27
27
5
,,,
ffir lit Females
33
,,,
~
aJElfl'fo'r Teaching
Males f~lfi Females
327
17
21
44
224 Hi
87
5
5
17 ,,,
34
~ GWALlOR
431
5 75 99
42 194 16
~ DATIA
15
4
11 ,.,
35
arHI' Others
~ Males
36
11
11
...
ffir liT i!!TI{ ~ ~ Females Age group
37
,.,
n1' sl'Tll All ages
0-4
S
6
7
8
9
5-9
10-14
15-19
20-24 25-29 30-34 35-59 60+
"1' iIf11[ All asc. 0-4
5
6
1 8
9 5-9
10-14 is-19 20-24 25-29
30-34
35-59
60+

fOI' ;r;niwr Total Population
-------arr,;~ ~ mrzrt Age group Male. Female.
1 2- 3
~~ 6v,130 51,017
All al('8
0-4 7,278 7,171 5 1,831 1,574 6 1,697 1,581
7 1,524 1,337
8 1,974 1,789
9 1,093 1,177
5-9 8,121 7,459
10-14 8,410 6,565 .5-19 6,868 5,096
20-24 6,062 4,940
25-29 4;737 3,964
30-34 3,105 3,096 35-59 12,291 9,901
60+ 2,595 2,761
~amt 75,221 66,378
All agos 0-4 8,768 9,511
S 2,260 1,950
6 2,110 2,092
7 1,620 1,554
8 2,478 2,275
9 1,455 1,3S1
5-9 9,922 9,122
10-14 ] 0,295 8,722
15-19 8,800 1,023
20-24 7,755 6,112
25-29 5,997 4,941
30-34 4,659 3,902
35-59 14,945 12,673
60+ 4,009 3,643
304
f-rnrt Illiterate
----------~ ~t Males Females
4 5
~~ SHIVPUal
24,039 33,937
'1,:2.78 7,171 1,611 1,441 1,246 1,220
811 780 924 1,009 367 545
4,958 4,995
1,924 2,685 1,342 2,201
1,214 2,410
99'1 2,291
881 1,973
4,222 7,671
1,212 2,522
wn OUNA
28,451 42,145
8;168 9,512
2,022 1,744
1,596 1,643
1,031 1,044
1,154 1,361
448 599
6,251 6,392
2,122 3,645
1,194 2.746
1,027 3,194
J ,170 2,555
1,083 2,285
5,041 9,200
1,790 3,106
"-2 """ iii IfTI, fit/~ C.2 PAR.T A AGE, SEX AND
~ (~ an: it; fiAt) Literate (without educatioDal level)· --------
ar;r)mfu; NOD-Pormai ----
~ ftnt Male. Females
(; .,
746 534
.0'
16
21 11
5 12 16 28 21 6 79 67 7J 39 62 SO 49 44 65 33 64 50
244 190 104 50
582 446
11 21 11
5 26 .. , 67 16
47 38
19 91
46 12
12 66
43 17 191 118
91 27
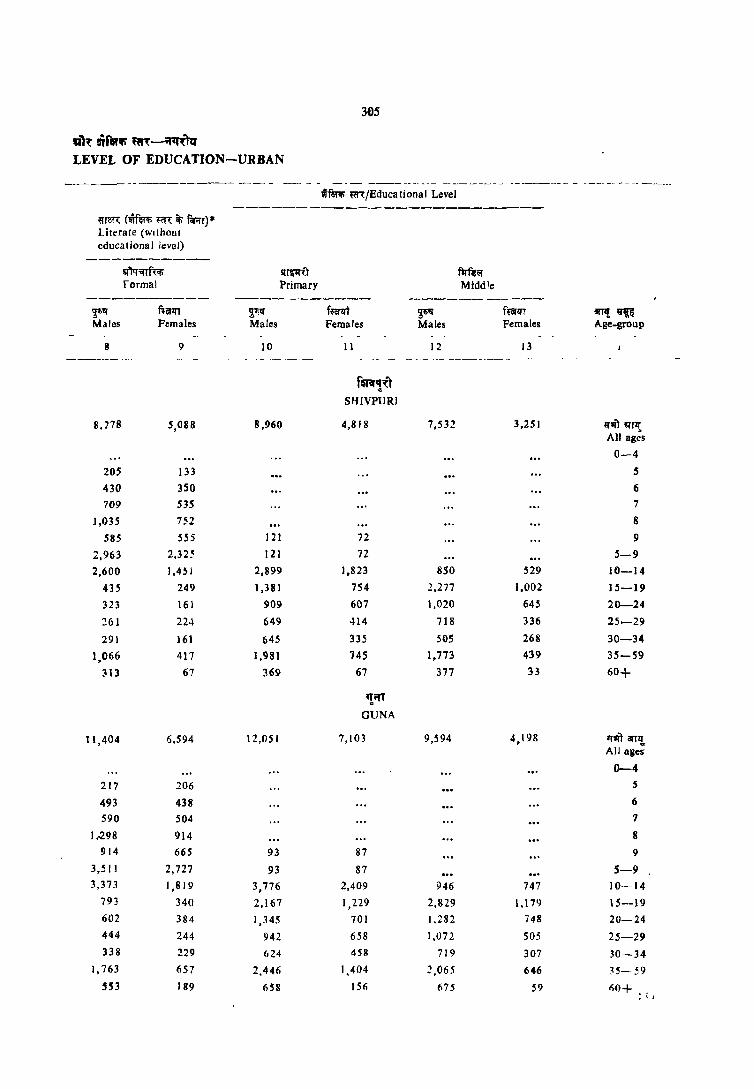
a'~ "ftlifi "'~ -~T1:r LEVEL OF EDUCATION-URBAN
~ren: (mm lOot iii f<r'fr)* literate (wIthout educational level)
~I'f
Males
8
8,278
205
430 709
J ,035
585
2,963
2,600
435 323
::!61
291
1,066
313
11,404
217
493 590
1,.298
914
3,S II
3,373
793
602
444
338
1,763
553
f'~1iT Females
9
5,088
133 350 535
752
555
2,32~
1,451
249
161
224
161
417
67
6.594
206
438 504
914
665
2,727
1,819
340
384
244
229
657
189
!!~I'f Males
10
!{~U Primary
8,960
121
121
2,899
1,381
909
649
645
1,981
369
12,05 I
93
93
3,776
2,167
1,345
942
624
2.446
6S8
305
wf81~ ~/Educa tional Level
f,,",y Females
II
SHIVPURJ
4,818
72
72
1,823
754
607
414
335
745
67
GUNA
7,103
87
87
2,409
1,229 701
658
458
1.404
156
~~I'f Males
12
7,532
850
'2,277
1,020
718
50S
1,773
377
9,594
946
2,829
1.282
1,072
719
:? ,065
675
flffc~ Middle
f~IfT Females
13
3,251
529
1,002
645
336
268
439
33
4,198
747
1,179
748
505
307 646
59
iIT,!9'~ Age-group
If'!! ~rll' All ag;s
0-4 S
6 7
8
9
5-9
10-14
15-19
20-24
25-29
30-34 35-59
60+
'lIT! afT'!. All alles-
0-4 5
6
7
8
9
5-9
10-14
15-19
20-24
25-29
30-34
3S-~9
£;0+ : 11
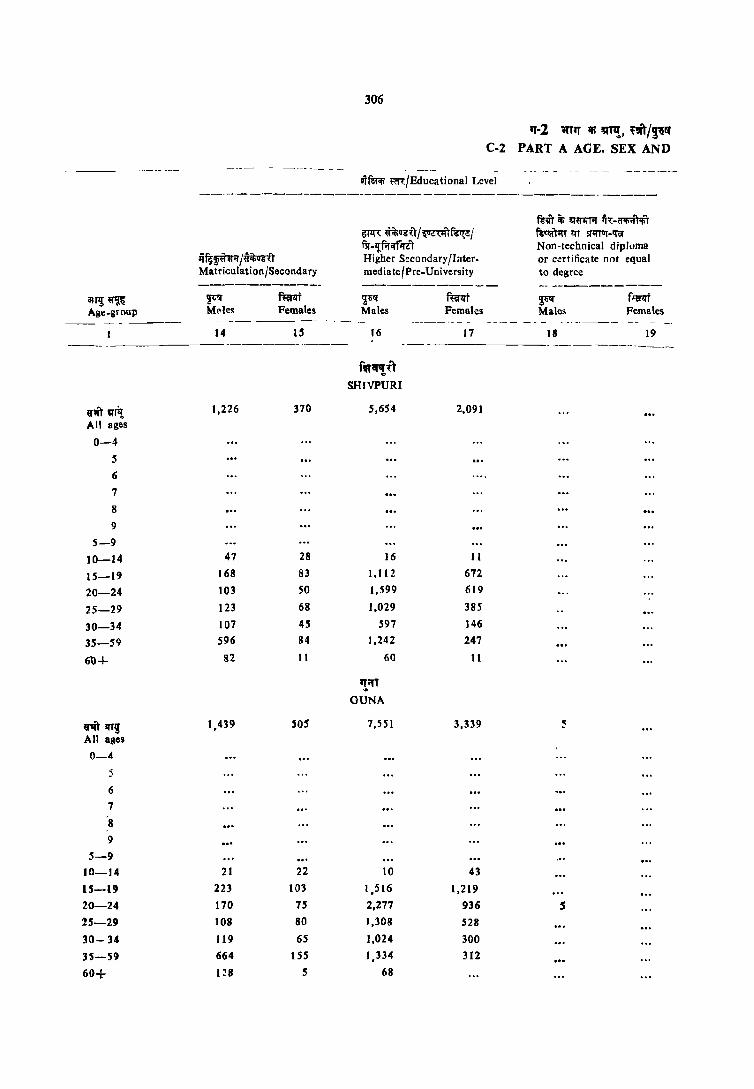
all'~~ Age-group
8'm 'l'rl! All ages
0-4 5
6
7
8
9
5-9
10-14 15-19 20-24
25-29
30-34 35-59
60+
8'1it ilfTlJ All ages
0-4
5
6
7
'8
9
5-9 10-14 1S-19 20-24 25-29
30- 34 35-59
60+
~~~~Wif /«11;1151:1 Matriculation/Secondary
14
1,226
47
168
103
123 107 S96
82
1,439
21 223
170 108
119 664
128
f~qt Females
370
28
83
50
68
45 84
1\
505
22
103 7S 80
6S ISS
S
306
'1'-2 11'1'1' iii ~"!, ~l/~q" C-2 PART A AGE, SEX AND
wfallii t<fr/Educational Level
~!f'l: ~~Q~~/~RI1;i!:/ fll-l{f.r1ff'IGT Higher Secondary/Intermediate/Pre-University
~I{ Males
16
f~ Females
17
fsm- ~ 'l'8'l'!Tif iir -1fIRm fc~ !:fT 5fl'I111f-'l'a' Non-technical dipluma or c~rt i fica te not equal to degree
~ Males
18
f~qt Females
19 ------------. -----------_._--
SHIVPURI
S,654
16
1,112 1,599
1,029 597
1,242
60
'!,"" GUN A
7,551
10
I,S 16 2,277
1,308
1,024
1,334 68
2,091
11
672
619
385 146
247
11
3,339
43
1,219
936 528
300 312
S

301
,"'T~lti~-~t:(
LEVEL OF EDUCATION-URBAN
Wf~lfi ~/Educauonal Level
-------------------------------------~lI') ij; 1!f6"l!T'f Cfifiiflif,)
~, lIT lIlITlIf-'l"iiI Tech nk:aI diploma or
certificate 1I0t equal to degree
~'i~ Males
~ Females
<I!fiifTifiT ~lit iJ f'll"l .-rHIlfi fm Graduate degree other than technical degree
'l~
Males fi;;fIl"T Females
W1i;ftif>T f~lit Ii f'IFif ~HrliRr~ mrt Post-gradua Ie degree other than technical degree
~ Males
Irfli ij'~ Age-group
-------------------------- ---------_. - --- -- --- _. - --~---~-20
101
10
39
II
11
28
178
16
36
54 10
62
21
6
6
10
5
4
22
2.301
80
579
597
349
646
51
2,563
43 729
594
445
727
26
23
f~<f~~T SHIVp{JRI
566
62 268
114
65
,57
, .. , GUNA
945
104
404
208
,1,4 1
87
24
927
191
211
169
339
10
1,085
209
226
191
433
lfi
25
316
17
135
94
36
35
415
II
188
82 67
6R
'Om "'If All age; 0-4
5
6
7
8
9 , 5-9
10-14
15-19 20-24
25-29
30-34
35-59
00+
~,,') "'t~ All !Iges
0"':':'4 5
6
7
8
9
5"':""'9 I
10-14 I
15-19 20-24
''l,. 25-,,9
"
30"":'34
3!i ~:?9 (\0+"

308
1'(-2, "I'rq Ifi an'!, "'n'j,!~1!i( C-2 PART A AGE, SEX AND
--------Ili"fllT'Ii ~'{/Educatjonal Level
---------------------------_----------f~m lIT r-mrlflffi"{ fSllI' t aiITif (Iifi";;l'iffr f:gm lfr f~)1rT Technical degree or diploma equal 10 degree or po,t-graduate degree
--------------------------------------~;;lff<:~ 'l'h: ~iR1.niT f1qf'li~m WT~ ,,!fl'f arn: h'T ;m1lJ' Engineering and technology Medicine Agriculture and dairying
------------- ----------- ------_._--iIfT7! ~ ~ f~1li ~1l1i f~t ~1l't f~1IT Age-group Males Females Males Females Males Females
-_---------_---26 27 28 29 30 31
f~(' SHIVPURI
~ ;qrl{ 110 165 23 6 All ages
0-4
5
6
7
8
9
5-9
10-14
15-19
20-24 Ii 23
25-29 53 23
30-34 28 17 II 6
35-59 II 91 12
60+ 6 I 1
"if' . GUN"
rit err,! 93 S 135 21 21 All ages
0-4
5
6
7 ... S
9
5-9 10-14
15-19 20-14 26
25-29 10 S 31 4
30~J4 16 36 13 10
U -59 42 67 4 10
60+

~ Uf~iifi ~-;:rtn)q LEVEL OF EDUCATION-URBAN
.rfIR'li m-/Educational Level
fCVT 1fT fifrCf'liTffi ~Yr iii 6ifT" Cf'liilr;tt ~'Ir 1fT fll~r Technical degree or diploma equal to degree or post-graduate degree
--------------------------------------'""";""--
~"
'f-I f'iffirnrt Veterinary
, Males
32
Females
33 ----------
6
6
~ Males
34
79
28 51
119
16
99
5
Teaching
ffillJt Females
35
f~~r SHIVPURI
17
6
6
6
GUNA
52
5
11
18
17
~~ Males
36
!llP1J Others
f~lfj Females
37
anI! "'J~ Age-group
- -- -- - - - _--- ----_
~'fT "I~ All ages
0-4 S
6
7
8
II
5-' 10-14 IS-19 20-24
2S-29
30-34
35-59
60+
U1ft'amt All 'lIes
0-4 , 6
7
8 9
5-9 10-14 IS-19
20-24
25-29
30-34
35-59
60+
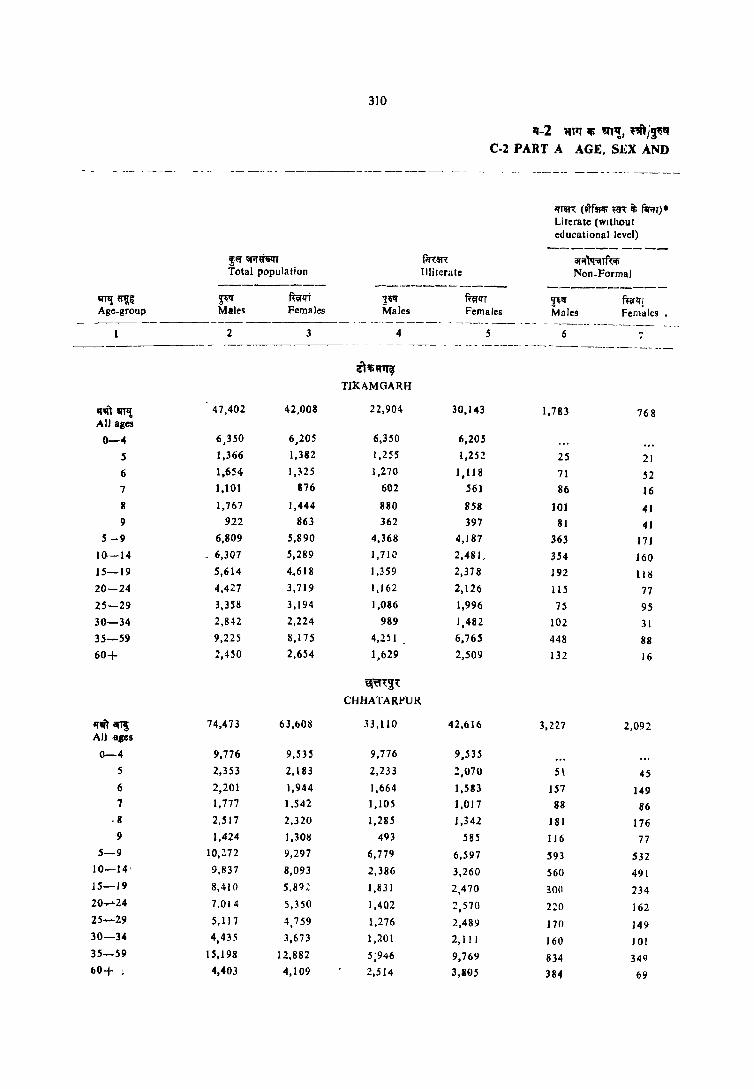
310
q-2 lItlf II> ,"'!, ~i~ C·2 PART A AGE, SEX AND
-_ ---. - _- --- _-_ -----.-- ---- -- ------ ._ ----~---- --------- ------.
iJT~l (lif$l'li .(R if, f.r.!1). Literate (wIthout educational level)
----------!;;r ;;rr~w f;rlm ar;r'\<r-illfut; Total population Illiterate Non.Formal
---------- -------------- -----------iITll 9111: ~ mrlft ~~ ffeflfT 111l1f ftiil"lfT Age.group Males Females Males Females Males Fem~les ,
--------- - -- -_--_------ - -.-._-_ ---- --_ - -_----_- -------~-----~
2 3 4 .5 6 "; --- _- ---- _--_---- ----- - -
- _po, _____ -- --- ---------- - ----------~ ------ ---ilili~qiJ
TJKAMGARH
"'" m,! 47,402 42,008 22,904 30,143 1,783 768
All ages
0-4 6,350 6,205 6,350 6,205
5 1,366 1,382 1,255 1,252 25 21 6 1,654 I,ns 1,270 1,118 71 52 7 1,101 876 602 561 86 16 8 1,767 1,444 880 858 101 41 9 922 863 362 397 81 41
.5 -9 6,809 5,890 4,368 4,187 363 171 10-14 6,307 5,289 1,71 () 2,481, 354 160 15-19 5,614 4.618 1,359 2,378 192 11 K 20-24 4,427 3,719 1,162 2,126 115 17 25-29 3,358 3,194 1,086 1,996 75 95 30-34 2,842 2,224 989 1,482 102 31 3.5-59 9,225 8,175 4,2~ 1 6,765 448 88
60+ Z,4S0 2,654 1,629 2,509 132 16
~~~~l:
CHHATARPUR
If.rt ~ 74,473 63,608 33,110 42,616 3,227 2,092 All -lipS
0-4 9,776 9,535 9,776 9,535
5 2,353 2,183 2,233 2,070 5\ 45 6 2,201 1,944 1,664 1,583 1.57 149 7 1,777 1.542 1,105 ],017 88 86
.8 2,~ 17 2,320 1,285 1,342 181 176 9 1,424 1,308 493 585 ] 1 6 77
.5-9 IO,~72 9,297 6,779 6,597 593 .532 10-14' 9,B37 8,093 2,386 3,260 560 491 15-19 8,410 5,BQ~ 1,831 2,470 300 234 20..,....24 7,0 14 5,350 1,402 2,570 220 162 25-29 5,1 J 7 4,759 1,276 2,489 170 149 30-34 4,435 3,673 l,lOI 2,111 160 101 35-59 15,198 12.882 5;946 9,769 834 34Q 60+ ; 4,403 4,109 2,514 3,805 384 69
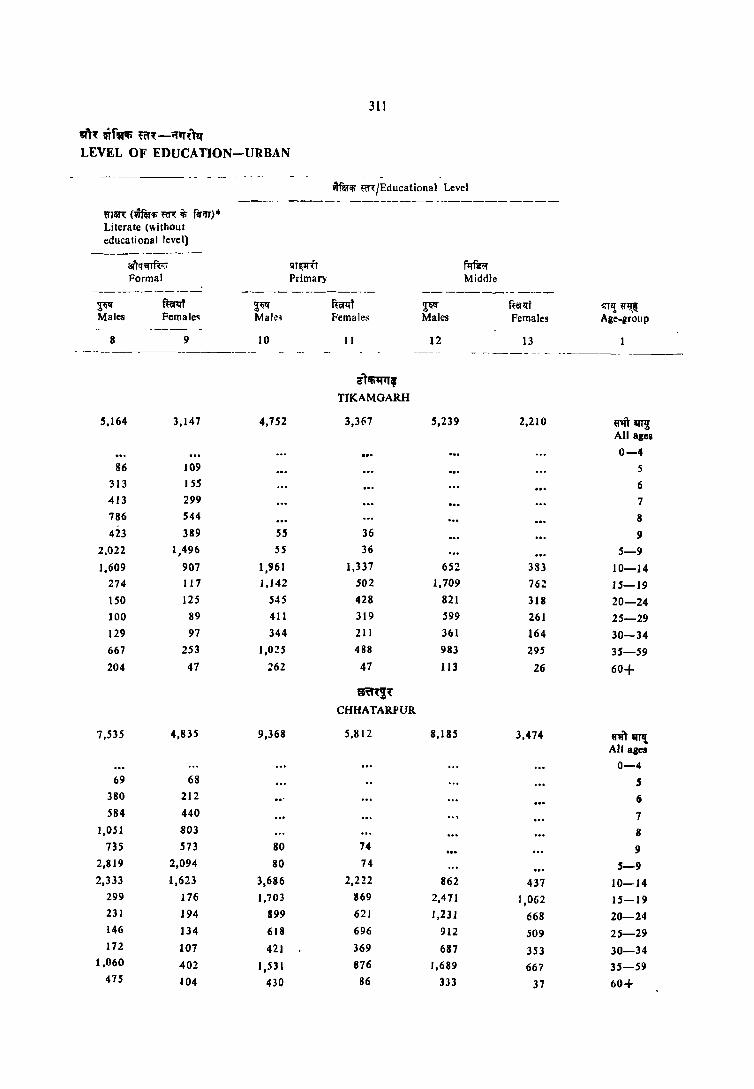
",'l~ ~fWfi m~-';f'T~llf LEVEL OF EDUCATION-URBAN
8"11lf,\ (wm1i feR: ij; flf'IT)· Literate (\1ritbout educational level)
~ Males
8
5,164
86 313
413
786
423
2,022
1.609
274
l50
100
129
667
204
7,535
69
380 584
1,0.5 1
735
2,819
2,333
299
231 146
172
1,060
475
arT'f;;rft.;:; Formal
9
3,147
109
15S
299
544 389
1,496
907
117
125
89
97
253
47
4,835
68 212
440 803
573
2,094
1,623
176
J 94 134 107 402
104
10
4,752
55 55
1,961
1,142
545 411
344 1,025
262
9,368
80
80
3,686 1,703
899
618
421
1,531
430
IIT~tT Primary
311
tif9111 '~n::JEducational Level
~qt Females
II
cT~, TIKAMGARH
3,367
36 36
1,337 S02
428 319
211
488
47
~l!t
CHHATARPUR
5,812
74
74
2,222
1169
621 696
369
876
86
~~ Males
12
5,239
652 1,709
821 599
361
983
113
8,185
862 2,471
1,231
912
687
1,689
333
flf~", Middle
f~iirqj Females
13
2,210
383
762 318
261 164
295
26
3,474
437 1,062
668
509 353
667
37
irTIi ~ Age-group
6'1ft~ All ages
0-4 5
6
7
8
9
5-9
10-14
15-19
20-24 25-29
30-34 35-59
60+
W1ft' qJ''! All ages
0-4 , 6
7
8
9
5-9
10-14 1S-19
20-24
25-29
30-34 35-59
60+
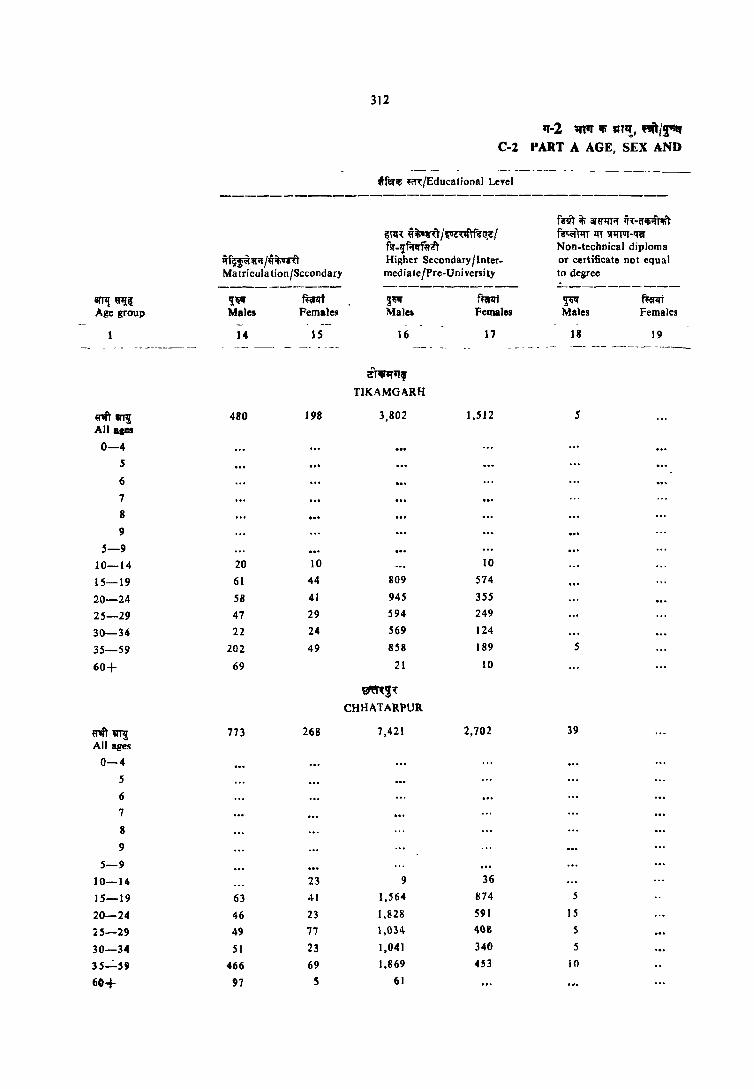
312
11-2 1fI1I iii a,~, m/r'" C-2 PART A AGE, SEX AND
-- ----- - _--- -_------ --_- ---------tflft"if," ,,":{Educa.ional Level
------------------------------------f6lfi if; ara''lTif lj~·ijlfiif'Ai\'
~TIH ~ij;qTU/~lf6Il;e{ fgcorTIIT tTT ~1fI1II'-!fa-flf -,!fifqf~zT Non.technical diploma
1\r~1Tif/~~T Higher Secondary J Inter- or certificate nol equal Matricula tion /Sccondary mediate/Pre-University '0 degree ----------- ------_-_ .. _-- ----------
arTlJ ~~ 'I" ftijrqf ~~ f~ ~ ftenJt Age group Males Female~ Male. Females Males Females
J4 15 16 17 18 19 - - ------- -- - -- - --- --- -- ------ ----_
iT~' TIKAMG..\RH
""l1l'i1 480 198 3,802 1,512 S All aces 0-4
5
6
7
8
9
5-9 10-14 20 10 10
15-19 61 44 809 574
20-24 58 41 945 355
25-29 47 29 594 249
30-34 22 24 569 124
35-59 .202 49 8S8 189 5
60+ 69 21 10
~!'{
CHHATARPUR
"" \1T! 773 268 1,421 2,102 39
All ages
0-4
5
6
1
8
9
5-9 10-14 23 9 36
IS-19 63 41 1,564 874 5
20-24 46 23 1,828 591 15
25-29 49 71 1,{}~4 4611 S
30-34 S I 23 1,041 340 5
3S_:_'S9 466 69 1.869 453 10
60+ 91 5 61

313
~'{ ~~ ~-ll1Rrzr LEVEL OF EDUCATION-URBAN
~~ m/Educational I.evel -----------------------------------fliT it; at'ij"l'fA ~T ~II'T I<T lIlfT1IT..qor <I'Ii'i~rfnT~ ~rfglft'~foq;:;r
Technics 1 diploma or f1A r.mf'l'i" ft 1ft' ~rcFI;)'ffi: ftlft' certificate 1I0t equal Graduate degree other Post-graduate degree other to degree than technical degree than technical desree
----------- ---------- -----------~ ffif<Tf ~lf mrlTT ~ mrlTt ampr~
Males Females Males Females Males Females Ale Stoup
20 21 22 23 24 25 1
~~ TIKAMGARH
139 1,289 426 584 193 n" 81'11£ AlIases
0-4 5
6 7
8 9
5-9 10-14
5 57 106 5 16 15-19
26 5 487 162 107 74 20-24
21 202 77 188 67 25-29
37 148 50 80 26 30-34
43 389 30 198 10 35-59
6 5 5 60+
~'{
CHHATARPUR
332 11 2,517 776 1,313 447 ~1ft" 8frIl AU aiel
0-4
5 , 7 8
9
5-9 10-14
60 106 141 18 15-19
50 784 287 278 152 20-14
25 494 130 304 108 25-29
65 303 93 212 88 30-34
131 11 792 116 484 81 35-59
39 5 35 60+
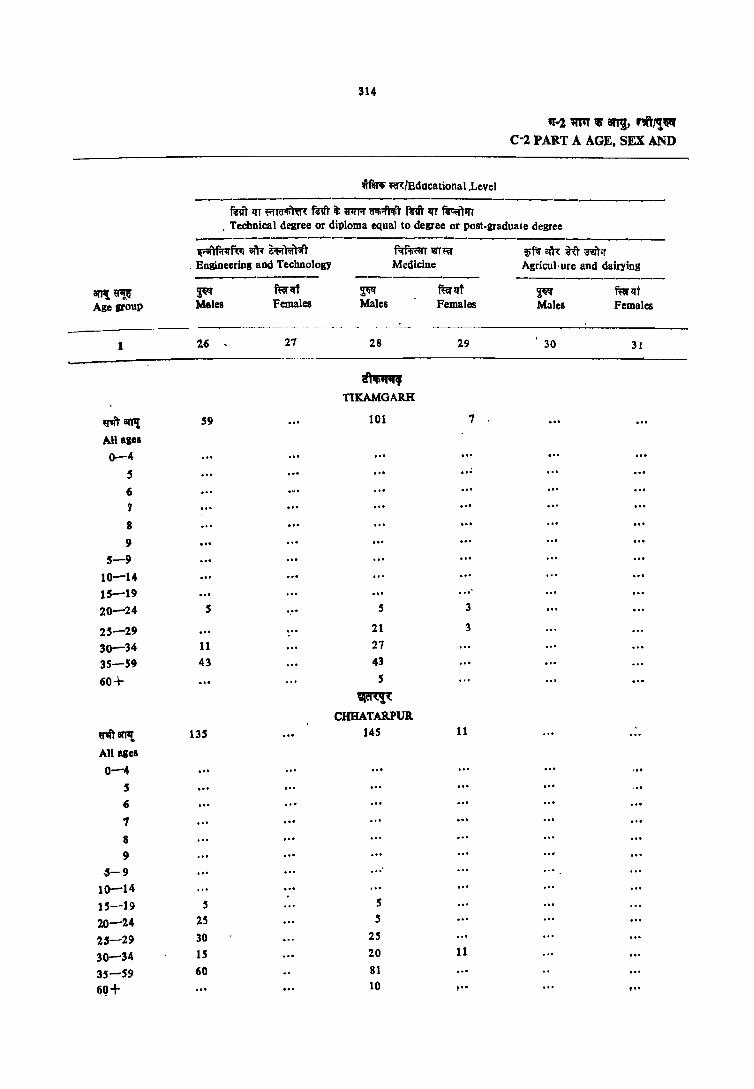
314
11'-2. 1ItII' 'I 81'11, nftl'!~ C-2 PART A AGE. SEX AND
~ m/Educational.Level ----------------------------------mrr lfT fifffi'lim mIT it; ~ ijifi;ftoft fm lfT fitorllfT
. Technical degree or diploma equal to degree or post.graduate degree -------------------------------------~R1I am- ~r.ir.rr Rf.mrr QIT~ wf\'.l~~m'T
. EngiDecring and Technology Medicine Agricul,ure and dairying --------- -------- -----_._-----
anat~ ~ ffiflff ~ ffir lfT ~ f\'a'lfj Age group Males Females Males Females Males Females
1 16 27 28 29 30 31
~ TlKAMGARH
~81'111 59 101 7
All agcl
0-4
5 ... 6 7
8
9
5-9
10-14 15-19 .. , 20-24 5 , .. !I 3
25-29 21 3
30-34 11 27
35-59 43 43
60+ 5
~ CHHATARPUR
~erPt 135 145 11
All ages
0-4
S (; ., 8 9
-5-9 .. , 10-14
15-19 5 5
20-24 25 5
25-29 30 25
30-34 15 20 11
35-59 60 81
69+ .. , 10 ... , ..
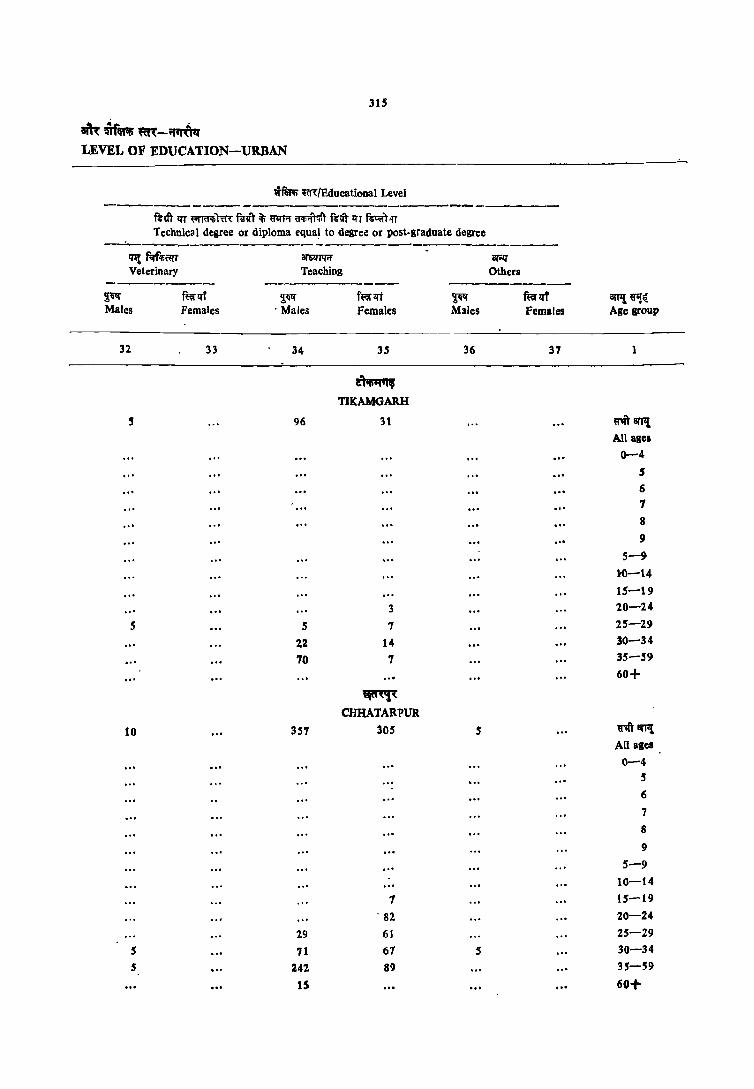
315
am: oiflR'li ~-~ LEVEL OF EDUCATION-URBAN
wmon ~/Rducational Level ---------------------------------
~Il'r IU ~ TU"{ fn'\" ~ ~ QlIiiIT<r.r f:glft' 1fT ~ >IT
Technic31 degree or diploma equa! to degree or post.graduate degree -------------------
~ f.tf'li«fr ar5!iNil' -
ar"Wi Veterinary Teaching Others --------- ------------
2;W ffirlff ~ f~lft ~ mnrt CIiTl{ ~( Males Females . Males Females Males Females Age group
32 33 34 3S 36 37 1
~ TIKAMGARH
5 96 31 ~arTIl All ageB
0-4
5 6 1 8
9
5-9
],,0-14
15-19
3 20-24
5 5 7 25-29
22 14 30-34
70 7 35-~9
60+
~'(
CHHATARPUR
10 3S'1 305 5 tr'$ft III'pt
All ages
0-4 S ... 6
7
8
9 5-9
10-14
1 15-19 . 82 20-24
29 61 25-29
5 71 61 5 30-34
5 242 89 3S-59
IS 60+
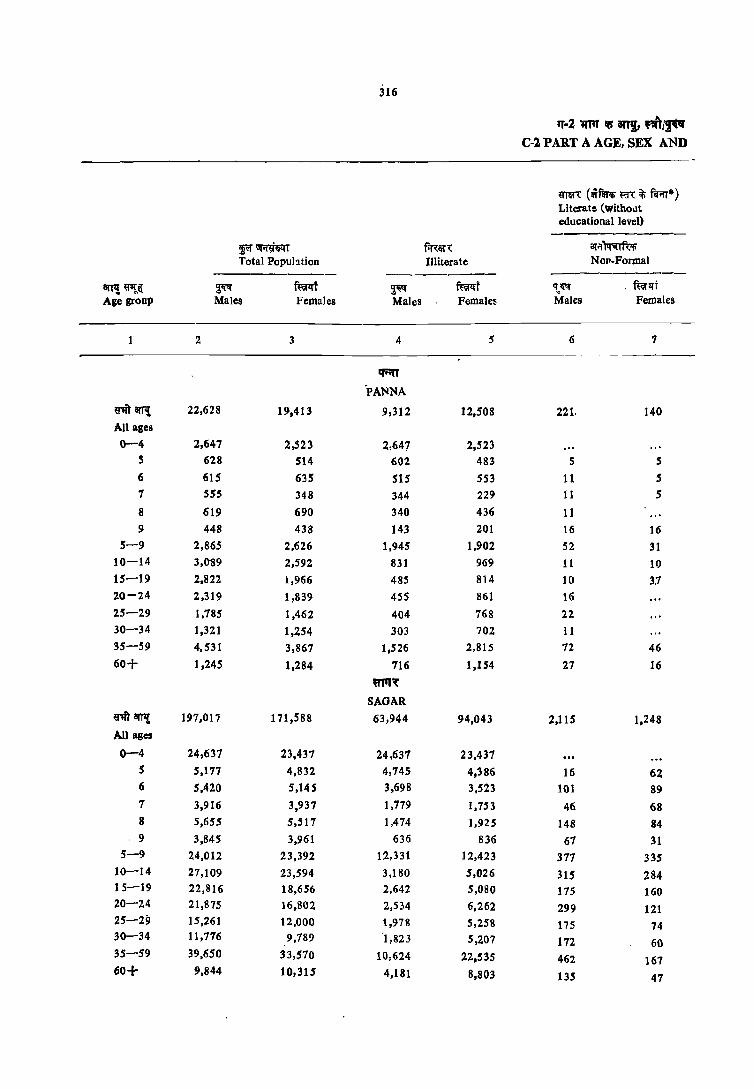
316
,,·2 iJ11T Ifi ifTi, ,,"/PI C-l PART A AGE, SEX AND
mm (lIT~ f61: ~ ~.) Literate (without educational level)
~~ fifi:~<: <lI'''I)rofu;
Total Popuhtion Illiterate NOli-Formal -------- --------- -----------
8W!~& flit ful<:rf ~ ~t '\~ . ffirlfT Age group Males Females Males Females Males Females
2 3 4 S 6 7
q;;n
'PANNA
~m illTl{ 22,628 19,413 9,312 12,508 221. 140 All ages
0-4 2,647 2,523 2,641 2,523 5 628 514 602 483 5 5
6 615 635 SIS 553 11 5 7 555 348 344 229 11 5
8 619 690 340 436 11 9 448 438 143 201 16 16
5-9 2,865 2,626 1,945 1,902 52 31 10-14 3,OS9 2,592 831 969 11 10 15-19 2,822 1,966 485 814 10 3.7 20-24 2,319 1,839 455 861 16 .. , 25-29 1,785 1,462 404 768 22 30-34 1,321 1,254 303 702 II 35-59 4,531 3,861 1,526 2,815 72 46
60+ 1,245 1,284 716 1,154 27 16
ml' SAGAR
~BI'Ili 197,017 171,588 63,944 94,043 2,115 1,248 All ages
0-4 24,637 23,437 24,637 23,437 5 5,177 4,832 4,745 4,386 16 62 6 5,420 5,14S 3,698 3,523 101 89 7 3,916 3,937 1,779 1,753 46 68 8 5,655 5,517 1,474 1,925 148 84 9 3,845 3,961 636 836 67 31
5-9 24,012 23,392 12,331 12,423 377 335 10-14 27,109 23,594 3,180 5,026 315 284 15-19 22,816 18,656 2,642 5,080 175 160 20-24 21,875 16,802 2,534 6,262 299 121 25-29 15,261 12,000 1,978 5,258 175 74 30-34 11,776 9,789 1,823 5,207 172 60 35-59 39,650 33,570 10,624 22,535 462 161 60+ 9,844 10,315 4,181 8,803 135 47
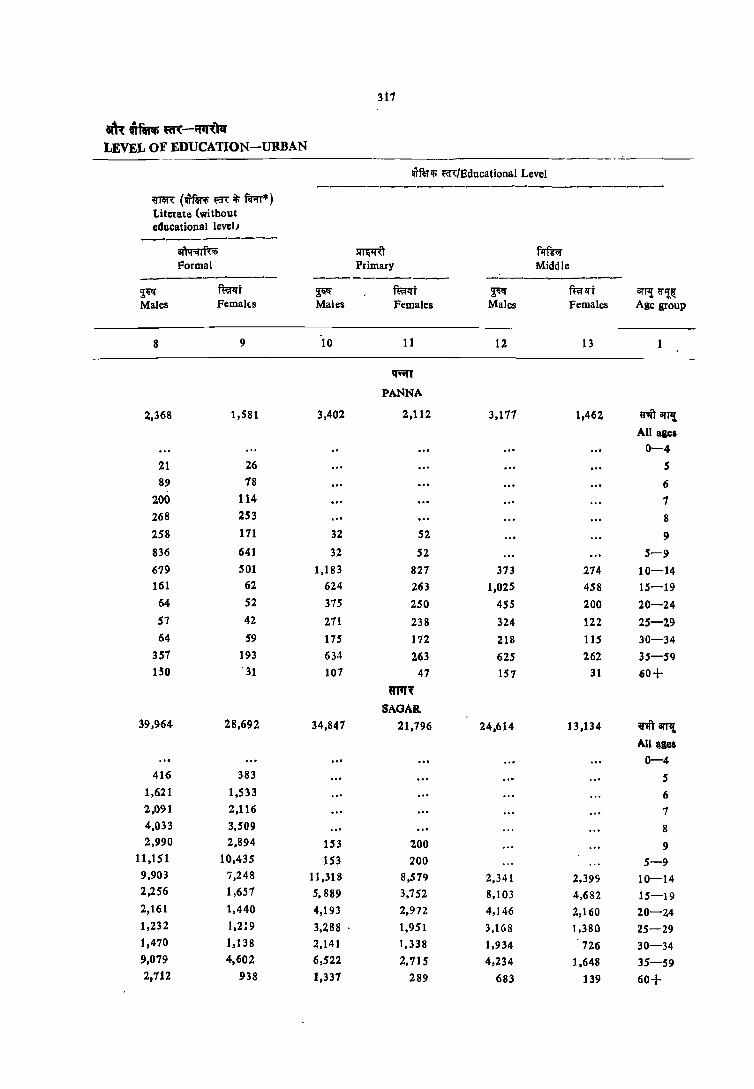
317
aftl "MAi m-;rrr~~ LEVEL OF EDUCATION-URBAN
~f~iji m/Educational Level ---------------------------
~ (m" m ~ fiil'i'lT*) Literate (without educational level)
---------~ ~"t firm; Formal Primary Middle
---------- --------- -----------~~ mmt ~ rep:rt ~ ffirlft arTl! ~~ir Males Femalts Males Females Males Females Age group
8 9 10 11 12 13
qnn
PANNA
2,368 1,581 3,402 2,112 3,177 1,462 ~"" arT,! All ages 0-4
21 26 5
89 78 6 200 114 7 268 253 8 258 171 32 52 9 836 641 32 52 5-9
619 SO) 1,183 827 373 274 10-14 161 62 624 263 1,025 458 15-19 64 52 375 250 455 200 20-24
57 42 271 238 324 122 25-l9 64 S9 175 172 218 115 30-34
357 193 634 l63 625 262 35-59 150 '31 107 47 157 31 60+
fI11Tl SAGAR
39,964 28,692 34,847 21,796 24,614 13,134 ~ arT,! Allues 0-4
416 383 5 1,621 1,533 6 2,091 2,116 7 4,033 3,509 8 2,990 2,894 153 200 9
11,151 10,435 153 200 5-9 9,903 i,248 11,318 8,579 2,341 2,399 10-14 2,256 1,657 5,889 3,752 8,103 4,682 15-19 2,161 ),440 4,193 2,972 4,146 2,160 20-24 1,232 1,2: 9 3,288 ' 1,951 3,168 1,380 25-29 1,470 1,138 2,141 1,338 1,934 726 30-34 9,079 4,602 6,522 2,715 4,234 1,648 35-59 2.712 938 1,337 289 683 139 60+

318
'f-l lI11Il1i itTJ, ~,/~ C-2 :f ART A AGE, SEX AND
wnfiP «n:/Educalional Level ---------------------------------------
f:g~r it; Of~qrrr q~-~~;ft~r ~!l1: ~6,lI~'Ql"~q'lfi~1 fu~ liT ~.Jfif fir-l!mf~ZT Non-technical diploma
~rr/~ro Higher Secondary/Inter- or certificate not equal MatIi:ulation/Secondary mediate! Pre- University to degree --------"'---- ---------- ----------
arJ'I! ~~ ~ fuill-T ~ fmf ~Ii mrlit Age grouP Ma!es Females Males Females Males Females
14 15 16 17 18 19
rnn PANNA
ro Ofl7! 346 110 2,373 1,006
All ages
0-4 5 6
7 8
9
5-9 10-14 5 1J 5 15-19 54 7 434 281 20-24 27 16 604 301
15-29 28 5 402 154 30-34 33 28 308 127 35-59 162 49 591 132 60+ 43 24
~
iAOAR
ritawt 9,656 4,148 10,740 4,208 32 All ages
0-4 5 6
7
8 9
5-9
10-14 36 32 16 26
15-19 1,166 1,024 2,368 2,016 10 20-24 2,145 977 3,781 1,100 5 25-29 1,514 795 1,552 483 11
30-34 1,315 520 1,094 274 35-59 3,045 138 1,8"20 288 s 5 60+ 435 62 97 10

319
am ~flft"lIi m-~m LEVEL OF EDUCATIO~-URBAN
mlli'li m/Educational Level ------- ------------------------------
N!IT it; ~ ~r",r w.r)1:rr 1fT !f1ll1IT ~ ~1fhrij- ~'li1 fuIJr ~ f1r;:;r Technical diploma or f;r;:;r ~CI"Ii" mIT HRA,'tu< fi'111 certificate not equal Graduate degree other Post.graduate d~gree other to degree than technical degree than technical degree
---------- ----_----- -----------~ ft«d ~ ff<iflfr ~ f~t anI{ ij'~~ Males Females Males Females Males Females Age group
20 21 22 23 24 25 1
q;;n
PANNA
SS 760 224 437 219 ~iII'Pl All ages
0-4 5 .,. 6
7 ... 8
9 5-9
10-14 11 17 27 12 15-19
11 197 94 98 52 20-24
11 156 53 83 63 25-29
S 104 23 71 22 30-34
16 269 21 169 69 35-59 16 5 5 60+
mq~
SAGAR
710 96 5,415 2,269 3,262 1,300 ~ar1'l{.
All ages
0-4 5 6 7 8
9 5-9
10-14
10 5 192 249 21 15-19 211 7 1,656 1,148 626 486 20-24 120 5 1,121 390 847 321 25-29 131 10 848 204 609 175 30-24 233 68 1,489 268 1,099 291 35-59
S 109 10 82 5 60+

320
"-2 a ~ an!, "f'J'~ C.2 PART A AGE. SEX AND
~ ~i'1:JBducational Level ------------------------------------
fur) 1fT kfTCflIiTOffi: mil' if; ~ CTi!i<f"r<!ft fuq) 1fT fu~TIlT Technical degree or diploma equal to degree or post-graduate degree
-........- ----------------------------------i:;or'lf'fl1"ror aiR aif") ..... tot·)" fqf.rnrr lITmt ~am: il:)~m Bogineeripg and technology Medicine Agriculture and dairying ------------ ------------ ----------
8n~ ~~~ ~ tffi" I1"t ~ ffirlft ~I!I" mrlff Age group Males Females Males Females Males Females
26 21 28 29 30 31
q;;n
PANNA
ritill'Tlt 66 22 11
Alleges 0-4
5
6 7 .. ' 8·
9 .. ' 5-9
10-14
15-19 20-24 11 .. ' 25-29 16 .. ' 30-34 5
35-59 33 .. ' 22 5
60+ .. ' m'f't
SAGAR
~ BfI1l' 236 5 429 57 18
All ages
0-4 .. ' ."
5 .. ' ., . 6 .. ' 7
8 9
$-9 10-14
15-19 5
20-24 51 38 10 6
25-29 39 81 IS
30-34 44 5 56
35-59 96 231 26 12
60+ ,., . ,. 23 $ .. r , ..

321
am ~ftTIIi m-~ LEVEL OF EDUCATION-URBAN
IifWl; m/Educational Level _-----------------------------------
mft' 1fT ~~ mft' it; ~'I'r.r ~r fulit 1fT ~'I'T Technical degree or diploma equal to degree or post-graduate degree ----------- -----
~~T or6lTTtrif ar;:<J
Veterinary Teaching Others ------- ---------- --~ mt ~ fter1ri ~ ~r iIlfII~ Males Females Males Females Males Females . Age group
32 33 34 3S 36 37
q;;n
PANNA
5 71 52 ~arJ1l All ages
0-4 5
.... 6
... 7
8
9 5-9
10-14 15-19
... 1-3 20-24 5 5 16 25-29
16 6 30-34 49 17 35-59
60+ :mq~ .
SAGAR
16 1,013 587 6 ril'arJ11 All ages
0-4 5 6
7
8
9
5-9 10-14 15-19
17 120 20-24 137 108 25-29
5 121 131 6 30-34 11 686 218 35-59
46 5 , .. 60+
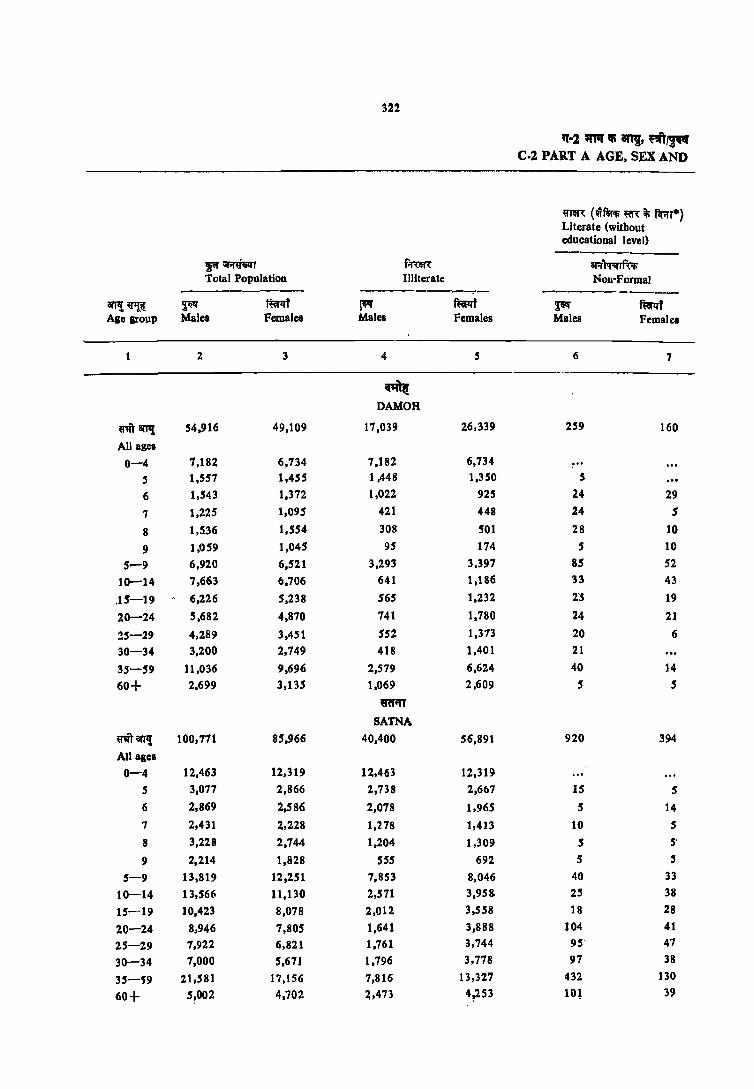
p ;;r.nTIiill'T Total Population -------
III'P! ~ ~ fl«l:If Ale group Males Females
1 2 3
ij'IftarJ1! 54,916 49,109
All ages
0-4 7,182 6,734
5 1,551 1,455
6 1,543 1,372
7 1,225 1,095
8 1,5.36 1,554
9 1,059 1,045
5-9 6,920 6,521
10-14 7,663 6,706
.15-19 . 6,226 5,238
20-24 5,682 4,810
25-29 4,289 3,451
30-34 3,200 2,749
35-59 11,036 9,696
60+ 2,699 3,13.5
rn an,! 100,771 85,966
All agCI
0-4 12,463 12,319
5 3,077 2,866
6 2,869 2,586
7 2,431 2,228
8 3,228 2,744
9 2,214 1,828
5-9 13,819 12,251
10-14 13,566 11,Il0
15-19 10,423 8,078
20-24 8,946 7,805
25-29 7,922 6,821
30-34 7,000 5,671
3S-~9 21,581 17,156
60+ 5,002 4,702
322
f.:ml1: Illiterate
~ ReNt Males Females
4 !5
~ DAMOH
17,039 26.339
7,182 6,734 1,448 1,350
1,022 925
421 448
308 501
95 174
3,293 3,397
641 1,186
565 1,232
741 1,780
552 1,313
418 1,401
2,579 6,624
1,069 2,609
mAT
SATNA
40,400 56,891
12,463 12,319
2,738 2,667
2,078 1,965
1,278 1,413
1,204 1,309
555 692
7,853 8,046
2,571 3,958,
2,012 3,558
1,641 3,888
1,761 3,744
1,796 3,778
7,816 13,327
2,473 4p253
11-2 mil !Wi 8f11, ~I!"' C·2 PART A AGE, SEX AND
~m"( (wf'Wt; ~ it; f;r;rr*) Literate (without educational level) ---------
ar-r~ Non-Formal
-----~ ftnt Males Females
6 7
259 160
... 5
24 29 24 5
28 10
5 10
85 52 33 43
2'5 19
24 21
20 6
21
40 14
5 5
920 394
15 5
5 14
10 5
5 5·
5 5
40 33
25 38
18 28
104 41 95' 41
97 38
432 130
10~ 39

323'
atk'tnm-~ LEVEL OF EDUCATION-URBAN
l&fm; ~"(/Educational Level -----_ --------men (wf&r<l; fO\ iii fiJiIT*) Literate (without educational level)
-----------ar1tr;rrfur ~ flIfur Formal Primary Middle
----------- ---------~ mt ~~ fterd ~ mrl1'f arrl!~ Males Females Males Females Males Females Ase group
8 9 10 11 12 13 1
~ DAMOR
11,901 8,771 9,521 6,204 7,417 4,095 U1ITam{
All alea 0-4
104 105 5 498 419 6 780 643 1
1,200 1,043 8 9IZ 829 41 33 9
3,494 3,038 41 33 5-9 2,816 2,113 3,567 2,521 602 764 10-14
517 471 1,600 1,067 2,564 1,459 IS-B' 610 489 868 75"5 1,285 681 20-24 456 382 682 540 837 510 25-29 353 334 548 452 639 241 30-34
2,771 1,s06 1,867 741 1,259 406 35-59 880 373 341 95 227 35 60+
mr.n SATNA
15,885 9,854 14,904 8,903 9,117 4,335 Ulft arT,! All agea 0-4
323 194 ... 5 786 606 6
1;143 810 7 2,019 1,431 8 1,515 1,066 80 65 9 5,846 4,107 80 65 5-9 4,628 3,062 5,378 3,359 906 616 10-14
718 430 2,509 1,599 2,530 1,137 15-19 522 411 1,615 1,243 1,175 831 20-24 388 363 1,088 851 1,047 636 25-29 317 331 846 571 897 321 30-34
2,481 950 2,726 1,071 2,182 746 35-59 920 191 597 143 374 43 60+
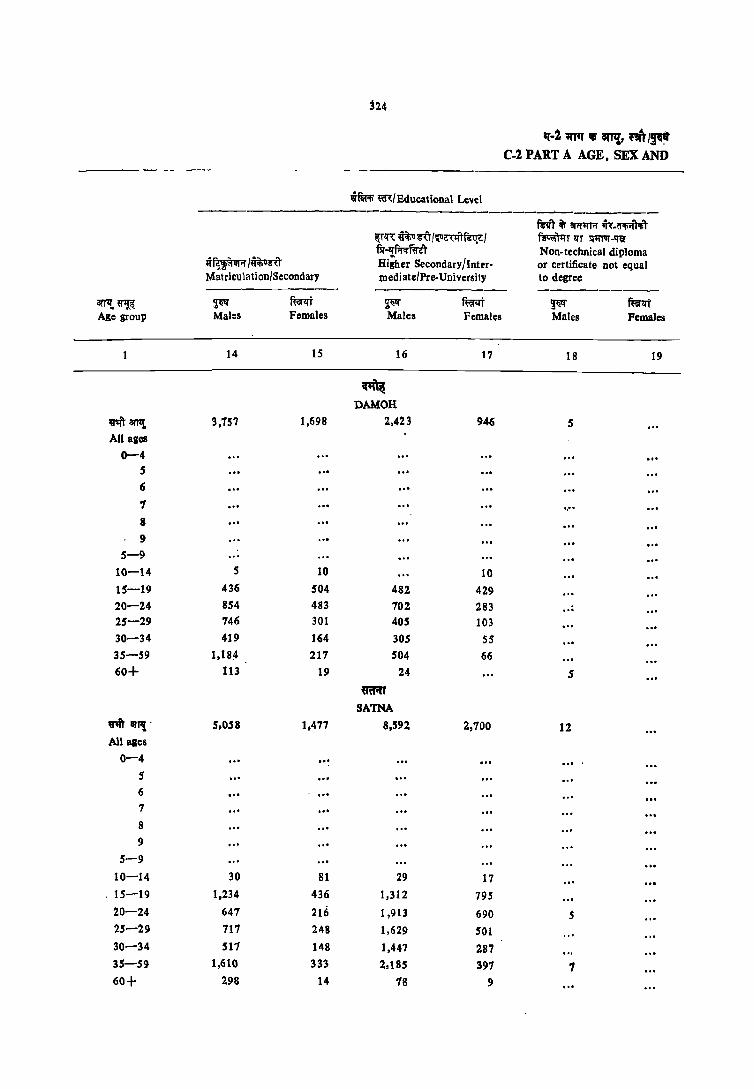
h4
1f·1 ;nil' iii iI1'P!, f1Il/~ C-2 PART A AGE, SEX AND
qf~ m/Educational Lenl -------------------------------------
mr it; SJ'!!'1fr.!' ~-~r.n I[T!!l: ~ 6(rl~~fSCY:/ ~TlIT ~-IRf flr~~ Non-technical diploma
ll~m/~i'U Higher Secondary/Inter- or certificate not equal Matriculation/Secondary mediate/Pre-University to degree
----------- ----------CITJ1t ~ ~~ mt ~ mt ~ mnrt Age group Males Females Males Females Males Females
14 15 16 17 18 19
~ DAMOH
~8l'T't 3,757 1,698 2,423 946 5 All ages
0-4 5 ... 6 ... 1 ', .. S
9
5-9 .. , 10-14 5 10 10 15-19 436 504 482 429 20-24 854 483 702 283 .,. 25-29 746 301 405 103 30-34 419 164 305 S5 35--59 l,t8~ 217 504 66 60+ 113 19 24 5
~
SATNA
~ iIIPl- 5,OSS 1,477 8,592 2,700 12 All Illes
0-4 .. , 5 .. , 6 .. , 7 .. , 8 9 .. ,
5-9 10-14 30 81 29 17 15-19 1,234 436 1,312 795 20-24 647 216 1,913 690 S 25-29 717 248 1,629 501 30-34 517 148 1,447 287 35-59 1,610 333 2,185 397 1 60+ 298 14 18 9
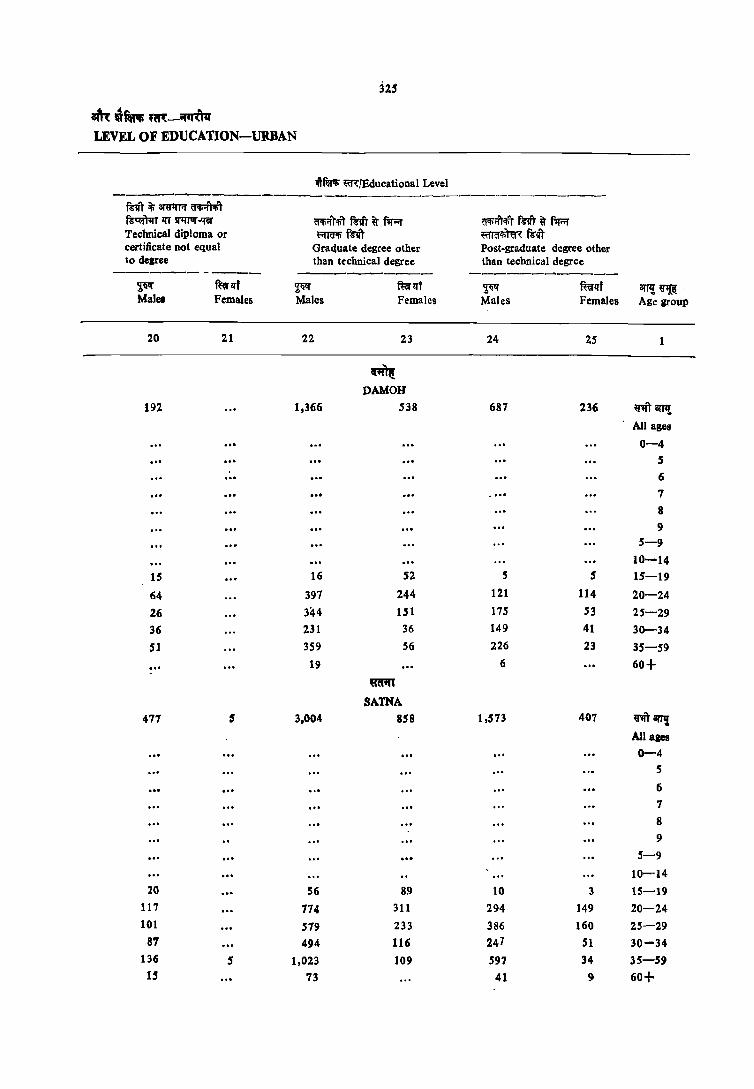
325
~.ttfn'~-~ LEVEL OF EDUCATION-URBAN
w~ mfEducational Level ----------------------~-------------
R"lI'Tij;~~T R"~ ~ 5IlJI1If~ 6"Ii.j'rfl fun' ~ f1r-'l' Q"Ii;ft'liT fifID ~ f1Fr Technical diploma or Brn;; mrr ~rcr'lil~ Rift certificate Dot equal Graquale degree other Post-graduate degree other to deBree than technical degree than technical degree
------- ----- ---------- ------------~ ~lft ~ ffi;r II't ~ ffirlff awr~ Males Females Males Females Males Females Age group
20 21 22 23 24 25
~ DAMOH
192 1,366 538 687 236 ~'I'T amr. All ages
0-4 S
... 6 7 8 9
5-9 10-14
15 16 52 5 5 15-19
64 397 244 121 114 20-24
26 344 1.51 175 53 2.5-29 36 231 36 149 41 30-34 51 359 56 226 23 35-59
... 19 6 60+
mr.n SATNA
477 5 3,004 858 1,573 407 ~arF! All aaes 0-4
5
6 7 8 9
5-9
10-14 20 56 89 10 3 15-19
117 774 311 294 149 20-24 101 579 233 386 160 25-29
87 494 116 247 51 30-34 136 5 1,023 109 597 34 35-59
15 73 41 9 60+

326
q·2 ;rrq qr ani, ""/~ C-l PART A AGE, SEX AND
lli"ffi m/Educationall.evel ------------- - --- _-------------
mr) ll"r Rra<fohn" fill) it; 9'IJr.I' cI~ fS'lft lIT ~ Technical degree or diploma equal to degree or post.graduate degree
----------------------------------------~)f.:r<ror am: ~r.rr.rr f.rf.!itl:rr~ P ar't<: itt '3ti't1J' Enginee ring and technology Medicine Agriculture and dairying
---------- ------------3I17I ~ ~ fuilit ~ fuill"T ~ mt Age group Males Females Males Females Males Females
26 27 28 29 30 31
~ DAMOH
~awt 83 133 17
All agcII
0-4 5
6
7
8 9
5-9 10-14 15-19 20-24 11 5
25-29 21 26
30-34 21 41 5
35-59 31 5i 12
60+ 5 e;n
SATNA
~'Iit ant! 338 3 189 13 10
All agcI
0-4 5 6 7 ",
8
9 5-9
10-14 15-19 3 5
20-24 56 13
25-29 83 24 3
30-34 73 49 5
35-59 121 83 5 10
60+ 5 15

327
~a~m-~ LEVEL OF EDUCATION - URBAN.
~ ~/Educational Level ---_ ----------------ftrlfi liT ~~"( tnT it; ~R ~ tnT liT ~ Technical de;Jree or diploma equal to degree or post-graduate degree
------------------------------------lilt. f<rtiI;-c«r ~ aTOll Veterinary Teaching Others
--------------- -------'!~ mm ~ f~f ~ mi arTlf. ~~ Males Females Males Females Male. Felll<lles Ale group
32 33 34 3S 36 37
~~ DAMOH
5 128 105 'I''IIT amt All Bges
0-4
5
6
7 8
9
S-9
10-14 lS-19
21 20-24 ·32 25-29
21 22 30-34 5 103 30 3'-59
5 60+ wcr.n
SATNA 291 127 ~arTIl
All ales
0-4
5
6
7
8
9
5-9
10-14
15-19 9 18 20-24
24 3S 25-29 73 24 30-34
170 49 35-S9 , .. ". 15 ,,, ... ~O+

328
... ·l1l1'l' .. 81T!, """ .... Col PART A AGE, SEX AND
mR (w~ ~ ~ f1r;rr*) Literate (without educational level)
~ ;;r;rnitfT f.t~ aJif~ Total Population Illiterate Non-Formal --_---- ---------
8TT!~ ~ mp:rt ~ fta'lft ~ ffiflft Age group Males Females Males Females Males Females
2 3 4 5 6 7
'(NT
REWA
~'I'Tl! 86,028 71,631 33,057 48,941 972 472
All ages
0-4 9,916 9,454 9,916 9,454
5 2,516 2,316 2,229 2,073 14
6 2,383 2,269 1,562 1,621 83 14
7 1,719 1;753 970 1,165 14
8 2,626 2,293 1,109 1,248 9 S
9 1,558 1,507 457 651 5 9
5-9 10,803 10,138 6,328 6,758 61 42
10-14 12,04-" 9,58"1 2,295 3,871 19 33
15-19 10,839 6,818 1,632 2,808 79 52
20-24 8,637 6,577 1,327 3,605 78 43
25-29 6,188 4,986 1,404 3,128 53 24
30-34 5,511 4,827 1,430 3,416 69 32
35-59 18,228 15,453 6,767 12,407 45' 220
60+ 3~84S 3.770 1.953 3.483 159 28
.""", SHAHDOL
'«'Ifr~, 128,919 110,637 59,056 78.917 2,042 1,051
All agel
0-4 16,140 16.479 16,140 16,479
5 3,876 3,602 3,563 3,419 5
6 3,950 3,652 2,994 3,055 10 10
7 2,897 2,946 1,664 1;963 10
8 3,899 3,947 1,805 2,344 10 19
9 . 2,460 2,396 762 1,074 15 24
5-9 17,083 16,543 10,788 11.855 44 58
10-14 16,709 13,917 3,767 5,963 63 81
15-19 12,740 9,938 2,939 4,775 156 188
20-24 11,420 10,143 3,002 5,920 145 124
25--29 11,012 9,379 3,286 6,167 286 138
30-34 9,313 8,265 3,102 6,002 225 141
35-59 30,146 20,801 13,389 16,941 959 241
60+ 4,269 5,098 2,607 4,169 198 66

329
~ \ifttlli ~-;m", LEVEL OF EDUCATION-URBAN
ififA; ~~IEduc:.\tional Level ------------...-------------
mR (ififA; ~ it; R'I'T*) Literate (without educational level)
----aftlfinfu; SITWI' firfT.r Formal Primary Middle
----------- ---------- ----------~If mr~t ~t!f mrllf ~ mrllt ant!~ Males Females Males Female. Males Females Age BIOUP
8 9 10 11 12 13
~ REWA
11,469 7,427 11,237 5,932 7,980 3.627 fl1Il8l'rll All agel
0-4
287 229 5
787 635 6
735 588 7
1.508 1.041 8
1,022 178 15 69 9
4,339 3.270 75 69 5-9
3,242 2,337 4,851 2,457 1.507 769 10-14
652 308 1,614 1.102 2.085 1,043 15-19
402 375 1,010 735 874 612 20-24
346 231 79] 482 72Z 309 25-29 307 198 499 369 6]6 261 30-34
1,690 515 1,979 642 1,832 578 35-59 491 128 412 75 343 51 60+
~ SHAHOOL
18.621 11,009 16.620 9.668 10.728 4,603 91ITarrll . All lies
0-4 313 179 5 94' 587 .. ' 6
1.223 983 7 2.084 1,584 8 1.604 1.216 79 82 9 6,171 4.548 79 82 5-9 5.186 3.435 5,838 3,614 1,168 144 10-14
160 554 2,588 1,70B 2,8'0 1,276 15-19 65' 483 1,107 1,215 1,526 802 20-24 6'0 499 1,454 928 1.328 68S 25-29 761 431 ],171 758 953 417 30-34
3,245 945 3.396 1,260 2,659 635 35-59 ,'9 lOt 313 103 242 43 60+
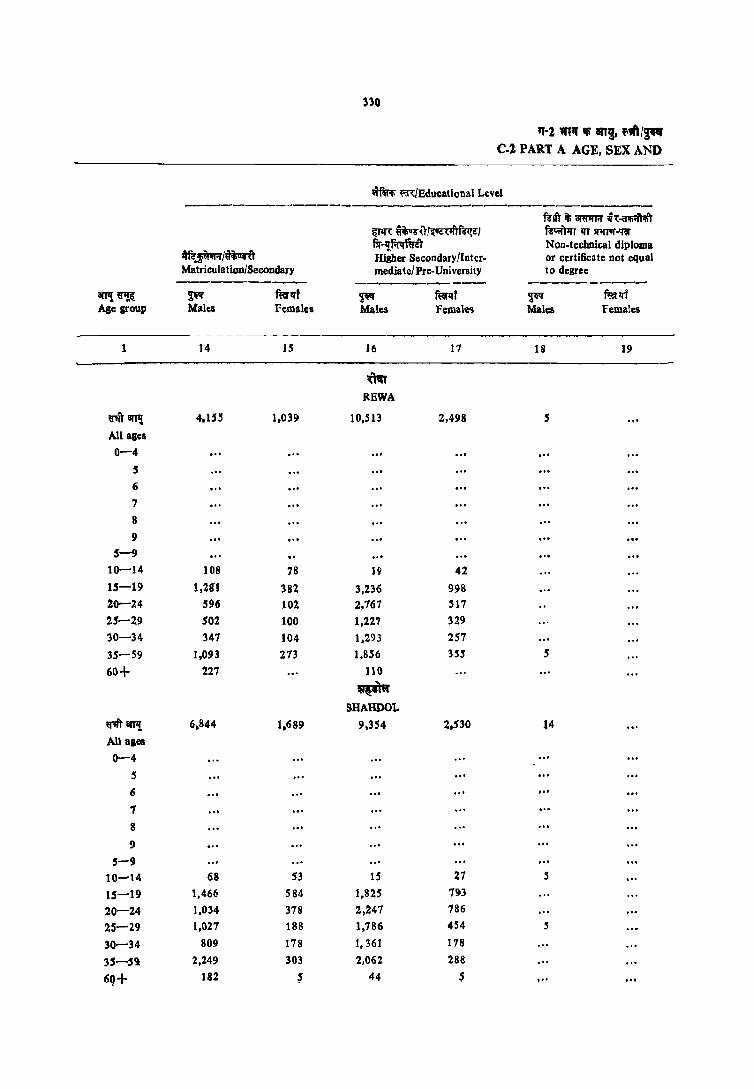
330
11-2 1nll iii' an!, ,.nl~ Col PART A AGE, SEX AND
lITftr-ti mlEducational Level ------
fl'dT it; aRI'1I1'I' 'li.:~j ~lR ~/~oa<¥(lf~l{aJ ~lfT~-IRI" flr-,!~j Noo-technil;al diploma
~~/~ Hisher SecondarY IInter- or certificD te Dot equal Matriculation/Secondary mediate/Pre-University to degree ----------- ----------- ---------
arF!~ ~ mrll'f ~ ~ijf ~ ft:a'lff Age group Males Females Males Female<; Males Females
1 14 15 16 17 18 19
~-m REWA
rit8fl1! 4.155 1,039 10,513 2,498 5
All aSCI
0-4
S
6
7
8
9 5-9
10-14 108 78 I!I 42 15-19 1,28"1 382 3,236 998 20-24 ,596 102 2,767 517
25-29 502 100 1,227 329
30-34 347 104 1,293 257
35-59 1.093 273 1,856 355 5
60+ 221 110
~ SHAHDOL
~iIffIi 6,844 1,689 9,354 2,nO .4 All ages
0-4
S
6
7 8
9
5-9 10-14 68 53 15 27 S
15-19 1,466 584 1,825 793
20-24 1,034 378 2,247 786
25-29 1,021 188 1,786 454 5
30-34 809 178 1,361 178
35-5g 2,249 303 2,062 288
69+ 182 S 44 S ,,,
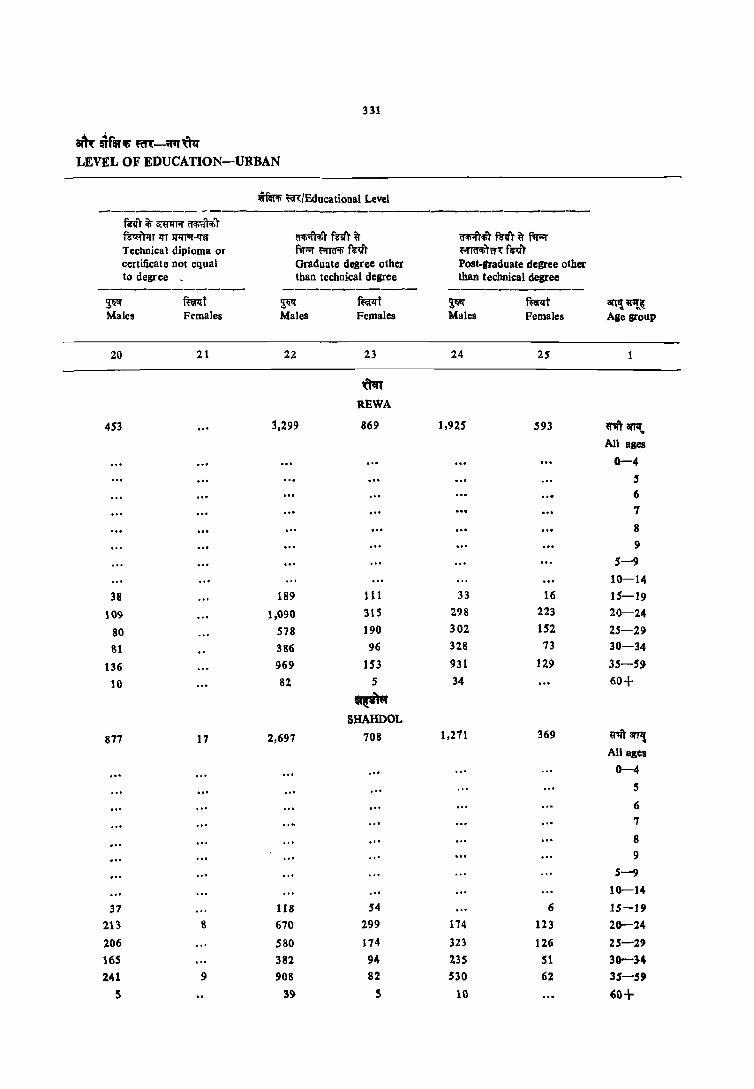
331
atlt ~flft'lfi mt-fI1ItN
LEVEL OF EDUCATION-URBAN
1ITm;; m/Educational Level --------- _--------
~!11 ~ ~ i:''1;,fT~r ~T lfT Si1IT"I-trn ~rfi"tlr~ ~ifiTmT~ fir;;; Technical diploma or f'IT"f mtl'li f6'Il'T ~rTr1;f:gqr certificate not equal Graduate degree other Post-fraduate degree other to degree than technical degree than technical degree
----------_- ----------- ----------~ mtl'.lt ~ f~t ~ mt atT'!~~ Males Females Males Females Males Females Age group
20 21 22 23 24 25 1
""" REWA
453 3,299 869 1,925 593 rn arfIl ..
All ages
0-4 5 6 1
8 I)
5-9 10-14
38 189 III 33 16 15-19
109 1,090 315 298 223 20-24
80 578 190 302 152 25-29
81 386 96 328 73 30-34
136 969 153 931 129 35-59
10 82 5 34 60+
~ SHAHDOL
877 17 2,697 708 1,271 369 "''"' arTlJ . All agcs
0-4
5
6 7
8 9
5-9 10-14
37 118 S4 6 15-J9
213 8 670 299 174 123 20--24
206 580 174 323 126 25-29 165 382 94 235 51 30-3-4 241 I) 908 82 530 62 35-59
5 39 5 10 60+
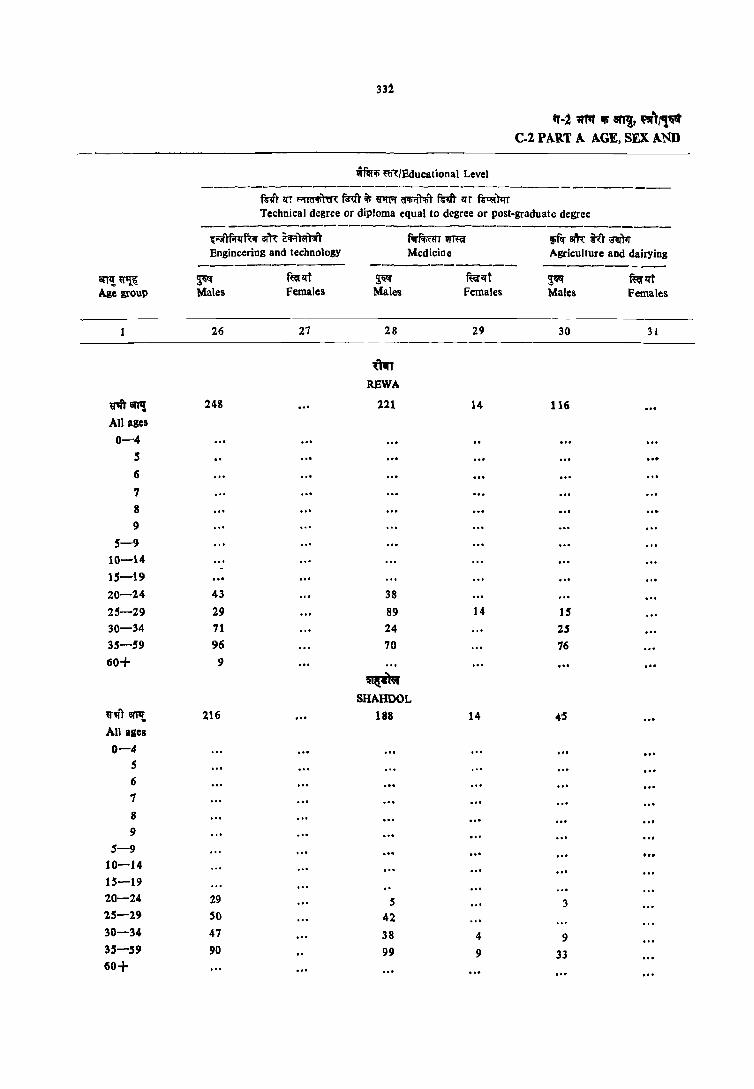
331
tr-.2 1frq '" sn~ ""1,-Col PART A AGE, SEX AND
fmifl ~"1:/Educational Level -------------------------------------
fur"t qr ~~ ~.n ~ ~ (('Ii'[1<tt ~m qr ~)1rr Technical degree or diploma equal to degree or post·graduate degree
-------------------------------------'{rot'1f;rqror ar'tt 2:"'I)<;r"r.rl fil'flIi«rr III'~ ~~ ~r;n(m Engineering and technology Medicine Agriculture and dairying
------------ ----------- ----------arF! ~~ ~ ffirqf ~ ft<lqf ~ ffirqf Age group 'Males Females Males Females Males Females
26 27 28 29 30 31
Uwn REWA
""BTP! 248 221 14 116 All ages
0-4 5 ... 6
7 8
9 5-9
10-14 15-19 20-24 43 38 25-29 29 89 14 15 30-34 71 24 25 35-59 96 70 76 60+ 9 ...
~ SHAHDOL
~'lfll1'11t 216 188 14 4'5 All ages
0-4 5 6
7
8
9 5-9
10-14 15-19 20-24 29 5 3 25-29 50 42 30-34 47 38 4 9 35-59 90 99 9 33 60+

am: ~f" ~-;miq LEVEL OF EDUCATION-URBAN
-;-f1ff;r mfEducational Level ---------------------------------
Technical degree or diploma equal to degree or pOst-graduate desree ---------------------------------
'l1! ~r 3T6lfA01' ar;q
Veterinary Teaching Others -_------ ------------ ----_._--~ ffir lff ~ f~lft ~ miflff iIfTl! ij''!( Males Females Males Females M:lIes Females Age group
32 33 34 35 36 37
~ REWA
371 214 5 ritarP{ All ages
0-4
5
6
7
8
9
5-9
10-14
15-19 5 45 5 20-24
50 26 25-29 35 22 30-34
212 121 35-59 14 60+
~ SHAHDOL
14 386 62 ~ar11I All ages
0-4
S
6
7
8
9
5-9 10-14
15-19 9 4 20-24
38 22 25-29 5 52 11 30-34 9 277 26 35-59
10 60+

j34
IJ-i 'ITIJ iii' an~, ",p C-2 PART A AGE, SEX AND
~IT{ (w fllfifi fen; it; fil'ifT*) Literate (Wilhout educalional level) --------
~~T f~<: iIT.;~f;:ifi Tolal POpuhlion Illiterate Nor. Formal --------- ------- -----------ilTJ1! ~'!.I{ ~ ~f ~ f~t q;,~ fialff
Age group Males Females Males Females Males Females
2 3 4 5 6 7
atlft SmHI
~iITJ1! 11,311 8,343 3,792 5,422 108 67 All aaes
0-4 1,283 1,308 1,283 1,308 5 349 389 305 350 6 266 288 178 219 7 206 253 76 126 5 8 381 291 146 116 5 9 230 212 28 65
5-9 1,432 1,433 734 876 5 5 10-14 1,300 1,211 25' 362 24 5 15-19 1,830 780 207 376 5 S 20-24 1,183 773 178 411
5 25-29 911 662 131 407 9 18 30-34 810 545 171 330 5 5 35-59 2,254 1,281 663 1,032 45 16 60+ 297 338 158 320 16 5
~ MANDSAUR
~8ITl! 133,529 122,397 43,583 72,725 107 679 All ases
0-4 16,231 15,185 16.231 15,78S 5 3,191 3,866 3,203 3,424 60 26 6 3,650 3.712 2,422 2,100 35 3( 7 3,082 3,314 1,435 1,895 40 IS 8 4,285 3,U3 ],465 1,832 4S 36 9 2,691 2,778 557 1,046 15 10
5-9 11,505 17,524 9,081 10,897 196 118 ]0-14 11,146 15,951 2,164 5,319 56 87 1S-19 15,247 13,602 2,195 5,188 J5 62 20-24 14,012 11,994 1,970 4,991 SO 60 25-29 10,299 9,133 1,273 4,253 81 68 30-34 8,301 6,842 1,417 3.473 26 27 35-59 26,938 23,148 6.292 16,075 221 150 60+ 7.793 7.751 2.959 6,737 92 107
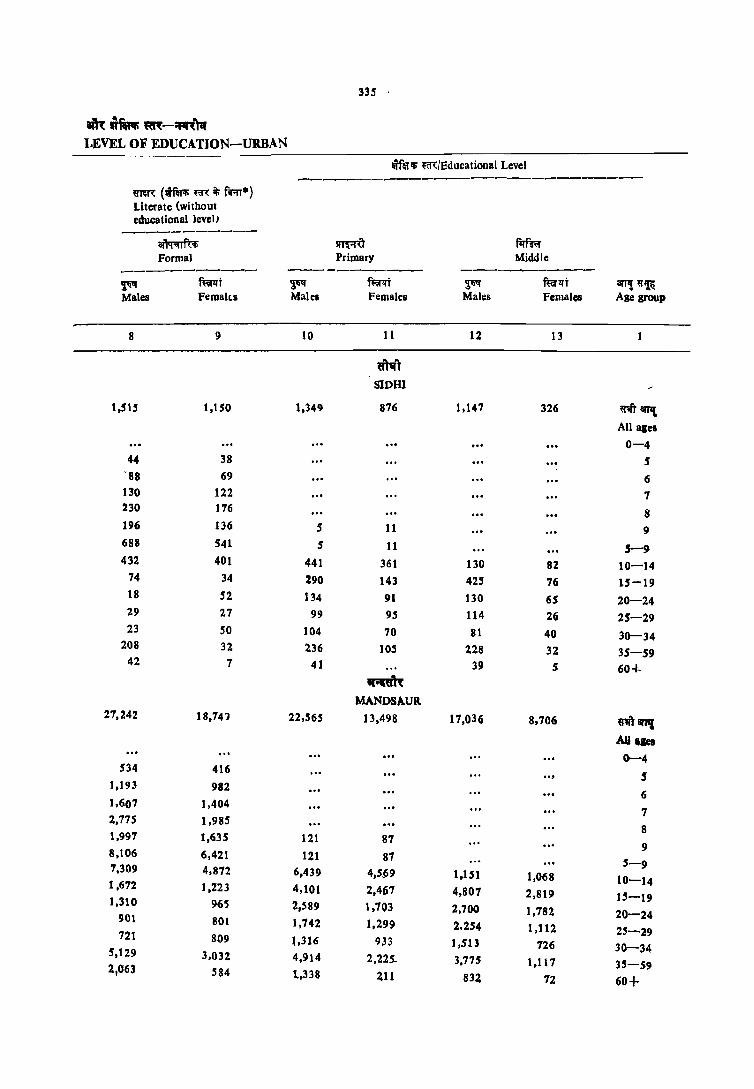
335
am ~firAi ~-"~fq LEVEL OF EDUCATION-URBAN
VfllHi m/Educational Level
--- ------------mR (VRfol; m ~ f;r;rr*) Literate {without educational level} -------_ .. _--~ ~ fqf~
Formal Primary Middle ---------- ---------- ------------~ ~t F' fum F' fur~t arTl! ~~ Males Femal~s Malel Females Males Females Age group
8 9 10 11 12 13
UN'\' SlDHI
1,515 1,150 1,349 876 1,141 326 ~arrrt All qes
0-4 44 38
'" 5 "88 69 6 UO 122 1 230 176 8 196 136 5' 11 9 688 541 5' 11 5-9 432 401 441 361 130 B2 10-14
74 34 290 143 425 76 15-19 18 52 134 91 130 65 20-24 29 21 99 95 114 26 25-29 23 50 104 70 111 40 30-34
208 32 236 lOS 228 3Z 35-59 42 1 41 39 5' 60-1" ...m:
MANDSj\UR. 21,242 18,141 22,565 13,498 11,036 8,706 61IlBl'l'l
AUQe8 0-4
534 416 5'
1,193 982 6
1,607 1,404 7
2,175 1,985 8 1,997 1,635 121 87 9 8,106 6,421 121 81
5-9 7,309 4,872 6.439 4,SM 1,151 1,068 10-14 1,672 1,223 4,101 2,461 4,801 2,819 15-19 1,310 965 2,589 1,103 2,700 1,782 20-24 901 801 1,742 1,299 2,254 1,112 25-29 721 809 1,316 933 1,513 726 30-34 5,129 3,032 4,914 2,225. 3,775 1,117 35-59 2,(163 584 t,338 ~11 83l 72 60+
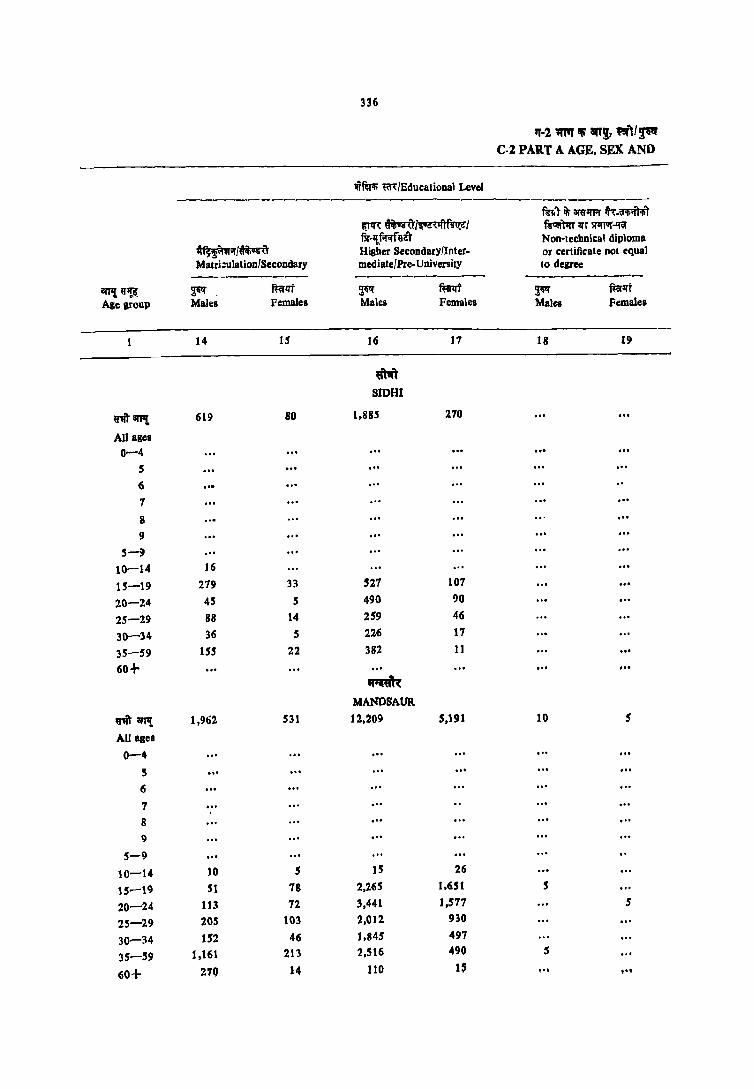
336
,,·2 'q1q iii an!, "'If'" C-2 PART A AGE, SEX AND
..rftFl; m/EducatioDal Level
f6~1 it; am~ ~.lfoIi;fR;l iifIR ~l\",wilfs\{el ~ I{T ST1(11II'",,",
fir-Ilf.m"6el Non-technical diploma ~~;r/~ Higher Secondary/Inter· 01 certificate Dot equal Matri :ulation/Secondary mediate/Pre.Univenity to degree ---------- ---------
aJ'P{ ij'~ ~, ~11i' ~ ~t ~ mrlft Age group Malea Femalea Males Females Males Femalea
14 15 16 11 18 19
mtft SIDHI
~aJ'P{ 619 80 1,885 210
All agel
0-4 S
6 ... 1 8 ,"
9 S-~
10-14 16
lS-19 219 33 521 101
20-24 45 5 490 90
25-29 88 14 259 46
30-34 36 5 226 17
35-59 155 22 382 11
60+ .. , ~
MANDSAUR
'J'IiI' 8fT!! 1,962 531 12,209 5.1!H 10 5
All alca
0-4 5
6 1 ... 8 9
5-9
10-14 10 5 15 26
15..-19 51 78 2.265 1,651 5
20-24 113 72 3.441 1.571 5
25-29 205 103 2,012 930
30-34 1S2 46 1,845 497
35-59 1,161 213 2.516 490 5
60+ 27Q 14 110 ., ,., '"

337
lilt". ~-~ LEVEL OF EDUCATION-URBAN
~1w.f; m/Educational Level -----------------------------------mrr ~ !iM'IIToi ~r ~r <IT sprrvr-'Rf ~r fi'it a- ~ fi'1iT a- flr.;r Technical diploma or N...-~~1iT Rffl'liTm mit certificate [1ot equal Graduate degree other Post-graduate degree other to degree than technical degree than technical degree
--------- ----------- ---------~ ft;a-trf ~ mr~j ~ fur~j arTIl Ul!~ Males Females Males Females Males Females Age 8toup
20 21 22 23 24 25
~l SlDm
18 5S9 58 220 78 n1ifll{.
All agel
0-4 5 6
7
8
9
5-9 10-]4
24 5 lS-]9 9 148 19 15 31 20-24 9 109 6 50 18 25-29
81 11 SO 16 30-34 196 16 105 13 35-59
1 60+ ~
MANDSAUR 424 27 4,737 1,489 2,457 593 "''1ft' iIIT!
All ases 0-4
5
6
7
8 9
5-9 5 10-14
31 70 111 10 4 15-19 90 1,358 61.3 346 202 20-24 76 1,002 386 725 121 25-29 78 5 747 170 398 122 30-34
130 11 1,499 204 945 144 35-59 20 5 61 S 29 60+

1
91ft'rrP1 ~l~~~ 0-4 ,
6
7
8
9
5-9 10-14 15-19
338
~ mlBducational Level
IT-l MIT iii IIT!r nit"" C-2 PAlT A AGE, SEX AND
-----------------------------Technical degree or diploma equal to degree or post-graduate degree
----------------------------(i"ilif"",f(l( am ~r EnsinecI?lI8 aDd TechnoloGY
~ Males
26
ffirvt Females
27
~ Males
28
tfteft' ADHI
36
Medicine
ffir4't Females
29
6
i"N aih: i'U mt.r Asriculture and dairYing
~ ~lell
30
6
~lft Females
3J
oo'
2Q-24 IS 25-29 30-H
35-59 60+
~.n- IIfI\ AUBle.
>; .4'
q-4 , 6 ., 8
9
$-9
10-14
.5 9
.5
166
,,,
15-19 $
20-24 25-29
30-34 35-59 ~()+
21 16
42 s:z .. ,
.-.
,-,
9
9
18
~ MANDSAUll
187
15
52 21 78
{5
3
3
34
11
6
17 ...
6
21
10
10
" . .·f
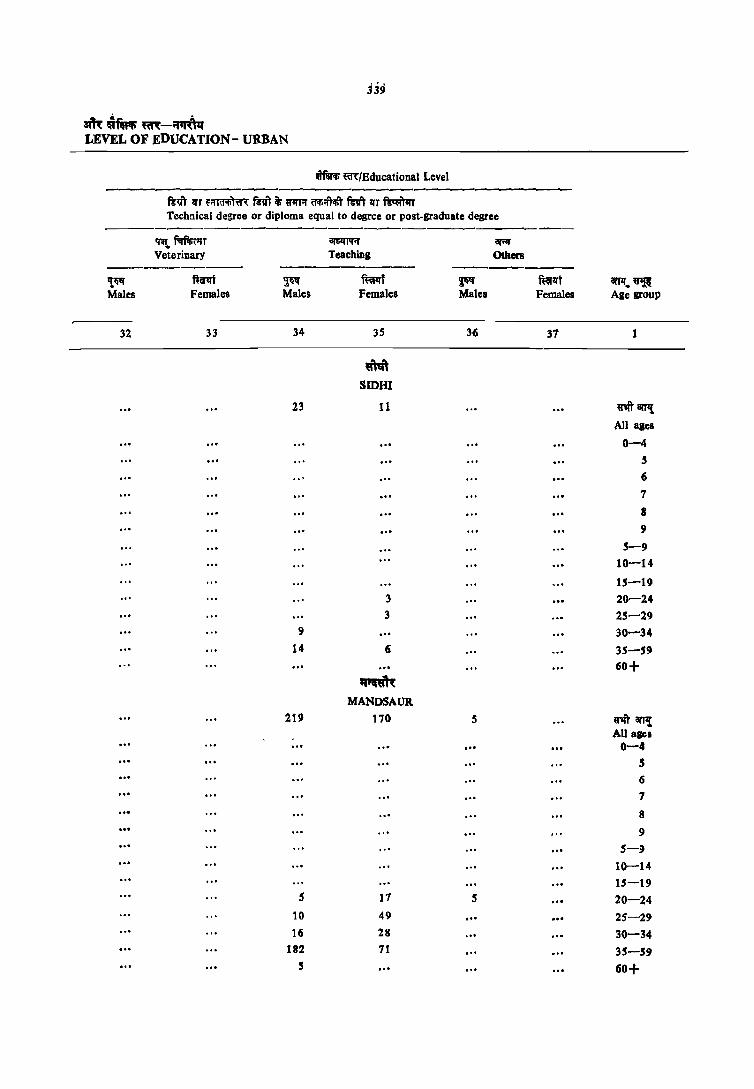
339
am:~m.~-~~ LEVEL OF EDUCATION- URBAN
~ ~IBducational Level
-----------------------------------,--------fi'Vt 1fT ~;;mi)~ fi'VT iii" ~ trifiM mrr 1fT ~ Technical degree or diploma equal to degree or post-graduate degree
I:f"l ~"IT Veterinary
---------,!qtf ft~t Males Females
3Z 33
~
Teaching ------------~ Males
34
23
9
14
219
5
10
16
182
5
~f Females
35
~ SlOBI
11
3
3
(;
~ MANDSAUR
170
17
49 28 71
apq
Others ----~ Males
36
.5
s
~lft Females
37
anlf. ~ Ale grOUP
1
~art'I! All a8el
0-4 , 6
7
8 9
5-9 10-14
15-19
20-24 25-29 30-34
35-59 60+
ritarJ'l! AU ages
0-4" 5 6
7
8
9
5-~
10-14 15-19
20-24
25-29
30-34
35-59
60+
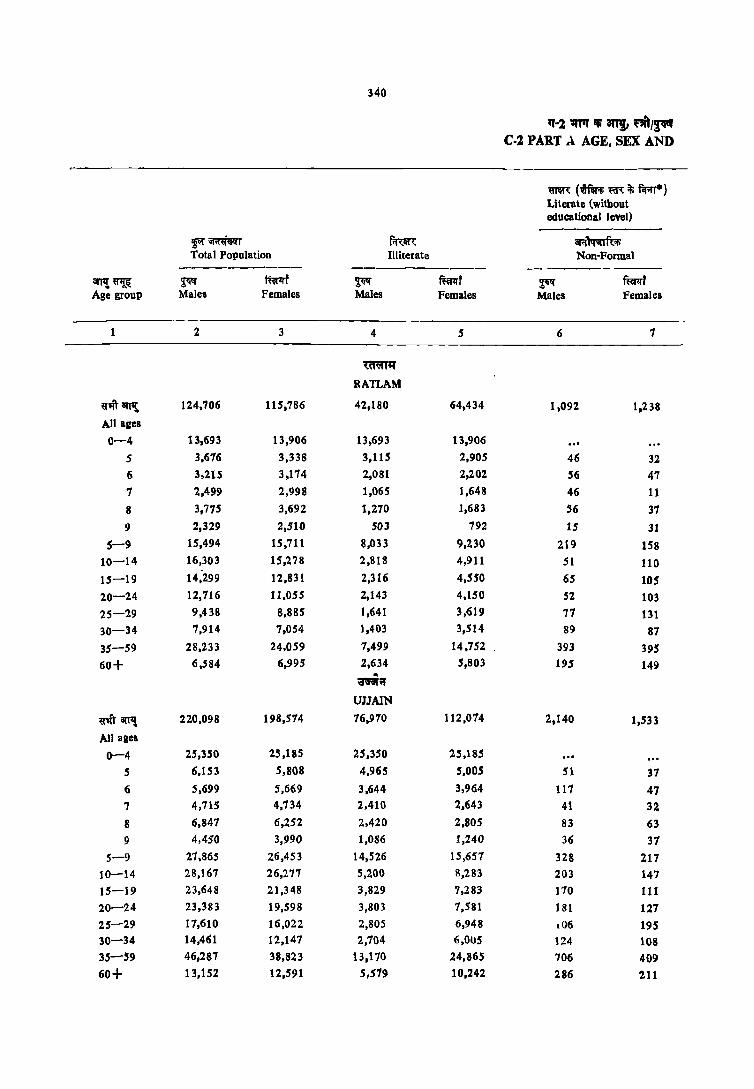
340
'I'-211T'1' '" at1!, nft'/J" C·2 PART A AGE, SEX AND
mm: (~ m 't; mr"') Literate (without educational level) --~----
~~r f;mn: ar;{~ Total Population Illiterate Non-Formal
----------arrli~ ~ mrzrf ~ fWrt ~ ~ Age group Males Females Males Females Males Females
1 2 3 4 5 6 7
~" RAlLAM
~.rr 8Wt 124,706 115,786 42,180 64,434 1,092 1,238
All ages
0-4 13,693 13,906 13,693 t 3,906
5 3,616 3,338 3,115 2,905 46 32 6 3,2lS 3,174 2,081 2,202 56 47
7 2,499 2,998 1,065 1,648 46 11
8 3,775 3,692 1,270 1,683 56 31
9 2,329 2,510 503 792 IS 31
5-9 15,494 15,711 8,033 9,230 219 158 10-14 16,303 15,278 2,818 4,911 51 110 15-19 14,299 12,831 2,316 4,550 65 105
20-24 12,716 J 1,055 2,143 4,150 52 103 25-29 9,438 8,885 1,641 3,619 77 131 30-34 7,914 7,054 1,403 3,514 89 87
35-59 28,233 24,059 7,499 14,752 393 395
60+ 6,584 6,995 2,634 5,803 195 149 .. ;niI'OI'
UJJAIN
~iIW! 220,098 198,574 76,910 112,074 2,140 1,533
All agcs
0-4 25,350 25,185 25,350 25,185
5 6,153 5,808 4,965 5,005 51 37
6 5,699 5,669 3,644 3,964 117 47 '1 4,'115 4,734 2,410 2,643 41 32
8 6,847 6,252 2,420 2,805 83 63
9 4,450 3,990 1,086 1,240 36 37
5-9 27.865 26,453 14,526 15,651 328 217 10-14 28,167 26,277 5,200 8,283 203 147 15-19 23,648 21,348 3,829 7,283 170 111 20-24 23,383 19,598 3,803 7,581 181 121 25-29 17,610 16,022 2,805 6,948 ,06 195 30-34 14,461 12,147 2,704 6,005 124 108 35-59 46,287 38,823 13,170 24,865 706 409
60+ 13,152 12,591 5,519 10,242 286 211

341
aiW ~fiRlIi ~-~ LEVEL OF EDUCATION-URBAN
wm-q;' ~~/Educational Level
mR (~Rrt ~ fir;rr*) Literate (without educationalleveJ)
8t~ ~ film; Formal Primary Middle
---------------- --------- ---------~ furlrt ~~ mY ~ mrll'f arr~ ~~ Males Females Males Females Males Females Age group
8 9 10 11 J2 13
~
RATLAM
20,910 16,170 21,284 14,546 17,091 9,634 ~ arr" All ages
0-4 515 401 5
1,018 925 6 1,388 1,339 7 2,450 1,91" 8 1,598 1,550 213 136 9 1,030 6,188 213 136 5-9 5,481 3,706 6,273 5,096 1,649 1,413 10-14 1,069 842 3,701 2,456 4,731 2,804 15-19
834 760 2,343 1,548 2,817 1,619 20-24 663 160 1 ,408 1,273 1,938 1,119 25-29 640 667 1,259 994 1,414 714 30-34
3,896 2,640 4,955 2,720 3,930 1,837 35-59 1,342 601 1,133 311 613 68 60+ ..
;a'\Nf;f
UJJAIN 36,558 27,406 36,299 24,149 28,851 15,114 Willl1
All ages
0-4 1,131 766 5 1,938 1,658 6 2,264 2,060 7 4,344 3,384 8 2,847 2,301 482 412 9
12,529 10,169 482 412 5-9 9,295 7,126 10,155 8,139 2,625 2,439 10-14 1,966 1,496 5,820 4,049 7,315 4,550 15-19 1.569 1,341 4,115 2,672 5,307 2,495 20-24 1,215 1,316 2,671 2,130 3,644 1,901 25-29 1,171 910 2,137 1,693 2,374 1,238 30-34 6,403 3,156 8,143 4,463 6,208 2,228 35-59 2,302 1,159 2,096 575 1,379 264 60+
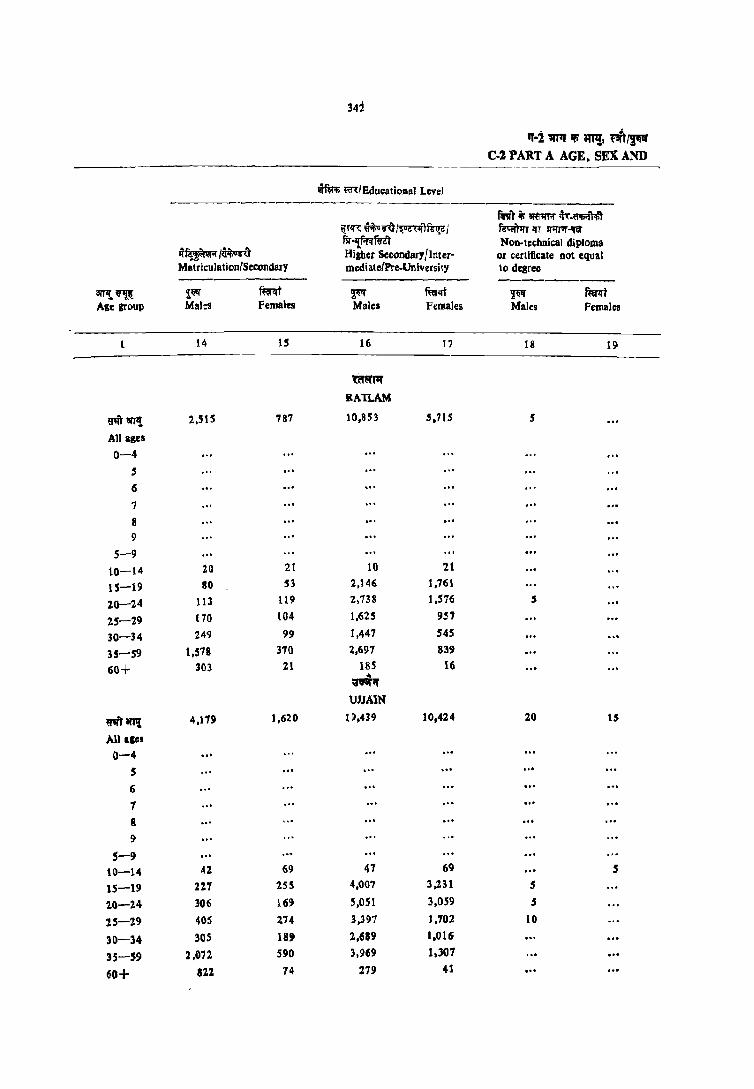
342
q·i 1n1f 111' ~ nftl~ C·l PART A AGE. SEX AND
vftr<!; mlEducational Level
mrl if; ~ 1l • ..atfiif'l<1i\' ~r~ ~~TI~l~~1 ~ 1fT lI1fI1IT~ Ilr~f.rct'fuit Non-technical diploma
il~~ Higber Secondary/Intcr- or certificate not equal M8lriculation/SeCOlld8lY medialelPrc-Utliversity to degree --- _-------- ---------
IlW!. ~1!t 1~ mm ~ ffiIlrt ~ ~t Age IrOUP Males Females Males Females Males Females
1 14 15 16 17 18 19
t8&1'1111'
KATLAM
R'itant! 2,5tS 787 10,853 5.715 5
All ages 0-4
5
6
1
8 9
5-9
10-14 20 21 10 21
15-19 80 53 2,146 1.761
20-24 113 119 2,738 1.516 S
25-29 170 104 1,625 957
30-34 249 99 1,447 545
35-59 1,578 310 2,691 839
60+ 303 21 185 16 .. ~~
UJJAIN
"'ant 4.119 1,620 111.439 10,424 20 15
All lie. 0-4
5
6
7
8
9
S-9 1()-14 42 69 41 69 5
15-19 2%'1 255 4,007 3,231 5
10-24 306 169 S,051 3,059 5
25-29 40S 274 3.397 1.102 10
30-34 30S 18' 2.689 1,016
35-59 2,072. 590 3,969 1,301
60+ nz 74 219 41

3U
aik'_m:-~ LEVEL OF EDUCATION-UJ,BAN
IITftAi m/EducatioDal Level -------------------------------------mrrt~~" ~tirm lIT SI1fTUl' ~ ~'All' fi1ft ~ N-..;r ~;ft;r;l R"1it 9' f1r;:;r Technical diploma or ~mn ~~~it certificate not fQual Graduate degree other Post-graduate degree other 10 degree than technical degree thaD technical degree
--------- ---------- -------------~ mill' ~ ~lit ~ f~q'r aJI!~ Males Females Males Femalts Males Females Age grOUP
20 21 22 23 24 as 1
tlIiJIIr
RATLAM
638 32 4,839 2,045 2,4'6 1,000 nl arfl! AUqea
0-4
." 5
6
1 8
9
5-9 10-1'
15 151 230 26 31 15-19 165 1,046 810 439 '49 20-24 157 S 1,093 478 541 318 25-29
74 5 822 244 405 162 30-34 216 11 1,626 268 1,003 140 35-59 10 5 102 16 36 60+ ..
~;r
UJIAlN
926 15' 8.441 3,Ci76 4,449 2.003 nl ""'l AU ....
0-4
5
6 1
8 9
5-9 ... 10-14 44 2J!) 326 38 41 U-19
172 5 1,906 1,459 722 "4 20-24 160 1,'195 ga5 1,069 $ID 25-U 165 10 1.672 4Z0 761 391 30-]4 371 2,649 535 1,,45 451 35-59
16 ... 200 11 114 10 60+
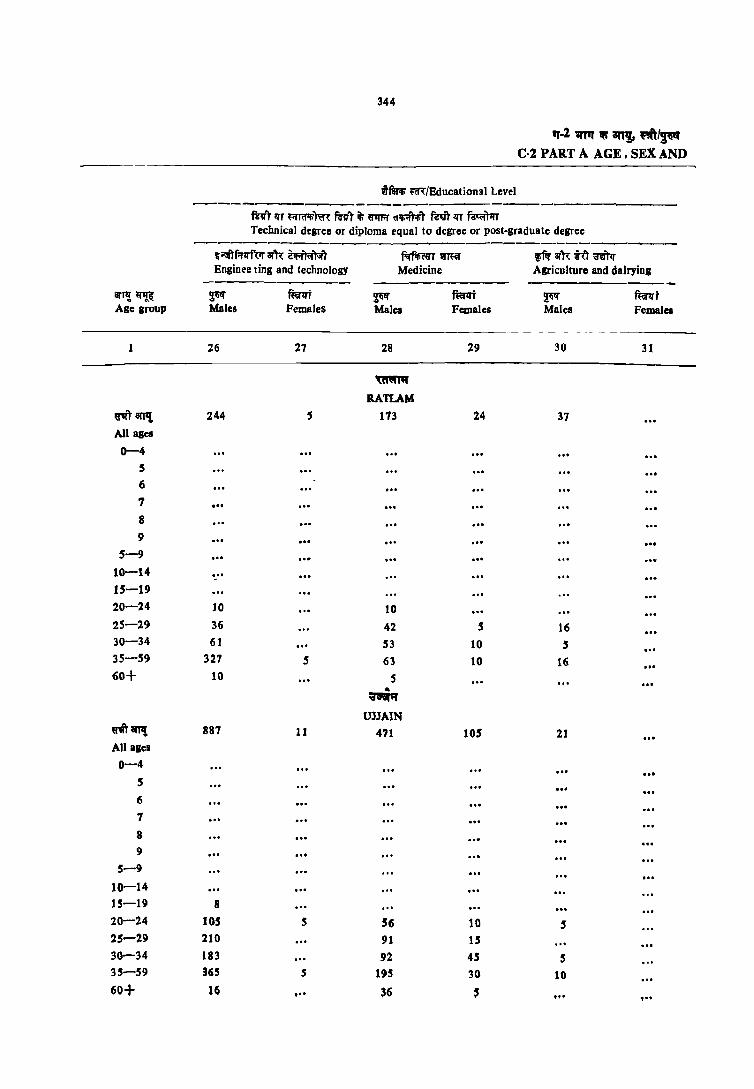
344
.... 1 11111 '" 8t1!t ~/~ C·2 PART A AGE I SEX AND
"1m; m/Education!l1 level --------------------------fsvllfT ~J(fII;m furl it; UlI'R' d~ mrr 1fT ~T Technical degrec or diploma equal to degree or post-graduate degrec
--------------------------------------~Oiiflf;:rlffm ar'R bRr..r.ft ~tm~ Pr ar'tt Rl mlJ' Enginec ring and technology Medicine Agriculture and dairying
---arl1! ~ ~ mrll't ~ mi ~ mi Age group Males Females Males Females Males Femalcs
1 26 27 28 29 30 31
~
RATI.AM
"l8l'l1{. 244 113 24 37 A11ases
0-4 5
6
7
8
9 ... 5-9
10-14 ." ... 1S-19 20-24 JO 10 25-29 36 42 S 16 30-34 61 53 10 S ... 35-59 327 5 63 10 16 ... 60+ 10 5
.-;wrlf
UllAIN mi\'l1l 887 11 471 105 21 All aiel
0-4 ... 5 6 ... 7
8 9 ...
5-9
10-14 15-19 8
20-14 ]05 5 56 10 5 25-29 210 91 15 30-34 183 92 45 5 35-59 365 5 195 30 10 60+ 16 ," ~6 , .. ' t··

345
~uf~m-~ LEVEL OF EDUCATION-URBAN
wfw.!; mlEducational Level -----------------------------------mn 1fT Mi<tifl1'€1( ~ iii I.1II'R ~'l' n-m- JfT ~qr
Technical degree or diploma equal to del!Iee or post-sraduate degree -----------------------------
Ill!. ~r <I!'S'IflIA' ar;:lf
Veterinary Teaching Others -------- ---------- ------~ mrzrt ~ ~1If ~ furtrt arrl1~ Males Femalet Maler. Females Males Females Ale Il'oup
32 33 34 35 36 37
~
RATLAM
11 302 156 "1.,., All agea ... 0-4
5 6
7
B 9
... 5-9 10--:14 15-19
20 20-24 26 55 25-29
10 31 14 30-34 10 124 67 35-.5'9
15 nf;r
60+
UJJAIN
436 423 6 hl iIT'! All agea
0-4 5 6 7 B 9
5-9 10-14 15-19
21 81 26-24 31 107 25-29 80 62 30-34
S 276 Hi9 6 35-59 ,., ,., ~8 ,., , .. . .. 60+

346
~t-2 1m II an!. ",,1(,. C-2 PART A AGE, SEX AND
~ (w~ ~ it; f.Rr*) Literate (without educational level)
!OI' Gl'R'il§!fr fi'l'nR ar;r~ Total Population Illiterate Non-Formal
------ ------ ---------8W!~ ~ fflI'd ~ Mlff ~ ffifqf Age group Males Females Males females Males Females
1 2 3 4 ! 6 7
~ SHAJAPUR
~r<ll'P!; 65,533 59,235 25,585 39,090 640 429
AU ages 0-4 8,193 8.280 8.193 8.2.80
5 2.115 1.637 1.819 1,466 49 5 6 1,876 1,909 1,341 1,489 45 19 1 1,612 1,389 874 815 35 14 8 2,250 2,006 938 1,182 30 S
9 1,091 1,212 319 436 15 14 5-9 8,944 8,1.53 5.291 5,449 173 57
10-14 9,060 1,732 1.788 3,301 25 24 15-19 1.336 5,915 1,429 2.652 45 25
20-24 6,148 5,399 1.136 2,628 40 42 25-29 4,594 4,409 836 2,413 14 24 30-34 4,034 3,634 107 2,245 29 24 35-59 13,195 11,432 4,242 8,325 203 172
60+ 3,986 4,257 1,935 3.728 102 57 nm
DSWAS
~'Ift' arT'i 18,410 70,357 29,541 . 43,935 270 221
All alcI
0-4 10,395 9,537 10,395 9,537
S 2,320 2,242 2,065 2,047 S 6 2,143 2,095 1,722 1,730 10 S 7 1,&44 1,696 1,144 1.121 15 5 8 2,499 2,403 1,125 1,403 29 15
9 1,394 1,343 407 542 10
S-9 10,200 9,719 6,463 6,842 64 30
10-14 9,633 8,665 1,803 2,966 20 20 15-19 8.883 7,074 1.224 2,711 21 30 20-24 8.464 1.237 1,216 3,197 25 2S
25-29 6,301 5,559 1,007 2.687 15 10 30-34 5,207 4,232 1,016 2,399 20 16
35-59 14,852 13,594 4,448 9,454 66 56
60t 4,421 4,619 1,907 4,132 40 30
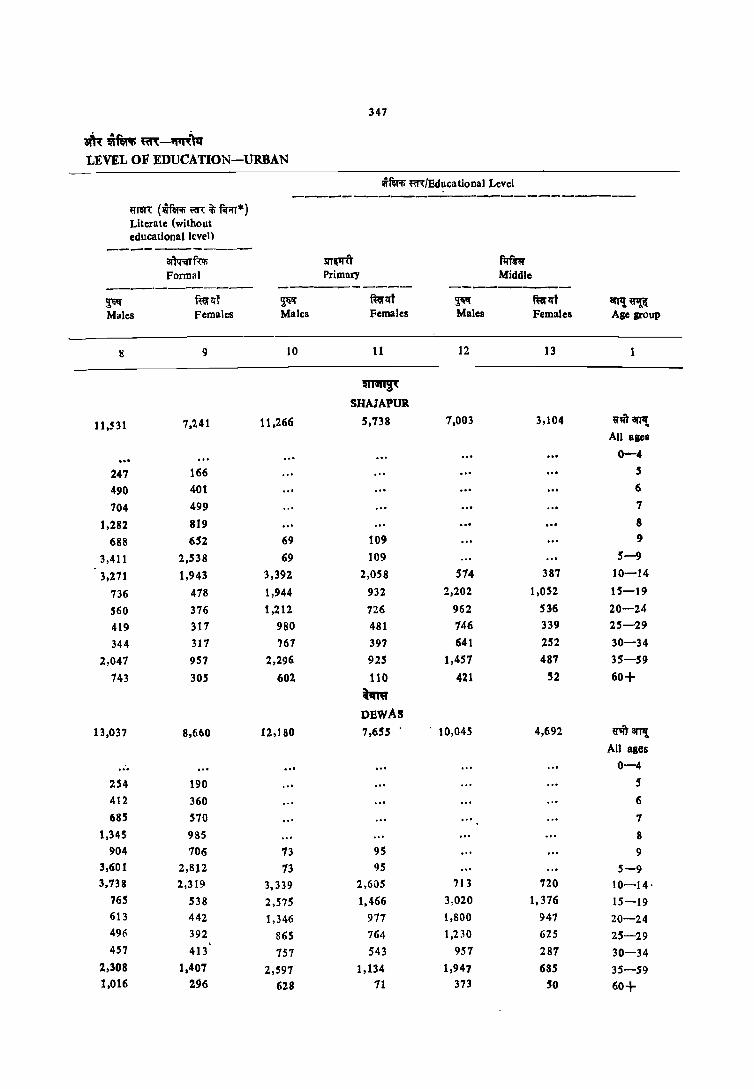
347
~ ~m. ~-;m)-q LEVEL OF EDUCATION-URBAN
w~ ~tn:/Educ:ational Level ------------------------
"I'rm (w~ ~ it f,r;rr*) Literate (without educ:ationallcvel)
----------ai\q;n'f~ 5I'T(IfU flffr.r Fonnal Primary Middle
----------- ----------- ----------~ f~l[T ~~ ~~, ~ ~Il't i!fI'l!~ Males Females Males Females Males Females Age group
8 9 10 11 12 13 1
~ SHAIAPUR
11,531 7,241 11,266 5,738 1,003 3,104 "I''Ift arPt All agea
0-4
247 166 S
490 401 6
704 499 7
1,282 819 8
688 652 69 109 9
3,411 2,538 69 109 S-9
3,271 1,943 3,392 2,058 514 387 10-14
736 418 1,944 932 2,202 1,052 15-19
560 376 1,212 726 962 536 20-24
419 317 980 481 746 339 25-29
344 317 761 397 641 252 30-34
2,047 957 2,296 925 1,451 481 35-59
143 305 602 110 421 52 60+
~ DBWAs
13,037 8,660 12,180 7,655 10,045 4,692 "1''" an,! All aaes
... 0-4
254 190 5
412 360 6 685 570 7
1,345 985 8 904 106 73 95 9
3,601 2,812 73 9S 5-9 3,738 2,319 3,339 2,605 713 720 10-14-
765 538 2,575 1,466 3,020 1,376 15-19 613 442 1,346 917 1,800 947 20-24 496 392 865 764 1,230 625 25-29 457 413 757 543 957 287 30-34
2,308 1,407 2,597 1,134 1,947 685 35-59 1,016 296 628 11 373 SO 60+

348
WT-2 11m iii anJ, ""'/21" C-2 PART A AGE. SEX AND
WNA; m{Educational Level --------------------------------n-~r if; iIlWrA' ~,-il"fi;:fA;1"
~lI1: ~ro{~~'lfr~{ ~ <rr lIlfTOf..ljGf f3r-'lf.rqf~tt Non-technical diploma
llfWnr;r{~ro Hitlhcr Secondary/Inter- or certificate not equal Matri:ulation{Secondary mediate{Pre-Univershy to degree -------
iIW!~ ~ ffirlri ~ fur<rf ~ ffirIrj
I\ge group Males Females Males Females Males Females
14 15 16 17 18 19
~'{
SHAJAPUR.
«WI" i!II1! 822 260 4,658 2,111
All BIOI
0-4 5 6 ...... 7 8
9 5-9
10-14 10 5 14 is-I 9 78 39 825 676 20-24 40 48 1.398 607
25-29 62 76 147 363
30-34 11 18 669 221.
35-59 440 74 1,000 283
60+ 121 20 5 q
:PIilWAS
U'lit8lTll 1,291 320 1,304 3,017 10 10
All ages
0-4 5 6 1 8 9
5-9 10-14 5 11 15 25
15-19 36 5 1,161 843
20-24 106 20 2,175 949 10 25-29 90 81 1,519 611
30-34 106 26 993 261 S
3~-S9 678 153 1,360 317 S
60+ 276 25 76 5
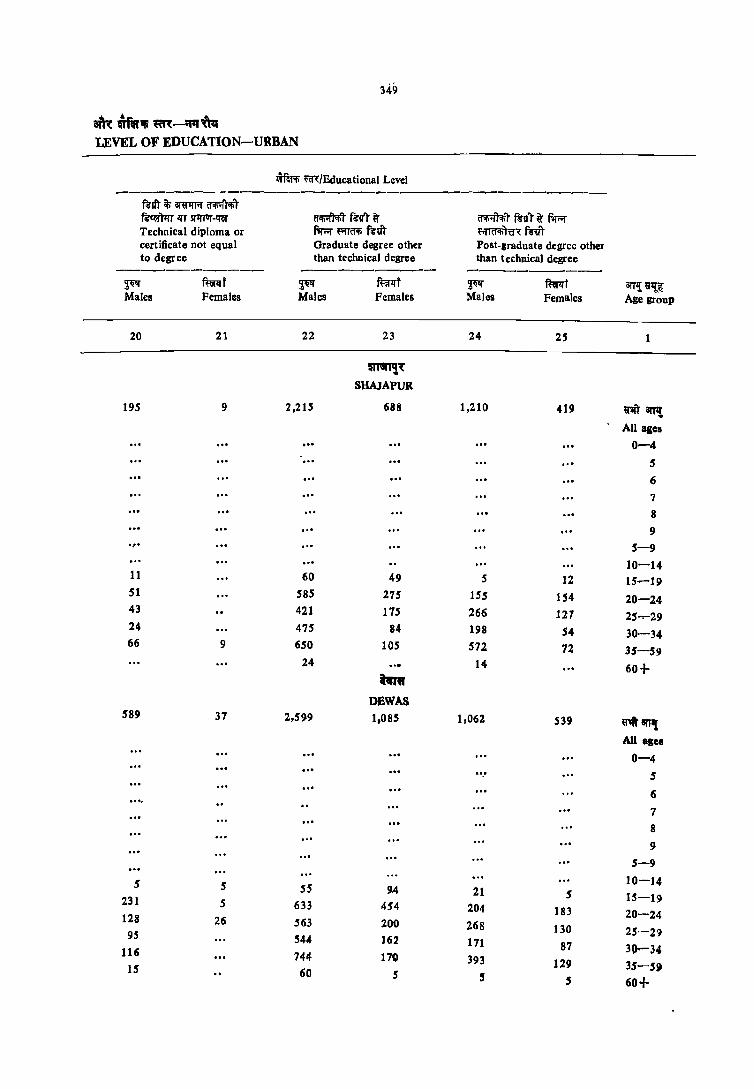
349
am: ~. ~-;priN LEVEL OF EDUCATION-URBAN
wf1R";f; m/Educational Level -------- --------------------------------
f4'1it ij; 6WII1'f fflIiilTapT ~);rr Ifr sPI1'Il'-«reI' 8;;p;rfapl f~lfT ~ 1f"Ii"I'l<n"t f4'u"t ~ N;:;:r Technical diploma or f1r;:;r ~a<Ii fi"tTT ~.mrIi)W<: f~T certificate not equal Graduate degree other Post-graduate degree other to degree than technical degree than technical degree
-------_---- ----_---_-- ---------~ ~f ~ ffiil<rT ~ mt iIlTl{ u'I!i1 Males Females Males Females Males Females Age grOUP
20 21 22 23 24 25
miirTl!'t SHAJAPUR
195 9 2,215 688 1,210 419 Ulftan'l! All ages
0-4 ... 5
6 7
8 ". 9 .,. 5-9
10-14 11 60 49 5 12 15-19 51 585 275 ISS 154 20-24 43 421 175 266 127 25..,....29 24 475 84 198 S4 30-34 66 9 650 105 572 72 35-59
24 14 60+ RJ"
OBWAS 589 37 2,599 1.085 1,062 539 ~,"I[
All asel
0-4 ... ... S
6 7
8 9
5-9
S 5 S5 10-]4
94 21 5 15-19 231 5 633 454 204 183 20-24 128 26 563 200 268 130 25-29 95 544 162 171 116 81 30-34 744 17'0 393 129 3S-5~ IS 60 5 5 5 60+

350
q-i 1Iiit iii aTI!r ~'I'!~ C-2 PART A AGE. SEX AND
~-----_-~----~--_-wfW!; f{]<:/Educational Level
-------------------------------------mrr ~r HRI'fll~ wlr'li WfTol ~.ft fuqr 1fT ~)lrr Technical degree or diploma equal to degree or post-graduate degree
-- ------------------------------------\iOi"tfifl1roT ern: ~1f'l)<'I'r.rf Rrfq;mT m'ffi' ffii am: rn :a1f)q Engineering and technology Medicine Agriculture and dairying
------------ ---_------- ----------Bl'fI! ~~ ~ mrlfT ~ mrzrT ~~I!I' mrzrr Age group Males Females Males Females Males Females
26 27 28 29 30 3J
m;r~
SHAJAPUR
~ant!. 57 101 8
All ages
0-4 5
6
7 .,. S
9
5-9
10-14
15-19 20-24 5 6
25-29 9 24 8
30-34 24 38
35-59 19 33
60+ ~
DSWAS
~8f11f. 196 11 110 17 35
All llIea
0-4 5 6
7
8
9 5-9
10-14
15-19
20-24 36 11 5 5 25-29 65 35 10 30-34 50 10 6 35-59 45 55 11 10 60+ ... 5 10
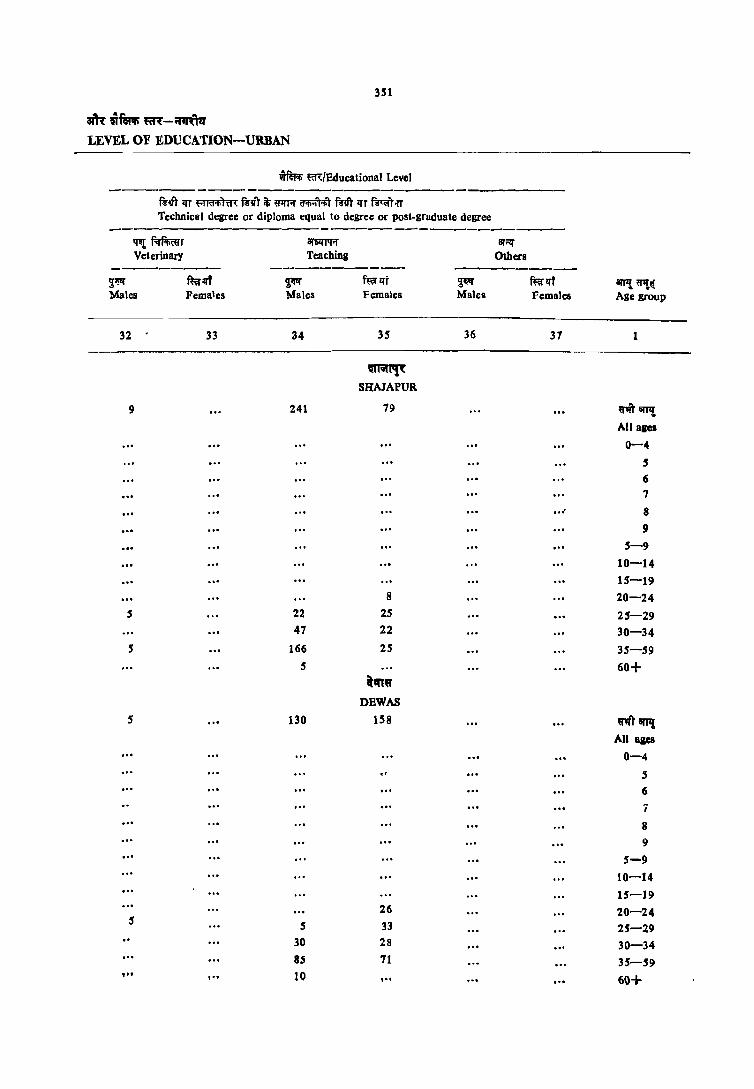
351
am: urn ~-~ LEVEL OF EDUCATION-URBAN
'4i'AFi; m/Educational Level ----------------------------------
~qr ;rr ~rm~ ~lTr it' ~or <I"fiOll~ ~lil" ;rr ~olT Technical degree or diploma equal to degree or post-graduate degree
-------------------~~r arSlfJ'lA' arN:l' Veterinary Teaching Others
--------- ------------ --------~~ ~lff ~ f~lft ~ mrlff an'!, ~If Males Females 'Males Females Males Females Age grOUP
32 33 34 35 36 37 1
~'(
SHAIAPUR
9 241 19 ~art'If. All agel
0-4
$
6 7
.. , 8
9
5-9
10-14
15-19 8 20-24
5 22 25 25-29 41 22 30-34
5 166 25 35-59 5 60+
hnr DEWAS
5 130 158 ~8ITIl All BICS
0-4
S 6
7
8
9
5-9
10-14
15-19 26 20-24
5 5 33 25-29 30 28 30-34 85 71 35-59
,n I·' 10 ,., 60+ , ..

3'2
IT-2 1fI1f ~ anJ, ""'~ C-2 PART A AGE. SEX AND
~nm (i~ m: it; forifT"') Literate <without educational level} ----------
:f'I' ~T f.t"w~ ar;r~
Total Popui:l.tion Illiterate . Nop.Formal
------- --------- ----------3I''Pl tl1J..fl: ~lf ft;al:ft ~ ft;al:ff . ,~ ffirll'i Age group Males Females Males Females Males Females
1 2 3 4 5 6 7
mpt JHABUA
rn8n~ 34,995 31,262 12,209 17,702 1)0 106 All agel
0-4 3,97' 4,354 3,975 4,354
5 1,089 914 933 864 14 5 6 813 916 507 629 9 25
7 8SS 853 421 461 5 8 935 1,041 32,S 524 5 9 610 595 152 173
5-9 4i302 4,319 2,338 2,651 24 40 10-14 4,188 3,854 797 1,216 13 5 IS-19 4,689 3,390 618 1,049 14 5 20-24 3,972 3,134 609 1,118 10 25-29 2,918 2,568 745 1,151 5 10 30-34 2,415 1,784 514 842 10 35-59 6,975 5,916 2,035 3,775 38 25 60+ 1,558 1,854 519 1,534 IS 10
crt DHAR
lI1iTamt 69,435 63,545 27,329 40,494 161 209 AM &leI
0-4 8,140 8,053 8,140 8.053 5 1,913 1.875 1,169 1,705 10 10 6 1,991 1,900 1.514 1,481 10 15 1 1,610 1.821 833 1,149 5 5 8 2,282 2.359 998 1,278 10 9 1,348 1.346 324 511 5
5-9 9,204 9,308 5,438 6,197 34 36 lCi-14 9,332 8,537 2,113 3,360 IS 31 15-19 7.779 6,211 1,552 2,643 10 29 20-24 6,891 6,061 1,228 2,844 10 5 25-29 4,855 4,931 965 2,572 15 30-34 4,131 4,039 1,168 2,346 9 26 35-59 14,553 12,297 4,902 8,818 54 51 60+ 3,926 4,073 1,818 3,$96 ~4 lO
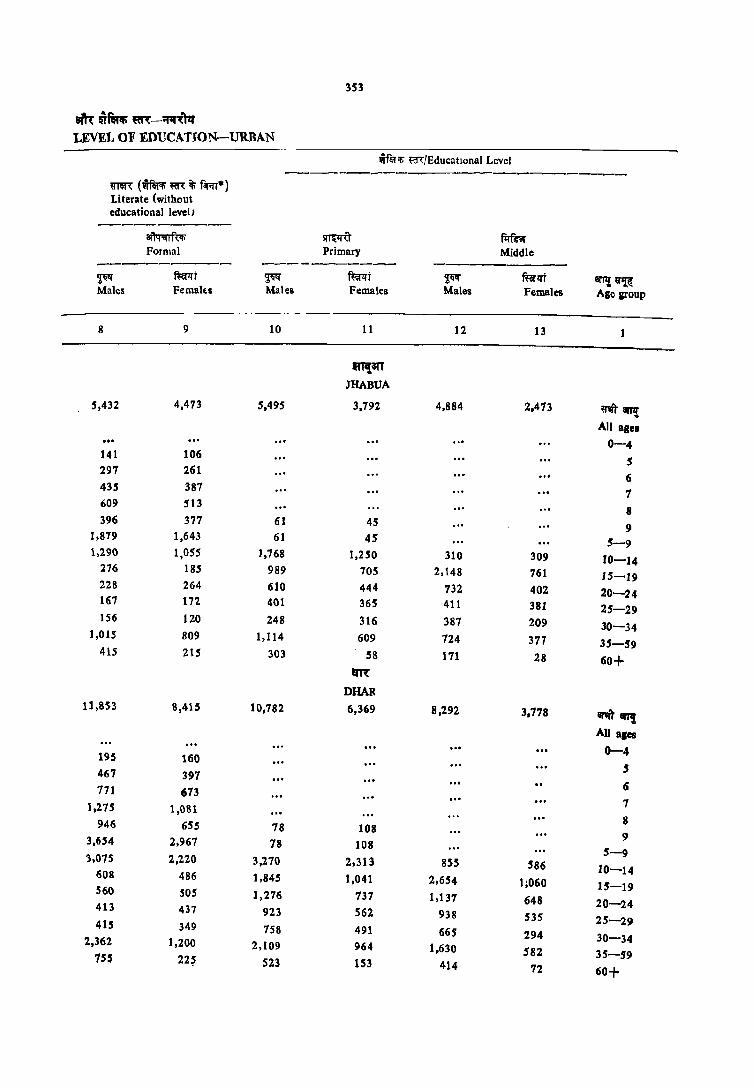
3S3
am ~~ ~-;rq~fq LEVEL OF EDUCATION-URBAN
wf&l'li ~/Educatlonal Level ------------------------
mf\ (w~ m it\' f<r-rr*) Literate <without educational level' -----_----~ srmiT firfr.r Formal Primary Middle ---------- ---------- -----------
~ ~t ~ mt ~ mrll'T 8lTl! ~ Males Femalts Males Females Males Females ABe group
8 9 10 11 12 13
1fT!a{T JHABUA
5,432 4,473 5,495 3,792 4,884 2.473 man,! All aiel
0-4 141 106
5 297 261 ... 6 435 387 7 609 513
8 396 377 61 45 9 J,879 1,643 61 45 5-9
1,290 1,055 J,768 1,250 310 309 10-14 :l76 185 989 705 2,148 761 15-19 228 264 610 444 732 402 20-24 167 172 401 365 411 381 25-29 156 120 248 316 387 209 30-34
1,015 809 1,114 609 724 377 35-59 415 215 303 58 171 28 60+
I1R
DHAR 11,SS3 8,415 10,782 6,369 8,292 3.778 anft8l'r!
AU ales
195 160 0-4
467 397 S
771 673 (;
1.275 I,OSl 7 8 946 (iS5 78 108 9 3,654 2,967 78 108
5-9 3,075 2,220 3,270 2,313 8SS 586 10-14 608 486 1,845 1,041 2,654 1;060 15-19 560 50S 1,276 737 1,137 648 20-24 413 437 923 562 938 535 25-29 415 349 758 491 665 294 30-34 2,362 1,200 2,109 964 1.630 582 35-59 155 22~ 523 IS3 414 72 60+

154
'1·2 Wfq .. an" '1Jft/~ Col PART A AGE. SEX AND
t~ m/Educational Level ---------------------------------------
fi'1i\' ~ affllnir 1h:~T ~l!"~~,~~, ~~Tl!"TJI'l11IIT~ 6r"i~ Non-technical diploma
~fa'~/~ Higher SecondarY/Inter- or certificate not equal Matriculation/Secondary . mediate/Pre-University to degree ----------- --- ----------
iI'J'l!~ ~ mr~t !I1If ffirllt ~ mrllf Age &roup Males Females Males Femalc\ Males Fcma~es
14 JS J6 J7 18 19
,"!WY JHABUA
~T III'll 478 147 3,729 1,734 16 a.1
All ....
0-4 .. , S
6 ." 7
I 9
'-9 10-14 , S 5 S 15-19 to 611 S82 10-24 53 5 1,104 534 16 H-29 39 43 653 292 30-34 42 24 555 164 3~-59 284 60 795 152 60+ 56 5 5
tm DRAM.
~atPt 762 172 5,919 2,712 10 All .tea 0-4
5 6
7 8
9 5-9
10-14 5' 5 21 15-19 10 5 1,045 827 20-24 16 31 1,603 770 5 25-29 52 21 874 471 30-34 47 31 832 286
35-59 461 74 1.429 327 60+ 176 5 126 S 5
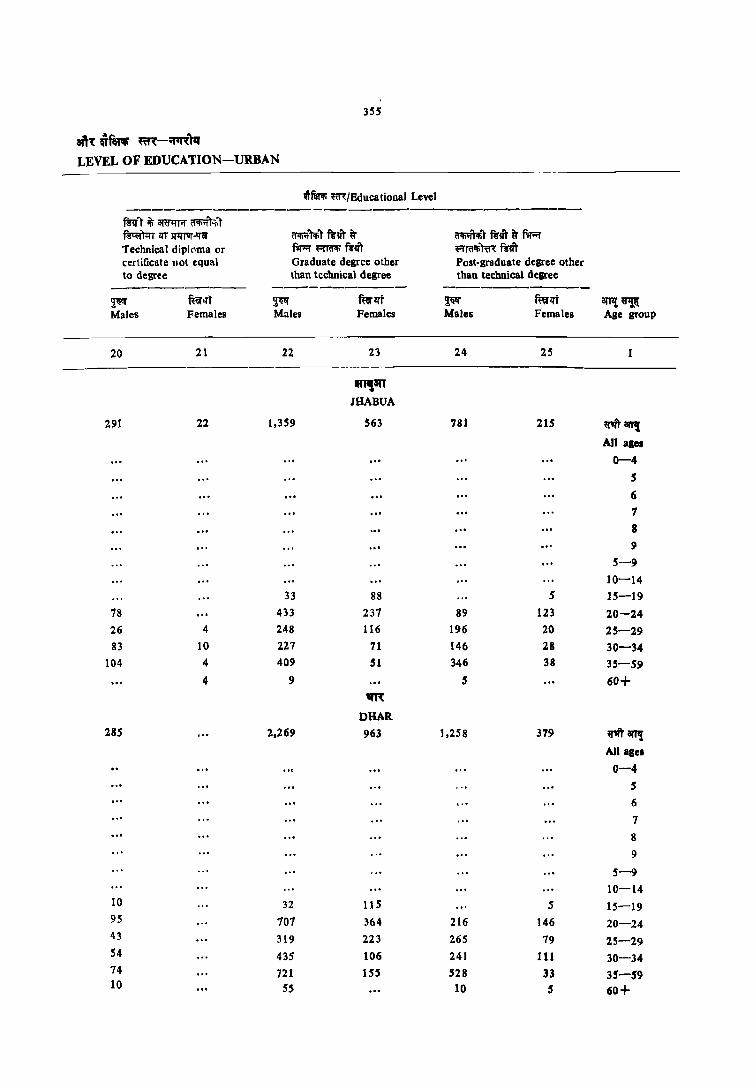
355
ait~!iTm. ~-~Tq
LEVEL OF EDUCATION-URBAN
f~ m/Educational Level ----------------------------------~!JT it; am~ \'IifiifT~:t ~ lIT SI1rTVr-'«l Cfi1ii't1<liT R'M ~ ~rRit~RFr Technical dipl(lma or fW;r ~ ~dl' ~1(Ii!fi~~ certificate not equal Graduate degree other Post. graduate degree other to degree than technical degree than technical degree
----------- --------- ------------~ ffirqf ~ ffir~t ~ ffir~ arJl! ~ Males Females Males Females Males Females Age gt'oup
20 21 22 23 24 25 1
~an JHABUA
291 22 1,359 563 781 215 rit81T! An 81e.
0-4
5
6 7 8
9
5--9 10-14
33 88 5 15-19 78 433 237 89 123 20-24 26 4 248 116 196 20 25-29 83 10 227 71 146 28 30-34
104 4 409 51 346 38 35-59 4 9 5 60+
'1R
DRAR 28S 2,269 963 1,258 379 ritamr
All agel
0-4 S
6
7
8 9
5-9 10-14
10 32 115 S 15-19 95 707 364 216 146 20-24 43 319 223 265 79 25-29 S4 43S 106 241 III 30-34 74 721 IS5 528 33 35-59 10 S5 10 5 60+

an~~ Age group
1
~m arP! All ages
0-4
5
6
7
8
9
5-9
10-14
15-19
20-24 25-29
30-34
35-59
60+
~'II"r an" All ages
0-4
5
6
7
S
9 5-9
10-14
15-19
20-24
25-29
30-34 35-59
60+
~flH1i m/Education3l Level
IT· 2 ;nq 'Ii 8lT9;, ftft /~ C-2 PART A AGE, SEX AND
mr liT ~ij'liTm ~!I'T iff ~ CI!Rr'ilT ~'1r lfT ~ Technical degree or diploma equal to degree or post·graduale degree
-------~---~----------.-----------------
~...,.rf;;l:rror aiR: ~r RWI'fl"T wmr 'lif~ ar1<: i"(r :amlf Enginee ring aDd technology Medicine Agriculture and dairying
----------- ----------~ ffil"lrt ~ ft:wrt ~~ mrzrt Males FemaleS Males Fem.1h:s Males Females
---_----- ----------~----_
26 27 28 29 30 31
m;arf .JHABUA
68 47 12 16
21 8 5 10 31
36 16 4 10
~
DHAB. 180 160 5
15
26 11 37 16 5 5 37 48 64 80
5

351
~~f~~-il~ LEVEL OF EDUCATION - URBAN
-------------------------
IiTm'P m/Educational Level ---------~------------------
R"1;fi llT rom't'T~ fe'll' 1t; ~fl1R cF"li'rrij;r ftvr lfT ful:\'l11rT Tech1ical de:::ree or diploma equal to degree or post.graduate degree
----------~----------------------------_ ~ f.m;cflT a;nm orr!!' Veterinary Teaching Others
---------- ----------,!~1i RiiI"lft ~1i ftiil"zrT ~ ftiil"!1t 3TTi19 ij'l!& Males Females Males Females Males Fem.lles Age group
---32 33 34 3S 36 37
m~T
JHABUA
10 51 22 ij''') arr,! All ages
0-4
5
6
7
8
9
5-9
10-14 15-19
5 4 6 20-24 4 2S -29
5 30-34 S 41 12 35-59
60+ '1Tt
DHAR S 164 49 ~"r iIfl'lI
AU ages
0-4
S
6
7
8
9 5-9
10-14
15-19 11 20-24
5 11 25-29 21 30-34
5 133 28 35-59 S 60+
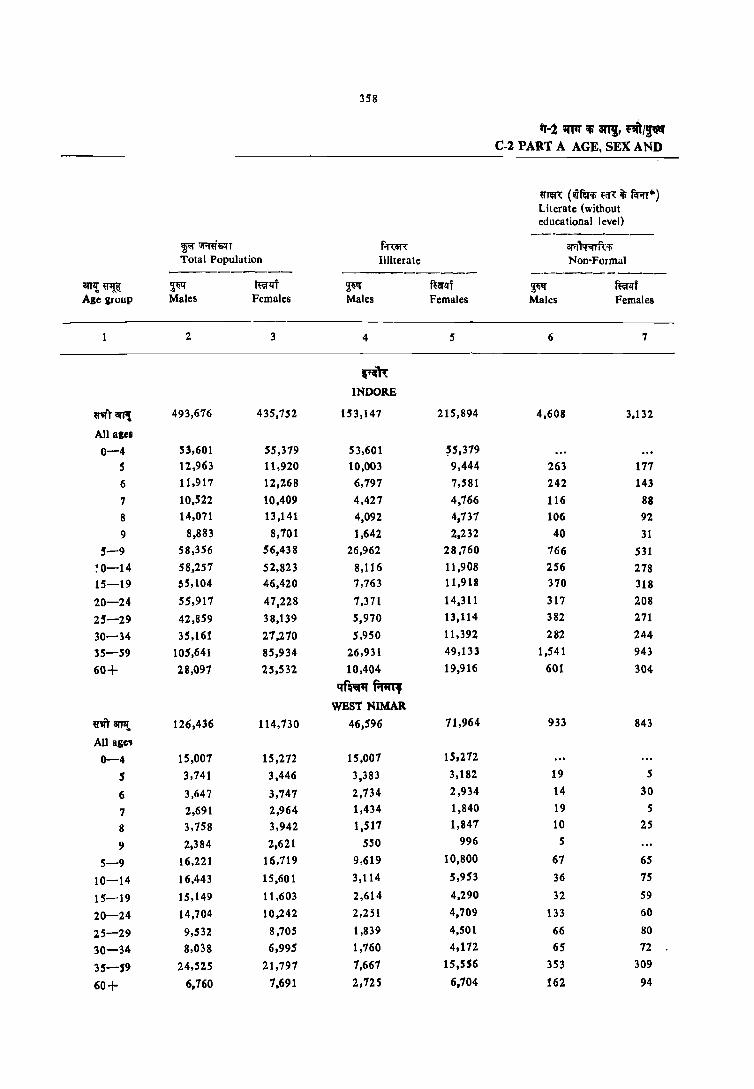
358
"'-1 mtT II an~, ~/~ C-2 PART A AGE, SEX AND
ij'm"{ (wm'li fiJ~ it; f1m*) Literate (without educational level) _--------
:!j<'I'~lSll'T f-rnr<: 0A~;p Total Population Illiterate Non-Formal
--------- ----------- -----------anl!~ 2:~ ffirlfr ~ ft:~lff ~ f~!I'f Age group Males Females Males Females Males Females
2 3 4 5 6 7
~ INDORE
~"r8fTl! 493,616 435,752 153,147 215,894 4,608 3,132
All agel
0-4 53,601 55,319 53,601 55,319
5 12,963 11,920 10,003 9,444 263 111
6 11,917 12,268 6,197 7,581 242 143
7 10,522 10,409 4,427 4,166 116 88
8 14,071 13,141 4,092 4,131 106 92
9 8,883 8,101 1,642 2,232 40 31
5-9 58,356 56,438 26,962 28,760 166 531
~0-14 58,251 52,823 8,116 11,908 256 278 15-19 ~S, 104 46,420 7,763 11,918 370 318
20-24 55,911 47,228 1,371 14,311 317 208
25-29 42,859 38,139 5,970 13,114 382 271
30-34 35,161 21,210 5,950 11,392 282 244
35-59 105,641 85,934 26,931 49,133 1,541 943
60+ 28,091 25,532 10,404 19,916 601 304
qf~~ WEST NIMAR
ij''Ift arJ1{ 126,436 114,130 46,596 71,964 933 843
All age'
0-4 15,001 15,272 15,001 15,212
5 3,741 3,446 3,383 3,182 19 5
6 3,647 3,747 2,134 2,934 14 30
7 2,691 2,964 1,434 1,840 19 5
8 3,758 3,942 1,517 1,841 10 25
9 2,384 2,621 550 996 5
5-9 16,22 ] 16,119 9,619 10,800 67 65
10-14 16,443 15,601 3,114 5,953 36 75
15-19 15,149 11,603 2,614 4,290 32 59
20-24 14,704 10,242 2,2;1 4,709 133 60
25-29 9,532 8,705 1,839 4,501 66 80
30-34 8,038 6,995 1,760 4,112 65 12
35-59 24,525 21,797 1,667 15,556 353 309
60+ 6,160 1,691 2,725 6,104 162 94
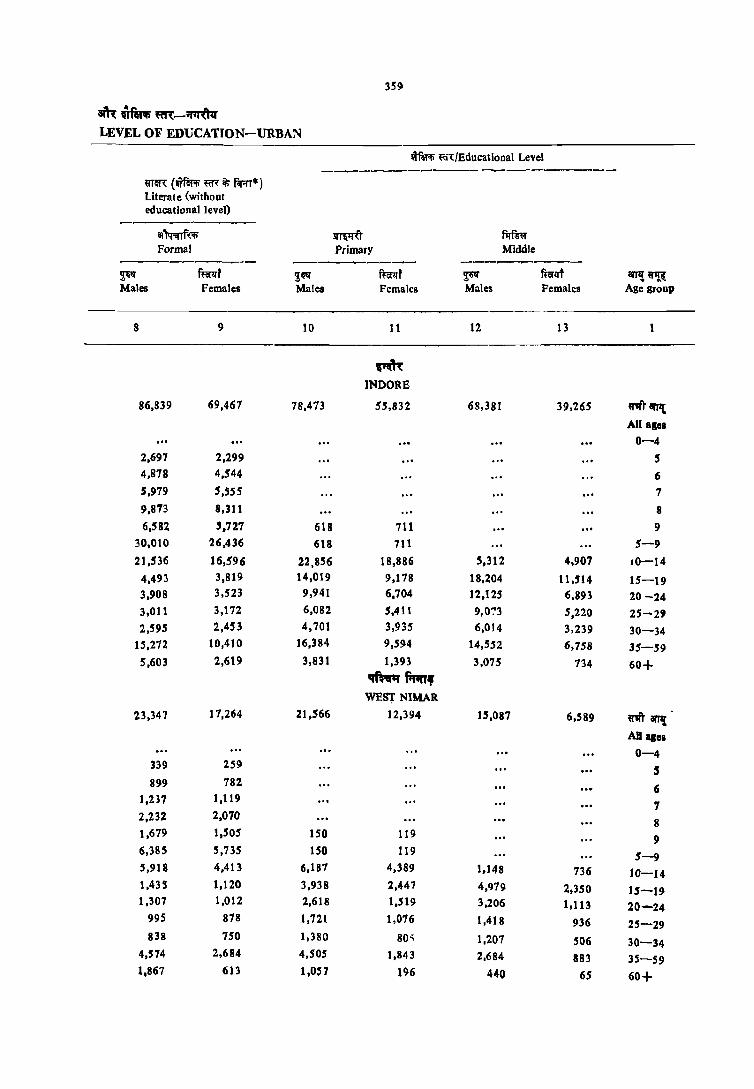
359
am:~f~~-~ LEVEL OF EDUCATION-URBAN
t~ ~l;/Educational Level --------------------men:: (WftR; m ~ f;r;rr*) Literate (without educational level)
-----------iIl~ ~ firfu;r Formal Primary Middle
--------_- --------~ ffa"lrt i~ f~lft ~ fta'1ff arT,! ~~ Males Females Males Females Males Females Age group
8 9 10 11 12 13
~ INDORE
86,839 69,467 78,413 55,832 68,381 39,265 n"l' IlI'P! All ages
." 0-4
2,697 2,299 5 4.878 4.544 6 5,919 5,'55 7 9,813 8,311 8
6,582 ',727 618 711 9 30,010 26,436 618 711 5-9
21,536 16,596 22,856 18,886 5,312 4,907 .0-14
4,493 3,819 14,019 9,118 18,204 11,514 15-19 3,908 3,523 9,941 6,704 12,125 6,893 20-24 3,011 3,172 6,082 5,411 9,0':"3 5,220 25-29 2,595 2,453 4,701 3,935 6,014 3,239 30-34
15,212 10,410 16,384 9,594 14,552 6,758 35-59 5,603 2,619 3,831 1,393 3,075 734 60+
qf~ ""'" WEST NIMAR
23,347 17,264 21,566 12,394 15,087 6,589 W1ft'~ All 1101
0-4 339 259 5 899 782
6 1,237 1,119
7 2,232 2,070
8 1,619 1,505 150 119 9 6,385 5,735 ISO 119 5-9 5,918 4,413 6,1B7 4,389 1,148 736 10-14 1,435 1,120 3,938 2,447 4,Q19 2,350 15-19 1,307 1,012 2,618 1,519 3,206 1,113 20-24
995 818 1,721 1,076 1,418 936 25-29 838 750 1,380 80;; 1,207 506 30-34
4,574 2,684 4,505 1,843 2,684 8B3 35-59 1,867 613 1,057 196 440 65 60+

360
IT-2 1fT1f If\' ""'!, """ I~ C-2 PART A AGE, SEX AND
~fWli mlEduc3tional Level ---------------------
full,. it; ar«m;r ~.-~ ~Tq< ~it;~ro/~~/ ~ lfT SI'II1'T..tf\iT fsr -lff.rorfrn Non-technical diploma
Il~/~r Higher Secondary/Inter- or certificate not equal MatriculationlSecondary mediate/Pre. University to degree ----------- ---------------- ----------
3t'l1f.~ ~m mrzrt ~ ffirlft ~ mrl1t Age group Mal~s Females Males Females Males Females
14 15 16 17 18 19
~ INDORE
~ 31T,! 11,375 4,650 48,656 28,586 128 27
All ages
0-4 ... 5
6
7
8
9
5-9
10-14 88 79 92 169
15-19 - 321 217 9,162 8,336 5
20-24 724 662 12,607 8,219 27 5
25-29 1,057 754 8,576 5,349 24
30-34 982 606 6,910 2,851 24
35-59 6.059 2,092 10,474 3,519 47 17
60+ 2,144 239 818 128 5
IIfAII fiAT, WEST NIMAR
~~ 31Tli 1,694 356 11,003 3,86 1 5
All ages
0-4
5 6
7
8
9
5-9
10-14 7 IS 33 20
15-19 4S 10 1,944 1.230
20-24 245 92 3,402 1,183
25-29 18S 62 1.901 806
30-34 133 67 1,573 369
35-59 837 110 2,019 247
60+ 237 130 , ,"
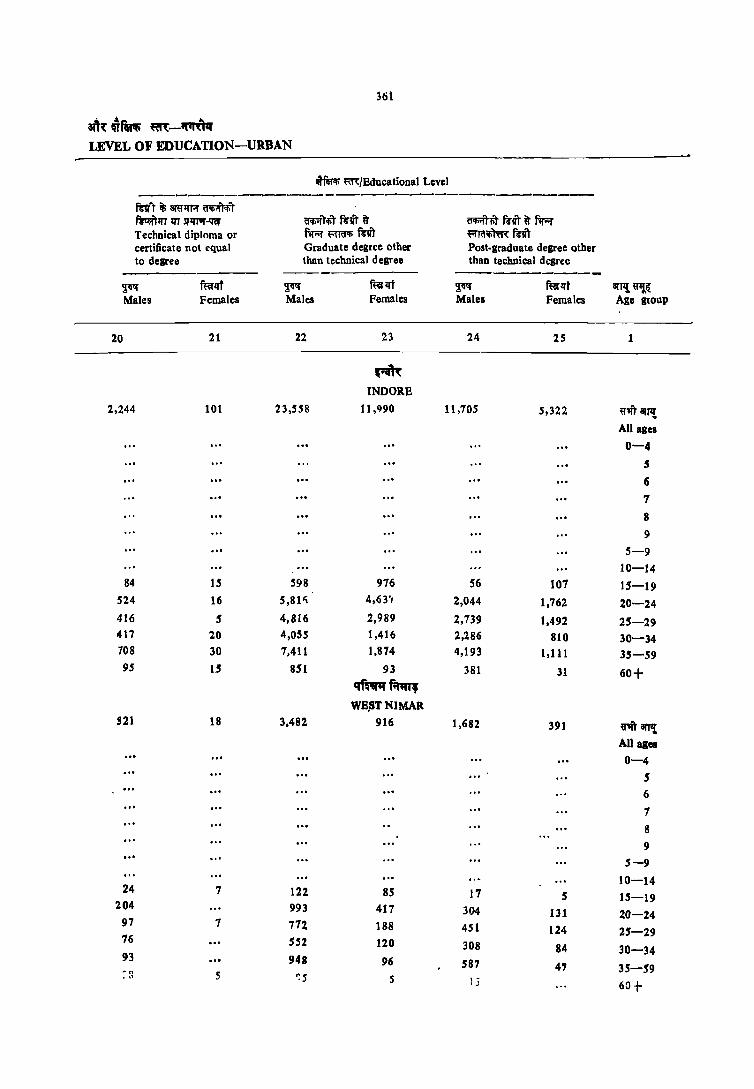
361
81lt~m. ~-~ LEVEL OF EDUCATION-URBAN
tftf<!; ~/Educational Level ----------------------------------fnr iii affl'IfR \'flIi\'ftolir ~'IT lIT :ll~J1IT-IJ'l!I' ifi!i'fr<Jil R'W it ~tt R'IIT it f1r;:;r Technical diploma or N"i ~R'!u ~f(I~~M certificate not equal Graduate degree other Post·graduate degree other to degree than technical degree than technical degree
-----------~ ffiflft ~ fufllt ~ ffiflft ill'J'If. «l!.
362
q.1l1't'f iii 8l't!, ~~ C-2 PART A AGE, SEX AND
~ m/Educational Level ------- ----
mr"t lI'T ~)m fi'!1r it; ~ <:I~ iTvr lI'T ~ Technical degree or diploma equal to degree or post-graduate degree
-----~-----------------,..-------------
~orrf.rq-fur arh: bRr.tr.Tr f.rf1rnrr mer Iiflr arh: ~ \11it If EDgince ring and technology Medicine Agriculture and dairying
-------:----~~ ~ mrll'T ~ fur'lIi ~ mt Age group Males FemaleS Males Females Males Females
I 26 27 28 29 30 31
~ INDORE
~BlPt 1,919 31 1,803 459 21 AlJales
0-4 5 6
7 8 9
5-9 10-14 15-19 25 S 10 20-24 269 6 205 96 6 25-29 305 10 358 115 30-34 482 358 79 10 ~S-59 153 10 713 124 5 60+ 85 s 164 35
qf~~
WEST NlMAR
UlUart'! 141 U6 33 33 AIl agel
0-4 5 (j
9 S ... 9
5-9 10-14 15-19 20-24 23 5 12 25-29 31 26 22 S 30-34 41 82 S S 35-59 41 83 6 10 60+ s
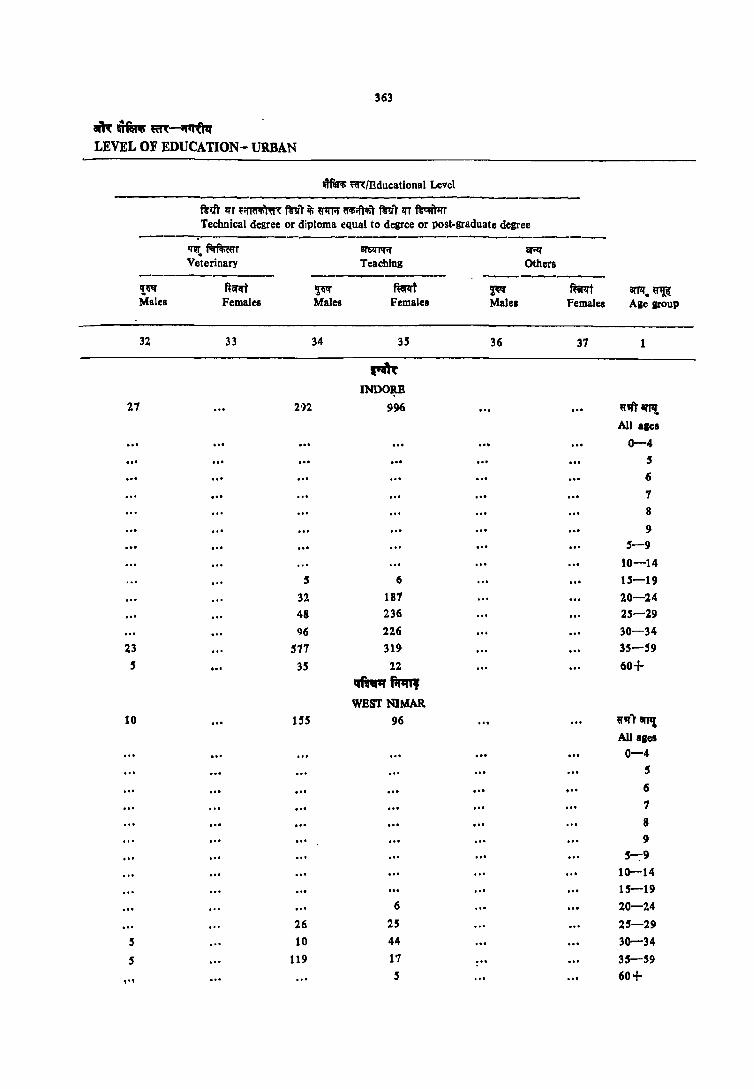
363
m~~-;r~ LEVEL OF EDUCATION- URBAN
~ m/Bducational Level ----~----------
~lft ITT ~~ fuv'l' il'i ~R a<Ii;ft'll't mr ITT ~ Technical degree or diploma equal to degrce or post.l!I'aduate degree
--------;-----------------------------'Ill;. f.m;~r ~ 8f;::q'
Veterinary Teaching Others --------- -------'!~ ft~1Ti' ~ mt ~ ftwITt arTII'. ~ Males Females Males Female. Malea Females Ale Iroup
34 33 34 35 36 37 1
...m INDORB
21 2')2 996 «1ft arJ'It All a,el
0-4 ... ... 5 6 .. , 1 8
9 5-9
10-14 5 6 15-19
32 181 20-24 48 236 25-29 96 226 30-34
23 577 319 35-59 5 35 22 60+
~-WBST NIMAR.
10 135 96 ~"i' 11111£
All Blel
0-4 5
." ." 6
7
8 9
5-:-9 10-14 15-19
6 20-24 26 25 25-29
5 10 44 30-34
5 119 17 ... 35-59
,., S 60+

364
.... :z 1IR II iIfT!, m/~ C-2 PART A AGE, SEX AND
mI"{ (-;f1In; m if; ~.) Literate (without educational level)
~~r fimn: ar.r~ Total PoPUl:l.tiOD Illiterate Nor-Formal --------- ---------
lIlTI! ij1{ I{ ~ f~' ~ ~, 't,qq' mp,i Ase group Males Females Males Females Males Females
2 3 4 5 6 7
~~ EASTNIMAR
rnlllTl! 160,356 148,844 60,310 86,980 396 292 All ages
0-4 20,006 19,200 20,006 19,200 5 4,817 4,035 4,625 3,910 19 14 6 4,313 4,431 3,S71 3,766 23 34 7 3,337 3,424 1,938 2,262 33 15 8 4,796 4,449 2,163 2,292 14 18 9 3,179 3,031 1,006 1,068 9 5
5-9 20,442 19,369 13,303 13,298 99 U 10-14 21,019 19,643 4,924 6,491 37 41 1$-19 18,581 16,043 3,662 5,460 30 25 20-24 16,001 14,697 2,717 5,919 2S 23 25-29 12,211 11,000 2,198 5,012 25 19 30-34 9,869 9,364 1,970 4,528 24 5 35-59 33,688 30,419 8,509 19,445 135 71 60+ 8,491 9,060 3,021 7,624 18 19
'mI'I', RAJOARH
mill11! 54,989 49,927 22,971 33.832 1,261 776 All aael
0-4 6,955 7,073 6,955 7,073 5 1,836 1,471 1.676 1,381 5 6 1,467 1,32!! 1,106 998 . S 7 1,334 1,249 642 819 9 8 1,900 1,486 811 869 14 10 9 897 913 237 440 9
5-9 7,435 6,445 4,412 4,507 37 14 10-14 6,852 6,1S9 1,462 2,601 46 28 15-19 6,107 5,039 1,299 2,187 102 62 20-24 S,6~3 4,548 1,100 2,247 110 162 2"-29 3,854 3,643 934 2,149 129 95 30-34 3,219 3,027 854 1,809 81 78 35-59 11,548 10,181 4,207 7,778 491 251
~~+ 3,265 3,12~ 1!6S~ 3,398 163 ~~

365
amUhAs~-~ LEVEL OF EDUCATION-URBAN
ifm; ~.: IEducational Level ------ ------mR (~fm; m it; Worr*) Literate (without educatioDallevel) -------8l~ ~ ~ Formal PrimarY Middle --------- -------- -------
~ ~t ~4I!f mr1.ft ~ fuJq' 8lTI! ~ Males females Males Females Males Females Age Iroup
8 9 10 11 12 13
,,~
BAST NIMAR
33,896 24,208 24,347 16,805 17,529 9,723 WlftIll'l1l All ales
0-4 174 111 5 719 630 6
1,365 1,147 , 2,619 2,139 8 2,041 1,853 123 105 9 6,911 5,880 123 105 .. , 5-9 7,827 6,161 6,649 5,435 I,SS8 1,490 10-14 2,604 1,693 4.211 3,168 5,649 3,454 15-19 2,022 1,615 2,917 2,186 2,867 1.483 20-24 1,747 1,326 2,107 1,606 1,995 929 25-29
1,465 1,415 1,644 1,334 1,401 767 30-34 8,768 5,032 5,385 2,759 3,382 1,507 35-59
2.512 I,O~6 1,306 213 673 93 60+
'mI'1f B.AJGARH
8,397 5,256 7,516 4,580 4,140 2,052 Wlftarfl! All ales
.... 0-4
159 85 5
357 328 (j
683 430 7
1,076 608 8
597 411 54 62 9
2,872 1,862 54 62 5-9
2,446 1,541 2,293 1,638 553 264 10-14 442 384 1,322 784 1,385 635 15-19 376 255 846 51' 614 395 20-24 219 171 542 394 386 234 25-29 201 271 416 364 368 188 30-34
1,347 612 1,671 720 1,114 311 35-59 472 95 3f~ 101 316 24 60+
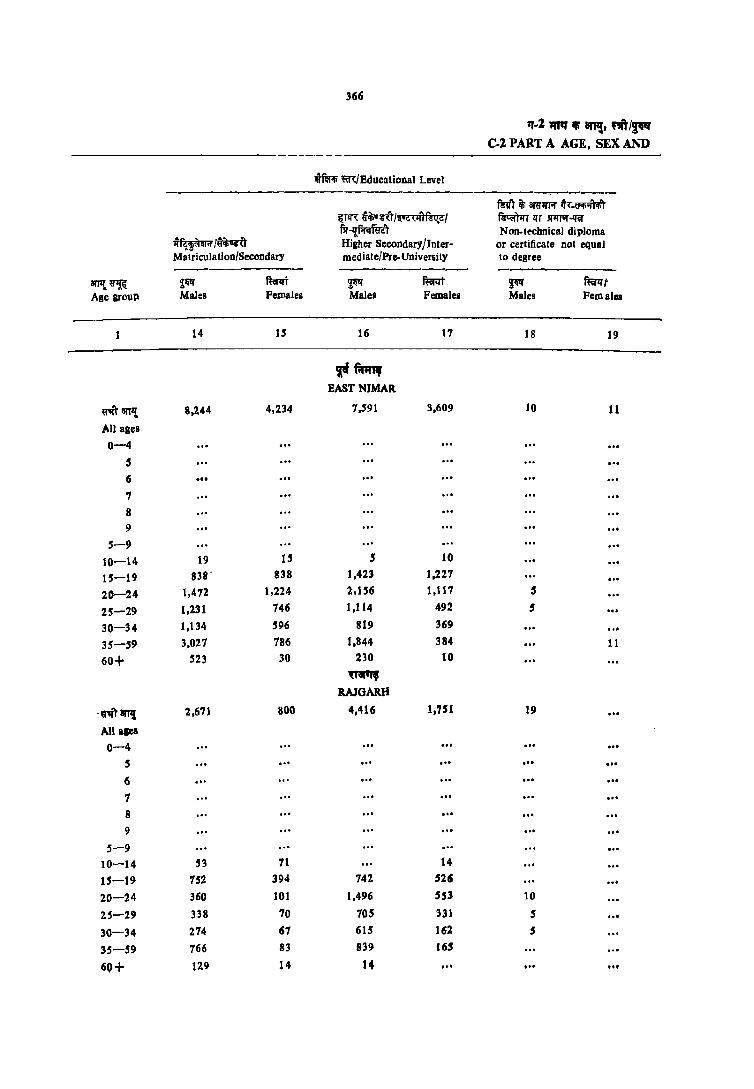
366
".2 "'" II' i111!, ,,"/~ C.2 PART A AGE, SEX AND
-,ffi'1i m/EducatioDal Level
fQ1 iii SRrIl'J'il' iTt_~ i{T!!': ~rn/\ua(l'liflll{al ~T lTT JIlITUT..qijf
~/~ m~ Non.tf'cbnicaJ diploma Higher Secondary/lnter- or certificate not equal
Matriculation/Secondary mediate/Pre-University to degree --- ----------------- -------8fTIt ~ $~ mm ~ ft:;;r<rt ~ ~t Age grouP Males Females Males Females Males Females
14 IS 16 17 18 19
~~ EASTNIMAR
~<I\111 8,244 4,234 1,591 3,609 10 11
All ages
0-4 5 6 7 8 9
5-9 10-14 19 l' 5 10
15-19 838- 838 1,42.3 1,227
20-24 1,472 1,224 2.,156 1,117 5
25-29 1,231 746 1,114 492 .5
30-34 1,134 596 819 369
35-59 3,021 186 1,844 384 11
60+ '23 30 230 10
~ RAJGARH
'""'1Il'I1 2,611 800 4,416 1,751 19
All aleS
0-4 ... 5 ... 6 ... 7
8 9
5-9 10-14 53 71 14
15-19 152 394 742 526
20-24 360 101 1.496 553 10
25-29 338 70 70S 331 5
30-34 274 67 615 162 5
35-59 766 83 839 165
60+ 129 14 14 ,., ,., , ..

361
aftl~fnm-~ LEVEL OF EDUCATION-URBAN
~ m/Educatiooal Level -----------------------------------fn'l'it;~~ ~lI'Tsrrrur-'fF.l' Q'lIj,'Jr.r.;. mft « f\{p;; ~.m f~!IT ?r f'lFf Technical diploma or ~mi'r fij ItI'Il) 't1 < fu'!l'l' certificate not equal Graduate degree other Post-graduate degree other to degree than technical degree than technical degree ----------- --------- -------------~ fi:ut ~ ~zrt ~ ~lfr
~~ Males Females Males Females Males Females Age group
20 21 22 23 24 25
.~ t" . EASTNIMAR
1,187 71 3,708 1,641 1,958 764 ~ ... ) arJ'!! All ages ... 0-4
5 6
1
8
9 5-9
10-14 61 S 104 150 20 15-19
313 9 1,001 728 325 251 20-24 195 16 887 428 501 265 25-29 214 617 122 385 12S 30-34 318 36 970 199 707 91 35-59 14 5 128 15 34 60+
mq RAJGARH
82 1.840 511 707 248 nT 6I'1l{
All asea .. , 0-4 .. , 5 .. , 6 .. , 7
.. ' 8 .. , 9
5-9
." JO-14 52 62 7 8 15-19
5 620 229 128 74 20-24 29 383 126 135 64 25-29 24 240 29 102 29 30-34 II) ~21i tiS 312 74 35-.59·
5 14 23 60+
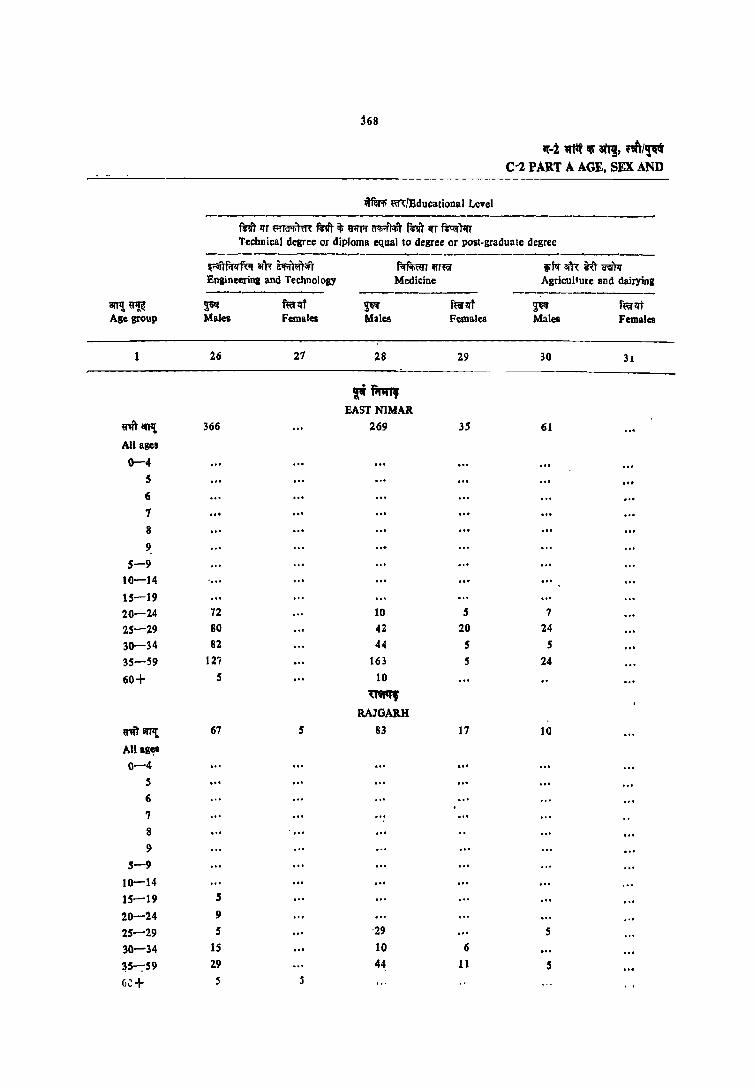
j68
rr-11(fif ttl' Itt!, ,,,.,,.. C-2 PART A AGE. SEX AND
tfuot; m/Educ:a.lional Level
fi"1h liT ffia'!im fi"!h " u;rrr 6'!Ii;:r'Rft f~ liT ~"t"T Tec:hnica.1 degree or diploma equal to degree or post-graduate degree ------------------_._--------------
~~ ifl< mwn;;fr ~rwr~ fill1"a.~t roQ Engineering and Technology Medicine Agriculture and dairying --------- ---------- ------------
an'1~ ~ ~lft ~ f~lft ~ f~ll't Age group Malea Females Males Females Males Females
1 26 21 28 29 30 31
fif~ EAST NIMAR
mar!l! 366 269 35 61
All ages
0-4 5
6
7
8 9
5-9 10-14 15-19 20-24 72 10 5 7
25-29 80 42 20 24 30-34 82 44 5 5 35-59 12; 163 S 24
60+ 5 10 ~,
RAJGARH
6'",,1' ilTfIt 67 5 83 17 10
Anag~
0-4 5 6
7 ... 8 ... 9
5-9 10-14 15-19 5
20-24 9
25-29 5 -29 5
30-34 15 10 6
~5--:,S9 29 44 11 5 (j~+ 5 5

'" .... ~ LEVEL OF EDUCATION-URBAN
fftR; mlBilucational Level --------- ------------mI\' 1fT f"Ila",)'d( mft' it; ~r.r ~ ffWt 1fT ~ Todmical dcsree or diploma equal to degree Qr pOlt-graduate degree -------- ----
'"t fIIm;m ~ lIP'f Veterinary Teaching Others
~ fterlIf ~ ~ ~ n..t 1l'PL. Males Female. Males Female. MaliS Fet!Daics Ale Il'oup
32 33 34 35 36 37 1
p~ EAST NlMAR.
20 464 471 U'It~ . Main
0-4
5 6
7 8
". , $-9 ... 10-14
5 15'-1'9 ~2 132 0" 2'G-2'4 54 141 t$_"~!)
(;4 98 j$-!4 20 '107 t8 SS-$9
17 6, ." 60+
~ aAJOOH
, 284 99 W'IlIIfI\ ~
All aPl
." ... e-4 5 .. , ." ", .... (;
1
. " .. , ... 8 9
", 5-9
." 10-14
", ,,' 15-19 14 20-24
10 9 25-29
15 26 30-34
S 115 50 35-59
". ", , .. , t" ~O+

370
1(-11111( • itt!, mp C-2 PART A AGE, SEX AND
mR ("4fftfol; ~ it; m,·) Literate <without ec1ucational level)
~~T f~ iIP11'1'i11 F(1fi
Total Population Illiterate Non-Formal ------- --------- -----OI'P! ~ ~ fi:i'lff ~ mt ~ ffiIlrt Age sroup Males Females Males Females Males Females
2 3 4 5 6 7
~ VIDISHA
"'~ arP! 71,113 61,792 26,780 35,682 1,112 1,012
All ages 0-4 9,299 8,625 9,299 8,625
5 2,138 1,962 1,897 1,718 9
6 2,134 1,949 1,444 1,424 5
7 1,632 1,478 788 183 9
8 2,287 2,032 875 899 5 5
9 1,362 1,227 399 389- 9-
5-9 9,553 8,649 5,404 5,272 9 32
10-14 9,143 8,024 1,762 ~,432 19 55
15-19 8,216 6,167 1,293 1,819 37 115
20-24 7,777 6,131 1,182 2,416 79· 94
25-29 5,191 4,842 917 2,062 81 93
30-34: 4,414 3,649 982 1,976 110 93
35-59 )3,480 11,987 4,092 7,967 482 388
60+ 3,841 3,632 1,800 3,077 290 143
m.mr BHOPAL
u'lfl iIITIl 364,648 317,205 131,427 165,819 5,410 4,225
All aiel
0-4 43,401 42,661 43,401 42,661
5 10,59% 9,548 8,386 7,602 75 55 6 10,254 9,457 6,259 6,307 35 40 7 8,354 8,399 3,169 4,160 25 20 8 11,389 9,871 4,268 4,052 n 40 9- 6,929 6,6J3 1,737 2,098 5 15
5-9 47,518 43.888 24,418 24,220 19~ 171 10-14 44.922 40,375 9,424 10,683 178 222 15-19- 37,301 33,987 7,48l 10,714 511 547 20-24 38,862 34,855 6,950 11,993 724 S50 25-29 31,474 29,092 5,542 11,645 664 604 30-34 26,218 21,891 5,103 9,824 423 394 3S-S9. 79,899 55,740 22,365 32,416 2,088 1,365 6Q+ t4,41~ J4,104 6,650 Jl,46~ ,77 318
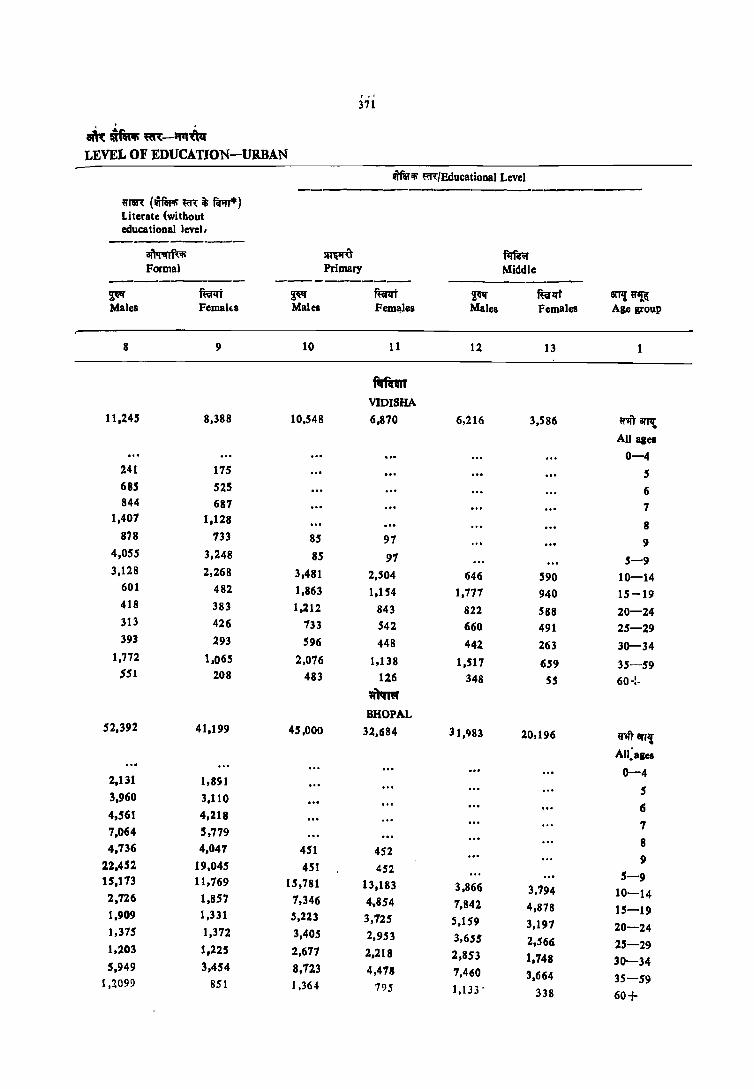
, .' 371
~.m:-.. ~ LEVEL OF EDUCATION URBAN
.mt!fi m/Educational Level --- --------------urm: (1ITft:A; m ~ ~.) Literate <without cduca tional level,
------------~ ~ Amr Formal Primary Middle ---------- ----------- --------
~ ffirfj ~ ffi:!<fj ~ mrlrt 8l'TI{ 'f~ Males Femalu Male. Feml!les Males Females Age group
8 9 10 11 12 13
Rfimr VIDISHA
11.245 8,388 10,548 6,870 6,216 3,586 frlftamt All ages
0-4 241 175 5 685 525 6 844 687 7
1,407 1,128 8 878 733 85 97 9
4,055 3,248 85 91 5-9 3,128 2,268 3,481 2,504 646 590 10-14
601 482 1,863 1,154 1,777 940 15-19 418 383 1,212 843 822 588 20-24 313 426 733 542 660 491 25-29 393 293 596 448 442 263 30-34
1,772 1.065 2,076 1,138 1,517 659 35-59 551 208 483 126 348 55 60-:·
11)mr
BHOPAL 52.392 41,199 45,000 32,684 31,'>83 20,196 «lIT arr'l
All~ase8 ... 2.131 l,8S1
0-4
5 3.960 3.110
6 4,561 4,218
7,064 5,779 7
8 4.736 4.047 451 452 9 22.452 19,045 451 452
5-9 15.173 11,769 15,781 13,183 3,866 3,794 10-14 2,726 1,857 7,346 4,854 7,842 4,878 15-19 1.909 1,331 5,223 3,725 5,159 3,197 20-24 1,375 1,372 3,405 2,953 3,655 2,566 25-29 1,203 1,225 2,677 2.218 2,853 1.748 30-34 5.949 3,454 8,723 4,478 7,460 3,664 35-59 1,2099 851 1,364 795 1,133 . 338 60+

371
q·1 '"'" • ani _If!' C-2 PART A AGE, SEX AND
t~ m(Educational Level --------------
Rill" if; amifT'I' ~.~I" ~q"( fiurlt,~~iftf~, ~lfrSl'1l'rll'..IRI' m-lJ.f.RfuiT Non-technical diploma
~fWm;r/~ Higher Secondary/Inter- or certificate not equal Matri::ulationfSecondary mediate/Pre-University to degree
IITP! ~ ~ mAt ~ fum ~ mt Age BJOUP Mafes Females Males Females Males Females
1 14 15 16 17 18 19 ... v.JDlSHA
~an, 3,359 1,497 6,323 3,101 18 18 MasR 0-4 ...
S 6 ... 7 ... 8 ... 9
5-9 ." 10-14 98 147 9 28 ... . 1.5-19 1,135 575 1,436 9'53 5 9 ZO-24 608 259 1,912 887 25-29 361 186 1,044 595 8 5 30-34 171 1-01 814 282 S 35-59 786 222 1,013 33-8 S .. , 60+ 191 5 81 18
1ftII1w BHOPAL
~art'I{ 21,828 12,643 36,943 22,844 187 201 All alci 0-4 ...
5 ... 6 7 8 ... 9
5-9
10-14 434 552 64 113 15-19 4,325 3,291 6,418 6,753 10 20 20-24 3,055 2,116 8,733 S,!63 10 21 25-29 2,604 1,632 6,387 4,liWi S 36 30-34 2,236 1,483 5,$8 2,MlO 5 20 35-59 '1,599 3,366 8,95'5 3,409 9'7 84 (iil+ 1,543 19·' 7S5 85 60 20

313
~ •• ~-""& LEVEL~OF EDUCATION-URBAN
tftf;t; ~/Bducational Level ------ ---------
Nfl ~ anrqr.r ~T ~ IfT3flrf"IT-IRI' ~"t<I;lmrT~ ~T RVT « f;r-;r Technical diploma or f;r;:;:r~tfiIi~Vt ~Rflfi't'ti~ fnr certificate not equal Graduate degree other Post-graduate degree other to degree than technical degree than technical degree
------~--- -----. -----~ fm't ~ fm't ~ mt orJ11~ Males Pemales Males Females Males Females Ale group
20 21 22 23 24 25 1
fidm VWISHA
372 5 3,115 1,031 1,334 481 ~,",arrl{
All ages
0-4 5 6
.... 7
8 9 ...
5-9
... ... 10-14
24 102 102 17 15-19
136 ... 1,129 435 253 212 20-24
65 599 262 331 134 25-29
38 5 510 107 240 61 30-34
100 766 121 476 49 35-59
10 ... 49 24 60+ Ww
BHOPM.
6,824 361 18,321 9,425 8,915 4,72/1 ~ar,,;
All· 811C1
t)-.-.4 ... 5
... ... 6
7 ... ... S
... 9
... 3-9
... 10-14
82 53 493 804 20 9-7 15-19
~18 80 4,400 3.393 1,2-39 1,99:1 20-24
915 " 3.925 2,0-76 2,096 1,324 25.-29
880 78 2,7311 1,3-1'5 1,642 5106 30-34
3,958 90l 6,231 1,80G 3,741 7-8'0 35-59
65 .. , 527 15 2 1-+ 10 60+
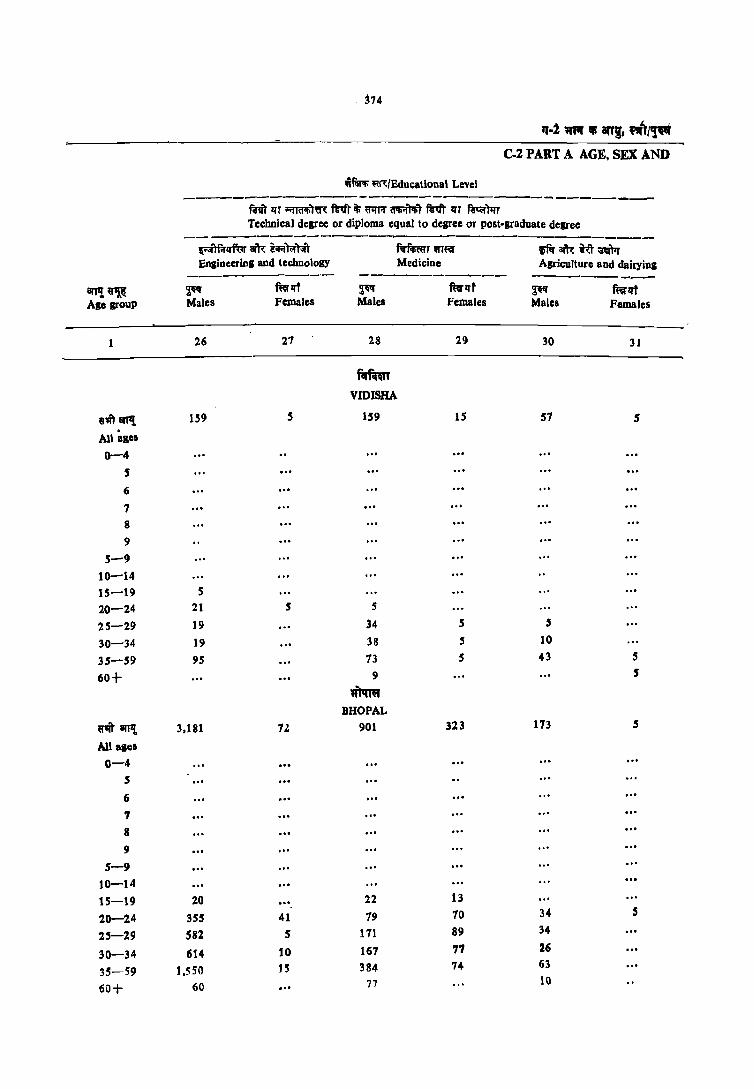
. 374
q·2 1I'Pf iii ani. ",1/'1. C-2 PART A AGE. SEX AND
~~ ~/Bducationat Level ----------------------------------mit liT !'iffil'iIi)ffi: mil' it; U'IlT'I' ~ fc1It liT ~m Technical degree or diploma equal to degree or post-graduate degree
----------------------------------.:;ilf;rlfror ar'R zifitr.rnrr ~rVT~ 1"fltafr1: ~~ Engineering and technolosy Medicine Agriculture and dairying
------------ ---------- -------8Jl1i u~ ~ ftallf ~ ftwlif ~. ffirzrt Age group Males Females Males females Males Females
1 26 27 28 29 30 31
firflmT VIDISHA
am arP! 159 5 159 15 57 5 . All aiel
0-4 S
6
7
8 9
5-9 10-14 15-19 5 20-24 21 5 5
25-29 19 34 5 , 30-34 19 38 5 10
35-59 9S 73 5 43 5
60+ 9 5
"'"'" BHOPAL
U'Iff III1l 3.181 7J. 901 323 173
Al18lci
0-4 5
6
7
8 9
5-9 10-14 15-19 20 22 13
20-24 355 41 79 70 34 5
25-29 582 5 171 89 34
30-34 614 10 167 77 26
:15-59 1,550 15 384 74 63
60+ 60 77 10 ...
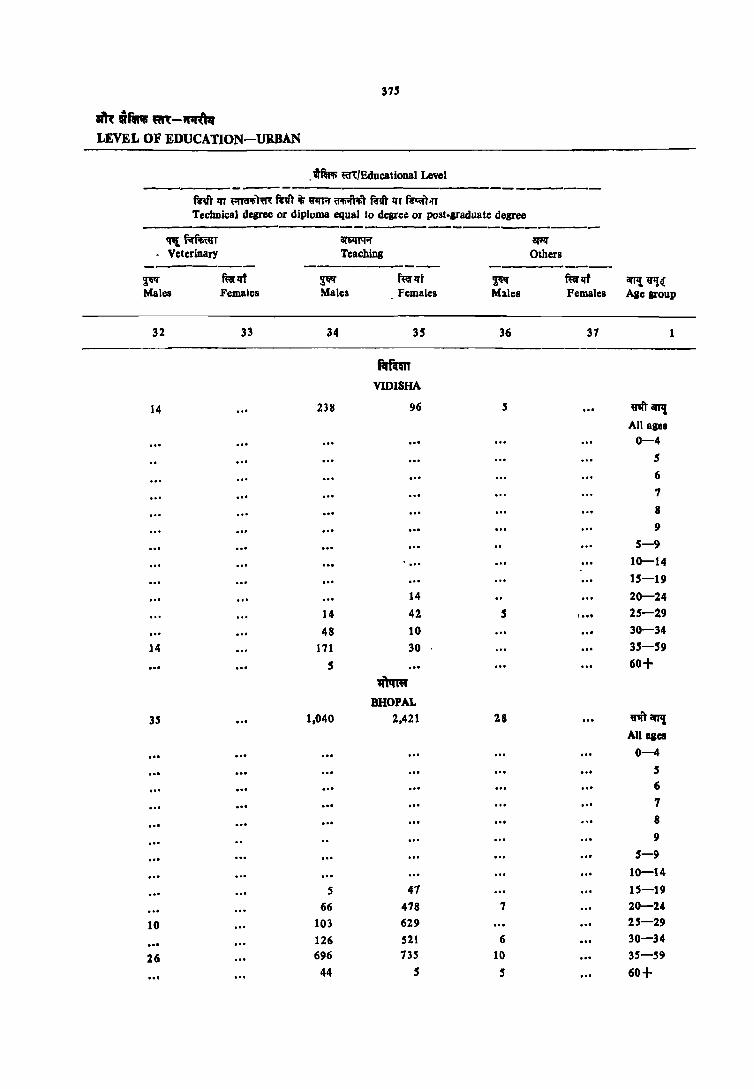
31.5
lilt uftAr fiR-~ LEVEL OF EDUCATION-URBAN
. ifm' m/Educational Level --------- -------fW"\ft lIT ~)'ffi: tn1 iii ~;r ~ mfI" zrr ~.n Tel:hnic:al degree or diploma equal to degree or post-Iraduate degree -----------
!pf, f;rfirnrr ~ ~
- VeterinarY Teac:hina Others ------- ---------- --------~ w«zrt ~ f~zrt ~ w«zrt iIrfll ~'! <! Males Females Males Females Males Females Age group
32 33 34 35 36 37 1
flImn VIDISHA
14 238 96 5 W1ITarJ'I! All ale8 0-4
.5 6
... 7
... 8
... 9
5-9 10-14 15-19
14 20-24 14 42 5 25-29
48 10 30-34 14 171 30 35-59
5 60+
"""" BHOPAL
35 1.040 2,421 28 V'lftarJ'll All qe.
0-4 5 6 ... 1 8
9
5-9 10-14
S 47 15-19 66 478 7 20-24
10 103 629 25-29 126 521 6 30-34
26 696 735 10 35-59 44 5 5 ." 60+

n6
"-2 ...,_ .. "'It ",1". C-l PART A AGE, SEX AND
mY1: (wfilw R(( it; w.r,.) Literafe (without educational level)
!'I'~T f"imR aR~
Total Pop Illation Illiterate Non-Formal
------ ----- ------_ arJ'I!"'~ 2.W fi;ep:r' ~ ffip:rt ~ ~d
Ale lToup Males Females Males Females Males Females
2 3 4 5 6 7
~ SEKORB
~ ar'l! 46,"4 40,728 19,545 26,170 730 630
All Illes
0-4 5,914 $,881 5,974 $,881
5 1,297 1,142 1.174 1.144 5"
6 1,317 1.284 1,094 966 14 23
7 1,05$ . 1.031 649 691 9 $
8 1,538 1.454 714 856
9 8S9 84% 230 407
5-9 60,67_ 5.855 3,862 4.065 23 33
10-14 6,408 5,401 1.584 2,201 14 75
15-19 5.132 4,335 999 1,726 47 93
20-24 4,871 3,791 956 1,609 71 46
25-29 3,404 3,012 '738 1,613 68 89
30-34 1,698 2,175 676 1,298 76 69
35-59 8,959 7,510 3,426 5,442 335 201
60+ 2,594 2,511 1,317 2,316 97 19
~ RAlSP.N
~arPt 31,912 32,824 16,676 21,558 282 133
NI ....
0-4 4,959 4,931 4,959 4,931
5 1.042 1,087 948 1,014
6 1.180 1,178 944 962 10
1 874 932 574 500
8 1.398 1.216 662 662 15
9 721 738 102 331 ... ,-9 5,215 5.150 3,330 3,469 25
r8-14 5,305 4.715 1,189 1.634 15 10
15-19 4.366 3,406 923 1,450 25 17
2Il-24 3,421 1,156 712 1,426 14 31
2'-29 2.192 2.471 664 1.390 10 10
30-34 2,199 2,026 683 1.354 31 10
35-59 1,719 5,113 3.246 4.365 124 50
60+ 1,907 1,647 966 1,,30 al $

377
am:~fn~-~ LEVEL OF EUGCATION-URBAN
~ ~"(/Educatiooal Level --------------------
mn: (.;.fWI; ~ % mr*) Literate (without educatiooallevel) ----------at~ ~ fl:rmr Formal Primary Middle
--------- --------- -------~ furlrt ~~ fuRt ~ fin, an, ~~ Males Females Males Females Males Females Age group
8 9 10 11 J2 13 1
-SEHORE
7,815 4,618 6,099 3,966 4,211 1,954 ~tft 81'1\ All alCl ... 0-4
123 93 5 209 294 6 396 337 7 824 598 8 584 402 4.5 33 9
2,131 1,725 45 33 5-9 2,710 1,416 1,728 1,265 329 321 10-14
619 280 1,424 749 1,198 579 15-19 391 219 682 528 721 336 20-24 221 191 482 341 474 224 25-29 i70 154' 349 292 407 194 30-34
1,082 539 1,11.5 67.5 832 280 35-.59 466 88 2.64 70 lSI 14 60+
~ RAISEN
6,810 4,651 5,463 3,350 2,962 1,240 ~an,
All 8101 ... 0-4 94 72 ,
226 216 6 300 433 1 721 5.54 8 50S 381 15 26 9
1.846 1.656 15 26 5-9 2,089 1,564 1,634 1,255 373 221 10-14
447 360 1,086 664 985 313 1.5-19 362 204 614 414 401 216 20-24 261 191 467 366 338 149 25-29 163 140 298 188 162 112 30-34
1,212 466 990 423 606 148 35-.59 421 7Q 29Q lS 91 21 60t

378
"-2 '"" iii 8fP!, "",f~ Col PART A AGE, SEX AND
-rfm; ~fEducatioDal Level -----------------------------
mr1it;am~~-~ IrTq', Ru~1/~.')1l,T?/ ~TlJT !I1I'J1IT..tRr fir -Iff.!qfiral Noo-tethoic:al diploma
~~f~ Higher Secondary/Inter- or certificate not equal MaJriculation/Secondary mediate/Pre-University to degree --------- ---------- -----------
iIf1l\ ~ i~ mrlft ~ ffirlli ~ ~t
Age group Males Females Males Females Males Females
14 IS 16 17 18 19
-SEHORE
""'8fT!{ 2,239 780 3,682 - 1,821
All alcs
0-4 5 6 7 8 9
5-9 .. , 10-14 43 28 23 15-19 653 285 744 568 20-24 385 171 1,027 .565 25-29 267 17 641 341 30-34 166 88 492 116 35-59 600 121 744 208 60+ 124 5 28
~ RAISEN
ffiamt 1,522 549 2,841 1,020 10 All aaes 0-4
5 6 7 8 9
5-9 10-14 31 5 1.5-19 486 218 409 299 20-24 240 104 735 280 2.5-29 19.5 52 .579 193 5
30-34 ISO 62 473 117
3.5-.59 38.5 78 624 132 .5
6Q+ 66 ~ 4\ ," ,., , ..
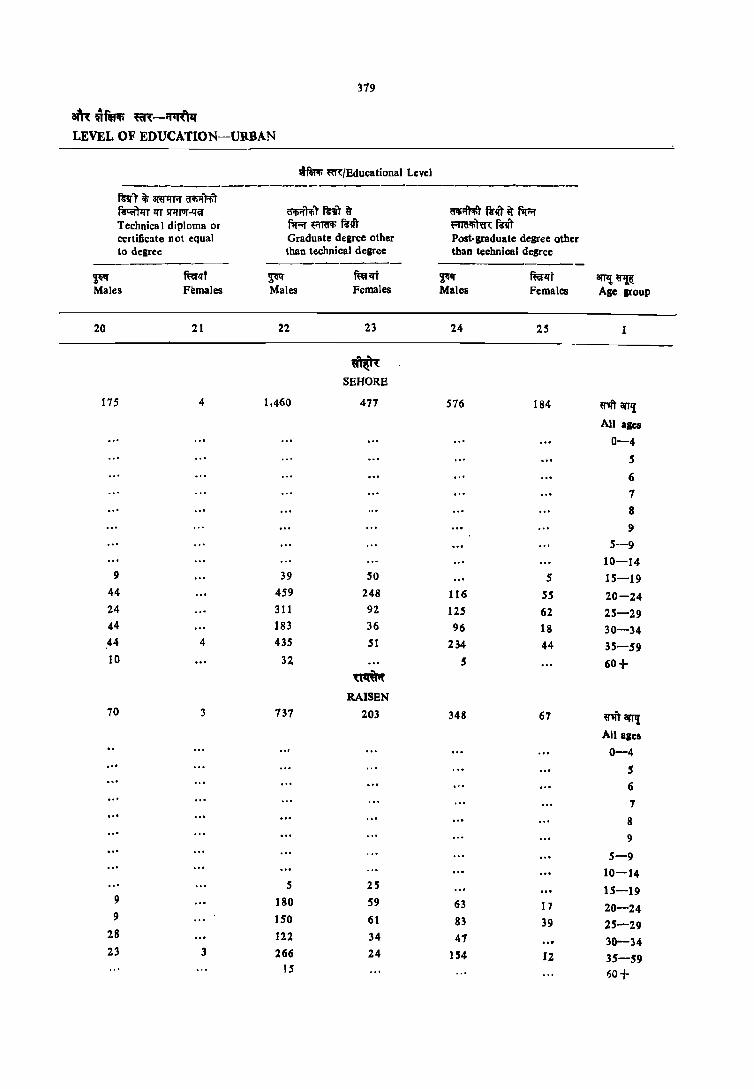
379
81h~f~ ~-~ LEVEL OF EDUCATION-URBAN
tf1r-l; ~/Educational Level -----------------------------------
mrr ~ CiWl1fiI' ~r-r.r ~~ lfT S!1I'l'II'-!fer a<p.rr.r,r !'tiT q ~ift'<!;'t !'tlit 6' fiI;:;r Technical diploma or fir;:;r ~ R"lit ~~miT certificate not equal Graduate degree other Post-graduate degree other to degree than technical degree than technical degree
-----------~ mrlrl ~ ffillft ~'I" mrl1T arr,~ Males Females Males Females Males Females Age group
20 21 22 23 24 25 1
• SEHORB
175 4 1,460 477 576 184 ij'1ft arrl! All agel
0-4
5
6 7
8 9
5--9 10-14
9 39 50 5 15-19 44 459 248 116 55 20-24 24 311 92 125 62 25-29 44 183 36 96 18 30-34 ,44 4 435 SI 234 44 35-59 10 32 5 60+
~ RAISBN
70 3 737 203 348 67 ~\ft iff! An aiel
0-4
S 6
7
8 9
S-9
10-14 5 2S 15-19
9 180 S9 63 17 20-24 9 ISO 61 83 39 25-29
28 122 34 47 30-34 23 3 266 24 154 12 35-59
15 60+

380
"·1 'Ift1T .. an~ ""'/~ C·l PART A AGE. SEX AND
wfW!; ~/Educational level -------------- ----------------mrr Il"r ~1m" fnr ~ ml'11'r ~~'I\'t f:&''lf 1fT ~ Technical degree or diploma equal to degree or post-graduate degree
----------------~1mror 31'17: m.n;;fi AAttrr ~iif wfif am i'U ;nj'tq Enginee ling and technology Medicine Agriculture and dairying
----1Im!~ ~ ~lI't ~ ffirtrt ~ mf Age grOUP Males Females Males Females Males Females
26 27 28 29 30 31
~ SEHORE
mft8J11! 38 39 4 57 All ages
0-4
S
6
7
8
9
5-9 10-14 15-19 20-24 9 S
25-29 20 4 19 "30-34 14 10 10 35-59 14 5 28 60+
~ &AlSEN
NiII11{ 19 87 7 19 All ages
0-4 5 6
7 8
9 5-9
10-14 15-19 20-24 5 15 S 25-29 5 17 3 S 30-34 5 23 3 9 ~5-5Q S 28 60+ 5
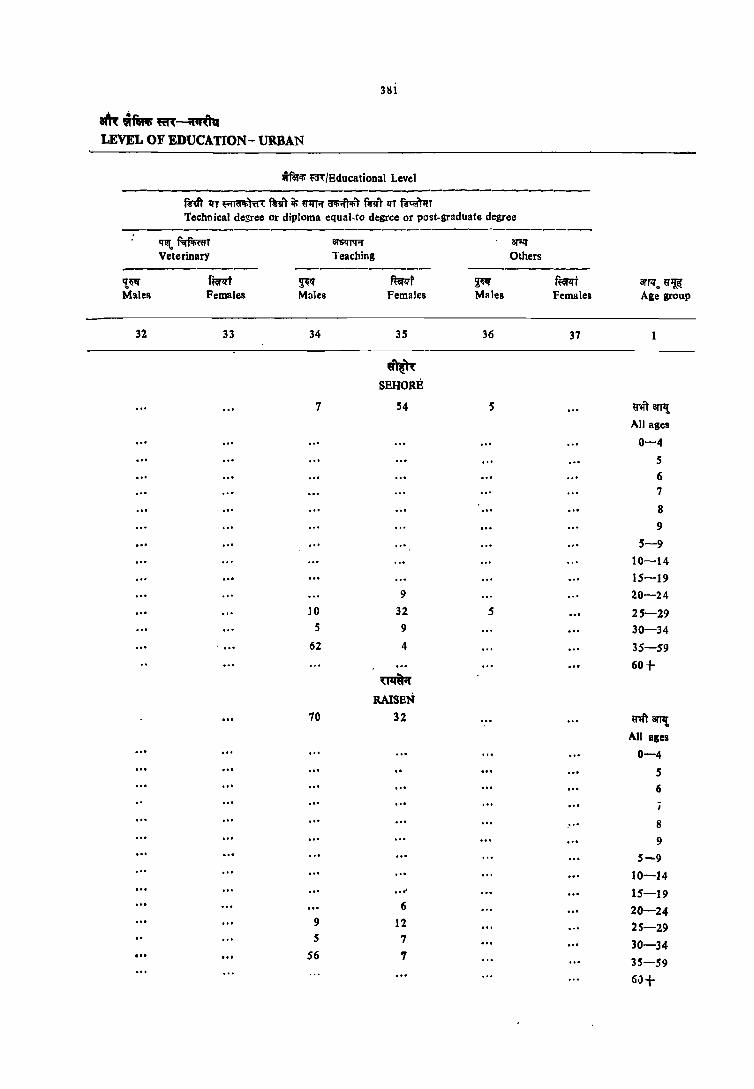
~alm.m-~ LEVEL OF EDUCATION- URBAN
im'li m/Educational Level
ftm lfT t'illdill)tI~ tn, ii; ~ ~ mrr 1fT ~T Technical de3J'ee or diploma equal,to degrce or post-graduate degree
IIl!{.~T ~ ar~
Veterinary Teaching Others ----------- ---------
'{ttf f~t ~If mr ~ f~t arrlio ~l!& Males Females Males Females Males Females Age group
32 33 34 35 36 37
U~ SEHORE
7 S4 5 ~j"4T arT!{
All ages
0-4 .. , 5 ... 6
7
8
9
5-9
10-14 15-19
9 20-24 ]0 32 5 25-29
5 9 30-34 . ... 62 4 35-59
60+ ~
RAISEN
70 32 UlrT an, A.ll ages
0-4
5 6
.. , 8
9 5-9
10-14 .. ~ 15-19
6 20-24 9 12 25-29 5 7 30-34
56 7 35-59
61l+
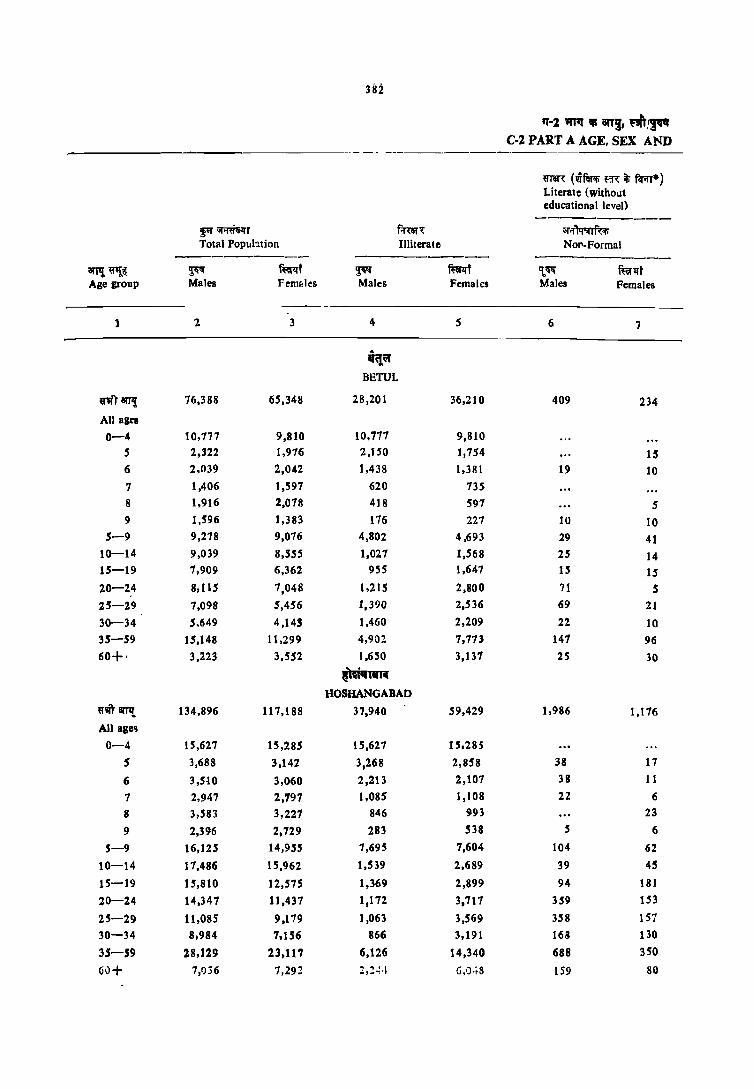
3112
IT-l "'" IllS an!, ""'I" C-2 PART A AGE, SEX AND
---- ------
~ (wfWl; ~ iii f'(irrllL) Literate (without educational level) ----------
~~r f'rnf<: crif~ Total Popllbtion Illiterate Nor-Formal
----------- ----------anI! ~~ ~~ ~t ~ mt ~~ ffiflfT Age group Males Females Males Females Males Females
1 2 3 4 5 6 7
.. • q~
BETUL
~"r"t 8l'J1! 76,388 65,348 28,201 36,210 409 234
AIJ ages
0-4 10,777 9,810 10,771 9,810
5 2,322 1,916 2,150 1,754 IS 6 2.039 2,042 1,438 1,381 19 10 7 1,406 1,597 620 135
8 1,916 2,078 418 591 5 9 1,596 1,383 176 221 10 10
5-9 9,278 9,076 4,802 4,693 29 41 10-14 9,039 8,555 1,027 1,568 25 14 15-19 7,909 6,362 955 1,647 IS IS 20-24 8,115 7,048 1,2ts 2,800 71 S 25-29 7,098 5,456 1,390 2,536 69 21
30-34 5.649 4,145 1,460 2,209 22 10 35-59 15,148 11,299 4,90:!. 1,713 141 96 60+· 3,223 3,H2 1,650 3,131 25 30
~1m' HOSHA".~GABAD
«'1ft amt 134,896 117,188 37,940 59,429 1,986 1,116
All age.
0-4 15,627 15,285 15,627 15,28;
5 3,688 3,142 3,268 2,858 38 11
6 3,5tO 3,060 2,213 2,101 38 11
7 2,947 2,797 1,085 1,108 22 6
8 3,583 3,227 846 993 23
9 2,396 2,729 283 538 S 6
5-9 16,125 14,955 7,695 7,604 104 62
10-14 17,486 15,962 1,539 2,689 39 45
15-19 15,810 12,575 1,369 2,899 94 181
20-2.4 14,347 11,437 1,172 3.711 359 153
25-29 11,085 9,179 ] ,063 3,569 358 151
30-34 8,984 7,156 866 3,191 163 130
35-59 28,129 23,117 6,126 14,340 688 350
Gu+ 7,Oj6 7,292 2,~~·. G,Q·tS 159 80
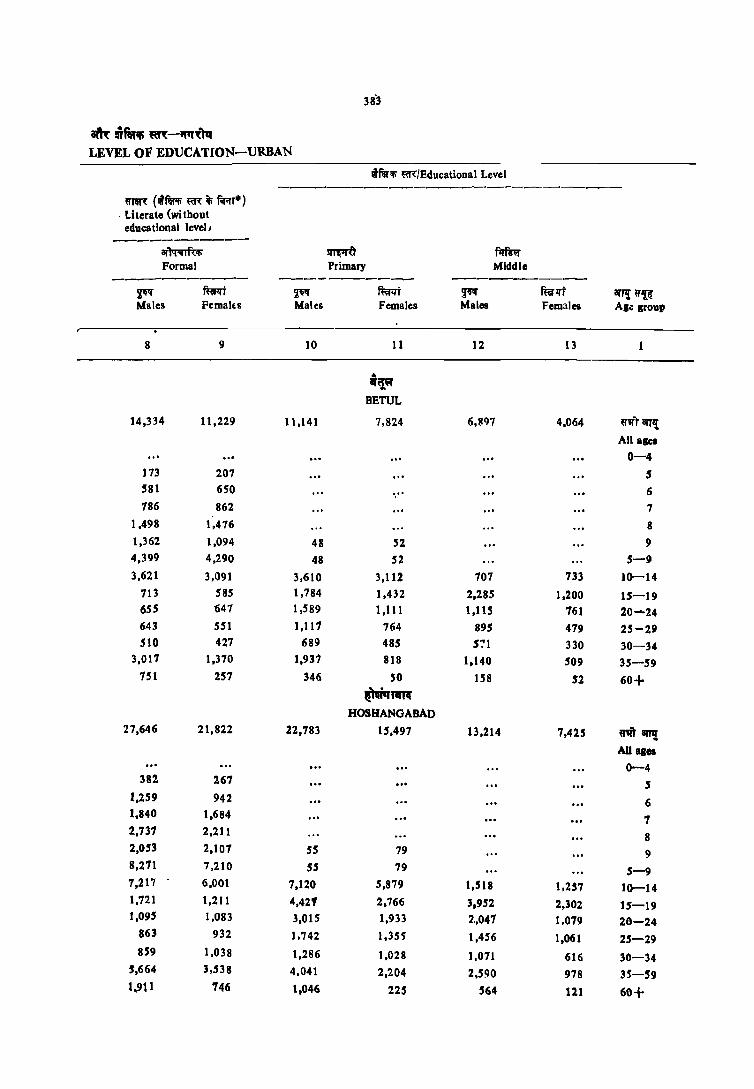
383
~~~~-~~'\q LEVEL OF EDUCATION-URBAN
iRHi m/Educational Level -----------------------------
meR (rifWt; ~ t firil"r*) . Literate (wi thout
educational level J
-----------ar~ ~ fitmr Formal Primary Middle
--------- ---------- -----------~ ffiRt ~ mt ~ ffirlfT arJ1{ ""'R Males Pemaks Males Pemales Males Females Ale Iroup
8 9 10 11 12 13
.. . ~ BETUL
14,334 11,229 11,141 7,824 6,897 4,064 ~'ft arT,! All agel
", 0-4 173 207 5 581 650 ". 6 786 862 7
1,498 1,476 8 1,362 1,094 48 52 9 4,399 4,290 48 52 5-9
3,621 3,091 3,610 3,112 707 733 10-14 113 585 1,784 1 ,432 2,285 1,200 15-19 (iSS 647 1,589 1,111 1,115 761 20-24 643 551 1,111 764 895 479 25-2~
510 427 689 485 571 330 30-34 3,011 1,370 1,931 818 1,140 509 35-59
151 257 346 SO 158 52 60+ ~nnt
HOSRANGABAD 27,646 21,822 22,783 15,497 13,214 7,425 m8l'J1{
AD Illes 0-4
382 267 , 1,259 942 6 1,840 1,684 7 2,731 2,211 8 2,053 2,107 55 79 9 8,271 7,210 55 79 5-9 1,217 6,001 1,120 5,879 1,518 1,257 10-14 1,721 1,211 4,42' 2,766 3,952 2,302 15-19 1,095 1,083 3,015 1,933 2,.041 1,079 20-24
863 932 1,742 1,3S~ 1,456 1,061 25-29 8S9 1,038 1,286 1,028 1,071 616 30-34
5,664 3,538 4,041 2,204 2,590 978 3S-SCJ 1.911 746 1,046 225 564 121 60+

384
,,-2 """ iii an!, "" /J"' C-2 PART A AGE, SEX AND
wfW!; ta1:/Educational Level --------~Q" ~ amJfA' ~~,.
~!!<: ~/~1:{C1 R~'IT 1ff SI'II'J'Il''''IW
~"'/~ fir-~mfijcft Non-technical diploma Higher Secondary/Inter- or certificate not equal
Matri:ulation/Secondary . mediate/Pre-University to degree
arT!!~ ~ mrlft ~fI' ~f ~ mrlft Age group Males Females Malet Females Males Females
1 14 15 16 17 18 19
.. . ~ BBTUL
«1IT an,;, 1,762 3,216 3,875 1,342 5 11
All aaes
0-4 ." 5 ... 6
7
8 ." 9
5-9
10-14 43 36 5
15-19 1.6]6 1.035 473 407
20-24 1.658 812 1,111 392 11
25-29 1.233 575 868 263 5
30-34 1,075 316 609 156
35-59 1.893 432 150 115
60+ 208 10 48 10 ... tmwrRR
HOSHANGABAD
ij''Ift arT!! 16,616 6,642- 6,336 2,454 \l
All agCI
0-4' ... S .,. 6 ... 7
8
9 ."
5-9
10-14 52 84 6
15-19 2,963 2,023 1,114 966
20-24 3,169 1,703 1,576 621 5
25-29 2,776 1,073 995 374
30-34 2,315 623 971 197 6
35-59 4,756 1.068 1,538 266
60+ S97 '1 U.S 17 ,,, ,"

385
~~~m-~ LEVEL OF EDUCATION-URBAN
~ ~/Educational Level ----------------------------------mft~~~ ~lfT5[~""Rf Q<liiI"t'!I, mIT « Niil ~;fIop-T ~1iT ~ I'1r-<r Technical diploma or ~mit ~Ta"liTm ~1iT certificate not equal Graduate degree other' Post-graduate degree other 10 degree than technical degree than technical degree
---------- ---------- ----------~ fterlft ~ mrlff ~ ftwd 1lI'P{~ Males Females Males Females Males Females Age group
20 21 22 23 24 25 1
' .. lI'aw ..
BBTUL
533 11 1,688 755 779 268 ~'II"r arTIl AJJqOl
.. , 0-4 5 .. , 6
.. , 7
. " ... a ... 9
," 5-9 10-14
,10 38 31 15-19
84 11 465 345 104 110 20-24 165 348 150 230 79 25-29
104 ," 263 104 173 69 30-34
148 531 125 267 10 35-59
15 ." 23 60+
~l'U HOSHANOABAD
927 25 4,211 1,710 2,083 633 "r arJ'It All agel .. , 0-4
S
." .. , 6 7
." 8
9 .. , 5-9 ... 10-14 29 131 204 9 2S 15-19
262 6 1.207 821 338 271 20-24 158 14 928 369 598 155 25-29 141 6 659 158 353 88 30-34 306 1,192 154 757 93 3.5-59
31 ,,, 83 6 23 ... 60+

386
'1-2 """ iii iTT!, "'~ .. C-2 PART A AGE. SEX AND
ffiIR; ~/Educational Level -----------------
mIT 1fT Alld'l,)'d( frir ~ ~ ~r fNr 1fT ~ Technical degree or diploma equal to degree or post-graduate degree
--------------------------------~f(q arl< ~Rri1it fErflmrr Wffif iN am: roO ~ Engineering and technology Medicine Agriculture and daiIying
----------------- -------- ----------arTI{~ ~ ~lft ~ ~llf ~ ~qf Age group Males Females Males Females Males Females
26 27 28 29 30 31
'''' BETUL
rit8i'Pt 313 100 22 38 All agts
0-4 3 6 7 8 .. , !)
~-!) .,. 1'0-14
15-19
2()-%4 16 ., S 25-29 76 25 6 11 30-34 132 26 6 S
35-" 289 49 6 16 60+ 5
~-HOSHANGABAD
"fI'ft 'tit! 374 207 27 126 All tIC. 0-4
5 6
7 S 9
5-9 10_:14
15-19
20-24 80 5 12 2S-~9 52 35 5 28 30-34 138 52 29 3"'__;"9 98 80 22 S8
40+ ~ ,., 34 ,., .. , ,.,

381
~t!il~m-~ LEVEL OF EDUCATION-URBAN
WRT<!; m/Educational Level ----------------------------------
mit lI'T fitla'l>1M mIT ~ ~I'l' ~ Rift lI'T ~ Tecbnical degree or diploma equal to degree or post-graduate degree
---------'nL f;rf;mrl 8J$q'1II;:r 81'"1
. Veterinary Teaching OtheJs --------- -----------~ ffirlI'f ~ mf ~ ftw.r' arJI!~ Males Females Males Females Males Females. Age group
32 33 34 3S 36 37
-'E!" BETUl
11 102 162 «'11') arF,!
All alia
0-4 S
6
7
8
9
5-9 10-14
11 15-19 20- 43 20-24
22 32 25-29
11 33 30-34
11 49 44 35-59
... 60+
~'IWR HOSHANGABAD
12 364 348 "T II'P! All &lea
... 0-4
5
6
7
8
9 5-9
10-14
." 15-19
5 SO 20-24 35 114 25-29
6 63 80 30-34 6 228 105 ... 35-59
32 ... 60+

3HI!
q·2 """ " an~ '~/~ C-2 PART A AGE. SEX AND
~nm: (im ~ ~ f.Rr*) Literate (Without educational level) ---------
~mGlTT f.mr"{ at·M'4.f<'Ii Total Population Illiterate NOli-Formal
--------- ---~---- -----------Bl'fIl U1J.~ ~" ffiIlrf ~ mr 't~ ffiflit Age group Males females Males Females Males Females
2 3 4 5 6 7
~ JABAL PUR
U"ft anI! 533,698 456,794 172,888 235,081 2,757 1,763
All ages
0-4 57,538 58,759 57,5)8 58,759
5 14,147 13,601 12,3Z2 12,071 139 56 6 14,356 14,051 9.565 9,967 188 107
7 10,629 11,065 4,653 5,017 114 61
8 15,374 14,677 4,828 5,445 ]33 57 9 9,707 9,839 1,899 2,390 64 SO
5-9 64,213 63,233 33,268 34,890 638 331 10-14 65,720 62,022 10,423 14,034 224 177 15-19 59,899 47,777 9,190 12,288 179 215 20-24 56,70B 46,103 7,lSi ]5,020 140 1I6 25-29 45,384 38,126 6,208 14,184 141 108 30-34 39,491 30,093 6,401 13,657 208 84 35-59 120,063 87,492 32,863 53,827 936 430 60+ 23,974 22,625 9,671 18,206 236 241
,,(r~d!l(
NARSIMHAPUR ritarTl! 46,429 41,698 13,879 20,604 209 121 All agel
0-4 5,294 5,162 5,294 5,162 5 1,200 1,101 1,118 1,032 19 S 6 1,265 1,206 873 828 15 5
. 7 1,005 884 428 364 5 8 1,252 1,204 256 339
9 1,001 968 101 187 10 5-9 5,723 5,362 2,782 2,749 39 20
10-14 6,196 5,963 740 1,243 15 10 15-19 5,S59 4,507 662 1,034 5 5 20-24 5,038 4,496 532 1,376 ]5 5 25-29 3,759 2,B52 383 956 9 5 30-34 3,020 2,668 327 1,096 14 15 35-59 9,118 8,051 2,213 4,as3 83 48 60+ 2.619 2,610 937 2,102 30 10

3119
~~~ftR-~ LEVEL OF EDUCATION-URBAN
~ ~a"{/Educational Level ------------------------
mm: (wm~ m ~ mr*) Literate (without educational level)
-----------at~ ~ fJrmT Formal Primary Middle
----------~ ~f ~~ f~r ~ mt C!!11! ~~ Males Females Males Females Males Females Age group
8 9 10 11 12 13
~~
JABALPUR
95,924 73,390 76,916 56,254 53,769 ' 33,145 ~1fT CIlTJ! All ages
0-4 1,686 1,413 ' ' 5 4,604 3,971 6 5,862 5,981 7
10,412 9,115 8 7,354 6,917 389 422 9
29,918 27·589 389 422 5-9 24,582 19,769 24,607 21,706 5,4~4 5,894 10-14 5,923 3,944 13,403 8,943 15,527 9,616 15-19 4,366 3,189 9,140 6,168 8,079 5,051 20-24 3,125 2,943 6,528 5,60 t 6,592 3,8H 25-29 3,091 2,764 5,158 3,965 4,820 2,659 30-34
19,584 10,934 15,071 7,712 11,745 5,500 35-59 5,107 2,099 2,608 1,067 1,481 559 60+
;ro"1'l~ NARSIMHAPUR
9.349 7,322 1,634 S,903 4,914 3,376 ~arJ'I! All ages
0-4 63 64 5
378 373 6 572 521 7 995 864
8 855 722 39 49 9
2,863 2,544 ~9 49 5-9 2,178 1,629 2,651 2,431 598 611 10-14
S72 419 1,306 949 1,668 1,062 15-19 412 362 813 776 794 550 20-24 271 261 613 464 468 379 25-29 252 422 384 353 376 235 30-34
1,935 1,367 1,406 768 854 490 35-59 860 321 423 !,oS lSI 49 60~
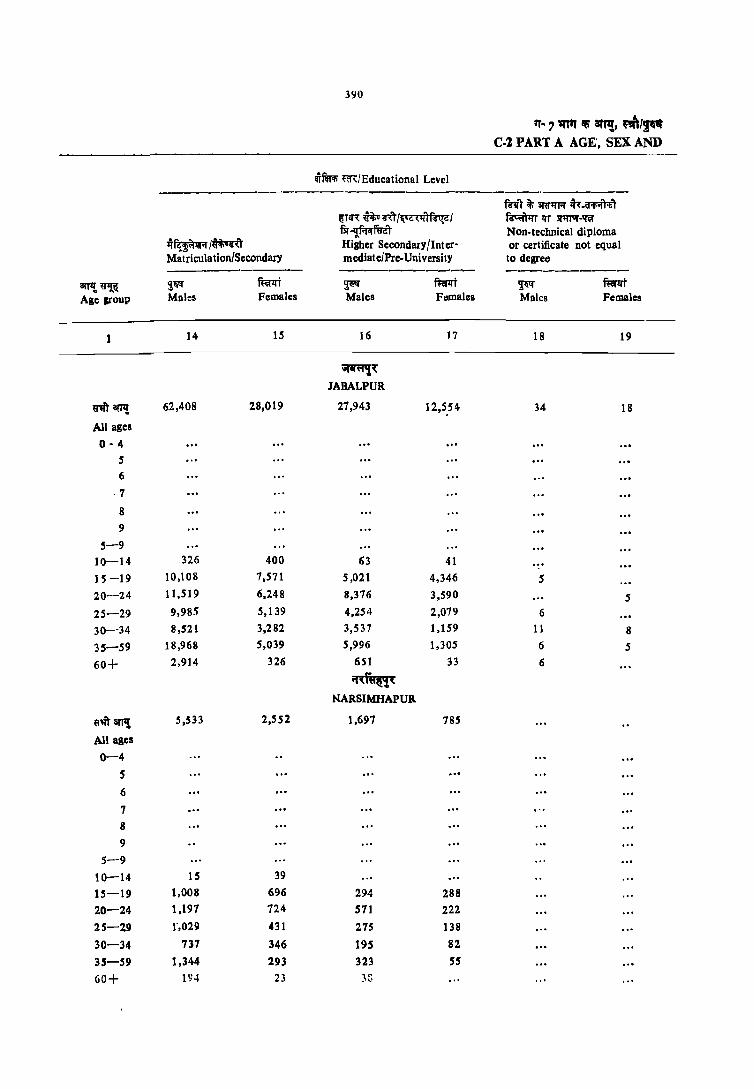
390
IT-,1I'tiI • 8h7!, ~/~ Col PART A AGE', SEX AND
iftf<l;' m/Educational Level -----------------...... -------------------mrr it; 3Rr~ ;j.-~
1fTI.!', ~Rr/~~~I R-toil1n' lfT STIfT1Il'-1fif fir -lif.rqfuit Non-technical diploma
~~/~ Higher Secondary/Inter- or certificate not equal Matricula tion/SecondarY mediate/Pre-University to degree ----------- ---------------- -----------
8TT't ~ $~ ftQIrt ~ mm ~ m:rll'T Age &roup Males Females Males Females Males Females
14 15 16 f7 18 19
~~ JABALPUR
WfftClfTl! 62,408 28,019 27,943 12,5,54 34 18
All ages
0-4
5 6
·7
8
9
5-9
10-14 326 400 ti3 41 ... 15 -19 10,108 7,571 5,021 4,346 5
20-24 11 ,5 19 6,248 8,376 3,590 5
25-29 9,985 5,139 4,254 2,079 6
30-34 8,521 3,282 3,537 1,159 11 8
35-59 18,968 5,039 5,996 1,305 6 5
60-!- 2,914 326 651 33 6
~~ NARSIMHAPUR
El'lft BTTl! 5,533 2,552 1,697 785
All ages
0-4
5
6
7
8
9
5-9
10-14 15 39
15-19 1,008 696 294 288
20-24 1,197 724 511 222
25-29 1',029 431 215 138
30-34 737 346 195 82
35-59 1,344 293 323 55
GO+ 1'1'; 23 1" _ \)

391
amn.. ~-~ LEVEL OF EDUCATION-URBAN
t~ m/Educational Level -------------------------. ----------mrr iii OI'U'lWl ~
f.!tm"'lfT II'T 5I1lfGT ~ ff'1iliTif> r fi'm- ~ ~ R'it ~ f'lFf Technical diploma or fl:I;;:r FrnI"li fi'it A'raifiTffi: mrr certificate not equal Graduate degree other Post-graduate degree other to degree than technical degree than technical degree
-----------~ fulqf ~ mrlfj ~ ffitll't orTI{~ Males Fe~les Males Females Males Females Age grOUP
20 21 22 23 24 25 1
~~
JABALPUR
5.028 224 20,928 8,999 9,Hil 3,739 ~amt All agel .. , 0-4
5
6 .. , 7 8
." .. , 9 ... . .. 5-9 ... 10-14 193 8 309 744 21 46 15-19
1,105 40 5,000 3,745 1,174 1,314 20-24 928 67 4,621 2,172 1.947 1,039 25-29 933 41 3,739 1,175 1,876 587 30-34
1,772 68 6.578 1,117 3,847 704 35-59 87 669 36 282 36 60+
~~ NARSIMHAPUR
165 5 1,804 662 824 208 ~l"Irr IIl1'l All agel
0-4 .. , 5 ." 6 .. , 7
8
9 5-9
10-14 6 38 49 5 15-19
14 5 549 347 119 99 20-24 SO 408 127 204 47 25-29 43 381 64 170 27 30-34 46 380 70 332 31 35-59 I" , .. 43 ,,, ." ... 60+
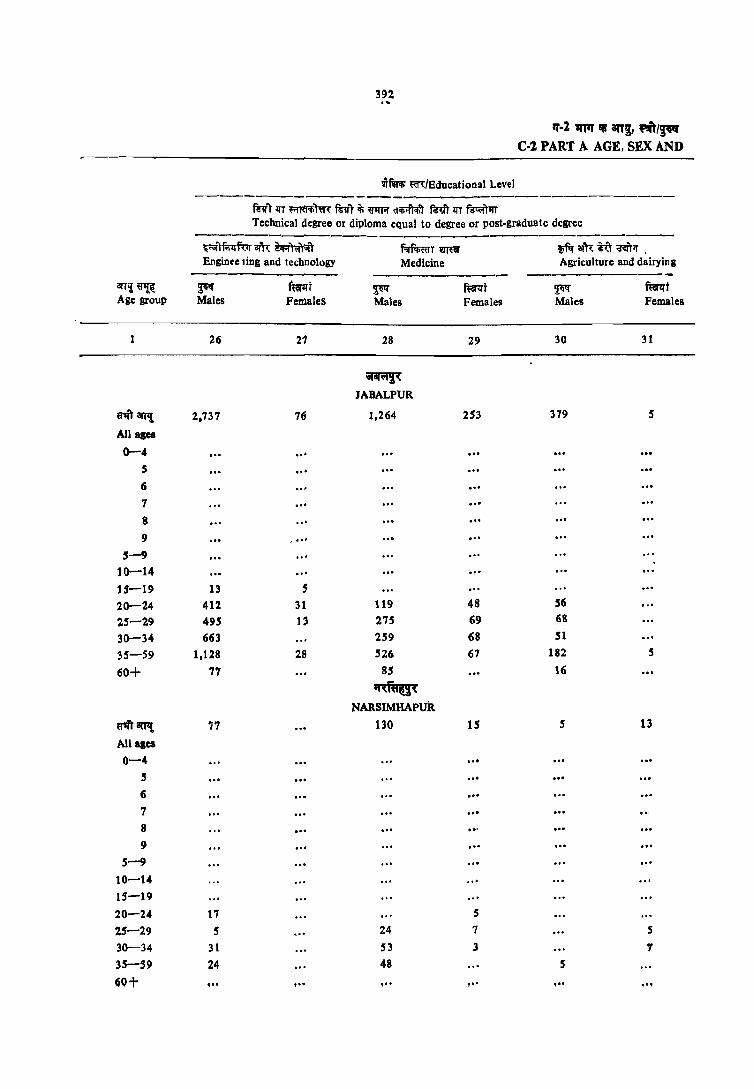
392
11'-2 11111' qr 81T~, "",~ C-2 PART A AGE, SEX AND
wfilT<!; ~'Educational Level -------------- ----------------mr1ll"T ~Tffi: fulT1 ~ ~ d'li'ft<!i1 ~dl' ll"T ~ Technical degree or diploma equal to degree or post-graduate degree
------------------------------TiNirf.!ll"fur ~'h: ~~ f;;rfirnrr 'WffiI' lifisr at~ iu ~lf .
Enginee ling and technology Medicine Agriculture and dairying ---------- -----------
arT,!~ ~ mrzrt ~ ft:a'l:rt ~ mt Age group Males Females Males Females Males Females
26 21 28 29 30 31
~ JABALPUR
mRarfl! 2.737 76 1,264 253 379 5
All ages
0-4 .0' S .. , 6 7 .. ' 8 .. , 9 , ...
5-9 .. ' 10-14 .. , 15-19 13 S 20-24 412 31 119 48 56
25-29 495 13 275 69 68
30-34 663 259 68 51
35-59 1.128 28 526 67 182 5
60+ 77 85 16
"<feu< NARSIMHAPUR.
(f'Iitamt 77 130 15 5 13
All ages
0-4 5 oo'
6 oo'
7 .. , 8 9
5-9
10-14 15-19 20-24 17 S
25-29 5 24 7 5 30-34 31 S3 3 7
35-59 24 48 5
60+ , .. tOO ,,, ,0' ,,, ,0,
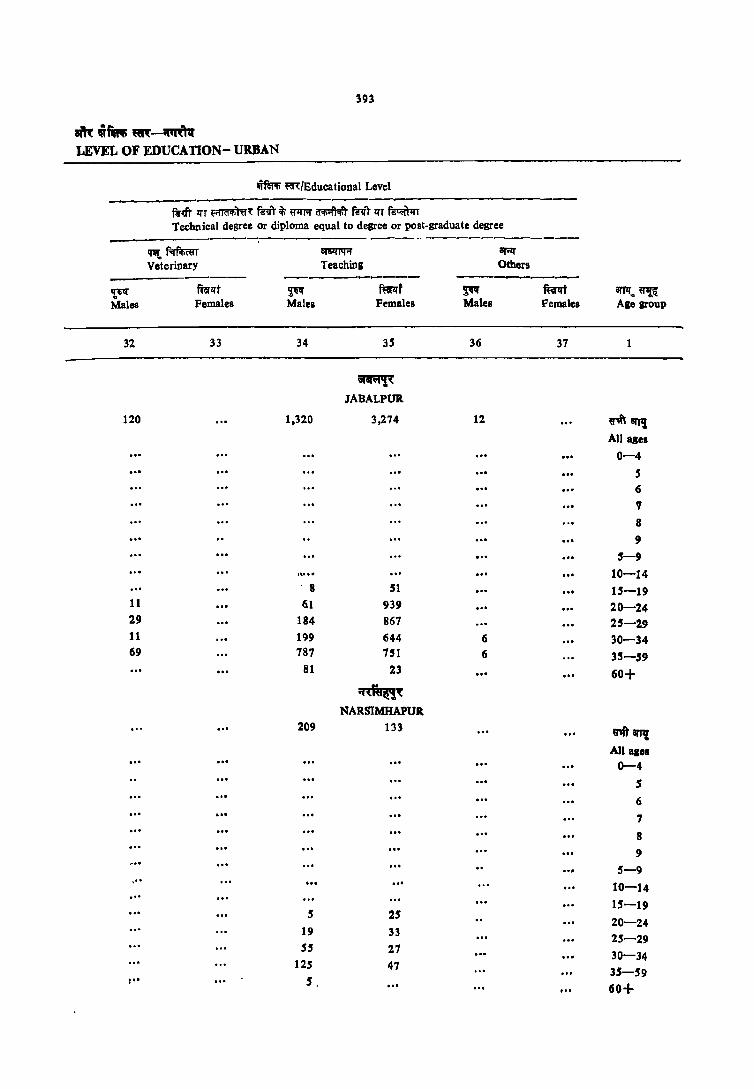
393
~ \ifialli 'lft-~ LEVEL OF EDUCATION- URBAN
~ m/Educational Level ,-----------
fTvr liT ~~~ fTV'1' it ij1I'!';f ~ frn1' liT ~ Technical degree or diploma equal to degree or post-graduate degree --------, --------.....------------------
~AAmT ~ ar;:q-
Voterinary Teaching Others -------- ----- -----'t" mrlit ~ ftnt ~ mm arTIf .. ~ Males Females Males Females Malel FemaJes Ale group
32 33 34 3' 36 37
~ JABALPUR
120 1,320 3,274 12 ~-4'I IIf111 All Illes
0-4 , 6 7 8
9 5-9
10-14 . 8 51 IS-19
11 61 939 20-24 29 184 867 25-29 11 199 644 6 30-34 69 787 151 6 3'-59
81 23 ... 60+
~~ NARSIMHAPUR
209 133 g,ft'arJ1!
All alOI 0-4
5
6 7
8 9
5-9 ",
10-14 15-19
S 25 20-24
19 33 25-29 5S 27 30-34
12S 47 35-59 I" 5,
60+

~94
:rr-Z 1f1:rr "" an" "'1/,!~ C-Z PART A AGE, SEX AND
mR (wft1!l; m it; lim") Literate (without educational level)
~~T ~ 8A~1'fuI; Total Population Illiterate Non-Formal -- -----~- --------
8\1'1!~ .~ ffil"l:It ~ ~l.Jt ~ ffip:rt Age group Males Females Males Females. Males females
1 2 3 4 5 6 7
"wm MANDLA
"''"1 37,979 35,200 11 ,796 18,810 233 142
All ages
0-4 4,553 4,680 4,553 4,680 ·5 1,048 929 939 842 5 5 6 942 1,011 654 640 9 14 7 809 900 324 388 14 8 965 1,037 275 401 23 14 9 717 660 95 166 10 14
5-9 4,481 4,538 2,286 2,439 45 59 10-14 4,812 4,798 609 1,021 64 28 IS-I 9 4,615 3,984 475 1,006 40 23 20-24" 4,039 3,243 397 1.112 9 5
25-29 3,103 2,660 291 1.086 IS 5
30-34 2,410 2.026 290 951 10 9
35-59 7,912 7,239 2,126 4.787 32 14
60+ 1,896 1,991 762 1,695 8 ... ~.l
CHHINDWARA ,,~ 8I11t 137,540 123,627 51,922 71,638 845 450
All ages
0-4 116,631 16,222 16,631 16,222
5 3,110 3,6~6 3,452 3·,461 14 15
6 3,507 3,585 2,677 2,716 23 20
7 3,256 3,240 1,813 1,829 14 20
8 4,061 4,106 1,499 1,609 9 30
9 2,597 2,609 416 745 5
5-9 17,139 17,225 9,917 10,359 66 85
10-14 17,844 17,391 2,247 4,010 33 60
15-19 15,404 13,091 1,925 3,591 60 SO
20-24 14,021 11,670 1,834 4,203 90 45
25-29 10,567 9,550 1,671 4,740 66 58
30-34 9,414 7,637 2,402 4,564 116 44
35-59 29,938 23,887 11,993 17,663 355 78
~Qt 6!409 6,80~ 3,241 (j,140 58 lO

395
, . ' am: ~m. ~-""-':fq LEVEL OF EDUCATION-URBAN
wm'li m:/Educational Level ------ --------
mR (~m: t f.r;n*) Li terate (without educational level! ----------~ ~ Am; Formal Primary Middle
----------- ---------~ ~t ~ mm ~ fta'1I'i iI'fI! ~~ Males Femaits Males Females Males Females Age group
8 9 10 11 12 13 1
~ MANDLA
6,605 5,608 5,853 4,387 4,324 2,597 mrj amz All agos
... 0-4
lOS 82 5 219 351 6 485 498 1
668 622 8
553 434 59 46 9 2,090 1,994 59 46 5-9
1,550 1,289 2,041 1,946 585 411 10-14
331 281 981 168 1,312 792 15-19 298 280 596 420 623 383 20-24 110 261 504 388 466 318 25-29 211 280 316 224 313 '202 313-34
1,477 990 1,1379 546 822 412 35-59 465 224 271 46 144 14 60+
~,
CHHINDWARA
21,6913 21,246 20,921 14,487 12,649 7,051 "''1ft iIfI'I1 All Rles
0-4 244 210 ... S 801 849 6
1,429 1,391 7 2,559 2,467 8 2,051 1,771 66 93 9 7,090 6,689 66 93 5-9 7,'144 6,610' 6,529 5,3135 1,239 1,242 10-14 1,833 1,573 4,413 3,338 3,866 2,297 15-19 1,252 1.229 2,927 2.071 2.364 1,411 20-24
944 1,1303 1,844 1,2613 1,582 807 25-29 994 818 1,247 864 1,191 413 313-34
6,177 2,812 3,2.11 1,402 2,135 812 35-59 1,621 428 654 JH 251 65 GO+

396
"-2 WIlT iii an!, ~l/~ C-2 PART A AGE, SEX AND
~ m/Educational Level -----------------------------------
fuJiT it; atWIT'f ih:_~T ~ ~f~a<:II'''tfi~1 ~ 1fT srnvT.orn-
~;rf~6{t fir -'{f.t<rfij aT NOD-technical diploma Higher Secondary/Inter- or certificate DOt equal
Matri::ulation/Secondary mediate/Pre-University to degree
iITT1! ~ ~ mrll'j ~ ~r ~ mrlff Age grOUP Males Females Males Females Males Females
1 14 15 16 17 18 19
Qwr MANDLA
~8TP{ 4,400 1,990 2,076 837
All ages
0-4 5 ... 6
7 8 9
5-9 10-14 18 32 S
15-19 991 727 368 306
20-24 80S 405 659 251
25-29 721 318 288 140
30-34 609 189 241 63 '
35-59 1,095 306 468 78
60+ 143 14 47 ~,
CHHINDWARA
~.tt 'ft't 11,975 5,53\ 4,735 1,482 5 8
All alCS
0-4 5 6
7 8 9
'-9 10-14 52 105
15-19 2,370 1,608 836 520
20-24 2,590 1,612 1,508 439 8
25--2.9 2,227 948 818 231
30-34 1,799 580 553 146
35-59· 3,524 661 918 142 S
60+ 395 10 92 5

391
am: '"111'11 m:~~ ·LEVEL OF EDUCATION-URBAN
~ mfEducational Level
R"ir iii amm;r ~T ~ 1fT 3I1ITVI'~ i.'I'fiif'i"<!;"t R"!I'''t it ~"t RII"t it f\:r;;r Technical diploma or fir;:;r ,"",0'Ii Rm ~m<IiT~~ fi11"t certificate not equal Graduate degree other Post-graduate degree other to degree than technical degree than technical degree ----------- ----------- ----------
~ mt ~ mf ~ mt arJ'I! ij~ Males Females Males Females Males Females Age groUP
20 21 22 23 24 25 1
;iRT MANDLA
220 18 1,255 503 846 220 ~'Ift <lITIl All ages ... .. , ... 0-4
S 6 ... 7 ... . .,. 8 9
5-9 10-14
4S 68 12 15-19 68 5 342 267 214 102 20-24 39 319 84 216 38 25-29 28 9 212 47 110 36 30-34 85 5 302 37 293 32 35-59
30 14 60+ fifft",
CHHINDWARA 345 18 3,164 1,112 1,626 417 ffiillJ1!
All ages
0-4 5 6
1
8 9
5-9 10-14
13 S 80 '96 8 .S 15-19 123 8 1,041 461 260 136 20-24 57 5 71S 29S 523 149 25-29 46 586 119 333 S9 30-34 92 678 141 488 69 35-59 10 6S 10 60+

j98
'C-2 1n1t " an'!, ,'!(til!" C-2 PART A AGE, SEX AND
Wf1::R; m/Bducational Level -------------------------------------
n-Vt 1fT ~)m- mrr it; ~ iJ!Ii;ft<t>T f"" 1fT ~)qT Technical degree or diploma equal to degree or post-graduate degree
--------------------.-----------------~rot aIlt' m~1 ~r~fel' ,~am~~ Engineering and Technology Medicine Agricul1ure and dairying --------- ----_ -------------
an,!~ ~ ~lff ~ mPT' ~ f~lft Age group Males Females Males Females Males Females
1 26 27 28 29 30 31
qAT MANDLA
~arTI! 101 63 12 11
All ages
0-4 S
6
7
8 .. ' 9
5-9 ... - ... 10-14 15-19 20-24 19 5 5
25-2.9 14 33 6
30-34 19
35-59 49 19 8 5 60+ 6 ... ",.,,,.,.
CHHINDWARA
~1IJTIt 154 129 21 52
Alialea 0-4
5 ... (;
7 8 9
5-9 10-14 15-19 2.0-2.4 15 5 5 13 25-2.9 42 24 5 18 30-34 36 29 S 15 35-59 61 71 5 5 60+ ... ...

399
~~hftn-~ LEVEL OF EDUCATION-URBAN
~~ m/Educational Level ------------------------------
f1"4\" lf1 'fimIiti\ffi: R-VT il; ~if .~'liT f1"lfi If T f'(tffi'ifT Technical degree or diploma equal to degree or post. graduate degree ----------------------
'1I1I ~r <lI'5!I'J1R' ar;I:I'
Veterinary Teaching Others ------- ----------- '---~ ffifqf ~ f~lft ~ ~lff arT1{ Ul!~ Males Females Males Females Males Females Age group
32 33 34 35 36 37 1
. 'fW\ll1
MANDLA
191 75 5 ~amt All ages
0-4
,,' '5
6 7
8 9
." 5-9
10-14
15-19 5 9 20-24
14 23 25-29 48 16 5 30-34
119 21 35-59 5 60+
f_Wiiil,1 CHHINDWARA
S 323 160 ~amr . All ages
O-'Ot
5 6
7
8 9
5-9
10-14 8 15-19
41 20-24 36 SO 25-29 60 25 30-34
5 214 36 35-59 ,o! ... 13 60 -I-

400
If·21(T1f IJ ~ ",/~ C·2 PART A AGE, SEX AND
m:I'i: (lIi"ft;;ri ~ it; fiRr"') Literate (witbout -educational I eve!) -------
pmlilfl f-mR ar.r~. Total Population Illiterate Non-Formal ------ ------ -------
8JJ1! ~'m: ~ ffirlit ~ ~, ~ ~t Age group Males Females Males Females Males Females
1 2 3 4 5 6 7
fn;ft
SOONl
"vii' aTl't 33,026 29,678 9,501 14,642 71 31 All ages 0-4 3,843 3,674 3,843 3.674
5 886 835 780 783 6 816 938 431 590 7 718 656 226 261 5 8 871 973 181 292 5 9 666 552 93 104 .. ,
5-9 3,964 3,954 1.711 2,030 5 5 10-14 4,527 4,401 456 724 15-19 3.952 3,133 329 636 10 5 20-24 3,484 26,37 368 80S ... 25--29 2,488 2,282 253 828 23 10 30-34 2,194 1,841 258 851 35-59 6,977 5,907 1,673 3,570 19 5 60+ 10553 1,804 601 1,503 10 5
amtl'n'l' BALAGHAT
61i\'lII'TI! 52,058 47,744 16,4,}O 26,473 209 123 All agel 0-4 6,167 6,131 6,167 6,131 .. ,
5 1,389 1,225 1,261 1,125 14 5 6 1,233 1,316 864 969 23 5 7 1,102 1;258 467 643 14 5 8 1,168 1,388 258 412 9 9 9 950 956 144 227
5-1) 5,843 6,143 2,994 3,475 59 23 10-14 6,178 6,072 780 1,504 19 18 15-19 6,478 5,204. 676 1,338 24 9 20-24 6,309 . 4,640 640 1,615 11 14 25-29 4,026 3,702 524 J,593 5· 9 30-34 3,324 3,260 498 1,695 20 9 35-59 11,323 9,988 3,258 6,973 49 32 ~O+ 2.325 2,549 918 2,207 J4 9
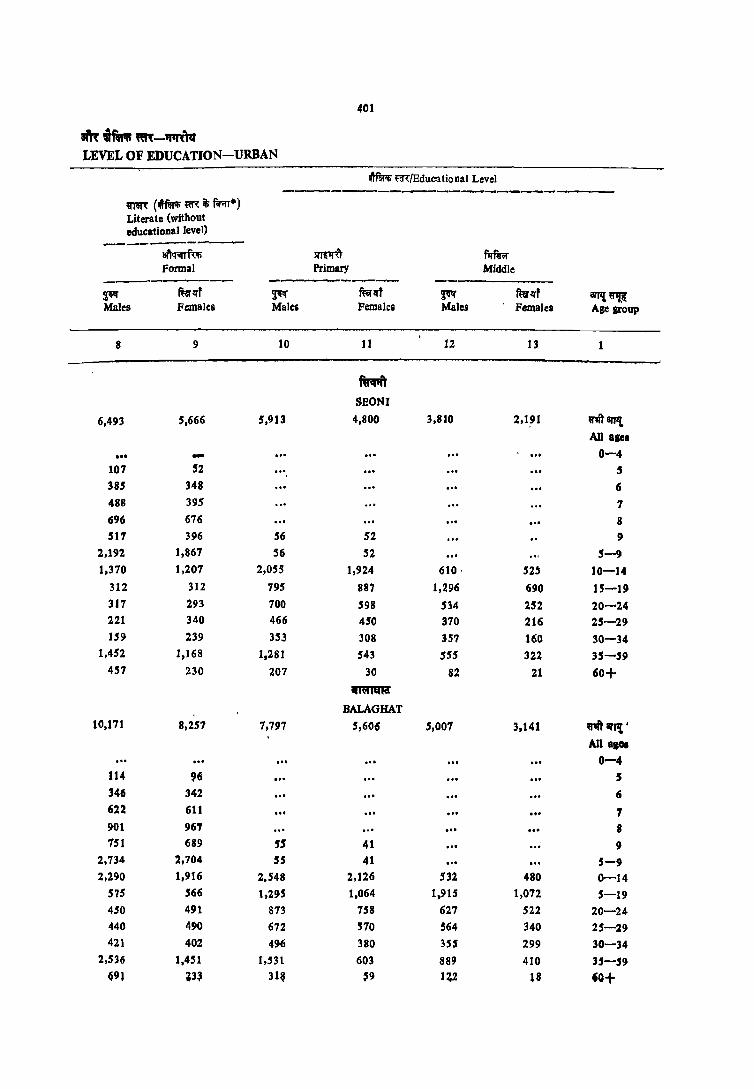
401
m "ftIIr ~-'f1Rjq LEVEL OF EDUCATION-URBAN
II1fm; ~/Educational Level
--------------------~-~ ml'{ (tftl$ m iii f.m*) Literate (without educatioDal level)
-----arn-nm srm-ft f1Imr Fonnal Primary Middle
---------~ fuiJ"lff ~ fNlft ~ fuiJ"lft amt~ Males Females Males Females Males Females Age group
8 9 10 II 12 13
ftA';ft
SEONI
6,493 5,666 5,913 4,800 3,810 2,191 ""1II'Pt All ale. ... - 0-4
107 52 .5 385 348 , 488 395 7 696 676 8 517 396 56 52 9
2,192 1,861 56 52 5-9 1,370 1,207 2,055 1,924 610· 52~ 10-14
312 312 795 887 1,296 690 15-19 317 293 700 598 534 252 20-24 221 340 466 450 370 216 25-29 159 239 353 308 357 160 30-34
1,452 1,168 1,281 543 555 322 35-39 457 230 207 30 82 21 60+
lIT\imnir
BALAGHAT 10,171 8,257 7,797 5,606 5,001 3,141 U1ft' 8I'JI! •
All Ble. 0-4
114 ~6 .5 346 342 6 622 611 ... ... ., 901 961 , .. S 151 689 5' 41 9
2,734 2,704 55 41 5-9 2,290 1,916 2,548 2,126 532 480 0-14
575 566 1,295 1,064 1,915 1,072 5-19 450 491 873 758 621 522 20-24 440 490 672 510 564 340 25-29 421 402 496 380 3SS 299 30-34
2,536 1,451 1,531 603 889 410 35-59 69l ~3~ 311S ,9 1~2 18 60+
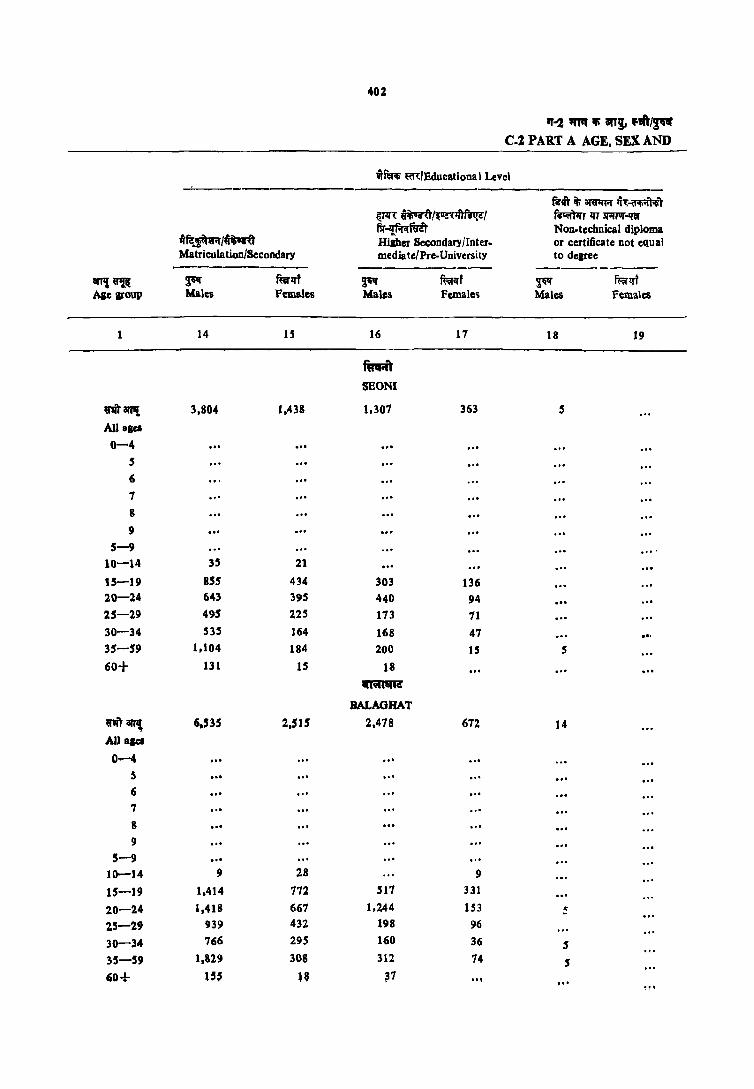
402
"'"2 1ffIT .. ,"" '~/~ C-Z PART A AGE. SEX AND
wm..; m/Educational Level _.__-----------------Nil" iti ~ lT1;~l
~~/~~/ ~r lfr lI'lUVI'-'liI' fir-l{fiA"fuit Non-technical diploma
al~.FnA/~ Higher Secondary/Inter- or certificate not equal Matriculation/Secondary mediate/Pre-University to degree ------- --- --------
8ITI! ~ ~ mrlff ~ ffiflff ~ ffiflft Age group Males Females Males Female .. Males females
1 14 IS 16 17 18 19
fiffr.ft' SBONI
milllf! 3,804 1,438 1,307 363 S
A11alCi 0-4
5 6 7 8 9
5-9 .... 10-14 35 21
IS-Ill 8.55 434 303 136 20-24 643 395 440 94 25-29 495 22.5 173 71 30-34 535 164 168 47 .,. 35-S!l 1.104 184 200 IS .5 60+ 131 IS 18 ."
mmI'R'
BALAGHAT
~~ 6.535 2,515 2,478 672 14 All aiel
0-4 .. , ", S 6 ." 7
8 .. , 9
5-9 10-14 9 28 9 15-19 1,414 772 S17 331
20-24 1,418 667 1.244 IS3 ~
15-29 939 432 198 96
30-34 766 29.5 160 36 5 35-59 1,329 308 312 74 5 60+ 1" U ~7 .. ,
'" '"
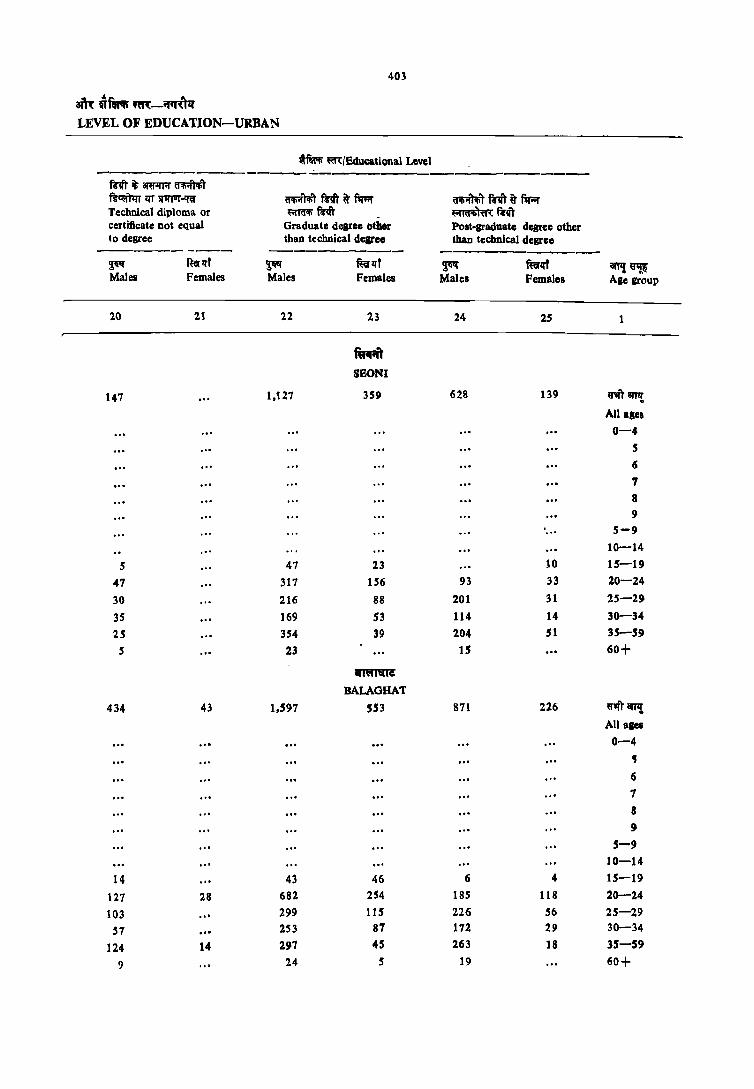
403
at\'( ~m..s m:-~ LEVEL OF EDUCATION-URBAN
tfWl; ~IEduea\ional Level ----------------------------------mil' it am+rR ~ ~~lITll1fI'UI'~ tAi;,,~ RIIT ij' f1r;;r ~ fftt ij' fir;;r Technical diploma or ~mrr ('O(liiI"'~'6( Rift' certificate Dot equal Graduate dearee other Post-graduate degtCe other to degree than technical deareo than tecbnical degree ------- ----~ ft:a"lff ~ mrlft ~ ffim aTrl!~ Male& Females Males Females Males Femalos Age grOUP
20 21 22 23 24 25 1
fP;ft
SOONI
147 1,127 359 628 139 "' ""! All ales
0-4
5 6 1 8
9 .,. 5-9
10-14
5 47 23 10 15-19
47 317 156 93 33 20-24
30 216 88 201 31 25-29
35 169 53 114 14 30-34
25 354 39 204 51 35-59
5 23 15 60+
~
BALAGHAT
434 43 1,597 553 871 226 "T O!lfl{ All api
0-4
iIJ
6 7 8
9 5-9
10-14
14 43 46 6 4 15-19
127 28 682 254 18S 118 20-24
103 299 115 226 S6 25-29
57 ." 253 87 172 29 30-34
124 14 297 45 263 18 35-59
9 24 5 19 60+

404 -".~ 1l1't II anS' "",,~
C-2 PART A AGE, SEX AND
wfWli ~'EducatioD11 Level --- ---------------m-r lfl' ~)m m-r ii; ~ dlfiifT<oT fm liT ~ Technical degree or diploma equal to degree or post-graduate degree ----
~f;prfur 81'11: mOlWt ~T~ ~ar~rn~ Ensinee ring and technology Medicine A.gricuttllre and dairying
~~ ~ mr!:l"t ~ mt ~ ~t Age group Males Females Males Females Males Females
1 16 27 28 29 30 31
f~ SEONI
91ITq 95 45 4 20 All ales
0-4 ," .,. S ," 6 ". 7 ... 8 ... 9 ... .. '
5-9 10-14 .. ' 15-19 20-24 15 5 25-29 25 10 4 S
30-34 25 S S 35-59 30 25 10 60+ .. '
~
BALAGHAT
91ITarI'I{ 197 4 76 33 19 All ages
0-4 ."
5 6 7
8 9
5-9 10-14
IS-19 20-24 38 5 10 25-29 24 5 5
30-34 53 14 4 10
35-S9 78 4 48 19 5
60+ • 5 . .. S

405
~"m.~-~ LEVEL OF EDUCATION-URBAN
-rtilAi" ffi/Educational Level ------ -----------mrr 1fT ~re.: "rtrl ii ~'I'r.r ~l ftr!IT 1fT ~
Technical degree or diploma equal to degree or po&t-graduate degree -------------
1f1I~ ~lIfil' i!IPli Veterinary Teaching Others -------- ----------
~ ~t ~ ~f ~ ~ -arr,!~ Males Female. Males Females Males Females Age grOUP
32 33 34 35 36 37
ftR;ft
SEONI
60 45 ~'1T arTI! All ages
.•. ... 0-4
5 6
7
8
9
5-9 10-14
15-19 5 10 20-24
19 25-29 10 5 30-34 40 10 35-59"
S 60+
~
BALAGHAT 183 98 91ft anI{
All aiel 0-4
S
6
7
8
9
S-~
10-14
IS-I 9 5 10 ... 20-24
24 27 25-29 44 23 ... .. , 30-34
100 31 35-59 !) .. , 60+
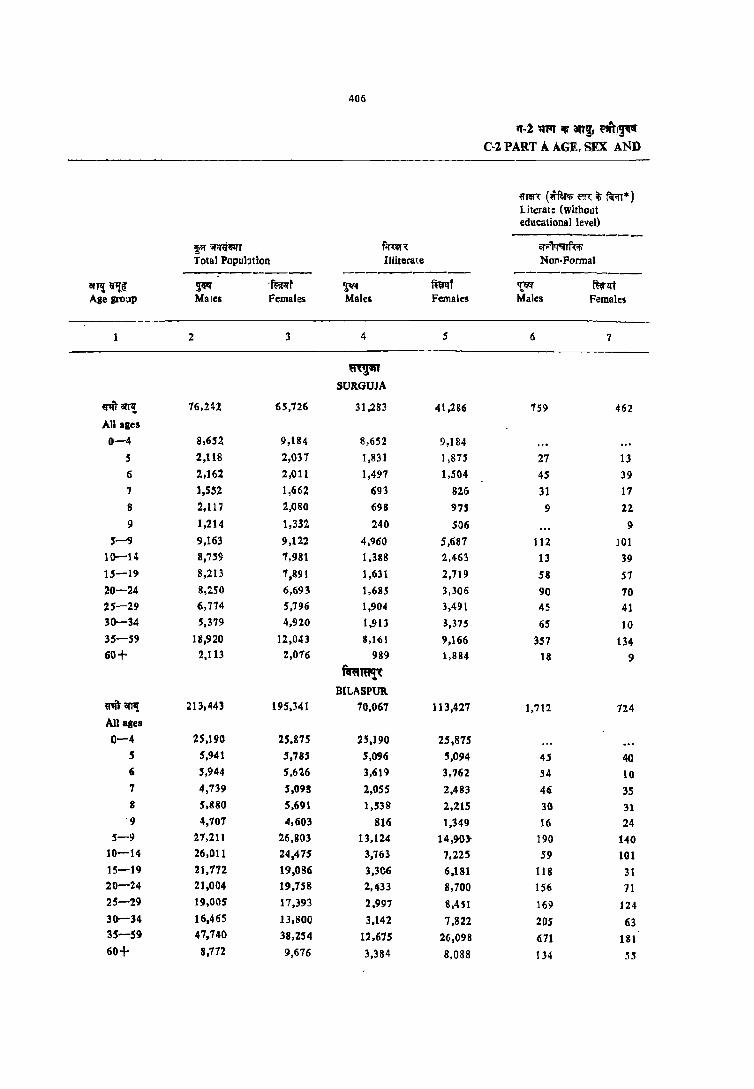
406
'1-2 111'1 iii m!, ~I~ C-2 PART A AGE. SEX AND
~RR (~ftFi; ffi ~ f~*) Literat: (without educational level)
!i"" :;mf"'" f;m'f, ar;;~ Total PopuhtiOD Illiterate N(IJ'I·Formal
---------- -------------8lfl! IJl!I! ~ '~r ~ ffiIll'f 't~ ~qf Age group Males Females Males Females Males Females
2 3 4 5 6 7
8lp1' SURGUJA
tr'italT! 76,242 65,726 31,283 41,286 'S~ 462
All ages
0-4 8,652 9,184 8,652 9,] 84
5 2,118 2,031 1,831 1,875 27 13 6 2,162 2,OU 1,497 1,504 4S 39 7 1,552 1,662 691 826 31 11 8 2,117 2,080 698 975 9 22
9 1,214 1,332 240 506 9 5'-9 9,163 9,122 4,960 5,681 112 101
10-14 8,759 1,981 1.388 2.463 13 39 15-19 8,213 ',891 1,631 2,719 58 51 20-24 8,250 6,693 1,685 3,306 90 70 25-29 6,714 5,196 1,904 3,491 45 41 30--34 S,37~ 4,920 1.913 3,375 65 10 35-59 18,920 12,043 3,161 9,166 357 134 60+ 2,113 2,016 989 1.884 18 9
f1n:Imt{( BILASPUR
~Gfl1! 213,443 195,341 10,061 113,427 1,712 724 Allllfes
0-4 25,190 25.S7S 25,J90 25,875
5 5,941 3,185 5,096 5,094 45 40 6 5,944 5.61.6 3,619 3,162 S4 10 7 4,139 5,09!! 2,055 2.483 46 35 8 5,880 5.691 1,538 2,215 30 31 9 4,10'7 4,603 816 1,349 16 24
5-9 21,211 26,803 13,124 14,90} 190 140 10-14 26,011 24,475 3,763 7.225 59 101 IS-19 21,172 19,086 3,3C6 6.181 118 31 20-24 21.004 19,758 2,433 8,100 156 71 25-29 19,005 17,393 2,997 8,4H 169 124 30-34 16,465 13.800 3.142 7.822 205 63 35-59 47.740 38,254 12,675 26,098 671 181 60+ 8,172 9,676 3,384 8.088 134 55
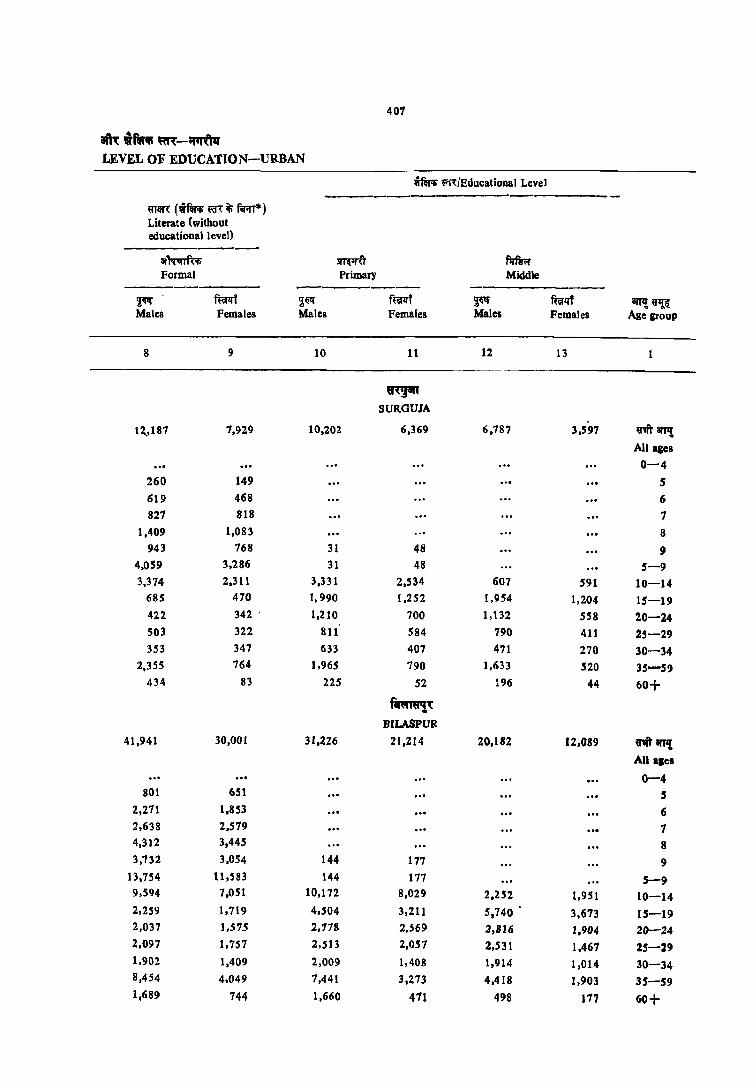
401
am:U~~-~ LEVEL OF EDUCATION-URBAN
~ \'1i~/Educa.tioDal Level -------------mm (wm m ~ far;rr*) Literate <without educational level)
ar~ ~ firlr.r Formal Primary Middle -----------
~ mt ~~ fm' ~ fuflif iW! «~ Males Females Males Females Males Females Age group
8 9 10 11 12 13 1
~ SURGUSA
12,,187 7,929 10,202 6,369 6.787 3.591 ~arfl!: All aps
0-4
260 149 5 619 468 6
821 818 7 1,409 1,083 8
943 168 31 48 9 4,059 3,286 31 48 5-9 3,314 2,311 3,331 2,534 607 591 10-14
685 410 I,990 I.252 1,954 1,204 15-19 422 342 . 1,210 700 l,t32 558 20-24 503 322 811 584 790 411 25-29 353 347 633 407 471 270 30-34
2,355 764 1,965 790 1,633 520 35-59 434 83 225 52 :96 44 60+
f~, BILASPUR
41,941 30,001 31,226 21,214 20,182 12,089 nl'arP{ All aIel ... 0-4
801 651 5 2,271 1,853 6 2,638 2,519 1 4,312 3,445 8 3,732 3,054 144 117 9
13,754 11 ,S83 144 177 5-9 9,594 7,051 10,172 8,029 2.252 1,951 10-14 2,259 1,719 4,504 3,211 5,740 3,673 15-19 2,037 1,575 2,178 2,569 2,816 . 1,904 26-24 2,097 1,757 2,513 2,051 2,531 1,467 25-29 1,902 1,409 2,009 1,408 1,914 1,014 30-34 8,454 4,049 1,441 3,273 4,418 1,903 35-59 1,689 744 1,660 471 498 177 60+
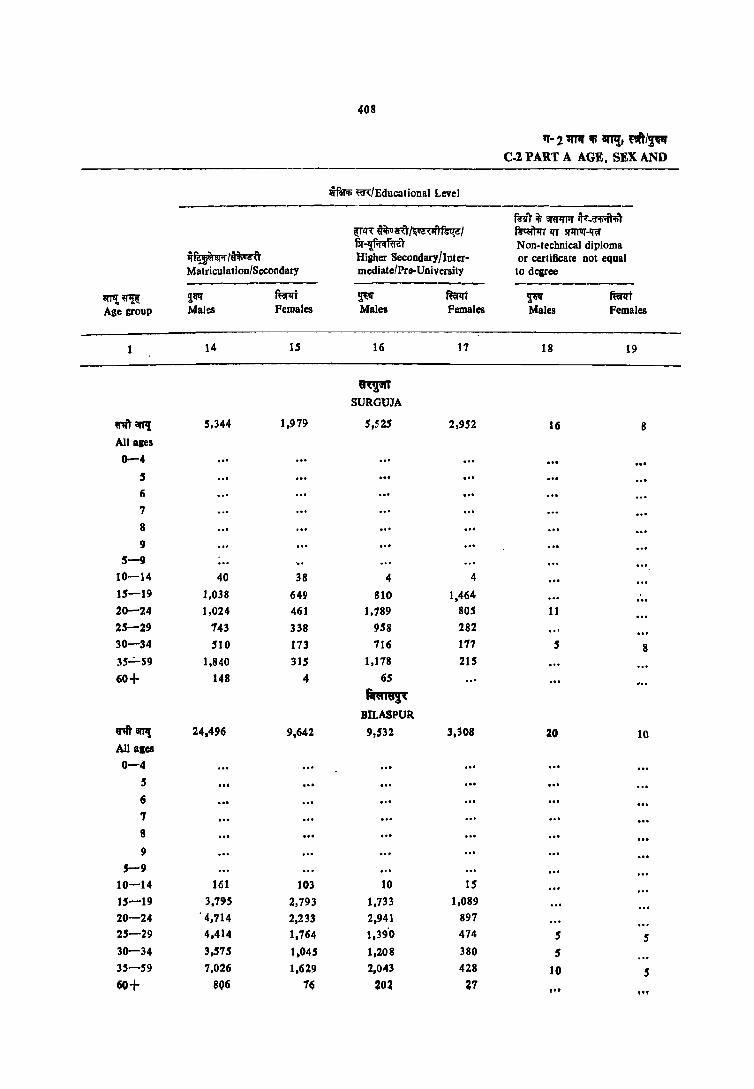
408
11'- 2 '"" III II'I!, "'" /~ Col PART A AGE. SEX AND
wm;; m/Educational Level
fflr"r it; BIWIioI' q.-~ i[T!11: ~~/~~I ~1fT 3I1fl1Il'-Qif flr~fue"r Non-technical diploma
1l~'~ Higher Secondary/Inter- or certificate not equal Matriculation/Secondary mediate/Pre-University to degree --- ---------
81'J'1!~ ~~ ffim ~ ~ ~ mt Age group Mal=s Females Malell Females Males Females
1 14 IS 16 17 18 19
~ SURGUJA
"'I' arP! 5,344 1,979 5,525 2,952 16 8 All ales
0-4
5 6
7
8
9
5-9 10-14 40 38 4 4 15-19 1.038 649 810 1,464 ... 20-24 1,024 461 1,789 80S 11 25-29 743 338 958 282
30-34 510 173 716 177 5 8 35"':"'59 1,840 315 1,178 215
60+ 148 4 6S
Ril'iiij(
BILASPUR
V'lITiII'P! 24.496 9,642 9,532 3,308 20 10 All ales
0-4
5 .. , 6
1 8
9
5-9
10-14 161 103 10 15
U-19 3,795 2,793 1.733 1,089
20-24 ·4,714 2,233 2,941 897
25-29 4,414 1,764 1,39·0 474 5 5 30-34 3,575 1.045 1.208 380 5 35-59 7.026 1,629 2,043 428 10 5 60+ 806 76 203 aT ... . ..
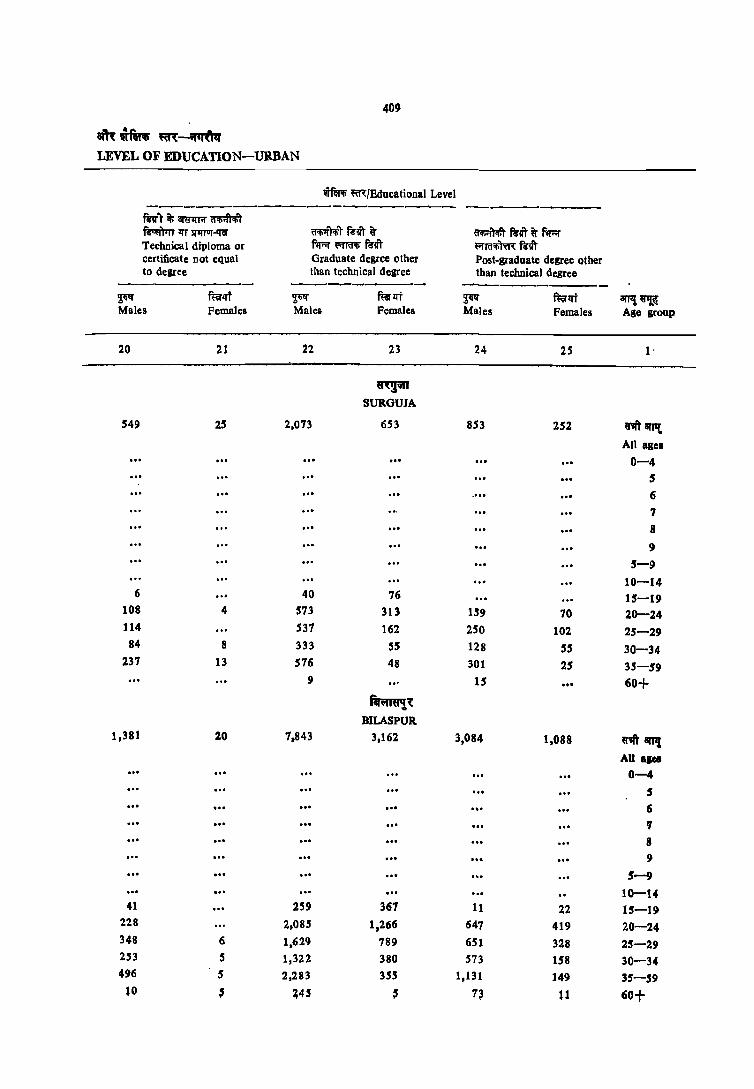
409
m~~~-~ LEVEL OF EDUCATION-URBAN
~ ~/Educational Level ----_------------------. -----------mr)~am~~T fcqftm 1fT !I1f1'UI'-'Rf <l"Ii;ft'liT R'lIT ~ ~ ~lil" ~ f'r.:;r Technical diploma or f'll"l'~~lIT ~"Id'li"l'd< RlIT certificate Dot equal Graduate degree other Post-graduate degree other to degree than technical degree than technical degree ---------
~ mrirl ~ f'arlli ~ mrlft arTll ~ Males Females Males Females Males Females Age group
20 21 22 23 24 25 l'
~\'iI1
SUP-OUIA
549 25 2,073 653 853 252 "" aII'll. All asee
0-4 5
6 7 8
9
5-~
10-14 6 40 76 15-19
108 4 573 313 IS9 70 20-24 114 531 162 250 102 25-29 84 8 333 S5 128 S5 30-34
237 13 516 48 301 25 35-59 9 15 60+
~~ BILASPUR
1,381 20 1,843 3,162 3,084 1,088 '"'" err,! All agee ... 0-4
5
6
7 ... S
9 .5-9
10-14 41 259 367 11 22 15-19
228 2,085 1,266 641 419 20-24 348 6 1,629 789 651 328 25-29 253 S 1,322 380 573 158 30-34 496 5 2,283 3SS 1,131 149 35-59
to , ~45 , 7~ u 60+
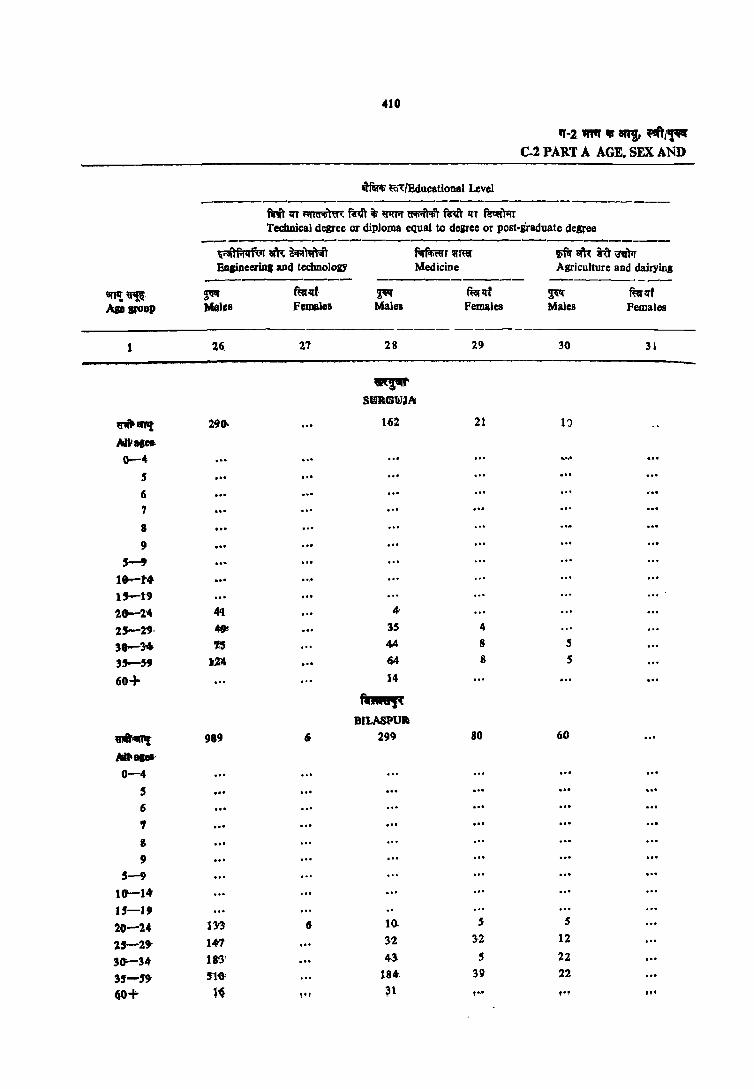
410
"~1 '"'" • air """" C-2 PART A AGE. SEX AND
~ ~"'t'Bducational Level ---------------------------------
mit ~ ""ic:t",)'t!( ~ ii ~ ~ fAT I{T ~ Technical degree or diploma equal to degree or post-araduate degree
-----\iil1Mllf.,i, ~'h: m~ ~r"mr iNam:~~ EDpneeriPlS and technology Medicine Agriculture and dairying
----------IIJTIt ~, $'" ffit~r· ~ ffitd ~ Werll'f _pup Miles Female. Male. Pemalea Males Females
1 26. 21 28 29 30 31
~ SltIllGlIJl1i
~'"'t 290· 162 21 1:>
AlIt ... 0-4 ...... ,
6 7
8
9 ... 5--9
18-t. 1'_t9
28-2;4 4<1 4'
25-2'9, ..,. 35 4
3a-l4 '" 4A 8 S ,,__,, 124 64 8 S
60+ 14
f.'AS~ Bll.ASPUa
d",,! 989 ti 299 80 60
".. .... ' 0-4
5 .. , 6
'I '0'
8
9
S-9
10'-14-
"-J9 20-24 13'l 6 10. S 5
"5-29" 14>1 3·2 3·2 12
30'-34 18'3' 43 S 22
,,-,,' no' 184-- 39 22
40+ l'~ ,,, ~1 'o~ ,., tI'
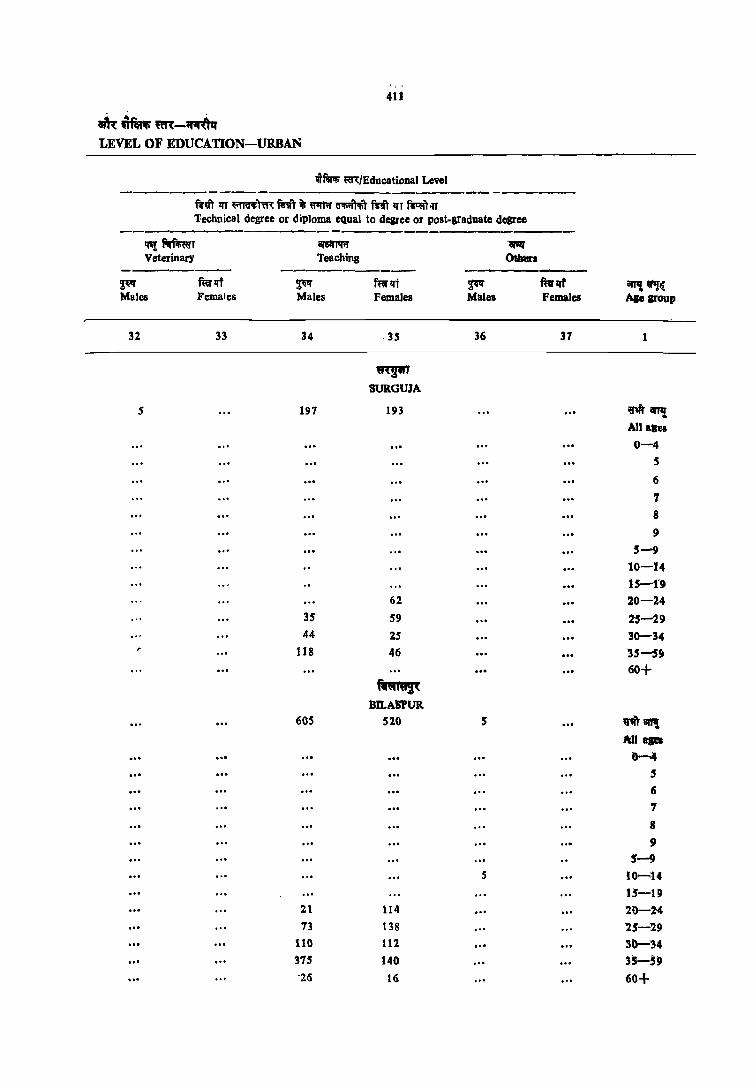
411
aftt ufiRtli ~-~ LEVEL OF EDUCATION-URBAN
wft!;r; ~/Educational Level ---------- ---Ran lIT \"Imi)~ tn) ~ ~ ~ ~ lJT ~'"
Technical degree or diploma equal to degree or post-sraduate desree --------------'PI Rf.mrT ar5IIm ~ VeterinarY Teaching 0*-. -_------ ---------- --
2;" ffirlff ~ mp:rj ~ ffirlff ~WIf( Males Females Males Females Males Females Ale JrOup
32 33 34 .35 36 37 1
wtJWT SURGUJA
5 197 193 "II'P! All ales
0-4
S
6 ., 8
9
5--9 10-14 15-1'9
62 20-24 3S 59 25-29 44 25 30-34
118 46 3.5-:59 60+
ftj"i+ij< BlLAS'PUR
60"5 520 5 \1"Ifrad! Idlqea
0-4 5 6 ., 8
9 5-9
S IO-U
1S-19 21 114 29-2'4 73 138 '25-"29
110 112. 30-34 ... 375 140 35-59 '25 15 60+

411
"-2 m iii afr!j. ""i'!~ C-2 PART A AGE, SEX AND
meR (wffi ~ it; ~"') Literate (without educational level) --------
p~ f.mn: ar;r~
Total Population nliterate Non-Formal
--- ----------- -----------arr!~ ~ ffip:rt ~ ~Il't ~ ffirll't Age group Males Females Males Females Males Females
2 3 4 5 6 7
UQ1IJ RAIGARH
~arPt 63,773 57,360 20,930 34,479 355 198
1'01\ ages
Cl-'-4 6,331 6,995 6,337 6,995
5 1,405 1,497 1,120 1,233 15 22
6 1,610 1,737 915 1,018 20 11
7 1.281 1,465 422 600 15 5
8 1,417 1,836 423 695 10
9 1,283 1,322 215 412 5
5-9 6,996 7,857 3,094 3,958 63 38
10-14 7,914 7,428 1,206 2,318 15 22
15-19 7,899 5,499 1,167 2,001 5 10
20-24 7,510 5,537 900 2.615 IS 21
25-29 5,471 5,081 . 1,256 2,760 41 21
30-34 4,842 4,124 915 2,295 11 16
35-59 14,035 11,909 4,932 8,752 142 54
60+ 2,724 2,913 1,088 2.479 44 5
(11iiI"il(iilCi
RAJNANDGAON
~'"' an,! 14,179 70,073 23,955 40,133 303 213
All ages
0-4 8,793 8,658 8,793 8,658
5 1,964 1,866 1,815 1,758 19 20
6 1,955 1,752 1,344 1,241 66 34
7 1,670 1,545 783 884 22 25
8 2,074 1,801 566 722 14 15
9 1,722 1,552 295 418 9 10
5-9 9,385 8,515 4,803 5,023 130 104
10-14 9,282 8,854 1,015 2,234 19 5
15-19 8,380 7,100 891 2,015 10 25
20-24 7,456 6,432 791 2,333 S 5
25-29 5,701 5,718 734 2,584 13 5 30-34 5,206 4,919 794 2,664 5 10 35-59 16,744. 15,579 4,798 11,014 97 36 60 ~ 3.228 4,277 J ,326 3,602 22 25
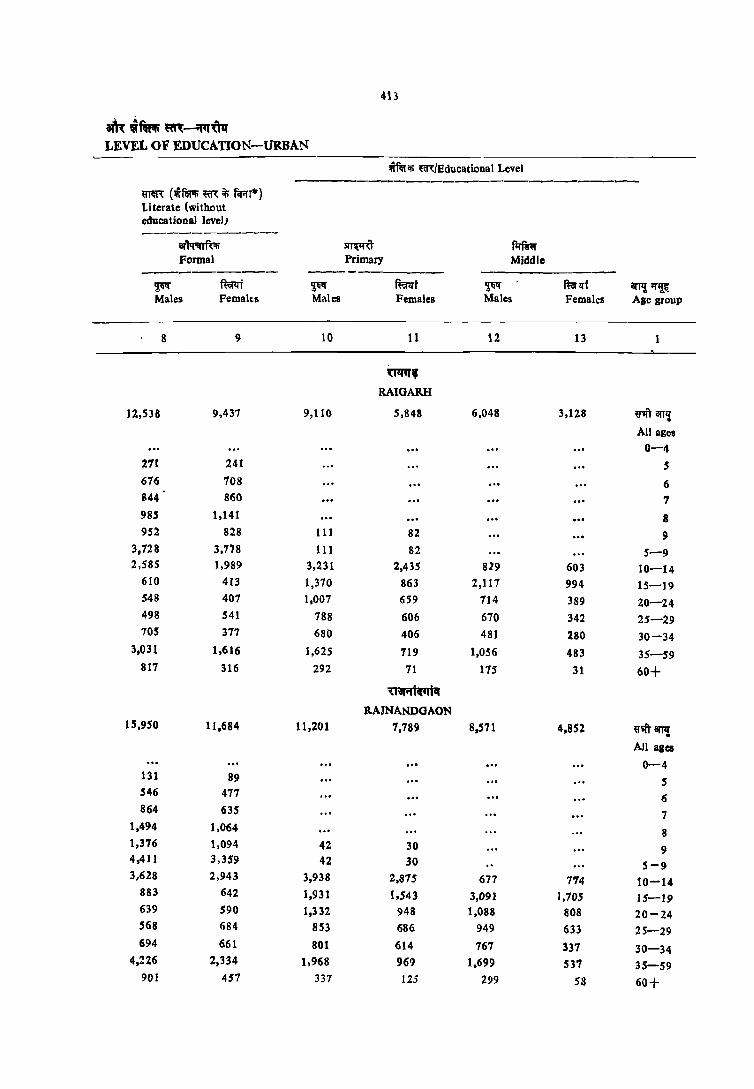
413
~ ~ft:t1Ii m-~Uq LEVEL OF EDUCATION-URBAN
m~;p m/Educational Level --------
mIIR: (w~ m it' fij;:rr*) Literate (without educational level) _----------
ar'l<r;nfu; ~ ~ Formal Primary Middle ----------- ---------- ----------
~ mt ~ ~t ~ mll:rt iII'1l! ;r~ Males Femalts Males Females Males Females Age group
8 9 10 11 12 13
UIffl, RAIGARH
12,538 9,437 9,110 5,848 6,048 3,128 «lIT an,!
All ages
0-4 271 241 5 616 708 6 844 860 1 985 1,141 8 952 828 111 82 9
3,728 3,778 111 82 5-9 2,585 1,989 3,231 2,435 829 603 10-14
610 413 1,370 863 2,117 994 15-19 548 407 1,007 659 114 389 20-24 498 541 788 606 670 342 25-29 70S 377 680 406 481 280 30-34
3,031 1,616 1,625 719 1,056 483 35-59 817 316 292 71 175 31 60+
~iI"i"lliii RA1NANDGAON
15,950 11,684 11,201 7.789 8,571 4,852 ~'4t arTI! All ages
0-4 131 89 5 546 477 6 864 635 7
1,494 1,064 8 1,376 1,094 42 30 9 4,411 3,359 42 30 5-9 3,628 2,943 3,938 2.875 677 774 10-14
883 642 1,931 1,543 3,091 1,105 15-19 639 590 1,332 948 1,088 808 20-24 568 684 853 686 949 633 25-29 694 661 801 614 767 331 30-34
4,226 2,334 1,968 961) 1,699 537 35-59 901 457 337 125 299 5S 60+

414
IJ-i o;nq ~ an~, "'~ C-2 PART A AGE, SEX AND
WNr!; mlEducational Level ----------------------------
ftlAT it; ar~ ~_~r ~>n:~I~~1 N~ ~ 5PrJ11r-tflr
1l~1~ fir 1,.fircrftl it Non-technical diploma Higher Secondary/Inter- or certificate nol equal
Matri~ulatioDISecODdary mediate/Pre-University 10 degree
<Wr~ ~ fiqlfT ~ mY '!W mtlfT Age group Males Females Malei Females Males Females
1 14 15 16 17 18 19
'atmiJ
RAIGARH
~anl! 6,175 2,416 4,753 850 ' 21
All ages
0-4 5
6
7
8
9 5-9
10-14 44 60 5
15-19 1,130 764 1,262 381 5
20-24 1,405 754 1,929 221
15-29 944 417 455 127
30-34 784 2S0 455 69 10
35-59 1,S1i4 164 597 52 5
60+ 199 5 50
~A RAJNANOOAON
~ aril! 7,033 2,890 2,997 1,042
All ages
0-4 5
6
7
8 9
5-9
10-14 5 25
15-19 910 614 572 447
20-24 1,384 849 1,136 219
25-29 1.210 639 416 149
30-34 1,110 347 263 107
35-59 2,163 405 597 60
60+ 2St 10 U

41'
aiR ~f"ar ~-;wqUq LEVEL OF EDUCATION-URBAN
iRfol; m/Educational Level -------------------------------
~IIT ~ am'IIT'I' CI'llloiT'i>T ~)ln' lIT st1fl'lT~ ~ifioI'''ti!fl"~1I"1~ ~')' ~V"t ~ fIFI' Technical diploma or f1r.;r ~Q!Ii fm ~m<mw;::fnTT certificate not equal Graduate degree other Post-graduate degree other to degree than technical degree than technical degree
----------- ----------- ----------~ ftep.rf ~ mf ~ f~ arT!! ~ Males Females Males Females Males Females Age group
20 21 22 23 24 25 1
'{1'tR, RAIGARH
266 5 2,205 693 1,028 234 fl''''' arrl£ All ages
0-4 5 6 7
8 9
5-9
10-14 24 65 60 5 IS-19 85 682 348 185 117 20-24
21 504 163 252 14 25-29
26 389 87 240 38 30-34
110 5 510 36 351 35-59
54 60+
(1\11,,144. t1r RAJNANDGI\ON
324 10 2,409 927 1,011 412 ~ arT,!
All ages
0-4 5
6 7
8 9
5-9
10-14
10 64 95 5 IS 15-19
63 S 795 460 201 130 20-24
84 565 195 t36 117 25-29
39 464 81 205 66 30-34
120 S 486 97 345 84 35-59
to " 34 18 ... 60+

416
"-2 ;rTIl' iii 8tl!, nft'/,~ C-2 PART A AGE. SEX AND
~ m/Educational Level
ftdt II'T ~ ftlft it; I'flWI' wliil'l"'!>'t fm 1fT ~rll'T Technical degree or diploma equal to degree or post-graduate degree
------------------_._--------------~mam-m~ f.rf'IiWT !iIT«i filii~"{" rn ~ Engineering and Technology Medicine Agriculture and dairyins ---------- -------- ------------
arr'1~ ~ mrllf ~ fint !!W ~lft Age group Males Females Males Females Males Females
26 21 28 29 30 3.1
lm, RAIGARH
q'l{t awt 1815 S8
All ascs
0-4 3
6
7
8
9
5-9 10-14
15-19 44
20-24 49
25-29 15 10
30-34 37 16
35-S9 42 31
60+ ~R
RAJNANOOAON
rirarP! 103 5 98 16
All ales 0-4
5 6
1 8 9
5-9 10-14 15-19 13
20-24 S S 5 10
2S-29 20 38
30-34 20 10 S
35-59 45 4S
60+ ,,, ... ,., .. , ,,,

417
~~~fftl-~ LEVEL OF EDUCATION- URBAN
rRfm; ~JEducational Level ---R'Vl" ~T ~\ mit it; ~ ~ furl liT R'tOil1rr Technical degree or diploma eqnal to degree or post. graduate degree
----------------------~ f.;rf.t;-t«T ~ 817'11' Veterinary Teaching Others -------- ----------
,!'lS1l!' ~l:I"t ~ fmf ~ fint a:rr!f.~ Males Females Males Females Main Females Age group
32 33 34 35 36 37
'O'IA, RAIOARH
120 72 ~arP{
All ales ... 0-4
5 .. , 6
7
8
9
S-9 10-14
15-19 5 20-24 ... 16 30 25-29
31 5 30-34 68 26 35-59 , S ... 60+
mAR'f~
RAJNANDGAON 224 100 U'lftSmt
An alea .,. ... . .. 0-4 .. , 5 .,. . .. 6 .. , 7
." ... 8 . . ,. . .. 9 ... 5--9 ... .. , 10-14 ... IS-19
.0' S 10 .. , 20-24 15 26 25-29 35 26 ... 30-34
1$5 37 35-S9
,,' 'n IS ,., ... 60+
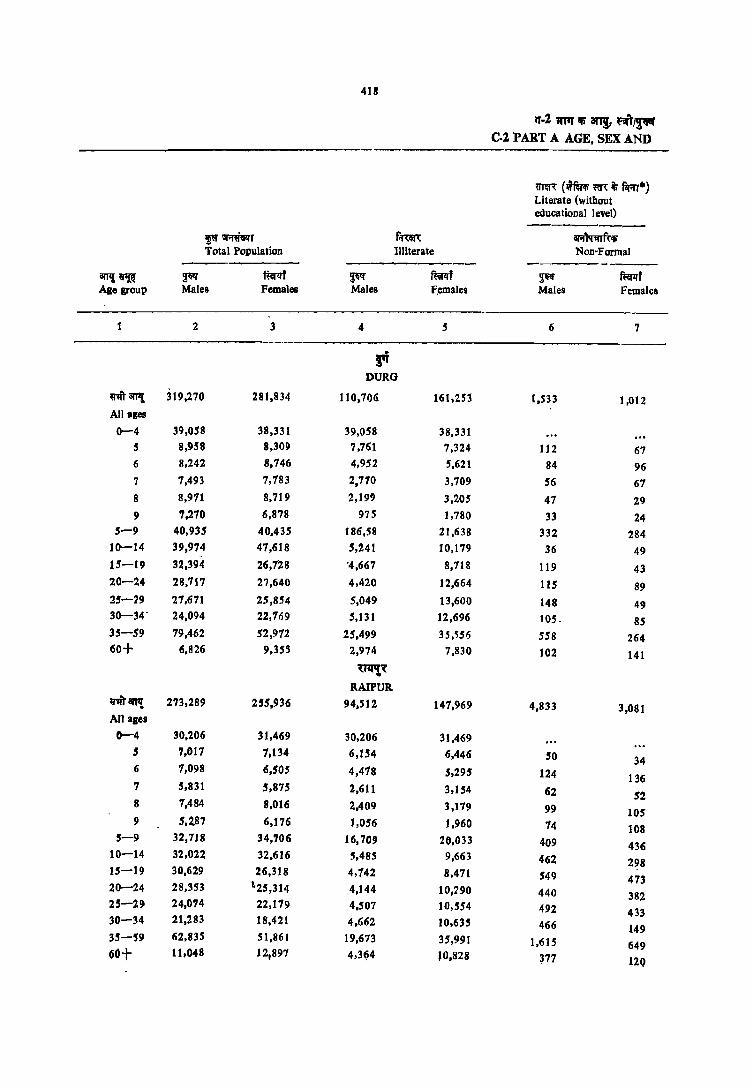
4lS
11'-2 ~ Ifi 8I'T!, f'it~ C-2 PART A AGE, SEX AND
mm- (Qjfm; m ~ fiAT·) Literate (witbout educational level) ------
p~T f~ ar.rN'il"rft'li Total Population Illiterate Non-Formal ------ -------- ---------
arr,~ ~ ~d ~ fterff ~ ft:wrf Age group Males Females Males F.emales Males Females
1 2 3 4 5 6 7
fi DURO
marT!! 319,270 281,834 110,706 161,253 1,533 1,012 All ages
0-4 39,058 38,331 39M8 38,331 5 8,958 8,309 7,761 7,324 112 67 6 8,242 8,746 4,952 5,621 84 96 7 7,493 7,183 2,710 3,709 S6 67 8 8,971 8,719 2,199 3,205 47 29 9 7,270 6,878 975 1,780 33 24
5-9 40,935 40,435 186,58 21,638 332 284 10-14 39,974 47,618 5,241 10,179 36 49 -15-19 32,394 26,728 "4,667 8,718 119 43 20-24 28,117 27,640 4,420 12,664 115 89 25-29 27,671 25,854 5,049 13,600 148 49 30-34' 24,094 22,769 5,131 12,696 105. 85 35-59 79,462 52,972 25,499 35,556 558 264 60+ 1'1,826 9,355 2,974 7,830 102 141
~t
RAIPUR marT!{ 2'73,289 255,936 94,512 147,969 4,833 3,081 An ales
0-4 30,206 31,469 30,206 31,469 .5 7,011 1,134 6,154 6,446 50 34 6 7,098 6,505 4,418 5,295 124 136 7 5,831 5,875 2,611 3,154 62 S2 8 7,484 8.016 2,409 3,179 99 105 9 5,2.87 6,176 1,056 1.960 14 108
5-9 32,718 34,706 16,709 20,033 409 436 10-14 32,022 32,616 5,485 9,663 462 298 15-19 30,629 26,318 4,142 8,471 549 473 20-24 28,353 ~25,314 4,144 10,:190 440 382 25-29 24,074 22,119 4,507 10,554 492 433 30-34 21,283 18,421 4,662 10,635 466 149 35-59 62,835 51,861 19,673 35,991 1,615 649 60+ 11,048 12,897 4,3(i4 lO,828 ~77 120
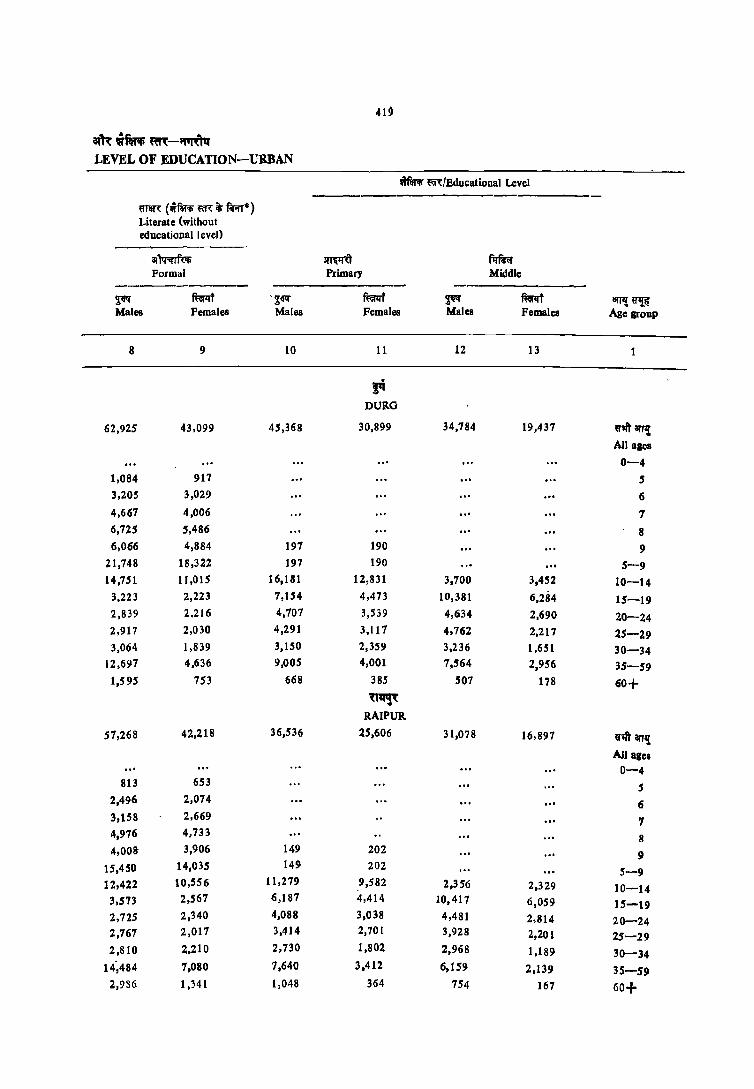
419
am~m.~-~ LEVEL OF EDUCATION-URBAN
~ ~"1:/Educational Level --mm: (riTfWf; mit; f.r;rr*) Literate (without educational level) -------
aIN'qTfti!; ~ fiImT Formal Primary Middle
---------~ mf .~~ ffirlrr ~ ~ 0!fTl! ij'~ Males Females Males Females Males Females Age group
8 9 10 11 12 13 1
ri DURO
62,925 43,099 45,368 30,899 34,784 19,437 u~~ All aaes
-0-4
1,084 917 5 3,205 3,029 6
4,667 4,006 7 6,125 5,486 8 6,066 4,884 191 190 9
21,748 18,322 197 190 5-9 14,751 11,015 16,181 12,831 3.700 3,452 10-14
3,223 2,223 7,154 4,473 10,381 6,284 15-19 2,839 2.216 4,707 3,5j9 4,634 2,690 20-24 2,917 2,030 4,291 3,117 4,762 2,217 25-29 3,064 1,839 3,150 2,359 3,236 1,651 30-34
12,697 4,636 9,005 4,001 7,564 2,956 35-59 1,595 753 668 385 507 178 60+
~1II!'t
RAIPUR
57,268 42,218 36,536 25,606 31,078 16,897 «1ft an,!
All ages
0-4 813 653 5
2,496 2,074 6 3,158 2,669 7 4,976 4,733 8 4,008- 3,906 149 202 9
15,450 14,035 149 202 5-9 12,422 10,556 11,279 9,582 2,356 2,329 10-14 3,573 2,567 6,181 4,414 10,417 6,059 IS-19 2,725 2,340 4,088 3,038 4,481 2,814 20-24 2,767 2,017 3,414 2,701 3,928 2,201 25-29 2,810 2,210 2,730 1,802 2,968 1,189 30-34
14~484 7,080 7,640 3.412 6,159 2,139 35-59 2,936 1,341 1,048 364 754 167 60+
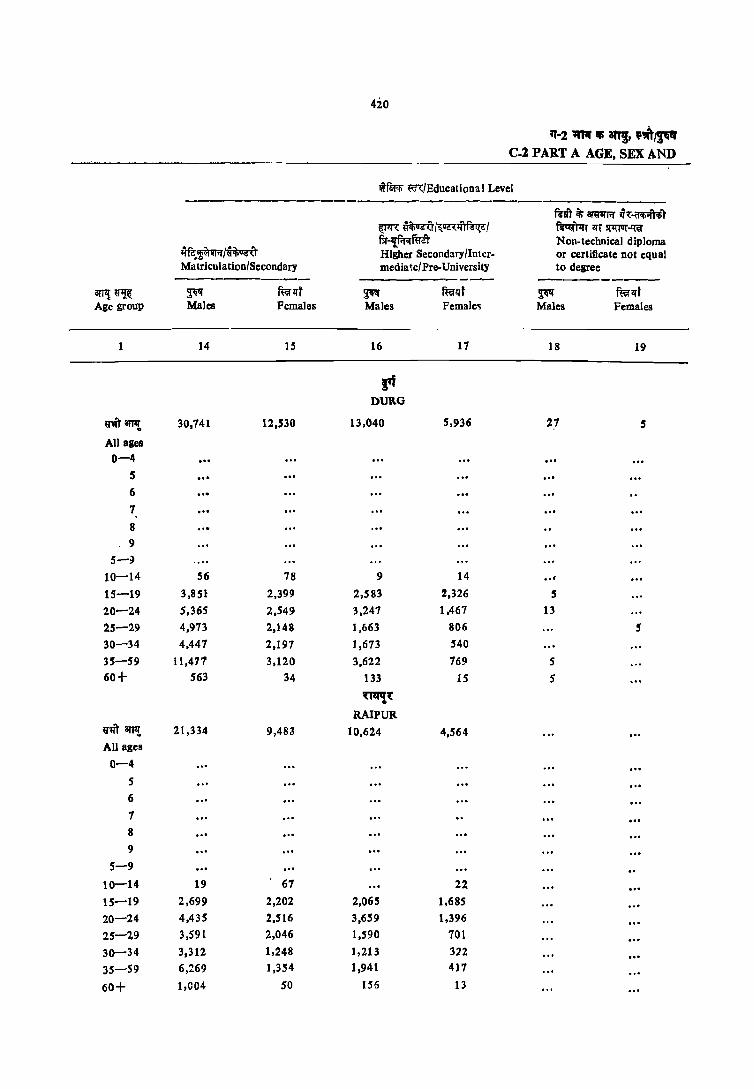
420
11'-2 11111' Ifi' ani, '~/P' C-2 PART A AGE, SEX AND
WfWli mlEducationa I Level ------------------
fTiIT iii am"IrliI' q~~l ~~I~m~1 ~ lI'T lIliIUI'-'"f fir -I{f.r<rfili't Non-technical diploma
~fe:~/~ Higher Secondary/Inter- or certificate not equal Ma triculation/Secondary media tel Pre-University to degree --------
arT!! ~ ~ ffirlJT ~ mrll'f ~ ffirlJi Age group Males Females Males Female, Males Females
14 15 16 17 18 19
rf DURO
ritawt 30,741 12,530 13,040 5,936 27
All ages 0-4
5 ... 6 .,. 7
8 9
5-~
10-14 56 78 9 14 ... 15-19 3,851 2,399 2,583 2,326 5
20-24 5,365 2,549 3,247 1,467 13
25-29 4,973 2,148 1,663 806 5
30-34 4,447 2,197 1,673 540
35-59 11,471 3,120 3,622 769 5 60+ 563 34 133 15 5
~'{
RAIPUR ij"m 3JP! 21,334 9,483 10,624 4,564 All ages
0-4
5
6
7
8
9
5-9 10-14 19 67 22
15-19 2,699 2,202 2,065 1,685
20-24 4,435 2,516 3,659 1,396
25-29 3,59l 2,046 1,590 701
30--34 3,312 1,248 1,213 322
35-59 6,269 1,354 1,941 411
60+ 1,004 50 156 13
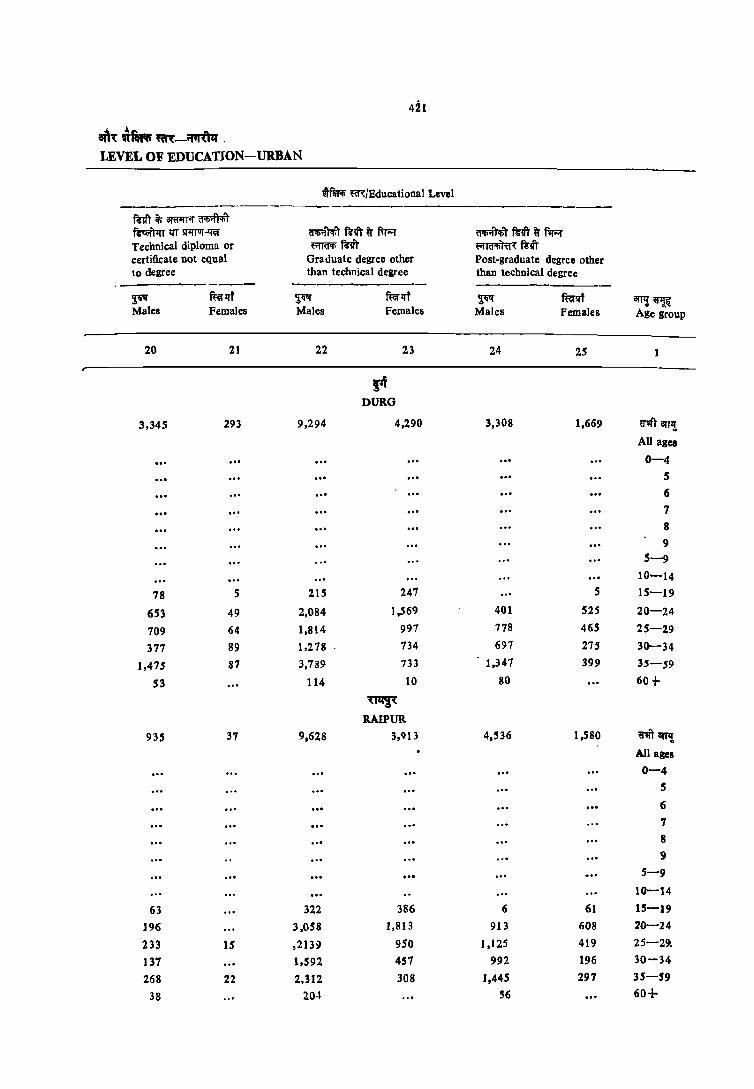
421
atl~ im. ~-~ . LEVEL OF EDUCATION-URBAN
wfm;' m/Educational Level --------------~
mrT ~ i!ffllfT;; ~ f6~ lIT srrrur-'[ii( (f'I>if'R;') f6lfr it No;; ijiIi'<I'T'Ili f6'1'f ~ f'l"'l' Technical diploma or ~f6lfr t"'Ild1lld( f6!lT certificate not equal Graduate degree other Post-graduate degree other to degree than technical degree than technical degree
. ---------- -----------~IST ffip:cf ~ ffirllf ~ ffirlfi illTl!~ Males females Males females Males Females Age group
20 21 22 23 24 25
~ DURO
3,345 293 9,294 4,290 3,308 1,669 ~'it' an,! All ages
0-4 5 6 7
8
9 5-9
10-14
78 5 215 247 5 15-19
6S3 49 2,084 ] ,569 401 525 20-24
709 64 1,814 997 778 465 25-29
377 89 1,278 734 697 275 30-34
1,475 87 3,789 733 1,347 399 35-59
S3 114 10 80 60 +-~
RAIPUR
935 37 9,628 3,lI13 4.536 1,580 rit8i'fl! All ages
0-4 5 .. , 6 7 8 9
5-9
10-14
63 322 386 6 61 15-19
]96 3,058 1,813 913 608 20-24
233 15 ,2139 950 1,125 419 25-29.
137 1,592 457 992 196 30-34
268 22 2,312 l08 1,445 297 l5-59
38 204 56 60+
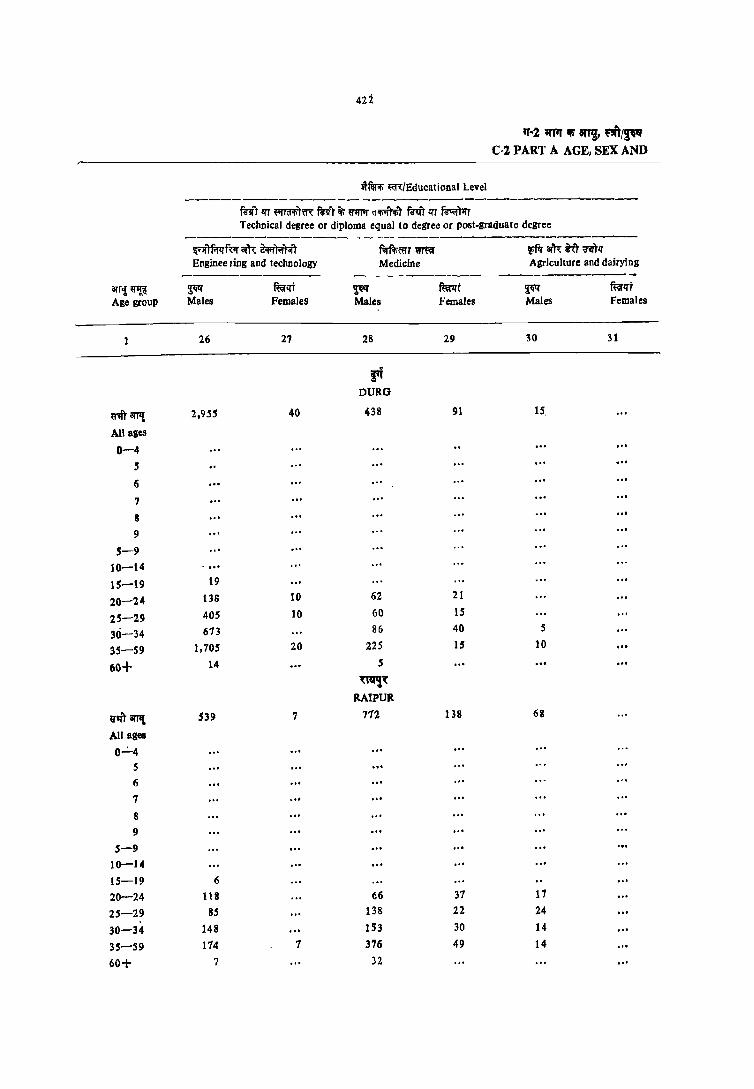
422
1l'-2 1I1Il' " sn~ fit/~ C-l PART A AGE, SEX AND
lITflI:riI; ~/Educational level ----------------....-------------------
mrr II'T ~)m mrr 'Ii U1'IJif l1.r mrr liT ~I!T Technical degree or diploma equal to degree or post-graduate degree
!{<Jfrmfw am: ~r AAffi"T WIt« ffif ar'l\ ~r ~IJ' Enginee ling and technology Medicine Agriculture and dairying
OTr,! ~ ~ fui!!fT ~ mt ~ mrll'T Age group Males FemaleS Males Females Males Females
26 27 28 29 30 31
ri DURG
~r8TJ'l! 2,955 40 438 91 15,
All ages
0-4 5
6
7 8
9
5-9
10-14 15-19 19
20-24 138 10 62 21
25-29 405 10 60 15
30-34 673 86 40 5
35-59 1,705 20 225 15 10
60+ 14 5 mrq~ .
RAIPUR
9''I"r 8I'I1l 539 ? 772 138 68
All ages
0":"'4
S
6
7
8
9
5-9 10-14
15-19 6
20-24 118 66 37 17
25-29 85 138 22 24
30-34 148 153 30 14
35-59 174 1 376 49 14
60+ 7 32

423
8I'~U~m-~q LEVEL OF EDUCATION-URBAN
wftrt; ffilEducational Level -----------------------------------
miT q-r ~1m: fi"!IT it" ij'~r.r Cl"li';ftifjT mit q-r ~ Technical degree or diploma equal to degree or post-graduate degree
~---------------
'l'1!. f;tf<rnrl ~1'1~ OR Veterinary Teaching Others
-------- --------~ mf ~ ffirq-f ~ mt arr,~
Males Females Males Females Males Females Age group
32 33 34 35 36 37
fT DURO
5 801 1,280 5 rnarTll All ages
, .. 0-4
... S
... 6 7
8
... 9 5-9
10-14 5 15-19
.,. 40 252 20-24
." 102 332 25-29
." 111 265 30-34
5 414 416 5 35-59 14 10 60+
~'{
RAIPUR.
620 442 rn sr"l All asCI
0-4 5
6 7
8
9
5-9 10-14 15-19
13 80 20-24 .. , 41 129 25-29 86 94 ... 30-34
6 ." 458 143 35-S9
t" 22 6 ." ,., 60+ , ..
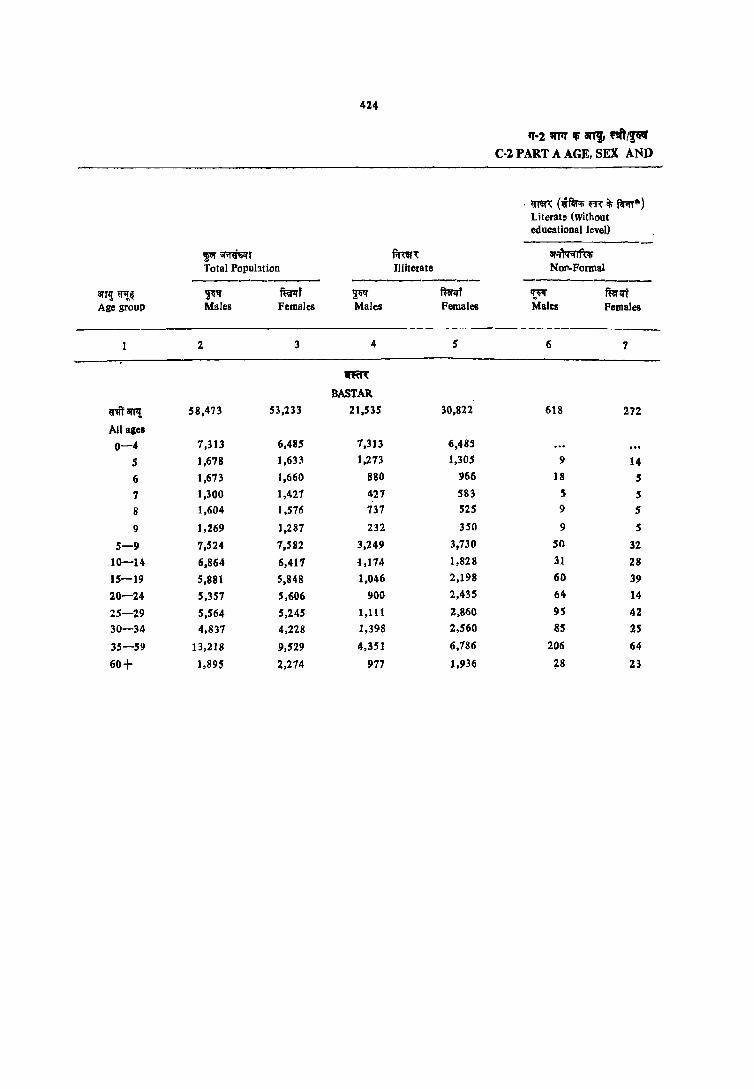
424
11'-2 WTIf 'II' an" ~/~ C-2 PART A AGE, SEX AND
. mm (l!TfiIf<!;mit'f~*) Literate (without educational level)
f\'I'~r r.mr1: ar~ Total PopuhtioD Illiterate NOli-Formal
--------- --------- ----------arTI! ~Q ~II' ~f Ff funrr 't~ mprt Age group Males Females Males Females Males Females
2 3 4 5 6 7
~
BASTAR.
~'IiT ar!I! 58,473 53,233 21,535 30,822 618 272
All ages
0-4 7,313 6,485 7,313 6,485
5 1,678 1,633 1,273 1,305 9 14
6 1,673 1,660 880 966 18 S
7 1,300 1,421 421 583 5 5
8 1,604 1,576 737 525 9 5
9 1,269 1,281 232 350 9 5
5-9 7,524 7,582 3,249 3,730 50 32
10-14 6,864 6,417 '1,174 1,828 31 28
15-19 5,881 5,848 1,046 2,198 60 39
20-24 5,357 5,606 900 2,435 64 14
25-29 5,564 5,245 1,111 2,860 95 42
30-34 4,837 4,228 1,398 2,560 85 25
35-59 13,218 9,529 4,351 6,186 206 64
60+ 1,895 2,274 977 1,936 ~8 23

42$
~ ,,~ ~-lif'n:'N LEVEL OF EDUCATION-URBAN
R'Ii m/Educational Level ---------------------------
mR (fftfot; m ii f.r.rr*) Literate <without educational level)
----~fu; ~ firlT.I Formal Primary Middle
------- ----_----- ---=---------~" ffirlif ~" ffird ~ mrlff 8W!~ Males Females Males Females Males Females Age groUp
8 9 10 11 12 13 1
~
BASTAR
10,329 8,320 7,923 5,589 6,963 3,675 1I'1it arJ1l All ages
0-4 397 314 5 714 689 6 868 839 7
1,158 1,046 8 983 862 45 69 9
4,180 3,751 45 69 5-9 2,225 1,853 2.644 2,070 759 621 10-14
416 301 1,188 960 2,161 1.372 15-19 354 383 726 822 1,011 556 20-24 374 342 784 613 854 476 25-29 361 402 583 313 545 297 30-34
2,092 1,058 1,741 681 1,456 339 35-59 321 22l 212 60 116 14 60+
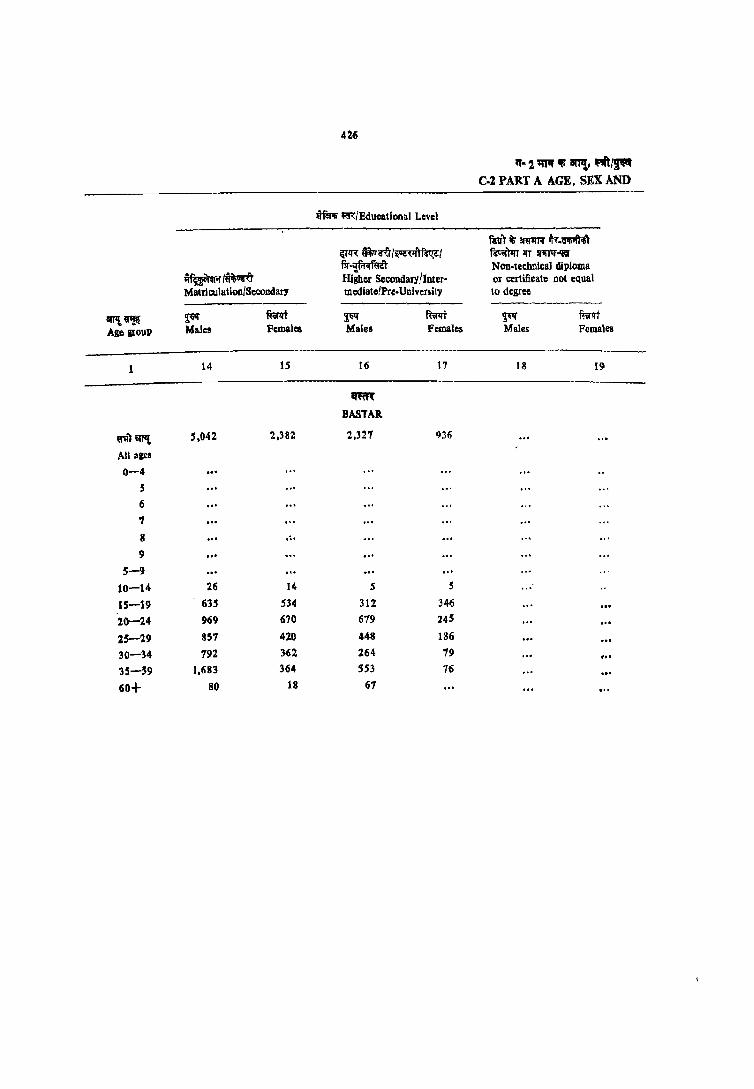
426
'f- 2 """ " Bn'!, ~~ C-2 PART A AGE, SEX AND
~ m/Educalional Level ----mr"t ~ amm:r ~-~
~IR ~rlrl~~1 ~IU !i1IN ....
flr~ Non-technil.:al diploma ~~ ffigher SecondarY/Inter' ar certificate Dol equal Matriculation/Secondary mediatetPre-Univer&ily to degree
-------ar!ll ~ ~w mm ~ mt ~ m.IfT Age IIIOUP Ma.les females Males Females Males Females
1 14 15 16 17 18 19
IfftR
BASTAR.
IJ'II) <n1t 5.042 2.382 2,321 436 ,.'"
All ales
0-4 000
S
6 ., 8 ... 9
5-9
10-14 26 14 5 S
15-19 635 534 312 346
20-24 969 670 619 245
25-29 857 420 448 186
30-34 192 3'2 264 19 ... 35-59 J,683 364 '53 16
60+ 80 18 61

421
am ~f"ltI' ~-~m LEVEL OF EDUCATION-URBAN
WAr;; m/Educational Level
fcV'r it; onTIJR ~T ~1+rr lfT ~..qer Technical diploma or certificate not equal to degree
~ Males
20
413
33
130
108 143
mf Females
21
39
5
23
6
6
a'liiftiliT ~iT ~ f1r.:;r ~ mfr Graduate degree other than technical degree
~ Males
22
2.069
49 475
524
385 618
18
~t Females
amR BASTAR
23
873
95 357
226
113
83
~ ~iT ~ f1r;:;r ~e-l:fQl Post-Braduate degree other than technical degree
~ Males
~t arp!~
24
987
13
107
339
231
285 11
Females Age group
2S 1
262
86
61
60
5'
, All ales
0-4
5 6
7 8
9
5-9
10-14 15-19 20-24
25-29
30-34 35-59 60+
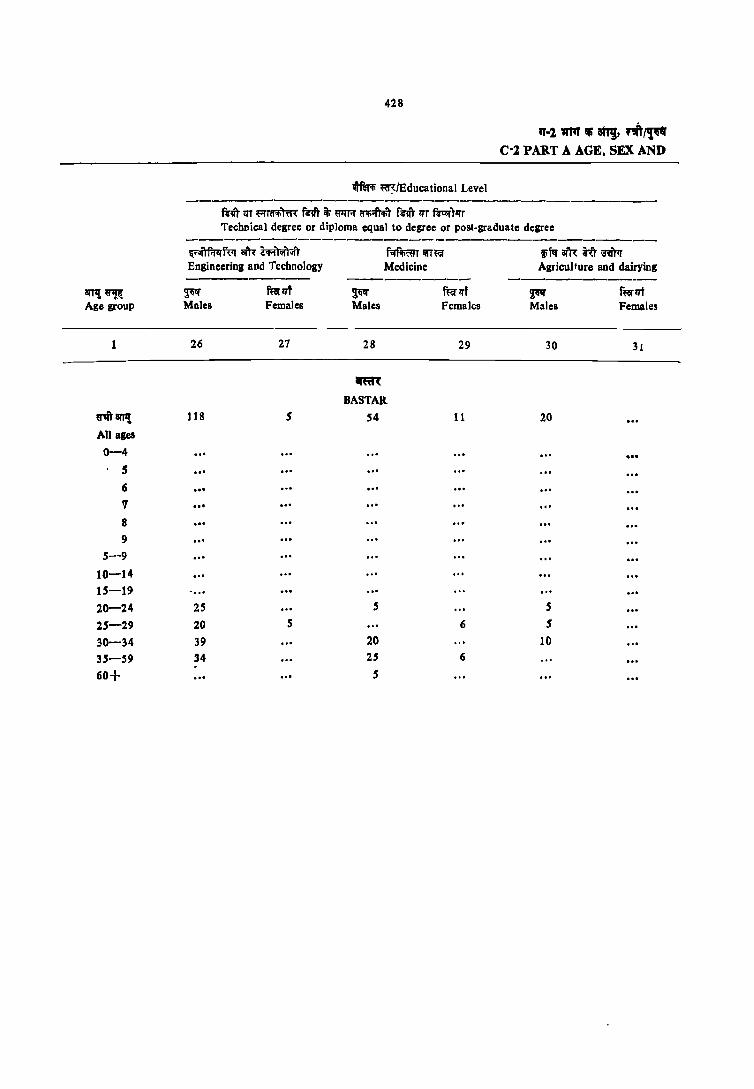
428
q-111Trt iii atrg, ,0Jit 1,,-Co 2 PART A AGE, SEX AND
~ ~/Educational Level -------------------------------------
Nit 1fT ~1(T'f;."t~ mrr il; ~ <:Jifi~ fG'it zrT ~)I!'T Technical degree or diploma equal to degree or post-graduate degree
---------------------._-----------------~fu;ffl~ f;ff<rnrr wr~ "N af'R itr :a1iI'lT Engineering and Technology Medicine Agriculture and dairYing --------- ---------- -------------
8W!~ ~ mrzrt ~ ~zrf ~ mrzrt Age group Males Females Males Females Males Females
26 27 28 29 30 3J
~
BASTAR
~m8!T'{ 118 5 54 11 20
All ales
0-4 ... S ... 6 .. , , ... ,,' .., 8 .. , 9 ...
5-9
10-14 15-19
20-24 2S S S
25-29 20 5 6 5
30-34 39 20 10
35-59 34 2S 6
60+ 5

429
am:~f~m:-~ LEVEL OF EDUCATION-URBAN
~ Rf'ififfiT VeterinarY
2;~
Males
32
21
10
11
llflfi m/Educatiooal Level
fuqr liT ~"tm: fuvr il> ~if ~r fullr liT f~.rr Techoicnl degree or diploma equal to degree or post-graduate degree
33
aw:J'J'I'if Teaching
~ Males
34
f~lI't Females
35
qmt
BASTAll
54
5 15 15
20
47
15 S
16 11
~ M::Iles
36
0Jftf
Others
~ lit arTl! ~I! ~ Females Age grOUP
37
«it Bl'I~ All ages
0-4
5 6
7
8
9
5-9 10-14
15-19 20-24
2S-29
30-34 H-59 60+

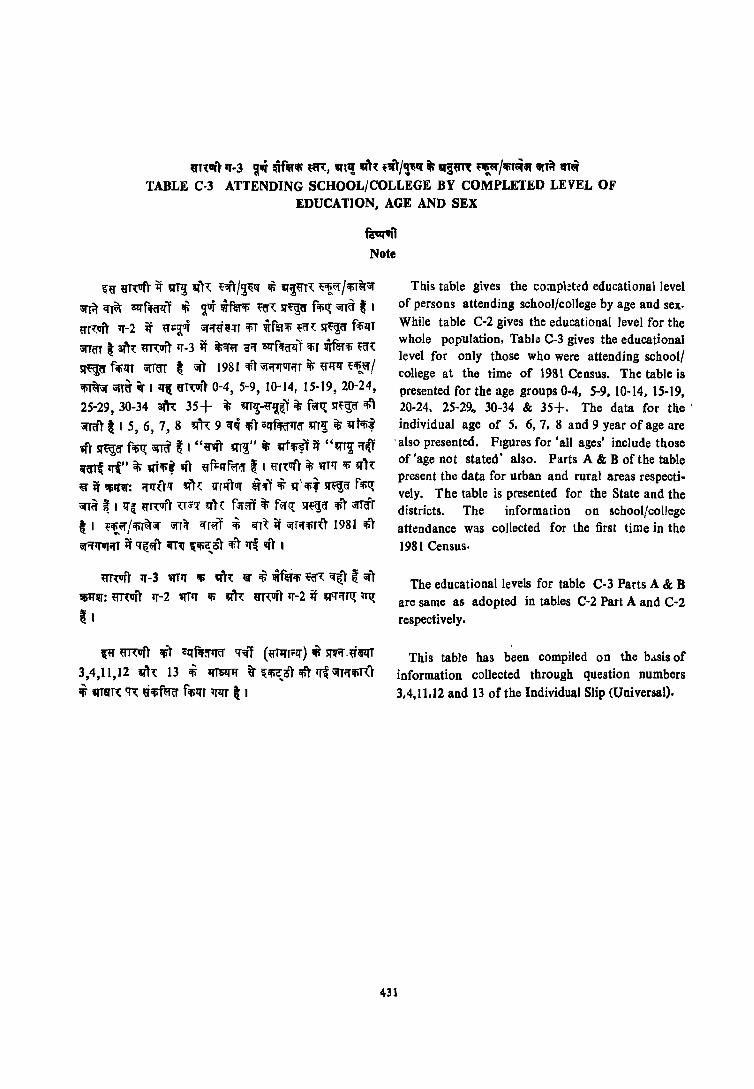
~n"li 11-3 ~ai ~f~1fi ~~, lin,! Q'h: ,,,r/'!'til'i[ iti a3~ ~"/Ifi,~ar If'iiI' qf~ TABLE C-3 ATTENDING SCHOOL/COLLEGE BY COMPLETED LEVEL OF
EDUCATION. AGE AND SEX
f~i
Note
~ij' ijT'(1lTT li' ~~ "IT"{ ~orTIfj,Q'i ~ "I~«T"{ ~~~/'liT~~
~riiI' ~ GlffifalfT ~ ~ !iTfe:r'li ~"{ sr~a f'li~ GfTa- ~ I
ij'T<.urr 1f-2 it «1=~aj Gfif~Il!:fT 'liT !iTf!9~ ~cn: ~wr f<fiijT
i;fTor ~ aft'{ rnvr'T 1f -3 ij ~<m a'i'f olffifcflir 'liT !iTfIH"fi ~cr'{ ~ fililH GfraT ~ Gf) 1981 'liT i;fiflfOJ'ifT ~ «1ilf ~ifi...~ I ~ iiTTff if Ilf( ij'T1:vr'T 0-4, 5-9, 10-14, 15-19,20-24,
25-29, 30-34 aiR 35+ it ~-ij'~Q:t it f~~ sr~wr 'Iii ~mr'T ~ I 5, 6, 7, 8 "11\ 9 cr" 'liT ozrfiiffi'lfff ~~ ~ "It'li,
'II''T ~ff fifi~ ijJfff ~ I "ij'~ "'r~" it "It"fi?J it ""IT~ i'fifl' ~ 11'(" ~ Wifi'f 'if'T ij'f+'I'fi'l'i:T ~ I «r~OJ'r it 'lTTIf 'Ii ql'{ llf it "IiqQf: "lI~r!f "IT ~ lfr'l'TGf ~'h1 ~ q;' 'Ii~ ~cr f"fi~ i;fTff ~ I lf~ ij'f1:OJ'r '{f'i!f qT{ fJf;;rT ~ ~lq; srf~cr 'liT merT ~ I nr\il'/'Ii~~ ~Tit crr~T i iiI"~ it i;fTi'f"fir~T 1981 ifiT
i5Rqur"T it If~~i iiI'T~ '('Ii<;oT 'Ii'T tri lifT I
mvri 1f-3 mlf "Ii "Il~ II' ~ !iTf~'Ii ~~ ~T ~ ;,;r)
lIIill'Qf: frn:vri 11'-2 mlf 'Ii "l'{ ijHvrT 1f-2 if wri'f~ n~ ~ I
~ rnvri '!i') 0lffif~lfer 1f",1 (ij'TlI'r;:zr);Ii sr(o'f.~1§lfT
3,4,11,12 ~ih: 13 ~ IITSlfll' ir ~'Ii<;or 'Iii If{ i>l'Tif"fiRr
;Ii 1I1ll~ ~ ~'liffltr fifilfT IflfT ~ I
This table gives the co:upHed educational level of persons attending school/college by age and sex.
While table C-2 gives the educational level for the whole population. Tabl~ C-3 gives the educational level for only those who were attending school! college at the time of 1981 Census. The table is presented for the age groups 0-4. 5-9. 10-14. 15-19, 20-24. 25-29 .. 30-34 & 35+. The data for the' individual age of 5. 6, 7. 8 and 9 year of age are
. also presented. FIgures for 'all ages' include those of 'age not stated' also. Parts A & B of the table present the data for urban and rural areas respectively. The table is presented for the State and the districts. The information on school/college attendance was collected for the first time in the 1981 Census.
The educational levels for table C-3 Parts A & B are same as adopted in tables C-2 Part A and C-2 respectively.
This table has been compiled on the basis of information collected through question numbers 3,4,11.12 and 13 of the Individual Slip (Universal).
431

432
11'-3 mil' Ifi i'f uf.~ ~, ~ Vk ~ /'J."f C·3 PART A ATTENDING SCHOOL/COLLEGE BY COMPLETED
''llil'j;ml;r it orA' m jlil' IIfRtr f1I' ;rint"" Total persoDs attending frnR: Total populatioD SchooliCollege Illiterate
---------- ------------- ----------anI{ '1iIil: ~ ~rn ~qq mt"ll'i ~ f"'lIt AgC'-group Males . Females Males Pemales Males Females
2 3 4 5 6 7
,,~q sr~
MADHYA PRADESH
~'"' mil: 5,619,98] 4,966,475 1,507,832 991,193 122,078 98,324
All ages
0-4 665,7]4 659.3.51 12,639 11,261 12,639 11,261
5 159,380 146,959 41,798 33,309 20,911 16.720
6 152,SS3 148,480 78 655 66,060 28,862 23,784
7 123,258 123,267 85,054 74,075 20,667 16,708
8 -167.288 157,247 125,194 100,703 17,470 13,379
9 108,992 107,315 90,489 77,547 6,569 . 5,758
5-9 711,470 683,269 421,190 3.51,695 94,480 76,348
10-14 713,722 645,675 564.827 411,631 12,981 8,918
15-19 627,216 514.301 348,645 170,621 794 501
20-24 581,774 4924681 125,358 32,80.5 1.54 184
25-29 458,398 406.310 17,181 4,382 112 104
30-34 383,806 323,223 4,788 1,976 86 101
35+ 1,472,624 1,237,261 11,774 4,770 • 744 845
~ffiili'{ail'1f -rffi. m , ~f.tlif am;, rnf~ ~. Includes figures for educational levels not classifiable.
rearail' : '81it iII'P!' it '1IITl! ~T ;mtt' it; lllillit Wlffim • I
Note: Figures or 'Ase not stated' are included in "All ages",
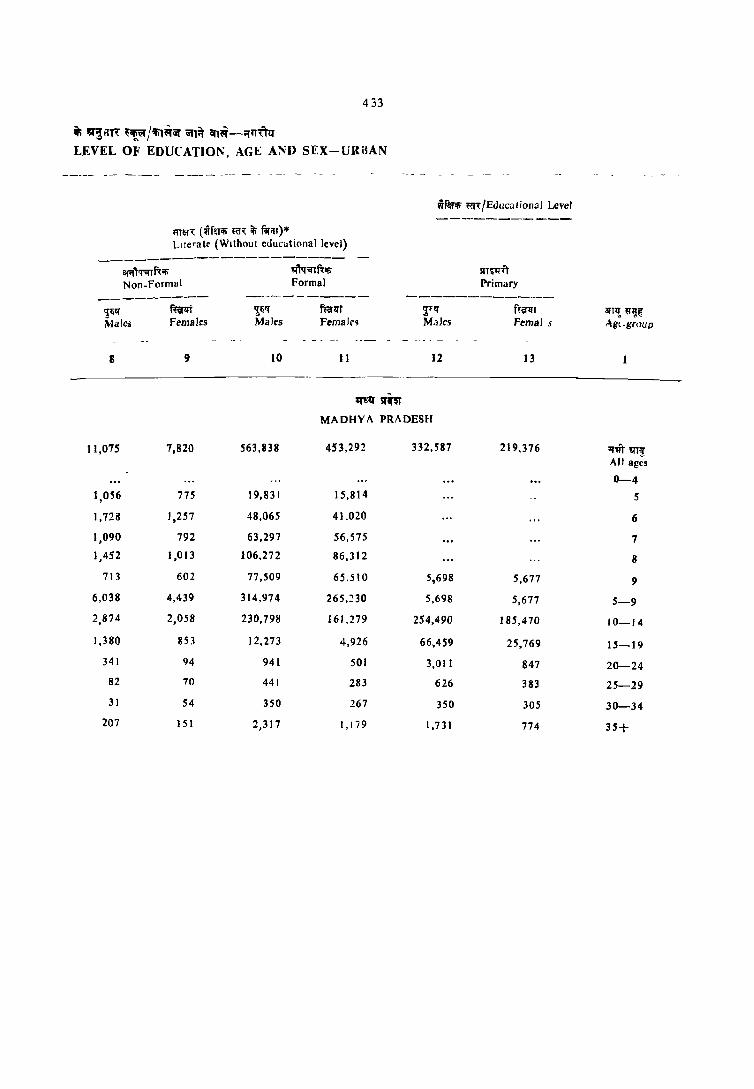
433
~ ~~iI~ ~~/~l~iOt iill;r CfI~-l'I'tTih7 LEVEL OF EDUCATIOl'\, AGE A:"'D SEX-URBAN
'ITa': (Wfeflfi HI", ~ ~ilI)* LIterate' (Without educutionallevel)
--------------------~;nRIfi Formal
-----------~q' Male5
8
f~ Females
9
,!fi'l fiallt Malts FemaJr,
10 11
ife:rlfi ffi</Educalional Level
!lr~iI' Primary
-------------~Tq' ff{iflll
M.1JeS Pernal s
12 13
~1f sr~ MADHYA PRADESH
11,075 7,820 563,838 453,292 332,587 219,376
1,056 775 19,831 15,814
1,728 1,257 48,065 41.020
1,090 792 63,297 56,575
1,452 1,013 106,272 86,312
713 602 77,509 65.510 5,698 5,677
6,038 4,439 314,974 265,230 5,698 5,677
2,874 2,058 230,798 161,279 254,490 ] 85,470
1,380 853 12,273 4,926 66,459 25,769
341 94 941 501 3,011 847
82 70 441 283 626 383
31 54 350 267 350 305
207 151 2,317 1,179 1,731 774
aTl,! ~~~ Ag!.gmup
~it mll All ag;s
0-4
5
6
7
8
9
5-9
10-14
15-19
20-24
25-29
30-34
35+
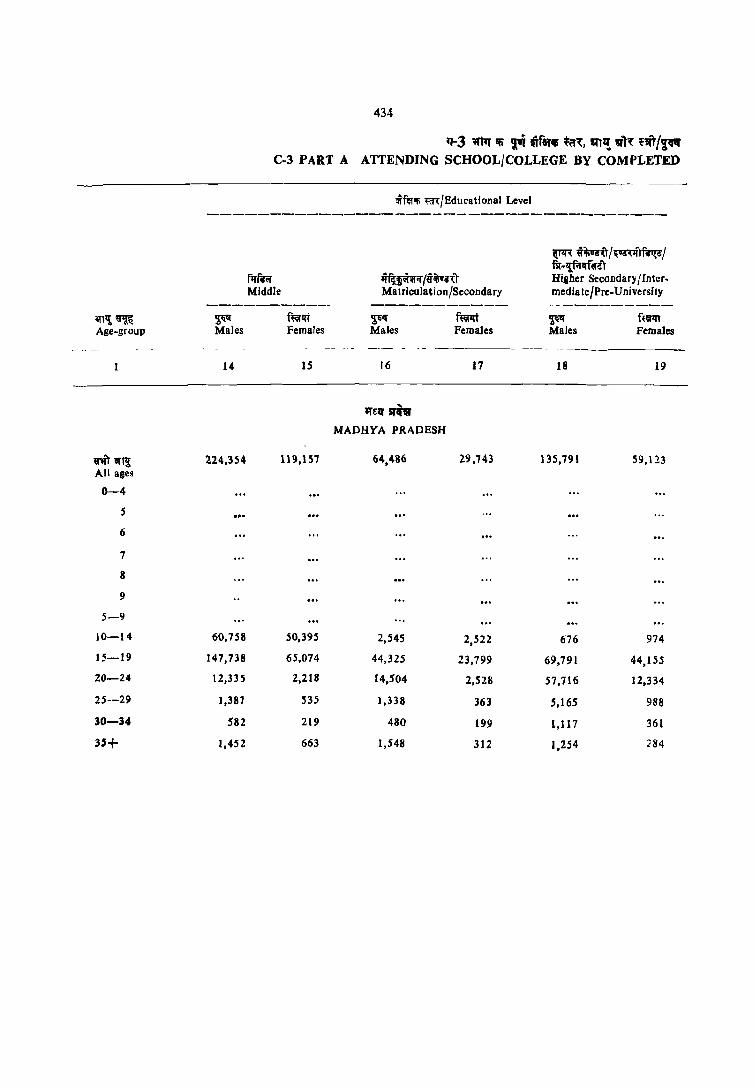
434
ff-3 ~q Iti i'i ufat. *<'f\, 'fT~ '11'1\ '''1/'!l'' C-3 PART A ATTENDING SCHOOL/COLLEGE BY COMPLETED
,,"f~~ m</Educational Level
------------------------------------_
~m ~~nT/~')~/ 6r-l{fifll'r«~T
flftr.r ~~;r/t~Hr Higher Secondary I Inter-Middle Matriculation/Secondary media tefPrc-University
----------.. ---------- ~ - ---------arltt ~ ~ f~qi $~If fmi ~ ft'iflfl Age-group Males Females Males Females Males Females
-- - ---- -
14 15 16 17 18 19
'1'611' SI"V
MADHYA PRADESH
~ 1fT! 224,354 119,157 64.4&6 29,743 135,791 59,113 All ages
0-4
S
6
7
8
9
5-9
10-14 60,758 50,395 2,545 2,522 676 974
15-19 147,738 65,074 44,325 23,799 69,791 44,155
20-24 12,335 2,218 14,504 2,528 57,716 12,334
25--29 1,381 535 1,338 363 5,165 988
30-34 582 219 480 199 1,117 361
3'+ 1,452 663 1,548 312 1,254 284
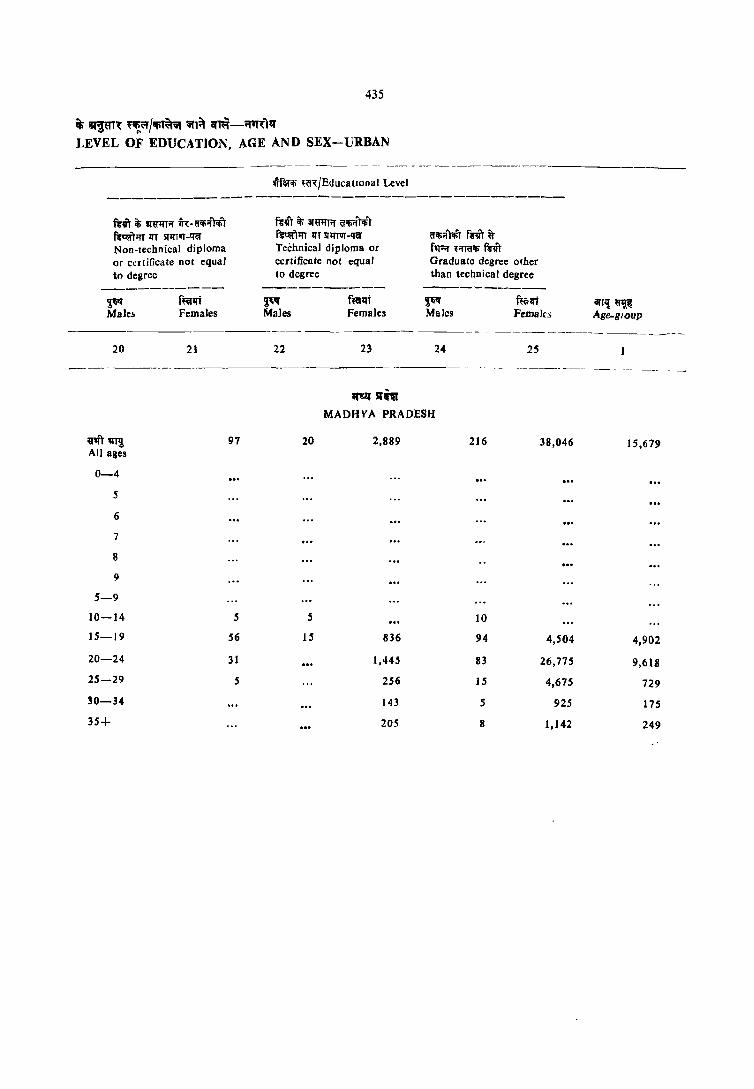
435
~ "2m~ t~~/Ifi~~ ~1i\' «~-"",~')?f LEVEL OF EDUCATION, AGE AND SEX-URBAN
-------- ---- --- --- ----- - --- --------------------------------
~flllifi HI<:/Educauonal Level
-------------------------------------!Tit if; Q"~;; h-fflli'lR;r fW"<'Ilm lIT srllillf-~ Non-technical diploma or ccIlificate not equal to degree
~ f~1Ii Maleli Females
20 21
----- - -------_ --------
~'Il'r "Il1 All ages
0-4
5
6
7
8
9
5-9
10-14
15-19
ZO-24
25-Z9
30-34
35+
97
5
S6
31
5
fi'llr if; arij'lfR tliRR;r ~lllT IH SlllroT-~ Technical diploma or certificate not equal to degree
'!W f~lJt Males Females
fflli'lR;r fdt ~ hr"l' t;mT1li mit Graduate degree other than technical degree
----------~ f~1Ii Males Females
arllj; ~ Age-glOup
._------- ------ ------- --------------- ------_--22 23 24 25
--- -----_ ----- ------ - -
IfUJ srq MADHYA PRADESH
20 2.889 216 38,046 15,679
S 10
IS 836 94 4,504 4,902
1,44S 83 26,775 9,618
256 15 4,675 729
143 5 9Z5 175
205 8 1,142 249

436
'1-3 ~T" ifi ~ ~f~ifi ~, WI'!, ~ ~~/~ C-3 PART A ATTENDING SCHOOL/COLLEGE BY CO:\1PLETED
--_-- -- ---_ -------_- --- -----------------
im~ .::n::/Educational Level ----------------------------------------
~Ift' lIT mifili"hf\ f'-ITT ~ 6''WI' ~ fWlft' lIT fl"cotTlfr Technical degree or diploma equal to degree or pO'it-graduate degree
lfiIiifTtr I'iir ~ f1R 'lfT6l1i're-, f6tiT -------------------------Post.graduate degree other ~f'llffl;1T ~~ h;j't<'l'RT flffiFtm wmr than technical degree Engineering and technology Medicine ------------- ----------- ----------
!Iff!! ~~ ~ fterqt ~ mrlfr ~ f~lIi Age-group Males Femal~s Males Females Males Females
26 27 28 29 30 31
qq sri~
MADHYA PRADESH
gom 'ITiJ 9,429 4,837 1,=86. 92 1,134 312 All ag;~
0-4
5
6
1
8
9
5-9
10-14
15-19 278 458 155 8 42 10
20-24 5.511 3,431 783 63 529 156
25-29 2,412 602 176 5 31S 95
30-34 530 182 72 75 12
35+ 694 IS8 100 IS 173 38

437
Ii V~Rr~ ~/itiln iJT~ <fl~-"'f~", LEVEL OF EDUCATION, AGE AND SEX-URBAN
._--_-------- --- --------------- ------------------- --------llif~'ii ~(f~/Edllcational Level
----------------------------------------m-it lIT ~H'ilim'{ fillr it; 61u;r crp.ft~r fW;fT 1fT ~nrT Technical degree or diploma equal to degree or post-graduate degree
------------ ----------- ------------------'iifli ~1'{ iif ;J::ITIf Agriculture and dairying
,!lilf mt Males Females
32 33
'"I f'qfit;i:E1T Veterinary
~ mf Males Females
34 3S
~lili Males
-- --_-
36
~r;If[q;r
Teaching
f~qf Females
~If
ar;:l£ Others
Males fuRt Females
-- - ----- -------- _----_
37 38 39
--------------------~--~
212
156
24
16
16
10
10
7
7
qttf Sl't~
MADHYA PRADESH
519
10
127
168
31
183
1,192
56
738
210
95
93
5
5
m,! E1~ Age-group
----~
ij'm ~ All ages
0-4
5
6
7
8
9
5-9
10-14
15-19
20-24
25-29
30-34
35+

inl! ~G: Age. group
-- --- - --
nt~ All ages
0-4
5 (,
7
8
9
5-9
10-14
15-19
20-24
25-29
30-34
35+
~$ft ~P! All ages
0-4
S
6
7
8
9
3-9
!0-14
15-19
20-24
25-29
30-34
35+
438
'f-3 ;fT'f Ifi T'i ~flRlfi '('f~, IRT~ "h f~1;~fif C-3 PART A ATTEI'D1NG SCHOOL/COLLEGE BY COMPLETED
~1~.''I'/I!iT~;;r it ;;rf.t ~ for OlI'filtI for ;;r'l<riqr Total persons attending f'l\l3, Total population School/College Illiterate
---------- ------------- ----------. ~" ft~qi ~ fm-lI"i ~" fm-qr Males Females Males Female~ Males Females
2 3 4 5 6 7
-_--- -- - ---
~"T MORENA
97,557 80,693 27,236 13,141 2,191 1,548
13,041 12,298 219 152 219 152
3,151 2,727 735 567 398 326
2,933 2,641 1,321 996 463 423
2,439 2,026 1,475 980 369 249
3,409 2,660 2,265 1,442 315 196
l,063 1,753 1,557 1,103 122 71 13,996 11,807 7,353 5,089 1,667 1,265
- 13,3-18 10,294 10,043 5,548 267 107
11,001 7,999 6,624 1,952 19 5 9,782 7,684 2,392 271
7,530 6,245 321 17
6,014 5,127 72 29 5 22,709 19,175 139 62 15 15
fl{Gi'
BHIND
91,343 74,869 26,310 ll,25 I 1,969 1,193
11,685 11 ,022 111 103 111 103 3,033 2,447 640 314 362 174 2,655 2,447 1,124 734 508 297
2,257 1,961 1,427 933 350 248 3,064 2,280 2,087 1,201 292 214 1,943 1,654 1,596 998 116 49
12,953 10,789 6,873 4,181 1,628 982 12,597 9,378 10,353 5,627 J 84 87 10,168 7,181 6,403 1,895 IS
8,059 6,565 1,938 240 6,426 5,438 282 39 5,426 4,638 66 39
23,894 19,784 258 103 32 22

439
it; ar~"Tl: 'I'~/Ifi. \;fA lfT~-"rtfuf LEVEL OF EDUCATION, AGE AND SEX-UR8AN
_----- - --------
wf~~ rcr~/Educational Level
-----------mV1: (~ffi m it; ~;n). Literate (without educational level)
----------------------arllltr-nm; ~lf"{iI\" ~U NOD-Formal Formal Primary
------------ ----------- -----------'!"l'f f~ ~l'f f~lft ~l:il'f f~ 3fPl ~ Male\ Females Males Females Males Females Age-group
-- ---------- -----.
S 9 10 11 12 13
-------- ---- ._--- ----_ ------- -~---- --.
,!~i11 MORENA
355 133 9,502 5,930 5,679 2,837 u1ft arrl! All ages
0-4 10 15 327 226 S 29 830 574 6 38 45 1,068 687 7
67 20 1,882 1,226 II 29 10 1,268 911 138 111 9
173 89 5,375 3,624 138 111 5-9 103 35 3,862 2,198 4,402 2,362 10-14 48 10 191 64 1,037 349 15-19 24 5 5 58 5 20-24
10 20 25-29 6 5 5 30-34
16 J5 20 10 35+
f~{I.
BHIND
194 79 8,987 5,032 5,842 2,982 ~ 'Il"1f All age;
0-4 15 5 262 D6 5 25 5 590 432 II 15 1,062 685 7 30 ]0 1,765 977 8 10 5 1,27 ] 801 199 144 9 96 25 4,950 3,030 199 144 5-9 40 25 3,727 1,908 4,603 2,570 10-14 28 ]0 258 69 934 217 ]5-19
5 20 37 22 20-24 5 5 25-29
10 10 !I 30-34 20 10 27 15 48 20 35+
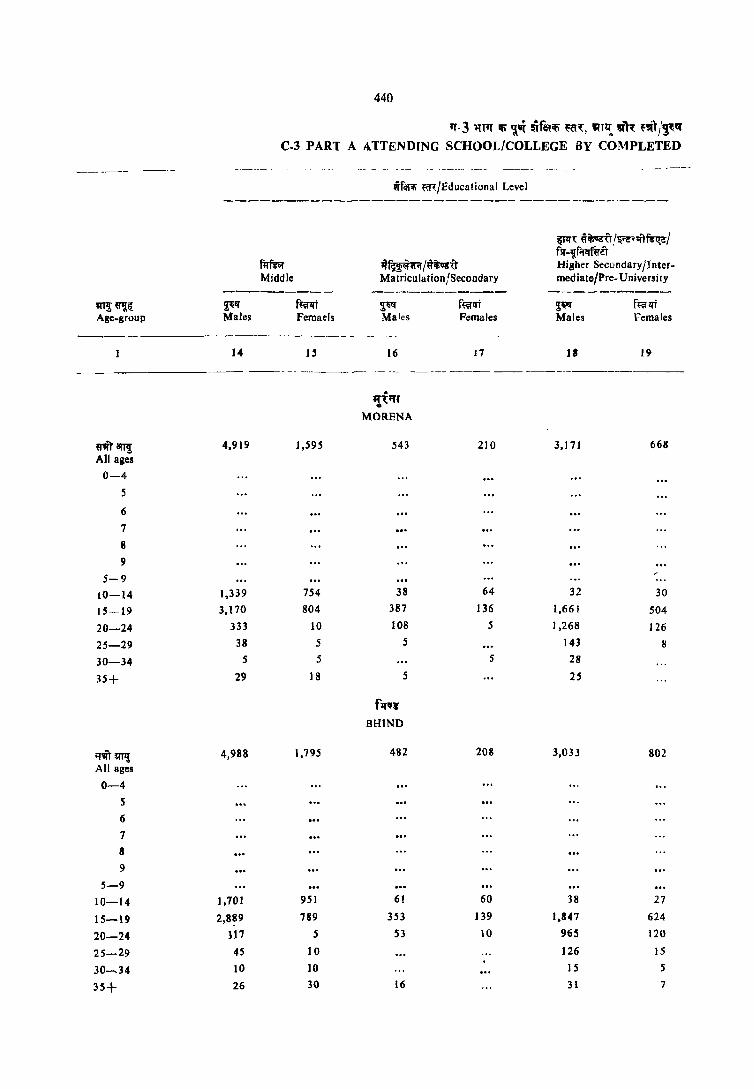
~If Males
440
if -3 ~Tif Ifi ~oi ~frififi ~a~, WfT~ ",~ ~'J(t /~~lS( C-3 PART A ATTENDING SCHOOL/COLLEGE BY COMPLETED
f;rmr Middle
f~l'ft Femaels
tfclfili m/Educational Level
~~~~/~~-u Matriculation/Secondary
2;qtf
Males f~lft Females
~~ ~ij;qu!~z~;ftF6~/ fsr -lJfiflffiriT Higher Secondary/J IItermediate/Pre- U niversi ty
~qtf Males
fmlfi Females
------------------------------ - -- -- ---- ------ - --
ntarTi All ages 0-4
5
6
7
8
9
5-9 10-14 15-19
20-24
25-29
30-34
35+
qm~ All ages
0-4
5
6 7
8
9
5-9 10-14
15-19
20-24 25-29
30~34
35+
14 IS 16 J7 18 19
---- -- -----_- --- -- ---------- ------- --------------------
4,919
1,339
3,170
333
38
5
29
4,988
1,701
2,8~9
117 45
10
26
1,595
754
804
10
5
5
) 8
1.795
9S1
789
5
10
10 30
MORENA
543
38 387 108
5
5
f~Ql'
BHIND
482
61
353
53
16
210 3,171 668
64 32 30
136 1,661 504 .5 1,268 126
143 8
5 28
25
208 3,033 802
60 38 27
139 1,847 624
10 965 120
126 15
IS 5
31 7

441
.i; "~~R: '''!,\iOI' Ilfil~'ti( 'tiCA 1IT~-Of'ttTlf LEVEL OF EDUCATION, AGE AND SEX--URBAN
f6"..rr if; SHrifT'! ~~ -tr~'!r"ft f€C"I)ifT lIT SlifTUf -'«i Non-technical diploma or certificate not equal to degree
~I'f Males
20
furlli Females
21
m!l1if ~~/Educa!i(lnal Level
f6~T if; ar~'! (I~;f];fT f6tOl"r;rT 1fT SllUlIJ· '«i Technical diploma or cer! ificate not equal to degree
Ff Males
22
f~qlft Females
23
~T~~T~ f'Ff~" fsir Graduate degree other than technical degree
Ff Males
24
f~1IT Females
2S ----------- -------- -----------------
....
5
10
10
48
28 20
MORENA
fllQ'&"
BHIND
693
101
467
91
20
10
615
SO 426
81
15
39
195
70 106
4
9
5
122
39
68 5
5
Vp! If~ Age-group
W'I[T arr~ All ages
0-4
5
6
7
8
9
5-9
10-14
15-19
20-24
25-29
30- 34
35+
ij"'Iit mll" All agt~ 0-4
5
6
7
8
9
5-9
10-14
15-19
20-24 25-29
30-34
35+
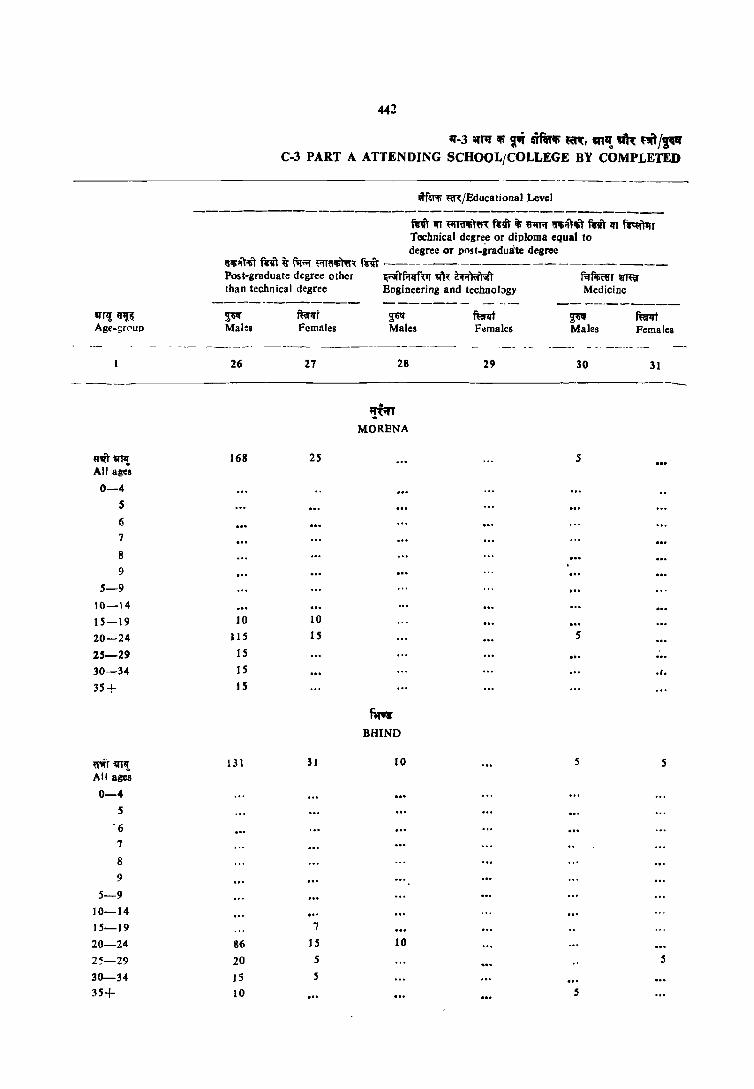
442
11-3 ~'" !Wi i..r .ffl1'~ ~, '"~ ~ ''''/~ C-l PART A ATT.ENDING SCHOOL/COLLEGE BY COMPLETED
-------------------------------------------
~rl! mJ:~ Age-:;r('up
--
----
am~ All ages
0-4 5
6 7
8
9
5-9
IO-i4
15-19 20-24
25-29 30-34
35+
~t "Ill! All ages
0-4 5
-6
7
8
9
5-9 10-14 15-19 20-24
2~-29
30-34 35+
1I1fm; ~/Educational Level ----------------------------------------
- -_-
mit 1ft ~H'lIi~ RiiT it ~ ~;i\,~ mit 1ft ~"t1rr Technical degree or diploma equal to degree or post-gradultte degree
<rlli"i'~ mIT ~ 111'"'1' 'i"HI'tim~ fm _-- --------------------Post-graduate degree other ~,)fiflff~ m~ z...~T f;rf;rnJl Wffir Ihan technical degree Engineering and technobgy Medicine
-----~--------
______ R_ - -.- --_._---------~ ~lfr ~ f'Ent ~ ~r Males Females Males F"males Males Females
-------- ----- ----------------- -_- - -- --_-_ ---
26 27 28 29 30 3) --_ ~
MORENA
168 25 5
10 10
liS IS S
15 ... 1 S .1.
IS
f~ BHIND
131 31 10 5 5
7
86 15 10
20 5 5
15 5
10 5
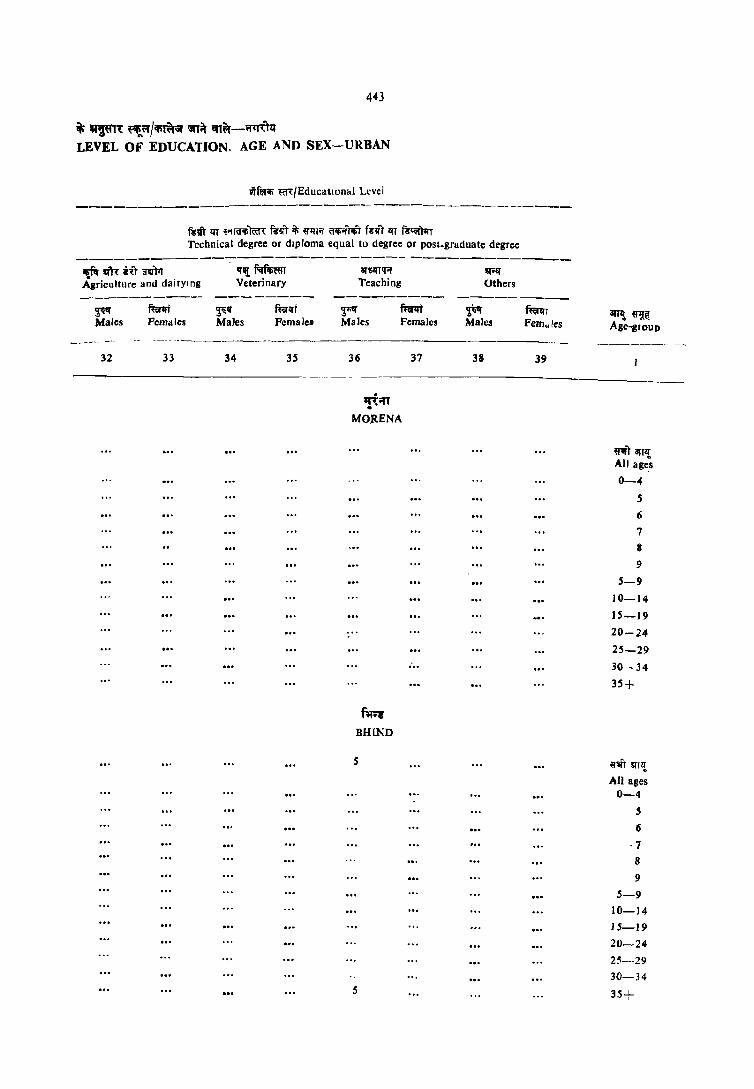
443
it; ~ '{i1fi.:~/~WrQf :snif <n~-~1:f LEVEL OF EDUCATION. AGE AND SEX-URBAN
Viftf'li m/EducatlOnhl Lt:vel
-----------------------------------------RVT lIT 'iillQili)rn{ ~~T ~ ~Inrr ij'iIi;;JT'liT f~!lr lIT ~~ Technical degree or diploma equal to degree or post-graduate degree
------------7---------------------------m si\"{ i'n amrr Agriculture and dai rYI ng
~'!I mrlli Males Females
~I!f
If~ ~fiI;«IT Veterinary
f~lI"i Males Female.
~
ar6I.TTVf Teaching
fum Males Females
-. __ . __ ._ -- ----- ----------------------32 33 34 35 36
~.n MO,RENA
~ BHIND
s
5
31
~
'""I" Others
Males
38
mnn Fem,,/es
39
arT'!. 6lJ:~ ABe-group
-_--_ --
")an~ All age,s
0-4
5
6
1
II
9
5-9
10-14
15-]9
20-24
25-29
30 - 34
35+
InfT 'lTl! All ages 0-4
5
6
·1
8
9
5-9 10-14
15-19
20-24
2~---29
30-34
35+

aTf'I! lI1I1 Age-group
--
444
'1'-3 t1l'1' iii 9.vT ~fR ~, VI,! '11't ~1/'!~ C-3 PART A ATTENDING SCHOOL/COLLEGE BY COMPLETED
~\'f'ifil'~ ~~/~~;;r it ;;rR" q,ol ~ iltf.f:r Total persons attending f.rw'{
Total population School/College Illiterate
---------- -_---------- ---------If~ ~11T ~ fi:erllt '!~ f~ Males Females Males Females Males Females
----_ - - - --- - - -- -.---- - ------ -_---------- ---- --- ------2 3 4 5 6 7
-- -------- -- -----_-- ---- - -
mf~
GWALIOR
rit~ 3:<6,406 283.005 88.798 53.921 5,080 4.066 All ages
0-4 39,145 36,687 710 717 710 717
5 10,016 8.579 2,847 2,118 1,008 769
6 9,331 8,513 4,438 3,461 859 755
7 6,974 6,730 4.356 3,796 666 557
8 10,205 9,004 6.854 5,098 735 492
'I 6,171 5,923 4,589 3,569 235 207
5-9 42,696 38,749 23,084 17,992 3.504 2,779
10-14 .42,358 35,386 31,409 21,146 754 485
15-19 37,457 29.745 21.120 10,280 26 II
20-24 33.985 29,493 9,311 2,712 24
25-29 26,618 23,468 1.659 416 6 5
30 -34 20,443 17,524 394 191 5
35+ 83,354 71,698 937 352 81 40
~fRI:rt
DATIA
~~r iIW,?; 32,519 28,472 7,950 4,239 863 5 II AHagOI
0-4 4.266 3.823 29 27 29 27
5 1,168 940 231 126 144 38
6 954 731 230 251 93 109
7 864 729 457 288 190 88
8 1,170 834 798 401 173 99
9 597 591 423 314 98 66
5-9 4,754 3,825 2.139 1,381 699 399
10-14 4,227 3,622 3,011 1,9JI 110 n 15-19 3,909 2,799 2,033 729
20-24 3,100 2.424 594 93
25-29 2,138 1,982 68 16 4
30-34 1,820 1,707 11 6
35+ S,'~91 ~,"265 55 27 17 7
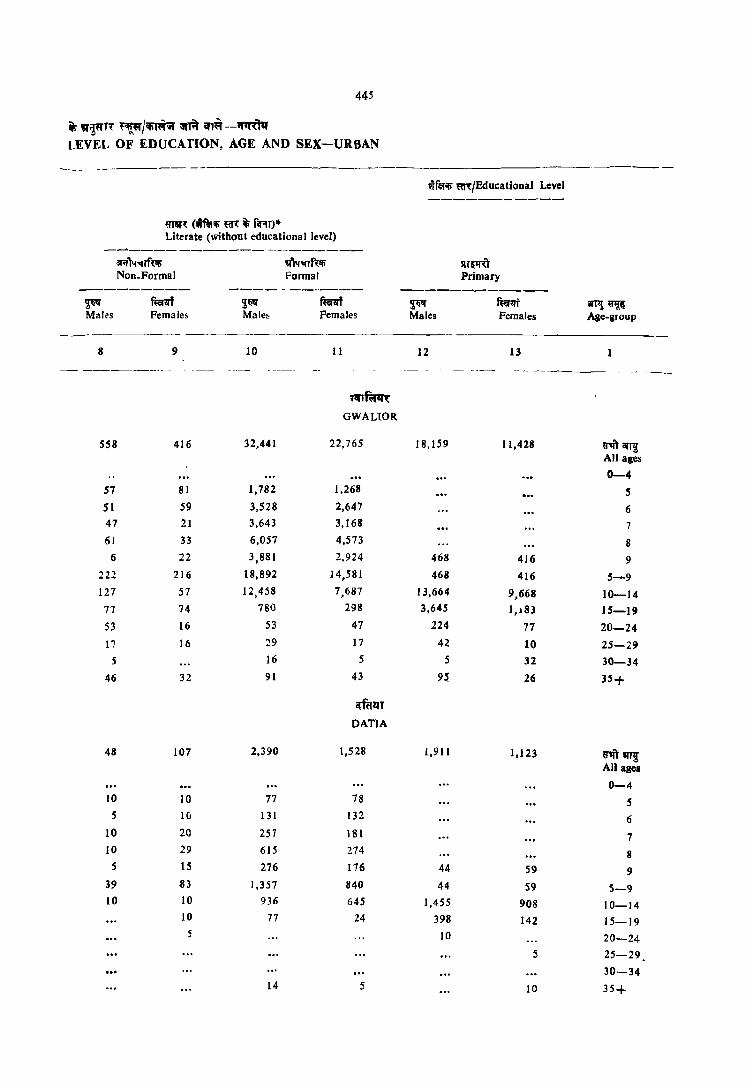
445
~ "''!'fTr ~!f!.\Cf/~ ~ if'#-~ LEVEL OF EDUCATION, AGE AND SEX-URBAN
------ -------
Wf01;; ~/EducatioDal Level
mJ~ (ifti;; m ~ fifllT)· Literate (without educational level)
ar;r'ltmf{lli ~fu; 51TlIliT Non_Formal Formal Primary
--------- ---- --_ .. _--- ------------~ fterllf i'ili fterllf ~ ~ arTlJ ~ Males Female~ Male~ Females Males Females Age-group
---- ---------
8 9 10 II 12 13 -. --_---------- ---- -- - -.-- ----- ---- ---_
~,ft;r~
GWALlOR
558 416 32,441 22,765 18,159 11,428 ~arri All ages
0-4 57 81 1,782 1,268 5 51 59 3,528 2,647 6 47 21 3,643 3,168 7 61 33 6,057 4,573 8
6 22 3,881 2,924 468 416 9 222 216 18,892 14,581 468 416 5-9 127 57 12,458 7,687 13,664 9,668 10-14 77 74 780 298 3,645 l,j 83 15-19 53 16 53 47 224 77 20-24 17 16 :!9 17 42 10 25-29 5 16 5 5 32 30-34
46 32 91 43 95, 26 35+
l'{ftlzn
DATlA
48 107 2,390 1,528 1,911 1,123 U1IT~ All ages
0-4 10 10 77 78 S 5 1() 131 132 6
10 20 257 181 7 10 29 615 274 8
5 15 276 176 44 59 9 39 83 1.357 840 44 59 5-9 10 10 936 645 1,455 908 10-14
10 77 24 398 142 15-19 5 10 20-24
5 25-29
30-34 14 5 10 35+

446
'T-3 liTtf If; ~ mllllfi ~, 'iTl!. 'f~ f"Ji'r/'!.'i1t C-3 PART A ATTENDING S(HOOL/COLLEGE BY COMPLETED
-.- --- --_---_----- ---------- - -- -------- --_-_-- - - ----- -- ---_--- ---tmifi ~6l:/EducationaI Level
--------------------_. ---------------
~rlR i~/~"lfi"ll;i!'/ fIT -if.imit
fll'tnr ·~"Qfoi'/~~U Higher Secondary/Inter-Middle Matriculation/Secondary mediate/Pre-University
----------_ ----------- ----------anI! ~~ ~~ fu(~ $~~ f~t ~ mr Age sroup Males Females Maleb Females Males females
----- ----------------- -------- --- -- --_-_._- - ------ -------- - - ---
14 IS 16 17 18 19
- ------- - _-----_-_----------_ -----------_-_ - --_ n"fllPl~
GWALIOR
m~ 13,749 6,898 1,6605 7105 12,537 05,612 AIJ ages
0-4
S 6
7
8 9
!I-9 10-14 4,149 2,988 153 127 103 128
IS-19 8,401 3,579 1,145 499 6,0529 4,132
20-24 815 194 244 31 5,019 1.125
2S-29 145 37 28 10 642 123
30-34 73 31 16 21 112 57
35+ 146 63 79 26 132 47
~f~llT DATlA
~qJ~ 1.440 630 131 34 922 229 All ages
0-4 5
6
7
8
9
5-9
10-14 471 303 19 10 10 5 15-19 894 298 77 20 SS2 191 20-24 66 14 29 5 312 29 25-29 4 5 39 4
30-34 05
35+ 4 5 4

447
~ lQ"~K ~II!~ /~ ;rA ~- ... rn:~ I,EVEL OF EDUCATION. AGE AND SEX-URBAN
---_._-_.- --------
mrr t ."PI'm:-trifiil111i'l" ~'hrr 1fT SI1ITUI' qaNon.technical diploma or ctnificate not equal 10 degree
~ Males
~ Females
-tftlifi ffi{/Educational Level
frir ~ !;Ifllf;r ~ fgtif)1:ry 1fT lI1;1lJf qa
Technical diploma or .::ertificate not equal to degree
~~ Males
f~ Females
;:rrit~ mit q f'I;:;r tontJlli mnGraduate degree other than technical degree
----~------
~~ Males
ftwIrt Females
~.-
an~~ Age-group
--- ------------
20 21 22 -- - ._-- --_. __ .-----------_._-
II 5 159
II ; 30
84
27 18
23
, .. ~ GWALTOR
26
S
5
10
5
d'l'f'n DATIA
24
3,397
445
2,233
489
84
141
206
35
157 9
5
25
---------- ---- --_._----
1.488
... 464
872
86
21
44
67
44
20 4
W1it.." All ages
0-4 5
6
7
8 9
5-9 10-14 15-19 20-24
25-29
30-34
35+
U1ft~ All ages
0-4 S
6
7
8
9
5-9
10-14 15-19
20-24 25-29
30-34
35+

---
iTl"I! ~& Age.group
- --
fr..n-~ All ages
0-4 .5
6
7
8
9
5-9
10-14
15-19
20-24
25-29
30-34
33+
'11fT ilfT~ All ages
0-4 5
6
7
8
9
5-9 10-14
15-19
20-24
25-29
~0-34
3'i+
--
--
_--- -
-- -- -
448
1f-3 ~Trr 'Ii ~ *f~ ~('f'{, an'!, ~1, ~'lit/,!~1{ C-3 PARl A A1TENDI~G SCHOOI_/COLLEGE BY COMPLETED
- - -- -- - -- - - -- - - - - -- ----------- --_-----------------
~fmi «Il/Educational Level
alit If! ~H'Iif1I~~ filiT ~ "",if ~OO f~lit If! f~~T Technical degree or diploma equal 10
degree or post-graduate degree 61Ii;f'r'!ft fslfr ~ f""it ~r~'liRm: fm ------- -----------------Post.graduate degree other ii.;;frfifq-f'li{ ~ affi~)it r.rf"'i'EH llrniif than technical degree Engineering and technology Medicine
Fl Males
26
670
2S
361
132
49 103
34
20
.5
10
f~1f! Females
27
458
31
305
78
18
26
10
10
!i~1!f Males
--_ -
28
'l.f1'f"q~ GWALIOR
70
37
22
5
5
q-fffllT
DATIA
f~j ~1f Females Males
-- --- -_
- -_- - -
29 30
- - - -- _---------
.5 209
5
III
71
11
5 11
f~qj Females
31
- - ----
34
5
29

449
~ ~ 'If!." /IfiTiirvr liI'lif 1I'ffl-i'f~'hr LEVEL OF EDUCATION, AGE AND SEX-URBAN
-rfe:!ifi" ~6<iEducatlonal Level
~!l1 lIT ~r6ifi"rffi: R"«1 1t «'!"lor 6'f."orl''iiT tnr II'T ~~ Technical d.gree or dillloma equal to degree or post-graduate degree
~ ar'\"( Rr '31I11f Agriculture and dairying .
q-rtf~ Ve'"terinary
~ Ratrr ~ hPt Males Females Males Females
'fr;lfTq-r
Teaching
~~ Males
f~ Females
~ Males
WII' Others
mt Femaies
---- -------------------------
33 34 3S
72 .5
67 s
5
36
21
II
11
dftll1 DATJA
.5
s
37 38 39
....
wtif til! All ages
0-4 S 6
7
8 9
.5-9 10-14 15-19 20-24 25 -29
30-34
35+
~"rl' iIIT~ All alfes
0-4 S
6
7
8
9
5-9
10-14
IS-l!I
20-24 25-29 30-34
35+
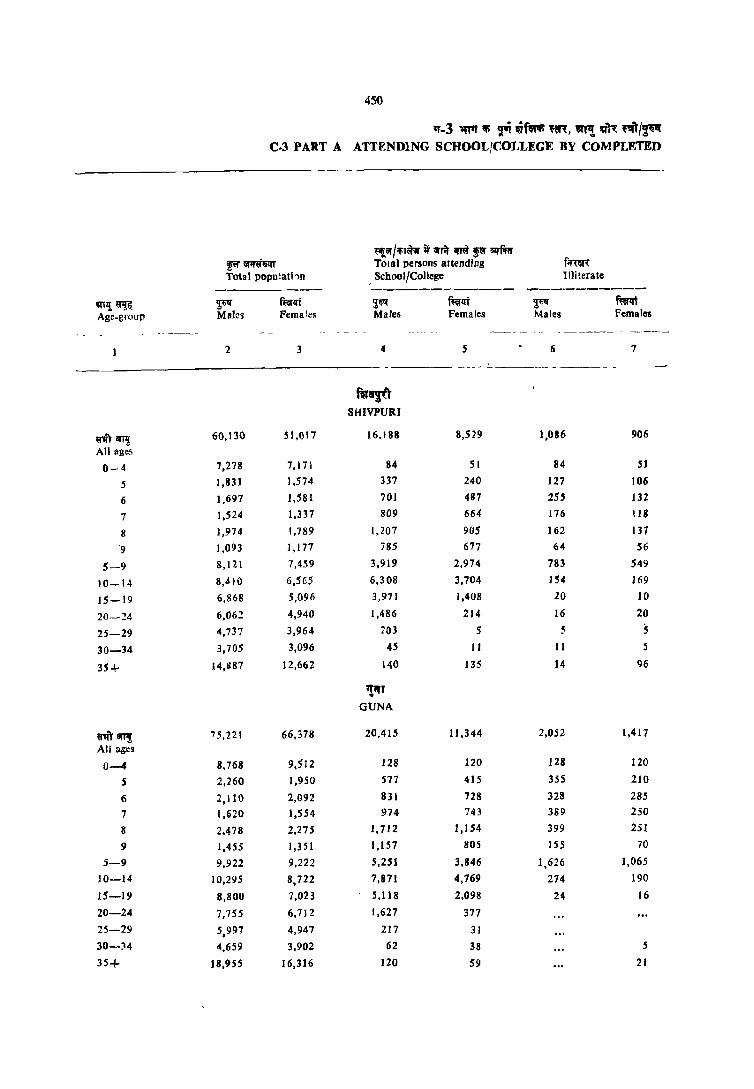
450
,,-3 'qfIf Ifi ~ ~f@llllfi ,~, '"'! m~ "' I~ C·3 PART A ATTENDlNG SCHOOL!COLLEGE BY COMPLETED
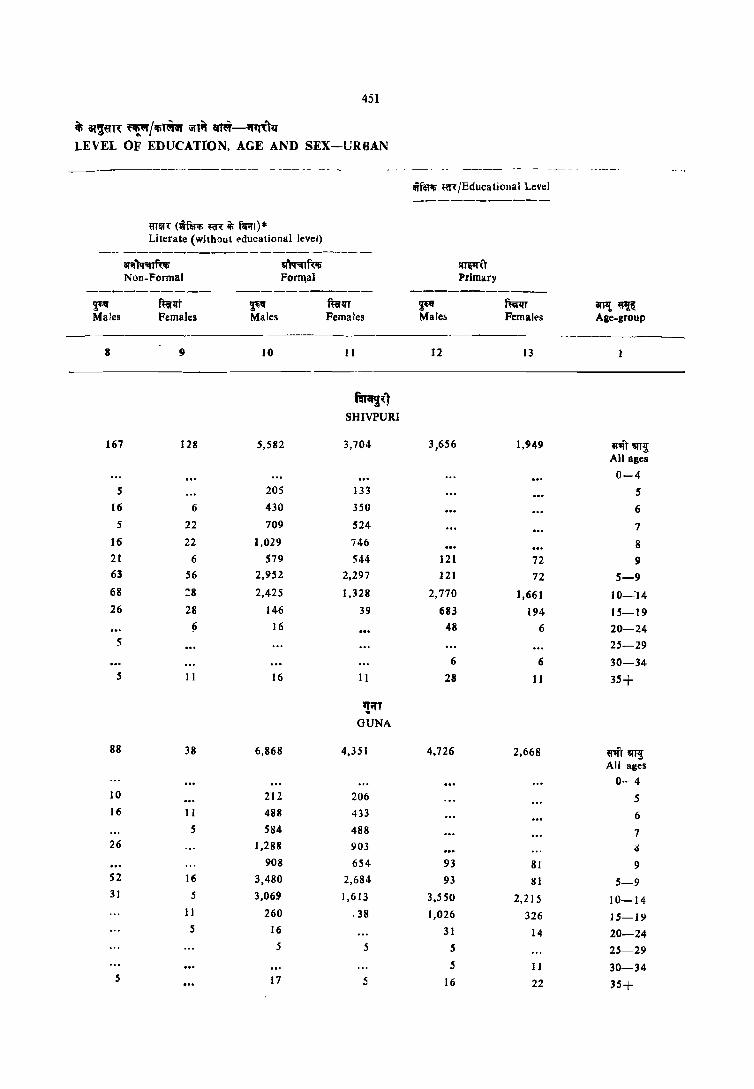
451
ifi 3l~~m: ~/iifi~ iifli% crt~-ifl[\ll.T LEVEL OF EDUCATION, AGE AND SEX-URBAN
~" Males
aran: (lITm1fi ~(l1: iii fiRl) * Literate (without ('ducalionlli level)
ff;fllT Females
~'I" Males
~fut; For~al
f~1iT Females
-~------------- -------_
8 9 10 II
-------------- -----
167
5
16
5
16
21
63
68
26
5
5
88
10
16
26
52
31
128
6
22
22
6
56
:8 28
(i
11
38
I I
.5
16
.5
II
5
5,582
205
430
709
1,029
579 2,952
2,425
146 16
16
6,868
212 488
584
1,288
908
3,480 3,069
260
16
5
17
m"'i~1 SHIVPURI
3,704
133
350
524
746
544
2,297
1,328
39
11
I!if' GUNA
4,351
206 433
488 903
654
2,684
1,613
-38
5
5
litf1;l~ ~/Educatjollal Level
~q
Males
12
3,656
121 121
2,770
683 48
6
28
4,726
93
93
3,550
1,026
31
5
5
16
~U Primary
f~ Femal('s
13
1,949
72
72
1,661
194 6
6
11
2.668
81
81
2,215
326
14
1 I
22
iIP{. ~ Age_group
~"'T '1T~ All ages
0-4
5
6
7
8
9
5-9
10--14
15-19 20-24
25-29
30-34
3.5+
""'r~ All ages
0- 4
.5
6
7
l!
9
5-9
10-14 ]5-19
20-24
25-29
30-34
35+

452
~-3 ~T~ • '* vr". ~, '"f! lilt m/'J"f C-3 PART A ATTENDING SCHOOL/COL,t,EGE MY COMPLETED
wf~ m/Educalional Level
------------------------------------~ titvro!~Z<itfi~/ fsr-if;fll'fifit
flrfr.r Jj~/d'~ Higber Secondary/Inter_ Middle Matriculation/Secondary mediate/Pre. University
--------_- --_------- ----------~~~ ~ fuI1rt ~ f~1ff ~ ffCi lit Age-~mup Males Fernaels Males Females Males Females
- -------------14 15 16 17 18 19
fGT"lll SHIVPURI
91iT~ 3,057 1,128 258 105 1,820 481 All age~
0-4 5'
6 7
8
9
5-9 10-14 827 479 47 28 16 11
1S-19 1,910 611 152 67 957 409
20-24 238 33 42 11 761 61
25-29 16 11 7S
30-14 II
3S+ 49 6 5 11
llifT GUNA
~~ 3,489 1,439 254 97 2.32S 1,146 All ages
0-4 5
6 7
8
9
S-9
10-14 920 682 21 22 5 43
IS-19 2,271 755 190 70 1,300 848
20-24 215 16 38 891 234
25-29 25 11 98 II
30-34 21 5 11
3S+ 36 5 S S 26
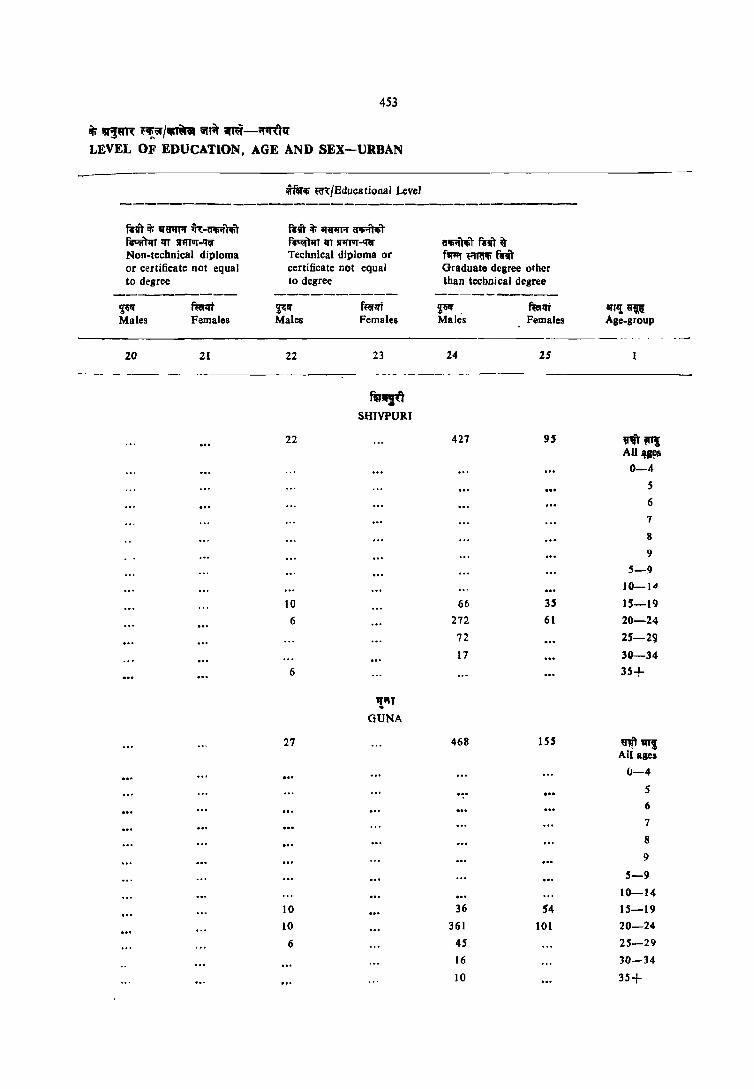
453
it; a,m: i'''!.iI'/~ lifTiI' ~-l'I1R:ll1' LEVEL OF EDUCATION, AGE AND SEX-URBAN
rtf ..... HR/Educatioaal Level
Rit it; vtl1l"A' ~-il1IiiIm RiI'it;iIf~~ ~ lIT l(l'I'vr~ ~l'Il lIT lJlfTVr-~ olliil'\1Ji'T fcit t Non-technical diploma Technical diploma or f'll"r RRI1Ii mit or certificate not equal certificate not equal Graduato degree other to degree to degree than tecbnical degree
---------- ---------- ----------~ fum ~If f«f1U ~. ftc;1ft arr'I ~~ Males Females Males Females Males Females Age-group
-----.
ZO ZI Z2 23 24 2S
- -----_- -_-----_
m~i SHlVPURI
22 427 95 m"'! Al1w:s
0-4 S
6
7
8
9
5-9
10-1"
10 66 3S 15-19
6 272 61 20-24
72 25-29
17 30-34 6 35+
."" .. GUNA
27 468 155 ~1Ill All agel
0-4
... S
6
7
8
9
5-9
10-14
10 36 54 15-19
10 361 101 20-24
6 45 25-29 16 30-34
10 35+
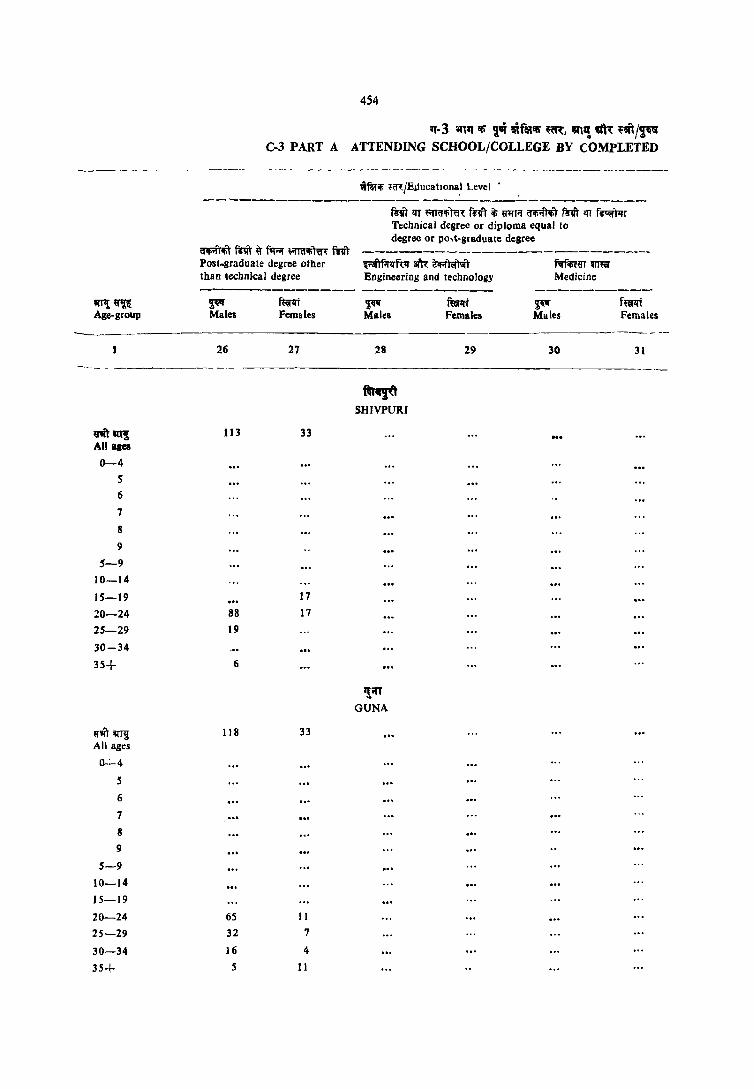
454
q·3 WlQ ~ ~'" !ilflR~ '~, !lfl'!. m~ ,'Ji\/~ C·3 PART A ATTENDING SCHOOL/COLLEGE BY COMPLETED
.--------------------- --- ------- ----- -- -- ----- --- -- - ----------- --------------
'I'P! ~ Age·group
~"i"'Tt'~ All ages
0-4 5
6
7
8
9
5-9 10-14
IS-19
20-24 2S-29
30-34
35+
9..rr~ All agcs
0_:_4
S
6
7
8
9
5-9
10-14
15-19
20-24 2S~29
30-34
35+
'liifelili H'Il:/~ucatlOna,1 Level .
--------------------------------------few lIT ~'Hr~ )~r{ fn1 ~ 9'lf1'f CflIi"IJ;r,1 mit 1fT !'6tir)lrr Technical degree or diploma equal to degree or po,t-graduate degree
~;fr;tT mit ~ f'll"f l-ilTailire. miT -------------------------Post.graduate degree other Ihan technical degree
~ Males
26
113
88
19
6
118
65
32
16
5
~trt Females
27
33
17
17
33
11
7
4
11
~~ am: m)<;ill;fr Engineering and technology
~ f~lft Males Females
28 29
ftr~ SHIVPURI
qifT .. GUNA
Medicine
~ Males
30
f~1lt Females
31
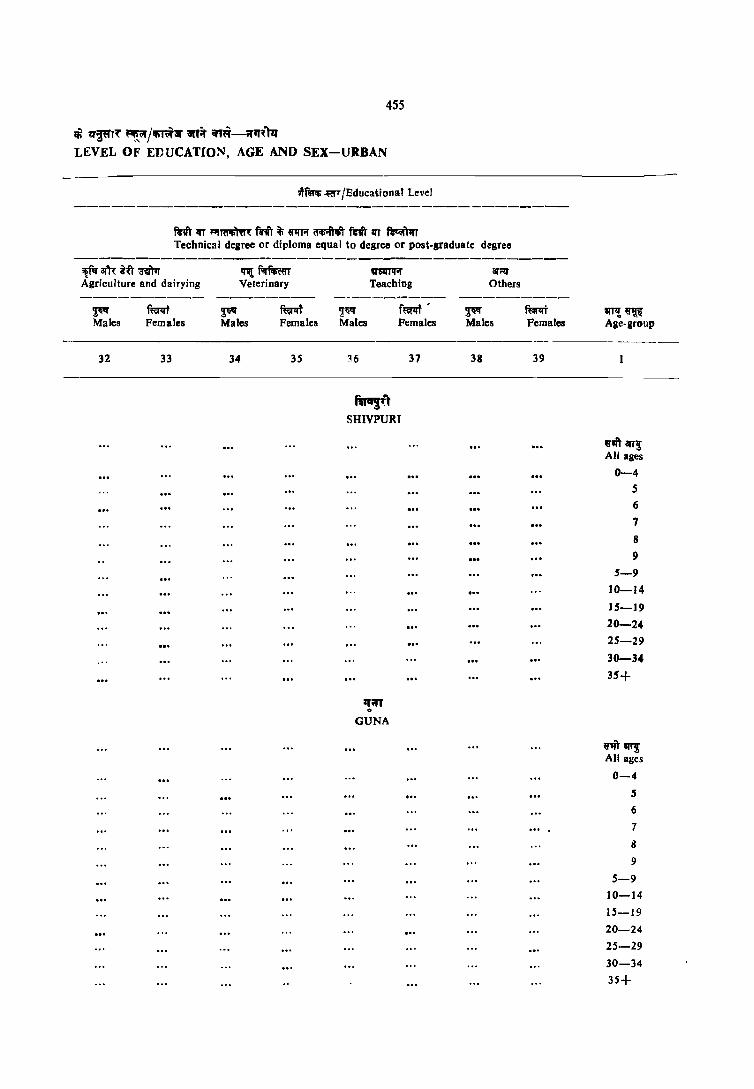
455
Ii 'Q'¥T~ ~(If/'fi(~i( ~~ ~~-;ftT~"hf LEVEL OF EDUCATION, AGE AND SEX-URBAN
~f~ ~ !Educational Level
Rift 1fT J;f~ mit if «1fr-f ~ fm 1fT ~ Technical degree or diploma equal to degree or post-graduate degree
lIif" arR iu ~ Agriculture and dairying
2;~
Males
32
fum Females
33
II1L ~t«T Veterinary
~ fu;r1d Males Females
34 35
~ Teaching
2~ f~' Males Females
~6 37
~,
SHIVPURT
GUNA
~
arrzr Others
Males
38
mt Females
39
'lTl! ~ Age-group
------
um arT!! All ages
0-4
5
6
7
8
9
5-9
10-14
]5-19
20-24 25-29
30-34
35+
"""'i All ages
0-4
5
6
7
8
9
5-9
10-14
15-19
20-24
25·-29
30-34
35+

- ---------
an,! ~( Age-group
1
-----_._-
n't an! All ages 0-4
5
6
7 8
9
.5-9
]0-14
1.5-19
20-24
25-29
30-34
35+
rit~ All ages
0-4
5
6
7
8
9
5-9
10-14
15-19
20-24
25-29
30-34
35+
456
'T-3 ~ lti T'i ~f~lti ,m:, '"~ ~ ~T/~" C-3 PART A ATTENDING SCHOOL/COLLEGE BY COMPLETED
~ilI'ifnqr ~~or/~ 1t ~ lfIi ~or ilfNa-Tolal persons attending f;:rm;:
Tolal population School (Collesr Illiterate ---------- ------------- ----------~ ftifllf Ff mrll'T ~ f~1I't Males Females Male~ P,males Males Females
2 3 4 5 6 7
---------------~----
~ ... TIKAMGARH
47,402 42,008 11,977 6,008 '1,059 527
6,350 6,205 75 70 75 70 1,366 1,382 308 214 197 89 1,654 1,325 613 321 245 119
1,101 876 616 394 127 89 ],767 1,444 '990 635 113 65
922 863 649 481 94 25 6,809 5,890 3,176 2,050 776 388
6,307 5,289 4,550 2,575 184 45 .5,614 4,618 3,159 1,077 19 .s 4,427 3.719 897 J33
3,358 3,194 52 26
2,842 2,224 21 10 .5
11,675 10,829 36 41 4 15
~~~ CHHA.TARPUR
74,473 63,608 19,369 10,874 2,217 1,552
9,776 9,535 121 94 121 94
2,353 2,183 468 447 348 344
2,201 1,944 1,028 610 500 263
1,777 1,542 1,045 823 378 302
2,517 2,320 1,679 1,245 456 271
1,424 1,308 1,032 781 116 73
10,272 9,297 5,251 3,906 1,797 1,252
9.837 8,093 7,376 4,568 277 146
8,410 5,892 4,626 1,838 15 18
7,014 5,350 1,737 335 6 5
5.117 4,759 158 55 10
4,435 3,673 52 21 5
19,601 16,991 44 54 22
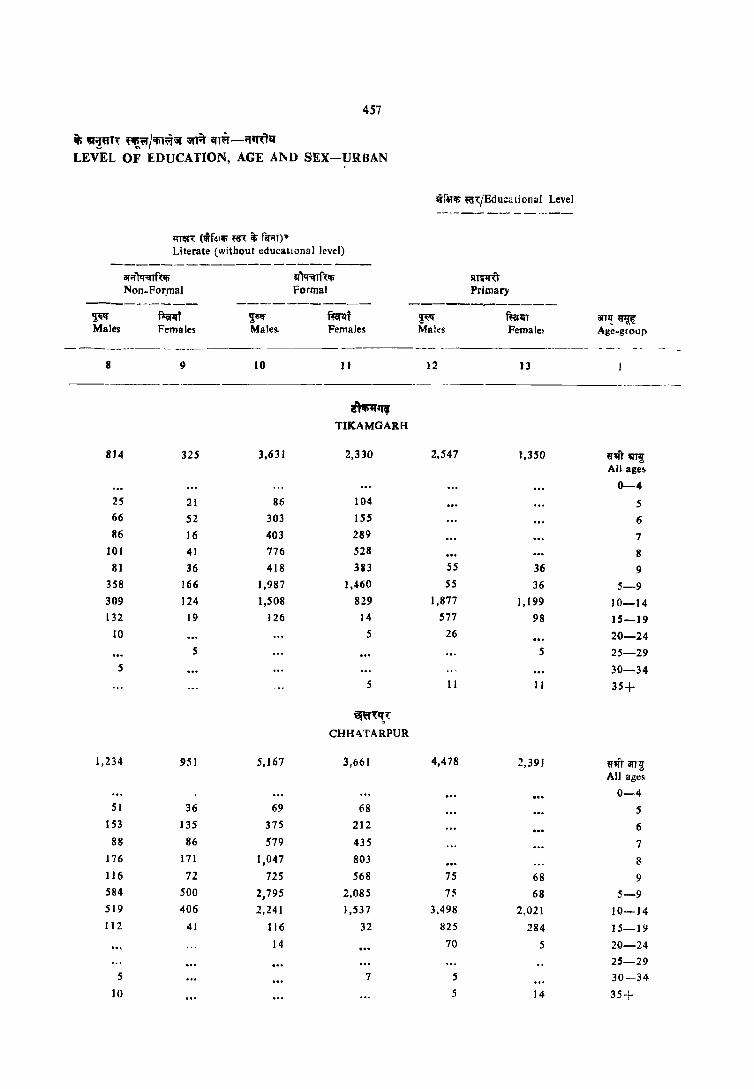
457
~ V~lIT, ~~ Jifi1~~ iinit CJl~ -ilIf\Tti
LEVEL OF EDUCATION, AGE AND SEX-URIJAN
Qi'f~ij; tij''{jEducationaJ Level ----_._ -- - - ._---
;mr'{ (~f~lili ~cn: ii> fiAT)" Literate (without educational level)
-----~------------------
ilfifmrf(1!; "f'<r~ij; $IT~T Non-For_mal Formal Primary
----_.----- ------------- ------------~ ~lIf ~~ fmt <pili mr3IT ""I! ~ Males Females Males. Females Males Female~ Age-group
- ----.------ -_ -------- ._------ - --- - -
8 9 10 II 12 IJ
-_._------ .----- ----- ----------_
~q,
TlKAMGARH
814 325 3.631 2,330 2,547 l,BO ~"r 'IT!! All age~
0-4 25 21 86 104 5 66 52 303 155 6 116 16 403 289 7
101 41 776 528 8 81 36 418 383 55 36 9
358 166 1,987 1,460 55 36 5-9 309 124 1,508 829 1,877 1,199 10-14 132 19 126 14 577 98 15-19
10 5 26 20-24 5 5 25-29
5 30-34 5 11 11 35+
~~~,
CHH<\TARPUR
1,234 9~1 5,167 3,661 4,478 2,391 ~'Ifr an!! All ages
0-4 51 36 69 68 5
153 135 375 212 6 88 86 579 435 7
176 171 1,047 803 8 116 72 725 568 75 68 9 584 500 2,795 2,085 7~ 68 5-9 519 406 2,241 1,537 3,498 2,021 10-14 112 41 116 32 825 284 15-19
14 70 5 20-24 25-29
5 7 5 30--34 ]0 5 14 35+

458
rr-3 lfTrr If; ~ui !iTf_ f<R, !Jn~ 1lI~ ''''/'1_ C-l I:' ART A ATIEN DING SCHOOL/COLLEGE By COMPLETED
lfi"f~", ~(I'"(/Educational Level
------------------------------------
~IR ~r/l{i1;Wt'f60."/ fsr -¥forcrT«it
fll'fcw ~f~w;y/im-U Higher Secondary/Inter. Middle Ma trieula lion /Secondary mediate/Pre-University
---------- ----------_ ----------arrl£ 'I1Jil: '!" f~qf 2~" f~ i"'f ffiIlri Age gr.1Up "'-ales Females Male. Females Males Females
--- ----------- --_ ------------_-1 14 15 16 17 18 19
-~--- _--
!"tlf."'" T1KAMGARH
lim arTll 2,268 890 97 40 1,187 434 All ag~~
0--4
5
6
7
8
9
5-9 10-14 652 357 20 10 10 15-19 1,457 496 61 16 731 350 20-24 143 16 16 14 430 68
:5-29 5 s 20 5 30- 34 S 5 S
:35+ 5 10
iq~~'t~
CHHATARPUR.
~m ar~ 3,(n5 1,134 46 45 2,292 806 All ages
0-4 5
6
7
8
9 5- 9
10 -14 831 403 23 9 32
J 5-19 2,026 665 41 23 1,316 658
20-24 192 34 906 101
25-29 11 9 40 11
30-34 10 9 J1
35"';- 5 14 5 10 5

459
" a~r~ ~t:r/JfiT~it it1~ ~~-i'f'Rm LEVEL OF EDUCATION. AGE AND SEX-UR,tJAN
r.iT ~ qlf~Tij' lr~-(flfiilr'fif R't\'l)~T 1fT SI1IT1IT 'l"iiI' Non-technical diploma or c~rlificate not equal 10 degr~e
'!~ Males
20
9
5
5
ffifut Females
21
mllllli «T~/Edu.:atlOnal Level
fnr ~ q~Tij' (lifiij''T'IIT r6t<'lPrT ZIT SI~I11T IRt Technical diploma or .::ertificate not equal to degree
~1i1f Males
22
15
5
5
5
6S
60
5
f~i Frmales
23
~l~ TIKAMGARH
~~~,~
CHHATARPUR
tf~T~ "'liT ~ fllnr ~H'1Ii R'IiT Graduate degree other than technical degree
~1iIf Males
24
236
46
218
11
11
640
]00
446
73
10
10
ffirII'r Femal,'s
23 -_._-----
102
72
30
295
114
163
18
~ll{ ""ll8' Age-group
-~-------
--------
"r'llllf All ag;s
0-4
5
6
7
8
9
5-9
10-J4
15-19
20-24
25-29 30-34
35+
"'iff aH~ All Biles
0-4
5
6
7
Il
9
5-9 10-14
]5-]9
20-24
25-- 29 30-34
35+

460
'1'-3 ~1f( lfi 'ivr «ftt~ ~, 9iO~ ~ ~""/~ C-3 PART A ATTENDING SCHOOL/COLLEGE BY COMPLETED
--------------- - - - - - -- - - - -------- ----
"'It ~ Agc-g:'.lUP
-----
"","t v~ All ages
0-4
5
6 7 8
9
5-9
10-14
15-19 20-24
2!1-29 30-34
35+
"I''lf1 3W! A'l ages
0-4 5
6
7
8
9
5-9
10- 14 15--19
20-24
25--29
30-34 35+
wfWli ~/Educational Level -----------------------------------~~--
Technical degree or diploma equal to degree or post-graduate degree
~ .. 'f.Ii'r f«I' ~ I1A ~ffi: fm ----------------------Post-graduate degree other ~f;rllf,\lf m'\ Zlfif~T firflliffiT WffiI' than technical d~gree Engineering and technobgy Medicine
------------ -------_. --- ---------~~ f~ ~ fu;rl:rt ~If f~ Mdles . Females Males F.:males Males Females
26 27 28 2S1 30 31
!TIF~~-
TIKAMGARH
69 10 ~
5 5
43 5 10 5
5
5
~~t'!'t CHHATARPUR
108 31 14 10
5 S 5
84 20 9
24 7 5

461
~ SR'2~r~ r'{"/~ iitl;r ilft#-iItI''{TtI LEVEL OF EDUCATION, AGE A~D SEX-URBAN
_------------- ------- ._-_._--- .. ----Viflllili HIT/Educational Level
------------------------------------------R-llr ~ ~1(I1Ii)'lil: ~llr % ~'lTi'f (fili"ilI;1 fWIIT 1fT f~~ Technical d,gree or diploma equal to degree or posl-graduate degree
--------------_:__----------------------------i6'f~ arn: _it alr)1r . Agriculture and dairying
q1i' f.;ffit;tm Veterinary
~ Teaching
Wi!" Others
---------- -------- .. _ ------- ---- --------2;'l1II' Mules
32
~ Females Males
33 34 ---_. __ -
' ...
f~ Females
35
2;~
Males
36
Females
37
~~ Males
38
.- ---_.-_._._---- -------
~~'" TIKAMGARH
~~'('~ CHHATARPUR
16
5
II
7
7
fur," Females
39
alTl! «~~ Age-group
mfr~ All ages
0-4 5 6
7
8
9
5-9 10-14
IS-19
20-24
25-29
30-34
3S+
j
6
7
8
9
5-9 10-14 IS-19
20-24 25-29 30-34
35+
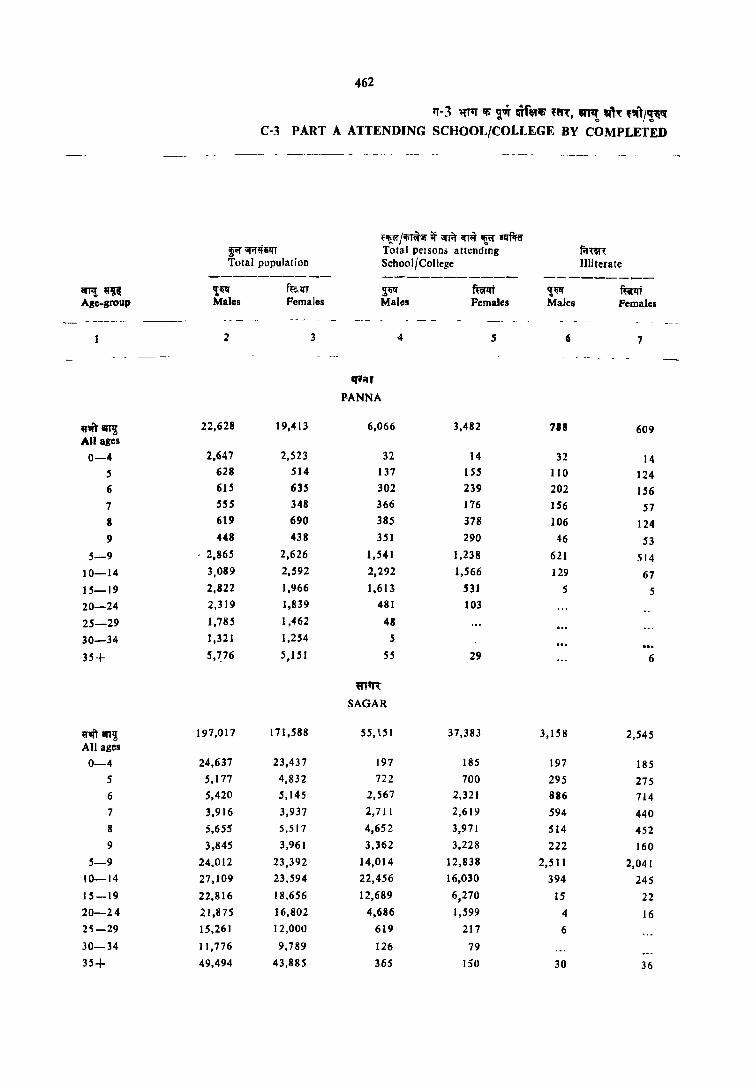
iIITI! Ufl Age-group
--_-
v'litaq All ages
0-4 .5 6
7
8
9
5-9
10-14
15-19
20-24
25-29
30-34
35+
~an~ All ages
0-4
5
6
7
8
9
5-9
10-14
15-19
20-24
2~-29
30-34
35+
462
11'-3 'I{T1T -.; ~1!j ~f"lIi '(ft, '"'! 1JI'1t ''liI)!,!~'' C-3 PART A ATTENDING SCHOOL/COLLEGE BY COMPLETED
fWf /ifiT~ it ilfrit qr~ Il!" ~tr fimn: :rr~~il.lT Total pel sons attendIng
Total population School/College lJIiterate
---------- ----------- ---------'1~ ff:;,!fT ~~ ftl!flfr '!~ mr Males Females Malcl9 Females Males Females
-_----- -
2 3 4 S 6 7
- - -
IP~' PANNA
22,628 19,413 6,066 3,482 788 609
2,647 2,523 32 14 32 14 628 514 137 ISS 110 124 615 63.5 302 239 202 156 55S 348 366 176 156 S7 619 690 385 378 106 124 448 438 351 290 46 53
- 2,865 2,626 1,541 1,238 621 514 3,089 2,592 2,292 1,566 129 67 2,822 1,966 1,613 53) 5 5 2,319 1,839 481 103
1,785 1,462 48
1,321 1,254 5
S,~76 5,151 S5 29 6
Wl~
SAGAR
197,017 171,588 55,tsl 37,383 3,158 2,545
24,637 23,437 197 185 197 185 5,177 4,832 722 700 295 275 5,420 5,145 2,567 2,321 886 714 3,916 3,937 2,711 2,619 594 440 5,655 5,517 4,652 3,971 514 452 3,845 3,961 3,362 3,228 222 160
24.012 23,392 14,014 12,838 2,5 II 2,041 27,109 23,594 22,456 16,030 394 245 22,816 18,656 12,689 6,270 15 22 21,875 16,802 4,686 1,599 4 16 15,261 12,000 619 217 6
11,776 9,789 126 79
49,494 43,885 365 ISO 30 36
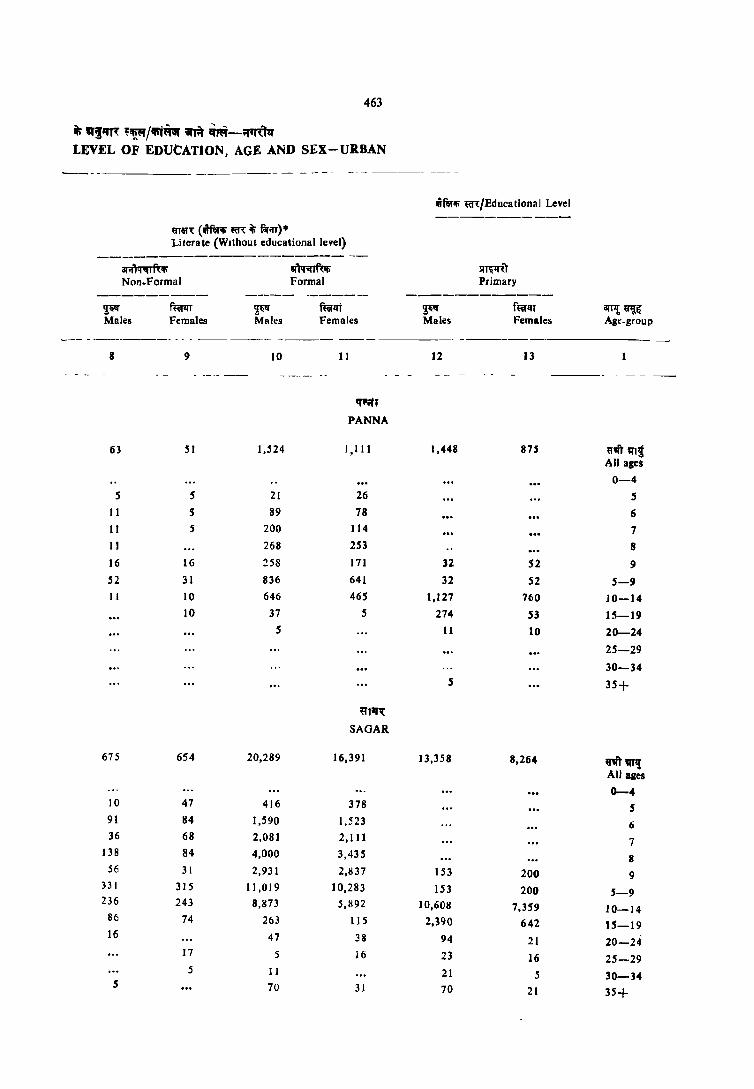
463
it; "!~ ~~/IIi't~ i1Il~ ~-~rrm LEVEL OF EDUCATION, AGE AND SEX-URBAN
~TeT"= (.mr'li ~ it; RifT)· Literate (Without educational level)
~fu; Non.Formal
m'ITf<'Ii Formal
~ Males
f~ Females
F' Males
f~lTt Females
.;mCfi ~"=/Educalional Level
~If Males
51T~T Primary
f~I(T Females
iIfT1! ~ir Age.group
--- ---------_---_- - - - -_----- ----- --------_. - -_-------------_
8
63
5
II
II
II
16
52 II
6iS
10
91
36 138
56
331 236
86
16
s
9
51
5
S S
16
31
10 10
654
47
84 68 84
31 315 243
74
17
5
10
1,524
21 89
200
268
:258
836 646
37 5
20,289
416
1,590
2,081
4,000
2,931
11,019
8,873
263
47
5
11
70
11
"'ifT PANNA
I, III
26
78 114
253 171
641
465
5
~'IJ~
SAGAR
16,391
378
1,523
2,111 3,435
Z,tl37
10,283 5,1192
115
38
16
31
12
1,448
32
32
1,127
274 11
5
13,358
153
153 10,608
2,390
94
23
21
70
13
875
52 52
760
53 10
8,264
200
200
7,359
642
21
16
S
21
R'Ifi'l"I! All age$
0-4
5
6
7
8
9
5-9
10-14
lS-19
20-24 25-29
30-34
35+
w4t'lJl! All ages
0-4
5 6
7
8
9
5-9
10-14 15-19
20-24
25-29 30-34
35+

awt~~ Age-group
rit~ All qcs
0-4 5
6
7
8
9
5-9
10-14
15-19 20-24
25-29 30-34
35+
ili'rT m1! All ages
0-4 5
6
1
8
9
5-9
10-14
15-19
20-24
25-29 30-34
35+
464
'T-3 mq lfi T'i ~fetlfi ~, "'I!. ,,~ ~w.T/'jVl C-3 PART A ATTENDING SCHOOL/COLLEGE BY COMPLETED
.rfellli ~;:n:/Educa\ional Level
--------------------- ------------. -- ----
~ Males
flImr Middle
f«l1rt Females
14 IS
1,335
368 881
69
11
9,435
2,299
6,555
458
41
17
65
560
258 296
5
5,364
2,233
2,987
112
I]
21
I{~Jm/~t~T Matriculation/Secondary
~" Males f~ Females
~ tt8'!TT/~~fi'~/ fiJ-l{f.:rllf"ftt Higher Secondary/Intermedia te /Pre-University
~ Males
fWlrl Females
t6 17 18 19
q;;n
PANNA
48
"'T'T1:
SAGAR
42 6
1,761
31
986
613
71
II
49
12
S
7
783
32
627
84
26 10
5
667
II
358
262
26
II
4,568
16
2,190
2,173
173
16
193
134 53
6
2,052
26
1,~9(,
374 SO
5
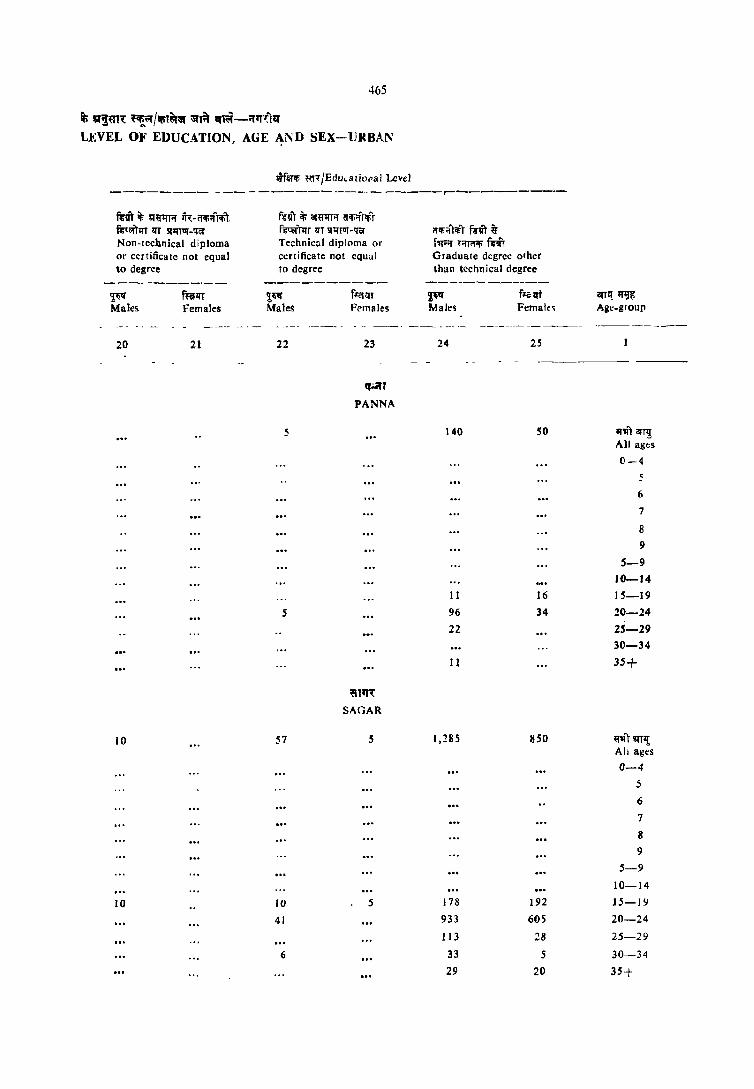
465
.. a~~m: 'Itl.tor/IfiT~iSI' 'iTTi'r ql~-;r'J1:llf LEVEL OF EDUCATION, AGE ~ND SEX--lJRBAN
l!if~'fi" ffi,/Edul.aliol'al Level -------- - -- - ----------.--- -----r------------
R"it it Qij"I1T'l' ~l: -lilfi;:ftifi"l ~t<'llm Iff 5f1fTUf -qaNon-technical diploma or certificate not equal to degree
~ Male~
20
10
10
fi:alff Females
21
f€~T ~ aTQlfT'l' aifi";fpi'r f5tt;II1T ll"T Itl1TUf -qaTechnical diploma or certificate not equal to degree
'!~ Males
fJ<l;:n Females
ilifiilT'lfr fi'm it f"." ~;rr1'Iifi" mrr Graduate degree olher than technical degree
Ff Male~
ilrr~ 1'I1J~ Agc-g I Oui1
- -- ------ -------- -----------------------
22
5
5
57
10
41
6
23
IJ<.OfT
PANNA
~T"~ SAGAR
5
5
24
140
11
96
22
11
1,285
178
933
113
33
29
25
--------- ----
so
16
34
850
192
605
28
5
20
11''111 arr~ All ages
0-4
6
7
8
9
5-9 10-14 15-19 20-24
25-29 30-34
35+
ij",rt !!tTl!, All ages
0-4
5
6
7
8
9
5-9
10-14
J5-J9
20-24
25-29
30---34
35+
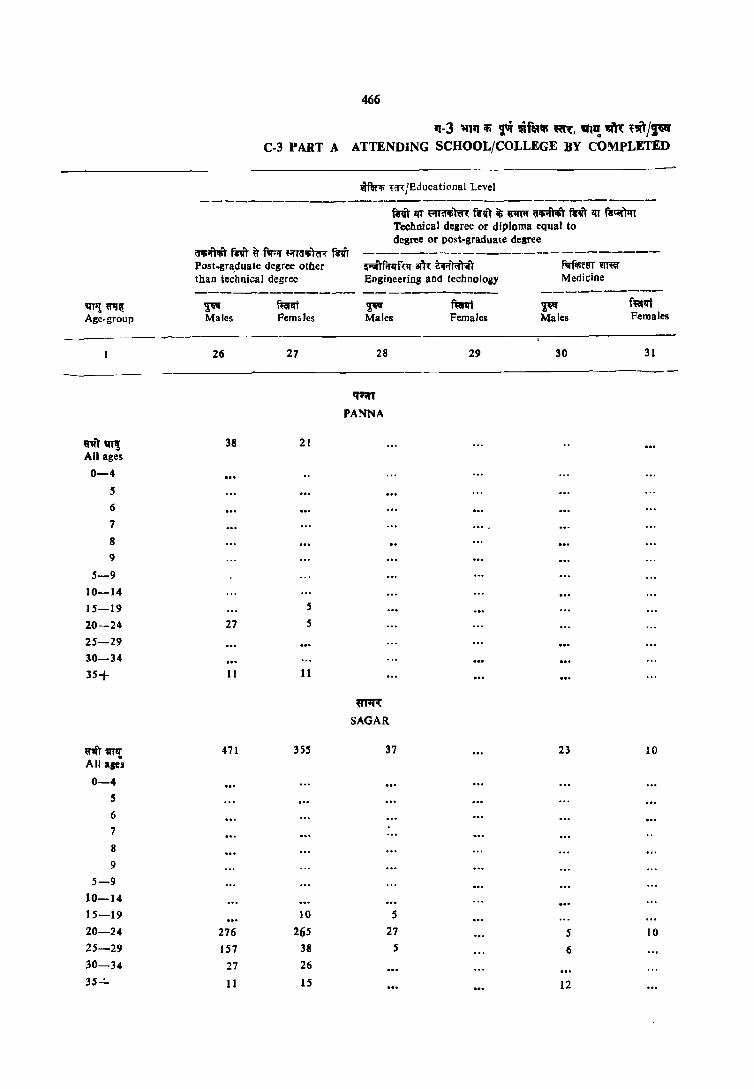
QT'I tT1J~ Age. group
466
11-3 ~111 iii T'i ~r~", ~, .. ~ m f:it/p C-3 PART A ATTENDING SCHOOL/COLLEGE BY CO!\1PLETED
lIi"m'F tI1,)E.iucational Level
--------------------------------------
(I1!i;ft1liT miT ~ f'lFoT ''ffCl'F'tm- mfr Post.gra:duate degree other than technical degree
~ Males Fem&les
miT lIT ~~~ kv"l' it ~ ~~ kit l{f k~t Technical degree or diploma equal to degree or post-graduate degree
------------------------~f.rlff('l am ~~ Engineering and technology
~ f~ Males Females
~
f;rl"1fiC1iIT ~ Medicine
Males Females
- ~- --- ~---------.-----------------;--------~
n"l' !IIl1 All ages
0-4
5 6
7
8
9
5-9 10-14 15-19
20-24
25-29 30-34
35+
WIT) 'QTlf
All age'" 0-4
5 6
7
8
9
5-9 10-14 15-19
20-24 25-29
30-34 35"':"
26
38
27
II
471
276
157
27
11
27
21
5
5
II
355
10
265
38
26
15
28
q;;n
PANNA
~1'" SAGAR
37
5
27 5
29 30 31
23 10
5 10
6
12

467
Ii lJI~t ~/ifiT~:;r :;r,i't ~T~-"Iflr~ LEVEL OF EDUCATION, AGE AND SEX-URBAN
--- ---_-- -------------
wfetlf. ~Qi /Educational Level
~';r ll'T .;j'T<fII;tm: f~T ij; 61rR CI'Ii;ft1;!iT f8'1T ll'T R<<'Ilq-T
Technical degree or diploma equal to degree or post-graduate degree
IIifiI' orR i<1" .WItT Agriculture and dairying
~I;I(
Males
32
s
5
~r Females
33
~ f,ffttm Veterinary
!q'E!I'l1R
Teaching
~ mm '!~ fw Males
34
Females Males
3S
!!fan
PANNA
5
5
m'1": SAGAR
25
19
6
Females
37
110
73
16
22
~
or·1f Others
Males
38
furut Fen,ales
39
m'!.~ Age-group
l1l1I1 tTl1r All IIle;
0-4 5
6
7
8
9
5-9 10-14 15-19 20-24 25-29 30-34
35+
.,.,rr WI! All ages
0-4 5
6
7
8
9
5-9 10-14
IS-19 20-24 25-29
30-34
35+
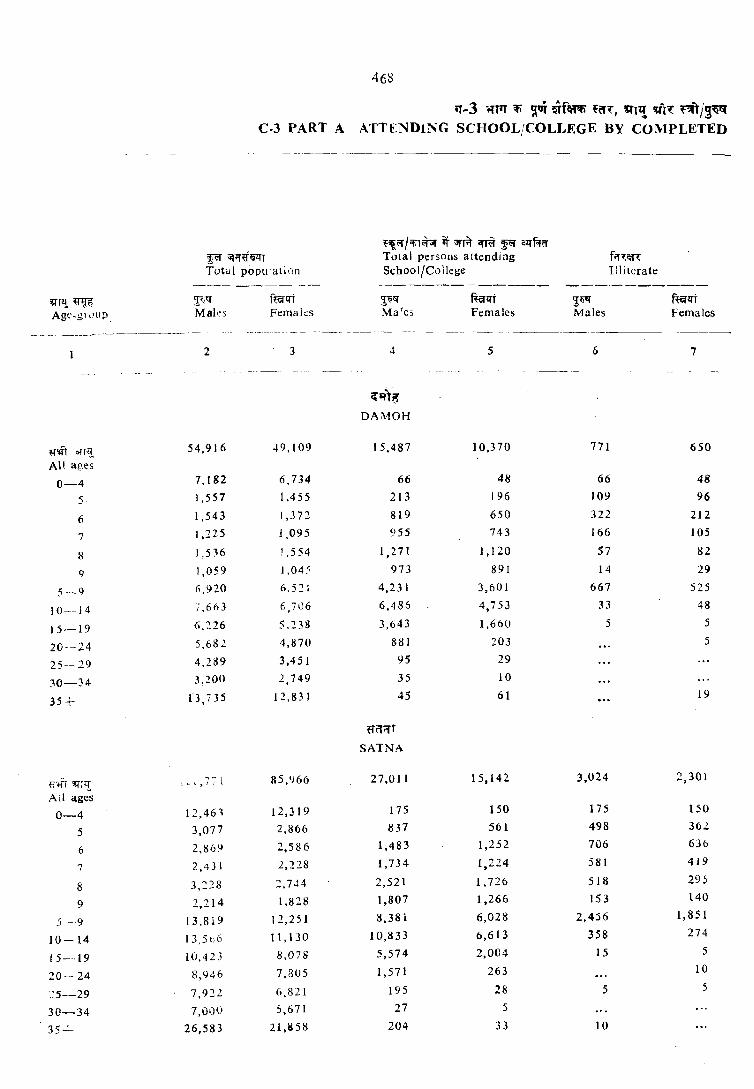
ifllJ: ~ Agr.gHlup
468
11-3 +{ftT lfi ~ ~flRl'i f~"{, ~t7! ~1~ ")/~~t{ C·3 PART A ATTENDlNG SCHOOL/COLLEGE BY COl\IPLETED
HJ5;f/'f.l~ it'll'Ti't cmr ~ &ffofcr ~ ~~~l:fr Total persons attendi ng f'{~!lR Total popu :ation School/College Illiterate
-_-_ ---- ~-- ------------- ---.-~-----
tp;o:r f~qi %1'i~ ru:rlfT ~~ ffirzrt Maks Femal~s Ma'es Females Males Females
~--.-----~---- ---------- --- "_
-- -----~- . __ -_-- _-- - - -----~--------- _--_ -~--- --~-----
2 3 4 5 6 7
"_----- . _"_ .. _- . -_. -_.- -------
~~t~ DA1'vtOH
~'lTT OfT,! 54,916 49,109 \5,487 10,370 771 650
All ages
0-4 7,182 6,734 66 48 66 48
5 1,557 1,455 213 196 109 96
6 1,543 1,372 819 650 322 212
7 1,225 1,095 955 743 166 105
8 1,536 ! ,554 1,27 I 1,120 57 82
CJ 1,059 1,045 973 891 14 29
5-9 (i,nO 6,521 4,231 3,601 667 525
10-14 -; ,6(i3 6,706 6,486 4,753 33 48
15--19 6,226 5,238 3,643 1,660 5 5
20--24 5,682 4,870 881 203 5
25--29 4,289 3,451 95 29
:10-34 3,200 2,749 35 10
35+ 13,735 12,831 45 61 19
tl(l:;T
SATNA
ff..rr ifT,! ~ ~ l ,7'7 t 85,966 27,011 15,142 3,024 2,301
All ages
0-4 12,46 1 12,319 175 150 175 150
5 3,077 2,866 837 561 498 362
6 2,869 2,586 1,483 1,252 706 636
7 2,431 2,228 1,734 1,224 581 419
8 3,:28 :,744 2,521 1,726 518 295
9 2,214 1,828 1,807 1,266 153 140
5---9 13,819 12,251 8,381 6,028 2,456 1,851
10-14 13,5tjo 11,130 10,833 6,613 358 274
f 5---·19 10,423 8,078 5,574 2,004 15 5
20---24 8,946 7,805 1,571 263 10
::5-29 7,922 6,821 195 28 5 5
30-34 7,0<)0 5,671 27 5
35 -T- 26,583 21,S58 204 33 10
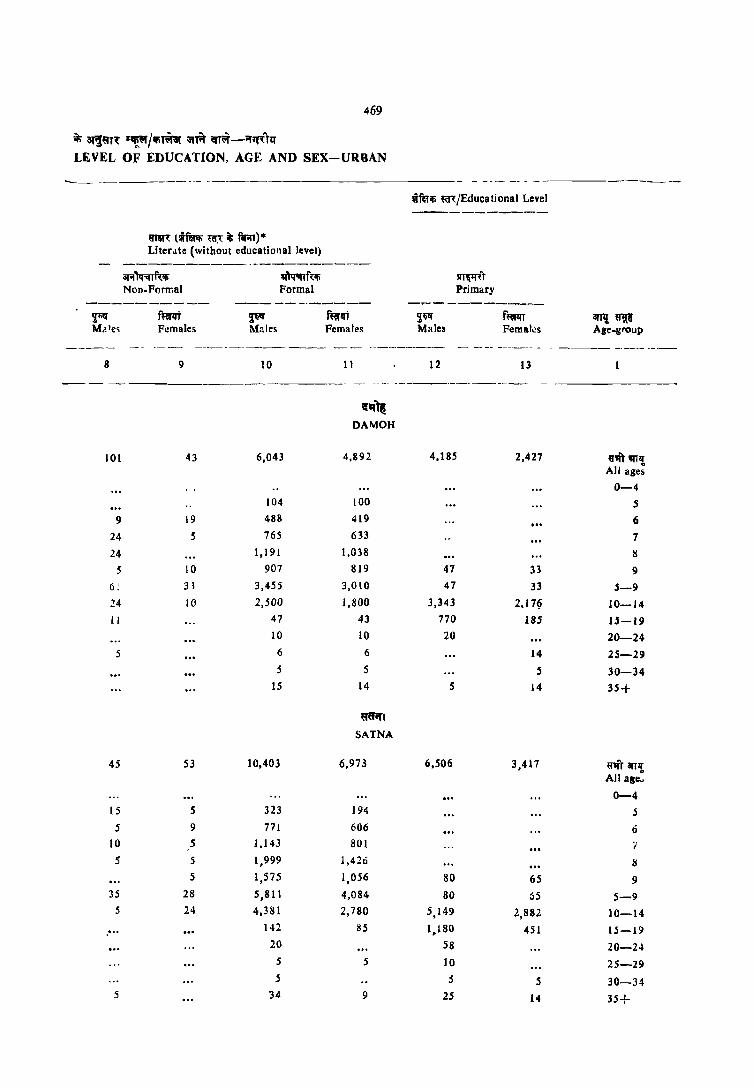
469
~ ~~n~ ~~/Ifi~ iilr.t _"~-"rRTtr LEVEL OF EDUCATION, AGE AND SEX-UR8AN
-------------- -- --- -- - -- -------
8
101
9
24
24 5
6 !
.24
II
5
45
15
5
)0
S
35
5
5
9Tm: lif~ «I! iii fi(;n). Liteute (without educational leVel)
Of~"""f(I!; NOD-Formal
mrrt Females
9
43
19
5
10
31
10
53
5
9
5
5
5
28
24
~f"{111 Formal
~I!f Males
10
6,043
104
488
765
1,191 907
3,455
2,500
47
10
6
5
IS
10,403
323
771
1,143
1,999
I,S75
5,811
4,381
142
20
5
5
34
ffiirq-j Females
11
~q" DA~OH
4,892
100 419
633
1,038
S19
3,010
1,800 43
10
6
5
14
~Clifl
SATNA
6,973
194
606
801 1,426
1,056
4,OS4
2,7S0
85
5
9
~fw.~ ~~/Educational Level
~~ Males
12
~T Primary
4,1S5
47
47
3,343
770
20
s
6,506
SO
SO
5,149
1,1S0
58
10
5
25
fl1il'llT Femal.:!s
13
2,427
33
33
2,17~
185
14
5
14
3,417
6S
:is 2,S82
451
5
14
~~ Age-group
tf'" "'If All age~ 0-4
S
6
7
IS
9
5-9
10-14 l.S-J9
20-24 25-29
30-34
35+
a,,) anI!; All age.
0-4 5
6 -;
8
9
5-9 10-14 15-19
20-24
25-29
30-34
35+

470
;or-3 ~ !fi ,;ui ,*f~ 'CR, aT,! Q~ nit I,!~fi( C-3 PART A ATTENDING SCHOOL/COLLEGE BY COMPLETED
vrflll'li ~a<:/Educational Level
------------------------------------
ijtlR ~~T /~')fi~e/
I{~qri{/~ f5f -!f.'I;fflril'
f'l'fR Higher Secondary/lnter_ Middle Matriculation/Secondary mediate/Pre-University
---------- ----------- ----------an,! ~il ~ fum ~ f~ ~~ ffiAt Age group Males Females Malos Females Males Females
--- -- ---_---- ----_ --------- -.
1 14 l' 16 17 18 19 -_ - --~-.-- --_-- ------ _--- ---------- - ----------- ---------
~ DAMOH
~ "''I 7,870 1,665. 537 259 726 336 All ages
0-4 5 6 7 8 9
5-9
10-14 582 699 5 10 10
15-19 2,094 918 310 206 382 270
20-24 143 33 178 38 325 52
2S-~9 36 5 19 9 5 30-34 10 9 5
35+ 5 10 15 5 5
~a;::rT
SATNA
~m1! 3,010 1,145 1,323 428 2,079 617 All ages
0-4 5
6
7
8
9
5-9 10-14 882 564 30 71 29 17
15-19 1,993 553 1,048 338 1,129 508
20-24 59 28 193 19 810 79
25-29 14 23 69
30-34 15 15
35+ 49 24 28 10
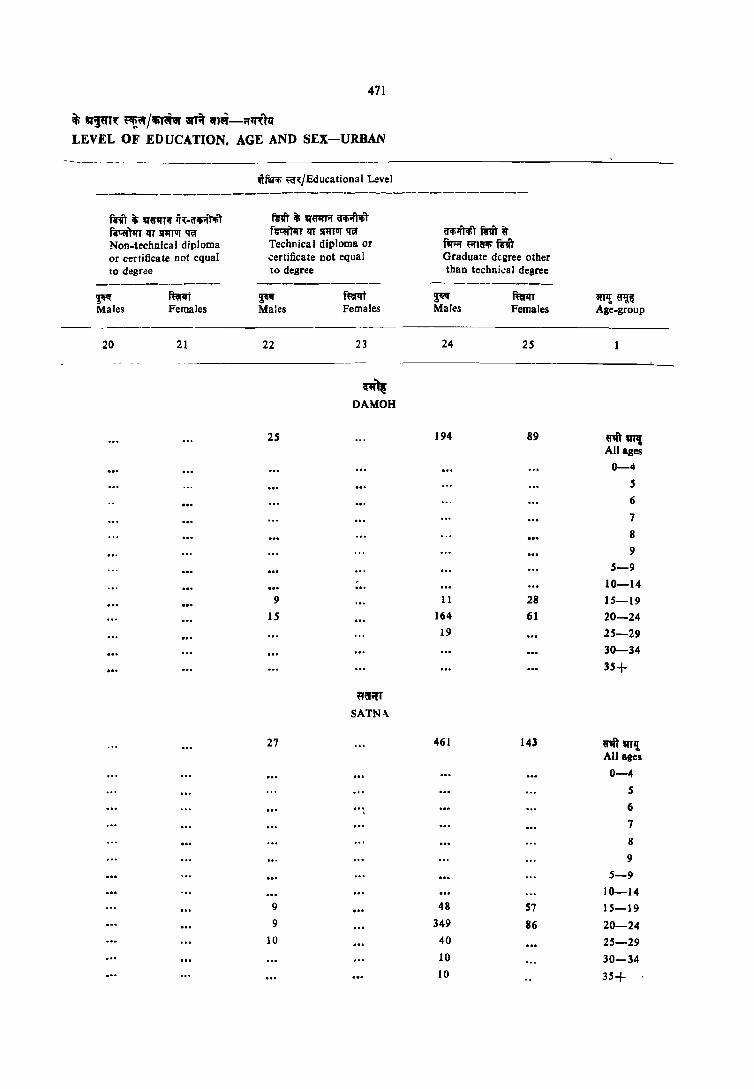

iI'P! Q''l;i[ Age-group
rit W1~ All ages
0-4
S
6
7
8
9
.5-9 10-14
1.5-19 20-24
2.5-29 30--34
35+
orm m; All ages
0-4 5
6
7
8
9
'5-9
10-l4 15-19
20-24
25-29
30-34
35-4-
472
'11-3 ~q iF T'i irflRifi 'fn~, ~ Ql'{ tit/,!~q C-3 PART A ATTENDING SCHOOL/COLLEGE BY COMPLETED
wmif' ~/Edllc3liunal Level
fOlVT lIT fOlI;;ltitffl< mit it; Q'l:ITol i'lifO;:iA;) frit lI"T ~)qT Technical degree or diploma equal 10
degree or po~t-:.,raduate degree i'Ri";fTfl fnr ~ f\l"riI t1l'T(fiIi"'J«r{ frit ----------------------- -Post-graduate degree other ~Tf;:fl~f~tf $l'R ~'A")~r.rr l'irfiI;~m m~ than technical degree Engineering and technology Medicine
~ Males
-. -- --------
26.
25
5
20
96
S
63
15
4 )0
f{Ol1<i Females
27
10
5
5
.59
3
38
18
l~1!f mt Tilt Males Females Males
-- ----- -- - --- --- -- -----_-
28 29 30
~ DA\10H
5 5
5
.5
~(I;n
SATNA
7 3 15
3 s 7
5
.5
f~qt Females
31

473
~ ,,~n- fl~5:r/ifiT~iT :snit qT~-",IJ~", I.EVEL OF EDUCATION, AGE AND SEX-URBAN
.=tfe;ifj «R/Educational Level
fdt lIT fij~)'rn-{ milT ~ ~lfI'f aifjijfot;') f~IIT lIT f~~ Technical degree or diploma equal to degree or post-graduate degree
ifjlt! m~i-u~ Agriculture and dairying
~" f~lil Males Females
32 33
q'~ Rf'lIimT Veterinary
~ f~ii\'lft Males Females
34 3S
ClfRT'I'ij Teaching
~ f~1Ii Males Females
36 37
i"~ DAMOH
~~;;r
SATNA
15
5
5
5
3
3
~"
~Ii
Others
Males
3'
f~ll': Fem,.Ies
39
iIfl'~ Age-group
nT~ All ages
0-4 5
6
7
8
9
5-9 10-14 15-19 20-24
25-29
30-34 35+
~,j) ~11! All ages
0-4 5
6
7
II
9
5-9
10-14 15-19
20-24
25-29
30--34
35+
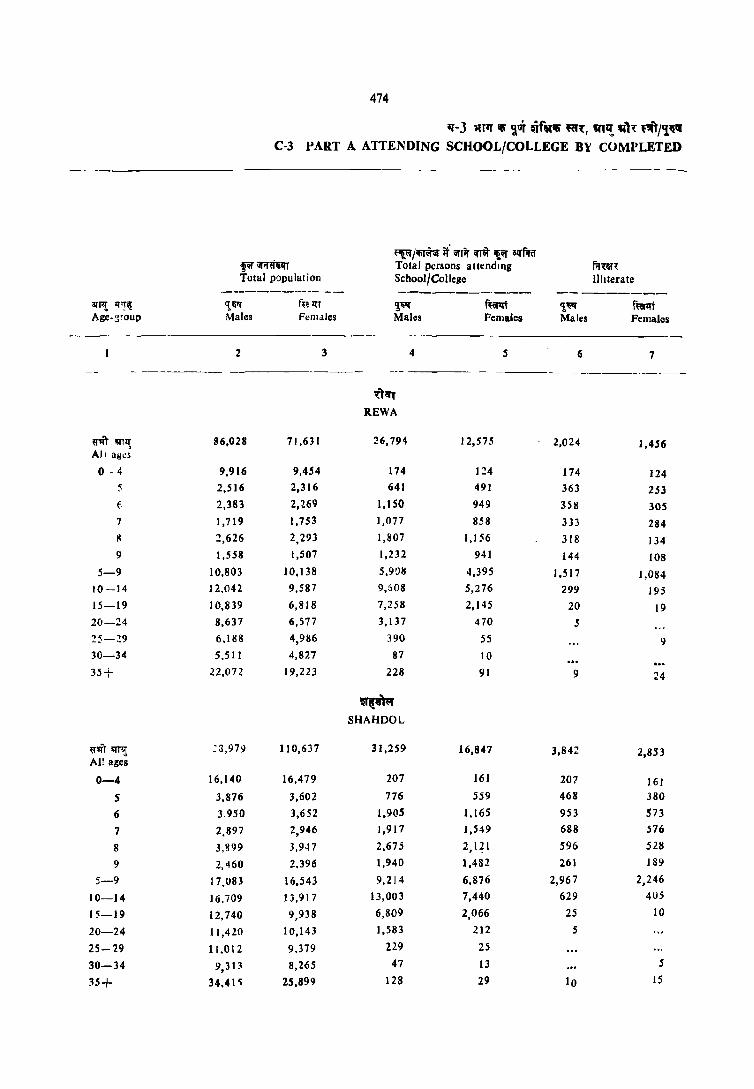
an~ ,,~
Age-3fou p
---- - ----
474
'l' - J llT'l' "" ~ of Qf """ f(1'{, "''!, IAl'{ ro 1,!1Sl!I C-3 PART A ATTENDING SCHOOL/COLLEGE BY COMPLETED
f~/~ if: ;;rlit ri 'l!:~ iqf.!tr ~ ""~61IT Total persons allendmg f.mH Total population School/College illiterate
---------- -- ------_-._-- ---------'\~ ~HI '!~ ft~ 'l~ f~ Males Females Males Females Males Females
2 3 4 S 6 7 -- --------_ ._-- - ---------_
1:11fT REWA
~ lII'llf All a!l~;
86,028 71,631 26,794 12,575 2,024 1,456
o - 4 9,916 9,454 174 1:!4 174 124 2,516 2,316 641 491 363 253
6 2,383 2,269 1,150 949 358 305 7 1,719 1,753 1,071 858 333 284 tl 2,626 2,293 1,807 1,156 318 134 9 1,558 1,507 1,232 941 144 108
5-9 10,803 10,138 5,9011 4,395 1,517 1,084 10-14 12,042 9,587 9,(,08 5,276 299 195 15-19 10,839 6,818 7,258 2,145 20 19 20-24 8,637 6,577 3,137 470 5
~5-:!9 6,I1!8 4,986 390 55 9 30-34 5,511 4,827 87 10
JS+ 22,072 19,223 228 91 9 24
~~ SHAHDOL
~iff 'q'fl:); :3,979 110,637 AI! ages
31,259 16,847 3,842 2,853
0-4 16,140 16,479 207 161 2{)7 161
5 3,876 3,602 776 SS9 468 380
6 3.950 3,652 1,905 1,16S 953 S73
7 2,897 2,946 1,917 1,549 688 576
8 3,!l99 3.947 2,675 2,ql 596 528
9 2,460 2,396 1,940 1,482 261 189
5-9 17,083 16,543 9,214 6,876 2,967 2,246
10-14 16.709 13,917 13,003 7,440 629 4U;
15-19 12,740 9,938 6,809 2,066 25 10
20-24 11,420 10,143 1,583 212 5
25-29 11,012 9.379 229 2S
30-34 9,313 8,265 47 13 S
35+ 34,41 ~ 25,899 128 29 10 15
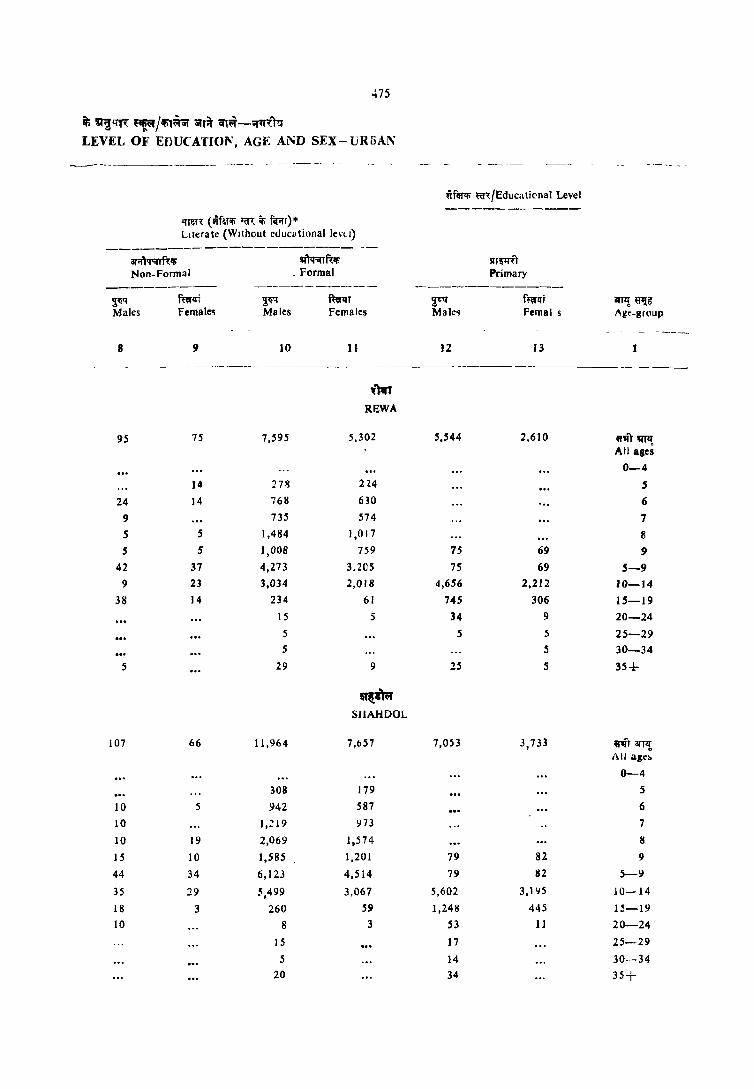
475
$ ~~G'R ~~/~1~ ijfl~ <fl~-~tr~M LEVEL OF EDUCATION, AGE A~D SEX-UR5Al'I
------ --- ----- - - - ---_ ----
lif!ff'fi" Iit("{/Educatit'nal Level -----------
"Iren (~fafifi I:(fl; q; fifi'll) * Ltlerate (Without cduc,ltional le\'ll)
----------------------ar~''I'lTftlili ~fut; IIUlI'ft
Non-Formal . Formal Primary ---------- ----------- ------------~ mro ~ ~lIT T=q' f~lIt arYl!, ij1f~ Males Female<! Males Females Mak~ Femal s .... ge-gcoup
----------
8 9 10 11 12 13
- -------- --------- ----------- ----- ._- ----
l'M REWA
95 75 7,595 5,302 5,544 2,610 f!'IIT~ All ages
0-4
14 278 224 S
24 14 768 630 6
9 735 574 7
5 5 1,484 1,017 8 5 5 1,008 759 75 69 9
42 37 4,273 3.20S 75 69 5-9
9 23 3,034 2,018 4,656 2,212 JO-14 38 14 234 61 745 306 15-19
15 5 34 9 20-24
5 5 5 25-29
5 S 30-34
5 29 9 25 S 35+
$I~-mr SIIAHDOL
107 66 11,964 7,657 7,053 3,733 61fT aHl! All a8e~
0-4
308 179 5
10 5 942 587 6
10 1,= 19 973 7
10 19 2,069 1,574 8
15 10 1,,585 1,201 79 82 9
44 34 6,123 4,514 79 112 5-9
35 29 5,499 3,067 5,602 3,1 '.IS 10-14
18 3 260 59 1,248 445 15-19
10 8 3 53 11 20-24
15 17 25-29
5 14 30-34
20 34 35+
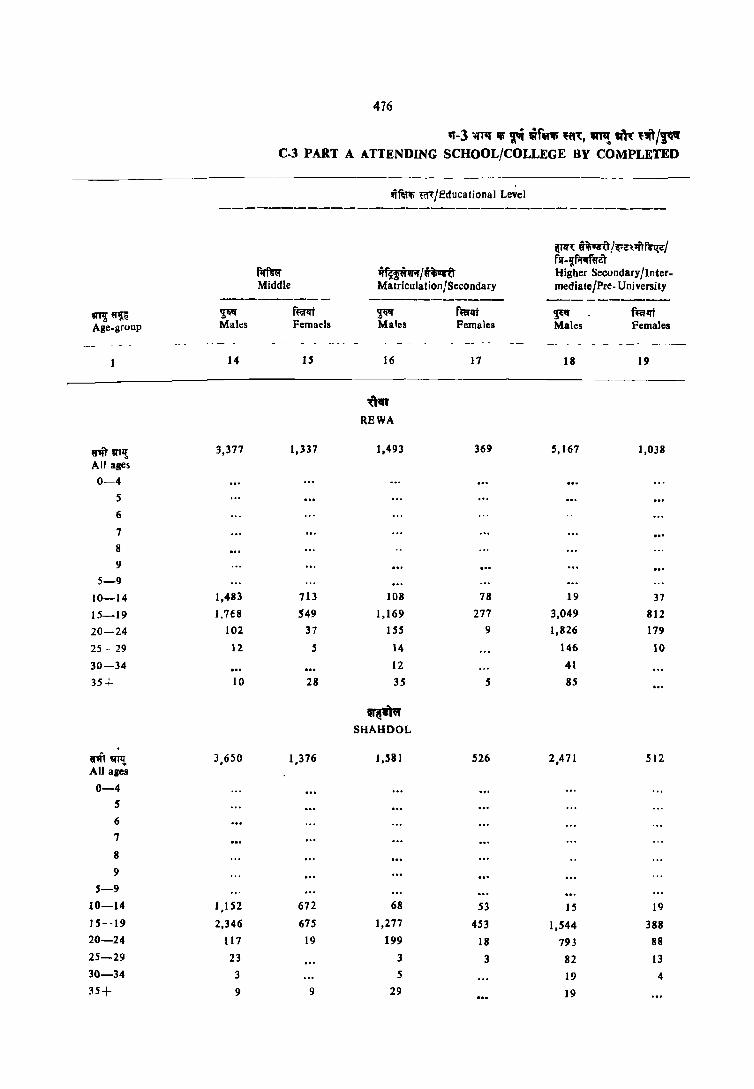
476
q-3 "iN iii 'f'i \if"lIi 'f'I'{, ~ ~l '~/F' C.3 PART A ATTENDING SCHOOL/COLLEGE BY COMPLETED
------wm m/Educational Level
-----------------------------------
~Tlf~ iitaro!~i!<1jT~1
~~w;t'/i~ fsr-'lfffi,,"el
f1rmr Higher Secondary IInter-Middle Matriculation/Secondary mediate/Pre- University
--------- ----------- ----------~"1J:Q ~ f~ ~ f~1Ii ~ f~1Ii Age-group Mal.:s Femaels Males Females Males Females
- ---. - - ------ ---. __ 14 15 16 17 18 19
"«In' REWA
rit ~II! 3,377 1,337 1,493 369 S,167 1,038 All ages
0-4 5 6
7 8 9
5-9
10-14 1,483 713 108 78 19 37
15-19 1.71:8 549 1,169 277 3,049 812
20-24 102 37 ISS 9 1,826 179
25 -- 29 12 S 14 146 10
30-34 12 41
35--1- 10 28 35 5 85
~~lII SHAH DOL
ritilTi! 3,650 1,376 1,581 526 2.471 512 All ales
0-4 5 6 7
8
9
5-9 10-14 1,1 S2 672 68 53 15 19 ) 5--19 2,346 675 1,277 453 1,544 388 20-24 117 19 199 18 793 88
25-29 23 3 3 82 13 30-34 3 5 19 4 35+ 9 9 29 19
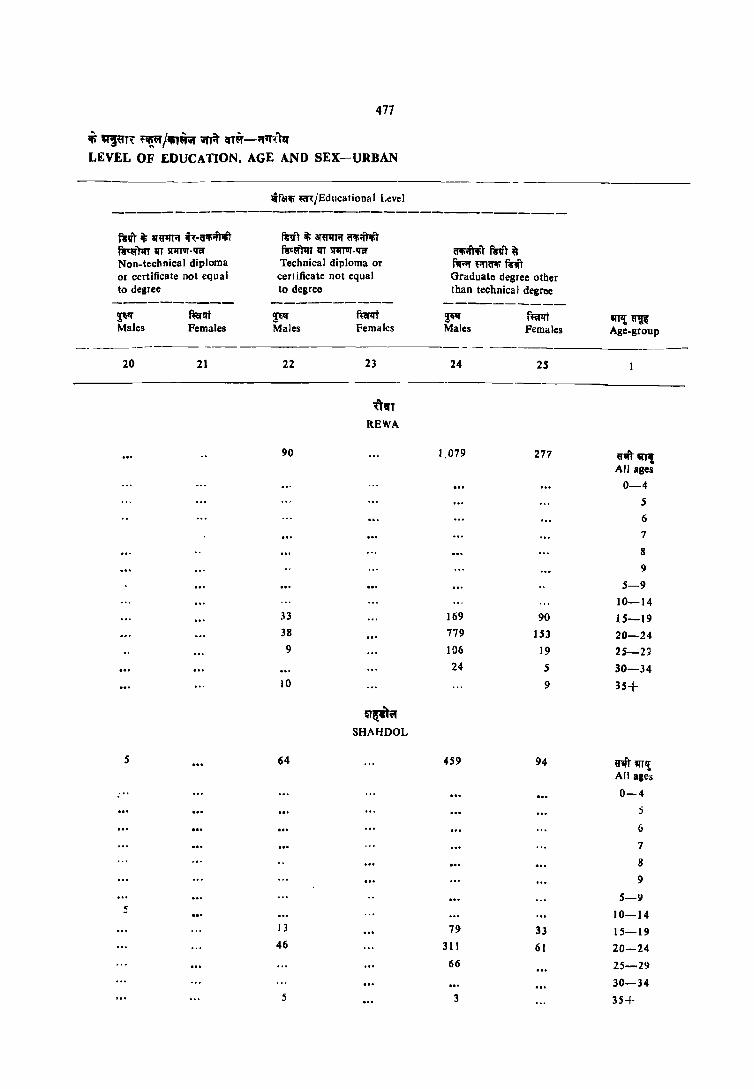
477
<Ii ",~m: ~/ili'fn iiIR .-r~-,,'t{1q LEVEL OF EDUCATION. AGE AND SEX-URBAN
----------- --------lifotlli' ~l;/Educational Level
--------------------------------------fcit it; ar~" ii'Nflli'~ ~Ir') it; iIl'~" ClI(i'~ ~Iir)ln 1fT R1IT1IT. '«f fctiITln 1fT Si1IT'IT. '«f ~r f1'vr6 Non-technical diploma Technical diploma or f1I;;:r ~RAi ~it or certificate not eq u al cerl ificate not equal Graduate degree other to degree to degree than technical degree
---------- ---------- ----------~III' ~Ifi ~ fuprt ~ f~1fi ~P! "1' Males Females Males Females Males Females Age-group
-- ---------- ---
20 21 22 23 24 25
---- --------_.
"., REWA
90 1,079 277 «1ft' wrt All ages
0-4
5 6
7
8
9
5-9 10-14
33 169 90 15-19 38 779 153 20-24 9 1!l6 19 2.S-21
24 5 30-34 10 9 35+
~~" SHAHDOL
5 64 459 94 rn'IIT,! All ages
0-4 j
6
7
8
9
5-9 5 10-14
13 79 33 15-19 46 311 61 20-24
66 25-29
30-34 5 3 35+
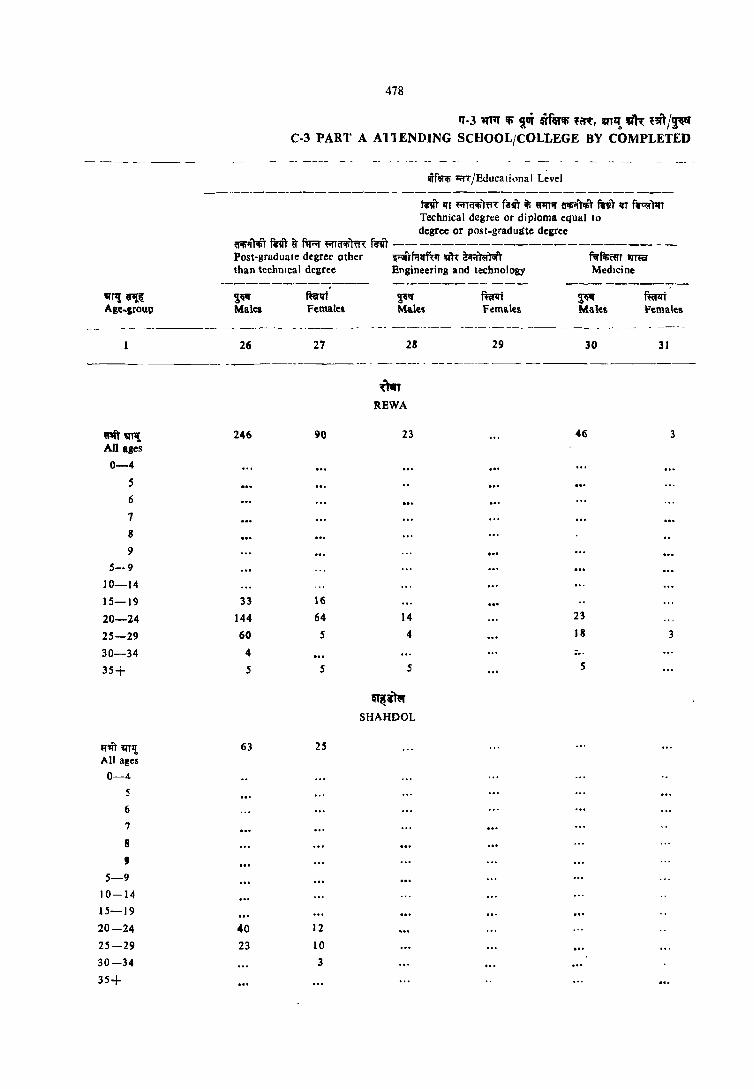
!II11l ~il Age.group
~~ All ages
0-4
5 6
7
8
9
5--9
10-14
15-19
20-24
25-29
30-34
35+
'T'IIt mil All age;
0-4 5
6
7
8 , 5-9
10-14
15-19
20-24
25-29
30-34
35+
478
IT-3 ~TIT Iti ~ai iiflHlti 'fI~, !Q"~ "'~ ''JI1/~ C-3 PART A AllENDING SCHOOL/COLLEGE BY COMPLETED
IITf~ ~iit/Educational L~vel
frir Ifl m"lIi)fl~ flnft ii\' 'flITiI ~iI'T.,rr mft III f~)1r1 Technical degree or diploma equal to degree or pos I-graduate degree
ij'lIiil'AiT I'm' ~ f1rnf ~iAi)ffi fm --------------------- --Post-graduate degree other ~f;llrf"{1T mt ffi"tm'T fqfil;rtl'r WRa' than techmcal degree Engineering and technology MedIcine
2;~ ~lft ~I!f ful'1fi ~" MalCi Females Males F<I!malell Males Females
~ -_- ------- - ------- -_- - -- ----------_ ---------- ---- ------_
26 27 28 29 30
-~------ -------- - --- ---- - -- --------_ -----------
246
33
144
60
4
5
63
40
23
90
16
64
5
5
25
12
10
3
~ REWA
23 46
14 23
4 18
"-5 S
~m SHAHDOL
3J
3
3
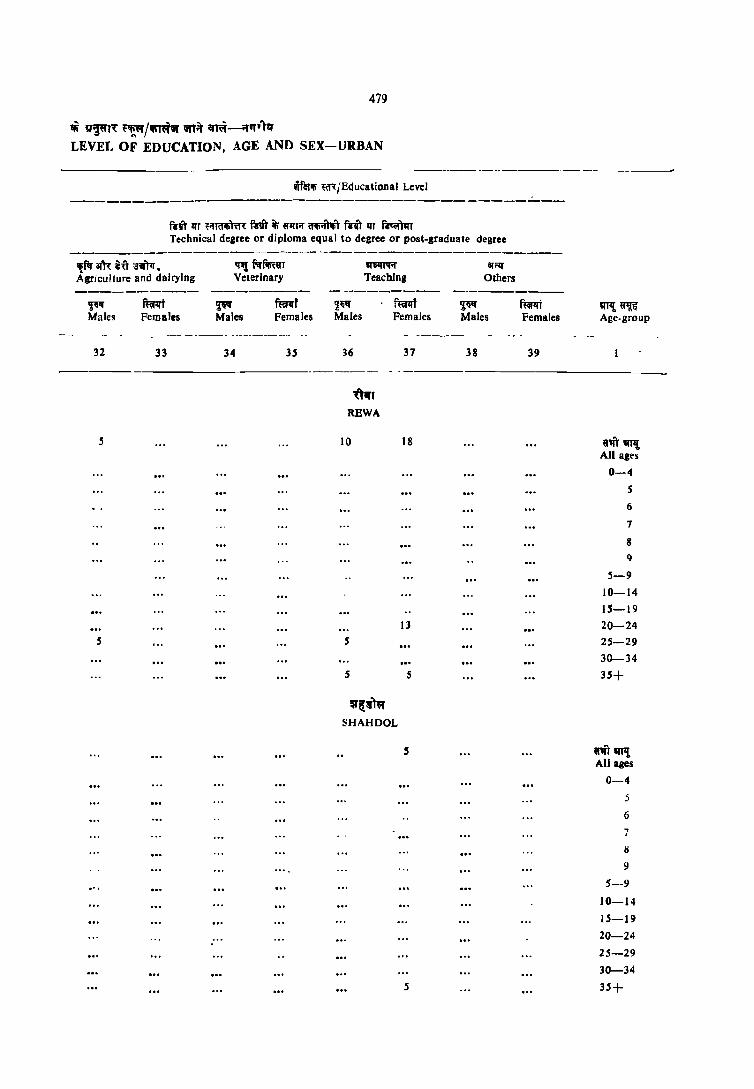
479
$ ll~f( ~ /Ifir" QfTit q'~-if,,'Tr.r LEVEL OF EDUCATION, AGE AND SEX-URBAN
__ ------------------------
rftfet~ ~jEducational Level ----------------------------------------
~it Irr ~iI'Tmm: mit ii fl'II'Tif ~ mit 1fT ~ Technical dearee or diploma equal to degree or post-graduate degree
~arRi"{r~. Agriculture and dairying
~ Males
32
Females
33
'1'l f'irfilrt«r Veterinary
~ ffiA'T ~~ Males Females Males
34 3S 36
!lf1ll'Aif Teacbing
f~qf Females
37
--------------------
.5
s
'0'" REWA
10
5
s
~8:'I)\;r SHAHDOL
18
13
s
.5
ar",
Others
~If Males
38
mm Females
39
~~ Age-group
61ft 'fPt All ages
0-4
S
6
7
8
9
5-9
10-14 15-19
20-24 25-29
30-34
35+
n1 ~'l All ages
0-4 j
6
7
H
9
5--9
10-14
15-19
20-24
25-29
30-34
35+
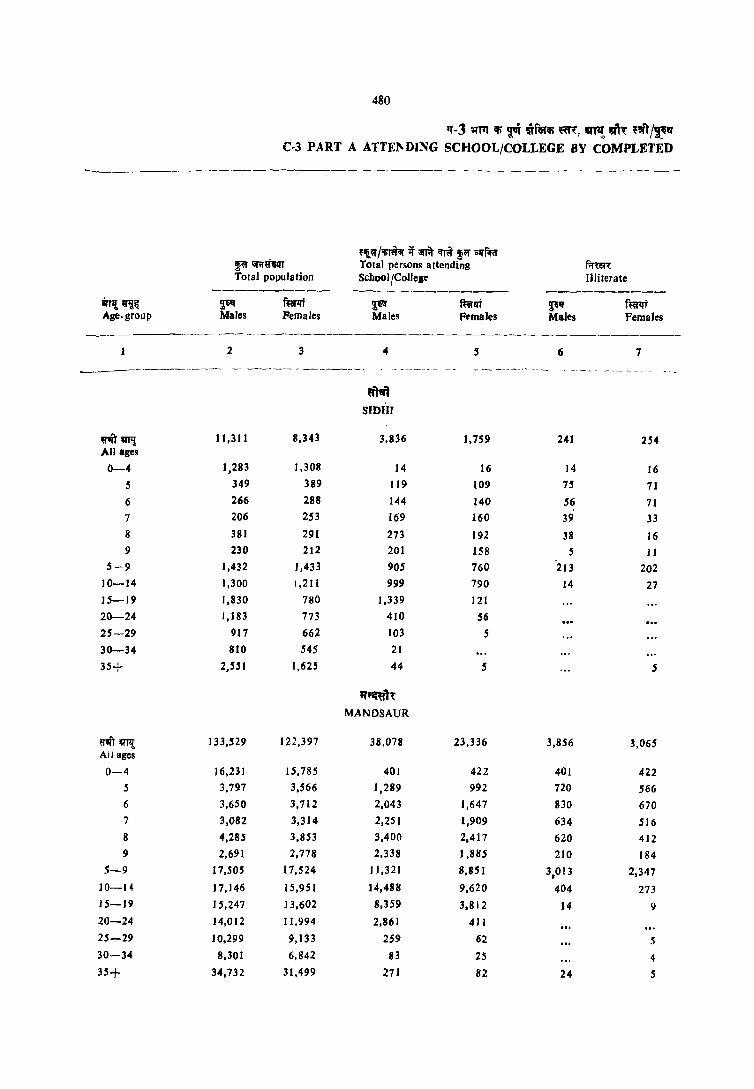
---------
in,! ~il: Age-group
480
1f-3 ~'f11 Ifi' ~ ~flHifi 'Cf1:, ~ ","( ''i;rr/~Q' C-3 PART A ATTEl\DING SCHOOL/COLLEGE BY COMPLETED
----------------------- ---
,~;;r/ifi'TIR it iIIR 'Ili !Of ;zrf.t(( ~ ;;r;r~'1IT Total persoDK attending f;m:r'{ Total population School fColleg~ Illiterate
---------- ---~--------- ----------l:'es
mrzri Fl ~zrr ~'f f~1It Females Males PtmaJes Males Females
2 3 4 5 6 7
--------------- --- ------_ - -------.--_ -- -_------- - -_ ._-- -~-.- _- ---_ -- -- -
~ SIDHI
"1 !All! 11,311 8,343 3,836 1,759 241 254 All ages
0-4 1,283 1,308 14 16 14 16 5 349 389 119 109 " 71
6 266 288 144 140 56 71 , 7 206 253 169 160 39 33 8 381 291 273 192 38 16 9 230 212 201 158 .5 II
5-9 1,432 1,433 905 760 213 202 10-14 1,300 1,211 999 790 14 27 15-19 1,830 780 1,339 121
20-24 1,183 773 410 56
25-29 9]7 662 103 5
30-34 8]0 545 21
35+ 2,SS! 1,625 44 S S
,,;q:~l~
MANDSAUR
~'ft !lIT,! 133,529 122,397 38,078 23,336 3,856 3,065 All ages
0-4 16,231 15,785 401 422 401 422 5 3,797 3,566 1,289 992 720 566 6 3,650 3,712 2,043 1,647 830 670 7 3,082 3,314 2,251 ],909 634 516 8 4,285 3,853 3,400 2,4] 7 620 412 9 2,691 2,778 2,338 1,885 210 184
5-9 17,505 17,524 11,321 8,85 I 3,013 2,347 10-14 17,146 15,951 ] 4,488 9,620 404 273 15-19 15,247 13,602 8,359 3,812 14 9 20-24 14,012 11,994 2,861 411 25-29 10,299 9,133 259 62 5 30-34 8,301 6,B42 83 25 4 35+ 34,732 31,499 271 82 24 5
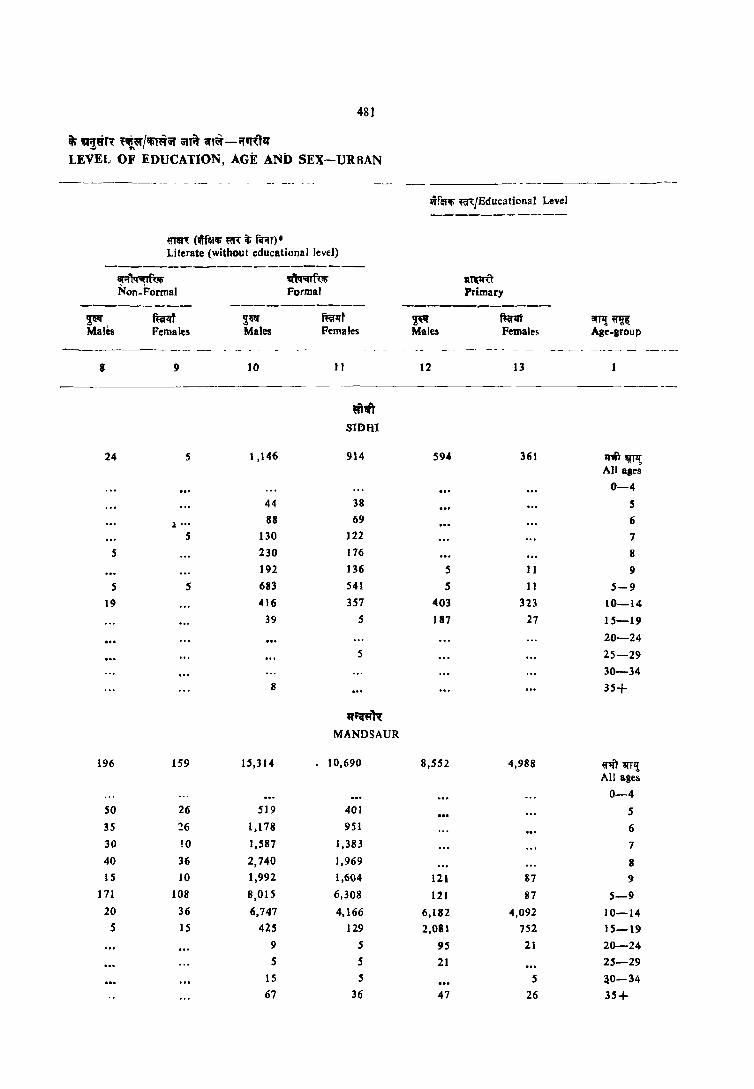
481
itr ~gTl 'lIl"/!fiT~~ iiiA' .1~ -"'Rllf LEVEL OF EDUCATION, AGE AND SEX-URBAN
tfllllli m/Educational Level
~ (tfeJlIi m it; f~T)· Literate (without educational level)

482
fT-3 "TfT ifi ~vj uf~ ,crt, ~n~ ql~ n"I"~ C-3 PART A ATTENDING SCHOOL/COLLEGE BY COMPLETED
-'Ilrlli I;i:I\,'Educational Level --------------- - ------_._------------
ijllft i~/~~1 fsr -Iffifmtl'
flfmr l{~wif/iiPl'u Higher Secondary IInler. Middle Matricula tion (Secondary mediate/Pre-University
---------- -- ------- ---- -- - - - -------1!\"f'i ~~ 'I~ ~ 'l~ f~ 'l~ f~ Age group !\IIales Females Male. Females Males Females
------ _-14 IS 16 17 18 19
a)",)
SIDHI
~II")~ 544 lIS 281 23 848 57 All ages
0-4 5
6 'T ••
7
8
9
5-9 10-14 130 82 16
15-19 361 33 ZS6 23 478 32
20-24 27 10 301 2S
25-Z9 5 44
30-34 16
35+ 21 9
qiqg't(
MANDSAUR
U'ft~ 5,453 2,921 92 26 3,517 1,251 All ages
0-4 5
6
7
II
9
5-9
10-14 1,121 1,021 10 5 5 21
15-19 3,797 1,81 7 40 21 1,905 1,012
20-24 480 41 10 1,497 198
2,5-29 20 21 5 93 S
30-34 10 36 10
35-L. 25 IS 26 41
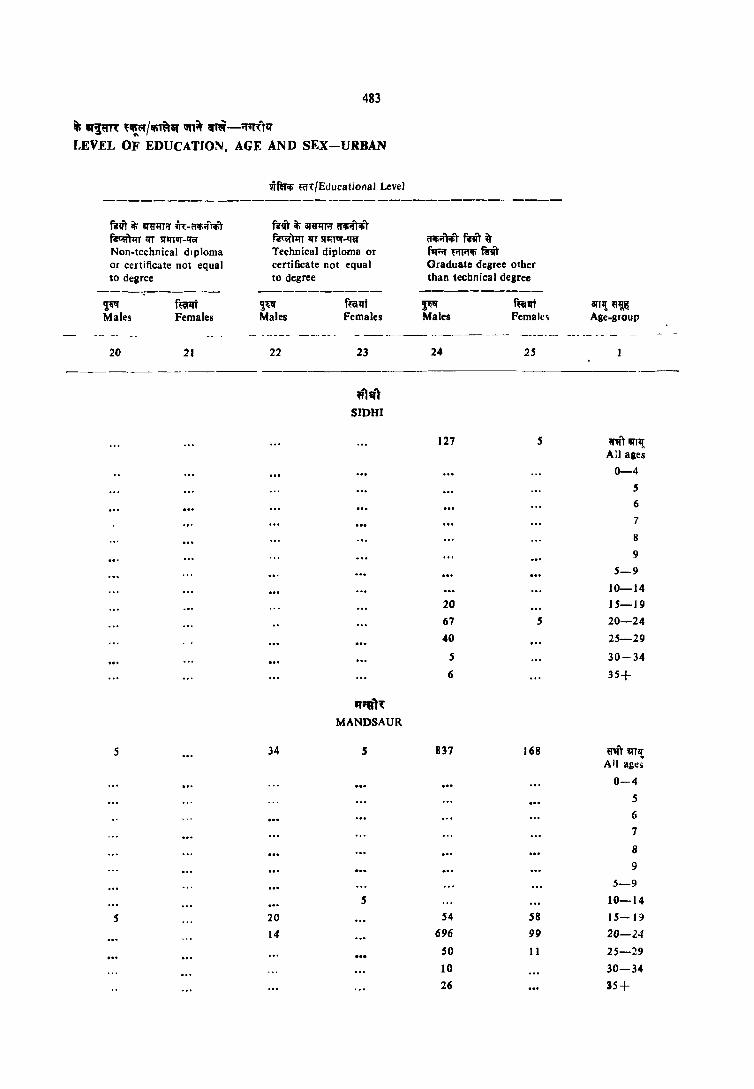
483
* "~m~ ~1II!.~/~iI' \il'l~ ~-I'Im:T'f LEVEL OF EDUCATION. AGE AND SEX-URBAN
fait it; i!I1I1WI' ~h-niliil"t;ir ~~T llT '!IlI1Uf-q'OI' Non-technical diploma or certificate not equal to degree
~ Males
20
5
S
f~ Females
21
wftrol; Hf,/Educational Level
~ifT it; ar~Ti!" ~T ~)IfT II'T lIIfTUf-q'OI' Technical diploma or certificate not equal to degree
~'{If Males
22
34
20
14
f«llli Females
23
~1q" SIDHI
q;w1~
MANDSAUR
S
5
nlf,ilf.t;r fctiT ~ f'l"""I' ~lIimft Graduate degree other than technical degree
F' Males
24
127
20
67
40
5
6
837
54
696
50
10
26
f~1Ii Femak~
25
5
5
168
58
99
11
iT!,! ,,~~ Age-llroup
W"TWIl!, All ages
0-4
5
6
7
8
9
5-9
10-14 15-19
20-24
25-29
30-34
35+
",,1 WIlT All ago:;
0-4
5
6
7
8
9
5-9
10-14
15-19
20-24
25-29
30-34
3S+

~rli ~~ Age-group
~1ft'~ All ages
0-4
S
6
7
8 9
5-9
10-14
J5-19
20-24
25-29
30--34
35+
~'Ift'~'1 Allagea
0-4 S
6
7
8
9
5-9
10-14 15-19
20-24
25-29
30-34 35+
484
rr-3 ~rr 16 W'i WrlRl6 ~, "''! ~ '.Up C-3 PART A ATTENDING SCHOOL/COLLEGE BY COMPLETED
wmlfi .:n:/Educational Level
fWt IJI' ma1i"tm: twVT ~ ~ ~ fWt 1fT ~r Technical degree or diploma equal to degree or po~t-graduate degree
6'~ tm U" f'lFf RT(I'lfi~ mIT Post.graduate degree other ~f.tqf~~ am: ~Ifo'rr.r~r
Engineering and technology ~m~ Medicine than technical degree
~ Malea
26
20
6
14
156
10
60 60 10
16
Females
27
2S
2S
58
47
10
~ Males
28
~ SIOHI
s
5
"""~ MANDSAUR
5
5
mtlfJ Females
29
~ Males
30
f~1ft Females
31
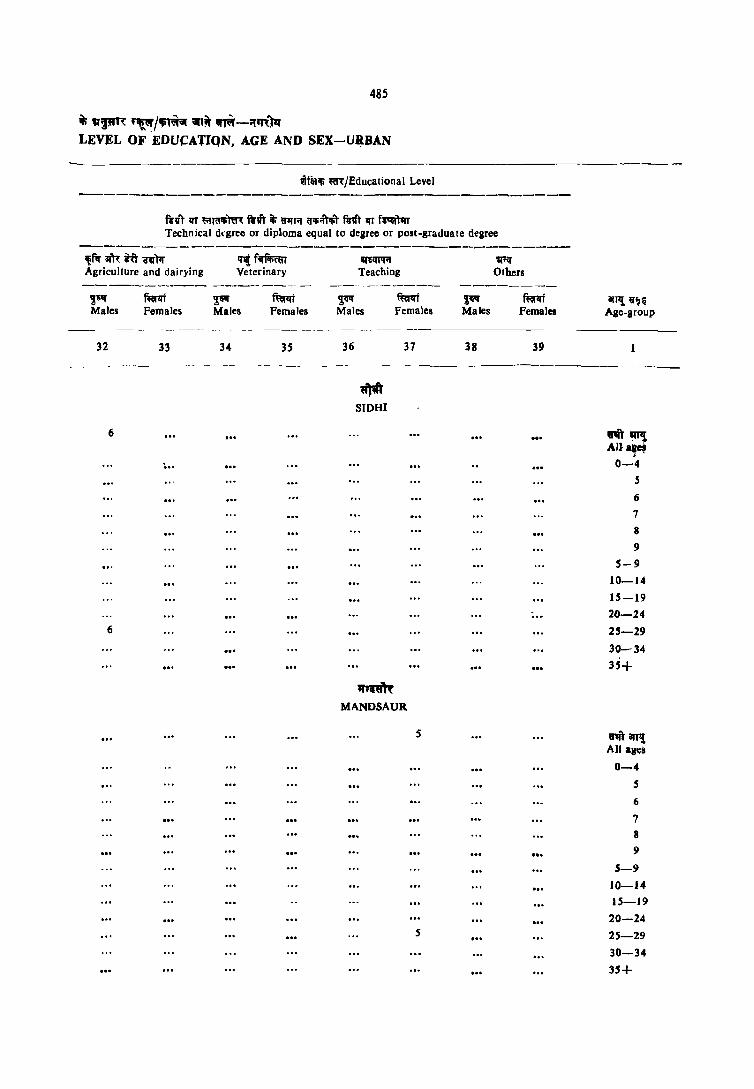
485
if; vpn: f~/iJi~ iill!f ~-if-n)q LEVEL OF EDUCATIQN, AGE AND SEX-U~BAN
wf"iIi m/Educational Level
MVT lIT ~m;nn: twit if; 9lI'rij a'ifi;JA;T NV) qr f~ Technical d.'gree or diploma equal to degree or post-graduate degree
----------------------------------------,rlf aft1: i"U \lW)1r Agriculture and dairying
~'{;lf
Males
32
fuf1fi Females
33
rnIr~m Veterinary
~ Males
34
~1:Jt Females
35
Q'51Jl1A Teaching
~ Males Females
36 37
~ Males
38
Q"'..q Others
ffirqf Females
39
arT'; ij'~q Age-group
-- ------------------- - ----_
6
6
~ SIDHI
~ MANDSAUR
...
s
5
:.;; 0-4
5
6
7
8
9 5-9
10-14 15-19 20-24 2!1-29
30-34 35+
mihrpt All ages
0-4 S
6
7
8
9
5-9 10-14 15-19 20-24 25-29
30-34 35+

486
"1-3 ;nIT ~ T'i ~f~ felt, "''! ,,'R ~)/~1!I' C-3 PART A ATTENDiNG SCHOOL/COLLEGE BY COMPLETED
._---------
''fl;f I if;l~ if ,,"if ifT~ fOI' ClfIiRr ~~mr Total persons attending f;r'{m: Total popu lalion School/College Illiterate
--------- ----------- -----------1Il'lq( ~ mrlli ~ RwIfT ~If ffirlfi Age-group MlI1es Females Males Females Males Females
-~---------~
2 3 4 5 6 7
--------------- - --~-
~'f
RATLAM
rn'l'Tl! 124,706 115,786 35,088 23,253 3,761 2,955 All ages
0-4 13,693 13,906 313 313 313 313
5 3,676 3,338 1,362 982 816 565
6 3,215 3,174 1,993 1,594 '879 622
7 2,499 2,998 1,95 I 1,872 527 538
8 3,775 3,692 2,955 2,435 459 437
9 2,329 2,510 2,013 1,844 198 169
5-9 15,494 15,111 10,275 8,728 2,879 2,331
10-14 16,303 15,278 13,381 9,479 494 297
15-19 14,299 12,831 8,204 3,905 59 j
20-24 12,716 11,055 2,325 644 5 -
25-29 9,438 8,885 278 83 j
30-34 7,914 7,054 63 rli 5
35+ 34,817 31,054 235 55 S .5
\iiiir.r
UJJAIN
l'I1ft wI! 220,098 198,574 60,975 40,765 6,704 5,351
All ages
0-4 25,350 25,185 887 766 887 766
6,B3 5,808 2,388 1,758 1,242 971
6 5,699 5,669 3,347 2,859 1,108 1,153
7 4,715 4,734 J,218 2,912 944 841
8 6,8 47 6,252 5,313 4,065 942 666
9 4,450 3,990 3,721 3,022 371 325
5-9 27,865 26,453 17,987 14,615 4,814 3,955
10-14 28,167 26,277 22,712 16,671 840 548
15-19 23,648 21,348 13,008 6,832 48 31
20-24 23,383 19,598 4.687 1,297 16 10
25-29 17,610 16,022 794 167 11
30-34 14,461 12,147 251 68 29
35+ 59,440 51,414 521 260 54 36

487
~~m: ik' 1'~/~~ \itA ~~-"If~)q LEVEL OF ~DUCATION, AGE AND SEX-UR.BAN
-- ------ --~- --- --__ -- --~. ----- ---- ---
1'imQ; mjEducational Level ------------
mt'\ (fm;r; m it; f1Ar). Literate (without educational level)
-----------------------arotW;n-ftiw ~ft1t; IITW-T Non.Pormal Formal Primary
---------- ------------ - _- - ------------~ n~1It ~111 mt 9;~ f~1It 8IP{ ~ Males Females Males Females Males Females Age.group
- -- ----.-"' -- _--- ---
8 9 10 11 12 13
_--- ------- - ----- - - --- --- ----- - -_--- - --------
l(ll'\iimI
RATLAM
277 187 12,552 9,453 8.280 5,606 ~,.~
All ages
0-4
46 21 500 39b 5
46 47 1,068 925 6
46 5 1,378 1,329 7
56 26 2,439 1,972 8
IS 21 1,588 1,5!9 213 136 9
209 121 6,974 6,141 213 136 5-9
41 57 5,188 3.207 5,994 4,618 16-14
10 5 3l'7 79 1,935 769 15-19
5 29 5 91 41 20-24
S 4 5 16 25-29
5 5 5 30-34
5 36 10 42 21 35+
~;r
UJJAIN
652 353 21,940 16,614 13,954 9,014 ~",. "''! All ages
0-4
46 37 1,100 iSO 5
112 47 1,927 1,658 6
36 32 2,238 2,039 7
n 63 4,298 3,336 8
36 37 2,826 2,248 482 412 9
302 217 12,390 10,032 482 412 5-9
182 90 8,689 6,212 1 C,348 7,398 10-14
98 37 563 182 2,822 1,088 15-19
40 48 21 156 42 20-24
II 30 40 15 25-29
20 19 5 30-34
S 103 110 78 37 35+

488
,,-3 ~ an T'i' ~et~ ~"l, 'fr~ ~ ~.fr/~ C-3 PART A ATTENDING SCHOOL/COLLEGE BY COMPLETED
-~----. -- --- _-- -- ---- ---- _--- - -- - - - --- ----- - - - _--- --- -- -
tfmr ttft/Educational Level
-------------------------------------~ ~vrn/~roft~1 flr-lJ:flf~rn
firfr.r ~tm/"u Hiaher Secondary/Inter-Middle Mat riculation/Secon dary mediate/Pre-University
---------_ .. ----------_ ----------~~ ~ f~1ft $'( mm ~ f~ Ale-group Males Females Males females Males females
_-----_- -- --.-- - --__ -_ ---
14 IS 16 17 18 19 --------
~ RhLAM
&1itwp{ 5,937 3,065 106 58 3,J63 1.465 All ages
0-4 5 6
7
8 9
5-9 10-14 1.634 1,274 20 J6 10 10
15-19 3,827 1,691 66 26 1,854 1,161
20-24 403 80 10 JO 1.165 257
25-29 26 15 5 92 16
30-34 10 5 5 10
35+ 37 10 37 10
;Jm UJJAIN
rit """It 8,925 5,252 285 216 6,453 3,107 All ages
0-4 .... S
6
7
8
9 5-9
ID-14 2,574 3,202 4l 58 36 58 ~
15-19 5,506 2,754 165 143 3,561 2,387
20-24 651 123 30 2,425 578
25-29 85 32 292 58
30-34 19 5 6 81 21
35+ 92 36 42 15 57 5

489
~ V~~ ~W/lr,~ ~;it '1'~-~~~ LEVEL OF EDUCATION. AGE AND SEX-URBAN
~f'l1ii1i ~(I1;JEducational Level -------------------------------------fm iF Clf61fTrr ii~·a"",'h!;T fnr !Ii iIl'~llW CliilirrTiiliT fuc\'!)lrr lIT lf1lT'II'-em Rc\'!)lrr lIT SlJfT"f-em C!iiliOfT'lfr fell'T ~ Non.technical diploma Technical diploma or f1fii! ~I C!iiIi fum or certific.le not equal certificate not equal Graduate degree other to degree to degree than technical degree ----------- --- --------- -----------~Ii ~ ~ mr~t ~ fnrlfi Jrll! ~ Males Females Males Females Males Females Age-group
----20 21 22 23 24 25
r'f"'" IlATLAM
46 734 361 «'"" ml{ All ages
0-4 5
6
7
8
9 5-9
10-14 10 119 142 15-19
35 446 199 20-24 80 34 25-29
47 30-34
42 4 35+
\i~~ UJJAIN
5 5 112 1,378 560 «'lit m>.r All agc~
0-4
5
6
7
8
9
.5-9
5 10-14 5 31 170 175 15-19
50 943 348 20-24
15 159 21 25-29
S ... 53 II 30--34
10 52 5 35+
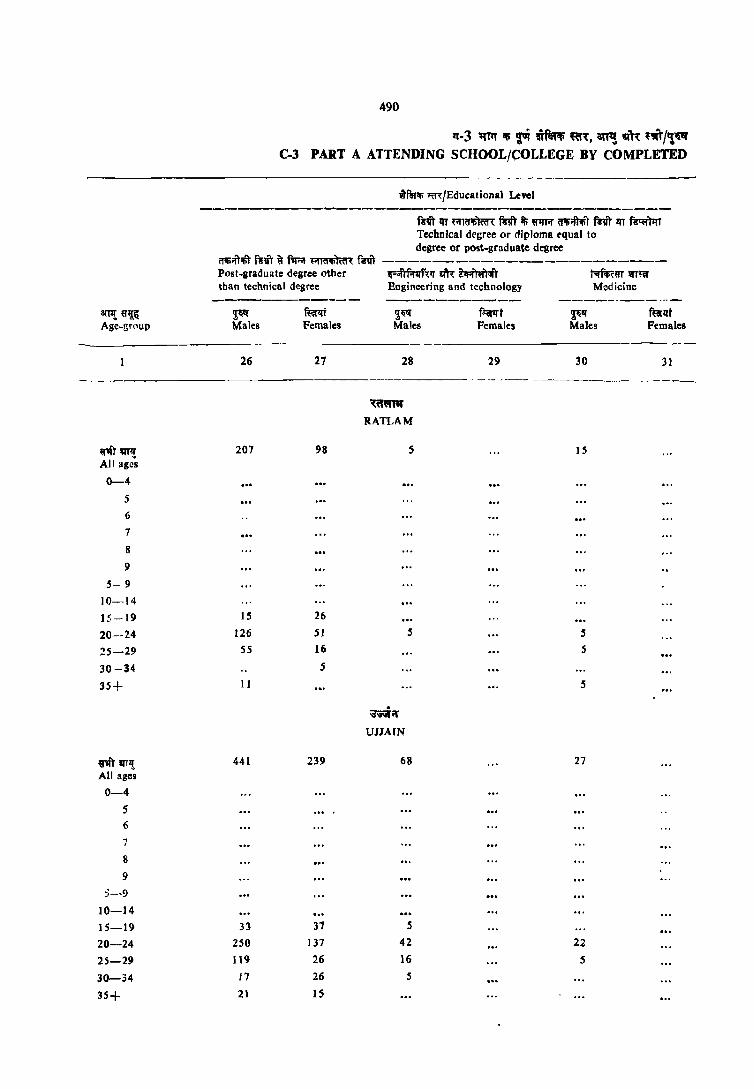
"T qrlf All age~ 0-4
5
6
7
8
9
5-9 10-14
15-19
20--24
25-29
30 -34
35+
V1it !lffl! All ages
0-4
5
6
7
8
9
:1-9
]0-14
IS-19
20-24
25-29
30-34
35+
490
1f-3 mtt ~ f'l ~ ~~, ant! 1A'1~ "wir/'!~ C-3 PART A ATTENDING SCHOOL/COLLEGE BY COMPLETED
fmifi ~/Educalional Level
f~VI' III "'mr~ fi1ft' il; ~ iAi;fR;1 ~VI' III f~M Technical dcgree or diploma tqual 10
degree or post-graduate degree i'I1Ii;:iTiIi\" fgVT ~ f'lr.''' f"'('IIfI)ffl( fm ------------------------Post-graduate degree other ~;;ftf;rm,>;~ '1'11: ~~ ~m' ~«r than technical degree Engineering and technology Medicine
~ Males
26
201
15
126
55
11
441
33
250
119
11
21
~ Females
27
98
26
SI
16
5
239
37
137
26
26
IS
~~ Males
28
~
RATLAM
S
5
68
S
42
16
5
f~t Females
29
~" Males
30
15
5
5
5
27
22
5
flia'qt Females
31

491
t sr~ ~~iElimQl QI'T;1 "1~-;:rf("{111 LEVEL OF EDUCATION, AGE AND SEX-URBAN
-- ---------- - ----- --- -----------------------~---------------
IIlm'l'i m/Educational Level
~m lIT ~m'li)«P: RIIT it; lJIflOf a'l'i;:rl<tit fS'IiTlIT fi'~ Technical degree or diploma equal to degree or post-graduate degree
,,!fir 'lh: i.T ~ Agriculture and dairying
Ti" Ralrt Males Females
--------- ---------
32 33
q"QT AAffil Ve~terinary
~" fum Males Pemales
34 35
ilf5lfl'lr-l' -r.t1' Teaching Others
~ Males
36
~R"lq
RATLAM
5
5
~;:r
UJJAIN
31
IS
10
5
fKl1lT Pemales
37
5
5
S4
38
IS
~ Males
33
RQQT
Fem~les
39
arTl! E!fl Age-group
~'" ""'Ii All ages
0-4 S
6
7
8
9
5-9 10-14
15-19 20-24 25-29
30-34
35+
~'IlT ami AI! age"'s
0-4 5
6
7
8
9
5-9 10-14
15-19 20-24
25-29 30'-34
35+
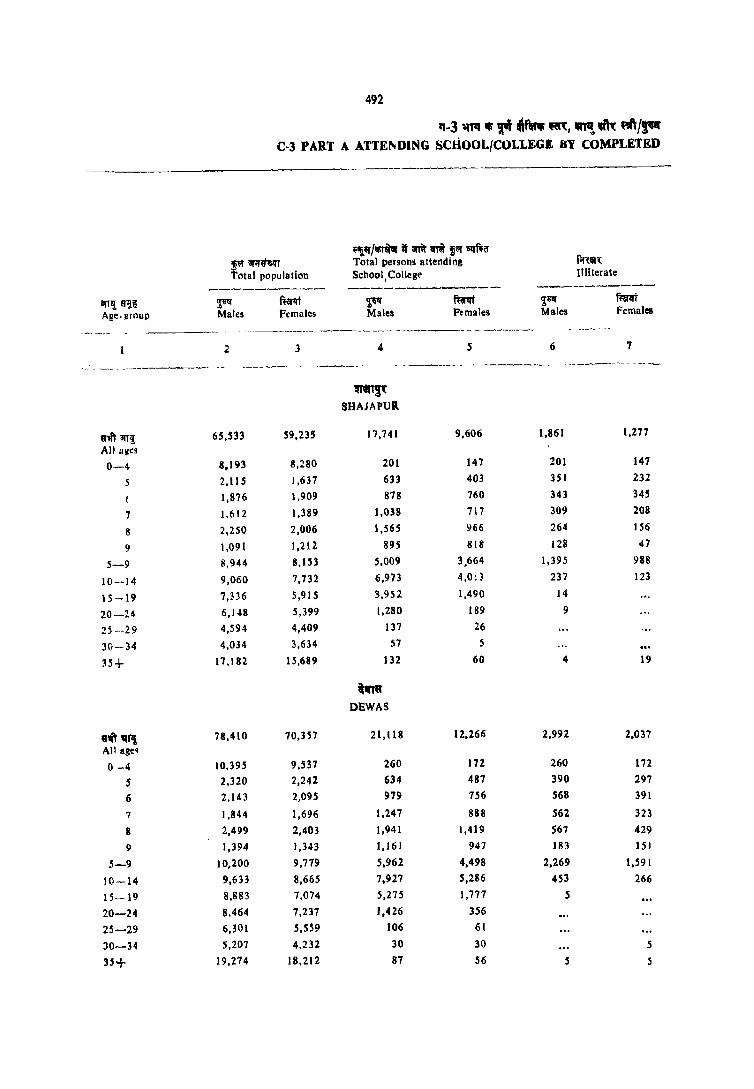
492
11-3 ~ $ '" ,,1ft ~, ~ ~ ""IsC-3 PART A ATTE~DlNG SCHOOL/COLLEGE 8Y COMPLETED
~\~/~ it il!lit IIlW ~~ ilfflttl fir(., PI iiA~'1lT Total persons attending Total population School, College Illiterate
------------------~-- --------------ISHii 6lJ.1! ~ mrq; ~ mt $~ flalrt Aile- group Males Females Males Females Males Females
,- ----------- --_,-------, -------2 3 4 5 6 7
~ --- - _-------- ----- - ---------- - - -- -
moS( SHAJAPUl
~,ft ar!9; 65,S33 59,235 17,741 9,606 1,861 1,277
All ages
0-4 8,193 8,280 201 147 201 147
5 2,11 S 1,637 633 403 351 232
( 1,876 1,909 878 760 343 345
7 1.612 1,389 1,038 717 309 208
8 2,250 2,006 1,565 966 264 156
9 1,091 1,212 895 818 128 47
5-9 8,944 8,153 5,009 3,664 1,395 988
10-14 9,060 7,732 6,973 4,0: 3 237 123
15-19 7,B6 5,915 3,952 1,490 14
20-24 6,ln 5.399 1.280 189 9
25--29 4,594 4,409 137 26
30-34 4,034 3,634 57 5
~5+ 17.182 15,689 132 60 4 19
t~ DEWAS
,'Ii\' "1'\ 78.410 70,357 21,118 12.266 2,992 2,037
All ageq
0-4 10,395 9,537 260 172 260 172
5 2,320 2,241 634 487 390 297
6 2,143 2,095 979 756 568 391
7 1,844 1,696 1,247 888 562 323
8 2,499 2,403 1,941 1,419 567 429
9 1,394 1,343 1,161 947 183 151
5-9 10,200 9,779 5.962 4,498 2,269 1,591
10-14 9.633 8,665 7,927 5,286 453 266
15-19 8,883 7,074 5.275 1,777 5
20-24 8,464 7,237 1,426 356
25-29 6,301 5,559 106 61
30-34 5,207 4.232 30 30 S
3~+ 19,274 18.212 87 S6 S 5

493
itt .~,,~ ./*'0 ani'!' ~-~m LEVEL OF EDUCATION, AGE AND SEX-URBAN
fifetifi m/Educalional Level
------------mf' (ffWI; ~ it; f.;n)* Literate (Wilhout educational level)
--------------------ar;fttmftlt; ~m; 51T~1 Non-Formal Formal Primary
--------- ------ ----- ------------Ft f~ Ft ffillft ~ ftwllt 1ITIl~ Males Females Males Females Males females Age_group
-~ -_ - - -,- . - . -- _- _- __ - _- ------ ----_-.-
8 9 10 '11 12 13
-----. --- ------_-----_.
~ SHAJAltUR
218 81 6.566 4.256 4.363 2.230 ntilTll All ages
0-4
45 S 238 166 5
45 19 490 396 6
3S 14 694 495 7
30 5 1,272 805 8
IS 14 683 647 69 109 9
168 57 3,377 2.509 69 109 5-9
20 19 2.933 1.642 3,210 '1,833 10-14
15 204 73 1,000 269 1.5-19
10 12 5 37 20-24
5 6 5 15-29
11 5 6 30-34
S 25 13 36 14 35+
~ DEWAS
78 45 7,393 4,924 4,891 2,849 nt tn'l! All ages
0-4
5 244 185 .5
10 5 402 360 Ii
10 5 675 560 .,
29 IS 1,345 975 8
10 895 70J 73 95 9
59 30 3 • .561 2.782 73 95 5-9
15 10 3,499 2.028 3,242 2,293 10-14
S 272 60 1,485 441 U-J9
5 4 70 10 20-24
5 5 5 25-29 30-34
5 11 15 21 5 35+
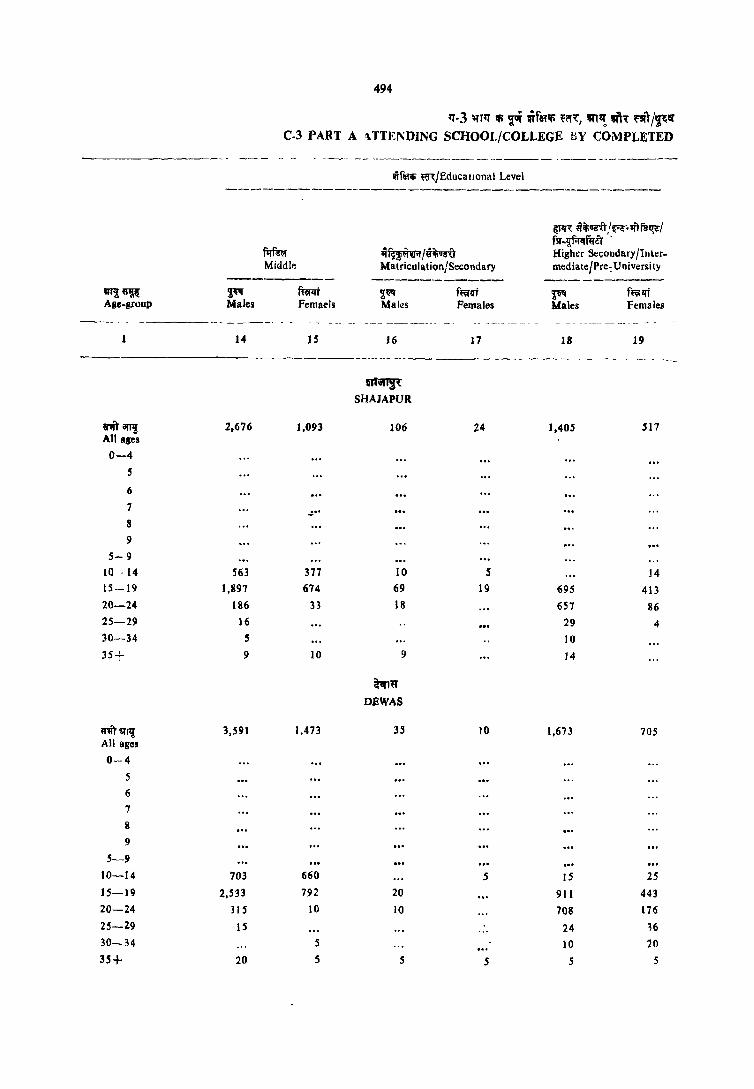
494
tT-3 'l=fTtT '" ~ IiTffflfi ~('f~, "l~ ,,'h 'f~1/'r<rl C-3 PART A -\ TTE]'I\DING SCHOOL/COLLEGE BY COMPLETED
- - ---- - - ------ -- ----------------~----.-------- .~-------------
';f~ 'fCll:/fducallonal Level ------------------------------------------
~T~g d~Qro!~~;1ft~~1 fsr-lJ;f"!l:fQ"it '
f1rfr.r ~f~/j~q-Q Higher Secondary lInter. Middle Matriculation/Secondary mediate/Pre: University
--------- ------------ ----------'"~~ ~ f~ ~~ f~1Ii ~ f~qi Age-group Males Femaeli Males Females Males Females
----- --- -------. ----- -----_-- - ----_ -_--
14 15 16 17 18 19 -_--- --~ --- -------- _ _ -_- - - -_ _--- -
Uf~ SHAJAPUR
~tft <Ill! 2,676 1,093 106 24 1,405 517 All ages
0-4 S
6 7 ... 8
9
5- 9
10 - 14 563 377 10 S 14 15--19 1,897 674 69 19 695 413
20-24 186 33 18 657 86 25-29 16 29 4 30-34 5 10 35+ 9 10 9 14
"1~ DEWAS
mil srrl! 3,59] 1,473 35 10 1,673 705 All ages
0--4 :;
6
7 8 9
5-9 10-14 703 660 5 IS 25 15-19 2,533 792 20 911 443
20-24 JlS 10 10 708 176
25-29 IS 24 ~6
30~34 5 10 20
3.5+ 20 5 S 5 S 5

495
it; ~~~'l' ~t;'/~ ~ ~~-"''R~ I.EVEL OF Et UCATION. AGE ANO SEX-URBAN
frir it; II'!Ilfr" irt -lIIp,JT"')' f'Alm Iff 5I1IfIIT em Non-technical diploma or cel tificate not equal 10 degr~e
~ mm Males Females
wf~1!i «rt!Educational Level
fi'it it; !q'qlftor ~ f~)ltt lIT ~GT em Technical diploma or .;:ertificate not equal to degree
~ Males
f«nrt Females
-.-------.~-----.------
. 20 21
5
5
22
11
5
6
32
S 17
5
5
23
Ulinl~ SHAJAPUR
~ DEWAS
~~lfirfmv f1rr;r ~l(l'll; mIT Graduate degree other than technical degree
2:~ Males
24
409
49
294
47
14
5
300
34 209
32 10
IS
FemaleS
25
80
30
47
4
135
36
93
5
iI1It ~ Age-group
1
rit~ All agel
0-4 5
6
7
8 9
5-9 10-14
15-19
20-24
25-29 30-34
3S+
If.n- lUll" All ages
0-4 5
6
7
8
9
5-9 10-14
IS-19
20-24
25-29 30-34
35+
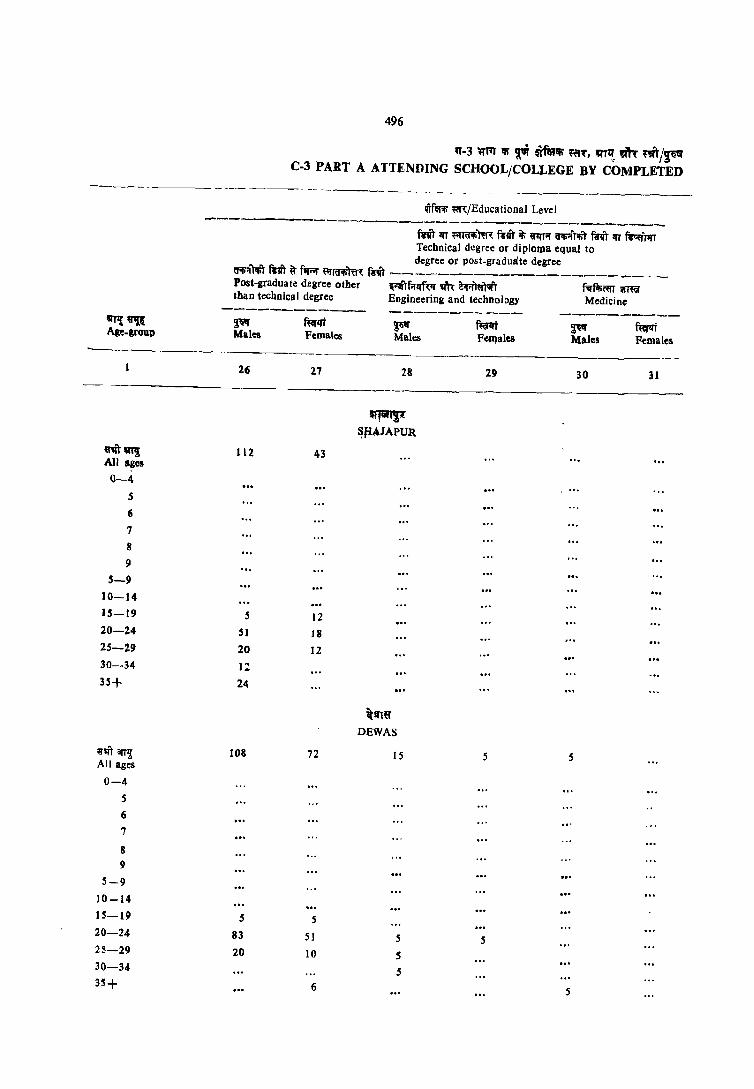
-----------
496
'1-3 lI"'T !fi' ~..r «flRlfi' ~'" '"~ an ~m/~ C-3 PART A ATTENDING SCHOOL/COLLEGE BY COMPLETED
- ----- ---_- -- -----_ tfn t(f~:jEducalional Level
----------------------------------------
IIITI! tI1i( Age-group
rit~ All ages
0-4 S
6
7
8
9 5-9
10-14
1S-19 20-24 25-29
30--34
35+
~'IlT art1 All ages
0-4
5
6
7
8
" 5-9 10-14 15-19
20-24
25-29
30-34
35+
mit 1fT ",ra-!im~ ~ir it ;alfI~ ~"t~ frit Iff ~)1rr Technical degree or diploma equal 10 degree or post-graduate degree
00Ii~"'Ift fflit i!t fll"f ~rtrli)m: frit - _____________________ _ Post-graduate degree other ~;:;ftf;"rf~ ~ ~;;r"t f'iffil;ffiT WffiI' than technical degree Engineering and technology Medicine
------------~ Males
26
112
5
51
20 11
24
108
5
83
20
ffirlJi Females
27
43
12
18
12
72
S
51 10
6
~I!T Males
28
1ITJIfJ1!£ ~JiAJAPUR.
~.,'" DEWAS
IS
5
S
5
ftnt FtJllales
29
5
~ Males
30
\ ...
5
5
~ Females
31

497
Ii !Q':JWT~ '~/IIiT~iiI' ~ ,"~-if"'~ LEVEL OF EDUCATION, AGE AND SEX-URBAN
Wfllllfi m/EducatJonal Level
fi'it lIT ~I(f1IiTffi: miT if; EIl'IA m;il" fi''1r qr ~T Technical degree or diploma equal to degree or post-graduate degree
----------------------------------------'lJflf arn: ~U ~ ~ fqfifRij'r Agriculture and dairying Veterinary
---------- --------~lf mt ~ ~ Males Females Males Females
32 33 34 35
, ...
~6l:ITq;:r
Teaching
------.----,!lilf f~f Males Females
36
'$l~'{
SHAJAPUR
6
6
tifT~ OEWAS
37
s
5
11
5
6
arrlf Others
---------~ fuiv:t Males Females
38 39
'tT!l! ~ Age-group
"r~ All ages
0-4 S 6
7
B
9
5-' 10--14 15-19 20-24
25-29
30-34
35+
"lm~ All ages
0-4
5
6
7
8
9
5-9
10-14
IS-I!)
20-24 25-29
30-34
35+
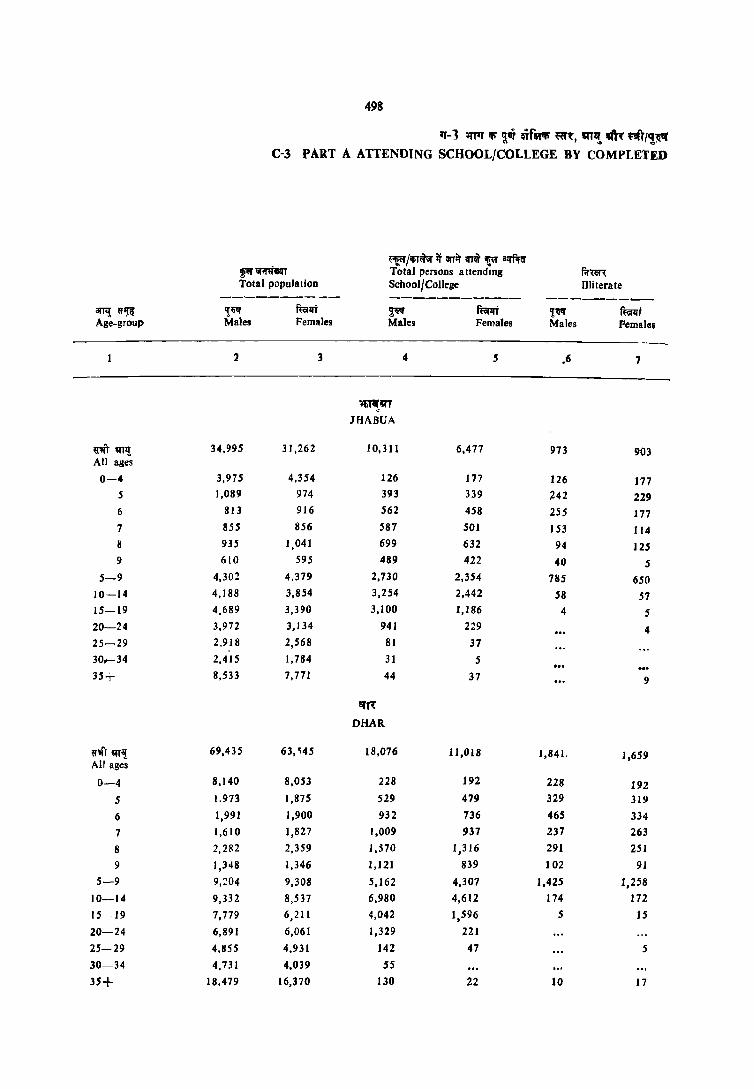
arIl! fI~ Age-group
~ ml! All ages
0-4
5
6
7
8
9
5-9
10-14
15-19
20-24
25-29
30..-34
35+
tf.{t ml! All ages
0-4
5
6
7
8
9
5-9
10-14
15-19
20-24
25-29
30-34
35+
498
IT-3 ;rrIT ifi ~uf if'llli «ft, "'I!. llitt ~T I'!~ C-3 PART A ATTENDING SCHOOL/COLLEGE BY COMPLETED
~~/~~ i't ..,.it ~ ~ i~m ~~"IIT Total persons a ttendmg f.r~ Total population Schoolj College lIliterate
---------- ----------- ---------'f~ ~Ifi ~ ~Ifi '1" ffiM Males Females Males Females Males Pemales
2 3 4 5 .6 7
~'~iIfT JHABUA
34,995 31,262 10,311 6,477 973 903
3,975 4,354 126 177 126 117 1,089 974 393 339 242 229
813 916 562 458 255 177 855 856 587 501 153 114 935 1,041 699 632 94 125 610 595 489 422 40 5
4,301 4,379 2,730 2,354 785 650 4,188 3,854 3,254 2,442 58 57 4.689 3,390 3,100 1,186 4 5 3,972 3,134 941 2~9 4 2,918 2,568 81 37
2,415 I, 784 31 5
8,533 7,771 44 37 9
~"" DHAR
69,435 63, ~45 18,076 11,018 1,841. 1,659
8,140 8,OB 228 192 228 192 1.973 1,875 529 479 329 319
1,991 1,900 932 736 465 334
1,610 1,827 1,009 937 237 263
2,282 2,359 1,570 1,316 291 251
1,348 1,346 1,121 839 102 91
9,204 9,308 5,162 4,307 1,425 1,258
9,332 8,537 6,980 4,612 174 172
7,779 6,211 4,042 1,596 5 15
6,891 6,061 1,329 221
4,855 4,931 142 47 5
4,731 4,039 55 18,479 16,370 130 22 10 17
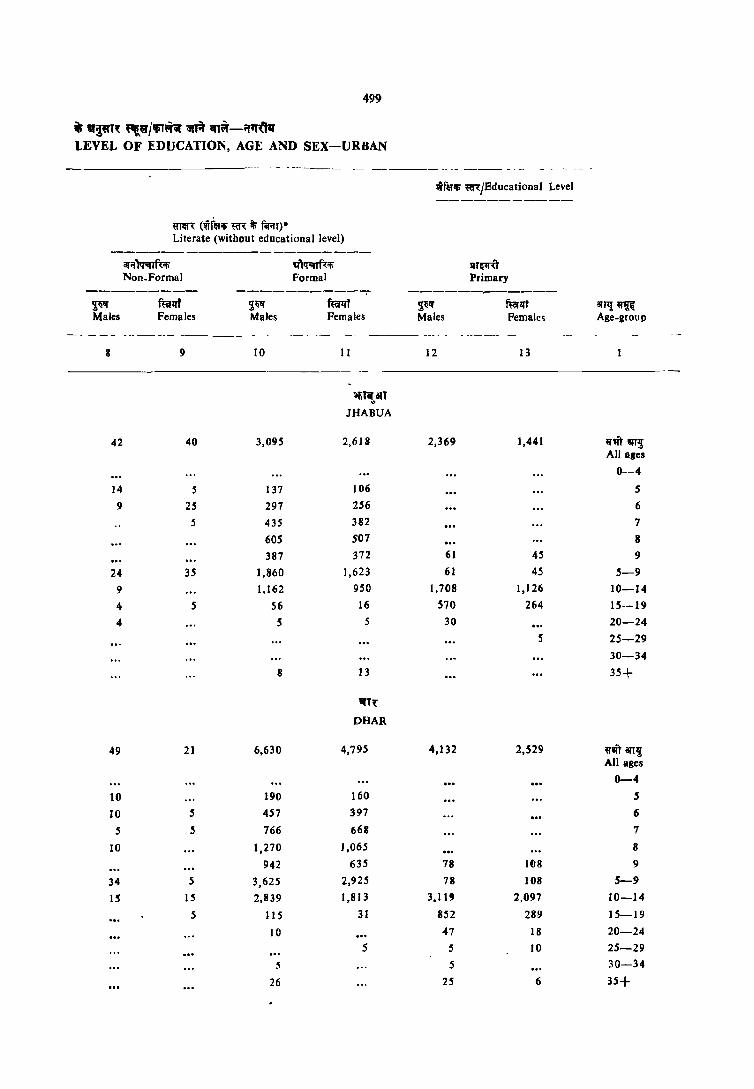
499
•• lWT~ "lif/lfiTn ~ ,"~-Pf* LEVEL OF EDUCATION, AGE AND SEX-URBAN
- - - --- ----- --- ------ -__ - -_- - --- -- - -- -- -
IiflHlIi mJEducational Level
-----------'1m<: ("4ifet~ ~ it; fil'lW Literate (without educational level)
---------------------arif~ q'If:;ffi'l;~ SIT~ Non_Formal Formal Primary
--------- ------------;- ------------~ futlff $W mf iii" mrlft an~~ Males Females Males Females Males Femalc~ Age-group
-_ ----- ------_ --------- ---------
8 9 10 11 12 13
~~"T JHABUA
42 40 3,095 2,61 S 2,369 1,441 um!IIT! All ages
0-4
14 S 137 106 S
9 2S 297 256 6
5 435 382 7
60S 507 8
387 372 61 45 9
24 35 ],860 1,623 61 45 5-9
9 1,162 950 1,708 1,126 10-]4
4 5 56 16 570 264 15--19
4 S 5 30 20-24
5 25-29
30-34
8 13 35+
'1T~
DHAR
49 2] 6,630 4,795 4,]32 2,529 ~1iT arr~ An ages
0-4
]0 190 160 5
10 5 457 397 6
5 5 766 668 7
10 1,270 1,065 8
942 635 78 108 9
34 5 3,625 2,925 78 108 5-9
IS I5 2,839 1,813 3,11' 2,097 10-14
5 liS 31 852 289 15-19
10 47 18 20-24
S 5 10 25-29
~ 5 30-34
26 25 6 35+
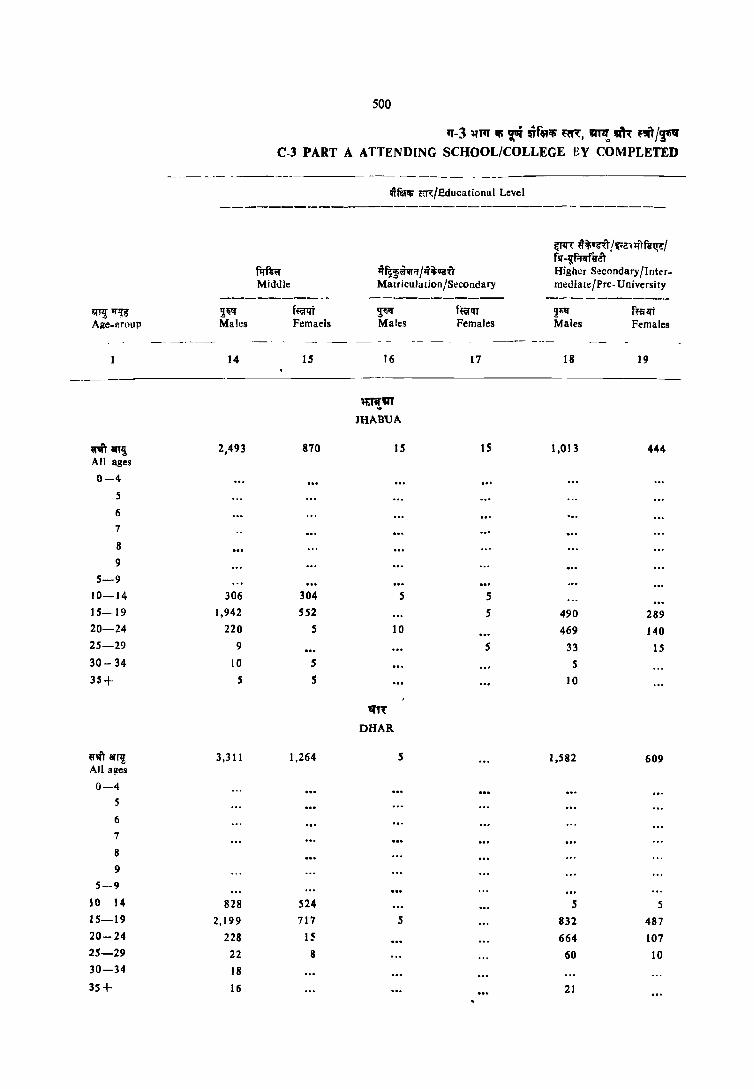
~~ Age-llfl1up
~an~ All ages
0-4
5
6 7
8 9
5-9 10-14 1S-19 20-24 25-29
30- 34
35+
~m arl1 All a!les
0-4 5
6
7
8 9
5---9
10 14 15-19
20-24 25-29 30-34
35+
500
"-3 ~'" I!fi ~ ~f"q; ~~, ~ ah ~-ir/'F'C-3 PART A ATTENDING SCHOOL/COLI,EGE HY COMPTJETED
w~ liCl1:!Educational Level
~ ~ifuro!iJe,~1fgo/-!
fl:rmr 1l~~"Wif I~ifq-u fsr-~f~f~iT High':f Secondary IInter-
Middle Matriculation/Secondary mediate/Pre- University
--------- ----_._--_-- ----------2:~ fffillt ~ f~!n IJl;1f fmlft Males Femaels Males Females Males Females
--- ---- ------ _--- ----
14 IS 16 17 18 19
~~aT
JHABUA
2,493 870 15 15 1,013 444
306 304 5 5 1,942 SS2 5 490 289
220 5 10 469 140 9 S 33 15
10 5 s 5 s 10
tI',t
DHAR
3,311 1.264 S 1,582 609
828 524 5 5
2,199 717 5 832 487 228 1~ 664 107 22 8 60 10 18
16 21
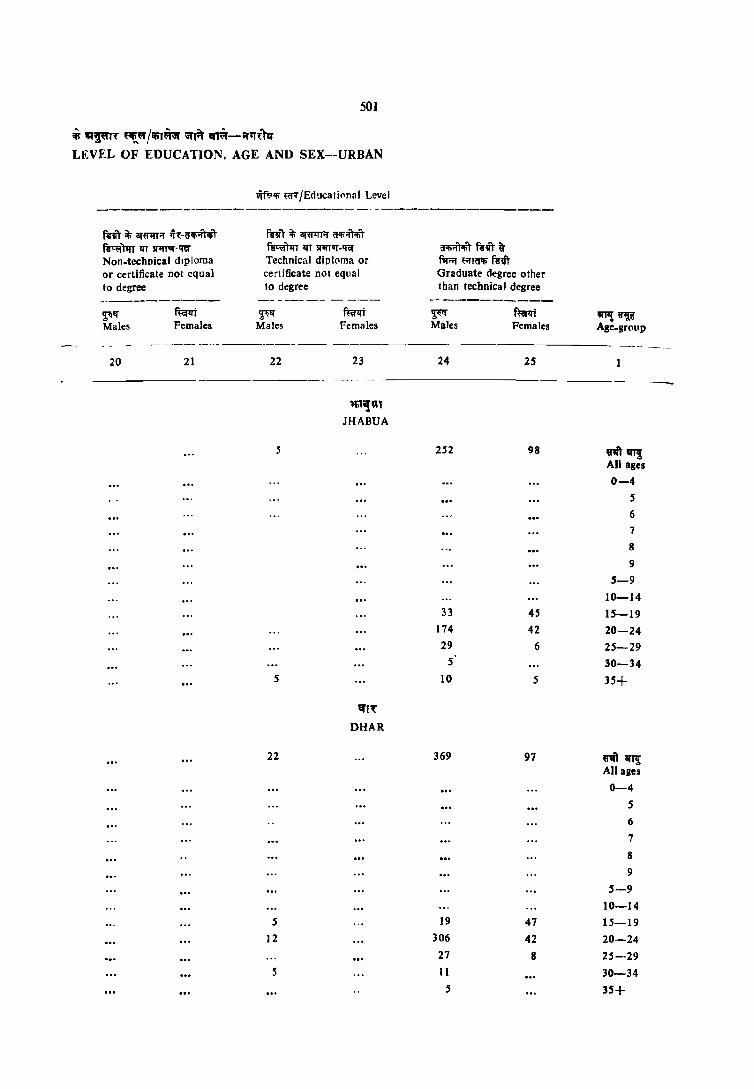
501
is IA~ ",!\=f /rJ(ifir;( ~ ~-If,,-.:b:r
LEVEL OF EDUCATION, AGE AND SEX--URBAN
~r'!''ti ~<Il'/Edllcafil'nal Level
fcit ~ ar~~ ~h-<r~ fi'~i ~ ilHPlT;r a'ti~"t""'" f1"~)1rr If! 5I1fI'VI'- 'RI' frt~ If! SI1!1"T-'RI' ~""'" fi'oft ~ Non-technical dIploma Technical dipl(lma or "'"' ~1<r'ti fi'oft or certificate not eQlIal certificate not equal Graduate degree other to degree to degree than technical degree
----------~--- -- -_-_-- -- - _--_ _-----------~I!f mrl1i '!'i" ft.f~t ~ f~11i III'P! ~ Males Females Males Females Males Pemales Age-group
- ----- ------------- --- ---------- - --------20 21 22 23 24 25
~~QT
JHABUA
5 252 98 U1i\"~ All ages
0-4
:I
6
7
8
9
5-9
10-14 33 45 15-19
174 42 20-24 29 6 25-29
5 30-34 S 10 5 35+
"T~ DHAR
22 369 97 U1i\"~ All allcs
0-4
5
6
7
8
9
5-9
10-14
5 19 47 15-19
12 306 42 20-24 27 8 25--29
5 II 30-34
5 35+
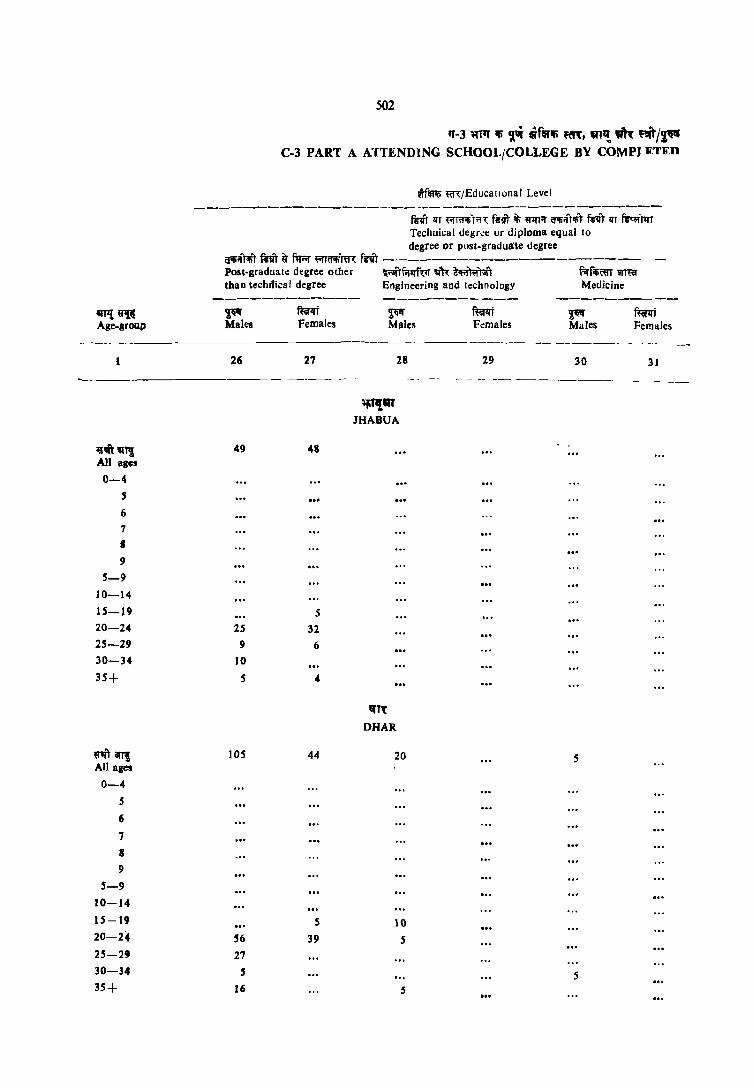
~~ Age.group
502
"-3 l{TtT iii 'lwi ~f.1Ii f(R, '"~ .m n"/'I." C-3 PART A ATTENDING SCHOOL/COLLEGE BY COMPJ·""·TRD
mlliofi ~/Educallonal Level
----------------------------------------mfr Ifr ~Hf'ti).n: feliT it; U1I1;r' tflIi;ft'l'iT mT If! ~)lrr Technical degn:e or diploma equal 10
degree or post-graduate degree ijIIiijf.t;T 1m' ij' f'li"f ~tJiii:Rr'l: fnr ---------------------Post-graduate degree other ~f.llff'i;ll m ~~T fiffificQT !IIffif than techdical degree Engineering and technology Medicine
F' Males
ffiflfi Females
F' Males
fum F.:males
F' Males
fti1rt Females
_. -----_._---------1
----------
.~~~ All ag~
0-4 S
6
7
• 9
5-9 10-14
15-19 20-24 25-29 30-34
35+
n'iIII1 All ages
0-4
5
6
7
8
9
5-9 10-14
15-19
20-24
25-29 30-34
35+
26
49
2S 9
10
5
105
56 27
5
16
27
48
5
32
6
4
44
S
39
28
~'i{81' JHABUA
"'It DHAR
20
10
5
29 30 31
5
5
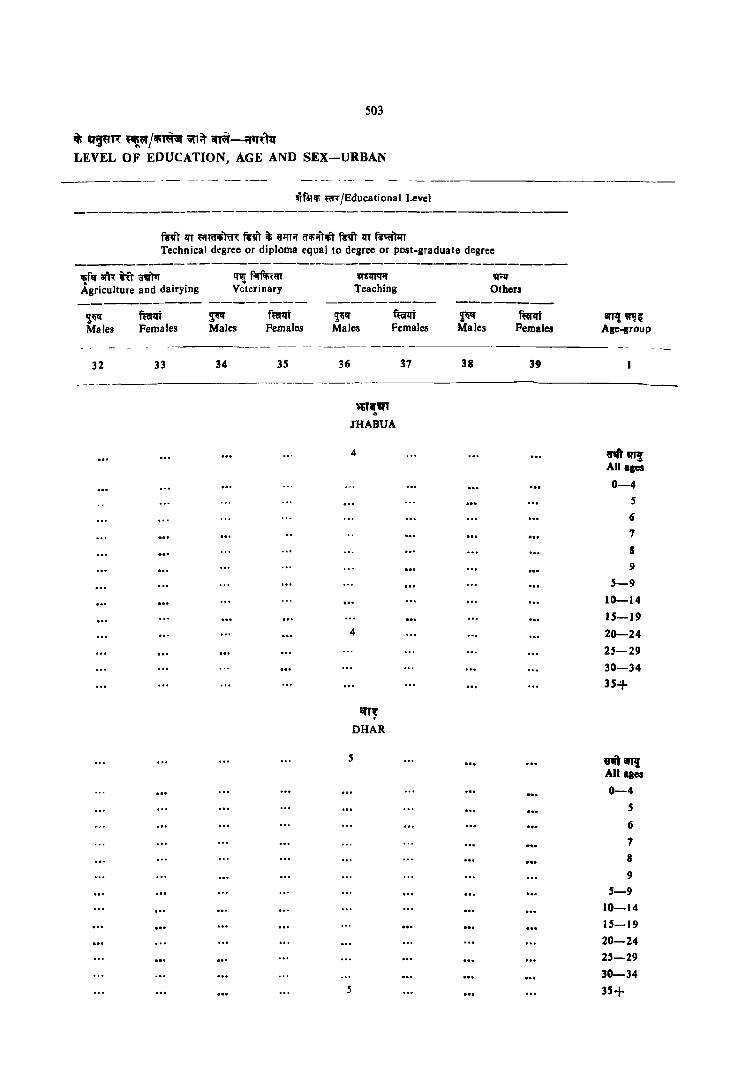
503
~ ~"'T~ "t\lfJIfiOOr \iI"~ ,n#-iflTl:", LEVEL OF EDUCATION, AGE AND SEX-URBAN
----------------~fe:t'fi ~/Educational Level
R'vr 1fT tilre;ire<: fi'VT it; ~1fTif a'fiifrilft R'vr 1fT r~~ Technical d~gree or diploma equal to degree or post-graduate degree
~f~ am: ifr ~ Agriculture and dairying
IfW f.;rilr;('iIT Vc"terinary
---------- --------~~ Males
32
Females
33
~ Males
34
Females
35
Teaching
~~ Males
36
~Ift Females
37
JHABUA
4
4
"T": DHAR
5
5
~ Males
38
!APII' Others
Females
39
8I11l ~n Age..group
nt"'! All ages
0-4 5
6 7
8
9
5-9
10-14
15-19
20-24 25-29
30-34
35+
l1itillTl! All lies
0-4 S
6
7
8
9
5-9
10-14 1S-19 20-24 25-29
30-34
35+

al'lli "'~e: Age-group
V'it1fT! Allaps
0-4
5 6
7
8
9
5-9
10-14
15-19
20-24
25-29
30-34
35+ .
"''" 1rT~ All aps
0-4
5
6
7
8
9
5-9
10-14
15-19
20-24
2~-29
30-34
35+
504
1T-3 .,llf iii ri jfIRlfi \=~, ~ ~ m/~ C-3 PART A ATIE!'tDING SCHOOL/COLLEGE H\' COMPLETED
~~<;/i!il~;;r it ~ ~ ~<; 6Iff1tn ~ ilI';rI;RIl"T Total persons attending fifUl<: Total population School/College Illiterate
---------- -------------- ----------~" fteJlfI ~ ft9JIfT rn" f~1fT Males Femdles Malc.> Female.~ Males Females
2 3 4 5 6 7 --_---- ---- - ---_-- -- ------ ------- -- - - ---
,,;n, INDORE
493,676 435,752 137,324 97,866 12,000 10,064
53,601 55,379 2,552 2,193 2,552 2,193 12,963 11,920 5,270 4,411 2,386 1,977 11,917 12,268 7,384 6,520 2,339 1,900 10,522 10,409 1,173 6,976 1,769 1,365 14,071 13,141 11,253 9,508 1,379 1,265 8,883 8,701 1,565 6,860 462 479
58,356 56,438 39,245 34,275 8,334 6,987 58,257 52,823 47,928 37,333 956 693 55,104 46,420 30,225 17,577 48 58 55,917 47,228 12,570 4,410 10 42,859 38,139 2,176 720 10 35,161 27,270 738 314 5 20
133,739 111,466 1.393 587 81 93
-nl'iflf A"" WEST NfMAR
126,446 114,730 32,3 10 20,134 2,542 2,421
15,007 15,272 251 269 251 269 3,741 3,646 843 749 509 495 3,647 3,747 1,623 1,487 724 690 2,691 2,964 1,678 1,544 436 430 3,758 3,942 2,503 2,287 286 237 2,384 2,621 1,886 1,722 100 142
16,221 16,719 8,533 7,789 2,055 ],995 16,443 15,601 12,139 8,471 115 142 15,149 11,603 8,013 3,143 25 14,704 10,242 2,818 307 5 5
9,532 8,705 315 33 8,038 6,995 SO 26
31,285 29,488 ]77 46 21 11
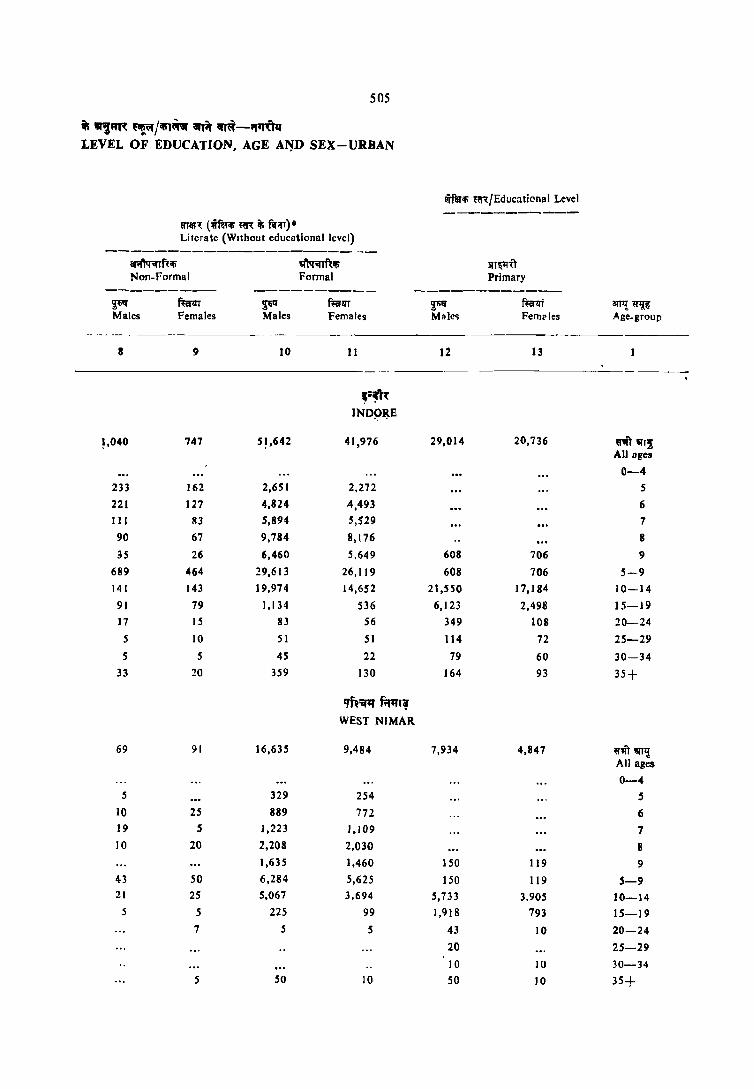
505
~ "~m ~/~~ iltit Cf~-or'Rfq LEVEL OF EDUCATION, AGE A~D SEX-URBAN
Jijfllfifi ~'/Educational Level
-----------{fllll, (mlllifi ~ ij; ~;rl)* Literate (Without educational level)
-------------------- ---ar.r'lt!;;nft ifi ~Rifi 5n~ft Non-Formal Formal Primary
--------- ----------- ------------~ frc!ll'T Fi fuilqr ~ mrlft ~~ Males Females Males Females Male~ Fem;;les Age-group
-- --- -- - ----
8 9 10 II 12 13
--------------- - ---~;~
IND~~E
~,040 747 5,,642 41,976 29,014 20,736 U'lT 1Ir1~ All ages
0-4
233 162 2,65 I 2.272 5
221 127 4,824 .4,493 6
111 83 5,894 5,529 7
90 67 9,784 8,176 8
3S 26 6,460 5,649 608 706 9
689 464 29,613 26,119 608 706 5-9
141 143 19,974 14,652 2 t,5 SO 17,184 10-14
91 79 1,134 536 6,123 2,498 I !i--19
17 15 83 56 349 108 20-24
5 10 51 51 114 72 25-29
S 5 4S 22 79 60 30-34
33 20 359 130 164 93 35+
IJf,'iA for"" WEST NIMAR
69 91 16,6B 9,484 7,934 4,847 «'fiT 1IrI11 All ages
0-4 5 329 254 5
10 25 889 772 6 19 5 1,223 J ,I 09 7 10 20 2,208 2,030 II
1,635 1,460 150 119 9 43 SO 6,284 5,625 150 119 5-9 21 25 5,067 3,694 5,733 3,905 10-14
5 5 225 99 1,918 793 15-19
7 5 5 43 10 20-24
20 25-29
10 10 30-34
5 50 10 50 10 35+

506
'l' -3 ~llT iti ~qj !ilf~iti f(f(, "'ll! Qlt nrr I'!'iq C-3 PART A ATTENUING SCHOOL/COLLEGE BY COMPLETED
IITf~", f1l1: IEducalional Level
------------------------------------
I!rlll:l:T~T/~~f fll'-¥f.r~fiT
f'lROI' ll~fOTQfij fU~U Higher Secondary lInter. Middle Matriculation/Secondary mediate/Pre-Unrversity
---------- ---------- ----------3f1T{ ill~ lj;~ ~1If ~~ f~ ~~ mm Age group Males Females Male_ Females Males Females
14 IS 16 17 18 19
~ INDORE
rit·'""! 21,268 12,321 537 279 15,260 8,790 All ages
0-4 5
6
7
B
9
5-9
10-14 5,151 4,455 78 69 77 137
15-19 13,892 7,333 241 130 8,065 6,228
20-24 1,720 306 80 27 6,000 2,056
25-29 230 130 10 25 737 177 30-34 103 37 5 II 203 110
H-r 161 62 122 15 173 78
mqf~
WEST NIMAR
• IJ'fT ~ 5,766 2,262 26 20 3,468 858 All ages
U-4 •• i
5
6
7
8
9
5-9
10-14 1,092 675 7 IS 33 15
15-19 4,102 1,513 19 1,918 691
20-24 SJO 65 1,692 129 25-29 21 97 17
30-34 5 S 12 6
35+ J 5 10 15

507
t lA'iWR ~/1ti~ ~ cml-Of~nr LEVEL OF EDUCATION. AGE AND SEX-URBAN
wmlfi" ool:/Educational Level
n-m- it; ~~ri{ h-~lfi"if')-ifiT mrr it; ~""Tif ij1fiif'T<!i1 ~tOl]lrr 1fT 5[J!T1IT ~ f~T 1fT II'1fTIIT ~ ~1Ar.tt mit ~ Non.technical diploma T~chnical diploma or r'T", ~T~lfi" mrr or eel tificate not equal .::ertificate not equal Graduate degree other to degree to degree than technical degree
---------- ---------- ----------~ f~t ~~ ffa1li ~~ ffirlfT arT!! ~~ Mdles Females Males Females Males Females Age-group
- -~- - ----- ---_--- --_---------- -
20 21 22 23 24 25
~;~
INDORE
17 312 10 4,436 2,2U 'f1l'T'OTTlJ; All ages
0-4
S
6
7
8
9
5-9
10-14 58 5 493 647 15-19-
12 172 5 3,124 1,372 20-24 5 44 5 4 133 25-29
16 139 15 30-34 21 106 51 35+
qfftq'~ WEST NIMAR
43 7 645 107 "1m!! All ages -
0-4 5
6 7
8
9
5-9
10-14 19 7 79 35 15-19 24 430 55 20-24
120 17 25-29 5 30-34
10 35+

arJl! Q'1Ji! Age-group
81ft~ All ages
0-4
5
6
7
8
9
5-9
10-14 15-19
20-24 25-29 30-34
)5+
«1fT IJI1l! All ages
0-4 S
6
7
8
9
5-9
10-14 15-19
20-24 25-29
30-34
35+
508
11-3 ~ " T'i mlftllt ~'(, at., IIik f'"/'i~ C-3 PART A ATTENDING SCHOOL/COLLEGE BY COMPL'ETEl>
~f&Tq; mfEducational Level
---------------- - -----------------------mft 1fT r.r'''~ mft it; ~ ~ miT lIT ~ Technical degree or diploma equal to degree or post-graduate degree
i'l1Ii;ftiIiT fi'W ~ fw'l ~1""'1ffl( fm ---------______________ _ Post-graduate degree other V;;r')fif!Jf'(1T ~,.( i'fi'i'llTr.fr ~ar wr~ than technical degree Engineering and technology Medicine
~ Males
26
1.293
51
789 289 77
87
165
5
76 S6
17
10
f~!JT Females
27
550
54
357
82 28 2S
31
31
!I~ Males
- -- - --- ~-- --
ril'''k INDORE
28
158
20 63 42 28
5
Iff",,, ~ WEST NIMAR
S
s
-
f~t !Ii" Pemales Males
------- --- --29 30
5 280
5
140 5 52
32
52
S
5
ftirllt Pemales
31
93
10 52
IS
16

~09
t .'{ "'!~/.Tl!r\jf ilTlf cmr-~fq LEVEL OF EDUCATION. AGE AND SEX-URBAN
11mili m/Educational Level
fi"it lIT M~~ fnT if ~lrr ('llIirrTiliT ~VT lIT fi"ti1'I1rr Technical degree or diploma equal to degree or post-graduate degree
'Ii~ ~'{ iu ;a1J")'I . ' q~ ~iIi~m Cll'5QTq;r qiZT
Agriculture and dairying Veterinary Teaching Others ---------- -------- ---------_ ---------
Ti" ffirlli ~ f;iirlff ~ f~1li ~ fti'lrt Males Females Males Females Males Females Males Females
32 33 34 3S 36 37 3' 39
~ INDORE
6 7 54 77
5
6 15 45
14 21
7
7 21 5
qff'q''' f~qT~ WEST NIMAR
7 6
7
6
arT'l ~ Age-group
-----
U1H~ . All aSCI
0-4 5
'6
7
8
9
5-9 10-14
15-19
20-24 25-29
30-34
35+
""1m! All ages
0-4 5
(;
7
8
9
5-9 10-14 15-19
20-24
25-29
30~34
35+

ttI'I! ~ Age.group
~iIIl1! All ages
0-4
5
6
7
8
9
5-9
10-14
15-19
20-- 24
25-29
30-34
35+
ij'mmlj; All ages
0-4
S
6
7
8
9
5-9
10-14
15-19
20-24
25-29
30-34
35+ ,
510 '
,,-3 lf1'T ifi IJ1Ii ~ffilfi ~f({, '"I! "''{ ~"'1/~~1
511
3Ti~H ifi" ,~/~~~ ~"it ~T~-;:",(h~ LEVEL OF EDUCATION, AGE AND SEX-UR8AN
Wflll'if; ~JEducational Level -----------
mPlR (wmilti «R it; f1r1l1)* Literal.: (without educational level)
----------------------ar~l<Rr~ ~rf~if; ~~T Non_Formal Formal Primary
---------- ----------- -----------~" ft:iJI1It ~ ffirq-j 2;" mm IITIi ~ Mdles Females Male~ Females Males Females Age-group
------ ------- ----~
8 9 10 11 ]2 13 I
"Ii f~ EAST NIMAR
113 116 14,192 11,092 8,067 5,6S2 mSlP! All ages
..• 0-4 19 5 174 106 , 19 25 709 610 6 28 15 1,356 1,137 7 9 18 2,604 2, 117 8 5 5 2,017 1,819 109 ]05 9
80 67 6,860 5,810 109 105 5-9 19 29 6,851 5,092 6,187 4,689 10-14 10 20 353 Jl6 1,618 804 15-19 5 9 65 19 20-24
24 4 10 10 25-29 5 5 13 30-34
66 15 60 25 35+
~1~
RAlGARH
64 14 5,330 3,354 2,977 1,805 marfl! All ages
0-4 145 85 5
5 357 328 6 9 683 430 7 9 10 1,058 608 8 5 592 407 54 62 9
27 10 2,834 1,857 54 62 5-9 9 5 2,280 1,386 2,204 1,479 10-14
19 158 87 650 245 15-19 .5 16 46 9 ~0-24
.5 14 .5 25-29
30-34 S 18 19 5 .5 35+
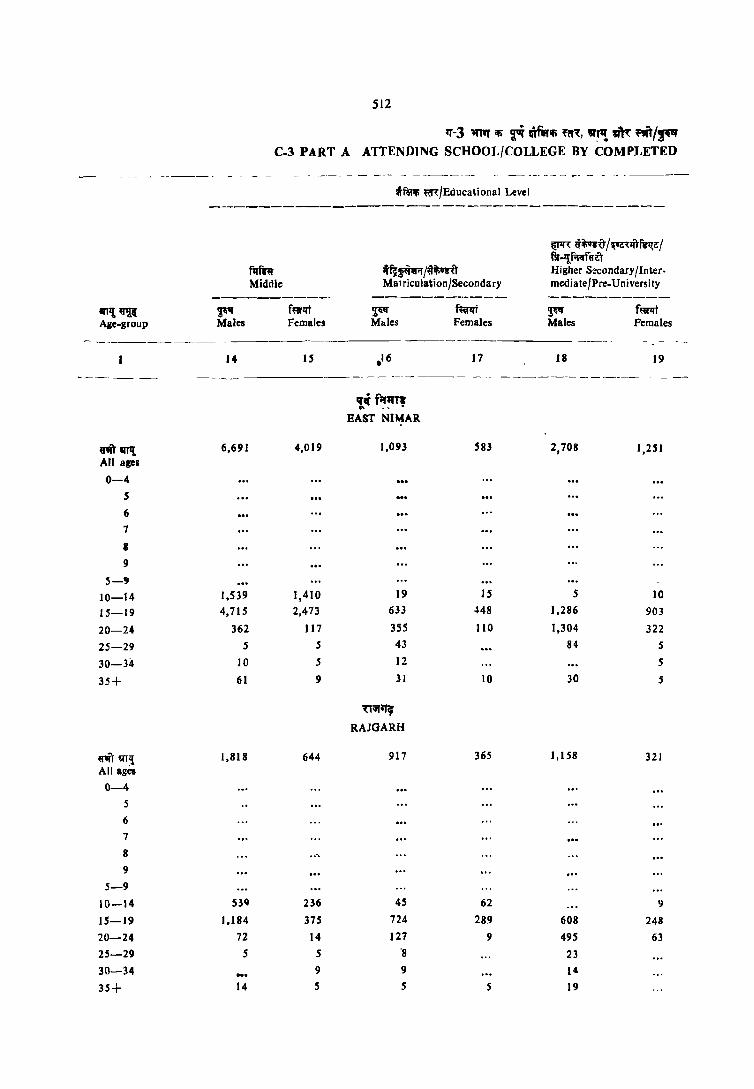
Ifl't~ Age-group
----------
mqrl{ All ages
0-4 5
6
7
• 9
5-9 10-14 15-19
20-24
25-29
30-34
35+
rit ~rr, All ages
0-4 S
6
7
• 9
5-9
10-14
15-19 20-24
25-29
30-34
35+
512
~-3 ~ ~ ~ Uflllfi ~'{, ,,~ ~ nft/~ C-3 PART A ATTENDING SCHOOL/COLLEGE BY COMPLETED
~ Males
14
6,691
fl'fmt Middle
1,539 4,715
362
5
10
61
1,818
534
1,184
72
5
14
f",,1fT Females
4,019
1,410 2,473
117
5
5
9
644
236
375
14
5
9 5
*f~ m/Educational Level
1j~~/~it;1I~"t Ma t riculationjSecondary
~ff Males
f~ Females
~ d':tvi'U/~J{Tfi'~~1 fir..l{f~<rr«er Higher Secondary fInter. mediate/Pre-University
~ f""," Males Females
--- ---------------
If" f~"T~ 4' -" •
EAST NIMAR
1,093
19 633
3SS 43
12
31
'U\jf~
RAJGARH
917
45
724
127 '8
9
5
17
S83
15
H8
110
10
365
62
289
9
5
11
2,708
5
1,286
1,304 84
30
1,158
608
495
23 14
19
19
1,251
10
903
322 5
5
5
321
9
248
63

513
rt; .~ fJ!t'f/1filQ ~A ~-~~ J.EYEL OF EDUCATION, AGE AND SEX-URBAN
fgit ~ iI~ iR-~r.tT R~r 1fT '5(JlIVf-Qc:r Non-technical dIploma or certlfica Ie nOI equal to degree
20
f~ Femaies
21
.rfllRi ~;p:/Educallo'lal Level
R!lf~ar~~ ~lJlT 1fT SilrTVf-tm Technical dipk>ma or certificate nol equal 10 degree
i<=1i Males
22
140
51
88
f~iit!{T Femal(s
23
,,, ifffr·' EAST NIM~R
5
S
,\fift'"
RAJGMUI
61ti~R;f frit ~ hr"f ~fm" Graduate degree othe. tha n tcchlll ca I degree
~~III Males
24
~89
70 520
75
5
20
322
35
258
14
15
ftQ!{T FeOla:.:.
25
344
80
233
20
II
30
5
2S
~~ Atl ages
0-4 5
6
7
8 9
5-9
10-14 IS-19
20-24
25-29 30-34
35+
8'lf ml! All agea
0-4
5
6
7
t!
9
5-9 10-14
15-19
20-24
25-29
~o -34
35+
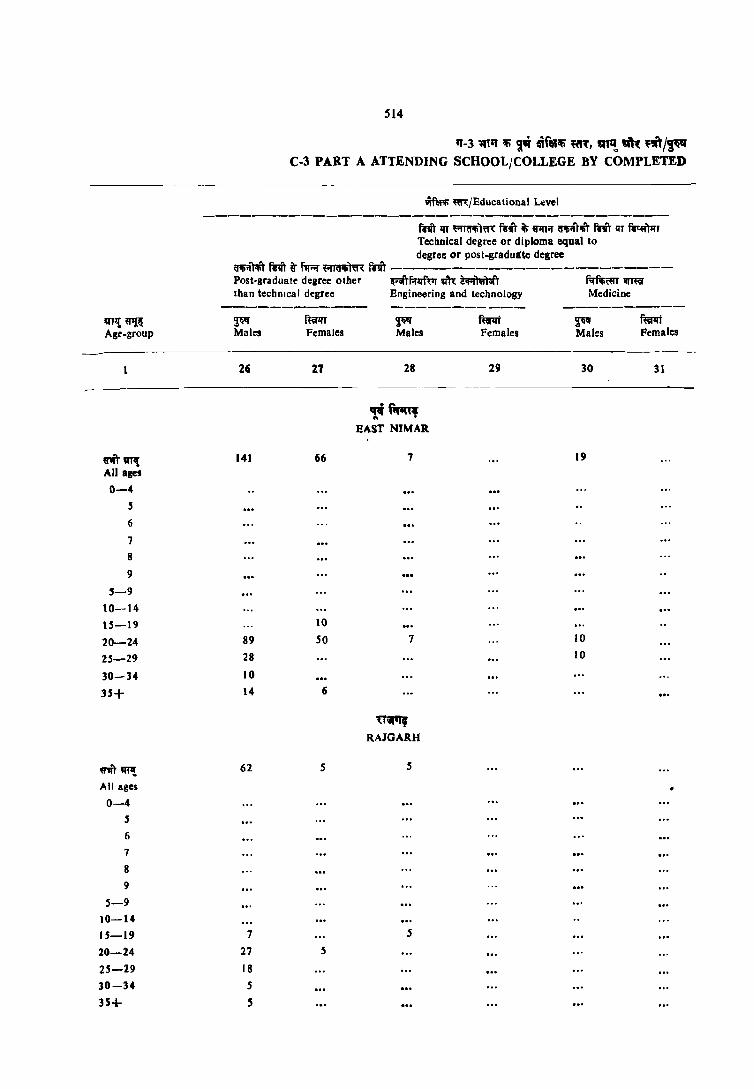
'q"~~ll Age-group
roW( All ages
0-4 5 6
7
8
9
5-9
10-14 lS-19
20-24 25-29
30-34
35+
rit'f11! A 11 ages
0-4 S
6
7
8
9
5-9 10-14
1S-19
20-24
25-29 30-34 35+
514
11-3 ~II lti ~" ~f"'lti tft'(, '"~ oan -.;ir/~ C-3 PART A ATTENDING SCHOOL/COLLEGE BY COMPLETED
\lf~ ~/Educational Level
miT lIT 1iimflIi)'ff{ fc4T it; fllfI;r ~ijllliT flit liT fAr)"lf, Technical degree or diploma equal to degree or post-graduate degree
~ijFtiT fm" U' f1A" ~ffi\ filiT -----------------------Post-graduate degree other ~~lIfm m ~l f;tfir;i:9T ~ Ihan technical degree
~~ Males
26
141
89 28
10
14
62
7
27
18
5
S
f~ Females
66
10
50
6
5
5
Engineering and technology
-----------~ Males
28
.~ ~ .
EAST NlMAR
7
7
~ RAJGARH
5
s
mt Females
29
Medicine ----------~ mt Males Females
30 31
19
10
10
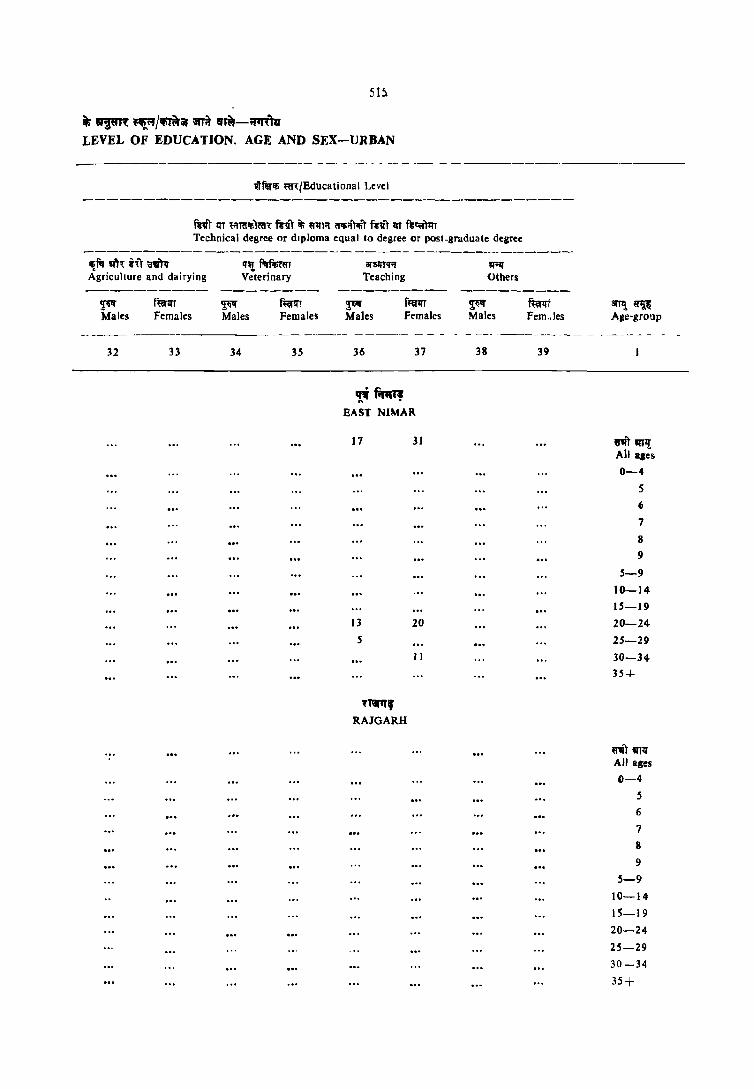
51)
~ WpR ~/miif ;rr~ .m-~ LEVEL OF EDUCATION, AGE AND SEX-URBAN
_---------_._-_. ---- -- - .. _.- - --_._.- -----
~rlllifi ~'Educational Level
~VT liT ~TC!~)«I'{ RIIT ~ ~1" C'I'ifi"tTifiT fi'lir lIT fi'~ Technical degree or diploma equal to degree or post-graduate degree
~'" m<: i~T atITlf Agricuhure and dairying
~ Males
f~1iT Females
If,! f;rf.i;t'e-r Veterinary
~ Males
f~, Females
~
ill'PiTlfil' Teaching
Males fferliT Females
------ ._--------------------- --_ .. - - --
32 33 34 35 36 37
'1. fiI .. " EAST NIMAR
17
13
5
lT1r", RAJGARH
31
20
II
~
!IT"oq Others
Males
38
~!ft Fem.,les
39
SfTl!. e1IW Age-group
""'"' !liJJ{ All ales
0-4
5
6
7
8
9
5-9
10-14
15-19
20-24 25-29
30-34
35+
"TWTl:!" All ages
0-4
5
6
7
8
9
5-9 10-14
15-19
20-24
25-29 30-34
35+
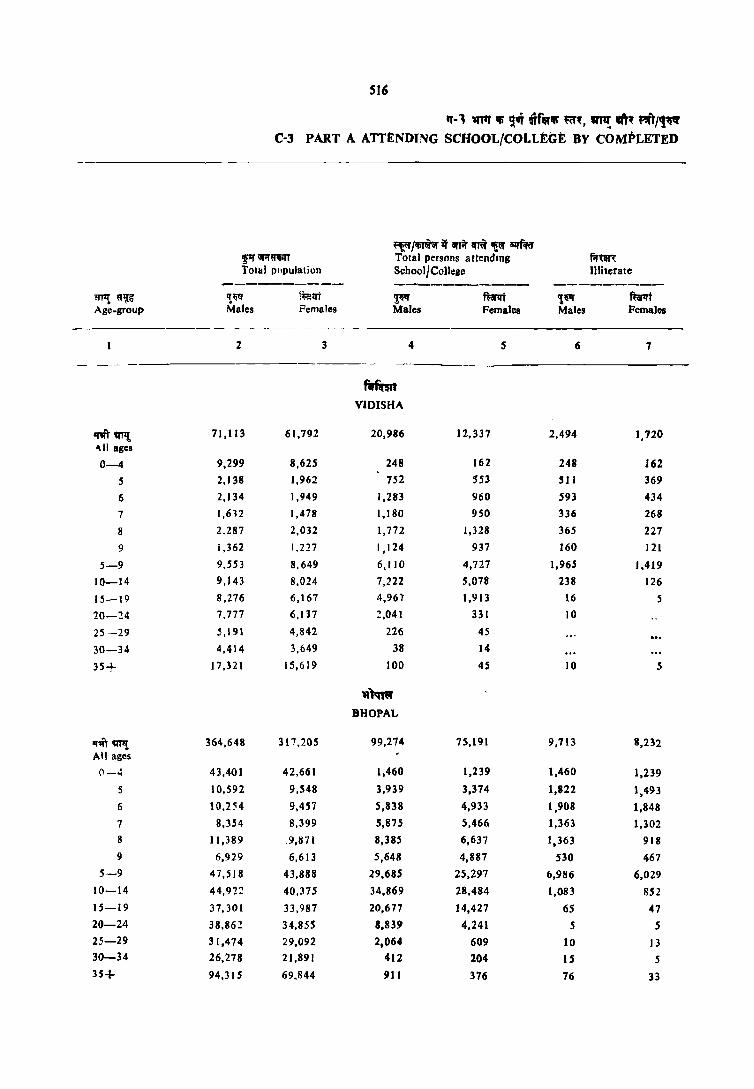
516
1J-1 ~ iii ~'CIj $ir"lIi mt, ~ cttt ""j/!~ C-3 PART A ATTtNDJNG SCftOOL/COLLEGE BY COMPLETED

5'17
.. ~T~ ~"/~ ",Tit 'fl~ -~m1tf LEVEL OF ID(JCA nON, AGE AND SEX-URBAN
----------- ------- ----------_
trIA> m/Educalional Level
-----------mn: (..,tu m: t R;tT). Literate (without educational level)
----------------------3I';r~~ ~ IH~ Non_Formal Formal Primary
--------- -------~---- ------------~ ftrn ~~ ~ ~~ mrllf iIfTI! ~ Males Females Males Females Males Females Age-group
8 9 10 II 12 13
------ -
",,",T VIDISHA
3l 42 7,122 5,239 4,540 2,663 n1'"'t A II ages· 0-4
9 241 175 5
5 685 525 6
5 844 677 7
5 1,407 1,09? 8
.878 723 85 92 9
5 18 4,055 3,198 85 92 5-9
5 14 2,878 1,967 3,362 2,288 10-14
18 10 r 51 51 993 242 15-19 5 67 9 20-24
14 25-29
5 5 30-34
5 19 9 10 21 3S+
~q'RI[
BHOPAL
317 346 37,954 30,550 19 .. 778 15,050 UtIT 'SIfll All ages
0-4
36 40 2,081 1,841 5
30 25 3,901 3,060 6
10 14 4,502 4,148 7
47 20 6,976 5,699 8
5 10 4,666 3,977 446 433 9
127 1 II 22,126 18,72S 446 433 5-9
59 53 14,348 10,864 15,115 12,452 10-14
76 t04 938 525 3,BC2 1,941 15-19
30 10 116 65 269 80 20-24
10 10 20 IS 25 35 25-29
10 15 31 35 30-34
5 38 118 86 61 60 35+
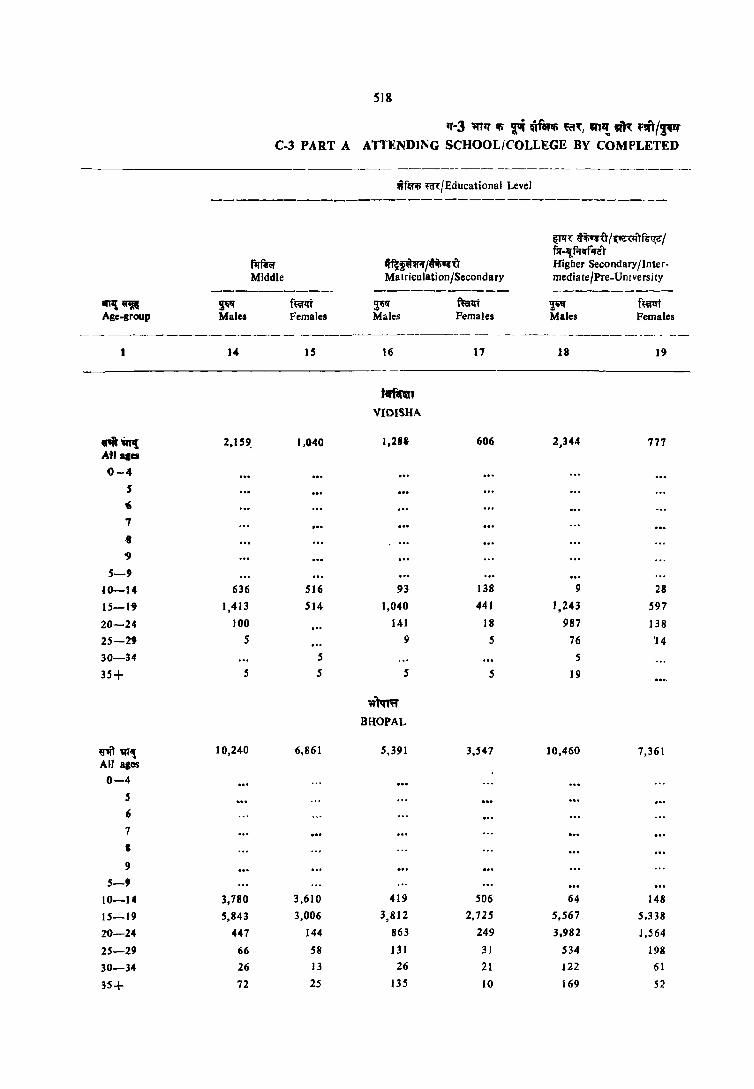
518
1l-3 <nil ifi" ~ ~fetlfi ~ct', '"'!. ~ ~rit/~ C-l PART A ATTENDING SCHOOL/COLLEGE BY COMPLETED
-- ----------------- ------ ------
wfm; m/Educational Level
-------------------------------------~"{ ~if;'sU/i:"~;ilfs~1 fil-~f.rifr,..a .. T
firffir ~F''fo'I'/~·(U Higher Secondary/Inter-Middle Matriculation/Secondary mediate/Pre-UnIversity
----------. ----------- ----------1IT't~ FI f~!li ~Iif fufq; 'F' f~t Age-group Males Females Males Females Males Females
- ------------------ ---------------------------- - ---_
14 IS 16 17 18 ]9
tlffim1 VIDISHA
... ~ 2,159, 1,040 1,28& 606 2,344 777 AU aces 1>-4
S
(t
..,
.. '9
5-9 10-14 636 516 93 138 9 28
15-1' 1,413 514 1,040 441 1,243 597
20-24 100 141 18 987 138
25-29 5 9 5 76 '14
30-34 5 S
35+ s 5 5 5 19
~)qm
BHOPAL
~m~ 10,240 6,861 5,391 3,S47 ]0,460 7,361 AU ages
0-4
5 6
7 , 9
5-9
10-14 3,780 3,610 419 506 64 148
15-19 5,843 3,006 3,812 2,725 5,567 5,338
20-24 447 144 863 249 3,982 1,564
25-29 66 58 131 31 534 198
30-34 26 13 26 21 122 61
35+ 72 25 135 10 169 52

519
:ifi "PR ~ j'fiIQ iff.t ~~-i('tt)q LEVEL OF EDUCATION, AGE AND SEX-URBAN
tr~~ mJEducational Level -------------------------------------fro iii ar{fllTlf lll:·a...mit ~1I'1' iii ar6lfr.f a'li;h't ~m 1fT 1I~-1Ilf ~ lIT SIlITIIl"·1Ilf ~fn1tt Non-technical dIploma Technical diploma or f1r;;r '""~ ~it or certificate not equal certificate not equal Graduate degrce other to degree to degree than technical dClree
---------- ---------- ----------~" faIri ~ fuillt ~ f~ VP!~ Males Females Males Females Males Females Age-group
---------- -- ----- --------- -- -------_ 20 21 22 23 24 2.5
----- -- ~ ---- ------ ----
fifflraT VlDlSHA
41 790 162 rn 'I'P!. All ages
0-4 5 6 7 8
9 S-9
10-14-9 78 49 15-19
32 619 101 2fl-24 60 12 25-29 24 30-34
9 ••• 35+
~ BHOPAL
5 10 394 8J 3,376 1.919 vlit~ All age~ 0-4
~ .. 5 6
7 8
9
5-9 10-14
5 10 72 53 439 580 JS-J9
191 20 2,155 1,203 20-24 38 .5 584 77 25-29
~ .. 26 5 68 34 30-34
, ... 68 129 2S 35+
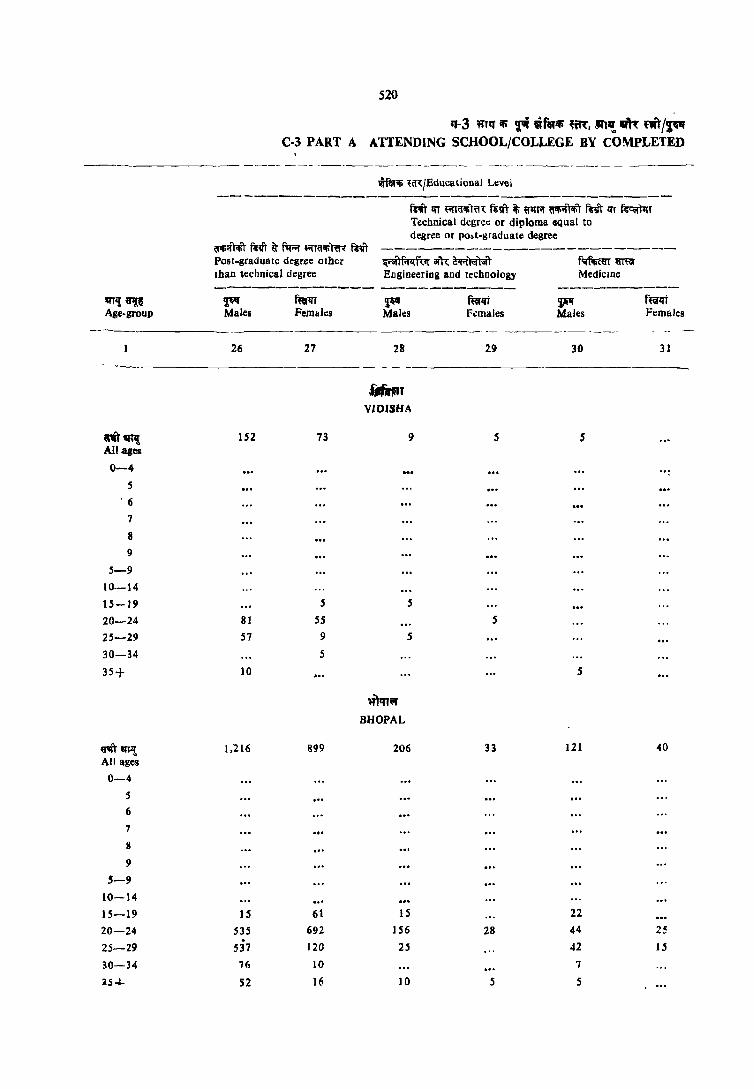
_--------
IIHI! ~ Age-group
-------
m~ AU.ages
0-4
5 , 6
7
8
9
5-9 10-14
15-19
20-24
25-29
30-34
35+
"" ~rl! All ages
0-4
S
6
7
8
9
5-9
10-14
15-19
20-24
25-29
30-34
15~
520
q-3 mq '" ~ "r,,$ ~~, .!Rl~ .m 'fit/'J.'i'I C-3 PART A ATTENDING SCHOOL/COLLEGE BY CO~PLETED
~f'lf'ti '~/EducatioDal Level
Irit 1ft ~H!illiT~"( Rll"T it; ~~{if ~;fTlift fWt trr f~~T Technical degree or diploma equal to degree or po.t-graduate degree
6'~;yr;tT fioft ~ f1F! ~ra ~"Im mIT post-graduate degree other ~lf.rl<f"{1f iIl'~ ~~T
Engineering and technology f"f~iHIT IIl'ffii MediclDe than ,echnical degree
~ Males
26
152
81
57
]0
1,216
]5
535 . 537
76
S2
Females
27
73
5
5S 9
5
899
61
692
120
10
16
~ Males
28
f'fir~" VI DISH A
~cn~ BHOPAL
9
5
5
206
15
156
25
10
mrlli F.:males
2.9
5
5
33
28
5
~ Males
30
5
5
]21
22 44
42
7
5
f~1li Females
31
40
25
15
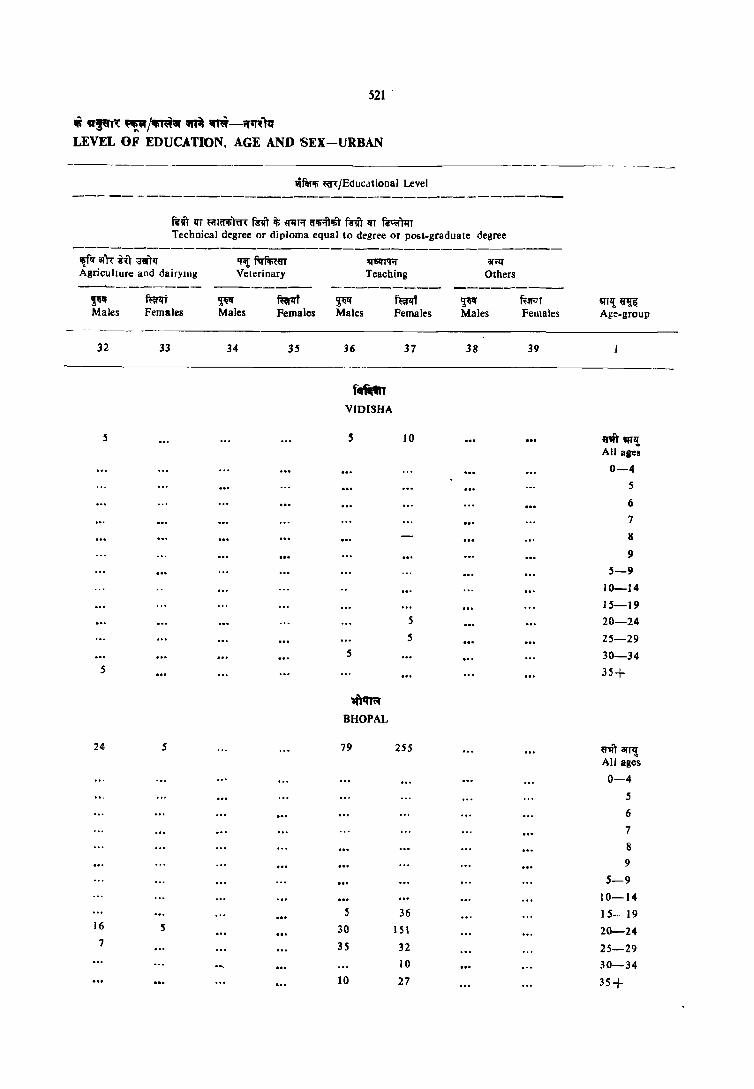
521 .
~ v~'( "!"/~ m ~~-ii'T~'T1f LEVEL OF EDUCATION, AGE AND 'SEX-URBAN
-------- . ___ -~miji ~/Educadonal Level
~liT lIT Frllif11i"Rn: tnT if; ~Ti'f triji;ft;tt ~liT lI'T ~)1rr Technical degree or diploma equal to degree or post-graduate degree
----------------------------------------
-
'!if1J iIl'h: i,{T ".rtf Agriculture and dairYing --""----------
--
~IJ Males
---
32
5
5
24
16
7
mm Females
33
5
5
~ fq-fiI;-~ Veterinary
--------~ ~ Males Females
34 35
'lr6llT'l'ii Teaching
-----_----2;~
Males
36
f~ VIDlSHA
5
~ BHOPAL
79
5
30
35
10
f~ Females
37
10
5
5
255
36 IS 1
32
10
27
ar;:lf
Others ----------~ r.:~T Males Females
38 39
'lrT,! ~ Age-group
m "''! All ases
0-4
5
6
7
8
9
5-9
10-14
15-19
20-24
25-29
30-34
35+
U"IIT iTT,! All ages
0-4
5
6
7
8
9
5-9 10-14
15-19 20-24
25-29 30-34
35+

IIll{m Age.group
g~ ""'t All ages
0-4
5
6
7
8
9
5--9
10-14
15-19
20-24
25-29
30-34
3.5+
81ft q'fl! All ages
0-4
5
6
7
8 «)
5-9
10-1.4
15-19
20-24
25-29
30-14
35+
522
q-3 -.:r1'T ~ fI1 ~fft '''~, "'Ii al-.: 00'/~l!( C·3 PART A ATTEND1NG SCHOOL/COLLEGE BY COMPLETED
-_--- -- -- ------ - - - - - -- -- -_---- --- _- ---- ----- ----------
fl' ~~.l:fT ~t'" J 1fiT~ it ~it ~~ f" 0lf1111' Total persons attending f",~m:
Total population School/College Illiterate --------- ------------ --_ .. _------~ fu:t"1ff ~ ffirlff ~~ ffirlff Miles Females Males Females Males Females
2 3 4 5 6 7
~~ SBHORE
46,754 40,728 12,243 6,804 1,211 823
5,974 5,881 ISO 73 ISO 73 1,297 1,242 348 240 2H 146
1,317 1,284 449 50S 230 188 1,05S 1,032 618 460 213 124
1,538 1,454 1,003 703 183 110 859 842 667 489 47 60
6,067 5,855 3!085 2,398 898 627
6.408 5,401 4,677 2,936 142 114
5,732 4,335 3,187 1,124 9
4.871 3,791 939 199
3,404 3,072 130 9
2,698 2,275 5 18
11,553 10,081 43 23 5 5
'{lqih, RAISEN
37,912 32,824 9,489 6,027 988 806
4,959 4,931 45 46 45 46
1,042 1,087 210 175 121 103
1,180 1,178 485 457 253 241
874 932 SIS 562 220 130
1,398 1,216 905 658 179 120
721 738 571 499 54 93
5,215 5,150 2,685 2,352 827 686
5,305 4,715 3,958 2,774 103 6S
4.366 3,406 2,244 766 9
3,421 2,756 450 71
2,792 2,471 54
2,190 2,026 9
9,626 7,360 29 18 4 8

523
~'"~ iti ~/ffiWrit m ~-~~1~ LEVEL OF EDUCATION, AGE AND SEX-URBAN
~fer'li tat/Educational Level
-----------ffi~H (wfer;r. ~~ it; firrr)* Literate (without educational level)
------------------------arll lq;n":;ri ~Ifu; !fT~:T NOD-Formal Formal Primary
---------- ----------- -----------~ f'itzrt ~III fuilll ~~IJ fuillT IIITI! ~~ Males Females Males Females Males Females Age_group
- - --- ._--- --- - --_-"_ -_ -- ---- _-------- -- - ------ -------
8 9 10 11 12 13
- ----- ---------------------
~)'{
SEHORE
23 42 4,903 3,117 2,'02 1,41 I II'._p 'lT1!: All ages
0-4 123 93 5
9 23 209 294 6
9 396 337 7 820 594 8 584 397 36 33 9
18 23 2,132 1,715 36 33 5-9
5 2,51 I 1,355 1,676 1,144 10-14
5 223 33 747 210 B-19
5 9 5 28 17 20-24
5 5 5 25-29
30-34 5 5 5 6 35+
~'lfinr Ro\lSEN
30 10 3,898 3,044 2,112 1,3! 4 W'I1T ~rl! All ages
0-4 89 72 5
5 .' .. 226 216 6 295 433 7
10 716 538 8 502 381 IS 26 9
IS 1,828 1,641 15 26 5-9 10 5 1,907 1,352 1,565 1,119 10-14
5 143 46 .507 165 1.5-19 .5 10 .5 20-24
25-29
30-34 10 5 10 35+
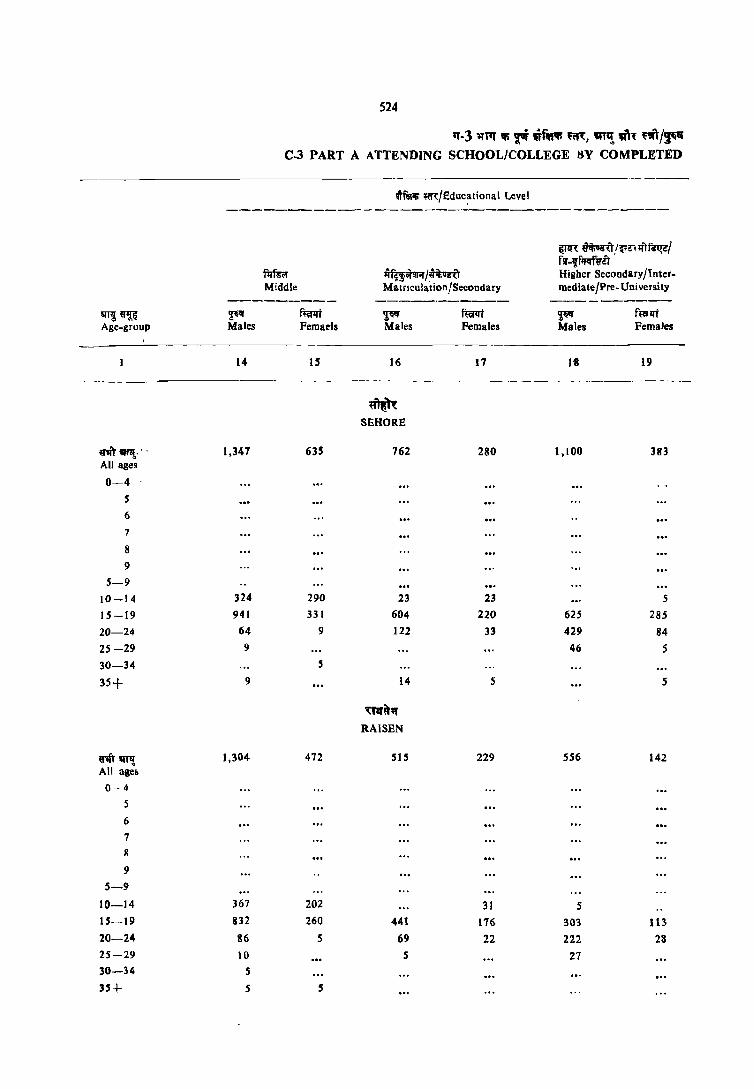
524
'1'·3 tllq iii rsi -rflftlll' '~, '"l! "","{ '~/~ C·3 PART A ATTENDING SCHOOL/COLLEGE BY COMPLETED
tffi ~/Educ~tional Level
------------------------------------
~nn: tl~!~!<Jfi~/ f!l' -11:fiAfij'it
fiIf~ ~~/t~ Higher Secondary/Inter-Middle Matrlcula'tion/Secondary mediate!Pre- University
--------- ----_. __ ---- ----------1lITl!'f~ ~ f@li ~ f~ ~ ffallt Age-gruup Males Femae-Js Males Females Males Females
14 15 16 17 It 19
-----. -- - -_ - ---------- --_
~ SEHORE
q,ft~.' . 1,347 635 762 280 1,100 383 All ages
0-4 S
6
7
8 9
5-9 10-14 324 290 23 23 5
15-19 941 331 604 220 625 285 20-24 64 9 122 33 429 84
25 -29 9 46 5 30-34 5
35+ 9 14 5 5
~~;f
RAISEN
riI' 'til'! 1,304 472 SIS 229 SS6 142 All age& o _- 4
5
6
7 II
9 S-9
10-14 367 202 31 5 15-19 832 260 441 176 303 113
20-24 86 5 69 22 222 28 25-29 10 S 27 30-34 5
35+ S 5

525
~ IlIPt'( ~\=J~'im m ~-",IR"ttf I.EVEI. OF EDUCATION, AGE AND SEX-URBAtIIi
fm iii; SH!~,;r ~f-alliilTIlli1 fe-<.it'fr IH !I1l'TVf "iii" Non-technical diploma or certificate not equal to degr~e
~ mrlrt Males Females
28 21
Vim-iii ~~/Educational Level
f;rit it; qpt;r 1!'Ii.mIT f~1 m sPrlllf "iii" Technical diploma or ':I:rtificate not equal to degree
~ Males
22
f~ Females
23
--------- ------- - -----
Wl,lt SBHORE
9
5
5
mir.:r RAISEN
a~TlffT mrr~ f'Wof ~Iai!i miT Graduate d'gree other than technical degree
~li" Males
24
339
29
249
56
5
56
5
34
12
5
fi:erllt Females
25
102
56
42
14
10
5
S
anI! ~ , Agl"-group
~wjj ~11( All aaes
0-4
5
6
7
8
9
5-9
10-14
15-19 20-24
25-29
30-34
35+
riI"~ All ages
0-4
5
6
7
8
9
5-9 10-14
15-19
20-24
25-29 30-34
35+
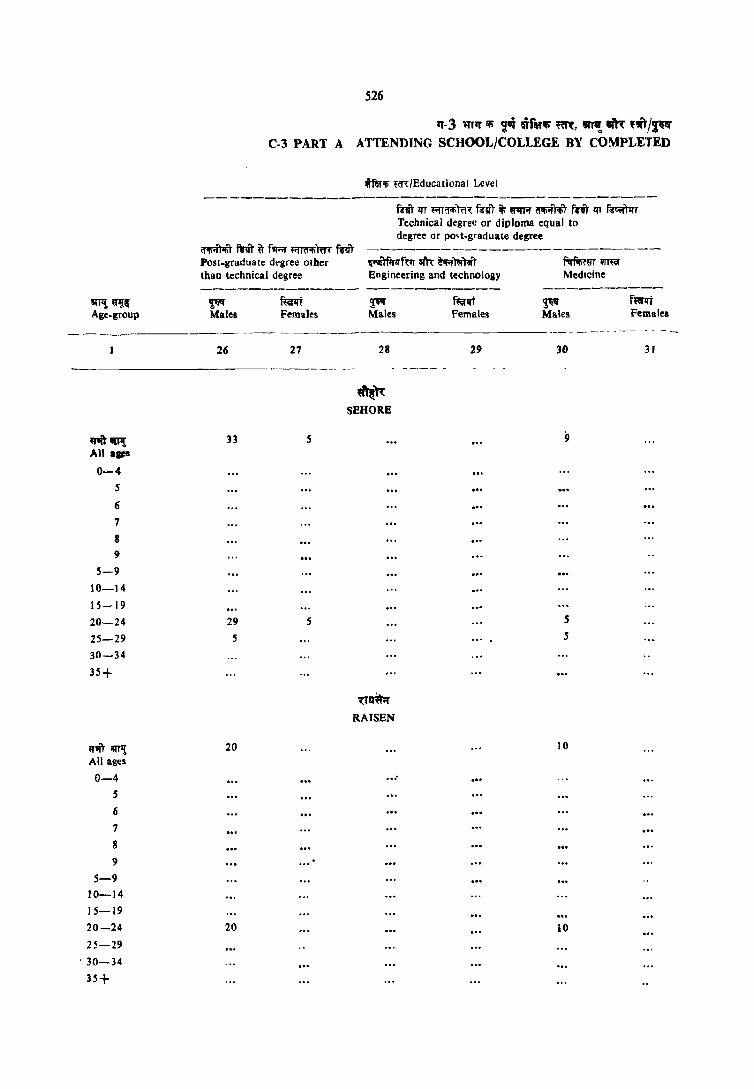
111"111 ~1Ji{ Age-group
~III'P! All BpS
0-4 S
6
7
8 9
5-9
10-14
15-19
20-24
25-29 30--34
35+
"wit 'ill'! All ages
0-4 S
6
7
8
9
5-9 10-14 15-19 20--24
25-29 . 30-34
35+
526
rr-3 mrr Ifi ~ui oifIRIli ~~, '"~ !lin ,it/~ C-3 PART A ATTENDING SCHOOL/COLLEGE BY CO!.\tPLETED
Wf'Hifi fiR/Educational Level
miT Ifr m::lar;'m~ fnT it; ~ ClIRTitiT fWVT III r~)lrr Technical degree or diploma equal to degree or po't-graduate degree
Cl'liOO mit ~ f'A ~ifirm- fm Post-graduate dt"gree other ~')f;rlff~tr am ffi~
Engineering and technology "fiI;?~ ~ Medicine than technical degree
~ Males
26
33
29
S
20
20
mrlTt Females
27
5
s
~ Males
21
~~ SEHORE
~I'l~ RAISEN
•• 1
f~qt Females
~ Males
f~1Tt Females.
------------ - -- --- - - - ----
29 30
s s
10
10
31
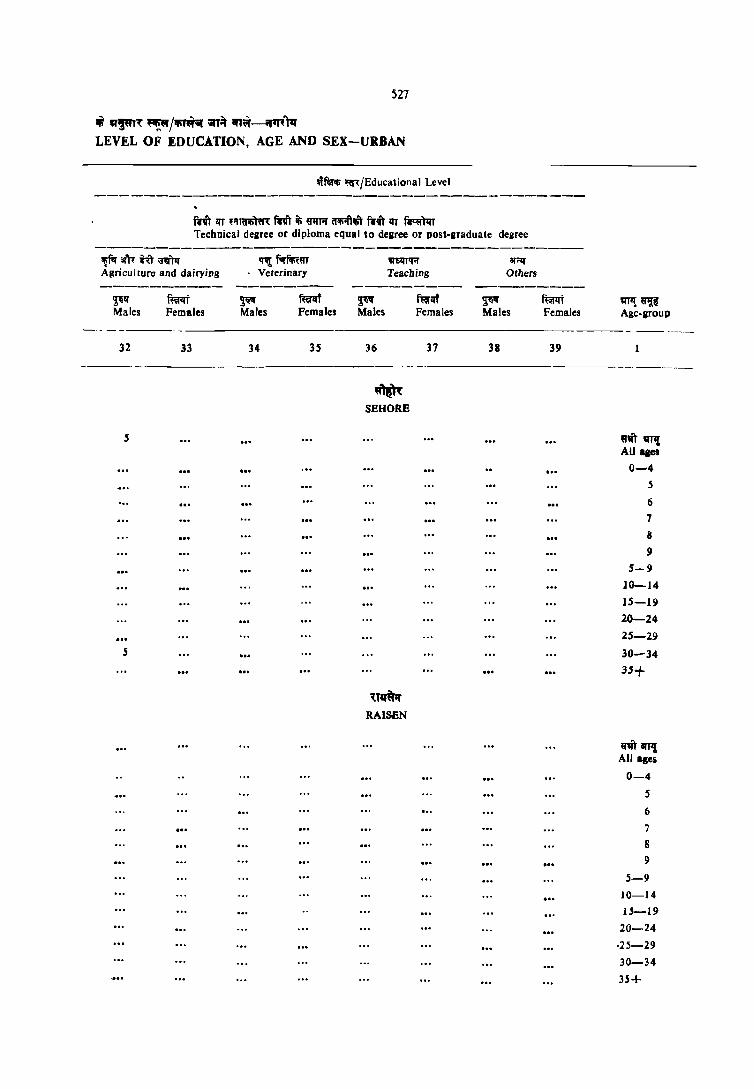
527
..r a~~ ~ /~ ;;n~ 1n~__;pr~"t1J LEVEL OF EDUCATION, AGE AND SEX-URBAN
w~ ~/Educational Level
~VT lIT '~1~ mT it; «Jr!iJ (Rilft1liT ~VT lIT fiqr)ln Technical degree or diploma equal to degree or post-graduate degree
'liN ar1T i~"t ;nr"'t1r Agriculture and dairying
~III Males
fum Females
32 33
5
5
~ ~fit;tm 'l'EllTcr.r ar~
. Veterinary Teaching Others
~ mt ~~ f~ ~ Males Females Males Females Males
34 35 36 37 38
-------~ -- --
~ SEHORE
~,.
RAlSEN
fum ~~ Females Age-group
--- - -- ------39
--------------
8'" '"1 Allqea
0-4 .5
6
7
8
9
5-9
]0-14 ]5-19
20-24 25-29
30-34
JS+
marTl! All ases
0-4
5
6
7
8
9
5-9 10-14
U-19
20-24
·25-29
30-34
35+

illTl! ~ Age-group
U1ft" arr~ All ages
0-4
5
(.
7
8
9
5-9
10-14
15-19
20-24
25-29
30-34
35+
,,'lit ~rl! All ages
0-4
S 6
7
8
9
5-9
10-14
15-19
20-24
25-29
30-34
35+
-
528
1J-3 'mIJ Ifi iaJ sif"lfi 'n, "'~ .,,, .ml'" C-3 PART A ATn:NDING SCHOOI~/COLLEGE BY COMPLETED
~~ ... jipl"iiI' ii' iifrit m ~... oq-f.J1i f;t~ ~ iifif~lii!IT Total persons attendmg
Total pupulallon So.;hool/ Colle~e illiterate .. --------- . ._ --- ----------- ---_-----If~ ila.1Il ~ mrltl ,!~III mAr Males Females Males Females Males Females
_-------
2 3 4 5 6 7
-_-- -------_------_ ----_ -- --_- _---- -- --- _-i • .-
BETUL
76,388 65,348 19,407 14,462 1,579 1,264
10,777 9,810 88 32 88 32
2,322 1,976 371 372 203 160
2,039 2,042 1,204 1,119 614 464
1,406 1.597 1,072 1,134 296 272
1,916 2,078 1,646 1,673 148 197
1,596 1,383 1,472 1,189 66 43
9,278 9,076 5,765 5,487 1,327 1,136
9,039 8,555 7,570 6,352 132 85
7,909 6,362 4,508 2,096 17
8,1 IS 7.048 1,197 313
7,098 5,456 86 88
5,649 4,143 38 48 4
18,371 14,851 101 42 12 11
~'Qf~1Tint HOSHANGABAD
134,896 117,188 37,912 25,774 1.720 1,284
15.627 15,285 112 126 112 126
3,688 3,142 667 409 264 154 3,510 3,060 1,797 1,331 50S 384
2,947 2,797 2,232 1,908 419 230 3,583 3.227 2.938 2,381 229 17U
2,396 2,729 2,160 2.268 85 104
16.125 14,955 9,794 8,297 1,502 1,042
17,486 15,962 15,141 11,885 8S 77
15,810 12,575 9,587 4,668 5 16
14,347 11,437 2,713 482 5
11,085 9,179 231 51
8,984 7,1 S6 59 45
35,185 30.409 215 IS8 II 22
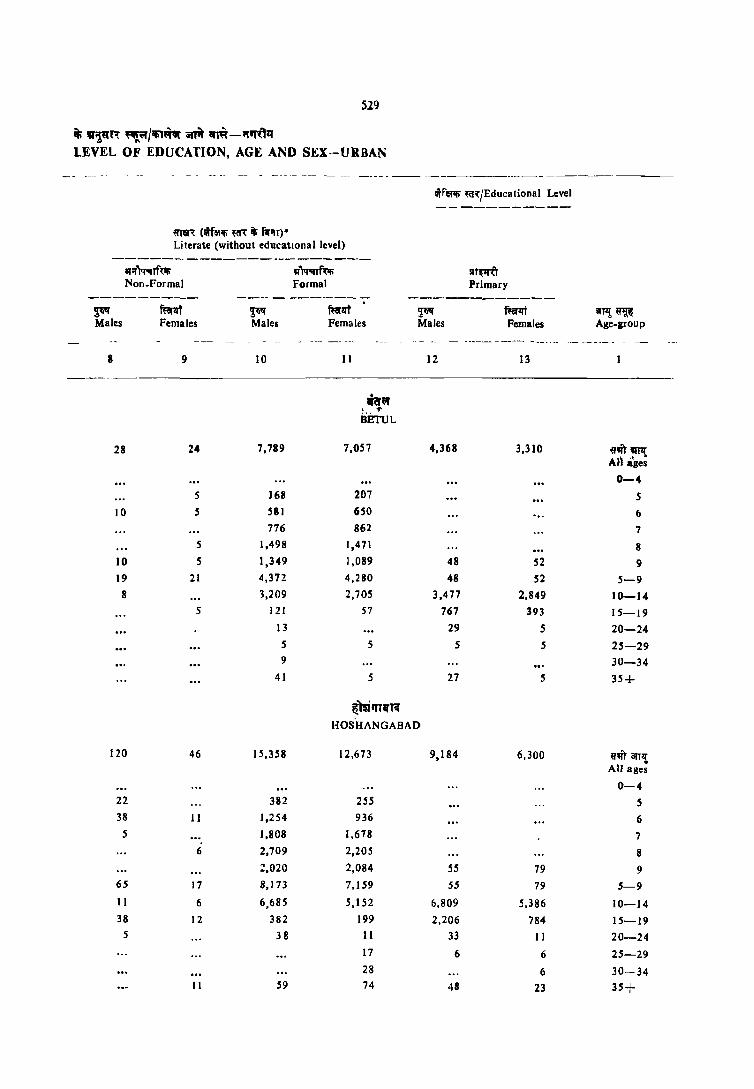
529
it; V1"T~ ~\II'/IJ1~ i!'A cn~-if'1'1lq LEVEL OF EDUCATION, AGE AND SEX-URBAN
---------- ._-- ----- ------_. ---
wrlWifi ~~/Educational Level
~ta'l: (if5lifi m it ~;IT)' Literate (without educatIonal level)
~
ay,,)Rrf{1li Non_Formal
fii'lff Males Females
8
28
10
10
19
8
120
22
38
5
65
11
38
5
9
24
5
5
s S
21
5
46
11
6
, 7
6
12
II
~~ Males
10
7,789
J68
581
776
1,498
1,349
4,372
3,209
121
13
5
9
41
15,358
382
1,254
1,808
2,709 1,020
8,173
6,685
382
38
59
1If~ Formal
Females
II
7,OS7
207 6S0 862
',471 1,089
4,280
2,705 57
5
5
~ Males
12
4,368
48
48
3,477
767
29
5
27
~m"TirR HOSHANGABAD
12,673
255 936
1,678
2,205
2,084
7,159
5,152
199 11
17
28 74
9,184
5S
55
6,809
2,206 33
6
48
Slr~ Primary
Females
13
3,310
52
52 2,849
393
S
5
5
6,300
79
79
5,386
784
II
6
6
23
3f'Pi ~ Age-group
emvrll,; Ali a'ges
0-4 5
6
7
8
9
5-9
10-14 15-19
20-24 25-29
30-34
35+
"'IT amr AU age;
0-4
5
6
7
8
9
5-9
10-14
15-19
20-24
25-29
30-34
35+

530
1T-3 ~ Iti 'lui iI~" ~\, WT,! ~ ~'"/~ C-3 PART A ATTENDING SCHOOL/COlLEGE BY COMPLETED
wf~ ~(f\/Educational Level
-------------------------------------
~ ~it;~"t/~Tfc~1 fif-'{fif<l:f!l'!£
fm 1l~~/",~1:£ Higher Secondary lInter-Middle Matriculation/Secondary media Ie !Pre-Unlversity
----------~ ----------- -----------3l'I,!~ ~ f~1ft ~If furIft ~ f~ Age-group Males Females Males Females Males Females
14 15 16 17 18 19
----_. _-- ------- - - ------- -- ----------
• ~
BETUL
rn ""'l 2,677 1,430 1,865 934 825 344 All ages
0-4
5
6
1
8
9
5-9 10-14 691 681 43 31 5
15-19 1,8(;1 697 1,363 678 352 255 20-24 83 21 425 131 447 83 25 -29 11 5 14 62 10
30-34 S 14 32 II 5 35+ 16 21
~)~'fR't HOSHANGABAD
ril \TTl! 4,956 2,656 3,434 1,562 1,910 908 All ages
0-4
5
6
7
8
9
5-9 10-14 1,498 1,189 52 76
IS-19 .3,245 1,416 2,574 1,381 1,014 742 20-24 186 17 740 76 883 ISO 25-29 15 6 17 6 S6 11 30-34 6 6 5 35+ 12 17 40 6 6
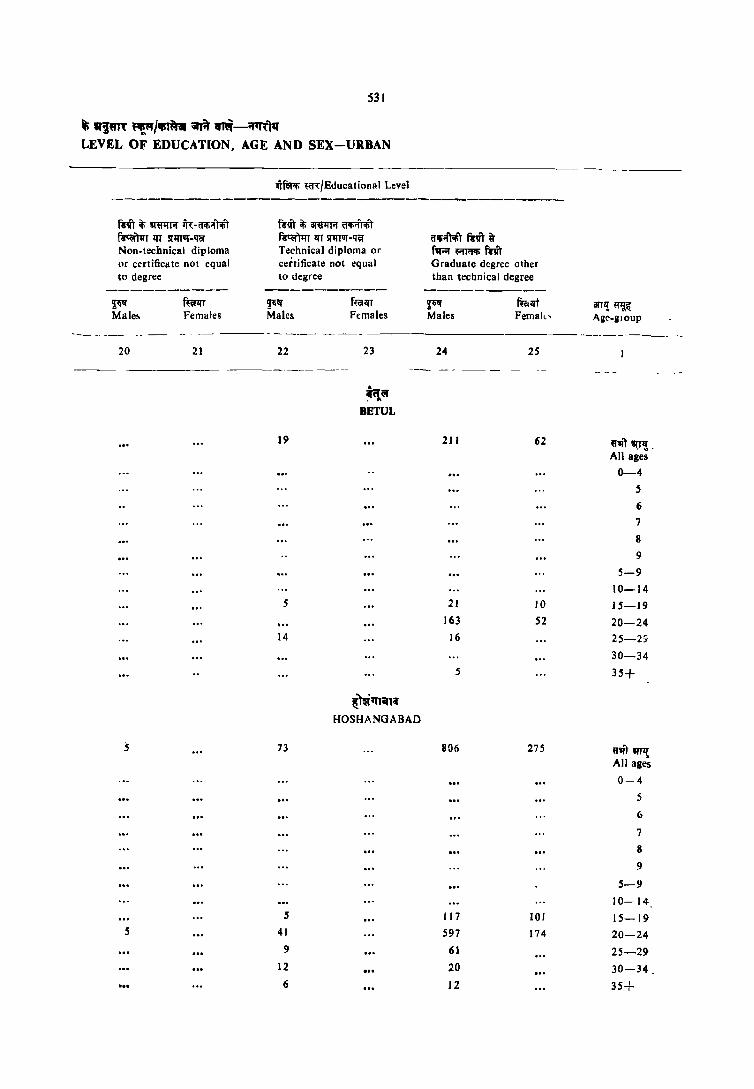
531
, "~mt ~/.m. ;nit ~-~1q LEVEL OF EDUCATION, AGE AND SEX-URBAN
!'iit ij; ~r;r iT~-Oifi"r.trr !'i~T 1:11 5!~vr-qaNon-technical diploma or certificate not equal to degree
f~ Females
-.lf~ ~a~/Educational Level
!'ilft ij; amTir arim fit:\;r);n 1fT 5!lIT1If -'nr Technical diploma or certificate not equal to degree
~Ii Males
ffiillH Females
------------20 21
5
22
19
5
14
73
5
41
9
12
6
23
~\If BBTUL
~mll1inil' HOSHANGABAD
olli"'\;r;'T filii" Q-f'l"'" RIi'PIi friI' Graduate degree other than technical degree
~" Males
24
2J1
21
163
16
5
806
117
597
61
20
12
25
62
10
52
275
101
174
arr,!~ AIlC-IlJOUp
"'liT SlTII" All age;' 0-4
5
6
7
8
9
5-9 10-14
15-19
20-24
25-29
30-34
35+
,,1ft '"li All ases
0-4
6
7
8
9
5-9
10-14
15-19-
20-24
25-29
30-34
35+

~r,! «IJ.~ . Ag~-group
..tl' 4J11i't All Illes
0-4
5
6 7
8
9
5-·9
[0-[4
15-[9
20-24
25 -29
30-34
35+
«if ~l! All ages
0-4 5
6
7
8
9
5-9 [0-14
15-19
20-24
25-29
30-34
3!i+
532
"-3 ~ Ifr ~" tifiwlJ ~, '"" ~ ~/'l"t C-3 PART A ATTENDING Sci:lOOL/COLLEGE BY COMPLETED
fflft1li m/Educ:ational Level
--------------------------------------fWt Iff ~HAi)m f.it ~ ft1Ilif tfiIioIJ;it mit q, fiqr)1f, Tecbnical degree or diploma equal to' degree or post-graduate degree
<Ai"'~ ~ ir fsr;;:r ~la~:ffi'l: IW'Iit -----------------------post-graduate degree olhu ~f.!qf'l:'r m ~r.mrT f.Jf.-(fi Vffir than techOical degree Bogineermg and technolDgy Medicine
------------ ----------- _--_._-----~ mrlft ~" ffiilIi ~ ffiilIi Males Females Males F"males Males Females
26 17 28 29 30 31
~" BETUL
41 26 5
3 J 16 5
10 5
5
~~T"',( HOSHANGABAD
241 48 28 S
II
163 36 II 5
56 , 1 [ 6 12 6

533
.~~/~~~-~ LEVEL OF EDUCATION, AGE AND SEX-URBAN
t~1Ii ~(Educational Level
filii" lIT ~m;~ fl"liI" iii ~I;; i'l1Ii;;"tIIir f1'V')' lIT f~ Technical degree or diploma equal to degree or post-graduate degree
~ rni'l:r;;m Agriculture and dairying
~ mro Males Females
32 33
,',
'I'll! NfiI;~ Veterinary
~ fiwrt Males Females
34 35
Teaching
---..!.------~ Males
36
m BETUL
mt1rt Females
37
II
5
6
~)~'"..,~ HOSHA NGABAD
12
6
6
22
6
6
5
5
~
!IFlf Others
Males
31
~ Females
39
~~ AJ;e-group
~~ Allqea ,.
0-4
5
6
7
8 9
5--9 ]0-14
15-]9 20-24 25-29 30-34
35+
m 1Il'l All ales
0-4 5
6
7
8
9
5-9 ]0--14
15-19·
20--24
25-29 30--34
35+
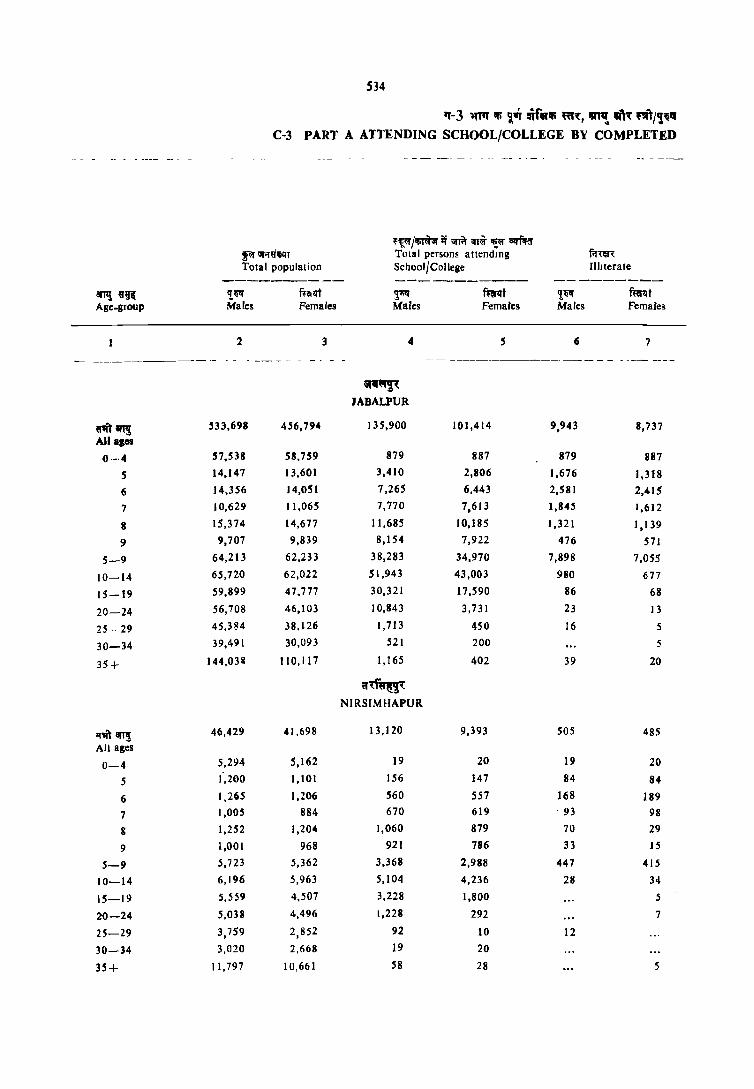
arTl! ~Il{ Age_group
534
'1-3 ~ Iti ~ ... .iflHlti m,. WI,! wft, ~T/'~" C-3 PAnT A ATTENDING SCHOOL/COLLEGE BY COMPLETED
~'lJ.""/~ if ;;r,~ "'" "!"'" Olff.t:ff ~liI'if"',," TOlal persons atlendmg f.n:lln: Total population School/College illiterate
---------- ----------- ---------'!~ ftillllT ~ mt '!~ ~t Males Females Males Females Males Females
2 3 4 5 6 7
-------------- -- - - - -- - -- - --- ------------------- - - - --- ---_-_
:p~
JABALPUR
~Ift! !l33,698 456,794 135,900 101,414 9,943 8,737 All aces
0---4 !I?,538 58,759 879 887 879 887
5 14,141 13,601 3,410 2,806 1,676 1,318
6 14,356 14,0~ I 7,265 6,443 2,581 2,415
7 10,629 11,065 7,770 7,613 1,845 1,612
8 15,374 14,677 11,685 10,185 1,321 1,139
9 9,707 9,839 8,154 7,922 476 571
5-9 64,213 62,233 38,283 34,970 7,898 7,055
10-14 65,720 62,022 51,943 43,003 980 677
15-19 59,899 41,777 30,321 17,5'90 86 68
20-24 56,708 46,103 10,843 3,731 23 13
25-29 45,3 S4 38,126 1,713 450 16 5
30-34 39,491 30,093 521 200 5
35+ 144,0311 110,117 1,165 402 39 20
",r~~ N]RSIMHAPUR
'f'li'l~ 46,429 41,698 13,120 9,393 505 485 All ages
0-4 5,294 5,162 19 20 ]9 20
5 1',200 1,101 156 147 84 84
6 1,265 1,206 560 557 168 189
7 1,005 884 670 619 ' 93 98
8 1,252 1,204 1,060 879 70 29
9 1,001 968 921 786 33 IS
5-9 5,723 5,362 3,368 2,988 447 415
10-14 6,196 5,963 5,104 4,236 28 34
15-19 5,559 4,507 3,228 1,800 5
ZO-24 5,038 4,496 t,228 292 7
25-29 3,759 2,852 92 10 12
30-34 3,020 2,668 19 20
35+ 11,797 10,661 58 28 5'

535
~ "1flR ~/1J1~ iiflit "~-if'Tl~ LEVEL OF EDUCATION, AGE AND SEX-URBAN
IitfaJ~ ~/EducatioDal Level
-----------men: (riifer~ m 'Ii ~;rl)* Literate (Without educational level)
-------------------_---ar.!)tffif'l:lfi ~fl:lIi" 51T~ Non-Formal Formal Primary
--------- ----~-- ------ ------------~ f~1fI ~ ~qt ~" f~lIt ~~ Males Females Males Females Males Pemales Agc-group
- ._-- _- ------------ - ------- -- ---.- ------_-
8 9 10 11 12 13
~ lABALPUR
817 531 52,951 45,135 29,190 22,071 mllf11 All ages
0-4
69 41 1,664 1,447 S
158 97 4,525 3,931 6
104 56 5,82 I 5,946 7
109 36 10,255 9,010 8
64 45 7,252 6,889 362 417 9
50S 274 29,518 27,:!23 362 417 5-9
183 127 21,945 17,017 23,184 19,255 10-14
9tl 120 1,049 526 5,121 2,160 15-19
15 50 52 261 83 .20-24
5 42 54 48 33 25-29
27 35 20 31 30--34
11 ISS 95 179 67 35+
il\fwO'{ NARSIMHAPUR
44 IS 4,931 3,910 3,194 2,618 ~tIT§ All ages
0-4
10 5 63 59 5 15 378 368 6
5 572 521 7 991 850 II
5 8SS 717 34 49 9 29 10 2,858 2,51 S 34 49 5-9 10 5 1,952 1,338 2,526 2,233 10-14 5 97 36 606 304 15-19
12 19 10 20-24
25-29 5 8 30--34
19 5 10 13 35-1-

rit~ All .;es 0-4
5
6
7
I
9
5-9 10-14
15-19
20-24
25-29
30-34
35+
~1 ""1 All ages
0-4 S
6 7
8
9
5-9 10- 14
15-19 2{)- 24
25-29
30-34
35+
.'1'" Males
536
q-3 ltT'f;wi ~ iflftlfl' ~CR", IIfT~ q~ ""''!'" C-3 PART A ATTENDING S{'HOOLiCOLLEGE BY COMPLETED
flfmr Middle
mm Females
tfllllli m/Educalional Level
1{~~w;J lfiurit Matriculation/Secondary
f~t Females
~If{ ~~/~rfslJCl fsr -1J."r.r~tt Higher Secondary/fnter. mediate/Pre-University
~ mm Males Females
- -----------_- ----_----------------- --------------- --- ---- --------.
14
17,540
5,283
11,431
565
89
70
92
2,074
574
1,389 92
S
10
5
J5
11,615
5,544 5,765
160 41
28
66
1,295
586
699
5
s
16
~ JABALPUR
11,117
306 7,823
2,326
268
108
281
;r-«",~~ NIRSIMHAPUR
1,2]8
15
830
328 22
S
19
17 18 19
6,093 9,714 4,651
347 63 36
5,000 4,311 3,409
524 4,773 1,150
102 425 21
40 115 IS
79 92 20
S52 680 357
39
462 271 259
5 I 40~ 88
10 10

537
Ii; "'~~n ~~ /~~ ~Ti\' .-r#-;:r",", LEVEL' OF EDUCATION, AGE AND SEX--URBA.N
frit 1ti snr+rr;r ~~-i'll!iiJT;tt f6cormr lIT 1I+!T1I!.'i~ Non-technical diploma or certificate nOI equal to d:grcc
~"'f Males
20
fufln Females
21
~f'Si!f; ~6'/Educalional Level
f6l!! 1ti 3f~rrr i'll!iifriffr f6"<orim lIT lI+rr1l! -'iiif Technical dIPloma or cetllficate not equal to d~gree
22 23
iflI;;:ft<r.T fnr u-f1rr;r Rlifi1i fnr Graduate degree other than technical degree
----------~" Males
Ifrf! !I~f Age-group
- --- - ----- _. __ ._---_._- -_ 24 25
- ----------------------- ----------_
5 376
5 137
151
25
29
29
10
5
5
'i{if~~t
JABALPUR
10
5
5
... 'd"",~'{
NARSIMHAPUR
5
3,069
233
2,030
577
89
140
411
31
343
32
5
1,702
490
1,104
72
J5
20
I 13
29
77
7
"' arTi All ages
0-4
5
6
7
8
9
5-9 10-14
15-19
20-24
25-29
30-34
35+
'l"viI'IIT!!; All ages
0-4
S
6
7
8
9
5-9
10-14
15-19 20-24
25-29
30-34
35+

3I"P! Eil(~ Age-group
- -- _---
"""'1 All ages
0-4
S
6
7
8
9
5-9 10-14
15-19
20-24 25-29
30 -34
35+
q"T m!! All ages
0-4
5
6
7
8 9
5-9
10-14
15-19
20-24 25~29
30-34
35-!-
538
1'1-3 ~11J if; T'i uf~ ,a~, anI! ~l "'i\"/,~ C-3 PART A ATTENDING SCHOOL/COLLEGE BY COMPLETED
wfeTlfi m/Educalional Level -----~---------------- - -------------------
fem lIT ~18..rr«n: fi1ft' it; «lITif ~~j fro lIT W<;~T Technical degree or diploma equal 10
degree or post-graduate degree iflfi;ftqif feliT ij' hr.'! ~T8Ifirnn: fm' -----------------------Post-graduate degree other ~f.rl!'f~ "h z;r.rm!;iIT j";;If'li(9T lIIT~ than l~chnical d~gree Engineering and technology Medicine
-------------- - ----------- --------- ---~ f~1IT V" f~t i"'" ff<iflfi' Males Females Males Females Males Females
---- - ---- -_-
26 27 28 29 30 31
~~~ JABAL PUR
660 4S1 170 36 1S3 46
.,.
IS 26 13 5
416 367 112 26 62 26
111 44 Jl 69 16
3S 5 6 10 5
84 10 28 5 11
;II~rU~I{ NIRSIMHAPUR
41 31 12
5
29 26 12
12

539
iti ~\ ~/~ :snit ~-;rtJt~ LEVEL OF EDUCATION, AGE AND SEX-URBAN
vrm1fi mjEducational Level
f:('1T ~r ~r(l'li~ ~'lT ~ !ll'fTif (l'1fiifT'4iT ~«T ~ f~~r Techn Ical d.-gree or diploma equal to degree or post-graduate degree
llif~ am ~T ;rom Agriculture and daiJying
~l'fi '~
IfQl' f'iff.r;tffi VeOterinary
fuJqj 2:~ Males Females MaJes Females
32 33 34 3S 36
qt!fT1r.r Teaching
~l'fi Female~
37
------------------------ --
52 .
40
6
6
~~ JABALPUR
73
18
26
6
23
Of'{'f~~
336
21
223
53
20
20
NARSIMHAPUR
12
12
~ Males
38
WQ" Others
fuizn Femaies
39
anI!: 5"~<? Age-group
~'11 Gn~ All ages
0-4 5 , 7
8
9
5-9 10-14
15-19
20-24 25-29
30-34
35+
~mm~ All ages
0-4
5
6
7
8
9
5-9 10-14
15--19
20-24 25.-29
30-34
35+

'A'1l! "Wf Age.group
!I'1i\' arri All ages 0-4
5
6
7
8
9
5-9
10-14
15-19
20-24
25-29
30-34
35+
rit~ All ages
0-4
5 6
7
8 .
9
5-9
10-14
15-19
20-24
25-29
30-34
35+
540
tT-3 ~tT Iti 2ai !iTfll"A'i ~'{, lin,! !Jit~ f!f)/~" C·3 PART A ATTENDING SCHOOL/COLLEGE BY COMPLETED
---- ---- -- - - --_.- _----- -------_ --- -----------
~"f.~ I 'fit" if ~ m !"" oll'fiF;:r !""~ Totsl persons attending fifur< Total population School/College Illiterate --------- ------------ --_._------~ fti:fqt ~ fuf!1t ~ fuf!1t MIles Females Males Females Males Females
------- --------- ----------- -_
2 3 4 5 6 T
"lIAr MANDLA
37,979 H,200 10,623 1,977 589 716
4,253 4,680 25 3S 25 35 1,048 929 200 204 100 126
942 1,011 429 492 155 ]26 809 900 619 638 139 ]26 965 1,037 736 757 50 126 717 660 65Z 54S 30 55
4,481 4,538 6,637 2,636 474 560 4,872 4,798 4,080 3,558 85 ]06 4,61 S 3,984 2,886 1,545 10 4,039 3,243 797 230 5 5 3,103 2,660 69 22 2,410 2,O!6 18 18 9,868 9,231 103 19
ftto:tlfT" CHHINDW I\RA
137,540 123,627 36,456 25,248 3,308 2,819
16,631 16,622 ]52 172 ]52 172 3,710 3,686 703 567 444 352 3,507 3,585 1,628 1,470 812 601 3,256 3,240 2,174 2,040 731 644 4,067 4,106 3,200 2,995 642 548 2,597 2,609 2,291 2,055 201 228
17,139 17,225 9,996 9,126 2,830 2,373 17,844 17,391 14,586 11,634 287 253 15,404 13,091 8,261 3,756 I~ 5 14,021 11,670 2,826 404 5 5 10,567 9,950 267 30 9,414 7,637 67 20
36.347 30.690 263 80 10 10

541
~~m: ir ~/fIi'~ ~A .m-;{'(\TQ' LEVEL OF EDUCATION, AGE AND SEX-URBAN
- - --- - - - _--- - - -- - --, -- - _- -- -- - --- ------- -_- _- - --- -_ --
"'felll>" ~/Educational Level ----------
mR (iRrll>" ~ it; ftr;:n). Literate (without educational level)
- - --------------------- .. ;pj",,"~ ~fu; mWT NOD.Ponna) Pormal Primary
---------- ----------- -----------~ mAT ~ ~qi ~" ffifIIt .-r, U1ft Males Females Males Females Males Females Age-group
8 9 10 11 12 13
- -----_ .... MANDLA
Il2 82 3,545 3,106 2,499 2,040 vwUarpt All ages
0-4 101 78 ,
.5 14 270 352 6 14 480 498 7
23 14 663 617 8 10 14 553 434 59 41 9
36 55 2,067 1,980 59 41 5-9
60 28 1,408 1,084 1,924 J,752 10-14
27 27 14 438 215 15-19
9 37 18 20-24
5 5 5 25-29
4 5 5 30-34 26 19 30 35+
,,;<[1.f1l" CHHINDWARA
109 95 14,367 12,327 8,356 5,597 U1ft" WTlJ: All ages
0-4 14 5 244 210 5 19 20 798 849 6 14 15 1,429 1,381 7
9 25 2,549 2,422 8 .5 2,020 ], 741 66 85 9
61 65 7,040 6,tl04 66 85 5-9 19 20 6,865 5,486 6,175 4,611 10-14
9 10 335 158 1,990 862 15-19 5 14 20 57 5 20-24
5 .5 .5 25-29 5 10 10 5 30-34
10 104 25 49 20 35+

542
rr-3 ~lTf iii 'A'i jflRlli '('I"{, lIlT,! an ''"/~ C-3 PART A ATTENDING SCHOOL/COLLEGE BY COMPLETED
tf¥<!; m/Educarional Level - -_--------------- -- ---.------------ .. - _------
~TIH ~iI;u6"U!~~·Hl·)fst:l;~i
firfror !l~~~w;:r /~iI;urit fsr-9:f"lll'f",it Higher Sec.,lndar y IIlJter-
Middle MatrIculation/Secondary mediate/Pre- Umverstty
--------- ----------- -----------III',,¥~ ~ f~1It ~ ffQl'Q'T '!~ fliQlrt Age-group Males Femaels Maks Females Males Females
--- ~----- -_. _---- - ------------ _ ---- -_--- - -------
14 15 16 17 18 19 -__ ._ . --------- ---- -- ---. ""
MANDLA
U1ft'iIIll All ages
1,814 989 1,092 554 691 351
0-4
5 6 .
7
8 9
5-9 10-14 580 457 18 32 5
15-19 1,165 504 879 485 309 259 20-24 63 23 168 32 359 83 25-29 22 9 9 30-34 5 5 5
35+ 5 5 5
fW",~T CHHINDWARA
'""'111'111 4,523 2.538 3,203 1,253 1,757 455 All ages
0-4 5
6 7 8
9
5-9
10-14 1,189 1,169 52 95
15-19 3,031 1,324 2,067 1,018 750 329
20-24 250 45 970 110 945 116
25-29 20 42 51 10 30~34 5 14 5 5
35+ 2S 49 25

543
~ a~~T~ ~/IIi~;n~ ..m-l'frr~ll1 lEVEL OF EI)UCATION, AG.i<_ AND SEX-URBAN
fsit if; !ll'IJI1T~ ~,{-l'f""'A;r fs<OI)1rr iiT SI1fT1If 'fer Non.technical diplomd or certificate not equal 10 degr~e
~ mrzrt Males Females
20 21
lififtl!i «n:/Edul:ational Level
fm if; !ll'JIlrt;f CfiIi'l'');fft
f5'<<'I'tlfl 1I1 lJ1f11lf <rer TechnJ~al diploma or ..:::rtlficale not equal 10 degree
~~I'f Males
22
5
5
40
13
22
5
f~T Females
23
ltlIt"T
MANDLA
.f~~l CHHINDWARA
5
5
ff'f;;ft'lft I'!it ~ f1F~ ""'Irrl!i fm Gra.luate dcglee other than techDical degree
---------_ 2;~
Males ftwlI1 Females
- - -------------
24
204
40
127
23
5
10
701
52
535
97
IS
25
8Ci
46
39
133
45
78
10
an,;~ Age-group
U1ft~ All ~ge~
0-4
5
6
7
8
9
5-9
JO-14
15-19
20-24 25-29
30-34
35+
m~ Alllgn
0-4 S
Ci
7
8
9
5-9
10-14
JS-19
20-24 25-29
30-34
35+

'HI! ~~ Age-group
544
"-3 'qT" if; ~.r ~f~ifi ~l, m~ .m 00 /P' C-3 PART A A1TENDJNG SCHOOL/COLLEGE BY COMPLETED
~feFli mjEducallOnal Level
~ir ~I ~IClililf1"{ f;!llit ~ l;[1!1ij Clifi;:ft'fiT mrT III ~;;r)1r1 Techmcal deglLe or diploma equal to degree or po~t-gradua:te degree
~;jT'fir ~iT ~ hrnr ~I(fifi)'ff,{ fm -------------------------Post-gradual~ degree other ~f;urf~t[ m~ ~ijr.rr.rr f'q"fi!jm WT~ than technlcdl degree EngineeTlng and technology Medicine
~~ Males
ft~1fT Females
~'f Males
ffiI1ri ~ Femalo=s Males
ffiJlJt Females
---------- - -------------
~eft 1111 All ages
0-4
5
Ii --7
If
9
5-9
10-14
lS-19
20-24
25-29
30-34
35+
rn arYl{
All a8;5
0-4 5
6
7
8 9
5 -9
10-14
15-19
20-24
25-29
30-34 3~+
26
37
23
14
76
19
42
10
S
27
45
12
2S
8
2S
25
28
'fVi\lt
MAl'oDLA
fW~~T" . CHHTNDWARA
29 30 -- 31
5 s
S 5

545
Ii apl~ "!.~/rm~i{ ifTl't ~-IlI'Rtq L£VEL OF EDUCATION, AGE AND SEX-URBAN
---------- ----- - -----tlflHifi ~l:/Edllcatlonal Level
~1iT lIT ~~I~ifi)~ mT it; 6t{I'f iJ~ifiT f~iI Ifr Nt~ Technical degree or diploma equal to degree or post-graduate degree
----_-----------------------------------iff" Of" i~T ;rom q~ f.ifit;~6r Agriculture and dairying Veterinary
---------- --------'PI!!' mT ~ ~f Males Females Males Females
_------- -------. ·32 33 34 35
.5
5
~SlI'T~
Teaching
----_----'J,l;" Males
J6
qq~T
MANDLA
10
10
f~II' Females
37
4
4
f"iitilfl" CHHINDWARA
JO
5
5
ar·1f Others
---------'Pili fuiI;r Males Females
38 39
...
'ITl! ~~ Age-group
"T 'IT~ A,JI ages
0-4
5
6
7
8
9
.5-9
10--14
15-19
20-24
2.5-29
30-34
3.5+
«ir ~r~ All ages
0-4
.5 6
7
8
9
5-9
10-14
15-19
20-24
25-29
30-34
35+
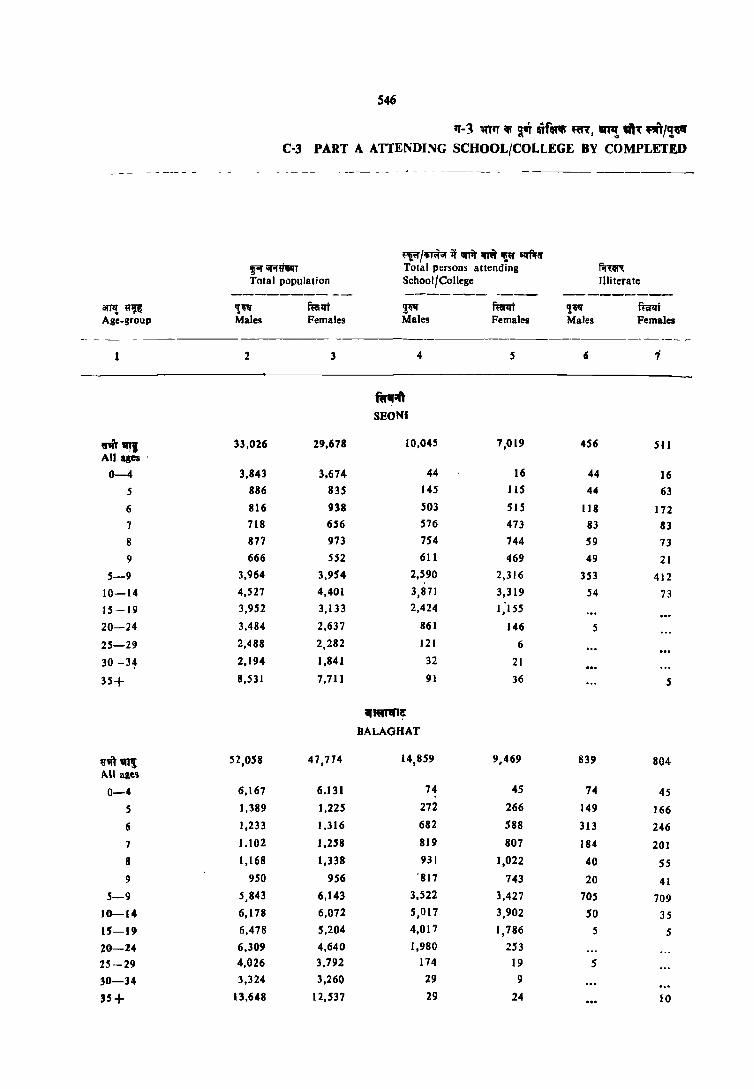
arYl! ,,~ Age-group
- _---
'""" "11 All ages
0-4
5
6
7
8
9
5-9
10-14
15-19
20-24
25-29
30 -3~
35+
~nft~ MI age~
0-4
5
6
7
8
9
5-9
10-14
U-19
20-24
25--29
30-34
35+
546
"-3 'ItT" lti ~vr ~f!Rlli ftn, ~ -'l ""'/'!~ C-3 PAIn A ATIENDING SCHOOL/COLLEGE BY COMPLETED
f~ I~ it ;;nit iiI'l'i Ill"' ilffif!l' ~IiPrPrr Total persons attending ffim: Total population School/College Illiterate
--------- -_ -_------ ---- ---------'t~ f'falfi ~~ mrlfi 'i~ fu!1fi Males Females Males Females Males Females
----- --2 3 4 5 6 i
fir,,1Ift SeONI
33,026 29,678 10,045 7,019 456 511
3,843 3,674 44 16 44 16
886 835 145 115 44 63
816 938 503 SIS 118 172 718 6'6 576 473 83 83 877 973 754 744 59 73 666 S52 611 469 49 21
3,964 3,954 2,590 2,316 353 412 4,527 4,401 3,871 3,319 54 73 3,952 3,133 2,424 1;155
3.484 2,637 861 146 5 2,488 2,282 121 6
2,194 1,841 32 21
8,531 7,711 91 36 5
1(1\111'1{1!'
BALAOHAT
Sl,OSS 47,774 14,859 9,469 839 804
6,167 6.131 74 45 74 45 1,389 1,225 272 266 149 166
1,233 1,316 682 588 313 246
1.102 1,258 819 807 184 201 1,168 1,338 931 1,022 40 55
950 956 '817 743 20 41 5,843 6,143 3,522 3,427 70S 709 6,178 6,072 5,017 3,902 50 35 6,478 5,204 4,017 1,786 5 5 6,309 4,640 1,980 253
4.026 3.792 174 19 S 3,324 3,260 29 9
13,648 12,537 29 24 10

547
~ "PT'( ~/lIil~ii( ~A cni -~1q LEVEL OF EDUCATION, AGE AND SEX-URBAN
---------- -------------------
~ Males
mm CWffllf; fiR: it; fer-H)· Literate (without educational level)
ar;:jltf~Tf~ Non_Formal
~1rl Female~
~~ Males
q"N'fTn:~ Formal
milrt Females
wf~1Ifi ffi':/Educalional Level
'l~
\1ales
lnmr Pdmary
Females 3fT!! ~ Age-group
--_----- ---- --------_---.- --------_.----._---- -- ------- ------------------. ------
8 9
10 5
5 5
5 5
5
76 27
9 5
23 5
14 5
9 9
55 23
14
9
5
10
3,485
101
385 488
696
507
2,176
1,228
51
5
20
4,831
114
346
622
883
742
2,702 2,032
73
5
II
2,929
52
343 390
665
396
1,846
1,042 26
S
5
5
4,268
96
337
602
958
661
2,654
1,560
32
9
5
9
12
2,301
56
56 • 1,955
256
24
9
3,654
55 55
2,385
600
14
13
1,992
52
52
1,699
2i8
6
1
5
10
2,139
41
41
1,832
252
9
~~1 An ages
0-4
5
6
7
8
9
5-9
10-14 15-19
20-24
25-29
30-34
35+
~'"" mi All ales
0-4
5
6
7
8
9
5-9
10-14 15-19
20-24 25-29
30- 34
35+

548
11'-3 lI'TIf ~ T'i m~'" f~, 'Q~ III~ ml~~ C-3 PART A ATTENOI:"olG SCHOOL/COLLEGE BY COMPLETED
-- _-_ - - - ------------ ----_ - -- - - - ---- - - ----
rltfllfiF ~/Educational Level
------------------------------------~If'{ iit;qiT/,ue(q')fiJ~i!1 fll' -lJf;JlIfm
flffi'or q.r~W;:j' /iii\'q;:T Higher Secondary lInter-Middle Matriculation/Secondary mediate/Pre-University
_--------- ------------ ----------al'T~~~ '!~ ftPf '!~ f~ ~ fta1tt Age group Males Females Mal~. Females Males Females
14 15 16 17 18 19
~,
SEON'
~CIl! 1,150 913 1,136 389 630 151 All ages 0-4
5 6 7
8
9
5-9
10-14 599 484 35 21
]5-19 1.054 462 751 325 288 III
20-24 62 5 213 37 310 39
25-29 5 ...... 28 27
30-34 5 5 12 5 5
35+ 20 16 37
~1'Z
BALAGHAT
mft "11 2.210 1.136 1,843 603 1,377 339 All ages
0-4 5
6
7 ... 8 9
5-9 10-14 527 452 9 14 9 15--19 1,563 666 1.:!41 534 478 270 20-24 89 14 52S 51 885 60 25-29 21 5 40 9 30-34 5 10 5 35+ 19
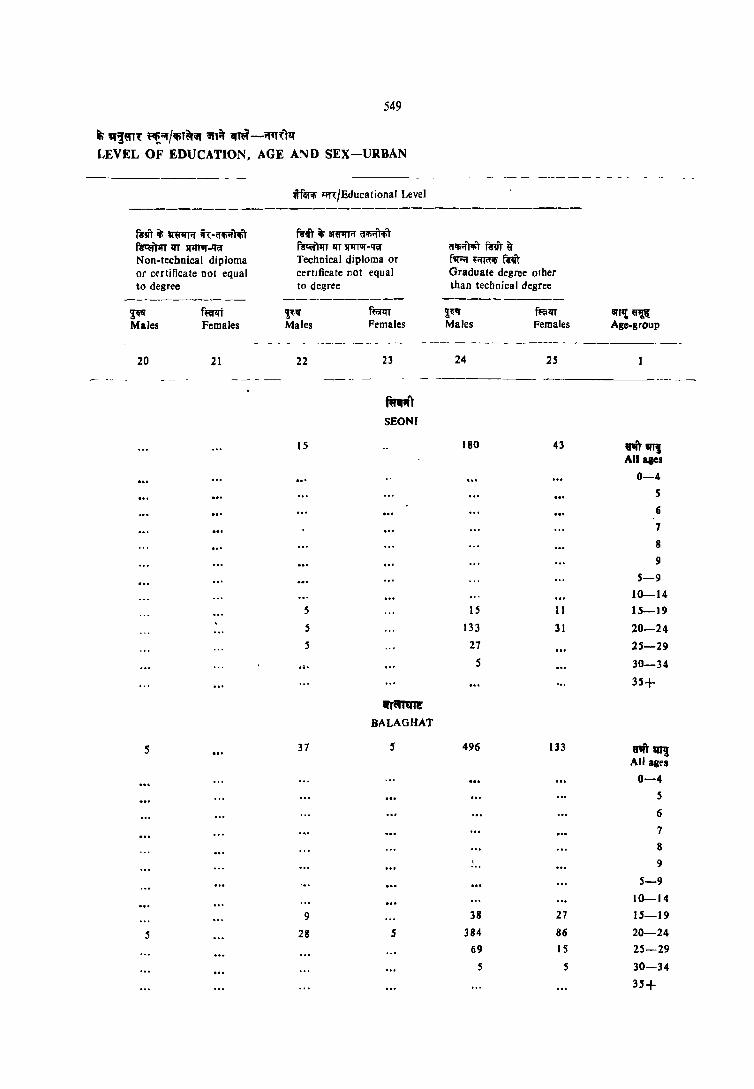
549
Iti q~m~ ~;;Y/~T~Qt ~Tit ~-"'l'fl:Tq LEVEL OF EDUCATION, AGE AND SEX-URBAN
tflfilfi ~""/Educational Level
fi'vr if Iffi1ITif ih: -(f~Aft fi'it it; ar~ (f~');it f':qj'Jlrr lIT S11fTlIT -'«J fAi'l1fT lIT '!fI'Il'Jf-~ <:Iifiifm mit fr Non-technical diploma Technical diploma or f'liif {ifIi'Iifi mIT or certificate not equal cerllficate not equal Graduate degree other to degree to degree than technical degree
---------- ---------- ----------~ f~ 'Xl" f~1fT ~1i" fRiiIfT an,£~ Males Females Males Females Males Females Age-group
---- _ -_ - ----- - --- - -- _--- -
20 21 22 23 24 25
--- --- ---- - ---------- -----_-
ffl1t"t SEONJ
15 180 43 W1ITtrTJ All ages
0-4
5
6
7
8
9
5-9
J~14
5 15 11 15-19
5 133 31 20-24
5 27 25-29
.0. 5 30-34
35+
.!'lImn! BALAGHAT
s 37 S 496 133 U1it~ All agel
0-4
5
6
7
8
.I •• 9
5-9
1~14
9 38 27 15-19
5 28 S 384 86 20-24
69 IS 25-29
5 5 30-34
35+
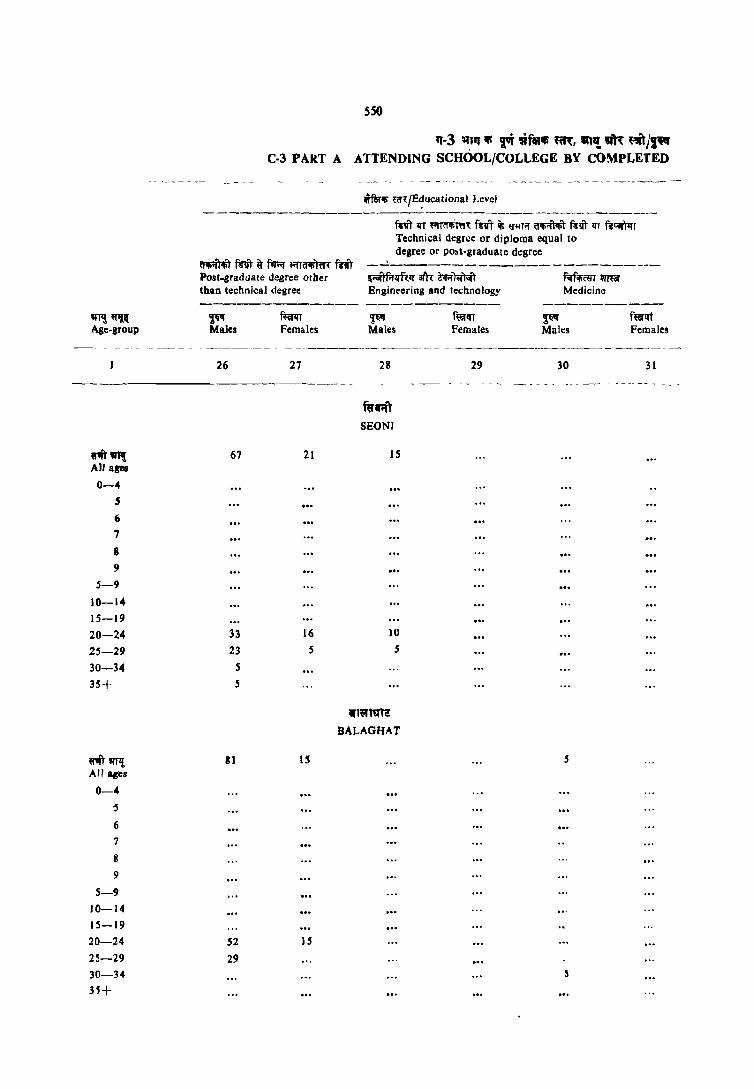
IfTl! ~~ Age-group
~O! All aps
0-4 5
6
7
8 9
5-9 10-14 15-19
20-24 25-29 30-34 35+
ritllTll All ages
0-4 '5
6
7
8
9
S-9 10-14 15-19 20-24
25-29
30-34 35+
550
If-3 ~,l1f iii i'i 9fOlifi fm:, Wl'{ "'" m/p' C-3 PART A ATTENDING SCHOOL/COLLEGE BY CO~PLETED
Williii' f1ft./E~ucalional Level
my tIT ~(I1tinr, fn" if; ij"Iflif allioo f~lft lfl ~T Technical degree or diploma equal to degree or po~t-graduate degree
Post.graduate degree otber ~Iff~~ arn: Zif;:r~ Mili1'mwmr Medicine Ihan technical degree Engineering and technology
~ Males
26
67
33 23
S
5
81
52
29
~1I1 Ti" Females Males
27 28
----_-----
M,",1 SEONI
21 IS
16 10
5 5
.1"OO! BALAGHAT
IS
IS
f~qT Females
~ Males
f~lIi Females
29 30 31
S
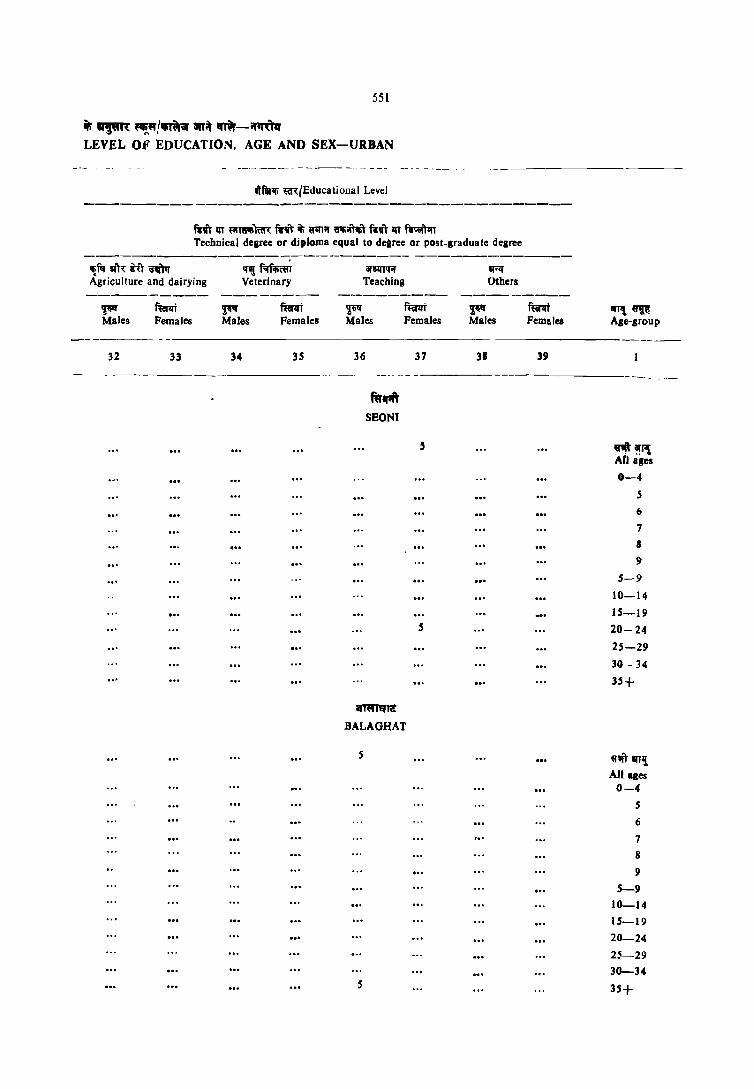
551
iti ~ "!~/mill' iII'T~ ~-~ LEVEL OF EDUCATION. AGE AND SEX-URBAN
fm ... ~'Educatiollal Level
mft lIT "'T81IIffin: !'Wi\" it {NI~ \'IIIi~ fliT lIT ~ Technical degree or diploma equal to degree or post-graduate degree
iI!~mi\T~ Agriculture and dairying
~ fta'Ift Males Females
32 33
~~ Veterinary
~ Males
34
furlJt Pemales
35
- -------------- -------
arll(Jq;f
Teaching
~ mm Males Pemales
36
fW.-ft SHONt
;mnqo,!,
BALAGHAT
5
5
37
5
~
IIiiJ Others
Males
31
ftnt Pemales
39
iII1'\ ~ Age-group
~~11£ At] ages
0-4
5
6
7
8
9
5-9
10-14
15-19
20-24
25-29
30 - 34
35+
«tiT lIT!! All ages 0-4
5
6
7
8
9
5-9
10-14
15-19
20-24
2!i-29
30-34
35+

mqU'fi Age_group
V'it1lTlA All ages
0-4 , 6
7
• 9
5-9
10-14
15-19
20-24
-25-29
30-34
35+
~WfI .,,~ All ages
0-4
S
6
7
8
9
5-9
10-14
15 - 19
20-24
25 - 29
30-34
35+
552
q-3 liN ~ 'l'f.'uflft'li ffl'{, ""! aR roJ~ C·3 PART A ATTfo:ND1NG SCHOOL/COLLEGE BY COMPLETE
~t;:r/lfil~ it ~if Ifr" pr iilffiFif f<'r ilfornillT Total persons attending fil~~ Total populatIOn School/College Illiterate
--------- ------ .-- ----- --_.-------~ mrll'T ~~ ftaar ~lilf f~IfT Mal~s Femaks Mdle~ Females Males Females
-----~--- -----_ 2 3 " 5 6 7
- --- -_- - --.. - -- _- ~--- --_ -
~'{,!\i(r
SVRGUJA
76,242 65,726 18,152 13,054 1,294 1,087
8,652 9,184 93 103 93 103 2,118 2,037 611 482 324 320 2,162 2,011 1,041 785 381 277 1,552 1,662 1,042 944 187 1J3 2,117 2,080 I,SS7 1,237 157 154 1,214 1,332 986 844 25 41 9,163 9,122 5,237 4,292 1,074 905 8,759 7,981 6,977 5,011 111 51 8,213 7,891 4,161 3.043 II 27 8,250 6,693 1,418 546
6,774 5,796 162 2S
5,379 4,920 19 9 21,033 14,119 76 22 5
f.~mfq'{ . BILASPUR
213,443 195,341 54,474 36,772 2,503 2,049
25,190 25,875 218 319 218 319 5,941 5,785 1,244 1,108 423 422 5,944 5,626 3,070 2,375 770 377 4,739 5,098 3,166 2,922 502 353 5,880 5,691 4,584 3,SSI 295 182 4,707 4,603 3,878 3,245 81 88
27,211 26,803 15,942 13,201 2,071 1,622 26,011 24,475 20,722 15,178 176 78 21,772 19,086 11,944 6,347 29 21,004 19,758 4,419 1,119 5 19,005 17,393 523 191 5 16,465 13,800 136 95 5 56,512 47,930 411 200 5 20

553
~ ,,!m "!,,,j"TiIvr iIf.f ~-~ LEVEL OF EDUCATION, AGE AND SEX - URBAN
_-------- ----- --------- --- -- ------------- -- ---- - ---- --- -
if",...- ~,/Educational Level
-----------wm, (trtl'11" ~, ~ for;!!)'" Literate (Without educational level)
----------------------ar.!'1"IRTf'(;r; ~fuI; srT~r Non-Formal Formal Primary
--_------ ---------- ------------~ f~IfT ~~ mrlfT ~ mr~i arTl! 1!111~ Males Femaks Males Females Milks Females Agt"-group
------ - ------ ----- -- --_ - --- -- --
8 9 10 11 12 13
-_ - - -- --- ---- -----_ -- - - - --
~~~i1r
SURGUJA
134 123 7,292 5,358 4,240 2,788 fi'1rr ~n! All ages
0-4
27 13 260 149 5
45 39 615 468 6
26 17 827 814 7
9 22 1,391 1,061 8
9 929 747 31 48 9
107 101 4,024 3.238 31 48 5-9
13 17 3,069 2,031 3,177 2,303 10-14
8 156 63 976 429 1!1-19 4 '}3 27 9 20-24
4 5 14 25-29
5 9 30-34
4 29 4 10 35+
N"r~, BILASPUR
287 174 22,700 .17,527 12,035 8,355 "1 lIT/{ All. ages
0-4 29 3S 791 651 .5 54 5 2,246 1,793 (j
46 35 2,618 2,533 7 30 20 4,2.59 3,349 8 10 19 3,648 2,965 139 173 9
169 115 13,563 11.291 139 173 .5-9 35 43 8,.503 5.800 9,633 7,288 10-14 41 .5 342 190 2,118 803 15-19 26 S 47 16 54 2S 20-24 J 1 27 27 25 9 25-29
11 31 JO 17 30-34 74 69 56 26 35+
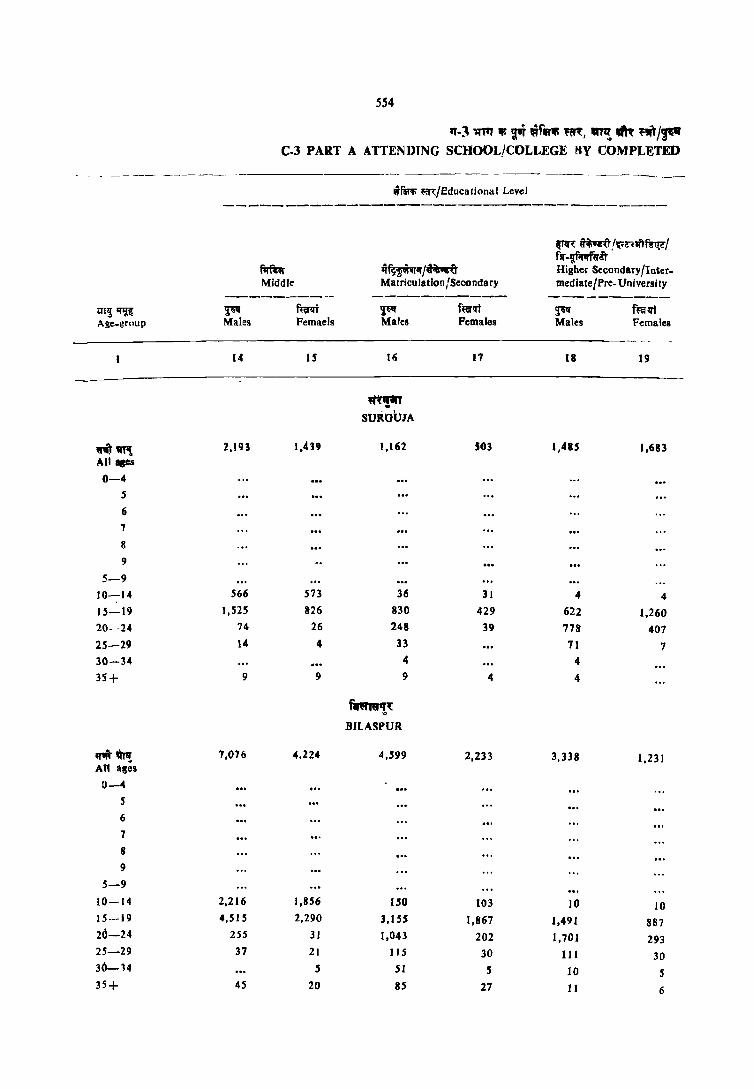
554
"-3 ~ Iff ~ "f" m, ~ ~ ~/'J"f C-3 PART A ATTENDING SCHOOL!COLI.EGE MY COMPLETED
- -- -- ----- --_- ------ --- ---------- ~-----
.r~ m/.Educalional Level
---------------------------------------
~"H i~ !,«z.1ftfWl!;C/
f1Imr Il~~/~ fsr-~q.fr Higher Sccondary/lnter_
Middle Matriculation /Secondary mediate/Pre- University ---------- -- ------------- ----------
1.l'r~~ ~ fum ~lf f~!ft ~ f~lfi Age_~rnup Males Femael! Males Females Males Females
14 IS 16 17 18 19
..,. SUROUIA
'fIi:\'''Tll 2,193 1,419 1,162 503 1,485 1.683 All qes
0-4
5
6
1
8
9
5-9
10-14 566 573 36 31 4 4 15-19 1,525 826 830 429 622 1,260
20-24 74 26 248 39 778 407 25-29 14 4 33 71 7 30-34 4 4
35'+ 9 9 9 4 4
~'( BILASPUR
"'"~ 1,016 4,224 4,599 2,233 3,338 1,231 An lise!
U-4
5
6
7
8 9
5-9
10-14 2,216 1,856 ISO 103 10 10 15---19 4,515 2,290 3,155 1,867 1,491 887 20-24 255 31 1,043 202 1,701 293 25-29 37 21 115 30 111 30 30-14 5 51 5 10 5 35+ 4S 20 85 27 11 6

55-5
j ~Tl ~/.,.,n ;qq. .mr-fflflfll Lf:VEL OF EDUCATION. AGE AND SEX--URBAN
tr!liili ~/Educational Ll:vel
fi'Vt ~ 0I"fl"1IT'" q~·tliifiOO ~V"1 ~ 0I"6'1IT'" ifiifiiffiifif ~t",)1fT 1fT 'SI1JTQT-E«r flt<'inrr 1fT SI1ITVr-E«r ~iifif fi'Vf" Non-technical dIploma Technical diploma or f1t;;r roil'iifi fSVf or certificale not equal certificate not equal Graduate degree other to dq;rcc to degree than technical degree
---------- ----------- ----------~.t{ ffirzrl ~I{ fiilJl!t 2:QI{ f~zrt 'fTl! ~( Males Females Males ftmales Males Pema es Age-group
20 21 22 23 24 25
_- -------- ------- -~- - _-_- -- - --- -_ --- -- --- --- - --
~i'iI'T ,. SURGUJA
II 2111 69 ~",1 3IT~ All ages
0-4
5
Ii
7
8
9
5-9
10-14
6 26 9 15-19 236 47 20-24
IS 13 25-29
5 30-34
4 35+
fiif,"""~ .. BllASPUR
57 1,405 719 ~'1T 'fTl! All &Sc:8
0-4
5
6
7
8
9
5-9
10-14
15 222 282 IS-19
31 967 367 20-24
12- 42 25-29
... 3S 10 30---34
11 54 16 ~S+

556
1T-3 ~ ~ ~ !SWIRl(; ~, BnJ! .m ""I," C-3 PART A ATTENDING SCHOOL/COLLEGE BY COMPLETED
._------ --------- ------------ ---- - --- -- -
arJ1! ~~ Age-group
W'lll All ages
0-4
5
6
1
11
9
5-9
10-14 15-19 20~24
25-29
30-34
J5+
rnq{l{ All ages
0-4 S
6
7
8
9
5-9
10-14
15-19
20-24 25-29
30-34
3S+
I1lf~;; ~"{/Educational Level
---------.----~--==-------------------------
fWt lIT r.rt~ mit it; RR ~ fm If!' ~ Technical degree or diploma equal 10
degree or post-graduate degree <flIiOO fnr a- f1Ir.t ~m fm -----------------------Post-graduate degree oth~r ~qfw qR l~r.rr f;ffi;"efIT WlW than technical degree Engineering and technology Medicine
~ Males
26
49
44
4
355
II
232
55 10
47
mm Females
27
4
202
22
IS8
6
11
S
~ Males
28
II
6
5
r-mW'{l: BILASPUR
68
42
11
mt ~ Females Males
_------ ---_._----29 30
,
15
10
6
'mrlli' Pemales
31
.. .:
s
5
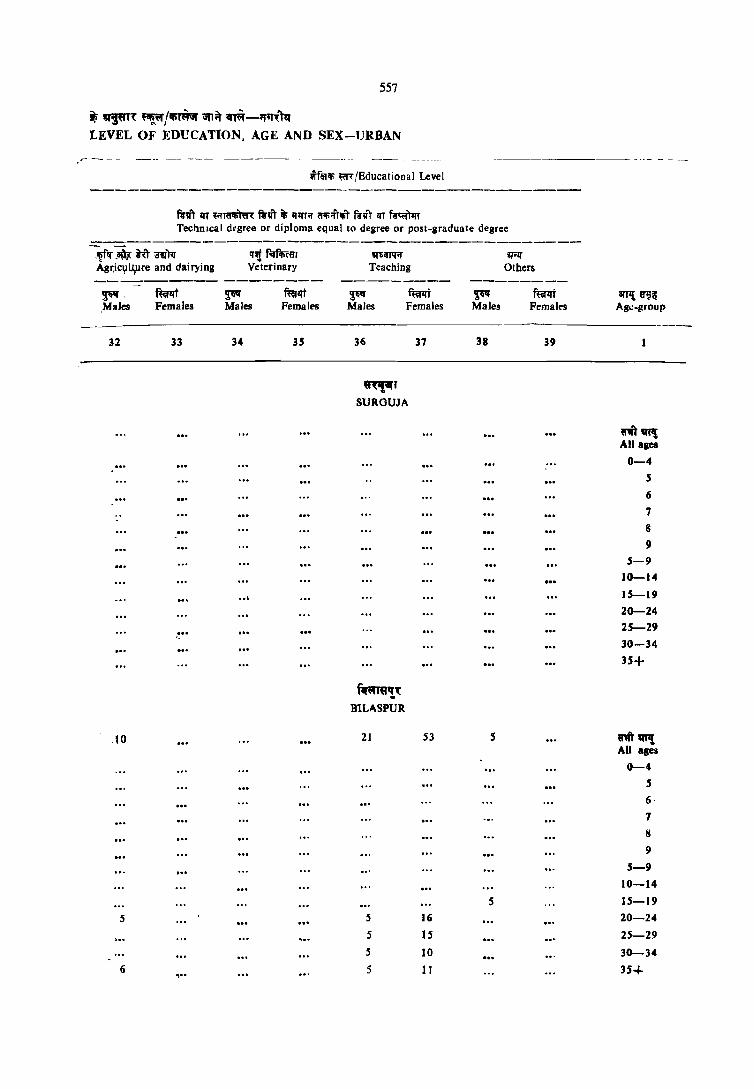
557
iI 1lI¥f\ ~/~ ijfli\' i{ffl-;:rtTl:TtI LEVEL OF EDUCATION. AGE AND SEX-URBAN
vrf~!fi ~~"{Educational Level
fh'T 1fT {Of~ R'IIT iF ~IIH (llfiifTIJT fc"ITT III fsc;:fl1rr TechDlcal d~gree or diploma equal to degree or post-graduate degree
-~~li -aW" i-U a-v)-q 'ntf~frl Agr,ic~u,ure and dairying Ve"terinary
-~-------- --------~- mm ~ rerlrt Males Females Males Females
32 33 34 35
,to
5
6 •...
1If51JT1fif Teaching
---------~ tmt Males Females
36 37
~'rr SURGUJA
BIL"SPUR
21
S
5
5
5
53
16
15
10 1 ]
WIJ Others
--------~ fmt Males Females
38 39
5
5
arP{ ~iI Ag.:-group
m~ All ages
0-4 5
6
7
8
9
5-9
10-14
IS-19 20-24 25-29
30-34
35+
m~ All ages
~4
S
6-
7
K
9
5-9 10-14
15-19
20-24
25-29
30-34
35+
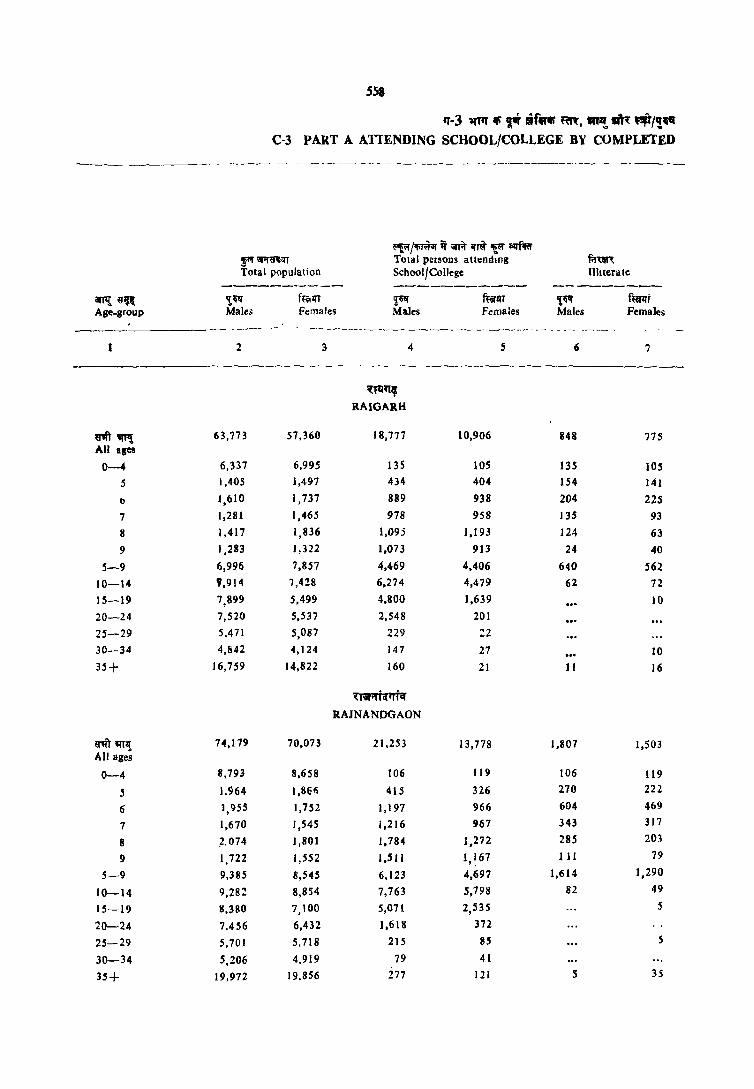
amt "" Age-group
1
~'I1't All ages
0-4
5
b
7
II
9
5-9
10--14
15-19
20-24
25-29
30-34
35+
~m1! All ages
0-4
5
6
7
8
9
5-9
10-14
15-19
20-24
25-29
30-34
35+
558
1f-3 mq iii !Jar _fIR .. ~, In'!, 1Il~ ~/'!_ C-3 PART A ATIENDING SCHOOL/COLLEGE BY COMPLETED
~ I~ it ;flit '1'''' 'E"f ;1If.I6' !lII1!f~n1fl Total persons attendm8 f.I~ Total population School/College illiterate
---------- ----------- ----_-----'!~ f~1fT ~Q!f ~~r 'i~ f~t Males Females Males Females Males Females
-------. _" -------.----------- ---------- ---~----.- - - _-. ---~----
2 3 4 S 6 7
~~'" RA.IOARH
63,773 57,360 18,777 10,906 848 775
6,337 6,995 135 lOS 135 lOS 1,405 1,497 434 404 154 141
J,610 1,737 889 938 204 225
1,281 1,465 978 958 135 93
1,417 1,836 1,095 1,193 124 63 J ,283 1,322 1,073 913 24 40
6,996 7,857 4.469 4,406 640 562
',914 7,428 6,274 4,479 62 n 7,899 5,499 4,800 1,639 10
7,520 5,537 2,548 201
5,471 5,087 229 :2
4,842 4,124 147 27 10 16,759 14,822 160 21 ] 1 16
~ 1_" i ;{rrlCf
RAJNANDGAON
74,179 70,073 21,253 13,778 1,807 1,503
8,793 8,658 106 119 106 119
1.964 1,866 415 326 270 222
1,9S5 1,752 1,197 966 604 469
1,670 1,545 1,216 967 343 317
~.074 1,801 1,784 1,272 285 203
1,722 1,552 1,511 1, ~ 67 III 79
9,385 8,545 6,123 4,697 1,614 1,290
9,282 8,854 7,763 5,798 82 49
8,380 7,100 5,071 2,535 5
7,456 6,432 1,618 372
5,701 5,718 215 85 5
5,206 4,919 79 41
19,972 19,856 277 121 5 35
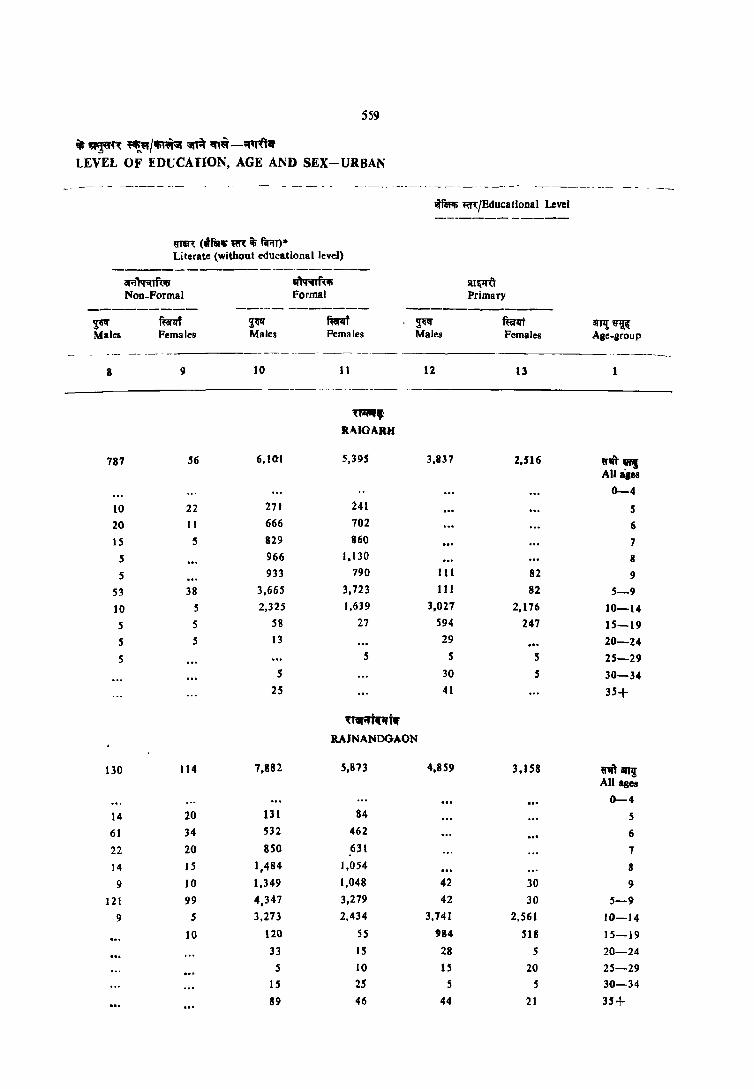
559
iit ~ ~"/~i( ~ ;ra~-~. LEVEL OF EDUCATION, AGE AND SEX-URBAN
_-- - - ------_-- --- ,------ _- - _--- - - - ----_- _------ --_ ---- - --- ---------- ----
ifWc!; '<f~:fEducational Level ------.- -----
mn: (i"'lIi m: ii ~T)" Literate (without educational level)
-----------------------aJPI~ ~ lll~ Non-Formal Formal Primary
---------- ------ -------- ------------~ fmf ~~ ~t ~ mrlli an3);~ Males Females Males Females Males Females Age-group
--- -_- - -- --------- - ----------
8 9 10 J I 12 13
~,
R..t.IOARH
787 .56 6,1(}1 5,395 3,837 2,516 w1iT"'I All a,es
0-4
10 22 271 241 5 20 II 666 102 6
15 5 829 860 7 5 966 1,130 8
5 933 790 III 82 9
53 38 3,665 3,723 111 82 5-9
10 5 2,325 1,639 3,027 2,176 10-14
5 5 58 27 594 247 15-19
5 5 13 29 20-24
5 5 5 5 25-29 S 30 .5 30-34
25 41 35+
~hr RAJNANDGAON
130 114 7,882 5,873 4,859 3,158 miIfJ!I All ages
0-4 14 20 131 84 5 61 34 532 462 6 22 20 850 631 7
14 15 1,484 1,054 8 9 10 1,349 1,048 42 30 9
121 99 4,347 3,279 42 30 5-9
9 5 3,273 2,434 3,741 2,561 10-14
10 120 55 '84 518 15-19 33 IS 28 5 20-24 5 10 15 20 25-29
15 25 5 5 30-34
89 46 44 21 35+
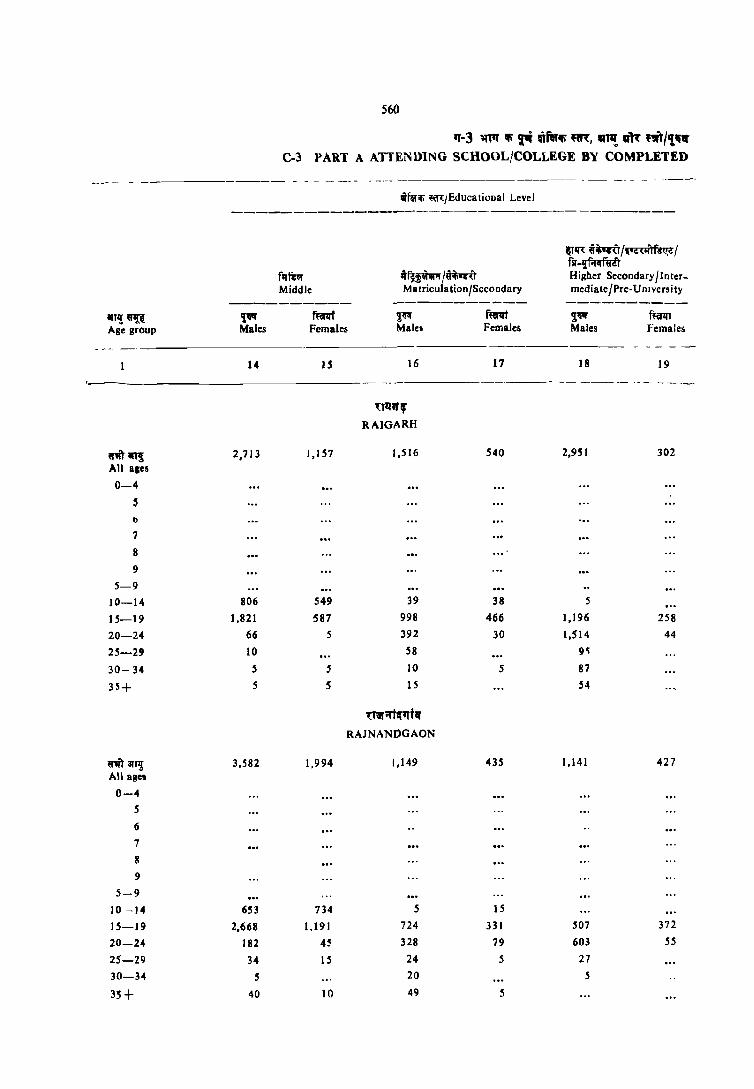
560
1f-3 'lnIf '" ~ iff"'" ~, 'luI!, a,," ,,ftI'l.1f C-3 PART A ATTENl>ING SCHOOL/COLLEGE BY COMPLETED
-_- --- - -- ---- - -----_- - ---- ------------ -------- - - -- - -----~
"'flll~ ~/Educalional Level
------------------------------------
~rll"{ i~/~')ft~1 f5l' -q:f'if.rwi't
f~~0'1 1l~~1IA li~T H i~her Secondary lIn ter_ Middle Matriculation/Secondary mediate/Pre-U nJversity
---------- ----------- ----------anI! ~ 'l~ ~ ~~ f~ $~ f~ Age group Males Female~ Male. Females Males Females
----_---- _--- -_-
14 IS 16 17 18 19
'- ------------ ---- ----
'{tlt", RAIGARH
~m Ill! 2,713 1,157 1,516 540 2,951 302 All ages
0-4 , tl
7
8 9
5-9 10-14 806 549 39 38 5
15-19 )'821 587 998 466 1,196 258
20-24 66 5 392 30 1,514 44
25-29 10 58 9~
30- 34 5 5 10 5 87
35+ 5 5 15 54
lTQfi'l'tll'IT'1!I'
RAJNANOGAON
rnar~ 3,582 1,994 1,149 435 1,141 427 All ages
0-4 5
6 7
8 9
5-9
10 -14 653 734 5 15
15-19 2,668 1.191 724 331 507 372
20-24 182 4S 328 79 603 55
25-29 34 15 24 5 27
30-34 S 20 5
35+ 40 10 49 5
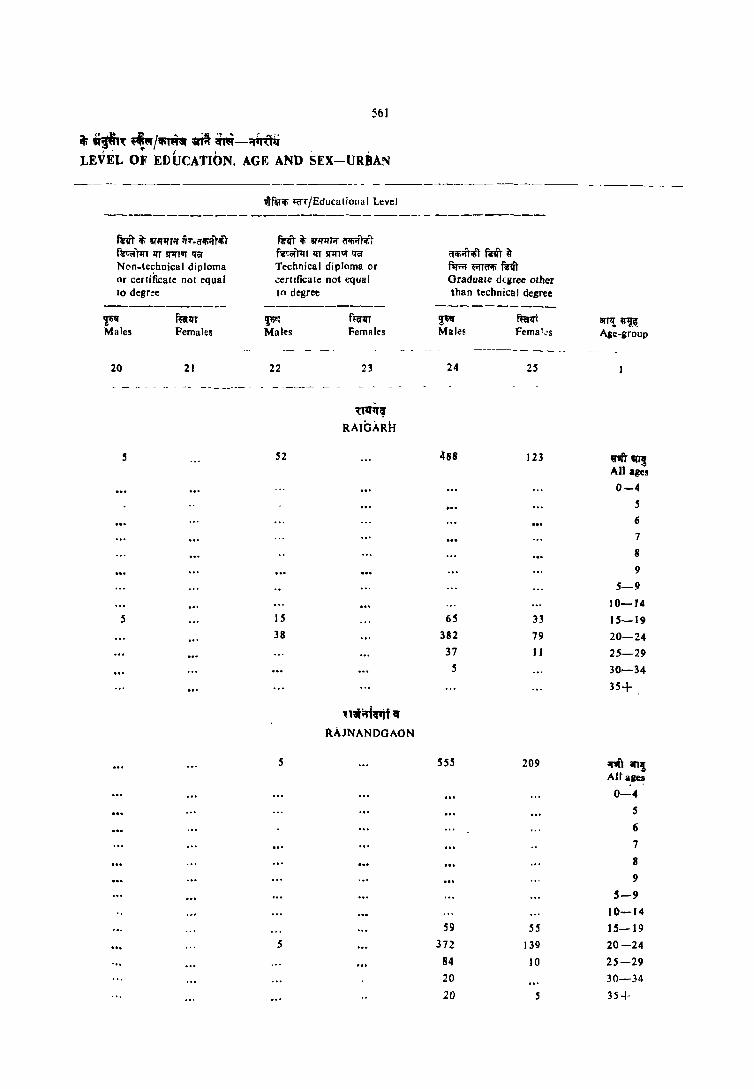
561
it; .~~ ~/~ .r.r im-~ ~ - • I I '.
LEVEL OF EDUCATION. AGF. AND SEX-URBAN
Rit ~ 1I"~~T;r h.1f" .. ftilliT fl'tOrTln II'T SI11TVT 'HiT Non-technica I diploma or certificate not equal to degree
~ Males
20.
5
5
mtll'T Females
21
.rf~", ~{/Educational Level
fRr ~ V~T'if 1f",;r"t<r.r f'6t~)1:r, lI'T SllftVT !faTechnical diploma or .;errrficate not equal tn degree
~ Males
22
52
IS
38
5
5
f~ Females
23
~lilirlf{"i • RAJNANDGAON
"",;ft'lil mfr it nrnr ~HI'" mit Graduate degree other than technical degree
'!~ Males
24
4118
65
382 37
5
sss
S9
372
84
20.
20
2S
123
33 79
II
209
S5 139
10.
afT,! "1~ Agc:.group
V1UWI! An ages 0-4
5
6
7
II
9
5-9
10.-14 15-19 20.-24
25-29
30.-34
35+
~'() ~! AHaaes
0.-4
S
fi
7
8
9
5-9 10.-14
IS-19
20.-24
25-29
30.-34
35+
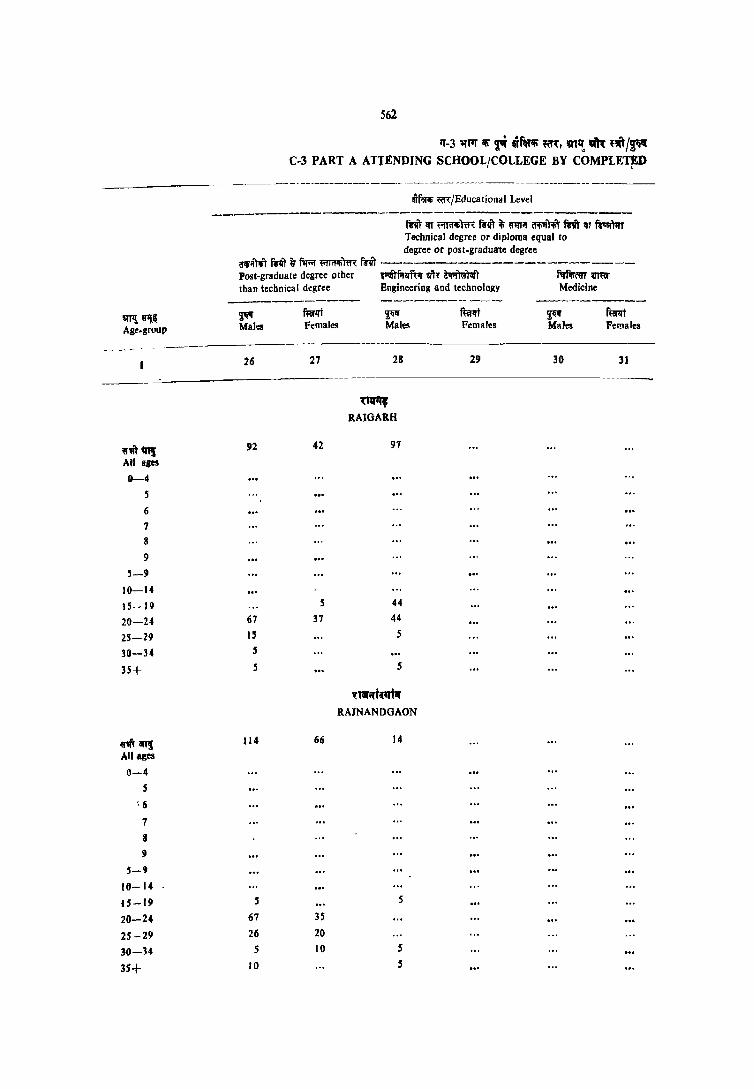
~''! ~ Age_group
,,'Ift~ All ages
0-4
5
6
7 8
9
5-9
10-14
15-19
20-24
25-29 30-34
35+
ritillT! AII_ges
0-4 5
'·6
1
8
9
~-9
10-14
1S-19
20-24
25 -29
30-14
35+
562
1f-3 ~T'f ~ ~ ~f"~~, m~ tm ~rit/~ C-3 PART A ATTENDING SCHOOL/COLLEGE BY COMPLET~D
.irl9ili m/Educational Level ---------------_._--------------------
Technical degree or diploma equal to degree or post-graduate degree
"'Iii!" fRr {r f1l"f l'ifl'l'IlIiffll: mil' ----------------------Post-graduate degree other ~fillIf<1l' m'( ~T f.rf'lim Wmf than technical degree Engineering and technology Medicine
------------ -----------~ Males
26
92
67
U S
5
114
5
67
26 5
10
ffiflli Females
27
42
5
37
~ Males
28
(~
RAIGARH
97
44
44
5
5
~ .. ;ri~t. RAJNANDGAON
66
35 20
10
14
5
5
S
~ Females
29
---------~ mm Males Females
30 31

563
~ ~ ~/~ij( ~ ~-i'(11'Uq LEVEL OF EDUCATION, AGE AND SEX-URBAN
-----------------------------------------
ifillili ~IEducational Level
fi"it III ';mr~)rn~ fnr it; ij'1flil ailiilTiliT f~!lr Ifr ftq;ft1lT Technical degree or diploma equal to degree or post-graduate degree
1Ii~ ~h: i',T om Agriculture a!\d daitYlng
~ Males
32
r~1ll Females
33
'"! fil'filiffiT Veterinary
~ fiifIIl Males Females
34 35
ar5llT'l'f Teaching
~ Males
ful'1It Females
36
'{UIITC;
RAIGARH
37
,{T\ifi'(i~i "
RAJNANDGAON
15
IS
~
Wlf Others
Males
38
ful'IiT Fenlales
39
arTl! ~ Age-group
q.,ff' ,,-'!ft, AlI'ages
0-4 5
6 7
B 9
5-9
10-14
15-19 20-24'
25"':'29
30-34'
35+
~art! Alllt&cs 0_:_4
.5
6
'7
&
'9
5-9 10-14-
15-19 20-24 25-29
30-34
35+

'IT'{ ~ Age·SrouP
~; 0-4
5
6
?
8
9
5-9· 10-14
15-19
20-24
25-29
30-14
35+
Il:~ 11'!, Al 'lies G-4
5
6
7
8
9
5-9
10-14
15-19
20-24 25-29 30-34
35+
564
tt-3 ltl!' $ ~ Nf~ ~~~, ~'! !l~ ~/P, C.3 PART A ATT~NDING SCllpO~ICOLLE~E BY COMPL'ETE~
H:_or!;filoP jf ~ m p qfiFir ~~ Tolal persons attending f'n:m Total population School/College Illiterate
------- ----------- ---~------
~ Nrn ~ fu;rlft i~ f'fnt Males Females Males Females Males Females
-----.~---
1 3 4 , {i 7
ri DUP.O
319,Z70 281,834 83,~66 58,406 4,434 3,527
39,058 38,331 449 406 449 406
8,958 8,309 1,988 1,540 112S 399
8,2U 8,746 4,61~ 4,2S0 1,350 1,163 . 1,493 7,783 5,466 4,604 803 589
8,971 8,719 7,t06 5,840 429 418
7,210 6,818 6,409 5,140 183 129
40,935 40,435 25,586 . 21,375 3,590 2.899
39,974 37,618 32,620 24,565 218 165
32,394 26,128 18,514 9,822 36 10
28,717 27,640 5,004 1,596 19 15
27,671 23,854 578 238 5
24,094 22,769 168 84 5
86,288 62,H7 7JS 243 62 23
'{~ R~I~UR
273.289 2",936 68,935 49,000 4,197 3,475
30,206 31,469 367 319 366 319
7,017 7,134 1,)90 1,128 S53 455
7,098 1,505 3,845 3,142 ),250 9905
5,831 5,875 4,010 3,344 815 650
7,484 8,OI~ 5,612 ~,197 618 441
S,287 6,176 4,314 4,431 218 309
32,118 34,706 19,232 17,243 3,455 2,851
32,On 3Z,616 24,243 20,143 329 228
30,629 26,318 16,339 9,082 18
28,353 25,314 6,739 1,564
24,014 22,179 819 183 17 12
21,2S~ 18,421 398 89 6 6
1J,883 64,758 730 294 23 42
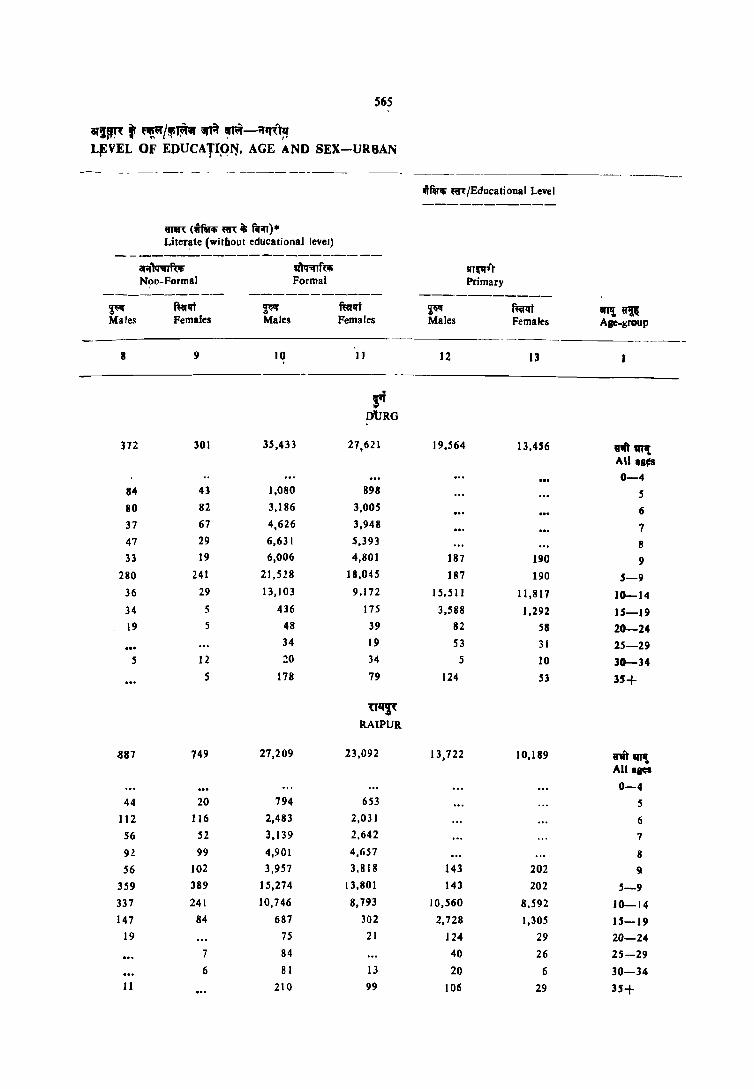
565
at'~ f ~/'~ itA ~-,,~)~ L~VEL OF EDUCATIP~, AGE AND SEX-URBAN
_--- --- -- ----------- --- _-_------- ---- -------lTRTIii ~/EducatioDal Level -----------
mR (mrlli ~ it; f(;n). Liter~te (without educational level)
- - ---------------------arIIN;n~ ~rf~ SIT~ir NOD-Formal Formal Primary
----------- ----------- -----------~ NiII'lii ~ fuiflli ~~ f~ 1IrI'Il~ Males Females Males Females Males Females Age-group
-----8 9 10 II 12 13
. S"
D'tJRG
37Z 301 3S,433 21,621 19,564 13,4'6 81it~ AU .8t!s 0-4
84 43 1,080 898 S 80 82 3,186 3,OOS 6 37 67 4,626 3,948 7 47 29 6,631 5,393 8 33 19 6,006 4,801 187 190 9
280 241 21,528 18,045 187 190 5-9 36 29 13,103 9,172 15,.511 11,817 10-14 34 5 436 175 3,588 1,292 IS-19 19 48 39 82 58 20-24
34 19 53 31 25-29 5 12 ~O 34 5 10 30-34
5 178 79 124 53 35+
l'~ RAIPUR
887 749 27,209 23,092 13,722 10,189 m~ All 18C:S
0-4 44 20 794 653 5
112 116 2,483 2,031 6
56 52 3,139 2.642 7
9l 99 4,901 4,657 8 S6 102 3,957 3.818 143 202 C}
359 389 15,274 13.801 143 202 5-9 337 241 10,746 8,793 10,S60 8.592 10-14 147 84 687 302 2,728 1,305 15-19
19 75 21 124 29 20-24
7 84 40 26 2S-29
6 81 IJ 20 6 30-34 11 210 99 106 29 3S+

566
1f-3 ~If ~ ~ irf&T~ ~~'{, 1Ifr~ ~ ''"/~ C-3 PART A ATTENDING SCHOOL/COLLEGE BY COMPLETED
---- -_ .. - _-- ---- --- .- - -------_------ ------
Wf~1Ii m/Educational Level
-------------------------------------~ ij-it;unr/~qr~ll;z/ f!l-~f~~f!rzr
flrmr ,,~~;r /\liti'nr Higher Secondary/Inter-Middle Ma 1 rlculatlon/Secondary media Ie/Pre-University
----------- ----------- ----------arr,!~ ~" f~qt ~({ f~1IT 9;W f'll'lfl Age-group Males Females Males Females Males Females
----------------_----------~-------
14 15 16 17 18 ]9
---- _------- --~----- - - ---_ rt
DURO . ,
61iti'W! 12,775 8,109 4,859 1,848 4,586 2,644
All ages
0-4
S
6
7
8 , 5-9
]0-14 3,627 3,305 56 63 9 14
15-19 8,549 4,639 3.108 I,SS6 2,525 1,983
20-24 448 77 1,377 ]65 ],879 589
25-29 80 36 130 19 118 48
30-34 II 5 50 ]4 15 5
35+ 60 38 138 29 40 5
'{1~~
RAIPUR
~ !lUI! 11,465 6,71 S 3,842 1,608 4,217 1,984 All a:ges
0-4
5
6
7
8
9
5-9
10-U 2,252 2.214 19 60 14
'15-19 8,455 4,292 2,142 1,340 1,829 1,444
20--24 559 155 1,392 164 2,163 483
25-29 59 20 126 14 lSI 28
30-34 S4 53 14 60
35+ 87 35 104 IS 14 15

567
t ~~ ~=f/~ ~Ti't ~-~~)Ir LEVEL OF EDUCATION, AGE AND SEX-URBAN
RIIT ~ 'I"~ ~-~m ~lfT R1I'f1II'-'«I' Non-technical diploma or certificate not equal to degree
~~ Males
20
mm Females
21
lif~li!i ~(fl:/Educational Level
RIIT~ar!.l'l'[Til'~ fitOffl'fT 1fT SIlfI1Jf-'«I' Technical diploma or certificate not equal to degree
~" Males
22
ffiiqT
Females
23
"~m ~oft« hrn:r t-rffllIi miT Graduate degree other than technical degree
~~ Males
24
f~1fI Females
25
iI'T'i~ Age-sroup
--- --------------------------
s
5
229
61
122
22
5
20
126
56
53
10
7
Fi DURO
15
5
10
~Tq1~
RAIPUR
8
8
1,135
165
818
88
15
50
2,402
283
1.765 ]82
72 100
618
153
429
31
.5
834
269
495
37 20
14
W1IT",,! All qcs
0-4
5
6
7
8
9
5-9
10-14 15-19
20-24
25-29 30-34
U+
~..rrllll'l! All ages
0-4
5
6
7
8
I)
'-9 10-14
U-19
20-24
2.5-29 30-34
35+
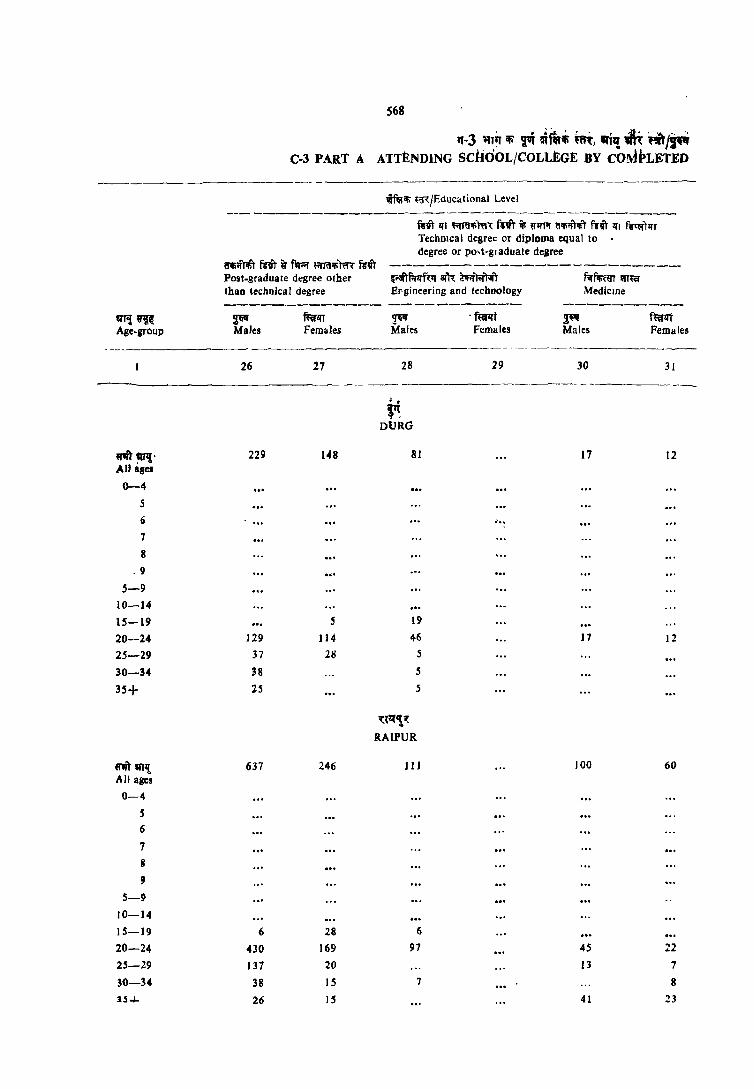
568
tt-3 ~T~ ~ ~ ~("i fal, 'Ii,! ~ "/~ C-3 PART A ATTENDING SChOOL/COLLEGE BY COM"LETED
- - ----------------- ------~
\lmili .iR:/Educational Level --- -------------~------------------------
fWliT Ifl ~~~~ fnr • ~"lrT~ (I'Iii'lTIliT frlil' 1I1 fi'tVj:Tfn TechnIcal degre~ or diploma equal to degree or po't-graduate degree
a'1Ii;r');fi'r fAt ~ f'll'"l' I-iffiI'liT'fft fi'liT -------------------------Post-graduate degree olher ~Nfrf.rq-f~q ail<: m~r f:qmm rm~ Ihan technical degree El'gineering and technology Medicine ------------- ----------- ----------
tTJ1i 'ii! ~ ffirllT ~ - ffirqf ~ f~1tt Age-group Males Females Males Females Males Females
26 27 28 29 30 31
~- --- - --------_ .. ~
DURO
W1it ~. 229 148 81 17 12 . . All ages
0-4
5
6 ... 7 8
.9
5-9 10-14 15-19 S 19
20-24 129 ]] 4 46 17 12 25-29 37 28 .s 30-34 38 5
35+ :zs .s
'{t~"1:
RAIPUR
fI1it $1111" 637 246 III 100 60 All age~ 0-4
S 6
7 B
9 5-9
10-]4 15-19 6 28 6
20-24 430 169 97 45 22
25-29 137 20 13 7
30-34 38 15 7 8
2S~ 26 IS 41 23
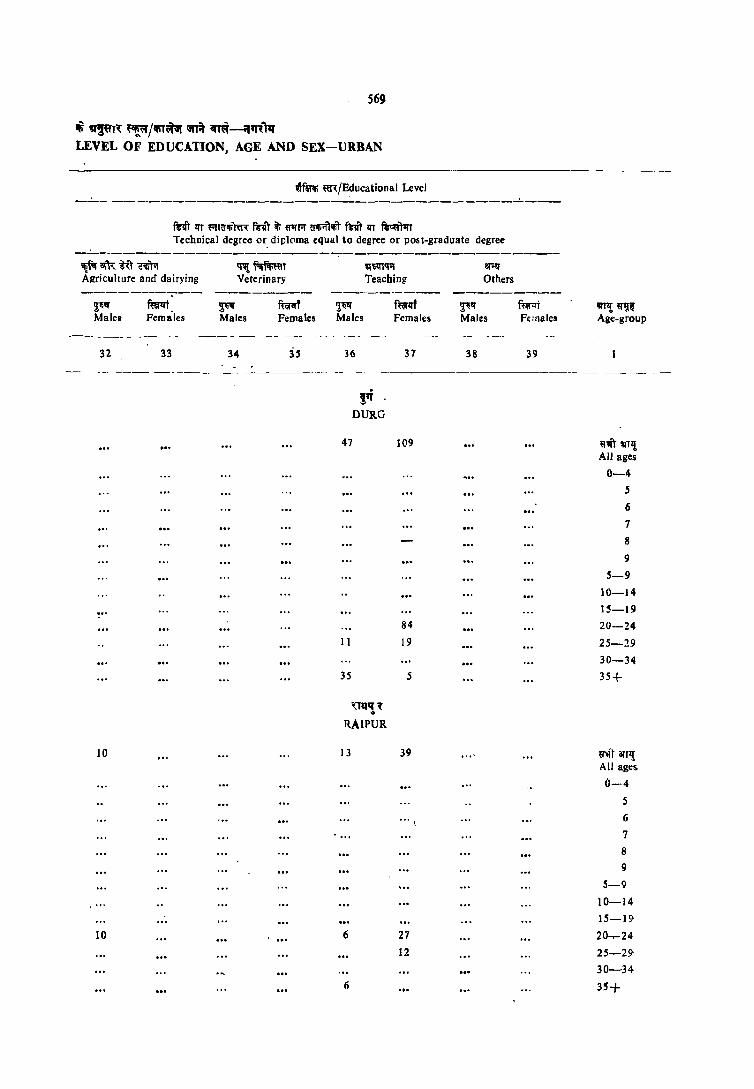
569
~ Ill~~ ~/IfiT~G{ ~i% ~m__",,~"q LEVEL OF EDUCATION, AGE AND SEX-URBAN
wf~ m/Educational Level _...:.__ ----------------------------------~---
~!lT !IT ~r<r'!i~ tnT ij; ~A 6'11i'ft1liT ~m !IT ~)1rr Technical degree or. diploma equal to degree or post-graduate degree
-----------------------:--------------------'If~ aIR ~l ~TlI ~~~T Agriculture and dairying Veterinary ------------ --------
9;~" mt ~ furlrf Malet Females Males Females
------ -" _-- . ----- - ----
32 33 34 3S
10
10
~~
Teaching ----~-----
~~ Males
36
i~ DURO
47
11
35
,(Tlflf '{ .. RAIPUR
13
6
6
fwlli Females
37
109
84
19
5
39
27
12
a!~1i
Others
---------~" mr:.t Males Feillaies
38 39
IIW! ~1iI& Age-group
~1fr ~, All ages
0-4
S
6
7
8
9
5-9
10-14
15-19
20-24
25-29
30-34
35+
~'tl1 arr,! All ages.
0-4
5
6
7
8
9
5-9 10-14
15-19-
20-24 25-29-30-34
35+
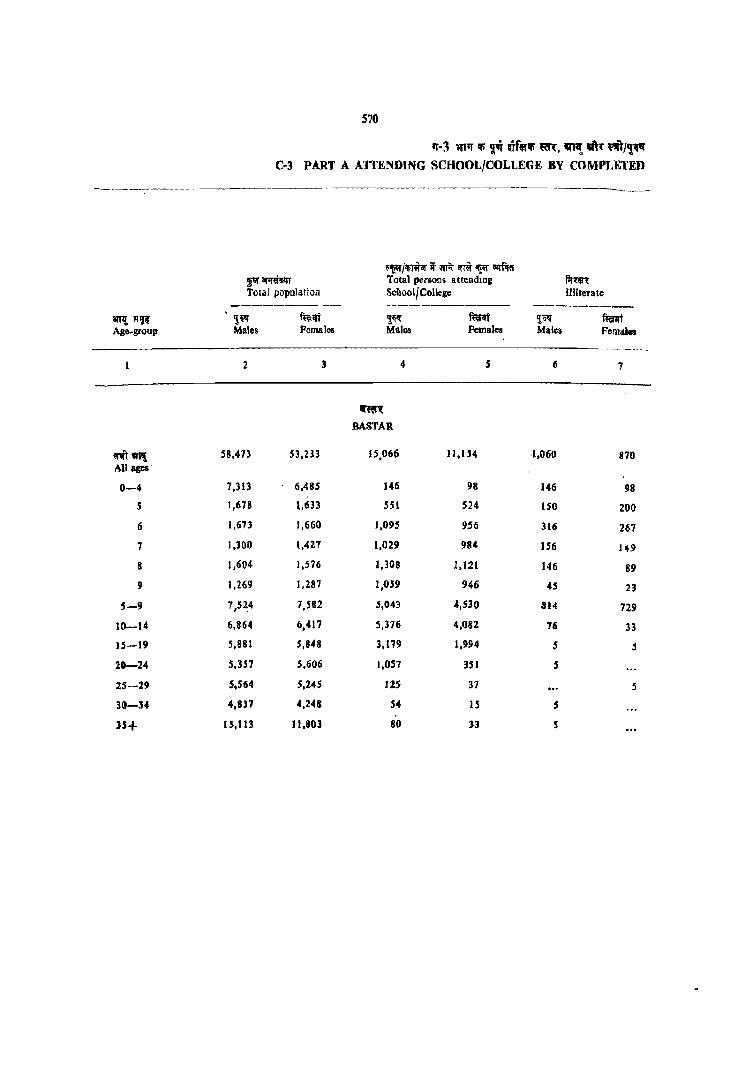
ilP! flU Age-group
mit",,! All ages'
0-4
5
6
7
8
9
5-9
10-14
15-19
20-24
25-29
30-34
U+
570
'f-3 mIT iii 'r1 irf.1fi ~, ~ a)~ ffi/'~ C-3 PART A ATTENDING SCHOOL/COLLEGE BY COMPLETED
._--------- ---
~~/~ii"tlff.r;m)"!;;rill'f.ffl ~~ Total perIODS attendmg fimrt Total population School/College Illiterate
---------- _-------- ---------~lil!l' mtlfl ~li'l' ffirlfI '!W fint Males Females Males Females Males Females
2 3 4 5 6 7
.fn BASTAll
58,473 H,233 15,066 ll,t54 ,1,060 870
7,313 6,485 146 98 146 98
1,618 1,633 SSI 524 150 200
1,673 1,660 1,095 9.56 316 267 1,100 1,427 1,029 9814 1S6 149
1,60<$ 1,576 1,308 1,121 146 89
1,269 1,281 1,059 946 45 23
7,52.4 7,582 5,043 4,S30 814 729
6,864 6,417 5,376 4,0112 76 33
S,88[ 5,848 3,179 1.994 5 5
S,lS1 5,606 1,057 351 ~
5,564 5,245 IZS 37 5
4,8]7 4,248 54 15 5
15,113 11,803 BO 33 S

571
iti ,,¥T,( ~lII/~~ ;snit ",it-~ LEVEL OF EDUCATION, AGE AND SEX-URBAN
~ Males
~rreT<: (wfet'f ~ ~ fifilW Literate (without educational !evel)
ar;;:ltrinf~
Non_Formal
fullff Females
~ Males
~ Formal
mt Females
wfn m/Educational Level
~ Males
SlTwl Primary
Females
--- ---- ---- - ---------- - -- ---
8
87
9
14
5
9
9
4S
18
14
5
5
9
60
9
5
5
5
5
28
14
10
" ...
5
10
6,265
392
765
868
1,153
960
4,139
2,008
9S
8
S
5
II
If~(
BASTAR
5,272
314
684
830
1,027
849
3,704
1,522
32
S
12 13
3,032 2,288
45 69
45 69
2,501 1,888
463 312
18 5
S 9
5
iIfTli ~ Age-group
~1i'rq All age,
0-4 , 6
7
8
9
5-9
10-14
15-19
20-24
25-29
30-34
35+

S72
1T-3 \ll1t ~ ,.r ~ ~~, 1A'l'! "" 'tft/~ C-3 PART A ATTENDING SCHOOL/COLLEGE BY COMPLETED
-._-_--tfllroli m/Bducational Level
-------------------------------------
~ ~ii;.ro/~fi"~1 fsr.'_flm'"«eT
f1rl'c\;r ~~/"'ro Higher Secondary/Inter. Mid'Jle Matriculation/Secondary mediate/Pre.Universjty
---------- ---------- ---------ar"t~ ~ f~ ~~ mm ~ f~ Age-group Males Females Males -Females Males Females
14 15 16 17 18 19
~
BASTAR
9"ft"" 2,8-22 1,624 116 519 629 . 333 . All ases
0-4
S
6
1
8
9
5-9 ... 10-14 747 607 23 14 5 S
IS-II' 1,822 938 468 376 264 266
20-14 203 60 242 III 340 52
25-%9 2% 14 9 14 9
30-34 ·14 10 5 6
35+ 14 5 2S 5 6 S

573
~ "PR ~,,/~ ..A ~1~-Yfq~11I LEVEL OF EDUCATION. AGE AND SEX-URBAN
wmiil1 ~~/Educational Level
fcit if 'RIlIr;r ~-aIliot1'1iT FAl' ~ q{Pltor ~ f-fc:orm lIT ~ IRI" fFof)ln lIT SIl!l1lf IRI" al!iifFl;'T fl'lfT ~ f1rnr Non-tecbnical diploma Tecbnical diploma or ~fnj or certificate not equal .::ertificate not equal Graduate degree other to degree· to degree tban technical degree
---------- ---------- ----------~ mm ~ f~ !I" mm arJ'l!~ Males Females Males Females Males Females Age-group
-- ~---
20 21 22 23 24 25
.m BASTAR
20 28 293 142 tJ"" 111111 All age.
0-4
5
6
7
8
... 9
5-9
10-14
~ .. 5 36 51 15-19
5 23' 185 86 20-24
5 53 H-Z9
5 5 30-34
, .. 5 14 6 35+
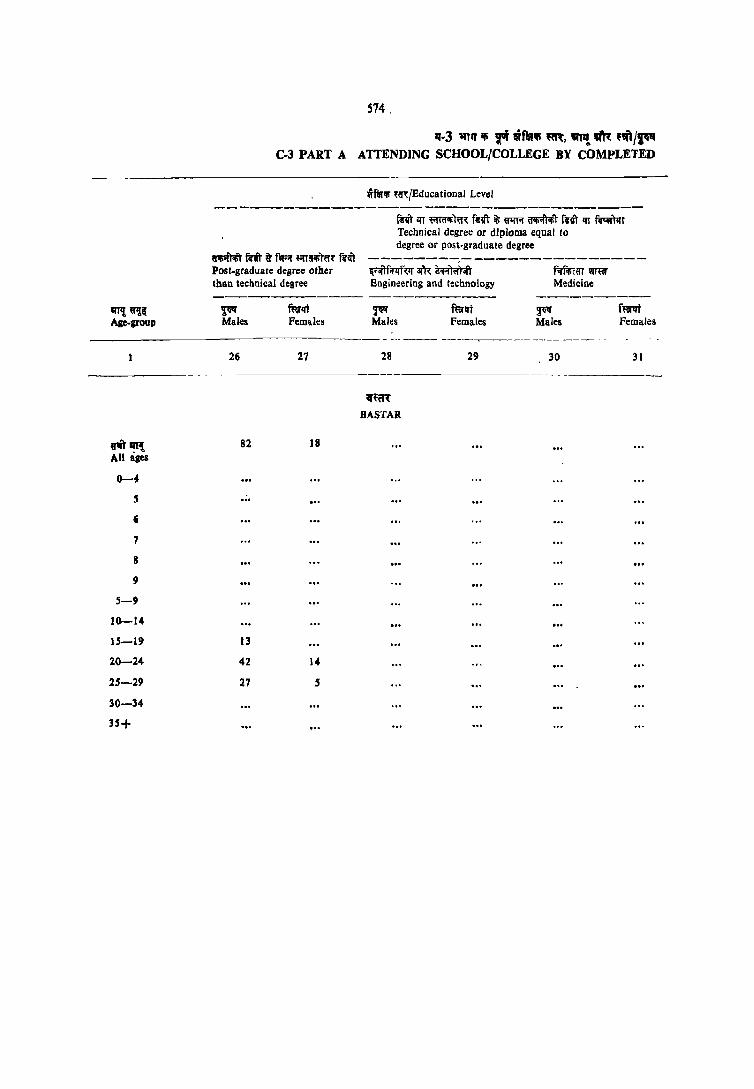
'I17l ~il Age-group
574.
q·3 ~q iii 1'i uf"lfi ~, '111!. ~ ~'"/~ C·3 PART A ATTENDING SCHOOL/COLLEGE BY COMPLETED
iIlIiifr.tt mit ~ f'R ffi(f'l'iffi~ fi'it Post-graduate degree other than technical degree
~ furqi Males Females
wm'l'i ,a\{Educational Level
1m" l1T ~~l'\'l~ fell'," ~ 61!TiI' iIlIiift'l'i't I\Iit I{T ~Irr Technical degree or diploma equal 10
degree or post-graduate degree
~f'l'qf\tl' am: rr.n.rr.rt Enginellring and technology
~ Males
fuiq-t Females
Mlldicine
~ Males
f~lli Females
----------------- --- -- -----~------.-----
rit~ All ages
0-. s (j
7
B
9
5-9
10-14
15-19
20-24
25-29
30-34
H+
26
82
13
42
27
27
18
14
S
28
"~Rt
BASTAR
29 30 31
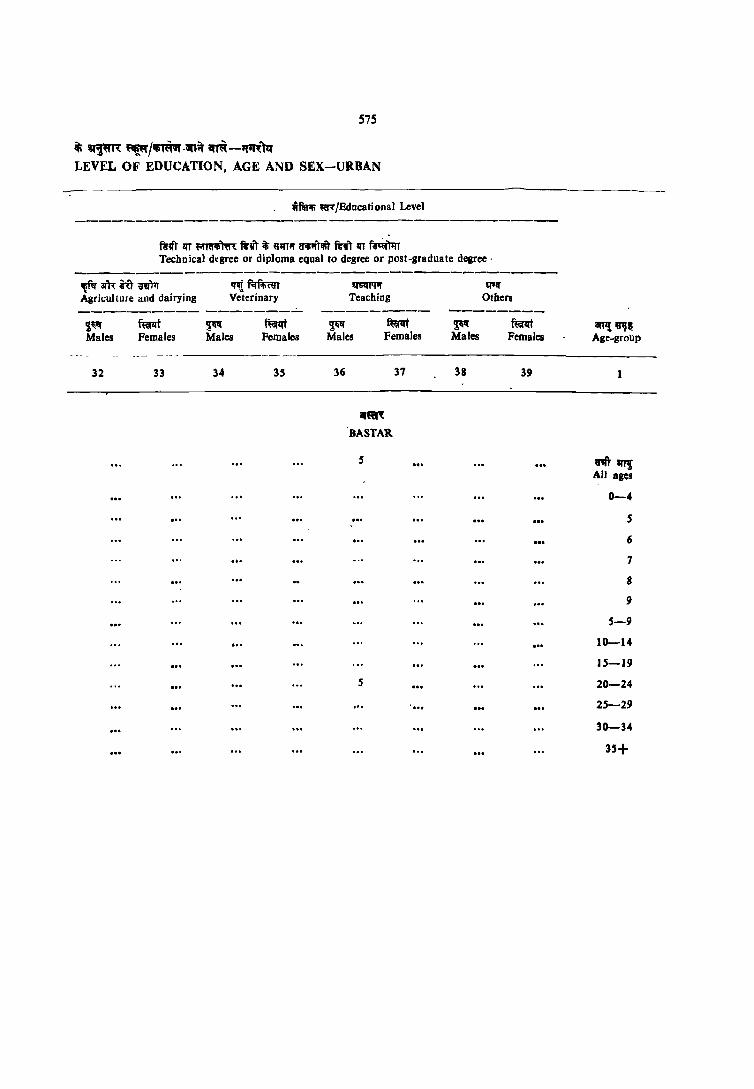
575
~ IR'~',( ~~ jlJ. -iiTlit ~ -iTlttTtr
LEVEL OF EDUCATION, AGE AND SEX-URBAN
wm1!fi ~/Educational Level
fl'vj 1fT MfflIfim fl'Vt it; 61fT'! IJifi'Ijllil" m-TIfI fW~ Technical d~gree or diploma equal to degree or post-graduate degree·
IIlfli am: i"U 'd1Tl1T lfW~m Agriculture and dairying Veierinary ---------- --------$~ fup.rt ~ ~ Males Females Males Females
--- - -- .
32 33 34 3.5
!ll'SIRIr.f Teaching
---------~ ~ Males Females
36
iI~
'BASTAR
.5
5
37
!II'"..tr Others
--------~ fmt Males Females
38 39
iW{~8 Age-group
U1ft'~ All ages
0-4
.5
6
7
8
9
.5-9
10-14
1.5-19
20-24
2.5-29
30-34
35+
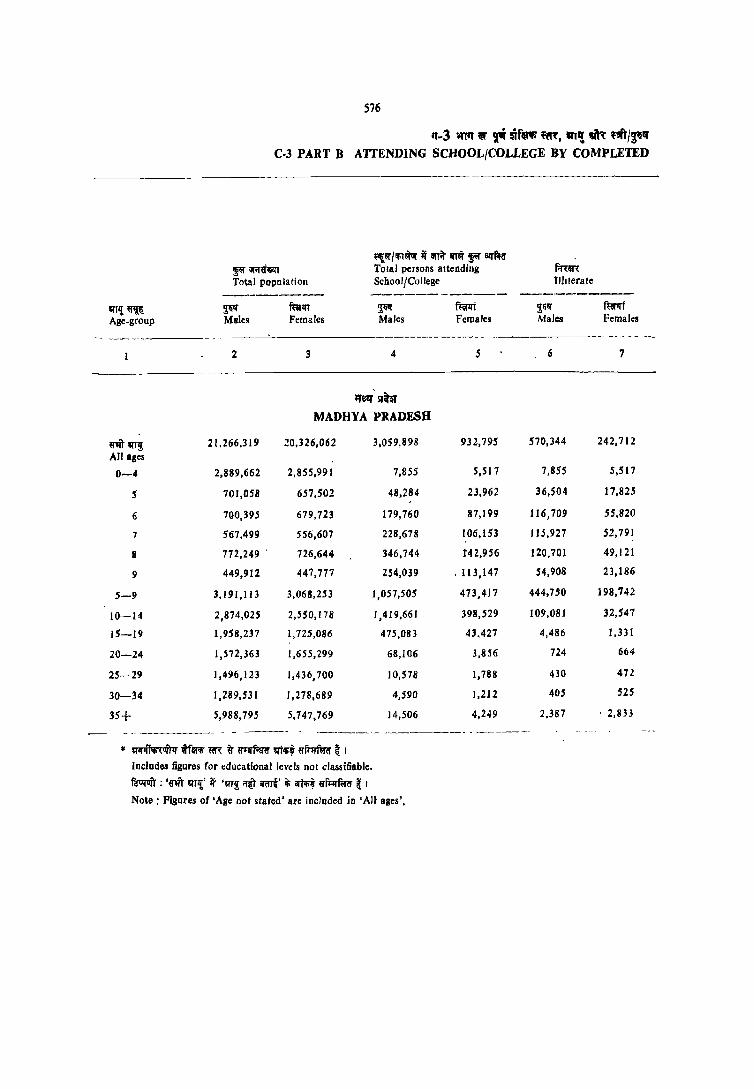
576
fT-3 ~TfT {I ~ ~fefti fft'{, "''! ~ ''"I~'' C-3 PART B ATTENDING SCHOOL/COLLEGE BY COMPLETED
''liil'/!fil~ if ilrrif ifI~ p iilfllter ~ ii!'II'Q'11<I Total persons attending f;n:m Total population School/College Illiterate
---------- ----------- --_._------"-I'i~ ~ ~1fT ~ mrrrt $ij1ll' f~t
Age.group Males Females Males Females Males Females
--- ------- --- -_---- - - -_ 2 3 4 j 6 7
q-f.'IJ' srhr MADHYA PRADESH
e1it~ 21,266,319 :!0,326,062 3,059,898 932,795 570,344 242,712
All ages
0-4 2,889,662 2,855,991 7,855 5,517 7,855 5,517
5 701,058 657,502 48,284 23,962 36,504 17,825
6 700,395 679,723 179,760 87,199 lJ 6,709 55,820
7 567,499 556,607 228,678 106,153 115,927 52,791
B 772,249 . 726,644 346,744 1'42,956 120,701 49,121
9 449,912 447,777 254,039 . 113,147 54,908 23,186
5-9 3,191,113 3,068,253 1,057,505 473,417 444.750 198,742
10-14 2,874,025 2,550,178 1,419,661 398,529 109,081 32,547
15-19 1,958,237 1,725,086 475,083 43.427 4,486 1,331
20-24 1,572,363 1,655,299 68,106 3,856 724 664
25-29 1,496,123 1,436,700 10,5'78 1,788 430 471.
30-34 1,289,531 1,278,689 4,590 1,212 405 525
35+ 5,988,795 5,747,769 14,506 4,249 2,387 . 2,833
-- - - _--- --------- ----------- - -----..
* ~If ffm; <a\ ~ 'I1'iIf.-mr qi4i~ q~fi;rn t I Includes figures for educational levels not classifiable.
~:'«it ..-r'i' it '~r~ "ll~' i'j; art~ qf1:lrm-er t I Note: Figures of 'Age not stated' are included in 'AU ages',
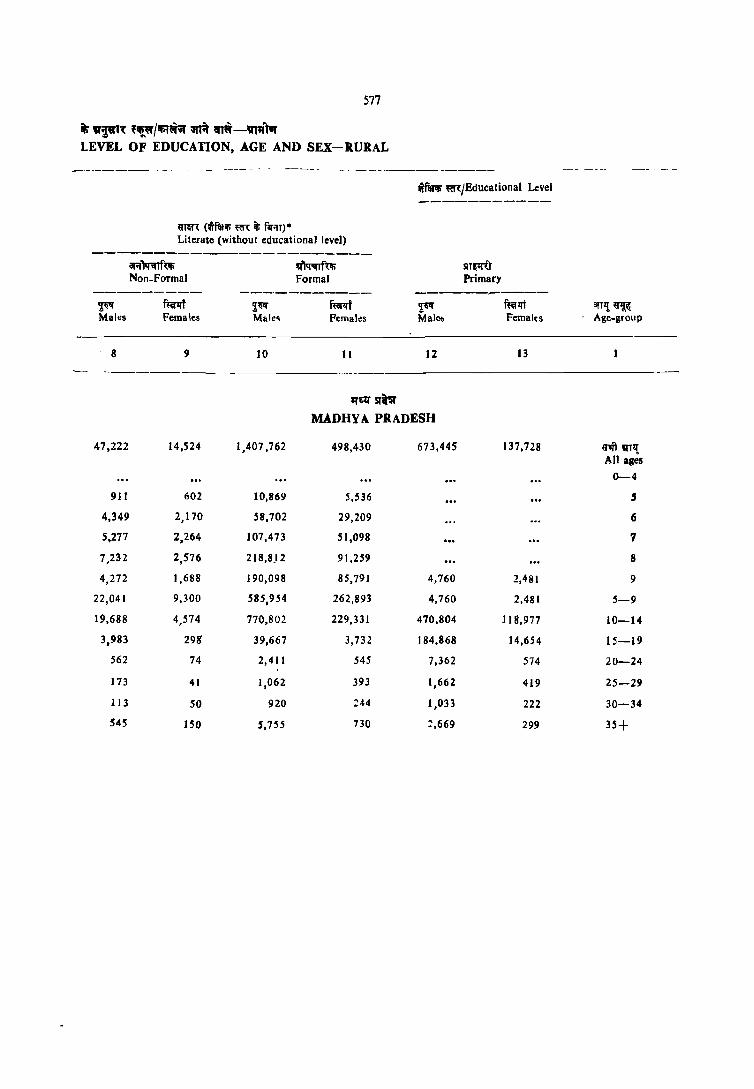
577
iti IA'~',{ '''i''/Itil~ ~ 'fIW-'lr'lTwr LEVEL OF EDUCATION, AGE AND SEX-RURAL
Wffi ~/Educational Level
~ Males
- 8
Q'IGI"l: (lifatifi ~ ~ fiT'lT)· Literate (without educational level)
iIT'I')RTf~ Non-Formal
fum Females
9
~~ Male~
10
'f~ Formal
mf Pemal~s
II 12
------------ _------
47,222 14,524
911 602
4,349 2,170
5,277 2,264
7,232 2,576
4,272 1,688
22,041 9,300
19,688 4,574
3,983 29g
562 74
173 41
113 SO
545 150
1,407,762
10,869
58,702
107,473
218,8.12
190,098
585,954
770,802
39.667
2,411
1,062
920
5,755
1f'L1:l'5I'~
MADHY A PRADESH
498,430 673,445
5,536
29,209
51,098
91,259
85,791 4,760
262,893 4,760
229,331 470,804
3,732 184,868
545 7,362
393 1,662
:44 1,033
730 ~,669
511~1 Primary
Females
13
137.728
2,481
2,481
118,977
14,654
574
419
222
299
arr,!~ Age-group
<l," 'I'll{ All ages
0-4
5
6
V
8
9
5-9
10-14
15-19
20-24
25-29
30-34
35+

578
'1'-3 ¥IT'1' ",., mn~, '"'! .m 'f:,"/~ C-l PART B ATTEl\DING SCHOOL/COLLEGE BY COMPLETED
----_ --------- - - -- ---.,~ f(Il;/Educalional Level
------------------------------------
~ «~/~i!(lI'lft'~/ fsr-~g-iI' fiJfr.r ~~/~~
Higber /Secondary /Inler_ Middle Matriculation/Secondary
mediate/Pre_ University ------ ----------- -----------~H9;~ ~ f~1If ~ f~
~ f~1If Age-group Males Females Males Females
Males Females 14 15 16 17 IS 19
-IIS!f smr MADHYA PRADESH
trIir'"l 247,290 29,988 50,009 5,210 52,987 3,568 All ages
0-4
5
(j
7
8
9
5-9 ... 10-14 47,417 12,610 ',SS4 409 301 81 IS-19 178,853 16,444 36,185 4,206 26,021 2,566 20-24 17,281 487 10,331 443 22,739 746 25-29 1,740 188 1,028 103 2,520 108 30-34
697 112 341 25 642 25 3.S+ 1,185 143 512 '10 754 43

579
Iii .pR: ~ /rnWif ~ "~-'!lq1'1' J,EVEL OF EDUCATION, ~GE AND SEX-RURAL
fi'lft it; a:r~if lj'Nrlliif'fiIiT fi't~)lrT qr 51l1Tur·~ Non-techmcal dlph)ma or certificate not equal to degrt'e
~lif fierqr Males Females
- -------20 21
-;fll1l1i m/Educauonal Ltvel
~IJ'\ iii a:r~if <:!IIi;ft'IiiT ~t~)1n qr li1fTur· 'fer Technical diploma or cerl dicate nOI equal to degree
iqtf nerlfT Males females
22 23
Q"lf SI'~
r.tl<:!lli m, 'I'fuiI; Graduate and above
~'ilif f~qr Males Fema e~
24 25
- ---- -~--
MADHY A PRADESH
98 5 504 10 10,235 620
10 5
84 5 99 5 837 185
5 262 5 6,429 319
90 1,873 64
11 428 11
37 662 42
'f~ !l~~ Ag~-group
-- -
00 aT~ All ages
0-4
5
6
8
9
5-9
10 -14
15-19
20-24
25-29
30-34
35+

~ 'flft Age_group
«...rr~ All ages
0-4
S (.
7
8
9
5-9
10-14
15-19
20-24
25-29
30-34
35+
nt qfl! All ages
0-4
.5
6
7
8
9
~-9
JO-14
15-19
20-24
25-29
30-34
35+
S86
'1-3 ~ w ~ ~f" ~, "'~ .m ~/'!~ C-3 PART B ATIENDING SCHOOL/COLLEGE BY COMPLETED
~~/~ 11' \ilTit m ~iI' III'fifff ~ ViI' iAUiIlT Total persons attending
Total population School/College Jlliterate
---------- ----------- ----------'!:~ m.lft ~ fum 'l~ fterlft Males Females Males Females Males Females
2 3 4 5 6 7
Q'(iI!1 . MORENA
613,185 511,778 107,527 16,326 13.148 3,488
87,979 80,830 305 103 305 103
21,678 17,599 1,368 392 900 283
21,691 18,051 5,001 1,18 I 2,486 644
16,419 14,001 6,074 1,531 2,456 629
25,138 19;054 11,458 2,773 2,720 732
12,297 9,857 7,355 1.775 1,238 356
97,224 78,56Z 31,255 7,652 9,799 2,643
84.026 60,697 51,490 7,643 2,805 54l
57,302 44,231 19.310 597 128 41 47,101 44.573 3.559 101 25 IS
43,271 36,545 668 70 5 42 36,479 32,163 191 25 10
J 59,463 134,011 649 131 81 92
f~ BHIND
441,626 365,978 94,315 20,300 12,898 4,692
60,389 54,503 163 106 163 106 15,204 12,137 1,271 610 929 407 14,242 11,492 3,939 1,605 2,298 1,022
11,222 8,964 4,985 1,679 2,310 806 16,678 12,129 9,200 2,757 2,972 877
9,551 7,637 6,655 2,406 1,403 544 66,897 52,360 26.050 9,057 9,912 3,657 62,526 42,765 45,281 9,947 2,618 813 42,742 31,833 18,603 828 91 32,657 31,924 3,002 116 24 25 28,967 26,505 491 59 10 5 23,451 21,910 113 40 10 10
123,780 103,984 558 127 70 76

58l
• WJ~ ~/~" ~ ~-~ LEVEL OF EDUCATION, AGE AND SEX-RURAL
----------------- --- -_- ----------------------------------
mn: (~M\ t 11f;rr)* Literate (Without educational level)
~ Males Females
~qI!{ Males
-----------------------
8
1.452
55
125 174 239 129
722
538
115 30
10 10
26
1,525
24 137
141
156
122
581
688,
186
15 10
36
9
233
19
38 10
67
24
156
62
]0
5
405
35
35
25
64
79
237 119
15
15
10
10
to
49.913
413
2,391
3,444 8,499
5,168
20,S 1 5
27,563
1,381 96
67
20
191
38,310
318 1,504
2,533
6,072
4,920
15,347
21,631
1,068
93
20
10
116
~qj Females
II
'~lfr MORENA
9,808
90
499
893 ],97S
1,134 4,790
4.881
90
14
5
5
19
fo:rq BHIND
10,819
168
548 84S
1,816
1,699
5,079
5,560
119
10
15
5
23
i~ ~/Educational Level
~ Males
12
25.044
219
219
17,694
6,545
308
82 41
145
23,063
210
210
17,396
5,127 134
40
15
131
lI~T Primary
mr!ft Females
13
2,283
62
62
1,946
209
43 14 5
5
3,459
84
84
3,071
227
20
20
B
13
anl!~ Age.group
91I'T !QT'! All ages
0-4 5
6
7
8
9
5-9
10-14
15-19 20-24
25-29 30-34
35+
rn~ All ages
0-4
5
6
7
8 9
5-9 10-14
15-19 20-24 25-29
30-34
35+

582
1f-3 ~ II ~ mllWi m, ~,~ al1: ~'!Jft/~ C-3 PART B ATIENUING S('HOOL/COLLEGE BY COMPLETED
tfllf~ m/Educalional Level - -------_._---------- ---------------
IiTIf': ~""1.·",.,1I'11:~1 fsr -lff.rllfm
fl1li'iif 1l~~1ft'lI/~~1 Higher Secondary I In ter. Middle Matrieula tion /Secondary mediatejPre-U n1vem\y
--------_._- ----__ ._------- -----------alTl! fI'llli 'ltil!f i~ ~liQ' fuitrt ~ ~ Age group Males Females Male~ Females Males Females
----_------ -
14 1.5 16 17 18 19 --- ----_ ..
,i~T MORENA
mihlTl!, 12,451 433 1,073 33 3,890 38 All ages
0-4 5
6 ... 7
8 9
5-9 10-14 2,751 209 89 5 50 15-19 8,338 195 763 28 1,999 24 20-24 1,109 9 195 1,501 9 25-29 123 5 224 5 30-34 31 5 10 51 35+ 89 15 11 64
fii'Q~
BHIND
«1ft IAlI! 13,132 739 1,199 46 3.730 135 All ages
0-4 5
6
7 8
9 5-9
10-14 2,826 362 68 8 49 IS 15-19 9,112 343 886 25 2,088 100 20-24 995 20 190 3 1,321 20 25-29 109 10 44 10 167 30-34 21 5 31 35+ 66 5 .5 69

583
Iti vp1'~ ~(lF/~ irA -m-V11I1ar LEVEL OF EDUCAtiON, AGE AND SEX-RURAL
---- ------''--- ---------
mn if; QlfA' ~-i'lIR)!it f(~ III SI1fTVT..tnf Non-technical diploma or certificate not equal to degree
~ Males
f~ Females
~ ~/Educatiooal Level
fl'liI" if; iIf&ll'Tif ~ fitor)1rr IH 1I1fT11l-IRf Technical diploma or certificate not equal to degree
~'i Males
f~ Females
--- --- -------- -----------------20
20
5
1 S
21 22
J1
5
5
23
MORENA
fl1'1
BHIN.D
~~1f~ Graduate and above
--------:--~ Males
24
'56
41 294 152
26 42
427
31 230
86 21 59
ffiilli Females
25
10
S
5
3
3
arT,! ~ Age-group
~~ AU ages 0-4
5
6
7
8
9
'-9 10-14 15-19 20-24 25-29 30-34
35+
~qr.
AlI"e~ 0-4
5
6
7
8
9
5-9 10-14
15-19
20-24 25-29
30-34
35+
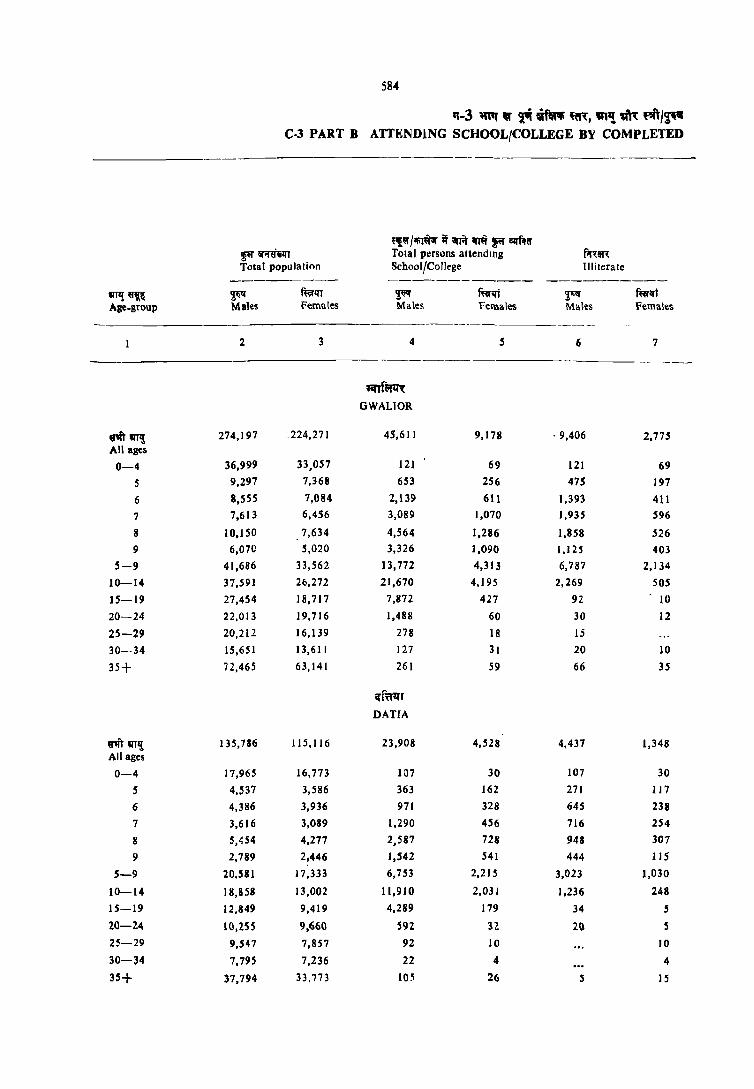
WTI!~ Age-group
.. 'iii' IIfTll All ages
0-4
5
6
7
8
9
5-9
10-14
15-19
20-24
25-29
30-34
35+
~'Ift !Ill,! All ages
0-4
5
6
7
8
9
5-9
10-14
15-19
20-24
2~-29
30-34
35+
584
11-3 ~ w i'i uf", ~lR, '"'i ~~ ~/~ C-3 PART B ATTIt;NDING SCHOOL/COLLEGE BY COMPLETED
~,;~/ifil~ if \ll'A' ~ ~ arfltEl fil' iiJ'iI'~li<n TOlal pt:rsons attending f;:l'~m: Total population School/College Illiterate
--------- ------------ -----------~ ffirqr ~ ffirqj T'I' f~lfj Male'S Females Males Fesnales Males females
-------.-
2 3 4 S 6 7
---_--- --------- ---_-
n"f~ GWALlOR
274,197 .224,271 45,611 9,178 ·9,406 2,775
36,999 33,057 121 69 121 69
9,297 7,368 653 256 475 197
8,SSS 7,084 2,139 611 1,393 411 7,613 6,4S6 3,089 1,070 1,935 596
10,1 SO 7,634 4,S64 1,286 1,858 526
6,070 5,020 3,326 1,090 1.125 403
41,686 33,562 13,772 4,313 6,787 2,134
37,591 26,272 21,670 4,195 2,269 50S
27,454 18,717 7,872 427 92 10
22,013 19,716 1,488 60 30 12
20,212 16,139 278 18 IS
15,651 13,611 127 31 20 10
72,465 63,141 261 59 66 3S
q'f~r
DATIA
135,786 115,116 23,908 4,528 4,437 1,348
17,965 16,773 107 30 107 30
4,537 3,586 363 162 271 117
4,386 3,936 971 328 645 238
3,616 3,089 1,290 456 716 254
5,454 4,277 2,587 728 948 307
2,789 2,446 1,542 541 444 lIS 20,581 17,333 6,753 2,21S 3,023 1,030
18,858 13,002 11,910 2,031 1,236 248
12,849 9,419 4,289 179 34 S
10,255 9,660 592 12. 20 5
9,547 7,857 92 10 10
7,795 7,236 22 4 4
37,794 33,773 105 26 5 15
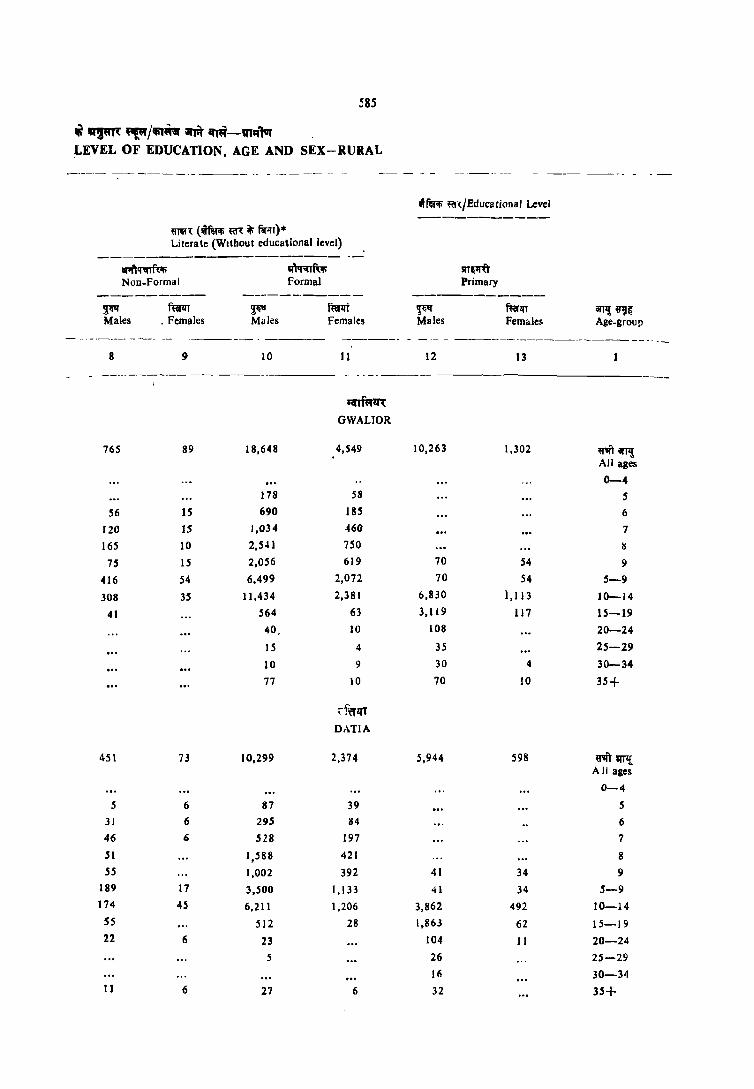
585
Ii "1m ~/~iar arA aml-Q'lq'tar LEVEL OF EDUCATION, AGE AND SEX-RURAL
m1n:: (rfmili m it; fir",)· Literate (Without educational level)
iIIiIlrnfu!; Non.Formal
~ Males . Females
8 9
~ Mules
10
~m; Formal
ft;;rllt
Females
II
,"fef'll ffll:/Educa tional Level
'!~ Males
12
srr~ Primary
ft;;r1{1
Females
13
--------- ---
765
56
120 165
75
416
308
41
451
5
31
46
51
55
189
174
SS
22
11
89
15
IS
10
15
54
3S
73
6
6
Ii
17
45
6
6
18,648
178
690
J,034
2,5", ]
2,056
6,499
11,434
564
40,
IS
10 77
10,299
87
295
528
],588
],002
3,500
6,211
512
23
5
27
~"Zf{ GWALTOR
4,549
58
185
460
7S0
619
2,072
2,381
63
10
4
9
10
,f'ffqT DATlA
2,374
39
84
197
421
392
1,133
1,206
28
6
10,263
70
70
6,830
3,119
108
35
30
70
5,944
41
41
3,862
1,863
104
26
16
32
1,302
S4 S4
1,113
117
4
10
598
34
34
492
62
11
anI! ~fl Age-group
rittrTl! All ages
0-4 5
6
7
IS
9
5-9
10-14
15-19
20-24
25-29
30-34
35+
rit WI{ A II ages
0-4
5
6
7
8
9
5-9 10-14
15-19
20-24
25-29
30-3·1
35+
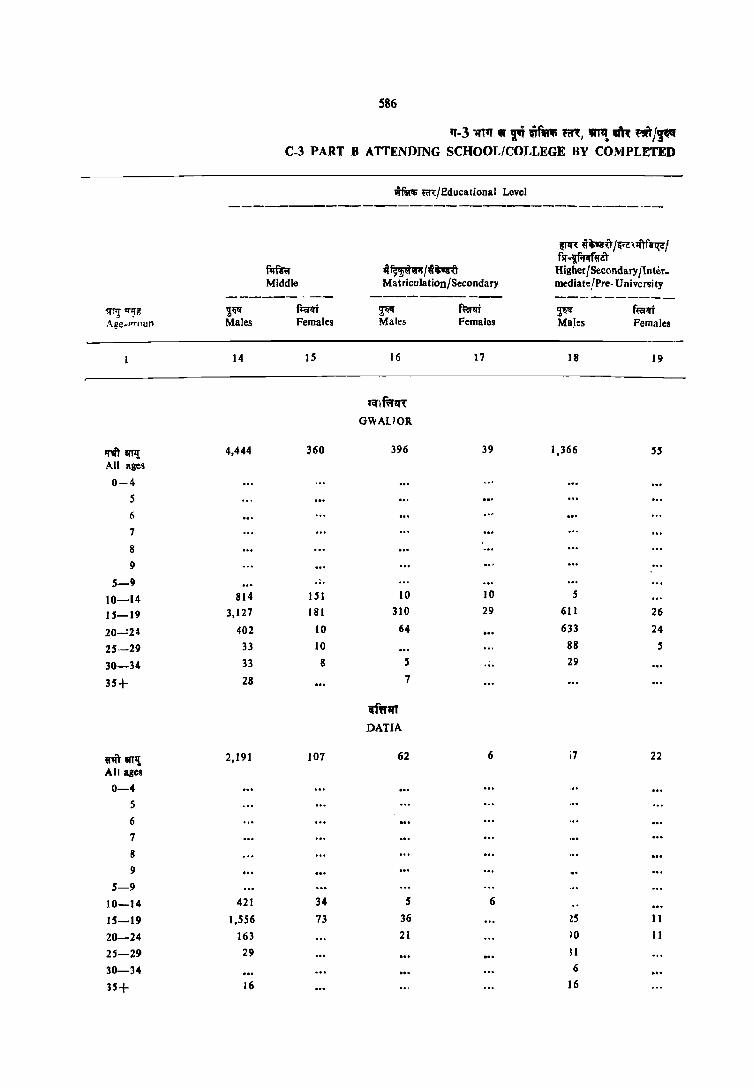
586
11-3 liT" .. '" ~ m, ~ m ,fJ(t/'jf!f C-3 PART 8 ATTENDING SCHOOL/COLLEGE BY COMPLETED
-.jMol; m/Educalional Level
-------------------------------------
~ u~_u/~~UnfV1?1 fsr-~~a
flImT Il~{i~ Higher {Secondary IInter-Middle Matriculation/Secondary mediate!Pre- University
--------- ----------- -----------<;!"1lJ "'~il' ~~ f;:or!ft ~I!I f~ ~ f~!ft A~e •• 'r(lur Males Females Males Females Males Females
14 15 16 17 18 19
'''1 f\=rq'{ GWAlIOR
'l"lftml! 4,444 360 396 39 1,366 55 All ages
0-4 5 6
7
8 9
5-9 ... 10-14 814 1 S 1 10 10 5
lS-19 3,127 181 310 29 611 26
20-.:24 402 10 64 633 24
25-29 33 10 88 5
30-34 33 8 5 ... 29
35+ 28 7
tfw," DATIA
U''Iil'm,! 2,191 107 62 6 i7 22 All ages 0-4
5
6 7
8
9
5-9 10-14 421 34 5 6
15-19 1,556 73 36 ~S 11
20-24 163 21 10 11
25-29 29 II
30-34 6
H+ 16 16

587
~ III~R ~/1IilQ ~ ,,~- vml..-LEVEL .OF EDUCATION. AGE AND SEX-RURAL
------------ --- ------ -- -- --------------
fWr ~ 'fll~rif ~~.tll'i;!'t~T ~mlJTlI"JT1II' em Non-technical diploma or certificate not equal 10 degr~e
~ mm Males Females
20 21
wmili ~l;/Educational Level
tnt if; !R"!fl'fl'r !PIi".mrr f~r IJT 1I11lUf em Techmcal diploma or ~ertificate not equal to degree
~ Males
22
f~ Females
23
~aili~~fuili Graduate and abqve
~~ Males
24
~ Fema ..:5
2.5 ------- -_----
7
7
r.(Tf\l1~
GWALlOR
<{f'E'l'l:fT DATIA
316
8
204
92
13
57
7
50
. 10
.5
5
3fTlI ~ Age-group
U''Tf arr~ All ages
0-4
5
6
7
8
9
5-9
10-14 15-19
20-24 25-29
30-34
35+
,,"'1ft iIIlli All agts
0-4 5
6
7
8
9
5-9 10-14
15-19
20-::!4
25-29 30-34
35+
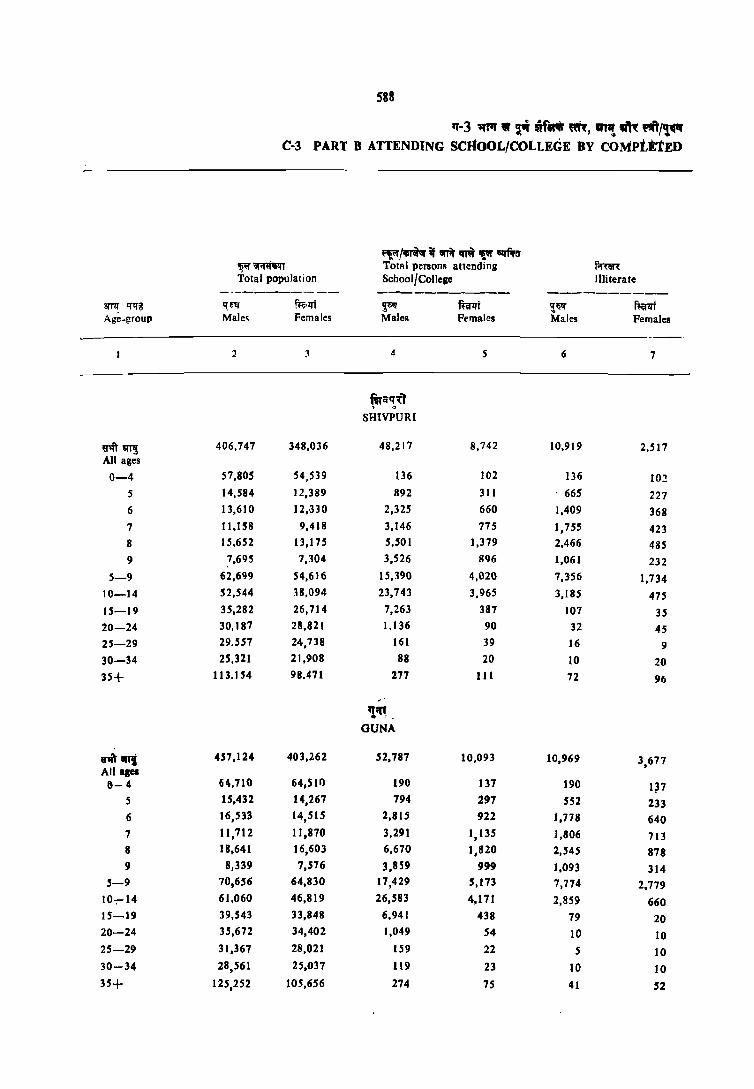
3TflI' q'1fIJ Age-group
~~ All ages
0-4
5
6
7
8
9
5-9
10-14
15-19
20-24
25-29
30-34
35+
81ft -IS All agel 6- 4
5
6
7
8
9
5-9
107""14
15-19
20-24
25-29
30-34
35+
588
rr-3 mrr _ ~ mri "''(, ~ m """"" C-3 PART B ATIENDING SCIiOOL/COtLEGE BY COMPtttED
~~/~ if ~ ifIi ~ iq'f.f~ ~~1I1 TotRI persons attending f.mR. Total population School/College flIiterate
------------ ----------- ----------q:~tr !l~,rn ~ mrlft '!~ f~t Male~ Females Males Females Males Females
2 ~ 4 5 6 7
mqq'~l , .. SHIVPURI
406,747 348,036 48,2 J7 8,742 10,919 2,517
57,805 54,539 136 102 136 102 14,584 12,389 892 311 ' 665 227 13,610 12,,330 2,325 660 1,409 36S 11,ISS 9,41S 3,146 775 1,755 423 15,652 13,175 5,501 1,379 2,466 485 7,695 7,304 3,526 896 1,061 232
62,699 54,616 15,390 4,020 1,356 1,134 52,544 38,094 23,743 3,965 3,185 475 35,282 26,714 7,263 387 101 3S 30,IS7 28,821 1,136 90 32 45 29,557 24,738 161 39 16 9 25,321 21,908 88 20 10 20
113.154 9S.471 277 III 72 96
,;n, . GUNA
457,124 403,262 52,787 10,093 10,969 3,617
64,710 64,511) 190 131 190 In 15,432 14,267 794 297 552 233 16,533 14,515 2,815 922 ],718 640 11,712 11,870 3,291 1,135 1,806 713 18,641 16,603 6,670 1,820 2,545 818
8,339 7,516 3,859 999 1,093 314 70,656 64,830 17,429 5,173 7,774 2,119 61,060 46,819 26,583 4,171 2,859 660 39,543 33,848 6,941 438 79 20 35,672 34,402 1,049 54 10 10 31,367 28,021 159 22 5 10 28,561 25,037 119 23 10 10
125,252 105,656 274 75 41 52

·" 5!S9
~ W¥rt ~",~ \ilR ~~-~).r lEVEL OF EDUCATION, AGE AND SEX-RURAL
-- - - ----- -------- -- - - ---
~ ~/Education81 Level
-----------mn: (\ff'e:tlll' m ~ ~T). LIterate (without educational level)
------------------------ar.I~ !If'lq;nf~ IIT'01I"U Non-Formal Formal Primary
----- ---- --- --- -- ----- ------_-_._-~ tt.:m ~ f@rf ~ fffil;jj 3f11! ~ Mal.;s Female~ Males Fem:;I~< Males Females Age-group
8 9 10 II 12 13 ---------------_--- ---------- --------
f~n'! .. ~) SHIVPURI
1,092 193 21,503 4,780 10,089 1,161 m~i All ages
0-4 9 5 218 79 5
70 15 846 277 6 99 10 1,293 341 7
164 35 2,871 860 8 66 45 2,310 590 89 30 9
408 109 7,536 2,147 89 30 5-9 501 59 12,864 2,078 6,625 1,184 10-14 ))3 5 945 40 3,138 133 15-19 35 5 28 5 132 20-24 11 19 5 29 15 25-29 5 14 24 30-34
19 10 82 53 35+
'1if~ , GUNA
. \' I 4,005 203 26,126 4,482 10,408 1,335 ~ "''I All ages
0-4 15 4 228 60 5 68 24 969 259 6 82 44 1,403 378 7
171 36 3.954 906 8 97 8 2,571 645 97 32 9
432 115 9,126 2,247 97 32 5-9 475 80 15,692 2,183 6,856 1,108 10-14
63 1,079 28 3,164 175 IS-19 20 46 12 171 8 20-24
6 4 1 S 36 4 25-29 35 4 20 5 30-34
.5 4 99 8 59 4 35+

590
rr-3 ~!If ~ mlA'lfi ,~, 1Il~ erR nit/g~ C-3 PART B ATTENDING St:HOOL/COLLEGE BY COMPLETED
tfalili mJEducational Level ------------------------.------.--------
~r~ ~~')/~Tfsl1,Z/
ll~~wil/tl~ fsr -,!fif!ffiriT
f"~OJ Higher Secondary I' n ter_ Middle Ma triCllla Ii on /Secondary mediate/Pre-University
---------- _-_------_ .. _-- ----------iTTl! ~ 'l~" ft:em 'l~ ffiiJqT 'l~ ~ Age group Males Females Male. Females Males Females
---------14 15 16 17 18 19
f~~'{) SHtVPURI
~~ 3,266 248 314 94 866 30 All ages
0-4
5
6 7
8
9 5-9
10-14 S59 144 9 2S 15-19 2,319 84 244 69 376 15 20-24 319 10 61 445 10 25-29 34 ) 34 5
30- 34 $
35+ 30 5 5
~r;:n
'" GUNA
""~ 3,273 275 181 36 699 77 All ages
0-4 5
6
7 8
9 5-9
10 -14 687 129 IS 4 8
15-19 2,117 127 116 32 322 53 20-24 364 4 35 329 16,
25-29 41 4 34 30-34 30 4 5
35+ 35 7 15 10

591
~ ~ ~/rtrlR ;rR wrtlr-vr"'" LEVEL OF EDUCATION. AGE AND SEX-RURAL
Jtfa~~ ~/Educational Level
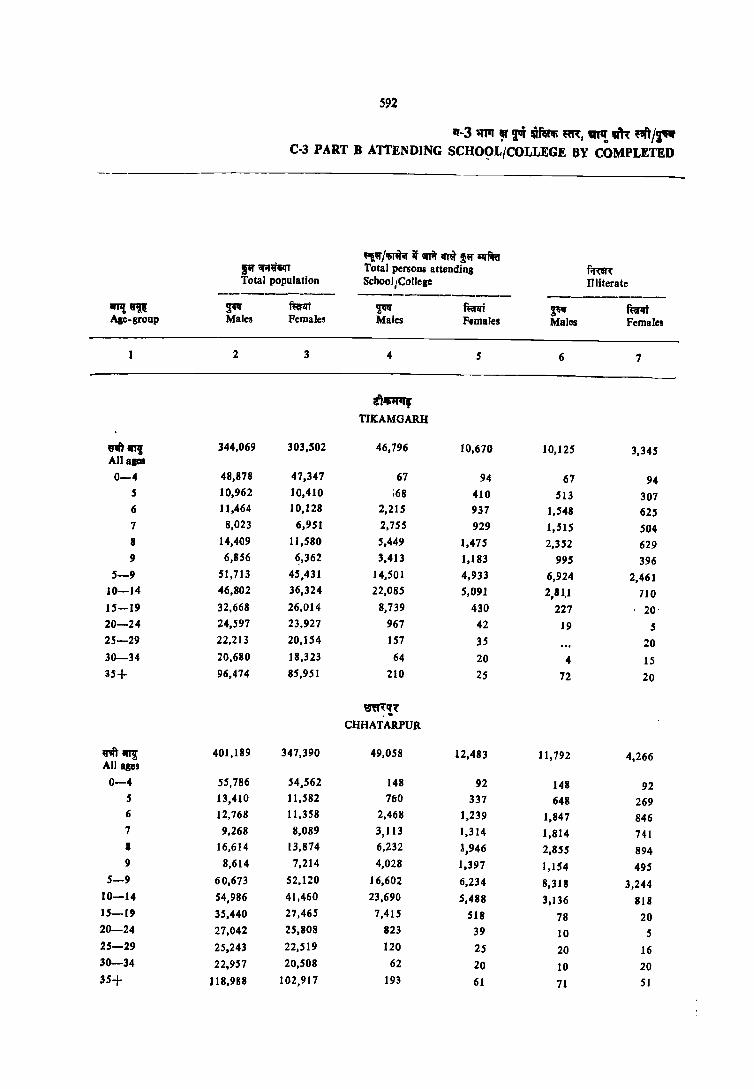
~81t Age-group
n\'1I'I! Allaps
0-4
5
6
7
8
9
5-9
10-14
15-19
20-24
25-29
30-34
35+
~~ All ages
0-4
5 6
7
I
9
5-9
10-14
15-1' 20-24
25-29
30-34
35+
592
1f-3 ~ "fIT if.;r; ~, IIITI!. m mjpt C-3 PART B ATTENDING SCHO~L/COLLEGE 6Y COMPLETED
''Ill!' /Ifilior it ~ iffil !ill!' ilfmr tw~m Total persons attending frnn: Total population School/College Illiterate -------- ------------ ----------~ fterI:rt ~ mnrt ~ mrIIt Males Females Males Females Males Females
2 3 4 5 6 7
!1~ TIKAMGARH
344,069 303,502 46,796 10,670 10,125 3,345
48,878 47,347 67 94 67 94 10,962 10,410 i68 410 513 307 11,464 10,128 2,215 937 1,548 625
8,023 6,951 2,755 929 1,515 504 14,409 11,580 5,449 1,475 2,352 629 6,856 ~,362 3,413 1,183 995 396
51,713 4S,431 14,501 4,933 6,924 2,461 46,802 36,324 22,085 S,091 2,81.1 710 32,668 26,014 8,739 430 227 20· 24,597 23,927 967 42 19 5 22,213 20,154 157 3S 20 20,680 18,323 64 20 4 IS 96,474 85,951 210 25 72 20
'ifm'1f~ .. CHHATARPUR
401,189 347,390 49,058 12,483 11,792 4,266
55,786 54,562 148 92 148 92 13,410 11,582 760 337 648 269 12,768 11,358 2,468 1,239 1,847 846 9,268 8,089 3,113 1,314 1,814 741
16,614 13,874 6,232 1,946 2,855 894 8,614 7,214 4,028 1,397 1,154 495
60,673 52,120 16,602 6,234 8,318 3,244 54,986 41,460 23,690 5,488 3,136 818 35,440 27,465 7,41S 518 78 20 27,042 25,808 823 39 10 5 25,243 22,519 120 25 20 16 22,957 20,508 62 20 10 20
118,988 102,917 193 61 71 51

~ v~m ~/ItiT~;;r~ ~-vn:r"t1lf LEVEL OF EDUCATION, AGE AND SEX-RURAL
riffe,'1i «('l"/Educational Level ---------------
men: (1if~!'li m if; for'l')* Literate (Without educ~tional level)
---------------------Of;:rN;rrn:1!i" mq;:nfu!; lrr~r NC'n-Formal Formal Primary
_---------- ---------- -------------'J01'.f ~ ~"f f~1ti ~o" f~iiI!fr 1iITl! ~~ Males Females Males Female~ Male~ Femr.ks Age.group
8 9 10 II 12 13
!I~q",
TlKAMGARH
6,226 1,604 15,717 3,809 9,211 1,437 millT~ All ages
0-4
67 54 87 49 S
233 lSI 434 161 6
284 141 956 283 7
849 220 2,249 626 6
S06 IS6 1,793 602 119 29 9
1,939 723 5,519 1,721 119 29 5-9
3,310 827 9,495 2,015 5,214 1,324 10-14
802 44 641 64 3,222 83 15-19
77 20 99 20-24
26 5 5 5 41 25-29
10 5 5 5 30-34
52 26 5 11 35+
~~~'!~
CHHATARPUR
3,567 966 18,729 5,101 10,044 1,644 "''ifr~ All ages
0-4
15 10 97 S9 5
127 98 494 296 6
255 93 1,044 481 7
494 190 2,882 862 8 290 107 2,452 766 132 29 9
1,183 498 6,968 2,464 132 29 5-9
1,895 421 11,068 2,589 6,8~9 1.479 10-14 366 42 606 49 2,965 125 15-19
64 47 86 5 20-24 16 15 5 5 25-29
5 30-34
42 21 21 35+
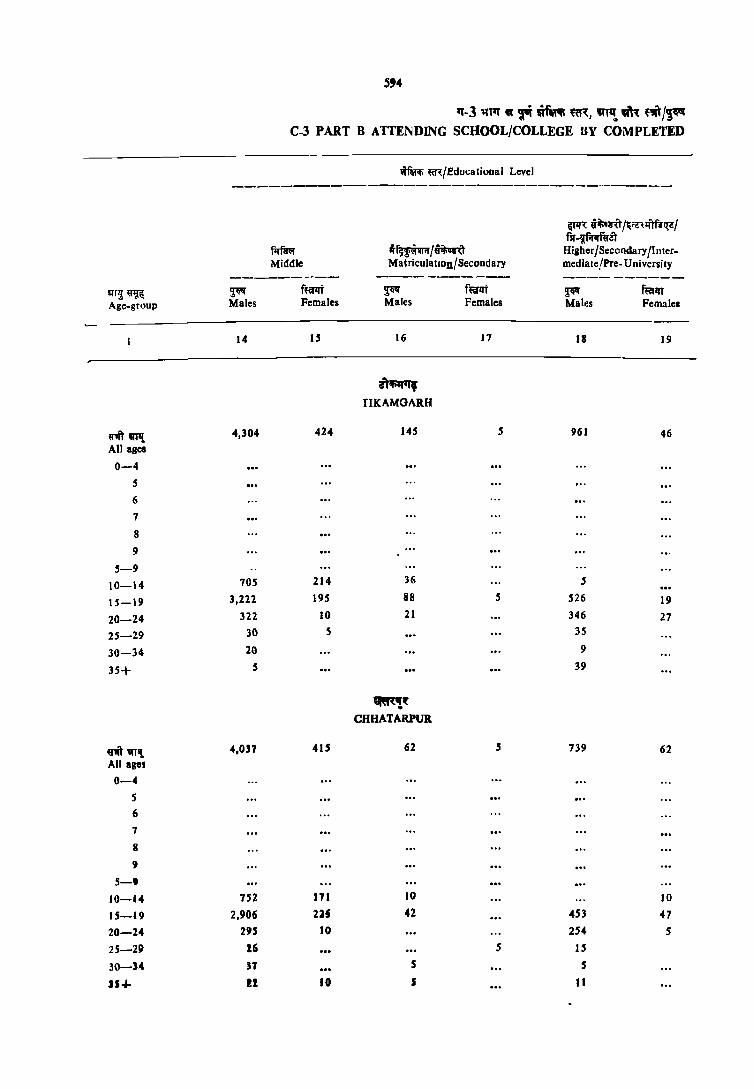
5'4
q-3 ~Tq « ~ \If\llWi ~, 1Ril!, .m ''" I~ C-3 PART 8 ATTENDING SCHOOL/COLLEGE llY COMPLETED
'imor. m/fducational Level
------------------------------------
~'{ "it;1Irit /~ra-HITB~/ fsr-!{~~i\'
~ il~m/i~ Higher/Secondary/Inter. Middle Matriculation/Secondary mediate !Pre-U niversi ty
---------- ----------- -----------~r~~ ~ f~qt ~ f~1rt ~ f~1lT Age·group Males Females Males Females Males Females
14 15 16 17 18 19
i\'~ flKAMGARH
ff1itVlli 4,304 424 145 5 961 46 All ages
0-4
5 6
1
8
9
5-9 10-14 105 214 36 5
15-19 3,222 195 88 5 526 19
20-24 322 10 21 346 27
25-29 30 5 3S
30-34 20 9
35+ 5 39
~~ CHHATARPUR
«'"~ 4,On 41S 62 5 739 62 All age!
0-4
5 6
7
8
9
5-9
10-14 752 171 10 10
IS-I 9 2,906 2J§ 42 453 47
20-24 295 10 254 S
2S-2P 16 5 15
30-34 :n 5 5
11+ II 10 J tl
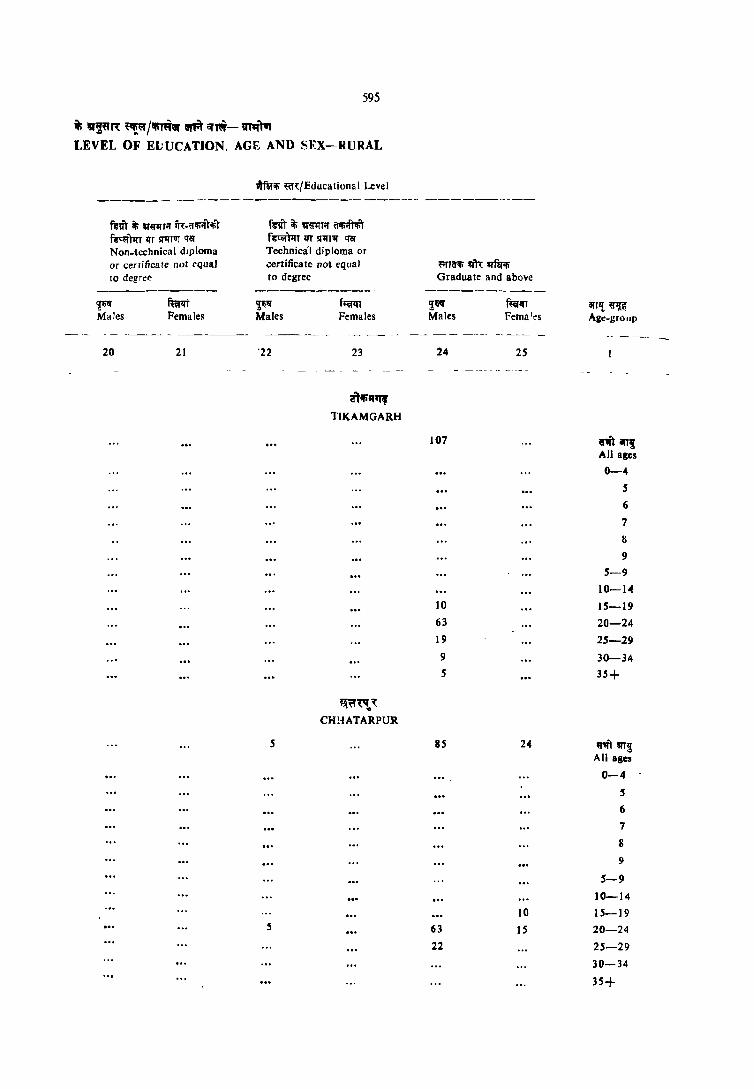
595
it; IA~~"~ ~t=r/-.s. ~ <f~-VTqlWf I.EVEL OF ElJUCATION, AGE AND SEX-RURAL
fsm iii "fl1'I"T;r iTl:.<!i!iiIrifir f~q;j'tllT 1fT snfTIIT qaNon-technical dIploma or certificate not ("qual 10 del1r~e
~ mm Males Females
20 21
"fu~ «!'l:/Educationa I Level
fsm iii ~!!l!T;r (liliOO f~T 1fT lI1'I"IIII ~ Technical diploma or .::ertificate not equal to degree
';'ili! Males
'22
05
05
f~ Females
23
~1-.s,,~
TlKAMGARH
~~'"..~
CHHATARPUR
~nJ~ ~ !IIf~~ Graduate and above
'I~ Males
24
107
10
63
19
9
05
805
63
22
2S
24
10
IS
an,! ~ Ag~-grOllp
81il: ~i All aces
0-4
05
6
7
8
9
05-9 10-1<1
105-19 20-24
25-29
30-34
35+
~,,"m~ All BIle5
0-4
5
6
7
II
9
5-9 10-14
105-19 20-24
25-29 30-34
3.5+

596
q-3 ~" fIi mfRlfi ~ft', '"~ 1Ii\'{ ~T/~ C·3 PART B ATTENDING SCHOOL/COLLEGE BY COMPU~l'ED
- ------------------------
f'§." (!f;T~ it :JrA- lIM f"" Olffotlf
~~~ Toral persons attending fif~m: Total population School/College Illiterate
--------- ------------ ---_.- -------;;'i'1.~ ~ ffifqt ~ ~ '!"" f~l{T
"'ge-group Miles Females Males Females Males F~ma:es
2 3 4 5 6 7
q;;n
PA.NN<\
Of'II)' <111'2; 259,614 238,323 34,640 8,901 8,888 3,303
All a!!e~
0-4 37.690 35,834 87 101 87 101
5 8,507 7.779 855 361 758 293
(. 7,842 7.816 2,043 9~8 1,465 683
7 6.385 5,983 2,318 985 1,340 609
8 10,179 8,856 4,171 1.444 2,(124 708
9 5,365 4.939 2,783 1,058 916 308
5-9 38,2711 35,372 12,169 4,777 6,503 2,601
10---_14 35.883 30,237 16,57.0 3,728 2,201 531
15-- 19 23,774 19.638 5,065 207 83 16
20-24 19,098 19,635 626 11
25-29 18,073 17,883 64 6
30-34 15,837 15,521 IS 10 10
35+ 70,900 64,166 67 61 15 44
aTIR SI\GA.R
8''" -rpt 502,SH 451,974 77,342 25,658 11,758 5,848
All ages
0-4 77.488 72,585 137 164 137 164
5 15,747 13,687 752 351 542 253
6 17,280 15,522 4,509 2,276 2,753 1,371
7 11.634 11,039 5,131 2,593 2,113 1,064
8 17,233 15,452 8,934 4,240 2,614 1,289
9 10,537 10,348 6,851 3,600 1,267 605
5-9 72.431 66,049 26,177 13,060 9,289 4,582
, 0--14 (:8,013 54,978 38,091 11,305 2,123 953
15-19 47,964 39,960 10,784 799 101 35
20-24 42,032 40,776 1,486 140 10 25
25-29 35,271 30,134 206 57 2(1 20
30-34 28,088 26,089 149 30 20 20
35+ 131,173 121.378 293 98 60 49

597
if; ~~m: ~/lfi~ m ri-~T" LEVEL OF EDUCATION, AGE AND SEX-RURAL
-- - -------------- ------ _ -- -_- --- -- -- -------------
767
20
S6
76
102
81
336
332
88
10
2,394
29
264
294
445 271)
1,311
889
153
IS
5
5
20
mR (lim~ m iii fl;n). Literate (without educational level)
aril~~ NOll-Formal
~fui .
flel1lt Females
9
182
11
II
28
40
11
102
74
6
728
25
152
143
133
89
541
182
5
~Qq Males
10
Formal
14,407
76
521
902
2,045
1,745
S,289
8,607
448
16
5
10
16
38,798
181
1,492
2,724
5,ln5
5,198
15,470
22,086
964
5S
25
45
138
ffiflJT Females
11
"~T PANNA
4.245
57
233
347
696
717
2,050
2,177'
17
m'R SAGI\R
14,969
74
752
J ,387
2,818
2,832
7,863
6,980
39
27
10
S
39
~ RrtfEducational Level
~ Males
12
7,241
41
41
4,916
2,222
37
5
16
16,619
108
108
11,830
4,443
139
25
35
40
1fT~~' Primary
f~ Prmal~~
13
1,009
23
23
872
97
6
11
3,090
74
74
2,781
187
20
15
S
10
iii,! ~~ Age-grouo
n) lIlT,! All ages
0-4
5
6
7
8
9
5-9
10-14
15-19
20-24
25-29
30-34
35+
fl'wIT "''! All ages
0-4
5
6
7
8
9
5-9
10-14
15-19
20-24
25-29
30-34
35+

598
1f-3 mIT I!J t'i millfi ~ff~, !Rl~ ~ 'fW.1/~ C.3 PART B ATTENDING SCHOOL/COLLEGE BY COMPLETED
wfllrofi m/Educational Level -----------------~----- ------_._--------
iFlR ~ipl'"U/~i!:'(lIlft~1 fir.l{f..mEli!:f
f1ITli'l ll~~'i/tit;ql'~f Higher Secondary/Inter-Middle Matriculation/Secondary mediate/Pre.Universi ty _ ---------- _------_---- _o _________
IIT7f. ~ ~ f~1It ~4!1" fmi ~ f~t Age-group Males Females Males Females Males Females
14 is 16 17 18 19
q .. " PANNA
rn~ 2,689 IS6 S8 481 6 All ages
0':'_4
5
6 7 ""' 8 9
5-9 10-14 464 74 15-19 1,947 7; 42 209 6 20-24 247 11 10 2<41 25-29 17 6 21 30-34 5 3S+ 10 5
~t~
SAGAR
""WTlJ: 5,743 809 All sses
634 64 1,131 113
0-4 5
6
7
8
9 5-9
10-14 1,128 399 34 10 15-19 4,144 401 36. 49 608 74 20-24 387 10 210 5 490 34 25-29 25 17 27 5 30-34 2S S 35+ 30 5
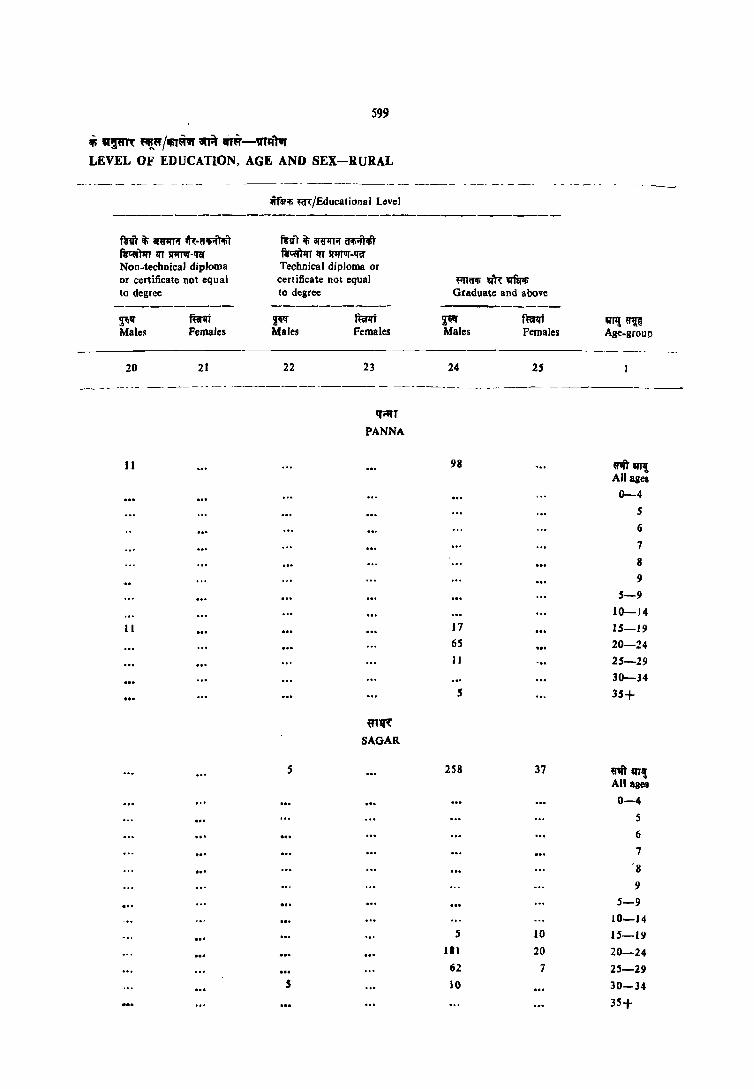
599
Ii; "!I'm flI!.lII' /rm'irir IrA ~-V"'~ LEVEL OF EDUCATION, AGE AND SEX-RURAL
riliT it; ar~ ih:-~~ fI't,,)1n 1fT lI1ITVI'o!Rf Non-technical diploma or certificate not equal to degree ----------'Pi'" ft:i1rt Males Females
20 21
II
II
...
';-f~~ m/Educational Level
fWll" it; ar~iJ a;t;OO fc~ 1fT 5I1IT1JT-!Rf Technical diploma or
cert ificate not equal to degree
----------~ Males
22
S
s
fum Females
23
q;;fT
PANNA
m~
SAGAR
l'nWF q'R~ Graduate and above
--------~ Males
24
98
17
65
11
5
258
5
lBl
62
10
f~ Females
25
37
10
20
7
1I'J1! ~ Age-group
81iT'ITI! All ages
0-4
S
6
7
8
9
5-9 10-14
15-19
20-24
25-29
30-34
35+
61ft' tIT!!; All agea
0-4
5
6
7
8
9
5-9 10-14 15-19
20-24
25-29 30-34
35+

600
1f-3 ~ W 'lvi'. ufn «I,". '"~ 'I'll ~/1!" C-3 PART B ATTENDING SCHOOJJ/COLLEGE BY COMPLETED
~~/~ if ;;nil' crri ~\1 C!:I'fiIff ~~~!H Total p.:rsons attending ~1: Tot:!! population SCh~DI 'College Ilhlerale
---------- --- -------.--- ----------IlfTI! 9'1J~ 'Pi" r'ilI!lr ~I{ mrll"r 'i~ ~ mt Age-group Males Females Males Females Males Females
---_--2 3 4 5 6 7
---------_----_------..__------- -_-
~)i! DAMOH
.m ~l! 319,768 297,660 47,502 15,579 6,181 2,966 AU ages
0-4 48,395 45.621 98 94 98 94
S 9,682 8,844 351 232 226 ISS
6 11,178 10,738 2,844 1,383 1,695 806
7 7,381 6,846 3,146 1,571 1,207 608
8 11,825 10,834 5.944 2,800 J,357 654
9 6,983 6,731 4,355 2,171 501 ~28
~-9 47,049 43,993 16,640 8,163 4,985 2,451
10-14 44,946 36,328 24.042 6,705 991 322 15-19 29,669 26,512 5,797 462 40 31 20-24 25,808 26,336 628 54 21 22 25-29 22,528 20,167 83 20 .5 5 30--34 18,197 18,117 41 26 5
35+ 83,076 80.451 172 56 36 41
"i:filT SATNA
",-it WI! 494.982 47 I ,668 90,563 23,316 J 5,870 6,818 All ages
0-4 68,176 65,294 ISO 115 ISO 115
S 16,309 14,681 1,518 579 1,246 467
6 ]5,319 14,969 4,448 1,955 3,272 1,450
7 12,431 11,652 5,375 2,267 3,042 1,364
8 17,768 16,970 8,681 3,567 3,349 1,454
9 10,656 10,0('19 6,853 2,168 1,650 807
5-9 72.4~3 68,281 26,873 11,136 12,559 5,541
10-14 69,552 61,686 41,179 10,803 2,963 1,103
15-19 49,264 43,005 18,61 ) 1,041 153 34
20-24 35,820 38,504 .3,041 80 5 5
25--29 32,505 32,415 300 24
30-34 27,808 29,923 88 15 S
35+ 139,210 131,460 286 83 ...,
20 ....

601
t ~m ~/~~ ;nit ~-~qTvr LEVEL OF EDUCATION, AGE AND SEX-RURAL
----------- --- ---_--- - - -- - - - -_ - - -- - --- _----- ----- -- ------------_
riifrft'ti ~~:fEducational Level ------------
mill;: (~miti m iii fil'iTI)* LJlerate (without educalional level)
-- - --------------------ar,,'t'RTf<:iti il'\q;!nf'<iti SIT~'T NOD-Formal Formal Primary
---------- ------------ -----------~~ ~ ~!f fufqj i~ f~1Jl aliI{ ~Il: M.lles Females Males Females Males Pernal. , Age-group
------ ----- -- --------------------------- ---_ 8 9 10 II 12 13
C{q~ DAMOH
730 262 26,921 10,121 9,827 1.769 frtIT'TII! All ages
0-4
15 10 110 67 S
85 46 1,064 531 6
80 15 1,859 947 7
120 92 4,467 2.053 8 71 10 3,732 1,882 51 57 9
371 175 11,233 5,480 .51 .57 .5-9
325 87 15.030 4.536 6,982 1,615 10-14
30 537 63 2,677 82 15-19
31 16 66 20-24
10 20 25-29
10 10 10 IS 30-34
5 81 5 20 35+
mI;:fT
SATNA
424 160 34,933 I 1,622 23,515 3.870 fr'lT anI{ All ages
0-4 10 10 262 102 5
49 15 1,126 491 6
44 24 2,288 879 7 49 24 5,282 2,089 8 49 29 5,044 1,859 109 73 9
203 102 14,003 5,420 109 73 5-9 178 44 19,824 6,114 16,490 3,266 10-14 35 946 44 6,639 463 15-19
4 S 44 15 163 10 20-:4
15 5 20 10 25-29
5 5 10 30-J4 .5 10 76 19 75 24 35+

602
'1-3 ~ ., ~ ul\l!t; ~~, 'I'"! '11\ 'f"t!~ C-3 PART B ATTENDING SCHOOL/COLLEGE BY COMPLETED
----- - --------
IIlRYIfi '8<:/Edueational Level
------------------------------------
~TIR~T/~~I fsr -¥flr;ffrn
Nmr ~~QPr/i~ Higher Secondary I Inter_ Middle Ma tricula tion /Secondary mediate/Pre-University
---------- ----------- ----------dill! a'II~ 'l~ fufIrl ~~ mt ~ mt Age group Ma~e!I Females Male. Pemales - Males Females
14 IS 16 17 IS 19
~ DAMOH
"""'1 3,24S 405 195 26 2114 21 All ages • 0-4
5 6
7
S
9
5-9
10-14 694 145 15
15-19 2,275 239 107 26 132 21
20-24 247 10 42 131
25-29 11 5 15 21
30-34 6 , s 35+ 15 s 10 5
~~if' SATNA
nt~ S,509 563 3,492 136 3,305 127 All ascI
0-4
5
6
7 ... 8
9
5-9
10 -14 1,582 261 127 15 15
15-19 6,233 263 2,754 1:21 1,789 109
20-24 S84 24 538 1,337 14
25-29 6S S 44 JOO 5
30-34 15 5 10 39
_IS I- 30 S 20 2S
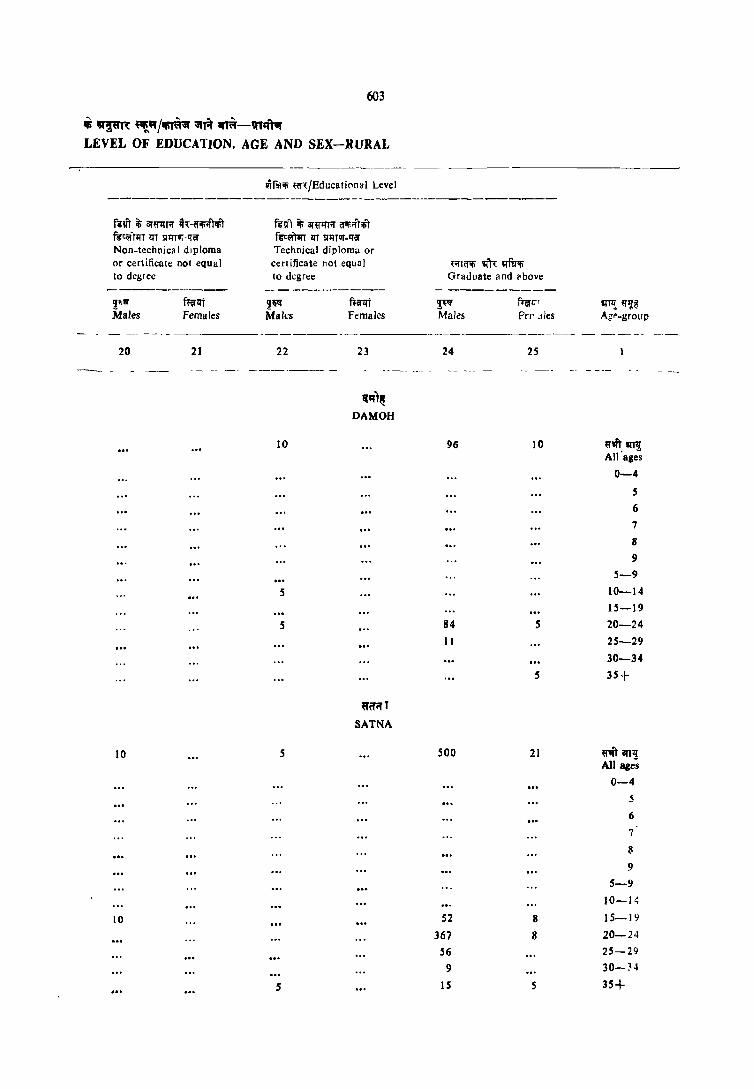
603
~ ,,~ ~"l"/'IfiI~ ~R ,"~-'lTqT" LEVEL OF EDUCATION. AGE AND SEX-RURAL
__,---------------- -- -------
IiTfo:11fi Hr"(/Educational Level
f61IT iii CII«lI'rif ITHr1fiifm f6tft iii Clllifl'fTif oif.if"t~"t f6cOITl'fT !Ii lIl'fT1IT -'n. fi'cOIlIf[ !Ii STlU1IT -IJ~ Non-technica I d'ploma Technical diploma or or certificate not equal cerlificate nOI equal ~iflCfili m"( m~ 10 degree to degree Graduate a nd ~ bove
------------- -- ----------- - ---------2f.1!f ~ztt 21i1!l ft:~t ~ fIQ1P ,,"TI! ~lle Males Females Males Females Males Fer' .tles Agt>-group
- -- --.- ------_ - ------
20 21 22 23 24 25
-- -- -- -_ ------ .---- - - - ---- ---- - -- - ---
~IfT~ DAMOH
10 96 10 ",til" II"Tlj AIJ'ases
0-4
S
6
7
II
9
5-9
5 10-14
15-19
S 84 S 20-24
II 25-29
30-34
S 35+
~fforT
SATNA
10 S 500 21 """' ill II AU age~
0-4 5
6
7
8
9 5-9
10-14
10 52 8 15-1'1
367 8 20-24
56 25-29
9 30-~.t
5 15 5 35+

anq; 8~ Age-group
~~ All ages
0-4
5
6
7
8
9
5-9
10-14
15-19
20-24
25-29
30-34
35+
~iIR! All ales
0-·4
5
6
7
8
9 5-9
10-14
15-19
20-24
25-29
30-34
~q.
604
rr-3 lWT II ~ tlr"" ~t, IIR~ a~ "i/~ C-3 PART B ATTENDING SCHOOL/COLLEGE BY COMPLETED
~~ f~/~ it iillit ~ ~ Imer
f.rlm Total persons attending Total population School f College Illiterate
---------- --.. ---------- ----------'t~ m~j ~ ffif~ '1~ ~t Males Pemales Males Females Males Females
2 3 4 5 6 7 ------_--- ---- --- -_
m,. REWA
527,198 522,726 110,828 27,784 20,11 t 8,169
75,125 74,833 215 134 215 134 19,062 16,751 1,959 792 1,777 687 19,494 18,250 5,770 2,279 4,348 1,662 13,116 12,188 5,729 2,357 3,480 1,564 21,770 20,S74 10,989 4,256 4,448 1,850 10,303 10,194 6,700 2,877 1,821 846 83,746 71,958 31,146 12, ~61 15,874 6,610 77,889 68,554 49,835 13,381 3,803 1,302 51,765 45,192 24,346 1,401 113 40 36,045 42,298 4,088 112 20 5 31.924 36,109 540 51 5 29,917 32,853 164 24 S
143,548 144,798 444 110 77 78
~m. SHAHDOL
561,416 544,093 67,510 15,589 19,581 5,761
70,166 71,086 258 116 258 116 19,449 18,429 1,779 609 1,592 572 19,449 18,351 4,684 1,747 3,631 1,406 14.512 14,285 5,219 1,757 3,332 1,060 20,941 20,248 7,926 2,385 4,104 1,099 11,171 11,490 5,338 1,689 1,901 522 85,523 82,804 24,946 8,188 14,560 4,660 72,321 67,844 30,330 6.H2 4,483 882 49,961 46,054 10,022 572 189 U 40,078 44,590 1,329 46 20 5 42,213 39,903 197 25 .5 5 35,605 36,390 101 15 21 15
165,284 155,200 297 65 36 60

60S
Ii W!~ ./1IiT~ ~ ~-vn:ftwr LEVEL OF EDUCATION, AGE AND SEX-RURAL
"fvl!'i ttll:jEducational Level -----------
mllf1; (ffm; m it; fir;rr)* Lilerate (Withoul educational level)
-------------------- ---~fu; m.rro.; ~ Non-Formal Formal Primary
--------- ---------- -----------~ rmt ~~ m.lrt ~ ffiflrt ~Ufl Males Females Males Females Males Females Age-group
------------------8 9 10 (( 12 13
~'\11,
REWA
912 239 39,060 12,800 25,3$8 5,276 "'~ AU ages
0-4
20 162 104 5 44 14 1,378 602 6 64 14 2,186 778 7 93 62 6,447 2,345 8
64 38 4,590 1,908 226 85 9 284 128 14,762 5,738 226 85 5-9 438 95 22,732 6,879 19,080 4,604 10-14 .119 5 1,341 144 5,767 525 15-19
19 80 19 161 29 20-24 S 15 34 24 25-29
16 5 S 14 16 30--34 30 5 85 73 9 35+
~1'" SHAHDOL
.349 57 26,971 7,206 14,037 2,081 "'~!& All ages
0-4 (0 177 36 S 30 10 1,023 331 6 35 1,852 698 7 25 21 3,797 1,266 8 45 5 3,240 ],126 lSI 36 9
146 36 10,088 3,456 151 36 5-9 163 21 15,480 3,632 9,289 1,822 10-14 15 1,172 57 4,267 217 15-]9 S 70 16 243 5 20-24 5 10 16 36 25-29 S 15 24 30 -34
10 126 5 25 35+
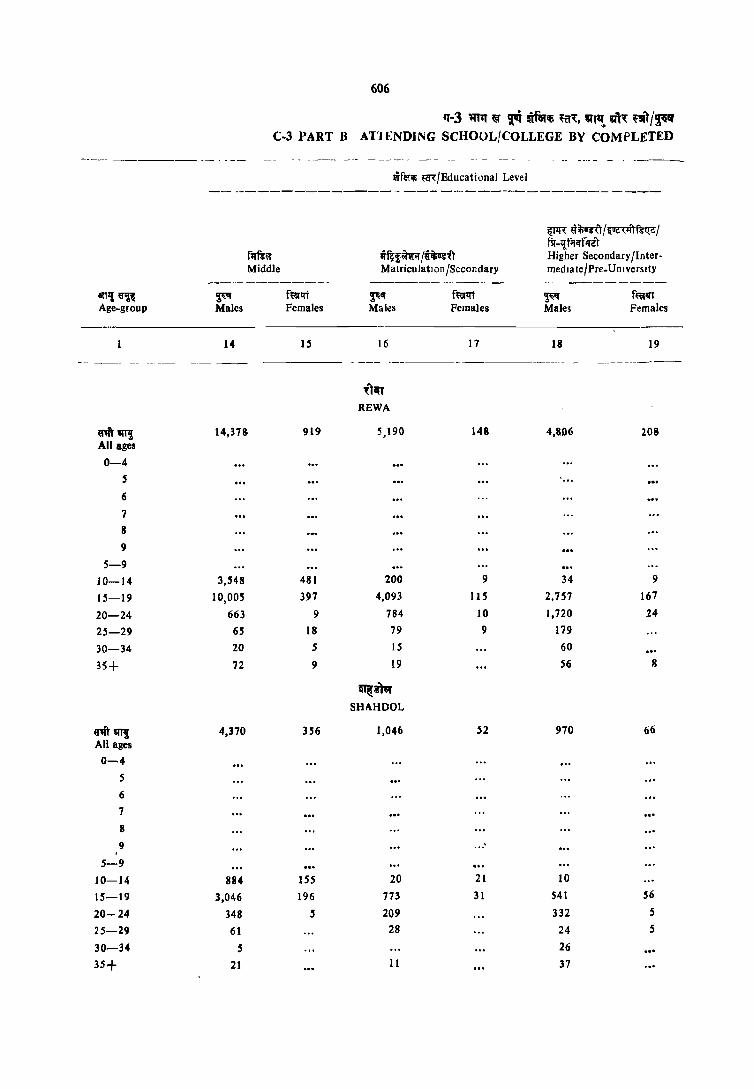
~'Il~ Age-group
$iiI!! Males
14
606
fT-3 l11q Q( ~ UfIRIti ~a" 'f'l! m, ~lIIT/~" C-3 PART B ArIENDJNG SCHOOL/COLLEGE BY COMPLETED
f~fi'<'f Middle
f~qt Females
Qff~iIIi m/Educational Level
q-~~~;; /~~1:T MatriculatIon/Secondary
$Ii" Males
16
f~q't Females
17
iPIR !jiliunr /"Ua<:J!"Tfg~ / fll-llfllcrflJeT Higher Secondary/IntermedIate/Pre_UnIversIty
~ Males
18
f~~q'r Females
19
-----------------
~~ All ages 0-4
5
6
7
8
9
5-9 10-14 15-19
20-24 25-29
30-34
3~+
61ft",! All ages
0-4
5
6
7
8
9
5-9
10-14
15-19
20-24
25-29
30-34
35+
14,37S
3,548
10,005
663
65
20
72
4,370
884
3,046
348 61
S
21
919
481 397
9
18
5
9
356
155
196
5
,Tin REWA
5,190
200
4,093
784 79 15
19
~mr SHAHDOL
1,046
20
773
209 28
11
148
9
liS 10
9
52
21
31
4,806
34
2.757
1,720
179
60
56
970
10
541
332
24
26 37
20S
9
167
24
8
66
56
5
5
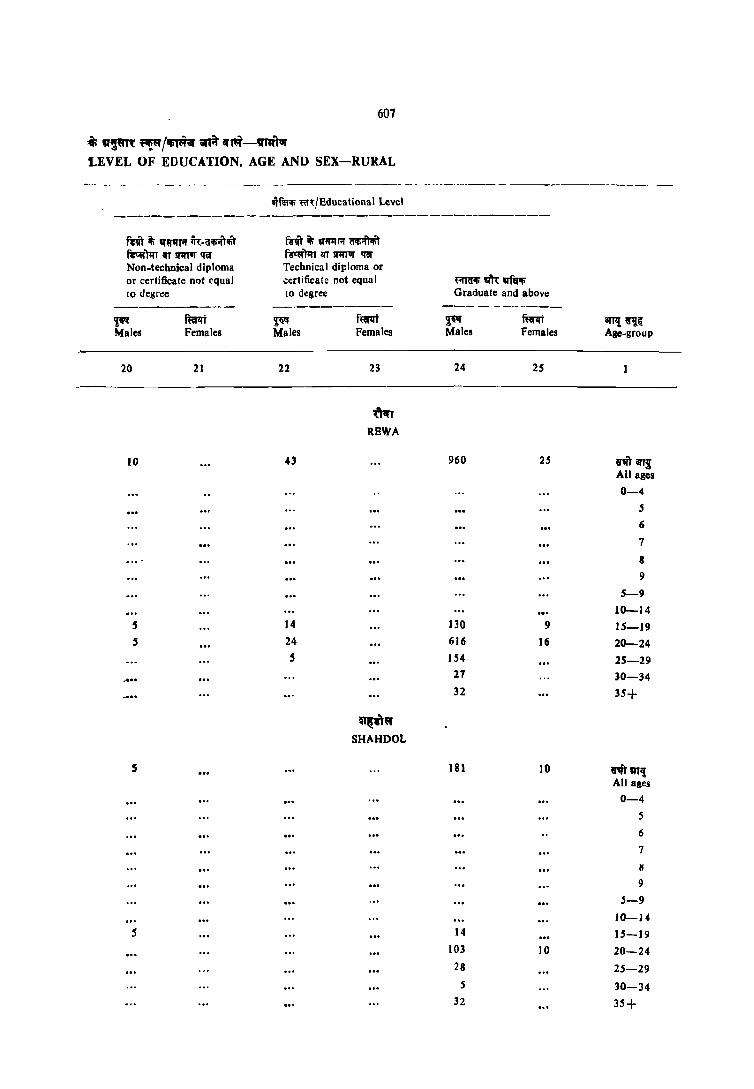
607
:$ a~ ~/rm.;rA .~-'111i\GI' LEVEL OF EDUCATION. AGE AND SEX-RURAL
'fftil~ m~'Educational Level
miT iii 111'811'1'1 ~.(I"",r~"t mit iii 1Il'!I1II'i!' ~;:ftltt ~)1rr lIT lI1IT'T CRI' f~)1rr lIT lIlI111f CRI' Non-technical diploma Technical diploma or or certificate not equal .::ertifica t e not equa I ~(I~~~If-'; 10 degr~e to degree Graduate and above
---------- ---------- ---- -----._--~ ~ ~ f~ ~" ffir1ri Bm{~~ Males Females Males Females Males Females Age-group
20 21 22 23 24 25
",,' REWA
10 43 960 25 ~'" iIITi All ages
0-4 , 6
7
8
9
5-9 10-14
S 14 130 9 15-19 5 24 616 16 20-24
S 154 25-29 27 30-34 32 35+
"~,, SHAHDOL
S 181 10 rit till! All ages
0-4 5
6
7
H
9
5-9 10-14
S 14 15-19 103 10 20-24
28 2'-29 5 30-34
32 35+

q-rl!~ Age-group
--_---_.
U1fi q-r~ All ages
0-4
5
6
7
8
9
5-9
10-14
15-19
20-24
25-29
30-34
35+
mit m'i All ages
0-4
5
6
7
8
9
5-9
10-14
15-19
20-24
25-29
30-34
35+
608
q-3 111'1 ... T'i uf_"~ tCl~, "" "'~ "'J~ C-3 PART B ATTF.NDING SCHOOL/COLLEGE BY CO.MPLETED
--_._----- ---~
fllJ:ol) ~I<'r.r it ~Tii ;nor ~ azrfotcr ~<'r ;;r;f~ilTT Total persons attending f'l"('" Total population School/College Illiterate
--------- ------------ ----.-------~ ftiifllT ~~ mrlfT ~ f~IfT Males Females Males Females Males Females
--------_--- -_-_--_-- --------- --- --_. 2 3 4 5 6' 7
----
~h,j
SIDm
496,418 474,395 59,634 13,040 14,337 5,066-
66,389 68,850 291 151 291 151
17,645 16,64~ 1,492 683 1,214 575
18,130 18,502 3,989 1,495 2,900 1,069
12,562 12,319 3,968 1,433 2,468 874 21,469 20,533 6,842 2,088 2,959 1,004
9,483 10,515 3,771 1,541 1,129 595
79,289 78,514 20,063 7,239 10,670 4,118 68,361 62,540 26,310 5,123 3,200 732 46,605 39,770 10,639 395 110 25 35,746 37,232 1,794 SO 25 15
35,100 33,419 210 23 5 5 30,121 31,784 93 14 5 10
134,S78 122, I 37 191 19 30 10
~l~ MANDSAUR
517,482 489,991 83,048 20,849 16,890 6,107
69,261 67,761 198 151 198 151
18,332 16,783 1,537 741 '1,121 540 16,321 15,979 5,059 1,838 3,474 1,225 14,253 14,424 6,783 2,405 3,637 1,326 19,176 17,963 10,295 3,401 3.846 1,352 9,638 9,995 6,480 2,371 1,437 495
77.720 75.144 30,154 10,756 13,514 4,936 64,548 59,107 37,652 8,618 2,948 837 46,914 42,857 11,972 936 115 35 43,847 43,262 1,863 104 10 26 37,496 36.124 410 63 20 10 31,849 31,146 144 65 10 28
145,704 134,527 618 150 66 83

609
iti "iUT,{ "'!.~/IfI'T~iiI' iil'A ~~ -VT~tVT LEVEL OF EDUCATION, AGE AND SEX-RURAL
~!;f Maks
8
302
5
14
14
24
28
85
136
47
10
S
IS
-1,485
34
198
232
237
102
803
.571
88
5
5
10
ffill{'{ (~"f!ll1f; ~tf{ ~ fiil''lT)·
Literate (without edu~ational level)
ar~~~ Non_Formal
~ Females
9
61
4
4
13
9
30
17
4
9
" 67
19
37
78
96
60
288
169
5
,!1;!;f
Males
10
24,546
274
1,076
1,486
3,859
2,Sl0
9,204
13,937
1,203
85
4
28
62
37,938
382
1,387
2.915
~,212
4,767
15,662
20,675
I,] 53
71
SO 45
259
11
~1tftSIDH!
6,045
103
422
546
1,075
929
3,074
2,894
52
9
4
'!r;an MANDSAUR
10,300
183
576
1,002
1,953
1,721
5,436
4,726
83
5
19
9
23
Qtfll{~ m/Educational Level
'l1;tl' Males
5lT~ Primary
ffOrlfi Fema:cs
lIIPi~i! Age-group
-- -------- -----------
12
12,130
104
104
7,839
3,866
250
28
15
14
,759
175
175
12,207
4,835
238
90
25
189
13
1,506
17
17
1,326
146
4
3,018
96
96
1,522
311
28
]4
23 23
«'I) "'I{ All ages
0-4
S
6
7
8
9
5-9
10-14
15-19
20-24
25-29
30-34
35+
6"'111 arTt!" All age;
0-4
5
6
7
8
9
5-9
10-14
15-19
20-24
25-29
30-34
35+

610
'1-3 "'" • '1'i .if ... ,~, '"1!. .m 'tf/p-C.3 PART B ATTENDING SCHOOL/COLLEGE BY COMPLETED
tl¥J ~/fducational Level -------------------
~ t~/t"~1I""t~/ fll'-~a
fiImr Ilf~/v~ Higher/Secondary/loter_ Middle Matriculation/Secoodary mediate/Pre-University
-------- ---------- --------_ ~~ ~ mAt ~ f~ ~ ~'If Age-group Males Females Males Females Males Females
14 IS 16 17 11 It
,,1eft SIOHI
.,.,..., USO 202 1,966 112 J.3tS SO All .... 0-4
S 6 ... , 8 t
5-' 10-14 1,118 125 76 26 5 4 15-1t 3,267 (it 1,434 (it 685 17
20-24 288 4 429 13 604 25-29 42 5 19 74 9 30-34 5 4 23 35+ 36 4 4
'l"tllt MANDSAUR
I1ITVfIl 6,441 773 196 28 l,t25 121 All ages
0-4 5 6 7 8 9
5-' 10-14 ] ,209 359 34 5 5 15-lt 4,556 380 119 28 1,063 80 20-24 536 24 728 32 25-29 15 20 10 69 30-34 15 5 10 24 35+ 40 9 35 5

611
.. ~ ~/.mr ;nir 1I1W-'V1'IM LEVEL OF EDUCATION, AGE AND SEX-RURAL
_-
IITfmr mJEducational Level
-----------------------------------~w ~ IRnfI'f ~-~i1rft ~Ift ~ arnr.r ~ fI~ lIT STlnIlf-'nf ~ilU lIT !I1!lI!f-1Rr Non-technical diploma Technical diploma or or certificate not equal certificate not equal ~~'lfliPli to degree to degree Oraduate and above
---------- ---------- ---------~ f~ ~If f~1fi' P' ~Ifi' III'Tlf"il Males Females Males Females Males Females Age-sroup
20 21 22 23 24 25
9"" SlDHI
208 IS mtmt All ales 0-4
5 6
7
8 9
5-9 10-14
28 13 IS-19 104 5 20-24
33 ... 25-29
18 30-34
26 35+
,,;t9'~
MANDSAUll
19 49 ... 346 34 ~"'''l All agcs
0-4 .5
... 6 7
8
9
.5-9
s 10-14
15 30 19 15-19
5 245 9 20-24
39 52 25-29
5 30-34
S 15 7 35+

612
'f-3 ltT'T W ~ UfIR ~, '"'! ~ 'fir/". C-3 PART B ATTENDING SCHOOI./COLLEGE BY COMPLETED
'iii" /1IiTft it m ri ~ ... !lffiFo for iil"if~'1lT Total person~ attending f;m:R: Total population School/College Illiterate
---------- ------------ ----------wrq, ~~ ~ ~1fi ~ fufq; i6'" fferlff Age-group Males Pemales Males Pemales Males Females
2 3 4 5 6 7
~
RATJ-AM
~'!1! 271,177 265,060 33,068 8,024 8,412 2,770
All qes
0-4 37,4~9 37,183 162 93 162 93 , 9,841 8,983 795 327 645 227
6 9,109 9,049 1,923 787 1,'37 '41 7 7,302 7,459 2,453 867 1,546 516
8 10,460 10,158 3,917 1,216 1,826 556
9 4,758 5,354 2,369 830 745 258
5-9 41,469 41,003 11,457 4,028 6,299 2,097
10-14 36,245 32,892 15,670 3,426 1,876 499
15-19 26,106 23,534 4,787 354 60 30
20-24 22,532 21,962 695 51 10 5
25-29 18,976 19,212 123 21 11
30-34 17,164 16,500 40 5
35+ 77.186 72.744 129 46 5 36
~;r UJJAIN
PI' arr! 359,752 338,578 48,974 9,567 11,310 3,293 All agcs 0-4 46,897 48,396 234 97 234 97
S 11,984 11,1)60 890 300 718 209
6 11,346 10,677 2,416 703 1,720 503
7 9,919 9,505 3,752 1,013 2,309 601 8 13,318 12,383 5,478 1,672 2,266 809 9 6,819 6,320 3,679 1,013 1,215 333
5-9 53,387 49,945 16,216 4,700 8,228 2,456 10-14 48,871 42,373 23,655 4,226 2,669 681 15-19 33,01S 28,700 7,080 413 95 20-24 28,406 27,246 1,130 17 S 25-29 25,167 23,523 199 27 30
30-34 21,904 20,912 132 14 10 5
35+ 120,002 97,398 293 59 44 50

613
• ~m ~/Ifi"" irA ~-v"itvr , LEVEL OF EDUCATION, AGE AND SEX-RURAL
wm..; ~/Bducatjonal Level -----------
mil: (~ ~ it; R;n)'" Literate (without educational Jeve')
----------------------1I'~W;n-fi:1I; ~ ~"t NOD-Formal Formal Primary
---------- ----------- -----------~ f~ ~ mrll'j ~ ft:erqj IIIfI1 V11t Males Females Males Females Males Females Age-group
8 9 10 II 12 13 I
---------- ----
11n1111 RATLAM
622 13S 14,427 ~ 3,727 6,908 1,092 Vtitan, All _ge,
0-4 20 15 130 85 5 45 20 340 226 6 45 40 862 312 7
120 15 ] ,971 645 8
45 ]0 1,543 528 3S 3S 9 276 101 4,848 ],796 35 35 5-9
306 35 8,805 1,860 4,403 906 10-14
30 670 45 2,280 III 1S-19 4S 16 80 25 20-24 15 5 25 5 25-29
2S 5 30-34 10 39 5 60 S 35+
.. ~;r
UJJAIN
a,251 222 21,371 4,406 10,714 1,343 m'D",! All ages 0-4
S 167 91 S 64 18 632 182 6 94 18 1,349 394 7
262 S9 2,950 804 8 94 18 2,311 625 59 36 9
SI9 114 7,410 2,095 S9 36 5-9 ti2S ]09 12,978 2,226 6,865 1,120 10-14
88 774 49 3,408 168 15-19 10 30 5 212 20-24
29 9 32 9 25-29 15 9 49 30-34
10 lOS 9 89 35+

614
11-3 \11lI • '" ~ ~, "TI!. ~ m/~ C·3 PART B ATTENDING SCHOOL/COLLEGE BY COMPLETED,
~ferlfi m/Edueational Level ----------------------------------
(TlR~/~~1
S;~VJir/~~ fir-!f;r~
f'l'iflr Higher Secondary/Inter. Middle Ma trieula tion /Seeondary mediate/Pre-University
---------,- ---------ifTI! ut~ '!" ftrn 2;~ ffni' ~ ~ Age group Males Females Male. Females Males Females
14 15 16 17 18 19
~" RATLAM
11iI'''''l 2,183 269 15 388 31 AlIqes 0-4
5 (i
7
8 ... 9
5-9 10-14 276 127 5 15-19 1,590 142 5 146 26 20-24 292 201 5 25-29 15 31 30-34 10 5 3S+ S 5
~ ... UJIAIN
U1iT1ITlI 3,350 252 71 7 772 36 All ages
0-4 5 (;
7 8 9
5-9 10-14 S03 90 15 IS-19 2.379 157 37 7 276 32 20-24 418 9 392 4 25-29 19 5 70 30-34 15 5 14 35+ 10 5 20
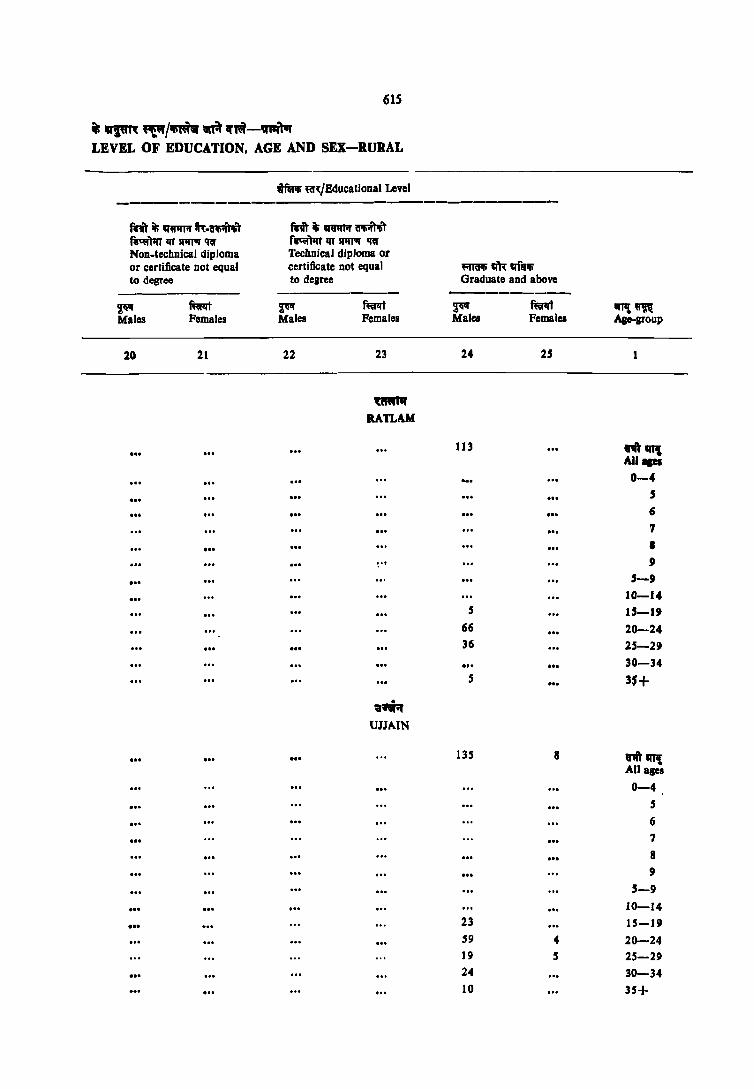
615
• ~ R£.W/"* ~ "'M-~ LEVEL OF EDUCATION. AGE AND SEX-RURAL
tftttli ~~/BducatioDal ~vel ----- ------------
mi\' ~ 'I'nA ~-trriAit mil' ~ QIrt;r ~ ~)1n lIT SPfl1Ir CRf f~ lIT SPfl1Ir qw
NOD-technical diploma Technical diploma or or certificate not equal certificate DOt equal ~qnqf'lIi to degree to degree Graduate and above
---------- ---------- -------~ mt ~ mt ~ ftni IIIPl ~ Males Females Males Females Males Female. Ale-group
20 21 22 23 24 25
UW1'I RATLAM
113 m"" AIIIICI 0-4
5 ... 6 'II ... ... •
~ ., 9 s-, 10-14
5 IS-I' 66 20-24 36 25-2!J
30-34 5 ... 3~+
qrwaA UlJ'AIN
135 8 m'ITlJ: All ages
0-4 5 6 7
8
9
5-9 ... 10-14 ... 23 IS-l!J 59 4 20-24 19 S 25-29 24 30-34 10 35+

iIIl1! ~ Age_group
616
IJ-3 lITIJ 'I' ~ ~f"lIIi «f~, '"Ii 1R1t "T/11!1'iI C-3 PART B ATTENDING SCHOOL/COLLEGE BY COMPLETED
~1§.Of/~ it tilTit "l~ ~<'I' .lI'f~;r f'" ;;rnilill'l Total persons attending fimn Total population School (College Illiterate
---------- _---------- ----------,,~ fi~II'T ~ fi:~i '1"' FlORr Males Females Males Females Males Females
-~ - -- -- _------- -_ ----- -- --- ---- - - -----
2 3 4 5 6 7 -- ------
UlGlT~
SHAJAPUR
nt.~ 369,984 345,495 S 1,143 8,476 10,655 2,806 All agcs
0-4 48,628 47,525 120 59 120 59 .5 12,741 11,426 766 295 600 257 6 11.539 10,972 2,581 760 1,868 587 7 9,339 9,322 3,516 846 2,261 495 8 13,733 12,699 5,952 1,368 2,312 620 9 6,583 6,404 3,778 865 964 272
5-' 53,936 50,823 16,593 4,135 8,007 2,231 10-14 50,643 42,181 25.991 3,823 2,376 399 IS-19 32,098 28,333 6,953 275 85 5 20--24 27,879 27,345 1,099 29 14 20 25-29 24,436 23,616 132 SO 5 21 30-34 22,269 21,848 61 5 19
35+ 110,025 103,764 180 86 29 71
~I.m' DBWAS
,"wit ~ 333,892 312,650 50,006 10,841 10,098 3,103 All ages
0-4 47,906 46,434 164 143 164 143 5 11,842 10,321 992 318 767 246 6 11,284 10,734 2,496 990 1,619 593 7 8,683 9,124 3,S49 1,212 1,883 598 8 13,229 12,339 5,917 1,957 2,309 762 9 6,139 6,445 3,608 1,252 956 23S
5-9 51,177 .49,052 16,562 5,729 7,534 2,433 10-14 45,250 39,780 23,821 4,434 2,299 480 15-19 30,624 25,976 7,842 335 46 5 20 -24 26,681 26,073 1,054 58 10 5 25-29 22,836 22,118 206 37 10 30-34 20,256 18,501 83 28 10 35+ 89,063 84,640 233 64 35 26

617
Ii IIfljm ~!IJT~ iI'l:t .~-~1wt LEVEL OF EDUCATION, AGE AND SEX-RURAL
-------- ---_-_- ----- - - -__ ----- -----
lim-iii m/Educational Level
----------ffi!IH (~fel'li fa"( i!; ~;j'T)* Literate (Without educational level)
----------------------8A~~1Ii IIfN;nror; l[~ Non.Formal Fonnal Primary
--------- ---------- -----------~ fwat P' f~1:1i "" T~qf an,!. Males Females Male, Females Males Females Age-group
-------------
I 9 to 11 12 13
-------- -----------
18.~
SH"JAI'UR
949 140 23,371 4,131 12,163 1,1 ~3 "Wf! All a,es
0-4 26 140 38 5 93 14 619 1S9 6 ~I 19 1,203 331 '1
IBI 19 3,458 729 8 71 19 2,638 536 98 38 9
428 72 8,059 1,793 98 38 '-9 44~ 54 14,371 2,284 8,280 999 10-14
SO 9 743 25 3,497 101 15-J9 10 62 220 20-24 10 16 14 21 25-29 5 21 5 II 30-34
83 5 37 10 35+
hH DEWAS
729 217 23,838 6,139 10,889 J,032 "-'lff WI,-All ages.
0-4 36 189 72 5 97 -48 780 349 , 71 18 1,'95 596 7
148 48 3,460 1,147 II 36 12 2.546 975 71 3-0 9
387 126 8,569 3.140 71 30 5-9 275 66 14,141 2,928 6,614 1176 10-14
41 12 963 24 3,8 ~ I 96 lS-J9' 1 S 36 12 214 11 211-24
6 1 ~ 31 6 ~S-2'1
6 II 12 16 30-34-5 76 12 6~ 12 35+

618
'1-3 ~T'I .. ~ .tr.~ t:~, !In,,! m~ t:'itjp C..3 PART B ATTENDING SCHOOL/COLLEGE 8Y COMPLETED
~ ~/Educalional Level
------------------------------------~t iil;v&,u /'(rz"tli"rr-u:zl f II" -t.{f.:Af~i't
f~ q.f~lIr.!/iit;vro Higher/Secondary Ilnter-Middle Matnculatlon/Secondary mediatc:!Pre- UnIversily
--------- ----------- ----------'"l!~ ~ fqrQ'T . ~ f"ll"lft ~. f~1ft Age-group Males Females Males Females Males Females
J4 IS 16 17 18 19
~n'"Jt SHAJAPUR
~'1111!: 3,226 213 IS 5 616 25 All ~ges
0-4 S
6
7
8
9
5-9 10-14 513 82 S 5
15-19 2,2S2 116 10 3105 19
20-24 419 5 256
25-29 21 10 29 6
30-34 S
35+ 21 10
tmr DBW~S
~IIHII{ 3,596 234 26 633 60 All age~
0-4 5
6 7
8
9
5-9 .... 10-14 421 84 10
15-19 2,657 144 10 289 54
20-24 418 II 277 6
25-29 58 6 40
:-0-34 21 6
35+ 10 s 10
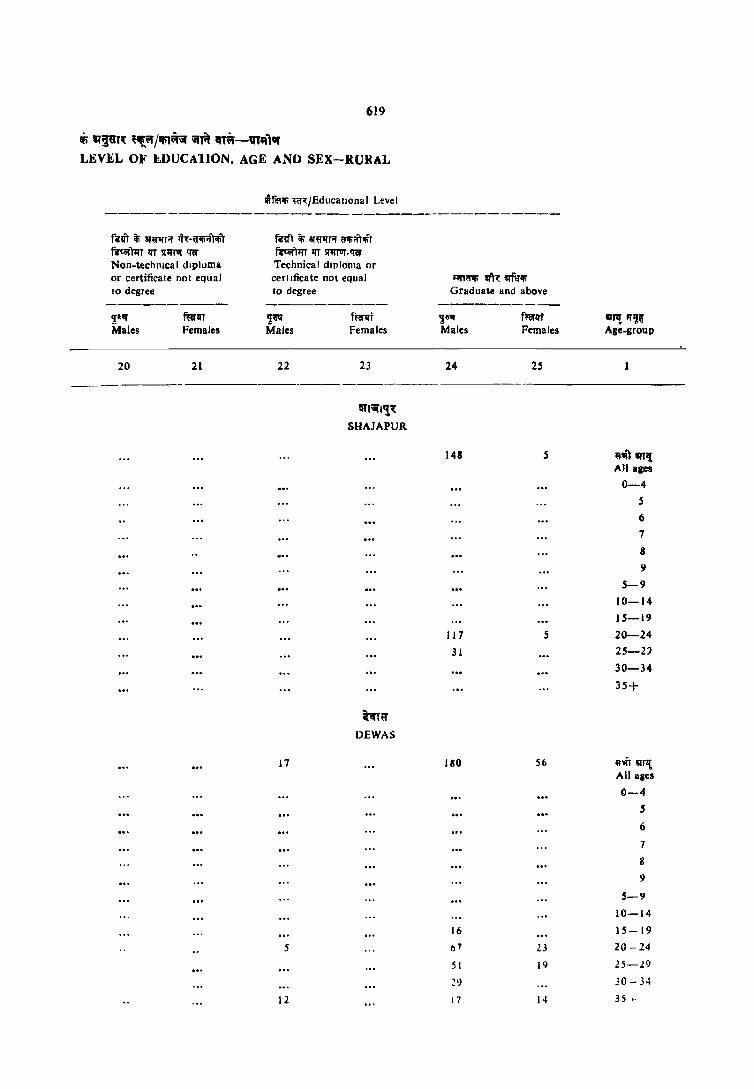
619
Iii "~T' ~,_~ j'filR itA 1fT~-VT"I" LEVEL 01' i.DUCAlION, AGE AND SEX-RURAL
fd't if; iUI1IPf lT~·oll\'if');tft fWc~i't;(r 1fT ~;(rur q'iiT
Non-technical dlpluma or certificate not equal to degree
'lUI
Males
20
---------
ffirlfT Females
21
-rflll'li 'o~/Educalional Level
fn" if; iII~I" O'!i;:ftiliT fi'toft;(l 1fT ~.q'iiT Technical diploma or cerllficate not equal 10 degree
~ Males
22
17
5
12
fum Females
23
~liifl'!'
SHAJAPUR
~Hr
DEWAS
J;!1<fi1i sih: 'ffu'li Graduate and above
'!"" Males
24
148
117
31
180
16
117
S I
17
f'l1llrt Pemales
25
s
S6
l3
19
14
,,~ 1I''lt!' Age-group
6'111 "Ill An ages
0-4
5
6
7
8
\I
5-9
10-14 IS-19
20-24
2S-21
30-34
3S+
~..n iIITJ{
All alles
0-4 5
6
7
II
9
S-!I
10-14
IS-19
20 -- 24
25-l9
30 - 34
35 ~

'I'll{ ~ Age_group
61ft" 'lII! All ages
0-4
5
6
7
8
9
5-9
10-:-14
15-19
20-24
2S-29
30-34
35+
rn II["! All ages
0-4
5
6
7
8
9
5-9
10-14
15-19
20-24
25-29
30-34
35+
620
11'-3 "I'll' 'If ~ uf'lltr f"'{, IAlI! m'\ m/~q' C-3 PART B ATTENDING SCHOOL/COLLEGE BY COMPLETED
f~\'I' I iIiI~ it illTit 1IT<'t j\'I' iIlfAlI j\'I' ilA~.lfI Total persons attending f;nm Total population School/College Illiterate --------- ----------- ----------~ furlli ~ ffGrlli ~~~ fuill'l Males Females Malcs Females Males Females
2 3 4 5 6 7
~QT
JHABUA
365,555 363,356 24,064 7,564 6,594 2,555
57,302 58,697 134 130 134 130 12,257 12,553 718 365 607 299 13,886 13,998 1,752 842 1,270 594
9,886 9,847 1,991 845 1,262 435 17,897 16,521 3,405 1,189 1,482 460 5,989 6,222 1,440 748 376 211
59,915 59,141 9,306 3,989 4,996 1,999 50,086 47,31 I 10,355 2,974 1,404 356 32,075 32,587 3,571 376 24 20 25,215 27,986 435 35 5 24,075 25,115 98 22,229 21,401 65 5 10 94,586 91,068 80 55 21 45
"1'll
DHAR
468,348 456,141 57,516 17,164 12,472 4,990
67,521 70,221 300 184 300 184 16,273 15,491 1.210 512 985 398 17.244 17,055 3.145 1,592 2,290 1,106 13,371 13,119 4,373 1,871 2,460 992 20,437 19,471 6,737 2,741 2,681 1.187
9.675 9,429 4,356 1,862 1,070 396 77,006 74,564 20,021 8,578 9,486 4,078 63,165 58,09~ 25,710 6,979 2,473 635 41,801 40,2JJ 8,986 1,155 125 3b 35,094 35,956 1,379 46 21 10 ]0,655 30,474 436 49 , 28,586 28,102 157 32 5 5
124,410 118,365 513 128 51 42

621
~ Vi6T~ "!."'/Ifil~ ~A 1f1~-~TIIf LEVEL OF EDUCATION, AGE AND SEX-RURAL
ffllfoli m/Educational Levol -----------
mf{ (ifGlifi m it; i1Ar). Literate (without educational level)
-----------------------if~'l1Rrf~ a-~ Ilf~'U Non.Formal Formal Primary --------- ----------- ----------
~ mrl:if ~ ften;rf ~ fmlli illl'T'{ ~ Males Females Males Female& Males Females Age-group
8 9 10 II 12 13
~:iI'~ . JHABUA
328 101 9853 3,474 5,197 1,146 ~\lr "'l! All aaes 0-4
19 15 92 51 5 39 IS 443 233 6 14 2S 715 385 7 68 20 1,856 709 8 34 IS 1,006 491 24 30 9
174 91 4,112 1,869 24 30 5-9 126 5 5,278 1,554 3,2S9 932 10-14
14 410 36 1,788 113 1S-19 S 5 76 10 20-24
5 10 24 25-29 S IS IS 30-34
19 10 10 35+
"''t DHAR
788 160 23,978 7,969 14,757 3,100 mVT!{ AU ages
0-4 14 211 114 5 43 9 1,011 478 6
111 39 1,803 840 '7 116 41 3,939 1,514 8 n 9 3,022 1,400 192 57 9
356 98 9,987 4,345 192 57 5-9 332 H 12,950 3,49b 9,222 2,506 10"":"14
58 13 694 53 4,665 497 ]5-19 92 291 20-24
IS 5 34 9 135 22 25-29 10 4 29 4 . 63 4 30-34 20 188 49 179 13 H+
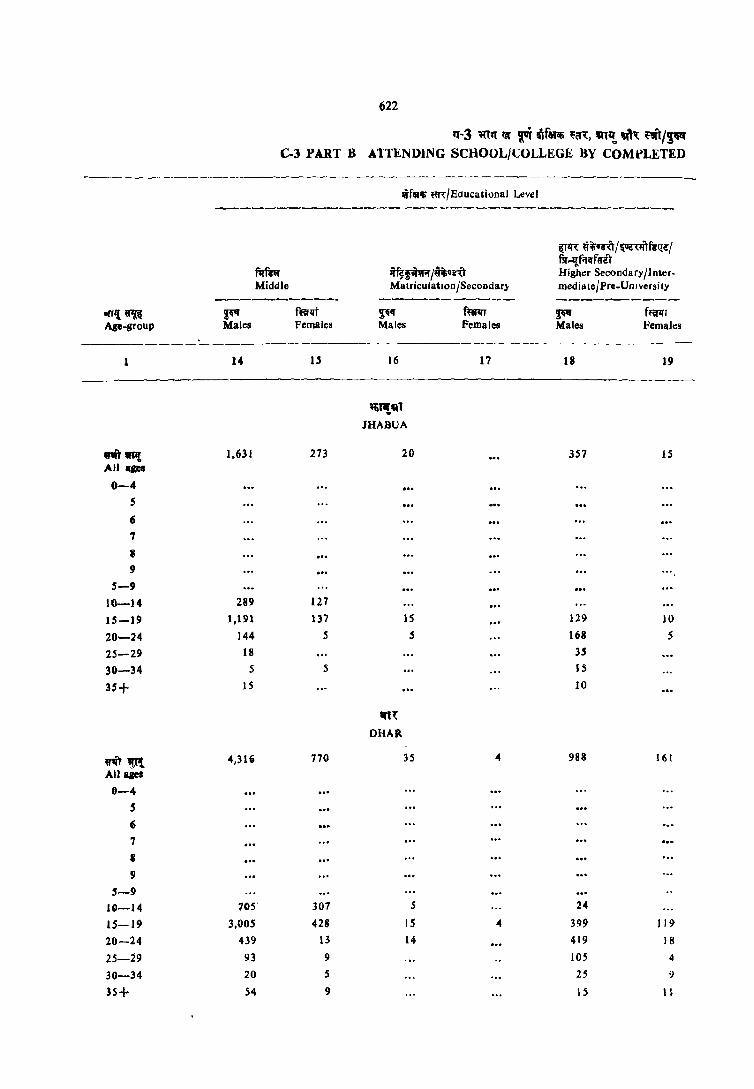
622
'1'-3 mil Qf 'lvi ilfltlli {:al:, all!, "'l: ~t/~ C-l PART B ATTENDING SCHOOL/COLLEGE BY COMPLETED
------------- ---_. __ ---------------
01([1{ 61ft Age-group
ntwPf All 1[#,
0-4 S
6
7
II
9
5-9
10-14
15-19
20-24 25-29 30-34
35+
"tiT 'J[\ All aleS
0-4 5
6
7
• 9
5-9 10-14 15-19
20-24 25-29 30-34
35+
~ Males
14
1.631
289
1,191
144 18
5
IS
4,31(;
fil'mr Middle
70S-
3,005 439
93 20 54
fRrql Females
273
127
137
5
5
770
307
428
13
9
5
9
ifllllli fm:/Educlitional Level
lj~fOTR/~it;G~u Malriculatlon/Secondar;,
~~4f Males
16
JHABUA
'In DHAR
20
IS
S
35
S
15
14
f~ Females
17
~1l1: ij'ij;.1'~ /~,{lflf~l{e/ fir 'I{fi'fqf «z'T Higher Secondary/Intermedijlte/Pre-UOl~ersity
~ Males
18
357
129
168
35
15
10
988
24
399 419
lOS
25
15
f{iflfl Females
19
15
l()
5
161
J II}
J 8
4
')
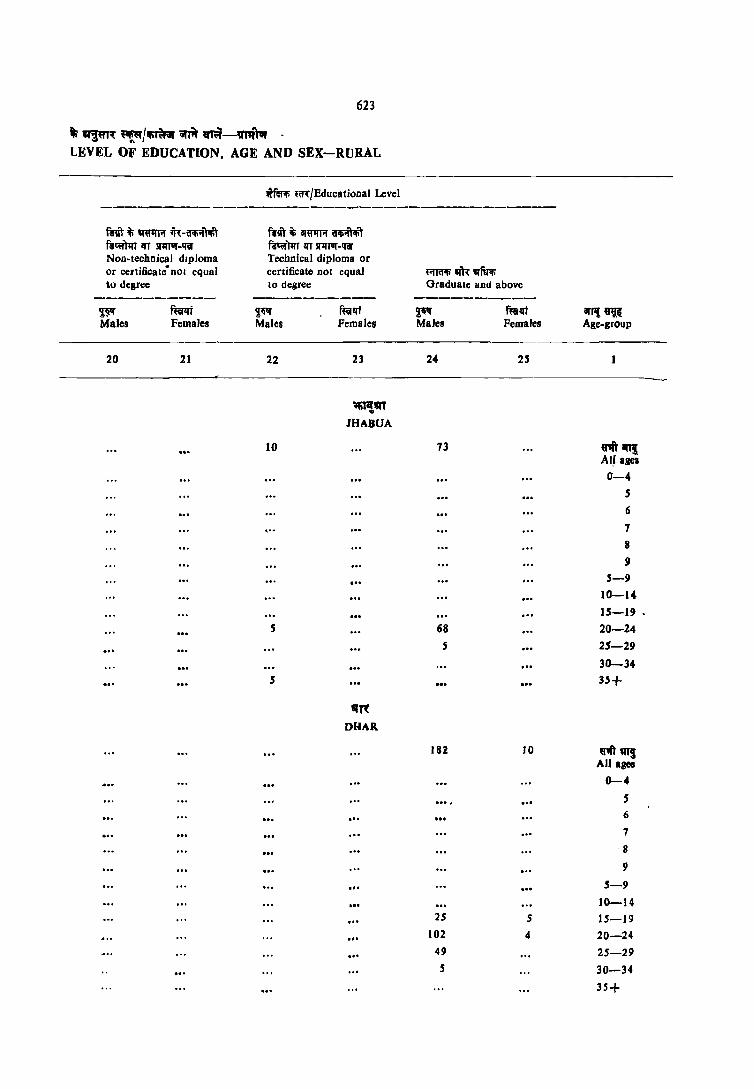
623
rtf ~~ ~/~ iitR ~-""'" -LEVEL OF EDUCATION, AGE AND SEX-RURAL
mfr iii q-~ ih:-fl'~~'\1ti\' fitiihn lIT sllnvr-q"iI' Non-technical diploma or certificate· nOI equal \0 degree
~ Males
20
~ Females
21
~flli'l\' '~/Educational Level
fllftiliil~~ ~mr I:IT SIlII1lf-q"iI' Tecbnical diploma or certificate not equal to degree
~li. Males
22
10
5
5
f~1It Females
23
~aT JHABUA
lilt DHAR
'"
."
...
...
~~qfii<l; Graduate and above
ili" Males
24
73
68 S
I8Z
25
102 49
S
m,1It Females
25
10
5
4
iII'~U1N Age-group
t1itarT! AI~ agel
0-4
5
6
7 8
9
5-9
10-14-
15-19 -
20-24 25-29
30-34 35+
V'fims All ages
0-4
S 6
7
'8
9
5-9
10-14 15-19
20-24 25-29
30-34
35+
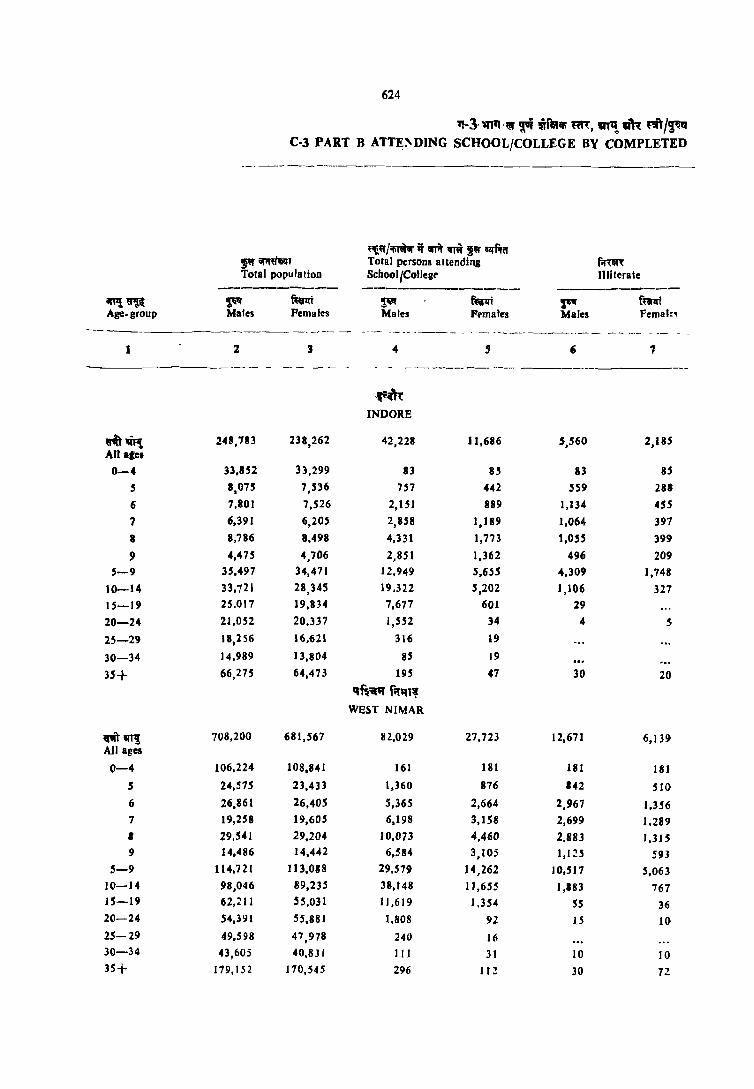
~~ Age-group
-------
~~ AII.,el 0-4
5
6
7
8 , 5-9
10-14
15-19
20-24
25-29
30-34
35+
~WTlJ All ages
0-4
5
6
7
I
9
5-9
10-14
IS-19
20-24
25-29
30-34
]5+
624
1t-3'1I11HA' 1'i ~fi1lfi ~, '"~ an ~i/~q C-3 PART B ATT~I\DING SCHOOL/COLLEGE BY COMPLETED
------------
~,_"'/~ if ~ ml t"" i'flit\'! P iilifWiqT TOlal persons altending f~ Total population School/Collegt Illiterate
---------- ------------ ----------~ ~ ~ mt ~ f«rlfT Males Pemales Males Pc-male-! Males Female,
----------- -_---- - _---- -_- _- ~--- - - -. ----------~-----~-- _--- ---- - --
2 3 4 3 " 1
- ---- _- - - - ---- -------- ------- -------
,"~'t INDORE
248,783 238,262 42,228 ]1,686 5,560 2,185
33,152 33,299 8] 8.5 83 85
8,075 7,536 757 442 559 288
7,801 7,526 2,151 889 1,1]4 455
6,391 6,205 2,8S! 1.189 1,064 ]97
8,786 8,498 4,331 1,773 1,055 399
4,475 4,706 2,85 I 1,362 496 209 35,497 34,471 12,949 5,655 4,309 1,748 33,721 28,345 19,322 5,202 1,106 327 25,017 19,834 7,677 601 29
21,052 20,337 1,552 34 4 S
18,256 16.621 316 19
14,989 13,804 85 19
66,275 64,473 195 47 30 20
q~"", rf{l:n; WEST NIMAR
708,200 681,567 82,029 27,723 12,671 6,139
106,224 108,841 161 181 181 181
24,575 23,433 1,360 876 142 SIO
26,861 26,405 S,365 2,664 2,967 1,356 19,258 19,605 6,198 3,158 2,699 1.289 29,541 29,204 10,073 4,460 2,B83 1,31 S 14,486 14,442 6,584 3,105 1,125 j93
114,721 113,088 29,579 14,262 10.517 S,OB 9B,046 89,235 ]8,148 1I,6Sj 1,883 767 62,211 55,031 11,619 1,354 55 36 54,391 55,881 1,808 92 IS 10 49,598 47 ,978 240 16
43,605 40,831 III 31 10 10 179,1 S2 170,545 296 11 ~ 30 72

fi25
i:: 111m ~/~~ m .m-vrwlat LEVEL OF EDUCATION, AGE AND SEX-RURAl,
-'fei'li m/Educational Level -----------
mer, (Vim'li m ~ fiI'I'l)* Literate (without educational level)
-----------------------ar~'\tArful; Q)tr;nf1:'Ii srrwr Non.Formal Formal Pr;mary
---------- ----------- -----------~ n.ro !~ fur_t ~ f@1tl .-r~ ~ Males Females Males Females Males Females ,~ge.group
-----_ 8 9 10 II 12 13
-------
~~ INOORE
408 116 19,286 6,803 10,992 1,995 "'" lIEf'!. All ases
0-4
15 19 184 135 5
58 29 959 404 6
63 10 ,1,731 782 7 34 19 3,241 1,355 8
44 S 2,~ IS 1,08S 97 63 9
213 82 8.331 3,762 97 63 ~-9
151 34 10,123 2.919, 7,225 1,711 10-14
30 693 71 3,370 201 15-19 30 193 20-24
24 5 20 5 25-29
IS 9 26 S 30-34
IS SO 12 40 II 35+
qf~'iI'II~ WEST NIMAR
574 201 40,191 J 5,.576 20,1146 4,.597 .,.17') ~l( Ah IfgeS
C-4
20 497 366 5
61 46 2,337 1,261 6
17 36 3,411 1,833 7
81 31 7,I01i 3,114 8
501 IS 5,220 2,419 I lIB 77 9 300 129 II1,S74 8,993 1&11 77 5-9 :1:02 57 20,580 6,413 14,489 4,021 10-14
42 S 7611 9-3 5,SII3 4bM IS-19
10 61 10 2M 21 2Q-24
5 IS S 31 25-29
36 5 2S II) 30-34
1 5 S 111 35 ~s 35-1-

626
iJ-3 miT'~ ~ *fllliti HR, "'~ qlt m,~ C.3 PART B ATTENDING SCHOOL/COLLEGE BY COMPLETED
itfe:rili fcn:/Educational Level
-----------------------------------
ill"!< (rij;q-(t/~~I fsr·lJfifcrf~
fqfillfl lif~f«ij';f /~~u:ro Higher Secondary /Inter. Middle Malricula tion/Sccondary mediate/Pre-Umversity
---------- ------------- ----------IITIII ~~ ~~ fq ~~ mt ~ mrrrt Age group Males Females Male. Females Males Females
14 " 16 17 18 19
,,"~ INDORE
um~ 4,HI 432 2S 9 1,255 117 All ages
0-4 5
6 7
8
9
5-' 10-14 713 201 5 S S 15-19 3,001 221 5 4 529 98 20-24 529 5 10 S72 10 25-29 S4 5 124 5 30-34 15 15
JS+ 34 S S 11
q'f"" f;if"" WEST NIMAR
um '«I'! 11,325 1,011 82 5' 1,312 134 All ages
0-4 5
6 7
,8
9 5-9
10-]4 ',1)00 39 6 5 15-19 ,4,608 649 38 513 103 20-24 610 21 29 5 670 26 25-29 51 103 5 30-34 20 5 20 15+ 41 10 5

627
if; Q§~t-.: ~'f/",,\=i ... il'tif ii1't~-V1q)~ LEVEL OF ELUCATJON. AGE AND SEX-RURAL
~;f~~ ~~/Educauonal Level
f611T if; if~PHif ir~·(I'~TiliT r.1ir if; if6llJ;i ~r.tit tcc.i)lrr IH SllllVl" q~ fi"<O!"P" llf SlllfVl" tRl Non-to:chnic .. 1 dIploma Technical dIploma or or cerllficale 1I0l equal ;:ertlfio.:ale not equal ~T<'~ 1IR malli 10 degree to degree Gra<luate and above
---------- --------- ----------~ mrlfT ~~I!f ff.ro ~ f«J1Il a""It ~~ Males Femaks Males Females Males Females Agc-group
--~---------- - --
20 21 22 23 24 25
~;:i(l~
INDORE
21 330 2~ ""Il ~~ All agea
0-4
S
6
7
8
9
5-9
... 10-14 to 10 5 15-19
213 14 20-24 II 77 S 25-29
14 S 30-34 10 3S+
""'if" fif1fr'l .... EST NIMAR
11 217 tr'lfi Wl{ AU agn
0-4 5
i
7
8
9
5-9 10-14
5 (; 15-19
6 141 20--'24 40 25-29
30-34
29 35+

atP! 6IJ.t Age-group
~1rI' AI' aacl 0-4
5
6
7
8
9
5-9
10-14
15-19
20-24
25-29
30-34
15+
mIlT, Ali aCc_
t h' 0-4
S
6
7
8
9
5-9
10-14
15-19
20-24
25-29
30-34
35+
628
'1-3 O{T'I II( 'laT ~f"" m~, 1Rl~ 1Ift~ "'I'~ C-3 PART B ATTENDING SCHOOL/COLLEGE BY COMPLETED
'~/~ it ;;ni'l m ~~ il[flta ~\'Il'ln'iIO Total persons attending f.n:'T1. Total population School/College IllIterale ---------- ------------ ----------
IJ~" f~~t ~ mrlfl 1~ f~r Male~ Femaloa Males Females Males Female.
-----2 3 .. S 6 7
------ -------------------- _-
Ti r .. "" EAST NIMAR
434,487 409,893 52,317 ]9,476 10,645 4,984
61,963 60,448 135 118 135 118 14,404 13,155 4S1 344 334 257 14,718 13,944 2,785 r,sss 1,929 1,071}
11,021 10,889 4,028 .2,223 1,993 1,189 15,511 14,518 6,791 3,154 1,667 1,178
9,221 8,831 5,039 2,493 1,157 492 64,874 61,336 19,094 9.799 8,080 4,195
58.268 51,817 2',811 8.514 2.304 618 39,621 33,154 6,283 823 71
32,697 34,001 :in 60 27
30,996 29,208 81 32
26,132 24,142 84 50 5 119,804 1lS,09S H8 70 31 47
'{1'('l,
RAJGARH
3S1l,949 336.519 38,147 6,644 9,067 2,136
46,232 45,506 US 46 US 46 H,7J7 11,093 835 210 661 118 11,424 11,201 2,281 71S 1,508 495 8,662 8,944 2,121 658 1,533 161
13,646 13,039 4,840 1,096 2,104 422 5,927 6,117 2,795 716 784 185
St,ns 50,394 13,472. 3,195 6,591 1,641 47,130 41.967 18,043 2,664 2,035 319 31,196 27,927 4,979 309 130 25 27,201 27,200 972 67 48 16 24,804 23,160 162 54 S 10 2l,935 21,773 66 41 10 36
109.642 98.H] 258 55 83 36

629
.. "!fm ",,/1510 wf.t ;mi-~ LEVEL OF EDUCATION, AGE A~D SEX-RURAL
------ - - -- ------- -------- -------_
imilli ~1:/Educa lioDal Level -_.--.------t't'11R (WN~ m tRill)" Literate (Without edllcationallcvel)
-------------------- --~1Ii q'A;nro.; Itri;1rU NOD-Formal Formal Pumar)!
--------- ----------- ----------~ f~ ~ fufJrt ~ f~Jrt 8!'11! ~ Males Females Males Females Males Females Aile-group
8 9 10 II 12 13
Tif~ BAST NIMAR
898 369 26.781 10.909 10.008 2,481 i1it IIlI All ages 0-4
19 27 98 59 5
1Z2 64 734 442 6
136 59 1,899 975 7
136 50 3.989 1,926 8
99 45 3,732 1.929 51 27 9
S II 245 10.452 S,331 51 27 S-9
333 114 J 5,491 5,411 7.105 2,135 10-14
49 10 568 8:! 2,746 301 IS-19
34 18 62 20-24
10 19 10 S 2S-29
24 21 20 14 30-34
S 119 18 14 3S+
~1'" RAJGARH
143 51 17,795 3,207 7.465 972 nl' WIlS All aaes 0-4
174 33 5
50 S 723 216 6
20 9 1,167 288 7
30 9 2,706 664 8
20 9 1,897 461 94 60 9
119 33 6.667 1,661 94 60 5-9
164 14 10,329 1,467 4,884 808 10-14
4S 627 51 2.210 till 15-19
5 53 lSI! 20-24
36 5 20 7 25-29
6 5 IS 30-34
<S -5 63 9 71 5 35+
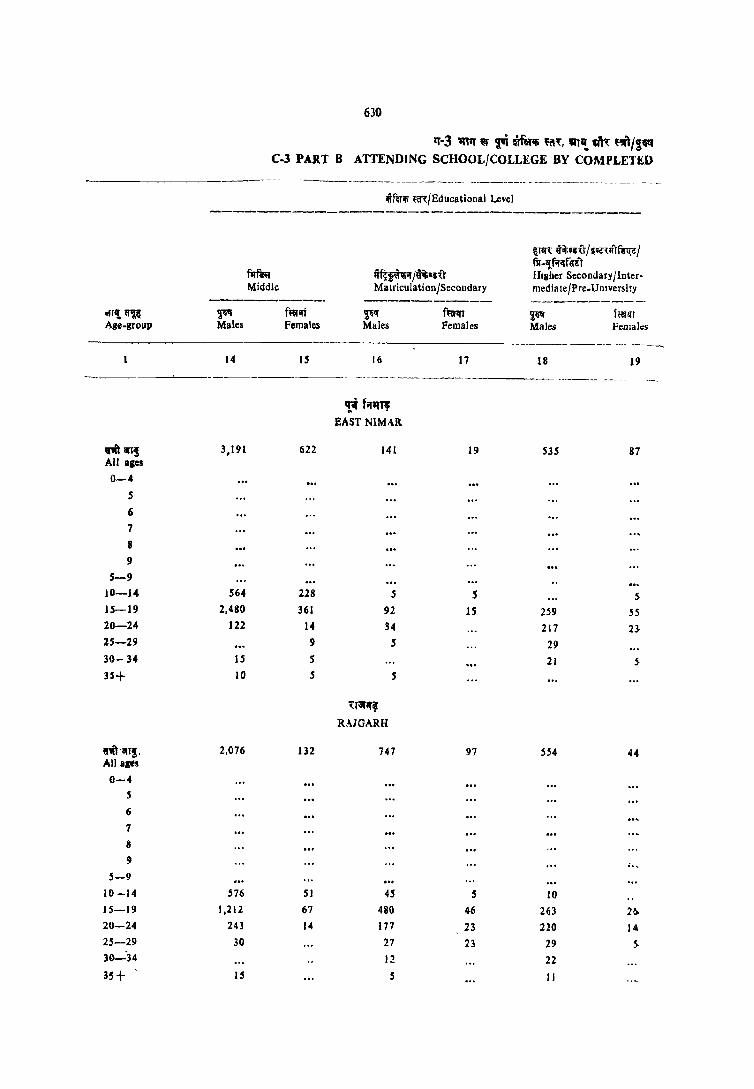
~cm~ All ages
0-4
5
6
7
8
9
5-9
10-14
15-19
20-24
25-29 30- 34
35+
" .. \"all! ' All a~s
0-4 .5
6
7
8
9
S-9 10 -14 15-19 20-24
25-29
30-"34
35+
630
'1'-3 """ Qr !'i ~1Ii ~" '"I!, ~ f'lI'l/J'fi1f C-3 PAR.T B ATTENDING SCHOOL/COLLEGE BY COMPLETED
-------- ------------------ ------------------------~--- ---_
~ Males
14
IlrIT.i Middle
fflllfT Females
IS
wf~~ m/Educational Level
4f~fm/\lii;QHr Matriculation/Secondary
~~ Males
16
ffll1rT Females
17
~Tlr{ ij-~Qsl:T / fillCl:I{T~I.\~/ fsr-'lR'I'f«e:r Higher Secondary lIntermediate/Pre-UllIversity
~ MaJes Femal~s
18 19 .-~- ---------_--- --------------------
3,191
564 2,480
122
15
10
2,076
576 1,212
243
30
IS
622
228 361
14 9
5
S
132
51
67 14
'lot f~"~ EAST NIMAR
141
S
92 34
5
-':fii(IT,
RAJGARH
S
747
45 480
177 27 12
5
19
S 15
97
S
46
23
23
53.5
259
217
29 21
10 263 220
29
22
11
87
s.
.; ...

631
Ii; IA'~~ 'If!.\IF /rm'irir \lI'A ~~-I1T"r'" LEVEL OF EDUCATION, AGE AND SEX-RURAL
rem iii ar~ lh:-u;p.jPlrr AM 1fT JI1fTWTolfCf Non.technical diploma or certificate not equal to degree
~" Males
20
....
....
....
~ Females
21
~r,,~ ~/Educational Level
~II"') iii if~ «'IiOO ~ 1fT JI1I11If·lfCf Technical diploma or cerl ificate not equal to degree
~ fum Males Females
22 23
;f.rmf EAST NIMAR
14
S
9
~ RAJGARH
~u~ ~mf.llli Graduate and above
~ Males
24
104
14
53
28
5 ,
100
12
67 15
5
f~ Females
25
5
,
5
s
"l11 ~ Age.glOup
mClTt All ales
0-4
S
6
7
8
II
5-9 10-14 15-19
20-24
25-29 30-34
35+
nl"q All ages
0-4 5
6
7
S
9
5-9 10-14
15-19 20-24
25-29
30-34
35+
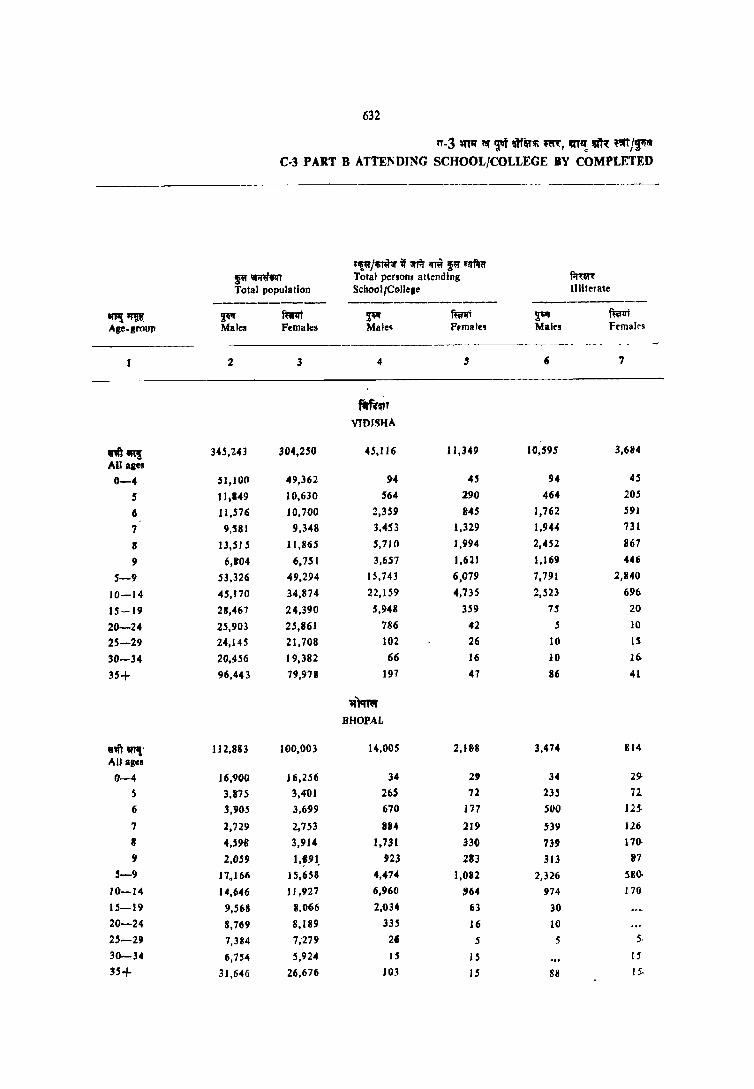
~"lll: Age_grou"
t
~lIn! All ages
0-4
5
6
7
II
9
S-9
10-14
15-19
20-24
25-29
30~34
35+
rir ".,,-AU ages
11-4 5 6
7
II
9
5-9
10-14
15-19
20-24 2'-29 30-34
35+
632
l'T-3 mil ~ ~ ~f~~ ~i!R, IIIT,!.m: ~/P C-3 PART B ATTEJliDJNG SCHOOL/COLLEGE BY COMPLETED
------------------- --- ----------_
't<'l' J;ml;ir it orf.r ""' :1<'1' v.rflffi fir ;;r;r~t1IT Total persons attending f;mn Total population School/Colle.e Illiterate
---------- ------------ ---------~ fmt ~ mr1I'i ~'" fufQi Males Females Male~ F,male, Male, Femaks
-- ------- ----
2 3 4 $ ., 7
firRUT VI DISH !.
345, OZ4J 304,250 45,116 11,349 10,595 3,684
~II,IOO 49,362 94 4~ 94 45
11,149 10,630 564 290 464 20~
11.516 10.700 2,359 845 1,762 591
9.~81 9,348 3,4S3 1,329 1,944 131
J3,~J ~ 11.86~ 5.710 1,994 2,452 867
6,'04 6,751 3.657 1.621 1,169 446
S3,326 49,294 15.743 6,079 7,791 2,840
45,170 34.874 22.159 4,735 2,523 696
28,467 24,390 5,948 359 75 20
25.903 25.861 786 42 ~ 10
24,145 21,708 102 26 10 15
2MS6 19.382 66 16 10 1&
96.443 79.978 197 47 86 41
,,)emf
BHOPAL
112.883 100,003 14.00S 2,188 3,474 814-
16.900 16,256 34 2' 34 29-
3.375 3,401 26S 72 23-S 72
3,905 3,699 670 117 !WO 1H
2.729 2, 7.53 114 219 ~39 126
4,"t 3,91" 1,731 330 739 17(}
2.0" 1,~91. 923 283 313 87 17.166 15,658 4,.7<4 1,082 1,326 S8o.
14.646 11 ,921 6,960 .964 974 J 70
9.'68 B.066 2.034 63 30
8.769 8,189 335 16 10
7,384 7;279 26 5 S S·
6.754 S,924 Ij B 15
31,646 26,676 103 IS 88 J 5.
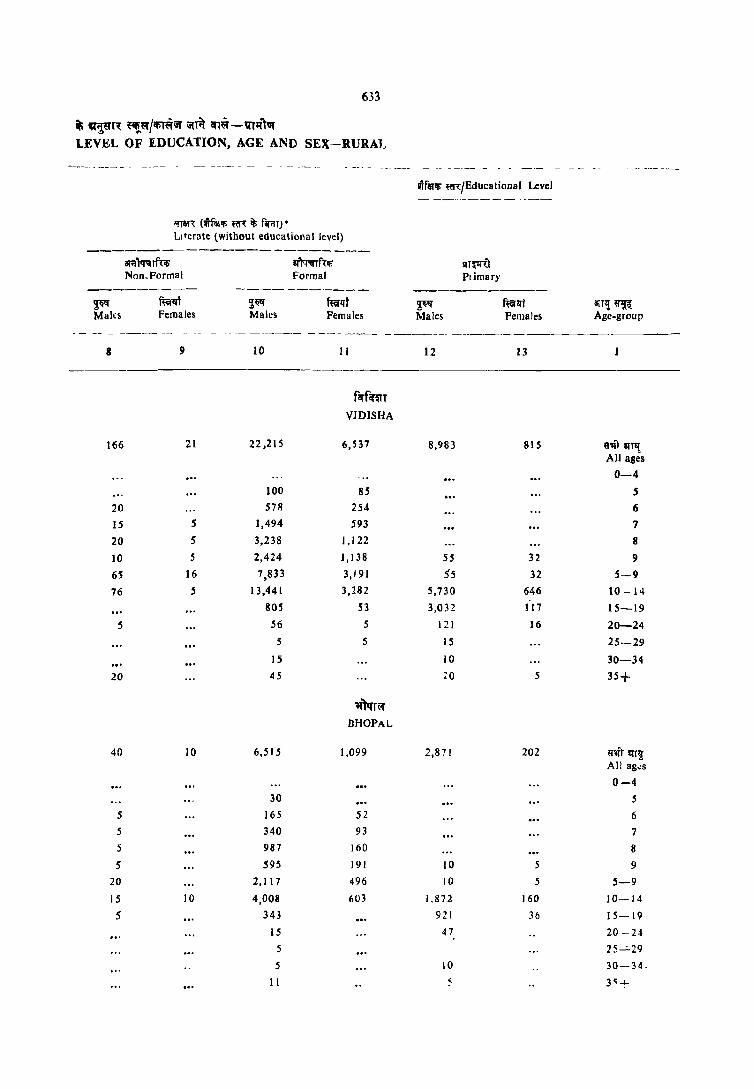
633
~ C¥T~ ~~/ifi1~Ojf OjfA CfI~ -VT'l'hrt LEVEL OF EDUCATION, AGE AND SEX-RURAl,
~ Malls
"!Ten (m~lfi ~~ t fiil"lT)· Literate (without educational level)
ar.illfiil rf{;l; Non_Formal
ffil'l:ft Females
~~ Males
m'ITf<~ Formal
fuJqf Females
I!Tfe:r~ ~/Educalional Level
~ Males
!1T~i Primary
f~qj Females
-- --------------------------- ---------- ------_.-- -------------
8 9 10
--------_._-----_
166
20
15
20
10
65
76
5
20
40
5
5
5
5
20
15
5
2.1
5
5
5
16
5
10
10
22,215
100
578
1,494
3,238
2,424
7,833
13,441
805
56
5
15
45
6,515
30
165
340 987
595 2,117
4,008
343
15
5
5
11
II
f<rfq~TT
VJDISHA
6,537
85
254
593
1,122
1,138
3,191
3,282
53
5
5
;r)qn;r
BHOPAL
1,099
52 93
160
191
496
603
12
8,983
55
55 5,730
3,032
121
15
10
2,87 I
10
10
1,872
92 I
47
10
5
13
815
32 32
646
117
16
5
202
5
5
160
36
Bifl! ~ Age-group
6"q1 ~T1f All ag~s 0-4
.5
6
7
8
9
5-9 10 -14
15-19
20-24 25-29
30-34
35+
'!'liT ~rlj' All ag;s
0-4
5
6
7
8
9
5-9
10-14
15-19
20 -24
25__.:_29
30-34.
3~+

------- ----
'Il!~ Age-gwup
634
'1·3 'liT" « ~.r ~f~iII' ftl'(, "'T~ "'~ f;t)/~ C.3 PART B ATTENDING SCHOOL/COLLEGE Sy COMPLETED
Plfe1'li ~Cf{/Educatjonal Level --------------------------------------
,!li<!f
Males
14
fiTfi<'! Middle
fzorqj Females
15
Iff~W<l(~ifi;vrtt M,llriculat:on/S,'condary
?' Males
16
f~!ft Females
17
~rlR «~3U ! ... ~< If''tfll!;~l flf.~fif1l'r'flt Higher/Secor dary fIr. rer. media t~/Pre- U niv~rsi ty
'!"" 'Males
f~1ft Females
19
_--------- - ----------------- - -
mft'~ All ages
0-4
5
6
7
8
9
5-9 10-14
15-19
20-24 25-29
30-34
35+
6'1ft mil All ages
0-4
5 6
7
8
9
5-9 10-14
15-19
20-24
25-29
30-34
U"'-
1,814
368
1,290
1 16
10
S
20
628
90
487
50
175
79
90
5
36
n 16
firfa:m VIDISHA
597
21
430
135
5
5
mlfm' BHOPAL
233
166
62
5
64
26
37
610
300
254
46
5
oS
215
82
128
oS
42
32
5
5
22
II
II
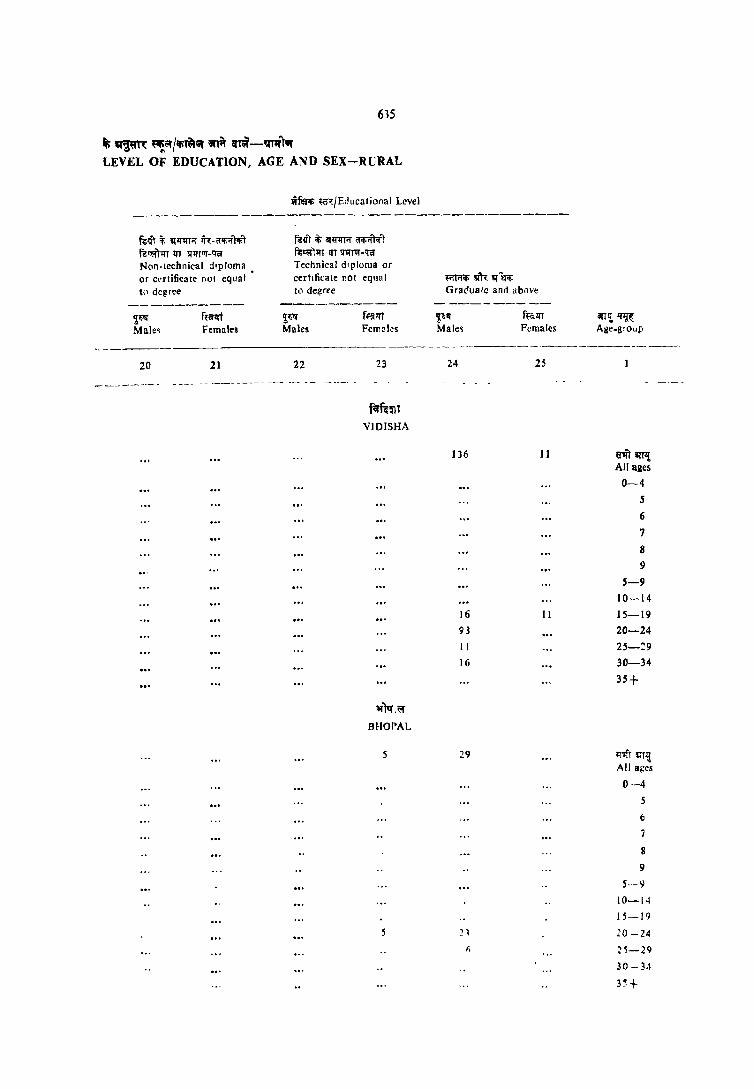
615
It; !If~1: ~t:!'/Ifi~~ ~~ "m-';mi'tllf LEVEL OF EDUCATION, AGE AND SEX-RURAL
fuoit ~ ~ql{T" lj'H'!If.'IJ;tt
fu..rt'lfT III SI'IITUf-'1'<I Non-technical dIploma or c"rtificate not equal· to degree
'!~ Male~
ffro Females
Wffi HI<jE,lucalional Level
fu<rT if; a{~ a'<r.iI'nrr ~r:or1J1T 1fT lIJ1T'lf-'l<f Technical dIploma or certtficate not eqllal to degrre
~~ Males
..n;:rq; 9;1~ 9;I-1-l'f.
Grac'ualc and above
f~ll'l Females
-------------- -----------------
20 21 22 23
f<rf~~T VIDISHA
lfTcr.t:!'
BI-IOI'AL
5
24 25
136 11
16 11
93
II
16
29
an,! ~ Agc-gloup
ritiWi All ages
0-4
5
6
7
8
9
5-9
10-14 15-19
20-24
25-~9
30-34
35+
I:!i'T IiT~ All a;:cs
0--4
5
o 7
8
9
S-9
10-14
15--19
20 -24
25-29

m'l~ Age.group
-_ -- - - -
rit i!!Pj All ages
0-4
5
6 7
8
9
5-9
10-14
IS-H>
20-24
25-29
36-34
35+
"rq All ages
0-4 S
6
7
8 9
5-9
10-14
15-19
20-24
25-29
30-34
3St
636
~-3 '!tIlT ~ f'i ~if",'" ~~" ~Ili 1il1: ~lj~tt C-3 PART B ATTENDiNG SCHOOLlCOLLEGE BY COMPLETED
-- --- - -- -------- ---- ------------------ -----------------
~'i;>jI'fil~ it 1fTit m ~ ill'1\~ r",m ~'i'iA'mT Total persons attendmg
Total population SchooljCollege 1I1nerate --------- ----------- ----------~ ~!ft 9;'n fuilrt ~W fia'lfr Males Females Males Females Males females
Z 3 4 5 6 7
~r8~ SEHORE
297,913 271,986 45,572 8,896 10,150 ;',044
41,277 39,412 162 125 162 12S 9,895 9,147 759 299 588 237 9,912 8,85 I 2,194 735 1,556 492 7,554 7,3(j7 2,974 1,029 1,846 620
11.339 10,182 5,066 1.4JJ 2,427 657 5,321 ~,305 3,034 1,098 888 330
44,022 40,852 14,027 4.~93 7,305 2,336 40,730 34,167 22,276 3,655 2,484 450 26,747 11.8i6 7,554 382 i04 36 23,155 22,170 1,181 40 21 16 19,634 18.682 III 20 IS IS 17,019 16,18B 51 16 5 II !l5,O~4 77.397 180 50 40 46
l'11Ilm RAISEN
334,547 305,259 45.721 13,106 8,984 3,891
49,460 48,7.53 122 6.5 122 6S 10,853 10,282 S68 346 485 289 10,993 10,624 1,911 9S0 1,411 702 9,592 9,040 3,319 1,413 1,953 781
12,427 11.437 4,993 2,001 2,133 881 6,466 6,52:1 3,542 1,552 943 403
)0,332 47,906 14,332 6,262 6,925 3,0.56 42,740 37,238 21,622 6,121 1,762 667 29,310 26,297 7,857 467 62 25 26,723 25,917 1,21 S 61 2.5 23,008 21,470 228 35 S 15 19,459 18,182 5) 5 34 93.110 79,296 228 80 49 39

637
Ii ,"~m ~/iJ1~ iiOit arl~-'1rqlvt LEVEL OF 'EDUCATION, AGE AND SEX-RURAL
imlti m/Educational Level
-----------ml'\ (.rmlti fa'{ ~ firifT)* Literate (Without educational level)
----------------------~ft'i ~1rnf<:,.. lnmr NOD_Formal Formal Primary
--------- ---------- -----------~ f~ ~ f~1lt ~" fffi"1lt arPt~ Males Females Males Females Males Pemales Age-group
8 9 10 II 12 13
- _- _- --------- ------------------~1~'(
SEHORB
210 52 21,189 4,531 9,794 1,031 ~ alT,! All ages
0-4
10 5 161 57 5
5 5 633 238 6 5 1,124 409 7
29 29 2,609 747 8 10 10 2,102 725 34 33 9
58 48 6,629 2,176 34 33 5-9 107 5 13,378 2,283 5,940 839 10-14 29 1,077 62 3,460 149 15-19 10 30 5 161 20-24
IS IS 5 25-29 5 5 25 5 30-34
40 55 35+ ,(Tzri!t;y
RAISEN
201 87 2C,946 7.129 10,159 1,571 ~ lIT,! All ages
0-4 10 73 57 5 15 484 248 6 20 16 1,346 616 7 3S 21 2,825 1,100 8 20 10 2,S23 1,123 SS 16 9
100 47 7,25 I 3,143 55 16 5-9 75 3S J 2,731 3,883 6,4':;0 1,417 10-14 20 5 791 41 3,501 123 15-19
5 40 16 98 20-24 5 16 15 25-29
10 30-34 97 20 20 16 35+

638
If-3 1l11T 'II fIi ~flftiili 'CR, all!, a~ ,1JiT Irq C-3 PART B ATTENDING stHOOLjCOLLEGE BY COMPLETED
- _--------- --.-_- - ---- ----- - --- --- ----- -------
tifft1i!i ~/Educalional Level
-----------------------------------
tl:TII'"{ ~1t;a~l/~ror1flllf:1 fsr-,!f";flSi't
fl'f~\'r llr~f"QT" /~~m:r Higher Secondary/Inter. Middl( Matriculation/SccClndary mediate/Pre-Univcr~ity
---------- --_._-------- -- ---------iIIT'1 ~~ '!~ ~ $1i1f ffi;\"~ ~~ f~W-!T Age group Males Females Male. Females Males Femalc5
---_ -- ----
14 15 16 17 18 19 ------ -_- ------------ --
'61~n SEHORE
ri'r~ 2,713 154 886 26 523 48 All ages
0-4
5
6
7 8
9
S-9 10-14 342 78 19 S
15-19 2,004 71 617 26 263 29
20-24 324 S 235 235 14
25-29 n 10 10
30-34 5
35+ 5 5 10 5
~Zfi;r
RAISEN
WIft aTT~ 3, I S5 253 1,363 98 741 77 All ages
0-4
5
6
7
8
9
5-9 10-1<1 559 109 30 5 S 5 15-19 2,293 134 935 87 249 51 20-24 2.50 368 367 21 25--29 30 19 S 83 30-34 8 5
35+ 5 5 10 31

639
~ v,m: ~/IIi~iiI' iifti\' CifTlif-lIDftvr LEVEL OF EDUCATION, AGE AND SEX-RURAL
--------- -------------- - -----
Roil" iii q~T<! q"{-tt'li'lr'lir f~~)lrr trT srmvr ~ Non-technical diploma or certificate not rqual to degree
~ ~ Males Females
20 21
iifaTlfi ~{/Educatjonal Level
f~oiI" iii lR'«t'Itif 6lfi'l'''\"II\1 f~ 1fT lIlllVr ~ Technical diploma or .=ertificate not cql'al to degree
~ Males
22
s
5
8
8
f~ Females
23
~~~t~
SEHORE
'{Tt;~if R~ISEN
flfTlIif. IlR lR'fEilfi Graduate 311d above
----------l~ Males
24
107
61
IS
5
26
164
5
79
65
IS
~ Females
25
10
10
~ 91IW Age-group
fi'lfi CllTI All ages
0-4 5
6
7
8
9
5-9
10-14
15-19
20-24
25-29
30-34
35+
fi'lfi" m,! All ages
0-4
5
6
7
8
9
5-9
10-14 15-19
20-24 2S-29
30-34
35+

arr'!~fl Age-group
640
1f-3 ~If '" ri ~flHlfi f(t~, '"I! al~ "T/,!~ C-3 PART B ATIENDING SCHOOL/COLtEGE BY COMPLETED
?1'iiARrr ~t~ /~ it ;;nit <rnI "l~ !IfNO'
f.!~ Total persons attending Total population School/College rJliterate
---------- ----------- ----------'i~ ~lIi ~ mT 'l~ f~i Males Females Males Females Males Females
------_----- - --- --------- --- ------------ --------- - _-- ~----
2 3 4 5 6 7 ---- - -- -------- -- - -- --- - ----------_- --------- --- --- -_- ----_--
.r1J;lI1 BETUL
,'lit IfTl! 392,619 391,032 60,71 I 30,123 13,327 8,071 All ages
0-4 56,608 55,234 185 145 185 145 5 11,786 ] 1,673 1,198 778 923 585 6 12,527 12,340 4,619 2,918 3,292 2,033 7 10,140 9,864 5,.528 3,398 3,089 1,772 8 13,403 13,703 7,333 4,796 2,682 1,727 9 8,894 8,417 5,793 3,278 1,126 693
5-9 56,755 55,997 24,472 15,167 11,112 6,811 10-14 55,524 54,408 26,471 13,191 1,834 900 15-19 35,287 33,539 8,243 1,291 76 35 20-24 27.422 29,.590 904 91 10 41 25-29 23,213 24,796 70 40 15 30-34 21,509 23,760 51 46 10 31 35+ 115,771 I 13,331 270 107 83 77
~mrn"'Tq HOSH \NGABAD
fI''liTml!, 391,377 360,478 61,370 20,732 10,023 4,759 All ages
0-4 54,889 51,464 112 .54 112 54 5 11,894 10,637 384 245 263 176 6 12,344 11,199 2,802 1,625 1,823 1,025 7 9,724 9,491 4,094 2,291 2,209 1,173 8 13,356 11,764 6,789 3,053 2.508 945 9 8,436 8.025 5.728 2,726 1,070 469
.5-9 55,754 51.116 19,798 9,940 7,872 3,787 10-14 52,9~ I 46,329 30,180 9,686 1,913 776 15-19 36,866 30,408 9,518 800 44 JO 20-24 29,898 29,913 1,278 60 10 15 25-29 26,611 24,470 154 20 IS 10 30-34 22.313 21,184 64 25 :!O 35+ 111,656 105,242 216 108 59 69

641
~ a:t'2"T~ f"f!'/"'~ ;;fA' ~~--mq'b, LEVEL OF EDUCATION, AGE AND SEX-RURAL
--._-- - ---------_ . . -
~feJlfi ~~/Educalional Level
-----------"fIlF: (mel'li ~i;f"l: it; fiiAl)· Lilero.lte (without educational level)
-- - ---------------------ar·;l'f;nft.t; "I'l'f'fln:'-fi srrq:q·) N(\[l-Formal Formal Primary
---------- ----------- -----------~lf ftQlH ~lf freflH ~~". mrlfr IITIIi "1I~ M.lle~ Females Males Females Males Females Age-group
-_ --- -----_-
8 9 10 II 12 13
-- ---- -- _---- ---------------
.~" BETUL
95 89 28,717 16,047 12.597 4,735 «1rr~ All ages
0-4
5 275 1~8 5
5 15 1,322 870 6
10 20 2,429 1,60fi 7 15 IS 4,636 3,054 8
15 10 4,583 2,525 69 49 9
45 64 13,245 8,242 69 49 5-9
35 25 14,566 7,636 9,119 4,122 10-14
10 662 104 3,261 533 15-19
81 5 57 5 20-24 15 5 20 15 25-29
15 10 25 30--:'4
5 117 20 35 5 35 I-
~)QiI"(TifT'{
HOSHANGAB<\O
166 89 30,680 12,582 13,815 2,575 ,,'lit il'TlJ All age;
0-4
10 5 J 11 64 5 29 20 950 580 6
5 10 1,881 1,IU8 7
35 10 4,246 2,099 8 IS 10 4,576 2,201) 6S 40 9 93 54 11,765 6,0~9 611 40 5-9
44 30 17.964 6,362 9,371.1 2,266 10-14 20 5 765 80 4,143 230 15-19
19 21 1211 5 20-2* 5 15 10 35 25-29
25 5 J 0 30-34 S 98 2.5 45 15 3'+
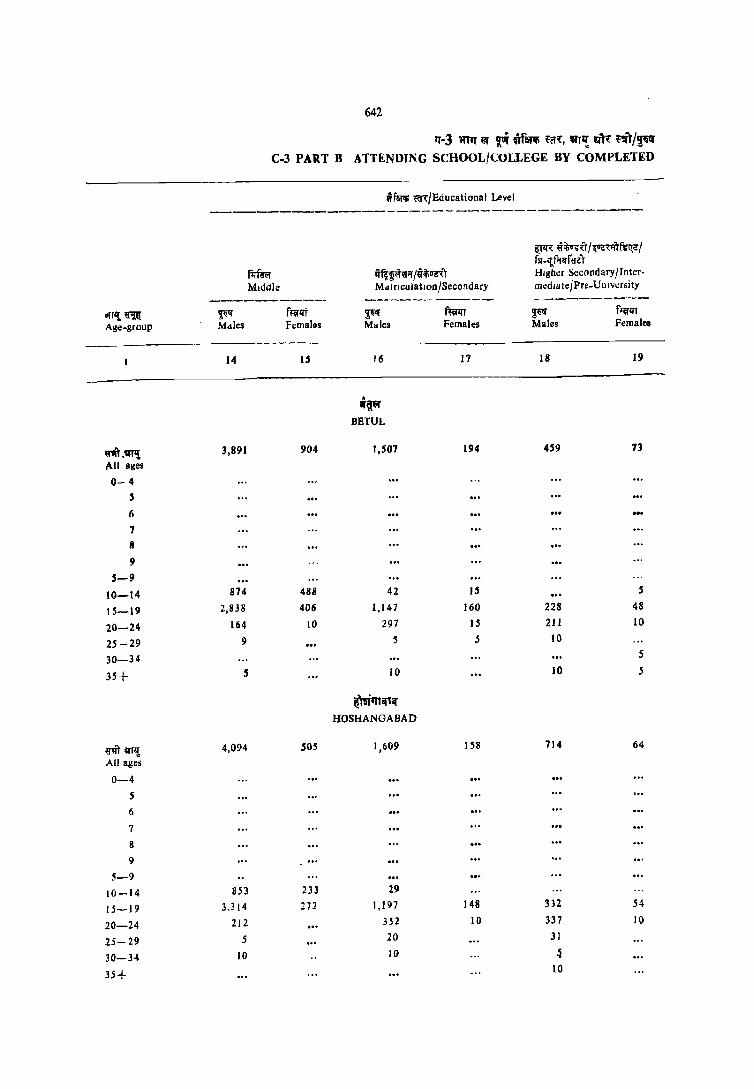
642
rr-3 mrr Ill" ~ ~rllflfi fff{, VI'! ~ ~'Jf'I'!l" C·3 PART B ATTENDING SCHOOL/COLLEGE BY COMPLETED
iflll'li .m:/Educational Level
-------------------------------------~q;: lii''t'u5·ft/~mlT~1 flf -I{f'liff !leT
fl1ir.r q~~~W~ 1~it;vi\T Higher Secondary/Inter-
Middle MellriculatlOo/Secondary media te/Pre.Unlversity
_--------_ .. ------------ -- ---------orrl{.~ ~'" f~1It ~!f f~ ~ ffiiflil
Age-group Melles Femalos M"les Females Males Females
14 1.1 16 17 18 19
. iI'¥I'
BETUL
rn_Vf~ 3,891 904 1,507 194 459 73
All ages
0- 4
5
6
7
R
9
.1-9
10-14 874 488 42 IS 5
15-19 2,838 406 1,147 160 228 48
20-24 164 10 297 IS 211 10
25-29 9 5 5 10
30-34 .1
35+ .1 10 10 5
~~lT1if'lf HOSHANGABAD
q,ft aT,! 4,094 .105 1,609 158 714 64
All ages
0-4
5
6
7
g
9
5-9
10-14 853 233 29
15-19 3,]14 272 1,197 148 332 54
20-24 212 352 10 337 10
25-29 5 20 31
30-34 10 10 ~
JS+ 10

643
li;,a~R: ",!:(:f/~~~ ~R m-V"n~ LEVEL 0:1<' EDUCATION, AGE AND SEX-RURAL
reID ij; 3I'QlIH IT'-"~iJT<tT fut;;fn:rr III ~:nrr!Jf· 'HI NOIl-tcchl'ical d 'ploma or certificate not equal 10 d~g,,~e
'JU! Males
20
5
5
m.!lT
Females
21
.rrf"'~ «r,/Educational Level
fn'l ij; ilHfll!iJ oq;;itOf;T fut;;;r)~! '.IT sr~!!Jf· oraTechnical dlplolTId or cerllficate not equal to degree
~ Males
22
J 2
S
7
5
5
ft:a-1H Females
23
ilcr=r BETUL
~)~rrlil1<f HOSHANGA8AD
~rT1f; mt ~fcr~ Grdduate And above
'J"ff Males
24
f<erlll Females
25
IIITI! 'J~i'i
Age-group
-----------------_
101
9
77
10
5
264
15
2q
29
5
10
5
5
If'lft an!! All ages
0-4
5
6
7
8 9
5-9
10-14
15-19-
20-24
25-29-30 -34
35+
~t ~r!i All ag;s
0-4
5
6
7
If
9
5-9
·10-14-
15-19
20-24
25-29
30-34
35+

!TTl! ~ Age-group
~ VY,! All ages
O~4
5
6
7
8
9
5-9
10-14
15-19
20-24
25-29
30-34
35+
~m m'l A 11 ages
0-4
5
6
7
8
9
5-9
10-14
15-19
20-24
25-29
30-34
H+
644
rr-3 ~IJ II 'l'i 5if~iIi ~~n:, ~T~ ~ nn/~q C-3 PART B ATTENDING SCHOOL/COlLECE BY COMPLETED
~~<i/~ iT ~...m ~"" GlI'fim ~\jfi'fij'l§I.fT TOldl persons attending fifUf~ Total l'opuJation School {Collegt Illiterate
------_---- ------------- ----------T"l p~ ~ ~t ~li"t f~1rt Males Female~ Male~ P~males Males females
2 3 4 S 6 7
qr~,~
JABAL PUR
615,352 592,899 103,190 35,488 i7,549 9,146
84,S 17 82,521 120 127 120 127 18,942 17,881 738 564 574 417
20,368 19,286 5,612 2,960 3,830 2, 1:22 15,038 14,233 6,978 3,757 3,660 2,044 21.519 20,242 10.995 5,559 3,993 2,060 13,379 13,579 8,490 4,670 1,824 1,037 89,245 85.222 32.813 17.510 13.881 7,680 !t6,F02 79.313 50,035 16,167 3.292 1,231 61,958 53,926 17,503 1,189 146 30 49.390 50,771 1,862 III 10 IS 43.322 40,6! 6 261 40 15 10 35,057 35.984 92 46 15 22
164,9:! I 164,256 459 6S 69 31
;pf~'(
N l\RSIMHAPUR.
290,55::' 271,166 46.933 19,408 6,950 3,976
39,553 39,138 77 37 77 37 9,022 8,299 212 207 166 157
R,752 9,205 2,100 1,340 1,444 843
7,189 6,988 3,34:1 2,024 1,757 984
10,010 9.038 4,934 2,773 1,514 963
5.820 5,841 3.867 2,555 732 424
40.793 39,371 14,453 8,899 5,614 3,370
4<'.007 35.~97 21,986 9,165 t, 132 SI8
29,845 24,018 8,663 1,123 9Z 10
23,816 23,392 1,303 81 S 10
19,797 17,"76 144 29 10
15.322 14,395 89 9
81,187 78,283 190 45 20 30

645 .
t v~,m: fiti~/~r~~ ;miil' <n~ -w;fTQ1UJ
LEVEL OF EDUCATION, AGE AND SEX-RURAL
~ffi m/Educational Level -----------
mrl: (~fetifi ttl"( if; ~T)· Literate (without educational level)
--------- ---------------ar~)tr:;jTfu; ~)q-:qyfu; 5IT~ Non_Formal Formal Primary
--------- ----------- -----------~ ftorllf '!~ ~t '!~ f.erllt ill'Tl!~ Males Females Males FemaLs Males Females Age-group
8 9 10 11 12 13
---------
iiIQ~ JABALPUR
951 344 47,487 19,081 23,945 5,516 ~'Ift' ~I! All ages
0-4
IS 5 149 142 5
65 44 1.717 793 6
85 39 3,233 1.675 7
90 S9 6,913 3,440 8
85 29 6,487 3.530 95 73 9
339 176 18,499 9,580 95 73 5-9
460 143 27,437 9.354 17,202 4,931 10-14
108 15 1,183 93 6,302 4J2 15-19
25 36 20 172 20 20-24
36 5 45 15 25-29
10 5 27 5 15 10 30-34
10 5 239 100 30 35+
'1tf~~l' NARSIMHAPUR
449 206 21.375 -10,942 10,743 2,980 rn~, All ages
0-4 5 41 SO 5
36 25 620 472 6 41 10 1,542 1,031 7 51 35 3 368 1,774 8 56 3S 3,048 2,071 31 2S 9
189 106 8,619 5,398 31 25 '-9 184 95 12,075 5.384 7,600 1,700 10-14
61 4 .543 110 2,873 231 15-19 10 35 15 122 5 20-24
I') 20 14 25-29
10 5 30 30-34 72 10 56 S 35+

646
'T-3 ltl'T II '" m"lti H'~, !fn, Rh '''') J,'II1If C~3 PART B ATTENDING SCHOOL/COLLEGE BY COMPLETED
Wfa'lifi Hf"(jEducauonal Level --_ .. _--------- -----~----- -------_ .... ---------
~TtI1: l1ij;en)/~euiTf6ll;l/ flT .!ff'!!ifl'fit
f1:rfTt;r q-~~IT;f /11if;1I6,) HIRher Seconl1ary jlnter. Middle Ma Iricula lion !Sccondary ITledl ale!Pre-U nt vers! tl'
----------- ----------- ______ 0_--... _-alTl{ lJl!iI ~l" fl:al.lf q1iif f~i ~ f~am Age group Males Females Male~ Females Males Females
14 IS 16 17 18 19
n\l1'~\
JABALPUR
rit~ 8.'86 1,034 3,155 289 1,340 63 All ages
0-4 5
6
7
8
9
5-' 10-14 1.580 497 60 10 S 15-19 6,590 522 2,449 248 701 44 20-24 330 10 561 22 620 19 2S-29 59 5 65 10 30-34 IS 10 5
35+ 10 10 5
;:n:f~{
NARSIMHAPUR
mft 'iT,! 4,292 900 2,109 308 809 76 All ages
0-4 5
6 7
8
9
S-9
10-14 927 448 68 20 IS-J9 3.162 433 1,512 258 40l 71 20-24 161 10 473 25 359 5 25-29 10 5 31 5 27 30-34 16 4 5 21
B+ 10 10

647
itt III'~~T,{ ~~ !lfimif ~ i{~- 'lnI'TUT
l.EVEL OF EDUCATION, AGE AND SEX-RURAL
Vifillifi ~(n:/Educational Level -------------------------------------
Rlft it; q'~ro, ~"{-(l~r'!i\' f6..rr~~~'~ fi'e.illrr qr lIlfTiII 'fer fg..r)1r1 III Sfl'IIOf 'fer Non-technica I diploma Technical diploma or or cerlificate not equal .;;ertificate not equal torTCflIi m: II'f~1Ii 10 degr~e to degree Graduate and above
---------- ---------- ----------~ ffilll'T ~~ f~ ~ fta'II't
1II1l{ "" Males Females Males females Males Females Age-group
20 21 22 23 24 25
1PI'\II"~ JABALPUR
18 159 15 fliTlIl1 All ag"s 0-4
S
6
7
8
9
5-9
10-14 2S 5 15-19
13 95 S '20-24 S 25 5 25-29
30-34 IS 35+
;H:f«!.!~'{ NARSiivlHAPUR
5 17 189 IS 61illl'lg All ages
0-4
S 6
7
8
9
5-9
10-14 5 12 5 15-19
5 127 10 20-24 3S 5 25-29 7 30-34
16 35+

8TT1! g~ Age_group
V1IT~ All ages
0-4
S
6
7
8
9 5-9
10-14
15-19
20-24
25-29
30-34
35+
"'" arl~ All ages 0-4
5
6
7 8
9 5-9
10 -14
15-19
20-24
25-29
30-34
35+
648
rr-3 ~rr \W ~vr if'H'ti Hn:, all!. ,,11: ~T/'r~" C-3 PART B ATTENDING SCHOOL/COLLEGE BY COMPLETED
~~ /~ it ;;flit iITi iIJ.;;r alff"", 'N"f~ Total persons attending f;r~lI'n: Total population School/College IllIterate
---------- ----------- ----------II'~ ~lrt ~ fterll't 'i~ f~T Males Females Males Females Males Females
2 3 4 S 6 7
--------q'litlfT
MANDLA
479,887 484,328 67,580 25,199 14,570 8,040
57,806 58,970 218 153 218 153 14,512 15,232 l,OB 702 807 603 16,306 17,194 5,072 2,843 3,529 1,992 12,021 12,335 5,241 2,991 2,608 1.705 17,114 17,497 7,704 3,739 2,712 1,628 10,395 10,992 S,729 2,763 1,371 745 70,348 73,249 24,798 13,037 11,027 6,672 68,726 64,975 31,217 10,3 J 1 3,061 1,090 46,032 45,213 9,618 1,448 158 51 35,110 40.141 1,214 66 IS 4 35227 35,469 124 29 20 10 30,369 30,663 84 24 5 5
135,564 135.550 213 79 50 Sf}
fWC{;UlT CHHINDWARA
489,998 481,966 70,778 29,681 14,367 7,424
67,116 66,718 129 110 129 110 15,075 14,853 1,006 580 738 420 15,737 16,053 4,371 2,801 2,928 1,843 14,032 14,400 6,404 3,857 3,338 1.875 16,587 17,378 8,180 4,566 3,193 ] ,483 10,949 11,315 6,43 8 3,727 1,463 702 72,379 73,998 26,400 15,S.l1 11,661 6,324 69,208 66,857 32,709 12,560 2,423 925 44,436 40,566 9,827 1,243 79 10 34,584 35,439 1,186 73 5 31,690 31,652 100 15 10
27,842 27,935 60 30 10 J 5
142,402 138,583 320 100 40 40

64'
" ,,~~ "!"/~Q \1fR _'~-'lTq"'" LEVEL OF 'EDUCATION, AG'E AND SEX-RURAL
wmlli m/Educatiooal Level
-----------'lTan: (mtr", m iii fir;rr) * Literate (Without educlitional level)
----------------------!lA1<RTfl:'" ~'lTm; 51r~T Nl'o-Formal Formal Primary
--------- ---------- -----------Ti~ f~1li ~~ f~lft T''' f~lft ~Tl! ,,~
Males Females Maks Female, Males Females AgC'.group
8 9 10 II 12 13
"~T MANDLA
756 236 30,511 11.897 15,194 3,923 w~ an,! All ages
0-4
29 24 216 76 5
64 38 1,479 813 6
128 43 2,S05 1,243 7
104 38 4,888 2,073 8
3S 29 4,215 1,948 108 43 9
359 170 13,304 6,153 108 43 5-9
294 57 16,249 5,527 10,758 3,316 10-14
S9 5 765 127 4,051 522 )5-19
25 34 14 188 14 20-24
10 9 10 5 25-29
]5 5 15 14 30-34
5 S 89 14 40 5 35+
f~;qcr,~
CHHINDWARA
74~ 281 34,463 16,885 14,OOS 3,737 U"ll"T ml! A II ages-
0- 4
15 10 253 ISO 5
107 68 1,336 889 6
83 63 2,983 1,919 7
132 49 4,855 3,034 8
73 48 4,834 2,899 68 77 9
409 237 14,261 8,892 68 71 5-9
284 34 19,123 7,817 9,974 3, ~ 28 10-14
19 5 794 94 3,790 297 15-19
I ~ 22 10 101 19 20-24
15 15 5 2S -29
15 10 10 30-31
10 5 159 44 45 35 +
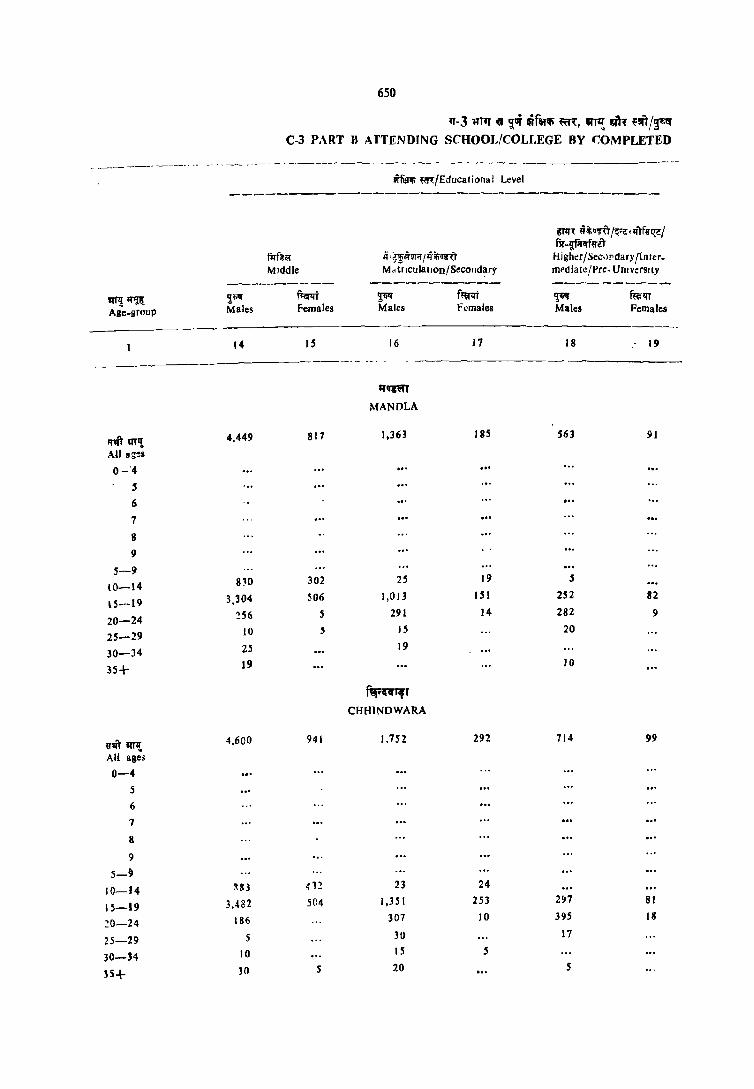
650
fI-J +rT'T « '<{of ~f"iJ ~\, Wl1! ~'ll f!l')!~ C-3 PART H A fTENDING SCHOOI-!COLLEGE RY COMPLETED
- ---~-- -~---- -----.-_ .. - _- ---- ------ --_ --------------- -------._------_--1lfuA; "<f~:fEducalional Level
--,...------------------------------------
trrq~ !lil;o;ft /~.i!'ll')f~'t_!I fsr.'PII,""e-il'
filf~" ii '~""ur;r I ~iliortt Higher /.sec,)f1dary IInler. MIddle M" trlculalJon/Second~ry m~dia(e!pre- UmversllY
----------- ---r------.--- --_-_ - ------q~~ ~f,1Ij f~ Ti" f~qt ~ fRlq'J'
Age.group Males females tvfales f~males Males Females
14 IS 16 17 18 19 ------- -_- -
qqm
MANDLA
'l1it ItTl'IJ, 4,449 817 1,363 18S 563 91
All a!:'S
0-'4
5
6
7
8
9 5-9
10-14 8~0 302 25 19 S
l5-19 3,304 506 I ,OJ 3 lSI 252 82
20-24 :!56 291 14 282 9
25-29 10 5 15 20
30-34 25 19
35+ 19 10
f~~"r CHHINDWARA
Q'~qrl! 4.600 941 1,752 292 714 99
AU ages
0-4
J
6
7
8
9
5-9 10-14 ~IU 412 23 24
15-19 3,482 504 1,35 I 253 297 81
~0-24 186 307 10 395 18
25-29 5 3U 17
30-34 10 15 S
35-t- ]0 s 20 5
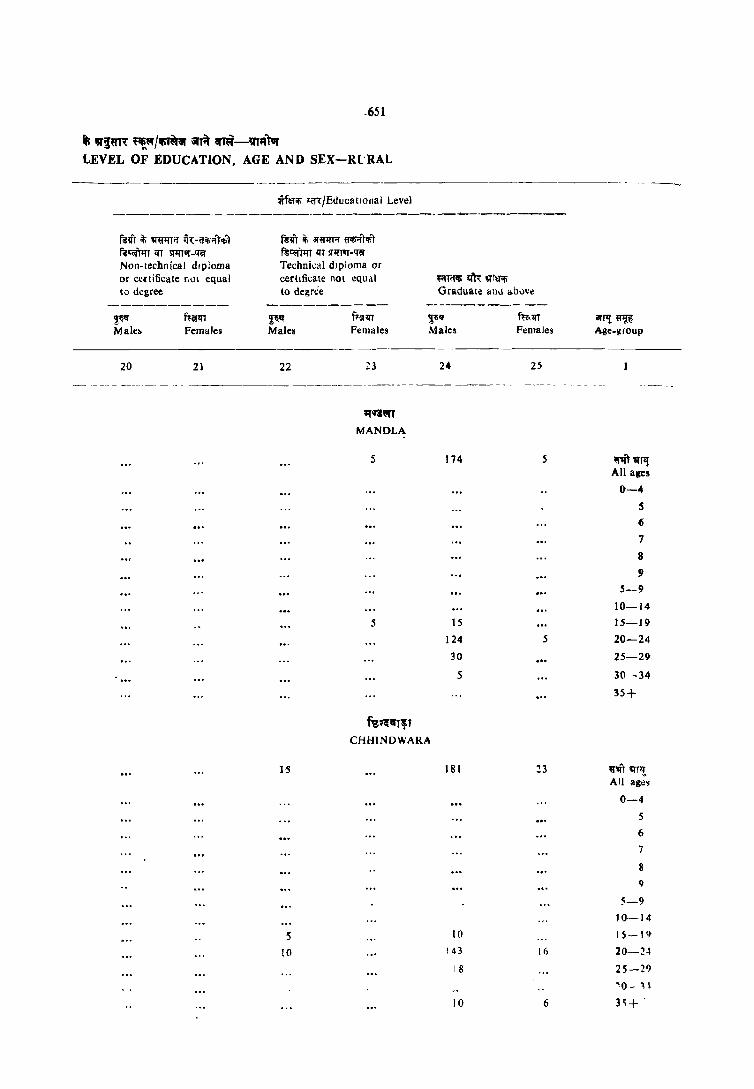
-651
~ "iJm'{ ~/m" iilT~ ~-VT"l" LEVEL OF EDUCATION, AGE AND SEX-Rl'RAL
------------ ---------
~lfl it. ~fl"i!T'f q.: -<rii'i'tTijil FitOi'rlll IH lI1IlOT-<r.f Non-technical diploma or cCltificate [\\)1 equal to degree
~ Male~
ifblifi J(f{/EduclltlOl1al Level
~!lT if, arfl"llr'! (lili't"Ilfil f~~IIlIIH srllIOT''l~ Technkal diploma or certificate not equal to degree
~" Males
f~ii1lfT Pemales
~ifTi!lIi ~ 'l"tUifi Graduale anJ abl)w,
~" Males
f~tn Females
-----------
20 21 22
1-S
S
10
23
ij'q'l'
MANDLA
5
5
fog;t~T;T
CHHINDWARA
24
174
15
124
30
5
1 g 1
10
143
18
10
25
s
5
23
16
6
iIIf1! "Wi Age-group
~1T1l! All ages
0-4 S (i
7
8
9
~-9
10-14 )~-J9
20-24
2~-29
30 -34
35+
fl"'IIf 'q"Pl All ag;~
0-4
5
6
7
8 Q
5-9 10-14 I S--19
20-2-1
25-29
~o - ~ 1
3'i+ '

vrq~ Age.group
652
IT -3 ~'" 'I' 'l'f ~f"'lIi ~(R I lilT,! dr~ ffi i fl" C·3 PART B ATHNDlNG SCHOOL/COLLEGE BY COMPLETED
f"!lffifil~ it itli't <mY ~ ~f.tl'! ~;;rif~ Total persons attending fin:1If\ Total population School/College Illiterate
--------- ----------- --_._------T'lf ~g!lt ~ ffif!It ~I<\f ~ Males Females Males Females 1\lale5 Females
----------
2 3 4 5 6 7
---------------
fQ'l.(~l
SEONI
1J'Ii'r lIfT,! 375,415 371,594 55,406 22,901 10,361 5,935 All ages
0-4 50,374 49,714 118 102 118 102
5 11,781 11,716 676 444 477 326
6 11,947 12,303 3,408 2,099 2,340 1,318
7 10,609 10,963. 4,673 3,128 2,368 1,639
8 12,681 13,068 6.435 3,565 2,085 1,206
9 8,380 8,503 4,909 2,849 1,076 560
5 9 55,398 56,554 20,100 12,085 8,346 5,049
10-14 53,603 49,787 26,049 9,685 1,727 718
15-19 35,138 31,053 7,863 836 94 20
20- 24 26,381 29.519 832 69 15 15
25-29 26,189 24.364 145 20 IS
30-34 20,983 22,753 72 15 IS
35+ 106,714 101,273 188 56 20 31
trrt:fnlTC!
BALAGHAT
«ir liT,! 52\),025 527,983 86,193 43,973 13,483 9,031 All ages
0-4 65,170 66.076 158 117 ISS 117
5 16,715 16.4H 853 610 620 411
6 15,710 15,957 4,5~1 3,202 2,861 2,017
7 14,711 15,617 7,162 5,032 3,528 2,466
8 15.337 15,677 8,Q81 5,922 2,817 17,81
9 12,367 13,071 8,379 5,690 I,H2 992
5-9 74,839 76,755 29,897 20,456 11,358 7,727
10-14 67,366 61,21S 40,115 20,900 1,800 1,078
15-19 47.1 ~O 44,471 13,310 2,222 69 30
20-24 38,175 42,122 1,852 116 10
25-29 37,660 38,250 249 43 11 5
30-34 33,590 33,441 112 26 IS 10
3S+ 155,841 158,832 393 78 64 54

653
~ 'Q'~T' ~,,!5;yjifT~\it \it~ -nit -'n'l)'I
I EVEL OF EDUCATION, AGE AND SEX-RURAl.
~fetiI; m/Educational Level -----------
mt~ (wrtl'li ~ iii ~T). Literate (without educational level)
------------------------ar-!'lq~rf~ ~~ sn~ Non_Formal Formal Primary
--------- ----------- ------_----~ ffifl:ft 2;~ ffifl:ft ~ r~lIt ilp!~ Males Females Males Females Males Females Age-group
8 9 10 11 12 13
---------- -- ------------------------------- -- - -- -- - - ----- --- ----
f",,1 SEONI
355 118 26.539 12.426 12.287 3,420 ~an! All ages
0-4
199 118 5
20 20 1,048 762 6
30 15 2.276 1,474 7
4S 34 4,305 2,324 8
4S 3,698 2,221 89 69 9
139 69 11.526 6,898 89 69 5-9
159 49 14,198 5,419 9,005 3,071 10-14
35 624 2S 3,035 265 ]5-}I}
5 45 5 66 5 20-24
5 10 15 36 25-29
IS 10 26 5 30-34
5 106 20 20 5 35+
iI"~!'
BALAGHAT
445 323 43,349 25.493 18,~08 7,428 ~'Ifll! All ate.
0-4
5 21 229 178 5
66 47 1,595 1.077 6
122 87 3,512 2,480 7
96 52 6,068 4,089 8
41 21 6,735 4.609 71 68 9
330 228 18.138 ] 2.433 71 68 5-9
103 84 23,820 12.795 13,280 6,472 10-14
5 1,108 198 5,237 841 IS-19
S 8 36 26 165 22 20-24
21 IS 46 13 25-29
5 IS 5 30 30-34
]91 10 73 5 35+

... rlt~ Age-group
~'I'Tl! All ages
0-4 S
6 ., 8
9
5-9 10-14
15-19 20-24
25-29
30-34
35+
ij",ft lin,! All .ages
0-4
S
6
7
8
9
5-9
10.-14 15-19
20:-24
25-29
30--34
35+
654
1f-3 "lT1f ~ ~ Ofatlfi ~i't~, IAT~ ~ ~.n/~ C-3 PART B ATTENDING SCHOOL/COLLEGE BY COMPLETED
~ Males
14
3,722
944
2,652
95
20
10
6.110
1,072
4,721
flfmr Middle
266
2S 10
10
f~ Females
IS
688
403
275 5
5
1,237
455 763
5
S
~fil111i ~/Educational Level
q~~m /iit;at;;r Mlilrlculatlon!Secondary
16
f"",,,)
~EONI
1,443
10
1.106
296
5
5
21
~~ff.J1Z
BALAGHAT
2,585
34 1,874
605
33
10
21
f~ Females
17
201
2S
172
S
370
10
323
31
5
----_._----
i[PH 6"itignr/~Qg"{lI"rfW~/ fsr-q:f;rlff«a-r Higher Secondary I Intermediate IPI ~-Ul1l v"rsily
~ Males
18
544
6
300 201
28
5
5
944
5 336
522 50
Iii
IS
ff"lfl F.:mal~s
19
93
69 25
77
5
67
5

655
~ a~~n: ~~ IIfiT~iI' iI"f.r Cf m - 'l1'1ftvr LEVEL OF EDUCATION, AGE AND SEX-RIJRAL
vlfIHOfi ~'!Educational Level
---------------------------------------f~ofr ~ !A""IlI'r'l qt-Cf'li'l'TiifiT fsofr ~ !A"lrII'tif ~ f5'<or)1rr ql !IlJl1II 'fiil' f6"ori1f1 'lI l(111ll'f 'fQr
Non-technica I dIploma Technical diploma or Of certificate I},I( equal .::ertificate not equal r;flfliJ; m. !A"faiJ;
to degr.:e to degree Graduate and above ---------- ---------- ----------~ mrlli ~ fa:enri ~~ ftrn 1II"Tl! ~ Males Pemales Males Females Males Females Age-group
20 21 22 23 24 2!1 -------
f~;(i(T
SEONJ
10 14S 20 rit~ All ages
0-4
S
'6
7
8
9
!i-9 10-14
S II 10 15-19 !i 104 10 20-24
25 2S-29 !i 30-34
35+
ifT~Q11!'
BAL<\GHAT
30 339 14 91il' IIITIf All age;
0-4
5
6
7
8
9
!i-9 ... 10-14 10 10 15-19 15 237 8 20-24 S 58 25-29
IS 6 30-34 18 35+
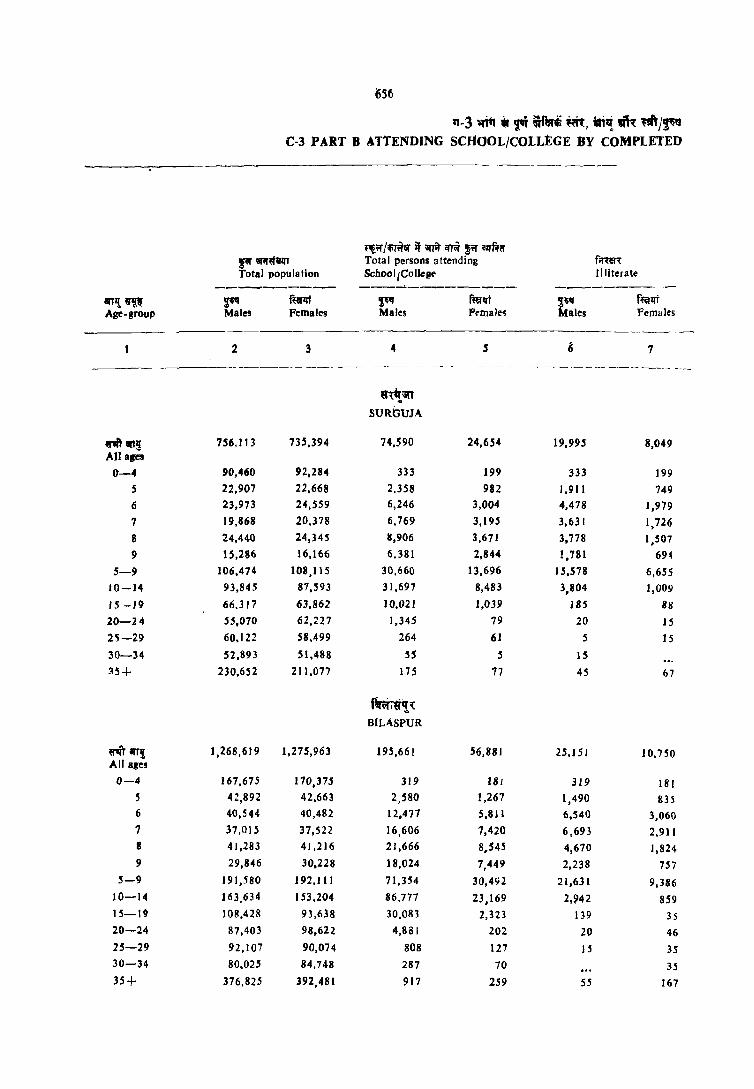
lIT!! "" Age-group
~arr~ All ages
0-4 5
6
7
8
9
5-9
10-14
15 -19
20-24
25-29
30-34
~5+
marT! All ages
0-4
S 6
7
8
9
5-9
10-14
15-19
20-24
25-29
30-34
35+
i556
rr-3 If'itt .. ~ if\t$ '~, '"~ m ~/~Ii C-3 PART B ATTENDING SCttOOL/COlLEGE BY COMPLETED
t~OI' /if1~\II' it iUit ~ !OI' olffifi'f f~lI!,{ r 'iA~ttn Total persons attending
Total population School,Collel!l.' Illiterate
--------- ---~--------- ----------~ ffirlft ~ ~t
t::les f«il:lT
Males Females Males Pemale~ Females
2 3 4 5 I; 7
-_---.--------- - --.-----_----- ------- ----
m:tr'30 SUROUJA
756,113 735,394 74,590 24,654 19,995 8,049
90,460 92,284 333 199 333 199
22.907 22,668 2,358 982 1,911 749 23,973 24,559 6,246 3,004 4,478 1,979 19,868 20,378 6,769 3,195 3,631 1,726 24,440 24,345 11,906 3,671 3,778 1,507
15,286 16,166 6.381 2,844 1,781 694 106,474 108,115 30,660 13,696 15,578 6,655
93,845 87,593 31,697 8,483 3,804 ],009
66.317 63,862 10,021 1,039 185 88 55,070 62,227 1,345 79 20 15 60,122 58.499 264 61 5 15
52,893 51,488 S5 5 15
230,652 211,077 175 77 45 67
~;tt~"{ B(LASPUR
1,268,619 J,275,963 195,661 56,881 25,151 10,750
167,675 170,375 319 181 319 1111 4 ~,89 2 42,663 2,580 1,267 1,490 835 40,544 40,482 12,477 5,811 6,540 3,060 37,015 37,522 16,606 7,420 6,693 2,91 I 41,283 41,216 21,666 8,545 4,670 1,824 29,846 30,228 18,024 7,449 2,238 757
191,580 192,111 71,354 30,4'12 21,631 9,386 163,634 153,204 86,777 23,169 2,942 859 108,428 93,638 30,083 2,323 139 35
87,403 98,622 4,881 202 20 46 92,107 90,074 808 127 IS 35 80,025 84,748 287 70 3.5
376,82.5 392,481 917 259 55 167

657
• Vi"U: ~l=r/-.n" .. '1r~ In~ - VlQTar lEVEL OF EDUCATION, AGE AND SEX-RURAl.
--_ -------- ------ -~-- -_---- -- ---- -----_
.'iflRll1 m/Educational Level
-----------'lml: fiAtlii m t fer;tW Literate {without educational level}
-----------------------~Tf~ ~lIi .F~ Ncm.Formal Format Primary
--------- --------_-- -----------pt fmt 1" ftMt t'" f.~ ~. M.f. Femal~ Males Female! Miles Pemales A~-arotlp
_---- -------------------8 9. JO tI 12 n
-4-----------
W1fI' SUaGUJ.\
646 117 32,"4 11,117 14,"4 3.l'3 ~:s 0-4
JO Ie 438 222 5
54 35 1.714 990 , 64 27 3,07S 1,442 7
182 40 4.946 2,124 • 6.5 10 4,3.52 2,028 182 112 9
37.5 122 14 • .525 6,807 182 112 5-9
227 60 17,049 4,]30 9,796 2,829 10-14
34 1.136 110 4,33\ 416 15-19
70 S 206 IS 20-24
10 10 3'J 20 25-29
5 10 5 30-34
10 S.5 10 J 5 3.5+
f."1W'!"( BILASPUR
1,.547 497 97,766 33,8611 43,992 9,261 ~ljT I{~ll All ales.
0-4-
64 10 1,027 422 j.
275 102 .5,662 2,649 6
230 Ilti 9,6113 4,393 7'
231 78 16,765 6,6013 I:
162 SO 15,343 6,453 282 }89 !W
9"62 356 48,479 20.561 282 1119 5-1}
402 liZ 46,317 12.912 33.465 &,245 10-14
fll4 1,948 2!S 9,StJ7 716 1 s- 19r
10 139 44 337 43 20-24-
5 5 133 19 120 44- 25 - 29
101 IS 4S 5 30-34.
:!o 19 507 49 115 I.S 35,

alT~ ~~. Age group
~" Males
658 .
'1-3 ~1" 'I 'l" ~f"iiifi fffi:, ~T,! J;f)"{ f~/~","q C-3 "ART B ATTENDING SCHOOL/COLLEGE BY COMPLETED
fll"mt" Middle
mm Females
wren; ~/Educational Level
ql~~QfoI /-«~ Matriculation{Sccondary
~ '.,
Mab
fupri ,
Females
~14\ ~il;.Rr/~Tfi"tJ:c/ fsr -9"RqfQZT High~r Seconilary/lnternledta te /Pre. U ni versity
~ .. Males Females
-_._.--_ .. _------- _._---
~m: AII'ige;
0-4 5
6
7
8
9
5-9
10-14 15-19
20-24
25-29 .30-34
35 +
S"'Ifr crr,! All ages
0-4 5
6
7
8
9
5-9 1(1-14
15-19 20-~4
H""':29 30-34 '
)5+
14
4,042
782
2,881 :270
59
10 40'
16, 930
3,480
12,402 869
80 25
70
IS
568
243
312 7
. 5
1.887
996
853 15
.5
15
.5
16
~,
SURGUJA
1,447
30 1 ,013
332
68 S
fil'liifT~q~ . BILASPUR
5,615
167
3,978 1,150
174 62
• 65
17
5 61
6
429
45
348 21
14
• i8
'8"63
....
10 436 331
72 10
5
3,890
S
1,775
1,917
124 25
40
. 70
5 Si)
10
S
150
122 24

659
-is "PR ~"/ftiTi:rif .. A ""tir-VTI'1'\" LEVEL OF EDUCATION, AGE AND SEX-RURAL
riif~1f; 1'ii</Educational Level
f4fir q; 3HIJIH lj,·o'li";fYlf;f fhl q; 3Iij1!l;r alf;;rfo;ol ~)'II 111 SI'fTUI- 'iii! ~)'Ir 111 SlIITUf -'iii! Non-techr.ical d1plllma Technical dIploma or or certificate nor equal cert ificate not equal Hlt111i ~~ miFIi to degree to degree Graduate and above
---------- -------------- ----------~1!f f~ll"f 'I~ fi<rqf 'j1N f{illft 'l"f1! ~_Ij;~ Males Females Males Females Males Females Age-grl?up
----- --- ----_-- __ po _____________ - _---- --- --- -- --_ ---- ----
20 21 22 _ 23 24 25
~~~~ SllRGWA
139 27 8'11 in~ , ( AlI"a~ s" ",!Jt .-0-4
5
6 _ 7
8 9
5-9 10--14
6 15-19
116 ,27 20~24
II " .... 25-29
30-34
5 35+ .,. " : '
f·"'~'!~ BILASPLR
4 46 72iJ , ~9 Il'll'T ql~. , Alragt"~-
,-,' 1',
0-;-4
S
6
7
-8
9 5':"9
10 _:_ I ~
4 5 QO 24 15 _: 19
J(. .:JO~ 10 2(1...":'24 , 5 ! ~ 3 ~5 - 2'1
30 ' (f'-- :1 4" , ,

~. Age.groDP
rit", AU ...
0-4 5
6
'1
8
9
5-9 '10-14
15-19
20-14
25-29
30-14
U+
riuq AU_
0-4
)
6
1 11
9
5-9
10-14
1S'-19
20-24
2S-29 ]0--34
U+
11-3 ltf't .. '" ~ 'ft~, "'11 ;ft"( ~~ C·3 PART B ATTENDiNG SCHOOL/COLLEGE BY COMPLETED
-------------
~''fIiI" if ilM ;ri f" I1{flta-ft'~ Total persons attending f;mn: Total population School/College Illiterate
-------- ----------- --_ .. _------F' ffiIirt F' fum ~ RAt Males Females Males Females Males Females
2 J 4 5 6 7
~ IlAIGAk-B
655,840 666,224 101,389 46,673 20,371 12,992
7f.S36 72,622 385 319 385 319 111,224 19,271 2,422 1,607 1,862 1,296 20,293 21,272 8,S67 5,814 5,927 3,998 16,937 17,001 8,987 5,135 4,419 2,132 19,690 19,663 11,268 5,950 3,555 1,953 14,946 16,157 9,353 5,178 1,711 J,1l8 90,091 93,363 40,598 23,684 17,474 11,098 84,844 83,427 41.822 16,875 2,187 1,IH 62.880 58,664 15,455 4,970 180 249 44,211 52,375 2,148 490 20 30
. Se,023 50,]7) 287 77 10 IS 44,584 47,216 HiO 58 10 25
206.270 l07,U8 4H IU 95 96
~~ :RA:JNAN'BGAON
SO),lP Sl9,SH 71,679 24,"10 12,6.64 6.l46
66,445 66,591 145 145 IU 145
16,ll4 U,~6 1,119 520 784 404
16,387 17,Oll 5,277 2,699 3,280 1,703
15,701 15,095 7,297 3,206 3,327 1,582
Hi,491 16,586 S,8l3 3,Bli 2,345 t,14}
13,317 13,590 8,095 3,497 1,239 570
78,030 78,2l0 30,600 13,732 10,975 5,402
n,()99 67,924 35,473 9,765 1,406 516 46,H2 44,415 9,728 951 57 20
34,315 39,325 950 78 5 10
34,348 35,309 219 45 .s 26
30,127 32,171 98 5
141,516 155,439 431 175 61 127
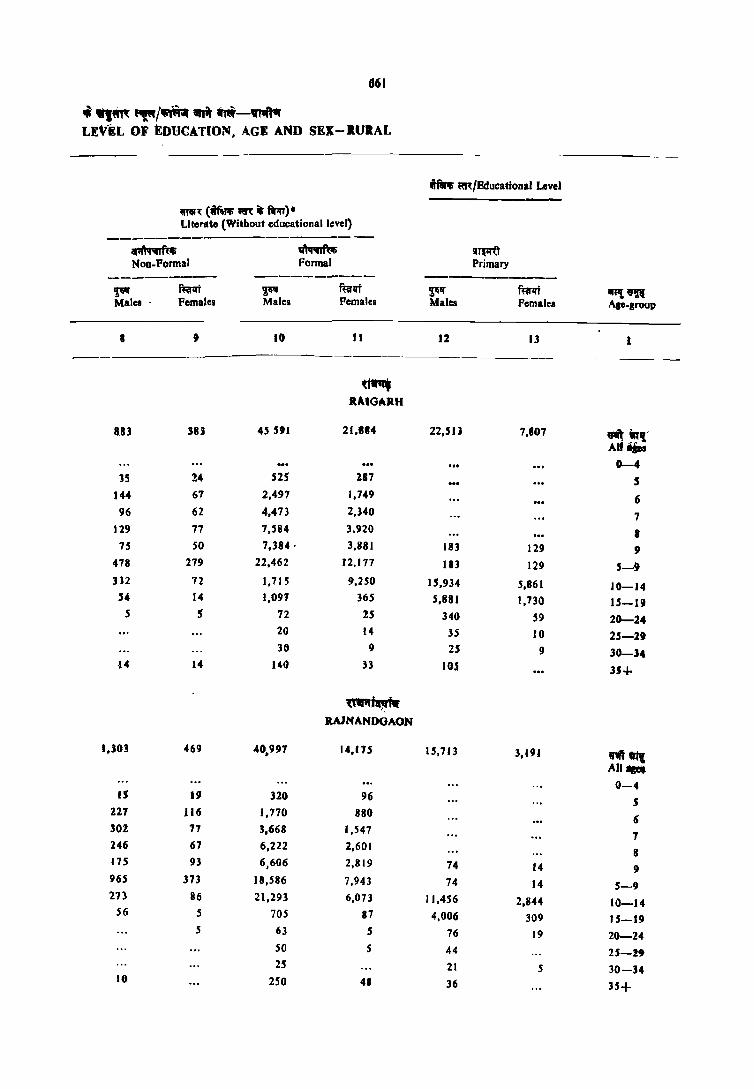
661
• ~ "",,1-- "'~ --~ LEVEL OF EDUCATION. AGE AND SEX-.URAL
--~~-
& .. m/Educational Level
mf1;(~ftI"{t~)· Literato (Without educational level)
-------------------.. ",q'llli F«> ~1'<IIi In~"t NOD-Pormai Formal Primary
--------- ---------- ---------~ ~ F' mrll't ~1f ful'qf ~Uft Males Females Males Females Males Females Asc-group
I 9 lit Jl 12 13
-------_-
t~ RlIGAR.H
8BJ 'I] 4' "1 21,8'4 22,SI J 7,807 ~ inlf All ....
0-4 35 14 52' 187 5
144 67 2,497 1,749 6 96 62 4,473 2,340 7
1'29 77 7,584 3.920 8 7S SO 7,384 . 3,881 183 129 ,
478 279 22,462 12.177 183 129 S-9 312 72 1,715 9,250 15,934 5,861 10-14 54 14 1,091 365 5,881 1,130 15-11) , 5 72 15 340 59 20-24
20 14 3S fO 2S-2I 30 II 25 9 30-34
t4 14 140 33 10l 35+
\I".,~i. ItAJNAN[)(JAON
l,)OJ 4611 40,9117 14,n5 1S,713 3,191 ""," tit All.,. 0-4
IS I!J 320 96 S
221 1I6 1,770 880 6 302 17 3,668 J ,547
7 246 67 6,222 2,601
B 175 93 6,606 2,819 74 14 II 1165 373 18,586 7,943 74 14 5-9 27) 86 21,293 6,073 11,456 2,844 10-14
56 .5 705 87 4,006 309 15-111 5 63 5 76 19 20-24
50 5 44 25-!9 25 21 5 30-34
10 250 48 36 H+

66l
1f-3 mil If '1'i "fat. 'al, "'~ ~ m/S~I!( C-3 PART B ATTENDING SCHOOL/COLLEGE BY COMPLETE_D
wfa:l1i ~/Educational Level
-------~---------------------------
~- ~N;·8'-n-/ s:un;rrf6'{{a-/ f5l"-'{f"<{f"'~T
flIfr.J ii~~Jiii;anT Higher Secondary JInter-Middle Matriculation/Secondary mediate/Prt-Unlversity --------_ .. ----------- ----------
"'1~'1t ~ f"'lIt ~C f~1It ~ n~ql Age-group Males Females Males Females Males Fcmale~
--~----- -------- -_---- - - -
14 IS 16 , 17 IS 19
-----------. -
lllOtJl
RAJGARH
riI" "'\ -")' 8.116 2,354 2.4?0 1,033 _ I,qo .)10 AU .~~i_
0,4
S
6
7
8
9 ... 5-9 t •••
10-14 I,SSS S23 70 19
IS~19 5,932 1,70~ 1,798 831 478 72 , , 20-24 497 92 517 159 54S 114
)
25-29 34 5 61 9 53 24
30-34 34 9 24 5 16
3S+ 34 14 15 5 19 1
llVl';:rT'l'trT" RAIN'A'N'O'G'AON
~'IiT "IT. 5,109 6S9 565 107 SSZ 49 AU ages
o~_~'~ ~;iJ S {' 6
,7
8 _ 9
S-9 10-14 1,026 246 S IS
IS-19 4.~36 398 374 92 256 30 20-24 377 II 121 10 237 19 25-29 34 5 38 S 32
3<r34 15 5 22 35+ 20 22- 22

663
t ~M'" ~/if\m;r ;fA ~-Vtq1ar LEVEL OF EDUCATION, AGE AND SEX-RURAL
tfel'~ ~~/Educational Level
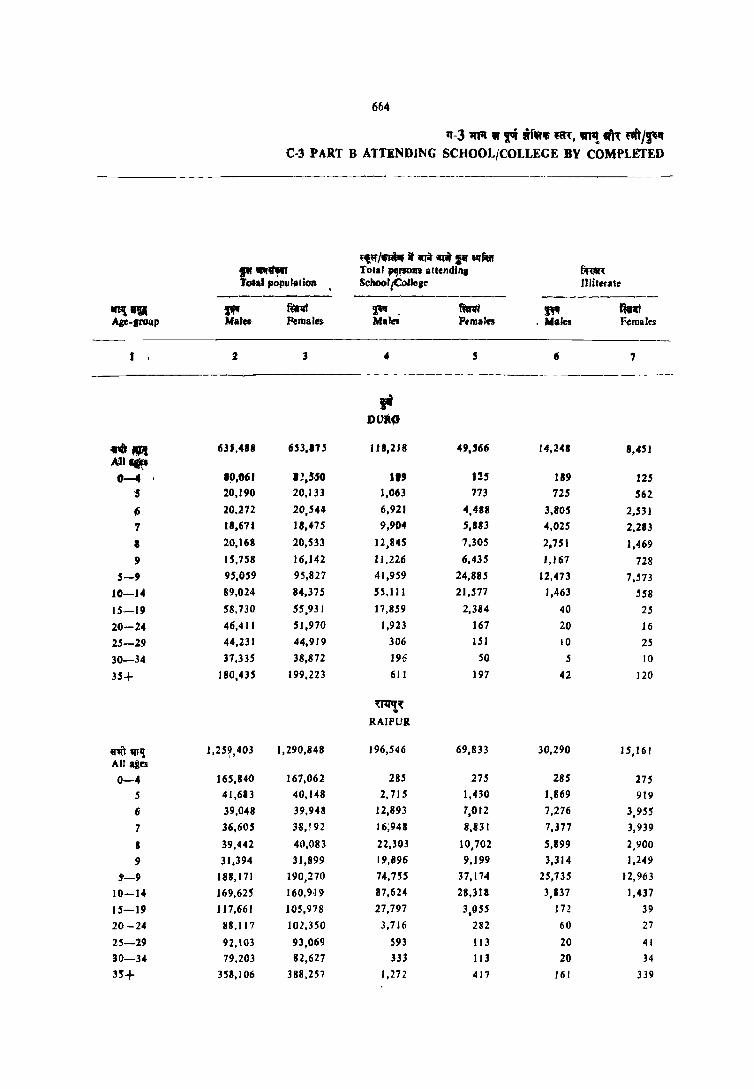
664
rr-3 1tt1I • '{oi urwili ~, ~ ..n mJp. C-3 PAR.T B ATTENDING SCHOOL/COLLEGE BY COMPLETED
-- - ----------------- -----
"~/" if wR d I" "'M
P """'" TOlal ,",!'10m allendinl tIrw1:
Total popul'licm SchoolJCoIle,e lIlil'rllt
--------- ------------ ---------~ .... ~ tUm ~ ftni ~ fftiWi Age-8I'011P Malclt Pemall$ M.,ei P,maln . Wales Females
I 2 3 ~ 5 6 ? . _- -- - -~---- -- -- ----------~- - ----- .-
" DVR(l
n.," 631,418 6B.I1S IlI,2IS 49,'66 14,241 8,451 All. 0-4 '~,O'I '2,'"'0 II' 125 119 J25 , 20,190 20,133 1,063 773 725 562
6 20.272 20,544 6,921 4,488 3,805 2,531
7 18,671 18,475 9,904 5,883 4,025 2.2113
• 20,168 20,533 12,845 7,30S 2,751 1,469
9 15,758 16,142 11,226 6,43S 1,167 728
5-' 95,059 95,827 41,959 24,885 12,473 7,573
10-14 89,024 84,375 S 5,111 21,577 1,463 558
15-19 58,730 55,931 17,8.59 2,384 40 25
20-24 46,411 51,970 1,923 167 20 16
25-29 44,231 44,919 306 151 10 25
30-34 37,335 38,872 196 SO S 10
35+ 180,435 199.223 611 197 42 120
uq~ .. RAIPUR
~.u 'IT,! 1,2S?,403 1,290,848 196,546 69,833 30.290 15,161 All a,es 0-4 165,840 167,062 28S 27S 28S 275
.5 41,683 40.148 2.715 1,430 I,B69 919
6 39.048 39.948 12,893 7,012 7,276 3,9SS
7 36,605 38,! 92 16;948 8,831 7,377 3,939
II 39,442 40,083 22,303 10,702 S,B99 2,900
9 31,394 31,899 19,896 9,199 3,314 1,249
5'-9 188,171 190,270 74,755 37,174 25,735 12,963
10-14 169,625 160,9-19 87,624 28,311 3,837 1,437
15-19 117,661 105,978 27,797 3,055 172 39
20-24 88,117 ] 02,350 3,716 282 60 27
25-29 92,t()3 93,069 593 113 20 41
3G-34 79.203 82,627 333 113 20 34
35'+ 358,106 388.257 1,272 417 lfjl 339
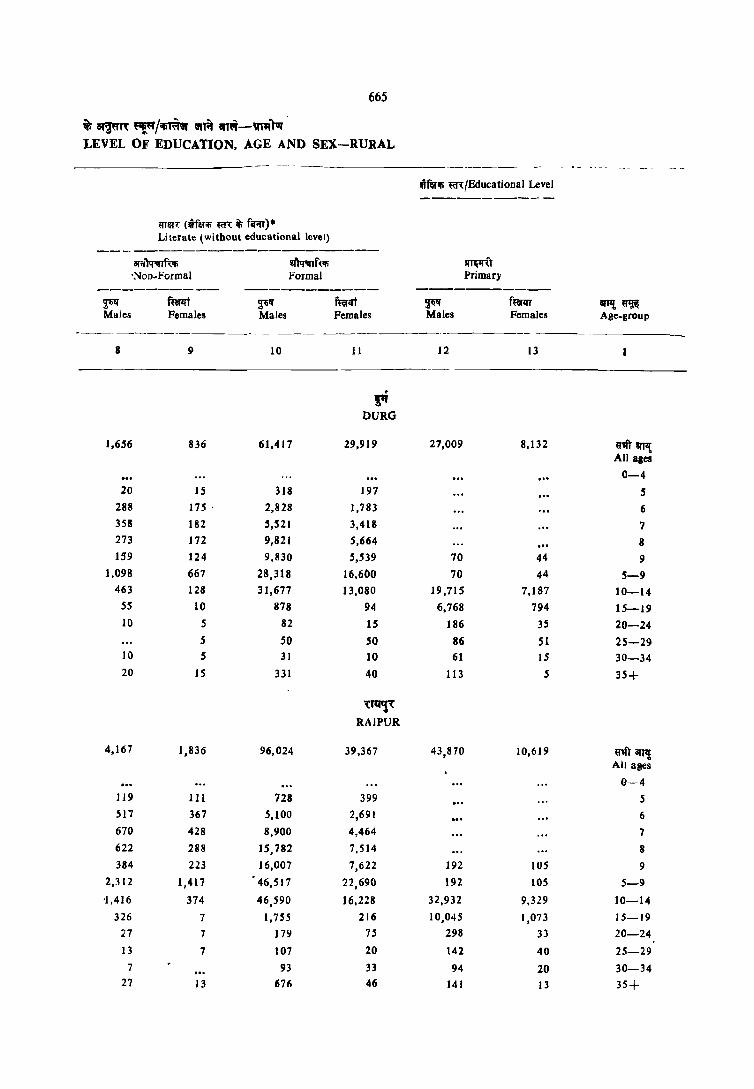
665
itr ~m ~/'ifirm. iitA ilfTl;(-'Xf'l'Tar
LEVEL OF EDUCATION, AGE AND SEX-RURAL
----_---- --------
IliflHlIi m/Educational Level ----------- -
aTIH< (~flH'" Ocn: ~ frn)* Literate (without educational leVel)
-- -. --------------------ar~)tr;nfut; ~f~'Ii IITW.T 'Noo.Formal Formal Primary
---------- ----------- -----------~ ftifllt ~Ii Iliirlfi ~ f.nr iII'P{ ~ Males Females Males Females Males Females Age-group
------ --------------_.-
8 9 10 II 12 13
l'i DURO
1,6,56 836 61,417 29,919 27,009 8,132 a1IT III1l[ All ales
0-4
20 IS 318 197 S 288 175 ' 2,828 1,783 6 358 182 5,521 3,418 7 273 172 9,821 5,664 8 159 124 9,830 5,539 70 44 9
1,098 667 28,318 16,600 70 44 5-9 463 128 31,677 13,080 19,715 7,187 10-14
55 10 878 94 6,768 794 15-19 10 5 82 IS 186 35 20-24
5 SO 50 86 51 25-29 10 5 31 10 61 IS 30-34 20 15 331 40 113 5, 35+
'{tqq'{ . RAJPUR
4,167 1,836 96,024 39,367 43,870 10,619 iii'll) arrl! All aaes
0-4 119 III 728 399 5 517 367 5,100 2,691 6 670 428 8,900 4,464 7 622 288 ] S, 782 7,514 8
384 223 15,007 7,622 192 105 9
2,312 1,417 • 46,517 22,690 192 105 5-9
'1,416 374 46,590 16,228 32,932 9,329 10-14
326 7 1,755 216 10,045 1,073 15-19
27 7 179 75 298 3J 20-24
I3 7 107 20 142 40 25-29
7 93 33 94 20 30-34 27 13 676 46 141 13 35+

666
'1'-3 'ai11T " T'i .. lfffftil'l' ~i'T\, 'rTf!. ~"{ ~""'/~ C..J PART B ATTENDING SCHOOL/COLLEGE BY COMPLETED
wf'aN; ~/Educational Level ------------------------------------
~m: ~ilivsU/~.~/ fsr-W~a
fllf.r.f qf~1r.f /-«"Wa Higher/Secondary lInter. Middle Matriculation/Secondary mediat~!Pre- Umverslty
--------- ------------ ----------~~ ~~ fr.fllt ~ fmlft ~ f~1ft Age-group Males Pemales Males Females Males Pemales
14 IS 16 17 18 19
- --------
!,tt DURO
"'Iil"~ 11,248 1,990 1,463 151 915 72 All ages
0-4
5
6
1
8
9
5-9
10-14 1,738 620 50 S .s 15-19 8,731 1,306 962 116 420 39 20-24 66J 30 368 2S 418 27 25-29 51 20 31 ... 46 30- 34 47 10 5 21 ]5+ 20 S 47 S 5 .5
'Q1f'!,l
RArpUR
,,'lit arr~ 17,305 2,482 1,790 124 2,530 211 All ~ges 0-4
S
6
7
8
9
5-9
10 -14 2,829 951 13 7 15-19 13,264 1,465 984 92 1,195 ISO 20-24 986 46 610 26 1,193 49
2S-29 73 62 88 7 30-34 53 13 S3 7 7
H+ 100 7 67 47

667
&i V~"R 'ffIi!l/~ m lT~-VTl::rl11J LEVEL OF EOUCATION, AGI': AND SEX-RURAL
fTlft it; qff~f~ iT~-iJiI"l'T'f,'T Rt~)l{f 1fT 5llITUJ 'fi'l Non-technical diploma or cel tifica Ie not equal to degr~~
20
~t F.:males
21
3J
33
7
2l
14
wfe:r'li fij,/Educalional Level
fi"1r'T it; qfflfR iJlIi"if');t) f~)l{l l:Jl SIlI'IUJ 'fi'I Technical dIploma or .:::ertificate not equal to degree
~ Males
22
f~ Females
23
~q PURG
,(I~
RAIPUR
229
6
144
31
16
32
528
48
341
72
13
53
tilliJiti q'h: afs iti Graduate and above
i~ Males
24
ffiflli Females
IS
15
13
20
25
iff,! 61I~ Alit-group
6''" ttl1 All ages
0-4
S
6
7
8
9
5-9
10-14 15-19
20-24 25-29
30-34
35+
'1'1[1 an~ All ages
0-4
.5
6
7
8
9
5-9
10-14 15 - 19
:0 - 2~
25 29
JO - H
l'it-

6Tl1! q~ Age_group
q-m aflt All ages
0-4
5
6
7
8
9
5-9
10-1·4
15-19
20-24
25-29
30-34
35+
668
If-3 mrr W fIl ~f"lti ,a'(, 1A1~ w1'( ro/~~ C-] PART B ATTENDING SCHOOL/COLLEGE BY COMPLETED
~:sr-r~ f'WO I~ ~ ;rf.t ri 'r' Olfflfff
f;!~ Total persons attending Total population School/College Illiterate
---------- --------_._-- -_--------_ q'~f{ ~Irt ~ mt 'i~ f~<rt Males Females Males Females Males Females
2 3 4 5 6 7
Imf'(
B4.STAR
861,848 869,300 74,46 ) 28,035 18,991 8,142
111,692 115,351 351 271 351 271
28,283 28,497 1,964 1,137 1,375 710
26,326 27,913 5,425 2,967 3,339 1,658
24,668 25,864 7,262 3,876 3,682 1,696
29,IB9 29,86B 9,211 4,268 3,443 1,51 I
19,878 21,475 7,241 3.120 1,929 739
128,344 133.616 31,103 15,368 13,769 6,313
112,360 109,041 32,443 10,581 4.463 1,287
79,134 81,176 8,687 1,470 225 56
58,064 69,354 1,043 112 40 51
70,016 68,972 258 39 SO 15
60.294 60,844 186 29 35 20
241,120 230.788 166 ISO 61 123

669
$ ~T'{ ~~/IfiT~iiI iiIA ~1~ -VlQ)1qo
l.EVEL OF EDUCATION, AGE AND SEX-RURAl"
riff,", '~R:jEducatioDal Level
-----------mR (~ m iii fifilf)-Literate (without educational level)
--------------:-------......... _ ar;rrr..rfuIi' 'I"'\q"lTfv.; !lT~') ·Non_Formal Formal Primary
-----_._- - --- --- ---~-------- -----------~
. fial:l't '!llf{ ~1:I't '!llff f~alrt ilnt{~ Males Females Males Females Males Females Age-group
--------~
8 9 10 11 12 13
~-.:
BASTAR
2,107 826 35,448 14,411 12,187 3,442 «'1ft' qF{ All ales
0-4
43 52 545 376 5
ISO 89 1,936 1,221 (j
275 132 3,304 2,048 1
334 98 5,434 2,659 8
213 99 4,929 2,193 171 89 9
j ,015 471 16,148 8,495 171 89 5-9
852 312 17,794 5,724 8,347 2,853 10-14
180 45 1,216 141 3,404 471 15-19
24 69 14 186 9 20-24
10 39 14 20 5 125 - 29
10 40 15 S 30-34
10 138 14 40 , 35+
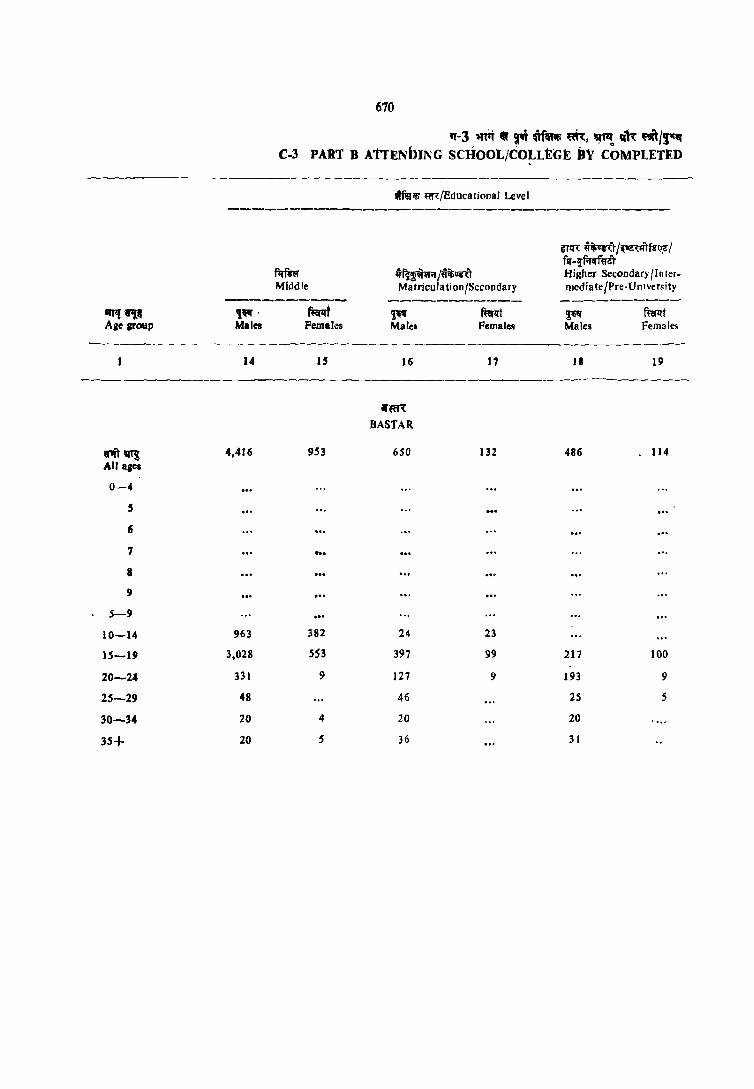
670
C-3 rr-3 ~ .. f!i m-_ ,~, ~~ q'\1: ""/'r"
PART B A17ENbI~G SCHOOL/COLL1Wl: )It COMPLETI!:D
riifllJlfi ~/Educational Level
-----------------------------------~!R ~ipR"t I{IIZ\l'I"tfg~i?: r fsr -¥fOJarf«€t
fifmr 4f~Wil/~~"t Higlter Secondary /Inter-Middle Matricula tion {Secondary media Ie {Pre-U n1 ver~ity
--------- ----------- ----------1fT,! "'1' ,'" . ~ ~ fum ~ fta1rt Age group Males Females Male. Females Males Female.
14 U 16 17 18 19
----~-----
lfm't
BASTAR
U1iTVl! 4,416 953 650 132 486 114 All ages
0-4
5
II
7 0 ••
8
9
5-9
10-14 963 382 24 23
lS-B~ 3,028 5S3 397 99 217 100
20-24 331 9 127 9 193 9
2S-29 48 46 25 S
30-34 20 4 20 20
3S+ 20 S 36 31
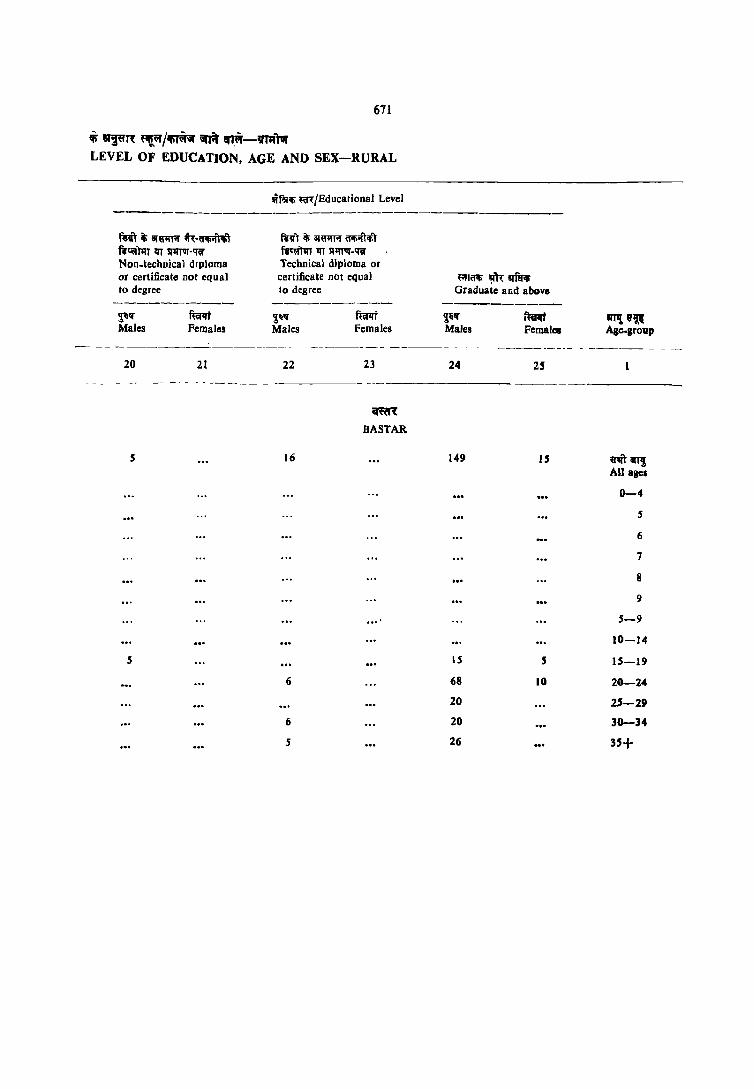
671
ii "~~m: "'!~ /'fIrfiril iIA ~~-miTar LEVEL OF EDUCATION, AGE AND SEX-RURAL
wr~iIi tal/Educational Level -----------------------------------frit ~ ar~iI' t1:-~ Rt'ilrnr lIT SlJIl'1Ir·~ Non-technical dIploma or certificate not eq u al to degree
~" Males
-----_---
20
5
s
mt Females
21
fC«1 ~ iII«'fTil 6l!iifTilif ~ot\ln lIT SlJIl'1Ir.~ Technical diploma or certificate not equal 10 degree
~ Males
22
16
6
6
5
fufqt Females
23
~
BASTAR
....
Rl<f1li~1I'fiI'Ii Graduate and above
~ Males
24
149
15
68
20
20
26
f~ Females
25
15
5
10
~8'~ Age-group
~'" lIT! All ages
0-4
5
6
7
8
9
5-9
10-14
15-19
20-24
25-29
30-34
35+


~m:UfT '1'-4 1:t'lWl' lifl!{1tf ~, "!.~ iifTil' q-mr 'Ii1\" alf~'fi IfiT!:iIf~llJ iti l12~m: iI~ ('llP! 5-14)
TABLE C-4 CHILDERN (AGES 5-14) BY SINGLE YFAR OF AGE, SCHOOL ATTENDANCE
AND ECONOMIC ACTIVITY
Note
lf~ 1:tCfi iJ~ ijT~vft ~ a:rh ~~il 5 -14 q~ 'fir ~~i:t<n
an~ en~ ~ 'liT ~ti;orA' ~ i'lfh ~~ if iOfTiJ qT~ ~ or;rm~ or~1!fi\Uf fCfi!JT ~t[T ~ I or;;:;ft!fit 3f1tr ~!T q;Tif
Cfi~iJ ~<n~, l=f'TlrrrflCfi CfiTif ~iJ ~~ 6ih 'l'i'flf if ~iJ ormT if l:fm'15CT f.l;trr iilTCTr ~ I ~ muTr it ~ \!fliJ ql~ ~ if iifiti ~ ~ ~if ~ en=( it ~fr Sff~ff 'fi'T ~ ~ I w ~RUfT it ~T'ilr am f~r ~ lI1'1', llT;fTUf
aTt"( .,.roll ~'lI"r ~ a:r~ ~ fitiQ: '>rra- ~ I
,~ ~'T CifiT otTfiRmcr q-:;;if (m~) ~ 'Sf~ 1if1?l lT 3, 4, 13, 14 am: 15 ~ ;rrUf:q' iJ ~~T <tT ~ 'i!Rifi~T iii anm qo: ~~ f.i;;n' lfll"T ~ I
673
1his is a new tL.ble and classifies children at each of the ages 5-14 with those attcndirg sc1:ool and tho~e not attending sc", (11. The children are further classified as main \\'orkers, marginal workers and non-workers. This table gives an idea of t11e prevalence of child labour in relation to school attendance. The table plesents the data for total, rural and urban areas for the state and the districts.
The tabJe has been compiled on the basis of information collected through 'question numbers 3, 4, 13 14 and 15 of the Individual Silp (Universal).
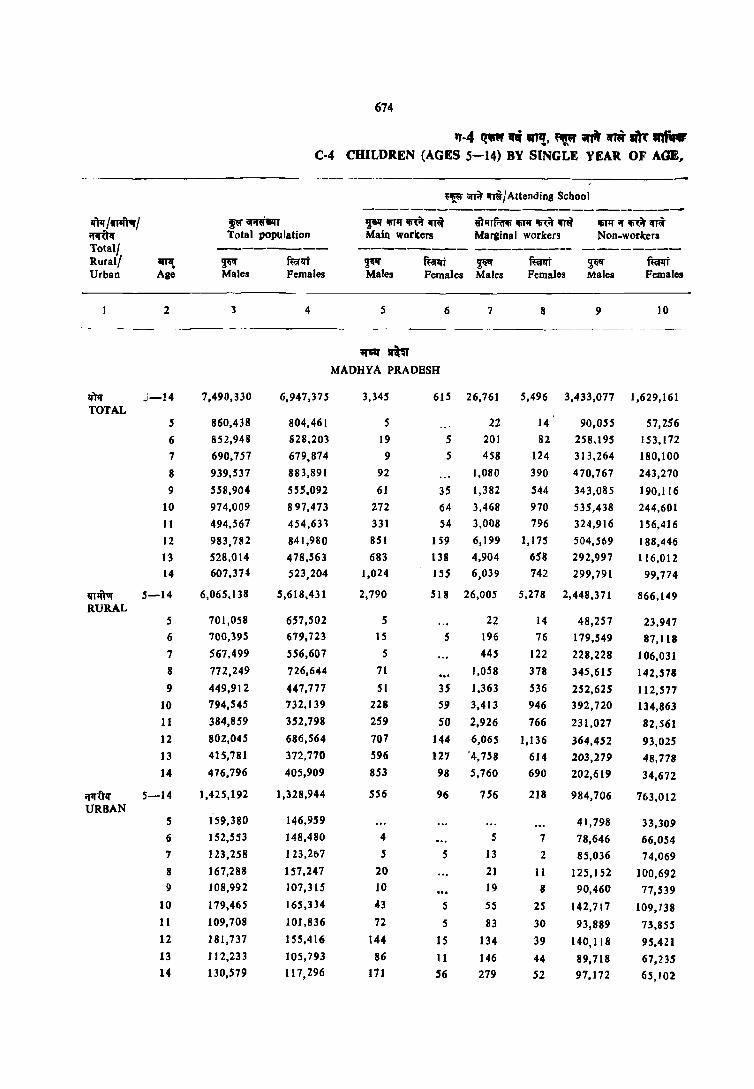
674
rr·4 «lW q WTI!, • ~ ~ ~ ""'"' C-4 CHILDREN (AGES 5-14) BY SINGLE YEAR OF AGE,
{'~ orR Ifnl/Attending School --------------------------
rfpr !'IT'ft1lf I f« iffitlllT IJ" .,,, rn "'" UilfTf.6iI; IIiJlT ~if ri IIiJlT l'f rn m ~ Total population Main workers Marlinal workers Non-workers Totall --------- --------- --------- --------Rural! amt ~ fuilrt ~ ~i'iIqt ~ fufqt ~II" mm Urban Age Males Females Males Fernales Males Fernales Males Fernales
2 3 4 5 6 7 8 9 10
--------_
'fSQ' •
MADHYA PRADESH
~ J-14 7,490,330 6,947,37.5 3,345 615 26,761 5,496 3,433,077 1,629,161 TOTAL
5 860,438 804,461 5 22 14 90,055 57,256
6 852,948 828,203 19 5 201 82 258.195 153,172
7 690,757 679,874 9 5 458 124 313,264 180,100
8 939,5]7 883,891 92 1,080 390 470,767 243,270
9 558,904 5.55,092 61 35 1,382 544 343,085 190,116
10 974,009 897,473 272 64 3,468 970 535,438 244,601
11 494,567 454,631 331 54 3,008 796 324,916 ] 56,416
12 983,782 841,980 851 159 6,199 1,175 504,569 188,446 13 528,014 478.563 683 138 4,904 658 292,997 116,012 14 607,374 523,204 1,024 ISS 6,039 742 299,79] 99,774
m~ 5-14 6,065.138 5,618,431 2,790 518 26,005 5,278 2,448,371 866.149 RURAL
5 701,058 657,502 5 22 14 48,257 23,947 6 700,395 679,723 15 S 196 76 179,549 87,118 7 567,499 556,607 5 445 122 228,228 106,031 8 772,249 726,644 71 1,058 378 345,615 142,578 9 449,912 447,777 51 3S 1,363 536 252,625 112,577
10 794,545 732,139 228 59 3,413 946 392,720 134,863 11 384,859 352,798 259 50 2,926 766 231,027 82,561 12 802,045 686,564 707 144 6,065 1,136 364,452 93,025 13 415,781 372,770 596 127 ·4,758 6J4 203,279 48,778 14 476,796 405,909 853 98 5,760 690 202,619 34,672
;rIfUIf 5-14 1,42.5,192 1,328,944 556 96 756 218 984,706 763,012 URBAN
1'59,380 .5 146,959 41,798 33,309 6 152,553 148,480 4 5 7 78,646 66,054 7 123,258 123,267 5 5 ) 3 2 85,036 74,069
8 ]67,288 157,247 20 21 11 125,152 100,692 9 108,992 107,315 10 19 8 90,460 17,539
10 179,465 165,334 43 5 55 25 142,717 109,138 11 109,708 101,836 72 5 83 30 93,889 73,855 12 181,737 155,416 144 15 134 39 140,1 I8 95,421 13 112,233 IOS,793 86 11 146 44 89,718 67,235 14 130,579 117,296 171 56 279 52 97,172 65,102

675
Ifini-wT~l.ri at~ iI'rei ("'r~ 5-14) SCHOOL ATTENDAI\CE AND ECONOMIC ACTIVITY
~lfiT1flfi<:~~ MaIO workers
~I!f ftalfi' Males Females
11
817,027
1,323
2,152
4,1 ;4
15,551
1B,551
84,629
59,808
252,021
149,995
228,824
775,105
J,IS2
1,994
4,000
14,923
17,754
81,051
57,381
240,726
142,182
213,944
41,922
171
158
174
628
797
3,578
2,426
11,296
7,813
14,880
12
S51,080
SIS
1,378
3,071
10,011
13,336
58,203
47,541
164,190
109,528
143,306
532,954
500
1,343
2,958
9,751
12,996
56,626
46,076
159,013
105,960
137,731
18,126
IS
35
114
259
341
1,~77
1,465
5,176
3,568
5,S7S
~~;;r ~~ ;;YT~ mINot Attendir g School
~fhnf;ilili iliTlf lfi'~~ ~ Marginal workers
~~ mlfi' Males Females
13 14
lfi'TIf ~ lfi<:~ '11" Non-workers
~F,lf f~ll't Males Females
15 16
"'~ !iI~V MADHYA PRADESH
61,134
11 S
445
1,040
2,9 ~3
3,207
10,549
6,173
18,063
9,157
9,453
58,996
112
438
1,036
2,904
3,143
10,303
5,961
17,442
8,729
8,929
2,138
3
?
4
29
64
246
212
621
429
524
233,139
226
892
2,3-55
6,544
8,807
29,736
22,828
66,567
43,461
51,682
229,482
258
883
2,281
6,494
8,711
29,345
22,597
65,543
42,656
50,714
3,656
8
9
74
50
95
391
231
1,025
805
968
3,148,985
768,918
591,936
371,812
449,115
192,618
339,654
100,331
202,079
70,278
62,245
2,753,870
651,511
518,203
333,786
407,677
174,976
306,830
87,305
172,6:13
56,237
44,692
395,115
117,407
73.732
38,026
41,437
17,642
32,825
13,026
29,425
14,041
17,553
4,527,885
746,409
672,673
494,220
623,678
342,254
563,898
226,998
421,443
208,766
227,546
3,984,049
632,782
590,298
445,216
567,443
312,922
510,300
200,748
367,702
174,634
182,004
543,836
113,627
82,375
49,004
56,235
29,332
53,598
~6,251
53,740
34,132
45,542
anI! Age
2
5-14
5
6
7
8
9
10
11
12
13
14
5-14
5
6
7
8
9
10
11
12
13
14
Il')tr /'ITlfT III I ;j'lj't1'<r Total/ Rural/ Urban
!I'm TOTAL
tWfT'f RURAL
5-14 ifIl"'TIl
5
6
7
8
9
10
II
12
13
14
URBAN

676
q·4 ~"' .... ~, ~\II ~ ~n~ m ~ C·4 CHILDREN (AGES 5-14) BY SINGLE YEAR Of AGE.
¥ iifffllfT~/AUendjog School ---------------------------
lfTrr {"!'frill / ~~T ~1I'1!il'lfm"'l.r (l'r'IfTf.a1fi IfiI'f lIi~it ~ II(TII' :r !!Kit lfTol <rI1"Ull' Total population Main workers Marginal workers Non-workers
Total l --------- -------- -------- --------Rural/ SrTIl ~~ f~lft ~~ f~t ~~ ~lft ~If mrlft Urban Age Males Females Males Females Males Females Males Females
2 3 4 5 6 7 8 9 10
r - - ----- ----- - _-.----------.
'Ii", MORENA
If'tlT 5-14 208,594 161,361 93 11 208 .5 99,840 25,917 TOTAL
S 24,829 20,326 ." 2.103 959
6 24,625 20,692 6,323 2,177
7 I g,858 16,027 7,549 2,511
8 28,548 21,714 13,723 4,215
9 14,360 11,611 S 3,906 2,878
10 29,318 21,276 5 34 1 ':',836 4534 , II 12,130 8,986 16 10 8,823 2,360
12 29,819 21,085 21 5 82 5 18,487 3,583
13 8,880 6,307 II 5 24 5,726 1,217
14 17,227 , 3,336 41 54 10,365 1,483
'lf1il'IJf 5-14 181,250 139,259 93 11 208 5 82,444 15,280
RURAL
5 21,678 17,599 1,368 392
6 21,691 18,051 5,001 1,181
7 16,419 14,001 6,074 1,531
8 25,138 19,054 11,458 2.773
9 12,297 9,857 5 7,350 1,775
10 25,484 18,385 5 34 14,951 2,826
11 10.319 7,542 16 10, 7,383 1,489
12 26,010 18,337 21 5 82 S 15,721 2,133
13 7,351 5,084 11 5 24 4,473 561
14 14,861 11,350 41 54 8,666 619
.,.rr{tlf 5-14 27,344 22,102 17,396 10,637 URBAN
5 3,151 2,727 735 567
6 2,933 2,641 1,121 996
7 2,439 2,026 1,475 980
8 3,409 2,660 2,265 1,442
9 2,063 1,753 1,557 1,103
10 3,834 2,892 2,885 1,708
1I 1.810 1,444 1,440 871
12 3,809 2,748 2,767 1,450
13 1,530 1,223 1,252 655
14 2,365 1,987 1, 00 864

677
1Jtq-~ Ii ~p1'( ar-ri (atT! 5-14) SCHOOL ATTE~DANCE AND ECONOMIC ACTIVITY
~~ if~ \lITi\' ~~/Not Attending School - - -------------_--------._------------
!l.~ ~ lIi'(i\' ifr" lJllrrf.ij'ifi" ~" rn err" IIif'I' if iji~ cffii tfIlf /mff)fr I Main workers Marginal workers Non_workers if'll'UlI'
---------- ---------- ------------ T""atal/ ~lilf f~t ~ ft;;rlff ~1ilf fmlfr OW! Rural/ Males Females Male, Females Males Females Age Urban
--_ -~ ----- ~----- ---------- ----11 12 13 14 15 16 2
_-- ----------- ------------ --_------- --- -_-------- ---- ~ - -------- ----1---
Ilion MORENA
13,966 1,90B 461 2,201 9-',026 lJl,317 5-14 IfPr TOTAL
46 It 22,681 19,355 5
20 18,282 ] 8,51 5 6
67 6 5 20 11,238 ]3,491 7
144 11 S 40 14,677 17,447 8
161 22 19 55 5,269 8,655 9
1,105 141 82 285 10,257 16,316 10
842 122 43 184 2,397 6,319 II
.4,792 741 160 762 6,097 15,990 12
),756 27B 54 252 1,310 4,556 13
4,853 S75 94 60, 1,8:0 10,674 14
11 3,05 1 1,764 422 2,175 85,032 120,024 5-14 ~ RURAL
36 11 20,274 17,196 5
15 16,675 16,870 6
67 6 5 20 10,273 12,445 7
134 11 5 40 13,542 16,229 8
151 22 19 55 4,772 8,005 9
'1,035 118 76 274 9,383 15,167 10
777 106 33 184 2,101 5,762 11
4,647 697 148 757 5,392 14,740 12
1,670 237 48 244 1,124 4,037 13
4,518 555 88 602 1,495 9,574 14
915 143 39 28 8,994 11,293 5-14 ~ URBAN
10 2,407 2,160 5
5 1,607 1,645 6
964 1,046 7
10 1,135 1,218 8
10 497 650 9
69 23 6 11 874 1,149 10
65 16 9 296 557 11
325 44 12 5 70S 1,250 12
86 40 6 8 186 519 1]
335 20 6 3 324 1,091} 14

678
q·4 ~t'l .. Ii "'If, ~1JlII' !ftf.I' "T~ 1R'1~ ""41J .. " C·4 CHILDREN (AGES 5-14) BY SINGLE YEAR OF AGE,
----- _-- _- -- --------.-.---- -- ~-------- - - - - ______ - - ____ - _o _________ ._
~or 1iIT~ ~/Attending School ---------------- --------------
=~ftUJf ~;;r;I'~~T ~,~ ~ ~,~ ~,~ ~ .. hl1f~~ 1!i11l' m ,,~ ~111' if ifi'{lf iflW Total population Main workers Marginal workers Non·workers
Total/ ---- ----~-- ---------- -------- --------Rurall ~ ~~" f~ ~" f~llt :;w furlrt ~ f~1IT Urban Age Males Females Males Females Males Females Males Fell'alea
---_- ------ - ---- ----- --------------.--.---~--- ----------_._---- --.---------------- ---- -------_ 2 3 4 5 6 7 8 9 10
------fwg
BHIND
!{)1r 5-14 154,972 115,293 61 187 13 83,309 28,7" TOTAL
5 18,238 14,585 1,911 924
6 16,897 13,940 ... 5,062 2,339
7 13,480 10,925 3 6,409 2,602
8 19,742 14,409 11,288 3,958
9 11,494 9,291 7 8,244 3.404 10 111,410 13,697 5 21 14,120 4,544
11 12,048 9,324 5 14 9,Sll 3,283
12 19,325 12,509 10 49 14,228 3,621 13 10,8ZS 7,957 10 29 j 8,143 2,312 14 13,520 8,6S5 31 64 9 9.393 1,799
VT1fIUJ' 5-14 129,423 95,125 51 155 13 71,124 18,990 RURAL
5 15,204 12.137 1,271 610
6 14,242 11,492 3,939 1,605
7 11,222 8,964 4,985 1,679 8 16,678 12,129 9,200 2,757
9 9,551 7,637 4 6,651 2,406
10 16,230 11.362 5 21 11 ,546 3,062 11 9,970 7,730 5 9 7,774 2,286 12 16,143 10,351 5 38 11,621 2,365 13 9,007 6,387 10 26 5 6,585 1,357 14 11,177 6,935 26 57 9 7,552 863'
m~ 5-14 25,549 20,168 10 32 17,185 9,807 URBAN
5 3,033 2,447 640 314 6 2,655 2,447 1,124 734
7 2,257 1,961 3 1,424 933
8 3,064 2,280 2,087 1,201 9 1,943 1,654 3 1,593 998
10 3,180 2,335 2,574 1,482 II 2,077 1,594 6 1,737 997 12 3,177 2,159 5 11 2,607 1,256 13 1,819 1,570 3 1.5S8 95S 14 2,344 1,720 S 7 1,841 936

679
_.-M •• ~ ~ (.111 5-14) SCHOOL ATTENDANCE AND ECONOMlC ACTIVITY
~ ;rif iII~ lffil/Not AUending School
-----------------------------------lJ'If IIiTIf ~ on" ~lIiTIfrnm m ;r rn Iff" ::t~/ Main workers Marginal workers Non-workers
--------- ---------- ----------- Total/ fill; ftnr ~ ffitllt ~ mt aff,! Rural! Males Females Males , Females Males Females Age Urban
- ---~-------------11 12 13 14 IS 16 2
f1l1l1'
BHIND
6,528 163 261 261 59,626 86,058 5-14 m TOTAL
30 16,296 13,660 5
41 3 5 11,183 11,598 6
5 4 5 7,059 8.309 7
65 8 14 8,381 10,431 8
45 }-2 3,}98 5,875 9
359 31 17 26 4,887 9,096 10
336 27 13 26 2,169 5,988 11
f ,735 37 66 62 3,231 8,788 12
:.1,281 9 70 49 1.292 5,583 13
2,625 5S 78 68 1,330 6,725 14
:S,835 157 2SS 249 52,003 75,715 5-14 '!111fTIII' RURAL
30 13,903 11,527 5
30 3 5 10,268 9,884 6
5 4 5 6,229 7,281 7
60 8 14 7,409 9,358 8
40 12 2,850 5,219 9
297 31 17 23 4,343 8,246 10
303 27 13 23 1,867 5,394 11
-1,578 37 62 59 2,838 7,889 12
1,174 9 67 46 1,144 4,972 13
2,318 50 78 68 1,147 5,945 14
693 5 7 12 7,623 10,344 5-14 iflTitlf
URBAN 2,393 2,133 5
17 1,515 1,713 6
831 1,028 7
5 971 1,079 8
5 342 656 9
62 3 544 850 10
33 3 302 594 11
157 4 3 393 900 12
107 3 3 149 612 13
308 5 184 780 14

680
q-4 ~!fillil' ~ iii!,!, f"!." ,""$I' ~ 'Il~ wtfr..rlf> (-4 CHILDREN (AGIS 5-14) BY SINGLE YEAR OF AGE,
-------- --- - -- - --- ----- - -- - --_-----_- -.---- .--- --- _-.- _- ---~
.~;;nit Ifr~/Attend,llg School - -----_. ~.---------- --~- - -----------
'lftrr/lJfIf'Ivr/ ~;;r \jfifij'ilfT ~i!f il'iTJf il'i1:il' qr<1r ~TJfTf.ail> il'iTJf iI>'1;it qm- il'iTJf if ".\it ql~ If'IliTIf Total population Mam worKers Marginal workers N011-workers TOlal/ --------- --------- -------- --------Rural/ arT1! ~'Ii!f fui'llT ~ fui'!fT ~li!f funrT T'!f f~"IH Urban Age Males Females Males Females Males Female, Males Females
-- ------ - --.---- - - - ---------- --- ------ - - ---- ------ -- --- -
2 3 4 5 6 7 8 9 10
"'Tfi;rrr~ GWALIOR
<Wr 5-14 164,331 133,969 183 II 448 32 89,305 47,603 TOTAL
5 19,313 15,948 8 6' 3,492 2,368
6 17,885 15,597 4 8 6,565 4,072
7 14,586 13,187 14 7 7,431 4,809 8 20,356 16,637 IS 22 8 11,382 6,377 9 12,241 10,943 14 7,901 4,6.59
10 21,121 16,081 26 .5 71 6 13,673 6.871
11 J 2.038 10,156 16 54 8,617 4,578
12 21,202 15,181 47 67 6 13,874 6,118
13 11,789 9,721 19 70 7,894 3,960
14 13,800 10,519 54 5 120 8,475 3,792
VTJfTvr 5-14 79,277 59,834 40 424 32 34.978 8,475 RURAL
5 9,297 7.368 8 6 645 ?50 6 8,555 7,084 8 2,131 611 7 7,613 6,456 14 7 3,075 1,063 8 10,150 7,634 22 8 4,543 1,278 9 6,070 5,020 14 3,312 1,090
10 10,144 6,994 9 71 6 5,675 1.254 II 5,617 4,7 J 6 :; 48 3,627 987 12 10,249 6,466 10 67 6 5,828 1.028 13 5.403 3,895 70 3,089 507 14 6,179 4,201 15 102 3,053 407
~')'IT 5-14 85,055 74,135 142 11 24 54,326 39,128 URBAN
S 10,016 8,579 2,847 2,118 6 9,331 8,513 4 4,434 3,461 7 6,974 6,730 4,356 3,746 8 10,205 9,004 15 6,839 5,098 9 6,171 5,923 4,589 3,569
10 10,977 9,087 17 S 7,998 5,616 II 6,420 5,440 II 6 4,989 3,591 12 10,953 8,71) 37 8,046 5,090 .. .... 13 6,386 5.826 19 4,805 3,453 14 7,622 6,318 39 5 18 5,422 3,385
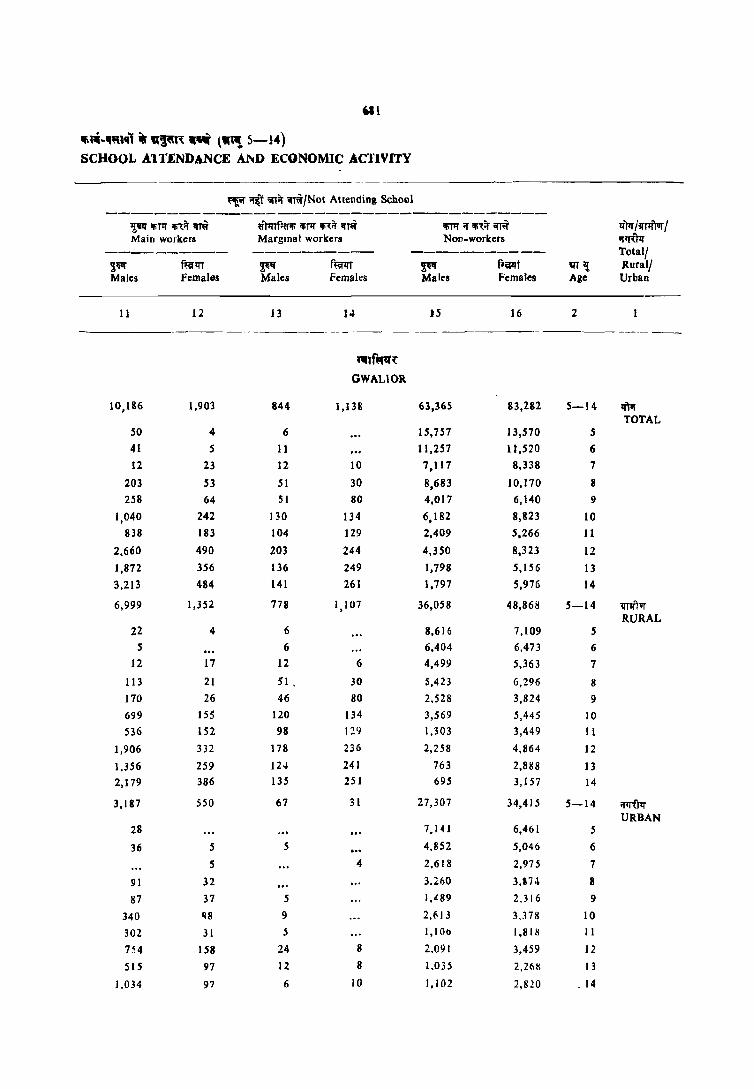
"1 ~~·II\I\\ql ilr ~ ,,~ \ .. ~ 5-14) SCHOOL Al TENDA-NCE A~D ECONOMIC ACllVITY
~ TIlf '5Ilir ~/Nol Atlellding School ------------------------------------
~'ll'ilil'lfili1:it~ {fl1rrf;a-iIi 'lil'lf iIi1:il' iI~ lfiT'I'r Of 'Ii~ir ;m:r lfm I~Tllfar / Main workers MargID8 I workers Non-workers iJl'f1:1'1f
-.--------- --------~- -_--------- Total/ ~~ ffillfT ~ f~ ~" f'~t ~I~ Rural/ Males Femal.s Males femaks Males Females Age Urban
11 12 13 14 IS 16 2
---- ---- -------- -- - - .- --_._-_ --_---- ---
nflf\ll1l'{
GWALIOR
10,186 1,903 844 1,138 63,365 83,282 5-14 lOll TOTAL
SO 4 6 15,757 13,570 5
41 5 11 11,257 11,520 6 12 23 12 10 7,117 8,338 7
203 53 51 30 8,683 10,170 8
258 64 51 80 4,017 6,140 9
1,040 242 130 134 6,182 8,823 10
838 183 104 129 2,409 5,266 11
2,660 490 203 244 4,350 8,323 12
1,872 356 136 249 1,798 5,156 13
3,213 484 141 261 1,797 5,976 14
6,999 1,3052 778 1,107 36,0058 48,868 05-14 1ITIflUf RURAL
22 4 6 8,616 7,109 5
5 6 6,404 6,473 6
12 17 12 6 4,499 5,363 7
))3 21 51. 30 5,423 6,296 8
170 26 46 80 2,528 3,824 9
699 155 120 134 3,569 5,445 10
536 152 98 129 1,303 3,449 11
1,906 332 178 236 2,258 4,864 12
1,356 259 124 241 763 2,888 13
2,179 386 135 25] 695 3, I 57 ]4
3,187 550 67 31 27,307 34,415 5-14 OfIJ1:Tlf URBAN
28 7.14 I 6,461 5
36 5 5 4.8S2 5,046 6
5 4 2.618 2.975 7
91 32 3.260 3,1114 8
87 37 5 1,489 2.316 9
340 118 9 2.1\ 13 3,378 10
302 31 5 1,10b 1,81 M 11
754 ]58 24 8 2.091 3,459 12
515 97 12 8 1.035 2,26~ 13
1,034 97 6 10 1,102 2,820 .14

682
:q-4 q~ 'III!( "f\,!, "'i" iI'A 'n~ "" mrq~ C-4 CHILDREN (AGI.S 5-14) BY SINGLE YEAR OF AGE,
----
~'L~ ;orR" ffl/Attending School -------______ 0 ____ - ________
If)rr j'lTlftvr / !iii' ~1i!JT l!Iilf IIiTII' ~it ffl ij'mRl<ti <mlI' rn ,,~ IIiTII' ;r rn err" ~ Total population Main workers Marginal workers Non-workers Totalj --------- --------- -------- --------Rural! iII1l! ~" furqt ~~ fur:rt ';'Ill!f ~t ~~ ffi:r:rt Urban Age Males Females Males Females Males Females Males Females
2 3 4 5 6 7 8 9 10
.fflqT
DATtA
mtr 5-14 48,420 37,783 5 96 14 23.713 7,563_ TOTAL
S 5,705 4,525 594 288
6 5,340 4,667 1,200 579
7 4,479 3,818 1,748 743
8 6,624 5,111 4 3,380 1,130
9 3,186 3,037 9 5 1,957 850
10 6,254 4,803 9 3,969 1,332
11 3,539 2,724 10 5 2,376 722
12 5.860 3,999 23 4 3,779 945
13 3,491 2,456 19 2,245 528
14 ·3,941 2,643 5 22 2,464 446
Vl1Ifar 5-14 39,440 30,335 5 81 14 18,57-6 4)31
RURAL 3,586 363 162 5 4,537
6 4,386 3,936 971 328
7 3,616 3,089 1,290 456
8 5,454 4,277 4 2,582 728
9 2,589 2,446 9 5 1,534 536
10 5,099 3,847 9 3,220 769
11 2,901 2,105 10 5 1,869 384
12 4,8')..\ 3,195 18 4 3,091 504
13 2,1121 1,861 9 1,802 196
14 3,144 1,993 5 22 1,855 167
;rtJ'i\"I{ 5-14 8,980 7,448 IS 5,135 3,332
URBAN 231 126 5 1,168 940
6 954 731 230 2S1
7 864 729 457 288
8 1,170 834 798 401
9 597 591 423 314
10 1,155 956 748 563
11 638 619 .,. 507 338
12 966 803 5 689 440
13 670 595 10 444 332
14 797 649 609 278

683
1f~~,...m • ~R:" (JT'! 5-14) S(:JlOOL ATTENDANCE AND ECONOMIC ACTIVITY
f~~ ~r Ql'rii ~"r/Not Allending School ------------------------------------
1J:'!l' 1111~ ~if ~l{ IiIPfrfi'tI'IIi ;Jfil~ lfi\if If"' I!il1I' ;r ;Jfi~if ~=r qm /llT~"t'l / Main workers Marginal workers I\on-workers if1[~TIf
---------- ---------- ----------- Total/
~'llll f;iif1IT ~ f~ ~III mrllT aTlIl' Rural/ Males Females Males Females Ma!~s Females Ag; Urban
--- - - -------
11 12 13 ]4 ] 5 16 2
qftf~T DATIA
2,752 610 239 540 21,615 29,056 5-14 lI)1r
TOTAL 18 5,093 4,238 S
.5 4,135 4,088 6
23 8 4 2,7011 3,062 7
44 24 21 13 3,175 3,944 8
49 24 14 27 1,158 2,131 9
280 71 46 63 1,950 3,337 10
221 70 16 45 915 1,882 II
622 1:8 52 148 1,384 2,744 12
556 106 43 108 628 1,713 13
934 148 47 132 469 1,917 14
2,360 496 239 518 18,177 25,076 5-14 llTmlJf RURAL
18 4,156 3,424 .5
5 3,410 3,607 6
14 8 4 2,312 2,621 7
44 24 21 13 2,803 3,511 8
33 24 14 27 1,000 1,851 9
218 58 46 63 1,606 2,958 10
199 57 16 45 806 1,614 11
540 128 52 1411 1,193 2,410 12
454 83 43 93 51 ] ',489 13
836 114 47 125 379 , ,587 14
392 114 22 3,438 3,980 5-14 ifi)"{Tlf
URBAN
937 814 .5
725 480 6
10 397 441 7
372 433 8
16 158 277 9
63 13 344 379 10
22 13 109 2tJS II
83 30 191 334 12
102 24 15 11.5 224 13
98 34 7 90 330 14

684
fT. 4 ~ ... W'" I fll'lII' IIT~ .M "" w1f1lflll' • ft .
C·4 CHILDREN (AGES 5-14) BY SINGLE YEAR OF AGE.
~i.W iJf.t ;nW/Attcndiol School
--------------------------'litIr /flflfrur I ~iifiJfiwIr( lJtl1 'filII' m ri &ill'r~ ~ii1r m ;ni .11PI'm;nW lim Total population Main workers Marginal workers Non·.workers Totall --------- --------- -------- --------Rural/ ilfTl!; ~ f~qf pi fum ~ m.-Iri" 'i~ mrlrT Urban Ale Males P,males Males Females Males Females Males Pemales
2 3 4 5 6 7 8 9 10
f~,l SHIVPURI
II'N 5-14 131,173 106,733 101 384 50 43,875 14,612 TOTAL
5 Hi,415 13,963 1,229 551 6 15,307 13,911 3,026 1,147 7 12,682 10,755 5 6 4,025 1,439 8 17,627 14,964 5 6,703 2,284 9 8,789 8,481 5 19 4,287 1,573
10 17,695 13,556 48 10 8,439 2.344 II 8,215 6,247 14 85 24 4,546 1,333 12 18,423 12,624 19 89 10 8,517 1,916 13 1,966 5,78~ 311 49 3,940 961 14 8,65.5 6,442 20 83 5 4,162 1,060
V'I'Iftur 5-14 115,243 92,710 87 366 36 38,680 7,949 RUllAL
5 14,584 12,389 892 311 6 13,610 12,330 2,325 660 1 11,158 9,418 3,146 775 8 15,652 13,175 5 5,496 1,379 9 7,695 7,304 19 3,507 896
10 15,614 11,717 42 10 6,968 1,344 11 6,974 5,240 9 85 10 3,547 707 12 15,977 10,917 19 89 10 6,784 991 13 6,737 4,914 38 43 2,959 451 14 7,242 5,246 20 83 5 3,055 431
;rllitlf 5-14 16,BO 14,023 UllBAN
14 18 14 10,195 6,663
5 1,831 1,574 337 240 6 1,697 1,581 701 487 7 1,524 1,337 5 6 879 664 8 1,974 1,789 1,207 90S 9 1,093 1,177 5 780 677
10 2,081 1,779 6 1,471 ',000 II 1,~41 1,007 5 14 999 626 12 2,446 1,708 ". 1,733 918 13 1,229 874 6 981 516 14 1,412 1,197 1,107 629
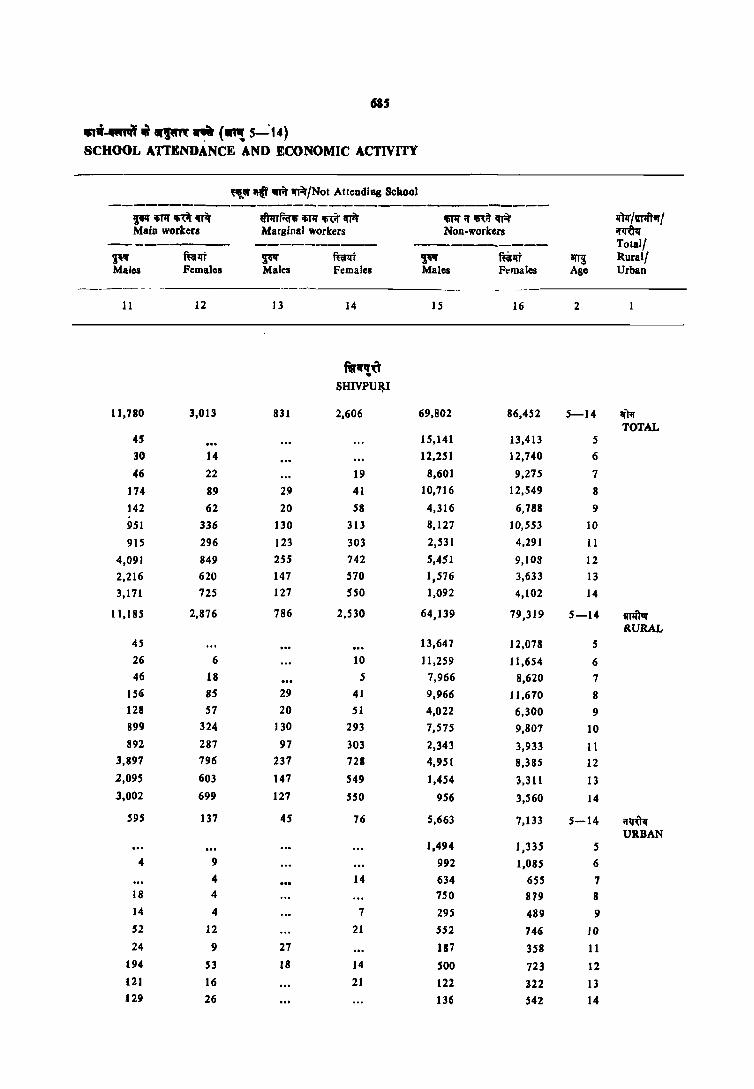
61S
.... ..wM iii 81SWft ~ (In'! S_: 14) SCHOOL ATTENDANCE AND ECONOMIC ACTIVITY
\'1\111' IIt\'.r.r ~"r/Not AtiendiDg Scl1001
~iIiTII'CRit~ ~ilmrm<W'r !liN ~ ~it iI'fnr If''tlr/'lf'ftwr I Main workers Marginal workers Non-workers ~
--------- ---------- ---------- TOlal!
1''' full.1t ~ fi:rn ~ ftilft ~ Rural! Males Females Males Females Males Females Age Urban
-------- - --
11 12 13 14 15 16 2
m~~ . SHIVPU~I
11,780 3,013 831 2,606 69,802 86,452 5-14 1f(1r TOTAL
45 15,141 13,413 5
30 14 12.251 12,740 6
46 22 19 8,601 9,275 7
174 89 29 41 10,716 12.549 8
142 62 20 58 4,316 6,788 9
951 336 130 313 8,127 J 0,553 10
915 296 123 303 2,531 4,291 11
4,091 849 255 742 5,451 9,108 12
2,216 620 141 570 1,576 3,633 13
3,171 125 127 5S0 1,092 4,102 14
11,185 2,876 786 2,530 64,139 79,319 5-14 CIT1ft1r RURAL
45 13,647 12,078 5 26 6 10 11,259 11,654 6 46 18 5 7,966 8,620 7
156 85 29 41 9,966 11,670 8 128 57 20 51 4,022 6,300 9 899 324 130 293 7,575 9,807 10 892 287 97 303 2,343 3,933 11
3,897 796 237 728 4,951 8,385 12 2,095 603 147 549 1,454 3,311 13 3,002 699 127 550 956 3,560 14
595 137 45 76 5,663 7,133 5-14 ,,~
URBAN 1,494 1,335 5
4 9 992 1,085 6
4 14 634 655 7 18 4 750 879 8 14 4 7 295 489 9 52 12 21 552 746 10
24 9 27 117 358 11 194 53 IS 14 500 723 12 121 16 21 122 322 13 129 26 136 542 14
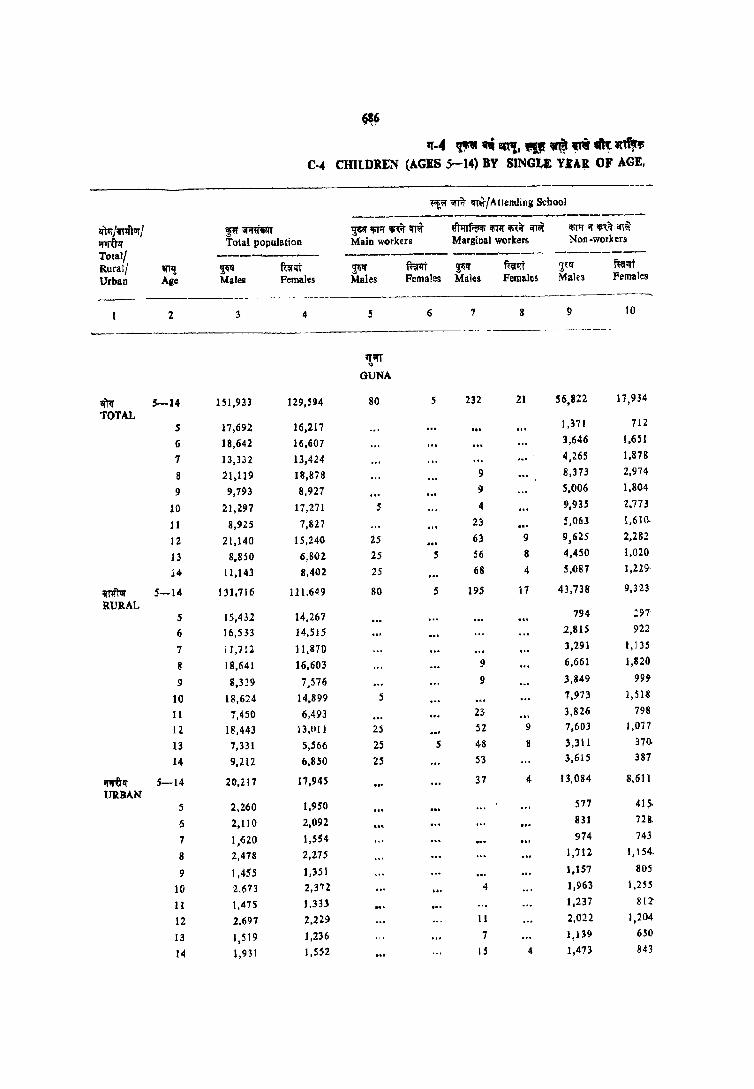
6~
'1'-4 ~;nien".,,~._ C·" CHILDREN (AGES 5-14) BY SINGI,.J: Y.rA~ OF AGE,
t'!i'. ... Iit1~ ~/Altendillg Scbool
-----------------------lfTtr jW!tfllJf / ~or;rnm ~~I'f~it!ll~ ~1~1f,fIf;r;;:ij-lm" 'IiT'If <r 'Ii'~ ifT~ ~ Total population Main workers Marginal wcrkers Non-workers
Totall --------- ------- --------Rural! ~ ~ IW;Ilt ~ fum ~If ful'1lt ~~rf fteilfT Urban Age Males Females Males Females Males Females Males Females
-------~
2 3 4 S 6 7 8 9 10
---------
~;n
GUNA
If"l1r 5-14 ISI,933 129,594 80 5 232 21 56,822 17,934
TOTAL S 17,692 16,217 1,371 712
6 18,642 16,'07 3,646 1,651
7 13,332 13,424 4,265 1,878
8 21,119 18,878 9 8,373 2,974
9 9,793 8,927 9 5,006 1,804
10 21,297 17,271 5 4 9,935 2.773
II 8,925 7,827 23 5,063 1,610.
12 21,140 15,240 25 63 9 9,625 2,282
13 8,850 6,802 25 S 56 8 4,450 1,020
14 11,143 8,402 25 68 4 5,087 1,229-
m')-qr 5-14 131,716 111.649 SO 5 195 17 43.738 9,323
RURAL 5 15,432 14,267 794 :.97
6 16.5B 14.515 2,815 922
7 11,712 ] 1.870 3,291 1,135
8 IB,641 16,603 9 6,661 1,820
9 8,339 7,376 9 3,849 999
10 18,624 14,899 5 1,973 1,518
11 7,450 6,493 23 3,826 798
12 18.443 13,tll J 25 52 9 7,603 1,077
13 7,331 5,566 25 5 48 8 3,31 I 370.
14 9,212 6,850 25 53 3,615 387
;rwlt 5-14 20,217 17,945 37 4 13,084 8.611
URBAN 5 2.260 1,950 517 41$-
6 2,110 2,092 831 728.
7 1,620 1,554 974 743
8 2,418 2,215 1,712 1,154-
9 1,455 1,351 1,157 80S
10 2,673 2,372 4 1,963 1,255
11 1.475 1.333 1,237 8[2-
12 2.697 2,229 11 2,022 1,204
13 1,519 1,236 7 1,139 650
14 1,931 1,552 IS 4 1,473 843
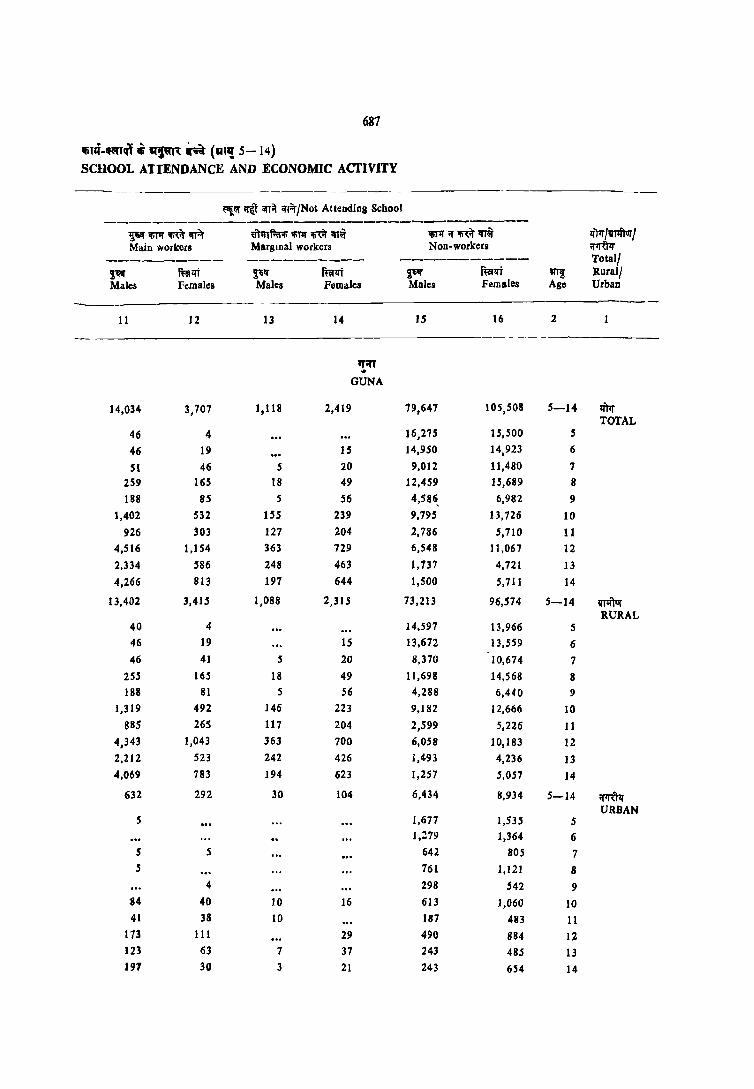
687
Ifi,d-~,ql. ~('{ ~ (al~ 5-14) SCHOOL ATTENDANCE AND ECONOMIC ACI'IVJTY
~iiI';rtf ;';Tit 'l'1i:rjNot Attending School ------------------------------
~<m'mliff.l' m~f.Qlfi IliTlf ~ liT" lIiJ1l';r rn '"" lJf1r/witor/ Mllin workers Marginal workers Non-workers ;rm:"tlJ
------_--- ---------- ----------- Total! ~QIf m.lfi ~~tt' ffiillfi ~tt' f.alli IITJ Rurall Males Females Males Females Males Females Age Urban
11 12 13 14 IS 16 2
1!ifT GUNA
14,034 3,707 1,118 2,419 79,647 105,508 5-14 ~ TOTAL
46 4 16,275 15,500 5
46 19 15 14,950 14,923 6
51 46 5 20 9,012 11,480 7
259 165 18 49 12,459 15,689 8
188 85 5 S6 4,586_ 6,982 9
1,402 532 ISS 239 9,795 13,726 10
926 303 127 204 2,786 5,710 11 4,516 1,154 363 729 6,548 11,067 12
2,334 586 248 463 1,737 4,721 13
4,266 813 197 644 1,500 5,711 14
13,4D2 3,415 1,088 2,315 73,213 96,574 5-14 o;rllftur RURAL
40 4 14,597 13,966 5 46 19 IS 13,672 13,559 6
46 41 5 20 8,370 10,674 7
255 165 18 49 11,698 14,568 8 188 81 5 S6 4,288 6,440 9
1,319 492 146 223 9,182 12,666 10
885 265 117 204 2,599 5,226 11
4,343 1,043 363 700 6,058 10,183 12
2,212 523 242 426 1,493 4,236 13 4,069 783 194 623 1,257 5,057 14
632 292 30 104 6,434 8,934 5-14 mrll' URBAN
5 ],677 J,SH 5 l,:l79 1,364 6
5 5 642 80S 7 5 761 1,]2] 8
4 298 542 9 84 40 ]0 16 613 1,060 ]0 41 38 10 187 483 11
173 III 29 490 884 ]2 123 63 7 37 243 485 13 191 30 3 21 243 654 14
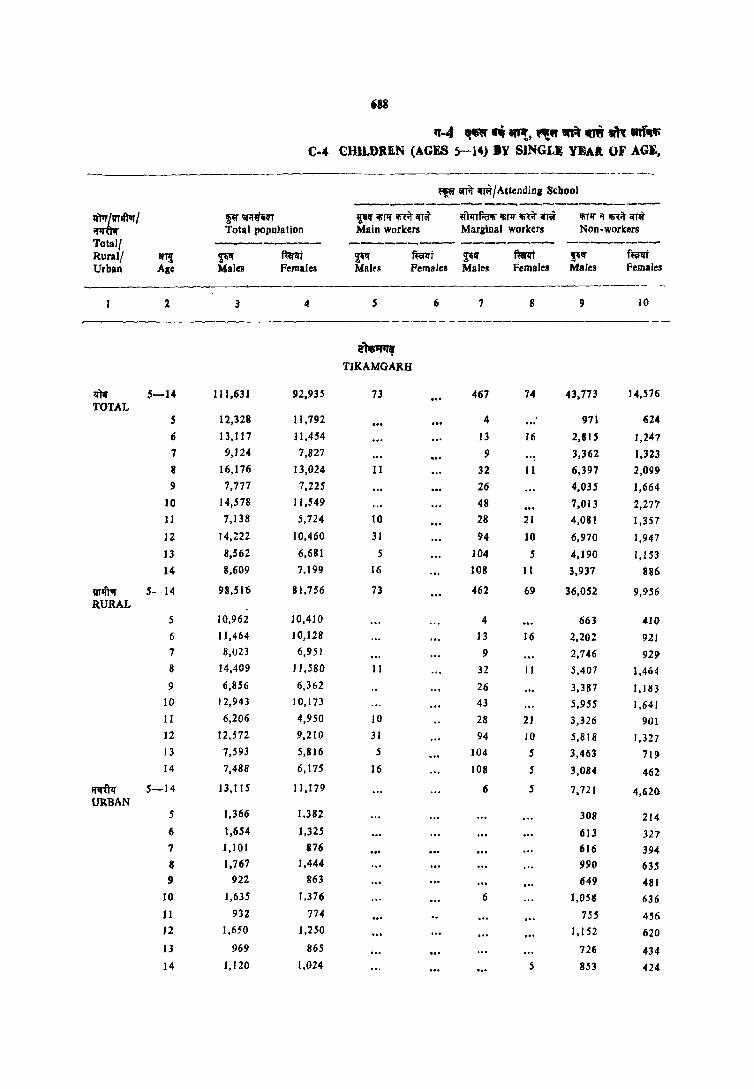
'88
"-4 ~ ~ ....,. "!" .. IIOW m ."fw C·4 CHILDREN (AGES 5-14) BY SINGLE YEA. OF AGE,
~-~-----.--------.- --_ ~;,;nit if~JAtlendjDI School
--------------------------~~:lftqrl pi' 'iTif~II'T §'III' IfifJf ;n{it lfTi ij"fl!Tf.a'Ifi 1fiT1f Ifi~ IfTi IfiTIf if lRit 1fT~
Total population Main workers Marlinal workers Non-workers
Total! --------- --------- -------- ._._._------Rural/ arT~ ~ mt ~ ~t ~If fuI1rt ~" fum Urban Age Males Females Mairs Females Males Females Males Females
-_---- -_
2 3 4 S 6 7 8 9 10
~ TIKAMGARH
zit1r 5-14 111,631 92,935 73 467 74 43,773 14,S76 TOTAL
S 12,328 11,792 4 971 624
6 13,1 J 7 11,454 13 16 2,BI5 1,247
7 9,124 7,827 9 3,362 1,323
8 16,176 13,024 11 32 11 6,397 2,099
9 7,771 7,225 26 4,035 1,664
10 14,578 11,549 48 7,013 2,277 11 7,138 5,724 10 28 21 4,081 1,357
12 14,Z22 10,460 31 94 10 6,970 1,947
13 8,562 6,681 5 104 5 4,190 1,153
14 8,609 7,199 16 108 11 3,937 886
lITifrJr 5-14 98,51"6 81,756 73 462 69 36,052 9,956 RURAL
5 10,962 10,410 4 663 4W
6 11,464 10,128 13 16 2,202 921 7 8,023 6,951 9 2,746 929 8 14,409 11,580 II 32 11 5,407 1,404
9 6,856 6,362 26 3,387 1,183 10 12,943 10,173 43 5,955 1,641 1 I 6,206 4,950 10 28 21 3,326 901 12 12,572 9,210 31 94 10 5,8 I 8 1,327 13 7,.593 5,816 5 104 5 3,463 719 14 7,488 6,175 16 108 5 3,084 462
i'ltTillr 5-14 13,115 11,179 6 S 7,721 4,620 URBAN
.5 1,366 ]'382 308 214
6 1,654 1,325 613 327 7 1,101 1176 616 394 8 1,767 1,444 990 635 !) 922 863 649 481
10 1,635 1,376 6 1,058 636
11 932 774 755 456 12 1,650 1,250 J ,I 52 620
13 969 865 726 434 14 1,120 1,024 .5 853 424

689
IfiTd -IPITq'l ~ ~i"r~ if~ (Wi,! 5 - I ~) SCHOOl, ATTENDANCE AND ECONOMIC ACTIVITY
- --_- - - ---------------- _--- _-- ---- - -- -_-_-_--~ ~T ""it 'fR/Not Attending School
----------------------------------- -~ lfiTlr m lrr~ ij1JfT~'li lfiTlr rn lfT~ i!'i'l1iJ'rn~ qml'AfJf~1 Main workers Marlliral workers Non-workers iJ'llUlf
---------- ________ "_ -- ---------- Total/ ~~I'{ f~, ~ ffillfl ~~I'{ f~lIt a"l! RuralJ Males Females Males F~males Males Females Age Urban
II 12 13 14 I~ 16 2
---------- ----
~1Pi"'" TIKAMGARH
12,841 3,7S3 1,393 4,781 '3,0114 69,751 5-14 lim TOTAL
25 II 11,317 1I,ISB 5
25 5 9 10,255 10,186 6
47 14 18 26 5,687 6,463 7
261 100 89 89 9,3S6 10,726 8
216 97 101 ISS 3,398 5,2S1 9
1,128 432 237 389 6,152 8,451 10
1,011 302 156 41t 1,1151 3,632 II
3,602 1,028 377 1,300 3,148 6,175 12
2,945 769 264 1,090 1,054 3,665 13
3,580 1,006 l43 1,281 825 4,015 14
12,326 3,522 1,336 4,579 48,267 63,630 5-14 ~'1IJ RURAL
2S II 10,269 9,990 5
25 5 9 9,215 9.187 6
47 14 18 16 5,203 5,992 7
242 96 84 84 8,634 9,925 8
207 97 101 179 3,134 4,904 9
1,040 429 237 368 5,669 7,735 10
982 292 150 4' 1 1,710 3,325 11
3,442 948 371 1,129 2,816 5.697 12
2.869 723 236 1,038 915 3.33 { 13
3,447 918 131 1,245 'JiB 3,545 14
51' 231 57 202 4,817 6,121 .5-14 'J1!"€tll UR8AN
1.038 1,168 5
1.040 999 6
10 485 472 7
19 ,3 6 , 7p 501 • 10 5 264 377 9
88 3 21 .. 3 716 16 29 11 6 141 30-8 11
160 81 6 71 332 478 12 76 4S 28 '2 139 334 J 3
133 88 12 37 122 470 14

690
,,-4 ~ ""101!, "'!" ~ ~~ • mll'i C-4 CHILDREN (AGES 5-14) BY SINGLE YEAR OF AGE,
~ IlIR w/AttendiDg School -----------------------
Iil1r /I'ItfTIf f pit~ ~lfiTII'mlif'" ~nrrf.a~ IfiTII' ,"if "''' IIi'I1f If ~i\' emf ~Iri\'lf Total population Main workers Marginal workers Non-workers Totall -------- ------- --------Rural/ i!f11l ~ mrlft ~ ffim ~ ffiflft F' mrlft Urban Age Males Females Males Pemales Males Females Males Females
2 3 4 .5 6 7 8 9 10
~ CHHATARPUR
iN 5-14 135,768 110,910 IS 545 43 52,35. 20,153 TOTAL
S 15,763 13,768 1,2'8 785
6 14,969 13,302 5 3,491 1.849
7 11,045 9,631 4,158 2,137
8 19,131 16,194 19 9, 7,892 3,182 9 10,037 8,522 29 4 5,031 2,174
10 17,741 14,010 58 4 8,327 2,987
11 8,747 7,366 55 8 4,9.56 1,944
12 17,695 13,065 10 126 17 7,980 2,000
13 9,932 7,305 138 4,723 1,474
14 10,708 7,807 5 114 4,573 1,122
IlTt{Tur 5-14 115,659 93,580 15 510 43 39,766 11,679 RUR.AL
5 l3AI0 11,585 760 337
6 12,768 11,358 5 2,463 1,239
7 9,268 8,089 3,113 1.314
8 16,614 13,874 19 9 6,213 1,937
9 8,614 7,214 24 4 4,005 1,393
10 15,196 11,725 58 4 6,393 1,626
11 7,384 6,IS8 44 8 3,870 l,IB4
12 15,1 SO 11,137 10 126 17 6,09S 1,439
13 8,351 5,981 126 3,)69 724
14 8,904 6,456 5 109 3,284 485
flU" 5-14 20,109 17,190 35 12,593 8,414 URBAN
5' 2,353 2,183 468 4.7
6 2,201 1,944 1,028 610 ., 1,777 1,5'42 1,045' 823
8 2,517 2,320 1,679 1,245
9 1,424 1,308 6 1.026 . 781
10 2,544 2,285 1,934 1,361
11 1,363 1,208 II 1,085 760
12 2,545 1,928 1,IS85 1,061
lJ 1,5'81 1.322 12 1.154 750
14 1,804 1,3S1 6 1,289 636
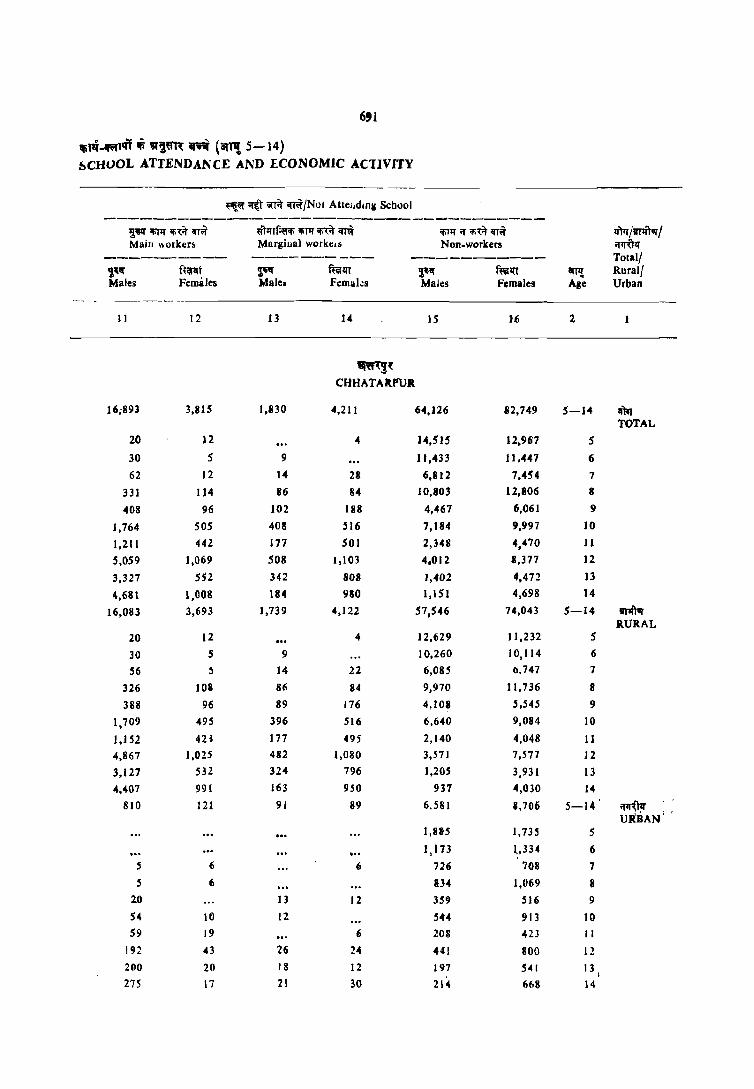
6'1
ltitf{-II'flqT it1lJ1'i~ ~ (atT1! 5-14) bCHOOL ATTENDANCE AND E.CONOMIC ACTIVITY
'--~~ ;r(t ;;rrit iIT;ii"/NOI AttelJdlDg School
-----------------------------------~~ iliTl'!" Ifi"f.r il(T~ mJlTf~ IfiTl'!" m iIT~ 1fiT1:f;r ifiB iIT~ fftlf /vrl'l"rrsr I Main \'to[kt!r~ Marginal wOrktliS Non-workers ;rtrUlf
---------- ---------- --_-------- Total/ ,~~ f.~t ~ ffi{1U ~'1( f~1U iIIT~ Rural! Males Females Male. femal~s Males females Ag""e Urban
-_--- --.... _- --
11 12 13 14 15 Hi 2
~(
CHHATAltPUJ.
16,893 3,815 1,830 4,211 64,126 82,149 5-14 llTq TOTAL
20 12 4 14,515 12,96"7 5
30 5 9 11,433 11.441 6
62 12 14 28 6,812 7,454 7
331 IJ4 86 84 10,803 12,806 8
408 96 102 188 4,467 6,061 9
1,764 50S 408 516 7,184 9,997 10
1,211 442 171 501 2,348 4,470 11
5,059 1,069 508 J,103 4,012 8,371 12
3,327 5)2 342 808 1,402 4,472 13
4,681 ) ,008 184 980 1,15 I 4,698 14
16,083 3,693 ),739 4,122 57,546 74,043 S-14 mm RURAL
20 )2 4 12,629 11,232 5
30 S 9 10,260 10,114 6
56 ~ 14 22 6,085 (1,747 7
326 108 86 84 9,970 11,736 8
388 96 89 176 4,108 5,545 9
1,709 495 396 516 6,640 9,084 10
1,152 421 177 495 2,140 4,048 1 I
4,867 1,025 482 1,080 3,571 7,577 12
3,127 532 324 796 1,205 3,931 13
4,407 991 163 9S0 937 4,030 14
810 121 91 89 6,581 1.706 5-14 ;rJJ,rll" URBAN' .
1,8115 1.735 5
1,173 1.,334 6
S (; 6 726 708 7
5 6 1134 1,069 II 2.0 13 12 359 516 9
54 10 12 5,U 913 )Q
59 19 (; 20S 423 11
192 43 26 24 441 BOO 12
200 20 18 12 197 541 13
27S 17 21 30 214 668 14

692
11'-4 'l[{.W .t tIT,. ~"" m ~T" tik Wlf'll" c-.. CHILDREN (AGES 5-l4) BY SINGLE YEAR OF AGE.
~ ... ~ ~I Attending School --------------- ---------
:;r:I!Turl F' IlI"fW6II'T !"l'lIiPI'm-m ~lIiTlfm;ml 'li11l'<t'm;ot{ Total population Main workers Marginal worker. Non.workers
Total! --------- --------- ------- ---------Rurall ~ !(OI'f fmt ~ ffiflfl ~ mrJl't ~Q' ~Iff Urban Age Males Femalel Males Females Males Females Males Pemale.
2 J 4 5 6 7 8 9 18
q'J;fT
PANNA
~ 5-14 80,114 70,826 72 227 34 32,223 11,276 TOTAL
S 9,135 8,291 992 517 r; 8,451 8,451 .•. 2,345 1,167
1 6,939 6,HI 2,684 1,161
8 10,198 9,5"46 .5 5 4,551 1,817
9 5,113 5,371 10 3,123 1,349
10 11,002 9,446 .5 43 5,417 1,706
11 5,092 4,21l II 3,072 1,067
12 10,905 8,89j II 87 8 4,790 1,332
lJ 5,514 5,099 20 22 2,600 705
14 6,458 5,116 32 54 20 2,648 4" ~ 5-14 74,161 65,609 72 227 34 28,391 8,472 RURAL
5 8,507 7,179 855 361
6 7,842 7,816 2,043 928
T 6,385 5,983 2,318 985
8 JO,179 8,856 5 5 4,166 1,439
I) 5,365 4,919 10 2,172 1,058
10 10,259 8,144 5 43 4,901 1,311
11 4,579 3,885 II :,624 784
11 10,011 8,232 11 B7 8 4,195 940
IJ 5,091 4,6U 20 22 2,306 436
14 5,881 4,701 32 54 20 2,211 228
~1[~1J 5-14 5,953 5,211 3,832 2,804
URBAN· 5 628 514 137 155
6 615 635 ]02 239 , SSS 348 366 176
8 619 690 38S 378 I) 448 438 35. 290
10 141 702 517 39.5 U 'I] :J88 449 283 II 8]4 ", 595 392
U 4U 424 29$ 268 f4 l'n 41S ... 431 227
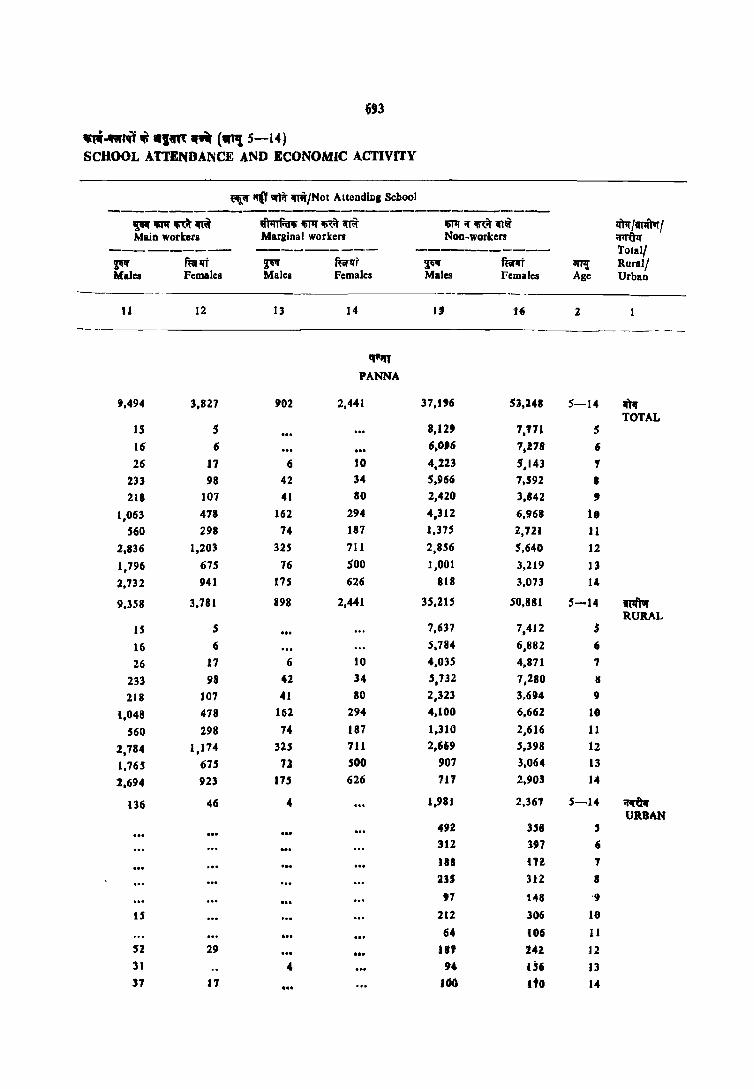
GU
... -_flit" _1m ~ (.''1 5-14) SCHOOL ATTENDANCE AND ECONOMIC ACTIVITY
~ IfCY .wr lriJNot Allendiog School
-----------------------------------'!'Ir~rnd ~mm~ m ;rmllli liPf /flirtr I Main workera Marginal worken NOD-worken ~
--------- --------- ---------- Totall gw futlft ~ ffirll-r ~ fum al'l~ Rural/ Males Females Males Females Males Females Age Urban
-------II 12 13 14 IJ 14i 2
--_----- --_-- -_
"'''' PANNA
9,494 3,827 902 2,441 37,196 5],248 5-14 IfR TOTAL
15 .5 8,129 7,nl S 16 6 6,OJ6 7.1.78 6
26 17 6 10 4,223 5,143 , 233 98 42 34 5,966 7,592 • 218 107 41 80 2,420 3,142 ,
1,063 478 162 294 4,312 6,968 1. 560 298 74 187 1,375 2,721 11
2,836 1,203 325 711 2,856 5,640 12
1,796 675 76 500 1,001 3,219 I3
2,732 941 175 626 818 3,073 14
9,358 3,781 898 2,441 35,215 50,881 5-14 ,(Ift1Jr RURAL
15 5 7,637 7,412 ; 16 6 5.784 6,882 6
26 17 6 10 4,035 4,871 1
233 98 42 34 ',732 7,280 • 218 107 41 80 2,323 3.694 9
1,048 478 162 294 4,100 6,662 10
560 298 74 187 1,310 2,616 11
1,784 1,174 325 711 2,ti69 5,398 12
1,165 675 71 500 907 3,064 13
2,694 923 .75 626 711 2,903 14
136 46 .. 1.981 2,361 5-14 ~ URBAN
492 U8 5 31Z 397 , 188 171 , :US 312 8
97 148 '9
IS 212 306 10
64 106 11
52 29 .,. II' 141 12 31 .. 94 1;6 J3 31 n 106 ItO 14

694.
,,·4 qQ irIi at'!, fI{W iiQt g ~ wnfllMi C-4 CHILDREN (AGES 5-14) BY SINGLE YEAR OF AGE,
~or Of Tit ~it I Aliendmg School
------------------------~/'lT"Iftar/ ~ Iil'Al'rn 1jtlllliTll" m;nW ~fhrrf.611i IIiJ1I" rn iI1lT lIiJ1I"iflRit~ ~ TOlal population Main workers Mal'linal workers Non-worlcers Total/ ------ --------- --------- -------_ Rural/ 81r~ ~ fitrlli ~ ft«lIi ~ fttIlIi ~ ffi:fl!t Urban Age Males Females Males Females Males Females Males Females
2 3 " .5 Ii 7 • 9 iO - -_. -----_
WPf'('
S~GAR
IfPr 5-14 191,566 168,013 98 19 119 144 99,820 H,070 TOTAL
5 20.'24 11,519 1,474 1,051
Ii 22,'100 20,668 7,076 4.597
7 lS,S${J 14,976 9 5 7,833 5,201
8 22,817 20,969 9 13,577 1,211
9 14,382 14,309 4" 10,J 68 6,827
10 23,608 20,136 88 16 1.5,99.5 8,449
11 14,993 13,168 10 .5 83 10 10,920 5,565
12 23,791 18.996 26 5 176 49 14,312 6,170
13 1.5,720 13,005 16 5 2J2 28 9,660 3,7J5
14 17,OJl 13,267 45 5 198 3S 8,105 3,27&
II"J1It'1" 5-14 140,445 121,027 75 19 779 95 63,413 24,251 RURAL
.5 15,747 13,687 752 351
6 11,280 15,522 4,509 2,276
7 11,634 11,039 9 .5 5,122 2,588
8 17,233 15,452 9 8,925 4,240
9 10,537 10,348 44 6,807 3,600
10 17,264 14,240 88 5 10,524 4,024
1J 10,6"81 9,485 10 5 75 10 6,984 2,726
12 17,186 13,617 10 5 161 33 8,980 2,493
13 10,993 8,929 10 5 212 IS 5,841 1,151
14 . 11,8!>-0 8,706 45 5 181 26 4,969 802
;orqWr 5-14 SI,121 46,986 23 40 49 36,407 28,819 URBAN,
5 5,171 4,832 722 70G
-6 ',420 5,145 2,567 2,32J
7 3,916 3,937 2,711 2,619
II 5,65S 5,517 4,652 3,911
9 ),34S 3,961 3,362 32211
10 6.344 5,1197 II 05,471 4,425-
II 4,3J 2 3,612 1 3,936 2,839
12 6,605 5,379 16 15 16 5,331 3,617
13 4.727 4,075 6 13 3,819 2,564-
14 ' • .121 4,560 17 10 3,836 2,471

'" 1Iit'i-m"i'f ~ ~ vi ("''t 5-14) SCHOOL A1TENDANCE AND ECONOMIC ACfIVITY
~iI' 1ft\' GIR ri/Not Attending School ---------------------------------
lJ"fifilT{m"", ~~lI"mm II>P ... 'I' m;fflr lfflf /fTlftllf I Main workers Marginal workers NOD-workers ;rlf'~
--------...- --------- --------- Total/
I" RallT ~ ffiltrt ~ r,,~ al'l1! Rural/ Males Females Males Females Males Females Age Urban
11 12 13 14 15 16 2
~~
SAGAR
15,989 9,367 1,346 4,900 73,494 100,513 5-14 If''tlJ' TOTAL
30 4 19,420 17,463 5 IS 10 9 15,600 16,061 6 40 10 18 18 7,650 9,737 7
IS8 105 34 93 9,110 12,561 8 229 181 9 114 3,932 7,187 9
i,IOl 887 99 477 6,323 10,308 10 1,129 991 123 553 2,727 6,044 11 4,123 2,537 453 1,333 4,701 8,901 12 3,318 2,122 294 1,102 2,219 6,033 13 5,845 2,525 307 1,205 J,811 6,218 14
14,370 7,913 1,202 4,508 60,606 84,241 5-14 mftvr RURAL
30 14,965 13,336 5
10 10 9 12,752 13,237 6 40 10 18 18 6,446 8,418 7
147 88 31 88 8,121 11,036 8 212 145 9 114 3,466 6,489 9
1,012 798 86 461 5,554 8,952 10 1,082 871 liB 533 2,411 S,334 II
3,705 2,184 415 1.234 3,913 7,661 12 2,96B I,B2S 254 1,004 1,70B 4,929 13 5,165 1,971 262 1.055 J ,269 4,842 14
1,619 1.4'4 144 392 12,888 16,272 5-14 ;rm URBAN
4 4,455 4,127 5 5 2,84B 2,B2S 6
1,204 1,318 7 II 17 3 5 9B9 1,524 8 17 36 466 697 9 91 88 13 16 769 1,357 10 47 114 5 20 316 710 11
417 353 37 99 788 1,2]4 12 351 297 40 98 5 II 1,104 13
680 548 4J UO 543 1,376 14
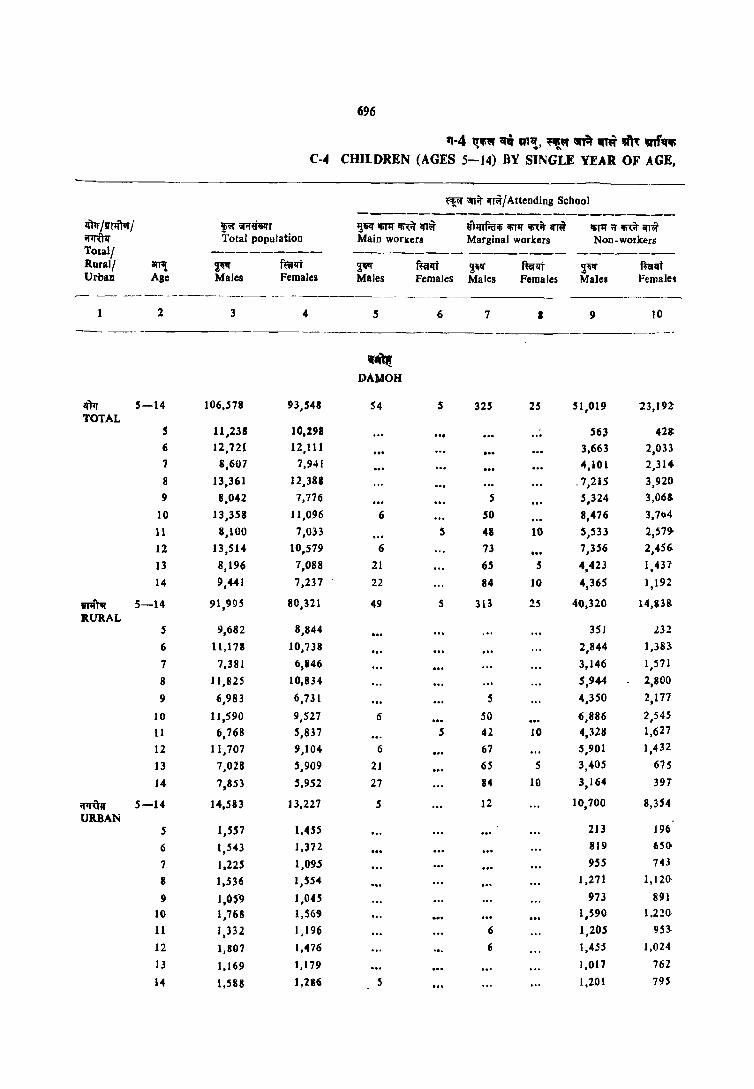
696
'1-4 I:!lf.\II -q m~, "!" ~ 1ITW ~ vn,,~ c-.. CHilDREN (AGES 5-14) BY SINGLI YEAR OF AGE,
~;;nif '"ijAttending School
--------------------------linT !fTlftIlf ! ~flmT ~11.J IfiT1f m iIli u'hrrf.:erili ifilli' lIi1:it arri iliTII';; m ~ri iI1I'"U1.J Total population Main workers Marginal workers Non-workers Total! --------- --------- -------- --------Rural! If11! ~If f",lft ~ fullIi ~lf fuJlft ~ fujlfr Urban Age Males Females Males Females Males Females Males Female9
--- ----- -- ------- -- --- -_- _.
2 3 4 5 6 7 I 9 to ----- ---- -_--_----- --------
-*'t DAMOH
II'R 5-14 106,578 93,548 54 S 325 25 51,019 23,ln TOTAL
5 11,2311 10,298 ... S63 428:
6 12,721 12,111 3,663 2,033 7 8,607 7,941 4,101 2,314
8 13,361 12,381 .7,215 3,920
9 8,042 7,776 S S,324 3,068-
10 13,358 11,096 6 50 8,476 3,7()4
11 1,100 7,033 S 48 10 S,S33 2,519-
12 13,514 10,579 6 73 7,356 2,456
13 8,196 7,088 21 65 5 4,423 1 437 , 14 9,4'41 7,237 22 84 10 4,365 1,192
V11I'''t~ 5-14 91,995 80,321 49 S 313 15 40,320 14,838. RURAL
5 9,682 8,844 3SJ .l32
6 11,1711 10,738 2,844 1,383.
7 7,381 6,146 3,146 1 .571 , 8 11,825 10,834 5,944 2,800
9 6,983 6,731 5 4,350 2,117
10 11,590 9,527 6 50 6,886 2,545
11 6,768 5,837 5 42 10 4,328 1,627
12 11,707 9,104 6 67 5,901 1,432
13 7,028 5,909 21 65 S 3,405 675
14 7,853 .5,952 27 84 10 3,164 397
iflTUII' 5-14 14,583 J 3,227 5 12 10,700 8,354 URBAN
5 1,557 1,455 213 196
6 1,543 1,372 819 6S()
7 1,225 1,095 955 743 , 1,536 1,554 1,271 1,12Q.
9 I,OS-9 1,045 973 891
10 1,768 I,S69 1,590 1.22Q.
11 1,332 1.196 6 1,205 9SJ.
12 I,B07 1,476 6 1,45:5 1,024
13 1,169 1,179 1,017 762
14 1,51S ],186 5 1,201 795

697
IIF\'Ttf-"m !f11R~~T~ ii1~ (,n3! 5-14) SCHOOL ATTENDANCE AND Ef01"tlOMIC ACTIVITY
~IIl\'l" "liff ;;n~ '""t/Not AUt'f"ding School -----------------------------------
ll'lJ lIiIlr ""it ;r.~ ml'um 'Iil1J 'li<:it lI'r~ 'Iil1J "I 'li<:it iffi'r 7<)tr/lJrIft'lll Main workers Marginal workers Non-workels "liI'(T,.
----------- ---------- ----------- rotal/ ~'f fHAT ~ ffir!it ~ f~lft C!f!'l{ Rural/ Males Females Males Females Males Females Age Urban
11 12 13 14 15 16 2 _ - -- -- _-_ - --- -- - ---- - ------ - -_--- --_-- -----
~ DAMOH
10,198 5,265 964 2,947 44,018 62,114 5-14 ~~ TOTAL
10 10,66S 9,870 5 10 II 9,048 10,066 6 10 5 13 5 4,482 5,617 7
IDS 65 27 42 6,014 1,360 8
107 93 33 80 2,574 4,535 9 651 465 78 293 4,09B 6,574 10 6-0 428 100 338 1,808 3,672 11
2,761 1,521 305 644 3,012 5,959 12 2,248 1,214 188 709 1,253 3,723 13 3,686 1,461 220 836 1,064 3,739 14
9,789 4,902 901 2,857 40,624 ~7,69S 5-14 VlIll11T RURAL
10 9,321 .,612 5 5 II 8,.329 9,343 6
5 13 5 4.22: 5.265 7 lOS 65 27 42 5,749 7,926 8 107 93 33 80 2,489 4,381 9 634 414 78 287 3,937 6,281 10 590 406 94 327 1,714 3,462 II
2,635 1,438 268 610 2,830 5,623 12
2.205 1,121 188 692 1,144 3,416 13 3,499 1,346 2(J0 813 lIS 9 3,385 ]4
409 364 63 90 3, ~94 4,419 5-14 iliI<T'f URBAN
1.344 ',258 5 5 719 722 6
10 260 3S2 7
2fi5 434 II
8S 154 9 17 51 6 161 2H 10 20 22 6 11 95 :no II
126 83 37 34 182 33~ 12 43 93 17 109 307 13
'S7 115 19 23 175 354 14
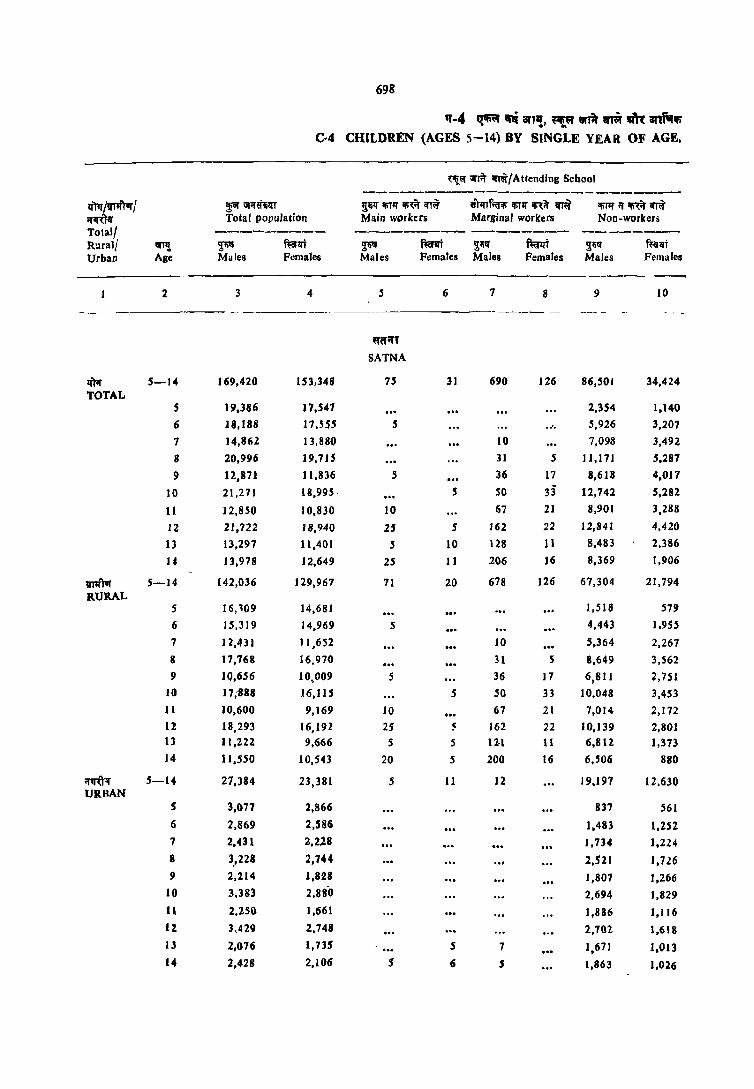
698
11'-4 ~ ~ alTIa', ~" m 'frir m anf'1~ .. '" C·4 CHILDREN (AGES 5-14) BY SINGLE YEAR OF AGE,
~ ... Offill" ~/Attendjng School
-------------------------'l.fPr /'lflftUf I ~ \iI'''~liillT !Jliill" 1IiT'f Ifi'f.r ifli fihrr~ iliTl1 ifi\~ ifli lfiIlI'''I'mm ,,~1ll" Total population Main workers Marginal workers Non-workers Total/ --------- ---------- -------- --------Rural/ IIFI,! ~ f~l:1i ~ fuflft ~li" ful'lli ~li"fl' mtlJT Urban Age Males F.:males Males Females Males Females Males Females
2 3 4 5 6 7 8 9 10
~CI';f'
SATNA
lI)Ir 5-14 169,420 153,348 75 31 690 126 86,501 34,424 TOTAL
5 19.386 17,547 2,354 1,140
6 18,188 17,.555 .5 .... .5,926 3,207
7 ]4,862 13,880 10 7,098 3,492
8 20,996 19,715 31 5 lI,I71 5,287
9 12,871 II,836 .5 36 17 8,618 4,017
]0 21,271 18,995. .5 SO 33 12,742 5,282
11 12,8S0 10,830 10 67 21 8,901 3,288
12 21,722 18,940 25 5 162 22 12,841 4,420
13 13,297 11,401 5 10 128 11 8,483 2,386
14 13,978 ] 2,649 25 11 206 16 8,369 1,906
V11f"'" .5-14 142,036 129,967 71 20 678 126 67,304 21,794
R.URAL 5 16, ~09 14,681 1,518 579
6 15,319 14,969 .5 4,443 1.955
7 ] 2,431 J 1,652 10 5,364 2,267
8 17,768 16,970 31 5 8,649 3,562
9 10,656 10,009 5 36 17 6,811 2,751
10 17 ;888 16,115 5 SO 33 10,048 3,453
II 10,600 9,169 10 67 21 7,014 2,172
12 18,293 16,192 2S ~ 162 22 10,139 2,801 13 11,222. 9,666 5 5 12·1 11 6,BI2 1,373 14 11,550 10,543 20 5 200 16 6,506 880
;rlJ'(tlf 5-14 27,384 23,381 5 11 12 19,197 12,630 UR.IJAN
S 3,077 2,866 837 561
6 2,869 2,586 1,481 1,252
7 2,431 2,2,28 1,734 1,224
8 3 .. 228 2,744 2,521 1,7l6 9 2,214 J,828 1,807 1,266
10 3.383 2.880 2,694 1,829
II 2,250 J ,661 1,886 1,116
lZ 3,429 2.748 2,702 1,618 IJ 2,076 1,735' S 7 1,671 1,013 14 2,428 2,106 5 6 S 1,863 1,026

699
-';'~-If\=!'Tq') tis' ,,~~ ~ (1A1~ 5-14)
SCHOOL ATTENDANCE AND ECONOMIC ACTIVITY
~" ;r~ "'Tit iifliltJNot Attending School -----------------------------------------
~Ijlf 'IiT%f m iifrilr ~TifTf;a'" If"TP' m iifr~ 'PTif ;r ,",it iifr~ q)q /'1T%fTvrl Main workers Margil'al work~rs Non-workers 'IlRf-q
---------- ---------- ----------- Total/ ~lilf f~qr ~1j'f r~1IT ~1iT fl'QllfT m~ Rural/ Males Females Males Pemales Mairs Females Age Urban
----~---- - - _---- ---- -- --_. __ . 11 t2 13 U 15 16 2
W(f;rr
SATNA
15,337 12,554 1,290 4,253 65,527 101,960 5-14 IIW TOTAL
3S 5 5 6 J6,992 16,396 5 44 30 17 12,213 lot,301 6 69 97 10 23 7,674 10,269 7
410 306 63 161 9,321 13,955 8
360 31'6 95 125 3,756 7,362 9
1,720 1,154 192 48S 6,S68 12,037 10
1,230 1,158 152 445 2,491 5,918 11
4,529 3,495 301 1,106 3,864 9,893 12
2,908 2.~99 274 701 1,499 5,794 13
4,032 3,496 198 1,184 1,149 6,036 14
14,265 11,835 1,272 4,198 58,446 91,994 5-14 !lT1ft" RURAL
3S 5 5 6 14,752 14,091 5
44 30 17 10,827 12,968 6
69 80 10 23 6,977 9,282 7
390 290 63 161 8,634 12,952 8
311 294 95 125 3,398 6,821 9
1,599 1,111 192 485 6,000 11,029 10
1,168 1,098 152 445 2,188 5,433 11
-4,225 3,2?S 296 1,088 3,446 8,981 12
2,695 2.374 274 682 1,315 5,221 13
3,729 3,258 18S 1,166 9JO 5,217 14
1,072 719 18 55 7,081 9.966 5-14 ;:rll~::;
URBAN 2,240 2,3 t}S 5
1,3117 1,334 (j
17 697 911'7 7
20 16 686 1,003 II
49 21 3511 540 9
121 43 568 1,008 10
62 60 302 485 11
304 200 5 18 418 912 12
214 125 19 184 573 13
303 238 12 18 239 818 1 +

700
1(-4 qq ~ "r~, ifIIi" ~r.t .T~ ,," mf'l'ifi . .. C-4 CHILDREN (AGES 5-14) BY SINGLE YEAH. OF AGE,
~l'I' iiI'A' ifRi/Athmding School --------------------------
tft;r /'lflfIvr / :pr mUlfI ~ ;r;nr m err" mllTf.:a'1Ii' ;r;nr m emf lI\11I'if m error ~~ Total population MaIO workers Marginal workers Non-workers
Total! --------- --------- -------- -------~
Rurall 8fl1! ~ . fum ~1i1f fum !!1i1f ~lIt ~1i" fum Urban Age Males Females Males Females Males Females Males Fem .. les
~-----.-.
2 J 4 5 6 7 8 9 10
-aerr RBWA
~ 5-14 184,480 166,238 85 10 726 71 95,686 35,532
TOTAL 5 21,579 19.067 2,599 1,283
6 2U77 20.520 12 6,908 3,227
7 14,835 13.941 6,807 3,215
8 24,397 22,867 11 - 12,796 5,402
9 11,861 11,701 5 7,932 3,813
10 24,155 22,692 87 11 14,734 5,860
11 11,979 10,464 15 30 16 8,742 3,272
12 24,282 20,496 37 S 148 16 15,249 4,718
13 13,541 I t,640 24 178 11 9,510 2,639
14 15,975 12,850 9 5 270 10,410 2,104
mTvr 5-14 161,635 146,512 60 10 726 71 80,195 25,861
RURAL 5 19,062 16,751 1,959 792
6 19,494 18,250 12 5,758 2,279
7 13,116 12,188 5,729 2,357
8 21,770 20,S14 11 10,989 4,246
9 10,30J 10,194 5 6,700 2,872
10 21,348 20,054 87 11 12,658 4,367
II 10,223 9,085 15 30 16 7,218 2,414
12 21,046 18,07 I 20 5 148 16 12,730 3,432
J3 11,473 10,093 20 178 11 7,806 1,791
14 13,799 11,251 5 5 270 8,649 1,312
'!1fUIf 5-14 22,845 19,726 25 15,491 9,671
URBAN S 2,516 2,316 641 491
6 2,383 2,269 1,150 949
1 1,719 1,753 1,071 8S8
8 2,626 2,2!H 1,807 1,156
9 1,558 1,507 1,232 941
10 2,807 2,638 2,076 1,492
II 1,156 1,378 1,524 857
12 3,235 2,42S 17 2,519 1,286
13 2,068 1,547 4 1,703 848
14 2,176 1,599 .. 1.761 793

701
$11i-lMtq"f ~ atIU~ .... (Itt,! 5-14)
SCHOOL ATTENDANCE A~D ECONOMIC ACTlVITY
~~lIf ~~ ~R ilRjNot Allending School
----------------------------------!!iq- iiIi1lI' rn ;rriir ~"iiIi1lI'm;if.f iiIi1lI' 'l'1fi\iI' ffl q-trr jllll,'rar I Main workers Marginal workers Non-workers 'IlJ;:')1f
--------- ---------- -----_---- Tolal! ~!f f~lft ~ ftiRt ~~ ... fffillT an!; Rural/ Males Females Males Females Males FelU .. les Age Urban
11 12 13 14 15 16 2
tm REWA
14,197 13,609 1,331 4,243 11,8.49 112,713 5-14 II'ttr TOTAL
15 4 18,964 17,780 5 29 54 11 14,921 11,227 6
74 88 18 23 7,936 10,616 1 404 324 54 111 11,143 17,019 8
:Z24 209 61 119 3,645 7,SS3 9
t ,622 1,533 272 694 7,441 14,595 10
1,I1S 1,,0511 169 496 1,901 5,{i22 11
4,590 3,986 432 1,191 3.825 10,580 12
2,591 2.611 124 759 1,114 5,560 13
4,133 3,683 206 840 946 6,219 14
'14,041 13,088 1,322 4,190 65,285 103.292 5-14 ri1I'f RUR,o\L
15 4 ... 17,089 15,9SS S
29 54 II 13,695 15,907 6
74 88 18 23 7,295 9,721 7
399 324 54 111 10,328 IS,883 8
219 193 61 119 3,322 7,004 9
1,542 1,480 272 682 6,190 13,S 13 10
1,051 1,018 164 496 1,145 5, t 41 11
4,384 3,861 432 1,191 3,331 9,565 ]2
2,409 2,566 118 738 941 4.987 13
3,925 3,499 201 819 749 5,617 14
750 521 IS 53 6,564 9,481 5-14 if1T"U1f URBAN
1.875 1,825 5 1,232 1,321 6
642 895 7 4 814 1,137 8 4 16 322 550 9
80 53 12 651 1,081 ]0
65 39 5 162 482 JI 206 J24 494 1,01.5 12
182 105 5 20 173 573 13 209 184 5 20 197 602 14

702
q·4 ~~ 'fli "f3!, ~" ilTif .. ~ .l'{ '!fIr"", c· .. {Hh DREN (AGES 5-14) BY SINGLE YEAR OF AGE:
------ -_--_---- -----------
~'" ;;niT mrjAttcnding School ----------------------------
tfttr IIJTlftIlf f f<; ;;r;t~lil:l'r l!'ll' lIiTl'f ~~iT ;mOt ~lfrRf~ lfillr..rot if'" ;ritl'f ;:or ~it if~
"1J"@r Total population Main workers Marlinal workers Non.workers Total/ --------- --------- -------- --------Ruralf aft,! ~ f~1It ';llf fuillt $~ f~1It ~ mt Urban Age Males Females Males Females Males Females Males Females
2 3 4 S 4i 7 a , HI
~ SHAHOOL
iN 5-14 191,636 181,J07 45 5 371 29 77,078 29,002 TOTAL
5 23,32' 22,031 2,SS6 1,161
6 23.400 22,003 6,S19 2,912
7 17.409 17,231 6 7,131 3,306 , 24,840 24,195 5 11 10,585 4,506
9 13,631 13,887 11 5 7,267 3,167
10 25,166 24.352 SO 14 11,90 I 4,497
11 11,476 1] ,399 17 5 6,76S 2,689-
12 24,531 20,897 IS 118 11,273 3,143-
13 13,729 12,538 64 6,736 2,077
14 14,128 l2,S74 25 5 93 5 6,276 1.537
mPr 5-14 157,B44 150,647 40 5 360 29 54,876 14,686-RURAL
5 19.449 18,429 1,779 60!).
6 19,449 18,351 4,684 1,747
7 14,512 14.285 6 5,214 1,757
8 20,941 20,248 5 lJ 7,910 2,385
9 JJ.171 11,490 11 5 5,327 1,684
10 20,838 20,394 .50 14 8,640 2.316
11 8,931 9,244 17 5 4,592 1.342
12 20,073 17,693 10 118 7,822 1,520
13 1 J ,070 10.224 64 4,632 805
14 11,409 10.289 25 5 83 S 4,277 S2G
;rm:rll' 5-14 33,792 30,460 5 11 22,202 14,316 URBAN
S 3,'76 3.602 776 55~
6 3,950 3,652 1,905 1.165
7 2.U7 2,946 1.917 1,549-
I 3.199 3,9-47 2,ii7S 2.121 , 2.460 2,396 1.940 1,482
10 .... 328 3,958 3.261 2,181
11 2.'45 2,IS6 2.173 1.348
12 4,457 3,204 5 3,451 1.623 13 2,659 2,314 2,104 1,272
14 2,719 2,285 11 1.999 1,017
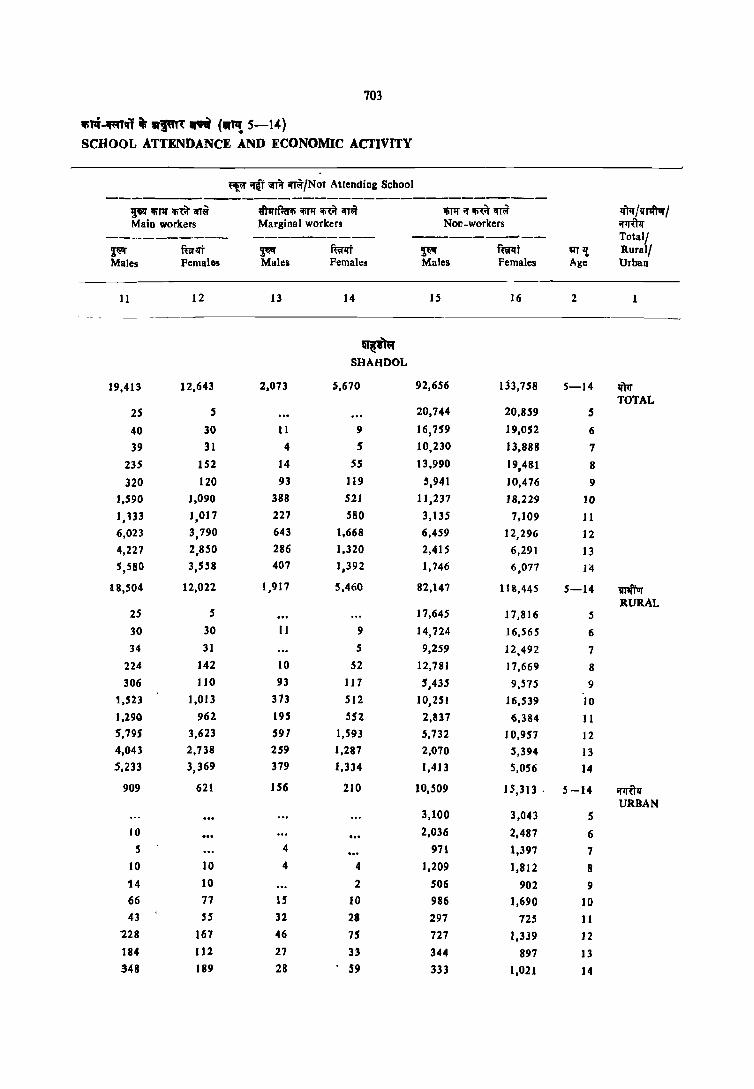
703
1fi11i~ql' 1JI'~...r (,,~ 5-14) SCHOOL ATTENDANCE AND ECONOMIC ACTIVITY
~ ~"f i;f'f.t ~/Not AttendiDg School
----------------------------------lj~1Jl1I' m~~ ~rfiij'l!i Ilil1l' l!i1:if iIl(if 1Ii1lf if rn iOW 7ft;r /r;mfrur I Main workers Marginal workers NOD_workers ~
----------- ---------- ----------- Total/
~ fuJlit ~ ffirlit ~ f~t ~1! Rural! Males Femalos Males Females Males Females Age Urban
11 12 13 14 IS 16 2
~ SHAHDOL
19,413 12,643 2,073 5,670 92,656 Ij3,758 5-14 q)Jr TOTAL
25 5 20,744 20,859 5
40 30 11 9 16,759 19,052 6
39 31 4 5 10,230 13,888 7
235 152 14 55 13,990 19,481 8
320 120 93 119 ',941 10,476 9
1,590 1,090 388 521 11,237 18,229 10
1,133 1,017 227 580 3,135 7,109 11 6,023 3,790 643 1,668 6,459 12,296 12
4,227 2,850 286 1,320 2,415 6,291 13 5,580 3,558 407 1,392 1,746 6,077 14
18,504 12,022 1,917 5,460 82,147 118,445 5-14 V11ftar RURAL
25 5 17,645 17,816 5
30 30 11 9 14,724 16,565 6
34 31 5 9,259 12,492 7 224 142 10 52 12,781 17,669 8
306 110 93 117 5,435 9,575 9
1,523 1,013 373 512 10,251 16,539 10 1,290 962 195 SSZ 2,837 6,384 11 -S,79; 3,623 591 1,593 5,732 10,957 12 4,043 2,738 259 1,287 2,070 5,394 13 .5,233 3,369 379 1,334 1,413 5,056 14
909 621 156 210 10,509 15,313 . 5 -14 ;nrU1l URBAN
3,100 3,043 S 10 2,036 2,487 6
5 4 971 1,397 7
10 10 4 4 1,209 1,812 8
14 10 2 506 902 9 66 77 15 10 986 1,690 10 43 S5 32 28 297 725 11
'228 167 46 75 727 1,339 12 184 112 27 33 344 897 13 348 189 28 59 333 1,021 14

704
'1'-4 qq -Ii 8lT~, "'!" iI'A ~ m 'II1t"~1J C-04 CHnDREN (AGES 5-14) BY SINGLE YEAR OF AGE,
------------- ---
~~ ... \lITi't if~'Attendjng School ------------------------
!I'W /VTIf')vr! ~ \jf~~'111 ~If 'tiTIf 'Ii1:i't ffl u1lf'1f.tr1; lIiTIf ~it ~ 'tiT'!' ;Y 'ti.it if[iit ~ Total populatiob Main workers Marainal workers Non-workels Total, --------- --------- -------- --------Rural! 11111 ~ ~ ~ f~lI't ';~III' ffir1It ~III' ffirlI't Urban Age Males Females Malts Females Males Females Male., Females
------ ------- -------- -------_----- - -- - _----- --2 3 4 ~ , 7 I 9 10
~ SIOHI
riA 5-14 150,381 143,698 33 $ 'OS 68 047,739 13,847
TOTAL 5 17,994 17,033 4 J,611 788
6 18,396 18,790 5 3 4,128 1,632
7 12,768 12,572 9 2 4,128 1,592
I 21,149 20,824 S 17 2 7,093 2,27S
9 9,713 10,727 7 9 3,965 1,689
10 21.663 20,6" 73 6 7,985 2,17S
11 7,670 8,176 S 34 8 3.898 1,335
12 20,116 17,235 134 5 7,O~7 1,292
13 8,988 8,139 14 5 100 13 3,881 631
14 11,223 9,546 9 126 8 4,023 434-
V'I1ft1r 5-14 147.649 141,054 28 5 469 4} 45,876 12,315
RURAL , 17,645 16,645 4 1,492 679
6 18,130 18,502 3,989 1,495
7 12,562 12,319 5 3,963 1,433
8 21,469 20,533 5 14 6,823 2,088
9 9,483 10,515 5 5 .3,766 1,536
10 21,305 20,301 66 5 7,722 1,97S
11 7,491 7,936 5 32 8 3,757 1,143
12 19,844 16,991 130 6,84} 1,145
13 8,769 7,990 9 S 92 13 3,709 516
14 10,951 9,322 9 IlS B 3,811 306
~ 5-14 2,732 2,644 S 36 17 1,863 1,532
URBAN 5 349 389 119 109
6 266 288 5 3 139 137
7 206 2H 4 2 165 H9
8 311 291 3 2 :70 :9a 9 230 212 3 j J9' IH
10 3S8 354 7 2 264 202
11 1711 240 1 140 192
12 273 245 4 5 1.4 147
13 219 149 5 8 172 115
14 272 224 212 128
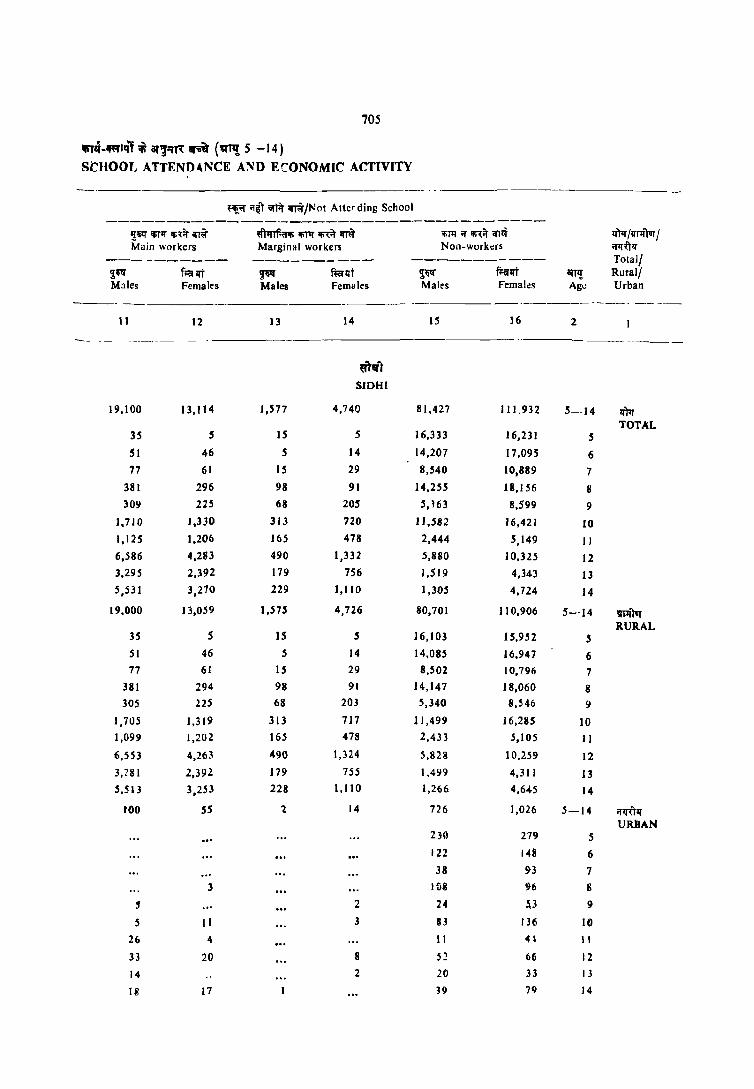
705
"'T4-It\=f'Q"f ~ ay'~R;rd (~T1! 5 -14) SCHOOL ATTEND4NCE A~D ECONOMIC ACTIVITY
--._--- -----
~~.r 'Ill'\' ;;flit iI'~/l'1ot Atterding School ----------------------------_ __._.--------
~"lI' Itmr I&~it ifT~ ~'hrrf.i'flI; Ifn"lr lI><:it ~ !&T1l ;r ~it i(l ~ lIW /11r+r'tuT / Main workers Marginal workers Non-workers if1l'UlI'
---------- ---------- ----------- TOla11 ~'!i fl'iilllt ~ fuillt 9;~ ~lI't OfTIJ Rurall Males Females Males Females Males Femal.:s Ag.: Urban
----- -- ------- - ._--------_. ------
11 12 13 14 15 16 2
--------- _. __ --
~er)
SIDHI
19,100 13,114 ],577 4,740 81,427 111,932 5-14 IfFr TOTAL
35 5 IS 5 16,333 16,231 5
51 46 5 14 14,207 17,095 6
77 61 15 29 8,540 10,889 7
381 296 98 91 14,255 18,156 8
309 225 68 205 5, ~63 8,599 9
1,710 1,330 313 720 11,582 16,421 10
1,125 1,20b 165 478 2,444 5,149 II
6,586 4,283 490 1,332 5,880 10,325 12 3,295 2,392 179 756 1,519 4,343 13
5,531 3,270 229 1,110 1,305 4,724 14
19,000 13,059 1,575 4,726 80,701 110,906 5--14 !WITur RURAL
35 5 15 5 16,103 15,952 5 51 46 5 14 14,085 16,947 6 17 61 IS 29 8,502 10,796 7
381 294 98 91 14,147 18,060 8 305 225 68 203 5,340 8,546 9
1,705 1,319 313 717 11,499 16,285 10 1,099 1,202 165 478 2,433 .s,105 11
6,553 4,263 490 1,324 5,828 10,259 12
3,281 2,392 179 755 1.499 4,311 13 5,513 3,253 228 1,110 1,266 4,645 14
tOo 55 '2 14 726 1,026 5-14 ;;~TIf URBAN
230 279 5
122 14S 6
38 9-3 7
3 HiS 96 8
S 2 24 ~3 9-
5 II 3 13 136 10
26 4 II 4\ 11
33 20 8 S~ 66 12
14 2 20 33 13
III 17 39 79 14

706
,,-4 ~Q ~ "'I!, ~,,;n~.m""~ "Irq C-4 CHII.DREN (4GES 5-14) BY SINGLE YEAR OF AGE,
~~ iiIlit ~r~/AttendlDg School
--------------------------<rm IVl1rTar I ~~ ;.;r;r~lJr 12. it!" iIil1r ifi(it 'fI ~ ,,'hI1Rr'ti 'till!' 'til:ii 11'''' llir~;r m en" ;m'Pr Total population Main worKers Marginal workers Non-workers
TO'd.11 --------- --------- -------- --------RuralJ srr, ~'" f~lIi ~If ffil'lTf ~\" f'tflli ~ti" ~iillTr Urban Aile Males Femalcs Males Femalcs Males Femalcs M III es Femalc5
2 3 4 5 6 7 8 9 10
iti'ttil"{
MANOSAUR
'IiPr 5-14 176,919 167,726 121 41 181 96 92,713 37,708 TOTAL
S 22,130 20,649 2,826 1,733
6 19,971 19,692 5 7,091 3,484
7 17,334 17,137 9,034 4,314
8 23,461 21,817 14 5 13,680 5,813
9 ]2,329 12,173 23 15 8,796 4,241
10 22,525 2 1,133 20 5 83 14,715 5,697
II 11,412 10,367 30 9 101 ]9 8,210 3,433
12 21,932 19,731 3S 1'2 34 13,551 4,295
13 13,284 12,581 20 17 198 14 7,979 2,549 14 12,541 11,246 15 10 204 9 6,818 2,148
vritvr 5-14 142,268 134,251 95 41 120 R8 66,991 ] 9,245 RURAL
5 18,332 16,783 1,537 741 6 16,321 15,979 5 5,054 1,838 7 14,253 14,424 6,783 2,405 8 19,176 11,963 J4 5 10,280 3,396 9 9,638 9,995 19 15 6,461 2,356
10 18,036 17,047 20 5 83 10,827 3,070
11 8,616 7,958 15 9 94 19 s,ns 1,763
12 17,923 15,830 30 135 34 10,278 2,003
13 10,448 9,867 20 17 195 ]0 5,512 1,010 14 9,525 8,404 10 10 174 5 4,482 664
;rJrttq- 5-14 34,651 33,475 26 62 8 25,722 18,462 URBAN
5 3,797 3,866 1,289 992 6 3,650 3,112 2,043 1,647 7 3,082 3,314 2,251 1,909 8 4.285 3,853 3,400 2,417 9 2,691 2,778 .3 2,335 1,885
10 4,489 4,086 3,888 2,627 11 2,796 2,409 IS 7 2,493 (,670 12 4,008 3,900 5 17 3,280 2,292 13 2,836 2,713 3 4 2,407 1,539 14 3,016 2;842 5 31 4 2,331 1,484
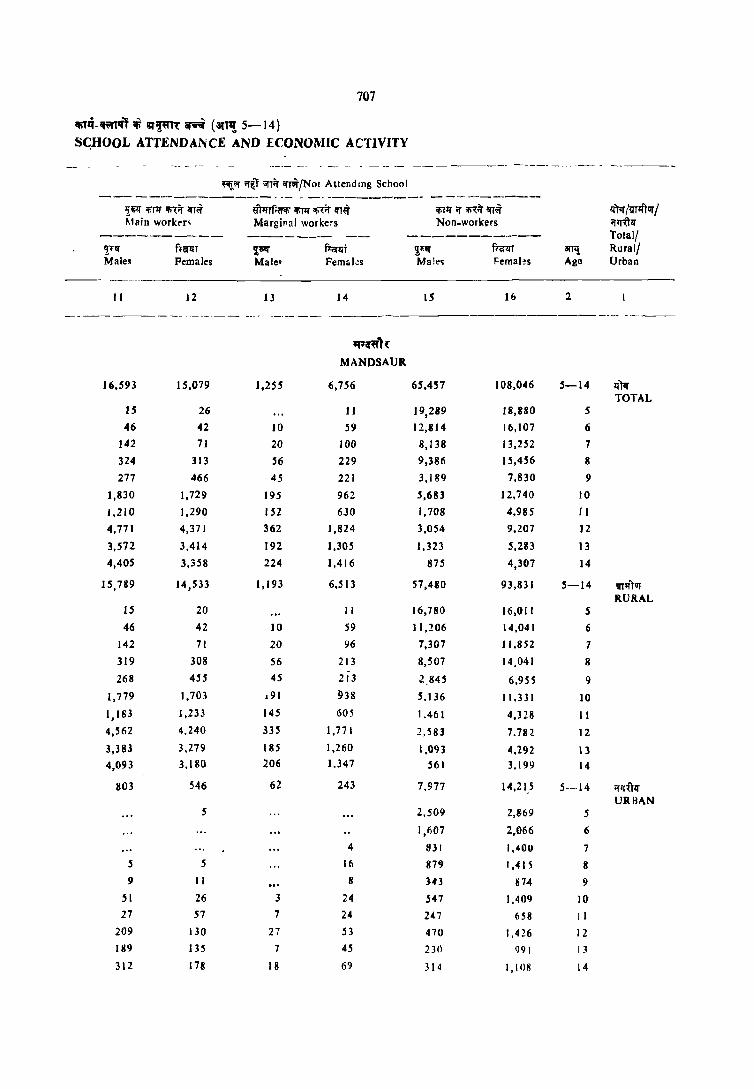
707
~lq-."lqT ~ 1If~~ ~ (att'! 5-14)
SCHOOL ATTENDANCE AND ECONOMIC ACTIVITY
--- _- _-_ -- - -- -- -- -- ---- ---------- ------------
~11f ;r~ \ifTii ifr,,/Nol Attendmg School --- ------------ -.- - -- ------,.._--- -----------
lll1!lf 'liTlr lfi"{it iU<f ~'n!rfrC!'fi 'lirll' '!i<~ en <f 'iiIII' ;:r 'Ii~ 'IT<f If'''tlf /'lffftlIf / ~1aill workl'r' Margiral workers Non.workers ;rlfUlI'
---------- ------- -- ----------- Total/ ,!Tli niifl:lr il1i P:a-Il't 2,'J:1II' fTa'll'r 3ft,! Rural/ Male~ Females Malec Femal~s Male~ Femal~s Age Urban
II 12 13 14 15 16 2
---------------- ---- -_--- ---- -------- --------------- -----.--
,,;;:~h
MANDSAUIl
16,593 lS,079 1,255 6,756 65,457 108,046 5-14 Il'R TOTAL
15 26 II 19,289 18,880 5
46 42 10 59 12,814 16,107 6
142 71 20 100 8,138 13,252 7
324 313 56 229 9,386 15,456 8
277 466 45 221 3,189 7,830 9
1,830 1,729 195 962 5,683 12,740 10
1,210 1,290 152 630 1,708 4,985 11
4,771 4,37 I 362 1,824 3,054 9,2.07 12
3,H2 3,414 ]92 1,305 1,323 5,283 13
4,405 3,358 224 1,416 875 4,307 14
15,789 14,533 1,193 6,513 57,480 93,831 5-14 vtJlTlIf RURAL
IS 20 II 16,780 16,011 5
46 42 10 59 11,206 14,041 6
142 71 20 96 7,307 11,852 7
319 308 56 213 8,507 14,041 8
268 455 45 213 2,845 6,955 9
1,779 1,703 .91 l}38 5.136 11.331 10
1,183 1,233 145 605 1.461 4,328 II
4,562 4,240 335 1,771 2,583 7.782 12
3,383 3,279 185 1,260 1,093 4,292 13 4,093 3,180 206 1,347 561 3,199 14
803 546 62 243 7,977 14,21.5 5-14 ;r11~Tzr URIiAN
5 2,509 2,&69 5
1,(,07 2,066 6
4 831 1,40U 7
.5 5 16 879 1,415 8
9 1 [ II 343 ti14 9
51 26 3 24 547 1,409 10
27 57 7 24 247 658 I [
209 130 27 53 470 [ ,426 12
189 135 7 45 230 991 13
312 178 18 69 314 I,IOS 14

708
rr-4 ~If." If1i lIlT'!, ~"l~ ;n~ lU~ VR atf ... -.; C-4 (HILDREN (AGES 5-14) BY SINGLE YEAR OF AGE.
~t'f iITil" ~ffi/Altending School
--------------------------ffrtr jVrffTvr I ~ ilAQ'~r IJ&lI' 'liP!' 1Ii~ lIT~ ~~IfiT1frn"Ti Ifillf ;or rn lIT" l!~lI' Total population Main workers Marginal workers Non.workers
Total/ --------- --------- ------- --------Rural! ~ ~ fWlrt ~If furqt ~ fuilft ~If furqt Urban Age Males Females Males Females Males Females Males Female.
2 3 4 5 6 7 8 9 10
~'"" RATLAM
!ft1I' 5-14 109,511 104,884 60 5 789 83 4!1,933 25,574 TOTAL
5 13,517 12,320 2,157 1,309
6 12,324 12,223 9 3,908 2,381
7 9,801 10,457 39 4,366 2,740
8 14,236 13,850 26 15 6,846 3,637
9 7,086 7,864 10 34 5 4,338 2.6-70
10 15,675 14,130 99 10 8,289 3,656
11 6,205 6,078 10 56 .5 4,IOS 2,329
12 14,644 12,996 5 216 24 7,523 3,020
13 7,873 7,448 10 175 5 4,274 1,990
14 8,150 7,519 30 136 20 4,128 1,842
1I'T1ftwr 5-14 77,714 73,895 5S 5 716 83 26,l96 7,367
RURAL 5 9,841 8,98 J 795 327
6 9,109 9,049 9 1,914 787
7 7,302 7,459 39 2,415 867
8 10.460 10,158 26 IS 3,892 1,202
9 4.758 5,354 10 34 5 2,325 826
10 11,294 10,356 99 10 4,696 1,163
J1 3,843 3,705 10 56 5 1,985 626
12 10,418 9,274 5 210 24 4,137 858
J3 S,~75 4,911 10 175 5 2,175 463
14 5,414 4,646 25 129 20 1,963 249
I!1r'61f 5-14 31,797 30,989 5 13 23,637 18,207 URBAN
5 3,676 3,338 1,362 982
6 3,~15 3,174 1,993 1,594
7 2,499 2,998 1.951 1,872
8 3,775 3,692 2,955 2,435
9 2,329 2,510 2,013 1,844 10 4.381 3,774 3,593 2,493 11 2,361 2,173 2,120 1,703
12 4,226 3,72\ 6 3,386 2,163
13 2,598 2,5)7 2,098 1,527
14 2,736 2,812 , 6 2,16" 1,594

709
ifinf-qrtl ~ 3J~tm: ~ (V'l! 5-14) SCHOOL ATTENDAl\CE AND ECONOMIC ACIlVITY
"1[01' i!lt ;;rf.r q~/No' Attending School
-------------------------------------~I!iT"l'~it~ ~Iti~m:it~ ItiT"I' l{ m:it ~ J;fti! IVTlf'r~ { M.dn workers Marginal workers Non-workers iltr~"t!f
--------- ---------- ---------- TOlal/
~" mrllt ~ ffiii!!T i Jilf ffa'lfT 8!'Tl! Rural! MaJes Females Males Females Males Females Age Urban
--~------- - ----------~-----------.------ --- --- -----_--- -----------_ II 12 13 14 15 16 2
- -_- - ------- -----
'(6,"'"
RATLAM
12,036 6,914 1,247 5,148 45,446 67,160 5-14 q'T1J TOTAL
36 5 9 5 11,316 11,001 5
41 38 26 10 8.341 9,793 6
98 63 47 43 5,251 7,612 7
297 211 82 152 6,984 9,836 8
316 277 S6 228 2,312 4,685 9
1,628 943 205 804 5,455 8,718 10
8S4 469 83 454 1,096 2,821 11
3,684 2,157 394 1,511 2,826 6,278 12
2,119 1,207 169 935 1,127 3,311 13
2,942 1,545 176 1,007 738 3,105 14
)1,241 6,689 1,203 5,065 38,143 54,686 5-14 ~ RURAL
36 5 9 5 9,001 8,645 5
41 38 26 10 7,119 8,214 6
92 63 47 39 4,708 6,489 7
287 208 82 152 6,173 8,582 8
313 294 56 228 2,019 4,022 9
1,544 943 200 800 4,756 7,440 10
818 450 78 445 896 2,180 11
3,456 2,101 375 1,496 2,240 4,789 12
1,952 1,145 159 911 803 2,387 Il
2,701 1,463 171 980 424 1,936 14
795 225 44 83 7,303 12,474 5-14 ifrr'(N URBAN
2,314 2,H6 S 1,222 1,580 6
5 3 543 l,IZ2 7
10 3 811 1,254 8
22 3 293 663 9
84 5 3 699 1,278 10
37 19 5 10 200 641 11
228 55 19 15 586 1,489 12
166 63 II 25 32) 923 13
241 82 5 28 314 1,169 14

710
,,·4 ~ If1i ~, ~" ~ Ii{'~ .m anfllflli
C-4 CHILDREN (AGES 5-14) BY SIl\GLE YEAR OF AGE,
~ i!f.r ~/AUendlOg School
--------------------------1f)1r IVll'fT'!j ¥I' 9fiJ~lfl 'J:~ lIil+r ~~ 'fl~ ~T1l'1fi:tI~ !tiPf ""~ <1'1" 1Iil1l' if 1fR~ lfrif iJlfUlf Total population Main workers Marginal workers Non-workers Total! --------- -------- -------- --------Ruralj alll! ~!{ mrlrT ~1!1" ~lft 2;~" i'falft ~ t1iOt!.l't Urban Age Males Females Males Females Male, Females Males Females
2 3 4 5 6 7 8 9 10
~
~" UJJAIN
~ 5-14 153,290 J45,049 148 33 731 139 79,69J 40,040 TOTAL
5 18,137 16,868 3,279 2,058
6 17,045 16,346 5 5,758 3,562
7 14,634 14,239 23 6,947 3,925
8 20,165 ) 8,635 53 10,738 5,737 9 11,270 10,311 5 38 13 7,356 4,022
10 21,873 20,454 10 IS 104 43 12,844 6,244
11 9,504 9,161 10 107 36 6,663 3,741 12 22,633 18,281 40 5 164 37 12,945 5,024 13 10,790 10,078 18 120 6 6,332 3,127 14 12,239 10,676 59 13 122 S 6,830 2,602
Vl1l'flrr 5-14 102,258 92,318 llS RURAL
28 713 139 39,044 8,759
5 1 J ,984 11,060 890 300 6 11,346 10,677 5 2,411 7()3 7 9,919 9,505 23 3,729 1,013 8 13,318 12,383 53 5,425 1,672 9 6,819 6,320 38 13 3,641 1,000
10 14,694 13,333 10 15 99 43 7,136 1,497 11 5,281 5,174 10 107 36 2,981 785 12 14,986 11,794 30 160 37 6,880 1,01S
13 6,465 5,857 15 117 6 2,176 493 14 7,445 6,21 S 45 13 116 5 3,175 281
iJ1IWr 5-14 56,032 52,731 33 5 18 40,647 31,28 I _ROAN
5 6,153 5,808 2,388 1,7.58
6 5,699 S ,«69 3,347 2,1159
7 4,715 4,734 3,218 2,912
1 6,147 6,252 S,313 04,065 , 4.450 J,94}0 5 3,716 3,022 H) 7,1&0 7,t21 6 5,708 4,74'7
11 4,223 3,987 3,682 2,9S6
12 7,647 6,486 10 5 S 6,06.5 4.009
13 4,325 4,221 4 3 3,556 2,6'4
14 4,793 4,461 14 6 3,654 2,321
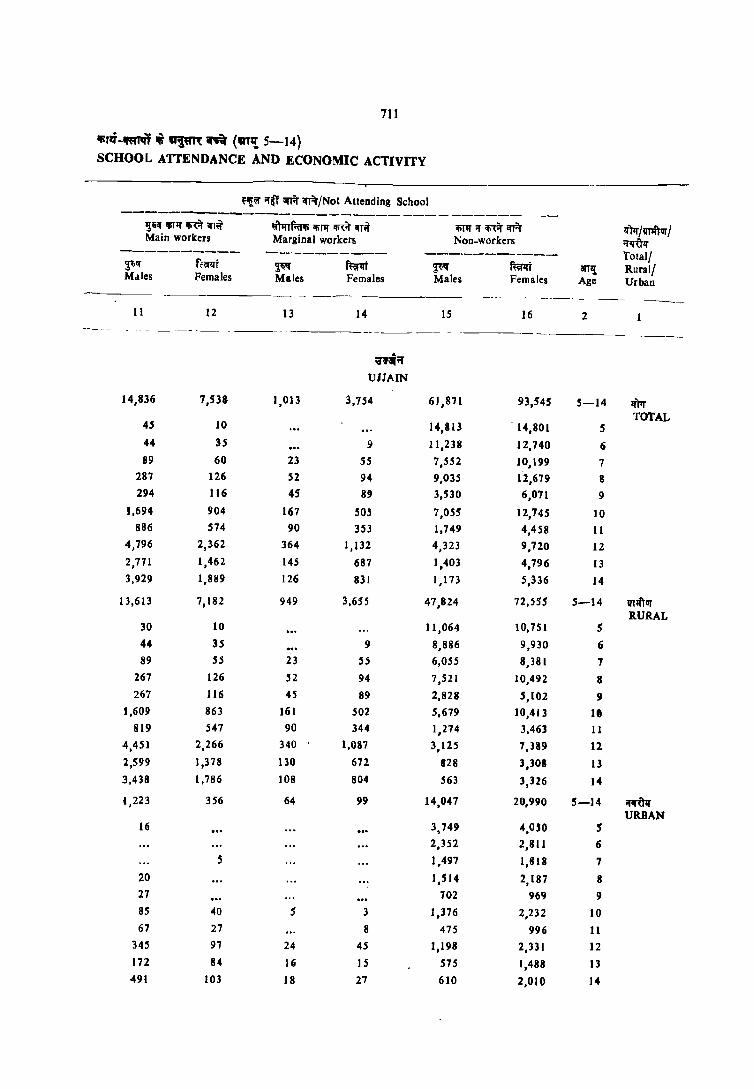
711
~TIf-~ ..r "IWR ~ (lIlT,! 5-14)
SCHOOL ATTENDANCE AND ECONOMIC ACTIVITY
fl§:'" if~"f orR ifRjNot Attending School
----------------------------------!!;~q lfiTlI' rn "'~ Main workers
~\" ffiilliT Males Females
~fin' 'IlIll' m Ifr" Marginal workers
~ f~ Males Females
-----_ - -----
II 12 13 14
lfi"T1I' if 'fi1:ir ifFr Non-workers
~If fufIIt Males Females
15 16
arT,! Age
2
'tlq /iTffrllf I ifif'UlJ TOlal! Rural/ Urban
------------ -- - -------- - --- ----
14,836
4S
44
89
287
294
1,694
886
4,796
2,771 3,929
13,613
30
44
89
267
267
1,609
819
4,4.51
2,599
3,438
1,223
16
20
27
85
67
345
172
491
7,533
10
35
60 126 116
904 574
2,362
1,462
1,889
7,182
10
35
55
126
116
863
547
2,266
1,378
1,786
356
5
40
27
97
84
103
1,013
23
52
45
167
90 364
145
12(;
949
23
52
45
161 90
340
130
108
64
5
24
16
18
;n ....
UJJAIN
3,754
9
55
94 8!)
SO, 3S3
1,132
687
831
3,655
9
S5
94
89 502
344
1,087
672
804
99
3
8
45
15
21
61,871
14,813
11,238
7,5.52
9,035
3,530
7,055
1,749
4,323
1,403
1,173
47,824
11,064
8,886
6,055
7,521
2,828
5,679
1,274
3,125
828
563
14,047
3,749
2,352
1,491
1,514
702
1,376
475
1,198
575
610
93,545
- 14,801
12,740
10,199 12,679 6,071
12,745
4,458
9,720
4,796
5,336
72,555
10,7 S 1
9,930
8,381
10,492
5,102
10,411
3,46]
7,189
3,308
3,326
20,990
4,OSO
2,811
1,818
2,187
969
2,232
996
2,331
1,488
2,010
5-14
5
(;
7
8
9
10
11
12
13
14
5-14
5 6
7
8
9
l' 11
12
13
14
5-14
5 6
7
8
9
10
11
12
13
14
Iflq TOTAL
VTII'TIIf RUR.AL
~ URBAN

712
11'-4 ~~ q III",!. ~" ~ qy~ ~t vtf'f'!fi C-4 CHILDREN (AGE'S 5-14) BY SINGLE YEAR OF AGE,
---- -- -- --- ---- -- ------- _--- -----------------~"" ;;n~ ~!Attending School
--------------------------It"'tq jr;mi'rur I ~ ~!fliiltt ~1!i11I"~~il~ ~ll!Tf.al!; '!i11t lfi~iI' iU~ lfi'IlI' ~ iIilit <rT~ ~ Total population Main workers Marginal workers Non-workers Total! ----_---- --------- -------- ---------Rural! ~ FI' f~ '!~ fwn ~I!f fu:rqt ~I!f fwrt Urban Age Males Females Males Females Males Females Males Females
2 3 4 5 6 7 8 9 to --_---- .-
.~
SHAJAPUR
m 5-14 122,583 108,889 81 1,019 164 53,467 15,470 TOTAL
5 14,~57 13,063 1,399 698
6 13,4!S 12,882 9 3,450 1,520
"I IO,9S 2 10,711 22 S 4,S32 I,SSS
8 15,983 14,706 S 34 38 7,478 2,297
9 7,~74 7,615 5 75 14 4,593 1,669
10 17,026 15,715 5 146 36 9,091 2,651
11 7,294 6,173 10 128 27 4,506 1,,43
12 18,270 14,706 40 261 32 9,357 2,049
13 8,397 6,339 10 171 4,844 946
14 8,717 6,979 5 173 14 4,217 737
ITI'I')III , 5-14 104,579 93,004 76 980 158 41,528 7,799 RURAL
5 12,741 11,426 166 295
6 11,539 10,972 9 2,572 760
7 9,339 9,322 22 S 3,494 841
8 13,733 12;699 S 34 32 5,913 1,337
9 6,583 6,404 5 75 14 3,698 852
10 14,647 13,612 5 146 36 7,279 1,505
II 6,070 5,004 10 128 27 3,437 608
12 15,669 12,573 35 256 32 7,478 995
13 7,002 5,169 10 160 3,70" 322
14 7,255 5,823 5 1.51 14 3,187 284
if~ 5-14 11,004 ",885 5 39 6 11,939 7,671
UR8~N 5 2,115 1,637 633 403
Ii 1,876 1,9~9 878 760
7 ~,6\ 2 1,389 1,038 717
B 2,250 2,006 6 1,565 960
9 1,091 1,212 195 lUI
10 2,371 2,103 1;1112 1,146
11 I,P4 1,168 1,070 735
12 2,601 2,1301 5 6 1,830 I,{)H
13 i,3"96 1,170 11 1,139 624
14 1,462 1,156 22 1,030 453

713
~l'(-iif\,{lql t lJI'~l~ .i~ ('All! 5 14)
SCHOOL ATTENDAl'ICE A;\D ECONOMIC ACTIVITY
~ if!'!) \if1i1r ,Hiir/Not Atterding Sehoul _------------------------------------
l1;'i'T 'f.lif 'f,,;r '1101 ~·hllf."f, l!ilif 'R~ 'fI~ l!i111 'f 'fi'~ an~ !l'r'T i;nJfTIlf / [\1.110 worker, MargillJI workel, NOI'-",orkers l'Il11:Tlf
------------ ------------ ----------- Total/ ~~~ fuillT ~~ ftorqT ~~ ffF.f1:lT iATll" Rural! Maks F.:males Males Felllal~~ Mai(s females Age Urban
- --------- ------------ - ---- -- -- ------ --------
II 12 13 14 15 16 2
-- -------- ------- --------- ----
~lifT~~
SHAJAPUR
I] ,707 5,086 1,232 5,469 54,077 82,700 5-14 l<T'T TOTAL
.5 4 9 13,453 12,350 5
33 10 14 9,923 11,337 6
53 15 29 37 6,316 9,096 7
198 SO 60 125 8,208 12,196 8
(93 89 25 145 2,783 5,~99 9
1,456 420 167 738 6,161 11,870 10
789 352 116 456 1,744 3,995 II
4,379 1,781 490 1,825 3,742 9,020 12
2,273 946 ) 53 816 947 3,631 13
3,333 1,419 189 1,303 800 3,506 14
11,963 4,839 1,178 5,312 48,854 74,896 5-14 VTl'ITvr RUR\L
5 4 9 11,971 11,116 5
29 10 14 8,930 10,188 6
48 10 29 37 5,746 8,430 7 194 50 54 125 7,53~ 11,156 8
184 89 25 139 2,596 5,311 9
1,345 399 Ib2 708 5,711 10,964 10
766 322 116 450 1,613 3,597 II
4,123 1,709 472 ] ,741 3,305 8,097 12
2,152 898 147 810 1129 3,138 13
3,122 1,348 169 ] ,279 620 2,898 14
744 247 54 157 ~,2H 7,804 5-14 'ftT,'llf-
U~NI 1,48 ! I, ~ 14 5
5 9114 1,149 6
-5 5 570 fo67 7
5 .5 (0.75 1,040 8
9 6 187 3118 9 III 21 .5 30 45] 906 10
23 30 6 132 3'J7 II
256 71 18 84 431 9~3 12
121 48 6 6 Ilg 492 13
210 71 20 24 I S() 608 14
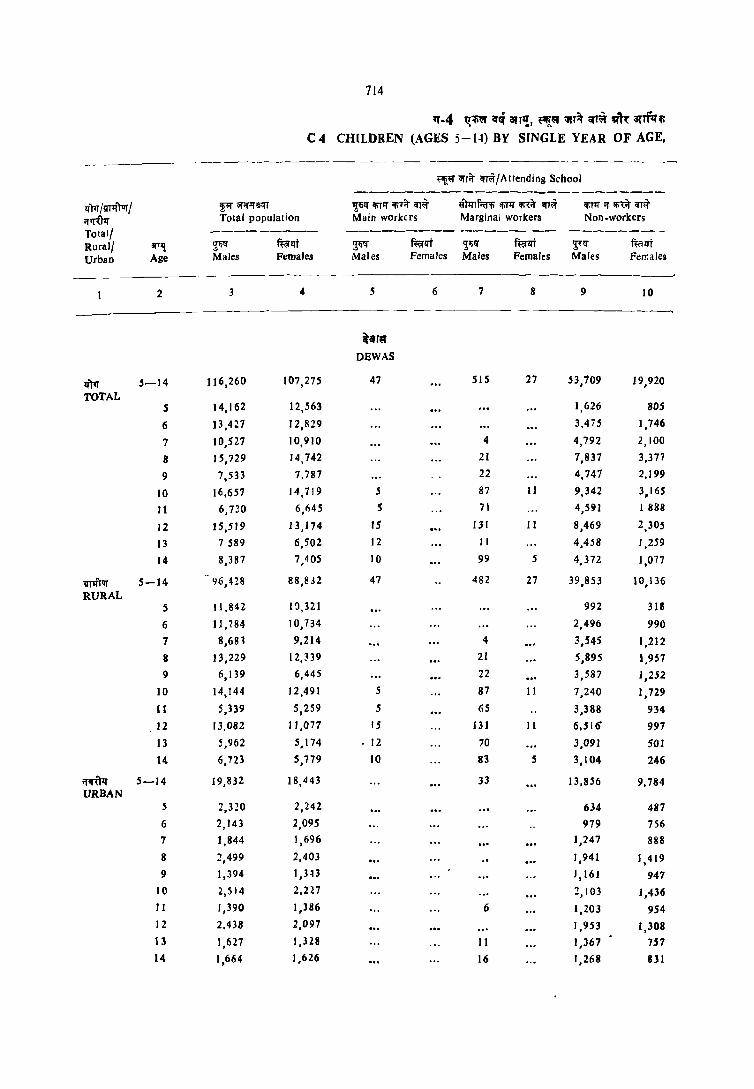
714
"-4 ~:m=r ;r" anI!, ~~ ;;fTlt <fr~ "'~ atTflf~ C4 CHlLDREN (AGES 5-1-t) BY SINGLE YEAR OF AGE,
--------- _- ----------- ----- - -- ------ ----
~;; "fliT 1fr~/Atlending School
---------------------------r.i'm /'Iffl'"tolr / ¥f ;;r;r"f'3'-ll 1_!liilf 'FT1f '!i-it" 1fl~ flnrrRr'li 'PJ1I" ~iT "'~ 'liflf 'I' 'li~ "Iii-'ftr':Ttr Total population Main workers Marginal workers Non .workers
Total! --------- --------~- -------- ---------Rurall arrl!, '!'iq ~qr ~'i fu.;fq-r '1;'i'i f~1ff ,!<1!l" f~1fr
Urban Age Males Females Males Females Males Females Males Females
2 3 4 S 6 7 8 9 10
hr" DEWAS
IIi1r 5-14 116,260 107,275 47 SIS 27 53,709 19,920
TOTAL 5 14,162 12,56] 1,626 80S
6 13,427 12,829 3,475 1,746
7 10,527 10,910 4 4,792 2,100
8 15,729 14,742 21 7,837 3,377
9 7,533 7,787 22 4,747 2,199
10 16,657 14,719 5 87 11 9,342 3,16S
11 6,730 6,645 5 7 , 4,591 I 888
12 15,519 13,174 IS 131 11 8,469 2,305
13 7 S89 6,502 12 II 4,458 ',259
14 8,387 7 ,~O5 10 99 5 4,372 1,077
lITmllf 5-14- 1J6,428 88,832 47 482 27 39,853 10,136 RURAL
5 11,842 1 'J,321 992 318
6 11,184 10,734 2,496 990
7 8,68J 9,214 4 3,545 1,212
8 13,229 12,339 21 5,895 1,957
9 6,139 6,445 22 3,587 1,252
10 14,144 12,491 5 87 11 7,240 1,729
II 5,339 5,259 5 65 3,388 934
12 13,082 11,077 r; 131 II 6,510 997
13 5,962 5,174 12 70 3,091 501
14 6,723 5,779 10 83 S 3,104 246
YfIJiN 5-14 19,832 18,443 33 13,856 9,784 URBAN
5 2,320 2,242 634 487
6 2,143 2,095 979 756
7 1,844 1,696 1,247 888
8 2,499 2,403 1,941 1,419
9 1,394 1,3'13 1,161 947 10 2,514 2.227 2, I 03 1,436 II 1,390 1,386 6 1,203 954 12 2,438 2,097 1,953 1,308 13 1,627 1,328 11 1,367 757
14 1,664 1,626 16 1,268 831
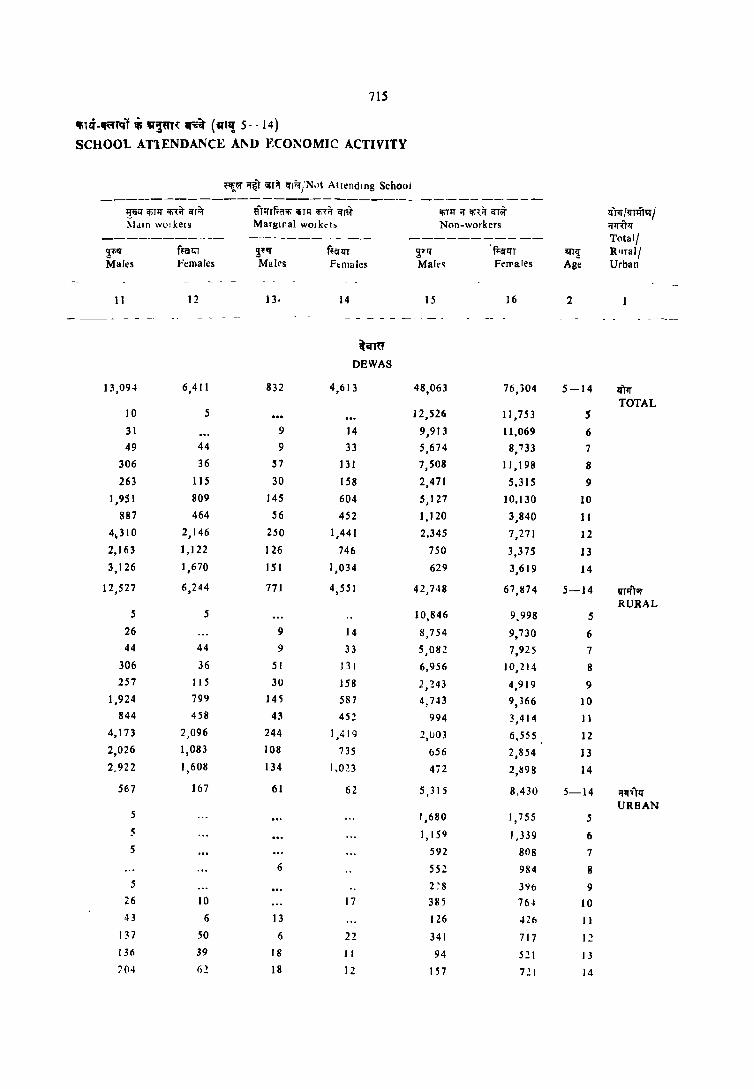
71S
1f.1Ii -lIarqT ~ !ll'lID{ ~it (C{'~ 5 - - 14)
SCHOOL AT1ENDANCE Al\U ECO~OMIC ACTIVITY
~<i i'fiiT .IT~ CfI9-/N,Jt Attending School ---------------------------------- --- _--
lp;'1 q;p:r 'li<:it ;;ni';r ij-hnf;:~if, "'Til If.'it q-r~ if,Tll 'I !fo<::i'r <n~ ,illY /'lTt:itlll / ~1<lIn wo: kels Marginal wor k~1> Non-workers i'f1Tl:T'f
----------- ---------- ----------- Total/ 2l:IlI f.all"T 21'q" fH!'fT 2"fQ" -fi:ortTT m~ R1rral/ Malt's Females Maks Ftmale$ Mak~ Ft'll'ales Age Urban
II 12 13· 14 15 16 2
---- - -- - - -
(crm DEWAS
13,09~ 6,411 832 4,613 48,063 76,304 5-14 IftIT TOTAL
10 5 12,526 11,753 S 31 9 14 9,913 11,069 6 49 44 9 33 5,674 8,"733 7
306 36 57 131 7,508 11,198 8
263 115 30 158 2,471 5,315 9
1,951 809 145 604 5,127 10,130 10
887 464 56 452 1,120 3,840 II
4~31 0 2,146 250 1,441 2.345 7,271 12
2,163 1,122 126 746 750 3,375 13
3,126 1,670 IS 1 1,034 629 3,619 14
12,527 6,244 171 4,551 42,748 67,1174 5-14 II'rr:rTCIT RURAL
5 5 10,846 9.998 .5 26 9 14 8,754 9,730 6 44 44 9 33 5,082 7,925 7
306 36 51 J 31 6,956 10,214 8 257 115 30 158 2,243 4,919 9
1,924 799 145 587 4,7.0 9,366 10 844 458 43 452 994 3,414 II
4,173 2,096 244 1,419 2,uO] 6,555 12 2,026 1,083 108 735 656 2,854 13 2,922 1,608 134 1,023 4i2 2,l!98 14
567 167 61 62 5,315 8,430 5-14 'lIT' Til" URBAN
5 r ,680 1,755 5 ~ I,ISQ 1,339 6 S 592 808 7
6 552 984 8 5 2~8 3<)6 9
26 10 17 385 76~ 10 4] 6 13 126 426 II
D7 50 6 22 341 717 12 13e1 39 18 I I 94 521 13 ;'04 62 18 12 157 721 14

716
11'-4 ~ifilf iiI'li ~n,!, 'II!.~ iifT~ ~I~ ill, ilfTf"iI!i
(,·4 fHI. OREN (AGfS 5- 14) BY srNGLE YEAR OF AGE,
~",;;rr:t qr.r/ A tlending School ---.-----------~-----------
'lfrrr/'lrrftl1l/ ~<'I' Gf;jij'1ii'lT ~'lI' 'PTII' iIi,it <mf ij'llI'rRr" If'iTll'!f;<it 'I1.r iliTll' if if>l:it q-r.r <lrr-Uzr Total population Main \\orkers Marginal workers Non.workers
Total/ --------- --------- -------- --------Rural! arrll' ~~I!T f"!'allt ~~ ~1It ~1i1i f.a-llt 1f;!f ~ Urban Age Males Females Males Fem.lles Males Females MJks Females
-~---- ----- -- -
2 4 5 6 7 8 9 10
~ii!"'r JHABUA
Ii'I1t 5-14 118,490 114,685 79 10 936 193 24,630 11,555
TOTAL S 13,346 13,527 1,111 70S
6 14,700 14,914 13 5 2,301 1,295
7 10,741 10,700 13 10 2,565 1,336
8 18,832 17,562 5 6S 10 4,034 1,811
9 6,598 6,818 5 78 31 1,846 1,139
10 18,414 16,686 4 S 160 21 3,980 1,650
11 4,879 4,976 90 21 1,516 904
12 15,906 14,142 3S 5 192 47 3,527 1,175
13 6,690 7,007 10 lSI 26 J ,921 856
14 8,385 8,354 20 173 21 1,8~9 684
lnm-ur 5-14 110,000 106,452 70 10 930 193 18,661 6,759
RURAL 5 12,257 12,553 718 365
6 13,886 13,998 13 S 1,739 837
7 9,886 9,847 13 10 1.978 835
8 17,891 16,521 5 65 10 3,335 1,179
9 5,989 6,222 5 78 31 1,357 717
10 17,320 15,738 5 160 21 3,181 1,036
11 4,262 4,386 90 21 988 475
12 14,845 13,285 35 5 192 47 2,689 693
13 5,953 6,307 10 151 26 1,341 344
14 7,705 7,595 15 167 21 1,335 278
i'fIIUIf 5-14 8,490 8,233 9 6 5,969 4,796 URBAN
5 1,089 974 39-3 339
6 8'3 916 562 458
7 855 8S3 587 501
8 935 1,041 699 !'i32
9 616 595 489 422
10 1,093 948 4 799 614
11 617 589 528 429
12 1,061 858 838 482
13 737 700 580 512
14 680 759 5 6 494 405

717
~ ~ -It't:flql ~ at~~" iI';;~ (au,! 5- 14 )
SCHOOL ATTENDANCE AND ECONOMIC ACflVITY
-_- -_. _--_ - ----- ---------------- -
~"i'" ;j~r iilTit ifl7:r/No! Attending School ------------------ -- - ------------------~ ;;TlI' ~it CfT~ ij'nrTfi:cr'F 'fiTI'f 'fi'f.r ffl 'fiT'll" if ;nit IfR littr I 'lJJtfrar I Main workers Marginal 'Work",rs Non-workers ;j~
------------ ---------- ----_------ Total/ ~fq' ft:r.t<rt ~If ft:erllt f~llt 8fT~ Rurall Males F"maks Mal~s ~maks es Ft'l1lales Age Urban
----.......,..:---------- -------
11 12 11 14 15 16 2
----- ----
~.T,!IIIT
JHABUA
23,247 16.669 5,008 13,~43 64,590 72,915 5-14- tftq' TOTAL
10 6 9 31 12,216 12,785 5
61 36 56 63 12,268 13,514 6
149 159 166 300 7,847 8,895 7
690 499 403 727 13,636 14,5IS 8 606 612 318 607 3,746 4,429 9
3,639 2,931 1,368 2.336 9,263 9,744 10
1,514 1,28S 468 1,030 1,292 1,735 11
7,863 5,042 1,239 3,736 3,049 4,137 12
3,424 2,506 519 2,069 665 1,550 13
5,29] 3,595 463 2,445 609 1,610 14
22,765 16,393 4,939 13,178 62,635 69,91 ~ 5-14 lI'I1ituJ RURAL
10 6 9 31 11,520 12,151 5 61 36 56 63 12,017 13,057 6
128 156 166 300 7,601 8,546 7 651 478 403 723 13,438 14,131 8
'SO 609 318 603 3,6S1 4,262 9
3,543 2,891 1,363 2,300 9,073 9,484 10
J ,481 1,266 456 1,019 1,247 1,60S 11 7,763 4,939 1,233 3,685 2,932 3,916 12
3,346 2,470 490 2,045 615 1,422 13 5.202 3,542 445 2,409 540 . 1,345 14
482 276 69 165 1,955 2,996 5-14 iI''1"U1r URBAN
696 635 5
251 458 6 22 3 247 348 7 38 20 4 198 385 8 26 3 4 95 166 9 96 40 6 35 189 259 10 33 19 12 12 45 130 II
100 103 6 51 117 221 12 78 35 29 24 !i0 129 13 89 53 17 3S 68 265 14

718
,,·4 t:t~" liili .n~, ~" ~itr m a'h $hf1l ... C-4 CHILDREN (AGES 5-14) BY SINGLE YEAR OF AGE,
- -_----------------- - -- -----------
H!"f ;;fTi!" IfT~/Altcndlng School -----------------------------
~/v,,:r)vr/ ~<1 or;rij"Iiill"T ~19" ifiTIf ifi~ir qT~ ~rIfTfra'iIi" ili"rlf ili"l:if ifF" "'TIf ;r 'Ii<:::r Ifl~ ;m'Tzr Tutal populallon Main workelS Marginal worker~ Non-workers Total/ --------- -----_--- --------- --------Rural/ aITll",. ~ mr7.fT q~ ~e:7.fT ~~ fiall"T ~q Mll;l Urban Age Males Females Males Fernalc~ Males Females Males Females
- ---_-- ---- -- ----- - --- -----_ - - - - --_ --- -_----
2 3 4 .5 6 7 8 9 10 - --~ -- -
~'{
DHAR
~ 5-14 158,707 ] 50,508 102 36 569 92 57,201 24,348 TOTAL
5 18,246 17,366 5 4 1,734 986
6 19,235 18,955 4 4,277 2,324
7 14,986 14.946 16 4 5,366 2,803
8 22,7] 9 21,830 5 32 12 8,271 4,045
9 11,023 10,775 5 36 13 5,442 2,683
10 22,924 21,272 IS 59 15 9.471 3,649
11 8,31 F 8,050 14 5 91 15 4,519 2,187
12 20,731 18,037 24 5 155 11 8,878 2,759'
13 9,474 8,984 15 20 75 9 4,430 1,571
14 11,050 10,293 25 106 4 4,814 1,341
Vl'1iTvr 5-14 14_0,171 132,663 97 36 558 87 45,075 15,435 RURAL
5 16,273 15,491 5 4 1,205 508
6 17,244 17,055 4 3,345 1,588
7 13,377 13,1 19 ]6 4 4,357 ] ,867
8 20,437 1'),471 5 32 12 6,700 2,729
9 9,675 9,429 5 36 13 4,320 1,844
]0 20,416 18,798 15 47 ]5 7,688 2,286-
11 6,962 6,747 10 5 91 IS 3,427 1,323
12 18,325 15,854 24 5 ]55 11 7,051 1,694-
13 8,030 7,774 IS 20 75 4 3,318 862
14 9,432 8,926 25 106 4. 3,665 735
~"hT 5-14 18,536 17,844 4 11 5 12,126 8,914
URBAN S 1,973 1,875 529 479
6 1,991 1.'100 932 736
7 1,610 1,827 1,009 937
B 2,282 2,359 1,570 1,316-
9 1,348 1,346 1,121 &39-
]0 2,508 2,474 II 1,783 1,363-
II 1,356 1,303 4 1,092 863-
12 2,406 2,U3 1,827 1,065
]3 1,444 1,210 5 1,112 709
14 1,61·j 1.367 1.149 606
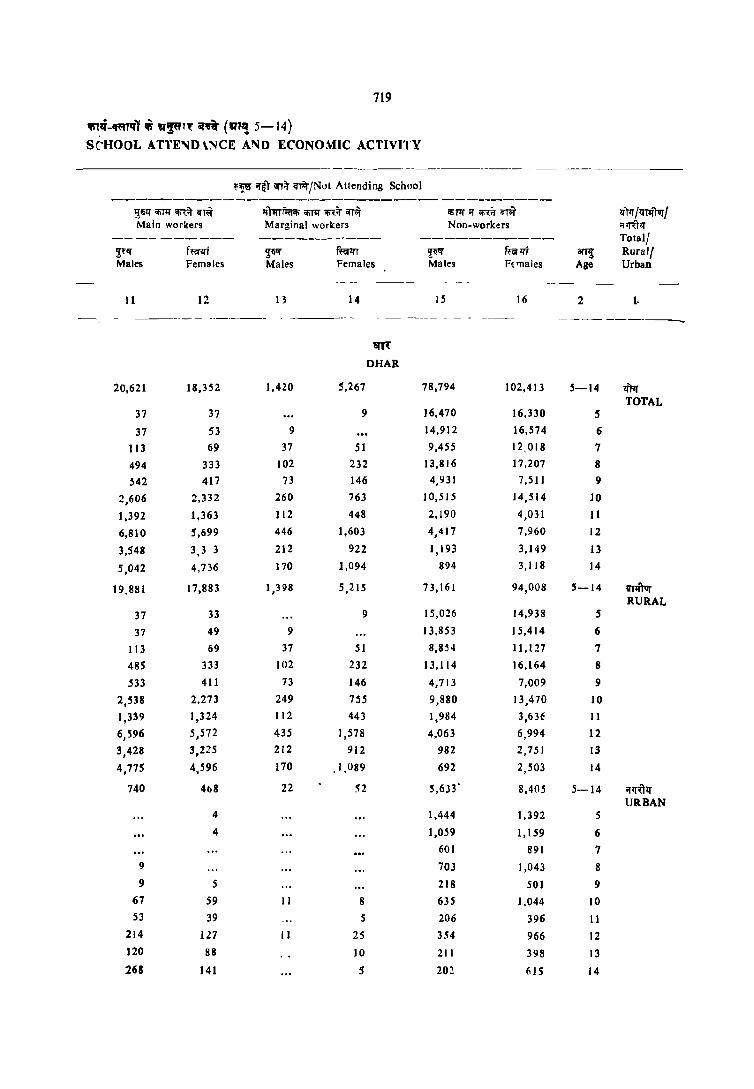
719
~.Ii-ifflTf{l ~ ~~T"{ Gf~ (Iln~ 5-14) SCHOOL ATTE"'JD\~CE A1'IID ECONOMIC ACTIVITY
- -------- -----------------_.
~~ iJ~T ;;nil" erR/Not Attending School
------------------------------------l1'zr lfifir iIi1:i't inc.iT Il"TIITf,:ijlfi "'II( 'Ii<it crr~ "'!if ~ rn crrc.iT zrm/fJTifrvr/ Main workers Marginal workers Non-workers OllR'hr
--- -- ------- ------ -~--- ----------- Total/
~f" fwrt ~~ f~~ 9"qli f~<rt arr~ Rural! Males Females Males Females Males Ft'l1ales Age Urban __ ._
- - --- --- _-- _ II 12 13 14 IS 16 2 I.
--_ .. _-- - ------- - - ------ - -- - -- ----- -----__ ~
DHAR
20,621 18,352 1,420 5,267 78,794 102,413 5-14 liN TOTAL
37 37 9 16,470 16.330 5
37 53 9 14,912 16,574 6
113 69 37 51 9,455 12,018 7
494 333 102 232 13,816 17,207 8
~42 417 73 146 4,931 7,511 9
2,606 2,332 260 763 JO,515 14,514 10
1,392 1,363 112 448 2,190 4,031 11
6,810 5,699 446 1,603 4,417 7,960 12
3,548 3,3 3 212 922 1,193 3,149 13
5,042 4,736 170 1,094 894 3,118 14
19.881 17,883 1,398 5,215 73,161 94,008 5-14 1Il1(1vr RURAL
37 33 9 15,026 14,938 5
37 49 9 13.853 15,414 6
113 69 37 51 S,8H 11,127 7
485 333 102 232 13,114 16,164 8
533 411 73 146 4,713 7,009 9
2,538 2,273 249 755 9,880 13,470 10
1,339 1,324 112 443 1,984 3,63E 11
6,596 5,572 435 1,578 4,063 6,994 12
3,428 3,225 212 912 982 2,751 13
4,775 4,596 170 .1,089 692 2,503 14
740 468 22 52 5,633' 8,405 5-14 illiUlf URBAN
4 1,444 t ,392 5
4 1,059 1,159 6
601 891 7
9 703 1,043 8
9 5 218 501 9
67 59 II 8 635 1,044 10 53 39 5 206 396 11
214 127 11 25 354 966 12 120 88 10 211 398 13
268 141 S 20~ 615 14
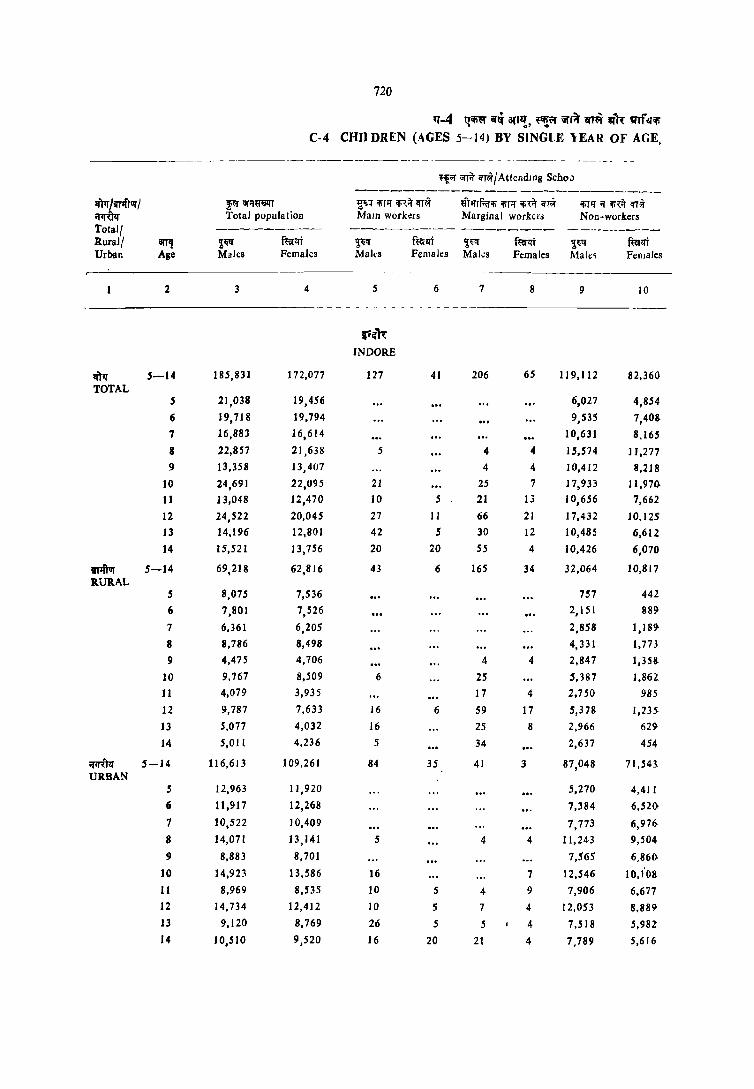
720
rr-4 ~~ iii'li a{l~, ~~ 'il'1~ "'~ WR- an 4~ C-4 CHIlDREN (AGES 5-14) BY SINGLE lEAH OF AGE,
"------------------------------ ----~---- _-------- - -
~~;;r;;rf.t i!fw,/AttendJng Scho.> ---------------------------
'/l'rrr /v:rrWrr I ~;;r~~T 11;"=1 'lirlf <n.ii lfI~ mIfTRr'li 'li111 .. ,il' i!fl~ .. 11f ~ ifj,it lfI;J
IJ1rtllJ Total population MaIn workers Marginal workers Non-workers Totall --------- ---------- -------- -----------Rural/ iIfTli ~~ mrl!T ~q ftiiilfT ~o:q f~lfi l~q f~l!t Urban Age Males Females Maks Females Maks Females Malel Females
2 3 4 5 6 7 8 9 10
rr~h INDORE
1f)1) 5-14 185,831 172,077 127 41 206 6S 119,112 82,360 TOTAL
5 21,038 19,456 6,027 4,854
6 19,718 19,794 9,S3S 7,408
7 16,883 16,614 10,631 8.165
8 22,857 21,638 5 4 4 15,574 11,277 9 13,358 13,407 4 4 10,412 8,218
10 24,691 22,095 21 2S 7 17,933 ll,97()'
11 13,048 12,470 10 5 21 13 10,656 7,662
12 24,522 20,045 27 11 66 21 17,432 10.12S
13 14.196 12,801 42 5 30 12 10,485 6,612
14 15,521 13,756 20 20 55 4 10,426 6,070
I11ftur 5-14 69,218 62,816 43 6 165 34 32,064 10,817 RURAL
5 8,075 7,536 757 442
6 7,801 7,526 2,151 889
7 6,361 6,205 2,858 1,189-
8 8,786 8,498 4,331 1,773
9 4,475 4,706 4 4 2,847 1,358
10 9,767 8,509 6 25 5,187 1,862.
11 4,079 3,935 17 4 2,750 985
12 9,787 7,633 16 6 59 17 5,378 1,235-
13 5,077 4,032 16 25 8 2,966 629
14 5,011 4,236 5 34 2,637 454
~ 5-14 116,613 109,261 84 35 41 3 87,048 71,543. URBAN
5 12,963 11,920 5,270 4,411
Ii 11,917 12,268 7,384 6,520
7 10,522 10,409 7,773 6,976
8 14,071 13,141 5 4 4 11,243 9,504
9 8,883 8,701 7,565 6,86()'
10 14,923 13,586 16 7 12,546 10JOS
11 8,969 8,535 10 S 4 9 7,906 6,677 12 14,734 12,412 10 S 7 4 12,053 8,889
13 9,120 8,769 26 5 5 4 7,518 5,982'
14 10,510 9,520 16 20 21 4 7,789 5,616
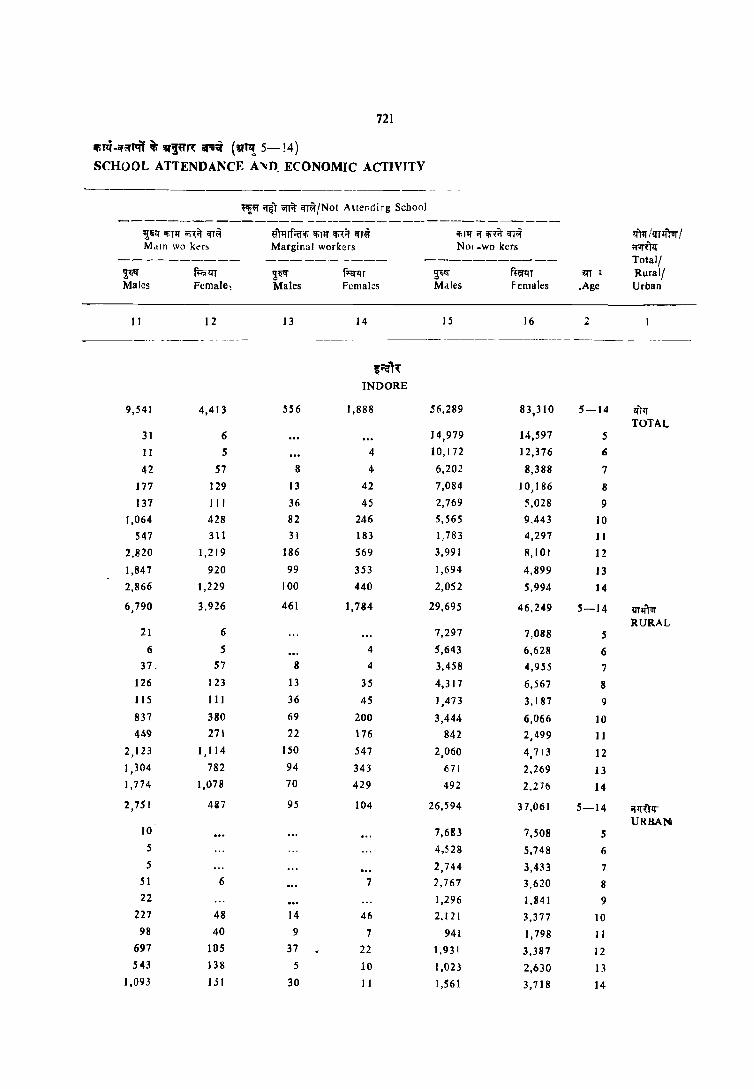
721
IlliT~ -Ifi;ftlff it; !Q'~~~ ifi'Cf (!Q'"! 5-!4) SCHOOL ATTENDANCE A~D. ECONOMIC ACTIVITY
--------- ------- ------------ --
~;;r ~1 \i[lir ~/Not Atter.dirg School --------------- -----------------------
~lill ~Ilf 9i,~ qr;Of ~TlIlf;u'" 9i11l 9i\~ 'H~ ~Iq ;:r ""if <n~ >.rm !!lfI'fTvr / M.lIn wo kt"r, Marginal workers NOI _wo kcrs ;r~ftll
----------- ---------~ ----------_ Total( 2;q"Ii fF.lm 2;q"Ii f~lIT Ti!f ffefliT iR"T 1 Rural/ Males Fcmalel Males Females Males Females .Age Urban
J I 12 13 14 J 5 16 2
--- ------- - - -------_------------------------------- ----- - ._---
i~1, INDORE
9,541 4,413 556 1,888 56,289 83,310 5-14 Ill-IT TOTAL
31 6 ) 4,979 14,597 5
11 5 4 10,172 12,376 6
42 57 8 4 6,202 8,388 7
177 129 13 42 7,084 10,186 8
137 III 36 45 2,769 !i,02B 9
1,064 428 82 246 5,565 9,443 10
547 311 31 183 1,783 4,297 11
2,820 1,219 186 569 3,991 8,101 12
1,847 920 99 353 1,694 4,899 J 3
2,866 1,229 100 440 2,052 5,994 14
6,790 3,926 461 1,784 29,695 46.249 5-14 IITlfT'lf RURAL
21 6 7,297 7,088 5 6 5 4 5,643 6,628 6
37. 57 8 4 3,458 4,955 7 126 123 13 35 4,3 I 7 6,567 8 115 III 36 45 1,473 3.187 9 837 380 69 200 3,444 6,066 10 449 271 22 176 842 2,499 II
2,123 1,114 150 547 2,060 4,713 12 1,304 782 94 343 671 2.269 13 1,774 1,078 70 429 492 2.276 14
2,751 487 95 104 26,594 37,061 5-14 ~if\rlf" URBAM
10 7,683 7,508 5 5 4,528 5,748 6 5 2,744 3,433 7
51 6 7 2,767 3.620 8 22 1,296 1.841 9
227 48 14 46 2,121 3,377 10 98 40 9 7 941 J,798 1 1
697 105 37 22 1,931 3,387 12 543 138 5 10 1,023 2,630 13
1,093 151 30 J I J ,561 3,718 14

722
tt-4 It~ ~ IQ'rq I ~l\'f iilr.t 'lfltii u1r 9;ltr~1fI ~ "
C4 CHILDREN (AGES 5--14) BY SINGLE \,EAR OF AGE •
.....________ - ---~ _-- --- - - -------~ -_ -------"_ - ~-- - -~---- - - - --~-----~-----
~" ;if.t 'Iliff A ttending School --- -----_-------- ------------
,irr/"IlrifrlJ! J 'Ji"ii! 'if1lfli!j( Il'!f 'li1111!il:1r '11~ ~r)ifrf;«'Ii <t;!lI l!if.f ~liiI qijif;r lfi1:1r '1m ~1Jit1f 'lotal ~opulatiCln M~1I1 WOlht. Marginal workels Non.worku:;
Total! __ 4 ________
------------ --------- ----------Rurall an,! ~ijq' fWf[ ~~ ~~t WI' fullti ,!~'i f~l!i Urban Age Males Forn.les Males Females Males Females Males Females
-- --- -~---- --- ----~-~----
2 3 4 ~ 6 1 8 9 10
- --- - -~~--- - ------ _---- -- ---~-- -- _--- ---------- -- ----_---
qft~ f~'l WEST NIMAR
!fltr 5-14 245,431 234,643 79 20 293 105 88,028 42,052
TOTAL 5 28,116 26,878 2,203 1,615
6 30,508 30,151 4 S 6,984 4,146
i 21,H9 22,569 10 7,876 4,692
8 J ],299 33,146 19 5 12,551 6,742
I) 16,810 17 ,063 4 IS 8,466 4,81l
10 34,569 32,479 5 42 3S H,~99 6.410
11 14,579 14,nO 10 31 10 8,225 J,981
12 31,027 26,146 25 15 S5 15 12,728 4,487
13 14,988 14,560 15 S 71 5 6,973 2,841
14 19,327 16,701 19 61 S 7,623 2,3'16
mTur 5-14 212.767 102,323 70 20 286 105 67,372 25,792 RURAL
5 24,S7 S 23,433 1,'6() 876
6 26,861 26,405 4 S 5,3(11 2,659
7 19,25H 19,6u5 10 6,198 3,1 ~8
8 29,541 29 ,20~ 19 j 10,049 4.~55
9 14,4&6 14,442 4 15 6,HO 3.090
10 30,3117 28,434 38 35 11,2; 7 4,114
11 11,n8 11,945 )() 31 10 6,149 2,435
12 26,968 22,839 20 IS S5 15 9,801 2,502
13 12,497 12,072 IS 5 77 5 5,129 1,437
14 16)16 13,945 Jj ,7 5 5,467 1,071
<!1IUIl' 5-14 32,664 32,320 "9 7 20,656 16,260
URIlAN 5 3,741 3,446 843 749
6 3,647 3,741 1,623 1,487
7 2,691 2,964 1,678 1,544-
8 3,758 3,942 2,503 2,287
9 2.384 2,621 1,886 1,722
10 4,182 4,0'4S 3,122 2,295
11 2.601 2,411S 2,075 1,S46
12 4,058 3,907 5 2,927 1,985
13 2,491 2,488 1,843 1,404
14 3,111 2,156 4 2,156 1,240
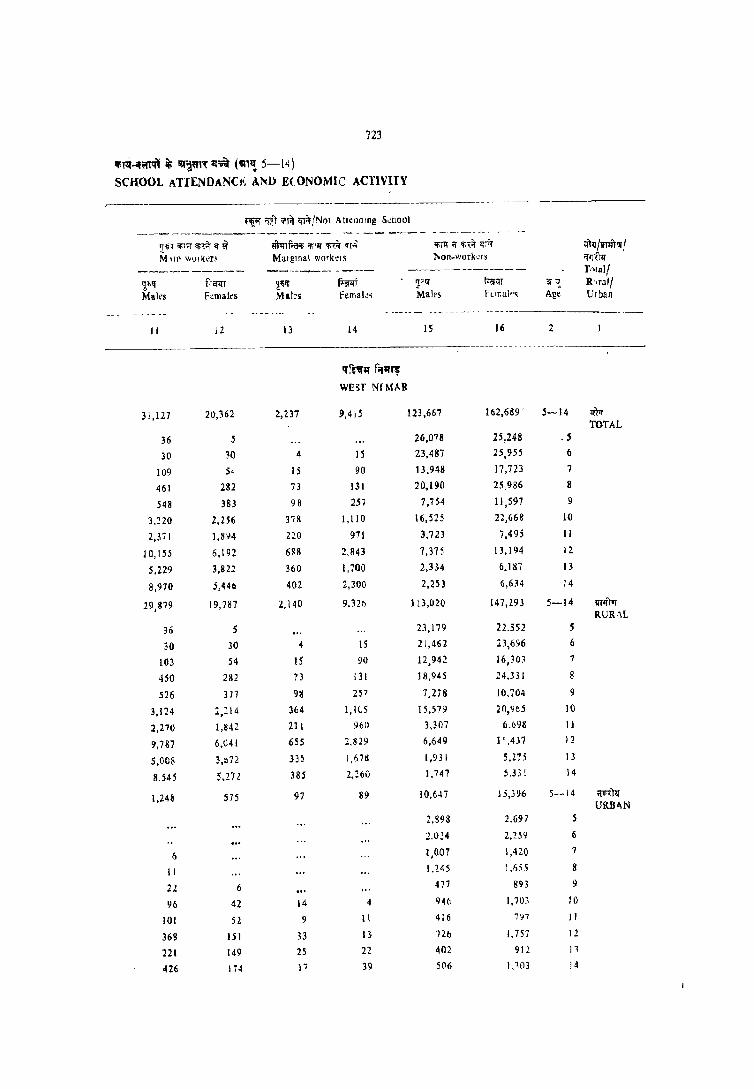
723
1I'i~-ilorrq) ~ f;I~,«" CI~ (CI1l! 5-14) SCHOOL ATIENDANC": A~Jj EfONOMIC ACnVITY
--~---------
~'lj_or ;;~T 'ilr~ <n~/NOI Allelldtng S.;llool --------------- _- -_--- _- ~- - -- -----_ - _--- -- ---- ----
Til '!il11 ;r.f.t <r if mtnf.<I'Ii 'f~lf ~ or';; ~T1!;; 1f;,~ 'ITi;r !!llJ/lITliT'lfj MII11 WlHKef1 MUlglflal w(}rkelS lIoon-workcrs if'rcrll"
----------- -----_-- ----- ------------ Tn1al/ 'l,~'1 f.-or'lT g~!f Foro ~fI' f<?l.1T or'?, R,ml!
Maks F~R1aks Mites Femal.!, Mairs ftll-;alp~ Age urban
- ------ - --- -- ---
II 12 13 14 15 16 2
q:~" f,,"~ WEST NfMAR
3J ,127 20,362 2,237 9,415 123,661 162,689 - ~-14 m.r TOTAL
36 5 26,078 25,248 . 5
30 30 4 15 23,487 25,955 6
109 5<1 15 90 13.948 17,723 7
461 282 73 131 20,190 25,986 8
548 383 98 257 7,754 11,597 9
3)2Q 2,256 37& 1,110 16,515 22,668 IQ
2.37 1 1.894 ZZO 971 3.723 7,495 11
10,155 6.192 6~8 2,843 7.375 13,194 IZ
5.229 3,822 360 1,700 2,334 6.187 13
8,970 5,446 402 2,300 2,253 6,6H 14
19,879 19,787 2,140 9.32fi 113,020 147,293 5-14 lIT'fforr RUR,\L
36 23,179 22.552 5
30 30 4 15 21,462 23,696 6
103 54 15 90 12,942 16,30~ 7
450 282 73 131 18,945 24.331 8
526 377 98 257 7,278 10.704 9
3,124 2,214 364 1,1(5 15.579 20,~(lj 10
2,270 I,M2 211 961l 3.307 6.69H IJ
9,787 6.041 655 2,829 6.649 11,437 12
5,008 3,n72 335 1,67g 1,931 5,275 13
8.545 5,272 385 2,160 1.147 5,33l 14
1,248 575 97 89 10.647 1;,396 5-14 ;mIll' URBb,N
2,898 2.697 5
2.024 2,259 6
6 1,007 1,420 7
II 1.245 1,655 8
21 6 477 893 9
96 42 14 946 1.703 10
101 52 9 11 416 7~7 II
368 IS I 33 13 n(J 1.757 12
221 149 25 22 402 912 ]1
426 114 17 39 SCl6 1,103 J4

724
"'-4 ~If.\=r ~ IIlI'TI!., ~~~ 'll'lit QT~ 1IlI"~ a,f'1fi
C-4 <'HI1DREN (AGES 5-14) BY SINGLE YEAR OF AGE,
-------- -- - _-_ ----- -- - - -- ---.- - - - _---- ---------- - - - ---- -- - --
~ ... ;;rr~ q'1~'/Altending School
--------------------------zft;r I mtfl1lf / ~.,.;;r"l!lSlIT lllilf '!ill!' '!i'{~ ;n~ urof."'ffiIi '!ill!' 'Ii'{:f ~ ~ ~ 'In:~ q'1~
"~'-I' Tolal population Main workers Marginal workers Non_workers
Total/ ----------- --------- -------- ---------Rurall arr~ T''' f~ Ti'1' furqr ~Ii ftoi'lI'r $1;t.f fu!'q;
Urban Age Males Females Males Fem:.des Males Females Males FelT aIel
--- ---------- --- ------ - _-- ------------ ------------ - -- --_- - --_
2 4 5 6 7 8 9 10
_- -----_-- - ------ - --- ------
qli f;rq,. " .
Er\ST NIMAR
ttnT 5-14 164,602 152,165 59 21 450 78 70,085 38,930
TOTAL 5 19.221 17,190 I,Oll 810
6 19,031 18,375 5 4,482 3,176
7 14,3 58 14.313 5 6,187 4,133
8 20.306 18,966 13 4 10,228 5,927
9 12,400 lI,Q62 20 16 7,566 4,701
10 21,233 19,668 5 103 12 11,640 6,298
11 11,035 10.691 5 72 19 7,143 4,003
12 21,215 18,322 20 5 112 12 9,9~6 4,770
13 11,"'212 10,745 15 5 64 7 5,733 :,827
14 14,592 12,034 10 67 3 6,126 2,284
«TPTvr 5-14 123,142 113,154 54 21 438 69 44,414 18,223
RURAL 5 14,404 P,1S5 451 344
6 14,718 13,944 5 2,785 1,580
7 11,021 10,889 5 4,028 2,218
8 15,511 14,518 13 4 6,778 3,150
9 9,221 8,8H 20 16 5,019 2,477
10 16,300 14,940 5 103 12 7,909 3,072
II 7,815 7,354 5 72 16 4,517 1,777
12 15.937 13,590 20 5 105 12 6,250 2,019
13 7,878 7,541 20 5 59 4 8,293 979
14 10,337 8,392 10 67 3,383 607
'11f:1'1f 5-14 41.460 39,012 5 12 9 25,671 20,706
URHAN 5 4,817 4,035 582 466
6 4,313 4,431 1,697 1,597
7 3,337 3,424 2,160 1,915
8 4,796 4,449 3,450 2,777
9 3,179 3,031 2,547 2,224
10 4,'133 4,729 3,731 3,225
11 3,219 3,337 3 2,626 2,226
12 5,278 4.731 7 3,696 2,751
13 3,334 3,204 5 S 3 2,440 1.848
14 4,255 3,642 3 2,744 1,677

725
'fini-lI~r"f Ii 3I'~~n'{ il"ii (Illfl! 5-14) SCI-lOOL ATTENDANCE AND ECONOMIC ACTIVITY
------------- ---------- - -- - - ------ - -- -------
'ifJ. ... 'lit .rr~ ~/Not Attending School --- ------------------ ----- --------~--~ 'fil1f 'Ii1:it ;rn;f ~"l+rmllifl'f'fi~~ 'filII' If m ifT~ 1f1;r/lJrfftar/ Main workers Marginal workers Non-workers iI~"tq-
----------- --_-------- ----------- Total! ~If ff<'l<ri ~ r,;;;<ri 'J;lilf r,erlft an,! Rural{ Males Pemales Males Females Males Females Age Urban
---------- --._------- ----- --- -- - - - -------_
II 12 13 14 IS 16 2
- ----- ------- -- -
'l~ f;n(~ EAST NIMAR
20,815 14,694 1,054 4,141 72,140 94,302 5-14 IfIIT TOTAL
15 16 .,. 5 18,173 16,358 S
10 14 5 14,539 15,174 6
41 36 22 9 8,108 10,130 7
210 171 40 95 9,815 12,769 8
771 224 53 120 3,984 6,801 9
2,026 1,382 211 556 7,254 11,416 10
1,488 1,330 127 437 2,201 4,902 11
6,462 4.622 325 1.220 4,350 7,691 12
3,436 2,789 172 724 1,782 4,934 13
6,348 4,110 106 971 1.935 4,667 14
18,965 14,080 957 4,030 ~8,315 76,731 '-14 !fIlftur RURAL
15 16 S 13,937 12,790 $
10 10 S 1 1,922 12,344 6
36 36 22 9 6,936 8,621 7
205 166 40 92 8,474 11,105 8
768 219 53 120 3,361 6,000 9
1,886 1,3S1 186 546 6,217 9,954 10
1,419 1,277 124 432 1,678 3.851 11
5,962 4,420 298 1,195 3,301 5,938 12
3,092 2,684 144 701 1,270 3.167 13
5,S71 3,901 90 924 1,217 2,960 14
1,850 614 97 III 13,824 17,572 5-14 lfIT"(tq' URBAN
4,235 3,569 5
4 2.616 2,830 6
S 1.172 1,509 7
5 5 1,341 1,664 8
10 6 623 801 9
140 31 25 10 1,037 J .462 10
69 53 3 4 522 1,051 11
SOO 202 26 25 1,049 J,153 12
344 lOS 27 22 512 1,226 13
777 208 16 47 718 1,707 14

728
l'f-4 q~ ~ 1R'1'!" ~.i( \ifA ~~ sit, ~r'fl'i C-4 CHILDREN (AGES 5-14) BY SINGLE YEAR OF AGE,
-- --------------.~iif iifTit l!T~/Attending School
--------------------------<lT1f !vrmur / ~;;f \ififtf<i!lT lJ"q- 'liP, 'Ii,it l!T~ «nrTRroIi I!illf 'Rit 'n~ I!illf if 'R;f ilT~
~ TO'al population MaID workers Marginal workers Non-workers,
Totall --------- --------- ------- ---_-----Rurall ai'll! Til'£ fur:rr 2:.lf fl'eT!lT 2:<lf ful'IlT ~~ ~ Urban Age Males Females Males Females Males Females Males Females
-------- -- _-----_. - -2 3 4 S 6 7 8 9 10
--- -~----- - ------- --
f.f~m VIOISHA
<1m 5-14 1 1i,192 100,842 51 351 12 50,832 20,607
TOTAL 5 13,987 12,592 1,316 843
6 13,710 12,649 5 3,637 1,804
7 10,213 10.826 4,633 2,278
8 15.802 ) 3.897 7,482 3.323
9 8.167 7.978 5 4',776 2,558
10 15,235 ) 2,924 21 6 8,276 3,406
II 7,141l 6.517 5 26 4,654 1,999
1Z 15,573 11,745 10 89 7,812 2,~69
13 6,925 5,132 5 68 6 3,828 1,091
14 9,432 6,580 30 136 4,419 1,035
AUf 5-14 98,496 84,169 5) 338 12 37,S 13 10,802
RURAL
5 11,849 10,630 564 290
6 11,576 10,700 5 2,354 845
7 9,581 9,348 3,453 1,3.29
B 13,515 11,865 5,710 1,994
9 6,8U4 6,751 5 3,652 1,621
10 13,039 10.829 21 6 6,533 2,000
II 5,726 5,206 26 3,440 1,071
12 13,072 9,636 10 89 5,875 1,051
13 5,630 3,997 5 62 6 2,80( 353
14 7,703 5,206 30 129 3.13 I . 248
;um<r 5-14 ) 8,696 16,673 13 13,319 9,805
URBAN 5 2,138 1,962 752 SB
6 2,134 1,949 1,283 960
7 1,632 1,478 1,180 950
8 2,287 2,032 1,772 1,328
9 1,362 1,227 1,124 937
10 2,196 2,095 1.744 1,407
II ) ,422 1,311 1,214 927
12 2,501 2,109 1,937 1.2: 8
13 J.295 1.135 6 1,027 738
14 1.729 1.374 6 1,288 788
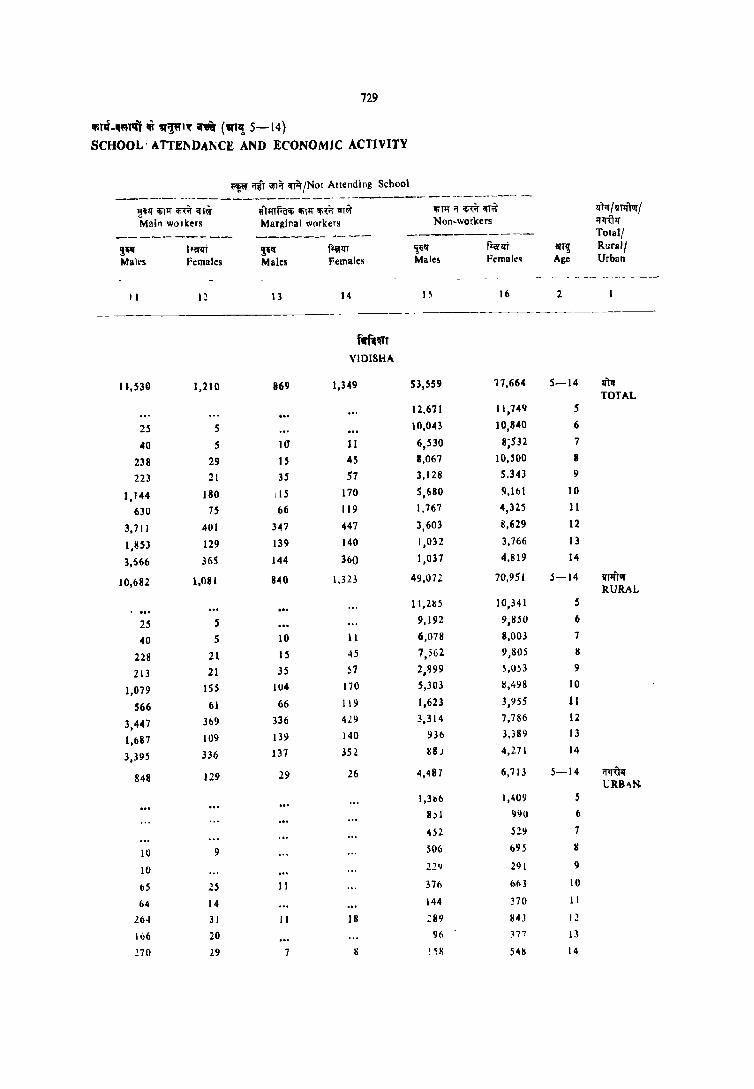
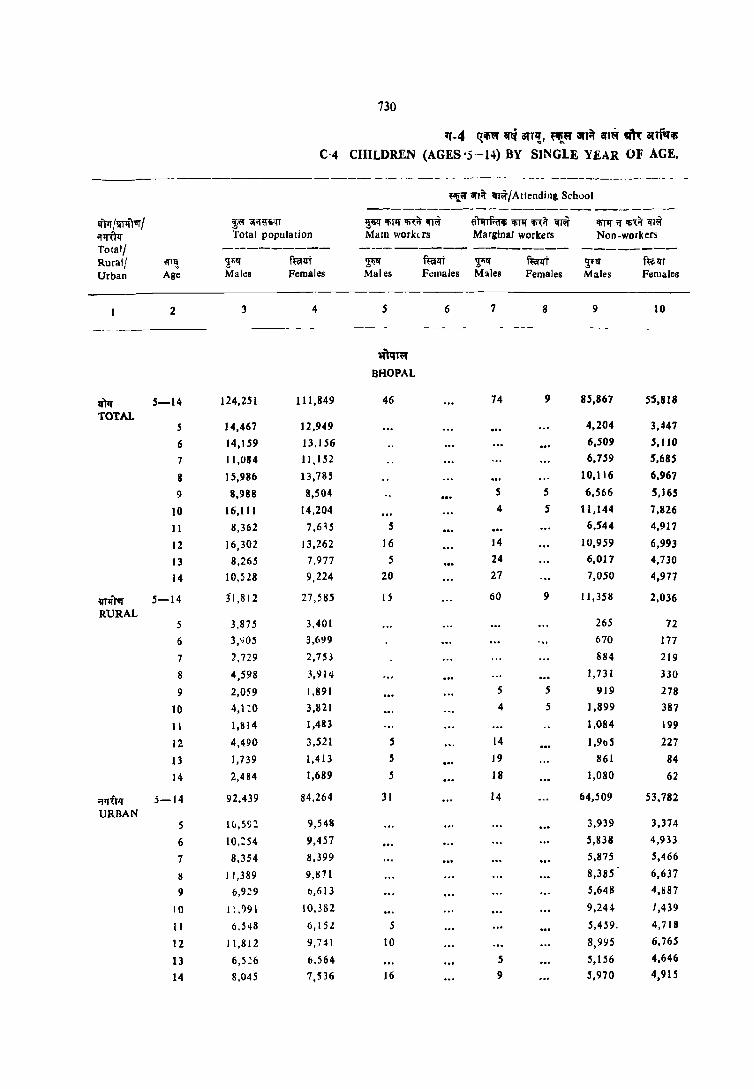
730
1f-4 ~iMI' ~ an,!, ~~ \jf'~ ~I~ vl~ anf'iil> C-4 CHILDREN (AGES'5 --14-) BY SINGLE YEAR OF AGE,
-- ---- --- - - ---- --- - ---------------------- - -
~or \iflit ~1~/AttendiJlg School
--------------------------If)lr [iTlITIIf I ~0!'1'if1i~ ljlitf qiTIf ~if cn~ tiTlflfrifili 'liT1f ~it ~ lIi11f ;r mij- "1fT\{
;:P[,r.r Total population MaIn workers Marginal workers Non -workers
Total/ ---_------ ---------- -------- --------Rural! o!l"l! ~l;" f~t1t ~ futlft 2:J;1f fuil'lft ~flf f~IfT
Urban Age Males Females Males F.:males Males Females Males Females
2 3 4 5 6 7 8 9 10
---- - --_ -- -----_ ----
oq)qT\lf
BHOPAL
.)lr 5-!4 124,251 111,849 46 74 9 85,867 5'5,818
TOTAL 5 14,467 12,949 4,204 3,447
6 14,159 13.1.56 6,509 5,110
7 11,084 11,152 6,759 5,685
8 15,986 13,785 10,116 6,961
9 8,988 8,504 S 5 6,566 S,165
10 16,111 14,204 4 5 11,144 7,826
II 8,362 7,6~5 5 6,544 4,917
12 16,302 13,262 16 14 10,959 6,993
13 8,265 7.977 5 24 6,017 4,730
14 10,518 9,224 20 21 7,050 4,977
llTlfTvr 5-14 31,812 27,585 15 60 9 11,358 2,036
RURAL 5 3.875 3.401 265 72
6 3,<;05 3,699 670 177
7 2,729 2,753 1184 219
8 4,598 3,914 1,731 330
9 2,059 1,891 5 .5 919 278
10 4,1 :0 3,821 4 5 1,899 387
11 1,814 1,483 1,084 199
12 4,490 3,521 5 14 1,91l5 227
13 1,739 1,413 S 19 861 84
14 2,484 1,689 5 18 1,080 62
Ofllitlf 5-14 92.439 84,264 31 14 64,.509 53,782
URBAN 5 Iv,5<;:! 9,548 3,939 3,374
6 10,:54 9,457 5,838 4,933
7 8,354 8,399 5,875 5,466
II 11,389 9,871 8,385 6,637
9 6,9~9 b,613 5,648 4,887
10 I! ,1)91 10,382 9,244 1,439
II 6,548 6,15Z 5 5,459. 4,718
12 11,812 9,741 10 8,9~S 6,765
13 6,5~6 6.564 5 5,156 4,646
14 8,045 7,536 16 9 5,970 4,915
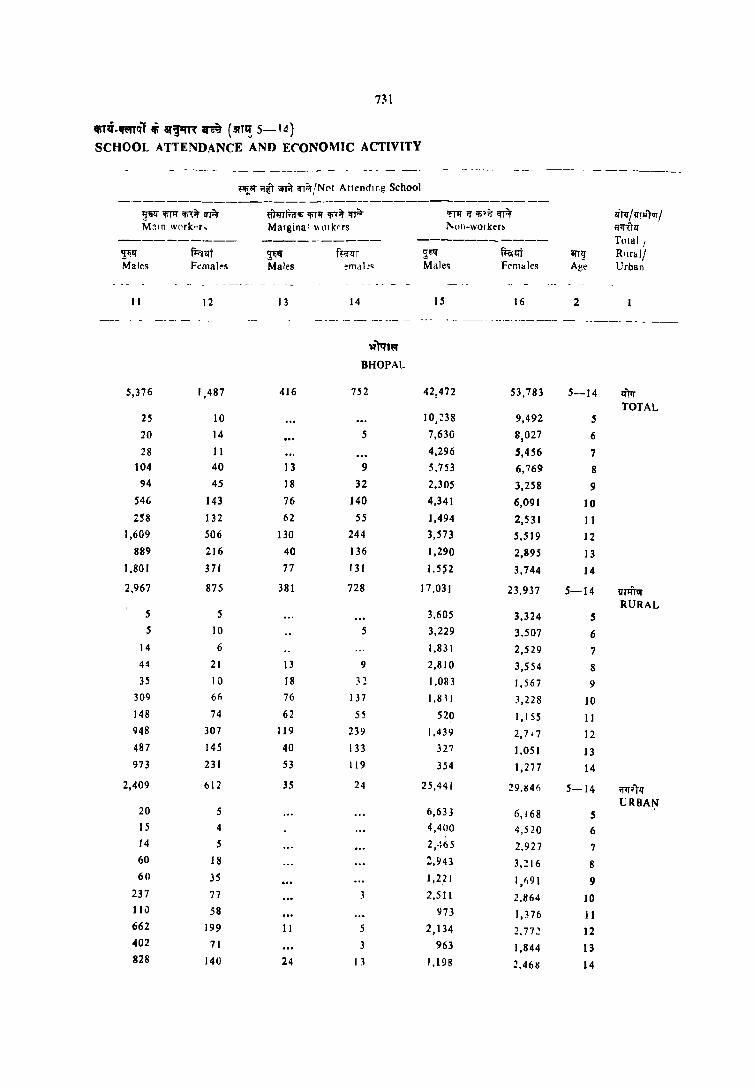
731
IlliTli.lfmqlli" at~n ~ (3fT,,! 5-14) SCHOOL ATTENDANCE AND ECONOMIC ACTIVITY
- - --- -- - -- ~ ------.--- -- - -- _--- - ---------- ------------_ --_- -----_ ~iIl'.'" ;j~T ;;rf.t q-I1:r/NN Attencllr,g School
--------------.......__-----------------------l'j"lill" 'IiTll" 'Ii"{it 'n;;" iWrrr.nl> 'liTl!' 'Ii,it ~ ~ Of 'Ii'.: 'I'Ft 'litir / !rrIJT'1f / M3ln work"r" Marginal \HHkers ]'.ol1-wOIkrn ij'lf"{Tlf
---------- ----------- ------_---- TOlal I
Tilf fl:'ill"T 'I1llf n'Sfll"T ~6ll ~1ft 3!TlJ' Rural! Males Females Males ~m..ll!, Male~ Females Ag~ Urban
- -_ - - -- - ------
II 12 13 14 IS 16 2
- -_ - ------- -- - - -- ---- -- --- --- --- --_.-._._------ ---------- -- - -_ If)q,~
BHOPAL
5,376 1,487 416 752 42,472 53,783 5-14 lim TOTAL
25 10 IO,~38 9,492 5 20 14 5 7,630 8,027 6
28 11 4,296 5,456 7 104 40 13 9 5,753 6,769 8 94 45 18 32 2,305 3,258 9
546 143 76 140 4,341 6,091 10
258 132 62 5S 1,494 2,531 11 1,609 506 130 244 3,573 5,519 12
889 216 40 136 1,290 2,895 13 1,801 371 77 131 1.5~2 3,744 14
2,967 875 381 728 17,031 23,937 5-14 !1T'lfTUf
RURAL 5 5 3,605 3,324 5 5 10 5 3,229 3.507 6
14 6 1,831 2,529 7 44 21 13 9 2,810 3,554 8 35 1Q 18 3~ 1,083 1,567 9
309 6(, 76 137 1,8' 1 3,228 10 148 74 62 55 520 1,155 11 948 307 119 239 1,439 2,7' 7 12 487 145 40 133 327 1,051 13 973 231 53 119 354 1,277 14
2,409 612 35 24 25,44i 29.114(, 5-14 ill,..) ..
20 5 6,633 URBAN
6,168 5 IS 4 4,4()O 4,520 6 14 5 2 .. :65 2,927 7 60 J 8 :,943 3,~ 16 8 61l 3S I ,2~ 1 1,1i91 9
237 77 3 2,5]1 2.864 10 110 58 973 1,376 11 662 199 II 5 2,134 2.772 12 402 71 3 963 1,844 13 828 140 24 13 1,198 2.4611 14
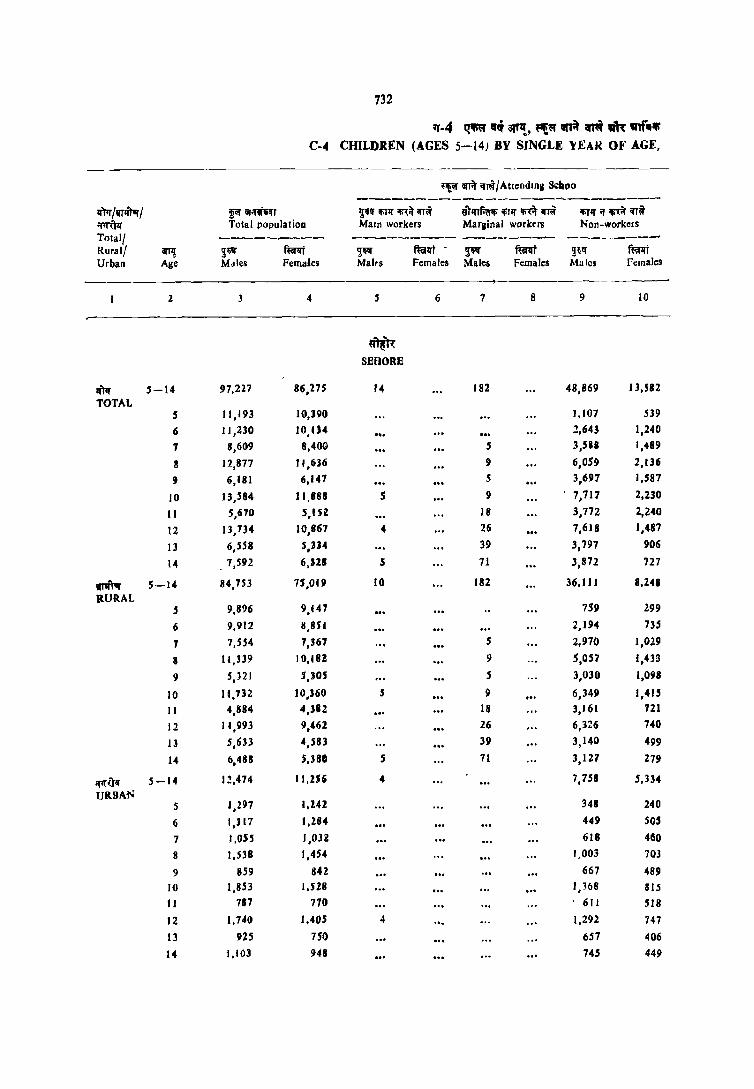
732
,,-4 qq ... ~, ~t=I' WA ri ~ ,,,rlllll' C-4 CHILDR.EN (AGES 5-14) BY SINGLE \'EA~ OF AGE,
~i!i:;;r ~ "Iii I A ttendrna SclalJO --------------_-_.._.--------~"tq /wrrftwr / fiiI" \ifol.'lfr ~li!f ~llf '!r{;r iff" ~n'IITRr~ ~Tlf rn ;mf ~q;r rn iffi ;rl1'-uzr Total population Main workers Marginal workers Non-workers Totall -------- --------- -------- --------Rural/ arr~ ~~ mn.rt ~ ~Ift- ~ f~ ~~tf ffiflrt Urban Age Mdle~ Females Mairs Females Males Females Males Females
2 3 4 5 6 7 8 9 10
oltR SEHORE
m 5-14 97,227 86,275 14 182 48,869 13,582
TOTAL 5 11,193 10,390 1,107 539
6 11,230 IO,tS4 .:!,643 1,240
T 8,609 8,400 5 3,511 ',489
8 12,877 11,616 9 6,059 2,136
9 6,181 6,141 5 3,697 1,587
10 13,584 11,888 5 9 7,717 2,230
11 5,610 5,1 Sl 18 3,772 2,240
12 13,134 10,867 4 26 7,618 1,487
13 6,558 S,n4 39 3,797 906
14 7,592 6,U8 S 71 3,872 727
m"t" 5-14 84,153 15,019 10 182 36,111 8,248
RURAL S 9,896 9,147 759 299
6 9,912 8,811 2,194 7H
7 7,554 7,361 5 2,970 1,029
8 II,U9 10,IU 9 5,057 1,439
9 5,)21 S,JOS S 3,030 1,098
10 11,132 10,160 .5 I) 6,349 1,415
II 4,884 4,3e! 18 3,161 721
12 11,993 9,462 26 6,116 740
13 5,6Jl 4,583 39 3,140 499
14 6,4811 5,180 5 71 3,127 279
l{IfUI.f 5-14 12,474 II,ZS6 4 7,758 5,334
UIl9AN 5 J ,2111 1,142 348 240
6 I,B7 1,284 449 505
7 I,OB I,on 618 460
8 I,S38 1,454 1,003 703
9 8S9 84Z 667 489
10 1,853 1,528 1,368 81S
11 787 710 . 6 Jl 518
12 1,140 1,405 " 1,292 147
13 925 750 651 406
14 1,103 948 745 449

733
.N -.wllJl " 8T!9'R '" ("11{ 5-14) SCHOOL ATTENDANCE AND ECONOMIC ACTIVITY
---_-
~ ;w~ ;r~ ~",/Not Attending School
----------_-------------------------~lfiAmri ~lfiAm"m lIiT1I ... rnll'l~ ~ /1Illfttr I Main workers Marginal worker. NOD-workers ~
--------- ---------- ----------- Totall ~~ f~1It i~ m.1it ~ mm arT,! Rural/ Males Females Males Females Males Females Age Urban
11 12 13 14 IS 16 2
m~'h: SEHORE
8,303 3,359 690 2,353 44,169 66,981 5-14 If)q TOTAL
30 S IO,OS6 9,846 5
20 .5 .5 5 8,562 8,885 , 5,017 6,910 1
1,58 16 14 31 6,6]6 9,453 8
81 54 13 29 2,384 4,476 , 836 266 64 288 4,952 9,102 10
413 228 4:J 137 1.425 3.547 H
2,688 1,082 217 700 3,182 1.598 12
1,,49 102 169 464 1,004 3,262 13
2,527 1,001 166 698 951 3,902 14
1,895 3,235 644 2,325 39,911 61,211 5-14 fTIfItr RURAL
30 5 9,107 8,843 .5
20 5 5 5 1,693 8,106 6 4,580 6.338 7
1S4 16 14 31 6,105 8,702 8 72 54 9 29 2,206 4.124 9
827 266 53 277 4,487 8.402 10
394 224 43 137 1,268 3,299 11 2,595 1,042 198 688 2,848 6,993 12
1,469 679 ISS 460 810 2,944 13
2,333 9"" 166 698 786 3,459 14-
408 124 46 :8 4,2S1 5,710 5-14- ;W~ URBAN
949 1,003 S
869 778 6 431 572 1
5 HI 151 8 9 4 178 353 9 9 10 12 465 701 10
19 4 157 248 Jl 93 40 18 12 334 606 12 79 22 14 4 175 318 13
194 57 164 443 14

734
'1'·4 ~ ri ~, ~~ ~ if~ ale: onf'~,. ('·4 CHILDREN (AGES 5-14) BY SIl\GIE YEAR OF AGE,
- -----.-~----- --- --------~--- -----~-
~<'r;;rf.r q;~/Attendlng School ---------_-_ ---------------
trTlr /'I1'~vr I ~ ;;mt~T lJ"!;1I lIOH! If;'f.I ql~ ~')J1rf;ol!> iliT'll iIi'~ lH~ !f;Tl!' ;r !P}f '11~ ;r~T!£ Total population Main workers Marginal w'Jrkcrs N Oll-WOI kcrs Total! --------- ----~---- --------- ------- -----Rural/ arT!! ~~ ftoilfr ~l!I' f~lfr g~1f fui!!t ~1il!l' ftel!IT Urban Age Males Female~ Males Females Male. Females Males FemaJrs
-- ,---- - _-_ .-------~- .--~----- -.---- ---------~ .--
2 3 4 5 6 7 8 9 10
- __ ------------- -----_._,----- - _" - -- --------------~- --.----~ ----_ -----
~111ir.f RAISEN
Iitlr 5-14 103,592 95,009 2S 517 123 42,055 17,386
TOTAL 5 11,895 11,368 778 521
6 12,173 11,802 4 2,391 1,407
7 10,~66 9,972 21 3,812 1,975
8 13,825 12,653 26 15 5,873 2,644
9 7,187 7,261 30 16 4,082 2.036
10 12,600 11,951 5 69 26 6,613 2,900
11 6,832 6,099 60 20 4.205 1,107
12 13.233 11,438 5 I IS 31 6.~42 2,249
13 6,667 5,788 10 73 10 3,BI 1,161
14 8,712 6.678 5 118 5 4,228 785
~'hr 5-14 93.072 85,144 25 509 114 35,420 J 2,269
RURAL 5 10,853 10,282 568 346
6 10,993 10,624 4 1,906 950
7 9,592 9,040 21 3,297 1,413
8 12,427 11.437 26 IS 4,967 1,986
9 6,466 6,523 30 16 3,512 1,536
10 11,257 10,623 5 69 26 5,551 2,171
11 6.086 5,4H 60 16 3,610 1,120
J2 11.777 10,240 5 110 31 5,559 1.537
13 5,971 5,Q69 10 73 5 2,983 723
14 7,649 5.863 5 116 5 3,466 3b8
~ 5-14 10.510 9,865 8 9 6,635 5,117
URABN S 1,042 1,087 210 175
6 1,180 1,178 485 457
V 874 932 ... SIS 562
8 1,398 1,216 905 638
9 721 738 571 499
10 1,342 1,328 1,062 729
11 746 655 4 595 488
12 1,456 1,198 5 983 712
13 696 1}9 4 548 439
14 1.063 815 3 762 39S
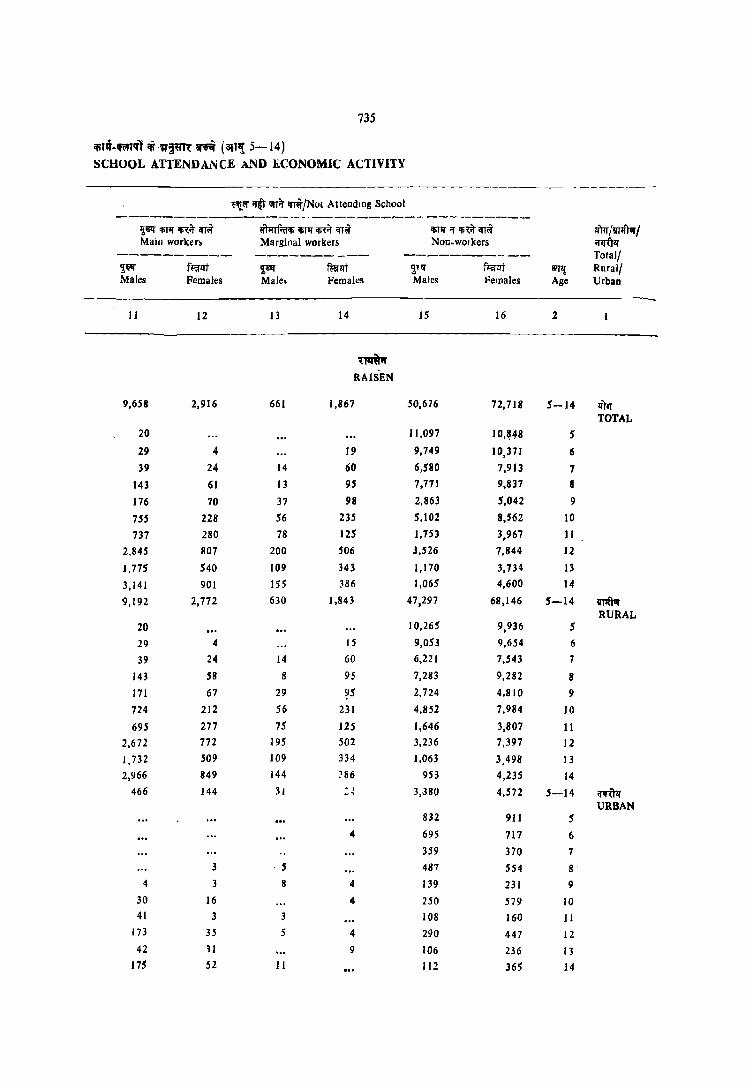
735
iti,q.-~'q'T iii' -'R'2~ 1if~ (an,! 5-14) SCHOOL ATTENDANCE AND ECONOMIC ACTIVITY
-- - --------- -t"i,l'I' ;rift OfTif ffl~JNot A tteDdmg School
---------------------------~ ----------~'lf 'Ii11I' '!i1.:if il'r.t- iPrrf'fl'li 'liT1r m qr~ iliTll ;r 'Ii\if ill" ~"Tir /mf/11If I Main worker:. Marginal workers NOD-wolkers ;tlitrll'
--------- -------_-- --------- -- Total! '!~ r~iflft ~ ftif~i ~'If ft'CI<IT iITT,! Rural! Males Females Male. Femalt!s Males Females Age Urban
----_-11 12 J 3 14 15 J6 2
~ RAiSEN
9,658 2,916 661 1,867 50,676 72,718 5-14 l:ftll TOTAL
20 11,097 10,H8 5
29 4 19 9,749 10,371 6
39 24 14 60 6,580 7,913 7
143 61 13 95 7,771 9,837 8
176 70 37 98 2,863 5,042 9
755 228 56 235 5,102 8,562 10
737 280 78 125 1,753 3,967 11
2,845 807 200 506 3,526 7,844 12
1,775 540 109 343 1,170 3,734 13
3,141 901 I5S 386 1,065 4,600 14
9,192 2,772 630 1,843 47,297 68,146 5-14 IlTIrJur RURAL
20 10,265 9,936 5
29 4 15 9,0)3 9,654 6
39 24 14 60 6,221 7,S43 7
143 58 8 95 7,283 9,282 8
171 67 29 ?5 2.724 4,810 9
724 212 S6 231 4,852 7,984 10
695 277 75 125 1,646 3,807 11
2,672 772 195 502 3,236 7,397 12
1.732 509 109 334 1,063 3,498 13
2,966 849 144 ~86 953 4,235 14
466 144 3. ~~ 3,J80 4,572 5-14 ~ URBAN
832 911 5
4 695 111 6
359 370 7
3 . 5 487 554 8
4 3 8 4 139 231 9 30 16 4 250 579 10 41 3 3 108 160 II
173 35 5 4 290 447 12 42 H 9 106 236 13
175 52 II 112 365 14
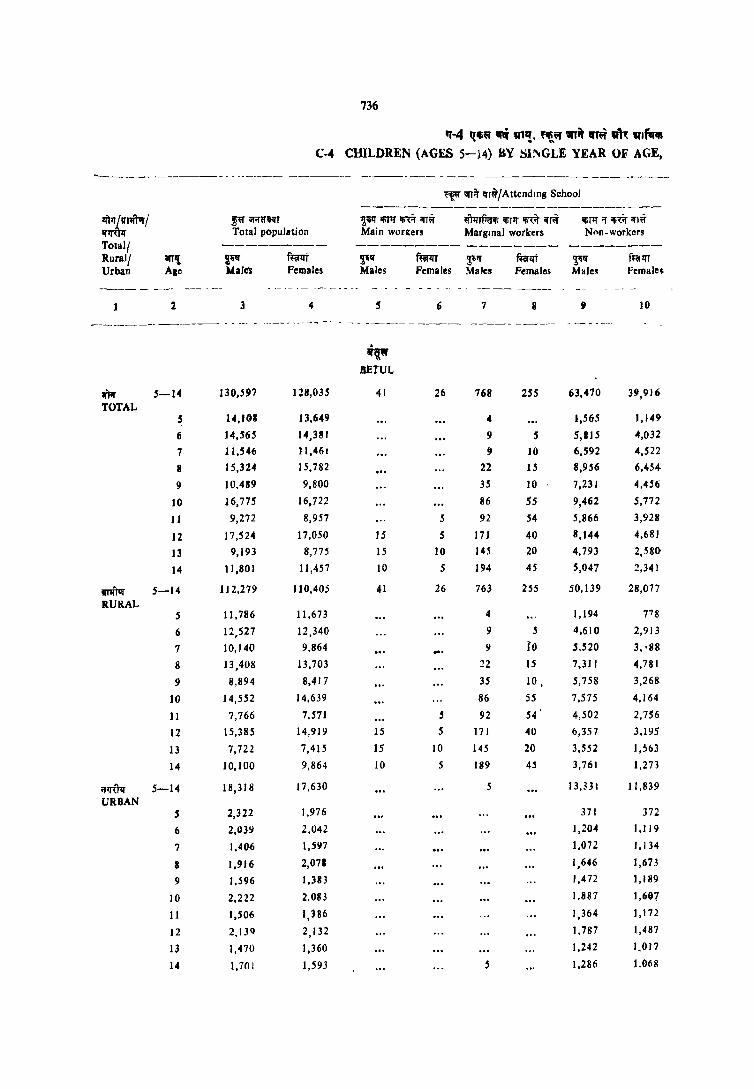
736
'1-4 ~." "" Clll!. "i'" ;ni\' ""' "'~ '1""'. C-4 CHILDREN (AGES 5-14) BY Sl~GLE YEAR OF AGE,
---- ---------_ - - ------- _-------- ----- --_ ---------- -.. ------
~ iilJif ;rr,,/Attendmg School ----------------------------
lfI::/rfflftvr / !"f "I'flmT 2.If;m'rn iiIT;ij- IfMf.Q;r, ;r,rll" 'li\if ;r rot IliTIl" "f ~~~ 'T1~ If If Total population Main WOCkers Marginal workers Non-workers TOla1{ --------- --------- -------- --------Rural! lIT,! 2~" f~1lt ~" furll"T ~" mrllt ~ fnlll'T
Urban Ale Nales Females Males Females Males Females Males Female~
------ --- _-.- --- --- _- - - - - -- --_ ---
2 3 4 5 6 7 8 II II)
------- ------- - - --- - -.---------. -- - -_ - -_--- -- ------------ ------- ---------
ip BEtUL
lIN S-14 130,597 128,035 41 26 768 25S 63,470 39,916
TOTAL 5 14,1011 13,649 4 1,565 1,141}
(j 14,565 14,381 9 S 5,1115 4,032
7 11,546 11,461 9 10 6,592 4,522
B 1S,324 15,782 22 15 8,956 6,454-
9 10,489 9,800 35 10 7,231 4,456
10 16,775 16,722 86 SS 9,462 5,772
11 9,272 8,957 5 92 54 5,866 3,928
12 17,524 17,050 15 5 171 40 8,144 4,681
13 9,193 8,775 15 10 145 20 4,793 2,S8!)
14 11,801 11,457 10 5 194 45 5,047 2,341
lITIfrur 5-14 112,279 110,405 41 26 763 H5 50,139 28,077
RURAL .s 11,786 11,673 4 1,194 778
6 12,527 12,340 9 .5 4,610 2,913
7 10,140 9,864 ... 9 fo 5,520 3, '88
8 13,408 13,703 12 15 7,311 4,781
9 8,894 8,417 35 10, 5,758 3,268
10 14,552 14,639 86 55 7,575 4,164
II 7,766 7,571 5 92 54 4,502 2,756
12 15,385 14,919 15 5 171 40 6,357 3.195
13 7,722 7,415 IS 10 145 20 3,552 1,563
14 10,100 9,864 10 5 189 4.5 3,761 1,273
;r~Tq' 5-14 18,318 17,630 5 13,331 11,839
URBAN 5 2,322 1,976 371 372
Ii 2,039 2,042 1,204 1,119
7 1.,4(~6 1,597 1,072 1,134
8 1,916 2,078 1,646 1,673
9 1,596 1,383 1,472 1,189
10 2,222 2,083 1.887 1,6(17
II 1,506 1,386 1,364 1,172
12 2,13'1 2,132 1,787 1,487
13 1,470 1,360 1,242 1.017
14 1,70 I 1,593 .5 1,286 1.068
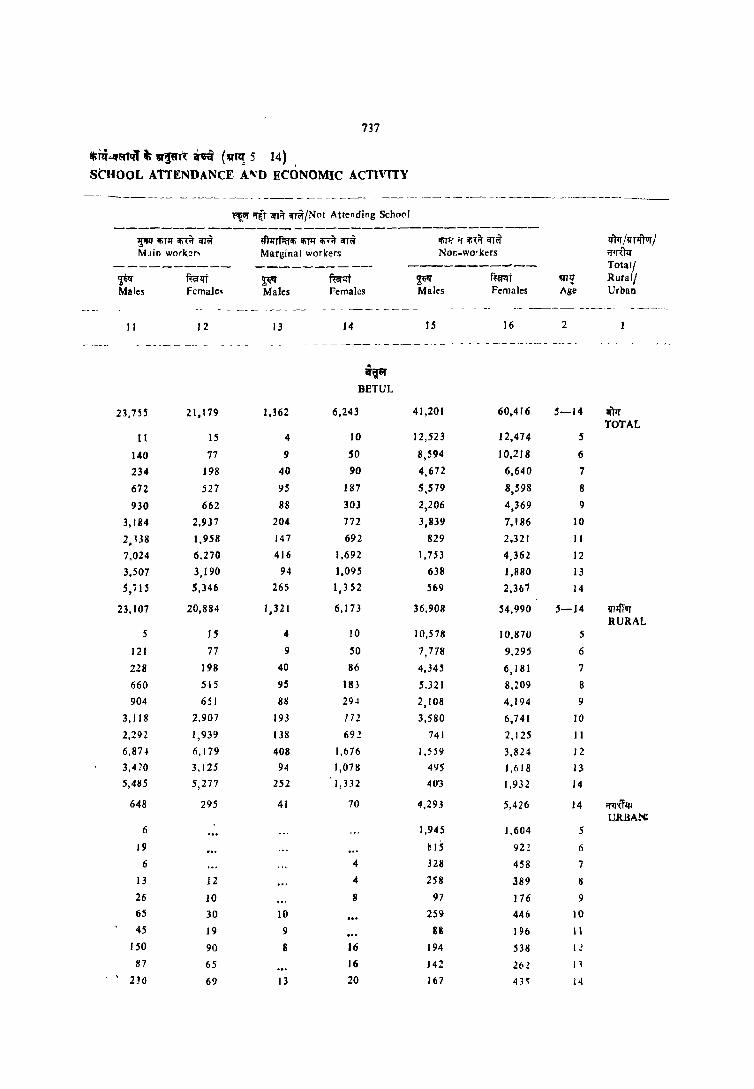
737
~nr ~~f1if t lQ'~"rt ~ (lQ'~ 5 14) StHOOL AtTENDANCE AI\iO ECONOMIC ACTlVTTY
--------- -- ----- --_-_ ---- - -- - - ---------- --- _-- -- --- -_-_ -----_ - ------------
~or ~r \iflit -a:w,/Not Attending Schofll
------------------------------------lj'ill ~TIJ rn iiT~ ij"ilJrf;:O!li IIiTIJ lli'it qr~ iliTl'f if iji,it iiT~ Ilm / 'fTlllvr I MJin work.er, Marginal workers Nor.-wo' kers iflffur
---------- ---------- ----------- Total/
'1ttf mr'lt ~ mrlli ~'I' f.~t !!f11J Rurall Males Female. Males Females Males Females Age Urban
--- - --- --- ---- -----_
" 12 13 14 J5 16 2
---_ - --- -- -- -------- --- - - --- -- - --------------- _----------_- -----_-- - -----
. ifP
BETUL
23,75 S 21,179 1,362 6,243 41,201 60,416 5-14 lIN TOTAL
II 15 4 10 J 2,523 12,474 5
140 77 9 SO 8,594 10,218 6
234 198 40 90 4,672 6,640 7
672 527 95 187 5,579 8,598 8
930 662 88 303 2,206 4,369 9
3,184 2,937 204 772 3,839 7,186 10
2,ll8 1,958 147 692 829 2,321 11
7,024 6.270 416 1,692 1,753 4,362 12
3,507 3,190 94 1,095 638 1,880 13
5,i 15 5,346 265 1,352 569 2,367 14
23,107 20,884 1,321 6,173 36,908 54,990 5-14 '1IlI'TVf RURAL
5 15 4 10 10,578 10,870 5
121 77 9 SO 7,778 9,295 6
228 198 40 86 4,345 6,181 7
660 515 9S 183 5,321 8,209 8
904 651 Hll 294 2,108 4,194 9
3,118 2.907 193 171. 3,580 6,741 10
2,292 1,939 138 69~ 741 2,125 II
6,87 ~ 6,179 408 1,676 1.559 3,B24 J2
3,420 3,125 94 1,078 495 1.618 13 S,4!!S 5,277 252 1,332 40'3 1,932 14
648 295 41 70 4,29.l 5,426 14 'ffl'i:"flIl URBAN:
6 1,945 1,604 5
19 ~IS 922 6
6 4 328 458 7
13 J 2 4 258 JB9 8
26 10 8 97 176 9
65 30 10 259 446 10
45 19 9 l1li 196 11
I SO 90 8 16 194 538 12
87 65 16 142 2to! I ,
230 69 13 20 167 435 14

738
"-4 ~1Ii{:f ." Wtl:l', ~" ;f,~ ... ~ em: ",rq~ .. '" C-4 CHILDRFN (AGfS 5-14) BY SINGLE YFAR OF AGE,
~ "----------~-- ---- --------~------- ---~----- ----t''£<'l' orf.r iffii/Attending School
----------------- -------
:~~:'1ftQf I ~ ~ij'ilff ~ Ifil>[ lIi<:it emir fi~iIiflI'~~if~ iIiflI'lI'miIT", To'al population MaIn workers Marginal wor1Cers Non-workers
Total! --------- --------- -------- ---- -------Rural/ iIIJ'It ~ mt 'j;.1f mt ~~'f ~lIt ~If furo Urban Age Males Females Males Females Males Females Males Females
2 3 4 S 6 7 8 9 . 10
- -------- -- -------- -_- ---_
~,"~rt HOSHANGABAD
Il11T 5-14 142,306 128,362 31 10 208 15 74,674 39,783
TOTAL 5 15,583 13.779 1.015 654
6 15,855 14.259 4,599 2,956
7 12,670 12,288 6,327 4,199
8 16,939 14,991 9 9,718 5,43S
9 10,832 10,155 28 10 ',861 4.984
10 17,,69 16,244 14 5 ' I 1,556 6,365
11 10,081 9,949 S 28 7,632 4,480
12 18,f100 15,431 6 46 j 1,453 4.817
13 10,860 9,836 S 10 51 6,978 3.224
14 13,318 10,824 IS 33 7,499 2,671
lfllftur 5-14 - 108,69S 97,445 21 10 194 15 49,160 19,601
RURAL 5 11,894 10,637 384 245
6 12,J.l4 11,199 2,802 1,625
7 9,724 9.491 4,094 2.291
8 13,356 11.764 9 6,780 3,053
9 8,436 8.02.5 28 10 05,701 2,716
10 13.478 12,527 14 .5 7,927 3.360
11 1,400 7,218 5 2) S,ISZ 2.188
12 14.360 1t,1l3 46 7,861 2.234
13 7,8S4 '.()93 5 10 46 4,359 1.246
14 9,848 1,718 IS 28 -4,663 643
:{1I'Uq- 5-14 33,611 30.917 6 14 24,914 20,182 URBAN
S 3,688 3,142 661 409
6 3,510 3.060 ... 1,797 1.331
7 2,947 2.797 2.232 1.908
8 3,583 3.2?7 2.938 2,381
9 2,3'96 2.729 2.160 2,268
10 4,090 3,717 3.628 3.006
11 2,680 2,731 S ... 2,4S I 2.292
12 4.240 3.664 6 3,586 2,S83
13 3,006 2,143 S 2.169 1,917
14 3.410 3,196 S 2.836 2,028

739
1fi1~-If;;JTq:l Ii "~Il ~ (aT,! 5-14)
SCHOOL 'A1TEl'DAI\CE AI\D ECONOMIC ACTIVITY
---------------- ~--- ------- _- ---- - -- - -- ------------.-- - - ---- --_ ~ ;rj!T ilIlit 'iI"r"/Not Attending Sch 101
-----~---------------------- --------l!ilf 'O'if ,",it 'flof ~'hlT Rr'O if;Tlf ~;r 'I1"f ,"Ilf ;; rn 'ilof 1I)-.r /vrri'trrr I Main wOlkers Marginal workers Non-workers :=fll1:llf
---------- ______ -i ___ ----------- TOlal/ ~~ t~I 7;'11' ~lfT ,!lilf f'OfllT anlL Rurall Male~ Females Males Females Mdles Females Age: Urban
II 1.2 13 14 15 J6 2
~ml~ HOSHANGABAD
11,521 5,292 835 2,402 55,037 110,860 5-14 Ii'!IJ TOTAL
15 14,517 13.125 5 31 9 5 11,215 11,298 6 51 42 9 6,284 8,048 7'
20S 57 23 29 6,983 9,470 8 222 114 10 49 2,712 5,598 9
864 SJ8 112 243 5,023 9,093 10
621 478 65 187 1,729 4,805 11
3,25 1 1,436 246 695 3,595 8,490 12
2,206 992 183 547 1,436 5,063 13 4,054 1,636 177 646 1,540 5,872 14
10,928 5,114 81~ 2,398 46,970 70,307 5-14 IIHr"tur RURAL
IS 11,496 10,392 5 25 9 5 9,508 9,569 6 44 42 9 5,575 7,158 7
193 57 23 29 6,3 ~O 8,624 8 204 114 10 49 1.493 5,137 9
796 532 112 243 4,629 8,387 10 599 ' 464 61 187 1.531 4,379 II
3,090 1,390 246 691 3.111 7,458 IZ
2.115 950 179 547 1,150 4.339 13 3,847 1,565 169 646 1,126 4,~63 14
593' 178 17 4 8,067 10,553 5-14 ;r1f7111' URBAN
3.011 2,733 5
6 1.707 1.728 6
6 708 889 7
12 631 846 8
17 219 "462 9
67 6 395 70.5 10
Zl 14 198 425 II
J(,J 45 4 484 1,032 I ~
92 42 S 2116 ' 7.!4 13
208 70 7 J, 1'4 '1 J609 14

740
rr·4 ~~ ~ an,!, ~'" ilUi{ Ifl~ ~R anfqiff C4 CHILDREN (AGES 5 - 14) BY SINGLE YEAR OF AGE.
.~ ... \;f,it iI"~/Atlending School ------------------------
lim /fJT"+fl'ar / ~ <ifif!.HilJ( ljtill" ifillf ifi~ ifl~ «nrrf.crifi 'fillf ifi\it ifl~ 'IiTIf ;r ifi~ir 'H~ .,if\)'lr Tolal population Main workers Marginal workers Non-workers Total! --------- ---------- -------- ---------Rural! 5TT,! ~li' fui"lft ~I'f fui"1ft ~~I'f fml!f ~tl'f f~lIt
Urban Age Males Females Males Females Males Females Males Females
------ ----------------- --- -------- -_ - ----------
2 3 4 5 6 7 8 9 10 - - - _-_ -_
~t JABALPUR
l:1't1f 5-14 305,719 289,791 63 15 1.302 488 171,709 Ill, J 46 TOTAL
5 33,088 31,482 4,148 3.370
6 34,724 33.337 19 5 12,858 9.397
1 25,661 25.299 5 10 1.4,738 11.366
8 36,892 34,919 89 66 22,591 15,679
9 23,085 23.418 68 59 16,576 12.534
10 38,385 35,848 5 198 124 26,029 16,525
11 23,029 21,918 6 155 35 17,174 11,435
12 39.314 34,019 20 5 275 83 2.5,028 13.072
13 24,098 24,223 5 219 68 15.820 9,559
14 27.494 25.328 32 269 49 16,749 8,209
wr101f 5-14 1;5,846 164,535 46 10 1,263 483 81,539 33,183
RURAL 5 18,942 17.881 138 564
6 20,368 19,286 19 5 5,593 2.955
7 15,038 1~,2J3 10 6,968 3,757
8 21,519 20,242 89 66 10,906 5,493
9 13,379 13,579 68 59 8,422 4,612
10 21,852 20,354 S 198 124 12,688 5,259
11 12,983 11,969 150 35 8,628 3,655
12 22,732 19,836 20 5 266 83 12,122 3,531
13 13,966 13,507 5 204 68 7,771 2,099
14 15,069 13,647 21 259 44 1,103 1,259
~if\11f 5-14 129,933 125,256 17 5 39 5 90,170 71,963
URBAN
5 14,147 13,601 8,410 2,806
6 14,356 14,051 7,265 6.443
7 IO,(j29 11,06) 5 7,770 7,609
8 15,174 14.617 11,685 IO,I~5
9 9.707 9.839 8.1 '4 7.922
10 16,534 15.494, 13,341 11.266
11 10,047 9.948 6 5 8,546 7,780
12 16,$113 14,183 9 12,905 9,541
13 10,132 10,71(j IS tI.049 7,460
14 12,425 11.681 II 11 S 9,046 6.950
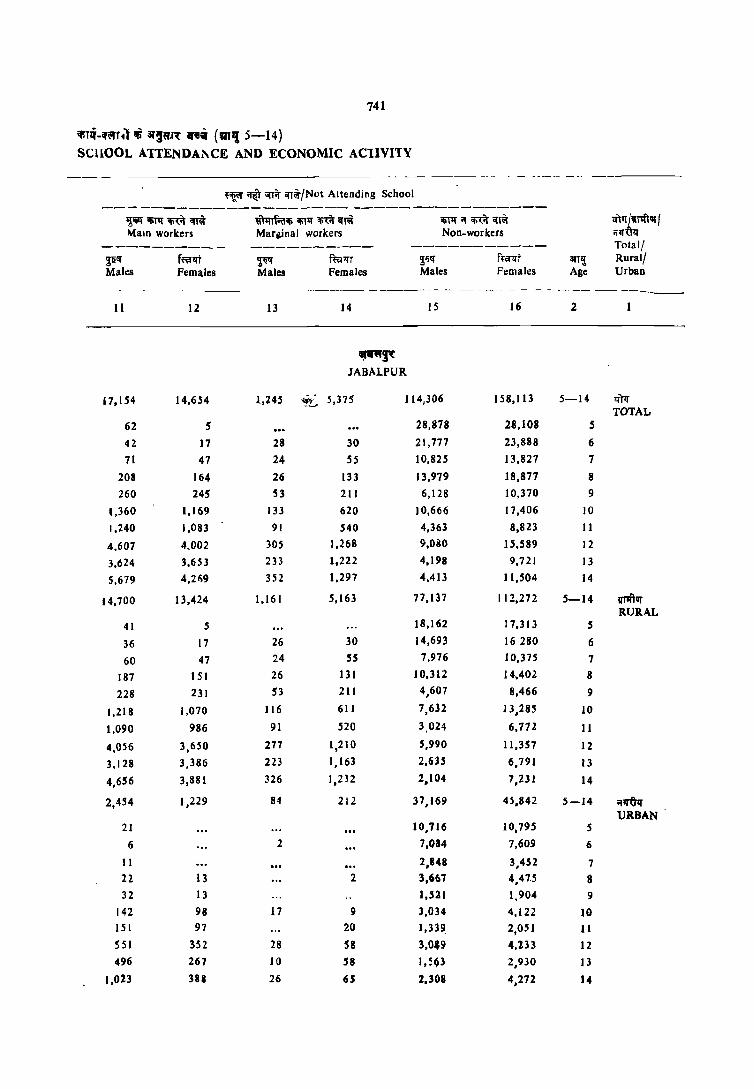
741
i'iTli-if~r1111i 3T'''J~ ar;;ii (1Il1,! 5-14) SCHOOL AITENDAi\CE AND ECONOMIC AClIVITY
-- -- ------- - - -----_ ---
,~;;r ~ \ifTit 'ffff/Not Alteading School
------------------------------------"};~ilill{~~ \l~iIi iIiT'Il'!i~ «~ '!ill{ i! ~ ql~ <t~t'j {ilPitllll ~alD workers Marginal workers Non-workers i!~Uq
--------_- ---------- ----------- Total/ pEr f~lft ~~ f~lfr ~'ilf ff<l'lfT an'i Rural/ Malc:s Females Males Females Males Females Age Urbaa
- ---- -- -----~----- -- ------ - - - ---- - --- -- - _---_ -.-_
11 12 13 14 15 16 2
~f( JABALPUR
17,154 14,654 1,245 .~:.::. S,l7S 114,306 158,113 5-14 lfrr TOTAL
62 5 28,878 28,108 5
42 17 28 30 21,777 23,888 6
71 47 24 55 10,825 13.827 7
208 164 26 133 13,979 18,877 8
260 245 53 211 6,128 10,370 9
1,360 1,169 133 620 10,666 17,406 10
1,240 1,083 91 540 4,363 8,823 11
4,607 4,002 305 1,268 !),080 15,589 12
3,624 3,653 233 1,222 4,198 9,721 13
5,679 4,21\9 352 1,297 4.413 11,504 14
14,700 13,424 1,161 5,163 77,137 112,272 5-14 VI1ftIlT RURAL
41 5 18,162 17,313 S
36 17 26 30 14,693 16280 6
60 47 24 55 7,976 10,375 7
187 151 26 131 10,312 14,402 8
228 231 53 211 4,607 8,466 9
1,218 1,070 116 611 7,632 13,285 10
1,090 986 91 520 3,024 6,772 11
4.056 3,650 211 1,210 5,990 11,357 12
3.128 3,386 223 1,163 2,63S 6,791 13
4,656 3,881 326 1,232 2,104 7,23l 14
2,454 1,229 84 212 37,169 4~,842 S-J4 i!~ URBAN
21 10,716 10,795 S
6 2 7,084 7,609 6
11 2,848 3,452 7 22 13 2 3,667 4,41.5 8 32 13 1,521 1,904 9
142 98 17 9 3,034 4,122 10 IS I 97 20 1,33~ 2,0~1 11
S51 352 28 58 3,049 4,133 12
496 261 10 58 1,~~1 2,930 13
1,023 381 26 6.5 2,308 4,172 14

742
"·4 qlli'l' ri ~, ~~ ii1ti% ~lvi 'CI't'{ &nfllflli
C· .. CHILDREN (AGES 5-:14) BY SIl\GLE YEAR OF AGE,
-------~~ - -- --_----- ---- -~----- ------------ ----------------------------- ----------- -----
~;:r iif.r ;m1rjAltendlng School
--------------------------Q)1r/VHr'\lJr! ~;:r OliHr6ll1 ~'ll" llil'lf Iti<lt ifl~ m'lfTf.alli IliT'lf lIi~it ifTl'f 'l>TIf ;r iIfj,it qr~ ~'I'Ulf Total popula'lon' Main workers Marginal workers Non.wOl ken Total/ --------- -------- -------- --------~ Rural/ an,! ~~ furlli ~" ~l.Ji ~fi" ffiflli ~lf 1t0l1JT Urban AJe Males Females Males Pemales Male, Females Males Females'
2 3 .. .5 6 7 8 9 10
~~ NARSIMHAPUR
~)1r 5-14 92,71B 86,593 SO TOTAL
10 lSI 10 44,709 25,268.
S 10,222 9,400 368 355, 6 10,017 10.41 I 5 2,655 1,897 7 8,194 7,873 ",010 2,643 8 11,262 10,241 .5 9 5 5,980 3.64-6. 9 6,820 6,809 5 4,7~4 3,341
10 11,160 10,812 14 5 6,968 4,053 11 7,012 5,981 5 28 4,80J 2,607 12 11,463 10,448 5 28 6,143 3,122 13 7,322 6,887 10 S 25 4,309 1,988 14 9,246 7,73}. 25 S 37 4,689 1,615
wftllf 5-14 80,799 75,268 50 10 151 10 36,237 18,044. RURAL
5 9,022 8,299 212 207-6 8,752 9,205 S 2,095 1.340-7 7,189 6,988 3,340 2,024.. 8 10,010 9,038 5 9 5 4,919 2,767-9 5,820 5,841 5 3,863 2,555
10 9,849 9,492 14 5 5,808 3,053. II 5,954 5,141 5 28 3,811 1.934 12 10,037 9,048 5 28 4,976 2,130-13 6,202 5,801 10 25 3,430 1,238 14 7,965 6,41S 25 5 37 3,723 79S
;r'I'~nr 5-14 11,919 URBAN
11,325 8,472 7,224
5 1,200 1,101 156 147-6 1,265 1,206 560 557-7 1,005 884 670 619-B 1,2H 1,104 1,060 879-9 1,001 968 921 786.
10 1,311 !, '21 1,160 1,001 11 1,058 840 932 6H 12 1,426 1,400 1,167 992 13 1,120 1,08S 879 710. 14 1,281 1,317 966 SZo.
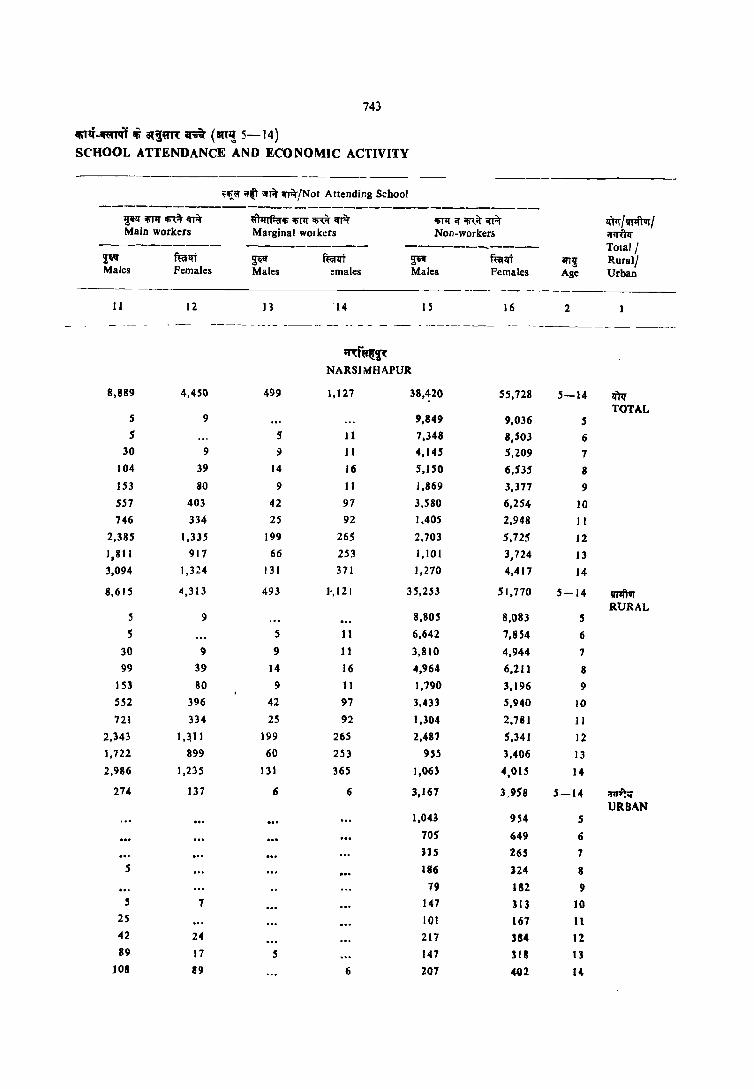
743
~q~ Itl ot~~R ~ (ilnl! 5-14) SCHOOL ATTENDANCE AND ECONOMIC ACTIVITY
~~iiT ;:f~ "R lI'f.r/Not Attending School
------------------------------------Z!'lt ~ m lI'f.r ~fra~ ilif1f .ror "I'R iIif1f ;r iIi1.. i't "I'R "Iittr/wftur/ Main workers Marginal workers Non-workers ... lTfur
---------- ---------- ------_---- TOlalj
~'Ii" fialJt i1it!f fiarlJ't ~~ fuilft an! RuralJ Males Females Ma.les :males Males Females Age Urban
----- --------II 12 J3 14 15 16 2
----_ - ---- ----- ---_-_- - ------- --- _- ----------- ---
~f~~ NARSIMHAPUR
8,889 4,450 499 1,127 38,~20 55,728 5-14 ltm TOTAL
5 9 9,849 9,036 5 5 5 11 7,348 8,503 6
30 9 9 11 4,145 5,209 7 104 39 14 16 5,150 6,535 8 153 80 9 II J,869 3,]77 9
557 403 42 97 3,580 6,254 10
746 334 25 92 1,405 2,948 II 2,385 1,335 199 265 2,703 5,725 12 1,811 917 66 253 1,10 I 3,724 13 3,094 1,324 131 371 1,270 4,417 14
8,615 4,313 493 ]',121 35,253 51,770 5-J4 IR1ftur RURAL
5 9 8,805 8,083 5 5 5 11 6,642 7,854 6
30 9 9 11 3,810 4,944 7 99 39 14 16 4,964 6,211 8
153 80 9 11 1,790 3,196 I)
552 396 42 97 3,433 5,940 10
721 334 25 92 l,l04 2,781 11
2,343 1,3.11 199 265 2,487 5,341 12
1,722 899 60 253 9SS ),4Q6 13
2,986 1,235 131 365 1,063 4,OlS 14
274 ]37 6 6 3,167 3,958 5-14 ;nr~-... URBAN
I,O,n 954 5 705 649 6 ]]5 165 7
5 116 124 8
79 182 9 S 7 147 113 10
2S 101 167 Il 42 24 217 384 I! 89 17 S 147 ]18 I]
108 19 6 207 402 14

744
;r-4 ~q ~ lin,!, 'It!" ~rft in~ alt alt~1fi C-4 CHJLDRtN (AGES 5-]4) BY SINGLE VEAR OF AGE
- -------- - ----- -_ -- _- -----------~---
l'~or iilTit IO'~/ Attending School --------------------------_
'Ii'm /'1Tlftvr I ~.r;Hi~1IT ,!!,11 "Iil;J Ifi,it l!f.f mll'rm 'l>1lI rn 1O'''f IfiTll' 'f If.\i\' '!T"f ij;rU1f Total population Main wQrkers Marginal workers Non.workers Total/ --------- --------- -,...------- --------Rurall ~ ~ mtll1 ~~ ~1I1 ~!f ftGrll1 ~'!f f'm't Urban Age Males Females Males Females Males Females Males Females
---------- --- - - - -.- -_-_ - -
2 3 4 5 6 7 8 9 }o
--------- - --------------------- .... , MANDlA
~ 5-14 148,427 147,560 186 29 977 95 61,568 29,318
TOTAL 5 15,561 16,161 1.253 906
6 17,248 18,205 14 4 5,486 3,331
7 12,829 13,236 5 29 4 5,827 3,625
8 18,079 18,534 10 72. 16 8,357 4,480
9 11,112 11,652 20 10 44 12 6,317 3,~86
10 19,198 18,605 30 .5 201 16 9,431 4,127
11 9,391 9.0!O 20 91 12 5,675 2.537
12 21,024 19,389 50 10 244 13 8,928 3,261
13 11,317 10,947 25 129 12 5,132 2,093
14 12,667 11,761 2S 5 153 4 5,162 1,673
VTlIfar 5-14 139,074 138,224 186 29 972 95 54,857 23,224
RURAL 5 14,5.2 1S,2J2 I,O~3 702
6 16,306 17,194 14 4 5,051 2,839
7 12,021 12,335 .5 29 4 5,208 2,986
8 17,114 17,497 10 67 16 7,626 3,722
9 10,395 10,99,! 20 10 44 12 5,665 2,741
10 18,039 17,555 30 5 201 16 8,458 3,355
II 8,S88 8,361 20 91 12 4,952 1,913
12 19,876 18,197 SO 10 244 13 7,975 2.486
13 10,529 10,075 25 129 12 4,483 1,479
14 11,694 10,788 25 5 153 4 4,380 1,001
~ 5-14 9,353 9,336 6,711 6,094
URBAN S 1,048 929 200 204
Ii 942 1,011 429 492
7 809 90'0 619 638
8 965 1,037 5 731 757
9 717 660 652 S4S
10 1,159 1,050 973 772
11 803 710 723 625
12 1,148 1,193 952 775
d 788 872 649 614
14 973 973 783 762
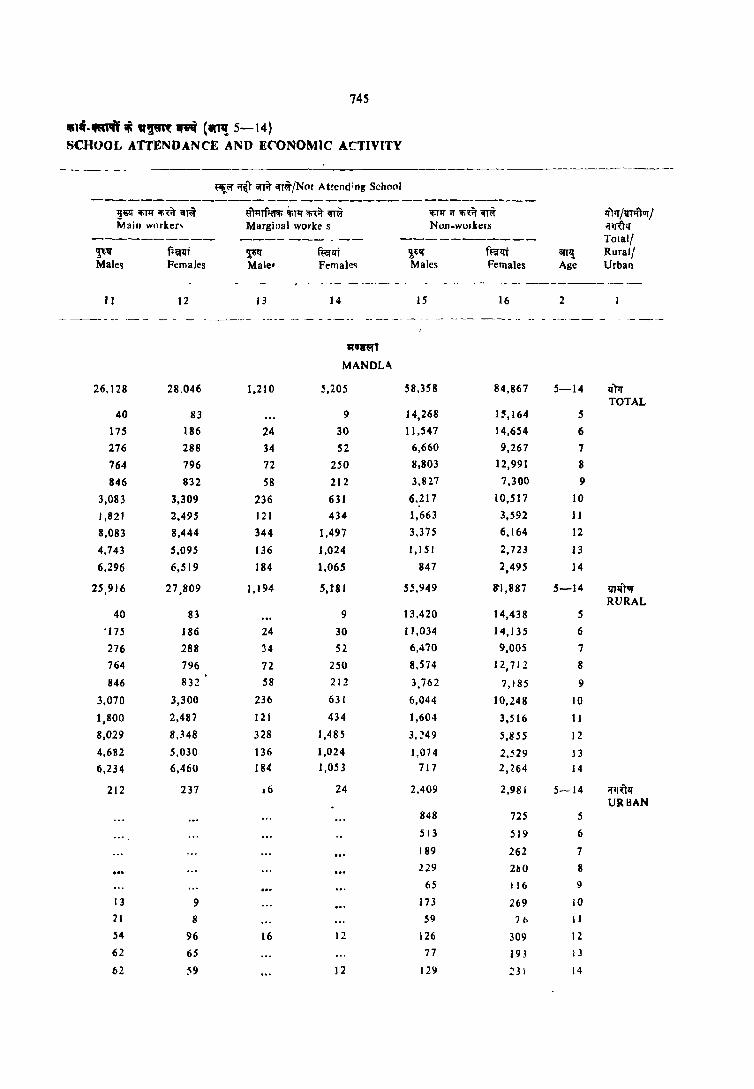
745
IIInf-1I'I1'tl ;fi ,,~ .... ('ll'i 5-14) SCHOOL ATTENDANCE AND ECONOMIC ACTIVITY
lIilI' ~T1l' ~"l;~ "l~ Main worker,
~1i1f f''ifll't Male~ Females
II
26,128
40
175
276
764
846
3,083
J ,821
8,083
4,743
6,296
25,916
40
'175
276
764
846
3,070
1,800
8,029
4,682
6,234
212
13
21
54
62
62
12
28,046
113
186
288
796
832
3,309
2,495
8,444
5,095
6,519
27,809
83
186
288
796
832
3,300
2,487
8,348
5,030
6,460
237
9
8
96
65
~9
~yf~ itoTIf 'li'lt "'~ Marginlll worke s
~ ft:erll't Male. Female~
13
1,210
24
34
72
58
236
121
344
136
184
1,194
24
34
72
58
236
121
328
136 184
16
14
,,'r.:rT MANDL&.
5,205
9
30
52
250
212
631
434
1,497
1,024
1.065
5,1'81
9
30
52
250
212
631
434
1,485
1,024
1,053
24
12
12
if.T11 ;r ~~ "'~ Non-wOlkers
2,1i1f ffalti Males Females
58.358
14,268
11,547
6,660
8.803
3.827
6,217
1,663
3,375
1,1 S I
847
55,949
13,420
11,034
6,470
8,574
3,762
6,044
1,604
3, ~4 9
1,074
717
2,409
848
513
189
229
65
173 .59
126
77
129
16
84,867
1~, 164
14,654
9,267
12,991
7,300
10,.517
3,592
6,164
2,723
2,495
11"1,887
14,438
14.135
9,OOS
12,712
7,185
10,248
3,516
S,85S
2,529
2,264
2,981
725
519
262
2~0
116
269
71>
309 19.1
~31
ilfIl! Age
2
5-14
5
6
7
8
9
10
lJ
12
13
14
5-14
5
6
7
8
9
10
II
12
13 14
5-14
5
6
7
8
9
10
11
12
I J
14
U;'tlf /'l[fffTur I iftffiqTOlal! Ruralj Urban
U;'tlf TOTAL
lIlllTIIf RURAL
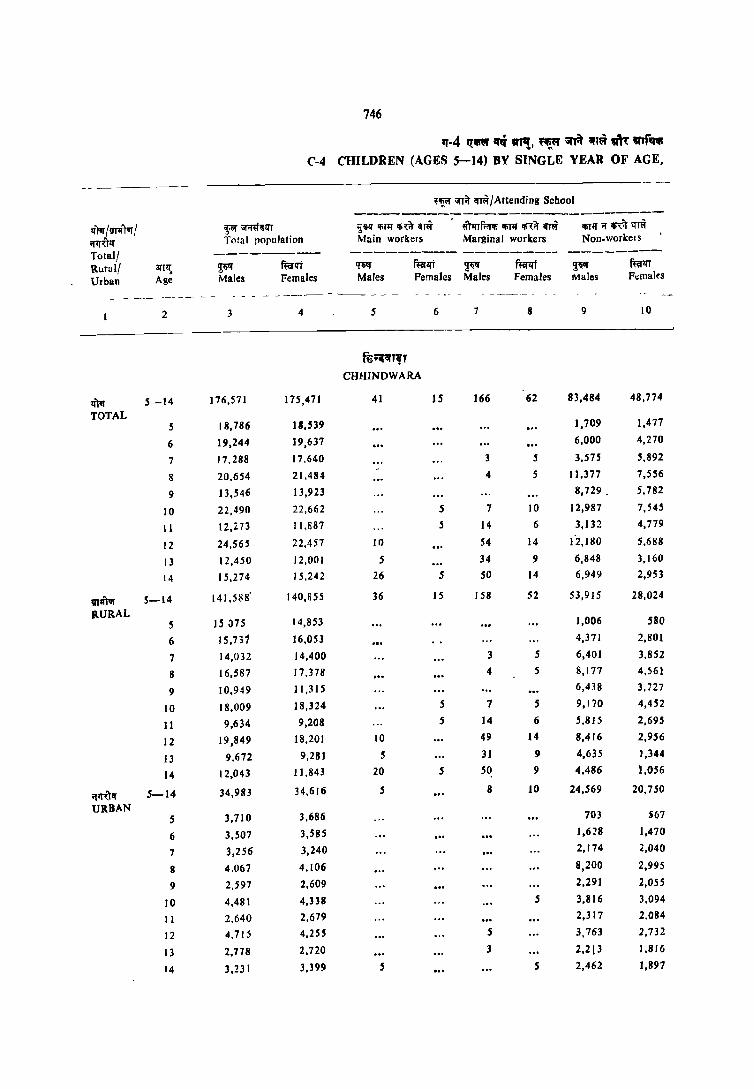
746
,,·4 ~Q If1i 1IfP!, "!l=I' ~ 'fl~ "'~ IJITr"" ('·4 CHILDREN (AGES 5-14) BY SINGLE YEAR OF AGE,
~~;;nit 1fT~/Attending School ---------------------_ ... ----
'€fPr {wftllf! '!j<'I" iifif#"li!lT lj liIJ ipTif ip~ ffl ~f.rrir;iIiJlIiIil:it~ iIiJlI if iIi\'ir 1fT"
;r;T,ft'€f Total population Main workers Marginal workers Non.workel s
Total! --------- --------- --------- ---------Ruml! 1!Uzt;. Ti" mrllt 'IW ffalli ~ ffiI'1l'j ~" mrlfl
Urban Age Males Females Males Females Males Females Males Females
- --------- - - -- - - ---- - -_ - - - - -~----
2 3 4 5 6 7 8 9 10
ft'Sq'f',' CHHINDWARA
'!I)1r 5-14 176,571 175,471 41 15 166 (j2 83,484 48,774
TOTAL 5 18,786 J8,H9 1,709 1,471
6 19,244 19,637 6,000 4,270
7 17.288 17.640 3 5 3.575 5.892
8 20.654 21.484 4 5 11.377 7,556
9 13,546 13,923 8,729. 5.782
10 22,490 22,662 5 7 10 12,987 7,545
II 12.273 11.887 5 14 6 3,132 4,779
12 24,565 22,457 10 54 14 (2.180 5.688
13 12,450 12,001 5 34 9 6,848 3,160
14 15,274 15,242 26 5 SO 14 6,949 2,953
'lI~ 5-14 141.588' 140,855 36 15 158 52 53,915 28,024
RURAL S IS 075 14,853 1,006 580
6 15,731 16,OB 4,371 2,801
7 14,032 14,400 3 5 6,401 3,852
8 16,587 17.378 4 5 8,177 4,~61
9 10,949 ] 1,315 6,4~8 3.727
10 18,009 ] 8,324 S 7 5 9,170 4,452
11 9,634 9,208 .5 ]4 6 5.815 2,695
12 19,849 18,201 10 49 14 8,416 2,956
13 9,672 9,281 5 31 9 4,635 1,344
14 12,043 11.843 20 5 50 9 4.486 2,056
ifarolf 5-14 34,983 34.616 5 8 10 24,569 20.750
URBAN 5 3,710 3,686 703 )67
6 3,507 3,585 1,628 1,470
7 3,256 3,240 2,174 2,040
g 4.067 4.106 8,200 2,995
9 2.597 2,609 2.291 2,055
10 4.481 4,338 5 3,816 3.094
11 2.640 2.679 2,317 2.084
12 4.715 4,255 5 3.763 2,732
13 2.178 2,720 3 2,213 1.816
14 3.231 3,)99 5 5 2,462 1,897
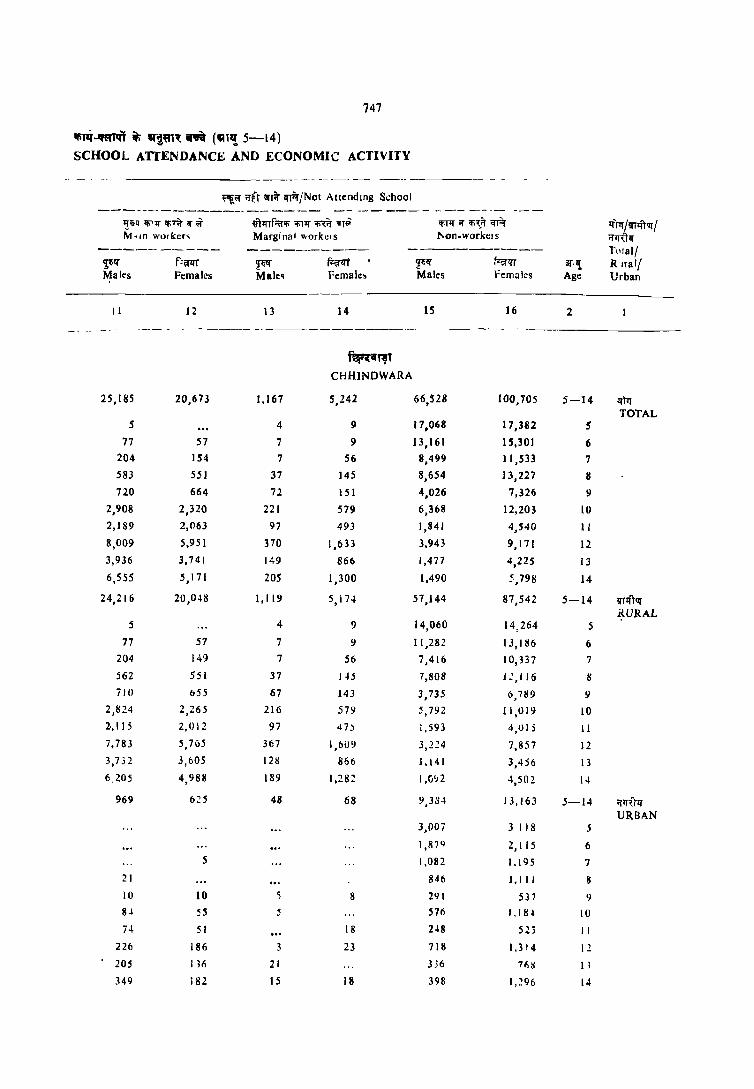
747
IliN-mlfl it; ~~:al~ ~ (~l'i 5-14)
SCHOOL ATTENDANCE AND ECONOMIC ACTIVITY
----- - ----- --- -_ ------ _-- ------ --------- - -
~~ ... iff\" \;fTit qri.tJNOI Allendmg S(;hool ------------....___------ ---- -- -------- --- -----
t[iq Ifi"' 1'[ 'f;7;!t q if ~lfTf.<r'f; 'fill!" "Ii<:~ liT" 'f;Tl[ if 'f;\_it CTR q-);r /'IT'fTv( / M<,n w",ker' Marginal workc,s "on-wockel S ifl'rUQ"
----------- ---------- - ----------- rl1!al/ ~~If f=en:rr 'IW f~ ~If f~lIT Of,,! R Irall Males Femall!s Male~ Female~ Males femuks Age Urban
-----
II 12 13 14 IS 16 2
-_----- ---------
f~"~T CHHINDWARA
25,185 20,673 1,167 5,242 66,S28 100,105 5-14 lim TOTAL
5 4 9 17,068 17,382 5 77 57 7 9 13,161 15,301 6
204 154 7 56 8,499 11,533 7
583 551 37 145 8,654 13,227 8 720 664 72 151 4,026 7,326 9
2,908 2,320 221 579 6,368 12,203 10
2,189 2,063 97 493 1,841 4,540 11
8,009 5,951 310 1,633 3,943 9,111 12
3,936 3,141 149 866 1,477 4,225 13
6,555 5,171 205 1,300 1,490 5,798 14
24,216 20,048 1,119 5,IH 57,144 81,542 5--14 lI"TIJTV( RURAL
5 4 9 14,060 14,264 5
17 57 1 9 11,282 13,186 6 204 149 1 56 7,416 10,331 1
562 551 37 J.l5 7,808 J.?,116 8 711) 655 67 ]43 3,735 6,789 9
2,824 2,265 216 579 5,792 11,019 10 2.,115 2,012 97 47:> 1,593 4,015 II
7,783 5,765 367 l,bOY 3,224 7,857 12 3,732 3,605 In 866 l, 141 3,456 13 6,205 4,988 189 1,282 1,(I'J2 4,502 14
969 6~5 48 68 9,334 J 3, 163 5-14 ;1if"ftlJ
URBAN 3,007 3 118 5
1,87 Q 2,115 6 5 1,082 1.195 7
21 846 J,J II II
10 10 S 8 291 537 9 8 .. 55 5 576 I, 18 ~ 10
74 51 18 H8 5'· "') II
226 186 3 23 718 1,3' 4 12
20S IHi 21 336 71,S 11
349 i82 15 18 398 1,296 14

748
11'-4 I{:r.~ q tllQ, flll'l' iWT~ .n;i ~\ ".r'llii • C\
C-4 CHILDREN (AGES 5-14) BY SIl\GLE YEAR OF AGE,
------------------ - --------- . __ ----_-
~ "-lif ;rr;t/Altendmg School ---------------------------
7ftlr / rmftllf / :8"- ;;r;:rn!fT 1J,l,;!f 't'Pr rn ,";;f 9'FrrRl'li ilitl!' iRif ~ 'liT1f "' 'Ii<ir <{lit ~')1r Total population Main worKers Marginal workers Nl)n-workers Total/ ------_-- --------- -------- ---------Rural/ arT'{ ~QI!f • ftel<rT 2;'i1!f mrlTT ~I!f fter<rT ~I!f fui!fT Urban Age Males Females Males Females Males Females M~les Females
2 3 4 5 6 7 8 9 IQ
----------------- ----- - --
~;ft
SEONI
If)'lr 5-14 117,492 114,696 47 377 99 52,186 27,305 TOTAL
S 12,667 12,HI 821 558
6 12,763 13,241 3,911 2,615
7 11,328 11,619 23 5,226 3,601
8 13,558 14,041 9 20 7,180 4,289
9 9,045 9,055 23 5 5,497 3,313
[0 14,620 14,029 11 37 IS 7,874 4,252
11 7,904 7,400 10 52 30 4,908 2,496
12 15,876 14,435 5 88 7,542 3,108
13 9,111 8.612 16 68 25 4,765 1,698
14 10,620 9,711 5 76 .5 4,462 1,376
!II1ITur 5-14 109,001 106,141 36 377 99 45,736 21,670
RURAL 5 11,781 11,716 676 444
6 11,947 12,303 3,408 2,099
7 )0,609 10,963 23 4,650 3,128
Ii 12,681 13,068 9 20 6,425 3,54.5
~ 8,380 8,503 23 5 4,885 2,845
10 13,560 12,970 II 37 15 6,948 3,337
11 7,252 6,769 10 52 30 4,321 1,959
12 14,774 13,418 5 88 6,607 2,343
13 8,244 7,841 10 68 25 4,055 1,137
14 9,773 8,789 76 5 3,760 835
;:rQUIT 5-14 8,490 8,355 11 6,450 5,635
URBAN 145 115 5 886 835
6 816 938 503 515
1 118 656 576 473
8 877 973 754 744
9 666 552 611 469
10 1,060 1,059 926 915
II 6S2 630 587 537
12 1,101 1,017 935 765
13 866 77Z 5 710 561
14 847
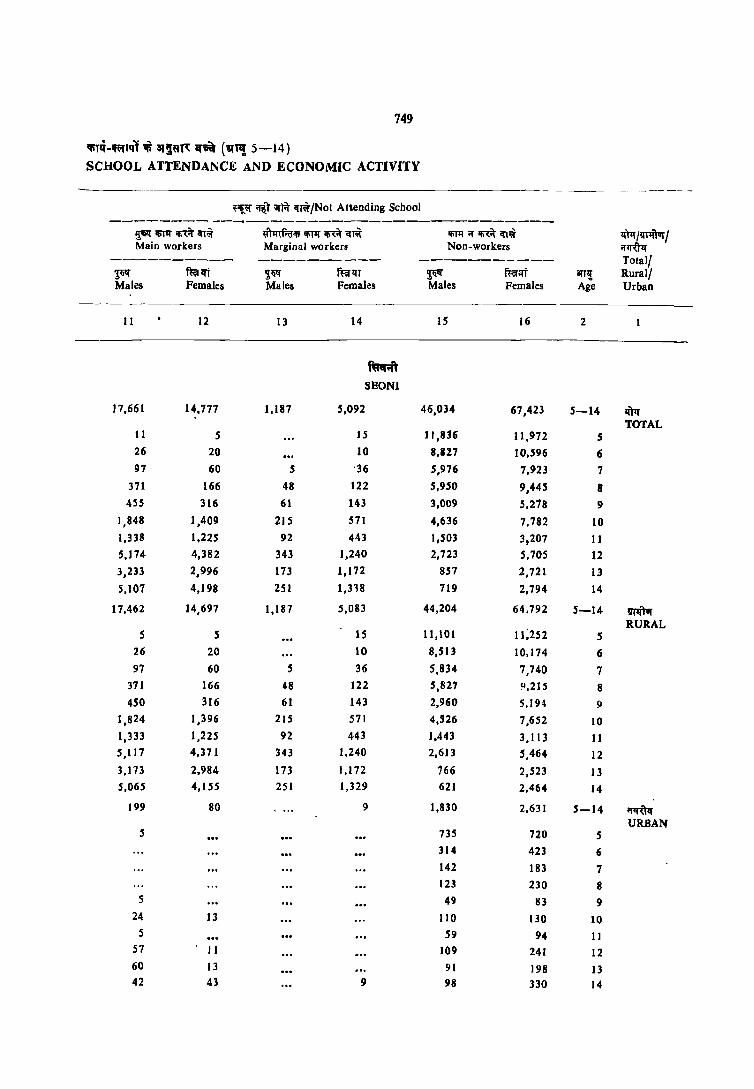
749
IfiTq-~,ql ;i iI~9~ ""' ('&Ill! 5-14) SCHOOL ATTENDANCE AND ECONOMIC ACTIVITY
PI£t;' ,,~"t \iltir q:r~/Not A"ending School
---........-------_----------------_.,...------_ ~~Ifil:i'tifl~ ~~'5~~q~ iliTll if' rn;;n;i[ 'l{ftT/~1 Main workers Marginal workers Non-workers if'trU'l{
---------- ---------- ---------- TOlal/ ~If f~1ft $~ ffilqr ~ ~llt an,! Rural! Males Females Males Females Males Females Age Urban
-_- -__ -----
11 12 13 14 IS 16 2
f~1 SBONI
J 7,661 14,777 1,187 5,092 46.034 67,423 5-14 Ii\1r TOTAL
11 5 IS 11,836 11,972 5 26 20 10 8,127 10,596 6 97 60 5 -36 5,976 7,923 7
371 166 48 122 5,950 9,445 8 455 316 61 143 3,009 5,218 9
1,848 1,409 215 571 4,636 7,782 10 1,338 1,225 92 443 1,503 3,207 11 5,174 4,382 343 1,240 2,723 5,705 12
3,233 2,996 173 1,172 857 2,721 13
5,107 4,198 2S1 1,3'18 719 2,794 14
17,462 14,697 1,187 5,083 44,204 64,192 5-14 !Il1itur RURAL
5 5 IS 11,101 11;252 5 26 20 10 8,513 10,174 6 97 60 5 36 S,834 7,740 7
371 166 48 122 ',827 ~,215 8 4S0 316 61 143 2,960 5,194 9
1,824 1,396 215 571 4,526 7,652 10 1,333 1,225 92 443 J,443 3,113 11 5,117 4,371 343 1,240 2,613 5,464 12 3,173 2,984 113 1,172 166 2,523 13 5,065 4,155 251 1,329 621 2,464 14
199 80 9 1,830 2,631 5-14 illf"UlJ URBAN
5 7JS 720 5 314 423 6 142 183 7 123 230 8
5 49 83 9 24 13 110 130 10
5 59 94 II 57 11 109 241 12 60 13 91 198 13 42 43 9 98 330 14
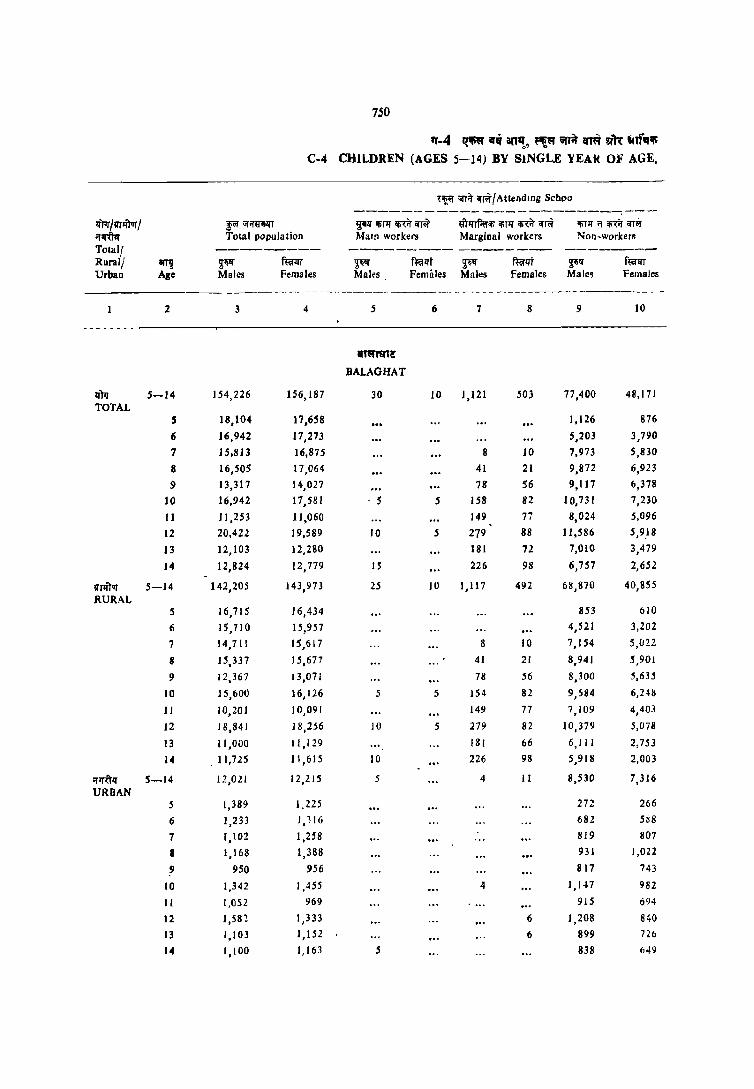
750
"'-4 ~q if" an~, "l~ 9I'I;r 1fTtii' 1lJ'n: -'«"If> C-4 CHILDREN (AGES 5-14) BY SINGLE YEAf( OF AGE,
~~or "!Tit <r~fAltendmg Schoo ------_ ---------- --------- -----
'lfrrr I ffTli:tur I ~ iiI'"ftilillT ~lilllfinr lIi<:;r~ .ihnm 'l'iTIf rn q~ IfiTIf " ~\iI crn;r :rm Total population MaIn workers Marginal workers Non-workers TOlal! --------- --------- -------- --------Rural; 8ITlj ~~ fuM ~ f~!lt ~1i f~!Jt ~1i r~l.lT Urban Age Males Females Males Females Mal~s Females Male~ Females
- ----------- ----_-----_-_----------- -----------------~-
2 3 4 5 6 7 8 9 10
.,~'ft{'!'
BALAGHAT
lim 5-14 154,226 156,187 30 10 J ,121 503 77,400 48,171 TOTAL
5 18,104 l' ,658 1,126 876
6 16,942 17,273 5,203 3,790
7 15,813 16,875 8 10 7,973 5,830
8 16,505 17,064 41 21 9,872 6,923
9 13,317 14,027 7Ir 56 9,117 6,378
10 16,942 17,581 . 5 5 158 82 10,731 7,230
11 11,253 11,060 149 77 8,024 5,096
12 20,422 19,589 10 5 279 88 11,586 5,9.18
]3 12,103 12,280 181 72 7,010 3,479
]4 12,824 12,779 15 226 98 6,757 2,65.2
fnrillJ 5-14 142,205 143,97 J 25 10 1,117 492 68,870 40,855 RURAL
.5 16,715 16,434 853 610
6 15,710 15,951 4,521 3,202
7 14,711 15,617 8 10 7,154 5,(122
Ii 15,337 15,677 41 21 8,941 5,901
9 12,367 13,071 78 56 8,300 5,635
10 15,600 16,126 5 154 82 9,584 6,248
11 10,201 10,091 149 77 7,109 4,403
12 18,841 18,256 10 .5 279 82 10,379 5,078
13 11,000 11,129 181 66 6,111 2,753
14 11,725 11,615 10 226 98 5,918 2,003
OfI1i'tIl 5-14 12,021 12,215 5 4 1I 8,530 7,316 URBAN
S 1,389 1.225 272 266
6 1,233 1,116 682 S~8
7 1,102 1,258 819 807
8 1,168 1,388 931 1,022
9 950 956 817 743
10 1,342 1,455 II J ,147 982
II 1,0$2 969 915 694
12 J,58~ 1,333 6 J,208 840
13 1,103 1,152 6 899 726
14 I,JOO 1,163 5 838 649
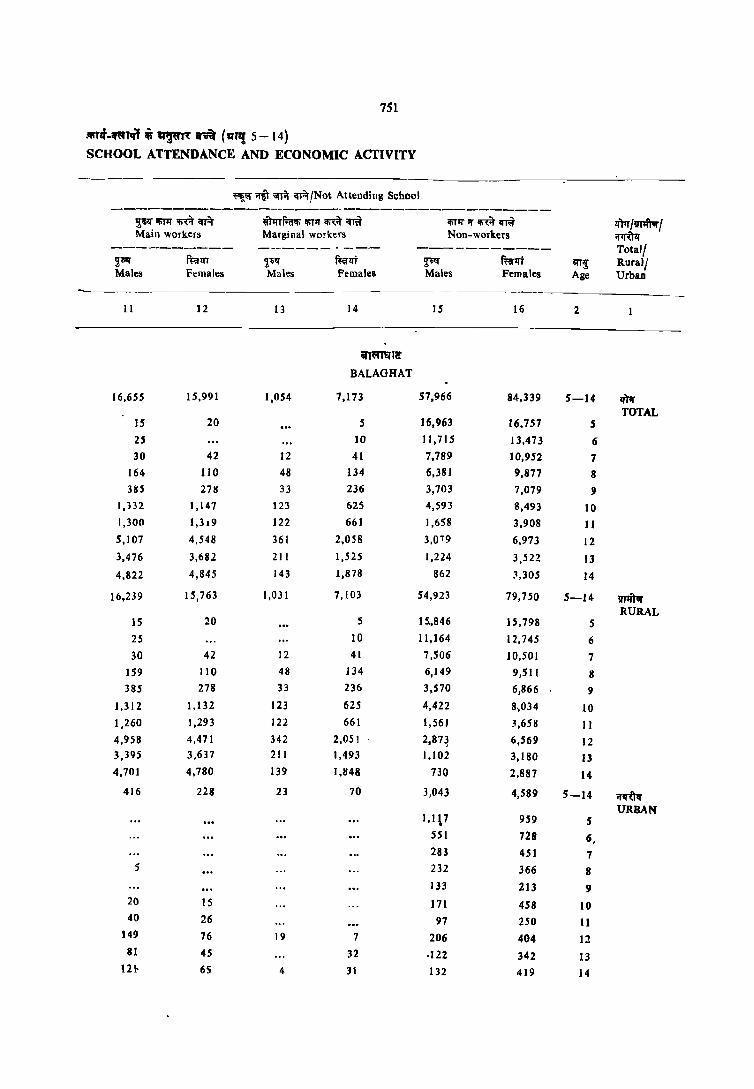
7S1
.~mf-~Tq'f i ~ ~ (aT,! 5-14)
SCHOOL ATTENDANCE AND ECONOMIC ACTIVITY
~ ... ;r~ 'OIT~ lfR/Not Attending School ---------------------------------------
~!f ;;r;rq' rn err"" it1l"rf.wi; lIiT" rn lfIvf lIiT1l"rrrn~ tftrr /'ITlfrvr / Main workers Marginal workers Non-workers '1'1fU1f
------------ ------- - -..-- ----------- Total! ~'8111' w..!fT ~li" fterllt ~'8111' ~lli m,; Rural/ Males Females Males Females Males Females Age Urban
---- -----_ --.._____
11 12 13 14 IS 16 2
iI1~~lC!'
BALAGHAT
16,655 15,991 1,054 7,173 57,966 84,339 5-14 m TOTAL
IS 20 5 16,963 16.757 5
25 10 11,715 13,473 6 30 42 12 41 7,789 10,952 7
164 110 48 134 6,381 9,877 8 385 278 33 236 3,703 7,079 9
1,132 1,147 123 625 4,593 8,493 10 1,300 1,3 &9 122 661 1,658 3,908 11 5,107 4,548 361 2,058 3,0 7 9 6,973 12
3,476 3,682 211 1,525 1,224 3,.522 13 4,822 4,845 143 1,878 862 3,305 14
16,239 15,763 1,031 7,103 54,923 79,750 5-14 lmitvr RURAL
15 20 5 15.,846 1 S, 798 5 25 10 11,164 12,745 6
30 42 12 41 7,506 10,501 7 159 110 48 134 6,149 9,511 8 385 278 33 236 3,570 6,866 9
1,312 ),132 123 625 4,422 8,034 10 1,260 1,293 122 661 1,56! 3,658 11 4,958 4,471 342 2,05 I 2.87~ 6,569 12 3,395 3,637 211 1,493 1,102 3,180 13 4,701 4,780 139 1,848 730 2.887 14
416 228 23 70 3,043 4,589 5-14 rrlJiN URBAN
1,1 \1 9S9 5 551 728 6, 283 451 7
5 232 366 8 133 213 9
20 15 171 458 10 40 26 97 250 II
149 76 19 7 206 404 12 81 45 32 .122 342 13
121.- 65 4 31 132 419 14
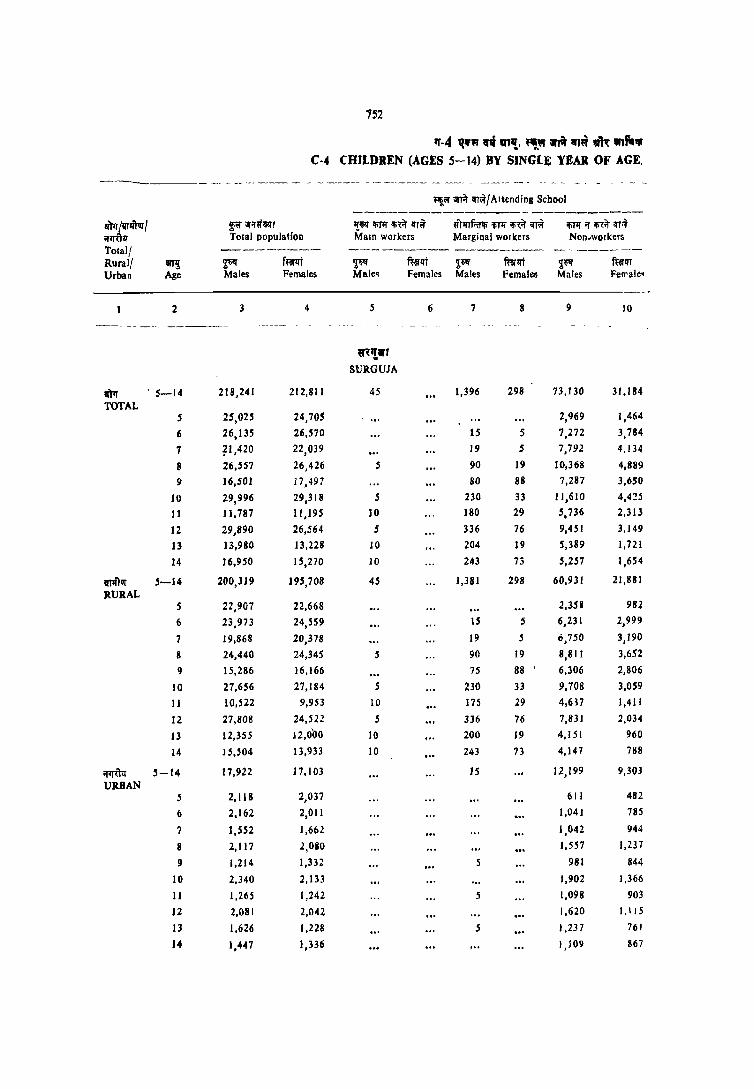
152
11'-4 'qlf" '" "''!, • wA If'~ .m IIlfc. C-4 CHILDREN (AGES 5-14) BY SINGLE YEAR OF AGE. -_ "--" -- -- -_- ---- - - ------- - -- --- --- - -- ----- - ----_- ---~- -- ---- - - - - - -_ -.
",or ~ ~~/Altending School
------------------------Jim jvTrfrvr I f\'T \t;ni&ll'I ~'If 1fi1lr lIi,it IfT~ ur~lf.-(l1li 'fir~ 1li1:it m 1fi1lr;Y ~it '"~ i!1IUlf Tolal population MaIO workers Marginal workers Non.wOlkers Total/ --------- --------- -------- ----------Rural/ mil ~ f~ ~ mrllT ~ mrlfi ~O'f ftiillfl
Urban Ag'"e Males Females Male~ Females Males Females Males Ferule-
2 3 4 5 6 7 8 9 10
------ - - ~ - -- -
ifR'farr .. StJRGUJA
!l)tr - 5-14 218,241 212,811 45 1,396 298 73,130 31,184
TOTAL 5 25,025 24,705 2,969 1,464
6 26,13S 26,570 15 5 7,272 3,784
7 ~1,420 22,039 19 5 7,792 4.134
8 26,557 26,426 5 90 19 10,368 4,889
9 16,501 17,497 80 88 7,287 3,650
10 29,996 29,318 5 230 33 11,610 4,425
11 11,787 11,195 1O 180 29 5,736 2,313
12 29,890 26,564 5 336 76 9,451 3.149
13 13,980 13,228 10 204 19 5,389 1,721
14 J6,950 15,270 10 243 73 5,257 1,6S4
Vl1!11Jf 5-14 200,319 195,708 45 1,381 298 60,931 21,881
RURAL S 22,907 22,668 2,358 98~
6 23,973 24,559 IS S 6,231 2,999
7 19,868 20,378 19 5 6,750 3,190
B 24,440 24,345 S 90 19 8,811 3,652
9 15,286 16,166 75 88 6,306 2,806
]0 27,656 27,184 5 230 33 9,708 3,059
11 10,522 9,953 10 17S 29 4,6H 1,411
12 27,808 24,522 5 336 76 7,831 2,034
13 12,355 !2,OOO 10 200 19 4,151 960
14 J 5,504 13,933 10 243 73 4,147 7118
~ S-14 17,922 17,103 IS 12,199 9,303
URBAN 5 2,118 2,037 611 482
6 2,162 2,011 1,041 785
7 1,552 1,662 1,042 944
8 2,117 2,0110 1,5S7 1,237
9 1,214 1,332 5 981 844
10 2,340 2,133 1,902 1,366
11 1,265 1,242 5 1,098 903
]2 2,081 2,042 1,620 1,1'5
13 1,626 1,228 5 1,237 761
14 1,447 ] ,336 1,109 867

1S3
lII11i-..wnllll .~''{ .... (v,~ 5-14) SCHOOL ATTENDAJ.'IICE AND ECONOM1C ACTIVITY
~ ~ ~f.r lfTi/Not Attending School ------------------------------------
~'liA'li"tit~ ~'hnf<i'l'li 'liTll" 'li"tit ~ 'liA Of 'li'tit 'fIi I1T'I /<;fAIur I Main workers Marginal worker~ Non-workers iI'I,{I"
--------_- ---------- ----------- TOlal/ ~Ii' ffQlff ~~ f~lff i'ili' f~lH afTl~ Rural/ Males Females Males Females Males Females Ag~ Urban
- --------- - ---------- _. - -- -- -- --- - _-_--_ ----_-_ ----------- -
II 12 13 14 15 16 2
---_- -----
~ .. SUROUJA
39,137 15,112 3,341 18,527 101,192 147,690 5-14 iffII'
TOTAL 85 20 19 14 21,952 23,207 5
175 68 56 120 18,616 22,593 6
417 146 99 291 13,094 17,464 7
918 392 229 676 14,947 20,450 8 1,224 479 253 881 7,657 12,449 9
4,787 1,870 708 2,600 12,656 20,389 10
2,851 1,313 309 1,795 2,702 5,745 11
12,946 4,835 959 5,352 6,192 13,150 12
6,213 2,527 362 3,023 1,803 5,938 13
9.521 3,463 347 3,774 1,573 6,305 14
38,873 15,044 3,318 18,527 95,771 139,9,58 5-14 vl1fivl RURAL
85 20 19 14 20,445 21,651 5
175 68 56 120 17,495 21,367 6
417 146 99 291 12,584 16,746 7
918 392. 229 676 14,~88 19,606 8
1,219 474 253 881 7,434 11,967 9
4,782 1.870 708 2,600 12,224 19,622 10
2,826 1.313 309 1,795 2,564 5,406 II
12,86~ 4,811 954 5,352 5,816 12,248 12
6,145 2,517 349 3,023 1,500 5,481 13
9,441 3,434 342 3,774 1,321 5,865 ) 14
264 68 23 5,421 7,732 5-14 ;fll"U11 URBAN
1,507 1,55'5 5
1,121 1,227 6 510 718 7
5059 843 8
6 S 223 482 9
6 432 768 10
25 137 33\1 II
80 25 5 376 903 12
69 10 12 303 457 13
80 29 5 252 441 14
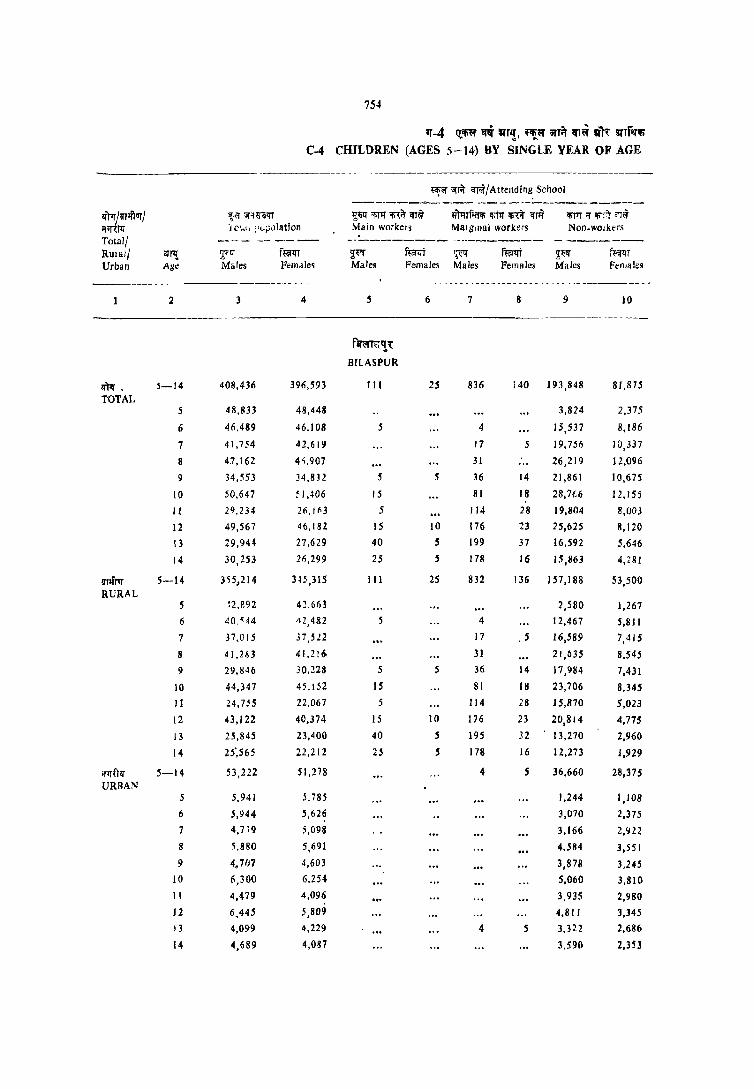
754
fT-4 ({.~ <IIi !l:JTI!, ~\II' 'ifT~ ~l~ al, !l:JTf'l'!fi'
C-4 CHILDREN (AGES 5-14) BY SINGLE YEAR OF AGE
---------
~or orR <rr~/Attellding. School --_._--_. ----- ---------------------1:fTrr I !frm'1f I 'i<i ;;r.l~::rr ~i1:( >nil! 'fo\i\" <rr~ ,i'tl!rf;1f'li >i;m m 'fTll ""Ill ;r ",,-:71 <:T~ .,-rttlT -j C"\-'I :'"pulation Main workelS Mars/nal workers Non_wodlers Totall ---- - ---_ ---- ---------- ----------_ ----------Rurall arT!!; ~Frr f~1TT 2;W furl<i t~<'-f mr!li ~J:'-f fmr Urban Age Males Fem~le~ Males Females Males Females Males Fefllales
2 3 4 5 6 7 8 9 10
-------
fIf\ll'T~,!~
BIlASPUR
1I'rT. 5-14 408,436 396,593 III 25 836 i40 193,848 81,875
TOTAL 5 48,833 48,448 3,824 2,375
6 46.489 46,108 5 4 15,537 8,186
7 41,754 42,619 17 5 J 9,756 10,337
8 4.7,16Z 4~,907 31 26,219 12,096
9 34,553 34,832 5 5 36 14 21,861 10,675
10 50.647 ~l ,406 15 81 18 28,7t.6 11,155
II 29,234 26,1 ~3 5 114 28 19,804 B,OO)
12 49,567 46,182 15 10 176 23 25,625 8,120
13 29,9H 27,629 40 5 199 37 16,592 5,646
14 30,253 26,299 25 S 178 16 15,863 4,,81
IrIl1'rrr 5--14 3S5,214 345,315 III 25 832 136 157,188 53,500 RURAL
5 l2,892 4~<663 2,580 1,267
6 40, ~ 44 112,482 4 12,467 5,8 J I
7 37,015 37,522 17 . S 16,589 7,415
8 41,283 41,2 J 6- 31 21,635 8.545
9 29,846 30.228 5 5 36 14 17,984 7,431
10 44,347 4;,152 IS 81 18 23,706 8,345
II 24,755 22,067 5 J 14 28 15,870 5,023
12 43,122 40,374 15 10 176 23 20,814 4,775
13 25,845 23,400 40 5 195 32 13,270 2,960
14 25',565 22,212 25 5 178 16 12,273 1,929
;mill< 5-14 53,222 51.278 4 S 36,660 28,375 URBAN
5 5,941 5,785 1,244 1,108
6 5,944 5,626 3,070 2,375
7 4.719 5,098 3,166 2,922
8 5,880 5,691 4.584 3,551
9 4,,7(J7 4,603 3,878 3,245
10 6,300 6.254 5,060 3,810
" 4,479 4,096 3,935 2,980
12 6,445 5,809 4,811 3,345
13 4,099 0,229 4 5 3,322 2,686
14 4,689 4,087 3,590 2,353

755
~-"mql ~ "~n: ... (1m! 5-14) SCHOOL Al1El\DAI\CE AJ'jD ECONOMIC ACTIVITY
----- - --~---------- - -- - --- - -- - --------- _- ------- ---- -- --- ----- -- -- ----~ ;;~1 anit qFr/Nol Attending Schaol
------------------------------ ---------lj"elf 'lIT1i ~it i!fr.f mmf.:aif; <fiT11 rn <n~ !!iTIi ;; rn <n<f If'm/'lnfrrr/ ~Iain workers Marginal workers Non-workers if~!J
-------- --- -------,,--- ----------- Totall ~'lill" t.i1I1fT ~ ~lIi' ~~ ffirlrt arrl! RuralJ Males F~males Males Females Males Females Age Urbao
II 12 13 14 15 16 2
----------------- _- - -------- ---------- --- _------- --- - ----- - _--- - - -
f~"r!~ BILASPUR
35,679 26,397 2,257 10,561 175,705 277,596 5-14 r.ft'IT TOTAL
96 30 17 29 44,896 46,014 5
46 31 39 40 30,858 37.851 6
122 96 23 88 21,836 32,094 7
442 212 100 176 20,370 34,423 8
681· 464 99 478 11,870 23,195 9
3,147 J ,993 383 1,375 18,255 35,864 10.
2,675 2. 103 248 1,070 6,388 14,959 11
10,266 8,000 660 2,916 12,825 27,1l2 12
7,880 6,128 389 2,173 4,844 13,641 13
10,325 7,340 298 2,215 3,564 12,442 14 . 'l1'lr1~ 34,323 25,720 2,207 10,488 160,553 255,44" 5-14
RURAL
91 30 17 29 40,204 41,337 5
46 31 39 40 27,983 34,600 6
112 90 23 88 20,274 29,923 7
432 201 100 176 19,083 32,294 8
646 446 99 414 11,676 21,860 9
3,034 1,934 370 1,367 17,142 33,487 10
2,601 2,047 248 1,065 5,917 13,904 II
9,894 7,8'10 632 2,907 11 ,591 24,848 12
7,637 5,977 386 2,150 4,317 12.275 13
9,829 7,154 293 2,192 2,967 10,917 14
1,356 677 50 73 15.152 22,149 5-14 'f1T"U11' URBAN
5 4,693 4,577 5
2,874 3,251 6
10 5 1,563 2,171 7
9 10 1,286 2,129 8
3S 19 S 794 1.335 9
113 S9 13 8 1,112 2,376 10
73 56 5 471 1,055 J 1
371 190 28 9 1,234. 2,264 12
243 151 3 22 528 1,366 13
496 186 5 24 597 1,525 14

756
'1·4 ~ iI1i at,!, "!." itf.t ri m--,,,fq C-4 CHILDREN (AGES 5-14) BY SINGLE YEAR OF AGE,
~w iifliT ,",,/Attending School --------------------------
'lftrr/wriur/ ~ iifif!i'ilrr ~i!fiTlJ'mqr~ !ft1rrfrcrlli IfiTlJ'm ~ IfiT1I' or lI1,iT qr" if1J'Utr Total population Main workers Marginal workers Non-workers Total/ --------- --------- -------- --------Rural/ lIT,:!: ~~ mm ~ fum ~ fuiqf 2:ilf ffaqf Urban ' Age Males Females Males Females Males Females Males Females
2 3 4 .5 6 7 8 9 10
~rlfq,
RAIGARH
q-)'Ir 5-14 190,84S 192,£.75 50 19 1,526 630 91,587 48,794
TOTAL S 20,629 20,768 2,856 2,012
6 21,903 23,008 9 10 9,447 6,742
7 18,218 _ 18,466 36 19 9,930 6,073
8 21,108 21,499 63 14 12,300 7,128
9 16,229 17,479 S 81 24 10,345 6,062
10 23,049 23 630 10 .s 211 98 12,749 6,430
11 12,995 13,001 4 171 70 8,212 4,031
12 25,645 24,592 15 10 364 176 11,818 4,899
13 14,624 14,296 15 172 79 7,0~8 2,940
14 . 16,445 15,336. 5 413 141 6,842 2,476
l1ra:iTur 5-14 175,935 176,790 46 19 (523 630 80,851 39,909
RURAL .5 19,224 1'9,271 2,422 1,607
6 20,293 21,272 9 10 8,558 5,805
7 16,937 17,001 36 19 8.952 5,115
8 19,690 19,663 63 14 11,205 5,936
9 14,946 16,157 S 81 24 9,272 .5 149
10 21,074 21,703 10 5 217 98 11,173 5,260
II 11,766 11!659 171 70 7,183 3,045
12 23,624 22,809 IS 10 364 176 10,251 3,968
13 13,491 13,123 IS 172 79 6,147 2,141
14 14,889 14,133 5 410 141 5,687 1,884
if1Iuq- 5-14 14,910 15,285 4 3 10,736 8,885 URBAN
5 1,405 1,497 434 404
6 1,610 1,737 889 938
7 1,281 1,465 978 958
8 1,417 1,836 I 095 1,193
9 1,283 1,322 1,073 913
10 1,975 1,927 1,576 1,170
II 1,229 1,342 4 1,030 987
12 2,021 1,783 1,566 931 .
13 1,133 1,172 941 799
14 1,557 1,203 3 1,1 S5 592
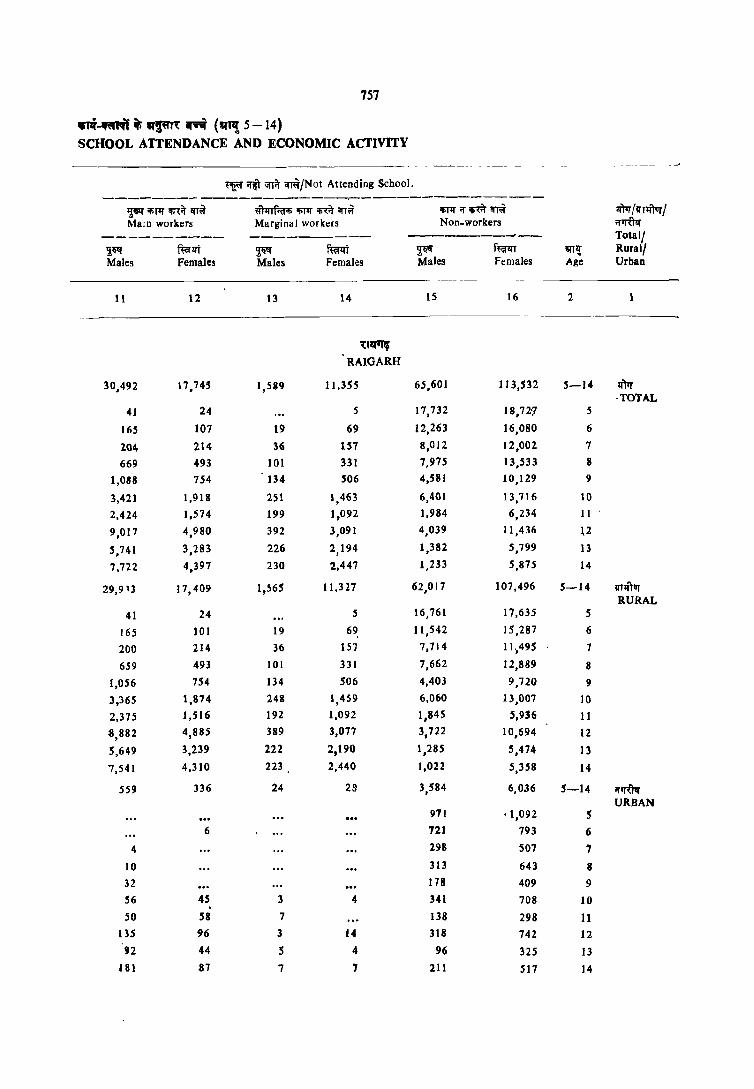
157
IIrrri-fil'll it; ,,~ ~ ('Ill! 5 - 14) SCHOOL ATTENDANCE AND ECONOMIC ACTIVITY
--~---- - --- - - ----- --- -~
~ if@" ;;rr~ qffi/Not Attending School.
--------------------.-----------------~ IIiT1l' 'fi1:~ Off'" mmf~ ;pJ1I' 'fi1:~ crr", ;pJ1I' if rn ~ 'Iitrr/rrrtftvrl MaIO workers Marginal workers Non.workers if1J'Uq-
---------- ---------- ----------- Totall ~~ fia'lft ~ fu:rIIt ~ f~T mil Rurall Males Females Males Females Males Females Age Urban
11 12 13 14 15 16 2
~11111l
RAIGARH
30,492 17,745 I,SS9 11,3SS 65,601 113,532 5-14 'Iitrr . TOTAL
41 24 5 17,732 18,72:7 5
165 107 19 69 12,263 16,080 6
104- 214 36 157 8,012 12,002 7
669 493 Jot 331 7,975 13,533 8
1,088 754 134 S06 4,581 1 ° ,129 9
3,421 1,918 251 1,463 6,401 13,716 10
2,424 1,574 199 1,092 1,984 6,234 11 .
9,017 4,980 392 3,091 4,039 11,436 l2
5,741 3,283 226 2,194 1,382 5,799 13
7,722 4,397 230 2,447 1,233 5,875 14
29,9\3 17,409 1,565 11,327 62,017 107,496 5-14 rrTlt1vr RURAL
41 24 5 16,761 17,635 5
165 101 19 69 11,542 IS ,287 6
200 214 36 157 7,714 11,495 7
659 493 101 331 7,662 12,889 8
1,056 754 134 506 4,403 9,720 9
3,365 1,874 248 1,459 6,060 13,007 10
2,375 1,516 192 1,092 1,845 5,936 11
8,882 4,885 389 3,077 3,722 10,694 12
5,649 3,239 222 2,190 1,285 5,474 13
7,541 4,310 223 2,440 1,022 5,358 14
559 336 24 29 3,584 6,036 5-14 ;;~ URBAN
971 '1,092 5 6 721 793 6
4 298 501 7
10 313 643 8
32 178 409 9
56 45 3 4 341 708 10 . SO 58 7 138 298 11
135 96 3 14 318 742 12
92 44 5 4 96 325 13
al 87 7 7 211 517 14

758
1'1-4 ~ ... ~, ~"l" vn~ ;n" all af'"". C-4 CHILDREN (AGES 5- 14) BY Sl.l\GLE YEAR OF AGE,
.'IJ."f unir qror/Atlend:JlIl Schl,ol -------------- --._-- - ------ - ----
If)1r /vrll''I''I j ~<'f orif~ijln ~ilf If;1l;' iHif ql~ ~ihnf'6lf; "'Iii 'fi,if qr~ 'filii if ""it 'fT~ iflfU!:f To[al population Main ",orker~ Marginal w·:pkcrs No,.w, or k:r~ To[all ---------- -- - - ---- - ----- - ------ - ----------Rural/ anI! ~T.q- f~l[T ~{q- i'fer!:fT ~'" ffiiflfl ~Ii ffo:l!:fT Urban Age Males Fcm8le~ Male" Females Male~ Females Male, Fcmal·~s
-.-- ------------ ------.--2 3 4 5 6 7 8 9 10
-- ._ -- ------- --- --_- -- ------.-_ ------- ----- - ---_-_- - --- --- -----~
1:'VI'~iqmi'f RAJNANDGAON
q'tlf 5-14 168,797 193,523 66 20 682 126 79,212 33,846 TOTAL
5 18,099 17,813 1,533 845 6 18.343 18,765 8 4 6,466 3,661 7 17,37 I 16,640 8,5 IJ 4.173 8 18,564 H,387 Jj 6 IO.S82 5.071 9 15,039 15,141 6'1 28 9,546 4,635
10 19,848 19,841 7 116 12 11,445 4,789 II 12,569 11,290 5 10 45 17 8,.186 3,226 12 21,592 20,497 14 5 184 29 10,189 3,382 J3" 13,087 12,480 25 5 106 12 6,583 2,183 14 14,285 12,670 1+ 148 19 6,170 1,875
lITlft"l • 5-14 150.129 146,154 59 20 678 110 65,337 23.366 RURAL
5 16,134 15,946 1,119 520 6 16,387 17,013 8 .5,269 2,699 7 15,70i 15,095 7,297 3,206 8 16,491 16,586 15 ' 6 8,798 3,805 9 13,317 13.590 61 24 8,034 3,472
10 17,751 17,793 116 12 9.613 3,360 11 11.003 9,857 5 10 45 11 6,800 2.147 J2 . 19,384 18,399 14 5 184 29 8,366 2,052 13 11,486 10,906 25 5 106 12 5,280 1,232 14 12,474 10.969 14 143 12 4,761 873
om'!lf 5-14 ~ 8,668 17.369 7 4 IS 13,875 10,480 URBAN
5 1;964 J ,866 415 326 6 1.955 1,752 4 1,197 962 7 1,670 J,545 1,216 967 8 2,074 1,801 1,784 :,272 9 1.722 1,552 4 1,511 1,163
10 2,096 2,048 7 1,832 1,41\1 .11 1,566 1,432 . 1,386 1.019 ...
12 2,208 2,098 1,8:3. 1.33:) 13 1,601 1,574 1.302 951 14 1,811 1,701 4 7 1,409 1,001

759
~q-~q'l ~ at~~m: ~ (all,! 5-14) SCHOOL AT fENDANCE AND ECONOMIC ACTIVITY
'III,. 'PJ+r ,"~ir ": ~ Md!l1 warier;
~r'lTfitlli ,"ill ,""if 'flilr Margir:\ ' ')rk:r~
.' 'If .,. 'Ii(>r <r~ >Wr / 'IlJfrur I "'~ TUldl/
'!,.q fT·nT M tie; F_;llal~s
11
24,918
5
46
64
396
621
2,315
?,183
7,564
4,961
6,763
24,444
5 42
(-4
385
601
2,287
2,147
7.453
4,871
6,590
474
5
10
20
28
~6
111
90
173
12
33,201
25
56
134
510
946
3,285'
3,260
9,978
7,002
8,005
32,818
25
56
118
510
946
3,262
3,232
9,873
6,908
7,888
381
16
23
28
105
95
117
13
ff;;r'u 'lll.d:s
14
;-. ·\Vorken
~q
M.des
15
._--------
1,646
8
38
84
177
265
174
409
.!66
226
1,620
8
38
M4
J60
265
174
40<1
262
221
26
17
4
5
" T;sr"fi1(ati<{
RAJNANDGAON
4,156
4
48
58
125
281
533
535
1,079
800
693
4,('84
48
54
125
261
5~9
535
1,0(1]
785
682
72
4
4
19
15
15
11
62,273
16,553
11,822
8,757
7,488
4,63 d
5,699
1,976
3,233
1,146
964
57,991
15,003
11,069
8,303
7,208
4,46:
5,469
1,832
2,959
943
745
4,282
1,550
754
454
280
174
230
144
274
204
220
16
arTlJ Ag~
2
Ruralj Urban.
------.. -- .... _---
92,174
16,939
14,996
12,276
12,669
9,251
11,222
4,241
6,015
2,479
2,078
85,755
15,402
14,210
11,717
12,140
8,885
10,630
3,915
5,3i7
1,965
1,514
6,419
1,537
786
558 529
366
593
326
647
514
564
5-14
5
6
7
8
9
10
11
12
13
14
5-14
5 ()
7
8
9
10
J 1
12
13
14
5-14
.5 6
7
8
9
10
11
12
13
14
IIlIT TOTAL
mrur RURAL
iflJUIi URBAN

760
11-4 ~~ I!I~ ",~, "!~ arA ~'" Ii\"( 1tlf'A;
C-4 CHILDREN (AGES S-14) BY SINGLE YEAR OF AGE,
.~or orf.!" lIT~/A\lending School --------------------------
7itfr Il((lftllfl IF" \i[;{IFI!:lT lfilr 'liT1!' 16"~1t lITir ~"tlrr~m ... 1tifT~ 'f;11!' ;{ l!i7ir!flit' ~ Total population MaID workers Marginal worlCers Non-workers Totall ---_--- ------- -------- ---------Rural/ arJ1i ~ fu:i1lt TiQ' fu:i1lt ~~Q' fuf~i ~~Q' fu:llii Urban Age Males Females Males Females Males Females Males Females
2 3 4 5 6 7 8 9 10
-~-- ---------------------- ---_--- -- ----
rf DURO
!I'm 5-14 264,992 258,254 ) 19 48 884 373 154,272 91,981
TOTAL 5 29,148 28,442 3,051 2,313
6 28,514 29,290 11 17 11 ,527 8,722
7 26,164 26,257 11 11 15,359 10.47'
M 29,139 29.253 43 17 19,«i08 13,129
9 23,028 23,020 43 34 17,592 Il,S4~
10 31,805 31,273 IS 128 84 22,348 12,782
11 20,590 18,538 10 5 103 4S 15,938 9.025
12 31,660 30,661 20 5 184 75 20,073 10,367
13 21,947 20,907 34 5 210 S9 14,650 7,420
14 22,996 20,614 40 33 151 32 18,826 6,206-
lImllf 5-14 184,083 180,201 96 29 841 369 96,133 46,064
RURAL 5 20,190 20,131 1,063 773-
6 20,272 20,544 11 17 6,911 4,471
7 18,67 j 18,475 11 Jl 9,893 5,871
8 20,168 20,533 43 17 12,802 7,288
9 15,758 16,142 43 34 11,183 6,402
10 22,338 21,903 15 '"
119 84 14,626 6,645'
11 14,052 12,405 10 5 97 45 10,131 4,552
12 21,964 21,655 20 184 75 12,513 4,155
13 15,056 14,386 21 5 199 59 8,934 3:028
14 15,615 14,026 30 19 133 28 8,078 2,277
;:pJ\')lf 5-14 80,909 78,053 23 19 44 4 58,139 • 45,917.
URBAN 5 8,958 8,309 1,988 1,550
6 8,242 8,746 4,616 4,2SG
7 7,493 7,783 5,466 4,604
8 8,971 8,719 7,106 ~,840
9 7,27G 6,878 6,409 5,140
10 9,468 9,370 7,722 6,137
11 5,538 6,133 5 5,807 4,473
12 9,696 9,006 5 7,560 5.612
13 6,891 6,521 13 II 5,717 4,392
14 7,381 6,588 10 14 18 4 5,748 3,928

761
"".!I'rif • ~ ... (~'! 5-14) 8J:HOOL ATI'ENDANCE "NO ECO~Ql\JJC ACTIVITY
~'" ;r~T \iI"A mINot Attendin. School
-----....-----------------------------~lfiPJmll~ ~~Ifil'lrrn'"w lfiT1I';:r;p~m l{tir /fJJJfrur I Main workers Marginal workers Non.wolkers ;r~lJ
--------- ---------- ----------- Totall 1~ fl~t F' ~lft ,;~ fmlft ""! Rural/ Males Females Male. Females Males Females Age Urban
------------- - ---_- --- ---------------11 12 13 14 15 16 2
ri DURO
20,738 30,436 1,046 3,169 87,932 132,247 5-14 li)1r TOTAL
3S IS 26,061 26,114 5 IS 35 22 17 16,940 20,500 6 51 60 32 28 1,0,711 15,682 7
265 254 38 74 8,885 15,780 8 374 594 49 141 4,971 10,709 9
1,599 2,468 208 405 7,507 15,534 10 1,617 2,Sfl1 94 3BS 2,829 6,5) 8 II 5,723 8,563 218 900 5,443 10,750 12 4,500 7,257 193 684 2,360 5,482 13 6,560 8,631 193 534 2,225 5,179 14
19,084 29,258 908 3,037 67,021 101,444 5~14 ~ RURAL
35 IS 19,092 19,345 , IS 35 22 17 13,315 16,004 6 45 44 32 28 8,689 12,519 7
239 249 38 74 7,047 12,906 8 3S3 555 43 141 4,135 9,009 9
1,431 2,352 184 390 5,962 12,433 10 1,550 2,475 83 373 2,18~ 4,956 11
5,307 8,246 )92 856 3,747 7,722 12 4,104 7,070 170 648 1,629 3,576 13 6,005 8,217 144 510 1,225 2,974 14
1,654 1,178 138 132 20,911 30,803 5-14 ='r!R'llf URBAN
6,970 6,769 5 3,626 4,496 6
S IS 2,022 3,163 7 26 5 1,839 2,874 8 21 39 5 835 1,699 9
168 Jl7 24 15 1,545 3,101 10 67 86 11 12 648 1,562 11
416 316 26 44 1,695 3,029 12
397 186 23 37 730 1,905 13
555 414 49 24 1,000 2,204 14

762
"-4 rrlfi~.,q If''!, ~~ iifT~ ri tilt ~iI'lflflfi C-4 CHILDREN (AGES 5-14) ~Y SINGLE YEAR OF AGE,
~ \ll'lit ifT;it/Attending School
------------------------'lftrr I flTlfrvr I ~or 1j1"',"'lii1.!T ljlii'lfllilll rnm ~h!Tf.:t!lIi lIif1l' rn q~ IIillI ;:y lIi(iI 'iI~ 'fm:TIl' Total population Malll workers Marginal workc:rs Non-workers TOla11 --------- --------- -------- --------Rural! arl'l! ~ fmi ~" ftepU ~" mrlrt ~~ ffUT
. Urban Aso Males Females Males Females Males Females Male • Females
2 3 4 S 6 7 8 9 10
tlq'f'
RAIPUR
IlTtJ 5-14 412,536 418,512 172 45 1,430 247 204,252 102,586
TOTAL 5 48,700 47,281 4,106 2,558
6 46,146 47,Hl 16,738 10,153
7 4~,BIj 44,067 39 7 20,919 12,169
8 46,926 48,100 7 39 13 27,870 15,887
9 36,681 38,076 78 20 24,193 13,610
10 50,297 51,410 7 78 46 29,405 14,346
11 31,334 29,705 20 159 39 20,693 10,301
12 52,464 50,Ill3 33 20 273 61 26,258 10,515
13 32,411 30,137 33 7 352 33 17,720 6,914
14 35,142 32,181 73 18 413 29 16,351 6,131
!iTIlTur 5-14 357.796 351.189 152 33 1,392 238 160,836 65,221
RURAL 5 41,6l!3 40,148 2,715 1,430
6 39,0~8 39,948 12,893 7,On
7 36,605 38,192 39 7 16,909 8,825
8 39,442 40,083 7 39 13 22,2511 10.689
9 31,394 31,899 78 20 19,819 9,179
10 42,567 4.1,286 7 78 46 23,J58 9',1 J I
II 26,237 24,393 14 ISS 39 16,355 6,460
12 44,713 42,287 26 20 257 5~ 20,841 6.031
13 27,169 24,797 33 7 ~5~ 33 11,655 3,662
14 28,939 26,156 66 7 394 29 12,033 2,801
ifIJlTIl' 5-14 64,740 67,323 21 12 38 9 43,616 37,365 URBAN
5 7,017 7,134 ",' 1,390 1,128
6 7,098 7,505 3,845 3,142
7 5,83 I 5,875 4,010 3,344
8 7,484 8,016 5,612 .5,197
9 5,287 6,176 4,374 4,431 10' 7,710 8,1 ~5 6,047 5,215
11 5,096 5,31 I 7 4 4,338 3,841 12 7,751 7,816 7 IS 9 5,417 4,484 II 5.242 5,340 4.065 3,252 14 6,203 6.025 7 12 19 4,318 3,330
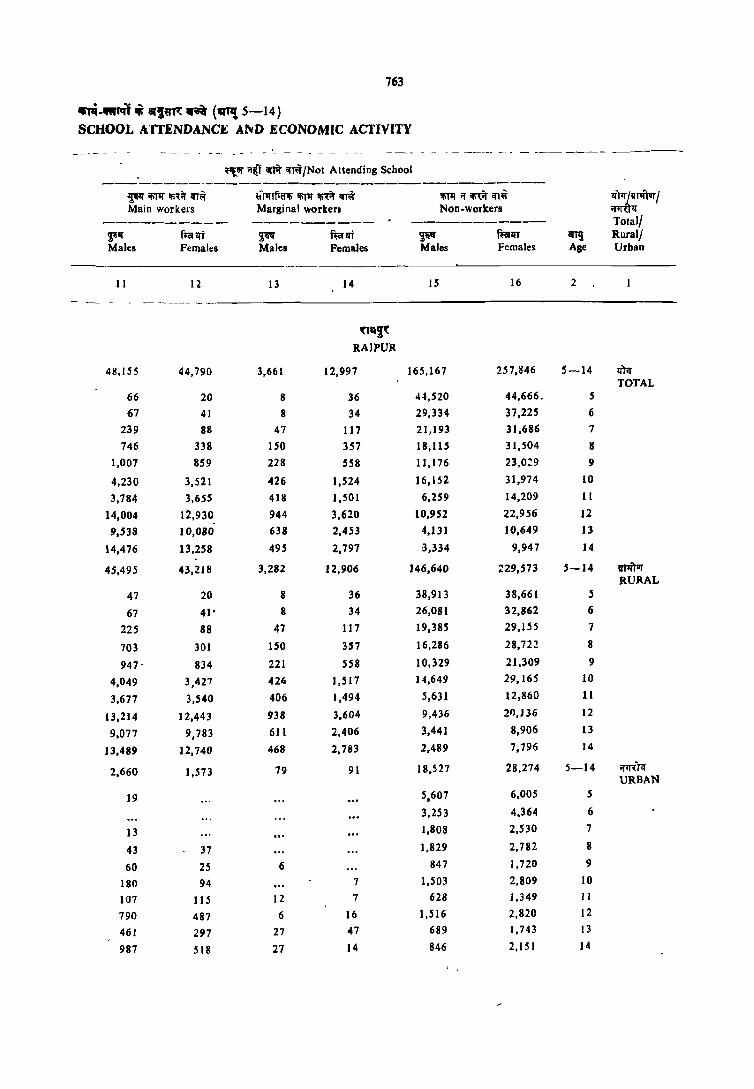
763
~TIi __ 11if -i 8f~fr~ ~ (,,"£5-14) SCHOOL AITENDANCE A~D ECONOMIC ACTIVITY
---- - - - - -_ -- - - --_ - - - ----_-- - -- - -- - - ---_-- --- - -- ---_--
~ ... 0I~1 "'~ crT\{/Not Attending School -----------_---------------------------~ 'fiTII" if;,i( <rT~ ~i)1fTf;8l1i I!iTIf iIi1:it crffi !fi11I if m Cfl\{ :::It~/ Main workers Marginal worken Non-workers
---------- ---------- ----------- Total/ ~III' fl'a l;Ji 9;liIII' fta' Ifi ~ ffiflfT iIIT,! Ruralf Males Females Males Females Males Females Age Urban
-_-----II 12 13 14 IS 16 2
- -_ ---- ----
Uq~'(
RAlPVR
411,155 44,790 3,661 12,997 165,167 257,1146 5-14 I<TII TOTAL
66 20 8 36 44,520 44,666. 5
67 41 8 34 29,334 37,225 6
239 88 47 117 21,193 31,686 7
746 338 ISO 357 18,115 31,504 8
1,007 8S9 228 558 11,176 23,0:9 9
4,230 3,521 426 1,524 16,152 31,974 10
3,784 3,655 418 1,501 6,259 14,209 11
14,004 12,930 944 3,620 10,952 22,956 12
9,538 10,080 638 2,453 4,131 10,649 13
14,476 13,258 495 2,797 '),334 9,947 14
45,495 43,218 3,282 12,906 146,640 ;:29,573 5-14 Vflitvr RURAL
47 20 8 36 38,913 38,661 5
67 41' 8 34 26,081 32,862 6
225 88 47 111 19,385 29,155 7
703 301 150 357 16,286 28,722 8
947- 834 221 558 10,329 21,309 9
4,049 3,427 426 1,517 14,649 29,165 10
3,677 3,540 406 1,494 5,631 12,860 11
13,214 12,443 938 3,604 9,436 21),136 12
9,071 9,783 611 2,406 3,441 8,906 13
13,489 12,740 468 2,783 2,489 7,796 14
2,660 1,573 79 91 18,527 28,274 5-14 if~Tll" URBAN
19 5,607 6,005 5
3,253 4,364 6
13 1,808 2,530 7
43 37 1,829 2,782 8
60 25 6 847 1,720 9
180 94 7 1,503 2,809 10
107 115 12 7 628 J ,349 II
790 487 6 16 1,516 2,820 12
461 297 27 47 689 1,743 13
987 518 27 14 846 2,151 14

764
"'-4 ~~~ ri '"'!, ~~ ...A ifT" aR .IA .. C-4 CHILDREN (AGES 5-14) BY SJNGLE YEAR OF AGE,
~'f ~M" ~/AI\ending School
--------------------------~lffall "" l1iI9'illT ,&11' I!iJlI' ~'{if 1I1~ ~'fi11frn~ I!iJlI' if rn '"~
TOlal populalion Main workers Marginal workers ' Non.workers TOIaI/ --------- --------- ------- --------Rural! ~ ~ f~ ~ mrllt ~ mrlft ~ furqt
Urban Age Males Pemales Male:t Females Males Females Males Females
-'------- ---- - -- - - ---- ------- - ------ -_ - ---- --
2 3 4 5 6 7 8' 9 10
~
BASTAR
IfTIf 5-14 255,092 256,6.56 116 32 1,074 198 72,766 34,331
TOTAL 5 29,961 30,130 5 2,510 1,661
6 27,999 29,573 15 6,50.5 3,923
7 25,968 27,291 , 46 8,244 4,860
8 30,793 31,443 46 15 10,473 5,374
9 21,147 22,762 9 96 24 8,205 4,032
10 34,007 33,685 J 5 120 40 11,039 4,663
II 14,304 14,846 10 115 40 5,984 2,879
12 35,052 32,820 29 9 230 55 9,790 3,430
13 16,839 17,153 24 9 181 24 5,276 1,872
14 1~.022 16,954 ,48 4 200 4,739 1,636
'!IT1Jfqr 5-14 240,704 242,656 117 32 1,074 198 62,35 S 25,719
RURAL 5 28,2d3 28,497 5 1,959 1,137
6 26,326 27,913 15 5,410 2,967
7 24,668 25,864 46 7,215 3,876
8 29,189 29,8611 46 15 9, J 65 4,253
9 19,878 21,415 " , 9 96 24 7,146 3,086
10 32,385 31,998 15, 120 40 9,796 3',540
II 13,128 13,694 5 135 40 4,975 2,034
12 33,254 31,373 29 9 230 55 8.411 2,614
13 15,718 16,204 24 9 181 24 4,384 1,302
14 17,875 15,772 44 4 200 3,894 909
;ml:TIJ S-14 14,3118 14,000 9 10,411 8,612 URBAN
5 1,678 1,633 551 524
6 1,673 1,660 1,095 9;6
7 1,300 1,427 1,029 9114
8 1,604 1.S76 J,108 1,121
9 1,269 1,287 1,059 946
10 1,622 1,687 1,243 I, J 23
11 1.176 1,152 5 1,009 845
12 1,798 1,447 1,379 816
13 I, 21 949 892 570
14 1,147 1,182 4 845 727
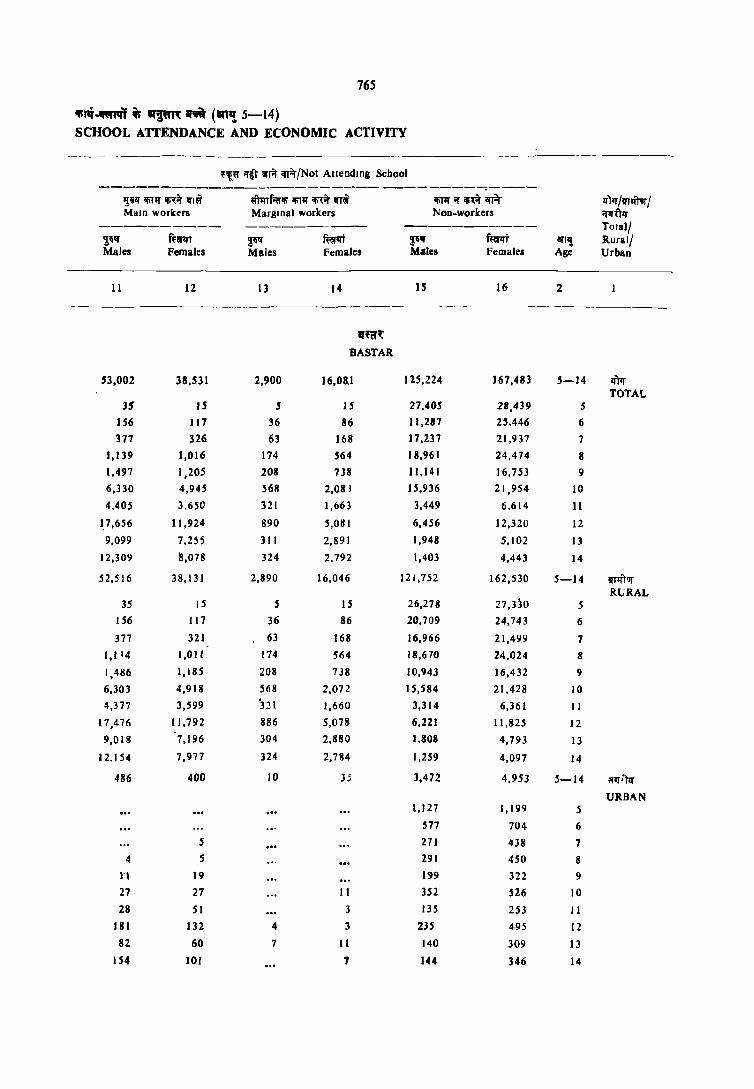
765
1Ii'''~ its IQ'~''( ~ ('"'! 5-14) SCHOOL AlTENDANCE AND ECONOMIC ACTIVITY
-_--- ------ - ---- ---
~lI!~ ~r ~f.t ifTiOr/Nol Allendlng School ------------------------ ----------;----
'.!'II' 'iiiII' ~it ;rl~ Ifmf.cr;r; ~I'II' iJ;\it IfrW 'IiI'II';r m iI'R lI')rr /llflftllf! MaID workers Marginal workers Non.workers 'l'JfUIf
-------_-- ---------- ----------- Totall 1~" ffiiRT ~ ffirrt ~" Rem 8fT,! Rural! Males Females Males Females Males Females Age Urban
II 12 13 14 J5 16 2
----------~- ----- ------ -- - -- - --- ------------_
if"R'(
BASTAR
53,002 38,531 2,900 16,0&1 125,224 167,48] 5-14 IiTrr TOTAL
J5 IS 5 IS 27,405 28,439 5
156 117 36 86 I J ,287 25,446 6
377 326 63 168 17,237 21,937 7
1,139 1,016 174 564 18,961 24,474 8
1,497 1,205 208 738 11,141 16,753 9
6,330 4,945 568 2,081 15,936 21,954 10
4,405 3,650 321 1,663 3,449 6,614 11
J.7 ,656 11,924 890 5,081 6,456 12,320 12
9,099 7,255 311 2.891 1,948 5.102 13
12,309 8,078 324 2,792 1,403 4,443 14
52,516 38,131 2,890 16,046 121,752 162,530 5-14 llf'II'T1Jf RURAL
35 IS 5 IS 26,278 27,3jO 5
156 117 36 86 20.709 24,743 6
377 321 63 168 16,966 21,499 7
1,1 14 1,011 174 564 18,670 24,024 8
1,486 1,185 208 738 10,943 16,432 9
6.303 4,918 568 2,072 15,584 21,428 10
4,377 3,599 3:!1 1,660 3,314 6,361 11
17,476 11,792 886 5,078 6,221 11,825 12
9,018 7,196 304 2,880 1.808 4,793 13
12.154 7,977 324 2,784 1,259 4,097 14
486 400 10 Jj 3,472 4,953 5-14 ;rrr·)lf
URBAN 1,127 1,199 5
577 704 6
5 271 438 7
4 S 291 450 8
n 19 199 322 9
27 27 11 351 S26 10
28 51 3 135 253 II
181 132 4 3 235 495 12
82 60 7 II 140 309 13
154 101 7 144 346 14

~1 '1'-5 ttlli\lf ~1q QTq f~firrqt .. TABLE C-5 SINGLE YEAR AGE RETURNS
~ Note
~g' ij'T~T it ~~r/'J}i.r!f cF ",;~nl:: ;;rif~~lH 'fiT l:1;!fi~
~lf ~~ fara~1IJ' sr~a' f'lilfT ;;rnrr ~ ari'~ g'JcrT 'l\ilf ~ f~~ IJni'tllJ' a'!iff "tRIll' Ill'JfT if; q~tf-~~tf milii \1q~iQ' . . ifi\TQ' \iI'fcf r I 1Il ij'RVJ'T 197I .iliT GfiI1TlIJ'ifT 'fiT ij'RlIJ'r tf -I V
q;~~ ",,1lf ~~ f~fllJ"q) ;ji ~~ ~ I
lfi{ Q;ifi 'f~~t'i '5Jif«j~Tlf'-un:VJT t i31) \ifi'f ~lftrif 't\'~hif, utf~lf!fiTlff.fi{T !R"~ lftiififT fififfaHrl ~ ft"J'tI; lIi~
srlil~ ~ ~~q"'f1 i31'ifffUfif!1ll ;f; !R'T,! ij-oiwT aIT~ ~ II,;~ n '1ft «QUf;rr 't\'~;f I '5I'Tif;J ur~flIJllt fflfg ~;l an'{ i>l'ifflUfifT
mf~ ~ U"l'lf of'fil 'fiT 2f,\TIfflT 'fiT ~tlflfif 'f.\~ it u~rlfifl ~)lfT I
~u ~m:VJT 'fi) olfflffilfCf q:;ff (mlfrrlf) if; srH u~'n 3 9;1'10;,: 4 if; l1Telfif ~ ~!fi<!:ot 't\'T 'l~ i31'TifOfiT<..1 if; ~n: q~ , ~1fi'fi;rCf fllilfT fflTT ~ I
767
This table plesents the single year age distribution of the population by sex and presents the data separately for rural aod urban areas for the (State) as a whole. It corresponds to table C-IV-
.Single year age returns of 1971 Census.
This is an important demographic table which ..would help the demographers. statisticians and planners in many ways viz .. for computing mortality rates from age data of the earlier censuses. for preparing life tables and for studying digital preference in age returns at the census etc.
This tp,ble has been compiled. based on information collected through question number 3 and 4 of the Individual Slip (Universal).


769
q·S ~ ""lq ""l f.~f"qt C·S SINGLE YEAR AGE RETURNS
llltr mTvr ;rtTW:r Total Rural Urban
- ----------- ----------- -----------~ ~ fffllfl ~ "~1fI ~ ffQlff "ge Males Females Males Females Males Females
.. -------
2 3 4 5 6 7
_-'-_----- --- -- -~-- ------ - _-- ---- --- -~~-----------
,,5qsmt M~DHYA PRADESH
"til IITI! 26,816,303 25,292,537 - 21,266,319 20,326,062 5,619,983 4,966,475
All a~s
0 729,llO 718,884 596,826 586,832 132,284 132,052
518,628 510,785 420,082 413,145 !)8,H7 97,641
2 732,333 721,362 589,878 583,116 142,4SS 138,247
3 717,006 801.963 631,770 651,823 145,237 I~O,140
4 798,318 762,347 651,106 621,076 147,2U 141.272
S 860,438 804,461 701,058 657,502 159,380 146,959
6 852,948 828,203 700,395 679,723 152,5,53 148,480
7 690,757 679,874 567,499 556,607 123,258 123,267
B 939,537 883,89'} 772,249 726,644 167,288 157,247
9 558,904 , 555,092 449,912 447,717 108,992 107,315
10 974,009 897,473 794,545 732,139 179,465 ] 65,334
11 494,561 454,633 384,859 3S2,798 109,708 101,836
12 983,782 841,980 B02,045 686,564 181,737 155,416
13 528,014 478,S63 415,781 372,770 112,233 105,793
.4 607,374 523,204 476,796 405,909 130,579 117,296
IS 684,831 535,643 547,459 423,523 137,372 112,120
16 587,502 528.982 452,990 410,741 134,512 118,240
17 330.556 292,802 236,809 214,972 93,747 77,830
18 726,983 670,811 551,888 526,992 175,095 ]43,819
19 250.581 211,149 164,092 148,8'58 86,489 62,291 20 - 799,291 911,4]8 615,618 721,362 183,673 ]90,056 2] - 243,]41 ]89,282 160,328 136,563 '82,813 .52,720
22 574,766 532,856 424,306 410,412 150,460 122,445
23 252,845 240,117 175,396 181,444 77,449 58,673
24 284,094 274,306 196,715 205,519 87,379 68,788
25 949,941 905,46S 759,481 711,820 190,460 193,645
26 291,786 239,142 210,814 178,171 80,972 60,970
27 210,377 175,979 155,814 134,241 54,563 41,738
28 409,652 448,232 307,415 357,963 102.237 90,269 29 92,765 74,193 62,599 54,505 30,165 19,688 30 1,041,322 1,019,052 823,778 814,305 21 7,~44 204,747 31 19,395 56,317 53,396 42,369 25,999 13,948
--- ----------- --- --_ --------- ----------
f!tipft : 'U1!T ~' it 'Iff,! ~r .;:ni' iii m, qfi:lff'qffi t I
Note; Figure. o( 'Age not stated' are included in 'all ages',
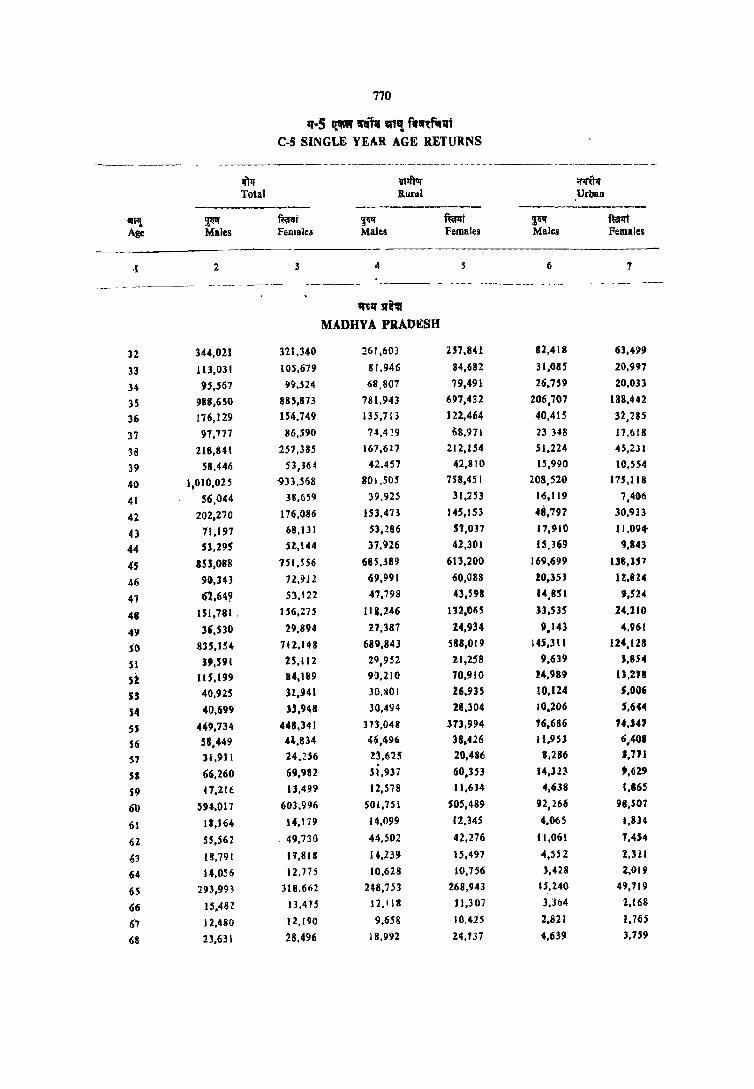
710
'1·5 qw Qll1 VI,! f'~"Jli CoS SINGLE YEAR AGE RETURNS
------- - --------- - -----------.~-- -- -- ------------- -
~lf 1I1~ ;mi'rIr Total RurAl Urban
-------- ---------- -----------lip! F' ~i '!~ ~t ~ f~1rt Age Males Females Males Females Males Female;
-I 2 3 4 6 1
.--- - _- ------- ------ -------- --_--- - ------- ---- -- --- - ---------
1ftq'Sf",
MADHYA PRADESH
lZ 144,021 321,340 261,603 2S7.841 82,418 63.4l)!t
33 113.031 105,679 81.946 84,682 31,085 20,997
3~ 95,561 99,524 68,807 79,491 26,759 20,033
3S 9B8,6S0 885,873 781,943 697,432 206,707 188,442
36 176,129 IS4.749 135,7[3 122,464 40,415 32,285
37 97,777 86,590 74.4 ~9 68,971 23348 17,618
38 218,1141 257,385 167,617 212,154 51,224 4S,231
39 58,446 53,364 42.457 42.810 1S,990 10,554
40 1,010,015 '933.558 801.50S 7S8,451 208,520 175,118
41 56,044 38.659 39,925 31.253 16,119 7,406
42 202,270 176,086 153,473 145,IS3 411,797 30,933
43 71,191 68,IJI n,286 51,037 17,910 11.094'
44 H,29S H,I44 37,1H6 42,301 1.5,369 9,&4)
45 8SS,088 1SI,5S6 685,389 613,200 169,699 13I1,lf7
46 90,343 12,912 69.991 60,088 !O,3H 12.824
41 6l,64? 53,122 "7,798 43,598 14.SH 9,524
48 151,781. ]56,:75 111,246 IU,OtiS U.5]S 24,210
49 36,530 29.894 27,387 24,934 11,143 4,961
SO 835,154 7H,I48 689.843 S88,Ol9 14!i,311 U4,12I
SI )9,591 2S,II2 24,952 21,258 11.619 S.854
,~ US,199 14,189 110,210 70,910 14.989 ll,278
$I 40,925 31,941 .lO,~OI 26,935 10,124 $.006
54 40.699 Sl,948 30,494 18,304 10,206 ',64<4
55 449,734 448,341 373,048 373,994 16,686 74,,.7
S6 SB,449 4.\,834 46,496 38,426 It,953 6~408
51 31,911 24,2.56 23.62S 20,486 8,286 J,711
S8 66,260 69.982 51,937 60,353 14,323 9,629
S9 _41,216 13,499 12,578 11,634 4,638 1,865
6Il 594,017 603,996 SOl,1S1 S05,489 92,266 98,S07
61 18,164 14,179 14,099 12.34S 4.065 1.834
{iZ 55,562 49.130 44.502 42,276 11,061 1,U4
-&3 18.791 11,818 14,23!J 15,497 4,j12 2,3ll
64 14,OS6 12.175 10,628 10,756 ),428 2,019
65 293,993 318,662 248,753 268,943 15,240 49,119
06 IS,48Z 13,415 12,118 J1,307 3.]04 2.168
67 12.480 12,190 9,658 10.425 2,821 1.76S
08 23,631 28,496 18,992 24,137 4,639 3,1S9

771
11-5 ~~ 1lI'~ mil ~~fVrqi C-S SINGLE YEAR AGE RETURNS
q);-r lInftur ;rlRrq Total Rural Urban
---------- ------------ -----------'anI!, '!~" f~qj ,!I;q- ffirtrt ~ tmf Age Males Females Males Females Males Females
-------- _- - -- ---_--- ---- ------- -----------I' 2 3 4 5 6 q
-----_----
IfIl:J srm MADHYA PRADESH
69 6,455 6,894 4,942 5,978 1,513 917 70 266,746 300,650 228,533 255,447" 38,214 45,202 71 6,885 5,914 5,376 5,215 1,509 698 72 22,409 21,123 17,998 17,913 4,421 3,209 73 6,707 5,935 5,116 5,034 1,591 901
74 5,585 4.213 3,935 3,455 1,651 757
75 96,392 110,714 82,481 94,527 13,912 16,188
76 7,446 6,397. 5,736 5,140 1,710 1,257
77 3,845 3,214 2,924 2,840 921 373
78 9,171 9,147 7,048 7,897 2,122 1,250
79 2,597 1,945 1,977 1,692 620 253 80 90,281 106,239 76,885 89,641 13,396 16,598 81 3,603 . 2,423 2,691 2,'101 912 321 82 5,710 5,112 4;663 4,229 1,047 883
83 1,643 1,329 1.214 J ,125 428 205 84 1,252 1,057 871 838 382 219 85 21,,246 23,349 17,865 19,085 3,380 4,263 86 1,277 1,002 1,000 822 277 179 87 1,019 939 813 791 206 148 88 1,120 J ,176 883 1,006 237 170 89 50;: 693 427 614 76 78 90 17,139 20,815 14,682 16,686 2,457 4,128 91 436 384 350 317 86 67 92 860 989 648 802 212 187 93 267 249 183 202 85· 47 94 205 201 157 148 48 52 95 3,583 4,767 2,989 3,812 594 955 96 436 392 367 309 69 82 97 232 198 183 147 49 51 98 675 718 569 566 105 152 99 435 492 334 165 102 127
100+ 4,884 6,486 4,158 5,020 725 1,467


~~l rr-6 qf;f liflifq "'II '"1' m: ~ir/~q • ~~T,( m~T TABLE C-6 POPULATION ·BY FIVE YEAR AGE GROUP AND SIX
'~T
Note.
~\f «n:urT it \i[if~~ !fiT ~rlf m~ ~'!f1/Ijliq lj~:qOfr .. "fiT zitl-r, ilHrrllf ~1~ OfIf~Tq IIf'!fT cff fifll; ~iPftT-~ sr~q
. fifill'r ~ncrr ~ I ~t'l'~ 0-4, 5-9', 10-14, 15-19, 20-24,
25-29, 30-34, 35-39, 40-44, 45-49, 50-54, 55-59,
60-64, 65-69, 70~74, 75-79, 80-84, 85-89, 90-94,
95-99, 100+ iti qt:q q1filf 'f11! ij"Jt~T it; f~ll; sr~~ f'liQ;
\ifrn ~ I ~« muir ifor «1[1 m~ «~QT it "'ilfl! OfQ:1' iifaTi qt" it' '"~ 'lFi wrflf~ t I ";qy~ Of~T ~ tri" ~ ~, fcrf'lfi''f m1t «~~1 it; mifi~ it' i5I1, <til "«~ 'qT~ «'L~" it; lIltT if ~ f1'CT ifi"( srtta' f.til!: ~ m ~ I ~ ~~vrr 'fI't "{W-f ~.'h: f-iml it; f\1'tt ~",R:r;;r f1plrj qllr t I lf~ «r"{vrr 1971 <t\' iiRlfUI",' iiI>" ~R.uft IT -I V it' qfdwGZ ~ ~,;.q- t I
773
This table gives tho age and sex composition of . the population separately for total, rural and urban areas. The figu~es are presented for quinquennial age groups. 0-4, 5-9, 10-14. 15-19, 20-24. 25-29. 30-34, 35-39. 40-44, 45-49. 50-54. 55-59, 60-64, 65-69, 70-74, 75-79, 80-84, 85-89, 90-94, 95-99, 100+. All ages in the table include • Age not stated' also. ThCl figures for Age not stated can be derived by subtracting the sum of figures of various age groups from the total of 'All ages'. The table has been compiled for the State and the districts. The table corresponds to appendix to table C-IV of 1971 Census.


775
"-6 qN ",,111 'IT'! 8'~ ~ 'f'Jft J,!~ .. !lfpn: 'A6wr C-6 POPULATION BY FIVE YEAR AGE GROUP AND SEX
---_----lI"rlT wrrUT orlT~ Total Rural Urban
---------- ----------- -----------anl!~ ~ mr ~ ~ ~ mm Age-group Males Females Males Females Males Females
---, _-_--- -- _--
2 3 4 5 6 7
----- - --- ----- -- ---- - --------- - ---_- - -_ ,,~ Sf~~
MADHYA PRADESH
ntarPI 26.886.303 25.292,537 21,266,319 20,326,062 5,619.983 4.966,475 All aaes
0-4 3,5!iS,396 3,515,341 2,889,662 2,855,991 665,734 659-,351
5-9 3~902,5a4 3,751,522 3.191,1 i 3 3,068,253 711,400 683,269
10-14 3,587,747 3,195,853 2,874,025 2,550,178 713,722 645,675
1S-19 2,580,453 2,239,387 1,953,237 1,725,086 627,216 514,301
20-24 2,154,137 2,147,980 1,572,363 1-,655,299 581,774 492,681
25-29 1,954,521 1,843,011 1,496,123 1,436,700 458,398 406,310
30-34 1,673,337 1,601,912 1,289,531 1.278,689 383,806 323.223
35-39 1,539,842 1,437,961 1,202,159 1,143,831 337,683 294.130
40-44 1,392,831 1,2611,588 1,086,115 1,034,194 306,7J5 234,394
45-49 1,196,391 1,063.760 948,810 873,884 247.581 189,875
SO-54 1,071,568 887,337 871,299 735,426 200,269 151,911
55-59 623,571 600,912 507,686 504,893 11 5,88S 96,010
60-64 700,590 698,498 585,219 586,363' 115,371 lJ 2, 135
65-69 352,041 379,717 294,463 321,390 57,578 58.:126
70-74 308,332 337,834 260,947 287,066 47,385 50,768
75-79 119,451 131,417 100,165 112,095 19,285 19,312
80--84 102,488 'I 16,lS9 86,324 97)34 16,164 18,226
1S-89 25,164 27,158 20,988 22.319 4,175 4,839
90-94 18,901 22,637 16,020 18,156 2,887 4.481
9S-99 5,361 6,566 4,442 5,199 919 I,J67
100+ 4,882 6,488 4,157 5,019 n5 1,468
. farqVf):- 'rir m'f 'l 'm~ ~T il"1frf it; m;;t ~for(f t I
Note:- Figures or 'Age not staled are included in 'All ages',
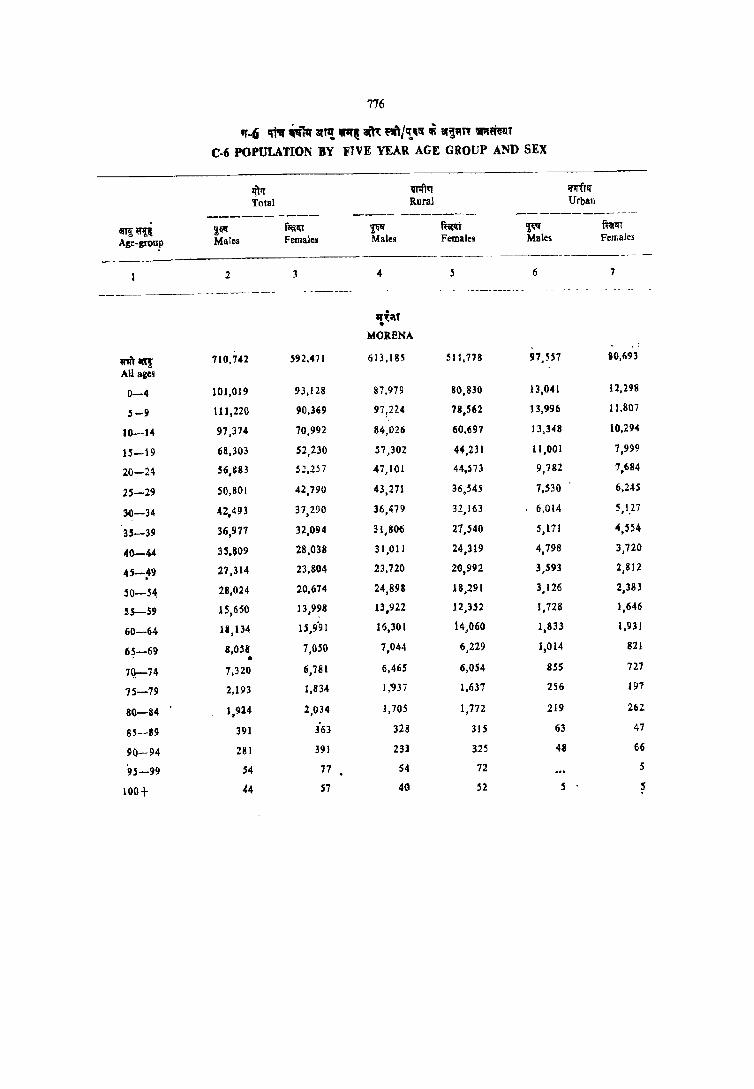
776
'f-Ci iii'" ~N au~ ~ ~ ''lft/'!~~ Ii OI~"Tt iIr.IUt!tlT
C-6 POPULATION BY FIVE YEAR AGE GROUP AND SEX
~ lI1'11')~ iflT'{f1i
Total Rural Urban
---------- ------------ -----------ill!~ !l;~ flw1r r~1f ~ ~ fmi Age-group Males Females Males Females Males Females
2 3 4 ~ 6 7
- ~ --~---- ------ - ------- ----------- -- ---_-------- -- -- - ------II~~T .
MORENA
~1It! 710,742 592.471 613,185 511,718 97,557 80,693
All ages
0-4 101,019 93,ll8 87,979 80,830 13,041 12,298
5-9 111,220 90,369 97[224 78,562 13,996 11.807
10-14 91,374 70,992 84,026 60,697 J 3,348 10,294
15-19 68,303 52,230 57,302 44,231 11,001 7,999
20-24 56,883 S ~,25 7 47,101 44,S73 9,782 7.684
25-29 SO,801 42,790 43,271 36,345 7,530 6,245
30-34 42,493 37,290 36,479 32,163 6,014 5,1,27
35-39 36,971 32,094 31,806 27,540 S,I71 4,S54
40-44 3S,~09 28,038 31,011 24,319 4,798 3,720
4S-~9 27,314 23,804 23,720 20,992 3,593 2,812
50-5,", 28,024 20,674 24,898 18,291 3,126 2,383
Ss-59 15,650 13,9~8 13,922 12,352 1,728 1,646
60-64 11,134 15,9'91 16,301 14,060 1,833 1,931
65-69 8,038 7,050 7,044 6,229 1,014 821 •
7(!-74 7,320 6,781 6,465 6,054 8SS 727
75-79 2,193 1,834 1,'937 1,637 256 191
80-84 1,9:14 2,034 1,705 1,772 219 262
85-89 391 363 328 31S 63 47
9Q-94 281 391 233 325 48 66
"95-99 54 17 S4 72 S
lOOt 44 57 40 52 S S
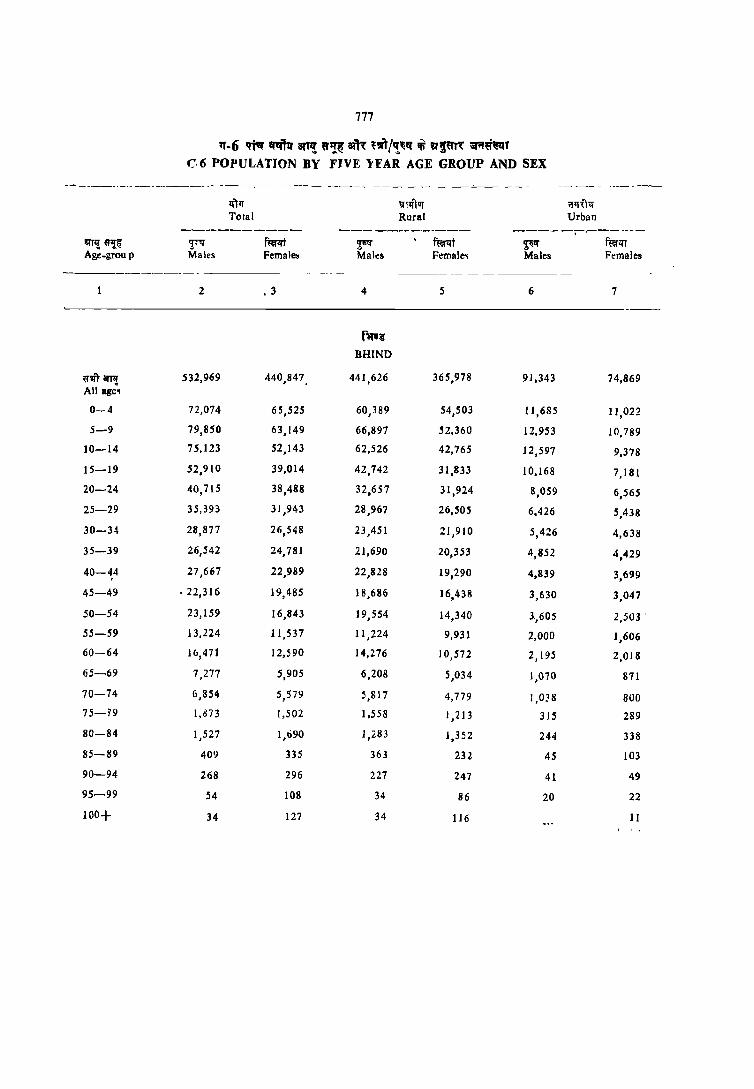
771
"'-6 ~ 'fll[fqo 8t11! "!~ ait~ ~""l/,~" 111 ~~~ iiI'''~I!!:I' C. 6 POPULATION BY FIVE l'FAR AGE GROUP AND SEX
~-.--.-------~----.. ---- ----_ ------_ - --- - _-_-- _-_- ------- ------
lfTIf lJTlJrvr ij'll:r"!f Total Rural Urban
---------=--- --- ---------- ----- --~--.---!All! ~~ rnr ~ ~ f~t ~ mt<rr Age_group Males Females Males Femal~ Males Females
--------_--- -
2 . 3 4 5 6 7
f1llJ:r BHINO
liT'lT~ 532,969 440,847, 441,626 365,978 91,343 74,869 All age~
0-4 72,074 65,525 60,389 54,503 11,685 11,022
5-9 79,850 63,149 66,897 ~2,360 12,953 10,789
10-14 75,123 52,143 62,526 42,765 12,597 9,378
15-19 52,910 39,014 42,742 31,833 10,168 7,181
20-24 40,715 38,488 32,657 31,924 8,059 6,565
25-29 35,393 31,943 28,967 26,505 6,426 5,438
30-34 28,877 26,548 23,451 21,910 5,426 4,638
35-39 26,542 24,781 21,690 20,353 4,852 4,429
40-44 27,667 22,989 22,828 19,290 4,839 3,699
45-49 .22,316 19,485 18,686 16,438 3,630 3,047
50-54 23,159 16,843 19,554 14,340 1,605 2,503 .
55-59 13,224 11,537 11,224 9,931 2,000 1,606
60-64 10,471 12,590 14,276 10,572 2,195 2,018
65-69 7,277 5,905 6,208 5,034 1,070 871
70-74 6,854 5,579 5,817 4,779 1,0:8 800 75-~9 1,673 1,502 1,558 1,213 315 289
80-S4 1,527 l,b90 1,283 1,352 244 338
85-89 409 335 363 232 45 103
90-94 268 296 227 247 41 49
95-99 54 IDS 34 86 20 22
100+ 34 127 34 116 11
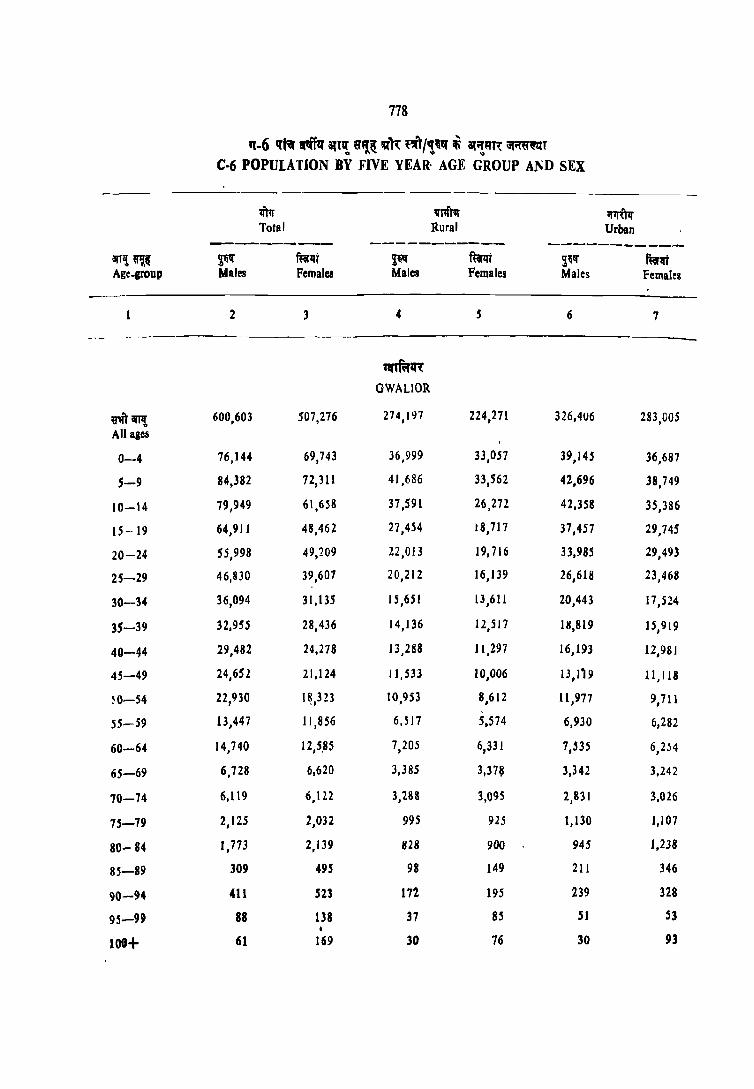
778
11-6 Ift;f ~ au'!, 6''l~ ~" ~l/,!~q ~ 81'~"'~ ~~T C-6 POPULATION BY FIVE YEAR' AGE GROUP Al\D SEX
------ --~.---
ittr 'Nfllf i(1J\Pr Total Rural Urban
--------- ----------- -----------arT,! ~ ~ fi:iIlT ~W fmt ~~'f ftw~ Age-croup Males Females Males Females Males Females
2 3 4 5 6 7
~fi;rq'(
GWALIOR
mllP! 600,603 507,276 274,197 224,271 326,406 283,005 All ages
0-4 76,144 69,743 36,999 33,057 39,145 36,687
5-9 U,382 72,311 41,686 33,562 42,696 38,749
10-14 79,949 61,658 37,591 26,272 42,358 35,386
IS -- 19 64,91 I 48,462 27,454 18,717 37,457 29,745
20-24 55,998 49,209 22,013 19,716 33,985 29,493
25-29 46,830 39,607 20,212 16,139 26,618 23,468
30-34 36,094 31,13S 15,651 13,611 20,443 17,524
35-39 32,955 28,436 14,136 12,517 111,819 15,919
40-44 29,482 24,278 13,288 11,297 16,193 12,981
45-49 24,6Sl 21,124 11,533 10,006 13,1~9 11,118
~O-S4 22,930 1 ~,323 10,953 8,612 11,977 9,711
55-59 13,447 11,856 6,517 5,574 6,930 6,282
60-64 14,740 12,5,85 7,205 6,331 7,535 6,254
65-69 6,728 6,620 3,385 3,37~ 3,342 3,242
70-74 6,119 6,122 3,288 3,095 2,831 3,026
75-79 2,125 2,032 995 915 1,130 1,107
80- 84 1,773 2,139 828 900 945 1,238
85-89 309 495 98 149 211 346
90-94 411 523 172 195 239 328
95-99 88 138 37 85 51 53 •
100+ 61 169 30 76 30 93

779
q~6 qt. n1. Ifl'!. ~'t~ m '~/'t~1!( •• ~ ~ C 6 POPULATION BY FIVE n:AR AGE GROUP ~ND SEX
zmr mlvr ~ Total Rural Urba::!
--------- ----------- ---------lIlT'; "'IJ&' ~ rmt, ~W f~lff ~ ffirlft Age-group Males Females Males Females Males Females
.... -__ 2 '3 4 5 6 7
-----.....,_ _"_ ri'~IlT
DATlA •
""r~ 168,305 143,588 135,786 115,116 32,519 28,472 All ages
0-4 22,231 20,596 17,965 16,773 4,266 3,823
5-9 25,335 21,159 20,581 17,333 4,754 3,825
10-14 23,085 16,624 13,858 13,002 4,227 3,622
15-19 16,758 12,218 12,849 9,419 3,909 2,799
20-24 13,355 12,084 10,255 9,660 3,100 2,424
25-29 11,685 9,839 9.547 7,857 ~,138 1,982
30-34 9,61 S 8,942 7,795 7,236 1,820 1,707
35-39 9,155 8,162 7,530 6,415 1,625 1,747
40-44 8,805 7,142 7,094 6,294 1,711 1,548
45-49 7,249 6,471 5,881 5,456 1,367 ~,OlS
SO-54 7,443 6,048 6,285 4,937 1,158 1,111
55- 59 4,065 3,605 3,377 2,904 689 701
60-64 4,729 4,370 3,933 3,414 796 957
65-69 1,9,81 2,251 1,593 1,717 388 534
70-74 1,666 2,105 1,330 1,689 335 416
75-79 518 375 373 311 145 64
80-84 330 524 285 443 45 81
85-89 69 123 49 81 20 42 90-94 59 104 47 66 11 38
95-99 15 41 IS 30 Il
100+ IS 15
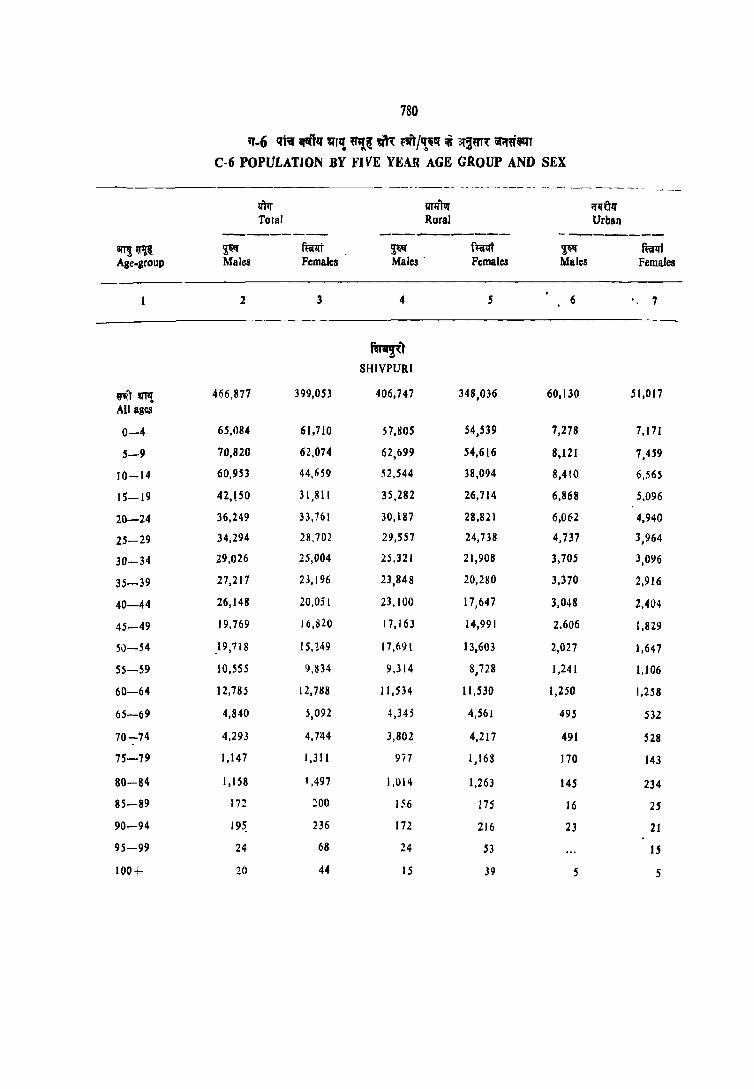
780
q-6 qt:;f ",,111' ~r,! ~~ Q''' ~ I'!"-PI. ;i 3{~mt Q{;f"~T C-' POPULATION BY FIVE YEAH AGE GROUP AND SEX
-------- -_ --- ---_- -- --- -.- --- --_-
IlFr !ITlr~ ifIIUII' Total Rural Urban
-------- ----------- --------~~ ~ ft«l.ft ~ fl'alfT ~ ffip:If Age-group Males Females Males· Females Males Females
2 3 4 5 6 7
f~) SHIVPURI
uY<"I" ~ 466,877 399,053 406,747 348,036 60,130 51,017
All ages
0-4 65,084 61,710 51,805 54,539 7,278 7,171
5-9 70,820 62,074 62,699 54,616 8,121 7,459
10-14 60,953 44,(;59 52,544 38,094 8,410 6,565
15-19 42,150 31,811 35,282 26,714 6,868 5,096
20-24 36,249 33,761 30,1117 28,821 6,062 4,940
25-29 34,294 28,702 29,557 24,738 4,737 3,964
30-34 29,026 25,004 25,321 21,908 3,70S 3,096
35-39 27,217 23,196 23,848 20,280 3,370 2,916
40-44 26,148 20,Oj 1 23,100 17,647 3,048 2,404
45-49 19.769 16,820 17,163 14,991 2.606 1,829
50-54 .19,718 15,149 17,691 13,603 2,027 1,647
55-59 10,555 9,834 9,314 8,728 1,241 1,106
60-64 12,785 12,788 11,534 11,530 1,250 1,258
65-69 4,840 5,092 4,345 4,561 49S 532
70-74 4,293 4,7H 3,802 4,217 491 528
75-79 1,147 1,311 977 1,168 170 143
80-84 1,158 1,497 1,014 1,263 145 234
85-89 In ::00 156 175 16 25
90-94 19~ 236 172 216 23 21
95-99 24 68 24 53 IS
100+ 20 44 IS J9 5 5

781
,,-6 ~ qtt"fq 'l'lli ~'!' ~ ''"/'!~ -i at~Tl ii[,,"~ C·6 POPULATION BY FIVE YEAR AGE GROUP AND SEX
--------_ -- - -- - - ----- ----__ ._--
1fT~ ~ Age-group
~Ii Males
If'rtr Total
fl'\!flfi Females
~~Ii Males
IIrif~ Rural
Females
-----------~--.---------------------
fl'tft !lIT1! All ages
0-4
5-9
10-14
15"':"19
20-24
25-29
30-34
35-39
40- 44
45-49
SO-54
55-59
60-64
65'-69
70-74
7'5-79
80-84
85-89
90-94
95-99
100+
2
5'32,345
73,478
80,578
71,355
48,343
43,427
37,364
33,220
29,546
27,611
21,888
21,572
11,850
14,704
6,319
5,901
2,212
1,859
345
307
65
29
3
469,640
74,022
74,052
55,542
40,871
41,115
32,968
2g,940
25,452
21,73.8
18,469
15,964
11 ,061
12,865
6,125
5,692
2,127
1,703
263
328
100
85
4
~.ifT GUNA
. 457,124
64,710
70,656
61,060
39,543
35,672
31,367
28,561
15,705
23,920
18,899
18,838
10,158
12,838
5,419
5,222
1',936 .
1,676
290
266
S5
29
5
403,262
64,S 10
64,830
46,819
33,848
34,402
28,021
25,037
21,962
18,847
15,961
13,721
9,520
11,284
5,359
5,065
1,843
1,448
229
261
90
65
~ Males
6
75,221
8,768
9,922
10,295
8,800
7,755
5,997
4,~59
3,841
3,690
2,988
2,734
1,692
1,866
900
678
275
183
55
42
10
;:r~N Urban
Females
7
66,378
9.512
9,222
8,722
7,023
6,712
4,947
3,902
3,490
2,891
2,507
2.243
1;541
.1,580
765
627
283
25'S
3S
67
10'
20
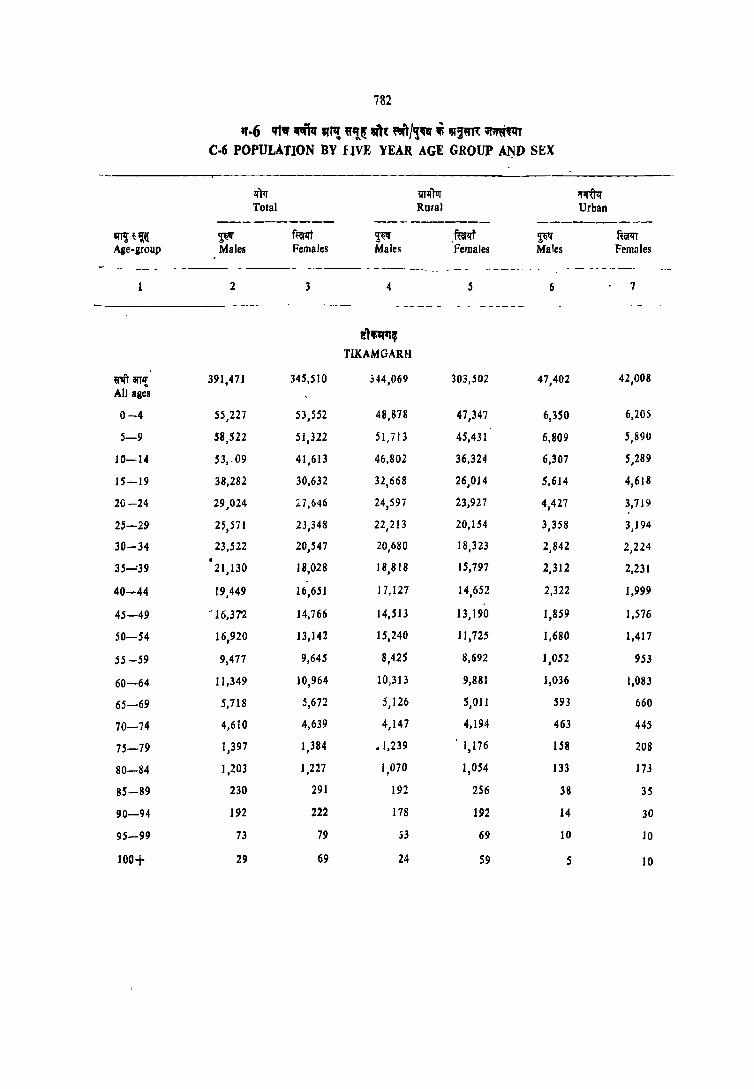
782
"-6 iii" ~ "Pi ~'i~ 'flt "",,- i ~'~1,{ ;nn:i~ C-6 POPULATION BY fIVE YEAR AGE GROtJP A~D SEX
m~~,~ Age-group
~ Males
lfFr TOlal
Females ~~ Males
il'~Tur Rural
--- ------- - ---- -_-__ - - -----_ --
~ arrl1 All ag;s
0-4
5-9
10-14
15-19
20-24
25-29
30-34
35-'39
40-44
45-49
SO-54
55 -59
60-64
65-69
70-74
75-79
80-84
85-89
90-94
95-99
100+
2
391,471
•
55,227
38,522
53, ,09
38,282
29,024
2~,S71
23,522
21,130
19,449
-16,37"2
16,920
9,477
11,349
5,718
4,610
1,397
1,203
230
192
73
29
3
345,510
53,552
51,322
41,613
30,632
:<7,646
23,348
20,547
18,028
16,651
14,766
13,142
9,645
10,964
5,672
4,639
1,384
1,227
291
222
79
69
4
!If.1l''', TIKAMGARH
344,069
48,878
51,713
46,802
32,668
24,597
22,213
20,680
18,818
17,127
14,513
15,240
8,425
10,313
5,126
4,147
.1,239
1,070
192
178
24
fuflli Females
s
303,502
47,347
45,431
36,324
26,014
23,927
20,154
18,323
15,797
14,652
13,190
11,725
8,692
9,881
5,011
4,194
, 1,176
1,054
256
192
69
59
~ Males
6
47,402
6,350
6,809
6,307
5,614
4,427
3,358
2,842
2,312
2,322
1,859
1,680
1,052
1,036
593
463
158
133
38
14
10
s
;:rtrtl'lf Urban
Fem~les
7
42,008
6,205
5,89U
S,289
4,618
3,719
3,194
2,224
2,231
1,999
1,576
1,417
953
1,083
660
445
208
173
35
30
10
10

783
1T·6 qf~ ~!If,! a~( m~ , .. 1/'1''' ~ ",!9Tt iif.r C·6 POPULA liON BY FIVE YEAR AGE GROUP AND SEX
lim ITfliTqr ifllUll .
10tal Rural Urban ----------- ----------- ----------
aryl! 81l~ ~qTf ffil<fr !!liIf furlli ~. ~~1It Age-group Males F.:males Males Females Males Females
--.- ----_ - ---- - -- _- _- --- - -------- ----_- - ----_ 2 3 4 5 6 7
--- ----------- ... -----_-- _------------- - --_--
9~H!t
CHHAIARPUR
~~ 475,662 410,998 401,189 347,390 74,473 63,608
All ages
0-4 65,562 64,097 55,786 54,562 9,776 9,535
5-9 70,945 61,417 60,673 52,120 10,272 9,297
10-14 64,823 49,553 54,986 41,460 9,837 8,093
15-19 43,850 33,357 35,440 27,465 8,410 5,892
20-24 34,056 31,158 27,042 25,808 7,014 5,350
25-29 30,360 27,277 25,243 22,519 5,117 4,759
30-34 27,392 24,180 22,957 20,508 4,435 3,6~~
35--39 24,714 22,93S 20,774 19,266 . 4,000 3,668
40-44 2S,~11 21,541 21,566 18,468 3,111 3,079
45-49 21,311 18,651 18,101 15,967 3,2.10 2,685
50-54 22,175 15,475 19,467 13,507 2,708 1,968
55-59 11,481 11,164 9,913 9,683 1,568 1,481
60-64 15,334 13,099 13,592 11,470 1,742 1,630
65-69 6,979 6,699 6,092 5,802 887 897
70-74 6,525 5,961 5,595 5,141 931 821
75-79 2,081 1,919 1,726 1,599 3$5 321
80-84 1,843 1,781 1,486 I,SI5 357 265
8S-89 474 307 379 225 96 82
90-94 204 241 184 184 20 63
95-99 71 60 6S 45 10 IS
10Q+ 55 62 SO 46 5 16
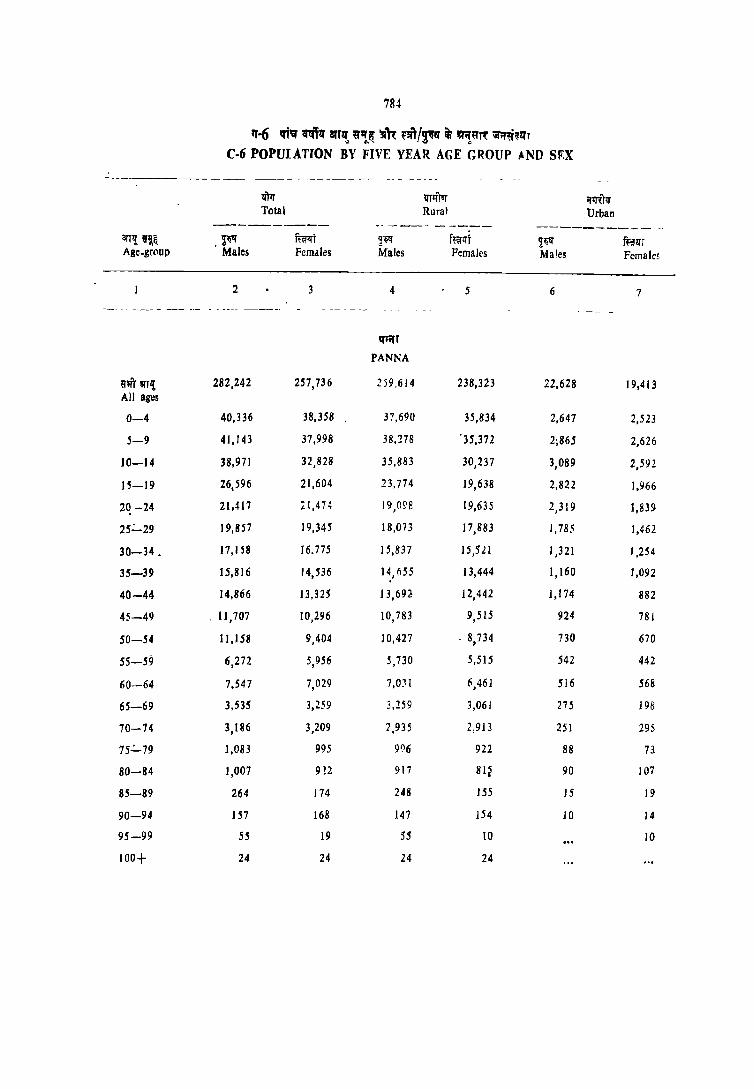
784
1T-6 "'''' <r,,1~ iIT'~ ~'!~ '3llt 'f~'/'jtfl iti "1~~ iit.!'9lrZi'T
C-6 POPULATION BY FIVE YEAR AGE GROUP AND SV.X
---- .--_- -_-----_--- -- - -----
l111r ~TIf"tur ;r;n:r!f Total Rural Urban
----------- ..... ---- ----- ---------- - .-arT,! 9'~~ .Ff ftwli 'Wl" f~;;Il:rt ~~ ff;!!IT Age-group Males Females Males Females Males Females
2 3 4 5 6 7 -- _-- -_- - ----- _---- - -- - --_
q;ifT
PANNA
ij"'!T 'fTI! 282,242 257,736 259,614 238,323 22,628 19,413 All ages
0-4 40,336 38,358 37,690 35,834 2,647 2,523
5-9 41,143 37,998 38,278 '35,372 2~86j 2,626
10-14 38,971 32,828 35,883 30,237 3,089 2,592
15-19 26,596 21,604 23,774 19,638 2,822 1,966
20 -24 21,417 LI,4H 19,098 19,635 2,319 1,839
25':_29 19,857 19,345 18,073 J7,883 l,785 1,462
30-34. 17,158 16.775 15,837 15,521 1,321 1,254
35-39 15,816 14,S36 14,655 13,444 1,160 1,092
40-44 14,866 13,325 J 3,69~ 12,442 1,174 882
45-49 . 11,707 10,296 10,783 9,515 924 781
SO-54 11,158 9,404 JO,427 . 8,734 730 670
55-59 6,272 5,956 5,730 5,515 542 442
60-64 7,547 7,029 ?,OJI 6,461 516 568
65-69 3,535 3,259 3,259 3,061 275 198
70-74 3,186 3,209 2,935 2,913 251 295
75":"'79 1,083 995 9~6 922 88 71
80-84 1,007 9 !2 917 81~ 90 107
85-89 264 174 248 155 J5 19
90-94 J57 168 J47 154 10 14
95-99 55 19 55 to 10
lOOt 24 24 24 24

785
'1-6 qt. Cfl!llq a:r'P! ~~ v'll ,.j/~ $ 8li!8" iif;rmT
C·6 POPULATION BY F)\ F \'EAR AGE GROUP AND SEX
;.ftIr ll'Tl1TUJ' ~<rU!f TOlal Rural Urban
---_-------- --------- ---- -----------m~~ '!~ ~ ~ ft~ 2;li~ fi~ Age-group Males Females Males Females Males Females
2 3 4 5 6 7
---_
"""~ SAGAR
ij'l!\' aJTlI 69 9,570 623,562 502,553 451,974 197,017 171,588 All ag~s
0-4 102,125 96,022 77.488 72,585 24,637 23,437
5-9 96,443 89.441 72,431 66,049 24,012 23,392
10-14 95,122 78,572 68,013 54,978 27,109 23.594
15-19 70,781 58,617 47,964 39,960 22,816 18,656
20-24 63,907 57,578 42,032 40,716 21,875 16,802
25-29 50,538 42,134 35,277 30,134 15,261 12,000
30-34 39,864 35,878 28,088 26,089 11,776 9,789
35-39 35,440 32,511 24,965 23,112 10,476 9,399
40-44 33,054 29,528 23,258 21,633 9,796 7,895
45-49 28,051 24,408 20,005 17,497 8,046 6,912
50-54 25,316 21,847 18,179 16,257 7,197 5,590
55-59 15,933 15,215 11,798 11,442 4,134 3,774
60-64 18,1 SO 17,159 13,791 13,043 4,359 4,116
65-69 9,369 9,169 7,325 6,931 2,045 2,238
70-74 8,337 8,252 6,532 6,258 1,805 1,994
75 -79 3,054 2,867 2.315 2,067 739 800
SO-84 2,468 2,745 1,920 1,966 548 779
85-89 617 597 478 473 139 124
90-94 572 515 456 357 116 158
95-99 170 208 97 149 73 59
100+ 74 241 54 193 20 48

786
'(-6 1ft .. ~""' ~r,! "'!~ ~ ,=sit/~~ iii 3Ti"Tt ~~~ C-6 POPULAlION BY FIVE YEAR AGE GROUP AND SEX
Iit:r IrtliA ;;IRTIf Total Rural UrblD ---------- ----------- -----------
arJ11~ ~ ftqllt ~ tmi ~ fttllt Age-group Males Females Males Females Males Females
2 3 4 5 6 1
~,
DAMOH
«tit '"I 374,684- 346,769 319,768 297,660 54,916 49,109 All ages
0-4 SS,S77 52,354 48,39'; 45,621 7,182 6,734
5-9 53,969 50,514 47,049 43,993 6,920 6,521
10-14 52,609 43,034 44,946 36,328 7,663 6,706
15-19 35,895 31,81 I 29,669 26,512 6,226 5,238
20-24 31,490 31,206 25,808 26,336 5,682 4,870
25-29 26,817 23,6 PI 22,528 20,167 4,289 3,451
30-34 21,396 20,866 I B,I97 18,117 3,200 2,749
35-39 20,310 18,479 17.330 15,683 2,980 2,796
40-44 17,853 17,020 15,209 14,728 2,644 2,292
45-49 15,202 13,873 12,844 11,974 2,358 1,899
SO-54 14,277 12,193 12,378 10,584 1,899 1,609
55-59 8,023 8,37 I 6,868 7,271 1,155 1,100
60-64 9,359 9,214 8,266 7,892 1,093 1,322
65-69 4,745 5,281 4,051 4,616 695 665
70-74 3,871 4,899 3,378 4,304 493 595
75-79 1,488 1,640 1,266 1,414 222 226
80-84 1,098 1,598 987 1,391 111 207
85-89 246 306 217 258 29 48
90-94 231 256 189 203 42 53
95-99 74 83 69 69 5 14
100+ 34 69 25 64 9 S

iITl! ~ Age.group
------ _- ~ - --
«'1fT "'1 All ages
0-4
5-9
10-14
15-19
20-24
25-29
30-34
35-39
40-44
45-49
50-54
55-59
60-64
65-69
70-74
75-79
80-84
85-89
90-94
95-99
100+
787
"6 qN "qlQ' .r~ ~~ ..n '''J(r/~ff $ ."!~1\ ijf~'Q'T (-6 POPULATION BY FIVE YEAR AGE GaOUp AND SEX
-- - - - ---------- ----- ---- ---------------- - ----_---- ------
~~ Males
-- ~-
2
595,753
80,639
86,302
83,118
59,687
44,765
40,427
34,808
34,045
31,130
26,681
22,749
13,5 13
l6,044
8,402
7,691
2,658
1,876
491
378
60
75
If)1r Total
~l:{t Females
-------- - --
3
557,634
78,612
80,532
72,816
51,083
46,309
39,236
35,594
32,206
29,383
23,770
19,349
12,704
15,805
7,827
7,197
2,233
2,028
365
336
70
46
m,,-''tur if1Tm ~ml U~~
~~ f~trt ~1iq' fi~!Tt Males Femules Males Pemaies
--- --------.----~-
4 S 6 7
9'a-ft
SATNA
494,982 471,668 100,771 85,966
68,176 66,294 12,463 12,319
72,483 68,281 13,819 12,251
69,552 61,686 13,566 11,130
49,264 43,005 10,423 8,078
35,820 38,504 8,946 7,805
32,505 32,415 7,922 6,821
27,808 29,923 7,000 5,671
27,848 27, t 78 6,197 5,028
25,463 24,894 5,667 4,489
22,340 20,432 4,341 3,338
19,279 16,613 3,470 2,735
11,607 11,138 1,906 1,567
13,757 J 3,727 2,287 2,078
7,367 6,858 1,035 970
6,763 6,272 928 925
2,338 1,922 320 311
1,592 1,708 284 320
419 334 73 , 30
332 268 46 68
55 70 5
SO 46 25
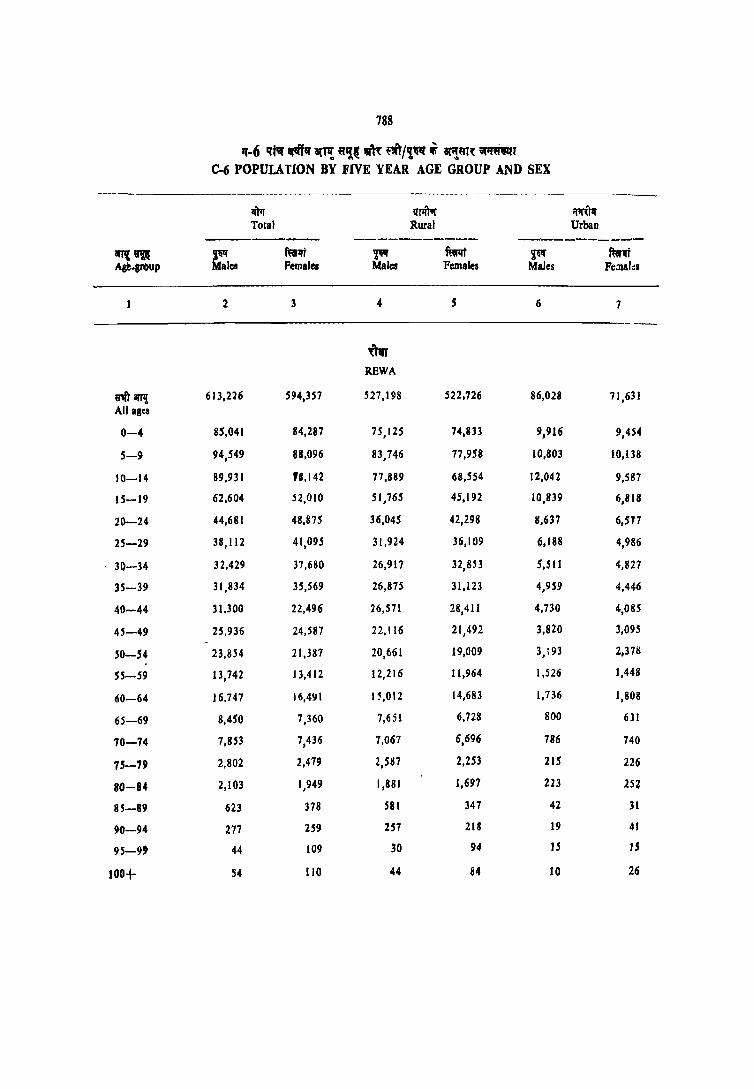
788
11'-6 qf;f~" an,! "'l~ IA'~ dt/'!"..r at,m~ ~{Iq" C-6 POPULATION BY FIVE YEAR AGE GROUP AND SEX
~ v~ II1l'UIf Total Rural Urban
-------- ----------- -----------~~ ~es
f~1It ~ ~ ~W mrllt Age-croup Pemales Males Females Males Fe:nal:1
2 3 4 S 6 7
Uti' REWA
U1lr~ 613,216 594,357 527,198 522,726 86,028 71,631 All ages
0-4 85,041 84,287 75,125 74,833 9,916 9,454
5-9 94,549 88,096 83,746 77,958 10,803 10,138
10-14 89,931 98,142 77,889 68,554 12,042 9,S87
lS-19 62,604 52,010 51,765 45,192 10,839 6,818
20-24 44,681 48,87S 36,045 42,298 8,637 6,517
2S-29 38,112 41,095 31,924 36,109 ~,188 4,986
30-34 32,429 37,680 26,917 32,853 5,511 4,827
35-39 31,834 35,569 26,875 31,123 4,959 4,446
40-44 31,300 22,496 26,571 28,411 4,730 4,08S
45-49 25,936 24,587 22,116 21,492 3,820 3,09S
50-54 23,854 21,387 20,661 19,009 3,193 2,378
55-59 13,742 13,412 12,216 11,964 1,526 1,448
60-64 16,747 16,491 15,012 14,683 1,736 1,808
6S-69 8,450 7,360 7,651 6,728 800 611
70-74 7,853 7,436 7,067 6,696 786 740
75-79 2,802 2,479 2,587 2,253 21S 226
80-84 2,103 1,949 1,881 1,697 223 252
85-89 623 378 581 347 42 J1
90-94 277 259 2S7 218 19 41
95-9' 44 109 30 94 15 15
100+ S4 110 44 84 10 26
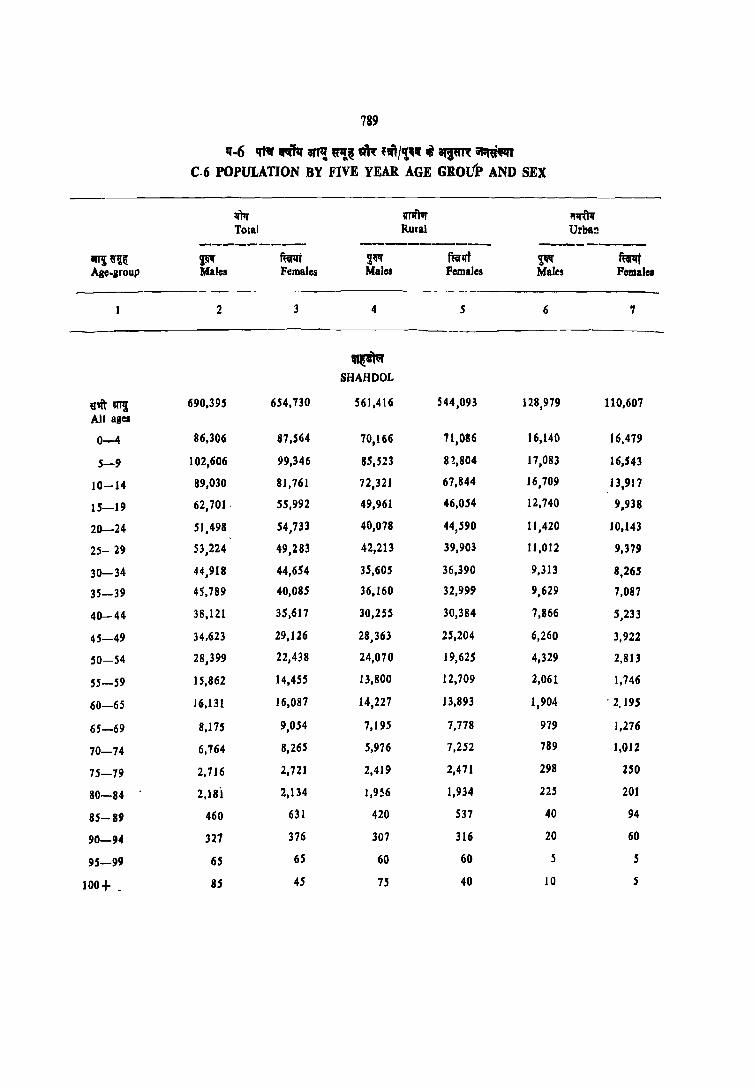
789
q·6 qf;f ",qo .,~ ''1' ""' 'it/'1." .r qm iit.I'~ C.6 POPULATION BY FIVE YEAR AGE GROuP AND SEX
If)1r IfTII'TUT ~q-{R Total Rural Urba!!
--------- ----------- -------.-rJ WllQ: ~ ffir1It ~~ f~qf ~ ft:t~ Age-sroup Males Females Males Females Males Females
2 3 4 5 6 7
~ SHAHDOL
''Ifr~ 690,395 654,730 561,416 544,093 128,979 110,607 All ages
0-4 86,306 87,S64 70,166 71,086 16,140 16,479
5-9 102,606 99,346 85,523 81,804 17,083 16,543
10-14 89,030 81,761 72,321 67,844 16,709 13,917
15-19 62,701, 55,992 49.961 46,054 12,740 9,938
20-24 51,498 54,733 40,078 44,590 11,420 10,143
25- 29 53,224 49,283 42,213 39,903 11,012 9,379
30-34 44,918 44,654 35,605 36,390 9,313 8,265
35-39 45,789 40,085 36,160 32,999 9,629 7,087
40-44 38,121 35,617 30,255 30,384 7,866 5,233
45-49 34,623 29,126 28,363 25,204 6,260 3,922
SO-54 28,399 22,438 24,070 19,625 4,329 2,813
55-59 15,862 14,455 13,800 12,709 2,061 1,746
60-65 16,131 16,087 14,221 13,893 1,904 ' 2.195
65-69 8,175 9,054 7,195 7,778 979 1,276
70-74 6,764 8,265 5,976 7,252 789 1,012
75-79 2,716 2,721 2,419 2,471 298 250
80-84 2,18i 2,134 1,956 1,934 225 201
8S-89 460 631 420 537 40 94
90-94 321 376 307 316 20 60
95-99 65 65 60 60 5 5
100+ _ as 4S 75 40 10 5

790
"·6 ~"lq v"! "''l~ m ~i/~'" i lA"~T\ :;r."t~ C-6 POPULATION BY fIVE \'EAR AGE GROUP AND SEX
~ Males
<rPr 'lT111l1f ~tn:'hr Total RUlal Urban
f~11'T Females
~~ Males
RiiI'll't Females
~tr Male~
------- _-- - - ------ - - - -- - - - - - - - - -- ----
2 3 5 6 - ---------- --- -
~~i SlDHI
~llr ~ 507,729 482,738 496,418 474,395 11,311 All-ages
0-4 67,672 70,158 66,389 68,850 1,283
5-9 80,720 79,946 79,~89 78,S 14 1,432
10-14 69,661 63,751 68,361 62,540 1,300
15-19 48,436 40,550 46,605 39,770 1,830
2(1-24 36,929 :8,005 35,7-15 37,:!32 1,183
25-29 36,017 34,081 35,100 33,419 917
30-34 30,931 32,32.9 30,121 31,784 810
35-39 30,055 27,550 29,272 27,096 782
40-44 25,862 24,564 25,295 24,188 566
45-49 21,351 18,613 20,952 18,387 399
50-54 19,481 15,538 19,092 15,412 388
55-59 ]0,143 9,153 10,025 9,047 118
60-64 ] 2,816 12,249 12,69~ 12,085 124
65 -69 5.686 5,541 5,626 : ,481 61
70-74 6,202 5,678 6,158 5,632 44
75-79 2,210 2,091 2,177 2,072 33
80-84 2, I ~9 2,017 2,122 1,973 17
85-89 599 332 589 l32 9
90-94 346 277 346 n7
95-99 ]55 95 150 95 5
100+ 8S 66 80 61 5
7
8,343
1,308
1,433
:,211
780
773
662
545
454
376
226
126
106
164
59
.)7
19
44
5

791
'1-6 qi:q "~ atTt! ~~~ at~ ~"1/~.1!( ~ it~~n \1("~~T C·6 POPULATION BY FIVE YEAR AGE GROUP AND SEX
- .----~---- ------- -- -----_-_. -_ ..
!IFr ~UJ 'fII'\TlI' Total Rural Urban
---------- ----------- ---------_ ~~~ ~~" ~ ~ tmr ~ furqt
Age-group Males Females Males Females Males Females
2 3 4 5 6 7
q'~"ll MANDSAUR
~ IfTll 651,011 612,388 517,482 489,991 133,529 122,397 AI) agC's
0-4 85,492 83,547 69,261 67,761 16,231 1 S,785
5-9 95,225 92,668 77,720 75,144 17,505 17,524
10-14 81,694 75,058 64,548 59,107 17,146 15,951
15-19 62,161 56,459 46,914 42,857 15,247 13,602
20-24 57,859 55,256 43,847 43,262 14,012 11,994
25-29 47,795 45,257 37,496 36,124 10,299 9,133
30-34 40,150 37,988 31,849 31,146 8,301 6,842
35-39 36,390 34,581 29,509 27,916 6,881 6,665
40-44 34,247 30,194 27,61 Z 24,391 6,635 5,803
45-49 27,167 24,589 21,440 19,623 S,727 4,965
50-54 25,055 20,877 20,264 17,084 4,7!H 3,79J
55-59 J 4,129 14,106 11,225 11,583 2,904 2,523
60-64 17,895 16,857 14,889 13,863 3,006 2,994
65-69 10,025 9,468 8,157 7,746 1,868 1,723
70-74 8,389 8,156 6,934 6,697 1,455 1,459
75-79 ],763 3,477 3,082 2,80S 681 671
80-84 2,321 2,294 1,845 1,756 476 531
85-89 484 6SS 335 487 149 168
90-94 423 519 318 404 105 115
95-99 84 130 49 90 35 40
100+ 64 124 45 81 19 43
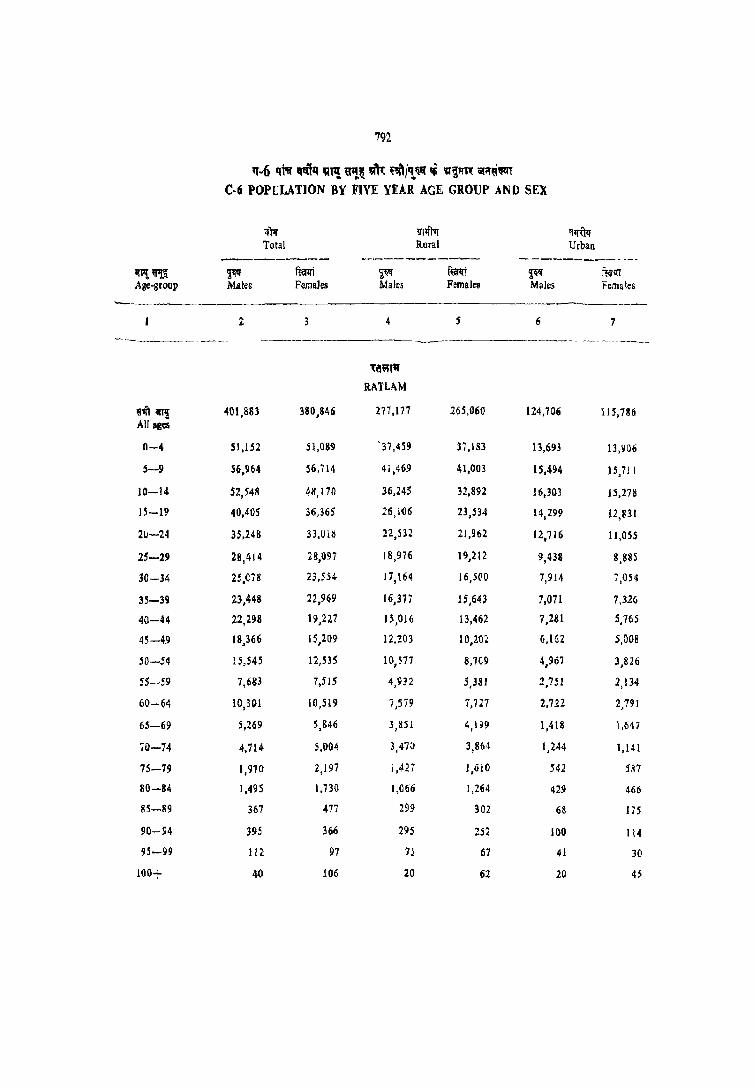
792
'1-6 qr. 'Itft~ ~l1! ~~ dR ~f'~. V~'lR iI~~@In C-Ii POPULATION BY FIVE YEAR AGE GROUP AND SEX
1l'1l1' !lIIlI'l1 i'l1[UIf Total Rural Urban
--------- ----------- -----------~
~~ ~ ~ ~ ftau ~" ft«!IT Age-group Males Females Males Females Males Females
Z 4 S 6 7
'tt'l,"1l
RATLAM
rit IITlJ 401,883 380,846 277,177 265,060 t24,706 11),186 All ales
0-4 51,152 51,089 '37,459 37,183 ll,693 13,906
5-9 56,964 56,714 41,469 41,003 15,494 15,7 J I
10-14 52,548 48,170 36,24S 32,892 J6,303 1),2711
lS-19 40,405 36,365 26,1()6 23,534 14,299 12,831
211-24 35,248 33,OIll 22,532 21,962 12,716 11,055
25-29 28,414 28,097 18,916 19,212 9,438 8,885
30-J4 25,o()j8 23,554 11,164 16,500 7,914 7,054
35-39 23,448 22,969 16,377 15,643 1,071 1,326
40-44 22,:m 19,227 15,016 13,462 7,281 5,765
45-49 18,366 15,209 12,203 10,201 6,162 5,008
SO-54 15,545 12,535 10,577 8,109 4,967 3,826
55-59 7,683 7,515 4,932 5,381 2,751 2,134
60-64 10,301 10,519 7,579 7,127 2,712 2,791
65-69 5,269 \S46 3,851 4,199 1,418 1,647
70-74 4,714- 5,004 3,470 3,864 1,244 1,141
75-79 1,970 2,197 j ,427 1,610 542 587
80-84 1,495 1,730 1,066 J ,264 429 466
S5-89 367 477 299 302 68 175
90-94 :195 366 295 252 100 114
95-99 112 97 1l 67 41 30
lOOt 40 106 20 62 20 4S

793
'1-6 111. ~lq 'AT,! ,,_~ !R'~ ''JIj/,!~lII' Ii 3{~m iitrf,,~, C-6 POPULATION BY FIVE YEAR AGE GROUP AND SEX
q)1r 'lT1{1VI "'~~ q Total Rural Urban -----_. __ -------...!.----- ------_--
arr~ ijlI~ ~ f~1Jj ~" f~l:It ~ mrlli ABe-group Males Females Males Females Males Females
- __ .. .---- - - - ---- -- ------ --- --- ---_--_ --- - ------
2 3 4 5 6 7
- -----_ --- - --------- --- . ------_ ----------------- -------- ---
~;j~ UJJAIN
W4'T an,! 579,850 537,152 359,752 338,578 220,098 198,574 All ages
0-4 72,246 73,58J 46,897 48,396 25,350 25,185
5-9 81,251 76,399 53,387 49,945 27,865 26,453
10-14 77,039 68,651 43,871 42,373 28,167 26,277
15-19 56,663 50,048 33,015 28,700 23,648 2 I ,348
20-24 51,788 46,843 28,406 27,246 23,383 19,598
25-29 42,778 39,545 25,167 23,523 17,610 16,022
30-34 36,364 33,058 21,904 20,9 12 14,461 12,147
35-39 32,508 30,547 19,985 19,096 12,523 11,450
40-44 30,647 26,317 19,188 16,580 11,458 9,737
45-49 23,799 20,957 14,589 ]3,511 9,210 7,446
50-54 23,141 19,213 14,747 12,818 8,394 6,395
55-59 11,868 11,014 7,166 7,220 4,703 3,795
60-64 16,572 16,180 11,117 10,990 5,455 5,190
65-69 7,946 7,876 5,036 5,374 2,909 2,502
70-74 7,667 8,568 5,278 6,088 2,389 2,480
75-79 3,056 3,116 2,117 2,204 939 912
80-84 2,764 3,114 1,837 2,309 927 804
85-89 732 759 451 503 280 256
90-94 524 693 342 431 182 262
95-99 114 224 74 167 41 57
10~+ 104 235 74 107 30 128

794
'1-6 1fi;;r ~ ~''! ~I!~ srlt ~/~_ ri Ill~ iiI';J~~ C-6 POPULATION BY FIVE YEAR AGE GROUP AND SEX
--- -----"-------_._-If);r mill)' ~trUlf Total Rural Urban ---------- --------- -------,--
'"J{~ F' fliWrt ~ ft~ ~ fum Age-group Males Females Males Females Males F~Jnales
2 3 4 5 6 7
----~--------
",·lJt SHAJAPUR
~m~ 435,517 404,730 All ages
369,984 345,495 65,533 59,235
0-4 56,822 55,805 48,628 47,525 8,]93 8,180 5-9 62,880 58,976 53,936 50,823 8,944 8,153
10-14 59,703 4Q,913 50,643 42,181 9,060 7,732 15-19 39,434 34,248 32,098 28,333 7,336 5,9J5 20-24 34,027 32,743 27,879 27,345 6,148 5,399 25-29 29,030 28,025 24,436 23,616 4,.594 4,409 30-34 26,302 25,483 22,269 21,848 4,034 3,634
35-39 24,437 22,930 20,848 19,620 3,589 3,311 40-44 23,170 20,117 19,868 17,311 3,301 2,806
45-49 17,754 16,391 15,168 14,136 2,586 2,254
SO-54 17,108 15,204 14,663 13,358 2,445 1,846
55- 59 9,716 9,6114 8,443 8,469 1,272 1,215 60-64 13,426 12,882 11,931 11,307 1,489 1,57.5
65-69 6,748 7,108 5,851 6,238 897 930
70-74 7,196 7,274 6,430 6,373 766 901
75-79 3,258 3,366 2,979 2,976 279 390
80-84 2,914 2,984 2,544 2,678 369 306
85-&9 694 662 598 610 96 52
90-94 553 524 495 449 5& 75
95-99 112 12J 87 99 24 24
100+ 122 144 112 139 10 S
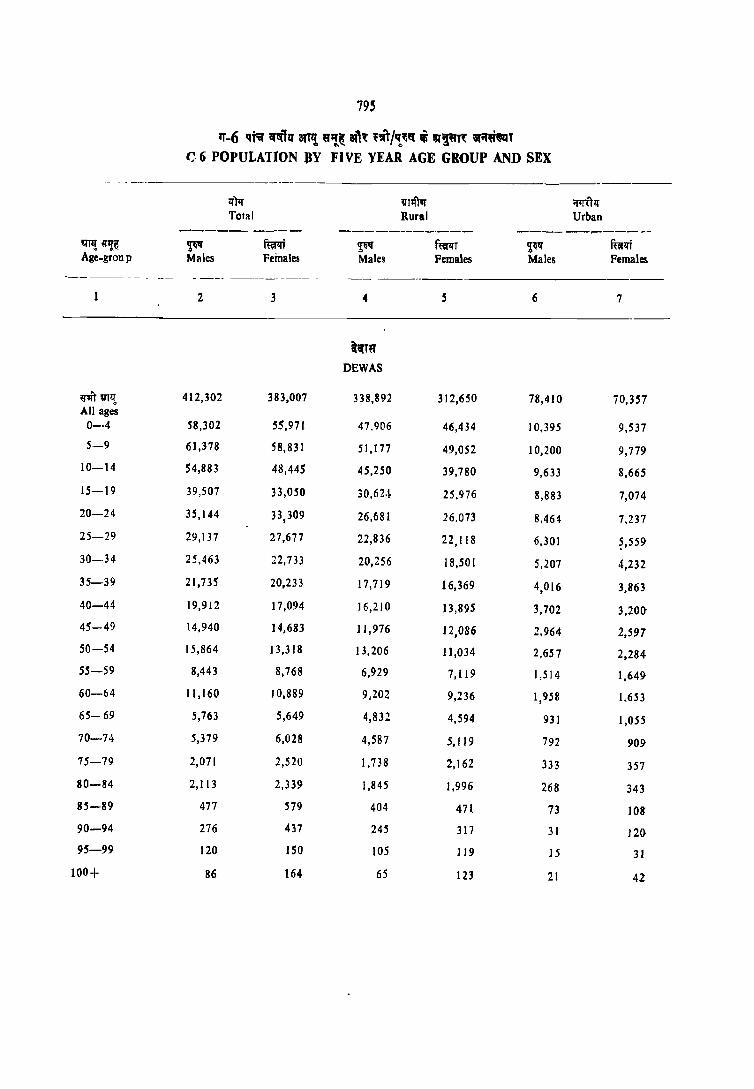
795
'1'-6 qi'q crtihr at"! "1!.~ at'" '~T/,!~q Ii ~~ iiI"~,",r C. 6 POPULATION BY FIVE YEAR AGE GROUP AND SEX
-- - - ----- ------------<[TIT ~1'lft1lf ;:rif,{T<[ Totlll Rural Urban
--------- ------------- -------__ ----'lIl! ~'!~ ~ m ~ ~T ~w ~1li Age-group Males Females Males Females Males Females
~-------- - - ---- ------- ----- - -----------
2 3 4 S 6 7
~cmr
DEWAS
rn mIL 412,302 383,007 338,892 312,650 78,410 70,357 All ages 0-·4 58,302 55,971 47,906 46,434 10,395 9,537
5-9 61,378 58,831 51,177 49,052 10,200 9,779 ]0-14 54,883 48,445 45,250 39,780 9,633 8,665
15-19 39,507 33,050 30,62.t. 25.976 8,883 7,074
20-24 35,144 33,309 26,681 26.073 8,464 7.237
25-29 29,137 27,677 22,836 22,118 6,301 ~,559
30-34 25,463 22,733 20,256 18,50 I 5,207 4,232
35-39 21,735 20,233 17,719 16,369 4,016 3,863
40-44 19,912 17,094 16,210 ]3,895 3,702 3,200
45-49 14,940 ] 4,683 ] 1,976 12,086 2,964 2,597 50-54 15,864 13,318 13,206 1 ],034 2,657 2,284
55-59 8,443 8,768 6,929 7,119 1,514 1,649
60-64 11,160 10,889 9,202 9,236 1,958 1.653
65- 69 5,763 5,649 4,832 4,594 931 ],055
70-74 5,379 6,028 4,587 5,119 792 909
75-79 2,071 2,520 1.738 2,162 333 357
80-84 2,113 2,339 1,845 1,996 268 343
85-89 477 579 404 471 73 108
90-94 276 437 245 3]7 31 121}
95-99 120 ]50 lOS 119 15 3J
100+ 86 164 65 123 21 42

796
11·6 If'" ~ .,~ ~(aitl '~/~ ~ i51!mt iifiI~~ C·6 POPULATION BY FIVE YEAR AGE GROUP AND SEX
lIlif wrt'f '1lR'Tlr Tolal Rural Urbaa
-------- -------- ---------1ITt$ ~ fmt ~ la'qi S~ fmf Age-sroup Males Female. Males Pemales Males .t'emllies
2 3 4 5 6 1
~I!q,
.fH"'BUA
~arJi 400,550 394,618 365,555 363,356 34,995 31,262
All ages 0-4 61,277 63,051 57,302 58,697 3,975 4,354
5-9 64,217 63,520 59,915 59,141 4,302 4,379
10-14 54,2H 51,165 50,086 47,311 4,188 3,854
15-19 36,763 35,977 32,075 32,587 4,689 3,390
20-24 29,187 31,120 25,215 27,986 3,972 3,134
25-29 26,992 27,683 24,075 25,11.5 2,918 2,568
30-34 24,643 23,184 22,229 21,401 2,415 1,784
35-39 22,029 22,174 20,019 20,473 2,011 1.702
40-44 21,292 18,201 19,541 16,819 1,750 1,388
4'5-4-9 16,801 16,236 15,3 S 1 15,010 1,453 1,226
~O-54 15,509 12,332 14,383 11,347 1,126 985
55-59 8,152 8,876 7,517 8,261 635 615
60-64 9,650 9,997 9,003 9,294 648 703
65 -69 4,170 4,480 3,771 4,030 398 450
10-74 3,055 3,640 2,807 3,290 247 ]sO
75-79 961 1,219 838 1,079 122 140
80-84 1,019 1,198 915 1,070 lOS 128
85-89 205 191 186 160 19 31
90-114 169 171 160 141 9 31
95-99 39 66 35 55 5 10
100+ 64 50 60 40 4 10
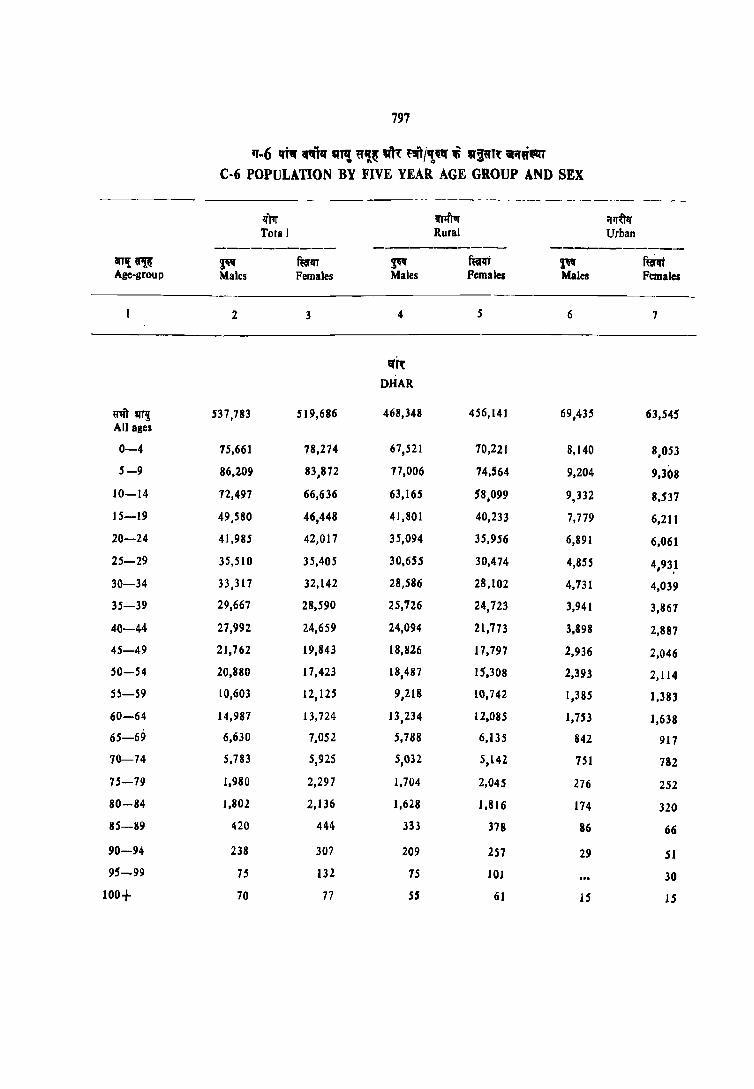
797
11'·6 Ift'l' "111 $["i ~'!~ ~ '1Jit/'t~ ~ a~~'t ~fi~ C-6 POPULATION BY FIVE YEAR AGE GROUP AND SEX
---- -- ----- - ---_ .. ---.-- -- -- --------- ~---
If)1f ifll')"vr l'IlfU!f Tota I Rural Urban
---------- ----------- ----------1IT'f~ ~ furlrr ~ ffiro ~ ~ Age-group Males Females Males Pemales Males Females
--~
2 3 4 5 6 7
'fA: DHAR
~m~ 537,783 519,686 468,348 456,141 69,435 63,54s All ages
0-4 75,661 78,274 67,521 70,221 8,140 8,053
5-9 86,W9 83,872 17,006 74,564 9,204 9,108
10-14 12,497 66,636 63,165 s8,099 9,332 8,537
15-19 49,580 46,448 41,801 40,233 7,779 6,21t
20-24 41,985 42,017 35,094 35,956 6,891 6,061
25-29 35,510 35,405 30,655 30,474 4,855 4,93,1
30-34 33,317 32,142 28,586 28,102 4,731 4,039
35-39 29,667 28,590 25,726 24,723 3,941 3,867
40-44 27,992 24,659 24,094 2.1,773 3,898 2,887
45-49 21,762 19,843 18,826 17,797 2,936 2,046
SO-54 20,880 17,423 18,487 15,308 2,393 2,114
55-59 10,603 12,125 9,218 10,742 1,385 1,383
60-64 J 4,987 13,724 13,234 12,085 1,753 1,638
65-69 6,630 7,052 5,788 6,135 842 917
70-74 5,783 5,925 5,032 5,l42 751 782
75-79 1,980 2,297 1,704 2,045 276 252
80-84 1,801 2,136 1,628 J ,816 174 320
85-89 420 444 333 378 86 66
90-94 238 307 209 257 29 51
95-99 75 132 75 101 30
100+ 70 77 S5 61 15 IS

798
"-6 1ft"" ~1q atT!! W'f~ at~ ''''/'!'f$'t( " ot~"'t 1ir.f"~T C·6 POPULATION BY FIVE YEAR AGE GROUP Al"'D SEX
zmr IITIITIlT iflf1:Tlf Total Rural Urban
---------- ---_, ------_ ------------arT1l ~ ~~ mm Ti" ftiillT ~ fierlfT Ag~-group Males Females Males Females Males Femalr~
.- --_--_-- --- -_--_- -- - --- ------ ----------
2 3 4 5 6 7 - --- -- -----.--
{~~~
INDORE
Ii'iT arT! 742,459 667,014 148,783 231,262 493,676 435,752 All ages
0-4 87,453 88,678 33,852 33,299 53,601 55,379
5-9 93,853 90,909 35,497 34,471 58,356 56,438
10-14 91,977 81,167 38,721 28,345 58,257 52,823
15-19 80,12 [ 66.254 25,017 19,834 55,104 46,420
20-24 76,969 07,565 2 [,1)52 20,337 55,917 47,228
25-29 61,115 54,759 18,256 16,621 42,859 38,139
30-34 50,150 41.074 14,989 13,804 35,161 27,270
35-39 42,753 36,483 13,205 12,500 29,548 23,983
40-44 36,680 31,560 12,218 11,325 24,462 20,235
45-49 31,007 27,546 9,784 9,479 21,222 18,068
50-54 28,640 22,856 9,960 8,502 18,679 14,355
55-59 16,906 14,319 5,177 5,026 11,729 9,294
60-64 18,534 17,535 6,400 7,189 12,134 10,346
65-69 9,351 8,944 3,417 3,473 5,933 5,471
70-74 8,747 8,779 3,417 3,784 5,329 4,995
75-79 3,225 2,838 1, I 57 1,110 2,069 1,727
80-84 2,651 2,984 958 I,H4 1,666 1,610
85-89 814 820 307 :'52 507 568
90-94 454 779 164 :!89 290 490
95-99 149 160 44 55 105 106
100+ 103 334 39 115 64 219
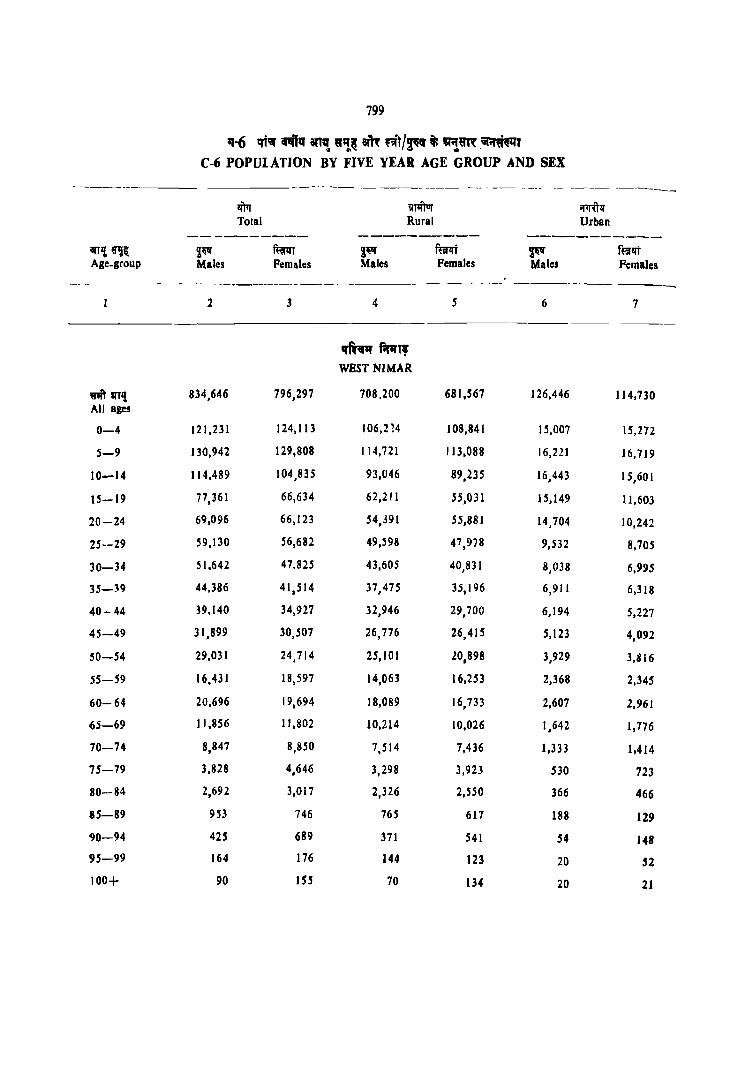
799
11-6 qf;f Cfl'{lq an, ,,'!,~ at'll ,'it/~1f it "'lUR oii(';fi~' C-6 POPULATION BY FIVE YEAR AGE GROUP AND SEX
.~----_- ---- ------------ _·· ____ o_ -- ------ -----_ Ifm iTIftvr ij1T\TlT Total Rural Urban
---------- ---------- -----------anI! ~~ ~ ~T S~ flro S~ ffi"1IT Age_group Males Females Males Females Males Females
0_ --- .... _--------- ----- ___ 0 ___ -
2 .J 4 5 6 7
-_--
"ft~ fipr" WEST NIMAR
m~,! 834,646 796,297 708.200 681,567 126,446 114,730 All ages
0-4 12 I ,231 124,113 I 06,2 ~4 108,841 15,007 15,272
5-9 130,942 129,808 114,721 113,088 16,221 16,719
10-14 114,489 104,835 93,046 89,235 16,443 15,601
15-19 77,361 66,634 62,211 55,031 15,149 11,603
20-24 69,096 66,123 54,391 55,881 14,704 10,242
25--29 59,130 56,682 49,598 47,978 9,532 8,705
30-34 51,642 47.825 43,605 40,831 8,038 6,995
35-39 44,386 41,514 37,475 35,196 6,911 6,318
40-44 39,140 34,927 32,946 29,700 6,194 5,227
45-49 31,899 30,507 26,776 26,415 5,123 4,092
SO-54 29,031 24,714 25,101 lO,898 3,929 3,816
55-59 16,431 18,597 14,063 16,253 2,368 2,345
60-64 20,696 19,694 18,089 16,733 2,607 2,961
65-69 11,856 11,802 10,214 10,026 1,642 1,776
70-74 8,847 8,850 7,514 7,436 1,333 1,414
75-79 3,828 4,646 3,298 3,923 530 723
80-84 2,692 3,017 2,326 2,550 366 466
85-89 953 746 765 617 188 129
90-94 425 689 371 541 54 14B
95-99 164 176 144 123 20 52
100+ 90 ISS 70 134 20 21

SQO
'1-6 qi~.tttl' ill,! ,IU Y.l'l1: ~it/'!\" i 81~"I"£ ~~T C...c; POPULA llON BY FIVE YEAR AGE GROUP AND SEX
-- --------- ------- ----------"~-- ------ ..... _- ------ ---
ll)ll l£11!'M Oill.ilf
Total Rural Urban
-------- ----------- -----------~!!{.~ ~liq ~qt ~!f fm"t ${'1 ~u:i
Age..group Males females Males Females Male~ Females
-- - --- ---- --.-~------ - --.----- ----_-- ---------------- _-_ ---- - - - --
2 3 4 5 6 7
q~ fl'flm .. . EAST NIMAR
~'\" ml{ 594.843, 558.737 434,487 409,891 160,)56 148.844
All ages
0-4 81,969 79.649 61,963 60,448 20,006 19,200
5-9 85,3 16 80,705 64,874 61,336 20,442 19,369
10-14 79,287 71,460 58,268 5).817 21,019 19,643
15-19 58,202 49,197 39,621 33.154 18,581 16,043
2C-24 48.698 ~8,699 32,69; 3~,OOI 16,001 14,697
25-29 43,207 4.(),208 30,996 29,208 12,211 11,000
30-34 36,001 34,106 26,132 24,742 9,869 9,364
35-39 32,527 30,922 23,891 21,900 8,635 9,022
40-44 28,682 26,925 20,,,91 19,485 8,285 7,440
45-49 26.113 23,389 18,854 17,510 7,258 5,879
50-~4 21,967 19,915 16,234 14,Bl3 5,734 5,102
55-59 14,732 14,086 10,956 11 , 110 3,776 2,976
60-64 15,300 14,791 11,729 11,381 3,571 3,409
65-69 9,256 10,094 7,384 7,937 1,872 2,157
70-74 7,019 7,247 5,447 5,573 1,572 ],613
73-79 3,111 3,418 2,427 2,630 684 788
80-84 2,076 2,184 1,598 1,581 478 602
85-89 624 746 452 SS9 172 187
90-94 366 537 282 396 84 141
95-99 118 216 93 149 24 67
100+ 93 108 59 72 34 36
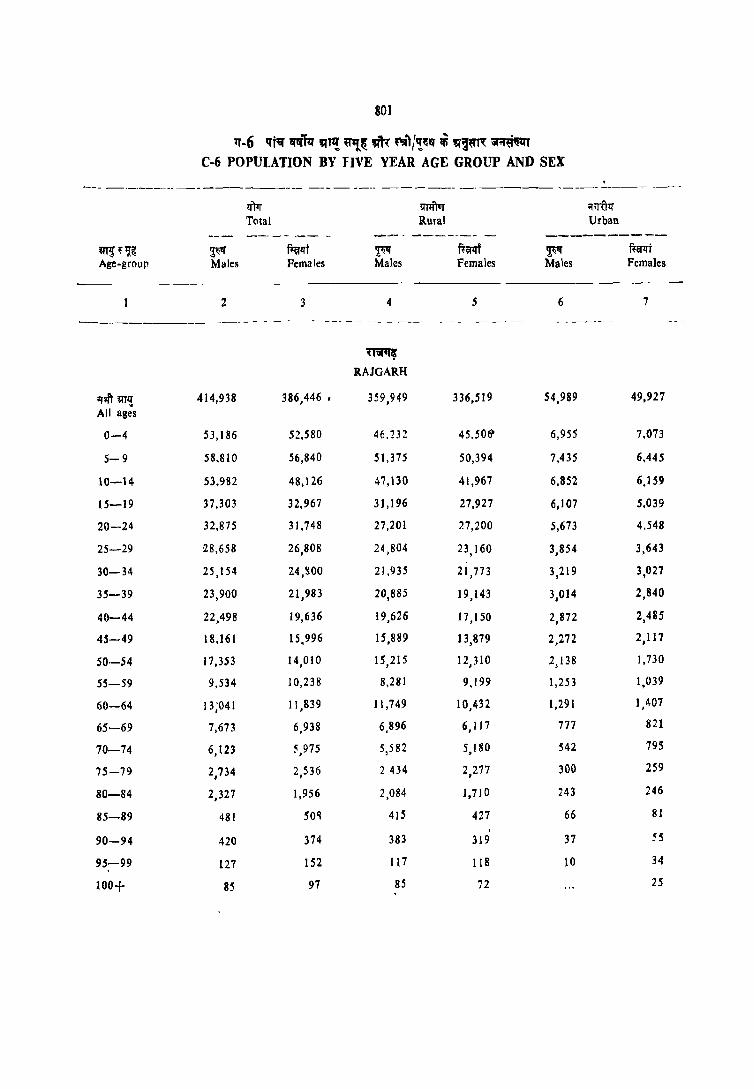
aOl
tT-6 q'jli{ q1!(1~ "T~ ~,,~ "" ~i/~~Q ~ ~~ iiR~~ C-6 POPULATION BV fiVE YEAR AGE GROUP AND SEX
. --_ --.----~------------.--- ------ ------ -~------- ----~-- ~------------ ---lJ)1r lIT1rivr ;;<rUlJ Total Rural Urban --_- -- - --- - ----.. --~-- -.. ----------
q'f~ pr~ ~ ft:ifll't m R~r ~ Ri;flJT Age-group Males Females Males Females Males Females
2 3 4 5 6 7
--._....,------_._---- _- - _- - - - - - - - -- - -__ - - - _- --- _- --- - - ------
~ RAJGARH
qit q'fl! 414,938 386,446 • 359,949 336,519 54,989 49,927
All ages
0-4 53,186 52,580 46.232 45.506- 6,955 7.073
5-9 58,810 56,840 51,375 50,394 7,435 6,445
10-14 53,982 48,126 47,130 41,967 6,852 6,1 59
15-19 37,303 32.967 31,196 27,927 6,107 5,039
20-24 32,875 3J ,748 27,201 27,200 5,673 4.548
25-29 28,658 26,808 24,804 23,160 3,854 3,643
30-34 25,154 24,gOO 2J ,935 21,773 3,219 3,027
35-39 23,900 21,983 20,885 19,143 3,014 2,840
40-44 22,498 19,636 19,626 17,150 2,872 2,485
45-49 18,161 15,996 15,889 13,879 2,272 2,117
50-54 17,353 14,010 15,215 12,310 2,138 1,730
55-59 9,534 10,238 8,281 9,199 1,253 1,039
60-64 13 ;041 11,839 11,749 10,432 1,291 1,407
65-69 7,673 6,938 6,896 6,117 777 821
70-74 6,123 5,975 5,582 5,180 542 795
75-79 2,734 2,536 2434 2,277 300 259
80-84 2,327 1,956 2,084 1,710 243 246
85-89 481 50'1 415 427 66 81 ,
90-94 420 374 383 319 37 55
95-99 127 152 117 118 10 34
100+ 85 97 85 72 25

802
'1'-6 G"R Cf"Tqo aT"! g'!.~ 3Il'{ ''JI'T/'!~ ~ !tijij'T'{ iilOfij"'lT
C6 POPULATION BY Fl VE YEAR AGE GROUP Al\n SEX
----_"_ ------_ ---~ -- - - --- -.--- - -- - -- ----------
ll:Tlf lfl~iur ffil~ Total Rural Urban
----------- ------------- -----------'ITlf. ff~ ~ fum ~ mi ~Qtf ~ Age-group Males Females Males Femah:s Males F .. males
2 3 4 5 6 7
--- -- ----- -------_ ---------- -- ---._---- - ------ - - ---
f1tf-m VlDlSHA
~arr~ 4111,156 366,742 345,243 304,950 7 J ,113 61,792 All ages
o --4 60,399 5~,987 ) 1,100 49,362 9,299 g,6:?5
5-9 62,879 57,943 53,326 49,294 9,553 8,649
10- 14 54 313 42,8Y9 4S,I70 34.874 9,143 8,024
15-19 36,743 30, ~57 :!8,467 24,390 8,276 6,167
20-24 31,680 31,998 25,903 25,861 - 7,777 6,137
25-29 29,336 26,550 2 ... ,145 21,708 5,191 4,1142
30-34 24,870 23,03] 20,456 19,3112 4,414 3,649
35--39 23,556 20,157 19,965 16,886 3,591 3,270
40-44 20,869 17,654 17,875 14,667 2,994 2,9116
45-49 17,443 14,444 14,566 11,884 2,877 2,560
50-54 15,Z 17 I :!,339 1_1,:!O4 10,407 2,613 1,933
55-59 9,571 S,lo7 8,166 6,930 1,405 1,!38
00-64 11,562 9,771 9,990 8,302 1,573 1,469
65-09 5,549 4,584 4,740 3,875 809 709
70-74 4,966 4,4110 4,268 3,698 698 782
75-'9 1,934 1,736 1,630 1,430 304 306
80-84 1,560 1,401 1,260 1,236 300 225
85--89 367 266 300 236 67 31
90--()4 401 313 344 233 57 79
95 -99 124 130 IDS llS 19 15
100+ 44 95 30 80 14 IS
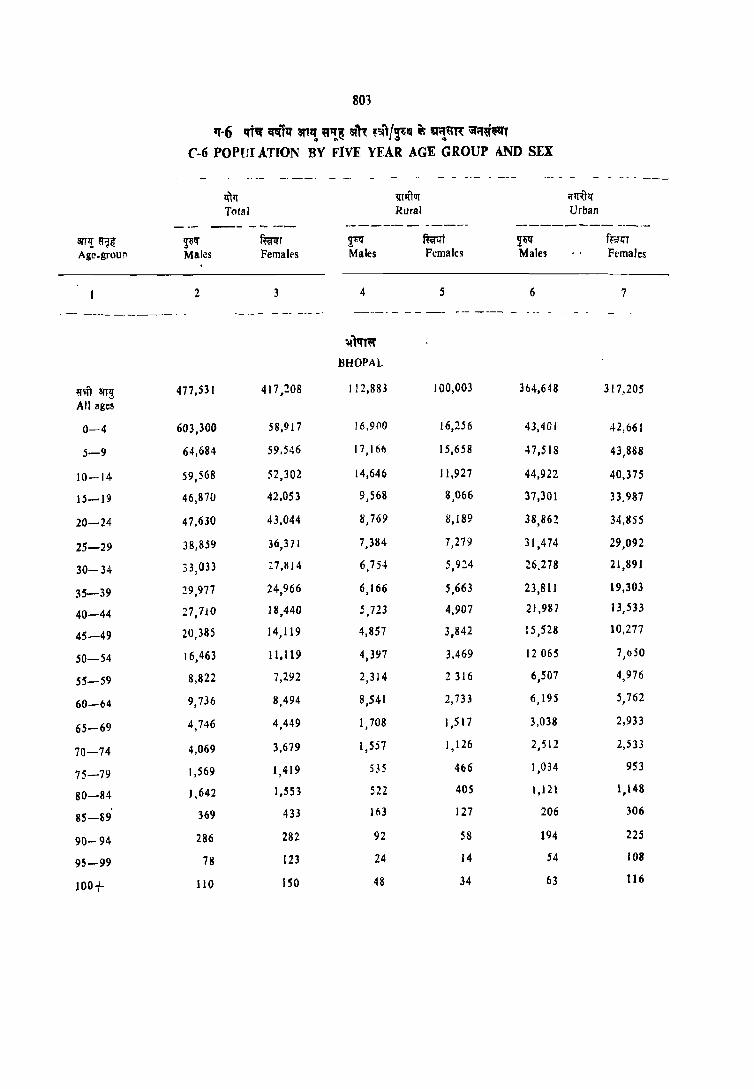
803
q-6 qi,_ ~111 atT~ ~~~ !jill ~;;i/'fi~ " ~i!~ iit.{dl!IlT
('.6 POP(JI ATION BY FIVE YEAR AGE GROUP AND SEX
-_------ - -- - -- - - ---- --- - -----_
lftlT lXTJfTIJ! ;jlT\Tlf
Total Rural Urban --- _. - ..-_ ~------. - ----- -------- --_--
arT,! ~if ~~I!f ~r ~ mrrr 2W f~;:rIH
Age.grour Males Femalrs Males Females Males Females
2 3 4 5 6 7
_--_ - ----------. ----- - -- ------ -- ---- - - - --- --- ---_ -_ --- --
~)If1\11'
BHOPAL
ijm arr~ 477,531 417,208 112,883 100,003 364,648 317,205
All ages
0-4 603,300 58,917 16,9(10 16,256 43,401 42,661
5-9 64,684 59,546 17,166 15,658 47,518 43,888
10-14 59,568 52,302 14,646 11,927 44,922 40,375
15-19 46,870 42,053 9,568 8,066 37,301 B,987
20-24 47,630 43,044 8,769 8,189 38,862 34,~55
25-29 38,859 36,371 7,384 7,279 31,474 29,092
30-34 33,033 ;:7,1114 6,754 5,924 26.2 78 21,891
35-39 29,977 24,966 6,166 5,663 23,811 19,303
40-44 27,710 18,440 ! ,723 4,907 21,987 13,533
45-49 20,385 14,119 4,857 3,842 15,528 10,277
50-54 16,463 11,119 4,397 3,469 12 065 7,uSO
55-59 8,822 7,292 2,314 2 316 6,507 4,976
60-64 9,736 8,494 8,541 2,733 6,195 5,762
65-69 4,746 4,449 1,708 1,517 3,038 2,933
70--74 4,069 3,679 1,557 1,126 2,512 2,533
75-79 1,569 1,419 535 466 1,034 953
80-84 1,642 1,553 522 405 1,121 1,148
85-69 369 433 11i3 127 206 306
90- 94 286 282 92 S8 194 225
95-99 78 123 24 14 S4 108
100+ 110 150 48 34 63 116
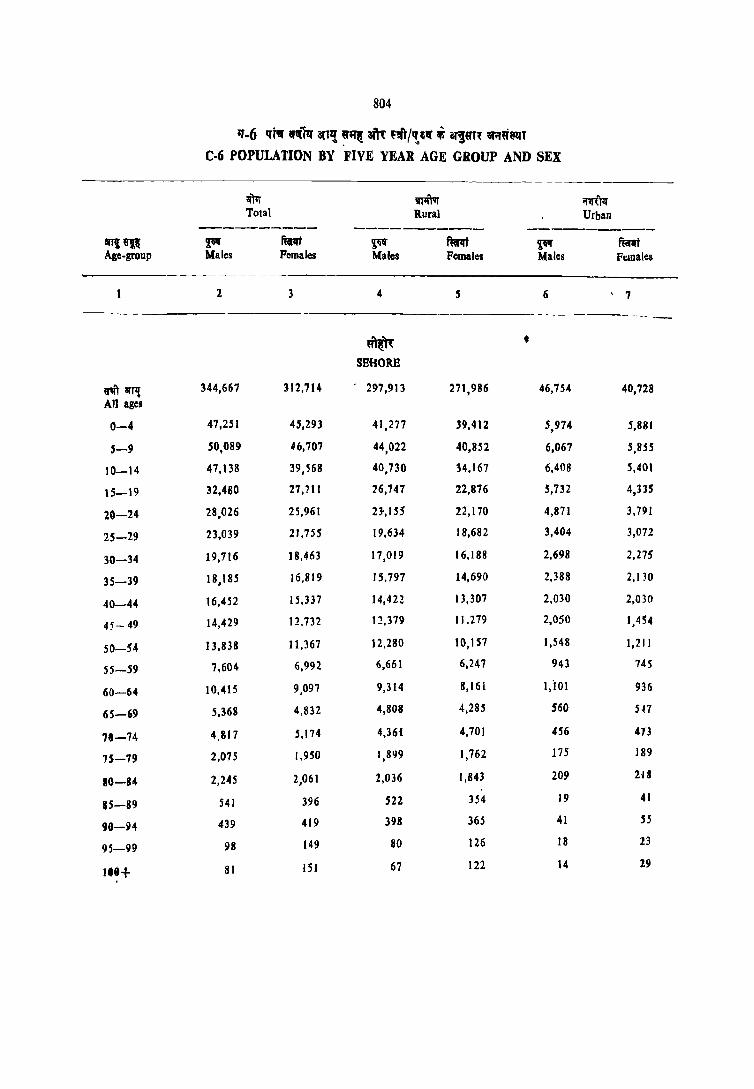
804
11-6 qt;.- If\tlq- an7! ~,,~ at'1't f!lT/,!'I1( ~ iJ~«T,{ w.ni~T C-6 POPULATION BY FIVE YEAR AGE GROUP AND SEX
------------l:l)lr lIl1i"ta! ~,'Pr Total Rural Urban
---------- -----_---- ----------BI1i~ ~ ft«lrt ~ fft1li ~ tmt Age-group Males Females Males Females Males FI:.ldales
2 3 4 5 6 7
-- - ------ ----
'"~ • SEMORB
U1i'I' iltTl! 344,667 312,714 297,913 271,986 46,754 40,728 All ages
0-4 47,251 45,293 41,277 39.412 5,974 5,881
5-9 50,089 46,707 44,022 40,852 6,067 5,855
10-14 47,138 39,568 40,730 34,167 6,408 5,401
15-19 32,480 27,711 26,747 22,876 5,732 4,335
20-24 28,026 25,961 B,IH 22,170 4,871 3,791
25-29 23,039 21,755 19,634 18,682 3,404 3,072
30-34 19,716 18,463 17,019 16,188 2,698 2,275
35-]9 18,185 16,819 15,797 14,690 2,388 2,130
40-44 16,452 15,337 14,422 13,307 2,030 2,030
45- 49 14,429 12,732 12,319 11.219 2,050 1,454
SO-54 13,838 11,367 12,280 10,157 1,548 1,211
55-59 7,604 6,992 6,661 6,247 943 745
60-64 10,415 9.091 9,314 8,161 1,101 936
65-69 5,368 4,8:12 4,808 4,285 560 5H
,.-74 4,817 5,174 4,361 4.701 456 413
15-79 2,075 l,950 ',899 1,762 175 189
8(}-84 2,245 2,061 2,036 1,843 209 211
85-89 541 396 522 354 19 41
90-94 439 419 398 365 41 55
95-99 98 149 80 126 18 23
I.G+ 81 151 67 122 14 19

805
11-6 tti'l!{ ~lq atl'! ~'!~ 'tn: t'Jft/'t'1!f " itI~l iit.IU~ C·6 POPULATION BY FIVE YEAR AGE GROUP AND SEX
----- -- --- _-- ___ o ______ -- - -~~-- ---__ - --------- - -- --- -- - _____
lI'~ lI11I'fur ijlJ\flf Total Rural Urbc
-------- ----------- --------_ art! '«,~ ~ fmt ,;~ f~1{f ~'ft ~ift Age-group Males Fl!males Males Females Males Females
----- -------------------- _-_ -------
2 3 4 5 6 7
--~.---. ----._
,{lq~;{
RAISEN
~'iIT 'IT! 372,459 338,083 334,541 305,259 31,912 32,824 All ages
0-4 54.419 53,684 49,460 48,153 4,959 4,931
5-9 55,547 53,056 50,332 47,906 5,215 5,150
10-14 48.045 41,953 42,740 31,238 5,305 4,715
15-19 33,676 29,702 29,310 26,297 4,366 3,406
20-24 30,144 28,673 26,723 25,917 3,421 2,756
25- 29 25,800 13,941 23,008 21,470 2,792 2,471
30-34 21,668 20,208 19,469 18,182 2,199 2,026
35-39 20,574 17,176 18,467 16,079 2,107 1,697 ,
40-44 18,369 16.478 16,452 14,952 1,917 1,526
45-49 15,989 13,281 14,400 12,169 1,589 ], III
50-.54 14,802 11,081 13,417 10,168 1,385 913
55-59 8,731 7,590 8,010 7,125 722 465
60-64 10,126 8,248 9,422 7,528 704 720
65-69 5,045 4,493 4,611 4,217 434 276
70-74 4~617 4,013 4,279 3,668 338 34S
75-79 1.826 1,433 1,674 1,318 152 115
80-84 1,620 1,475 1,457 1,369 163 116
85-89 458 351 408 319 49 32
90-94 393 262 350 243 43 19
9J-99 92 94 79 85 13 9
Ido+ 9·4 79 84 65 9 14
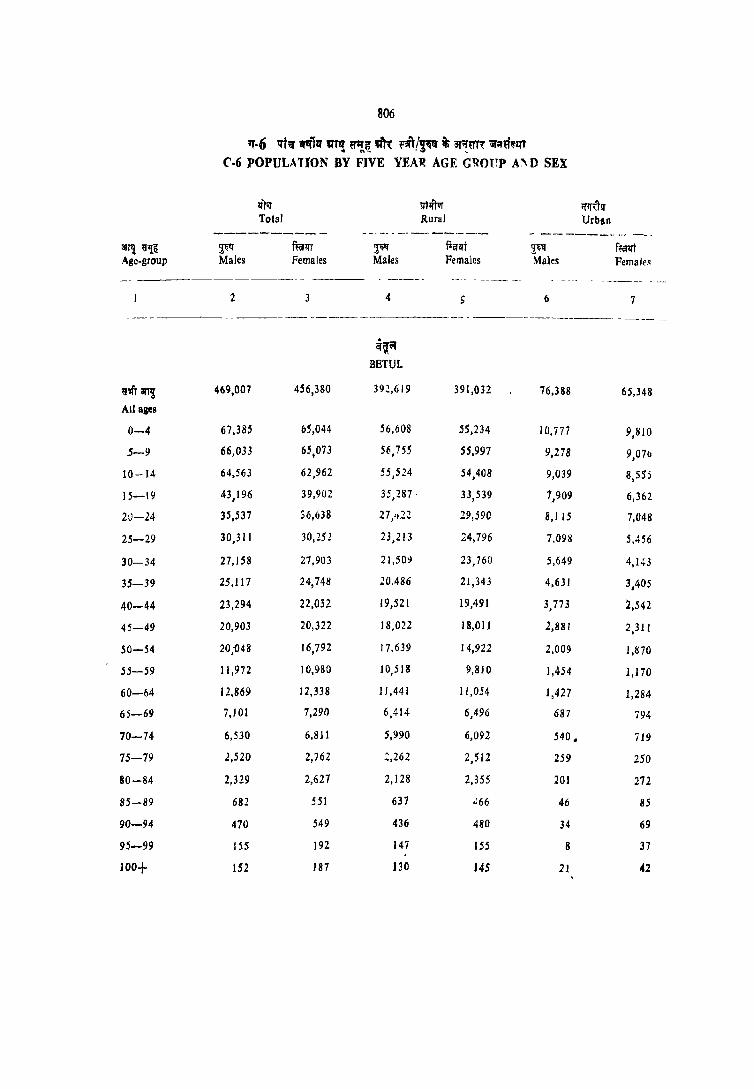
806
rr-6 qf~ "1~ '"'! ~~.m: fOrI!!" ~ ;r,,!m~ :s(OI"l_1trT
('-6 POPULATION BY FIVE YEAn AGE G!~OUP A:'\ 0 SEX
Iff;r lltmvr lflf<:TIf Total Rural Urban
--------- -- --- ._- - ------------ - -----_-- .... -----all',! ~Ij_~ ~q- rn.'IIT ~If f:RIfT 2'fi1f f~ Age-group Males Females Males Females Males Female~
-------- ----- - --------- - ---- _-2 3 4 ) 6 7
- -_.----~------- --- -_------ -----._--_.---_ - ----------------- --_-_
~~~ BETUL
~'fr~ 469,007 4'6,380 392,619 391,032 76,388 65,348
All ages
0-4 67,385 65,044 56,608 55,234 10,777 9,810
5-9 66,033 65,073 56,755 55,997 9,278 9,07b
10-14 64,563 62,962 55,524 54,408 9,039 8,555
15-19 43,196 39,902 35,287 ' 33,539 7,909 6,362
20-24 35,537 36,638 27/t22 29,590 8,115 7,048
25-29 30,311 30,251 23,213 24,796 7,098 5,456
30-34 27,158 27,903 21,509 23,760 5,649 4,143
35-39 25,117 24,748 20,486 21,343 4,631 3,405
40-44 23,294 22,032 19,521 19,491 3,773 2,542
45-49 20,903 20,322 18,022 18,01 I 2,881 2,3JI
50-54 20,1>48 16,792 17,639 14,922 2,009 1,870
55-59 11,972 10,980 10,518 9,810 1,454 1,170
60-64 12,869 12,338 11,441 11,054 1,427 1,284
65-69 7,101 7,290 6,414 6,496 687 794
70-74 6,530 6,811 5,990 6,092 540. 719
75-79 .!,S20 2,762 ':,262 2,512 259 250
80-84 2,329 2,627 2,128 2,355 201 272
85-89 682 551 637 ·~66 46 85
90-94 470 ;49 436 480 34 69
95-99 155 192 147 155 8 37
100+ 152 187 130 145 2J 42

807
"·6 qjif q-,,", ~'! ~'!~ ~ih: ~~)/~I'.{ iii 1Jli!~1,{ Q1'if5ttH
{.·6 POPllLAUON BY FiVE YEAR AGE GROUP AND SEX
lI')rr Vllftvr ;pr\~ Total Rural Urban
---------- ---------.,--- -------------am~ EIiI~ ~~ f~ ~~ f~l:lt ~ fiQq't Age-group Males Females Males Females Males Females
------ -- -------_._--- ------ - -- -- -- - - --
2 3 4 .s 6 7
~)~l'J'l.Tt HOSHANGABAD
(f1l.''t il'r~ 526,273 477,666 391,371 360,478 134,896 117,188 All-ages
0-4 70,S 17 66,749 54,889 51,464 J 5,627 15,'85
5-9 71,879 66,071 55,754 51,IJ6 16, l25 14,955
10-l4 70,427 62,290 52,941 46,329 17,486 : 5,962
15-19 52,676 42,983 36,866 30,408 15,810 12,575
20-24 44,245 41,350 29,898 29,913 14,347 11,437
25-29 37,696 33,649 26,611 24,470 11,085 9,179
30-34 31,298 28,340 22,313 21,184 8,984 7,156
35-39 27,411 26,711 19,847 20,125 7,564 0,586
40-44 26,359 23,806 19,506 18,441 6,853 5,365
45-49 23,206 20,615 17,29 S 15,847 5,9Jl 4,768
50-54 20,826 17,9 J 8 16,242 13,999 4,583 3,919
55-59 14.117 1 J ,683 10,899 9,204 3,218 2,479
60-64 14,217 12,950 11,312 10,337 2,905 2,613
65--69 7,995 8,018 6,453 6,355 1,543 1,063 70-74 6,490 7,273 5,196 5,696 1,294 1,577 75-79 2,750 2,809 2,144 2,260 605 549
80-84 :!,260 2,313 1,795 1,778 465 53S 85-89 625 729 468 55) 157 176 90-94 406 588 347 474 60 114 95-99 139 IS7 117 124 22 J3 100.+ 39 u 34 4,9 5 :13
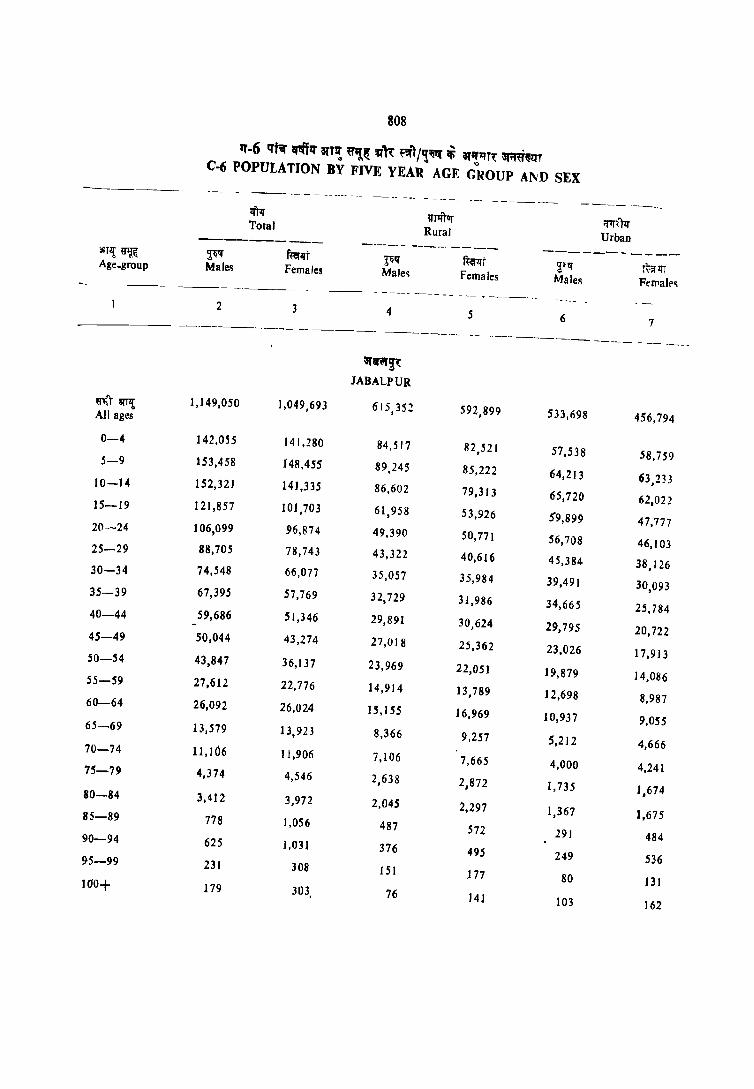
808
'1'-6 q'~ IlI1ffll' an,£! '"i~ ~l\ ~T /,~ ~ at~JfTt iiA"~T C-6 POPULATION BY FIVE YEAR AGE GROUP A]\<D SEX
----------- -------- - -- -- ---- --- ---- -~- ----- ---_ ----- - ~---- ------m IrJ11Tor 1ftnTl!' Total Rural Urban --------- ------ - ---- ---_ -----------3lr~ ~ ~" ~lJt Jli" mt ~f" r"t:~l!T Age_group Males Females Male~ Females Males Ft'lJ1ale~ ---- -'--~--- '--- - - ___ a _____ - - - __ ... ______ •
2 3 4 5 6 7 ------------- ~------- ---------- -_ --------- ----- -------~-
\iI'''~~ JABALPUR
~T~ 1,149,050 ],049,693 615,352 592,899 533,698 456,794 All ages
0-4 142.055 141,280 84,S 17 82,521 57,538 58.759 5-9 153,458 148.455' 89,245 85,222 64,213 63,233 10-14 152,321 141,335 86,602 79,313 65,720 62,022 15'-19 121,857 101,703 61,958 53,926 !9,899 47,777 20--24 106,099 96,874 49,390 50,771 56,708 46,103 25-29 88,705 78,743 43,322 40,6J6 45,384 38,126 30-34 74,548 66,077 35,057 35,984 39,491 30,093 35-39 67,395 57,769 32,729 31,986 34,665 25.784 40-44 59,686 51,346 29,891 30,624 29,795 20,722 45-49 50,044 43,274 27,018 25,362 23,026 17,913 SO-54 43,847 36,137 23,969 22,051 19,879 14,086 55-59 27,612 22,776 14,914 13,789 12,698 8,987 60-64 26,092 26,024 15,155 J 6,969 10,937 9,055 65-69 13,579 13,923 8,366 9,257 5,212 4,666 70-74 11, J()6 11,906 7,106 7,665 4,000 4,241 75-79 4,374 4,546 2,638 2,872 1,735 1,674 80-84 3,412 3,972 2,045 2,297 1,367 1,675 85-89 778 1,05'6 487 572 291 484 90-94 625 1,031 376 495 249 536 95-99 231 308 151 177 80 131 1(10+ 179 303 76 141 103 162

809
",-6 q'N qq1q "''! ~'!~ 8l'l'{ ~"t/~~lt ~ at§qT'{ iif;r~~ C·6 POPOLATION BV FIVE YEAR AGE GROUP AND SEX
------ ---.~-~-~--- ---,----- --- ----~-
litrr I;jT~fl'llJ' '1IJ<Ttr Total Rural Urban
------------ ---------- -_.------- ---~~ ~~ ff~ ~~" ~t[t ~ljl{ f~qT Age-group Males Females Males Females Males Fem9les
-- _________ .w _______ • ____________ ------_
I 2 3 4 5 6 7
-------------- ~--------
.nf~~~ NARS[MHAPUR
~~ 336,981 313,464 290,552 271,766 46,4:29 41,69B All ages 0-4 44,847 44,299 39,553 39,138 5,294 5,162
5-9 46,515 44,733 40,793 39,371 5,723 5,362
JO-14 46,203 4J ,860 40,007 35,897 6,196 5,963
15-19 35,404 28,525 29,845 24,018 5,559 4,507
20-24 28,855 27,888 23,816 23,392 5,038 4,496
25-29 23,556 19,928 19,797 17,017 3,759 2,852
30-34 18,342 17 ,063 15,322 14,395 3,020 2,668
35-39 15,724 15,882 13.382 13,745 2,341 2,137
40-44 16,070 14,797 13,884 13,099 2,186 1,698
45-49 14,134 13,658 12,406 11,835 1,728 1,823
50-54 13,82~ 11,941 12,047 ]0,573 1,775 ],368
55-59 8.840 8,485 7,752 7,460 1,088 1,025
60-64 10.376 9,315 9,225 '8,252 1, lSI 1,063
65-69 5,143 5,321 4,496 4,821 648 500
70-74 4,741 4,867 4,301 4,401 440 466
75-79 1,846 1,909 1,648 1,662 198 247
80-84 1,460 1,775 1,284 1,555 176 22()
85-89 331 369 288 339 43 40 90-94 302 407 292 353 9 ~4
95-99 131 104 121 94 9 10
1-00+ 65 104 61 94 5 :~O

810
11'-6 qt'!{ ~q ~r'i ~~ $l'l~ ~T/'!li.~ Ii 3{~m'{ iilift{QQ'T
C-6 POPULATION BY FIVE YEAR AGE GROUP AND SEX
If)'lr mJur ;rlTUIf Total Rural Urban ------.__.._ ----------- ---------
arr~m ~ f~lli ~ fr«1ii i" ~ Age-group Males Females Males Females Males Females
2 3 4 S 6 7
--------_- - -- -- -- ---- -- - _----- - ------ --- _-- --_ -----~-
"1J1~
MANDLA
rit~ SI7,866 519,528 479,887 484,328 37.979 35,200 All ages
0-4 62,360 63,650 57,806 58,970 4,S53 4,680
5-9 74,829 77,787 70,348 73,249 4,481 4,538
10-14 73,598 69,773 6R,726 64,975 4,872 4,798
15-19 50,647 49,197 46,032 45,213 4,615 3,984
20-24 39,149 43,383 35,110 40,141 4,039 3,243
25-29 38,331 38, i 28 35,227 35,469 3,103 2,660
30--34 32,779 32,689 30,369 30,663 2,410 2,026
3S-39 30,908 28,637 28,864 26,547 2,044 2,091
40-44 24,789 25,454 22,974 23,950 1,815 1,50S
45-49 24,441 22,194 22.737 20,674 1,704 1,519
50-54 21,'97 18,300 19,1)33 16,961 1,464 1,339
55-59 13,027 11,821 12,083 11,0'\$ 944 786
60-64 12,129 13,832 11,892 13,014 838 818
65-69 6,345 7,988 5,927 7,Sl9 418 469
70-74 5,638 7,695 5,292 7,347 347 H8
75-79 2,409 3,403 2,266 3,268 143 IlS
tlt-84 2,369 3,059 2,276 2,927 94 112
8S-89 593 791 561 756 32 1;
90-114 453 740 437 105 16 ];
9S-99 169 161 160 152 10 15
100+ 163 200 163 195 5
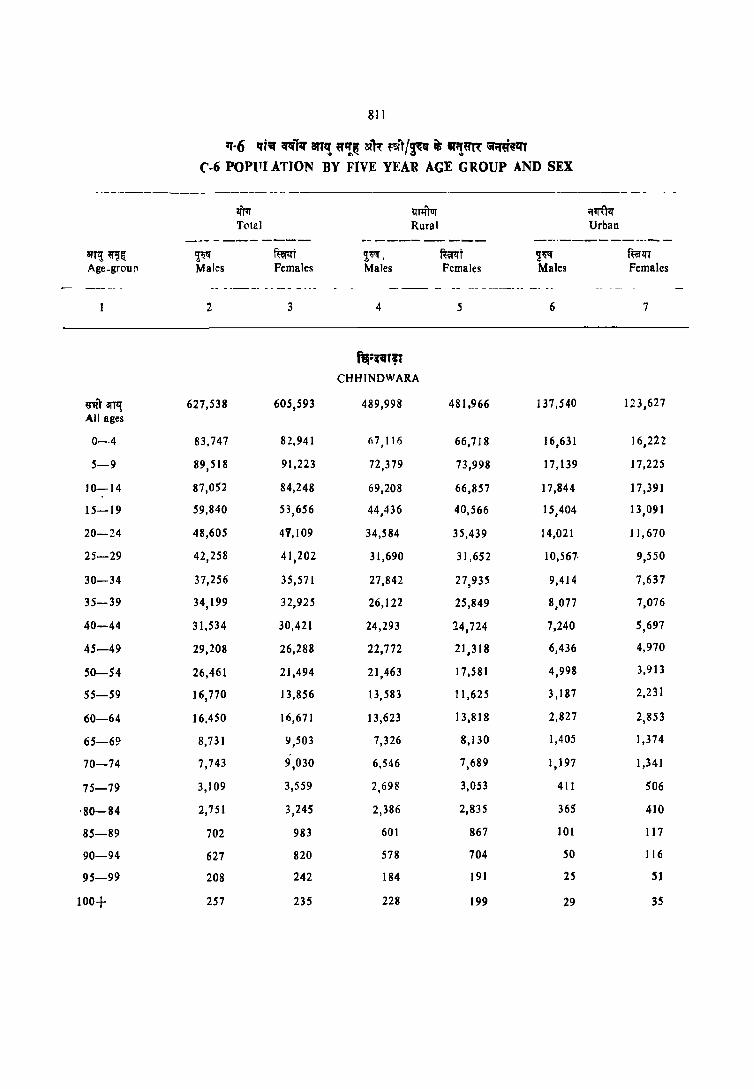
811
~·6 q"t~ ""1~ an~ ~~i! ~R r-ff I~'l ~ .l!~ :;nr~,~, ('·6 POP(1I ATJON BY FIVE YEAR AGE GROUP AND SEX
- ---------------- ----------
lim l;[l1l"~ ;:r~')11
Total Rural Urban ---- - --- ---- -_. ---- ----- -_._----_---- -~
aUI! ~i[ ~~ mr ~~, rnr-rr ~~I't f~i;!l1r Age.grouf' Males Females Males Females Males Females
-- ------ - - --- - --- ----- -- -- --- - ------ -- --- --
2 3 4 5 6 7
r~;~", CHHINDWARA
~) arTl{ 627,538 605,593 489,998 481,966 J 37,540 123,627 All ages
0-4 83,747 82,941 07 116 , 66,718 16,631 16,222
5-9 89,518 91,223 72,379 73,998 17,139 17,225
10-14 87,051 84,248 69,208 66,857 17,844 17,391
15-19 59,840 53,656 44,436 40,566 15,404 13,091
20-24 48,605 4V,I09 34,584 35,439 14,021 1 J, 670
25-29 42,258 41,202 31,690 31,652 10,567· 9,550
30-34 37,256 35,571 27,842 27,935 9,414 7,637
35-39 34,199 32,925 26,122 25,849 8,077 7,076
40-44 31,534 30,421 24,293 24,724 7,240 5,697
45-49 29,208 26,288 22,772 21,318 6,436 4,970
50-54 26,461 21,494 21,463 17,581 4,998 3,913
55-59 16,770 13,856 13,583 11,625 3,187 2,231
60-64 16,450 16,671 13,623 13,818 2,827 2,853
65-69 8,731 !I,503 7,326 8,130 1,405 1,374
70-74 7,743 9,030 6,546 7,689 1,197 1,341
75-79 3,109 3,559 2,698 3,053 411 506
'80-84 2,751 3,245 2,386 2,835 365 410
85-89 702 983 601 867 101 117
90-94 627 820 578 704 50 J 16
95-99 208 242 184 191 25 51
100+ 257 235 228 199 29 35
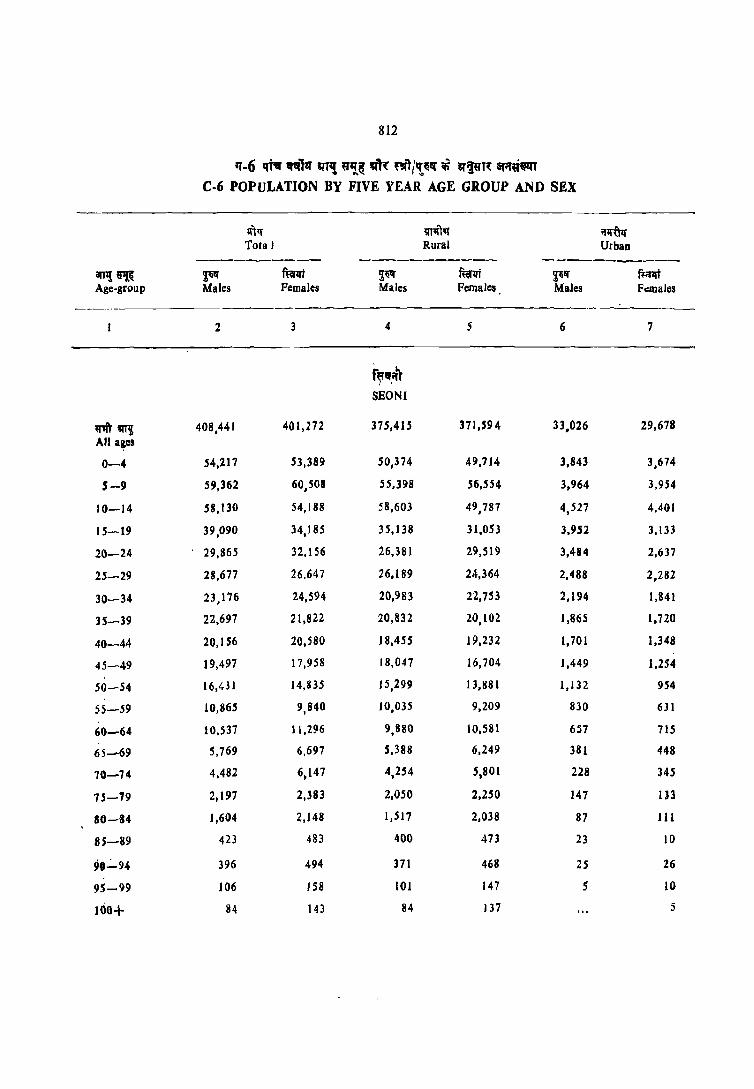
812
1(·6 1ft. iAlll 'l'T~ ~'i~ vt'{ nr1/'t~1!( ~ i1'~~m: &filf~~ C·6 POPULATION BY FIVE YEAR AGE GROUP AND SEX
;j')~ ~ll{Tlif i'lt("UIf Tota I Rural Urban
---------- ----------- -----------arr,!~ ~ ~lft ~ fta1rt ~ ... fl:alft Age-group Males Females Males Females Males F.:males
-------
2 3 4 5 6 7
r""",. [ ,
SEONI
rnq 408,441 40 I ,272 375,415 371,594 33.026 29,678
All a~s
0-4 54,217 53,389 50,374 49,714 3,843 3,674
5-9 59,362 60.508 55,398 56,554 3,964 3,954
10-14 58,130 54,188 58,603 49.787 4,527 4,4GI
15-19 39,090 34,185 35,138 31,053 3,952 3,133
20-24 29,865 32,156 26,381 29,519 3,484 2,637
25-29 28,677 26.647 26,189 24,364 2,488 2,282
30-34 23,176 24,594 20,983 22,753 2,194 1,841
35-39 22,697 21,822 20,832 20,102 1,865 1,720
40-44 20,156 20,580 J 8,455 19,232 1,701 1,348
45-49 19,497 17,958 18,047 16,704 1,449 1,254
SO-54 16,431 14,835 15,299 13,881 1,132 954
5)-59 10,865 9,840 10,035 9,209 830 6Jl
60-64 10,537 11,296 9,880 10,581 6.57 715
65-69 5,769 6,697 5,388 6,249 381 448
70-74 4,482 6,147 4,254 5,801 228 345
75-19 2,197 2,383 2,050 2,250 147 1]3
80-34 1,604 2,148 1,517 2,038 87 III
8S-89 423 483 400 473 23 10
90~94 396 494 371 468 25 26
95-99 106 15S 101 147 S II)
100+ 84 143 84 137 5
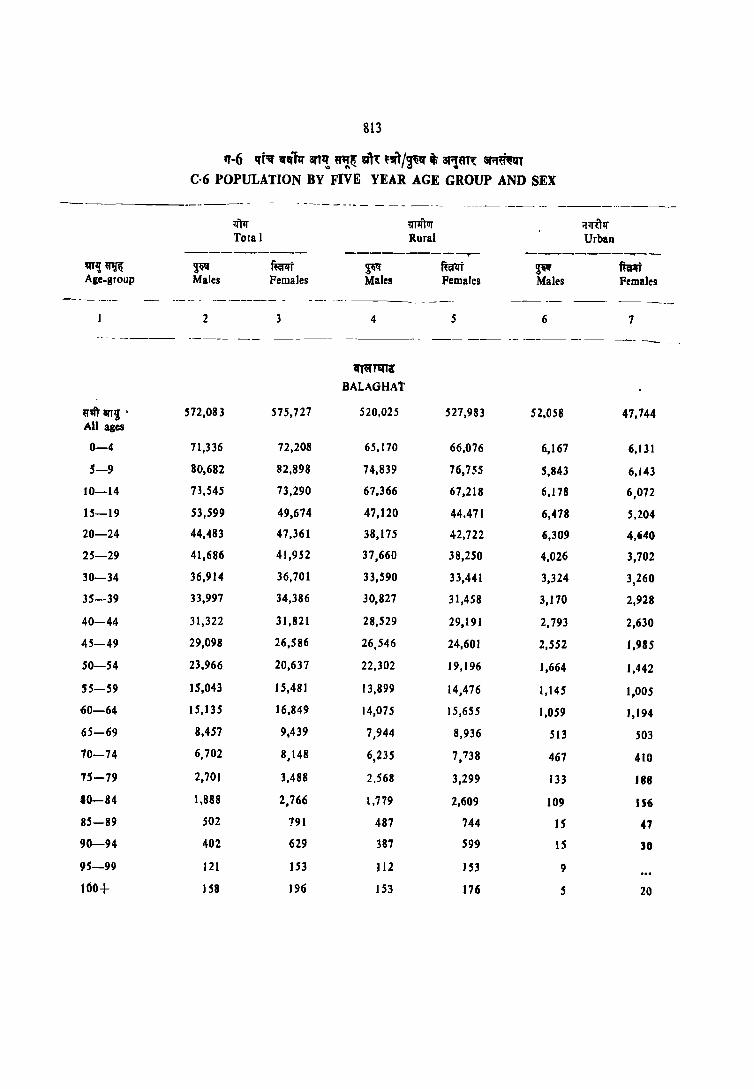
813
'1-6 qt~ ,,_l1i arT!!. "~e: vl~ ,it/~ it; r.r"~ 6A~T C·6 POPULATION BY FIVE YEAR AGE GROUP AND SEX
-------- ._-----_.-----
$lT1!~ Age-group
~qt( Males
2
lI'l1r TOlal
Females
3
mJiTur Rural
----------,...-~ Males Females
4 5
~ Males
6
Females
7
--- ----- --- ----- -- ---.- --
""'1ft an~ . All ages
0-4
5-9
10-14
15-19
20-24
25-29
30-34
35-39
40-44
45-49
50-54
SS-59
60-64
65-69
70-74
75-79
80-84
85-89
90-94
95-99
I()O+
572,083
71,336
80,682
73,545
53,599
44,483
41,686
36,914
33,997
31,322
29,098
23,966
15,043
15,135
8,457
6,702
2,701
1,888
502
402
121
158
575,727
72,208
82,898
73,290
49,674
47,361
41,952
36,701
34,386
31,821
26,586
20,637
15,481
16,849
9,439
8,148
3,488
2,766
791
629
153
196
~Ttm
BALAGHAt
520,025
65,170
74,839
67,366
47,120
38,175
37,660
33,590
30,827
28,529
26,546
22,302
13,899
14.07S
7,944
6,235
2.568
1,779
487
387
112
153
527,983
66,076
76,755
67,218
44.471
42,722
38,250
33,441
31,458
29.191
24,601
19,196
14,476
15,655
8,936
7.738
3,299
2,609
744
599
153
176
52,058
6,167
5,843
6,178
6,478
6,309
4,026
3,324
3,170
2,793
2,552
1,664
1,145
1,059
51)
467
133
109
15
IS
9
5
47,744
6,131
6,143
6,072
5,204
4,640
3,702
3,260
2,928
2,630
• ,985
1,442
I,OOS
1,194
503
410
188
156
47 ]0
20
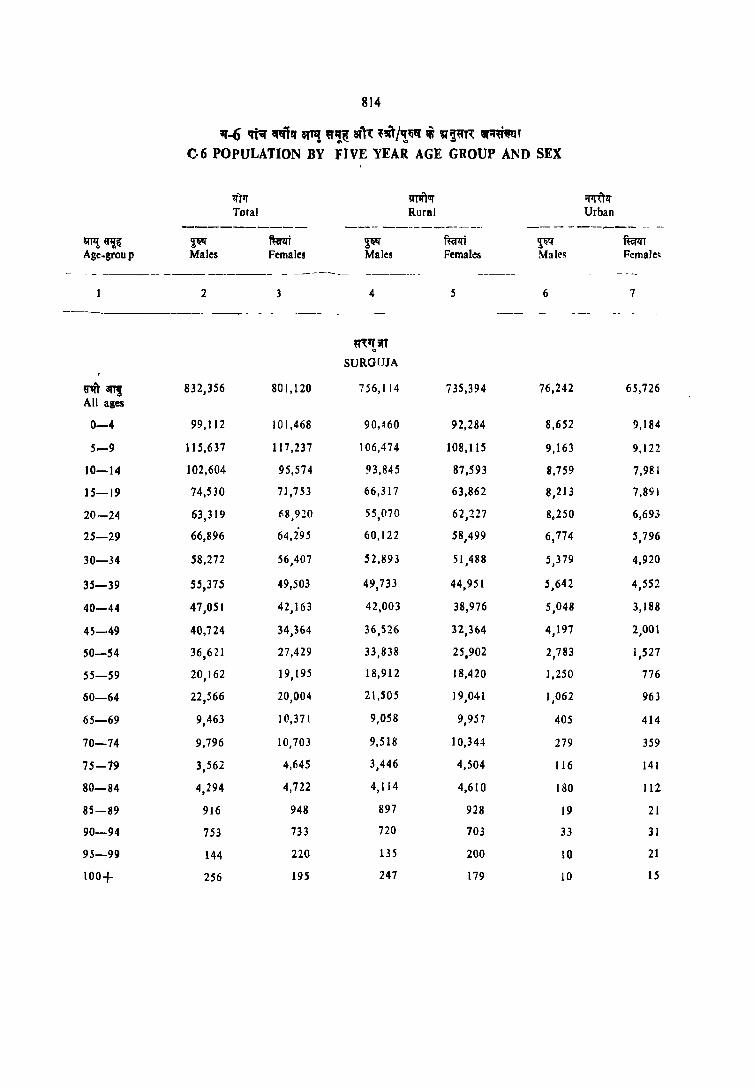
814
~-6 qt-q Cftflq at,,! ~!~ ail..: nrr/!'fIt .w 'l~R \lI;r~~T C·6 POPULATION BY FIVE YEAR AGE GROUP AND SEX
If)1J' 1l'T1ft1IT 'i1TUlf Total Rural Urban
---------- ---- -_.-----------_ _- - - ---__ -- -- --
~ «'I~ ~ ftalft ~ f«rrt $Wi ffir1.fT Age-group Males Females Males Femal.:s Mail's Female~
- - - ------ ----------- -- ----- ---_ ---------
2 3 4 5 6 7
----- ----- --_--
"~'I' if' '" SURGUJA
1]',", lIlT! 832,356 801,120 756,114 735,394 76,242 65,726 All ages
0-4 99,112 10 I ,468 90,~60 92,284 8,652 9,184
5-9 115,637 117,237 106,474 108,115 9,163 9,122
10-14 102,604 95,574 93,845 87,593 8,759 7,981
15-19 74,530 71,7B 66,317 63,862 8,213 7,891
20-24 63,319 1'8,920 55,070 62,227 8,250 6,693
25-29 66,896 64,295 60,122 58,499 6,774 5,796
30-34 58,272 56,407 52,893 51,488 5,379 4,920
35-39 55,375 49,503 49,733 44,951 5,642 4,552
40-44 47,051 42,163 42,003 38,976 5,048 3,188
45-49 40,724 34,364 36,526 32,364 4,197 2,001
SO-54 36,621 27,429 33,838 25,902 2,783 1,527
55-59 20,162 19,195 18,912 18,420 1,250 776
60-64 22,566 20,004 21,505 J 9,041 1,062 963
65-69 9,463 10,371 9,058 9,957 405 414
70-74 9,796 10,703 9,518 10,344 279 359
75-19 3,56.2 4,645 3,446 4,504 116 141
80-84 4,294 4,722 4,114 4,610 180 112
85-89 916 948 897 928 19 21
90-94 753 733 720 703 33 31
9.5-99 144 220 135 200 10 21
100+ 256 195 247 179 10 15
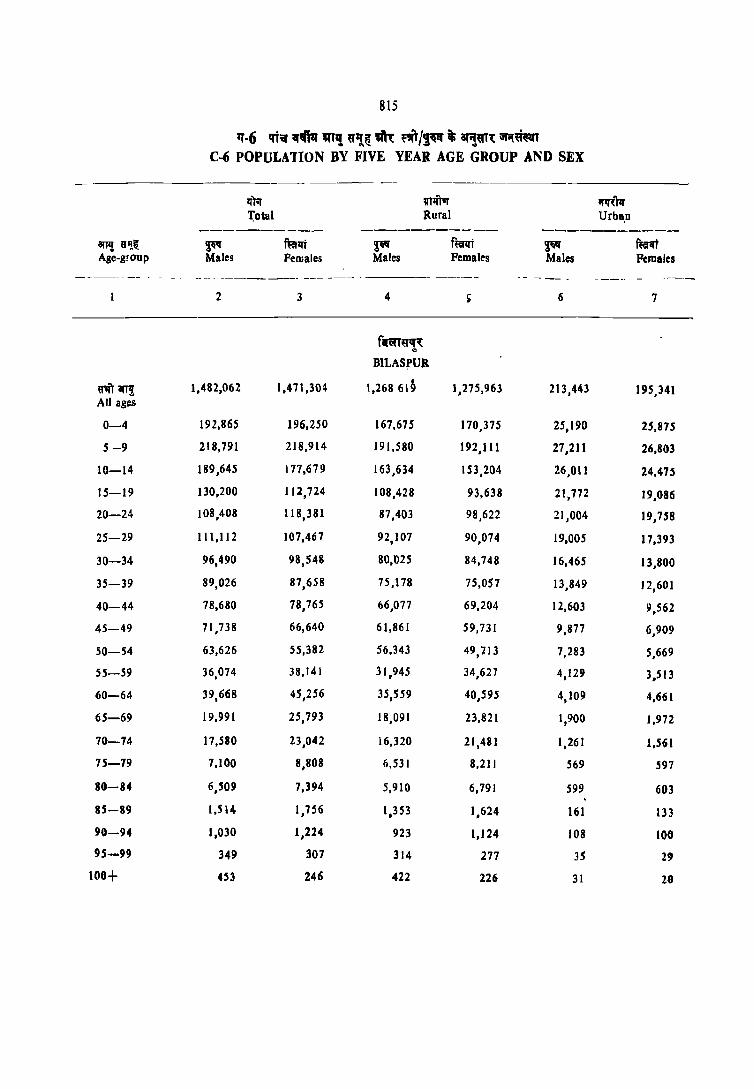
815
q·6 q1=;f .. ,,'Pl '"II WI{ ~.m: f1iT I~ t ati!~fn: iitot~ C-6 POPULAlION BY FIVE YEAR AGE GROUP AND SEX
-------~);r mlftar mrll' rota I Rural Urba,n
----------- ----------- -----------iIIlIl 8' '! ~ ~ futtrt ~ ft~t ~ flpt Age·group Males Females Males Females Males Ftmales
---------- - -- -- - ------- _--- ---- --- - --------- -- ---- - _--_.- -
2 3 4 > 6 7
f~~q~ .. BILAS?UR
8'1i'I an! 1,482,062 1,471,304 All ages
1,268619 1,275,963 213,443 195,341
0-4 192,865 196,250 167,675 170,375 25,190 25,875
5 -9 218,791 218,914 191,580 192,111 27,211 26,803
10-14 189,645 177,679 163,634 153,204 26,01l 24,475
15-19 130,200 112,724 108,428 93,638 21,772 19,086
20-24 108,408 II 8,381 87,403 98,622 21,004 19,758
25-29 111,112 107,467 92,107 90,074 19,005 17,393
30-34 96,490 98,548 80,D25 84,748 16,465 13,800
35-39 89,026 87,658 75,178 75,057 13,849 12,601
40-44 78,680 78,765 66,077 69,204 12,603 9,562
45-49 71,738 66,640 61,861 59,731 9,877 6,909
SO-54 63,626 55,382 56,343 49,113 7,283 5,669
55-59 36,074 38,141 31,945 34,621 4,129 3,513
60-64 39,668 45,256 35,559 40,595 4,109 4,661
65-69 19,991 25,793 18,091 23,821 1,900 1,972
70-74 17,510 23,042 16,320 21,481 1,261 1,561
75-79 7,100 8,808 6,531 8,211 569 597
80~84 6,509 7,394 5,910 6,791 599 603
115-89 1,514- 1,756 ',353 1,624 161 133
90-94 1,030 1,224 923 1,124 108 100
95-99 349 307 314 277 3S 29
100+ 45J 246 422 226 31 20
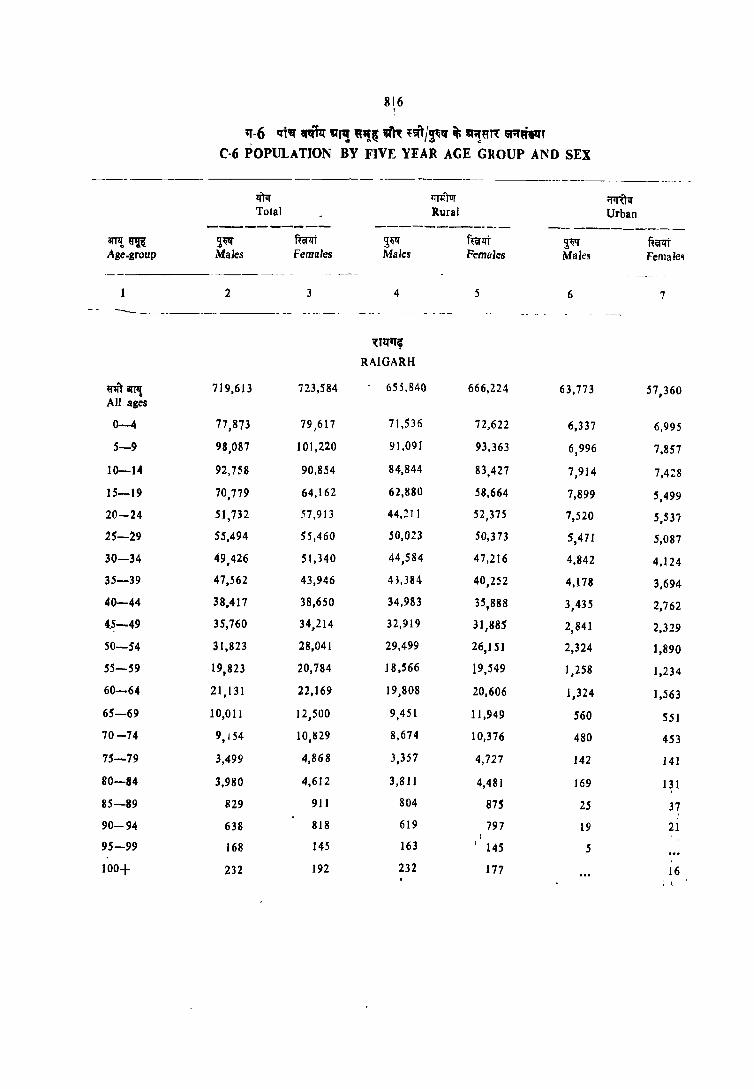
816 !
q·6 1ft", ~ "'f! ~~, m~ ~'5Il/~q iti "~,,1'{ ;r;r"'II'T
C·6 POPULATION BY FIVE YEAR AGE GROUP AND SEX
._----- -~-- ----_._ li'm lfI11111f ;;q~ TOlal Rural Urban
---------- ------------.. - -- -----------iiTl!~ ~~ f~ ~fi\t f~lIt ~W ~ij"lIt Age.group MaJes Females Males Females Males Female~
-_----_---------- -
2 3 4 5 6 7 --------_. ---- - - --_-
~'lfrr~
RAlGARH
ritlrPl 719,613 723,584 655,840 666,224 63,773 57,360 All ages
0-4 77,873 79,617 71,536 72,622 6,337 6,995
5-9 98,087 101,220 91,09J 93,363 6,996 7,857
10-14 92,758 90,854 84,844 83,427 7,9] 4 7,4:8
15-19 70,779 64,162 62,880 58,664 7,899 5,499
20-24 51,732 57,913 44,:!1 J 52,375 1,520 5,537
25-29 55,494 55,460 50,023 50,373 5,471 5,081
30-34 49,426 51,340 44,584 41,216 4,842 4,124
35-39 47,562 43,946 43,384 40,252 4,178 3,694
40-44 38,417 38,650 34,983 35,888 3,435 2,762
.5-49 35,760 34,214 32,919 31,885 2,841 2,329
SO-54 31,823 28,041 29,499 26,1 S 1 2,324 1,890
55-59 19,823 20,184 18,566 19,549 ],258 1,234
60-64 21,131 22,169 19,808 20,606 1,324 ],563
65-69 10,011 12,500 9,451 11,949 560 551
70-74 9,154 10,1129 8,674 10,376 480 453
75-79 3,499 4,868 3,357 4,727 142 141
80-84 3,980 4,612 3,8H 4,481 169 131
85-89 829 911 804 875 25 37 :
90-94 638 818 619 797 19 21
95-99 168 145 163 I
145 5
]00+ 232 ]92 232 ]77 16 : ,

817
'1'-6 qf;;J ""'V an,! ~'l' all n~/,!ll!f" ~ Q~ C 6 POPULATION BY FIVE YEAR AGE GROUP AND SEX
ll"11r VllrTUf 'ItrUll" Total Rural Urba"!
--------- ----------- ---- -- -----arrll ~~li ~ mt ~li1f f~lff ~ f~l:ft Age-group Males Females Males Females Males Females
------- --------- -
2 3 4 5 6 7
mr"i~"i1l' RAJNANDGAON
ritarnr 577,896 589,605 503,717 519,532 74,179 70,073 All ages
0-4 75,238 75,251 66,4 f 5 56,593 8,793 8,658
5-9 87,41 s 86,745 73,030 78,230 9,385 8,515
10-14 81,381 76,778 72,090 67,924 9,282 8,854
15-19 54,732 51,515 46,352 44,415 8,380 7,100
20-24 42,070 4\ 757 34,615 39,325 7,456 6,432
25-29 40,049 41,026 34,348 35,309 5,701 5,718
30-34 35,333 37,092 30,127 32,173 5,206 4,919
35-39 33,089 33,573 28,678 29,015 4,411 4,558
40-44 29,494 30.463 25,355 26,839 4,140 3,624
45-49 28,347 26,503 24,760 23,287 , 3,587 3,216
50-54 22,411 21,165 19,581 18,692 2,830 2.474
55--59 14,374 15.547 12,597 13,840 1,777 1,707
60-64 13,288 18,593 11,857 16,683 1,431 1,910
65-69 7,739 11,286 6,970 10,289 769 998
70-74 6,173 8,594 5,588 7,882 584 713
75-79 2,835 4,212 2,614 3,929 222 282
80-84 2,455 3,494 2,290 3,239 164 255
85-89 597 903 569 844 28 59
90-94 450 604 425 579 24 25
95-99 128 171 124 140 5 31
" 100+ 108 185 108 180 5

818
rr-6 ~f;f ~ il'l!. 'J'i~ ,,1\ fit/,!'!" ~ il~mt QA~~' C'-6 PO PULA TION BY FIVE YEAR AGE GROUP AND SEX
~ lI'nfrwr ;:rlI'{t1f Total Rural Urban
--------- ----------- -----------~'!~ ~ ffirlrt ~ ffirIrt ~~ f~qt Age.group Males Females Males Females Males F.males
2 3 4 5 6 7
. J1'
DURO
~8IT1! 954,758 935,709 635,488 653,875 319,270 281,834 All ages
0-4 123,119 120,881 84,061 82,550 39,058 38,331
5-9 135,994 136,261 95,059 95,827 40,935 40,435
to-I4 128,998 121,99] 89,024 84.375 39,974 37,618
1S'-19 91,124 82,659 58,730 55,931 32,394 26,728
20-24 75,129 79,610 46,411 .!i 1,970 28,717 27,640
25-29 71,903 70,772 44,231 94,919 27,671 25,854
30-34 61,429 61,641 37,335 38,872 24,094 22,769
35--39 55,848 57,721 38.411 35,870 22,438 21,851
40-44 54,812 48,893 30,685 35,166 24,127 13,727
45-49 50,622 40,506 32,301 31,789 18,321 8,717
SO-54 37)94 31.086 27,309 25,724 9,985 5,362
55-59 21,389 20,976 16,797 17,660 4,592 3,316
60-64 19,547 24,767 16,504 20,864 3,043 3,903
65-69 10,514 15,559 9,116 13,421 1,398 2,138
70-74 8,589 1I,7ll 7,464 9,979 1,143 1,733
15-79 3,785 5,081 3,254 4,358 532 723
110-84 2,830 • 3,349 2,392 2,849 438 soo tS-8' 672 831 567 123 10~ 113
'0--94 480 641 J9S 510 8S III
U-f9 1S8 214 110 U, 47 79
100+ 18, 209 149 11S 34 J4

819
'1·6 qtlEf ~"fq ~1i! "''!~ IIftt ~/~~ ~ ~!"'T,{ Q(;f~ C-6 POPULATION BY FIVE YEAR AGE GROUP AND SEX
--------- -.- -------,--- --~-----
tfttT VJlftvr ~~II' Total Rural Urban
--------- -... ---------- -------- ---qHJil: ~ ~qt ~ ~rn ~" fum Age-group Males Females Males Females Males Females
----- - - --- - --- ----------- ---- - --------- ---------- --- _- - ------ - -------- -2 3 4 5 6 7
---------------~.-
,,~
RAIPUR
um~r~ 1,532,692 '1,546,784 1,259,403 1,290,848 273,289 255,936 All ages
0-4 196,045 198,531 165,840 167,062 30,206 31,469
5-9 220,889 224,976 188,171 190,270 32,718 34,706
10-14 201,647 193,536 169,625 160,919 32,022 32,616
15-19 148,289 132,296 111,661 10S,978 30,629 20,318
20-24 116,470 127,664 88,117 102,350 28,353 25,314
25-29 116,171 115,248 92,103 93,069 24,074 22,179
30-34 100,486 101,048 79,202 82,627 21,283 18,421
35--39 91,060 88,382 72,743 72,495 18,317 15,887
40-44 79,548 81,584 63,223 68,720 16,315 12864
45-49 73,600 10,541 60,867 59,963 12,733 10,578
50-54 61,213 55,551 50,919 47,670 10,234 1,881
55- 59 38,063 40,980 32,827 36,329 5,236 4,651
60-64 38,021 46,415 32,855 40,506 5,166 5,909
6.5-69 19,499 21,364 11,078 24,211 2,421 3~092
70-74 1.5.969 20,802 14,273 18,681 1,696 2,1IS
75-79 6,418 9,043 S,S88 8,306 830 738
80-84 5,46~ 8,177 4,844 7,6S7 625 7lQ
85-89 1.403 1.849 I,Z23 1,703 170 14' 90--94 1,110 I,B7 981 1,229 129 107
IIS-H 160 ua 254 llO , 19
lOO+ 35, 4ti! 3,2 4.10 6 51

arJi~ Age-group
U1ft~ All ages
0-4
5-9
10-14
15-19
2{)-24
25-29
30-34
35-39
40-44
45-49
30-54
55-59
60-64
65-69
70-74
75-79
80-84
85-89
90-94
95-99
100+
a~a
11-6 qtli( 'I!I~ at''! '''~ 8{1-.: ~it/~~q ;i i{~~T~ ~"IftI'T C-(i POPULATION BY FIVE YEAR AGE GROUP AND SEX
--- -- - ---- ------- ------ --------- -
i~" Males
lit'T Total
mro Females
Iii" Males
IIl1[JlJI
Rural
fur~ Females
_-- ----- - --_ - --- - --_------- --- ---- -- - -- - - - -
2 3 4
~ Males
f~ Females
7
---- -----------------
920,321
J19,005
13~,868
119,224
85,015
63,421
75,580
65,131
62,778
49,227
44,636
33,545
19,278
19,526
10,046
9,056
3,426
3,145
913
799
217
241
922,533
121,837
141,198
115,458
87,024
74,960
74,2 t 7
65,072
57,634
45,970
35,908
28,448
19,032
22,213
12,084
10,922
4,224
3,836
996
813
257
254
861,848
1 J 1,692
128,344
112,360
79,134
58,064
70,016
60,294
58,496
45,859
41,777
31,705
18,408
J 8,568.
9,636
8,768
3,322
3,083
889
773
205
230
869,300
115,351
133,616
109,041
81,176
69,354
68,972
60,844
54,376
43,429
34,187
27,060
18,410
21,100
] 1,613
10,586
4,094
3,734
954
762
.,234
249
58,473
7,313
7,524
6,864
5,881
5,357
5.,564
4,837
4,282
3,367
2,859
1,840
870
959
409
288
104
62
23
26
12
11
53,233
6,485
7,582
6,417
5,848
5,606
5,245
4,228
3,257
2,541
1,721
1,388
622
1,114
471
336
130
102
42
50
23
S
LIST OF AGENTS
Agra 13. Roshan Ranjit Brothers
1. MIs. Banwari Lal Jain Publisbers 37 J /7, Baba Ayaram Road (Rest)
Moti Katra (Reg.) Ahmadnagar
2. Sumit Law Agency 14. V.P. Jorewakar 30197. Pipal Mandi (Rest) Prop. Rama General Stores
Navi Path (Rest) 3. Agarwal Law Co.
8/121, Bing Ki Mandi (Rest) Ajmer
Ahmadabad IS. Book Land
663, Madar Gate (Reg.) 4. New Order Book Co.
Gandhi Road, Ellis Bridge (Reg.) Allahabad
S. Kunal Subscription Agency 16. University Book Agency
Mina Park Society, Nava Wadaj (Reg.) 15-B, Elgin Road (Reg.)
6. Gujarat Law House 17. Kitabistan Near Municipal Swimming Bath 30 Chak Road (Reg.) Bhadra (Rest)
18. Law Book Co.
7. Mahajan Bros. Sardar Patel Marg, P.B. 4 (Reg.) Super Market Basement Ashram Road, Navrangpura (Reg.) 19. Ram Narain LaI Deni Prasad
2 Katra Road (Reg.)
8. Himanshu Book Co. 10 Mission Market 20. Universal Book Co.
Near Gujarat College (Rest) 20 M.G. Road (Reg.)
9. Academic Book Centre 21. A.H. Wheeler &. Co. Pvt. Ltd.,
10 Walkeshwar Society City Book Sbop (Rest)
Politechnique (Rest) 22. New Book House
10. Educational Booksellers 32, Tashkant Road (Reg.)
Gandhi Road (Reg.) 23. Universal Book Shop
11. Lawyers Credit & Supply Cop. Society M.G. Road (Reg.)
Std. City Civil Court Compound. 24. Law Publisher Bbadra (Rest) Sardar Patel Marg
12. IDdian Law House P.B. No. 77 (Reg.)
252, 1st Floor Kashipura 2S. International Library Outside Raipur Gate (Rest) 36 Alipibag, Punjabi Colony (Rest)

Aligarb
26. Misra Book Agency Shyam Nagar. Aligarh-202001 (P"est)
AmbaUa Cantt.
27. English Book Depot (Reg.)
28. Shivlak Publications 14, Green Park, Amballa Cantt. (Haryana) (Rest)
29. Paul Brothers, 314, Indra Market Amballa Cantt-133001 (Rest)
Amritsar
30. Law Book Agency G.T. Road Putligarh (Reg.)
31. The Book Lovers Petreat Hall Bazar (Reg.)
Anand
32. Vijays Magazine Agency Station Road (Rest)
AnantBpur
33. Shri Vani Stores Kamla Nagar (Rest)
Aizawl
34. Modern Book Stall Hospital Road, Bara Bazar, Aurangabad (Rest)
35. H. Kausar Book House Manzoorpura New Rd (Rest)
Ballabgarh
36. Om Trade Well Unchagaon Gate (Reg.)
Bangalore
37. Tnternational Book House (P) Ltd. 4 K.O. Road (Reg.)
38. L.P. Publishers & Distributers Pvt. Ltd. 90-91 M.G. Road (Rest)
2
39. S.S. Book Emporium 118, l\{ount Joy Road, Hanumant Nagar (Reg.)
40. Standard Book Depot Avenue Road (Reg.)
41. Vichara Sahltya Ltd. BaJapet (Reg.)
42. Coming Man Residency Road (Rest)
43. Veena Book Centre. 1st Floor. Aparan Shopping Comples. Subedar Chatram Road Magestic, Bangalore-560009 (Rest.)
44. Bhagyalakshmi Stores 524, Shrinagar Main Road Barashankari (Rest)
45. N.S.A. Majeed Khan C/o. Khan Transport & Air Travels (Rest)
Blnsdrom
46. Current Books &: Periodicals Agencies 'C' Block. No. 25 (Rest)
BlIlandlllahr
41. Vikas Law Book Centre 51, Oaf Mandi Rly. Road lRest)
Bareilly
48. Pathak Pustak Bhawan Ram Narain Part (Reg.)
49. Ashok Book Depot Dara Bazar (Rest)
Bbagalpur
50. Sri Dipak Kumar Das. Lokepur Abala Kutheir, P.O. and Dist. Bankura (Rest)
51. Paper & Stationary Stores D.M. Singh Road, Bhagalpur (Reg.)
3
Broda Bombay
52. New Medical Book House 64. Charles Lambert & Coy. 540, Madan Zampa Road (Reg.) 101. M.G. Road. P.B. 1032 (Reg.)
51 Baroda Productivity Council 65. Current Book House (Book Division) Maruti Lane, Raghunath Dadaji Street Productivity Road (Rest) (Reg)
54. Hamdip Agencies 66. Current Technical Literature Co. Pvt. Ltd. Madan Zampa Road (Rest) India House, 1st Floor,
Bhopal Opp. G.P.O. (Reg.)
55. Lyall Book Depot 67. C. Jamnadas & Co, Bookseller
Moh Din BuildinS 146 C, Princess Street (Reg.)
Sultania Road (Reg.) 68. International Book House Ltd.
Bhubaneshwar Indian Mercantile Mission Bxtn. Madame Cama Road (Reg.)
56. The Modern Book Depot Unit 111. Stational Square (Reg.) 69. Kothari Book Depot
57. Vani Vikash Acharya Dande Marg. Parel (Reg.)
B-1, Saheed Nagar (Rest) 70. Lakhani Book Depot
58. Bidya MaJ1dir Girgaum (Reg.)
Eastern Tower Market Building (Rest) 71. Lok Yang Maya Oriba Pvt. Ltd.
Bhavnagar 190/B. Khetwadi Main Road (Reg.)
59. Shah Parsbotam Das Gigabbai 72. World Literature M.G. Road (Rest) Pyara Singh Chug House
La1 Bahadur Shastri Marg. Bhandup (Rest) Bholpor
60. Bholpur PustakaJaya 73. M. & J. Services
Rabindra Sarani 2-1, Mohan Kuoj Dadar
P.O. Bholpur, Birbhum (W.B.) (Rest) 68, JyoteJea Fule Road (Reg.)
mjapur 74. Popular Book Depot Dr. Bhadkamkar Road (Reg.)
61. Shah D.V. Deshpande Prop. Vinod Book Depot 75. Sunder Das Gian Chand Near Sherabhthe Chowk (Rest) 601, Girisaum Road
62. Ajay Law Agency Near Princess Street (Reg.)
Hospital Chowk (Best Chopra) Bhagvan Bazar (Rest) 76. Thacker &; Co.
Rampart Row (Reg.) Baidyu8th
63. Jaidip Agency 77. All India Book Supply Co.
Distt. San thai Parganas. Bihar (Rest) Kalbadevi Road (Reg.)
4
78. Students Book Centre 93. Girl Trading Agency 4-Narayan Niwas Bhandarkar Road. Matunga (Rest) 10/2. Jambul Wadi
94. Bombay Law House Kalbadevi Road, Bombay-400002 (Rest) 76, Madows Street (Rest)
79. Aruna Enterprise 64, Shan grill, 6th Floor 95. Executive Book Services
Near Colaba South Post Office 74, Princess Street (Reg.) Bombay.400005 (Rest)
96. G.A. Brothers 80. Vora Book Stall 50. Princess Street (Rest)
146/B, Shamal Das Gandhi Marg Chikhal House, Bombay·400002 (Rest) 97. Devendra S. Sharama
81. Shanti Book Depot Sattan Chawl, R·7 H.F. Society Road
11, Happly Home, Vallabh Baugh Lane 5th Natwar Nagar Road
Ghatkopar (East) Bombay.77 (Rest) Jogcshwari (E) (Rest)
82. Usha Book Depot 98. Nav Bharat Sahitya Mandir S85/A, Chitra Bazar (Reg.) 162, Shamal Das Gandhi Marg
Princess Street (Rest) 83. Dhan Lal Bros.
5, Gandhi Road (Reg.) 99. Sterling Book House
84. N.K. Tripathi Pvt. Ltd. ISI·D.N. Road, Fort (Rest)
Princess Street (Reg.) 100. Vidya Book House
85. Bhayani Book Depot 19·Krishna Niwas. CRest)
I SO, Prince~s Street (Reg.) 101. R. Basant &; Co.
86. Shri Agency 3~C. Podar Chambers
6, Harish n-D Dixet Road Sayed Abdulha Brelvi Road (Rest)
Vile Parle (Reg.) Caleutta
87. Universal Dook Depot Corpn. 546, Jar Mahal, Dhabi Talao (Reg.) 102. Das Gupta & Co. Ltd.
88. Subscribers Subscription Services India 54/2, College Street (Reg.)
190, Bazar Gate Street (Rest) 103. Venus Book Agency
89. C. Shanti Lal & Co. 20, British Indian Street 86, Princess Street (Reg.) Ground Floor, Calcutta-700069 (Rest)
90. Creative Books & Periodicals Pvt. Ltd. 17, Police Court Lane (Reg.) 104. R. Chambrary & Co. Ltd.
Kant House, 91. A.K. Agencies P-33 Mission Row Ext. (Re8.)
L2/15, Luxmi Raman Society Bangur Ngr. (Reg.) 105. S.K. Lahiri & Co. Ltd.,
Jaina Book Agency (India) College Street (Reg.)
92. 649·A, Goregaon 106. W. Newsman & Co. Ltd. Dhabi Talao (Reg.) 3-01d Court House Street (Reg.)
S
107. Mukherjee & Coy. 124. Lahari" Co. P-27-B, C.I.T. Road, Scheme-52 (Rest) 8/IA, Ashtos Road (Rest)
108. K.K. Roy. 125. Unique Form Centre
5S-Gariahat Road, P.B. 10210 (Rest) 1. Mangoc Lane (Rest)
109. Manimala 126. Sh. L.C. Paul
123-Bow Bazar Street (Reg.) 34oF, Canal West Road (Rest)
110. Modem Book Depot Cbandigarb
78-Chowringhee Centre (Reg.) 127. Jain Law Agency
111. New Script Shop No.5, Sector 220 (Reg.) 172/3, Rash Behari Avenue (Reg.)
128. Rama News Agency 112. Mukhrjee Library
BookseI1ers Secter-22lReg.) 1, Gopi Mohan Datta Lane (Rest)
129. Universal Book Store 113. K.L.M. (P) Ltd. Sector 17-0 (Reg.)
251-B.B. Ganguly Street (Res.) 130. English Book Depot
114. Scientific Book Agency No. 34. Sector 22-0 (Reat) 103-Netaji Subhash Road (Reg.)
131. Jain General House 115. P.D. Upadbyay No. 70-72 (2)
IS-Munshi Sardaruddin Lane (ReI') Sector 17-D (Reg.)
116. G .A. Enterprise 132. Manik Book Shop IS/Ill, Sinthee Road (Reg.) 70-72 (5), Sector 17-D (Re,.)
111. K.P. Bagcbi 133. Naveen Book Agency 286-B.B. Ganguly Street (Reg.) 80-82. S~or 17-D (Rest)
118. Overseas Publications 134. Chandisarh Law House
14-Har Street (Rest) 1002, Sector 22-B (Rest)
119. Book Corporation 135. Variety Book Store
I-Mangoc Lane (Reg.) Soo 69, Sector 17-D (Rest)
136. Legal Book Centre 120. S.C. Sarkar " Sons Pvt. Ltd. Sector 57-58-59
Law Publisher" Book Sellers Near Fountain Bankim Cbattarjee Street: 700 073 (Reg.)
Cuttack 121. Techno Dooks International 137. Managcr Cuttack Law Times
P-4, New Howrab Approach Road (Rest) Cuttack (Reg.)
122. Basaniwal Enterprises 138. Books International 309-Bipin Behari Ganguli Street (Rest) Banka Bazar (Rest)
123. Best Books 139. Legal Reliables IA College Row (Rcst) Biswanath Lane (Rest)
6
Chindwara 154. Dhanwantri Medical & Law Book House
140. Lath Enterprises 1522-Lajpatrai Market (Reg.)
6/62-63. Narsinghpur Road (Rest) 155. Federal Law Depot
Coimbatore Kashmere Gate (Reg.)
141. Marry Martin 156. Indian Army Book Depot 14/42 B Third Street Tata Bad (Reg.) 3-Ansari Road, Daryaganj (Reg.)
142. Continental Agencies 157. 1M. Jaina & Bros. 4-A, Sakthi Vihar (Rest) Mori Gate (Reg.)
143. Radhi Mani Stores ISS. K.L. Sethi 6O-A. Raja Street Rest B-5S. Shakarpur (Reg.)
Chirala 159. Universal Book & Stationery Co. 16-Netaji Subhash Marg (Reg.)
144. Mahalakshmi Enterprises Opp. Mohan Theatre (Rest) 160. Universal Book Traders
SO- Gokhle Market (Reg.) Debradun
Bishan Singh & Mahendra Pal Singh 161. Young Man & Co.
145. Nai Sarak (Reg.) 23-A, Cannaught Place (Reg.)
146. Jugal Kishore & Co. 162. General Book Depot
23-C, Rajpur Road (Reg.) 1691-Nai Sarak (Reg.)
147. Natraj Publishers 163. Munshi Ram Manohar Lal
52-Raj pur Road (Reg.) Oriental Bookseller & Publishers P.B. 1165, Nai Sarak (Reg.)
14S. International Book Distributor 1st Floor. 913 Rajpur Road (Reg.) 164. Premier Book Co.
Nai Sarak (Reg.) Damoh
165. Motilal Banarsi Das 149. Ram Shankar Agrawal Bungalow Road, Jawabar Nagar (Reg.)
253-Asati Ward-2 (Rest) 166. Sangam Book Depot
Delhi Main Market Gupta Colony lReg.)
ISO· Atma Ram & Sons 167. University Book House Kashmere Gate (Reg.) IS-U.B. Banglow Road, Jawaher Ngr.
lSI. D.K. Agencies (P) Ltd. (Rest)
73-B, Anand Nagar (Inderlok), 16S. Om Law Book House Delhi-I 10035 (Rest) Gokhale Market Civil Court Compound
152. Bahri Bros. (Reg.)
243, Lajpat Rai Market (Reg.) 169. Ashok Book Agency
153. BookweU Poorvi Shalimar Bagb (Reg.)
8S-Sant Nirankari Colony 170. D.K. Book Organisation P.B. 1565, Delhi-9 74·D. Anand Nagar (Reg.)

7
)7J. Hindustan Book Agencies (India) 187. Delhi Law House 17·UB, lawahar Nagar (Rest) 77-Gokhlr Market (Rest)
172. Eagle Book Services 188. Medical Hou!.e (Regd.> F-195 Mansarover Garden (Reg.) 3656-Qutab Road (Rest)
173. Raj Book Agency 189. Sher-e-Punjab Law Book House A-99, Shiv Puri (Reg.) 3/8, Kuncha Mir Ashiq. Chawri Bazar
(Rest) 174. Krishna Law Hou~e
Tis Hazari (Reg.) 190. Capital Agencies Balbir Nagar, Shahdrua (Rest)
175. Indian Documentation Service Ansari Road (Rest) 191. Law Literature House
2646-BiJimaran (Rest) 176. Standard Booksellers
402. Kueha Bulaji. Chandni Chowk 192. Ajanta Books International
Dariba Kalan (Reg.) I-UB lawahar Nagar (Rest)
177. Sbyam Bros. 193. V.K. Bros, Fl Old Seemapuri IX/5134. East Old Salimpur Delhi (Rca.) Shahdara (Rest)
178. Capital Law House 194. Pustak Jagat
Viswas Nagar, Shahdara (Reg) Moti Nagar (Rest)
179. Ekta Book Co. 195. Jitendra Book Services
Majlis Park, Adarsh Ngr. (Reg.) Sitaram Bazar (Rest)
180. Commercial Houlle 196. Research Co. 1478-Dewan Hall Road 1865, Tri Nag~r (Rest) Ncar Moti Cinema (Rest)
197. International Trade Linkers.
181. Venus Enterprises Booksellers & Publishers Model Town (Rest) B2185, Ashok Vihar Floor-II (Reg.)
198. Chomica Botanica
182. Fine Book Services I.P. Exten., Delhi (Rest)
10520 Baghichi Purki Subzi Mandi, Delhi (Reg,) 199. Pustak Mahal
183. Texla Law Agency Khari Baoli (Rest)
Gurdwara Marg, Shahdara (Rest) 200. eRG Publications
184. Emvee Enterprises 8/57-A Vijay Nagar, Double Storey (Rest]
632·Bhai Pramanand Colony (Rest) 201. Pioneer Publications
185. All Indian Educational Supply Co. 12 -Banglow Road (Rest)
lawahar Nagar (Rest) Dbanbad
186. Roop Rai Bros. 202. New Skotoch Press 20e·Bhai Parmanand Colony (Reg.) P .B. 26 (Rest)

203. P.M. Ansari Hitapur (Rest)
DarbhaDga
204. Sahitya Sagar P.B. No. 12, P.O. Imhorisarai (Rest)
Dbule
20S. Swanandi Knowledge Book Agency (Rest)
ErnakDlam
206 Pai &. Coy. Broadway (Reg.)
Ferozpur Cantt.
207. English Book Depot 78-Jhok Road (Reg.)
Gauhati
20S. United Publishers Pan Bazar Main Road (Rest)
209. Ashoka Publishing House (Rest)
Gay.
210. Sahitya Sadao Gautum Hudh Marg (Reg.)
Goa
211. Savitri Book Agency Indra Niwas, Bordom Bicholim lRcst)
212 Prabhu Book Service Nai Subji Mandi (Reg.)
213. Indian Publication 2052·Sectors Urban Estate (Rest)
Gandhidham
214. Abdee Agency TBZ,26
Guntur
215. Bharat Book Depot, 3rd Line, Arundelpet (Rest)
8
G".lior
216. Loyal Book Depot Saraswati Sadan, Patankar Bazar (Reg.)
217. Tatar Bros. Sarafa Bazar, Lashleer (Reg.)
21S. Anand Pustak Sadan Shinde Ke Chhaoni (Res.)
219. M.e. Dafter Bros. M.B. lain & Bros. Sarfa, Lashkar (Rest)
220. Adarsh Pustak Sadan 5/26, Bhan Ka Bazar (Reg.)
221. A. Gupta Book Agency, Anand Niwas, Falka Bazar (Rest)
Gbaziabad
222. Gupta Book Agency 69. Gupta Colooy
Hydefabad
223. Books Syndicate Devka Mahal. Opp. Central Bank (Reg.)
224. Labour Law Publications 873, Sultan Bazar (Reg.)
225. Madhavi Agencies, Near St. Theresa's Girls Convent, Elura·S34006. (W.G.Dt.) (Rest)
226. Asia Law House Opp. High Court (Reg.)
227. Book Links Corporations Narayanagoda (Reg.)
228. Ratna 16-11-493, Dilsukh Nagar Colony (Rest)
229. National Law House 4-3-714. Ramkute (Rest)
Hardwar
230. Pandi Salyeshwara Nand Kailash Chand Pandey Saraswati (Reg.)

23]. Rudrakash Mala Pustakalaya Bara Bazar (Rest)
HI .....
232. Jain Book Depot Rohtak Wala Nohara Agra Road (Rest)
233. Raghu Enterprises Gaushala Road, Chandra Puri (Rest)
Jadore
234. Modem Book House Shiv Vilas Palace (Reg.)
235. Surya Kant Dinesh Kan t Swaroop Sahitya Sadan, 21J.Khajuri Bazar. M.G. Road
Impha)
236. P.C. Jain Co. Jmpbal Manipur (Rest)
237. K.C. Robbi MIs. Kecec Enterprises. Poona Road (Rest)
238. Khuraijam Ajit Singh Pukhri South (Rest)
239. R.K. Manikant Singh.
Jaipur
"THANGMEI BAND " Senapati Kollup. Imphal-795004 (Rest)
240. Bharat Law House Booksellers & Publishers Opp. Prem Prakash Cinema (Reg.)
241. Books &. News Mart. M.I. Road, laipur-302001 (Rest)
242. PitaJiya Pustak Bhandar Mishra Rajaji Ka-Rasta (Reg.)
243.' Kishore Book Depot Sardar Patel Marg (Reg.)
9
Jameshedpur
244. Gupta Stores Dhatkidith (Reg.)
JamBagar
245. Swadesbi Vastu Bhandar Ratnabai Masjid Road (Reg.)
:>46. Scientific & Technical Literature Co. Teen Batti <Rest)
Jodhpur
247. Owarka Das Ratbi Wholesale Books, Cinema and News Agents Outna Sujatigarh (Reg.)
248. Rathi's Media Centre. Rathi Bhawan. Over Bridge, Jodhpur-342001 (Rest)
249. Rajasthan Law House. High Court Road (Reg.)
250. Kanpoon Prakasbak Opp. Gurudwara Anand Cinema Road (Reg.)
251. United Book Traders Opp. Police Lane (Rest)
252. Charbhuja Traders Juni Mandi (Rest)
Jabalp.r
253. Modem Book House 286.Jawaharganj (Reg.)
254. Paras Book 129·CaBtt. (Rei,)
JIII.si
255. Universal Law House Manik Chowk (Rest)

Jamnm
256. Heldia Publishers 128.A, Gandhi Nagar (Rest)
JbUDjbuDUD
257. Shashi Kumar Shuat Chander Jhunjhunun tReg.)
Jalanclbar City
258 Law Book Depot Adda Basti. G. T. Road (Rest)
Kakinada
259. N. Venkateshwar Rao Mangapathy Agencies (Rest)
Kanpur
260. Advani & Co. P. Box 100. The Mall (Reg.)
261. Sahitya Niketan Sharadhanand Park (Reg.)
262. Universal Book Stall The Mall (Reg.)
263. Law Book Emporium 16/60, CivIl Lines tReg.)
264. Pustak Bhawan 40/69, Paredi (Rest)
265. AdvanJ Book Distributors 34-Anand Bazar 7/199 Swaroop Nagar (Rest)
Karaikal
266. Selvi Store House 185-188, Thiruvallar Road (Rest)
267. Potdar A vinash Sitaram, 1946. B· Ward. Manglawar Peth Kolbapur-416002 (M.S.) (Rest)
10
:luat.
268. S.V. Kamat Kumta (Reg.)
Kuipet
269. V. A. N. Raju New Agent (Rest)
KUrseODg
270. Ashoka Bros. 69-HiB Cart Road P. O. Kurseong (Rest)
271. I. D. Sinha Kailash Pustak Bhandar 12 Park Location (Rest)
Karnataka
272. Aspiration Stores Post (AMP) Via Hospet (Rest) Pin Code 583201 (KARNATAKA)
Kottayam
273. Law India Book SeUers & Publishers (Rest)
Kishtwar
274. Wazir Book Deptt. (J&K) (Rest)
Luckno"
275. British Book Depot 84. Hazarat Ganj (Reg.)
276. Eastern Book Co. 24. LaIbagh Road (Reg.)
277. Ram Advani Hazarat Ganj. P. B. 154 (Reg.)
278. S. Kumar and Associates Guru Govind Singh Marg (Reg.)
279. Aquarium Supply Co. C-14, Vivekanandpuri (Rest)
280. Law Book Academy 19S·Rajendra Nagar (Rest)
281. U. P. Plastics & Marketing 111 Mawaiya Park (Rest)
Ladhiana
282. LyalllBook Depot Chavra Bazar (Reg.)
283. Mohindra Bros. Kachori Road (Rest)
284. Nanda Stationery Bhandar Pustak Bazar (Reg.)
Madru
285. C. Subha Chetty & Co. 62-Big Street, Tripalicane (Reg.)
286. P. Vardhachary & Co. 8-Linghi Chetty St. (Reg.)
287. Shunmugam Book Stores News Agent & Book Sellers 28 South Bazar Kovilpatti.627701 Tamil Nadu (Rest)
288. Multi Services 23-Ranganathan Street T. Nagar Madras-6000 J 7. (Rest)
289. C. Sitaraman & Co. 33.Royapettach High Road (Rl!g.)
290. Madras Book Agency 42-Tirumangalam Road (Reg.)
291. Swamy Publishers P. B. No. 2368 (Rest)
292. Sangam Publishers II-S. S. Street (Reg.)
293. G. Somasundaram 44-Areat Road, Vadapalain (Rest)
294. M. M. Subscription Agencies Harington Road (Rest)
11
295. Lea Lives 71O-T. H. Road (Rest)
296. West Coast Paper & Stationers Hampankatta Square Mangalore-57500l. (Rest)
Meerut
297. Loyal Book Depot Near Govt. College (Reg.)
298. Angira Library 51-Victoria Park Octroi (Rest)
299. Bharat Educational Store Chippi Road (Reg.)
Moradabad
300. Rama Book Depot Station Road (Rest)
Mhow Cantt.
301. Oxford Book Depot Main Street (RestJ
Mathara
302. A. N. Gupta Railway Book Stall. Railway Station (Rest)
Mussoori
303. Hind Traders Ramanand Shop, Deodhar Road (Rest)
Mysore 304. People Book House
Opp. Jagan Mohan Place (Reg.)
305. Geeta Book House New State Circle (Reg.)
NaiDi Tal
306. Council Book Depot Bara Bazar (Reg.)
Nagpar
107. Western-Book Depot Residency Road

12
308. Tribal Research Centre 322. Prashanta Publisher Block No. 11. Surajbali Rd. 18-D, LUDsdeD Square, Ncar Birla Mandir Sadar (Rest) Delhi-I 10001 (Rest)
Nadiad 323. Book Corporation IS, Dr. Ambedkar Stadium Market
309. R. S. Desai Delhi Gate, New Delhi-110002 (Rest) Station Road (Rest)
Chaware Y cshwant Rao Gyanobarao 324. Ratnason Publication Agencies
310. III-G/49, Lajpat Nagar Knowledge Book Agency (Rest) New De1hi·llOO24 (Rest)
Nashik 325. Shuu and Company (Services) (P) Ltd. 3U. G.K. Bros. 29-A, Mig-Plats, Rajouri Garden
Main Road (Reg,' New Delhi-I 10021 (Rest)
New Delhi 326. Jyana Book Depot
312. Atlantic Publishers and Distributors Karol Bagh 'Reg.)
B-2, Vishal Enclave, New Delhi-27 (Reg.) 327. Lakshmi Book Store
313. Amrit Book: Co. 72 Janpath, P.O. Box 558 (Reg.)
Connaught Circus tReg.) 328. Mehra Bros.
314. Aparna Enterprises 500, Kalkaji (Reg.)
New Delhi (Rest) 329. Na\l~g Traders
315. Centrlll News Agency Dcsh Bandhu Gupta Road Da, Nagar (Reg.)
23/90 Connaught Circus (Reg.)
316. English Book Stores, 330. Oxford Book &; Statienery Co.
7-2, Connaught Circus (Reg.) Scindia House <Reg.)
317. Jain Book Agency C/o Prem House. 331. People Publishing House (P) Ltd. Connaught Circus (Reg.) Rani Jhansi Road (ReB.)
318. Rajdhani Prakashan, 20, Ansari Road, 332. Rama Krishna &; Sons (Lahore) Darya Gang, New Delhi-ll0002 (Rest) 16/B, Connaught Place (Reg.)
319. Marwab Publisher, Distributors (P) Ltd. 333. R.K. Publislicrs
H-39, Green Park Extension 23/B, Beadanpura, Karol Bagb (Reg.) New Delhi-16 (Rest)
Estern Book Company (Sales) 334. International Book House 320. Nehru Place (Rest) 1267/1268, Kashmere Gate
Delbi-6 (Rest) 335. Ravindra Book Agency
321. Country Book House 30-C, Amar Colony Market Lajpat Nagar (Reg.) Shop No. G-5, Jyoti Bhawan
. Commercial Complex, 336. Hind Book House Dr. Mukherji Nagar. Delhi-9 (Rest) ~2-Janpath (Reg.)

13
337· Sat Narain & Sons 353. UBS Publishers 40·A. NDMC Market, Babar Road (Rca.) S·Ansari Road (Reat)
338. Delbi Book Co. 354. Deep Publications M/12, Connaught Circus (Rest) 154/B, Savitri Nagar (Rest)
339. Navrang 355. Sanaccp Pustak Bhandar P.B. 7, Indrapuri (Rest) Rajouri Garden (Rest)
340. Book India Corporation 356. Print India
Ncw Rohtak Road (Reg.) II-Darya Ganj (Rest)
341. Globe Publishers 357. National Literature Palace 13, Jaipur Estate East (Rest)
WZ·230, Ram Chowk, 342. Scientific Instruments Stores Palam Enclave (Reg.)
A-35S. New Rajinder Nagar (Reg.) 358. Kamal & Co.
343. Jain Bros. 302·Gautam Nagar (Rest) East Park Road, Karol Bagb (Rest)
359. S. Chand &. Co. Ltd.
344. Jain Map &; Book Agency P.O. Box No. 5733, Ram Nagar (Rea.)
Karol Bagb (Reg.) 360. Nceta Prakashan
Eastern Book Enterprisea 0-50, South Extension (NDSE) 345. Part-! (Rest> 1274/3, Had Singh Nalwa Street
Karol Bash (Rest) 361. Satish Book Depot
346. The Mac Millan Co, of India Ltd, 511 A2, New Market. Karol Bagb (Rest)
2/10 Ansari Road (Rest) 362. Mohan Law House
347. Star Publication Pvt. Ltd. 0-617. Malvi,a NaSa[ (Rest)
4/5-B. Asaf Ali Road (Rest) 363. Mabajan Book Agency
348. Grower Book & Stationery Co. Nanga] Raya (RegJ
58-Nehru Place, Shop No. 109 364. Rajendra Book Agenq New Delhi (Reg.) IV D/SO Old Double Storey
349. Modem Book Centre Lajpat Nagar (Res.)
H-39, Green Park (Reg.) 365. Eagle Book Servicca
350. Sterling Publishers (P) Ltd. F-195. MaDsarover Garden (ReI')
SafdarjuDg Enclave (Rest) 366. Suneja Book Centre
351. Golden Book Centre Connaught Circus (Reg.)
Bank Street. 367. Lakshmi Book Store Karol Bap Janpath (Reg.)
352. HaJjcct &: Co .• 368. Metropolitan Book Co. Ltd. Chuna Mandi, Pahar Ganj (Rest) 1, Nctaji Subhash Marg (Reg.)

369. Progressive Book Depot poo Ganj (Rest)
370. Space Age Ist-B/186, Lajpat Nagar (Rest)
371. Kamal Publications 33-Bhagat Singh Market Malvia Nagar (Rest)
372. Janta Book Comer uole Market (Rest)
373. Manohar Book Service XI/4239, Ansari Rd. Darya Ganj (Rest)
374. Universal Law Linkers 330 Chi rag (Rest)
Nokha
375. Shri Shayam Sunder Misra M unsif Magistrate Nokha (Rest)
Nowgoog
376. Sri Padma Dhar Nath Morigaon Commercial Institute (Rest)
Pali
377. 'Om Prakash Sunil Kumar Sarafa Bazar (Rest)
Palgbat
378. Kumar Printers Printers & Publishers Ottapalam (Rest)
Patol
379. J.N.P. Aggarwal & Co. Padri Ki Haveli (Reg.)
380. Vibhagiya Prakashan Vikri Kendra Atetha Karayalaya, Neva Sachiwalaya (Reg.)
14
381. Laksbmi Trading Co. Pardri Ki Haveli Patna (Reg.)
Poodicherry
382. Jagan Nath Pandit &. Sons Arfabad Colony P.O. Gulzarbagh (Rest)
383. Puthaghalam 142, Gandhi Road (Rest)
384. Honest Book House 9 Rua Duplix (Rest)
Pune
385. Saraswat 1821/1 J.M. Road Opp. Modem High School (Reg.)
386. International Book Service Deccan Gbym Khana (Reg.)
387. Raka Book Agency Opp. Nathers Chawal Near Appa Balwant Chowk (Reg.)
388. Verma Book Centre 649 Naraya Path (Rest)
389. Popular Book House, 75 Deccan Ghym Khana (Reg.)
390. Dastane Ramchandra & Co. 456. Raviwar Path, Phadke Hand Chowk (Rest)
Pudukkottai
391. Meenkashi Pathippagam 4142, East Main Street (Rest)
392. P.N. Swaminathan & Co. Bazar Street (Reg.)
Rajkot
393. Y ogayoga At & Co. P.O. Nayagar Dt. Puri-752069 Orissa (Rest)
394. Viaay Book Depot Opp. Health Visitors School Bank of India Building (Reg.)
395. Mohan Lal Dossabhai StatelBank of India Building (Reg.)
Raipur
396, Central Book House Sadar Bazar (Rest)
Ranchi
397. Crown Book Depot Upper Bazar (Reg.)
398. Chotanagpur Law Agency Court Compouud (Rest)
Rajgangpur
399. Crown Tire & Equipment Co. Block No.1 Qr. No. 30 D.C. Colony (Rest)
400. Law Books Agency Bhupendra Road Shiv Bhawan Opp. Swami Narayan Temple Raj Kot~360001 (Rest)
Robenonpet
401. Eswari Book Centre 11 & 12 Market (KGF 563122) '(Rest)
Rotbak
402. Manthan Publications B·l11/1629. Para Mohalla (Rest)
403. The Law House Opp, Chotturam Park (Rest)
Sangrur
404. Darshan Pustkalaya Gandhi Marg (Reg.)
Secunderabad
405. Anapurana Industries 1·3·14 Kalasegada (Rest)
0406. Vijay Book Apacy 11-1·477 Mylar,adda
ShimJa
407. Minerva Book House the Mall (Rest)
408. Ambe New Agency H.P. University Campur Summer Hill ShimJa (H.P.) J 11 005 (Rest)
Sikkilb
409. Rachna Development Area Gangtok (Rest)
ShriUong
410. Paul Agency & Distributors Umpling Shillong (Rest)
Sivakasi
411. Ganesh Stores South Car Street (Rest)
Salem
412. Jain Magazine Agency Rajgarh Road (Reg.)
Sunt
413. Shri Gajanan Pustakalya Tower Road (Reg.)
414. Raghuwanshi Law House Near Pura Gate (Rest)
Solapur
415. Gazanan Book Stores Main Road (Rest)
Sunam
416. Sahiba Agencies Gceta Rhawan Road (Rest)

SUaranpur
417. Chandra Bbarata Pustak Bhanndar Court Road (Rest)
418. Verma & Co. P.B. No. 51 24/6 Gatta Mail Colony (Rest)
Tiroehirapalli
419. Shri Vidya Book Shop 62 High Road (Rest)
TriYaocJrum
420. Sukumai Book Stall Station Road (Rest)
421. International Book Depot P.B. 4 Main Road (Reg.)
422. Shri Devi Book House Dcvi Vilas Compound (Reap
TuticoriD
423. K. Thiagarajan (Rest)
Umretb
424. Indu Kumar Ochbav Law~Gandhi (Rest)
VllI'8oui
425. Viswa Vidbayalaya K.40/18, Bbaironatb Marg (Reg.)
426. International Publicity Service Bhaironath Kathki Haveli (Reg.)
l' 427. Kalpana Corporation
P.B. No.5, Varanasi (Rest)
428. Meena Book Centre Varanasi (Rest)
VishakhapatBam
429. K.V. Book: Stores Marripalam Vizag (Visakbapatanam-5300 J 8) (Rest)
430. Gupta Bros. (Books) Vizia Building Main Road (Reg.)
431. Book Centre Main Road (Rest)
Vij.p".da
432. Vishalandhara PublisbioS Cband Ram Building (Rest)
433. Novadaya Subscription Agency (Reg.)
Villapuram
434. Baby Stores 167·168, Tbiru-vi.ka-Road (Rest)
Vellore
435. S. Thangavalu Booshan Nagar. Solavanpit (Rest)
Copyright © 2022 FDOKUMEN