Private schooling for low-income families: A census and comparative survey in East Delhi, India
Upload
khangminh22Category
view
1download
0
CENSUS' OF INDIA .1991
SERIES-20
PUNJAB
PART IX .. A
fOWN DIRECTORY
Directorate of Census· Operations 1
Punjab
Reglstrar General of India (In charge of the census of India and vital statistics)
Office Address: 2A Mansingh Road New Delhi 1100'11. India
Telephone: (91-11 )3383761 (91-11)3383145 [email protected] http://www.censusindia.net
Fax: . Email:
Internet:
Registrar General of India's publications can be purchased from the following:
•
•
•
•
•
The Sales Deppt (Phone:338 6583) Office of the Registrar General of India 2-A Mansingh Road New Delhi 110011, India'
Directorates of Census Operations In the capitals of all states and union territories in India
The Controller of Publication Old Secretariat Civil lines Delhi 110 054
Kltab Mahal . Stflte Emporia Complex. Unit No.21 Baba Kharak Singh Marg New Delhi 110001
Sales outlets of the Con'troller of Publication allover India
Census data available on floppy disks can be purchased from the following:
• Office of the Registrar General, India Data Processing Division 2nd Floor, 'E' Wing Pushpa Shawan Madangir Road New Delhi 110 062, India
Telephone: {91-11)6961558 Fax: {91-11)698 0295 Email: [email protected]
© Registrar General of India
The contents of tbis publication may be quoted citing the source clearly
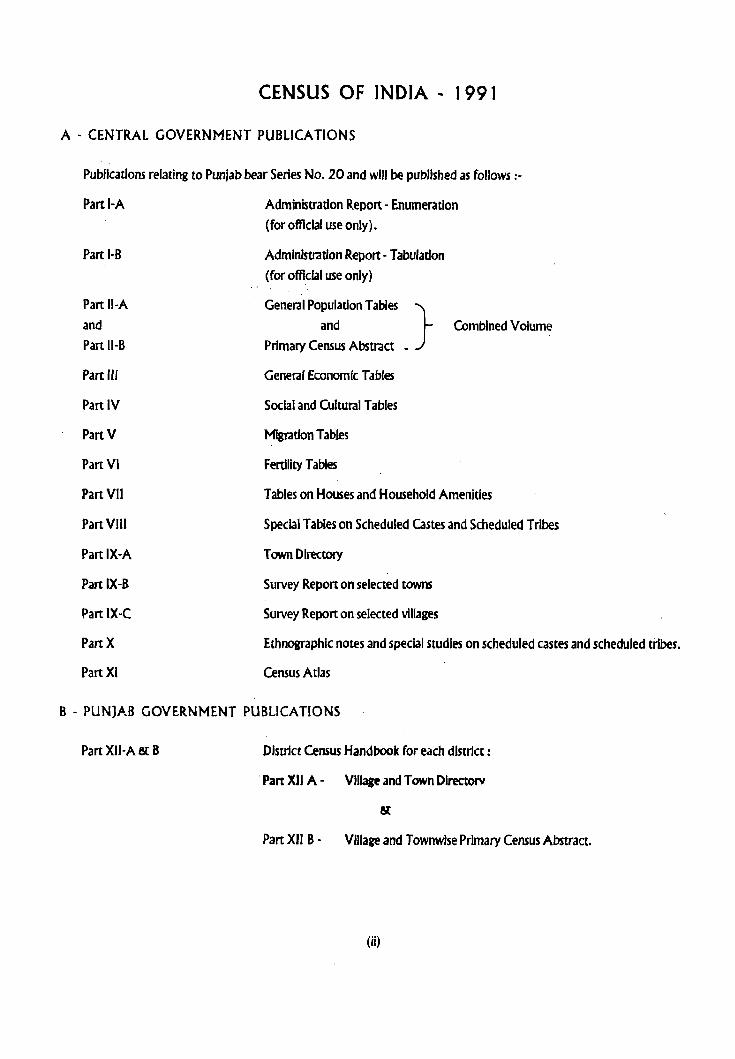
CENSUS OF INDIA - 1 991
A . CENTRAL GOVERNMENT PUBLICATIONS
Publications relating to Punjab bear Series No. 20 and will be published as follows :-
Part I-A
Part I-B
Part II-A and Part II-B
Part III
Part IV
PartV
Part VI
Part VII
Part VIII
Part IX-A
Part IX-B
Part IX-C
Part X
Part XI
Administration Report - Enumeration (for official use only).
Administration Report -Tabulation (for official use only)
General Population Tables } and
Primary Census Abstract •
General Economic Tables
Social and Cultural Tables
Migration TabJes
Fertility Tables
Combined Volume
Tables on Houses and Household Amenities
Special Tables on Scheduled Castes and Scheduled Tribes
Town Dlre<:tory
Survey Report on selected towns
Survey Report on selected villages
Ethnographic notes and special studies on scheduled castes and scheduled tribes.
Census Atlas
B - PUNJAB GOVERNMENT PUBLICATIONS
Part XII-A & B District Census Handbook for each district:
Part XII A - Village and Town DlrectolV
Part XII B - Village and Townwlse Primary Census Abstract.
(ii)


FOREWARD
PREFACE
CONTENTS
SECTION - A
ANALYTICAL NOTE
STATEMENTS
Statement -I
Statement -II
Statement - III
Statement -IV &
Status and growth history
Physical aspects and location of towns, 1989
Municipal Finance, 1988··89
Civic and other Amenities, 1989
Statemem IV-A Civic and other amenities in notified slums, 1989
Statement -V
Statement -VI
APPENDICES
Appendix-I
Appendix-II
Appendix-III
Appendix-IV
Appendix-V
MAPS
Medical, Educational, Recreational and Cultural Facilities, 1989
Trade, Commerce, Industry and Banking, J 989
Urban Primary Census Abstract
Location of towns arranged in alphabetical order
Towns arranged according to population size, 1991.
Towns arranged district-wise according to population size, 1991.
Towns showing their oLitgrowth with population
Places of tourist interest in towns of Punjab
SECTION - B
(iii)
Pages
v
vii
3
70
90
110
122
142
170
194
221
226
229
232
'35

FOREWORD
The State-level Town Directory was brought out for the first time after the 1971 Census. The tradition of compilation of such a Directory after every census is continuing since then with some minor modifications. It provides basic data on demographic, economic, social and cultural aspects in respect of each town in a state. This publication has in fact proved to be of immense utility to planners, administrators, academicians and researchers. The basic frame of the Town Directory of 1991 ~erles is more or less the same as In the case of earlier censuses.
The Town Directory is divided into two sections: Section-A, besides providing primary census abstract, contains an analytical note, the town directory covering 7 statements (I-VI and IV-A) and a few appendices. The statements No. I to VI provide for each town information on the origin and growth history of population, physical aspects; latest position regarding municipal finance, civic, medical, educatlQnal, recreational and cultural facilities available in the town as a whole as also details on trade, commerce, industry and banking institutions etc. Statement IV -A introduced for the first time in 1981 Census provides information on the availability of civic and other amenities in the notified slums of the cities and Izrge towns having 50,000 or more population each. Section - B contains a number of important maps including maps on land-use pattern.
It is hoped that the present volume will be useful to the Central/State Government departments, district administrations, local bodies etc. in micro-level planning and administration of the urban areas and for preparing the development plans in relatIon to their hinterland. The maps on land··use whiCh present morphology of the towns are expected to be helpful to the town planners for working out balanced, well integrated and farsighted developmental plans.
The data for the town directOlY have been collected and complied painstakingly in the Censu5 Directorate by a team of devoted workers led by Sh. H.L. Kalla, Joint Director under the direction of Shri D.S. Jaspal, I.A.S., Director of Census Operations, Punjab. These data were collected through local administration and various concerned departments of the State Government. The task of planning, finalisation and coordination of dlis publication was carried out centrally by Dr. M.K. Jain, Deputy Registrar General, (Social Studies) uf my office. Smt. Minati Ghosh, Deputy Registrar General (Map), provided the technical guidance in thr preparation of the maps. The draft manuscript compiled in the Census Directorate has been scrutinised in the Social Studies Division at the guidance of Shri Budh Singh, Deputy Director.
I thank all other officers who have' contributed to this project.
(A.R. NANDA)
Registrar General, India
New Delhi
Dated: 21 st February, 1 994.
(v)


PREFACE
Urbanisation is an index to economic development. The levels of urban development also usher in an era of economic growth of an urban centre. Besides natural increase (birth-death) the growth rate of urban population is a consequence of constant shifc from rural to urban areas. Moreover, it reflects the transformation taking place in the population from primary to secondary and tertiary sectors of the economy. It is a welcome change as long as the urban centres can withhold the pressure of the existing provision of requisite amenities viz., drinking water, sanitation, electrification, educational, medical, communicational, etc. However, the larger urban centres in particular, are becoming increasingly dense in population. Viewed in chis context, the current position in Punjab is that three out of every ten persons (29.55) dwell in urban areas as against four out of every ten (25.72) in India, excluding Jammu & Kashmir.
The Publication of all-India and State Level Town Directory was taken up in 1971 to acquaint the readers with the demographic, social, economic and cultural aspects of urbanites. This practice has continued in the subsequent censuses of 1981 and 1991.
The present volume brings out detailed data similar to 1971 and 1981 series with some modifications and innovations in order to make the publication more informative and useful. With this objective, a few statements and inset tables based on primary census abstract data and infrastructural facilities available, have been included. It also includes urban land use maps of some selected towns.
This volume has two sections. Section A includes analytical note, six statements and theh appendices. It also covers information on civil adiministrative status, growth history, physical aspects, civil and other amenities, municipal finances, recreational and cultural aspects, etc. Section B includes maps.
This basic census data relates to 1991 Census, and the non-census data pertains to the yearl989. This volume would be immensely beneficial for evaluation and undertaking the strengthening of the existing basic civic and infrastructural facilities in the towns.
The compilation of the State Town Directory was initiated in 1990 under the stewardship of Sh. D.S. Jaspal, lAS, Director of Census Operations, Punjab. We are greatly indebted to him for giving us JII guidance and encouragement for successful and timely completion of this project. The data for the Town Directory have been compiled as part of District Census Handbooks which have been separately brought out tor each district on behalf of the state government.
In blinging out this volume we have received immense guidance from Sh. A.R. Nanda, the ex-Registrar General & Census Commissioner, India. I am, however, greatly beholden to Dr. M. Vijayanunni, the Registrar General & Census Commissioner, India who has all along been giving useful guidance and encouraging us to complete this project most expeditiously. Our thanks are also due to Sh. M.K. Jain, Deputy Registrar General (SS) and Shri. Budh Singh, Deputy Director of Social Studies Division, and Smt. Minati Ghosh, Deputy Registrar General (Map) and Dr. R.P. Singh, Asstt. Registrar General (Map) of Map Division and their teams of workers for providing us all assistance in seeing this project through.
In my own Directorate, initially the project was looked after by Sh. A.S. Dhillon, Assistant Director. However, I have been ably assisted by S/Sh. N.S. Bhadauria, Assistant Director and Madhav Shyam, Research Officer (Map) in drafting and completing of this manuscript.
Sh. Bhagirath Singh, Investigator deserves special thanks for having completed the entire compilation work with assistance of S/Sh. Major Ram and Harcharan Singh, Computors, and Smt. Shashi Arora, Assistant Compiler.
(vii)

The maps included in this publica ion have been prepared in the map section by the team comprising of S/Sh. Surinderjit Singh, Sr. Geographer, Tejpal Singh, Cartographer, Jiwan Singh, Sr. Artist, Smt. Usha Kalra and Sh. Kulbir Singh, Artists and Sh. Jagjit Singh and Smt. Sangeeta Rahi, Draftsman under the overall supervision of Sh. Madhav Shyam, Research Officer (Map). The typing of the manuscript has been done by Sh. Pawan Bajaj, Sr. Steno. and the photostating by Sh. Ajit Singh, Daftri. I greatly appreciate the excellent work done by them and express my sincere thanks.
Dated: 24th July, 1996
(viii)
(H.t. KAllA)
Joint Director Directorate of Census Operations,
Punjab, Chandigarh

ANALYTICAL NOTE


ANALYTICAL NOTE
GENERAL INTRODUCTION
Punjab ranks among the most urbanised parts of India. According to 1991 Census, 29.55 percent of Punjab's population resides In urban areas and thIs is significantly hlgherthan that of the country as a whole(2S.71 %). During 1981-91, the urban population in Punjab State has Increased by 28.95 percent.
The levels of urbanisation achieved by an area reflect
The State Level Town Directory has two sections. Section A, besides giving brief analysis of the data and urban Primary Census Abstract includes following statements and appendices :-
Statement-I
Statement-II
Status and growth history.
Physical aspects and location of towns, 1989.
Its overall economic development. 'However, the Statement-III urbanisation patterns in our country are somewhat
Municipal Finance, 1988-89
different than that of advanced industrialised countries of Statement-IV the world. It does not refiect the industrialisation alone.
Civic and other amenities, 1989.
Rather, it is the pull and push factor which is affecting growth Statement-IV-A Civic and other amenities in notlfled slums, 1989. structure of urban components in India. Another distinct
feature of India's urbanisation, as true In case of Punjab's population as well, Is that the larger towns, though fewer in Statement-V Medical, educational, recreational and
cultural facilities, 1989 number, Inhabit a big chunk of urban population. At the same time, urbanisation is a complex phenomenon too and the emerging trends warrant a deeper understanding of urban Statement-VI Trade, commerce, Industry and
banking, 1989. setdements at various levels. The scientific analysis of urban data on Infrastructural facilities and Primary Census abstraC[ unfold the soclo-economlc and demographic variables. Most Appendix-I vital problems which are IntrinSically related with urban development Include; sanitation, water supply,
Location of towns arranged in alphabetical order.
electrification, communicational, educational, medical, etc. Appendix-II The study of urbanisation and Its Impact In view of the
Towns arranged according to popUlation size.
above said problems would help In knowing the demographic, social, economic and cullUral aspects of Appendix-III people.
Towns arranged district-wise according to population size.
The District Census Handbooks brought out by the Census Department on behalf of the State Government contain Village and Town Directory and Vlllagewise Primary Census Abstract. The need of bringing out the State Level Town Directory as a separate publication was realised in 1971 to caterto the needs of Town Planners, Administrators, Planners, Scholars alike. It was In this backgr'ount that all India and State Level Town Directory was first published In 1971. '
, It has been our endeavour to Improve upon the data at every Census, both qualitatively and quantitatively and with this In mind, certain modifications/additions were made In the data included in Town Directory of 1981 Census. The addItions/modifications made at the 1981 Census In the Town Directory broadly Included Information on civic administration status, Scheduled Caste/Scheduled Tribe population, adult literacy centres, civic and other amenities in slums of class I and class II towns etc. The pattern adopted at the 1991 Census has, by and large, been the same as that of 1981.
3
Appendix-IV
Appendix-V
Towns showing their outgrowths with population.
Places of tourist interest in towns of Punjab.
Section B of State Level Town Directory Includes maps, apart from four state maps.
Urban Land Use (ULU) maps of 18 selected towns are Induded In this publication. The towns for which Urban Land Use maps have been presented Include Pathankot, Flrolpur, Abohar, Machhlwara, Anandpur Sahib, Rupnagar, Sahibzada Alit Singh Nagar (Mohall), Nabha, Sirhind, Goblndgarh, Sangrur, Longowal, Bamala, Ahmedgarh, Bathlnda, Mansa, Farldkot and Moga. These maps show the rollowlng details :-
I. BUliness Are.1 : Wholesale business areas, retail trade business areas and mixed business/commercial are,,< other than above.

2. Industrial AIP.1 : Area of mix(>d Industries, areas of specified industries, areas of small scale industries, and other industrial or manufacturing areas.
J. Public Service AIC'J : Municipal Corporation areas dealing with administration, octroi and other associated activities, hospitals, dispensaries, maternity and child welfare centres/area, etc., banks, share markets, etc., water works, miscellaneous public service areas, mental asylum, leprosy homes, homes for the handicapped and community centres, etc.
4. Eduational AlC'a : All. educational institutions, arChives, museums, etc. and libraries.
5. liecreation.11 An'.1 : Parks, zoo, acqu~riums, play grounds, stadia, theaters, cinemas, etc. and cultural centres, etc.
6. Resident/ill An.>il : Residential area, slum and associated area.
7. Adm/nistfi1t/ve AmJ : Coures/jails, stare assembly, secretarlat,etc. government offices (excluding public service offices), and circuit house, dak bungalow, etc.
8. Miscell:meous
9. Open spaces/al71ble areiJs/other iJ/l'iJS
CENSUS CONCEPTS AND DEFINHIONS
It would be in the fitness of things to introduce the conceptual frame for defining the urban area and the related concepts followed by the Census of India.
TOWN
The definition of urban area as adopted at the 1991 Census is as follows :
a)
b)
All statutory towns Le. all places with a municipality, corporation, contonment board or notified town area committee, etc.
All other places which satisfied the following criteria i
I) a minimum population of 5,000
ii) at least 75 percent of the male working population engaged in non-agricultural pursuits; and
ili) a density of population of at least 400 persons per sq. km. (1,000 per sq. mile).
Besides the Directors of Census Operations in Statesl Union Territories were allowed to include, in consultation
4
with the concerned State GovemmenclUnlon Territory Administration and the Census Commissioner of India, some places having distinct urban characteristics as urban even if such places did not strictly satisfy all the criteria mentioned under category (b) above. Such marginal cases include major project colonies, areas of intensive industrial development, railway colonies, important tourist centres, etc.
URBAN AGGLOMERATION
The concept of Urban Agglomeration (UA) was introduced at the 1971 Census and has been followed In the subsequent censuses of 1981 and 1991.
An Urban Agglomeration fOlms a continuous urban spread and normally consists of a town and its adjoining urban outgrowths (OGs), or two or more physically contiguous well recognised OGs, if any of such towns. Thus, an urban agglomeration constitutes:
i) A city or a town with a continuous outgrowth, the outgrowth being outside the statutory limits but falling within the boundaries of the adjoining village or villages; or
Ii) Two or more adjoining towns with their outgrowth, if any, as in (i) above; or
iii) A city and one or more adjoining towns with or without outgrowths all of which form a continuous spread.
According to 1 991 Census, there are 120 urban areas in the state. Among them 112 have statutory Status and eight are census towns. The I 12 statutory towns are comprised of 3 Municipal Corporations, 96 municipal committees, 10 notified area committees (NACs) and 3 cantonment boards. Funher, 22 of these towns are urban agglomerations.
There were 37 UAs in Punjab at the 1971 Census. Their number came down to 19 at the 1981 Census because OG~ of the remaining 1 8 Urban Agglomerations of 1971 merged with their respective core towns. The number of UAs finalised for t 991 Census Is 22 and the details of which are given below ;-
N.weofUA D/strfcl
I. Sujanpur Gurdaspur
2, Pathankot Gurdaspur
3. Batala Gurdaspur
4. Qadian Gurdaspur
5. Majitha Amritsar
6. Dharamkot Firozpur

NameotOA iJIiIi'Iil
7. Zira FirozPur
8. ]alalabad FlroZllur
9. Samrala Ludiliana
10. Phagwara J(apunhala
11. N;!I1gal Township Rupn3glll'
12. Kharar Rupnagar
13. Patlala Pac/ala
14. Sanaur Patiala
IS. Goblndgarh Patiala
16. 11113wanigJrh Sangrur
17. loogowal Sangruf
IS. lunam Sangrur
19. T~ Sangrur
20. Mop FilJidkor
21. Faridkot Fari<loc
22. Jaiw Fa-/dkot
STANDARD URBAN AREA
IRlroooCE'!d .1ulte 1971 CemU!, lheconcept of Standard Urban Area (SUA) envisaged thl! projected growth of a cicy or tOwn l1av1ng a popu!adon of 50,000 or more In 1971, as it would be In 1991 taking Into account not only the towns and villages which would get merged Into it but also the imervening areas wllkh were potentially uroon. As such, the characteristic feature of a SUA emphasise that:
i} It should haVE a core town of <I mInimum population of 50,000.
ii) it shoold be a contiguous area made up of other urban as weff as rural admlnfsO'adve units havfng close mutuaf socio-economic linkage with the COil! townj and
Jiil the posslbHlcy is chac (he entire area would get urbanised within a period o{ 2-1 decades.
Based on chI" above criteria, Sute Town and COUntry Planning O1ganisatioA, PunJaIJ lit cOIuultatlon wIth Director, Census Operations, Punjab, under (he (Weld II guidance of Central Town and Country Planning Ory.nisation, finalised 1 2 SUAs at the 1971 Census. The same concept has i:leen followed in the subsequent censu5e5 of 1981 and 1991 in defining the SUA.
5
The details of (2 SUAs finalised for 1991 Census are as under :-
Dk&icc N_ofSUA
Gurdaspur I. Batala
2. Patllankot
AmrilSar 3. AmrllSaI'
FirOlllur 4. Abohar
5. Firozpur
Ludhia~a 6. Ludhiana
)al,mdhJr 7. Jalandhar
Kapun:hala a. Phagwara
Homiarjlur 9. HoWfarpUJ
Pat!a]a 10. Palia].
Batllinlla 11. Bathillda
raridkot 12. Moga.
CENSUS HOUSE
A 'Census House' is a building or part of <I building having a separace maln €ntr.mce {rom the road or (ommon courtYard or staircase, etc used or recognised as a .separate unit. It may be o(cupied or vacant. It may be used for a residential or non-re~idential purpose or both.
CE.NSUS HOUSE.HOLD
A 'Cen~us Household' is a group of persons who commonly tive together and would take lhelr mul5 from a common kitchen unless the exigencies of work prevented any of them from doing so. There may be a household of persons related by blood or a howel1olc:l of unrelated peBOtlS
or having a mix of both.
SCHEDULED CASTES/SCHEDUL£D TRISES
Articles 34 I and 342 of the Indian Constitution define Scheduled Castes and Scheduled Tribes respectively. Ankle 341 states thae me president may with respect to any State or Union Territory, and where It Is a Statel after consultation with (he Governor thereof, by public nodficacion, spedfy the casces, races or tribes arparcs of or groups Within castes, races, or tribes which shall for the purposes of this Consdtution, be deemed to be Scheduled Castes in relation to chat State or Union Territory, as the case may be.
Article 342 states that the President may with reipect to any State or Union Territory, and where it Is a State. afler consultation with the Governor ,hereof, by public notification specify the tribes or tribal communities or parts

of or groups within tribes or tribal communities which shall for the purposes of this Constitution be deemed to be Scheduled Tribes in relation to that State or Union Territory, as the case may be.
For the Punjab State, no Scheduled Tribe has bee~ notified under the Indian Constitution. As regards Scheduled Castes, 38 castes (including unclassified) have been notified and details of which are given below :-
1. Ad Dharmi
2. Balmiki, Chuhra, Bhangi
3. Bangali
4. Barar, Burar, Berar
5. Batwal
6. Bauria, Bawaria
7. Bazigar
8. Bhanjra
9. Chamar, Jatia Chamar, Rehgar Raigar, Ramdasi, Ravldasl
10. Chanal
11. Dagl
12. Daraln
13. Deha, Dhaya, Dhea
14. Dhanak
15. Dhogri, Dhangiri, Siggi
16. Dumna, Mahasha, Doom
17. Gagra
18. Gandhila, Gandll Gondola
19. Kablrpanthl, )ulaha
20. Khatlk
21. Kori, Koli
22. Marija, Marecha
23. Mazhabi
24. Megh
25. Nat 6
26. Od
27. Pasi
28. Pema
29. Pherera
30. Sanhai
31. Sanhal
32. Sansi, Bhedkut, Manesh
33. Sansoi
34. Sapela
35. Sarera
36. Sikligar
37. Sirkiband
38. Unclassified
LITERATE
A person who can both read and write with understanding in any language is taken as literate for the purpose of census. A person who can merely read but cannot write, is not literate. It is not necessary that a person who Is literate should have received any formal education or should have passed any minimum educational standard. In the 1991 Census, the Department of Education In the Ministry of Human Resource Development and the Planning Commission suggested that instead of the age group 0-4, the Census Organisation should consider children in the age-group 0-6 as illiterate since the ability to read and write with understanding is not generally achieved specially in rural areas, until a child attains the age of 7 or more. Accordingly I the t 99 t Census, chil~ren of the age of 6 years or less have been considered as illiterates even if the child was going to school and might have picked up reading and writing a few words.
WORK
'Work' is defined as participation in any economically productive activity. Such participation can be physically or mentally In nature. Work Involves not only actual work but also effective supervision and direction of work. It also includes unpaid work on farm or In family enterprise.
MAIN WORKERS
Main workers are those who had worked for the major part of the year preceding the date of enumeration i.e. those who are engaged in any economically productive

activity for 183 days or six months or more during the year.
MARGINAL WORKERS
Marginal workers are those who worked any time at all in the year preceding the enumeration but did not work for a major part of the year i.e. those who worked for less than 183 days or six months.
NON-WORKERS
Non-workers are those who had not worked any time at all in the year preceding the date of enumeration.
CLASSIFICATION OF WORKERS
The main workers have been classified into following nine industrial categories at the 1991 Census:-
I. CultIvators: A person was considered as cultivator if he or she was engaged either as employer, worker or family wo'rker or land owned or held from Govt. or held from private person or institution or payment in money, kind or share of crop. Cultivation included supervision or direction or cultivation.
II. Agricultural Labourers : Any person who worked on another person's land for wages in cash, kind or share of crop, was recorded as an agricultural labourer.
III. Livestoc~ Forest!); Fishingj Huntingj P/anl:4tlon, Orchards and Allied Activities :
It covers all those persons who are engaged in activities, such as, rearing of livestock, plantation and conservation of forests, hunting, plantation of crops, such as, tea, coffee, rubber, fruits, etc.
IV. Mining and Quarrying
It includes all those persons who are engaged in mining and quarrying activities.
V. Manu~cturlngj processingj servicing and repairs
a) Household Industry
Household industry is defined as an industry conducted by the head of the household himself/herself and lor by the members of the household at home or within the village In rural areas and only within the precincts of the house where the household lives in urban areas. The larger proportion of workers in household industry consists 'of the members of the household including the head and the industry is not a registered factory.
b) Other than Household Industry
As the title states it includes all those persons who are
7
engaged in manufacturing, processing, servicing and repairs in industry other than the household industry.
VI. (:onstructlon : It includes persons engaged in construction activities, slich as, maintenance of building, roads, railways, telegraphs, telephone, water reservoirs, etc.
VII. Thlde and Commerce
Persons engaged in wholesale and retail trade of any commodity are grouped under this category ..
VIII. Tldnsport, storage and communiCiition
Persons engaged in transport activities, such as, railways, tram ways, motor buses, bullock carts, tongas and services rendered for transportation, such as, packing, etc. It also includes activities like storage, warehousing, communication, such as, postal, telegraph, wireless, etc.
IX. Other Services
It includes persons engaged in various types of economic activities who are not covered under industrial categories I to VIII above.
SCOPE OF TOWN DIRECTORY
., his Town Directory includes statutory as well as Census Towns in the State. It has 7 statements numbered as I - VI and IVA. For convenient understanding and reference of the data users the towns have been arranged in alphauetical order. The particulars of each constituent unit of Urban Agglomeration have been furnished separately which help In getting an idea of the Urban Agglomeration in total as well as its constituent units separately.
The State Town Directory presents totals to the Primary Census Abstract for each town as was done in 1981 Census. However, whereas, in the Town Directory given In District Census Handbooks, the Primary Census Abstract provides wardwise data for each town, the State Town Directory volume provides data for the town as a whole. In this volume, the Primary Census Abstract for urban areas of the State ~s a whole appears first followed by towns arranged in alphabetical order.
Bedides, statements I to VI and IV A, this volume contains following appendices :-
Appendix I
Appendix II
Appendix III
Location of towns arranged in alphabetical order;
Towns arranged according to population size i
Towns arranged districtwise according to population size;

Appendix IV Towns showing their outgro'Aths with their population; and
Appendix V Names of places of tourist il)terest in different towm of the state.
EXPLANATORY NOTE:
St.1tement-l: This statement shows ~tatLls and growth histo!)' of each town in the State. It has 21 columns giving information on class and civic status, area, number of households, population and growth rate since t 90 I, density of population and sex ratio from 1971 onwards. Following abbreviations have been used in this statement:-
Municipal Corporation
Municipal Committee
Cantonment Board
Notified Area Committee
Census Town
M. Corp.
MC
CB
NAC
CT
The towns/Urban Agglomerations have been grouped into following six classes on the basis of population size :-
Class I 100,000 and above
Class II 50,000-99,999
Class III 20,000-49,999
Class IV 10,000-19,999
Class V 5,()()(}9,999
Class VI BelowS,OOO
In case of Urban ·Agglomerations which are formed with Out-Growths, the population of Out-Growth has been added to the town whose OG(s) it was, and the combined population of the town and Out-Growth, if any, has been taken for detennlning the population size-class of the town. Further, in this statement, one column giving the name of the Community Development Block has been added and this is the only variation in statement - I when compared to the 1981 Census. The name of CD Block has been shown only in case of Census Towns.
St4tement - 1/ : This statement furnishes information on physical aspects and location particulars as in 1989 for all the towns in Punjab. It inlcudes particulars about the rainfall, temperature and distance of the towns from the State, District, Tahsil Headquarters and from nearest city with popUlation 100,000 and more, railway station, bus stand and navigable river/canal. '
8
The road distance from the nearest city with population of 100,000 and more has been furnished with reference to city located in the State of Punjab barring neighbouring city of Chandigarh in the Union Territory of Chandigarh.
Stiltemenl·-I!I : This statement furnishes information on municipal finance of each town for the year 1988-89. The statement has 1 7 columns. The columns 4 to 10 indicate receipts are further categorised while columns lIto 1 7 give expenditure incurred. The receipts are further categorised as receipts through taxes, revenue derived from municipal properties and powers apart from taxation, receipts through government grant, loan advances, etc. Likewise, the expenditure head incorporates expenditure of General Administration, Public Safety, Public Health Finance, Public Works, Public Institutions, etc.
Sutement-IV: This statement has 19 columns and the details presented relate to the year 1989. It gives class, civic administration status, population, Scheduled Caste popUlation and civic and other amenities available in each town. Apart from this, data on road length (In kilometres), system of sewerage, number of different types, source and the system of storage of protected water supply have been recorded under Col. 12 and 13. The abbreviations used under these columns are as follows :-
Source of Supply System of storage
(Col 12) (Col. 13)
Tubewell/Handpump TW Overhead Tank OHT
Tap Water T Service Reservoir SR
Tank Water TK Borewell Pump Sys. BWP
Well Water W Pressure tank PT
River infiltration galle!)' RIG
Sutement -, V-A : Although, pockets of areas resided by poorer sections of society do exist in the State, yet, there are no notified or recognised slums in any of the class-I and class-II towns of Punjab and, hence, this statement has not been compiled.
Sutement - V: This statement has 20 columns giving extent of availability of medical, educational, recreational and cultural facility available in each town. The information relates to the year 1989.
Medical institutions like hospitals, dispensaries, health centres, nursing homes etc. eXisting in towns and catering to the medical needs of town dwellers are shown under col. 4. The infomlation under this column includes the number of institutions which are run by or aided by government,

local bodies and charitable agencies or social organisations but excludes institutions run by private doctors. The following codes have been used to denote various types of medical institutions under this column:-
Hospital H
Dispensary D
Health Centre/Primary Health Centre HC
Family Planning Centre FPC
TB Clinic TB
Nursing Home NH
Others 0
The medical Institutions providing treatment in various systems of medicines i.e. allopathic, ayurvedic, homoeopathic and unani have been further distinguished by adopting following additional codes. For allopathic, no separate code has been assigned :-
Ayurvedic A
Homoeopath ic Hom
Unani U
Columns 6 to 16 provide information on Art, Science and Commerce colleges of degree level and above medical and engineering colleges, polytechnic, vocational training institutions, Higher SecondaryllntermediatelPUc/ Junior College and schools of various level and adult literacy centres. In view of the increasing employment of women in urban areas, the housing need of single working woman has been a problem. Therefore, the number of working women hostel with number of seats in brackets is shown under col. 16.
The abbreviations used for presentation of data under col. 6 are as follows :-
Arts only
Science only
Arts and Science only
A
S
AS
9
Commerce only C
Science and Commerce SC
Art and Commerce AC
Arts, Science, Commerce ASC
law L
University U
Others 0
The abbreviations used to present data on recognised shorthand, type writing and vocational training institutions under col. 10 are as follows ;-
Shorthand
TypeWriting
Shorthand and Type Writing
Others
Sh
Type
Sh.Type
o The number of recreational and cultural centres are
indicated under Col. 1 7 to 20 and the abbreviations used for presenting information on public libraries and reading rooms under col. 20 are as follows :-
Public Libraries
Reading Rooms
PL
RR
It may also be added that if a particular type of medical or educational facility is not available in the town, the name of the nearest place and its distance from the town where available has been furnished.
Stiltement VI : This statement aims to provide information on trade, commerce, industry and banking aspects of each town. It has 14 columns. The first two columns partain to sr~ no., class and name of town. Col. no. 3 to 5 give names of three most ~mportant commodities imported in order of importance. Likewise, three most important commodities exported are detailed under cols. 6 to 8. The cols. 9 to 11 provide Information on three most important commodities manufactured in the town. The situation with regard to number of banks! number of agricultural cr~dit societies and number of non-agricultural societies is given under col. 12 to 14.

Table-1 depicts rural-urban growth population in India (74.29%) is rural and 217,611,012 (25.71 %) is urban and Punjab during 1901-91. by residence. During this century India's population has
increased from 238 million in 1901 to 846 million in 1991 According to 1991 Census, India's population stood resulting in an overall increase of 255 per cent. The growth
at 846,302,688 pp.rsons out of which 628,691,678 rate of population during 1951-91 (134.39%) was nearly ANALYSIS OF DATA
Table - 1
Growth of Population in Punjab State in relation to India
Census PUNJAB STATE ALL INDIA
YC?r Total Rural Urban Total Rural Urban
Popula· Popula- Decadal Popula· Decadal Popula· Popula- Decadal Popula- Decadal
tion tion Percentage tion Percentage tion tion Percentage tion Percentage
variation variation variation variation
2 3 4 5 6 7 8 9 10 11
1901 7544790 6,610,024 934,766 - 238,:196,327 212,5i4,454 25,851,873
1911 6731510 5,918,286 -10.46 813,224 -13.00 252,093,390 226,151,757 +6.40 25941633 +0.35
1921 7152811 6,283,285 +6.17 869,526 +6.92 251,321,213 223,235,046 -1.29 28,086,167 +8.27
1931 8012325 6,843,91 Z +8.92 1,168,413 +34.37 278,977,238 245,521,249 +9.98 33,455,989 +19.12
1941 9600236 7,942,822 +16.06 1,657.,414 t 41.85 318,660,580 274,507,283 + 11.81 44,153,297 +31.97
!951 9160500 7,171,233 - 9.71 1,989,267 +20.02 361,088,090 298,644,381 +5.79 62,443,709 +41.42
1961 11135069 8,567,763 + 19.47 2,567,J06 +29.06 439,234,771 360,298,168 +20.64 78,936,603 +26.4)
1971 13551060 10,334,881 +20.63 3,216,179 + 25.27 548,159,652 439,045,675 +21.86 109,113,977 +38.23
1981 16788915 1,2141,158 + 17.48 4,647,757 +44.51 685,184,692* 525,457,335 +19.61 159,727,357 +46.39
1991 20,281,969 14,288,744 +17.69 5,993,225 28.95 846,302,688** 628,691,676 +19.65 217,611,012 +36.24
• The 1981 census could not be held In Assam. The Populalioollgures for 198 J for Assam have been worked out by Interpolation.
•• The 1991 Census was not held in Jammu & Kashmir. The PopUlation figures include the population for Jammu & Kashmir as projected by the standing committee of Expem on population pmjections, October, 1989.
2 1/2 times higher than that of during 1901- 51 (5 1. 46%). The recent decade of 1 981 .. 91 witnessed an increase of 2 3.51 percent in the country's population which is slightly lower than that of 25.00 per cent during 1971-81.
The increase In rural and urban population during 1901-91 was 195.79 percent and 741 .76 percent respectively. This signifies that during this century the growth of urban population was nearly four times larger than the rural. The first fifty years (190 1-5 1) witnessed an increase of 40.51 and 141.54 percent in its rural and urban population respectively. The growth In population accelerated during the post Independence censuses of 1951-91 and during thIs period, the urban growth rate rose by 248.49 per cent while the corresponding increase in India's rural pcpularion was 110.52 percent. During 1981-91, it recorded a rural growth rate of 19.65 ,per cent as against 19.68 per cent during 1971-81. The rate of urban growth has slowed down
10
from 46.39 per cent during 1971-81 to 36.24 per cent during 1981-91.
In Punjab State, the population has increased from 7545790 in t 90 t to 20281969 in 1991 : the corresponding increase in its rural population was from 6610024 to 14288744 and the urban population increased from 934766 to 5993255. The first decade of present centUlY ( 1901-11 ) saw a decline of (-) 10.46% in its rural population. There has been consistent, though moderate rise ever since 1911. The rural growth rate rose from 6.1 7% during 191 1-21 to 16.06% during 1931-41. The decade t 941-5 1 witnessed a decline of (-) 9.71 % in its rural population primarily due to the panition of the country in 1 947 which resulted In large scale exchange of population between India and Pakistan. The decade 1951-61 registered a growth rate of 19.47% in its rural population which moved up further to 20.63% during 1961-71. The rural growth rate lowered down to 17.48% during 1971-

81 and during the decade 1981-91, the State recorded a rural growth rate of 17.69%.
In the first decade of this century, 190 t .. t t Punjab State recorded a decline of (-) 13.00% in its urban population. Thereafter, the State's urban population experienced an accelerated growth till 194 t. During 1941-5 t, the growth rate of urban population of Punjab (20.02) was almost 112 of what it was in previous decade. It moved up to 29.06% during t 951-61 primarily due to
the improved medical facilities which accentuated the rate of natural increase after independence as mortality rate showed declining trends. The birth rate could not be brought down to the desired level. The urban growth rate slowed down to 25.27% during t 961-71. However, the decade 1971-81 recorded a phenomenal increase of 44.51 % in its urban population which was the highest ever recorded and this was mainly due to .)ddition of some new towns during this period. The urban growth rate recorded during 1981-91 stands at 28.95%.
Table-2
Proportion of Urban Population in each State (arranged in descending order of percentage of urban population)
India/State Toral Urban Percentage of urban population population population to total
population
3 4
All INDIA •• 846,302,688 217,611,012 25.71
SLUes
l. Mizoram 689,756 317,946 46.10
2. Goa 1,169,793 479,752 41.01
3. Maharashtra 78,937,187 30,541,586 38.69
4. Gujarat 41,309,582 14,246,061 34.49
50 Tamil Nadu 55,658,946 19,077,592 34.15
6. Karnaraka 44,977,201 13,907,788 30.92
7. Punjab 20,281,969 5,993,225 29.55
8. Manipur 1,837,1~9 505,645 27.52
9. West Bengal 68,077,965 18,707,601 27.48
10. Andhra Pradesh 66/508,008 17,887,126 26.89
11. Kerala 29,098,518 7,680,294 26.39
12. Haryana 16,463,648 4,054,744 24.63
13. Jammu & Kashmir*· 7,718,700 1,839,400 23.83
14. Madhya Pradesh 66,181,170 15,338,837 23.18
15. Rajasthan 44,005,990 10,067,113 22.88
16. Uttar Pradesh 139,112,287 27,605,915 19.84
17. Meghalaya 1J74,778 330,047 18.60
18. Nagaland 1,209,546 208,223 17.21
19. Tripura 2,757,205 421,721 15.30
11
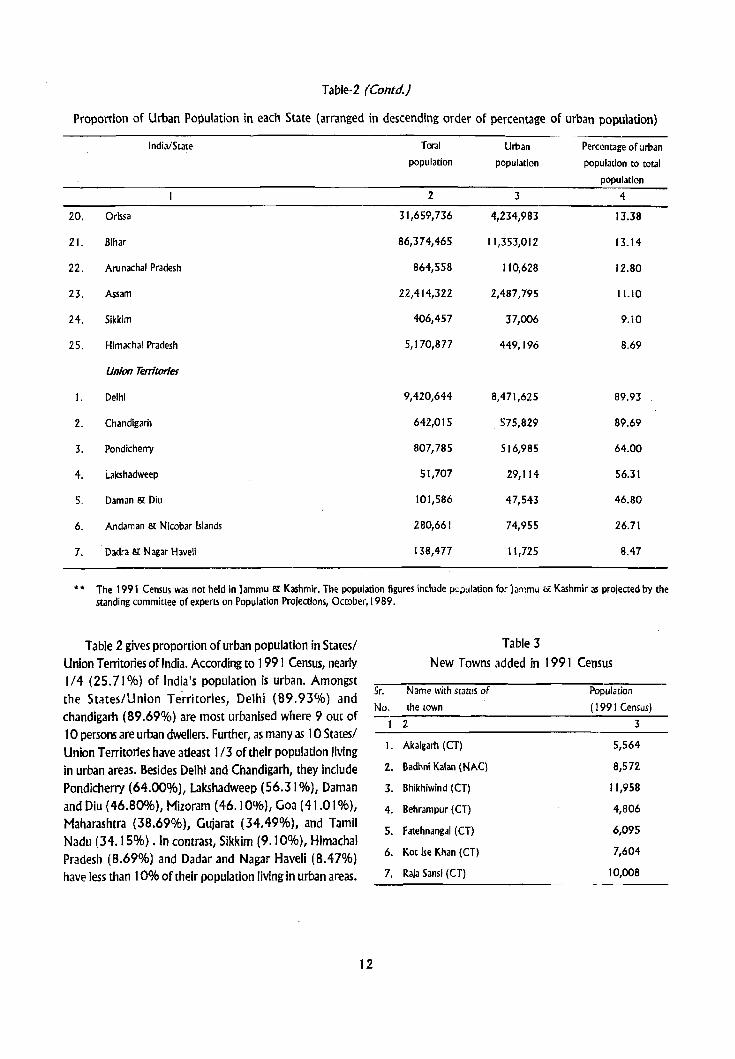
Table-2 (Contd.)
Proportion of Urban Population in each State (arranged in descending order of percentage of urban population)
India/State Taral Urban Percentage of :Jrban population population population to total
population 2 3 4
20. Orissa 31,659,736 4,234,983 13.38
21. Bihar 86,374,465 11,353,012 13.14
22. Arunachal Pradesh 864,558 110,628 12.80
23. Assam 22,414,322 2,487,795 11.10
24. Sikkim 406,457 37,006 9.10
25. Himachal Pradesh 5,170,877 449,196 8.69
Union Tenitories
1. Delhi 9,420,644 8,471,625 89.93
2. Chandigarh 642,015 575,829 89.69
3. Pondicherry 807,785 516,985 64.00
4. Lakshadweep 51,707 29,114 56.31
5. Daman & Diu 101,586 47,543 46.80
6. Andaman & Nicobar Islands 280,661 74,955 26.71
7. Dadra & Nagar Haveli 138,477 11,725 8.47
•• The 1991 Census was not held in Jammu & Kashmir. The population figures include p(.);lulation for Jammu & Kashmir as proiected by the standing committee of experts on Population Projections, October, 1 989.
Table 2 gives proportion of urban population in States/ Union Tenitories of India. According to 1 991 Census, nearly 1/4 (25.71%) of India's population is urban. Amongst the States/Union Territories, Delhi (89.93 % ) and chandigarh (89.69%) are most urbanised where 9 out of to persons are urban dwellers. Further, as many as 10 States/ Union Tenitories have adeast 1/3 of their population Jiving in urban areas. Besides Delhi and Chandigarh, they include Pondicherry (64.00%), Lakshadweep (56.31 %), Daman and Diu (46.80%), Mizoram (46.10%), Goa (41.01%), Maharashtra (38.69%), Gujarat (34.49%), and Tamil Nadu (34.1 S%) .In contrast, Sikkim (9.10%), Himachal Pradesh (8.69%) and Dadar and Nagar Haveli (8.47%) have less than 10% of their population living in urban areas.
12
Sr.
No. 1
I.
2.
3.
4~
5.
6.
7.
Table 3
New Towns added in 1991 Census
Name with status of Population the town (1991 Census)
2 3
Akalgarh (eT) 5,564
Badhni Kalan (NAt) 8,512-
Bhikhiwind (eT) 11,958
Behrampur (CT) 4,806
F atehnangal (CT) 6,095
Kot Ise Khan (Cl) 7,604
Raja Sansi (CT) 10,008

Table 3 gives infonnation on new towns added at the 1991 Census. There were 1 34 townsf.'t:Jrban Agglomerations at the time of 1981 Census. DOring 1981-91, 21 NACs were de-classified and merged with other towns and 7 new towns were created. Thus, the number of towns is 120 as per 1991 Census.
Among the newly added 7 towns, 1 (8adni Kalan) NAC has a statutOI)' status while the remaining 6 towns are Census Towns. These 7 towns together have a population of 54,607 which makes barely 0.91 per cent of the total urban population of the State. Further, 2 of these 7 new (owns have class IV status, 4 are class V towns and one falls
. in the population size class VI.
Table -4
Towns declassified and wholly merged with others in 1 991 census.
Name with status of Population
the town (1981 census)
2
(a) Declassified
(i) AJnala (NAC) 7506
(ii) Balachaur (NAC) 6630
(iii) Barriwala (NAC) 5151
(iv) Begowal (NAC) 6744
(v) Bhulath (NAC) 4926
(vi) Chamkaur Sahib (NAC) 4692
(vii) Chola Sahib (NAC) 5913
(viii) Dhlllwan (NAC) 5320
(ix) GhJgga (NAC) 4900 -
(x) Hathur (NAC) 5146
(xi) Khanauri Kalan (NAC) 4923
{xii) Khem Karan (NAC) 8757
(xlii) KilllanwarijNAC) 5966
(xiv) Lakhewali (NAC) 3555
(xv) Lchian (NAC) 5496
(xvi) Ma!sian (NAC) 5700
(xvii) Moonak (NAC) 8536
(xviii) Na4ala (NAC) 4608
(xix) Narot )3lmal Singh (NAC) 2660
(xx) Talwandi Chaudhrian (NAC) 3416
(xxi) TalwandiSabo (N"'C) 10,454
(b) Wholly merged wilh other Nil
13
Tab!~,..4 gives details oftowns de-classified and wholly merged- with status at the 1991 Census. In all, 21 NAG were de-classified during 1981·91. Together, these 21 NAG have a population of 12 1001 as per 1981 Census. In Punjab, there is no case where any town got merged with the other town during 198 t -91 .
Tablf~'S
Districtwise proponion of urban population in descending order
Name of TaL'll Urban Percentage of district Population Popuiarion urban Population
fotal population -2 3 4
1. Ludhiana 2.471594 1242781 50.28
2. ]alandhar 2026787 728802 35.96
3. Amntsar 2504560 853831 34.09.
4. Pa!iala 1896242 566973 29.90
5. Kapurthala 646647 166605 25.76
6. Rupnagar 915603 232317 25.37
7. faridkot 1130876 439839 25.41
8. Sangrur 1710120 417994 24.44
9. F!rorpur 1607817 384400 23.91
10. Bathinda 1559963 351133 22.51
II. Gurc!.Jspur 1756732 386412 22.00
12. Hos!1I<1rpur 1455026 222138 1 S.27
State Tota! 20281969 5993225 29.55
Table 5 shows dlstrictwise proportion of urban population in descending order. As revealed by 1991 Census, Punjab State has a population of 20,281,969. Among the districts, Amritsar with a population of 2,504,560 is the most populous and is closely followed by Ludhiana (2,471 ,594). These tWo districts together contain one·fourth (24.53) of the total population of the State. By contrast, Kapurtha[a and Rupnagar districts are lowly populated and together they account for only 7.70 per cent of the total population of the State. The most populous district of Amritsar is nearly four times larger than [he [east populous district of Kapurthala.
29.55 per cent of the Punjab State's population is urban. Among the districts, Ludhiana with one-half (SO.28) of il~' population living in urban areas is the most urbanised district in {he State and Hoshiarpur district with 15.27 per cent urban population is the least urb3nised. Besides

Ludhiana, )alandhar (35.96), and Amritsar (34.09) districts have signif!cant proportion of urban population. These three districts together accommodate nearly onehalf (47.14) of the total urban population of the State. Each of these three districts have a Municipal Corporation viz., Ludhiana Municipal Corporation, Amritsar Municipal
Corporation and Jalandhar Municipal Corporation. These three Municipal Corporations support nearly two-fifths (37.73%) of the State's urban population. It is for the first time that Punjab has returned a metropolitan city (ciry with population over one million) - Ludhiana and it conpins one-sixth ( 1 7.40%) of the urban population of the State.
Size
Class
of
T<mn
II
III
IV
v
VI
Total
Number
of
Towns in
1981
2
7
10
27
36
40
14
134
Table-6
Distribution of towns by Population Size-19B rand 199 r Censuses
1981 Percentage No 1991 Percemage
PopulJtion of population of population of populati9n
of [his CJragOJ), Towns of this category
or (owns to lOLaI in 1991 of towns to tota I
urban population urlfan pOll\llat[on
3 4 5 6 7 ,
2155714 46.38 10 3246224 54.16
668780 14.39 18 119Jl71 J9.9J
940482 20.24 25 774453 12.92
524505 11.28 46 648230 10.82
301905 6.50 14 102945 1,72
56371 1.21 7 28202 0.47
4647757 100.00 120 5993225 100.00
Table 6 exhibits a comparative picture oftowns by size clJss of population (lC the 1981 and 199-1 Censuses. During 1981-9\, 21 Notifred Area Committees (NACs) w('re denotified and 7 new towns have been newly created. Thus, the number of towns in the State has declined from 1 34 in 1981 to 120 in 1991. Among the newly created 7 toWJJS,
one (8adhni Kalan) is NAC and remaining six are Census Towns.
number of class IV towns show an increase but their share in total urban population has come. down from t t .28 per cem in !981 to 10.82 percent in 1991.
The composition of population in the various she chsses of towns has also undergone change during 198 . -, I. Oass 1 towns of 1991 accommodate 54.16 per cent of State's ~rban population as against 46.38 percent ;n 1981. Likewise, class II (Owns of 1991 contain 19.91 per cent of the State's urban population as against 14.39 per cent in 1981. This signifies that the share of population in class I and class II towns has grown from 60.77 per cent in 198 1 to 74.07 per cent in 1991. However, all the remaining size classes of towns have experienced decline in their share in total urban population at the 199 t CeJlslIs. Among the '-'.Irlous population size <lasses, class I class II and class IV towns registered an increase in their number while class III, class V and class VI towns suffered decline in their number during 1981-91. The number of class I towns has increased from 7 to 10, class 11 towns from 10 to 18 and class IV rowns from 36 to 46 during this period. Although, the
14
Tablt -7 (A)
Distribution of statutory and nOll-statutory towns by size-class
Size class Total number
of towns ofcowns
2
10
II 18
III 25
IV 46
V 14
VI 7
Total 120
Number of
towns having
Statutory bodies
3
10
18
25
4J
11
5
112
Number of non
municipal ~nsus
& project towns
4
3
3
2
8

Table l-A presents distribution of statutory and nonstatutory towns by size class and Table 7-B indicates towns by civic staws_
The urban frame of Punjab as per 199 I CenslIs is
com.::. h.ed of 112 statutory towns and 8 census towns. Among the stau.ltory [Owns 3 are municipal corporations, 96 are municipal committees, 10 are notified area committees and 3 cantonment boards.
T.lble-7(B)
Towns by civic status
Size
Class of
Number of [Owns having
Total Municipal Municipa! Cantorill1t:nt Notified Census
number Corporation Committee BOdrd Arta Town
town of {Owns
2 3
10 3
II 18
II! 25
IV 46
V 14
VI 7
Total 120 3
Table-8
Density by size class of towns, ] 99 J Census
Size Class
ofTown
II
III
IV
V
VI
TOlal
Number Density (Population
of Towns per sq. km.)
2 3
10 5831
18 4053
25 2889
46 2522
14 2007
7 2081
120 4160
Table 8 presents density of population by size class of towns. On an average, there are 403 persons concemrated in a sq.km. of an area in the state as per figures relating to the 1991 Census. The urban areas, however, have an average density of 4160 persons per sq.km. In general, the urban density and ,izE: c(,m of towns h.we direct bearing d5 is descemible from Table 8. However, among (he (Owns under various population size classes, disparity in density of
Committee
4 5 6 7
7
i6
24
36 7 3
9 1 3
4 2
96 :5 10 8
15
population is observed. 10 class I towns which inhabit 54. 16 per cent of state's urban population have an overall density of 5,834. Likewise, 18 class II towns accommod.'uing 19.91 per cent of the urban population have a density of 4,053. The density of population in the remaining size classes of towns is observed aSi class Iii - 2,889, class IV - 2,522, <.lass V '2,007 and class VI - 2,081.
Table-9
Sex ratio by size class of towns, t 99 t Census ._-_. __ ._-------------ClJ\S of Number Sex-ratio (number of
wwn5 of town, females per thousand m3les)
2 3
10 853
II 18 880
III 25 887
IV 46 898
v 14 '874
7 915
Total 120 869

Sex ratio by size class of towns in Punjab is given in Table-9.
Punjab has an urban sex ratio of 869 females per every 1,000 males. However, variation in sex ratio under various classes of towns is observed. The smallest sized class VI (.Owns have the highest sex ratio (915) while the largest sized class I towns have the lowest sex ratio (855).
Table - 10
Average number of households per Census House by size . class of towns, 1991 Census
Size class
of (Owns
II
III
IV
V
VI
Total
Number of
[Owns
2
10
18
25
46
14
7
120
Average Number of house-
holds per Census house
3
1.06
1.05
1.06
1.02
1.06
1.02
1.05
Table 10 displays average number of households per census house by size-class of towns at the 1991 Census.
The data in the above table reveals that on an average, the urban areas in the State have 1.05 households per census house. In o~herwords, there are I 05 hous~holds per every 100 census houses in urban areas of the State. Among different size-classes of towns the number of census households varies between 1.02 and 1.06 per census house or 102 and 106 perl 00 census houses.
16
Table - t I
Rainfall and temperature at district headquarters town
N~me of the Aver~ge annu~1 Temperature (0C)
district he~d- rainfall Maximum Minimum qu~rters town (mm.)
2 3 4
Gurd~spur 536.8 38.9 4.4
AmrllSar 892.3 40.2 3.6
Firozpur 658.0 40.2 4.4
Ludhiana 526.0 40.2 5.5
Jalandhar 946.3 38.3 2.2
Kapurth~la 595.0 38.3 2.2
Hoshiarpur 1106.0 38.0 2.2
Rupnagar 784.0 42.4 3.4
Pati~l~ 680.2 38.7 6.4
Sangrur 645.4 38.7 6.4
Bathinda 876.0 41.2 5.1
Faridkot 356.3 40.2 4.4
Table II shows average annual rainfall and temperature at the district headquarters in the State.
The average annual rainfall is maximum ( II 06.0 mm) in Hoshiarpur and the minimum in Faridkot (356.3 mm). The overall trends show that the rainfall decreases as one proceeds from north-east to south-west part of the State and it is mainly concentrated during the monsoon months of July to September.
Likewise, the summers are extremely hot and winters are intense cold. The maximum temperature ranges between 38.0 °C and 42.4 °C while variation in minimum temperature is between 2.2 °C and 6.4 0c.

Table - 12(A)
Distance of Towns from the Nearest City
Name of Class of Total No. Number of towns which are within a distance of
City Towns of Towns 10 11·25 26·50 51-100 101 Kms.
Kms. Kms. Kms. Kms. and above
2 3 4 5 6 7 8
Abohar
II
III
IV
V
VI
Total
AmrilSar
II
III 3 2
IV 3 2
V
VI 2
Total 10 2 6
Batala 2
II
III
IV 2
V 2
VI
Total 9 3 5
Barhinda
II 5 4
III 5 J
IV 7 2 2 2
V
17
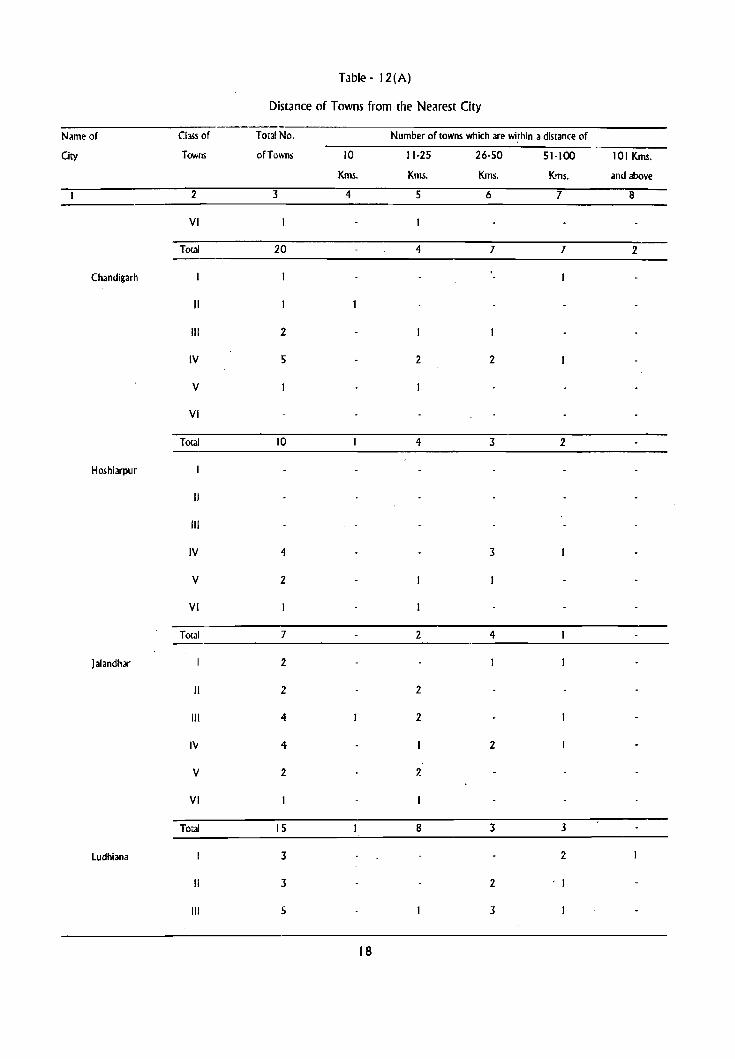
Table - 12(A)
Distance of Towns from the Nearest City
Name of Class of Total No. Number of towns which are within a distance of
City Towns of Towns 10 11-25 26-50 51-100 101 Kms.
Kms. Kms. Kms. Kms. and above
2 3 4 5 6 7 8
VI
Total 20 4 7 7 2
Chandigarh
II
III 2
IV 5 2 2
V
VI
Total 10 4 3 2
Hoshiarpur
II
til
IV 4 3
V 2
VI
Total 7 2 4
Jalandhar 2
II 2 2
III 4 2
IV 4 2
V 2 ?
VI
Total 15 8 3 3
Ludhiana 3 2
" 3 2
III 5 3
18

Table - 12(A)
Distance of Towns from the Nearest City
Name of Class of Total No. Number of (Owns which are within a distance of
City TCNlIlS of Towns 10 1 '·25 26·50 SHOO 101 Kms.
Kms. Kms. Kills. Kms. and above
. 2 3 4 5 6 7 8
IV 9 2 4 3
V 2
VI
Total 22 4 10 7
Moga
II 2 2
III
IV 2 2
V 2 2
VI
Total 6 4 2
Pathankot
II
III
IV 3
V
VI
Total 4 2
Patiala
II 3 2
III 5 3 2
IV 7 4
V
VI
Total 16 7 7
Grand Total 120 5 31 50 29 5
19

Table 12A indicates distance of towns from the nearest city.
A town with a population of 100,000 or more is regarded as a "city" by the Indian Census. The city or bigger towns are the hub of industrial, commercial and administrative activity and smaller towns tend to grow around bigger ones which, besides other aspects, help in reducing the pressure of population in the bigger towns. The above tables aims to present existing scenario in this regard in respect of 10 cities of Punjab and Union Territory of Chandigarh.
Out of 120 towns in the State,S are located within 10 kms ofthe city, 31 towns are located within 11 to 25 kms, SO are located within 26 to 50 kms, 29 are situated within
51 to 100 kms and the remaining 5 are located at a distance of more than 100 kms from their respective city. The maximum number of towns(22) can be seen around Ludhiana· city among which 4 are located at a distance of lIto 25 kms, 10 at a distance of 26 [0 50 kms, 7 at a distance of 5 t to 100 kms and 1 is located beyond 100 kms from Ludhiana city. 20 towns have Bathinda as the nearest city, 16 towns have Patiala, t 5 towns have Jalandhar and 1 1 towns have Amritsar as the nearest ciey. On the contrary in the case of Abohar city, there is only one town and that tOO is located at a distance of 26 to SO kms. As can be seen from the table, the maximum number of towns (SO) are located at a distance of 26 to 50 kms. from their respective city.
Table - 12(B)
Distance of Towns from the District Headquarters
Name of District
Headquarters Town
Gurdaspur
Am ri tsar
Firozpur
Ludhiana
Jalandhar
Kapurthala
Hoshlarpur
Rupnagar
Patiala
Sangrur
Batinda
Faridkot
Total
10kms. 11-25 kms.
2 3
4
3 2
2
2
2 5
2
2
5
3
2
18 26.
The district headquarters are the public service centres and should be conveniently approachable to the public. Table - 12(B) provides distance of towns in Punjab from the district headquarters.
Four-fifths (98) of the towns in Punjab are situated
Number of Towns within
26-50 kms.
4
6
5
5
7
4
4
4
8 .
5
4
54
51-100kms.
5
2
3
2
2
2
2
5
20
101 kms. & above
6
2
within 50 km. from the district headquarters town, and another 20 towns have district headquarters within 51-100
. kms. distance. Only in case of 2 towns the habitants are required to travel over 100 kms. to reach the district headquarters.
20

Table - 13(A)
Towns not connected by Rail
Distance trom the Nearest Rail Heads No. of Towns
2
Upto Ikm 2
2 to 5 kms 3
6 to 10 kms 3
IItol5kms 9
16 to 25 kms 6
26 kms and above 4
Toul 27
Table - 13 (8)
Towns having navigable riverlcanal within 10 kms
51. Name of navigable
No river / canal
I 2
Ravi (R)
2 Beas (R)
3 Satiuj (R)
4 Ghaggar
Name ofrown
(distance in kms)
3
Dera Baba Nanak (0) Dinanagar (10)
Dasua (8) Mukerian (7) Sri Hargobindpur (0) Talwara (2) Talwandi Bhai (2)
Anandpur Sahib (5) Fazilka (9) Firozpur (7) Firozpur Cantt. (8) )alalabad (9) Ludhiana (8) Nangai Tawnship (I) Naya Nangal (2) Nurmahal (9) Phillaur (2) Rahon (5) Rupnagar ( I )
Dera Bassi (3) Table 13-A indicates number of towns which are not connected by rail and also the distance from the nearest rail heads. Out of 120 towns, 93 towns enjoy the rail facility within the town. Among the remaining 27 towns, this facility is available within a distance of 2-5 kms in respect of 3 towns, 6·10 kms In case of 3 towns. 11- t 5 kms for 9 towns, 16-25 kms for 6 towns and at a distance of over 25 kms'in respect of 4 towns. However, all the towns in the State are connected by road.
As revealed by table 13-B, Besides rail and road service, navigational river is also available within· a distance of 10 kms in case of 20 towns and details for which are available in Table 13-8.
Table - 14
Per Capita Receipt and Expenditure by Size - Class of Towns
Size Civic No. of PER CAPITA
Class Status Towns RECEIPT (Rs.) EXPENDiTURE (Rs.)
of Toul Receipt Receipt Total General Expenditure Public Expenditure Expenditure
Towns Receipt Through From ail Expenditure Administr3- on Public Works on Public on all other
Taxes other tion Health and Institutions aspects
sources Conveniences
2 3 4 5 6 7 8 9 10 II 12
M.Corp 3 336.68 200.58 136.10 341.99 52.84 27.72 99.91 1.36 160.16
(100.00) (59.58) (40,42) (100.00) (15.45) (8.11) (29.21) (0.40) (46.83)
MC 7 233.12. 144.70 88.42 244.49 31.37 79.93 40.96 0.56 91.67
(100.00) (62.07) (37.93) (100.00) (12.83) (32.69) (16.75) (0.23) (37.50)
I( M.C 16 210.56 110.46 100.10 194.63 28.84 66.07 39.59 2.07 58.06
(100.00) (52.46) (47.54) (100.00) (14.82) (33.95) (20.34) (1.06) (29.83)
N.A.C. 146.15 146.15 164.10 41.03 123.07
(100.00) (100.00) (100.00) (25.00) (75.00)
C.B. 326.42 130.18 196.23 307.54 9.43 162.26 28.30 1 B.87 88.68
(100.00) (39.88) (60.12) (100.00) (3.07) (52.76) (9.20) (6.14) (28.83)
21

Size Civic No. of
Class Sr.1!US TCM'1lS
of
Towns
2 3
III M.c. 23
NAC
c.a.
IV M.C 36
N.A 7
C.T. 3
V M.e. 9
NAC 2
CT. 3
VI M.e. 4
C.B
C.T. 2
M.corp 3
M.e. 95
TJble-14
Per Capita Recei~lt and Expenditure by Size - Class of Towns
PER CAPITA
RECEIPT (Rs.) EXPENDITURE (Rs.)
Total
Receipt
4
288.59
Receipt
Through
Taxes
Receipt T owl
from all Expenditure
other
sources
5 6 7
82.96 205.63 210.00
(100.00) (28.75) (71.25) (100.00)
165.63 131.25 34.38 206.25
General Expenditure
Administra· on Public
tion Health and
Conveniences
8 9
45.21 43.66
Public
Works
10
49.01
(21.53) (20.79) (23.H)
34.38 75.00 78.12
(100.00) (79.25) (20.75) (100.00) (16.67) (36.36) (37.88)
858.07 332.26 525.81 690.32 87.10 341.94 116.12
Expenditure Expenditure
on Public on all other
Ins!ltutions
11
0.85
(0.40)
90.32
aspects
12
71.27
(33.94)
18.75
(9.09)
54.84
(100.00) (38.72) (61.28) (100.00) (12.62) (49.53) (16.B2) (13.09) (7.94)
174.46 76.61 97.85 170.36 48.93 36.07 39.46
(100.00) (43.91) (56.09) (100.00) (28.72) (21.17) (23.17)
626.14 209.09 417.05 626.14 77.27 34.09 153.41
(100.00) (33.39) (66.61) (100.00) (12.34) (5.44) (24.50)
177.27 93.94 83.33 162.12 50.00 12.12 62.12
(100.00) (52.99) (47.01) (100.00) (30.84) (7.48) (38.32)
58.82 52.94 5.88 64.71 35.30 29.41
(100.00) (90.00) (10.00) (100.00) (54.55) (45.45)
10.53 10.53 10.53 10.53
(100.00) (100.00) ( 100.00) (100.00)
621.43 85.71 535.72 571.43 42.86 85.71 192.86
(100.00)
170.00
(13.79) (86.21) (100.00) (7.50) (15.00) (33.75)
(100.00)
1.11
(100.00)
336.68
3.33 166.67 170.00
(1.96) (98.04) (100.00)
1.11 1.11
(]OO.OO) (100.00)
200.58 136.10 341.00
6.67 86.67 43.33
(3.92) (50.98) (25.49)
52.84 27.72 99.91
(100.00) (59.58) (40.42) (100.00) (15.45) (8.11) (29.21)
228.24 108.51 119.73 206.95 36.46 59.44 42.94
(100.00) (47.54) (52.46) (100.00) (17.45) (28.44) (20.55)
22
.36
(0.21)
47.73
(7.63)
1.52
(0.93)
10.00
(5.88)
1.36
(0.40)
1.11
(0.53)
45.54
(26;73)
313.64
(50.09)
36.36
(22.43)
250.00
(43.75)
23.33
( 13.73)
1.11
(100.00)
160.16
(46.83)
69.03
(33.03)

Table - 14
Per Capita Receipt and Expenditure by Size - Class of Towns
Size Civic No. of PER CAPITA
Class Status Tcmns RECEIPT (Rs.) EXPENDITURE (Rs.)
of Total Receipt Receipt Total General Expenditure Public Expenditure Expenditure
Tcmns Receipt Through from all Expenditure Admlnlstra- on Public Works on Public on all other Taxes other tlon Health and Institutions aspects
sources Conveniences
2 3 4 5 6 7 8 9 10 11 12
NAC II 416.17 134.17 282.00 432.00 66.86 30.70 94.33 23.77 216.34
(100.00) (32.24) (67.76) (100.00) (15.48) (7.11) (21.83) (5.50) (50.08)
C.B. 3 56:).40 199.61 363.79 492.00 39.06 250.94 73.79 46.40 81.81
(100.00) (35.43) (64.57) (100.00) (7.94) (51.01) (14.99) (9.43) (16.63)
C.T. 8 12.24 0.55 11.69 11.35 0.76 0.45 6.38 1.66 2.10
(100.00) (4.49) (95.51) (100.00) (6.70) (3.96) (56.21) (14.63) (18.50)
Total 120 282.25 I 44.<J6 138.19 269.17 43.82 48.72 65.91 2.52 108.20
(WO.OO) (51.04) (48.96) (100.00) (16.28) (18.10) (24.48) (0.94) (40.20)
Table 14 furnishes infonnation on per capita receipt and expenditure by size-class of towns. The receipts are further classified as (i) receipts through taxes and (ii) receipts from other sources. Similarly, expenditure incurred has also been segregated into five groups, viz., general administration, expenditure on public health and conveniences, public works, expenditure on public institutions and expenditure on all other aspects.
The data in sub-joined table 14 reveals that the per capita receipt of Rs. 282.25 is higher than the per capita expenditure of Rs. 269.1 7 signifying that there Is no deficit financing in the budget of local bodies in Punjab State. The table shows no clear cut pattern In the per capita receipts under different size classes of towns.
Size
Class of
Tcmns
II
III
IV
V
VI
Total
Pucca'Road
Length
2
452.41
397.12
191.34
161.75
117.31
113.51
327.60
Table - 15
Road Length by Area and Population
Per 100 Sq. Km. Per 1,000 Population
Kutcha Road Total Road Pucca Road Kutcha Road Total Road
Length Length Length Length Lenlth
3 4 5 6 7
40.64 491.26 0.78 0.07 0.85
75.30 472.42 0.98 0.19 1.17
45.55 236.89 0.66 0.16 0.82
53.69 215.42 0.64 0.21 0.85
34.04 151.35 0.58 0.17 0.75
7.74 121.25 1.57 3.59 5.16
57.38 384.98 0.79 0.14 0.93
23

The road length is an important Indicator for measuring levels of urban development of an area. Table 15 furnishes average road length by area and population, and according to size-class of towns in the State. Urban areas on an average have a road length of 384.98 kms (including 57.38 kms of Kutcha roads) per 100 sq.km of area. Apparently, an interesting feature which attracts one's attention is that average road length per 100 sq. km is directly related to pqpulation size-class of towns. Bue no definite reiarionship emerges between size-class of towns and road length per 1000 population. Broadly speaking, it is also inversly related
to population size·class of towns. Among the various size classes of towns, tile road length is observed to be higher in class-I towns and than gradually descends with the lowering of the status of the towns by size-class.
The availability of roads per 1000 population in this table would enable the reader in understanding the pressure of population on roads. The urban areas of Punjab on an average have a road length of 0.93 km per 1000 of population as is reflected by this table.
Table - 16(A)
Distribution of Towns by most common type of Sewerage and Size-Class of Towns
Most Common type of Size class of Towns Sewerage/Drainage II III IV V VI
·--~------------2;~.--------~3---------4~----------~S~--------~6---------=7---
OSD 2 2 •
PT.
s 8 16
Total 10 18
Table t 6·A gives information on most common type of seweragel drainage prevalent in different size-class of towns. Among the 120 towns in the State, open surface drainage is the most common type.in 6 I tovms while sewer is most common in 58 towns. In the remaining one town, namely, Kot-Fatta Pit system is still prevalent.
Undoubtedly, sewer is the most modern type of sewerage/drainage and is gaining importance especially in
11 30 11 5
14 16 2 2
2S 46 14 7
bigger towns. The table reveals that in 8 out of 10 class I towns, 16 out of 18 class II towns and 14 out of 25 class iii towns, sewer is the most common type of sewerage/ drainage. Open surface drainage is the characteristic of mainly the smaller towns as out of 61 towns having OSD as common type of sewerage/drainage, t 1 each belong to class III and class V, 30 are class IV and 5 are class VI towns. The class I and class II towns have only two towns each having OSD as the most common tYpe of sewerage/drainage.
Table - 16(B)
Size·Class
of Towns
II
III
IV
V
VI
Total
Latrines by Type and Size - Class of Towns
Total Percentage Distribution of Number of Water Borne Service
Towns Laterines Laterines
2 3 4
10 84.11 14.02
18 45.88 41,43
25 41.39 36.26
46 50.26 37.81
14 33.95 33.17
J 65.78 11.74
., 120 76.20 17.44
24
Otbers
5
1.87
12.69
22.35
11.93
32.88
22.48
6.36

Table 16-8 presents percentage distribution of laterines by type and size-class of towns_ This information helps in understar.Jing the quality of maintenance of towns.
The towns under various size-classes mainly have waterborne laterines. The table reveals that more than threefourths (76.20%) laterines in the towns are water-borne. In class I towns, the proportion of water-borne laterlnes is
;Is high as 84.11 per cent. There has been a shift from service laterines to water-borne laterlnes as the proportion of water-borne laterines in towns has increased from 14. t 1 per cent in 1979 to 76.20 per cent in 1989.
t 7.44 per cent of laterines in the towns are service laterines while 6.36 per cent fall under the category "Others" .
Table-16(C)
Distribution of Towns by most Common method of disposal of night soil and Size Class of Towns
Most Common method of
Disposal of Night Soil
s
ST
HL
WB
PT
B
o
Total
II
2 3
9 15
3
10 18
Table 16-C shows distribution of towns by most common method of disposal of night soil by size class of towns. This table intends to present the advancements made under the government's programmes of stopping practice of removal of night soil as headload and also minimising the use of human labour in the process of disposal of night soil.
Sewerage system of disposal of night soil is observed to be most common in class-I towns as this system prevails in 9 out of to class-' towns. Likewise, in class-II and Qass III
Size class of Towns
III IV V VI 4 5 6 7
12 8
8 2
2
10 23 8 3
3 3 2
25 46 14 7
towns, this is the most common system being followed. However, in as many as 47 towns under various size-classes, wheel barrows is still prevalent and another 1 1 towns have septic tank laterines for disposal of night soil. Despite government's best efforts of introducing sowerage system all over, the high cost of sewerage Projects and meagre resources available with the local bodies appear to be main obstructions in the replacement of traditional systems of disposal of night soil with the most modern underground sewerage system.
Table - 1 7 (A)
Size class
of Towns
II
III
IV
Total No.
of Towns
2
10
18
25
46
Protected water supply by size class of towns
Distribution of towns by most common source of proteCted water supply
~ T W m 3 -4 5 6
10
18
4 21
12 34
25

Table - 17 (A)
Protected water supply by size class of towns
Size class Total No. Distribution of towns by most common source of protected water supply of Towns ofTowns TW
2 3
V 14 10
VI 7 5
10LlI 120 31
Table 17 -A gives Infonnadon on protected water supply by size-class of towns. Tap is the most common source of protected water supply in the towns of Punjab as 89 out of 120 towns In the State obtain protected water supply through taps. All the 10 class-I and 18 class-II towns, 21
T W TK 4 5 6
4
2
89
(out of 25) class-III towns and 34 (out of 46) class-IV (owns in (he State get protected water supply through taps. However, tubewell is the most common source of protected water supply in majority of the smaller towns.
Table - 17(8)
System of Storage of Water Supply by size-class of Towns
Total No. of
Distribution of Towns by the most
Common System of Storage
Size
Class of
Towns Tcwns OHT SR IG BWP PT 2 3 4 5 6 7
10 10
II 18 16
III 25 20
IV 46 21 2
V 14 3
VI 7 3
ToEa! 120 73 3
System of storage of water supply by size-class of towns Is Indicated in Table 17-B.
Over head tank is the most common system of storage In 73 out of 120 towns in the State. According to sizeclass, all the 10 class I towns have this system of storage. The position Is appreciable In class-II towns as 16 out ,of 18 class-II towns have this kind of storage system. Among the remaining size-classes, 20 class-III, 2 t class-IV and 3 towns each class V and class- VI get protected water supply through
26
7
8
over head tanks.
Service reservoir is most common storage system in 3 towns out of which one belongs to size-class II and remaining 2 belong to size-class IV.
As many as 36 towns In the State do not have any kind of storage system. Three of these 36 towns namely Kartarpur, Nakodar and Raikot have class-III status while all others are smaller towns.

Table-18(A)
Fire-Fighting Services by Size-Class of Towns
Number of Towns where Service Is Size
Class of
Towns
Total
No. of
Towns
Available Not Available
2
10
II 18
III 25
IV 46
V 14
VI 7
Total 120
Table 18-A presents data on fire-fighting services by size-class of tow~. The table reveals that fire-fighting services are available in only one-fourth (32) towns in the State. Generally speaking, the larger the towns the greater is the n~ed for availability of some kind of organised fire-fighting services. This is further supported by the fact that all the
3 4
10
16 2
4 21
2 44
14
7
32 88
10 class-I towns and 16 out of 18 class-II towns have availability of fire-fighting services within town. The two class-II towns which do not have this facility locally include Malerkotla and Nabha. In contrast, none of the towns under size-class V and VI have this facility available to them within the towns.
Table - 18(B)
Availability of Fire-Fighting Services at Other places by Towns not having it
Size
Class of
Towns
Total
No. of
Number of Towns where Fire Fighting Service is
not available and available at distance of
Towns -5 kms, 5·9 kms. 10·19 kms. 20+ kms. Total
2 3 4
10
II 18
III 25
IV 46
V 14
VI 7 )' ,
Total 120 4
Table 18-8 gives distance at which the fire-fighting service is available in respect of those towns where it is not available locally. In all, fire-fighting services are not available locally in respect of 88 tow~ and their class-wise distribution reads as : class II - 2, class II! . 21, class IV - 44, class V -14, and class VI - 7.
The Two towns under size-class II which do not have
2
2
5
27
5 6 7
2 2
6 12 21
15 26 44
5 7 14
2 4 7
28 51 88
this facility locally include Malerkotla and Nabha and for them, same is available at a distance of over 20 kms.
Apparently, It is the smaller towns which do not have these services and majority of them have to depend upon some kind of organised fire-fighting services from a distance of more than 20 kms.

It is gratifying that all the to~ns in Punjab state provide amenities required for human growth. These slums lack in electricity for domestic consumption. basic faclities, such as, hygienic, sanitarion, etc. At the same
time, the local bodies/state governments cannot remain a The ever increasing problem of slums is a matter of silent observer and, thus, draft plans for the upliftment of
concern. It is mainly associated with the towns due to slum dwellers by providing chem basic civic necessities. In immigration from rural areas. The ruralities with meagre or the absence of requisite information on notified,slums in no resources at their disposal shift to towns especially the the state, it has not been feasible to give further details in bigger ones and start dwelling in open spaces/lands which this regard. ultimately grow as slums as all these do not have basic
Table - 19 (A)
Type of Medical facilities by size-class of towns
Size No Population
class of of town Hospital Dispensary
of towns in each
towns size-class
2 3 4 5
10 3,246,224 68 118
II 18 1,193,171 40 64
III 2S 774,453 33 53
IV 46 648,230 29 50
V 14 102,945 3 10
VI 7 28,202 2 4
Torai 120 5,993,225 175 299
Health care facilities are fundamental and create conditions for greater efficiency and productivity. Table 19-A furnishes Information on the type of medical facilities by size-class of towns in Punjab. The type of medical institutions available include; hospital, dispensary, health centre, family planning centre, TB clinic and nursing homes while other than all these have been grouped as 'Others' for the purpose of this table.
According to 1991 Census, 5993225 persons are residing in urban areas spread over 120 [Owns. In all there are 671 medical institutions in urban areas of the State. They include 175 hospitals, 299 dispensaries, 58 health centres, 62 family planning cemres, 18 T8 clinics, 11 nursing homes and 39 'Other' type of medical institutions. This signifies; (i) a town on an average has six medical institutions of one t'lpe or the other and (ii) on an average, there is one medical institution after every 8932 persons in urban areas of the State.
The availability of medical institutions under various size-class of towns reveals that the ctisparity in town -institution ratio widens and the institution - population ratio
Number of Institutions
Health Family T.B. Nursing Others centre Planning Clinic Home
Centre
6 7 8 9 10
23 12 9 3 10
4 13 7 3 20
5 IS 2 3 2
17 17 2 4
6 3 3
3 2
58 62 18 11 39
28
becomes narrower with the decline in size-class of town. This is furth~r illustrated as;
10 class - I towns in the State have a population of 3,246,224 and 243 medical institutions. In other words, on an average, there are 25 medical Institutions in a class I town and each institution serves a population of 12882. Among class II towns, town - institution and institution -population ratios are 1:8 and 1 :7902 respectively. A similar trend is observed in all other size-classes of towns.
The table further reveals that there are 1 75 hospitals, 299 dispensaries and 58 health centres in urban areas of the State. This signifies that there is a hospital after every 34,247 persons, a dispensary after every 20,044 persons and a health centre after every 103,331 persons. In class I towns, there is a hospital after every 47,739 persons, a dispensary after every 27,5 to persons and a health centre after every 1 41, I 40 persons. An over all pattern obselVed for various class of towns shows that the pressure of population on medical services lessens with the decline in size-class of towns.

Table - 19 (8)
Use of medical facilities at other places by towns not having these facilities
Size
Class of
Towns
No. of
Towns
No. of towm where (he medical f.dlitY is not
avail.lble but available at ~ distanct of
-5 kms. 5-9 kms. 10·19 kms. 20+ kms. Total (cols.3 to 6)
7 2 3 4 5~
10
II 18
III 25
IV 46
V 14 2
VI 7
Total 120 2
Table 1 9 - B shows use of medical facilities at other places by towns not having these facilities. With the exception of tVolO towns, all other towns in the State have some kind of medical facilities available to them within the town. Two towns which do not have this facility locally are Akalgarh
------ ----------------------
2
2
(Ludhian3 District) and Fateh Nan!al (Ciurdaspur District). Both these (owns are Census Towns md belong to population size·class V and avail medical facilitks from within a distance of 5 kms.
Table - 19 (C)
No. of beds in medical institutions
Size-class of towns No.of !owns No. of beds jer 1000 population
II
III
IV
v
VI
Total
As observed from the data in Table 19 C, urban areas of Punjab have 2.39 beds per 1000 (239 per one lac) of population. No regular pattern is discernible in this regard among different size-classes of towns in the State. The smallest sized class-VI towns emerge at top in terms of number of beds available per 1000 population merely
2 3
10 ~97
18 238
25 1.'6
46 2,8
14 1.2.
7 4.46
120 2.39
29
\
because of their low popr.'ation base as all tie 7 toWlS in class-VI have a total POp!~lation of only .l82CZ. The dass· I towns have 2. Q7 bed,~ per 1000 (297 r.er one lac) population and is followe~~ by class-II, class-IV,:lass-1II !nd class-V towns. I

Table - 20 (A)
Schools per 1000 population
Size Class
of towns
No of Number per 1000 population
towns Higher Sec'/inter/
Puc/Junior college
2 3
10. 0.03
18 0.04
III 25 0.06
IV 46 0.08
V 14 0.12
VI 7 0.21
Total 120 0.05
Table 20-A provides information on number of schools per 1000 population under various size-classes of towns.
The Punjab State has three universities namely, Punjabi University at Patiala, Guru Nanak Dev l,.Iniversity at Amritsar and Punjab Agricultural University at Ludhiana. There are five medical colleges in the State, one each at Amritsar, Patiala and Faridkot and two at Ludhianaj and four Engineering Colleges, one each at Bathinda, Jalandhar, Ludhiana and Patiala. Out of 120 towns, 35 towns do not have a college available t.o them locally and majority of these towns are small towns. However, all these towns avail the facility of college from nearby towns.
As revealed by the cable, the schools have been grouped aSj Higher Secondaryllnter/PUC/]unior College; Secondary/Matriculation; Junior Secondary and Middle; and PrimalY Schools. It may also be added, here that all private educational institutions not recongnised by the government and also all those which are not affiliated to any Board ofthe State or Central Government have been excluded while furnishing data on educational facilities.
The urban areas of Punjab have 281 Higher secondary/ Inter/PUC/Junior Collegesj 471 Secondary/Matriculation level schools; 228 Junior Secondary and Middle Schools and 1,435 Pril11ay Schools. In other words, there is one Higher Secondary/lnter/PUC/Junior College available for every 21,328 (0.05 per 1,000) persons; Secondary/
30
Secondary/ Junior Secondary Primary Matriculation and Middle
4 5 6
0.04 o.e)3 0.19
0.09 0.05 0.20
0.07 0.08 ·0.24
0.15 0.10 0.33
0.22 0.13 0.42
0.28 0.21 0.64
0.08 0.05 0.24
Matriculation school against every 12,724 (0.08 per 1,000) personsj Junior/Secondary/Middle School for every 18,272 (0.05 per t,OOO) persons; Primay School after every 4,176 (0.24 per 1,000) persons. The distribution pattern of schools under different size-classes of towns shows that in general, school - population ratio shows improvement with the decline in status of the town according to population size. In class-I towns, the number of various categories of educational institutions per 1000 population is as follows:
Hr. Secondary/lnter/PUC!Jr. College 0.03 per 1000 persons
Secondary/Matriculation 0.04 per 1000 persons
Junior/Secondary/Middle School 0.03 per 1000 persons
Primary School 0.19 per 1000 persons
In other words, there is one Hr. Secondary/Inter/PUC! Jr. College after every 29,S II persons, Secondary/ Matriculation school after every 2 1,21 7 persons, Jr. Secondry and middle school after every 2,750 persons. and Primary School after every 4,41 7 persons in class I towns.

Size-class of towns
II
III
IV
V
VI
Total
Table - 20 (8)
Adult Literacy centres
No_ of towns
2
10
16
25
46
14
7
120
No_ of town~ having adult
literacy centres
3
4
5
3
7
3
2
24
Adult education is the back bone of the nation. The number of Adult Literacy Centres under various classes of towns in the State is given in table 20-B. This table exhibits that out of 24 Adult literacy Centres in urban areas of
Punjab, four are in class I towns, five in class II towns, three in class III (owns, seven in rl3ss IV lowns, 3 in class-V towns and the remaining 2 in class VI towns.
Table - 21
Distribution of Woman's hostels, stadia, cinema,auditoria/drama/community halls and public libraries by size-class of towns
Size- Total No of towns having
class of No. of Working Stadia Cinemas Auditoria Public
towns towns Women's ele. Libraries
Hoslels (No.) (No.) (No.) (No.) (No.)
2 3 4 S 6 7
10 7 16 78 17 PL-24 RR-74
II 16 4 15 36 28 PL - 33 RR- 3S
III 25 4 27 16 PL - 27 RR-27
IV 46 7 23 12 PL - 29 RR- 33
V 14 4 6 PL - 10 RR-IO
VI 7 2 3 PL - 4 RR- 4
Total 120 12 43 172 82 PL - 117 RR - 184
PL - Public Liurades
RR - Reading Rooms
31

Table 21 reveals data on working women's hostels, stadia cinema, auditoria, drama, community halls and public libraries by size-class of towns in Punjab, The public libraries have been further classified (i) public libraries (PL) and (ii) reading room (RR). Undisputedly, the demand for all such facilities enhance with the growing size of towns.
The need of having working women's hostels cannot be over-emphasised in view of the growing employment of women in urban areas. The table reveals that there are 12 such working women's hostels in urban areas of the State among which seven are in class-I towns, four in class-II towns and one in class-Ill towns. The smaller towns under sizeclass IV to VI do not have any working women's hostel apparently because of their smaller population size and lesser need of having such hostels. Likewise, stadia, cinema, auditoria and public libraries are mainly concentrated in bigger towns. Out of 43 stadia, 31 are in class-I and c1assII towns. There are 1 72 cinemas in the towns of Punjab out of which nearly two-thirds ( 116) are located in class-I and class-II towns. Similarly, more than one-half of the auditoria (45 out of 82) are found in class-I and class-II towns. It is also observed that in the State, there is a cinema after every 34,844 persons and an auditorium after every 73,088 persons. An overall trend of towns under different size-classes exhibits that the population-cinema and auditoria ratio is more in class-I towns and gradually tapers down with the lowering of the size-class.
Table 22A, 22B and 22C present data on three most
32
important commodities manufactured in the State and their order of 1m portance is based on the volume of lOta I outPUt. Secondly, the commodities manufactured have been classified by sections, divisions and groups as per the National Industrial Classification, 1987.
The State owns famous position with regard to industrial development. State Government is also beckoning the entrepreneurs by offering incentives, concessions and subsidy for setting up of industries. Among the important industrial centres, Ludhiana, Jalandhar, Batala,Phagwara, Rajpura, Kartarpur, Dhariwal and Gobindgarh find special mention in the State. Besides, SAS Nagar (Mohali), Khanna, Amloh, Dera Bassi and Kurali are fast developing industrial centres in the State.
Table 22A gives details of first most important commodity manufactured in the towns of Punjab. In as many as 46 towns manufacture of agricultural implements and its associated products/electrical goods/sewing machine/bicycle, etc. is the most important commodity manufactured. The textile goods and woolen goods, etc. is the most important commodity manufactured in 24 towns and manufacture of food products is the most important commoditY in 17 towns. Among other significant products, manufacture of furniture goods is the most important in 11 towns and fertilizers etc. in 6 towns. The sports goods which have earned a world-wide reputation is the most important commodity manufactured in one town namely Jalandhar.

Table - 22(A)
Important Commodities Manufactured by Size Class of Towns and Industrial Category
(FIRST IMPORT ANT COMMODITY)
Industrial Category Name of CommoditY All Size - Class of Towns
Towns II III IV V VI
2 3 4 5 6 7 8 9
SECTION 2 116 10 18 25 46 11 6
DIVISION -2 17 2 3 9 2
2
Group 201 (i) Milk
(ii) Ghee
202 2 2
(i) Jams 2 2
204 4 3
(I) Wheat flour
(ii) Rice 3 3
206 3 2
(i) Sugar 3 2
DIVISION - 21
Group 211 6 5
(i) Vegetable oils 2 2
(Ii) Groundnut oils
(fiI) Mustard oils 2 2
DIVISION - 21
Group 228
(i) Snuff
DIVISION- 23 14 2 2 3 4 3
Group 230 14 2 2 3 4 3
(I) Textile Fabric
(ii) Cotton Cloth 3
(iii) Khadl Cloth 3
(Iv) Cotton thread 2
(v) Cotton balls
(vi) Bedsheet (Cotton)
(vii) Carpet 3 2
33

Table - 22(A)
Important Commodities Manufactured by Size Class of Towns and Industrial Category
(FIRST IMPORTANT COMMODITY)
Industriai Category Name of CommoditY All Size - Class ofT owns
Towns II III IV V VI
2 3 4 5 6 7 8 9
DIVISION-26 10 4 6
Group 261
(i) Niwar
263 9 4 5
(i) Woollen garmencs 6 3 3
(li) Woollen garments 3 2
DIVISION-27 11 2 5
Group 273
(I) Basket
276 9 2 4
(i) Wooden Furniture 9 2 .oJ
279
(i) Wooden wheels for cartS
DIVISION-29 5 2
Group 291
(I) Leather Shoes 4 2
(ii) Rubber Shoes
SECTION - 3
DIVISION-30 4 1
Group 301 2
(i) Fertilizers 2
305 2
(i) Soap 2
DIVISION-32
Group 322
(i) Earthen pottery -I
DIVISION-33 3
Group 338
(i) Rolling bars
34

Table· 22(A)
Important Commodities Manufactured by Size Class of Towns and Industrial Category
(FIRST IMPORTANT COMMODITY)
Industrial Category Name of Commodity All Size - Class of Towns
TCM'I1S II III IV V VI
I 2 3 4 5 6 7 8 9
339 2
(i) M_S_ Rounds
(ii) Diesel pumping Sfl
DIVISION·34 3 3
Group 340
(I) Iron and Steel 2 2 Product
343
(i) Locks
DIVISION-35 46 :3 II 6 19 3 4
Group 350 33 6 6 14 2 4
(I) Agricu Itural 21 3 3 10 2 J Implements
(iI) Machine tools 2
(iii) Toka machine
& its parts
(iv) Tube well apparatus
(v) Thresher 3 2
(vi) Combine machIne
(vii) Tt3ttot to6ls 2
(viii) Trollies 2
352 j
(I) Motor $patt I>~i'ts
(Ii) Oil engine 2
359 2
(i) Sewinl 2 Machine
DIVISION· 36
Group 360 4 2 2
(I) Electrical materials J 2
(Ii) Electrical Generator
35

Industrial Category
DIVISION - 37
Group
DIVISION·38
Group
Table - 22(A)
Important Commodities Manufactured by Size Class of Towns and Industrial Category
(FIRST IMPORTANT COMMODITY)
Name of Commodity All Size - Class ofT owns
Towns II III IV
2 3 4 5 6 7
375
(I) Piston Ring
316 3
(i) Spair parts for 3 Bicycle
385 (I) Sports goods
36
V VI
8 9
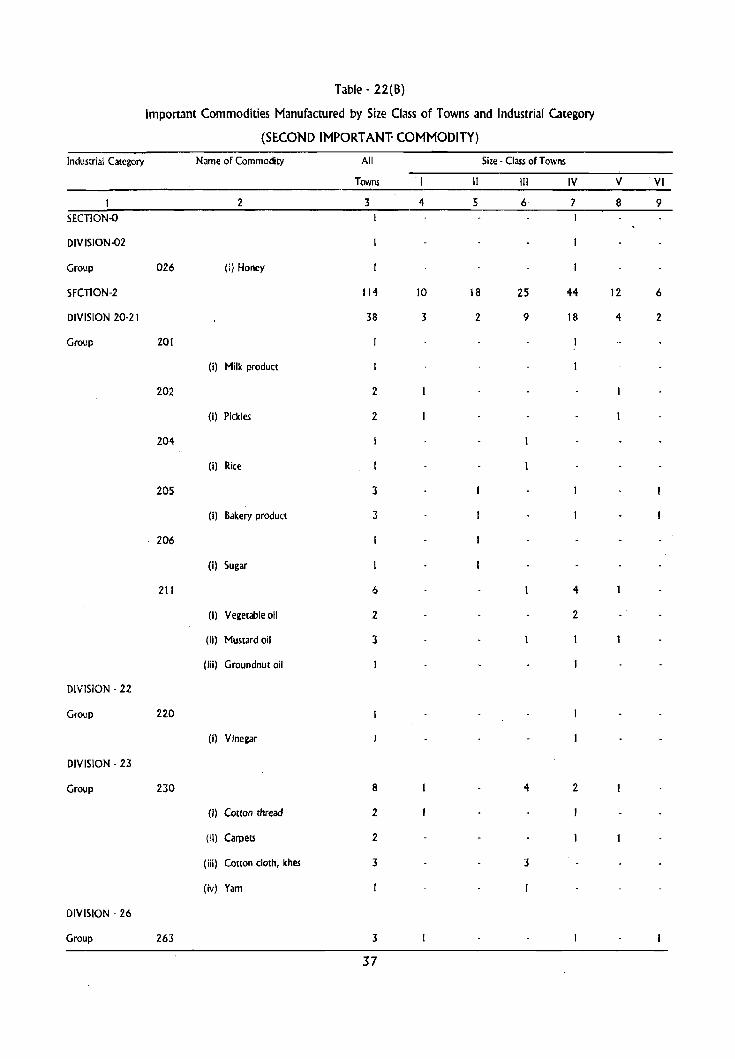
Table - 22(8)
Important Commodities Manufactured by Size Class of Towns and Industrial Category
(SECOND IMPORT ANT· COMMODITY)
Industrial Category Name of Commodity All Size· Class of Towns
Towns ' I II III IV V VI
2 3 4 5 6 7 8 9 SECTION-O
DIVISION-02
Group 026 (i) Honey
SFCTION·2 114 10 18 25 44 12 6
DIVISION 20-21 38 3 2 9 18 4 2
Group 201
(i) Milk product
202 2
(i) Pickles 2
204
(i) Rice
205 3
(i) Bakery product 3
206
(i) Sugar
211 6 4
(i) Vegetable oil 2 2
(ii) Mustard oil 3
(Iii) Groundnut oil
DIVISiON· 22
Group 220
(I) Vinegar
DIVISION· 23
Group 230 8 4 2
(i) Cotton thread 2
(ii) CarpelS 2
(iii) Cotton cloth, khes 3 3
(iv) Yam
DIVISION· 26
Group 263 3
37

Table - 22(8)
Important Commodities Manufactured by Size Class of Towns and Industrial Category
(SECOND IMPORT ANT COMMODITY)
Industrial Category Name of Commodity All Size - Class of Towns
Tcmn5 II III IV V VI
2 3 4 5 6 7 8 9
(I) Woollen Blanket 3
DIVISION - 27
Group 276 11 2 8
(i) Wooden furniture 8 7
(ii) Wooden articles 3
DIVISION - 28
Group 280
(i) Paper
(ii) Tractor
DIVISION -29 36 3 7 6 16 2- 2
Group 291 13 2 6 2 2
(I) Leather shoes 11 6 2 2
(ii) Chappals 2 2
SECTION - 3
DIVISION - 30
Group 300
(i) Chemicals for Rubber product
301
(i) Fertilizer
305 3 2
(i) Incense
(Ii) Soap 2
DIVISION - J 1
Group 313 2
(i) PVC Pipes
{iiI Spun Pipes
DIVISION - 32
Group 320 2
(i) Conduit pipe 2
38
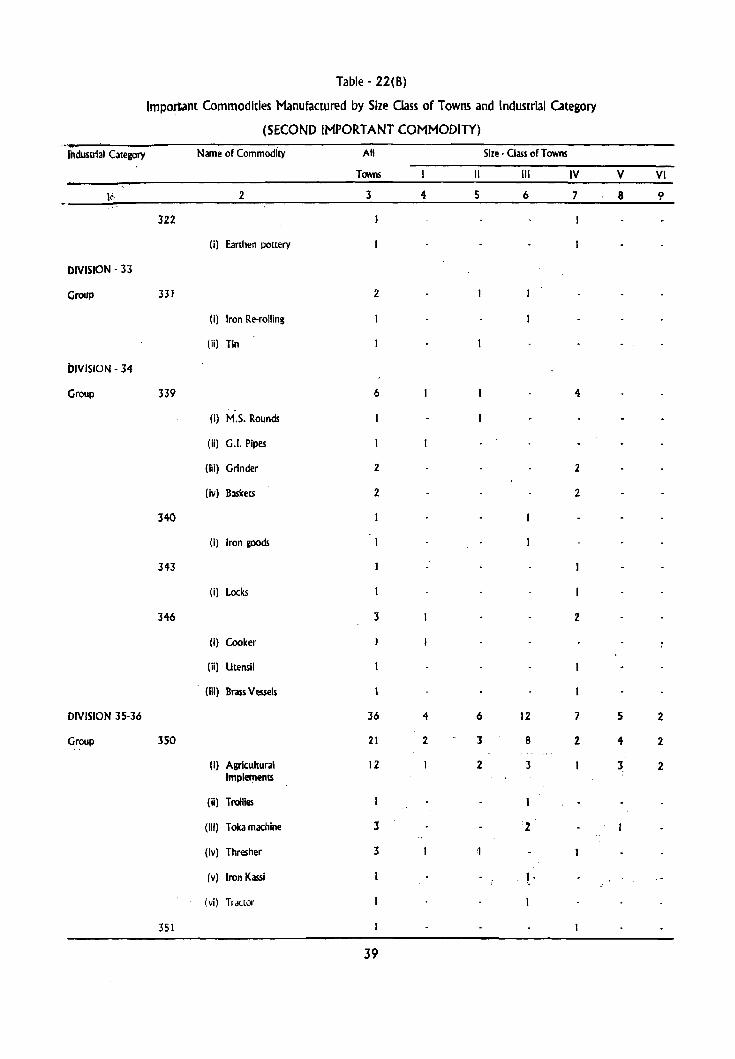
Table - 22(8)
ImpoJ1ant Commodities Manufactured by Size Class of Towns and Industrial Category
(SECOND IMPORTANT COMMODITY)
Industrial Category Name of CommoditY All Size - Class of Towns
Towns II III IV V VI
Ie- 2 3 4 5 6 7 8 9
322
(i) Earthen pottery
DIVISION - 33
Group 331 2
(i) Iron Re-rolling
(iil Tin
blVISION - 34
Group 339 6 4 , .
(i) M.S. Rounds
(ii) G.!. Pipes
(iii) Grinder 2 2
(iv) Baskets 2 2
340
(i) Iron goods
343
(i) Locks
346 3 2
(i) Cooker
(Ii) Utensil
(iii) Brass Vessels
DIVISION 35·36 36 4 6 12 7 5 2
Group 350 21 2 3 8 2 4 2
(i) Agricultural 12 2 3 3 2 ImplementS
(ii) Trollies
(iii) Toka machine 3 ~
(iv) Thresher 3
(v) Iron Kassi J '
(vi) Tractor
351
39
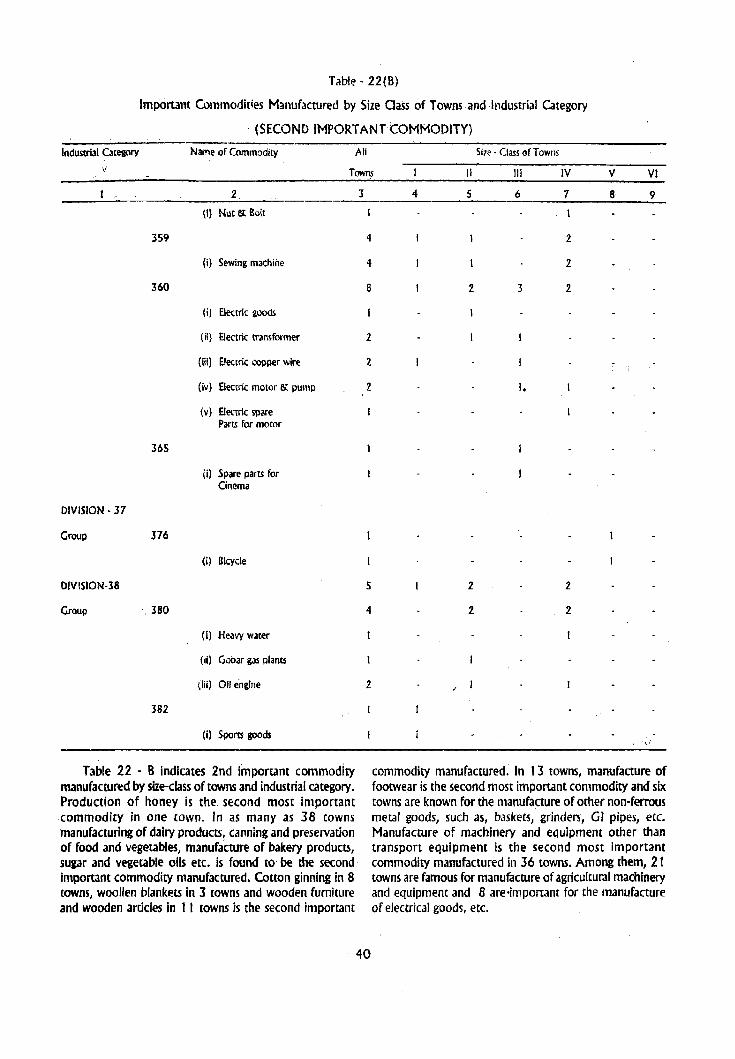
Table· 22(B}
Important Commodities Manufactured by Size Class of Towns and Industrial Category
(SECOND IMPORT ANT tOMMODITY) -
Industrial Category Name of Commodity AU Size· Class of Towm
v Towns II III IV V VI
2
(1) Nut & Roil
359
(i) Sewing machine
360
(i) Electric goods
(Ii) Electric transfonner
(iii) Electric copper wire
(iv) Electric motor & pump
(v) Electric spare Parts for motor
365
(i) Spare parts for Cinema
DIVISION· 37
Group 376
(i) Bicycle
DIVISION·38
Group ·.380
(i) Heavy water
(ii) G obar gas plants
(iii) 011 engine
382
(I) SportS goods
Table 22 • B indicates 2nd important commodity manufactured by size-class of towns and industrial category. Production of honey is the. second most important commodity in one (Own. In as many as JB towns manufacturing of dairy products, canning and preservation of food and vegetables, manufacture of bakery products, sugar and vegetable oils etc. is found to be the secondimportant commodity manufactured. Cotton ginning in 8 towns, woollen blankets in J [Owns and wooden furniture and wooden articles in 11 towns is the second important
3 4 5 6 7 8 9
4 2
4 2
8
2
2
2.
5
4
2
2 3 2
1.
2 2
2 2
/
commodity manufactured. In 1 3 towns, manufacture of footwear is the second most important commodity and six towns are known for the manufacture of orher non-ferrous metal goods, such as, baskets, grinders, GI pipes, etc. Manufacture of machinery and eQuipment other than transport equipment is the second most important commodity manufactured in 36 towns. Among them, 21 towns are famous for manufacture of agricultural machinery and equipment and 8 are'important for the manufacture of electrical goods, etc.
40

Table· 22(C)
Important,Commodlties Manufactured by Size Class of Towns and Industrial Category
(THIRD IMPORTANT COMMODITY)
'imluslriai Category . Name of CommoditY AU Size - Class of Towns
Towns , I II III IV V VI
2 3 4 5 6 7 8 9
SECTION72ad 111 10 18 25 42 10 6
DIVISION-20-21 21 6 2 6 4 2
Group 202
(i) Juice
204 5 2 2
(i) Rice 5 2 2
205 3 2
(i) Maggi product
(il) Bakery product 2 Biscuits
206 3
(i) Sugar 3
209
(I) Confectionery
211 5 3
(i) Mustard oils 2
(ii) Rosin & Pine oils 1-
(ill) Veget.lbie oib 2 2
216
(I) Ice
217
(i) Oil cakes
DIViSION - 22
Group 228
(i) Tobacco
DIVISION - 23 9 2 5
Group 230 5 2 3
(i) Khadi cloths 2
(ii) Co[[on clorhs
(iii) Cotton bales 2
41

Table - 22(C)
Important Commodities Manufactured by Size Oass of Towns and Industrial Category
(THIRD IMPORTANT COMMODITY)
Indusbial Category .' N.JI.Il@ of CcmmodilY All Size - Class of Towns
T~ " III IV V VI
2 3 4 5 6 7 8 9
234
Ii) 5arees
236 2
(i) Hosiery goods 2
DIVISION· 26
Group 263
(i) Durries
DIVISION-27 14 10 2
Group 276 14 10 2
(i) Wooden furniture 13 9 Z
(Ii) Country carts
DIVISION·29 IB 2 2 9 4
Group 291 18 2 2 9 4
(i) Leather shoes 17 2 2 B " (Ii) Suit cases
SECTION
DIVISION - 30
Group 305 11 2 6
(I) Soap 10 2 6
(iI) Detergent Powder
DIVISION 31 6 4
Group 310
(I) Tyre moiling
312 2
(I) Conduit pipes
(iI) Rubber product
313 2 1 .
(i) PVC pipes
(ii) Water bottles
316
42

Table - 22(C)
Important Commodities Manufactured by Size Class of Towns and IndustriJI Category
(THIRD IMPORTANT COMMODITY)
Industrial Category Name of Commodity All Size - Class of Towns
Towns II ill IV V VI
2 3 4 5 i:- 7 8 9
(i) Paraffin Wax (Candles)
DIVISION 32 4 2
Group 322 3 2
(i) Earthen pottery 3 2
324 .1
(i) Cement pipes I··
DIVISION 33 2
Group 330
(i) Iron re-rolling
339
(I) G.!. Sanitary items
DIVISION 34 5 3
Group 340 4 3
(I) Iron Rods
(ii) Shutter 2 2
(iii) Chill Rolls
346
(i) Brass Utensils
DIVISION 35·36 21 4 9 4 2
Group 350 10 2 6 2
(I) Agrlculwral 9 2 5 2 implements
356
(I) Hand pump
357 3
(I) Lathes machine
(ii) Grinding machine
(iii) Labels
43

Table - 22(C)
Important Commodities Manufactured by Size Class of Towns and Industrial utegory
(THIRD IMPORTANT COMMODITY)
Industrial Category Name of Commodity All
TOO/ns
359
360
365
DIVISION 38
Group 385
2
(i) Sewing machine
(ill Spare parts for sewing machine
(i l Elecuical goods and spare parts
(i) T.V. Picture Tube
(i) Sports goods
Table 22 . C gives infonnation on third important commodity manufactured by size-class of toWnS and industrial category. Rice milling is the third important commodity in 5 towns while manufacwre of bakery products etc. is important in 3 towns. Manufacture of sugar is the third important commodity in 3 towns and 5 towns are known for the manufacture of vegetable oils. In 14 towns, wooden furniture and fixtures is the third important commodity and
3
4
2
2
3
3
44
Size· Class of Towns
II III IV V VI
4 5 6 7 8 9
2
2
2
18 towns have manufacture of footwear as the third important commodity manufactured. In as many' as 11 towns, manufacture of soap, detergent, etc. is the third important commodity. Among others, 9 towns are known for the manufacture of agricultural implements while three towns have manufacture of electrical goods and spare pans as the third important commodity.

Table· 23(A)
ImpQJtant Commodities imported by Size Class of Towns and Industrial Ccltegory
(FIRST IMPOR rANT COMMODITY),
Industrial Category Name of COm!l"0dity All Size· Oa.;s cf Towns
Towns Ii III IV V VI ~
2 3 4 5 6 7 il 9
SECTION 6 119 10 18 25 46 13 7
DIVISION 60 93 8 14 15 36 13 7
Group 600 34 3 4 19 3 4
(i) Wheat II 3 4
(ii) Rice 3
(iii) Paddy 2 2
(iv) Food grains 12 8
(v) Karyana goods 6 .. 601 6 2
(i) Chillies
(il) Pulses 2
(Iii) Fruirs
(iv) Milk
(v) Sail
602 19 4 5 5 4
(i) Silk & Cotton 4 2 Cloth
(II) Cotton fabric
(III) Ginned cottoll 8 2 2 3
(iv) Synthetic fabric
(v) Woolen cloths 3
(vi) Textile
(vii) Polythenes
606 33 6 4 12 8 2
(i) Vegetable oils 2
(ii) Mustard oils 3 2
(iii) Sugar 23 5 3 7 6
(iv) Confectionary
(v) Sugar cane .. 2
45

Table· 23(A)
Important Commodities Imported by Size Class of Towns and Industrial Category
(FIRST IMPORT ANT COMMODITY)
Industrial Category Name of Commodity All Size· Class of Towns
Towns II III IV V VI
2 3 4 5 6 7 8 9
607
(i) Snuff
DIVISION· 61 8 3 4
Group 610
(i) Timber
612 2
(i) L~ather shoes 2
614 2
(i) Diesel
(Ii) Petroleum product
616 2 2
(I) Fertilizer
(n) Insecticides "
617
(i) Incense
DIVISION 62
Group 621
(i) Electrical motor generator
. DIVISION 63 17 2 3 7 5
Group 630
(i) Wooden Furniture
631
(i) Rubber Product
631 1
(I) Limestone
639 14 2 7 4
(i) Pig iron 5 2
(Ii) Brass
46

Table - 23(A}
Imponant Commoditle, Imported by Size Class of Towns and Industrial Category
(FIRST IMPORTANT COMMODITY)
Industrial Category Name of Commodity All Size - Class of Towns
Towns II III IV ,V VI
2
(iii) Iron
(iv) Coal
Table 23 (A) shows first important commodity imported by size-class of [owns. As many as 93 [owns are famous for wholesale trade in cereals, pulses, basic food stuffs, textile fibres, edible Oils, fats, etc. In 8 towns, the
3
7
47
4 5 6 7 8 9
5 2
first important commodity relates to trade in wood, leather goods, fuel, chemicals, etc. while 1 7 towns are known for the wholesale trade in wooden furniture, rubber products, limestone and other misc. products.

Table - 23(8)
Important Commodities Imported by Size Class of Towns and Industrial Category
(SECOND IMPORTANT COMMODITY)
Industrial Category Name of Commodity All Size - Class ofT owns
Towns " III IV V VI
2 1 4 5 6 7 8 9
SECTION 6 119 10 18 26 45 II 7
DIVISION 60 83 5 9 18 37 8 6
Group 600 15 2. 4 7
(i) Pulses
(Ii) Wheat 2 2
(iii) Paddy 6 3 2
(iv) Rice 2
(v) Cereals 2
(vi) Food grains 2
602 27 2 2 ,9 II 2
(i) Cotton 5 4
(ii) Cotton cloth 18 4 9 2
(iii) Silk cloth
(iv) Jute bags
{v} Cotton Seeds
(vi) Rugs
606 40 1 5 5 18 5 4
(i) Groundnut oil 2
(ii) Sugar 10 2 6
(iii) Sugarcane 2 2
(ivj J aggery
(v) 011 Seeds
(vi) Vanaspatti Ghee
(vii) Vegetable Oils 19 3 8 4 3
(viii) Mustard Oil 4 2
607
(I) Tea
DIVISION 61 14 2 5 5
Group 610 4 2
48

Table· 23(8)
Important Commodities Imponed by Size Class of Towns and Industrial Category
(SECOND IMPORT ANT COMMODITY)
Industrial CateJOry Name of Commodity All Size· Class of Towns
Towns II III IV V VI
2 3 4 5 6 7 8 9
(I) Timber 4 1 2
612 2 I
(I) Leather product 2
614 3 2
(I) Petroleum product
(II) Petrol & diesel
(iii) Cookinggas
616 3
(i) Fertilizer 2
(ii) Phosphate
618 2
(i) Glass & Crockery 2
DIVISION· 62 4
Group 620 3
(i) Agricultural 2 Implements
(II) Spare parts for Agricultural implements
621
(I) Electrical goods
DIVISION· 63 18 3 7 2 2 4
Group 631 2
(I) Rubber goods 2
632 5 2
(I) Cement 5 2
639 II 3 5 2
(I) Pig' Iron
(ii) Iron 4 3
(iii) S[eel balls
(Iv) Iron steel sheets 3 2
49

Table - 23(8)
Important Commodities Imported by Size Class of Towns and Industrial Category
(SECOND IMPORTANT COMMODITY)
Indusuial Category Name of Commodity All
Towns II
SIze - Class of Towns
III IV V VI
2
(v) Stainless steel
(vi) Sports items
Table 23 (8) shows second important commodity imported by size-class of towns and industrial category. Wholesale trade in agricultural raw materials, food, bewerages, Intoxicants and textiles is the second important characteristics of 83 towns. Among them, 15 towns are known for the wholesale trade in cer~als and pulses, 27 towns are famous for wholesale trade in textile fibres while
3
50
4 5 6 7 8 9
40 towns are important centres for wholesale trade in manufacture of food stuffs. Among other towns, wholesale trade in wood, leather products, fuel, petroleum products, etc. in 14 towns and wholesale trade In machinery! agricultural products, such as, rubber goods, cement, pig iron, sports item, iron and steel, etc. in 1 8 towns is the second important activity.

Table· 23(C)
Important Commodities Imported by Size Class of Towns and Industrial Category
(THIRD IMPORTANT COMMODITY)
Industrial Category Name of Commodity All Size· Class ofTowns
Towns II III IV V VI
2 3 '" S 6 7 8 9
SECTION 6 120 10 19 2S 46 13 7
DIVISION 60 64 '"
9 9 31 7 '" Group 600 13 3 5 '"
(i) Wheat 2 2
(ii) Maize
(Hi) Paddy 3
(Iv) Rice 3 3
(v) Pulses 2
(vi) Food grains 2
601 5 2
(I) Vegetable 5 2
602 12 2 6
(i) Cotton 4
(il) Clothes 3 3
(ill) Woollen 3 2
(Iv) Woollen Shaw
(v) Textile goods
604
(I) Rice Husk ,
606 29 2 3 3 17 3
(I) Sugar 12 2 8 2
(O) Jaaety 1·
(ill) Vegetable oils 8 5 II
(Iv) Vanaspatti Ghee 6 1 2 3
(v) Edible 011
(vi) Oil seeds
607 3 2
(i) Tea 3 2 2
51

Table - 2:3(C)
ImDortant. #\Qdities Imported by Size Class of Towns and Industrial Category
(THIRD IMPORTANT COMMODITY)
Industrial Cate&Ol'Y . - ·~''''N3me of Commodity All Size· Class of Towns
Towns II III IV V VI
2 3 4 5 6 7 8 9
609
(I) Durrles
DIVISION 61 12 4 3 2
Group 610 3 2
(I) Timber
(iI) Fuel wood 2 2
612 2
(i) Leather shoes 2
613
(I) Bicycle pans I
614 2
(I) Kerosene oil
(Ill Waste 011
615
(11 Medicines
616
(i) Fertilizers
617 1,
(I) Soap
618
(I) Utensils
DIVISION • 62 11 3 4 3
Group 620 7 2 3
(i) Agricultural implements 5 2 2
(ii) Tractor partS
(iii) Spare partS for combine machine
621 2
(i) Elemkai apparatus 2
52

Table· 23(C)
Important Commodities Imponed by Size Class of Towns and Industrial Cat-egory
(THIRD IMPORTANT COMMODITY)
Industrlal Category Name of CommoditY All Size· Class of Towns
Towns II· III IV V VI
DIVISION 63
Gfoup
622
623
631
632
639
2
(i) Electronic goods
(i) Bicycle parts
,(il Rubber product
(II Burnt bricks
(ii) Cement
(iii) Building materials
(il Pig iron
(Ul Iron IOOds
(Ui) Cast iron
(Iv) Steel and Iron scraps
(v) Ingoes steel
(vi) Sports IOOds
(Vii) Iron machinery parts
{viii} Enamelled copper wire
(bt) Spare parts for sewln, machine
(x) Coal
(xl) Earthen pottery
(xli) 011 enllne parts
(xiii) M.S. Rounds
The table 23 " C highlights third I~portant commodity imported by size-class of towns and Industrial category. Wholesale trade in cereals and pulses in 1 3 towns and vegetable in 5 towns is the third important commodity imported. Wholesale trade in textile fibre in 1 2 towns, wholesale trade in manufacture food stuffs in 29 towns and wholesale trade in tea in three towns is the third most
3
33
2
2
10
3
5
2
21
2
2
4
3
2
53
4 5 6
5 6 8
2
5 3 7
2
7
9
.. 2
4
2
2
8 9
4
2
2
important commodity imported. Among others, in 7 towns agricultural and industrial m~chinery and electrical appliances In 2 towns rank as the lrd Irhporunt commodity imported. As many as 33 towns have wholesale trade of other items, such as, rubber products, cement, iron goods, coal, etc. as the third important commodity imported.

Table· 24(A)
Important Commodities Exported by Size Class of Towns and Industrial Category
(FIRST IMPORT ANT COMMODITY)
Industrial Category Name of CommoditY All Size - Class of Towns
Towns II III IV V VI
2 3 4 5 6 7 8 9
SECTION 6 118 10 18 25 46 13 6
DIVISION 60 83 5 12 IS 33 12 6
Group 600 35 6 5 15 4 5
(i) Wheat 2S 6 2 10 4 3
(II) Rice 8 3 4
(iii) Paddy
(Iv) .Food Grains
601 22 2 5 8 6
(i) Fruits
(I:) Sugar 3
(iii) Ghee
(iv) Vegetable oils
(v) Sugarcane 2 2
(vi) Chillies 5 2 2
(vii) Milk I.
(viii) Vegetable 5 ·1 2
(Ix) Jams
(x) Groundnut oli 2 2
602 19 4 4 8 2
(i) Clothes
(Ii) Khadl clothes
(III) Cotton bark 4
(iv) Lime yarn
(v) Cotton 5 3
(vi) Processed cotton 2 I.
(vii) Silk yarn
(vUl) CarpetiDurries 3 2
(Ix) Shawl I 1"1:
607 2
(i) Coffee
(0) Snuff I' iiJ
S4

Table - 24(A)
Important Commodities Exported by Size Class of Towns and Industrial Category
(FIRST IMPORTANT COMMODITY)
Industrial Category Name of Commodity All SiZE - Class of Towns
Towns II III IV V VI
2 3 4 5 6 7 8 9
609 5 3 2
(i) Wollen Blanket 2
(li) Textile Fabric
(iii) Hosiery product
(Iv) Bed Sheet
DIVISION 61 9 3 2. 4
Group 610 4 3
(i) Bubbar grass
(ii) Timber
(iii) Fuel wood
(Iv) Basket
611
(i) Paper
612
(i) Shoes.
616 2
(I) Fertilizers 2
617
(i) Ivory goods
DIVISION 62 II 5 5
Group 620 6 2 J
(i) Agricultural machine tools
(ii) Thresher
(Iii) Toka machine
(Iv) Agricultural Implements 2
(v) Tractor and Tractor parts
621 3 2
0) Electrical copper wire
(ii) Electrical casing
5S

Table - 24(A)
Important Commodities Exponed by Size Class of Towns and Industrial Category
(FIRST IMPORTANT COMMODITY)
Industrial Category Nami' of Commodity All Size - Class of Towns
TC7M15 II III IV V 'II
2
(ill) Electrical Generators
623
(i) Auto spare parts
(Ii) Bicycle parts
DIVISION - 63
Group 630
(i) Furniture
631
(i) Rubber pipe
639
(i) Rolling bars
(ii) Iron and sleel product
(iii) Hand tools
( Iv) Brass Vessel
(v) Sewing machine spare parts
(vi) Straw Board
(vii) Engine parts
(viii) Earthen pottery
Table 24 - A provides information on first important commoditY exported. Food stuff and textile goods are the main items of expon in 83 towns. Among them, cereals and pulses in 35 towns, fruits and edible oils etc. in 22 towns and textile goods in 19 towns are the first important commoditY exponed. Apart from this, S towns are famous for the export of woollen blankets, hosiery product etc.
3
2
15
2
2
12
2
2
2
2
S6
4 5 6 7 8 9
2
8 4
2
2
6 3
2
2
and two for the export of coffee and snuff. Export of WOOd,
grass, timber, etc. is the characterstic of four towns while two [Owns have fenilizers as the first important commoditY exported. Among other towns, six are known for the export of agricultural implements, three for electrical goods, two for auto spare pans and furniture and 12 for the export of miscellaneous goods.

Table - 24(B}
Important Commodities Exported by Size Class of Towns and Industrial Category
(SECOND IMPORTANT COMMODITY)
Industrial Category Name of Commodity All Size - Class of Towns
Towns II III IV V VI
2 3 4 5 6 7 8 9
SECTION 6 117 10 18 25 45 14 S
DIVISION 60 7S 4 9 17 30 II 4
Group 600 38 4 6 15 9 4
,i) Wheat 14 3 4 4 2
(ii) Rice 14 2 2 9
(iii) Paddy 4 2
(vi) Maize 4 2
(v) Pulses
(vi) Food Grains
601 18 3 3 5 6
(i) Fruits
(ii) Vegetable oil 5 2 2
(iii) Ghee
(Iv) Mustard oil
(v) Potato
(vi) Skimmed milk 2
(vii) Eggs
(viii) Sugarcane
(ix) Groundnut oil 2
(x) Sugar 2
(xi) Chillies
602 13 6 5
(i) Cotton 10 5 4
(ii) Blanket
(iii) Yam
(iv) Carpet
604 2 2
(I) Oil cake
(ii) Poultry product
606 2
57

Table - 24(8)
Important Commodities Exported by Size Class of Towns and Industrial Category
(SECOND IMPORT ANT COMMODITY)
Industrial Category Name of Commodity All Size· Class of Towns
Ta.vns II III IV V VI
2 3 4 5 6 7 8 9
(i) Bakery porduet
(Ii) Jams
609 2 2
(i) Woollen blanket
(ii) Polythene bags
DIVISION 61 6 2
Group 610
(i) Bam
612 3
(I) Shoes 3
616
(i) Fertilizer
617
(i) Washing soap
DIVISION 62 II 2 4 3
Group 620 8 2 3
(i) Agricultural Implements 5 2
(IIi Toka machine
(ill) Trollies
(iv) Tractor
621 2 2
(i) EI«(rical material
(Ii) Electrical Transfonner
623
(I) Bicycle
DIVISION 63 25 4 3 6 11
Group 630 4 2 2
(i) Wooden fumiture
(ii) Card board
(iii) Wooden Toys
58

Table - 24(8)
Important Commodities Exported by Size Class of Towns and Industrial Category
(SECOND IMPORT ANT COMMODITY)
Industrial Category Name of Commodity All Size· Class ofTowns
Town.~ II III IV V VI
2
(iv) Ambar charkha
631
(i) Chappal
(ii) Conduit pipe
(ill) Spun pipe
634
(I) Pressure cooker
635
(i) Heavy water
637
(I) Stone
639
(I) Basket
(II) Iron pipe
(nl) Grinder
(Iv) Gobar gas plane
(v) Ball Bearing
(vi) Locks
(vii) Spare parts for Cinema
(viii) Nut bolt
(ix) Pinon ring
(xl MachineI)' parts
(xl) Sapre parts for sewing machine
(xli) Truck Body
Table 24 - B shows second important commodity exported by size-class of towns. In 38 towns. cereals and pulses (onn the second Important commodity exported and 1 8 towns have fruit, vegetable 011 etc. as the second important commodity exported. Export of footwear, chemicals, etc. is the ,,:::...:ond largest commodity in six towns
3
3
15
2
2
2
59
4 5 6 7 8 9
2
2 3 3 6
while 8 towns are known for the export of agricultural implements. In 2S towns, wooden furniture, conduite pipe, household equipment find place as I he second importanc commodity exported and another t 5 towns are known for the export of miscellaneous goods.
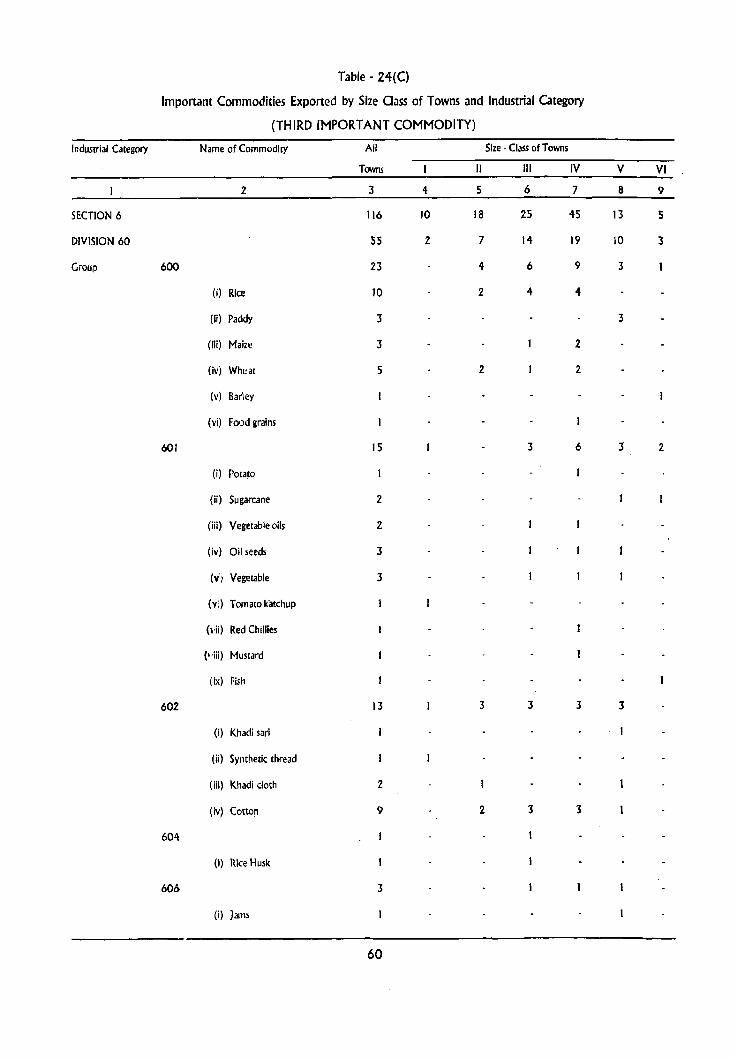
Table - 24(C)
Important Commodities Exported by Size Qass of Towns and Industrial Category
(THIRD IMPORTANT COMMODITY)
Indusuial Category Name of CommoditY All Size - Class of Towns
Towns II III IV V VI
2 3 4 5 6 7 8 9
SECTION 6 116 10 18 25 45 13 S
DIVISION 60 S5 2 7 14 19 10 3
Group 600 23 4 6 9 3
(I) Rice 10 2 4 4
(Ii) Paddy 3 3
(ill) Maize 3 2
(Iv) Whl;~at 5 2 2
(v) Bar'ley
(vi) FOJd grains
601 15 3 6 3 2
(i) Potato
(ii) Sugarcane 2
(iii) Vegetable oils 2
(iv) Oil seeds 3
(v') Vegetable 3
(vi) Tomato katchup
(\ ii) Red Chillies
C, 'iii) Mustard
(ix) Fish
602 13 3 3 3 3
(i) Khadi sari
(Ii) Synthetic thread
(iii) Khadi doth 2
(iv) Cotton 9 2 3 3
604
(I) Rice Husk
606 3
(i) Jams
60

Table - 24(C)
Important Commodities Exported by Size Class of Towns and Industrial Category
(THIRD IMPORT ANT COMMODITY)
Industrial Category Name of Commodity All Size - Class of Towns
Towns II III IV V VI
2 3 4 5 6 7 8 9
(ii) Soda Water
(iii) Confectionery
--DIVISION 61 11 2 6 2
Group 610
(i) Ban
612· 5 4
(i) leather shoes 5 4
617 5 2
(i) Washing soap 4 2
(ii) Detergent Powder
DIVISION 62 19 4 6 6 2
Group 620 15 2 5 5 2
(i) Agricultural implements 12 2 4 4 2
(ii) Boaring engine
(iii) Thrashers
(iv) Toka Machine
621
(i) Electrical goods
623 3 2
(I) Auto spare parts
(ii) Spare partS bicycle 2 2
DIVISION 63 31 7 5 4 14
Group 630 7 6
(I) Wooden furniture 5 4
(ii) Wooden materials lathe machine
(Iii) Wooden wheels for cartS
631 3
61

Table - 24(C)
Important Commodities Exported by Size Class of Towns and Industrial Category
(THIRD IMPORTANT COMMODITY)
Industrial Category Name of CommOditY All Size - Class of Towns
Towns II III IV V VI
2 3 4 5 6 7 8 9
(I) PVC Pipes
(Ii) Conduit pipes 2
637
(i) Building materials·
639 20 6 4 3 7
(I) G.I. Sanitary fittings
(Ii) Machine tools
(iii) Sewing machine 3 2
(Iv) Water bottles I·
(v) Spare parts for sewing machine
(vi) Motor parts
(vii) G.!. Pipes
(viii) Labels
(ix) Locks
(x) Ice
(xi) Picture tubes for T.V.
(xii) Diesel Pumping set
(xiii) Earthen pottery 3 3
(xiv) Sports goods 2 2
(xv) Hides
Table 24 (C) exhibits information on third important commodity exported by size-class of towns. Pulses and cereals in 23 towns and vegetable, edible oils, etc. in t 5 towns are the third important commodity exported. Export of textile fibres is observed as the third important commodity in I 3
towns while t 9 towns are known for the export of agricultural implements, electrical goods, auto spare parts, etc. Besides 20 towns in the State have other miscellaneous goods as the third important commodity exported.
62

Table 25
Disuibution of Banking SelVices, Agricultural and Non-Agricultural Credit Societies by size-class of towns
Size Total
Class No. of Banks
of Towns Towns (No.)
2 3
10 10 (552)
II 18 18(228)
III 25 25 (206)
IV 46 46 (238)
V 14 14 (36)
VI 7 6 (17)
Total 120 119(1277)
Table 25 provides infonnadon on availability of banking selVices, Agricultural and Non-Agricultural Credit Societies under various size-classes of towns in the Stare. Banking and Ag~cultural Credit Societies play a vital role in the economic, commercial and industrial growth of an area and greatly influence the pace as well as the pattern of economic growth. ~he structure of Indian banking system has changed considerably since independence and in particular after the nationalis~tion of 14 major banks in 1969. There has been a rapid expansion in branch network of commercial banking system heading to a significant improvement in their population coverage over all these years.
The table reveals thatoutof t 277 banks of various kinds, 552 banks are located in to class-I towns in the State. The number of banks in t 8 class-II towns is 228. This signifies that more than three-fifths (62.80%) of the total banks in urban areas of Punjab are situated in class-I and class-II towns while the remaining two-fifths (37.20%) are distributed over 92 towns falling under class-III to class-VI.
The state has 86 Agricultural Credit Societies and majority of them (43) are located in class-IV towns. However, among the 976 Non-Agricultural Credit Societies, more than one-half (504) are located in class-I towns.
63
Number of Towns having
Agricultural Non-Agrlculrural Credit Societies Credit Societies
(No.) (No.)
4 5
5 (II) 10(504)
3 (4) 14(164)
9(10) 19(119)
26 (4J) 24 (l40)
9(11 ) 8 (38)
7 (7) 3 (II)
59 (86) 78 (976)
Table 26
Average household size by size-class of towns
Size-class of towns
II
III
IV
V
VI
Total
Average household size
2
5.54
5.53
5.80
5.79
5.75
5.64
5.60
Table - 26 gives average household size by size-class of towns in Punjab. The average size of household refers to the average number of persons living in a household.
The average size of household in urban areas of Punjab is 5.60 per household or 560 persons per 100 households. Among the various size-classes of towns, it varies between 5.53 persons per household (553 per 1 00 households) In class-II towns and 5.80 persons per household (580 per 100 household) in class-III towns. The average number of persons per household in c1ass-J towns of the State is 5.54 or 554 per 100 households.

Table
Proportion of Ii~rates by
Size class Total population Excluding age group
of towns Population 0-6
Total Males Females Total Males Females 1 • 2 3 4 5 6 7
3,246,224 1,752,157 1,494,067 2,742,625 1,482,197 1,260,428
II 1,193,171 634,872 558,299 998,664 530,594 468,070
III 774,453 410,403 364,050 648,679 343,268 305,411
IV 648,230 341,513 306,717 540,551 283,639 256,912
V 102,945 54,942 48,003 86,470 46,188 40,282 . VI 28,202 14,724 13,478 23,694 12,375 11,319
Total 5,993,225 3,208,611 2,784,614 5,040,683 2,698,216 2,342,422
According to 1991 Census, 58.5 t per cent of the state's population is literate. However, in urban areas 72.08 per cent of the state's population is found literate as is noticed from Table-27. Among the various size-classes of towns, the literacy rate is the highest (73.82%) in class-I towns,
64
followed by 71. t 3 per cent in class-II towns. It varies between 67.79 and 70.80 per cent in the remaining size classes of towns. In general, the disparity in the literacy rates of different size·c1asses of towns is not much.

27
sex and size-class of towns
Literates
Total Males Females
8 9 10
2,024,499 1,157,385 867,114
710,369 410,497 299,872
454,451 261,253 193,198
366,432 210,175 156,257
61,222 35,805 25,417
16,500 9,484 7,016
3,633,473 2,084,599 1,548,874
The literacy rates among males and females are 77.26 and 66.12 per cent respectively. In omerwords, more than three·fourths among males and two-thirds among females in the urban areas of Punjab are literate. With the exception of class-III towns, the male-female disparity gradually widens
65
Percentage of literates
to total population
excluding 0-6 age'group
Total Males Females
11 12 13
73.82 78.09 68.80
71.13 77.37 64.07
70.06 76.11 63.26
67.79 74.10 60.82
70.80 77.52 63.10
69.64 76.64 61.98
72.08 77.26 66.12
with the loweringofsii . .: "I;l< v:wwr .. !nclass-I towns 78.09 per cent among males and 68.80 per cent among females are literate resulting in a gap of 9.29 per cent which further widens to 14.66 per cent in respect of class-VI.

Table - 28
Proportion of Scheduled Castes and Scheduled Tribes Population by Size-Class of Towns.
Size
Class of
Tcmns
II
III
IV
V
VI
Total
Total
Population
2
3246,224
1193,171
774,453
648,230
102,945
28,202
5993,225
Scheduled Caste
Population
3
568,433
223,714
182,087
167,462
27,608
10,782
1180,086
Percentage of Scheduled Percentage of Scheduled Caste Tribe Schedu led Tribe
Population to Population Population to Total Population Total Population
4 5 6
17.51
18.75
23.51
25.83
26.82
38.23
19.69
According to t 991 Census, 28.31 percent of Punjab's population belongs to Scheduled Castes. In urban areas, however, only one-fifth (19.69%) are scheduled castes as It emerges from Table-2B.
scheduled caste population to total·population increases with the lowering of size-class oJ town. It varies ~tween 17.51 per cent in class-I towns and 38.23 per cent in class-VI towns.
The table further reveals that the proportion of There is no scheduled tribe population· in the State.
Table - 29
Percentage Distribution of Main Workers by Size-Oass of Towns.
InduslJial Category of Main Workers SIZE - CLASS OF TOWNS II III IV V VI
.2 3 4 5 6 7
2.15 4.04 7.07 10.42 10.93 11.20
II 5.00 7.34 8.82 14.73 16.73 25.83
III 1.32 0.97 0.82 0.93 0.94 2.94
IV 0,01 0.01 0.01 0.02 0.Q3
V 31.60 20.54 18.55 15.92 14.92 12.29
VI 4.65 3.88 3.30 3.91 2.90 1.67
VII 25.46 26.63 28.27 26.20 20.56 19.52
VIII 7.30 7.38 5.96 5.17 4.38 4.14
IX 22.51 29.21 27.21 22.71 28.62 22.38
Total 100.00 100.00 100.00 100.00 100.00 100.00
Table 29 depicts percentage distribution of main workerS workers, 1.32 per cent engaged in livestock, forestry, fishing, by size-class of towns. In class-I towns, 2.15 per cent of hunting and plantations, orchards and allied activities, 0.01 % main workers are cultivators, 5.00 per cent agricultural engaged in mining and quarring, 31.60 per cent engaged
66

in manufacturing, processing, servicing and repairs, 4.65 per cent in constructions, 25.46 per cent in trade and commerce, 7.30 per cent in transport, storage and communications and 22.51 per cent are engaged in other services. This shows that secondary and tertiary activities are most dominant in class-I towns and they engage 36.25 per cent and 55.27 of the main workers respectively while only 8.48 per cent of the main workers are engaged in primary activities_ A similar trend is observed in class-II and class-III towns in the State. However, in towns under sileo class IV, V and VI, primary and tertiary activities are more dominant and in class-IY/to VI towns, the proportion of workers engaged in primary sector is quite significant.
The overall patterns show that proportion of workers engaged in primary sector increases with the lowering of size-class of towns, while in secondary sector, proportion of main workers declines as the size-class of towns decreases.
67
In all the towns, the proportion of workers in tertiary sector is found to be the maximum.
Urban Primry Census Abstract i Primary Census Abstract (Urban) has 42 columns providing information on area, occupied residential houses,. no. of households, population by sex, population in age group 0-6, Scheduled castes, literates, main workers and their break LIP into 9 industrial categories, marginal workers and non-workers for each town and for the State as a whole. The additional feature of 1991 Census is that the children below the age of 7 years have been taken as illiterate as per the recommendations of the Depanment of Education in Human Resource Development and the Planning commission. This has been done in order to make the census data on literacy comparable with the international statistics. Prior to t 99 t Census, the children below the age of 5 years were taken as illiterate.


STATEMENT • I
STATUS AND GROWTH HISTORY
69

STATEMENT
Status and
51. Class, Name and Location Name of Name of Area Number of Population No. Civic Administration Code Tahsil C.D. Block (in Sq. Households Including 1901
StatuS of Town Number Kms.) Houseless Households
(in 1991 Census) 2 3 4 5 6 7 S
I Abohar (M.C.) 3/X Abohar 23.07 IS,057
2 IV Adampur 5/X Jalandhar S.20 3,313
3 111 Ahmedgarh (M.C.) lOll Malerkotla 3.88 4,123
4 V Akalgarh (C.T.) 4/111 Jagraon Sudhar 5.48 1,179
5 V Alawalpur (M.C.) S/XII Jalandhar 1.00 1,152 4,123
6 V Amloh (M.C.) 9/Xl Nabha 2.69 1,714
7 I Amrltsar (M.Corp.) ZIIV Amritsar 114.95 126,283 162,429
8 VI Amritsar Cantt. (C.B.) 2/v Am ri tsar 2.85 780
91V Anandpur (M.C,) S/III AnOll1dpur 3.00 2;OS3 5,028
Sahib Sahib
10 V Badhni K31~n (NAC) 12/1 Moga N.A. 1,407
I 1 IV Baghapuran (NAC) I 21 iii Moga 6.00 2,761
12 IV Banga (M,C) 511 Nawan 1.50 3,030 4,697
Shahr
13 IV Banur (M.C.) 9flV Rajpura 4.50 1,665 5,610
141V Bareta (M.C.) II/XI Mansa 4.00 1,965
15 1J1 Barnala (M.C.) to/X Barnala 16.00 13,671 6,905
16 IV Bassi (M.C.) 9/1 Fatehgarh 5.00 3,075 13,738
Sahib
17 I Batala .................... See Batala Urban Agglomeration .... --............. -
Batala U.A.' NA. 16,387 27,365
70

·1
Growth History
and Growth Rate of the Town at the <;ensuses De~ity Sex Ratio 1911 1921 1931 1941 1951 1961 1971 1981 199! (1991 1971 1981 1991
Census)
9, 10 II 12 13 14 15 16 17 IB 19 20 21
9,492 8,916 14,035 21,222 25,476 46,863 58,925 86,334 107,163 4,645 850 920 852
(·6,07) (+57.41) (+51.21)(+20'.05) (+83,95) (+25.74) (+46.52) (+24,13)
5,177 8,105 10,960 15,331 1,870 1,042 920 1,033
(+56.56) (+35,23) (+39,88)
3,283 4,368 6,258 9,074 12,499 16,874 25,560 6,588 895 907 888
(+33.05) (+43.27) ( +45.00) (+37,75) ( +35.00) (+51.48)
5,564 1,015 896
4,452 4,539 4,732 5,851 6,468 6,468 899 916 915
(+ 1.95) ( +4.25~ (+23.65) (+ 10.55)
1,543 1,889 2,184 2,863 3,582 4,848 7,098 9,854 3,663 862 896 S98
(+22.42) (+15.62)(+31.09) (+25,11) (+35.34) (+46.41) (+38,83)
152,756 160,218 264,840 391,010 336,114 390,055 454,805 594,844 708,835 6,166 827 8S3 883
(·5.96) (+4.88) (+65.30) (+47.64) (-14.04) (+16.05) (+ 16.60) (+30.79) (+ 19.16)
7,992 3,224 11,040 3,832 1,345 872 926 894
(·59.66) (+242.43) (-65.29)
4,041 4,266 4,189 5,000 8,571 10,674 3,558 857 834 B67
(·19.63) (·1.80) (+19.36) (·71.42) (·24.54)
8,572 .. 885
14,289 17,287 2,881 883 932
(·20.98)
4,602 5,089 5,840 9,112 9,843 10,212 11,885 13,490 17,72111,814 910 918 921
(·2.02) (+10.58) (+14.76) (+56.03) (-8.02) ( +3.75) (+ 16.38) (+13.50) (+31.36)
3,468 4,308 5,459 7,453 10,014 2,225 876 871 881
(+2i.22) ( +26.72) (+36.53) (+34.36)
5,317 7,041 8,313 9,494 11,537 2,884 880 878 884
(+32.42) (+ 18.07) (+14.21) (+21.52)
5,341 7,714 8,915 12,341 15,996 21,354 31,847 43,680 . 75,430 4,714 860 868 847
(-22.65) (+44.43) (+15.57) (+38.43)(+29.62) (+33.50) (+49.14) (+37.16) (+72.69)
11,125 11,560 12,979 14,400 13,151 13,042 14,385 16,672 18,138 3,628 893 923 938
(·19.02) (+3.91) (+12.28) (10.95) (·8.67) (-0.83) (+10.l0) (+15.90) (+8.79)
-------.------------ See Batala Urban Agglomeration -----------.---.-
26,430 26,122 33,204 44,458 55,850 51,300 76,488 101,966 103,367 N.A. 892 891 886
(-3.42) (-1.17) (+27.11) (+33.89}(+25.62) (·B.ls) (+49.10) ( +33.31) (+ 1.37)
71

STATEMENT
Status and
SI. Class, Name and location Name of Name of Area Number of Population No. Civic Administration Code Tah~il CO. Block (in Sq. . Households including 1901
Status of Town Number Kms.) Houseless Households
(in 1991 Census) 2 3 4 5 6 7 8
Batala (M.C.) I/X Satala 8.75 13,585 27,365
18 I Bathinda (M.C.) II/Ill Bathinda 97.00 30,495 13,185
19VI Behrampur (CT.) I/IV Gurdaspur Oinanagar 3.26 793
20rV Bhadaur ,M.e.) 10/XI Barnala 6.()(1 2,282 7,710
211V Bhawanlgarh .................... See Bhawanigarh Urban Agglomeration .. - ............ - ..
Bhawanlgarh U.A.· NA 2,373
Bhawanlgarh (M.e.) IOIIV Sangrur i59 1,724
22 IV Bhllchiwlnd (cr.) 2/X Patti Bhikhlwind 10.00 1,712
23VI Bhogpur (CT.) 5/XIll Jalandhar Bhogpur 3.00 837
24 IV Bhucho Mandl {M.q IIIIV Bathinda 2.20 1,686
25 IV Budhlada (M.C) II/X Mansa 5.18 3,157
261V Dasua (M.C) 7/111 Oasua 16.00 3,271 6,401
27 V Dera Baba (M.Cl INIl Batata 0.7B 1,151 5,118
Nanak
28 V Dera Bassi (M.C) 91111 Rajpura 3.06 1,830 4,641
29 IV Dhanaula (M.C) 10/IX Barnala 5.00 2,690 7,443
30 IV Dharlwal (M.C) ll1V Gurdaspur 1.27 2,546
311V Dharamkot ...... -........ --.. - See Dharamkot Urban Agglomeration ------....... --...
Dharamkot U.A.· NA 1,921 6,731
Dharamkot (M.C) 3/1 Zira 1.10 1,815 6,731
72

Growth History
and Growth Rate of the Town at the Censuses Density SeX' Ratio
1911 1921 1931 1941 1951 1961 1971 1981 1991 (1991 1971 1981 1991
Census)
9 10 II 12 13 14 15 16 17 18 19
26,430 26,122 33,204 44,458 55,850 51,300 60,784 87,135 86,006 9,829 897
(-3.42) (·1.17) (+27.11) (+33.89) (-25.62) (-8.1S) (+18.49) (+43.35) (-1.30)
15,037 20,154 22,771 24,833 34,991 52,253 65,318 127,363 159,042 1,640 828
(+14.05) (+34.03) (+12.99) (+9.06)(+40.91) (+49.33) (+25.00) (+94.99) (+27.87)
4,806 1,474
5,465 5,577 6,282 7,862 7,727 9,407 10,428 13,350 14,808 2,468 863
(·29.12) (+2.05) (+12_64) (+25.15) (-1.72) (+21.74) (+10.85) (+28.02) (+10.92)
-------------------- See Bhawanigarh Urban Agglomeration --------------------
20 21
894 893
819 865
.. 944
884 883
4,253 5,437 6,706 9,817 13,900 N.A. 895 894 879
(+27.84) (+23.34) (+46.39) (+41.59)
4,253 5,437 6,260 8,90 I 10,115 3,905 891 890 880
(+27_84) (+15.14) (+42.19) (+13.64)
11,958 1,196
6,882. 4,896 1,632
(-28.86)
- 669
896 • 881
1,624 . 2,277 2,945 7,820 10,006 4,548 864 853 900
(+40.21) (+29.34) (+165.53) (+27.95)
8,369 5,364 7,077 8,620 11,713 15,968 18,717 3,613 889 893 893
(-35_91)(+31.94) (+21.80) (35.88) (+36.33) (+17.22)
3,597
(-43.83)
4,556
(-10.98)
4,236
(-8.73)
9,206 7,895 8,721 10,363 14,657. 18,351 1,147 914 916 898
-- (-14.24) (+10.46) (+18.83) (+41.44) (+25.20)
4,333 5,176 5,872 2,868 5,288 5,338 6,212 7,380 9,462 765
(-4.89) (+19.46) (+13.45) (·51.16) (+84.38) (+0.95) (+16.37) (+18.80)
3,890
(-8.17)
6,094 6,886
(-18.12) (+13.00)
4,182 5,070 3,651 4,051 5,807 7,421 9,602 3,138 905
(-7.51) (+21.23) (-27.99) (+ 10.96) (+43.35) (+27.79) (+29.39)
7,521 9,560 9,552 11,238 11,877 13,885 15,967 3,193 875
(-9.22) (+27.11) (+0.08) (+ 17.65) (+5.69) (+16.91) (+14.95)
757 675
913 908
887 900
4,186 7,388 7,731 9,601 9,985 12,212 14,21411,192 897 948 927
(+76.49) (+4.64) (+24.19) (+4.00) (+22.30) (+ 16.39)
-------------------- See Dharamkot Urtan Agglomeration --------------------
5,859 5,960 6,779 8,360 6,845 6,443 7,720 9,328 11,981 NA 865 883 898
(-12.95) (+1.72) (+13.74) (+23.32) (-18.12) (-5.87) (+19.82) (+20.83) (+28.44)
.5,859 5,960 6,779 8,360 6,845 6,443 7,146 9,125 11,29310,266867886902
(-12.95) (+1.72) (+13.74) (+23.32) (-18.12) (-5.87) (+10.91) (+27.69) (+23.76)
73

STATEMENT
StaniS and
51. Class, Name and. LIlC3tion Name of Name of Area Number of Population
No. Civic Admlnimadon Code Tahsil CD. Block (in Sq. Households Including 1901
Status of T()wn Number Kms.) Houseless Households
(in 1991 Census)
2 3 4 5 6 7 8
32 III Dhuri (M.C.) 10/111 Malerkotla 15.00 6.694
33 IV Dinanagar (M.C) 1/111 Gurdaspur 14.36 2,846 5,191
34 V Doraha (M.C) 4/V1II Khanna 1.90 1,700
35 II Farldkot .................... See Faridkot Urban Agglomeration --------.--.••• ---.
Farldkot U.A.· NA 10,426 10,405
Farldkot (M.C) JUlV Faridkot 18.14 10,356 IO,40~
36 IV Fatehprll (M.e.) tllX Batala 1.50 1.903
Churlan
31 V F atehnangal (C.T.) I/VII Gurdaspur Dhariwal 3.66 924 .+.
38 II Fazllka (M.C,) 3/iX Fazilka 7.34 10,026 8,505
39 II Flrazpur (M.C.) 31V Firozpur 11.33 13,850 49,341
40 II Firozpur Cantt. (C.B.) 3/VI Firozpur 20.10 11,133
41 V Garhdlwala (M.C.) 71V Hoshlarpur 0.62 975 3,652
42 IV Garhshankar (M.C.) 711X Garh Shankar 5.00 2,052 5,803
43 III Glddarbaha (M.C.) 121IX Muktsar 8.25 4,702
44 iii Gobindgarh --.. ---.......... -- See Gobindgarh Urban Agglomeration ... --...... - ..... -
Goblndgarh U.A. * NA 7,899
Goblndgarh (M.C,) 9fXlI Nabha 32.00 7,502
45 IV Gonlana (M.e.) 11111 Bathinda 9.00 1,694
46 IV Goraya (NAC) 5/!V Phillaur 2.65 1,914
74
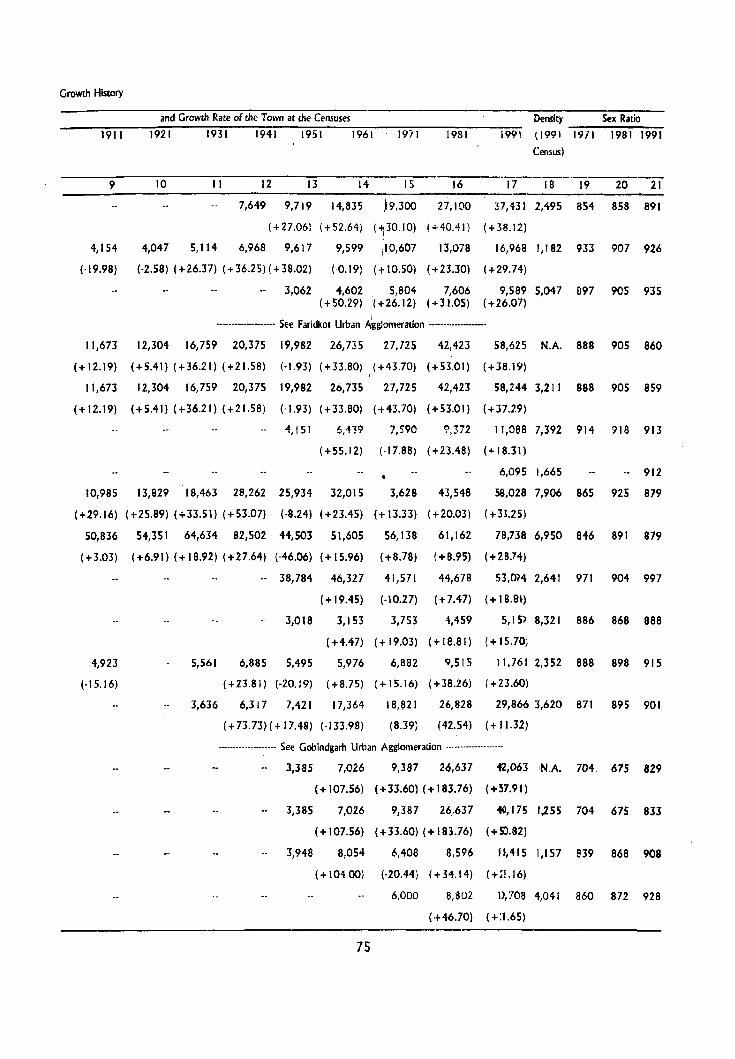
Growth History
and Growth Rate of the Town at the Censuses Densley Sex Ratio
1911 1921 1931 1941 1951 1961 1971 1981 1991 (1991 1971 1981 1991
Census)
9 10 11 12 13 14 IS . 16 17 IB 19 20 21
7,649 9,719 14,835 19,300 27,100 :a,43 I 2,495 854 858 891 I
( +27.06) (+52.64) (1 30.10) (+40.41) (+38.12)
4,154 4,047 5,114 6,968 9,617 9,599 i1O,607 13,078 16,968 1,182 933 907 926
(-19.98) (-2.58) (+26.37) (+36.25)(+38.02) (-0.19) (+10.50) (+23.30) (+29.74)
3,062 4,602 5,B04 7,606 9,589 5,047 897 905 935 (+50.29) (+26.12) (+31.05) (+26.07)
............. - ..... See Faridkot Urban ~gglomeration ................ _.
11,673 12,304 16,759 20,375 19,982 26,735 27,725 42,423 58,625 N.A. 888 90S 860
(+12.19) (+5.41) (+36.21) (+21.58) (·1.93) (+33.80) ( +43.70) (+53.01) (+38.19)
11,673 12,304 16,759 20,375 19,982 26,735 27,725 42,423 58,244 3,211 888 905 859
(+12.19) (+5.41) (+36.21) (+21.58) (-1.93) (+33.BO) (+43.70) (+53.01) ( +37.29)
4,151 6,139 7,590 ~,372 11,08B 7,392 914 918 913
(+55.12) (-17.88) ( +2.3.48) (0\- 18.31)
6,095 1,665 .. 912
10,985 13,829 18,463 28,262 25,934 32,015 3,628 43,548 58,028 7,906 865 925 879
(+29.16) (+25.89) (+33.51) (+53.07) (·8.24) (+23.45) (+ 13.33) (+20.03) (+31.25)
50,836 54,351 64,634 82,502 44,503 51,605 56,138 61,162 78,738 6,950 846 891 879
(+3.03) (+6.91) (+18.92) (+27.64) (·46.06) (+ 15.96) (+8.78) (+8.95) (+28.74) _.
38,784 46,327 41,571 44,678 53,014 2,641 971 904 997
(+19.45) (-10.27) (+7.47) (+18.!H)
3,018 3,153 3,753 4,459 5,15) 8,321 886 868 888
(+4.47) (+ 19.03) (+18.81) (+15.70;
4,923 5,561 6,885 5,495 5,976 6,882 9,515 11,761 2,352 888 898 915
(-15.16) (+23.81) (-10.19) (+8.75) (+ 15.16) (+38.26) ( +23.60)
3,636 6,317 7,421 17,364 18,~21 26,828 29,866 3,620 871 895 901
( + 73.73) ( + 17.48) (·)33.98) (8.39) (42.S4) (+ 11.32)
.................... See Gobindgarh Urban Agglomeration ....................
3,385 7,026 9,387 26,637 12,063 ;N.A. 704 675 829
(+ 107.S6) (+33.60) (+183.76) (+57.91)
3,385 7,026 9,387 26.,637 40,175 t,2SS 704 675 811
(+107.56) (+33.60) (+ 181.76) (+5).S2)
3,948 8,054 6,408 8,596 H,41S 1,157 839 868 908
(+ 104.00) (-20.44) (+14.14) (+;1.16)
6,000 8,802 1),708 4,041 860 872 928
(+46.70) ( +:1.65)
7S

STATEMENT
Status and
51. Class, Name and Location Name of Name of Area Number of Population
No. Civic Administration Code Tahsil C.D. Block (In Sq. Households Including 1901 Status of Town Number Kms.) Houseless Households
(in 1991 Census)
2 3 4 , 5 6 7 8
47 II Gurdaspur (M.e.) ltv I
Gurdsa:rPur 10.B5 9,603 5,764
48 IV Guru Har Sahai (M.C.) 3IVII Firozpu,f 1.50 1,675
49 Y Harian" (M.e.) 7/YI, Hoshiarpur 1.29 1,209 6,005
50 I !ioshiarpur (M.e.) 7tvll I
Hoshiarpur 28.21 22,109 17,549
51 III ]agraon (M.c.) 4/1 ]agraon 14.00 7,852 18,760
52 III )aitu .................... See )aitu Urban Agglomeration ........... - •......
]aitu U. A. * NA 4,594
)aitu (M.q 121Y1 Faridkot 9.06 4,578
53 III ]aialabad .................... See lalalabad Urban Agglomeration .............•......
]alalabad U.I\.* NA 3,932
)ah1labad (' 1.c.) 31V1II Fazilka 2.84 3,056
54 I ]alandhar (M.Corp.) 51lX ]alandhar 80.41 89,660 67,735
S5 III ]alandhar eafltt, (C.B.) 5/X )alandhar 15.21 6,277
56 IV landlala (M.e.) 2tvl Amrltsar 4.20 3,168 7,750
57 II KapurlhdJa (M.e.) 6/1 Kapurthala 56.00 11,601 18,519
58 III Kartarpur (M.e.) 5/XIV ]aJandhar 5.95 3,499 10,840
59 II Khanna (M.e.) 4/X Khanna 16.02 12,402 3,838
60 III Khar.1r .................... See Kharar Urban Agglomerar;on " .................
Kharar U.A.· NA 4.889
76

-I
Growth History
and Growth Rate of the Town at the Censuses Density Sex Ratio ----~19~1~1--~19~2~1----~19~3~1--~1~94~1--~19~5~1--~1~96~1~~19~7~1--~19~8~1----~19~91 (1991 ~1~9~71~~19~8~1~19=9~1
Census)
9 10 II 12 13 14 15 16 17 18 19 20 21
6,248 8,906 12,094 16,641 22,677 27,665 32,064 39,529 54,733 5,045 861 902 862
(+8.40) (+42.54) (+35.80) (+37.60)(+36.27) (+22.00) (+15.90) (+23.28) (+38.46)
1,470 2,311 3,128 4,293 4,601 7,684 10,500 7,000 880 886 912
(+57.21) (+35.35) (+37.24) (+7.17) (+67.01) (+36.65)
5,395 5,205 5,971 6,417 4,725 4,468 5,002 5,633 6,473 5,01 B 954 917 899
(-10.16) (-3.52) (+14.72) (+7.47) (-26.37) (-5.44) (+14.95) (+12.61) (+14.91)
17,449 21,285 26,730 35,345 45,291 50,739 57,691 85,648 122,705 4,350 870 861 877
(-0.57) (+21.98) (+25.58) (+32.23)(+28.14) (+12.03) (+13.70) (+48.46) (+43.27)
15,039 17,731 27,108 26,704 24,519 29,617 ~2,999 39,683 47,372 3,384 918 928 916
(-19.83) (+17.90) (+52.88) (-1.49) (-8.18) (+20.79) (+It.42) (+20.26) (+19.38)
-------------------. See J .. ,cu Urban Agglomeration -----•.••.•...•.•. --
7,694 7,912 8,542 11,435 7,621 17,170 19,446 26,061 28,850 N.A. 875 883 890
(+2.83) (+7.96) (+33.87) (·33.35)(+125.30) (+13.26) (+34.02) (+10.70)
7,694 7,912 8,542 11,435 7,621 17,170 19,403 25,907 28,7583,114 874 BB2 890
(+2.83) (+7.96) (+33.B7) (-33_35)(+125.30) (+13.01) (+33.52) (+11.00)
.. ------.. --.. -.... - See Jalalabad Urban Agglomeration -------.. --------.--
5,096 3,833 7,703 7,134 6,283 7,723 11,032 16,639 23,108
(50.82) (+ 38.88)
NA 836 847 832
(·24.78)( + 100.97) (·7.39) (·11.93) (+22.92) (+42.85)
5,096 3,833 7,703 7,134 6,2B3 7,723 10,213 14,734 18,476 6,506 833 844.811
(-24.78)( + 100.97) (-7.39) (-11.93) (+22.92) (+32.24) (+44.27) (+25.40)
69,318 71,008 89,030 135,283 168,816 222,569 296,106 408,196 509,510 6,336 861 852 870
(+2.34) (+2.44) (+25.38) (+51.95)(+24.79) (+31.84) (+33.04) (+37.85) (+24.82)
.. 33,174 42,461 33,724
(+27.99) (·20.58)
33,356
(-L09)
31,520 2,072 948 1,051 1,058
(-5.50)
6,959 7,4/'4 8,888 11,520 12,704 11,915 14,060 16,335 19,293 4,594 916 907 893
(·10.21) (+7.26) (+19.08) (+29.61)(+10.28) (·6.21) (+18.00) (+16.18) (+18.11)
16,367 16,242 20,210 26,067 26,947 29,334 35,482 50,300 64,567 1,153 849 869 866
(-11.62) (-0.76) (+24.43) (+28.98) (+3.38) (+8.86) (+20.96) (+41.76) (+28.36)
8,631
(-20.38)
3,319
(·13.52)
8,512 9,878 12,150 11,220 12,202 14,644 17,878 21,0933,545 884 902 899
(-1.38) (+16.05) (+23.00) (-7.65) (+8.75) (+20.01) (+22.08) (+17.98)
6,555 7,941 12,646 24,416 34,820 53,761 71,990 4,494 879 879 890
(+21.14)(+59.25) (+93.07) (+42.61) (+54.40) (+B.91)
.. -----.... -... -.... See Kharar Urban Agglomerarion ..... -.--.......... .
6,072 6,317 8,216 10,686 21,807 26,109 NA 872 829 864
(+4.03) (+30.06) (+30.06) (+104.07) (+19.73)
77

STATEMENT
Status and
SI. Class, Name and Location Name of Name of Area Number of Population
No. CIVic Administration Code Tahsil CO. Block (in Sq. Households Including 1901
Status of Town Number Kms.) Houseless Households
(In 1991 Census)
2 3 4 5 6 7 8
Kharar (M.e.) 8N11 Kharar 4.20 4,857
61 V Kot Fatta (M.e.) liN Bathlnda 0.39 983
62 V Kot 1se Khan (C.T.) 3/11 Zira Dharamkot At 4.55 1,267 Kot Ise Khan
63 II Kot Kapura (M.e.) 12/v Faridkot 14.50 10,312 9,519
641V Kurali (M.C.) 81Y1 {harar 7.40 2,981
65 IV Lehragaga (M.C,) 101Y1II Sunam 8.40 2,598
66 IV Longowal ._ ............... See Longowal Urban Agglomeration ............... _ ••
Longowal U.A.· NA 2,664
Longowal (M.C.) tONI Sagrur 3.25 2,537
67 I Ludhiana (M.Corp.) 4/V Ludhiana 134.67 193,862 48,649
68 IV Machhiwara (NAC) 41Y1 Samrala 3.00 2,391
09 IV Mailtha .................... See Maiitha Urban Agglomeration ....................
Majitha U.A.· 1,73'1 6,403
Maiitha (M.e.) 2/111 Amritsar 1.50 1,614 6,403
70 II Malerkotla (M.e.) 10/11 M~lerkotla 4.25 13,986 21,122
71 II Malout (M.e.) 12JVlii Muktsar 10.00 9,862
72 II Mansa (M.C) II/IX Mansa 20.00 9,420
73m M~L:r (M.C.) liN!!! T.?fwandi 4.80 4,038
Sabo
74 I Moga .. - ............... _ See Moga Urban Agglomeracion ....................
78

-I
Growth HL~tory
and Growth Rate of the Town at the Censuses Density Sex Ratio
1911 1921 1931 1941 1951 1961 1971 1981 1991 (1991 1971 1981 1991 Census)
9 10 11 12 13 14 15 16 17 18 19 20 21
6,072 6,317 8,216 10,235 21,208 25,938 6,176 874 826 862
(+4_03) ( +30_06) (+24_57) (+ 107.21) (+ 18.94)
640 3,808 4,308 4,973 5,61114,387 913 865 888
( +495.00) (+ 13.13) (+ 15.44) (+ 12.83)
7,604 1,671 -- 888
10,644 14,063 16,502 20,584 19,683 32,021 34,116 47,550 62,430 4,306 882 882 904
(+11.82) (+32.12) (+17.34) (+24.74) (-4.38) (+62.68) (+6.54) ( +39.38) (+31.29)
6,390 9,776 12,637 17,592 2,377 860 889 883
(+52.99) \+29.27) (+39.2!)
3,61~ 7,847 9,531 12,241 15,555 I B52 879 889 893
(+ 117.01) (+21.46) (+t8.43) (+27.07)
------------------ See longowal Urban Agglomeration ----------------.--
6,848 6,543 9,269 11,209 12,971 16,254 NA 818 853 875
(-4.45) (+41.66) (+20.93) (+ 15.72) (+25.31)
6,848 6,543 9,269 10,512 12,530 15,419 4,744 826 851 875
(-4.45) ( +41.66) (+ 13.41) (+19.20) ( +23.06)
44,170 51,880 68,586 111,639 153,795 244,032 401,176 607,052 1,042,740 7,743 807 815 795
(-9.21) (+17.46) (+32.20) (+62.77)(+37.76) (+58.67) (+64.39) (51.32) (+71.77)
9,621 13,554 4,518 922 918
(+40,88)
--.--.------------. See Mailtha Urban Agglomeration .---.---------------
5,223 5,664 6,709 9,004 7,368 6,973 8,225 9,394 10,713 N.A. 895 896 867
(-1B.43) (+8.44) (+18.45) (+34.21) (-18.17) (-5.36) (+ 17.95) (+ 14.21) (+14.04)
5,223 5,664 6,709 9,004 7,368 6,973 7,801 8,729 9,912 6,608 898 896 869
(·18.43) (+8.44) (+ 18.45) (+J4.21) (·18.17) (-5.36) (+ 11.87) (+ 11.90) (+ 13.55)
23,880 24,564 25,240 29,321 32,575 39,543 48,859 65,756 88,60020,847 885 888 886
(+13.06) (+2.86) (+2.75) (+ 16.17)(+ 11.10) ( +21.39) ( +23.56) (+34.58) (+34.74)
20,774 26,746 40,533 56,868 5,687 878 895 862
(+28.75) (+51.55) (+40.30)
11.729 15,251 22,473 31,351 43,289 55,089 2,754 890 905 874
(+30.03) (+47.35) (+39.51) (+38.08) (-+27.26)
3,847 10,944 13,407 18,853 25,180 5.246 881 892 863
(+ 184.48) (+22.51) ( +40.62) (+33.S6)
..... --........ --... See Moga Urb~n Agglomeration ........ -...... -.. -
79

STATEMENT
StatUs and
SI. Class, Name and Location Name of Name of Area Number of Population No. Civic Administration Code Tahsil c.O. Block (in Sq. Households including 1901
Status of Town Number Kms.) Houseless Households
(in 199 t Census) 2 3 4 5 6 7 8
Moga U.A.* NA 18,909 6,725
Moga (M.C.) 12/11 Moga 16.10 18,490 6,725
75 IV Morinda (M.C) 81Y Rupnagar 3.00 2,958
761V Mukerian (M.C.) 7/1 Dasua 2.59 2,935 3,589
77 II Muktsar (M.C.) 121Y1I Muktsar 13.80 11,096 6,389
78 IV Mullanpur Dakha (NAC) 4/1V Ludhiana 2.05 1,788
79 II Nabha (M.C.) 9/X Nabha 15.48 9,530 18,468
80 III Nakodar (M.C) 5/v1I Nakodar 3.60 4,615 9,958
81 III Nangal Township ------------------- See Nangal Township Urban Agglomeration -------------------
Nangal Township U.A.· NA 6,812
Nangal Township (NAC) 8/11 Anadpur 7.90 6,308
Sahib
82 III Nawanshahr (M.C.) Sill Nawanshahr 9.59 5,194 5,641
83 IV Naya Nangal (NAC) 8/1 Anadpur 14.92 2,655
Sahib
841V Nurmahal {M.C} 5/v1 Philiaur 5.75 1,798 8,706
85 Pathank6t -------------------- See Pathankot Urban Agglomeration ---------------
Pathankot U.A.· No 21,910 6,091
Pathankot (M.C.) 1/11 Pathankot 22.10 21,218 6,091
86 I Patiala ----.--.•. -.--.--. See Patiala Urban Agglomeration --.-.... ----•. ---.. -
Patiala U.A,· 48,218 53,545
80

·1
Growth History
and Growth Rate of the Town at the Censuses Density Sex Ratio
1911 1921 1931 1941 1951 1961 1971 1981 1991 (1991 1971 1981 1991
Census)
9 10 II 12 13 14 15 16 17 18 19 20 21
14,145 . 17,581 27,785 36,598 47,779 61,625 80,272 110,958 NA 886 889 882
(+24.29) (+58.04)(+31.72) (+30.55) (+28.98) (+30.26) (+38.13) " 14,145 17,581 27,785 36,598 47,779 61,625 80,272 108,304 6,727 886 889 883
(+24.29) (+58.04)(+31.72) ( +30.55) ( +28.98) (+30.26) (+34.92)
5,837 6,068 7,540 9,326 13,502 17,440 5,813 888 885 876
(+3.96) (+24.26) (+23.69) (+44.78) (+29.17)
7,493 8,676 10,937 14,454 17,813 6,878 908 921 951
(+ 15.79) ( +26.06) (+32.16) (+23.24)
8,834 10,539 14,839 20,651 22,097 30,765 39,403 50,941 66,383 4,810 883 918 906
(+38.27) (+19.30) (+40.80) (+39.17) (+7.00) ( +39.23) (+28.08) (+29.28) (+30 .. >1)
8,115 1(',138 4,945 899 909
(+24.93)
13,620 14,750 17,311 22,625 25,676 30,603 34,761 45,921 54,421 3,516 861 883 889
(·26.25) (+8.30) (+ 17.36) (+30.70) (+ 13.49) (+ 19.19) (+ 13.39) (+32.10) (+ 18.51)
8,859 9,434 9,584 10,981 11,307 14,452 18,156 26,239 28,478 7,911 931 886 876
(·11.04) (+6.49) (+ 1.59) (+ 14.58) (+2.97) (+27.81) (+25.63) (+44.52) (+8.53)
------.------------ See Nangal Township Urban Agglomeration ----------.-------.
34,372 21,356 25,523 32,003 NA 802 811 874
(·37.87) (+19.51) (+25.39)
34,372 21,356 25,523 29,311 3,710 802 811 870
(-37.87) (+19.51) (+14.84)
4,475 5,316 7,153 10,275 13,140 14,097 17,527 26,726 29,955 3,124 864 875 917
(·20.67) (+ 18.79) (+34.56) (+43.65) (+27.88) (+7.28) ( +24.33) (+52.48) (+12.08)
7,987 9,997 10,390 12,046 807 861 875 8.44
(+25.17) (+3.93) (+ 15.94)
7,178 6,845 7,079 8,324 6,794 6,905 8,135 9,676 11,149 1,939 897 884 917
(·17S5) (·4.64) {+3.42) (+ 17.59) (-18.38) (+ 1.63) (+ 17.81) (+ 18.94) (+ 15.22)
-------------------- See Pathankot Urban Agglomeration ------.-.---------
7,007 7,353 9,763 12,354 32,415 54,810 78,192 I JO,039 128,198 NA 863 912 911
(+15.04) (+4.94) (+32.78) (+26.54)( + 162.38) (+69.09) (+42.66) (+40.73) (+ 16.50)
7,007 7,353 9,763 12,354 32,415 54,810 78,192 110,039 123,930 5,608 863 912 911
(+15.04) (+4.94) (+32.78) (+26.54)( + 162.38) (+69.09) (+42.66) (+40.73) (+12.62)
------------------- See Patiala Urban Agglomeration ... -.-------.. ----.
46,974 47,531 55,129 69,850 97,869 125,234 151,041 206,254 253,706 NA 850 880 910
(·12.27) (+1.19) (+15.99) (+26.70)(+40.11) (+27.96) (+20.61) ( +36.55) (+23.67)
81

STATEMENT
Staws and
51. Class, Name and Location Name of Name of Area Number of Population
No. Civic Administration Code Tahsil CO. Block (In Sq. Households Including 19.01
Status of Town Number Kms.) Houseless Households (In 1991 Census)
2 3 4 5 6 7 8
Patiala (M.C.) 91V1 Patiala 31.20 44,897 53,545
87 IV Patran (NAC) 91V1II Samana 5.00 2,382
88 III Patti (M.e.) 2/1X Patti 4.30 4,480 8,187
89 V Payal (M.C) 21IX Khanna 0.42 980 5,515
90 II Phagwara - .................. See Phagwara Urban Agglomeration .• - ••........•••••.
Phagwara U.A.· NA 15,834 17,147
Phagwara (M.C) 6/111 Phagwara 16.00 14,884 17,147
91 III Phillaur (M.C.) 51V Phillaur 0.75 3,535 6,986
92 III Qadian ------------------- See Qadian Urban Agglomeration ... ----.-.....
Qadian U.A. * NA 3,010
Qadian (M.e.) 1/XI Batala 9.06 2,838
93 IV Rahon (M.e.) 5/111 Nawansharhr 5.18 1,798 8,651
94 III Raikot (M.C) 4111 Jagraon 10.65 3,172 10,131
95 IV Rajasansi (C.T.) 2/11 Ajnala Chogawan 15.55 1,772
96 II Rajpura (M.C,) 91V Rajpura 14.00 13,377
971V Raman (M.C.) 11IVll Talwandi 3.99 2,911
Sabo
98 VI Ramdas (M.C.) 2/1 Ajnala 2.50 852
99 III Rampura Phul (M.e.) 1111 Rampura Phul 5.79 6,039 4,964
100 V Rayya (NAC) 21V1I Baba Bakala 1.50 1,425
82

-I
Growth History
and Growth Rate of the Town at the Censuses Density Sex Ratio
1911 1921 1931 1941 1951 1961 1971 1981 1991 (1991 1971 1981 1991
Census)
9 10 II 12 13 14 15 16 17 18 19 20 21
46,974 \47,531 55,129 69,850 97,869 125,234 150,486 205,141 238,368 7,640 856 886 917
(-12_27) (+1.19) (+15.99) (+26.70)(+40.11) (+27.96) (+20.16) ( +36.32) (+16.20)
7,998 14,328 2,866 901 912
(+79.14)
7,987 10,439 12,882 17,595 14,297 15,833 18,389 19,765 27,776 646 819 886 807
(·2.44) (+30.70) (+23.40) (+36.59) (-18.74) (+ 10.74) (+ 16.14) (+7.48) (+40.53)
4,708 3,554 3,575 5,224 5,852 13,933 897 911
(·24.51) (+0.59) (+ 12.02)
.--,,-----------,,---- See Phagwara Urban Agglomeration --,,-------------.. -
11,779 11,395 12,049 16,194 25,591 37,929 55,012 75,961 88,316 NA 833 803 844
(-31.31) (-3.26) (+5.74) (+34.40) (+58.03) (+48.21) ( +45.04) ( +38.08) (+ 16.26)
11,779 11,395 12,049 16,194 25,591 37,929 52,622 72,499 83,163 5,198 864 804 846
'-31.31) (·3.26) (+5.74) (+34.40)(+58.03) (+48.21) (+38.74) ( +37.77) (+ 14.71)
5,224 4,696 5,168 9,011 9,484 11,058 11,543 17,650 20,95623,941 919 831 791
(-25.22) (·10.11) (+10.05) (+74.36) (+5.25) (+16.60) (+4.39) (+52.91) (+18.73)
.~ .. ~ .................... -.... - See Qadian Urban Agglomeration -----------.----
-- 11,531 11,502 13,607 16,424 20,012 NA 924 942 934
(·0.25) (+ 18.30) (+20.70) (+21.85)
.- 11,531 11,502 13,119 15,804 18,867 2,082 926 946 940
(·0.2S) (+14.06) (+20.47) (+ 19.38)
6,292 5,947 6,692 8,065 6,541 6,316 6,607 8,671 10,771 2,079_ 877 879 896
(-27.27) ,,5.48) (+ 12.53) (+20.52) (·18.90) (-3.44) ( +4.6li (+31.24) ( +24.22)
7,510 8,379 11,810 13,777 10,193 12,239 11,709 . 17,106 21,061 1,978 933 923 910
(-25.87) (+11.57) (+40.95) (+16.66) (-26.61) (+10.26) (+4.18) (+46.09) (+23.12)
10,008 644 892
4,735 23,310 27,925 40,214 58,645 70,983 5,070 861 837 868
(+392.29) (+19.80) (+44.01) (+45.83) (+21.04)
6,446 9,507 11,574 14,318 17,275 4,330 851 866 868
(+47.49) (+21.74) (+23.71) ( +20.65)
5,397 3,046 3,153 4,322 4,123 4,765 1,906 651 877 910
(·43.56) (+3.51) ( +37.08) (-4.60) (+15.57)
4,515 4,943 6,836 9,515 14,409 19,700 23,406 31,890 35,530 6,168 891 879 898
(·9.05) (+9.48) (+38.30) (+39.19)(+51.43) (+36.72) 1+1881) (+36.25) I+IL41)
7,049 9,122 6,081 898 787
( +29.41)
83

STATEMENT
Status and
51. Class, Name and location Name of Name of Area Number of Population No. Civic Administration Code Tahsil C.D. Block (In Sq. Households Including 1901
Status of Town Number Kms.) Houseless Households (in 1991 Census)
2 3 4 5 6 7 8
101 III Rupnagar (M.C.) 8/IV Rupnagar 25.00 7,419 8,888
102 II S.A.S. Nagar (NAC) 8!V1II Kharar 16.68 18,813
(Mohali)
103 III Samana (M.C.) 911:< Samana 5.50 6,042 10,209
104 IV Samrala -... ---------------- See Samrala Urban Agglomeration ---------------.
Samrala U.A.· NA 2,593
Samrala (M.C.) 4/VII Samrala 9.00 2,474
105 IV Sanaur -------------------- See Sanaur Urban Agglomeration ------.--.------.---
Sanaur U.A.· N.A. 2,754 8,580
SanaUi (M.C.) 91V1II Patiala 518 2,448 8,580
106 VI Sangat (M.C.) II!VI Bathinda 1.24 471
107 II Sangrur (M.C.; ION Sangrur 13.90 10,747 11,852
108 IV Shah Kot (N.A.C.) 51V1II Nakodar 3.00 1,712
109 VI Shamchaurasi (M.C.) 7!V1II Hoshiarpur 0.18 683
110 III Sirhlnd (M.C) 9/11 F atehgarh Sahib 11.50 5,138 5,415
I J 1 VI Sri Hargobindpur (M.C.) fiX" Batala 0.52 579 4,380
1121V Sujanpur --.. ----...... -----. See Sujanpur Urban Agglomeration ....................
Sujanpur U.A. • N.A. 2,659 5,687
SuJanpur (M.C.) III Pathankot 0.31 2,532 5,687
1131V Sultanpur (M.C) 6/1! Sulnnplil' 5.00 2,521 Y,004
Lodhi
84

Growth History
and Growth Rate of the Town at the Censuses Density Sex Ratio 1911 1921 1931 1941 1951 1961 1971 1981 1991 (1991 1971 1981 1991
Census)
9 10 11 12 13 14 15 16 17 18 19 20 21
6,935 7,606 8,764 10,385 14,213 14,136 16,454 25,165 37,996 1,520 854 870 880
(-21.97) (+9.68) (+ 15.22) (+ 18_50)( + 36.86) (-0.54) (+ 16.40) (+52.94) ( +50.99)
32,351 78,457 4,704 817 866
(+ 142.52)
9,273 9,685 ·10,563 14,912 15,364 16,133 21,162 31,282 36,556 6,647 860 897 901
(-9_17) (+4.44) (+9.07) (+41.17) (+3.03) (+5.01) ( +31.17) ( +47.82) (+16.86)
------------------- See Samrala Urban Agglomeration ------------------
4,734 5,439 7,554 10,824 14,921 NA 851 85S 901
(+ 14.89) (+38.59) ( +43.29) (37.85)
4,737 5,439 7,554 10,824 14,287 1,587 851 858 903
(+ 14.89) ( +38.59) ( +43.29) (+31.99)
------------------- See Sanaur Urban Agglomeration -------------------
6,307 6,532 6,846 8,426 7,948 9,007 11,217 13,634 16,490 ' NA 900 901 905
(-26.49) (+3.57) (+4.81) (~23.08) (-5.67) (+ 13.32) (+24.54) ( +21.55) ( +20.95)
6,307 6,532 6,846 8,426 7,948 9,007 10,299 13,031 14,612 2,821 903 900 903
(-26_49) (+3.57) (+4.81) (+23.08) (-S.67) (+ 13.32) (+14.34) ( + 26.53) , (+12.13)
933 2,874 3,531 2,859 2,731 2,202 871 883 930
(+208.04) (+22.86) (-19.03) (-4.48)
9,041 10,799 13,901 17,132 18,741 28,344 34,015 45,220 56,419 4,059 882 894 895
(-23_72) (+19.44) (+28.72) (+23_24) (+9.39) (+S1.24) (+20.01) i +32.94} ( +24.77)
7,018 10,246 3,415 925 910
(+46.00)
2,988 2,470 2,468 3,062 3,71120,617 878 919 892
(-17.34) (-0.08) (+24.07) ( +21.20)
3,843 4,064 4,103 5,823 7,808 9,608 18,028 30,380 30,818 2,680 868 809 891
(+29.03) (+S.75) (+0.96) (+41.92)(+34.09) ( +23.05) (+87.64) (+68.52) (+ 1.44)
3,049 2,341 2,430 3,215 3,461 6,656 898 908 972
(-23.22) (+3.80) ( +32.30) (+7.65)
------------------ See Sujanpur Urban Agglomeration -------------------
5,512 4,756 10,269 10,458 12,783 13,561 160,907 NA 894 905 907
(-3_08) (-13.72) (+ 1.84) (+22.23) (+6.09) (+ 18.65)
5,512 4,756 10,269 10,458 12,568 13,095 15,41449,723 898 905 908
(-3_08) (-13.72) (-1.84) (+20.18) (+4.19) (+17.71)
6,492 8,141 8,60Q_ 10,168 7,733 7,661 9,176 12,143 13,722 2,740 850 874 898
(-27_90) (+25_40) (+5.71) (+18_15) (-23_95) (-0.93) (-19.78) (-32.33) (-13.00)
85

SI. Cla,5s, Name and
No. Civic Administration
Status of Town
2
114 III Sunam
Sunam U.A. *
5unam (M.C)
115 IV, Talwandi Bhai (M.C)
1161V Talwara (C.T.)
1171V Tapa
Tapa U.A. *
Tapa (M.C.)
118 III Tarn Taran (M.C)
1191V Urmar Tanda (M.C.)
120 III Zira
Zira U.A. *
Zira (M.C.)
1. • "Includes outgrowth(s)"
2. (.) Denotes NIL
,3.N.A. Data not available.
location Code
Number
3
101V1I
3/1V
7/11
10/XII
2fVIII
7/LV
3/111
STATEMENT
Status and
Name of Name of Area Number of Population Tahsil C.D. Block (In Sq. Households including 1901
Kms.) Houseless Households
(in 1991 Census) "1 5 6 7 a
............... _'._. See Sunam Urban Agglomeration . ___ ........ _ ... _-..
N.A. 7,385 10,069
Sunam 3.89 6,964 10,069
Firozpur 3.00 1,663
Dasua Talwara 10.90 4,119
.. _._ ..........•.... See Tapa Urban Aggiomeration .................. -
N.A. 2,377
Bamala 2.47 2,373
Tarn Taran 36.00 7,YS3 4,428
Dasua 17.00 3,328 10,247
............•.•..... See Zira Urban Ag_glomeration .........••.•.......
4,046 4,001
Zira 19.42 4,018 4,001
86

-I
Growth History
and Growth Rate of the Town at the Censuses Density Sex Ratio
1911 1921 1931 1941 1951 1961 1971 1981 1991 (1991 1971 1981 1991
Census)
9 10 11 12 13 14 15 16 17 18 19 20 21
-------------------- See Sunam Urban Agglomeration --------------------
7,329 8,265 10,652 14,187 16,782 21,408 28,158 36,180 43,909 NA 890 SRQ 895
(--27.21) (+12.77) (-28.8B) (-33.19) (+ 18.29) ( +27.57) (-31.53) ( +28.49) (+21.36)
7,329 8,265 10,652 14,187 16,782 21,408 26,966 35,505 41,11810,570 892 890 896
(--27.21) (+12.77) (-28.88) (+ 33.19)( + 18.29) (+27.57) (+25.96) (+31.67) (+15.81)
4,886 6,018 9,117 10,462 3,4B7 870 863 920
(+23.17) (+51.50) (+ 14.75)
17,865 17,907 17,379 1,594 745 768 839
( +0.24) (-2.95)
----------:--------- See Tapa Urban Agglomeration --------------------
4,671 6,220 8,467 11,108 14,161 NA 867 878 873
(+33.16) (+36.13) (+31.19) (+27.48)
4671 6,220 7,748 11,088 14147 5,728 875 878 872
(+33.16) ( +24.67) (+43.11) (+27.71)
4,260 5,988 10,103 16,607 16,344 20,961 24,116 36,903 47,529 1320 919 896 877
(--3.79) (+40.56) (+68.72) (+64.38) (·1.58) (+28.25) (+ 15.05) (+53.02) (+28.79)
7,016 8,362 9,510 12,734 9,857 10,383 12,262 17,655 18,786 ;,105 929 1J04 940
(--31.53) (+19.18) (+13.73) (+33.90) (-22.59) (+5.34) (+ 18.10) ( +43.98) (+6.41)
-------------------- See Zira Urban Agglomeration --------------------
4,378 4,622 5,318 5,963 6,389 8,118 9,264 19,581 23,722 NA 918 859 894
(+9.42) (+5.57) (+15.06) (+12.13) (+7.14) ( +27.06) (+14.12) (+111.37) (+21.15)
4,378 ··4,622 5,318 5,963 6,389 8,118 9,264 19,581 23,587 1,2'15 918 859 894
(+9.42) (+5.57) (+ 15.06) (+ 12.13) (+7.14) (+27.06) (+14.12) (+ 111.37) ( +20.46)
87

STATEMENT - II
Physical Aspects and Location of Towns, 1989
89

STATEMENT
Physical Aspects and Location
51. Class and Name Physical Aspects Name of and Road
No. of Town Rain fall Temperature S[3te HQ District HQ (inm.m.) (In Centigrade)
Maximum Minimum
2 3 4 5 6 7
1. I Aboh;!r 723.9 40.2 4.4 Chandigarh Flrozpur
(284) (112)
2. IV Adampur 946.3 38.3 2.2 Chandigarh Jalandhar
(172) (16)
3. III Ahmedgarh 730.' 40.2 5.5 Chandigarh Sangrur
(98) (50)
4. V Akalgarh 769.1 40.2 5.5 Chandlgarh Ludhian'
(130) (28)
S. V A1awalpur 946.3 38.3 2.2 Chandigarh Jalandhar
(171) (14)
6. V Amloh 700.0 38.7 6.4 Chandigarh Patlala
(64) (49)
7. J Amrltsar 892.3 40.2 3.6 Chandigarh Amritsar
(228) (0)
8. VI Amritsar Cantt. 892.3 40.2 3.6 Chandigarh Amritsar
(231) (3)
9. IV Anandpur Sahib 1087.6 42.4 3.4 Chandlgarh Rupnagar
(80) (39)
10. V Badhnl Kalan 361.9 40.2 4.4 Chandlgarh Faridkot
(183) (55)
II. IV Baghapurana 361.9 40.2 4.4 Chandlgarh Farldkot
(180) (55)
12. IV Banga 910.1 40.2 5.5 Chandigarh Jaiandhar
(99) (47)
13. IV Banur 585.3 42.4 3.4 Chandlgarh Patlala
(25) (40)
14. IV Bareta 359.3 41.2 5.1 Chandigarh Bathinda
(169) (106)
15. II Damala 416.1 41.2 5.1 Chandigarh San~rur
(158) (37)
16. IV Bassi 548.7 42.4 3.4 Chandigarh Patiala
(42) (45)
17. I Batala .. - .. -.. - .. -.-- See Satala Urban Agglomeration -----------.. ---.. -
.. "tala U.A. • .-...... ----.-.... See Constituent Unit ... ----..... -------- ._ 90

-II
of Towns, 1989
distance (in Kms_) from Navliable Rlverl Tahsil HQ Nearest CICY with Railway Station Bus Route Canal (If within
Population of one 10 KmS.)
Lakh and more
8 9 10 11 12
Abohar Bathlnda Abohar Abohar
(0) (88) {OJ (0)
Jalandhar Jalandhar Khurdpur· • Adampur
(16) (16) (0) (0)
Malerkoda Ludhiana Ahmedgarh Ahmedgarh
(18) (26) (0) (0)
)agraon Ludhlana Mutlanpur Akalgarh
(28) (28) (8) (0)
Jalandhar Jalandhar Alawalpur Alawalpur
(14) (14) (0) (0)
Nabha Patiala Gob indgarh Amloh
(29) (49) (8) (0)
Amritsar Batala Amr!ts3r Amritsar
(0) (38) (0) (0)
Amritsar Amritsar Al11ritsar Cantt Amritsar Cantt
(3) (3) (Ot (0)
Anandpur Sahib Chandigarh Anandpur Sahib Anandpur Sahib Sadu] (R)
(0) (80) (0) (0) (5)
Moga Moga Moga Badhni Kalan
(23) (23) (23) (0)
Moga Moga Moga Baghapurana
(20) (20) (20) (0)
Nawanshahr Jalandhar Banga Banga
(13) (47) (0) (0)
Rajpura Chandigarh Rajpura Banur
(14) (25) (14) (0)
Mansa Pat!ala Bareta Bareta
(51) (I04) (0) (0)
Bamala Ludhiana Barnala Barnala
(0) (76) (0) (0)
Fatehgarh Sahib Chal'ldigam Bassi Bassi
(6) (42) (0) (0)
---.. -.-... --.. ----- S':e BJtala Urban Aggloil~erJtion ------------------..
---------.---------- See Constituent Unit --------------------
91

STATEMENT
Physical Aspects and Location
SI. Class and Name Physical Aspects Name of and Road
No. of Town Rain fall Temperature State HQ District HQ (inm.m.J (In Centigrade)
Maximum Minimum
2 3 4 5 6 7
Batala 763.5 40.2 3.6 Chandigarh Gurdaspur
(232) (33)
IS. I Bathinda 876.0 41.2 5.1 Chandigarh Bathinda
(210) (0)
19. VI Behrampur 536.B 3B.9 4.4 Chandigarh Gurdaspur
(295) (12)
20. IV Bhadaur \416.1 41.2 . 5.1 Chandlgarh Sangrur
(185) (64)
21. IV Bhawanigarh .................... See Bhawanigarh Urban Agglomeration .......... ---......
Bhawanigarh U.A. .................... See Constituent Unit .....................
Bhawanigarh 645.4 38.7 6.4 Chandigarh Sangrur
(102) (19)
22. IV Bhikhiwind 562.7 . 40.2 4.4 Chandigarh Amritsar
(250) (40)
23. VI Bhogpur 946.3 38.3 2.2 Chandigarh Jalandhar
(177) (20)
24. IV Bhucho Mandi 876.0 41.2 5.1 Chandigarh Bathinda
(198) (12)
25. IV Budhlada 868.8 41.2 5.1 Chandlgam Bathlnda
(174) (BS)
26. IV Dasua 1054.0 38.0 2.2 Chandlgarn Hoshiarpur
( 173) (41)
27. V Dera B<lba Nanak 763.5 40.2 3.6 Chandlgarh Gurdaspur
(261 ) (38)
28. V Dera Bassi 585.3 '42.4 3.4 Chandigarh Patiala
(20) (63)
29. IV Dhanaula 416.1 41.2 5.1 Chandigarh 5angrur
(146) (25)
30. IV Dhariwal 536.8 38.9 4.4 Chandigarh Gurdaspur
(253) (12)
31. IV Dharamkot -................... See Dharamkot Urban Agglomeration "'-""-'-"-"
Dharamkot U.A.· .................... See Constituent Unit .. -.... -............
Dha"arni(ot 766.9 40,2 4.4 Chandigarh Firozpur
(185) (59)
92

·11
ot Towns, 1989
distance
Tahsil HQ
8
Batala
(0)
Bathinda
(0)
Gurdaspur
(12)
Barnala
(27)
Sangrur
(19)
Patti
(20)
Jalandhar
(20)
Bathinda
(12)
Mansa
(33)
Dasu3
(0)
Satala
(29)
Rajpura
(37)
Barnala
(12)
Gurdaspur
(12)
(24)
(in Kms.) from
Nearest City' wIth Railway Station Bus Route Population of one
Lakh and more
9 10 11
Amricsar Baula Salala
(38) (0) (0)
Ludhiana Bathinda Bathinda
(136) (0) {OJ
Pathankot Dinanagar Behrampur
(35) (8) (0)
Bathinda Barnala Bhadaur
(65) (27) (0)
•••••••••••••••••••• S4!e Bhawanigarh Urban Agglomeration •....•...........••.
............•.•••... See Constituent Unit --............... .
Patiala Nabha BhaW3ni&drh
(37) (16) (0)
Amrltsar Patti Bhikhlwlnd
(40) (20) (0)
Jalandhar Bhogpur Bhogpur
(20) (0) (0)
Bathinda Bhucho Mandl Bhucho Mandl
(12) (0) (0)
Bathin(J~ Budhlada Budhlada
(88) (0) (0)
Hoshiarpur Dasua Dasua
(41) (0) (OJ
Batala Dera Baba Nanak Dera Baba Nanak
(29) (0) (0)
Chandigarh Ghaggar Dera Bassi
(20) (2) (0)
Patiala Barnala Dhanaula
(81) (12) (0)
Navlaable River!
Canal (If within
10 Kms.)
12
Beas (R)
(8)
RavI (R)
(0)
Ghauar (R)
(2)
Batala Dhariwal Dhariwal Upper Bari Doab(C)(O)
(21) (0) (0)
.... -- ...... -...... See Dharamkot Urbar; Agglomeration ----.--.-•• --.--.-,
--.. --..... -.~ ...... See Constituent Unit! ----...... ----------
~()ga Moga OhzramkC1t
(16) (16) (O)
93

STATEMENT
Physical Aspects and Location
SI. Class and Name Physical Aspects Name of and Road
No of Town Rain fall Temperature State HQ District HQ
(inm.m.) (In Centigrade)
Maximum Minimum
2 3 4 5 6 7
32. III Dhuri 640.0 40.2 5.5 Chandigarh Sangrur
(126) (14)
33. IV Dinanagar 536.8 38.9 4.4 Chandigarh Gurdaspur
(277) (12)
34. V Doraha 526.0 40.2 5.5 Chandlgarh Ludhlana
(79) (21)
35. II Faridkot . .................... See Faridkot Urta[l Agglomeration ..........•••• - ....
Faridkot U.A.· .•.................. See Constituent Unit .................•..
Faridkot 356.3 40.2 4.4 Chandlgarh Farldkot
(209) (0)
36. IV Fatehgarh Churian 763.5 40.2 3.6 Chandigarh Gurdaspur
(258) (57)
37. V Fatehnangal 763.5 38.9 4.4 Chandlgarh Gurdaspur
(247) (13)
38. I! Fazllka 723.9 40.2 4.4 Chandigarh Firozpur
(299) (84)
39. II Firozpur 658.0 40.2 4.4 Chandlgarh Flrozpur
(215) (0)
40. I! Flrozpur Canu. 658.0 40.2 4.4 Chandigarh Firozpur
(217) (2)
41. V Garhdiwala 1054.0 38.0 2.2 Chandigarh Hoshiarpur
(160) (28)
42. IV Garhshankar 854.0 40.2 5.5 Chandlgarh Hoshiarpur
(92) (41)
43. III Giddarbaha 475.4 41.2 5.1 Chandlgarh Faridkot
(236) (65)
44. III Gobindgarh •.••••••••••••••...• See Goblndgarh Urban Agglomeration ..................•.
Gobindgarh U.A.· • ••••..••..••....•.• See Constituent Unit ...•... _ ..........
Gobindgarh 548.7 38.7 6.4 Chandigarh Patiala
(59) (42)
45. IV Goniana 876.0 41.2 5.1 Chandigarh Bathinda
(221) ( 11)
46. IV Goraya 950.7 40.2 5.5 Chandigarh ]alandhar
(121) (36)
94

·11
ofTowns, 1989
distance
Tahsil HQ
8
Malerkotla
(18)
Gurdaspur
(12)
Khanna
(20)
Faridkot
(0)
Batala
(26)
Gurdaspur
(13)
Fazilka
(0)
Firozpur
(0)
Flrozpur
(2)
Hoshiarpur
(28)
Garhshankar
(0)
MlIktsar
(49)
Nabha
(37)
Bathind
( II)
Phillaur
( II)
(In Kms.) from
. Nearest City with Railway Stacion Bus ROUle
Population of one
Lakh and more
9 10 11
Patiala Dhuri Dhurt
(61) (0) (0)
Pathankot Dinanagar Dlnanagar
(24) (0) (0)
Ludhlana Doraha Doraha
(21) (OJ (OJ
......• _ ......... See Faridkot Urban Agglomeration ................... .
................... - See Constituent Unit ... _ ............... .
Bathinda Faridkot Farldkot
(63) (0) (0)
Batala F atehgarh Churlan Fater.;;Jrh Churian
(26) (0) (0)
Batala Dhariwal Fatehnagal
(20) (I) (0)
Abohar Fazilka Fazilka
(32) (0) (0)
Moga Firozpur Firozpur
(33) (0) (O)
Moga Firozpur Cantt. Firozpur Cantt.
(33) (0) (0)
Hoshiarpur Khudda Garhdiwala
(28) (6) (0)
Hoshiarpur Garhshankar Garhshankar
(41) (0) (0)
Bathinda Giddarbaha Giddarbaha
(25) (0) (0)
............. --... See Gobindgarh Urban Agglomeration ....................
.......... _ ...... See Constituent Unit ....................
Patiala Gobindgarh Gobindgarh
(42) (0) (0)
Bathlnda Goniana Gor.lana
(11) (0) (0)
Ludhiana Goraya Goraya
(25) (0) (0)
95
Navigable Rlver/
Canal (If within
10 Kms.)
12
Ravi (R)( 10)
U.B.D(C)(9)
U B D (C)(O)
Saduj(R)(9)
Satluj (R)
(7)
Satluj (R)
(8)

51. Clas.~ and Name
No. or Town
2
.. 7. "Gurdaspur
48. IV Guru Har Sahai
49. V Hariana
50. I Hoshiarpur
51. III J agraon
52. III Jaitu
Jaltu U.A.*
Jaltu
53. III Jalalabad
Jalalabad U.A.·
Jalalabad
54. I Jalandhar
55. III J aiandh <II' C~n tt.
56. IV Jandiala
57. "K~purthala
58. III Kartarpur
59. "Kh~nna
60. III Kharar
Kharar U.A.*
Khmr
STATEMENT
Physic~1 Aspects ~nd location
Physical Aspects N~me of and Ro~d Ra!n fall Temperature State HQ District HQ
(inm.m.) (in Centigrade)
Maximum Minimum 3 4 5 6
536.8 38.9 4.4 Chandlgarh
(265)
658.0 40.2 4.4 Ch~ndigarh
(254)
1106.0 38.0 2.2 Chandigarh
(147)
ll06.0 3S.0 2.2 Chandigarh
(132)
769.3 40.2 5.5 Chandigarh
(131)
....... ,. ........... See Jaitu Urban Agglomeration .................. _
._ ................. See Constituent Unit .................. ..
356.3 41.2 5.1 Chandigarh
(128)
.................... See Jal.,labad Urban Agglomeration ....................
.. .................. See Constituent Unit ....................
723.9 40.2 4.4 Chandigarh
(263)
946.3 3S.3 2.2 Chandigarh
(157)
946.3 38.3 2.2 Chandigarh
(154)
769.0 40.2 3.6 Chandlgarh
(20S)
595.0 38.3 2.2 Chandigarh
(168)
946.3 38.3 2.2 Chandigarh
(173)
859.4 40.2 5.5 Chandigarh
(71)
.......... __ .... See Kharar Urban Agglomeration --.• --
............ _ ...... See Constituent Unit ......... _ ... _.
894.0 42.4 3.4 Ch~ndigarh
(14)
96
7
Gurdaspur
(0)
Firozpur
(39)
Hoshiarpur
(15)
Hoshiarpur
(0)
Ludhlana
(38)
Faridkot
(44)
Flrozpur
(50)
Jalandhar
(0)
Jalandhar
(3)
Amritsar
(20)
Kapurthala
(0)
Jalandhar
(16)
Ludhiana
(43)
Rupnagar
(27)

-11
of Towns, 1989
distance
Tahsil HQ
8
Gurdaspur
(0)
Firozpur
(39)
Hoshiarpur
(IS)
Hoshiarpur
(0)
Jagraon
(0)
Faridkot
(44)
Fazilka
(36)
]alandhar
(0)
Jalandhar
(3)
Amrltsar
(20)
Kapurthala
(0)
Jalandhar
(16)
Khanna
(0)
Kharai'
(0)
Nearest City with
Population of one
Lakh and more
9
Bata!a
(33)
Bathinda
(125)
Hoshiarpur
(15)
]alandhar
(40)
ludhiana
(38)
(in Kms.)
Railway Station
10
Gurdaspur
(0)
Guru Har Sahai
(0)
Hoshlarpur
( 15)
Hoshiarpur
(0)
Jagraon
(OJ
from
Bus Route
11
Gurdaspur
(0)
Guru Har Sahai
(0)
Hariana
(0)
Hoshiarpur
(0)
)agraon
(0)
..• --..•....•. _ ..... See Jailu Urban Agglomeration ... -•..... __ ..... .
.• _ •............... See Constituent Unit .-................. .
Bathinda Jaitu Jaitu
(39) (0) (0)
.... _ ..... -... --..• See Jalalabad Urban Agglomeration .•... -.. -.-.... -...
... --.---............ See Constituent Unit ---............ -... -
Bathinda Jalalabad J;llalabad
(135) (0) (0)
Ludhiana ]alandhar ]alandhar
(61) (0) (0)
Jalandhar 1 alandhar Canti. Jalandhar Cantt.
(3) (0) (0)
Amritsar Jandiala Jandiala
(20) (0) {OJ
Jafandhar Kapurthafa Kapurthala
(18) (0) (0)
Jalandhar Kartarpur Kartarpur
(16) (0) (0)
Ludhiana Khanna Khanna
(45) (0) (0)
----------.. ------- See Kharar Urban Agglomeration ------------------
------------------- See Constitueiu Unit -------------... --
Chandigarh KurJ!i Kharar
(14) (11) (0)
97
Navigable Rlver/
Canal (If within
10 Kms.)
12
Abohar Branch
Sirhind(C)(8)
Sadu) (R)
(9)

SI. Class and Name
No. of Town
2
61. V Kot Fatta
62. V Kot Ise Khan
63. II Kot Kapura
64. IV Kurali
65. IV Leimapga
66. IV Longowal
Longowal U.A.
Lonacwal
67. I Ludhlana
68. IV M~hhlwara
69. IV Malitha
Malltha U.A. *
Majltha
70. II Malerkotla
71. II Malout
72. II Mansa
73. III Maur
74. I Moga
Moa-a U.A.*
Moga
STATEMENT
Physical Aspects and Location
Physical Aspects Name of and R.oad
Rain fall Temperature state HQ District HQ (In m.m.) (in Centigrade)
Maximum Minimum
3 4 5 6 7
876.0 41.2 5.1 Chandlgarh Bathlnda
(207) (26)
766.9 40.2 4.4 Chandigarh Flrozpur
(170) (SO)
356.3 41.2 5.1 Chandigarh Faridkot
(203) (11 )
\894.0 42.4 3.4 Chandigarh RupnallJr
(25) (16)
359.3 38.7 6.4 Chandlgarh Sangrur
(155) (45)
...•.•..•••••.••.•.. See Longowal Urban Agglomeration ................... .
• ......... ...;,. ....... See Constituent Unit .................. _
669.7 38.7 6.4 Chandillarh San.rur
. (139) (18)
526.0 40.2 5.5 Chandlgarh Ludhlana
(93) (O)
859.4 40.2 5.5 Chandigarh Ludhlana
(n) (50)
......... _ ... _ .. See Malitha Urban Agglomeration ._.-..... _ ......
........ _ .......... See Constituent Unit ......... - ... _-
892.3 40.2 3.6 Chandigarh Amrltsar
(246) (18)
730.5 40.2 5.5 Chandigarh Sangrur
(123) (32)
475.4 41.2 5.1 Chandiprh Fjlrk!kot
(253) (SO)
868 .. 8 41.2 5.1 Chandlgarh Bathlnda
(175) (55)
868.0 41.2 5.1 Chandlgarh Bathlnda
( IS7) (42)
.-...... _ ...... See Moga Urban AIIIJomeration .--.----
.......... - ....... See Constituent Unit .-... - ..... _ .. -
361.4 40.2 4.4 Chandigarh Faridkot
( 159) (3S)
98

·11
of Towns, 1989
Tahsil HQ
Bathlnda
(26)
Zira
(15)
Farldkot
(11 )
Kha~ar
(11)
Sunam
(26)
San;::ur
(18)
Ludhlana
(0)
Samra!-
(12)
Amrltsar
(18)
Malerkotla
(0)
Mukts ...
(32)
Mansa
(0)
Talwndi Saba
(e,
Moga
(0)
8
distance (in Kms.) from Nearest City with Railway Station !ius Route Population of one
lakh and more
9 10 Jl
Bathinda Kot Fatta Kat Fatta
(26) (0) (0)
Moga Moga Kat be Khan
( 16) (16) (0)
Bathlnda Kot Kapura Kot KapunI
(52) (0) (0)
Chandlgarh Kurall Kurati
(25) (0) (0)
Patiala lehragaga lehragaga
(90) (0) (0)
... ---...• ,-.- See .Longowal Urban Agglomeration •....•.••. --•••
.......•.•..... -. See Constituent Unit .•...•......••.....•
Patiala Sangrur longowal
(74) (18) (0)
)alandhar Ludhiana Ludhiana
(61) (0) (0)
Ludhlana Khanna Machhiwara
(50) (27) (0)
...••••• -.-.. _. See MaUtha Urban Agglomeration ••......••.•. _ •....
... _ ...•...... _. See Constituent Unit .•..•••. - .........•
Amritsar Majitha Majltha
(18) (0) (0)
Ludhlana Malerkotla Malerkotla
(43) (0) (0)
Bathlnda Malout Malout
(35) (0) (0)
Bathlnda Mansa Mansa
(55) (0) (0)
Bathinda Maur Maur
(42) (0) (0)
......•...•.••. _.- See Moga Urban Agglomeration .. _ •.•••••... _.
-........... -------- See Constituent Unit ....•... -----.. -... .
Ludhlana Moga
(60) (0)
99
Moga
(0)
Navigable Riverl
Canal (If within
10 Kms.)
12
Satlul (R)
(8)

SI. Class and Name
No. of Town
2
75. IV Morlnda
76. IV Mukerial1
77. II Muktsar
78. IV Mullanpur D.kha
79. II Nabha
80 III Nakodar
81. III Nangal Township
Nangal Township U.A!'
Nanga! Township
82. III Nawanshahr
83. IV Naya Nangal
84. IV Nurmahal
85. I Pathankot
Pathankot U.A.'
Pathankot
86. I Patlala
Patlala U.A. *
Patiala
87. IV Patran
88. III Patti
Rain fall
(Inm.m.)
3
894.0
1054.0
475.4
515.3
814.9
Physical Aspects
Temperature
(In Cemigrade)
Maximum
4
.42.4
38.9
42.2
40.2
38.7
38.3
Minimum
5
3.4
4.4
4.4
5.5
6:4
2.2
STATEMENT
Physical Aspects and Locatlon
Name of and Road
State HQ District HQ
6 7
Chandigam Rupnagar
(28) (26)
Chandlgarh Hoshlarpur
(184) (57)
Chandigarh Farldkot
(235) (63)
Chandigarh Ludhlana
(112) (19)
Chandigarh Pad ala
(91) (26)
Chandigarh Jalandhar
(142) (24)
............. _ ..... See Nangal Township Urban Agglomeration ...... - .. _ .. _ ..
... - ............. - See Constituent Unit .... - ........ _ .. .
1087.6 42.4 3.4 Chandlgarh
(lOt)
910.1 40.2 5.5 Chandigarh
(86)
1087.6 40.4 3.4 Chandigarh
(104)
814.9 38.3 2.2 Chandigarh
772.8
680.2
359.3
562.7
(129)
.................. - See Pathankot Urban Agglomeration ... -.-.--.....
.................... See Constituent Unit .... _ ••• _ ........ .
38S 4.4 Chandigarh
(267) .
.................... See Patlala Urban Agglomeration ... - ... - ........
.................... See Constituent Unit ...... _ ........ ..
38.7 6.4 Chandigarh
(65)
38.7 6.4 Chandigarh
( 122)
40.2 4.4 Chandigarh
(216)
100
Rupnagar
(60)
)atandhar .
(60)
Rupnagar
(63)
)a1andhar
(33)
Gurdaspur
(38)
Pari ala
(0)
Padala
(57)
Amlitsar
(SO)

-II
of Towns, 1989
distance
Tahsil HQ
8
Rupnagar
(26)
Dasua
(16)
Muktsar
{OJ
Ludhlana
(19)
Nabha
(0)
Nakodar
(0)
Anandpur Sahib
(0)
Anandpur Sahib
(24)
Philiaul
(19)
Pathankot
(0)
Patiaia
(0)
Sam ana
(26)
Patd
(0)
(in Kms.) from
Nearest CitY with Railway Station Bus Route Population of one
Lakh and more
9 10 11
Chandigarh Morinda Morinda
(28) (0) (0)
Pathankot Mukerlan Mukerian
(38) (0) (0)
Bathinda Muktsar Muktsar
(70) (0) (0)
Ludhiana Mullanpur Mullanpur
(19) (0) (0)
Pall ala Nabha Nabha
(26) (0) (0)
Jalandhar Nakodar Nakodar
(24) (0) (0)
------------------- See Nangal Township Urban Agglomeration -------------.--
--. ------,------ See Constituent Unit ------.----.--.--
Jalandhar Naugal Dam Nangal
(91) (0) (0,
Ludhiana Nawanshahr Nawanshahr
(52) ,(a) (0)
Jalandhar Nangal Dam Nangal
(94) (0) (0)
Jalandhar Nurmahal Nurmahal
(33) (0) (0)
-------.--.---- See Pathankot Urban Agglomeration .---.--------•• --
------------------ See Constituent Unit -------------------
Batala Pathankot Pathankot
(71) (0) (0)
--------•• -- - See Padala Urban Agglomeration ---------------
--"-"'--"'-- See Constituent Unit ••••••• - •••• -••••
Chandigarh Patlala Patlala
(65) (0) (0)
Patiala Sunam Patrar.
(57) (35) (0)
Amritsar Patti Patti
(50) (0) (0)
101
Navigable Rlverl Canal (if within
10 Kms.j
12
Satluj (R)
(I)
Satluj (R)
(2)
Saduj (R)
(9)
UB.D.(C)
(6.5)
Patlala Branch
ofSirhlnd (C) (0)

STATEMENT
PhySical Aspects and location
SI. Class and Name Physical Aspects Name of and Road
No. of Town Rain fall Temperature State HQ District HQ (lnm.m.) (in Centigrade)
Maximum Minimum
1 2 3 4 5 6 7
89. V Payal 650.0 40.2 5.5 Chandlgarh Ludhiana
(85) (42)
90. 11 Phagwara -------------------- See Phagwara Urban Agglomeration -----------------.--
Phagwara U.A.· -----.-.-.-•••.. See Constituent Unit ...•. -----•.. -... -
Phaivma 950.7 38.3 2.2 Chandlgarh Kapurthala
(122) (41)
91. III Phlllaur 950.7 40.2 5.5 Chandlgam Jalandhar
(110) (47)
92. III Qadian -.---.--.--•• _ .. See Qadian Urban Agglomeration _ •••.•• - •••.•..
Qadian U.A.*. - .. --... -.-... See Constituent Unit .. -.-------•. -
Qadlan 763.5 40.2 3.6 Chandlgarh Gurdaspuf
(241) (39)
93. IV Rahon ,910.1 40.2 5.5 Chandlgarh Jalandhar
(94) (68)
94. III Raikot 769.3 40.2 5.5 Chandigarh Ludhlana
(134) (41)
95. IV Ra)asansl 892.3 40.2 3.6 ChllAdlgarh Amritsar
(243) (15)
96. 11 Rajpura '585.3 38.7 6.4 Chandlgarh Patiala
(39) (26)
97. IV Raman 420.0 41.2 5.1 Chandlgarh Bathlnda
(238) (45)
98. VI Ramdas 710.0 40.2 3.6 Chandlgarh Amritsar
(274) (46)
99. III' Rampura Phul 975.0 41.2 5.1 Chandlgam Bathlnda
(184) (26)
100. V Rayya 769.0 40.2 3.6 Chandlgarh Amrltsar
(189) (39)
I 0 I. III Ru pnagar 784.0 42.4 3.4 Chandlgarh Rupnagar
(41) (0)
102. II S.A.S. Nagar 894.0 42.4 3.4 Chandlgarh Rupnagar
(Mohall) (8) (33)
103. ill Saman~ 359.3 38.7 6.4 Chandigarh Patiala
(96) (31)
t02

" of Towns, t 989 .
distance (in Kms.) from Navigable .Riverl
Tahsil HQ Nearest City with RaHway Stadon Bus Route Canal (if within
Population of one 10 Kms.)
lakh and more
a 9 fO J 1 12
Khanna Ludhiana Khanna Payal
(10) (42) ( 14) (O)
............. - ..... See Pi1agwara Urban Agglomer3tion ..... _ .. - ........
.................... See Constituent Unit .•. - .•.....• - .....
PhagWara )aJandhar Phagwara PhagWara
(0) {2.3) (OJ (0)
Phiflaur Ludhiana PhilJauf Phillaur Satluj (R)
(0) (14) (0) (OJ (2)
............ - .... - See Qadfan Urban Agglomeration .. - ...... _ .. _ .• _
_ .. _--... _ ...... See Constituent Unit ............. - .....
Batala Barala Qadian Qadian
OS) (IS) (0) {OJ
Nawallshahr ludhiana Rahon Rahon
(8) (50) (0) (0)
Jagraon Ludhhna )agrJon Raikot
(24) (41) (24) (0)
Ajnala Amritsar AlllrilSar Raja Sansi
(12) (15) (IS) (0)
Rajpura Patiaia Rajpura Rajpura
to} (26) (0) (0)
Talwandi S2bo Bathinda Raman Raman
( 13) (45) (0) (O}
Ajnal", Amritsar Ramdas Ramdas
<21 ) (46) (0) (0)
Rampura Phul Bathinda RampuraPhul Rampura Phul *
(0) (26) (0) (OJ
Baba Sakala Amrirsar Rayya Rayya
(3) (39) (0) (0)
RupnJgar Chandigarh Rupnagar Rupnagar Satlul (R)
(0) (41) (0) (0) (5)
Kharar Chandigarh Chandigarh S.A.S. Nagar
(6) (8) (8) (Mohall) (0)
Sam ana Patiala Patlala Samana
(0) (31 ) (31 ) {OJ
103

SI. .ClJJS and Name No. of Town
-104. IV Samrala
Samrala U.A. *
Samrala
105. IV Sanaur
Sanaur U.A. *
Sanaur
106. VI Sangat
107. II Sangrur
108. IV Shahkot
109. VI Shamchaurasi
110. 111 Sirhind
II I. VI Sri Hargoblndpur
112. IV Sujanpur
Sujanpur U.A. *
Sujanpur
I I 3. IV Sultanpur
114. 111 Sunam
Sunam U.A."
Sunam
115. IV Talwandl Bhal
116. IV Talwara
STATEMENT
Physical· Aspects and location
Physical Aspects Name of and Road
Rain fall (inm.m.)
Temperature
(In Centigrade) State HQ District H<}
MJximum Minimum
3 4 5 6
------------.-.----. See Samrala Urban Agglomeration -... _ ..... __ •••
.................... See Constituent Unit ................... .
859.4 40.2 5.5 Chandigarh
(59)
................... - See Sanaur Urban Agglomeration ................... .
.. ------.--------. See Constituent Unit ............ -..... ..
680.2 38.7 6.4 Chandigarh
(69)
420.0 41.2 5.1 Chandigarh
(232)
645.4 38.7 6.4 Chandlgarh
(121)
814.9 38.3 2.2 C{landigarh
(153)
1106.0. 38.0 2.2 Chandigarh
(149)
548.7 42.4 3.4 Chandigarh
(43)
763.5 40.2 3.6 Chandigarh
(233)
•.•••• - ••. _-.- See Sujanpur Urban Agglomeration - ...... _ ..........
................... - See Constituent Unit .................. --
950.0 38.9 4.4 Chandigarh
(273)
595.0 38.3 2.2 Chandlgarh
(192)
.................... See Sunam Urban Agglomeration • __ ._-.
........ --.. --.... See Constituent Unit .............
669.7 38.7 6.4 Chandigarh
( 129)
547.0 40.2 4.4 Chandlgarh
( 153)
.1054.0 38.9 4.4 Chandigarh
(216)
104
7
ludhiana
(34)
Patlala
(4)
Bathlnda
(22)
Sangrur
(0)
]alandhar
(65)
Hoshlarpur
( 17)
Patlala
(39)
Gurdaspur·
(40)
r.urdaspur
(44)
Kapurthala
(24)
Sangrur
( 19)
Flrozpur
(32)
Hoshlarpur
(84)

- II
ofTowns, 1989
distance
Tahsil HQ
8
Samrala
(0)
Pariala
(4)
Bathlnda
(22)
Sangrur
(0)
Nakodar
( 13)
Hoshiarpur
(17)
F atehgarh Sahib
(3)
Batala
(32)
Pathankot
(6)
Sultanpur lodhi
(0)
Sunam
(0)
Firozpur
(32)
Oasua
(43)
(in Kms.) from Nearesi Cicy wifh Railway Station Bus Route Population of one
lakh and more
9 10 II
-------------------: See Samrala Urban Agglomeration -----------,--------
------------------ See Constituent Unit -------------------
Ludhiana Khanna Samrala
(34) ( 15) (0)
----------.---.-- See Sanaur Urban Agglomeration --.-----------------
-.-.----------- See Constituent Unit ---------------.----
Padala Patlala Sanaur
(4) (4) (0)
Bathinda Sangat Sangat
(22) (0) (0)
Patiala Sangrur Sangrur
(56) (0) (0)
ludhiana Shahkot Shahkot
(60) (0) {OJ
Hoshiarpur Shamchaurasi Shamchaurasi
( 17) (0) (0)
Patiala Sirhind Sirhind
(39) (0) (0)
Batala QadIan Sri Hargobindpur
(32.) (16) (0)
----------•• ---••.. - See Sulanpur Urban Agglomeration ....... - ...... _ ...
--'-"-'-"-'-"---- See Constituent Unit ----.-.--.-.-.. ---.-
Pathankot Sujanpur Sujanpur
(6) (0) (0)
Jalandhar Sultanpur Sultanpur
(42) (0) (0)
.----.---------. See Sunam Urban Agglomeration -.... -.... -.... -••.•
-... -------" ... --.. - See Constituent Unit -.-.-------------.. -
Patiala Sunam Sunam
(64) (0) (0)
ludhlana Talwndi Bhai Talwndi Bhal
(90) (0) (0)
Hoshlarpur Talwara Talwara
(84) (0) (0)
105
Navigable Riverl
Canal (if within
10 Kms.)
12
Sirhind (C)
(9)
.,r .. '''·
.~ .
I
UBP (4:) .. (0)
Abohar Branch of
Sirhind (C) (7)
Beas (R)
(2)

51. Class and N3m~
No. of Town
2
117.IV Tapa
Tapa U.A.*
Tapa
118. 1II Tarn Taran
119. IV Urmar Tanda
120. III Zira
Zira U.A.*
Zira
* Includes outgrowth (s)
STATEMENT
Physical Aspects and Location
Physical Aspects Name of and Road
Rain fall Temperature State HQ 7 District HQ
(inm.m.) (in Centigrade)
Maximum Minimum
3 4 5 6
..••......••.... ---. See Tapa Urban Agglomeration .......•............
.••.....••....•••... See Constituent Unit .•.••.••..••••......
416.1
788.2
1054.0
41.2 5.1 Chandigarh
( 168)
40.2 3.6 Chandigarh
(225)
38.9 4.4 Chandigarh
(164)
•••••••••••••• ----.- See Zira Urban Agglomeration -.--•. --.•• ----.. --.
--------.--•••. ----- See Constituent Unit ---••... ------.•• ---
766.9 40.2 4.4 Chandigarh
(189)
7
Sangrur
(47)
Amrltsar
(26)
Hoshiarp,ur
(32)
firozpur
(35)
* * In case of Adampur, the distance of adloining village where the railway station is located is '0'
106

II
of Towns, 1989
distance
Tahsil HQ
B
Barnala
(21)
Tarn Taran
(0)
Daslla
(15)
Zira
(0)
(in Kms.) from
Nearest City with Railway Station Bus Route Population of one
Lakh and more
9 10
••.••••••••••••••••• See Tapa Urban Agglomeration •••• _ •.•••••••••••
. ••.••..••••••••••••• See Constituent Unit •••••••••••••••••••
Bathinda Tapa Tapa
(40) (0) (0)
Amritsar Tarn Taran TJrn lar:lO
(26) (0) (0)
Hoshiarpur Urmar Janda Urmar Tanda
(32) (0) (0)
•..••••••.•.•••••••• See Zira Urban Agglomeration .•••••••••••• _ ••••
•..••••.•.......•..• See Constituent Unit •.•••••••••..•••••••
Amritsar TJlwandi Bha! Zira
(81) (5) (0)
107
Navigable River/
Canal (if within
10 Kms.)
12


STATEMENT -III
MUNICIPAL FINANCE .. 1988-1989
109

STATEMENT
Municipal Finance·
-51. Class and Name Civic Roceipts
No. ofiown AdministratIon Receipt Revenue derived from Munid· Government ~oan Advance
status (In 1990) throtlgh Taxes pal properties and Power Grant
etc. a? art from T <I)(ation
2 3 4 5 6 7 B
I Abohar M.C. 103,080 15,020 3,000 30,250 1,320
2 IV Adampur M.C. 13,B~0 1,100 2,500 1,250 510
3 III Ahmedgarh M.C. 55,050 3,250 500
4 V Akalg3rh CT. N.A. N.A. N.A. N.A. N.A.
5 V Alawalpur M.C. 1,950 500 3,000 ~OO
6 V Amloh M.C. 1,320 500
7 1 Amritsar M.Corp. 1,005,350 489,690 102,450 6,980
8 VI Amrittfr caritt. CS. 1,346 350 l,nS
9 IV AnJl'Idpur Sahib M.C. 8,460 1,030 7,920 380 1,130
10 V Badhni Kalan NAC N.A. N.A. N.A. N.A. N.A.
II IV Baghapurana NAC 18,594
12 IV Banga M.C. 7,760 5,880 3,300 1,750
13 IV Santlr M.e. 4,970 960 250
14 IV Bareta M.e. 9,720 1,790 2,400 8,760
15 II Barnala M.e. 75,940 5,550 22,760 9,070
16 IV Bassi M.e. 13,720 2,380 2,000 1,250
17 I Batala ..................... See Baul .. Urban agglom~ra!ion .. _ .. - .... ,_._.
Batala UA* ..................... See constituent Unit ._ .. _._ ...... _ .•
Bata!a M.e. 108,160 24,300
18 I Bathlnda M.e. 385,241 27,316 40,540 1,500 7,174
19 VI Behramp~r CT. 5 140 407
20 IV Bhadaur M.e. 5,770 210 2,570 500
21 IV Bhawanig"rh .......... _ ..... __ • See BhawanigJ:m Urban agglomeration _ .... - .... __ ......
Bhawanigaril UA" .• ,._----_ .. -. See consliwent Unit ...... - .. _-_ .. _-
Bhawanigarh M.e. 14,950 2/240 oJ/()30 1,050
:2l lV Bnikhiwil1{i cr. N.A. N.A. N.A. N.A. N.A.
2.3 vt I3hogpur C.T. 0.33 14 460
24 tV Bhllcho Mandl M.C 1,620 4.620 2,200 620 440
25 IV Budhlada M.e. 26,655 3,321 10,770 12,078 58&
26 IV DasllJ M.e. :l1,040 1/t70 5,000 5,250 140
27 V Dera Saba Nanalc M.e. 3,370 5,400 500
28 V Dera Bassi M.e. 6,870 3,430. 2,160 750
29 IV Dhanaula M.e. 1,360 330 3,750
30 IV Dhariwal M.e. 15,130 650 250 80
"'~";'
J 10 "~ .
~~: .

-III
1988-1989
(In Rs. '00)
Other
Sources
(Specify)
9
61,430
, 4,910
1,240
N.A.
560
10,680
Total
Receipts
10
214,100
24,130
60,040
N.A.
6,510
.12,500
2,263,690 3,868,160
47,443
N.A.
7,493
31,150
4,380
2,080
20,730
3,550
202,248
81
2,030
N.A.
1,6,970
3,200
270
2,840
5,810
4,220
51,064
18,92t>
N.A.
26,087
49,840
10,560
24,750
134,050
22,900
132,460
664,019
633
11,080
22,270
N.A.
474
26,470
56,612
B,170
9,270
16,050
11;250
20,330
General
Administration
II
5,500
6,180
20,430
N.A.
1,300
7,500
34,770
1,662
3,050
N.A.
15,825
1,770
6,360
5,580
19,390
11,490
Public
Safety
12
7,270
3,120
N.A.
150
32,100
1,626
N.A.
1,310
1,000
6,880
2,260
Expenditure (In Rs. '00)
Public
Health &
Conveniences
13
40,580
3,590
18,850
N,A.
200
402,260
26,226
2,150
N,A.
410
3,000
23,080
Public
Works
14
113,000
10,860
11,590
N.A.
3,710
327,480
13,008
5,830
N.A.
9,712
28,840
1,170
7,560
51,160
3,020
Public
Institution~_
15
300
N.A.
30,785
3,048
N.!> •
60
-,--------.----.------ See Batala Urban Agglomeration ---------------------
,-----------------.-- See constituent Unit ---------------------
48,230
35,480
18
4,790
13,200
62,799
650
36,100
240,966
66
940
850
103,650
177
3,430
650
--------------------- See Bhawanigarh Urban Agglomeration .--------------------
--------------------- See constituent Unit ---------------------
9,840
N.A.
60
9,070.
11,080
9,310
1,440
6,330
2,950
6,210
1,270
N.A.
580
2,289
4,000
1,200
330
N.A.
8,600
25,175
3,700
800
2,570
5,790
111
N.A.
4,190
8,379
2,720
3,030
6,130
710
N.A.
250
1,501
Others Total
(Specify) Expenditure
16 17
50,560 216,910
6,500
5,890
N.A.
1,150
4,970
27,130
60,180
N.A.
6,510
12,470
3,033,620 3,861,015
4,930
3,000
N.A.
22,080
2,020
50,500
14,030
N.A.
25,537
54,470
9,550
1,050 18,190
37,490 138,000
5,360 22,130
57,300 15'6,330
313,590 756,485
367 628.
1,410 11,220
12,550
N.A.
160
3,330
3,868
12,930
70
100
2,130
7,930
23,660
N.A.
220
26,020
52,292
32,660
5,340
13,760
8,690
19,930

STATEMENT
Municipal Finance·
SI. Class and Name Civic Receipts No. of Town Administration Receipt Revenue derived from Munici· Government Loan Advance
status (in 1990) through Taxes pal properties and Power Grant etc. apart from Taxation
2 3 4 5 6 7 8 31 ·IV Dharamkot ...... ~ .............. See Dharamkot Urban Agglomeration ..... -....••... _ .•••
Dharamkot UA* ...•................. See Constituent Unit ......• _ ..........•.
Dharamkot M.e. 9,130 1,440 5,700 1,810 1,200
32 III Dhuri M.e. 47,550 6,260 3,470
33 IV Dinanagar M.e. 18,790 2,330 1,000 1,000
34 V Doraha M.e. 31,466 1,627 5,850 2,960
35 II Faridkot ....................• See Faridkot Urban Agglomeration ................•....
Faridkot U.A.* ....................• See Constituent Unit ••.. -.....••..... -...
Faridkot M.e. 45,210 8,140 7,850 5,760 610
36 IV Fatehgarh Churian M.C. 10,440 2,120 4,500 2,250 30
37 V Fatehnangal e.T. 115 8 788
38 II Fazilka i'1.e. 41,670 13,970 10,200 20,700 1,070
39 II Firozpur M.e. 77,380 4,690 34,780 35,030 2,130
40 II Firozpur Cantt. e.8. 69,251 50,360 52,490
41 V Garhdiwala M.e. 6,800 1,100 500
42 IV Garhshankar M.e. 16,560 1,570 4,700 2,750 5,800
43 III Giddarbaha M.e. 3,280 7,800 3,600 6,100 660
44 III Gobindgarh ... : ................. See Gobindgarh Urban Agglomeration •.•.........••... -..•
Gobindgarh UA" ..................... See Constituent Unit .....................
GobindgJrh M.e. 7,420
45 IV Goniana M.e. 15,690 2,260
46 IV GoraYJ NAC 29,030' 1,090 9,3'5U
47 II Gurdaspur M.e. 66,190 4,021 23,900 14,375 2,336
48 IV Guru Har Sahai M.e. 15,000 4,000 3,000
49 V Hariana M.e. 5,580 560 1,500 250 220
50 I Hoshiarpur M.C. :94,050 17,970 11,750 64,600 2,930
51 III Jagraon M.e. 63,190 6,123 9,500 10,750
52 III Jaitu ..................... See Jaim Urban Agglomeration •• -•. _ .... _ .•.•....
Jaitu UA" ..................... See Constituent Unit ....... _ .•..........
Jaitu M.e. 31~950 3,690 4,800 22,250 4,900
53 III Jalalabad .....•• _ ••. --_ .. _ .... See Jalalabad Urban Agglomeration '-'"''''-'''''''''''
Jalalabad UA* .................... - See Constituent Unit -•... -........... --..
Jalalabad M.e. 24,230 4,840 3,800 12,970 1,430
54 I Jalandhar M.Corp. 1,413,350 34,420 99,010 io,ooo
112

-III
1988-1989
(In Rs. '00) Expenditure (Ill Rs. '00)
Other Tocal General Public Public Public Publk Others Total Sources . R.eceipts Administration SJfety Health & Works Institutions (Specify) Expenditure
(Specify) Conveniences
9 10 11 12 IJ 14 IS 16 17
----------.-------.-- See Dharamkot Urban Agglomeration ---------.-------.---
.--.--.-------------- See Constituent Unit -----.-.--.-------.--
490 19,770 3,530 650 4,530 2,550 2,710 13,970
571280 26}480 28,090 4,200 58,770
700 23,820 10,150 1,000 6,000 8,440 25,590
1,187 43,090 8,609 5,864 16,4:36 1,356 7,9JO 40,195
----------.---.----- See faridkot Urban Agglomeration ----.--.---•. --------
.-.-.---.-.-_ •• _ See Constituent Unit -----------------
6,120 73,690 14,920 3,870 21,740 16,630 300 15,770 73,230
740 20,080 7,580 10 2,840 8,890 19,320
5 916 41 20 481 17 559
18,690 106,300 30,020 4,940 44,350 18,190 310 8,390 106,260
19,200 173,210 4,4S0 4,460 24,520 1,700 'i70 21,840 57,270
570 172,671 5,192 9,206 86,009 15,337 9,682 38,266 163,692
700 9,100 2,800 4,600 2,30D 9,700
4,430 35,810 4,020 1,010 4,180 10,620 9,500 29,330
42,820 64,260 19,1JO 5,540 14,750 25,090 510 90 65,1 to
.-----.----------.... See Gobindgar!l Urban Agglomeration ---.-----.-----------
--•• -----:----------- See Constituent Unit ---------.-••• --.... -
265,600 273,020 15,770 50,730 20,070 186,300 272,870
7,430 25,380 6,930 940 12,100 5,620 330 2,670 28,590
4,330 43,800 11,210 5,540 4,940 20,080 41,770
2,187 113,009 22,598 7,682 22,272 55,687 146 108,385
3,500 25,500 15,000 1,000 3,000 4,000 2,500 25,500
700 8,810 2,880 20 680 3,940 2,410 9,930
6,810 298,Ito 61,030 14,960 119,120 75,510 740 22,570 293,930
4,770 94,333 20,070 28,130 36,980 500 1,860 87,540
.• ------•••• -- See J aitu Urban Agglomeration ....... -.----•• --.-.-
--.---.-.-------•. --- See Constituem Unit -----.--.---------.--
5,1 TO 72,700 24,400 1,770' 26,430 5,950 260 3,610 62,420
•.• _ •• - •••••• -••• - See Jalalabad Urban Agglomeration .• -----.---.--.-
••• ---.------.--.- See Constituent Unit •• ---.--.-----.--
5,210 52,480 12,210 290 22,840 18,030 53,370
15,880 1,572,660 550,100 4,000 (14,500 733,430 123,660 1,525,690
113

STATEMENT
Municipal Finance·
SI. Class and Name Civic Receipts No. of Town Administration Receipt Revenue derived from Munici· Government loan Advance
status (in 1990) through Taxes pal properties and Power Grant etc. apart from Taxation
2 3 4 5 6 7 8 55 III J alandhar Cantt. CB. 103,066 34,217 1,602 56 IV Jandiala M.C. 19,740 2,820 4,700 1,000
57 II Kapurthala M.C 77,596 2,776 7,800 36,226 1,377
5~ III Kartarpur M.C 11,590 4,600 11,230
59 II Khanna M.C ·106,850 5,410 10,350 8,500 300 60 III Kharar .......••......... _. See Kharar Urban Agglomeration -: ....•.••••.••••••.
Kharar UA* ..................... See Constituent Unit .... _ ....••.....•.•.
Kharar M.C 25,350 2,280 2,330 370
61 V Kot Fatta M.C 878 174 2,621 750
62 V Kot Ise Khan CT. 9 118 1,300
. 63 II Kot Kapura M.C 216,180 1,550 2,100 17,500 550 64 IV Kurali M.C 22,170 5,400 1,000
65 IV lehragaga M.C 12,600 3,860 4,790 10,250
66 IV longowal ._ ••....•.•.... _ .•• See longowal Urban Agglomeration .....................
longowal UA* .•................•.. See Constituent Unit .... , •••••..•.• ~ •.••.
longowal M.C 3,918 59 5,810 250
67 I Ludhiana M.Corp. ~,116,580 32,320
68 IV Machhiwara M.C 15,500 2,030 7,600 2,000 1,070
69 IV Majitha .............••...... See Majitha Urban Agglomeration .....................
Majitha lIA* ..................... See Constituent Unit .................. _.
Majitha M.C 4,760 460 5,000 - 750
70 II Malerkotla '1.C 91,890 6,670 6,580 7,400 16,210
71 II Malout M.C ,9,620 2,130 9,500 39,570
72 II Mansa M.C 71,400 8,310 6,210 29,420 2,230
73 III Maur M.C 22,345 2,335 2,290 10,620 264 74 I Moga ................. _ •. See Moga Urban Agglomeration .....................
Moga UA* .......••..........•• See Constituent Unit ••....••• _ ..•...•...
Moga M.C 178,150 11,580 8,700 17,'500
75 IV Morinda M.C 3,240 3,900 5,000 780 76 IV Mukerian M.C 21,150 670 2,000 5,130 800
77 II Muktsar M.C 1,620 5,910 12,000 1,500
78 IV Mullanpur Dakha N.A.C 3;970 3,000 3,000
79 II Nabha M.C 8,710 3,450 8,500 29,750
80 III Nakodar M.C 5,120 5,510 15,000 4,120
114

III
1988·1989
(In Rs. '00) Expenditure (In Rs. '00) Other Total General Public Public Public Public Others Total
Sources Receipts Administration Safety Health & Works Institutions (Specify) Expenditure (Specify) Conveniences
9 10 11 12 13 14 15 16 17 127,543 266,428 27,121 106,088- 35,854 27,645 17,147 213,855
28,260 14,260 10,490 3,310 28,060 32,713 158,488 20,423 3,814 64,741 34,535 29,422 152,935
830 28,250 6,330 960 18,030 270 5,090 30,680 33,080 164,490 9,040 4,120 45,570 18,440 2,140 85,640 IQ4,950
•.......•••••.••..•.. See Kharar Urban Agglomeration •......••..••..•...••
••...••.....••..•.... See Constituent Unit ...................•.
6,570 36,900 12,820 2,250 4,390 2,920 11,430 33,810
233 4,656 509 187 3,195 120 4,011
100 1,527 150 40 1,670 25 1,885 32,370 280,250 23,500 14,900 30,250 3,320 16,800 185,330 274,100
1,170 29,740 16,230 790 4,530 2,720 5,430 29,700
3,140 34,640 13,380 1,200 260 3,470 13,480 31,790
••••••••••••.•••.•... See Longowai Urban Agglomeration ..••.•••...... - ••••.
'-.• -".' .••• - ••• See constituent Unit ........••....•..••••
697 10,734 1,845 836 1,000 6,464 10,145 22,941 2,171,841 610,000 110,000 1,198,040 428,000 2,346,040
760 28,960 6,700 1,860 6,740 4,390 2,870 22,560
...•.••.• _ •..•••••• See Majitha Urba,n Agglomeration •......•..•......•...
..•.•.••••......••••• See Constituent Unit ........•••.... : ...••
480 11,450 2,000 640 1,800 1,300 1,950 7,690
14,840 143,590 21,HO 32;610 1,110 82,130 137,190 86,030 146,850 29,450 6,330 20,430 44,550' 44,650 145,410
5,350 122,920 17,850 11,310 57,520 2,920 1,270 30,170 121,040
3,412 41,266 11,370 9,760 1,310 3,410 60 15,700 41,610
••••••.....•••.••.... See Moga Urban Agglomeration ••••••••••••••••..•••
••.... --.. -•• --•..•.. See Constituent Unit - .••• -.---.--.-•. -
40,890 251,820 68,960 3,460 46,190 3,340 620 136,480 259,050
23,280 36,200 11,370 1,270 4,040 17,730 1,400 35,810 1,160 30,410 8,360 1,640 5,450 6,870 8,370 30,690
64,590 85,620 45,740 29,380 4,270 79,390 16,440 26,410 11,820 12,900 24,720 66,260 116,670 5,630 880 32,380 32,580 28,980 100,450 30,650 60,400 2,000 3,000 12,000 30,780 5,050 52,830
115

STATEMENT
Municipal Finance
SI. Class and Name Civic Receipts No. of Town Administration Receipt Revenue derived from Munici- Government LO,ln Advance
status (in 199O) through Taxes pal properties and Power Grant etc. apart from Taxation
I 2 3 4 5 6 7 8 81 Iii Nangal Township .-•••..•••••. -•• ----- See Nangal Township Urban Agglomeration ----------.
Nangal Township UA* -------------------- See Constituent Unit --.------------------
Nangal Township M.e. 41,930 1,060 3,100 880 50 82 III Nawanshahr M.e. 49,810 4,250 5,000 6,500
83 IV Naya Nangal N.A.e. 95,8~5 1,470
84 IV Nurmahal M.e. 11.110 1,760 3,300 5,000
85 I Pathankot --------------------- See Pathankot Urban Agglomeration ---------------
Pathankot UA* --------------------- See Constituent Unit ---------------------
Pathankot M.e. 15,990 9,370 23,000 3,000
86 I Patiala ••. -•....•••• ---.•... See Patiala Urban Agglomeration ------.-.--------••• -
Patlala UA* ------------.-------- See Constituent Unit ---------------------
Patiala M.e. 440,810 20,470 30,490 36,000
87 IV Patran N.A.C. 18,400 2,240 5,000 1,400
88 III Patti M.e. 22,456 2,672 5,100 19,350
89 V Payal M.e. 3,630 2,750 500
90 II Phagwara ----.---------------- See Phagwara Urban Agglomeration .----.-.--------.-•• -
Phagwara UA* -----.------------- See constituent Unit -.--------•• -.---•• -.
Pahgwara M.e. 14,850 4,440 53,930
91 III Phillaur M.e. 25,690 900 3,660 12,000
92 III Qadian -------------------- See Qadian Urban ~gglomeration •• -.-----------.-----
Qadlan UA* ---------••••• -••..• - See constituent Unit -•.....•..•••• ----
Qadian M.e. 9,760 850 2,500 750 660
93 IV Rahon' M.e. 5,610 190 1,200 7,140 800
94 III Raikot M.e. 23,540 870 5,900
95 IV Rajasansi e.T. N.A. N.A. N.A. N.A. N.A.
96 II Rajpura M.e. 190,290 7,280 6,400 13,250 2,280
97 IV Rarnan M.e. 2,737 7,035 . 4,174 4,000
98 VI Ramdas M.e. 1,620 10 2,900 250
99 ill Rampura Phul M.e. 5,670 3,270 2,800 4,370 1,230
100 V Rayya N.A.e. 9,400 750
101 III Rupnagar M.e. 8,400 6,900 13,210
102 II S.A.S. Nagar (Mohall) N.A.e. 10,600
103 III Samana M.e. 30,280 3,680 9,000 '1,010 80
104 IV Samrala --.------------------ See Samrala Urban, Agglomeration ----------.-.------
Samrala U.A.* -------.------------- See Constituent Unit ---------------------
116
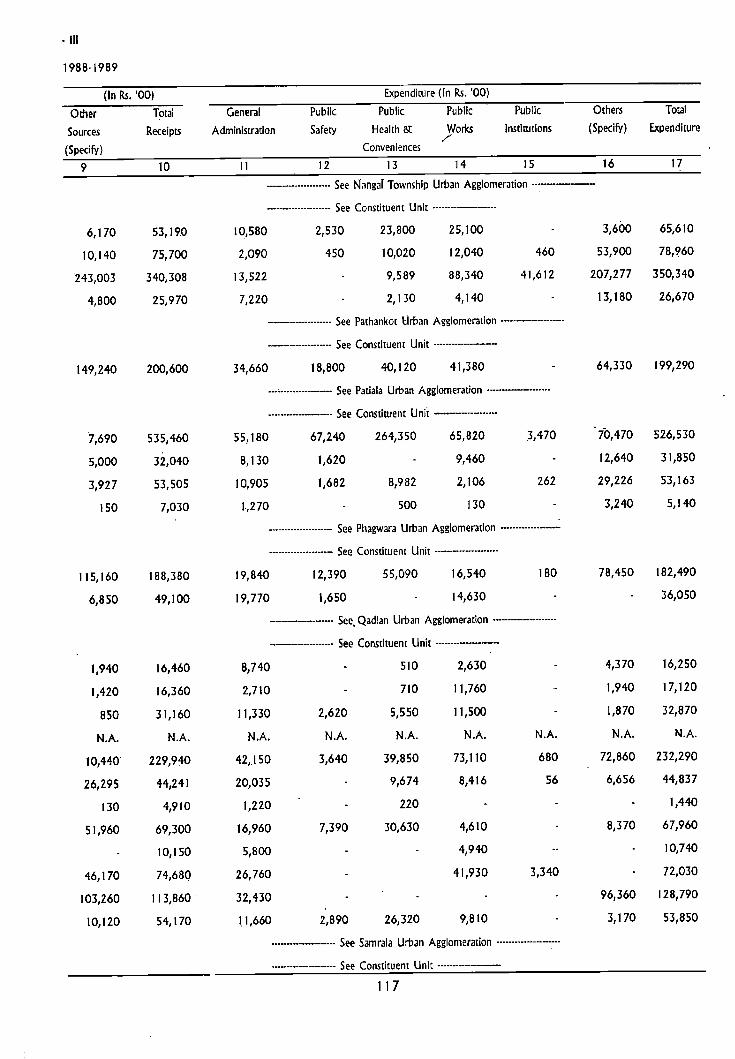
·111
1988·1989
(In Rs. '00) Expenditure (In Rs. '00)
Other Total General Public Public Public Public Others Total
Sources Receipts Administration SafetY Health & Works Institutions (Specify) Expenditure /'
(Specify) Conveniences
9 10 II 12 13 14 15 16 17
.•. - .•............•• See Nangai Township Urban Agglomeration •..•••••.••••••• _ •••
.....••............•. See Constituent Unit •.......• - .••.•••••.
6,170 53,19.0 10,580 2,530 23,800 25, tOO 3,600 65,610
10,140 75,700 2,090 450 10,020 12,040 460 53,900 78,960
243,003 340,308 13,522 9,589 88,340 41,612 207,277 350,340
4,800 25,970 7,220 2,130 4,140 13,180 26,670
..•.......•••........ See Pathankot Urban Agglomeration ...•.•.•..........••.
.•• - •.......• - .•.•. See Constituent Unit ..•..•........••• - .•
149,240 200,600 34,660 18,800 40,120 41,380 64,330 199,290
... , •.•.••....•.•..•. See Patiala Urban Agglomeration •.•.••••.•.. - ......•
.••.•• - .....•• - .... See Constituent Unit •••••.•.•.•.•.•••.•••
7,690 535,460 55,180 67,240 264,350 65,820 3,470 70,470 526,530
5,000 32,040 8,130 1,620 9,460 12,640 31,850
3,927 53,505 10,905 1,682 8,982 2,106 262 29,226 53,163
150 7,030 1,270 500 130 3,240 5,140
..•...........•...... See Phagwara Urban Agglomeration .•••..•••....•.•••••
•.•.•••.....•.•.•.... See Constituent Unit •...•.........•••.•..
115,160 188,380 19,840 12,390 55,090 16,540 180 78,450 182,490
6,850 49,100 19,770 1,650 14,630 36,050
- •••. - •. - •• - •. -. See, Qadian Urban Agglomeration .-....... - .••....•.
.• - ..••••••.••.....• See Constituent Unit ... - ... - ..... - .•••
1,940 16,460 8,740 510 2,630 4,370 16,250
1,420 16,360 2,710 710 11,760 1,940 17,120
850 31,160 11,330 2,620 5,550 11,500 1,870 32,870
N.A. N.A. N.A. N.A. N.A. N.A. N.A. N.A. N.A.
10,440 229,940 42,150 3,640 39,850 73,110 680 72,860 232,290
26,295 44,241 20,035 9,674 8,416 56 6,656 44,837
130 4,910 1,220 220 1,440
51,960 69,300 16,960 7,390 30,630 4,610 8,370 67,960
10,150 5,800 4,940 10,740
46,170 74,680 26,760 41,930 3,340 72,030
103,260 113,860 . 32,430 96,360 128,790
10,120 54,170 1.1,660 2,890 26,320 9,810 3,170 53,850
..................... See Samrala Urban Agglomeration ............... -.~ ..
.. - ............ - ••. See Constituent Unit .....................
117

STATEMENT
Municipal Finance
SI. CI~s and Name Civic Receipts
No. ofTown Administration Receipt Revenue derived from Munici- Government Loan Advance
status (In 1990) through Taxes pal properties and Power Grant
etc. apart from Taxation
2 3 4 5 6 7 8
Samrala M.e. 31,650 5,700
105 IV Sanaur --------------------- See Sanaur Urban Agglomeration --------------------
Sanaur UA* ------------------- See Constituent Unit ---------------------
Sanaur M.e. 520 440 2,600 12,840
106 VI Sangat M.e. 2,575 394 1,009 500
107 II Sangrur M.e. 76,970 6,3110 13,990 9,000
108 IV Shahkot N.A.e. 2,210 1,700 31,350 3,750
109 VI Shamchaurasi M.e. 1,850
110 III Sirhind M.e. 6,170 1,950 6,500 3,750 14,390
111 Vi Sri Hargobindpur M.e. 1.670 310 90
112 IV Sujanpu~ --------------------- See Sujanpur Urban Agglomeration ---------------------
Sujanpur U,A.* ••• ---•.• --.-------. See Constituent Unit --.---.------------
SuJanpur M.e. 440 880 750
113 IV Sultanpur M.e. 3,640 2,500 19,370 930
114 Sunam -.•. -.---.--------- See Sunam Urban Agglomeration ---------------------
Sunam U.A.* --------------------- See Constituent Unit ---... -------..... --
Sunam M.e. 46,421 5,703 7,370 12,580 348
115 IV Talwandi Bhai M.e. 18,490 2,810 3,000 7,250 280
116 IV Talwara e.T. N.A. New Cer1SUs Town In 1991
117 IV Tapa -.... --------.. ------ See Tapa Urban Agglomeration .. ---.. ----.. --------
Tapa U.A.* ----.. -----------.--- See Constituent Unit ----------.--------.
Tapa M.e. 13,360 1,840 1,700 4,500
118 III Tarn Taran M_e. l6,880 3,720 12,700 1,250
119 IV Urmar Tanda M.e. 19,510 3,500 1,370
120 III Zira --------------------- See Zira Urban Agglomeration .-------------------.
Zira UA* --------------------- See Constituent Unit --------------------
Zira M.e. 26,900 6,770 8,220 11,760 430
I. (-) Dash Denotes nil
2. • Includes Outgrowth(s)
3. N.A. Data Not available
118

,III
1988-1989
(In Rs. '00) Expenditure (In Rs. ~OO) Other Total General Public Public Public Public Others Total Sources A.ecelpts Administration SafelY Healm& Works Institutions (Specify) Expendlwre
(Specify) Conveniences 9 10 11 12 13 14 15 16 17
1,580 38,930 18,490 18,840 1,600 38,930
------, .. -.----- See Sanaur Urban Agglomeration ----------------
------------- See Constituent Unit ------.... ----
3,480 19,880 2,600 ~7,310 19,910
547 5,025 1,474 ISS 928 1,010 1,427 4,994
4,570 110,910 20,780 7,330 51;470 20,020 30 20,810 120,440
11,51,Q ~3,550 960 8,9!9 18,200 16,920 44,150
1,850 840 130 800 120 1,890
4t,l90 74,950 2,740 4,540, 10,139 • '25,010 29,040 71,460
2,070 1,380 1,260 2,640
-.-------- See Sujanpur Urban Agglomeration -_.---.--
"---"-'-- See Consdtuent Unit .--.----.--
5,21~ 7,280 3;300 ' 1,000 ".,> ,\,'
770 1,060 1,210 7,340 .. , i ~"
, 16,890 43,330 2,180 32,260 350 11,680 46,470
-.----' _....cc. See Sunam Urban 'Agglomeration ----------..!-.-.. ------.,---.--.- See Constlwent Unit •..... --..• -.-.. ----
10 72,432 12,086 3,730 29,908 19,478 257 7,819 73,278
410 32,240 6,700 930 16,660 9,930 2,430 36,650
New Census Town In 1991
- See Tapa Urban Agglomeration •... -~ .• - .. -.-
- •. __ ..;. •.. - See Constiwent Unit .-.---.-.--
990 22,390 8,100 2,000 2,500 7,000 1,330 20,930
7,OCXJ 61,550 16,050 11,430 28,880 130 56,490
1,470 25,.850 1,150 600 18,020 19,770
------- See Zira Urban Agglomeration .----.----.--
.. ----.-... -- See Constiwent Unit .....•.... -.•.. --
3,110 574,900 10,350 1,540 32,730 7,370 7,280 59,270
119

STATEMENT:: IV
'eIV'le AND OTHER AMEN'f'T"IES, 11989
f2J

STATEMENT
Civic and Other
SI. Class and Civic Popula· Scheduled Road System of Number of Latrines
No. Name of administration tion Caste length Severage
Town status Population (in Kms.) Water Service Others
in 1990 Borne
2 ] 4 5 6 7 8 9 10
I Abohar M.C 107,163 19,760 118.64 OSD,S 5,400 2,000 1,850
2 IV Adampur M.C. 15,331 5,289 15.50 OSD,S 200 1,200 100
3 III Ahmedgarh M.e. 25,560 3,976 26.90 OSD,S 325 100 2,700
4 V AJcalgarh CT. 5,564 1,523 NA OSD
5 V Alawalpur M.e. 6,468 3,745 11.00 OSD 200 100 800
6 V Amloh M.C. 9,854 2,219 10.00 OSD 200 2,000 1,000
7 I AmrilSar M.Corp. 108,~35 124,783 599.89 -OSD,5 50,'697 12,000 60
a. VI AmrllS3l' Cantt. e.B. 3,832 1,005 J5.20 , OSC,S 2,535 59,
9 V Anandpur Sahib M.C. 10,674 2,898 7.00 OSD,S 500 16
10 V Badhnl Kalan NAC 8,572 2,875 5.00 OSD 450 136
11 IV Baghapurana NAC 17,287 4,484 5.00 OSD 680 1,100
12 IV Banga Me 17,721 6,517 19.00 5,OSD 1,600 590
13 IV Banur M.e. 10,014 3,011 10.50 OSD 600 9
14 IV Barela M.C. 11,537 2,812 7.00 OSD,PT 50 200 150
15 II Bamala M.C. 75,430 17,368 42.00 S,OSD 1000 4,800 108
16 IV Bassi M.C. 18,138 4,454 8.00 OSD,PT ISO 500 112
17 I Batala ................. :. See Batala Urban Agglomeration ............... _ ..
Batala UA* 103,367 27,407 51.70 S,OSD 2,311 15,511 25
122

IV
Amenities, 1989
Method of Protected water supply Fire Electrification (Number of connections) Others
disposal of Source System of Storage Fighting Domestic Industrial Commercial Road
night soil of with capacitY in Servlces* Lighting
Supply litres (in brackets) (points)
11 12 13 14 15 16 17 18 19
S,WB T,TW OHT YES 14,520 418 3,774 1,718 18
(20,000)
ST,HL TW Jalandhar 2,086 76 866 82
16
PT,ST T,TW OHT Ludhiana 4,417 334 1,992 97
(910) 26
WB TW .• Airforce Station 543 5 138 NA 32
Halwara (1)
WD,ST T,TW Jalandhar 1,062 27 207 134
(14)
WB TW Gobindgarh 1,902 IIJ 775 100 3
(8)
O,WB T,TW OHT Yes 90,822 11,645 44,301 19,697
(18,200)
O,WB T,TW OHT Amrirsar 453 5 55 673 3
(228) (3)
S,ST T,WT OHT Nangal Township 1,737 36 684 154 9
(451) 20
PT,HL T,TW 8WP Moga 1,319 119 107 NA
(23)
WB,HL T,TW Moga 3,871 920 71
(20)
PT,S T,TW Phagwara 3,243 204 1,376 453 85
(35)
WB,B TW OHT Rajpura 8,889 216 619 1. 1460
(137) (14)
WB,PT T,TW SR Mansa 2,009 66 475 168
(4,550) (35)
S,B T,TW OHT Yes 10,589 326 2,930 15 320
(2,540)
WB,HL . TW,TK BWP Chandigarh 3,161 62 1,036 465 44
(42)
.•.. -.----.••. -..•. See Batala Urban Agglomeration .-•. _-_.-..... _ .•••
S.WS T,TW OHT Yes 15,829 2,700 5,558 3,081 221
(2,875)
123

STATEMENT
Civic and Other
51. Class and Civic Popula· Scheduled Road System of Number of Latrines No. Name of administration tion Caste length Severage
Town status Population (in Kms.) Water Service Others in 1990 Borne
2 3 4 5 6 7 8 9 10
Batala M.C. 86,006 21,637 51.70 S,OSD 2,311 15,511 25
18 I Bathlnda M.C. 159,042 32,266 75.00 S,OSD 1,500 800 8
19 VI 3ehrampur C.T. 4,806 1,715 N.A. OSD 255 S
20 IV Bhadaur M.C, 14,808 5,690 7.00 OSD,CD 80 200 508
21 IV Bhawanigarh •••..•.••.....•. : .. See BhawJmgarh Urban Agglomeration •..•.•... - .••.•..
Bhawanigarh UA* 13,900 3,252 5;00 S,OSD 550 50
Bhawanigarh M.C. 10,115 1,962 5.00 S,OSD 550 50
22 IV Bhikhiwilld C.T. 11,950 3,149 2.00 OSD,S 200 125 8
23 VI Bhogpur C.T. 4,896 1,469 NA OSD 377 128
24 IV Bhucho Mandl M.C. 10,006 3,291 19.50 S.OSD 4,445
25 IV Budhlada M.C. 18,717 2,959 18.89 S.OSD 495 44
26 .IV Dasua M.C. 18,351 3,864 15.45 OSD 2,500 500
27 V 0.: Baba Nanak M.C. 7,380 1,630 2.00 OSD 455
28 V Dera Bassi M.C. 9,602 1,386 6.66 S,BSD 3,000 4
2S IV Dhanauia M.C. 15,967 4,803 5.00 OSD 5 400
30 IV Dhariwai M.C. 14,214 . 820 1.44 OSD,S 95 385 2
31 IV Dharamkot ................... See Dharamkot Urban Agglomeration .......... _ .....
Dharamkot U.A. • 11,981 2,782 3.00 S,OSD 300 200 150
124

·IV
Amenities, 1989
Method of Protected water supply Fire Electrification (Number of conne.::t!ons) Others olSposalof Source Syst.em of Storage Fighting Domestic Industrial Commercial Road
night soil of with capacity in SelVices· lighting
Supply litres (in brackets) (points)
II 12 13 14 15 16 17 18 19
S,WB' T,TW OHT Yes 15,829 2,700 5,558 3,081 221
(2875)
S,ST ·T,TW OHT Yes 29,435 649 6,638 3,295 68
(5142)
B TW Gurdaspur 697 14 210 N.A. 60
(12)
ST T,TW BWP Bamala 2,589 78 340 2 220
(27)
-----------.---.--- See Bhawanigarh Urban Agglomeration -.--------.-.. -----
WB,S T,TW Sangrur 2,436 208 922 66
(19)
WB,S T,TW Sangrur 2,436 208 922 66
(19)
ST TW Amritsar 725 61 420 N.A. 16
(40)
ST TW ]alandhar 1,164 85 829 NA 21
(20)
S,WB T,TW OHT Bathinda 2,577 85 661 223 23
(2503) (12)
S,PT T.TW OHT Mansa 4,988 170 1,299 'J45
(800) (32)
WB T,TW SR Hoshlarpur 3,146 103 1,397 520 47
(41)
WB/B T,WT OHT Bamala 948 18 321 . 155 8
(430) (29)
WB,PT T,TW OHT Chandigarh 8,703 229 1,129 201 736
(228) (20)
WB,B T,TW OHT Bamala 2,945 120 307 2 205
(455) (12)
WB,T T,rw Gurdaspur 3,222 105 904 259 25
(12)
---------------- See Dharamkot Urban Agglomeration ------------
ST,WB T,TW BWP Moga 1,640 570 43 168
(16)
125

STATEMENT
Civic and Other
. SI. Class and Civic Popula- Scheduled Road System of Number of Latrines
No. Name of adminiStration tion Caste length Severage
Town status Population (in Kms.) Water Service Others
in 1990 Borne
2 3 4 5 6 7 8 9 10
Dharamkot M.C. 11,293 2,575 3.00 S,OSD 300 200, 150
32 III Dhuri M.C. 37,431 a,182 26.00 OSD,S 400 4,000 602
33 IV Dlnanagar M.C. 16,968 4,759 7.00 OSD,S 96 872
34 V Doraha M.C. 9,589 1,004 12.25 S,OSD 500 650 350
35 II Faridkot ---.-.-------.----- See F aridkot Urban Agglomeration --------------.--
Faridkot U.A.* 58,625 15,572 56.50 S,OSD 1,500 2,000 1,802
Faridkot M.C. 58,244 15,370 56.50 S,OSD 1,500 2,00(1 1,802
36 IV F atehgarh Churian M.C. 11,088 1,597 3.50 OSD,S 135 600 860
37 V Fatehnangal C.T. 6,095 1,756 6.32 OSD 15 15
3~ (( Fazilka M.C. 58,028 : 1,710 57.98 OSD,S 2,000 4,000 530
39 II Firozpur M.C. 78,738 13,483 46.34 S,OSD 4,000 6,000 2,880
40 II Flrozpur Cantt C.B. 53,094 10,490 26.06 S,OSD 3,500 500 25
41 V Garhdlwala M.C. 5,159 1,326 2.00 OSD 40 1,121
42 IV Garhshankar M.C. 11,761 4,423 3_66 OSD 980 22
·43 III Glddarbaha M.C. 29,866 9,109 30.00 S,OSD 842
44 III Gobindgarh .---... _ .. --•• ,-. See Gobindgarh Urban A"gJomeration ---•• ---------
Gobindgarh U.A.* 42,063 6,123 26.00 S,OSD 4,000 300
Gobindgarh M.C. 40,175 5,660 26.00 S,OSD 4,000 300
45 IV Gonlana M.C. 10,415 2,169 13.05 S,OSD 355 200 3
126

IV
Amenities, 1989
Method of Protected water supply Fire Electrification (Number of connections) Others disposal of Source System of Storage Fighting Domestic Industrial Commercial Road
night soil of with capacity in SelVices· Lighting
Supply lieres (in brackets) (points)
11 12 13 14 15 16 17 18 19
ST,WB T,TW BWP Moga 1,640 570 43 168
(16)
WB,S T,TW OHD Sangrur 7,333 555 2,550 3 22
(1,200) (14)
HL,S T,TW OHT Gurdaspur 2,437 180 931 270
(100) (12)
S,ST TW OHT Khanna 1,845 149 911 3 11
(225) (21)
------------------- See Faridko[ Urban Agglomeration ----------------
WB,S T,TW OHT Yes 9,115 2,158 164 5 256
(2,043)
wa,s T,TW OHT Yes 9,115 2,158 16 .. 5 256
(2,043)
WB TW Batala 1,909 112 842 L09
(26)
WB TW Gurdaspur N_A. N.A. N.A. N.A. N.A.
(13)
S,PT T,TW OHT Yes 8,061 219 2,568 900 106
(300)
S,ST T,TW OHT Yes 9,228 433 3,240 1,370
(1,755)
S,ST T,TW OHT Yes 13,651 569 4,858 627 86
(500)
ST TW,T Hoshiarpur 1,025 25 536 132 7
(2S)
B,WB T,TW Hoshiarpur 1902 109 928 250 16
(41)
S,PT T,TW OHT Yes 5,690 178 1,233 124 15
(1,600)
------------------- See Goblndgarh Urban Agglomeration ------------------
S,ST I,IW OHT Yes 6,713 573 2,595 1,771 7
S,ST T,TW OHT Yes 6,713 573 2,595 1,771 7
S,WB T,TW OHT llathinda 6,771 90 77i 245 22
(45,500) (11)
127

STATEMENT
Civic and Other
-51. Class and Civic, Popula- Scheduled Road System of Number of Latrines" 1
No. Name of administration tlon Caste length Severa,e Town status Population (in Kms.) Water Service Others
in 1990 Borne 2 3 4 5 6 7 8 9 10
46 IV Goraya N.A.C. 10,708 2,494 10.60 S,OSD 800 745
47 II Gurdaspur M.e. 54,735 11,047 31.94 S,OSD 405 2,750 12
48 IV Guru Har Sahal M.e. fO,Sao 1,183 10.00 ')SD,PT 300 100
49 V Hariana M.e. 6,473 1,780 1.00 OSD 500 \
';0 I Hoshiarpur M.C. 122,705 29,750 69.30 S 1,300 716
51 III Ja~aon M.e. 47,372 14,219 2:l.23 S,OSD
52 III Jaltu ••• __ .......... See laltu Urban A,glomeration ........... _ ... _.
Jaltu U.A.* 28,850 9,813 31.50 S,OSD 523 630 418
Jaltu M.e. 28,758 9,807 31.50 S,OSD S23 630 418
53 III Jalalabad ................... See lalalabad Urban Agglomeration ___ ,_ ........... _.
)alalabad U.A.* 23,108 2,692 38.05 S,OSD 20 200 458
lalalabad M.e. 18,476 1,707 38.05 S,OSD 20 200 458
54 I Jalandhar M.Corp 509,510 140,696 349.00 S,OSD 10
55 III )alandhar \..antt. e.B 31,520 6,200 14.81 S,OSD 4;500 19
56 IV Jandiala M.e. 19,293 5,771 7.00 S,OSD 1,500 1,400
57 II Kapurthala M.e. 64,567 13,751 59.75 S 8,002 2,135 64
58 III Kartarpur M.e. 21,093 9,255 19.00 S,OSD 300 2,000
59 II Khanna M.e. 71,990 14,709 38.50 S,OSD
128

·IV
Amenities, 1989
Method of Protected water supply Fire Electrification (Number of connections) Others
disposal of Source Sysre'm of S wrage Fighting Domestic Industrial Commercial Road
night soil of with capacity in Services· Lighting
Supply litres <in brackets) (points)
11 12 13 14 15 16 17 18 19
ST T,TW Phagwara 3,088 375 1,250 257 65
(8)
S,WB T,TW OHT Yes 7,779 367 2,793 1,664 68
(300)
PT,WB T,TW OHT Firozpur 2,669 92 677 200 29
(150) (39)
0 r,TW' Hoshiarpur 1,225 31 460 113 17
(15)
S T,TW OHT Yes 18,917 739 6,498 2,949 451
(400)
S,HL T,TW OHT Moga 9,609 358 3,3.~5 3
(800) (30)
•••• ----------.-- See Jaitu Urban Agglornerati(;m ----------------
S,PT T,TW OHT Kotkapura 3,827 1,212 181 4
(273) ( 16)
S,PT T,TW OHT KOlkapura 3,827 1,212 181 4
(273) (16)
------------------ See Jalalabad Urban Agglomeration ---------------
WB,HL T,TW OHT Fazllka 3,250 156 892 252
(210) (36)
WB,HL T,TW OHT Fazilka 3,250 156 892 252
(210) (36)
S,WB T,TW OHT Yes 82,46 6,760 26,307 730 N.A.
(45,000)
PT.S T,TW OHT }alandhar 4,61S 136 1,528 63
(1,818) (3)
~T T,TW OHT Amritsar 2,747 158 490 257 114
(910) (20)
WB TjTW OHT Yes 10,278 453 1,195 2,831 7
(2,400)
S,HL T,TW Jalandhar 3,106 221 1,352 212 3
(16)
WS,S T,TW OHT Yes 11,935 635 4,584 26 60
(5,000)
129

STATEMENT
Civic ana ,Other
SI. Class and Civic Popula- Scheduled Road System of Number of Latrines
No. Name of administration don Ca<;te length Severage
Town statUs Population (in Kms.} Wa,ter Service O~hers
in 1990 Borne
2 3 4 5 6 7 8 9 10
60 III Kharar .-----.--.. -.-.--- See Kharar Urban Agglomeration -------........ -..•
Kharar U_A.* 26,109 6,084 16.50 OSD 850 1,750 3
Kharar M.e. 25,938 6,015 16.50 OSD 850 1,750 3
61 V Kot Fatta M.e. 5,61 [ 2,049 2. II P.T,CD 9
62 V Kot Ise Khan C.T. 7,604 2,022 2.00 OSD 200 150 150
63 (( Kot Kapura M.C. 62,430 17,714 50.00 S,OSD 1,500 4,000 2,043
64 IV Kurali M.C. 17,592 3,987 8.00 OSD,Pi 2,380 325
65 IV Lehragaga M.e. 15,555 3,722 13.85 OSD,PT 100 300 260
66 IV Longowal .. - ••. -.-_ ....... See Longowal Urban Agclomeration _ ......... -..•.•.
Longowal U.A.* 16,254 4,063 8.00 OSD 25
Longowal M.C. 15,419 4,032 8.00 050 25
.67 I Ludhiana M.Corp. [,042,740 123,521 946.00 S,OSD 350,000 4,000 ., I to
68 IV Machhiwara N.A.C. 13,.554 4,287 8.00 OSD 756 1,250 2
69 IV Malitha .. -.... -..... - .... See Majitha Urban Agglomeration ........ --._ .•. --
Majitha U.A.* 10,713 4,372 7.50 S,OSD 150 350 75
Maiitha M.C. 9,912 3,876 7.50 S,OSD 150 350 75
70 II Malerkoda M.C. 88,600 4,814 56.40 S,OSD 3,000 7,000 3
71 II Malout M.C. 56,868 14,348 46.00 S,OSD 2,510 1,451
130

·IV
Amenliies, 1989
Method of Protected water supply Fire Electrification (Number of connections) Others disposal of Source System of Storage Fighting Domestic Industrial Commercial Road
night soil of with capacity in Services" Lighting Supply litres.(in brackets) (points)
II 12 13 14 15 16 17 18 19
...•..•... -------- See Kharar Urban Agglomeration -.------.---.-...• •
WB,HL T,TW OHT SAS Nagar 5,092 201 1,313 403 366
(Mohali) (6)
WB,HL T,TW OHT SAS Nagar 5,092 201 1,313 403 366
(Mohall) (6)
PT,ST TW,W BWP Bathinda 742 12 76 26
(26)
H,L,O TW,T BWP Moga 1,140 410 47 14
(16)
S,WB T,TW OHT Yes 10,190 2,731 586 3 428
(1,362)
WB,O T,JW OHT SAS Nagar 987 178 1,027 240 14
(500) (Mohal1} ( 17)
WB,HL T,TW OHT Sangrur 3,126 184 647 2 21
(500) (45)
.. ---•• -.. -.-- See Longowal Urban Agglomeration ---------------
WB,B 'fW"W '\, -- Sangrur 2,541 35 357 t 16
(18)
WB,B TW,W . Sangrur 2,541 35 357 16
(18)
S,WB T,TW OHT Yes 156,876 18,125 49,267 142 1;188
(19,350)
WB,O TW Khanna 3,037 92 991
(28)
---.---... --------- See Majitha Urban Agglomeration .--.-------.-.-
WB,B T,TW Amritsar 2,106 21 203 70
(18)
WB,B T,TW Amritsar 2,106 21 203 70
(18)
S,ST T,TW OHT Sangrur 13,222 869 5,172 12 39
(910) (32)
S,HL T,TW OHT Yes 9,261 407 2,624 930
(4,095)
131

STATEMENT
CMe and Other
51. Class and Civic Popula- Scheduled Road System of Number of Latrines
No. Name of administration tion Caste length Severage
Town status Population (In Kms.) Water SelVke Others in 1990 Borne
1 2 3 4 5 6 7 8 9 10
72 II Mansa M.e. 55,089 11,619 25.56 S,OSD 1,500 851 84.
73 III Maur M.e 25,180 7,611 29_00 OSD,S 157 127 503
74 I Moga ---------------- See Moga Urban Agglomeration ----------------
Moga U.A.* 110,958 19,204 31.00 S,OSD 8,441 14
Moga M.e. 108,304 18,260 31.00 S,OSD 8,441 14
75 IV Morinda M.e 17,440 4,142 7.00 S,OSD 100 500
76 IV Mukerian M.e. 17,813 3,464 8.95 05D
77 II Mukrsar M.e 66,383 16,911 10.50 S,OSD
78 IV Mullanpur Dakha N.A.e. 10,138 3,706 5.50 . S,OSD 1,846 57 109
79 II Nabha M.e. 54,421 6,399 75.90 S,OSD 400 6,000 2,'()09
80 III Nakodar M.C. 28,478 9,938 17.50 S,OSD 872 2
81 III Nangal Township ----•• ----------- See Nangal Township Urban Agglomeration ----------~-
Nangal Township U.A.* 32,003 7,419 40.50 OSD,S
Nangal Township N.A.e. 29,311 6,698 40.50 05D,S'
82 III Nawanshahr M.e. 29,955 9,152 43.50 S,OSD 1,477 4,500
83 IV Naya Nangai N.A.e. 12,046 2,123 59.00 S
84 IV Nurmahai M.e. 11,149 3,897 4.00 OSD 240 430 .4
85 I Pathankot ------------------ See Pathankot Urban Agglomeration ---------------
Pathankot U.A.* 128,198 26,358 33.12 S 4,030 7,897 6,810
132

·IV
Amenllies, 1989
Method of Protected water supply Fire Electrification (Number of connection~) Others
disposal of Source System of Storage Fighting Domestic Industrial Commercial Road
night soil of with capacity in Services * Lighting Supply lIeres (In brackets) (points)
II 12 13 14 IS 16 17 18 19
S,ST T,TW OHT Yes 11,253 400 2,350 B09
(4,095)
PT,S T,TW OHT Bathinda 3,819 93 1,001 425 3
(150) (42)
.•••...•..•.•...... See Moga Urban Agglomeration - ....•... _ •••....
S,WB T,TW OHT Yes 17,297 5,586 886 7 473
(3,240)
S,WB T,TW OHT Yes 17,297 5,586 886 7 473
(3,240)
ST,HL TW,T SAS Nagar 3,476 164 951 425 47
(Mohali) (20)
WB T,TW OHT Talwara 3,204 114 1,599 418 52
(200) (28)
S,WB T,TW OHT Yes 12,245 414 3,312 1,173 243
(2,320)
WB,PT T,TW ludhiana 1,758 93 834 2 39
(19)
S,ST T,TW OHT Patiala 8,523 493 3,644 1,223 4
(796) (26)
S,WB T,TW OHT )alandhar 5,558 1,941 2,314 611
(24)
••• -_ •...•••• - •• See Nangal Township Urban Agglomeration - •.•.•.••.....••..
WB,ST T,TW OHT Yes 1,143 27 551 150 6
(228)
WB,ST T,TW OHT Yes 1,143 27 551 150 6
(228)
S,HL T,TW OHT Phagwara 5,294 292 12,674 800 99
(455) (38)
S TW OHT Yes 12 N.A. N.A. N.A. N.A.
(910)
WB T,TW )alandhar 1,750 10 470 350 3
(33)
......•.... , ..••... See Pathankot Urban Agglomeration ----.. ------------.
S,ST T,TW OHT Yes 21,010 624 5,913 1,687 110
(11,802)
133

STATEMENT
Civic and Other
51. Class and Civic Popula· Scheduled Road System of Number of Latrines
No. Name of administration tion Caste lenl!(h Severage
Town status Population (in Kms.) Water Service OtherS in 1990 Borne
2 3 4 5 6 7 8 9 10
Pathankot M.C. 123,930 24,121 33.12 S 4,030 7,897 6,810
86 I Patiala .•.• : .•.•..•....... See Patiala Urban Agglomeration -------.---'--.
Patiala U.A.* 253,706 24,688 460.00 S,OSD 3,350 30,000 29
Patiala M.C. 238,368 22,910 460.00 S,OSD 3,350 30,000 29
87 IV Patran N.A.C. 14,328 1,790 10.00 OSD,S 546 306
88 III Patti M.C. 27,776 5,635 12.80 OSD,S 98 5,870 2
89 . V Payal M.C. 5,852 2,285 3.00 OSD,S l,iH6 51 109
90 II Phagwara --------....... -- See Phagwara Urban Agglomeration ..... - .. --•. ---
Phagwara U.A.* 88,316 22,648 62.00 S 9,000 5,005
Phagwara M.C. 83,163 19,425 62.00 S 9,000 5,005
91 III Phillaur M.e. 20,956 8,109 10.79 S,OSD 1,000 650 500
92 III Qadian ......... --.. ------ See Qadian Urban Agglomeration ----------...... -.
Qadian U.A.* 20,012 2,389 14.40 OSD 500 2,200
Qadian M.e. 18,867 1,525 14.40 OSD 500 2,200
93 IV Rahon M.C. 10,771 4,578 29.50 S,OSD 540 570 145
94 III Raikot M.e. 21,061 7,292 21.91 S,OSD 8
95 IV Rajasansi e.T. 10,00B 4,092 3.00 OSD 21 141 262
96 II Rajpura M.C. 70,~83 4,205 113.00 S,05D 6,189 1,808
97 IV Raman M.C. 17,275 4,856 18.10 5,05D 448 578 95
134

-IV
Amenities, 1989
Method of Protected water supply Fire Electrification (Number of connections) Others
disposal of Source System of Storage Fighting Domestic Industrial Commercial Road
night soil of with capaCitY in Services' Lighting
Supply Htres (in brackets) (points)
II 12 13 14 IS 16 17 18 19
5,ST T,TW OHT Yes 21,010 624 5,913 1,687 110
(11,802)
------------------- See Patlala Urban Agglomeration -------------------
S,WB T,TW OHT Yes 56,665 1,565 13,872 2,002 387
(58,250)
S,WB T,TW OHT Yes 56,665 1,565 13,872 2,002 387
(58,250)
WB TW OHT Sangrur 879 162 780 3
(91) (40)
WB,B T,TW OHT Amritsar 3,731 418 1,014 593 224
(683) (50)
WB,PT T,TW Ludhiana 1,758 93 834 2 39
(19)
------------------- See Phagwara Urban Agglomeration -------------------
S,WB T,TW OHT Yes 14,136 1,422 4,397 197 N_A.
(2,800)
S,WB T,TW OHT Yes 14,136 1,422 4,397 197 N.A.
(2,800)
WB,PT T,TW OHT :hiana 3,480 109 1,012 280 20
(100) (14)
------------------- See Qadian Urban Agglomeration -------------------
WB,HL T,TW OHT Batala 2,949 206 407 252 40
(450) (IS) ..
WB,HL T,TW OHT Batala 2,949 206 407 252. 40
(450) (15)
PT,HL T,TW Phagwara 1,345 57 489 166 12
(45)
WB,O T,TW Ludhiana 2,889 105 1,186 456
(41)
ST,B T,TW OHT Amritsar 1,281 45 262 1,786
(10) (IS)
S,WB T,TW OHT Yes 27,668 7B6 4,085 1,785 3,578
(3,000)
S,PT T,TW OHT BJthinda 2.638 138 855 150 4
(750) (45)
135
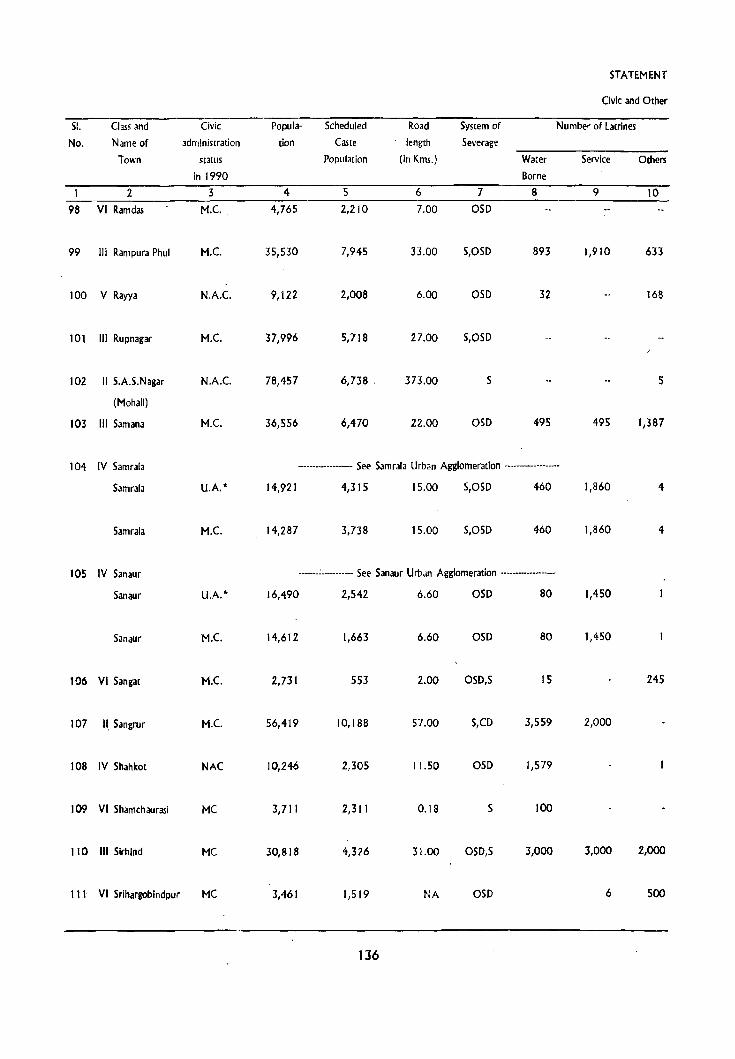
STATEMENT
Civic and Other
51. Class and Civic Popula- Scheduled Road System of Number of Latrines
No. Name of administration tion Caste length Severage
Town status Population (in Kms.) Water Service Others
in 1990 Borne
1 2 3 4 5 6 7 8 9 10
98 VI Ramdas M.C. 4,765 2,210 7.00 OSD
99 III Rampura Phul M.C. 35,530 7,945 33.00 S,OSD 893 1,910 633
100 V Rayya N.A.C. 9,122 2,008 6.00 OSD 32 168
101 III Rupnagar M.C. 37,996 5,718 27.00 S,OSD
102 II S.A.S.Nagar N.A.C. 78,457 6,738 . 373.00 S 5
(Mohall)
103 III Sam ana M.C. 36,556 6,470 22.00 OSD 495 495 1,387
104 IV Samrala --.----.-.--------- See Samrala Urban Agglomeration -------------------
Samrala U.A.* 14,921 4,315 15.00 S,OSD 460 1,860 4
Samrala M.C. 14,287 3,738 15.00 S,OSD 460 1,860 4
105 IV Sanaur -------:--------.-- See Sanaur Urban Agglomeration .---.--------------
Sanaur U.A.* 16,490 2,542 6.60 OSD 80 1,450
Sanaur M.C. 14,612 1,663 6.60 OSD 80 1,450
106 VI Sangat M.C. 2,731 553 2.00 OSD,S 15 245
107 U Sangrur M.C. 56,419 10,188 57.00 S,CD 3,559 2,000
108 IV Shahkot NAC 10,246 2,305 11.50 OSD 1,579
109 VI Shamch aurasi MC 3,711 2,311 0.18 S 100
110 III Slrhlnd MC 30,818 4,326 31.00 OS D,S 3,000 3,000 2,000
III VI Srihargoblndpur MC 3,461 1,519 NA OSD 6 500
136

·IV
Amenlti~s, 1989
Method of Protected water supply Fire Electrification (Number of connections) Others disposal of Source System of Storage Fighting Domestic Industrial Commercial Road
night.soil of with capacity in Services· Lighting Supply litres (In brackets) (points)
11 12 13 14 15 16 17 18 19 WB,HL T,TW Amritsar 742 29 III 43 883
(46)
S,PT T,TW OHT Yes 6,252 296 1,838 700
(228)
WB,Hl TW,T Amritsar 1,317 117 763 65 8
(39)
S,WB T,TW OHT SAS Nagar 5,953 151 2,457 660 36
(59,280) (Mahali) (33)
S T,TW OHT Yes 18,202 574 1,591 3,328
(2,000)
S,WB T,TW OHT Patiala 6,214 263 2,224 5 95
(900) (31)
............••.•... See Samrala Urban Agglomeration ...•••.•••• - •.•.••
S,WB T,TW OHT Khanna 3,885 114 1,040 3 209
(71 ) (IS)
S,WB T,TW OHT Khanna 3,885 114 1,040 3 209
(71) (15)
................... See Sanaur Urban Agglomeration .....•.•••••••.....
WB,ST T,TW Patiala 2,245 64 478 256 44
(4)
WB,ST T,TW Patiaia 2,245 64 478 256 44 J'
(4)
WB,Hl rw,w OHT Bathinda 2,310 11 182 59 3
(137) (22)
S,ST T,rw OHT YES 11,150 226 3,076 145
(683)
WB T,rw ]alandhar NA NA NA NA NA
(65)
WB 'IW,W Hoshairpur 521 21 209 N.A. N.A.
(17)
WB TW,TK OHT Goblndgarh 6,305 366 2,019 801 130
(910) (8)
ST,HL TW,W Bathinda 171 36 24 60 41
(32)
137

STATEMENT
Civic and Other
51. Class and Civic Popula' Scheduled Road System of Number of Latrines
No. Name of 3dministradon tlon Caste length Severage
Town status Population (In Kms.) Water Service Others . in 1990 Borne
2 3 4 5 6 7 8 9 10
tt2 IV Sujanpur ._,-_ ......... - See Sujanpur Urban Agglomeration ...............•...
Sujanpur UA* 16,090 5,487 6.00 OSD,S 1,000 100
Sujanpur Me 15,41 I 5,392 6.00 OSD,5 1,000 100
113 IV Sultanpur MC 13,722 1,~72 9.90 OSD
114 III Sunam ...•.•••........... See Sunam Urban Agglomeration ...................
Sunam UA* 43,909 S,964 21.00 S,OSD 1,503 1,020 110
Sunam M.C. 41,118 7,941 21.00 S,OSD 1,503 1,020 110
115 IV Ta!wandi Bhai M.C. 10,462 2,561 7.33 OSD,S 400 600 50
116 IV Talwara C.T. 17,379 3,737 25.65 S. 4,535 20
117 IV Tapa _ •••..•.•••.•.•. See Tapa Urban Agglomeration ...................
Tapa U.A.· 14,161 3,553 9.00 S,OSD 170 800 1,230
Tapa M.C. 14,147 3,553 9.00 5,05D 170 BOO 1,230
118 III Tarn Taran M.C. 47,529 8,948 20.00 S,OSD 7,000 776 "687
119 IV Urmar Tanda M.C. 18,786 5,540 23.02 OSD SOO 700 400
120 III Zira ._-•.•......... See Zira Urban Agglomeration ...................
Zira U.A.* 23,722 6,018 . 18.15 OSD,S 330 1,300 280
Zira M.C. 23,587 5,973 18.15 050,5 330 1,300 280
• Includes Outgrowth (5)
NA Data Not Available
t38

-IV
Amenities, 1989
Method of Protected water supply Fire Electrification (Number of connections) Others"
disposal of Source Syslem of Storage Fighting Domestic Industrial C~1merciJi Road
night soil of with capacity in Services· \ Lighting
Supply litres (in brackets)
J;l (points)
II 12 13 14 15 16 18 19
------------------- See Sulanpur Urban Agglomeration ------------------,
O,ST T,TW OHT Pathankot 3,356 51 '~97 249 35
(455) (6)
O,ST T,TW OHT Pathankot 3,356 51 9~7 249 3.s
(455) (6)
WB T,TW OHT Kapurthala 4,800 124 t,te~ 1,818 l!
(2,SOO) 26)
------------------- See Sunam Urban Agglomeration ------------------
S,O T,TW OHT Sangrur 7,993 246 2,75;;1 10 46
(910) (19)
S,O T,TW OHT Sangrur 7,993 246 2,752 10 46
(910) (19)
WB,ST TW OHT Faridkot 3,377 726 159 3
(227) (26)
S T,TW OHT Yes 1,050 16 640
(225)
------------------- See Tapa Urban Agglomeration -------------------
WB,HL T,TW Barnala 2,621 120 420 260
(21 )
WB,HL T,TW Barnala 2,621 120 420 260
(21)
S,ST T,TW OHT Amrltsar 6,392 546 2,614 780 98
(150) (26)
HL,ST T,TW B,WP Hoshiarpur 3,149 144 1,607 ~98 IHJ
(32)
------------------- See Zira Urban Agglomeration ---.. -----------
WB,S T,TW OHT Moga 3,738 1,168 136 2' 336
(500)- (28)
WB,S T,TW OHT Moga 3,738 1,168 136 2 336
(500) (28)
139


STATEMENT - V
MEDICAL, EDUCATIONAL, RECREATIONAL AND CULTURAL FACiliTIES, 1989
141

STATEMENT
Medical, Educational, Recreational
51. Class and !':lame Population Medical Facilities· Educational Facilities·
No. .ofTown Hospitals/ Beds in Arts/Science/ Medical Engineering Polytechnics
Dispensaries/ Medical Commerce Colleges Colleges
T.B. Clinics, Institutions Colleges (of
etc. noted in degree level
column-4 and above)
2 3 4 5 6 7 8 9
I Abohar 107,163 H-2 I J 8 ASC Faridko[ Bathinda Bathinda
D(A-6,Hom-2) 20 (106) (70) , (70)
FPC
TB
FC
2 IV Adampur 15,331 HC 10 A Jalan~har Jalandhar Jalandhar
D(A) (16) (16) (16)
FPC
3 III Ahmedgarh 25,560 He 4 A Ludhlana Ludhlana
D(Hom·l) (26) (26)
FPC
4 V Akalgarh 5,564 Sudhar Sudhar Ludhiana Ludhlana Ludhiana
(2) (2) (28) (28) (28)
5 V Alawalpur 6,468 HC 4 Jalandhar Jalandhar Jalandhar Jalandhar
(DCA) (14) (14) (14) ( 14)
6 V Amloh 9,854 H 25 Gobindgarh Patiala Patiala Patiala
FPC (8) (49) (49) (49)
7 I Amritsar 708,835 H(A,I,15) 2182 A(3) 3 Jalandhar 3
D(A-5,U-3) 16 ASqI5) (80)
HCM-I,IS AS(7)
HC(J4) 16 AC(3)
TB(3) 295 L
0(1)
8 VI Amritsar Cantl. 3,832 D Amritsar AmritsJr Jalandhar Amritsar
(3) (3) (77) (3)
9 IV Anandpur Sahib 10,674 H 30 AS Chandigarh Chandigart- Chandlgarh
(80) (80) (80)
10 V Badhni Kalan 8,572 D 8 Moga Farldkot Ludhlana Guru Teg Baha-
(23) (85) (80) durgarh (28)
II IV Baghapurana 17,287 H 30 GlJrU Teg Faridkot Ludhlana Guru Teg Baha-
Bahadurgarh (8)(55) (85) durgarh (8)
12 IV Banga J 7,721 H 25 A Jalandhar Jalandhal Jalandhar
FPC AS (47) (47) (47)
142

-V
and Cultural Facilities, 1989
Educational F acHities'
Recognised Higher Secon· Secondary( Junior Primary
Shorthand dary/lnterme· Matriculation Secondary Schools
Typewriting & diate/PUC and Middle
Vocational (Pre·University Schools
Training College/Junior
Institutions College Level)
10 II 12 13 14
0 2 9 2 6
2 4
2 6
2 4
2 4
4 . 29 JS 26 87
2 3 5
3 7
2 2
2 5
8 3
143
Working
Adult Women's
Literacy Hostels Stadia
Classesl with
Centres, Number
Others of
(Specify) Seats
15 16 17
1(23)
1(80) 2
No. of Recreational and
Cultural Facilities
Cinema Auditoria
Drama!
Community
Halls
18 19
7
21 14
3
2 2
Public Libraries
including
Reading
Rooms
20
PL(2)
RR(2)
PL·2
RR·2
PL·2
RR
PL
RR
PL
RR
Pl(9)
RR(26)
RR
PL·2
RR
PL·2
RU
PL
RR

STATEMENT
Medical, Educational, Recreational
SI. Class and Name Population Medical Facilities· Educational Facilities·
No. of Town Hospitalsl Beds in Arts/Science! Medical Engineering Polytechnics Dispensaries! Medical Commerce Colleges Colleges
T.B. Clinics, Institutions Colleges (of
etc. noted in degree level
column·4 and ~bove)
2 3 4 5 6 7 8 9
13 IV Banur 10,014 H 20 Rajpura Chandigarh Chandigarh Chandigarh
FPC (14) (25) (25) (25)
14 IV Bareta 11,537 H 25 A Patiala Patiala Patlala
D(A) (104) (104) (104)
15 II Barnala 75,430 H(2) 1.20 A Ludhiana Ludhiana Sunam
D(A-l,2) ASC (76) (76) (35)
FPC AS
16 IV Bassi 18,138 H 25 Sirhind Chandigam Chandigam Chandigam
(9) (42) (42) (42)
17 I Batala -----... ------- See Batala Urban Agglomeration --------------
Batala U.A.* 103,367 H-5 121 A Amritsar Jalandhar
D(A-2,2) ASC(2) (38) (67)
FPC
Batala 86,006 H-5 121 A Amritsar Jalandhar
D(A-2,2) ASC(2) (38) (67)
FPC
18 I Bathinda 159,042 H(A-I,4) 269 A Faridkot
D(A-2,Hom- 22 ASC(2) (63)
1,9) 0
FPC(2)
TB 25
0
19 VI Behrampur 4,806 HC 25 Dinanagar Amritsar Jalandhar Batala
(8) (80) (81) (44)
2.0 IV Bhadaur 14.808 HC 30 Barnala Ludhiana Longowal Ahmadgarh
NH(2) (27) (103) (SO) (37)
21 IV Bhawanigarh --------------•. See Bhawanlgam Urban Agglomeration --------.--.-..
Bhawanigarh UA * 13,900 HC 30 A Patiala Patiala Ahmedgarh
D(A·I) (37) (37) (35)
FPC
Bhawanigarh 11,115 HC 30 A Patiala Patiala Ahmedgarh
D(A·l) (37) (37) (35
FPC
144

-V
and Cultural Facilities, 1989
Educational Facilities' Working No. of Recreational and
Recognised Higher Seeon- Secondary/ Junior Primary Adult Women's Cultural Facilities
Shorthand daryllnterme- Matricu laeion Secondary Schools Literacy Hostels Stadia Cinema Auditoria Public
Typewriting & dlate/PUC and Middle Classes/ with Drama/ Libraries
Vocational (Pre-University Schools Centres, Number Community including
Training College/Junior Others of Halls Reading
Institutions College Level) (Specify) Seats Rooms
10 II 12 13 14 15 16 17 18 19 20
3 1 3 PL
RR
3 5 PL
RR(2)
0(2) 4 3 7 2 2 PL(2)
RR(3)
2 7 PL
RR
---------------- See Batala Urban Agglomeration ----------------
0 5 13 14 25 2 2 PL(2)
RR(2)
0 5 13 14 25 2 2 PL(2)
RR(2)
0(2) 6 10 9 23 I(NA) 3 5 3 PL(2)
RR(3)
2 5
2 2 5 PL
---------------- See Bhawanigarh Urban Agglomeration ----------------
3 PL(2)
3 PL(2)
145

STATEMENT
Medical, Educational, Recreational
SI. Class and Name Population Medical Facilities· Educational Facilities·
No. of Town Hospitalsi Beds in Arts/Sciencel Medical Engineering Polytechnics Dispensaries/ Medical Commerce Colleges Colleges
T.B. Clinics, Institutions Colleges (of
etc. noted in degree level
column-4 and above)
I 2 3 4 5 6 7 8 9
22 IV Bhlkhiwlnd 11,958 H 25 Patti Amritsar Jalandhar Amritsar
(20) (40) (120) (40)
23 VI Bhogpur 4,896 D 6 Tanda ]alandhar ]alandhar ]alandhar
(12) (20) (20) (20)
24 IV Bhucho Mand 10,006 D 4 Bathinda Faridkot Bathlnda Bathlnda
(12) (75) ( 12) (12)
25 IV Budhlada 18,717 H 30 ASC(2) Patiala Bathlnda Bathlnda
FPC (109) (88) (88)
26 IV Dasua 18,351 H 50 A Jalandhar Jalandhar Hoshlarpur
D(A,Hom-l) 5 ASC (56) (56) (41)
FPC
27 V Dera Baba Nanak 7,380 H 25 A Amrltsar Jalandhar Batala
FPC (51) (97) (29)
28 V Dera Bassi 9,602 H 30 ASC Chandigarh Chandiph Chandlgarh
D(A-l,Hom.l) (20) (20) (20)
FPC
29 IV Dhanaula 15,967 H 30 A Pad ala Patlala Sunam
FPC (89) (89) (20)
30 IV Dhariwal 14,214 H 170 A(2} Amritsar Jalandhar Batala
D(2} 14
FPC (59) (93) (21)
31 Dharamkot --------------- See Dharamkot Urban Agglomeration ---------------
Dharamkot U.A. * 11,293 D 12 AS Faridkot Ludhlana Guru Tei
(7S> (S2.) 8ahadur Gam (43)
Dharamkot D 12 AS Faridlcot ludhlana Guru Tei
(75) (82) Bahadur Garh (43)
32 III Dhuri 37,431 H(2) 52 ASC(2) Patiala Patiala Patlala
D(A, I,Hom-l) (61) (61) (61)
33 IV Dinanagar 16,968 D(Hom-1,2) 4 A Amrltsar Jalandhar Pathankot
ASC (83) (107) (24)
34 V Dora.ha 9,589 H 4 AS(2) Ludhiana Ludhlana Ludhlana
(21) (21) (21 )
146

-V
and Cultural Facilities, 1989
Educational Facilities· Working No_ of Recreational and
Recognised Higher Secon- Secondary/ Junior Primary Adult Women's Cultural Facilities Shorthand dary/lnterme- Matrkulation Secondary Schools Literacy Hostels Stadia Cinema Auditoria Public
Typewriting & diate/PUC and Middle Classes/ with Drama! libraries Vocational (Pre-University Schools Centres, Number CommunitY including
Training College/Junior Others of Halls Reading
Institutions College Level) (Specify) Seats Rooms
10 II 12 13 14 15 16 17 18 19 20
2
0
2 2 3 PL
RR
0(3) 2 2 4 PL
RR
0(5) 4 2 8 PL
RR(3)
2 5
0 3 3 3 3 PL(2)
RR
2 6 PL
3 3 4 5 PL
RR
--------------- See Dharamkot Urban Agglomeration ----------------
7 RR
7 RR
0 3 10 2 PL(2)
RR
2 1 2' 7 PL
RR
2 PL
147

STATEMENT
Medical, Educational, Recreational
SI. Class and Name Population Medical Facilities· Educational Facilities'
No. of Town Hospitals/ Beds In Arts/Science/ Medical Engineering Polytechnics
Dispensarles/ Medical Commerce Coileges Colleges
T.B. Clinics, Institutions Colleges (of
etc. noted in degree level
column·4 and above)
2 3 4 5 6 7 8 9
35 II Faridkot ................ See Faridkpt Urban Agglomeration ................
Faridkol U.A.· 58,625 H·4 653 A Bathinda Flrozpur Cantt.
D(A·2,Hom· 1,2) 8 ASC (63) (30)
FPC
TB
Farldkot 58,244 H·4 653 A Bathlnda Flrozpur Cantt.
D(A·2,Hom·J ,2) 8 ASC (63) (30)
FPC
TB
36 IV F atehgarh Churian 11,088 H 30 Kala Afghana Amrltsar Jalandha. Datala
HC (8) (32) (99) (26)
FPC
37 V F atehnangal 6,095 Dhariwal Dhariwal Amritsar Jalandhar Batala
(I) (I) (60) (94) .(20)
38 II Fazilka 58,028 H 56 AS Farldkot Ludhlana Flrozpur Cantt.
HC (92) (86)
FPC
39 II Flrozpur 53,094 H·4 392 AS(2) Faridkot Ludhlana Flrozpur
(33) . (123) Cantt. (2)
40 II Firozpur Cantt. 78,738 H·3 200 AS(3) farldkot Ludhiana
D(A'I,Hom·l)
FPC
TB
41 V Garhdiwala 5,159 D 4 AS Jalandhar Jalandhar Hoshiarpur
(62) (62) (28)
42 IV Garhshankar 11,761 HC 50 A(2) Jalandhar Jalandhar Hoshlarpur
D(Hom·l) (62) (62) (41 )
43 III Giddarbaha 29,866 H·2 50 A(2) Farldkot Bathinda Bathlnda
D(A· I ,Hom, I) ASC(2) (65) (25) (25)
44 III Goblndgarh ................ See Goblndgarh Urban Agglomeration ... , •.• - .......
Goblndgarh U.A.· 42,063 H 50 AS Patlala Patlala Patlala
D(U·I,2) (42.) (42.) (42)
FPC
148

-V
and Cultural Facilities, 1989
Recognised Higher Secon-
Shorthand dary/lnterme-
Typewriting & diate/PUC
Vocational (Pre-University
Training College/Junior
Institutions College Level)
10 II
O(S) 5
0(5) 5
0(2)
0 2
3
0(3) 2
2
0
0(1)
3
Educational Facilities· Working No. of Recreational and
Secondary! Junior Primary Adult Women's Cultural Facilities Matriculation Secondary Schools Literacy Hostels Stadia Cinema Auditoria
and Middle Classes/ with Drama!
Schools Centres, Number Community
Others of Halls (Specify) Seats
12 13 14 IS 16 17 18 19
._ ... -...... - See Faridkot Urban Agglomeration ... -....... --•••
4 18 2 I(NA) 2 2
4 18 2 I(NA) 2 2
3 3
l
4 2 10 1(20) 2 10
5 2 4 2
5 3 11 3
3 3
2 2
3 6
-.. ------------- See Goblndgarh Urban Agglomeration -------------,--
4 l 8
149
Public
Libraries
Including
Reading
Rooms
20
PL(2)
RR(l)
PL(2)
kR(l)
Pl
PL(2)
kR(2)
PL(2)
RR(2)
PL(2)
kR(3)
PL
PL
Pl
RR(2)
PL(2)

STATEMENT
Medical, Educational, Recreational
51. Class and Name Population Medical Facilities * Educational F acilltles *
No. of Town Hospitals! Bem in Arts/Science/ Medical Engineering Polytechnics
Dispensaries! Medical Commerce Colleges Colleges
T.B. Clinics, InstilUtions Colleges (of
etc. noted in degree level
column-4 and above)
2 3 4 5 6 7 8 9
Gobindgarh 40,175 H 50 AS Patiala Patiala Patiala
D(U-l,2) (42) (42) (42)
FPC
45 IV Goniana 10,415 HC 10 AS Faridkol Bathinda Bathlnda
D(A-l,l) (74) (11) (t t)
46 IV Goraya 10,708 D(2) 4 Sang Dhesian Ludhiana Ludhiana Phagwara
FPC (5) (25) (25) (8)
47 II Gurdaspur 54,733 H(3) 129 A Amrltsar Jalandhar BataJa
D(A-I,Hom-l) 32 ASC (71) (100) (33)
FPC
TB,NH
48 IV Guru Har Sahai 10,500 H 25 Firozpur Jalandhar Jalandhar Flrozpur
D(Hom-I,2) 16 (39) ( 155) (155) (39)
, 49 V Hariana 6,473 HC 4 A Jalandhar Jalandhar Hoshlarpur
D (49) (49) (15)
FPC
50 I Hoshlarpur 122,705 H(4) 241 AS(3) Jalandhar Jalandhar
D(A-2,Hom·I,2) 12 AC (40) (40)
HC
NH(3)
FP~
TB
51 III )agraon 47,372 H(2l 49 A Ludhlana Ludhlana Ludhlana
HC AS (38) (38) (38)
52 III )aitu ...... -----.. See JailU Urban Agglomeration .... ---------...
Jaitu U.A.* 28,850 H 25 A Faridkot Bathinda Bathinda
D(U) 10 (44) (32) (32)
FPC
0
Jaitu 28,758 H 25 A Faridkol Bathlnda Bathlnda
D(U) 10 (44) (32) (32)
FPC
0
150

-v
and Cultural F acUities, 19 B9
.: jltCOfnised HlgIter Secon-
Shorthand dary!ln(erme-
Typewriting & dlatelPUC
Vocational (Pre-UniversitY
Training CollegelJunior
Institutions College Level)
.10 " 3
0(4) 2
·0
"' O' 3
0(2) 4 ~ ,J
0 4
2
2
Educational F acilides' Working No. of Recreational and Secondaryl Junior Primary Adult Women's Cultural Facilities
Matriculation Secondary Schools Uteracy Hostels Stadia Cinema Audltoria and Middle Classes! with Drama!
Schools Centres, Number CommunitY Others of Halls
(SpecifY) SealS 12 13 11 IS 16 17 1B 19
4 3 8 1
2 3 2
6 5 2
9 6 2
1
1
7 20 2(148) 2 4 2
5 11 3
t -. _._- See Jalm Urban Agglomeration -_._._ •..•••• -
2 12
12
151
Public Libraries Including
Reading Rooms
20
PL(2)
PL
RR
PL
RR(2)
PL(3)
RR(2)
PL
RR PL
RR
PL(3)
RR(7)
PL
RR
PL(2)
RR(2)
PL(2)
RR(2}

STATEMENT
Medit3l, Educational, Recreational
51. Class and Name PopulJt;ol1 Medical Facilities' Educational FaCilities' No. .-ofTown Hospitals! Beds In Arts/Science! Medical Engineering Polytkllmcs
Dispensaries! . Medical Commerce Colleges Colleges TJI. Clinics, Institutions CSlleges (of
etc~ .. noted in degree level
column-4 and above)
2 . 4 5 6 7 8 '9
53 III );tlalabad .. __ .......•.. See )alalabad Urban Aggtbmeration .......... : .....
Jalalabad U.A.· 23,108 H 25 A Faridko( ludhiana Firozpur Cantt
O(Hom) 4 ASC (55) (50)
FPC
Jalalabad 18,476\ H 25 A Faridkol Firozpur Cann
DiHoml 4 ASC (55) (50)
FPC
54 I Jalandhar 509,510 H(IO) 1072 'AS( 12) r HC 68
0(~·13Hom-1 ,U·1 ,27) ..
FPC
T8
0
5S III Jalandhar Cante, 31,520 H(2) 86 AS )alandhar Jalandhar Jalandha..
0 14 (3) (3) (3)
fPC ~,
56 IV )andiala 19,293 0(2) 25 Amri!5ar AmrilSJr Jalandhar Amrltsar
(20) (20) (60) (20)
57 (( Kapurthala 645,567 H(2) 147 AS Jalandhar Jalandhar 2
0(A-I,5 Hom-I) 8 AC (18) (18)
FPC
TB 3
0
58 III Kartarpur 21,093 HC,~ 25 A Jalandhar Jalandhar Jalandhar
FPC ( 16) ( 16) (16)
59 II Khanna 71,990 H(2) 85 AS(2) Ludhlana ludhiana Ludhlana
D(A·j, Hom·1) (43) (43) (43)
FPC
60 III Kharar ... _ ............ See Kharar Urban Aggl~erJlion ..... __ ._ .....
Kharar U.A.· 26,109 H 30 A Chandigarh Chandigarh Chandigarh
D(A·I, Hom·l) (14) (14) (14)
Kharar 25,938 H 30 A Chandigarh Chandigarh Chandigarh
O(A-I,Hom·I) .. (14} • (14) (14)
152

-V
and Cultural Facilities, '1989
Educational Facilities * Working
Recognised Higher Seeon- Sec onc.tary / Junior Primary Adult Women's
Shorthand dary/lnterme- Matriculation Secondary Schools Literacy Hostels
Typewriting & diateipUC and Middle Classesl with
Vocational (Pre-University Schools Centres, Number
Training College!Junior Others of
Institutions College level) (Specify) Seats
10 II 12 13 14 15 16
--------------- See Jalalabad Urtan Aftiomeration ------------
0 2 2 10
.0, 2 2 10
0(3) 21 26 18 117
4 9
3 2 II 16
0(4) 6 4 15 20 1(60)
L
4 5
3 4 39 9
--------------- See Kharar Urtan Agglomeration ---------------
0(2) 7 5
0(2) 7 5
153
No. of Recreational and
Cultural Facilities Stadia Cinema Auditorla
Drama!
Community
Halls
17 18 19
3 15
2
2 2 2
3
Public
Libraries
including Reading
Rooms
20
PL
RR(2)
PL
RR(2)
PL(IO)
RR(IO)
PL
RR(2)
PL
RR
PL(4)
RR(4)
PL
RR
PL
RR
PL
RR
PL
RR

STATEMENT
Medical, Educational, R~reational
51. Class and Name PopulJtl()n Medical Facilities· Educational Eacilities * No. of Town Hospitalsl Beds in Arts/Science! Medical Engineering Polytechnics
Dispensarlesl Medical Commerce Colleges Colleges
T·.B. Clinics, Institutions Colleges (or
etc. noted in degree level
column·4 and above)
1 2 3 4 5 6 7 8 '9 ._
61 V Kot Fatta 5,611 D(A) Bathi:1da Faridkot Bathinda Bathinda
(26) (108) (261 (26) , 62 V Kot Ise Khan 7.,604 HC 12 Faridkot Faridkot Ludhlana Guru Teg 8aha-
D(Hom) 2 (26) (26) (~) dur Garh (45)
63 II Kot Kapura 62,430' H 50 AC Faridkot 8athinda Guru Teg Baha-
0(2) 4 (11) (52) durGam (21)
NH(3)
64 IV Kurall 17,592 H 25 Morinda Cl1andigam Chandlgarn Chandlgarlt
D 4 (8) (28) (28) (28)
65 IV lehrataga 15,555 D 25 A Patiala Paciala Sunam
fPC (90) (90) (26)
66 IV longowal ••••••••••• - See Longowal Urban Agglomeration •••••• _ ••.••••
Longowal U.A.· 16,254 H 30 Sangrur Patiala Patiala Sunam
HC (18) (74) (74) (40)
D(A)
Longowal 15,419 H 30 Sangrur Patiala Patiala I
Sunam
HC (18) (74) (74) (10)
D(A)
67 I Ludhlana 1,042,740 H(t4) 2020 AS(IO) 3
HC(3) 10 ASC(3)
D(A·6Hom·1 ,U·I ,29) 4
FPC
T8(2) 64
68 IV Machhiwara 13,554 HC 30 A Ludhiana Ludhiana ludhiana
D(Hom) (47) (47) (47)
FPC
69 IV Majitha ••.•• --.• - See Majitha Urban Agglomeration •.•••••••.••.•..
Majitha UA* 10,713 D 5 Amritsar Amritsar )alandhar Arnritsar
(18) ( 18) (98) (18)
Majitha 9,912 0 5 Amritsar Amritsar )alandhar Arnritsar
(18) (18) (98) (18)
70 II Malerkoda 88,600 H(2) 100 A LudhianJ Ludhiana Ahmedgarh
D(U·I,Hom·l) 4 ASC (43) (4.3) (15)
FPC
154

-V
and Cultural Facilities, 1989
Recognised Higher Secon-
Shorthand dary /In terme:
Typewriting & diate/PUC
Vocational (Pre-University
Training College/Junior
Institutions College Level) _.- 10 1J...
O{l)
0(1) 2
0(1)
2
1
0(9) 2S
2
Educational Facilities· Working No. of Rl'creatlonal and Secondary!
Matricu ladon
12
4
3
37
2
2
10
I
Junior Primary Adult Vfomen's Cultural Facilities
Secondary Schools Literacy Hostels Stadia Cinema and Middle Classes/ 'with
SChools ·tentres, Number
Others of
(Spedl'y) Seats
13 14 IS -16 17 18
4 ·1
5
10 :}
8
6
•. ----...... See Longowal Urban Agglomeration ...... " .. -.....
5
5 I ,
18 404 . 2 14
2
--.. -.... --- See Majitha Urban AgglOm,ation ...... - ........
3 8
3 8
2 18
155
,) ..
Auditoria
Dramal
CommunitY
Halls
19
5
l'
Public
Libraries
Including
Reading
Rooms
20
PL
RR(J)
PL
PL
RR
PL
RR
PL RR
PL(3)
RR(2)
'L
lR
PL{~)
~R

STATEMENT
Medical, Educational, Recreational
SI. Class and Name. ,
Population Me411cal Facilities * Educational F acHities * ,
No. of TOwn HospitalsI' Beds in Am/Science! Medical Englneerlnc Polytechnics Dispensari~~1 Medical Commerce Colleges Colle,es ,
T.B. Clinkis, Institutions Colleges (of
etc. noted In degree level
column-4 and above)
__,... 2 3 4 " 5 6 7 8 '9
71 II Malout 56,868 H 38 AS Farldkot Bathinda
D (80) (35)
72 \l M¥'Q 55,089 H{2} H2. A Patiala Bathinda Bathlnda
D(A-I Hom-I) ASC '(Iloj (55) (55)
FPC
73 III Maur 25,180 H 25 Talwandi Sabo Faridkot Bathinda Bathinda
D(A-Il 4 (18) (105) (43) (43)
74 I~ -------_.--.- See Moga Urban Agclomeration ---------------"
Hop.'UA' 110,958 H-2 ' 250 AS Ludhiana Ludhiana Flrozpur Cantt.
D(A·I,I) ASC(2) (66) (66) (25)
Hoc', 110,304 H-2 250 AS Ludhiana Ludhlana Firozpl,lr Cantt.
D(.~-I,I) ASC(2) (66) (66) (25)
75 IV M4nda 17,440 H 25 AS Chandlgarh Chandigarh Chandigarh
FP.C (25) (25) (25)
76 IV ...... etian 17,813 H 50 ASC. ]alandhar ]alandhar Pathankot
DCA-I,Hom-!) (72) (72) (38)
FPC
77 Il HlJllctsar 66,383 H:2) 50 A Faridkot Bathlnda 8athlnda i
D'iA-1) AS (63) (70) (70)
ASC
78 LV Mullanpur Dakha 10,138 r 25 AS Ludhiana Ludhlana Ludhiana
) (19) (19) (19)
71}, ) Ill, Nabha 54,421 : H,(3) 136 A Patiala Pad ala Padala
D(Hom-I,2) AS (26) .(26) (26)
FPC
I TB 18
80 1 III Nakodar /28,478 i H 56 ASC (4) ]alandhar )alandhar ]alandhar
D 4 (24) (24) (24)
FPC
81 III Nangal Township ------------ See Nangal Township Urban Agglomtration -.------------
Nangal Township 'JA· 32,OO:~ , 100 Naya Nangal Chandigarh Chandigarh Chandigarh
\ )(A- t ,Hom- I ) (2) (101 ) (lOt) (tal)
12
156

-v
and CulWral Facilities, 1989,
Recognised Higher Se<;on-
Shorthand daryl hH,enne-
Typewriting & diate/PUC
Vocational (P(e-University
Training College/Junior
Institutions College Level)
to II
3
0(2) 3
0(2) 8
0(2) ,8
0(1 )
0 2
0(2) 3
0(4} 3
o
0(1) 2
Educational Faciiilies· WorRing No. of Recreational 3I)'d
Secondaryl Junl!?r Primary ",-' Adult Women's Cuitural Facjlltles
Matriculation Secol)dary Schools Uter;;cy Hostels Stadia Clnem3 Audltorla
aJ'l,d Middle Clas~esl with Drama!
Schools Centres, Number Community
Others of Halls (Specify) Seat!.
12 13 14 15 16 17 18 19
2 9 1
3 5 to 2
2 4 6
•••••••• -.-••••• See ML)ga Urban Agglomeration -.----.---.--
2 2 12 2 ,4 2
2 2 11 2 4- 2
3 8
3 3 1
s 9 4
2
6 6 9 1(30)
2 4
--.• -•..• ,-.-•• See Nangal Township Urban Agglomeration ........... -••••
3 3
157
Publlc
libraries
Incl\ldlng
Reading
Rooms 20
P,L
RR,
PL
RR
PL
RR(2)
PL
RR
PL
RR
PL
PL
RR
PL
RR(4)
flL
RR
PL(3}
RR(2)
PL
RR
PL(2}
RR(2)

C;TATEMENT
Medical, Educational, Recreational
51. Oass and Name Population Medical Facilities· Educational Facilities·
No. of Town Hospitals! Beds in ArtslSciencel .Medical Engineering PoIytechnks Dispensaries! Medical· Commerce Colleges Colleges T.B. Clinics, Institutions Colleges (of
etc. noted In degree level
column-4 and above)
2 3 4 5 Q 7 8 9
Nangal Township 29,311 H 100 Naya Nangal Chandigarh Chandlgarh Chandigarh
D(A·I,Hom·l) (2) (101) (101), (101) I
T8 . 12
82 III Nawanshahr 29,955 , H-2 55 A Ludhiana Ludhlana Phagwara
D(Hom'I,2) ASC (52) (52) (38)
FPC
83 IV Naya Nanga' 12,046 H 80 AS Chandigarh Chandlgarh Chandlgarh
D(Ai· (104) (104) (104)
0
84 IV Nurmahal 11,149 H 25 A Jalandhar Jalandhar . Jalan<llar
D(Hom·l) (33) (33) (33)
0 /
85 I Pathankot j'--- See Pathankot Urban Agglomeration _ •• __ ........
Pathaqkot UA * 128,198 H(2) 108 A(3) Amritsar Jalandhar 1.
HC 'AS(2) (109) (96)
D(A-2,Hom·I,5) 8
FPC
Pathanko[ 123,930 H(2) 108 A(3) Amritsar Jalandhar
HC AS(2) (109) (96)
D(A-2,Hom-1,S) 8
FPC
86 , Pacla'a .... _-- See Patlala Urban Agglomeration -"--"
Padala UA- 253,706 H(A-1,6) 1353 2
D(A-3,Hom-l,7) 40 ASC(5)
FPC
T8 166
0
Patiala 238,368 H(A-1,6) 1353 2
D(A·3,Hom·I,7) 40 ASC(5)
FPC
T8 166
0
)58

·V
and Cultural Facilities, 1989
Recognised Higher Seeon·
Shorthand dary/lnterme·
Typewriting III diatelPUC
Vocational (Pre·University
Training College/Junior
Il!$dtudons College Level)
to II 0(1) ,2
0(3) 3
2
0(2) 5
0(2) 5
0(5) 13
0(5) 13
Educational Facilities· Working No. of Recreadooal and Secondaryl Junior Primary Adult Women's Cultural F acllities
Matriculation Secondary Schools Literacy Hostels Stadia Cinema Auditoria and l'iUddie Classes! with Drama!
Schools Centres, Number Community Others of Halls
,(SpecifY) Seats 12 13 14 15 16 17 1B 19
3 3
10 4 12 2
3 3
2 3
_ ••.••. _._- See Pathankot Urban Agglomeration ............... .
6 3 15 2 3
6 3 15 2 3
•• _ •••••.. _ •. See Patiala Urban Agglomeradon ........•. - •...
12 30 36 2(NA) 5 2.
12 30 36 2(NA) 5 2
159
Public
Libraries
including
Reading
Rooms 20
PL(2)
RR(2)
PL
RR
PL
kR
PL
RR
PL
RR
PL(2)
RR
PL(2)
RR

STATEMENT
Medical, E,ducadonal, Rel:reatlonal
51. CI~ and Name Population Medical Facilities· Educational facilities· "
No. of Towf'!, Hos~taIsI Beds in Arts/sclencel Medical EngIn,e~","' PolytechJ\kiS Dispensaries! Medical Commerce Colleges College; . , 1.B. Clinics, Institutions Colleges (of
etc. noted In degr.ee .level
coIumn-4 and above)
2 3 4 5 6 7 . '8 9 ",., .
87 IV Patran 14,328 D 4 AS Patiala Patiala Patiala
(57) (57) (57)
88 III Panl 27,776 H 50 AS Amritsar Jalandhar Amrltsar
(50) (130) (59)
89 V Payal 5,852 , HC 8 Doraha Ludhiana Ludhiana Ludhlana
D{A) (10) (42) (42) (42)
90 II Phagwara ------•••••••• See Phagwara Urban Agglomeration .---........
PhagWara UA' 88,316 H 50 A(3) Jalandhar Jalandhai-
D(A-I,Hom-I,S) 12 AS (23) (23)
FPC
Phagwara 88,163 H 50 A(3) Jalandhar Jalandhar
D(A·I,Hom·I,S) 12 AS (23) (23)
FPC
91 III Phlllaur 20,956 H(2) 50 ASC Ludhiana Ludhlana Ludhiana
D(A·I,I) (14) (14) ( .'1)
FPC
92 III Qadian .. _ ..... _ ..... See Qadlan Urban Agglomeration .............. -.
Qadlan UA· 20,012 H 25 AS Am ri tsar )alandhar Batala
FPC (53) (82) (15)
Qadian 18,867 H 25 AS Amritsar Jalandhar Bataia
FPC (53) (82) (15)
93 IV Rahon 10,771 D(Hom·l) 4 Nawanshahr Ludhiana Ludhiana "hagwara
(8) (50) (50) (42)
94 IV Raiasansi 10,008 HC 36 Amritsar Amritsar Amrltsar Amrits~
(IS) (IS) (15) (15)
95 III Raikot 21,061 D(A·I,l) 10 A Ludhiana Ludhiana Ludhlana
FPC (41) (4l) (41)
96 II Raipura 70,983 H SO AS(2) Patiala Patiala Pad ala
D(A·I,S) 4 (26) (26) (26)
FPC
97 IV Raman 17,275 H 10 Talwandi Sabo Faridkot Bathinda Bathinda
D(A,t,l) 12 ( 13) (t08) (45) (45)
FPC
160

V
and Cultural Facilities, 1989
Educational Facilities * Working No: of Recreational and
Recognised Higher Secon: Secondalyl Junior PrimaI)' Adult Women's Cultural Facilities
Shorthand dal)'/lnterme- MJtriculation Secondal)' Schools Literacy Hostels Stadia Cinema Audltorla Public Typewriting & diate/PUC and Middle Classesl with Drama! Libraries
Vocational (Pre-UniversitY Schools Centres, Number CommunitY Including , Training College/) unior Others of Halls Reading
institutions College Level) (S~lfy) Sea~ Rooms lO . II· 12 13 14 IS 16 17 18 19 20
2 6 4
0(2} 2 2 5 8 PL
RR
2 4 RR
---------------- See Phagwara Urban Agglomeration ------------
O(l} 4 14 3 15 2 PL(4)
RR(4)
0(3) 4,· 14 3 IS 2 PL(4)
RR(4)
0(5) 2 1 , 2 4 PL
RR
-------------- See Qadlan Urban Agglomeration ---------------
0 1 , 4 PL
RR
0 3 4 PL '~.f '
RR
2 2 6 PL
RR
2 2 PL
RR
3 4 PL
RR
0(2) 3 5 10 14 PL
RR
3 4 2 PL
RD
161
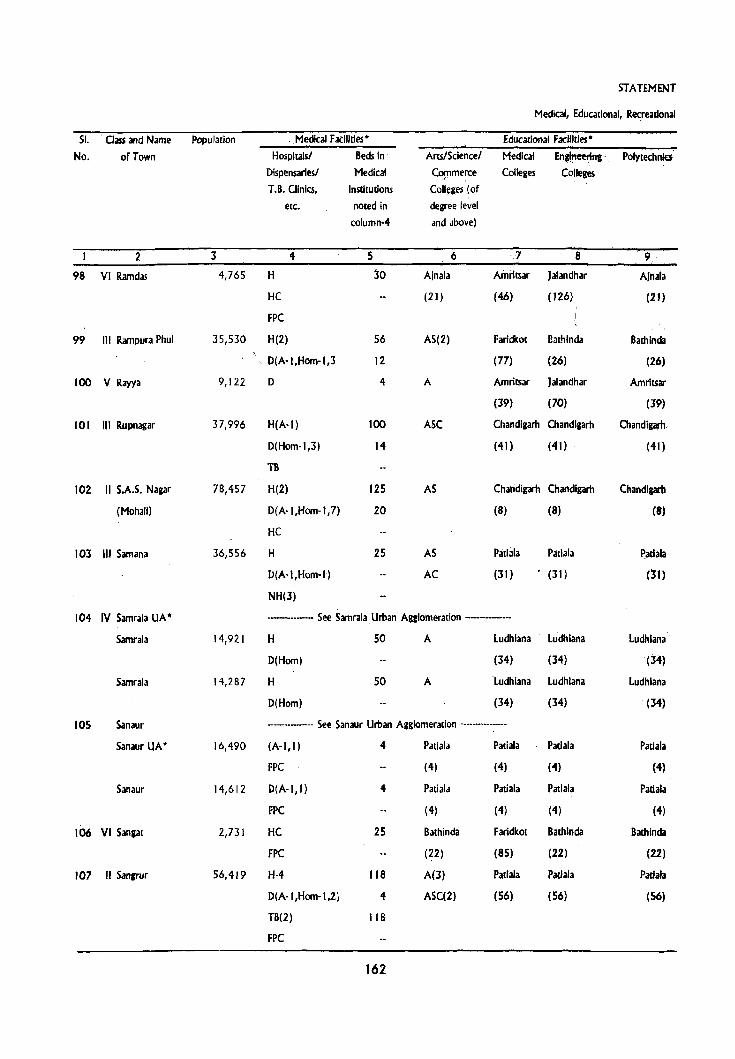
STATEMENT
Medical, Educational, Recreational
51. Class and Name Population ,Medical Facilities· Educational F acUities·
No. ofTown Hospltalsl Beds In Arts/Sclencel Medical En,iMering , PolytechnIG Dlspensaries/ Medical Coplmerce Colleges Colleges
T.B. Clinics, Institutions CoU!!ges (of
etc. noted in degree level
column-4 and above)
I 2 3 4 5 6 7 8 9
98 VI Ramdas 4,765 H 30 Ainala Amntsar Jalandhar Ajnala
HC (21) (46) (126) (21 )
FPC I
99 III Rampura Phul 35,530 H(2) 56 AS(l) Faridkot Bathinda Bathlnda
, D(A·I,Hom·I,3 12 (77) (26) (26)
100 V Rayya 9,122 D 4 A Amritsar Jalandhar Amrltsar
(39) (70) (39)
101 III Rupnagar 37,996 H(A·I) 100 ASC Chandlgarh Chandlgarh Chandlgartt.
D(Hom·I,3) 14 (41) (41) (4l)
TB
102 " S.A.S. Nagar 78,457 H(2) 125 AS Chandlgarh Chandlgarh Chandlgarh
(Mohall) D(A·I,Hom-I,7) 20 (8) (8) (8)
HC
103 III Samana 36,556 H 25 AS Patiala Padala jlatiala
IJ(A·I,Hom·l) AC (31) (31) (31)
NH(3)
104 IV Samrala UA * ._ •• -.. -••••• See Samrala Urban Agglomeration ..••• __ •• _.-
Samrala 14,921 H 50 A Ludhlana Ludhlana ludhlana
D(Hom) (34) (34) (34)
Samrala 14,287 H 50 A Ludhlana Ludhiana ludhlana
D(Hom) (34) (34) , (34)
105 Sanaur ---------- See Sanaur Urban Agglomeration -----------:----
Sanaur UA· 16,490 (A-I,I) 4 Patiala Patiala Padala Pad ala
FPC (4) (4) (4) (4)
Sanaur 14,612 D(A-I,I) 4 Patiala Patiala Pad ala Pad ala
FPC (4) (4) (4) (4)
106 VI Sangat 2,731 HC 25 Bathinda Faridkot Bathlnda Bathlnda
FPC (22) (85) (22) (22)
107 " Sangrur 56,419 H-4 118 A(3) Padala Padala Padala
D(A-I ,Hom-I ,21 4 ASC(2) (56) (56) (56)
TB(2) 118
FPC
162

-V
and Cultural Facilities, 1989
Educational Facilities· Working No_ of Recreational and
Recognised Higher Secon- Secondary! Junior Primaiy Adult Women's Cultural F acilldes Shorthand dary/lnterme- Matriculation Secondary Schools Literacy Hostels Stadia Cinema Auditoria Public
Typewriting & diate/PUC and Middle . Classesl with Dramal Libraries Vocational (Pre-UniversitY Schools Centres, Number CommunitY includln, Training College/)unior Others of . Halls Reading
Institutions College Level) (Specify) Seats Rooms 10 1+ 12 13 14 1,5 16 17 18 19 20
2. Z PI.
0 8 7 7 I 2 PL
RR(2)
0(2) 3 2 5 PL
RR
0(3) 3 7 10 2 2 PL
RR
0(3) 3 3 7 10 PL
RR
0(1) 3 3 7 19 PL
RR
------ See Samrala Urban Agglomeration -------------
0 2 3 3 PL
RR
-q t, ,2 3 3 PL
RR
------- See Sana~r Urban Agglomeration ---------------
2 2. 6 PL
RR
.... ' 2 6 PL
RR
3 PL
0(2) 2 10 1 28 3 2. 2 PL(J}
163

STATEMENT
Medical, Educational, R~~eatlonal ~l ' j,
SI. Class and Name Poptdalioll Medical Facilities· Educational Facilities·
No. of Town Hospitalsl Beds In ArulSdencel Medical Engineering Polytechnics
Dispensariesl Medical Commerce Colleges Colleges
T.B. Clinics, Institutions Colleges (of
etc., noted In degree level
column-4 and above)
, " ~, , ,3 4 5 6 7 8 9
108 Shahkot 10,246 HC 16 A' Ludhiana Ludhiana Ludhlaiia
(60) (60) (60)
109 VI Shamchaurasi 3,711 D 4 Hoshiarpur )alandhar Jalandhar Hoshiarpur
(17) (23) (23) (17)
110 III Slrhlnd 30,81,6 \, D(A·I,31 4, AS Patiala Patiala Patlala
FPC (39) (39) (39)
111 VI Sri Hargobindpur 3,461 H 25 Qadlan Amritsar )alandhar Batata
D 10 (16) (60) (99) (39) ,
112 IV Sujanpur .--•• ----.-. See Sujanpur Urban Agglomeration .---.---.-----
Suianpur UA· 16,090 D 12 A Amlitsar Jalandhar Pathankot
FPC (113) (102) (6)
Sujanpur 15,414 D 12 A Amrltsar )alandhar Pathankot
FPC (113) (102) (6)
113 IV Sultanpur 13,722 H SO A )alandhar )alandhar Jalandhar
O(A·I ,Hom, I ) ASC (42) (42) (42)
114 III Sunam •• -••••• -.-••• See Sunam Urban Agglomeration "--'---'--'"
Sunam UA* 43,909 H(2) 60 A Patlala Patiala
O(A-2,Hom·l) 10 AS (64) (64)
HC 4
FPC
Sunam 41,118 H(2) 60 A Patiala Patiala
D(A-2,Hom-1) 10 AS (64) (64)
HC 4
FPC
115 IV Talwandi Bhal 10,462 HC 12 Faridkot Faridkot Ludhlana Flrolpur
D(Hom) 2 (26) (26) (90) (32)
116 IV Talwara 17,379 H 124 Mukerian Jalandhar Jalandhar Hoshiarpur
D(A-Jl (27) (99) (99) (84)
117 IV Tapa .--.--.... _ •••• See Tapa Urban Agglomeration .-•••• -.----•••
Tapa UA* 14,161 HC 8 A Ludhiana Ludhlana Sul,\ali1
(97) (97) (32)
Tapa 14,147 HC 8 A Ludhiana Ludhiana Sunam
(97) (97) (32)
164

·N
,and CullUral facilities, 1989
, Retognised Highedecon-
Shorthand dary/lnterme·
Typewriting & diate/PUC
Vocational (Pre' UniversitY
Training College/Junior
InstilUtlons College Lellel)
10 II
""
2
0(1) 3
-'0 1- .
0(3)
0(3)
o 2
Educational f acitities * Working No. of Recreational and Secondary/
Matriculation
12
. 1
2
I.
5
4
4
3
3
Junior Primary Adult Women's Cultural Facilities
Secondary Schools Literacy Hostels Stadia Cinema and Middle Oassesl with
Schools Centres, Number
13
6
4
4
4
4
3
Others of (Specify) SealS
14 15 16 17 18
3
7
·2
•• --........ ---- See Suianpur Urban Agglomeration --.. -..... ---
4
4
4
_ ........ _-- See Sunam Urban Agglomeration .. ---....... _.
10
10
2
6
_ .... -.. - See Tapa Urban Agglomeration ._ ... _-..
6
6
165
Audltoria
Drama!
CommunitY
Halls
19
2
2
2
Public Libraries
Including
Reading
Rooms
20'
PL
RR.
PL
RR(2)
,
PL
RR
PL
RR
PL
RR
PL
RR(2)
PL
RR(2)
PL
RR
PL
RR
PL
PL

STATEMENT
Medical, Educational, Recreational '\
SI. ~s;e Population ' ' ' Medical Facilities· Educational Facilities·
No. ,.trOWlt i-Io$pltals! Beds in Arts/Science! Medical Enclneering PoIytecbnlcs Dispensaries! Medical Commerce Colleges Colleges
T.B. Clinics, Instiwtions Colleges (of
etc. noted in degree level
column·4 and above)
2 3 4 5 6 7 8 9
118 III Tarn Taran 47,529 H(4) 210 AS Amritsar Jalandhar Amritsar
D(Hom-I,I) . AC (26) (106) (26)
FPC
119 IV Urmar Tanda 18,786 H 30 ASC Jalandhar Jalandhar Hoshlarpur
HC (41 ) (41) (ll)
D(A-l)
120 III Zira --------------- See Zira Urban Agglomeration ------------
Zira UA* 23,722 H 50 A(3) Faridkot Ludhlana Flrozpur Cantt.
D(A) (40) (91) . (35)
FPC
Zira 23,587 H 50 A(3) Faridkot Ludhiana Flrozpur Cann.
D(AI (40) (91) (35)
FPC
1. Dash (-) Denotes Nil
2.
3.
4.
• ••
NA
Includes Outgrow!h(S)
Where the Medical or Educational Facility Is not available in the town the name of the nearest Place ancfits distance from the town where [he facility is available is indicated.
Data not available.
,,166

-V
and Cultural Facilities, 19B9
Recognised Higher Sec;on-
Shorthand dary/lnterme:
Typewriting & diate/PUC
Vocational (Pre-University
Training College/Junior
Institutions College Level)
10 11
3
0 2
Educational Facilities· Working No. of Recreational and Secondary/ Junior Primary Adult Women's Cultural Facilities
Matr-iculation Secondary Schools Literacy Hostels Stadia Cinema Auditorla and Middle dasses/ with Dramal
Schools CentreS, Number Community Others of Halls
(Specify) Seats 12 13 14 15 16 17 lB 19
4 5 10 6 1(80)
3 2 B
------------ See lira Urban Agglomeration "-------------
2 4
2 4
167
Public
Libraries Including
Reading'
Rooms
20
PL
RR
PL(2)
PL
RR
I'L
RR


5T A TEMENT .. VI
TRADE, COMMERCE, INDU~TRY AND BANKING, . 1989'
169
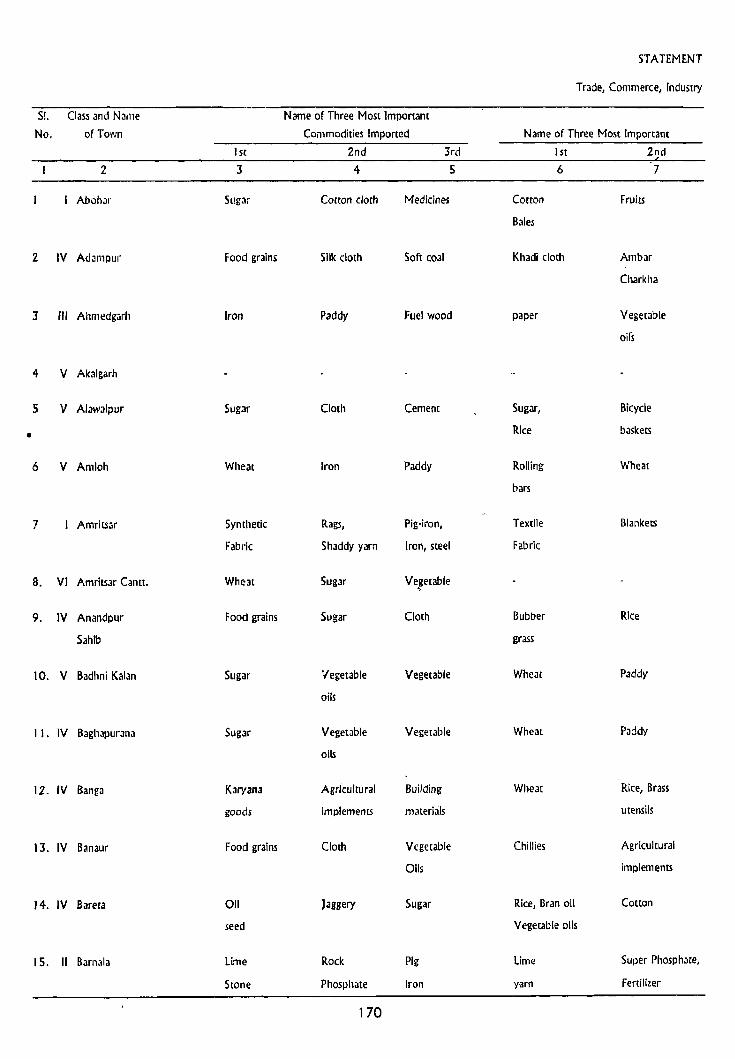
STATEMENT
Trade, Commerce, Industry
S!. Class and Name Name of Three Most Important
No. of Town Commodities Imported Name of Three Most Imporratlt
1st 2nd 3rd 1st 2nd
2 3 4 5 6 7
Abohal' Sugar Conan Cloth Medicines Cotton Fruits
Bales
2 IV Adampur Food grains Silk cloth Soft coal Khadi cloth Ambar
Charkha
J III Ahmedgarh Iron Paddy Fuel wood paper Vegetable
oirs
4 V Akalgarh
5 V Alawalpur Sugar Cloth Cement Sugar, Bicycle
• Rice baskets
6 V Amloh Wheat Iron Paddy Rolling Wheat
bars
7 I Amritsar Synthetic Rags, Pig·iron, Textile Blankets
Fabric Shaddy yarn Iron, steel Fabric
B. VI Amritsar Cann. Wheat Sugar Vegetable ,
9. IV Anandpur Food grains Sugar Cloth Bubber Rice
Sahib grass
10. V Badhni Kalan Sugar Vegetable Vegetable Wheat Paddy
oils
11. IV Baghapurana Sugar Vegetable Vegetable Wheat Paddy
oils
12. IV Banga Karyana AgriCultural Building Wheat Rice, Brass
goods implements materials utensils
13. IV Banaur Food grains Cloth Vegetable Chillies Agricultural
Oils implements
14. IV Baret;! Oil Jaggery Sugar Rice, Bran oil Cotton
seed Vegetable oils
15. II Barnala Lime Rock Pig Lime Super Phosphate,
Stone Phosphate iron yarn Fertilizer
170

-Vi
an.d BankiAg, 1989
Commodities Exported
lrd 1st
8 9-
~ynthetic leather ,
thread
Wooden
furniture
Agricultural .
implements
Khadi
cloth
Paddy
Cutting, Printing
& Stitching machines
Shoes
Cotton
Cotton
goods
Khad.i cloth
Agricultural
implements
Khadi
cloth
Rolling
bars
Textile
Fabric
Niwar
Nylon
Wooden,
Name of Three Most Important
Commodities Manufactured'
2nd
10
Cotton
thre,ad
Honey
Paper:-
Bicycle,
Baskets
Agrkulr,ural
implements
Blan~et,!i
wooden
furnitures
Shoes
(Articals) Furniture
Potatoes, Khadi Pulk,_,
Diesel engines cloth utensils
leather Agricultural leather
shoes implements shoes
Rice leather Mustard
shoes eil
G.!. Sanitary Basket, Fertilizers
Fitting Bllckets
171
lid ....
11
Juice
. Durries
Y~getable
oil$
leather
shoes
Leather
shoes
CUlling, printing
Number of
Banks
'P" ,.:
17
8
6
3
130
& Stitching machines
Leather 4
shoes
2
4
Brass- 15
utensils
Wooden 3
furniture
Cotton 3
cloth
G.I. Sanitary 8
Fittings
Number of "NlJmberof
Agricultural Non-Agricultural .. Societies Societies
fl 14
54
, 2
3
4 IS
18
S,
3

STATEMENT
Trade, Commerce, Industry
SI. Class and Name Name of Three MoS[ Important
No. ofTown Commodities Imported Name of Three Most Important 1st 2nd __ 3rd 1 st 2nd
2 3 4 5 6 7
16. IV Bassi Food grains Cloth Tractor Cloth,woollen Spare parts for
Parts Blankets Sewing Machine
17. Batala ----------------- See Batala Urban Agglomeration ---------------------
Batala U.A. * -------------------- See Constituent Unit ----------------------
Batala Pig iron Coal, M.S Machine Agricultural
Coke Rounds Tools implements
18. I Bathlnda Cloth Coal Rice Fertilizer Vegetable
Husk. oils
19. VI Behrampur Karyana Cloths Agricultural Paddy, Wheat
goods Implements Rice
20. IV Bhadaur Textiles Sugar Vanaspatti Food Cotton
Ghee, cloth grains
21. IV Bhawanigarh -_ ....... _-----... ----- See Bllawanigarh Urban Agglomeration --•. _-_.--.. ---•• ,-
Bhawanigarh U.A. ...... _ .... --... _---"'----- See Constituent Unit .. -........ ----......
Bhawanlgarh Cloth Vanaspatl Sugar Electric Conduit
Ghee casing & pipes
Capping Of wood
22. IV Bhikhiwind Karyana Sugar Vanaspati Rice Wheat
goods Ghee
23. VI Bhogpur Sugar Vegetable Cement, Sugar Potato,
Cane oils Fertilizer Rice &
wheat
24. IV Bhucho Mandl Salt Cloth" Sugar, Cotton oil
Vanaspati Ghee seed cake
25. IV Budhlada Mustard Leather Rice Cotton Wheat
26. IV DaslIJ Sligar Cloth Steel Rice, Sugar cane
Wheat
172

'Vi
and Banking, 1989
CommodItIes E~I)Orted
3rd lSI
8 9
.. Wooden wheels Wooden wheels
for carts for carts
Sports Machine
goods Tools
G.I. Fertilizers
pipes
Agricu I tu r al
implements
Earthen Wooden
Pottery furnIture
Boring Electric
Equipments, Goods
leather product
Brass
Vessels
Agricultural Toka
implements machine &
Pumping sets
Agricultural Mustard
implements oil
Rice Mustard
oil
Agricultural Agricultural
implements implements
Name of Three Most Important
Commodities Manufactured
Woollen
blankets
2nd
10
3rd
11
Spare parts for
Sewing Machines
Number of Number of
Banks Avicultural
Societies
12 13
4
.............. - ....... See Batala Urban Agglomeration ................... _ ..
................. - .... See Constituent Unit ....... __ .......... -
Avicultural
implements
G.!. pipes
Woollen
blankets
Earthen
pottery
~.-...... - ...... - .... ----
--- ........ - ...... _----
Conduit
pipes &
Iron screw
. Grinder
Agricultural
implemen~ .
Buckets
Buckets
Shoes
Sports goods 19
Seeds 36
Shoes 2
Country 2
carts
See Bhawanlprh Urban Agglomeration ••.•..•• --.•. - .••
See Constituent Unit ... - ..................
173
Boring
Equipments
suitcase & shoes
Sugar
Motor spare
parts &
Electric goods
Agricultural
implements
Shoes
soda silicate
Tobacco
4
3
3
4
3
6
2
2
Number 'of
Non·Agrlcultural
Societies
14
-47.
252
6
10
3
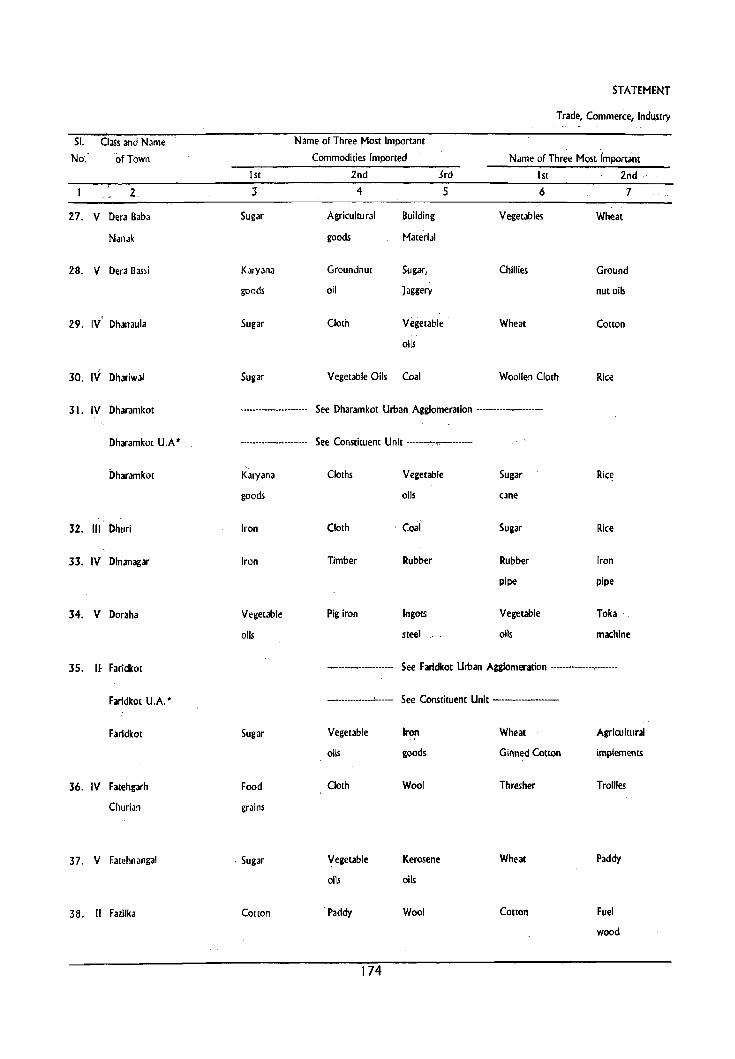
SI. Class and Name
No. of Tawil
Z
27. V Dera Baba
NJnak
28. V Dera Bassi
29. IV Dhallaula
30. IV Dhariwal
31. IV Dharamkot
Dharamko( U.A·
Dharamkot
32. III Dhuri
33. IV Dlnanagar
34. V Doraha
35. I~ Faridkot
Faridkot U.A.·
Faridkot
36. IV Fatehgarh
Churian
37. V Fatehnangal
38. I( Fazllka
STATEMENT
Trade, Commerce, Industry
Name of Three Most Important
1 st
3
Sugar
KaryJl1a
goods
Sugar
Sugar
~--".--"-."-" .. -"----
--------------.. -~------
Karyana
goods
Iron
Iron
Vegetable
oils
Sugar
Food
grains
. Sugar
Cotton
Commodities Imported Name of Three Most important 2nd 3rd 1st 2nd 4 5 6 7
Agricultural Building Vegetables Wheat
goods Material
Groundnut Sugar, Chillies Ground
oil ]aggery nut oils
Cloth Vegetable Wheat Cbtton
oils
Vegetable Oils Coal Wooil~n Cloth Rice
See Dharamkot Urban Agglomeration ............ - .......
See Constituent Unit ....... ,..,_." ...........
Cloths Vegetable Sugar Rice
oils cane
Cloth Coal Sugar Rice
Timber Rubber Rubber Iron
pipe pipe
Pig iron Ingots Vegetable Toka
steel oils machine
------.. -.. -----"' .. _---- See Faridkot Urban Agglomeration .. · .. ····_· .. c· ......
----------_ .. ---_!------
Vegetable
oils
Cloth
Vegetable
oils
Paddy
174
See Constituent Unit _ ....................
Iron
goods
Wool
Kerosene
oils
Wool
Wheat
Ginned Cotton
Thresher
Wheat
Cotton
Agricultural
implements
Trollies
Paddy
Fuel
wood

and Banking, 1'989
Commodi(ies Exported , ,3rd 1st
8 9
Paddy Agricultural
implements
Khandsari Motor
spare parts
Maize Rice
Washing Soap Woollen Cloth
Wheat Threshers
Cotton Sugar
Wooden Woollen
furniture cioth
Soap vegetable
and steel oils
Shoes Agricultural
Implements
Wooden Trollies
material,
Lathe machine
Sugar cane
Rice Cotton
cloth
Name of Three Most Important
Commodities Manufactured
2nd 3rd 10 II
Wooden Shoes
combs
Carpets Shoes
Country Wooden
carts furniture
Wooden Furniture Washing Soap
Number of Number of
Banks Agricultu ral
Societies
12 13
2
3
3
2
..•.•••......•..••.• _. See Dnaramkot Urban Agglomeration ................. _ .... .
•••••••.•••.••.••••.... See Constituent Unit .........•.•••.•....•..
vinegar
Trollies
Wooden
furniture
Toka
machine
~.-.. -------.. -.... -------
. ---------~~-----------
oil engines
Thresher
Agricultural
Implements
Wooden 4
,furniture
Iron Rods & Bars 11
Washing 5
soap
Soap 6
& steel
See Faridkot Urban Agglomeration ... - ..................
See Constituent Unit .......•........•..••..
Shoes 19
Lathe 3
machines
Shoes II
175
Number of
Non·Agricultural
Societies
14
6
6
3
15
12
33

SI. Class and Name No. of Towl1
1st
2 3
39. II Firozpur Sugar
40. II Firozpur Canu. Sugar
41. V Garhdiwala Sugar
42. IV Garhshankar Cloth,
Cement
43. III Giddarbaha Snuff
m3,terial
44. III Goblndgarh
Gobindgarh U.A.·
Goblndgarh Iron
Steel
45. IV Goniana Raw
cotton
46. IV Goraya Pig-iron
47. II Gurdaspur Sugar
48. IV Guru Har Food
Sahal grains
49. V Hariana Couon &
Silk cloth
50. I Hosiliarpur COlten for
spinning
Name of Three Most Important
Commodities Imported
2nd 3rd
4 5
Vegetable Veg~tables,
oils Mustard oil
Vegetable Textile
oils goods
Cement Ve~etable.
oils
Glass, Ve~etable
Groceries & ti'uits
and Crockery
Cotton Iron
goo~
STATEMENT
Trade, Commerce, Industry
Name of Three M\lst Important
1st 2nd
6 7
Wheat
Wheat
Threshers
Mangoes
Sugar cane
Snuff
Rice
Gobar
gas plants
Shoes,
)aggery
Potato
Co((on &
Cotton Seeds
••••. - •.•.• ----..•.. -- See Gobindgarh Urban Agglomeration -,-----..... -........ .
...... -----........... See Constituent Unit ......•• --."....--•••
Coal Waste Irol'l'& Food
oils Iron products grains
Wheat Oil Raw Wooden
seeds cotton Furniture
Steel Brunt Toka Ball
balls Bricks machine parts Bearing
Cement Ghee Wheat,' Paddy
wheat flour
Sugar Ghee Wheat Rice
Vegetable Sugar Jams Pickles,
oils Sarees
Iron steel MJcilinery Ivory Pressure
sheets for pans goods cookers new Utensils
176

-Vi
and Banking, 1989
Name of Three Most Important Number of Number of Number of Commodities Exported Commodities Manufactured Banks Agricultural Non-Agricultural
3rd 1st 2nd 3rd Societies Societies
8 9 10 11 12 13 14
Cotton Wheat Thresher Cotton 16 3
Hour Machine bales
Agricultural Wheat, Gobar Agricultural 6 5
implements Threshers Machines gas plants implements
Jams Jams leather Wooden 2 2 2
& Pickles & Pickles shoes fumiture
leather oil engines leather Wooden 6 8
shoes and Shoes furniture I
leather porducts
Soap Snuff Cotton & Soap 6 5
Cotton Seeds
----_------------------ See Gobindgarh Urb41n Aggloll)eration -------------------.---
-------.-------_ .. -.. _--- See Constituent Unit ----------.----.---
Agricultural lron·& Steel, Shoes, II
Implements steel porducts Grinders and Angle iron
Agricultural implements
Oil seeds, Agricultural Wooden Shoes 5 8
vegetable oils implements furniture
Electrical Thresher, Motor Electric 9
goods Toka parts parts goods
Conduit Sewing Conduit Rice 12
pipe machine pipe sheller
Shoes, Agricultural le41ther Wooden 3
Seeds implements Shoes furniture
Vegetable Jams Pickles Sarees 2 8
Thresher, Threads Pressure Resin & 22 2 4
cookers Pine oils
177
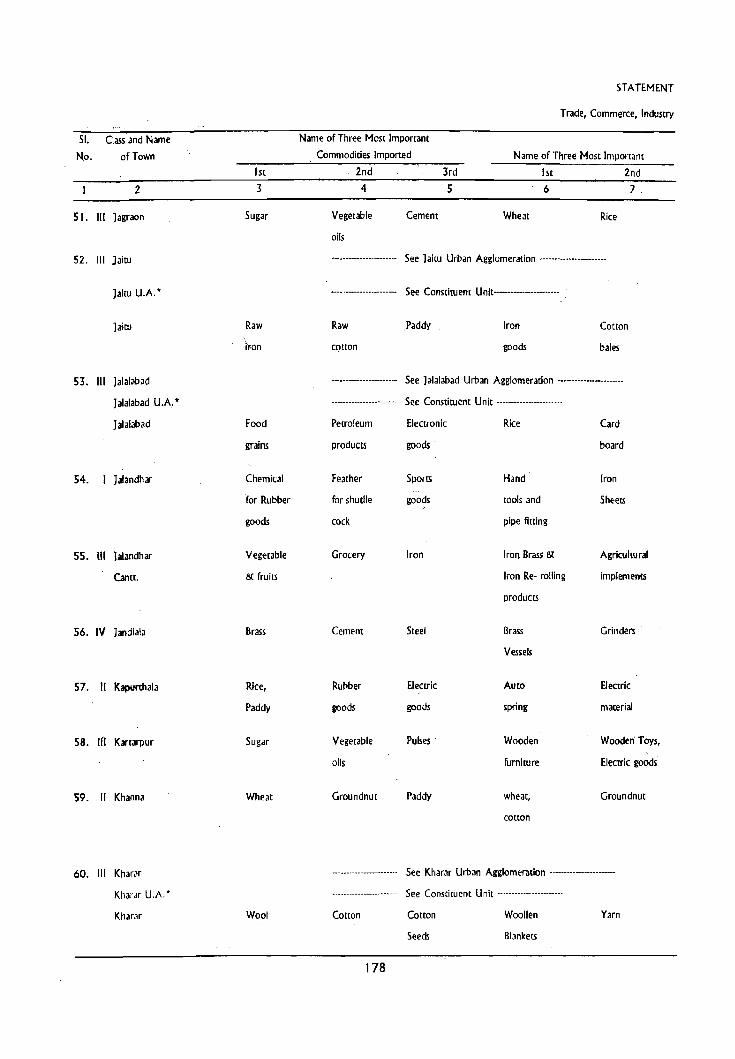
51. Class and Name
N.o. or Town
2
51. III Jagraon
52. III Jaitu
]aitu U.A.·
]aitu
53. III Jalalabad
J alalabad U .A. •
]alalabad
54. I Jalandhar
55. III ]a1.andhar
Cantt.
56. IV Jandiala
57. II Kapurthala
58. tn Kartarpur
59. " Khanna
60. III Kharar
Kilarar U.A.·
Kharar
1st
3
Sugar
Raw , i~on
Food
grains
Chemical
for Rubber
goods
Vegetable
& Fruits
Brass
Rice,
Paddy
Sugar
Wheat
Wool
Name of Three Most Important
. Commodities Imported
2nd
4
Vegetable Cement
oils
3rd
5
STATEMENT
Trade, Commerce, Industry
Name of Three Most Important
1 st 2nd
6 7
Wheat Rice
._.................... See )aitu Urban Agglomeratiori ....................•..
•...................... See Constituent Unit·······_·············· .
Raw Paddy Iron CO[ton
cotron goods bales
See Jalalabad Urban Agglomeration ..•...•................
Petroleum
products
Feather
for shutlle
cock
Grocery
Cement
Rubber
goods
Vegetable
oils
Groundnut
See Constituent Unit ...................... .
Electronic
goods .
Sports
goods
Iron
Steel
Electric
goods
Pulses
Paddy
Rice
Hand'
tools and
pipe fitting
Iron Brass &
Iron Re· rolling
products
Brass .
Vessels
Auto
spring
Wooden
furniture
wheat,
cotton
Card
board
Iron
Sheets
Agricultural
implements
Grinders .
Electric
material
Wooden Toys,
Electric goods'
Groundnut
_.-...... _-_ ... __ .--_.. See KharJr Urban Agglomeration ._ ...... __ ......... -..
..... -......... _....... See Constituent Unit ...................... .
Cotton Cotton Woollen Yarn
Seeds Blankets
178
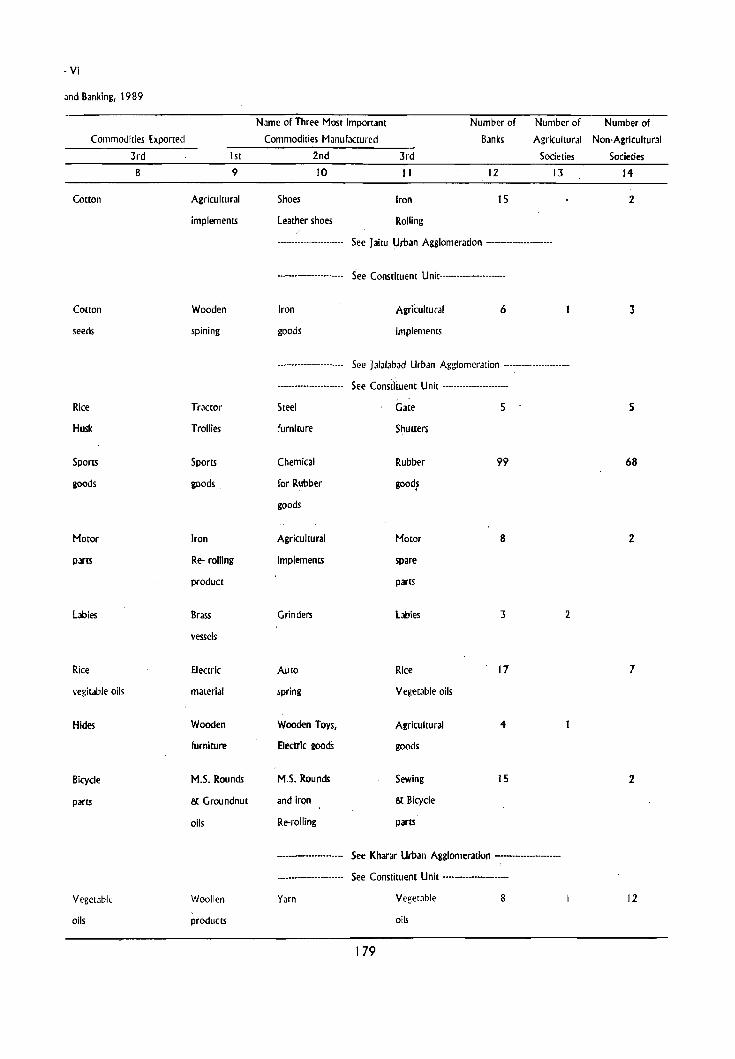
-Vi
and Banking, 1989
Commodities Exported
3rd 1st
B 9
Cotton Agricultural
Cotton
seeds
Rice
Husk
Sports
goods
Motor
parts
Lables
Rice
vegitable oils
Hides
Bicycle
parts
Vegetable
oils
implements
Wooden
spining
Tractor
Trollies
Sports
goods
Iron
Re- romng
product
Brass
vessels
Electric
material
Wooden
furniture
M.S_ Rounds
& Groundnut
oils
Woollen
products
Number of Number of Name of Three Most Important
Commodities Mallufactured
Number of
Banks Agricultural Non-Agricultural
2nd 3rd Societies
10 11 12 13
Shoes Iron 15
Leather shoes
Iron
goods
Steel
furniture
Chemical
for Rubber
goods
Agricultural
implements
Grinders
Auto
spring
Wooden Toys,
Electric goods
M.S_ Rounds
and iron
Re-rolling
Yarn
Rolling
See J aitu Urban Agglomeration ----------.----------
See Constituent Unit-----------------------
Agricultural 6
implements
See ]alalJbad Urban Agglomeration ----------------------
See Constituent Unit -----------------------
Gate 5
Shut[ers
Rubber 99
good~
Motor 8
spare
parts
tables 3
Rice 17
Vegetable oils
Agricultural 4
goods
Sewing 15
& Bicycle
parts
See Kharar Urban Agglomeration ---------------------
See Constituent Unit ---------------------
179
Vegetable
oils
8
2
Societies
14
2
3
5
68
2
7
2
12

SI. ClasS ana Name
Nee ... 6fTOi.vn
.Y I 2
61. V Kot Fatta
62. V Kot Ise Khan
63. II Kot Kapura
64. IV Kurali
65. IV Lehragaga
66. IV longowal
Lol1iowal U.A.· <:
Longowal
67. I Luqhiana
68. IV Machhiwara
69. IV Majitha
~ajitha' U.A. •
Majitha
70. II Malerkotla
ht
3
Sugar
Karyana
goods
Petroleum
product
Pig·iron
Cloth
Diesel
Wool
Food-
grains
Rice
Coal
STATEMENT
Trade, Commerce, Industry
Name of Three Most Important
Commodities Imported Name of Three Most Important
2nd 3rd 151 2nd 4 5 6 7
Rice Jaggery Cotton Wheat
Cloth Timber Rice Wheat
Fuel wood
Cotton Food- Tractor Electric
grains parts Transfor-
mers
Cotton Iron Sewing Vegetable
Seeds Sheets machine parts oils
Sugar Ghee Wheat Cotton
See longowal Urban Agglomeration ... -------.-.--•. -----
SUlar
Stainless
steel
Vegetable
oi)!
See Constituent Unit -.. ---.. -------•. ------
Cloth
Edible
oils
Sugar
Wheat
Hosiery
goods
Wheat
Rice
Bicycles
Rice
.---••• -.--••• -.-•• ,--- See Majillla Urban Agglomeration ----.• -.• --.---.-----
--......... -.--... --. See Constituent Unit --.-.•.• ---.---.. -.. -
Wheat
Iron
180
Leather
Shoes
Spare
parts for
sewing machine
Bed-
sheets
vegetable
CarpelS
Ghee

-VI
and Bantll1f; 1989
Commodities Exported
lrd
8
Soda
Ban
Water
bjotdes,
Agricultural implements
Locks
Wooden
Furniture
Cotron
~Ing
~Ine&~to
spare partS
Maize
Wooden
furniture
Bicycle
Pans
1st
9
Agricultural
Implements
Wooden
Furniture
Tractor
parts
Sewing
machine
Agricultural
implements
Agricultural
impl~~nu
Bicycles
Groundnlit
oils
Cotton
sheets
DIq'CIt!
pans
Name of Three Most Important Number of Number of Number of
Commodities Manufactured Banks Agricultural Non-Agricultural
2nd 3rd Societies Societies
10 II 12 13 14
Shoes Furniture 2 8
AgrlwlturaJ 2 8
implements
Electric \Vater 13 3
T ransfonners ' bottles
Locks, Soap 6 24
Pumpilll5ets
Fruniture Leather .. shoes
...... __ .. _ .... _---......... _- See Loncowal Urban Agglomeration -----------------
----_ .. _ ....... _- See Co~dtuent Unit ---------------------
Wooden Khadl 3
furniture Oath
sewing Hosiery 124 3 25
Machines goods, Auto
spare partS
vegetable Furniture, .. oils iron goods , '
-- See Mailtha Urban Agglomeration ,------------------
------- See Constituent Unit ---------
Carpets Wooden 2
furniture, shoes
;JeWln, ChIli 10
machine, R.olls
Sports goods
181
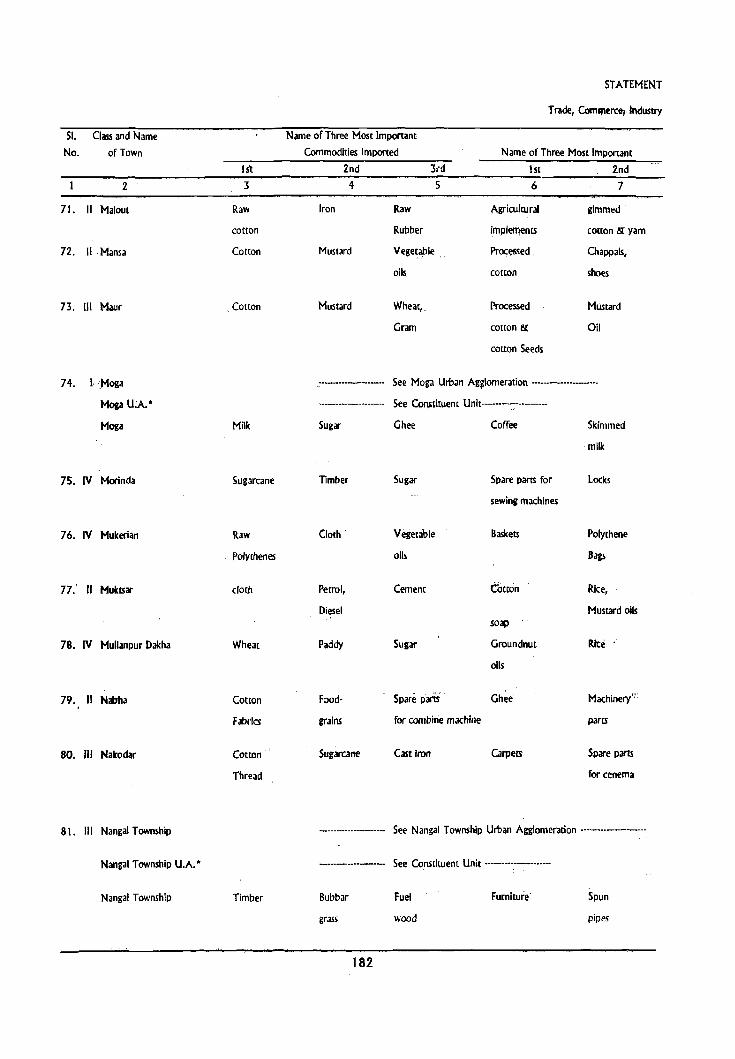
STATEMENT
Trade, Comll'lerce,: lJ1dusuy
51. Class and Name Name of Three Most Important
No. of Town Commodities Imported Name of Three Most Important
1st 2nd 3 .. d 1st 2nd
2 3 4 5 6 7
71. II Maiou( Raw Iron Raw Agricultural glmmed'
cotton Rubber imp1el11ents cotton & yarn
72. II ·Mansa Cotton Mustard Veget,able . Processed Chappals,
oils. cotton shoes
73. m MalIr , Cotton Mustard Wheat,. Processed Mustard
Gram cotton & Oil
cotton Seeds
74. I, ,Moga .. .... _ ..... ---_ ... -_ .. -_ .... See Moga Urban Ag~lomeration _ .... --...•.....•...
Moga U:A.* .... _--_ .... _---------. See Co~,ituent Unit-··-·---;~-------
Moga Milk Sugar Ghee Coffee Skimmed
milk
75. IV Morinda Sugarcane Timber Sugar Spare parts for Locks
sewing machines
76. IV Mukerian Raw Cloth Vegetable Baskets Polythene
Pofychenes oils Bags
77. " Muktsar cloth Petrol, Cement Ctltton Rice,
Diesel Mustard oils soap
78. IV Mullanpur Dakha Wheat Paddy Sugar Groundnut Rite
oils
79. 11 Nabha Cotton Food- Spare parts' . Ghee Machinery 'I:
Fabrics grains for combine machine parts
80. III Nakodar Cotton Sugarcane Cast Iron Carpets Spare Parts
Thread for cenema
81. III Nangal Township See Nangal Township Urban Agglomeration ---------------------
Nangal Township U.A. * See Constituent Unit -----•• ----•.•.. ---.-
Nangal Township Timber 8ubbar Fuel Furniture Spun
grass wood pipes
182

-Vi
and Banking, 1989
Name of Three Most Important Number of Number of Number of
Commodities Exported Commodities Manufactured Banks Agricultural Non-Agricultural
3rd 1st 2nd 3rd Societies Societies
8 9 10 II 12 13 14
Wheat Agricultural P.V.C. Tyre 7 10
implements pipes
Agrlcultu ral Tubewell Chappals, Grinding II 2 4
apparatlls apparatus shoes machine
'lheat, Rubber Electrical Hand 4 2
jram shoes appliance Pump
.. _ .......... -.. -_ ...... __ ... _-- See Moga Urban Agglomeration .•••...................
---_ .. -------- See Constituent Unit····_·······_-······
Tomato Skimmed Thrashers Maggi 23 14
katchup milk products
Agricultural Sugar Spare parts for Agricultural 3 5
Implements sewing machines Implements
RIce, Agrlcultur31 Baskets Wooden 12
wheat implements Furniture
Wheat Agricultural Shoes, Candles 12 18
implements, S03P carpets
Colton Machine Groundnut Washing 6 2
tools oils soap
Stitching Ghee, Agricultural Khadl 14
machine Horllcs Implements cloth
confectionery, Carpet Spare parts Confectionery 17 10
Tablet manufacturing for (enema Items
machine
------------- See Nangal Township Urban Agglomeration ••••••........ --.~-
-_ .. _ .. --_ ...... _ .... -.. _- See Constituent Unit ._ •.•......•...•••••.
Conduit Wooden Spun Conduit 8 5
pipes furniture pipes pipes
183

SI. 'Cl3SS and Name
No. o(Town
2
82. III Nawanshahr
83. IV Naya Nagai
84. IV Nurmahal
85. Pathankot
Pathankot U.A.·
Pathankot
86. Patlala
Patlala U.A. *
Padala
87. IV Pauan
88. III Patti
89. V Payal
90. II Phagwara
Phagwara U.A * .
Phagwara
1st
3
Leather
Name of Three Most Important
Commodities Imported
2nd
4
Sugarcane Cloth
STATEMENT
Trade,' Commerce, IndustrY
Name of Three Most Important
3rd 1 St 2nd
5 6 7
Shoes Sugar
Raw materials Jute Soft ' Fertilizer Heavy
for fertilizers
Wheat
Fruit
Wheat
Food grains
Wheat
Wool
Plr-lron
Bags
Rice
.-. ............. --...... --~ ....
............ __ .. _---_ .......... -
Timber
_ .. _---.. ---..... _ ...... __ ....
........ -.. -----_ .............. _
Electric goods,
staple yarn
Paddy
Paddy
Vegetable
oils
Steel
184
stone water
Sugar Durries .,Jut bolt,
Spare parts
for motors
See Pathankot Urban Agglomeration -----------------------
See Constituent Unit ---------------------
Petroleum Timber . Stone , 'II
products
See Patiala Urban Agglomeration -------------------
See Constituent Unit ...... ,·-··-·--------
Iron Enamelled Piston rings,
& steel Copper wire Biscuits
Mustard Rice Wheat
Cotton Wheat Eggs
Vegetable Woollen Maize
shawls
See Phagwara Urban Agglomeration ----------------------
See Constituent Unit ------------------
Sugarcane Oil engine Sugar
parts

Vi
and Banking, 1989
Name of Three Most Important Number of Number of Number of Commodities Exported Commodities Manufactured Banks Agricultural Non-Agricultural
3rd 1st 2nd 3rd Societies Societies 8 9 10 11 12 13 14
Toka Sugar Toka Ice 13 4 machines machines
P.V.c. Fertiliz~r 'Heavy P.V.C. S pipes water pipes
Earthen Carpet and Nut and Earthen 7
pottery Desi sugar bolt pottery
----- See Pacmnkot Urban Agglomeration ----.-------
-_ .. --................ __ .. _ ...... See Consdtuent Unit ... -........ _ ........
Building Wooden'and Pickles, Washing soap, 23 6
matenals steel furniture Jams mill stones
........ _-_ .. _ .......... -.. _ See PaclaJa Urban Agglomeration .......................
-------~---.. -.. - See Constituent Unit ._-..................
Machine Piscon Enamelled Biscuits 59 16
tools rings copper wire machine tools
Red Rice Desi Bakery 3
chillies Shellers soap products
Rice, Cotron Iron, Soap 6 5
cotton cloth kassi
Paddy Soap Mustard SUlar 4 2
oils products
-----------_ .. _--_ .... See Phagwara Urban Agglomeration ...... __ ........
---_ ... _ .. --.... See Constituent Unit .~ ......... _ .......
Cloth, Oil engine Sugar CottOR, 21 2
chemical parts Agricultural
implements
185

STATEMENT
Trade, CommerCe, Industry
SI,., ~~,dName. Name of Three Most ImP<;lrtant
No, afTown Commodities Imported Name of Three Most Important
1st 2nd 3rd 1st 2nd
I 2 ·3 .. 5 .6 7
91.- III Phillaur Sugar Cement Pig-iron Agricultural Machine
implements parts
92. III Qadlan .... -.... _---.......................... See Qadian Urban Agglomeration --------------------
Qadian U.A*. --~---.... ---.. --------.. See Constituent Unit ----------.-----------
Qadi,," Wheat Paddy Oil Seeds . Earthen Vegetable
Pottery' oils
93. IV Rahon insecticides Vegetable Toilet soap, Milk Poultary
medicine oils, Sugar soap, !)etergents Products
94. III IbIkot Food- Cloth Sugar Wheat Cotton
grains
95. IV bjasansl Karyana . Sugar Vegetable, Carpers
goods oils
96. II ibjpura Food grain, Iron, Bicycle Bicycle Biscuits
Potatoes Aluminium parts tools Bakery produCt
97. IV Ibman Cotton Karyana Cloth Cotton Vegetable' ;
goods bales oils
98. VI Randas Food Vegetable Tea Whea~ .. M~ile
. grains oils
99. 111 Rampura Phui Cloth Sugar Vept~ Cotton Washi"y;
Oils Soap
tOO.V Rayya Sugar Cement Ste,!1 Whe'l( Rice
10 l. III Rupnagar Gonfee- Gooking EleCtric Potatoes locks
-tionary Gas Apparatus
102. II S.A.S. Nagar Cement Steel Brunt Electric Tractors
(Mohall) Bricks 'goods
103. III Sam ana Incense Pulses Sugar Oil Seeds, Wheat,
stlcks spices chillies Rice
186

·Vi
and Banking, 1989
Commodities Exported
8 9
Auto spare machine
parts parts
Rice Earthen
pottery
Vegetables Wooden
Furniture
Maize Soap
Carpets
Detergent Bicycle,
powder hand [Ools
Mustard, Cotton
cotton cloth
Barley Wooden
furniture
Oil Seeds, Ginned
Ginning blades cotton
Oil Wooden
Seeds Furniture
Soap Locks
Picture Electric
Tubes for T.V. goods
Diesel Diesel
Pumping sets Pumpings sets
Nan"ie of Three Most Important
Commodities Manufactured
2nd 3rd
10' II
Agricultural Auto spare
implements parts
Number of Number of
Banks Agricultural
Societies
12 13
9
See Qadian Urban Agglomeralion __ ._o._o·_o·_._
Taka
handles
Milk
products
Mustard
oils
Bakery
products
Agricultural
implements
Agricultural
implements
Cotton
cloth
Agricultural
implements
Soap
Tractors
Tubes for T.V.
Dhoop and
Incence Stkk.'i
See Constituent Unit .• - ....•.. ------.--
187
ShuUel'S
Shoe:;
Sugar
products
Detergent
Powder
Shoes
Rice
Soap
Rice
sheller
Wooden
Fruniture
Picture
Shoes
4
3
4
3
14
4
6
6
6
14
9
7 2
Number of
Non·Agricultural
Societies
14
2
10
2
,"
19
57

SI. Class and Name No. ofTown
2
104.IV Samrala
Samrala U.A·
Samrala
10S.IV Sanaur
SanaurU.A*
Sanaur
106. VI Sangat
107 .. II 5angrur
10S.IV Shahkot
109. VI Shamchaurasi
110. III Sirhind
111 . VI Sri Har Gobind
·pur
112.1V Sujanpur
Sujanpur U.A * .
SuJanpur
113.1V Sultanpur
STATEMENT
Trade, Commerce, Industry
Name of Three Most Important
Commodities Imported Name of Three Most Important 1st
3
Wheat
Cement
Gram,
sugar
Sugar
Sugar
Rice
Iron
Sugar
Wheat,
pulses
Electric motor,
Generators
2nd 3rd 1st 2nd 4 S 6 7·
: •••.......•.....•• - •• See Samrala Urban Agglomeration ...•...................
...... -.--...... ----- See Constituent Unit -•.•.. -----.----.. -.-..
Paddy Sugar,
Groundnut
Groundnut
011
Agricultural
implements
_ ...•. - •........•.. See Sanaur Urban Agglomeration ...••..••••••• - ••. - .•
--••. - •.••••••.•. See Constituent Unit .•.•....• -•••.•..•..•.•
Fertilizers
Fertilizers
Cloth
Tea
Veeetable
oils
Timber,
Fuel wood
Cereals
Burnt
Bricks
Cotton
Pulses
Rice,
Vlneger
Utensils
Agricultural
Equipments
Vegetable
0115
Vegetable
Wheat
Wheat
Chillies
Wheat
Diesel
engines
Rice
Milk
Pulses
Rice
Rice
Maize
Truck
body
Wheat
•••••...••.•....•..•..• See Sujanpur Urban Agglomeration -.-••••• - •.........•..
•.••••. -.............. See Constituent Unit ....... -•.•..•........•
Cloths
Veeetabie
oils
188
Cement
Sugar
Silk
yarn
Electric
Generators
Woollen
coat
Chillies

-Vi
and Banking, 1989
Commodities Exported
3rd
8
Spare parts
for Sewing machine
Food-
grains
Agriculture
implements
Cotton
Wheat
Sugar-
-cane
Rice
Fish
Earthen
'Pottery
Rice
1 St
9
Agricultural
implements
Agricultural
implements
Agriculture
implements
Retind
oils
Rice
sheller
Leather
shoes
Diesel
engines and
Number of Name of Three Most Important
Commodities Manufactured Number of
Banks Agricultural Non-AgrIcultural. 2nd 3rd Sadeties Societies 10 11 12 13 14
-------------------- See Samrala Ulnan Agglomera[lon ""-----------"-----
-----------------.---". See Constituent Unit _._ ..... _._-_.<> ... _.
Spare parts Hosiery 8
for sewing machine goods
.-._---... _-_.-...... See Sanaur Urban Agglomeration --------"-"_----_."-
-----_._. __ .-,_ .. _-- See 'Constituent Unit .-.. _---------------
Shoes Wooden and 3
steels Furniture
Shoes Wooden 3
Furniture
Tin Cement 13
pipes
Vegetable. 5
oils
Bakery Earthen 2
products Pottery
Electric wire, Agriculture 10
Coal cutting implements
centrifugal pumps chained pick boxes
Agricultural Leather Earthen 4
implements shoes Pottery
---- .. ---.... _- ............. -- See Sujanpur Urban Agglomeration ----.---~------------: ..
-----......... _ .... __ ............ See Constituent Unit --_._---------------
Woolh>n wooden Earthen 3
garments Furniture ware (cheries)
Gen~rating Electric AgricUitliral 21 2
Sets Generawr Motor Equipments
189 /

SI. Class and Name No. of Town
2
114. Sunam
Sunam U.A*.
Sunam
11 5. IV Tawandl Bhal
116. IV Talwara
117. IV Tapa
Tapa U.A*.
Tapa
118. III Tarn TMan
119. IV Urmar Tanda
120. III Zlra
Zira U.A*.
Zira
Notes:· * Includes outgrowth (s)
Desh (-) denots nil
NA Data not available
1st
3
Chillies
Paddy
Iron,
Cement
Sugar
Pig·iron
Wooden
Furniture
Paddy
Name of Three Most'lmportlnt Commodities Imported
2nd 3rd
4 5
STATEMENT
Trade, Commerce,' Industry
Name of Three Most Important 1st 2nd
6 7
-._ •••. __ .•••. See Sunam Urban Agglomeration ••..••••.. - ..• : ..... .
- •. -._ •••. _..... See Constituent Unit - ...•.. _ ... - •.. ---
Cotton
Sugar
Food-
grains
Di,esel
englne
Tea
Cotton
Chillies
Rice
Fuel
Wood
Cotton
Wheat
Shoes,
Twine
------------------ . See Tapa Urban Agglomeration ---------•.. -.-...•
-----_ .. ----... ---_ See ConstitUent Unit -.---.-... -•..
Vegetable Tea Wheat Cotton
oils cotton bales
Rubber Clothes Straw" Rice,
boards Wheat
Spare parts Cloth Wheat Haize
Diesel engines
...... _ .. -.. _...... See Zira Urban AgglomeratiOn ......... _-..... - ..
...... -_ ..... -..... See Constituent Unit -_._. __ ...
Karyana
goods
190
'Maize Rice Wheat

·VI
and Banking, 1989
Commodities Exported
3rd
8
Agricultural
Implements
Agricultural
implements
Wooden
Furniture
Ice
Vegetable
Rice
Agricultural
implements
Number of Number of Name of Three Most Important
Commodities Manufactured
Number of
Banks Agricultural Non·Agricultural 1st 2nd 3rd Societies Societies 9 10 11 12 13 14
..••................... See Sunam Urban Agglomeration .......•..••...•......•
• _ •••. _ ••.......... - See Constituent Unit .........••.•••..••....
Combine Machine Water Agr.lcultural 7
for Harvesting pumps Implements
Agricultural Bakery Shoes 4
implements Products
Leather Twine Wooden 4 2
shoes Furniture
~ ~~ ••• _~ •• _ ~_M ________ "! Set> Tapa Urban Agglomeration ..•.•.................
---------------------- See Constituent Unit ' .. '."' .. '---"'-"---
Cotton Mustard 011 3
bales oils cakes
Panjas Cotton Vegetable 11 22
weighing machine Khes oils
Hannonlum . Diesel Cotton 4 14 16
spare pans, engine threads
Drilling machine
-------------------- See Zira Urban Agglomeration ... --.-.----.... -.. --
--.......... _-_ ........... _----- See Constituent Unit ................... _ ..
Agricultural Rice Shoes 6 7
implements shellers
191


URBAN PRIMA,RY CENSUS ABSTRACT
193

Location Name of Statel Area No. of
Code District/UN in Sq.Kms Occupied
No. City/Town
2
3/X Abohar (M.C.)
5/XI Adampur(M.C)
1011 Ahmedgarh (M.C.)
41111 Akalgarh (C.T.) *
5/XII Alawalpur (M.C.)
9/XI Amloh (M.C.)
3
23.07
8.20
3.88
5.48
1.00
2.69
2.85
Residential
Houses
4
16,777
3,303
3,717
860
1,152
1,496
780 2/V Amritsar Cantt (C.B.)
2/1V Amritsar (M.Corp.) 114.95 114,155
8/111 Anandpur Sahib (H.C.) 3.00
1211 Badhnl Kalan (N.A.C.) * 23.96
121111 Baghapurana (N.A.C.) ** 6.00
5/1 Banga (M.C.) 1.50
9/1V Banur (M.C.) 4.50
ll1XI Bareta (M.C) 4.00
10/x Bamara (M.C) 16.00
9/1 Bassi (M.C.) 5.00
Batala (U.A. *) 8.75
I IX Batala (M.C.) "8.75
Bakewal (O.G.) N.A.
Gaunspura (O.G.) N.A.
Nawanpind O.G. N.A.
Umarpura (O.G.) N.A.
Marrianwala (O.G.) N.A.
Bhatha Inderjit (O.G.) N.A.
Kothe Malwa O.G. N.A.
Sagarpur (O.G.) N.A.
Bhode·Df-Khuf (O.G.) N.A.
Kharal (O.G.) N.A.
Bawali Inderjit (O.G.) N.A.
Alowal (O.G.) N.A.
Haveli Chobdaran (O.G.) N.A.
Jhariwalan (O.G.) N.A.
Manl Ghauranga (O.G.) N.A.
111111 Bathinda (M.C.) 97.00
1I1V Behrampur (C.T.) * 3.26
2,030
1,388
2,702
2,956
1,661
1,947
13,422
2,856
16,342
13,540
706
359
85
165
191
292
187
179
124
83
141
156
39
57
38
28,840
793
No. of
House
holds
5
18,057
3,313
4,123
1,179
1,152
1,714
780
126,283
2,083
1,407
2,761
3,030
1,665
1,965
13,671
3,075
16,387
13,585
706
359
85
165
191
292
187
179
124
83
141
156
39
57
38
30,495
793
194
P
Total population (inclu
ding Institutional &
Houseless population)
M F 678
107,163 57,875 49,288
15,331 7,541 7,790
25,560 13,540 12,020
5,564 2,934 2,630
6,468 3,377 3,091
9,854 5,191 4,663
3,832 2,023 1,809
708,835 376,478 332,357
10,674"
8,572
5,718
4,548
4,956
4,024
17,287 8,946 8,341
17,721 9,227 8,494
10,014 5,324 4,690
11,537 6,092 5,445
75,430 40,831 34,599
18, I 38 9,361 8,777
103,367 54,800 48,567
86,006 45,440 40,56's
3,975 2,133 1,842
2,601 1,386 1,215
462 251 21 I
1,226 687 539
1,316 712 604
1,830 966 864
1,091 570 521
1,092 586 506
778 426 352
608 345 263
882 473 409
756 422 334
238 127 III
340 193 147
166 83 83
159,042 85,286 73,756
4,806 2,472 2,334
URBAN PRIMARY
Total Population
in the age group
0·6
9
9,930
1,405
2,191
459
520
925
283
"59,547
996
746
1,525
1,338
908
1,114
6,502
1,542
9,033
7,364
343
219
36
156
126
165
136
96
88
99
71
63
21
33
17
14,350
367
F 10
8,452
1,235
1,963
400
486
741
257
51,342
834
677
1,418
1,353
752
949
5,620
1,320
7,632
6,203
293
183
43
104
125
146
120
114
71
48
65
65
14
2S
13
11,951
381

CENSUS ABSTRACT
Scheduled
Castes
M F
11 12
10,437 9,323
2,742 2,547
2,135 1,841
793 730
1,980 1,765
1,169 1,050
522 483
66,728 58,055
1,543 1,355
1,585 1,290
2,352 2,132
3,396 3,121
1,615 1,396
1,504 1,308
9,278 8,090
2,390 2,064
14,666 12,741
11,547 10,090
337
325
17
406
312
94
428
207
334
192
56
182
55
132
42
325
274
17
304
288
76
394
170
277
138
42
161
49
96
40
17,088 15,178
898 817
M
Scheduled
Tribes
F 14
-Literates INDUSTRIAL CATEGORY OF MAIN WORKERS Total Main
Workers
(I·IX)
Culdvators Agricultural
Labourers
II M F M F M 15 16 17 18 ,19
34,434 22,758. 29,922 1,658 1,494
5,285 4,957 3,158 296 140
8,423 6,447 6,996 394 158
2,109 1,597 1,466 61 141
2,319 1,733 1,751 88 167
3,351
1,448'
2,620
1,085
2,646
998
126
191
148
3
253,121 196,864 199,667 13,792 4,575
3,841
2,263
2,756
1,770
4,999 3,975
6,432 .' - 4,854
2,899 1,961
3,059' 1,921
23,704 16,271
6,338 5,144
2,735
2,475
4,683
4,702
2,581
3,304
22,072
",751
303
88
224
317
134
162
311
827
835
304
470
703
1,131 2,730
300 '369
33,445 24,749 27,063 1,552 1,863
28,369 21,337
1,316
926
145
295
374
608
269
249
131
61
335
178
63
81
45
918
642
82
183
176
491
195
180
70
32
232
76
53
39
39
56,070 39,422
1,637 1,206
f95
22,491
1084
702
116
311
373
399
280
274
166
162
282
244
66
.71
42
1,311 I; 156
85
25
42
19
24
19
10
7
4
2
102
35
38
154
54
13
34
43
32
113
32
20
23
14
42,230 3,550 1,479
1,264 49 121
F M F 20 21 22
10 ... --2,405 76
3 328
28
105
2
7
2
188
184
3
82
299
141
593
327
23
36
22
11,820 585
1~3
749
11
14
70.5., 24
99~' .7
.79.1 . 6
582
3,315
'3-611 •
1,608
1,055
27
8'9
148
21
45
45
49
3S
69
23
1,285
,612
2
73
49
4
8
7
22
4
4
35

location Name of Slatei
Code District/UAI
Number City/Town
2
3/X Abohar (M.C.)
S/XI Adampur(M.q
10/1 Ahmedgarh (M.e.)
4/111 Akalgarh (C.T.)'
SIXII Alawalpur (M.C,)
9/XI Ahtloh (M.C.)
21V Amrirsar Canee (C.B.)
2/1V Amritsar (M.Corp.)
8/111 Anaridpur Sahib (M.C,)
1211 8~ni Kalan (N.A.C,) *
12/111 Bjgtrapurana (N.A.C)'*
5/1 BJr\'IiI (M.C.)
9/1V 8aRut (M.C.)
II/XI B~ (M.C.)
10/X 8pla (M.e.)
9/1 ~(M.C,)
B,a~ (U.A.*)
I/X B~1a (M.C.)
~al(O.G~)
G,aunspura (O.G.)
~wanpind O.G.
l!l11arpura (O.G.) ~ <'~ ,
M~anwala (O.G.)
Bhatha Inderlit (O.G.) - t. \ .
Kothe Malwa O.G.
Sagarpur (O.G.)
Bhode·Di·Khui (O.G.)
Kharal (O.G.)
Bawali Inderjit (O.G.)
Alowal (O.G.)
Haveli Chobdaran (O.G.)
Jhariwalan (O.G.)
MJni GhaurJllga (O.G.)
'11/111 Bathinda (M.C.)
111V BehraIllPur(C.T.)*
lhlestock, Forestry,
Fishing, Hunting &
Plantations, Orchards
& AlUed ActivitJes
III
M F
23 24
424
21
35
8
7
;w. 171
1,330
4
5
20
18 _
20
47
290
52
124
111
4
5
2
801
5
18
27
68
3
2
3
9
4
42
INDUSTRIAL CATEGORY OF MAIN WORKERS
Mining &
Quarrying
Manufacturing, Processing, Servicing & Repairs in
M
25
3
9
5
5
4
IV
F
26
196
Household
Industry
VIa) M F
27 28
759
343
379
7
28
85
50
17
33
3
3
Other than house·
hold Industry
V(b)
M F
29 30
7,161
341
1,876
88
269
484
206
217
IS
2,'
2
8
393
39
16
94
76
90 59,518 1,160
'I
9.. , 213 _
129
215
214
167
12
8
3
3
2
3
2
3
11
558
7
4
4
23
16
9
17
27
13
2Q
15
5
45
4
250
155
543
434
. 239
281
4,215
750
6,495
5,370
196
238
19
167
25
102
80
32
10
45
65
111
9
9
17
6,966
82
4
25
30
10
46
17
72
30
2
39
187
2
URBAN PRIMARY
Construction
VI
M
31
1,039
139
221
56
50
124
19
6,799
124
17
65
149
39
68
581
445
991
748
79
35
6
12
7
18
5'1
10
6'
13
5
1,873
5
F
32
4
10
2
158
2
11
7
5
57

CENSUS ABSTRACT
M
Trade &
Commerce
VII
F , 33 34
9,240
699
132
12
22
3
9
12
Transport, Storage &
Communications
M 35
2,119
167
393
65
95
211
vm F
36
8
3
2 2,534
302
286
761
157 6 87 6
279
2
~3,513
655
,331
1,400
1,471
372
945
5,918
,li442
1,913
7,234
,,210
,;,129
71
33
6
76
57
29
'5
8
27
15
6
4
3
11,358
175
1,2 17 15,624
5 ,19,0
3
10
7
3
12
86
23
75
65
6
200
4
40
303
260
76
104
1,727
, 231
2,555
2,130
115
67
,16
14
8
41
SO,
, "26
37~
16
21
7
3
3
4,995
24
2
2
10
3
17
16
81
INDUSTRIAL CATEGORY OF MAIN WORKERS
M
37
5,278
979
1,101
658
256
472
332
36,086
1,009
335
718
996
480
361
~<166
879
5,295
4,S15
339
96
10
50
17
94
14
55
12
17
;31
5
27
7
6
12,911
232
Ocher Services
IX
F 38
1,143
258
275
55
53,
105
143
,10,207
174
63
137
283
79
118
862
237
,1,123
992
60
15
2
18
2
13
9
7
2
2,821
36
197
M
39
Marginal Workers
144
6
44
3
15
25
F
40
572
5
3
7
205
5
28
3
295
12
Non-Workers
M
41
27,809
4,377
6,543
1,468
1,626
2,501
1,025
176,811
2,983
2,073
4,260
4,525 '
2,743
2,788
18,744
4,610
27,736
22,948
1049
684
1,35
376
339,
567
290
312
260
183
,191
178
61
122
41
43,031
1,207
F 42
47,058
7,492
11,626
2,569
'3,003
4,534
1,618
318,565
, 4,653
3,929
7,912
8,177
4,555
5,278
33,440
8,474
47,014
39,254
1,757
1,190
210
497
603
845
497
487
351
263
399
333
104
143
81
69,911
2,273

location Name' of Statel
Code J)is~tlUAI
No. OlY/Town
1 . 2
10/XI 8hadaur U'1.C)
Bhawanigarh (U.A. *)
10/iV Bhawan~arh (M.C)
Jhugi Sasti Outside M.C. Limits (O.G.)
An~a
in Sq.Kms
3
6.00
2.59
2.59
N.A.
UX Bhikhiwind (C.T.) * 10.00
5/XIIl Bhogpur(C.T.)** 3.00
II/IV Bhucho Mandi (M.C.) 2.00
I IIX Budhlada (J.i.C,) 5.18
7/111 Dasua (M.e.) 16.00
IIVIl Dera Baba'Nanak(M.C.) 0.78
9/II1 Dera BaSsi (M.e.) 3.06
IO/lX Dhanaula (M.C.) 5.00
Dhararnk6t (U.A.*) 1.10 , J 3/r Dharamkol (M.C.) 1.10
80 Houses Outside N.A.
Me Limits (O.G.)
t/iV Dhariwal (M.C.)
la/Ill Dhuri (I'(C.)
I lui Dinanagar (M.e.)
4NJII Doraha (M.e.)
Faridkot(U.A.*)
IUIV Faridkot (M.C)
House'& Rice Sellers
o!,! Bhblowal Road(O.G.)
1.27
15.00
14.36
1.90
18.14
18.14
N.A.
I/VIl Fateh~angal (c.r.)* 3.66
. I/IX FatehPrh ehurian (M.C.) 1.50
" 3/1X Fazllk~~.C.) 7.34
3/V Flrozpu~ (M.C.) 11.33
3/Vl FirozptlfCantt (C.B.) 20.10
7/V , Garh~ala (M.C.) 0.62
7/lX Garhsl'iankar (M.C.) 5.00
12/IX Glddjrbaha (M.e.) 8.25
Gobindgarh (U.A. *) 32.00
9/XII Gobindgarh (M.C.) 32.00
Iqbal Colony (O.G.) N.A.
Sant Nagar (O.G.) N.A.
No. of
OCcuPied
Residential
!iouses
4
2,277
2,373
1,724
649
1,510
834
1,637
3,014
3,225
1,151
1,766
2,610
1,810
1,717
93
2,545
5,962
2,843
1,600
10,339
10,269
.70
924
1,902
8,944
11,569
10,154
959
1,706
4,699
5,371
5,078
128
97
No. of
House,
holds
5
2,282
2,373
1,724
649
1,712
837
1,686
3,157
3,271
1,151
1,830
2,690
1,921
1,815
106
2,546
6,694
2,846
1,700
10,426
10,356
70
924
1,903
10,026
13,850
11,133
975
2,052
4,702
7,899
7,502
i56
150
198
Total populatlon-(lndu
ding Institutional &
Houseless pOpulation)
p
6
14;808
-"'3,900
101115
,3,782
11,958
4,896
10,006
18,717
18,351
1,380
'9,602
15,967
11,981
1'1,293
688
14;214
.. '3'7,431
1-6,968
9,589
~S8,625
"58,244
381
6,095
"11,088
.; 58,028
78,738
··53,094
5,159
~11,761
29,866
'42063
, 40,175
754
691
M 7
7,866
7,396
5,381
2,015
7,165
2,603
5,266
9,886
9,670
4,407
5,032
8,405
6,314
5,937
377
7,375
19,792
8,811
4,955
31,526
31,329
197
3,187
5,795
30,879
41,909
26,588
2,733
6,141
15,714
23,003
21,923
427
400
F 8
0,942
6,SQ4
4,734
1,770
4793 ' , ! 2,293
4,740
8',831
8,681
2;973 4;570
7,562
5;667
5;356
311
6;839
17,639
8,157
4',634
27,099
26,915
184
2,908
5,293
21;149
36,829
Z6,506
2,426
5,620
14,152
19,060
I B,252
327
291
URBAN PRIMARY
Total Population
in the .age group
0·6
M 9
f~"021 1,271
88B
383
1,034
364
951
1,699
1,529
546
B09
1,411
1,186'
1,115
71
1175
3,309
1,421
730
5,103
5,076
27
540
1,007
5,423
6,951
5,254
414
971
2,725
3,926
3,699
84
73
F 10
f,201
, ~,095
732
363
902
295
842
1,419
1,374
457
746
1,239
991
945
46
. 996
',' 2,925
: 1,293
., 701
'): 4,448
4,408
40
483
829
4,730
5,982
4,657
324
837
2,378
3,566
3,373
73
73

CENSUS ABSTRACT
Scheduled
Castes
M
11
3065
1717
1053
664
F 12
2625
1535
909
626
1741 1408
797 672
1732 1559
1598 1361
2013 1851
880 750
725 661
2539 2264
1444 1338
1337 1238
107 100
444 376
4329 3853
2488 2271
507 497
8307 7265
8205 7165
102 100
955 801
846 751
6165 5545
7285 6198
5393 5097
698 628
2353 2070
4844 4265
3402 2721
3132 2528
99
98
67
70
M
13
Scheduled
Tribes
14
Literates.
M
15
3163
3986
3129
857
4306
1978
3053
6433
6520
3382
3656
3990
3406
3255
151
5517
12352
5904
3553
20468
20372
96
1824
3681
19444
26801
16959
1996
4200
9439
14669
14161
215
210
F
16
2191
2773
2204
569
1639
1498
19B4
4618
5120
1716
2754
2119
2660
2555
105
4296
8994
4607
2929
14165
14100
65
1114
2943
13590
20183
14358
1490
3244
6228
10716
10398
125
141
199
INDUSTRIAL CATEGORY OF MAIN WORKERS Total Main
Workers
(I-IX)
M
Cultivators
M F 17 18 19 20
4081
3919
2854
1065
4637
1227
2705
5116
4898
2715
2586
4446
3378
3169
209
3348
10040
4157
2490
16068
15968
100
1020
2795
16299
20759
11349
1352
3040
8139
12514
11921
231
237
226
165
113
52
1260
585
522
63
70 579
74 ·102
232 153
341 168
438 349
94 148
337 162
133 1227
116 896
111 777
5 119
302 35
601 104
240 117
237 48
1636 775
1632 770
4 5
42 125
195 148
1046 719
2160 902
1084 94
132 130
266 377
570 1017
337 245
323 239
11 4
11
10
11
6
6
4
32
85
Agricu Iturai
labourers
II
M F 21 22
1856 153
618 10
460 5
158 5
732
170
206
295
496
260
100
1258
765
715
50
52
807
455
154
1537
1515
22
267
543
577
1555
63
74
835
584
239
212
24
3
6
28
14
23
7
7
7
13
3
27
27
14
40
3
13
20

Location Name of Statel
Code District/UN
Number Clw/Town
2
la/xI Bhadaur (M.C.)
Bhawanigarh (U.A.·)
IOIIV Bhawanigarh (M.CJ
Jhugi Basti Outside M.C. Limits (O.G.)
21X Bhikhiwind (CT.)'
S/XIII Bhogpur (C.T.)··
II/IV Bhucho Mandi (M.C)
l1/X Budhlada (M.e.)
71111 Dasua (M.C.)
INII Dera 8aba Nanak(M.C)
91111 Dera Bassi (M.C.)
IOIlX Dhanaula (M.C)
Dharamkot (U.A.*J
311 Dharamkot (M.C.)
80 Houses Outside M.C. limits (O.G.)
1I1V Dhariwal (M.C.)
10/111 Dhurl (M.C.)
1/111 Dinanagar (M.e.)
4!V1IJ Doraha (M.C.)
Farldkot (U.A.*)·
12llV Farldkot (M.C)
House & RIce Sellers
on Bholowal Road(O.C.)
I!VII Fatehnangal (C.T.)·
Livestock, Forestry, fishing, Hunting &'
Plantations, Orchards
& Allied Activities
!Ii
M F
23 24
11
43
28
15
7
,4
21
78
92
5
38
4B
24
21
3
19
69
52
43
33
32
9
7
7
I
2
2
ll1X F3tehgarfl Churian (M.C) 26
3/1X Fazilka (M.C.) 170
3!V Firozpur (M.C)
3!V1 Firozpur Cantt (C.8.)
7!V Garhdiwala (M.C.)
7/IX Garhshankar (M.C.)
J2/1X Giddarbaha (M.C.)
Gobindgarh (U.A.·)
9/XII Goblndgarh (M.C.)
Iqbal Colony (G.G.)
Sant Nagar (O.G.)
453
13B
20
4B
_ 43
51
49
7
31
15
2.
INDUSTRIAL CATEGORY OF MAIN WORKERS Mlning&
Quarrying Manufacturing, Processing, Servicing & Repairs In
M
25
3
2
7
7
IV
26
200
Household Industry
V(a)
M F 27 2S
17
31
21
10
3
68
48
lOB
67
27
36
26
39
3B
6
2.02.
29
137
18S
187
12
14
205
349
93
15
26
67
151
141
10
7
6
4
6
4
5
23
3
3
3
2
17
IS
IS
15
47
106
12
11
2
3
14
11
3
Other than house· hold Industry
V(b)
M F 29 30
201
608
373
235
256
177
361
966
452
103
732
321
275
272
3
1278
2106
615
494
1318
1312.
6
254
306
2297
1828
994
139
235
860
5681
5347
III
152
21
20
3
7
19
9
69
II
3
20
2
12
23
23
58
37
16
3
3
16
B
8
URBAN PRIMARY
Construction
M
31
VI
71
179
85
94
29
21
96
140
224
27
134
110
82
B2
107
322
317
61
596
595
7
22
890
774
1575
71
69
185
579
552
13
12
F
32
5
2
5
5
49
49
4
25
26
2
10
10

CENSUS ABSTRACT
M
trade &
Commerce
VII
F
33 34
350
1040
758
282
711
438
1067
2195
1696
402
645
662 .
655
648
7
1041
3826
1482
794
3343
3334
9
78
1005
5383
5866
2887
535
776
2728
3305
3243
23
28
2
8
6
2
3
21
27
17
3
12
4
4
4
19
44
5
12
41
41
2
4
120
149
75
8
10
72
14
I3
Transport,
Storage &
Communications
M
35
53
212
136
76
128
64
220
366
323
53
146
220
1.42
126
16
161
918
234
174
1170
1131
39
53
85
HI3
2459
2538
80
141
344
760
722
15
18
VIII
F
36
3
4
3
3
2
II
3
14
14
2.
16
. 82
127
7
7
INDUSTRIAL CATEGORY OF MAIN WORKERS
Other
Services
M 37
262
603
471
132
2192
183
532
800
1198
1669
593
574
500
490
10
649
1666
855
595
7108
7092
16
215
643
4743.
6573
2967
288
533
2311
1496
1409
33
19
IX
201
F 38
60
118
99
19
59
64
156
271
372
87
210
114
.100
95
5
272
479
219
195
1461
1457
4
38
186
77{;
1658
811
106
235
371
2.82
2.72
7
M 39
Marginal
Workers
3
3
40
3
2
2
3
12
12
32
115
13
2.
7
7
F 40
80
2
2
455
44
18
63
74
83
3
3
2
293
211
4
16
2
II
11
Non-Workers
M 41
3784
3474
2524
950
2528
1336
2561
4767
4770
1692
2446
3957
2936 .
2768
168
4027
9749
4653
2465
15446
15349
97
2135
2999
14465
21137
15239
1381
3099
7574
10482
9995
196
163
F
42
6636
6337
4619
1718
4723
1764
4508
8446
8225
2816
4233
7355
5551
5245
306
6537
16955
7917
4397
25460
25280
180
2866
5096
25810
34458
25418
2294
5338
13580
18712
17918
326
280

Location Name of State!
Code Dis trictl UAI
No. CltY/Town
Area No. of
in Sq.Kms Occupied
Residential
Houses
234
Dalip Nagar (O.G.) N.A. 68
11 III Goniana (M.C.) 9.00 1664
51lV Goraya (N.A.C.) 2.65 1900
I/V Gurdaspur (M.e.) 10.85 9598
31V1I Guru Har Sahai (M.e.) 1.50 1452
7/VI Hariana (M.e.) 1.29 1188
91V1I Hoshiarpur (M.C.) 28.21 21433
4/1 Jagraon (M.C.) 14.00 7761
Jaitu (UA*) 9.06 4549
121V1 )aitu (M.C.) 9.06 4533
Kothe Lal Penni (O.G.) N.A. 16
)alalabad (U.A.*) 2.84 3186
3!VIII )alalabad (M.C.) 2.84 2375
Extended area N.A. . 811 block No. 22 (O.G.)
511X )alandhar (M.Corp.) 80.41 83810
SIX J alandhar Cantt. (C.B.) 1 5.21 6270
2/VI Jandiala (M.C.) 4.20 3164
6/1 Kapurthala (M.C) 56.00 11038
5/XIV Kartarpur(M.C.) 5.95 3472
4/X Khanna (M.C.) 16.02 12049
Kharar (U.A. *) 4.20 4876
8NII Kharar (M.C.) 4.20 4844
Nawanshahr (O.G.) N.A. 32
liN Kot Fana (M.C.) .39 982
3/111 Kot Ise Khan (C.T.)· 4.55 1146
1211V Kot Kapura (M.C.) 14.50 10265
8/VI Kurali (M.C.) 7.40 2968
101V1II Lehragaga (M.C.) 8.40 2582
. Longowal (U.C.) 3.25 2663
JOIYI Longowal (M.e.) 3.25 2537
Plndi Kehar Singh N.A. 126
& Plndi Dhilwan (O.G.)
4N Ludhiana (M. Corp.) 134.67 187488
41V1 Machlliwara (N.A.C.)·· 3.00 2383
Majitha (U.A.·) 1.50 1679
No. of
House·
holds
5
91
1694
1914
9603
1675
1209
22102
7852
4594
4578
16
3932
3056
876
89660
6277
3168
11601
3499
12402
4889
4857
32
983
1267
10312
2981
2598
2664
2537
127
193862
2391
1739
202
Total population (inclu
ding Institutional &
Houseless population)
P M F
6 7 8
443 253 190
10415 5459 4956
10708 5555 5153
54733 29390 25343
10500 5491 5009
6473 3409 3064
122705 65378 57327
47372 24723 22649
28850 15261 13589
28758 15216 13542
92 45 47
23108 12611 10497
18476 10202 8274
4632 2409 2223
509510 272472 237038
31520 15313 16207
19293 10191 9102
64567 34611 29956
21093 11109 9984
71990 38094 33896
26109 14010 12099
25938 13928 12010
171 82 89
5611 2972 2639
7604 4028 3576
62430 32790 29640
17592 9341 8251
15555 8219 7336
16254 8669 7585
15419 8225 7194 I 835 444 391
1042740 580961 461779
13554 7066 6488
10713 5738 4975
URBAN PRIMARY
Total Popu lation
in the age group
0·6
M
9
70
1001
843
4194
1058
523
9537
3938
2597
2594
3
2192
1684
508
39911
2760
1860
5276
1700
6261
2242
2230
12
486
723
5899
1414
1557
1481
1410
71
87942
1373
997
F
10
47
785
786
3565
853
458
8438
3508
2188
2184
4
1783
1330
453
34928
2444
1481
4634
1571
5469
1850
1838
12
435
661
5072
1312
1223
1270
1197
73
76289
1129
829

CENSUS ABSTRACT
Scheduled
Castes
M
11
73
1145
1271
F
12
56
1024
1223
5815 5232
611 572
953 827
15841 13909
7557 6662
52,14 4599
5210 4597
4 2
1503
979
524
1189
728
461
r5204 65492
3224 2976
3072 2699
7280 6471
4888 4367
7769 6940
3321 2763
3283 2732
38
1095
1043
31
954
979
9319 8395
2117 1870
1981 1741
2176 1887
2158 1874
18 13
67465 56056
2292 1995
2339 2033
M
13
Scheduled
Tribes
F
14
Literates
M
15
83
3668 .
3815
22077
3238
2427
47593
15811
8211
8187
24
8534
7371
1163
F
16
52
2737
2948
16313
2543
1818
36208
12977
5721
5700
21
5794
4973
821
INDUSTRIAL CATEGORY OF MAIN WORKERS
Total Main Workers .
(I-IX)
Cultivators
M F M
Agricu!tural
Labourers
II F M F
17 18 19 20 21 22 -----------------------125 2
2786
3098
14436
27.81
1727
32973
12758
7940
7913
27
6871
5718
1153
173
ISS
1462
137
103
3244
769
400
399
384
335
'49
20
130
373
99 I i2
1.t)18
1111
116~ 1148\
19
496
409
87
2
4
19
10
5
4
148
342
441
255
631
2744
1416
831
829
2
525
168
357
3
5
138
13
44
44
3
2
188552
10679
6071
23612
6913
25439
9727
9678
49
1309
2290
14834 142492 11263 2111
. 10
49 4461
12
1266
1267
307
1787
·575
164
19123
6287
4696
2834
2728
106
10325
4656
17717
5209
19493
69
6934
57
784
1621
13857
4665
3198
1776
1711
65
60S5
5279
17641
5732
19741
6789
6748
41
1674
1989
16606
4779
. 4281
4892
4614
278
623
263
1948
253
1361
607
605
2
43
228
1012
356
151
425
888
211
248
290
290
677
195
1016
252
307
138 2273
132 2040
6 233
366775 261857 328047 15312 4483
4155
3208
3228
2203
203
3576
2783
257
111
405
4151
56
3
2
2
14
9
9
6
575
68
82
22
14
24
24
425 16 "1
.453 31
1315
114
342
1278
1263
15
16554
1120
1094
16
4
36
36
194
65
36

Location Name of State!
Code District/UAI
Number City/Town
2
Dalip Nagar (O.G.)
II/II Gonian;a (M.C.)
SIIV Gorayal (N.A.Cl
IIV G!:Ifdaspur (M.C.)
3/VII Guru h'ar Sahai (M.C.)
7IVI Hariana (M.C)
9lVIl Hoshlarpur (M.C)
4/1 ]agraon (M.c.)
)altu {U.A. *}
~2/VI Jaltu (M.C)
Kothe Lal Perm I (O.G.)
lalalabad (U.A.*)
3lVIII Jalalabad (M.C.)
Extended area block No. 22 (O.G.) .
S/IX Jalandhar (M.Corp.)
SIX 1alandhar Cantt. (C.J •• )
21V1 Jandiala (M.C.)
M, Kapurthala (M.e ,)
S/X!V Kartarpur(M.C}
4/X Khanna (M.(.)
Kharar (U.A. "j
$lVlI Kharar (M.e:)
Nawanshahr (O.G.)
1 IN Kp~ Fatta (M.C,)
3/IIk K~t ISf K'nan (C.T.)' I
t 2/W ~(ot Kapura (M.C.) I
!t1V1 iKurali (M.C.)
1 01V1~J Lehragaga (H.C)
Longowal (U.c.)
10NI Longowal (M.C)
4!V
'tlVl
Pindi Kehal' Singh . & Pindi Dhilw~n (!J . G \ '
" Livestock I forestry,
Fishing, Hunting lit
Plantatloll"i, Orchar ds
& Allied Actlvitifs ___ Ill __ _
INDUSTRIAL CATEGORY OF MAIN WORKERS
Mining &
Quarrying
IV
Manufacturing, Processing, Servicing & Repairs in
Household
Industry
VIa)
Other than house·
hold Industry
V(b)
URBAN PRIMARY
Construction
"I M F' M F M F M F M F
----------------------------------------~----~---23
35
I!
25[0
t8
36
738
127
40
40
65
54
II
900
139
32
152
45
172
22
22
31
22
36
11
60
30
30
6170
20
7
24 25 26 27 28 29 30 31 32
2
13
78
9
8
8
2
2
84
18
7
2
B
2
2
61Z
8
4
13
10
40
146
69
38
II
867
102
92
92
106
93
13
6328
228
9
204
1240
9B
179
179
84
73
349
55
188
161
157
4
575
47
26
4
5
9
2
88
37
18
18
9
9
667
5
38
20
52
5
5
3
117
46
4
7
7
7
75
II
71
339
1032
1196
502
134
6458
2073
1248
1248
647
588
59
38896
790
1089
3067
1580
4759
1819
1812
7
51
242
2799
1111
456
225
207
18
150358
359
233
7
8
26
2
346
14
22
22
2
2
975
10
4
98
7
82
52
51
7
80
25
17
II
6
2423
6
2
2
110
64
561
65
71
1226
673
189
189
132
106
26
5555
236
102
627
334
857
167
166
64
50
831
266
177
153
153
21431
90
54
9
28
5
17
17
5
5
62
2
9
5
2
2
11
2
I
2
2
254 Ludhiana 1M. Cor~.) I
Machhiw;wJ (N.A: C.) [' •
Majitha (ll.A.·)
--~----' t---,----------------------~------------------~-------------204

CENSUS ABSTRACT
Trade &
Commerce
M
33
II
1346
778
3977
1098
385
9253
4368
2330
2329
2129
1864
265
39468
2192
1442
4458
1020
6869
1365
1343
22
liS
546
5142
1374
1767
364
362
2
69087
854
426
VII
F
34
10
12
76
3
5
288
32
28
28
6
4
2
1197
48
9
177
10
104
22
22
4
90
9
13
3
3
1206
7
2
Transport,
Storage &
CommunicJtions
M
35
5
.158
176
886
194
62
2201
930
456
455
394
275
119
11449
247
260
1139
207
1883
437
434
3
65
82
1870
309
317
67
66
21 II t
223
132
VIII F
36
3
4
10
31
6
3
3
355
14
63
8
19
9
9
7
3
273
4
INDUSTRIAL CATEGORY OF MAIN WORKERS
M
37
35
590
415
6682
512
311
8055
1957
1587
1583
4
2377
2161
216
33314
2201
654
5839
788
3068
1935
1927
8
162
326
3247
1287
667
341
336
5
38278
458
396
Other
Services
IX
205
38
2
148
123
1314
123
92
2228
643
260
259
351
307
44
7710
526
181
1418
. 183
1014
489
488
22
69
748
313
124
64
64
10214
156
70
M
Marginal
Worker>
39
2
25
3
3
II
II
162
7
"2
3
3
55
8
8
F
40
309
7
7
359
95 .
15
9
9
46
210
13
124
124
Non-Workers
M
41
128
2673
2455
14954
2709
1682
32380
11965
7318
7300
18
572.9
4473
1256
129818
9258
4912
16963
5375
18353
7218
7177
41
1298
.2039
16129
4562
3938
3769
3603
166
252914
3490
2955
F
42
188
4783
4998
23881
4871
2961
53774
21880
13182
13136
46
10113
7939
2174
225416
15584
8839
27913
9716
32535
11483
11396
87
2550
3347
28418
7895
7172
7323
6938
385
446467
6231
4864

Location Name of Statel Area
Code DistrktlllN In Sq.Kms
No. City/Town
2 3
21111 Majitha (M.C.) 1.50
Rorl and Idgah (O.G.) N.A.
10/11 Malerkotla (M.C.) 4.25
121V1II Malout (M.e.) 10.00
IIIIX Mansa (M.C.) 20.00
IIIVIII Maur (M.C.) 4.80
Moga (U.A.·) IQ.IO
12111 Moga (M.C.) 16.10
Lande ke (Amritsar road) N.A.
(O.G.)
Dune ke (firozpur road) N.A.
(O.G.)
81V Morinda (M.C)
711 Mukerian (M.C.)
12IVII Muktsar (M.C.)
3.00
2.59
13.80
4/1V Mullanpur Oakha (NAC)" 2.05
9/X Nabha (M.e.)
5IVII Nakodar (M.e.)
15.48
3.60
Nangal Township (U.A.O) 7.90
8/11 Nangal Township (N.A.e.) 7.90
Oustee Colony Block-A(OG) N.A
Oustee Colony Block-B(OG) N.A
5111 Nawanshahr (M.C.) 9.59
8/1 Naya Nangal (N.A.c.) 14.92
S/VI Nunnahal (M.e.) 5.75
Pathankot (U.A.") 22.10
1/11 Pathankot (M.C.) 22.10
KhanpLlr (O.G·,) N.A.
Lamin (O.G.) N.A,
Dhaki (O.G.) N.A.
Patiala (O.G.) 31.20
91V1 Patiala (M.C.) 31.20
ThapJr College of Engg. N.A.
(O.G.)
No. of
Occupied
Residential
Houses
4
1568
111
12439
9831
9087
3744
18156
17757
95
304
2955
2882
10945
1723
8563
4593
6782
6278
129
375
5142
2574
1766
21789
21101
298
356
34
44995
41718
140
No. of House
holds
5
1614
125
13986
9862
9420
4038
18909
18490
95
324
2958
2935
11096
1788
9530
4615
6812
6308
129
375
5194
2655
1798
21910
21218
298
356
38
48218
44897
140
206
Total population (inclu
ding Institutional &
Houseless populac!on)
P 6
9912
801
88600
56868
55089
25180
110958
108304
451
2203
17440
17813
66383
10138
54421
28478
32003
29311
687
2005
M F
7 8
5304 4608
434 367
46978 41622
30535 26333
29401 25688
13517 11663
58957 52001
57511 50793
232 219
1214 989
9297 8143
9131 8682
34831 'l1552
5312 4826
28812 25609
15184 13294
17074 14929
15676 13635
354 333
1044 961
29955 15630 14325
12046 6534 5512
II 149 5815 5334
,28198 67092 61106
123930 64865 59065
1865 984 881
2196 1124 1072
207 119 88
253706 132858 120848
238368 124352 114016
1009 726 283
URBAN PRIMARY
Total Population
in the age group
0-6
M
9
901
96
8545
5623
5151
2282
9471
9217
2P
1577
1642
5Ar;,
892
4339
2318
2451
2204
71
176
2397
795
913
10229
9850
165
197
17
20010
184'17
48
F
10
754
75
7599
4559
4115
1983
8106
7893
31
182
1299
1335
4977
797
3823
2010
2193
2000
63
130
Z040
708
773
9070
8724
173
158
IS
17431
16142
38

CENSUS ABSTRACT
Scheduled
Castes
M
11
2067
272
F
12
1809
224
2576 2238
7628 6720
6311 5308
4096 3515
10405 8799
9888 8372
45 40
472 387
2197 1945
1762 1702
8966 7945
'1984 1722
3357 3042
5219 4719
3967 3452
3579 3119
114
274
81
252
4822 4330
1144 979
2079 1818
13964 12394
12797 11324
522
606
39
448
593
29
13005 11683
12048 10862
6
M
13
Scheduled
Tribes
F
14
Literates
M
15
3060
148
22922
19128
17132
6152
36875
36165
163
547
5854
6145
20997
3248
20006
10484
12778
11769
249
760
10970
5134
3860
46734
45496
521
671
46
93786
88092
605
F
16
2100
103
14265
13038
11870
4059
28078
26620
128
330
4265
5086
15430
2478
15180
7545
9474
8745
193
536
8675
3766
3027
36381
35485
345
534
17
74963
71243
167
207
INDUSTRIAL CATEGORY OF MAIN WORKERS
Total Main
Workers
((-IX)
Cultivators
M
17
2565
218
24306
16294
15359
7256
29970
29260
114
596
4570
4411
18049
2722
14083
8262
8188
7543
155
490
7861
3383
2952
32345
31389
454
438
64
64941
60880
159
F
18
111
M
19
395
20
962 1541
917 280
999 1013
357 1547
3047 1883
3013 1658
10
273
302
9
?16
275
85
1284 1232
136
1339
596
852
829
5
18
987
355
144
2080
2035
22
20
3
9741
9416
II
621
127
337
42
41
440
45
193
568
516
26
10
16
1081
933
F
20
52
6
61
3
34
34
78
5
3
144
2
2
4
2
2
20
20
Agricultural
Labourers
II M F 21 22
968
126
36
3909 149
822 21
1704 152
1089 70
3403 490
3200 479
2
201
499
279
2039
343
930
942
29
29
989
86
787
1491
1423
38
29
2147
1805
11
104
33
44
2
2
149
5
22
21
50
47

Location Name of Statel INDUSTRIAL CATEGORY OF MAIN WORKERS
Code DistrictlUA/ Livestock, Forestry, Mining & Manufacturing, Processing, Servicing & Repairs in
Number City/Town Fishing, Hunting & Quan),ing
Plantations, Orchards
& Allied Activities
III
M
2 23 24
2/111 Majitha (M.C.)
Rorl and Idgah (O.G.)
10/11 Malerkqtia (M.C.)
12NIIl Malout (M.C)
IIIIX Mansa (M.e.)
IINIIl Maur (M.C.)
Moga (U.A.*)
12111 Moga (M.C.)
Lande ke (Amrltsar road)
(O.G.)
Dune ke (Firozpur road)
(O.G.)
8N Morlnda (M.C.)
711 Mukerlan (M.C.)
12NIIMuktsar (M.C,)
7
219
87
237
89
214
212
2
2
85
151
4/IY Mullanpur Dakha (NAC)·* 13
9/X Nabha (M.C.)
SIYII Nakodar (M.C.)
Nangal Township (U.A. 0)
161
37
3
8/11 Nangal Township (N.A.C.) 2
OUstee Colony Block-A(OG)
Oustee Colony Block·B{OG)
5/11 Nawanshahr (M.C)
8/1 Naya Nangal (N.A.C.)
SNI Nurmahal (M.C,)
Pathankot (U.A. *)
I III Pathanko[ (M.C)
Khanpur (O.G.)
Lamin (O.G.)
Dhaki (O.G.)
Patlala (O.G.)
9/VI Patiala (M.C.)
50
16
10
265
260
2
2
1086
1039
Thapar College of Engg.(O.G.)
7
5
3
16
16
3
10
4
23
22
121
118
M 25
4
3
4
32
31
IV
F
26
208
Household
Industry
VIa)
M F
27 28
22
4
689
604
328
166
494
494
89
24
333
3
246
271
143
137
6
208
6
84
133
123
9
1712
1684
65
31
20
10
111
III
8
5
49
172
8
25
24
33
6
27
27
270
, 269
Other than house
hold Industry
V(b)
M F
29 30
220
13
5959
3646
2641
891
4648
4592
12
44
1031
610
2216
300
2885
1521
592
462
24
106
1185
2575
409
3433
3313
S9
41
20
10906
9575
2
85
80
75
33
67
67
18
4
43
4
33
33
13
12
17
77
89
86
2
50S
429
URBAN PRIMARY
Construction
M 31
VI
53
964
541
584
227
570
527
10
33
195
223
415
32
556
223
254
162
37
55
234
43
148
2547
2395
73
77
2
3317
3071
32
2
20
16
8
4
3
6
3
6
72
70
300
283

CENSUS ABSTRACT
Trade &
Commerce
M
33
400
26
6666
5535
5096
1870
8558
8499
30
29
1365
1989
5140
850
4758
2365
1512
1383
26
103
2683
158
797
10138
996.8
62
102
6
19211
18771
VII F
34
2
48
60
40
57
164
163
14
34
46
16
57
21
26
26
44
11
7
172
167
3
2
934
Transport,
Storage &
Communications
M
35
119
13
1049
1174
1085
377
2326
2267
26
33
289
425
1159
168
802
449
540
472
23
45
581
58
96
4472
4391
52
20
9
4516
4320
2
VIII
F
36
3
9
5
2
12
11
3
3
3
2
9
6
10
10
9
2
3
69
69
125
120
INDUSTRIAL CATEGORY OF MAIN WORKERS
M
37
381
15
3306
3605
2670
1000
7873
7810
25
38
825
691
5361
392
3314
2117
5073
4855
45
173
14'?0
396
428
9266
8969
141
147
9
20965
19682
156
Other
Services
IX
209
F
38
70
553
703
623
164
2145
2128
9
8
229
251
948
114
1020
478
77S
754
5
16
584
262
ll9
1602
1571
16
'14
7416
7206
11
M
Marginal Workers .
39
14
1.4
46
13
42
42
38
2
2
2
7
16
30
26
4
36
36
F
40
211
23
139
12
35
35
210
20
20
10
27
13
13
28
28
Non-Workers
M·
41
2739
216
22658
14227
13996
6248
28945
26209
118
618
4727
4720
16744
2590
1~728
6920
8884
8131
199
554
7762
3151
2847
34717
33450
530
686
51
67881
63436
567
F
42
4497
367
40449
25393
24550
11294
48919
47745
209
965
7870
8380
30058
4690
24250
12678
14077
12806
328
943
13328
5157
5163
59013
57017
859
1052
85
111079
104572
272

location Name of State/ Area No. of
Code DistrictlUAI in Sq.Kms Occupied
No. CitylTown
2 3
D.C.W. Colony (O.G.) N.A.
Hira Bagh Colony (O.G.) N.A.
Back Side of Central Jail N.A.
(O.G.)
Back side Thapur Engg. N.A.
College (O.G.)
. Village Kheri GLljran side (OG)~.A.
Village Rasulpur Saidan
(O.G.)
9/V1II Patran (N.A.e.) **
2IlX Patti (M.C.)
4/1X Payal (M.C.) *.
Phagwara (U.A.·)
61111 Phagwara (M.C.)
N.A.
·5.00
4.30
0.42
16.00
16.00
Mohalla Gobindpura (O.G.JN.A.
Kot Rani (O.G.)
51V PhiIJaur (M.e.)
Qadian (U.A.·)
llXI Qadian (M.C.)
N.A.
.75
9.06
9.06
Harijan Colony, I.T.1. N.A. Balmiki Graveyard and D.A.V. Hr. Sec. School (O.G.)
5/111 Ranon (M.C) 5.18
4/11 Raikot (M.C) 10.65
·2/11 -Rajasansi (C.T.) • 15.55
9/V Rajpura (M.e.) 14.00
11/V1I Raman (M.e.) 3.99
2/1 Ramdas (M.C.) 2.50
11/1 Rampura Phul (M.C.) 5.76
2/V1I Rayya (N.A.C) ., 1.50
81lV Rupnagar (M.C.) 25.00
8/111 S.A.S. Nagar (Mohali) 16.68
(N.A.C.)"
9/IX SalllanJ (1'1.(.)
Samrala (U.A. *J
5.50
9.00
Residential
Houses
4
1342
87
957
393
184
174
2334
4403
961
15063
14202
453
408
3304
3010
2838
172
1798
3448
1578
13186
2809
816
5749
1375
7376
18525
5420
2508
No. of
House
holds
5
1342
87
957
393
193
209
2382
4480
980
15824
14884
525
415
3335
3010
2838
172
1798
3472
1772
13377
2911
852
6039
1425
7419
18613
6042
2593
210
Total population (inclu
ding Institutional &
Houseless population)
P
6
4788
418
4821
2019
1117
1166
14328
27776
5852
88316
83163
2697
2456
20956
20012
18867
1145
10771
21061
10008
70983
17275
4765
35530
9122
37996
78457
36556
14921
M
7
2606
225
2596
1085
626
642
F
8
2182
193
2225
934
491
524
7494 6834
15373 12403
3063 2789
47892 40424
45060 38103
1517
131 S.
11701
10346
9726
620
1180
1141
9255
9666
9141
525
5682 5089
11025 10036
5290 4718
37997 32986
9247 8028
2495 2270
18718 16812
5106 4016
20212 17784
42040 36417
19233
7850
17323
7071
URBAN PRIMARY
Total Population
in the age group
0-6
M
9
630
34
455
158
115
123
1354
2479
520
6905
6469
226
210
1465
1733
1631
102
890
1866
1038
5768
1672
479
3092
813
3120
6355
3387
1344
F
10
553
35
353
121
89
100
1197
1967
·471
6268
5811
243
214
1393
1522
1449
73
830
1623
836
5101
1434
393
2634
681
2970
5620
2878
1158

CENSUS ABSTRACT
Scheduled
Castes
M
11
241
13
217
122
203
155
953
31S1
1229
F 12
223
12
205
99
147
132
837
2484
1056
12150 • 10498
10485
830
835
4453
1234
774
460
9010
734
754
3656
1155
751
404
2456 2122
4106 3686
2157 1935
2203 2002
2610 2246
1153 1057
4255
1091
3690
917
3004 2714
3628 3110
3422 3048
2269 2046
M 13
Scheduled
Tribes
F 14
M
15
1895
150
1721
813
251
259
4574
9389
1821
33420
31724
917
779
8303
6661
6358
303
3450
6597
2743
25969
4837
1366
10962
3505
14532
32865
11861
5369
Literates
F
16
1430
118
1180
569
106
150
3483
5712
1361
24166
23153
488
525
5174
5182
4997
185
2541
5151
1926
19279
3181
978
7934
2110
10965
25623
8802
4083
211
INDUSTRIAL CATEGORY OF MAIN WORKERS
Total Main
Workers
(I-IX)
M F
17 18
1496
117
1132
528
311
318
3765
8301
1615
26293
24658
911
724
6710
4882
4591
291
2810
5655
2685
19663
5180
1193
9958
2834
10480
21500
10009
4018
154
3
95
53
4
5
129
364
76
1562
1523
22
17
503
242
237
5
174
336
312
1616
340
67
605
I1S
1115
4129
500
.324
Cultivators
M
19
7
15
10
75
41
144
1007
253
602
515
32
55
263
480
437
43
446
999
207
407
632
263
1188
181
325
194
536
348
F
20
4
2
2
2
4
4
4
2
5
Agricu lrural
Labourers
II
M 21
2
6
78
3
166
87
150
2044
495
1418
1010
21
387
505
62
57
5
981
942
468
1382
604
338
772
262
347
189
1039
648
F
22
2
2
16
10
35
29
6
20
78
5
II
37
32
8
8
40
115
8

URBAN PRIMARY
location Name of Statel INDUSTRIAL CATEGORY OF MAIN WORKERS
Code DistrictlUAI Livestock, Forestry, j"lining& Manu~acturing, Processing, Servicing & Repairs if) Construction
Number CitylTown Fishing, Hunting & Quarrying
Plantations, Orchards Household Other than house·
& Allied Activities Industry hold Industry
III IV Veal V(b) VI
M F M F M F M F M F
2 23 24 25 26 27 28 29 30 31 32
D.c.W. Colony (O.G.) 1007 66 49 15
Hira Bagh Colony (O.G.) 2 25 14
Back Side .of Central Jail 22 3 IB 145 10 118
(O.G.)
Back side Thapur Engg. 17 10 104 47
College (O.G.)
Village Kheri Gujran side (OG) 4 3
Village Rasulpur Saidan 2 46 17
(O.G.)
91V1II Patran (N.A.C.) ** 28 65 4 553 4 158
2/1X Patti (M.C.) 67 2 36 7 640 5 117
4/1X Payal (M.C) * * 6 14 164 7 65
Ph~gwara (U.A.*) 183 IB 52B 99 Jj 179 111 811 23
61111 Phagwara (M.C,) 176 17 464 99 10495 109 709 23
Mohalla Gobindpura (O.G.) 6 19 588 2 63
Kot Rani (O.G.) 25 96 39
5/V Phillaur (M.C.) 62 7 2 485 12 906 15 276 45
Qadian (U.A. *) 17 106 579 3 141
I/XI Qadian (M.C.) 17 II 542 3 131
Harljan Colony, I. T.I. 95 37 10 Balmiki Graveyard and D.A.V. Hr. Sec. School (O.G.)
5/111 Rahon (M.C.) 15 174 8 182 56
4/11 Raikot (M.C.) 71 51 76 29 689 9 149
2111 Rajasansi (c. T .) • 22 687 167 256 27 110
91V Rajpura (M.C.) 162 19 648 101 5093 127 766 16
II Nil Raman (M.C.) 68 18 51 13 859 20 112 7
211 Ramdas (M.C.) 4 26 2 99 14
1111 Rampura Phul (M.C.) 120 4 146 7 1354 38 436 13
2/V1I Rayya (N.A.C.) •• 9 16 340 68
811V Rupnagar (M.C) 49 10 109 4 1528 19 221 19
81111 S.A.S. Nagar (Mohali) 36 5 362 38 6316 444 749 116
(N.A.C)··
9/1X Samana (M.e.) 78 7 187 11 1290 3 450 4
Samrala (U.A. *) 37 5 687 25 117
212

CENSUS ABSTRACT
Trade &
Commerce
M
33
IS
30
247
75
29
44
1857
1502
291
6693
6562
96
35
1242
1853
1831
22
455
1678
311
6164
1757
132
3276
635
2637
3897
4281
1196
VII
F
34
3
3
2
9
17
7
142
137
4
33
10
10
15
7
112
49
49
3
49
249
16
18
Transport,
Storage &
Communications
M
35
10
12
90
42
7
33
233
365
56
1279
1228
35
16
280
442
432
10
105
362
226
1547
313
77
742
130
649
1071
695
236
VIII
F 36
5
2
17
17
3
4
4
4
41
8
4
10
50
4
INDUSTRIAL CATEGORY OF MAIN WORKERS
M 37
413
21
399
220
26
48
577
2523
271
3600
3479
51
70
2689
1202
1133
69
395
689
397
3494
784
240
1924
1193
4615
8686
1452
744
Other
Services
IX
213
F
38
64
3
78
49
4
108
311
49
IllS
1090
15
10
366
228
223
5
84
222
96
1159
189
53
487
110
996
3186
343
263
Iv!
Marginal
Workers
39
2
29
29
3
7
9
3
3
F
40
26
34
34
3
4
23
28
10
4
Non-Workers
M 41
1110
108
1464
557
315
324
3727
7072
1448
21570
20373
606
591
4990
5464
5135
329
2872
5370
2604
18331
4060
1302
8751
2272
9732
20537
9221
3832
F
42
2028
190
2130
- 881
487
519
6679
12039
2713
38828
36546
1158
1124
8749
9424
8904
520
4915
9700
4402
31347
7660
2203
16197
3901
16668
32287
16819
6747
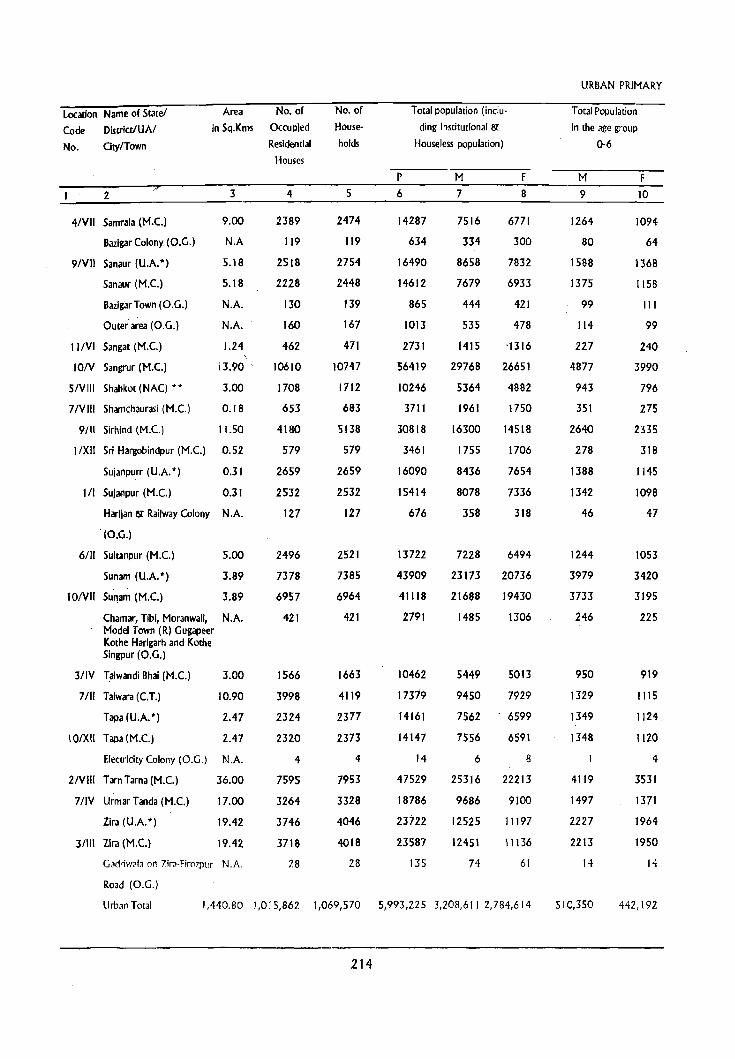
Location Name of Statel Area No. of
Code DistrictlUAI In Sq.Kms Occupied
No. CitY/Town
2 3
4NII Samrala (M.C.) 9.00
Bazlgar Colony (O.G.) N.A
9NII Sanaur (U.A.*) 5.18
Sanaur (M.C.) 5.18
BazigarTown (O.G.) N.A.
Outer area (O.G.) N.A.
l1NI Sangat (M.C) 1.24
ION Sangrur (M.C) 13.90
S/VIll Shahkot (NAC) 00 3.00
7/V1ll Shamchaurasi (M.C.) 0.18
9/11 Sirhind (M.C) 11.50
I/XII Sri Hargobindpur (M.C) 0.52
Sujanpurr (U.A.O) 0.3 I
III SuJanpur (M.C.) 0.31
Harlian & Railway Colony N.A.
(O.G.)
6/11 Sulranpur (M.C.) 5.00
Sunam (U.A. *) 3.89
10IVII SUl1am (M.C.) 3.89
Chamar, Tlbi, Moranwali, N.A. Model Town (R) Gugapeer Kothe Harigarh and Kothe Singpur (O.G.)
3/1V Talwandi Bhai (M.C.) 3.00
7/11 Talwara(C.T.) 10.90
Tapa (U.A.O) 2.47
101X1I Tapa(M.C) 2.47
Electricity Colony (O.G.) N.A.
2IVIIl Tarn Tarna (M.C.)
711V Urmar Tanda (M.C.)
Zira (U.A.*)
3/111 Zira (M.C)
36.00
17.00
19.42
19.42
Gadriwala on Zira·Firozpur N.A.
Road (O.G.)
Residential
Houses
4
2389
119
2518
2228
130
160
462
10610
1708
653
4180
579
2659
2532
127
2496
7378
6957
421
1566
3998
2324
2320
4
7595
3264
3746
3718
28
No. of
House
holds
5
2474
119
2754
2448
139
167
471
10747
1712
683
5138
579
2659
2532
127
2521
7385
6964
421
1663
4119
2377
2373
4
7953
3328
4046
4018
28
Total population (inclu
ding Institutional &
Houseless population)
P 6
14287
634
16490
14612
865
1013
2731
56419
10246
3711
30818
3461
16090
15414
676
13722
43909
41118
2791
10462
17379
14161
14147
14
47529
18786
23722
23587
135
M F 7 8
7516 6771
334 300
8658 7832
7679 6933
444 421
535 478
1415 '1316
29768 26651
5364 4882
1961 1750
16300 14518
1755 1706
8436 7654
8078
358
7336
318
7228 6494
23173 20736
21688 19430
1485 1306
5449 5013
9450 7929
7562 6599
7556 6591
6 8
25316 22213
9686 9100
12525 11197
12451 11136
74 61
Urban Total 1,440.80 1,015,862 1,069,570 5,993,225 3,208,6112,784,614
214
URBAN PRIMARY
Total Population
in the age group
0·6
M 9
1264
80
1588
1375
99
114
227
4877
943
351
2640
278
1388
1342
46
1244
3979
3733
246
950
1329
1349
1348
4119
1497
2227
2213
14
5 I 0,350
10
1094
64
1368
1158
111
99
240
3990
796
275
2335
318
1145
1098
47
1053
3420
3195
225
919
1115
1124
1120
4
3531
1371
1964
1950
14
442,192

CENSUS ABSTRACT
Scheduled
Castes
M II 12
1968 1770
301 276
1317 1225
865 798
444
8
280
421
6
273
5352 4836
1226 1079
1240 1071
2266 2060
777 742
2935 2552
2884 2508
51 H
970 902
4793 4171
4240 3701
553 470
1313 1248
2048 1689
1885
1885
1668
1668
4790 4158
2861 2679
3234 2784
3211 2762
23 22
629,876 550,210
M 13
Scheduled
Tribes
F
14
Literates
M 15
5217
152
4474
4166
79
229
824
20431
3456
1227
10799
1004
5561
5294
267
4616
13301
12633
668
3336
7419
4233
4228
5
16710
6882
6996
6952
44
16
4017
66
3154
2986
16
152
547
15074
2748
909
8305
793
4089
3902
187
3581
9332
8922
410
2474
5656
2867
2865
2
12494
5536
4992
4963
29
INDUSTRIAL CATEGORY OF MAIN WORKERS Total Main
Workers
(I-IX)
M F
17 18
3868
ISO
4549
4051
231
267
801 ...
323
417
410
6
41
14627 1692
2636
942
8108
8~9
4027
3842
185
3495
11828
11046
782
2787
4682
4118
4113
5
13185
4551
6651
6607
44
199
56
539
58
232
215
J 7
281
736
725
11
131
557
228
228
1032
370
365
360
5
Cultivators
M
19
348
782
675
107
194
438
140
90
528
93
179
179
260
1528
1098
430
298
2
544
544
787
555
810
808
2
F
20
5
14
14
25
7
4
3
4
4
4
2
2
2
Agricultural
Labourers
II
M F
21 22
7 527
121
1139
969
124
142
135
6
46
130
754
175
418
652
264
296
295
328
1101
953
148
368
59
600
600
1318
605
1782
1767
15
31
12
25
11
17
4
4
19
26
25
9
II
11
15
4
3
3
- 2,084,599 1,548,874 1,675,567 120,057 73,719 1,342 125,421 4,359
215

URBAN PRIMARY - _--._'_._ ... _---"-.
location Name of Statel INDUSTRIAL CATEGORY OF MAIN WORKERS -------"'_ Code Districr/UAI lIVCSlork, For~5tr y, Mining & Manufacturing, Processing, Servicing & Repairs In Construction
Number City/Town Fbhing, Hunt';lg & Quarr/ing
PIJntari(q~, Orchards Household . Other than house-
& AIIl~d Activitie:. Industry hold Industry
10 IV V(a) V(b) VI _,,_. __ w __ ._ ---_._-M F H F H F M F M F
2 2J 24 2S 26 27 28 29 30 31 32 -~--.--.'-~~_., ..... ----
41V1l .Samra!a (M.C) 37 5 683 25 117
Bazigar Colllny IO,G,) 4
9/Vll Sanalli' (U.A.·) 64 2 66 76 458 4 280 5
Sanaur (M.C.) 61 2 64 76 426 4, 239 5
BazigarTown (O.G.)
Outer areJ (O.G.) 3. 31 41
I I IV! Sangat (M.C) 7 57 7 54 4
IOIY Sangrur (M.q 298 16 340 30 1780 31 663 14
51V1II Shahkot (NAC) •• 19 31 8 332 134
71V1II Shamchaurasl (M.C.) 5 29 61 42
9/11 Sirhind (M.C) 97 170 22 1662 7 396
I/Xl! Sri Hargobillclpur (M.c.) 4 3 56 22
Sujanpurr (U.A .• ) 44 4 4 42 10 318 4 603 2
1/1 Sujanpuf (M.C.) 42 4 4 42 10 304 4 564 2
Hariial1 & Railway Colony 2 14 39
(O.G.)
6/11 Sultanpur (M.C.) 42 23 499 13 152
Sunam (UA *) 110 B 213 IB 1451 40 615 8
lOlVlI SUl'lam (M.C) 99 7 211 18 1427 40 563 B
Chamar, Tlbi, Moranwali, 11 2 24 52 Model Town (R~ Gugapeer Kothe Harigarh and Korh€ Slngpur (O.G,)
311V Talwandi B!1ai (M.C.) 10 36 4 512 67
7/11 Ta!wara (LT.) 184 23 5 218 2 924 37
Tapa (U.A!) 73 '} 4 456 17 97
IO/XIi Tapa (M.C.) 73 2 4 456 17 97
Electricity Colony (O.G.)
21V1II Tarn Tarna (M.C) liS 6 101 8 2016 44 352 3
71lV Urmar Tanda (M.e) 29 2 2 112 4 481 9 160
Zira (U.A.·) 86 3 36 5 770 15 125
31111 Zira (M.e) 86 3 36 5 759 15 124
Gadriwal;1 on Zira-Firozpur II
Road (O.G.)
Urban Total 19,100 1,496 130 2 27,468 3,452 423,949 8,584 74,102 1,563
216
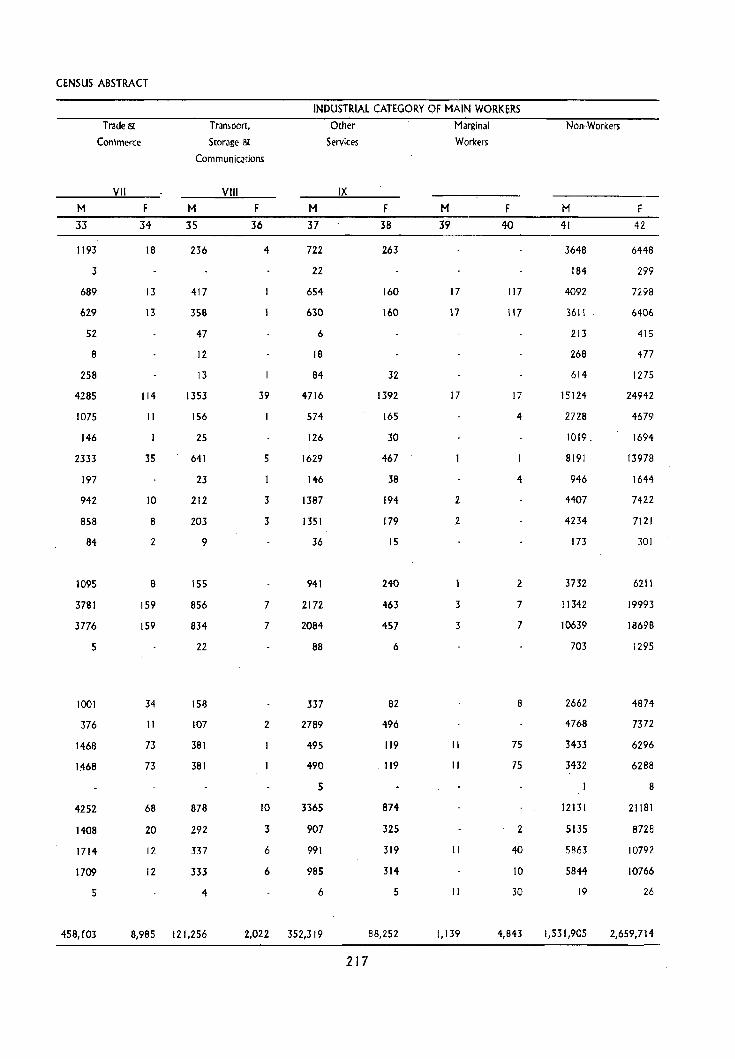
CENSUS ABSTRACT
INDUSTRIAL CATEGORY OF MAIN WORK~RS
M
33
1193
3
689
629
52
8
258
4285
1075
146
2333
197
942
858
84
1095
3781
3776
5
1001
376
1468
1:468
4252
1408
Trade &
Conimerce
VII
F
34
16
13
13
114
11
35
10
8
2
8
159
159
34
II
73
73
68
20
Transpon,
Storage &
Communications
M
35
236
417
358
47
12
13
1353
156
25
641
23
212
203
9
155
856
834
22
158
107
381
381
878
292
VII!
F
36
4
39
5
3
3
7
7
2
10
3
M
37
722
22
654
630
6
18
64
4716
574
126
1629
146
1387
1351
36
941
2172
2084
88
337
2769
495
490
5
3365
907
1714 12 337 6 991
1709
5
458, r03
12 333
4
8,985 121,256
6 985
6
2,022 352,319
Other
Services
IX
217
F
38
263
160
160
32
1392
165
30
467
38
194
179
15
240
463
457
6
82
496
119
. 119
874
325
319
314
5
88,252
M
39
Marginal
Workers
17
17
17
2
2
3
3
II
II
11
11
1,139
F
40
117
117
17
4
4
2
7
7
8
75
75
2
40
10
30
4,843
Non-Workers
M 41
3648
l84
4092
3611
213
268
614
15124
2728
1019.
8191
946
4407
4234
173
3732
11342
10639
703
2662
4768
3433
3432
12131
5135
5863
5844
19
1,531,905
F
42
6448
299
7298
6406
415
477
1275
24942
4679
1694
13978
1644
7422
7121
301
6211
19993
18698
1295
4874
7372
6296
6288
8
21181
8728
10792
10766
26
2,659,714

APPENDIX - 1
219


APPENDIX -I
LOCATION OF TOWNS ARRANGED IN ALPHABETICAL ORDER
SI. No. Name of Town with Location Code Tahsil District
2 3 4 ~'''''-''''''''''''''''--~''_.,,-~-
1. Abohar 3/X Abolla. Firozpur
2. Adampur SIXI Jalandhar Jalandhar
3. Ahmedgarh 1011 Ma!erkotla Sangrur
4. Aka I garh 4/11J Jagraon Ludhiana
5. Alawalpur 5/XII Jalandhar Jalandhar
6. Amloh 9/XI Nabha Patiala
7. Amrltsar 2/1V Arnritsar Arnritsar
8. Amrltsar cantt. 2/V Amrit,ar Amrltsar
9. Anandpur Sahib 8/111 Anandpur Sahib Rupnagar
10. Badhnl Kalan 1211 Moga Faridkot
11. Baghapurana 12/111 .Moga Faridkot
12. Banga 5/1 Nawanshahr Jalandhar
13. Banaur 9/1V Rajpura Patiala
14. Bareta II/XI Mansa Bathinda
15. Bamala 10lX Barnala Sangrur
16. Bassi 911 Fatehgam Sah~ Patiala
t 7. Batala l/X Batala Gurdaspur
18. Bathinda 11/111 Bathinda Bathinda
19. Behrampur IIlV Gurdaspur Gurdaspur
20. Bhadaur 10lXI Bamala Sangrur
21. Bhawanigarh IOIIV Sangrur Sangrur
22. Bhlkhiwind 2/X Patti Amritsar
23. Bhogpur 5/XIIt ]alandhar )alandhar
24. Bhucho Mandl 1lliV Bathinda Bathinda
25. Budhlada l1/X M:msa Bathinda
26. Dasua 7/111 Dasua Hoshiarpur
221

SI. No. Name of Town with Location Code Tahsil District
2 3 4
27. Dera Baba Nanak I/VII Batala Gurdaspur
28. Dera Bassi 91111 Rajpura Patiala
29. Dhanaula IO/IX Bamala Sangrur
30. Dhariwal lilY Gurdaspur Gurdaspur
31. Dharamkot 3/1 lira Firozpur
32. Dhuri 1011lI Malerkotla Sangrur
33. Dinanagar 1/111 Gurdaspur . Gurdaspur
34. Doraha 41V1II Khanna Ludhiana
35. Faridkot l2/1Y Faridkot Faridkot
36. Fatehgarh Churiaon 1I1X Batala Gurdaspur
37. Fatehnangal l/VII Gurdaspur Gurdaspur
38. Fazllka 3/1X Fazilka Fazilka
39. Firozpur 31V Firozpur Firozpur
40. Firozpur Cantt. 31V1 Firozpur Firozpur
41. Garhdiwal~ 71V Hoshiarpur Hoshiarpur
42. Garhshankar 7/1X Garhshaskar Hoshiarpur
43. Giddarbaha 12/1X Muktsar Faridkot
44. Goblndgai11 9/XII Nabha Patiala
45. Goniana 11 III Bathinda Bathinda
46. Goraya 5/1Y Phillaur Jalandhar
47. Gurdaspur IIV Gurdaspur Gurdaspur
48. Guru Har Sahai 3IVII Firozpur Firozpur
49. Harlana 71V1 Hoshiarpur Hoshiarpur
SO. Hoshiarpur 71Y1I Hoshiarpur Hoshiarpur
51. Jagra~n 4/1 Jagraon Ludhiana
52. Jaitu 121Y1 Faridkot Faridkot
53. )alalabad 31V1II Fazilka Firozpur
54. Jalandhar 5/1X Jalandhar Jalandhar
222

SI. No. Name of Town with Location Code Tahsil District
2 3 4
55. Jalandhar Cantt. 5/X Jalandhar Jalandhar
56. Jandiala 21Y1 Amritsar Amritsar
57. Kapurthala 6/1 Kapurthala Kapurthala
58. Kartarpur 51XIV Jalandhar Jalandhar
59. Khanna 4/X Khanna Ludhiana
60. Kharar SlYtI Kharar Rupnagar
61. Kot Fatta lIlY Bathinda Bathinda
62. Kot Ise Khan 3/11 Zira Firozpur
63. Kot Kapura 121Y Faridkot Faridkot
64. Kurali S/VI Kharar Rupnagar
65. Lehragaga 101V1II Sunam Sangrur
66. Longowat 10NI Sangrur Sangrur
67. Ludhiana 4N Ludhiana Ludhiana
6S. Machhiwara 4/V1 Samrala Ludhiana
69. Majitha 2/111 Amritsar Amritsar
70. Malerkotla 10/11 Malerkotla Sangrur
71. Malout 121V1Il Muktsar Faridkot
72. Mansa II/IX Mansa Bathinda
73. Maur I INIII Talwandi Sabo Bathinda
74. Moga 12/11 Moga Faridkot
75. Morinda SN Rupnagar Rupnagar
76. Mukerian 711 Dasua HoshiarpUi
77. Muktsar 12NII Muktsar Faridkot
7S. Mullanpur Dakha 4/IV Ludhiana Ludhiana
79. Nabha 9/X Nabha Patiala
80. Nakodar 5NII Nakodar Jalandhar
81. Nangal Township 8/11 Anandpur Sahib Rupnagar
82. Nawanshahr 5/11 Nawanshahr Jalandhar'
223

SI. No. Name of Town with Location Code Tahsil District
I 2 3 4
83. NayaNangal 811 Anandpur Sahib Rupnagar
84. Nunnahal SIVI Phillaur Jalandhar
85. Pathankot 1/11 Pathankot Gurdaspur
86. Patiala 91V1 Patiala Patiala
87. Patran 91V1II Samana Patiala
88. Patti 211X Patti Amritsar
89. Payal 411X Khanna Ludhiana
90. Phagwara 6/111 Phagwara Kapurthala
91. Phillaur SIV Phillaur Jalandhar
92. Qadian I/XI Batala Gurdaspur
93. Rahon 5/111 Nawanshahr Jalandhar
94. Raikot 4/11 Jagraon Ludhiana
95. Rajasansi 2111 Ajnala Amritsar
96. Rajpura 91V Rajpura PatiaJa
97. Raman IINII Talwandi saho Bathinda
98. Ramdas 2/1 Ajnala Amritsar
99. Rampura Phul 11/1 Rampura Phul Bathinda
100. Rayya 2Nll Baba Bakala Amritsar
101. Rupnagar 8/1V Rupnagar Rupnagar
102. S.A.S. Nagar (Mohali) 8NIII Kharar Rupnagar
103. Samana 9/1X Samana Patiala
104. Samrala 4IVII Samrala ludhiana
lOS. Sanaur 91V1I Patiala Patiala
106. Sangat IINI Bathinda Bathinda
107. Sangrur 10N- Sangrur Sangrur
108. Shahkot 51V1II Nakodar )alandhar
109. Shamchaurasi 71V11I Hoshiarpur Hoshiarpur
110. Sirhind 9/11 Fatehgarh Sahib Patiala
224

51. No. Name of Town with Location Code Tahsil District
2 3 4
1 1 1. Sri Hargobindpur llXII Batala Gurdaspur
112. Sujanpur 1 II Pathankot Gurdaspur
113. Sultanpur 6/11 Sultan pur Lodhi Kapurthala
114. Sunam 101V1I Sunam Sangrur
115. Talwandi Bhai 3/1V Firozpur Firozpur
116. Talwara 7/11 Dasua Hoshiarpur
117. Tapa 10/XII Barnala Sangrur
118. Tarn Taran 21V1Il Tarn Taran Amritsar
119. Urmar Tanda 7/1V Dasua Hoshiarpur
120. Zira 3/111 Zira Firozpur
225
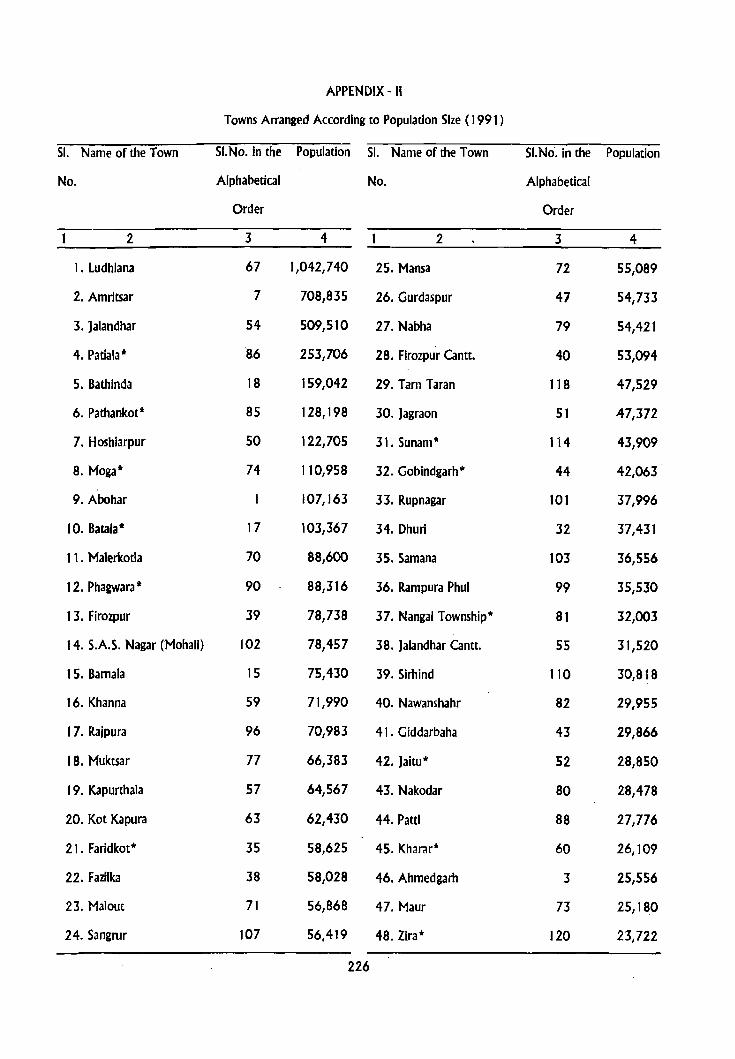
APPENDIX -II
Towns Arranged According to Population Size (1991)
SI. Name of the Town SI.No. in the Population SI. Name of the Town SI.Ne. in the Population
No. Alphabetical No. Alphabetical
Order Order
2 3 4 2 3 4
1. ludhiana 67 1,042,740 25. Mansa 72 55,089
2. Amrltsar 7 708,835 26. Gurdaspur 47 54,733
3. ]alandhar 54 509,510 27. Nabha 79 54,421
4. Patiala* 86 253,706 28. Firozpur Cantt. 40 53,094
5. Bathinda 18 159,042 29. Tam Taran 118 47,529
6. Pathankot* 85 128,198 30. Jagraon 51 47,372
7. Hoshiarpur 50 122,705 31. Sunam* 114 43,909
8. Moga* 74 110,958 32. Gobindgarh* 44 42,063
9. Abohar 107,163 33. Rupnagar 101 37,996
10. Batala* 17 103,367 34. Dhurl 32 37,431
11. Malerkotla 70 88,600 35.Samana 103 36,556
12. Phagwara * 90 88,316 36. Rampura Phul 99 35,530
13. Firozpur 39 78,738 37. Nangal Township* 81 32,003
14. S.A.S. Nagar (Mohali) 102 78,457 38. Jalandhar Cantt. 55 31,520
15. Bamala 15 75,430 39.Sirhind 110 30,818
16. Khanna 59 71,990 40. Nawanshahr 82 29,955
17. Rajpura 96 70,983 41. Giddarbaha 43 29,866
18. Muktsar 77 66,383 42. Jaitu* 52 28,850
1 9. Kapurthala 57 64,567 43. Nakodar 80 28,478
20. Kot Kapura 63 62,430 44. Patti 88 27,776
21. Faridkot* 35 58,625 45. Kharar* 60 26,109
22. Fazilka 38 58,028 46. Ahmedgarh 3 25,556
23. Malout 71 56,868 47. Maur 73 25,180
24. Sangrur 107 56,419 48. Zira* 120 23,722
226
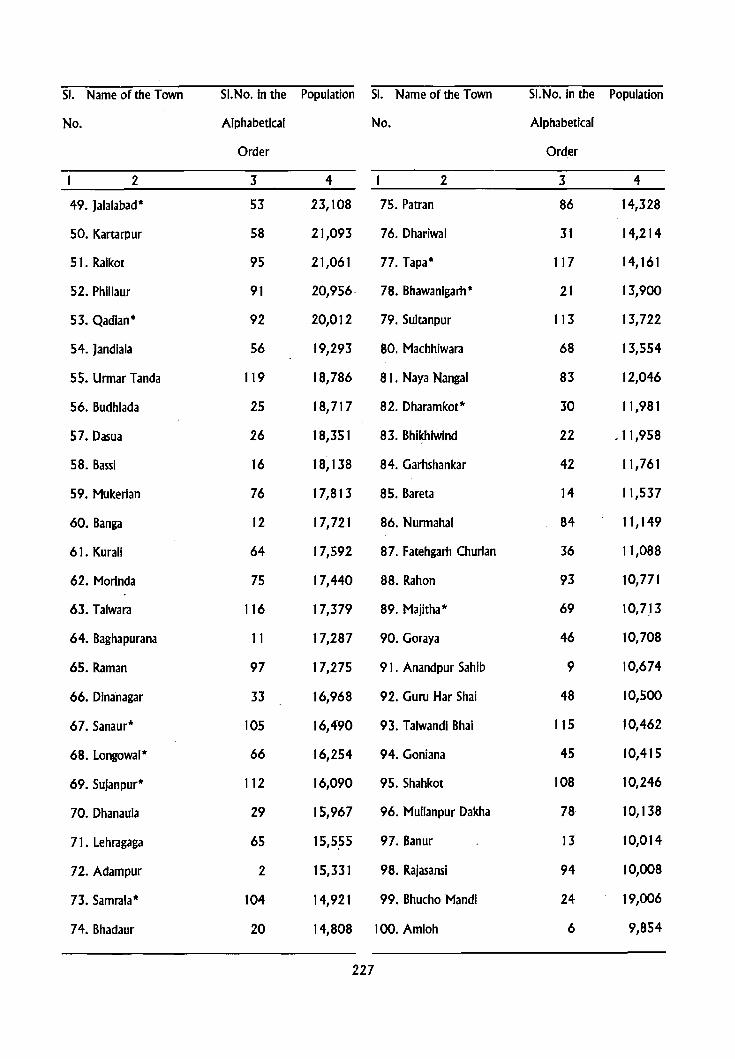
SI. Name of the Town SI.No. In the Population SI. Name of the Town SI.No. in the Population
No. Alphabetical No. Alphabetical
Order Order
2 3 4 2 3 4
49. )alalabad* 53 23,108 75. Patran 86 14,328
50. Kartarpur 58 21,093 76. Dhariwal 31 14,214
51. Ralkot 95 21,061 77. Tapa* 117 14,161
52. Phillaur 91 20,956- 78. Bhawanigarh* 21 13,900
53. Qadlan* 92 20,012 79. Sultanpur 113 13,722
54. Jandlala 56 19,293 80. Machhiwara 68 13,554
55. Urmar Tanda 119 18,786 81. Naya Nangal 83 12,046
56. Budhlada 25 18,717 82. Dharamkot* 30 11.981
57. Dasua 26 18,351 83. Bhikhiwind 22 .11,958
58. Bassi 16 18,138 84. Garhshankar 42 11,761
59. Mukerian 76 17,813 85. Bareta 14 11,537
60. Banga 12 17,721 86. Nurmahal 84 11,149
61. Kurali 64 17,592 87. Fatehgarh Churian 36 11,088
62. Morlnda 75 17,440 88. Rahon 93 10,771
63. Talwara 116 17,379 89. Majitha* 69 10,713
64. Baghapurana 11 17,287 90. Goraya 46 10,708
65. Raman 97 17,275 91. Anandpur Sahib 9 10,674
66. Dinanagar 33 16,968 92. Guru Har Shai 48 10,500
67. Sanaur* 105 16,490 93. Talwandi Bhai 115 10,462
68. Longowal* 66 16,254 94. Goniana 45 10,415
69. SuJanpur* 112 16,090 95. Shahkot 108 10,246
70. Dhanaula 29 15,967 96. Mullanpur Dakha 78 10,138
71. Lehragaga 65 15,5,55 97. Banur 13 10,014
72. Adampur 2 15,331 98. Rajasansl 94 10,008
73. Samrala* 104 14,921 99. Bhucho Mandl 24 19,006
74. Bhadaur 20 14,808 100. Amloh 6 9,854
227

51. Name of the Town 5J.No. In the Population 51. Name of the Town 51. No. in the Population
No. Alphabetical No. Alphabetical
Order Order
2 3 4 2 3 4
1 01. Dera Bassi 28 9,602 111. Kot Fatta 61 5,611
102. Doraha 34 9,589 1 12. Akalgarh 4 5,564
103. Rayya 100 9,122 113. Garhdlwala 41 5,159
104. Badhnl Kalan 10 8,572 1 I 4. Bhogpur 23 4.896
105. Kot Ise Khan 62 7,604 1 I 5. Behrampur 19 4,806
106. Dera Baba Nanak 27 7,380 116. 'Ramdas 98 4,765
107. Hariana 49 6,473 117. Amrltsar Canu. 8 3,832
108. Alawalpur 5 6,468 118. Shamchaurasl 109 3,71 t
109. Fatehnangal 37 6,095 11 9. 5r1 Hargoblndpu' 111 3,461
110. Payal 89 5,852 120. 5angat 106 2,731
it Includes the population of outgrowth (s)
228

APPENDIX - III
Towns Arranged Dlstrlctwise According to Population Size (1991 )
SI.No. Name of the Town Population SI.No. Name of the Town Population
2 3 2 3
1. GURDASPUR DISTRICT 2. Flrozpur 78,738
1. Pathankot* 128,198 3. Fazllka 58,028
2. Batala* 103,367 4. Flrozpur cantt. 53,094
3. Gurdaspur 54,733 5. Zira* 23,722
4. Qadlan* 20,012 6. )alalabad* 23,108
5. Dlnanagar 16,968 7. Dharamkot* 11,981
6. SuJanpur* 16,090 8. Guru Har Sa hal 10,500
"!, Dharlwal 14,214 9. Talwandl Bhal 10,462
.:. fatehgarh Churian 11,088 10. Kot Ise Khan 7,604 ',,1:
~ Dera Saba Nanak· 7,380 4. LUDHIANA DISTRICT
10;, .fatehnangal 6,095 1. Ludhlana 1,042,740 '"lj.'
Il+ 8ehrampur 4,806 2. Khanna 71,990
12.. Sri Hargoblndpur 3,461 3. )agraon 47,372
2. AMRITSAR DISTRICT 4. kalkot 21,061
IIF AmrItsar 708,835 S. Samrala* 14,921
2. Tam Taran 47,529 6. Machhlwara 13,554
3. Pattf 27,776 ·7. Mullanpur Dakha 10,138
4. )andlala 19,293 8. Doraha 9,589
5. Bhlkhlwfnd 11,958 9. Payal 5,852
6. Malltha* 10,713 10. Akalgarh 5,564
1. RaJasansl 10,008 5. JALANDHAR DISTRICT
8. Rayya 9,122 1. )alandhar 509,510
? Ramdas 4,765 2. )alandhar Cantt. 31,520
10. Amritsar Cantt. 3,832 3. Nawanshahr 29,955
3. FIROZPUR DISTRICT 4. Nakodar 28,478
1. Abohar 107,163 5. Kartarpur 21,093
229

SI.No. Name of the Town Population SI.No. Name of the Town Population
2 3 2 3
6. Phlilaur 20,956 5. Kurali 17,592
7. Banga 17,721 6. Morinda 17,440
8. Adampur 15,331 7. Naya Nangal 12,046
9. Nurmahal 11,149 8. Anandpur Sahib 10,674
10. Rahon 10,771 9. PATIALA DISTRICT
11. Goraya 10,708 1. Patiala* 253,706
12. Shahkot 10,246 2. Rajpura 70,983
13. Alawalpur 6,468 3. Nabha 54,421
14. Bhogpur 4,896 4. Gobindgarh* 42,063
6. KAPURTHALA DISTRICT 5. Samana 36,556
1. Phagwara * 88,316 6. Sirhind 30,818
2. Kapurmala . 64,567 7. Bassi 18,138
3. Sultanpur 13,722 8. Sanaur* 16,490
7. HOSHIARPUR DISTRICT 9. Patran 14,328
1. Hoshiarpur 122,705 10. Banur 10,014
2. Urmar Tanda 18,786 11. Amloh 9,854
3. Dasua 18,351 12. Dera Bassi 9,602
4. Mukerian 17,813 10. SANGRUR DISTRICT
5. Talwara 17,379 t. Malerkotla 88,600
6. Garhshankar 1 t ,761 2. Bamala 75,430
7. Harlana 6,473 3. Sangrur 56,419
8. Garhdiwala 5,159 4. Sunam* 43,909
9. Shamchaurasi 3,711 5. Dhuri 37,431
8. RUPNAGAR DISTRICT 6. Ahmedgarh 25,560
1. S.A.S Nagar (MohaJi) 78,457 7. Longowal* 16,254
2. Rupnagar 37,996 8. Dhanaula 15,967
3. Nangal Township* 32,003 9. Lehragaga 15,555
4. Kharar* 26,109 10. Bhadaur 14,808
230

SI .• No. Name of the Town Population SI.No. Name of the Town Population
2 3 2 3
11. Tapa* 14,161 10. Kot Fatta 5,611
12. Bhawanlgarh* 13,900 11. Sangat 2,131
11. BA THINDA DISTRICT 12. FARIDKOT DISTRICT
1. Bathinda 159,042 1. Moga* 110,958
2. Mansa 55,089 2. Muktsar 66,383
3. Rampura Phul 35,530 3. Kot Kapura 62,430
4. Maur 25,180 4. Faridkot* 58,625
5. Budhlada 18,717 5. Malout 56,868
6. Raman 17,275 6. Glddarbaha 29,866
7. Bareta 11,537 7. Jaltu* 28,850
8. Gonlana 10,415 8. Baghapurana 17,287 ~.,.
9. Bhucho Mandl 10,006 9. 8adhni Kalan 8,572
~~:lncludes the population of outgrowth (s)
231

APPENDIX - IV
T own5 Showing their Outgrowths with Population
SI. No. Name of Town the with Population of Out growth Population of
Locatipn Code Core Town Outgrowth
2 3 4 5
1. Satala 1/X 86006 (i) , Bakewal 3,975
(ii) Gaunspura 2,601
(iiO Bhatha Inderjit 1,830
(iv) Marlianwala 1,316
(v) Umarpura 1,226
(vi) Sagarpur 1,092
(vII) Kothe Malawa 1,091
(viii) Bawall Inderjit 882
(bt) Bhode-di-Khui 178
(x) Alowal 756
(xi) Kharal 608
(xii) Nawanplnd 462
(xiii). )harrtwalan 340
(xiv) Haveli Chobdaran \
238
(xv) Man! Ghauranga 166
2. Bhawanigarh 101lV 10,115 (I) )hugi Basd (outside 3785
M.C. Limts)
3. Dharamkot 3/1 11,293 (i) 80 Houses outside 688
M.C. Umits
4. Farldkot 12/1V 58,244 (i) Houses and Rice sellers 381
(on Bholowal Road)
5. Gobindgarh 9/XII 40, i 75 (I) Iqbal Colony 754
(II) Sant Nagar 691
(ill) Daiip Nagar 443
6. )aitu 12NI 28,758 (i) Kothe Lal Premi 92
232

SI. No. Name of Town the with Population of Out growth Population of
Location Code Core Town Outgrowth
2 3 4 5
7. Jalalabad 3/V1II 18,476 (i) Extended area block No.22 4,632
8. Kharar 8NtI 25,938 (I) Nawanshahr 171
9. Longowal 101V1 15,419 (i) Plndi Kehar Singh 835
& Pind; Dhilwan
10. Maiitha 2/111 9,912 (I) Rori and Idgah 801
11. Moga 12/11 108,304 (i) Duneke (Firoipur Road) 2,203
(ii) Lande ke (Amritsar Road) 451
12. Nanga! Township 8/11 29,311 (i) Outsee Colony Block 'A' 687 "
(U) Oustee Colony Block 'B' 2,005
13. Pathankot 1111 123,930 (i) Lam in 2,196
(i1) Khanpur 1,865
(iii) Dhaki 207
14. Patiala 9/VI 238,368 (I) Back side' of Central Jail 4,821
(Ii) D.C.W. Colony 4,788
(iii) Backside of Thapar College of Engg. 2,019
(iv) Village Rasulpur Saidan 1,166
(v) Village Khen Gujran Side 1,117
(vi) Thapar College of Engg. 1,009
(vii) Hira 8agh Colony 418
15. Phagwara 61111 83,163 (I) Mohala Gobindpura 2,697
(iI) Kot Rani 2,456
16. Qadian lIXI 18,867 (i) Harilan Colony I.T.I.
Balmlki Graveyard &
D.A.V. Hr. Sec. School 1,145
17. Samrala 4NII t 4,287 (I) Bazlgar Colony 634
18. Sanaur 9NII 14,612 (I) Outer Area 1,013
(i) Bazigar Town 865
233

51. No. Name of Town the with Population of Out growth Population of
Location Code Core Town Outgrowth
1 2 3 4 5
19. Sujanpur III 15,414 (I) Harijan & Railway Colony 676
20. Sunam 10IVII 4 1,118 (i) Chamar, Tlbbi, Moranwali, 2,791
Model Town (Rural), Gugapeer,
Kothe Harigam and Kothe Singhpur
21. Tapa 10/XII 14,147 (I) Electricity Colony 14
22. Zira ' 3/111 23,587 (I) Gadriwala (on Zira Firozpur lRoad) 135
234

APPENDIX - V
Places ofTourist Interest In the Towns ofthe Punjab State
51. Name of Places of Tourist
No. the Town Interest
1. Pathankot
2. Batala
3. Gurdaspur
4. Dinanagar
5.Dera Baba Nanak
kAmritsar
2. Tam Taran
3. Jandiala
4. Ramdas
1. Fazilka
2 3
t. GURDASPUR DISTRICT
Some Muslim tombs, a temple of Lord Shiva and group of Buddhist caves near Pathankot.
Gurdwara Kandh Sahib
Smadhi Baba Rore Boore, Damar Saraj· ul-Haq
Dayanand Math
Chola of Sri Guru Nanak Dev preserved in a glass showcase in a Gurdwara.
2. AMRITSAR DISTRICT
Golden Temple, Akal Takht, Rambag Garden, Centtal Sikh Museum, )allianwala Bagh, Durgiana Mandir, Tower of Baba Atal Rai
Gurdwara with a gilt domed structure
Temple of Bhadar Kali (Goddess)
Smadh of Baba Buddha, Tomb Shah Habib Kotli
3. FIROZPUR DISTRICT·
Grave of Pir Gurian
2. Dharamkot Smadh Baba Blshan Singh
t. Ludhiana
2. )agraon
3. Raikot
4. !Samrala
5. M.lChhiwara
4. LUDHIANA DISTRICT
Punjab Agricultural University
. Tomb of Baba Mehkam-ud-Din
Gurdwara Tahana Sahib
Temple of Durga, Tomb of jogi pir
Gurdwara Cham Kamal and Temple of Goddess Bhadar Kali
SI. Name of Places of T ()urist
No. the Town Interest
1. Jalandhar
2. Nakodar
3. Kartarpur
4. Phillaur
5. 1'-:!urmahal
6. Rahon
2 3
5. JALANDHAR DISTRICT
800 year old Imam Nasir Mausolem, Devi Talab, Four Centuries old 1ama Masjid and Temple Baba Sodal.
Tombs of Ustad and Shagird
Gurdwara Gangsar
Fort which was originally a mughal caravan Seral presently the (State Police Training School is housed In thIs fon)
Serai and Sara Mandir
Dera Baba Rlkhi
7. Goraya Silraj Kund (Tank) related to Pandvas
6. KAPURTHALA DISTRICT
t. Phagwara Temple of Mama Devi built by Mughal Emperor.
2. Kapunhala Panch Mandir, a famous mosqu~ designed by a French Architect, Tomb of Zia-ul-Din, Shalimar garden and Jagatjit Place.
3. Sultanpur Gurdwara Ber Sahib
7. HOSHIARPUR DISTRICT
1. Hoshiarpur Temple of Sida Mata and Sheesh Mehal
2. Urmar Tanda Smadh of Saint Baba Hargobind and Smadh of SaInt Baba Boota Bhagat
3. Shamchurasi Smadh of Saint Baba Inder Dass and Tomb of Baba Shami Shah
t. Kurali
2. Anandpur Sahib
8. RUPNAGAR DISTRICT
Smadhi in water of Baba Gosain wala, Temple Sitla Mata
. Gurdwara Keshgarh and other important Gurdwaras and Shri Guru Tegh Bahadur Museum
235

SI. Name of Places of Tourist SI. Name of Places of Tourist
No. the Town Interest No. the Town Interest
2 3 2 3
9. PATIALA DISTRICT S. Longowal Gurdwara Bhai Mani Singh, Sidh Smadh Desmi
1. Patiala Darbar Hall in Fort Patiala, the Art Gallery at Sheesh Mahal, Baradari Place, 6. Tapa Math of Baba Sukha Nand GOrdwara Dukh Niwaran, Shahi Samadhan, Rajindera Tank, Temple Kali 11. BATHINDA DISTRICT Devi etc.
1. Bathinda Fort (Razla Sultan was imprisoned in this 2. Nabhs" Rani Mahal fort)
3. Sirhind Aam Khas Bagh, Tombs of Ustad and 2. M.!nsa , Smadh of Baba Bh~i Gurdas Shagird, Mosque of Saint Butcher Sadna, HaveliroqarMal, TombsofMir 3./Goniana Gurdwara Bhai Jagla JI Miran and Taj Bibi, Gurdwara Fatehgarh
12. FARIDKOT DISTRICT Sahib, Rauza Sharif
10. SANGRUR DISTRICT 1. Muktsar Gurdwara Sahidgahj (built in memory of the fony muktas)
1. Malerkotla Smadh of Baba Roda, Smadh of Baba Atma Ram, Mosques, Shrine of Sheikh
2. Kot Kapura Shrine of Mehrana Sadur-ud-Din.
2. Sunam Tomb of Pir Khawaja Mahommd Banai, 3. Faridkot Fort (beautifully designed Sheesh Mahal. Smadh Bawa Mansa Ram, Smadh Baba of mirrors in fort), Smadh ofBaba Farid Manga Ram
4. Giddarbaha ' Gurdwar~ founded by Sri Guru Goblnd 3. Dhanaula Tomb ofPir Khanan, Hanuman Temple Singh
4. ~hada~( Smadh of Baba Cham Dass 5. Jaitu ' Tlbbi Sahib
236


JAMMU I & ./\.
PUNJAB KASHMIRro \ _"'~HAR- _.
""\ .-' KALAN,i ·'''· . .It (! J'
!:l ~ II 'R f~Cfi mu6
ADMINISTRATIVE DIVISIONS 1991
_ .... 4AMlAL i.i Pa hankot
'" JO 0 loJ. ........ NARaT r.L.
f · JAIMAL • 'y
• vSI!!~t::._ t.7_ " Km 10 5 0 \0 20 t>- ..r .. ..t ~INAN~GA;7 ./ 1-
'_"'~~ANAUR GURDASPUR yt:...-.... .., ". ) \Q @. \,. C'
~ j .!:_ERA 8A8A( • . o · '. \ >lUKERIAN , . . ' \,. ".. ;/ NANAK \ .' . . 0 '. . ""'-. 1-r " . '2_ , . DHARIWAL i ( · ·0 . ~\
,.:. Ajnala ,,0 . ,.' "1~ . .: 0 '.' . TALWARA· , . @ ,FA TEHGARtf '\ ... .;' 'KAHNU _ ) \
30 40Km
i . 0 ('C~~AN " B@Qtala~~~:-l~WAN 't' Da@~ua ~~ /i~J"-' " V) . "' -._. ;M~J[THA·\: ... ·: 0 _ .. :: \.I"l,-" '" / L {'~
'-{HOGAWAN ,C:" .:--..,.. y- r" •
~
(
<... . 0 '~~RKA ' . . .. ~ "- " SRIHARGOBIND" \., 8HUNGA \ \_\ lAMRITSAR 0f:'::.\:.~ . \. PUR 07 TAI~,oA i 0 '\ 1 v~'J/ @ I '\0 " .-' --../ '- I • '\. \lARSIKKABaba \} • __ -" . \ . \:r-~, JANDIALA'L 'RAYY,o, Bakala / ) ° \ HOSHIARPUR "
d: ~ ~ '\ /'\" 0 @ / 0 ~HOG-' j - -, '"- - f\ o. / NADALA r-f PUR ,HOSHIARPUR-I @ \ • GANDIWIND J ,- _J~/ r' \ \ 'J 0 . Tarn Taran KHADUR7 C'I. \,c ).Jr
•• I~ @oSAHIj!/ iJALANDHAR 0 '\HOSH'ARPUR"~ " I ~ NAUSHEHaA' ( , IWESTI ADAMPUR. f/ J ' ,/'.
t· 0 Ir, i:;,PT PANNUAN ;' 'Ii'.) /- _/ MAHILPUR ( (\ \S'
B::~~I- .5tJkc~aHLA j ''\rJKA~'5'R-;,'' @ ~V I ~""; a \ ~ \ oS-C' @ ( SAglS I' ; THALA :.IfLANDHARr~ha9warh. Garh •• _\ V". { Patti ~'\ J' Sulta~pur l_~, '- j~~~~'iAR @)V"'-'" Shankar ,>AnandP~lr'\ (VALfoHA (LOdhi @ ('~ ""'l.. ... , 4!\ 0 "'. @ f;~'/' Sahib. @ (.? • ~.- \;- . /.----t._. Nakodar/ '-. ..) -"..., BANGA " ;5AROYA \ 0 / ~l'
L "" t;v.).~ ""C. @ ,./0 0 \ \ ' ~URPUR I ""II:; • ..,.. ./ ! '- SHAHKOT \ RURKA , @ l BEOI 1 1 ,......_.J I "'-. 0 JNURMAHAL KALAPhillaur l AUR Nawan-l8alachaur I;: /
J. } "'\..,@\OShahrl@ r • . \ ."\..""- '/ ~-Z3-'-J.~ ./",( \. ) l UT.OF
.1"" ® \@ZIRA (DHARAMKo'n '-.~ _.'( -,' -, ....... - ___, 16\ ''''_ CHANDIGARH ,J FIROZPUR '\ - <) AT f SIDHWAN BET I LUDHIANA \ 0 ~ ',
GHALL KHURD'_"- --...__ ) I , \ \ . \ 0 ~ , t! L, KOT ISo KHAN '\ 0 ;LUDHIANA-II@.)'MACHHI_'I\ RUPNAGAR r./-""~' o I ·-:--· __ ·....._r " rlUDHIANA-! /I / WARA V(CHAMKAlIR ,..,. ... ,f MAJRI i
~ . ....,...-._ I MOGA-II @ ;-4' . I \1 @ 1SAHI8 ( 0" 't. ./."\;..> ° Moga I @) SUDHAR , . . rvo ,~SamrQla \ ... ,
.J' 1'/ ',,! N MOGA-I . Jagraon O() OEHLDN ,tPORAHA \~J- I\f ~--.. /') - '0'/. 'A ,- 0 ( t:\' 1;.- 0 . ,-J 2-/ ..-; { . ) @ •
• /..._. GU~~H~tR'> ___ ,- FAR;6'KOT \> BA~HA '. / \~~HOZ~ ___ .... _th~~f)!l r~~;').fo ::i~~~ _Kharar • ...f-, r . '6\ J \. i" ! PURANA ." ). ., )' . ./, \ .,.-..> ( \ \. < 'f' . SIR~INDo'VQ\ if, ., /1 ., • J.ALALABA'\_ (' ,-" .. .. , 0 _I ... ' ° 1 '--'\.. "lAHMEDGARH .l,.. . ..:::.-..... ' ';:;l.. 7teh arheJ "'\ ..) • q .r".t -'~). ? KOT (f\ r 'yoiIHe,LAtINGH )':;EHAL KALAN/ r .' \--. . ~'7\ S~hIb91~_1 ''''vil :' 0 l
( ....•.. • M. uktsar ~L KAPURA 1 ..... ·--.) '- . ~r/""'" . 0 '- ® J .. .. \ I Rajpura , OERA ~ (I. ... / '@ o )'·'I,'...· .. ·, Malerkotla ·.. I\@,.'BASSl
f·
., .... / . 0 .... ( ."" . 5EHNA . .. " .. .. ' . ) 0 ...... ... ...
. 1-'- ' ... <-' . \, - '. 0 """"! r' ) J~ r~J-\ ......... ; / @ _~ziikO r l-~.,........_.~.,l/ ~\. I ..... . ...... I 0 /' Nabha r' 'v ('".I' ("'''''- '\
'\/' ' ..... ..... ? ¢?:J J 0 ,,) PHUL '1 ... @ riDHURln·· .. e. '(§) \~ PATIALA ; GHA~AUR '? l ., : ; "}' . /' J (KOT BHAII? . .. ~ATHANA\_-.~,-;:;-; .. S.", ... ..' Barnala \_~/~,...~/ I.._f..... "';~-;;,NIl) @ ,,' "·~"__ r,./·
... I 1':-. MALOUT···.· ,AT . BATHINDA ·.. -' I3J 1 :' ' @ ,. GARH/ .. '. .../
/.• _~ -'-_ \" / GIDDARBAH" 'i' . ./ Rampura r_.r-( .-'S 0 • .r.,~r~l _.' y . (y-! "\ . 0 .... 0 1. V . / Phul '\' ''\ I SANGRUR ·· r-) (" S I" \..
/' (.J . @J,AbOhar ...... \. ... ····· l-'~ . .. ,-:~A.':':'f~~! '-...\._ (@J\I~\l:..'i [email protected] r · r;,BH~NER ~ / 0·" , . ." . ..__, SANGAT :: _ \ ~- / '7 --' 0 -1. C'" '\IJ '\ HERI / • KHUIAN (, . LAMBl o \ 0 r-.... -~J ,J I (' Sun am 1 .... """. ..... .
/ SARWAR . ('y"\,J '. T . .., . --~ .1.' './
l "1 . ( "-. ; alwondl (. Manso Yo. . 'r' \. I , ; @' Sabo 7 @ ... /{..
._._. __ • ._ • ._._ /'_'''''''''''''' ~ .. .. , 0 f'J/ ... ·.· c I RAJ A S T H·AN"'l:'\ ...... ·_· "\:...._. \ .... ,~UO~LAD~ /' 7LEHRAGAG:rJ' i.
.--,.J) 'J ;' . P'-=. '\.. t.
BOUNDARY, INTERNATIONAL.
STATE/U.T ..
DISTRICT.
TAHSIL.
C.D. BLOCK
HEADQUARTERS: DISTRICT: TAHSIL: C.D.BLOCK
Pocket for Kopurthala . _K
Pocket for Patiala P Pocket for Patti . PT
Pocket for Sun am S
~ .~ JHUNIR / ). \"', r") "'11· 0 it'o. .-- "" /..J '"
\ " '" .--.J \ . .~ . --.. ·-.,·v \ j ./ ~. ..,{ 'i
_ ._._ }f '-) < \_. A
® @ o
8aud upon Survey of India map with the pe rmission of the Surveyor General of Indio. © Government of IncIkl ~


PUNJAB URBAN POPULATION
1991 Km 10 5 0 10 20 30 LO Km
BOUNDARY, INTERNATIONAL " STATE/U T . _._._
>I , DISTRICT - . - . >I TAHSIL ... . ...... .. _ ._._
POCKET FOR KAPURTHALA :· ··· ----R--- -POCKET FOR PATIALA .: . . p
n IQ map with the permission 'of tht Surveyor General of In"' ..,Ig. Bos.d upon Survey of I d" "
~~Ri~~~~GiopOUFLUARTBAN POPULATION ION 1991
~ 40.01 AND ABOVE
~ 30.01 - 40.00
~ 20.01 - 30 00 I SlA1E A~ERAGE 29:55 I
[[[[] 10~OI - 20.00
I: : : : : : : :1'000' AND BELOW
o ENTIRELY RURAL
C G OVCMlllcnt of India CcIpytIeII&;~ ". .


JAMMU / PUNJAB & ."J\
LOCATION AND GROWTH OF ~ ASH M ~.~.r .~ TOWNS HAVING POPULATION ~ ("../t.J"c]r/_.I 50000 AND ABOVE 1981-91 .. rtATHANKO{ : 1-,-
~ .p'! UA..J 10 ~ 0 10 20 30 40
~ ....... ,.,,, ~ ;-' ....... ~\ ~ i ~
~ r' . ..J ):? GURDASPUR i \.'",",. ,r \ \ \
i '\.'---'_ r:l . i \. V) .,i '\ B SATALA U.A\ r~
(. D ----z,/\/ \ , \. .oj_,.. '\ ',' 'V l.,~ \ d AMRITSAR ;/~) \. ~ \. ..,
• . ,,( . ~ \ <:> .J 1'/) . ",HOSHIARPUR \ ~
{.I / ~ \JALANDHA.R L '(''\ ~ / ~ /~ r-\'" '"') (\ r' .
( / KAPURTHALA ~ r' K /.o '_'\)-. . 1-f . . [d" \V'-· . ~lr' . J .,rJ.J .~ :-:-'. ~'", ') )
( ~. /. . ../'. ! <....~r::: PHAGWARA \... '\ ./ ,,~. r --. ~./ ...,_, U.A........... . 1
~ '~}_i '\; ...,~ '" ') 1 .,A..- '- \ \ J \... . \. r' ~ ...... . __ .~ -' o,./.~ ....... . ~_ . ....--.j ....J 't. U.T. OF
KILOMETRES
. .J' O~FIROZPUR . I ---. ,-(,-,- '-{HA.NDIGARH
~ ; FIROZ~~A~.T. r ---. --m-."'-( LUDHIAI'IA V~ " '<~\..l r" /' \..."j N ~ i 0 r 'I S.~.!:u~ _,} 'A
.r" \ ~ MOGA U.A. . ~ / ............. ) .. ;r ,... ./ ? t888l FAR IDKOT U.A. I ,/ '" KHANNA~ / ') ~
rJ r r-J ~ II _,/"s"" __'-'v-\ (, . _\ /r '\.oJ i./~ f{ '. ~ .r".,) ) ~ (1.../ V · j "'v./ J A( . m KOT KAPURA ".r-- \...~/''-) ~ ( ~ ," / "( ~ < ~. ? c:. ;:> r ·" MALERKOTLA . ~ 1 ( m i MUKTSAR r-.~ .""'._J \ II /N~~~A RAJPURA("'! \
\ FAZILKA j. ?J ~. ("",._bJ ~ ;>.'7 v 1 c:.. 7 r i BARNALA 1 ~ .. /' /. . ~ . ~ . ~ ...-_r.../ PATIALA 1/-, ,.
/" { ~ C~MALOU( . _"''' ~ "-. '''\",-,,, SANGRUR \ u.~· "? l ~ r "1 .flATHINDA I. \, (' ~J \ ".-
( ABOHAR \"' . I 1",,"") /"'. . ........ ./ ._._._._._. (L.",. ~ f' (. /' ~ -'-._ ' / ...... RAJ A 5 T H A N·]·'·..... ''\_. \.. ,..._ P ~ . "'\ '-. . ..,.J' MANSA . I ~ \.
BOUNDARY. INTERNATIONAL .. ... _._. _ STATE/U.T ... .. .. .. . _,_ . . _ DISTRICT.. ... .. .. . .. _. _._
POCKET FOR KAPURTHALA
" PATIALA ......
U.A. URBAN AGGLOMERATION
K P
S '1 ./. \.\ rl . ..,J \ .f'... _, ""' /- ~
..) t' "\-..;"".1 \ v I.J "'"' ......... ~ A ~
If '"' ! \..,) ~
POPULATION SIZE OF URBAN CENTRES 1991
D CLASS I 100 000 AND ABOVE
D CLASS II ~O 000 - 99 999
The administrative headquarters of Chandigarh. Haryana and Punjab are at Chandigarh.
PERCENTAGE INCREASE 1981\.91
II 50.01 AND ABOVE
~ 40.01 - 50.00
m 30.01 - 40 . 00
~ 20 . 01 -,. 30 .00
D 20. 00 AND BELOW
8IHd upon Survty of ~dia mop with the permissiQn .oj tile Surveyor. Gentral of India. © Government of India CoPYrighl'l999


PUNJAB JAMMU I
LOCATION AND GROWTH OF TOWNS HAVING POPULATION BELOW 50 000,1981-91
& /.1\ KASHMIR.r \
_._./ ._. '"\ . J
'["''/1.. ( e.. __: SUJANPUR
~ '] v'-;.:~/ 1-" (DINANAGAR L.?
~ i N~ . _,. •• } .... BEHRAMPUR ,/
.'\ ...... ~ _'" .-... ~ ,I" l DERA BABA DHARIWAL ( "\ .
..,. . ..1 ~_ ''/ NANAK -, - ')i7/. ':--" , ,r ./r"'FATEHGARH t_ N I /LMUKERIAN 'D ,r. RAMDAS ~ CHURl AN FATEH NANGAL ~\ . ' _ TALWARA\
I =\ .'-... QADIANi'77I_///. DASUA , • __ '''' , U.A. ~ ~ r'~ U) .,J RAJASANSI -_ - L -. - _ GARDHI-\
\. N MAJITHA UA \. ~ SRI _"':J WALA'_ \ \. HARGOBIND:: : ' ~URMAR -- '\ 1l 1 AMRITSAR. \,\.PUB, / ...,r) ~ TANDA HARIANA • d \. JANDIALA . I. ~ \ ..
j FiAYYA/) ) ~qGP_ UR'\ 0 c.. ~ / S". ,0 , .
, ~ TARN / ~ KART~RPUR ~SHAM CHAURASI\ ~ , .1 U:2:; TARAN rI' F - - M~) " NANGAL ...
- - . -___ "" M tc=' ALAWALPUR "TOWNSHIP \I
{• N 'BHIKHIWINO . / . '-- . -~ ADAM.- C (~.,r. U A. - '5 PUR :-",' l ( 1-
. . ~ ' ( i - ,..j ( GARH- \ .! - ' \ ,
( ' SULTANPUR ) D r' K ",,,-SHANKAR '--\NAYAi/',_~ ••• ~. • _ r-- , ~-- jU - ~ NANGAL., \
( PATTI j _ - ./ JALANDHARV) ( ' m V'.~ ( (.,
. ,.._,. ____ - ~/~/ ":;;'l. (NAKODJlB..., CANTT'l;~ BANGA ~ ~ ANAN~:~f:> ~ "\"..; ).r/ '\J '-1_ SHAHKOT ,>. : "''''': ~ N~~t~R E:_ "'1 -\.... . \" I
,~._,. '-- ____ ~ u C- _ .. G~RAYA ~ \ ' 1 • KOT ISE .~ _ NUR- \_- _: PHILLAUR I2L:i ' \. .
,,-.1 ZIRA ~ K~~N ') __ ~~AJ::._·E~ ~ _~ ....... R~O!} .. .._/ .... , _ . ).--,. 't U.T. OF .J u.A. ~ J ~DHARAMKOT MACHHIWARA! . ___ "-{HANDIGARH
10 5 0 ,0 20 30 40
KILOMETRES
~ . > (F::~ :{L, DAKHA MORINDA ~ KURALI , /
.
TALWANDI BHAI _ + . --- -~ . V/MULLANPUR 'v'r . • J :_ -- - U.A. ') ~ '''\ RUPNAGAR '~<l
r' I / -. ( N BAGHA ) 'd D DORAHAf::aSAMRALAt \7 V7,l Q2<J .....). ,It. r' -" PUR ANA U A _._~) A (' ,.. / 8Z8 GURU HAR SAHAI ~ .~ GARH~ r - .. g' .... BASSI b=d '\
,I'" ~ ;.' , BADHNI 'l RAIKOT~.",,~. Lj 'f'-'~. ' . . '_, " J,KHARAR"~ • ~ . """ KALAN , . ~ , \_ _ PA~AL ( • . 6 t- u.Af " q .A~ JALALABAD! ,' 1 1("/ AHMEDGAR~"'" \ • ./AMLOH .. .. . , \.1 mJ'
r. ) ",,' .) (' SIRHIND ~ [LJ ('( U.A/ \" •. ' \... ~/ V . BANUR DERA~ .,. c. _ JAITU r::--"J r' ( c:..; - ( GOBINDGARH U.A. BASSil' .r ·':) ' 1b_~ 8HADAUR DHURI)'
( I ~~'-.) '" ggg: /' (""1 '\ \ I ~._:.;j [ii. GONIANA ' ~ • • . . 7 ~ (['/'1 DHA~~LA ~''-'''''''''7 SANAUR /.,,? V
1 c.~ GIDDARB!_H~) BHUCHO MANDl ~ G \TAPA U.AU BHAWANIGARH~rj ~ J;~ /1 L [-';-'> RAMPURA~. ~ r SAMANA .v, /. "r" SANG AT PHUL 'LONGOWAL ~ \ F=JU.A. ~ I . '--, [Q]~, -,U.A. ~ l. t:::t!'\ ~J \ ,/
/ L ( l.:::; ~ \ SUNAM ) . .;.>,"" " ....... '
l._._._._._._ ( L.......... KOHATTA ~ 0, U.A, ( l RAJ A S ·_·_·_·l....... / -~ RAMAN MAUR BUDHLt[)_A (LEHRA GAGA P r5.. I ~
. T HAN ',,\ ._. .., t:::::J \.. .r-?~ .:!lr{- '\ ..... _,./ • F7}j . ~ \;. --r.A TRAN •
~"'J·1. BARET A rLLJ> . \.''''l r") . \ .f'... . ....,....... /-' ..
, I' "'\ • ...;--J \ v i'" .J ....... ,.... PERCENTAGE INCREAS!:: ('. .~ '( 1981-91
If ..... ! \.-) A BOUNDARY.INTERNATIONAL . . . . . _._._
STATE/U.T ... .. .. . .. _._._ r DISTRICT . .... . .... .. _. _._
POCKET FOR KAPURTHALA.. .. K PATIALA " ........ P
II POPULA TION SIZE OF § URBAN CENTRES 1991 '!888l
D CLASS III . ~ ( 20000 - 49999' ~
O CLASS IV F-:l ( 10000 _ 19999 , '8
o o
CLASS V /0' :.:1 5000 - 9999 , rU
CLASS VI : Q BELOW 5000 I ~
The administrative headquarters of Chandigarh. Haryana and Punjab are at Chandigarh. '0 Bosed upon Survey 01 India map with the permission 01 the Surveyor General 01 india.
50.01 AND ABOVE
40.01 50.00
30.01 40.00
20.01 30.00
10.01 20.00
10.00 AND BELOW
DECREASE
NEW TOWN

I GlJROOWAR.o MANJlSAHi8
1 GURllIWARA KESGARH SO"B
3 GUWOWM1ASAH(l13AGH
4 GlRUDWARA ANANDGARHSAHIB
~ ASHRAM DERA 6DERASANTGARH
1 SAW MLL
B TEIiGRAPHOffa
9 CflAPAMSHAlA ~ POSTlflU
n ffiUCESTATtOti
!2 ~HALSA COLLEGE
I . \::::::::.: ;' "' i .,',
I I I l \ \
SQUNOARY,ftI.IJMC1PAL COMMtn[E
RAllYjAY LiNE WITH STATlON,BRCAD GAUGE.
STATE HIGHWAY,.
I!IAD
RIVER,
ootHARDS .,
BoHd ~on S~r~y d Indio m~ wi!h !hi permiuiln of Iht Surve)Ol' Gen.rol 01 IMia
-'75'-
" 11
~..._
.1M!lSTR~L __ S,H22
il] 81'J6It ~ ~
6 I1EOOCA [[iffilll
~RE~" ~
~RECIIE.I
\ \ \~
HOSPITAL
iANK
TEMPLE
I),JRUDWARA
OCTROI POST
ANANDPUR SAHIB URBAN LAND USE
'ImES
00 0 00 2QO lOO Ltt.:±:±:-a
\'-'1/. \ \ \ \ \ \ \ ~ \ \ (.
"I \ I I
i I ( \,
"> /
(.~ I J
)
/" ,/
" / " .. " ........ V~ It.,
© Gov~ntII l nt o li'ldiaCQPyr!]ht,1999.
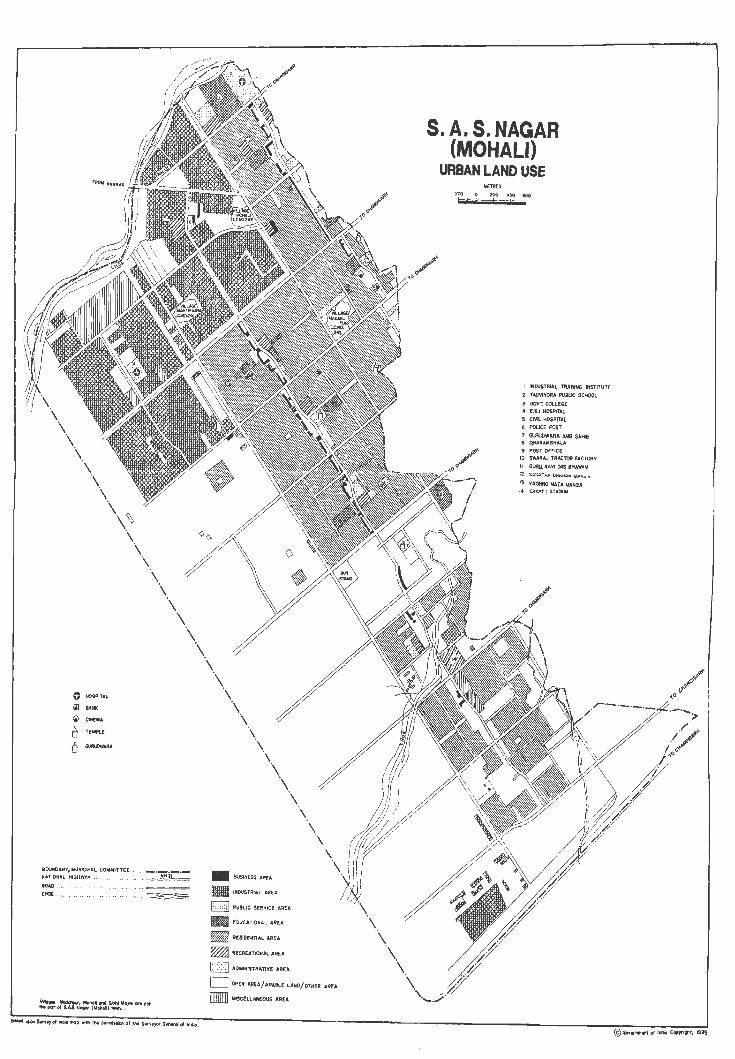
\ \ \ \ \
\ \ \\~
\ \
o HOSPITAL
CINEIilA
TEMPLE
BOUNDARYJ MUNICIPAL COMMITTEE . . ItAfiOHA L. HIGHWAY.
\ \
\ \ \ \
ROAD . . CH(X • .... .. .. ,,~
\ \ \
\ \ \
\ \ \
\ \ \
\ \.
• BUSINESS AREA
.. INDUSTRIAL AREA
S PUBLIC SERVICE ARU
• EDIJCATIONAL AREA
• RESIDENTIAL AIl'E:A
~ AI!:CREATIONAL. AREA
o ADMINISTRATIVE: ARE:A
\
0 ' ()PErt ARU/ARABLE LAN%rH!" AREA
illIIIIll Mr$CElLANfOUS AREA
s. A. S. NAGAR (MOHALl)
URBAN LAND USE "'IfTRfS
fOG 200 40n eoo
1 INDUSTRIAL TRANNG IIIISrrTUTE
2 '(AOVINORA PUBLIC SCHOOL
! GOVr. COlL.EGl: .. £.S,I, HOSPITAL
, CIVIL HOSPITAL 6 POlICE POST
7 GURUDWARA MIl $A)'tB 8 qHARAMSH~LA
, POST OfFICE
10 SWAltA.! TAACTOFf FACTOOY
1/ GlJ&L RAVI D4S 8H~WAN
\2 'St.llAi,4N D~AM MANINf
13 VAISHNO t.4ATI. MANOIR 14 ClOClI:tr STAOUI

BOUNDARY,MUNICIPAL COMMITTEE .. _._._ ~j
R"LWAY LINE WITH ST'TION,BROADGAUGt.~~=
STATE HIGHWAY. . ,--~~'iJL__
ROAD ..
• BUSINESS AREA
m INDUSTRIAL AREA
C=-J PUBLIC S~RVICE AREA
m EDUCATIONAL AREA
~~ RESIDENTIAL ARE A
~ RECREATIONAL AREA
ADMINistRATIVE AREA
o HOSPITAL
ill BANK
ir'!i COURT
IIU JAIL
,., THEATRE
o SHOIUM
,.; GURUDWARA ',-' d TEf.FlE
* OCTROi paS1
I.. LIBRARY
1"'1 MuseUM
/ <' .>
/
SANGRUR URBAN LAND USE
~ETRES 1Ci) 0100 200::!OO4VO!l00
it .,' ---# -. ~-'
./ /
/
I MUNICIFAl.. COMMITTEE OFFICE
2 POLICE STATION ISADARI
3 PUBLIC HEALTH CENTRE
4 BANASAR BAGH
5 FOREST DEPARTMENT OFFICE
6 PANCHAYAT 8HAWAN
7 FISHRJES
8 ZlLA PARISHAD
9 REST HOUSE
10 AKAL DEGREE COLLEGE FOR WOMEN
II INDUSTRIAL TRAINING INSTITUTE
12 GOVT. GIRLS HIGHER SEC, SCHOOL
13 GURU NANAK KHALSA HIGH SCHOOL
14 MARSH HIGH SCHOOL
15 RAJ HIGH SCHOOL
16 FIRE STATION
17 SUS STAND
16 GRAIN MARKET
19 MUSEUM
20 WAR HEROES STADIUM
21 RANBIR CLUB
22 PUNJAB STATf ELECTRICITY BOARD
23 CREMA TION GROUND

\ i i i i \ i i i i i i i i i i i i i i i
8o.,dUpoIISllfy,yot rndiamap "jlhlh. p'rminion
r'-'-' i i i i 1 , i i i
'-'-., I 1.....- .
'-.J
aflndlo
MACHHIWARA URBAN LAND USE
METRES
W-tl-J?-Wr-¥b~
-'-'_'_'_'-'_'-'-'_'_'--"
r'-i i i i i i i
,.._ .. _,+_._._. __ ._._.1
BOU<DARY. NOTIFIED AREA COMMITTEE .... .... " _._._
ROAD ..
NAlA ..
i i I i i I ""-_ ", I
_'~
< ... ". " ·_·_·_'_o_. "'~-~ __ -.-.-.-.-:~:-
I NATIONAL COLLEGE
2 HLK CHILLNG CENTRE
3 VETERINARY HOSPITAL
4 POLICE STATION
5 POST OFFICE
6 NOTIFIED AREA CO"MinEE OFFICE
T DUSSEfilA GROUND
Ii GURUDWARA
• OCTROI POST
_ 8USlNESS AREA
• INDUSTRIAL AREA
[ITS] PU8L IC SERVICE AREA
• EDUCATIONAL AREA
~ RESIDENTIAL AREA
~ RECREATIONAL AREA
J::::::::I ADMINISTRATIVE AREA
D OPEN AREA/ARABLE LAND/OTHER AREA
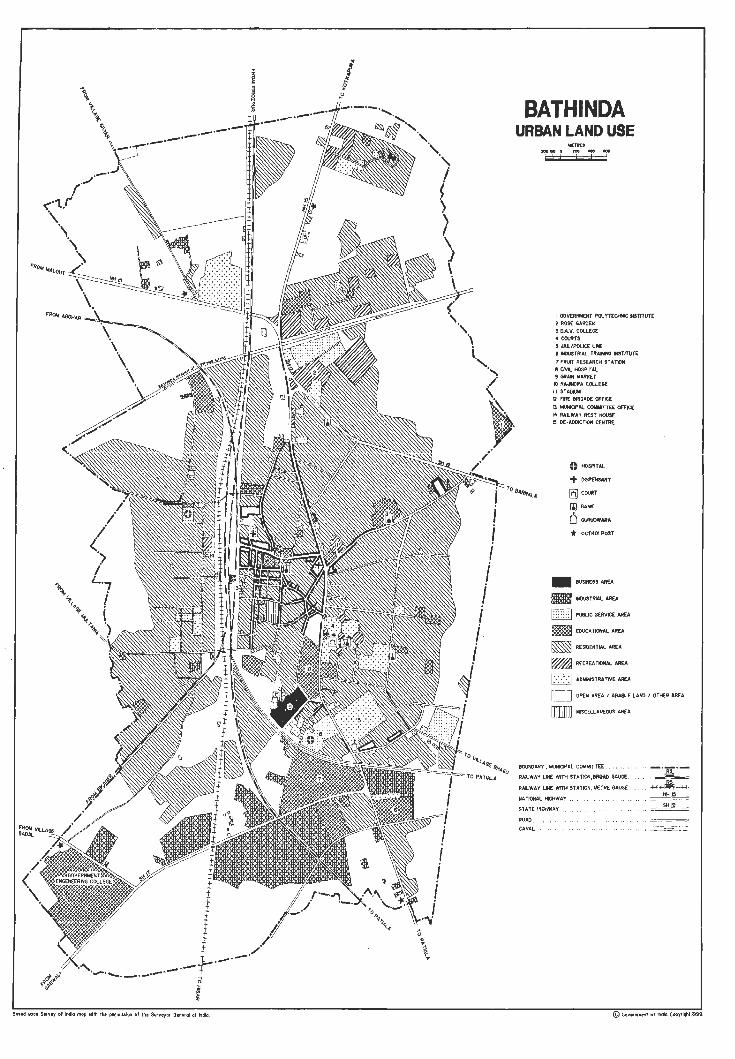
_' Bosed upon SIK¥IIIV (I' indio mop with Ih. permission oj thft Sun'III~(lr Gtfleral or "IIIJa.
BATHINDA URBAN LAND USE
Mt:TRU
I GOVERhNENT POl YT£OHC INSTITUTE 2 ROSE GAROEN ;, CA ..... COLLEGE 4 COURTS 5 JAIl/POLICE IN[ 6 N>USTRIAL TAAtM INSTITUT&:
1 FRlrfT R£SORCH STATION e CM. HOSPITAL 9 GRAIN MARKET
10 RAJKlRA COLlEGE 115T~
12 FIRE BRIGADE OFFICE Il MUNICIPAL COMMITTE{ OFfICE 14 RALW,i'" REST HOUSE ~ O£·AODICTIOH CENTRE
@ HOSPIUL
+O<SI'£ .... ,. 6J crun
IllJ BANI(
[)- QUROOWAFtA
* OCTROI POST
_ aUSM;SS AREA
_ NlUSTRIAl AREA
GI.J PU6UC S£RVlCE AREA
~ EDUCAnONAL AREA
~ RESIDENTIAL AREA
~ RECREATIONAl AREA
D AbMlNrSTRA rtv£ AREA
D OPEN AREA I ARABLE LAND I OTHER AREA
_ WSCElLANEOLIS AREA
BOUNDARY. h(JNlCIPIlL COMMITTEE .•
RALWAY UNE WllH STATION,BROAD GAUGE ..
RAIlWAY UNE WITH STATION, METRE GAUGE
NATtONAL.'ilGHWAY .
STATE HIGHWAY.
ROAD ..
CANAL. . .
_- --'iE'-__ +H~-H+ ~-
© Goyernment 01 Indio Co~yrIQhI~999.

\ "
~Y,MI.III~IPALCOMlollrrEE
RIILVI'A~ LIhE WITH STI\TI0ti, flR(.W) "MIG(
MOGA URBAN LAND USE
I
~L [i}] COURT
11] BAN..:
<fr IHUTRE
6 TEMPL'
er G\JRLUNAIIA * I)CTFlOIPOST
:).$.IoI ,[l,COLlEOE
SAMFl ... T HOTEL
S. TAHSIL OFFICE
GENERAL~PlTAL
MrTQrS
100 0 roo 200 300 400 :yJO b 't" ___ I ± h -i
"OOSINESSAAEA
mlNOUSTIWIL AREA
cr:J PI.9..lC SER'W'ICl! AR9.
~Et\!CAnooALARtA
~~HTlAlil,m:.l
~RE~A110IUtl..AREA
[3 AaoIINISTR.lTIVE AREA
C]C»'EN N£.iI, I ARA8LE LAfClI OTHER AREA
fIIlIT.OMISClLl .... H£OO5 AREA
Go iWUIoIClf'''L co..urt(f orner
_-

RUPNAGAR URBAN LAND USE
... ,"'" 100 11)0 200 300 LOO
I i i i i i i i i i i i i i i i i i
i i i i i . ___ . ..._
01 i i . ..._ . ...._
BOUNDARY,MUNICIPAL COMMITTEE .
RAILWAY LINE WITH STATiON. BROAD GAUGE. NA llONAl HIGHWA Y
STATE HIGHWAY ..
ROAD.
CANAL
0 HOSPITAL
[II BANK
t TEMPLE
6 GURUDWARA
f'r MosaUE
6 CHURCH
PO POST OFFICE
0 STADIUM .. THEATRE
IllJ JAil
* OCTROI POST
O_j
i (oJ
i dJ ! ~ (G
l.-o_._o_
.. =o~._ .. _llli..l:!= . __ _§H 24..::=
/'-. . / " _' \ .
\ \ \ \ \ \ \
~~_\ \
-~ [7::>:]
fill! ~ -r<J r -- I L __ I
lllillllIIll
BUSINESS AREA
INDUSTRIAL AREA
PUBLIC SERVICE AREA
EDUCATIONAL AREA
RESIDENTIAL AREA
RECREATIONAL AREA
ADMINISTRATIVE AREA
OPEN AREA/ARA.8LE LANDI OlHER AREA
MISCELLANEOUS AREA
PINCASSIA TOURIST COMPLEX
NEHRU S1 AD1UM
PUNJAB ROADWAYS WORKSHOP
CANAL REST HOUSE
PANCHAYAT BHAWAN
HAWKS' CLUB
KAl Y AN TALKIES
POST OFFICE
MUNICIPAL COr-1MITTEE OFFICE
10 GOVERNMENT JERSEY COW BREEDING FARM
11 NIRANKARI BHAWAN
12 J.R.THEATRE
13 GURUOWARA BHATHA ~/l.Ull:~
14 YOUTH HOSTEL
15 CREMATION GROUND

Xw a:W <r~
CJ~ QC W..l :E~ X~ «:::t
r- ....... \ \ \ \ . ,
'1 i
a
"' 0 a .. a
(/) ,~
~g tiN ::>0
2
a
0 Q
..J <I fa: Ul o I
~ ! u '"
'" W 0:
'" 0: w I f-a "-0 z :'l w ..J III
'" 0:
'" "-
'" '" a:
'" z W IL a
D
!+ : w " OJ
'" (!)
0
w <I 0 w Q:
f- Ill.. >-~ z ::I: 0 a i= <.) c(
f-..J Ul
~ i!: ~ i ,.: ~ ~
<I 3:
,: ..J I ., Q: >- "E <I c(
~ ~ W f- ~ ~ <I
0 <I f- a 0
'" a: "' II: Q.
00
'" '" .."
i !;. 0-0
U .. i ;; C E c Ii .. Q
'" @
w £. '0 c o ";;; ~
.~
· a. · ;5
;5 i
'" • E • 'ii .E 1; ... · t ~ VI
.____ _____ _ji

BARNALA URBAN LAND USE
METRES 100 0 100 200300.00~ H-t-t±:t=td
I MUNICP AL COMMITTEE OFFICE 2 S.o. COLLEGE 3 CIVL HOSPITAL 4 POLICE STATION II GIlLS COLLEGE 6 BUS STANO 1 PUNJAB RELEF SOCIETY 8 RAM BAGH CREMATION GROUND 9 GRAIN MARKET
10 INOUSTRIAL TRAINING INSTITUTE
"'- " __ . ___ ._. ........... __ . . ...._ ._._' . _ . __ 0 CIUlL HOSPITAL
BOUNlARY. MUNlCf'AL COMMITTEE • .
RALWAY LN: WITH STATION, BROAD GAUGE
STATE _II,!, .
ROAD ..
Based upc:n Survey 01 indio mop wi'" the pefmin;on of the SUtV.YOf Gtntfal ot Indio.
-'T'-~---...-: -~-
[6J BANK
rill COURT
'i THEATRE
6 TEMPLE
e GURUOWARA
/1 I I j i I . I
_ BUSINESS AREA
mtB INDUSTRIAL AREA
[ J l PUBLIC SERVICE AREA
~ EDUCATIONAL AREA
_ RESIDENTIAL AREA
CJ ADt.INISTRATIVE AREA
C J OPEN AREA I ARABLE LAND I OTHER AREA
© Gov,rnment of India CopyriQhI,1999

z ~ a:: ~
o
o o N
0: :> 0-0: :> Z
0 I-
__J <t f- >-a:: (/) a:: 0 <t I
(/J
2 w __J
:> Cl. (/)
U 0
{} +
f-<! (/)
a:: 0 w <t a._ a:: w 3:
f- f- __J 5 0
" 0: <! a._ :::l a:: 2 :::l W ::Ii f-a:: <t 0 I w :::l U CD u f- f- (.') 0
~ [9 ~~tiJ. <t W a:: <t
\ ".
/
/ /
/
<t w a:: <t' _j
<t w 0: <t
,<t __J
': 2 « Q I i=: ... 2
j ~ ? ~
a::
<t W II: <!
;i Z o i= <! W 0: U W a::
<! W 0: <! W > i= <! 0: f(/J
z ::li o «
Mt J 01 ,
IC
:t ~ " -.J
~
'\ /
r
'"
w w (.') (.')
:::l :> <t <! (.') (.')
0 w « a::
w 0 f-W a:: W f- m ::Ii f- z" Z ~ 0 Q ::Ii j:: f-0 « <t U f- f-..J (/) Vl <! I I Cl. >-U
f- f- « Z 3 3 3: >-OJ W W
I <! ::;; (.') 3: 2 2 I .,: :J :J I
__J (.')
0: >- >- J: « « « « 0 3: 3:
2 W 2 0 OJ d ..J j::
f-«
0 « <i <! f-CD a:: a:: z (/)
w u
f-G: Z !,i~Q ~~~~~ ~~t;~~ Q:UJWO .... W:::t:UI-(/)
~ fP (/J W ;::2 00 0: _a..a..G: ,._
"'!ll~_
<t W 0: <t 0: W I f-0
0
~ _j
W _j m <! 0: <!
<! W 0: <!
~
(/) 0 a:: « ci I
<! U 0 a:: a:: 0
1ft
~ ., '" ';:
'" Q, 0 U
" '0 .!:
'0 c GJ
E c ... .. > 0
(!)
@
;;; ... GJ C GJ (!)
... o
'" " > ... " III .. :5
c: o
'" '" E ... " "-01
:5
Cl. .. E .. "0
.=
>. GJ > ... " III
c: o Cl.
" "0 .. '" '" <0

f-' , , , . I /',
.... / \ .
II
L ______ ___.
t ;;
1 • & @
;;
j
1

~-----------------------------------------------------------------------------------------------------, ~
"-\-""oj,
"'11 l» , • >--"1
, 0" i . r , , \ \ !
o Sl o ~ o o
~~ 1.0.. 0
~~ ~o
Q
....... ..._ .--... __
'" w DO :3 '" :3 DO
" w
" '" DO U
-' DO " '> " -' ~ '" z ~ " 0
~ ;::: i c; '" '" U
'" ~ m 8 iii J ,
............. . -- ........ ........ ./.,
r
~ 15
~ ...
~
t i u
'" '" DO
" ~ ..
DO
~ a
!E :l
~ w
:3 -' " '" " " " '" "' '" ~ >
;::: z '" '" a
;::: '" ~ ., r w ~ DO Z Z
~ ~ w 1; '"
T 'I
il ~ I II i "'I II
g ~
~ w a i" :li
~ ~ ~ ~ l < x l
i i ~ ! ~ <
1 ~. ~ ~ '" >- ~ < " ~
'I: w
'" . r
'" ~ " < < ~ Ir f
i ~ , t "Ii t ~ , J

/ / i i I /
I i
BOUNDARY, MUNICIPAL COIIlMITTEE .. .. __ • __
ROAD •••• • •••••.•• •• •••• •• •••• ::=:::=== POND ....... . ... . . .. .. . . . .. ... . c:::;;::;;::;-----;;:,
8aNd _ Sur-..y of _ mop wffh "" pumi •• iOft of 'he Sur .. yor G •• ...,I of Indio.
LONGOWAL URBAN LAND USE
METRES 100 0 100 2!00 SOC 400
TO ENG'NI!:EAtNG '"5nT=
I SUB TAHSIL OFFICE 2 GlA!UDWARA IlMAI MANA SNlH II MUNICIML COMMTTEE OffICE 4 GOVT. GIRLS HIGH SCHOOl. !I DHARAMSHALA-P.RIMARY SCHOOL 6 CAEMATIOH GROUNo
7 VETERtlARY HOSPITAL
_ 8US11'lESS AREA
_ INDUSTRIAL AREA
[8 PUBUC SERVICE AREA
I!Ill!!lI EDUCATiONAL AREA
~ RESID£NTIAl AREA
1;::;::;1 ADMINISTRATIVE AREA
o OPEN AREA/ARABLE LAHO/OTHER AREA
+ PRIMARY H!::ALTH CENTRE
iii BANK
8 THE LONGOWAL AGRICULTLRAL CO-OP. SOCIETY 9 GAUSHALA
t5 GURUDWARA
6 TEMPLE * OCTROI P.OST 10 POST OfFICE
II RAMLEELA GROUND

SIRHIND URBAN LAND USE
METRES 100 100 200 300 400 500
Based upon Survey of India map with lhe permission of the Surveyor Ganeral of Indict
BOUNDARY, MUNICIPAL COMMITTEE
RAilWAY LINE WITH STATION, BROAO GAUGE
NATIONAL HIGHWAY
ROAD
POND
, POLICE LINES 2 OLD TAHSil OFFICE
CREMA TJO~, GROUND DUSSEHRA GROUND
'~ SA1"SANG B:-l"W AN
{}
+ ~ ., 6 6 LJ
"*
MUNICIP,~L COM~ITTEE OFFICE GRAIN MARKET POLICE ST ATION
HOSPITAL
D!SPENS ARY
BANI<
THEATRE
GURUDWARA
TEMPLE
~saUE
OCTROi FOST
_ BUSINESS AREA
_ INDUSTRIAL AREA
C-=:J PUBLIC SERVICE AREA
_ EDUCATIONAL AREA
~ RESIDENTIAL AREA
_ RE CRE ATIONAL AREA
CJ ADMINISTRATIVE AREA
C OPEN AREAl ARABLE LANDI OTHER AREA
© Government of In"'a Copyr l~t. 1999.

1 MUNICIPAL COMMITTEE OFFICE 2 GURU GOBINO SINGH CIVil. HOSPITAL
3 VETERINARY HOSPITAL
4 J.B. T. SCHOOL 5 INDUSTRIAL TRAINING INSTITUTE
6 GOVT. BRAJINDRA COLLEGE
7 JAIN SENIOR SECONDARY SCHOOL 8 GENERAL HOSPIT AL
9 COURTS
10 GRAIN MARKET
11 NEHRU STADIUM
r'-\ , \ \
,_.-""
FARIDKOT URBAN LAND USE
METRES
200 0 200 400 600 h:t-t -·- -=tz- . h=s=1
\ \ \ , \ \
" /" ',-, '
" .-,/ ---- . ___. . --........... ---._.
BOUNDARY, MUNICIPAL COMMITTEE.. .. .. .. . . .. _ • _,_
RAR.WAY l.t.E WITH STATION. BROAD GAUGE. . •. .!!.
NATIONAL HIGHWAY. .. .. ","
'STATE tlGHWAY . .. .. .... .. SH 15
ROAD .. .. .. .. ..
ORCHARDS .. .. .. .. ...... .. .......... 1$ $ * ~~ij
Bosed upon Survey of India map with the permission of the Surveyor General of India ..
o HOSPITAL
[ill COURT
III BANK
~ THEATRE
bTEMPLE 6- GURUOWARA
o STADIUM
* OCTROI POST
_ BUSII£SS AREA
_ INDUSTRIAL AREA
I : : : : : : ':1 PUBLIC SERVICE AREA
~ EDUCATIONAL AREA
~ RESIDENTIAL AREA
~ RECREATION"L AREA
I : -: -: -: I ADMINSTRA TIVE AREA
o OPEN AREA I ARABLE LAIC I OTIER AREA
[[[I]] IoISCELLANEOUS AREA
Governmenl of IndiG Copyrigllt,1999.

o 2
o
i ~
.. w '" . " 11 ~ :l
'" « >
" ~ '" ~
S i;I '" >- II ~ ~ ~ ~ ~
_,_', r' ", , " I i i i i i i i
,/
~ · ffi · 5 0
5 " " ~ w w
" '" ~ w '" " '" '" ~ " .. w · • oJ
~ «
<i .J " · z , § ~ Q ..
~ >- ~ >- ~ :l I " ~ · § ~ i:l Q « '" «
II[Jm~~D C
Mjl li ll .'" :g .. ~
" " " ", '
'" z'
~ " in :I:
i ~ oJ
>-" ~ Q
'" g .. cr «
, 'i'
I ~o
i t 8
l' , 3 r;l)
, I
t ~
i ~ ______________________________________________________________ ~l
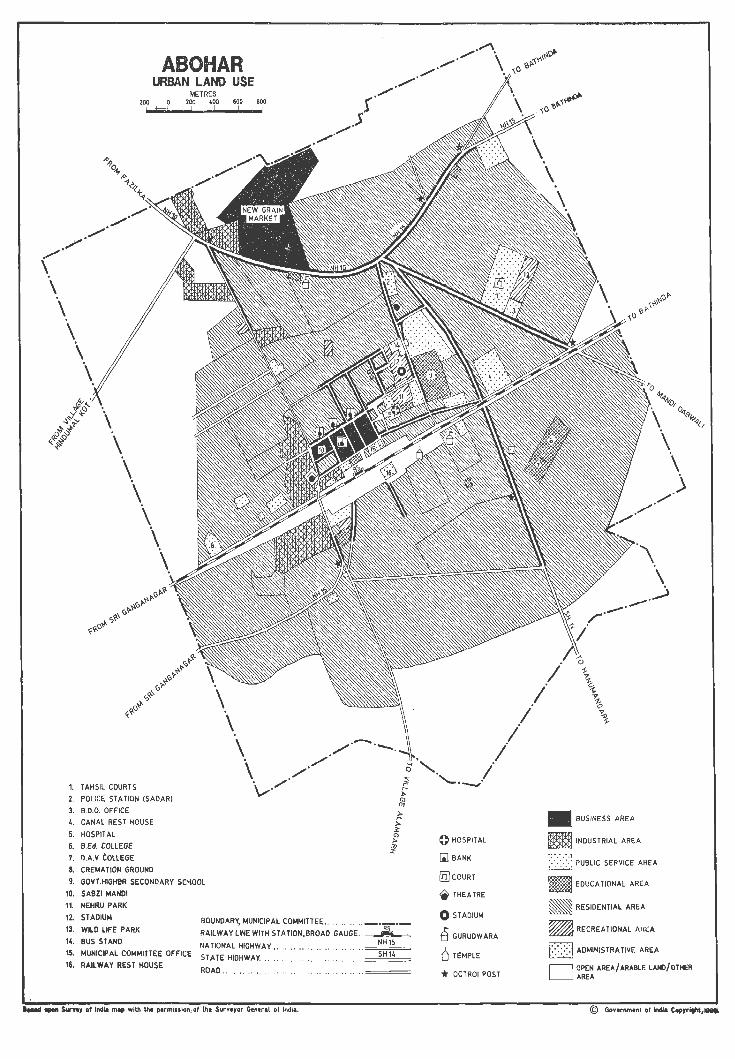
,/" /'
\ \
ABOHAR URBAN LAND USE
METRES zoo 200 400 600 800
./ ./
./
\ \ \ \
\ \ \ \ \ \ \.
1. TAHSIL COURTS
2. POLICE STATION (SADAR)
3. B.D.O. OFFICE
4. CANAL RES T HOUSE
5. HOSPITAL
6. B.Ed. COllEGE
7. n.A.V. COLLEGE
8. CREMATION GROUND
9. GOVT.HIGHI!R SECONDARY SCHOOL
10. SABZI MANDl
11. NEHRU PARK
\ \ \ \ ./ \",/
12. STADIUM
13. WILD LIFE PARK BOUNDARY, MUNICIPAL COMMITTEE. , .. " " "-'RS'-RAILWAY UNE WITH STATION.BROAD GAUGE" ....
NH15 14. BUS STAND NATIONAL HIGHWAY ........ 15. MUNICIPAL COMMITTEE OFFICE STATE HIGHWAY, ., .. 16. RAILWAY REST HOUSE
SH14
ROAD ..
....., .... Sune, ot Ind .. map with: the permission; of the Surveyor Gln.ral of India.
I' /
/ /
/ . / "-._-,
o HOSPITAL
[l] BANK
Iill COURT
~ THEATRE
o STADIUM
e GURUDWARA
6 TEMPLE
* OCTROI POST
• BUSINESS AREA
mmm INDUSTRIAL AREA
k:: ::1 PUBLIC SERVICE AREA
• EDUCA lIONAL AREA
• RESIDENTIAL AREA
~ RECREA nONAL AHEA
~:::::::l ADMINISTRATIVE AREA
1\ OPEN AREA/ARABLE LAND/OTIER L_j AREA
© Government of india Coprright,-.

"......_._._j
,...._._._._i
~ HOSPITAL
+ DISPENSARY
L.J BANI(
~ THEATRE
~ TEMPLE
GURUDWARA
* oCTROI POST
I i I I l"
i i i '. 1I"",.?4f I
'YI+o.q
I t£tflU r.4[MORIAL FOSTGRII.OUA T[ COLLEGE
2 SPINNING MIL
.3 OASHMESH FUBuC SCHOOL
i i i
~ S.D_COLLEGE
~ SABZI MAND l i 6 Kt-IALSA HIG~ SCHOOL •
7 MAHATMA GANDHI HIGHER SECONOARY l SCHOOL •
e GAUSHALA I '3 INDUSTRiAl TRA.NING INS mUTE i
i i i i i i i I i
I :'_'_'_'-'-'-'l
BOUNDARY, MUNICIPAL COMMITTEE
RAILWA'( LINE WITH STATION, BROAD GAUGE .
STATE HIGHWAY
ROAD
Bas.d vpon SVr y.y ot ,"dlo mop ",'111 111, parl'l lUlOn ot In, Sur ~lIyo r G, nllrl,r of Indio
I """·V/"·"'._.J·
-'1!r' =--' ...... _, =_;..$ .. Jl I3 _:::.......::_
MANSA URBAN LAND USE
~ETRES
200 400 600 I
L.._._._._._._._._ . ..., i I
1"""'-'_'_.1 i i
j'_'_.i I
-8USlt~ESS AREA -INDUSTRIAL AREA
PU8L1C SEFlVIC£ AREA
EOUCATIONAl AREA
~ RESIDENTIAL AR[.o
~ RECREATIONAL AREA
.AOMI~ISTRATIVE AREA
L_-=-- ~ OPEN AREA I ARABLE LAND /OTHER AREA
(c) Gov.ernm,n T 01 Indio Co pyr i'lht, 199~
Copyright © 2022 FDOKUMEN