The 1991–2004 Evolution in Life Expectancy by Educational Level in Belgium Based on Linked Census...
22
The 1991–2004 Evolution in Life Expectancy by Educational Level in Belgium Based on Linked Census and Population Register Data L’e ´volution de l’espe ´rance de vie par niveau d’instruction en Belgique de 1991 a ` 2004 sur la base de donne ´es de recensement lie ´es au registre de la population Patrick Deboosere Sylvie Gadeyne Herman Van Oyen Received: 19 July 2007 / Accepted: 18 April 2008 / Published online: 19 June 2008 Ó Springer Science+Business Media B.V. 2008 Abstract The aim of this study is to determine trends in life expectancy by educational level in Belgium and to present elements of interpretation for the observed evolution. The analysis is based on census data providing information on educational level linked to register data on mortality for the periods 1991–1994 and 2001–2004. Using exhaustive individual linked data allows to avoid selection bias and numerator–denominator bias. The trends reveal a general increase in life expectancy together with a widening social gap. Summary indices of inequality based on life expectancies show, however, a more complex pattern and point to the importance to include the shifts in population composition by educational level in an overall assessment of the evolution of inequality by educational level. Re ´sume ´ L’objectif de l’e ´tude est de de ´terminer le sens et l’ampleur de l’e ´volution des ine ´galite ´s en espe ´rance de vie en Belgique selon le niveau d’instruction. L’analyse part des donne ´es des recensements qui fournissent l’information sur le niveau d’instruction. Ces donne ´es ont e ´te ´ lie ´es au registre de la population qui fournit l’information sur la mortalite ´ pour les pe ´riodes 1991–1994 et 2001–2004. L’utilisation de donne ´es exhaustives et d’un enregistrement de la mortalite ´ lie ´ Keywords Life expectancy Social inequality Socioeconomic position Educational level Mortality Belgium P. Deboosere (&) S. Gadeyne Interface Demography, Vrije Universiteit Brussel, Pleinlaan, 2, 1050 Brussel, Belgium e-mail: [email protected] H. Van Oyen Scientific Institute for Public Health, Brussels, Belgium 123 Eur J Population (2009) 25:175–196 DOI 10.1007/s10680-008-9167-5
Transcript of The 1991–2004 Evolution in Life Expectancy by Educational Level in Belgium Based on Linked Census...

The 1991–2004 Evolution in Life Expectancyby Educational Level in Belgium Based on LinkedCensus and Population Register Data
L’evolution de l’esperance de vie par niveaud’instruction en Belgique de 1991 a 2004 sur la base de donnees derecensement liees au registre de la population
Patrick Deboosere Æ Sylvie Gadeyne ÆHerman Van Oyen
Received: 19 July 2007 / Accepted: 18 April 2008 / Published online: 19 June 2008
� Springer Science+Business Media B.V. 2008
Abstract The aim of this study is to determine trends in life expectancy by
educational level in Belgium and to present elements of interpretation for the
observed evolution. The analysis is based on census data providing information on
educational level linked to register data on mortality for the periods 1991–1994 and
2001–2004. Using exhaustive individual linked data allows to avoid selection bias
and numerator–denominator bias. The trends reveal a general increase in life
expectancy together with a widening social gap. Summary indices of inequality
based on life expectancies show, however, a more complex pattern and point to the
importance to include the shifts in population composition by educational level in
an overall assessment of the evolution of inequality by educational level.
Resume L’objectif de l’etude est de determiner le sens et l’ampleur de l’evolution
des inegalites en esperance de vie en Belgique selon le niveau d’instruction.
L’analyse part des donnees des recensements qui fournissent l’information sur le
niveau d’instruction. Ces donnees ont ete liees au registre de la population qui
fournit l’information sur la mortalite pour les periodes 1991–1994 et 2001–2004.
L’utilisation de donnees exhaustives et d’un enregistrement de la mortalite lie
Keywords Life expectancy � Social inequality � Socioeconomic position �Educational level � Mortality � Belgium
P. Deboosere (&) � S. Gadeyne
Interface Demography, Vrije Universiteit Brussel, Pleinlaan, 2, 1050 Brussel, Belgium
e-mail: [email protected]
H. Van Oyen
Scientific Institute for Public Health, Brussels, Belgium
123
Eur J Population (2009) 25:175–196
DOI 10.1007/s10680-008-9167-5

directement aux donnees du recensement evite des erreurs de selection et du biais
entre numerateur et denominateur. On peut constater qu’en general l’esperance de
vie progresse pour tous les niveaux d’education mais que cela va de pair avec un
elargissement des inegalites. L’utilisation d’indices d’inegalite montre neanmoins
une realite plus complexe et la necessite d’inclure l’evolution de la composition de
la population par niveau d’education dans une evaluation globale de l’evolution des
inegalites.
Mots-cles Esperance de vie � Inegalite sociale � Position socio-economique �Niveau d’instruction � Mortalite � Belgique
1 Introduction
After the Second World War, the development of welfare states led to the belief that
inequalities in health would gradually disappear. And yet, the Black Report and the
Whitehall studies pointed out significant health inequalities in highly developed
countries (Marmot 1995; MacIntyre 1997), generating a growing body of research
by a multi-disciplinary community. Over the past decades, strong evidence has been
accumulated across a large set of industrialised countries that inequalities in health
have persisted, with differences in healthy life expectancy among the extremes of
the social ladder ranging from a couple of years to over a decade (Pappas et al.
1993; Valkonen 1999; Mackenbach 2005). Several studies observed a widening of
health and mortality inequalities by socioeconomic status over the past decades (Fox
1989; Harding 1995; Valkonen 1999; Martikainen et al. 2001a; Mackenbach 2005).
Socioeconomic position refers to the structural location, reflecting the social and
economic characteristics that determine the position individuals and groups hold
within society (Kunst 1997; Gadeyne 2006). In order to capture the impact of
socioeconomic characteristics in industrialised countries, it is generally agreed that
at least three dimensions must be considered as determinants for the socioeconomic
environment both for individuals and for society: income, education and work
(Kunst and Mackenbach 1994a). Some authors add wealth as a fourth dimension,
because it is much more unevenly distributed than income (Hummer et al. 1998)
and also it adds the intergenerational transfers of material resources. The
measurement of all these indicators is far from straightforward. Much energy has
been devoted to their harmonisation and standardisation for international compar-
ison (Valkonen 1993; Mackenbach et al. 1997; Kunst et al. 1998). Among those
indicators, education has a number of advantages. First, it applies to the adult
population regardless of labour market position. Second, it affects potential earnings
and access to material resources that influence health, and therefore shares some of
the health effects with other indicators (occupation, income and wealth) and is
strongly correlated with them (Galobardes et al. 2004). Third, as formal education is
normally completed in young adulthood and partly reflects the characteristics of the
family and community of origin, it is an indicator that measures early life
socioeconomic position and that remains relatively stable over the life course from
early adulthood onwards (Davey-Smith et al. 1998).
176 P. Deboosere et al.
123
It is worth noting that the meaning of educational level as an indicator of
socioeconomic position varies for different birth cohorts because of the upward
secular trend in educational attainment. While finishing secondary education before
the Second World War resulted in a relatively high social position, this is no longer
the case nowadays. This is an important problem if we wish to compare
socioeconomic positions across birth cohorts. Using a relative index of inequality
has been one of the most common solutions for correcting for the overrepresentation
of lower educated persons among the oldest birth cohorts (Kunst and Mackenbach
1995; Kunst 1997). Besides of being an indicator of socioeconomic position,
education is also related to cognitive abilities and informational resources, helping
individuals to mobilise health resources (Elo and Preston 1996). Clearly, the
emancipating role of education plays a crucial role and also affects health indirectly
by providing skills in mastering and finding solutions for complex day-to-day
problems and by endowing people with a sense of control over their life (Mirowsky
and Ross 2007).
Formal education is a good indicator to measure educational capital both at the
individual level and the societal level. Analysing inequalities in health from this
point of view has a double entry: it concerns both inequality and progress. If persons
with different educational attainments perform differently within the same societal
context, then higher educated populations could be regarded as a kind of vanguard
group in the health transition. Just as analysing data of Japanese men and women
helps to understand future developments of longevity and factors that contribute to
healthy life expectancy, we can turn to the higher educated to better understand and
capture future health processes. Historically, the improvement in the educational
level of a population reflects the progress to reduce risks with a negative impact on
health (Hayward et al. 2006). Our interest thus focuses on the absolute progress in
educational attainment.
In Belgium, there is a long tradition of research in health and mortality
inequalities, and many papers explicitly dealing with the subject have been
published over the past decades (Lagasse and Namurois 1982; Vuylsteek 1984;
Schepers et al. 1985; Lagasse et al. 1990, 1992; Masuy-Stroobant 1992; Raes et al.
1993). Recently, Belgian research has been boosted by the availability of the health
interview surveys conducted in 1997 (Van Oyen et al. 2002, 2005) and of the
national mortality database, i.e. a linkage of census data and register data on
mortality (Gadeyne and Deboosere 2002; Bossuyt et al. 2004).
The aim of this article is to investigate trends in life expectancy by
educational level in Belgium at the turn of the millennium. In order to
calculate life expectancies, we used the 1991 and 2001 census data linked to
mortality and migration data from the National Register. The character of the
data—exhaustive individual census records, individually linked to mortality
data during a follow-up period of 3 years—enables a very precise evaluation of
education-specific mortality trends. First, we investigate if and how life
expectancy by educational level has changed over the period 1991–2004.
Second, we analyse to what extent these changes can be interpreted as changes
in health inequalities.
Evolution in Life Expectancy by Educational Level 177
123

2 Data
Mortality data generally come from vital statistics registration systems, which have
to be related to census data or other appropriate population data in order to compute
the mortality rates. This combination of data from two different sources can
generate a large number of errors due to inappropriate matching of the two sources
(Kunst and Mackenbach 1995). In this study, based on a linkage of the 1991 and the
2001 censuses to register data on mortality and emigration in 1991–1994 and 2001–
2004, record linkage was based on a unique identifier present in both the census and
register files. As a consequence, socio-demographic characteristics in the census
were unambiguously matched to migration and mortality data in the population
register in a follow-up period of three years after each census.
The mortality data can be considered as almost fully accurate. Problems of death
registration account for \0.05% of the annual deaths and mainly relate to late
registration of deaths occurring outside the country. The registration of emigration
is more problematic, as persons leaving the country often omit to report their
emigration to the authorities, sometimes resulting in a considerable time lag in the
registration of emigration. Nevertheless, the internal consistency of the migration
data suggests a high degree of accuracy for the period 1991–1994. In 2001, the
emigration data may be slightly less accurate, as evidenced by the fact that
emigration is three times higher in the first year of observation than in the two
consecutive years. The explanation is likely to be the accumulation of inaccuracies
in the population registers of some municipalities during the intercensal period.
Corrections of the register based on non-returned census forms resulted in a sudden
surge in emigration registration in the first year after the census. The importance of
emigration is, however, relatively small and errors due to possible overestimation of
the denominator will not necessarily alter our research results. Moreover, it mostly
concerns non-returned census forms and these cases are excluded from the analysis.
Education is measured as a categorical variable by attained level of education.
The categories are comparable with the international ISCED classification. The
attained level of education is preferred above the number of years of schooling or
the age at the end of the studies, as these do not discriminate very well between
slower completion of the educational curriculum and higher levels of attainment.
Substantial efforts were made to clean and control the educational data in order to
guarantee comparability between the two census files. Analysis of the census data
shows clear differences in the response pattern between 1991 and 2001 due to the
question wording. The differences are marginal as far as secondary and tertiary
education are concerned.
The main problem with the 1991 data arises from the fact that persons without
formal education cannot be distinguished from non-response. Respondents were
asked to tick the highest diploma they had obtained without the possibility of
choosing an option ‘‘without formal diploma’’. This resulted in a high non-response,
mainly among older respondents who finished primary school and sometimes lower
secondary school—as can be deduced from the number of years of school
attendance—without receiving a formal certificate. In the 2001 census, the question
wording was modified, resulting in a much higher response rate.
178 P. Deboosere et al.
123
Selectivity in non-response can influence the outcome. Analysis of the missing
data shows that non-response is selective in at least two regards. Lower educated
persons are in general less inclined to declare their level of educational attainment,
this phenomenon being accentuated in the 1991 census due to the question wording.
Non-response is also related to health and the risk of dying. It is evident that in the
stressful situation of a terminal illness, people or their family are not preoccupied
with filling in the census form. In addition, ill persons are not necessarily at home
and may be hospitalised or transferred to long-term care facilities. In other words,
older and sick persons with a high risk of dying have a higher risk of not answering
the census. Analysis of the data shows a large overrepresentation of non-response
for education among persons who die in the months following the census.
The dataset delivered by Statistics Belgium allows us to control the group
composed of persons with no formal education or with non-response for education
in 1991 (27%) using the answers on education in the 2001 census. Based on these
2001 data, among the non-response in 1991, less than 5% could be classified in the
academic or non-academic higher educational level. About 40% of the non-response
in 1991 is composed of persons with a primary education in 2001 and about 25%
with a lower secondary education. Finally, 10% of the non-response in 1991
pertains to persons who confirmed having no formal education in 2001 and 15% of
those who did not answer the question on educational attainment in 1991 did the
same in 2001.
Due to mortality or emigration, 1.37 million persons registered in the 1991
census were no longer present in the census of 2001. For most of them the
educational level in 1991 was known. For the non-response among those who had
disappeared, we applied a weighting factor with a similar distribution to the pattern
we found in the analysis of surviving non-respondents. As mortality differs by
educational level, we also applied a correction factor for differential mortality. The
result is summarised in Tables 1, 2 and gives a comparable and more correct
distribution of educational attainment of men and women above age 25 in 1991 and
2001. However, the calculation of life expectancies proper is restricted to the
original data and the reason for this restriction will be further documented in the
discussion section.
Table 1 Census populations and register-based mortality in 1991–1994 and 2001–2004 by sex
Population aged 25+ Deaths in follow-up period
Year 1 Year 2 Year 3
(March 1991)
Men 3,248,365 51,349 50,830 52,116
Women 3,547,930 51,042 50,084 52,129
Total 6,796,295 102,391 100,914 104,245
(October 2001)
Men 3,481,352 50,818 50,980 50,096
Women 3,766,701 52,327 53,019 51,375
Total 7,248,053 103,145 103,999 101,471
Evolution in Life Expectancy by Educational Level 179
123

For each three-year period we consider a semi-closed population as we are
studying population attrition by death or emigration and do not allow for
immigration. In order to keep the 1991 and the 2001 populations as comparable
as possible, we restricted the 2001 population to persons already living in Belgium
in 1991. Migration can be considered as a perturbing factor if we want to study
trends in life expectancy by educational level. Immigration indeed substantially
influences the population composition by educational level and several studies have
illustrated the existence of a healthy migrant effect (Abraıdo-Lanza et al. 1999;
Razum et al. 2000; Razum and Rohrmann 2002). As a large proportion of recently
arrived immigrants have no formal education or only primary education, including
them could considerably alter the position of the lowest educated and make it
difficult to clearly interpret the results.
3 Methods
In order to measure mortality differences, life expectancy is preferred to the
frequently used odds ratios, relative risks or standardised mortality rates/ratios. The
simplicity of these indicators is an important advantage, but they tend to reflect the
intensity of mortality and do not report on the prematurity of death (Shkolnikov
et al. 2001). Life expectancy, in contrast, measures the essential time dimension of
mortality, has the advantage of ready interpretation and is, in addition, easy to use
across populations.
Life expectancy is better suited to capture the double conceptual approach of the
relationship between educational attainment and mortality. In recent decades,
Table 2 Absolute and percent distribution by educational level of the total Belgian population aged 25+
in 1991 and 2001
Men (1991) Men (2001) Women (1991) Women (2001)
Absolute numbers
No answer 158,781 211,579 205,232 262,991
No formal education 109,407 136,963 145,192 170,634
Primary education 883,074 522,139 1,141,239 703,914
Lower secondary 752,107 799,541 791,609 843,202
Higher secondary 771,766 842,516 730,363 816,344
Tertiary education 573,230 856,182 534,296 871,049
Total population 3,248,365 3,368,920 3,547,930 3,668,134
Percentages
No answer 5 6 6 7
No formal education 3 4 4 5
Primary education 27 16 32 19
Lower Secondary 23 24 22 23
Higher secondary 24 25 21 22
Tertiary education 18 25 15 24
180 P. Deboosere et al.
123

research on the education–mortality relationship has often been dominated by the
inequality aspect and relative risks of mortality are well adapted to this research.
Life expectancy by educational level offers scope for a more global assessment
including both the health inequalities aspect and the role of education in the
improvement of life expectancy.
The two datasets with linked population-at-risk and mortality data allow for
analysing trends in education-specific life expectancy without the classic numerator-
denominator problem. In order to enhance stability and reliability, life expectancy is
calculated for the three-year period following each census. The use of a three-year
period also neutralises the possible bias of selective missing data, the mortality risk
of non-respondents being high in the first months after the census due to serious
health problems. The census of 1991 was held on 1 March; the census of 2001 on 1
October. For all persons present in each census, mortality and migration data were
drawn from the population register over a follow-up period of three years. Based on
this information, the exact number of person-years lived is calculated by age, sex
and educational level. Age-specific death rates (nMx) were calculated and converted
into age-specific probabilities of dying nqx by applying the simplified equation
(Shryock et al. 1971; Newell 1988). The life tables were computed using the classic
life table formulas based on one-year intervals.
In order to evaluate changes in inter-group inequalities, we introduced summary
indices of inequality based on life expectancies. In the case of education, where
policy plays an important role in the population distribution, the evaluation of the
widening or narrowing of the life expectancy gap between educational groups
should also address changes in the educational distribution in the population.
Several measures have been developed to take account of changes in population
distribution by socioeconomic category. Such indices have been constructed for
mortality rates (Kunst and Mackenbach 1994a, b), but can also be determined for
life expectancies. Shkolnikov and colleagues have demonstrated that the population
attributable risk (PAR) index can be transformed into a population attributable life
loss (PALL) index. In absolute terms, this index represents the increase in overall
life expectancy that would be achieved if all groups had the life expectancy of the
best group. In relative terms, it is equal to the percentage increase in overall life
expectancy that would occur if all groups had the life expectancy of the best group
(Shkolnikov et al. 2001).
PALLabs ¼ ehighestx � ex
PALLrel ¼X
i
ððehighestx � ei
xÞ � pix=exÞ
If the proportions of the subgroups were constant over all the age groups, then we
would have the following equation: PALLabs = PALLrel* ex (Shkolnikov et al.
2001).
This equation does not hold when the proportions of the subgroups are changing
over time (in a cohort life table) or by age (in a period life table). The PALLabs may
differ considerably depending on whether it is deduced directly from the life
expectancies or whether it is deduced from the PALLrel, especially in the case of a
period life table where proportions of the subgroups by age are completely
Evolution in Life Expectancy by Educational Level 181
123

independent from the older ages. A legislative change in the age of compulsory
education will, for instance, produce important and abrupt shifts in the educational
composition by age. This is not a problem for the PALLabs, based on the absolute
difference between life expectancies, as exhighest and ex both take into account the
mortality rates and the educational composition of all ages above age x. The
PALLrel, in contrast, is very sensitive to age-specific changes in the educational
composition. In order to capture the impact of the composition effect, it is
appropriate to consider the population-weighted life expectancy loss as a composite
measure of inequality and to distinguish on the one hand the PALL-index in
absolute terms and on the other hand the Composite Index of Inequality (CII). The
CII is simply equal to the sum of the population-weighted life expectancy losses:
CIIabs =P
i (ehighestx � ei
x) * pix. In relative terms, the CIIrel is identical to the
PALLrel proposed by Shkolnikov and colleagues.
The CII quantifies the combined effect of inequality in LE and the population
distribution of educational attainment. The CII is not a decomposition in order to
assess the respective contribution of population structure and LE by educational
attainment to total LE, neither is it equal to PALLabs as only the population fractions
of the concerned birth cohort at age x are taken into account and combined with the
LE based on the observed mortality rates of all birth cohorts above age x.
4 Results
Table 3 summarises the results. Life expectancies by gender and observation year
follow the well-known gradient by educational attainment.
During the observation period, life expectancy increased in all educational
groups except among women without formal education. The increase varies
Table 3 Life expectancy and summary indices of inequality at age 25 by educational level and sex, 1991
and 2001
Men
(1991)
Men
(2001)
Change
(91–01)
Women
(1991)
Women
(2001)
Change
(91–01)
No diploma 47.45 47.56 0.11 54.47 53.98 -0.49
Primary
education
47.84 49.29 1.45 55.09 56.17 1.08
Lower
secondary
49.66 51.33 1.67 56.65 58.00 1.35
Higher
secondary
50.59 52.52 1.93 57.10 58.52 1.42
Tertiary
education
52.68 55.03 2.35 57.69 59.90 2.21
Total LE 49.15 51.38 2.23 55.42 57.09 1.67
PALLabs 3.53 3.65 0.12 2.28 2.81 0.53
CIIabs 2.19 1.92 -0.27 0.82 0.82 0.00
CIIrel (%) 4.47 3.73 -0.74 1.48 1.43 -0.05
182 P. Deboosere et al.
123

considerably according to educational level. The smallest increase and even a
decrease is observed in the groups without formal education, the largest increase is
in the groups with tertiary education (2.35 years in men and 2.21 in women). The
increase in life expectancy between 1991 and 2001 by educational level follows the
existing gradient, resulting in widening differences by educational level. Higher
education not only means higher life expectancy, but also implies a faster increase
in life expectancy compared to lower educational levels. The result is an overall
increase in disparity in life expectancy between the highest and the lowest educated,
attaining in 2001 7.47 years for men (compared to 5.23 in 1991), and 5.92 years for
women (compared to 3.22 in 1991).
The gender gap in life expectancy is closing and mortality has declined faster
among men than among women within each educational level. In 2001, life
expectancy of the highest educated men attained life expectancy of the lowest
educated women. Among women, disparities have grown faster than among men
and the gap between highest and lowest life expectancies in women increased more
both in relative and absolute terms than in men.
As can be observed in Table 3, life expectancy increased almost as fast for the
overall male population as for the highest educated men. This results from the
combined effect of an increase in life expectancy among the highest educated men on
the one hand and an increase in the proportions of higher educated on the other. There
has been a phenomenal shift in the overall educational distribution as documented in
Table 2. The fraction of the male population with tertiary education has risen from
17.6% to 25.4% and the fraction with primary or without formal education has
decreased from 27.2% to 15.5%. The indicators of total impact in Table 3 clearly
show this trend for men. The population attributable life loss due to inequalities in life
expectancy barely changes between 1991 and 2001. The composite index of
inequality is even decreasing both in absolute (0.3 years) and relative terms. The
widening disparity in life expectancy by educational level among men is thus
compensated by the important shift towards higher educational attainment.
The shift in educational attainment among women is even more spectacular than
men. In the overall population, the proportion of women with tertiary education has
increased from 15.1% to 23.8% and the proportion with primary education at most
has dwindled from 32.2% to 19.2% (Table 2). This shift is, however, barely
compensating for the huge increase in disparity in life expectancy among women
with the PALL increasing in absolute terms by half a year. The rapid increase in
educational attainment in the younger age groups results, however, in a neutral-
isation of the growing inequality in mortality between the educational levels, as
expressed in the composite indices of inequality.
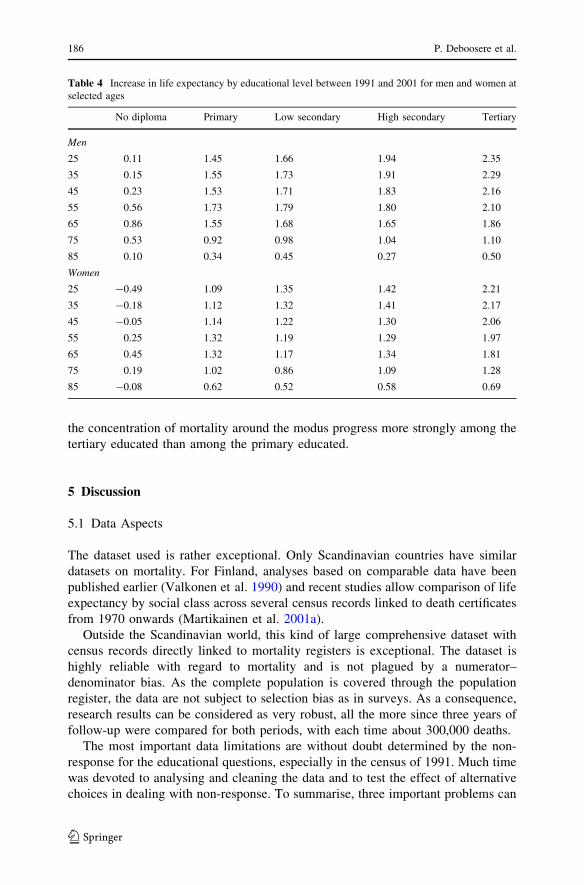
Figure 1 presents the indicators of population attributable life loss for the age
range 25–90. Between 1991 and 2001, men show a slightly worsening PALL in
absolute terms up to the age of 75. For women, the trend in PALL at age 25 is
reproduced for all ages. While the PALL for women is lower than for men in 1991
and comparable from age 72 onwards, it overtakes the PALL for men at age 68 in
2001 and remains higher up to the oldest ages.
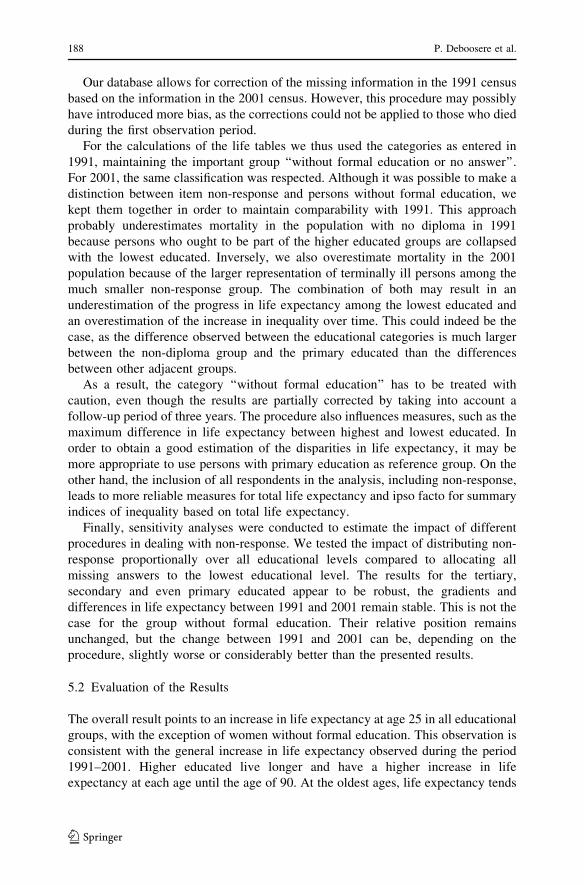
The trend in CII by age (Fig. 2) is much more volatile, as it is directly influenced
by changes in the educational population distribution by age. The widening
Evolution in Life Expectancy by Educational Level 183
123
inequalities among women are largely compensated by the growing numbers of
higher educated women until age 37 in absolute terms and until age 55 in relative
terms. For the older age groups, inequality is increasing as indicated by the CII.
Among men, inequality in terms of the CII is in general decreasing, but the
improvement does not hold for all ages and there is even an increase in inequality in
the age group 65–75.
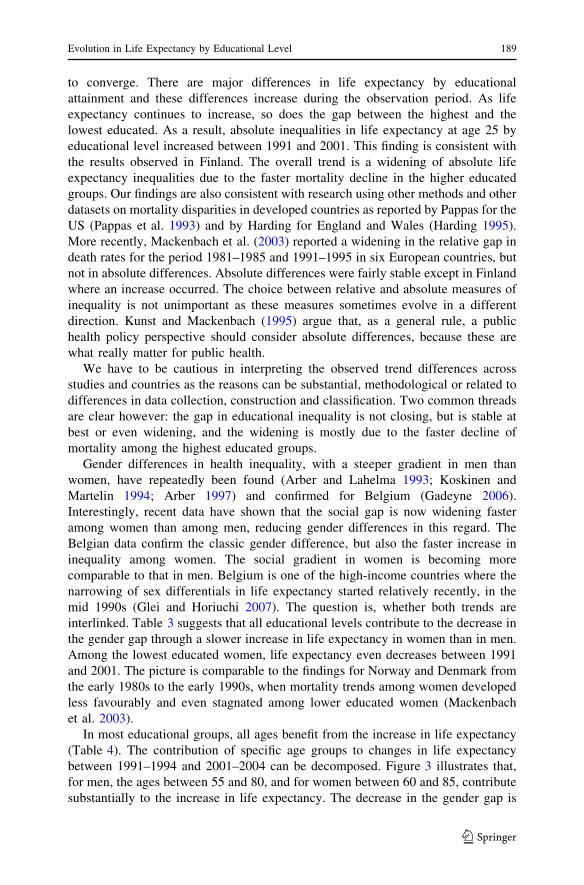
Table 4 gives an overview of the increase in life expectancy between 1991 and
2001 by educational level at selected ages. The table indicates that a substantial
share of the increase in life expectancy can be attributed to the age groups above 65.
This is true for all educational levels.
The age decomposition of the differences in life expectancy between 1991 and
2001 allows for a better assessment of the age-specific contribution. The age
decomposition is calculated according to Arriaga’s formula (1984). The contribu-
tion of mortality differences in an age group x to x + n to differences in the life
expectancy at age 25 between 1991 and 2001 is calculated for each educational
level separately (sea also Preston et al. 2001, pp. 64–65).
The dark line in Fig. 3 represents the decomposition of the increase between
1991 and 2001 for the total population. The increase in life expectancy occurs at all
ages, but is concentrated in the age group 55–80 for men and 60–85 for women with
a peak towards the older ages among women. Overall this suggests an ongoing
rectangularisation of the survival curves. The decomposition by education shows a
comparable pattern for all educational levels. At the lowest level, however, the
decomposition reveals negative contributions under age 55, as illustrated by the
lighter line for primary education. The rectangularisation of the survival curve and
0.00
0.50
1.00
1.50
2.00
2.50
3.00
3.50
4.00
25 27 29 31 33 35 37 39 41 43 45 47 49 51 53 55 57 59 61 63 65 67 69 71 73 75 77 79 81 83 85 87 89
age
po
ten
tial
yea
rs li
fe e
xpec
tan
cy lo
st
men 2001
men 1991
women 2001
women 1991
Fig. 1 ‘‘Population Attributable Life Loss*’’ in absolute terms for men and women by age in 1991 and2001. * (PALLabs = ehighesteducationallevel
x � ex), the difference between life expectancy at age x in thehighest educational level and life expectancy at age x in the total population
184 P. Deboosere et al.
123

0.00
0.50
1.00
1.50
2.00
2.50
252729313335373941434547495153555759616365676971737577798183858789
age
years of life expectancy lost
men
199
1
men
200
1
0.00
0.50
1.00
1.50
2.00
2.50
252729313335373941434547495153555759616365676971737577798183858789
age
years of life expectancy lost
wom
en 1
991
wom
en 2
001
0.00
2.00
4.00
6.00
8.00
10.0
0
12.0
0
14.0
0
16.0
0
18.0
0
252729313335373941434547495153555759616365676971737577798183858789
Ag
e x
proportion life expectancy lost compared to highest life expectancy
men
199
1
men
200
1
0.00
2.00
4.00
6.00
8.00
10.0
0
12.0
0
14.0
0
16.0
0
18.0
0
252729313335373941434547495153555759616365676971737577798183858789
Ag
e x
proportion life expectancy lost compared to highest life expectancy
wom
en 2
001
wom
en 1
991
Fig
.2
Th
eco
mp
osi
tein
dex
of
ineq
ual
ity
(CII
)b
yag
efo
rm
en(l
eft)
and
wo
men
(rig
ht)
in1
99
1(d
ark
lin
e)an
d2
00
1(d
ott
edli
ne)
inab
solu
te(u
pp
er)
and
rela
tiv
ete
rms
(lo
wer
)
Evolution in Life Expectancy by Educational Level 185
123
the concentration of mortality around the modus progress more strongly among the
tertiary educated than among the primary educated.
5 Discussion
5.1 Data Aspects
The dataset used is rather exceptional. Only Scandinavian countries have similar
datasets on mortality. For Finland, analyses based on comparable data have been
published earlier (Valkonen et al. 1990) and recent studies allow comparison of life
expectancy by social class across several census records linked to death certificates
from 1970 onwards (Martikainen et al. 2001a).
Outside the Scandinavian world, this kind of large comprehensive dataset with
census records directly linked to mortality registers is exceptional. The dataset is
highly reliable with regard to mortality and is not plagued by a numerator–
denominator bias. As the complete population is covered through the population
register, the data are not subject to selection bias as in surveys. As a consequence,
research results can be considered as very robust, all the more since three years of
follow-up were compared for both periods, with each time about 300,000 deaths.
The most important data limitations are without doubt determined by the non-
response for the educational questions, especially in the census of 1991. Much time
was devoted to analysing and cleaning the data and to test the effect of alternative
choices in dealing with non-response. To summarise, three important problems can
Table 4 Increase in life expectancy by educational level between 1991 and 2001 for men and women at
selected ages
No diploma Primary Low secondary High secondary Tertiary
Men
25 0.11 1.45 1.66 1.94 2.35
35 0.15 1.55 1.73 1.91 2.29
45 0.23 1.53 1.71 1.83 2.16
55 0.56 1.73 1.79 1.80 2.10
65 0.86 1.55 1.68 1.65 1.86
75 0.53 0.92 0.98 1.04 1.10
85 0.10 0.34 0.45 0.27 0.50
Women
25 -0.49 1.09 1.35 1.42 2.21
35 -0.18 1.12 1.32 1.41 2.17
45 -0.05 1.14 1.22 1.30 2.06
55 0.25 1.32 1.19 1.29 1.97
65 0.45 1.32 1.17 1.34 1.81
75 0.19 1.02 0.86 1.09 1.28
85 -0.08 0.62 0.52 0.58 0.69
186 P. Deboosere et al.
123

be pinpointed: educational distribution among the oldest-old and life expectancy
and trend in life expectancy among the lowest educated persons.
For the oldest-old, especially above age 90, the number of higher educated is so
low and the number of missing answers so high that research results have to be
considered with utmost caution. Therefore, we preferred to draw most tables and
graphs up to the age of 90 only, even if we closed the life tables at age 100.
As the 1991 census data did not allow to distinguish non-response and persons
without formal education, we could not simply eliminate the non-response from the
analyses. In addition, merging the lowest educational group with persons with
primary education, as is often done in international research, leads to an unjustified
lowering of the life expectancy of primary educated and an unnecessary loss of
information. As a consequence, we preferred to maintain the distinction and to warn
about the potentially poor reliability of results for the group without formal
education.
-0.100
0.000
0.100
0.200
0.300
0.400
0.500
25 30 35 40 45 50 55 60 65 70 75 80 85 90 95 100
age
Co
ntr
ibu
tio
n in
life
exp
ecta
ncy
incr
ease
-0.100
0.000
0.100
0.200
0.300
0.400
0.500
25 30 35 40 45 50 55 60 65 70 75 80 85 90 95 100
age
Co
ntr
ibu
tio
n t
o li
fe e
xpec
tan
cy in
crea
se
Fig. 3 Decomposition of the age-specific contribution to life expectancy increase between 1991 and2001 for the total population (dark line) and for primary educated (light line) men (upper) and women(lower)
Evolution in Life Expectancy by Educational Level 187
123
Our database allows for correction of the missing information in the 1991 census
based on the information in the 2001 census. However, this procedure may possibly
have introduced more bias, as the corrections could not be applied to those who died
during the first observation period.
For the calculations of the life tables we thus used the categories as entered in
1991, maintaining the important group ‘‘without formal education or no answer’’.
For 2001, the same classification was respected. Although it was possible to make a
distinction between item non-response and persons without formal education, we
kept them together in order to maintain comparability with 1991. This approach
probably underestimates mortality in the population with no diploma in 1991
because persons who ought to be part of the higher educated groups are collapsed
with the lowest educated. Inversely, we also overestimate mortality in the 2001
population because of the larger representation of terminally ill persons among the
much smaller non-response group. The combination of both may result in an
underestimation of the progress in life expectancy among the lowest educated and
an overestimation of the increase in inequality over time. This could indeed be the
case, as the difference observed between the educational categories is much larger
between the non-diploma group and the primary educated than the differences
between other adjacent groups.
As a result, the category ‘‘without formal education’’ has to be treated with
caution, even though the results are partially corrected by taking into account a
follow-up period of three years. The procedure also influences measures, such as the
maximum difference in life expectancy between highest and lowest educated. In
order to obtain a good estimation of the disparities in life expectancy, it may be
more appropriate to use persons with primary education as reference group. On the
other hand, the inclusion of all respondents in the analysis, including non-response,
leads to more reliable measures for total life expectancy and ipso facto for summary
indices of inequality based on total life expectancy.
Finally, sensitivity analyses were conducted to estimate the impact of different
procedures in dealing with non-response. We tested the impact of distributing non-
response proportionally over all educational levels compared to allocating all
missing answers to the lowest educational level. The results for the tertiary,
secondary and even primary educated appear to be robust, the gradients and
differences in life expectancy between 1991 and 2001 remain stable. This is not the
case for the group without formal education. Their relative position remains
unchanged, but the change between 1991 and 2001 can be, depending on the
procedure, slightly worse or considerably better than the presented results.
5.2 Evaluation of the Results
The overall result points to an increase in life expectancy at age 25 in all educational
groups, with the exception of women without formal education. This observation is
consistent with the general increase in life expectancy observed during the period
1991–2001. Higher educated live longer and have a higher increase in life
expectancy at each age until the age of 90. At the oldest ages, life expectancy tends
188 P. Deboosere et al.
123
to converge. There are major differences in life expectancy by educational
attainment and these differences increase during the observation period. As life
expectancy continues to increase, so does the gap between the highest and the
lowest educated. As a result, absolute inequalities in life expectancy at age 25 by
educational level increased between 1991 and 2001. This finding is consistent with
the results observed in Finland. The overall trend is a widening of absolute life
expectancy inequalities due to the faster mortality decline in the higher educated
groups. Our findings are also consistent with research using other methods and other
datasets on mortality disparities in developed countries as reported by Pappas for the
US (Pappas et al. 1993) and by Harding for England and Wales (Harding 1995).
More recently, Mackenbach et al. (2003) reported a widening in the relative gap in
death rates for the period 1981–1985 and 1991–1995 in six European countries, but
not in absolute differences. Absolute differences were fairly stable except in Finland
where an increase occurred. The choice between relative and absolute measures of
inequality is not unimportant as these measures sometimes evolve in a different
direction. Kunst and Mackenbach (1995) argue that, as a general rule, a public
health policy perspective should consider absolute differences, because these are
what really matter for public health.
We have to be cautious in interpreting the observed trend differences across
studies and countries as the reasons can be substantial, methodological or related to
differences in data collection, construction and classification. Two common threads
are clear however: the gap in educational inequality is not closing, but is stable at
best or even widening, and the widening is mostly due to the faster decline of
mortality among the highest educated groups.
Gender differences in health inequality, with a steeper gradient in men than
women, have repeatedly been found (Arber and Lahelma 1993; Koskinen and
Martelin 1994; Arber 1997) and confirmed for Belgium (Gadeyne 2006).
Interestingly, recent data have shown that the social gap is now widening faster
among women than among men, reducing gender differences in this regard. The
Belgian data confirm the classic gender difference, but also the faster increase in
inequality among women. The social gradient in women is becoming more
comparable to that in men. Belgium is one of the high-income countries where the
narrowing of sex differentials in life expectancy started relatively recently, in the
mid 1990s (Glei and Horiuchi 2007). The question is, whether both trends are
interlinked. Table 3 suggests that all educational levels contribute to the decrease in
the gender gap through a slower increase in life expectancy in women than in men.
Among the lowest educated women, life expectancy even decreases between 1991
and 2001. The picture is comparable to the findings for Norway and Denmark from
the early 1980s to the early 1990s, when mortality trends among women developed
less favourably and even stagnated among lower educated women (Mackenbach
et al. 2003).
In most educational groups, all ages benefit from the increase in life expectancy
(Table 4). The contribution of specific age groups to changes in life expectancy
between 1991–1994 and 2001–2004 can be decomposed. Figure 3 illustrates that,
for men, the ages between 55 and 80, and for women between 60 and 85, contribute
substantially to the increase in life expectancy. The decrease in the gender gap is
Evolution in Life Expectancy by Educational Level 189
123
mainly situated in the same age range. Analysis of age-specific death rates (not
presented) shows that gender differences are increasing among the oldest-old above
age 90. Under the age of 55, differences remain relatively stable for the total
population but show diverging patterns by educational level. Among the higher
educated, the gender gap tends to narrow, while among the lower educated and
especially among the numerically important group of the lower secondary educated,
the gender gap continues to increase. Among women, almost all ages contribute to
the increase in inequalities in life expectancy. Among men the picture is more
mixed. Only among men without formal education is mortality inequality compared
to the highest educated increasing over the whole age range. For all other
educational levels, inequality is decreasing in the age group 60–80.
The age-specific contribution to a change in life expectancy is necessarily
restricted by the existing intensity of the mortality rate. Once mortality is virtually
non-existent at a certain age, it becomes impossible to contribute to future
increases in life expectancy in this age group. The low mortality rates under the
age of 50 explain the small contribution to life expectancy gains at these ages.
Mortality among women with the lowest educational level increases between 25
and 65, resulting in negative increase in life expectancy under the age of 50 years
(Table 4).
5.3 Interpretation of the Results
The relation between education and health is of course well known and amply
documented in the literature. The pathways linking education and mortality have
been discussed for a long time. The role of education as a social determinant of
health is now largely accepted and concurrent hypotheses (spurious relationship,
drift hypothesis or reverse selection, diminished access to health care, etc.) at best
only partially contribute to the main causal relationship (Macintyre 1997). A
vigorous debate is still going on among researchers concerning the practical
mechanisms through which socioeconomic position and education in particular
affect health. Intervening mechanisms have been presented as mutually excluding or
even antagonistic (Davey-Smith et al. 1998), but appear to be often simply
juxtaposed. According to Ross and Wu (1996), the intervening mechanisms linking
education and mortality (or health in general) can be classified in three types:
economic resources, psychosocial resources and health behaviours. The general
impression is that health and education are linked through complex and multifaceted
pathways that are difficult to disentangle, even with regard to the respective
contribution of education as ‘‘knowledge’’ and education as the indicator of past and
future socioeconomic position.
5.4 Are We Moving Towards More Inequality?
The question is: why is there a widening in life expectancy by educational level, or
even more specifically: why don’t lower educated people profit as much from the
general increase in life expectancy?
190 P. Deboosere et al.
123
This discussion is particularly important with regard to the explicit goals of the
World Health Organization (WHO 1985; WHO Regional Office for Europe 1998)
and the European Union to reduce socioeconomic health inequalities. The second
target of the Health for All policy framework of the WHO European Region
(Health21) addresses the problem of reducing health inequalities within countries.
The target is to reduce by the year 2020 the health gap among socioeconomic
groups by at least one fourth in all member states by improving the level of health of
disadvantaged groups. Contrary to this political aim, health disparities seem to have
increased in absolute terms particularly as measured by mortality, the most radical
health indicator (Koskinen 2003).
The interpretation of these findings is complex. As pointed out, the trends in
terms of progress and in terms of inequality in life expectancy is unevenly
distributed across age groups and sexes. Moreover, for interpretation we also have
to take into account the change in the proportions of educational categories within
the population. This change in composition has more than one relevant consequence
for the assessment of trends in health equality.
As the proportion of the lower educated in the total population has decreased
quite dramatically, Mackenbach et al. (2003) noted that lower educational groups
may represent a more ‘‘extreme’’ group in terms of (relative) socioeconomic
position and associated material, behavioural and psychosocial characteristics.
A related hypothesis is that, as the proportions of the lowest educated are
shrinking, inverse health selection effects become increasingly important in
explaining poor health status among the lowest educated. Martikainen et al.
(2001b) have stated that the dwindling in size of a lower status is an unlikely cause
for the increasing life expectancy difference in their Finnish data and argue that the
explanation is more likely to be found in differential health behaviour.
Among the lowest educational groups in Belgium between 1991 and 2001, both
the tendency towards a more ‘‘extreme’’ group and the inverse selection process are
possibly contributing to the trend in the youngest age groups where the lowest
educational levels have become extremely small. This can help to explain the slow
progress in life expectancy and even the increase in mortality among lower educated
women in the younger age groups. It is, however, relatively unimportant in the older
age groups where the lowest educated still represent a major group within the
population.
There is a more profound process taking place. A policy intended to reduce
inequity in health has to address the social conditions contributing to unequal
chances in health. The second target of Health21 on Equity in health explicitly states
‘‘Educational levels produce a similar gradient of health risk to that produced bysocial class. Since levels of educational attainment are strongly related to levels ofdeprivation, a key strategy must be to remove the financial, cultural and otherbarriers that hinder equal access to education’’ (WHO Regional Office for Europe
1998) and a country as Sweden vowed to tackle health inequalities by creating
‘‘social conditions that will ensure good health for the entire population’’
(Hongstedt et al. 2004). Marmot summarises the problem in a lapidary manner:
‘‘If the major determinants of health are social, so must be the remedies’’ (Marmot
2005) and Koskinen concludes in a comment on widening socioeconomic
Evolution in Life Expectancy by Educational Level 191
123
inequalities in Western Europe that in addition ‘‘to tackle the factors which havebeen established as causes of growing inequalities in mortality (...) it is necessary toreduce social inequalities in the general material and cultural resources of healthand wellbeing’’ (Koskinen 2003). In terms of reducing inequality in health this
strategy implies changing the composition of the population to guarantee that more
people have better chances for an optimal development of health and well-being. In
order to assess the implementation of this policy, it is not sufficient to look at the
inequalities in life expectancy between educational levels; the distribution of the
population over educational levels has to be taken into account too. Measures of
social impact such as PALL and CII have to be included in a comprehensive
assessment of trends in health inequalities. If not, the overall evaluation tends to
conclude to an increase in inequality, while one of the most efficient policies to
tackle inequality by changing the upstream conditions is neglected.
Of extreme importance in this regard is the observation that the enormous
expansion of the highest educated did not slow down the progress in life expectancy
among the highest educated. Quite the contrary, the strongest progress in life
expectancy is precisely observed for this rapidly expanding educational group.
In other words, there is no dilution of the educational advantage in this group. A
tempting conclusion could be that there is an autonomous effect of education on
health. Opening up higher education to a larger group of people distributes more
resources over a larger fraction of the population. More people have an additional
asset in life to cope with problems they encounter, improve their chances in life
(access to occupation, income and wealth) and minimise risks (health behaviour, life
style, place of residence, work environment). Some authors have emphasised the
role of the ability to cope with life circumstances as a possible pathway for better
health prospects of persons with higher SES (Kristenson 2006). Similar concepts
proposed in the literature are the ‘‘sense of coherence’’, ‘‘the locus of control’’ or
‘‘control beliefs’’. Several studies have proved the major influence of these abilities
or strategies on health outcomes (Bosma 2006). It has also been largely documented
that education plays a crucial role in acquiring or improving this ability (Mirowsky
and Ross 2007). This has important policy implications: investment in higher
education is also investment in population health.
5.5 Education as Driver of Progress
This point brings us to a final conclusion concerning the link between compression
of mortality and education. The concept of compression is closely linked to that of
rectangularisation of the survival curve. More homogeneous populations tend to
have a more concentrated distribution of mortality. This is an interesting
observation as progress in life expectancy and the secular trend of decreasing
mortality have been accompanied in all countries by a compression of mortality.
It is no hazard that life expectancy and concentration have so powerfully
progressed together since the Second World War. It is in this context that it is
appropriate to evaluate the disparities in educational life expectancy in Belgium
with reference to life expectancy and mortality distributions of other populations.
192 P. Deboosere et al.
123

The higher educated can be considered as a vanguard population. ‘‘Best-practice life
expectancy’’ (Vaupel) shows the capability of humans, in a given medical and
societal context, to extend their length of life.
6 Conclusions
Is inequality in health increasing in Belgium or how can we summarise the changes
over the last decade of the 20th century?
Several conclusions can be drawn. A major problem is the growing inequality in
health. This is in line with most of the literature. The gap between higher educated
and lower educated is still growing. This is not only a problem of the very poor.
Inequality is present across the entire educational gradient and the increase in
inequality is observed among almost all educational groups.
The growing gap in health by educational attainment coincides, however, with
increasing life expectancy for all educational levels. This is an important
observation because it implies that the growing gap is probably due, for a large
part, to the positive effects linked to higher education (directly or as a proxy for
underlying dimensions of well-being). This progress is shared by a growing
proportion of the population. The democratisation of the educational system and the
broad range of measures to guarantee general access to an efficient healthcare
system are producing positive results. No doubt, they are important contributors to
the steady improvement in health.
The increase in life expectancy among the higher educated is occurring in
conjunction with a dramatic increase in the proportion of higher educated in the
population. In other words, there is no dilution of the health advantage of the higher
educated. Quite the contrary is happening. This is a strong argument against the
hypothesis of an enduring inequality in distribution of health by social status. This
hypothesis looks at educational attainment as a measurement of relative positions
and disregards the aspect of increasing cognitive abilities and greater self-control.
At the same time, it is becoming increasingly important to focus on the health
situation of the lower educated. Health selection mechanisms may be partly
contributing to the poor health of the small group of persons without formal
education, but mechanisms of social marginalisation with a negative health impact
cannot be excluded.
The increasing gap between the best performing and all other educational levels
shows that there is still plenty of scope to further improve population health. Policy-
oriented research has to monitor both inequality between groups and composition
effects, especially when change in the distribution is part of the pursuit of equity.
There is no reason to accept the leverage of education in health outcome in
developing countries and deny the importance of the ‘‘upstream’’ conditions in
developed countries, especially when we observe that the gradient suggests a
general effect of education and not only a problem of deprivation or poverty.
Education is one of the most fundamental collective investments in human
capital and the driver of social and economic progress; as such education yields a
Evolution in Life Expectancy by Educational Level 193
123

high return on investment. Health improvement can be considered as an unintended
result of the progress in education and thus an important extra bonus.
Acknowledgements The data have been collected by Statistics Belgium. This study is funded by
Belgian Science Policy, research programme Society and Future. Language editing by Tadek Krzywania
(Institute Public Health Belgium).
References
Abraıdo-Lanza, A. F., Dohrenwend, B. P., Ng-Mak, D. S., & Turner, J. B. (1999). The Latino mortality
paradox: A test of the ‘‘Salmon Bias’’ and healthy migrant hypotheses. American Journal of PublicHealth, 89 (10), 1543–1548.
Arber, S. (1997). Comparing inequalities in women’s and men’s health: Britain in the 1990s. SocialScience & Medicine, 32, 425–436.
Arber, S., & Lahelma, E. (1993). Inequalities in women’s and men’s ill health: Britain and Finland
compared. Social Science and Medicine, 37(8), 1055–1068.
Arriaga, E. (1984). Measuring and explaining the change in life expectancies. Demography, 21(1), 83–96.
Bosma, H. (2006). Socio-economic differences in health: Are control beliefs fundamental mediators? In
J. Siegrist & M. Marmot (Eds.), Social inequalities in health, new evidence and policy implications(pp. 153–166). Oxford: Oxford University Press.
Bossuyt, N., Gadeyne, S., Deboosere, P., & Van Oyen, H. (2004). Socio-economic inequalities in health
expectancy in Belgium. Public Health, 118, 3–10.
Davey-Smith, G., Hart, C., Hole, D., McKinnon, P., Gillis, C., Watt, G., Blane, D., & Hawthorne, V.
(1998). Education and occupational class: which is the more important indicator of mortality risk?
Journal of Epidemiology and Community Health, 52(3), 153–160.
Elo, I. T., & Preston, S. H. (1996). Educational differences in mortality: United States, 1979–85. SocialScience and Medicine, 42(1), 47–57.
Fox, A. J. (Ed.). (1989). Health inequalities in European Countries. Proceedings of European ScienceFoundation workshops, London, 1984–1986. Aldershot: Gower Press.
Gadeyne, S. (2006). The ultimate inequality. Socio-economic differences in all-cause and cause-specificmortality in Belgium in the first half of the 1990s. NIDI/CBGS-publications, 39. Dordrecht: Kluwer
Academic Publishers.
Gadeyne, S., & Deboosere, P. (2002). Socio-economische ongelijkheid in sterfte op middelbare leeftijd inBelgie. Een analyse van de Nationale Databank Mortaliteit. Brussels: Statistics Belgium.
Galobardes, B., Shaw, M., Lawlor, D. A., Lynch, J. W., & Davey Smith, G. (2004). Indicators of
socioeconomic position (part 1). Journal of Epidemiology and Community Health, 60, 7–12.
Glei, D. A., & Horiuchi, S. (2007). The narrowing sex differential in life expectancy in high-income
populations: Effects of differences in age pattern of mortality. Population Studies, 61(2), 141–159.
Harding, S. (1995). Social class differences in mortality of men: recent evidence from the OPCS
Longitudinal Study. Population Trends, 80, 31–37.
Hayward, M., Crimmins, E., & Zhang, Z. (2006). Consequences of educational change for the burden of
chronic health problems in the population. In A. H. Gauthier, C. Y. C. Chu, & S. Tuljapurkar (Eds.),
Allocating public and private resources across generations. Riding the age waves-Vol 2 (pp. 227–
242). Dordrecht, Netherlands: Springer.
Hongstedt, H., Lundgren, B., Moberg, H., Pettersson, B., & Agren, G. (2004). The Swedish public health
policy and the National Institute of Public Health. Scandinavian Journal of Public Health, 32(suppl
64), 1–64.
Hummer, A. H., Rogers, R. G., & Eberstein I. W. (1998). Sociodemographic differentials in adult
mortality: A review of analytic approaches. Population and Development Review, 24(3), 553–578.
Koskinen, S. (2003). Commentary: Is there a common background behind growing inequalities in
mortality in Western European countries? International Journal of Epidemiology, 32, 838–839.
Koskinen, S., & Martelin, T. (1994). Why are socio-economic mortality differences smaller among
women than among men? Social Science and Medicine, 38(10), 1385–1396.
Kristenson, M. (2006). Socio-economic position and health: the role of coping. In J. Siegrist &
M. Marmot (Eds.), Social inequalities in health, new evidence and policy implications (pp. 127–
151). Oxford: Oxford University Press.
194 P. Deboosere et al.
123
Kunst, A. E. (1997). Cross-national comparisons of socio-economic differences in mortality. Department
of Public Health. Rotterdam: Erasmus Universiteit Rotterdam.
Kunst, A., & Mackenbach, J. P. (1994a). International variation in the size of mortality differences
associated with occupational status. International Journal of Epidemiology, 23(4), 742–750.
Kunst, A., & Mackenbach, J. P. (1994b). Measuring socio-economic inequalities in mortality. In
G. Masuy-Strroobant, C. Courbin, & P. Buekens (Eds.), Sante et mortalite des enfants en Europe:inegalites sociales d’hier et d’aujourd’hui (pp. 97–127). Louvain-la-Neuve, Belgium-Paris, France:
Academia-Bruylant, L’Harmattan.
Kunst, A., & J. P. Mackenbach (1995). Measuring socioeconomic inequalities in health. Copenhagen:
World Health Organization Regional Office for Europe.
Lagasse, R., Humblet, P. C., Hooft, P., Van de Voorde, H., & Wollast, E. (1992). Atlas of avoidable
mortality in Belgium 1980–1984. Archives Public Health, 50, 1–97.
Lagasse, R., Humblet, P. C., Lenaerts, A., Godin, I., & Moens, G. F. G. (1990). Health and social
inequities in Belgium. Social Science and Medicine, 31(3), 237–248.
Lagasse, R., & Namurois, A. (1982). Variations sociales de divers indicateurs de sante perinatale
observees dans trois arrondissements wallons. Population et famille, 56(2), 71–102.
Macintyre, S. (1997). The Black report and beyond: what are the issues? Social Science and Medicine,44(6), 723–745.
Mackenbach, J. P. (2005). Health inequalities: Europe in profile. Rotterdam: Erasmus MC Rotterdam.
Mackenbach, J., & Kunst, A. (1997). Measuring the magnitude of socio-economic inequalities in health:
An overview of available measures illustrated with two examples from Europe. Social Science andMedicine, 44(6), 751–771.
Mackenbach, J. P., Bos, V., Andersen, O., Cardano, M., Costa, G., Harding, S., Reid, A., Hemstrom, O.,
Valkonen, T., & Kunst, A. E. (2003). Widening socioeconomic inequalities in mortality in six
Western European countries. International Journal of Epidemiology, 32, 830–837.
Marmot, M. (1995). Socio-economic differentials in mortality: The Whitehall Studies. In A. Lopez, G.
Caselli, & T. Valkonen (Eds.), Adult mortality in developed countries: From description toexplanation (pp. 223–242), Oxford: Clarendon Press.
Marmot, M. (2005). Social determinants of health inequalities. The Lancet, 365, 1099–1104.
Martikainen, P., Makela, P., Koskinen, S., & Valkonen, T. (2001a). Income differences in morality:
A register-based follow-up of three million men and women. International Journal of Epidemiology,30(6), 1397–1405.
Martikainen, P., Valkonen, T., & Martelin, T. (2001b). Change in male and female life expectancy by
social class: decomposition by age and cause of death in Finland 1971–95. Journal of Epidemiologyand Community Health, 55, 494–499.
Masuy-Stroobant, G. (1992). Inegalites sociales et mortalite infantile: un probleme d’accessibilite aux
services de sante. Reflets et perspectives de la vie economique 31(2,3), 213–225.
Mirowsky, J., & Ross, E. C. (2007). Life course trajectories of perceived control and their relationship to
education. American Journal of Sociology, 112(5), 1339–1382.
Newell, C. (1988). Methods and models in demography. London: Belhaven Press.
Pappas, G., Queen, S., Hadden, W., & Fisher, G. (1993). The increasing disparity in mortality between
socioeconomic groups in the United States. The New England Medicine Journal, 329(2), 103–109.
Preston, S. H., Heuveline, P., & Guillot, M. (2001). Demography: Measuring and modeling populationprocesses. Oxford: Blackwell Publishers.
Raes, V., Kerkhofs, E., & Louckx, F. (Eds.). (1993). Sociale ongelijkheid en verschillen in gezondheid.
Brussel: VUBPRESS.
Razum, O., & Rohrmann, S. (2002). The healthy migrant mortality effect: role of selection and late entry
bias. Artherosclerosis, 64(2), 82–88.
Razum, O., Zeeb, H., & Rohrmann, S. (2000). The ‘healthy migrant effect’—not merely a fallacy of
inaccurate denominator figures. Internation Journal of Epidemiology, 29, 191–192.
Ross, E. R., & Wu, C.-L. (1996). Education, age and health. Journal of Health and Social Behaviour, 37,
104–120.
Schepers, R., Smet, M., & Van Wanseele, C. (1985). Sociale ongelijkheid in ziekte, dood en
gezondheidszorg. Welzijnsgids, 23, 1–21.
Shkolnikov, V., Valkonen, T., Begun, A., & Andreev, E. M. (2001). Measuring inter-group inequalities in
length of life. Genus, LVII(3–4), 33–62.
Shryock, H. S., Siegel, J. S., et al. (1971). The methods and materials of demography. Washington D.C:
U.S. Government Printing Office.
Evolution in Life Expectancy by Educational Level 195
123

Valkonen, T. (1993). Problems in the measurement and international comparisons of socio-economic
differences in mortality. Social Science and Medicine, 36(4), 409–418.
Valkonen, T. (1999). The widening differentials in adult mortality by socioeconomic status and their
causes. In J. Chamie & R. L. Cliquet (Eds.), Health and mortality. Issues of global concern.Proceedings of the symposium on health and mortality (pp. 291–312) November 1997, Brussels:
United Nations, Population Division, Department of Economic and Social Affairs, United Nations
Secretariat and Family Study Centre, Flemish Scientific Institute.
Valkonen, T., Martelin, T., & Rimpela, A. (1990). Socio-economic mortality differences in Finland 1971–85. Helsinki, Central Statistical Office of Finland, Studies nr. 176.
Van Oyen, H., Bossuyt, N., Deboosere, P., Gadeyne, S., Abatih, E., & Demarest, S. (2005). Differential
inequity in health expectancy by region in Belgium. Soc.-Praventivmed, 50, 301–310.
Van Oyen, H., Bossuyt, N., Deboosere, P., Gadeyne, S., & Tafforeau, J. (2002). Differences in health
expectancy indicators in Belgium by region. Archives of Public Health, 60(6), 341–362.
Vuylsteek, K. (1984). Sociale ongelijkheid tegenover ziekte en dood. Tijdschrift voor geneeskunde, 40(5),
291–299.
WHO (1985). Formulating strategies for health for all by the year 2000: Guiding principles and essentialissues. Geneva: World Health Organization.
WHO Regional Office for Europe (1998). Health21, An introduction to the health for all policyframework for the WHO European Region. European Health for All Series (5), 36.
196 P. Deboosere et al.
123