2022 Country Report - Belgium - European Commission
65
EN EN EUROPEAN COMMISSION Brussels, 23.5.2022 SWD(2022) 602 final COMMISSION STAFF WORKING DOCUMENT 2022 Country Report - Belgium Accompanying the document Recommendation for a COUNCIL RECOMMENDATION on the 2022 National Reform Programme of Belgium and delivering a Council opinion on the 2022 Stability Programme of Belgium {COM(2022) 602 final} - {SWD(2022) 640 final}
-
Upload
khangminh22 -
Category
Documents
-
view
0 -
download
0
Transcript of 2022 Country Report - Belgium - European Commission

EN EN
EUROPEAN COMMISSION
Brussels, 23.5.2022
SWD(2022) 602 final
COMMISSION STAFF WORKING DOCUMENT
2022 Country Report - Belgium
Accompanying the document
Recommendation for a COUNCIL RECOMMENDATION
on the 2022 National Reform Programme of Belgium and delivering a Council opinion
on the 2022 Stability Programme of Belgium
{COM(2022) 602 final} - {SWD(2022) 640 final}


2
Belgium is experiencing a strong economic rebound…
Belgium's economy performed well prior
to the COVID-19 crisis, but was hit hard by the pandemic. In the 5 years before the pandemic, Belgium's real GDP expanded by 1.8% per year on average, a bit below the euro area, leaving behind the slow pace of the recovery from the global financial recession. In 2020, restrictions on economic activities led to a decline in Belgium’s real GDP by 5.7% (see Graph 1.1), with consumer spending declining by as much as 8.2%, slightly more than the euro area.
Graph 1.1: Real GDP growth, public debt and
headline balance as % of GDP
Source: European Commission
Belgium’s economy recovered strongly thanks to decisive government measures
to protect businesses and employment. Government support measures, notably Belgium’s short-time work scheme (1) (see Annex 3), have protected households’ income, while the restrictive measures taken to contain the spread of the virus led to a strong increase
(1) Belgium has been granted EUR 8.197 billion of financial
assistance under the European instrument for temporary support to mitigate unemployment risks in an emergency (SURE) following the COVID-19 outbreak.
in the savings rate. Employment remained stable in 2020 and employment growth resumed vigorously in 2021, reaching pre-COVID levels. As a result, household spending rebounded strongly once restrictions were eased. The unemployment rate increased slightly to 5.8% in 2020 and 6.3% in 2021. It is forecast to improve to 5.8% in 2022. Business support measures have kept bankruptcies at low levels, about 30% below pre-crisis level. Investment and foreign trade also recovered quickly, already surpassing their pre-crisis level at the beginning of 2021. Overall, real GDP growth bounced back to 6.2% in 2021, above the EU average of 5.9%.
Russia’s invasion of Ukraine is clouding
the 2022 outlook. The recovery is expected to continue although at a slower pace with the further easing of restrictions in 2022. The high level of inflation and the drop in consumer confidence are expected to curb the expansion of private consumption and household investment. Uncertainty, high cost coming from input prices and wages and supply side constraints are expected to weigh on business investment. On the other hand, the RRF and the energy transition can support gross fixed capital formation. Furthermore, a slowdown of import and export growth is expected for 2022, following less favourable world trade developments. Based on the Commission Spring 2022 forecast, GDP growth is projected at 2% in 2022 and at 1.8% in 2023.
High inflation is pushing up nominal wages, which have been growing
moderately in the past years. On the back of increasing energy prices and the economic recovery, headline inflation is set to increase substantially in 2022. The Belgian government adopted temporary support measures to mitigate the impact of energy costs on households, including the extension of social tariff to more beneficiaries, excises and VAT reductions, and one-off rebates on the
-20.0
0.0
20.0
40.0
60.0
80.0
100.0
120.0
-8
-6
-4
-2
0
2
4
6
8
06 07 08 09 10 11 12 13 14 15 16 17 18 19 20 21 22' 23'
% o
f G
DP
%, pps
Public debt (RHS) Real GDP growth Headline balance (RHS)
ECONOMIC AND EMPLOYMENT SNAPSHOT

3
electricity and heating fuel invoice. In addition, the system of automatic wage indexation is set to help employees to maintain their purchasing power. However, the Belgian Central Council of the Economy estimated an increase of 1.2% over the period 2020-2022 for the gap in the wage level compared to neighbouring countries.
Labour shortages risk hampering further
economic growth. The job vacancy rate reached a historically high level of 4.7% in the fourth quarter of 2021, one of the highest in the EU. Employers report difficulties in finding people with the right skills. There are considerable shortages in professional, technical and scientific occupations as well as in sectors such as healthcare, construction, education and training. In 2021, Belgium recorded one of the highest levels of skills mismatches across the EU (2).
Private indebtedness remains high. The debt of Belgian non-financial corporations is high but reflects to a large extent cross-border intra-group lending, which reduces risks. Household indebtedness, which mainly reflects mortgage debt, continued to increase in 2021 on the back of a positive net credit flow. Measures introduced by the National Bank of Belgium to bolster banks’ resilience to risks related to real estate markets are expected to have mitigated those risks (European Systemic Risk Board, 2022) (see Annex 16).
Surging house prices point at increasing
vulnerabilities in the housing market. House prices have risen in recent years and grew by 7.1% in 2021. The risk of overvaluation has increased, now amounting to over 20% (3). This matters especially from the perspective of housing affordability.
(2) Measured as the relative dispersion of employment
rates by education level.
(3) The average house price gap is the simple average of the price-to-income, price-to-rent and model valuation gaps. The latter is estimated based on Philiponnet and Turrini (2017). Price-to-income and price-to-rent gaps are measured in deviation to the long term average (from 1995 to the latest available year).
… but government finances have worsened…
The large scale support to the economy in the wake of the pandemic put additional
strain on government finances. The fall in economic activity and the measures taken by the government to mitigate the socio-economic impact of the pandemic saw the government deficit rise from 2% of GDP in 2019 to 9% in 2020. In 2021, the progressive phasing-out of crisis measures and higher revenues driven by the economic recovery resulted in an improvement of the budget deficit to 5.5%. Based on the Commission Spring 2022 forecast, the government budget deficit would remain at persistently high levels, at 5% in 2022 and 4.4% in 2023 (see Annex 18), despite the withdrawal of most COVID-19 measures. The temporary government measures adopted in response to soaring energy prices in 2022, the automatic indexation of public wages and social benefits in response to inflation, additional defence spending and the inflow of people fleeing Ukraine will weigh further on public finances in the short run.
The projected government deficits in
2022 and 2023 also reflect higher non-
temporary current spending. The increase in non-temporary current expenditure over 2022-2023 is not only driven by the automatic indexation of public sector wages and social benefits, but also by rising ageing costs and by permanent measures taken by the government during the pandemic (e.g. an increase in the minimum pension and health care sector wages). In the absence of significant compensatory budgetary measures, these structurally increasing current spending help explain the projected deterioration in government finances as compared to pre-pandemic projections.
Belgium’s high debt-to-GDP ratio is not
expected to stabilise in the medium term. The rebound in GDP and decline in the government deficit cut the debt-to-GDP ratio to around 108% in 2021 (down from around 113% of GDP in 2020). According to the

4
Commission Spring 2022 forecast, it would then stabilise at around 107.5% in 2022-2023 due to a persistent government deficit. At unchanged policy, the government debt would increase over the next decade, reaching about 117% of GDP in 2032 (see annex 19). The recent lengthening of government debt maturity will mitigate the impact of higher interest rates in the short-term. However, the degree of vulnerability varies across government entities, as these show large disparities in terms of deficit and debt levels.
Budgetary coordination between the different government levels is not
effective yet. The cooperation agreement of December 2013, which aimed at ensuring the budgetary coordination of all government bodies (federal level and federated entities), has not been fully implemented in practice. In particular, the budgetary targets presented in Stability Programmes have tended not to be endorsed by the federal, regional and community governments, which resulted in the absence of a credible multi-annual budget planning (see also Annex 11).
… and some structural challenges have remained unaddressed
The Belgian labour market is still
characterised by a relatively low
participation rate (people working or looking for a job) and lasting regional
disparities in unemployment. In 2021, the employment rate continues to be below the EU average (70.6% vs 73.1%). Poor labour market outcomes, especially for vulnerable groups (4), are linked to financial disincentives to work, limited effectiveness of activation measures to help the jobless find work, lack of appropriate skills, low attractiveness of some low-skilled professions in terms of working conditions, discrimination and a low effective pension age. As regards the implementation of the European Pillar of Social Rights (see Annex 12), skills mismatches, high educational (4) Low-skilled, people with a migrant background (in
particular non-EU born women) and people with disabilities
inequalities, a low level of basic and digital skills among disadvantaged young people, and low participation in adult learning (5) constitute considerable challenges in Belgium, also in view of the green and digital transition. Unemployment shows marked regional disparities, peaking in the Brussels Region at 12.4% compared to 6.3% in Belgium overall in 2021 (see Annex 15).
Belgium’s labour productivity is among
the highest in the EU, but its growth is
hampered by some weaknesses. The country outperforms neighbouring countries in terms of labour productivity (see Table 1.1), although some country-specific characteristics, like large skills mismatches (see below), somewhat inefficient R&D support schemes and limited innovation diffusion (see Annex 9) hinder further labour productivity growth. Weak labour productivity growth affects the non-market services sector. This can be partly attributed to the relatively low level of intangible investment in professional and science services, which lag behind the EU average.
Table 1.1: Average annual growth rate of
hourly labour productivity in %, 2012-20
Source: Belgian Productivity Board
High regulatory burden and
administrative complexity hamper growth
in several sectors. Exit and entry rates of firms are among the lowest in the EU, in particular in services sectors, which are affected by high regulatory burden. Entry restrictions in certain professions can create unjustified rents and lead to shortages. The combination of high regulation, high wage
(5) The indicator on adult learning participation over the
previous four weeks is used in the country report, rather than the indicator on learning over the previous 12 months, as Adult Education Survey (AES) data for the 12-month indicator are only available for 2016 at the moment, while the new Labour Force Survey (LFS) indicator agreed for use in the social scoreboard and as 2030 headline target on skills will only be available in 2023.
BE DE FR NL
Total Economy 1 0.7 0.8 0.1
Manufacturing 2.4 0.7 1.1 1.5
Market Services 1.6 1.2 0.9 0.3
Non-Market Services -0.3 -0.5 0.5 -0.7

5
costs and labour market rigidity weighs on the retail sector's performance, with average prices higher than in neighbouring countries (see Annex 10).
Belgium will continue to face
considerable challenges in making its economy more climate-resilient and
sustainable. Significant efforts remain in reducing emissions in the transport and building sectors. A comparatively small share of employees work in the green economy (0.8% vs 2.1% in the EU). Considering the current level of energy consumption and the share of renewables in the energy mix, there is a significant gap with the current 2030 target for renewables and the projected needs to meet the climate neutrality goal in 2050. Additional transformative investments and policy measures will be needed to sustain further improvements by 2030 in electricity production, housing (heating and cooling) and transport. The green transition will also require the workforce to be upskilled and reskilled to realise the strong potential for creating quality jobs (see Annex 6).
Belgium performs relatively well on the
UN’s Sustainable Development Goals (SDGs), although more could be done to
improve its environmental sustainability. The country is still lagging behind in terms of life on land (SDG 15), clean water (SDG 6) and affordable and clean energy (SDG 7). As regards the digital transition, Belgium is gaining ground in many areas (see Annex 8), but strengthening digital skills remains a challenge (SDG 4) (see Annex 1).

THE RECOVERY AND RESILIENCE PLAN IS UNDERWAY
6
Belgium’s recovery and resilience plan
(RRP) helps address several of the
country’s challenges. The plan includes reforms and investments to boost the green and digital transition (see Annex 2). Planned measures cover pensions, spending reviews, labour markets, education and skills, as well as research and innovation. With an estimated allocation of EUR 5.9 billion in grants (1.29% of 2019 GDP), the RRP however only accounts for part of the identified investment needs in Belgium. In view of further addressing them, complementary recovery plans were adopted at different levels of government.
The RRP focuses heavily on measures
that contribute to the green transition. With 50% of spending dedicated to the climate transition, the RRP is well above the mandatory target of 37%. It includes key investments and reforms to improve the energy efficiency of public buildings (over 1 million m² to be renovated) and housing (over 200 000 m²) and to incentivise the uptake of low carbon heating solutions and investments in renewable heat networks. The plan will also boost innovative energy technologies geared to the decarbonisation of industry. It contains a series of measures to adapt the regulatory framework in order to develop the renewable hydrogen market and to boost research and development and investments in the hydrogen value chain, including its transport. Moreover, support measures are envisaged to boost multimodal transport, improve rail and develop urban infrastructure, electrify the large fleet of company cars and public buses, and accelerate the roll-out of more than 78 000 charging stations. Investments are also planned to improve water management and increase climate change resilience (including protection against floods) alongside reforms and investments to further boost the circular economy.
Belgium is making progress on
implementing green transition measures
in the RRP. Initial measures have been launched or are in the pipeline. These include the adoption of the law to reform the company car tax scheme, the adoption of the framework for charging infrastructure in Flanders and the launch of calls for interest for research and development in hydrogen technologies in Flanders and Wallonia. Reforms of energy grant schemes for renovating houses and other buildings are being adopted in the different regions and communities. A full assessment of the implementation of the RRP measures will take place once Belgium will have submitted the related payment request.
The ongoing RRP implementation will help
accelerating the digital transition. With 27% of spending dedicated to the digital transition, the RRP exceeds the mandatory target of 20%. Investments and reforms are envisaged to accelerate or enable digitalisation, including 5G readiness. Reforms to enable 5G rollout are being put in place. The 5G auction at federal level is expected in the first half of 2022. Sizeable investment in digitalising public administration, including the justice system is expected to contribute to a business-friendly environment and thereby support the economic recovery (see Annex 11). The plan will also support digital education and inclusion.
The RRP is also expected to help address
some of Belgium’s fiscal sustainability
challenges. A landmark initiative in the RRP is the systematic integration of spending reviews in the budgetary planning cycle of all government levels. Spending reviews will help improve the quality and composition of public spending. Belgium also committed to an ambitious pension reform to improve the social and financial sustainability of the pension system, incentivise people to remain
THE RECOVERY AND RESILIENCE PLAN IS UNDERWAY

7
active on the labour market after meeting early retirement conditions, increase the solidarity and insurance role of the pension system (including gender balance), as well as ensure convergence between and within the different pension systems (private and public sector).
The RRP also includes measures to
address some labour market challenges,
thereby helping implement the European Pillar of Social Rights. To boost access to the labour market, the RRP contains measures to strengthen participation in adult learning, including the introduction of individual learning accounts. To improve the effectiveness of active labour market policies, the RRP includes a reform of the functioning of the regional public employment service in Wallonia as well as measures to tackle discrimination on the labour market. However, most investments focus on upgrading education and training infrastructure, and less on strengthening incentives to participate in training. Box 2.1 highlights some key upcoming deliverables under the RRP.
Box 2.1: Key deliverables under the Recovery and Resilience Plan in 2022-23.
Adoption of a proposal for a pension reform
Integration of spending reviews in the budgetary process
Revision of the regional legislative framework on 5G radiation standards
Award of contracts for hydrogen projects, renewable or waste heat projects
Investments to improve the energy efficiency of public and private buildings
Award of contracts for recycling facilities
Start of ‘Blue Deal’ projects to increase water availability and resilience to climate change
Upgrade of railways and works to make stations more accessible
Start of deploying charging stations for electric vehicles
Digitisation of the justice system
Equipment of schools with ICT infrastructure and devices

FURTHER PRIORITIES AHEAD
8
Beyond the challenges addressed by the
RRP, as outlined above, Belgium faces
additional challenges not sufficiently
covered in the plan. Outstanding challenges include addressing fiscal sustainability issues, improving the tax and benefit system to boost employment, addressing skills mismatches and taking resolute steps towards achieving climate neutrality. Addressing these challenges will also help make further progress on achieving the SDGs related to reduced inequalities, affordable and clean energy and climate action. Moreover, closing the gap in regional disparities would stimulate long-term sustainable and inclusive growth boosting the economic potential of Belgium.
Sustainability of public finances
Belgium’s fiscal sustainability challenges are significant and related to the high
level of government debt and to the
projected increase in ageing cost (see Annex 19 and 2021 Fiscal Sustainability Report). The 2021 Ageing Report projects an increase of 5.4 pps of GDP by 2070, mostly due to pension and long-term care spending, compared to an average increase of 1.7 pps in the euro area.
Public expenditure on pensions is
projected to increase by almost 3 pps of GDP by 2070, with most of the increase
expected by 2040 (6). Over the same time span, pension spending in the euro area is projected to increase by 0.1 pp. on average (European Commission, 2021). The effective
(6) These estimations do not include the impact of new
measures adopted by the government after the finalisation of the report that would overall result in a further increase in pension expenditure.
retirement age, at 61.9 years in 2018 (7), remains well below the statutory retirement age, in particular in the public sector, where half of the workforce retires by the age of 60 (see Graph 3.1). In its RRP, Belgium pledged to reform the pension system in order to improve its financial and social sustainability.
Graph 3.1: Age distribution of new pensioners
Source: SPF Pensions, Annual Report 2019
Long-term care spending is expected to increase in the medium and long term. In 2019, Belgium was already the fourth highest spender in the EU on long-term care (Ageing Report 2021) and its spending is expected to further increase by 14% by 2030. While the long-term care system is well developed, financial reasons can limit access to it. There is room to improve the cost efficient use of the different care settings. In 2018, data from the Belgian Health Care Knowledge Centre (Devos et al., 2019) suggested that institutionalisation may be unnecessary or at least premature for 1 in 4 (25%) people in residential care. Moreover, there are large regional differences (8). Given Belgium’s high
(7) Based on the administrative data and excluding survivor
pensions.
(8) In Brussels, almost one third (30.7%) of elderly people living in residential structures still have at least some autonomy, almost half of these being totally independent. In Flanders, this proportion stands at 20%, of which 37% are physically fully independent.
0%
13% 12%9%
7% 4%
53%
3%
22%
28%
19%
8%4%
3%
14%
2%
0%
10%
20%
30%
40%
50%
60%
-60 60 61 62 63 64 65 65+
Private sector Public sector
FURTHER PRIORITIES AHEAD

9
density of residential beds for the over-65s, there may be scope to strengthen the use of home care services at least for patients with low levels of dependency, while increasing efficiency. The COVID-19 crisis has stalled the implementation of planned cost-saving measures (2021 Long-Term Care Report). While the Walloon Region has adopted a deinstitutionalisation strategy – moving from institutional to community-based services - as part of the RRP, fiscal sustainability challenges remain (see also Annex 14).
Total public expenditure as a share of GDP remains among the highest in the
euro area. The level of public investment as a share of GDP has recently increased to 2.8% of GDP in 2021, but remains below the euro area average (3.1% of GDP). By contrast, current expenditure is among the highest in the euro area, as was already the case before the crisis. According to a recent study of the National Bank of Belgium (Godefroid et al., 2021), the level of public expenditure in Belgium was 4.5 percentage points of GDP above the average of the main neighbouring countries (France, Germany and the Netherlands) in 2019. Belgium spends comparatively more than the euro area average on public wages (12.3% of GDP in 2019 vs. euro area average of 9.9%). Additionally, subsidies have more than doubled, as a percentage of GDP, since 2000. In 2019; subsidies stood at 3.7% of GDP compared to 1.6% for the neighbouring countries, with half of that share constituted by wage subsidies (9).
There are concerns about the efficiency
of public spending, notably to support the
green transition. A study of the National Bank of Belgium (Cornille et al., 2017) and recent analysis (e.g. Court of Auditors, 2021, Dumont, 2019) also raise questions in terms of the cost efficiency and quality of certain policies (e.g. exemption from social contribution for first recruitments, and R&D incentives). Spending reviews could help unlocking efficiency gains and reprioritise expenditure towards the country’s economic (9) This category includes, for instance, payroll tax
exemptions (at the federal level) and the system of service vouchers (at regional level).
and societal goals. Their systematic integration into the budgetary process by all entities, as provided for in the RRP, is an important step in the direction of improving the efficiency and quality of public spending. Moreover, introducing green budgetary practices would help increasing the accountability and transparency on the budget’s contribution towards the country’s green objectives (European Commission, 2022).
Tax-benefit system
High labour taxes discourage more people from working or looking for a job. While the 2016 tax reform reduced the tax burden on labour for the lowest income earners, the tax wedge (social security contributions and taxation of labour income) remains the highest in the EU for those earning the average wage (see Annex 17). Moreover, the tax brackets of the personal income tax system are rather narrow. As a result, even average income earners are subject to the highest income tax rates (45% and 50%), limiting the real progressivity of the system (see Graph 3.2). In addition, high labour taxation may also discourage participation in lifelong learning.
Graph 3.2: Personal income tax rates for a
single person, 2020
Source: Commission services
The complexity of the benefit systems
risk creating disincentives to work. The complex design of unemployment benefits does not provide a clear signal to jobseekers (OECD, 2020). Unemployment benefits are unlimited in time and not means-tested for
0%
10%
20%
30%
40%
50%
60%
0 20,000 40,000 60,000 80,000 100,000
Ma
rgin
al ta
x r
ate
Taxable income (EUR)
Belgium France Germany

10
the long-term unemployed. Combined with lenient job search and availability requirements, these design features of the Belgian unemployment benefit system may reduce the effectiveness of activation policies (OECD, 2018). For beneficiaries of social benefits with low earning potential, disincentives to take up work also remain as the options to combine income from work and social benefits are limited and complex (Marx and Horemans, 2021). Non-cash social benefits, where some are linked to the unemployment status of beneficiaries, contribute to existing inactivity, unemployment and low-wage traps.
The extensive use of special schemes makes the tax-benefit system complex
and creates distortions. To offset the heavy tax burden on labour, wage subsidies have been broadly used. In particular, the withholding tax exemption for overtime, R&D work and night/shift work is costly in budgetary terms and leads to inefficiencies (Schoonackers, 2020). Various features of the corporate tax system (e.g. tax shelter for audio-visual and film productions) do not seem to be the most cost- efficient means of supporting specific sectors. Moreover, some personal income tax deductions disproportionally benefit high- income earners. Broadening tax bases and reducing tax rates would make revenue collection easier and reduce distortions or disincentives to work, invest and consume.
Some features of the tax system distort
investment choices and lead to
overinvestment in certain assets. Taxation of immovable property is a case in point, since rents (10) are undertaxed and interest on housing loans for secondary residences are tax-deductible. In Wallonia, homeowners continue to benefit from favourable tax treatment for their mortgage payments (‘chèque habitat’). Moreover, some features of the tax framework, including the tax incentive
(10) When immovable property is rented out for professional
purposes, actual rental income is taxed. When immovable property is rented out for housing purposes, the cadastral value is taxed. The cadastral value is on average 20% to 25% of the actual rental income (European Commission 2012).
for savings and the rigid design of the tax rules applying to long-term savings and pension schemes, create obstacles to a better allocation of capital. The tax on securities accounts also acts as a disincentive to invest in financial instruments (11).
Belgium’s energy taxation still
encourages the use of fossil fuels. Excise duties on fossil fuels used for heating (e.g. gas oil, natural gas) are low, particularly compared to electricity. This discourages the investment in low carbon heating solutions and leads to fossil fuel subsidies. Flanking measures focused on energy efficiency may be needed to support the most vulnerable households (see Annex 6). As highlighted by the Belgian Court of Audit (2022), the partial refund of excise duties on diesel for professional use goes against environmental objectives and benefits an increasing number of road transporters, leading to growing traffic transit and an increasing budgetary cost. Other environmentally harmful subsidies include a tax exemption for energy used in agriculture and fisheries, as well as reduced VAT rates for coal and coke.
The government announced a broad tax reform to reduce labour taxes and
greening energy taxes in a budget-
neutral way. The federal government agreement pledges to reform labour taxation to boost employment and greening energy taxes to provide appropriate price signals and discourage the use of fossil fuels. While the RRP refers to a proposal for a broad tax reform, it does not include a firm commitment to adopt the tax reform over the RRF period. Given Belgium’s budgetary challenges, it will be particularly important to ensure that the labour tax reduction is fully financed. Several financing options could be envisaged according to a study by the High Council of Finance (2020).
(11) Annual tax of 0.15% on securities accounts that exceed
EUR 1 million in average value.

11
Skills mismatches and education
While Belgium performs well in education overall, inequalities are a concern. About one out of five pupils aged 15 fails to perform basic mathematics, reading or science tasks (OECD Pisa Results 2018). Furthermore, the share of young people with at least basic digital skills has dropped in recent years. The gap in educational outcomes is highly linked to students’ socio-economic and migrant background and is among the highest in the EU. Inequalities also exist between schools and educational programmes (see Graph 3.3). Besides, the share of high achievers in mathematics and science continues to decline. Finally, more than one out of three young adults with disabilities do not finish secondary education and their limited participation in higher education is one of the reasons for their low employment rate. Important education reforms are underway in the French Community but some of them were delayed by the COVID-19 crisis (Pact for excellence). Also the Flemish Community is taking measures to improve the quality of compulsory education, notably for vulnerable pupils (Education and Training Monitor, 2021).
The education and training systems may
not be delivering all the skills needed on
the labour market. Labour shortages concern all skills levels and are persistent in various sectors, including ICT, professional, technical and scientific occupations, the care sector, construction, education and training. In particular, Science, Technology, Engineering and Mathematics (STEM) skills are in high demand on the labour market. Among upper secondary graduates from vocational programmes, only 33% had a degree in STEM in 2019. Also the share of STEM tertiary graduates remains well below the EU average (14.2 vs 20.8 per thousand inhabitants) and has not been increasing over time. The share of people with at least basic digital skills (54%) is at the EU average.
Low participation in adult learning
contributes to skills mismatches. Participation in adult learning (10.2% of aged 25-64) is slightly below the EU average (10.8%) but is particularly low for the low-educated (4.0%), for whom upskilling could offer better employment opportunities. Persons most at risk of losing their jobs are less involved in adult learning, suggesting that continuous training does not meet labour market demand and is insufficiently targeted (OECD PAL Dashboard). Besides, the share of
Graph 3.3: Average PISA score for reading, by Communities, gender, type of programme and socio-
economic and migrant background
40 PISA points correspond to one year of schooling. Source: OECD (2019) PISA results 2018
BEfl
BEfr
BEde
BE
EU-27
Girls
Boys
Advantaged
Disadvantaged
Native-born pupils with
parents born abroad
Pupils born abroad
Pupils without a migrant background
Vocational
General
EU-27 boys
EU-27 girls
EU-27 disadvantaged
EU-27 advantaged
Repetition
Non-repetition
Average Gender Socio-economicbackground
Migrant background Type of programme Grade repetition
400
420
440
460
480
500
520
540
560 Average PISA score
for reading

12
spending on active labour market policies devoted to training is limited (29% vs. 40% on average in the EU). Despite the existing incentives, only a small proportion of jobseekers follow a training related to a job in shortage (e.g. 5% of all jobseekers in Wallonia in 2019). Tackling these challenges is key for Belgium to contribute to reaching the 2030 EU headline targets on employment and skills. Moreover, closing the gap in regional disparities would stimulate long-term sustainable and inclusive growth for Belgium as a whole.
There are concerns about the quality, attractiveness and labour market
relevance of vocational education and
training (VET). A large share of the population has a negative perception of vocational secondary education (42.5% vs. 23.5% on average in the EU). In 2019, only 6.2% of students participated in work-based learning in Belgium compared to 29% on average in the EU (Cedefop database). According to public employment services, the lack of jobseekers with the relevant skills or experience accentuates shortages in technical professions. Increasing labour market relevance of the VET systems is particularly warranted in the French Community, where only 3 out of the 10 most popular upper secondary VET options prepare for occupations with labour shortages. In the Flemish Community, the reform of work-based training has led to an increase in the number of VET pupils, but concerns remain over its attractiveness and inclusiveness, in particular for pupils with a disadvantaged or migrant background. In addition, measures to attract qualified and experienced teachers to disadvantaged schools are lacking.
A growing shortage of qualified teachers
poses a particular challenge to the education system. Schools principals report important shortages of qualified teachers (45.5% vs. 24.6% in the EU), which hinder schools’ capacity to provide quality instruction (see Annex 13). The job vacancy rate in education is more than twice as high as in the euro area (3.2% in Q4-2020 vs 1.7%). The number of students in education bachelors decreased up until 2019. More than one out of
five starting teachers leaves the profession within the first five years of teaching. There is scope to strengthen the teaching profession by enhancing professionalisation, evidence-informed initial education, induction, and continuous professional development, including by preparing to address educational disadvantage and to teach in increasingly multicultural classes, as well as by developing more flexible and attractive career paths and frameworks.
Climate neutrality and reducing dependence on fossil fuels
Further efforts are needed to put Belgium on track to become climate neutral. With existing measures, greenhouse gas emissions in sectors not currently covered by the EU Emissions Trading System (ETS) are projected to be only 13% below 2005 levels in 2030. This leaves a considerable gap to reach the existing binding 2030 target of a 35% reduction (see Annex 5). Provided efforts are sustained to ensure that all existing and additional measures included in the 2019 national energy and climate plan (NECP) are fully implemented, greenhouse gas emissions are projected to decrease by -36% in the non-ETS sectors (12). The measures included in the RRP are expected to help accelerate the green transition. However, with the increased 2030 EU ambition set by the European Climate Law and the Fit for 55 package of proposals, further policy reforms and additional investments will be needed in the energy sector, industry, buildings and in transport (see also Annex 5). Belgium has started taking additional measures, in particular in the energy sector.
Whilst Belgium’s overall dependency on fossil fuels imports is high, dependency
on Russian gas is limited but above the
EU average for crude oil. Around 70% of Belgium’s gross inland energy consumption is covered by imported fossil fuels. Compared to
(12) The projections in the updated NECP, that is expected in
June 2023, will have to reflect the Belgian government declaration of 18 March 2022 on nuclear.

13
some other Member States, Belgium’s sources of energy imports are rather diverse and the country is well interconnected with neighbouring countries. The liquefied natural gas (LNG) terminal and capacity at Zeebrugge contributes to the EU’s diversification of gas routes and security of supply. Plans are also advanced to further extend connections to the North Sea grid, increasing Belgium’s access to offshore wind power. The share of Russian gas in imports in 2020 was 7% (EU27 average 44%), with natural gas making up 30% of gross inland consumption in Belgium. However, reliance on natural gas in the Belgian energy mix is expected to increase by 2030 following the planned partial nuclear phase out by 2025 (nuclear energy made up 16.4% in the energy mix in 2020) and the building of additional gas plants (13). To decrease natural gas dependency, Belgium could step up efforts to boost renewable energy and renewable hydrogen, accelerating energy-efficiency improvements and fuel switching in buildings. The share of Russian crude oil in imports in 2020 was 30% (EU27 average 26%), with oil making up 39% of the Belgian energy mix. With coal taking up less than 5% in the energy mix, the importance of coal in imports from Russia is not very high for Belgium (39% versus EU27 average of 54%) (14). Dependency on Russian oil in 2020 was thus higher than for natural gas. Transport accounts for a significant share of oil consumption in Belgium (39% in 2020).
Decarbonising electricity production will
be key to achieving climate targets and
reducing fossil fuel dependency. Belgium aims to reach a share of 17.5% of renewable energy sources in final energy consumption in 2030, which the Commission assessed as unambitious, since the Commission expected Belgium to reach 25% even before the
(13) Belgian government declaration of 18 March 2022. The
declaration proposes taking the necessary steps to continue the exploitation of two of the nuclear power plants until 2035 and to maintain the building of additional gas plants next to an increase in renewable deployment.
(14) Eurostat (2020), share of Russian imports over total imports of natural gas, crude oil and hard coal. For the EU27 average, the total imports are based on extra-EU27 imports. For Belgium, total imports include intra-EU trade. Crude oil does not include refined oil products.
European Climate Law (15). Renewable electricity production in Belgium is currently set to reach 37.4% of total electricity production by 2030 (see Annex 5). This level of ambition appears modest in light of the current challenges, namely the climate neutrality objective, the need to further reduce dependency on fossil fuels including through increased electrification, and the planned decrease in the share of nuclear in the energy mix. Due to limited marine space, further domestic renewable capacity will mainly have to come from solar power and onshore wind. According to the Belgian transmission system operator ‘Elia’, these capacities will double by 2030 as a result of the NECP measures (see Graph 3.4). However, in view of the challenges this ambition will need to be stepped up. Nevertheless, Belgium is planning to promote the deployment of offshore wind through the development of the multifunctional offshore energy hub (‘energy island’) in the Belgian part of the North Sea and by allowing the capacity in the North Sea to increase from 2.2GW to 5.8GW by 2028 (compared to 4.4GW in the NECP and potentially up to 8GW by 2030 (including by repowering) (16).
Graph 3.4: Evolution of installed solar and
onshore wind capacity under a scenario with
additional measures, GW, 2010-32
Source: Elia Adequacy and Flexibility Study for Belgium
2022 – 2032
Several investment bottlenecks hinder
the deployment of onshore wind power. The development of onshore wind energy projects has been hampered by several
(15) Share calculated using the formula in Annex II to
Regulation (EU) 2018/1999 on the Governance of the Energy Union and Climate Action, for the EU to reach its common binding target.
(16) Belgian government declaration of 18 March 2022.
4.8
11
2.5
4.9
0
2
4
6
8
10
12
14
10 11 12 13 14 15 16 17 18 19 20 21 22 23 24 25 26 27 28 29 30 31 32
Solar Onshore wind
GW

14
obstacles, including repetitive and lengthy appeal procedures, causing long delays (up to 9 years) for building permits. Reasons for long and repetitive appeal procedures include the insufficient capacities of appeal bodies to handle the appeals, the possibility to rule on appeals without examining all appeal grounds, thus leaving unexamined grounds of appeal open for further new appeals on the same project and the possibility to launch appeals without the need to demonstrate a direct interest in challenging the project. The permit-granting process could be facilitated by the introduction of spatial planning taking into account the resource potential of territories, the easing of restrictions in the vicinity of airports, radars and military zones, and by updating minimum distance requirements (to wind turbines). Renewable installations and grid development projects do not benefit from an overriding public interest status that could help streamline the permit-granting process. They often suffer from a lack of local acceptability. Local opposition to such projects can partially be related to insufficient participation or implication of municipalities and citizens in generation projects but also to a lack of understanding of the climatic challenge and renewable technologies. Moreover, strategies across government levels (federal, regional, local) to reach Belgium’s renewable targets either do not exist or are scattered and not mutually supportive. Belgian authorities have started to tackle some of those issues, in particular Flanders, which increased the staff of the appeal bodies.
To accommodate the increasing use of
variable energy sources in the electricity
grid, the onshore electricity network would need to be strengthened and made
smart. Yet the length of the permit-granting procedure for transmission lines undermines timely grid reinforcements. The lack of spatial planning tools supportive of the renewable targets also prevents the anticipation of related grid improvements. The pace of these works will have to factor in the renewable deployment to avoid becoming a bottleneck.
Rooftop solar power has considerable
potential, which is still largely untapped. The lack of a predictable or clear regulatory
framework undermines confidence and creates a barrier to further mobilise private investments in new rooftop solar installations, be they large or small. A complex legal framework for energy sharing creates a further obstacle to solar rooftop installations in multi-apartment and rented buildings. Also, the limited roll-out of smart metering systems (17) as well as the absence of ‘prosumer’ schemes (already advanced in Flanders) and of dynamic pricing deter self-consumption, energy sharing and demand a side response. Removing these barriers will help ensure power grid stability to accommodate a growing share of variable renewables and lower peak load requirements.
The share of fossil fuels used in buildings
is still very high. Residential and service sectors account for 37% of total gas consumption in 2020. Despite proactive policies, the energy-efficient renovation of the building stock remains low, in particular through medium- and deep-renovation. Moreover, Belgium does not comply with the target of renewables growth in heating and cooling (1 percentage point per year until 2030 on average). To reduce dependency on fossil fuels, further policy options include a ban on fossil fuels in new constructions and making renovations of the least energy-efficient buildings mandatory following a transfer of ownership, as recently introduced in Flanders. Phasing out financial support for fossil fuel-based heating and shift incentives towards low carbon heating solutions such as heat pumps could further reduce fossil fuel dependency.
Road congestion remains high, generating air pollution and economic loss. The transport sector is responsible for 35% of non- ETS greenhouse gas emissions in Belgium and congestion contributes to air pollution in particular around Brussels and Antwerp (see Annex 5). Growing commuter and freight traffic volumes have resulted in road
(17) The roll out of smart meters has so far remained
limited (3.3% penetration rate for 2019-2020), 5th worst EU performer. Source: EC Report 2019 – Benchmarking smart metering deployment in the EU-28. In the Flanders region, a quarter of end users had a digital meter by March 2022.

15
congestion returning to pre-COVID levels. The average number of hours per year spent in traffic jams is one of the three highest in the EU (18). Moreover, congestion costs in Belgium were estimated around EUR 9 billion (European Commission, 2019). Rising congestion is partly explained by the continuous increase in the number of cars since 2007, incentivised in particular by toll-free roads and large tax subsidies for commuting by car. Policy options such as road user charging for private vehicles (like for lorries) and the further development of cycling and public transport solutions, in particular improved sub-urban and inter-city services and infrastructure, could be used to reduce road congestion. Developing these clean mobility alternatives to the use of individual cars, including efficient public transport, will also help further decarbonise the transport sector and reduce Belgium’s dependence on oil.
The 2021 summer floods have
demonstrated that Belgium’s climate
resilience raises concern. Beyond the loss of human lives, the material damage of the floods alone amounted to more than EUR 2 billion and government expenditure increased to provide relief and for the rebuild of uninsured property and infrastructure, further exacerbating fiscal sustainability challenges. Including disaster risk management in budgetary planning, in governance and institutional arrangements to address ex ante climate-related risks and reduce ex post disaster consequences could help increase climate resilience.
(18) European Commission, Hours spent in road congestion
annually. In Belgium the average number of hours per year spent in traffic jams rose from 35.8 in 2014 to 39.1 in 2017.

KEY FINDINGS
16
Belgium’s recovery and resilience plan
includes measures to address a series of
structural challenges through:
a reform to improve the sustainability of the pension system;
actions to improve the efficiency and quality of public spending, thanks to spending reviews;
investments in the digitalisation of public administration and education and a reform to enable 5G deployment;
investments in energy-efficient renovation of buildings, clean mobility, circular economy, and the hydrogen value chain.
Beyond the reforms and investments in
the RRP, Belgium would benefit from:
improving the effectiveness and efficiency of its long-term care systems, including contributing to the country’s fiscal sustainability;
reforming the tax and benefit systems to reduce disincentives to work, simplifying these systems, limiting the use of tax expenditure and making the tax system more neutral towards investment choices;
addressing labour shortages and skills mismatches, notably by improving the performance and inclusiveness of the education system, including by strengthening the quality and labour-market relevance of vocational education and training, and of teachers’ career paths and training;
reducing the dependency on fossil fuels and increasing the share of renewables in energy consumption, by facilitating planning and easing the granting of permits
for renewable energy installations, in
20_AT_CR22_Publicati
on-StandardWord_1 TC LW DONE.docxparticular for onshore wind
projects, facilitating the granting of permits for grid expansion needed to integrate a higher share of renewables and by adopting predictable and supportive framework conditions for solar energy installations;
phasing-out subsidies for fossil fuel use in buildings, introducing gradual phasing out of fossil fuel use in new buildings and accelerating energy efficient renovations;
addressing road congestion, by further developing cycling and public transport solutions, as well as implementing road user charging for cars.
KEY FINDINGS
ANNEXES


19
Cross-cutting progress indicators 21
Annex 1: Sustainable Development Goals 21
Annex 2: Recovery and Resilience Plan - Implementation 23
Annex 3: Other EU instruments for recovery and growth 24
Annex 4: Progress in the implementation of country-specific recommendations 27
Environmental sustainability 30
Annex 5: Green Deal 30
Annex 6: Employment and social impact of the green transition 34
Productivity 36
Annex 7: Resource efficiency and productivity 36
Annex 8: Digital transition 38
Annex 9: Innovation 40
Annex 10: Industry and single market 42
Annex 11: Public administration 45
Fairness 47
Annex 12: Employment, skills and social policy challenges in light of the European Pillar of Social Rights 47
Annex 13: Education and skills 49
Annex 14: Health and health systems 51
Annex 15: Economic and social performance at regional level 53
Macroeconomic stability 55
Annex 16: Key financial developments 55
Annex 17: Taxation 57
Annex 18: Key economic and financial indicators 59
Annex 19: Debt sustainability analysis 60
References 62
LIST OF TABLES
Table A2.1: Key elements of the Belgian RRP 23
Table A4.1: Summary table on 2019, 2020 and 2021 CSRs 28
Table A5.1: Indicators underpinning the progress on EU Green Deal from macroeconomic perspective 33
Table A7.1: Selected resource efficiency indicators 37
Table A8.1: Key Digital Economy and Society Index Indicators 39
LIST OF ANNEXES

20
Table A9.1: Key research, development and innovation indicators 41
Table A10.1: Key Single Market and Industry Indicators 43
Table A11.1: Public administration indicators - Belgium 46
Table A12.1: Social Scoreboard 47
Table A13.1: EU-level targets and other contextual indicators under the European Education Area strategic framework 49
Table A14.1: Key health indicators 52
Table A15.1: Selected indicators at regional level 54
Table A16.1: Financial soundness indicators 56
Table A17.1: Taxation indicators 57
Table A18.1: Key economic and financial indicators 59
Table A19.1: Debt sustainability analysis for Belgium 60
Table A19.2: Heat map of fiscal sustainability risks for Belgium 61
LIST OF GRAPHS
Graph A1.1: Progress towards SDGs in Belgium in the last five years 22
Graph A2.1: Share of RRF funds contributing to each policy pillar 23
Graph A3.1: ESIF 2014-2020 total budget by fund (EUR billion, % of total) 24
Graph A3.2: Cohesion policy contribution to the SDGs (EUR billion) 25
Graph A4.1: Belgium's progress on the 2019-2020 CSRs (2022 European Semester cycle) 27
Graph A5.1: Fiscal aspects of the green transition: Taxation and government expenditure on environmental protection 30
Graph A5.2: Thematic – Energy Share in energy mix (solid, oil, gas, nuclear, renewables) 31
Graph A5.3: Thematic - Biodiversity Terrestrial protected areas and organic farming 31
Graph A5.4: Thematic – Mobility Share of zero emission vehicles (% of new registrations) 32
Graph A6.1: Fair green transition challenges 35
Graph A6.2: Energy poverty by income decile 35
Graph A7.1: Employment and value added in the Circular Economy sectors 36
Graph A11.1: Open data maturity 45
Graph A11.2: Performance on the single market public procurement indicator 45
Graph A13.1: Shortages of qualified teachers as reported by principals 50
Graph A14.1: Life expectancy at birth, years 51
Graph A14.2: Projected increase in public expenditure on health-care over 2019-2070 (AWG reference scenario) 51
Graph A15.1: Unemployment rate, 2020 in Belgium 53
Graph A15.2: Territories most affected by the climate transition in Belgium 54
Graph A15.3: CO2 emissions from fossil fuels per head, 2018 in Belgium 54
Graph A16.1: Credit growth 55
Graph A16.2: Evolution of house price index 55
Graph A17.1: Tax wedge indicators (%) 58

ANNEX 1: SUSTAINABLE DEVELOPMENT GOALS
21
This Annex assesses Belgium’s progress on
the Sustainable Development Goals (SDGs)
along the four dimensions of competitive
sustainability. The 17 SDGs and their related indicators provide a policy framework under the UN’s 2030 Agenda for Sustainable Development. The aim is to end all forms of poverty, fight inequalities and tackle climate change, while ensuring that no one is left behind. The EU and its Member States are committed to this historic global framework agreement and to playing an active role in maximising progress on the SDGs. Graph A1.1 is based on the EU SDG indicator set which was developed to monitor progress on SDGs in an EU context.
While Belgium performs very well or is
improving on several SDG indicators related
to environmental sustainability (SDG 2, 7, 9,
11, 12, 13), it still needs to catch up on others (SDG 6, 15). The ‘Circular material use rate’ improved from 17.7% in 2015 to 23.0% in 2020 and is well above the EU average (12.8%). On ‘Addressing ‘Affordable and clean energy’ (SDG 7), Belgium has made some progress on the share of renewable energy in total energy consumption, which increased from 8.1% in 2015 to 13% in 2020, but is still lower than the EU average (22.1% in 2020). Measures included in the emerging technologies component of the recovery and resilience plan (RRP) aim to support the shift away from fossil fuels.
Belgium performs very well or is improving on most SDG indicators related to fairness
(SDG 1, 2, 3, 4, 5, 8, 10). Belgium outperforms
the EU average in most indicators related to poverty, inclusive growth and inequality (SDGs 1, 8, 10), which is due to the high redistributive impact of the tax and benefit system. Belgium improved on various employment indicators like ‘Long-term unemployment rate’ (3.7% in 2016, 2.6% in 2021) or ‘Number of young people neither in employment nor in education’ (13.0% in 2016, 10.1% in 2021). The RRP includes measures to further tackle unemployment, notably by boosting training and life-long learning.
Belgium performs very well on SDG
indicators related to productivity (SDG 4, 8,
9). Belgium’s gross domestic expenditure on R&D is among the highest (3.48% of GDP in 2020) in EU, and it has significantly increased since 2015
(2.43% of GDP). In Belgium, the share of households with Very High Capacity Network (VHCN) coverage in 2021 (68.9%) is slightly below the EU average (70.2%). Although the percentage of people with at least basic digital skills is at the EU average (54%), strengthening digital skills remains a challenge. For this reason, a large share of investments in the RRP focuses on increasing the digital infrastructure and equipment to improve digital skills at all levels of the education system.
Belgium performs very well on SDG indicators related to macroeconomic stability
(SDG 8, 16). Belgium performs well, and has
further improved on the quality of its institutions, including trust in institutions (SDG 16). The percentage of the population with confidence in the European Central Bank increased from 49% in 2016 to 69% in 2021 (EU: 47% in 2021). Belgium also outperforms the EU average on indicators related to ‘Decent work and economic growth’ (SDG 8). The introduction of spending reviews at all government levels through the RRP is expected to further improve macroeconomic stability.
CROSS-CUTTING PROGRESS INDICATORS
ANNEX 1: SUSTAINABLE DEVELOPMENT GOALS

22
Graph A1.1: Progress towards SDGs in Belgium in the last five years
For detailed datasets on the various SDGs see the annual ESTAT report ‘Sustainable development in the European Union’, https://ec.europa.eu/eurostat/product?code=KS-09-22-019; Extensive country specific data on the short-term progress of Member States can be found here: Key findings - Sustainable development indicators - Eurostat (europa.eu). Source: Eurostat, latest update of 28 April 2022. Data mainly refer to 2015-2020 and 2016-2021.

ANNEX 2: RECOVERY AND RESILIENCE PLAN - IMPLEMENTATION
23
The Recovery and Resilience Facility (RRF) is
the centrepiece of the EU’s efforts to
support its recovery from the COVID-19 pandemic, fast forward the twin transition
and strengthen resilience against future
shocks. Belgium submitted its recovery and resilience plan (RRP) on 30 April 2021. The Commission’s positive assessment on 23 June 2021 and the Council’s approval on 13 July 2021 paved the way for disbursing EUR 5.9 billion in grants under the RRF over 2021-2026. The financing agreement was signed on 27 July 2021. The key elements of the Belgian RRP are set out in Table A2.1.
Table A2.1: Key elements of the Belgian RRP
(1) See Pfeiffer P., Varga J. and in ’t Veld J. (2021), “Quantifying Spillovers of NGEU investment”, European Economy Discussion Papers, No. 144 and Afman et al. (2021), “An overview of the economics of the Recovery and Resilience Facility”, Quarterly Report on the Euro Area (QREA), Vol. 20, No. 3 pp. 7-16. Source: European Commission 2022
Graph A2.1outlines the share of funds contributing to each of the RRF’s six policy pillars.
The progress made by Belgium in
implementing its plan is published in the
Recovery and Resilience Scoreboard. The Scoreboard also gives an overview of the progress made in implementing the RRF as a whole.
Total allocation EUR 5.9 billion in grants (1.24% of 2019 GDP)
Investments and Reforms 68 investments and 31 reforms
Total number of Milestones and Targets 210
Estimated macroeconomic impact (1) Raise GDP by 0.5%-0.9% by 2026 (0.6% in
spillover effects)
Pre-financing disbursed EUR 770 million (August 2021)
First instalment Belgium did not yet submit a first payment
request
ANNEX 2: RECOVERY AND RESILIENCE PLAN - IMPLEMENTATION
Graph A2.1: Share of RRF funds contributing to each policy pillar
(1) Each measure contributes towards two policy areas of the six pillars, therefore the total contribution to all pillars displayed on this chart amounts to 200% of the estimated cost of the 22 recovery and resilience plans approved in 2021. The bottom part represents the amount of the primary pillar, the top part the amount of the secondary pillar. Source: RRF Scoreboard https://ec.europa.eu/economy_finance/recovery-and-resilience-scoreboard/country_overview.html
0%
10%
20%
30%
40%
50%
60%
70%
Green transition Digital transformation Smart, sustainableand inclusive growth
Social and territorialcohesion
Health, andeconomic, social andinstitutional resilience
Policies for the nextgeneration

ANNEX 3: OTHER EU INSTRUMENTS FOR RECOVERY AND GROWTH
24
The EU’s budget of more than EUR 1.2 trillion
for 2021-2027 is the investment lever to
help implement EU priorities. Underpinned by an additional amount of about EUR 800 billion through NextGenerationEU and its largest instrument, the Recovery and Resilience Facility, it represents significant firepower to support the recovery and sustainable growth.
In 2021-2027, EU cohesion policy funds (19)
will support long-term development objectives in Belgium by investing EUR 2.88
billion (20). This includes EUR 182.6 million from the Just Transition Fund directed to alleviate the socio-economic impacts of the green transition in the most vulnerable regions. The 2021-2027 cohesion policy funds partnership agreements and programmes take into account the 2019-2020 country-specific recommendations and investment guidance provided as part of the European Semester, ensuring synergies and complementarities with other EU funding. In addition, Belgium will benefit from EUR 2.9 billion support for the 2023-27 period from the Common Agricultural Policy, which supports social, environmental, and economic sustainability and innovation in agriculture and rural areas, contributing to the European Green Deal, and ensuring long-term food security.
In 2014-2020, the European Structural and
Investment Funds (ESIF) allocated EUR 3.20
billion (21) from the EU budget to Belgium. The total investment including national
financing amounts to EUR 6.80 billion (see Graph A3.1), representing around 0.22% of GDP for 2014-2020 and 6.66% of public investment (22). By 31 December 2021, 98% of the total was allocated to specific projects and 53% was reported as spent, leaving EUR 3.18 billion to
(19) European Regional Development Fund (ERDF), European
Social Fund+ (ESF+), Cohesion Fund (CF), Just Transition Fund (JTF), Interreg.
(20) Current prices, source: Cohesion Open Data
(21) ESIF includes cohesion policy funds (ERDF, ESF+, CF, Interreg), the European Agricultural Fund for Rural Development (EAFRD) and European Maritime and Fisheries Fund (EMFF). According to the ‘N+3 rule’, the funds committed for the years 2014-2020 must be spent by 2023 at the latest (by 2025 for EAFRD). Data source: Cohesion Open Data, cut-off date 31.12.2021 for ERDF, ESF+, CF, Interreg; cut-off date 31.12.2020 for EAFRD and EMFF.
(22) Public investment is gross fixed capital formation plus capital transfers, general government.
be spent by the end of 2023 (23). Among the 11 objectives the most relevant ones for cohesion policy funding in Belgium are research and innovation, competitiveness of SMEs, low-carbon economy, sustainable and quality employment, social inclusion, education and vocational training for skill and life-long learning (in total EUR 2.737 billion). By end 2020, European Regional Development Fund (ERDF) investments supported more than 30 000 businesses, while the European Social Fund (ESF) supported measures for almost 1.5 million participants, of whom more than half were low-skilled (53%). Thanks to the Youth Employment Initiative (YEI) 150 000 young people benefitted from targeted support for their integration in the labour market. The ERDF also invested more than EUR 162 million in energy efficiency. Also other EU programmes, including the European Agricultural Fund for Rural Development (EAFRD) and the European Maritime and Fisheries Fund (EMFF), contribute to addressing the investment needs.
Graph A3.1: ESIF 2014-2020 total budget by fund
(EUR billion, % of total)
(1) The data for the EAFRD and REACT-EU refer to the period 2014-2022 Source: European Commission, Cohesion Open Data
Cohesion policy funds already substantially
contribute to the Sustainable Development
Goals (SDGs) objectives. In Belgium, these funds support 10 of the 17 SDGs with up to 97% of expenditure contributing to the attainment of the goals (see Graph A3.2).
(23) Including REACT-EU. ESIF data on
https://cohesiondata.ec.europa.eu/countries/BE
1.8227%
0.071%
2.4335%
2.2934%
0.193%
EAFRD EMFF ERDF ESF YEI
ANNEX 3: OTHER EU INSTRUMENTS FOR RECOVERY AND GROWTH

25
The REACT-EU instrument (Recovery Assistance for Cohesion and the Territories
of Europe) under NextGenerationEU provided
EUR 225.7 million of additional funding to 2014-2020 cohesion policy allocations for
Belgium to ensure a balanced recovery, boost convergence and provide vital support to regions following the coronavirus outbreak. REACT-EU provided support in Belgium to contribute to the short-time work schemes, support small and medium-sized enterprises (SMEs), invest in research and innovation (R&I), reinforce the primary healthcare, education, training and skills development, promote energy efficiency and reduce material deprivation with direct food delivery. REACT-EU supported vulnerable groups that are hit hardest by the COVID-19 crisis by providing support and guidance towards work and developing the necessary basic and professional skills in light of the green and digital transitions.
The Coronavirus Response Investment
Initiative (24) provided the first EU emergency support to Belgium in relation to the COVID-
19 pandemic. It introduced extraordinary flexibility, enabling Belgium to re-allocate resources for immediate public health needs (EUR 1.1 million). For instance, Belgium shifted resources to purchase protective equipment and healthcare material, increase the apprenticeship premium for nursing students, boost healthcare
(24) Re-allocating ESIF resources according to Regulation (EU)
2020/460 of the European Parliament and of the Council of 30 March 2020, and Regulation (EU) 2020/558 of the European Parliament and of the Council of 23 April 2020.
staff numbers and, working capital for SMEs, and provided support to digitalise the education system and public administration.
Belgium received support under the European instrument for temporary support to
mitigate unemployment risks in an
emergency (SURE) to finance short-time
work schemes, similar measures and as an
ancillary, health-related measures. The Council granted financial assistance under SURE to Belgium in September 2020 and top-up support in April 2021 for a maximum of EUR 8.197 billion, which was disbursed by 25 May 2021. SURE is estimated to have supported some 25% of workers and 45% of firms for at least one month in 2020 and 10% of workers and 25% of firms in 2021, primarily in wholesale and retail trade, manufacturing, and accommodation and food services. Belgium is estimated to have saved a total of EUR 0.14 billion on interest payments as a result of SURE’s lower interest rates.
The Commission provides tailor-made expertise via the Technical Support
Instrument to help Belgium design and implement growth-enhancing reforms, including for implementing its recovery and resilience plan (RRP). Since 2018, Belgium has received assistance through 56 technical support projects. Projects delivered in 2021 aimed for example to strengthen the national fiscal framework and policy evaluation in the budgetary process, or develop hydrogen value chain and open-access networks. The Commission also helped Belgium
Graph A3.2: Cohesion policy contribution to the SDGs (EUR billion)
Source: European Commission
0.01
0.01
0.03
0.08
0.12
0.22
0.69
0.71
0.90
1.81
0.0 0.5 1.0 1.5 2.0
SDG 3 Good health and well being
SDG 11 Sustainable cities and communities
SDG 12 Responsible consumption and production
SDG 15 Life on land
SDG 13 Climate action
SDG 7 Affordable and clean energy
SDG 1 No poverty
SDG 4 Quality education
SDG 9 Industry, innovation, infrastructure
SDG 8 Decent work and economic growth

26
implement specific reforms in the RRP, for instance for carrying out spending reviews. In 2022, new projects will start supporting, among others, the overall RRP monitoring, reporting, audit and control frameworks and assist with the application of the ’Do no significant harm’ principle.
Belgium also benefits from other EU programmes, such as the Connecting Europe
Facility, which allocated EU funding of EUR 784.6 million to specific projects on strategic transport networks, and Horizon 2020, which allocated EU funding of EUR 3 390 million.

ANNEX 4: PROGRESS IN THE IMPLEMENTATION OF COUNTRY-SPECIFIC RECOMMENDATIONS
27
The Commission assessed the 2019-2021
country-specific recommendations (CSRs) (25)
addressed to Belgium in the context of the
European Semester. The assessment takes into account the policy action taken by Belgium to date (26), as well as the commitments in the recovery and resilience plan (RRP) (27). At this early stage of the RRP implementation, overall 80% of the CSRs focusing on structural issues in 2019 and 2020 have recorded at least “some progress”, while 20% recorded “limited” (see Graph A4.1). Considerable additional progress in addressing structural CSRs is expected in the years to come with the further implementation of the RRP.
(25) 2021 CSRs: https://eur-lex.europa.eu/legal-
content/EN/TXT/?uri=CELEX%3A32021H0729%2801%29&qid=1627675454457 2020 CSRs: EUR-Lex - 32020H0826(01) - EN - EUR-Lex (europa.eu) 2019 CSRs: EUR-Lex - 32019H0905(01) - EN - EUR-Lex (europa.eu)
(26) Incl. policy action reported in the National Reform Programme, as well as in the RRF reporting (bi-annual reporting on the progress with implementation of milestones and targets and resulting from the payment request assessment).
(27) Member States were asked to effectively address all or a significant subset of the relevant country-specific recommendations issued by the Council in 2019 and 2020 in their RRPs. The CSR assessment presented here takes into account the degree of implementation of the measures included in the RRP and of those done outside of the RRP at the time of assessment. Measures foreseen in the annex of the adopted Council Implementing Decision on the approval of the assessment of the RRP which are not yet adopted nor implemented but considered as credibly announced, in line with the CSR assessment methodology, warrant “limited progress”. Once implemented, these measures can lead to “some/substantial progress” or “full implementation”, depending on their relevance.
Graph A4.1: Belgium's progress on the 2019-2020
CSRs (2022 European Semester cycle)
Source: European Commission
Limited Progress20%
Some Progress64%
Substantial Progress12%
Full Implementation4%
ANNEX 4: PROGRESS IN THE IMPLEMENTATION OF COUNTRY-SPECIFIC RECOMMENDATIONS

28
Table A4.1: Summary table on 2019, 2020 and 2021 CSRs
(Continued on the next page)
Belgium Assessment in May 2022* RRP coverage of CSRs until 2026
2019 CSR1 Limited Progress
Ensure that the nominal growth rate of net primary government
expenditure does not exceed 1,6 % in 2020, corresponding to an
annual structural adjustment of 0,6 % of GDP.
Not relevant anymore Not applicable
Use windfall gains to accelerate the reduction of the general
government debt ratio. Not relevant anymore Not applicable
Continue reforms to ensure the fiscal sustainability of the long-term
care Limited Progress
and pension systems, including by limiting early exit possibilities
from the labour market. Limited Progress Relevant RRP measures planned as of 2021
Improve the composition and efficiency of public spending, in
particular through spending reviews, Some Progress Relevant RRP measures planned as of 2021
and the coordination of fiscal policies by all levels of government to
create room for public investment.Limited Progress
2019 CSR 2 Limited Progress
Remove disincentives to work and strengthen the effectiveness of
active labour market policies, in particular for the low-skilled, older
workers and people with a migrant background.
Limited ProgressRelevant RRP measures planned as of 2021,
2023, 2024.
Improve the performance and inclusiveness of the education and
training systems Limited Progress
Relevant RRP measures planned as of 2021,
2022, 2023, 2024, 2025, 2026
and address skills mismatches. Some ProgressRelevant RRP measures planned as of 2021,
2022, 2023, 2024, 2025, 2026
2019 CSR 3 Some Progress
Focus investment-related economic policy on sustainable transport,
including upgrading rail infrastructure, Some Progress
Relevant RRP measures planned as of 2022,
2023, 2024
the low carbon and energy transition Some ProgressRelevant RRP measures planned as of 2021,
2022, 2023, 2024, 2026
and research and innovation, in particular in digitalisation, taking into
account regional disparities. Substantial Progress
Relevant RRP measures planned as of 2021,
2022, 2023, 2024, 2025,
Tackle the growing mobility challenges, by reinforcing incentives and
removing barriers to increase the supply and demand of collective
and low emission transport.
Some ProgressRelevant RRP measures planned as of
2021,2022, 2023, 2024, 2025, 2026
2019 CSR4 Some Progress
Reduce the regulatory and administrative burden to incentivise
entrepreneurship Some Progress
Relevant RRP measures planned as of 2021,
2022, 2023, 2024
and remove barriers to competition in services, particularly
telecommunication, retail and professional services.Some Progress
2020 CSR1 Substantial Progress
Take all necessary measures, in line with the general escape clause
of the Stability and Growth Pact, to effectively address the COVID-
19 pandemic, sustain the economy and support the ensuing
recovery. When economic conditions allow, pursue fiscal policies
aimed at achieving prudent medium-term fiscal positions and
ensuring debt sustainability, while enhancing investment.
Not relevant anymore Not applicable
Reinforce the overall resilience of the health system and ensure the
supply of critical medical products.Substantial Progress
Relevant RRP measures planned as of 2022,
2023
2020 CSR2 Some Progress
Mitigate the employment and social impact of the COVID-19 crisis,
notably by promoting effective active labour market measures Some Progress
Relevant RRP measures planned as of 2023,
2024
and fostering skills development. Some ProgressRelevant RRP measures planned as of 2021,
2022, 2023, 2024, 2025
2020 CSR 3 Some Progress
Ensure effective implementation of the measures to provide liquidity
to assist SMEs and the self-employed Full Implementation
and improve the business environment. Some ProgressRelevant RRP measures planned as of 2021,
2022, 2023, 2024
Front-load mature public investment projects Some ProgressRelevant RRP measures planned as of 2021,
2022, 2023, 2024, 2025, 2026
and promote private investment to foster the economic recovery. Some Progress Relevant RRP measures planned as of 2022
Focus investment on the green and digital transition, in particular on
infrastructure for sustainable transport, Some Progress
Relevant RRP measures planned as of 2021,
2022, 2023, 2024, 2025, 2026
clean and efficient production and use of energy, Some ProgressRelevant RRP measures planned as of 2021,
2022, 2023, 2024
the circular economy, Some ProgressRelevant RRP measures planned as of 2021,
2022, 2023, 2024
digital infrastructure, such as 5G and Gigabit Networks, Some ProgressRelevant RRP measures planned as of 2021,
2022, 2025, 2026
and research and innovation. Substantial ProgressRelevant RRP measures planned as of 2022,
2023

29
Table (continued)
* See footnote 27 Source: European Commission
2021 CSR 1 Some Progress
In 2022, use the Recovery and Resilience Facility to finance
additional investment in support of the recovery while pursuing a
prudent fiscal policy. Preserve nationally financed investment.
Full Implementation Not applicable
When economic conditions allow, pursue a fiscal policy aimed at
achieving prudent medium-term fiscal positions and ensuring fiscal
sustainability in the medium term.
Some Progress Not applicable
At the same time, enhance investment to boost growth potential.
Pay particular attention to the composition of public finances, on
both the revenue and expenditure sides of the budget, and to the
quality of budgetary measures in order to ensure a sustainable and
inclusive recovery. Prioritise sustainable and growth-enhancing
investment, in particular investment supporting the green and digital
transition.
Limited Progress Not applicable
Give priority to fiscal structural reforms that will help provide
financing for public policy priorities and contribute to the long-term
sustainability of public finances, including, where relevant, by
strengthening the coverage, adequacy and sustainability of health
and social protection systems for all.
Limited Progress Not applicable

ENVIRONMENTAL SUSTAINABILITY
ANNEX 5: GREEN DEAL
30
The European Green Deal intends to
transform the EU into a fair and prosperous
society, with a modern, resource-efficient
and competitive economy where there are no net emissions of greenhouse gases by 2050
and where economic growth is decoupled
from resource use. This Annex offers a snapshot of the most significant and economically relevant developments in Belgium in the respective building blocks of the European Green Deal. It is complemented by Annex 6 on the employment and social impact of the green transition and Annex 7 for circular economy aspects of the Green Deal.
Belgium has made progress in laying the foundations for a low-carbon economy, but
significant efforts are still needed to reach
its EU greenhouse gas (GHG) reduction targets. Belgium is committed to accelerate climate efforts in line with the EU general climate neutrality target by 2050. Between 1990 and 2020, economy-wide GHG emissions decreased by 24%, less than the EU average. The transport sector remains a major source of GHG emissions, with road users not paying for the full impact of externalities and variable infrastructure costs, which increases traffic congestion. Under current land management practices, Belgium is projected to see moderately increasing net removals by 2030. Through its national energy and climate plan (NECP), Belgium is putting in place additional measures to achieve its 2030 target of -35% for the sum of sectors not covered by the EU Emissions Trading System (28). However, this target is below the path that would be needed to achieve the 2030 EU ambition set by the European Climate Law and the Fit for 55 package of proposals, with a gap of 34 percentage points (pps) with existing measures. The additional measures will reduce this to 11 pps. The Flemish and Federal government have recently taken further measures to accelerate the climate and energy transition.
The NECP contains some promising measures, including the obligation to renovate within 5 years of buying a house in Flanders and a ban on gas as a heating system for new buildings as from 2023. The Flemish government also intends to introduce a ban on the sale of new diesel or petrol-driven vehicles as from 2029. Belgium is also investing in
(28) Buildings, road and domestic maritime transport, agriculture,
waste and small industries.
a second zone of wind turbines off its coast to be connected to the grid by 2025-2026. The government also agreed that from 2026 all new company cars will have to be zero-emission, and rail infrastructure will be further developed. In its recovery and resilience plan, Belgium allocates 50% of expenditure to climate objectives and outlines crucial reforms and investments to further the transition to a more sustainable, low-carbon and climate-resilient economy (29).
Government expenditure on environmental
protection is among the highest in the EU (see Graph A5.1). In 2020, total government expenditure on environmental protection in Belgium (1.5% of GDP) included spending related to waste management, waste water management, pollution abatement, protection of biodiversity and landscape, R&D on environmental protection, as well as other environmental protection expenditure. The Belgian government has a low to medium exposure to uninsured climate induced damages, even though the disastrous 2021 summer floods have demonstrated that budgetary exposure to specific dangers can be significant.
Graph A5.1: Fiscal aspects of the green transition:
Taxation and government expenditure on
environmental protection
Source: Eurostat
Belgium is lagging behind in the transition to
renewable energy. The share of energy from renewable resources in Belgium’s gross final energy consumption reached 13% in 2020, but only by purchasing renewable rights of 1 percentage point from other EU Member States. Belgium aims to reach 17.5% renewable energy in
(29) The share of financial allocation contributing to climate
objectives has been calculated using Annex VI of the RRF Regulation.
0.0
1.0
2.0
3.0
4.0
5.0
6.0
7.0
Environmental taxes (% ofGDP)
Environmental taxes (% oftotal taxation)
Government expenditure onenvironmental protection (%
of total expenditure)
BE (2020) EU27 (2020)
ENVIRONMENTAL SUSTAINABILITY
ANNEX 5: GREEN DEAL

31
2030, significantly below the 25% that the Commission expected Belgium to reach even before the European Climate Law. In 2020, renewable electricity production in Belgium amounted to 25.1% of total electricity production and is currently set to reach 37.4% by 2030. While representing a significant leap, this level of ambition appears low in light of the EU climate neutrality objective, the partial nuclear phase-out and the increasing use of electricity for decarbonisation in other sectors such as transport, industry and heating.
Graph A5.2: Thematic – Energy
Share in energy mix (solid, oil, gas, nuclear,
renewables)
The energy mix is based on gross inland consumption, and excludes heat and electricity. The share of renewables includes biofuels and non-renewable waste. Source: Eurostat
In terms of biodiversity and ecosystem
health, there is still a lot of room for
improvement. Conservation measures need to be adopted and/or further improved. With 14.6% of its territory being protected areas and 7.3% of its utilised agricultural area under organic farming, Belgium reported a deterioration in the conservation status of its protected habitats in 2018, having only just under 5% in good conservation status, even lower than in 2012 (8.6%). The protected species in good conservation status showed a promising increase from 19% in 2012 to 25% in 2018. On birds, 56% of the breeding species showed short-term increasing or stable population trends (compared to 66% over 2007-2012). For wintering species requiring the designation of Special Protection Areas, the corresponding figure is 7.6%, but there is a large proportion (69%) of unknown short-term trends. Biodiversity measures taken by Flanders and Wallonia include the creation of national parks, works for ecosystem restoration (defragmentation, remeandering of rivers), and targeted schemes such as for the protection of farmland birds
(Flanders) and hedge planting (Wallonia). On measures applicable in marine sites, discussions remain complex under the common fisheries policy since Belgium needs to agree on measures with other Member States.
Graph A5.3: Thematic - Biodiversity
Terrestrial protected areas and organic farming
For terrestrial protected areas data for 2018, and data for the EU average (2016, 2017) is lacking. Source: European Environment Agency (terrestrial protected
areas) and Eurostat (organic farming).
In terms of pollution, air quality in Belgium
continues to give cause for serious concern. The latest available annual estimates by the European Environment Agency (30) point to some 6,500 premature deaths attributable to fine particulate matter concentrations, 270 to ozone concentration and 750 to nitrogen dioxide (NO2) concentration. Flanders still fails to ensure in one main urban zone, Antwerp, compliance with the limit values for NO2 set under Directive 2008/50/EC, due to road traffic congestion around the city. As regards air quality, among the different sources of air pollutants, agriculture is the main source of ammonia emissions (93 %). Belgium has an average risk of non-compliance with its national ammonia reduction commitment, both for 2020-2029 and for 2030 and beyond. Intensive agriculture in Flanders, increasing transport notably to/from the Port of Antwerp, and relatively high population density in Flanders and Brussels exert significant pressure on ecosystems and biodiversity. Water pollution (linked to agriculture) in the Flemish region in particular also requires close attention.
Since the transport sector remains a particularly important source of greenhouse
(30) European Environment Agency. Air Quality in Europe – 2021
Report. Please see details in this report on the underlying methodology, p.106.
0
10
20
30
40
50
60
70
80
90
100
2005 2010 2015 2018 2019 2020
Solid fossil fuels, peat and oil shale Oil Gas Nuclear Renewables
0
5
10
15
20
25
30
2016 2017 2019 2020Terrestrial protected areas (% total area)Area under organic farming (% total utilised agricultural area)EU27 (terrestrial)EU27 (organic)

32
gas emissions in Belgium, there is room to
enhance the use of sustainable mobility. Although increasing fast in recent years, the share of electric vehicles and the density of public charging points in Belgium is still below the EU average. On the other hand, Belgium has one of the highest shares of electrified railway kilometres in the EU. Congestion level remains high and more than 10 percentage points above the EU average.
Graph A5.4: Thematic – Mobility
Share of zero emission vehicles (% of new
registrations)
Zero emission vehicles (passenger cars) include battery and fuel cell electric vehicles (BEV, FCEV). Source: European Alternative Fuels Observatory.
0.0
1.0
2.0
3.0
4.0
5.0
6.0
7.0
8.0
9.0
10.0
2016 2017 2018 2019 2020 2021
% o
f ne
w r
egis
trat
ions
BE EU27

33
Table A5.1: Indicators underpinning the progress on EU Green Deal from macroeconomic perspective
(1) The 2030 non-ETS GHG target is based on the Effort Sharing Regulation. The FF55 targets are based on the COM proposal to increase EU's climate ambition by 2030. Renewables and Energy Efficiency targets and national contributions under the Governance Regulation (Regulation (EU) 2018/1999). (2) Distance to target is the gap between Member States’ 2030 target under the Effort Sharing Regulation and projected emissions, with existing measures (WEM) and with additional measures (WAM) respectively, as a percentage of 2005 base year emissions. (3) Percentage of total revenues from taxes and social contributions (excluding imputed social contributions). Revenues from the ETS are included in environmental tax revenues (in 2017 they amounted to 1.5% of total environmental tax revenues at the EU level). (4) Covers expenditure on gross fixed capital formation to be used for the production of environmental protection services (i.e. abatement and prevention of pollution) covering all sectors, i.e. government, industry and specialised providers. (5) The climate protection gap indicator is part of the European adaptation strategy (February 2021), and is defined as the share of non-insured economic losses caused by climate-related disasters. (6) Sulphur oxides (SO2 equivalent), Ammonia, Particulates < 10µm, Nitrogen oxides in total economy (divided by GDP). (7) Transportation and storage (NACE Section H). (8) Zero emission vehicles include battery electric vehicles (BEV) and fuel cell electric vehicles (FCEV). (9) European Commission Report (2019) 'Benchmarking smart metering deployment in the EU-28'. (10) European Commission (2021). Each year the DESI is re-calculated for all countries for previous years to reflect any possible change in the choice of indicators and corrections to the underlying data. Country scores and rankings may thus differ compared with previous publications. Source: Eurostat, JRC, European Commission, EEA, EAFO
Target Target
2005 2019 2020 2030 WEM WAM 2030 WEM WAM
Non-ETS GHG emission reduction target (1)
MTCO2 eq; %; pp (2) 81.6 -10% -17% -35% -22 1 -47% -34 -11
2005 2016 2017 2018 2019 2020
Share of energy from renewable sources in gross final
consumption of energy (1) % 2% 9% 9% 9% 10% 13% 18%
Energy efficiency: primary energy consumption (1) Mtoe 51.6 48.5 48.5 46.5 48.4 43.9 42.7
Energy efficiency: final energy consumption (1) Mtoe 36.8 36.4 36.1 36.4 35.8 33.3 35.2
2015 2016 2017 2018 2019 2020 2018 2019 2020
Environmental taxes (% of GDP) % of GDP 2.6 2.7 2.7 2.7 2.6 2.5 2.4 2.4 2.2
Environmental taxes (% of total taxation) % of taxation (3) 5.7 6.0 6.0 6.0 6.1 5.8 6.0 5.9 5.6
Government expenditure on environmental protection % of total exp. 2.35 2.21 2.41 2.46 2.53 2.48 1.66 1.70 1.61
Investment in environmental protection % of GDP (4) 0.50 0.48 0.55 0.62 - - 0.42 0.38 0.41
Fossil fuel subsidies EUR2020bn 2.88 2.97 3.29 3.42 3.47 - 56.87 55.70 -
Climate protection gap (5) score 1-4
Net GHG emissions 1990 = 100 80 80 82 83 82 76 79 76 69
GHG emissions intensity of the economy kg/EUR'10 0.31 0.31 0.30 0.29 0.29 0.28 0.32 0.31 0.30
Energy intensity of the economy kgoe/EUR'10 0.14 0.14 0.14 0.13 0.13 0.13 0.12 0.11 0.11
Final energy consumption (FEC) 2015=100 100.0 101.3 100.4 101.2 99.5 92.6 103.5 102.9 94.6
FEC in residential building sector 2015=100 100.0 100.4 98.9 97.9 95.4 96.3 101.9 101.3 101.3
FEC in services building sector 2015=100 100.0 100.6 100.6 100.9 99.7 96.8 102.4 100.1 94.4
Smog-precursor emission intensity (to GDP) (4)tonne/EUR'10 (6) 0.57 0.54 0.51 0.48 0.46 - 0.99 0.93 -
Years of life lost caused due to air pollution by PM2.5 per 100.000 inh. 691 670 715 728 605 - 863 762 -
Years of life lost due to air pollution by NO2 per 100.000 inh. 144 145 145 120 69 - 120 99 -
Nitrate in ground water mg NO3/litre 27.9 30.3 29.4 28.6 28.3 - 21.7 20.7 -
Terrestrial protected areas % of total - 21.5 24.9 - 14.5 14.6 - 25.7 25.7
Marine protected areas % of total - 36.8 - - 36.8 - - 10.7 -
Organic farming% of total utilised
agricultural area5.2 5.8 6.3 6.6 6.9 7.3 8.0 8.5 9.1
00-06 06-12 12-18
Net land take per 10,000 km2 13.0 11.0 5.0
2015 2016 2017 2018 2019 2020 2018 2019 2020
GHG emissions intensity of transport (to GVA) (7) kg/EUR'10 0.63 0.62 0.57 0.54 0.56 0.57 0.89 0.87 0.83
Share of zero emission vehicles (8) % in new registrations 0.3 0.4 0.5 0.7 1.6 3.5 1.0 1.9 5.4
7 12 19 16 11 15 8 8 12
Share of electrified railways % 85.6 86.0 86.0 86.1 86.4 - 55.6 56.0 -
36.1 39.0 39.4 40.1 41.0 - 28.9 28.8 -
Year BE EU
Share of smart meters in total metering points (9)
- electricity% of total 2018 0.0 35.8
Share of smart meters in total metering points (9)
- gas% of total 2018 0.0 13.1
ICT used for environmental sustainability (10) % 2021 55.6 65.9
Number of plug-in electric vehicles per charging point
Congestion (average number of hours spent in road congestion per year by a
representative commuting driver)
Prog
ress
to
polic
y
targ
ets
National contribution to 2030
EU target
Digi
tal
Fisc
al a
nd f
inan
cial
indi
cato
rs
1.7 out of 4 (increase from historical level of 1). This is a low/medium risk category (4 being a high risk).
Clim
ate
Ener
gyPo
lluti
onBi
odiv
ersi
ty
2000-2006 2006-2012 2012-2018
8.9 10.7 8.3
Mob
ility
BELGIUM EU
'Fit for 55'
Distance Distance

ANNEX 6: EMPLOYMENT AND SOCIAL IMPACT OF THE GREEN TRANSITION
34
The green transition not only encompasses
improvements to environmental
sustainability, but also includes a significant social dimension. While measures in this regard include the opportunity for sustainable growth and job creation, it must also be ensured that no one is left behind and all groups in society benefit from the transition.
In synergy with the Recovery and Resilience
Facility, the European Social Fund Plus (ESF+)
will help unlock the potential for ‘green jobs’ in Belgium. The Just Transition Fund will help
mitigate the social impact of the transition
in Wallonia (see Annex 3). The Belgian national energy and climate plan (NECP) referred to the need to up- and reskill the workforce and develop new training offerings for those that are already in employment and for young people. It also set out measures to reduce energy poverty and ensure that the population at risk is protected, but did not include a quantitative objective for reducing energy poverty.
Key energy-intensive sectors remain
sizeable, there is potential to further expand
the green economy, which provides strong
potential for creating quality jobs. The greenhouse gas (GHG) emissions intensity of the Belgian economy decreased between 2015 and 2020 (in terms of gross value added) and is now about 10% below the EU average, while the average carbon footprint per worker, at 17.94 tonnes of GHG emissions, is higher than the EU average (13.61 tonnes in the EU; see Graph A6.1). Fossil fuel-based energy production has been identified as a declining sector where job losses are to be expected (31). Belgium's energy-intensive industry, including the chemical and cement sectors (32), provides jobs for 2.6% of the total workforce, for whom up- and reskilling opportunities will be particularly important (see Annex 15). The environmental goods and services sector provides jobs to a comparatively small share of the employed population (1% vs 2.2% in the EU) (33), yet wind and solar energy potential as
(31) SWD(2021) 275 final.
(32) 2020 European Semester: Overview of Investment Guidance on the Just Transition Fund 2021-2027 per Member State (Annex D).
(33) There is currently no common EU-wide definition of green jobs. The environmental goods and services sector (EGSS) accounts only report on an economic sector that generates
well as energy efficiency improvements offer further opportunities for green jobs (34).
The rapid rising energy prices may pose an
important social challenge, in particular for
vulnerable households. The share of the population being unable to keep their homes adequately warm decreased from 5.2% in 2015 to 4.1% in 2020, which is below the EU average (8.2%). Lower-income groups are affected most (see Graph A6.2). However, these figures do not take into the recent increase in energy prices, nor the flanking measures taken by the government to mitigate the impact on consumers. A recent study suggests that the impact of flanking measures depends on the position of the household in the income distribution and the specificities of the energy contract (Capéau et al., 2022). Consumption patterns vary across the population: the average carbon footprint of the top 10% of emitters is about 5.5 times higher than that of the bottom 50% of the population (against 5.3 times in the EU).
Tax systems are key to ensuring a fair
transition towards climate neutrality. Revenues from environmental taxes are close to the EU average (2.5% vs. 2.2% in EU in 2020). While recent reforms have reduced the labour tax wedge for very low-income earners, it remains among the highest in the EU for most wage levels (see Annex 17). Flanking measures accompanying higher energy costs have the potential to mitigate the impact on the disposable income of lower income households by using the revenue generated from higher environmental taxes to support disadvantaged groups. However, flanking measures in Belgium so far were not enough directed to housing energy efficiency works, which could offer a more permanent and sustainable solution to higher energy costs.
environmental products, i.e. goods and services produced for environmental protection or resource management.
(34) https://publications.jrc.ec.europa.eu/repository/handle/JRC126047
ANNEX 6: EMPLOYMENT AND SOCIAL IMPACT OF THE GREEN TRANSITION

35
Graph A6.1: Fair green transition challenges
(1) Numbers are the normalised indicator performance, signifying factors relative to the EU27 Average. Carbon inequality: average emissions per capita to 10% vs bottom 50% (2019). Source: Eurostat and World Inequality Database
Graph A6.2: Energy poverty by income decile
(1) HH050 :Inability to keep home adequately warm; HY020 : Total disposable household income Source: Eurostat EU-SILC survey (2020,2019 for IT)
0.00
0.50
1.00
1.50
2.00
GHG tonnes per Euroof gross added value
(MS/EU)
GHG tonnes perworker (MS/EU)
Employment share inenergy-intensive
industries (MS/EU)
Share of population inrural areas at risk of
poverty (MS/EU)
Energy poverty(MS/EU)
Carbon inequality(MS/EU)
Belgium EU 2020 Belgium 2015
0%
5%
10%
15%
20%
25%
1 2 3 4 5 6 7 8 9 10
Un
able
to
kee
p h
om
e ad
equ
atel
y w
arm
(p
er
inco
me
de
cile
)
Income decile
Belgium
European Union

PRODUCTIVITY
ANNEX 7: RESOURCE EFFICIENCY AND PRODUCTIVITY
36
The efficient use of resources is key to
ensuring competitiveness and open strategic
autonomy, while minimising environmental
impact. The green transition presents a major opportunity for European industry by creating markets for clean technologies and products. It will have an impact across the entire value chain in sectors such as energy and transport, construction and renovation, food and electronics, helping create sustainable, local and well-paid jobs across Europe.
Belgium holds second place among the EU
countries in circular secondary material use, with a 17.6% use rate in 2016 and 23% in 2020, way above the EU average of 12.8%. Significant investments are included in the RRP, as the federal initiative “Belgium Builds Back Circular” (10 circular projects and sensitisation actions towards SMEs), the “Recycling Hub” of the Flemish Region (6 investments in new recycling facilities) and the “Deployment of Circular Economy” in Wallonia (reuse, upscaling and recycling of metals and construction materials, promoting eco-design, eco-innovation and also the selective collection/sorting of material flows). The RRP also includes the Brussels “Strategy for the Economic Transition” that aims at reorienting regional economic instruments towards the circular economy. Overall, Belgium has made progress in strengthening its circular economy policy framework. However, it lags behind other EU countries on socioeconomic outcomes (e.g. exports of products from eco-
industries or employment in the circular economy).
Resource productivity is well above the EU average. Resource productivity expresses how efficiently the economy uses material resources to produce wealth. Improving resource productivity can help minimise the negative impacts on the environment and reduce dependency on volatile raw material markets. Resource productivity in Belgium was 2.7 purchasing power standards (PPS) generated per kg of material consumed in 2020, while the EU average is 2.2 PPS per kg. The "material intensity" variable shows how many additional kg of material consumption would be associated with an increase in GDP, at the current resource productivity rates. Belgium performs well, at the same level as the EU average.
Belgium’s economic growth is not yet
decoupled from the generation of waste. After a downward trend, waste generation has started to increase in recent years (5 917 kg/capita in 2018, whereas 5 573 kg/capita in 2016), remaining above the EU average of 5 234 kg/capita annually. Belgium’s municipal waste recycling rate is around 54%, well above the EU average of around 48%, and above the 2020 EU targets of 50% and close to the 2025 EU target of 55%. This comparatively high value illustrates the advanced level of waste management in Belgium. Overall, Belgium performs well on waste generation and management, taking into account the indicator for the recycling and circular material
PRODUCTIVITY
ANNEX 7: RESOURCE EFFICIENCY AND PRODUCTIVITY
Graph A7.1: Employment and value added in the Circular Economy sectors
Source: Eurostat
1.16% 1.11% 1.10% 1.13%0.68% 0.68% 0.68% 0.66%
1.72% 1.73% 1.75%1.71%
0.94%0.94% 0.96%
0.97%
0.0%
0.2%
0.4%
0.6%
0.8%
1.0%
1.2%
1.4%
1.6%
1.8%
2.0%
2015 2016 2017 2018
Persons employed in the circular economy, BE (% of total employment) Value added at factor cost, BE (% of GDP )
Persons employed in the circular economy, EU27 (% of total employment) Value added at factor cost, EU27 (% of GDP )

37
use combined with a lower (than the EU average) production of municipal waste per capita in two of the three regions (Wallonia and Flanders). Waste prevention and reuse are the most preferred options and top the waste hierarchy.
Further measures can help Belgium maintain its leading position in environmental
technology. This includes sustainable product design, resource-efficient production processes, digital solutions, industrial symbiosis, remanufacturing in key value chains, alternatives to the unsustainable extraction of raw materials, and new circular business models. There is also scope to shift reusable and recyclable waste away from incineration (43% since 2017), including through economic instruments, to ensure that the post-2020 recycling targets, in particular on plastics, are met. Nevertheless, Belgium is the highest recycler of packaging in Europe (84.2%), way above the EU average in 2019 (64.8%).
Table A7.1: Selected resource efficiency indicators
Source: Eurostat
SUB-POLICY AREA 2015 2016 2017 2018 2019 2020 EU27
Circularity
Resource Productivity (Purchasing power standard (PPS) per kilogram) 2.5 2.5 2.5 2.7 2.7 2.7 2.2 2020
Material Intensity (kg/EUR) 0.4 0.4 0.4 0.4 0.4 0.4 0.4 2020
Circular Material Use Rate (%) 17.7 17.6 18.5 19.9 23.5 23.0 12.8 2020
Material footprint (Tones/capita) 14.0 13.1 12.6 12.4 11.9 - 14.6 2019
Waste
Waste generation (kg/capita, total waste) - 5573 - 5917 - - 5234 2018
Landfilling (% of total waste treated) - 6.4 - 7.8 - - 38.5 2018
Recycling rate (% of municipal waste) 53.5 53.5 53.9 54.4 54.7 54.2 47.8 2020
Hazardous waste (% of municipal waste) - 6.0 - 5.2 - - 4.3 2018
Competitiveness
Gross value added in environmental goods and services sector (% of GDP) 1.1 1.1 1.1 1.1 1.1 - 2.3 2019
Private investment in circular economy (% of GDP) 0.2 0.2 0.2 0.2 - - 0.1 2018
Latest year
EU 27

ANNEX 8: DIGITAL TRANSITION
38
The Digital Economy and Society Index (DESI)
monitors EU Member States’ digital progress. The areas of human capital, digital connectivity, the integration of digital technologies by businesses and digital public services reflect the Digital Decade’s four cardinal points (35). This Annex describes Belgium’s DESI performance. The Belgian recovery and resilience plan (RRP) dedicates 27% of its total budget to digital measures, well above the 20% target. It focuses mostly on human capital and eGovernment. Belgium still faces important challenges on connectivity, be it on fibre or 5G rollout. (36)
Belgium presents mixed results in terms of
connectivity. It scores almost at the EU average in terms of Very High Capacity Network (VHCN) coverage (69% of households were covered in 2021 compared to the EU average of 70%), thanks to its extensive and modern cable network. However, it still lags behind in terms of fibre deployment (9.7% of households were covered with fibre to the premises (FTTP) in 2021 compared to the EU average of 50% (37)). Belgium’s performance is also below the EU average when it comes to 5G deployment, even though this could improve as the 5G spectrum auction is expected to take place in the first half of 2022.
Belgium overall displays a mixed
performance in human capital, with some
important challenges remaining. Although the share of individuals employed as ICT specialists is above the EU average, demand for ICT specialists remains high as reflected by the vacancy rate in the ICT sector, which was at a record high of 8.9% (38) in the fourth quarter of 2021. Moreover, although scoring slightly above the EU average, increasing the share of women among ICT specialists remains a challenge for Belgium. To address this challenge, Belgium has set up an
(35) 2030 Digital Compass: the European Way for the Digital
Decade Communication, COM (2021) 118 final
(36) The share of financial allocation contributing to digital objectives has been calculated using Annex VII of the RRF Regulation.
(37) Broadband coverage in Europe studies, data available at: https://digital-agenda-data.eu/datasets/digital_agenda_scoreboard_key_indicators/visualizations
(38) Eurostat
interfederal strategy on Women in Digital. (39) The proportion of people with at least basic digital skills is at EU average. For young people, in particular the low-qualified, this share is declining. Furthermore, the low share of ICT graduates risks prolonging this situation.
Belgium achieves its most solid performance in the integration of digital technology. It scores above the EU average in all the indicators of this dimension. Belgium fares particularly well on SMEs with at least basic digital intensity and the share of businesses using big data and cloud (10, 9 and 13 percentage points above the EU average respectively).
Belgium’s performance is moderate in digital public services, both in public services for
businesses and for citizens. However, the large share of digital investments dedicated to this dimension in the Belgian RRP represents a good opportunity to improve these results.
(39) ‘Women in Digital National and Intersectorial Strategy’ for
2020-2025 https://news.belgium.be/fr/plan-interfederal-et-intersectoriel-women-digital
ANNEX 8: DIGITAL TRANSITION
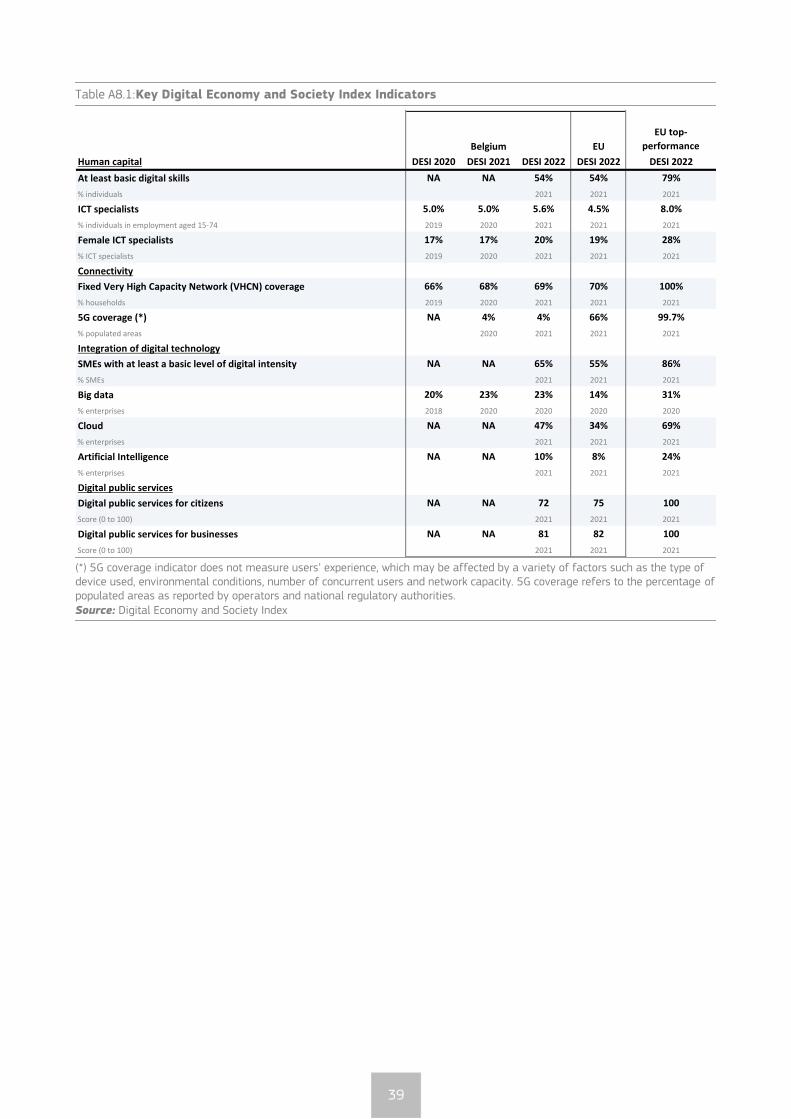
39
Table A8.1: Key Digital Economy and Society Index Indicators
(*) 5G coverage indicator does not measure users’ experience, which may be affected by a variety of factors such as the type of device used, environmental conditions, number of concurrent users and network capacity. 5G coverage refers to the percentage of populated areas as reported by operators and national regulatory authorities. Source: Digital Economy and Society Index
EU
EU top-
performance
Human capital DESI 2020 DESI 2021 DESI 2022 DESI 2022 DESI 2022
At least basic digital skills NA NA 54% 54% 79%
% individuals 2021 2021 2021
ICT specialists 5.0% 5.0% 5.6% 4.5% 8.0%
% individuals in employment aged 15-74 2019 2020 2021 2021 2021
Female ICT specialists 17% 17% 20% 19% 28%
% ICT specialists 2019 2020 2021 2021 2021
Connectivity
Fixed Very High Capacity Network (VHCN) coverage 66% 68% 69% 70% 100%
% households 2019 2020 2021 2021 2021
5G coverage (*) NA 4% 4% 66% 99.7%
% populated areas 2020 2021 2021 2021
Integration of digital technology
SMEs with at least a basic level of digital intensity NA NA 65% 55% 86%
% SMEs 2021 2021 2021
Big data 20% 23% 23% 14% 31%
% enterprises 2018 2020 2020 2020 2020
Cloud NA NA 47% 34% 69%
% enterprises 2021 2021 2021
Artificial Intelligence NA NA 10% 8% 24%
% enterprises 2021 2021 2021
Digital public services
Digital public services for citizens NA NA 72 75 100
Score (0 to 100) 2021 2021 2021
Digital public services for businesses NA NA 81 82 100
Score (0 to 100) 2021 2021 2021
Belgium
ANNEX 9: INNOVATION
40
The Annex provides a general overview of
the performance of Belgium’s research and
innovation system. Belgium is among Europe’s innovation leaders according to the 2021 edition of the European Innovation Scoreboard (40). Its performance has steadily improved over time relative to the EU. Total R&D intensity reached 3.5% of GDP in 2020.
In the last decade Belgium's innovation performance has continued to improve. The highly skilled workforce, a solid science base, world-class universities and good public-private partnerships are strong assets. The share of the country’s scientific publications among the top 10% most cited scientific publications worldwide has gradually increased since 2010, reaching 12.4% in 2018 (above the EU average of 9.9%). The share of joint public-private publications has significantly increased over the last decade (11.8% in 2019 compared to 10.4% in 2010) and Belgium continues to score above the EU average in terms of public R&D financed by businesses (with a 2.9% increase between 2010- 2019). Business enterprise R&D expenditure (BERD) is the highest in the EU (2.53% in 2020, well above the EU average of 1.53%), rising faster than public spending. The share of graduates in science and engineering remains largely unchanged and is well below the EU average despite high demand on the labour market for these profiles.
Despite the many strengths of the innovation system, innovation continues to be
concentrated in a few industries. Business dynamism measured by employment in fast-growing companies in 50% of the most innovative sectors has not taken off and remains below the EU average. The proportion of high-growth firms is below the EU-27 average for the main economic sectors except for electricity, gas and air conditioning, administrative and support service activities. This points to some weaknesses in the economy in generating new growing businesses that can accelerate the business renewal of its economy towards new growth areas, such as green sectors, as reflected by below EU average environmental-related (41) patents. Although Belgium is among the leading countries in terms
(40) 2021 European Innovation Scoreboard, Country profile:
Belgium 2021 https://ec.europa.eu/docsroom/documents/45905
(41) OECD Environmental Performance Reviews: Belgium 2021 | en | OECD
of intangible investment intensity in Europe (ratio of investment in intangible assets over gross value added), these investments are lagging behind in the professional and science services, where more investment in software and R&D could help innovate and increase productivity (42). In addition, differences across regions in terms of innovation performance persist (43), and coordination mechanisms between the federal and regional governments should be strengthened. This also applies to the regions. To address some of the persistent challenges, the recovery and resilience plan contains wide-ranging measures focused on developing digital skills, large R&D investments and innovation measures in digital and emerging technologies such as energy and the circular economy and the development of alternative production processes for nuclear medicine to treat cancer.
(42) JRC Country Factsheet on Productivity – Belgium, European
Commission, internal communication, 2022.
(43) 2021 Regional Innovation Scoreboard, Country profile: Belgium 2021.https://ec.europa.eu/docsroom/documents/45905
ANNEX 9: INNOVATION

41
Table A9.1: Key research, development and innovation indicators
Source: DG Research and Innovation - Common R&I Strategy and Foresight Service - Chief Economist Unit
Data: Eurostat, OECD, DG JRC, Science-Metrix (Scopus database and EPO’s Patent Statistical database), Invest Europe
Compound EU
annual growth average
2010-2020
R&D Intensity (GERD as % of GDP) 2.06 2.43 2.86 3.16 3.48 5.4 2.32
Public expenditure on R&D as % of GDP 0.66 0.72 0.79 0.81 0.92 3.4 0.78
Business enterprise expenditure on R&D (BERD) as % of GDP 1.38 1.7 2.05 2.33 2.53 6.2 1.53
Scientific publications of the country within the top 10% most
cited publications worldwide as % of total publications of the
country
13 13.7 12.4 : : -0.6 9.9
PCT patent applications per billion GDP (in PPS) 3.5 3.3 3.2 : : -1.2 3.5
Public-private scientific co-publications as % of total
publications10.4 11.4 11.9 11.8 11.2 0.8 9.05
Public expenditure on R&D financed by business enterprise
(national) as % of GDP0.061 0.077 0.076 0.080 : 2.9 0.054
New graduates in science & engineering per thousand pop.
aged 25-3411.9 12.1 11.8 11.9 : 0.4 16.3
Total public sector support for BERD as % of GDP 0.227 0.263 : 0.335 : 4.4 0.196
R&D tax incentives: foregone revenues as % of GDP 0.109 0.143 0.1784 0.209 : 7.4 0.100
Share of environment-related patents in total patent
applications filed under PCT (%) 13 11.5 11.1 : : -1.9 12.8
Venture Capital (market statistics) as % of GDP 0.035 0.028 0.048 0.061 0.074 7.8 0.054
Employment in fast-growing enterprises in 50% most
innovative sectors2.4 2.7 1.7 2.2 : -1.0 5.5
2020Belgium 2010 2015 2018 2019
Finance for innovation and Economic renewal
Key indicators
Quality of the R&I system
Academia-business cooperation
Human capital and skills availability
Public support for business enterprise expenditure on R&D (BERD)
Green innovation

ANNEX 10: INDUSTRY AND SINGLE MARKET
42
Productivity growth is a critical driver of
economic prosperity, well-being and
convergence over the long run. A major source of productivity for the EU economy is a well-functioning single market, where fair and effective competition and a business-friendly environment are ensured, in which small and medium enterprises (SMEs) can operate and innovate without difficulty. Businesses and industry rely heavily on robust supply chains and are facing bottlenecks that bear a negative impact on firms’ productivity levels, employment, turnover and entry/exit rates. This may impact the Member States’ capacity to deliver on Europe’s green and digital transformation.
Belgium’s labour productivity is among the
highest in the EU, but productivity growth
rates have not yet returned to pre-2008
levels. Belgium is one of the best performing EU countries in terms of labour productivity, just after Luxembourg and Ireland (see Annex 18). However, productivity growth rates have not yet returned to pre-2008 levels. One of the hardest hit sectors by the COVID-19 pandemic was hospitality, with value added dropping by 59%. The regions, the federal level and the EU have provided various support schemes to SMEs (44).
The Belgian economy has been less affected
by materials shortages, but staff shortages
and skills mismatches are above the EU average. The Belgian economy is less dependent on key raw materials than the EU average. This is partly explained by the low share of manufacturing in its economy. However, there was a shortage of materials in the construction sector. The RRP proposes measures to address staff shortages, skills mismatches and decreasing productivity. It includes measures to support technological innovation such as developing interconnectivity, digitalising SMEs and public administration and accompanying training measures (see section on employment).
The Belgian economy is a very open economy, and the business environment is considered
supportive to SMEs. More than 80% of the goods produced in Belgium are exported. Belgium ranks first in trading across borders. It performs better than the EU average on access to finance. The proportion of high-growth firms using
(44) 2021 SME Country fact sheet
different financing resources such as bank loans, equity, trade credit and overdrafts is above the EU average (Benedetti-Fasil et al, 2021). However, Belgium is average on public procurement, and the level of involvement of SMEs in bids (54%) and public contracts (30%) is below the EU average (60% and 45% respectively). Rising energy prices weigh upon businesses, which fear an ‘energy gap’ (supply crunch) during the green transition.
Although the economy is well-integrated in the single market, barriers remain. The regulatory burden in some professions (lawyers, architects, accountants, real estate agents, tourist guides in Wallonia) may weigh on their competitiveness. Belgium shows a moderate delay in incorporating 6 of the 17 single market-related directives into national law. It faces more infringements procedures than the EU average, but takes less time to comply with court rulings than before, even though this is still above the 18-month threshold.
ANNEX 10: INDUSTRY AND SINGLE MARKET

43
Table A10.1: Key Single Market and Industry Indicators
(Continued on the next page)
SUB-POLICY
AREAINDICATOR NAME DESCRIPTION 2021 2020 2019 2018 2017
Growth
rates
EU27
average*
Value added by source (domestic)
VA that depends on domestic intermediate inputs, % [source: OECD (TiVA), 2018]
58.83 62.6%
Value added by source (EU)
VA imported from the rest of the EU, % [source: OECD (TiVA), 2018]
23 19.7%
Value added by source (extra-EU)
% VA imported from the rest of the world, % [source: OECD (TiVA), 2018]
18.2 17.6%
Cos
t
com
peti
tive
ness
Producer energy price (industry)
Index (2015=100) [source: Eurostat, sts_inppd_a] 163.4 116.4 127.5 124.5 109.1 49.8% 127.3
Material Shortage using survey data
Average (across sectors) of firms facing constraints, % [source: ECFIN CBS]
19 12 10 11 11 73% 26%
Labour Shortage using survey data
Average (across sectors) of firms facing constraints, % [source: ECFIN CBS]
16 13 15 14 13 23% 14%
Sectoral producer pricesAverage (across sectors), 2021 compared to 2020 and 2019, index [source:Eurostat]
7.8% 5.4%
Concentration in selected raw materials
Import concentration a basket of critical raw materials, index [source: COMEXT]
0.17 0.16 0.18 0.21 0.22 -23% 17%
Installed renewables electricity capacity
Share of renewable electricity to total capacity, % [source:Eurostat, nrg_inf_epc]
32.90 29.70 27.00 24.40 35% 47.8%
Net Private investmentsChange in private capital stock, net of depreciation, % GDP [source: Ameco]
3.3 5 4.5 4.4 -25.0% 2.6%
Net Public investmentsChange in public capital stock, net of depreciation, % GDP [source: Ameco]
0.4 0.4 0.4 0.2 100% 0.4%
Sing
le
Ma
rket
inte
gra
tion
Intra-EU tradeRatio of Intra-EU trade to Extra-EU trade, index [source: Ameco]
1.72 1.69 1.67 1.67 1.62 6% 1.59
Prof
essi
ona
l
serv
ices
rest
rict
iven
ess
Regulatory restrictiveness indicator
Restrictiveness of access to and exercise of regulated professions (professions with above median restrictiveness, out of the 7 professions analysed in SWD (2021)185 [source: SWD (2021)185; SWD(2016)436 final])
5 4 25% 3.37
Prof
essi
ona
l
qua
lific
ati
ons
reco
gnit
ion
Recognition decisions w/o compensation
Professionals qualified in another EU MS applying to host MS, % over total decisions taken by host MS [source: Regulated professions database]
19 45%
Transposition - overall5 sub-indicators, sum of scores [source: Single Market Scoreboard]
On average
AboveOn
averageOn
average
Infringements - overall4 sub-indicators, sum of scores [source: Single Market Scoreboard]
Below average
On average
On average
Below average
HEADLINE INDICATORS
Econ
omic
str
uctu
re
RESILIENCE
Shor
tage
s/su
pply
cha
in
disr
upti
ons
Stra
tegi
c
depe
nden
cies
Inve
stm
ent
dyna
mic
s
SINGLE MARKET
Com
plia
nce
-
coop
era
tion
EC
and
MS
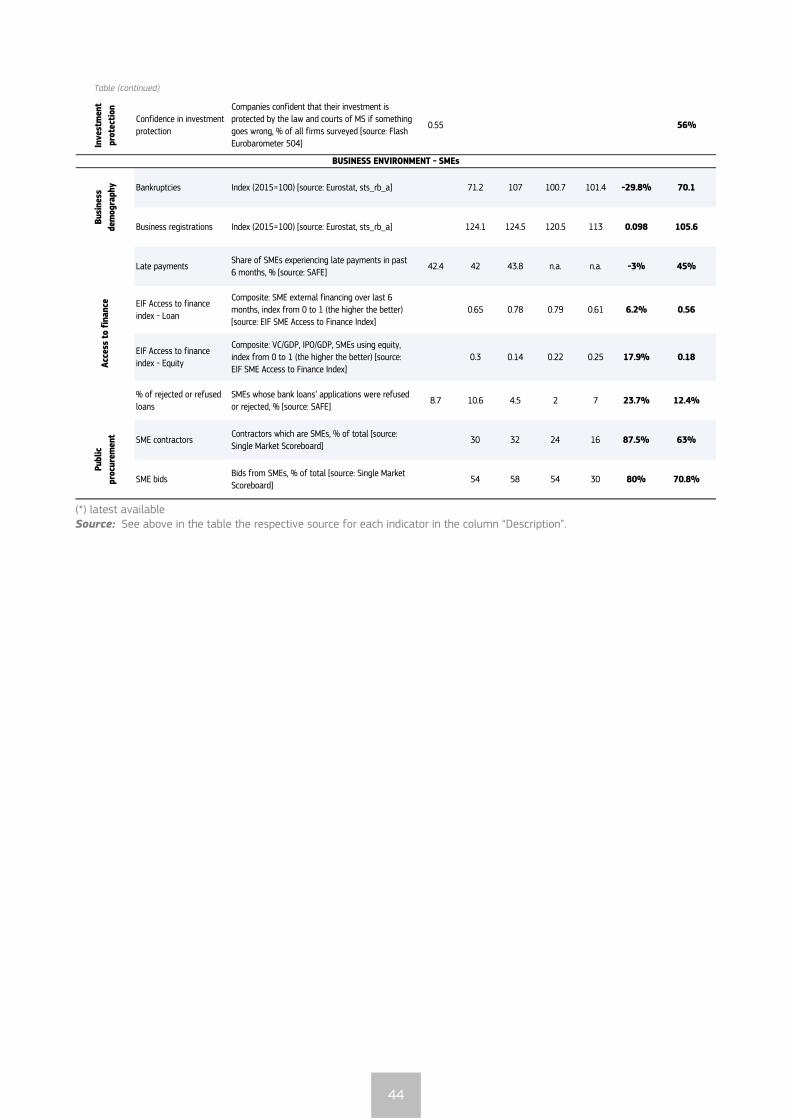
44
Table (continued)
(*) latest available Source: See above in the table the respective source for each indicator in the column “Description”.
Inve
stm
ent
prot
ecti
onConfidence in investment protection
Companies confident that their investment is protected by the law and courts of MS if something goes wrong, % of all firms surveyed [source: Flash
Eurobarometer 504]
0.55 56%
Bankruptcies Index (2015=100) [source: Eurostat, sts_rb_a] 71.2 107 100.7 101.4 -29.8% 70.1
Business registrations Index (2015=100) [source: Eurostat, sts_rb_a] 124.1 124.5 120.5 113 0.098 105.6
Late paymentsShare of SMEs experiencing late payments in past 6 months, % [source: SAFE]
42.4 42 43.8 n.a. n.a. -3% 45%
EIF Access to finance index - Loan
Composite: SME external financing over last 6 months, index from 0 to 1 (the higher the better) [source: EIF SME Access to Finance Index]
0.65 0.78 0.79 0.61 6.2% 0.56
EIF Access to finance index - Equity
Composite: VC/GDP, IPO/GDP, SMEs using equity, index from 0 to 1 (the higher the better) [source:
EIF SME Access to Finance Index]
0.3 0.14 0.22 0.25 17.9% 0.18
% of rejected or refused loans
SMEs whose bank loans’ applications were refused or rejected, % [source: SAFE]
8.7 10.6 4.5 2 7 23.7% 12.4%
SME contractorsContractors which are SMEs, % of total [source: Single Market Scoreboard]
30 32 24 16 87.5% 63%
SME bidsBids from SMEs, % of total [source: Single Market Scoreboard]
54 58 54 30 80% 70.8%
Bus
ines
s
dem
ogra
phy
Acc
ess
to f
inan
cePu
blic
proc
urem
ent
BUSINESS ENVIRONMENT - SMEs

ANNEX 11: PUBLIC ADMINISTRATION
45
Good administrative capacity enables
economic prosperity, social progress, and
fairness. Public administrations at all government levels deliver crisis response, ensure the provision of public services and contribute to building resilience for the sustainable development of the EU economy.
Belgium’s public administration
effectiveness is ranked around the EU
average. (45) The key challenge is related to the complex coordination between the levels of government, which have an impact on the effectiveness and efficiency of public policies and services. Several measures in the Belgium’s recovery and resilience plan aim to push forward digitalisation and administrative simplification, with an emphasis on investments in the public administration and the justice system. This is expected to reduce the administrative burden and help create a more business-friendly environment.
Belgium scores well as to the provision of
digital public services for businesses and
citizens. COVID-19, teleworking and the launch of more digital public services have boosted usage. The e-government benchmark indicator stood at 74.1 in 2021 (EU average of 70.9). In 2021, 74% of internet users in Belgium interacted digitally with the Belgian authorities.
Belgium scores below the average on
government transparency. The open data index stood at 54.5 in 2021 significantly lower than the EU average (81.1) (see Graph A11.1). The publication of open data at federal and regional level is diverse and there is room to improve coordination between government levels.
Public administration workplace
attractiveness and gender balance in senior
government positions are a challenge. The Belgian government promotes flexibility and competence-based Human Resource management in the civil service in order to increase the attractiveness of governmental positions and to address the ageing of its workforce. Gender equality for senior management positions is also an issue. The government also aims to develop more training and development opportunities for staff and more staff mobility.
(45) Worldwide Governance Indicators, 2020
Graph A11.1: Open data maturity
Source: Open Data Maturity | data.europa.eu
Graph A11.2: Performance on the single market
public procurement indicator
The competition and transparency indicators are triple-weighted, whereas the efficiency and quality indicators have unitary weights. All others receive a 1/3 weighting in the SMS composite indicator. Source: Single market scoreboard 2020 data
Belgium’s ranking on selected fiscal framework´s indicators is below the EU
average. This applies to the national medium-term budgetary framework and strength of fiscal rules indices. In addition, the single market’s public procurement indicator shows that there is room for improvement in terms of transparency, competition, access to SMEs and quality of information in procurement (see Graph A11.2).
A persistent lack of data prevents having a
full overview of the efficiency of the justice system. Stakeholders report lengthy delays in certain courts and the judicial branch of the
0
0.1
0.2
0.3
0.4
0.5
0.6
0.7
0.8
0.9
BE EU27 average
Open Data Policy Open Data Quality
Open Data Portal Open Data Impact
ANNEX 11: PUBLIC ADMINISTRATION

46
Council of State faces backlogs due to a lack of resources. The overall quality of the justice system faces challenges, in particular on digitalisation, which the RRP aims to address. As regards judicial independence, no systemic deficiencies have been reported. (46)
(46) For more detailed analysis of the performance of the justice
system in Belgium, see the 2022 EU Justice Scoreboard (forthcoming) and the country chapter for Belgium in the Commission’s 2022 Rule of Law Report (forthcoming).
Table A11.1: Public administration indicators - Belgium
(1) High values stand for good performance barring indicators # 7 and 8. (2) Measures the user centricity (including for cross-border services) and transparency of digital public services as well as the existence of key enablers for the provision of those services. (3) Break in the series in 2021. (4) Defined as the absolute value of the difference between the share of men and women in senior civil service positions. Source: ICT use survey, Eurostat (# 1); E-government benchmark report (# 2); Open data maturity report (# 3); Fiscal Governance
Database (# 4, 9, 10); Labour Force Survey, Eurostat (# 5, 6, 8), European Institute for Gender Equality (# 7), Single Market Scoreboard public procurement composite indicator (# 11); OECD Indicators of Regulatory Policy and Governance (# 12).
BE 2017 2018 2019 2020 2021 EU27
1 62.0 63.0 64.0 66.0 74.0 70.7
2 na na na na 74.1 70.9
3 na na na na 54.5 81.1
4 60.0 60.0 60.0 60.0 na 56.8
5 45.4 45.3 46.6 48.0 53.0 55.3
6 10.0 9.9 8.6 8.0 11.6 18.6
7 0.8 0.8 0.7 0.7 0.7 0.3
8 21.0 20.9 21.8 21.6 21.0 21.3
9 0.68 0.68 0.68 0.68 na 0.72
10 1.3 1.3 1.3 1.3 na 1.5
11 4.3 1.3 1.3 -1.7 na -0.7
12 1.93 na na 1.82 na 1.7
E-government
Public Financial Management
Evidence-based policy making
Indicator (1)
Medium term budgetary framework index
Strength of fiscal rules index
Public procurement composite indicator
Share of individuals who used internet within the last year to
interact with public authorities (%)
2021 e-government benchmark´s overall score (2)
2021 open data maturity index
Scope Index of Fiscal Institutions
Share of public administration employees with tertiary education,
levels 5-8 (3)
Index of regulatory policy and governance practices in the areas of
stakeholder engagement, Regulatory Impact Assessment (RIA) and
ex post evaluation of legislation
Educational attainment level, adult learning, gender parity and ageing
Open government and independent fiscal institutions
Participation rate of public administration employees in adult
learning (3)
Gender parity in senior civil service positions (4)
Share of public sector workers between 55 and 74 years (3)

FAIRNESS
ANNEX 12: EMPLOYMENT, SKILLS AND SOCIAL POLICY CHALLENGES IN LIGHT OF THE EUROPEAN PILLAR OF SOCIAL RIGHTS
47
The European Pillar of Social Rights provides
the compass for upward convergence
towards better working and living conditions in the EU. The implementation of its twenty principles on equal opportunities and access to the labour market, fair working conditions, social protection and inclusion, supported by the 2030 EU headline targets on employment, skills and poverty reduction, will strengthen the Union’s drive towards a digital, green and fair transition. This Annex provides an overview of Belgium’s progress in achieving the goals under the European Pillar of Social Rights.
The poor labour market integration of vulnerable groups, which has worsened
during the COVID-19 crisis, contributes to
poor social outcomes for these groups. Despite the slowly increasing trend, the employment rate (71.6% in Q4-2021) remains below the EU average (74.1%). Moreover, there are large disparities in labour market outcomes between regions and population groups (see Annex 15 for regional disparities in the unemployment rate). The low-skilled and people with a migrant background have seen a further deterioration of their position on the labour market. In particular, the gap in employment between non-EU born and native born women is among the highest in the EU, at 27.0 percentage points in 2021 (versus an EU average of 15.2 percentage points). The disability employment gap has increased, reaching 36.3 percentage points, which is well above the EU average of 24.3 percentage points. At the same time, increasing labour demand is reflected in the currently record high vacancy rate. Disincentives to work stemming from the tax and benefit systems, and low effectiveness of activation measures, in particular for vulnerable groups, hold back labour market participation. To enhance labour market integration, the recovery and resilience plan (RRP) foresees an increased provision of personalised support to vulnerable jobseekers in Wallonia and further digitalisation of the public employment services in Brussels and Flanders. The European Social Fund Plus (ESF+) complements these reforms with investment in active social inclusion measures that targets people far from the labour market.
Table A12.1: Social Scoreboard
(1) Update of 29 April 2022. Members States are classified on the Social Scoreboard according to a statistical methodology agreed with the EMCO and SPC Committees. It looks jointly at levels and changes of the indicators in comparison with the respective EU averages and classifies Member States in seven categories. For methodological details, please consult the Joint Employment Report 2022. Due to changes in the definition of the individuals' level of digital skills in 2021, exceptionally only levels are used in the assessment of this indicator; NEET: neither in employment nor in education and training; GDHI: gross disposable household income. Source: European Commission
Skills mismatches, high educational
inequalities and low adult learning
participation pose important challenges to Belgium, also in view of accompanying the
fair green and digital transitions. Labour shortages are observed in several low- and high-skilled professions. There are considerable shortages in professional, technical and scientific occupations due to the low number of graduates in science, technology, engineering and mathematics (STEM) and concerns over the attractiveness and labour market relevance of vocational education and training (VET). In compulsory education, there are large educational inequalities linked to pupils’ socio-economic and migrant background, manifesting through large differences in outcomes between schools, which lead to poor labour market
6.7
54.0
10.1
7.7
3.7
70.6
6.3
2.6
103.6
20.3
22.0
44.9
36.3
7.8
54.6
1.5
Critical
situationTo watch
Weak but
improving
Good but to
monitorOn average
Equal opportunities
and access to the
labour market
Early leavers from education and training
(% of population aged 18-24) (2021)
Individuals' level of digital skills (% of population 16-
74) (2021)
Youth NEET
(% of total population aged 15-29) (2021)
Gender employment gap (percentage points) (2021)
Income quintile ratio (S80/S20) (2020)
Dynamic labour
markets and fair
working conditions
Employment rate
(% population aged 20-64) (2021)
Unemployment rate
(% population aged 15-74) (2021)
Long term unemployment
(% population aged 15-74) (2021)
GDHI per capita growth (2008=100) (2020)
Social protection
and inclusion
At risk of poverty or social exclusion (in %) (2020)
At risk of poverty or social exclusion for children (in %)
(2020)
Impact of social transfers (other than pensions) on
poverty reduction (% reduction of AROP) (2020)
Disability employment gap (ratio) (2020)
Housing cost overburden (% of population) (2020)
Children aged less than 3 years in formal childcare (%
of under 3-years-olds) (2020)
Self-reported unmet need for medical care (% of
population 16+) (2020)
Better than average Best performers
FAIRNESS
ANNEX 12: EMPLOYMENT, SKILLS AND SOCIAL POLICY CHALLENGES IN LIGHT OF THE EUROPEAN PILLAR OF SOCIAL RIGHTS

48
outcomes. Adult participation in learning (25-64) over the past four weeks in 2020 was below the EU average (10.2% vs 10.8%), in particular for the low-educated (4.0%). The share of the population with at least basic digital skills is at the EU average (54%), but it has declined over time and especially for young low-skilled people. Further strengthening the incentives for adults to participate in learning and enhancing the performance and inclusiveness of the education and training systems are important for Belgium to contribute to reaching the 2030 EU headline target on skills.
The share of people at risk of poverty or
social exclusion remains high in particular
for specific groups. The share of people at risk of poverty or social exclusion in 2020 was significantly higher for low-skilled adults (37.9%), adults with a migrant (non-EU) background (46.5%) and persons with disabilities (31.9%) relative to the overall population (20.3%), suggesting a strong correlation between lower employment rates and the prevalence of poverty. The share of children at risk of poverty in 2020 was, at 15.6%, recording a lower rate compared to the EU average (18.9%), but with important regional differences (it reached 41% in Brussels in 2019; Welzijnsbarometer, 2020). Overall, the participation of young children (less than 3 years old) in childcare is high (54.6% in 2020), but this rate is much lower for children at risk of poverty or social exclusion (34.3%). Strengthening active social inclusion is important for Belgium to contribute to reaching the 2030 EU headline target on poverty reduction. The national RRP includes several measures to boost the employability of the most vulnerable, including by reducing digital inequalities. Furthermore, it includes investment in childcare and social housing, including for persons with disabilities. The ESF+ will complement these investments with actions to support de-institutionalisation of persons with disabilities in Wallonia.

ANNEX 13: EDUCATION AND SKILLS
49
This Annex outlines the main challenges for
Belgium’s education and training system in
light of the EU-level targets of the European Education Area Strategic Framework and
other contextual indicators, based on the
analysis from the 2021 Education and Training Monitor. While Belgium scores above EU average on EU-level targets and has reached several of them, its education systems face equity challenges that risk to worsen due to the pandemic and contribute to skills mismatches. Teacher shortages could further affect negatively educational outcomes.
Belgium has reached the EU-level targets on early childhood education, early leavers from
education and training and tertiary
educational attainment, but fails to make significant progress in basic skills of low-
achieving 15-year-olds and in adult learning. The average good level of students’ basic skills and digital skills are decreasing, and the gap in educational outcomes linked to pupils’ socio-economic and migration background is high. There are also significant gaps in educational outcomes for students with special needs, between
communities and regions, and between schools and education tracks. Despite having reached the EU-level target on reducing early school leaving, the level is above the EU average in cities. Participation in adult learning is particularly low for the low-educated (4.0%) (see Annex 12).
Teachers are not well prepared to provide quality instruction to the increasingly diverse
student population. In the 2018 TALIS survey, Belgian teachers stressed the high diversity of students in the classroom more than teachers in other countries did (above the EU average for students being non-native speakers, having special needs, being migrants or with a migrant background, and coming from socio-economically disadvantaged homes). At the same time, teachers indicated feeling less well prepared than the EU average to teach in a multicultural and/or multilingual setting.
Strengthening the teaching profession, fundamental to improving educational
outcomes for all, is highly relevant to
address the growing shortage of qualified
teachers. More than in other EU countries,
ANNEX 13: EDUCATION AND SKILLS
Table A13.1: EU-level targets and other contextual indicators under the European Education Area
strategic framework
(1) The 2018 EU average on PISA reading performance does not include ES; d = definition differs, u = low reliability; Data is not yet available for the remaining EU-level targets under the European Education Area strategic framework, covering underachievement in digital skills, exposure of vocational educational training graduates to work based learning and participation of adults in learning. Source: Eurostat (UOE, LFS); OECD (PISA).
96% 98.2% d 91.9% 98.3% 2019 92.8% 2019
Reading < 15% 19.5% 20.4% 21.3% 2018 22.5% 2018
Mathematics < 15% 20.1% 22.2% 19.7% 2018 22.9% 2018
Science < 15% 19.8% 21.1% 20.0% 2018 22.3% 2018
< 9 % 10.1% 11.0% 6.7% 9.7%
Men 11.6% 12.5% 8.9% 11.4%
Women 8.6% 9.4% 4.5% 7.9%
Cities 13.6% 9.6% 9.6% 8.7%
Rural areas 9.5% 12.2% 4.9% 10.0%
Native 9.0% 10.0% 5.8% 8.5%
EU-born 16.6% 20.7% 10.8% u 21.4%
Non EU-born 19.1% 23.4% 14.9% 21.6%
45% 43.1% 36.5% 50.9% 41.2%
Men 37.1% 31.2% 44.0% 35.7%
Women 49.2% 41.8% 57.8% 46.8%
Cities 45.7% 46.2% 52.7% 51.4%
Rural areas 39.1% 26.9% 44.9% 29.6%
Native 45.3% 37.7% 52.8% 42.1%
EU-born 46.3% 32.7% 54.0% 40.7%
Non EU-born 27.6% 27.0% 38.1% 34.7%
27.8% 38.3% 28.0% 2019 38.9% 2019
2015 2021
Indicator Target Belgium EU27 Belgium EU27
Participation in early childhood education (age 3+)
Low achieving 15-year-olds in:
Early leavers from education and training (age 18-24)
Total
By gender
By degree of urbanisation
By country of birth
Tertiary educational attainment (age 25-34)
Total
By gender
By degree of urbanisation
By country of birth
Share of school teachers (ISCED 1-3) who are 50 years or over

50
principals report that shortages of qualified teachers (BE 46.5%, BEnl 34.2%, BEfr 65.6% vs EU-23 24.6%), including for students with special needs (BE 55.6%, BEnl 39.4%, BEfr 80.9% vs EU-23 37.8%) and for vocational education and training (VET) (BE 33.8%, BEnl 28.0%, BEfr 43.3% vs EU-23 16.4%), hinder schools’ capacity to provide quality instruction (TALIS 2018). While the age pyramid of teachers is more favourable than on average in the EU, the number of young people choosing education as a first career choice is decreasing. Newly recruited teachers have less favourable working conditions than older ones, including temporary contracts and assignments to multiple and disadvantaged schools. Newly recruited teachers in Belgium received less formal induction activities than the EU average (6.6% vs EU-23 25.1%; BEnl 1.2%; BEfr 15.2%). The EU’s Structural Reform Support Programme (SRSP) is currently providing support to the Flemish Community to develop coherent support for teachers at the start of their careers and give guidance to its highly autonomous schools on how to set up such induction schemes (2020-2022). Continuing professional development is a professional duty, but there is no minimum number of defined hours in the Flemish Community. In the French Community, principals reported the second lowest planning of continuing professional development at school level (23.1% vs EU 56.2%; BEnl: 48.2%). More than one out of two principals reported that there is no mentoring programme for teachers in schools. Since TALIS 2018, the Communities have been taken some measures to improve the professionalisation of the teaching profession. From 2023/2024, the French Community will strengthen initial teacher training and increase it to 4 years.
Graph A13.1: Shortages of qualified teachers as
reported by principals
Source: Talis 2018 (OECD, 2019)
Belgium’s spending on education as a share of GDP was among the highest in the EU
(6.2% vs 4.7%) and its expenditure on
employee compensation as a share of public spending on education was also the highest
(82% vs 64%). Comparing Belgium with other ‘high spending’ countries and given that spending is set to remain high, better educational outcomes should be possible.
The reforms and investment measures under
the recovery and resilience plan (RRP) aim to improve the performance of the education
system, but only few measures have as a
specific objective to address the structural inequalities in the education system. Key support is expected to help improve the digital performance of young people in the primary, secondary and higher education systems. In the French Community, a global action plan against early school leaving and COVID-19 related support to students in compulsory education, as well as support for school infrastructure are foreseen. The RRP will also help modernise higher education in the Flemish Community.
0
10
20
30
40
50
60
70
80
90
Shortage of qualified teachers hinder schools’
capacity to provide quality instruction
Shortage of teacherscompetent to teach
students with specialneeds
Shortage of qualifiedteachers for Vocationaleducation and training
(VET)
%
BE BE-nl BE-fr EU

ANNEX 14: HEALTH AND HEALTH SYSTEMS
51
Especially relevant in light of the ongoing
COVID-19 pandemic, resilient healthcare is a
prerequisite for a sustainable economy and society. This Annex provides a snapshot of the healthcare sector in Belgium.
Life expectancy in Belgium is higher than in
the EU as a whole, but fell sharply in 2020 by more than 15 months due to COVID-19. As of 17 April 2022, Belgium reported 2.71 cumulative COVID-19 deaths per 1 000 inhabitants and 347 confirmed cumulative COVID-19 cases per 1 000 inhabitants. Before the pandemic, ischaemic heart disease, strokes and lung cancer were the main causes of death. Low treatable mortality was also reflected in low cancer mortality rates.
Graph A14.1: Life expectancy at birth, years
Source: Eurostat database
Health spending relative to GDP in Belgium
was above the EU average in 2019. Compulsory health insurance ensures almost universal coverage (99% of the population). Most health spending is publicly funded, but still remains slightly below the EU average. Public spending on health is projected to increase by 0.6 percentage points (pps) of GDP by 2070 (compared to 0.9 pps for the EU) (2021 Ageing Report).
The number of doctors in Belgium has
increased at a slower pace than in most EU
countries in the last decade, remaining below
the EU average. About 44% of doctors are over 55 years old, raising concerns about growing shortages in the future. In response, the number of students admitted to medical schools has increased in recent years. Workforce shortages were apparent during the first wave of COVID-19, especially intensive care nurses.
Graph A14.2: Projected increase in public
expenditure on health-care over 2019-2070 (AWG
reference scenario)
Source: European Commission/EPC (2021)
Through its recovery and resilience plan
(RRP), Belgium plans to invest EUR 83 million in health-related measures. The investment mainly relates to digital health services and improving health data collection and availability (notably by developing standardised data sets to improve data sharing). The plan also includes investments in nuclear medicine for cancer treatment and in health research and innovation.
80.580.9 80.9 81.
81.3
80.4
81.181.5 81.6 81.7
82.1
80.8
2015 2016 2017 2018 2019 2020
EU Belgium
6.6
5.7
0.9
0.6
0 2 4 6 8
EU
Belgium
% of GDP
2019
2070increase
ANNEX 14: HEALTH AND HEALTH SYSTEMS

52
Table A14.1: Key health indicators
(1) Doctors' density data refer to practising doctors except for FI, EL, PT (licensed to practice) and SK (professionally active). Nurses' density data refer to practising nurses (imputation from year 2014 for FI) except for IE, FR, PT, SK (professionally active) and EL (nurses working in hospitals only). More information: https://ec.europa.eu/health/state-health-eu/country-health-profiles_en Source: Eurostat Database; except: * Eurostat Database and OECD, ** ECDC.
2016 2017 2018 2019 2020 EU average (latest year)
Treatable mortality per 100 000 population
(mortality avoidable through optimal quality
healthcare)
71.5 71.0 70.5 65.0 92.1 (2017)
Cancer mortality per 100 000 population 246.5 238.5 229.8 229.0 252.5 (2017)
Current expenditure on health, % GDP 10.8 10.8 10.8 10.7 9.9 (2019)
Public share of health expenditure, % of current
health expenditure77.3 77.4 76.9 76.8 79.5 (2018)
Spending on prevention, % of current health
expenditure 1.4 1.5 1.6 1.6 2.8 (2018)
Acute care beds per 100 000 population 512.1 500.5 496.7 500.0 387.4 (2019)
Doctors per 1 000 population * 3.1 3.1 3.1 3.2 3.8 (2018)
Nurses per 1 000 population * 11.0 11.2 11.1 8.2 (2018)
Consumption of antibacterials for systemic use in
the community, daily defined dose per 1 000
inhabitants per day **
22.5 21.2 20.7 19.8 15.3 14.5 (2020)

ANNEX 15: ECONOMIC AND SOCIAL PERFORMANCE AT REGIONAL LEVEL
53
The regional dimension is an important
factor when assessing economic and social
developments in Member States. Taking into account this dimension enables a well-calibrated and targeted policy response that fosters cohesion and ensures sustainable and resilient economic development across all regions. Although average GDP per capita is higher in Belgium than in the EU, disparities between and within regions are significant. Regional disparities remain significant in Belgium and have not fundamentally decreased in recent years. Several regions are drifting away from the EU average. GDP per head in Flanders is 120% of the EU average while in Wallonia it is around 87% of the EU average (with large differences ranging from 163% for Walloon Brabant to 72% for Luxembourg) (see Table A15.1). It is important to highlight the specific performance of Brussels, where GDP per capita corresponds to 205% of the EU average, reflecting the importance of incoming commuters. However, real GDP growth between 2010 and 2019 has been higher in Flanders (+1.8%) and Wallonia (+1.7%) than in Brussels (+0.9%), whose GDP growth rate is well below the national average (+1.6%).
Competitiveness also differs widely across
regions. According to the 2019 Regional Competitiveness Index, the three most competitive regions of Belgium are the Brussels Region, Walloon Brabant and Flemish Brabant, all scoring 84.7. While the four Walloon provinces of Hainaut, Namur, Liège and Luxembourg range between 59.6 and 64.6, the Flemish provinces (excluding Flemish Brabant) range between 76.4 and 82.4. R&I intensity appears to be among the factors explaining the difference in performance.
Labour productivity varies at sub-national
level. Overall, real labour productivity, measured as gross value added per person, was 130% higher than the EU average in 2019. Labour productivity is the highest in the Brussels Region and in Walloon Brabant, although real productivity growth differs considerably: 0.29% in the Brussels Region and 1.93% in Walloon Brabant. These values represent the lowest and highest values in Belgium, respectively.
Graph A15.1: Unemployment rate, 2020 in Belgium
Source: European Commission
Unemployment shows marked regional
disparities. Belgian unemployment was 5.6% in 2020. Unemployment in the Flemish region is systematically lower, whereas in the Walloon region it is higher except for Luxembourg (see Graph A15.1). Unemployment is highest in the Brussels Region (12.3%), although on a declining trend. Labour mobility across regions has increased in recent years, but remains limited. The COVID-19 pandemic affected unemployment most in Liège, followed by West-Flanders and the Brussels Region.
Climate transition affects Belgian regions
differently. In agreement with the Belgian authorities, the Commission decided to allocate the full amount of the Just Transition Fund to the Hainaut province, in particular to Charleroi, Mons and Tournai (see Graph A15.2). These have the highest industrial greenhouse gas emission intensity of Belgium, mainly due to the production of cement, chemicals and electricity. In addition, Hainaut once depended on steel, textiles and coal. Its industrial transition is still underway, which poses difficulties in terms of economic development and causes a relatively high unemployment. Furthermore, carbon-intensive sectors in the region employ more than 13 000 people.
ANNEX 15: ECONOMIC AND SOCIAL PERFORMANCE AT REGIONAL LEVEL

54
Graph A15.2: Territories most affected by the
climate transition in Belgium
Source: European Commission
Graph A15.3: CO2 emissions from fossil fuels per
head, 2018 in Belgium
Source: European Commission
Table A15.1: Selected indicators at regional level
Source: Eurostat, *EDGAR Database.
NUTS 2 RegionGDP per head
(PPS)
Productivity
(GVA (PPS) per
person
employed)
GDP growthUnemployment
rate
Population
with high
educational
attainment
R&D
expenditure
Regional
Competitivene
ss Index
CO2 emissions
from fossil
fuels per head
EU27=100,
2020
EU27=100,
2018
Avg % change
on preceding
year, 2010-
2019
% of active
population, 2020
% of population
aged 30-34,
2017-2019
% of GDP, 2017Range 0-100,
2019
tCO2 equivalent,
2018
European Union 100 100 1.57 7.1 39.4 2.19 57.3 7.2
Belgium 119 130 1.61 5.6 47.0 2.68 76.0
Brussels Region 205 161 0.85 12.3 55.4 2.04 84.7 4.6
Flemish Region 120 127 1.84 3.5 47.9 2.65 76.9 9.5
Antwerp 141 143 2.03 4.0 45.1 3.45 82.4 10.6
Limburg 95 109 1.83 3.6 46.5 1.58 76.8 8.1
East Flanders 107 122 1.79 2.7 49.4 2.69 82.1 11.3
Flemish Brabant 128 144 1.79 3.8 55.8 4.20 84.7 10.9
West Flanders 114 118 1.75 3.3 42.6 1.33 76.4 6.4
Walloon Region 87 115 1.67 6.7 44.8 2.52 63.1 10.9
Walloon Brabant 163 160 3.52 6.2 61.0 7.67 84.7 7.7
Hainaut 74 104 1.18 8.3 37.6 1.43 59.6 11.4
Liège 83 108 1.18 7.8 40.4 2.18 63.8 10.6
Luxembourg 72 98 1.23 5.1 43.0 0.28 60.6 11.1
Namur 79 104 1.24 6.1 42.0 1.02 64.6 13.9

MACROECONOMIC STABILITY
ANNEX 16: KEY FINANCIAL DEVELOPMENTS
55
This Annex provides an overview of key
developments in Belgium’s financial sector. The financial sector appears relatively sound and moderately profitable. Banks solvency is satisfactory, with a slightly increasing capital adequacy ratio close to 20.6% in Q3 2021 (vs. 19.3% in the EU). Credit quality is strong, with a record low non-performing loans ratio of 1.6% in Q3 2021 (vs. 2.1% in the EU). With a return-on-equity of 8.9%, Belgian banks are only moderately profitable but still perform better, on average, than the EU (7.1%). Belgian banks face several challenges. Like in other Member States, they need to manage the risk of persistently low interest rates, the risk of a sudden rise in inflation, climate transition, digitalisation, compliance costs and fierce competition. Other challenges are more specific to Belgium and include a buoyant residential real estate market, a relatively high banking tax and the obligation to pay a minimum interest rate (0.11%) on regulated savings accounts, which can put net interest margins under pressure in a low interest rate environment. There is also the fact that the contributions to the Belgian Deposit Guarantee Scheme (DGS) are not invested into a segregated and diversified portfolio of low-risk assets (see previous country reports for details).
The residential real estate market exhibits
medium vulnerabilities that are mitigated by
appropriate and sufficient macro-prudential
policy measures. The European Systemic Risk Board (2022), after having issued a recommendation in 2019, has identified several key vulnerabilities: signs of house price overvaluation, elevated house price growth, elevated and rising household indebtedness, dynamic housing credit growth and loose though gradually tightening credit standards. Since 2015, growth in loans to households has been strong and reached 6.5% in December 2021 (vs. 4.2% in the euro area), one of the highest growth rates in the EU. Nevertheless, the current policy mix can be considered appropriate and sufficient and has been instrumental in mitigating risks. The borrower-based measures introducing loan-to-value-thresholds for various sub-segments of loans have led to a marked improvement in the quality of the mortgage production. Moreover, the conversion of the current Article 458 of the Capital Requirements Regulation measure into a sectoral systemic risk buffer of equivalent magnitude will
continue to ensure an appropriate capital buffer against unexpected losses on the stock of loans.
Graph A16.1: Credit growth
(1) Loans adjusted for sales and securitisation (year-on-year change) Source: ECB
Graph A16.2: Evolution of house price index
Source: Eurostat
-8
-6
-4
-2
0
2
4
6
8
10
12
2009
2010
2011
2012
2013
2014
2015
2016
2017
2018
2019
2020
2021
Total private NFC HH
%
0
20
40
60
80
100
120
140
-40
-30
-20
-10
0
10
20
30
07Q
4
08Q
4
09Q
4
10Q
4
11Q
4
12Q
4
13Q
4
14Q
4
15Q
4
16Q
4
17Q
4
18Q
4
19Q
4
20Q
4
21Q
4
2015=
100
Rate
of
change y
-o-y
(%
)
MFI loans for house purchase (y-o-y growth rate)
Real House Price Index (2015=100), right axis
Nominal House Price Index (2015=100), right axis
MACROECONOMIC STABILITY
ANNEX 16: KEY FINANCIAL DEVELOPMENTS

56
Table A16.1: Financial soundness indicators
(1)Last data: Q3 2021. (2) Includes issuance by supranationals such as EU. Source: ECB, Eurostat, Refinitiv.
2017 2018 2019 2020 2021
Total assets of the banking sector (% of GDP) 229.2 217.8 215.4 243.8 235.3
Share (total assets) of the five largest bank (%) 68.8 73.4 74.0 75.3 -
Share (total assets) of domestic credit institutions (%)¹ 50.9 50.3 49.6 50.6 52.0
Financial soundness indicators:¹
- non-performing loans (% of total loans) 2.7 2.3 2.1 2.1 1.6
- capital adequacy ratio (%) 19.0 18.8 18.7 20.3 20.6
- return on equity (%) 8.8 8.2 8.6 5.9 8.9
NFC credit growth (year-on-year % change) 6.4 9.5 7.5 2.0 2.7
HH credit growth (year-on-year % change) 5.2 5.7 7.0 4.7 6.5
Cost-to-income ratio (%)¹ 58.2 61.2 59.5 56.7 54.6
Loan-to-deposit ratio (%)¹ 90.2 93.2 93.4 79.0 77.3
Central bank liquidity as % of liabilities 2.9 2.7 2.2 8.4 8.4
Private sector debt (% of GDP) 187.8 184.6 186.6 192.0 -
Long-term interest rate spread versus Bund (basis points) 40.5 39.8 44.6 36.2 35.9
Market funding ratio (%) 65.4 64.1 63.0 62.7 -
Green bond issuance (bn EUR)² - 10.9 - 1.3 17.5

ANNEX 17: TAXATION
57
This Annex provides an indicator-based
overview of Belgium’s tax system. It includes information on the tax structure, i.e. the types of tax that Belgium derives most revenue from, the tax burden for workers, and the progressivity and redistributive effect of the tax system. It also provides information on tax collection and compliance, and on the risks of aggressive tax planning.
Belgium’s tax revenues are high in relation
to GDP and the tax system relies heavily on
labour taxation. Total tax revenues amount to 43.6% of GDP, compared to 40.1% in the EU on average. Tax revenues have remained broadly stable since 2010, but a series of tax reforms have reduced labour taxation (22.7 % of GDP in 2020, a reduction of 1 percentage point since 2010). Revenue from recurrent property taxes, environmental taxes and consumption taxes is close to the EU average. Revenue from transaction taxes on immovable property are among the highest in the EU.
While recent reforms have reduced the
labour tax burden for those earning a very
low wage, it remains among the highest in
the EU for most wage levels. The ’tax shift’ reform reduced the total tax burden for very low
wage levels in various steps between 2015 and 2018. This is seen in the evolution of the tax wedge for single workers at 50% of the average wage, which decreased from 41.8% in 2010 to 34.6% in 2021 (the tax wedge measures the difference between the wage cost for employers and the net wage for workers). While these reductions are substantial, the total tax burden remains very high for workers earning slightly more, e.g. at 67% of the average wage (both for single earners and for second earners; see Graph A17.1). For workers earning 100% or 167% of the average wage, the tax wedge is the highest in the EU. These high statutory tax rates are coupled with a wide range of deductions and exemptions that make the tax system complex and untransparent. Overall, the ability of the tax and benefit system to reduce income inequality (as measured by its effect on the GINI coefficient) is high.
Belgium is doing moderately well on
digitalising the tax administration, which can
help reduce tax arrears as well as cut
compliance costs. Outstanding tax arrears have increased slightly by 0.3 pps to 15.5% of total net revenue. This is significantly below the EU27 average of 31.8%, though that average is inflated by very large values in a few Member States. The Annual Report on Taxation 2021 highlights room for improvement in the rate of filing tax returns
ANNEX 17: TAXATION
Table A17.1: Taxation indicators
(1) Forward-looking Effective Tax Rate (OECD) (*) EU-27 simple average, as no aggregated EU-27 value For more data on tax revenues as well as the methodology applied see European Commission, Directorate-General for Taxation and Customs Union, Taxation trends in the European Union: data for the EU Member States, Iceland, Norway and United Kingdom: 2021 edition, Publications Office, 2021, https://data.europa.eu/doi/10.2778/843047 and the ‘Data on Taxation’ webpage (data https://ec.europa.eu/taxation_customs/taxation-1/economic-analysis-taxation/data-taxation_en). For more details on VAT GAP see European Commission, Directorate-General for Taxation and Customs Union, “VAT gap in the EU : report 2021”, Publications Office, 2021, https://data.europa.eu/doi/10.2778/30877 Source: European Commission
2010 2018 2019 2020 2021 2010 2018 2019 2020 2021
Total taxes (including compulsory actual social contributions) (% of
GDP)43.6 44.8 43.5 43.6 37.9 40.1 39.9 40.1
Labour taxes (as % of GDP) 23.7 22.2 21.7 22.7 20.0 20.7 20.7 21.5
Consumption taxes (as % of GDP) 10.9 11.0 10.8 10.5 10.8 11.1 11.1 10.8
Capital taxes (as % of GDP) 8.8 11.5 10.8 10.3 7.1 8.2 8.1 7.9
Total property taxes (as % of GDP) 3.1 3.5 3.5 3.5 1.9 2.2 2.2 2.3
Recurrent taxes on immovable property (as % of GDP) 1.3 1.2 1.3 1.3 1.1 1.2 1.2 1.2
Environmental taxes as % of GDP 2.4 2.7 2.6 2.5 2.4 2.4 2.4 2.2
Tax wedge at 50% of Average Wage (Single person) (*) 41.8 34.1 33.1 32.8 34.6 33.9 32.4 32.0 31.5 31.9
Tax wedge at 100% of Average Wage (Single person) (*) 55.9 52.7 52.3 52.2 52.6 41.0 40.2 40.1 39.9 39.7
Corporate Income Tax - Effective Average Tax rates (1) (*) 23.8 23.8 20.3 19.8 19.5 19.3
Difference in GINI coefficient before and after taxes and cash
social transfers (pensions excluded from social transfers)11.0 10.3 12.9 12.4 8.4 7.9 7.4 8.3
Outstanding tax arrears: Total year-end tax debt (including debt
considered not collectable) / total revenue (in %) (*)15.2 15.5 31.9 31.8
VAT Gap (% of VTTL) 11.4 12.3 11.2 10.5
Dividends, Interests and Royalties (paid and received) as a share of
GDP (%)9.6 15.0 9.8 10.7 10.5
FDI flows through SPEs (Special Purpose Entities), % of total FDI
flows (in and out)1.9 6.7 13.6 47.8 46.2 36.7
Tax structure
Progressivity &
fairness
Tax administration &
compliance
Financial Activity
Risk
Belgium EU-27

58
online (European Commission, 2021b). The VAT gap (an indicator of the effectiveness of VAT enforcement and compliance) has remained relatively stable in Belgium at 12.3%, above the EU-wide gap of 10.5%. Furthermore, the average forward-looking effective corporate income tax rate was above the EU average in 2020. After a spike to 15% in 2019, the share of dividends, payments and royalties in Belgium’s GDP decreased to 9.8% in 2020, below the EU average of 10.5%. A disproportionate share of such transfers suggests that companies engage in a country for aggressive tax planning.
Graph A17.1: Tax wedge indicators (%)
(1) The second earner average tax wedge measures how much extra personal income tax plus employee and employer social security contributions (SSCs) the family will have to pay as a result of the second earner entering employment, as a proportion of the second earner’s gross earnings plus the employer SSCs due on the second earner’s income. For a more detailed discussion see OECD (2016), “Taxing Wages 2016”, OECD Publishing, Paris. http://dx.doi.org/10.1787/tax_wages-2016-en (*) EU-27 simple average as there is no aggregated EU-27 value. The tax wedge is defined as the sum of personal income taxes and employee and employer social security contributions net of family allowances, expressed as a percentage of total labour costs (the sum of the gross wage and social security contributions paid by the employer). It is calculated for specific types of tax payers in terms of household composition and income level expressed as % of average wage. Source: European Commission
34.6
46.2
52.658.9
56.9
At 50% of Average Wage(Single person)
At 67% of Average Wage(Single person)
At 100% of Average Wage(Single person)
At 167% of Average Wage(Single person)
For second earner at 67% ofAverage Wage (Two earnercouple, 1st earner 100% of
AW) (1)
BE EU-27 (*)

ANNEX 18: KEY ECONOMIC AND FINANCIAL INDICATORS
59
ANNEX 18: KEY ECONOMIC AND FINANCIAL INDICATORS
Table A18.1: Key economic and financial indicators
(1) NIIP excluding direct investment and portfolio equity shares (2) Domestic banking groups and stand-alone banks, EU and non-EU foreign-controlled subsidiaries and EU and non-EU foreign-controlled branches. Source: Eurostat and ECB as of 2022-05-02, where available; European Commission for forecast figures (Spring forecast 2022)
2004-07 2008-12 2013-18 2019 2020 2021 2022 2023Real GDP (y-o-y) 3.0 0.7 1.5 2.1 -5.7 6.2 2.0 1.8
Potential growth (y-o-y) 2.1 1.4 1.2 1.5 1.3 1.4 1.5 1.6
Private consumption (y-o-y) 1.6 1.5 1.5 1.8 -8.2 6.4 4.2 2.5
Public consumption (y-o-y) 1.4 1.3 0.6 2.0 -0.4 4.4 0.8 0.3
Gross fixed capital formation (y-o-y) 6.0 0.2 2.5 4.4 -6.1 7.8 -0.1 3.0
Exports of goods and services (y-o-y) 5.7 0.8 3.6 2.0 -5.5 9.6 3.3 3.9
Imports of goods and services (y-o-y) 5.9 1.3 3.8 1.6 -5.9 9.1 3.6 4.1
Contribution to GDP growth:Domestic demand (y-o-y) 2.4 1.1 1.5 2.4 -5.8 6.1 2.2 2.0
Inventories (y-o-y) 0.5 0.0 0.1 -0.6 -0.3 -0.5 0.0 0.0
Net exports (y-o-y) 0.2 -0.3 -0.2 0.3 0.4 0.6 -0.2 -0.3
Contribution to potential GDP growth:Total Labour (hours) (y-o-y) 0.6 0.6 0.4 0.5 0.6 0.6 0.7 0.7
Capital accumulation (y-o-y) 0.6 0.5 0.6 0.7 0.5 0.7 0.6 0.6
Total factor productivity (y-o-y) 0.8 0.4 0.2 0.2 0.2 0.2 0.2 0.2
Output gap 1.3 -0.4 0.0 1.5 -5.5 -1.0 -0.5 -0.3
Unemployment rate 8.3 7.7 7.9 5.5 5.8 6.3 5.8 5.6
GDP deflator (y-o-y) 2.0 1.6 1.5 1.8 1.3 4.5 4.5 3.0
Harmonised index of consumer prices (HICP, y-o-y) 2.1 2.5 1.4 1.2 0.4 3.2 7.8 1.9
Nominal compensation per employee (y-o-y) 2.7 2.5 1.3 2.0 -1.5 4.2 6.0 5.5
Labour productivity (real, hours worked, y-o-y) 1.8 0.0 0.7 0.7 3.1 -1.3 -2.0 0.7
Unit labour costs (ULC, whole economy, y-o-y) 0.9 2.6 0.7 1.5 4.4 -0.2 5.0 4.4
Real unit labour costs (y-o-y) -1.1 0.9 -0.7 -0.3 3.1 -4.5 0.4 1.4
Real effective exchange rate (ULC, y-o-y) 0.1 0.3 0.0 -1.6 . . . .
Real effective exchange rate (HICP, y-o-y) 0.3 -0.3 0.9 -1.2 1.2 0.7 . .
Net savings rate of households (net saving as percentage of net disposable
income) 10.7 9.9 5.7 5.6 13.9 . . .
Private credit flow, consolidated (% of GDP) 9.3 11.7 7.6 7.6 1.1 . . .
Private sector debt, consolidated (% of GDP) 125.2 176.2 178.0 186.6 192.1 . . .
of which household debt, consolidated (% of GDP) 44.1 53.0 57.9 60.4 65.6 . . .
of which non-financial corporate debt, consolidated (% of GDP) 81.1 123.2 120.1 126.3 126.5 . . .
Gross non-performing debt (% of total debt instruments and total loans and
advances) (2) 2.6 4.2 3.1 1.8 1.8 . . .
Corporations, net lending (+) or net borrowing (-) (% of GDP) 1.3 1.5 1.6 1.1 3.5 3.2 3.3 3.2
Corporations, gross operating surplus (% of GDP) 24.2 23.6 24.8 26.1 25.9 28.0 27.7 27.0
Households, net lending (+) or net borrowing (-) (% of GDP) 3.6 3.8 1.4 1.0 6.4 3.0 0.7 0.8
Deflated house price index (y-o-y) 6.8 0.8 0.5 2.6 3.6 . . .
Residential investment (% of GDP) 5.9 6.1 5.8 6.1 6.2 6.3 . .
Current account balance (% of GDP), balance of payments 2.3 0.1 0.6 0.2 0.8 -0.4 -2.2 -1.7
Trade balance (% of GDP), balance of payments 2.5 -0.2 0.6 0.7 1.4 0.1 . .
Terms of trade of goods and services (y-o-y) -0.5 -0.6 0.2 0.8 0.5 -0.7 -1.9 0.7
Capital account balance (% of GDP) -0.2 0.0 0.0 0.1 0.0 0.2 . .
Net international investment position (% of GDP) 35.6 49.9 46.3 41.1 44.5 57.0 . .
NENDI - NIIP excluding non-defaultable instruments (% of GDP) (1) . 58.4 48.9 38.8 37.8 36.9 . .
IIP liabilities excluding non-defaultable instruments (% of GDP) (1) . 241.1 194.2 189.4 204.6 198.9 . .
Export performance vs. advanced countries (% change over 5 years) 0.4 -3.2 -6.8 -4.1 11.4 . . .
Export market share, goods and services (y-o-y) -2.5 -3.3 0.1 -0.7 5.6 -0.3 -1.3 -0.4
Net FDI flows (% of GDP) -2.0 -3.0 2.3 -1.0 -0.3 3.3 . .
General government balance (% of GDP) -0.7 -3.9 -2.1 -2.0 -9.0 -5.5 -5.0 -4.4
Structural budget balance (% of GDP) . . -2.4 -3.0 -5.8 -4.6 -4.5 -4.2
General government gross debt (% of GDP) 92.8 100.4 104.1 97.7 112.8 108.2 107.5 107.6
forecast
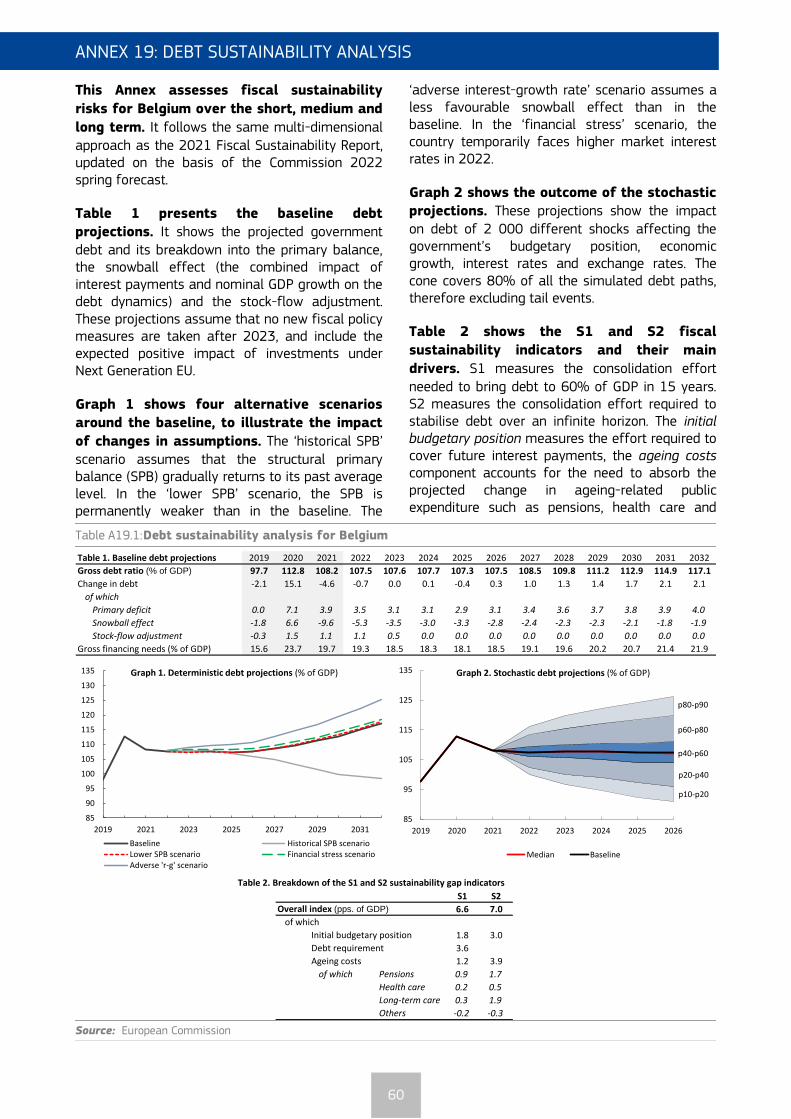
ANNEX 19: DEBT SUSTAINABILITY ANALYSIS
60
This Annex assesses fiscal sustainability
risks for Belgium over the short, medium and
long term. It follows the same multi-dimensional approach as the 2021 Fiscal Sustainability Report, updated on the basis of the Commission 2022 spring forecast.
Table 1 presents the baseline debt
projections. It shows the projected government debt and its breakdown into the primary balance, the snowball effect (the combined impact of interest payments and nominal GDP growth on the debt dynamics) and the stock-flow adjustment. These projections assume that no new fiscal policy measures are taken after 2023, and include the expected positive impact of investments under Next Generation EU.
Graph 1 shows four alternative scenarios around the baseline, to illustrate the impact
of changes in assumptions. The ‘historical SPB’ scenario assumes that the structural primary balance (SPB) gradually returns to its past average level. In the ‘lower SPB’ scenario, the SPB is permanently weaker than in the baseline. The
‘adverse interest-growth rate’ scenario assumes a less favourable snowball effect than in the baseline. In the ‘financial stress’ scenario, the country temporarily faces higher market interest rates in 2022.
Graph 2 shows the outcome of the stochastic projections. These projections show the impact on debt of 2 000 different shocks affecting the government’s budgetary position, economic growth, interest rates and exchange rates. The cone covers 80% of all the simulated debt paths, therefore excluding tail events.
Table 2 shows the S1 and S2 fiscal
sustainability indicators and their main
drivers. S1 measures the consolidation effort needed to bring debt to 60% of GDP in 15 years. S2 measures the consolidation effort required to stabilise debt over an infinite horizon. The initial budgetary position measures the effort required to cover future interest payments, the ageing costs component accounts for the need to absorb the projected change in ageing-related public expenditure such as pensions, health care and
ANNEX 19: DEBT SUSTAINABILITY ANALYSIS
Table A19.1: Debt sustainability analysis for Belgium
Source: European Commission
Table 1. Baseline debt projections 2019 2020 2021 2022 2023 2024 2025 2026 2027 2028 2029 2030 2031 2032
Gross debt ratio (% of GDP) 97.7 112.8 108.2 107.5 107.6 107.7 107.3 107.5 108.5 109.8 111.2 112.9 114.9 117.1
Change in debt -2.1 15.1 -4.6 -0.7 0.0 0.1 -0.4 0.3 1.0 1.3 1.4 1.7 2.1 2.1
of which
Primary deficit 0.0 7.1 3.9 3.5 3.1 3.1 2.9 3.1 3.4 3.6 3.7 3.8 3.9 4.0
Snowball effect -1.8 6.6 -9.6 -5.3 -3.5 -3.0 -3.3 -2.8 -2.4 -2.3 -2.3 -2.1 -1.8 -1.9
Stock-flow adjustment -0.3 1.5 1.1 1.1 0.5 0.0 0.0 0.0 0.0 0.0 0.0 0.0 0.0 0.0
Gross financing needs (% of GDP) 15.6 23.7 19.7 19.3 18.5 18.3 18.1 18.5 19.1 19.6 20.2 20.7 21.4 21.9
S1 S2
Overall index (pps. of GDP) 6.6 7.0
of which
Initial budgetary position 1.8 3.0
Debt requirement 3.6
Ageing costs 1.2 3.9
of which Pensions 0.9 1.7
Health care 0.2 0.5
Long-term care 0.3 1.9
Others -0.2 -0.3
Table 2. Breakdown of the S1 and S2 sustainability gap indicators
85
90
95
100
105
110
115
120
125
130
135
2019 2021 2023 2025 2027 2029 2031
Baseline Historical SPB scenarioLower SPB scenario Financial stress scenarioAdverse 'r-g' scenario
Graph 1. Deterministic debt projections (% of GDP)
p10-p20
p20-p40
p40-p60
p60-p80
p80-p90
85
95
105
115
125
135
2019 2020 2021 2022 2023 2024 2025 2026
Graph 2. Stochastic debt projections (% of GDP)
Median Baseline

61
long-term care, and the debt requirement measures the additional adjustment needed to reach the 60% of GDP debt target.
Finally, the heat map presents the overall
fiscal sustainability risk classification
(Table A19.2). The short-term risk category is based on the S0 indicator, an early-detection indicator of fiscal stress in the upcoming year. The medium-term risk category is derived from the debt sustainability analysis (DSA) and the S1 indicator. The DSA assesses risks to sustainability based on several criteria: the projected debt level in 10 years’ time, the debt trajectory (‘peak year’), the plausibility of fiscal assumptions and room for tighter positions if needed (‘fiscal consolidation space’), the probability of debt not stabilising in the next 5 years and the size of uncertainty. The long-term risk category is based on the S2 indicator and the DSA.
Overall, short-term risks to fiscal
sustainability are low. The Commission’s early-detection indicator (S0) does not signal major short-term fiscal risks (Table A19.2).
Medium-term risks to fiscal sustainability
are high. Both elements of the Commission’s medium-term analysis lead to this conclusion. First, the debt sustainability analysis (DSA) shows that government debt is projected to rise from about 108% of GDP in 2022 to around 117% of GDP in 2032 in the baseline (Table 1). This debt path is also sensitive to possible shocks to fiscal, macroeconomic and financial variables, as illustrated by alternative scenarios and stochastic
simulations, generally pointing to high risks (Tables A19.1 and A19.2). Moreover, the sustainability gap indicator S1 signals that an adjustment of 6.6 pps. of GDP of the structural primary balance would be needed to reduce debt to 60% of GDP in 15 years’ time (Table 2). Overall, the high risk reflects the currently large deficit and high debt, the high sensitivity to adverse shocks and the projected increase in age-related expenditure, in particular for pensions.
Long-term risks to fiscal sustainability are
high. Over the long term, both the sustainability gap indicator S2 (at 7 pps. of GDP) and the DSA point to high risks. The S2 indicator suggests that, to stabilise debt over the long term, it will be necessary to address budgetary pressures stemming from population ageing, especially those related to long-term care and pension expenditure (Table 2).
Table A19.2: Heat map of fiscal sustainability risks for Belgium
(1) Debt level in 2032: green: below 60% of GDP, yellow: between 60% and 90%, red: above 90%. (2) The debt peak year indicates whether debt is projected to increase overall over the next decade. Green: debt peaks early; yellow: peak towards the middle of the projection period; red: late peak. (3) Fiscal consolidation space measures the share of past fiscal positions in the country that were more stringent than the one assumed in the baseline. Green: high value, i.e. the assumed fiscal position is plausible by historical standards and leaves room for corrective measures if needed; yellow: intermediate; red: low. (4) Probability of the debt ratio exceeding in 2026 its 2021 level: green: low probability, yellow: intermediate, red: high (also reflecting the initial debt level). (5) The difference between the 90th and 10th percentiles measures uncertainty, based on the debt distribution under 2000 different shocks. Green, yellow and red cells indicate increasing uncertainty. Source: European Commission (for further details on the Commission’s multi-dimensional approach, see the 2021 Fiscal
Sustainability Report).
BaselineHistorical
SPB
Lower
SPB
Adverse
'r-g'
Financial
stress
Overall HIGH MEDIUM HIGH HIGH HIGH HIGH
Debt level (2032), % GDP 117 98 118 125 119Debt peak year 2032 2021 2032 2032 2032Fiscal consolidation space 96% 84% 96% 96% 96%Probability of debt ratio exceeding in 2026 its 2021 level 47%Difference between 90th and 10th percentiles (pps. GDP) 35
Short term Medium term Long term
Overall (S0)
Overall (S1+DSA)
S1
Debt sustainability analysis (DSA)
S2Overall
(S2+DSA)Overall
HIGH HIGH
Deterministic scenariosStochastic
projections
LOW HIGH HIGH HIGH

REFERENCES
62
REFERENCES

63
Bauer, P., Fedotenkov, I., Genty, A., Hallak, I., Harasztosi, P., Martínez-Turégano D., Nguyen D., Preziosi, N., Rincon-Aznar, A., Sanchez-Martinez, M. (2020), Productivity in Europe – Trends and drivers in a service-based economy. JRC Technical Report. Joint Research Centre. Brussels, Belgium.
Benedetti Fasil, C., Del Rio, J.C., Domnick, C., Fako, P., Flachenecker, F., Gavigan, J., Janiri, M., Stamenov, B. and Testa, G., (2021), High Growth Enterprises in the COVID-19 Crisis Context. Joint Research Centre. Luxembourg.
Capéau, B., Decoster, A., Güner, D., Sheikh Hassan, N., Vanderkelen, J., Vanheukelom, T. en Van Houtven, S. (2022), We are all facing the same storm, but not all are in the same boat. A distributional picture of the purchasing power effects of the 2021-22 energy price shock and compensating measures, Discussion Note - Mimeo.
Central Council of the Economy (2022) Rapport technique du secrétariat 2021. https://www.ccecrb.fgov.be/p/fr/956/rapport-technique-du-secretariat-2021/1
Cornille D., P. Stinglhamber and L. Van Meensel (2017), Public Sector Efficiency in Belgium, National Bank of Belgium, Economic Review, 31-41.
Court of Auditors (2021), Premiers engagements – Réduction groupe cible pour les cotisations patronales àl’ONSS.
Devos C, Cordon A, Lefèvre M, Obyn C, Renard F, Bouckaert N, Gerkens S, Maertens de Noordhout C, Devleesschauwer B, Haelterman M, Léonard C, Meeus P (2019), Performance du système de santé belge – Rapport 2019 – Synthèse. Health Services Research (HSR). Bruxelles: Centre Fédéral d’Expertise des Soins de Santé (KCE). KCE Reports 313B. D/2019/10.273/33.
Dumont, M. (2019), Tax incentives for business R&D in Belgium, third evaluation, Federal Planning Bureau, Working Paper 04-19.
European Commission (2012), Press Releases – Taxation: European Commission asks Belgium to revise its taxation of property income from abroad, 22 March 2012, https://europa.eu/rapid/press-release_IP-12-282_en.htm?locale=en
European Commission (2019), Directorate-General for Mobility and Transport, Handbook on the external costs of transport.
European Commission (2021a), Taxation trends in the European Union: data for the EU Member States, Iceland, Norway and United Kingdom: 2021 edition, https://data.europa.eu/doi/10.2778/843047
European Commission (2021b), Annual Report on Taxation 2021: review of taxation policies in the EU Member States, https://data.europa.eu/doi/10.2778/294944
European Commission (2022), Green Budgeting survey key findings, available at: https://ec.europa.eu/info/business-economy-euro/economic-and-fiscal-policy-coordination/green-budgeting-eu_en.
European Systemic Risk Board (2022), Vulnerabilities in the residential real estate sectors of the EEA countries, https://www.esrb.europa.eu/news/pr/date/2022/html/esrb.pr220211~9393d5e991.en.html.
Godefroid H., S. Van Parys, P. Stinglhamber (2021), What kind of public expenditure is high in Belgium? A comparison with neighbouring countries, National Bank of Belgium, Economic Review.
High Council of Finance (2020), Réduction des prélèvements sur le travail et les possibilités de financement https://www.conseilsuperieurdesfinances.be/sites/default/files/public/publications/csf_fisc_2020_05.pdf
Marx and Horemans (2021), Terug op de sporen. Krijtlijnen voor een sociaal-economische relance. Berichten Centrum voor Sociaal Beleid, Universiteit Antwerpen.
OECD (2020), Addressing labour market challenges in Belgium, Economics Department Working Papers No. 1602, Paris: OECD Publishing.
OECD (2018), How Demanding are Activation Requirements for Jobseekers? New evidence on activity-related eligibility criteria for unemployment and social assistance benefits. OECD paper, Paris
Bauer, P., Fedotenkov, I., Genty, A., Hallak, I., Harasztosi, P., Martínez-Turégano D., Nguyen D., Preziosi, N.,

64
Philiponnet N., Turrini A. (2017), Assessing House Price Developments in the EU, European Economy - Discussion Papers 2015 - 048, Directorate General Economic and Financial Affairs, European Commission.
Schoonackers R. (2020), Tax incentives for R&D: Are they effective?, National Bank of Belgium Economic Review.
Rapport de la Cour des comptes transmis à la Chambre des représentants (2022), Accises sur les produits énergétiques. Exonérations et remboursements, https://www.ccrek.be/FR/Publications/Fiche.html?id=26ba8c94-f977-451b-aef8-44992f303d6b