Belgium - International Trade Union Confederation
23
Belgium SDG MONITORING BY TRADE UNIONS General Information COUNTRY: Belgium UNION: ACV-CSC, ACLVB-CGSLB, ABVV-FGTB DATE COMPLETED: June 2017 BACKGROUND ANALYSIS/COUNTRY CONTEXT: 1. Is your Government working on the Trade Union Priority SDGs? a. If not what are the Goals that are not being tackled by your Government and why have these not been prioritised? Yes. The Belgium government decided to work on all the 17 SDG’s. See website: http://www.sdgs.be/fr 2. To what extent is your Government integrating the SDGs into national plans and in what concrete plans? The implementation of the Agenda 2030 in Belgium falls under the different strategies in relation to sustainable development adopted by the respective levels of power: - At the federal level: the Long-term Vision for Sustainable Development (2013) with 55 long term objectives, 2050 as its horizon and a proposed set of indicators, and the federal sustainable development plans; - Flanders: Vision 2050 - A long-term strategy for Flanders, which constitutes the third Flemish strategy for sustainable development; - Wallonia: the second Walloon strategy for sustainable development; - The Brussels-Capital Region: the regional sustainable development plan; - The German-speaking Community: the second regional development concept.
-
Upload
khangminh22 -
Category
Documents
-
view
2 -
download
0
Transcript of Belgium - International Trade Union Confederation

Belgium
SDG MONITORING BY TRADE UNIONS
General Information COUNTRY: Belgium UNION: ACV-CSC, ACLVB-CGSLB, ABVV-FGTB DATE COMPLETED: June 2017
BACKGROUND ANALYSIS/COUNTRY CONTEXT: 1. Is your Government working on the Trade Union Priority SDGs?
a. If not what are the Goals that are not being tackled by your Government and why have these not been prioritised? Yes. The Belgium government decided to work on all the 17 SDG’s. See website: http://www.sdgs.be/fr 2. To what extent is your Government integrating the SDGs into national plans and in what concrete plans? The implementation of the Agenda 2030 in Belgium falls under the different strategies in relation to sustainable development adopted by the respective levels of power: - At the federal level: the Long-term Vision for Sustainable Development (2013) with 55 long term objectives, 2050 as its horizon and a proposed set of indicators, and the federal sustainable development plans; - Flanders: Vision 2050 - A long-term strategy for Flanders, which constitutes the third Flemish strategy for sustainable development; - Wallonia: the second Walloon strategy for sustainable development; - The Brussels-Capital Region: the regional sustainable development plan; - The German-speaking Community: the second regional development concept.

2
In addition, a first National Sustainable Development Strategy (NSSD) was approved in Spring 2017 after consultation with the stakeholders. (As trade unions, together with civil society, we were consulted through the intervention of the Federal Council for Sustainable development, and gave a not so positive advice on the proposed NSSD. See: http://www.frdo-cfdd.be/fr/publications/advices/avis-sur-le-texte-cadre-strategie-nationale-de-developpement-durable ) It focuses on the implementation of the 2030 Agenda in Belgium and aims to create the basis for a coherent approach to sustainable development policies. It is composed of a comprehensive framework text – with a common vision describing the desired future situation for Belgium translating the SDGs in the Belgian context and a selection of priority themes for which the public authorities will jointly implement concrete actions and where enhanced coordination is particularly necessary since insufficiently ensured through the existing mechanisms of cooperation and consultation. Belgium has also set up an institutional framework to promote transversality and participation. The Inter-Ministerial Conference for Sustainable Development (IMCSD) – composed of federal, regional and community ministers responsible for sustainable development and development cooperation – is the central coordination mechanism for dialogue between the various Agenda 2030 implementing authorities in Belgium. The task of developing the earlier mentioned National Strategy for Sustainable Development was assigned to the IDCSD. 3. Which Ministries and departments are in charge of the integration of the SDGs in your country? At the federal level, a ‘co-piloting’ division of tasks was established between the Prime Minister, the Deputy Prime Minister and Minister for Development Cooperation, the Deputy Prime Minister and Minister of Foreign Affairs and European Affairs, and the Minister of Sustainable Development. The Minister of Sustainable Development will follow the implementation of Agenda 2030 in Belgium, while European and international action will be monitored by the Deputy Prime Minister and Minister for Development Cooperation and Deputy Prime Minister and Minister for Foreign Affairs and European Affairs.

3
ASSESSING IMPLEMENTATION 1. Are there any forms of consultation/dialogue in place with the Government for the implementation of the SDGs in your country? Yes
a. If not, why is this so? b. If so, what is the nature of these consultations/dialogue? b. Yes, but limited to consultation through structures like the Federal Council
for Sustainable development (FRDO-CFDD) (http://www.frdo-cfdd.be/nl), and online consultations like (www.sdgs.be), or work session by, the federal institute for sustainable development (http://fido.belgium.be/nl) or The SHIFT (https://theshift.be/en/inspiration/campaigns-sdg-voices-taking-off)
The 3 Trade Unions have a seat in the Federal Council for Sustainable development (FRDO-CFDD) and can give input in this consultation body. We would like to note that type of advices that we formulate in the FRDO-CFDD normally have to be short and therefore we have little opportunity to workout a in-depth analyses in this consultation process. The last advise (May, 2017) that the members of the Federal Council for Sustainable development (FRDO-CFDD) worked out was concerning the “Avis sur le rapport belge pour la Voluntary National Review 2017”: http://www.frdo-cfdd.be/fr/publications/advices/avis-sur-le-rapport-belge-pour-la-voluntary-national-review-2017
2. Has your union participated in these consultations and/or carried out social dialogue with the Government on issues related to the implementation of the SDGs?
a. What are the key inputs that have been provided by your union on the SDGs in the current period? As trade unions we have an official seat in the Federal Council for Sustainable development, and have been consulted and could give input through a number of “advice papers” Concerning the activities of the The SHIFT (responsible for the Belgium SDG Charter and the “SDG voices”), we have not been properly consulted as an actor in our own right. We have given input to improve the text of the Belgium SDG charter, focusing on importance of social dialogue but this was not taken up by the SHIFT in the Charter text. We would like to mentioned that the government have given a rather big role to The SHIFT (almost outsourcing all “PR” work concerning the SDG’s) to this organisation. The SHIFT has for example elected the Belgium “SDG voices” (https://theshift.be/fr/inspiration/la-campagne-des-sdg-voices-prend-son-envol) without a clear open transparent consultation towards the trade unions. As trade unions we questions this way of working.
b. Have these inputs been taken on board? All the advice papers of the FRDO-CFDD have been given to the relevant Ministers, but we have seen very little on what have been taken on board of the advice by the Minister The Shift did not take our input on board.

4
ASSESSING IMPLEMENTATION 3. How is your government reporting on the SDGs’ implementation at the national level?
a. Do you have access to this information? The Inter-Federal Institute for Statistics takes care of the systematic follow-up of the progress made in achieving the SDGs, and a specific working group has also been set up in its midst to that end. As one of its first tasks, and taking into account the global (UNSC), regional (EUROSTAT and OECD) SDG indicators as well as the first indicators used at national and sub-national levels, the working group has selected two indicators per SDG which, combined with a baseline evaluation, will contribute to an overview of the implementation of Agenda 2030 by Belgium The Belgium government have a website http://www.sdgs.be/fr where some information are published
b. Are the reporting mechanisms adequate? We are still waiting on the first official report outcome, so difficult to answer. 4. Have national plans for the implementation of the SDGs been allocated enough resources for their implementation? We have no clear view on how many resources have been allocated or not.

5
SDG1 End Poverty in All its Forms Everywhere
Target Indicators for Parallel TU monitoring
Data Source/Point
Analysis of Data
General remarks on the SDG 1:
Les organisations syndicales belges suivent de près la thématique de la pauvreté. La lutte « institutionnelle » contre la pauvreté repose sur l’accord de coopération du 5 mai 1998 entre l’Etat fédéral et les entités fédérées relatif à la continuité de la politique en matière de pauvreté. Selon les termes de cet accord, les différentes autorités du pays (fédérales, régionales et communautaires) s’engagent, dans le respect de leurs compétences respectives, « à poursuivre et à coordonner leurs politiques de prévention de la précarité d'existence, de lutte contre la pauvreté et d'intégration des personnes dans la société ».
La Conférence interministérielle de l'Intégration sociale est le seul instrument de coordination des différentes politiques en matière de lutte contre la pauvreté. Bien que l’accord de coopération prévoir que celle-ci se réunisse au moins deux fois par année, force est de constater que la périodicité prévue dans l’Accord n’est pas respecté (dernière conférence interministérielle tenue en 2013). L’accord de coopération de 1998 crée également un Service de lutte contre la Pauvreté, la Précarité et l'Exclusion sociale. Ce Service évalue l'effectivité des droits fondamentaux des personnes qui vivent dans des conditions socio-économiques défavorables. Le Service de lutte contre la pauvreté, la précarité et l’exclusion sociale publie, tous les deux ans, un rapport consacré au rôle des services publics dans la lutte contre la pauvreté. Le dernier (et huitième) rapport bisannuel a été publié en décembre 2015. En vertu de l’article 4, § 2 de l’Accord de coopération du 5 mai 1998, ce rapport est transmis au Conseil national du Travail et au Conseil central de l’Economie, lesquels rendent un avis. La dernière consultation des partenaires sociaux s’est faite à l’été 2016. Au niveau fédéral, un Plan de Lutte contre la Pauvreté, impliquant toutes les administrations fédérales, est adopté sous la coordination du Secrétaire d’Etat ou du Ministre ayant la Lutte contre la Pauvreté dans ses attributions. Le troisième plan fédéral de lutte contre la pauvreté (2016-2019) a été présenté en 2016. La méthodologie adoptée dans l’élaboration de ce plan fédéral, et l’implication/consultation des stakeholders n’a pas été optimale. Les syndicats n’ont pas manqué d’y réagir conjointement. La Plateforme belge contre la pauvreté et l’exclusion sociale UE2020 a été créée en 2010 dans le cadre de la stratégie Europe 2020 (par analogie avec la Plateforme européenne contre la pauvreté et l’exclusion sociale). Il s’agit d’un organe de concertation central pour la préparation et le suivi de la politique belge et européenne dans le domaine de la lutte contre la pauvreté et l’exclusion sociale en vue de la rédaction et du suivi du Plan national de Réforme. Les

6
organisations syndicales sont actives au sein de cette plateforme qui se réunit en principe 4 fois par an. C’est aussi au sein de cette plateforme que les syndicats et autres organisations actives dans la lutte contre la pauvreté se sont exprimés sur le 3ème plan fédéral de lutte contre la pauvreté. Les syndicats belges sont membres fondateurs et actifs au sein de la plateforme de collaboration Decennium Doelen 2017 qui a vu le jour il y a plus de 10 ans. Decennium doel 2017 regroupe 13 organisations (syndicats, associations de lutte contre la pauvreté, mutuelle, etc.) qui unissent leurs forces pour améliorer structurellement les conditions de vie des personnes vivant dans la pauvreté. Depuis quelques années, Decennium Doelen a centré ses activités sur les développements en matière de pauvreté en Flandres. Les organisations syndicales belges font partie du réseau BMIN (Belgian Minimum Income Network) qui regroupe de nombreuses associations de lutte contre la pauvreté, les syndicats, l’IPP Intégration sociale et certains académiciens. Le réseau BMIN interpelle le monde politique et demande l’augmentation de tous les revenus et allocations au-dessus du seuil de pauvreté européen pour la Belgique.
1.1 By 2030, eradicate extreme poverty for all people everywhere, currently measured as people living on less than $1.25 a day
Proportion of population below the international poverty line, by sex, age, employment status and geographical location (urban/rural)
World Bank1
Dans le cadre de la politique européenne, trois indicateurs sont utilisés pour mesurer la pauvreté : le risque de pauvreté sur la base du revenu, la privation matérielle grave et les ménages à très faible intensité de travail. En Belgique, sur base des chiffres tirés de l’enquête EU-SILC 2016:
- 15,5% de la population belge connaissaient un risque de pauvreté sur la base du revenu - 5,5% de la population souffraient de privation matérielle grave - 14,6% de la population belge entre 0-59ans vivaient dans un ménage à très faible
intensité de travail.
http://statbel.fgov.be/fr/modules/publications/statistiques/marche_du_travail_et_conditions_de_vie/indicateurs_silc_de_pauvrete_2004_-_2016.jsp
Le taux de risque de pauvreté de chaque Etat membre de l’UE est calculé chaque année sur base de l’enquête EU-SILC (European Union – Statistics on Income and Living Conditions). L’enquête EU-SILC est organisée pour la Belgique par la Direction générale Statistique - Statistics Belgium qui interroge en moyenne 6000 ménages belges par année. Le taux de risque de pauvreté correspond au pourcentage de personnes qui ont un revenu inférieur au seuil de pauvreté. Le seuil de pauvreté est égal à 60 % du revenu net médian au niveau individuel. La possession d'une habitation n'y est pas prise en compte. Pour SILC 2016, le seuil de pauvreté correspond au calcul suivant : 60% de 22.295 euros par an équivaut pour une personne isolée à un seuil de 13.377 euros par an, soit 1.115 euros par mois. Le seuil de pauvreté d’un ménage composé de deux adultes et de deux enfants est obtenu en multipliant le seuil des personnes isolées par un facteur 2.1 (“2.1” correspond à la somme du
1 World Bank Extreme Poverty Threshold was changed to USD 1.90 in 2015
7
‘poids’ de la valeur 1, attribuée au chef de ménage, de la valeur 0,5 attribuée au deuxième adulte (frais et dépenses partagés) et de la valeur 0,3 par enfant) :
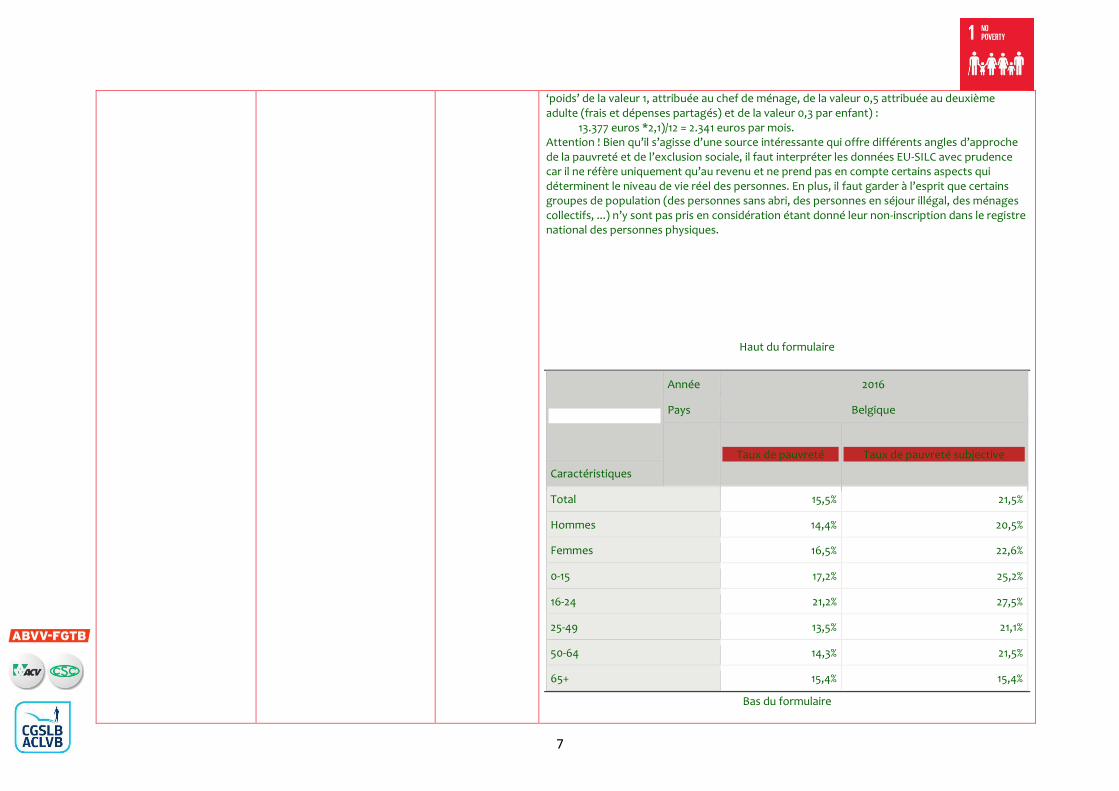
13.377 euros *2,1)/12 = 2.341 euros par mois. Attention ! Bien qu’il s’agisse d’une source intéressante qui offre différents angles d’approche de la pauvreté et de l’exclusion sociale, il faut interpréter les données EU-SILC avec prudence car il ne réfère uniquement qu’au revenu et ne prend pas en compte certains aspects qui déterminent le niveau de vie réel des personnes. En plus, il faut garder à l’esprit que certains groupes de population (des personnes sans abri, des personnes en séjour illégal, des ménages collectifs, ...) n’y sont pas pris en considération étant donné leur non-inscription dans le registre national des personnes physiques.
Haut du formulaire
Année 2016
Pays Belgique
Taux de pauvreté Taux de pauvreté subjective
Caractéristiques
Total 15,5% 21,5%
Hommes 14,4% 20,5%
Femmes 16,5% 22,6%
0-15 17,2% 25,2%
16-24 21,2% 27,5%
25-49 13,5% 21,1%
50-64 14,3% 21,5%
65+ 15,4% 15,4%
Bas du formulaire

8
Le taux de pauvreté subjective indiqué dans le tableau ci-dessus correspond au pourcentage de personnes vivant dans un ménage pour lequel la personne de référence indique avoir des (grandes) difficultés à lier les deux bouts.
Employed persons living below the nationally-defined poverty line by sex and age
OECD (most likely only OECD countries) & ILO and UN Regional Commissions
Haut du formulaire
Le tableau ci-dessous donne un aperçu global de l’évolution du taux de risque de pauvreté selon le sexe et l’âge en Belgique
Année
2011 2012 2013 2014 2015 2016
Pays Belgique Belgique Belgique Belgique Belgique Belgique
Taux de
pauvreté Taux de
pauvreté Taux de
pauvreté Taux de
pauvreté Taux de
pauvreté Taux de
pauvreté Caractéristiques
Total 15,3% 15,3% 15,1% 15,5% 14,9% 15,5%
Hommes 14,6% 14,7% 14,6% 15,0% 14,1% 14,4%
Femmes 16,0% 15,9% 15,5% 15,9% 15,6% 16,5%
0-15 18,5% 17,3% 16,8% 17,9% 17,4% 17,2%
16-24 15,3% 16,5% 17,0% 20,4% 19,5% 21,2%
25-49 13,1% 13,3% 13,8% 14,4% 13,5% 13,5%
50-64 12,1% 12,8% 11,7% 11,8% 12,1% 14,3%
65+ 20,2% 19,4% 18,4% 16,1% 15,2% 15,4%
Bas du formulaire Source : SPF Economie – Statistics Belgium
Il ressort de ce tableau qu’entre 2015 et 2016, le taux de risque de pauvreté a augmenté de 0.6 point de pourcentage et que les femmes restent plus touchées que les hommes de manière générale.
Le taux de risque de pauvreté chez les personnes vivant seule est lui aussi alarmant.Ici encore, les femmes sont plus touchées que les hommes :
Haut du formulaire

9
Année 2016
Pays Belgique
Taux de pauvreté
Caractéristiques
Homme seul de moins de 65 ans 23,6%
Femme seule de moins de 65 ans 26,8%
Homme seul de 65 ans et plus 17,1%
Femme seule de 65 ans et plus 17,3%
Total personne seule 21,8%
Source : SPF Economie – Statistics Belgium
Bien que travailler soit un rempart contre la pauvreté, tout travail ne garantit pas ce même objectif. Selon l’enquête EU-SILC 2016, 4,7 % de travailleurs sont confrontés à un risque de pauvreté (attention ! ces chiffres ne comprennent pas le travail non enregistré, vers lequel se tournent certaines personnes plus vulnérables pour survivre).
Année 2016
Pays Belgique
Taux de pauvreté
Caractéristiques
Travailleur 4,7%
Chômeur 45,9%
Retraité/pensionné 13,3%
Population inactive - autre 32,0%
Source : SPF Economie – Statistics Belgium
Plusieurs facteurs impactent lourdement la qualité de vie des travailleurs actifs :

10
- Le revenu généré par le travail n’est pas suffisant pour répondre aux besoins du ménage (sont donc durement touchés les ménages à un seul revenu ou les familles monoparentales)
- Les jeunes travailleurs et les travailleurs les moins qualifiés sont aussi concernés par un risque de pauvreté accru.
- La précarité de l’emploi ne permet pas aux travailleurs de sortir de la pauvreté (comparés aux chiffres relatifs aux travailleurs sous contrat de travail dit ‘classique’, les scores des personnes ayant un contrat de travail flexible ou de courte durée sont considérablement plus élevés)
- L’inaccessibilité des services sociaux de base (enseignement, logement, garde d’enfants, mobilité, soins de santé…) renforcent le risque de pauvreté.
Les travailleurs sont aussi lourdement impactés par les mesures prises par le gouvernement actuel dont la mesure la plus contestée a été la suspension de l’indexation automatique des salaires.
Percentage of people living in extreme poverty (1.9 USD a day in 2011 purchasing power parities-PPP)
World Bank
D’après les chiffres EU-SILC 2016, 5,5 % de la population souffre de privation matérielle grave. Se trouvent dans une situation de privation matérielle grave les personnes qui ne peuvent acquérir certains biens ou services essentiels pour vivre, dont au moins 4 des éléments suivants :
- payer un loyer ou des factures courantes - chauffer correctement son domicile - faire face à des dépenses imprévues - consommer de la viande, du poisson ou un équivalent de protéines tous les deux jours - s’offrir une semaine de vacances en dehors du domicile - posséder une voiture personnelle - posséder un lave-linge - posséder un téléviseur couleur - posséder un téléphone
Percentage of people living in poverty on 3,1 USD a day
World Bank No information available on the website Belgium’s HDI value for 2015 is 0.896— which put the country in the very high human development category—positioning it at 22 out of 188 countries and territories. Between 1990 and 2015, Belgium’s HDI value increased from 0.805 to 0.896, an increase of 11.2 percent.
http://hdr.undp.org/en/countries/profiles/BEL
UN Human Development Index UN HDI
1.3 Implement nationally appropriate social protection systems and measures for all, including
Proportion of population covered by social protection floors/systems, by sex, distinguishing children,
ILO & OECD
Le modèle de sécurité sociale propre à la Belgique joue un rôle prépondérant dans la lutte contre la pauvreté. Sans transferts sociaux, le taux de risque de pauvreté (pauvreté monétaire) en Belgique concernerait non pas 15,5% de la population, mais 44,2% (EU-SILC 2016) !
11
floors, and by 2030 achieve substantial coverage of the poor and the vulnerable
unemployed persons, older persons, persons with disabilities, pregnant women, new-borns, work-injury victims and the poor and the vulnerable
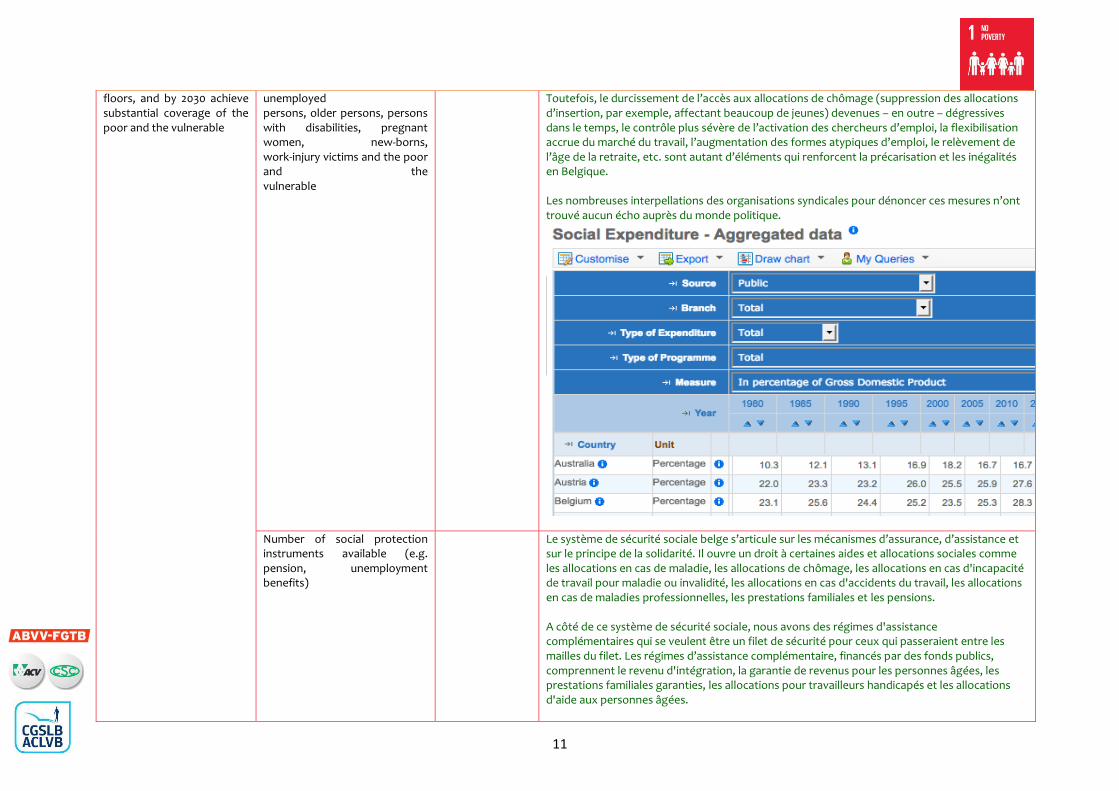
Toutefois, le durcissement de l’accès aux allocations de chômage (suppression des allocations d’insertion, par exemple, affectant beaucoup de jeunes) devenues – en outre – dégressives dans le temps, le contrôle plus sévère de l’activation des chercheurs d’emploi, la flexibilisation accrue du marché du travail, l’augmentation des formes atypiques d’emploi, le relèvement de l’âge de la retraite, etc. sont autant d’éléments qui renforcent la précarisation et les inégalités en Belgique. Les nombreuses interpellations des organisations syndicales pour dénoncer ces mesures n’ont trouvé aucun écho auprès du monde politique.
Number of social protection instruments available (e.g. pension, unemployment benefits)
Le système de sécurité sociale belge s’articule sur les mécanismes d’assurance, d’assistance et sur le principe de la solidarité. Il ouvre un droit à certaines aides et allocations sociales comme les allocations en cas de maladie, les allocations de chômage, les allocations en cas d'incapacité de travail pour maladie ou invalidité, les allocations en cas d'accidents du travail, les allocations en cas de maladies professionnelles, les prestations familiales et les pensions. A côté de ce système de sécurité sociale, nous avons des régimes d'assistance complémentaires qui se veulent être un filet de sécurité pour ceux qui passeraient entre les mailles du filet. Les régimes d’assistance complémentaire, financés par des fonds publics, comprennent le revenu d'intégration, la garantie de revenus pour les personnes âgées, les prestations familiales garanties, les allocations pour travailleurs handicapés et les allocations d'aide aux personnes âgées.

12
1.a Ensure significant mobilization of resources from a variety of sources, including through enhanced development cooperation, in order to provide adequate and predictable means for developing countries, in particular least developed countries, to implement programmes and policies to end poverty in all its dimensions
Proportion of total government spending on essential services (education, health and social protection)
UN Regional Commissions
In terms of investment as a percentage of GDP, hospitals and schools investment reached 0.9% of GDP in Belgium, in France and in the Netherlands, slightly above the percentage in the Euro Area (0.8%) and in Germany (0.7%). The level of investment in public goods attained 0.5% of GDP in Belgium and in Germany, which was below the average of the Euro Area and of the Netherlands (0.7% of GDP) and of France (0.8% of GDP). The redistribution investment reached 0.4% of GDP in Belgium, slightly above the percentage in the Euro Area, in the Netherlands, and in Germany.
http://www.plan.be/admin/uploaded/201701270618330.WP_1701_11411.pdf
Public social protection expenditure as a percent of GDP in function of health care (%)
ILO
Country Expenditure 2005 2006 2007 2008 2009 2010 2011 2012 2013
Belgium Including health care (Coverage) 26,5 26 27,3 29,7 29,7 30,5 30,7
Belgium Excluding health care (Coverage) 18,9 19,8
Spending till 2013 have always slightly gone up.

13
SDG5 Achieve gender equality and empower all women and girls
Target Indicators for Parallel TU monitoring
Data Source/Point Analysis of Data Point
5.4 Recognize and value unpaid care and domestic work through the provision of public services, infrastructure and social protection policies and the promotion of shared responsibility within the household and the family as nationally appropriate
Proportion of time spent on unpaid domestic and care work, by sex, age and location
ILO UN
All women in formal employment are covered by social protection regulation but the level of protection is low or inexisting in case of part time job knowing that: - 41,5% of women work part time (10% for the men) and 80% of all part time workers are women (source: FOD Economie= Belgian Ministry of economy). - The reasons for part-time work in Belgium are: * can’t find a full-time job (10 %) * obligation to provide care for dependant persons (19,5 %) * The position is only proposed as a part-time job (15, 9 %)
Percentage of woman in informal/formal work2
Percentage of woman covered by social protection3
5.5 Ensure women’s full and effective participation and equal opportunities for leadership at all levels of decision-making in political, economic and public life
Proportion of women in managerial positions
ILO
Share of female participation in Education
UN
Gender budgeting UN WOMEN
2 Officially monitored by 8.3.1 but covers non-agricultural employment only 3 Awaiting Official Indicator

14
SDG8 Promote sustained, inclusive and sustainable economic growth, full and productive employment and decent work for all
Target Indicators for Parallel TU monitoring
Data Source/Point
Analysis of Data Point
8.3 Promote development-oriented policies that support productive activities, decent job creation, entrepreneurship, creativity and innovation, and encourage the formalization and growth of micro-, small- and medium-sized enterprises, including through access to financial services
Proportion of informal employment in non-agriculture employment, by sex
ILO
Share of low paid work (share of workers earning less than two thirds of median earnings)
50% earn less than 2.976 € gross (=median) per month In 2014, a worker employed full time earned an average of € 3,414 gross a per month. However, this figure overestimates the real salary range. The median salary is closer to the truth because low salaries are very concentrated while high salaries are much more dispersed.
Share of permanent vs temporary employment
OECD
Share of precarious work
National data
8.5 By 2030, achieve full and productive employment and decent work for all women and men, including for young people and persons with disabilities, and equal pay for work of equal value
Average hourly earnings of female and male employees, by occupation, age and persons with disabilities
FOD (Belgian Ministry of Economy) and own calculation
Hourly wage: € 21,71 Men: € 21,34 Women: € 19,94 What these numbers don’t tell is that the purchasing power of the Belgians has been steadily declining since 2009 and feel back to 2006 level. The evolution of the Belgians purchasing power is lower than the evolution in France and the Netherlands since 1996, while the wage standard and the blocking of salaries with these countries plus Germany. This comparison was used to justify the price index skip and salary freeze. To say we leave “above our mean” is utterly false.
Unemployment rate, by sex, age and persons with disabilities
Eurostat 6,9 % Men: 7,3 % Women: 6,5 % Another way to look at employment: Besides those who are unemployed, there are those who work too much and would like to have more time to balance their work with their private life. There are also those whose work is tough in one way or another, sometimes harmful to health. The Dublin Foundation, in its five years survey, observed a work intensification resulting from increasing demands of productivity, stress, and the pressure linked to the employment situation,…This series of element lead to health problems, burnout musculoskeletal disorders and back pain, depression.

15
ILO Gender Wage Gap
DGSIE, Survey on Wage structure and Distribution, 2016
Since the first “Equal Pay Day”, in other words after over 10 years, the salary gap has been reduced. It has gone down by 8% in 14 years. However, if we continue at this rythm, we will have to wait until 2051 before reaching equal pay.
Underemployment rate (unemployed looking for work and involuntary part time workers)
ILO
8.6 By 2020, substantially reduce the proportion of youth not in employment, education or training
Proportion of youth (aged 15-24 years) not in education, employment or training
This rate is going up since 2012. This young people completely dropped off the radar. No one seems to know what they are up to. According to the commitments taken by Belgium in the context of the Europe 2020 strategy, this rate should drop down to 8,2% in 2020.
8.7 Take immediate and effective measures to eradicate forced labour, end modern slavery and human trafficking and secure the prohibition and elimination of the worst forms of child labour, including recruitment and use of child soldiers, and by 2025 end child labour in all its forms
Proportion and number of children aged 5-17 years engaged in child labour, by sex and age
UNICEF
No data for belgium in the UNICEF report
Percentage of adults in situations of forced labour and number of human trafficking cases

16
8.8 Protect labour rights and promote safe and secure working environments for all workers, including migrant workers, in particular women migrants, and those in precarious employment
Frequency rates of fatal and nonfatal occupational injuries, by sex and migrant status
ILO
Frequency rates of fatal By gender:
Source: http://fedris.be/fr/professionnel/secteur-prive/statistiques/rapport-annuel-statistique
Comment: Number of occupational injuries (covering all types of injuries) have gone down over the last 3 years, but still stays high
Increase in national compliance of labour rights (freedom of association and collective
National data + ITUC Survey
Comment: concerning the right to strike: Restrictions with respect to type of strike strike The most common form of industrial action, a strike is a concerted stoppage of work by employees for a limited period of time. Can assume a wide variety of forms. See general strike, intermittent strike, rotating strike, sit-down strike, sympathy strike, wildcat strike action (e.g. pickets, wild-cat, working to rule, sit-down, go-slow go-slow A form of industrial action whereby the workers deliberately reduce

17
bargaining) based on International Labour Organization (ILO) textual sources and national legislation, by sex and migrant status
their pace of work in order to restrict output. See work-to-rule )The judiciary's intervention in collective disputes is undermining the effective exercise of collective bargaining rights, particularly where bans are made on inherent components of collective action (such as pickets), with the imposition of fines or with a preventive impact before the action has even started. The Unions filled a complaint to the Council of Europe European Social Charter on this, were they ask Belgium to change this, but Belgium still have to comply.
Number of trained labour inspectors as a ratio of workforce
ILO & ILO
We do not have the numbers of the trained labour inspectors but we do have the last year report from the department of social inspection: https://socialsecurity.belgium.be/sites/default/files/rapport-annuel-inspection-sociale-2015-fr.pdf From this year report we can mention that they have a staff of almost 300, from which 190+46 are inspectors.
Ratification of ILO Conventions FOA and CB
ILO & ILO
Belgium have ratified 108 Conventions and 1 Protocol
Fundamental Conventions: 8 of 8
Governance Conventions (Priority): 4 of 4
Technical Conventions: 96 of 177 Out of 108 Conventions and 1 Protocol ratified by Belgium, of which 72 are in force, 34 Conventions have been denounced; none have been ratified in the past 12 months. See: http://www.ilo.org/dyn/normlex/en/f?p=NORMLEXPUB:11200:0::NO::P11200_COUNTRY_ID:102560 Comment:

18
Seen the difficult institution situation in Belgium with the different levels of power, it is not only the federal parliament that have to approve ratification but also the regional authorities and the communities. This means a lot of delay in the decision making process. In this regard the trade unions can mention that the following convention are not yet being ratified by Belgium which concerns us: C131 - Minimum Wage Fixing Convention, 1970 (No. 131) C187 - Promotional Framework for Occupational Safety and Health Convention, 2006 (No. 187) C130 - Medical Care and Sickness Benefits Convention, 1969 (No. 130)
Collective Bargaining Coverage
CB Coverage
Source 2003 2004 2005 2006 2007 2008 2009 2010 2011 2012 2013
Other administrative records and related sources 96 98 98 96 96 96 96 96 96 96 96
Comment: In Belgium we have a fairly favourable legislative context to negotiate collective agreements
Trade Union Density
TU Density Source 2001 2002 2003 2004 2005 2006 2007 2008 2009 2010 2011 2012 2013
Records of workers' organizations 56,3 55,6 54,1 54 53,7 54,8 54,7 54,4 54,9 53,8 55,1 55 55,1
Comment: The Belgium unions have a fairly high trade unions density. Belgium trade unions can also organise all groups of workers, even those on pension, non-active etc.
8.b By 2020, develop and operationalize a global strategy for youth employment and implement the Global Jobs Pact of the International Labour Organization
Existence of a developed and operationalized national strategy for youth employment, as a distinct strategy or as part of a national employment strategy
Survey question4
http://survey.ituc-csi.org/Belgium.html - nothing concreetly mentioned for Belgium www.werk.belgie.be: Report: In the The Belgian National Welfare Strategy at Work 2016-2020 proposed by the Minister of Work: Strategic and operational objectives: This national strategy focuses on the integration of young people, the elderly and the disabled. It is important that young people get insight into the risks at work and learn the right attitudes to deal with these risks and that older workers can continue to work healthy.
4 Some date can be collected as primary data vis-à-vis a yes/no type questionnaire or by referring to the ITUC Trade Union Rights Index/Survey

19
SDG10 Reduce inequality within and among countries Target Indicators for Parallel TU
monitoring Data Source/Point Analysis of Data Point
10.4 Adopt policies, especially fiscal, wage and social protection policies, and progressively achieve greater equality
Labour share of GDP, comprising wages and social protection transfers
ILO Labour share of GDP remained quite steady, fluctuating between 58% (58.4% in 2004 –and 61.8% (2013), ending at 59.6% in 2016. Although the labour share is under light pressure in Belgian as well, Belgian figures look better than those of Southern European or Anglo Saxon countries
Share of top 1% and top 10% income earners in overall GDP
Top 10%: World Bank
Share of top 10% declined from 25.14% in 2004 to 21.96% in 2012
Share of bottom 40% income earners in overall GDP
Bottom 20%: World Bank The income share of the bottom 20% income earners remained steady between 2004 and 2012, evolving from 8.37% to 8.62%. Belgium belongs to a group of better performing countries; however its score is lower than countries like Iceland, the Netherlands or Finland, but also Belarus, Moldova, Kyrgyz Republic and Kazachstan…
Minimum wage as % of the median wages to read
Statutory Minimum Wage information (Requires information from National Level on Median Wage) information on minimum and median wages in UN Regional Commissions Stats
The minimum monthly wage being 1520 euro and the median wage 2976 in 2014, the median wage only is 51.1% of the median wage. (sources: Federal Public Service Economy and ILO) Though inequality figures all by all look quite well in Belgium, the country has a persistent problem of poverty. It is linked to long term unemployment, and hits migrants harder than autochthonous people. Child poverty is rising, especially in single parent families
10.7 Facilitate orderly, safe, regular and responsible migration and mobility of people, including through the implementation of planned and well-managed migration policies
Recruitment cost borne by employee as a proportion of yearly income earned in country of destination
National data
Involvement of social partners in migration policy
Survey question Social partners are not involved in migration policy in Belgium. However, they are represented in the Board of regional labour offices, which provide training for all categories of job searchers
Freedom of association for migrant workers
Survey question All workers active in Belgium are free to join a union of their choice. For workers who have no official right to stay in the Belgian territory, the threshold to join a union nevertheless could be high, although membership of TUs is protected by privacy legislation. Some unions make extra efforts to reach out to migrant workers, especially in the construction sector. In Brussels, one union defends the rights of (sometimes illegal) house personnel
Migrant wages compared to minimum wage
ILO (Mean monthly employment-related income of employed persons by sex, total and migrants
No data available in ILO dataset

20
SDG13 Take urgent action to combat climate change and its impacts
Target Indicators for Parallel TU monitoring
Data Source/Point
Analysis of Data Point
13.2 Integrate climate change measures into national policies, strategies and planning
Number of countries that have communicated the establishment or operationalization of an integrated policy/strategy/plan which increases their ability to adapt to the adverse impacts of climate change, and foster climate resilience and low greenhouse gas emissions development in a manner that does not threaten food production
Survey question
National adaptation plan 2016-2020 - adopted by the National Climate Commission on December 16, 2016 - The Federal Council for sustainable development, together with the regional councils were asked to give an advice on this plan. - The stakeholders were involved in this process. - A common advice was sent to sent to the Minister on the national adaptation plan for Belgium (February 2017)
http://www.frdo-cfdd.be/sites/default/files/content/download/files/2017a01f.pdf
Despite the political agreement of December 2015 between the 4 Ministers in charge of climate (1 Federal – 3 Regional) on, among other goals, the reduction each region would make in its emissions of greenhouse gases; there were no collaboration agreement. Due to this lack of collaborative agreement, the National Climate Commission decided in 2017 to do not develop a national climate plan for the period 2016-2020 but to concentrate itself on the elaboration of an integrated National Energy/Climate Plan as proposed by the European Clean Energy Package. At this moment, Belgium has not yet setup an integrated national plan for climate and energy. At political level, the discussions are on-going but stakeholders were not yet involved.
National and/or sectoral dialogues have been launched engaging social partners on the means to achieve a Just Transition for workers and communities in greenhouse gas-intensive sectors.
Survey question
Trade unions have the possibilities to put climate and energy issues at the agenda of discussion held at various levels
(national/regional/sectoral/entreprises). See : www.a-m.be/uploads/artikels%20mag%204%202014/am_magazine_04_2014_lr_sociaal_overleg_en_milieu_een_overzicht.pdf
Unfortunately, there is no real involvement of trade union what concerns industrial transition. Belgium profiles itself as a country who contributes to the international climate fund (Green Climate Fund) but as trade unions we have to note that the funded that Belgium provides are not ‘additionnal’ fundings as required by the COP 15th in Copenhagen. In the annex of the draft-Voluntary National Report, Belgium has placed attention on 2 indicators from which: we, as Trade Unions, agree with the priority of the indicator 13.2 but do not see the relevance of the emphasis on 13.1.2 since we are not currently confronted in Belgium with huge natural disasters.

21
SDG16 Promote peaceful and inclusive societies for sustainable development, provide access to justice for all and build effective, accountable and inclusive institutions at all levels
Target Indicators for Parallel TU monitoring
Data Source/Point
Analysis of Data Point
General comment There is no evidence that the implementation of the SDG 16 has improved. Especially for 16.3 with regards of unsentenced detainees, the unavailability of data of unsentenced detainees since 2015, show that this is no priority for the Belgian government. Rising costs for legal aid has made access to court more difficult. This policy needs to be reversed. Better data collection by the government is indispensable for a follow up of the SDG 16.
16.3 Promote the rule of law at the national and international levels and ensure equal access to justice for all
Unsentenced detainees as a proportion of overall prison population
Regional Human Rights Commissions In 2014, 31,2 % of the overall prison population was awaiting their trial. (en détention provisioire) There’s no data available after 2014.
Availability of legal aid, existence of labour courts
Survey question / National data Legal aid for citizens with little income is available via a pro deo system. However the existence of separate labour courts has been recently questioned from a purely economic questions, the labour courts exist, function well and are not under immediate threat of abolishment.
Cost and time to settle legal case Survey question / National data The introduction of VAT for lawyers has made legal assistance from lawyers, and hence court access more costly. For labour courts, the time to settle the case is very reasonable in general.
16.10 Ensure public access to information and protect fundamental freedoms, in accordance with national legislation and international agreements
Number of verified cases of killing, kidnapping, enforced disappearance, arbitrary detention and torture of journalists, associated media personnel, trade unionists and human rights advocates in the previous 12 months
ITUC Rights Index ILO Tripartite body evaluations ILO Supervisory system OHCHR Universal Periodic Reviews
None.

22
TRACKING PROGRESS AND RECOMMENDATIONS 1. To what extent has the implementation of the SDGs improved since the previous period and what have been the main policy developments in this respect during the last year? - Difficult to answer this question for now, since we have not received any baseline report to be able to evaluate progress on the SDG’s (first year for Belgium to do the NVR) - For Belgium we can note, in terms of policy development, the approval of the National Strategy for Sustainable Development (NSSD) (https://www.sdgs.be/fr/news/strategie-nationale-de-developpement-durable-sndd-proposee-au-conseil-des-ministres) but seen the advice from the FRDO-CFDD (http://www.frdo-cfdd.be/fr/publications/advices/avis-sur-le-texte-cadre-strategie-nationale-de-developpement-durable) on this NSSD, as under scribe by the 3 trade unions, we are not very pleased with this strategy frame for the reasons as mentioned in the advice note. 2. What would be your recommendation and proposals for national policy and strategy? We ask for:
• Better consultation with the social partner on the SDG’s implementation and follow-up • For now we do not see that Belgium is aiming very high on reaching the SDG’s (Agenda 2030), and we are asking how will Belgium
translate the Agenda 2030 into its own policies and the international consequences of the Belgium policies • We continue to ask for special focus on social dialogue, giving attention to people (working poor) at risk of poverty, element of lifelong
learning… • Demander aux Ministres de se concentrer sur les objectifs transformatifs = ceux qui ont un impact sur la réalisation d’autres objectifs et
qui donc méritent un focus particulier de nos autorités, indépendamment du fait qu’ils progressent en termes statistique ou non. • C’est pourquoi, nous demandons une priorité sur les objectifs 8 (travail décent) et 10 (inégalités). Ce dernier objectif 10 comprend
notamment des indicateurs qui font référence à la protection sociale et à la nécessité de mener des politiques salariales. • Signaler que ce dernier élément cadre d’ailleurs aussi dans la reconnaissance du rôle du secteur privé dans le développement. Via le
dialogue social, le secteur privé peut contribuer à améliorer les revenus. • Signaler que le rôle du dialogue social avec les entreprises du privé est également repris dans l’avis unanime du CFDD et donc demander
que le dialogue social employeurs/syndicats soit donc promu pour réaliser les SDG. » 3. What is your trade union doing in terms of activities/initiatives that could be framed within the SDGs? E.g. campaigns on labour issues, direct involvement in SDG implementation, framing your activities as SDG-related, etc. Participating activily in ECOSOC Commission on Social Development and UNCSW; representing CGIL CISL UIL, italian trade unions in ILO governing body, ITC-ILO and divers comittee; supporting and appruoval of specific labour law agaisnt forced labour and gangmaster system (caporalato); submitting to the italian parliament a new charter for universal labour law (CGIL);

23
TRACKING PROGRESS AND RECOMMENDATIONS 3. What is your trade union doing in terms of activities/initiatives that could be framed within the SDGs? E.g. campaigns on labour issues, direct involvement in SDG implementation, framing your activities as SDG-related, etc. Exemples : The following information was also giving through via the FRDO-CFDD to the Belgium Minister of Sustainble development in a compilation note from all members of the FRDO-CFDD in what actions do we take: - CSI/RSCD : participation à diverses activités qui alimentent les notes politiques de la CSI/RSCD http://www.ituc-csi.org/2030-Agenda en prêtant attention au « Decent Work Watch » et au shadow reporting, https://www.ituc-csi.org/SDG-pamphlet ; - OIT : contribuer à la mise en oeuvre des « Initiatives pour le Centenaire de l’OIT », en prêtant attention à : http://ilo.org/global/about-the-ilo/history/centenary/lang--en/index.htm ; - le plan de mise en oeuvre des SDG de l’OIT http://ilo.org/global/topics/sdg-2030/WCMS_510122/lang--en/index.htm, en veillant à ce que la Belgique : - respecte les normes et conventions de l’OIT (« do no harm, no regress ») ; - mette en oeuvre et respecte les recommandations de l’OIT ; - exploite les mécanismes de contrôle de l’OIT ; - veille à ce que l’OIT obtienne un droit de parole et de participation intégral et permanent au mécanisme d’exécution et de suivi de l’Agenda 2030. - programmes communautaires de coopération au développement 2017-2021 : pour la mise en oeuvre de notre politique « coopération internationale au développement », les 3 syndicats se pencheront, au cours du prochain programme pluriannuel, sur la réalisation des 7 SDG et des 21 objectifs mentionnés ci-dessus ; - Mutual campaigns “Pay rise”, “Trade Union Rights” and the “Social Rights First” from ETUC - National campaign on jobs: “two years left for social justice” (link: https://www.rtbf.be/info/belgique/detail_les-syndicats-lancent-le-grand-bulletin-du-gouvernement-michel?id=960826 and the campaign on Flexi-jobs - cadre stratégique communautaire (CSC) : membre de la plateforme de coordination du travail décent, composée de 9 organisations belges issues de la société civile (Solidarité Socialiste, FOS, Oxfam Solidarité, Wereldsolidariteit-Solidarité Mondiale, IFSI/ISVI [FGTB/ABVV], IIAV/IEOI [ACV-CSC], BIS/MSI [CGSLB-ACLVB], les mutualités chrétiennes [ANMC/LCM] et socialistes [UNMS]. En se concentrant sur les quatre objectifs stratégiques [création d’emploi, droits du travail, protection sociale et dialogue social] de ce CSC, ces 9 organisations belges et leurs organisations partenaires contribuent avec pertinence à la concrétisation de l’Agenda de Développement durable pour 2030 ; - participation et adhésion à la Plateforme Agenda 2030, en collaboration avec 11.11.11/CNCD, avec pour priorité d’apporter sa contribution sur la thématique du travail décent. Comme l’ACV-CSC, la FGTB-ABVV et la CGSLB-ACLVB font partie de la plateforme de la société civile Agenda 2030 – coordonnée par 11.11.11/CNCD -, les syndicats souscrivent aussi aux 10 propositions durables, comme présentées dans la section « ONG pour la coopération au développement » aux autorités belges.


![POUR UNE CONFÉDÉRATION PALESTINIENNE [For a Palestinian Confederation]](https://static.fdokumen.com/doc/165x107/631617cf511772fe4510aa46/pour-une-confederation-palestinienne-for-a-palestinian-confederation.jpg)