Expectancy, Attention, and Time
58
Cognitive Psychology 41, 254–311 (2000) doi:10.1006/cogp.2000.0738, available online at http://www.idealibrary.com on Expectancy, Attention, and Time Ralph Barnes and Mari Riess Jones The Ohio State University Seven experiments examine the influence of contextual timing manipulations on prospective time judgments. Subjects judged durations of standard vs comparison time intervals in the context of a preceding induction (context) sequence. In some experiments, the rate of the induction sequence was systematically manipulated rela- tive to the range of to-be-judged standard time intervals; in others, the induction sequence was omitted. Time judgments were strongly influenced by the rate of an induction sequence with best performance occurring when the standard time interval ended as expected, given context rate. An expectancy profile, in the form of an inverted U, indicated that time estimation accuracy declined systematically as a standard interval differed from a context rate. A similar expectancy profile emerged when the context rate was based on a harmonic subdivision (one-half ) of an ex- pected standard interval. Results are discussed in terms of various stimulus-based models of prospective time judgments, including those which appeal to attentional periodicities and entrainment. 2000 Academic Press The issue of primary interest in this research is the role of stimulus timing properties in controlling attending to auditory sequences. We examine the hypothesis that attention to events, such as speech and music, is controlled, in part, by low-level stimulus-induced expectancies. To evaluate this hypoth- esis we manipulate the timing properties of tone sequences and assess their impact on attending as measured in time judgment tasks. Central to the study of attention is the issue of attentional control. Much recent research on attention relies on visual displays where low-level stimu- lus control of attention has been distinguished from high-level cognitive con- trol of attention. Stimulus-driven attention refers to a transient bottom-up involuntary process. Attentional capture exemplifies this sort of low-level This research was sponsored, in part, by a National Science Foundation grant, BCS- 9809446, awarded to the second author. The authors are indebted to Maya Kennard, Mark Moody, and Scott Newman for assisting in data collection and to Susan Holleran, Jennifer Hoffman, Edward Large, Noah Mackenzie, Devin McAuley, Rosalee Meyer, and Peter Pfor- dresher for helpful comments on earlier versions of this article. Special thanks are extended to Bruno Repp, who offered a great many helpful comments on an earlier version of the article. Address correspondence and reprint requests to Ralph Barnes, Department of Psychology, 142 Townshend Hall, The Ohio State University, Columbus, Ohio 43210. E-mail: barnes. [email protected]. 254 0010-0285/00 $35.00 Copyright 2000 by Academic Press All rights of reproduction in any form reserved.
-
Upload
independent -
Category
Documents
-
view
0 -
download
0
Transcript of Expectancy, Attention, and Time
Cognitive Psychology 41, 254–311 (2000)
doi:10.1006/cogp.2000.0738, available online at http://www.idealibrary.com on
Expectancy, Attention, and Time
Ralph Barnes and Mari Riess Jones
The Ohio State University
Seven experiments examine the influence of contextual timing manipulations onprospective time judgments. Subjects judged durations of standard vs comparisontime intervals in the context of a preceding induction (context) sequence. In someexperiments, the rate of the induction sequence was systematically manipulated rela-tive to the range of to-be-judged standard time intervals; in others, the inductionsequence was omitted. Time judgments were strongly influenced by the rate of aninduction sequence with best performance occurring when the standard time intervalended as expected, given context rate. An expectancy profile, in the form of aninverted U, indicated that time estimation accuracy declined systematically as astandard interval differed from a context rate. A similar expectancy profile emergedwhen the context rate was based on a harmonic subdivision (one-half ) of an ex-pected standard interval. Results are discussed in terms of various stimulus-basedmodels of prospective time judgments, including those which appeal to attentionalperiodicities and entrainment. 2000 Academic Press
The issue of primary interest in this research is the role of stimulus timingproperties in controlling attending to auditory sequences. We examine thehypothesis that attention to events, such as speech and music, is controlled,in part, by low-level stimulus-induced expectancies. To evaluate this hypoth-esis we manipulate the timing properties of tone sequences and assess theirimpact on attending as measured in time judgment tasks.
Central to the study of attention is the issue of attentional control. Muchrecent research on attention relies on visual displays where low-level stimu-lus control of attention has been distinguished from high-level cognitive con-trol of attention. Stimulus-driven attention refers to a transient bottom-upinvoluntary process. Attentional capture exemplifies this sort of low-level
This research was sponsored, in part, by a National Science Foundation grant, BCS-9809446, awarded to the second author. The authors are indebted to Maya Kennard, MarkMoody, and Scott Newman for assisting in data collection and to Susan Holleran, JenniferHoffman, Edward Large, Noah Mackenzie, Devin McAuley, Rosalee Meyer, and Peter Pfor-dresher for helpful comments on earlier versions of this article. Special thanks are extendedto Bruno Repp, who offered a great many helpful comments on an earlier version of the article.
Address correspondence and reprint requests to Ralph Barnes, Department of Psychology,142 Townshend Hall, The Ohio State University, Columbus, Ohio 43210. E-mail: [email protected].
2540010-0285/00 $35.00Copyright 2000 by Academic PressAll rights of reproduction in any form reserved.

ATTENTION AND TIME 255
attentional control because it typically involves an immediate reaction to asalient or sudden and unexpected stimulus change that grabs attention(Egeth & Yantis, 1997; Yantis & Jonides, 1984; Remington, Johnston, &Yantis, 1992; Theeuwes, Kramer, Hahn, & Irwin, 1998 ). High-level cogni-tive control of attention has been associated with voluntary top-down pro-cesses that guide attending toward a goal over the long term. For instance,instructions such as ‘‘Search for a red target letter’’ in a large spatial arraypresumably induce a conscious goal-oriented cognitive guidance. More gen-erally, knowledge-based expectancies may also engage high-level controlprocesses (e.g., DeWitt & Samuel, 1990).
Distinctions between top-down and bottom-up properties of attentionalcontrol are compelling. Nevertheless, disagreements persist over the degreeto which attentional allocation in visual displays is purely stimulus-driven(e.g., Theeuwes, 1991; Theeuwes et al., 1998 ), modulated by stimulus prop-erties on a contingent basis via a top-down mechanism (Folk & Remington,1998), or dependent on particular stimulus properties, such as sudden onsets(e.g., Jonides & Yantis, 1988). For instance, even in search tasks where itseems plausible that viewers voluntarily guide attending from one spatiallocation in a display layout to another, some argue that stimulus salienceinfluences attentional allocation to certain spatial regions within a display,thus contributing to a search-guidance strategy (e.g., Theeuwes, 1992;Wolfe, 1994). However, a larger issue concerns the generalizability of find-ings about attentional control drawn from these tasks to situations that donot involve either static displays or visual items. For instance, in dynamicdisplays where items appear successively (e.g., sequences of letters, tones,words, and digits), a temporal rather than a spatial layouts exist. Are temporalfeatures and relations analogous to visual ones in the constraints they placeon focal attending in the latter situations? This is not clear. In sequentialdisplays, instead of voluntarily shifting attending in space, people must‘‘search’’ a temporal sequence, allocating more or less focal attending toelements that appear briefly at particular locations in time. In this case, ex-pectancy may not be a wholly voluntary control process. One possibility isthat temporal aspects of such tasks affect focal attending much as spatialfeatures contribute to guidance in visual search tasks. If so, this implies thatattentional control can be influenced by time relationships among stimuluselements. In the present research, we use auditory sequences to pursue thepossibility that sequence time structure controls attending. Indeed, we con-sider the hypothesis that this type of attentional control involves the inductionof low-level involuntary temporal expectancies.
Expectancy and Attention
We claim that in responding to dynamic environments, stimulus-drivenexpectancies related to the temporal layout of a to-be-attended event canaffect attending. In the context of more familiar definitions of expectancy

256 BARNES AND RIESS JONES
that draw heavily upon prior knowledge this claim may seem unusual. Toprovide a context for it, we refer to the insightful analysis of Kahneman andTversky (1982), who challenge a common view of expectancy: ‘‘. . . rulesthat govern perceptual expectancies differ from rules of probability theory’’(p. 148). They distinguish between active, conscious, expectancies and pas-sive, unconscious ones (where active and passive correspond respectivelyto voluntary and involuntary control). Both kinds of expectancies can betemporary, influenced by local context; however, passive expectancies mayalso be more permanent, ingrained through long-term exposure to certainevents. In addition to the voluntary top-down expectancies of visual search,Kahneman and Tversky admit an involuntary, bottom-up form of expec-tancy. The latter, they argue, can operate effortlessly to mediate various con-text effects that are observed in responding to event sequences. These distinc-tions set the stage for identifying two common approaches to isolatingdeterminants of expectancies.
One common approach to expectancy retains strong ties to probabilitytheory. In uncertain situations, people may be faster and/or more accurate inresponding to highly probable elements than to rare ones. This probabilisticapproach to expectancy has been fruitfully applied in judgment and decision-making tasks involving risk and/or uncertainty (e.g., Clemen, 1996; Kahne-man & Tversky, 1982). It has also influenced studies on attention to eventsequences. Thus, in auditory sequences, highly probable pitches are deemedexpected (e.g., Greenberg & Larkin, 1968). Similarly, oddball paradigmsoften rely on probabilistic determinants of expectancy in extended temporalsequences (Friedman, Makerem, Sutton, & Fleiss, 1973; Tueting, Sutton, &Zubin, 1971 ). In the latter, a causal connection between a frequently oc-curring element and an automatic expectancy is inferred from ERP findingsof a P300 response (i.e., a ‘‘surprise’’ reaction) to improbable (unexpected)elements. In these venues, expectancy is usually defined statistically in termsof the relative frequency of one value of a random variable within a probabil-ity distribution of prior occurrences of that variable; most commonly it is avalue corresponding to the distribution’s central tendency, i.e., it is a long-term average, a mode or mean. The widespread use of expected value, EV,as a measure of expectancy exemplifies this view. We refer to this approachto expectancy, which emphasizes long-term relative frequency of a randomvariable, as the statistical approach to expectancy. A strictly statistical ap-proach to temporal sequences of elements implies that local (short-term) se-rial context is less critical than global (long term) probabilities in determiningwhat is expected. Unless instructions communicate a different goal, this ap-proach implies that involuntary, but relatively long-lasting, expectancies areacquired probabilistically: One expects what is most probable.
The second approach to expectancy is less directly connected to long-termprobabilistic assessments of events and more concerned with the impact oflocal context. Two different ways of manipulating expectancies through local

ATTENTION AND TIME 257
context exist. One involves experimental cuing. This strategy retains an em-phasis on probabilistic interpretations of expectancy but focuses on the localcontext in that preliminary information orients an individual for an forthcom-ing target stimulus by virtue of reducing uncertainty (i.e., increasing validity)about the occurrence of a target in the near future. Thus, Posner (1980) wasable to cue people to expect a target occurrence at a given spatial locationif they had learned that the cue was a valid predictor of target location. Thisprobabilistic association of cues with near-future signal occurrences (i.e., cuevalidity manipulations) appears in both auditory (Johnson & Hafter, 1980;Hafter & Schlauch, 1991; Leek, 1987; Ward & Mori, 1996) and visual(Downing, 1988; Posner, 1980; Shulman et al., 1979) designs as well as inones using ERPs and the P300 (Gratton, Coles, & Donchin, 1992; Johnson &Donchin, 1982; Matt, Leuthold, & Sommer, 1992). Effectively, in cue valid-ity designs the main manipulation involves first-order conditional probabili-ties of sequential elements, such as cue and target, to connect attention withexpectancy. The role of immediate cuing and conditional probabilities inreducing effects of long-term uncertainty moved Kahneman and Tversky(1982) to identify these manipulations with a voluntary, conscious, but short-term type of expectancy, one that has determinants in a local context. Thegambler’s fallacy is a good example of the latter: one ’s expectancy for animprobable event changes as a function of local serial context (Derks, 1963;Jarvik, 1951). As more instances of a highly probable event are encountered,people begin to expect that a less probable event is ‘‘due.’’ Even within aseries of independent coin tosses, the local context motivates people to antici-pate a head as more tails are experienced. Clearly, this is contrary to thestatistical view of expectancy that it is shaped by long-term probability distri-butions. Furthermore, in sequential presentations people respond not only tolocal contingencies among elements but also to certain salient probabilisticpatterns (e.g., alternations and runs), even within putatively random se-quences (Jones, 1971, 1988).
The second means of manipulating expectancy through local context re-duces emphasis on probabilistic cuing, placing greater emphasis, instead, onpattern relationships. Pattern-based approaches to expectancy go beyond lo-cal cues and first-order conditional probabilities to view contextual informa-tion in terms of relationships among features or elements. For instance, inauditory sequences, deterministic arrangements of particular pitches (e.g.,ascending verus descending pitch sequences) may contribute to the guidanceof attending (Boltz et. al., 1981; Howard, O’Toole, Parasuraman, & Bennet,1984; 1986; Spiegel & Watson, 1981; see Leek, 1987). In fact, some expec-tancy theories link effects of serial pattern constraints on performance di-rectly to expectancies (Garner, 1974; Jones, 1974; Narmour, 1992; Restle,1970; Simon & Kotovsky, 1963). A digit sequence such as: 1-2-3-2-3- Xtends to evoke the expectancy that X will be ‘‘4,’’ although prior exposureto ‘‘4’’ is nil (for reviews see Jones, 1974, 1978, 1981). In this article, we

258 BARNES AND RIESS JONES
distinguish statistical approaches to expectancy from pattern-based ones.Traditionally pattern-based expectancy theories provide a role for local stim-ulus relationships, but these relationships are not temporal ones.
Given our distinction between statistical and pattern-based approaches, itis tempting to argue that long-term impact of probabilistic information sup-ports unconscious expectancies, whereas exposure to patterned sequencesdetermines a temporary, conscious, expectancy. If so, then a lengthy se-quence of As and Bs containing an embedded pattern such as AAAAB mightprovoke a conscious expectation of four As then a B (as in the gambler’sfallacy) as well as a conflicting, unconscious one that the more probableelement, A, will continue after the fourth A (as in an expected value). Al-though evidence for such conflicts exists, the problem is not simple (Kahne-man & Tversky, 1982; Sommer et al., 1990 ). Other evidence suggests thatpeople also unconsciously respond to patterned information that is eitherprovided over the long term or from a local context (e.g., Reber, 1989; Kah-neman & Tversky, 1982). A different approach to this puzzle eschews theknotty issue of consciousness by linking both short- and long-term expectan-cies directly to the time structure of to-be-attended events. Thus, the timespan of AAAAB is necessarily longer than that associated with adjacentoccurrences of A. If two expectancies are based on respectively differenttime periods, then they may simultaneously conflict or converge (see alsoNarmour, 1992, for examples of these kinds of expectancy conflicts in mu-sic). This analysis encourages a search for temporal correlates of expectan-cies.
Neither the statistical nor the pattern-based view explicitly acknowledgestemporal correlates of expectancies. However, in both expectancy involvesan anticipation of the ‘‘what’’ of a future event (e.g., a red ‘‘F,’’ a ‘‘4,’’or a low pitched tone). Anticipation tacitly implies a future orientation; itunderscores that expectancy is an inherently temporal construct involvingthe future, whether an immediate (short-term) future or a more remote (long-term) future. Although expectancy implies a predisposition to perceive orrespond at some future time, its temporal correlates do not figure in mosttheories.
The present research suggests a third way to view expectancy. It buildsupon the pattern-based view of expectancy, but expresses a more dynamicinterpretation of expectancy by explicitly connecting it to stimulus time rela-tionships within a pattern context. By stimulus time relationships we meanthe rate and rhythm created by elements comprising a sequence, i.e., thepattern’s temporal layout. We claim that people tacitly rely on these relation-ships to anticipate the ‘‘when’’ as well as the ‘‘what’’ of future elements(Jones, 1976). Time relationships have been shown to affect an individual’smonitoring of sequence elements (pitch, duration, and other features) (Boltz,1989; Boltz, Jones, & Kidd, 1981; Cutler, 1976; Dowling, Lung, & Herrbold,1987; Jones, Boltz, & Klein, 1993; Klein & Jones, 1996; Martin, 1972;
ATTENTION AND TIME 259
Shields, McHugh, & Martin, 1974; Skelly, Jones, Goodyear, & Roe, 1999;Wright & Dai, 1994). Much of this research is consistent with the generalidea that expectancy involves anticipations about ‘‘when’’ something willoccur in the future; furthermore, some experiments indicate that these tempo-ral anticipations can affect judgments about ‘‘what’’ is expected. It is possi-ble that when sequences of elements are involved, the time relationshipsamong successive elements contribute to a dynamic pattern-based control offocal attending which features temporal anticipations about future elements(Jones, 1976; Jones & Boltz, 1989; Martin, 1972). In sum, bottom-up expec-tancies may exist that are determined by pattern relationships, including timerelationships, with a local context. In the next section, we flesh out this thirdapproach to expectancy found in a dynamic attending approach.
Expectancy, Attention, and the Role of Stimulus Timing on TimeJudgments
Against the broad framework just outlined, the present research considershow attention and expectancy figure in a task that requires judgments abouttime intervals within local pattern contexts. Time judgments have long beenused to study focal attending, often motivated by an attentional resourceperspective (Michon & Jackson, 1985; Thomas & Weaver, 1975; Woodrow,1951; Zakay, 1989). Here we enlist a different perspective in which we usetime judgments to assess the influence of temporal pattern relationships onattending and expectancies that are tied to attending. It can be argued thatif stimulus timing does affect attention, then minimally we should expect tosee its influence on people’s judgments about time itself. Furthermore, ifexpectancies have temporal correlates, then the first step in revealing thesecorrelates involves testing for effects of temporal context on people’s expec-tancies about the ‘‘when’’ of future pattern elements. Therefore, in this re-search, we begin by asking whether a preceding temporal context affectsfuture time judgments. Listeners compare standard and comparison time in-tervals, where the tone ending a standard time interval is either expected orunexpected, given stimulus time relationships within a local pattern context.
Experimentally we consider two types of models that provide links be-tween time judgments and attention. In the General Discussion we return tosome implications of our experiments for resource theories of attention. Themodels of immediate interest derive, respectively, from statistical ap-proaches and dynamic attending theories. Both approaches address prospec-tive time judgments, where people know in advance that they will be judgingtime intervals. The prospective time judgment task is shown in Fig. 1. Listen-ers are exposed to a stimulus context that comprises an induction sequenceof brief tones; each tone marks an interonset- time- interval, or IOI. The IOIimmediately following induction IOIs is designated as the standard timeinterval. A comparison time interval is presented after a delay and peoplejudge its duration relative to the standard. In most of our tasks, listeners are

260 BARNES AND RIESS JONES
FIG. 1. Stimulus sequence used in Experiment 1. Interonset intervals (IOIs) precedingthe standard (induction or context sequence) were 600 ms and duration of standard (T ) andcomparison IOIs (T 6 ∆t) varied from trial to trial.
told to concentrate on the standard and comparison pair of time intervalsand report whether the comparison is shorter, the same, or longer than thestandard. Over a number of experiments we manipulate timing properties ofthe induction pattern and the standard IOI in order to render the latter moreor less expected. One goal is to assess effects of these manipulations onattention and expectancy relative to the standard time interval.
Statistical theories of expectancy, as already indicated, link attentionalcontrol and expectancy to the relative frequency of an item in some probabil-ity distribution. Unlike resource theory, they offer a means of describing theimpact of stimulus timing on attention and expectancy, assuming that thestimulus items of interest are time intervals provided by a task environment.Although they differ in details, all statistical models emphasize the follow-ing: (1) the random variable of interest (time interval) involves an intervalscaled metric; (2) frequency distributions of this random variable are associ-ated with some long or short-term stimulus context; and (3) summary statis-tics of a frequency distribution, such as central tendency and dispersion,determine the nature and strength of expectancies.
A number of models of temporal context have relied on statistical assump-tions to describe the impact of a distribution of context durations on timejudgments. Indeed, some of the oldest approaches to time estimation wereconcerned with statistical properties of session context on time estimates anddeterminants of the temporal indifference interval (Vierordt, 1868; Wood-row, 1985; for reviews see Allan, 1979; Hellstrom, 1985). In these tasks,people’s responses to a randomly presented set of durations within a sessionproduce systematic over- and underestimations of the standard time interval(and/or the comparison), but these errors in many cases are reduced nearthe central tendency of presented IOIs. Explanations often engaged statistical

ATTENTION AND TIME 261
determinants of a long-term memory trace based on the average of encoun-tered durations, where the trace, functioning as an internal standard, deter-mined the indifference interval (Michels & Helson, 1954; Hellstrom, 1977;1985). Recently, echoes of these ideas are found in different statistical mod-els that address local context effects on time and tempo discrimination per-formance (Drake & Botte, 1993; Ivry & Hazeltine, 1995; Ivry & Pokorny,1989; Keele, Nicoletti, & Sorkin, 1982; Sorkin & Montgomery, 1991). Themost successful of these assume that the mean of independent, interval-scaled, IOIs, from the IOI distribution provided by a local stimulus context(including the standard IOI), determines an expected value for the internalstandard. Again, the internal standard is a stored time interval that determinesan expectancy or memory trace, which is used to judge the comparison inter-val. Note that the statistical rationale is found not only in expectancy ap-proaches but also in memory models that equate a memory trace with theexpected value of a distribution of time intervals. Predictions from a statisti-cal account of a temporal memory trace are indistinguishable from thosebased on a statistical account of an expectancy time interval. Similarly, thestrength of an expectancy (or memory trace) is often associated with statisti-cal uncertainty, which can be indexed by IOI variability within a sequence.For instance, greater variability leads to a weak memory trace producing, inturn, poor performance in prospective time judgments. Thus, given the taskdepicted in Fig. 1, where the context sequence is isochronous, a statisticalanalysis predicts that best performance in judging a comparison will occurwhen values of a standard interval (T) are close, on an interval measurementscale, to the mean of context IOIs.
Dynamic attending models represent a new approach to attention in timejudgment tasks (Large, 1994; Large & Kolen, 1995; Large & Jones, 1999,McAuley, 1995). These different computational models have in commonwith statistical theories a focus on the importance of stimulus timing andtask constraints in determining time judgment performance. However, theyplace greater emphasis on stimulus time relationships as determinants of real-time attending and expectancies. Thus, moment-to-moment attending toevents such as speech and music is controlled, in part, by their relationalproperties, e.g., rate and rhythm. Successive IOIs are assumed to engageinternal attending rhythms which, in turn, direct attending (Jones, 1976).Attending rhythms are instantiated as oscillators capable of entraining, i.e.,‘‘locking into’’ the ongoing time structure. Essentially, dynamic attendingmodels present an entrainment approach to attention and expectancy (butsee Desain, 1992 for a nonentrainment, view). These models share the fol-lowing: (1) enlistment of one or more underlying periodicities (oscillators)that define a relevant time metric on a ratio scale, e.g., 1 :1, 1:2; (2) relianceon stimulus properties, such as relational dependencies among successivecontext IOIs, as a source of low-level attentional control; and (3) assumptions

262 BARNES AND RIESS JONES
FIG. 2. Example of an entrainment model (Large & Jones, 1999). (a) An attending rhythmcomprises a limit cycle oscillation and an attentional energy pulse. An expected point intime corresponds to the peak of the attentional pulse carried by the oscillator. (b) An attendingrhythm entraining to an isochronous induction sequence; this shows that period and phase ofan oscillator change as the oscillator adapts to stimulus time structure. Period is the time spanbetween peaks of successive attentional pulses; phase is a disparity (positive or negative)between a tone onset and an attentional pulse peak. As period and phase adapt, the attentionalpulse narrows.
that momentary attending, based on internal oscillations, is adaptive, en-abling more or less synchronous attentional tracking of both regular andirregular temporal sequences.
Figure 2a presents a schematic of the basic components of a hypotheticalattending rhythm. Large (1994) proposed that such a rhythm comprises anonlinear (limit cycle) oscillator and a symmetrical attentional energy pulse.1
When exposed to a series of tones, the oscillator component responds adap-tively by locking into time spans between successive elements (i.e., IOIs
1 Others (Reeves & Sperling, 1986) suggest that such a pulse may not be symmetrical; weplan to examine the issue of attentional asymmetry in future experiments. An asymmetricalattentional pulse can explain, for instance, slight asymmetries observed in certain expectancyprofiles (e.g., Experiment 3).
ATTENTION AND TIME 263
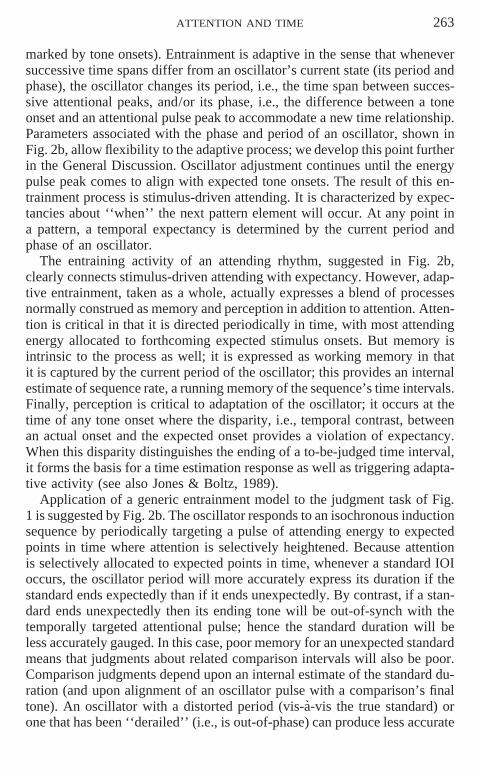
marked by tone onsets). Entrainment is adaptive in the sense that wheneversuccessive time spans differ from an oscillator’s current state (its period andphase), the oscillator changes its period, i.e., the time span between succes-sive attentional peaks, and/or its phase, i.e., the difference between a toneonset and an attentional pulse peak to accommodate a new time relationship.Parameters associated with the phase and period of an oscillator, shown inFig. 2b, allow flexibility to the adaptive process; we develop this point furtherin the General Discussion. Oscillator adjustment continues until the energypulse peak comes to align with expected tone onsets. The result of this en-trainment process is stimulus-driven attending. It is characterized by expec-tancies about ‘‘when’’ the next pattern element will occur. At any point ina pattern, a temporal expectancy is determined by the current period andphase of an oscillator.
The entraining activity of an attending rhythm, suggested in Fig. 2b,clearly connects stimulus-driven attending with expectancy. However, adap-tive entrainment, taken as a whole, actually expresses a blend of processesnormally construed as memory and perception in addition to attention. Atten-tion is critical in that it is directed periodically in time, with most attendingenergy allocated to forthcoming expected stimulus onsets. But memory isintrinsic to the process as well; it is expressed as working memory in thatit is captured by the current period of the oscillator; this provides an internalestimate of sequence rate, a running memory of the sequence’s time intervals.Finally, perception is critical to adaptation of the oscillator; it occurs at thetime of any tone onset where the disparity, i.e., temporal contrast, betweenan actual onset and the expected onset provides a violation of expectancy.When this disparity distinguishes the ending of a to-be-judged time interval,it forms the basis for a time estimation response as well as triggering adapta-tive activity (see also Jones & Boltz, 1989).
Application of a generic entrainment model to the judgment task of Fig.1 is suggested by Fig. 2b. The oscillator responds to an isochronous inductionsequence by periodically targeting a pulse of attending energy to expectedpoints in time where attention is selectively heightened. Because attentionis selectively allocated to expected points in time, whenever a standard IOIoccurs, the oscillator period will more accurately express its duration if thestandard ends expectedly than if it ends unexpectedly. By contrast, if a stan-dard ends unexpectedly then its ending tone will be out-of-synch with thetemporally targeted attentional pulse; hence the standard duration will beless accurately gauged. In this case, poor memory for an unexpected standardmeans that judgments about related comparison intervals will also be poor.Comparison judgments depend upon an internal estimate of the standard du-ration (and upon alignment of an oscillator pulse with a comparison’s finaltone). An oscillator with a distorted period (vis-a-vis the true standard) orone that has been ‘‘derailed’’ (i.e., is out-of-phase) can produce less accurate

264 BARNES AND RIESS JONES
time estimates. Specific predictions about time judgments rest on magnitudeand direction of the estimated time difference between the expected time fora comparison (supplied by the oscillator) and its observed time (supplied bythe comparison) (Jones & Boltz, 1989; see Large & Jones, 1999, for modeldetails).2 In short, in this view an expectancy about ‘‘when’’ a standard willend is influenced by local stimulus context, in particular by the rate andrhythm of preceding IOIs.
This and related entrainment models (e.g., McAuley, 1995) receive sup-port from recent findings using tasks similar to that of Fig. 1 (Large & Jones,1999; McAuley & Kidd, 1998; McAuley & Jones, 1998 ). Large and Jonespresented listeners with an isochronous (monotone) induction sequence fol-lowed by a standard IOI that was either identical to preceding IOIs, henceexpected, or dissimilar in that it ended unexpectedly. As predicted, people’stime judgments were most accurate when the standard ended at the expectedtime and worst when it ended very unexpectedly. Mean PC (proportion cor-rect) values for categorical time judgments, shown in Fig. 3a (averaged overthree response categories of Short, Same, and Long), indicate that as a stan-dard time interval deviates from the context IOI, it is judged less accurately.We refer to the profile of accuracy scores over different values of a standardIOI as an observed expectancy profile. The Large and Jones model predictsan expectancy profile for this task which is an inverted U; the flattened peakof the U is centered at the expected time interval as shown in Fig. 3b. Thesepredictions conform nicely to the observed profile in Fig. 3a.
Dynamic attending models imply that the influence of context on perfor-mance is evident in both perceptual bias and in sensitivity. Perceptual biasrefers to the influence of an expected point in time, whereas sensitivity refersto one’s ability to pick up a difference. To the extent that one’s expectancycoincides with the standard’s ending in the present task, listeners should bebest equipped to pick up differences of both longer and shorter. Shifts inexpectancy, however, can bias people to judge certain comparison IOIs thatare really the same as the standard to be longer or shorter. We report primar-ily accuracy scores in the subsequent experiments, but we also consider con-fusion matrices and various sensitivity measures (Ag, d′), all of which corre-late highly with our primary measure of proportion correct, PC.
To sum up, we consider two primary approaches to prospective time judg-ments: statistical and dynamic attending theories. Statistical and dynamicattending approaches both directly address timing constraints associated withstimulus contexts shown in Fig. 1. Indeed, for certain isochronous context
2 Different computational models may make slightly different predictions depending on taskassumptions and parameter estimates. For detailed analyses of these models the reader shouldconsult publications cited in this section. The main purpose of the present research was toabstract common features of different entrainment models to evaluate them in a context devoidof computational idiosyncrasies of individual models.

ATTENTION AND TIME 265
FIG. 3. (a) Mean PC scores (averaged over three response categories) as a function ofvalues of a standard IOI (see Fig. 1) reported by Large and Jones (1999). (b) Predictions ofan entrainment model (Large and Jones, 1999) for the data of a.

266 BARNES AND RIESS JONES
patterns, the latter two theories make similar predictions, namely that bestperformance is predicted for that standard interval that is equivalent in valueto the context IOI. However, we present other experimental contexts in whichthese two approaches make different predictions.
The present set of experiments is designed to consider in detail the influ-ence of serial context on time judgments in ways that shed light on theseapproaches. We manipulate timing properties of both the standard stimulusand the induction pattern in order to render the standard IOI more or lessexpected on the basis of the preceding stimulus pattern. Our strategy is two-fold. First, we aim to verify that context timing has a systematic impact ontime judgments. Therefore, all experiments we report involve manipulationsof standard time durations, presented relative to a preestablished context.This manipulation allows us to verify what we have called the expectancyprofile (e.g., Fig. 3). Second, we manipulate temporal properties of the serialcontext with the aim of observing changes in the expectancy profile thatresult from variations in the rate of the induction sequence.
Experimental Overview
We preview several groups of experiments in the forthcoming set. Thefirst three experiments all engage isochronous induction patterns of variousrates; the next three experiments all compare expectancy profiles gained withisochronous contexts with those arising from judgments of standard/compar-ison pairs preceded by no serial context. The final experiment examines ef-fects of task constraints.
Large and Jones (1999) first reported the expectancy profile of Fig. 3; inthis report, our initial experiment is designed to replicate these findings bymanipulating the duration of a standard time interval while holding constantthe rate of an isochronous context sequence. The following two experiments(Experiment 2 and 3) vary the rate of the isochronous context sequence.Experiment 2 is the flip of Experiment 1: The range of rates corresponds tostandard IOIs of Experiment 1, whereas the standard interval is held constant(equal to the fixed context IOI of Experiment 1). We predict similar expec-tancy profiles in Experiments 1 and 2. In Experiment 3, sequence rate wasvaried relative to a particular standard time interval to investigate effects ofratio versus interval time relationships between the context sequence and aparticular standard IOI. Such manipulations were predicted to create diver-gent expectancy profiles according to an dynamic attending but not a statisti-cal account. In Experiments 4 and 5 we eliminate the serial context precedingstandard/comparison IOIs in some conditions in order to learn whether apeaked expectancy profile would change. Experiment 6 continues investiga-tions of judgments about standard and comparisons in situations where noserial context is given in order to assess range effects involving standardIOIs. Finally, Experiment 7 revisits Experiment 3 to verify that expectancyprofiles are robust over variations in task and dependent measures. To sum

ATTENTION AND TIME 267
up, we manipulate properties of an induction sequence (also termed contextsequence) and durations of the standard (corresponding to expectancy levels)with the goal of assessing the shape of expectancy profiles as a function ofserial context.
EXPERIMENT 1: EXPECTED AND UNEXPECTED STANDARDDURATIONS
Experiment 1 was designed to replicate an experiment of Large and Jones(1999; Experiment 2). Listeners are presented with an isochronous contextsequence of IOIs (Fig. 1) and must categorize the comparison into one ofthree categories (Same, Shorter, and Longer) relative to a (variable) standard.The isochronous induction sequence is a pattern predicted by most dynamicattending models to entrain attentional rhythms. This sequence ends with astandard IOI which is sometimes identical to the preceding IOIs, but moreoften different (ending earlier or later). The standard IOI in the present exper-iment assumed five different durations to reflect five expectancy levels. Wedenote the variable duration of the standard interval by T (see Fig. 1). Com-parison time intervals are always pegged to a particular T value. The timedifference between standard and comparison intervals, when present, wasalways a suprathreshold one, i.e., a Weber fraction of .12 ( in these contexts,acuity thresholds are between .02 and .04; Drake & Botte, 1993; Large &Jones, 1999 ).
Experiment 1 differs from the original Large and Jones study in severalways. First, people were explicitly told to ignore the context IOIs and toconcentrate strictly on comparing the final (standard) IOI with the subsequent(comparison) IOI. Second, the context sequence is longer. Third, Weber frac-tions of standard/comparisons are constant over all T values; in the Largeand Jones experiment all suprathreshold time changes were 40 ms, meaningthat their noticeability may have varied as a function of T. Fourth, listenersreceived more practice trials (with corrective feedback) than in the Largeand Jones experiments to insure they understood the task. In spite of thesechanges, we predict outcomes similar to those predicted and observed byLarge and Jones (1999), shown in Fig. 3.
Method
Participants. Eighteen students volunteered to serve in the experiment in return for creditin an introductory psychology course at The Ohio State University. Data of four students wereeliminated due to equipment failure; analyses are based on the remaining 14 listeners, all ofwhom had less than 2 years formal musical training on any instruments (i.e., excluding choir/singing lessons).
Apparatus. Stimuli were programmed using version 5.0 of the MIDILAB software (Todd,Boltz, & Jones, 1989) on a 486 IBM PC-compatible computer interfaced by a Roland MPU-401 MIDI Processing Unit controlling a Yamaha TX81Z FM Tone Generator set to a sinewave voice. Stimulus patterns were presented on-line through AKG headphones (Model No.

268 BARNES AND RIESS JONES
K240) to listeners seated in a separate sound-attenuated room. To respond, listeners pressedone of three buttons mounted on special MIDILAB response panels. Responses were automati-cally recorded and stored in MIDILAB files.
Stimuli and conditions. All auditory sequences comprised a series of seven context IOIsfollowed by one standard and one comparison IOI arranged as in Fig. 1. The context sequencewas always isochronous, with all seven context IOIs equal to 600 ms. The IOIs of standard,T, and comparison, T 6 ∆t, intervals varied according expectancy condition (see below). Thetime between onset of the final standard tone and the first tone of the comparison interval was3 s, 600 ms of which was filled with a soft complex tone (component frequencies of 262,294, and 392 Hz) or chord; this chord functioned as a warning tone for the comparison interval;the time between the onset of the chord and the onset of the first comparison tone was 1200ms (see Fig. 1). Equally often the duration of standard IOI assumed one of the following fivevalues: T 5 600 ms (Expected), T 5 600 ms 6 21 ms (Unexpected: late/early), or T 5 600ms 6 76 ms (Very Unexpected: late/ early), resulting in a range of T values (in ascendingorder) of T 5 524, 579, 600, 621, and 676 ms. Thus, the duration of the standard correspondsto one of five different levels of expectancy ranging from expected to very unexpected. Ineach condition, for a standard interval, T, the comparison interval was T 6 ∆t, where the ratioof ∆t/T was .12 for all T values when ∆t was nonzero. Equally often the comparison intervalwas ‘‘Shorter,’’ ‘‘Same,’’ and ‘‘Longer’’ than the standard.
Design. The design was a one-way repeated-measures design with five levels of standarddurations (T 5 524, 579, 600, 621, and 676 ms).
Procedure. Listeners were asked to judge a comparison time interval relative to a (preced-ing) standard time interval on each of a series of trials. They heard recorded instructions,including demonstration patterns, and studied a diagram of the task (similar to Fig. 1). Twotypes of practice trials were employed. First, 8 practice trials comprising single pairs (standard-comparison) of time intervals were presented that involved standard durations, T, of 524, 579,600, 621, and 676 ms. Listeners judged related comparisons using three response categories(shorter, same, longer) vis-a-vis the standard duration. Next they received 30 practice trialsinvolving the isochronous context sequence (with the same T values). Context sequences werealways of the same duration; listeners were told to ignore it and to continue paying attentionto the standard and comparison as before. All practice trials involved corrective feedback inwhich they were told the correct response category after each response. They contained roughlyequal numbers of expected, unexpected, and very unexpected standard intervals.
An experimental session comprised 180 trials, on each of which listeners judged the finalIOI (comparison) relative to the standard as in practice trials; in this session they receivednoncorrective feedback. Stimuli were presented in blocks of 60 trials; within each block of60 trials, each of five standards occurred 12 times. These were ordered such that within sixsets of 10 trials, two of each of the five standards occurred. Equal numbers of the three typesof comparison time changes (longer, same, and shorter) occurred within each block of 60trials; no more than three of the same time change occurred successively. Each of the differentstandard durations (T or expectancy level) was presented a total of 36 times; thus, the relativefrequency of each T value was .20 and (taken together) that of an unexpected T value was.80.
In both practice and experimental session, every trial began with a 1-s (high pitched) warn-ing tone followed by 1 s of silence. Listeners were told to indicate their judgment of a compari-son by pressing one of three labeled buttons; they had 3 s seconds to respond prior to thenext trial. On all experimental trials, listeners received noncorrective feedback (indicatingsimply whether they were correct). To insure that only listeners who clearly understood thetask were included in the data analysis, only experimental session data from listeners whoscored 60% correct or better on the last 10 practice trials were included (chance is 33%); inaddition, all of the data of any listener who pressed a response button prior to the onset ofthe comparison interval on more than 5% of the trials were eliminated. All 18 subjects metthis criterion (four were eliminated due to equipment failure).

ATTENTION AND TIME 269
FIG. 4. Proportion correct as a function of duration of the standard in Experiment 1. Errorbars indicate a 95% confidence interval for each condition.
Results and Discussion
Figure 4 presents mean proportion correct responses (PC) for each of thefive standard durations (expectancy conditions). Accuracy in categorizingthe comparison time interval was greatest for the expected T value (600 ms)and least for the two very unexpected T values, where the standard endedvery early (524 ms) or very late (676 ms). The main effect of expectancywas significant, F(4, 52) 5 13.82, MSe 5 .011, p ,, .001. The profile ofobserved means provided a significant quadratic trend component, F(1, 13)5 25.4, MS e, 5 .023, p ,, .001. Linear and cubic trends were not evident(p . .8 and p . .15, respectively). Follow-up comparisons , using the TukeyHSD, indicated that PC differences among the expected condition and thetwo slightly unexpected conditions were not statistically significant. How-ever, all differences between these three mean PC values and the two veryunexpected PC values were significant (p , .0005 in all cases).
The observed inverted U expectancy profile replicates the data of Largeand Jones (Fig. 3a) found with a shorter induction sequence. This suggeststhat the expectancy profile observed in the earlier experiment is not specificto sequence length nor is it attributable to proportionately different timechanges between standard and comparison intervals based on different stan-dard T values. In addition, in spite of additional training (relative to Large &Jones) and instructions to the contrary, listeners were influenced by the con-text sequence. Generally, people are more likely to misjudge standard andcomparison pairs as the standard time interval departs from the IOI of anisochronous induction sequence.
Table 1 presents mean and standard deviation of d′ scores for each of thefive standard durations corresponding to, respectively, the expectancy levels.

270 BARNES AND RIESS JONES
TABLE 1Values of d′ for Experiment 1
d′Duration ofthe standard Standard
(ms) Mean deviation
524 0.67 0.58579 1.57 1.15600 2.03 1.07621 1.90 1.02676 0.40 1.14
The d′ scores were computed using the algorithm of McAuley and Kidd(1998) for tasks involving three response alternatives. First, one d′ was com-puted with trials in which a comparison IOI of the ‘‘same’’ duration as thestandard IOI were considered signals with trials in which the comparisonIOI was ‘‘shorter’’ than the standard IOI taken as noise. Next, a second d′was computed in which trials in which a comparison IOI of the ‘‘same’’duration as the standard IOI were considered signals with trials in which thecomparison IOI was ‘‘longer’’ than the standard IOI were treated as noise.In the final step of this procedure, these two preliminary d′ scores were aver-aged to arrive at a final, overall d′, which is presented for each condition inTable 1. Average d′ is highest for the late standard and lowest for the veryunexpected ones, F(4,52) 5 9.53, MSe 5 .613, p , .0001. These valuesagree with those reported for PC scores and confirm that expectancies affectsensitivity to time changes.
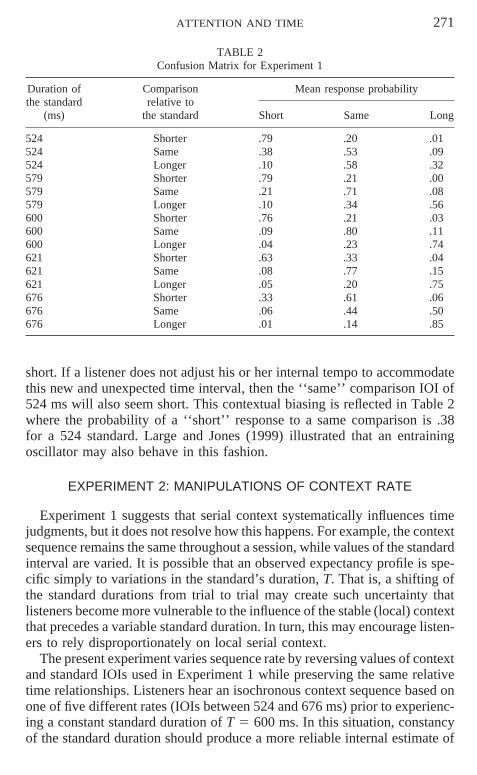
Table 2 shows the confusion matrix of responding to different compari-sons. Entries represent the mean proportion of responses in the three responsecategories to each of the three kinds of time changes in a comparison patternfor the five expectancy conditions. Note that the proportion of ‘‘same’’ re-sponses to short and long comparisons, respectively, form the separate false-alarm rates that enter into calculations of Table 1 d′ scores. Other responseprobabilities are informative as well. They reveal that people are much morelikely to be accurate with a short comparison (PC 5 .79 for the 524-msstandard ) when a standard ends early and much more likely to be accuratewith a long comparison when a standard ends ‘‘late’’ (PC 5 .85 for the676-ms standard). This pattern of responding reveals a perceptual biasing ofjudgments by the context sequence. It suggests the way that context shapestime judgments in that listeners appear to rely heavily upon an internal ex-pression of tempo established by the context IOI and that they continue torely on this referent to respond to a comparison interval in spite of changes inthe standard duration. Thus, if an established tempo period from the contextsequence is based on 600 ms, a standard of 524 ms will be unexpectedly
ATTENTION AND TIME 271
TABLE 2Confusion Matrix for Experiment 1
Duration of Comparison Mean response probabilitythe standard relative to
(ms) the standard Short Same Long
524 Shorter .79 .20 .01524 Same .38 .53 .09524 Longer .10 .58 .32579 Shorter .79 .21 .00579 Same .21 .71 .08579 Longer .10 .34 .56600 Shorter .76 .21 .03600 Same .09 .80 .11600 Longer .04 .23 .74621 Shorter .63 .33 .04621 Same .08 .77 .15621 Longer .05 .20 .75676 Shorter .33 .61 .06676 Same .06 .44 .50676 Longer .01 .14 .85
short. If a listener does not adjust his or her internal tempo to accommodatethis new and unexpected time interval, then the ‘‘same’’ comparison IOI of524 ms will also seem short. This contextual biasing is reflected in Table 2where the probability of a ‘‘short’’ response to a same comparison is .38for a 524 standard. Large and Jones (1999) illustrated that an entrainingoscillator may also behave in this fashion.
EXPERIMENT 2: MANIPULATIONS OF CONTEXT RATE
Experiment 1 suggests that serial context systematically influences timejudgments, but it does not resolve how this happens. For example, the contextsequence remains the same throughout a session, while values of the standardinterval are varied. It is possible that an observed expectancy profile is spe-cific simply to variations in the standard’s duration, T. That is, a shifting ofthe standard durations from trial to trial may create such uncertainty thatlisteners become more vulnerable to the influence of the stable (local) contextthat precedes a variable standard duration. In turn, this may encourage listen-ers to rely disproportionately on local serial context.
The present experiment varies sequence rate by reversing values of contextand standard IOIs used in Experiment 1 while preserving the same relativetime relationships. Listeners hear an isochronous context sequence based onone of five different rates (IOIs between 524 and 676 ms) prior to experienc-ing a constant standard duration of T 5 600 ms. In this situation, constancyof the standard duration should produce a more reliable internal estimate of

272 BARNES AND RIESS JONES
it, particularly if listeners follow instructions to ignore the context sequenceand concentrate on the last IOI (i.e., the standard). In other respects, Experi-ment 2 is identical to Experiment 1.
Method
Participants. Twenty-six OSU students, recruited from an introductory psychology course,volunteered to participate in return for course credit. They met the same criteria as those ofExperiment 1.
Apparatus and procedure. Identical to those in Experiment 1.Stimuli and conditions. These were identical to those of Experiment 1 with the following
exceptions. Five different isochronous context sequences were used. Each consisted of sevenfixed IOIs of 524, 579, 600, 621, and 676 ms, respectively; these amount to context sequencesof different rates, with those having an IOI of 524 ms as the fastest and those with an IOI of676 ms as the slowest. In each, the eighth IOI was the standard with T 5 600 ms. The finalIOI, the comparison, presented as in Experiment 1, was equally often 528, 600, or 672 ms(∆t/T 5 .12).
An experimental session comprised 180 trials, presented in 10 blocks of 18 trials each. Eachblock consisted of sequences with a common rate; within each trial block two randomizedorders of expectancy conditions were employed . Each block included six instances of eachof the three categories (shorter, same, and longer), presented randomly, with no more thanthree successive instances of the same category. Equal numbers of the three categories (shorter,same, and longer) occurred within each block of 18 trials; within each block of 18 trials (havingthe same rate), the first three were considered practice and performance on these trials wasnot analyzed. Each of the five context conditions occurred equally often over a session (relativefrequency of .20); however, the same T value of the standard interval (i.e., 600 ms) occurred,after seven IOIs, in all five conditions.
Results and Discussion
Figure 5 presents observed expectancy profiles in the form of mean PCscores (averaged over response category) for the five different context rates.The pattern of mean PC scores over these conditions replicates that of Exper-iment 1, F(4, 100) 5 20.69, MSe 5 .0096, p ,, .0001 (and those of Large &Jones in Fig. 3a). Again, performance was best when the context IOI matchedthe standard IOI, and this PC value did not differ significantly from the meanPC scores for the two slightly unexpected conditions (Tukey HSD) basedon rates of 579 and 621-ms IOIs. The result, again, is an inverted U curvewith a flattened top. When the same 600-ms standard followed either a muchfaster or much slower context sequence (ending, respectively, very late orvery early), people were poorer at judging its relationship to the subsequentcomparison IOI than when the rate was based on a 600-ms IOI. Relative tothe three other central expectancy conditions, each of the two very unex-pected conditions produced significantly lower PC scores (p , .01 in all sixcases, Tukey HSD).
Table 3 presents the mean and standard deviation of d′ scores (calculatedas in Experiment 1) for each rate condition. As in Experiment 1, the averaged′ is highest for the expected standard (3.134) and lowest for the very unex-pected ones (1.509 and 1.222 ), with F(4, 100) 5 10.21, MSe 5 1.708, p ,

ATTENTION AND TIME 273
TABLE 3Values of d′ Experiment 2
Rate of d′lead-in
sequence Standard(ms) Mean deviation
524 1.51 1.17579 2.82 1.88600 3.13 1.87621 2.15 1.21676 1.22 0.97
.00001. Table 4 presents the mean response probability for each of the threeresponse categories associated with each of the three types of comparisonchanges in the five rate conditions. These data also agree with those of Exper-iment 1. People are likely to respond ‘‘short’’ to comparisons based on astandard that is unexpectedly short relative to a slow context rate; similarly,they tend to respond ‘‘long’’ to the same comparisons when they are basedon a standard that is relatively long vis-a-vis a fast context rate.
The present data generalize the expectancy effect to different context rates.They also rule out the possibility that in previous experiments listeners arti-factually or disproportionately relied on local serial context simply because
TABLE 4Confusion Matrix for Experiment 2
Rate oflead-in Comparison Mean response probability
sequence relative to(ms) the standard Short Same Long
524 Shorter .59 .36 .05524 Same .10 .59 .32524 Longer .03 .15 .82579 Shorter .88 .10 .03579 Same .10 .75 .15579 Longer .05 .16 .79600 Shorter .90 .09 .01600 Same .10 .80 .09600 Longer .04 .21 .76621 Shorter .92 .06 .02621 Same .20 .69 .11621 Longer .05 .33 .62676 Shorter .82 .16 .03676 Same .24 .64 .12676 Longer .05 .54 .41
274 BARNES AND RIESS JONES
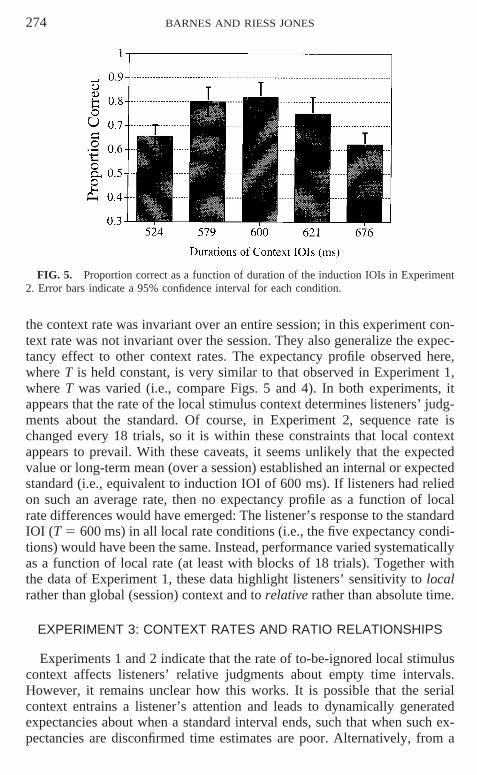
FIG. 5. Proportion correct as a function of duration of the induction IOIs in Experiment2. Error bars indicate a 95% confidence interval for each condition.
the context rate was invariant over an entire session; in this experiment con-text rate was not invariant over the session. They also generalize the expec-tancy effect to other context rates. The expectancy profile observed here,where T is held constant, is very similar to that observed in Experiment 1,where T was varied (i.e., compare Figs. 5 and 4). In both experiments, itappears that the rate of the local stimulus context determines listeners’ judg-ments about the standard. Of course, in Experiment 2, sequence rate ischanged every 18 trials, so it is within these constraints that local contextappears to prevail. With these caveats, it seems unlikely that the expectedvalue or long-term mean (over a session) established an internal or expectedstandard (i.e., equivalent to induction IOI of 600 ms). If listeners had reliedon such an average rate, then no expectancy profile as a function of localrate differences would have emerged: The listener’s response to the standardIOI (T 5 600 ms) in all local rate conditions (i.e., the five expectancy condi-tions) would have been the same. Instead, performance varied systematicallyas a function of local rate (at least with blocks of 18 trials). Together withthe data of Experiment 1, these data highlight listeners’ sensitivity to localrather than global (session) context and to relative rather than absolute time.
EXPERIMENT 3: CONTEXT RATES AND RATIO RELATIONSHIPS
Experiments 1 and 2 indicate that the rate of to-be-ignored local stimuluscontext affects listeners’ relative judgments about empty time intervals.However, it remains unclear how this works. It is possible that the serialcontext entrains a listener’s attention and leads to dynamically generatedexpectancies about when a standard interval ends, such that when such ex-pectancies are disconfirmed time estimates are poor. Alternatively, from a
ATTENTION AND TIME 275
statistical perspective it is possible that the temporal context preceding astandard establishes an expectancy for a stochastically likely time intervalor lays down a short-term memory trace for that time interval. To the extentthat the standard deviates from this internal representation, performance willbe poor. Both dynamic attending and statistical approaches assume that re-peated IOIs affect an underlying psychological process. In the former view,repetitions ‘‘fine tune’’ a periodic process which is modeled as an entrainableoscillator. In the latter account, the internal representation may be formalizedeither in terms of statistical properties of the context sequence-plus-standard(i.e., the mean and variance of these IOIs) or merely in terms of trace strengthlaid down by a given IOI which increases with the number of repetitions ofthat IOI (mode of IOI distribution). A critical question which separates theseapproaches involves the nature of the internal referent: Is it periodic, basedon ongoing activities of an adaptive oscillator, or is it an isolated time inter-val, based on a stored central tendency? Because oscillator models posit in-ternal periodicities, they predict that expectancies about ending times canrecur at harmonic multiples of the period of an active oscillator (seeChurch & Broadbent, 1990 for a related discussion). A statistical accountplaces no such harmonic constraint on the underlying process; indeed, meansand variances describe the internal representation in terms of interval valuesof IOIs, not in terms of IOI ratios.
Experiment 3 is designed to examine these interpretations. We presenttwo different groups of listeners with, respectively, different context se-quences; both groups receive the same set of standard time intervals usedin Experiment 1 (524 ms # T, # 676 ms). Listeners in one group, the Ratiocondition, heard a series of six context IOIs that are one-half the durationof the 600 ms standard; this standard is tentatively designated as the ‘‘ex-pected’’ one for this condition. That is, context rate in the Ratio conditionis based on IOIs of 300 ms; thus the ‘‘expected’’ standard is a harmonicmultiple of this (T 5 600 ms). Listeners in the second group, the Intervalcondition, heard an equivalent length context sequence with IOIs of 500 ms;in this condition, the standard T value closest to an ‘‘expected’’ one is T 5524 ms. Note that in terms of an interval scale, the mean of context IOIs inthe Interval condition (500 ms) is closer to a standard of 600 ms than is themean of IOIs in the Ratio condition (300); however, in terms of harmonicrelationships, context rate in the Ratio condition is more closely related toa standard of 600 ms than is context rate in the Interval condition.
Context rate manipulations provide for contrasting predictions from statis-tical and dynamic attending models. Statistical reasoning emphasizes the in-terval measurement scale of IOIs and their weights in terms of relative fre-quency. These models predict that best performance will occur with thestandard IOI closest, on an interval scale, to the context IOI; thus, in bothInterval and Ratio conditions mean PC should decline linearly from a peakvalue at T 5 524 ms. Second, because the IOI standard deviation of context-
276 BARNES AND RIESS JONES
plus-standard IOIs is larger in the Ratio than in the Interval context, a statisti-cal account predicts better overall accuracy in the Interval than in the Ratiocondition. In short, a statistical analysis of serial context predicts a maineffect of context condition, with performance superior in the Interval condi-tion, and no interaction of context (Ratio, Interval) with duration of the stan-dard (expectancy level); linear expectancy profiles are predicted for bothRatio and Interval conditions.
A dynamic attending interpretation offers alternative predictions. First,Ratio and Interval conditions should not necessarily differ in overall perfor-mance levels if the internal representation is periodic. This is because perfor-mance should be facilitated for standards with durations at or close to multi-ples of 300 ms in the Ratio condition. Second, an interaction of context rate(Ratio versus Interval) with standard duration (expectancy level) is predicted.For the Interval condition, oscillator models generate predictions similar tothose of statistical models because they predict best performance for thestandard closest to the established oscillator period of 500 ms (i.e., for T 5524 ms). The predicted interaction derives from differences associated withthe Ratio condition. An oscillator model predicts a quadratic expectancy pro-file with best performance around the T 5 600 value (similar to that of Figs.3a and 3b). The inducing sequence is proposed to entrain an oscillator witha period of 300 ms. In this case, attentional pulses will be targeted to periodsthat are harmonic multiples of this period; thus, ending tones of the standardwith T 5 600 ms will received greater concentrations of attending energy.In short, in contrast to the statistical approach, a dynamic attending approachpredicts only an interaction of context with standard duration with the spe-cific form of linear and quadratic trends for Interval and Ratio conditions,respectively.
Method
Participants. A total of 36 students from introductory psychology volunteered to participatein return for course credit. They met the same criteria as those of Experiment 1; they wererandomly assigned to Interval and Ratio conditions in equal numbers.
Apparatus and procedure. Identical to those in Experiments 1 and 2.Stimuli and conditions. Details of stimuli and conditions are identical to those of earlier
experiments except for the following details.In both Interval and Ratio experimental conditions, experimental stimuli consisted of six
context IOIs (not seven IOI as in Experiment 1). After 8 practice trials with single standard–comparison pairs, listeners in the Interval context condition received 30 more practice trialswith isochronous context sequences involving IOIs of 500 ms; corrective feedback was givenduring practice. Listeners in the Ratio conditions received the same number of additionalpractice trials with context sequences based on IOIs of 300 ms.
Design. The design was a 2 3 5 mixed factorial, with two levels of context (Interval, Ratio)and five standard durations (T 5 524, 579, 600, 621, and 676 ms). Context (Interval, Ratio)was a between-subjects variable; standards, as usual, varied within a session for each subject.
Results and Discussion
Figure 6 presents mean PC values as a function of expectancy level (stan-dard durations) for the Ratio and Interval context conditions. Overall, Ratio

ATTENTION AND TIME 277
FIG. 6. Proportion correct as a function of duration of the standard and context condition(Interval and Ratio) for Experiment 3. Error bars indicate a 95% confidence interval.
and Interval context conditions did not differ in level of accuracy, F(1, 29)5 .95; mean PC scores were .621 and .659 for Ratio and Interval conditions,respectively. Because d′ and PC scores are highly correlated, we report onlythe former. Similarly, confusion matrix data are redundant with trends estab-lished in Experiments 1 and 2; these data appear in Appendix A.
Expectancy profiles for both Interval and Ratio contexts, as a function ofstandard duration, appear in Fig. 6. Overall accuracy levels for the twogroups did not significantly differ. A main effect of standard duration (expec-tancy level) emerged, F(4, 136) 5 9.46, MSe 5 .009, p ,, .0001, but it wassignificantly qualified by context, F(4, 136) 5 15.84, MSe 5 .009, p ,,.0001. The interaction context with standard duration is evident in the differ-ent shapes of expectancy profiles for the two groups of listeners shown inFig. 6. Differences between the two context conditions are most evident inthe peak performance levels of the two groups; listeners in the Ratio condi-tion were best when standards were T 5 579, 600, and 621 ms (these pointsdo not differ reliably), whereas for listeners in the Interval condition theoptimal T value was 524 ms. Trend analyses verified that a significant linearbut not quadratic trend was obtained in the Interval condition, F(1,17) 529.14, MSe 5 .0195, p , .0001, whereas in the Ratio condition, there wasa significant quadratic but not linear trend, F(1,17) 5 19.51, MSe 5 .0136,p , .0005.
Predictions regarding the main effect of context and its interaction withexpectancy level are consistent with an entrainment interpretation of thesedata. However, it is clear that a definite PC peak does not appear for T 5600 ms in the Ratio condition data of Fig. 6; while resembling the expectancyprofile for context rates based on 600 ms IOIs, the profile for the 300-mscondition is somewhat flatter than might be anticipated if listeners reliably

278 BARNES AND RIESS JONES
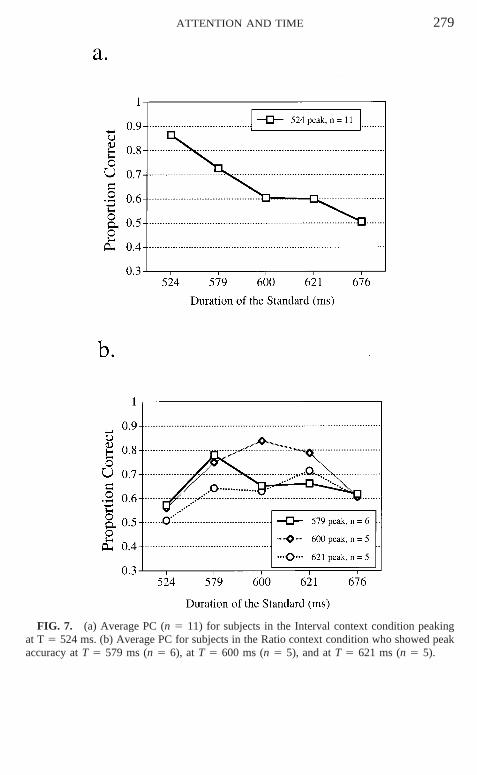
used an oscillator with a 300-ms periodicity. People in the Ratio conditiontend to be equally good with standard durations at and near a multiple of300; however, it is notable that for the T 5 600 condition, listeners in theRatio condition are better than those in the Interval condition, an outcomeat variance with statistical accounts. Absolute accuracy levels do not signifi-cantly differ between Ratio and Interval conditions for standards of T 5579, 600, 621, and 676 ms, thus localizing the interaction of context withexpectancy level (duration) to the T 5 524 ms standard, as predicted bythe entrainment model. We also examined individual expectancy profiles oflisteners within each of the two context groups. The majority of listeners (n5 11) in the Interval condition exhibited a strong linear trend similar to theaverage trend for this group shown in Fig. 6; the mean PC of this subset oflisteners appears in Fig. 7a (other listeners in this condition exhibited peakson T values other than 524, with three demonstrating a peak at T 5 600 ms).By contrast, none of the Ratio listeners exhibited a peak PC at T 5 524 ms.These listeners were divided roughly equally into three groups, shown inFigure 7b, with PC values peaking at T values of 679, 600 or 621 ms, respec-tively. One explanation is that listeners in the Ratio condition use some peri-odic mechanism, based on context IOIs, to remember the standard durationbut that period and/or phase of the oscillator is slightly distorted; we returnto this point in Experiment 8 (but see also footnote 1).
Taken together, the findings of Experiment 3 suggest that the nature ofthe internal standard that people use is periodic. This is more consistent witha dynamic attending than a statistical trace memory account. A critical find-ing in this respect is the interaction of context (Interval, Ratio) with standardduration (expectancy levels). One interpretation consistent with the natureof this interaction holds that the induction sequence in the Ratio conditionengaged an attending oscillator with a period near 300 ms (and/or one witha period of 600 ms) whereas that of the Interval context condition activatedan oscillator of 500 ms. In the case of a 300 ms induction IOI, a singleattending oscillator carries a period at (or near) 300 ms; judgments aboutstandard/comparison pairs, therefore, must be based on a multiple of theoscillator’s period. That is, listeners learn to make prospective judgmentsbased on the second iteration of an underlying oscillator. A second possibilityis that an oscillator with a period near 600 ms, is activated and reinforcedby the Ratio context sequence; comparisons of performance by the Ratiogroup with those of listeners who experienced a longer inducing sequenceof 600-ms I0Is in Experiment 1 are consistent with this possibility as well.Listeners in the Ratio condition of the present study (mean PC 5 .632) donot differ significantly from those of Experiment 1 (mean PC 5 .653) overall.
EXPERIMENT 4: SERIAL CONTEXT VERSUS NO CONTEXT
Experiments 1–3 provide accumulating evidence that the rate of an induc-tion sequence can systematically affect the shape of an expectancy profile.
ATTENTION AND TIME 279
FIG. 7. (a) Average PC (n 5 11) for subjects in the Interval context condition peakingat T 5 524 ms. (b) Average PC for subjects in the Ratio context condition who showed peakaccuracy at T 5 579 ms (n 5 6), at T 5 600 ms (n 5 5), and at T 5 621 ms (n 5 5).
280 BARNES AND RIESS JONES
But what happens when no induction sequence is present? Does a rudimen-tary tendency toward a particular PC profile remain? The differences amongexpectancy profiles discovered in Experiment 3 suggest that serial contextexerts strong influences on these profiles, but perhaps variability observedin that study (see Fig. 7) results from the influence of factors related to theset of standards themselves.
Experiment 4 investigates this issue by comparing the performance of lis-teners who receive no serial context preceding a standard–comparison timepair with that of listeners who receive a brief context sequence. We anticipatethat the effects of expectancy will be more evident in the Context conditionthan in the No Context condition.
Method
Participants. A total of 31 OSU students volunteered to participate in return for coursecredit. They met the same criteria as those of Experiment 1.
Apparatus. MIDILAB software continued to control the construction and generation of stim-uli via a 286 PC, but this system now interfaced with a Roland MPU-401 MIDI ProcessingUnit connected to a Yamaha TG 100 Tone Generator set to a Pan Floot voice. Patterns werepresented on-line to listeners through Beyer dynamic DT 770 headphones; otherwise the equip-ment set-up remained the same as in that Experiment 1.
Stimuli and conditions. Stimuli, conditions, and design were similar to those of Experiment3 with the following exceptions. Stimulus patterns in the Context condition comprised fourIOIs each of 600 ms which preceded one of five standard IOIs (these were identical to standardsin prior experiments). Stimuli in the No Context condition received the same standard–compar-ison IOIs (lacking the context sequence) as those in the Context condition and in the samerandom order.
Design and procedure. The 2 3 5 mixed factorial design crossed the two context conditionswith five standard durations. Context was the single between-subjects variable and subjectswere randomly assigned to either the Context (n 5 14) or the No Context (n 5 17) condition.
The procedure was identical to that of Experiment 1 with the following exceptions: Listenersin the No Context condition received 20 practice trials with single standard–comparison pairsof IOIs, whereas those in the Context condition received 8 preliminary trials with the singlestandard–comparison pairs of IOIs followed by 20 trials with the preceding context sequence.Corrective feedback was provided on all practice trials.
The experimental session comprised a total of 300 trials, all of which provided noncorrectivefeedback. The five different standard durations were randomized within each of five blocksof 60 trials as in Experiment 1. Constraints were that equal-occurrence probabilities neededto be obtained for (a) the five T values and (b) the three response categories (Shorter, Same,and Longer). In addition, no T value occurred more than three times in a row and no responsecategory occurred more than three times in a row.
Results and Discussion
Figure 8a presents mean PC as a function of standard durations for boththe Context and No Context conditions, Overall, peak accuracy occurs forthe standard duration of T 5 600 ms and poorest performance occurs withstandard T values of 524 ms and 676 ms. The main effect of standard durationwas significant, F(4,116) 5 39.80, MSe .005, p ,, .0001, as was the interac-tion of standard duration with context, F(4, 116) 5 6.89, MSe 5 .005, p ,

ATTENTION AND TIME 281
FIG. 8. (a) Mean PC as a function of duration of the standard and condition (Contextand No Context) in Experiment 4 where a warning sound intervened between standard andcomparison IOIs. (b) Mean PC as a function of duration of the standard and condition (Contextand No Context) in Experiment 5 in which the warning sound was omitted. Error bars indicate95% confidence intervals.

282 BARNES AND RIESS JONES
.0001. To assess differences in the profile of PC values between the Contextand No Context conditions, quadratic trends in the two conditions were com-pared. The effect was significant, F(1,29) 5 17.99, MSe 5 .007, p , .003,showing that expectancy profiles differed reliably as a function of context,with the observed quadratic shape significantly sharpened in the Contextcondition relative to the No Context condition.
In sum, a slight, but significant, expectancy profile is obtained in the ab-sence of a serial context which appears to be based on the set of standardsexperienced within an experimental session. However, when the standardduration is preceded by an isochronous context, this inverted U profile issignificantly sharpened. Relative to a condition where no context sequenceappears, the context pattern reduces accuracy for judgments of standard andcomparison time intervals when the standard is contextually unexpected andsomewhat heightens accuracy for judgments involving contextually expectedstandards.
EXPERIMENT 5: CONTEXT MANIPULATIONS WITHOUT AWARNING SOUND
The data of Experiment 4 are somewhat surprising in that the presenceof a serial context did not focus attention more sharply on the expected stan-dard to heighten the advantage for the standard with T 5 600 ms over theNo Context condition. One explanation may involve the presence of the softwarning sound which precedes the comparison IOI. In an entrainment view,the chord may disrupt the internal representation of the standard IOI; thatis, it may produce a maladaptive adjustment of the oscillator. Thus, chordonset could cause the oscillator to adjust its phase for all durations of thestandard except 600 ms. Given a statistical trace theory, the presence of thechord would cause memory trace interference. In either case, judgmentsabout the comparison should decline in accuracy. To clarify this, Experiment5 reproduces Experiment 4 but omits the chordal warning tone.
Method
Participants. A total of 24 students volunteered from an introductory psychology class toparticipate in return for course credit. They met the same criteria as those of Experiment 1.
Apparatus and procedure. These were identical to those in Experiment 4.Stimuli, conditions, and design. All stimuli and conditions were identical to those of Experi-
ment 4 with the exception that the soft chord was omitted on all trials. Listeners experienced3 s of silence between the final standard tone and the first comparison tone. The 2 x 5 mixedfactorial design was identical to that of Experiment 4; n 5 11 and n 5 13 subjects wererandomly assigned to the No Context and Context conditions, respectively. All listeners heardall five levels of expectancy randomly presented within a session as in Experiment 4.
Results and Discussion
Figure 8b presents the mean PC as a function of expectancy level for theContext and No Context conditions. Overall, listeners were more accurate

ATTENTION AND TIME 283
when provided an inducing sequence (mean PC 5 .72) than when they werenot (mean PC 5 . 65); this difference approached significance, F(1, 22) 53.12, MSe 5 .045, p , .10. Again variation in the duration of the standardhad a large overall effect on performance, F(4, 88) 5 41.30, MSe 5 .006,p ,, .0001, with accuracy levels highest for standards that ended as expectedand lowest for the very unexpected standards. The PC profiles of Contextand No Context conditions were compared by assessing differences in qua-dratic trends found in the two conditions. As in Experiment 4, this compari-son was significant, F(1, 22) 5 20.41, MSe 5 .009, p , .002, indicating thatexpectancy profiles differed reliably as a function of context, with the ob-served quadratic shape sharpened in the Context condition relative to the NoContext condition. This differential sharpening is reflected in a significantinteraction of context with expectancy level, F(4,88) 5 8.08, MSe 5.006, p, .0001.
In light of data from Experiment 4, a second ANOVA was performed toassess overall effects of the warning chord manipulations in conditions wherea serial context was present. We compared the performance of listeners inthe Context condition of Experiment 5, where no chord was present, withthat of listeners in the Context condition of Experiment 4, where the chordwas present. This analysis confirms that the presence of a chord significantlylowers overall performance relative to the No Chord condition, F(1, 25) 54.68, MSe 5 .040, p , .05. Overall, mean PC with a chordal warning was.643, whereas without the warning it was .718. However, interaction of thechord variable with expectancy level was not a significant, F(4, 100) 5 1.45n.s., indicating that the presence of a chord does not explain the nature ofthe expectancy profile. A similar analysis with No Context conditions indi-cated that the presence of the chord had no effect on overall accuracy in thiscondition nor did it significantly interact with standard T values. In general,removal of the warning sound raised overall accuracy in the Context condi-tion (relative to Experiment 4) but not in the No Context condition.
In sum, a serial context, even when it comprises only four IOIs, facilitatesthe performance of listeners with standard IOIs that fall with a narrow tempo-ral neighborhood about the expected value. This is most evident in Experi-ment 5, where no warning chord intervened between a standard and compari-son IOI.
EXPERIMENT 6: RANGE OF STANDARDS
The results of Experiments 4 and 5 indicate that listeners show a slight,but significant, elevation in accuracy of judgments about standard IOIs of600 ms relative to other standard values even when the serial context is notpresent. These findings suggest the presence of session range effects suchthat judgments about each standard are influenced, in part, by the range ofequiprobable standard T values that occur in a session. This is reminiscent of

284 BARNES AND RIESS JONES
FIG. 9. Mean PC as a function of the standard duration and range condition (midpoint524 ms or 676 ms) in Experiment 6.
session context effects on time judgments and time-order errors, mentionedearlier, that have been reported by others (e.g., Allan, 1979; Jamieson &Petrusic, 1975; Hellstrom, 1977, 1985; Woodrow, 1951). To verify this, Ex-periment 6 varies the set of standards presented to listeners in two differentNo Context conditions. In one condition the 600-ms standard is shorter thanthe midpoint of the range of presented standards; in the other it is longer.If range effects are operating, then accuracy of judgments about the 600-ms standard IOI should be lower than those about the midpoint IOI in thisexperiment. In addition, people should judge the 600-ms standards in bothconditions of this experiment with less accuracy than subjects judged themidpoint 600-ms standard in the No Context conditions of Experiment 5.
Method
Participants. A total of 26 students volunteered to participate in return for course credit.They met the same criteria as those in Experiment 1.
Apparatus and procedure. These were identical to those in Experiment 4.Stimuli, conditions, and design. Two No Context conditions (termed here 534 and 676)
were identical to those of the No Context conditions of Experiment 5 with the exception thatdifferent ranges of standard IOIs were employed. In the 524 condition, five standard IOIs,centered around a T 5 524-ms standard, were 448, 503, 524, 545, and 600 ms. In the 676condition, the five standard IOIs, centered around a T 5 676-ms standard, were 600, 655,676, 697, and 752 ms.
The experimental design was a 2 3 5 mixed factorial in which the two range conditions(524 and 676) were crossed with the same five different standards used in previous experi-ments. Listeners were randomly assigned to each of the two range conditions, with n 5 14and n 5 12 serving in conditions 524 and 676, respectively.
Results and Discussion
Figure 9 presents mean PC scores as a function of range condition andstandard duration. Once again a slight, but significant, observed PC profile
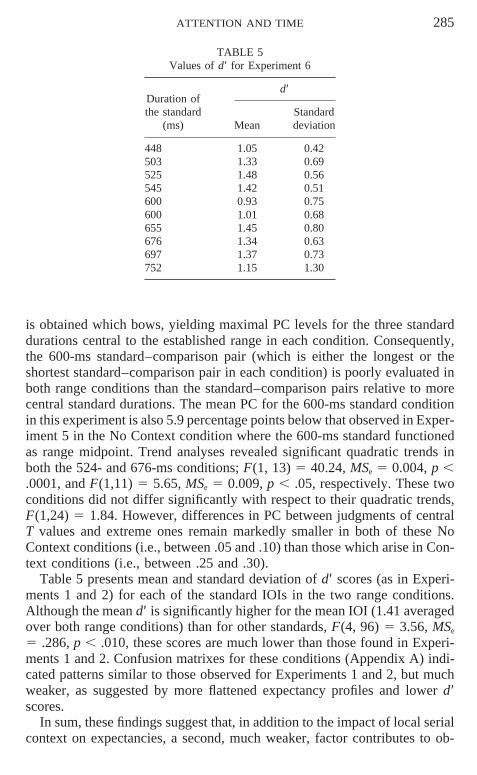
ATTENTION AND TIME 285
TABLE 5Values of d′ for Experiment 6
d′Duration ofthe standard Standard
(ms) Mean deviation
448 1.05 0.42503 1.33 0.69525 1.48 0.56545 1.42 0.51600 0.93 0.75600 1.01 0.68655 1.45 0.80676 1.34 0.63697 1.37 0.73752 1.15 1.30
is obtained which bows, yielding maximal PC levels for the three standarddurations central to the established range in each condition. Consequently,the 600-ms standard–comparison pair (which is either the longest or theshortest standard–comparison pair in each condition) is poorly evaluated inboth range conditions than the standard–comparison pairs relative to morecentral standard durations. The mean PC for the 600-ms standard conditionin this experiment is also 5.9 percentage points below that observed in Exper-iment 5 in the No Context condition where the 600-ms standard functionedas range midpoint. Trend analyses revealed significant quadratic trends inboth the 524- and 676-ms conditions; F(1, 13) 5 40.24, MSe 5 0.004, p ,.0001, and F(1,11) 5 5.65, MSe 5 0.009, p , .05, respectively. These twoconditions did not differ significantly with respect to their quadratic trends,F(1,24) 5 1.84. However, differences in PC between judgments of centralT values and extreme ones remain markedly smaller in both of these NoContext conditions (i.e., between .05 and .10) than those which arise in Con-text conditions (i.e., between .25 and .30).
Table 5 presents mean and standard deviation of d′ scores (as in Experi-ments 1 and 2) for each of the standard IOIs in the two range conditions.Although the mean d′ is significantly higher for the mean IOI (1.41 averagedover both range conditions) than for other standards, F(4, 96) 5 3.56, MSe
5 .286, p , .010, these scores are much lower than those found in Experi-ments 1 and 2. Confusion matrixes for these conditions (Appendix A) indi-cated patterns similar to those observed for Experiments 1 and 2, but muchweaker, as suggested by more flattened expectancy profiles and lower d′scores.
In sum, these findings suggest that, in addition to the impact of local serialcontext on expectancies, a second, much weaker, factor contributes to ob-

286 BARNES AND RIESS JONES
served expectancy profiles. This involves the influence of a random distribu-tion of equally probable standard IOIs within the session. We return to thistopic in the General Discussion.
EXPERIMENT 7: TWO RESPONSE CATEGORIES FOR INDUCTIONSEQUENCES OF DIFFERENT RATES
In this final experiment we address two issues. One concerns the influenceof context on sensitivity to a comparison time change. The second revisitsquestions raised in Experiment 3 involving manipulation of context rates.
Prior experiments have relied upon a three-category time judgment task.This may obscure effects of expectancy violations (standard durations) onlisteners’ sensitivity to temporal information. Perhaps expectancy profilesare specific to the three-category paradigm, reflecting some sort of percep-tual biasing associated with the three response options. Thus, whenever astandard IOI ends unexpectedly early, listeners may be moved to say ‘‘short’’or, conversely, ‘‘long’’ when the standard IOI ends unexpectedly late. Thefalse-alarm data of Tables 2 and 4 reveal that such tendencies are present.Arguing against a simple response bias interpretation of such data, however,is the fact that d′ in all of our experiments consistently mirrors the outcomesreported for PC values. Such data are consistent with the hypothesis that astimulus context induces a particular internal representation of some timeinternal which assimilates the standard IOI to it. A question we return to inthis experiment concerns the nature of this internal process.
In this experiment, we address this question using a two-category task.This enables us to both assess the robustness of our previous findings and toprovide conventional calculations of sensitivity to expected and unexpectedstandard time intervals. Accordingly, in Experiment 7 listeners hear onlycomparisons that are shorter or longer than the standard; we omit both thecomparison IOI and the response category that instantiate a ‘‘Same’’ judg-ment. Listeners responded with one of two responses (shorter or longer) oneach trial and also gave a confidence rating; we calculate a nonparametricROC measure of sensitivity, Ag (Davison & Jagacinski, 1977).
Using this task, we aim to verify findings reported in Experiment 3, witha design similar to the one employed in that study. Again, we assess theinterval versus ratio basis of timing associated with the underlying temporalrepresentation of a dynamic context. If the mechanism underlying changesin sensitivity, as indexed by Ag, involves a periodicity, then the data shouldfavor a ratio metric of timing. In Experiment 7, three groups of listeners areexposed to isochronous inductions sequences based, respectively, on differ-ent rates with IOIs of 300, 500, and 600 ms (for the same range of standardsas in Experiment 3). The conditions with 300 and 500 ms IOIs correspond,respectively, to Ratio and Interval contexts used in Experiment 3; the 600-ms condition corresponds to that of Experiment 1. Although both the 300-

ATTENTION AND TIME 287
and 600-ms induction sequences can be considered Ratio contexts (i.e., 2 :1 and 1:1 ratios of a 600-ms standard to context IOIs), for simplicity in thisexperiment we refer to the rates of the three different context conditions bytheir numerical context labels: 300, 500, and 600 (for context IOIs). Recallthat in Experiment 3, we observed linear and quadratic expectancy profilesfor the Interval (500) and Ratio (300) groups, respectively. However, break-downs of average profiles of both groups indicated that not all listeners ineither condition engaged the same, context-related, internal periodicity. Sub-sequent experiments suggest that factors such as the presence of a warningchord and even the range of standard T values may contribute to this internalperiod. Consequently, in the present experiment we omit the soft chord warn-ing, and although we cannot change the range of standards, we present allthree groups with three fewer standards, namely three (524, 600, and 676ms), thereby reducing options for confusion vis-a-vis closely related standarddurations. Predictions for this task remain identical to those of Experiment3. Given an entrainment perspective, if people rely on an internal periodicitybased on context IOIs, then context (300, 500, and 600) should interact withstandard duration (expectancy level). Specifically, quadratic trends shouldcharacterize expectancy profiles of the 300 and 600 groups, where harmonicratios relate the context IOI to the 600-ms standard and a linear trend shouldappear for the 500-ms standard, where T 5 524 ms is closest to the expectedstandard of 500 ms.
Method
Participants. A total of 38 OSU students volunteered to participate in return for coursecredit for an introductory psychology course. They met the same criteria as those of Experi-ment 1.
Apparatus and procedure. These were identical to those in Experiment 5 with the exceptionslisted below.
Stimuli and conditions. All stimuli and conditions were identical to those of Experiment 3with the following exceptions: (a) the soft chord warning chord was omitted; (b) three notfive standard IOIs were used (524, 600, and 676 ms); (c) The Weber fraction distinguishingthe comparison from the standard IOI was .09 not .12; and (d) comparison IOIs were alwayseither longer or shorter than standard IOIs, never the same; only responses of ‘‘longer’’ and‘‘shorter’’ were allowed.
Design. A 3 3 3 mixed factorial design crossed the three different sequence context rates(IOIs of 300, 500, and 600 ms) with three different standard durations (IOIs of 524, 600, and676 ms). Context was the single between-subjects variable with n 5 12, 12, and 14 subjectsserving in context conditions 300, 500, and 600 ms respectively.
Procedure. Listeners received 28 practice trials; the first 8 trials involved only standard andcomparison IOIs, and the next 20 trials involved these preceded by seven induction IOIs,all with feedback. During the practice trials the three standard IOIs occurred equally often.Experimental trials consisted of four blocks of 60 trials each where listeners received onlysequences followed by longer and shorter comparisons, all with no feedback. Two differentorders of the four blocks were used. Each of the three types of expectancy conditions occurred20 times per block, randomly arranged with the following constraints: (a) no more than threesuccessive trials of the same correct answer (long and short) and (b) no more than three succes-

288 BARNES AND RIESS JONES
FIG. 10. Mean Ag scores as a function of standard duration and context condition (300,500, and 600) in Experiment 8. Error bars indicate 95% confidence intervals.
sive trials with the same standard duration (524, 600, and 676 ms). On each trial listenersjudged the comparison as shorter or longer than the standard and rated their confidence on a3-point scale (1 5 least confident, 2 5 neutral, 3 5 most confident). They were allowed 4(instead of 3) s (following the offset of the final comparison tone) to make these responses.
Scoring. Both PC and Ag were calculated for each subject in each expectancy condition.The Ag score is a nonparametric recognition measure of the response operating curve (ROC).It is computed by the trapezoidal rule (Bamber, 1975; Pollack, Norman, & Galanter, 1964)based on a program by Davison and Jagacinski (1977). An Ag score estimates unbiased recog-nition accuracy in the two-choice case where chance is .50. An Ag score of 1.00 reflectsperfect discrimination and .50 reflects random guessing.
Results and Discussion
Analyses of PC and Ag scores lead to similar conclusions with respect toboth context and expectancy (standard duration) manipulations. Conse-quently, we present only Ag scores.
Figure 10 presents mean Ag for the three different context inductiongroups as a function of the three different standard IOIs (expectancy levels).Overall people were better with the 600-ms induction sequence than withthe other two contexts, F(2, 35) 5 4.91, MSe 5 .019, p , .05. A TukeyHSD test indicated that performance overall was equivalent in the 300 and500 conditions and significantly poorer than in the 600 condition. Expectancyeffects, due to different durations of the standard variable, were also influen-tial, F(2, 70) 5 22.73, MSe 5 .015, p , .0001. Performance, overall, wasbest with the 600-ms standard (mean Ag 5 .79 for T 5 600 ms versus meanAg 5 .63 for 524 and 676 combined). The effect of standard duration wasqualified by context, leading to a significant effect of the two variables, F(4,70) 5 3.639, MSe 5 .015, p , .01. In general, the shape of the expectancyprofile for 500 context condition differs from that for 300 and 600 conditions.

ATTENTION AND TIME 289
The latter both showed marked peaks in Ag with the expectancy level associ-ated with T 5 600, whereas for listeners receiving the 500 induction se-quence, performance was best with the T 5 524 ms standard, which producedslightly higher Ag scores than with the standard of T 5 600 ms.
Follow-up trend analyses on the interaction of context with expectancyproduced results similar to those reported for the PC data of Experiment 3.A significant linear trend over the three levels of standard was found for the500-ms context condition, F(1,11) 5 18.05, MSe 5 .0096, p , .0014,whereas both the 300 and 600-ms context conditions provided significantquadratic trends, with F(1,11) 5 19.73, MSe 5 0.0152, p , .001, and F(1,13) 5 38.37, MSe 5 0.01, p , .0001, respectively. Although performancewas, overall, poorer in the 300 than in the 600 condition, it is striking that themagnitude of difference in Ag between expected and unexpected (combined)standards is very large and virtually identical in both of these conditions (.19versus .20).
To sum up, in a two-response choice task with no feedback we find thesame pattern of outcomes observed in Experiment 3 using a three-categorytime judgment task with limited feedback. An induction sequence based onIOIs of 300 ms, which is ostensibly more distant (on a interval scale) froma standard IOI of 600 ms than is a sequence with IOIs of 500 ms (and hencemore variable), produces performance in listeners which does not differ inoverall accuracy from that observed in listeners who responded to the 500-ms context sequence. However, the expectancy profiles in the 300 conditiondo differ from the linear profiles observed in the 500 condition; the 300condition produced an inverted U profile that was virtually identical in shapeto that found in the 600 condition. This pattern of results is consistent withpredictions of an entrainment model, suggesting the operation of an internal,context sensitive periodicity.
GENERAL DISCUSSION
In this research our concern has been with attending to auditory events.We know much less about how people attend to auditory patterns than wedo about their attending to visual ones. Because auditory events typicallyunfold in time, this is an important, indeed primary, dimension for theseevents. Accordingly, we have concentrated on the role of stimulus time prop-erties in influencing people’s ability to selectively attend in time to timeintervals. We have used a prospective time judgment task involving suprathreshold changes in empty time intervals because our interest is in judgmenterrors due to a misdirection of attention rather than to inherent limitations intemporal resolving capacity (e.g., as in probit analyses of Halpern & Darwin,1982). The main features of the data, reported for seven experiments, relateto the ways context directs attention to provide accuracy profiles, i.e., expec-tancy profiles, as a function of mistaken judgments of unexpected standards.

290 BARNES AND RIESS JONES
In the present research, we pursued some of the determinants of expectancyprofiles in experiments that were variants of a simple standard–comparisontime-duration judgment task. Overall, two main stimulus features appear tosystematically influence attention and time judgments as registered by theshape of an observed expectancy profile. Both are contextual in nature.
One influence on expectancy profiles involves local serial context. Theexpectancy profile, which peaks at standard durations congruent with contextrate, indicates that contextual timing does selectively ‘‘tune’’ a listener fora particular standard IOI. This profile is hardy and resilient, appearing insome conditions of most reported experiments. It is weak primarily whenlocal serial context is missing (Experiments 4, 5, and 6). Finally, strong evi-dence exists that serial context selectively influences time estimation.
A second, but less pronounced, contextual influence on listeners’ timejudgments involves the range of presented standards present in a session asevident in Experiments 4, 5, and 6. When no induction sequence is present,people are slightly less accurate at judging time intervals based on standardintervals with extreme T values (within the presented range of standards) thanat judging other, more central, standards. These findings are not unrelatedto the phenomenon in the time estimation literature, variously termed theindifference interval (Woodrow, 1951), the central tendency effect (Holling-worth, 1910), anchoring (Fraisse, 1948; Goldstone, Lhamon, & Boardman,1957; Goldstone, Boardman, & Lhamon, 1959; Turchioe, 1948) and so on(see Allan, 1979; Hellstrom, 1985; McAuley, 1995, for reviews). The indif-ference interval is an estimated duration within a set of different IOIs experi-enced by a participant for which over- and underestimates are equal. Wood-row notes that in the course of an experiment, the ‘‘indifference intervaltends to move towards the average length of the intervals constituting thetotal series’’ (Woodrow, 1951; p. 1227). Most explanations of this and re-lated time-order errors appeal to the development of a memorial or perceptualrepresentation of an internal standard duration that systematically affects re-sponding to standard and/or comparison intervals (Hellstrom, 1985). Often,the development of such an internal standard is described in terms of an‘‘assimilation’’ process that transpires over the course of a session, but as-similation is rarely spelled out in terms of a real-time process. Furthermore,the literature reveals few systematic manipulations of the possible determi-nants of session and local context properties such as the range, mean, vari-ance, or serial patterning of context durations, all of which might explainassimilation and the indifference interval. Although Hellstrom (1985, 1977)has presented the most comprehensive explanation of such phenomena, noreal consensus exists on the underlying explanatory mechanism (Allan,1979). Current research on this topic indicates that trial-to-trial changes inthe tempo of local contexts as well as extreme rate differences within a ses-sion both affect assimilation (Jones & McAuley, 2000). However, a full pre-sentation of these issues is beyond the scope of the present discussion. In

ATTENTION AND TIME 291
sum, the second contextual influence on time judgments subtly reflects apoorly understood phenomenon in time estimation. We suggest a new wayof thinking about time estimation errors and assimilation, later in this article.
We have outlined two effects on expectancy profiles, but how general arethese effects? Specifically, can our results be generalized to faster/slowertempi or to other types of tasks that require time estimation? In our experi-ment IOIs ranged from relatively fast rates (e.g., IOIs of 300 ms) to ones ofmedium rates (e.g., IOIs of 676 ms). Others have shown expectancy effectsfor still slower rates (e.g., IOIs of 800 ms in McAuley & Kidd, 1998). It ispossible that optimal rates exist for the effects observed here, but these ratesare ones congruent with those found in speech and music. With regard toother categorization tasks, we have found (in Experiment 7) that expectancyeffects are at least as robust in a two-response category (Same and Different)task as in the three-category task.
Explanations of Stimulus Timing Effects on Duration Judgments
Theoretical perspectives on time judgments, outlined in the introduction,that focus primarily upon the role of stimulus timing on attention or memoryhave been identified as statistical and entrainment theories. In this section,we recapitulate evidence pertinent to hypotheses based on these frameworks.
Statistical theories. Statistical assessments of a serial context convincinglyexplain several of the present findings. For instance, the mean (or range mid-point) value of standard IOIs within a session, taken together with the mean(or mode) of IOIs comprising a local serial context may be used to summarizevarious contextual effects found to affect time judgment performance in Ex-periments 1, 4, 5, and 6. In addition, the sheer number of repetitions of aparticular IOI may strengthen a memory trace for that interval, as some argue(e.g., Keele et al., 1989; Ivry & Hazeltine, 1995). This analysis can alsoexplain some aspects of local context on observed expectancy profiles. Thus,as predicted, listeners who received (in different experiments) context se-quence lengths of 0, 4, or 7 identical induction IOIs showed increasing levelsof accuracy in judging the expected standards, F(2, 36 ) 5 8.21, MSe 5 .013,p , .005. In this regard, the Multiple Look model is the most precise ofsuch approaches; it indicates that tempo (rate) discrimination should improvefor a standard IOI that equals the sequence mean as the standard error ofthe mean IOI decreases due to increasing N (the number of IOIs) (Drake &Botte, 1993 ).
Nevertheless, a strictly statistical account does not fully address the pres-ent findings. In part, this is due to its emphasis on the interval nature of aninternal representation of the standard (or context) IOI. Our data suggest thatthe internal activity of listeners may not be based strictly on interval timeproperties as summarized by stimulus IOI distributions. This is evident fromthe data of Experiments 3 and 7: An isochronous induction sequence withan IOI that is one-half that of a standard designated as ‘‘expected’’ yields

292 BARNES AND RIESS JONES
an expectancy profile similar to that generated when the induction IOI equalsthe expected standard in both three- and two-category judgment tasks. If themean induction IOI is 300 ms and one of the standard IOIs is 600 ms, thenperformance is best with this standard and ones close to it. This finding isextremely difficult for all current statistical accounts because all summarizelocal context effects in terms of weighted interval time values. These modelsincorrectly predict that mean PC (or Ag) in conditions with a 300-ms induc-tion rate should be best with a 524-ms standard, declining linearly to a lowwith the 676-ms standard, and that performance should be much poorer thanin conditions with slower induction rates. Although the great majority oflisteners experiencing the 500-ms context rate were most accurate with theT 5 524-ms standard, not a single listener hearing the 300-ms context se-quence (in either Experiment 3 or 7) performed best with this standard. Infact, for the majority of listeners in the latter, the T 5 524-ms standard pro-duced the worst performance. In short, statistical models incorrectly predictequivalency of expectancy profiles for the 300- and 500-ms rate conditions,and they incorrectly predict that average accuracy in the 300-ms contextcondition will be lower than in the 500-ms rate condition.
Dynamic attending theories. Alternative views of stimulus timing basedon entrainment posit an active oscillator that locks into induction sequenceIOIs. The period of the oscillator gives a running internal estimate, i.e., amemory, of sequence tempo, and determines judgments of standard and com-parison time intervals by providing expected ending times for each interval.For instance, people expect a comparison interval to end at a particular time,given preceding occurrences; when this expectancy is violated by an earlyending, they tend to judge the comparison as ‘‘Short’’ (Jones & Boltz, 1989;Jones et al., 1993). The operative expectancy in this case is based, in part,on the current period of an attending oscillator. This raises the followingquestion: ‘‘What determines the oscillator’s period at the point where a lis-tener judges a comparison?’’ If a listener successfully ignores a context se-quence prior to a standard and/or always correctly adjusts the oscillator’speriod following an unexpected standard so that it faithfully reflects the stan-dard’s duration, then the answer to this question is: ‘‘Only the standard timeinterval will affect the oscillator’s period when a comparison is judged.’’But if either of these conditions holds and listeners do rely only on the stan-dard, then the resulting expectancy profile to supra-threshold changes in acomparison should be flat. That is, people should perform with uniformlyhigh accuracy even with unexpected standards. We do not find such profiles.Consequently, it appears that the quadratic expectancy profiles observed hereare symptomatic of contextually induced expectancies based on oscillatorperiods that are not fully adjusted following expectancy violations. A listenerwho encounters an unexpected standard appears to use the context to relyon the same oscillator period operative prior to the onset of the standard.
One way of viewing this interpretation returns to the issue of perceptual

ATTENTION AND TIME 293
biasing by the context sequence. Confusion matrix data support this account:People tend to incorrectly judge comparisons that are based on standardswhich end unexpectedly early as ‘‘short’’; similar perseverations occur forunexpectedly lengthened standard–comparison pairs. That is, the entrainedoscillator period ‘‘biases’’ a listener to expect a particular standard endingtime, but when the standard ends early it will seem short. If the oscillatorperiod is not corrected at this point, then this same expectancy will persistfor the comparison interval. In other words, ‘‘bias’’ in this situation refersto the expected duration conferred by a context sequence which persists toaffect comparison judgments. It can be explained in terms of sluggish correc-tions of the oscillator period to unexpected standard durations. In this regard,entrainment models offer an explanation of bias that ties it to the expectedlocus of a targeted attentional pulse. In such accounts, bias and attendingare interlinked and preparatory for perceiving.
The dynamic attending interpretation places an adaptive oscillator at theheart of an explanation of assimilation. In principle, an entraining oscillatorcan modulate both its period (period adaptation) and its phase (phase adap-tation) in response to an unexpected event (a perturbation). Both period andphase enter into targeting of an attentional pulse to some expected point intime (see Fig. 2). Therefore, either one or both of these oscillator parametersmay adapt efficiently, leading to four possible explanations of an expectancyprofile.
1. Both period and phase adapt. If both period and phase adapt swiftlyand completely to an unexpected ending of the standard, then people willalways correctly anticipate the ‘‘same’’ ending of a comparison, meaningthat they will judge all suprathreshold comparison changes (temporal con-trasts) accurately. This situation corresponds to the one described in the pre-ceding paragraph, which leads to a flat, highly accurate expectancy profile.
2. Neither period nor phase adapt. If neither period nor phase adapt swiftlyto an unexpected standard, then we will observe a quadratic expectancy pro-file because listeners will commonly underestimate the length of a standardending late and overestimate that of a standard ending early.
3. Only period adapts. If only the period of the oscillator adapts fully to anunexpected ending tone of the standard, then a quadratic expectancy profile isalso predicted because the listener will continue to misjudge comparisonendings on the basis of a misaligned (out-of-phase) attentional pulse.
4. Only phase adapts. Finally, if only phase adapts, then the unadaptedoscillator period will continue to generate inappropriate expectancies aboutthe comparison interval, meaning that once more a quadratic expectancy pro-file is predicted. We can rule out the first possibility, namely full adaptationof both period and phase, because a flat expectancy profile was not observed.However, the remaining three options all predict an inverted U expectancyprofile. Which is correct? We think that the final option, phase adaptation,is the correct one; at least for the range of different standards used here where

294 BARNES AND RIESS JONES
departures from the expected ending are relatively small (between 0 and 13%of a 600-ms period), phase adaptation is likely to be quick and fairly com-plete. There are three reasons for this conclusion.
First, independent data suggest that phase adapts rapidly. Both McAuleyand Kidd (1998) and Repp (1999) provide evidence in different, but related,tasks to suggest that relatively rapid and complete phase correction occursin response to small deviations from expected timing. In Large and Jones,an oscillator model was fit to data from a task similar to the present one withparameter estimates that indicated adaptation rates for a period parameterwere one-sixth those for a phase-adaptation parameter.
Second, rapid phase adaptation is supported by data we collected from afurther experiment (essentially an eighth study). In this experiment, the taskwas similar to Experiment 1 (but without a warning chord); however, wevaried the phase onset of the comparison IOI while holding constant thestandard duration. Thus, in this study, only the first tone of the comparisonwas varied, arriving very early (276 ms), on-time, or very late (1 76 ms) andpresented over trials in a random fashion. This manipulation was designed toaffect only the oscillator phase. Because both context and standard IOIs werefixed at 600 ms, we can assume that the induced period of the oscillator, setin motion by the context and standard, remains close to 600 ms. Thus, theonly determinant of an expectancy violation possible in this design is relatedto the onset of the comparison, i.e., a phase shift. If the expectancy profileswe have observed in Experiments 1–7 result either from a failure to adaptphase only or from poor adaptation of both phase and period, then this finalstudy should also produce a quadratic expectancy profile. Our findings indi-cated no quadratic expectancy profile. Accuracy levels were essentially flatand above 90% for all three levels of phase shift. Thus, by a process ofelimination, we conclude that the quadratic form of the expectancy profileis due largely to slow period adaption of the oscillator.
The third, and final, reason for assuming rapid phase adaptation (versusslow period adaptation) involves its evolutionary implications. As a generalrule, swift phase adaptation to surprising events enables fleeting, but oftenuseful, orientation responses. In many situations, instinctive reactions (e.g.,to flee) to a sudden stimulus are linked to rapid attentional re alignmentsand brief percepts of danger. Clearly, there is some evolutionary value toassuming a rapid aspect to an entrainment process, wherein the attentionalpulse can be swiftly redeployed in the direction of synchrony with successiveonsets without producing a persistant change to the oscillator’s basic period-icity.
For these reasons, we conclude that most adaptive changes which occurin response to expectancy violations of a standard time interval involve phasenot period: Period adaptation is a relatively slow process, whereas phaseadaptation is a relatively fast one. The slower process of period adaptationaccounts for the persisting memory of the context tempo against the rela-

ATTENTION AND TIME 295
tively ‘‘poor’’ memory of the standard. It also explains the continuation ofincorrect expectancies about ‘‘when’’ a comparison time interval should endand for the resulting over- and underestimates of it.
Although phase may be more adaptable than period, the persistence of astable periodicity underlies most dynamic attending models. Evidence forthis in time estimation comes from Experiments 3 and 7, where context se-quence rates based on both 300- and 600-ms IOIs yielded quadratic trendsover standard IOIs (from 524 to 676 ms), whereas rates of 500 ms IOIsyielded linear trends. If people use harmonic multiples of a persisting oscilla-tor period to make time judgments, then these findings make sense; this alsoassumes that a standard is expressed by an iteration of this stable periodicity.An alternative explanation involves a two-oscillator model which has beensuccessfully applied to time-discrimination data in rhythmical sequences(Jones & Yee, 1997; Large & Jones, 1999). An induction sequence of 300ms may reinforce not only an oscillator with a period of 300 ms, but also ahigher- order one with a period of 600 ms, thereby facilitating responses tostandards of 600 ms. Slight differences in predictions about the slope of theexpectancy profile distinguish these versions of the model; the present datado not resolve these differences conclusively. Nevertheless, all such accountsrest on the assumption that the internal process is inherently periodic.
We have addressed the issue of generalizability of the results we report toother rates and tasks. It is reasonable to ask if entrainment theory is likewisegeneralizable. It is straightforward to generalize an adaptive oscillator modelto other context rates because the attentional pulse as well as oscillator pa-rameters involving period and phase are normalized by oscillator period.With respect to other tasks, those which place a premium on temporal acuityand time difference (i.e., rather than categorical judgments) will show differ-ent kinds of impact of context on performance measures involving temporalacuity thresholds. Large and Jones (1999) successfully applied an oscillatormodel to a time-discrimination task using rates in the range we have usedhere. In that task, temporal variations (perturbation) in context rhythms re-duced performance and increased acuity thresholds. A version of the oscilla-tor model adapted to a two-alternative forced-choice task describes thosefindings fairly well.
Finally, the context effects that arise from manipulations of the range ofrandomized standard–comparison time intervals present a particularly inter-esting arena for extension of the dynamic attending view (i.e., in Experiments4, 5, and 6). They suggest new ways to approach phenomena, such as assimi-lation and the indifference interval (Allan, 1979; Fraisse, 1982 ; Woodrow,1951). In the range experiment (Experiment 6), we can determine an indiffer-ence interval which shifts with range (i.e., it is near 530 and 700 ms, respec-tively, for conditions with mean session IOIs of 524 and 676 ms); that is,it corresponds to the T value estimated to produce optimal PC levels. Inapplying an oscillator approach to stimuli in No Context conditions of Exper-

296 BARNES AND RIESS JONES
iments 4–6, it is important to emphasize that a serial context (from the per-spective of an entraining oscillator) remains present in spite of the No Con-text label. Any succession of IOIs within a session creates an extended andirregular context within which certain durations may be judged. Thus, eachtrial offers a local sequential context of some indeterminate length based ona few preceding trials, their ready signals, the standard and comparison timeintervals, and so on. Any limit cycle oscillator model will respond to sucha stimulus sequence as a series of IOIs to which it must adapt (see, e.g.,Large & Jones, 1999). In this case, a centering process operates; in fact, itis the consequence of entrainment characterized by slow period adjustmentplus rapid phase adaptation, both of which are governed by real-time errorminimization in response to the many perturbations which define temporallyirregular contexts. If a single oscillator is involved, then over a series oftrials, the period of this oscillator will be forced to slowly adapt to successiveIOIs; on average, its period will assume a value somewhere near the centerof the set of standard T values by virtue of minimizing the magnitude ofexpectancy violations. For instance, when various standard and comparisonIOIs (from 524 to 676 ms) are presented, adaptive properties of an oscillatorquickly adjust its phase to each new standard while at the same time draw itsperiod more slowly to a value around 600 ms, meaning that best performanceshould occur with standard–comparison pairs based on a 600-ms time span.The fact that IOI variability is great over IOIs in putative No Context condi-tions means that attentional energy will be widely distributed over the periodof this oscillator’s cycle; the result is a flattened attentional pulse. In otherwords, the predicted expectancy profile is fairly flat, similar to the flattenedprofiles observed in No Context conditions of Experiments 4–6. This alsopredicts a distribution of estimation errors commonly observed with the in-difference intervals because in this view the indifference interval corre-sponds to the period of a loosely entrained oscillation. In short, the processof entrainment explains what has historically been described as assimilation(Jones & McAuley, 2000).
Independent evidence for an entrainment interpretation of session rangeeffects is found in the performance of entrainment models of Large and Jones(1999). In Experiment 1 of their study, listeners who heard brief and highlyvariable context sequences performed very poorly in discriminating subse-quent time changes relative to listeners who heard more regular contextswithin a session. Moreover, listeners’ experience with irregular sequencescarried over to subsequent trials, affecting judgments of time intervals inregular (isochronous) sequences in the same session. Nevertheless, observedPC levels could be predicted by a loosely entrained oscillator carrying a wideattentional pulse. Irregular contexts induce loose entrainment and this widensthe attentional pulse; thus, less attentional energy is targeted to ending timesof standards central to the range and more energy is available for ending

ATTENTION AND TIME 297
times of noncentral standard durations. Observed differences in expectancyprofiles between No Context and Context sequence conditions (Experiments4 and 5) are consistent with this interpretation.
The issue of irregular timing contexts implies that all time intervals withinan experimental session have potential impact. In the present experiments,we have not systematically manipulated certain (other) time intervals suchas that between the initial warning tone (beginning a trial) and first contexttone and the interval between standard and comparison time intervals. Inprinciple these two intervals can affect the functioning of an attentional oscil-lator over a session. Such questions are currently under investigation in aseparate set of studies (McAuley, Jones, & Barnes, 2000). In sum, this inter-pretation offers an explanation of the observed flattening of the expectancyprofiles found in conditions with attenuated and irregular serial contexts.More generally, this view offers a new way of explaining phenomena associ-ated with range effects, assimilation, and the indifference interval in timeestimation.
Implications for Conventional Theories of Attention
The idea that attention involves the selective allocation of some sort ofinternal resource is a fairly general one. It underlies predictions about howpeople selectively attend to one region in space rather than to others (Ander-son, 1990; Posner, Snyder, & Davidson, 1980; Shulman, Remington, &McLean, 1979), to certain objects (Kahneman, Treisman, & Gibbs, 1992),a particular task (Zakay, 1998 ), or to a particular sensory modality (Kahne-man, 1973). One implication of the present studies is that resources, heretermed attentional energy, can be selectively allocated in time as well. Theexpectancy profiles we observe reflect gradients of attentional allocation intime; indeed, they are reminiscent of attentional gradients over spatial loca-tions (e.g., La Berge & Brown, 1989).
Attentional resource theories. A number of attentional resource theorieshave addressed prospective time judgment tasks, therefore it is useful to con-sider how such theories apply to the present task and data (e.g., Block &Zakay, 1997; Brown, 1997; Thomas & Cantor, 1978; Thomas & Weaver,1975). Virtually all of these approaches assume that performance in timejudgment tasks is determined by the amount of attentional resources that isallocated to the time dimension in a dual-task environment. That is, peopleare usually required to perform a nontemporal task while simultaneouslyrendering a time judgment. For example, one may judge pitches of successivetones or report colors of serially presented words as in a Stroop task (thenontemporal task) while also keeping track of passing time (e.g., Zakay,1998). Putative task competition permits assessments of attentional trade-offs: Greater attention to a nontemporal task means that fewer resources areallocated to an internal timer that is proposed to determine time judgments.

298 BARNES AND RIESS JONES
On the other hand, with little or no competition from a nontemporal task,maximal resources can be assigned to the internal timer that controls timejudgments (e.g., Zakay & Block, 1996, 1997; Zakay, 1989, 1993).
In the present research, we have departed from the dual-task constraintsby removing entirely any competition from a simultaneous nontemporal task.In principle, then, maximal resources can be allocated to prospective timejudgments. Thus, in the present case, the issue becomes one of assessing theapplicability of conventional resource models of time judgments to situationsin which to-be-judged time intervals are preceded by a context sequence.One possibility is that listeners will focus their attention simply on forthcom-ing standard and comparison intervals and ‘‘tune out’’ the preceding context;the argument for this strategy is that the constant length of induction se-quences enables listeners to successfully follow instructions to ‘‘ignore’’ thecontext IOIs. If this is the case, then predictions of an internal timer, a clockcounter, are straightforward; the internal timer will function optimally toassess the suprathreshold differences between standard and comparison timeintervals. To accomplish this, clock-counter models assume that a metro-nome fills each of the to-be-judged intervals with tics and a counter thenaccumulates the number, ni, of tics filling each interval, with a comparatorof the n1 and n2 values providing a response. In a single prospective time task,sans competition, we can assume maximal efficiency of the timer/counter forthese time intervals; consequently, such models predict a flat and uniformlyhigh PC profile across the different standard durations, if listeners allocateattention only to standard and comparison intervals. This would be true re-gardless of the rate of context sequences (i.e., 300-, 500-, and 600-ms IOIs).A second possibility is that listeners cannot ‘‘ tune out’’ the timing of thecontext sequence. This may be due, in part, to the fact that while they canallocate attention to an internal timer, they cannot allocate it in time to certaintime intervals (i.e., they cannot capitalize on the constant duration of a con-text sequence). It is also possible that the similarity of tone markers in theinduction sequence with those delimiting the standard prevent selective tar-geting of attention to standard and comparison time intervals. In either case,if people cannot focus attention on standard and comparison intervals, thenpredictions of the conventional approach are less straightforward. Resourcemodels have few provisions that enable meaningful prospective time judg-ments about standard and comparison time intervals as a function of contextstructure. This point is instructive, for it highlights an important limitationof resource models. In situations where, in principle, time estimations shouldbe optimal (because no competition exists), resource models cannot addresssystematic effects of a preceding temporal context. The reason is this: Unlikeentrainment models, which are sensitive to rate and rhythm of a contextpattern, clock-counter models are not sensitive to these properties of environ-mental events. In other words, clock counters cannot entrain to stimulusproperties. Although it might be possible to adapt such models to single-

ATTENTION AND TIME 299
task environments, such as this, by expressing sequence structure as a seriesof similar context IOIs (e.g., as a series of count estimates, ni), two problemsremain for such adaptations: (1) time intervals are expressed as interval codes(i.e., n1 and n2) and (2) no ‘‘look ahead’’ (i.e., temporal expectancy) functionis provided to explain the differential impact of a series of coded intervalson judgments of standard and comparison intervals. Even in dual-task envi-ronments, these models have encountered related problems because the tem-poral structure of material that fills a to-be-judged time interval systemati-cally affects time estimates (Boltz, 1991, 1993, 1998; Hirst, 1986; Klapp etal., 1985). In sum, our experiments add to the literature that question assump-tions and generality of attentional resource theories of time estimation.
Visual attention theories. Other approaches to attention have focusedlargely on responses to nontemporal visual events. Largely because we con-ceive of attending as involving timing, we have focused here on responsesto temporal auditory events (e.g., following Large & Jones, 1999). Mightfindings involving auditory events generalize to visual attention processes?While this question cannot be answered without further research, recent stud-ies point to numerous similarities between auditory and visual attentionalprocesses. Recently researchers have claimed that there is at least a partial(Mondor & Amirault, 1998) and perhaps a strong (Spence & Driver, 1996)link between the auditory and visual attention systems. Mondor and Zatorre(1995) demonstrated a number of similarities between auditory and visualattentional orienting; thus, attention may consume time (Mondor & Zatorre,1995) and can be allocated in external space (Mondor & Zatoree, 1995;Spence & Driver 1994) along a gradient (Mondor & Zatorre, 1995) analo-gous to that proposed for visual attention (e.g., La Berge & Brown, 1989).Relatedly, Rorden and Driver (1999) found that shifts of auditory attentionare sensitive to external spatial location and precede saccades to these loca-tions much as do shifts in visual attention.
If parallels between the two modalities are to be found, then do some ofthese extend to the stimulus control of attention? In visual attention, the issueof stimulus control is rarely studied using sequences of elements or enlistingtime estimation, so direct parallels between our task and those common tovisual attention do not exist. Nevertheless, in light of our findings, it is usefulto consider current disagreements about characteristics of stimulus-drivencontrol of visual attention (Egeth & Yantis, 1997; Folk & Remington, 1998;Theeuwes, 1991; Bacon & Egeth, 1994; Gibson & Kelsey, 1998; Gibson,1996). Two common descriptors of the phenomenon of capture, which isoften associated with stimulus-controlled attention, warrant comment. Onerelates to the persistence of the process (or lack thereof); in visual attentioncapture is often described as a brief and transient process which grabs atten-tion (Yantis & Jonides, 1990; Theeuwes et al., 1998). The other descriptorrelates to the particular stimulus property responsible for a capture of atten-tion, i.e., an abrupt onset of the item (Yantis & Hillstrom, 1994; Yantis &

300 BARNES AND RIESS JONES
Jonides, 1984; Jonides, 1981). Are persistence and abrupt onsets players inour paradigm where we claim that attention is controlled (in part) by thetime structure of a sequence? With regard to the influence of stimulus rate onattending, we have inferred an attentional persistence (evident in expectancyprofiles) of a periodic process that is not characteristic of the rapid transientprocess usually associated with attentional capture in visual attention tasks.That is, our results indicate that serial contexts which extend over severalinduction IOIs affect future attending to the standard and persist to affectjudgments about a comparison arriving 3 s later. Thus, we suggest that insome instances, attention can be driven by stimulus properties in ways thatare neither brief nor transient. What about abrupt onsets? Using the languageof visual attention, every tone in our tasks must be declared an abrupt-onsetitem. If we accept this, then in our tasks, the sequences involved may indeedpresent a series of abrupt onsets (each marking a time span); furthermore,these onsets may indeed have potential for affecting oscillator phase in waysthat are brief and transient such as the rapid and transient phase adjustmentsof the oscillator. At the same time, this issue becomes more interesting inauditory patterns because it is well known that some tone onsets in a se-quence are usually more effective at capturing attention (in this respect) thanothers, depending on the rhythm (e.g., Jones et al., 1982). Thus, the issueof abrupt onsets is surely relevant in understanding attending to auditoryevents, but it becomes more complicated.
Given the above discussion, direct parallels between phenomena studiedin visual attention and those at work in temporal sequences are risky. Never-theless, recent experiments involving attentional monitoring of visual se-quences suggest how dynamic stimulus control might operate in temporalsequences (Skelly et al., 1999); Skelly et al. found that the rhythmic structureof sequences of visual items differentially affected the speed with whichpeople judged successive letter pairs. To explain these findings, they specu-lated that two kinds of attentional control by stimulus properties may beobtained in any temporal sequence (auditory or visual). The first involvesattentional guidance by a local serial context to expected stimulus relation-ships. As in spatial tasks, where certain relational features of a spatial arraymay contribute to a control of attending in guided search (e.g., Wolfe, 1994),relational features of a temporal array of tones may guide attention to particu-lar points in time in temporal tasks. This kind of stimulus-controlled at-tending has persistence in that it involves attentional pacing; among otherthings, it involves stimulus time properties (e.g., rate and rhythm) that pre-cede a standard IOI. These are recurrent time relationships that appear topace attending via entrainment of an oscillator’s period (as discussed earlier).Attentional control of this sort involves low-level, temporally targeted expec-tancies; it is neither brief nor transient, but rather is pegged to context rate.The second aspect of stimulus-driven attention at work involves the natureof adaptive responses to unexpected, i.e., singular or surprising, stimulus

ATTENTION AND TIME 301
relationships. If we assume that entrainment involves the activity of one (ormore) oscillator, then temporal capture refers to an oscillator’s brief adaptiveresponse to an unexpected stimulus ending time. This may entail a brief andtransient activity which (given our earlier discussion of phase adaptation) isconnected to an oscillator’s phase adjustment (i.e., rather than the slowerperiod adjustment). In other words, phase adaptation instantiates a type oftemporal capture in that it is a dynamic adaptive process contingent upontemporally unexpected onsets (e.g., certain abrupt onsets), whereas periodadaptation (or lack thereof) instantiates a type of dynamic, context-sensitive,attentional pacing that assimilates expected onsets.
Clearly, the distinction between attentional pacing and temporal captureis more relevant to understanding attending to sequences in time than tosearching arrays in space. However, one visual attention task that falls intothe former category involves rapid serial visual presentation (RSVP) ofitems. In RSVP investigations, one goal of researchers is to estimate theduration required for processing successively presented items; experimentaltechniques rely on assessing interference effects that arise from a potentiallydisruptive items within fast sequences, sequences much faster than those wehave employed. However, processing time estimates derived from these andrelated tasks employing postitem masks range from 270 to 500 ms (Ray-mond, Shapiro, & Arnell, 1992; Duncan, Ward, & Shapiro, 1994; Duncan &Shapiro, 1996; Shapiro, Raymond, & Arnell, 1994; Chun 1997; Duncan,Martens, & Ward, 1997). Underlying these techniques is the assumption thatattentional processing time has a fixed value which can be measured indepen-dently of the time course (or pace) of the stimulus sequence itself (Chun,1997; Shapiro et al., 1994; Ward, Duncan, & Shapiro, 1997). Yet these esti-mates of processing time have varied from experiment to experiment. Wecannot rule out the possibility that such estimates are affected by variousaspects of sequence structure including the length of a sequence and its pre-sentation rate and/or rhythm. For instance, in some cases a sequential presen-tation involves a rhythmic pattern (Shapiro, et al., 1994), in others randomdurations involving brief sequences are involved (Duncan, Ward, & Shapiro,1994); still other designs use isochronous sequences of different rates (9.5s/item to 11 items/s) (Raymond et al., 1992; Ward et al., 1997). Perhapsthese factors contribute to the variability in estimates of processing time inRSVP tasks. Our perspective raises this possibility: Within limits, the paceof attending itself may be dependent on an established rate of environmentalchange.
Revisiting Expectancy
In proposing two aspects of stimulus-driven attending, namely attentionalpacing and temporal capture, we associate low-level expectancies with theattentional pacing aspect of an underlying entrainment activity, and temporalcapture refers to violations of these expectancies. We think this underscores

302 BARNES AND RIESS JONES
the usefulness of a dynamic attending account of expectancy which adds thetime dimension to a pattern-based approach to expectancy. This orientationmay have its most direct applicability in the auditory domain, where re-sponses to patterns of speech and music are sensitive to timing (e.g., Repp,1992, 1998). In fact, using musical events, Repp has shown that people de-velop real-time temporal expectancies about unfolding time intervals, appar-ently on the basis of both temporal and nontemporal aspects of musical struc-ture (e.g., rhythm, pitch change, and dynamics). Although he interpretsexpectancy determinants somewhat differently than we have, Repp’s dataindicate that listeners respond systematically to violations of temporal expec-tancies in ways consistent with our findings (e.g., Repp, 1999). Expectanciesthat arise in the auditory domain are often stimulus-driven in complex waysthat depend on pitch as well as on time relationships within a predisposingserial pattern context (cf. Jones, 1976). Although we have suggested thatthese expectancies are automatic (or passive) in the sense of Kahneman andTversky (1982), it is likely that these terms will finally prove too restrictivefor the entrainment approach that is outlined here.
At a general level, we think that a dynamic attending approach to expec-tancy conforms to popular intuitions about the way we relate to manychanges in our experienced environment. This is because expectancy typi-cally implies a future-oriented aspect of one’s attentional set. We expectwarm weather to come a few months hence. We expect a housemate to arrivehome from work in the evening. We expect a traffic light to change after somany seconds in the future. And, we expect the next note in a melody tosound a few hundreds of milliseconds in the future. Regardless of differencesin time scale, expectancies are conditional on time; they reflect anticipationsabout something that is destined to occur within some (broad or narrow)temporal neighborhood in the future. The present account attempts to capturethis qualitative aspect of expectancy.

ATTENTION AND TIME 303
APPENDIX AConfusion Matrix for Experiment 3 (Interval Condition)
Duration Comparison Mean response probabilitythe standard relative to
(in ms) the standard Short Same Long
524 Shorter .93 .07 .00524 Same .21 .73 .06524 Longer .02 .27 .70579 Shorter .77 .21 .01579 Same .19 .65 .16579 Longer .02 .3 .68600 Shorter .73 .25 .02600 Same .20 .58 .22600 Longer .07 .31 .63621 Shorter .66 .31 .03621 Same .12 .60 .27621 Longer .03 .33 .64676 Shorter .46 .47 .07676 Same .13 .51 .36676 Longer .03 .33 .64
APPENDIX BConfusion Matrix for Experiment 3 (Ratio Condition)
Duration of Comparison Mean response probabilitythe standard relative to
(in ms) the standard Short Same Long
524 Shorter .74 .22 .04524 Same .43 .49 .08524 Longer .05 .58 .38579 Shorter .78 .17 .05579 Same .16 .70 .14579 Longer .05 .34 .61600 Shorter .74 .19 .06600 Same .20 .66 .14600 Longer .07 .32 .61621 Shorter .73 .22 .05621 Same .12 .63 .24621 Longer .05 .29 .65676 Shorter .37 .59 .04676 Same .08 .53 .39676 Longer .03 .09 .87

304 BARNES AND RIESS JONES
APPENDIX CConfusion Matrix for Experiment 6 (524-ms Condition)
Duration of Comparison Mean response probabilitythe standard relative to
(in ms) the standard Short Same Long
448 Shorter .90 .09 .01448 Same .39 .54 .07448 Longer .05 .49 .46503 Shorter .91 .09 .01503 Same .28 .63 .10503 Longer .03 .37 .60524 Shorter .85 .14 .01524 Same .16 .69 .14524 Longer .04 .32 .64545 Shorter .73 .23 .04545 Same .09 .70 .21545 Longer .04 .19 .77600 Shorter .49 .43 .08600 Same .06 .63 .31600 Longer .02 .25 .73
APPENDIX DConfusion Matrix for Experiment 6 (676-ms Condition)
Duration of Comparison Mean response probabilitythe standard relative to
(in ms) the standard Short Same Long
600 Shorter .89 .11 .00600 Same .33 .61 .07600 Longer .09 .50 .42655 Shorter .86 .13 .01655 Same .21 .71 .08655 Longer .03 .42 .55676 Shorter .87 .13 .00676 Same .17 .71 .12676 Longer .03 .44 .52697 Shorter .80 .18 .02697 Same .11 .70 .18697 Longer .03 .33 .64752 Shorter .49 .46 .05752 Same .03 .66 .31752 Longer .02 .19 .79

ATTENTION AND TIME 305
REFERENCES
Anderson, G. J. (1990). Focused attention in three-dimensional space. Perception & Psycho-physics, 47, 112–120.
Bacon, W. F., & Egeth, H. E. (1994). Overriding stimulus-driven attentional capture. Percep-tion & Psychophysics, 55, 485–496.
Bamber, C. (1975). The area above the ordinal dominance graph and the area below the re-ceiver operating characteristic graph. Journal of Mathematical Psychology, 12, 387–415.
Block, R. A., & Zakay, D. (1997). Prospective and retrospective duration judgments: A meta-analytic review. Psychonomic Bulletin and Review, 4, 184–197.
Boltz, M. G. (1989). Rhythm and ’good endings’: effects of temporal structure on tonalityjudgments. Perception & Psychophysics, 46, 9–18.
Boltz, M. G. (1991). Time estimation and attentional perspective. Perception & Psychophysics,49, 422–433.
Boltz, M. G. (1993). The generation of temporal and melodic expectancies during musicallistening. Perception & Psychophysics, 53, 585–600.
Boltz, M. G. (1998). The processing of temporal and nontemporal information in the remem-bering of event durations and musical structure. Journal of Experimental Psychology:Human Perception and Performance, 24, 1087–1104.
Brown, S. W. (1997). Attentional resources in timing: Interference effects in concurrent tempo-ral and nontemporal working memory tasks. Perception and Psychophysics, 59, 1118–1140.
Chun, M. M. (1997). Types and tokens in visual processing: A double dissociation between theattentional blink and repetition blindness. Journal of Experimental Psychology: HumanPerception and Performance, 23, 738–755.
Church, R. M., & Broadbent, H. A. (1990). Alternative representations of time, number, andrate. Cognition, 37, 55–81.
Clemen, R. T. (1996). Making hard decisions: An introduction to decision analysis (2nd ed.).Belmont, CA: Duxbury Press.
Cutler, A. (1976). Phoneme-monitoring reaction time as a function of preceding intonationcontour. Perception and Psychophysics, 20, 55–60.
Davison, T. C., & Jagacinski, R. J. (1977). Nonparametric analysis of signal detection confi-dence ratings. Behavior Research Methods & Instrumentation, 9, 545–546.
Desain, P. (1992). A (de) composable theory of rhythm perception. Music Perception, 9, 439–454.
DeWitt, L. A. & Samuel, A. G. (1990) The role of Knowledge-based expectations in musicperception: Evidence from musical restoration. Journal of Experimental Psychology:General, 119, 123–144.
Derks, P. L. (1963). Effects of run length on ‘‘Gambler’s Fallacy.’’ Journal of ExperimentalPsychology, 65, 213–214.
Dowling, W. J., Lung, K. M., & Herrbold, S. (1987). Aiming attention in pitch and time inthe perception of interleaved melodies. Perception and Psychophysics, 4, 642–656.
Downing, C. J. (1988). Expectancy and visual-spatial attention: Effects on perceptual quality.Journal of Experimental Psychology: Human Perception and Performance, 14, 188–202.
Drake, C. & Botte, M. (1993). Tempo sensitivity in auditory sequences: Evidence for a multi-ple-lode model. Perception and Psychophysics, 54, 277–286.

306 BARNES AND RIESS JONES
Duncan, J., Martens, S., & Ward, R. (1997). Restricted attentional capacity within but notbetween sensory modalities. Nature, 387, 808–810.
Duncan, J., Ward, R., & Shapiro, K. (1994). Direct measurement of attentional dwell time inhuman vision. Nature, 369, 313–315.
Egeth, H., & Yantis, S. (1997). Visual attention: Control, representation, and time course. InJ. T. Spence, J. M. Darley, & D. J. Foss (Eds.), Annual review of psychology (pp. 269–297). Palo Alto, CA: Annual Reviews.
Folk, C. L., & Remington, R. (1998). Selectivity in distraction by irrelevant featural singletons:Evidence for two forms of attentional capture. Journal of Experimental Psychology: Hu-man Perception and Performance, 24, 847–858.
Fraisse, P. (1948). Les erreurs constantes dans la reproduction de courts intervalles temporels.Archives de Psychologie, 32, 161–176.
Fraisse, P. (1982). Rhythm and tempo. In D. Deustch (Ed), The psychology of music. (pp.149–179). New York: Academic Press.
Friedman, D., Hakerem, G., Sutton, S., & Fleiss, J. (1973). Effect of stimulus uncertainty onthe pupillary dilation response and the vertex evoked potential. Electroencephalographyand Clinical Neurophysiology, 34, 475–485.
Garner, W. R. (1974). The processing of information and structure. Potomac, MD: Erlbaum.
Gibbon, J., & Church, R. M. (1990). Representation of time. Cognition, 37, 23–54.
Gibson, B. S. (1996). Visual quality and attentional capture: A challenge to the special roleof abrupt onsets. Journal of Experimental Psychology, 22, 1496–1504.
Gibson, B. S., & Jiang, Y. (1998). Surprise! An unexpected color singleton does not captureattention in visual search. Psychological Science, 9, 176–182.
Gibson, B. S., & Kelsey, E. M. (1998). Stimulus-driven attentional capture is contingent onattentional set for displaywide visual features. Journal of Experimental Psychology: Hu-man Perception and Performance, 24, 699–706.
Goldstone, S., Lhamon, W. T., & Boardman, W. K. (1957). The time sense: Anchor effectsand apparent duration. The Journal of Psychology, 44, 145–153.
Goldstone, S., Boardman, W. K., & Lhamon, W. T. (1959). Intersensory comparisons of tem-poral judgments. Journal of Experimental Psychology, 57, 243–248.
Gratton, G., Coles, M. G., & Donchin, E. (1992). Optimizing the use of information: Strategiccontrol of activation of responses. Journal of Experimental Psychology: General, 121,480–506.
Greenberg, G. Z., & Larkin, W. D. (1968). Frequency-response characteristic of auditory ob-servers detecting signals of a single frequency in noise: The probe-signal method. TheJournal of the Acoustical Society of America, 44, 1513–1523.
Halpern, A. R., & Darwin, C.J. (1982). Duration discrimination in a series of rhythmic events.Perception & Psychophysics, 31, 86–89.
Hafter, E. R., & Schlauch, R. S. (1991). Cognitive factors and selection of auditory listeningbands. In A. L. Danar, D. Henderson, R J. Salvi, & R. P. Hammernik (Eds.), Noiseinduced hearing loss (pp. 303–310). Philadelphia, PA: Dederer.
Hellstrom, A. (1977) Time errors are perceptual: An experimental investigation of durationand a quantitative successive-comparison model. Psychological Research, 39, 345–388.
Hellstrom, A. (1985) The time-order error and its relatives: Mirrors of cognitive processes incomparing. Psychological Bulletin, 97, 35-61.
Hirst, W. (1986). The psychology of attention. In J. E. LeDoux & W. Hirst (Eds.), Mind andbrain: Dialogues in cognitive neuroscience (pp. 105–141). New York: Cambridge UnivPress.

ATTENTION AND TIME 307
Hollingworth, H. L. (1910). The central tendency of judgment. Journal of Philosophy, 7, 461–468.
Howard, J. H., Jr., O’Toole, A.J., Parasuraman, R., & Bennett, K. B. (1984). Pattern-directedattention in uncertain-frequency detection. Perception and Psychophysics, 35, 256–264.
Ivry, R. B., & Hazeltine, R. E. (1995). Perception and production of temporal intervals acrossa range of durations: Evidence for a common timing mechanism. Journal of ExperimentalPsychology: Human Perception and Performance, 21, 3–18.
Jamieson, D. G., & Petrusic, W. M. (1975). The dependence of time-order error direction onstimulus range. Canadian Journal of Psychology, 29, 175–182.
Jarvik, M. (1951). Probability learning and a negative recency effect in the serial anticipationof alternative symbols. Journal of Experimental Psychology, 41, 291–297.
Johnson, R., Jr., & Donchin, E. (1982). Sequential expectancies and decision making in achanging environment: An electrophysiological approach. Psychophysiology, 19, 183–200.
Johnson, D. M., & Hafter, E. R. (1980). Uncertain-frequency detection: Cuing and conditionof observation. Perception and Psychophysics, 28, 143–149.
Jones, M. R. (1971). From probability learning to sequential processing: A critical review.Psychological Bulletin, 76, 153–185.
Jones, M. R. (1974). Cognitive representations of serial patterns. In B. H. Kantowitz (Ed.),Human information processing: Tutorials in performance and cognition. Potomac, MD:Erlbaum.
Jones, M. R. (1976). Time, our lost dimension: Toward a new theory of perception, attention,and memory. Psychological Review, 83, 323–335.
Jones, M. R. (1978). Auditory patterns. In E.C. Carterett & M.P. Friedman (Eds.), Handbookof perception: Space and object perception (Vol. 8, pp. 255–288) New York: AcademicPress.
Jones, M. R. (1981). A tutorial on some issues and methods in serial pattern research. Percep-tion and Psychophysics, 30, 492-504.
Jones, M. R. (1988). What is an expectancy? Behavioral and Brain Sciences, 11, 387–388.
Jones, M. R., & Boltz, M. G. (1989). Dynamic attending and responses to time. PsychologicalReview, 96, 459–491.
Jones, M. R., Boltz, M. G., & Klein, J. M. (1993). Expected endings and judged duration.Memory and Cognition, 21, 646–665.
Jones, M. R., Boltz, M. G., & Kidd, G. (1982). Controlled attending as a function of melodicand temporal context. Perception & Psychophysics, 32, 211–218.
Jones, M. R., & McAuley, D. J. (2000). Categorical time judgments in extended temporalcontexts. Manuscript under review.
Jones, M. R., & Yee, W. (1997). Sensitivity to time change: The role of context and skill.Journal of Experimental Psychology: Human Perception & Performance, 23, 693–709.
Jonides, J. (1981). Voluntary versus automatic control over the mind’s eye’s movement. InJ. B. Long & A. D. Baddeley (Eds.), Attention and performance (9th ed., pp. 187–203).Hillsdale, NJ: Erlbaum.
Jonides, J., & Yantis, S. (1988). Uniqueness of abrupt visual onset in capturing attention.Perception & Psychophysics, 43, 346–354.
Kahneman, D., Treisman, A., & Gibbs, B. (1992). The reviewing of object files: Object-specific integration of information. Cognitive Psychology, 24, 175–219.
Kahneman, D. (1973). Attention and effort. Englewood Cliffs, NJ: Prentice-Hall.
Kahneman, D., & Tversky, A. (1982). Variants of uncertainty. Cognition, 11, 143–157.

308 BARNES AND RIESS JONES
Keele, S., Nicoletti, R., Ivery, R., & Pokorny, R. (1989). Mechanisms of perceptual timing:Beat-based or interval-based judgments? Psychological Research, 50, 251–256.
Klapp, S. T., Hill, M. D., Tyler, J. G., Martin, Z. E., Jagacinski, R. J., & Jones, M. R. (1985).On marching to two different drummers: Perceptual aspects of the difficulties. Journalof Experimental Psychology: Human Perception and Performance, 11, 814–827.
Klein, J. M., & Jones, M. R. (1996). Effects of attentional set and rhythmic complexity onattending. Perception and Psychophysics, 58, 34–46.
La Berge, D., & Brown, V. (1989).Theory of attentional operations in shape identification.Psychological Review, 96, 101–124.
Large, E.W. (1994). Dynamic representation of musical structure. Unpublished Ph.D. disserta-tion, The Ohio State University.
Large, E. W., & Jones, M. R. (1999). The dynamics of attending: How we track time varyingevents. Psychological Review, 106, 119–159.
Large, E. W., & Kolen, J. F. (1995) Resonance and the perception of musical meter. Connec-tion Science, 6, 177–208.
Leek, M. R. (1987). Directed attention in complex serial patterns. In W. A. Yost & C. S.Watson (Eds.), Auditory and visual pattern recognition (pp. 278–288). Hillsdale, NJ:Erlbaum.
Martin, J. G. (1972). Rhythmic (hierarchical) versus serial structure in speech and other behav-ior. Psychological Review, 79, 487–509.
Matt, J., Leuthold, H., & Sommer, W. (1992). Differential effects of voluntary expectancieson reaction times and eventrelated potentials: Evidence for automatic and controlled ex-pectancies. Journal of Experimental Psychology: Learning, Memory, and Cognition, 18,810–822.
McAuley, D. J. (1995). Perception of time as phase: Toward an adaptive-oscillator model ofrhythmic pattern processing. Unpublished dissertation, Indiana university.
McAuley, D. J., & Jones, M. R. (1998, November). Temporally-directed attending in judg-ments of time and tempo. Poster session presented at the annual meeting of the Psy-chonomic Society, Texas.
McAuley, D. J., Jones, M.R., & Barnes, R. (2000). Time judgments: A comparative analysisof time estimation theories. Manuscript in preparation.
McAuley, D. J., & Kidd, G. R. (1998). Effect of deviations from temporal expectations ontempo discrimination of isochronous tone sequences. Journal of Experimental Psychol-ogy: Human Perception and Performance, 24, 1786–1800.
Michels, W. C., & Helson, H. (1954). A quantitative theory of time-order effects. AmericanJournal of Psychology, 67, 327–334.
Michon, J. A., & Jackson, J. L. (1985). Introduction: The psychology of time. In J. A.Michon & J. L. Jackson (Eds.), Time, mind, and behavior (pp. 2–17). Berlin: Springer-Verlag.
Mondor, T. A., & Amirault, K. J. (1998). Effect of same- and different-modality spatial cueson auditory and visual target identification. Journal of Experimental Psychology: HumanPerception and Performance, 24, 745–755.
Mondor, T. A., & Zatorre, R. J. (1995). Shifting and focusing auditory spatial attention. Jour-nal of Experimental Psychology: Human Perception and Performance, 21, 387–409.
Narmour, E. (1992). The influence of embodied registral motion on the perception of higher-level melodic implication. In M. R. Jones & S. Holleran (Eds.), Cognitive bases of musicalcommunication (pp. 69–90). Washington, DC: American Psychological Association.
Pollack, I., Norman, D. A., & Galanter, E. (1964). An efficient non-parametric analysis ofrecognition memory. Psychonomic Science, 1, 327–328.
ATTENTION AND TIME 309
Posner, M. I. (1980). Orienting of attention. Quarterly Journal of Experimental Psychology,32, 3–25.
Posner, M. I., Snyder, C. R., & Davidson, B. J. (1980). Attention and the detection of signals.Journal of Experimental Psychology: General, 109, 160–174.
Raymond, J. E., Shapiro, K. L., & Arnell, K. M. (1992). Temporary suppression of visualprocessing in an RSVP task: An attentional blink? Journal of Experimental Psychology:Human Perception and Performance, 18, 849–860.
Reber, A. S. (1989). Implicit learning and tacit knowledge. Journal of Experimental Psychol-ogy: General, 118, 219–235.
Reeves, A., & Sperling, G. (1986). Attention gating in short-term visual memory. Psychologi-cal Review, 93, 180–206.
Remington, R. W., Johnston, J. C., & Yantis, S. (1992). Involuntary attentional capture byabrupt onsets. Perception & Psychophysics, 51, 279–290.
Repp, B. H. (1992). Probing the cognitive representation of musical time: Structural constraintson the perception of timing perturbations. Cognition, 44, 241–281.
Repp, B. H. (1998). Obligatory ‘expectations’ of expressive timing induced by perception ofmusical structure. Psychological Resources, 61, 33–43.
Repp, B. H. (1999). Detecting deviations from metronomic timing in music: Effects of percep-tual structure on the mental timekeeper. Perception & Psychophysics, 61, 529–548.
Restle, F. (1970). Theory of serial pattern learning: Structural trees. Psychological Review,77, 481–495.
Rorden, C., & Driver, J. (1999) Does auditory attention shift in the direction of an upcomingsaccade? Neurophychologia, 37, 357–377.
Shapiro, K. L., Raymond, J. E., & Arnell, K. M. (1994). Attention to visual pattern informationproduces the attentional blink in rapid serial visual presentation. Journal of ExperimentalPsychology: Human Perception and Performance, 20, 357–371.
Shields, J. L., McHugh, A., & Martin, J. G. (1974). Reaction time to phoneme targets as afunction of rhythmic cues in continuous speech. Journal of Experimental Psychology,102, 250–255.
Shulman, G. L., Remington, R. W., & McLean, J. P. (1979). Moving attention through visualspace. Journal of Experimental Psychology: Human Perception and Performance, 5,522–526.
Simon, H. A., & Kotovsky, K. (1963). Human acquisition of concepts for sequential patterns.Psychological Review, 70, 534–546.
Skelly, J. J., Jones, M. R., Goodyear, C. D., & Roe, M. M. (1999). Attentional pacing andtemporal capture in slow visual sequences. Unpublished manuscript.
Sommer, W. M., & Leuthold, H. (1990). Consciousness of attention and expectancy as re-flected in event-related potentials and reaction times. Journal of Experimental Psychol-ogy: Learning, Memory, and Cognition, 16, 902–915.
Sorkin, R. D. (1982). Temporal factors in the discrimination of tonal sequences. Journal ofthe Acoustical Society of America, 82, 1218–1226.
Sorkin, R. D., & Montgomery, D. A. (1991). Effect of time compression and expansion onthe discrimination of tonal patterns. Journal of the Acoustical Society of America, 90,846–857.
Spence, C. J., & Driver, J. (1994). Covert spatial orienting in audition: Exogenous and endoge-nous mechanisms. Journal of Experimental Psychology: Human Perception and Perfor-mance, 20, 555–574.
Spence, C. J., & Driver, J. (1996). Audiovisual links in endogenous covert spatial attention.
310 BARNES AND RIESS JONES
Journal of Experimental Psychology: Human Perception and Performance, 22, 1005–1030.
Spiegel, M. F., & Watson, C. S. (1981). Factors in the discrimination of tonal patterns. III.frequency discrimination with components of well-learned patterns. Journal of the Acous-tical Society of America, 69, 223–235.
Theeuwes, J. (1991). Exogenous and endogenous control of attention: The effect of visualonsets and offsets. Perception & Psychophysics, 49, 83–90.
Theeuwes, J. (1992). Perceptual selectivity for color and form. Perception & Psychophysics,51, 599–606.
Theeuwes, J., Kramer, A. F., Hahn, S., & Irwin, D. E. (1998). Our eyes do not always gowhere we want them to go: Capture of the eyes by new objects. Psychological Science,9, 379–385.
Thomas, E. A., & Cantor, N. E. (1978). Interdependence between the processing of temporaland non-temporal information. In J. Requin (Ed.), Attention and performance (7th ed.,pp. 43–62). Hillsdale, NJ: Erlbaum.
Thomas, E., & Weaver, W. (1975). Cognitive processing and time perception. Perception andPsychophysics, 17, 363–367.
Todd, B., Boltz, M., & Jones, M. R. (1989). The midilab auditory research system. Psycho-musicology, 8, 17–30.
Treisman, A. (1991). Search, similarity, and integration of features between and within dimen-sions. Journal of Experimental Psychology: Human Perception and Performance, 17,652–676.
Tueting, P., Sutton, S., & Zubin, J. (1971). Quantitative evoked potential correlates of theprobability of events. Psychophysiology, 7, 385–394.
Turchioe, R. M. (1948). The relation of adjacent inhibitory stimuli to the central tendencyeffect. The Journal of General Psychology, 39, 3–14.
Viervordt, K. (1868). Der Zeitsinn nach Versuchen. [The time-sense according to experi-ments]. Tubingen, Germany: H. Laupp.
Ward, R., Duncan, J., & Shapiro, K. (1996). The slow time-course of visual attention. Cogni-tive psychology, 30, 79–109.
Ward, L. M., & Mori, S. (1996). Attention cuing aids in auditory intensity resolution. TheJournal of the Acoustical Society of America, 100, 1722–1727.
Wolfe, J. M. (1994). Guided search 2.0: A revised model of visual search. Psychonomic Bulle-tin and Review, 1, 202–238.
Wolfe, J. M. (1998). What can 1 million trials tell us about visual search? PsychologicalScience, 9, 33–39.
Woodrow, H. (1951). Time perception. In H. S. Langfeld (Ed.), Handbook of experimentalpsychology (pp. 1224–1236). New York: Wiley.
Wright, B. A., & Dai, H. (1994). Detection of unexpected tones with short and long durations.Journal of the Acoustical Society of America, 95, 931–938.
Yantis, S., & Hillstrom, A. P. (1994). Stimulus-driven attentional capture: Evidence fromequiluminant visual objects. Journal of Experimental Psychology: Human Perceptionand Performance, 20, 95–107.
Yantis, S., & Jonides, J. (1984). Abrupt visual onsets and selective attention: Evidence fromvisual search. Journal of Experimental Psychology: Human Perception and Performance,10, 601–621.
Yantis, S., & Jonides, J. (1990). Abrupt visual onsets and selective attention: Voluntary versus

ATTENTION AND TIME 311
automatic allocation. Journal of Experimental Psychology: Human Perception and Per-formance, 16, 121–134.
Zakay, D. (1989). Subjective time and attentional resource allocation: An integrated modelof time estimation. In I. Levin & D. Zakay (Eds.), Time and human cognition: A life-span perspective (pp. 365–397). Amsterdam: North–Holland.
Zakay, D. (1998). Attention allocation policy influences prospective timing. Psychonomic Bul-letin and Review, 5, 114–118.
Zakay, D., & Block, R. A. (1996). The role of attention in time estimation Processes. InM. A. Pastor & J. Artieda (Eds.), Time, internal clocks and movement (pp. 143–164).Amsterdam: North–Holland.
Zakay, D., & Block, R. A. (1997). Temporal cognition. Current Directions in PsychologicalScience, 6, 12–16.
(Accepted March 3, 2000)