Measuring attention in the hemispheres: The lateralized attention network test (LANT
11
Measuring attention in the hemispheres: The lateralized attention network test (LANT) Deanna J. Greene a, * , Anat Barnea b , Kristin Herzberg a,1 , Anat Rassis b , Maital Neta a,2 , Amir Raz c,3 , Eran Zaidel a a Department of Psychology, University of California, Los Angeles, 1285 Franz Hall, Los Angeles, CA 90095-1563, USA b Bio-Keshev Institute, Kibutz Givat Chaim Ichud, Israel c MRI Unit in the Department of Psychiatry, Columbia University, College of Physicians and Surgeons and New York State Psychiatric Institute, NY, USA Accepted 4 May 2007 Abstract The attention network test (ANT) is a brief computerized battery measuring three independent behavioral components of attention: Conflict resolution (ability to overcome distracting stimuli), spatial Orienting (the benefit of valid spatial pre-cues), and Alerting (the benefit of temporal pre-cues). Imaging, clinical, and behavioral evidence demonstrate hemispheric asymmetries in these attentional net- works. We constructed a lateralized version of the ANT (LANT), with brief targets flashed in one or the other visual hemifield. We also modified the tests by including invalid spatial cues in order to measure the cost component of Orienting. In a series of experiments, we investigated the efficiency of the attention networks separately in each hemisphere. Participants exhibited significant estimates of all net- works measured by the LANT, comparable to the ANT. The three networks were represented in each hemisphere separately and were largely comparable across the two hemispheres. We suggest that the LANT is an informative extension of the original ANT, allowing for measurement of the three attention networks in each hemisphere separately. Ó 2007 Elsevier Inc. All rights reserved. Keywords: Attention; Conflict; Executive; Orienting; Vigilance; Hemispheric specialization; Hemispheric independence 1. Introduction Attention is believed to involve a bilaterally distributed network whose components are asymmetrically repre- sented in the two hemispheres. Physiological/imaging cor- relates of attention show that sustained attention (vigilance) tasks yield prefrontal and parietal activation, preferentially in the right hemisphere (RH) (Posner & Pet- ersen, 1990). Stroop and flanker-type conflict resolution tasks selectively engage the anterior cingulate cortex and left prefrontal cortex (Fan, Flombaum, McCandliss, Tho- mas, & Posner, 2003). Orienting of visuospatial attention selectively engages right parietal cortex (Corbetta, Kin- cade, Ollinger, McAvoy, & Shulman, 2000). Clinical and behavioral evidence is largely consistent with the imaging data. Clinical studies confirm that the RH is specialized for alerting, arousal and vigilance (Posner & Petersen, 1990). Hemi-neglect is more often reported and more severe in patients with right than left parietal lesions (for a review, see Mesulam, 1999). Further, normal and split- brain participants demonstrate a gradient of attention from right to left, occurring in diverse tasks of spatial attention, namely covert spatial orienting (Zaidel, 1995), line-bisec- tion (Reuter-Lorenz, Kinsbourne, & Moscovitch, 1990), and visual search (Pollmann, 1996; Pollmann & Zaidel, 0278-2626/$ - see front matter Ó 2007 Elsevier Inc. All rights reserved. doi:10.1016/j.bandc.2007.05.003 * Corresponding author. Fax: +1 310 206 3655. E-mail address: [email protected] (D.J. Greene). 1 Current address: University at Albany, State University of New York, Department of Psychology, Albany, NY, USA. 2 Current address: Department of Psychological & Brain Sciences, Dartmouth College, Hanover, NH, USA. 3 Current address: McGill University and Sir Mortimer B. Davis – Jewish General Hospital, Institute of Community and Family Psychiatry, Montreal, Quebec, Canada. www.elsevier.com/locate/b&c Brain and Cognition xxx (2007) xxx–xxx ARTICLE IN PRESS Please cite this article in press as: Greene, D. J. et al., Measuring attention in the hemispheres: The lateralized ..., Brain and Cognition (2007), doi:10.1016/j.bandc.2007.05.003
-
Upload
independent -
Category
Documents
-
view
0 -
download
0
Transcript of Measuring attention in the hemispheres: The lateralized attention network test (LANT

ARTICLE IN PRESS
www.elsevier.com/locate/b&c
Brain and Cognition xxx (2007) xxx–xxx
Measuring attention in the hemispheres: The lateralizedattention network test (LANT)
Deanna J. Greene a,*, Anat Barnea b, Kristin Herzberg a,1, Anat Rassis b,Maital Neta a,2, Amir Raz c,3, Eran Zaidel a
a Department of Psychology, University of California, Los Angeles, 1285 Franz Hall, Los Angeles, CA 90095-1563, USAb Bio-Keshev Institute, Kibutz Givat Chaim Ichud, Israel
c MRI Unit in the Department of Psychiatry, Columbia University, College of Physicians and Surgeons and New York State Psychiatric Institute, NY, USA
Accepted 4 May 2007
Abstract
The attention network test (ANT) is a brief computerized battery measuring three independent behavioral components of attention:Conflict resolution (ability to overcome distracting stimuli), spatial Orienting (the benefit of valid spatial pre-cues), and Alerting (thebenefit of temporal pre-cues). Imaging, clinical, and behavioral evidence demonstrate hemispheric asymmetries in these attentional net-works. We constructed a lateralized version of the ANT (LANT), with brief targets flashed in one or the other visual hemifield. We alsomodified the tests by including invalid spatial cues in order to measure the cost component of Orienting. In a series of experiments, weinvestigated the efficiency of the attention networks separately in each hemisphere. Participants exhibited significant estimates of all net-works measured by the LANT, comparable to the ANT. The three networks were represented in each hemisphere separately and werelargely comparable across the two hemispheres. We suggest that the LANT is an informative extension of the original ANT, allowing formeasurement of the three attention networks in each hemisphere separately.� 2007 Elsevier Inc. All rights reserved.
Keywords: Attention; Conflict; Executive; Orienting; Vigilance; Hemispheric specialization; Hemispheric independence
1. Introduction
Attention is believed to involve a bilaterally distributednetwork whose components are asymmetrically repre-sented in the two hemispheres. Physiological/imaging cor-relates of attention show that sustained attention
(vigilance) tasks yield prefrontal and parietal activation,preferentially in the right hemisphere (RH) (Posner & Pet-
0278-2626/$ - see front matter � 2007 Elsevier Inc. All rights reserved.
doi:10.1016/j.bandc.2007.05.003
* Corresponding author. Fax: +1 310 206 3655.E-mail address: [email protected] (D.J. Greene).
1 Current address: University at Albany, State University of New York,Department of Psychology, Albany, NY, USA.
2 Current address: Department of Psychological & Brain Sciences,Dartmouth College, Hanover, NH, USA.
3 Current address: McGill University and Sir Mortimer B. Davis –Jewish General Hospital, Institute of Community and Family Psychiatry,Montreal, Quebec, Canada.
Please cite this article in press as: Greene, D. J. et al., Measuring atte(2007), doi:10.1016/j.bandc.2007.05.003
ersen, 1990). Stroop and flanker-type conflict resolution
tasks selectively engage the anterior cingulate cortex andleft prefrontal cortex (Fan, Flombaum, McCandliss, Tho-mas, & Posner, 2003). Orienting of visuospatial attention
selectively engages right parietal cortex (Corbetta, Kin-cade, Ollinger, McAvoy, & Shulman, 2000). Clinical andbehavioral evidence is largely consistent with the imagingdata. Clinical studies confirm that the RH is specializedfor alerting, arousal and vigilance (Posner & Petersen,1990). Hemi-neglect is more often reported and moresevere in patients with right than left parietal lesions (fora review, see Mesulam, 1999). Further, normal and split-brain participants demonstrate a gradient of attention fromright to left, occurring in diverse tasks of spatial attention,namely covert spatial orienting (Zaidel, 1995), line-bisec-tion (Reuter-Lorenz, Kinsbourne, & Moscovitch, 1990),and visual search (Pollmann, 1996; Pollmann & Zaidel,
ntion in the hemispheres: The lateralized ..., Brain and Cognition

2 D.J. Greene et al. / Brain and Cognition xxx (2007) xxx–xxx
ARTICLE IN PRESS
1998). Thus, hemispheric contributions are elementary andshould be incorporated to any account of attention in thebrain.
Attention has been described as a system comprising atleast three separate and independent networks: executiveConflict resolution (C), spatial Orienting (O), and Alerting(A) (Posner & Raichle, 1994). Posner and associatesdevised a brief computerized battery, the attention networktest (ANT), to measure the efficiency of these attentionalnetworks (Fan, McCandliss, Sommer, Raz, & Posner,2002). Studies using the ANT have proven it to be a reli-able measure, capable of indexing the three networks inde-pendently of one another (Fan, McCandliss, Flombaum, &Posner, 2001; Fan, Wu, Fossella, & Posner, 2001; Fossella,Posner, Fan, Swanson, & Pfaff, 2002; Fossella et al., 2002).FMRI studies of the ANT confirm that it activates threelargely orthogonal networks (Fan et al., 2001; Fan,McCandliss, Fossella, Flombaum, & Posner, 2005). ThefMRI foci of the Conflict network show anterior cingulatecortex (ACC) and prefrontal cortex (PFC) activation; theOrienting network shows parietal activation; and the Alert-ing network shows fronto-parietal cortical activation inaddition to thalamic activation. Pharmacological studies(Marocco & Davidson, 1998) have related each of the net-works predominantly to a specific chemical neuromodula-tor: ACC and lateral PFC are target areas of themesocortical dopamine system, involved in C; cholinergicsystems arising in the basal forebrain play an importantrole in O; and the norepinephrine system arising in thelocus coeruleus of the midbrain is involved in A.
Roberts, Summerfield, and Hall (2006) directly com-pared auditory and visual presentations of the ANT, andCallejas, Lupianez, Funes, and Tudela (2005) studiedmixed modalities, utilizing auditory cues to index A andvisual cues to index O. However, neither of these studiesaddressed hemispheric differences in attention. Konradet al. (2005) modified the ANT by presenting the targetstimuli to the left and right of fixation in order to resembletypical cueing paradigms. However, the stimuli were notflashed briefly to one visual field, and the authors did notexamine visual field as a factor in their analysis.
The goal of this paper is to describe an adaptation of theANT to lateralized presentations. The lateralized ANT(LANT) is aimed at assessing the attentional capacity ofeach hemisphere and the hemispheric status of each net-work. Our goal was to first provide a battery that success-fully measures each component of attention (C, O, and A)separately in each hemisphere. Once this was achieved, wemodified the LANT to improve the task in a second exper-iment. In both experiments, we investigated the indepen-dence of all the networks, the reliability of the tests, andthe attentional capabilities of each hemisphere.
2. Experiment 1
By rotating the ANT stimuli 90� and using tachisto-scopic presentation, we developed a variation of the task
Please cite this article in press as: Greene, D. J. et al., Measuring atte(2007), doi:10.1016/j.bandc.2007.05.003
to assess the three attentional networks in each hemisphere.In the present experiment, we compared performance ofnormal participants on the ANT to the LANT and to thedata reported by Fan et al. (2002). One issue addressed isthe capacity for each hemisphere to support each atten-tional network. Another is the hemispheric specializationfor the component networks. In addition, we further exam-ined the alleged independence of the networks and the reli-ability of the measures.
2.1. Methods
2.1.1. Participants
Twenty-three right-handed young Israeli adults (11 menand 12 women) volunteered to participate in the experi-ment. None had a psychiatric or neurological history,learning disability or attention deficit, assessed by self-report. Handedness was evaluated with a modified versionof the Edinburgh Handedness Inventory (Oldfield, 1971).
2.1.2. Apparatus
Stimuli were presented via E-Prime on an IBM-compat-ible Pentium III personal computer, with a 733 MHz CPU,running Windows 98. Stimuli were presented on a 1500
MAG X3770 monitor with a refresh rate of 85 Hz and aresolution of 1024 · 768 pixels. Participants viewed thescreen from a distance of 57 cm, and responses were col-lected unimanually from a computer mouse placed in frontof the subject at midline.
2.1.3. Stimuli
Attention Network Test (ANT) targets consisted of aleftward or a rightward arrow centered 1.06� of visualangle above or below the fixation. This target arrow wasflanked on each side by two arrows in the same direction(congruent condition), in the opposite direction (incongru-ent condition), or by lines without arrowheads (neutralcondition). The participants’ task was to identify the direc-tion of the centrally presented arrow. A single arrow or linesubtended 0.55� of visual angle, and the contours of adja-cent arrows or lines were separated by 0.06� of visual angle.The stimuli (one central arrow plus four flankers) sub-tended a total of 2.99� of visual angle.
Targets were preceded by one of four types of cues: nocue, center cue, double cue, or a valid spatial cue. Forthe no-cue trials, participants saw only a fixation. For thecenter-cue trials, participants were shown an asterisk atthe location of the center fixation cross. For the double-cue trials, there were two asterisks corresponding to thetwo possible target locations—up and down. For thevalid-cue trials, the cue was at the target position.
Performance in the incongruent-flanker condition minusperformance in the congruent-flanker condition defined theConflict (C) or executive component of attention. Alerting(A) was defined as performance in the no-cue conditionminus performance in the double-cue condition. Orienting
ntion in the hemispheres: The lateralized ..., Brain and Cognition

D.J. Greene et al. / Brain and Cognition xxx (2007) xxx–xxx 3
ARTICLE IN PRESS
(O) was defined as performance in the center-cue conditionminus performance in the valid-cue condition.
Each trial consisted of five events. First, there was a fix-ation period for a random variable duration (400–1600 ms). Then, the warning cue was presented for100 ms. There was a short fixation period for 400 ms afterthe warning cue and then the target and flankers appearedsimultaneously. The target and flankers remained on thescreen until the participant responded, but for no longerthan 1700 ms. After participants made a response, the tar-get and flankers disappeared immediately and there was apost-target fixation period for a variable duration, whichwas based on the duration of the first fixation and reactiontime (RT) (3500 ms minus duration of the first fixationminus RT). After this interval, the next trial began. Eachtrial lasted for a total of 4000 ms. The fixation cross waspresent at the center of the screen during the entire trial.
Fig. 1 displays the experimental procedure for theLANT. This simple variation of the ANT rotates eachstimulus display 90� clockwise to present lateralized tar-gets. Thus, targets consisted of an upward or a downwardarrow centered 1.15� of visual angle to the right or left offixation. Each single arrow or line subtended 0.57� of visualangle, and the contours of adjacent arrows or lines wereseparated by 0.06� of visual angle. The entire stimuli (onecentral arrow plus four flankers) subtended a total 3.09�of visual angle. Each trial began with a fixation period of150 ms, followed by the presentation of the warning cuefor 100 ms. Then there was a fixation period for 750 ms,after which the target stimulus was flashed for 170 ms inorder to isolate the information to one hemisphere. Next,there was a 1500 ms response period that ended once par-ticipants responded. Finally, there was another fixationperiod of 1000 ms. Each trial lasted a variable length rang-ing from 2235 ms (the fastest response)—3670 ms, depend-ing on response time.
2.1.4. Design
The ANT had a 3 (Flanker type: neutral, congruent,incongruent) · 4 (Cue type: none, center, double, valid)factorial design. The LANT had a 3 (Flanker type: neutral,
Fig. 1. LANT stimuli and experimental procedure.
Please cite this article in press as: Greene, D. J. et al., Measuring atte(2007), doi:10.1016/j.bandc.2007.05.003
congruent, incongruent) · 2 (Target Visual Field: left,right) · 4 (Cue type: none, center, double, valid) factorialdesign.
2.1.5. Procedure
Participants were first exposed to a 24-trial practiceblock, in which they received feedback for their speedand accuracy. This was followed by four experimentalblocks for each test (ANT and LANT), with 96 trials perblock. Trials were presented in a random order within eachblock. The practice block lasted approximately 2 min,while the experimental blocks lasted approximately 6 min.Between blocks, participants were allowed a short breakperiod to rest their eyes. The order of taking the ANTand LANT was counterbalanced across participants. Thetotal session running both tests lasted approximately 1 h.
Participants were instructed to fixate on the central fix-ation cross at all times, and to respond to the directionof the target arrow as quickly and accurately as possible.For the ANT, responses were made by pressing the leftkey for left-pointing targets and the right key for right-pointing targets. Thus, ‘‘left’’ responses were made withthe middle finger of the left hand or with the index fingerof the right hand. ‘‘Right’’ responses were made with theindex finger of the left hand or the middle finger of the righthand. Response hand alternated between blocks in the fol-lowing order: left hand, right hand, left hand, right hand.For the LANT, responses were made unimanually on amouse placed at midline on its side, facing the respondinghand. Thus, ‘‘up’’ responses were made with index fingers,and ‘‘down’’ responses were made with middle fingers.Response hand alternated between blocks in a counterbal-anced order.
2.2. Results
Prior to analysis, trials with a reaction time less than230 ms and greater than 3 standard deviations from thegrand mean for each test (ANT = 887 ms, LANT =954 ms) were excluded. This procedure excluded 1.2% oftrials in the ANT and 1.8% of trials in the LANT.
We performed repeated measures ANOVAs with accu-racy and mean latency (ms) as dependent variables forthe ANT and LANT. Only correct trials were used forlatency analysis. Table 1 summarizes the data for theANT and the LANT for each condition. Fig. 2 displaysthe estimates of the three components of attention forlatency in each test. The effect of Conflict (C) was calcu-lated by subtracting the mean effect of congruent-flankertrials from the mean effect of incongruent-flanker trials.Orienting (O) was calculated by subtracting the mean effectof valid-cue trials from the mean effect of center-cue trials.Alerting (A) was calculated by subtracting the mean effectof double-cue trials from the mean effect of no-cue trials.Whenever an effect involving Flanker or Cue was signifi-cant in the overall ANOVA, we followed it up with morespecific ANOVAs involving C, O, and A.
ntion in the hemispheres: The lateralized ..., Brain and Cognition
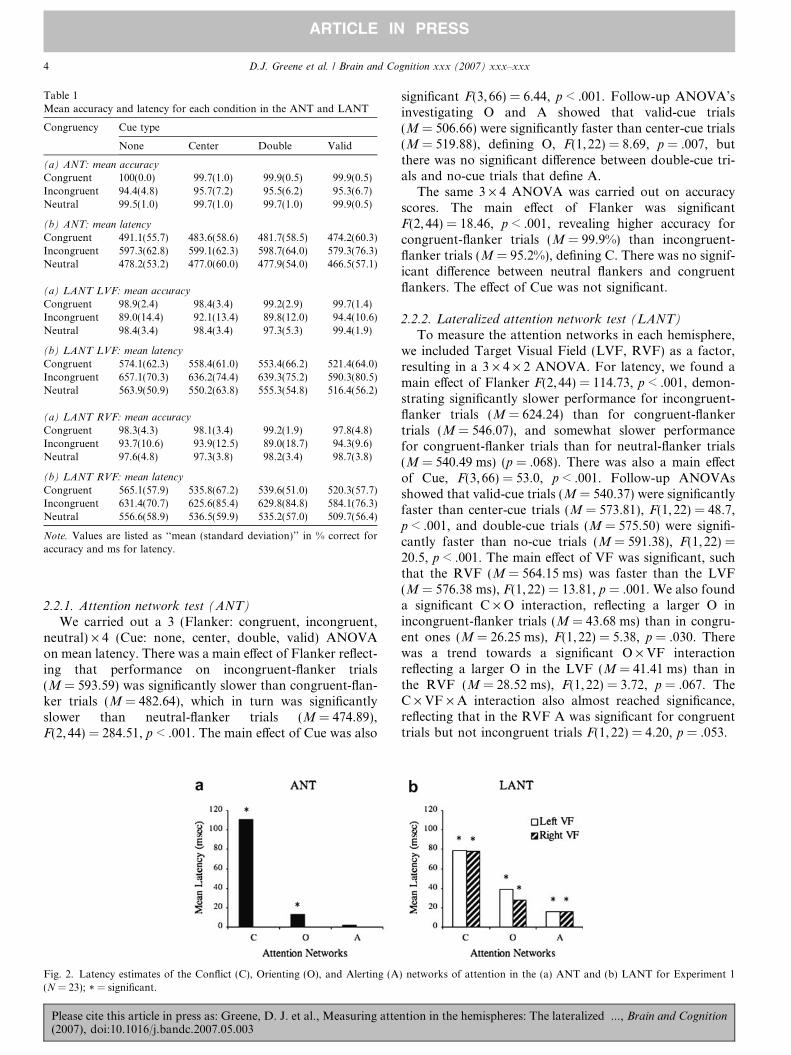
Table 1Mean accuracy and latency for each condition in the ANT and LANT
Congruency Cue type
None Center Double Valid
(a) ANT: mean accuracy
Congruent 100(0.0) 99.7(1.0) 99.9(0.5) 99.9(0.5)Incongruent 94.4(4.8) 95.7(7.2) 95.5(6.2) 95.3(6.7)Neutral 99.5(1.0) 99.7(1.0) 99.7(1.0) 99.9(0.5)
(b) ANT: mean latency
Congruent 491.1(55.7) 483.6(58.6) 481.7(58.5) 474.2(60.3)Incongruent 597.3(62.8) 599.1(62.3) 598.7(64.0) 579.3(76.3)Neutral 478.2(53.2) 477.0(60.0) 477.9(54.0) 466.5(57.1)
(a) LANT LVF: mean accuracy
Congruent 98.9(2.4) 98.4(3.4) 99.2(2.9) 99.7(1.4)Incongruent 89.0(14.4) 92.1(13.4) 89.8(12.0) 94.4(10.6)Neutral 98.4(3.4) 98.4(3.4) 97.3(5.3) 99.4(1.9)
(b) LANT LVF: mean latency
Congruent 574.1(62.3) 558.4(61.0) 553.4(66.2) 521.4(64.0)Incongruent 657.1(70.3) 636.2(74.4) 639.3(75.2) 590.3(80.5)Neutral 563.9(50.9) 550.2(63.8) 555.3(54.8) 516.4(56.2)
(a) LANT RVF: mean accuracy
Congruent 98.3(4.3) 98.1(3.4) 99.2(1.9) 97.8(4.8)Incongruent 93.7(10.6) 93.9(12.5) 89.0(18.7) 94.3(9.6)Neutral 97.6(4.8) 97.3(3.8) 98.2(3.4) 98.7(3.8)
(b) LANT RVF: mean latency
Congruent 565.1(57.9) 535.8(67.2) 539.6(51.0) 520.3(57.7)Incongruent 631.4(70.7) 625.6(85.4) 629.8(84.8) 584.1(76.3)Neutral 556.6(58.9) 536.5(59.9) 535.2(57.0) 509.7(56.4)
Note. Values are listed as ‘‘mean (standard deviation)’’ in % correct foraccuracy and ms for latency.
4 D.J. Greene et al. / Brain and Cognition xxx (2007) xxx–xxx
ARTICLE IN PRESS
2.2.1. Attention network test (ANT)
We carried out a 3 (Flanker: congruent, incongruent,neutral) · 4 (Cue: none, center, double, valid) ANOVAon mean latency. There was a main effect of Flanker reflect-ing that performance on incongruent-flanker trials(M = 593.59) was significantly slower than congruent-flan-ker trials (M = 482.64), which in turn was significantlyslower than neutral-flanker trials (M = 474.89),F(2, 44) = 284.51, p < .001. The main effect of Cue was also
Fig. 2. Latency estimates of the Conflict (C), Orienting (O), and Alerting (A(N = 23); * = significant.
Please cite this article in press as: Greene, D. J. et al., Measuring atte(2007), doi:10.1016/j.bandc.2007.05.003
significant F(3,66) = 6.44, p < .001. Follow-up ANOVA’sinvestigating O and A showed that valid-cue trials(M = 506.66) were significantly faster than center-cue trials(M = 519.88), defining O, F(1,22) = 8.69, p = .007, butthere was no significant difference between double-cue tri-als and no-cue trials that define A.
The same 3 · 4 ANOVA was carried out on accuracyscores. The main effect of Flanker was significantF(2,44) = 18.46, p < .001, revealing higher accuracy forcongruent-flanker trials (M = 99.9%) than incongruent-flanker trials (M = 95.2%), defining C. There was no signif-icant difference between neutral flankers and congruentflankers. The effect of Cue was not significant.
2.2.2. Lateralized attention network test (LANT)
To measure the attention networks in each hemisphere,we included Target Visual Field (LVF, RVF) as a factor,resulting in a 3 · 4 · 2 ANOVA. For latency, we found amain effect of Flanker F(2,44) = 114.73, p < .001, demon-strating significantly slower performance for incongruent-flanker trials (M = 624.24) than for congruent-flankertrials (M = 546.07), and somewhat slower performancefor congruent-flanker trials than for neutral-flanker trials(M = 540.49 ms) (p = .068). There was also a main effectof Cue, F(3,66) = 53.0, p < .001. Follow-up ANOVAsshowed that valid-cue trials (M = 540.37) were significantlyfaster than center-cue trials (M = 573.81), F(1,22) = 48.7,p < .001, and double-cue trials (M = 575.50) were signifi-cantly faster than no-cue trials (M = 591.38), F(1,22) =20.5, p < .001. The main effect of VF was significant, suchthat the RVF (M = 564.15 ms) was faster than the LVF(M = 576.38 ms), F(1,22) = 13.81, p = .001. We also founda significant C · O interaction, reflecting a larger O inincongruent-flanker trials (M = 43.68 ms) than in congru-ent ones (M = 26.25 ms), F(1, 22) = 5.38, p = .030. Therewas a trend towards a significant O · VF interactionreflecting a larger O in the LVF (M = 41.41 ms) than inthe RVF (M = 28.52 ms), F(1, 22) = 3.72, p = .067. TheC · VF · A interaction also almost reached significance,reflecting that in the RVF A was significant for congruenttrials but not incongruent trials F(1, 22) = 4.20, p = .053.
) networks of attention in the (a) ANT and (b) LANT for Experiment 1
ntion in the hemispheres: The lateralized ..., Brain and Cognition

Table 2Reliability of Conflict (C), Orienting (O), and Alerting (A) measured bycorrelation of first vs. second half of the tests
ANT (N = 23) LANT (N = 23) ANT (N = 40)
Overall LVF RVF (Fan et al.)
C .741*** .786*** .686*** .585** .770
O .708*** .330 .115 .521* .610
A .145 .194 �.101 .235 .520
Note. Boldface indicates significance; *p 6 .05, **p 6 .01, and ***p 6 .001.
D.J. Greene et al. / Brain and Cognition xxx (2007) xxx–xxx 5
ARTICLE IN PRESS
We conducted separate 3 · 4 ANOVAs for each visualfield. We found significant effects of Flanker in the LVFF(2, 44) = 102.31, p < .001, and in the RVF F(2, 44) =95.88, p < .001. The difference between congruent-flankertrials and incongruent-flanker trials was significant in theLVF F(1, 22) = 115.53, p < .001, and in the RVFF(1, 22) = 87.28, p < .001, defining C. In the LVF, therewas no significant difference between neutral and congru-ent flanker trials, but in the RVF, neutral-flanker trials(M = 534.51 ms) were somewhat faster than congruent-flanker trials (M = 540.23 ms), F(1,22) = 3.99, p = .058.The main effect of Cue was also significant in the LVFF(3, 66) = 46.57, p < .001, and in the RVF, F(3, 66) =28.98, p < .001. In both VF’s, valid-cue trials (LVFM = 542.71, RVF M = 538.03) were significantly fasterthan center-cue trials (LVF M = 581.61, RVFM = 566.0), and double-cue trials (LVF M = 582.8, RVFM = 568.2) were significantly faster than no-cue trials(LVF M = 598.38, RVF M = 584.38), rendering significanteffects of O and A. In the RVF, there was a significantC · O interaction, such that O was greater for incongru-ent-flanker trials (M = 41.50 ms) than congruent ones(M = 15.53 ms), F(1, 22) = 5.92, p = .024. There was alsoa significant C · A interaction, such that A was only signif-icant in congruent-flanker trials (p = .001), but not incon-gruent-flanker trials, F(1, 22) = 5.87, p = .024. Thus, inthe RVF there was a larger O in the incongruent trials,but a larger A in the congruent trials.
The same 3 · 4 · 2 ANOVA was carried out on accu-racy scores. The main effect of Flanker reflected that incon-gruent-flanker trials (M = 92%) were significantly lessaccurate than congruent-flanker trials (M = 98.7%) andneutral-flanker trials (M = 98.1%), F(2,22) = 8.34,p = .001. Neutral-flanker trials were only somewhat lessaccurate (M = 98.1%) than congruent-flanker trials(M = 98.7%) (p = .07). We found a main effect of CueF(1, 22) = 4.77, p = .04, revealing that valid-cue trials(M = 97.4%) were significantly more accurate thancenter-cue trials (M = 96.4%), but no difference betweendouble and no-cue trials.
When examining the visual fields separately, we foundsignificant effects of Flanker in the LVF F(1,22) = 10.77,p < .001, and in the RVF F(1, 22) = 5.2, p = .009. In bothVF’s, incongruent-flanker trials (LVF M = 91.3%, RVFM = 92.7%) were significantly less accurate than congru-ent-flanker trials (LVF M = 99.1%, RVF M = 98.4%)and neutral-flanker trials (LVF M = 98.4%, RVFM = 97.9%). The effect of Cue was significant in theLVF, F(3, 66) = 4.59, p = .006, reflecting higher accuracyin valid-cue trials (M = 97.9%) than in center-cue trials(M = 96.3%) (O), but no difference between double andno-cue trials (A). The effect of Cue was not significant inthe RVF.
2.2.3. Split-half reliabilityWe calculated the Pearson r product moment correla-
tions for the first two blocks of each test with the second
Please cite this article in press as: Greene, D. J. et al., Measuring atte(2007), doi:10.1016/j.bandc.2007.05.003
two blocks across subjects. The first and second halveswere balanced for stimuli and response hand. Latency esti-mates were used, as the very high accuracy scores did notprovide as robust estimates of the networks. Table 2 dis-plays these correlations for the ANT and LANT. C wasreliable in the ANT and both VF’s, measured by theLANT. O was reliable in the ANT and LANT-RVF, andA was not reliable in any test.
2.2.4. Intercorrelations among the three component networks
Table 3 displays correlations across attention networksand tests. To examine the mutual independence of the net-works, we calculated the correlations among the networksfor latency in the ANT and in each VF of the LANT. Thisyielded no significant correlations between networks inboth tests, suggesting network independence. To investi-gate the independence of the networks between hemi-spheres, we next examined correlations between the twoVF’s for each network in the LANT. There were significantcorrelations between C in the two hemispheres andbetween O in the two hemispheres, but not for A. Finally,we correlated each network of the ANT with the corre-sponding networks in the LVF and the RVF of the LANTin order to compare the effects of central and lateralizedpresentation. This demonstrated that C in the ANT wassignificantly correlated with C in the LANT overall andwith C in each VF. The other networks were not correlatedbetween tests.
2.3. Discussion
This experiment presents a simple variation of the ANTthat efficiently measures the Conflict, Orienting, and Alert-ing attentional networks in each normal cerebral hemi-sphere. Examining both latency and accuracy measures,we found that latency provided a more sensitive index ofperformance, especially in view of the high overall accuracyrate (98%).
Our first goal was to determine if each hemisphere cansupport all three networks of attention. The LANT pro-vided significant measures of all three in latency as wellas significant C and O in accuracy, indicating that eachhemisphere is capable of supporting the networks. In theANT, our dataset yielded consistently lower estimates ofthe networks than the dataset of Fan et al. (2002), andour estimate of A was not significant in either latency or
ntion in the hemispheres: The lateralized ..., Brain and Cognition

Table 3Pearson r cross-correlations among the three attention networks within and across the ANT and the LANT for latency
ANT LANT-LVF LANT-RVF
C O A C O A C O A
ANTC .028 .339 .680*** .049 .061 .669*** .089 �.016O .225 .078 .222 .321 �.028 .311 .353A .130 .156 �.141 .185 �.005 �.295
LANT-LVFC �.379 .237 .740*** �.142 .051O .369 �.158 .494* �.110A .196 �.011 .100
LANT-RVFC �.076 �.014O .294
Note. Significant correlations are indicated in boldface; *p 6 .05, **p 6 .01, and ***p 6 .001.
6 D.J. Greene et al. / Brain and Cognition xxx (2007) xxx–xxx
ARTICLE IN PRESS
accuracy. Since there were no methodological differencesbetween this version of the ANT and that of Fan et al., thisdiscrepancy is perplexing. Perhaps the difference is attribut-able to our smaller sample size (N = 23 vs. 40), which wasyounger (mean age 23 years vs. 30.1 years) and includedfewer women (52% vs. 57%). With 23 participants, thepower to detect an effect of cue at the .05 level of signifi-cance for latency in the ANT exceeds 80% (U = 1.7).
We also aimed to investigate the hemispheric specializa-tion of each attentional network. The LANT revealed atrend toward a significant O · VF interaction, showing thatO was larger in the right hemisphere (RH) than in the lefthemisphere (LH). Though only a trend (p = .067), thisinteraction suggests that the task is ‘‘direct access’’, i.e.,processed independently in each hemisphere (Zaidel,Clarke, & Suyenobu, 1990). Thus, each target may be pro-cessed by the hemisphere it reaches first. We also correlatedeach network in the LVF with the corresponding networkin the RVF. C and O, but not A, were correlated betweenVF’s, demonstrating the similarity between the networks inthe two hemispheres.
In our sample, like that of Fan et al., the ANT demon-strated independence of the networks. The LANT, on theother hand, exhibited significant interactions among net-works. There was a curious dissociation between A andO in the RVF, such that A was significant only for congru-ent trials, whereas O was largest for incongruent trials.Regarding reliability, Fan et al. report more reliable esti-mates of all three networks. In our sample, C was reliablein all tests (ANT, LANT overall and in each VF), and Owas reliable in the ANT and LANT overall, but not sepa-rately in each VF. A was not reliable in any test.
Direct comparisons between the ANT and LANT arenot definitive here, since subtle methodological differencesmay generate different results. Since the ANT displaysthe target stimulus until a response is made, while theLANT presents the target briefly for 170 ms, we cannotascertain whether differences in performance are due tothe different stimulus exposure times or to the mode of pre-sentation (central vs. lateralized). Thus, conclusions
Please cite this article in press as: Greene, D. J. et al., Measuring atte(2007), doi:10.1016/j.bandc.2007.05.003
regarding the correlations of networks between tests mustbe interpreted with caution.
Interestingly, neutral flankers did not provide theexpected results. The ideal neutral would yield performancebetween that of incongruent-flanker trials and congruent-flanker trials, demonstrating the facilitatory effect of con-gruency and inhibitory effect of incongruency on Conflict.Instead, our data demonstrated no difference in perfor-mance for neutral-flanker trials and congruent-flanker tri-als. This result may be the consequence of a perceptualpop-out effect of the target arrow when flanked by lineswithout arrowheads. This would explain why trials withneutral flankers were no slower than, and even sometimesfaster than, trials with congruent flankers. Further experi-ments that manipulate the number and nature of neutralflankers are necessary to test this hypothesis. On the otherhand, if the neutral flankers here are indeed properly neu-tral, it would follow that Conflict reflects a purely inhibi-tory process.
Like Conflict, spatial Orienting includes an inhibitoryprocess in addition to its facilitatory component. In theANT and LANT, we measured the facilitatory effect ofvalid spatial cues, which give rise to a benefit in perfor-mance. However, we did not measure the inhibitory effectof invalid spatial cues, which give rise to a cost in perfor-mance. Without invalid cues, we were unable to investigatethe relationship between the inhibitory component of Ori-enting and the other networks. Experiment 2 aims toaddress this issue, and presents modified versions of boththe ANT and LANT.
3. Experiment 2
In this experiment, we first aimed to replicate the generalfindings of Experiment 1. Our next goal was to investigatethe separate benefit and cost components of the Orientingnetwork and to examine whether the two inhibitory net-works (Orienting cost and Conflict) are subserved by thesame underlying process. Valid spatial pre-target informa-tion (a cue in the location that the target will appear) leads
ntion in the hemispheres: The lateralized ..., Brain and Cognition

D.J. Greene et al. / Brain and Cognition xxx (2007) xxx–xxx 7
ARTICLE IN PRESS
to a benefit in performance, OrientingBenefit (OB), whileinvalid spatial information (a cue in a different locationthan where the target will appear) leads to a cost in perfor-mance, OrientingCost (OC) (Posner, 1980). In fact, thesebenefit and cost components have been associated with dis-tinct ERP components, suggesting different underlyingneural mechanisms (Hillyard, Luck, & Mangun, 1994).By including invalid cues in the ANT and LANT, we canseparately measure both OB and OC. The inhibitory effectof OC may be similar to that involved in Conflict (C) andthey may engage the same cortical structures. Further,tasks sharing neural circuitry place demands on similarcognitive resources (Kinsbourne & Hicks, 1978), and there-fore, should interfere and correlate with each other. Fanet al. (2003) described and compared three types of conflict:Stroop language conflict, flanker conflict (exactly as wedefine C), and spatial conflict (similar to OC). Two brainregions, the ACC and left prefrontal cortex, were similarlyactivated in each type of conflict. However, they did notcorrelate with each other, indicating that they may tap intoseparate mechanisms after all. Measuring both C and OC ineach hemisphere, we can further examine whether these aretruly independent operations.
Experiment 1 compared the LANT to the ANT as thelatter was originally constructed, with the stimuli remain-ing on the screen. To ensure that the target presentationtime is equated between tests, Experiment 2 compares themodified LANT with a modified and fully matched ANT.We further investigated the independence of all the net-works, reliability of the task, and the attentional capabili-ties of each hemisphere.
3.1. Methods
3.1.1. Participants
Twenty-seven right-handed undergraduate psychologystudents at the University of California Los Angeles (13men and 14 women) participated in the experiment forcourse credit. None had a psychiatric or neurological his-tory, learning disability or attention deficit, assessed byself-report. Handedness was assessed with a modified ver-sion of the Edinburgh Handedness Inventory (Oldfield,1971).
3.1.2. Apparatus and stimuli
Apparatus and stimuli were the same as in Experiment1, with the following modifications. For both the ANTand the LANT, neutral flankers were excluded, invalid cueswere included, and the target stimuli were presented briefly.Invalid cues consisted of an asterisk cue appearing oppositeto the impending target location, and occurred 1/4 as oftenas each of the other cues. This allowed for the division ofOrienting into benefit and cost components. OrientingBenefit
(OB) was defined as performance in the center-cue condi-tion minus performance in the valid-cue condition. Orient-ingCost (OC) was defined as performance in the invalid-cuecondition minus that of the center-cue condition.
Please cite this article in press as: Greene, D. J. et al., Measuring atte(2007), doi:10.1016/j.bandc.2007.05.003
For both tests, the sequence of events began with a fix-ation period for a random variable duration (400–1600 ms), followed by an asterisk cue presented for100 ms. Next, there was a short fixation period for400 ms, after which the target and flankers appeared simul-taneously for 170 ms. Finally, there was a post-target fixa-tion period for a variable duration, based on the durationof the first fixation and the participant’s RT for that trial(3500 ms minus duration of the first fixation minus RT).Each trial lasted for a total of 4170 ms.
3.1.3. Design
The ANT had a 2 (Flanker type: congruent, incongru-ent) · 5 (Cue type: none, center, double, valid, invalid) fac-torial design. The LANT had a 2 (Flanker type: congruent,incongruent) · 2 (Target Visual Field: left, right) · 5 (Cuetype: none, center, double, valid, invalid) factorial design.
3.1.4. Procedure
The procedure of the experiment was the same as inExperiment 1, with the following exceptions. For boththe ANT and LANT, there were two experimental blocks,each consisting of 136 trials and lasting 9 min. For bothtests, response hand alternated in counterbalanced order.All other procedures were as reported in Experiment 1.
3.2. Results
As in Experiment 1, trials with a reaction time less than230 ms and greater than 3 standard deviations from thegrand mean for each test (ANT = 902 ms, LANT =936 ms) were excluded. This procedure excluded 1.6% oftrials in the ANT and 1.4% of trials in the LANT.
We performed repeated measures ANOVAs with meanlatency ( ms) as the dependent variable for correct trialsin the ANT and LANT. Experiment 1 demonstratedlatency to be the most meaningful measure, given the over-all high accuracy rates. Table 4 summarizes the data for theANT and the LANT for each condition. Fig. 3 displaysthe estimates of the components of attention in each test.The effects of the networks were calculated the same as inExperiment 1 with the addition of Orienting cost (OC),calculated by subtracting the mean effect of center-cuetrials from the mean effect of invalid-cue trials.
3.2.1. Attention network test (ANT)
We carried out a 2 (Flanker: congruent, incongru-ent) · 5 (Cue: none, center, double, valid, invalid) ANOVAon mean latency. There was a main effect of Flanker reflect-ing that performance on incongruent-flanker trials(M = 568.94) was significantly slower than congruent-flan-ker trials (M = 482.90), F(1, 26) = 272.85, p < .001. Themain effect of Cue was also significant F(4,104) = 33.83,p < .001. Follow-up ANOVAs investigating OB, OC, andA showed that valid-cue trials (M = 496.86) were signifi-cantly faster than center-cue trials (M = 520.57), definingOB F(1,26) = 24.54, p < .001, center-cue trials were signifi-
ntion in the hemispheres: The lateralized ..., Brain and Cognition

Fig. 3. Latency estimates of the Conflict (C), Orienting benefit (OB), Orienting cost (OC), and Alerting (A) networks of attention in the (a) ANT and (b)LANT for Experiment 2 (N = 27); * = significant.
Table 4Mean latency for each condition in the ANT and LANT
Congruency Cue type
None Center Double Valid Invalid
ANT
Congruent 509.8(59.5) 475.0(61.4) 470.6(63.8) 456.3(61.4) 502.7(65.6)Incongruent 583.8(74.2) 566.2(76.7) 563.2(73.4) 537.4(78.9) 594.2(72.9)
LANT LVF
Congruent 561.6(66.1) 516.0(74.0) 501.5(73.2) 494.6(69.5) 539.8(80.9)Incongruent 608.4(75.2) 580.9(77.1) 571.4(81.4) 540.2(71.3) 612.9(91.3)
(b) LANT RVF
Congruent 566.3(76.3) 513.0(80.6) 506.7(66.9) 485.1(67.8) 541.1(85.9)Incongruent 610.1(80.2) 586.0(87.1) 580.9(81.1) 550.8(84.3) 611.6(84.1)
Note. Values are listed as ‘‘mean (standard deviation)’’ in ms.
8 D.J. Greene et al. / Brain and Cognition xxx (2007) xxx–xxx
ARTICLE IN PRESS
cantly faster than invalid-cue trials (M = 548.48), definingOC F(1,26) = 25.03, p < .001, and double-cue trials(M = 516.89) were significantly faster than no-cue trials(M = 546.82), defining A F(1, 26) = 66.08, p < .001. Therewas a trend toward a significant C · OB interaction suchthat OB was larger for incongruent-flanker trials(M = 28.8) than for congruent-flanker trials (M = 18.62),F(1, 26) = 3.10, p = .09. There was also a significantC · A interaction such that A was larger for congruent tri-als (M = 39.23) than incongruent trials (M = 20.63),F(1, 26) = 9.12, p = .006.
3.2.2. Lateralized attention network test (LANT)
The LANT included Target Visual Field (LVF, RVF) asa factor, resulting in a 2 · 5 · 2 ANOVA. The significanteffect of Flanker revealed slower performance for incon-gruent-flanker trials (M = 585.32) than for congruent-flan-ker trials (M = 522.58), F(1, 26) = 130.44, p < .001. Themain effect of Cue, F(4,104) = 65.39, p < .001, led to fol-low-up ANOVAs to investigate the distinct networks.These showed that valid-cue trials (M = 517.67) were sig-nificantly faster than center-cue trials (M = 548.97),F(1, 26) = 53.42, p < .001, center-cue trials were signifi-cantly faster than invalid-cue trials (M = 576.36),F(1, 26) = 37.61, p < .001, and double-cue trials (M=540.12) were significantly faster than no-cue trials
Please cite this article in press as: Greene, D. J. et al., Measuring atte(2007), doi:10.1016/j.bandc.2007.05.003
(M = 586.61), F(1, 26) = 119.68, p < .001. Thus, we effi-ciently measured OB, OC, and A. There was a trend towarda significant C · OB interaction, such that OB was largerfor incongruent-flanker trials (M = 37.94) than for congru-ent-flanker trials (M = 24.65), F(1, 26) = 3.69, p = .066.There was also a significant C · A interaction, reflecting alarger A in congruent-flanker trials (M = 59.85) than inincongruent-flanker trials (M = 33.12), F(1,26) = 20.72,p < .001. The main effect of VF was not significant.
We conducted separate 2 · 5 ANOVAs for each visualfield to investigate the networks separately in each hemi-sphere. There were significant effects of Flanker in theLVF F(1,26) = 156.01, p < .001, and in the RVFF(1,26) = 77.81, p < .001, and therefore significant esti-mates of C in both VF’s. The main effect of Cue was alsosignificant in the LVF F(4,104) = 43.18, p < .001, and inthe RVF, F(4, 104) = 44.69, p < .001. Valid-cue trials(LVF M = 517.38, RVF M = 517.96) were significantlyfaster than center-cue trials (LVF M = 548.45, RVFM = 549.49), which were significantly faster than invalid-cue trials (LVF M = 576.35, RVF M = 576.37), resultingin significant measures of OB and OC. Also, double-cue tri-als (LVF M = 536.41, RVF M = 543.833) were signifi-cantly faster than no-cue trials (LVF M = 585.02, RVFM = 588.19), rendering significant effects of A. In theLVF, there was a significant C · OB interaction such that
ntion in the hemispheres: The lateralized ..., Brain and Cognition

D.J. Greene et al. / Brain and Cognition xxx (2007) xxx–xxx 9
ARTICLE IN PRESS
OB was larger for incongruent-flanker trials (M = 40.73)than congruent-flanker trials (M = 21.39), F(1,26) = 7.18,p = .013, and a significant C · A interaction reflecting alarger A in congruent-flanker trials (M = 60.17) thanincongruent-flanker trials (M = 37.04), F(1,26) = 5.70,p = .024. In the RVF, the C · A interaction was significant,again revealing a larger A in congruent-flanker trials(M = 59.52) than incongruent-flanker trials (M = 29.20),F(1, 26) = 16.0, p < .001.
3.2.3. Split-half reliability
We calculated the Pearson r product moment correla-tions on latency for the first block of each test with the sec-ond block across subjects. The first and second blocks werebalanced for stimuli and response hand. Table 5 displaysthese correlations for the ANT and LANT. C was reliablein the ANT, overall LANT (both VF’s), and the RVF inthe LANT. OB was reliable in the ANT, overall LANT,and both VF’s in the LANT. The other networks did notdemonstrate significant reliability.
3.2.4. Intercorrelations among the three component networks
Table 6 displays correlations on latency across attentionnetworks and tests. There was a significant negative corre-lation between C and OC in the RVF in the LANT. No
Table 5Reliability of Conflict (C), Orienting benefit (Ob), Orienting cost (Oc) andAlerting (A) measured by correlation of first vs. second blocks of the tests
ANT LANT
Overall LVF RVF
C .830*** .647*** .341 .677***
Ob .654*** .476* .391* .407*
Oc .172 .070 �.163 �.131A .184 .180 .322 �.100
Note. Boldface indicates significance; *p 6 .05, **p 6 .01, and ***p 6 .001.
Table 6Pearson r cross-correlations among the attention networks within and across
ANT LVF
C OB OC A C OB
ANTC �.082 �.066 .075 .661*** �.06OB .161 .193 .054 .16OC .088 �.133 �.25A �.136 .22
LVFC �.05OBOcA
RVFCOBOC
Note. Significant correlations are indicated in boldface; *p 6 .05, **p 6 .01, an
Please cite this article in press as: Greene, D. J. et al., Measuring atte(2007), doi:10.1016/j.bandc.2007.05.003
other correlations between networks were significant, sug-gesting mostly network independence. There was a signifi-cant correlation between C in the LVF and C in the RVF,but not for the other networks. We also found that C in theANT was significantly correlated with C in each VF, and Ain the ANT was significantly correlated with A in the LVF,but not the RVF. OB and OC were not correlated betweentests.
3.3. Discussion
This experiment implemented modified versions of theANT and the LANT in which neutral flankers wereexcluded, invalid cues were included, and the target stimuliwere presented briefly. First, we aimed to replicate the find-ings from Experiment 1, and in general, our findings weresimilar. The modified ANT and LANT efficiently measuredall networks of attention centrally and separately in eachVF. The reliabilities were also similar between the twoexperiments. Again, interactions showed a dissociationbetween A and OB, such that A was larger for congruent-flanker trials and OB was larger for incongruent-flankertrials. The C · A interaction was more prominent in Exper-iment 2, as it was significant in the ANT and in both VFs ofthe LANT. The C · OB interaction was present in the LVFin this experiment, rather than in the RVF as in Experi-ment 1, and was close to significant in the ANT. Interest-ingly, we did not find an OB · VF interaction, followingthe trend found in Experiment 1.
We also investigated the cost component of Orientingand examined the relationship between the inhibitory effectof invalid cues and that of incongruent flankers. OC wasefficiently measured by the ANT and by each VF in theLANT. Therefore, like the other networks, it can be sup-ported by both hemispheres. There were no interactionsbetween OC and C, indicating that the inhibitory processestapped by each may be driven by distinct neural mecha-
the ANT and LANT for latency
RVF
OC A C OB OC A
6 .013 �.020 .688*** .467* �.311 .0766 �.043 �.047 .015 �.007 .345 .0890 .169 .263 .209 .096 .100 .0381 �.203 .441* �.032 .271 .093 �.046
6 �.124 �.041 .660*** .125 �.374 .053.032 �.319 �.460* .155 .411* �.131
�.164 �.087 .241 .254 .072.035 �.160 �.214 .320
.362 �.397* �.177.002 �.127
�.229
d ***p 6 .001.
ntion in the hemispheres: The lateralized ..., Brain and Cognition
10 D.J. Greene et al. / Brain and Cognition xxx (2007) xxx–xxx
ARTICLE IN PRESS
nisms. However there was a negative correlation betweenOC and C in the RVF.
By controlling for target stimulus presentation time andthe experimental procedure of each trial, we were able todirectly compare the two tests in Experiment 2. Correla-tions between the tests demonstrated that C in the ANTwas correlated with C in both VFs in the LANT. However,A in the ANT was correlated only with A in the LVF of theLANT. Thus, while each hemisphere is capable of effi-ciently supporting Alerting, it may be dominated by theright hemisphere.
4. General discussion
The goal of the present study was to utilize a lateralizedadaptation of the attention network test by Fan et al.(2002) in order to assess the status of attentional networkswithin each hemisphere. The first experiment introducedthe lateralized ANT (LANT), which provided efficient esti-mates of the Conflict (C), Orienting benefit (OB), and Alert-ing (A) attention networks. The second experimentimproved upon the task by excluding uninformative, neutralflankers and including a measure of the cost component ofOrienting (OC). Again, all networks were efficiently mea-sured by both tests.
Experiment 2 showed no interactions between networksand Visual Field (VF) even though the OB · VF interactionwas nearly significant in Experiment 1. The absence of aninteraction is inconsistent with well-known clinical andimaging data that show clear hemispheric asymmetries inattention. Long-standing clinical data on patients withhemi-neglect consistently support the idea that right parie-tal damage leads to more severe and lasting impairments invisuospatial orienting (for a review, see Mesulam, 1999). Innormal participants, imaging data demonstrate right parie-tal activation on covert spatial orienting tasks (Corbettaet al., 2000; Thiel, Zilles, & Fink, 2004). A commonaccount of the orienting asymmetry posits that the lefthemisphere is responsible for shifting attention to theRVF, while the right hemisphere is involved in attentionalshifts in both VF’s (Heilman, 1995; Kolb & Whishaw,1990; Zaidel, 1995). However, behavioral data on covertorienting tasks in normal participants do not always yieldlaterality effects (interactions with visual field) (Losier &Klein, 2004; Nagel-Leiby, Buchtel, & Welch, 1990). Like-wise, our task may eschew laterality effects by drawingattention automatically to each hemisphere with quick, dis-crete trials. By lateralizing the stimuli, we tap the compe-tence of each hemisphere alone rather than measuringperformance under central conditions. Thus, the networkscan operate independently, though similarly, in each hemi-sphere when directly probed, but may make only partialand asymmetric contributions to central presentations.
The results from this study question the independence ofthe attention networks, as both experiments yielded signif-icant C · A and C · OB interactions. This suggests that Cshares processing components, albeit different ones, with
Please cite this article in press as: Greene, D. J. et al., Measuring atte(2007), doi:10.1016/j.bandc.2007.05.003
OB and with A. A was consistently larger for congruent-flanker trials, while OB was consistently larger for incon-gruent trials. Thus, the more one is engaged in Conflict res-olution processing, the less benefit will be gained from atemporally alerting cue (A). In contrast, more engagementin Conflict resolution also leads to an increase in benefitfrom a spatial cue (OB). Given that both A and OB arefacilitatory, this result is perplexing. It suggests that OB
and A may use fundamentally different processes with dif-ferent resources allocated to them, yet they both interactwith C. The LANT in Experiment 1 yielded the C · OB
interaction in the RVF, while the LANT in Experiment 2exhibited this interaction in the LVF. Thus, the lack ofindependence of the component networks can occur ineither hemisphere. However, it is possible that an interac-tion may be driven by a third, unrelated factor, so that amore definitive argument for independence can still bemade. For example, the absence of an interaction in onedependent variable, even in the presence of an interactionin another dependent variable, suggests independence. Sim-ilarly, if it is possible to modulate one network withoutaffecting the other, then they must be independent. Futurestudies that aim to manipulate the networks selectivelycould resolve this issue of independence.
The reliability of the networks was generally high for Cand OB, but insignificant for OC and A. The poor reliabilityscores may be attributable to the fact that the number of tri-als included for measuring OC is much smaller than that forthe other networks due to the infrequency of invalid cues.Additionally, when analyzing each VF separately, the num-ber of trials decreased by half, further lowering power.More importantly, unreliability may be due to the fact thatnetworks are defined as difference measures. Consequently,even though each defining trial type (e.g., trials preceded bydouble cues or trials preceded by no cue) may be highly reli-able, the difference (i.e., A) may not be, due to a high cross-correlation between the two trial types. Unfortunately,correlations among the networks are limited by these lowreliability coefficients. In principle, it is possible to correctfor unreliability when estimating the correlations betweennetworks (Nunnally & Bernstein, 1993). However, in ourcase correcting for attenuation yields uninterpretableresults due to low reliabilities of some of the networkestimates. Consequently, we must interpret with cautionthe correlations among the networks.
The C and OB networks were both correlated betweenthe two hemispheres, whereas the low reliabilities of theother networks preclude precise computation of the correla-tion coefficients. However, the presence of a significant cor-relation does not show that one hemisphere controls theoperation of any attentional network in both visual fields(‘‘callosal relay’’). Callosal relay would imply exclusive spe-cialization in one hemisphere, and it should exhibit a signif-icant main effect of Target Visual Field, reflecting the timefor callosal transfer (Zaidel, 1983). However, no such effectwas present in Experiment 2, supporting the conclusion thatthe LANT is a ‘‘direct access’’ task. A similar inference in
ntion in the hemispheres: The lateralized ..., Brain and Cognition

D.J. Greene et al. / Brain and Cognition xxx (2007) xxx–xxx 11
ARTICLE IN PRESS
support of ‘‘direct access’’ follows from the nearly signifi-cant interaction of OB · Target Visual Field in Experiment1. Taken together, the data suggest that the LANT reflectsindependent and similar networks in the two hemispheres.
We conclude that the LANT is a useful extension of theANT, yielding significant estimates of the attentional net-works in each hemisphere. The ability to tap the compe-tence of each hemisphere is useful for detecting andinterpreting the effects of unilateral lesions or of otherpathologies with hemispheric differences in attention. Theinclusion of invalid cues yields estimates of the inhibitorycomponent of spatial Orienting in addition to the facilita-tory component, and we recommend this modification forfuture use of the tests. The limited reliabilities of OC andA suggest that the present version of the test may not servewell to characterize stable individual differences in atten-tion for individual case studies. Further improvements thatincrease the reliability of the measures are necessary. None-theless, the LANT is a powerful measure of group differ-ences in attention. The LANT provides, in a single test, arelatively quick assessment of three components of atten-tion separately in each hemisphere. These componentsmay be selectively and asymmetrically impaired in a partic-ular population, and therefore, an efficient and simple testthat can assess all components is highly valuable.
Acknowledgments
We thank Ms. Nancy Sin for help in preparation of themanuscript. This work was supported by USPHS NIHGrant NS20187.
References
Callejas, A., Lupianez, J., Funes, M. J., & Tudela, P. (2005). Modulationsamong the alerting, orienting and executive control networks. Exper-
imental Brain Research, 167(1), 27–37.Corbetta, M., Kincade, J. M., Ollinger, J. M., McAvoy, M. P., &
Shulman, G. L. (2000). Voluntary orienting is dissociated from targetdetection in human posterior parietal cortex. Nature Neuroscience,
3(3), 292–297.Fan, J., Flombaum, J. I., McCandliss, B. D., Thomas, K. M., & Posner,
M. I. (2003). Cognitive and brain consequences of conflict. Neuroim-
age, 18(1), 42–57.Fan, J., McCandliss, B. D., Flombaum, J. I., & Posner, M. (2001).
Imaging attentional networks. Paper presented at the Annual Meetingof the Society for Neuroscience, San Diego, CA.
Fan, J., McCandliss, B. D., Fossella, J., Flombaum, J. I., & Posner, M. I.(2005). The activation of attentional networks. Neuroimage, 26(2), 471–479.
Fan, J., McCandliss, B. D., Sommer, T., Raz, A., & Posner, M. I. (2002).Testing the efficiency and independence of attentional networks.Journal of Cognitive Neuroscience, 14(3), 340–347.
Fan, J., Wu, Y., Fossella, J. A., & Posner, M. I. (2001). Assessing theheritability of attentional networks. BMC Neuroscience, 2, 14.
Fossella, J., Posner, M. I., Fan, J., Swanson, J. M., & Pfaff, D. W. (2002).Attentional phenotypes for the analysis of higher mental function.ScientificWorldJournal, 2, 217–223.
Fossella, J., Sommer, T., Fan, J., Wu, Y., Swanson, J. M., Pfaff, D. W.,et al. (2002). Assessing the molecular genetics of attention networks.BMC Neuroscience, 3, 14.
Please cite this article in press as: Greene, D. J. et al., Measuring atte(2007), doi:10.1016/j.bandc.2007.05.003
Heilman, K. M. (1995). Attentional asymmetries. In R. J. Davidson & K.Hugdahl (Eds.), Brain asymmetry (pp. 217–234). Cambridge, MA: TheMIT Press.
Hillyard, S. A., Luck, S. J., & Mangun, G. R. (1994). The cuing ofattention to visual field locations: analysis with ERP recordings. In H.-J. Heinze, T. F. Munte, & G. R. Mangun (Eds.), Cognitive electro-
physiology (pp. 1–25). Boston: Birkhauaser.Kinsbourne, M., & Hicks, R. E. (1978). Functional cerebral space: A
model for overflow, transfer, and interference effects in humanperformance. In J. Requin (Ed.). Attention and performance
(pp. 345–362). Hillsdale: Lawrence Erlbaum.Kolb, B., & Whishaw, I. Q. (1990). Fundamentals of human neuropsychol-
ogy (3rd ed.). New York: W.H. Freeman and Company.Konrad, K., Neufang, S., Thiel, C. M., Specht, K., Hanisch, C., Fan, J.,
et al. (2005). Development of attentional networks: An fMRI studywith children and adults. Neuroimage, 28(2), 429–439.
Losier, B. J., & Klein, R. M. (2004). Covert orienting within peripersonaland extrapersonal space: Young adults. Brain Research. Cognitive
Brain Research, 19(3), 269–274.Marocco, R. T., & Davidson, M. C. (1998). Neurochemistry of attention.
In R. Parasuraman (Ed.), The attentional brain (pp. 35–50). CambridgeMass: MIT Press.
Mesulam, M. M. (1999). Spatial attention and neglect: Parietal, frontaland cingulate contributions to the mental representation and atten-tional targeting of salient extrapersonal events. Philosophical Transac-
tions of the Royal Society of London. Series B, Biological Sciences,
354(1387), 1325–1346.Nagel-Leiby, S., Buchtel, H. A., & Welch, K. M. (1990). Cerebral control
of directed visual attention and orienting saccades. Brain, 113(Pt 1),237–276.
Nunnally, J., & Bernstein, I. H. (1993). Psychometric theory (3rd ed.). NewYork: McGraw-Hill.
Oldfield, R. C. (1971). The assessment and analysis of handedness: TheEdinburgh inventory. Neuropsychologia, 9(1), 97–113.
Pollmann, S. (1996). A pop-out induced extinction-like phenomenonin neurologically intact subjects. Neuropsychologia, 34(5),413–425.
Pollmann, S., & Zaidel, E. (1998). The role of the corpus callosum invisual orienting: Importance of interhemispheric visual transfer.Neuropsychologia, 36(8), 763–774.
Posner, M. I. (1980). Orienting of attention. The Quarterly Journal of
Experimental Psychology, 32(1), 3–25.Posner, M. I., & Petersen, S. E. (1990). The attention system of the human
brain. Annual Review of Neuroscience, 13, 25–42.Posner, M. I., & Raichle, M. E. (1994). Images of mind. New York:
Scientific American Library.Reuter-Lorenz, P. A., Kinsbourne, M., & Moscovitch, M. (1990).
Hemispheric control of spatial attention. Brain and Cognition, 12(2),240–266.
Roberts, K. L., Summerfield, A. Q., & Hall, D. A. (2006). Presentationmodality influences behavioral measures of alerting, orienting, andexecutive control. Journal of the International Neuropsychological
Society, 12(4), 485–492.Thiel, C. M., Zilles, K., & Fink, G. R. (2004). Cerebral correlates of
alerting, orienting and reorienting of visuospatial attention: An event-related fMRI study. Neuroimage, 21(1), 318–328.
Zaidel, E. (1983). Disconnection syndrome as a model for laterality effectsin the normal brain. In J. Hellige (Ed.), Cerebral hemisphere asymmetry
(pp. 95–151). New York: Praeger Publishers.Zaidel, E. (1995). Interhemispheric transfer in the split brain: Long-term
status following complete cerebral commissurotomy. In R. J. David-son & K. Hugdahl (Eds.), Brain asymmetry (pp. 491–532). Cambridge:The MIT Press.
Zaidel, E., Clarke, J. M., & Suyenobu, B. (1990). Hemispheric indepen-dence: A paradigm case for cognitive neuroscience. In A. B. Scheibel &A. F. Wechsler (Eds.), Neurobiology of higher cognitive function
(pp. 297–355). New York: Guilford Press.
ntion in the hemispheres: The lateralized ..., Brain and Cognition