
Intermodal selective attention. I. Effects on event-related potentials to lateralized auditory and...
15
Electroencephalography and chmcal Neurophyszology , 82 (1992) 341-355 341 © 1992 Elsevier Scientific Pubhshers Ireland, Ltd 0013-4649/92/$05 00 EEG90175 Intermodal selective attention. I. Effects on event-related potentials to lateralized auditory and visual stimuli * David L Woods, I~mmo Alho a and Alam Algazl Chntcal Neurophystology Laboratory, Dept of Neurology, UC Davis, VA Medical Center, Martmez, CA 94553 (U S A ), and a Dept of Psychology, Unwerstty of Helsmkt, Helstnkt (Fmland) (Accepted for pubhcatlon 5 October 1991) Summary The effects of intermodal selective attention on event-related brain potentials (ERPs) were examined in 2 experiments In experiment 1, auditory ERPs were compared (1) when subJeCts responded to easy and difficult-to-detect target tones m sequences of tone bursts, and (2) when they Ignored the same auditory sequences and played a demanding video game In experiment 2, auditory ERPs to tone bursts and visual ERPs to vertical line gratlags were compared as subjects responded tQ difficult-to-detect targets in one modahty or the other Attention to auditory stimuli resulted in blphasic enhancements In auditory ERPs, the Nd a (negative auditory difference wave, latency 120-160 msec) and the Pd a (positive auditory difference wave, latency 200-240 msec) waves These had longer latencles and somewhat different scalp distributions than NI and P2 compoq¢nts evoked by non-attended tones The Nd a and Pd a could be contrasted with the monophaslc processing negatlvitles typically found in dlchottc selectwe attention tasks Nd a amplltude~ were larger for difficult-to-detect targets (closely resembhng standards) than for standards then]selves, but no NdaS were recor~led to highly deviant targets Deviant auditory stimuli evoked mismatch negatlvlties (MMNs) that persisted during visual attention MMN amphtudes to difficult-to-detect deviants were enlarged with attention, but no change was found in MMN amphtudes to easy-to-detect devmnts In experiment 2 mtermodal attention was associated with blpllaslc changes m visual ERPs over the posterior scalp the occipital Pd v (100-130 msec), and contralateral-temporal Nd v (120-320 msec) deflections Deviant visual stimuli also elicited mismatch negativity/N2b components, largest over the inferotemporal cortex contralateral to the stimulated visual field Like the au&tory MMN, the MMN increased in amphtude with attention, but it was also evident during attend auditory conditions The results suggest that sustained, intermodal attention depends primarily in processing modulations in modahty-specificcortex We found no evidence of the participation of modahty non-specific cortex This excludes the posslblllW that lntermodal attention depends on a single, supramodal attention system The relatively long latency of lntermodal effects suggests that they may depend on the reafferent (top down) modulation, and do not index "template matching" operations Key words" Attention, Intermodal, Auditory, Visual, Event-related potential, Cortex The effects of mtramodal selective attention on event-related brain potentials (ERPs) have been well described in auditory (Hlllyard et al 1973, Naatanen 1982), visual (Harter and Prevlc 1978, Mangun and Hillyard 1988), and somatosensory modahtles (De- smedt and Tomberg 1989) In contrast, ERP studies of mtermodal selective attention, in which subjects attend to stimuli in one modahty while ignoring those in another, have been little pursued since the 1960s (Garcla-Austt et al 1964, see Naatanen 1975 for a review) Correspondence to David L Woods, Ph D, Chief, Clinical Neu- rophyslologlcal Laboratory, Neurology Service (127), V A Medical Center, 150 Muir Road, Martinez, CA 94553 (U S A ) * Thls research was supported by grantsXf~om the NIDCD and the VA Research Service to D L Woods, and by a U S PHS Interna- tional Research Fellowship to K Alho A central issue m lntermodal studies is the modailty specificity of attentlonal operations Behavioral evi- dence suggests that certain attenttonal operations may engage supramodal mechanisms For example, Buchtel and Butter (1988) found that both lpsdateral auditory cues and tpsdateral visual cues could speed reaction times to subsequent visual targets Similarly, Farah et al (1989) reported that patients with lesions of the parietal lobe had difficulty in disengaging attention from hemlspace contralateral to the intact hemisphere following either auditory or visual cues They argued that such results were compatible either with a single supramodal attentlonal system or modahty-speclfiC at- tentlonal systems under supramodal control ERPs provide a clear test of these alternatives A single, supramodal attentional system should produce slmdar ERP manifestations for analogous attentlonal opera- tlons in auditory and visual modahtles In contrast, modahty-speclfiC attentlonal systems under supramodal control should produce modahty-speclfiC ERP manlfes-
-
Upload
independent -
Category
Documents
-
view
0 -
download
0
Transcript of Intermodal selective attention. I. Effects on event-related potentials to lateralized auditory and...

Electroencephalography and chmcal Neurophyszology , 82 (1992) 341-355 341 © 1992 Elsevier Scientific Pubhshers Ireland, Ltd 0013-4649/92/$05 00
EEG90175
Intermodal selective attention. I. Effects on event-related potentials to lateralized auditory and visual st imuli *
David L Woods, I~mmo Alho a and Alam Algazl Chntcal Neurophystology Laboratory, Dept of Neurology, UC Davis, VA Medical Center, Martmez, CA 94553 (U S A ), and a Dept of Psychology,
Unwerstty of Helsmkt, Helstnkt (Fmland)
(Accepted for pubhcatlon 5 October 1991)
Summary The effects of intermodal selective attention on event-related brain potentials (ERPs) were examined in 2 experiments In experiment 1, auditory ERPs were compared (1) when subJeCts responded to easy and difficult-to-detect target tones m sequences of tone bursts, and (2) when they Ignored the same auditory sequences and played a demanding video game In experiment 2, auditory ERPs to tone bursts and visual ERPs to vertical line gratlags were compared as subjects responded tQ difficult-to-detect targets in one modahty or the other
Attention to auditory stimuli resulted in blphasic enhancements In auditory ERPs, the Nd a (negative auditory difference wave, latency 120-160 msec) and the Pd a (positive auditory difference wave, latency 200-240 msec) waves These had longer latencles and somewhat different scalp distributions than NI and P2 compoq¢nts evoked by non-attended tones The Nd a and Pd a could be contrasted with the monophaslc processing negatlvitles typically found in dlchottc selectwe attention tasks Nd a amplltude~ were larger for difficult-to-detect targets (closely resembhng standards) than for standards then]selves, but no NdaS were recor~led to highly deviant targets Deviant auditory stimuli evoked mismatch negatlvlties (MMNs) that persisted during visual attention MMN amphtudes to difficult-to-detect deviants were enlarged with attention, but no change was found in MMN amphtudes to easy-to-detect devmnts
In experiment 2 mtermodal attention was associated with blpllaslc changes m visual ERPs over the posterior scalp the occipital Pd v (100-130 msec), and contralateral-temporal Nd v (120-320 msec) deflections Deviant visual stimuli also elicited mismatch negativity/N2b components, largest over the inferotemporal cortex contralateral to the stimulated visual field Like the au&tory MMN, the MMN increased in amphtude with attention, but it was also evident during attend auditory conditions
The results suggest that sustained, intermodal attention depends primarily in processing modulations in modahty-specific cortex We found no evidence of the participation of modahty non-specific cortex This excludes the posslblllW that lntermodal attention depends on a single, supramodal attention system The relatively long latency of lntermodal effects suggests that they may depend on the reafferent (top down) modulation, and do not index "template matching" operations
Key words" Attention, Intermodal, Auditory, Visual, Event-related potential, Cortex
The effects of m t r a m o d a l selective a t ten t ion on event - re la ted bra in potent ia ls (ERPs) have been well descr ibed in audi tory (Hll lyard et al 1973, N a a t a n e n 1982), visual (Har te r and Prevlc 1978, M a n g u n and Hillyard 1988), and somatosensory modaht les (De- smedt and Tomberg 1989) In contrast , E R P studies of m t e r m o d a l selective a t tent ion , in which subjects a t tend to st imuli in one modahty while ignoring those in another , have been little pu r sued since the 1960s (Garc la -Aus t t et al 1964, see N a a t a n e n 1975 for a review)
Correspondence to David L Woods, Ph D, Chief, Clinical Neu- rophyslologlcal Laboratory, Neurology Service (127), V A Medical Center, 150 Muir Road, Martinez, CA 94553 (U S A )
* Thls research was supported by grantsXf~om the NIDCD and the VA Research Service to D L Woods, and by a U S PHS Interna- tional Research Fellowship to K Alho
A central issue m ln te rmodal studies is the modail ty specificity of a t ten t lona l opera t ions Behavioral evi- dence suggests that cer ta in a t tent tonal opera t ions may engage supramodal mechanisms For example, Buchtel and But ter (1988) found that both lpsdateral audi tory cues and tpsdateral visual cues could speed react ion t imes to subsequent visual targets Similarly, Fa rah et al (1989) repor ted that pa t ients with lesions of the parietal lobe had difficulty in disengaging a t t en t ion from hemlspace contra la tera l to the intact hemisphere following e i ther audi tory or visual cues They argued that such results were compat ible e i ther with a single supramodal a t ten t lona l system or modahty-speclfiC at- t en t lona l systems u n d e r supramodal control ERPs provide a clear test of these al ternat ives A single, supramodal a t t en t iona l system should produce slmdar E R P manifes ta t ions for analogous a t ten t lona l opera- t lons in audi tory and visual modaht les In contrast , modahty-speclfiC a t ten t lona l systems u n d e r supramodal control should produce modahty-speclfiC E R P manlfes-

342 D L WOODS ET AL
tatlons, with supramodal ERP components evident only during attentional shifting and focusing (Posner and Petersen 1990)
Another issue raised by intermodal studies relates to the latency of attentIonal selection In lntramodal tasks, the latency of ERP attention effects varies with the confuslblhty of stimuli (Hansen and Hlllyard 1983) For example, the latency of onset of attentlonal differences IS prolonged when at tended and non-attended tones are similar in pitch or location (Hansen and Hlllyard 1980, Alho et al 1987) Because stimuli in different modahtles are perceptually distinct, this line of reason- lng suggests that lntermodal attentlonal effects should have short latencIes Indeed, it has been argued that lntermodal attention might even be mediated by gating of sensory inputs at subcortIcal or thalamic levels (Oat- man 1971, Skinner and YIngllng 1977)
A subsidiary aspect of Intermodal studies relates to the degree to which the processing of stimulus de- viance is performed automatically Dewant auditory stimuli evoke several deviance related negativlties, in- cluding the mismatch negativity (MMN, Naatanen et al 1986) Woldorff et al (1991) recently reported that MMNs elicited by tone intensity changes were sup- pressed when subjects at tended to a competing tone sequence They concluded that the MMN was not automatic, but reflected covert shifts of attention In their paradigm they minimized covert attention shifts by using high rates of stimulus delivery and subject-by- subject adjustment of task difficulty In the present report, we examined the generahzablhty of these find- ings by using high stimulus delivery rates and same subject-by-subject adjustment of task difficulty in an lntermodal selective attention task
Methods
Expertment 1 Tasks and sttmuh The effects of lntermodal atten-
tion on auditory ERPs were examined by comparing auditory ERPs in attend audttory conditions, with those elicited by the same stimuli during attend vtsual condi- tions Auditory stimuli were tone bursts, 50 msec In duration, with 10 msec rise and fall times They were presented monaurally through T D H 39 headphones at 76 dB SPL over 30 dB nHL broadband masking noise Frequent (standard) tones were 1000 Hz and were presented with 85% probability In attend audttory conditions subjects pressed a button with the right thumb when they detected difficult-to-detect targets of 1064 Hz (dewant) or easy-to-detect targets of 1500 Hz (DEVIANT) The targets had been matched in r ise/fal l time, duration and subjective loudness with the 1000 Hz tones Target stimuli were presented with probabili- ties of 7 5% each Interstimulus intervals (ISis) were
fixed at 600 msec (onset to onset) The ear of stimulus delivery was varied across stimulus blocks, each lasting 5 mln No visual ERPs were recorded in experiment 1 During attend L'tsual conditions subjects ignored the auditory signals and played a video game presented on a monitor subtending 11 2 × 15 4 ° of visual angle In this condition, subjects manipulated a joystick-con- trolled "ray gun" in order to shoot simulated attackers and hostile aircraft (size, 0 9-1 9 °) The attackers m- creased In number and velocity over a period of several minutes until the subject's position was overrun Dur- ing attend audttory conditions subjects maintained fixa- tion on the video screen They viewed the display of the video game program before play began - - a low, pseudorandom presentation of aircraft and attackers The order of conditions (attend visual /a t tend audi- tory) was counterbalanced within and across subjects
EEG recordmg and subjects The EEG (bandpass 0 1-100 Hz) was continuously sampled (256 Hz /chan- nel) from 15 scalp electrodes (Fpz, F3, Fz, F4, T3, C3, Cz, C4, T4, T5, P3, Pz, P4, T6, Oz), and from an EOG electrode below the left outer canthus All electrodes were referred to balanced non-cephalic electrodes at the base of the neck (Woods and Clayworth 1985) Eleven subjects (age range 20-37 years, 6 male) with no history of drug or alcohol abuse participated in the experiment after giving informed consent according to institutional guidelines All were right handed with normal hearing and corrected visual acuity
Experiment 2 Tasks and snmuh In experiment 2 subjects selec-
tively attended to either auditory or visual signals in a balanced intermodal sequence Stimuli were presented in alternating attend-visual and attend-auditory blocks lasting 4 min and containing 400 visual and 400 audi- tory stimuli ISis (onset-to-onset) varied randomly from 200 to 400 msec In 50 msec increments Four visual and 4 auditory standard stimuli were presented randomly with probabilities of 11 25% each (90% overall) Four deviant auditory stimuli (slightly higher in pitch), and 4 deviant visual stimuli (shghtly shorter In length), were presented with probabilities of 1 25% each (10% over- all) To direct attention to a modahty as a whole, all 4 deviant stimuli in the attended modahty were desig- nated as targets, requiring a button press with the right thumb
Auditory standard stlmuh were tone bursts of 250 and 4000 Hz (50 msec duration, 5 msec rise/fal l time) The large difference between high and low pitched standards was used to evaluate pitch-related changes in ERP distributions (Woods et al 1992, in preparation) Tones were presented randomly to the left or right ears through TDH-39 headphones at 85-87 dB SPL (equal subjective loudness) Binaural masking noise (72 dB SPL) was used to minimize frequency smearing at

INTERMODAL SELECTIVE ATTENTION, I 343
the cochlea and to mask extraneous no~ses Deviant stlmuh were slightly higher in pitch than the corre- sponding standards They ranged from 275 to 325 Hz (for low pitched deviants) and from 4250 to 4750 Hz (for high pitched deviants) dependmg on subject per- formance m different blocks Subjects were encouraged to be both fast and accurate in their responses and were provided wlth feedback after each 4 mln block Target detection performance was continuously exam- lned, and the pitch of the target tones was increased or decreased between blocks to maintain the correct de- tection rate at 70-80% throughout the experiment
Visual stimuli were black-and-white line gratmgs of high (2 c / d e g ) or low (0 7 c / d e g ) spatial frequency Each stimulus was presented for 50 msec on a televi- sion monitor (11 2 ° × 15 4 °) posmoned 1 5 m in front of the subject Standard stimuli (luminance 7 footlam- berts, contrast 0 99) subtended 3 9 ° × 4 4 ° (width and height) and were presented 4 7 ° to the left or right of fixation Target stimuli had the same spatml frequen- cies as the standards, but were slightly shorter (range 2 9°-3 9 °) As with the auditory targets, visual target dlscrlmlnabdlty was adjusted throughout the experi- ment to maintain performance at 70-80% correct
EEG recording and subjects SubJects were trained on a 15 mln sequence before electrode apphcat~on The E E G (bandpass 0 1-100 Hz) was continuously digitized (256 Hz /channe l ) from 14 electrodes over the scalp (Fpz, Fz, F3, F4, C3, Cz, C4, T3, T4, T5, T6, Pz, O1 and 02 ) using a balanced non-cephahc reference Two perlorbltal electrodes, one lateral and inferior to the left eye and the other superior to the left eye, were used to monitor eye movements Subjects fixated on a small star in the center of the video monitor Dewa- t~ons in eye position were continuously monitored with vertical and horizontal E O G and closed-orcult video Twelve subjects (6 females, age range 22-42 years) with no history of drug or alcohol abuse participated in the experiment after gwlng informed consent according to institutional guldehnes All were right handed with normal hearing and corrected visual acuity
Data analysts expertments 1 and 2 ERPs were extracted off-hne by computer Trmls
contaminated by eye movements, peak- to-peak deflec- tions exceeding 70 /iV m any channel, or amphfier chppmg were excluded from the average under soft- ware control Following averaging, ERP amplitudes and latenc~es were quantified by computer Measure- ments were obtained relative to a 200 msec prestlmulus basehne after low pass digital filtering of the averages to ehmmate f requenoes above 40 Hz Mean voltages were obtained at 20 msec intervals starting at 60 msec after stimulus onset and continuing until 310 msec post stimulus The results were statistically evaluated using analysis of variance
Several precautions were taken to control possible type 1 errors First, main effects were tested at one electrode site (usually Cz or Fz for auditory ERPs and O1 or 0 2 for wsual ERPs) and were only reported if they reached significance for several related measures (peak and mean voltage, or several adjacent mean voltage measures) Second, scalp d~strlbutlons were only reported ff they were slgnlfcant after the strictest Greenhouse-Gelsser correction For example, scalp distribution interactions, with 14 scalp electrodes and 12 subjects ( F (13, 143)) were only reported when F ratios exceeded those required for significance at F (1, 11) Third, in comparing the scalp distributions of different components, the data were f r s t normalized to control for d~strlbutlon × electrode interactions result- ing simply from differences In component amphtude (McCarthy and Wood 1985)
R e s u l t s
Expertment 1 Behavtoral results Subjects responded faster (316 8
vs 392 7 msec, F (1, 10) = 82 07, P < 0 001) and more accurately (98 8% vs 83 0% correct ( F (1, 10) = 11 909, P < 0 006) to DEVIANTS (1500 Hz) than to devtants (1064 Hz) Reaction time variability was also reduced for the more salient DEVIANTS (mean RT standard deviation, 85 7 vs 106 4 msec, F (1, 10) = 11 45, P < 0 O06)
ERPs to audttory standards Fig 1 shows ERPs to auditory standards (1000 Hz) in attend visual (dashed line) and attend auditory (solid line) conditions In attend visual conditions, ERPs were characterized by small N1 (mean latency 99 msec and mean amplitude - 1 25 /zV at Cz) and P2 (174 msec, 0 65 ~zV) waves, superimposed on slow baseline shifts that preceded stimulus delivery The N1 had a centro-frontal distribu- tion and was associated with N l a and Nlc components over mid- and posterior temporal sites (Wolpaw and Penry 1975)
Fig 2 shows difference waves derived by subtracting auditory ERPs in attend visual conditions from those in attend auditory conditions For auditory standards (solid line in scalp distribution and insert) this subtrac- tion revealed 2 major deflections, the Nd a and Pda (negattt,e and postttve audttory dtfference waves) The Nd a began after the N1 peak, peaked at 140-160 msec (mean voltage - 0 85 /zV) and returned to basehne at 180-200 msec Slgmficant attention-related changes began after N1 peak and lasted untd 190 msec (for mean voltages at 20 msec intervals from 120 to 180 msec at Cz, F (1, 10) from 5 49 to 15 29, P < 005 for all comparisons) The Nd a had a fronto-central dlstn-

344 D L WOODS ET AL
/ , , , , ~ ~z -Hi , , . -~
f ~ i ~.,h _-... r- t ~ . , , , ~ . / .. X/.v- -\ -._~-...~, .--..~ I F, v _ i A Fc , ~ , : A I ~ I dVI.X. ~ I ./;',W.X,,.
I X/'-\ _ X/'-'\ \ Ti Cz :/,,~. TC I ~ / ILhA~_. ~z I ~,,,~ . ,,.,, ~
To ~ PTc
\ ,"':-~÷,b'~": ,~ ~ I AUDITORY ERPs
X T~ "'" & T ~ "" "" / STANDARDS
~ - ~ / - - ATTEND AUD
+ l # V I msec " 5oo
Fig 1 Auditory ERPs to 1000 Hz tone bursts averaged over car of stimulation during attend auditory (solid line) and attend visual (dashed line) conditions of experiment 1 Electrodes have been transposed so that those on the right were contralateral to the ear of stimulation, with electrode locations relabeled accordingly All electrodes were referred to a balanced non-cephalic site Insert enlarged ERPs from Fz and Cz
Grand mean of 11 subjects
/" /
. . . - f . ~ , :: i - ' ~ . . ~ ~, N~,. . ... ,. . . . . . / ~ ~ ,.-.-. _ i .._,_~-~ .,. ~, .<
I~ et-
]/- 7",. ...... ~_ i, ,, , t;Z t "-" tZ , , , ' : , : .-- -= .
/ !-',-_1 ~Y~iJ ,A,.'_. "-'-',-- , ~ c ; " - , - " / , , , ' = ' T - V - - ~ , - ~ - ,,->,1 ,_ ,
"" ,,'; i :", ik i / F.,,/'.,/ii ~.c . . . . .,, / ~ L_I ~/~! .~,,
I T, T '~., ,h Cz,, ,~ Tc , ",~ / ,,"
II ~: I A ' . ' , . ~ " " ~ II l i t -v,?' ~-:./ -'--{.' ~~/- lU
"~" I" '?',ni :'~" ,, '--~" t 'A PC I / ; : EXPERIMENT I \ ~'/_l.,,./~ ~ " ', ::, ~ ~ / " / A,in n,~'~'~..~,~ wAw~ \ >"Vh' ',;', " " ', ,'-',,'~, ;,, ' ' I . . . . . . . . . . . . . . . . . . . . . .
' '; "; ,,O"Z ',/ ' " "x :"" I ATTEND-IGNORE
\ : ~ \ / - - STANDARDS (1000 Hz) ', ,, ', : '" ~ ....... deviants ( 1 0 6 4 Hz)
- - I H V , , ,
~ . I . . .',~ I DEVIANTS (1500 Hz) +~,v I m~ r~o
Fig 2 Difference ERPs derived by subtracting ERPs in attend visual conditions from ERPs to the same stimuli during attend auditory conditions Averaged over ear of stimulation Electrodes have been transposed so that those on the right were contralateral to the ear of stimulation, with electrode locations relabeled accordingly Insert enlarged differences waves from Fz (top) and Cz Difference waves are shown
for standards (solid), deviants (dashed), and DEVIANTS (dotted, insert only)

INTERMODAL SELECTIVE ATTENTION, I 345
butlon similar to that of the N1 The Pd a had a longer peak latency (235 msec) than the P2 (174 msec) and produced enhancements in ERPs from 210 to 270 msec ( F (1, 1 0 ) = 1 2 3 8 - 1 5 6 9 , P < 0 0 1 ) It had a narrow fronto-eentral distribution with an amplitude maxamum at the vertex ( + 0 84/zV mean enhancement from 210 to 230 msec) Unlike the P2, the Pda was not seen at temporal electrodes
ERPs to dewant auditory sttmuh ERPs to deviant tones generated N1 and P2 deflections and, during attend auditory conditions, N2, P3 and slow wave com- ponents The P3 was shorter m latency (at the Pz electrode 369 msec_+90 msee vs 405 m s e c + 1 4 6 msec) and larger m amplitude (7 85 /zV + 0 81 /zV vs 4 97/~V _+ 0 57/zV) for correctly detected DEVIANTS than deviants (see Fig 2, insert)
As seen in Fig 2 (insert) attention exerted opposite effects on early components of ERPs to DEVIANT and dewant stimuli In comparison with standards, the Nd~ was enhanced m amplitude and shortened m la- tency for devtant targets In contrast, no Nd a whatso- ever was recorded to DEVIANTS (insert only) These opposite effects produced slgntficant attention ×
stimulus type interactions over most of the Nd a latency range from 90 to 150 msec (at Cz, F (2, 20) between 4 10 and 7 44, P < 0 05 for all comparisons)
M,smatch negatlvmes (MMNs, Naatanen et al 1986, Naatanen 1990) were evident to devtant and DE-
VIANT tones during attend auditory and attend visual conditions The MMN to devtants was enhanced in amplitude during attend auditory conditions from 110 to 190 msec (at Fz, F (1, 10) = 5 79-10 64, P < 005, for all comparisons) In contrast, attention resulted in no enhancement in the MMN to DEVIANTS and, in fact, was assocmted with reduced MMN amplitudes over a portion of the MMN latency range (from 140 to 180 msec, F (1, 10) = 6 192-8 97, P < 0 05)
Experiment 2 Behaworal results Auditory and visual targets were
detected with comparable accuracies (805% and 76 1%) and reaction times (auditory 518 9 msec; visual, 510 3 msec) However, there were significant "modal- Jty-priming" effects on reaction times Reaction times were 21 msec shorter (502 0 vs 523 3 msec) when the target was preceded by a stimulus in the same modahty than when preceded by a stimulus in the opposite modahty (F (1, 10) = 16 75, P < 0 005) The modahty- priming effect was greater for auditory than visual targets (38 vs 5 msec, F (1, 1 0 ) = 7 8 1 , P < 0 0 2 ) PrJming effects were only observed in the stimulus position lmmedJately preceding targets more distant preceding stimuli and stimuli that followed the target (but preceded responses) did not significantly Jnfluence RTs There was also some evidence of "inhibition of
/ \
\ .. . . . . . . . . . . . . / ~ ATTEND AUD ~ _ I ~ V [ ~ ---~ ATTENDVIS . . . .
Fig 3 ERPs to auditory standards in attend audztory (sohd) and attend visual (dashed) condtt,ons m experiment 2 ERPs were averaged over tone pitch and ear of dehvery Electrodes have been transposed so that those on the right were contralateral to the ear of stimulation, wah electrode locations relabeled accordingly Insert enlarged ERPs Cz and PTc electrodes All electrodes were referred to a balanced non-cephahc
site Grand mean of 12 subjects

346 D L WOODS ET AL
re turn" RTs were shor ter when targets followed stan- dards delivered to opposi te hemlspace than when they occurred on the same side (507 vs 518 msec, F (1, 1 0 ) = 6 8 6 , P < 0 0 5 )
Finally, there were two impor tant negative findings First, there was no evidence of tonal f requency or spat ial-frequency priming over and above the effects of modah ty priming RTs were comparable when targets followed stimuli in the same modah ty of the same or different f r e q u e n o e s (505 vs 506 msec, N S ) Second, devlant, MMN-ehClt lng stimuli in the non-a t tended modah ty did not p roduce significant al terations in the RTs to subsequent targets (520 vs 525 msec for RTs following s tandard stimuli, N S )
ERPs to audttory standards Fig 3 shows E R P s elicited by a t tended and non-a t t ended audi tory stan- dards in exper iment 2 Audi tory E R P s were character- lzed by a f ronto-centra l N1 ( - 3 17/zV and 116 3 msec at Cz), tempora l N l a and N l c deflections, and central P2 componen t s ( + 1 9 ~V and 204 msec) The N l a (measured as a mean voltage over 70 -90 msec) was larger over the left hemisphere (e g , T3 = - 0 33, T4 = + 0 235, hemisphere main effect over la terahzed elec- trodes, F (1, 1 1 ) = 1092, P < 0 0 0 7 ) And the N l c (130-150 msec) was larger over the hemisphere con- tralateral to st imulation ( F (1, 11) = 68 9, P < 0 001), consistent with previous reports (Knight et al 1988)
Fig 4 (left column) shows E R P distributions over successive 20 msec intervals f rom 100 to 350 msec The N1 had a slightly contralateral distribution over the f ronto-centra l scalp At 160 msec, ItS distribution spread to contralateral f ronto- tempora l areas (in par t due to contr ibutions f rom the Nlc ) By 180 msec the N1 was replaced by the P2, initially at parietal sites The P2 itself was maximal in ampli tude at Cz and symmetri- cally distributed and was followed by a small centro- frontal negativity
The effects of in termodal selective at tent ion on au- ditory ERPs were similar to those in experiment 1 Fig 5 shows difference waves (at tend minus non-a t tend) for auditory s tandards (solid line) and targets (dashed line) For standards, a t tent ion effects consisted of blphasi- cally modula t ions of the ERP, the Nd a and Pd~ The Nd d peaked at 140-150 msec (mean voltage - 1 14 /zV) and resulted in enhanced negative ampli tudes in E R P s from 110 to 170 msec ( F (1, 1 1 ) = 7 37-21 26, P < 0 01 for all comparisons) As In exper iment 1, the Nda occur red after the N1 peak and resulted in an increase in the latency of the N1 during a t tend condi- tions (at Cz, f rom 111 and 121 msec, F (1, 11) = 16 92, P < 0 002) The topographic distribution of the Nd a and Pd~ componen t s to s tandard stimuli is shown in the right column of Fig 4 At 100 msec, the Nd~ was not clearly developed, but by 120 and 140 msec it had a symmetrical f ronto-centra l distribution, with a steep voltage gradient over f ronto-polar areas (no N d . was
AUDITORY STANDARDS
NI/P2 NdJPd,
100 ms
120 ms
160 mo ~
180 ms
NI/P2 NclJPd a / ' x /x ,
200 ms ~ _ ~
/ x ,
240 ms
260 ms ~ ~ _ ~ "
350 ms
Fig 4 Scalp &stnbuttons of N1/P2 components ehclted by non- attended auditory standards (left columns) and Nd~/Pd d compo- nents (right columns) The Nd a and Pd a were obtained by subtract- lng ERPs to audttory standards during attend wsual condmons from ERPs to the same stlmuh during attend au&tory condmons Mean voltages are shown over 20 msec intervals centered at the latenc~es shown 0 e , 80 msec= mean voltage from 70 to 90 msec) ERP amphtudes on the right were contralateral to the ear of stimulation Averaged over ERPs to both ears and tone frequenoes Contour maps were obtained at voltage gradations of 6 25% using spherical sphne interpolation (Perrm et al 1987) Voltage maxima and minima are labeled for polarity, w~th pen-maximal contours set at 99% of
maximal voltage Electrode locations are shown as dots
seen at FPz, see Fig 5) At 160-180 msec, Nd a peak ampli tudes spread to poster ior temporal areas, due to a reduct ion in the central Nd a and an increase in Nd a ampli tude over temporal and parietal areas The Pd a developed by 200 msec at central sites It had a sym- metrical voltage gradient that reached mammal ampli- tudes ( + 1 19 /~V from 210 to 230 msec) after the P2 peak, causing an increase in P2 peak latencles with at tent ion (from 201 to 208 msec at Cz, F (1, 11) = 15 33, P < 0 001) The Pd a distribution was also distinct f rom that of the P2 its voltage maximum was more anterior and, unlike the P2, the Pd a was practically non-existent at temporal sites (Fig 5, insert)
ERPs to de~,tant auditory sttmuh Deviant st lmuh elicited N1 waves ( - 3 79 /~V, 102 msec) that were larger than those evoked by s tandards ( F (1, 1 1 ) = 53 95, P < 0 001) At t ended targets also elicited cen- trally distributed P2 and N2 components , and parl- etally distributed P3s (7 26/zV, 470 msec at Pz) At ten- t ion effects to deviant stimuli are shown in Fig 5 As wlth the deviants in experiment 1, the Nd a to deviant tones in experiment 2 was larger than the Nda to

INTERMODAL SELECTIVE ATTENTION, I 347
"% ,-, rpzj, .f"-,, ~ Cz ,,'~, , - / " " ~_ .t~l.k'J. _ . t , -- , . p -
/ _ , • "v" \ -- ~ ~ . : , - ¢" % . ~ l #
,.-'.', ~ pd "-,/ " " Fz ,.~; " laTe _ a " / " " Fz_.t.~,, ~__,.~,, . . . . T_ . 'A. . . ' , . ..-"
/ " r ~': - - ~ - - ' " . -~--~-~:--- ,.,,~, ', ; . ~, ,"
/ F, , , . ' ; :"'~' " F c . , ; ' " ' . ", . . /
Ti , ,, CZiDi '" Tc " .,,,
~lll " I -"]tV, ,: 7;,]" I'I; ; ' - ^ . t l l ',lL.I T ,~l ; 2 r ' " v ~l i L ; C . , . . . . ~ ', .~
/,4 ' ; - r v-,,--;; '--~: " "-r ~: - - : , - -~ lit ? ~PTI. . " ' ; Pz_; ' , "' ~"." PTc_ / ' l
L _ L ~ . . . ," . . 71 '~ , , , ,' r , ~ a.', / . ,: - ' r ' - ~ .¢ . ,~ ,4 . - r . . , , ~ - 7 . . ~ _ - _ - . ~" , - ' , , ~ EXPERIMENT 2
',,,' ! / / ;: f A U S DIFFERENCE WAVES N O, ,, . ;,:Oc ,i / ': ATTEND - IGNORE
~ ~ " ~ / -- AUD STANDARDS " ~ k,1~V "i~: ....... AUD TARGETS ~ , , I .--~,. :"
+ l pV l msec 800 ".;
}Fig 5 Difference waves, derived by subtracting auditory ERPs in attend visual conditions from ERPs to corresponding stimuli in attend auditory conditions for standards (solid) and targets (dashed) ERPs were averaged over tone pitch arid ear of delivery Electrodes have been transposed so that those on the right were contralatera) to the ear of stimulation Electrode locations have been relabeled accordingly Insert enlarged
responses from Cz and PTc Grand mean of 12 subjects
F z MMN/N2b
/ ~ ..~. ~ . . . . /-" / . - " " t . / ._ - - - ~ + .... - - - ~ ' " < - " ' > > " ....
F1 , Fc ",, / T M " v /4
\ " F ...... F-'?" EXPERI ENT . \ X.Z \ / I VAUD DIFFERENCE WAVES
0,, . ~Ic. . / DEVIANT-STANDARD
13~l ....... ATTEND VIS . . . . - - J c S . . . .
+1/.iV 1 m s e c " 1~30
Fig 6 Deviant minus standard difference waves to auditory stimuli in attend auditory (solid) and attend visual (dashed) conditions Insert enlarged ERPs from Fz and Pz ERPs were averaged over tone pitch and ear of delivery Electrodes have been transposed so that those on the
right were contralateral to the ear of stimulation Electrode locations have been relabeled accordingly Grand mean of 12 subjects

348 D L WOODS ET AL
AUDITORY MMN IGNORE ATTEND
180 ms
200 ms
IGNORE ATTEND
,o o @ O
@0 Fag 7 Scalp d~stnbutaons of audatory MMN components derwed from devmnt minus standard difference waves Mean voltages are shown over 20 msec antervals centered at the latencaes shown Amphtudes shown on the right were contralateral to the ear of stamulataon, wath dmtnbutaons averaged over ERPs to both ears and tone frequencaes Contour maps were obtained at voltage gradataons of 6 25% using spherical sphne anterpolatJons Voltage maxima and mlmma are labeled for polarity, wath pen-maximal contours set at
99% of maximal voltage Electrode locataons are shown as dots
s tandards (from 90 to 150 msec, F (1, 11) ranged from 1983 to 21 78, P < 0 0 0 1 for all comparisons) For
example, over 130-170 msec m e a n Nd d amphtudes averaged - 2 13 /zV for targets and - 1 12 /xV for s tandards The Nd a to targets also had shorter laten- ctes of onset stgmftcant effects were evident at 100 msec for deviant s t lmuh but not unt i l 120 msec for s tandards The P2 to a t t ended targets was a narrow, central posttlvtty be tween bt temporal negattvttles, and
the Pd a was reduced for targets (Fig 5, msert) In part this was due to the super imposi t ion of M M N / N 2 b componen t s (see below)
Fig 6 shows deviant mmus s tandard difference waves from exper tment 2 Despi te the complexity of the stim- ulus sequences and the difficulty of the task, M M N / N 2 b componen t s were evident durmg both con- dlttons (dashed hne) Fig 7 shows the topographtc dtstr tbuttons of the M M N / N 2 b m a t tend visual and a t tend audi tory condtt tons The M M N to non -a t t ended st tmuh was small m amphtude ( - 0 86 at Fz from 130 to 150 msec), and maximal at frontal sttes contra la tera l to the s t tmulated ear Audt tory a t ten t ton mcreased the amph tude of the M M N and N2b componen t s over a broad latency range (from 70 to 150 msec F (1, 1 1 ) = 6 53 -14 63, P < 0 05 for all compartsons) Moreover, wtth a t tent ton, the M M N dls t r tbut lon became more
Oi Oc .A.
0i N I 6 0
0 e
"" EXPERIMENT 2 VISUAL ERPs STANDARDS
ATTEND VIS . . . . . . . ATTEND AUD -1pV
+lpV 1 msec 800
Fig 8 ERPs to visual standards in attend visual (sohd) and attend auditory (dashed) condmons of experiment 2 ERPs were averaged over spatial frequency and wsual field Electrodes have been transposed so that those on the right were contralateral to the field of stlmulataon and have been relabeled accordingly Insert enlarged ERPs OI and Oc electrodes All electrodes were referred to a balanced non-cephalic sate
Grand mean of 12 subjects

I N T E R M O D A L SELECTIVE A T T E N T I O N , I
VISUAL STANDARDS NI/P2 Pdv/Nd v
,ooo @ 120 ms @ ~
140 m s O @ / \ / ^
.°°@@
NI/P2 Pdv/Nd v
,ooo,@@ / , ~x
/ '~ /%.
260 ms 0 ~ ~
350 ms ~ @ Fig 9 Scalp distributions of N 1 / P 2 components eho t ed by non- at tended visual s tandards (left columns) and Pd v / N d v components from difference waves (right columns) Difference waves were de- rived by subtracting visual ERPs in at tend auditory conditions from ERPs to corresponding st lmuh in at tend visual condmons for stan- dards (solid) and targets (dashed) Mean voltages are shown over 20 msec intervals centered at the latencles shown ERP amphtudes on the right were contralateral to the st imulated visual field Averaged over ERPs in both visual fields and of both spatial frequencies Contour maps were obtained at voltages gradations of 6 25% using spherical sphne interpolations Voltage maxima and minima are shown as points, with pen-maximal contours set at 99% of maximal
voltage Electrode locations are shown as dots
central and symmetrical, so that tt more closely resem- bled the dlstrtbutton of the Nd~ From 220 to 280 msec, a contralateral, central N2b was seen It may have persisted at longer latenctes and contributed to marked lpsllaterahty of the early porttons of the P3 (Ftg 7 bottom, right column)
ERPs to v~ual standard sttmuh Fig 8 shows ERPs to vtsual standards during attend visual (solid) and attend audttory (dashed) condttlons Fig 9 (left col- umn) shows correspondmg topographtc dlstrtbutlons Vtsual ERPs conststed of centra l / f ronta l N1 and P2 deflections, and polyphaslc deflections over the poste- rlor temporal and occipital scalp N1 ( - 2 91/xV at Cz) and P2 (+ 3 32 /xV) were recorded at the vertex with latencles longer than those of their auditory counter- parts ( 1 3 4 0 + 1 3 2 msecvs 1 1 6 3 _ 1 5 2 msec for the N1, and 2 1 3 1 + 0 6 msecvs 2 0 4 + 1 1 7 msec for the P2) The vtsual N1 had a central dlsmbutlon but, unlike the auditory N1, tts maxtmum amphtude was posterior to the vertex At longer latenctes an N160 deflectton became evident at posterior temporal sites contralateral to the stimulated vtsual field (140-160 msec, Ftg 9) The visual P2 was symmetrically dis-
349
trlbuted with maximal amphtudes at the vertex, and httle posttlvtty at mid- and postertor temporal elec- trodes
Distinct, polyphaslc ERPs were recorded at OCClpttal electrodes These were characterized by N 8 0 / P 1 2 0 / N160 components The NS0 component had a focal distribution over occipital sites, and larger amplitudes over the hemisphere lpstlateral to the stimulated visual field ( - 0 9 5 vs - 0 2 5 /~V, F (13, 143 )=419 , P < 0 01) The P120 was also restricted to occipital regtons and was largest lpsllateral to the sttmulated field ( + 0 33 tzV vs - 0 6 0 , F (13, 1 4 3 )=1 8 8 , P < 0 0 5 over all electrodes) In contrast, the N160 showed a contralat- eral occtpltal /posterlor temporal maximum (asymmet- rtcally distributed from 130 to 190 msec, F (3, 33)= 6 34-9 05, P < 0 05)
Fig l0 (sohd line) shows the effects of attention on ERPs to visual standards and dectants Attentlonal modulation of the vtsual ERP was restrtcted to compo- nents recorded over the occipital and posterior tempo- ral scalp ~ The topographic distribution of visual at- tentton effects is shown in Ftg 9 (right column) The shortest latency attention effect was the small Pd v (110-130 msec, +0 28 izV) that may have reflected an enhancement in the exogenous P120 The Pd v had a dtstrtbutlon that was symmetrical over posterior tem- poral and occtpttal regtons (Ftg 9, rtght) It was fol- lowed by a broad negattvlty, the Ndv ( - 0 79/zV) that was superimposed on exogenous components from 120 to 300 msec (F (1, 11) = 6 49-25 3, P < 0 05 for all comparisons) The Nd V showed an amphtude maxt- mum over posterior temporal areas contralateral to sttmulated visual field (Fig 9, right column) Its distri- bution remained stable trom 120 to 220 msec Not only was the Ndv larger contralaterally, but it had a shorter latency of onset over the hemisphere contralateral to the stimulated vtsual field (insert, Fig l l ) It was followed by a small partetal/occtpltal posltlVlty (P3, 330-510 msec), whose dtstrtbutlon resembled that of
i A small effect ol visual a t ten tmn was also apparent at cent ra l / f ronta l sites (Fig 10) This troy (ca 0 2 -0 5 ~V) effect was due largely to artifactual differences in the prest imulus baseline At the high rates of st imulus delivery used in experiment 2, the prestlm- ulus basehne was extracted 200-400 msec after the preceding snmu- lus Since the st imulus scenario was randomized, half of the preced- ing s t lmuh were tone bursts In the "ignore visual" condition, these tone bursts were at tended Hence, during "ignore visual" conditions the prest lmulus baseline at fronto-central electrodes would have included time-jittered contributions from enhanced N1 and particu- larly from enhanced P2 components Thus, this effect would shift the prest lmulus baseline positively in comparison with the prest lmulus baseline m attend visual conditions Since the figures show the ERPs re-basehned using mean prest lmulus voltages, the differential pre- ceding baseline effect appears as a small, negative deflection m the ERP at fronto-central sites See Woldorff (1989) for a further discus- sion

350 D L W O O D S ET AL
' " Fz " '" / , FI ,--', Fc
Ti ,,, C z ,, " Tc
~,, /" \ ,' ,
i .
is' ' ",' ," ': ~ ,; ",!~
, ~ , \ i ' :
"; ;c~ "", o , ,,:; . ',, ,. ., ~ . k o ,°
;IpV. I . . . .
+,~v l " m ~ : soo ; :
P T I N d v
P d v ~ / P T c , , " , , I
.'~.. l-- , ~ X ' : : ~_ . - , ~ _ ~ " ~ 7-"~ v \ ' , / /
'L #t
EXPERIMENT 2 , / \ ,VIS DIFFERENCE WAVES
" ATTEND - IGNORE
VIS STANDARDS
....... VIS TARGETS
Fig 10 Difference waves, derwed by subtracting visual ERPs m attend auditory conditions from ERPs to corresponding stimuli in at tend visual conditions for s tandards (solid) and targets (dashed) ERPs were averaged over spatial frequency and visual field Electrodes have been transposed so that those on the right were contralateral to the field of stimulation and relabeled accordingly Insert enlarged responses from PTI
and PTc Grand mean of 12 subjects
PTi M M N / N 2 b
" " X f - -
4r EXPERIMENT 2
TIS DIFFERENCE WAVES
DEVIANT-STANDARD
ATTEND VIS.
....... ATTEND AUD
Fig 11 Deviant minus s tandard difference waves to visual s t lmuh m attend visual (solid) and at tend auditory (dashed) condmons ERPs were averaged over spatial frequency and visual field Electrodes have been transposed so that those on the right were contralateral to the field of
sUmulatlon They have been relabeled accordingly Insert enlarged ERPs from PT1 and PTc Grand mean of 12 subjects
I N T E R M O D A L SELECTIVE A T T E N T I O N , I
VISUAL IGNORE ATTEND
MMN/N2b IGNORE ATTEND
@~ 260 ms
350 ms
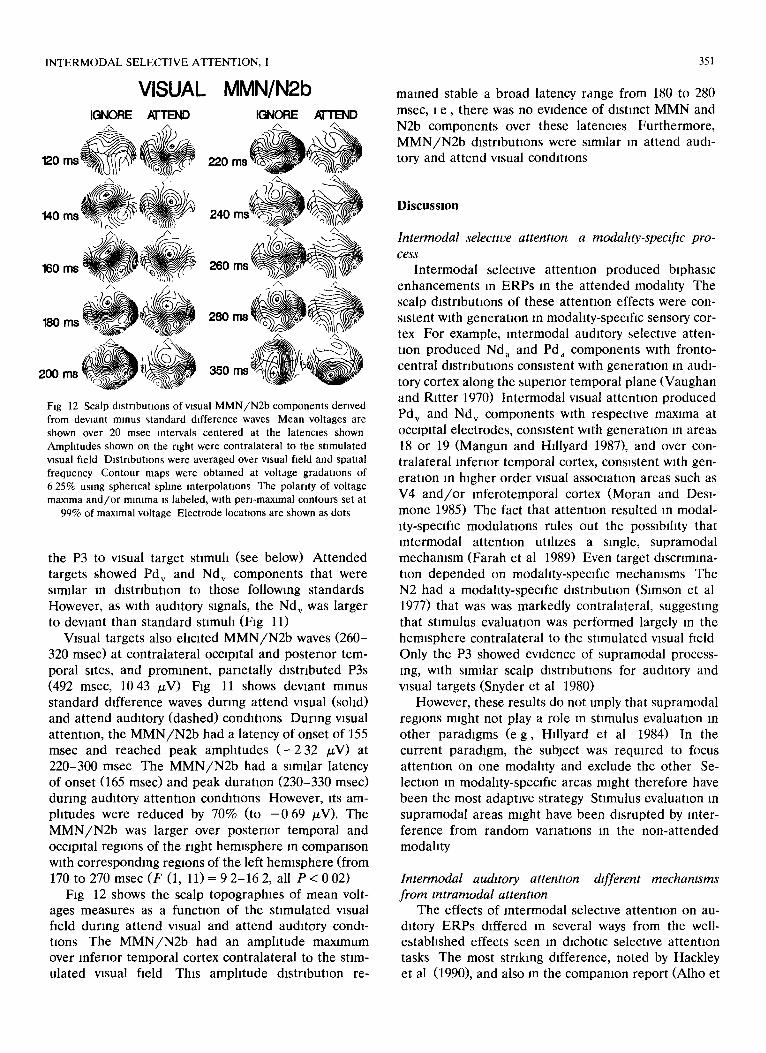
Fig 12 Scalp distributions of visual M M N / N 2 b components derived from deviant minus s tandard difference waves Mean voltages are shown over 20 msec intervals centered at the latencles shown Ampli tudes shown on the right were contralateral to the st imulated visual field Distributions were averaged over visual field and spatial frequency Contour maps were obtained at voltage gradations of 6 25% using spherical sphne interpolations The polarity of voltage maxima a n d / o r minima is labeled, with pen-maximal contours set at
90% of maximal voltage Electrode locations are shown as dots
the P3 to visual target stlmuh (see below) Attended targets showed Pdv and Nd v components that were slmdar m distribution to those following standards However, as wtth auditory signals, the Nd v was larger to dewant than standard stlmuh (Fig 11)
Visual targets also eltclted MMN/N2b waves (260- 320 msec) at contralateral occipital and posterior tem- poral sttes, and prominent, panetally distributed P3s (492 msec, 1043 ~V) Fig 11 shows devtant minus standard difference waves during attend wsual (sohd) and attend auditory (dashed) condlttons During visual attentlon, the MMN/N2b had a latency of onset of 155 msec and reached peak amphtudes ( - 2 3 2 /xV) at 220-300 msec The MMN/N2b had a slmdar latency of onset (165 msec) and peak duration (230-330 msec) during auditory attention conditions However, ~ts am- phtudes were reduced by 70% (to - 0 69 IzV). The MMN/N2b was larger over posterior temporal and occtpltal regions of the right hemisphere m comparison with corresponding regions of the left hemisphere (from 170 to 270 msec (F (1, 1 1 ) = 9 2 - 1 6 2 , all P < 0 0 2 )
Fig 12 shows the scalp topographies of mean volt- ages measures as a function of the stimulated wsual field during attend visual and attend auditory condi- tions The MMN/N2b had an amphtude maxamum over inferior temporal cortex contralateral to the stim- ulated visual field This amphtude distribution re-
351
mamed stable a broad latency range from 180 to 280 msec, 1 e , there was no evidence of distract MMN and N2b components over these latenc~es Furthermore, MMN/N2b distributions were slmdar in attend audi- tory and attend wsual condlUons
Discussion
Intermodal selecttve attentton a modahty-spectfw pro- cess
Intermodal selectwe attention produced b~phaslc enhancements in ERPs m the attended modahty The scalp d~strlbutlons of these attenUon effects were con- Slstent with generation m modahty-speclfiC sensory cor- tex For example, mtermodal auditory selectwe atten- tion produced Nd~ and Pd~ components with fronto- central dlstnbut~ons consistent w~th generation m audi- tory cortex along the superior temporal plane (Vaughan and Rltter 1970) Intermodal wsual attention produced Pd v and Nd v components w~th respectwe maxima at occipital electrodes, consistent with generation m areas 18 or 19 (Mangun and Hdlyard 1987), and over con- tralateral inferior temporal cortex, consistent with gen- eration in htgher order visual assoclatton areas such as V4 and /o r mferotemporal cortex (Moran and Desl- mone 1985) The fact that attention resulted in modal- lty-speclfic modulations rules out the posslbdlty that mtermodal attention utthzes a single, supramodal mechamsm (Farah et al 1989) Even target d~scrtmma- tton depended on modahty-specfflC mechanisms The N2 had a modahty-speclfic dlstnbutton (Slmson et al 1977) that was was markedly contralateral, suggesting that stimulus evaluahon was performed largely m the hemisphere contralateral to the stimulated visual field Only the P3 showed evidence of supramodal process- rag, wtth similar scalp distributions for auditory and visual targets (Snyder et al 1980)
However, these results do not ~mply that supramodal regions might not play a role m stimulus evaluation m other paradigms ( e g , Hdlyard et al 1984) In the current paradigm, the subject was required to focus attention on one modahty and exclude the other Se- lection m modahty-speclfic areas might therefore have been the most adaptive strategy Stimulus evaluaUon m supramodal areas might have been disrupted by inter- ference from random variations m the non-attended modahty
Intermodal au&tory attentton different mechamsms from mtramodal attentton
The effects of mtermodal selectwe attention on au- ditory ERPs differed m several ways from the well- estabhshed effects seen m d~chottc selectwe attenhon tasks The most striking difference, noted by Hackley et al (1990), and also m the compamon report (Alho et

352 D L W O O D S ET AL
al 1992), was that lntermodal attention was accompa- nied by biphasic modulations in auditory ERPs, in contrast to the monophasic "processing negatlvities" typically seen in intramodal auditory attention tasks (Naatanen 1990) Also, the Nd a also had a central distribution similar to that of the exogenous N1, rather than the more frontal distribution characteristic of early Nd components seen in dlchotic attention tasks (e g , Woods and Clayworth 1987) These differences suggest that inter- and intramodahty attentions modu- late processing in different cortical areas
Intermodal attention effects were not due to a sim- ple enlargement of the N1 and P2 but may have reflected either the selective modulation of the N 1 / P 2 subcomponents (Hackley et al 1990) or the addition of endogenous components to the ERP We found two differences between Nd a and the N1 distributions First, the Nda had a relatively steeper decline in amph- tude frontally, with little activity evident at fronto-polar sites Second, while the distribution of the N1 became more frontal with increasing pitch (Woods et al 1991), pitch-related changes were not seen in the distribution of the Ndd (Woods et a l , submitted) Neither the P2 nor the Pd a changed in distribution with pitch (tbtd), but the Pd a had a longer latency than the P2 and could be distinguished from the P2 by its more restricted fronto-central scalp topography
A curious feature of auditory lntermodal attention effects was their long latency of onset The earliest attention effects to standards were seen at 110-130 msec, well after the onset of the N1 These latencies are substantially longer than those of the early Nd (Nde, 50-70 msec) recorded In dIchotlc selective atten- tion tasks using easily discriminable auditory channels Task-specific factors do not appear to account for these latency differences Although the long interstim- ulus intervals of experiment 1 (600 msec) may have increased the latency of attention effects (Hansen and Hillyard 1984, Naatanen 1990), short ISis were used In experiment 2 Nor could the long-latencies be ex- plained by the parallel detection of targets of different pitches and locations in experiment 2 In the following report (Alho et al 1992) Nd a latencies were long in an intermodal task where attention was focused to a single auditory input
The long latency of the Nd a argues against subcorti- cal gating or filtering It also is unlikely that the Nd a reflects a template matching process similar to that proposed for the processing negativity (PN) (Naatanen 1982) In intramodal tasks, the latency of the PN is determined by the resemblance of at tended and non- at tended stImuh If intermodal PNs occurred, their latencies would presumably have been short, because of the distinctiveness of at tended stimuli and hetero- modal distractors Hence, the Nd a would have been expected to have a latency as short or shorter (60 msec
or less) than that of the Nd e to the most discriminable auditory inputs A possible explanation is that the Nd depends on reafferent projections from cortical fields responsive to both at tended and non-at tended stimuli (Edelman 1989) According to this line of reasoning, the Nd a and Pd a would depend on reafferent proJec- tions from "mult imodal" association areas, whereas the Nd e would depend on reafferent projections from modahty-specific cortex Hence, the latency of inter- modal attention effects would be prolonged because of the additional latency required for afferent projections to reach supramodal cortex
Another surprising feature was the absence of the frontal, long latency negative component (Nd l) rou- tinely seen in lntramodal selective attention tasks The Nd, has been hypothesized to reflect " template updat- ing" and "execut ive/supervisory functions" (Woods 1990) Its absence in intermodal attention tasks sug- gests that it reflects processing specific to dichotlc selective attention tasks
The attention-related enhancement in posltivity (Pd a) also deserves comment In a previous study of selective attention to speech passages (Woods et al 1984), we found that markedly deviant probes mixed with at tended speech passages elicited enhanced posi- tivities and speculated that such enhanced posltwmes reflect the rejection of the stimuli from further process- ing This explanation accords well with the reduced PdaS to targets In the current study Attended stan- dards may have been excluded at an early stage of processing (evoking enhanced positivlty), whereas the targets underwent more prolonged analysis associated with an enhanced and sustained Nd d
Modahty-pnmmg effects on RTs "Modall ty-prlmlng" effects were indexed by the re-
duction in reaction times (RT) to targets that followed standard stimuli in the same modahty (see also Alho et al 1992) In part, these may have reflected an improve- ment in the clarity of the representat ion of features that distinguished target and non-target stimuli Since the detection of targets required a perceptual discrimi- nation based on a single target feature (e g , visual targets were slightly shorter than standards), the repe- tition of a standard stimulus may have sharpened the feature representat ion (e g , " length") needed for com- parisons with the targets However, in contrast to RT priming effects in multi-dimensional auditory selectwe attention tasks (Woods et al 1991), the magnitude of R T facilitation was similar when targets followed tones of different pitch and location as when they followed tones with which they shared these cues This suggests that "relatwe pitch" might have been processed as an abstract feature like length in the visual modahty We also found that RTs were slowed in the primed spatial location suggestwe of "inhibition of re turn" (Posner et

INTERMODAL SELECTIVE ATTENTION, I
al 1985), or refractoriness of attention (Woldorff and Hillyard 1991)
Attenttonal modulation of the MMN Attended and non-at tended auditory deviants
e l ioted mismatch negativItles that were enhanced with attention, consistent with Woldorf's and HIllyard's re- cent report (1991) However, the issue of the atten- tlonal modulation of the MMN is complicated by the occurrence of multiple, overlapping components in the MMN latency range In particular, because the same subtraction operations are used to isolate stimulus deviance (MMN) and attention effects (Nd), any ap- parent attenttonal modulatton of the MMN wtll mevttably be assoctated wtth enhanced attentzon effects (Nds) to targets Conversely, enhanced Nds to targets will be associated w~th attentional modulation of the MMN Thus, the apparent attentlonal enhancement of the MMN could have been either real, or due to an under- lying Nd a enhancement to targets Changes m the MMN scalp topography with attention were consistent with increased contribution from Nd a generators However, topographic data failed to resolve the issue, m part because of the distribution of MMNs to non- at tended tones was variable (due to their small ampli- tude), and in part because Nd a and MMN distributions were slmdar Attentlonal modulation of the longer latency portion of the MMN may also have reflected overlap with other target-speofic negatlvltles (N2b or premotor potentials)
As in the following report (Alho et al 1992), the modulation of the MMN with attention was hmlted to deviant stimuli closely resembling standards This sug- gests that attentlonal modulation may be limited to the processing of small stimulus changes Perhaps more salient changes (such as DEVIANT stimuli) are pro- cessed automatically regardless of the direction of at- tention
It was also of interest that MMNs were obtained in experiment 2 despite the acoustic complexity of the stimulus sequence This suggests that separate acoustic traces were maintained for the different standard stlm- uh Since ISis between of repetitions of individual standards averaged 3 0 sec, the small amplitudes of the MMN may have reflected the degradation of sensory memory that would be expected at this relatively long ISI (Naatanen 1990)
The behavioral significance of the MMN also de- serves further comment The presentation of deviant stimuli dld not significantly influence reaction times to subsequent targets This suggests that the MMN does not reflect the automatic reorientation of attention However, when an MMN is evoked by markedly de- viant stimuh that slow reaction times to subsequent targets it is accompanied by N2b and P3a components
353
(Woods 1990) This suggests the N2b/P3a, rather than the MMN, may index the actual reorlentatlon of atten- tion
Auditory attention effects were larger and had shorter latencles of onset for hard-to-detect deviant stimuli than standards in experiments 1 and 2, and in the following report (Alho et a! 1992) At first glance, these results appear at odds with 2-stage theories of attentlonal selection (e g , Hlllyard et al 1973) Accord- ing to these theories, initial selection occurs when standards and targets are compared against " traces" or "filters" of standard stimuli that depend on frequent repetition for their maintenance (Naatanen 1990) In experiment 2, this factor should have been particularly important, because the individual targets occurred, on the average, only once every 24 sec One possible explanation is that the attent~onal trace or filter re- sponsible for short latency selective attention effects could be tuned to stimuli that were slightly different in p~tch from standards For example, auditory standards might have served as a frame of reference to permit the attentional trace to be focussed on tones of slightly higher pitch Indeed, the Nd a for deviants in both experiments resembled "processing negatlVitles" more than the biphasic Nda-Pd a recorded to standard stim- uh Moreover, enhanced attention effects were seen for targets similar in frequency to standards, but no Nd a was seen for DEVIANTS, suggesting that the attentional focus could only be shifted slightly from the sensory representations of standard stlmuh A simdar attentlonal extrapolation could explain Oklta's results (1987) demonstrating short latency attention effects to tones changing predictably in spatial position and pitch
Intermodal visual attention effects Like lntermodal auditory attention, lnterrnodal vi-
sual attention may have involved either the modulation of exogenous components or the addition of endoge- nous components to the visual ERP The Pd v ap- peared to reflect an enhancement of the exogenous P120 component similar to early enhanced positivltles seen in visual tasks manipulating spatial attention (Mangun and Hlllyard 1988) The Nd V (lasting for more than 200 msec) was superimposed on trl- or tetraphasic deflections in some subjects and was mor- phologically similar to the broad "processing negatlVl- ties" that have previously reported in visual selection tasks using cues of spatial frequency (Hat ter and Previc 1978), color (Hlllyard and Munte 1984), or location (Hlllyard et al 1985) Moreover, as with lntramodal spatial attention, the Nd v was larger over the hemi- sphere contralateral to the evoking stimulus The re- semblance between our results and those of visual spatial attention tasks raises the possibility that sub- jects may have performed a covert spatial attention task in our experiment, preferentially focusing atten-

354 D L WOODS ET AL
tlon on one visual hemlfield or the other for alternat- ing periods
The vertex components of the visual ERP remain an enigma The vertex N 1 / P 2 is not simply a volume-con- ducted or polarity-reverted reflection of parietal and occipital actwlty For example, visual vertex N1 was shorter in latency (by about 25 msec) and larger in amplitude (by 39%) than the occipital N160 The pos- terior and slightly contralateral distribution of these components suggests that they may arise in the supple- mentary motor regions, the infolded cmgulate gyrus, or regions of parietal cortex Although the visual "vertex" N1 and P2 were the largest components of the visual ERP, they were unaffected by lntermodal attention
Both Pd v and Nd v waves appeared to arise in visual association cortex The Pd v had a bilateral distribution consistent with a possible origin in prestrlate areas (Mangun and Hlllyard 1988) The Nd v was maximal in amplitude at occipital and inferior temporal sites con- tralateral to the stimulated visual field, consistent with generation in higher visual association cortices where neuronal responses are known to be modified by visual attention (Moran and Desimone 1985, Robinson and Petersen 1986) It IS of interest that Nd v components were larger m amplitude in the current study, where laterahzed stimuh were used, than In the subsequent report (Alho et al 1992) This IS consistent with previ- ous observations that the visual system may be less well equipped for modulating foveal processing than for modulating processing at the visual periphery (Neville and Lawson 1987)
with the more prominent, shorter latency components of the visual ERP Second, it could have reflected a release from stimulus-specific refractoriness However, this also appears unlikely in the absence of systematic alteration In the amplitudes of earlier components Third, it may have accompanied controlled visual pro- cesslng, performed overtly during visual attention, and covertly during auditory attention This posslblhty seems improbable for two reasons First, since the M M N / N 2 b was 30% as large during auditory attention as during visual attention conditions, this explanation tmphes that subjects frequently attended to visual stim- uh during attend auditory conditions This seems un- hkely because both tasks were demanding, perfor- mance in the attended modahty remained high, and the occurrence of visual deviants had no effect on the RTs to subsequent auditory targets Second, the mor- phology of ERPs to deviant visual stimuli differed in attend auditory and attend visual conditions in attend visual conditions M M N / N 2 b was followed by a large P3 (the P 3 / M M N amplitude ratio at contralateral in- ferior temporal sites was 1 94), but httle wsual P3 was evident during attend auditory conditions (the P 3 / M M N ratio was 0 25)
Scalp topographies suggest that the visual MMN originates In lateral occipital and mfero-temporal cor- tex of the hemisphere contralateral to the stimulated visual field Indeed, the ERP results suggest that visual cortex in the contralateral hemisphere remains the focus of processing for more than 300 msec after stimulus delivery
A visual mismatch negativity Difference waves (deviant minus standard) In attend
auditory as well as attend visual conditions revealed a broad negativity over occipital and inferior temporal regions of the hemisphere contralateral to the stimu- lated visual field The classification of these visual negatwItles is discussed more fully in the followmg report (Alho et al 1992) However, the visual M M N / N 2 b , like the auditory MMN, appeared to re- flect partially automatic processes, since tt was elicited during attend auditory as well as attend visual condi- tions The visual M M N / N 2 b also showed a right hemi- sphere amplitude predominance that has previous been reported for the auditory MMN (Paavllamen et al 1991) The persistence of the visual M M N / N 2 b during auditory attention con&tlons suggests that it, like the auditory MMN, may reflect the automatic detection of physical change in sequences of visual stimuli (Naatanen 1990) However, at least 3 other explana- tions need to be considered First, because the M M N / N 2 b was elicited by infrequent (shorter) visual stimuli, it could reflect stimulus-related differences In the visual ERP This possibility seems unhkely, since no deviance-related changes were seen in association
References
Alho, K, Tottola, K, Remlkalnen, K, Sams, M and Naatanen, R Brain mechamsms of selective hstenmg reflected by event-related potentials Electroenceph chn Neurophysiol, 1987, 68 458-470
Alho, K, Woods, D L, Algazi, A and Naatanen, R Intermodal selectwe attention II Effects of attentlonal load on processing au&tory and visual stimuh in central space Electroenceph chn Neurophyslol, 1992, 82 356-368
Buchtel, H A and Butter, C M Spatial attentlonal shifts implica- tions for the role of polysensory mechanisms Neuropsychologta, 1988, 26 499-509
Desmedt, J E and Tomberg, C Mapping early somatosensory evoked potentials in selective attention critical evaluation of control conditions used In tltratlng by difference the cogmtwe P20, P40, P100 and N140 Electroenceph chn Neurophyslol, 1989, 74 321-346
Edelman, G M The Remembered Present A Biological Theory of Consciousness Basic Books, New York, 1989
Farah, M J, Wond, A B, Monhelt, M A and Morrow, L A Parietal lobe mechanisms of spatial attention modahty specific or supramodal Neuropsychologla, 1989, 27 461-470
Garcla-Austt, E, Bogacz, J and Vanzulh, E Effects of attention and inattention upon visual evoked response Electroenceph chn Neurophyslol, 1964, 17 136-143
Hackley, S A, Woldorff, M and Hlllyard, S A Cross-modal selective

INTERMODAL SELECTIVE ATTENTION, I 355
attention effects on retinal, myogenic, bramstem and cerebral evoked potentials Psychophyslology, 1990, 27 195-208
Hansen, J C and Hdlyard, S A Endogenous brain potentmls assoca- ated with selectwe au&tory attention Electroenceph chn Neu- rophysIol, 1980, 49 277-290
Hansen, J C and Hdlyard, S A Selectwe attenUon to multidimen- sional auditory stimuh J Exp Psychol Hum Percept Perform, 1983, 9 1-19
Hansen, J C and Hlllyard, S A Effects of stimulation rate and attribute cuing on event-related potentials during auditory atten- tion Psychophyslology, 1984, 21 394-405
Harter, M and Prevlc, F H Size-specific mformahon channels and selectwe attention visual evoked potential and behavioral mea- sures Electroenceph chn Neurophysaol, 1978, 45 625-640
Hlllyard, S A and Munte T Selective attention to color and loca- tion an analysis with event-related brain potentials Percept Psychophys, 1984, 36 185-198
HiIlyard, S, Hlnk, R , Schwent, V and Picton, T Electrical signs of selective attention in the human brain Science, 1973, 182 177- 180
Hdlyard, S A, Simpson, G V, Woods, D L, Van Voorhls, S, Munte, T and Ajmone Marsan, C Event-related brain potentmls and selective attention to different modahties In F R Suarez (Ed), Cortical Integration Raven Press, New York, 1984 395-414
Hlllyard, S H , Munte, T F and Neville, H J Vtsual-spatml attention, orienting and brain physaology In M I Posner and O Marln (Eds), Attention and Performance XI Erlbaum, New York, 1985 63-84
Knight, R T, Scablnl, D, Woods, D L and Clayworth, C The effects of lesions of superior temporal gyrus and inferior parietal lobe on temporal and vertex components of the human AEP Electroen- ceph chn Neurophyslol, 1988, 70 499-509
Mangun, G R and Hillyard, S A The spatial allocation ol visual attention as indexed by event-related brain potentials Hum Factors, 1987, 29 195-211
Mangun, G R and Hfllyard, S A Spatml gradients of vasual atten- tion behavioral and electrophysiolgacal evidence Electroenceph chn Neurophyslol, 1988, 70 417-428
McCarthy, G and Wood, C C Scalp dastrabuhons of event-related potentmls an amblgmty assocmted w~th analysis of variance mod- els Electroenceph chn Neurophysaol, 1985, 62 203-208
Moran, J and Desamone, R Selective attentaon gates wsual process- ing m the extrastraate cortex Science, 1985, 229 782-784
Naatanen, R Selective attenhon and evoked potentials an humans - a critical review Baol Psychol, 1975, 2 237-307
Naatanen, R Processing negatwity an evoked-potential reflectaon of selective attention Psychol Bull, 1982, 92 605-640
Naatanen, R The role of attenhon in au&tory mformaUon process- ing as revealed by event-related potentmls and other brain mea- sures of cogmtive function Behav Brain Scl, 1990, 13 201-288
Naatanen, R , Sams, M and Alho, K Masmatch negativity the ERP sign of a cerebral masmatch process In W C McCallum, R Zappoh and F Denoth (Eds), Cerebral Psychophyslology Stud- ies in Event-Related Potentials Electroenceph chn Neurophys- iol, Suppl 38 Elsevier, Amsterdam, 1986 172-177
Neville, H J and Lawson, D Attenhon to central and peripheral visual space an a movement detectaon task an event-related potentml and behavioral study I Normal hearing adults Brain Res, 1987, 405 253-267
Oatman, L Role of vasual attention on auditory evoked potentials in unanesthetlzed cats Exp Neurol, 1971, 32 341-356
Okata, T Event-related potentmls and selectwe attentaon to tones moving in location and pitch an examination of movement veloc- ity Biol Psychol, 1987, 24 225-237
Paavllalnen, P, Alho, K, Relmkamen, K, Sams, M and Naatanen, R Right-hemisphere dominance of different mismatch negatlVl- ties Electroenceph elm Neurophyslol, 1991 78 466-479
Perrln, F , Pernler, F , Bertrand, O and Echalher, J F Spherical sphnes for scalp potential and current density mapping Elec- troenceph chn Neurophyslol, 1987, 66 75-81
Posner, M I and Petersen, S E The attention system of the human brain Annu Rev Neurosci, 1990, 13 25-42
Posner, M I , Rafal, R D, Choate, L S and Vaughan, J Inhibition of return neural basis and function Cogn Neuropsychol, 1985, 2 211-228
Robinson, D L and Petersen, S E The neuroblology of attention In J E LeDoux and W Hlrst (Eds), Mind and Brain Dialogues in Cognitive Neurosclence Cambridge University Press, New York, 1986 142-171
Slmson, R , Vaughan, H G and Ritter, W The scalp topography of potentials in auditory and visual discrimination tasks Electroen- ceph clln Neurophyslol, 1977, 42 528-535
Skinner, J E and Ylnghng, C D Central gating mechanisms that regulate event-related potentials and behavior Prog Clin Neu- rophyslol, 1977, 1 30-69
Snyder, E , Hillyard, S A and Galambos, R Similarities and differ- ences among the P3 waves to detected signals in three modahtles Psychophyslology, 1980, 17 112-122
Vaughan, H and R~tter, W The sources of au&tory evoked re- sponses recorded from the human scalp Electroenceph chn Neurophys2ol, 1970, 28 360-367
Woldorff, M G Auditory Selectwe Attention in Humans Analysis of Mechamsms Using Event-Related Brain Potentials Unwerslty Microfilms, Ann Arbor, MI, 1989
Woldorff, M and Hlllyard, S A Modulation of early auditory pro- cessmg during selective hstenlng to rapidly presented tones Elec- troenceph chn Neurophyslol, 1991, 79 170-191
Woldorff, M, Hackley, S A and HIllyard, S A The effect of chan- nel-selectwe attention on the mismatch negatwity wave elicited by deviant tones Psychophyslology, 1991, 28 30-42
Wolpaw, J R and Penry, J K A temporal component of the auditory evoked response Electroenceph clln Neurophyslol, 1975, 39 609-620
Woods, D L The physiological basis of selective attention Imphca- tlons of event-related potential studies In J W Rohrbaugh, R Johnson and R Parasuraman (Eds), Event-Related Brain Poten- tials Issues and Interdiscaphnary Vantages Oxford Unlv Press, New York, 1990 178-209
Woods, D L and Clayworth, C C Chck spatial posltaon influences middle latency auditory evoked potentials (MAEPs) m humans Electroenceph clln Neurophysiol, 1985, 60 122-129
Woods, D L and Clayworth, C C Scalp topographies &ssocmte N1 and Nd components during au&tory selective attention In Elec- troenceph chn Neurophysiol, Suppl 40 Elsevaer, Amsterdam, 1987 155-162
Woods, D L, Hdlyard, S A and Hansen, J C Event-related brain potentials reveal similar attentaonal mechanisms during selective listening and shadowing J Exp Psychol Hum Percept Per- form, 1984, 10 761-777
Woods, D L, Algazl, A and Alho, K Event-related potential signs of stimulus feature conjunction during human auditory selective attention NeuroReport, 1991, 2 189-192
Woods, D L, Alho, K and Algaza, A Intermodahty selectwe atten- tion evidence for processing m tonotoplc and non-tonotoplc auditory fields Psychophyslology, submitted