An Analysis of Intermodal Use of Electric and Human-powered ...
23
HAL Id: halshs-03523112 https://halshs.archives-ouvertes.fr/halshs-03523112 Preprint submitted on 12 Jan 2022 HAL is a multi-disciplinary open access archive for the deposit and dissemination of sci- entific research documents, whether they are pub- lished or not. The documents may come from teaching and research institutions in France or abroad, or from public or private research centers. L’archive ouverte pluridisciplinaire HAL, est destinée au dépôt et à la diffusion de documents scientifiques de niveau recherche, publiés ou non, émanant des établissements d’enseignement et de recherche français ou étrangers, des laboratoires publics ou privés. An Analysis of Intermodal Use of Electric and Human-powered Scooters with Train in the Provence-Alpes-Côte d’Azur Region, in France: Towards Extended Train Station Areas? Dylan Moinse, Matthieu Goudeau, Alain l’Hostis, Thomas Leysens To cite this version: Dylan Moinse, Matthieu Goudeau, Alain l’Hostis, Thomas Leysens. An Analysis of Intermodal Use of Electric and Human-powered Scooters with Train in the Provence-Alpes-Côte d’Azur Region, in France: Towards Extended Train Station Areas?. 2022. halshs-03523112
-
Upload
khangminh22 -
Category
Documents
-
view
1 -
download
0
Transcript of An Analysis of Intermodal Use of Electric and Human-powered ...

HAL Id: halshs-03523112https://halshs.archives-ouvertes.fr/halshs-03523112
Preprint submitted on 12 Jan 2022
HAL is a multi-disciplinary open accessarchive for the deposit and dissemination of sci-entific research documents, whether they are pub-lished or not. The documents may come fromteaching and research institutions in France orabroad, or from public or private research centers.
L’archive ouverte pluridisciplinaire HAL, estdestinée au dépôt et à la diffusion de documentsscientifiques de niveau recherche, publiés ou non,émanant des établissements d’enseignement et derecherche français ou étrangers, des laboratoirespublics ou privés.
An Analysis of Intermodal Use of Electric andHuman-powered Scooters with Train in the
Provence-Alpes-Côte d’Azur Region, in France: TowardsExtended Train Station Areas?
Dylan Moinse, Matthieu Goudeau, Alain l’Hostis, Thomas Leysens
To cite this version:Dylan Moinse, Matthieu Goudeau, Alain l’Hostis, Thomas Leysens. An Analysis of Intermodal Useof Electric and Human-powered Scooters with Train in the Provence-Alpes-Côte d’Azur Region, inFrance: Towards Extended Train Station Areas?. 2022. �halshs-03523112�

An Analysis of Intermodal Use of Electric andHuman-powered Scooters with Train in the
Provence-Alpes-Côte d’Azur Region, in France: TowardsExtended Train Station Areas?
Dylan Moinse1, Matthieu Goudeau2, Alain L’Hostis1 and Thomas Leysens3
1 LVMT, Univ Gustave Eiffel, IFSTTAR, Ecole des Ponts, F-77455 Marne-la-Vallée, France2 AREP, Direction Conseil et Programmation, Pôle Flux et Mobilités, F-75647 Paris, France
3 AME, Univ Gustave Eiffel, F-77455 Marne-la-Vallée, France
Paper Submission: December 30, 2021 / Preprint
Abstract— Featuring rapid adoption rates in recent years, personal standing scooters, as a micromobility, represent amissing complement to the first and last-mile of public transport. This paper examines intermodal trips involving private(e-)scooters and trains with the objective to investigate the influence of this intermodal combination on station catchmentareas. The methodology is based on the analysis of existing scientific research and empirical evidences. The case studyfocuses on access data from 12 railway stations collected by SNCF Réseau in the Provence-Alpes-Côte d’Azur region inSeptember and October 2020. Principal findings of this secondary analysis, based on 53 passengers using this personaldevice, suggest an over-representation of male and younger users, with very frequent intermodal practices mainly dedicatedto work or study, and a feeder distance between combined walking and cycling. There appears to be similarities betweenbike-and-ride and scoot-and-ride but also clear distinctions that characterize this emerging mode, among which the factthat scooter is almost always used both during access and egress stages. This article advocates that station areas shouldbe better considered by redesigning the surrounding public spaces to better balance the space of each mode, in favour ofalternatives to the car and sustainable cities.
Keywords— E-scooter; Intermodality; Micromobility; Public Transport; Urban transportation
1. IntroductionStanding scooters are a dramatically growing new trendin urban mobility (Oeschger, Carroll, and Caulfield2020, p. 1). These are small, light, electric, single-userand cost-effective alternative transportation optionsfor short distances (McKenzie 2019b; Abduljabbar,Liyanage, and Dia 2021, p. 1). Private e-scootersare increasingly spreading in France with a one-thirdincrease in sales in 2020 (FP2M and SML 2021) andin Europe with an increase in use from 20% to 60%during the first lockdown (Bert et al. 2020). In addition,preliminary data from the OMNIL (2021, p. 35) mobilityobservatory suggest that light transportation modeshave considerably increased in September and October2020 in the Île-de-France region. Beyond its rapidadoption rate, this personal device interacts with othermodes because it is relatively light and foldable (Tunceret al. 2020, p. 1), providing high flexibility for theuser (Zuniga-Garcia, Scott, et al. 2020, p. 2), anessential value that explains a large part of the appealof automobile (Héran 2015, p. 209).The evolution of urban mobility is a key to reducing
the costs generated by a car-oriented society, resultingmainly in GHG emission, urban sprawl, different formsof pollution (air, noise), socio-spatial fragmentation,budget costs, traffic accidents and congestion (Héran2001, p. 12). Although modal shift to public transportis one of the most energy efficient ways to contributeto sustainable mobility, it has the disadvantage of beinginflexible by following a fixed route (EEA 2020, p. 10).
Intermodality, i.e. using multiple means of travel toachieve a given trip (Polzin 2017), reduces the rigidityof public transport (Wiel 1998, p. 17) and is a key toimproving the efficiency of the urban transport system(Oostendorp and Gebhardt 2018, p. 82) by extendingthe stations’ service area (Amar 2016, p. 16).
In this context, Amar (2016, p. 222) describesthe evolution towards a more connected and efficientmobility through the revaluation of proximity modes,articulated to other scales and forms of mobility. Newmobility solutions are having a lasting impact on the21st century mobility system (Cervero 2019, p. 137).Emerging feeder modes reinforce the attractiveness ofpublic transport (Goletz et al. 2020, p. 116) and increase
1
their service area, allowing more destinations to bereached within the same time budget (EEA 2020, p. 10).New mobility solutions forms, such as the combinationof micromobility and public transport, are expectedto become relevant in the future (Oostendorp andGebhardt 2018, p. 77), especially in suburban areaswhere travel distances for accessing transit stops tend tobe longer (Cervero, Caldwell, and Cuellar 2013, p. 84).By providing on-demand mobility, e-scooters are
touted as a solution to the missing "first and last-mile" (FLM) transit connection (Holm Møller, Simlett,and Mugnier 2020, p. 9). Therefore, micromobilitycould be a valuable complement to heavy-duty publictransport networks by making it more efficient towardsa post-carbon city (Schultz and Grisot 2019, p. 3).Thus, e-scooters, incorporated as an intermodal option(Abduljabbar, Liyanage, and Dia 2021, p. 1), have thepotential to meet the challenges of public transportgaps (Gauquelin 2021). This emerging mode should beconsidered as a potential complement to the quality ofthe public transport system capable of promoting morevirtuous and longer distance trips, competing with carin urban and peri-urban areas. Micromobility optionshave a genuine capacity to be relevant as a segmentof intermodal trips, increasing the catchment area ofpublic transport and compete with car travel (CPB2020, p. 63).
However, the changes produced by the arrival of e-scooters in the city remain nascent, unclear, and difficultto predict (Tuncer et al. 2020, p. 1). There is a lackof empirical studies on the integration of micro-vehiclesand public transport, more specifically on e-scooter-railintermodal transportation (Zuniga-Garcia, Scott, et al.2020, p. 2). Gaps are identified across quantitativesupport in this respect (Schlueter Langdon and Oehrlein2021, p. 7), and trip purpose and demographics (Ensor,Maxwell, and Bruce 2021, p. 9). It can be explainedby the fact that these vehicles are new, methodology isnot standardized and data are only scarcely available(Oeschger, Carroll, and Caulfield 2020, p. 17).
The remainder of the paper is organized as follows.In Section 2, we review existing literature based mainlyon shared e-scooters, to highlight research gaps oncombined scooters. Further to a description of SNCFRéseau’s investigation protocol in Section 3, the presentarticle reports the results on train transfers by scooterin the Provence-Alpes-Côte d’Azur (PACA) region inFrance, with a focus on one peri-urban station in Section4. Results are discussed in Section 5, while Section6 concludes and provides also an outlook for furtherresearch.
2. Related workOne of the appealing aspects of micromobility solutionsis their role in enhancing connectivity to publictransport (Abduljabbar, Liyanage, and Dia 2021, p. 4).The use of micromobility including bikes and personalmobility devices (PMD) as human (kick) or electric-powered (e-)scooters can significantly enlarge servicearea available within transit isochrones (Kostrzewska
and Macikowski 2017, p. 4).As a new type of vehicle with particular technical
features – conveying a futuristic and sustainablerepresentation of the city (Boffi 2019, p. 1) – e-scootersenable unique mobility practices by allowing riders torapidly transform into pedestrians (Tuncer et al. 2020,p. 9). Kostrzewska and Macikowski (2017, p. 7) pointout that scoot-and-ride1 differs from bike-and-ride in theease of boarding the linked mode on public transport:e-scooters appear to be an interesting "Hybrid, distincttransport mode" option (Kager, L. Bertolini, and TeBrömmelstroet 2016, p. 1) when carried on dense orpoorly equipped transit, even during peak hours. It iseasily manoeuvrable, folded, and easy to carry, grantingenhanced mobility and speed, especially when combinedwith urban transport (Tuncer et al. 2020, p. 1), althoughthis depends on the type of public vehicle and thecontext.
The aim of this article is then to focus on theintermodal use of scooters, to capture the maincharacteristics of this practice which seems to begrowing and which differs from cycling combined withpublic transport in some points.
2.1. Search parameters considered in thereview of literature
Through a literature review based on previouslyconducted research on the uses and users of scooters,we will present the main results that emerge from theanalysis of 104 scientific articles and reports collectedon an international scale. Our intention is to cover allthe publicly available data on this new object of study,including both academic literature and industry-drivenresearch.
Very few scientific articles and reports examineexclusively the characteristics and impact ofintermodality involving a standing scooter. Therefore,it was decided to devote this literature review toall white and grey literature on scooters and theircombination with other modes of transport.
These papers have been systematically filtered inorder to identify trends in the research, as shown inFigure 1. The literature review is restricted to Europeand America, as few articles seem to exist on thissubject in other continents, at least in English. Itappears that studies about scooters are monopolizingthe subject of electric scooters and have mainly focusedon shared e-scooters soon after their emergence in 2017,especially during 2019 and 2020. While studies rateabout e-scooters as Personal Electric Vehicles (PEV)seems to be increasing from 2021 onwards. This isin line with the growth in the number of publicationsexpected by Abduljabbar, Liyanage, and Dia (2021,p. 2) who conducted a bibliometric analysis focusedon micromobility, from English-language journal articlesbetween 2000 and 2020.
Studies on the intermodal approach to e-scooterstend to focus on both personal and shared scooters,
1Throughout this paper, the term "scoot-and-ride" will refer tothe use of scooter in combination with transit.
2

2016 2017 2018 2019 2020 2021
Ref
eren
ces
Years
Personal scooters Scooter rental services Europe America
20
44
31
8
1
N=104
2016 2017 2018 2019 2020 2021
Fig. 1: Literature review overview: Uses and users ofpersonal and rented scooters in Europe and America
Sources: References, Realization: Moinse et al., 2022
accounting for one third of the literature reviewed (Table1). By contrast, this topic is more common in theEuropean literature (36%) than in the American one(17%). Although the question of integration of standingscooters and transit is regularly included in scientificresearch and reports, it is only partially discussed andrestricted to a few results which are outlined below.
In order to better understand the usages of scooters,we will first analyse the characteristics of all tripson scooters, and then we will examine the statisticsgathered on intermodal trips.
Filters Studies
reviewed
Studies addressing intermodality
Number Share
Personal scooters 44 16 36%
Scooter rental services 89 32 36%
Europe 40 14 35%
America 24 4 17%
Table 1: Share of studies on intermodal practices byscooter types
Sources: References, Realization: Moinse et al., 2022
2.2. Socio-demographic profile of scooterusers
This part deals with the main aspects defining the user’sprofile, including age and gender that will be exploredin the results section.
AgeField surveys based on the data analysis on scootersconcur on the relative youth of users of scooters.Generally, the median age of scooter users ranges from25 to 34 (Fig. 2). Accordingly, 6t-Bureau de recherche
(2019a, p. 14) observes that 45% of shared e-scooterriders are under 25 in Paris (France), while 33% areunder 24 in New Zealand (Fitt and Curl 2019, p. 4).In Calgary (Canada), Sedor and Carswell (2019) reportthat 70% are actually less than 30 while de Bortoli andChristoforou (2020, appendices) identify 46% as beingunder the 30-year mark in Paris.
The same applies to personal scooters which are morepopular with the younger population, with 41% of usersbetween 15 and 25 in a ratio similar to that for publicbikeshare in France (Richer 2021). A graduate thesis inLyon stands out from the overall results by counting halfof the users as being below 21 (Pestour 2019). Otherauthors suggest that the median age is closer to the25-34, as illustrated by Laa and Leth (2020, p. 3) whocounts 46% of both dockless and private scooter usersin Vienna (Austria) in this age category.
In the US – especially in Arlington, Baltimore,Minneapolis, Portland, San Francisco and Santa Monica– more than half (50-73%) of shared e-scooter users areunder 40 (NACTO 2020, p. 16).
Moreover, the 6t-Bureau de recherche (2019b, p. 65)research office determined the average age of users of thescooter-sharing system by frequency, revealing that themost casual users are likely to be older: regular usersare 35 on a mean basis, occasional users are 37, whereasusers having tried only once are 40.
Even though the under-30 age group seems to bethe most popular choice for scooters, Degele et al.(2018, p. 4) note another significant peak of customersbetween 45 and 50 who tend to cover longer distance,suggesting then user clusters partly divided into Y andX+ generations.
The effects of crises also appear to make more youngpeople shift to free-floating e-scooters, as the Apur(2020, p. 68) report shows with the public transportstrikes in the Île-de-France region.
GenderA second factor significantly influencing modal choicealong with age is gender. Scooters face a gender gap,with male users taking up two-thirds to three-quartersof the reported modal share (Fig. 3).
In Oslo (Norway), the typical user of docklesse-scooter program is a man (Fearnley, Berge, andJohnsson 2020, p. 16). In Austin, 62% of shared e-scooters are men (Zuniga-Garcia, Scott, et al. 2020,p. 16), while the NACTO (2020, p. 22) association ofNorth American cities and transit agencies lists 66-80%male users from Austin, Baltimore, Minneapolis, SanFrancisco and Santa Monica.
The same figure (67%) is also found among Limeusers in Paris, Lyon and Marseille, reaching 70% forvisitors (6t-Bureau de recherche 2019b, p. 50). Thismasculine population for shared scooters is equallyidentified (68%) in the French capital, as much by Apur(2020, p. 46) as de Bortoli and Christoforou (2020,appendices).
The results with the most critic unbalance for e-scooter services estimate the male rate at 74% in Vienna
3

21
25
26
30
30
30
33
34
26
28
29
34
34
37
1
2
3
4
5
6
7
8
Median (renters) Mean (renters)
Lyon
Paris
Paris
Vienna
U.S.
Paris
Germany
Paris, Lyon
& Marseille
1. Pestour 2019, p. 37
2. de Bortoli and Christoforou 2020, appendices
3. 6t-Bureau de recherche 2019a, p. 14
4. Laa and Let, 2020, p. 6
5. NACTO 2020, p. 16
6. Apur 2020, p. 46
7. Degele et al. 2018, p. 4
8. 6t-Bureau de recherche 2019b, p. 51
Private e-scooters Shared e-scooters
Fig. 2: Average age among e-scooter usersSources: References, Realization: Moinse et al., 2022
(Laa and Leth 2020, p. 3), 75% for Dott users in Paris(6t-Bureau de recherche 2019a, p. 13), 77% in Germanmetropolises (Degele et al. 2018, p. 3), and 87% inRiyadh (Saudi Arabia) (Almannaa et al. 2021, p. 9).
By considering the travel frequency by shared e-scooters, it turns out that men are more representedamong Lime regular users (76%) than casual users(68%) and one-time users (58%) (6t-Bureau de recherche2019b, p. 65). Even if this is less noticeable for Dottregular users (78%), with a 3% gap relative to overall(6t-Bureau de recherche 2019a, p. 25).
Gender inequalities seem to be strengthened whenit involves personal devices: over 60% of scooter usersin France are men (Richer 2021), Laa and Leth (2020,p. 5) reported 75% of male cycle path users by privatescooters in Vienna, Sedor and Carswell (2019) surveyedboth personal and shared scooters and obtained a 68%male share in Calgary.
However, the Île-de-France public transport strikedrew a more feminized population among the newmicromobility users, including shared e-scooters (Apur2020, p. 68).
Surprisingly, despite this inequality in the access toscooters, women have a more positive image of thismicromobility (72%) than men (67%) in the UnitedStates (Clewlow 2018, p. 15). These indicationscall for deepening the researches on gender use andrepresentation of this new transport mode.
58%
60%
62%
66%
67%
68%
68%
68%
74%
75%
77%
85%
87%
42%
40%
38%
34%
33%
32%
32%
32%
26%
25%
23%
15%
13%
13
12
11
10
9
8
7
6
5
4
3
2
1
Male Female
1. Almannaa et al. 2021, p. 9
2. Laa and Leth 2020, p. 3
3. Degele et al. 2018, p. 3
4. 6t-Bureau de recherche 2019a, p. 13
5. Laa and Leth 2020, p. 3
6. Sedor and Carswell 2019
7. de Bortoli and Christoforou 2020, appendices
8. Apur 2020, p. 46
9. 6t-Bureau de recherche 2019b, p. 50
10. NACTO 2020, p. 16
11. Zuniga-Garcia et al. 2020, p. 16
12. Richer 2021
13. Clewlow 2018, p. 14
Riyadh
Vienna
Germany
Paris
Vienna
Calgary
Paris
Paris
Paris, Lyon &
Marseille
U.S.
Austin
France
U.S.
Private e-scooters Shared e-scooters
80%
Fig. 3: E-scooter users rate by genderSources: References, Realization: Moinse et al., 2022
2.3. Mobility patterns of scooter tripsThis section addresses the basic characteristics ofscooter trips, i.e. frequency, purpose and distance.
FrequencyShared e-scooters are mostly used casually, while privatescooters seem to be used more frequently (Fig. 4).
In Paris, the use of e-scooters services at least once aweek is the case for between 25% and 50% (6t-Bureaude recherche 2019a; 6t-Bureau de recherche 2019b; 6t-Bureau de recherche 2020; Pestour 2019; Apur 2020) ofriders. Similar rates are detected in Vienna with 32%of all respondents using the e-scooter sharing system atleast once a week (Laa and Leth 2020, p. 3).
Data from City of Chicago (2020, p. 28) indicate thatmost e-scooter users were infrequent or occasional users.The opposite, usage rates for weekly or more reaches60% in Baltimore (U.S.) (BCDOT 2019, p. 27) and 70%in Oslo in summer (Norway), although this drops to 42%heading into the autumn (Fearnley, Berge, and Johnsson2020, p. 23).
More factors can influence travel frequency of sharede-scooters. The longer people have been subscribing,the more frequently they appear to use e-scooters,
4

62% of regular users beginning to access Dott at leastone month prior to the survey period (6t-Bureau derecherche 2019a, p. 47).Younger respondents between 17 and 39 report higher
scooter and bikeshare ridership: several times a weekor every day for the 17-24 (49%) and the 25-39 (47%),compared to 25% for the 40-54 and 31% for the 55-64age groups (BCDOT 2019, p. 27). Similarly, people whoidentify as Asian (57%), Black/African American (55%),or Hispanic/Latinx (55%) report being more frequentriders than those as White (30%) (BCDOT 2019, p. 27).
Unlike other modes, the use frequency of personal andshared e-scooters does not seem to be associated withthe residential context, with little difference between thecity centre, the inner and the outer suburbs (6t-Bureaude recherche 2020, p. 21).
Given the French legislation restricting the top speedof a scooter to 25 km/h, travel frequency is seen to havean effect on the perceived speed: frequent users report adriving speed above 20 km/h in comparison with 15-20km/h speed’s occasional users (Pestour 2019, p. 39).
The 6t-Bureau de recherche (2019b, p. 123) surveysuggests that 72% of users are very much in favour ofriding a rented e-scooter more often as long as the priceis reduced.
In terms of usage intensity, only one scientificpublication focused on personal e-scooters and finds that94% use it at least once a week (Laa and Leth 2020,p. 3). According to 6t-Bureau de recherche (2020, p. 22),18% of e-scooter owners said they never use one, whenfrequency could also depend on the trip purpose: apartfrom commuting, scooters are used for shopping, leisure,culture, etc. at least once a week in 24% of situations.
PurposeCommuting and leisure are the two main trip purposesfor e-scooters services, whereas no extensive research onreasons for riding by personal scooters seems to havebeen driven (Fig. 5).
E-scooters services are used for different purposes(McKenzie 2019a, p. 19). Destinations related to workor study by shared e-scooters are the most cited: 16-18%(6t-Bureau de recherche 2019a; 6t-Bureau de recherche2019b, pp. 34, 68), and 48% (39% and 9%) (Apur 2020,p. 58) in Paris; 39% (9% and 30%) (Fearnley, Berge, andJohnsson 2020, p. 24) in Oslo; 35% (Wachunas 2019),52% (BCDOT 2019, p. 28), and 61% (Zuniga-Garciaand Machemehl 2020, p. 16) in American metropolises.
A data-based analysis of bicycles and scootersdistribution in Zaragoza (Spain) shows a regularoccurrence during peak hours to the centre and theUniversity in the morning and evening in the oppositedirection (López-Escolano and Campos 2019, p. 11).The same phenomenon is present with students in St.George (U.S.) (The Spectrum 2019).
The next most mentioned activity is recreationand visiting family or friends by 20% (6t-Bureau derecherche 2019a, p. 34), and 46% in Paris (Apur 2020,p. 58), 78% in Lyon (Pestour 2019, p. 51), and 29%in Portland (PBOT 2018, p. 20). In Calgary, visiting
24%
15%
12%
19%
6%
6%
6%
9%
5%
46%
35%
22%
27%
10%
20%
13%
33%
27%
24%
20%
82%
26%
31%
13%
11%
28%
45%
22%
18%
15%
13%
33%
23%
14%
9%
10%
48%
47%
20%
10
9
8
7
6
5
4
3
2
1
Every day A few times per week
About once per week About once per month
At least once per year
1. 6t-Bureau de recherche 2019b, p. 63 ; 68
2. 6t-Bureau de recherche 2019a, p. 25 ; 34
3. 6t-Bureau de recherche 2020, p. 20
4. Apur 2020, p. 58 ; 59
5. BCDOT 2020, p. 27 ; 28
6. Degele et al. 2018, p. 6
7. Fearnley et al. 2020, p. 23 ; 24
8. Laa and Leth 2020, p. 3
9. Laa and Leth 2020, p. 3
10. Pestour 2019, p. 39 ; 51
Paris, Lyon
& Marseille
Paris
France
Paris
Baltimore
Germany
Oslo
Vienna
Vienna
Lyon
Private e-scooters Shared e-scooters
Fig. 4: Travel frequency by e-scooterSources: References, Realization: Moinse et al., 2022
represents 24% of the last shared e-bike and e-scootertrips (Sedor and Carswell 2019, p. 10).
When grouped with shopping, restaurant, anderrands, the statistics seem more consistent between30-50% in Europe and in the United States (twice29%; 30%; 40%; 50%; 55%; and 85%). Moreover,a clear peak in usage is visible at the weekend andin the later hours of the day in Hamburg (Germany)and Louisville (U.S.), indicating a recreational andtourist usage (Civity Management Consultants 2019;Hosseinzadeh et al. 2021, p. 12).
Thus, data suggest that e-scooters are less being usedas a first last-mile commute option, and more as a modefor running short-distance midday errands, travellingaround a campus, and leisure in Indianapolis (U.S.)(Mathew et al. 2019, p. 48).
Besides the last trip made by shared e-scooter, themain reasons appear to be commuting, followed byerrands: commuting trips have been achieved by sharede-scooters for 58% of users, most of the time for 19%,often for 15% and occasionally for 24% of them (6t-Bureau de recherche 2019b, p. 78).
In Baltimore, respondents were asked to rank thetop three most common purposes with dockless bike orscooter trips: entertainment or socializing (50%), workor education (49%), shopping or errands (38%), businesstrips (37%) and connections to transit (22%) are the
5

France
Austin
65%*
44%*
21%*
1%
15%
16%
18%
18%
27%
35%
39%
48%
52%
61%
41%*
91%*
93%*
1%
78%
20%
15%
14%
19%
46%
22%
23%
44%*
42%*
14%*
7%
16%
61%*
28%*
29%
17%
24%
11%
7%
34%*
10%
15%
67%
34%
22%
65%
69%
65%
15%
13%
13%
14
13
12
11
10
9
8
7
6
5
4
3
2
1
Commuting RecreationShopping ErrandsPublic transport Unkown
* Total greater than 100%
Private e-scooters Shared e-scooters
Baltimore
Paris
Oslo
Oakland
France
Paris
Calgary
Paris, Lyon
& Marseille
Lyon
Portland
Riyadh
Chicago
1. Zuniga-Garcia et al. 2020, p. 16
2. BCDOT 2020, p. 27 ; 28
3. Apur 2020, p. 58 ; 59
4. Fearnley et al. 2020, p. 23 ; 24
5. Wachunas 2019
6. Richer 2021
7. 6t-Bureau de recherche 2019a, p. 34
8. Sedor and Carswell 2019, p. 10
9. 6t-Bureau de recherche 2019b, p. 77
10. Pestour 2019, p. 39 ; 51
11. PBOT 2019, p. 20
12. Almannaa et al. 2021, p. 9
13. City of Chicago 2020, p. 84
14. Smart Mobility Lab 2020, p. 13
Fig. 5: Trip purpose by e-scooterSources: References, Realization: Moinse et al., 2022
most highly cited in the list (BCDOT 2019, p. 28).The intensive users explain that they mostly ride
shared scooters to and from work and for business trips(6t-Bureau de recherche 2019b, p. 77).
Few studies could provide usage evidence on privatescooters purposes. Richer (2021) analysed some fortyCerema-certified mobility enquiries between 2015 and2019 and determined that 24-30% of trips by personalscooters are for work or education in France, which is ahigher average than all trips (19%) and similar to privatebikes and public bikeshare. In urban areas over 200,000inhabitants in France, 3% of surveyed commuters statethat they are interested in riding a personal standingscooter (6t-Bureau de recherche 2020, pp. 22–23).
According to ITDP (2019, p. 19), a non-profitorganization, e-scooters are popular among commuterssince they save the need to change clothes or showerto get to work. We also remark that a rather stableamount of individuals (10%) ride to or from a publictransport station, indicating that personal and shared e-scooters are used for intermodal trips (Fearnley, Berge,
and Johnsson 2020, p. 24).
Distance
The scatter plot (Fig. 6) shows that private and sharede-scooters are best suited for short distances (Schellonget al. 2019, p. 3). E-scooter trips average between1.5 and 3 kilometres, lying at an intermediate positionbetween the estimated range of combined walking andcycling: between 0.5 and 1 kilometre for the pedestrianmode (El-Geneidy, Tetreault, and Surprenant-Legault2010, p. 2) and about 3 kilometres for the non-motorisedbicycle (van Oort 2020). On short-distance trips(1-4 kilometres), dockless e-scooters would provide anew alternative to the private automobile in car-parkconstrained environments (Smith and Schwieterman2018, p. 9).
The median distances for shared e-scooter are lessdispersed: from 0.6 (McKenzie 2019b, p. 6); 1 (Caspi,Smart, and Noland 2020, p. 13); 1.1 (Mathew et al.2019, p. 44); 1.2 (Zou et al. 2020, p. 5); 1.5 (McKenzie2019a, p. 5); 2.8 (6t-Bureau de recherche 2019b, p. 75);3 (6t-Bureau de recherche 2019a, p. 33) to 4 kilometres(Degele et al. 2018, p. 3). It should be noticed that thehighest values result from declarative data, while theremaining values based on georeferenced data streamsstabilize around 1.5 to 2.5 kilometres.
In France, the median distance of private standingscooter trips is 1 kilometre (1.6 on average) as opposedto 0.6 kilometre for walking and 1.4 kilometres forprivate and shared bikes (Richer 2021).
Data shows that the distances travelled by e-scooterservice are weather dependent: trips between Augustand September averaged 1.6 kilometres, while trips inJanuary and February were closer to 1.1 kilometres(BCDOT 2019, p. 14). It seems to be also influenced bythe location inside the urban area: trips averaged both1.9 kilometres long in a Baltimore and Portland centrearea, compared to an average of respectively 2.9 and2.6 kilometres near cities limits (BCDOT 2019; PBOT2018, p. 11).
It has been seen that from the 85th percentileonwards, there is a lower propensity to make longjourneys by this new device (less than 2.4 kilometres)than by public bikes (2.7 kilometres) and especially bypersonal bicycle (3.6 kilometres), which demonstrates aless wide range of distances for private scooters (Richer2021). The same is observed for e-scooter serviceswith the 75th percentile being less than 2.2 kilometres(Mathew et al. 2019, p. 45), although pricing may belimiting the distances travelled over long distances.
Regarding the distance covered by intermodal sharede-scooter trips in Paris, Lyon and Marseille, 6t-Bureaude recherche (2019b, p. 79) estimates that these dailytrips and all daily routes are shorter than the averagetime-distance: these rides lasted 16.5 minutes or anapproximate distance of 4 kilometres.
6

0.65
0.97*
11.36
1.45
1.54
1.56
1.61
1.75
1.78
1.79
1.80
1.84
1.85
1.852.09
2.20
2.20
2.41
2.42
2.57
2.62
2.74
3.623.65
4.664.70
5.32
12
5.7
12
13.82
12
13.86
19
12.27
5
11
13
14.45
18.63
13
0
2
4
6
8
10
12
14
16
18
20
0
1
2
3
4
5
0 1 2 3 4 5 6 7 8 9 10 11 12 13 14 15 16 17 18 19 20 21 22 23 24 25 26 27
Ave
rage
tra
vel t
ime
-dis
tan
ce in
min
ute
s
Ave
rage
dis
tan
ce in
kilo
met
res
ReferencesTravel distance in km. Travel time - distance
Mean (median) distance
1. 0.65 (0.55): Washington, D.C. (U.S.) (McKenzie 2019a, p. 6)
2. (0.97): Austin (Texas, U.S.) (Caspi et al. 2020, p. 13)
3. 1.00 [euclidean distance]: Oslo (Norway) (Fearnley et al. 2020, p. 17)
4. 1.36: Paris and Lyon (France) (Coulombel et al. 2020, p. 28)
5. 1.45: Austin (U.S.) (Bai and Jiao 2020, p. 270)
6. 1.54 (1.17): Washington, D.C. (U.S.) (Zou et al. 2020, p. 5)
7. 1.56 (1.00): France (Richer 2021)
8. 1.61: U.S. (NACTO 2020, p. 10)
9. 1.75: France (Fluctuo 2020a, p. 6)
10. 1.78: Europe (Civity Management Consultants 2019)
11. 1.79 (1.46): Washington, D.C. (U.S.) (McKenzie 2019b, p. 5)
12. 1.80 (1.13): Indianapolis (U.S.) (Mathew et al. 2019, p. 44)
13. 1.84: Germany (Statista Research Department 2020)
14. 1.85: Portland (U.S.) (PBOT 2018, p. 11)
15. 1.85: Calgary (Canada) (Sedor and Carswell 2019, p. 8)
16. 2.09: Minneapolis (U.S.) (Bai and Jiao 2020, p. 271)
17. 2.20: Paris (France) (Apur 2020, p. 27)
18. 2.20: Lyon (France) (Pestour 2019, p. 54)
19. 2.41: Chicago (U.S.) (City of Chicago 2020, p. 84)
20. 2.42: St. George (U.S.) (The Spectrum 2019)
21. 2.57: Baltimore (U.S.) (BCDOT 2019, p. 16)
22. 2.62: Louisville (U.S.) (Stevens 2019)
23. 2.74: U.S. (NACTO 2019, p. 11)
24. 3.62: Paris (France) (de Bortoli and Christoforou 2020, appendicies)
25. 3.65 (4.00): Germany (Degele et al. 2018 p. 3)
26. 4.66 (2.75): Paris, Lyon and Marseille (France) (6t Bureau de Recherche, 2019b, p. 75)
27. 4.70 (3.00): Paris (France) (6t Bureau de Recherche 2019a, p. 33)
* Median
Fig. 6: Average distance for all trips by shared e-scooterSource: References, Realization: Moinse et al., 2022
2.4. Scooters combined with transit
Various studies have identified the characteristics ofscooter-and-ride practises. This part takes a closer lookat the role of intermodality in the last scooter trips. TheFigure 7 shows a trend of around one third of scooterused for access or egress trip chains. There is also aclear distinction in the type of combination dependingon the area.In France, trips combining a scooter with another
mode account for 23% (6t-Bureau de recherche 2019b,p. 80), 26% (de Bortoli and Christoforou 2020, p. 12);27% (6t-Bureau de recherche 2019a, p. 35); 30%(Pestour 2019, p. 58) of total shared scooter trips;and 28% for the personal device (Richer 2021). InHannover (Germany), five of the nine commuters usinga personal e-scooter linked it to public transport (Edel,Wassmer, and Kern 2021, p. 8). In Europe, intermodaltrips including a scooter are mainly driven by publictransport, accounting for around 70%.
By contrast, Austin, São Paulo and New Zealand haverates mainly marked by their complementarity withprivate cars: respectively at 31% (Zuniga-Garcia andMachemehl 2020, p. 13); 43% (Kwak, Alves, and Greco2019); and 61% (Fitt and Curl 2019, p. 15).
Therefore, between a quarter and a fifth of standingscooter trips in France are combined with publictransport, notably the metro and train. A multiplechoice questionnaire shows that 43% of standing scooterriders associate this vehicle with the metro, 40% withthe bus, 22% with the train, and 17% with the tram inOslo (Fearnley, Berge, and Johnsson 2020, p. 25). Forunmotorized scooters in Stuttgart, 25% of intervieweesconnect it with the tram and the bus; and 17% with thetrain (Zirn, Sagert, and Ruether 2018, p. 4). In Paris,74% of shared e-scooters, bicycles, and mopeds usershave already linked one of these modes to the metro,33% to the bus, 29% to the suburban trains (RER) and20% to the tramway (Apur 2020, p. 60).
Beyond the last ride, a large proportion of userssometimes or often use scooters to reach a publictransport station. In the United States, one thirdof users usually connect a free-floating e-scooter withpublic transport (NACTO 2019, p. 9). This share istwice in Paris, where 70% of Lime users have made atleast one intermodal trip in the previous month (Lime2019, p. 5) and 60% of Voi users sometimes connect e-scooters with public transport (Holm Møller, Simlett,and Mugnier 2020, p. 12). Each month in the periodfrom March to November 2021, between 43% and 50%
7

4
23%
26%
27%
28%
30%
31%
43%
56%
61%
15%
18%
27%
56%
5%
9%
7%
15%
14%
12%
26%
21%
8%
6%
9%
5%
19%
17%
33%
All intermodal trips Train & local urban transit
Train Local urban transit
Other
2
1. 6t-Bureau de recherche 2019b, p. 80
2. de Bortoli and Christoforou 2020, p. 12
3. 6t-Bureau de recherche 2019b, p. 35
4. Richer and Rabaud 2021
5. Pestour 2019, p. 58
6. Zuniga-Garcia et al. 2020, p. 13
7. Kwak, Alves and Greco 2019
8. Edel, Wassmer and Kern 2021, p. 8
9. Fitt and Curl 2019, p. 15
Paris, Lyon
& Marseille
Paris
Paris
France
Lyon
Austin
São Paulo
Hannover
1
3
5
6
7
8
Private e-scooters Shared e-scooters
9 New Zealand
Fig. 7: Share and types of intermodal trips by e-scooterSources: References, Realization: Moinse et al., 2022
of privately owned standing scooter and solowheel usersin France switch between modes during a same trip(Mobiprox 2021).
3. MethodsThe literature review on the use of scooters, for all formsof journeys, revealed several descriptions dependingon the type of scooter and the geographical areas.With regard to personal scooters, the vast majority ofusers are young men who use it at least once a week,particularly to go to work or school. The distancecovered using this micromobility device is estimated tobe around 1.5 kilometres, although this is influenced bytrip purpose and by urban surrounding. These findingsprovide a baseline for this evidence-based research,which attempts to better understand the type of useand profile of public transport passengers using a privatescooter in France.
3.1. Objectives
This paper aims to achieve the following objectives witha secondary analysis of a survey data, property of SNCFRéseau, French national public rail network manager.
1. Identify and quantify transit passengers’ basictravel characteristics and mode shares for railstation access and egress trips;
2. Understand the comparative advantages ofintermodal practices related to the standingscooter, including what links and differentiates itfrom the bicycle and the car;
3. Locate the train station accessibility by scooterwhere micromobility-friendly developmentrecommendations can be made.
3.2. Survey protocolThis questionnaire was carried out as part of thestudies prior to the public utility enquiry for thetransport project "Ligne Nouvelle Provence Côted’Azur" (LNPCA). This project aims to create threemetropolitan express networks in the conurbations ofAix-Marseille, Toulon and the Côte d’Azur, to improverail links between the three metropolises (SNCF Réseaun.d.).
The face-to-face questionnaires were conducted byinterviewing individuals going to the station, filteringout train passengers. It was conducted a Tuesday ora Thursday over a period from late September to earlyOctober 2020, excluding school holidays. These datesare part of a context linked to the COVID-19 healthcrisis and correspond to the period of free movementafter the end of the first generalized lockdown on 11May 2020, and shortly before the implementation of thesecond national lockdown on 29 October 2020.
This station based survey collected information onthe age and gender of passengers, travel frequency andpurpose, the municipality (or even the street) of triporigin, the destination station, transfer modes as well asthe effects produced by the pandemic.
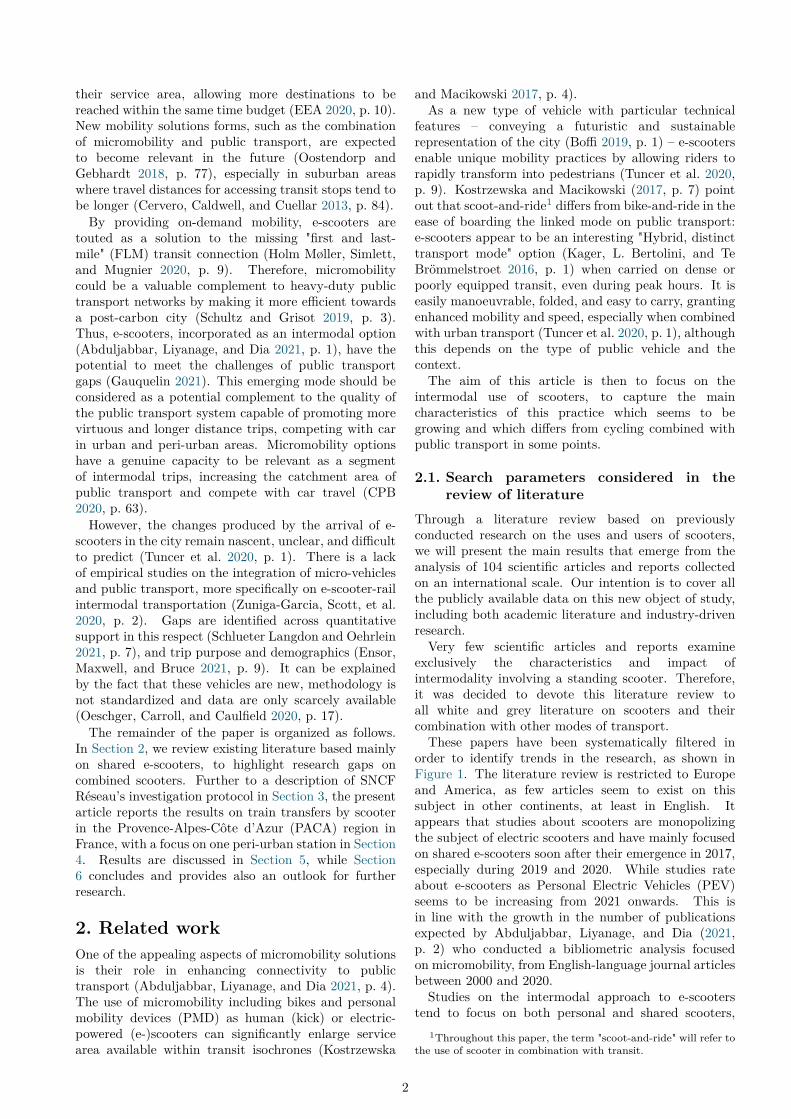
Twelve railway stations in Provence Alpes Côted’Azur region were surveyed to investigate the accessand egress characteristics of train passengers. Namely,the stations of: Grasse (1), Mouans-Sartoux (2),Ranguin (3), La Frayère (4), Le Bosquet (5),and Cannes-La-Bocca (6) in the Alpes-Maritimesdepartment; La Pauline-Hyères (7), La Seyne-Six-Fours(8), Ollioules – Sanary-sur-Mer (9), Bandol (10), andSaint-Cyr-Les Lecques – La Cadière (11) in the Vardepartment; and La Ciotat (12) in the Bouches-du-Rhône department (Fig. 8).
3.3. Description of the study areaThe twelve locations studied have similarities in thatnone benefit or operate free-floating scooter service,assuming that all the scooters observed in the surveyare owned by the user or borrowed for a long periodof time. Similarly, the type of scooter identified variesaccording to the stations studied, although the trend isfor electric scooters to predominate (Table 2).
It is also relevant to note that the stations are not allintegrated into the same urban context and do not allhave the same size, capacity or quality of rail service.
8
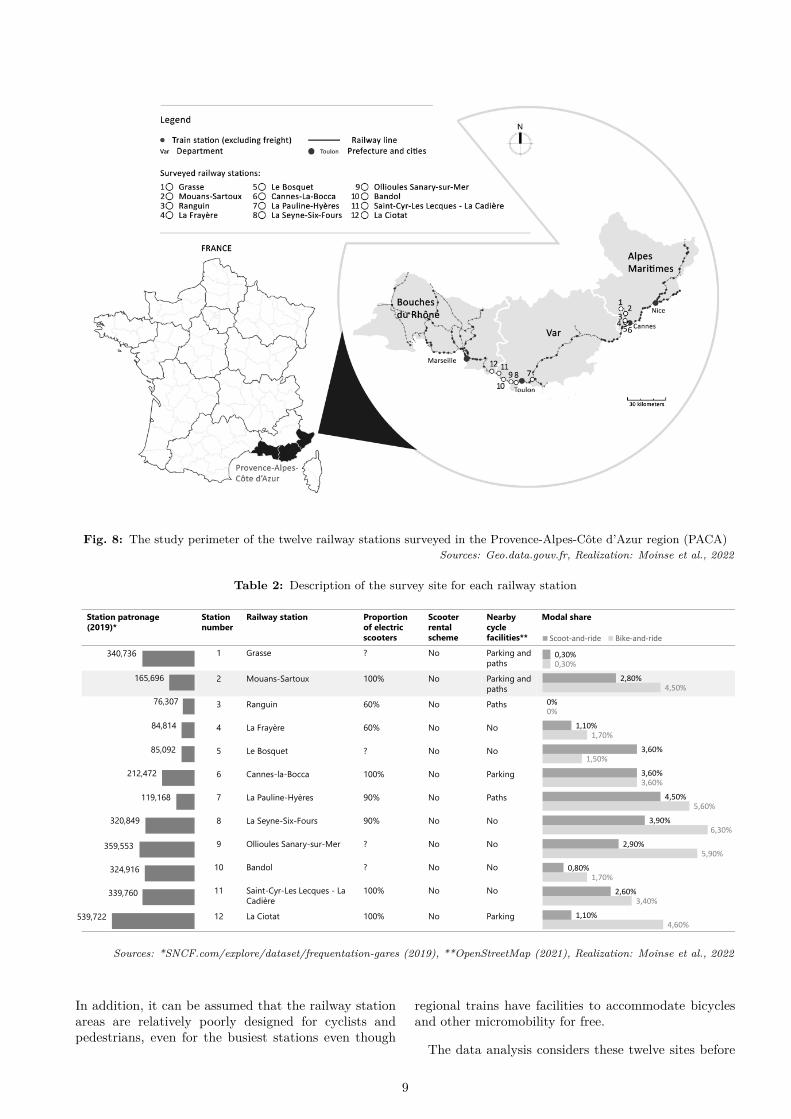
Fig. 8: The study perimeter of the twelve railway stations surveyed in the Provence-Alpes-Côte d’Azur region (PACA)Sources: Geo.data.gouv.fr, Realization: Moinse et al., 2022
Table 2: Description of the survey site for each railway station
Station patronage
(2019)*
Station
number
Railway station Proportion
of electric
scooters
Scooter
rental
scheme
Nearby
cycle
facilities**
Modal share
1 Grasse ? No Parking and
paths
2 Mouans-Sartoux 100% No Parking and
paths
3 Ranguin 60% No Paths
4 La Frayère 60% No No
5 Le Bosquet ? No No
6 Cannes-la-Bocca 100% No Parking
7 La Pauline-Hyères 90% No Paths
8 La Seyne-Six-Fours 90% No No
9 Ollioules Sanary-sur-Mer ? No No
10 Bandol ? No No
11 Saint-Cyr-Les Lecques - La
Cadière
100% No No
12 La Ciotat 100% No Parking4,60%
3,40%
1,70%
5,90%
6,30%
5,60%
3,60%
1,50%
1,70%
0%
4,50%
0,30%
1,10%
2,60%
0,80%
2,90%
3,90%
4,50%
3,60%
3,60%
1,10%
0%
2,80%
0,30%
Scoot-and-ride Bike-and-ride
340,736
165,696
76,307
84,814
85,092
212,472
119,168
320,849
359,553
324,916
339,760
539,722
Sources: *SNCF.com/explore/dataset/frequentation-gares (2019), **OpenStreetMap (2021), Realization: Moinse et al., 2022
In addition, it can be assumed that the railway stationareas are relatively poorly designed for cyclists andpedestrians, even for the busiest stations even though
regional trains have facilities to accommodate bicyclesand other micromobility for free.
The data analysis considers these twelve sites before
9

focusing on a single case study to illustrate ourarguments. In view of this, the Mouans-Sartoux station(2) attracted our attention for several aspects thatensure a comprehensive diagnosis:
• The station is located in the commune of Mouans-Sartoux in the Alpes-Maritimes department, with10,000 inhabitants in 2018 and a population densityof 733 per km2 compared to 979 in Bandol, with8,000 inhabitants (Insee 2021). It is located aboutten kilometres from Grasse and Cannes.
• This train station, part of the Grasse - Cannes-LaBocca railway axis, registered 120,000 passengers in2016 before rising to 160,000 users in 2019 (SNCF2020).
• As part of the reopening of the railway line in2004, four stops were put into service, includingthe one at Mouans-Sartoux. The PACA Region andthe Pôle Azur Provence Agglomeration Communityhave restored the original station with a waitingroom, ticket offices and information facilities (NicePremium 2011).
• The surroundings of the station are supplied withdedicated routes, car park facilities and one publicbicycle storage, giving a total of 34 available spacesincluding the 10 "boxcyclettes" (OpenStreetMap2021). The terminal is also bordered by abus line to Grasse, around 290 free car parkingspaces, dedicated carpooling spots and a park-and-ride facility to be opened in 2021 (Olivier 2021;OpenStreetMap 2021).
• Micromobility’s modal share for access is relativelyin line with the general average of the survey,standing at 2.80% for the standing vehicle and4.50% for the bicycle (all types).
• The station has the benefit of capturing onlysurveyed passengers with electric scooters, allowingfor a more in-depth insight into this emerging mode(Table 2).
It is relevant to note that Mouans-Sartoux city wasevaluated by 90 of its inhabitants in the context of theFrench Cycling Barometer in 2019. The territory thenrecorded a positive score of 3.69/6 – against an averageof 2.75/6 for cities with less than 20,000 inhabitantsand 2.57/6 for the 16 ranked cities of the department– thanks in particular to the comfort, safety, urbandesign and the public efforts made by the municipality.Between the last two editions of 2017 and 2019, thecycling situation has improved for 70% of respondents(FUB 2019).
3.4. Sample descriptionThe study interviewed a total of 2,537 passengers. Tothe question, "How did you get from your place ofdeparture to this station" 53 of them replied that theyhad accessed the station using "another mode"= such as
"scooter, skateboard, hoverboard, etc". It is this sub-category of the 53 passengers that will be analysed inthis article.
Among the travellers accessing one of the surveyedstations, 44% walked, 39% used a private or shared car,10% travelled by public transport, 5% by micromobility(bike, scooter, skateboard, hoverboard, etc.), and 2%by powered-two-wheelers (motorbike, motorcycle, etc.)(Fig. 9).
It should be noted that observations made inparallel with the administration of the survey showthat almost all the passengers interviewed who statedthat they had accessed a station "with another mode(scooter, skateboard, hoverboard, etc.)" had indeedused a scooter. However, the standing scooter ridersinvestigated were not categorized by type of scooter, i.e.whether it was a mechanical or electric scooter. Thereis no match in the entries between the observationsmade across electric and push and the results foreach individual. In the following, we consider thatthese travellers constitute the sub-sample of travellersaccessing a station by scooter. Thus, it can beconsidered that 2.09% of the surveyed travelling to oneof the railway stations used a standing scooter, whichis higher than those observed in the previous literaturereview.
N=2,537
1. Private car (driver): 4772. Private car (passenger): 4753. Ride-hailing service: 184. Carsharing: 55. Rental car: 36. Powered-two-wheelers: 52
1
2
34
56789
10
11 12
44%
3%2%19%
19%
8%2%
1%
5%
39%
2%10%
44%
7. Bus: 2098. Another public transport: 309. Coach: 610. Walking only: 1,12811. Bike: 8112. Another mode: 53
Private or shared car
Powered-two-wheelers
Public transport
Walk only
Micromobility
Access modes:
Fig. 9: Modal share and number of respondents by accessmode
Realization: Moinse et al., 2022
3.5. Geographical analysis methodA spatial analysis of the data collected in the case studysupplements the statistical results in order to confrontscooter trips and other access modes with the urbanenvironment. The departure and destination stationswere requested in the questionnaire, together with thestreet and municipality of origin. However, the preciselocation of the destination of the trip was not collected
10

during the survey.In order to map the origin and destination flows,
we geocoded the stages of each respondent’s journeyaccording to the mode to access the train station. Thegeocoding procedure depends on a multistep approach(Figure 10). First, to standardize the names of thestations and obtain their geolocation, we extracted theSNCF database of stations with their geolocation. Wemerged the database with the SNCF Open Data usinga Python code which applies a textual filter on theheadings of the origin and destination stations (1).Missing names in the survey results were comparedmanually by querying the SNCF API to obtain moreconclusive results and to correct some names. Thespatial data is taken from OpenStreetMap (OSM)2
running Photon 3 in order to carry out reproducible andopen access work. We request with the Photon tool togenerate single addresses that were georeferenced andallocated to each row (2).
N=2,537• Number of respondents
Database
Reworked mailing addresses
N=2,173• Source merged with SNCF data
Step 1
Null value stations or addresses dropped
N=1,095
• Source + SNCF merged withPhotonStep 2
Unique addresses from Photon requests
Null value geometries dropped
Textual similarity of station names ≥0.9
Distance between each segment
Fig. 10: Geocoding methodology for addressesRealization: Moinse et al., 2022
In more detail, the first step was to improve thequality of the stations and street mailing addressespreviously reworked by the owner of the database, witha Python code (using a "SequenceMatcher"). Thisprogram has resulted in the harmonization of stationnames to get better matches, and the implementation ofa textual similarity index between the registered stationsand the Open Data list4 (with a limit set at 0.9, on ascale from 0 to 1.0).The second part of the process enabled latitude and
longitude coordinates to be assigned to the locations,2©OpenStreetMap contributors (cf.
https://www.openstreetmap.org/copyright) / OpenStreetMap:https://www.openstreetmap.org/map=19/43.62020/6.97455
3Photon, Apache Licence, Version 2.0, GitHub:https://github.com/komoot/photon
4SNCF Open Data: https://ressources.data.sncf.com/explore/
while minimizing the approximations of the titles.In order to match the OSM database, the Pythoncode queried Photon which provided exact or similaraddresses with geographical coordinates. Then, weobtained unique addresses identified and matched withsurvey data (with a textual similarity above or equalto 0.9) to combine names and spatial coordinates. Thisapproach made it possible to calculate the straight-lineand travel distances (taking the shortest route on roads)for both access5 and train trips6.
The determination of the geographical coordinatesof the places of origin (address number, street andmunicipality), the departure and arrival stations andthe municipalities of destination guarantee GIS-basedanalysis on QGIS7.Travel time, which was not recorded in the
questionnaire, was also estimated in order to comparethe efficiency of this modal combination with privatecar. It is important to note that this predictedtime only takes into account the movement itself,excluding the additional time required for preparation,congestion, parking, or waiting time before reaching thestation. This bias affects all modal chains, albeit nonuniformly, which allows for a reasonable comparison oftrip duration across mode combinations.
In sum, the following statistical analysis is basedon the 2,537 responses to the questionnaire, while thespatial analysis of the data is based on 1,095 location-based journeys.
4. ResultsIn this section we will focus on the main findings ofthe station survey regarding the profile and practicesof scooter users in combination with train, i.e. 2.09%of passengers surveyed. It should be pointed out thatthis share varies significantly depending on the twelvestations studied and that it would seem that the higherthe modal share of bike-and-ride, the higher the shareof scoot-and-ride (Table 2).
4.1. Socio-demographic characteristics ofscoot-and-ride travelers
Individuals were interviewed about their age and gender,which could then be categorized by transfer mode.
Other things being equal, there is an over-representation of 18-34 among passengers accessing astation by scooter (Fig. 11). Compared to all modes,the majority age category of 18-24 is estimated at 29% asagainst 34% for intermodal scooter riders. These socialdisparities are more significant for the next category of25-34 representing 16% of all passengers as opposed to28% for scooter riders. Conversely, the 12-17 and over-55 age groups are less important in the distributionof intermodal scooter use by age: the youngest agegroup accounts for only 9% compared to 14%, and
5©OpenRouteService.org by HeiGIT (cf.https://openrouteservice.org/terms-of-service/)
6SNCF route planner: https://www.sncf.com/fr7QGIS: https://www.qgis.org/en/site/
11

the other age range for 2% compared to 14% onaverage. We can also point out that a less pronouncedincrease of scoot-and-ride users stands out: the 45-54age group at 15% versus 13%. We can also see thatthe age-related characteristics of combined scooter usersdiffer significantly from passengers surveyed accessing astation by bicycle. In relation to the age classes targetedby scooter, the modal share of intermodal cycling ismore concentrated among the over-35s, and particularlyamong adults 35-44 (21%), 45-54 (16%) and the over-55s(15%).
0%
5%
10%
15%
20%
25%
30%
35%
40%
12–17 18–24 25–34 35–44 45–54 55+
Pro
po
rtio
n o
f re
spo
nd
en
ts b
y a
ccess
mo
de
Age categories
Walk Bike
Bus Car (driver)
Car (passenger) Scooter
All modes
N=2,537
Fig. 11: Age by feeder modeRealization: Moinse et al., 2022
The socio-demographic features of intermodal trips byscooter are reflected in significant gender inequalities.Although the sample achieved a balance of 51% menand 49% women for all access modes, 83% of thescooter users were men and only 17% were women (Fig.12). These gender disparities are almost unchanged forcycling (79% men), while women are over-representedamong car drivers (62%). Only walking (54% men), thebus (54% men) and car passengers (56% women) arethe least discriminating feeder modes to access one ofthe surveyed stations.
4.2. Mobility behaviour by combining trainand scooter
Passengers were also surveyed on their mobilitybehaviour, i.e. travel frequency and purpose, as wellas the type of transit access then egress mode along theintermodal trip.Personal scooter is a combined mode used much more
frequently than all other modes revealing a specific useof this micromobility, as shown in Fig. 13. 79% ofsurveyed use a scooter as a feeder at least five daysa week whereas only half (56%) do so on average.Intermodal and daily trips by scooter differ from bicycle(67%) and car as a driver (65%), and more clearly from
51%
38%44%
54% 54%
79% 83%
49%
62%56%
46% 46%
21% 17%
Male Female
N=2,537
Fig. 12: Gender distribution by feeder modeRealization: Moinse et al., 2022
N=2,537
56%
65%
42%
56%
57%
67%
79%
21%
21%
21%
22%
21%
21%
15%
8%
12%
8%
9% 9%
10%
All modes
Car (driver)
Car
(passenger)
Bus
Walk
Bike
Scooter
5 days a week or more At least once a week
At least once a month At least 4 times a year
Less than 4 times a year First time
Fig. 13: Travel frequencyRealization: Moinse et al., 2022
walking (57%), bus (56%), and car as a passenger (42%).In aggregate, almost all (94%) of the respondents usetheir scooters at least once a week to reach a station,compared to three quarters (77%) for all modes. Theshares decrease to 88% for cycling, 86% for driving, 78%for walking and bus, and 63% for driving as a passenger.
The frequency of train use has remained broadly thesame since the start of the COVID-19 health crisis, for63% of passengers and 58% of scooter users. However,31% of new passengers and 28% of standing e-scooterusers had not previously used the train before thepandemic, while 6% (overall) and 4% (scooter travellers)of them are using the train for the first time. It shouldbe noted that 9% of scooter passengers say that theyhave increased their train use since the health crisis.
As regards trip purpose, 81% of the rail passengersaccessing a station by scooter commuted, including 55%to work and 26% to study. This figure should be
12

seen in the context of all modes with the train beingdistributed between working (37%), studying (31%) andleisure (20%). Commuting share by scooter is similarto purposes observed for cycling (80%) and car driving(82%), but with a higher proportion of students byscooter (Fig. 14). In contrast, the share of trips madeby scooter and train for leisure purposes decreases to8%, as do car drivers (8%) and cyclists (10%).
37%
66%
24%
32%
29%
65%
55%
31%
16%
32%
33%
37%
15%
26%
20%
8%
31%
20%
21%
10%
8%
8%
9%
7%
8%
All modes
Car (driver)
Car
(passenger)
Bus
Walk
Bike
Scooter
Home <> Work place
Home <> School, university, internship
Leisure, holidays, visit a friend
Other business trip
Administrative, medical, shop
Other
N=2,537
Fig. 14: Trip purpose by feeder modeRealization: Moinse et al., 2022
In order to get an overview of intermodal trips, thesurvey sought to measure the proportion of passengersusing the same mode for transit access and egress.Results clearly show that a very large majority (85%) ofrail passengers use a scooter both before and after theirtrain ride, as opposed to only 34% of all respondents.The Fig. 15 illustrates that several transfer modes arein fact not often used at both ends of the rail trip, suchas car passengers (2%) and drivers (11%) or bus users(17%). The values for cycling (59%) and walking (57%)tend to be close to those for the standing scooter.
4.3. Distances covered to reach stationsThe feeder trip distances were estimated for 46 of the53 respondents accessing one of the twelve stations byscooter, according to the location of their residence.The average distance is 2.4 kilometres, as shown inFig. 16 (a). The results show that for every 100intermodal users by scooter, 75 trips are longer than1.4 kilometres, 50 than 2 kilometres, and 25 than 3kilometres. Based on the predicted travel times bybicycle based on the OpenRouteService route planner,access trips take approximately 10.6 minutes. Thisfigure is coherent with the widely used value of 10minutes for the walkable radius around stations (Luca
34%
2%
11%
17%
57%
59%
85%
All modes
Car (passenger)
Car (driver)
BusWalk
Bike
Scooter
N=2,537
Fig. 15: The proportion of passengers using the samemode for transit access and egress
Realization: Moinse et al., 2022
Bertolini and Spit 1998).These distances travelled by scooter are higher than
the average feeder trip, regardless of mode, which is1.70 kilometres (0.87 kilometre when considering themedian).
The segment of the intermodal chain by train andscooter covers an average of 40.5 kilometres, as shownin Fig. 16 (b). The median access and train route is 35kilometres.
max.: 6,500
Q3: 3,000
mean: 2,396
Q2: 2,000
Q1: 1,400
min.: 600
max.: 170
Q3: 45mean: 41Q2: 35
Q1: 19
min.: 5
(a) (b)
n=48 n=48
1
2
3
4
5
6
7
Fig. 16: Distances travelled by combined e-scooter andtrain passengers
(a) The average distance (in kilometres) covered to reach astation by e-scooter
(b) The average distance (in kilometres) covered for access andtrain segments
Realization: Moinse et al., 2022
Thus, the scooter seems to provide only a 6% coverageof the distance trip (without considering the egresssegment from the station), whereas these first kilometrescorrespond to a quarter of the time spent on these trips.
The study aims to compare the benefits of standingscooters combined with the train, as opposed to an
13

entirely car-oriented use, so as to determine the modalshift potential of this practice from private car. Thedata analysis examine the attractiveness of the scooterand train combination by measuring travel time againsta trip that would have been made by car (Fig. 17).The estimated times by scooter and train to the
destination station appear to be 9.8 minutes longer onaverage. This means that intermodal trips generallylast more than 45.1 minutes, versus 35.3 minutes fora planned trip by car, regardless of parking and urbancongestion times for the latter.
0 20 40 60 80 100 120 140 160 180
Travel time (minutes)
Trip
s co
mb
inin
gtr
ain
an
d e
-sco
ote
r co
mp
ared
to h
ypo
thet
ical
car
use
n=46
Estimated travel time by e-scooter to the train station***
Estimated travel time by train in the intermodal trip (taking into account the connection time between trains)**
Estimated total travel time by hypothetical car from origin to destination*
Fig. 17: Estimated travel time by e-scooter and trainrelative to the assumed time by carSources: *OpenStreetMap (2021), **SNCF (2021),
***OpenRouteService (2021), Realization: Moinse et al., 2022
In the 46 scoot-and-ride trips surveyed, the relativeduration of the trips is, in average, 22% longer thanin a perfect scenario by car. However, it appears thatthis negative balance is prevalent among scoot-and-ridetrips exceeding 20 kilometres (Fig. 18). Among thenine trips that are characterized by a positive balance,no potential time savings could be identified beyondthe 33 kilometres threshold. On the contrary, the mostsignificant differences in favour of the car (i.e. between-40 and -50 minutes) are mainly observed above themedian distance (41.7; 44.6; 61.4; 65; 166 kilometres).
-50,00%
-30,00%
-10,00%
10,00%
30,00%
50,00%
70,00%
90,00%
110,00%
130,00%
150,00%
0 25 50 75 100 125 150 175
Tim
e sa
vin
gsb
y co
mb
inin
gtr
ain
an
d e
-sco
ote
r (%
)
Total distance (kilometres)
n=46
Scoot-and-ride trips
y = -0,0042x + 0,0578R² = 0,1706
Regression line-60
-50
-40
-30
-20
-10
0
10
20
0 25 50 75 100 125 150 175
Tim
e sa
vin
gsb
y co
mb
inin
gtr
ain
an
d s
coo
ter
(min
ute
s)
Total distance (kilometres)
n=46
Scoot-and-ride trips
y = -0,2975x + 2,2456R² = 0,569
Regression line
Fig. 18: Linear regression of door-to-door time saving bytrain with e-scooter on theoretical use of car
Realization: Moinse et al., 2022
4.4. Focus on the Mouans-Sartoux station
Once the characteristics of the intermodal trips andthe users are established, it is meaningful to analysea station in more detail in order to better understandthe effects of these mobility practices on the radius ofa station area. To this end, we will consider Mouans-Sartoux station (2), which is located in a small anddense town of 10,000 inhabitants.
By plotting the origin locations of passengers whohave used a scooter or a bicycle to reach the trainstation, hypothetical routes have been mapped out (Fig.19) between the two places based on the shortest route(excluding traffic areas restricted).
It appears that the median distances covered by thee-scooter are 1.5 kilometres and 3.6 kilometres for thebicycle. Between these micromobilities we find theprivate car for passengers with a range of 3.2 kilometres.Lastly, walking reaches a 700-metre median around thestation.
The spatial analysis of Mouans-Sartoux stationinvestigates the urban environment around passengerswho have chosen to use a scooter or a traditional,folding or electric bike to get to catch their train. Bymeasuring the density of inhabitants for each 200 x200 metres grid8, we infer that scooter users are morelikely to start from a relatively dense place in relationto the average population distribution of the commune,whereas cyclists are more likely to come from less denseareas (Fig. 20).
8Insee: https://www.insee.fr/fr
14

Train station (Mouans-Sartoux)
Built environment:
Isochrone (5 minutes by scooter)
Train line (Grasse - Cannes-la-Bocca)
Roadway
Access trips by micromobility:
Trip origin by scooterTrip origin by bike
Isochrone (10 minutes by scooter)
Municipality
Areas:
Shortest route by scooter
Shortest route by bike
Distance (metres) travelled by scooter1557
Distance (metres) travelled by bike3151
30 kilometres
1 kilometre
Fig. 19: Map of the first segments of the intermodal chain with e-scooter or bicycle to Mouans-Sartoux stationRealization: Moinse et al., 2022
5. DiscussionThe main results obtained from the analysis of thissurvey, collected in twelve stations in the Provence-Alpes-Côte d’Azur region, show that the use of scootersin combination with the train is not marginal, despiteits novelty in the modal range of options. Modal sharecorresponds to that of motorbikes and is almost equalto bicycles. This indicator which amounts to 2.09%is much higher than the 0.8% and 1.25% recorded byGioria (2016, p. 14) and Enov (2021, p. 18) revealingthe rise of this transfer mode, particularly with regardto the e-scooter. Following the COVID-19 health crisis,the growing standing scooter modal share in associationwith the train resonates with the significant increasein e-scooter sales recorded in France (FP2M and SML2021). More broadly, this could be explained by theresilience in walking and cycling (Héran 2020).The upward trend in these statistics could be
explained by the development of the electric scooters,as shown by the high proportion (approximately 90%)of this motorized device through this survey. Theimportance of the electric motor in the combinedscooter differs from the bicycle which remainspredominantly traditional, as the above-mentionedreport demonstrates, given a ratio of 0.20 for theintermodal e-bike compared to 0.58 for the e-scooter
(Enov 2021, p. 17).It can be deducted that the prevalence of this type
of scooter that at least partly supports the trips’ range,reaching more than 2 kilometres. It can be associatedwith 3 kilometres station radius by driving defined inFrench territorial engineering literature (Hasiak andBodard 2018, p. 3). Regardless of the mode, thisdistance exceeds the average distance made to reachone of the surveyed stations, including when activemodes are omitted. Similarly, it was seen that scooterachieves large areas over 40 kilometres, as a result of itscombination with the train. These results echo studiesconducted by Rabaud and Richer (2019, p. 7) whoevaluate the effective distance by scooter to be roughly23 kilometres in France, as well as by Edel, Wassmer,and Kern (2021, p. 8) who note that 44% cover morethan 20 kilometres in Hannover (Germany). The greaterdistance covered by bike to reach the rail station is foundin several studies such as BiTiBi (2017, pp. 20, 28)’sstudy which estimates the access trip to be 4 kilometres,for a total of 35 kilometres in Belgium and Liverpool.
It has been seen that a quarter of the time spentin the intermodal trip (off egress) depends on the firstmile stage by scooter, supporting the portion identifiedby Krygsman, Dijst, and Arentze (2004, p. 268). Theaverage access time by scooter is about 10 minutes,
15

Train station (Mouans-Sartoux)
Built environment:
Isochrone (5 minutes by scooter)
Train line (Grasse - Cannes-la-Bocca)
Access trips by micromobility:
Trip origin by scooterTrip origin by bike
Isochrone (10 minutes by scooter)
Municipality
Areas:
[25 - 1,600[[1,600 - 5,600[[5,600 - 12,400[[12,400 - 23,200[[23,200 - 49,100[
Population density:
30 kilometres
1 kilometre
Fig. 20: Population distribution around Mouans-Sartoux stationSources: Insee (2019), Realization: Moinse et al., 2022
while Enov (2021, p. 20) measured 15 minutes for allmodes considered in three major railway stations in thecountry. Although this intermodal practice seems toovercome both the short range of the scooter and thefixed route nature of the train, time required for thesetrips appears to be not competitive with a monomodaluse of the private car in regional city fringes (consideringthe absence of parking time and urban congestion).This differs from the Schlueter Langdon and Oehrlein(2021, p. 9)’s model illustrating that the integration ofmicromobility with public transport is faster than thecar. A possible explanation for this might be that themethodological approach in this paper is not sufficientlycomplex, and the case study is located in a sparselypopulated area beyond the city limits. The variationsbased on urban forms have been taken into account byEnsor, Maxwell, and Bruce (2021, p. 69) who predicta 1% reduction in car use in New Zealand’s fringeareas, compared to 3% in the major city inners, in thescenario of substantial availability of shared and ownedmicromobility. These calculations need to be qualified interms of time and congestion conditions, as indicated byMcKenzie (2019b, p. 9)’s research which shows that ride-hailing is faster than scooter services for the majority ofthe day, apart from during weekday commuting hours.
In contrast to the car, scooter origin points were
mostly observed in relatively dense areas in Mouans-Sartoux, despite the absence of cycle routes. Thisresult may suggest that the use of scooters in denseneighbourhoods may be explained by parking and trafficconstraints that encourage the use of alternatives toaccess the station. This hypothesis is in line with Smithand Schwieterman (2018, p. 9)’s findings that mostshared e-scooters are time-competitive with the car,between 0.8 and 3.2 kilometres, in Chicago’s parking-constrained environments.
Another significant aspect of this "Hybrid UrbanMobility tool" (Kostrzewska and Macikowski 2017, p. 7)is the way this mode is used: the scooter on boardthe train is used on a daily basis and for work orstudy purposes. These characteristics can reflect theconvenience provided by the scooter in combination withrail transport. The proportion of regular scooter userson the train largely exceeds the average share of dailytrain passengers. This outcome matches the reporton French metropolitan railway stations, which foundtwice as many frequent passengers by micromobility(Enov 2021, p. 18). The high frequency of scooteruse, like cycling and driving, appears to be related tocommuting. Conversely, it is interesting that few scooterusers take the train for leisure or social purposes, sharplycontrasting with shared e-scooters. This can be seen in
16

the context of the 6t-Bureau de recherche (2020, p. 40)report stating that 45% of respondents would not use ascooter for shopping purposes due to theft, versus only15% are reluctant to use this mode for commute trips.A last distinctive feature of the scooter appears among
the properties examined: unlike bicycles, nearly allpassengers by scooter use this mode for both accessand egress. This individual strategy can be found inthe fifth category of micro-vehicle and public transportintegration, outlined by Oeschger, Carroll, and Caulfield(2020, p. 3). This indicator shows that scooter hasan advantage when combined, as it can be carriedon trains more easily than bicycles, especially duringpeak periods. Standing scooter offers the advantage ofreaching a wider range of destinations once the travellerhave left the train. This advantage is not met inshared scooter use, with 44% of riders switching toa different mode for their return trip (6t-Bureau derecherche 2019b, p. 80).
Having discussed trip patterns, this paper addressessocio-demographic characteristics of passengers usingscooters. The main type of user profile is a youngman, between 18 and 34. These outcomes showa complementarity with the distribution of cyclingpassengers depending on age, over-represented from 35years onwards. A question emerges with regard to theyouthfulness of scooter users: is this an age-related effector rather a generation-based effect, suggesting a gradualincrease in the ageing proportion of standing scooterusers with the train? Results suggest a more pronouncedgender differences associated with the private scooter, asevidenced by Laa and Leth (2020, p. 3)’s online survey.This investigation reveals a travel pattern which tends toexclude a part of the public. While these findings partlyjeopardize sustainable mobility goals, the scooter maybe able to turn the tide. According to Héran, mentionshould be made of cities such Copenhagen or Strasbourg(France) which achieved gender parity by bicycle bymeans of a safer environment (Schepman 2014). Oneof the first barriers to micromobility for women is riskaversion, especially due to the volume and speed oftraffic (Garrard, Rose, and Lo 2008, p. 57). Still, scooterusers are the ones who feel most unsafe when riding,rating themselves at 6.3/10, according to a Frenchstudy undertaken by Smart Mobility Lab (2020, p. 25).Broach (2016, p. 118) shows that women were around38% less likely to cycle and that availability of low-traffic routes may be particularly important to them.In addition to this, Clewlow (2018, p. 14) argues thate-scooter could be a catalyst for attracting more womensince the electric assistance makes it possible to bridgethe distance for which they seem to be more sensitivewhile the standing position is more suitable for sometypes of clothing. The scooter as an intermodal devicecan be more gender inclusive as demonstrated by thesecond generational peak of users (45-54) identified inthe study, reminiscent of clustering customers observedby Degele et al. (2018, p. 4) on dockless e-scooters inGermany. These two issues represent a challenge for thescooter insofar as the population is ageing and evidencesthat women behave more virtuously for the environment
than men, except for mobility (Pech and Witkowski2021, p. 26).
Facing with the challenges of scoot-and-ride tocontribute fully to the sustainable mobility system,several recommendations intended for planners andtransport operators are highlighted in this study.
To ensure a significant modal shift from car driversto micromobility, it seems therefore necessary both topromote the use of these individual light modes and tocurb the development of the car (Bruno, Dekker, andLemos 2021, p. 530) within several-kilometre "bubbles"(Canepa 2007, p. 31). We did not observe scoot-and-ride competing directly with bike-and-ride – unveilinga similar evolution for each station – or walkingon greater distances. These two small modes havethe potential to substitute park-and-ride practises bysharing common features: frequency, purpose and evenage for passengers. Especially since replacing "kiss andride" by a micromobility ride means cutting the distancetravelled by car by twice, for the passenger and thedriver, since the driver often has to make a round trip orextend his journey by detouring to the station (Litman2021, p. 50).
While the first proposal is the development andmaintenance of cycle paths adapted to all types ofmicromobility (bike, scooter, skateboard, etc.), such ameasure would not be effective on its own if the supply ofservices dedicated to the car remains abundant, notablycar park. The interest of determining the averagerange of the scooter combined with the train is thento define the catchment area where residents couldadopt this mobility solution. For land use planningstakeholders, this geographic area has become a keyterritorial challenge to enhance rail services use (Hasiakand Bodard 2018, p. 1). The urban design approachshould be considered as one of the solutions to promotea lower carbon access to stations, as the modal shift fromcar to rail is significantly influenced by the connectionquality to the station (Stránský 2019, p. 38). In additionto protected cycle paths separated from car traffic,volume and speed moderation and a reduction in carparking (Richer 2021), the rail operator could workon the station, platform and train conception to makeaccess for scooters and bikes easier, since 23% of scoot-and-riders or bike-and-riders express a desire to transferwithout barriers (Enov 2021, p. 35). An alternativeto reducing the capacity of car parks in station areasis to manage access by allowing free parking only forcommuters – who have no other access to the stationthan by car – to prevent them from renouncing usingthe train.
Focusing on the case study of Mouans-Sartoux, it wasseen that the municipality is making efforts to developcycling in the railway station area, but is also favouringthe car use around. The most striking initiative isthe opening of the Château de Mouans-Sartoux carpark in 2021, providing 245 new free spaces in orderto ensure train and car intermodality (Ecomnews n.d.;Olivier 2021). As is widely admitted, urban decisionmakers and transit agencies should invest in cycling-and-ride rather than park-and-ride facilities, for reason
17

of space and cost-effectiveness and environment (Pucherand Buehler 2009, p. 79). Chan and Farber (2020,p. 2175) suggest that availability of car park, togetherwith measures encouraging active transportation, maygenerate conflicts and deter passengers from usingmicromobility for access. Given the park-and-ridefacility opened in August 2021, one recommendation forthe Mouans-Sartoux station area would be to transformthe other spaces dedicated to car parking into publicspaces, on which there will be protected cycle routesfavouring a greater diversity of micromobility users.These planning recommendations would increase
competitiveness of micromobility integrated withefficient train lines with respect to car travel, withinextended catchment areas in less dense areas, as CPB(2020, p. 63) points out.
6. ConclusionsIn this study, the secondary analysis of a surveyconducted in twelve French train stations, between thefirst and second lockdown measures due to the COVID-19 health crisis, examines in more detail the usagepatterns and socio-demographic characteristics of thescooter integrated in an intermodal trip. A sample of53 passengers accessing one of the surveyed stations byscooter was analysed.
The results suggest that the use of this lightvehicle contributes to enlarging service area withintransit isochrones, covering a two-kilometre distance (11minutes) at the walking and cycling interface. Thismeans that the coverage of the scooter is 5.5 times aswide as walking. Regarding the riders, young adultmen who take their scooter onboard the train bothfor access and egress frequently, to study or work,are overrepresented. 83% of surveyed scoot-and-ridepassengers are male and 62% are between 18 and 34years old. 79% of respondents by scooter access to thetrain station with at least five times a week, 81% ofthem were going to work or study when questioned, anda third of these commuters are students. During thesame trip, the scooter is both used as an access and anegress mode for 85% of riders. It has been seen that thecombination of the two modes takes place in dense areasand could be time-competitive with the car.
This implies the need for car restrictions andalternative incentives, as recommended in the casestudy, to encourage modal shift to rail and less energyconsuming intermodal practices. To achieve this, it isessential for urban decision-makers to further redesignpublic spaces around stations by reducing the spaceoccupied by car park and traffic, and by developingcycle routes. Looking at the potential virtues of thissynergy, it appears that local and regional authoritiescould benefit from their success in achieving sustainableand socially fair development goals. Extending therailway station areas by promoting micromobility couldreflect the emerging concept of the "15-minute city"(Duany and Steuteville 2021), where the combinationof walking, cycling, scootering and public transport(Sadik-Kahn 2021) would ensure that most commonly-
accessed services and activities can be reached withina 15-minute walk or cycling ride (Moreno and Hjelm2021).
The contributions of this work can be extendedto gain a deeper understanding of intermodalityassociating standing scooter with rail. First, the currentsurvey lacked the precise location of trip destination,precluding a detailed comparative analysis of the firstand last kilometres by scooter. Additionally, futureempirical studies should consider several indicators notaddressed in relation to the scooter and public transportcombination: such as distinguishing mechanical fromelectric scooters, users’ revenues and socio-professionalcategories, routes used to reach their destination, modessubstituted, reasons for choice mode, propensity toadopt this micro-vehicle, perception and acceptance.Future works examining the combination of scooterswith urban public transport may also provide interestingresults in comparison to the findings in this paper.
Several questions arise and take the form of futurechallenges. With a modal share of 2.09% for stationaccess by scooter, taking this folding mode onboardtrains does not seem to be an issue. However, to whatextent can scooter-and-ride practices develop to a stagewhere their presence on trains disturbs passengers onboard? Alongside this, at what point can the designof transit vehicle types becomes a limiting element inthe development of scoot-and-ride? To anticipate thischallenge, regional trains should integrate facilities forfolded standing scooters, in the same way as bicycles.But railway stations should also provide secure parkingspaces for private micromobility, especially for first orlast-mile riders, or as an alternative if the trend of scoot-and-ride practice strongly develops.
AcknowledgmentsWe would like to thank SNCF Réseau for sharing thissurvey for the publication of this article. We are gratefulto SNCF Gares Connexions for agreeing to send ustheir analysis and results of the survey on national trainstations. We acknowledge all the participants of thescientific conferences who gave us valuable advice: atthe Smart and Sustainable Cities conference (20 May2021); Embassy of France, FAID Cities of Tomorrow,Planning Transitions in Changing Rail Environments(20 July 2021); and at Future Days (30 November 2021).
18
References6t-Bureau de recherche. Comprendre les usages d’unservice de trottinettes électriques en free-floating.Enquête auprès des utilisateurs du service Dott àParis. Tech. rep. Dott, Nov. 2019, p. 70.
6t-Bureau de recherche. Le développement du vélo et dela trottinette dans les grandes villes françaises : unetendance confrontée au stationnement dans l’espacepublic. Rapport final. Tech. rep. Aug. 2020, p. 56.
6t-Bureau de recherche. Usages et usagers destrottinettes électriques en free-floating en France.Tech. rep. Lime, June 2019, p. 158.
Rusul L. Abduljabbar, Sohani Liyanage, and HusseinDia. “The Role of Micro-Mobility in ShapingSustainable Cities: A Systematic Literature Review”.In: Transportation Research Part D: Transport andEnvironment 92 (Mar. 2021), p. 102734. issn: 1361-9209. doi: 10/gh4pjs.
Mohammed Hamad Almannaa et al. “PerceptionAnalysis of E-Scooter Riders and Non-Ridersin Riyadh, Saudi Arabia: Survey Outputs”. In:Sustainability 13.2 (Jan. 2021), p. 863. doi: 10 /gjgqjc.
Georges Amar. Homo mobilis : Une civilisation dumouvement. 2e édition. Limoges: FYP EDITIONS,Apr. 2016. isbn: 978-2-36405-133-1.
Apur. Les mobilités émergentes, trottinettes, scooters etvélos en partage : Profils, pratiques, attentes à partird’une enquête réalisée auprès des utilisateurs. Tech.rep. May 2020, p. 98.
BCDOT. Baltimore City Dockless Vehicle Pilot ProgramEvaluation Report. Tech. rep. Baltimore CityDepartment of Transportation, Mar. 2019, p. 37.
Julien Bert et al. How COVID-19 Will Shape Urban Mobility.https://www.bcg.com/publications/2020/how-covid-19-will-shape-urban-mobility.aspx. June 2020.
Luca Bertolini and Tejo Spit. Cities on Rails: TheRedevelopment of Railway Station Areas. London: E& FN Spon, 1998.
BiTiBi. Bike. Train. Bike. The Final Report. Tech. rep.BiTiBi.eu, Mar. 2017, p. 49.
Nicolas Boffi. Extrait de l’étude portant sur l’impactenvironnemental des trottinettes électriques. Étude decas dans le contexte parisien. Tech. rep. ARCADIS,Nov. 2019, p. 3.
Joseph Broach. “Travel Mode Choice FrameworkIncorporating Realistic Bike and Walk Routes”. In:Dissertations and Theses (Feb. 2016). doi: 10 /gnr372.
Matthew Bruno, Henk-Jan Dekker, and LetíciaLindenberg Lemos. “Mobility Protests in theNetherlands of the 1970s: Activism, Innovation,and Transitions”. In: Environmental Innovation andSocietal Transitions 40 (Sept. 2021), pp. 521–535.issn: 2210-4224. doi: 10/gnbcsj.
Brian Canepa. “Bursting the Bubble. Determining theTransit-Oriented Development’s Walkable Limits”.In: Transportation Research Record: Journal ofthe Transportation Research Board (Jan. 2007),pp. 28–34. doi: 10/fb6x7x.
Or Caspi, Michael J. Smart, and Robert B. Noland.“Spatial Associations of Dockless Shared E-ScooterUsage”. In: Transportation Research Part D:Transport and Environment 86 (Sept. 2020),p. 102396. issn: 1361-9209. doi: 10/gg4kkt.
Robert Cervero. “Chapter 7 - The transit metropolis:a 21st century perspective”. In: Transportation,Land Use, and Environmental Planning (Nov. 2019),pp. 131–149. doi: 10/ghdkt4.
Robert Cervero, Benjamin Caldwell, and Jesus Cuellar.“Bike-and-Ride: Build It and They Will Come”.In: Journal of Public Transportation 16.4 (2013),pp. 83–105.
Kevin Chan and Steven Farber. “Factors Underlyingthe Connections between Active Transportation andPublic Transit at Commuter Rail in the GreaterToronto and Hamilton Area”. In: Transportation 47(Oct. 2020), pp. 1–22. doi: 10/gm97vv.
City of Chicago. E-Scooter. Pilot Evaluation. Tech. rep.Jan. 2020, p. 97.
Civity Management Consultants. E-Scooters inGermany. A data-driven contribution to the ongoingdebate. https://scooters.civity.de/en. 2019.
Regina Clewlow. The micro-mobility revolution: theintroduction and adoption of electric scooters in theUnited States. Tech. rep. Populus, July 2018, p. 17.
CPB. Good to Go? Assessing the EnvironmentalPerformance of New Mobility. Tech. rep. CorporatePartnership Board - International Transport Forum,2020, p. 89.
Anne de Bortoli and Zoi Christoforou. “ConsequentialLCA for Territorial and Multimodal TransportationPolicies: Method and Application to the Free-Floatinge-Scooter Disruption in Paris”. In: Journal of CleanerProduction 273 (Nov. 2020), p. 122898. issn: 0959-6526. doi: 10/gg5qjn.
Jutta Degele et al. “Identifying E-Scooter SharingCustomer Segments Using Clustering”. In:Conference: 2018 IEEE International Conferenceon Engineering, Technology and Innovation(ICE/ITMC). Boeblingen, Allemagne, June 2018,pp. 1–8. doi: 10/ggx674.
Andres Duany and Robert Steuteville. Defining the 15-Minute City | CNU. Feb. 2021.
Ecomnews. Pays de Grasse : Le projet de parkingintermodal à Mouans-Sartoux est officiellement lancé.https://ecomnews.fr/article/Pays-grasse-projet-parking-intermodal-mouans-sartoux-officiellement-lance.
19

Fabian Edel, Simon Wassmer, and Mira Kern.“Potential Analysis of E-Scooters for CommutingPaths”. In: World Electric Vehicle Journal 12.2 (June2021), p. 56. doi: 10/gk4hth.
EEA. The First and Last Mile — the Key to SustainableUrban Transport. Transport and Environment Report2019. Tech. rep. 18/2019. Luxembourg: EuropeanEnvironment Agency, Feb. 2020, p. 81.
Enov. Enquête Parcours Voyageurs SNCF Gares &Connexions : Rapport d’étude. Tech. rep. SNCF Gares& Connexions, 2021, p. 51.
Matt Ensor, O Maxwell, and Oliver Bruce. Mode Shiftto Micromobility. Tech. rep. 674. Waka Kotahi NZTransport Agency research, Feb. 2021, p. 110.
Nils Fearnley, Siri Hegna Berge, and Espen Johnsson.Delte elsparkesykler i Oslo. En tidlig kartlegging.Tech. rep. 1748/2020. Oslo: Transportøkonomiskinstitutt (TØI), Jan. 2020, p. 99.
Helen Fitt and Angela Curl. “E-Scooter Use in NewZealand: Insights around Some Frequently AskedQuestions.” In: (2019), p. 20.
FP2M and SML. COMMUNIQUE DE PRESSE -Baromètre marché FP2M/SML 2020. Apr. 2021.
FUB. Baromètre des Villes Cyclables. Résultats 2019.https://palmares.parlons-velo.fr/. Nov. 2019.
Jan Garrard, Geoffrey Rose, and Sing Kai Lo.“Promoting Transportation Cycling for Women:The Role of Bicycle Infrastructure”. In: PreventiveMedicine 46.1 (Jan. 2008), pp. 55–59. issn: 0091-7435.doi: 10/d574zp.
Alexandre Gauquelin. The Case for E-Scooters as PublicTransit. Feb. 2021.
Ahmed M. El-Geneidy, Paul Tetreault, and JulienSurprenant-Legault. “Pedestrian Access to Transit:Identifying Redundancies and Gaps Using a VariableService Area Analysis”. In: Transportation ResearchBoard 89th Annual Meeting. 2010.
Christian Gioria. Etude d’évaluation sur les servicesvélos – Enquête sur le stationnement sécuriséintermodal. Tech. rep. ADEME, Sept. 2016, p. 46.
Mirko Goletz et al. “Intermodality in EuropeanMetropolises: The Current State of the Art, andthe Results of an Expert Survey Covering Berlin,Copenhagen, Hamburg and Paris”. In: TransportPolicy 94 (Aug. 2020), pp. 109–122. issn: 0967-070X.doi: 10/gh5894.
Sophie Hasiak and Géraldine Bodard. “Influence Areasof Railway Stations : How Can We Explain TheirGeographic Forms?” In: World Congress on RailwayResearch. 2018, p. 6.
Frédéric Héran. “La réduction de la dépendanceautomobile”. In: Cahiers Lillois d’Economie et deSociologie 37 (2001), pp. 61–86.
Frédéric Héran. Le retour de la bicyclette. Une histoiredes déplacements urbains en Europe, de 1817 à 2050.La Découverte (20 août 2015). Poche / Essais. 2015.
Frédéric Héran. Le Vélo, Ce Mode de DéplacementSuper Résilient. https://theconversation.com/le-velo-ce-mode-de-deplacement-super-resilient-138039.2020.
Thomas Holm Møller, John Simlett, and Eric Mugnier.Micromobility: Moving Cities into a SustainableFuture. EY Report. Mar. 2020, p. 36.
Aryan Hosseinzadeh et al. “E-Scooters andSustainability: Investigating the Relationship betweenthe Density of E-scooter Trips and Characteristicsof Sustainable Urban Development”. In: SustainableCities and Society 66 (Mar. 2021), p. 102624. issn:2210-6707. doi: 10/gh43qm.
Insee. Comparateur de territoire -Commune de Mouans-Sartoux (06084).https://www.insee.fr/fr/statistiques/1405599?geo=COM-06084. Sept. 2021.
ITDP. The Electric Assist: Leveraging E-bikes and E-scooters for More Livable Cities. Tech. rep. Institutefor Transportation & Development Policy (ITDP),Dec. 2019, p. 52.
R. Kager, L. Bertolini, and M. Te Brömmelstroet.“Characterisation of and Reflections on the Synergyof Bicycles and Public Transport”. In: TransportationResearch Part A: Policy and Practice 85 (Mar. 2016),pp. 208–219. issn: 0965-8564. doi: 10/ggw58b.
Małgorzata Kostrzewska and Bartosz Macikowski.“Towards Hybrid Urban Mobility: Kick Scooter as aMeans of Individual Transport in the City”. In: IOPConference Series: Materials Science and Engineering245 (Oct. 2017), p. 052073. doi: 10/gkcxqx.
Stephan Krygsman, Martin Dijst, and Theo Arentze.“Multimodal Public Transport: An Analysis of TravelTime Elements and the Interconnectivity Ratio”. In:Transport Policy 11.3 (July 2004), pp. 265–275. issn:0967-070X. doi: 10/ffsvz7.
André Kwak, Luiz M. T. Alves, and RenataGreco. Pesquisa de Perfil Dos Usuários dePatinetes e Bicicleta Yellow Em São Paulo.https://medium.com/@growmobility/pesquisa-de-perfil-dos-usu%C3%A1rios-de-patinetes-e-bicicleta-yellow-em-s%C3%A3o-paulo-55728861ac57. July2019.
Barbara Laa and Ulrich Leth. “Survey of E-scooterUsers in Vienna: Who They Are and How They Ride”.In: Journal of Transport Geography 89 (Dec. 2020),p. 102874. issn: 0966-6923. doi: 10/ghgpzz.
Lime. Lime pour un Paris durable : Étude sur l’impactenvironnemental de Lime à Paris 2018-2019. Tech.rep. Oct. 2019, p. 31.
Todd Litman. Big Benefits from Small Modes. Feb.2021.
Carlos López-Escolano and Ángel Pueyo Campos. “Lesmobilités émergentes après la Grande Récession : duvélo partagé à la trottinette électrique. Le cas de laville de Saragosse (Espagne)”. In: Belgeo. Revue belgede géographie 4 (Dec. 2019). issn: 1377-2368. doi: 10/ghdkt6.
20

Jijo Mathew et al. “Analysis of E-Scooter Trips andTheir Temporal Usage Patterns”. In: Ite Journal 89(June 2019), pp. 44–49. doi: 10/ghdkt6.
Grant McKenzie. “Spatiotemporal ComparativeAnalysis of Scooter-Share and Bike-Share UsagePatterns in Washington, D.C.” In: Journal ofTransport Geography 78 (June 2019), pp. 19–28. doi:10/ggxxcf.
Grant McKenzie. “Urban mobility in the sharingeconomy: A spatiotemporal comparison of sharedmobility services”. In: Computers Environment andUrban Systems 79 (Nov. 2019), p. 15. doi: 10/gghbh6.
Mobiprox. La micro-mobilité atout majeur del’intermodalité. Nov. 2021.
Carlos Moreno and Frédéric Hjelm. Introducing the 15-Minute City. Séminaire. June 2021.
NACTO. Shared Micromobility in the U.S.: 2018. Tech.rep. 2019, p. 15.
NACTO. Shared Micromobility in the U.S.: 2019. Tech.rep. 2020, p. 22.
Nice Premium. Inauguration de la nouvelle gare deMouans-Sartoux – Green Code. Oct. 2011.
Giulia Oeschger, Páraic Carroll, and Brian Caulfield.“Micromobility and Public Transport Integration:The Current State of Knowledge”. In: TransportationResearch Part D: Transport and Environment 89(Dec. 2020), p. 102628. issn: 1361-9209. doi: 10 /gkzn9h.
Arthur Olivier. Mobilité : dans la Région Sud, les fondseuropéens permettent la construction d’un parkingsouterrain. July 2021.
OMNIL. La mobilité au temps de la Covid 19. EnquêteMobilité Covid. Vague 1 : Septembre-Octobre 2020.Tech. rep. Île-de-France Mobilités, Jan. 2021, p. 48.
Rebekka Oostendorp and Laura Gebhardt. “CombiningMeans of Transport as a Users’ Strategy to OptimizeTraveling in an Urban Context: Empirical Results onIntermodal Travel Behavior from a Survey in Berlin”.In: Journal of Transport Geography 71 (July 2018),pp. 72–83. issn: 0966-6923. doi: 10/gfhf3j.
OpenStreetMap. OpenStreetMap.https://www.openstreetmap.org/. Oct. 2021.
PBOT. 2018 E-Scooter Findings Report. Tech. rep.Portland Bureau of Transportation, 2018, p. 35.
Thierry Pech and Didier Witkowski. Les femmes et lechangement climatique. Tech. rep. Terra Nova, 2021,p. 32.
Antoine Pestour. “Approche socio-économique desenjeux relatifs aux trottinettes électriques en libre-service en France”. Mémoire de fin d’études. LAET(Lyon, France), Sept. 2019, p. 92.
Steven Polzin. First Mile-Last Mile,Intermodalism, and Making Public TransitMore Attractive - Blogs | Planetizen.https://www.planetizen.com/node/93909/first-mile-last-mile-intermodalism-and-making-public-transit-more-attractive#_ftn1. June 2017.
John Pucher and Ralph Buehler. “Integrating Bicyclingand Public Transport in North America”. In: Journalof Public Transportation 12 (Sept. 2009). doi: 10/ggn346.
Mathieu Rabaud and Cyprien Richer. “(Micro)mobilitésémergentes et intermodalités. L’irruption des «Engins de Déplacements Personnalisés » dans leschaines de mobilité.” In: Colloque de la commissionde géographie des transports du CNFG : "Lesmobilités émergentes. Fondements et conséquencesdes nouvelles pratiques de déplacement des personneset d’acheminement des marchandises". Oct. 2019.
Cyprien Richer. [Dossier Mobilités] #11 -Micromobilités et intermodalités : l’enjeu desengins de déplacement personnels. Mar. 2021.
Janette Sadik-Kahn. From 15-Minute Cities to ClutterControl: Top Trends from Micromobility World 2021.Feb. 2021.
Daniel Schellong et al. The Promise and Pitfalls of E-Scooter Sharing. May 2019.
Thibaut Schepman. Pourquoi les femmes roulent-ellesmoins à vélo ? https://www.terraeco.net/Pourquoi-les-femmes-roulent-elles,56681.html. 2014.
Chris Schlueter Langdon and Nadine Oehrlein. “HowMuch Better Is Public Transport with Intermodal?Quantifying User Benefits of Integration withMicromobility”. In: Working Paper (WP_DCL-Drucker-CGU_2021-03) (2021), p. 13.
Stéphane Schultz and Sylvain Grisot. MicromobilityExplorer - How to Make It Sustainable. Automotive.15marches et dixit.net, Sept. 2019.
Andrew Sedor and Nathan Carswell. Shared E-Bike ande-Scooter Mid-Pilot Report. Tech. rep. TT2019-1374.SPC on Transportation and Transit, Dec. 2019, p. 24.
Smart Mobility Lab. Usages, risques et accidentalitédes EDPM - Rapport d’étude. Tech. rep. FédérationFrançaise de l’Assurance (FFA), AssurancePrévention, Fédération des Professionnels de laMicro-Mobilité (FP2M), Oct. 2020.
C Smith and Joseph Schwieterman. “E-ScooterScenarios: Evaluating the Potential Mobility Benefitsof Shared Dockless Scooters in Chicago”. In: ChaddickInstitute Policy Series. DePaul University, Chicago,Dec. 2018.
SNCF. Fréquentation en gares.https://ressources.data.sncf.com/explore/dataset/frequentation-gares/table/?disjunctive.nom_gare&disjunctive.code_postal.2020.
SNCF Réseau. Accueil | Ligne Nouvelle ProvenceCôte d’Azur. https://www.lignenouvelle-provencecotedazur.fr/.
Václav Stránský. “Périurbain et Transit-OrientedDevelopment : un couple invraisemblable ?” In: FluxN° 115.1 (Apr. 2019), pp. 33–57. issn: 1154-2721. doi:10.3917/flux1.115.0033.
21

The Spectrum. E-scooters find a home in downtownSt. George, popular with college students.https://eu.thespectrum.com/story/news/2019/04/14/e-scooters-home-downtown-st-george-dixie-state-university-bike-share/3434274002/. Dec. 2019.
Sylvaine Tuncer et al. “Notes on the Practices andAppearances of E-Scooter Users in Public Space”.In: Journal of Transport Geography 85 (May 2020),p. 102702. issn: 0966-6923. doi: 10/ggxgv4.
Niels van Oort. Overview of the Research into theCombined Bicycle and Transit Mode. July 2020.
John Wachunas. Trip Data In Oakland Give ImportantNew Insights Into Scooter Demand In San Francisco.https://www.li.me/second-street/trip-data-oakland-important-insights-scooter-demand-san-francisco.Sept. 2019.
Marc Wiel. “Comment gérer la transition urbaine”. In:Recherche - Transports - Sécurité 58 (Jan. 1998),pp. 3–20. issn: 0761-8980. doi: 10/bgdbhw.
Oliver Zirn, Konrad Sagert, and M. Ruether. FoldableElectrified Ultralight Vehicles on Public Walkwaysfor Sustainable Traffic Chains. /paper/Foldable-Electrified-Ultralight-Vehicles-on-Public-Zirn-Sagert/27f9de4743b2c86211f05736231a0b2245ee5231.2018.
Zhenpeng Zou et al. “Exploratory Analysis of Real-Time E-Scooter Trip Data in Washington, D.C.”In: Transportation Research Record: Journal of theTransportation Research Board 2674 (May 2020),p. 036119812091976. doi: 10/ggxxcd.
Natalia Zuniga-Garcia and Randy Machemehl.“Dockless Electric Scooters and Transit Use inan Urban/University Environment”. In: 99th AnnualMeeting of the Transportation Research Board.Washington, DC, Jan. 2020, p. 17.
Natalia Zuniga-Garcia, James Scott, et al. “Evaluationof E-Scooters as Transit Last-Mile Solution”. In:(Sept. 2020), p. 25.
22