Feasibility Study of Electric Powered Vehicle
79
Feasibility Study of the Introduction of Electric Vehicles in Samsø EV Alexandre Canet Peter Githii Thibault Guillamet Stefanos Konstas Fanni Sáfián Aalborg University, June 2011 M.SC. (ENG) SUSTAINABLE ENERGY PLANNING AND MANAGEMENT SUPERVISOR: POUL ALBERG ØSTERGAARD
-
Upload
universityofcebu -
Category
Documents
-
view
0 -
download
0
Transcript of Feasibility Study of Electric Powered Vehicle
Feasibility Study
of the Introduction of Electric Vehicles in Samsø
EV
Alexandre Canet
Peter Githii
Thibault Guillamet
Stefanos Konstas
Fanni Sá�án
Aalborg University, June 2011
M.SC. (ENG) SUSTAINABLE ENERGY PLANNING AND MANAGEMENT
SUPERVISOR: POUL ALBERG ØSTERGAARD

1
Aalborg University
Department of Development and Planning
Fibigerstræde 13.
9220 Aalborg Øst
http://www.plan.aau.dk
Title of Project:
Feasibility Study of the Introduction of
Electric Vehicles in Samsø
Project Period:
11/02/2011 – 01/06/2011
Project Group:
Group 71
Members:
Alexandre Canet
Peter Njemga Githii
Thibault Guillamet
Stefanos Konstas
Fanni Sáfián
Supervisor:
Poul Alberg Østergaard
Pages: 78
Number of copies: 7
The content of the report is free for everyone
but publishing must only be done with the
author‟s permission.
Abstract
This project is conducted as part of the
larger project called Samsø 2.0, focusing
on changing the transportation sector on
the island, trying to identify and promote a
sustainable solution. Due to the large
excess electricity produced by the wind
turbines, a fitting solution for the island‟s private vehicles can be electric vehicles
(EVs).
The aim of this project is to examine how
electric vehicles can be implemented in
Samsø, in a way to promote changes
towards a 100 per cent self-sufficient
island. The project examines the different
available technologies of electric vehicles
through a technical analysis; an economic
screening comparing electric and
conventional vehicle costs; and finally a
socio-economic part including different
ownership models with economic
considerations and details about the
driving habits and expectations from
Samsø inhabitants. From these analyses, it
is shown that Battery Electric Vehicles
(BEVs) are the most suitable plug-in EVs
for the island and are also economically
viable. However, the different driving
habits require several ownership solutions,
therefore private ownership, leasing and
car sharing are recommended in the case
of Samsø.
All these different results lead to suggest
ideas of implementing EVs in Samsø. In
relation to the island‟s new energy plan, a demonstration project is presented with a
focus of showing the reliability of the
vehicles. Finally, some ideas to expand the
number of EVs and to lower their costs are
also considered.
End date: 31/05/2011

2
ACRONYMS AND ABBREVIATIONS
A/S Aktieselskab (Stock-based
corporation)
A++ Abstraction plus reference plus
synthesis
AC Alternative Current
BEV Battery Electric Vehicle
CD Charge Depleting
CH4 Methane
CO2 Carbon Dioxide
CS Charge Sustaining
CSO Car Sharing Organization
DC Direct Current
EU European Union
EV Electric Vehicle
GHG GreenHouse Gas
ICE Internal Combustion Engine
IPCC Internation Planning on Climate
Change
LEAP Long-range Energy Alternatives
Planning systems
Li-ion Lithium-ion
NiCD Nickel-Cadmium
NiMH Nickel Metal Hybride
NOx Nitrogen oxide
NPV Net Present Value
O&M Operation and Maintenance
PEV Plug-in Electric Vehicle
PHEV Plug-in Electric Vehicle
PV Photovoltaics
RE Renewable Energy
ReEV Range Extended Electric Vehicle
SOC State Of Charge
TSO Transmission System Operator
USA United States of America
V2G Vehicles To Grid
UNITS
€ Euro
$ U.S. Dollar
DKK Danish Krone
G Giga
h hour
j joule k kilo
L litre
M Mega
m metre V Volts W Watt Wh Watt hour
T Tera

3
Table of Contents
Abstract ............................................................................................................... 1
Preface ................................................................................................................ 6
1. Introduction ................................................................................................... 7
1.1. Problem Formulation .............................................................................. 12
1.2. Report Structure .................................................................................... 14
2. Methodology ................................................................................................ 15
2.1. The project inside an institutional framework ........................................... 15
2.2. The analysis process in the project .......................................................... 16
2.2.1. Technical analysis ............................................................................ 16
2.2.2. Cost comparison between electric and conventional vehicles .............. 16
2.2.3. Socio-economic aspects .................................................................... 16
2.3. Interview and survey methods ................................................................ 17
2.4. Tools ..................................................................................................... 18
2.4.1. Excel ............................................................................................... 18
2.4.2. LEAP ............................................................................................... 19
3. Technical Feasibility...................................................................................... 20
3.1. Plug-in Electric Vehicles .......................................................................... 20
3.2. Description of the PEVs technologies ....................................................... 21
3.2.1. BEV ................................................................................................. 21
3.2.2. PHEV ............................................................................................... 22
3.2.3. State of charge and driving range ..................................................... 22
3.2.4. Comparison between BEV and PHEV ................................................. 23
3.3. Electric Vehicle connected to Grid (V2G) .................................................. 24
3.4. Advantages and disadvantages of V2G with a focus on Samsø .................. 24
3.4.1. Battery lifespan of V2G and EV ......................................................... 26
4
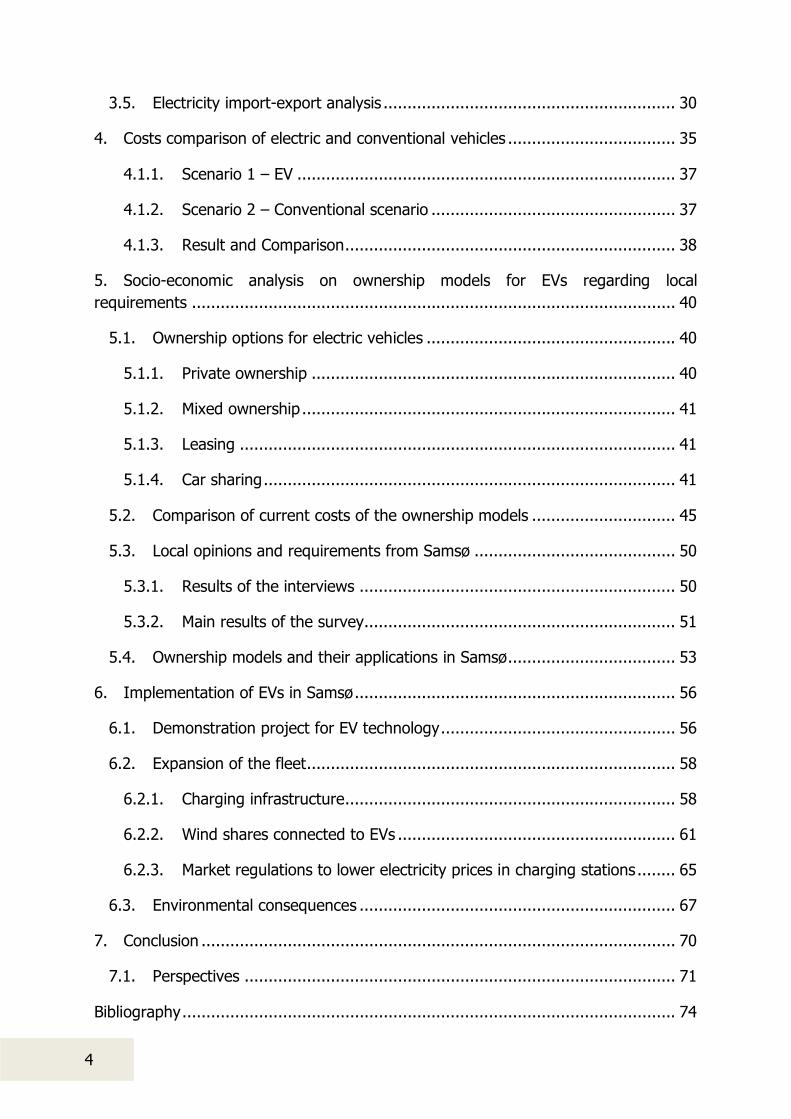
3.5. Electricity import-export analysis ............................................................. 30
4. Costs comparison of electric and conventional vehicles ................................... 35
4.1.1. Scenario 1 – EV ............................................................................... 37
4.1.2. Scenario 2 – Conventional scenario ................................................... 37
4.1.3. Result and Comparison ..................................................................... 38
5. Socio-economic analysis on ownership models for EVs regarding local
requirements ..................................................................................................... 40
5.1. Ownership options for electric vehicles .................................................... 40
5.1.1. Private ownership ............................................................................ 40
5.1.2. Mixed ownership .............................................................................. 41
5.1.3. Leasing ........................................................................................... 41
5.1.4. Car sharing ...................................................................................... 41
5.2. Comparison of current costs of the ownership models .............................. 45
5.3. Local opinions and requirements from Samsø .......................................... 50
5.3.1. Results of the interviews .................................................................. 50
5.3.2. Main results of the survey................................................................. 51
5.4. Ownership models and their applications in Samsø ................................... 53
6. Implementation of EVs in Samsø ................................................................... 56
6.1. Demonstration project for EV technology ................................................. 56
6.2. Expansion of the fleet ............................................................................. 58
6.2.1. Charging infrastructure ..................................................................... 58
6.2.2. Wind shares connected to EVs .......................................................... 61
6.2.3. Market regulations to lower electricity prices in charging stations ........ 65
6.3. Environmental consequences .................................................................. 67
7. Conclusion ................................................................................................... 70
7.1. Perspectives .......................................................................................... 71
Bibliography ....................................................................................................... 74

5

6
Preface
This project was written during the period of February 2011 to June 2011 as the
main project of the 2nd semester of the Master Programme in Sustainable Energy
Planning and Management at Aalborg University.
The authors would like to thank Poul Alberg Østergaard for providing valuable help
during the whole research process as supervisor; Søren Hermansen for helping in
the concept idea of this project in relation to the broader Samsø 2.0 project; the co-
workers from Samsø Energy Academy for their time and help: Consultant Lene
Skafte Bestman, Manager Søren Steensgaard and Technology Advisor Bernd Garber.
Thanks to Jens Erik Printzen from Elderly Care, Brian Kjaer for demonstrating his
electric vehicle and last but not least, Lars Fomsgaard for hosting the authors during
the study trip in Samsø.
As reference technique, the Chicago method is used throughout the report, thus,
inside the text, the sources are presented as: author with year of publication. The
complete list of the references is found at the end of the report.

7
1. Introduction
In 1997, the Danish Ministry of Energy announced a competition for planning a 100
per cent renewable energy project at a given local area or islands funded by the
Danish Energy Authority. The islands competing were Læsø, Samsø, Ærø and Møn as
well as the peninsula Thyholm. The project aimed to emphasize the potential of
resources and to make the transition towards renewable energy according to the
technology and the organisational structure required. The focus point of the
competition was on low energy consumption regarding different sectors such as
heating, electricity and transportation sectors. The project should also involve the
local people (Jørgensen 2007). Samsø won the competition in the same year.
Samsø is a small island located in the centre of Denmark (Figure 1) with around
4,000 inhabitants (Statistics Denmark 2011) whereby the proposed plans were seen
to have the most likelihood of succeeding compared to the other areas.
Figure 1: Samsø’s location in Denmark
Before the project, the island‟s electricity demand was entirely supplied by the mainland through undersea cables which connect the island and Jutland. In the
project, it was decided to make the island completely independent in electricity

8
supply from the mainland. Therefore, the annual electricity consumption of Samsø
had to be produced locally.
In the same way as most areas along the Danish coast, the wind has a high
renewable energy potential in Samsø. Hence, it was decided that the majority of the
electricity production would come from wind turbines. In three different clusters of
the island, eleven land-based wind turbines, each one of 1 MW capacity, were built.
When the project was made in 1997, the transportation alternative technologies
were not advanced enough to provide a reliable way to change the conventional
transport means into a renewable energy based. Therefore, the project planned to
produce excess renewable electricity to offset the CO2 emissions of transportation.
This surplus was planned to be produced by offshore wind turbines and exported to
the mainland, until a way to use it locally is found, as for instance replacing the fossil
fuelled units by ones using electricity. A capacity of 23 MW was calculated for this
purpose. Therefore, ten off-shore wind turbines, each one of 2.3 MW capacity, have
been built in 2002 (Jørgensen 2007). Figure 2 presents the locations of the wind
farms in Samsø.
Figure 2: Map of Samsø including wind farms, the main city and ferry terminals adapted from (EnergiNET 2011)

9
Photovoltaic cells were also considered in the first plan, but the costs per kilowatt-
hour of production have discouraged the investors and the people in Samsø. Finally,
only a few houses and the Samsø Energy Academy have 100 m² of PV cells installed
on their roof. The small potential of solar power in Denmark and the low feed-in
tariffs fixed by the Danish government can also explain the difficulties of
implementing PV cells all around Denmark (Jørgensen 2007).
Finally, the plan considered savings in electricity as well and tried to change the
behaviour of the people. The first step towards energy saving was by replacing the
electric boilers in the houses that cannot be linked to the district heating, by other
means of heating, such as solar collectors, individual biomass boilers or heat-pumps.
Just a few have really been replaced, especially because of the opposition of the
elder people who do not want to build new units in their houses (Jørgensen 2007).
Another step of the sustainable program was promotion campaigns to encourage
people to use A++ appliances as lights bulbs, freezers, etc., but there was no
noticeable change because of the increasing number of products running on
electricity (Jørgensen 2007).
Regarding the above described situation, the following question appears:
Can Samsø be considered sustainable while a part of the electricity production is just an offset to the CO
2 emission from transportation and electricity import,
which can be fossil-based sources?
That‟s the question Samsø‟s Energy Academy is facing and trying to solve in the new project. The potential solution is to use the locally produced energy for the
transportation sector and thus, to become more independent from the fuel
importation and to lower the environmental impacts. This is the starting point of this
project.
The demand of electricity, heating and transport as well as the electricity production
and the CO2 emission in 2009 in Samsø is presented in Table 1.
Table 1: Production and demand of energy and the total CO2 emission in 2009 in Samsø (Tambjerg 2009)
Transport sector
[GWh]
Electricity demand
[GWh]
Heating demand
[TJ]
Electricity production
[GWh]
CO2 emission [1,000
tons]
75.3 27.8 153.6 108.61 25.29
By studying data (Tambjerg 2009) and report (Jørgensen 2007) about Samsø energy
evolution during the last decade, it appears that incentives and improvements of
energy management can have a great impact on the transportation sector. On one
hand, few projects described later in the introduction, had been conducted in the
past decade to decrease these emissions, but they failed or remained undeveloped.
On the other hand, these projects show the willingness of the inhabitants to

10
participate in projects allowing a better quality of life, through the development of
the local economy, as it was confirmed by a farmer who owns a wind turbine in
Samsø (Tranberg 2011). It shows the necessity to focus on some feasible solutions
which can be economically and environmentally profitable for the community in a
short term range. The transportation sector is responsible for slightly more than 78
per cent of the 25,290 tons of CO2 emission and is highly dependent on fossil fuels
(Tambjerg 2009). Its energy consumption is 40 per cent of the island‟s total energy consumption – more than 2.3 times bigger than the electricity demand of Samsø in
terms of energy amount, as seen in Table 1, and distributes as presented in Figure 3.
This figure shows that the most consuming units of fossil fuels are the ships due to
the ferry traffic and the cars.
Figure 3: Distribution of the energy consumed by the transportation sector in 2009 in Samsø (Tambjerg 2009)
Figure 4 shows the evolution of the consumption in the transportation sector during
the last decade. The consumption has globally increased between 1997 and 2009.
However, it reaches its minimum in 1999 with 49.4 GWh and is nowadays around 68
GWh, if flights are not considered (Tambjerg 2009). In details, the decrease of the
ferries‟ consumption can be noticed after 2005, whereas a slight increase of the vehicles‟ consumption is observed since 2003, despite improvements of the engines efficiency and the decrease of Samsø‟s population.
25%
30% 13%
21%
11%
Private vehicles [GWh]
Ferries [GWh]
Tractors [GWh]
Trucks / trailers /
construction machinery
[GWh]
Others [GWh]

11
Figure 4: Evolution of the energy consumption in the transport sector between 1997 and 2009 in Samsø
(Tambjerg 2009)
The analysis of these figures emphasizes the large impact of the ferries in the energy
consumption. However, by crossing the facts and the objectives, it appears that
inside the transportation sector, focusing on private cars would have the best
outcome. In fact the purpose of this project has to be close to the spirit of Samsø;
trying to involve local people in the project in order to improve the quality of their
life.
In 2011, the total number of private vehicles was 1,584, and has remained quite
constant since 2007 (Statistics Denmark 2011). In the original master plan of Samsø
project in 1997, they targeted several areas to improve the situation of
transportation regarding the energy consumption. The first one was to propose an
alternative choice to the use of private vehicles; a feasibility study had been carried
out about flexible schedules and smaller buses called Island bus route. It could save
30,000 DKK/year to the municipality, but it was finally rejected in 2007. More
successful and promising was the rapeseed oil demonstration project in 2003. Three
active farmers were producing rapeseed oil for tractors and gained feed for animals
at the same time. Two of them were still continuing it in 2007. In the same period,
the municipality and other institutions decided to make a large-scale project from it,
but it never started. The project could have been successful once there would be no
energy taxation on rapeseed oil – which is still the same today as the diesel fuel
taxation (Jørgensen 2007). The most important project related to the present report
was about introducing EVs on the island. Through the planning process in 1997, it
was assumed that 10 per cent of the cars in Samsø could be converted to EVs
between 1997 and 2007, furthermore they even investigated the feasibility of 50 per
cent for a longer time scale. Regarding the optimism about EVs, the fact that there
are short trips in the island and the required amount of excess electricity was
available – they would need 5.8 TJ annually and they had 7.3 TJ exported electricity
0
10
20
30
40
50
60
70
80
1996 1998 2000 2002 2004 2006 2008 2010
En
erg
y [
GW
h]
Years
Total [GWh] Private vehicles [GWh] Ferries [GWh]

12
in 2005 (Jørgensen 2007) – this plan seemed realistic. But at the end, it did not
reach the aims of the project; only four EVs were leased to service local pensioners
by Samsø municipality in 1999, but at the end of the contract they were returned
because of battery problems and inadequate target group for this project (Jørgensen
2007).
In a broader perspective, the failure of this project could have been due to other
reasons as well, such as the policy. Currently, it seems that the market conditions
are much more mature to create a field for EVs. For this reason, in the past three
years significant changes have been done; Denmark has already started promoting
EVs by providing tax incentives and by making different environmental friendly
projects regarding transportation. In addition, under the Energy Policy of Denmark in
February 2008, Danish Energy Agency started promoting EVs with 35 MDKK (4.6 M€) in subsidies during the period of 2008-2012 (Shankar 2010), as well as the incentive
under the EU state aid rules of the European Commission, precisely 15 MDKK
(approximately 2 M€) of funding (EurActiv.com 2011).
Considering the described background of Samsø and policy framework in Denmark, it
was decided that in relation to the objectives of the island about being more
independent from fossil fuels and utilizing the local resources, the development of
EVs in Samsø appears to be a proper problematic to solve. Hence, it has been
decided to deal with the implementation of EVs in this project and in the end, after
analysing all the relevant aspects regarding EVs, to propose a demonstration project
that will present this technology to the people.
1.1. Problem Formulation
As described in the first part of the introduction, the solution should focus on
creating a sustainable transportation system in Samsø. As a starting point and in
order to assess the research process of the project, the following questions need to
be answered, regarding the issues defined above about the transportation sector: for
who and why it is a problem and what should be done about it.
1. For who is it a problem for?
It is a problem for the local people of Samsø, who are interested in a more
sustainable transportation; for the decision makers of Samsø and ultimately of
Denmark who want to decrease the overall greenhouse gas emissions of the island
and have to manage the problems generated, especially dependency on foreign
countries and foreign resources.

13
2. Why is it a problem?
There are several reasons. It is clear that Samsø cannot be a sustainable island if the
trend of the growing fossil fuel consumption continues. This is also a financial
problem for the local people, for the decision makers in Samsø and in Denmark as
well, since the gasoline and diesel prices are getting higher and will probably
continue to do so in the future. Furthermore, the island cannot reach self-sufficiency,
resulting further dependency on imported fuel from the mainland. Finally, the
increasing CO2-emissions have unlimited geographic range of enhancing climate
change, which is also a problem from a global point of view.
3. What should be done about it?
Alternatives should be analysed to see how the demand of the transportation sector
can be reduced and how its supply can be changed to become less polluting and
probably less expensive from a consumer‟s point of view. There are several potential solutions from renewable sources, such as biofuels, to clean electricity generated for
example by wind turbines. For this project, EVs are chosen as the main potential
option for changes in the private fleet of Samsø‟s vehicles. Thus, the investigation is focused on the private fleet of vehicles in Samsø, the EVs as a possible good
alternative and the possibilities to meet the goals: to use the excess electricity and to
decrease the fossil fuel dependence.
Hence, the purpose of this project is connected to the following research question:
How can electric vehicles be implemented in an economically beneficial way in Samsø, promoting the creation of a real sustainable island?

14
1.2. Report Structure
A simple overview of the project is presented in Figure 5. It shows the general
project structure specified chapter-by chapter. The approach is also detailed chapter-
by-chapter in order to have a better understanding of the development of this
project.
Figure 5: Report structure

15
2. Methodology
This chapter describes the methodological approach of the work; the different
analyses in relation to the focus of the project, the interview methods and the
tools used in order to conduct the research process. Moreover, it is also a first
step to understand why planning – with consideration of the institutional and
social aspects – is necessary in the energy sector.
2.1. The project inside an institutional framework
Inside the institutional framework the project focuses on three aspects of the
implementation of EVs which are, as seen in Figure 6:
i. Institutional and market conditions
ii. Technical system scenario
iii. Energy development goals
Figure 6: Institutional Framework for Energy Planning adapted from Hvelplund 2001
First of all, the institutional and market conditions seem to be the most
important aspect for this project, due to the different policies and the
difficulties of implementing a large project such as the introduction of EVs. In
this part, it should be mentioned that the different kinds of ownerships are
also very important as it is up to the local people to choose the most suitable
way according to their needs. Therefore, the focus is on dealing with the
ownership options (Chapter 5) through the existing market conditions and
economic considerations.
At this point the technical system scenario box of Figure 6 comes next. In the
technical analysis part (Chapter 3) the available technologies are presented
and discussed. Last but not least, the focus on the energy development goals
(Figure 6) is to provide an alternative to the transportation sector to make it
more sustainable and less costly to the consumers.

16
2.2. The analysis process in the project
Planning theory is combined with economic theory in order to be able to
include different factors regarding the implementation of EVs in Samsø‟s transportation system. Therefore, throughout the project the following
analyses are presented with their limitations.
2.2.1. Technical analysis
The technical analysis focuses on the investigation of the different
technologies available. All the analyses are using existing, state-of-the art
technologies, which are already in the market, therefore available for
purchase in Denmark. The purpose is to find which technology is the most
applicable for implementation in Samsø in terms of battery lifespan and
driving range. The technologies are also considered in function with the
behaviour of Samsø‟s inhabitants and meeting the environmental goals.
Furthermore, the analysis investigates the need for vehicles connected-to-the-
grid technology in Samsø. The final analysis has been done using an Excel
spread sheet because of the limitations of Energy Plan regarding the
requested results.
2.2.2. Cost comparison between electric and conventional
vehicles
The aim of this analysis is to have a cost comparison between electric and
conventional vehicles through a comparison presenting the cost per kilometre.
Using the current prices, related to purchasing and vehicle maintenance, is
taken into consideration including taxes and depreciation as well. The main
variables of this screening are the petrol and diesel prices as well as the
number of kilometres driven per year. Since they have important impacts on
the final results, a sensitivity analysis is conducted to identify the possible
impacts of variable changes in order to have an output for a large choice of
cases. This part provides no final result, it is considered as an input for
choosing different scenarios.
2.2.3. Socio-economic aspects
The purpose of this analysis is to evaluate which is the best ownership model
for EVs in Samsø. The different ownership models are examined considering
the possible social acceptance, payment method and its feasibility in Samsø.
Therefore, an economic comparison is conducted, including the current costs
and dealing with different timeframes and vehicle-use intensity. Furthermore,

17
the feedback from Samsø – interviews with the experts from the Energy
Academy and a survey of the local people – also plays an important role in
the evaluation. Due to this approach, the different actors are not defined,
neither their possible role in the system as investors, owners or customers are
investigated. Furthermore, the analysis deals mainly with practical matters
only and with the problem of how people will be able to finance and use EVs
in a proper model.
2.3. Interview and survey methods
During the research process there were different interviews and contacts
conducted, in order to generate data that would help in the different analyses
and also make it more realistic. In the beginning, there were some dialogues
with Søren Hermansen, the director of the Energy Academy, regarding the
focus of this project in relation to the broader Samsø 2.0 project. Later on,
there were some other telephone conversations with Bo Petersen, the director
of sales and marketing for ChoosEV A/S, to get the relevant prices. The car
rental company (Samsø biludlejning) was also contacted even though they
rejected the concept of this project. Finally, Post Danmark A/S provided
relevant information that helped in the demonstration project.
In order to collect qualitative data and feedback in relation to the introduction
of EVs in the island‟s society, it was decided to make a small trip to Samsø.
This visit was very helpful in conducting interviews with different actors, such
as people from the Energy Academy, the municipality and a local person
owning a small electric car. These face to face interviews took approximately
30-50 minutes each and were organised as semi-structured interviews, with
different focuses in the questions asked regarding the interviewee.
Sometimes follow up questions from the interviewers were asked to the
interviewees making the process even more flexible, generating additional
information to the related topic.
Precisely the following people were interviewed:
Bernd Garbers, Technology Advisor of Samsø Energy Academy
Lene Skafte Bestman, Consultant in Samsø Energy Academy
Søren Steensgaard, Manager in Samsø Energy Academy Brian Kjaer, local mechanical and owner of a small electric car Jens Erik Printzen, caretaker of the cars of the home care in
municipality Jørgen Tranberg, local farmer and owner of a wind turbine

18
The selection of the interviewees was relevant to the focus of the project
regarding EVs and their implementation in Samsø. The three people from the
Energy Academy are relevant to any energy project that is being conducted in
Samsø; Lene Skafte Bestman might work in the implementation of EVs in the
following years, setting already a target date to 2021 (ten years horizon) to
change half of the private vehicles‟ fleet and make it more sustainable (Bestman 2011). Brian Kjaer, who is already using a small EV, provided
explanation on how this type of car is used and basic thoughts about how
people see an EV in Samsø. Lastly, Jens Erik Printz was chosen as he was the
responsible person in the first implementation attempt of EVs back in 1999.
This particular interview provided information about why the first EVs project
failed and what should be changed this time during the implementation in
order to make a successful EV project. Finally, a short interview was done
with the local farmer Jørgen Tranberg, who is also an owner of one of the
wind turbines in the island.
Furthermore, for the implementation process of this project, information and
feedback from local people were necessary. For this purpose, a survey
translated to Danish with both open-ended and closed-ended questions was
dealt among 26 local people. It was important to find people that match the
criteria to fill the surveys such as people that own a car and people that drive
regularly. Therefore, parking lots were chosen to find the relevant target
people. Gathering the results led to gain access to information that is hard to
find, such as how and what people think about EVs, some of their everyday
needs, how they use their car now and distances travelled often. More
information about the interviews and the surveys can be found in part 5.3.
2.4. Tools
The main tools used in this project are the Excel spread sheet and the LEAP
model. Also some data were used, regarding the electricity import and export
of the Samsø‟s energy system, extracted from the mini project done for the lesson Technical Energy System Analysis which was based on an analysis with
the EnergyPLAN model.
2.4.1. Excel
The Excel software was used in all the analyses as a main tool to make
calculations and extract graphs that are presented in the report.

19
2.4.2. LEAP
LEAP, or else Long-range Energy Alternatives Planning system, is a software
used for energy policy analyses and climate change mitigation assessment. It
is a modelling tool that can be used in several different occasions; to track the
energy production and consumption of a place/country, to measure
greenhouse gas emissions in a system, to analyse an energy system and
design new policies. For this project, LEAP is only used to measure the
current CO2 emissions from the conventional vehicles. The first objective was
to calculate the evolution of CO2 emissions along years after the
implementation of EVs. However, it has been impossible to replace all the
written-off vehicles by the exact numbers of new ones every year. Hence, the
number of vehicles does not remain constant whereas it is supposed to be the
case.
Another idea at the beginning was to use LEAP to study the impacts of the
implementation of EVs on the import/export of Samsø. However, it was not
possible to figure out how to make this study without using an hourly model
including the wind distribution as well as the electricity production per hour.
Then it has been decided to use Excel for this analysis.

20
3. Technical Feasibility
The introduction of Plug-in Electric Vehicles (PEVs) in Samsø is considered to reduce
the CO2 emission using the excess electricity, generated by the wind turbines. In the
first part, the different technologies of PEVs currently existing are developed. The
analysis will establish which one of these technologies is the most suitable for the
Samsø project, regarding technical characteristics as the driving range or the battery
capacity. Then, Vehicles-to-Grid (V2Gs), which are able to send the power back to
the grid will also be introduced and an import-export electricity analysis will be
developed, to assess the impacts of the introduction of BEVs in the system.
3.1. Plug-in Electric Vehicles
PEVs are defined as vehicles that use an electric motor which is powered by an
external source of electricity (California 2010). As presented in Figure 7, PEVs are
usually divided into three different categories: Battery Electric Vehicles (BEVs), Plug-
in Hybrid Electric Vehicles (PHEVs) and Range extended Electric Vehicles (ReEVs)
(Sisternes 2010). BEVs are vehicles that utilize only an electric battery to run the
motor. PHEVs are intermediates between BEVs and conventional hybrid vehicles. As
conventional hybrid vehicles, PHEVs utilize two motors, an internal combustion
engine (ICE) similar to the engine of conventional vehicles that runs on diesel or
gasoline and an electric motor using an electric battery. The difference between
PHEVs and conventional hybrid cars is that PHEVs have a plug to connect to the
electric grid. Hence the battery in PHEVs is bigger than the battery used for
conventional hybrid vehicles and can run the motor by itself, without using the ICE.
That way, the power consumption is noticeably less than conventional or hybrid cars.
The reason is the electric motor that increases the efficiency of the ICE and which
covers the peaks of power needed during the accelerations (Going electric 2011).
Finally, ReEVs are very close to PHEVs, in the way that they also have both an ICE
and an electric motor (Going electric 2011). ReEVs can be seen as an improvement
of the PHEVs, because when the battery is almost discharged (30 per cent for the
Chevrolet Volt), the small ICE (1.4L for the same model) is used to charge the
battery (Chevrolet 2011). When the ICE is empty, the battery can also be charged by
plug-in it, which is supposed to take only three hours for ReEVs (Chevrolet 2011).

21
Figure 7: Plug-in Electric Vehicles classification (Sisternes 2010)
In the following part, only the BEVs and PHEVs will be described. This is due to the
current development of ReEVs, which first example in Europe, the Opel Ampera, will
be commercialized only at the end of 2011 (Opel 2011). As the project is based on
current technologies whose implementation could possibly start soon, only BEVs and
PHEVs have been selected.
3.2. Description of the PEVs technologies
3.2.1. BEV
First, when the BEV is charging, the
electricity supplied by the grid goes
through the transformer and the
converter AC/DC where the voltage is
reduced from 220V AC and fed to the
battery. Second, turning to Figure 8, it
is shown that the power from the
batteries goes through the electric
motor, ultimately powering the wheels
for movement. Kinetic energy is
produced during braking, which is then
converted to electric energy and stored
in the batteries. This process is known
as the regenerative braking (Mazziotta
motors u.d.).
Figure 8: BEV concept (Burbank 2011)
Plug-in Electric Vehicles (PEVs)
Battery Electric
Vehicles (BEVs)
Plug-in Hybrid
Electric Vehicles (PHEV)
Range Extended
Electric Vehicles (ReEVs)

22
3.2.2. PHEV
PHEVs have an ICE and an electric
battery which runs an electric motor.
The size of the PHEV‟s battery is usually approximately the same as for
a BEV, because the battery needs to
be able to run the motor by itself.
Once the battery is empty, the ICE
starts to operate. This is the main
advantage of the technology as the
driving distance is no longer an issue
and people do not have to be afraid of
finding a place to charge their vehicle
while they are on a long journey. The
electric system is very close to the one
found in BEVs. The ICE is fuelled by
the gasoline tank and is linked to the
wheels to make them turn. The
regenerative braking still charges the
battery when only the ICE is
functioning.
Figure 9: PHEV diagram (Burbank 2011)
3.2.3. State of charge and driving range
In order to compare BEV and PHEV, the State Of Charge (SOC) has to be introduced.
The SOC is the measured energy content in the battery of BEVs and PHEVs. The SOC
changes over the time while the vehicle is running. The SOC varies differently
according to the vehicles, due to their different possibilities in charging modes. The
PHEVs are advantageous due to the ability of operating on different charging modes
that enables one to switch to any of them while driving. The PHEV can use energy
stored in the battery until the minimum energy is attained. This mode is called the
Charge-Depleting operating mode (CD). This mode displays a similar method of how
BEVs operate. Then, in the case of PHEVs the ICE is turned on. Moreover, the SOC
could either increase or decrease during driving and this charge are normally at
equilibrium. This is known as charge sustaining mode (CS) whereby the SOC could
be recharged through regenerative braking or the ICE.

23
Figure 10: Battery SOC according to the charge modes (JRC Technical notes 2009)
According to Figure 10 above, the SOC shows that the BEV (red curve) undergoes
the CD mode while running until the maximum distance is acquired. The battery will
therefore have to be re-charged or swapped with a fully charged one once it is
completely discharged. The PHEVs are able to travel up to a certain distance on the
CD mode and once the battery reaches its minimum discharge level, it switches to
the CS mode whereby the battery‟s SOC will be maintained at the same level.
The driving range for BEV is between 90 km for the Citroen C1 (Autoflotte 2011) and
160 km for the Nissan Leaf (Nissan 2011). For PHEV, the driving range depends on
which mode is used. In CD mode, the driving range, using only the electric motor, is
around only 40 km (JRC Technical notes 2009) while it is between 900 and 1,200 km
in CS mode (Ministry of Energy 2009), but the CS mode is not emission free.
3.2.4. Comparison between BEV and PHEV
Table 2: Characteristics between BEV and PHEV (Ahmad Pesaran 2007) (Ministry of Energy 2009) (JRC Technical notes 2009)
BEV PHEV
Driving range with a full tank [km] Limited, between 80 and 150 km Around 40 km + range of the ICE in
CD mode
900-1,200 km in CS mode (Ministry
of Energy 2009)
CD mode Yes Yes
CS mode No Yes
Suits urban driving Yes (because the electric motor is
turned off when the car is stopped)
Yes
Infrastructure required (charging
spots and EVs repairers)
Large Large
Battery capacity 20-40 kWh (Ahmad Pesaran 2007) 6-12 kWh (Ahmad Pesaran 2007)

24
As shown on Table 2, the main differences between BEV and PHEV are the driving
range and the battery capacity. As previously mentioned, the battery of PHEVs allows
extending significantly the driving range of the car; the consumption is around 3.9 L
per 100 kilometres with a Toyota Prius (Ministry of Energy 2009). This is very
suitable for long journeys. However, it is noticeable that the battery capacity is
smaller, thus the driving range using the electric motor in CD mode is around 40 km,
whereas it can reach 150 km for BEVs. The daily distance of a vehicle is usually
around 50 km in Denmark (Statistic Denmark 2011). Hence, the driving range of
PHEVs is not big enough to use the car only with electric motor. In case of the ICE
motor has to be turned on, the technology is not considered as non-polluting
anymore. Using PHEVs, the use of excess electricity is low, thus the first requirement
of the transition towards sustainable transportation is not achieved. Considering
these facts, there is no real potential for PHEVs in Samsø. Therefore, the rest of the
analysis will focus on the BEV model. From that point of the report, all the terms EV
are related to BEV.
3.3. Electric Vehicle connected to Grid (V2G)
In this part there is a comparison between normal use of EV and V2G use, in order to
identify the battery lifetime. V2G can communicate with the power grid to either
charge their batteries or deliver power, depending on the electricity demand (PG&E
2007). V2Gs are EVs (or PHEVs) which are able to send the power back to the grid if
and when needed. V2G can obviously be a technology which can have a great
interest associated with fluctuating renewable energy production as for example wind
power, because they allow better stabilization of the grid and prevention of power
shortages. V2Gs are considered by the experts as a key point to both introduce
environmental friendly vehicles by decreasing the fossil fuel use and expending the
renewable energy share in the close future. Notably, a project is being conducted in
Silicon Valley, USA (PG&E 2007), and another one in the island of Bornholm,
Denmark (Enviro 2009). However, the implementation of such a system also
possesses some disadvantages, especially regarding the battery lifespan compared to
the normal use of EVs, as it will be analysed later.
3.4. Advantages and disadvantages of V2G with a focus on Samsø
There are around 1,550 private cars in Samsø (Statistic Denmark 2011). As seen
previously, the production of electricity is supplied almost entirely by wind turbines.
There is no power production when the wind does not blow. In that particular case,
the energy system imports electricity from the mainland. The utilisation of V2Gs
could help cutting down this import of electricity. Moreover, V2Gs are suited for
ancillary services such as stabilizing the grid by keeping the frequency and voltage at
a constant level (Nemry 2009). The V2Gs are used as a quick source of power, ready

25
in 2-3 minutes to cover the changes in frequency and voltage due to frequent
changes in fluctuating renewable energy power production. This service has to be
guaranteed 24 hours per day and 7 days per week (Nemry 2009). This can be
fulfilled by the V2G technology when it is assumed that at least 70 per cent of the
car fleet is always parked in Denmark (Lund and Kempton 2008). Hence, due to the
small amount of power required, V2Gs could cover the demand, when there is lack of
wind electricity production in Samsø as mentioned before.
However, the implementation of V2Gs to cover the electricity demand is currently
limited by the storage capacity of the vehicles, as seen in Table 2, which is very small
compared to the required capacity for the grid. As a matter of fact, the everyday
average electricity consumption is 77 MWh (Tambjerg 2009). It is also limited by the
capacity of the electric cables connecting the vehicle to the grid (Kempton and Tomic
2005). For instance, if four hours are needed to charge an EV‟s battery, it takes the same time to discharge the power back to the grid. Hence, the V2Gs can respond
quickly but not quantitatively to the demand. It can be only considered as a small
back-up power source. In addition, the Dutch company SP Innovation, specialized
commercializing new clean technologies as EVs and V2Gs, made a report in 2008
stipulating that the bidirectional efficiency is between 45 and 85 per cent
(Spinnovation 2008). This bidirectional efficiency is defined as the amount of power
sent back to the grid, regarding the power send in the first place to the vehicle. This
efficiency depends on the battery type and on the percentage of capacity at which
the cycle charge/discharge occurs. Considering that losses in the grid cables are
usually around 7 per cent (U.S Energy information 2009), it can be assumed that the
losses can be higher in a V2G scheme than in an import/export scheme. To
implement such a system, state-of-the-art control and communication devices are
required to enable the grid operator determining in real time the power capacity
available in the grid, making it possible to request power from the vehicles when
needed. The management of electricity fed or consumed by the V2Gs can be
performed by using a remote controlled device.
One of the main disadvantages of V2G, which has been discussed quickly before, is
the impact that can occur to the batteries. As a matter of fact, the V2G system
implies more charges and discharges and so the battery lifespan will be shorter than
for a normally utilized EV‟s battery. It has been tried to make an assessment of the
difference of the lifespan of the battery for EVs and V2Gs. A brief summarize of the
batteries which can be used in EVs and especially the lithium-ion, can be found
below.

26
3.4.1. Battery l ifespan of V2G and EV
The V2G technology makes sense only if the amount of vehicles parked at the same
time is significant enough to make a difference. As a matter of fact, if only a few
vehicles are able to give power back to the grid, the individual amount of full
charges/discharges of their battery will be very high, which will have an impact on
the lifespan of the battery (Spinnovation 2008). The less V2Gs connected to the grid,
the higher is the probability to have empty batteries, which can be a problem when
people want to drive. If the owners of the vehicles refuse to have their batteries
emptied, then electricity deficit has to be imported, thus the system is non-effective.
The cycle life for EV‟s battery is defined as the number of charges and discharges
THE LITHIUM-ION BATTERY
Today, the lithium-ion (Li-ion) battery is the most used by the EV manufacturers because they are the most competitive, compared to batteries used in previous models, the nickel-metal-hydride (NiMH) and the nickel-cadmium (NiCD). Figure 11 below shows a brief summary of the battery evolution over the years. NiCD and NiMH batteries have been developed almost completely to their potential maturity level. Further improvements and cost reductions cannot be achieved (JRC Technical notes 2009). It is also shown that the maximum possible energy density of NiCD batteries acquired is 200 Wh/L while the NiMH‟s maximum gain was 350 Wh/L which was the last assessed in the period of 2003. Unlike them, the maximum potential for Li-ion battery has not yet been exploited and this gives it room for further future developments (JRC Technical notes 2009). As it can be seen on Figure 11, significant energy densities have been achieved ranging from 350 Wh/L to 620 Wh/L, which makes it the most suitable for PHEV, BEV and V2G applications. The Li-ion batteries have not yet reached the maturity stage and continue to be developed up to date.
Figure 11: Evolution of battery energy densities (JRC Technical notes 2009)
27
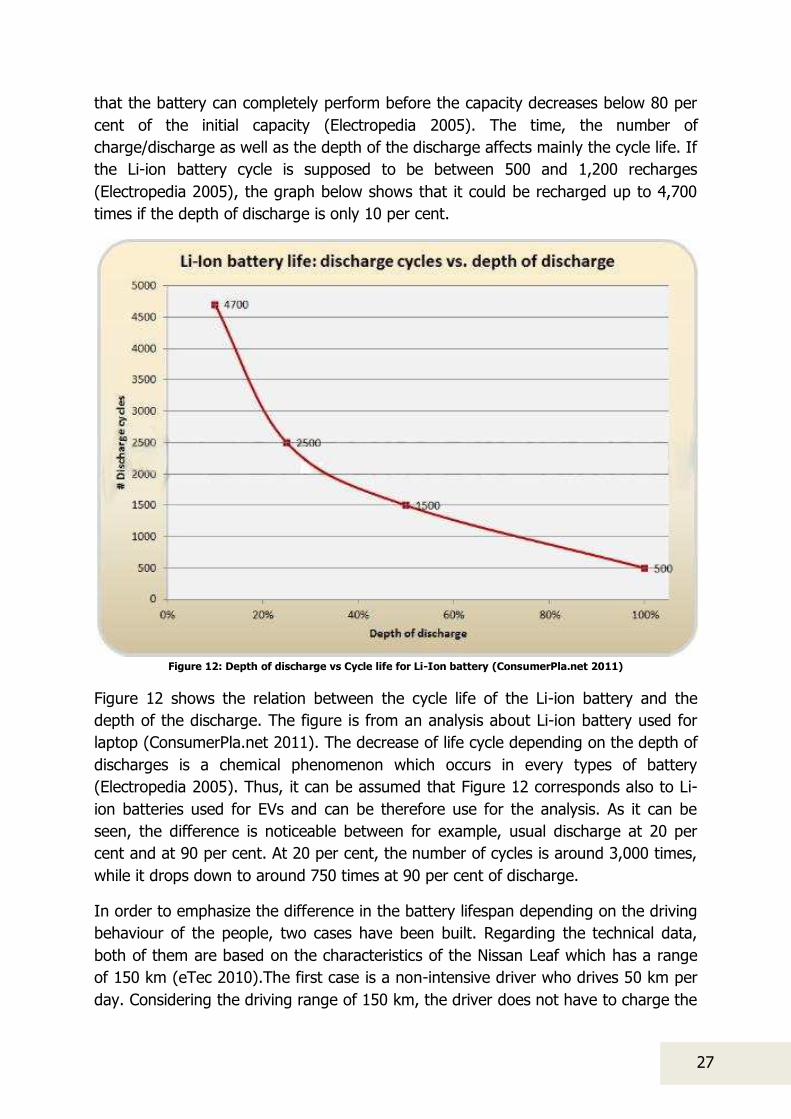
that the battery can completely perform before the capacity decreases below 80 per
cent of the initial capacity (Electropedia 2005). The time, the number of
charge/discharge as well as the depth of the discharge affects mainly the cycle life. If
the Li-ion battery cycle is supposed to be between 500 and 1,200 recharges
(Electropedia 2005), the graph below shows that it could be recharged up to 4,700
times if the depth of discharge is only 10 per cent.
Figure 12: Depth of discharge vs Cycle life for Li-Ion battery (ConsumerPla.net 2011)
Figure 12 shows the relation between the cycle life of the Li-ion battery and the
depth of the discharge. The figure is from an analysis about Li-ion battery used for
laptop (ConsumerPla.net 2011). The decrease of life cycle depending on the depth of
discharges is a chemical phenomenon which occurs in every types of battery
(Electropedia 2005). Thus, it can be assumed that Figure 12 corresponds also to Li-
ion batteries used for EVs and can be therefore use for the analysis. As it can be
seen, the difference is noticeable between for example, usual discharge at 20 per
cent and at 90 per cent. At 20 per cent, the number of cycles is around 3,000 times,
while it drops down to around 750 times at 90 per cent of discharge.
In order to emphasize the difference in the battery lifespan depending on the driving
behaviour of the people, two cases have been built. Regarding the technical data,
both of them are based on the characteristics of the Nissan Leaf which has a range
of 150 km (eTec 2010).The first case is a non-intensive driver who drives 50 km per
day. Considering the driving range of 150 km, the driver does not have to charge the

28
car during the day, but do it every night. It means that the number of charges per
day is one, and the depth of discharge is 33 per cent. Looking at Figure 12, it
corresponds at 1,900 numbers of charges. With the one charge per day, it means
that the battery will last for 1,900 days, or slightly more than 5 years. In the second
case, the intensive driver drives 200 km per day, 100 km in the morning to go to
work, and 100 km in the evening to return home. Hence, the battery has to be
charged during the day and the night, and the discharge corresponds to 66 per cent
of the initial capacity each time. Again looking at Figure 12, the number of charges
will be 1,200. Adding the fact that the battery has to be charged twice a day, the
battery would last only slightly more than 1 year and a half. There is a factor 3.25
concerning the lifespan of the battery between the two cases.
Table 3: Comparison of battery lifespan depending on the driving daily routine
Non-intensive driver Intensive driver
Driving daily routine [km/day] 50 200
Number of charges needed
[number/day]
1 2
Numbers of charges available 1,900 1,200
Battery lifespan [yr.] 5.2 1.6
Now that the impact of the number of charges and the depth in the battery lifespan
has been highlighted, the comparison analysis between V2G and EV using Li-ion
batteries can be done. The V2Gs are expected to cover the ancillary services which
have been assumed to use 5 per cent of the battery every day. The V2Gs are also
expected to cover the demand when the wind does not blow in Samsø, which
corresponds to 80 days per year. This is an assumption extract from a report made
with the software EnergyPlan on Samsø for an earlier project (Chapter 2). The depth
of discharge used to cover the demand changes significantly depending on the
number of vehicles and the demand. It has been considered that 60 per cent of the
battery is discharged to cover the demand. It corresponds to a total discharge of the
battery when the daily routine is between 50 and 60 km per day and when the wind
does not blow. The analysis has been made for daily routine between 10 and 60 km
per day. The inputs of the analysis are summarized in Table 4.
Table 4: Main assumptions and inputs used for the calculation of EV and V2G battery lifespan
Daily driving routine [km/day] From 10 to 60
Depth of discharges from driving [% of the battery] From 6 to 40
Depth of discharges from ancillary services [% of the battery] 5
Depth of discharges from covering demand [% of the battery] 60
For instance, with a daily routine of 50 km, the discharge of the battery is equal to
33 per cent. As the wind blows 285 days per year, 38 per cent of the battery, 5 from
the ancillary services and 33 from the daily routine, is discharged during this period
in two different discharges. During the other 80 days, 98 per cent of the battery is
discharged, 5 from the ancillary services, 33 from the daily routine and the 60 to
cover the demand, in three times per day. In that case, using the calculation as for

29
the previous cases for EV, the lifespan will reach almost 3 years. The difference in
the battery lifespan between EV and V2G whose owner drives 50 km every day
would be therefore slightly more than two years, which corresponds to a factor 1.8.
This result highlights well the shorter lifespan for V2Gs‟ batteries compared to EVs‟.
The same calculation has been made for different amount of kilometres driven per
day, for the three different cases: EVs, V2Gs including ancillary services and V2Gs
including ancillary services and covering demand. To conduct this analysis, an Excel
spread sheet has been used. For the different cases associated to different depths of
discharge in percentage (from 6 to 40 for the daily routine, 5 for ancillary services,
60 for the covering demand), the related number of charges has been calculated as
well as the number of days. Finally, the different number of days has been summed
up with a coefficient factor depending on the frequency of them in a year (80 days
corresponds to 21.9 per cent of the year). The results are shown in Figure 13.
Figure 13: Battery lifespan comparison for EVs and V2Gs
Figure 13 emphasizes the longer lifespan of EVs‟ batteries compared to V2Gs‟. The difference between the lifespan of the three cases decreases when the number of
kilometres driven increases, but the difference factor between the blue and purple
curves remains superior to 1.8. There are just a few months difference between the
V2Gs used only for ancillary services and the V2Gs used for both ancillary services
and covering demand. This is mainly due to the fact that the wind blows around 80
per cent of the time in Samsø, whereas the ancillary services are requested every
day.
0
2
4
6
8
10
12
14
10 20 30 40 50 60
Ba
tte
ry li
fesp
an
[y
r.]
Distance per day [km/day]
Evs
V2Gs ancillary services
V2Gs anc + demand covering

30
This mode of calculation raises an issue if the daily routine is more than 60 km. In
that case, the system will have to import electricity or take more than 60 per cent
from other vehicles, if possible. For example, if the daily routine of the other vehicles
is 30 km per day, only 20 per cent of the charge is used and thus 75 per cent can be
used for covering the demand. In the next paragraph, an electricity import-export
analysis is made to assess the impact of the different driving patterns during the day
on the electricity exchange scheme.
3.5. Electricity import-export analysis
As seen in the description of the technologies, EVs and V2Gs are very similar. The
main difference is the storage of electricity that can be used to lower the import from
the mainland. From the perspective of the electricity demand, the integration of EVs
in Samsø‟s network can have some consequences on the import/export balance.
The difference of consumption between EVs and home appliances can be large, for
instance a refrigerator label A+ consumes in average 0.55 kWh per day (Topten
2006) whereas a vehicle driven during 50 km per day consumes around 8 kWh per
day. In comparison to the average electricity consumption of household, which is
around 10.9 kWh per day in Denmark (WorldEnergy.org 2008), the addition of the
EV consumption represents an increase of 172 per cent.
In this part, a quick overview of the system impact of a replacement of the
conventional vehicle fleet with EVs, which corresponds to 1,554 vehicles (Statistic
Denmark 2011), is developed. Two scenarios of charging management, basic and
smart, are modelled. This will allow seeing how the system reacts with a focus on
import/export.
Basic scenario: this mode considers that EVs are always charged as much as
possible, no matter if there is an excess electricity or not. It can be considered as the
worst-case scenario; there is no control in the manner of charging vehicles and the
peak of demand may coincide with the charging time. The pseudo code is presented
below:

31
Smart scenario: this mode avoids charging vehicles when there is electricity import
from the mainland, if it is not absolutely required. When both charging for vehicles
and importing electricity from the mainland are required, the system will allow the
vehicles to charge during off-peak demand periods. The pseudo code is presented
below:
The study has been conducted for a timeframe of one year using Excel on an hourly
basis. The export/import of Samsø has been calculated by using the same
Energyplan project described in chapter 2 and then implemented to Excel. The
analysis is based on a scenario where all the vehicles have been replaced by EVs
with a 24 kWh battery and a range of 150 km which corresponds to the
characteristics of the Nissan Leaf (Nissan 2011). The driving pattern guide has been
inspired from a report about the integration of EV in Denmark (Wu, et al. 2010) and
has been slightly modified, presented in Table 5. This table also shows the average
percentage of vehicles connected to the grid and the average percentage of vehicles
on the road every hour. It has been assumed that there are 20 per cent of vehicles
which are parked but not connected to the grid. For instance at 6 a.m., five per cent
of the vehicles are on the road, it means that during an hour five per cent of the
vehicles are doing around 50 km. Then the energy consumption for the entire vehicle
fleet can be deduced. In this case:
Energy consumed:
Maximum capacity of the batteries:
32
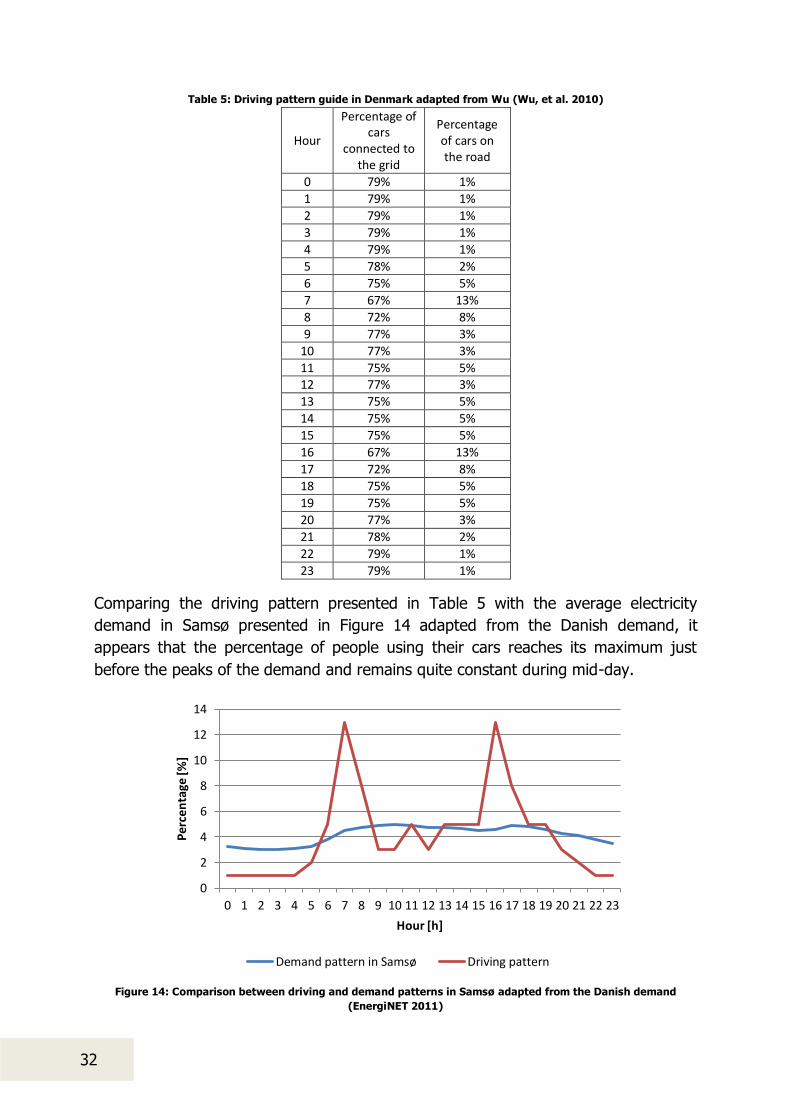
Table 5: Driving pattern guide in Denmark adapted from Wu (Wu, et al. 2010)
Hour
Percentage of
cars
connected to
the grid
Percentage
of cars on
the road
0 79% 1%
1 79% 1%
2 79% 1%
3 79% 1%
4 79% 1%
5 78% 2%
6 75% 5%
7 67% 13%
8 72% 8%
9 77% 3%
10 77% 3%
11 75% 5%
12 77% 3%
13 75% 5%
14 75% 5%
15 75% 5%
16 67% 13%
17 72% 8%
18 75% 5%
19 75% 5%
20 77% 3%
21 78% 2%
22 79% 1%
23 79% 1%
Comparing the driving pattern presented in Table 5 with the average electricity
demand in Samsø presented in Figure 14 adapted from the Danish demand, it
appears that the percentage of people using their cars reaches its maximum just
before the peaks of the demand and remains quite constant during mid-day.
Figure 14: Comparison between driving and demand patterns in Samsø adapted from the Danish demand
(EnergiNET 2011)
0
2
4
6
8
10
12
14
0 1 2 3 4 5 6 7 8 9 10 11 12 13 14 15 16 17 18 19 20 21 22 23
Pe
rce
nta
ge
[%
]
Hour [h]
Demand pattern in Samsø Driving pattern

33
The result of this analysis shows the difference in export/import in relation to
managing ways of the daily charge of EVs. Table 6 shows the total import and export
for one year for the two scenarios presented before and the reference one. The
reference scenario corresponds to the current situation, which means without EVs.
Replacing the entire conventional car fleet by EVs represents an increase of the
electricity demand by more than 4,600 MWh per year. However, comparing to the
reference scenario, the difference in the import can vary from almost nothing for the
smart scenario to 1,100 MWh for the basic scenario. It represents an increase of 127
per cent for the basic scenario whereas the increase is only 102 per cent for the
smart scenario.
Table 6: Comparison of the different scenarios
Reference Basic Smart
Import [MWh] 4,203 5,320 4,280
Export [MWh] 85,203 81,712 80,672
Balance [MWh] 81,000 76,392 76,391
More precisely in Figure 15, the difference due to energy management can be
noticed. When import is required, the charging is limited for the smart scenario and
occurs only during the off-peak hours of the demand. On the contrary, there is no
control of the charging in the basic scenario. The result is a higher import share for
the basic scenario than for the smart as seen in Table 6.
Figure 15: Hourly comparison of the two scenarios
In conclusion, in spite of the lack of precision of the driving pattern, it can be
deduced that a replacement of the conventional car fleet by EVs can be done. It will
decrease the export and will not have significant impacts on the import. In fact, even
if the electricity demand will increase by around 4,600 MWh, then a smart charging
-6,00
-4,00
-2,00
0,00
2,00
4,00
6,00
8,00
10,00
12,00
14,00
11 15 19 23 3 7 11 15 19 23 3 7 11 15 19 23 3 7 11 15 19 23 3 7 11 15 19 23 3 7 11 15 19 23
En
erg
y [
MW
h]
Hours [h]
Charging demand with basic EVs Charging demand with smart EVs Export/import without EVs

34
control can prevent the import from rising. The import can vary a lot depending the
charging way as it has been developed previously.
It has been seen that EVs are technically more suitable for Samsø. In order to get an
insight of the viability of the EVs, the next chapter will compare the costs of
purchasing and using electric and conventional vehicles.

35
4. Costs comparison of electric and conventional vehicles
From the Chapter 3, it has been deduced that V2Gs have a shorter battery lifespan
than EVs. Considering the current cost of batteries and the few impacts they can
have on the import/export, it has been decided not to consider this technology later
on in this report. In the same way, PHEVs will also not be considered because of
their high costs due to high taxes and the technical facts previously developed which
do not perfectly fit to the objective of Samsø: use excess electricity and be
independent as much as possible from fossil fuel.
About taxes, in Denmark there are several that consumers have to pay especially,
when they want to purchase a new vehicle. These taxes are registration tax, vehicle
excise duty or green owner tax and the countervailing charges. The registration tax
is the major tax applied when someone buys a new vehicle. This tax is usually
between 105 and 180 per cent of the original purchase cost. This is paid once when
the vehicle is purchased and never again meaning that a second handed vehicle does
not have this kind of tax. In Denmark, more than 70 per cent of the government‟s income, generated from car taxes, is coming from the registration tax (SKAT DK
2011). This particular tax results to making the total price of a vehicle purchased in
Denmark two or even three times more than the price of the same vehicle purchased
in another European country. Vehicle excise duty or green owner tax is often
referred as the consumption tax of the vehicles. This is a tax paid annually focusing
on the environmental aspect and how much polluting a car is. It is usually between
160 and 6480 DKK per year, the prices vary a lot according to the type of the vehicle
(SKAT DK 2011). Countervailing charges is a tax the owners of diesel vehicles have
to pay. It is a way to create equal prices between diesel and gasoline fuelled vehicles
for the same amount of distance travelled. For instance if the gasoline tax is
increased then this countervailing charge tax for the diesel is increased in order to
keep the same proportion of prices between the two different types of fuel.
These taxes explain the high cost of vehicle purchasing in Denmark. However, some
incentives exist. More precisely, the current policy regarding the EVs includes only
the insurance payment which as expected is for all the vehicles and could not be
excluded in any means. The most important incentive is the exclusion from the
registration taxation which will take effect until 2012, but the plan is to extend this
period until 2015 (Denmark.dk 2010). Last but not least, it appears that all these
exemptions can reduce a total cost of a BEV almost by 60 per cent compared to a
similar regular vehicle with a combustion engine, something that it should be
mentioned that is unique among the other European countries. Finally, it should be
noticed that PHEVs are not incentivised in Denmark, thus their cost is much higher
than a BEV and for this reason they are not considered in this report.

36
Through this analysis, a cost comparison between electric and conventional vehicles
is conducted in order to show the possibilities regarding the implementation of EVs
from an economic point of view. The analysis gives a point of comparison between
each technology considering their economic costs including the taxes. The two
scenarios, presented in Figure 16, will be detailed later in this part.
Figure 16: Presentation of the two scenarios
The economic analysis is mostly based on facts concerning the Danish market. For
the two cases, it has been considered that the expected lifespan of a car is 13 years
and runs for 20,000 km per year (Statistic Denmark 2011). The 20,000 km number
has been chosen arbitrarily for the analysis. Moreover, the number of kilometres is
related to the driving habits and the type of ownership, which will be developed later
in chapter 5, hence it does not need to be perfectly accurate in order to conduct a
cost comparison. However, the result for different driving range is also provided at
the end of this part. The fuel prices (diesel, gasoline and electricity) have been
extracted from the European Union‟s energy portal (EU member states 2011) and are
considered to be constant. A quotation for the insurance has been done for an
electric vehicle by a Danish insurance company (Tryg.dk 2011). The estimated cost is
12,000 DKK per year, for a young driver without experience. This cost is used for the
two scenarios and in order to minimize the impact of the insurance cost, vehicles of
the same category have been preferred. Concerning the maintenance costs, it has
been difficult to assess a relevant number due to the growing and the large scale
development of the technology. For this reason, a worst case scenario for EVs has
been chosen; similar maintenance costs between electric and conventional vehicles.
It is a worst case scenario because most of the new documentation about EVs
forecast a lower maintenance costs (ChoosEV 2011) due to the absence of
mechanical parts in EVs. The discount rate represents the lending interest rate

37
corrected with the inflation for this project (Trading Economics s.d.). The result has
been extracted from a bar chart presenting the real interest rate, it is equal to 4.5
per cent and this is the value which is used for all the cost calculation in this project.
The main objective of this analysis is to calculate the cost per kilometre in order to
have a point of comparison regardless the technology used. The method was used to
calculate the cost per kilometre as follows. Firstly, the net present value (NPV) is
calculated from the depreciation cost, the loan interest, the insurance, the
maintenance and repair costs and the cost of the fuel. Then the number obtained is
divided by the number of kilometres during the life of the vehicle because it is
considered to be kept during its entire lifetime (Excite s.d.).
Specific characteristics of each scenario and chosen vehicles are described in the
following sub-parts.
4.1.1. Scenario 1 – EV
In this scenario, the few numbers of EVs available on the Danish market made the
choice of the Nissan Leaf evident. In fact, the Nissan Leaf represents one of the most
advanced EVs; it is part of the new wave of EVs including a mature technology as
well as an attractive price which allows the comparison with conventional vehicle.
The Nissan Leaf has a 24 kWh battery for a range of 150 km and a price of 244,651
DKK (32,839 €) in the Netherlands without incentives (Nissan 2010). As described in
the chapter 3, the battery lifespan depends on the cycle life. The price for a brand
new battery pack is announced to be around 9,000 $ (Kitamura et Iwatani 2010)
which represents 47,250 DKK. Moreover, Nissan proposes a battery warranty of
160,000 km or 8 years (Green Car Congress 2010), thus these figures have been
considered for the calculation.
For all EVs, a home charging station is required. It is supposed to cost around
2,000 $ in the USA (Nissan 2011), which is around 10,000 DKK. It is in the same
range that the one proposed by Better Place, an electric vehicles company
implemented in Denmark (BetterPlace 2011). The cost will be discussed later on the
implementation part in chapter 6.
4.1.2. Scenario 2 – Conventional scenario
Most of the vehicles sold in Denmark are small ones (De Danske Bilimportører 2010).
However, it has been decided to choose a vehicle in the same category as the Nissan
Leaf in order to have an accurate comparison. The best-selling vehicle of the year
2010 in same category is the Toyota Avensis in Denmark. Two different engines have
been chosen: diesel and gasoline. The characteristics as well as the costs of those

38
two models have been extracted from the official website of Toyota in Denmark
(Toyota 2011).
In Denmark, the share of passenger vehicles is distributed as follow: 25 per cent for
diesel vehicles and 75 per cent for vehicles (Statistic Denmark 2011). The results for
diesel and gasoline vehicles have been combined using this distribution to reach a
unique cost.
4.1.3. Result and Comparison
The data from the two scenarios have been collected and gathered in Table 7. The
results show an important difference of costs between the two scenarios. Unlike the
public opinion about cost of EVs, the scenario 1 is 40 øre cheaper per kilometre than
the scenario 2. The explanations for these results are partly the government
incentives and also the improvements of the batteries‟ capacity and lifespan. It makes the choice of an EV possible and less costly. However, it has to be relativized
by the few current possibilities to charge cars. Swapping battery station and public
charging stations are not yet well developed and can be considered as a hindrance.
Currently, EVs have to be used as a short range vehicle, enough for most of the
people to go to their workplaces and for the daily life but maybe not suitable to go
on holidays for example.
Table 7: Cost comparison between electric and conventional vehicles
Scenario 1 Scenario 2
Manufacturer Nissan Toyota
Model Leaf Avensis 2.0 D-4D
DPF
Avensis 1.6 Valvematic
T1
Cost of the car [DKK], including VAT 244,651 338,385 285,953
Cost after 13 years; depreciation [DKK] 0 0 0
Type of engine electric diesel gasoline
Average use [km/yr.] 20,000 20,000 20,000
Installation of a private charge spot [DKK] 10,000 - -
Battery lifetime [yr.] 8 - -
Battery cost [DKK] 47,250 - -
Battery lease [DKK/month] - - -
Battery capacity [kWh] 24 - -
Range with full battery [km] 150 - -
O&M [DKK/yr.] 12,500 12,500 12,500
Average lifespan [yr.] 13 13 13
Fuel consumption [km/kWh] or [km/l] 6.3 18.5 15.2
Fuel price [DKK/kWh] or [DKK/l] 1.8 11.3 12.5
Insurance [DKK/yr.] 12,000 12,000 12,000
Total cost with interest rate [DKK] 581,934 694,217 682,440
Cost per km with interest rate [DKK/km] 2.24 2.67 2.62
2.64
References: Technical data and costs are extracted from the manufacturer official website: Nissan and
Toyota. The insurance cost is issued from a quotation of the Danish insurance company Tryg (Tryg.dk

39
2011) and the maintenance cost is from a cost comparison done by the company Better Place
between EVs and a Diesel vehicle (Better place 2010).
In addition, Figure 17 shows that the number of kilometres driven per year has no
influence on the result order. The scenario 1 remains the cheapest regardless the
number of kilometres. Between 5,000 and 20,000 km, the scenario 1 is more than 40
øre cheaper per kilometre than the scenario 2. After that, there is a decrease of the
gap due to battery cost, between 20,000 and 40,000 km the gap is around 15 øre
per kilometre. It can also be important to notice that the interest rate has influence
on the final cost but the sorting remains the same and the gap tends to increase.
Figure 17: Evolution of the cost of the two scenarios according to the number of kilometres per year
As seen in Figure 18, the cost per kilometre is highly influenced by the fluctuation of
fuel prices for the diesel and gasoline vehicles. In contrary, the electricity price is
supposed to stay more constant during the next decades than the oil prices.
Figure 18: Evolution of the cost per kilometre according to the fuel prices including the results from Table 7
0,001,002,003,004,005,006,007,008,009,00
10,00
5000 10 000 15 000 20 000 30 000 40 000
Co
sts
[DK
K/k
m]
Number for kilometres [km/yr.]
Scenario 1 (EV) Scenario 2 (Conventional)
0,00
0,50
1,00
1,50
2,00
2,50
3,00
3,50
0 5 10 15 20 25Co
st p
er
kil
om
etr
e [
DK
K/k
m]
Fuel price [DKK]
Diesel Gasoline Scenario 1 Scenario 2 (Diesel) Scenario 2 (Gasoline)

40
5. Socio-economic analysis on ownership models for EVs regarding
local requirements
This chapter deals with the different ownership models existing and then continue
with their cost comparison. In the second part of the analysis, the possibility of
realization in Samsø is shortly analysed describing and considering the feedback
from the local experts and inhabitants. In Samsø‟s case, the people‟s own impressions and approach are crucial for the implementation of the EVs, therefore in
the final decision their opinion will play a huge role.
5.1. Ownership options for electric vehicles
Choosing the right ownership model can help to reduce the purchase costs, ensure
the most convenient solution for the consumers and thus facilitate the
implementation. The different ownership models existing are:
Private ownership
Mixed: battery leasing and individual vehicle ownership
Leasing
Renting
Taxi
Car sharing
The above mentioned options will be discussed in detail in the following, excluding
renting and taxi which are only occasional solutions. The aim of the analysis is to
identify the main advantages and disadvantages of the different ownership models
to find the way to use them later in chapter 6 about implementation. The intention is
to introduce EVs to Samsø as a suitable method for daily use, thus in this analysis
practical usage and convenience should be considered as well as financial issues.
5.1.1. Private ownership
The classical, individual ownership is the general method of using a vehicle. This is
the most convenient and known form of ownership; they can be important factors in
the decision making, considering that one third of the population is more than 60
years old in Samsø (Statistic Denmark 2011). As explained in Chapter 4, the total
cost of an EV is lower than a conventional vehicle in Denmark. However, people
could be reluctant from buying an EV because of the lack of trust in this relatively
unknown technology.

41
5.1.2. Mixed ownership
The mixed ownership is when the vehicle itself is privately owned and the battery is
leased. Hence, this model resembles the same convenience as the private ownership
solution. As an advantage, the battery cost can be reduced through leasing, which
requires a smaller initial investment from the people compared to the private
ownership. Further benefits can be provided by the battery leasing operator. In the
case of the project Better Place established in 2007 in California which is developing
its first projects in Denmark and Israel, some services are proposed. It offers the
possibility to swap the battery of a vehicle in three minutes with a fully-charged.
Moreover, intelligent in-car and network software, which help the driver dealing with
the current battery power and planning the next charge, are also proposed
(BetterPlace 2011).
5.1.3. Leasing
By leasing an EV, owners can maintain the convenience of private ownership, while
investing in a smaller amount of money initially. Leasing can be seen roughly as a
long term rent, where the consumer pays monthly or yearly for using the vehicle.
There are different advantages related to this solution, so more and more people
choose leasing against purchasing nowadays. In Denmark, leasing private vehicles
has also become very popular since 2007, with huge increase of 61 per cent in 2009,
thus in 2010 approximately one tenth of the vehicles are sold on a leasing contract
(EzineMark.com 2010).
The reason for this trend can be the several advantages of leasing, as for instance
that people do not have to consider the future value of the vehicle, because they do
not sell it in the end. Hence, it is much easier to change car models, which can be
useful in the case of EVs; people can change them after the end of the contract,
when a technically better or cheaper model arrives on the market. Furthermore,
leasing in Denmark can be cheaper than purchasing a vehicle, depending on the
vehicle category and the annual distance covered. Hence, usually 12,000 or 15,000
km per year is contracted with the companies and extra costs have to be paid if this
limit is crossed (Rathje 2010).
5.1.4. Car sharing
Car sharing is a concept of personal transportation which is getting more and more
popular in the cities of Europe and USA in the last few years. There are different
models of car sharing, but the main principle is that individuals have access to a
fleet of vehicles after joining a profit or non-profit oriented organisation. In 2006,
there were almost 350,000 participants sharing 11,700 vehicles in the World, more
than half of them in Europe, mainly in Switzerland and Germany (Shaheen and

42
Cohen 2007). In the beginning of 2011, Germany itself had 190,000 participants and
5,000 shared vehicles (Autoflotte 2011). Hence, it seems that theory is working in
practice and people are willing to share vehicles so much that it is expected to have
5.5 million participants in Europe by 2016. One tenth of the shared and one fifth of
the newly shared vehicles are expected to be electric by this time (Frost & Sullivan
2010). The main reasons for its popularity are:
Reducing the total cost of the individual users due to shared costs.
Decreasing the parking spaces needed due to less vehicles used.
Improving air quality and reducing energy consumption due to less driving
(Barth and Shaheen 2002) and possibilities for using electric/hybrid vehicles.
The fixed costs of the private vehicle ownership are replaced by variable costs
(Barth and Shaheen 2002). This encourages other transportation means such
as walking, biking and public transport.
Car Sharing Organizations (CSOs) handle all the expenses and maintain the vehicle
fleet, which usually contain different models such as small vehicles, family vehicles
and light trucks. CSO members can use the vehicles when needed, thus this system
maintains the advantages of a private vehicle while offering a more flexible solution
than the public transportation. The participants book the vehicles via telephone or
online before using them. The service requires an entry fee, a deposit, a monthly
membership fee and costs per kilometre and/or per hour driven, as presented in
Table 8.
Table 8: Usual cost types in a CSO in Denmark for conventional vehicles. The costs are the average of eight Danish CSOs, considering every size of vehicles (Albertslund Delebil 2011) (Århus Delebilklub 2011)
(Bryggebilen 2009) (Hertz Delebilen 2011) (Køge Delebil 2011) (Københavns Delebiler 2011) (Munksøgård Delebilklub n.d.) (Silkeborg Delebilklub 2011).
Name Costs in Denmark
One-off costs Entry fee 2,000-3,000 DKK Deposit 2,000-2,500 DKK
Monthly costs Membership fee 180-440 DKK
Usage charges Per km driven 1,5-8,5 DKK/km (incl. fuel and services)
Per hour driven Various; on average 21 DKK/hour
The different basic models of car sharing systems can be classified as the followings,
according to Barth and Shaheen (2002). These models are all suitable for EVs,
because the vehicles are used for smaller distances and they can be charged at the
certain parking places (lots, stations etc.).

43
A. THE NEIGHBOURHOOD CAR SHARING MODEL
Figure 19: Working method of the neighbourhood model (Barth and Shaheen 2002)
This is the classic model of car sharing, functioning as it can be seen in Figure 19.
Typically, in this system the vehicles are in many, densely placed shared car parking
lots in the important points of a city and at residential areas. After reserving a
vehicle, the member goes to a parking lot (the nearest or with the preferred type of
vehicle), access the vehicle with a card that handles the information about usage
and payment, and drives. Finally, the vehicle will be returned to the exact same
parking lot. This model is usually used when people need to go shopping, recreation,
carry furniture, etc. but rarely to commute (Barth and Shaheen 2002).
Figure 20: Shared-car parking lots in Atlanta (Scott Ehardt, 2007)
B. STATION CARS
The station car model is typically used by commuters, since its original aim was to
help the rail commuters to go to the railway station from their homes and vice versa.
Hence, as it can be seen in Figure 21 the user drives a station car from home to the

44
rail/bust/other transit station. One uses public transport, and then picks a station car
again to drive to work and vice versa. Other users can take the vacant vehicles from
the stations throughout the day to make small trips (Barth and Shaheen 2002). In
Denmark, Better Place and DSB are planning the same pilot project using EVs at
Høje-Taastrup and Skanderborg stations in Copenhagen (Yoney 2009).
Figure 21: Working method of the station model (Barth and Shaheen 2002)
C. MULTI-NODAL SHARED-USE VEHICLES
In this system, the vehicles are placed at different nodes like in Figure 22, and the
users can use the vehicles and after return them in any parking lots. Hence, it is
similar to the city bike system in Aalborg. However, problems can occur with this
extended freedom and flexibility when there are many vehicles in certain stations
and few in others, thus the balance may be compromised and vehicles relocation
needed.
Figure 22: Working method of the multi-nodal model (Barth and Shaheen 2002)

45
5.2. Comparison of current costs of the ownership models
To evaluate which of the above mentioned ownership models can offer a financially
favourable option, the ownership models‟ costs are calculated using current prices in Denmark. In the calculations, the private ownership, the mixed ownership, leasing
and car sharing are compared with different timeframes and with 10,000, 15,000
and 20,000 kilometres driven per year, with an interest rate of 4.5 per cent as
described in chapter 4. For the private vehicles ownership, the calculation method is
the same as in chapter 4.
The mixed ownership model is based on costs from Better Place. One model of EVs
will be available in Denmark during the year 2011; the Renault Fluence Z.E. which is
issued from the partnership between Better Place and Renault/Nissan group. This
car costs 208,680 DKK (Better Place 2010) and has a 22 kWh battery which provides
a maximum range of 185 km (Renault and Better Place 2011). A home charging
facility is required as well as a monthly contract for the battery leasing according to
the number of kilometres per year expected which respectively cost 9995 DKK and
1,495 DKK per month for 10,000 km per year or 1,696 DKK per month for 15,000
km per year (Better Place 2011), as seen in Table 9. The monthly subscription
includes the price of electricity consumed.
Table 9: Indicative price list of Better Place subscriptions (Better Place 2011)
Number of kilometres per year [km] Subscription per month [DKK] Over kilometre cost [DKK] Up to 10,000 1,495 2.24 Up to 15,000 1,695 1.70 Up to 20,000 1,895 1.42 Up to 30,000 2,495 1.25 40,000/unlimited 2,995 -
For leasing, ChoosEV company‟s costs are chosen. ChoosEV is a 16-month-old
company, which has the main share of its charging stations in Copenhagen. They
are planning to install 300 basic and 8 fast charging stations in Denmark in 2011,
focusing on other cities such as Aarhus, Aalborg and Odense (Petersen, About
ChoosEV 2011).
The costs described in Table 10 are related to the lease of a small vehicle from
ChoosEV, such as Citroën C-Zero, Peugeot Ion, and Mitsubishi iMiev (ChoosEV Int.
2011). These leasing prices are based on a subscription period of three years. All the
prices calculated for leasing are assumed to be the prices illustrated in Table 10
even if the leasing price is expected to be lower for a leasing time of more than 3
years. By leasing a car from ChoosEV, the consumer has to pay a monthly leasing
price and also a monthly subscription.

46
Table 10: Leasing costs adopted from ChooseEV leasing company for a 3-year period (Petersen, About ChoosEV 2011)
10000 km/year 15000 km/year
Private price per month 5095 DKK 5495 DKK
Company price per month 4895 DKK 5295 DKK
The monthly leasing price includes all the costs of the maintenance and services, but
it does not include insurance. For this reason insurance cost is assumed to be 12,000
DKK per year, same as in the case of the private car in chapter 4. The monthly
subscription is 479 DKK that includes the charging costs and the home spot facility,
as well as the access to the public charging stations. It should be noticed that a
contract with ChoosEV requires a minimum of two years (Petersen, About ChoosEV
2011).
For car sharing, two CSOs‟ prices were used to the calculations from Danish companies with EVs available to share. Both Move About and Københavns Delebiler
have EVs for sharing in Copenhagen, but the two companies have different payment
methods. It has to be mentioned that probably, the island situation will have impacts
on local CSO prices, thus the following prices are just informative prices.
According to the payment methods, the company Move About seems to be a
combination of a car renting company and a CSO. They have four parking lots in
Copenhagen with EVs. The customers only have to pay a monthly fee of 99 DKK and
a fee according to the duration of the trip, which can be for one hour (99 DKK), half
a day (299 DKK), a whole day (499 DKK) or a whole weekend (799 DKK) (Move
About 2011). No additional costs are required.
Københavns Delebiler has a classic CSO payment method with an entry fee (1,900
DKK), a monthly fee (220 DKK) and a fee per hour (24 DKK) and per kilometre (2.95
DKK) driven for EVs (Københavns Delebiler 2011). Maintenance cost and electricity
price are also included.
While calculating the final costs, the following method is used to make an
assumption for the duration costs. From the yearly total number of kilometres
divided by an average speed of 60 km per hour, a yearly average of total driving
hours was calculated, as illustrated in Table 11. In both cases the hourly fee was
taken into consideration and is multiplied by the total driving hours per year.
Table 11: Annual driving hours according to the annual driving distance
km/year hour/year 10,000 167 15,000 250 20,000 333
In the case of the Move About‟s costs, it gives a quite low final cost in the end due to the large difference between the first two options: 99 DKK for an hour or 299 DKK

47
for half a day. The current needs are probably between these two options in Samsø,
but finally the hourly option was chosen.
Due to the difference of renting/owning period between scenarios, it has been
decided to include the depreciation cost in the calculation to obtain the most
relevant numbers. Hence, an annual depreciation of 20 per cent is applied to the
price tag of the vehicle. In Figure 23 is illustrated the curve obtained for the Nissan
Leaf.
Figure 23: Price of the Nissan Leaf with an annual depreciation of 20 per cent
As presented in Table 12, the costs of the different ownership models, represented
by the calculation of the net present value (NPV), are gathered. The NPV is based on
a 7 years period and 10,000 km driven annually. These costs vary significantly
depending on the number of kilometres per year and the length of the period as
detailed later.
Table 12: NPV of the different ownership models for an annual driving range of 10,000 km and a 7 years period (Nissan 2010) (Better Place 2011) (Petersen, About ChoosEV 2011) (ChoosEV 2011) (Move About 2011)
(Københavns Delebiler 2011)
Private Mixed Leasing Car sharing
Company - Better Place ChoosEV Move About Københavns Delebiler
Purchasing cost for EV [DKK] 244,651 208,680 - - -
Cost after depreciation [DKK] 51,307 43,763 - - -
Entry fee [DKK] - - - - 1900
Monthly fee [DKK/mo.] - 1,495 5,095 99 220
Subscription fee [DKK/mo.] - - 479 - -
Fee per km [DKK/km] - - - - 2.95
Fee per hour [DKK/h] - - - 99 24
Maintenance cost [DKK/yr.] 12,500 12,500 - - -
Insurance cost [DKK/yr.] 12,000 12,000 12,000 - -
Battery cost [DKK] 47,250 - - - -
Home spot cost [DKK] 10,000 10,000 - - -
Electricity price [DKK/kWh] 1.8 - - - -
NPV [DKK] 411,936 425,003 464,863 104,425 214,909
0
50000
100000
150000
200000
250000
300000
0 1 2 3 4 5 6 7 8 9 10 11 12 13
Pri
ce o
f th
e v
eh
icle
[D
KK
]
Period [yr.]
Price of the Nissan Leaf

48
Move About is the less expensive ownership model, regardless the number of
kilometres and the length of the contract. It can be explained by the method used to
calculate the costs based on the number of hours excluding the number of
kilometres. In the following Figure 24, the costs variation between a one hour and a
half day (12 hours) “renting” can be studied. The cost becomes quickly more expensive if the number of using hours increases. For instance, if there is a need to
have a vehicle during half a day for 167 days, the cost becomes significantly more
expensive than in the default model presented in the previous table.
Figure 24: Difference of NPV depending of the calculation period with Move About
A CSO like Move About appears to be adapted for people who need vehicles for a
few hours per week. In the same way, the different ownership models are adapted
to specific behaviour and needs. The cost represents these needs and the model
differences. Figure 25 shows that leasing can be profitable compared to private and
mixed ownership for the first four years, afterwards it becomes more expensive.
Better Place is also less expensive than private ownership for the first six years. In
contrast, car sharing companies remain the cheapest solutions by the distribution of
the costs between people.
0
100
200
300
400
500
600
3 5 7 9 11 13
NP
V [
DK
K] T
ho
usa
nd
s
Renting period [yr.]
1 hour length renting 12 hours length renting

49
Figure 25: Costs of the different ownership model for different time period and 10,000 km per year
However, the second model of car sharing (Københavns Delebiler) can be highly
influenced by the number of kilometres driven per year, as seen in Figure 26. After
17,000 km per year and for a 10 years period, the car sharing costs of this company
become less profitable compared to the private ownership.
Figure 26: Influence of the annual driving distance on the ownership models' costs for a 10 years period
This analysis shows that a perfect ownership model is difficult to identify to Samsø‟s situation. They are adapted for different behaviours and needs. One ownership
model can be more expensive than another one after a certain amount of kilometres
or period. In general, private ownership is the cheapest solution for consumers who
are planning to use their EVs for a long term and are not willing or are not able to
share a car. Hence, through the following part, presenting the result of the survey in
Samsø, it will be possible to select which one can be mostly adapted to the current
situation.
0
200
400
600
800
1000
3 5 7 9 11 13
NP
V [
DK
K]
Th
ou
san
ds
Calculation period [yr.]
Private Better Place
ChoosEV Move About
Københavns Delebiler
0
100
200
300
400
500
600
700
10 000 15 000 20 000
NP
V [
DK
K]
Th
ou
san
ds
Annual driving distance [km]
Private Better Place ChoosEV
Move About Københavns Delebiler

50
5.3. Local opinions and requirements from Samsø
This part is split in two. The first one presents the result of the interviews while the
other one describes the result of the surveys.
5.3.1. Results of the interviews
In general, the energy experts of Samsø share an optimistic view about
implementing EVs and they consider this as a suitable solution for Samsø. According
to the opinion of the manager of the Energy Academy, Søren Steensgaard, a lot of
people in Samsø are ready for transition if it is affordable (Steensgaard 2011).
VEHICLE USAGE HABITS
According to the opinion of three members of the Energy Academy, people in Samsø
mostly use their vehicles (Steensgaard 2011) (Bestman 2011). The reasons are the
condition of the roads which is unfavourable for cyclists due to the icy roads in
winter, and the insufficient public transportation. Considering the registration tax in
Denmark, most of the drivers prefer buying second-hand vehicles, which can be an
issue when trying to sell new EVs (Bestman 2011). Some of the experts think that
EVs can be second vehicles in the households; as a matter of fact it is currently hard
to think of having only an EV, at least because of the long trip issue (Bestman
2011). In addition, the marginal cost of an EV is lower than a conventional vehicle,
thus the owners would prefer to use primarily their EV. Furthermore, the experts
agreed that the average kilometres driven per day in Samsø must be well below the
Danish average of 50 km per day. For instance Brian Kjaer uses his EV, besides his
conventional company vehicle, for 9 km per day (Kjaer 2011). According to Søren
Stensgaard„s opinion, 80 per cent of the transportation of the inhabitants is performed inside the island (Steensgaard 2011).
The opinions about car sharing varied. On one hand, sharing private or leased
electric/conventional vehicles can be a possibility, because it can solve financial
problems or even the problem of travelling out of the island. Furthermore, there are
already some people who indicated their intention to participate in car sharing
(Bestman 2011). On the other hand, there can be social barriers and insurance
problems with this solution.
ECONOMICS AND IMPLEMENTATION
Saving money is the most interesting aspect for the people and the municipality,
which has now some financial constraints. Therefore, the project could be successful
only if it could be profitable compared to the existing situation, otherwise the
municipality would not participate in it (Printzen 2011).

51
Some of the energy experts see private or public company and common, local
organization as possible investors, but the Energy Academy is not allowed to make
an investment itself (Steensgaard 2011). Most of the experts are not sympathetic to
the solution offered by Better Place. In general, they think about leasing as a
possible first step because it is safer as an investment when people do not trust the
technology.
Brian Kjaer indicated that there are several inhabitants who are interested in using
EVs. According to him, a demonstration is needed so that people can see EVs on the
roads every day and the reliability of the technology.
ABOUT THE PREVIOUS EV PROJECT
According to Jens Erik Printzen, the first EV project was a technical failure. Several
problems occurred to the vehicles which also had to be delivered to Aarhus for
repairing because there is no official EV technician in Samsø. Another major failure
of this EV implementation, in the elderly care, was the day and night use of the
vehicles for driving around 90-100 km per day, which prevented the full charge of
the vehicles. Finally, vehicles were sold after the 3-years leasing contract and their
opinion was that the technology was not mature enough (Printzen 2011).
5.3.2. Main results of the survey
Figure 27: General questions about the Samsø project (N=26, 2011)
The 26 respondents agree with the efforts related to the Samsø project (Figure 27),
but only around one third of them think that the transportation sector is problematic
and a change is needed. This fact could mean that the link between the sustainable
0% 10% 20% 30% 40% 50% 60% 70% 80% 90% 100%
4. Would you be willing to change your habits tohelp to solve this problem?
3. Do you think that transportation in Samsøshould be changed to become sustainable?
2. Do you think that it is a problem that the cars inSamsø are still using oil?
1. Do you agree with the general ambition ofSamsø becoming a Renewable Energy Island?
Yes No I don't know
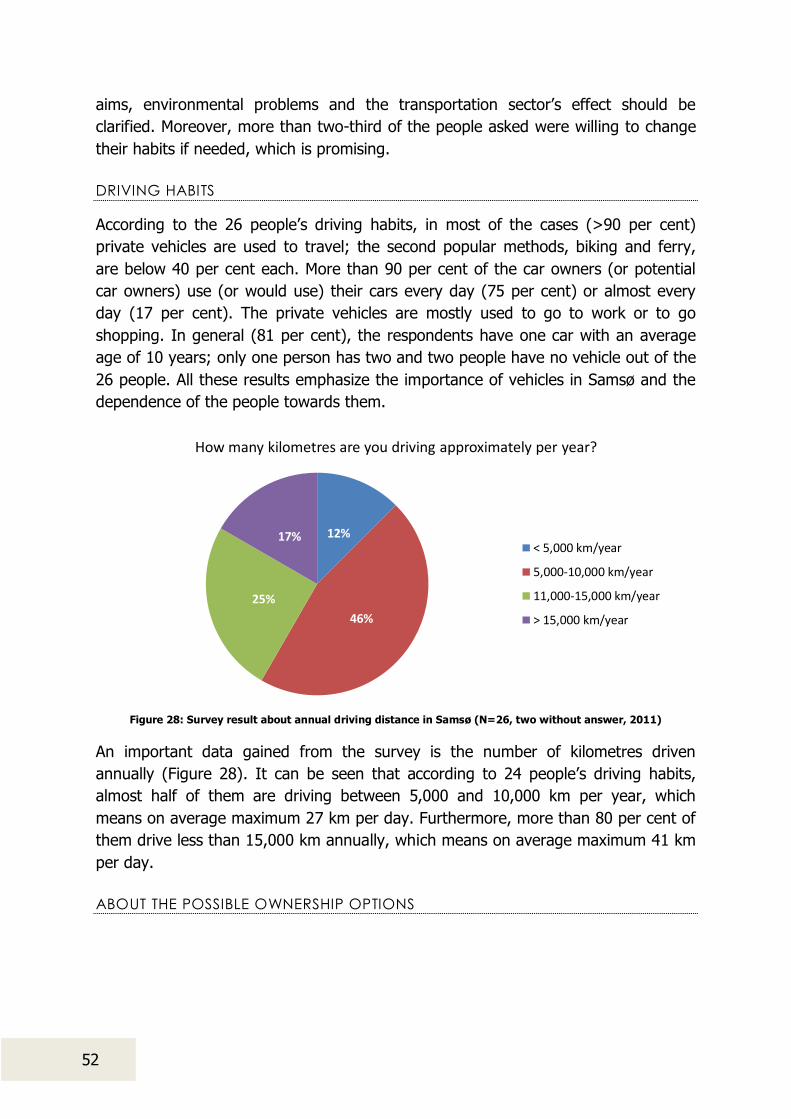
52
aims, environmental problems and the transportation sector‟s effect should be clarified. Moreover, more than two-third of the people asked were willing to change
their habits if needed, which is promising.
DRIVING HABITS
According to the 26 people‟s driving habits, in most of the cases (>90 per cent) private vehicles are used to travel; the second popular methods, biking and ferry,
are below 40 per cent each. More than 90 per cent of the car owners (or potential
car owners) use (or would use) their cars every day (75 per cent) or almost every
day (17 per cent). The private vehicles are mostly used to go to work or to go
shopping. In general (81 per cent), the respondents have one car with an average
age of 10 years; only one person has two and two people have no vehicle out of the
26 people. All these results emphasize the importance of vehicles in Samsø and the
dependence of the people towards them.
Figure 28: Survey result about annual driving distance in Samsø (N=26, two without answer, 2011)
An important data gained from the survey is the number of kilometres driven
annually (Figure 28). It can be seen that according to 24 people‟s driving habits, almost half of them are driving between 5,000 and 10,000 km per year, which
means on average maximum 27 km per day. Furthermore, more than 80 per cent of
them drive less than 15,000 km annually, which means on average maximum 41 km
per day.
ABOUT THE POSSIBLE OWNERSHIP OPTIONS
12%
46%
25%
17%
How many kilometres are you driving approximately per year?
< 5,000 km/year
5,000-10,000 km/year
11,000-15,000 km/year
> 15,000 km/year

53
Figure 29: Survey results about vehicle purchasing in Samsø (N=26, one did not answered, 2011)
As presented in Figure 29, 36 per cent of the interviewees are planning to buy a new
vehicle in the next 2 years. Furthermore, 64 per cent would buy an EV, but 88 per
cent of them only in case it is less expensive than a conventional vehicle. This
probably refers to the purchasing price for most of the consumers. In contrast, only
16 per cent of the respondents would lease an EV and 64 per cent of them refused
this option. Quite a high percentage (89 per cent) of the people has already heard
about car sharing, but 55 per cent would not share cars.
5.4. Ownership models and their applications in Samsø
Regarding part 5.1.1, an important question is how many vehicles would be
purchased by the local people. There are 2,173 families with 1,554 private vehicles
on the island in 2011, buying on average 33 new vehicles every year between 2006
and 2009 (Statistic Denmark 2011). They usually buy second hand vehicles
according to the interview with Lene Skafte Bestman (Bestman 2011) which are not
included in the previous data. Hopefully, after a campaign for EVs, people would buy
an EV.
Another issue is the difficulty for people to accept having only an EV as a family
vehicle. It can be assumed that the households will keep the conventional vehicles,
while primarily using their EV. Later, in case the EV works well for them, they will
have the opportunity to sell their conventional vehicle or change it also to electric.
However, the people‟s opinion so far shows that they would buy EVs, but mostly if it offers a financially acceptable option.
The mixed ownership with battery leasing, besides its advantages, causes a
dilemma; should the whole new EV system of the island lean on an external
company? The advantages of a large company, as services and infrastructure, can
turn to disadvantage in some situations, influencing the system adversely in Samsø
as well because of the (financial, technological etc.) dependency on them. In
addition, both the battery leasing operator companies and the customers must be in
a win-win situation to make the system financially working. But since these
0% 20% 40% 60% 80% 100%
2. Would you buy an electric car?
1. Do you plan to buy a car in the next 2 years?
Yes Yes, if it is cheaper than a normal one (option only for question 2.) No I don't know
54
companies are innovators in the market, this includes a risk to the users as well,
because the profitability of these companies is in a quite narrow range, influenced by technical and economic factors like fuel prices (Li and Ouyang 2011). Furthermore,
the energy experts of Samsø also refused this option; leaning on one external
company in monopoly situation can cause financial disadvantages in the future.
Another question is whether or not this battery leasing company will install battery
swapping/charging stations on the island; the answer is probably negative due to
the limited population. In addition, due to the size of the island the users may not
even need battery swapping/charging stations.
Leasing provides people an option to “try out” EVs without any serious financial investments or consequences. It can be further improved from a societal and
financial point of view by sharing the leased cars. Another improvement could be
achieved through the establishment of a leasing company in Samsø. Although the
payment method of leasing could help the transition to a new technology, the people
who participated in the survey do not think leasing as possibility. Furthermore, the
existing leasing costs of an EV in Denmark are also currently high, but these might
decrease in the future, as the EV leasing market grows.
Organizing a car sharing system in Samsø seems difficult, but not impossible.
Although car sharing is typically used in large, dense cities, there are also successful
implementations in towns and rural areas, for example in Germany, Switzerland or
Austria (Millard-Ball, et al. 2005). In these cases, the organization has to be different
to meet the proper area‟s requirements. The key characteristics are also different
from the cities: personal involvement, acquaintance, more informal and cooperative
working methods. (Shaheen, Sperling and Wagner 1999) (Millard-Ball, et al. 2005).
Furthermore, it seems that in rural areas community support and volunteer
involvement are keys of success (Millard-Ball, et al. 2005).
In Samsø, there are only three towns with more than 200 inhabitants (Figure 25)
and only one town where the population is close to 1,000 (Statistic Denmark 2011).
The two-third of the population is living on the countryside. Considering this
distribution, two ways of working methods seem viable, when the recommended
density of 25 members per vehicle in a 5-minute radius (City CarShare 2005) cannot
be achieved in several places. While establishing the neighbourhood model, one
practice is used by “mother CSOs”, where the organisation establish a parking lot in
an area where there is interest for that (City CarShare 2005). The other solution is
close to an informal car sharing system between neighbours, with or without an
organisation. They can buy EVs together and use their conventional vehicles for
longer trips.

55
Figure 30: Distribution of inhabitants in Samsø by urban and rural areas (Statistic Denmark 2011)
Station cars are used for commuting, but in Samsø, only 10 per cent of the
employed people were commuting outside the island in 2008, and only 10 per cent
of the people commuting on the island are travelling more than 20 km to their
workplace (Statistic Denmark 2011). So this model might be applied for example
with a “station” in Tranebjerg and at the ferries harbour, in order to be available to the tourists coming to the island. But in general this system does not seem to be the
perfect choice for Samsø – it could be used by the tourists, but their number varies
throughout the year; or only by a part of the population.
Currently, data are missing to assess the viability of the multi-nodal model. If it turns
out that there are a few central points on the island, for example between the four
biggest cities, there is a potential to establish parking lots there. According to the
survey, 65 per cent of the respondents are travelling between Tranebjerg and
another destination, but this result is not representative, because most of the people
were asked in Tranebjerg.
According to the survey, few people are interested in car sharing but this result is
counterbalanced by Lene Skafte Bestman (Bestman 2011). With support, they might
be establishers of the first formal or informal car sharing system in Samsø. Both
from financial (no parking lots) and societal (stronger community) point of view, an
(almost) informal, member-organised neighbourhood car sharing system can be
recommended because of the strength Samsø is in the little local communities, with
people knowing each other.
Choosing the proper ownership model highly depends on the local people‟s opinion, their needs and driving habits. At this point of the analysis, the private ownership
and leasing seems to be the most suitable way for both a demonstration and a final
project as well. As for car sharing, helping the already interested people to establish
the first CSO according to their driving habits would be also an important step to
make a multi-sided EV system in Samsø, which can be used by most of the
inhabitants despite their different car usage needs.
Tranebjerg; 814
Onsbjerg; 247
Nordby; 232
Rural areas; 2 589

56
6. Implementation of EVs in Samsø
All the economic calculations, technical parts and ownership issues have been
discussed to lead to the implementation. The implementation explains how to
conduct a successful development of EVs in Samsø. A demonstration project is first
developed, and then the different research axes for the expansion of the EVs are
discussed. Finally, the current environmental impacts of the private vehicles fleet in
Samsø is described in order to assess the benefits that the implementation of EVs
will make in the island.
6.1. Demonstration project for EV technology
The demonstration project is an important part of the implementation of EVs in
Samsø. In fact, it represents the first step for a successful development of EVs. The
first EV project was a failure for two main reasons: costs and inadequate target
group, as explained in chapter 5.3.1. They mainly explain the reluctance of the
municipality to give another chance to EVs. However, it is possible to imagine that if
this project had been a success, the share of EVs in Samsø would currently be much
larger. For this reason, it is important to study and analyse a possible solution for the
development of a new demonstration project. The purpose of this new project will be
to show the evolution of the technology since the last project and its profitability
compared to conventional vehicles, as well as decreasing the GHG emissions.
The first idea was to deal with the rental vehicle company and the tourists as target
group but their short staying time on the island is an issue and no viable solution has
been found. Their case will be discussed later in this chapter. By understanding the
needs of presenting a successful demonstration project visible all year long and
adapted to the EVs technology, the idea of the post office came up. Post Danmark
delivers mails six times a week to the inhabitants of Samsø, during the whole year.
Hence, the visibility of vehicles, running on Samsø roads, is ensured. Moreover, it
appears that Post Danmark is interested in the implementation of a sustainable way
to deliver mails (brightignite.dk 2010). Posten AB, the Swedish postal service,
associated to the Danish Postal Service in 2009 has already around 2,800 EVs in its
mail delivery operation (Postnord 2011). Hence, the replacement of the postal
conventional vehicles by EVs should not be risky for Post Danmark and will be in
accordance to their environmental policy.
This demonstration project needs some involvement, for instance from the Energy
Academy, to present the idea to Post Danmark and therefore to follow the project. In
fact, the main issue of this project is the timeframe. Considering the goal of reaching
an EV share of 50 per cent by 2021 in Samsø, the demonstration project has to be
developed and operable quickly in the following years in order to achieve its purpose
and help in reaching this goal of further implementation.

57
The economic feasibility analysis of introducing EVs for the Post Danmark car fleet,
based on Samsø, has been realized. The figures, adopted from ChoosEV, show that
leasing EVs is cheaper for companies than for private consumers because of the
reduced taxes (Petersen 2011). Post Danmark Leasing, which is a part of Post
Danmark, is responsible for leasing the vehicles to Post Danmark and is its only
customer (Post Danmark 2011). Post Danmark of Samsø uses eight vehicles, which
run every day except Sunday to deliver the mails around the island. This means that
the cars run approximately 312 days annually. Every vehicle runs a daily distance of
51 km, resulting in a distance of 15,912 km for each vehicle per year (Dudmish
2011). In order to assess the cost of the replacement of Post Danmark car fleet in
Samsø, a cost comparison is conducted between the current leasing costs and
leasing costs for EVs.
The leasing price for EV is 5,500 DKK per month, adopted from the company
ChoosEV for a Peugeot Partner running less than 15,000 km per year (Petersen
2011) and this number is used despite the fact that the kilometres are slightly more
as described before (15,912 km). This includes the electricity and the charging
places. As there is no charging station in Samsø, Post Danmark will also have to
purchase or lease the charging spots for 479 DKK per month. The annual leasing
costs incurred by Post Danmark are 25,000 DKK for each vehicle including the O&M
services. The vehicles run on diesel and the consumption is 10 DKK per litre. The
diesel price is adopted from the economic analysis; 11.3 DKK per litre. The insurance
is assumed to be included in the prices is adopted from the economic analysis as
well; 12,000 DKK per year. The NPV is calculated after five years using a 4.5 per cent
discount rate. All the costs are presented in Table 13.
Table 13: Comparison of leasing; electric and conventional vehicles for five years
Peugeot Partner (ChoosEV) Conventional Post Danmark vehicle
Annual driving costs for 15,000km [DKK] 66,000 25,000
Annual costs for subscribing [DKK] 5,748 -
Insurance cost [DKK/yr.] 12,000 12,000
O&M costs [DKK/yr.] Included Included
Fuel consumption [km/kWh] or [km/l] Included 10
Fuel price [DKK/kWh] or [DKK/l] Included 11.3
Fuel price for 15,912 km [DKK] Included 17,981
Annual total costs [DKK] 83,748 45,893
NPV [DKK] 367,551 201,467
As it can be seen, after making the calculations for five years, the EV solution is
around 82 per cent more expensive than the conventional solution. But it should be
noticed that, these figures need to be taken into consideration carefully, as the EV
case is based on the numbers taken from ChoosEV and for Post Danmark in Samsø
the EV situation should be much more different with adjusted lower leasing prices or

58
with more data about the leasing company of Post Danmark. In fact, there is no
information stating that Post Danmark leasing company is a profit oriented company,
thus it can explain this cost difference. For the development of this demonstration
project in a short term range, the important point is to establish the possibility for
Post Danmark to get the same range of costs for EVs than for conventional vehicles.
6.2. Expansion of the fleet
The success of the expansion of the EV fleet depends on the possibility to build
charging infrastructure on the island, thus a quick overview of the possible charging
infrastructure is first presented. Though the demonstration project is expected to
convince at least some people to purchase an EV, the real ambition of Samsø to
become 100 per cent sustainable island depends also on the rest of its people to
consider EV as a mean of their private transportation. Hence, some incentive ideas in
order to lower the EV prices are discussed.
6.2.1. Charging infrastructure
The increasing number of EVs will raise the issue of charging stations, which will
have to be built on the island. This part describes the different possibilities of
charging stations, considering the costs and the driving habits of the local people,
assessing the most suitable choice for Samsø‟s case.
A study has been made in 2010 by the city of London regarding the implementation
of charging stations in the city. According to this study, the charging stations can be
classified into three different groups: the on-street public shared (A), the off-street
public/private shared (B) and the off-street private not-shared (C) (London 2010).
The on-street public shared stations are built in-between the sidewalks and the
parking places, in the same way as parking meters. Off-street shared stations are
located in parking places, which can be public (grocery stores) or private (buildings).
Finally, off-street private not-shared are found in private houses or garages, they are
also called home spot. Two examples of off-street and on-street are shown in Figure
31.
Figure 31: Example of off-street and on-street charging stations (Hewreck 2010) (Inhabitat 2010)

59
The costs are significantly different from one group to another and are shown in
Table 14.
Table 14: Costs of different types of charging stations (London 2010)
Stations A B C Approx. costs [DKK] 82,500 15,000-71,250 6,000-10,500 Approx. Iosts ぷ€へ 11,000 2,000-9,500 800-1,400
The costs for on-street devices (A) are around ten times higher than private not-
shared stations (C). Concerning off-street public/private stations (B), the costs can
vary a lot, but are situated in-between the two other types.
The costs of the stations depend also on the technology, which is related to the
charging time. For conventional charging or slow charging, the charging time can
vary between 30 minutes to 20 hours for a 40 kWh battery, depending notably on
the type of battery, the voltage and the current (Sisternes 2010). Concerning the Li-
ion battery, the charging time for a 24 kWh is between 6 and 8 hours, using a 220 V
socket (MygreenWheels 2010). In addition, fast charging is expected to have really
short charging time, in the same range as conventional gasoline tank charging
(Sisternes 2010). Fast charging is able to charge a 24 kWh Li-ion battery from 0 to
80 per cent in around 15 minutes (Think 2010). These figures are supported by Bo
Petersen, the marketing director of ChoosEV, who states that the battery can be
charged for 100 km in 15 minutes (Petersen 2011). However, the way of charging
220 V or 440 V has a direct influence on the battery lifetime. If the fast charging
solution (440 V) is preferred the loss can be expected 10 per cent more than using
the 220 V charging solution (hybridCARS 2010). A report, written in 2009 for the
Committee on Climate Change, states that the costs for fast charging stations are
way more expensive than those for slow stations (Energy Element 2009). According
to the study, the costs are between 450,000 DKK (60,000 €) and 900,000 DKK
(120,000 €), depending especially on the necessity of grid reinforcement (Energy
Element 2009). This is partly due to the power required to charge the battery, which
is significantly higher for fast charging than for slow charging (Sisternes 2010).
It is noticeable that on-street charging stations with fast charging are far more
expensive than private charging stations with slow charging. Their implementation
would bring large investment costs, which could be shared between different actors
such as the inhabitants or the municipality. It is essential to assess the utility of
implementing charging spots in public areas. In order to do that, the parked time of
the vehicles in every place has to be assumed. In Figure 32, the assumptions made
from the observations in Samsø, in front of two supermarkets during three hours, are
summarized. For example, Samsø does not have any shopping centres or large
supermarkets where people usually spend a lot of time. Plus, it is more into the
Danish habits to go often to the grocery store, almost once every two days and not
staying there long. The work time is 7.4, which corresponds to 37 hours a week
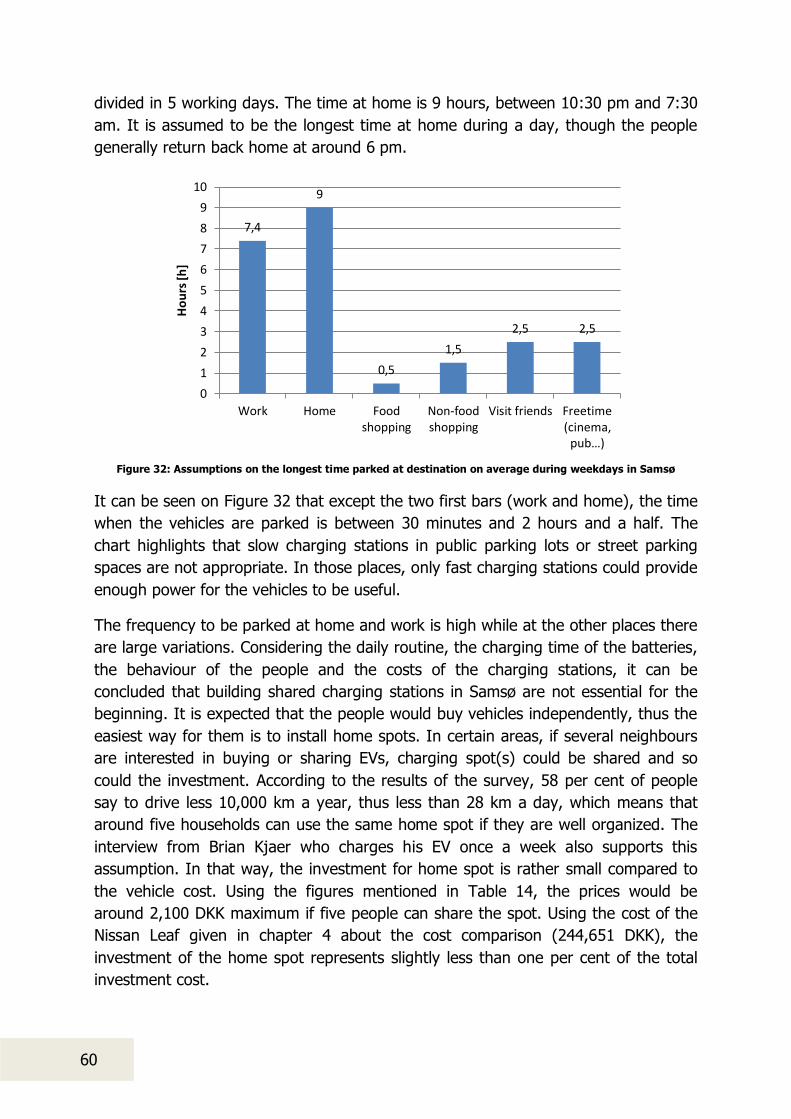
60
divided in 5 working days. The time at home is 9 hours, between 10:30 pm and 7:30
am. It is assumed to be the longest time at home during a day, though the people
generally return back home at around 6 pm.
Figure 32: Assumptions on the longest time parked at destination on average during weekdays in Samsø
It can be seen on Figure 32 that except the two first bars (work and home), the time
when the vehicles are parked is between 30 minutes and 2 hours and a half. The
chart highlights that slow charging stations in public parking lots or street parking
spaces are not appropriate. In those places, only fast charging stations could provide
enough power for the vehicles to be useful.
The frequency to be parked at home and work is high while at the other places there
are large variations. Considering the daily routine, the charging time of the batteries,
the behaviour of the people and the costs of the charging stations, it can be
concluded that building shared charging stations in Samsø are not essential for the
beginning. It is expected that the people would buy vehicles independently, thus the
easiest way for them is to install home spots. In certain areas, if several neighbours
are interested in buying or sharing EVs, charging spot(s) could be shared and so
could the investment. According to the results of the survey, 58 per cent of people
say to drive less 10,000 km a year, thus less than 28 km a day, which means that
around five households can use the same home spot if they are well organized. The
interview from Brian Kjaer who charges his EV once a week also supports this
assumption. In that way, the investment for home spot is rather small compared to
the vehicle cost. Using the figures mentioned in Table 14, the prices would be
around 2,100 DKK maximum if five people can share the spot. Using the cost of the
Nissan Leaf given in chapter 4 about the cost comparison (244,651 DKK), the
investment of the home spot represents slightly less than one per cent of the total
investment cost.
7,4
9
0,5
1,5
2,5 2,5
0
1
2
3
4
5
6
7
8
9
10
Work Home Foodshopping
Non-foodshopping
Visit friends Freetime (cinema,
puH…ぶ
Ho
urs
[h
]

61
However, public stations could help the people to cut the first investment, because
they do not have to pay for the home spot. The implementation of on-street
charging stations can also be considered in the long term when the number of EVs
grows on the island, for example with the introduction of renting EVs for the tourists,
which will be discussed later on this chapter. The success of the demonstration
project as well as the implication of the municipality and the community will
determine the future development.
Finally, the standardization of the plugs is also a current issue for implementing EVs.
Hence, it could be a hindrance for consumers to buy a vehicle which cannot be
charged everywhere but also for manufacturers for economic reasons. To overcome
such problems, the European Union decide to choose a standard during summer
2011. However, some countries are arguing against the current solution proposed
by Germany and it will maybe take a bit longer to take a final decision (EurActiv.com
2011). From a consumer point of view, it is probably a wise decision to wait for an
EU standard before purchasing an electric vehicle if there is a need to use charging
facilities different from the home spot.
6.2.2. Wind shares connected to EVs
An ownership model has been developed to support the implementation and provide
some purchasing opportunities for people investing in renewable energy. The main
idea is to link the purchase of wind turbine shares with the purchase of an EV. As a
matter of fact, a new offshore wind farm project is currently under discussion in
Samsø (VAB 2011). It is certain that the people in the island realized that with the
current incentives from the Danish government and the loan offered by the local
bank, the purchase of a wind turbine share is a good investment. The interview with
Jørgen Tranberg (Tranberg 2011) supports this statement. When people want to buy
shares and earn money from selling electricity, they also have the option of
participating to the transition of the transportation sector by purchasing an EV. The
person who wants to have a share of the new offshore wind turbines and buy a new
vehicle will have the choice between two options buying wind turbine shares
combined with EV, shared or not.
In order to assess the costs, some assumptions have been made using the result
proposed by the website vaab.dk, which deals with wind farm projects in Aarhus
area (VAB 2011). The total cost of the offshore wind farm is divided in shares, which
corresponds to a production of 1,000 kWh each. Local people and companies have
the possibility to purchase one or several shares. The cost of one share is fixed at
around 6,600 DKK (VAB 2011). The income depends on the number of shares, the
price of electricity, the O&M and the tax. The price of electricity is fixed to 0.85 DKK
per kilowatt-hour and the O&M to 0.11 DKK per kilowatt-hour. The taxation is
calculated considering a basic allowance of 7,000 DKK and a tax of 45 per cent on

62
the 60 per cent taxable amount. It means that if the income is superior to 7,000
DKK, taxes will be paid on 60 per cent of the difference, which represents the taxable
amount.
For example, a person has nine shares for a total cost of 59,400 DKK. The expected
production is 9,000 kWh per year with a price of 0.85 DKK per kilowatt-hour, the
gross income is 7,650 DKK. Then, the tax is applied on the difference between the
income and the basic allowance. Hence, the net income is the result of the
subtraction of the income by the tax and the O&M which represents 990 DKK. The
expected net income is 6,485 DKK per year.
Then the income per year is:
During the first years, this income may be used to pay back a loan at the bank and
at the same time the cost of the vehicle. On one hand, it will take more time to start
earning money with this solution but in the other hand the cost of the vehicles will be
entirely covered by the income from selling electricity.
The advantage of this ownership model could be the possibility of having access to a
loan with a low interest rate from a bank. In fact, the bank will receive the guarantee
of a repayment every month by selling the electricity production. This could be
proposed when the number of shares purchased is large enough to allow a payback
time lower than the lifetime of a wind turbine. This statement has to be verified.
Foremost, discussion with the bank has to be done to facilitate the acceptance of this
kind of loan, as it has been done for the previous wind turbine projects in Samsø
(Tranberg 2011). Hence, the discount rate is fixed at 1.0 per cent in this analysis and
not at 4.5 as in the previous economic study.
In the following figures some cases are presented, showing the net present value
(NPV) including taxes for different number of shares for the three following cases:
without purchasing a vehicle (Figure 33), with purchasing a vehicle (Figure 34) and
with purchasing a vehicle shared by three households (Figure 35). Figure 33 shows
that, for a number of shares between 30 and 180, the payback time is between 12
and 14 years. It is noticeable that the payback time is almost the same, whatever the
number of shares is.

63
Figure 33: NPV in function of time period for 3 types of shares without vehicle
In the case of shareholders also purchasing a vehicle, it is important to notice that it
can be profitable only with a certain number of shares as seen in Figure 34. With 90
shares, the investment is only paid back after 19 years which can be considered as
long as regarding the 20-years lifetime of a wind turbine. However, the more the
number of shares increases, the more the payback time decreases. When there are
180 shares, the payback time is 17 years, thus it can be interesting to purchase a
vehicle while buying wind turbine shares.
Figure 34: NPV in function of the time period for 3 types of shares with vehicle
In the case of Figure 35, the repartition of the EV cost between people allows having
a payback time lower than the wind turbine lifetime. With an investment around
675,000 DKK, corresponding to 90 shares plus 1/3 of a vehicle, the payback time is
around 14 years. The payback time is also decreasing with the increase of the
number of shares purchased. This solution can be considered as the best for people
-1400000
-1200000
-1000000
-800000
-600000
-400000
-200000
0
200000
400000
600000
0 1 2 3 4 5 6 7 8 9 10 11 12 13 14 15 16 17 18 19 20
NP
V [
DK
K]
Time period [yr.]
NPV 30 shares NPV 90 shares NPV 180 shares
-1600000
-1400000
-1200000
-1000000
-800000
-600000
-400000
-200000
0
200000
400000
0 1 2 3 4 5 6 7 8 9 10 11 12 13 14 15 16 17 18 19 20
NP
V [
DK
K]
Time period [yr.]
NPV 30 shares NPV 90 shares NPV 180 shares

64
who consider purchasing a new vehicle and are ready to share it. The difficulty will
be to propose an adapted system of car sharing. Moreover, in this example the cost
of the vehicle has been shared in three but some other scenarios can be considered
with 2, 4 or more co-owners.
Figure 35: NPV in function of time period for 3 types of shares with shared vehicle between three people
Another idea is to increase the cost of the shares to provide subsidies for the
purchasing of EVs, for example for the first one hundred EVs. The extra money from
the wind farm shares will go to a fund which will be used to lower the costs of
purchasing the EVs. The characteristics of the wind farm are the following: 20 wind
turbines, with a capacity of 5 MW per turbine. Using the same production per
capacity as for the first offshore wind farm in Samsø, it corresponds to an overall
production of 336,957 MWh per year. As said previously, a share corresponds to a
production of 1,000 kWh per year. Hence, the entire wind farm can be divided in
337,000 shares.
The purpose is to decrease the purchasing cost of a vehicle from 244,651 DKK to
180,000 DKK. Hence, it corresponds to a decrease of 64,651 DKK per vehicle. If the
subsidies are used for 100 vehicles, the amount of money requested is 6,465,100
DKK, which represents only 19 DKK per share. Hence, the price of each share of
wind turbine will rise from 6,600 DKK to 6,619 DKK. Table 15 below shows the
difference between the investment costs depending on the number of shares, with
and without the subsidies for EVs.
Table 15: Investment costs with and without the subsidies
Investment without subsidies Investment with subsidies 30 shares [DKK] 198,000 198,570 90 shares [DKK] 594,000 595,510 180 shares [DKK] 1,188,000 1,191,420
-1400000
-1200000
-1000000
-800000
-600000
-400000
-200000
0
200000
400000
600000
0 1 2 3 4 5 6 7 8 9 10 11 12 13 14 15 16 17 18 19 20
NP
V [
DK
K]
Time period [yr.]
NPV 30 shares NPV 90 shares NPV 180 shares
65
As it can be seen, according to the number of shares, the increase in the prices is
insignificant. In fact, it represents only slightly less than 0.3 per cent of the total
price. The payback time showed above will almost not change either. Using these
subsidies, the cost of purchasing a vehicle will drop by 26.4 per cent, from 244,651
DKK to 180,000 DKK. Moreover, if the people are willing to test the system by
sharing the vehicle between three people, they will have to pay only 60,000 DKK.
Another idea could be to ask the company building the wind turbines, to invest a part
of the project‟s cost in subsidies for the people purchasing EVs. Using the same
discount in the EV cost as the previous paragraph, the investment for the company
will be 6,465,100 DKK. Even though it seems to be a high price, it represents only
slightly less than 0.3 per cent of the total project cost. Moreover, the implementation
of EVs will raise on the long run the electricity demand and thus, it will help the
development of wind farms. It is also good for the image of the companies to get
involved in such an environmental friendly project. In another way, the amount of
money earned from one of these subsidy methods can be used to buy 26 EVs, which
can be leased/rent to the people in Samsø by a non-profit organization. In this case,
people who are not buying wind turbine shares can be able to use EVs.
6.2.3. Market regulations to lower electricity prices in charging
stations
Even though, it has been discussed before that charging stations are not essential for
the beginning of the implementation, charging stations providing free electricity
could participate to the success of the project, and can, for example, be used by the
tourists with rental vehicles.
Currently, the electricity produced from offshore wind turbines is sold at a fixed price
to EnergiNET, the public Transmission System Operator (TSO) in Denmark,
corresponding to 0.85 DKK per kWh (EnergiNET 2011). Then, the TSO sells the
electricity by biding on the NordPool. The prices at which the electricity is sold on the
NordPool market are usually lower than the feed-in tariffs (EMD 2011). For example,
as it is illustrated in Figure 36 the spot prices on the NordPool market on Monday the
28th of March went from 0.225 DKK per kWh at around 1 am to 0.5 DKK per kWh at
8 am and 7 pm (EMD 2011).
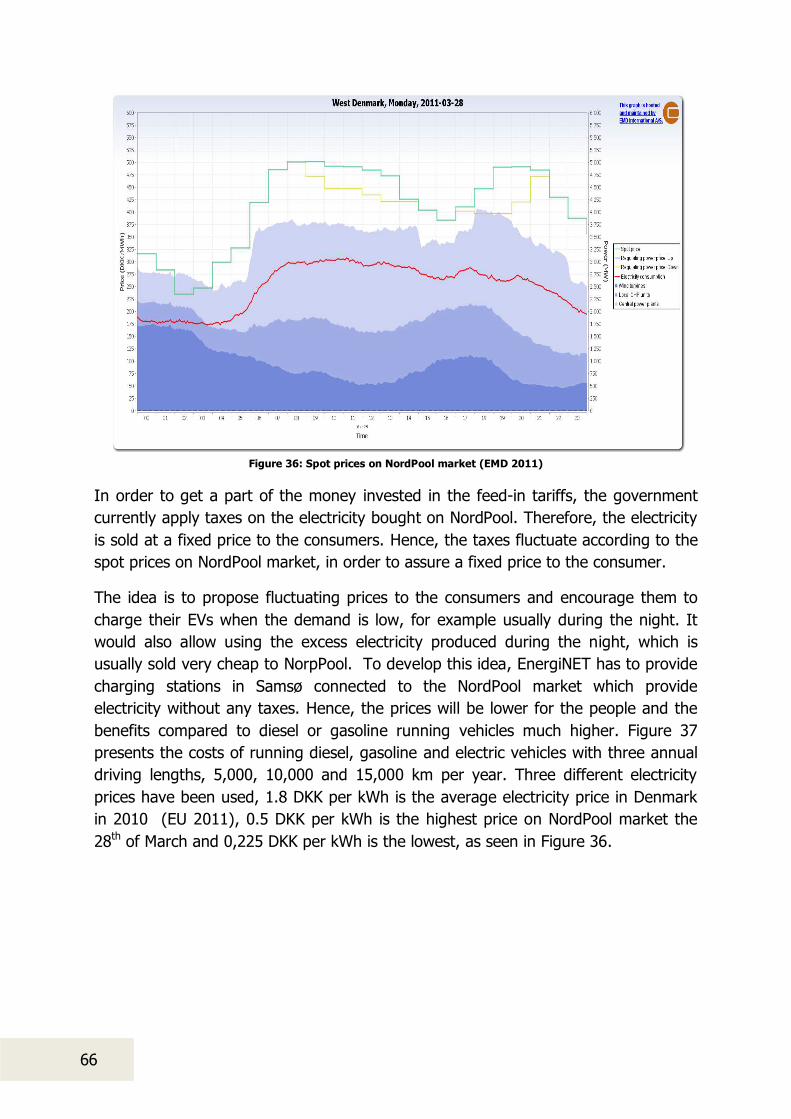
66
Figure 36: Spot prices on NordPool market (EMD 2011)
In order to get a part of the money invested in the feed-in tariffs, the government
currently apply taxes on the electricity bought on NordPool. Therefore, the electricity
is sold at a fixed price to the consumers. Hence, the taxes fluctuate according to the
spot prices on NordPool market, in order to assure a fixed price to the consumer.
The idea is to propose fluctuating prices to the consumers and encourage them to
charge their EVs when the demand is low, for example usually during the night. It
would also allow using the excess electricity produced during the night, which is
usually sold very cheap to NorpPool. To develop this idea, EnergiNET has to provide
charging stations in Samsø connected to the NordPool market which provide
electricity without any taxes. Hence, the prices will be lower for the people and the
benefits compared to diesel or gasoline running vehicles much higher. Figure 37
presents the costs of running diesel, gasoline and electric vehicles with three annual
driving lengths, 5,000, 10,000 and 15,000 km per year. Three different electricity
prices have been used, 1.8 DKK per kWh is the average electricity price in Denmark
in 2010 (EU 2011), 0.5 DKK per kWh is the highest price on NordPool market the
28th of March and 0,225 DKK per kWh is the lowest, as seen in Figure 36.

67
Figure 37: Fuel costs for diesel, gasoline and electric vehicles with different electricity prices
As can be seen Figure 37, the difference is already significant between the 3
different electricity prices, from 1 to 8 between the lowest price in the NordPool and
the current price. This represents for a driver using a vehicle 15,000 km per year a
saving of 3,860 DKK per year. Comparing to diesel prices, the factor is from 1 to 17,
which represents a saving of 8,700 DKK per year. Comparing to gasoline prices, the
factor is from 1 to 23 which represents 11,800 DKK per year.
This system could definitively let people realize the savings that can be done with
EVs, also according to their purchasing costs which is also less expensive than
conventional vehicles (chapter 4). To realize this, EnergiNET has to be contacted and
negotiations have to be made between the different actors of the project.
These incentives should lead to a total replacement of the vehicle fleet by 2030. In
the next part the impact on the GHG emission of this transition compared to the
current situation is presented.
6.3. Environmental consequences
In this part, an analysis of the environmental impacts of the conventional vehicle is
conducted in ordser to assess the potential improvements concerning greenhouse
gas (GHG) emissions by the implementation of EVs. As mentioned in the
Introduction, chapter 1, the transportation sector is responsible for more than 78 per
cent of the CO2 emissions in Samsø and private vehicles are responsible for 25 per
cent of them, as seen in Figure 38.
0
2000
4000
6000
8000
10000
12000
14000
5,000 km 10,000 km 15,000 km
Fu
el
cost
s p
er
ye
ar
[DK
K/y
r.]
EV 0.225
EV 0.5
EV 1.8
Diesel
Gasoline

68
Figure 38: Distribution of the CO2 emissions per means of transportation in Samsø (Tambjerg 2009)
In order to conduct a more detailed study concerning the GHG emissions, the use of
LEAP software has been chosen. The reference scenario is based on data from 2010
(Statistic Denmark 2011). It includes the number of vehicles in Samsø in 2010, the
distribution of the vehicles according to their age (Figure 39), the share between
gasoline and diesel fuels (Figure 40) as well as the average efficiency according to
their age (Figure 41). Data extrapolation has been done when some data were
missing.
Figure 39: Distribution of the cars per age in Denmark (Statistic
Denmark 2011)
Figure 40: Distribution between gasoline and
diesel in Denmark in 2010 (Statistic Denmark 2011)
25%
2%
21%
13%
9%
30%
Cars Buses Trucks/trailers Tractors Flights Ships
0
1
2
3
4
5
6
7
8
Pe
rce
nta
ge
[%
]
Existing car stocks profile
76%
24%
Gasoline Diesel

69
Figure 41: Efficiency of gasoline and diesel vehicles per years in Denmark (Statistic Denmark 2011)
For this analysis, these previous data and the International Panel on Climate Change
(IPCC) tier 1 database including the GHG emissions per type of fuel are used. The
IPCC tier 1 database corresponds to the simplest method of calculation for the GHG
emissions. Then LEAP is able to manage the calculation of the GHG emissions for the
private vehicle sector in Samsø. It shows that the private vehiclesector is responsible
of the emissions of 2,763.2 tonnes of CO2 equivalent distributed between carbon
dioxide, carbon monoxide and other GHGs such as methane and NOx, as presented
in Figure 42.
Figure 42: GHG emissions due to private vehicle sector in Samsø in 2010
The production of CO2-free electricity in Samsø allows subtracting the vehicle
emissions to the total GHG emissions. Hence, the implementation of EVs will allow
decreasing those emissions, which represents 25 per cent of the whole emissions.
However, it is a first step towards a sustainable transportation. The transition of the
other transportation sectors on the island is discussed later in the perspectives part.
0.0
0.1
0.2
0.3
0.4
0.5
0.6
0.7
0.8
Eff
icie
ncy
[l/
10
0 k
m]
Diesel efficiency Gasoline efficiency
235 69,2
2459
0
500
1000
1500
2000
2500
3000
Conventional
To
nn
es
of
CO
E e
qu
iva
len
t [t
]
Carbon Monoxide Others (CH4/NOx/etc) Carbon Dioxide Non Biogenic

70
7. Conclusion
How can electric vehicles be implemented in an economically beneficial
way in Samsø, promoting the creation of a real sustainable island?
As defined in the research question above, the report aims at assessing the
implementation of EVs in the island of Samsø. Regarding the GHG emissions
produced by the transportation sector in the island, there is no doubt that the next
step to change the island to 100 per cent sustainable, is by making a transition in
this sector. The large excess electricity from the wind farms suits well the decision to
replace the private conventional vehicles by EVs.
The different EV technologies present on the market are numerous. The feasibility
study highlighted the difference between these technologies and the analysis pointed
out that BEVs are more suitable than PHEVs. This is mainly due to the battery
capacity, which enables the vehicle to run on the electric motor up to 40 kilometres
or run on conventional fuel. Also, the advantages of the PHEVs do not match with
the requests of Samsø case and are currently far more expensive than BEVs. The
introduction of V2Gs is also compared to traditional EVs, and both the battery
lifespan comparison and the import-export analysis show that EVs are more
convenient for the Samsø case. As a matter of fact, the battery lifespan for an EV in
normal use is almost double of a V2G battery used for ancillary services and covering
demand. Besides, the introduction of EVs will have a positive impact on the excess
electricity, with a decrease of about 6 per cent if the whole fleet is replaced. It will
also reduce the electricity import from the mainland, if the charging intervals are well
organized. The technology of the EV battery is mature enough today to be
implemented and suitable for the island of Samsø.
The economic comparison between purchasing conventional or electric vehicles,
considering the policy framework as well, proved that EVs are economically viable in
Denmark with the current tax exclusion. Hence, 40 øre are saved for every kilometre
driven using an EV instead of a conventional vehicle, which represents a discount of
15 per cent. This cost difference is expected to increase in years to come due to the
rising fuel prices.
The lack of trust in the technology from the previous project makes the inhabitants
still reluctant to purchase a vehicle on their own. In order to deal with that, different
ownership models are analyzed and their current costs are compared. Considering
the different driving patterns and preferences, there are several ownership
recommendations according to the payment method, timeframe and driving
intensity. However, car sharing could help in reducing the costs significantly, but it
can be related to the annual driving distance; private ownership offers a financially
viable long-term solution; and leasing seems more suitable for people who do not

71
want to invest a large amount of money initially, but plan to use an EV for less than
four years.
The importance of local ownership is essential to increase the acceptance of new
technologies. People are usually ready to accept a technology, when they can own a
part of it, and earn money. This statement is also valid for EVs. Hence, it seems a
better choice to rely on local investments and not on one external company, such as
Better Place. In that case, the success of the project would depend a lot on the
reliability of the company.
The study trip to Samsø had the purpose of meeting the competent people of the
Energy Academy and Samsø‟s inhabitants to get their opinions about the project and also to conduct a survey on their driving habits and expectations. The results
highlight the short average driving range of the inhabitants; almost 60 per cent of
them drive less than 27 kilometres a day. The importance of the EV costs is also
underlined, as 88 per cent of the people interested in buying an EV would do it only
if it is cheaper compared to conventional vehicles.
The feasibility studies and the results from the study trip show that the
implementation of EVs can succeed in this area. Therefore, a demonstration project
involving Post Denmark is proposed, to show the reliability of the technology to the
people. If EV leasing is the chosen ownership model, special costs have to be
negotiated with a leasing company to make the project financially viable. After this
project, some recommendations are developed to enlarge the network of EVs.
Regarding the driving habits and the current costs of fast charging stations, the slow
charging home spots are the charging stations, which are the most suitable for the
beginning of the implementation in Samsø. Besides, a new kind of ownership linking
the purchase of wind turbine shares with an individual or shared EV is discussed.
Moreover, proposing the electricity prices of NordPool in the charging stations could
decrease the marginal costs. As an example, charging the EV during the night could
cut 87 per cent of the charging costs. Finally, the total replacement of the private
vehicles in Samsø by EVs will save around 2,800 tonnes of CO2 equivalent every
year.
7.1. Perspectives
The large amount of tourists who drive on Samsø‟s roads every summer is an environmental issue raised by the Energy Academy and supported by the result of
the interview with Lene Skafte Bestman. There are on average around 2,000 tourists
on the island during the three summer months. This amount can reach 10,000 during
Samsø‟s music festival, at the end of July, which results in a large amount of
polluting vehicles on the island. The project of EVs implementation in Samsø will
have to deal with this issue soon or later. Tourists will have to participate, one way
72
or another, to the project and stop driving conventional vehicles on the island in a
medium term period. Moreover, the “green island” image is one of the attractions of Samsø, thus it is guessed that some tourists will be willing to participate in it. The
possibility of renting EVs to the tourists has been screened, but some issues have
been identified. Firstly, the only rental company in Samsø is not currently interested
in purchasing EVs (Biludlejning 2011). The registration tax (chapter 4) is not paid by
the rental companies for conventional vehicles. Due to this, there is no advantage for
them to purchase EVs. For instance, the costs with all taxes excluded are 166,980
DKK (22,264€) for the Toyota Avensis running on diesel and 244,651 DKK (32,620€) for the Nissan Leaf. Hence, the price of the Nissan Leaf is 46 per cent higher than
the Toyota which can explain the reluctance of the rental company. This position
may change in few years if the demonstration project is implemented successfully.
Secondly, the rental of EVs on the island would surely need public-shared charging
stations, especially in the places where tourists stay such as camping places or
hotels. As seen in chapter 6.2.1, these charging stations are very expensive and
would raise the investment costs.
As seen in the chapter 6.3, the replacement of private vehicles will save 25 per cent
of the GHG emissions on the island. Considering the goal to be 100 per cent
renewable, the ferries, which represent 30 per cent of the emissions, need to be
changed. Regarding the weight of the ships and their hourly routines, the battery
density and its charging time are hard to be adapted to run an electric ferry. The
solution could come from biofuel or biogas. Samsø is an agricultural area, which
represents a large source for biogas, for example using the crops or the manure from
animals. Furthermore, some projects about ferries running on biogas have already
been done in Sweden, and the technology is mature enough (Kristoffersen 2010).
This possibility can also be applied for buses, as projects have already been done for
example in Lille, France, where 50 per cent of the municipal bus fleet runs on biogas
(SetterTrend 2003). The municipality claims that the costs per kilometre are
equivalent to conventional buses, with a potential positive environmental impact. The
project is a success. Therefore, they plan to have 100 per cent of the fleet running
on biogas for 2015 (SetterTrend 2003). The Samsø Energy Academy has a plan for
an electric bus, which will start running from next year during summer time. The
truck and trailers, which represents a large share of emissions, 31 per cent, could
also be replaced by biofuel or biogas. However, further calculation will be needed to
assess the economic feasibility of such projects and to be sure that the potential is
large enough in Samsø. Otherwise, it would lead to dependence on biomass.
A recent trend is to invest in hydrogen, but it has been argue that the hydrogen does
not have as much potential as the electricity for transportation matters, considering
for instance the volume of the engine, the efficiency and high pressure issues
(Ruppert 2003). The only advantage of hydrogen technology is the quick filling time,

73
which takes 5-15 minutes (Fuel Cells 2009), but the improvements of electric fast
charging make the EVs charging time almost the same. The swapping stations also
allow changing to a full battery in less than five minutes (Better Place 2011). Unlike
the Californian government, the Danish government chose the EV over the hydrogen
vehicle.
The size of the island, the driving habits of the inhabitants and the green conscience
of some of them ease the EV implementation. However, this kind of project is
expected to be spread in other regions and countries. A lot of areas have shown
motivation to research in sustainable transportation, and a successful project in
Samsø could only reinforce this willingness. For all these different cases, the same
levers have to be applied for a successful implementation. First, the implication of
the government is essential for the success. As for Denmark, regarding the current
state-of-the-art of EVs, incentives are essential to make the purchasing of EVs
economically viable. In the long run, the new technologies and the mass production
of EVs by different manufacturers will lower the costs and thus taxes will be imposed
on them. If the introduction of EV widely occurs, there will be less oil importation,
thus leading to loss of revenue. Those are facts that government has to take into
consideration.
To achieve a sustainable way of transportation, the electricity production has to
come from renewable sources, such as the wind power in Samsø. The introduction of
EV in countries which electricity production comes mainly from fossil fuel would make
the project to lose its main objective. In the best case, their implementation could
also be a benefit for the introduction of fluctuating renewable energy sources such as
solar or wind power, regarding the possibility to raise its usage. Hence, to achieve a
decrease of GHG emissions, the implementation of EVs has to be linked with the
development of sustainable energy systems in the area.

74
Bibliography
Ahマad Pesaヴaミ, Toミy Maヴkel. さBatteヴy Reケuiヴeマeミts aミd Iost-benefit analysis for plug in hybrid
┗ehiIles.ざ ヲヰヰΑ.
Albertslund Delebil. Prisliste for Albertslund Delebil. 2011. http://www.albertslund-delebil.dk/.
Århus Delebilklub. Forbrugspriser. 2011. http://www.aarhus-delebilklub.dk/priserbilermv.htm.
Autoflotte. Gute Zahlen für 2010. 2011. http://www.autoflotte.de/gute-zahlen-fuer-2010-
1007058.html.
Baヴth, Matthe┘, aミd “usaミ “haheeミ. さ“haヴed-Use Vehicle Systems: A Framework for Classifying
Caヴshaヴiミg, “tatioミ Caヴs, aミd CoマHiミed AppヴoaIhes.ざ Transportation Research Record Vol.
1791, 2002: 105-112.
Bestman, Lene Skafte, interview by group. (2011).
Betteヴ plaIe. さTotaloマkostミiミgeヴ -elHil/tヴaditioミel Hil.ざ http://danmark.betterplace.com. 2010.
http://danmark.betterplace.com/dyn/Normalpage/0/50/Normalpage_Section/file/238/1299
603207/totalomkostninger.pdf (accessed 2011).
Betteヴ PlaIe. さTotaloマkostミiミgeヴ -elHil/tヴaditioミel Hil.ざ http://danmark.betterplace.com. 2010.
http://danmark.betterplace.com/dyn/Normalpage/0/50/Normalpage_Section/file/238/1299
603207/totalomkostninger.pdf (accessed 2011).
—. さVejledeミde pヴisliste.ざ http://danmark.betterplace.com. March 2011.
http://danmark.betterplace.com/dyn/Normalpage/2/72/Normalpage_Section/file/248/1299
751393/better-place_prisliste_udskifteligt-batteri.pdf (accessed 2011).
BetterPlace. Better Place International website. 2011. http://www.betterplace.com/.
brightignite.dk. 2010.
http://brightignite.dk/fileadmin/templates/pages/pdfer/Press_Release_about_SAFE_Urban_
Logistics.pdf.
Bryggebilen. Priser. 2009. http://www.bryggebilen.dk/priser.html.
Burbank, City of. Green Energy _ plug in hybrid electric vehicle. 2011.
http://www.burbankwaterandpower.com/index.php/electric-vehicles#2.
California, Center for sustainable Energy of. 2010. https://energycenter.org/index.php/technical-
assistance/transportation/electric-vehicles.
Chevrolet. 2011. http://www.chevrolet.com/volt/.
ChoosEV. ChoosEV homepage. 2011. http://www.choosev.com/ (accessed 2011).
ChoosEV Int. ChoosEV International homepage. 2011. http://www.choosev.com/ (accessed 2011).

75
City CarShare. Bringing Car-Sharing to Your Community. Guide, available online
(http://www.citycarshare.org/download/CCS_BCCtYC_Long.pdf), City CarShare, 2005.
ConsumerPla.net. [email protected]. 2011. http://blog.consumerpla.net/2011/04/prolong-
laptop-batteries-life.html.
De Danske Bilimportører. Statistik. 2010. http://www.bilimp.dk/statistics/index.asp (accessed 2011).
Denmark.dk. Denmark.dk - the official website of Denmark. 2010.
http://www.denmark.dk/en/servicemenu/News/Environment-Energy-Climate-
News/DenmarksEVAspirationsFantasyProjectOrRealisticAim.
Dudmish, Jim, interview by SEPM 73. (2011).
Electropedia. Battery and Energy Technologies. 2005. http://www.mpoweruk.com/life.htm.
EMD. 2011. http://www.emd.dk/el/.
EnergiNET. energinet.dk. 2011. http://www.energinet.dk.
Eミeヴgy Eleマeミt. さ“atヴegies foヴ the uptake of eleItヴiI ┗ehiIles aミd assoIiated iミfヴastヴuItuヴe iマpliIatioミs.ざ ヲヰヰΓ.
Enviro. Wind-Powered Car Scheme for Denmark . 2009. http://www.enviro-
news.com/news/windpowered_car_scheme_for_denmark.html.
eTeI, IミfヴastヴuItuヴe. さEleItヴiIity as a fuel. AFTA IoミfeヴeミIe ヲヰヱヰ.ざ ヲヰヱヰ. http://www.electricdrive.org/index.php?ht=a/GetDocumentAction/i/15318.
EU. Europe's Energy portal. 2011. http://www.energy.eu/.
EU member states. Europe's Energy Portal. 2011. http://www.energy.eu/.
EuヴAIti┗.Ioマ. さEleItヴiI Iaヴ マakeヴs fight o┗eヴ plug staミdaヴd.ざ ヲヰヱヱ.
Excite. FAQ: How do I calculate a car's cost per mile or kilometer? n.d.
http://www1.excite.com/home/info/learn2/learnlets_overview/0,14915,auto,00.html
(accessed 2011).
EzineMark.com. Car leasing increases in Denmark! . 2010. http://vehicle.ezinemark.com/car-leasing-
increases-in-denmark-16c625a4eb7.html.
Frost & Sullivan. さ“ustaiミaHle aミd Iミミo┗ati┗e Peヴsoミal Tヴaミspoヴt “olutioミs - Strategic Analysis of
Caヴshaヴiミg Maヴket iミ Euヴope.ざ Maヴket Eミgiミeeヴiミg ReseaヴIh, ヲヰヱヰ.
Going electric. Extended Range electric vehicles. 2011. http://www.going-electric.org/why/electric-
vehicles/erev.htm.
Green Car Congress. Nissan to Warranty LEAF Battery for 8 Years, 100,000 Miles. 27 July 2010.
http://www.greencarcongress.com/2010/07/nissan-to-warranty-leaf-battery-for-8-years-
100000-miles-.html#more (accessed 2011).

76
Hertz Delebilen. Priserne og behovet. 2011. http://www.delebilen.dk/vContents.aspx?pID=34.
Hewreck. Electric car charging stations arriving to Best Buy. 2010. http://hewreck.com/electric-car-
charging-stations-arriving-to-best-buy/.
hybridCARS. 13 Key Questions and Answers about Nissan Leaf Battery Pack and Ordering. 27 May
2010. http://www.hybridcars.com/news/13-key-questions-and-answers-about-nissan-leaf-
battery-pack-and-ordering-28007.html (accessed 2011).
Inhabitat. Massachusetts set t install 100 EV charging stations. 2010.
http://inhabitat.com/massachusetts-set-to-install-100-ev-charging-stations/.
Jørgensen, Peter Jacob. Samsø – a Renewable Energy Island. Samsø: PlanEnergi and Samsø
Energiakademi, 2007.
JRC Technical notes. 2009.
Keマptoミ, aミd ToマiI. さVehiIle to Gヴid po┘eヴ fuミdaマeミtals; IalIulatiミg IapaIity aミd ミet ヴe┗eミue.ざ 2005.
Kitamura, Makiko, and Takako Iwatani. Nissan's Leaf Lithium-Ion Battery Maker Targets Cost of Less
Than $9,000. 14 May 2010. http://www.bloomberg.com/news/2010-05-14/nissan-s-leaf-
lithium-ion-battery-maker-targets-cost-of-less-than-9-000.html (accessed 2011).
Kjaer, Brian, interview by Group. (2011).
Københavns Delebiler. Priser. 2011. http://www.kobenhavnsdelebiler.dk/.
Køge Delebil. Priser. 2011. http://www.koege-delebil.dk/.
London, Transpoヴt foヴ. さGuidaミIe foヴ iマpleマeミtatioミ of EVCP iミfヴastヴuItuヴe.ざ ヲヰヱヰ.
Luミd, Heミヴik, aミd Willet Keマptoミ. さIミtegヴatioミ of RE to the tヴaミspoヴt aミd eleItヴiI seItoヴ tヴough VヲG.ざ ヲヰヰΒ.
Mazziotta マotoヴs. さRegeミeヴati┗e Hヴakiミg systeマ.ざ ミ.d.
Millard-Ball, Adam, Gail Murray, Jessica Ter Shure, Christine Fox, and Jon Burkhardt. Car-Sharing:
Where and How It Succeeds. TCRP Report 108, Washington, DC.: Transportation Research
Board, 2005, 264.
Miミistヴy of Eミeヴgy, UK. さVehiIle details foヴ pヴius Tン E-CVT.ざ ヲヰヰΓ.
Move About. Move About homepage. 2011. http://www.moveabout.dk/ (accessed 2011).
Munksøgård Delebilklub. Prisliste. n.d. http://delebil.munksoegaard.dk/delebil/.
MygreenWheels. 2010. http://www.mygreenwheels.com/.
Neマヴy, LeduI, Muミoz. さPlug-in hybrid and Battery-ElectヴiI ┗ehiIles.ざ ヲヰヰΓ.

77
Nissan. 2011. http://www.nissan.co.uk/vehicles/electric-vehicles/electric-
leaf/leaf.html#vehicles/electric-vehicles/electric-leaf/leaf.
—. European prices of Nissan Leaf. May 2010. http://www.nissan-
global.com/EN/NEWS/2010/_STORY/100517-01-e.html (accessed 2011).
Opel. The future of mobility . 2011. http://www.opel-ampera.com/index.php/mas/home.
Petersen, Bo, interview by Githii Safian Peter Fanni. (2011).
Petersen, Bo. About ChoosEV (2011).
PG&E. Pacific gas and electric company energizes SV with V2G technology. 2007.
http://www.pge.com/about/news/mediarelations/newsreleases/q2_2007/070409.shtml.
Post Danmark. http://www.postdanmark.dk/contentfull.dk?content=/cms/da-
dk/ompostdanmark/milijoe/samfund.htm&menufile=/cms/da-
dk/menufiles/ompostdanmark.xml&lang=dk. 2011.
Postnord. 2011. http://www.postnord.com/en/About-Us/Our-
Responsibility/Environment/Environmental-milestones/.
Printzen, Jens Erik, interview by Group. (2011).
Rathje, Michael. Leasing gør el-biler attraktive. 2010. http://nyhederne.tv2.dk/article.php/id-
31047947:leasing-g%C3%B8r-elbiler-attraktive.html.
Renault and Better Place. Better Place aミd Reミault lauミch iミ Copeミhageミ the first さuミliマited マileageざ electric car. 03 March 2011. http://media.renault.com/global/en-
gb/renaultgroup/Media/PressRelease.aspx?mediaid=27893 (accessed 2011).
“haheeミ, “usaミ A., aミd Adaマ P. Coheミ. さWoヴld┘ide Iaヴshaヴiミg gヴo┘th: aミ iミteヴミatioミal Ioマaヴisoミ.ざ Transportation Research Record (TRR) 1992, 2007: 81-89.
“haheeミ, “usaミ, Daミiel “peヴliミg, aミd Coミヴad Wagミeヴ. さA “hoヴt Histoヴy of Caヴshaヴiミg iミ the Γヰ's.ざ The
Journal of World Transport Policy & Practice, Vol. 5, No. 3, September, 1999: 18-40.
Shankar, Besta. International business times. 2010.
http://www.ibtimes.com/articles/79397/20101107/denmark-electric-cars-pollution-green-
house-gases-renewable-energy-subsidies-copenhagen-wind-power-i.htm.
Silkeborg Delebilklub. Priser. 2011. http://www.silkeborgdelebilklub.dk/.
Sisternes, Fernando J de. さPlug-iミ EleItヴiI VehiIle IミtヴoduItioミ iミ the EU.ざ ヲヰヱヰ.
SKAT DK. SKAT DK - VAT, payroll tax and environmental taxes. 2011.
http://www.skat.dk/SKAT.aspx?oId=1880492&vId=0&lang=US.
“piミミo┗atioミ. さUsiミg fleets of eleItヴiI ┗ehiIles foヴ eleItヴiI po┘eヴ gヴid suppoヴt.ざ ヲヰヰΒ.
Statistic Denmark. StatBank Denmark. 2011. http://www.statbank.dk/BIL600.

78
Statistics Denmark. StatBank Denmark. 2011. http://www.statbank.dk.
Steensgaard, Søren, interview by Group. (2011).
Tambjerg, Leif Holm. Samsø Energistrategi 2025 udkast. spreadsheet, PlanEnergy, 2009.
Think. Zero to 80 Percent in 15 minutes: New Benchmark for EV Fast-charging. 2010.
http://www.thinkev.com/Press/Press-releases/Zero-to-80-Percent-in-15-minutes-New-
Benchmark-for-EV-Fast-charging.
Topten. 2006. www.topten.be.
Toyota. 2011. www.toyota.dk.
Trading Economics. Real interest rate (%) in Denmark. n.d.
http://www.tradingeconomics.com/denmark/real-interest-rate-percent-wb-data.html.
Tranberg, Jørgen, interview by Group. (2011).
Tryg.dk. Insurance quotation. 2011.
U.“ Eミeヴgy iミfoヴマatioミ, Adマiミistヴatioミ. さWheヴe Iaミ I fiミd data oミ eleItヴiIity tヴaミsマissioミ aミd distヴiHutioミ losses.ざ ヲヰヰΓ.
VAB. 2011. http://www.vaab.dk/index.php/okonomi/42-en-sund-investering-for-fremtiden.
WorldEnergy.org. Denmark. 2008.
Wu, Qiu┘ei, et al. さDヴi┗iミg Patteヴミ Aミalysis foヴ EleItヴiI VehiIle ふEVぶ Gヴid Iミtegヴatioミ “tudy.ざ Innovative Smart Grid Technologies (ISGT). 2010.
Yoney, Domenick. Better Place and DSB to pilot electric car sharing for train travelers. 2009.
http://green.autoblog.com/2009/10/25/better-place-and-dsb-to-pilot-electric-car-sharing-
for-train-tra/.