Hybrid Systems for Diesel Powered Ships
46
Hybrid Systems for Diesel Powered Ships Hybrid topologies for slow speed ships Ship Voyage simulator for performance analysis Dr. Eleftherios Dedes (Research performed at the University of Southampton, UK) ΕΝΩΣΙΣ ΕΛΛΗΝΩΝ ΕΦΟΠΛΙΣΤΩΝ
-
Upload
khangminh22 -
Category
Documents
-
view
1 -
download
0
Transcript of Hybrid Systems for Diesel Powered Ships

Hybrid Systems for Diesel
Powered Ships
Hybrid topologies for slow speed ships
Ship Voyage simulator for performance analysis
Dr. Eleftherios Dedes
(Research performed at the University of Southampton, UK)
ΕΝΩΣΙΣ ΕΛΛΗΝΩΝ ΕΦΟΠΛΙΣΤΩΝ

Presentation Contents
• The emission problem
• Methods to determine fuel consumption/ shipping emissions
• Industry methods to reduce fuel consumption
• Investigation on Hybrid Power Systems
• Description of Ship Voyage Simulator
• ECMS non-linear Optimisation
• Results and Discussion

Typical exhaust pollution
(production of smoke) due to
transient engine loading when
fast ferries getting up to
service speed
Currently…
3
CO2SOx
NOxPM

The emission problem
• Comparison of Shipping with most pollutant Countries:
Source: IMO
FC x 3.1144
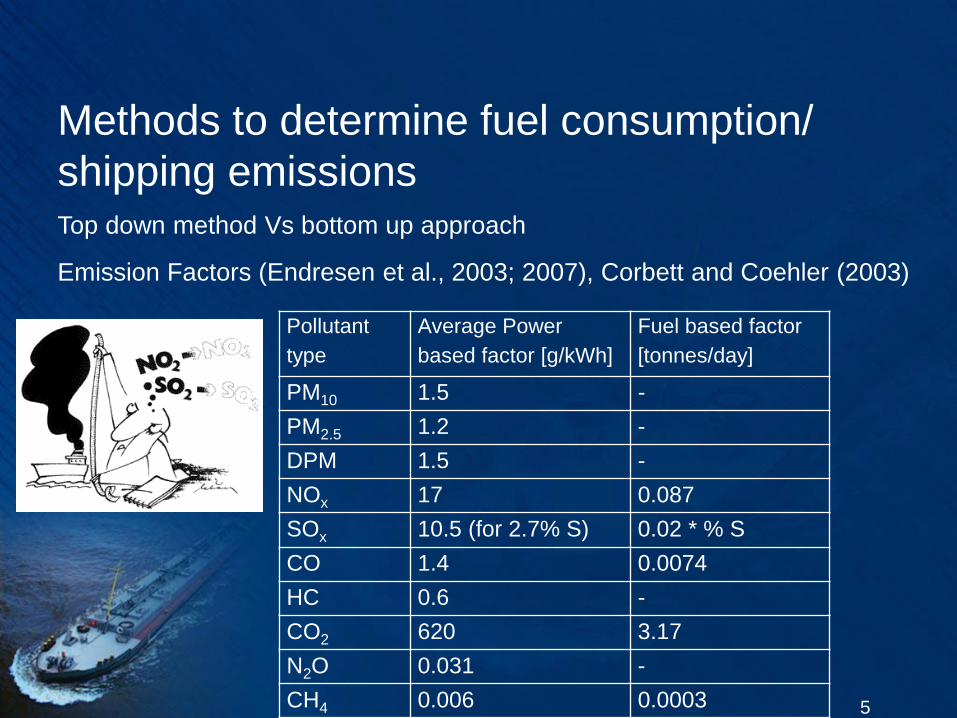
Methods to determine fuel consumption/
shipping emissionsTop down method Vs bottom up approach
Emission Factors (Endresen et al., 2003; 2007), Corbett and Coehler (2003)
5
Pollutant
type
Average Power
based factor [g/kWh]
Fuel based factor
[tonnes/day]
PM10 1.5 -
PM2.5 1.2 -
DPM 1.5 -
NOx 17 0.087
SOx 10.5 (for 2.7% S) 0.02 * % S
CO 1.4 0.0074
HC 0.6 -
CO2 620 3.17
N2O 0.031 -
CH4 0.006 0.0003

• Relationship between NOx and SFOC
Methods to determine fuel consumption/
shipping emissions

Therefore…• Research window:
• Emissions environment and fuel consumption
Emission inventories, doubt and unreliable, IMO formulas introduce
large error, strict environmental agenda by 2020
• Profitability of Shipping companies Fuel consumption reduction,
imperative for future sustainability
• Other mature methods to reduce fuel consumption
• Concept visualisation and Data collection:
• Energy requirements (actual operations), statistics
• System sizing (power, density)
• Storage media selection, installation requirements
• Modelling, Simulation and Optimisation
7
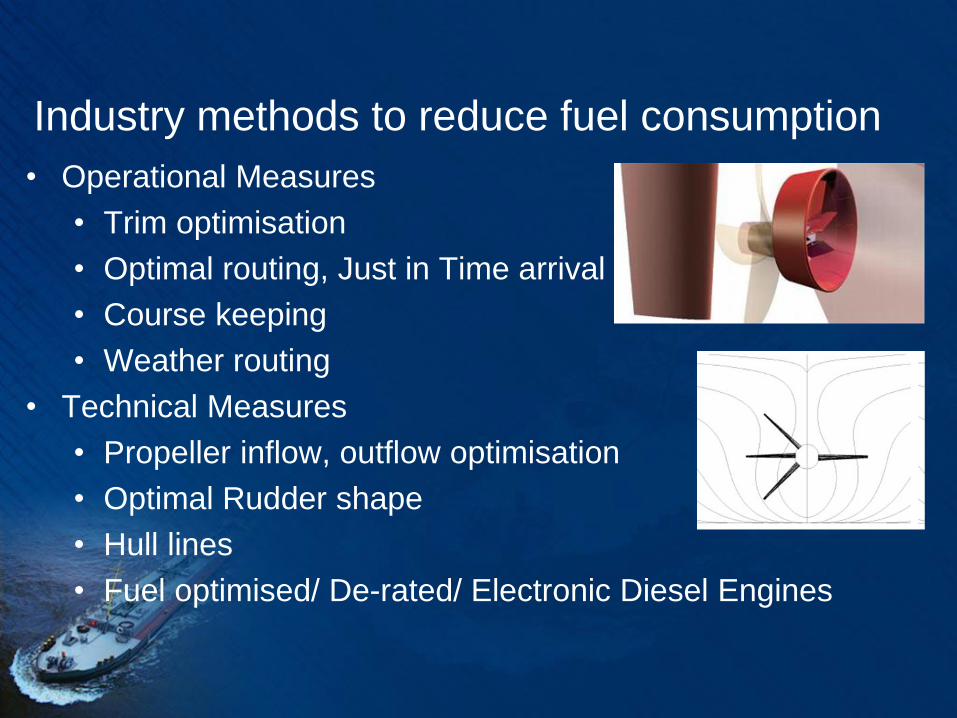
Industry methods to reduce fuel consumption
• Operational Measures
• Trim optimisation
• Optimal routing, Just in Time arrival
• Course keeping
• Weather routing
• Technical Measures
• Propeller inflow, outflow optimisation
• Optimal Rudder shape
• Hull lines
• Fuel optimised/ De-rated/ Electronic Diesel Engines

Industry methods to reduce fuel consumption
…>100% Total Savings!!
… Perpetuum Mobili “Αεικίνητον”
Ship-OwnerTechnical Manager Supt. Engineer

Concept Visualisation– Hybrid with batteries• All Energy saving measures except Main Engine retrofits target in
reducing power demand
• Hybrid decouples propeller demand from the efficient operation of the
Main Engine is fully compatible with current market options/retrofits
• Applies Energy Management strategy by:
• Operating prime movers near the most efficient thermodynamic points
• Given the scenario may utilise stored energy or merge electric loads to
main propulsion utilises benefits of All Electric Ships
• Manoeuvrability, ultra slow steaming capability
• Redundancy
• Lower maintenance needs for T/Cs, fuel pumps, complete O/H
• Limited operation of Engines in transient loads
• Limit energy conversions by inserting strict performance parameters
• Allow easier operation of ships sailing to ECAs
• Has a scalable power output and scalable Energy capacity
10

Concept Visualisation– Hybrid with batteries
11

Investigation on Hybrid Power systems• Data Collection from Greek Shipping Companies
• Energy and Power requirements Statistical Analysis
• Selection of Energy storage system
• Structural analysis and hydrostatic loss/ payload reduction
• Preliminary Financial viability assessment
• Development of Ship voyage simulator
• Setting up the Power handling problem in Matlab suite
• Non Linear Optimisation
12

13
Energy/ Power requirements statistical Analysis
• Determination of “off optimum” Engine operation point

14
Selection of Energy storage system
Type of Vessel: Energy [MWh]: Power [MW]:
Handysize 8 1
HandyMax 8 1
Panamax 15 2
Post –
Panamax
5 2
Capesize 4 1
Type Wh/kg Cost [$/kWh]
Lead Acid 35 90
Vanadium - Bromine 50 300
Silver Cadmium 70 -
Zinc - Bromine 70 -
Sodium/nickel chloride 115 110
Lithium Ion 150 600

Sodium Nickel Chloride Battery
• Extreme tests were undertaken in EUCAR organisation
• Impact
• Penetration tests
• Complete immersion in water
• Spike penetration and spraying with water
• Vibration testing
• 30 minute gasoline fire test
15

Sodium Nickel Chloride Battery
• This produces nickel containing re-melt alloy used in the
stainless steel industry.
• The ceramic and salt contained in the cells collects in the slag
and is compatible with their process.
• The slag is sold as a replacement for limestone used in road
construction – nothing goes to the landfill.
• One of the weak links in any recycle process is the collection of
the spent units at the end of life.
16

17
Structural analysis• Void spaces, Double bottoms, bosun store, poop deck
compartments, Top side tanks sufficient free volume
• Weight distribution, Battery Rule compliance, Risk parameters
Ship Type HandySize HandyMax Panamax Post - Panamax Capesize
Required Energy [MWh] 8 8 15 5 4
Required Battery Volume m3
Sodium Nickel Chloride 190Wh/L 42 42 79 26 21
Vanadium Redox Flow 30Wh/L 267 267 500 167 133
Engine Room Volume[m3] 3800 4530 4900 5150 9600
Free volume in current engine room:
35% of total volume
1300 1580 1650* 1760* 3350
Added Volume due to electric components: 1040m3
Additional Engine Volume: 2x100.4m3 + 4x59.30m
3 = 438m
3
Ship
Type
Handy
Size
Handy
Max
Pana
max
Post-
Panam
ax
Capesi
ze
Required Energy [MWh]
8 8 15 5 4
Required Battery weight [tonnes]
Sodium Nickel Chloride 150Wh/kg
70 70 130 43 35
Vanadium Redox Flow 50Wh/kg
160 160 300 100 80
Final Added weight to the vessel (propulsion system
+ storage)
323 323 384 297 288
414 414 554 354 334
Increase in Lightweight [%]
4.1% 3.4% 3.2% 2.0% 1.2%
5.2% 4.3% 4.7% 2.4% 1.4%

18
Hydrostatic impact - payload reductionCondition Cargo
[tonnes]
Cargo Loss
%
Ballast
[tonnes]
LCB
[m]
LCG
[m]
MTC
[tm]
Trim
[m]
Normal Ballast
Departure
0 0.00 23414.3 117.126 117.189 1040.2 2.08
Normal Ballast Arrival 0 0.00 26061.1 114.757 114.855 1068.1 3.045
Heavy Ballast Departure 16487.1 0.00 23411.7 115.991 116.059 1226.5 2.667
Heavy Ballast Arrival 16487.1 0.00 24476.8 116.88 116.682 1191.4 2.265
Grain Departure SF65 60188.4 0.00 2250.7 116.664 116.702 1346.4 1.674
Grain Arrival SF65 60188.4 0.00 2250.7 118.866 118.879 1298.4 0.514
69990 tonnes DWT
cargo Departure
65152.1 0.54 0 115.448 115.501 1364.5 2.323
69990 tonnes DWT
cargo Arrival
65152.1 0.54 0 117.517 117.548 1331.3 1.205
Homogenous Design
Departure
67858.4 0.52 0 115.656 115.702 1364.6 2.09
Homogenous Design
Arrival
67858.4 0.52 0 117.668 117.693 1336.3 0.983
Grain Departure SF42 87866.1 0.40 0 116.837 116.841 1392 0.335
Grain Arrival SF42 87866.1 0.00 939.4 117.483 117.482 1384.9 0

19
• Capacity determined by vessel type and statistical analysis
• Constraints of battery manufacturer e.g max 16 parallel units can
exist
• Nominal voltage of 557V
• 0.285 MWh energy density per bank.
• Possibility to connect multiple banks
• Highest operational efficiency at ultra low currents
NBB
=Energy
req.
0.285
demand
nominaldischarge/ Charge
16BB
P
VI
N
maxnom BB batC N Q
Efficient Sizing of the Battery Banks

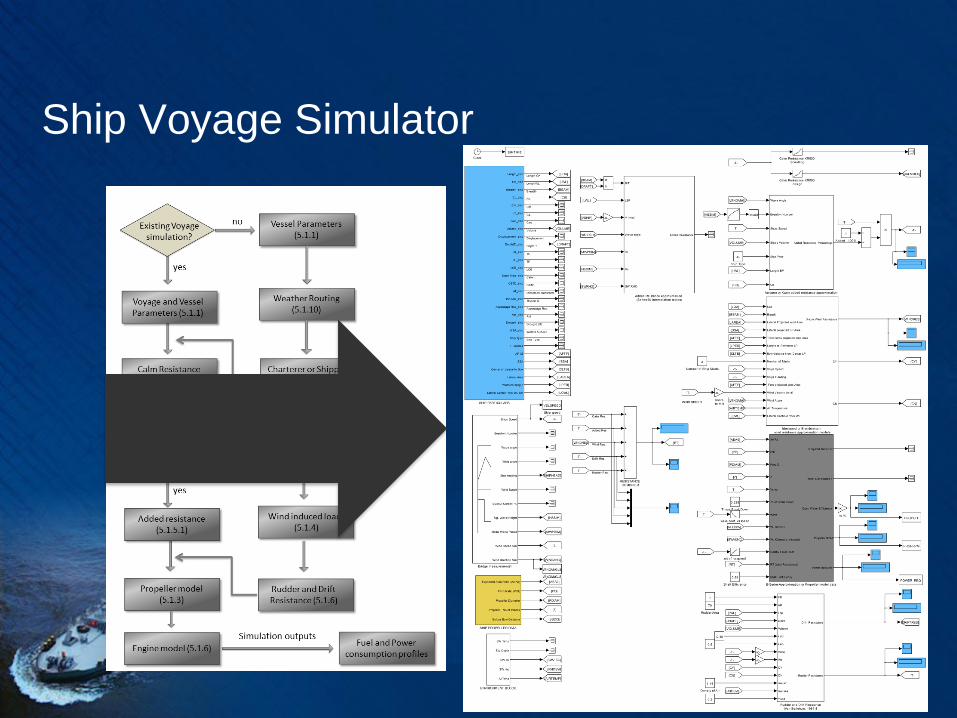
Ship Voyage Simulator
• Matlab/ Simulink environment
• Scalable and modular approach (Blocks and signal flows)
• Each block represents machinery, weather, propeller, ship model
• Hull Resistance (Holtrop – Mennen, Hollenbach methods)
• Added Resistance (Aertssen, Kwon methods)
• Wind Resistance (Isherwood, Blendermann methods)
• Wageningen Series open water performance method
• Battery models, Kinetic Energy approach (Manwell, McGowan)
• Experimental Data for Sodium Nickel Chloride
• Shop Test Data and sea trials data for the propulsion machinery
• Wind and wave generator models based on average reported data
20

Ship Voyage Simulator
• Simulator is separated into 2 sub-models in order to reduce the
complexity (Power profile generation, Optimisation)
• Time domain
• Air Emissions are quasi static phenomena No transients
• Generation of power demand using the voyage simulator:
• Random wind and wave generation (Hs, T, μ, Vwind, μwind)
based on captain observations (mean values reported)
• Mean value added resistance model
• RAO block if sea-keeping results are available
• Series 60 mean added resistance value for Tp, Hs and μ
21
Ship Voyage Simulator

ECMS non-linear optimisation
• SQP method, update of the Langrangian
• Converges rapidly to the solutions (compared to other methods)
• Single objective (minimisation of Fuel Consumption)
• Equivalent Cost Minimisation Strategy (ECMS) applications:
• A layouts (Hybrid Auxiliary loads, AES)
• B layout (Hybrid – Conventional system) (propulsion loads only)
• C layout (Fully integrated Hybrid system (Propulsion and
auxiliary loads. Propulsion system coupled with auxiliaries)
23
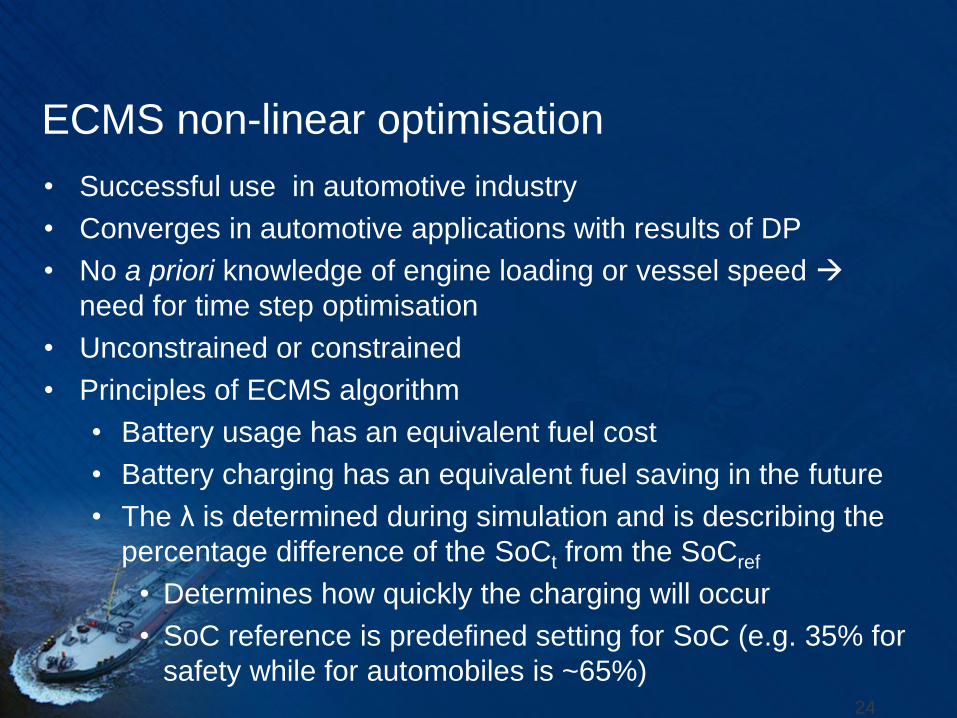
ECMS non-linear optimisation
• Successful use in automotive industry
• Converges in automotive applications with results of DP
• No a priori knowledge of engine loading or vessel speed
need for time step optimisation
• Unconstrained or constrained
• Principles of ECMS algorithm
• Battery usage has an equivalent fuel cost
• Battery charging has an equivalent fuel saving in the future
• The λ is determined during simulation and is describing the
percentage difference of the SoCt from the SoCref
• Determines how quickly the charging will occur
• SoC reference is predefined setting for SoC (e.g. 35% for
safety while for automobiles is ~65%)24

Optimisation Algorithms
• Optimisation Scenarios (A1,B, C)
25
MAIN 2-STROKE DIESEL ENGINE
AUXILIARY GENSET
AUXILIARY GENSET
AUXILIARY GENSET
ELECTRIC
MACHINE
PTO - PTI SYSTEMPOWER
CONVERTER
CONVERTER
TRANSFORMER
BATTERY
BANKS
GEAR BOX
TO AUXILIARY LOADS
TO PROPULSION LOADS
A B
C
RECTIFIER/
INVERTERTRANSFORMER

Optimisation Algorithms
• Power layout (D-A2) “All Electric Ship”
26
AUXILIARY GENSET
AUXILIARY GENSET
AUXILIARY GENSET
PROPULSION
MOTOR
POWER
CONVERTER
CONVERTER
TRANSFORMER
BATTERY
BANKS
GEAR BOX
TO AUXILIARY LOADS
TO PROPULSION LOADS
RECTIFIER/
INVERTERTRANSFORMER
PROPULSION
MOTOR
POWER
CONVERTER
CONVERTER
TRANSFORMER
AUXILIARY GENSET
AUXILIARY GENSET
AUXILIARY GENSET
HYBRID
CONTROLLER

• Multiple algorithm starts
• Find all the local minima
• Converge to the global minimum
• Efficiency static values
27
Component Description Necessary in layout Efficiency
Battery Converter and Transformer All layouts 98%
Transmission losses All layouts 99.5%
Gearbox efficiency A1, B, C 98%
Motor Converter Transformer B, C 99%
Electric Machine Power Converter A2, B, C 96%
Electric generator All layouts ~ 96%
Optimisation Algorithms

• Efficiency curves (polynomials based on real data fit)
28
Optimisation Algorithms

• Battery Efficiency curves (Based on laboratory measurements)
29
Optimisation Algorithms

Equivalent Cost Minimisation Strategy
• Layout C (Discharging/Charging respectively):
• Objective Functions (Motor/ Generator)
30
1 1 /
46
m-dis. 4 4 /
2
min M/E
/ , . 5 9 5 9
min 10
M E
i i i i A E sim
i
T F inv conv m
d x x MCR
f g x x x x MCR t
SFOC
x x w x x
1 2 1 2 /
56
gen-dis. /
3
min M/E
/ , . 6 6
min 10
M E
i i A E sim
i
T F inv conv m
d x x x x MCR
f g x x MCR t
SFOC
x w x
1 2 1 2 /
56
gen,charg. /
3
/ , . 6 6 min M/E
min 10
M E
i i A E sim
i
T F inv conv m
d x x x x MCR
f g x x MCR t
x w x SFOC
644 / , min
1
min 10n
i i T F inv sim
i BB bat
xf g x x x w SFOC t
N V

Results
• Ship Voyage Simulator
• Hybrid Power System ECMS optimisation outputs
31

Results
• Ship Voyage Simulator
• Results for Estimation of Power/ fuel consumption
32

Results
• Ship Voyage Simulator
• Results for Estimation of Power/ fuel consumption
33
Laden Voyage Ballast Voyage
Vessel 1 Vessel 2 Vessel 3 Vessel 1 Vessel 2 Vessel 3
Simulated
Fuel
consumption
616.11 614.07 1302.70t 978.45t 276.75t390.22t
498.66t
Measured
fuel
consumption
653.40 642.20 1359.10t 1206.80t 354.60t438.20t
594.40t
Fuel
difference-37.29 -28.13 -56.35t -228.35 -77.85t
-47.98t
-95.74t
Percentage
difference-5.71% -4.38% -4.14% -18.92% -21.95%
-10.95%
-16.11%
Ballast voyage Re-analysis of ballast voyage
Vessel 1 Vessel 2 Vessel 3 Vessel 1 Vessel 2 Vessel 3
Simulated
Fuel
consumption
978.45t 276.75t390.22t
498.66t1159.28t 307.43t
461.50t
600.44t
Measured
fuel
consumption
1206.80t 354.60t438.20t
594.40t1206.80t 354.60t
438.20t
594.40t
Fuel
difference-228.35 -77.85t
-47.98t
-95.74t-47.52 -47.17
23.30t
6.04t
Percentage
difference-18.92% -21.95%
-10.95%
-16.11%-3.93% -13.30%
5.32%
1.02%

Results
• Ship Voyage Simulator
• Further improvements in Estimation of Power/ fuel
consumption
• Metrological Models, statistical models for wind/waves
• Not suitable for swell effects
34

Results
• Ship Voyage Simulator
• Results for Estimation of Power/ fuel consumption
• Performance analysis
35

Results
• Ship Voyage Simulator
• Results for Estimation of Power/ fuel consumption
• Performance analysis
36

Results
• Determination of power profile for Hybrid scenarios
• On board data collection for auxiliary loads
37

Results
• Layout A1 (Power split for 14.4MWh)
• Battery output, 1 D/G output instead of 2 initially running
38

• Layout A1 (Power split for 2MWh Vs Conventional system)
• Battery output significantly increases the degree of Hybridisation
39
Results

Results
• Layout D-A1
• Feasible solution with non negligible savings that reach up to
6% of auxiliary fuel bill excluding additional savings due to
single D/G operation
• Savings depend on installed power
• quadratic relationship which concaves downwards
• Battery efficiency, charging effect reduces the energy
efficiency
• For 2MWh installed energy
• No significant losses in DWT
• 0.50% of the total A/E fuel bill, excluding again further
savings due to number of engines in operation
40

Results
• Layout D-B
• Taking into account the conversion losses, the Hybrid
solution is not feasible (electromechanical conversions)
• If improving sub component efficiencies, excluding the
battery:
• Daily reduction given the examined load profile is 0.095%
• Layout D-C
• Propulsion fuel consumption savings reaching up to 4.44%
• Cost effective to absorb power with high conversion
losses from the A/E than operate the M/E in less efficient
load
• Is directly dependent on the SFOC curve shape and
steepness 41

Constraints alternation and sensitivity analysis
Battery
Degradation
Battery capacity
2MWh 4MWh 7MWh 10MWh 14.4MWh
Baseline 0.53% 2.62% 4.88% 5.52% 5.70%
1% 0.19% 1.66% 2.98% 3.59% 3.79%
2% - 0.77% 1.34% 1.61% 1.81%
3% - 0.23% 0.28% 0.25% 0.30%
4% - - - - -
5% - - - - -
10% - - - - -
Case
Capacity
24h vector, 2h sample
rate, tref = 72h
24h vector, 2h sample
rate, tref = 48h
24h vector, 2h sample
rate, tref = 24h
2MWh 0.53% 0.52% 0.45%
4MWh 2.62% 2.94% 0.60%
7MWh 4.88% 4.91% 1.90%
10MWh 5.52% 5.52% 5.52%
14.4MW
h5.70% 5.70% 5.70%

Conclusions
• Hybrid potential is feasible for Auxiliary loads
• Battery usage is not suitable for application for direct Main
Propulsion due to conversion losses
• Sensitivity analysis show potential and viability
• Coupling the auxiliary generators and the main propulsion
including batteries is a promising alternative that yields to daily
savings of approximately 4.4% (dependent on loading)
• The battery system is working in ultra low currents maintains
high efficiency
• Degree of Hybridisation: ~50% discharging, ~40% charging,
~10% no action (auxiliary loads)
• Feasible system in term of construction
43

Conclusions
• The DWT is not significantly affected
• For A1 scenario, DWT effect is negligible
• For A2 scenario (AES), the Hybrid system is feasible due to the
absence of conversion losses
• However, this system was not simulated due to absence of
Engine data
• Ship Simulator is a useful tool for propulsion assessment and
performance monitoring
• The scalable and the extendable blocks allow great flexibility in
increasing the system’s complexity and the simulator’s precision
for future applications
44

Further details (including reference list)
• E. K. Dedes, D. A. Hudson, and S. R. Turnock. Design of hybrid diesel-electric
energy storage systems to maximize overall ship propulsive efficiency. In
Practical design of ships and other floating structure symposium, 2010.
PRADS’10, pages 703–713. COPPE UFRJ, 2010.
• E.K. Dedes, D.A. Hudson, and S.R. Turnock. Assessing the potential of hybrid
energy technology to reduce exhaust emissions from global shipping. Energy
Policy, 2012; 40: 204-218
• E. K. Dedes, D. A. Hudson, and S. R. Turnock. Technical feasibility of Hybrid
Powering systems to reduce exhaust emissions of bulk carriers. IJME
transactions of RINA, 2013.
• E. K. Dedes, S. R. Turnock, D. A Hudson. A modified activity based approach for
accurate estimation of fuel consumption from global shipping. International
Journal of Transportation Research part D. Under review, 2014.
• E. K. Dedes, S. R. Turnock, D. A Hudson. Diesel Hybrid systems for increase of
fuel efficiency and reduction of exhaust emissions from ocean going ships. To be
submitted to Journal of Energy, 2015.

Hybrid Systems for Diesel
Powered Ships
Thank you for your attention!
Dr. Eleftherios Dedes
Further questions: [email protected]