
Evaluations of Ingroup and Outgroup Members: The Role of Category-Based Expectancy Violation

Behavioral/Systems/Cognitive
Theta-Band Phase Locking of Orbitofrontal Neurons duringReward Expectancy
Marijn van Wingerden, Martin Vinck, Jan Lankelma, and Cyriel M. A. PennartzCognitive and Systems Neuroscience Group, Swammerdam Institute for Life Sciences–Center for Neuroscience, University of Amsterdam, 1090 GEAmsterdam, The Netherlands
The expectancy of a rewarding outcome following actions and cues is coded by a network of brain structures including the orbitofrontalcortex. Thus far, predicted reward was considered to be coded by time-averaged spike rates of neurons. However, besides firing rate, theprecise timing of action potentials in relation to ongoing oscillations in local field potentials is thought to be of importance for effectivecommunication between brain areas.
We performed multineuron and field potential recordings in orbitofrontal cortex of rats performing olfactory discrimination learningto study the temporal structure of coding predictive of outcome. After associative learning, field potentials were marked by thetaoscillations, both in advance and during delivery of reward. Orbitofrontal neurons, especially those coding information about upcomingreward with their firing rate, phase locked to these oscillations in anticipation of reward. When established associations were reversed,phase locking collapsed in the anticipatory task phase, but returned when reward became predictable again after relearning. Behaviorally,the outcome anticipation phase was marked by licking responses, but the frequency of lick responses was dissociated from the strengthof theta-band phase locking. The strength of theta-band phase locking by orbitofrontal neurons robustly follows the dynamics ofassociative learning as measured by behavior and correlates with the rat’s current outcome expectancy. Theta-band phase locking mayfacilitate communication of outcome-related information between reward-related brain areas and offers a novel mechanism for codingvalue signals during reinforcement learning.
IntroductionConstructing predictive representations of future reward is es-sential for goal-directed behavior. Goal-directed behavior ap-pears to be guided by a network of brain structures encoding thepredicted outcome of cues and actions as a result of associativelearning (Schoenbaum et al., 1998; Padoa-Schioppa and Assad,2006; Schultz, 2006; Rolls et al., 2008). Such predictive represen-tations have been found in the amygdala, prefrontal cortex, andventral striatum and are a requirement for learning mechanismsthat depend on the difference between actual and predicted re-ward (Rescorla and Wagner, 1972; Pennartz, 1997; Schultz et al.,1997; Sutton and Barto, 1998; Schultz, 2006). However, until nowthe neural coding of reward expectancy has been studied almost
exclusively in the domain of firing rates, whereas a number ofissues in reward processing require considering its temporal or-ganization. First, the effect that a reward-predictive representa-tion in a given brain structure exerts on its target areas willdepend on the temporal alignment of the firing of contributingneurons (Salinas and Sejnowski, 2000; Engel et al., 2001). Second,the temporal phasing of activity in two connected brain areas maymodulate the efficacy of their communication (Womelsdorf etal., 2007). Third, reward-dependent associative learning mecha-nisms likely involve long-term synaptic modifications dependingon the exact timing of presynaptic and postsynaptic activity (Levyand Steward, 1983; Markram et al., 1997; Lisman and Spruston,2005; Cassenaer and Laurent, 2007).
We investigated the relationship between single-unit activityand local field potential (LFP) oscillations during an associativelearning task in the orbitofrontal cortex (OFC), a prefrontalstructure that is strongly connected with the amygdala, parahip-pocampal cortex, medial prefrontal cortex, and ventral tier of thebasal ganglia, and is crucial for flexibly encoding reward-valuerepresentations and adjusting goal-directed behaviors (Becharaet al., 1994; Carmichael and Price, 1995; Ongur and Price, 2000;Fellows and Farah, 2003; Stalnaker et al., 2007; Schilman et al.,2008). Firing-rate changes of OFC neurons were shown to repre-sent the predicted reward value of cues and actions, both at thesingle-cell and population level (Schoenbaum et al., 1998; Wallisand Miller, 2003; Padoa-Schioppa and Assad, 2006; van Duurenet al., 2008). Moreover, OFC representations can be updated whenpreviously learned associations are no longer valid (Rolls et al., 1996;
Received Aug. 3, 2009; revised Feb. 10, 2010; accepted March 16, 2010.This work was supported by the Netherlands Organization for Scientific Research–VICI Grant 918.46.609 (to
C.M.A.P.) and the European Union Seventh Framework Programme FP7-ICT Grant 217148 (to C.M.A.P.). We wouldlike to acknowledge the software tools or assistance provided by the following: Peter Lipa (University of Arizona,Tucson, AZ) for the use of BubbleClust; A. David Redish (University of Minnesota, Minneapolis, MN) for the use ofMClust; Ruud Joosten and Laura Donga (Netherlands Institute for Neuroscience and University of Amsterdam,Amsterdam, The Netherlands) for help with rat surgeries; and Ed de Water, Theo van Lieshout, Cees van denBiggelaar, Johan Soede, Frans Pinkse, Hans Gerritsen, Ron Manuputy, Mattijs Bakker, and Wietze Buster (Universityof Amsterdam) for experimental setup and drive manufacturing. M.v.W. and C.M.A.P. designed the experiments;M.v.W. performed the experiments; M.v.W., M.V., and J.V.L. analyzed the data; and M.v.W., M.V., and C.M.A.P.wrote the paper.
Correspondence should be addressed to Marijn van Wingerden, Swammerdam Institute for Life Sciences–Centerfor Neuroscience, University of Amsterdam, P.O. Box 94216, 1090 GE Amsterdam, The Netherlands. E-mail:[email protected].
DOI:10.1523/JNEUROSCI.3860-09.2010Copyright © 2010 the authors 0270-6474/10/307078-10$15.00/0
7078 • The Journal of Neuroscience, May 19, 2010 • 30(20):7078 –7087

Schoenbaum et al., 1998). If the relationship between single-unitactivity and field oscillations is of importance for associative learn-ing, we would expect to find changes in this relationship that followthe dynamics of learning, expressed preferentially by those cellswhose activity is informative about upcoming task outcomes. Inaddition to testing this hypothesis, we also examined whether rhyth-mic LFP-locked spiking activity was associated with licking behavior,as this was found especially in advance of and following rewarddelivery.
Materials and MethodsSubjectsThree adult male Wistar rats (Harlan CPB), weighing 370 – 450 g at thetime of surgery, served as subjects in these experiments. Before trainingand surgery, the rats were housed two to a cage on a reversed light/darkcycle (lights off: 7:00 A.M., lights on: 7:00 P.M.) with ad libitum food andwater. After surgery, animals were housed individually in a transparentcage (40 � 40 � 40 cm), with other rats present in the climate-controlledcolony room. During training and recording, rats were maintained onfood restriction, with 5–15 g of food available from �0.5 h after training,depending on the amount of reward collected in the session, amountingto 90% free-feeding intake.
All experiments were conducted according to the National Guidelineson Animal Experiments and with approval of the Animal Experimenta-tion Committee of the University of Amsterdam.
Behavioral trainingApparatus. Odor discrimination training was conducted in an operantchamber (56 � 30 � 40 cm L � W � H) equipped with an odor-sampling port and trial light on a front panel and a tray for delivery offluids placed at the opposing wall (Fig. 1). The front panel was slanted at45° (with respect to ground level) above the odor-sampling port to allow
unhindered nose poking into the odor port by implanted animals. En-tries by the animals into the odor port and into the fluid well wererecorded by photobeam interruptions and stored on a computer dedi-cated to behavioral data acquisition. Licking responses were detected bya separate photobeam situated within the fluid well. During recordingsessions, behavioral events were synchronized with electrophysiologicaldata acquisition running on a separate computer. Odors were deliveredvia separate glass vials and tubing to avoid mixing. Upon entering theapplication system, they were mixed 1:1 with clean air and released intothe compartment directly behind the odor port by way of computer-controlled valves. Likewise, quinine and sucrose solutions were deliveredto the fluid well via separate fluid lines and electronically controlled byvalves (van Duuren et al., 2007). Training and task performance weredevoid of human interference.
Training procedure. The animals were trained on a two-odor Go/No-Go discrimination task (Schoenbaum et al., 1998). After habituationto the chamber and pretraining, rats were confronted with odor discrim-ination problems. Each session, one novel odor was associated with re-ward (100 �l of 15% sucrose solution), and a second novel odor with anaversive outcome (100 �l of 0.01 M quinine solution). Training sessionsconsisted of blocks of 5 � 5 pseudorandomly ordered positive and neg-ative odor trials. When a trial light was illuminated, rats could initiate atrial by poking their snout in the odor-sampling port. After a 500 msdelay, air flow through the odor-sampling port was switched from cleanair to the selected clean air/odorant mixture. A correct nose poke in theodor port (wait for odor 500 ms, constituting a prestimulus delay, andsample odor for at least 750 ms) was indicated by the trial light turningoff. After sampling, the rats could move over to the fluid well, into whichthey were required to make a nose poke for �1000 ms before the out-come (sucrose or quinine solution) was presented. We refer to the invari-ant 1000 ms delay period as the “waiting” or anticipatory period. Thiswaiting period allows sampling of neural activity during the waiting pe-
Figure 1. Task-related theta oscillations and phase locking. A, Operant chamber; impression of rat making odor poke (left) and fluid poke (right). B, Raw LFP segments recorded during differenttask periods (black) and bandpass-filtered LFP (4 –12 Hz) (green trace, hit trial; red, false alarm trial) and spike trains from one unit, recorded on a different tetrode (vertical green/red bars). psd,prestimulus delay. C, LFP power modulation, synchronized in time on sucrose delivery. Pseudocolors indicate averaged percentage increase in LFP power compared to the intertrial interval period.Green dashed line, Median time of odor onset; red dashed line, median time of odor offset; white dashed line, start of waiting period; white solid line, sucrose delivery. Theta oscillations (9 Hz) foundduring odor sampling are not visible here due to synchronization on reward delivery. D, Spike–field phase-locking spectrum averaged across all task-segments and all units. Shaded regions indicate95% bootstrapped confidence intervals on the mean. E, Polar histogram of mean phase values for all cells. Shaded part corresponds to number of significantly phase-locked units (270 of 525,Rayleigh test, p � 0.05). Mean phase, 11.3°. Distribution of phases deviated significantly from uniform distribution ( p � 0.001).
van Wingerden et al. • Phase Locking of Orbitofrontal Neurons J. Neurosci., May 19, 2010 • 30(20):7078 –7087 • 7079

riod that is not confounded by whole-body movement or novel sensoryinput (Schoenbaum et al., 1998; van Duuren et al., 2007). When the ratsleft the fluid well, an intertrial interval (ITI) of 10 –15 s was observedbefore the next trial started. A correct rejection was scored if the ratrefrained from entering the reinforcement tray for �5 s following sam-pling of the negative odor. Responses during the ITI had no programmedconsequences, while premature responses (i.e., short pokes) during theodor-sampling or waiting period resulted in immediate termination ofthe current trial and the start of a new trial.
Rats were implanted after they reached behavioral criterion, viz.,scoring �85% hits and correct rejections over a moving block of 20trials. Following surgery, animals were retrained on the familiar odorpair with which initial training took place until performance was backat criterion level. Recording of neural activity started in the subse-quent session. On each recording session, rats were confronted with anew odor pair. Furthermore, a reversal schedule of odor– outcomecontingencies was appended to the session in case the rat reachedcriterion performance. To assess learning in the reversal phase, aver-age performance over all sessions as a function of postreversal trialwas compared against chance level using a binomial test with ex-pected performance of 0.5 ( p � 0.05).
Surgical proceduresAnimals were anesthetized by intramuscular injection of 0.08 ml/100 g ofHypnorm (0.2 mg/ml fentanyl, 10 mg/ml fluanisone; VetaPharma), fol-lowed by 0.04 ml/100 g of Dormicum (5 mg/ml midazolam, s.c.; Roche),and mounted in a stereotactic frame. Body temperature was maintainedbetween 35 and 36°C. A microdrive, holding 14 individually moveableelectrode drivers, was chronically implanted onto a craniotomy (diame-ter: 2 mm) in the left hemisphere dorsal to the OFC at 3.4 –3.6 mmanterior and 3.0 –3.2 mm lateral to bregma. The drivers were loaded with12 tetrodes and 2 reference electrodes. Using dental cement, the drive wasanchored to six stainless steel screws, one of which was positioned in theleft parietal bone and served as ground. Immediately after surgery, alltetrodes and reference electrodes were advanced 0.8 mm into the brain.Next, the animal was allowed to recover for 7 d with ad libitum food andwater, during which the 12 recording tetrodes were advanced in dailysteps to the upper border of the OFC according to a standardized ratbrain atlas (Paxinos and Watson, 2007). The reference electrodes werelowered to a depth of 1.2–2.0 mm and adjusted to minimize spikingactivity on the reference channel.
After surgery, saline was injected subcutaneously (2 ml per flank), andpain relief was provided by 0.1 ml/100 g of presurgical weight of a 10%Finadyne (flunixin meglumine 50 mg/ml; Schering-Plough) solution ad-ministered in saline subcutaneously.
ElectrophysiologyUsing tetrodes (Gray et al., 1995), neural activity was recorded by a64-channel Cheetah setup (Neuralynx). Signals were passed through aunity-gain preamplifier headstage and a 72-channel commutator (Drag-onfly), amplified 5000�, and bandpass filtered between 600 and 6000 Hzfor spike recordings. If a signal on any of the leads of a tetrode crossed apreset threshold, activity on all four leads was sampled at 32 kHz for 1 msand stored for off-line analysis. Local field potentials recorded on alltetrodes were amplified 1000�, continuously sampled at 1874 Hz, andbandpass filtered between 1 and 475 Hz. Events in the behavioral taskwere coregistered and time stamped by the Cheetah system.
Data analysisIsolation of single-unit activity. Spike trains were sorted to isolate singleunits using a semiautomated clustering algorithm (BubbleClust) fol-lowed by manual refinement using MClust. Automated and manual clus-tering of spikes was done using the waveform peak amplitude, area,squared amplitude integral, and the first three principal components.Clusters were accepted as single units when having no more than 0.1% ofinterspike intervals shorter than 2 ms.
Spike–LFP phase locking. All analyses were done with Matlab (The Math-Works) and using FieldTrip (http://www.ru.nl/fcdonders/fieldtrip/), anopen source toolbox for the analysis of neurophysiological data. Briefly,for each spike of a given cell, we cut out a 1.0 s data segment of the LFPs
recorded simultaneously on the other tetrodes (such that we never in-cluded a spike–LFP pair from the same tetrode). Several methods exist tomeasure spike–LFP phase consistency (Fries et al., 1997; Jarvis and Mitra,2001; Pesaran et al., 2002; Womelsdorf et al., 2006). The basis of all ofthese methods is to determine the phase of a spike or a spike train relativeto an LFP trace in a particular frequency band. Here, we multiplied eachunfiltered LFP data segment by a Hanning window and Fourier trans-formed the windowed data segment of length T, so that the spike-triggered LFP frequency ( f ) spectrum is given as follows:
Xi� f � � �t
T
w�t� xi�t�e�2jft�, (1)
where xi(t) is the LFP time segment around the ith spike (i � 1, 2, . . . , N )and w(t) the Hanning window. Using a 1.0 s data segment length set theRayleigh frequency at 1 Hz, allowing a frequency resolution of 1 Hz. Wedetermined the complex average spike-triggered LFP spectrum acrossthe C different tetrodes as follows:
Xi� f �� �1
C �c�1
C Xic� f �
�Xic� f ��. (2)
Equation 2 ensures that the power of each LFP segment is ignored in thecomputation of the average spike phase. The spike phase is now simplygiven by �i � arg(Xi( f )). We measured phase consistency by means ofthe spike–LFP phase-locking value, which is defined as the resultantvector length across all spikes N, as follows:
PLV� f � � � 1
N �i�1
N Xi� f ��
�Xi� f ����. (3)
The resultant vector length is a real number in the range of 0 (low phaseconsistency) to 1 (high phase consistency). The more spikes we use toobtain our statistical estimate of the resultant length, the more reliable itis. Spike–LFP phase locking is a biased measure with respect to the num-ber of spikes that are entered in the computation. In the method usedhere (Womelsdorf et al., 2008) (cf. Lachaux et al., 2002), we controlledfor the bias by always entering the same fixed number of spikes (N � 50)into Equation 3 when we compared between samples with a differentnumber of elements. This was the case whenever we compared phaselocking between trial types (see Figs. 2 B, C, 3 A, B, 4C), different taskperiods (see Fig. 2 D), and different cell groups (see Fig. 4 A, B). Only inthe time-resolved estimate of phase locking (see Fig. 2 A), we used a lowercriterion of N � 40 spikes per cell because here the sliding time windows(500 ms) were half the size of regular LFP windows. We further reducedthe statistical variance of the spike–LFP phase-locking estimate by meansof a bootstrapping procedure. For every repetition, we drew a fixed num-ber of spikes without replacement from all spikes in the sample. For eachsample drawn, we determined the spike–LFP phase-locking value. Sub-sequently, we averaged these spike–LFP phase-locking values across allbootstrapped samples (N � 5000), producing an unbiased phase-lockingvalue. Nonetheless, the statistical significance of spike–LFP phase lockingcan still be assessed across the entire sample of spikes, using the Rayleightest ( p � 0.001).
Time-resolved power spectra and timing of theta oscillation onset. Forevery tetrode, we isolated LFP data segments in 500 ms windows (settingthe Rayleigh frequency resolution at 2 Hz) centered on the time point ofinterest, separated by time steps of 10 ms (see Fig. 3C,D, at 6 Hz). ForFigure 1C, we used a window of 800 ms, yielding a frequency resolutionof 1.25 Hz. Using Equation 1, the LFP power of the ith segment wasdetermined as �Xi( f )�:
�Xi� f �� � �t
T
w�t� xi �t�e�2jft�. (4)
To obtain the baseline-corrected LFP power Pi( f ), we first deter-mined the LFP power in the intertrial interval in the same way as inthe task period. We averaged the baseline LFP power across timesegments and trials. We then defined the baseline-corrected trial LFPpower by dividing the trial LFP power by the baseline LFP power.
7080 • J. Neurosci., May 19, 2010 • 30(20):7078 –7087 van Wingerden et al. • Phase Locking of Orbitofrontal Neurons

Since the number of trials before and after reversal differs betweensessions, the averaged power modulation shown in Figure 3, C and D,was only calculated for trials with N � 5 contributing sessions. Tostudy the dynamics of theta oscillation onset around the odor– out-come reversal (see Fig. 3E), we calculated a center-of-mass (COM)index for the waiting period as follows:
COM ��
i
N
�Pi� f ��i�
�i
N
Pi� f �, (5)
where N is the number of data segments between �2 and �2 s relative toreward delivery, and �i indicates the center of the LFP segment and rangesfrom �2 s to �2 s. To determine the trial-by-trial timing of the onset ofthe theta oscillation on hit trials (see Fig. 3F ), we determined the firsttime point from �2 to �2 s relative to reward delivery, where the calcu-lated theta power was �50% of the maximum theta power in that seg-ment (threshold crossing). We pooled these values as a function of trialnumber relative to reversal across sessions and performed a regressionanalysis of theta onset versus trial number on the first 15 hit trials afterreversal. To control for unequal trial numbers in the postreversal phase,we created a randomization distribution of correlation coefficients forthis regression by shuffling trials from all sessions with more than fourpostreversal hit trials. We then compared the observed correlation coef-ficient against the randomization distribution of correlation coefficientsto obtain the probability of finding that result. This statistical procedureensured that any bias due to unequal postreversal trial numbers wasremoved.
Multiple regression analysisTo investigate the contribution of a type of behavioral correlate in firingrate to phase-locking values during a specific period, we coded the pres-ence or absence of such a correlate per cell in a binary fashion. Next, weconstructed a design matrix with firing-rate correlate presence as dummyindependent variables to explain phase-locking values as a dependentvariable, separately for each trial period. This resulted in a matrix of�-weights (correlation-coefficients) and associated p values (see Fig.4 A, B). As a control predictor, rat identity was entered, which yielded noadditional explanatory power.
ResultsWe used tetrode arrays (Gray et al., 1995) to record single-unitactivity and LFPs from the OFC in 17 sessions from three maleWistar rats. Before each session, the tetrodes were moved indi-vidually to optimize the number of cells recorded simulta-neously. Histological verification of the tetrode endpoints andrecording tracks showed that all recordings were performed be-tween 3.2 and 4.2 mm anterior of bregma and confined to theventral and lateral aspects of the OFC (supplemental Fig. S1C–E,available at www.jneurosci.org as supplemental material). Ratsperformed a two-odor discrimination task in which they wererequired, in each new session, to associate one novel odor (S�) toa positive trial outcome (sucrose solution) and a second novelodor (S�) to a negative outcome (quinine solution). All record-ings were confirmed as having been made from OFC, as shown inthe example in supplemental Figure S1E (available at www.jneurosci.org as supplemental material). This yielded a total of525 well isolated single units (15–54 units per session, median:29) in conjunction with LFP signals recorded simultaneously. Inall analyses where pairs of single units and LFPs were used, theunit was recorded on a different tetrode than the LFP to avoid apossible frequency bias when the LFP around a spike was filtered.
BehaviorFollowing odor sampling, rats either made a Go decision, con-sisting of a locomotor response toward a fluid well followed by a
nose poke into the well and an immobile waiting period of 1 sbefore reinforcer delivery, or a No-Go decision, refraining fromthese responses (Fig. 1A,B). Rats required 86 6 (mean SEM)trials to reach the criterion of 85% correct Go/No-Go decisionsover the last 20 trials, making on average 16 2 false alarmresponses (i.e., erroneous Go responses) (Fig. 1B). When thecriterion was met, rats were exposed to a reversal schedule. Now,the odor previously associated with sucrose was coupled to qui-nine and vice versa. After reversal, rats quickly adjusted theirbehavior to the new odor– outcome contingencies, performingabove chance level after on average 30 4 trials (binomial test,p � 0.05). This provides evidence that the rats also learned thereversed odor– outcome contingencies. On hit trials, both beforeand after reversal, the mean reaction time (measured from odoroffset to reward delivery) was negatively correlated with increas-ing trial number (both p � 0.05, Spearman’s rank correlation).Licking behavior was analyzed separately (see below).
Analysis of oscillatory activityWe observed increments in theta power (4 –12 Hz) in the LFPsduring the waiting period of each trial, when the rat anticipatedreward, and during reward consumption, but not during move-ment (Fig. 1B,C). The characteristics of these oscillations aredifferent from the well known theta rhythm recorded from hip-pocampus, which has been linked to locomotion and spatial andepisodic memory formation (O’Keefe and Recce, 1993; Skaggs etal., 1996; Buzsaki, 2005). The LFP reflects the activity of a largenumber of neurons and could be confounded by volume conduc-tion of signals from other brain areas. In addition to the tetroderecordings, we performed recordings in two additional animalsin the same behavioral paradigm using linear silicon probes withelectrodes spanning the dorsoventral axis of the OFC (supple-mental Fig. S1C,D, available at www.jneurosci.org as supplemen-tal material). Current-source density analysis of the recordedLFPs showed the presence of a sink-source pair in the OFC, indi-cating that at least part of the recorded theta oscillatory activity islocally generated (supplemental Fig. S1A,B, available at www.jneurosci.org as supplemental material). Next, we examinedwhether theta-band rhythmicity was also visible in the firing pat-terns of single neurons recorded from the OFC. We determinedthe phase of each spike relative to the LFP components for fre-quencies ranging from 3 to 30 Hz. The normalized sum of thesesingle-cell phase vectors has a mean angle and a resultant lengthbetween 0 and 1. The resultant length of the vector reflects howconsistently a cell fires to a phase of the theta oscillation, with aspike–field phase-locking value of 0 indicating no consistency inphases, and a value of 1 indicating full consistency of spike phases(for a detailed explanation, see Materials and Methods). In amajority of OFC units (51%), spikes were significantly phaselocked to theta oscillations, with a maximum strength of lockingat 6 Hz (Fig. 1D).
Theta-band phase locking in relation to behavioraltask periodsBased on the prominent theta-band activity during the waitingperiod, we hypothesized that OFC theta oscillations may contrib-ute to processing of information related to outcome expectancy.To address this issue, we investigated theta-band phase lockingduring this period as a function of time (Fig. 2A). We calculatedtime–frequency representations of phase locking using symmet-ric segments of 500 ms centered on each time point, in steps of 10ms. We found that the strength of spike–field phase lockingsteeply rose during the waiting period, with a peak at 6 Hz, and
van Wingerden et al. • Phase Locking of Orbitofrontal Neurons J. Neurosci., May 19, 2010 • 30(20):7078 –7087 • 7081

rapidly collapsed at reward delivery (Fig.2A). To contrast phase locking across dif-ferent event-related time windows, we de-fined the following task periods in eachtrial: the odor-sampling period (0.5 s win-dow starting at odor onset), the move-ment period (a variable-length windowfrom odor offset until 0.2 s before fluidwell entry), the waiting period (a 0.8 swindow from 0.2 s after fluid well entryuntil fluid delivery), and the fluid deliveryperiod (a 2 s window starting at fluid de-livery). For each cell, a task-period-specific spike–LFP phase-lockingspectrum was determined using the sam-ple of spikes across all applicable trialswithin the task period under consider-ation. To remove the spike-number-related bias when comparing betweendifferent windows, we applied the boot-strapping procedure using 50 spikes percell for each condition. Subsequently, weaveraged the spike–LFP phase-lockingspectrum across all units considered for agiven task period.
This analysis confirmed that the stron-gest theta-band phase locking occurredduring the waiting period (Fig. 2B–D).Importantly, the increment in phase lock-ing during the waiting period was specificto the expectation of a positive outcome:phase locking was significantly higherduring the waiting period before sucrosethan during the waiting period before qui-nine and intertrial interval fluid-well visits(Fig. 2B). It was also significantly higherthan phase locking during both the su-crose and quinine delivery periods (Fig.2C,D) [all comparisons: Wilcoxon’smatched-pairs signed-rank (WMPSR)test between values at 6 Hz, unless noted otherwise]. These ob-servations confirm that theta-band phase locking does not occurmerely as a consequence of immobility or a general state of out-come expectancy, but relates specifically to expectancy of rewarddue to a learned association. Second, the enhanced phase lock-ing during reward anticipation does not appear to be a trivialconsequence of enhanced theta power, because the rewarddelivery period was marked by elevated theta power but a lowdegree of phase locking when all cells were considered (Figs.1C, 2C).
To investigate whether theta-band rhythmicity is also presentin the local spiking activity per se, we used the high-pass-filtered(600 – 6000 Hz) multiunit spike train instead of the LFP to calcu-late phase locking of units (see supplemental material, available atwww.jneurosci.org). Again, we found spectrally specific phaselocking during the waiting period that was significantly higher inthe waiting period before sucrose delivery than in the waitingperiod before quinine delivery ( p � 0.01 WMPSR) (supplementalFig. S3A, available at www.jneurosci.org as supplemental material).In addition, there was significantly more theta-band rhythmicityin the spiking output of the OFC during the waiting period beforesucrose than both the waiting period before quinine and the in-tertrial interval ( p � 0.05, one-tailed t test) (supplemental Fig.
S3B–D, available at www.jneurosci.org as supplemental mate-rial). Both results confirm the presence of outcome-dependenttheta-band rhythmicity in OFC spiking activity during the antic-ipatory period.
Spectral analysis of the oscillatory activity recorded duringdifferent trial periods indicated that besides the prominent theta-band (peak at 6 Hz) activity found during the waiting and rewarddelivery periods (Fig. 1C), another, weaker type of theta-bandactivity was present during the odor-sampling period, peaking at9 Hz. Because the focus of this paper is on reward expectancyoutside stimulus periods, theta-band phase locking during theodor-sampling period will not be further discussed below.
Strength of theta-band phase locking correlates with learningWe further investigated the relationship between theta-bandphase locking and flexible learning. Because neural representa-tions of reward expectancy are thought to be updated when ananimal acquires or adjusts odor-reward associations (Rolls et al.,1996; Schoenbaum et al., 1998; Padoa-Schioppa and Assad,2006), we hypothesized that theta-band rhythmicity is relevantfor modification of these representations. To determine changesin spike–LFP phase-locking value across different stages of ses-sions in which odor-reward representations were modified, asexpressed by changes in the behavior of the animal, we divided
Figure 2. Modulation of spike–field phase locking during reward expectation and delivery. A, Time course of average (across allcells) phase locking centered on reward delivery. Phase locking was calculated in 500 ms symmetric windows centered on eachtime point. Solid line, Reward delivery; dashed line, start of waiting period. B, Average spike–field phase-locking spectra duringwaiting period, separated for sucrose, quinine delivery, and during (unrewarded) intertrial interval fluid pokes. Shaded regionsindicate 95% bootstrapped confidence intervals on the mean. C, Same as in B, but now during fluid delivery period. D, Bar plot ofphase-locking values at 6 Hz (mean SEM) for different task periods. M, Movement; DS, sucrose delivery; DQ, quinine delivery; WS,waiting period before sucrose; WQ, waiting period before quinine. Numbers indicate percentages of cells significantly phase locked(Rayleigh’s test p � 0.05). Comparisons, ***p � 0.001; **p � 0.01; *p � 0.05, Wilcoxon’s matched-pairs signed-rank test.
7082 • J. Neurosci., May 19, 2010 • 30(20):7078 –7087 van Wingerden et al. • Phase Locking of Orbitofrontal Neurons

each session into four quadrants: the first and second half of thetrials during the acquisition of odor-reward contingencies (pre-reversal period) (Fig. 3A), and the first and second half of thetrials after the reversal of odor-reward contingencies (postrever-sal period) (Fig. 3B). In support of our hypothesis, we observed asignificant increase in phase locking during the waiting periodfrom the first to second half of the prereversal period ( p � 0.001)(Fig. 3A). During the postreversal period, we first observed asignificantly lower value of theta-band phase locking during thewaiting period on early trials compared to the second half ofacquisition ( p � 0.001). As the animal acquired the reversedodor– outcome contingencies, theta-band phase locking underthe sucrose rewarded condition returned to prereversal levels.During the second half of the reversal period, theta-band phaselocking in this period was significantly higher compared to thefirst half ( p � 0.001) (Fig. 3B). These findings demonstrate thattheta-band phase locking during the waiting period does notreflect a fixed appetitive/aversive outcome dichotomy, but is re-lated to the rat’s current outcome expectancy.
Trial-by-trial timing of LFP theta power modulationGenerally, spike–field phase-locking methods cannot be used on atrial-by-trial level because the number of spikes per trial is toolow. To study the learning-related changes in theta-band oscilla-tory activity on a trial-by-trial basis, we instead examined the
evolution of LFP theta power across trialsin relation to fluid delivery. Typically, onacquisition hit trials, the onset of the thetapower increment was situated in the wait-ing period (Fig. 3C, top). On hit trials im-mediately following reversal, rewarddelivery is unexpected and the onset of thetheta power increment appeared in the re-ward delivery phase (Fig. 3D, bottom),even though the behavioral sequenceleading up to sucrose delivery is very sim-ilar. As the rat acquired the reversed odor-reinforcer contingencies, the onset of thetheta power increment gradually returnedto the waiting period (Fig. 3D, bottom).For false alarm trials, an opposite patternwas observed. During acquisition, thetheta power increment was generallymuch weaker (Fig. 3D, top). On early re-versal false alarm trials, the onset of thetheta power increment was situated in theanticipatory period (Fig. 4C, bottom), re-sembling acquisition hit trials. Becausethese false alarm trials followed samplingof the previously positive odor, the ele-vated theta power may reflect the not yetupdated outcome expectancy pattern. Onsubsequent false alarm trials, theta powergradually subsided, in line with the con-tinued coupling of negative outcome tothis odor. To quantify these observationsacross sessions, we calculated the center-of-mass (where “mass” is theta power)timing relative to fluid delivery, averagedacross acquisition trials versus early rever-sal trials and separately for hit and falsealarm trials (Fig. 3E, green and red). In-deed, the relation between COM timing
before and after reversal for hits and false alarms is opposite inalmost all sessions. On hit trials, from acquisition (Fig. 3C, top) toearly reversal (postreversal hit trial 1–5) (Fig. 3D, bottom) theCOM shifted from 0.072 0.033 s to 0.670 0.033 s ( p �0.001), while on false alarm trials, the COM shifted in the otherdirection from 0.022 0.075 s to �0.106 0.042 s ( p � 0.001).To specify this shift on a trial-by-trial basis, we defined the onsetof the theta oscillation as the first moment when theta powercrossed a threshold set at 50% of the maximum theta power onthat trial. Regression analysis across sessions showed that, in thefirst 15 hit trials postreversal, theta onset shifted systematically toearlier moments with increasing trial number (slope: �0.066s/trial, p � 0.05) (Fig. 3F). These results confirm that theta-bandoscillatory activity mirrors the dynamic updating of outcomeexpectancies during learning, although behaviors closely associ-ated with expectancy also need to be taken into account (seebelow).
Phase locking by neuronal groups with different task-relatedfiring patternsSo far, we have pooled all neurons regardless of their firing-rateselectivity for particular task phases and behavioral events. How-ever, OFC cells are known to exhibit a wide range of firing-ratemodulations in relation to task events, and a subset of OFC cellsshows firing-rate sensitivity to actual and predicted reward
Figure 3. Learning-related changes in phase locking and LFP. A, Spike–field phase-locking spectra for prereversal phase,separated in early (cyan) and late (magenta) trials. B, Same as A, but now for reversal phase. C, Trial-by-trial modulation of thetapower (6 Hz) relative to reversal. Pseudocolor scale indicates theta power modulation compared to baseline, averaged overcontributing sessions (see Materials and Methods). Before reversal, odor 1 predicts sucrose (O1-S). After reversal, odor 1 predictsquinine (O1-Q). Dashed white line, Start of waiting period; solid white line, fluid delivery; ACQ, acquisition; REV, reversal. D, Sameas C, but now synchronized on fluid delivery following odor 2. E, Hit/false alarm trials show opposite patterns for theta power COM(see Materials and Methods). Dashed lines indicate moment of fluid delivery. Red and green lines indicate mean shifts. F, Trial-by-trial timing of theta onset on hit trials in relation to reversal. Green line indicates mean first time point in time window whereinstant theta power reached �50% of maximum theta power on that trial. Shading indicates SD.
van Wingerden et al. • Phase Locking of Orbitofrontal Neurons J. Neurosci., May 19, 2010 • 30(20):7078 –7087 • 7083

(Schoenbaum et al., 1998; Wallis and Miller, 2003; Padoa-Schioppa and Assad, 2006; van Duuren et al., 2008, 2009). Be-cause strong theta-band phase locking during the waiting periodbecomes a reliable predictor of reward with learning, we predictthat this property is predominantly expressed by those cells thatshow outcome selectivity in their firing rates. To investigate this,
we classified cells according to the task periods in which theyshowed firing-rate responses that were significantly differentfrom baseline in four basic groups (Table 1; supplemental Fig. S2,available at www.jneurosci.org as supplemental material). Often,cells exhibited firing rate correlates to more than one task period.To investigate the relationship between behavioral firing-ratecorrelates and phase locking, we performed a multiple linear re-gression analysis to predict phase-locking values from the pres-ence of one or more correlates per cell.
Of the four possible behavioral firing-rate correlates, only thepresence of a firing-rate correlate during the waiting period for agiven cell (W-cell) was a strong and positive predictor of theta-band phase locking during the waiting period at 6 Hz (�-weightregression coefficient SE � 0.038 0.019, p � 0.05 two-sidedt test) (Fig. 4A). Though it might seem obvious that the group ofcells with a firing-rate correlate during the waiting period shouldalso show the highest phase-locking value, this is not a trivialfinding since for each cell, a fixed number of spikes was used tocalculate phase-locking values, eliminating a bias toward higherphase-locking values due to high firing rate. Strikingly, when werestricted this analysis to the reward delivery period (Fig. 4B), onlythe W-cell category was positively correlated with phase-locking val-ues during reward consumption (�-weight SE � 0.041 0.007,p � 0.001). These findings suggest that the increase in theta-bandphase locking is dynamically expressed in anticipation of and duringactual delivery of reward by a select group of neurons that also ex-press expected outcome information through differential firingrates.
Trial-by-trial phase locking per unit predicts outcomeAs phase-locking values cannot be meaningfully defined per trial,we could not determine whether phase-locking values were abetter predictor of upcoming outcome than single-cell firingrates. However, we could select the group of trials in which asingle cell’s firing rate suggested one outcome, when actually theother outcome was coming up (mismatch trials) and contrast thephase-locking values for this group with the values for the groupof trials in which the firing-rate of a single cell correctly predictedthe upcoming outcome (match trials). In this contrast, we in-cluded those cells that significantly predicted the upcoming out-come (using a Bonferroni correction for the total number of cells;see Materials and Methods). To decode the predicted outcomeper cell per trial, we determined the mean firing-rate response in
Figure 4. Relationship between behavioral firing-rate correlates and spike–field phaselocking for different trial periods. A, Regression coefficients for the four categories of possiblebehavioral correlates. Only the waiting period correlate is a significant positive predictor ofphase-locking values during the waiting period (tested at 6 Hz). Shaded regions indicate SEM.B, As in A, but now for the fluid delivery period. C, Phase-locking spectra separate for trials inwhich the outcome decoded from the neuron’s firing rate matched (green) or failed to match(red) the actual outcome. Shaded regions indicate 95% bootstrapped confidence intervals onthe mean. There was a significant difference at 6 Hz ( p � 0.01, Wilcoxon’s matched-pairssigned-rank test).
Table 1. Distribution of behavioral firing-rate correlates across the recordedpopulation of cells
None324�/0.62
Odorsampling
Movementperiod
Waitingperiod
Fluiddelivery
Odor sampling 43 (26) 14 (6) 9 (7) 10 (8)88�/0.17 0.08 0.03 0.02 0.02Movement period 14 (4) 36 (12) 9 (5) 4 (0)72�/0.14 0.03 0.07 0.02 0.01Waiting period 9 (2) 9 (6) 24 (12) 9 (6)64�/0.12 0.02 0.02 0.05 0.02Fluid delivery 10 (9) 4 (2) 9 (5) 28 (20)62�/0.12 0.02 0.01 0.02 0.06
Triple OD_WT_FD OD_MV_FD OD_MV_WT MV_WT_FD6/0.01 2/0.01 4/0.01 3/0.01
Distribution of 256 significant task-related correlates from a sample of 201 out of 525 units. Rows show categories oftask-related correlates, columns specify single and double correlates in absolute numbers and fractions of total cellnumber. The numbers in brackets in the leftmost column indicate total number of units with a behavioral correlatein that category (including double and triple correlates, thus amounting to more than 256 correlates). Numbers inparentheses indicate the number of cells in correlate category that significantly discriminate between odors oroutcomes. OD, Odor sampling; MV, movement period; WT, waiting period; FD, fluid delivery.
7084 • J. Neurosci., May 19, 2010 • 30(20):7078 –7087 van Wingerden et al. • Phase Locking of Orbitofrontal Neurons

the waiting period for both quinine and sucrose delivery. Next,we used a leave-one-out decoding algorithm to predict for asingle-cell trial response during the waiting period whether theactual fluid delivered was sucrose or quinine. This was deter-mined by calculating the Euclidean distance of the single-cell’sfiring rate on that trial to the mean firing rate in the training set ofquinine and sucrose trials (the training set was defined as the setof trials remaining after removal of the single trial under study).Next, we pooled the phase-locking values per condition (match/mismatch) over cells (Fig. 4C).We hypothesized that the phase-locking value would be lower on mismatch trials than on matchtrials. As expected, we observed a higher phase-locking value(0.22 0.02) for decoded trials with a correct prediction than fordecoded trials with an incorrect prediction (0.18 0.01, p �0.01) (Fig. 4C). Thus, when the firing rates of single neuronscorrectly reflect the upcoming outcome, these cells are morestrongly locked to the ongoing theta oscillation, possibly enhanc-ing their effect on target cells. Conversely, when the outcomeprediction associated with a unit’s firing pattern fails to match theupcoming outcome, the unit’s spikes on that trial are less phaselocked.
Theta-band oscillatory activity in relation to licking behaviorThus far, theta-band phase locking has been examined in thecontext of reward expectancy. In rats, expectancy can be tightlycoupled to direct motor consequences such as anticipatory lick-ing (Neafsey et al., 1986; Gutierrez et al., 2006, 2010). We foundno systematic relationship between individual lick responses andtheta activity in LFP traces (i.e., individual licks were not system-atically associated with theta oscillations). However, based on theobservation by Gutierrez et al. (2006) that OFC spiking activitymay correlate with clusters of lick responses, we checked whetherthe frequency of licking was associated with theta-band phaselocking under the respective trial conditions (supplemental Fig.S4, available at www.jneurosci.org as supplemental material).The intensity of licking was higher during the sucrose deliveryperiod than during the sucrose waiting period, yet phase lockingwas selectively strong for the waiting but not the delivery period(compare Fig. 2D). Moreover, licking activity was significantlymore frequent during the quinine-anticipation period as com-pared to visits to the fluid well during intertrial intervals, yet thephase locking was weaker during this anticipation period (com-pare Fig. 2D). Although these findings do not preclude any rela-tionship between theta-band activity and licking (Gutierrez et al.,2010), they do suggest that theta-band phase locking is unlikely tobe linked directly to the vigor or intensity of rhythmic motoractivity expressed as licking.
DiscussionTo summarize, our results indicate that OFC neurons engage instrong theta-band phase locking in anticipation of reward, mir-roring the animal’s current expectation of positive outcome asmeasured by behavioral Go responses. Specifically, cells whosefiring rate was selectively modulated in anticipation of rewardshowed the strongest phase locking to the ongoing LFP thetaoscillation during reward anticipation and delivery periods.When, on reversal of odor– outcome contingencies, establishedoutcome expectancies were violated, theta-band phase lockingdeclined (Fig. 3B) and the onset of theta oscillations following thepreviously unrewarded odor now appeared in the reward deliveryperiod, coinciding with delivery of unexpected reward (Fig.3D,F). As the animals acquired the reversed odor– outcome con-
tingencies, the onset of theta oscillations shifted back over trialsto earlier moments in the waiting period (Fig. 3D, bottom).
Although the exact anatomical origin of LFP theta oscillationsrecorded from the OFC is not known, the present data suggestthat theta oscillations are, at least in part, locally generated, whileother brain areas may also contribute. First, theta-band rhythmwas not detectable during locomotion toward the reward site, incontrast to what is expected for a hippocampal source (Fig. 1C).Second, we found a strong alignment of theta-band spike phasesper cell (Fig. 1D) as well as between single-cell mean phases (Fig.1E), suggesting that rhythmic spiking and synaptic activity at thepopulation level contribute to the recorded LFP theta oscilla-tions. Third, the results of the current source density analysisindicate the presence of a sink-source couple within the OFC,suggesting a local source of theta oscillations (supplemental Fig.S1A–C, available at www.jneurosci.org as supplemental mate-rial), although not precluding other, more remote sources. Fi-nally, when we substituted the multiunit spiking activity forthe LFP as a reference to calculate phase locking and when wecalculated the frequency components of the autocorrelogramsof composite multiunit spike trains (cMUAs), spectrally spe-cific differences in theta-band oscillatory activity between be-havioral conditions remained present (supplemental Fig. S3,available at www.jneurosci.org as supplemental material).Multiunit activity originates from a much smaller tissue vol-ume than the LFP (Mitzdorf, 1987; Logothetis, 2003); there-fore, spike–MUA phase locking and cMUA autocorrelationare measures local to the OFC. Thus, our results demonstratethat during reward expectation, the spiking output of the OFCnot only shows theta-band rhythmicity, but also phase locks tolocally recorded neural mass activity.
In addition to correlating with reward expectancy, the ques-tion arises whether theta-band phase locking is also related tolicking behavior (Gutierrez et al., 2006, 2010). Unlike licking,which occurred across both waiting and delivery periods, theta-band phase locking was selectively enhanced only during the su-crose anticipation period (Fig. 2D). Theta-band phase lockingand the frequency of lick responses were dissociated betweensucrose anticipation and consumption periods (supplementalFig. S4A, available at www.jneurosci.org as supplemental mate-rial). Moreover, during the quinine anticipation period in falsealarm trials, the frequency of lick responses was higher than inintertrial intervals, whereas phase locking was weaker (supple-mental Fig. S4B, available at www.jneurosci.org as supplementalmaterial), again indicating a dissociation. Thus, phase lockingdoes not appear to correlate primarily to licking behavior, buta more global linkage certainly may exist because reward ex-pectancy can be considered a primary drive to initiate licking.Synchronized firing across OFC, amygdala, and agranularinsular cortex may arise in conjunction with licking-relatedactivity (Gutierrez et al., 2010), which however does not con-tradict a concurrent role in reward expectancy coding. Such aninterleaving of rhythmic movement and information codinghas been noted before in hippocampal, somatosensory, andolfactory structures, where theta activity correlates with loco-motion, whisking, and respiratory rhythms, respectively(Vanderwolf, 1969; Lisman, 2005; O’Keefe and Burgess, 2005;Kleinfeld et al., 2006; Verhagen et al., 2007).
The present findings may have significant implications for ourunderstanding of neural systems mechanisms for processing andacquiring reward information in the brain. Analysis of rewardprocessing has thus far focused on firing-rate modulation by pre-diction or delivery of reward (Schultz et al., 1997; Schoenbaum et
van Wingerden et al. • Phase Locking of Orbitofrontal Neurons J. Neurosci., May 19, 2010 • 30(20):7078 –7087 • 7085

al., 1998; van Duuren et al., 2008), and thus the temporal struc-turing of reward-related firing patterns remained unknown.Phase locking of OFC firing, as described here, may facilitate thetemporal alignment of OFC output with firing in target areas,such as the amygdala, striatum, and neocortical sensory-associational areas (Carmichael and Price, 1995; Schilman et al.,2008), and enhance the impact of this synchronized output dur-ing selective phases of the oscillation (Salinas and Sejnowski,2000; Engel et al., 2001). This impact may well depend on phaseconsistency between theta oscillations in OFC and in target areasthemselves (Chrobak and Buzsaki, 1998; Hyman et al., 2003;Womelsdorf et al., 2007; Schroeder and Lakatos, 2009). Theta-band phase locking may thus facilitate the communication be-tween areas involved in reward-dependent learning.
Recently, Schoenbaum et al. (2007) suggested that outcome-expectancy representations in OFC may serve to update andmodulate learned associations stored in amygdala and relatedstructures by comparing expected to actual outcomes. We ob-served a sustained theta-band activity during reward expectancyand delivery, expressed by elevated theta power and phase lockingspecific to outcome-selective cells. Previously, neural activity inamygdala and mPFC was shown to synchronize in the theta band(Pape et al., 1998; Siapas et al., 2005; Paz et al., 2008). We hypoth-esize that the synaptic updating process in OFC and related cir-cuits underlying modification of stored associations may rely onspike-timing-dependent plasticity (STDP) (Levy and Steward,1983; Cassenaer and Laurent, 2007) during coherent theta-bandactivity, which could be boosted by repetitive licking (Gutierrezet al., 2006). Under this hypothesis, the firing patterns phaselocked to OFC theta oscillations convey a synchronized rewardexpectancy signal to target areas, which may or may not be con-tinued into the period of the actual outcome, with significantconsequences for learning. For example, when the outcome failsto meet the predicted signal (as in reversal learning), theta oscil-latory activity in the delivery period collapses (Fig. 3C). Althoughthis collapse was observed for theta-band LFP power, it can besafely assumed that the synchronization in spiking output is re-duced at the same time, which may lead to a net weakening ofsynapses between OFC and target cells, consistent with STDPprinciples (Abbott and Nelson, 2000; Hayashi and Igarashi,2009). Predictive synchronized firing after sampling of the otherodor, previously coupled to quinine but now to reward, is regen-erated at the moment of unpredicted reward (Fig. 3D,F), whichmay selectively strengthen another set of synapses onto targetcells. During early reversal, the onset of oscillatory activity shiftedto progressively earlier moments in the trial, in broad agreementwith models of temporal difference (TD) learning (Schultz et al.,1997; Sutton and Barto, 1998). This class of reinforcement learn-ing (RL) models posits the existence of a signal representing theerror in reward prediction, as in classic conditioning theory(Rescorla and Wagner, 1972). This signal shifts backwards intime across learning trials toward the earliest reward-predictingevent available to the subject. Despite this global similarity, ourfindings add two novel elements. First, the theta rhythm mayimplement a timing or “clocking” system that provides temporalstructure to value signals. Such a timing system may fill in animportant gap in RL models that have been underconstrained asto how time steps may be neurally implemented (cf. Schultz et al.,1997). Second, in contrast to the transient nature of error signals,theta-band phase-locked activity conveys value signals in a sus-tained manner as they come to precede reward delivery. Thus,this type of value signal may complement an early and transientreward prediction error signal emitted by mesencephalic dopa-
mine neurons after learning (Schultz et al., 1997). As compared tothe quantities encoded in TD-learning and other RL models, thetheta oscillatory activity in OFC resembles a value function V(t),reflecting current reward predictions through time (cf. Pennartz,1997; Niv and Schoenbaum, 2008). Because the theta oscillatorysignal in OFC is expressed as a neural mass signal, it may exertvast and overriding effects on activity in its target structures.Although this hypothesis awaits further investigation, the currentfindings provide strong support for a role of the OFC in thetemporal coordination of signaling expected and actual rewards,partly in conjunction with its role in rhythmic licking.
Future experiments may test the causal role of OFC thetaoscillatory activity in the acquisition and reversal of learned as-sociations, for instance by local infusions of substances that wereshown to alter oscillations in other brain structures [e.g., GABAB
and muscarinic receptor antagonists (Leung and Shen, 2007) aswell as blockers of Ih (Glasgow and Chapman, 2008)]. Second,further experiments may examine whether information on neg-ative outcome predictions is also temporally structured by way ofoscillatory activity, and how positive predictions about non-ingestible rewards are coded. Aversion- or punishment-relatedinformation may be coded outside the region of OFC currentlystudied, for instance in anterior cingulate cortex (Johansen et al.,2001) or nondopaminergic cell groups of the VTA (Ungless et al.,2004). Another possibility explaining the lack of theta-bandphase locking during Go responses before quinine is that falsealarm responses are generated by habit systems and in the ab-sence of a clear negative expectancy, which if present would leadthe animal to refrain from making a response that will be pun-ished. Classical conditioning studies with an aversive outcomemay help resolve this matter.
ReferencesAbbott LF, Nelson SB (2000) Synaptic plasticity: taming the beast. Nat Neu-
rosci 3 [Suppl]:1178 –1183.Bechara A, Damasio AR, Damasio H, Anderson SW (1994) Insensitivity to
future consequences following damage to human prefrontal cortex. Cog-nition 50:7–15.
Buzsaki G (2005) Theta rhythm of navigation: link between path integrationand landmark navigation, episodic and semantic memory. Hippocampus15:827– 840.
Carmichael ST, Price JL (1995) Sensory and premotor connections of theorbital and medial prefrontal cortex of macaque monkeys. J Comp Neurol363:642– 664.
Cassenaer S, Laurent G (2007) Hebbian STDP in mushroom bodies facili-tates the synchronous flow of olfactory information in locusts. Nature448:709 –713.
Chrobak JJ, Buzsaki G (1998) Operational dynamics in the hippocampal-entorhinal axis. Neurosci Biobehav Rev 22:303–310.
Engel AK, Fries P, Singer W (2001) Dynamic predictions: oscillations andsynchrony in top-down processing. Nat Rev Neurosci 2:704 –716.
Fellows LK, Farah MJ (2003) Ventromedial frontal cortex mediates affectiveshifting in humans: evidence from a reversal learning paradigm. Brain126:1830 –1837.
Fries P, Roelfsema PR, Engel AK, Konig P, Singer W (1997) Synchroniza-tion of oscillatory responses in visual cortex correlates with perception ininterocular rivalry. Proc Natl Acad Sci U S A 94:12699 –12704.
Glasgow SD, Chapman CA (2008) Conductances mediating intrinsic theta-frequency membrane potential oscillations in layer II parasubicular neu-rons. J Neurophysiol 100:2746 –2756.
Gray CM, Maldonado PE, Wilson M, McNaughton B (1995) Tetrodesmarkedly improve the reliability and yield of multiple single-unit isola-tion from multi-unit recordings in cat striate cortex. J Neurosci Methods63:43–54.
Gutierrez R, Carmena JM, Nicolelis MA, Simon SA (2006) Orbitofrontalensemble activity monitors licking and distinguishes among natural re-wards. J Neurophysiol 95:119 –133.
Gutierrez R, Simon SA, Nicolelis MA (2010) Licking-induced synchrony in
7086 • J. Neurosci., May 19, 2010 • 30(20):7078 –7087 van Wingerden et al. • Phase Locking of Orbitofrontal Neurons

the taste-reward circuit improves cue discrimination during learning.J Neurosci 30:287–303.
Hayashi H, Igarashi J (2009) LTD windows of the STDP learning rule andsynaptic connections having a large transmission delay enable robust se-quence learning amid background noise. Cogn Neurodyn 3:119 –130.
Hyman JM, Wyble BP, Goyal V, Rossi CA, Hasselmo ME (2003) Stimula-tion in hippocampal region CA1 in behaving rats yields long-term poten-tiation when delivered to the peak of theta and long-term depressionwhen delivered to the trough. J Neurosci 23:11725–11731.
Jarvis MR, Mitra PP (2001) Sampling properties of the spectrum and coher-ency of sequences of action potentials. Neural Comput 13:717–749.
Johansen JP, Fields HL, Manning BH (2001) The affective component ofpain in rodents: direct evidence for a contribution of the anterior cingu-late cortex. Proc Natl Acad Sci U S A 98:8077– 8082.
Kleinfeld D, Ahissar E, Diamond ME (2006) Active sensation: insights fromthe rodent vibrissa sensorimotor system. Curr Opin Neurobiol 16:435–444.
Lachaux JP, Lutz A, Rudrauf D, Cosmelli D, Le Van Quyen M, Martinerie J,Varela F (2002) Estimating the time-course of coherence betweensingle-trial brain signals: an introduction to wavelet coherence. Neuro-physiol Clin 32:157–174.
Leung LS, Shen B (2007) GABAB receptor blockade enhances theta andgamma rhythms in the hippocampus of behaving rats. Hippocampus17:281–291.
Levy WB, Steward O (1983) Temporal contiguity requirements for long-term associative potentiation/depression in the hippocampus. Neuro-science 8:791–797.
Lisman J (2005) The theta/gamma discrete phase code occuring during thehippocampal phase precession may be a more general brain codingscheme. Hippocampus 15:913–922.
Lisman J, Spruston N (2005) Postsynaptic depolarization requirements forLTP and LTD: a critique of spike timing-dependent plasticity. Nat Neu-rosci 8:839 – 841.
Logothetis NK (2003) The underpinnings of the BOLD functional magneticresonance imaging signal. J Neurosci 23:3963–3971.
Markram H, Lubke J, Frotscher M, Sakmann B (1997) Regulation of synap-tic efficacy by coincidence of postsynaptic APs and EPSPs. Science275:213–215.
Mitzdorf U (1987) Properties of the evoked potential generators: currentsource-density analysis of visually evoked potentials in the cat cortex. IntJ Neurosci 33:33–59.
Neafsey EJ, Bold EL, Haas G, Hurley-Gius KM, Quirk G, Sievert CF, Ter-reberry RR (1986) The organization of the rat motor cortex: a micro-stimulation mapping study. Brain Res 396:77–96.
Niv Y, Schoenbaum G (2008) Dialogues on prediction errors. Trends CognSci 12:265–272.
O’Keefe J, Burgess N (2005) Dual phase and rate coding in hippocampalplace cells: theoretical significance and relationship to entorhinal gridcells. Hippocampus 15:853– 866.
O’Keefe J, Recce ML (1993) Phase relationship between hippocampal placeunits and the EEG theta rhythm. Hippocampus 3:317–330.
Ongur D, Price JL (2000) The organization of networks within the orbitaland medial prefrontal cortex of rats, monkeys and humans. Cereb Cortex10:206 –219.
Padoa-Schioppa C, Assad JA (2006) Neurons in the orbitofrontal cortexencode economic value. Nature 441:223–226.
Pape HC, Pare D, Driesang RB (1998) Two types of intrinsic oscillations inneurons of the lateral and basolateral nuclei of the amygdala. J Neuro-physiol 79:205–216.
Paxinos G, Watson C (2007) The rat brain in stereotaxic coordinates, Ed 6.Amsterdam: Academic/Elsevier.
Paz R, Bauer EP, Pare D (2008) Theta synchronizes the activity of medialprefrontal neurons during learning. Learn Mem 15:524 –531.
Pennartz CMA (1997) Reinforcement learning by Hebbian synapses withadaptive thresholds. Neuroscience 81:303–319.
Pesaran B, Pezaris JS, Sahani M, Mitra PP, Andersen RA (2002) Temporalstructure in neuronal activity during working memory in macaque pari-etal cortex. Nat Neurosci 5:805– 811.
Rescorla RA, Wagner AR (1972) A theory of Pavlovian conditioning: varia-tions in the effectiveness of reinforcement and nonreinforcement. In:
Classical conditioning II: current research and theory (Black AH, ProkasyWF, eds), pp 64 –99. New York: Appleton-Century-Crofts.
Rolls ET, Critchley HD, Mason R, Wakeman EA (1996) Orbitofrontal cor-tex neurons: role in olfactory and visual association learning. J Neuro-physiol 75:1970 –1981.
Rolls ET, McCabe C, Redoute J (2008) Expected value, reward outcome,and temporal difference error representations in a probabilistic decisiontask. Cereb Cortex 18:652– 663.
Salinas E, Sejnowski TJ (2000) Impact of correlated synaptic input on out-put firing rate and variability in simple neuronal models. J Neurosci20:6193– 6209.
Schilman EA, Uylings HB, Galis-de Graaf Y, Joel D, Groenewegen HJ (2008)The orbital cortex in rats topographically projects to central parts of thecaudate-putamen complex. Neurosci Lett 432:40 – 45.
Schoenbaum G, Chiba AA, Gallagher M (1998) Orbitofrontal cortex andbasolateral amygdala encode expected outcomes during learning. NatNeurosci 1:155–159.
Schoenbaum G, Saddoris MP, Stalnaker TA (2007) Reconciling the roles oforbitofrontal cortex in reversal learning and the encoding of outcomeexpectancies. Ann N Y Acad Sci 1121:320 –335.
Schroeder CE, Lakatos P (2009) Low-frequency neuronal oscillations as in-struments of sensory selection. Trends Neurosci 32:9 –18.
Schultz W (2006) Behavioral theories and the neurophysiology of reward.Annu Rev Psychol 57:87–115.
Schultz W, Dayan P, Montague PR (1997) A neural substrate of predictionand reward. Science 275:1593–1599.
Siapas AG, Lubenov EV, Wilson MA (2005) Prefrontal phase locking tohippocampal theta oscillations. Neuron 46:141–151.
Skaggs WE, McNaughton BL, Wilson MA, Barnes CA (1996) Theta phaseprecession in hippocampal neuronal populations and the compression oftemporal sequences. Hippocampus 6:149 –172.
Stalnaker TA, Franz TM, Singh T, Schoenbaum G (2007) Basolateral amyg-dala lesions abolish orbitofrontal-dependent reversal impairments. Neu-ron 54:51–58.
Sutton RS, Barto AG (1998) Reinforcement learning: an introduction.Cambridge, MA: MIT.
Ungless MA, Magill PJ, Bolam JP (2004) Uniform inhibition of dopamineneurons in the ventral tegmental area by aversive stimuli. Science303:2040 –2042.
van Duuren E, Escamez FA, Joosten RN, Visser R, Mulder AB, Pennartz CM(2007) Neural coding of reward magnitude in the orbitofrontal cortex ofthe rat during a five-odor olfactory discrimination task. Learn Mem14:446 – 456.
van Duuren E, Lankelma J, Pennartz CMA (2008) Population coding ofreward magnitude in the orbitofrontal cortex of the rat. J Neurosci28:8590 – 8603.
van Duuren E, van der Plasse G, Lankelma J, Joosten RN, Feenstra MG,Pennartz CM (2009) Single-cell and population coding of expected re-ward probability in the orbitofrontal cortex of the rat. J Neurosci29:8965– 8976.
Vanderwolf CH (1969) Hippocampal electrical activity and voluntarymovement in the rat. Electroencephalogr Clin Neurophysiol 26:407– 418.
Verhagen JV, Wesson DW, Netoff TI, White JA, Wachowiak M (2007)Sniffing controls an adaptive filter of sensory input to the olfactory bulb.Nat Neurosci 10:631– 639.
Wallis JD, Miller EK (2003) Neuronal activity in primate dorsolateral andorbital prefrontal cortex during performance of a reward preference task.Eur J Neurosci 18:2069 –2081.
Womelsdorf T, Fries P, Mitra PP, Desimone R (2006) Gamma-band syn-chronization in visual cortex predicts speed of change detection. Nature439:733–736.
Womelsdorf T, Schoffelen J-M, Oostenveld R, Singer W, Desimone R, EngelAK, Fries P (2007) Modulation of neuronal interactions through neuro-nal synchronization. Science 316:1609 –1612.
Womelsdorf T, Vinck MA, Bosman C, Oostenveld R, Desimone R, Fries P(2008) Putative excitatory and inhibitory neurons synchronize at differ-ent phases of the gamma cycle in visual area V4 of awake monkeys. FrontSyst Neurosci Conf Abstr Comput Syst Neurosci 2008. www.cosyne.org/wiki/Poster2008-2.
van Wingerden et al. • Phase Locking of Orbitofrontal Neurons J. Neurosci., May 19, 2010 • 30(20):7078 –7087 • 7087

Fig. S1: Current source density (CSD) analysis and histology.
Silicon probe recordings & Current-source density analysis
For the experiments described in figure S1, we used two additional Wistar rats in the
same weight and age group as the rats in the main experiment. Rat were trained on the
same task, and implanted with a modified microdrive holding a 32-site linear silicon
probe (NeuroNexusTech, Ann Arbor, MI, USA) with 1250μm2 circular sites spaced 100
μm. We calculated the fluctuation of theta power per site as a function of time around
reward delivery by calculating the baseline-corrected power of the LFP, filtered between
4-12 Hz, in 500 ms time windows in time steps of 50 ms. Next, we averaged z-scored
power modulations, determined relative to baseline theta power during the inter-trial
interval, across the number of reward delivery events to obtain an average time-site
representation of theta power for a given event (fig. S1A).
One-dimensional current source density (CSD) of the 4-12 Hz band-pass filtered LFP
traces was calculated per event (fig. S1B), using the formula
(1)
where CSD(z) is the current source density at depth z, in arbitrary units, φ(z) is the
recorded LFP at depth z, Δz is the depth interval (200 microns, because only every other
site was used to construct the CSD) and σ(z) is the conductivity in the z-direction,
assumed constant.
[ ]( )
)()()()(2)( 2 zz
zzzzzzCSD σφφφ
∆∆−−∆+−
=

Histology
After the final recording session, current (25 μA for 10 seconds) was passed through one
lead per tetrode to mark the endpoint of the tetrode with a small lesion. The animals were
deeply anesthetized with Nembutal (sodium pentobarbital, 60 mg/ml , 0.9 ml i.p.; Ceva
Sante Animale, Maassluis, the Netherlands) and transcardially perfused with a 0.9%
NaCl solution, followed by a 4% paraformaldehyde solution (pH 7.4 phosphate
buffered). Following immersion fixation, coronal sections of 40 um were cut using a
vibratome and stained with Cresyl Violet to reconstruct tetrode tracks and localize the
endpoints. Histological verification of the tetrode endpoints and recording tracks showed
that all recordings were performed between 3.2 and 4.2 mm anterior of bregma and
confined to the ventral and lateral aspects of the OFC (fig. S1C-E).
Legend Fig. S1: Current source density (CSD) analysis and histology. (A) Modulation of
theta power (bandpass filtered 4-12 Hz) by recording site on a linear silicon probe. Time
is synchronized on reward delivery. Pseudocolors show z-scored modulation of theta
power compared to inter-trial interval theta power, averaged over N=31 reward
deliveries. White traces show LFP traces (filtered 1-475 Hz) from two sites,
corresponding to maxima from CSD plot. Red lines show alignment of peaks and troughs
between example traces. (B) Current source density analysis of a representative reward
delivery event. Sources and sinks are depicted in pseudocolor (arbitrary units).
Black traces depict filtered LFP (4-12 Hz) from 16 recording sites. (C) Brain section with
part of the silicon probe in place. Purple box outlines the area from which (A) and (B)
were obtained. In black, raw traces of part of the trial depicted in (B) show that sinks and

sources are located within OFC. Black scale bar: 1s. (D) Corresponding figure from
standardized rat brain atlas. OFC depicted by VO and LO. (E) Brain section from rat
implanted with tetrodes. Two tetrode tracks are visible. Purple boxes mark tetrode
endpoint lesions.
Fig. S2: Classification of neurons according to behavioral correlates of firing rate.
Behavioral correlates of firing-rate changes were assessed by constructing peri-event time
histograms (PETHs) synchronized on task events (i.e., on- and offset of odor sampling,
fluid well entry, reward delivery). Firing rates in time bins (100 ms) around the event of
interest were each compared against firing rates in 5 control bins from the ITI on a trial-
by-trial basis to exclude within-session drift of firing rate as confounding factor and
tested for significance using the non-parametric Wilcoxon’s matched-pairs signed-rank
(WMPSR) test (p<0.01). Binned firing rates were considered significantly modulated in
relation to the task event only if the test bin of interest differed significantly from all 5
baseline bins (van Duuren et al., 2007). Cells were classified into four categories based
on the task period in which they exhibited significant firing-rate changes (for odor
sampling: change in relation to odor onset and during odor delivery; movement: change
after odor offset but before fluid poke onset; waiting: change after fluid poke onset but
before outcome; outcome: change following application of sucrose or quinine solution,
fig 1). See table 1 for the distribution of neurons across categories and examples of units
in each category.

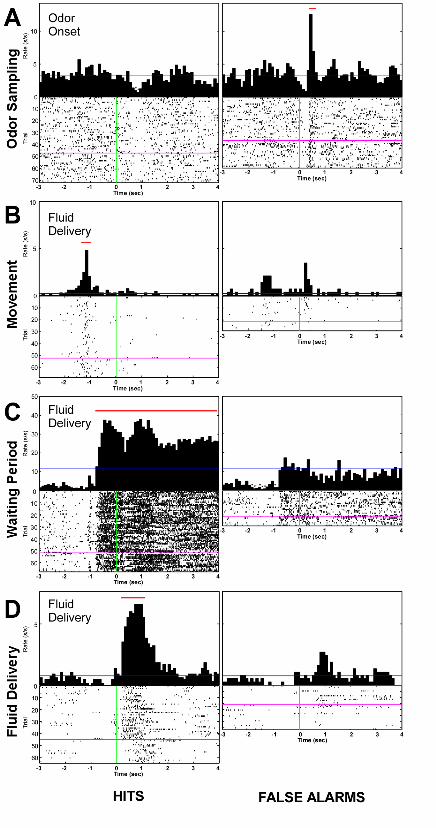
Legend Fig. S2: Classification of neurons according to behavioral correlates of firing
rate. Peri-event time histograms of units from four different classes. Panels show
rasterplots (bottom) and average firing rate (top) in 100 ms bins for the same unit, split
for Hit (left) and False Alarm (right) trials, aligned to the event in the top left corner.
Blue and magenta lines signify mean firing rate during the inter-trial interval period and
time of reversal, respectively. Red line indicates bins with firing rates significantly
different from inter-trial interval (p<0.01 Wilcoxon’s matched-pairs signed-rank test).
Fig. S3: Theta-band phase-locking and oscillatory spiking activity of OFC multi-
unit activity.
Spike-MUA phase-locking
To investigate whether theta-band rhythmicity is also present in the local spiking activity
per se, we used the high-pass filtered (600-6000 Hz) multi-unit spike train (as a point
process) instead of the LFP to form spike-MUA pairs and calculate phase-locking of
units. Artifacts were deleted from the multi-unit activity by a template-matching
algorithm incorporated in the MClust software and, as in spike-LFP analyses, we only
used the multi-unit activity from the electrodes on which our unit was not recorded.
Spike-phaselocking was now calculated using equations (1-3), except that the signal
)(txi now represents the multi-unit spiking activity instead of the LFP. Again, we found
spectrally specific phase-locking during the waiting period that was significantly higher
in the waiting period before sucrose delivery, compared to the waiting period before
quinine delivery (P < 0.01 WMPSR, fig S3A). As predicted from earlier literature

(Zeitler et al., 2006), the obtained spike-MUA phase-locking values were much lower
than the spike-LFP phase-locking values. This is because we measure population phase
from a very sparse sample (only the spiking output of the neurons around the electrode)
of the actual population activity.
Lumped time-resolved autocorrelograms
We combined the spike trains of isolated single units from each tetrode in composite
multi-unit signals (cMUAs) to assess the rhythmicity of the locally recorded spikes. To
this effect, we computed autocorrelograms of the spike trains of these cMUAs restricted
to a behavioral period by entering only spikes recorded in that period as the triggers for
the autocorrelogram. The analysis was restricted to those cMUAs constructed from at
least 2 isolated single units, with N > 600 spikes in each behavioral period that was
considered (sucrose waiting period, quinine waiting period, inter-trial interval), yielding
N = 47 eligible cMUAs. The autocorrelograms were constructed using bins of 10 ms,
extending 500 ms in either direction of time lag zero (see fig. S3B). For comparison, the
autocorrelograms were normalized to an area of 1. Next, we computed power spectra of
the Fourier-transformed autocorrelograms for each cMUA and compared these across
behavioral conditions (fig. S3C). A group analysis revealed significantly higher theta-
band rhythmicity in the waiting period before sucrose compared to both the waiting
period before quinine and the inter-trial interval (fig. S3D).
Legend Fig. S3: Theta-band phase-locking and oscillatory spiking activity of OFC multi-
unit activity. (A) spike-MUA phase-locking spectra during the sucrose waiting period

(green) and quinine waiting period (red). Shading indicates 95% confidence intervals;
Grey bar indicates significant difference (p<0.01, WMPSR test). (B) Two examples (Ex.1
and Ex. 2) of time-resolved normalized autocorrelograms (binsize: 10 ms) of cMUAs,
recorded from different rats, for spikes restricted to the sucrose waiting period (green),
quinine waiting period (red) or inter-trial interval (black). Dashed blue line corresponds
to uniform distribution of spike counts per bin. (C) Powerspectra of the Fourier-
transformed examples from (B). Because the autocorrelograms were normalized to have
equal power, the power spectra can be directly compared. (D) Group analysis of the
theta-band oscillatory power in the cMUA autocorrelograms (N=47). *: p<0.05, one-
tailed t-test, tested at 5 Hz.
Fig. S4: Frequency of licking responses and spike-field phase-locking are
dissociated.
When the animals inserted their head in the liquid reinforcer station, these entries were
registered by photobeam interruptions and stored on a computer dedicated to behavioral
data acquisition. When the animals next entered the fluid well, licking responses were
detected by a separate photobeam situated within the fluid well.
Legend Fig. S4: Frequency of lick responses and spike-field phase-locking per behavioral
period. (A) Mean spike-field phase-locking values (+S.E.M.) and mean licking frequency
(+S.E.M.) for sucrose waiting periods (green) and sucrose consumption periods (orange)
are plotted. These values show a double dissociation. (B) Like (A), but now the same

parameters are plotted for quinine waiting periods (red) and intertrial interval visits to the
fluid well (blue). *,***: p<0.05, p<0.001 Wilcoxon’s Matched-Pairs Signed Rank test. †:
p<0.0001 Mann-Whitney U-test.
Supplementary References
van Duuren E, Escamez FA, Joosten RN, Visser R, Mulder AB, Pennartz CM (2007) Neural coding of reward magnitude in the orbitofrontal cortex of the rat during a five-odor olfactory discrimination task. Learn Mem 14:446-456.
Zeitler M, Fries P, Gielen S (2006) Assessing neuronal coherence with single-unit, multi-unit, and local field potentials. Neural Comput 18:2256-2281.


Copyright © 2022 FDOKUMEN