The expectancy/valence theory and the motivation of farmers and ...
113
THE EXPECTANCY/VALENCE THEORY AND THE MOTIVATION OF FARMERS AND FARM WORKERS A thesis submitted in partial fulfilment of the requirements for the Degree of Master of Arts in Psychology in the University of Canterbury by Garry Diack University of Canterbury l984
-
Upload
khangminh22 -
Category
Documents
-
view
2 -
download
0
Transcript of The expectancy/valence theory and the motivation of farmers and ...

THE EXPECTANCY/VALENCE THEORY AND THE
MOTIVATION OF FARMERS AND FARM WORKERS
A thesis
submitted in partial fulfilment
of the requirements for the Degree
of
Master of Arts in Psychology
in the
University of Canterbury
by
Garry Diack
University of Canterbury
l984

ABSTRACT
This study was undertaken to investigate the
motivational determinants of samples of New Zealand
farmers and farm workers. The Expectancy/valence
theory of motivational effort, using a within-subject
methodology was applied to 55 farmers and 35 farm
workers. Barring two female farmers, all subjects
were male. Apart from a few isolated cases the two
groups failed to be able to predict perceived effort
levels required to complete their farm jobs in order
to obtain desired outcomes of work behaviour. No
differences were evident between farmers and farm
workers. The nature of the relationship of farmers'
jobs to their desired outcomes fails to satisfy the
model's underlying assumptions. A content analysis
isolated several intrinsic lifestyles, stock and
land orientated motivating features characteristic
of both farmers and farm workers. It was concluded
that the Expectancy/valence model of motivational
effort is inappropriate for application to farming
samples. No differences exist between farmers' and
farm workers' job repertoires and desired outcomes of
work behaviour.
ii

ACKNOWLEDGEMENTS
The author expresses deep gratitude to
B.D. Jamieson for the guidance and advice received
in the supervision of this thesis.
Support and access to membership lists was
appreciated from the Canterbury Regional Farm Workers
Association. Special thanks are due to D. Hedderwick
and D. Fantham for their liaison and assistance in
rural research.
Dr. W.J. Rosenburg proved invaluable in his
assistance with setting up of research data for
computation and interpretation.
Sincere gratitude is extended to my parents,
Helen and Alan Diack, and to my wife Wendy, whose
enthusiasm and effort continually supported and
motivated this research.
iii
CHAPTER
1
2
3
4
5
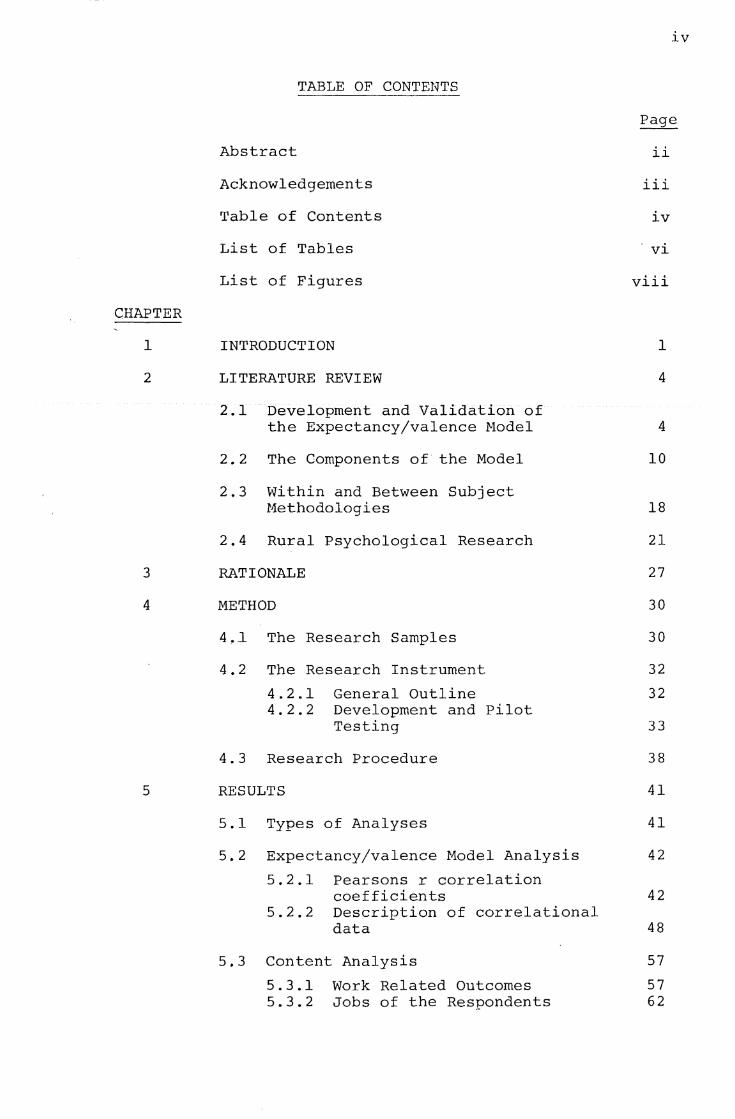
TABLE OF CONTENTS
Abstract
Acknowledgements
Table of Contents
List of Tables
List of Figures
INTRODUCTION
LITERATURE REVIEW
2.1 Development and Validation of the Expectancy/valence Model
2.2 The Components of the Model
2.3 Within and Between Subject Methodologies
2.4 Rural Psychological Research
RATIONALE
METHOD
4.l The Research Samples
4.2 The Research Instrument
4.2.1 4. 2. 2
General Outline Development and Pilot Testing
4.3 Research Procedure
RESULTS
5.1 Types of Analyses
5.2 Expectancy/valence Model Analysis
5.2.l Pearsons r correlation
ii
iii
iv
vi
viii
1
4
4
10
18
21
27
30
30
32
32
33
38
41
41
42
coefficients 42 5.2.2 Description of correlational
data 48
5.3 Content Analysis
5.3.l Work Related Outcomes 5.3.2 Jobs of the Respondents
57
57 62
iv

CHAPTER
6
7
DISCUSSION OF RESULTS
6.l An Expectancy/valence Perspective of Agricultural Motivation
6.2 The Validity of the Expectancy/ valence Model in Rural Jobs
6.3 Content Analysis: Discussion
6.4 Limitations of the Study
SUMMARY AND CONCLUSIONS
BIBLIOGRAPHY
APPENDIX ,
Copy of Research Questionnaire
V
Page
73
73
77
82
85
89
93
99
TABLE
1
2
3
4
5
6
7
8
9
lO
ll
l2
13
l4
l5
16
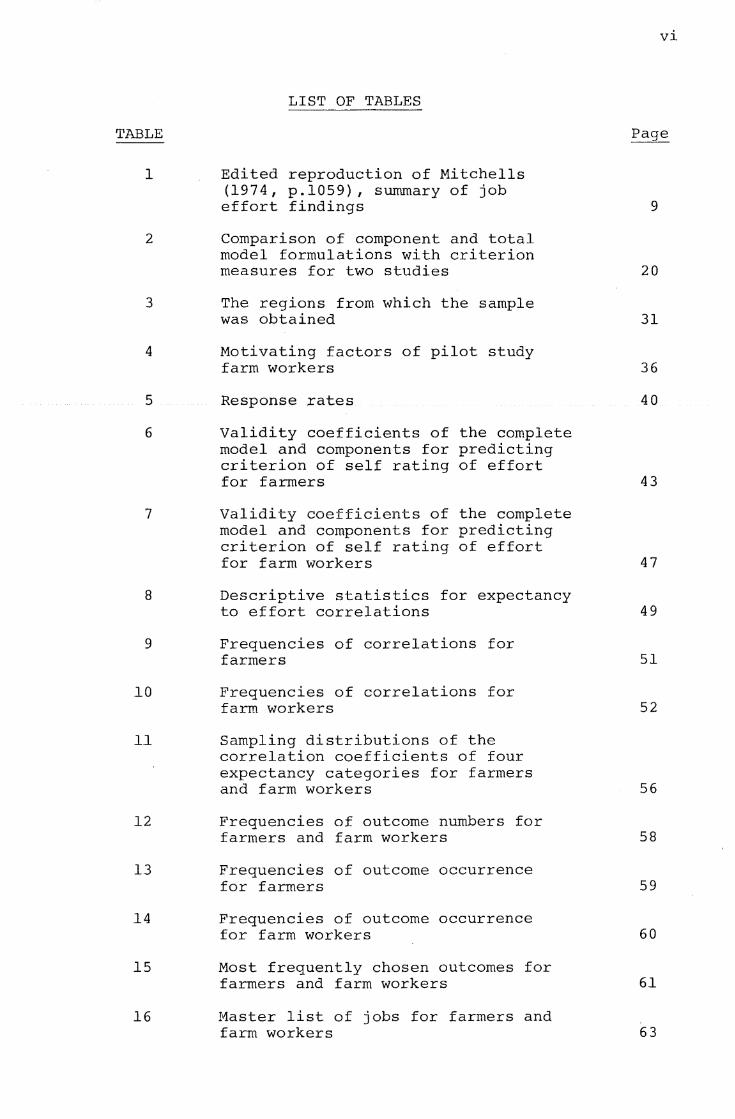
LIST OF TABLES
Edited reproduction of Mitchells (1974, p.1059), summary of job effort findings
Comparison of component and total model formulations with criterion measures for two studies
The regions from which the sample was obtained
Motivating factors of pilot study farm workers
Response rates
Validity coefficients of the complete model and components for predicting criterion of self rating of effort for farmers
Validity coefficients of the complete model and components for predicting criterion of self rating of effort for farm workers
Descriptive statistics for expectancy to effort correlations
Frequencies of correlations for farmers
Frequencies of correlations for farm workers
Sampling distributions of the correlation coefficients of four expectancy categories for farmers and farm workers
Frequencies of outcome numbers for farmers and farm workers
Frequencies of outcome occurrence for farmers
Frequencies of outcome occurrence for farm workers
Most frequently chosen outcomes for farmers and farm workers
Master list of jobs for farmers and farm workers
9
20
31
36
40
43
47
49
51
52
56
58
59
60
6l
63
vi

TABLE
17
18
19
Frequencies of numbers of jobs done by farmers and farm workers
Perceived job effort levels for farmers and farm workers
Desirability ranks for farmer and farm worker jobs
vii
64
66
68

Figure
1
2
3
4
5
6
7
LIST OF FIGURES
The Galbraith and Cummings Model
Frequency of Correlations for Farmers
Frequency of Correlations for Farm Workers
Perceived job effort for Farmers and Farm Workers
Job desirability for Farmers and Farm Workers
Relationship of Perceived effort and desirability of Farmers' jobs
Relationship of perceived effort and desirability of Farm workers' jobs
viii
7
53
54
67
70
71
72

1
CHAPTER ONE
, INTRODUCTION
Every action performed by an individual is partly
determined by a force of motivation and like fingerprints,
each individual's motivational force is unique. This makes
measurement a complex and difficult task.
Motivation is used by psychologists in a variety of
ways and circumstances and this has resulted in diverse
definitions and conceptions of the term.
Hull (1943) 1 considered motivation as being a
directional source of behavioural energy called a 'drive'.
The directional component being termed a 'habit'. In his
theory, behaviour resulted from the multiplicative relation
ship between drive levels and habit strength.
Locke (1968) 2 introduced the 'goal setting' approach
to motivation. This theory argues that intentions to work
towards a goal are the primary motivating force behind
behaviour.
From a work perspective, the aims of understanding
motivation assume three aspects; the understanding of
behavioural causes, the prediction of the effects extraneous
influences will have on behaviour, and the directing of that
behaviour. These are all implicit in the question, 'What
1. In Lazerson, 1975, p.359.
2. In Mitchell, 1979, p.255.
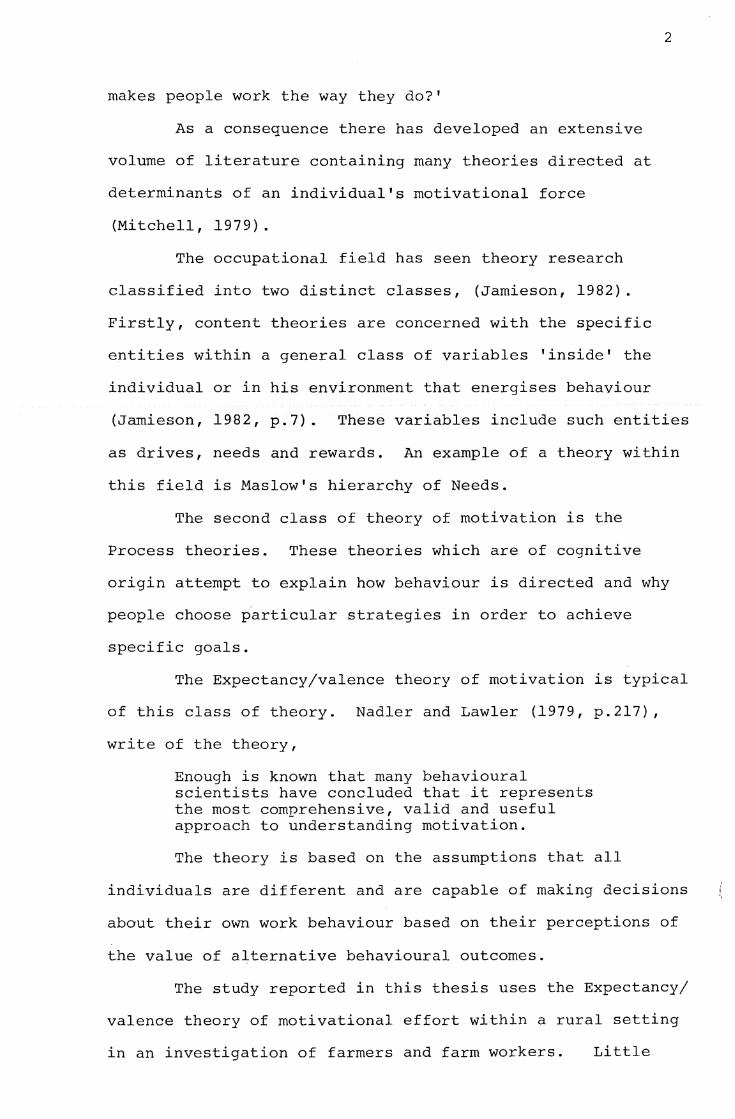
makes people work the way they do?'
As a consequence there has developed an extensive
volume of literature containing many theories directed at
determinants of an individual's motivational force
(Mitchell, l979).
2
The occupational field has seen theory research
classified into two distinct classes, (Jamieson, 1982).
Firstly, content theories are concerned with the specific
entities within a general class of variables 'inside' the
individual or in his environment that energises behaviour
(Jamieson, 1982, p.7). These variables include such entities
as drives, needs and rewards. An example of a theory within
this field is Maslow's hierarchy of Needs.
The second class of theory of motivation is the
Process theories. These theories which are of cognitive
origin attempt to explain how behaviour is directed and why
people choose particular strategies in order to achieve
specific goals.
The Expectancy/valence theory of motivation is typical
of this class of theory. Nadler and Lawler (1979, p.217),
write of the theory,
Enough is known that many behavioural scientists have concluded that it represents the most comprehensive, valid and useful approach to understanding motivation.
The theory is based on the assumptions that all
individuals are different and are capable of making decisions
about their own work behaviour based on their perceptions of
the value of alternative behavioural outcomes.
The study reported in this thesis uses the Expectancy/
valence theory of motivational effort within a rural setting
in an investigation of farmers and farm workers. Little
previous research in this tradition has considered such a
population.
3
The remainder of this report employs the following
format. Chapter Two presents a review of the literature
relevant to the development of the Expectancy/valence theory
and its operationalisation in a field setting. A review
of research conducted in the farming sector concludes
Chapter Two. A chapter outlining the rationale of the
study follows. Chapter Four presents the method used in
investigation of the sample. This includes a description
of the sample, research instrument and research procedure.
Chapter Five deals with the results of the study, which are
then discussed in the following and penultimate chapter.
The summary and conclusions chapter is followed by
references and an appendix containing a copy of the research
questionnaire.

4
CHAPTER TWO
LITERATURE REVIEW
2.1 DEVELOPMENT AND VALIDATION OF THE EXPECTANCY/VALENCE
MODEL
As its name suggests Expectancy Theory is based on the
principle of expected value. This principle implies that
people make choices based on the expected pay-offs of
alternative behaviours. Two structural components constitute
this process, Expectancy and Valence.
Expectancy is the subjective probability an individual
gives himself of attaining a desired outcome of his behaviour.
Valence is the anticipated value that this outcome will have
to the individual. The industrial-organisational application
of this theory proposes that work-related behaviours can be
predicted once we know the valence, and expectancy probability
that individuals attach to certain situational outcomes,
{Wahba and House, 1974).
A third component to emerge from latter studies of
Expectancy application is Instrumentality. In decision-making,
an individual knows that a single level of performance can be
associated with a number of different outcomes, each having
a certain degree of valence. Some outcomes, however have
valence-because they have direct value or attractiveness.
Others have valence because they are seen as leading to (or
being 'instrumental' for) the attainment of other outcomes
which have direct value or attractiveness. The measure of
involvement for attaining the absolute outcome is then a

measure of instrumentality, (Wahba and House, 1974).
The assumptions underlying the theory are that
relevant applications presuppose the possibility of
subjective measures of expectancy and valence, that
expectancy and valences are independent and that there
5
is a multiplicative relationship between them, (i.e. the
resulting function is a non linear monotonically increasing
product of expectancies and valences), (Mitchell, 1974).
The essential concept of expectancy has been
documented as early as the l7th century when it was used
in the field of economics (Wahba and House, l974). Its
use featured the differentiation of expenditure choices
using the objective probability of attaining a product
combined with the objective value of money at that time.
From this beginning its use has, in recent decades, become
apparent in fields of utility, decision-making, attitudes
and productivity.
The classical application of expectancy notions to
occupational psychology came from Vroom (1964). Vroom
proposed three expectancy models, that of Satisfaction,
Motivation and Performance. All were based on the concepts
of expectancy, valence and instrumentality. Instrumentality,
at this stage of theory development was included in the job
satisfaction and performance formulations only. Motivation
(Vroom's second model), was seen to be the force on a person
to perform an act. This force is a monotonically increasing
function of the algebraic s~ of the products of the valences
of all outcomes and the strength of the expectancies, that
the act will be followed by the attainment of these outcomes
(Vroom, l964, p.18).

Algebraically, n
F = E j=I
(E .. V.) lJ J
where F = the force to perform an act,
E .. = Expectancy that act i will be followed lJ
by outcome j,
V.= Valence of outcome j. J
6
The measurement of expectancy was said to vary between
0 (certain nonoccurrence) and l (certain occurrence). Valence
was considered to vary between -l (very unattractive) to
+l (very attractive).
The original Vroom motivation model underwent several
developments. Galbraith and Cummings (1967), attempted to
test a distinction between first and second level outcomes
first suggested by Vroom (1964), and then by Lawler and
Porter (1967). The distinction alters the model so that job
effort is predicted from the expectancy that a given level of
effort will lead to a given level of performance weighted by
the valence of that performance level, (see Figure 1). The
valence of this performance level is then determined by
examining the degree to which it is instrumental for the
attainment of second level outcomes weighted in turn by their
valences.

Figure l The Galbraith and Cummings Model
Behaviour
First level outcomes
where Behaviour= Effort,
E = Expectancy,
I = Instrumentality,
V = Valence.
First level outcomes
Mitchell (1974) provides the algebraic modifications for
the revised model. n
MF= E (L'. I .. V.) j=I lJ J
where MF = Motivational force
7
E = the expectancy that effort leads to performance,
I = the instrumentality of performance for the j
attainment of second level outcomes,
v. = the valence of the second level outcomes, J
n = the number of outcomes.
A further modification to the model was proposed by
Galbraith and Cummings (1967). Intrinsic and Extrinsic
valences associated with the outcomes were isolated. The

value and relevance to the model will be discussed later
in the text.
8
Vroom's models and their various modifications provoked
considerable research activity. Typically the procedures
followed a common pattern. Each subject indicated a degree
to which working hard (an effort level) was seen to lead to
good performance (a performance level). The subject also
indicated the degree to which good performance was likely to
lead to each of a predetermined list of outcomes. Finally,
the subject estimated the valence for each outcome. These
variables were then combined to generate a single E(EIV)
score, (see Figure l for symbol key), for each subject.
Scores were then correlated across subjects with a criterion
variable. Typically self, peer or superior ratings of effort
or performance served as a criterion variable.
Mitchell (1974), tabulates 13 such tests by five
authors using the E(EIV) formulation (see Table 1). Eight
of these found significant correlations with the criterion
achieving correlations of about r = 0.30, (Range= 0.12 to
0.64). Thus, prior to 1974 general support established
Expectancy theory as an acceptable model of behaviour.
Subsequent testing however, provided a mixed set of results.
Matsui and Terai (1975), in a cross cultural investiga
tion found Japanese correlations were as high as those in
American studies and concluded with general support for the
predictive ability of the model. Parker. and Dyer (1976)
supported the model when considering Retirement Decisions
of Naval officers. Drory (l976) and Connolly (1976), could
not establish commitment to support or non support of the
model as their results were of a conflicting nature. Both
authors plea for further indepth research of the model.

TABLE l
Investigator
Graen, 1969
Mitchell &
Albright (1972)
Mitchell &
Nebeker (1973)
Daehler &
Mobley (1973)
Arvey & Neil (1974)
9
Edited Reproduction of Mitchells (l974, p.1059)
Summary of Job Effort Findings
Model Results Criterion p
E(LIV) Task 1,2 Objective 0.05, 0.01 (achievement) r=0.28,0.39 Performance
E(LIV) Task 1,2 Objective n. s. n.s. (money) r=0.15,0.06 Performance
E (LIV) Task 1,2 Objective n.s. n.s. (control) r=0.04,0.03 Performance
E(LIV) r=O. 26 Supervisor 0.05 Rating
E(LIV) r=0.64 Self Rating 0.01
E(LIV) r=O. 23 Hours spent 0.05
E(LIV) r=0.39 Self Rating 0.01
r=0.28 Supervisor 0.01 Rating
r=0.16 Peer Rating n.s.
E(LIV) r=O. 30 Objective 0.05 (plant 1) Performance
E(LIV) r=0.12 Objective 0.05 (plant 2) Performance
E(LIV) (old) r=0.21 Supervisor n.s. Performance
E (LIV) r=0.03 Supervisor n.s. (young) Performance

10
Froman, (1976), found the theory's application to training
programmes extremely limited, as did Campbell and Willems
(1975). Reinharth and Wahba (1976) conversely found no
support at all for the predictive ability of the Expectancy/
valence model against scale measured criterion Measures.
Campbell and Pritchard (1979), compiled a survey of
approximately 35 published studies that have some relevance
as a test of Expectancy theory predictions. The result of
which showed that the available data do not portray the
Expectancy model as a very powerful explainer of behaviour.
The status of Expectancy theory in 1979 was the same as it
had been described by Connolly (1976, p.46),
the expectancy-type model appears to have enjoyed substantial if uneven support, in spite of some short comings in the relevant studies and seems to merit further work.
2.2 THE COMPONENTS OF THE MODEL
Research then moved from consideration of the model
as a unit of analysis to investigation of the various
components and alternative methodologies of Expectancy theory.
The logical foundation of component analysis is the
dependent variable or criterion measures. Leon (1979),
differentiated six dependent variables when considering out
comes with regard to prediction accuracy. They were self
reported effort, observed effort, self reported performance,
other rated performance, semi-objective performance and
objective performance. Semi-objective performance measures
are those derived from complex supervisory judgements but
are not ratings. An example of such a measure would be
percentage salary increases. Sale data would exemplify

11
objective performance measures. In Leon's study, the
criterion measure exhibiting greatest prediction validity
was a self reported effort rating (r = 0.28), with observed
effort measures next, (r = 0.23). It should be noted that
using performance measures as dependent variables (as the
remaining four variables were) is subject to criticism.
Vroom (1964), in his initial Expectancy formulations clearly
distinguished between effort and performance. In doing so
he developed an entirely separate model for prediction of
performance. Many studies have subsequently employed a
performance criterion for prediction of an effort model.
This, Mitchell (l974), considers to be conceptually inaccurate.
A somewhat higher correlation was exhibited in
Campbell and Pritchards' (l979), review of Expectancy studies.
They indicate that almost all studies purporting to test a
full expectancy model have been correlational field studies.
The correlational ceiling was found to be approximately
r = 0.30 when independent ratings of effort are used as the
criterion. This ceiling is exceeded however, each time a
self rated effort is used as the dependent variable. Campbell
and Pritchard go on to say that self ratings of effort are
constantly superior but introduce so much method variance
into the correlation that interpretation of such a coefficient
would be quite risky. The variance arises from the process
of having the same individual provide ratings of the indepen
dent variables (i.e. expectancy, valence and instrumentality),
and of the dependent variable. As a result the two measures
are not experimentally independent.
Lawler and Suttle (1973), put this problem to the test
by utilising three forms of predicted effort; self rating,

peer ratings and observer ratings.
show valid predictive accuracy.
12
All three were found to
1 Turney (1975) , also
provides support for self ratings of effort. He attained
a correlation of 0.6 (p<0.01), between self rating and
independent behavioural measures of effort. While behavioural
or alternative methods with higher validities are more
desirable, it is evident that self rating measures of effort
have in the past provided satisfactory criteria in Expectancy
research (Pritchard and Sanders (1973), Turney (1975),
Muchinsky (l977), Kopelman (1977), Shifflet and Cohen (1980),
Shifflet and Cohen (1982), and Anderson (1980)).
An allied problem of inconsistency, obvious in many
studies, is the methods that have been used to measure the
independent variables. De Leo and Pritchard (1974), consider
this a possible reason for the consistently low correlations
which are reported. Expectancy was conceptualised by Vroom
as a probability, with each reipondent choosing a measure
from 0.00 to 1.00. As Mitchell (1974), shows, few authors
have treated expectancy as such. Graen (1969), chose a
five point scale, while Lawler and Suttle (1973) and Mitchell
and Nebeker (1973) chose a seven point scale for measurement.
Instrumentality suffers similar inconsistencies. Vroom's
(1964), model suggested this variable may vary from +1.00
to -l.00. This reflects the relationship between good
performance and the various outcomes. Some investigators
have treated the instrumentality measure as a probability
with subjects estimating the performance to outcome relation
ship on five, seven or 10 point scales. Rank orders, paired
1. In Muchinsky (1977).

comparisons and forced distributions are other methods
encountered in the literature.
Failure to use Vroom's original formualtions of
instrumentality measure destroys an underlying assumption
of the model. If it is considered that valence measures
should vary from positive to negative, then at the two
13
extremes (i.e. a negative valence x a negative instrumentality,
or a positive valence x a positive instrumentality), the same
force should be attained. If either independent variable was
scored as a probabili~y, an equivalent force is not obtained.
This implies that a positive or negative perception of a
behaviour outcome cannot be diametrically opposite.
Theoretically, this seems devoid of logic but as Mitchell
(1974}, states, the impact of this problem is unknown.
Further inconsistencies arise from how each independent
variable should be operationalised. Valence measures of
outcomes have typically received one of three descriptions;
the importance of the outcome (Porter and Lawler, l968);
the attractiveness of the outcome (Pritchard and Sanders,
l973); and the desirability of the outcome (Galbraith and
Cummings, l967). Once again referring to Vroom's initial
formulation, it was envisaged that valence of outcomes should
be determined in terms of 'anticipated satisfaction'. This
is commonly equated with the 'attractiveness' of an outcome.
Little research was undertaken to determine which is the
best measure. Inconsistency in using the three variations
was seen as a source of model variance (de Leo and Pritchard,
1974).
Ilgen, Nebeker and Pritchard (1981), was one investiga
tion that did look at this issue. Using a clerical task
simulation methodology they found that valences were best

14
measured using scales of attractiveness. This would appear
to reinforce Vroom's original conception.
Specification of outcome lists is a further area of
inconsistency in Expectancy research and has been the focus
of a great deal of investigation. Early tests of the theory
provided the subject with a list of outcomes from which the
valence of each is considered. Mitchell (1974), described
the generation of such lists as an unsolvable dilemma.
Connolly (l976), suggests that a valid list should be
composed from a variety of sources, including available
survey data, preliminary interviews, pilot testing, particular
theories of needs and the researcher's informed intuition.
A basic premise of Expectancy theory suggests that each
individual has unique perceptions of what energises motiva
tion. The suggested list generating process contravenes
this and assumes a set of outcomes is common to each individual
within the tested sample space.
Perhaps the most theoretically desirable technique is
subject generation of outcome lists. Connolly (1976),
suggests that practical problems are associated with this
method but fails to illustrate any. Ivancevich (1976),
found that the prediction of performance of engineers was
better when subjects generated their own outcome lists.
This view was similarly expressed by Pritchard, De Leo and
Von Bergen (1976), Mitchell and Biglan (1971), Mitchell (1974)
and Parker and Dyer (l976).
Matsui and Ikeda (1976), considered the validity of
standardised outcome lists against self generated lists in a
Japanese sales setting. Although differences did not reach
significance, self generated lists were not only found to be

15
more relevant, but a more effective means of obtaining
expectancy theory measures. This reaffirms Vroom's original
suggestion that self generated lists, although practically
tedious, should be included within tests of the model.
A further finding from Parker and Dyer's (1976)
investigation of reenlistment decisions among naval officers
showed that superior accuracy of prediction was evident when
the outcome lists were small in number. Similarly, Rosenberg
(l965) suggests predictions based on large sets of outcomes
are less accurate than those based on a small set. Leon
(l979), considered this question directly, indicating the
tendency of research to utilise widely different numbers of
outcomes. Specifications have varied from one to 45 and have
exhibited differing correlations of motivational force to
criterion measures, of 0.00 to 0.50. Leon cites a study by
Schwab, Olian. and Heneman (1973), which showed that motivating
force computed for Expectancy variables pertaining to 10-15
outcomes, explained more variance in the dependent variables
than motivating force computed on the basis of one to nine
or greater than 16 outcomes. This, to some extent was
reinforced by Parker and Dyer (1976), who, although finding
outcome numbers difficult to specify, decided that there
should be at least more than five but less than 25 outcomes.
Leon's (1979) research found methodological inconsistencies
with Schwab, Olian and Heneman (1973), and from his own
investigation considered that if an ideal number of outcomes
does exist, probably five highly valent outcomes would be
the best number of predictors of motivational force. A
recent study in this field, Shifflet and Cohen (1980),
provides evidence of the existence of more than two or three
outcome categories. These categories defined degrees of

16
salience to the individual which would naturally be the case
with self-generated outcome lists. They concluded that
dimension scores composed of 11 items were substantially
better predictors of self report criteria than was a
standard list of 16 items.
In summary, a smaller list of between five and 11
salient (or self generated) outcomes appears to provide
superior predictions of motivation. Too many outcomes of
secondary importance simply adds "noise" (Mitchell, 1974).
Content of the outcome lists provides two areas of
concern. The inclusion of 'intrinsic' and/or 'extrinsic'
outcomes and 'positive' and/or 'negative' outcomes. The
implication gained from Vroom (l964), is that intrinsic
rewards should be omitted or at the very least considered
separately. Vroom defined intrinsic rewards as those that
are self administered, in contrast to those that are externally
administered (extrinsic rewards}. Misinterpretation and
redefinition of these terms has subsequently led to much
confusion in the literature, most notably documented by
Parker and Dyer (1976). Galbraith and Cummings (1967),
extended Vrooms' (1964) theory distinguishing between intrinsic
and extrinsic valences associated with the various behavioural
outcomes. House (l97l), further refined the theory by
distinguishing between two kinds of intrinsic valence of
outcomes, (l), those associated with task performance, and
(2) those associated with task accomplishment.
Following research by Graen (1969), Mitchell and
Albright (l972), suggested that intrinsic outcomes yield
superior predictions of performance and job satisfaction than
do extrinsic outcomes. Wahba and House (1974), suggest that
intrinsic outcomes may have greater motivational power than
17
extrinsic outcomes. Parker and Dyer (1976), tested both
forms of outcome with respect to retirement decisions and
found no support for intrinsic in preference to extrinsic
outcomes. They conclude that the role of intrinsic and
extrinsic outcome in expectancy research is a very complex
issue which is still far from settled.
The second area of concern over outcome lists is the
distinction between postive and negative outcomes. It was
postulated by Mitchell (1974), that since both rewards and
penalties are thought to have motivational value then the
addition of both forms of outcome to the model would give
it greater predictive value. This assumption received its
first direct test from Parker and Dyer (1976). They compared
the validity of an expectancy theory containing both positively
and negatively valent outcomes with the validity of the same
model with the negatively valent outcomes removed. Exclusion
was found to increase, if only slightly, the predictive value
of the model. This was in accordance with Anderson (1980),
who utilised a subject generated, limited number outcome list
with a sample of 107 public accountants. Statistical
analysis of the Expectancy/valence model with the negative
outcomes removed offered greater predictive ability than
inclusion of the negative outcomes. Research in this area
by Leon (l981), heralded a new problem. He found that
subjects treat positive outcomes linearly in relation to
perceived pay-off, (i.e. each outcome may be associated with
gradations of valence depending on its ultimate value).
Subjects fail to treat negative outcomes in the same manner.
The concept of linear gradations in the negative direction
escapes the subconscious capacities of the subjects. As such

18
they appear as just negative. Conversely subjects success
fully perceive gradations of positive outcomes. The
question~ble status of positive and negative outcomes
continues and until the demand for more research is fulfilled
will remain an uncertain aspect of Expectancy theory.
2.3 WITHIN AND BETWEEN SUBJECT METHODOLOGIES
Perhaps the most serious criticism of many tests of
Expectancy theory is their failure to use a within-subject
methodology. Parker and Dyer (1976), and Kopelman (1977),
present various theoretical and methodological reasons for
~reference of a within-subject approach. It is clear that
Vroom (1964), viewed Expectancy theory as a within-person
behavioural choice model. The typical practice, as mentioned
above has been to compute for each subject under study a
force score and a single criterion score based on a sample
wide outcome list. The relationship between these two scores
is then established using correlational techniques. The more
theoretically precise within-subject approach suggests that
an individual can choose the level of effort at which he
desires to work from among a set of alternative levels. As
Mitchell (1974), states, this requires that the investigator
assess the degree to ~1ich each of a set of effort levels
leads to each of a set of outcomes. Such an approach would
require that separate prediction scores be generated for each
level of effort and then determine which level the individual
will choose.
Muchinsky (1977), Parker and Dyer (1976), and Kopelman
(1977), similarly state that not a single investigation has
adopted this methodology to that date. To quote Kopelman

(1977, p. 652) ,
- In short, there has been a conceptual mismatch between expectancy theory as it is expounded and the data used to test it.
Despite the increased demands on investigators
field time and questionnaire development, several method
ological advantages do become apparent with the use of a
within-subject methodology. A significant difficulty
associated with between-individual expectancy research
19
is the problem of inter-individual differences (Kopelman,
l977). As mentioned, each individual's reward perception
is unique. By summing and correlating across individuals
with a single criterion measure, individual differences
contaminate predictions of the sample by directly affecting
the dependent variables. Use of the between-individual
paradigm to test behaviour predictions is an attempt to use
group data to establish relationships at the individual
level of analysis.
Kopelman (l977), and Muchinsky (l977), contrasted
the two forms of expectancy research. Using 159 college
students, Kopelman found the mean correlation of work effort
to criterion performance as being r = 0.24 for the between
subject approach and r = 0.35 for the within-subject method
ology. Similarly, Muchinsky's means were r = 0.31 and
r = 0.52 respectively. This exemplifies the superiority of
the within-subject methodology for prediction of work effort.
Further support has been provided by Matsui, Kagana,
Nagamatsu and Ohtsuka (l977); Oldham (1976) and Schmitt and
Son (-1981).
Muchinsky included within his research results
correlations of various components of the Expectancy model
as well as a mathematical formulation, with his criterion

measure. Four of the five components of his model had
average correlations which equalled or approximated the
average correlation of the complete model. As seen in
Table 2, these findings are similar to those reported by
Pritchard and Sanders (1973). In both studies the best
prediction of self reported effort was not the complete
model but a component; EV (r = 0.54) for Pritchard and
Sanders and E (r = 0.73) for Muchinsky (1977).
20
TABLE 2 Comparison of Component and Total Model Formulations
with Criterion Measures for Two Studies
Model Components
Total Model
M = E (T,IV)
r.v
r, I
E
E ( T,V)
E (EI)
Muchinsky (1977)
0.52
0.52
0.42
0.73
0.52
0.56
Prichard and Sanders (1973)
0.47
0.54
0.22
0 .13
0.52
N.B. Figures in the body of the table are Pearson r
correlations.
Where: M = Motivational Force
E = Expectancy
I= Instrumentality
V = Valence
This particular characteristic of Expectancy theory
was first highlighted by Mitchell (l974), who examined eight
studies that considered the validity of model components,
specifically, the weighting of components with valence ratings.
21
Although the results were not clear-cut, Mitchell concluded
that unweighted instrumentalities do as good a job of
predicting effort as the total model and that all model
components possess moderately good reliablity.
The Expectancy/valence model of motivation has
received much literature focus. Conclusions regarding its
validity appear guarde~ and dubious.
Expectancy theory has become so complex that it has exceeded the measures which exist to test it.
Lawler & Suttle, 1973, p.502.
Wahba and House (1974), considered the theory as
perhaps the most widely accepted theory of work motivation
among industrial-organisational psychologists of the day.
Expectancy theory is a simple appearing formulation that encompasses a highly complex and poorly understood set of variables and variable dynamics.
Campbell & Pritchard, 1979, p.242.
Prior to 1975 the emphasis was on complete model
testing. This gave way to component analysis from 1976.
However, perhaps the only common theme to emerge from many
of the literature tests of the theory is a plea for further
research. This study is an attempt to contribute to the
fulfilment of this request.
2.4 RURAL PSYCHOLOGICAL RESEARCH
Research in agricultural settings is an aspect of work
behaviour that has received little attention. Investigating
job characteristics and job satisfaction within a rural
sector, Clark (1979), highlighted the dearth of any form of
psychological research within this area. This is a
characteristic that is surprisingly evident in New Zealand,
a country that relies so heavily upon agriculture for its

economic well-being. This is not only a New Zealand
phenomenon however. Richards {1973), reviewed 25 years of
research into the psychology of farming, (1945 to 1970).
22
His review of 'psychological abstracts' revealed only seven
articles in American Journals within this period that dealt
with any apsect of agriculture. Similarly, a computer search
conducted for this study within the psychology files since
1967 yielded 254 studies, involving rural samples. Of these
only one pertained to a New Zealand situation, the vast
majority being conducted in India.
The dispersed nature of the work force in urban
industry contributes to this dearth of rural psychological
research. The farming community of New Zealand is not large,
accounting for ll.06 per cent of the total working population,
(New Zealand Year Book, 1982). A small population such as
this spread about the New Zealand rural area means no large
corporate enterprises, no large groups of labour and no
situations where the productivity capacity and behaviour of
several hundred workers is influenced directly by the decision
of a single manager. A farm management decision may influence
the working capacity of five workers as opposed to 500.
Adequate rural application of such concepts as leadership,
quality of working life and stress would probably develop
very different dimensions. This spread of population also
introduces the cost-utility question so relevant to modern
research. The geographical constraints upon access to a
rural sample make it a very expensive exercise to use such
a sample space.
Due to the seasonal requirements of farm work, Clark
(i979), found interviewing this type of sample difficult.

23
Haymaking, harvesting and shearing made contact with farmers
difficult due to the long and irregular hours worked. Wet
weather was found to facilitate data gathering as farmers
worked closer to home and had time not only to participate
but to consider what wa,s being asked of them.
Data gathering was often restricted to consultations
with farmers and farm workers at morning and afternoon teas,
as well as lunch hours, again because they were typically
close to home. Difficulties arise in seeking subjects
from the backblocks of their properties.
Seabrook (1982), is one of the few investigations to
provide some observations, ideas and research findings related
to the motivation and performance of workers within the
agricultural sector. Seabrook considers research rife with
dangerous researchers who devise a model, observe people and
only see things that prove the model.
Few models begin from the viewpoint of the individual and his core personality ... The more one studies agricultural workers, the clearer it becomes that one has to attempt to understand the individual and not to apply generalised themes.
Seabrook, 1972, p.68.
As a result of such observations Seabrook introduces
two approaches to facilitate future analysis. The 'Status'
approach rejects the idea that every worker aspires to the
same goals and suggests that effective management comes from
understanding the internal motivations of the worker and why
he is like he is. The second or 'Functional' approach
accepts that each person will respond to involvement and
responsibility and will work towards a joint target. Here,
the emphasis is on work targets, goals and work groups.
From her observations of 100 cowmen Seabrook came to
no generalised conclusions to explain why agricultural workers

behave in the way they do. The same environment created
different reactions within the cowmen.
This single investigation highlighted the virtual
24
non existence of rural motivation research. Richards (1973),
major finding indicated that since psychologists have
largely ignored agriculture, most of the reviewed studies
were conducted by other behavioural scientists.
There has been some interest shown in the concerns
of farm labour and job satisfaction among farm workers.
Little of this research has been carried out by psychologists.
Clark (l979) was one exception. She found that as a
consequence of their theoretical backgrounds the agricultural
graduate is concerned more with the practicalities of farm
workers, and as a result were more likely to investigate
factors such as working conditions, hours of work, wages,
social amenities and assessment of their employers.
Steeves (1969), concerned himself with the contrast
in job satisfaction between the farm and non farm context.
He showed that neither occupational sector may be more
satisfied than the other. Harris (1980), surveyed farmers
and farm workers looking for factors that could increase
job satisfaction. Among his findings was a recommendation
for farmers to allow their employees to live away from their
job environment and for the employer to give better farm
economic advice, (including hints on how to apply for rural
bank loans, home ownership accounts etc.) and factors that
could improve the farm workers job satisfaction via educational
reform.
Clark (l979), investigated the importance of job
dimensions and individual characteristics in job satisfaction
on a sample of farm workers from a psychological point of view.

This she did utilising the Job Diagnostic Survey (modified
in form), created by Hackman and Oldham (1974) . 1 It was
found that there was a significant occupational effect
25
among the various groups. Specifically, farmers perceive
their job as being relatively high in the degree of autonomy,
skill variety, task identity and job feedback, in comparison
with farm workers and agricultural students. The opposite
was the case in task significance, degree of feedback from
agents and dealing with others, where farm workers and
agricultural students scored higher. Concluding her study
Clarke considers that there is little need or scope for the
enrichment of a farmer's job, and not much more for the farm
worker. An important point to come out of this study is that
Hackman and Oldham's model of job characteristics is
inadequate in a rural context.
Cant and Woods (1968), conducted a study designed to
ident~fy and measure factors that make farm employees satisfied
or dissatisfied with employment. Their study was based on the
2 methods of Herzberg, (1959), and looked at factors of
satisfaction such as wages, living conditions, status and job
training. They concluded that farms with the most serious
labour problems are likely to be the ones where employees
lack status, receive little recognition for work well done
and get on badly with the farmer. The results of this study
suggest that dimensions similar to those identified by
Herzberg were associated with job satisfaction and dissatisfac
tion by farm employees of New Zealand.
1. In Clark (1979).
2. In Clark (1979).
26
Thus, in l968 Herzberg's model appeared quite robust
in the type of sample space to which it may be applied.
Surrounding the timing of Cant and Woods (1968) Herzberg
application, was a growing body of literature criticising
this methodology, (Bockman, l97l). As a consequence of
this literature trend, Cant and Woods' successful use of the
Herzberg methods should be regarded tentatively. Its
quality of robustness becomes dubious within the bounds of
criticism.
In summary, the literature focus on a New Zealand
farming sample has not included many psychologists. To date
it appears the field of sociologists and agricultural
research units. This is not purely a New Zealand phenomenon,
with India seemingly the only international exception to this
dearth of research. Of the limited probes into the area by
psychologists, a tentative use of Herzberg's methods by Cant
and Woods (l968), and an inappropriateness of Hackman and
Oldham's Job Diagnostic Survey by Clarke (1979), characterise
a New Zealand farming sample.

27
CHAPTER THREE
RATIONALE
The motivation of people working within the farming
sector is an area marked by personal opinions and stereo
typic generalisations. It was decided to investigate
characteristics of farmers and farm workers using the
Expectancy/valence theory of work effort. Probably the
theory is still regarded as the most acceptable theory of
work motivation {Wahba and House, 1974). An application to
the agrarian work force was intended to elicit further
features of the motivation of people working in rural
industries.
Since Vroom (1964), and the first industrial organisa
tional conception of Expectancy/valence theory, many
subsequent tests of various samples have developed and
extended the theory. As yet, the farming world has not
received attention from this perspective. Indeed, little
motivation research of any variety has been directed to this
sample. Seabrook (1982), is one of the few exceptions to
this generalisation.
To date, rural motivation has been the field of
speculative reasoning derived from intimate knowledge of
personal experiences. Most rural farmers are willing to
venture 'love of the land' and 'lifestyle' explanations of
farming motivation. This may well be the situation, but it
remains to be validated.

The rural contribution to primary production is
clearly documented by Clark (1979). Its 70% contribution
28
to New Zealand's export income, emphasises the importance of
the farming workforce. However, farming in the present
economic climate faces many problems. General dissatisfaction
is evident among farm owners whose existence is so. sensitive
to the state of the country's economy.
Monetary reward as a motivator of the farm worker
appears to be of questionable efficacy. Recently, when the
New Zealand workforce had an average weekly wage of $247.25
(New Zealand Year Book, 1982), the award rate for farm workers
on sheep, meat and wool farms and stations was $140.05 per
45 hour week, (Arbitration Court, 1982). A housing and food
allowance inflated this total to a possible $162.62 per week
for a farm worker over the age of 20 years. This was $78.00
below the national average weekly wage. Four other awards
covered the remaining agricultural workers. With the housing
and food allowances, the highest weekly wage was $179.49 for
farms and stations (dairy farms) employees and the lowest
being $159.20 for agricultural workers (market garden)
employees, (Arbitration Court, 1981).
It is anticipated that an attraction to farm work
regardless of employer or employee status, is not based
primarily on monetary reward but rather focuses on the land
and outdoor existence.
The design of the Expectancy/valence model utilised
in this study is such that an insight into motivational out
comes of behaviour may be determined. In the form of a
content analysis, this should approach Seabrook's (1982),
'status approach' of viewing each individual's contribution
as a separate entity.

29
The value of a relatively unresearched sample with
an untested theory (in this situation), is two-fold. Results
should produce characteristics of rural motivation useful in
the quest for knowledge. The application and testing of a
well-researched psychological model to the farming world is
also of importance.
Cant and Woods (l968), utilised a Herzberg (1959) 1
typology to identify and measure factors which make farm
employees satisfied or dissatisfied with their employment.
In this situation, application of the Herzberg method and
results appeared to generalise to a farming sector sample.
Clark ·(l979), adopted Hackman and Oldham's Job Diagnostic
Survey (1974 and 1975) 1 to study the job satisfaction of
farmers, farm workers and agricultural students. In this
situation the underlying Job Characteristics model was found
to be inadequate.
A test of the Expectancy/valence model of motivational
effort in this new setting contributes to the adaptability of
standard psychological models to the farming population.
This study is a probe into the motivation of farmers
and farm workers, seeking an involvement with the lifestyle
and land as opposed to a money or material reward involve
ment. It is an attempt to test a standard psychological
model in a relatively new context and determine its adapt
ability to a rural setting. The research thus has the status
of an exploratory investigation.
1. In Clark (1979).
30
CHAPTER FOUR
METHOD
4.1 THE RESEARCH SAMPLES
The final sample consisting of 109 males and two
females was composed of two distinct groups; farmers and
farm workers. As a result of the sampling procedure it was
later found that farmers (N=64; 62 males and two females),
had varying ownership status. Forty farmers owned their
properties while 24 farmers part-owned theirs.
Farm workers (N=47), similarly included employment
sub-groups. Twelve were employed as managers of the property
on which they worked, ~7 were employed as farm workers by
non-relatives and a further eight by their fathers in anti
cipation of eventually taking over the property.
These various groups of both farmers and farm workers
became included in the sample as a consequence of selection
and hence have little value to this study. Any sub-grouping
effects that do possibly exist would unlikely be evident due
to the small number within each sub-group.
It was decided to sample workers from a single class
of agricultural activity due to the difficulties of adapting
the research instrument to the many and varied farm settings
in New Zealand. Sheep and cattle farming, typical of the low
lying foothill country that is common in the Canterbury region
became the target population. This type of farming has an
advantage for would-be researchers. The farmer typically

31
employs a farm worker although this is dependent upon the
size of the property. This eases the economic burdens of
testing such a sample. The region of study spread from the
Parnassus-Cheviot area of North Canterbury through the hill
country to Waiau and Culverden, finishing in the foothills
of the Southern Alps in Mid-Canterbury, this latter region
being termed Ashburton.
Table 3 shows the regional spread of the sample. These
areas were chosen chiefly because they exhibited the type of
sheep and cattle farming desired, and for geographical
convenience in terms of access for the researcher.
TABLE 3 The Regions from which the Sample was obtained.
Region Numbers of Numbers of Farmers Farm Workers
Ashburton 2 10
Rangiora A
Amberley 8 2
Waikari 6 3
Hawarden 11 2
Culverden 5 5
Waiau 7 2
Parnassus 5 5
Cheviot 12 9
Omihi 2 2
Scargill 4 2
Other* 2 l
Total 64 47
* Other: this refers to farmers/farm workers who once
resided in this area and have since moved away.
Age ranges were similar for both groups. Farmers ranged from
23 to 67 years with a mean of 40.35 years. A cluster of 23
farmers within the 29 to 34 age group skews the sample.

Farm workers ages were contained within 17 to 55 years,
the mean age being 32.87 years. A mode of only four(at 29
years) indicates a more uniform spread throughout the age
range.
As mentioned, the sample is predominantly male,
32
with only two female respondents participating. No prior
preference was intended and the response merely confirms
that paid employment in farming is a male activity. Both
females were part farm owners in conjunction with husbands.
Their responses clearly indicated that the farm work and
economic return was genuinely shared within the relationship.
4.2 THE RESEARCH INSTRUMENT
4.2.l General Outline
A questionnaire, comprising six sections, based on the
version used by Muchinsky (1977), was developed for this
sample. l
The first section concerned biographical and filing
data. The next four sections directly measured the Expectancy
components required for the model. Section two required the
respondents to list the jobs they personally do in order of
effort output from the hardest to the easiest. The jobs were
to be drawn from a master list provided to each subject. The
list allowed sufficient room for alteration and modification
to establish a unique and personal job list for each
respondent. To complete section two percentage estimates of
effort were estimated for each job. This section formed the
dependent variable or criterion to which the remaining
components were related.
1. A copy of the final research instrument is contained in the Appendix.
33
Section three required respondents to list up to 10
motivating reasons why they work the way they do each day.
These reasons, termed outcomes of their work behaviour, were
then scored on the basis of their attractiveness using a
seven point scale ranging from -3 to 3, -3 indicating this
outcome to be most unattractive and 3 as being most attractive.
This section provided scores of 'valence' for each outcome.
Section four related each outcome to each job, again
using a similar scale. -3 indicated that doing a good job
detracts from attainment of the outcome to +3 which indicated
that doing a good job is the sole way to achieve the outcome.
The resultant measures were determinants of 'instrumentality'.
Section five required respondents to rate each job
done on a scale of Oto 5. Here O indicated no relationship
between working hard on the job and being a successful farmer,
to 5 which showed a strong relationship between working hard
on the job and being a successful farmer. These probabilities
provided measures of 'expectancy'.
The final section provided extended knowledge of how
respondents regard their farm jobs. A ranking of the degree
of preference for doing each job was attained. This section
had no specific relevance to the Expectancy model, but was
included to provide additional data regarding farm jobs.
4.2.2 Development and Pilot Testing
As a within-subject design was to be utilised in this
study it was decided to use a self-report criterion as the
dependent variable. As stated in the literature review, this
methodology appears to provide the best predictors of work
motivation, despite some criticism of its accuracy, (Campbell

34
and Pritchard, 1979). Establishing a list of jobs specific
to each respondent required using an open-ended list that
each individual could add to depending on their specific
circumstances. To aid this, a core list of jobs, that are
common to most sheep and cattle farms, was provided. This
was developed from pilot testing of a number of farmers/
farm workers.
An original list of some 24 jobs was gained from
interviews with farmers and from Ministry of Agriculture and
Fisheries guidelines. The pilot t~sting called for consider
able condensing to a core list of 13 jobs. As an example,
initially sheep drafting, sheep drenching and sheep dipping
were treated as separate jobs. As a consequence of pilot
testing it was found that if sheep are bought into the yards
for one of these treatments, invariably they are all done or
at least are considered as similar jobs by the subjects. As
a result a condensed 'sheep yards' job replaced these three.
By allowing the subjects to delete core jobs not done,
and also to add jobs not specified in the core list, it would
be possible to obtain a job list specific to each individual.
With intimate knowledge of these jobs little difficulty was
envisaged in respondents attaching a percentage rating of
effort expenditure to each job.
The specification of outcomes in section two was
developed from studies quoted in (Mitchell & Biglan (1971),
and Parker & Dyer (1976)). Subject specification, rather
than researcher specification, received the greatest support
in previous research and was the eventual form used in this
study.
Pilot testing of 12 farm workers from the Conway flat
region of North Canterbury produced 22 separate answers to the

instruction 'write as many reasons you can think of, that
motivate you to work'. As can be seen from Table 4, only
35
two motivating factors were common to all those interviewed.
This suggests that perhaps a uniform list of outcomes would
be difficult to obtain for this sample. The result of this
finding as well as the literature trends, pointed to the
desirability of subject generated outcome lists to be used
in this investigation. This formulation also fits into the
spirit of a within-person design where data should be specific
to the individual respondent.
Studies reported in the literature review (Leon (1979),
and Shifflet and Cohen (1980)) suggested that a small list of
between five and 11 salient (or self generated) outcomes would
provide the best and most manageable predictions of motivation.
Acting on this justification, a list of 10 outcomes was
requested from each respondent. This allowed respondents the
option of stating the number of outcomes (up to 10) that they
sought in their work.
The measurement and operationalisation of the three
components of the model are consistent with the most appropriate
recommendations to emerge from the literature. Invariably,
these date back to Vroom's (1964), conception of Expectancy/
valence testing. Expectancy was measured as a probability
with each respondent choosing a measure from Oto 5.
Instrumentalities and the valence of outcomes used a measure
consistent with Vroom's original -1.00 to +1.00 formulation.
Here a seven point scale from -3 to +3 is used. Pilot testing
used an i1 point scale from -5 to +5, however, respondents
found it difficult to use intermediate positions on the
sca·le.
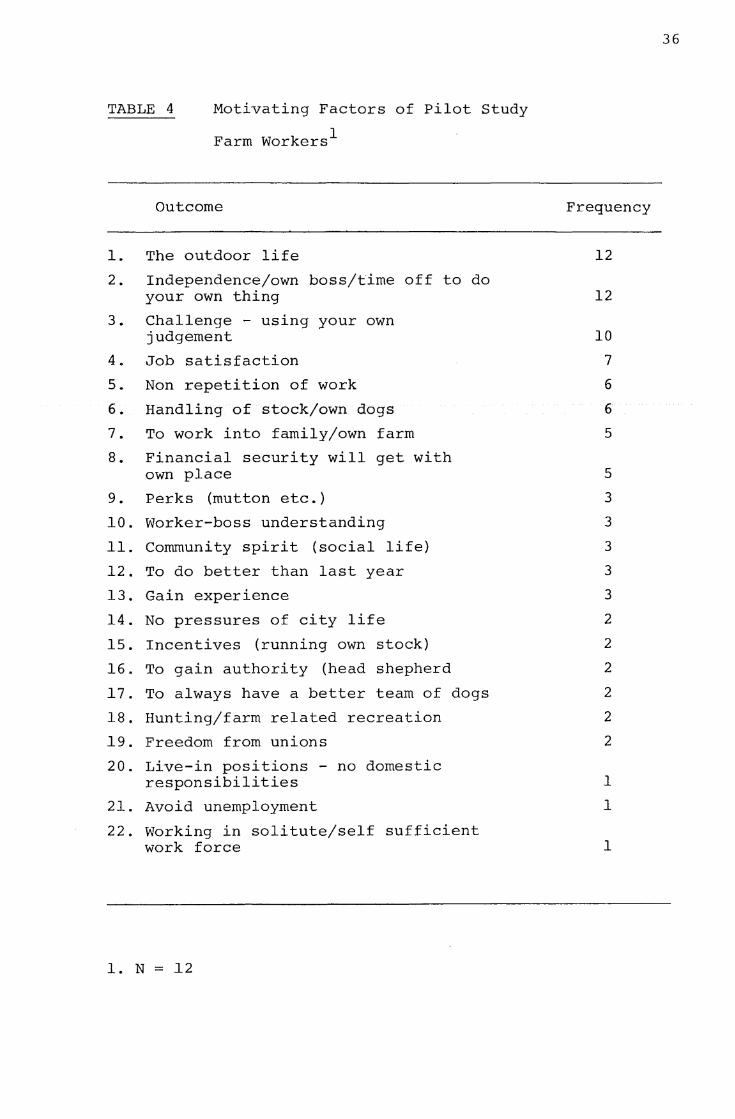
TABLE 4 Motivating Factors of Pilot Study
Farm Workers1
Outcome
1. The outdoor life
2. Independence/own boss/time off to do your own thing
3. Challenge - using your own judgement
4. Job satisfaction
5. Non repetition of work
6. Handling of stock/own dogs
7. To work into family/own farm
8. Financial security will get with own place
9. Perks (mutton etc.)
10. Worker-boss understanding
ll. Community spirit (social life)
12. To do better than last year
13. Gain experience
14. No pressures of city life
15. Incentives (running own stock)
16. To gain authority (head shepherd
17. To always have a better team of dogs
18. Hunting/farm related recreation
19. Freedom from unions
20. Live-in positions - no domestic responsibilities
21. Avoid unemployment
22. Working in solitute/self sufficient work force
1. N = l2
Frequency
12
12
10
7
6
6
5
5
3
3
3
3
3
2
2
2
2
2
2
1
l
1
36

The valence of outcomes was operationalised as a t
degree of 'atractiveness', again consistent with Vroom's
original conceptualisation.
An initial complete questionnaire was then pilot
tested with lO farmers and 10 farm workers. A page for
comment on ease of completion and for general opinions
provided the basis for extensive redesign. At 17 pages,
37
its length posed the most serious obstacle. Almost all of
the pilot sample expressed the disdain that rural workers
have for paperwork. This was very evident in the way these
questionnaires were completed and in final response rates.
Redesign of the format and job lists (as already mentioned),
reduced the length to a more manageable seven pages.
Further modifications resulted from constant enquiries
concerning the meanings of words and misunderstandings of what
specific questions required. In effect it had to be trans
lated to a rural context for respondents to be able to under
stand instructions. The very nature of farmwork for many
farm workers demands little book work 1 use of the written ~ .
medium. Expression on paper also seemed foreign to many
respondents. A recurring criticism was that it was easier
to ring or cross an answer selected from a list as opposed
to writing their own views.
The second format was developed and tested on five
farmers and five farm workers. Despite the continuing
dislike of paperwork it was considered that the instrument
was satisfactory for eliciting the information required.
From the pilot testing procedure it was envisaged that the
questionnaire would take approximately one hour to complete.
38
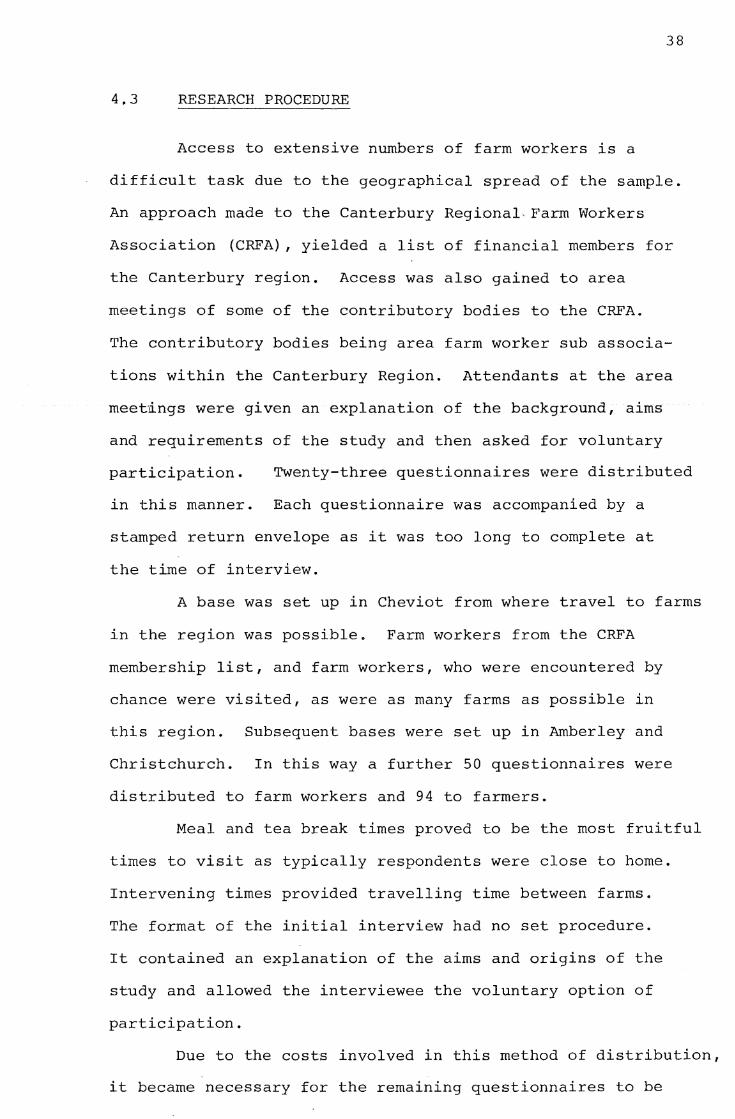
4.3 RESEARCH PROCEDURE
Access to extensive numbers of farm workers is a
difficult task due to the geographical spread of the sample.
An approach made to the Canterbury Regional, Farm Workers
Association (CRFA), yielded a list of financial members for
the Canterbury region. Access was also gained to area
meetings of some of the contributory bodies to the CRFA.
The contributory bodies being area farm worker sub associa
tions within the Canterbury Region. Attendants at the area
meetings were given an explanation of the background, aims
and requirements of the study and then asked for voluntary
participation. Twenty-three questionnaires were distributed
in this manner. Each questionnaire was accompanied by a
stamped return envelope as it was too long to complete at
the time of interview.
A base was set up in Cheviot from where travel to farms
in the region was possible. Farm workers from the CRFA
membership list, and farm workers, who were encountered by
chance were visited, as were as many farms as possible in
this region. Subsequent bases were set up in Amberley and
Christchurch. In this way a further 50 questionnaires were
distributed to farm workers and 94 to farmers.
Meal and tea break times proved to be the most fruitful
times to visit as typically respondents were close to home.
Intervening times provided travelling time between farms.
The format of the initial interview had no set procedure.
It contained an explanation of the aims and origins of the
study and allowed the interviewee the voluntary option of
participation.
Due to the costs involved in this method of distribution,
it became necessary for the remaining questionnaires to be
39
delivered in a voluntary postal fashion. A questionnaire,
a stamped return envelope,and a covering letter were sent
to the remaining farm workers on the CRFA membership list
(78 questionnaires). Farmers and their addresses were
selected from a farm location map on a geographical location
estimate of sheep and cattle farms supplied by the Ministry
of Agriculture and Fisheries. A further 61 questionnaires
were distributed in this fashion. The covering letter
contained the same information conveyed in the initial
interview of the personal distribution method. An additional
request for those unwilling to participate to return their
questionnaire blank was included.
In all manners of questionnaire distribution it was
explained that completion of all parts of the questionnaire
was necessary for adequate analysis of their responses.
Following an interval of three weeks a request was
published in a North Canterbury news bulletin for the
completion and return of outstanding questionnaires. After
a further four weeks each subject with an outstanding
questionnaire was posted a written request for the return of
their questionnaire. Many of the questionnaires were
returned blank or in such an incomplete state that they had
to be discarded from the sample.
The response rates are shown in Table 5.
The response rate for postal delivery is marginally
superior to those delivered personally. However, regardless
of delivery mode response was extremely poor. The re
occurring disdain that farmers and farm workers have for
paperwork appears very real. It should be noted that
questionnaire deployment coincided with final dates for the
1'(

40
return of government farm statistics, which is a long and
tedious written exercise for farmers. This may have had
some influence on the low response rate of 36%.
TABLE 5 Response Rates
Questionnaires Questionnaires %
Delivered Sent by Post Not Discarded Usable Usable Personally Return- Respons e
Deliv- Receiv- Deliv- Receiv- ed ered ed ered ed
Farmers 94 45 61 32 78 13 64 41
Farm workers 73 28 78 36 87 17 47 31
Totals 167 73 139 68 165 30 111 36%

CHAPTER FIVE
RESULTS
5.1 TYPES OF ANALYSES
Analysis of the questionnaire data assumed two
forms,
(1) The Expectancy/valence Model and its components.
(a) The various components of the Expectancy/valence
model, (M=E(EIV)), the sum of the instrumentalities
(EI), the Expectancies (E), and the Expectancy
multiplied by the sum of the Instrumentalities
(E(EI)) were computed. Pearson's r correlation
coefficient was used to relate these variables to
self rated effort levels for individual farmers
and farm workers.
(b) Descriptive statistics were used to investigate the
validity of the correlation coefficients.
Analyses were carried out using the Statistical
Package for Social Sciences (SPSS).
(2) Content Analysis.
41
(a) Analysis of the perceived work-related outcomes
considering their valence ratings, number and content
for farmers and farm workers.
(b) Analysis of the jobs done by the sample considering
effort ratings, number, desirability rankings and
variety.
42
5.2 EXPECTANCY/VALENCE MODEL ANALYSIS
5.2.1 Pearsons r correlation coefficients
A similar analysis was applied to each individual in
the sample based on that used by Muchinsky (1977). Having
defined a number of behavioural outcomes that stern from work
behaviour and having attached a valence rating to each,
the respondents' instrumentality score for the outcomes
relative influence upon a defined list of jobs was surnrnated.
The valence ratings of each outcome was then multiplied by
the surnrnated instrumentalities. A further multiplication by
the respondent's expectancy score for that job completes the
calculation of a force score of motivation for that particular
job.
A similar force score was calculated for each job in
the respondent's job repertoire (constituting a separate
motivational force for each effort level predicted by the
respondent) •
These force scores were then correlated with the
varying effort levels predicted to accomplish each job.
The components, 'the sum of the instrumentalities',
'expectancies' and 'expectancy multiplied by the sum of the
instrumentalities' were also correlated with the self-rated
effort levels. The resultant correlations for farmers are
shown in Table 6.
Pearson r correlations show the degree of relationship
existing between two variables. These variables are usually
represented by a set of figures. The formula produces a
single figure ranging from +l.00 to -1.00. A correlation
of +l.00 shows a perfect positive correlation. This means
that if one variable increases in a way that is identical to

43
TABLE 6 Validity Coefficients of the Complete Model and
Components for Predicting Criterion of Self-rating
of Effort for Farmers
Sub- Model (Prob) Sminstr (Prob) Expect (Prob) Expint (Prob) ject
1 -0.2643 0.230 -0.1673 0.322 -0.2430 0.249 -0.2373 0.255 2 0.0035 0.496 -0.3082 0.193 0.0498 0.446 -0.0788 0.414 3 0 .1714 0.296 0.3270 0.150 -0.0809 0.401 0 .1331 0.340 4 0.0173 0.480 -0.2562 0.224 -0.2232 0.255 -0.1264 0.356 5 -0.1870 0.261 -0.1327 0.326 -0.1093 0.355 -0.1866 0.261 6 -0.3894 0.084 -0.5047* 0.033 -0.1592 0.293 -0.4055 0.075 7 0. 34 72 0.180 0.2984 0.218 o. 3872 0.152 0.2298 0.276 8 -0.3508 0.132 -0.4461 0.073 -0.2199 0.246 -0.4258 0.084 9 0.2926 0.222 0.2173 0.287 0.2945 0.221 0.2923 0.223
10 -0.3441 0.165 UNCALC 0.3441 0.165 -0.3441 0.165 11 0.3746 0.143 0.5351 0.055 -0.0759 0.418 0.1735 0.316 12 0.2921 0.166 0.4082 0.083 0.3345 0.132 0.4549 0.057 13 0.6370* 0.024 0.7320** 0.008 0.4856 0.077 0.5943* 0.035 14 -0.3335 0.190 0.4806 0.095 -0.4836 0.094 -0.3382 0.187 15 0.3748 0.180 0.3884 0.171 0.0479 0.455 0.4247 0.146 16 -0.1094 0.355 -0.3768 0.092 0.1567 0.296 -0.1441 0.311 17 0. 7779** 0,004 0.8770*** 0.000 o. 7231** 0.009 0. 7408** 0. 007 18 0.0753 0.399 -0.0782 0.395 0.1885 0.259 0.0466 0.437 19 -0.3484 0.122 -0.1852 0.272 -0.0164 0.479 -0.2291 0.226 20 -0.0517 0.447 -0.5313 0.070 0.2220 0.283 -0.1494 0.351 21 0.0607 0.426 0.1218 0.353 0.1563 0.431 0.0975 0.382 22 -0. 8206*** 0. 001 -0.6208* 0.021 -0.7109** 0.007 -0. 8026**" 0 .001 23 -0.6291** 0.008 -0.4200 0.067 UNCALC -0.4200 0.067 24 0.4252* 0.039 0.0117 0.482 0.3194 0.098 0.4322 0.037 25 -0.3330 0.133 -0. 7317'** 0.001 -0.5771* 0.012 -0. 7991**"0.000 26 0.2241 0.254 0.1157 0.367 0.4038 0.109 0.1540 0.326 27 -0.0469 0.449 0.5072 0.067 -0.1685 0.321 -0.0548 0.452 28 0.5622* 0.045 0.5529* 0.049 0.5229 0.060 0.5964* 0.034 29 -0.2975 0.237 0.0095 0.491 -0.3661 0.186 -0.2369 0.286 30 0.1923 0.265 0.3238 0.140 0.0382 0.451 0.2071 0.249 31 UNCALC UNCALC UNCALC UNCALC 32 -0.5022 0.125 -0.6071 0.074 -0.5527 0.099 -0.5269 0.112 33 -0.4923 0.052 -0.4563 0.068 -0.4015 0.098 -0.3999 0.099 34 0.0000 0.500 UNCALC 0.0000 0.500 0.0000 0.500 35 -0.1678 0.311 UNCALC -0.1678 o. 311 -0.1678 o. 311 36 -0.3451 0.182 -0.0552 0.444 -0.4400 0.118 -0.3355 0.189 37 -0. 3119 0.139 -0.6062 0.011 0.3533 0.108 -0.4494 0.053 38 0. 4077 0.107 0.5080 0.055 0.3824 0.123 0.4188 0.100 39 -0.7163** 0.004 -0.7477** 0.003 -0.3449 0.136 -0.7569**0.002 40 0.1656 0.294 0.4793* 0.049 0.0714 0.408 0.1811 0. 277 41 -0.0683 0.436 UNCALC -0.0683 0.436 -0.0683 0.436 42 0.1602 0.284 -0.0209 0.471 0.2223 0.213 0.1619 0.282 43 0.1501 0.289 0 .1150 0.336 0.0000 0.500 0.0788 0.386 44 0.1565 0.333 UNCALC 0.1565 0.333 0.1565 0.333 45 -0.0699 0.424 -0.1762 0.313 -0.0890 0.403 -0.0568 0.438 46 0.4351 0.052 UNCALC 0.4351 0.052 0.4351 0.052 47 -0.4589 0.218 -0.6598 0.113 -0.1521 0.404 -0.4832 0.205 48 UNCALC UNCALC UNCALC UNCALC 49 -0.4279 0.083 UNCALC -0.4279 0.083 -0.4179 0.083 50 0.4211 0.113 0. 3117 0.190 -0.0362 0.461 0.2810 0.216

Sub-ject
51 52 53 54 55
44
Model (Prob) Sminstr (Prob) Expect (Prob) Expint (Prob)
-0.5287 0.180 UNCALC -0.5287 0.180 -0.5287 0.180 -0.0986 0.358 -0.0339 0.450 -0.1127 0.339 -0.0985 0.363
0.8554*** 0.001 0.8062** 0.002 0.7920** 0.003 0. 8977**'1Q. 000 0.0703 0.414 UNCALC 0.0703 0.0902 0.370 0.4078 0.058 0.1402
Model = Total Model
Sminstr = Sum of the Instrumentalities
Expect = Expectancy Values
0.414 0.0703 0.302 0.3089
Expsint = Expectancy Times the Sum of the Instrumentalities
(Prob) = The Probability of Occurrence
Uncalc = The Correlation was unable to be calculated
* **
***
= p<0.05
= p<0.01
= p<0.001
0.414 0.122

45
that of the second variable, a significant relationship
exists between the two. A -1.00 correlation show a negative
relationship. A correlation of zero indicates no relation
ship. It should be noted that a Pearson r correlation is
not a causal measure, but merely descriptive of any evident
relationships.
Perhaps the most apparent feature of the farmer sample
is the lack of significant correlations. In the 'model'
column, only eight farmers exhibited significant r values.
The results from subjects 13, 17, 24, 28 and 53 show positive
correlations of at least p<0.05 significance. Subjects 22,
23 and 39 conversely, have significant correlations to at
least the p<0.05 level of significance. Subjects who do
exhibit a significant 'model' to effort correlation typically
also exhibit correlations of the components to effort ratings
of similar significance levels.
Subject 25 is the only respondent to show significant
component correlations without having a significant 'model'
to effort correlation.
Subjects 6 and 40 show significant 'sum of instrumen
tality' relationships to self rated effort predictions without
any indication of a 'model' or remaining component relation
ship.
Two of the respondents have at least one component (or
as in the case of subjects 31 and 48, the whole model) that
was unable to be correlated with their ratings of effort.
An incalculable correlation for the 'sum of instrumentality'
component results from respondents scoring the same
instrumentality rating for every outcome - job, relationship.
This indicates an inability to differentiate the contribution

different jobs have to obtaining relevant outcomes.
Similarly an incalculable 'expectancy' correlation
results from the inability to distinguish expectancy
dimensions from different jobs. In this situation the
expectancy ratings are the same for all jobs. A lack
of distinction is hence compounded in the 'expectancy
times the sum of the instrumentality' component.
46
In the case of subjects 31 and 48, each job received
the same expectancy, valency and instrumentality ratings
thus making correlation calculations impossible. Although
the respondent indicated a different effort level required
to complete each of the jobs he does, they appear to him, to
have no discriminatory power in achieving his desired
behavioural outcomes.
Similar 'model' and component correlations with self
rated effort levels for farm workers are exhibited in
Table 7. As with farmers, few farm workers' results
indicate significant correlations. The results of subjects
2, lO, 13 and 15 show positive relationships between effort
levels and predictive ability of attaining desired work
related behavioural outcomes. From the significant negative
correlations, subjects 3, 16 and 26 show a declining predic
tive ability as effort levels required for successful job
completion increase. All significant levels have at least
a p<0.05, with subjects 3, 10 and 13 reaching a high p<0.001
level of significance.
Significant 'model' correlations in the farm worker
sample indicate significant relationships with components of
the model and the self rated criterion. Perhaps an indicator
of the potency of the 'sum of the instrumentality' as a
predictor for some subjects (namely respondents 5, 8, 12 and

47
TABLE 7 Validity Coefficients of the Complete Model and
Components for Predicting Criterion of Self
Rating of Effort for Farm Workers
Sub- Model (Prob) ject
1 2 3 4 5 6 7 8 9
10 11 12 13 14 15 16 17 18 19
0.3542 o. 218 0.6452* 0.016
-0.8576*** 0.000 0.0102 0.487
-0.1109 -0.2026
0.4998 -0.3479
0.2982
0.373 0.264 0.085 0.079 0.161
0.6787*** 0.001 -0.4153 0.133 -0.3969 0.080 o. 7473*** 0.000 0.2106 0.280 0.6033** 0.015
-0.6647** 0.009 0.2257 0.229
-0.1068 0.371 0.3263
20 -0.3500 21 0.2049 22 UNCALC 23 0.1651 24 -0.3821 25 -0.0382
0.127 0.121 0.285
0.362 0.110 0.448
26 27 28 29 30 31 32 33 34 35
-0.1659** 0.029 0.1284 0.362
-0.0378 0.447 0.4740 0.051 0.1304 0.343
-0.4379 0. 0714
-0.3791 0.1587
-0.2266
0.089 0.396 0.157 0.271 0.239
Where -
Sminstr (Prob)
0. 5718 0.090 0.6084* 0.024
-0.6492** 0.008 -0.1427 0.321 -0.6139* -0.4705
0.5199 -0.4525*
0.2606
0.022 0.061 0.076 0.030 0.195
o. 7819"'** 0.000 -0.4543 0.110 -0.5438*
0.3742 UNCALC 0.1798
-0.5306* 0.0742
-0 .1151 0.3215 0.0246
-0.2566 UNCALC
0.022 0.069
0.278 0.038 0.405 0.361 0.131 0.468 0.237
UNCALC -0.5591* 0.029 -0.2262 0.218 -0.6035*
0.1098 -0.0775
UNCALC 0.2126
-0.4626 0.4517 0.1403 0.0302
-0.1554
0.032 0.381 0.392
0.253 0.076 0.061 0.359 0.451 0.315
= Total Model
Expect (Prob)
0. 4871 0.134 0.6440* 0.016
-0. 7796*** 0.001 0.1275 0.339
-0.0323 0.462 -0.3422 0.138
UNCALC 0.5438** 0.010 0.1178 0.351 0.8306*** 0.000 0.2146 0.290
-0.1894 0.258 0.8164*** 0.000 0.2106 0.280 0.5133* 0.036
-0.5627* 0.028 0.1592 0.302 0.1695 0.299 0.1981 0.249
-0. 8083*** 0. 000 0.3679 0.148 UNCALC 0.1651
-0.3231 0.1378 UNCALC
-0.1705 -0.0859
0.4740 0.1951
-0.3326 -0 .1146 -0.5530
0.1840 -0.2277
0.362 0.153 0.319
0.319 0.380 0.051 0.272 0.159 0.355 0.061 o. 240 0.238
Model
Sminstr
Expect
Sum of the Instrumentalities
Expectancy Values
Expint (Prob)
0.5530 0.099 0.6451* 0.016
-0.8277'<** 0.000 0.1343 0.331
-0.1129 0.371 -0.3604
0.5199 -0.3148
0.2696
0.125 0.076 0.102 0.187
o. 7413*** 0.000 0.0282 0.471
-0. 3969 0.080 o. 7473*** 0.000 0.2106 0.280 0.4821 0.048
-0.6641** 0.009 0.1342 0.331
-0. 7211 0. 3718
-0.3500 0.0761 UNCALC 0.1651
-0.3951 0.0489
-0.6035* 0.1491
-0.0533 0.4740 0.1956
-0.3434 0.0911
-0.3791 0.2235
-0.2650
0.413 0.095 0.121 0.417
0.362 0.102 0.434 0.032 0.341 0.425 0.051 o. 271 0.515 0.384 0.157 0.194 0.203
Expsint = Expectancy Times the Sum of the Instrumentalities
(Prob) = The Probability of Occurrence
Uncalc = The Correlation is unable to be calculated
* = I)<0.05
** p(0.01
*** p<0.001

24(, is the significant negative relationships with the
criterion which are contained in the table. Perceived
instrumentality of achieving work-related outcomes becomes
more readily predictable for these farm workers, as effort
levels decrease.
Subject 22's components and those of several other
respondents are incalculable.
5.2.2 Description of correlational data
48
Results from the previous literature has in many cases
relied upon the consideration of mean correlations of the
tested sample, (Muchinsky, 1977; Pritchard and Sanders,
1973; Kopelman, 1977), thus facilitating a discussion of
the normative nature of the data. Mean correlations for
farmers and farm workers, exhibited in Table 8 for 'model'
and component correlations appear very low and clustered
about 0.00. The ranges are all above 1.500 for a possible
field of 2.000, indicating a wide distribution of data.
Hence the question of how useful the descriptive value of
the mean correlations for this data, becomes relevant.
Kurtosis values for all respondents in all groups are
negative indicating a flatter distribution than a normally
distributed sample would produce. The skewness values do
not appear very large indicating a slight deviation from the
normal distribution, with farmers exhibiting a slight positive
skew for all component and 'model' correlations. Farm
workers, conversely show a negative skew for the 'model' and
all components except the 'sum of the instrumentalities'.
The data thus appear to depart from normality, if only
a little. Median values for all categories suggest a degree
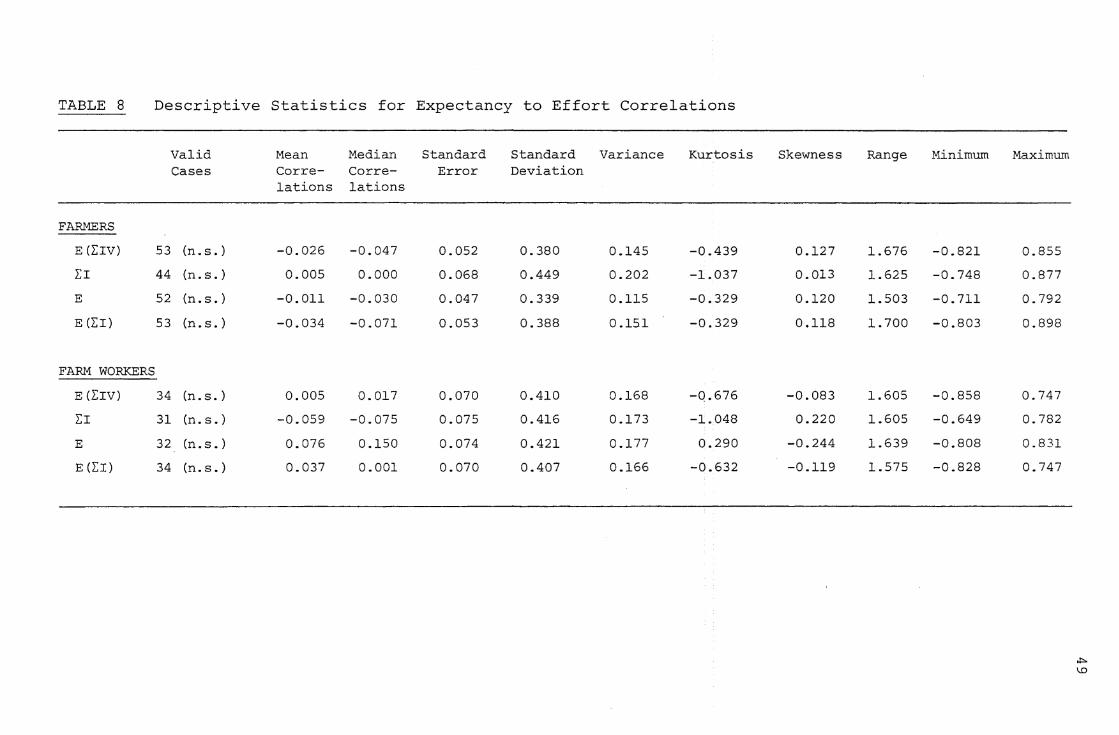
TABLE 8 Descriptive Statistics for Expectancy to Effort Correlations
Valid Mean Median Standard Standard Variance Kurtosis Cases Corre- Corre- Error Deviation
lations lations
FARMERS --E(EIV) 53 (n. s. ) -0.026 -0.047 0.052 0.380 0.145 -0.439
EI 44 (n. s . ) 0.005 0.000 0.068 0.449 0.202 -1.037
E 52 (n. s. ) -0.0ll -0.030 0.047 0.339 0.115 -0.329
E (EI) 53 (n. s. ) -0.034 -0.071 0.053 0.388 0.151 -0.329
FARM WORKERS
E(EIV) 34 (n. s. ) 0.005 0.017 0.070 0.410 0.168 -Q.676
EI 31 (n. s. ) -0.059 -0.075 0.075 0.416 0.173 -1.048
E 32 (n. s. ) 0.076 0.150 0.074 0.421 0.177 0.290
E (EI) 34 (n. s. ) 0.037 0.001 0.070 0.407 0.166 -0.632
Skewness Range
0.127 1.676
0.013 1.625
0.120 1.503
0.118 1. 700
-0.083 1.605
0.220 1.605
-0.244 1.639
-0.119 1.575
Minimum
-0.821
-0.748
-0. 7ll
-0.803
-0.858
-0.649
-0.808
-0.828
Maximum
0.855
0.877
0.792
0.898
0.747
0.782
0.831
0.747
.:,:.
'°

50
of normality for the data with all being very close to the
mean correlational values.
Frequencies of the correlated values for the model
and components are shown in Tables 9 and 10 for farmers
and farm workers respectively. The subsequent frequency
polygons plotted for the farmers in Figure 2 and farm
workers in Figure 3 show graphically the degree of normality
the data possess. The most deviant category from the normal
distributions is 'the sum of the instrumentalities',
characterised by higher kurtosis scores than the rest.
This is true for both farmers and farm workers. Despite
this block-like distribution and the somewhat alpine
distribution of the remaining categories, both Figures 2
and 3 exhibit an approximately normal distribution. This,
in conjunction with the closeness ·of the medians to means
and relatively low skew and kurtosis values for all
categories, suggest the data contain sufficient normality
characteristics to enable the use of mean values for
descriptive purposes.
The mean correlations for the four categories for
farmers and four categories for farm workers were calculated
using the formula for calculation of correlational means
(McNemar, l969, p.158). Correlation coefficients rare
transformed to z scores using
z
where
k = E (N.-k)Z.
av i=l l l
k E (N.-k) i=l l
Zav = average z score
N. = Number of cases in i-th sample l

TABLE 9 Frequencies of Correlations for Farmers
Class Interval E(EIV) EI E
-1.05 - -0.96 0 0 0
-0.95 - -0.86 0 0 0
-0.85 - -0.76 1 0 0
-0.75 - -0.66 2 3 1
-0.65 - -0.56 1 3 1
-0.55 - -0.46 4 3 3
-0.45 - -0.36 2 3 5
-0.35 - -0.26 9 2 2
-0.25 - -0.16 2 3 6
-0.15 - -0.06 4 3 7
-0.05 - 0.04 5 4 5
0.05 - 0.14 4 3 5
0.15 - 0.24 7 1 6
0.25 - 0.34 3 4 3
0.35 - 0.44 6 3 4
0.45 - 0.54 0 5 2
0.55 - 0.64 1 1 0
0.65 - 0.74 0 1 1
0.75 - 0.84 1 1 1
0.85 - 0.94 1 1 0
0.95 - 1.04 0 0 0
Totals 53 44 52
N.B. Totals vary due to exclusion of incalculable
correlations. See Table 5.
51
E(EI)
0
0
3
1
0
3
6
3
5
7
2
5
7
3
4
1
2
0
0
1
0
53

TABLE lO Frequencies of Correlations for Farm Workers
Class Interval E o:rv) I:I E
-1.05 - -0.96 0 0 0
-0.95 - -0.86 1 0 0
-0.85 - -0.76 0 0 2
-0.75 - -0.66 l 0 0
-0.65 - -0.56 l 4 l
-0.55 - -0.46 l 4 1
-0.45 - -0.36 5 3 0
-0.35 - -0.26 2 l 3
-0.25 - -O.l6 3 2 3
-0.l5 - -0.06 2 2 2
-0.05 - 0.04 3 2 l
0.05 - 0 .l4 3 4 3
0.15 - 0.24 4 2 8
0.25 - 0.34 2 2 0
0.35 - 0.44 l l l
0.45 - 0.54 l 1 3
0.55 - 0.64 l 2 2
0.65 - 0.74 2 0 0
0.75 - 0.84 l l 2
0.85 - 0.94 0 0 0
0.95 - l.04 0 0 0
Totals 34 31 32
N.B. Totals vary due to omission of incalculable
correlations. See Table 6.
E (I:I)
0
0
1
1
1
0
4
4
0
3
2
4
5
l
l
3
1
2
l
0
0
34
52

µl u z
9
8
7
6 -
~ 5 -A:: ::::i u u 0
Ii, 4 0
>< u z ~ 3 0
~ Ii,
2
1
-1.0
FIG. 2
I I ~
I
:\
I \ I ~ •••••• ":,/ ; I ..- \ I I / •. • ,..... \ i
,.... \ ;
-0.8 -0.6
FREQUENCY OF CORRELATIONS FOR FARMERS
-0.4
:~-,-} :\~\
/j :\\ . . ! j :\ \ :/; : \
I
-0.2
I •
~ JI
i I \ • ~ ,' I \ /' :f\/ • f\ /,,~ I \
i \! . ,/ ·\\ '1 I\ i\ -~, :
/ \ ! \ I / \ I\ \ J . j \ I 'I ·.·. \
i : \ I : j \ I I · \ I y \ I
0.0
\ I \ I \ I
V
0.2 0.4 0.6
CORRELATIONS (CLASS INTERVAL CENTRE POINTS]
0.8 1.0
LEGEND
E (LIV)
LI
E
E (LI)
Ul w

ril u z ~ ~ :::> u u 0
r,., 0
>< u z ril :::> 0
~ r,.,
8-
7
6
5
4
3
2
1
-1.0
FIG. 3
•. :·
I
I
' I
FREQUENCY OF CORRELATIONS FOR FARM WORKERS
j ' .' . !
. !! E : . . . ' ..
/.
J /\ Ii \ /.I .
,J I•:\ ,Ji
1; !/1 \ };. \ :-r•. \ l \\ \ r ;: • •.
I \ { \ \ L - 1 ·, /;/ ;\ ~
·l ' . ' ' =~ \ :: i; ·, •
(\ \ / / \ 1/2 ! ! ~ -;
,: :·:.
I '·f 7 I _:\ ~-.
\ 1\
! \ ! \ i
•• > ,. •, :l-... - -
....... •
\ ,· ·.; . .. ..
.. -0.8 -0.6 -0.4 -0.2 0.0 0.2 0.4 0.6 0.8
CORRELATIONS [CLASS INTERVAL CENTRE POINTS]
LEGEND
E (LIV)
n E
E (LI)
1.0
Ln .c,.
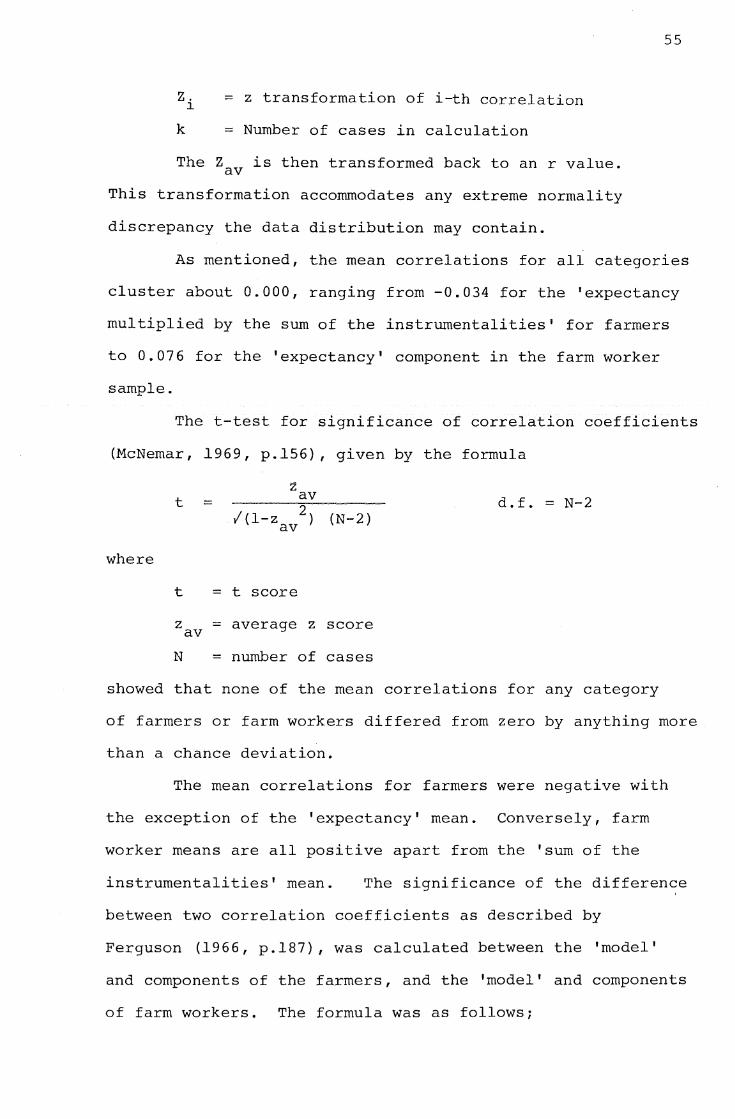
Z. = z transformation of i-th correlation l
k = Number of cases in calculation
The Z is then transformed back to an r value. av
This transformation accommodates any extreme normality
discrepancy the data distribution may contain.
55
As mentioned, the mean correlations for all categories
cluster about 0.000, ranging from -0.034 for the 'expectancy
multiplied by the sum of the instrumentalities' for farmers
to 0.076 for the 'expectancy' component in the farm worker
sample.
The t-test for significance of correlation coefficients
(McNemar, l969, p.l56), given by the formula
where
t = z av
/(1-z 2 ) (N-2) av
t = t score
z = average z score av
N = number of cases
d.f. = N-2
showed that none of the mean correlations for any category
of farmers or farm workers differed from zero by anything more
than a chance deviation.
The mean correlations for farmers were negative with
the exception of the 'expectancy' mean. Conversely, farm
worker means are all positive apart from the 'sum of the
instrumentalities' mean. The significance of the differen~e
between two correlation coefficients as described by
Ferguson (l966, p.187}, was calculated between the 'model'
and components of the farmers, and the 'model' and components
of farm workers. The formula was as follows;

where
2 rl - 2 r2 z =
/l/(N1-3) + (N2-3)
z = z transformation
z . = z transformation of i-th correlation ri
N, = number of cases l
None of the four differences tested reached significance
indicating farmers and farm workers are virtually similar
samples drawn from essentially the same population.
56
Table J.J. considers the sampling distribution of the
correlation coefficients for all categories of respondents.
Calculated in accordance with Ferguson (J.966, p.186), the
confidence intervals shown allow limited generalistaion to
the population from which the samples are drawn.
TABLE ll Sampling Distributions of the Correlation
Coefficients of Four Expectancy Categories
for Farmers and Farm Workers
Sample
Farmers
E(EIV)
EI
E
E(EI}
Farm Workers
E (EIV)
EI
E
E(EI)
where
E = Expectancy
I= Instrumentality
V = Valence
95% Confidence Intervals
-0.291 - 0.243
-0.291 - 0.300
-0.283 - 0.263
-0.298 - 0.236
-0.335 - 0.342
-0.404 - 0.301.
-0.280 - 0.413
-0.261 - 0.330
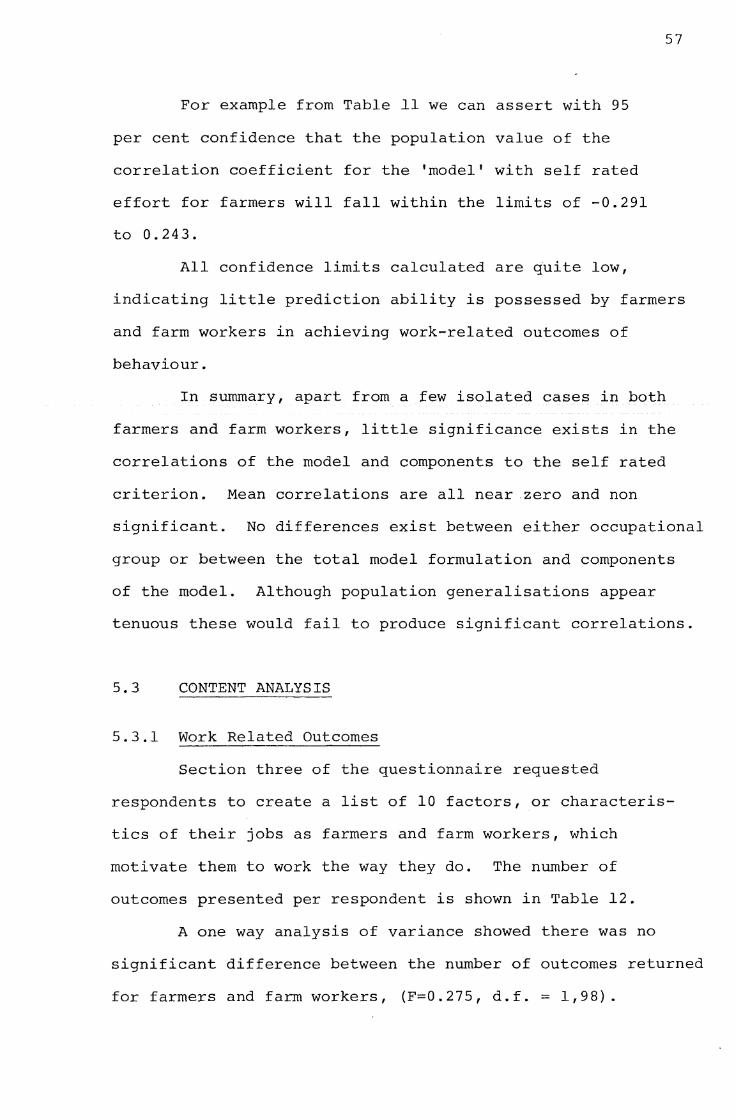
For example from Table ll we can assert with 95
per cent confidence that the population value of the
correlation coefficient for the 'model' with self rated
effort for farmers will fall within the limits of -0.291
to 0.243.
57
All confidence limits calculated are quite low,
indicating little prediction ability is possessed by farmers
and farm workers in achieving work-related outcomes of
behaviour.
In summary, apart from a few isolated cases in both
farmers and farm workers, little significance exists in the
correlations of the model and components to the self rated
criterion. Mean correlations are all near .zero and non
significant. No differences exist between either occupational
group or between the total model formulation and components
of the model. Although population generalisations appear
tenuous these would fail to produce significant correlations.
5.3 CONTENT ANALYSIS
5.3.l Work Related Outcomes
Section three of the questionnaire requested
respondents to create a list of 10 factors, or characteris
tics of their jobs as farmers and farm workers, which
motivate them to work the way they do. The number of
outcomes presented per respondent is shown in Table 12.
A one way analysis of variance showed there was no
significant difference between the number of outcomes returned
for farmers and fann workers, (F=0.275, d.f. = 1,98).
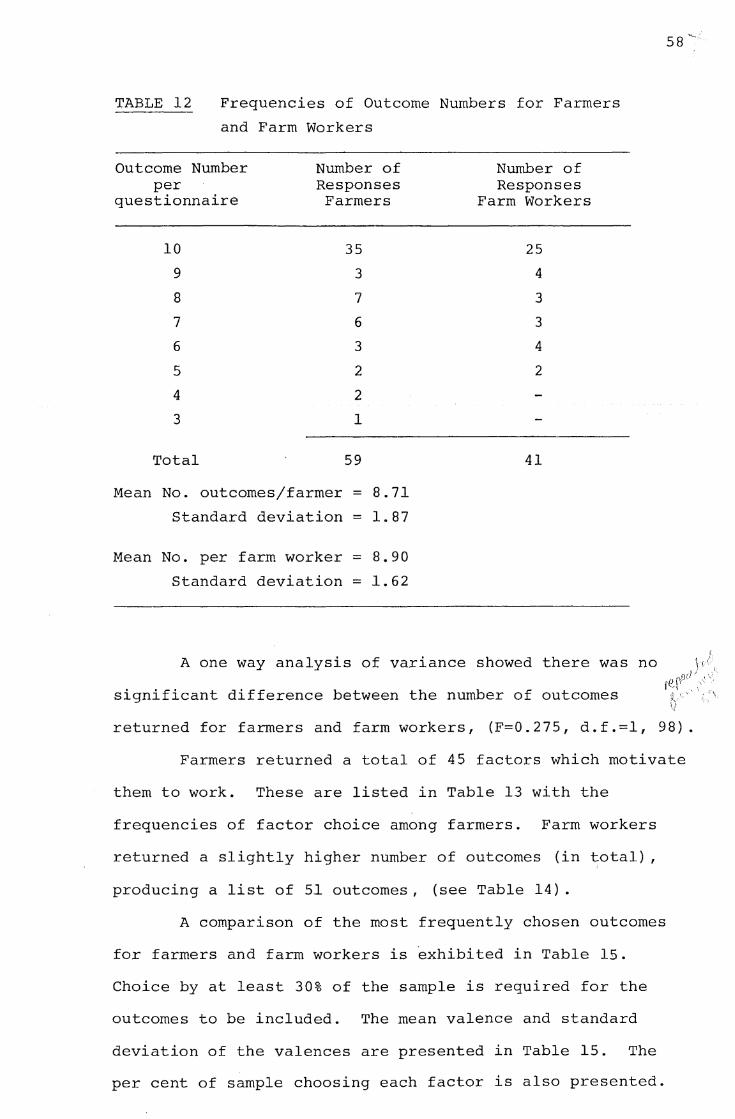
58 ~ ..
TABLE 12 Frequencies of Outcome Numbers for Farmers
and Farm Workers
Outcome Number Number of per Responses
questionnaire Farmers
10 35
9 3
8 7
7 6
6 3
5 2
4 2
3 1
Total 59
Mean No. outcomes/farmer = 8.71
Standard deviation = 1. 87
Mean No. per farm worker = 8.90
Standard deviation = 1.62
Number of Responses
Farm Workers
25
4
3
3
4
2
41
\ f A one way analysis of variance showed there was no
significant difference between the number of outcomes ,.)flrl 1 ,_: re.1,~. , \','
returned for farmers and farm workers, (F=0.275, d.f.=l, 98).
Farmers returned a total of 45 factors which motivate
them to work. These are listed in Table 13 with the
frequencies of factor choice among farmers. Farm workers
returned a slightly higher number of outcomes (in total),
producing a list of 5l outcomes, (see Table 14).
A comparison of the most frequently chosen outcomes
for farmers and farm workers is exhibited in Table 15.
Choice by at least 30% of the sample is required for the
outcomes to be included. The mean valence and standard
deviation of the valences are presented in Table 15. The
per cent of sample choosing each factor is also presented.
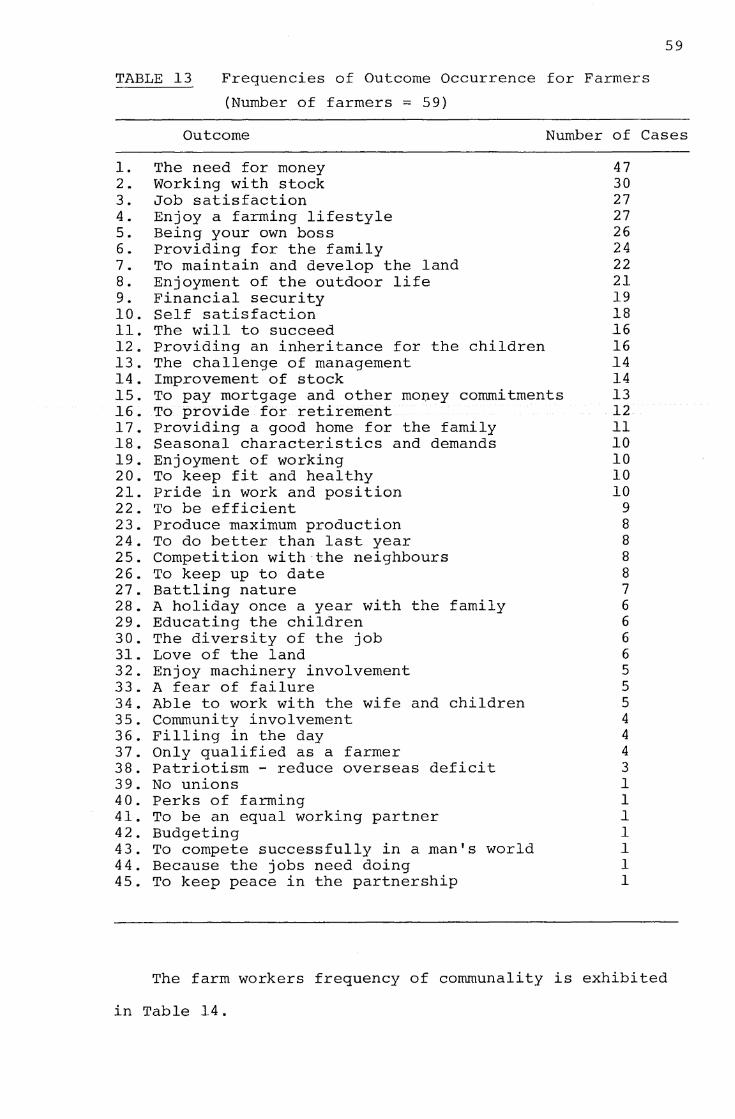
TABLE 13 Frequencies of Outcome Occurrence for Farmers
(Number of farmers= 59)
59
Outcome Number of Cases
1. 2. 3. 4. 5. 6. 7. 8. 9. 10. 11. 12. 13. 14. 15. 16. 17. 18. 19. 20. 21. 22. 23. 24. 25. 26. 27. 28. 29. 30. 31. 32. 33. 34. 35. 36. 37. 38. 39. 40. 41. 42. 43. 44. 45.
The need for money Working with stock Job satisfaction Enjoy a farming lifestyle Being your own boss Providing for the family To maintain and develop the land Enjoyment of the outdoor life Financial security Self satisfaction The will to succeed Providing an inheritance for the children The challenge of management Improvement of stock To pay mortgage and other money commitments To provide for retirement Providing a good home for the family Seasonal characteristics and demands Enjoyment of working To keep fit and healthy Pride in work and position To be efficient Produce maximum production To do better than last year Competition with the neighbours To keep up to date Battling nature A holiday once a year with the family Educating the children The diversity of the job Love of the land Enjoy machinery involvement A fear of failure Able to work with the wife and children Community involvement Filling in the day Only qualified as a farmer Patriotism - reduce overseas deficit No unions Perks of farming To be an equal working partner Budgeting To compete successfully in a man's world Because the jobs need doing To keep peace in the partnership
47 30 27 27 26 24 22 21 19 18 16 16 14 14 13 12 11 10 10 10 10
9 8 8 8 8 7 6 6 6 6 5 5 5 4 4 4 3 l 1 l 1 l 1 1
The farm workers frequency of communality is exhibited
in Table 14.

TABLE 14 The Frequencies of Outcome Occurrence for
Farm Workers
1. 2. 3. 4. 5. 6. 7. 8. 9. 10. 11. 12. 13. 14. 15. 16. 17. 18. 19. 20. 21. 22. 23. 24. 25. 26. 27. 28. 29. 30. 31. 32. 33. 34. 35. 36. 37. 38. 39. 40. 41. 42. 43. 44. 45. 46. 47. 48. 49. 50. 51.
(Number of farm workers= 41)
Outcome Number of Cases
The need for money Love of the outdoor life Job satisfaction To gain experience and education Flexible working hours An interest in farming The variety of work Working with stock To own own property Pride in work A good employer Responsibility - involvement in decisions Self satisfaction A good environment for the family To fill in time doing something you enjoy A commitment to the family Provide for retirement Working without supervision Working with dogs The challenge of building and development A sense of duty to stock To avoid collecting the dole Operating and maintaining machinery Good pay A need to succeed Enjoy physical work Competition Perks - use of farm facilities Don't enjoy city life To keep fit and healthy The privacy of working on your own Living in a good home The seasonal challenges The challenge of trying to improve stock The weather An opportunity to display confidence A test of one's judgement Lack of monotonous life Community involvement Involvement in a constantly changing field Growing seeds and plants Don't know any other jobs Patriotism - contribute to the economy To own a reliable car Curiosity The hereditary nature of farm status Hunting Farm forestry Working from home Ease of finding a new job Flexible holiday times
29 29 20 20 17 17 16 15 14 ll 10 10 10
9 8 7 7 6 6 6 6 6 6 6 5 5 5 5 5 4 4 4 4 3 3 3 2 2 2 2 2 2 2 1 1 l 1 1 l l 1
60
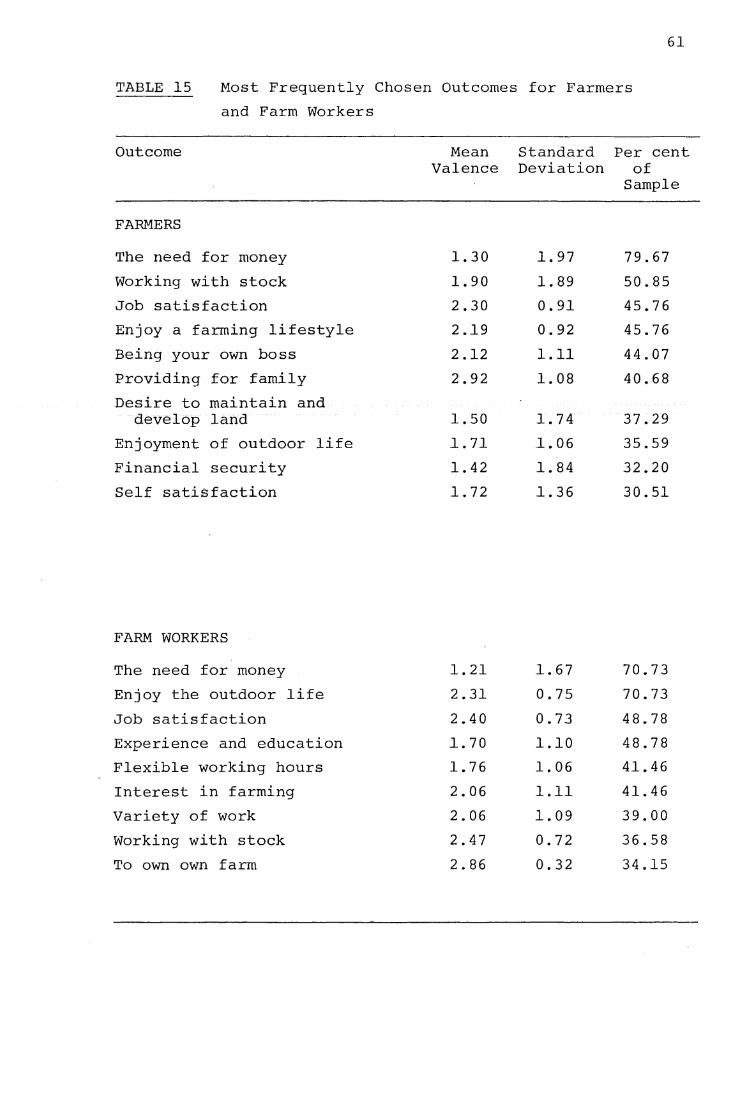
61
TABLE 15 Most Frequently Chosen Outcomes for Farmers
and Farm Workers
Outcome
FARMERS
The need for money
Working with stock
Job satisfaction
Enjoy a farming lifestyle
Being your own boss
Providing for family
Desire to maintain and develop land
Enjoyment of outdoor life
Financial security
Self satisfaction
FARM WORKERS
The need for money
Enjoy the outdoor life
Job satisfaction
Experience and education
Flexible working hours
Interest in farming
Variety of work
Working with stock
To own own farm
Mean Standard Per cent Valence Deviation of
Sample
1. 30 1.97 79.67
1.90 1.89 50.85
2.30 0.91 45.76
2.19 0.92 45.76
2.12 1.11 44.07
2.92 1.08 40.68
1.50 1.74 37.29
1. 71 l. 06 35.59
1.42 1.84 32.20
1.72 1.36 30.51
l. 21 1.67 70.73
2.31 0.75 70.73
2.40 0.73 48.78
l. 70 1.10 48.78
1.76 1.06 41.46
2.06 l.ll 41.46
2.06 1.09 39.00
2.47 0.72 36.58
2.86 0.32 34.15

The farmers and farm workers who were tested, work
the way they do to attain various cormnon outcomes.
62
'The need for money', 'job satisfaction', 'working with
stock' and the 'enjoyment of the outdoor life' are the
most cormnon joint outcomes. Both groups rate 'the outdoor
life' with reasonably high valences, as they do with
'working with stock'. 'The need to make money', although
the most popular work outcome for both groups rates a
moderate valence.
Farmer specific outcomes are 'being your own boss',
'providing for the family', and 'financial security'.
Farm workers seek 'experience and education', value the
'flexible working hours' and desire their 'own property'.
This last outcome, although being chosen by only 34% of the
farm working sample, exhibits the greatest valency rating.
Both samples possess a few outcomes recognised by at
least 70% of the respective samples (one for farmers and
two for farm workers). From this point the consensus drops
to the 30 to 50 per cent region.
5.3.2 Jobs of the Respondents
A master list of jobs done by the sample of farmers
and farm workers is shown in Table 16. The first 13 jobs
comprise the core list which had been included in the
questionnaire as a result of a pilot study. Subsequent
jobs were obtained from respondents' replies.
An analysis of the number of jobs listed in Table 16,
which are normally carried out by each group, is presented
in Table l7.
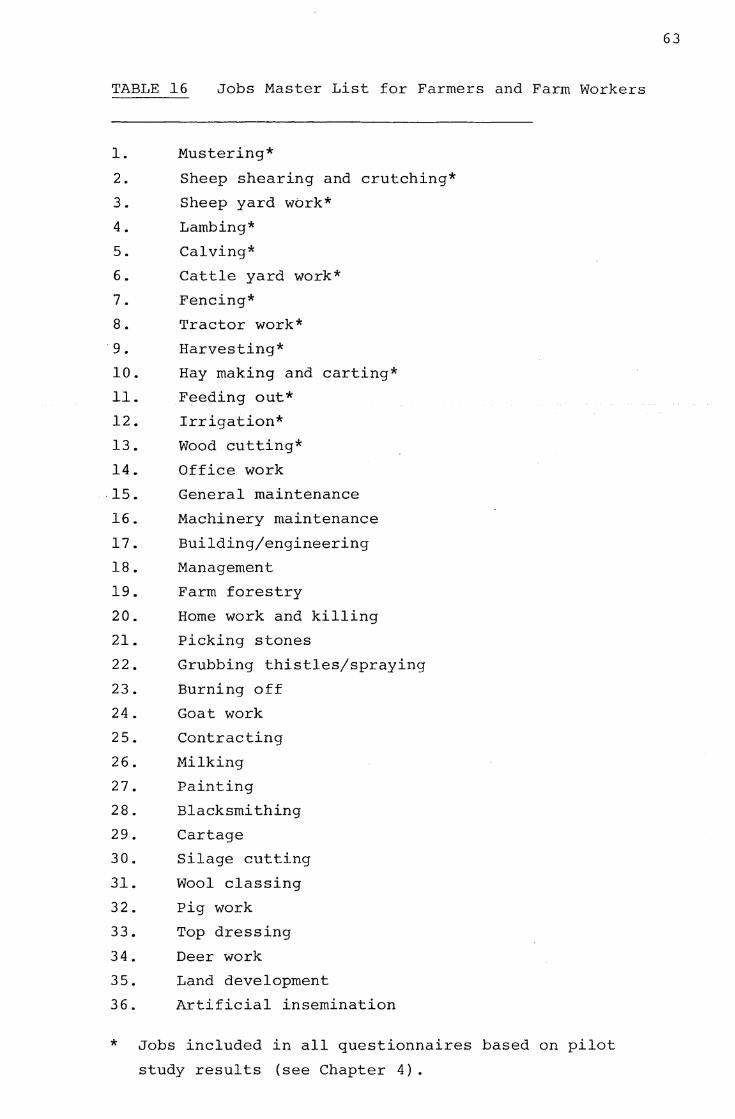
TABLE 16 Jobs Master List for Farmers and Farm Workers
1.
2.
3.
4.
5.
6.
7 •
8.
9 •
10.
11.
12.
13.
14.
15.
16.
17.
18.
19.
20.
21.
22.
23.
24.
25.
26.
27.
28.
29.
30.
31.
32.
33.
34.
35.
36.
*
Mustering*
Sheep shearing and crutching*
Sheep yard work*
Lambing*
Calving*
Cattle yard work*
Fencing*
Tractor work*
Harvesting*
Hay making and carting*
Feeding out*
Irrigation*
Wood cutting*
Office work
General maintenance
Machinery maintenance
Building/engineering
Management
Farm forestry
Home work and killing
Picking stones
Grubbing thistles/spraying
Burning off
Goat work
Contracting
Milking
Painting
Blacksmithing
Cartage
Silage cutting
Wool classing
Pig work
Top dressing
Deer work
Land development
Artificial insemination
Jobs included in all questionnaires based on pilot
study results (see Chapter 4).
63

TABLE 17 Frequencies of Numbers of Jobs done by
Farmers and Farm Workers
Number of Number of Number of jobs farmers farm workers
18 1 0
17 0 1
16 2 2
15 1 1
14 8 5
13 6 8
12 9 8
11 8 7
io 12 6
9 5 5
8 8 2
7 2 2
6 0 0
5 1 0
4 1 0
Total 64 47
Mean No. = 10.98
Standard deviation= 2.62
Mean No.= 11.62
Standard deviation= 2.28
The mean number of jobs reported as comprising
a farmer's position is 10.98 (s.d. = 2.62), per farmer.
64
The farm worker mean is 11.62 (s.d. = 2.28). It would
appear a farm worker's job contains slightly greater variety
than that of his employer. This is only a trend evident
in the sampling as a one way analysis of variance shows
no significant difference in the number of jobs farm workers
do in relation to farmers (F=l.61, d.f.=l,109).
The effort which the respondents perceived would be
required to complete each job was combined for both groups.

65
Jobs indicated as being completed by at least 30% of
respondents were tabulated and ranked according to mean
amounts of effort expenditure. As can be seen from Table
18 there exists very little difference between farmers and
farm workers regarding the perceived amount of effort jobs
require for completion. The rank ordering and effort
levels are virtually the same for both groups. A Pearson's
r correlation coefficient of r=0.89, (p<0.001), indicates
a high relationship between the effort levels of both
groups. Simi.lar gradients of perceived effort levels in
Figure 4 emphasise how closely farmers and farm workers
rate their jobs. Farm workers tend to vary a little more
than farmers in their estimations.
For the sampled agricultural workers, sheep shearing
and crutching yield the greatest effort prediction, with
the mean effort output predicted as 88% for farmers and
84% for farm workers. Hay making and carting, sheep yard
work and lambing are the next most effort demanding. Farm
workers, however, rate fencing before these three while
farmers consider fencing effort below the three mentioned.
Feeding out and calving receive the lowest perceived
effort requirements for both groups. Mean effort levels in
these jobs are in the 45 to 50 per cent range.
A further rank ordering of jobs was considered with
desirability as the criterion. A summation and mean ranking
was obtained for both groups and the results are presented
in Table 19. Again a 30 per cent consensus was required
within each group.
The first six ranks for both groups show the same
job in the same order indicating no differences in

66
TABLE 18 Perceived Job Effort Levels for Farmers
and Farm Workers
Rank Job
FARMERS
l
2
3
4
5
6
7
8
9
l0
ll
12
FARM
1
2
3
4
5
6
7
8
9
l0
ll
l2
13
Sheep shearing & crutching
Hay making and carting
Wood cutting
Lambing
Sheep yard work
Fencing
Harvesting
Cattle yard work
Mustering
Calving
Feeding out
Tractor work
WORKERS
Sheep shearing
Fencing
& crutching
Hay making and carting
Sheep yard work
Lambing
Wood cutting
Cattle yard work
Mustering
Harvesting
Calving
Tractor work
Feeding out
Building & engineering
Mean Standard Per cent
88.51
79.67
70.00
69.63
67.76
67.38
60.48
55.49
Sl. 95
51.32
50.17
46.19
84.31
73.56
71.20
67.70
67.60
67.52
63.75
59.90
56.67
53.83
48.19
46.10
41.25
Deviation of
16.34
19.08
23.85
23.88
20.87
20.56
21.93
19.44
24.99
23.68
22.70
22.06
18.57
21.82
22.66
19.27
25.11
24.43
19.28
27.41
26.83
21.24
27.70
23.22
23.82
Sample
61.90
77.77
88.89
90.48
92.06
95.24
33.33
65.08
87.30
53.97
82.54
85.71
69.57
93.48
86.96
95.65
97.83
91. 30
69.57
86.96
45.65
65.22
78.26
84.78
34.78

90
80-.µ 1-1 0
4-1 4-1 µl
70 'd (!) :>
·rl QJ 0 1-1 60 QJ A,
4-1 0
(!)
50 O'\ n:l .µ i::: (!) 0 1-1 (!) il< 40
30
FIG. 4 Perceived Job Effort for Farmers and Farm Workers
... ' ' \
Sheep Shearing
\
' \..., ', ..... .._...---~--
Haymaking Wood Lambing and Cutting
Carting
Jobs
...... ~ .................... \
\ \
Sheep Fencing Yard Work
\
Harvest-ing
....
Cattle Yard Work
.... ....._
' '
Muster-ing
......
' ·--..._
'
Calving
LEGEND
Farmers
Farm Workers
" ' -
Feeding out
Tractor work
Common in Effort Rating to Farmers/Farm Workers
0\ -..J
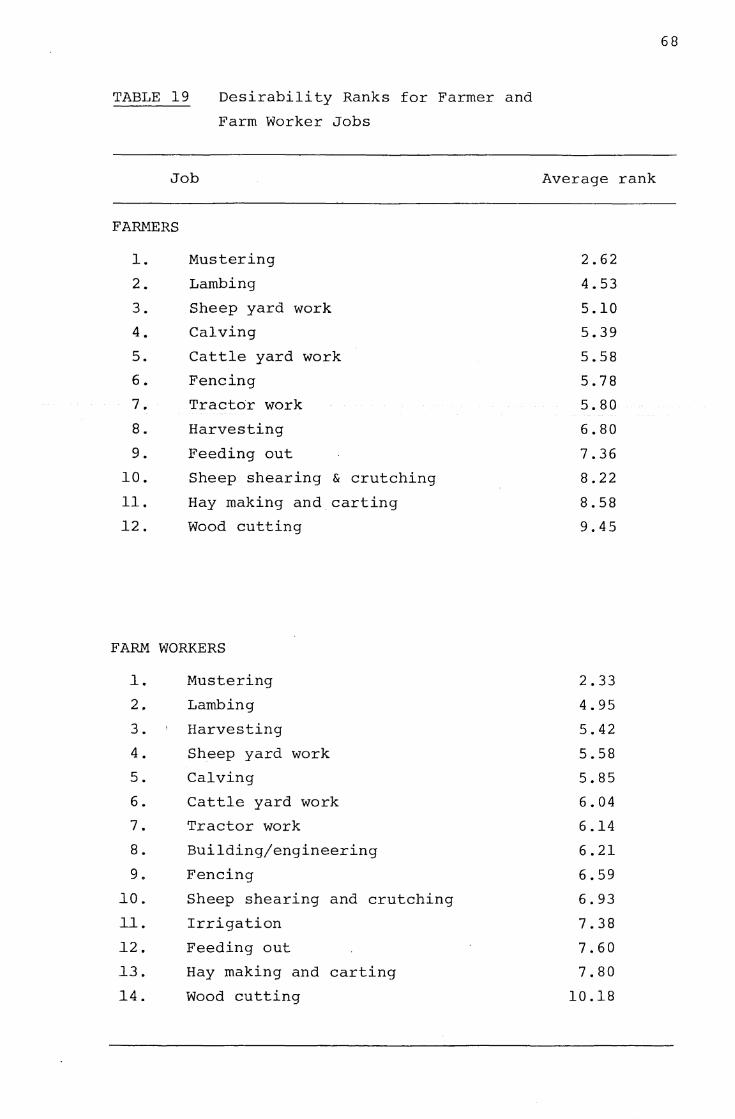
TABLE 19 Desirability Ranks for Farmer and
Farm Worker Jobs
Job
FARMERS
1.
2.
3.
4.
5.
6.
7.
8.
9.
10.
11.
12.
Mustering
Lambing
Sheep yard work
Calving
Cattle yard work
Fencing
Tractor work
Harvesting
Feeding out
Sheep shearing & crutching
Hay making and carting
Wood cutting
FARM WORKERS
l. Mustering
2. Lambing
3. Harvesting
4. Sheep yard work
5. Calving
6. Cattle yard work
7. Tractor work
8. Building/engineering
9. Fencing
.10. Sheep shearing and crutching
l.l. Irrigation
12. Feeding out
.13. Hay making and carting
14. Wood cutting
Average rank
2.62
4.53
5.10
5.39
5.58
5.78
5.80
6.80
7.36
8.22
8.58
9.45
2.33
4.95
5.42
5.58
5.85
6.04
6.14
6.21
6.59
6.93
7.38
7.60
7.80
10.18
68

69
desirability rankings between farmers and farm workers.
The difference in average rank assigned to each job (shown
in Figure 5) exhibits some agreement on desirability with
general gradients being quite similar. The only job
farm workers prefer doing which farmers don't is 'irrigation'.
As an indication of any relationship between perceived
effort ratings and desirability of farm jobs, the consecutive
rankings of both features were plotted. Figure 6 indicates
the farmers' relationships and Figure 7, the farm workers'
relationships. If a connection does exist it would be
reasonable to assume that the greatest effort demanding job
would be the least desirable. Conversely, the least effort
demanding job would be the most desirable.
Farmers (Figure 6), shows some evidence for this
prediction. Sheep shearing, hay making and wood cutting
specifically were ranked as the top three for effort
expenditure and these jobs secure the lowest rankings for
job desirability. Mustering, which was liked the best,
requires the fourth to greatest perceived amount of effort
expenditure.
Farm workers (Figure 7), exhibit similar trends.
In addition, wood cutting, the least desired job, requires
moderate effort to complete.
In summary, the motivating outcomes are similar for
both farmers and farm workers. Basically intrinsic in
nature they involve land and job orientated features. Jobs
done by both groups again show no occupational difference.
The most common jobs resemble the list provided in the
questionnaire. Desirability and effort rankings are similar
for both groups. A slight relationship is evident between
desirability and effort expenditure.

>, .µ -,-j .-, ·ri ..Q rd H
·.-l Ul OJ Cl
4-, 0
~ i::: rd ~
i::: rd OJ
::e:
10.00
9. 00.
8.00
7.00
6. oo.
s.oo
4.00
3.00
2.00
FIG. 5
I/ '/
'
Mustering Lambing
Job -Oesirability for Farmers and Farm Workers
.,..>-------- _.,,,,,
.,,,,..._ I .,,,. ', I
/ '....._t
Harvest- Sheep Calving Cattle Fencing Tractor ing Yard Yard work
Work Work
J
'.I I
I
I ' I
r / ' //
I ' / / y
LEGEND
Farmers
Farm Workers
Feeding Sheep Haymaking Wood out Shearing and Cutting
carting
Jobs Common in Desirability to Farmers/Farm Workers
--.J 0
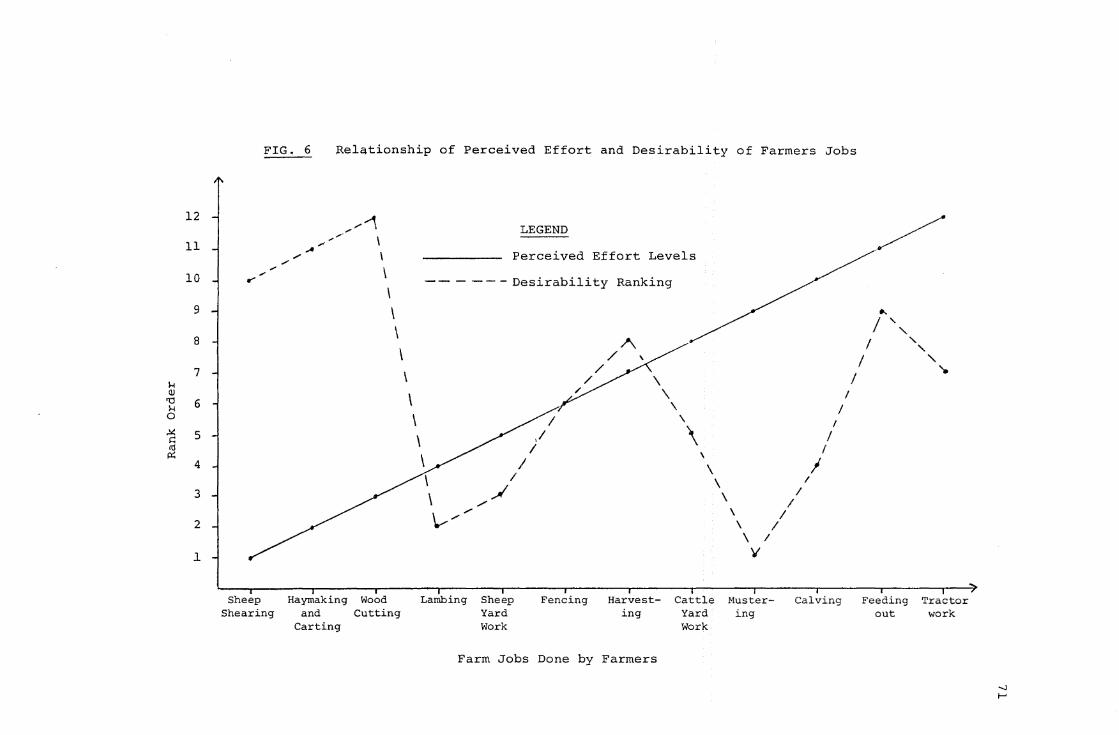
12
11
10
9
8
7 1,-t (U
'Cl 6 H 0
~ 5 .:: <tl
i::i:: 4
3
2
l
FIG, 6 Relationship of Perceived Effort and Desirability of Farmers Jobs
.,, .,,
Sheep Shearing
,, ...... -1 .,.,---- \
,.,,,.,, \
\
Haymaking Wood
\
\ \
and Cutting Carting
\
\ \
LEGEND
Perceived Effort Levels
- - - - - - Desirability Ranking
/
\ ~ /
\..--- ............
Lambing Sheep Yard Work
I
/ I
Fencing Harvesting
Farm Jobs Done by Farmers
' \
Cattle Yard Work
\ \
\ I \ I
\ I V
Mustering
/ /
I
I
I I
I
I I
Calving
/
I I
I
._ I ',
Feeding out
' ' ' '-
Tractor work
-..J I-'
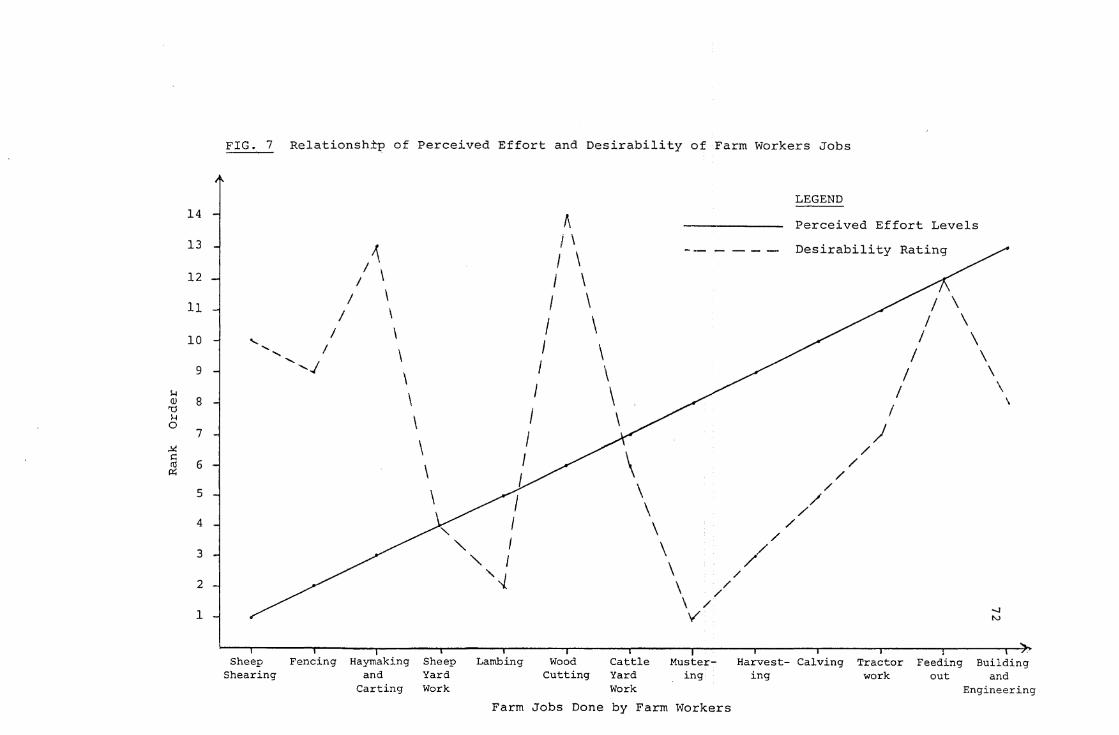
H QJ
'O H 0
..!< ~ co p:;
14
13
12
11
10
9
8
7
6
5
4
3
2
1
FIG. 7 Relationsh±p of Perceived Effort and Desirability of Farm Workers Jobs
~ I \
I \ I \
I \ I
...._, I \ ..... '-......J \
\
Sheep Fencing Haymaking Shearing and
Carting
\
\ \ \
Sheep Yard Work
I
J I I I
"- I '✓
Lambing
I I
I I
I I I I
A I \ I \
Wood
\ \
Cutting
\ \ \
LEGEND
Perceived Effort Levels
--- - - - - Desirability Rating
\ \
\ / \ /
\ / /
\ / \ /
\ // \ /
V
/
/ /
/
J
I I
I
Cattle Muster- Harvest- Calving Tractor Yard ing ing work Work
I
I I
I
\ \
Feeding out
\ \
\ \
-..J N
\
Building and
Engineering
Farm Jobs Done by Farm Workers

73
CHAPTER SIX
DISCUSSION OF RESULTS
The discussion of results will consist of four
sections; first, the motivation of farmers and farm workers
as revealed through an Expectancy/valence perspective,
second the validity of the model's application to a rural
sector and third, discussion of the content analysis as it
bears on agricultural motivation. The final section of the
results discussion considers the study's limitations.
6.l AN EXPECTANCY/VALENCE PERSPECTIVE OF AGRICULTURAL
MOTIVATION
Very clearly, the results indicated no differences
between farmers and farm workers. In all comparisons made,
including individual correlations, mean group correlations
and sample distributions, no significant difference between
the groups was distinguishable. As indicated earlier, the
two groups were characteristic of two samples drawn from
the same population. The only discriminating feature is
the defining variable, i.e. their ownership status in terms
of the property on which they work.
Thus within the parent population, there is the
apparent similarity of job descriptions and polarity of job
titles. Unlike an urban factory situation where employers
and/or owners may assume managerial roles, and the
consequential isolation from the employees, employers or

74
owners of farms carry out the same duties as their
employees. Employees are engaged, as the same job typically
requires more than one person to ensure its successful
completion. Being a farming employer does not, in general,
mean promotion to an exclusively managerial role except in
the case of very large holdings. As a result, the farmer/
farm worker distinction is often quite arbitrary in terms
of defining behavioural clusters. However, the analysis
considered the groups independently and in retrospect this
may have been an unnecessary distinction.
The most obvious feature to emerge from the results
is the extremely small number of significant correlations
in the relationships which were analysed. Of 90 subjects,
only 15 respondents had a significant correlation between
the motivation model and self ratings of effort. The
remaining 75 subjects were unable to predict the perceived
amount of effort required to complete their farm jobs in
order to obtain their desired outcomes of work behaviour.
A low number of significant correlations does not
appear to warrant great importance in previous literature.
Muchinsky (1977), presented 27 subjects' correlations with
a model and components similar to those used in this study.
Three of his subjects achieved significant 'model' to
criterion correlations, 13 significant 'expectancy' to
criterion correlations, and only four 'expectancy multiplied
by the sum of the instrumentality' to criterion correlations.
Despite this low number he quotes mean correlations (which
were insignificant), which are comparable with others in the
literature, (Pritchard and Sanders, 1973). His mean
correlations quoted in Table 2, see Chapter 2.3, appear
high. However, investigation of the number of cases for each

75
correlation shows N's ranging from three to seven with a
mode of five. Hence the correlation coefficients, although
high, remain insignificant.
Misleading results such as these plague the Expectancy/
valence literature and serve to confound evidence in support
of the model (Campbell and Pritchard, 1979).
Low numbers of significant correlations characterise
this study's subjects. As a whole the sample has low and
insignificant correlations with the criterion. The means
of the groups' correlations with the criterion are all
around the zero point, the range being from -0.06 to 0.08.
Prior to discussing these mean values, some justifica
tion for the consideration of the distribution of the
subjects' correlations is necessary.
The approach to analyse of Expectancy/valence tests
within much of the literature, is to correlate the results
from several subjects with a criterion (in the case of a
between-subject methodology) or to correlate various
motivational forces with a criterion for each subject (for
within-subject analysis). Regardless of which research
design, mean correlations provide the usual basis for
analytical discussions and conclusions, (Campbell and
Pritchard, 1979; Mitchell, 1974; Connolly, 1976).
The applicability of the mean as the most relevant
descriptive statistic depends on the distribution of the data
and may indicate the need for some transformation of the data.
Frequently this is not done. In this study it was apparent
that the data departed somewhat from normal distribution
characteristics. However, as the median values were very
close to those of the correlational means, the departure
from normality was not great.

In general, the mean is not as typical as the median when there are extreme measures. However, when scores are distributed in an approximately symmetrical fashion, the mean and the median will be equal or nearly so.
McNemar, 1966, p.18.
76
To counter as much variance as possible introduced by
non-normality of the data, a z score transformation was
considered necessary prior to mean calculations.
Mean correlations of around zero contradict all
previous literature. Correlation upper limits are typically
reported at around r = 0.30, this ceiling being exceeded
only in research where a self-rated criterion is utilised,
(Campbell and Pritchard, 1979). None of the mean correla-
tions in this study approached this value. Table 2,
(Chapter 2.5) compares Muchinsky's (1977), and Pritchard
and Sanders (1973), correlation means for model and component
relationships to the criterions. Muchinsky's most powerful
predictor of r = 0.73 for 'expectancy' and Pritchard and
Sanders r = 0.54 for the 'sum of the valences', greatly
exceeds those found in this study.
Not only does the model to criterion correlation
fail to support the literature trends, but there is also
no distinction between model and component prediction levels.
The correlations in this study show no relationship
between perceived amounts of effort to successfully execute
farm jobs and the ability of the sample to predict these
effort levels. The 95% confidence intervals calculated in
Table 11 (Chapter 5), for th~ sample distribution of mean
correlations allow minimal generalisation to the farming
population from which the sample is drawn. At its optimum,
we may assert with 95% confidence that the model means will

fall within the range -0.30 to 0.24 for farmers. This
is a very low correlation and in line with the sample
results.
77
For farmers and farm workers the Expectancy/valence
model has failed to show predictive ability except in a
small number of isolated cases, and of these half show
negative relationships.
6.2 THE VALIDITY OF THE EXPECTANCY/VALENCE MODEL IN
RURAL JOBS
The characteristic nature of a farming existence could
be the main reason for the lack of relationship among the
components of the model. Unlike urban jobs where commonly
a weekly wage or salary is paid on a fixed interval schedule,
despite fluctuations in production, the farmer's income is
subject to many uncertainties. Only after the completion of
seasonal production, such as fat lambs for slaughter, or
shearing, does a farmer receive payment. Subsequently, his
conception of the expectancies which various jobs contribute
to his success as a farmer, may be difficult to assess.
Consider the job 'fencing'. It requires considerable expense
to erect a fence, but it has little apparent direct economic
return. It keeps stock confined to certain areas with varying
degrees of nutritional value, thus giving a probable greater
monetary return post slaughter. It saves time, during
mustering. It allows better control in bad weather
conditions during lambing, thus increasing lambing percentages.
The indirect value of the fence is finally defined via many
direct production indicators. Conceptualisation of such a
job, and many with similar characteristics, is difficult to
78
assess with regard to expectancy and instrumentality
measures. The job assumes the characteristics of an
instrumentality which according to the Expectancy/valence
model subsequently must be related to an outcome in the
form of a further instrumentality. Conceptual differentia
tion difficrilties become apparent.
Following this argument, the variable interval
schedule of monetary reinforcement of farmers may generate
a different Expectancy/valence result for the same person
on a fixed interval reinforcement such as a farm worker.
Yet this is not the case as farm workers produce the same
Expectancy/valence result as do farmers.
The failure of the model however, seems to result
from the unique characteristics of a farmer's position.
With this in mind we now consider what were termed
"incalculable cor~elations" in the present study.
Essentially, subjects who exhibit an incalculable
component show an inability to differentiate the contributory
value of the various components. In the case of the 'sum of
the instrumentalities' an incalculable correlation results
from the respondent viewing each job as equally instrumental
in attaining the various outcomes of work behaviour. To
this respondent, there is no discrimination among the job
instrumentalities in the positions they occupy.
A closer look at the nature of the jobs farmers and
farm workers do in relation to the outcomes of work behaviour
provides some insight on this problem.
The desired outcomes of work behaviour were very similar
for farmers and farm workers. The farm workers produced a
master list containing greater variety, if only marginally.
The adjusted lists featured in Table 15 (Chapter 5), show
the most sought after outcomes. A 30% consensus was
considered as the cut-off point for these outcomes.
Below this level numbers of subjects exhibiting common
outcomes dropped too low to be usable.
79
The list of outcomes exhibiting the greatest consensus
is in an ungrouped state, (Table 15, Chapter 5). No
categories appearing to be related or facts of an underlying
dimension were combined. One could have combined outcomes
with a common underlying theme. To use money as an example,
'the need for money', 'financial security', 'to pay mortgage
and other financial commitments' and possibly 'a holiday
once a year' could have been calculated as a single financial
outcome. However, distinctions were made by respondents in
many of the responses to these specific outcomes. The mean
valence for the 'need for money' was 1.30 for farmers, a
moderate level indicating it is only mildly attractive because
it is a necessity. The same respondent in many cases had
'the need for money', 'financial security' and 'a holiday'
as three separate outcomes. Rather than view.them as first
and secondary outcomes of a more general outcome, they
appeared to be viewed as being separate.
Having interviewed almost half of the sample, the
author noted the reoccurring feature that farmers claimed
to be in the business of farming in today's climate because
of the 'way of life' commitment, and not for 'the money'.
Many farms are not very profitable at present, hence the
need for money and financial security (necessary states of
existence), were defined as distinct from 'to make money',
(an optional and unnecessary outcome).
Outcomes can be considered as intrinsic or extrinsic.
Intrinsic outcomes are those rewards derived from within the

individual, such as feelings and emotions. Extrinsic
outcomes adopt more materialistic characteristics such as
money.
80
Ten outcomes were most desired by farmers, six were
intrinsic in nature. These were working with stock, job
satisfaction, enjoy farming lifestyle, being your own boss
and self satisfaction. These were also shared by farm
workers. The differing outcomes pertaining solely to farm
workers were 'enjoyment of the outdoor life' and to 'gain
experience'. The trend to emerge is the strong intrinsic
nature of both farmers' and farm workers' desired outcomes.
It is the intrinsic nature of these outcomes and
their relation to the jobs they do that makes this sample
somewhat different to those reported in the literature. The
jobs provide the unit of analysis in this study as each has
attached a differing perceived effort level required to
satisfactorily complete the job.
Possibly the intrinsic nature of the outcomes intrudes
upon or is strongly related to the type of jobs to be done.
As can be seen, 'enjoyment of working with stock', 'like of
farming lifestyle' and 'enjoyment of the outdoor life' are
desired outcomes of behaviour. Working with stock covers
aspects of several jobs, including sheep yard work, lambing,
and calving, to name but a few. Enjoyment of the farming
lifestyle also involves several of the farm jobs, such as
tractor work and harvesting.
The outcomes farmers and farm workers desire, due to
the nature of their jobs, are composed of the jobs they do.
The intrinsic way of life and the love of the lifestyle
themes to emerge from the analysis do not clearly differentiate
between jobs and outcomes.
If this is true, it is a feature which directly
contravenes one of the underlying assumptions of the
Expectancy/valence model, namely:
The theory assumes independence between expectancy and valences and proposes a multiplicative interaction between them.
Wahba and House, 1974, p.123.
In a farming situation the intrinsic nature of the
lifestyles does not create independence between the
expectancy scores of the various job and valence ratings.
81
Perhaps the most characteristic feature of the
Expectancy/valence model of work motivation is that it is a
non-linear monotonically increasing product of expectations
and valences.
The relationship between the outcome valences and
jobs farmers do, in that some jobs actually comprise the
intrinsic outcomes of their work behaviour, means a biased
and almost constant valence measure on outcomes. Farmers
and farm workers virtually always find the intrinsic job
related outcomes highly valent. Hence, the valence and
possibly the expectancy components of the motivational force
= E(~IV) relationship will be conceptualised as constants.
It ceases to become a monotonically increasing function.
As perceived effort levels incryase the predictive ability
remains constant (producing incalculable results). This
interpretation would account for the results in the present
study which failed to show any relationship between outcomes
of work behaviour and perceived effort.
As these two assumptions are unable to be satisfied,
the application of the expectancy model as formulated in this
study is, in hindsight, apparently not appropriate for a
rural sample. To adequately apply the Expectancy/valence

82
model to the agricultural sector, the various jobs each
farmer and farm worker do would have to be listed. Those
with identical job lists would have to be clustered into
separate groups for analysis. A single motivational force
score would have to be calculated for each subject in a
common group, thus utilising between-subject methodology.
A standard list of outcomes of work behaviour would
have to be formulated, screened and transformed. The
transfonnation would require a coefficient attempting a 'way
of life' involvement versus a 'just a job' involvement.
Perhaps independent measures of valence and expectancy for
each jobs contribution would then be possible.
However, this suggested form of analysis contravenes
many methodological arguments advanced, if not by Vroom
(l964), then by some of his successors, (Kopelman, 1977;
Muchinsky, l977; and Mitchell, l979).
6.3 CONTENT ANALYSIS: DISCUSSION
The content analysis of this study was directed at
firstly, the outcomes of work behaviour and secondly, the
jobs done by farmers and farm workers.
The inclusion of intrinsic and/or extrinsic outcomes
has been previously discussed.
Mean valence scores for both groups showed no negative
outcomes. All have positive motivational value for the
respondents.
Specification of outcome lists was not as Mitchell
(l974), described, an unsolvable dilemma. The most popular
method of specification to emerge from the literature was
utilised, namely subject generation. This seemed to be the

83
only valid approach in a within-subject methodology.
Although the outcomes were many and varied for
individual farmers and farm workers, a consensus of most
desired outcomes supports the approach to outcome specifica
tion which was adopted.
As indicated from the literature, a small list of
between five and 11 salient outcomes was considered to give
the greatest prediction accuracy. Due to the occurrence of
many low correlations this cannot be confirmed. It was
found for farmers and farm workers in this sample, that
about nine outcomes adequately defined the outcomes of work
behaviour desired to be obtained. Salience was judged to be
high due to subject generation. An outcome not salient to
the respondent would not have been included.
The second area of content analysis concerned the
jobs that defined the position of farmers and farm workers.
The individual respondent job lists were in large measure
structured by the core list provided in the questionnaire.
Despite a desire to restrict respondents to sheep and cattle
farming, no two farms exhibit an identical set of jobs. As
a consequence the resultant job list for all farmers and
farm workers tested had 36 elements, including unusual jobs
such as artificial insemination and jobs outside the usual
gamut of sheep and cattle farming, e.g. pig work.
Using the 30% agreement, the jobs most farmers and
farm workers did contained ll common elements. They are
almost identical to those in the core list and showed no
differences for farmers and farm workers.
The perceived effort required to successfully complete
the j9bs showed sheep shearing and crutching to be the most
demanding, a possible reason why this job is commonly done
84
by contractors. Hay carting and woodcutting are the next
most demanding. Stock work requires only moderate amounts
of perceived effort, as much of this is a judgemental
process conditional on land, climate and price fluctuations,
rather than reflecting 'effort' as such.
Desirability ratings showed a clear preference for
mustering. Although a definite ordering effect defines the
remaining job desirability ranks, little discrimination is
evident. The three jobs sheep shearing, haymaking and wood
cutting which require greatest effort are the least desirable,
and this was an expected result. It would appear logical
to associate undesirability with greatest effort expenditure.
The possible exception to this is mustering. Rated as the
most desirable, this job also requires much effort. The
interaction of the outdoor life and stock work, (the most
frequent outcomes), are the chief components of this job.
The predicted interaction shape of a cross for job
desirability and an effort relationship appears to be
unlikely in a pure sense. The way of life theme previously
mentioned counters such things as freezing temperatures at
lambing time and back-breaking sweat over sheep yard work.
This may ease the desirability ratings up.
Although somewhat superficial, and ad hoc, the content
analysis is a by-product of the Expectancy/valence analysis.
It answers Seabrook's (1982), plea for more subject rather
than model orientated treatment of farm worker motivation.
Paired with the content analysis, the within-subject
Expectancy/valence model was designed to consider the subject
from his core personality. Contrary to what Seabrook implies,
the application of this model did not construe the individual's
response to fit a model rather, it tested the model as opposed

to testing the individual. The very nature of the
Expectancy/valence theory as a within-subject methodology
parallels Seabrook's 'status approach' and attempts an
internal understanding of the individual worker's motiva
tion.
6.4 LIMITATIONS OF THE STUDY
85
An extremely low response rate from farmers and farm
workers undoubtedly is a serious limitation of the study.
Two versions of questionnaire dispersal proved inadequate
in stimulating workers in the rural sector to participate
at a high response rate. It would be expected that a
personal interview in the 'field' of the respondents would
be superior to an impersonal postal enquiry. This wasn't
so as the postal dispersion response rate was slightly
greater than that of the personal approach.
Although some previous rural investigations have
achieved satisfactory response rates; Clark (l979),
received an 82% response rate and Harris (1980), a 75%
response rate, the failure in this case is not unique.
Ambler (1977) conducted a study directly concerned
with the response patterns to a mail survey of New Zealand
farmers. Ambler shows evidence of Australian farm surveys
obtaining response rates of 39 to 73 per cent. In Ambler's
introduction it is stated on the basis of a review of
literature -
The expected response to New Zealand mail surveys appears to lie in the range 20 to 30 per cent.
Ambler, 1977, p.3.
This seems particularly low with more recent reviews
exhibiting higher rates (Clarke, 1979 and Harris, 1980).

Ambler's own results produced a 59 per cent response
rate.
Of importance in Ambler's recommendations is the
type of question asked within the questionnaire. This
more than anything else reduces response rates.
As mentioned, conceptual confusion over the jobs
and outcome similarities would make successful completion
difficult for many respondents and reduce response rates.
86
Personal interviews and delivery had its value in
showing evidence of a strong current attitude of dissatis
faction with farming by many respondents. The economic
climate for agricultural production at present is bleak
with many farmers expecting sharp drops in profitability
for the current financial year. Enquiries of motivational
forces served to highlight this theme and possibly leading
to failures to respond as avoidance or denial behaviour.
A farmer's distaste for paper work and coincidence
with 'farm statistics' are also possible contributory
factors.
Despite the low sample size of the farmer and farm
worker groups, this study has in absolute terms involved more
subjects than some of those within the literature on
Expectancy/valence investigations. Muchinsky (1977), used
27 subjects, Ilgen, Nebeker and Pritchard (1981), used 88
and Matsui, Kagana, Nagamatsu and Ohtsuka (1977) used 62
subjects. Though response rates were low, sample size for
Expectancy/valence investigation is within the literature
bounds. Inspite of this, the study has been reduced to an
exploratory probe of the Expectancy/valence model in country
settings.

87
Use of a survey methodology creates limitations.
Voluntary response, biases the sample as the least apathetic
portions of the sample characterise the respondents. Harris
(l980), points out that response is a snapshot at that point
in time and cannot account for change. A more attractive
economic climate may shift farming outcomes to the material
extrinsic outcomes, thus making Expectancy/valence theory
more applicable.
What has been found is a trend which characterises
a mismatch of Expectancy/valence theory to a rural sample
at the present time. An investigation which obtains superior
response rates, and one which employs a longitudinal method
ology is required to describe and to generalise from a farming
sample to its parent population with acceptable degrees of
validity.
As a consequence of sampling, further groups emerge
which should in future research, command attention. The
ownership status of farmers creates two distinct groups,
owners and part owners. Similarly with farm workers; there
are those who are career employees and those being groomed
for inheritance of the family farm. With standardised job
lists characterising farmers and farm workers, future research
in rural sectors should separate such groups. Outcomes of
work behaviour may be different for each depending upon
economic considerations. The confounding of these subgroups
effects within a single sample, further limits the validity
of this investigation.
The limiting nature of the sample makes population
generalisations of the expectancy/model tenuous. As an
initial probe, the value of this study lies in the lack of

component independence and the questionable status of the
monotonically increasing function description of the
Expectancy/valence model. This sample exhibited these
features and as such, its only possible that the parent
population of rural workers does.
88
The suggestion of the inappropriateness of the model
for rural sector research should form the basis of further
investigation.
The study falls short of demonstrating the ability
of the farming sector to predict effort levels required to
achieve work-related outcomes. It would appear that the
sample tested is unable to do so. A foundation upon which
to base future research is possibly the most valuable
contribution of the study.
Content analysis of farm workers motivating outcomes
and jobs gives bodies such as the CRFA some indication of
specific needs of farm workers. Farmer employers might also
value such insights into their employees needs. However, as
Clark (l979), suggests, because of the individual nature of
each farm, the typically close relationship between farmer
and employee and consequent lack of anonymity, such an
investigation is unlikely to yield results which would
surprise or be of much use to the farmer as an employer.
Similar information describing farmers' positions,
has some value in that it helps to identify what has up to
now been largely speculation and personal opinion. The
nature of farm work is farm and individual specific. Without
larger response rates, results from this analysis remain
suggestive and by no means conclusive.

89
CHAPTER SEVEN
SUMMARY AND CONCLUSIONS
The Expectancy/valence model of motivational effort
was applied to a sample of New Zealand farmers and farm
workers. It was expected that the study would yield
increased knowledge of what motivational qualities and
determinants this portion of the rural sector possess.
The particular form of the Expectancy/valence theory used
in this study was determined by relevant literature develop
ments.
The primary aim of determining farming motivational
constructs was augmented by the desire to test the theory
in one area of the unique and relatively unresearched farming
sector of New Zealand.
Apart from some modifications to the terminology for
the rural context, little adaptation of the model was
considered necessary. A relatively low rate of 111
respondents from 306, sampled from the foot hill regions of
mid and north Canterbury comprised the two occupational
groups. Fifty-five farmer and 35 farm workers returned
sufficient information for the analysis. The additional
21 respondents participating in consequential content analysis
of the questionnaire.
The relationships examined were those of the independent
variables to a self-rated criterion and included various
contributory components of the model as well as that of the
complete model.
90
Apart from a few isolated cases, neither occupational
group was able to significantly predict perceived effort
levels, i.e. the effort levels required to satisfactorily
complete their individual farm jobs in order to obtain
specified desired outcomes of work-related behaviour. In
addition to the model analysis, no single component was
found to possess superior prediction qualities than any
other model as a whole.
Relationships to criterion prediction were in the
form of correlations. The mean correlations were clustered
around zero for both occupational groups for all components,
and model formulations. No significant differences were
present between occupational groups.
These findings are in contrast with the literature
trends where mean correlations of r = 0.30 are typical of
this form of investigation. A further characteristic of
the literature is for components to exhibit, if not greater,
at least similar significant predictive ability to the model
formulation.
Analysis of the outcomes of work behaviour and
associated valence ratings provided possible reasons for
insignificant correlation coefficients. Enjoyment of the
outdoor life, of a farming lifestyle and of working with
stock proved to be the most intrinsically desired outcomes
of work behaviour for both occupationsl groups. The need
for money was the primary extrinsic outcome for both groups.
The desired intrinsic outcomes are also combinations of many
of the jobs farmers and farm workers do. The independence
of the expectancies associated with each job and the valence
ratings of the outcomes, which is an underlying assumption
of the model, cannot be guaranteed. A bias towards constant

91
valence ratings for each outcome threatens a further under
lying assumption of the Expectancy/valence model. Due to
the nature of the lifestyle and the work which the farming
sector demands, the model formulation cannot assume the
properties of a monotonically increasing function.
The development of the Expectancy/valence model is
not sufficiently mature or alternatively comprehensive
enough for the model to be applied to farming samples. The
assumptions of component independence and the requirement of
the formulation to be a monotonically increasing function
cannot be satisfied. We can conclude that the sample tested
proved inappropriate for Expectancy/valence application.
Generalisation of the results to the population
however, are tenuous due to the low response rate incurred.
Thus the external validity of these results remains doubtful.
Content analysis of the motivational outcomes provide
features common to both occupational groups. Primarily,
intrinsic in nature, lifestyle, environmental and stock
involvement characterise farmers' and farm workers'
motivational outcomes. In a financially demanding world,
the need for money and financial security motivate farmers
and farm workers. A desire for independence and satisfaction
is also common to both groups, with farm workers working in
anticipation of eventual ownership of their own property.
Significantly absent are negatively valent outcomes. The
need for money while it has the lowest valence for both
groups, is not negative.
Predictably both occupational groups execute the same
jobs and perceive similar effort levels being necessary to
complete jobs. A further similarity of jobs for farmers and

92
farm workers is evident in the desirability rankings.
Mustering is the most preferred job of both groups, being
greater in desirability than the remaining jobs. Some
limited evidence exists of an inverse relationship between
desirability and perceived effort ratings for both groups.
Jobs requiring greater amounts of effort to complete are
generally the least preferred.
In conclusion, this study has little conclusive
evidence to add to either the Expectancy/valence literature
or to the small body of rural psychological knowledge.
Within this sample the Expectancy/valence model appears to
be an inappropriate measure of motivation, in its present
form. Generalisation to a wider population is questionable.
The findings do, however, provide a platform from which to
launch motivational research into farm worker motivation.
Features of farmer and farm worker motivational
outcomes, job effort, and job desirability support trends
commonly predicted in farm work but seldom verified.
The inapplicability of this model as with Clark's
(l979) use of the Job Characteristics Model point to the
rural sector being a specialist psychological sample.

BIBLIOGRAPHY
AMBLER, T.I. Response Patterns to a Mail Survey of New Zealand farmers. Agricultural Economics Research Unit, l977, Research Report No. 78.
93
ANDERSON, T.N. An Empirical Investigation into the Expectancy Theory of Motivation in an Accounting Environment. Dissertation Abstracts International, 1980, 41(6-A), 2659.
ARBITRATION COURT OF NEW ZEALAND. Farms and Stations (Sheep, Meat and Wool) - Award, l982.
ARBITRATION COURT OF NEW ZEALAND. Agricultural Workers (Orchards and Vineyards) - Award, l982.
ARBITRATION COURT OF NEW ZEALAND. Agricultural Workers (Market Gardens) - Award, 1981.
ARBITRATION COURT OF NEW ZEALAND. Farms and Stations (Meat (Other Than Sheep Meat), Grain Seed or Herbage) - Award, 1981.
ARBITRATION COURT OF NEW ZEALAND. Farms and Stations (Dairy Farms) - Award, l981.
BROCKMAN, V.M. The Herzberg Controversy. Personnel Psychology l98l, 24, l55-189.
CAMPBELL, J.P. and PRITCHARD, R.D. Research Evidence Pertaining to Expectancy-Instrumentality-Valence Theory, In Steers, R.M. and Porter, L.W. Motivation and WorkBehaviour, McGraw-Hill Book Co., New York, l97 9.
CAMPBELL, D.E. and WILLEMS, E.P. Expectancy Theory of Work Motivation: A Review, Catalog of Selected Documents In Psychology, 1975, 2, 255.
CANT, R.G. and WOODS, M.J. An Analysis of Factors Which Cause Job Satisfaction or Dissatisfaction Among Farm Workers In New Zealand, Agricultural Economics Research Unit (Lincoln College), 1968.
CLARK, B.M. Job Characteristics and Job Satisfaction among New Zealand Farmers, Farm Workers and Agricultural Students, Masters Thesis, University of Canterbury, 1979.
CONOLLY, T. Some Conceptual and Methodological Issues in Expectancy Models of Work Performance Motivation. Academy of Management Review, l976, l, 37-47.
94
DE LEO, P.J. and PRITCHARD, R.D. An Examination of Some Methodological Problems in Testing ExpectancyValence Models with Survey Techniques, Organisational Behaviour and Human Performance, l974, 12, 143-148.
DEPARTMENT OF STATISTICS, New Zealand Official Year Book, Wellington, 1982.
DRORY, A. Expectancy Theory, Academic Effort and Performance, Testing of the Model and some Moderating Variables. Dissertation Abstracts International, l976, 36 (12-B) , 6427.
FERGUSON, G.A. Statistical Analysis in Psychology and Education, McGraw-Hill Book Co., New York, 1966.
FROMAN, L. Some Motivational Determinants of Trainee Effort and Performance: An Investigation of Expectancy Theory, Dissertation Abstracts International, 1977, 38 ( 5-B) , 24ll.
GALBRAITH, J. and CUMMINGS, L.L. An Empirical Investigation of the Motivational Determinants of Task Performance: Interactive effects between Instrumentality-Valence and Motivation-Ability. Organisational Behaviour and Human Performance, l967, ~' 237-257.
GRAEN, G. Instrumentality Theory of.Work Motivation: Some Experimental Results and Suggested Modifications, Journal of Applied Psychology Monograph, 1969, 53, l-25.
HARRIS, G.T. A Socio-Economic Study of Farm Workers and Farm Managers, Agriculture Economics Research Unit (Lincoln College), April, 1980.
ILGEN, D.R., NEBEKER, D.M. and PRITCHARD, R.D. Expectancy Theory Measures: An Empirical Comparison in an Experimental Simulation, Organistaional Behaviour and Human Performance, 198l, 28, .189-223.
IVANCEVICH, J.M. Expectancy Theory Predictions and Behaviourally Anchored Scales of Motivation: An Empirical Test of Engineers. Journal of Vocational Behaviour, 1976, ~, 59-79.
JAMIESON, B. Motivation of Work Behaviour. Notes for course in Organisational Psychology, University of Canterbury, 1982.
KOPELMAN, R.E. Across-individual, Within-individual and Return on Effort Versions of Expectancy Theory. Decision Sciences, l977, ~, 65l-662.
LAWLER, E.E., III, and PORTER, L.W. Antecedent Attitudes of Effective Managerial Performance. Organisational Behaviour and Human Performance, 1967, ~, l22-142.

95
LAWLER, E.E., III, and SUTTLE, J.L. Expectancy Theory and Job Behaviour, Organisational Behaviour and Human Performance, l973, ~' 482-503.
LAZERSON, A. (Ed.) Psychology Today: An Introduction, Random House. Inc., New York, 1975.
LEON, F.R. Number of Outcomes and Accuracy of Prediction in Expectancy Research. Organisational Behaviour and Human Performance, l979, 23, 251-267.
LEON, F.R. The Role of Positive and Negative Outcomes in the Causation of Motivational Forces, Journal of Applied Psychology, l98l, 66{l), 45-53.
MATSUI, T. and IKEDA, H. Effectiveness of Self Generated Outcomes for Improving Prediction in Expectancy Theory Research, Organisational Behaviour and Human Performance, 1976, 17(2), 289-298.
MATSUI, T., KAGAWA, M., NAGAMATSU, J. and OHTSUKA, Y. Validity of Expectancy Theory as a Within-person Behavioural Choice Model for Sales Activities, Journal of Applied Psychology, 1977 62 (6), 7.64-767.
McNEMAR, Q. Psychological Statistics, John Wiley and Sons, Inc., New York, 1962.
MITCHELL, T.R. Organisational Behaviour, Annual Review of Psychology, 1979, i.Q_, 342-382.
MITCHELL, T.R. Expectancy Models of Job Satisfaction, Occupational Preference and Effort: A Theoretical Methodological and Empirical Appraisal. Psychological Bulletin, 1974, 81, l053-1077.
MITCHELL, T.R. and ALBRIGHT, D.W. Predictions of Satisfaction, Retention of Naval Officers, and Human Performance, 1972,
Expectancy Theory Effort, Performance and Organisational Behaviour ~, 1-20.
MITCHELL, T.R. and BIGLAN, A. Instrumentality Theories: Current Uses in Psychology, Psychological Bulletin, 197l, 76, 432-454.
MITCHELL, T.R. and NEBEKER, D.M. Expectancy Theory Predictions of Academic Effort and Performance. Journal of Applied Psychology, l973, ~, 61-67.
MUCHINSKY, P.M. A Comparison of Within and Across Subject Analyses of the Expectancy Valence Model for Predicting Effort, Academy of Management Journal, 1977, 20 (l) , l54-158.
NADLER, D.A. and LAWLER, E.E., III, Motivation: A Diagnostic Approach, In Steers, R.M. and Porter, L.W. Motivation and Work Behaviour, McGraw-Hill Book Co., New York, l979.

OLDHAM, G.R. Organisational Choice and Some Correlates of Individual Expectancies. Decision Sciences, October, 1976, 873-884.
PARKER, D.F. and DYER, L. Expectancy Theory as a Within Person Behavioural Choice Model: An Empirical Test of Some Conceptual and Methodological Refinements, Organisational Behaviour and Human Performance, l976, 17, 97-ll7.
96
PETERS, L.H. Cognitive Models of Motivation, Expectancy Theory, and Effort: An Analysis and Empirical Test, Organisational Behaviour and Human Performance, 1977, ~' l29-148.
PORTER, L.W. and LAWLER, E.E., III. Managerial Attitudes and Performance, Homewood, Dorsey Press, 1968.
PRITCHARD, R.D., DE LEO, P.J., VON BERGEN, C.W. A Field Experimental Test of Expectancy Valence Incentive Motivational Techniques, Organisational Behaviour and Human Performance, 1976, l5, 355-406.
PRITCHARD, R.D., and SANDERS, M.S. The Influence of Valence, Instrumentality and Expectancy on Effort and Performance, Journal of Applied Psychology, 1973, 57, 55-60.
REINHARTH, I., and WAHBA, M.A. A Test of Alternative Models of Expectancy Theory, Human Relations, 1976, 29 (3), 257-272.
RICHARDS, J.M. The Psychology of Farming: A Review of Twenty Five Years of Research, Journal of Vocational Behaviour, 1973, i, 485-501.
ROSENBERG, J. Cognitive Structure and Attitudinal Affect, Journal of Abnormal and Social Psychology, 1965, ~' 367-372.
SCHMITT, N., and SON, L. An Evaluation of Valence Models of Motivation to Pursue Various Post High School Alternatives, Organisational Behaviour and Human Performance, l98l, '!:]_.
SCHWAB, D.P., OLIAN-GOTTLIEB, J.C., HENEMAN, H.G. Between Subject Expectancy Theory Research: A Statistical Review of Studies Predicting Effort and Performance. Psychological Bulletin, l979, 86(l), 139-147.
SEABROOK, M.F. Motivation and Performance, Ergonomics, 1982, 25 (l), 65-72.
SHIFLETT, S., and COHEN, S.L. The Shifting Salience of Valence and Instrumentality in the.Prediction of Perceived Effort, Satisfaction and Turnover, Motivation and Emotion, l982, 6(1), 65-76.
SHIFLETT, S., and COHEN, S.L. Number and Specificity of Performance Outcomes in the Prediction of Attitudes and Behavioural Intentions, Personnel Psychology, 1980, 33, 137-150.

STEERS, R.M., and PORTER L.W. Motivation and Work Behaviour, McGraw-Hill Book Co., New York, 1979.
STEEVES, A.D. Dissatisfaction and the Farm-nonfarm Work Context, Social Forces, 1969, ~' 224-232.
97
VROOM, V.H. Work and Motivation, New York, Wiley Press, 1964.
WAHBA, M.A. and HOUSE, R.J. Expectancy Theory in Work Motivation: Some Logical Methodological Issues, Human Relations, 1974, 27(2), l21-147.

A P P E N D I X

Page 1
FARM WORK MOTIVATION
SECTION ONE
1. SURNAME
2. CHRISTIAN NAMES
3. ADDRESS
4 • PHONE NUMBER
5. AGE 6. SEX
7. MARITAL STATUS
8. IF MARRIED, NUMBER OF DEPENDENTS --------
99
9. PLEASE TICK THE MOST APPROPRIATE BOX FROM THE FOLLOWING
I OWN THE PROPERTY ON WHICH I WORK • I AM PART OWNER OF THE PROPERTY ON WHICH I WORK • I MANAGE THE PROPERTY ON WHICH I WORK • I AM EMPLOYED AS A FARM WORKER BY A NON RELATIVE • I AM EMPLOYED AS A FARM WORKER BY A RELATIVE •
IF SO STATE RELATIONSHIP TO EMPLOYER
SECTION TWO
1. Below is printed a list of farm jobs. Cross out the jobs
that do not apply to the work you do or are done by
contractors or employees, {if you are an owner or manager).
Add any further jobs you do which are not listed.
(a) Mustering
(b) Sheep shearing and crutching
(c) Sheep-yard work (i.e. drenching, drafting, dipping etc.)
(d) Lambing (i.e. beats, tailing, weaning etc.)
(e) Calving (i.e. beats, marking, weaning etc.)
(f) Cattle-yard work (i.e. dehorning, drenching,
ear tagging)
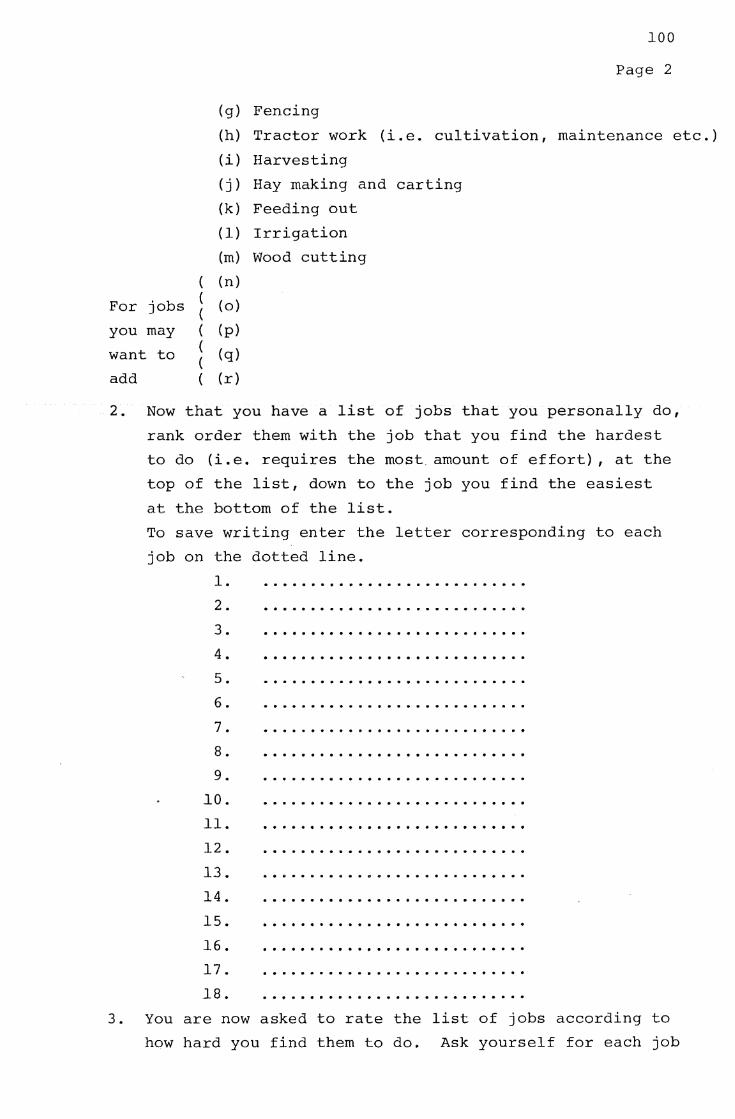
(
For jobs ( (
you may (
want to ( (
add (
(g}
(h)
(i}
( j)
(k}
( 1}
(m)
(n)
(o)
(p)
(q)
(r)
Fencing
100
Page 2
Tractor work (i.e. cultivation, maintenance etc.)
Harvesting
Hay making and carting
Feeding out
Irrigation
Wood cutting
2. Now that you have a list of jobs that you personally do,
rank order them with the job that you find the hardest
to do (i.e. requires the most. amount of effort), at the
top of the list, down to the job you find the easiest
at the bottom of the list.
To save writing enter the letter corresponding to each
job on the dotted line.
1.
2.
3.
4.
5.
6.
7.
8.
9.
lO.
11.
12.
13.
14.
15.
16.
17.
l8.
. .......................... .
. .......................... . 3. You are now asked to rate the list of jobs according to
how hard you find them to do. Ask yourself for each job

101
Page 3
'how much effort is needed to get this job done?'
The most difficult job may require 100% effort or 75%
effort, depending on how hard you personally find it to
complete. Write a percentage rating on the dotted line
beside each of the jobs in part 2 immediately above.
SECTION THREE
1. In the space provided below create a list of 10 factors
or characteristics of your job as a farm worker or farmer
that you feel motivates you to work. Simply ask yourself
'what motivates me to work the way I do each day?'
1.
2.
3.
4.
5.
6.
7.
8.
9.
10.
2. Now rate the attractiveness of each of the motivating
factors you have just listed using the following scale.
Circle the most appropriate number where -3 means you find
the motivating factor most unattractive to O where you find
the motivating factor indifferent, to +3 where you find the
motivating factor most attractive.
An example is given for the motivating factor 'to own a
Mercedes car'. Ask yourself 'how attractive is doing
everyday work to achieve this?'
-3 -2 -1 0 +l +2 ~ (most unatt- (indifferent) (most ractive) attractive)
Every-day work seems most attractive if you wish to own a
Mercedes.
Enter your list of motivating factors beside each
corresponding number.
1. -3 -2 -1 0 +l +2 +3 ---------------------

102
Page 4
2.
3.
-3 -2 -1 0 +l +2 +3
-3 -2 -1 0 +l +2 +3 --------------------4.
5.
6.
7.
8.
9.
-3 -2 -1 0 +l +2 +3
-3 -2 -1 0 +l +2 +3
-3 -2 -1 0 +l +2 +' ,_)
-3 -2 -1 0 +l +2 +3
-3 -2 -1 0 +l +2 +3
-3 -2 -1 0 +l +2 +3 --------------------10. -3 -2 -1 0 +l +2 +3
SECTION FOUR
This section is an attempt to relate your list of jobs to the
list of motivating factors you have created. To do this it is
necessary to rate the relationship between doing a good job on
each one in your job list and the possibility of achieving each
of your motivating factors.
You are requested to firstly fill in your motivating factors
down the left side of the table on the following page, and to
put the letter corresponding to each job on your list in the
spaces provided across the top of the table.
In this way it is possible to relate each motivating factor
with each job.
To do the rating choose the most appropriate number from the
following scale that best describes the job-motivating factor
relationship; where
-3 -2
(doing a good job detracts from the possibility of achieving this motivating factor)
-1 0
(doing a good job doesn't influence the possibility of achieving this motivating factor)
+l +2 +3
(doing a good job is the only way to achieve this motivating factor)
Instead of circling the most appropriate number as
before, choose it and writ~ it in the table on the next page.
An example will help clarify what is required. If the
first job across the top of the table is. 'doing the dishes'
and the first motivating factor down the left hand column is
'to own a Mercedes', ask yourself 'how much does doing a good
job of the dishes help contribute to the possibility of

owning a Mercedes?' An appropriate answer would be O, so it would be written into the first box.
JOB+
MOTIVATING
FACTORS
1. ,
2.
3.
4.
s.
6.
7.
8.
9.
10.
l"tj
Pl l.Q (D
u,
I-' 0 w

SECTION FIVE
104
:Page 6
In this section you are asked to rate the relationship
between working hard on each job on your list and how
successful you are as a farmer or farm worker (whichever is
applicable). The scale used here is such that O means there
is no relationship between the amount of effort you put into
each job and success as a farmer, to 5 which indicates
a strong relationship between effort and success as a farmer.
An example for the job 'to do the dishes' is given.
0 l
(no relationship between working hard and being a successful farmer)
2 3 4 5
(a strong relationship between working hard and success as a farmer)
An answer of O shows that working hard on the dishes has
nothing to do with being a successful farmer.
Circle the most appropriate number for your list of jobs.
1. For job (a) . . . . . . . . . 0 1 2 3 4 5
2. For job (b) . . . . . 0 1 2 3 4 5
3. For job (c) . . . . . . . . . 0 1 2 3 4 5
4. For job (d} . . . . . . . 0 1 2 3 4 5
5. For job (e) . . . . . . . . 0 1 2 3 4 5
6. For job (f) . . . . . . . . . 0 1 2 3 4 5
7 • For job ( g) . . . 0 1 2 3 4 5
8. For job (h) . . . . . . . . . 0 1 2 3 4 5
9. For job (i} . . . . . . . . . . . 0 1 2 3 4 5
10. For job ( j) . . . . 0 1 2 3 4 5
11. For job (k) . . . . . . . 0 l 2 3 4 5
12. For job (1) . . . . . . . . 0 1 2 3 4 5
13. For job (m) . . . . . 0 1 2 3 4 5
14. For job (n) . . . . . . . 0 l 2 3 4 5
15. For job (o) . . . . . . . . 0 l 2 3 4 5
16. For job (p) . . . . . . . . . 0 l 2 3 4 5
17. For job (q) . . . . 0 l 2 3 4 5
l8. For job (r) . . . . . . . . . 0 l 2 3 4 5

Page 7
SECTION SIX
Finally, rearrange your list of jobs in the space
provided below so that the job you like doing the best
at the top of the list down to the job you like doing
least at the bottom of the list.
Enter the letter corresponding to each job on the
dotted line.
1.
2.
3.
4.
5.
6.
7.
8.
9.
10.
ll.
12.
13.
14.
15.
16.
l 7.
18.
• •••• ti' ••• . ...................... .
. .............. , .................. .
. ................................. .
. ............ - .................... .
. ...... , .......................... .
. ................................. .
. ................................. .
THANKYOU FOR YOUR CO-OPERATION
is
the
10