The Importance of Digital Literacy Skills among Farmers for ...
Upload
khangminh22Category
view
0download
0
University of Nebraska - Lincoln University of Nebraska - Lincoln
DigitalCommons@University of Nebraska - Lincoln DigitalCommons@University of Nebraska - Lincoln
Library Philosophy and Practice (e-journal) Libraries at University of Nebraska-Lincoln
January 2020
Farmers’ Perspective on Agricultural Information Literacy: A Case Farmers’ Perspective on Agricultural Information Literacy: A Case
Study of Jind District, India Study of Jind District, India
DEEPAK KUMAR Librarian, Gandhi Memorial National College, Ambala Cantt., Haryana, India, [email protected]
JYOTI DEVI Ph.D. Scholar, Department of Library & Information Science, Kurukshetra University, Kurukshetra, India, [email protected]
Follow this and additional works at: https://digitalcommons.unl.edu/libphilprac
Part of the Information Literacy Commons
KUMAR, DEEPAK and DEVI, JYOTI, "Farmers’ Perspective on Agricultural Information Literacy: A Case Study of Jind District, India" (2020). Library Philosophy and Practice (e-journal). 3836. https://digitalcommons.unl.edu/libphilprac/3836

Farmers’ Perspective on Agricultural Information Literacy: A Case Study of
Jind District, India
Deepak Kumar
Librarian
Gandhi Memorial National College
Ambala Cantt., Haryana, India
Email: [email protected]
Jyoti Devi
Ph.D. Scholar
Department of Library & Information Science
Kurukshetra University, Kurukshetra, India
Email: [email protected]
Abstract
The primary purpose of the present study is to explore the level of information literacy among the
farmers with regards to agriculture at the Jind district of Haryana state in India. Survey method
with accidental sampling is used, and data were collected from a total number of 52 farmers who
lived in the two selected villages by using a self-structured questionnaire. The demographic profile
shows male dominancy on agriculture, and the majority of the farmers found literate. Their primary
source of income is agriculture (86.54%), and 84.62% of them own the land of fewer than four
acres. Rice, wheat, sorghum, cotton, and pearl millet are main crops that the farmers grow in their
fields. Agriculture, education, and health are the main areas on which all the farmers need
information, and TV & newspapers are found as the primary sources of acquiring the required
information. The low price of crop production (M=4.87), lack of electricity in rural areas
(M=4.85), and low level of literacy (M=4.73) are significant problems the farmers faced in
information searching. However, there is a need to make the farmers aware of the public library
and their importance and use, and Krishi Vigyan Kendra (KVK) and their utility.
Keywords: Information Literacy, Information Source, Information Needs, Agriculture, Farmers.
Introduction
Agriculture is the main occupation of Indian people, the world’s fasted developing country, and
this is playing a significant role in the economy and its allied sectors. The majority of the Indian
population lives in rural areas, and this research survey is extensive work in this regard among the
farmers who lived in villages who are extensively involved and agriculture and its allied
occupation. Under the lens of information literacy, it is being tried out to focus on agriculture, the

information needs of the farmers, and sources used to fulfill these needs. The practices of farmers
with regards to the information requirements on education, health, agricultural, economy, etc. are
the key factors to push this study further under the aegis of agricultural information literacy.
Therefore, this research aims at exploring the extent of agrarian information literacy among the
farmers of the Jind District of Haryana state in North India.
Literature Review
Jalaja & Kala (2015) enquires the agriculture information needs among 150 tribal farmers of
Palakkad by using the survey method and found that seed availability (96.18%), new crop
production (90.7%) and insecticide availability (80.91%) were major desired areas of information
need among the farmers and fellow farmers (90.07%) and community leaders (67.93%) were found
as the major sources of needed information. It was observed that major problem faced by the
farmer was to access and use the information included low level of income and poverty (73.26%
each), language barriers (71.75%), Inability to access formal channel of information (71.75%),
Lack of personal interest and special knowledge (71.75%) while 54.19% farmers faced problems
due to illiteracy and ignorance of the information. Mashroofa and Senevirathne (2014) investigate
the information literacy level of the 57 farmers by survey method and found that majority farmers
i.e. 42.2% and 56.6% were ‘always’ get information on time about irrigation and subsidy
respectively and 40% of the farmers got their desired information from community leaders.
Moreover, 66.7% farmers wished to get their desired information through oral communication and
71.1% farmers presented their willingness in mode of communication by directly speaking. Further
the authors found that 75.56% farmers were involved in information creation process but in case
of computer literacy level among the farmers is quite found very low as only 17.8% of them were
using the computer. Patel (2016) highlighted the instantaneous need to reinforce the ICT to enable
small, marginal and women farmers in particular in the light of measures already originated by the
government, NABARD and the private sector in developing farmer-friendly portals as an vital part
of digital India project to quicken farm productivity, production and profitability. The authors
highlighted the root cause of low productivity of the farmers in India like low level of productivity,
land degradation, profile of rural households, declining farm size and low level of income. Further,
the author through the lights on fovernment projects initiated for the farmers such as Farmers’
portal, Kisan Call Centre (KCC), Machine-to-machine (M2M), Nation e-goverance plan in
agriculture (NeGP-A), AGRISNET and e-Choupals etc. Soylu, Chevher and Schirone (2016)
investigate the information seeking behavior of 120 farmers from Sweden and Turkey and found

that current market price, weeding, farmer courses, information on pesticides and harvesting
technique were most desired information needs among the farmers in Sweden and internet,
journals, other people and books were found as the major sources to get their desired information.
While in case of Turkey, product and seed, weather broadcast and plant protection were major
information needs among the farmers. Malhan and Rao (2007) discussed the advances in
information and communication technologies (ICTs) and their penetration and impact on Indian
agriculture sector and found that 87% of the in the Jammu region and 55% farmers in Ludhiana
region reported that extension workers are not very cooperative. The author further found that 47%
and 35% of farmers in respective regions mention above stated that extension staff is not
responding to farmers queries and problems. 86% farmers of this region informed that even
agricultural inputs such as seeds, fertilizers, water for irrigation is not timely available.
Objectives
The main objectives of this study are as given below:
1. To find out the information needs of the farmers on agriculture and primary source to
acquire these needs
2. To find out the types of information required for educational purposes and its sources
3. To find out the information needed for health purposes and sources used to fulfill such
needs
4. To find out the types of information required on the agricultural economy and sources for
acquiring these needs
5. To find out the significant problems faced by the farmers while searching the information
on agriculture
6. To judge the awareness level of farmers on the availability of public library & KVK
Research Methodology
The present study is based on an empirical research model. As indicates in the title, the Survey
method is being used here. A structured questionnaire was prepared for the data collection on
information literacy among the farmers on agriculture, after then the questionnaire has been
translated into Hindi language for the convenience of the farmers as they feel more comfortable in
Hindi. The questionnaire was personally administered among the farmers, and 52 filled in
questionnaires out of 60 were received back with 86.67% response rate. Collected data then put
into SPSS 22 for further analysis as most of the questions were on a 5-point Likert scale, and mean

values of the variables are being extracted for convenience. The analyzed data is being presented
in the form of tables and graphs with the help of Microsoft Word & Excel 2013.
Scope
The scope of this study is limited to the Jind district of Haryana state. However, it is impossible to
study all the 306 villages of the district, so, due to the scarcity of time and some other limitations,
only two villages namely Lajwana Khurd and Sirsa Kehri has been chosen randomly for this
survey. Therefore, these two villages come under the scope of this survey.
Data Analysis & Interpretation
The collected data, as discussed in the research methodology section, is being presented in the
form of tables and graphs. The interpretation of the data is incorporated with each table or figure.
The data analysis and interpretation are given below:
Table 1: Demographic Profile of the Farmers (N=52)
Demographic Variable Number Percentage
Gender Male 52 100.0
Female 0 0.00
Age
Up to 30 8 15.38
31-40 12 23.08
41-50 15 28.84
Above 50 17 32.70
Marital Status Married 45 86.54
Unmarried 07 13.46
Education
Illiterate 3 5.77
Up to 5 8 15.38
6 to 12 32 61.54
Graduation 8 15.38
PG 1 1.92
Agricultural Experience
Less than 10 3 5.77
10 to 20 21 40.38
21 to 30 12 23.08
31 to 40 7 13.46
More than 40 9 17.31
Language Known Hindi 28 53.85
Hindi & English (Both) 24 46.15
Main Source of Income
Govt. Job 3 5.77
Business 1 1.92
Private Job 3 5.77
Agriculture 45 86.54
Land Ownership (in acre) Less than 4 44 84.62

5 to 8 5 9.62
9 to 12 1 1.92
12 to 16 1 1.92
17 to 20 1 1.92
Land took on rent for agriculture Yes 16 30.77
No 36 69.23
Land on Rent (in acre) N=16
Less than 5 8 50.00
6 to 10 6 37.50
11 to 15 1 6.25
More than 15 1 6.25
Type of crops grown
Rice 52 100
Wheat 52 100
Jowar (sorghum)/Bajra
(pearl millet)/Cotton 45 86.54
Mustard 5 9.62
Sugarcane 11 21.15
Vegetables 1 1.92
The detailed demographic profile of the farmers is being presented in table 1, i.e., gender, age,
marital status, education, agriculture experience, income source, land ownership, & on rent and
significant crops grown in the farms. It figures out that all the farmers were male, and 32.70% of
them were above the age of 50 years, 28.84% were between 41-50 years, 23.08% were between
31-40 years and 15.38 % were below 30 years of age. 86.54% of farmers were married, and the
remaining 13.46% were unmarried. While talking about the educational level, it was found that
that majority (61.54%) were studied between 6th to 12th class followed by graduation and 5th
class (15.38% each), and the remaining 5.77% were illiterate. Farmers were also enquired about
their agriculture experience, and it was found that 40% of them have 10-20 years of experience,
23.08% have 21-30 years, 17.31% have more than 40 years, and 13.46% have 31-40 years of
experience. There were 46.15% of farmers, who are familiar with both Hindi & English language,
and the remaining 53.85% know Hindi only. Agriculture was the primary source of income for
86.54% of farmers with some other source of income, such as government and private jobs (5.77%
each) and business (1.92%). The majority of the farmers (84.62%) owned the land of fewer than 4
acres, and 9.62% of farmers have 5-8 acres of land. There were only 30.77% farmers are such who
taken the land on rent/contract for agriculture and out of this proportion, 50% of them take less
than 5 acres of land on rent, 37.50% were taken 6-10 acres, and 12.50% were made more than 10
acres of land on lease. All the farmers were grown rice and wheat as the main crop followed by

Jowar/Bajra/Cotton (86.54%), sugarcane (21.15%), and mustard was being produced by 9.62%
farmers only.
Table 2: Types of Information Needs
Information Needs Number Percentage
Agriculture 52 100
Education 52 100
Health 52 100
Agriculture economy 51 98.08
Society 50 96.15
Current information 49 94.23
General information 49 94.23
Entertainment 34 65.38
Other 25 48.08
Farmers were asked about their information needs, and surprisingly all the farmers are being
needed the information on three significant aspects, i.e., agriculture, education, and health, as
shown in table 2. After these three major areas on which they required information, the agriculture
economy comes after as it is being needed by 98.08% farmers followed by details in society that
is required by 96.15% farmers. Current and general information on any aspect, both are being
required by 94.23% farmers. Entertainment (65.38% and other information (48.08%) was found
the least information needed elements among the farmers.
Table 3: Sources for acquiring the Information Needs
Sources Number Percentage
Internet 48 92.31
TV 52 100.00
Newspaper 52 100.00
Books 28 53.85
Radio 32 61.54
Social media 28 53.85
Library 23 44.23
Public information centre 23 44.23
NGO 10 19.23
Other 11 21.15
Table 3 represents the sources is being consulted by the farmers for obtaining their information
need, and it is found that TV and newspaper were the primary sources of information which were
being used by all the farmers to fulfill their information needs. Internet comes on 2nd priority with
a 92.31% consultancy rate. Farmers used radio (61.54%), book & social media (53.85% each),

library & Public information centers (44.23% each), NGO (19.23%), and other sources (21.15%)
a source for acquiring the information needs.
Table 4: Frequency for acquiring the Information Needs
Frequency Number Percentage
Daily 41 78.85
Weekly 8 15.38
Fortnightly 3 5.77
Total 52 100
Table 4 signifies the frequency of acquiring the information need by the farmers. It is revealing
that the majority of the farmers’ rate was daily as 78.85% of the total farmers acquire the needed
information; after then 15.38% farmers obtain weekly and remaining 5.77% of the farmers having
fortnightly frequency for receiving the information.
Table 5: Types of Information required for Agriculture
Type of information for agriculture Mean SD
Modern cultivation system 5.00 0.000
New Crop Production Material 4.98 0.139
Govt. scheme on agriculture 4.87 0.444
Fertilizer management 4.77 0.509
Disease pest management 4.63 0.486
Market information 4.54 0.699
Post harvesting technique 4.40 0.721
Agricultural Loan 4.27 0.630
Subsidize product 4.21 0.893
Seeds and plant material 4.17 0.819
Weeding thinning 4.15 0.751
Soil and water management 3.65 0.861
Weather information 3.62 0.889
Storage of crops 3.44 0.998
Table 5 indicates the types of information required by the farmers on agriculture, and the responses
of the farmers were recorded on a five-point Likert scale from very often to never. Higher the mean
value represents high requirement and vice versa. The finding reveals that information on the
modern cultivation technique is highly required with the mean value of 5.00. After then
information on new crop production material with the mean value of 4.98 and government scheme
on agriculture comes at third with a mean score of 4.87, information on fertilizer management
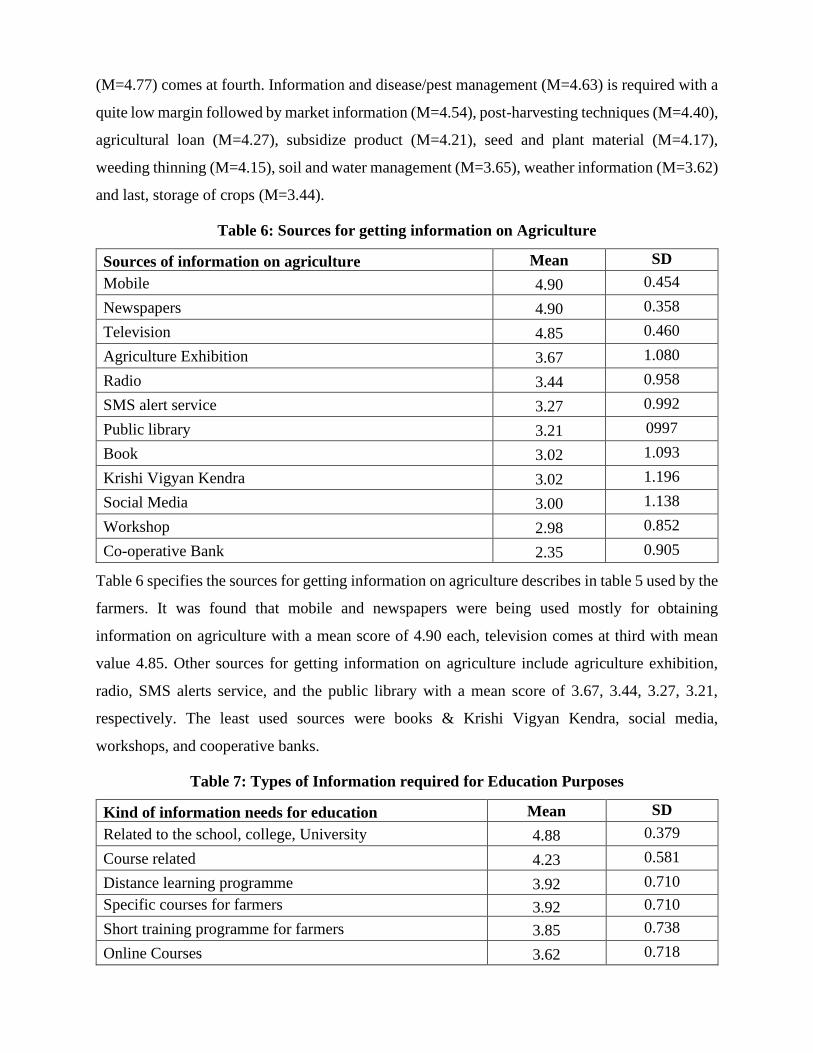
(M=4.77) comes at fourth. Information and disease/pest management (M=4.63) is required with a
quite low margin followed by market information (M=4.54), post-harvesting techniques (M=4.40),
agricultural loan (M=4.27), subsidize product (M=4.21), seed and plant material (M=4.17),
weeding thinning (M=4.15), soil and water management (M=3.65), weather information (M=3.62)
and last, storage of crops (M=3.44).
Table 6: Sources for getting information on Agriculture
Sources of information on agriculture Mean SD
Mobile 4.90 0.454
Newspapers 4.90 0.358
Television 4.85 0.460
Agriculture Exhibition 3.67 1.080
Radio 3.44 0.958
SMS alert service 3.27 0.992
Public library 3.21 0997
Book 3.02 1.093
Krishi Vigyan Kendra 3.02 1.196
Social Media 3.00 1.138
Workshop 2.98 0.852
Co-operative Bank 2.35 0.905
Table 6 specifies the sources for getting information on agriculture describes in table 5 used by the
farmers. It was found that mobile and newspapers were being used mostly for obtaining
information on agriculture with a mean score of 4.90 each, television comes at third with mean
value 4.85. Other sources for getting information on agriculture include agriculture exhibition,
radio, SMS alerts service, and the public library with a mean score of 3.67, 3.44, 3.27, 3.21,
respectively. The least used sources were books & Krishi Vigyan Kendra, social media,
workshops, and cooperative banks.
Table 7: Types of Information required for Education Purposes
Kind of information needs for education Mean SD
Related to the school, college, University 4.88 0.379
Course related 4.23 0.581
Distance learning programme 3.92 0.710
Specific courses for farmers 3.92 0.710
Short training programme for farmers 3.85 0.738
Online Courses 3.62 0.718

Any others 3.21 0.498
Table 7 represents the types of information required by the farmers on educational purposes in
which it shows that the information related to school, college & universities (M=4.88) required
most. The information about courses comes after with the mean score of 4.23 followed by distance
learning program, and specific courses for farmers (M=3.92 each), short training programs for
farmers (M=3.85), online courses (M=3.62) and any others come at last with mean score of 3.21.
Subsequently, table 8 indicated the sources for getting the information on educational purposes
discussed above, which shows that newspaper was being the most consulted source to fulfill such
purposes with the mean score of 4.90 after that friend or fellow farmers comes as source with the
mean score of 4.85. Thirdly, internet (M=4.15) followed by advertisement (M=3.67), public library
(M=3.21), social media (M=3.15), Krishi Vigyan Kendra (M=2.77) and any other sources
consulted least with the mean score of 2.48.
Table 8: Sources for getting information on Education Purposes
Sources of information on education Mean SD
Newspapers 4.90 0.298
Friends 4.85 0.415
Internet 4.15 1.289
Advertisement 3.67 0.810
Public library 3.21 1.016
Social Media 3.15 0.751
Krishi Vigyan Kendra 2.77 0.983
Any others 2.48 0.828
Table 9 shows the types of information required by the farmers for health purposes, and it indicates
that farmers seek information to live a healthy life and free health check-up (M=4.96 each)
followed by information on healthy food (M=4.94) and common diseases (M=4.52). Farmers also
need information on medicine (M=4.48), Yoga (M=4.44) and any other information (M=3.63) on
heath.
Table 9: Types of Information required for Health Purposes
Kind of information needs for health Mean SD
To live a healthy life 4.96 0.194
Free health check – up 4.96 0.194
Healthy food 4.94 0.235
Common Diseases 4.52 0.671

Medicine 4.48 0.700
Yoga 4.44 0.669
Any others 3.63 0.768
Subsequently, table 10 depicts the use of sources for getting information on health purposes
interpreted above and it can be seen that primary health centers (M=4.96) were being used as most
reliable source of information on health issues followed by newspapers (M=4.87), government
hospitals (M=4.77), doctors (M=4.75) internet (M=4.00), social media (M=3.60) free health
check-up camp (M=3.31). The least used sources being used for getting information on health
were NGOs (M=2.90) and any other sources (M=2.71).
Table 10: Sources for getting information on Health Purposes
Sources of information on health Mean SD
Primary Health Centers 4.96 0.194
Newspapers 4.87 0.397
Govt. Hospitals 4.77 0.469
Doctor 4.75 0.480
Internet 4.00 1.221
Social Media 3.60 0.664
Free Health check-up Camp 3.31 1.112
Non-Government Organizations (NGOs) 2.90 1.107
Any others 2.71 0.848
Table 11 shows the types of information required by the farmers on agricultural economy which
indicates that market price of the crop (M=5.00) is most required information followed by cost of
fertilizer (M=4.88), cost of crop production (M=4.79), cost of seeds (M=4.69), cost of labor
(M=4.40), loans (M=4.38), subsidy on products used in agriculture (M=4.17), cost of
manufacturing/machinery (M=3.79) and any other (M=3.46) information required by the least
number of farmers. Further table 12 represents the sources for getting information on agricultural
economy where it can be seen that television (M=4.96) & newspapers (M=4.94) are being most
preferred sources of data on the agrarian economy. Help from other farmers (M=4.71) comes after
then internet (M=4.15), from shopkeepers or mandi agents (M=3.85), local market or mandi
(M=3.83), social media (M=3.42). Most important, the Krishi Vigyan Kendra, which are
considered as a reliable source of information on such issues is being reviewed by the farmers with
least attention (M=2.92) and any other sources (M=2.56) of information.
Table 11: Types of Information required on Agricultural Economy

Kind of information needs about the economy Mean SD
Market price of crops 5.00 0.000
Cost of fertilizer 4.88 0.323
Cost of crops production 4.79 0.457
Cost of seeds 4.69 0.506
Cost of Labor 4.40 0.569
Loans 4.38 0.631
Subsidy on products used in agriculture 4.17 0.706
Cost of Manufacturing/machinery 3.79 0.637
Any others 3.46 0.779
Table 12: Sources for getting information on Agricultural Economy
Sources of information on health Mean SD
Television 4.96 0.194
Newspapers 4.94 0.308
Other farmers 4.71 0.572
Internet 4.15 1.178
Shopkeepers (Mandi Agents) 3.85 0.697
Local market (Mandi) 3.83 0.734
Social Media 3.42 0.776
Krishi Vigyan Kendra 2.92 0.882
Any others 2.56 0.802
Table 13: Problems faced by the farmers while searching for information
Types of problems Mean SD
Inadequate price of crop production 4.87 0.397
Lack of electricity in rural area 4.85 0.460
Low level of literacy 4.73 0.490
Lack of weather proof storage of crop production in market 4.62 0.631
Inaccessibility to rural area by NGOs 4.52 0.754
Inadequate transport 4.48 0.542
Inadequate market information 4.40 0.603
Inadequate subsidy or support price from government 4.37 0.793
Any others 3.42 0.893
Farmers are being faced some problems while getting information on agriculture, and these
problems can be seen in Table 13, which indicates the low price of crop production (M=4.87) and
lack of electricity in rural areas (M=4.85) were two major problems they faced. The difficulty of
Low level of literacy (M=4.73), lack of weatherproof storage of crop production in the market

(M=4.62), and inaccessibility to rural areas by NGOs (M=4.52) are being faced by the farmers.
After that, inadequate transport (M=4.48), insufficient market information (M=4.40), inadequate
subsidy, or support price of crops from government (M=4.37) is being pointed out as big challenge
in front of the farmers. Despite these any other problems (M=3.42), is being faced by the least
number of the farmers.
Table 14: Awareness about Public library
Response Number Percentage
Yes 52 100.00
No 0 0
Table 15: Awareness of getting books for reading from the public library at no cost
Response Number Percentage
Yes 44 84.62
No 8 15.38
Table 16: Awareness about the availability of Public Library in own village
Response Number Percentage
Yes 52 100.00
No 0 0
Table 17: Awareness about Krishi Vigyan Kendra (KVK) in Jind District
Response Number Percentage
Yes 36 69.23
No 16 30.77
Table 14 to 17 indicates some awareness issues among the farmers about the public library, getting
books from the public library at no cost, availability of public library in their village and
availability of Krishi Vigyan Kendra in their district. It was found that all the farmers were well
familiar with the public library. However, 84.62% of the farmers were aware of getting books for
reading from the public library at no cost, while 15.38% of them were not aware of this fact.
Further, all the farmers were aware of the public library is available in their village. But, in case
of availability of Krishi Vigyan Kendra (KVK) in Jind district, 69.23% of the farmers were aware
of this fact while 30.77% of them were not aware of the availability of KVK in Jind district
Major Findings
The major findings of this study is concluded below:
1. 86.54% farmers depends on agriculture as their main source of income.

2. The farm size is quite small as 84.62% of the farmers own less than 4 acre (1.62 hectare)
of land and 30.77% of the farmers take land on lease/rent for agriculture.
3. Rice and wheat is the major crop followed by Jowar (sorghum)/Bajra (pearl millet)/Cotton.
4. Agriculture, education and health are the primary areas on which the farmers need
information and TV, Newspaper and internet are main sources used to fulfill these needs.
5. Modern cultivation system (M=5.00), new crop production material (M=4.98), government
scheme on agriculture (M=4.87) are major thrust information requirement on agriculture
among the farmers and they were using mobile & newspaper (M=4.90 each) and television
(M=4.85) as a source for getting all such information on agriculture.
6. Major information requirement for education purposes, information related to
school/college/university (M=4.88) and course related information is most require instead
of online course (M=3.62) and newspapers (M=4.90) and friends (M=4.85) are major
sources to fulfill such information requirement on education.
7. To live a healthy life is the main motto of the farmers along with free health check-ups
(M=4.96 each) followed by healthy food (M=4.94) and farmers consults primary health
centers (M=4.96), newspapers (M=4.87) and government hospitals (M=4.77) as a source
for such type information need on health purposes.
8. In case of information requirement on agricultural economy, farmers need information on
market price of the crops (M=5.00), cost of fertilizers (M=4.88) and cost of crop production
(M=4.79) rather than cost of manufacturing/machinery (M=3.46) and television (M=4.96)
and newspapers (M=4.91) and help form other farmers (M=4.71) are used as major sources
to acquire the information on agriculture economy.
9. Major problems which farmers are being while information searching as per their
requirements, are inadequate price of crop production (M=4.87), lack of electricity in rural
areas (M=4.85) and low level of literacy (M=4.73).
10. Farmers were well familiar with the public library. However, 15.38% of the farmers were
not aware of that public library provide books for reading at no cost.
11. 30.77% of the farmers were not aware of the availability of Krishi Vigyan Kendra (KVK)
in Jind district.
Conclusion
Agriculture is the backbone of the rural economy, and the farmers are the critical components of
this economy. In developing a sustainable agriculture environment, information literacy is a

significant role to play by inclusive methods, and it helps the farmers in making them aware of
what they need in sustainable agriculture. Health and education are other two associated factors of
agriculture which directly affects the farmers as without these two, and they cannot survive in the
implementation of new tool & techniques of agriculture. A better learning platform should be
provided to the farmers where the agriculture experts and farmers can exchange their ideas, issues,
and concerns with each other, and information literacy is best suits with it. The present study
throws light on the scenario of rural farmers who are extensively involved in agriculture as a
primary occupation and present the role of information literacy in their life. The information
requirements of the farmers with regards to agriculture, health, education, and agricultural
economy depict that there is a need for critical change in the way the information is made available
to them. Moreover, there is a need to make the farmers aware of public libraries and their
importance, different government-initiated schemes for the farmers, and different platforms of
information availability.
References
Jalaja, V., & Kala, P. (2015, August). Case Study of Tribal Farmers' Agricultural Information
Needs and Accessibility in Attappady Tribal Block, Palakkad. IOSR Journal Of
Humanities And Social Science (IOSR-JHSS), 20(8), 7-12. Retrieved from
www.iosrjournals.org
Malhan, I., & Rao, S. (2007, August). Impact of Globalization and Emerging Information
Communication Technologies on Agricultural Knowledge Transfer to Small Farmers in
India. 1-21. Retrieved from http://www.ifla.org/iv/ifla73/index.htm
Mashroofa, M. M., & Senevirathne, W. (2014). Influence of Information Literacy skills in
accessing agricultural information: with special reference to paddy farmers of Ampara
district, Sri Lanka. 1-17. Retrieved from http://creativecommons.org/licenses/by/3.0/
Patel, D. (2016, July). Digital india reaching to small, marginal & women farmers. International
Journal of Research Granthaalayah: A Knowledge Repository, 4(7), 109-121.
doi:10.5281/zenodo.58715
Soylu, D., Cevher, N., Schirone, M., & Medeni, T. (2016). A comparative study of information-
seeking behavior and digital information needs of farmers in turkey and sweden.
International journal of ebusiness and eGovernment studies, 8(2), 18-33.

Copyright © 2022 FDOKUMEN