linking organic farmers to retail stores– agricultural - NIAM
48
LINKING ORGANIC FARMERS TO RETAIL STORES– AGRICULTURAL MARKETING PERSPECTIVE By KAVIYA P B.Sc. (Agriculture) CHAUDHARY CHARAN SINGH NATIONAL INSTITUE OF AGRICULTURAL MARKETING JAIPUR, RAJASTHAN - 302033 2019
-
Upload
khangminh22 -
Category
Documents
-
view
6 -
download
0
Transcript of linking organic farmers to retail stores– agricultural - NIAM
LINKING ORGANIC FARMERS TO RETAIL STORES– AGRICULTURAL
MARKETING PERSPECTIVE
By
KAVIYA P
B.Sc. (Agriculture)
CHAUDHARY CHARAN SINGH NATIONAL INSTITUE OF AGRICULTURAL MARKETING
JAIPUR, RAJASTHAN - 302033
2019
LINKING ORGANIC FARMERS TO RETAIL STORES – AGRICULTURAL MARKETING PERSPECTIVE
Case study submitted in fulfillment of the requirement for
Research Internship Program
To
Chaudhary Charan Singh National Institute of Agricultural Marketing, Jaipur, Rajasthan
By
KAVIYA P
B.Sc. (Agriculture)
CHAUDHARY CHARAN SINGH NATIONAL INSTITUE OF AGRICULTURAL MARKETING
JAIPUR, RAJASTHAN - 302033
2019
CERTIFICATE
This is to certify that the Case study entitled, “LINKING ORGANIC FARMERS TO
RETAIL STORES – AGRICULTURAL MARKETING PERSPECTIVE” submitted in
fulfilment of Research Internship Programme to Chaudhary Charan Singh National
Institute of Agricultural Marketing, Jaipur, Rajasthan is a record of bonafide research
work carried out by Ms. KAVIYA P under my supervision and guidance and that no part of
the report has been submitted for the award of any other degree, diploma, fellowships or other
similar titles or prizes.
Place: Jaipur
Date:
Approved By

ACKNOWLEDGEMENT
This research process would have never come to achievement without the help and
encouragement I received from various individuals.
I feel immense pleasure in placing my deep sense of gratitude and sincere thanks to
beloved Dr. P. Chandra Shekara, Director General, CCS National Institute of Agricultural
Marketing, for his continued encouragement during the various stages of the research process.
I feel extreme happiness to the opportunity conferred upon me to work under his guidance.
The completion of my research work was made possible by the combined support of,
Dr. Hema Yadav, Director, CCS NIAM. Special thanks for her support, guidance, suggestion
and encouragement throughout my internship programme.
I would express my heartfelt thanks to Ms. Shika Verma, Training Consultant, CCS
NIAM, who supports me a lot in all stages. Special thanks for her support and encouragement
throughout my research.
I am thankful to Dr. R. K. Mishra, Professor and Head, Department of Agricultural
Economics, OUAT, Bhubaneswar, who informed us about this golden opportunity. Special
thanks for his support and encouragement.
We extend my heartful gratitude to the farmers and retailers who had cooperated us.
On a personal note we owe our deep sense of our gratefulness to our beloved parents
for the dedicated and energetic efforts to cater the great boon of education and continuous
encouragement without whose blessing we would not have been possible.
We also acknowledge the favours of numerous persons who, though not been
individually mentioned here, have all directly or indirectly contributed during the course of the
study.
Last, but not least we fervently record our heartful thanks to the Almighty, who showers
blessings on us now and always.
(P.KAVIYA)
CONTENTS
CHAPTER
NO.
TITLE
PAGE NO.
1.
INTRODUCTION
1
2.
DESCRIPTION OF THE STUDY AREA
8
3.
METHODOLOGY
13
4.
RESULTS AND DISCUSSION
14
5.
SUMMARY AND CONCLUSION
21
ANNEXURE
REFERENCES

LIST OF TABLES
TABLE
NO.
TITLE
PAGE NO.
1.4
Location of NCOF and RCOF and their jurisdiction.
2
1.7.1
Average Price Difference between Organic and
Conventional Products (in Percentage)
4
1.7.2
Fee structure of TNOCD
5
2.1
Population Details of the District
9
2.2
Agricultural status of the village
11
2.2.1
Area, Production and Productivity of major crops cultivated
in the district
11
4.1
Comparison between profits received by the farmers in the
conventional and Organic farming
14
4.2
Comparison between cost of procuring fresh vegetables in
the current system and proposed direct linkage system
15
4.3.1
Preferences and ranking of problems alleged by the farmers
16
4.3.2
Position and Garrett’s Value
17
4.3.3
Calculation of Garrett’s score and Ranking for the problems
listed by the sample respondents
17
4.3.4
Calculation of Garrett’s score and Ranking for the
suggestions listed by the respondents
19

LIST OF FIGURES
FIGURE
NO.
TITLE
PAGE NO.
4.1
Average Garrett’s scores of problems expected to arise in
the process of linking farmers and retailers.
18
4.2
Average Garrett’s scores of suggestions proposed by the
respondents to link farmers and Retailers.
20
Abstract
Linking Organic farmers to Retail stores – Agricultural Marketing Perspective
In recent years, there is growing awareness of environmental protection, sustainable
agricultural practices and the adverse impact of chemical inputs on the soil, environment and
human health. This has prompted a shift towards organic farming and consumption of organic
food. The Government of India has come up with policy initiatives to promote organic food.
Such measures are expected to increase investment in organic food manufacturing and
retailing. India has around 8,35,000 certified organic farmers and 1.81 million hectare area
under organic certification and also there are 700 reliance fresh operating in 93 cities, 256 big
bazars operating in 120 cities and 890 Easy day stores operating in 246 cities who all are
supplying fresh vegetables to consumers. The farmers sell their produce to markets through a
long marketing channel. This results in increased cost of transaction, increased marketing costs,
reduced producer’s share in consumer’s rupee and less income. This study will be focused on
assessing the feasibility and viability of direct linkages between organic farmers and retailers.
For the specified purpose, the performance and current status of retail stores and farming
practices in Coimbatore district, Tamil Nadu was studied. A sample of 30 farmers was selected
randomly and primary data was collected using structured interview schedule. The study shows
that, the farmer can earn an additional profit of Rs.1, 99, 712.5, Rs.1, 04, 597.5 and Rs.79,
654.75 per acre of tomato, onion and Okra crops respectively. The challenges and suggestions
in implementing the alternative method of procurement were listed and ranked by the farmers.
The ranked data was analysed using Henry Garrett’s ranking technique. The results of Henry
Garrett’s ranking technique shows that the major challenges in implantation of the proposed
linkage are Lesser price, Delayed payment, Transportation cost, No assurance of procurement,
Organic conversion, Quality aspects and Certification cost. Similarly, the suggestions alleged
by the farmers were ranked using Henry Garrett’s ranking technique. Premium price,
Mandatory procurement by retailers, OTC payment, Organic awareness, Proper guidelines,
Training, Reducing certification cost, Quality standards and Contract basis are the suggestions
ranked by the farmers. Based on the empirical evidence provided, study suggests timely
inspections regarding organic standards, premium prices, promoting market information
among the farmers and organising awareness programs, training programs and also for certain
farmers, government can give subsidy in certification cost, creating new FPOs. By these all,
the linkage of organic farmers with retail store will be more efficient is being suggested from
the study.
1
CHAPTER I
1. Introduction
In recent years, there is growing awareness of environmental protection, sustainable
agricultural practices and the adverse impact of chemical inputs on the soil, environment and
human health. This has prompted a shift towards organic farming and consumption of organic
food. Organic food products are broadly defined as those food products are produced without
the use of synthetic external inputs such as chemicals, fertilizers, pesticides and synthetic
hormones or genetically modified organisms (GMOs).
1.1. Status of Organic Farming in the world
The total land under organic farming increased from 11 million hectare in 1999 to 69.8
million hectares in 2018, and the total number of organic producers increased from 2 Lakh in
1999 to 2.7 million in 2018. In 2016, the size of the global organic food market was USD 10.25
billion in terms of value and it is projected to grow at a Compound Annual Growth Rate
(CAGR) of 16.5 percent during 2017-2022, to reach USD 262.85 billion by 2022.
1.2. Status of Organic Farming in India
In India, the traditional method of agriculture was by default organic with negligible use
of chemical inputs. Looking at the premium that consumers were willing to pay for organic
food products prompted some Indian retailers to enter the organic food supply business. Survey
based studies have shown that Indian consumers, especially those with middle to high levels
of Income and higher education, believe that organic food products are healthier and superior
in quality to conventional products, and they are willing to pay a premium for such produce.
This has created lucrative business opportunities for the entreprenuers. India has the largest
number of organic producers in the world, according to World of Organic Agriculture Report
2018 published in February. With 8,35,000 certified organic producers globally, it is home to
more than 30 percent of total number of organic producers (2.7 million) in the World. India
contributes only 2.59 percent (1.81 million hectare) of the total area (69.8 million hectare).
It is found that before the beginning of cultivation of organic crops, their marketability
and that too at a premium over the conventional produce has to be assured. Inability to get a
premium at least during the period required to achieve the productivity levels of the
conventional crop will be a deterrent. The survey found that a number of young entrepreneurs
with innovative ideas have established start-ups in organic food business. In India, farm sizes

2
are small (average farm size is 1.15 hectare) and, therefore, retailers sourcing directly from
farmers are expected to work with a large number of farmers.
1.3. Organic certification:
Certification not only assures consumers that a product that is not observably different
from non-organic food was grown, processed and packaged according to rules that limit or ban
synthetic inputs and that protect the environment, and assures producers that unscrupulous use
of the term “organic” does not defraud them of price premiums and market shares (reduces
transaction cost for buyers). It also makes the market more efficient by reducing information
asymmetry along the marketing chain.
The 10th five year plan emphasizes promotion and encouragement of organic farming
with the use of organic waste, Integrated Pest Management (IPM) and Integrated Nutrient
Management (INM) (GOI, 2003).
In 2001, a National Programme for Organic Production (NPOP) which aims at
establishing national standards for organic products, based on IFOAM standards, was
launched.
1.4. Location of NCOF and RCOF and their jurisdiction
Name of the centre Location Jurisdiction
NCOF Ghaziabad All India, esp. Delhi, UP and
RCOF Bangalore Karnataka, Kerala, TN, Pondicherry
RCOF Bhubaneshwar Bihar, Orrisa, West Bangal
RCOF Hissar Haryana, HP, Punjab, J&K
RCOF Imphal All NE States
RCOF Jabalpur MP, Gujrat, Rajasthan, Daman & Diu
RCOF Nagpur Maharashtra, Andhra Pradesh, Goa, Dadar & Nagar Haveli
Source: Bhattacharya, 2005.
3
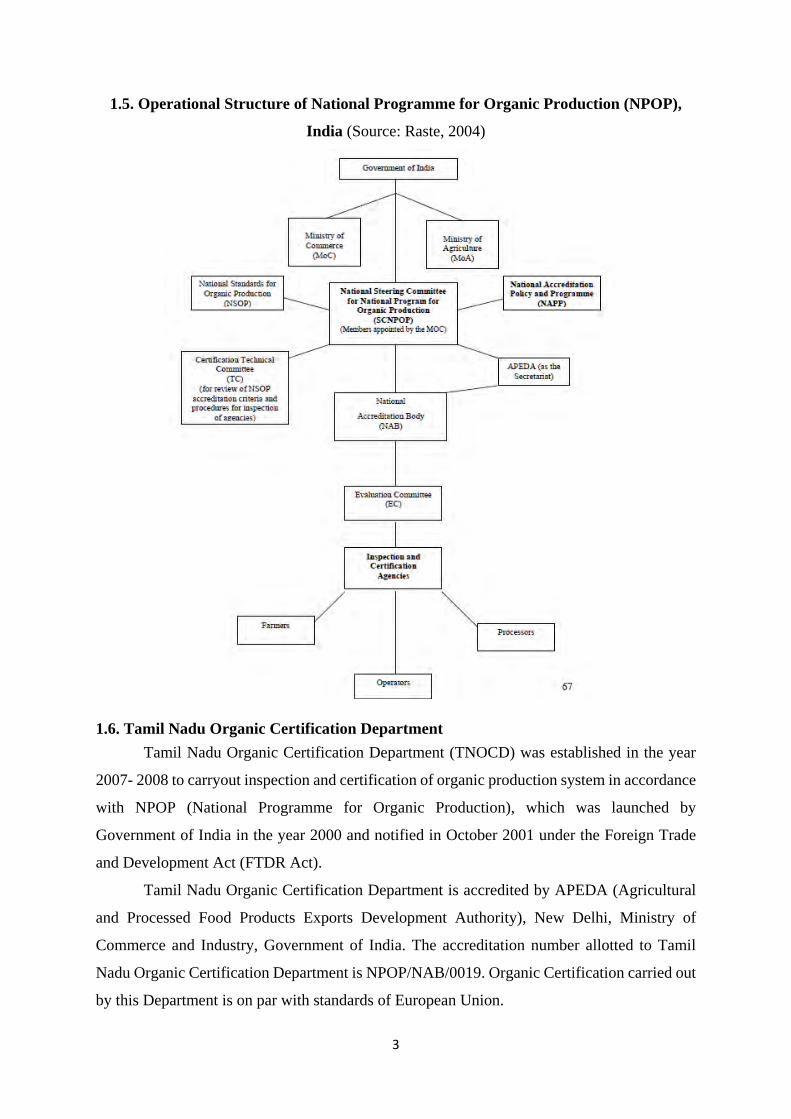
1.5. Operational Structure of National Programme for Organic Production (NPOP),
India (Source: Raste, 2004)
1.6. Tamil Nadu Organic Certification Department Tamil Nadu Organic Certification Department (TNOCD) was established in the year
2007- 2008 to carryout inspection and certification of organic production system in accordance
with NPOP (National Programme for Organic Production), which was launched by
Government of India in the year 2000 and notified in October 2001 under the Foreign Trade
and Development Act (FTDR Act).
Tamil Nadu Organic Certification Department is accredited by APEDA (Agricultural
and Processed Food Products Exports Development Authority), New Delhi, Ministry of
Commerce and Industry, Government of India. The accreditation number allotted to Tamil
Nadu Organic Certification Department is NPOP/NAB/0019. Organic Certification carried out
by this Department is on par with standards of European Union.
4
Tamil Nadu Organic Certification Department also imparts free training to registered
organic farmers on National Standards for Organic Production, and Tamil Nadu Organic
Certification Department Standards. During the year 2017-18, 30910 acres of land have been
registered under Organic Certification by 3672 farmers in Tamil Nadu.
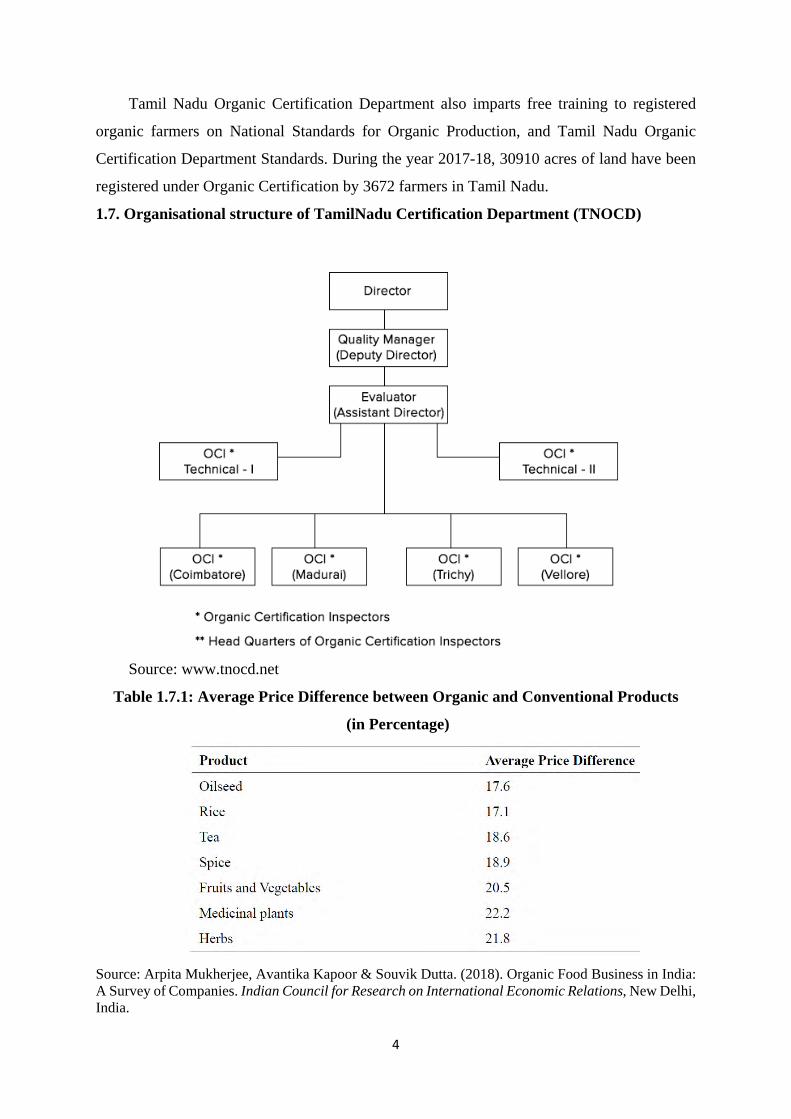
1.7. Organisational structure of TamilNadu Certification Department (TNOCD)
Source: www.tnocd.net
Table 1.7.1: Average Price Difference between Organic and Conventional Products
(in Percentage)
Source: Arpita Mukherjee, Avantika Kapoor & Souvik Dutta. (2018). Organic Food Business in India: A Survey of Companies. Indian Council for Research on International Economic Relations, New Delhi, India.
5
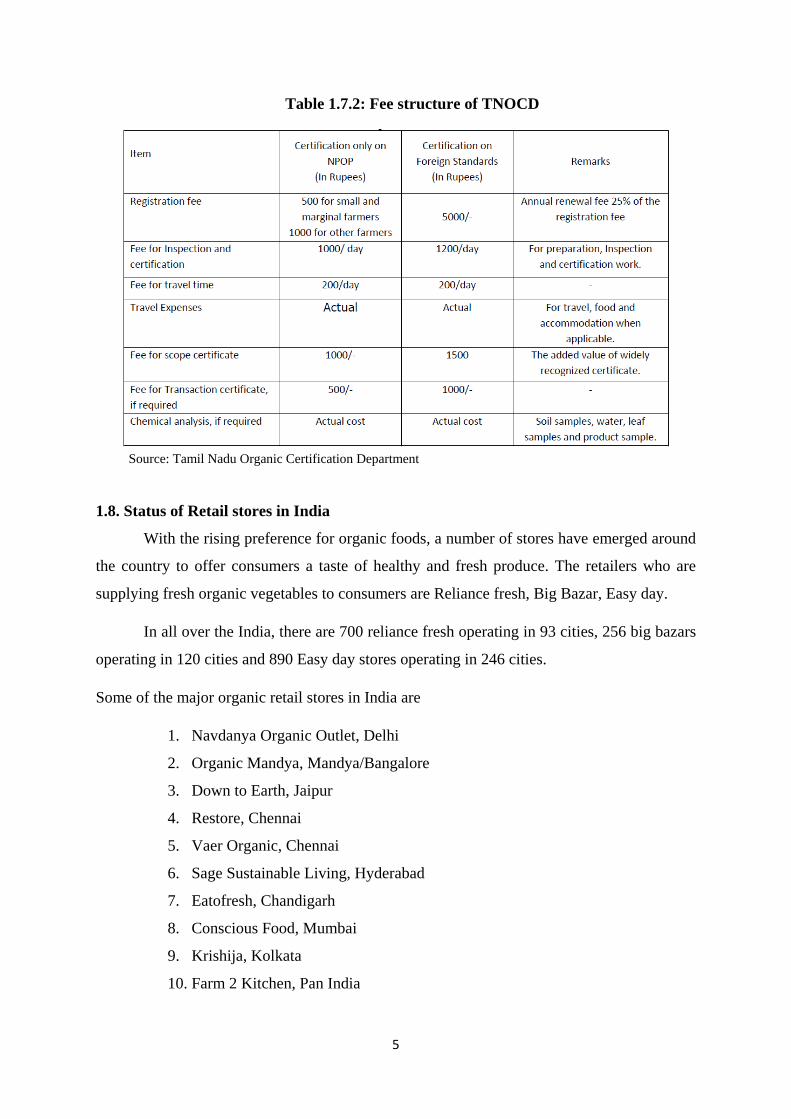
Table 1.7.2: Fee structure of TNOCD
Source: Tamil Nadu Organic Certification Department
1.8. Status of Retail stores in India
With the rising preference for organic foods, a number of stores have emerged around
the country to offer consumers a taste of healthy and fresh produce. The retailers who are
supplying fresh organic vegetables to consumers are Reliance fresh, Big Bazar, Easy day.
In all over the India, there are 700 reliance fresh operating in 93 cities, 256 big bazars
operating in 120 cities and 890 Easy day stores operating in 246 cities.
Some of the major organic retail stores in India are
1. Navdanya Organic Outlet, Delhi
2. Organic Mandya, Mandya/Bangalore
3. Down to Earth, Jaipur
4. Restore, Chennai
5. Vaer Organic, Chennai
6. Sage Sustainable Living, Hyderabad
7. Eatofresh, Chandigarh
8. Conscious Food, Mumbai
9. Krishija, Kolkata
10. Farm 2 Kitchen, Pan India

6
Some of the foreign corporate companies selling organic products are Organic valley,
Horizon Organic, Stonyfield organic in USA.
1.9. MARKETING CHANNELS FOLLOWED BY FARMERS:
Distribution Channels in domestic organic produce market
(Source: Kumar and Jain, 2003)
PROCUREMENT CHANNELS FOLLOWED BY RETAILERS:
• Retailer → Farmer Associations/Farmer cooperatives → Farmers
• Retailer → Farmer

7
In this paper, based on primary survey of 20 farmers engaged in organic farming and 10
farmers engaged in conventional farming, the assessment was done. For the specified purpose,
the performance and current status of 3 organic retail stores located at Coimbatore, Tamil Nadu
was studied. It also examines the organic retail stores perception about the growth of the sector
and makes policy recommendations for the holistic growth of this sector.
1.10. Research problem:
On the other hand, farmers sell their produce to markets through a long marketing channel.
This results in increased cost of transaction, increased marketing costs, reduced producer’s
share in consumer’s rupee and less income. This study will be focused on assessing the
feasibility and viability of direct linkages between organic farmers and retailers.
1.11. Objectives:
The specific objectives of the study are
• To suggest a possible linkage in order to link retailers to the local Organic farmers of
the nearby villages.
• To identify the challenges faced by the organic farmers in marketing and getting
premium prices.
• To compare the organic farming with conventional farming with respect to production,
marketing, selling prices and quality aspects.
• To understand the current procurement channels carrying out by retailers.
8
CHAPTER II
Description of study area
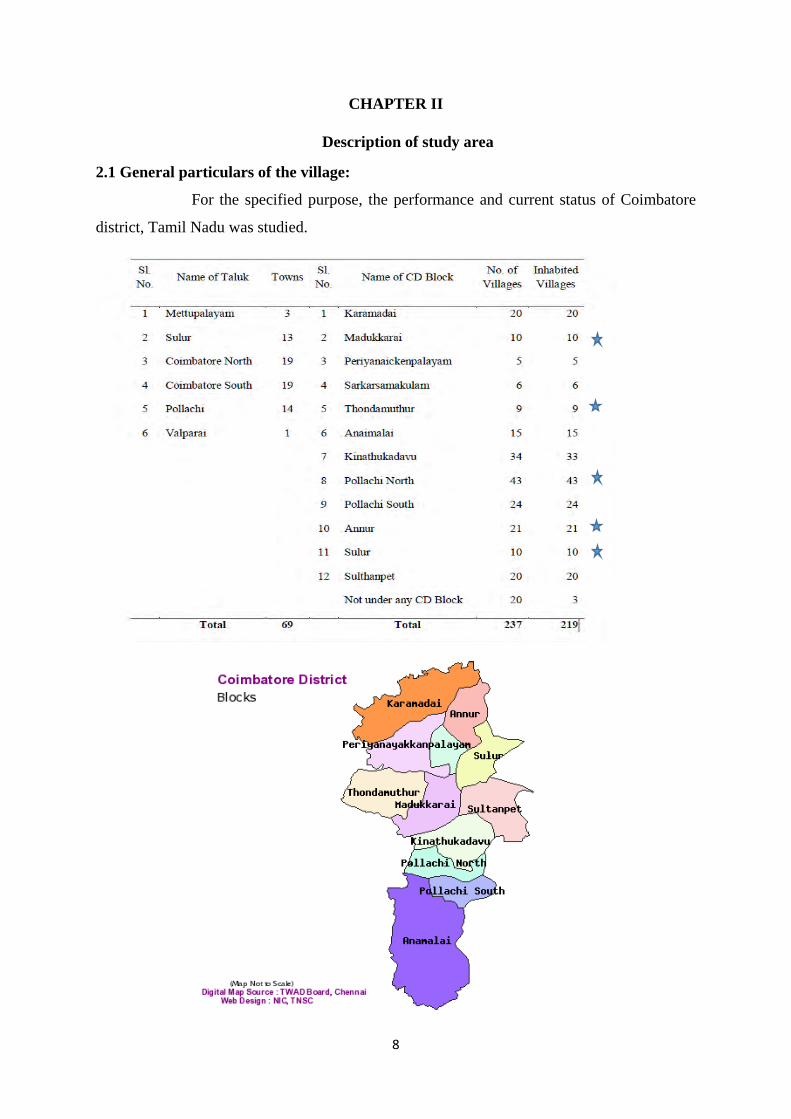
2.1 General particulars of the village:
For the specified purpose, the performance and current status of Coimbatore
district, Tamil Nadu was studied.

9
Table 2.1.Population Details of the District State District Number of Villages Total 15,979 237 Inhabited 15,049 219 Uninhabite
930 18
Number of Towns Statutory 721 51 Census 376 18 Total 1,097 69 Number of Households
Normal 1,84,62,231 9,55,286
Institution
47,452 Houseless 15,299 442
Population Total Persons 7,21,47,030 34,58,045 Males 3,61,37,975 17,29,297 Females 3,60,09,055 17,28,748 Rural Persons 3,72,29,590 8,39,105 Males 1,86,79,065 4,19,032 Females 1,85,50,525 4,20,073 Urba
Persons 3,49,17,440 26,18,940
Males 1,74,58,910 13,10,265 Females 1,74,58,530 13,08,675
State District
Number Percentage Number %
Literates Persons 5,18,37,507 80.09 26,35,907 83.98
Males 2,80,40,491 86.77 13,94,790 89.06 Females 2,37,97,016 73.44 12,41,117 78.92
Scheduled Castes Persons 1,44,38,445 20.01 5,35,911 15.50 Males 72,04,687 19.94 2,66,960 15.44 Females 72,33,758 20.09 2,68,951 15.56 Scheduled Tribes Persons 7,94,697 1.1 28,342 0.82 Males 4,01,068 1.11 14,245 0.82 Females 3,93,629 1.09 14,097 0.82
10
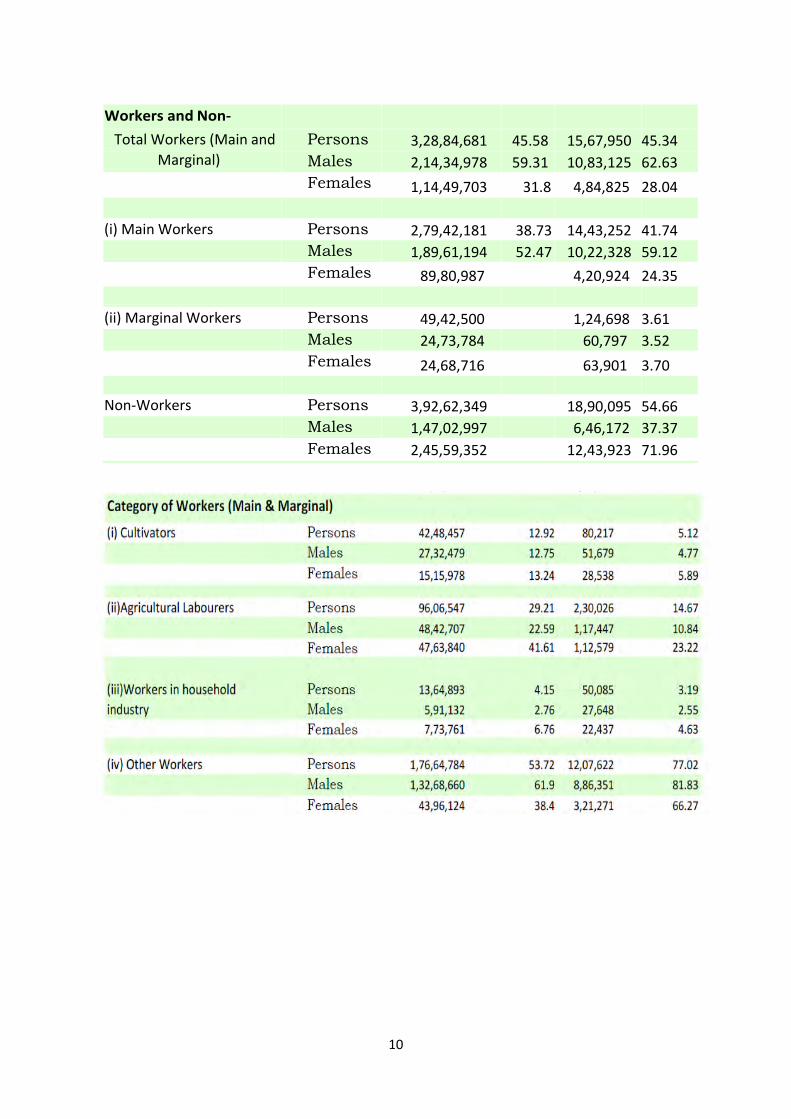
Workers and Non-
Total Workers (Main and Persons 3,28,84,681 45.58 15,67,950 45.34 Marginal) Males 2,14,34,978 59.31 10,83,125 62.63
Females 1,14,49,703 31.8 4,84,825 28.04 (i) Main Workers Persons 2,79,42,181 38.73 14,43,252 41.74 Males 1,89,61,194 52.47 10,22,328 59.12 Females 89,80,987
4,20,924 24.35
(ii) Marginal Workers Persons 49,42,500
1,24,698 3.61
Males 24,73,784
60,797 3.52 Females 24,68,716
63,901 3.70
Non-Workers Persons 3,92,62,349
18,90,095 54.66
Males 1,47,02,997
6,46,172 37.37 Females 2,45,59,352
12,43,923 71.96

11
2.2. Agricultural status of the village (2017-18):
Table 2.2: Land use pattern of the village
Sl.No.
Classification Area (ha)
1.
Forest
6647
2.
Barren and Uncultivable uses
4793
3.
Land put to Non-Agricultural uses
76045
4.
Cultivable Waste
8619
5.
Permanent Pastures and Other Grazing Land
77
6. Land Under Miscellaneous Tree Crops and
Grooves not included in Net Area Sown
3309
7.
Current Fallows
26647
8.
Other Fallow Land
68553
9.
Net Area Sown
172409
10. Geographical Area according to Village
Records
367098
11.
Total Cropped Area
176808
12.
Area cropped more than once 4399
Source: Deputy Director of Statistics, Coimbatore. (‘G’ Return)
2.2.1. Area, Production and Productivity of major crops cultivated in the district:
Table 2.3: Area, Production productivity of major crops Crops Area(ha) Production (MT) Productivity (Kg/ha)
Cbe India Cbe India Cbe India
Tomato 1,945 7,69,000 19,864 1,96,60,000 10,208 -
Onion 786 1,267 10,239 23,284 13,027 -
Okra 273 5,08,000 2,366 6,168 8,667 -
Banana 7,412 9,00,000 2,85,123 31,218 38,468 -
Coconut 84,531 22,15,000 12,197 16,046 144 -
12
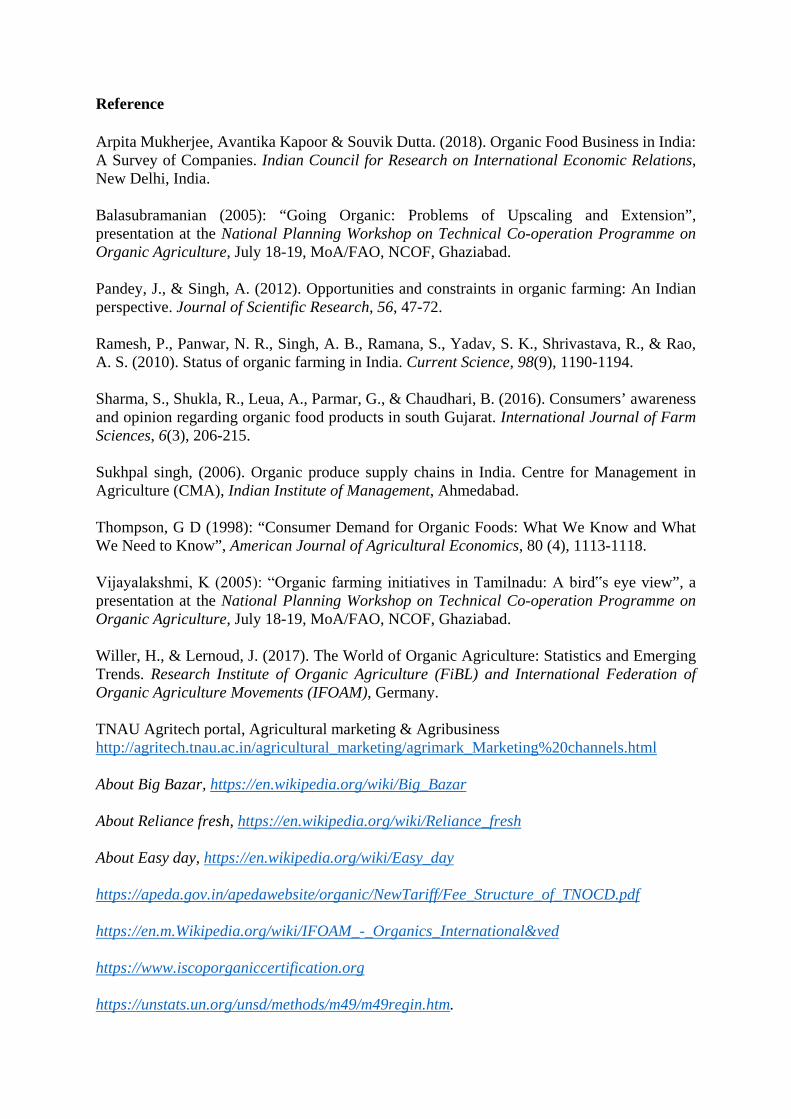
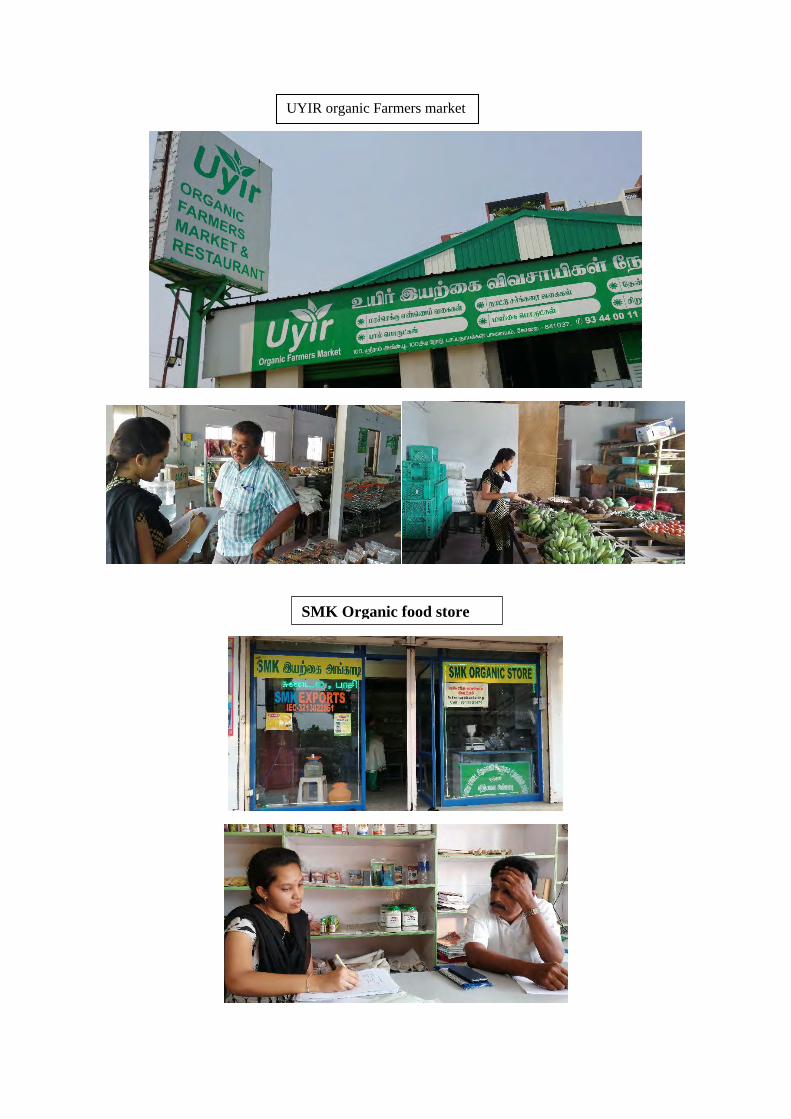
2.2. General particulars of the Retail Stores:
Uyir Organic farmer market, Sugam organics and SMK Organic food store are the
leading seller of organic products in Coimbatore. Uyir organic was started in the year 2015 at
Dr. Rajendra Prasad road, P N Palayam, Coimbatore-37. Sugam Organics was started in the
year 2002 at Avinashi road, Goldwins, Peelamedu , Coimbatore-14. SMK Organic store was
started in 2011 at Thirumurugan nagar, Vadavalli, Coimbatore-41.
Organic Retail Stores brings farmer and buyer into unified platform and ensures the
quality of the products and best price from the farmers. These stores procures fresh organic
fruits and vegetables from the nearby farmers and supply to consumers. In addition to that, they
also supplies organic products such as spices, Groceries, etc.
13
Chapter III
Methodology
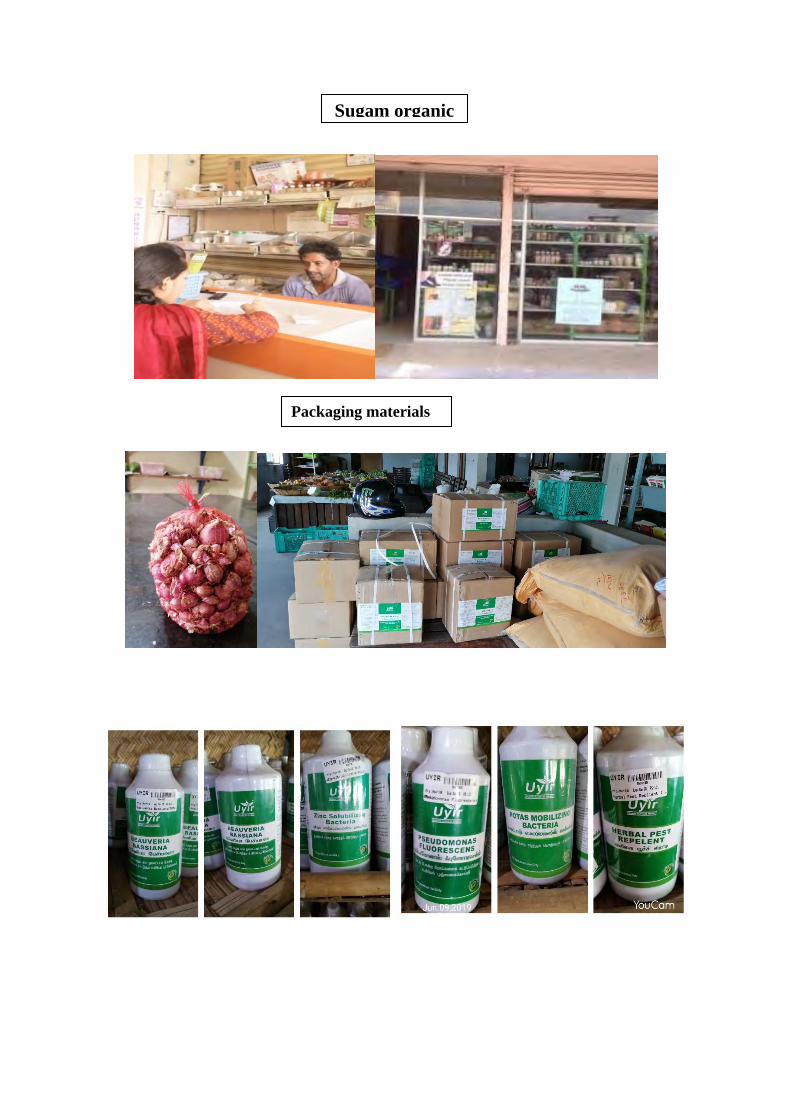
The assessment was done based on primary data collected from the 20 local Organic
and 10 conventional farmers and 3 Organic retail stores using the formulated structured
interview schedule. Simple random sampling was used in selecting sample respondents. Also,
Department of Sustainable Organic Agriculture at Coimbatore was investigated regarding the
method of certification of organic produces.
Using the collected primary data, the cost of production and marketing of vegetables to
the market and retailers for the existing system and for the proposed system of direct linkage
between farmers and the Retailers was calculated. Besides, the profit that farmers receive in
the current and proposed mode of marketing was calculated. Finally, the increased producer’s
share in consumer’s rupee and the additional profit that the farmers gain through the proposed
linkage were determined.
3.1 Henry Garrett’s ranking technique:
This technique is used to evaluate the most significant factor which influences the
respondent. As per this method, respondents have been asked to assign ranks for all factors and
the outcomes of such ranking have been converted into score value with the help of the
following formula:
Per cent position = 100 (Rij – 0.5) / Nj
Where, Rij = Rank given for the ith variable by jth respondents
Nj = Number of variable ranked by jth respondents
With the help of Garrett’s Table, the per cent position estimated is converted into scores. Then
for each factor, the scores of each individual are added and then total value of scores and mean
values of score is calculated. The factors having highest mean value is considered to be the
most important factor.
For the current study, the respondents have been asked to rank from 1 to 7 for the factors
that have to be established for the successful launch of linking farmers to the retailers. These
scores were manipulated mathematically and each factor has been assigned a rank based on its
importance and influence over the farmers.
14
Chapter IV
Results and Discussion
The findings of the present study as well as relevant discussion have been presented under
following heads:
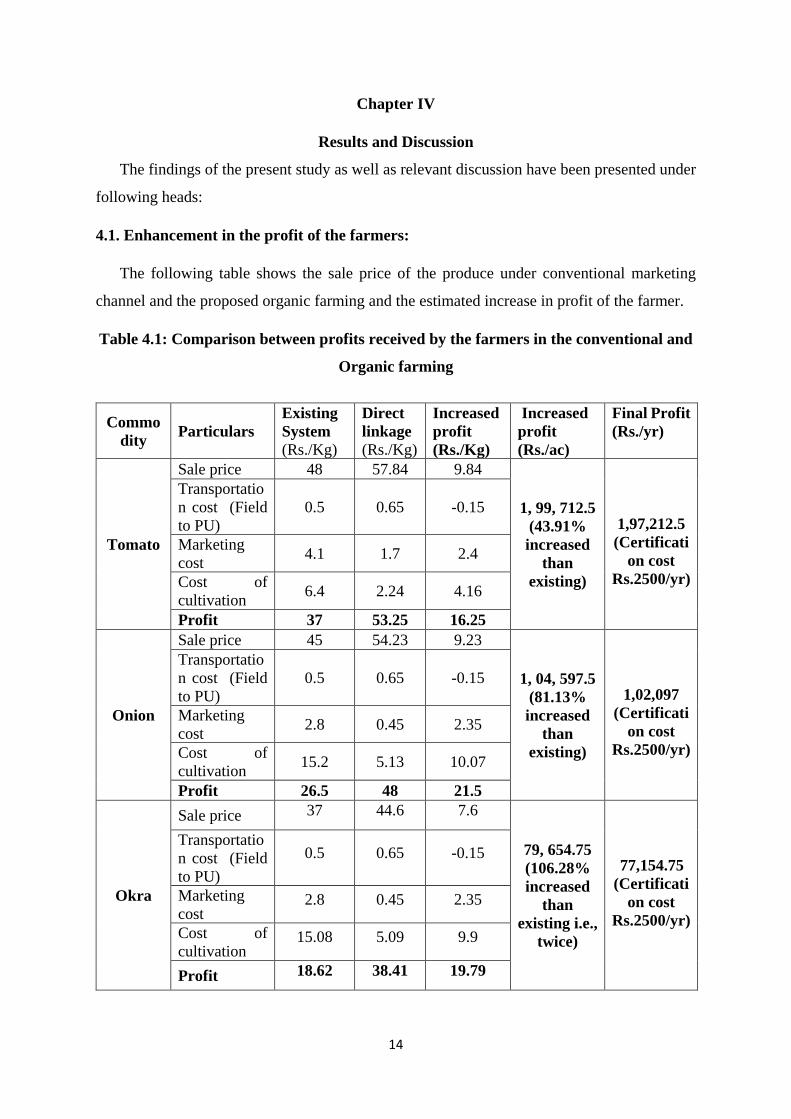
4.1. Enhancement in the profit of the farmers:
The following table shows the sale price of the produce under conventional marketing
channel and the proposed organic farming and the estimated increase in profit of the farmer.
Table 4.1: Comparison between profits received by the farmers in the conventional and
Organic farming
Commodity Particulars
Existing System (Rs./Kg)
Direct linkage (Rs./Kg)
Increased profit (Rs./Kg)
Increased profit (Rs./ac)
Final Profit (Rs./yr)
Tomato
Sale price 48 57.84 9.84
1, 99, 712.5 (43.91% increased
than existing)
1,97,212.5 (Certificati
on cost Rs.2500/yr)
Transportation cost (Field to PU)
0.5 0.65 -0.15
Marketing cost 4.1 1.7 2.4
Cost of cultivation 6.4 2.24 4.16
Profit 37 53.25 16.25
Onion
Sale price 45 54.23 9.23
1, 04, 597.5 (81.13% increased
than existing)
1,02,097 (Certificati
on cost Rs.2500/yr)
Transportation cost (Field to PU)
0.5 0.65 -0.15
Marketing cost 2.8 0.45 2.35
Cost of cultivation 15.2 5.13 10.07
Profit 26.5 48 21.5
Okra
Sale price 37 44.6 7.6
79, 654.75 (106.28% increased
than existing i.e.,
twice)
77,154.75 (Certificati
on cost Rs.2500/yr)
Transportation cost (Field to PU)
0.5 0.65 -0.15
Marketing cost
2.8 0.45 2.35
Cost of cultivation
15.08 5.09 9.9
Profit 18.62 38.41 19.79
15
From the above table, it was found that when the producer sells his produce through the
current marketing channel, the price received for the produce is Rs.48 per kg of tomato. And if
the organic farmers intends to sell his produce to the retailers he can sell his produce at Rs.57.84
per kg of produce. But in case of the current marketing channel, the farmers need not pay for
the transportation cost more and if the proposed direct linkage channel is implemented the
farmers need to bear an additional transportation cost of Rs.0.15 per kg of the produce. Despite
the inclusion of transportation cost, the farmers will get an additional profit of Rs.16.25 per kg
of tomato. Finally, the farmer will have an additional profit of Rs.1, 99, 712.5 per acre for
tomato. Similarly, the farmer can earn Rs1, 04, 597.5 and Rs.79, 654.75 per acre of onion and
Okra crops respectively which excludes certification cost of Rs.2500/year.
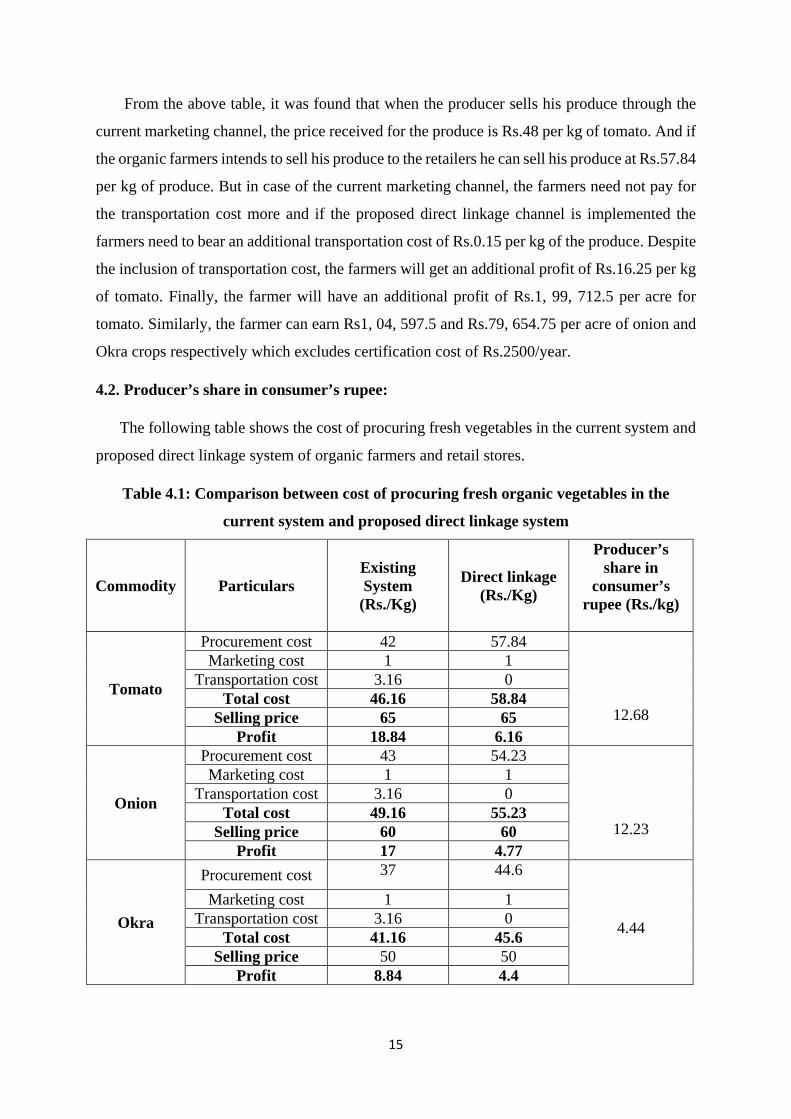
4.2. Producer’s share in consumer’s rupee:
The following table shows the cost of procuring fresh vegetables in the current system and
proposed direct linkage system of organic farmers and retail stores.
Table 4.1: Comparison between cost of procuring fresh organic vegetables in the
current system and proposed direct linkage system
Commodity Particulars Existing System
(Rs./Kg)
Direct linkage (Rs./Kg)
Producer’s share in
consumer’s rupee (Rs./kg)
Tomato
Procurement cost 42 57.84
12.68
Marketing cost 1 1 Transportation cost 3.16 0
Total cost 46.16 58.84 Selling price 65 65
Profit 18.84 6.16
Onion
Procurement cost 43 54.23
12.23
Marketing cost 1 1 Transportation cost 3.16 0
Total cost 49.16 55.23 Selling price 60 60
Profit 17 4.77
Okra
Procurement cost 37 44.6
4.44
Marketing cost 1 1 Transportation cost 3.16 0
Total cost 41.16 45.6 Selling price 50 50
Profit 8.84 4.4
16
The cost of procuring 1kg of tomato from the farmers is Rs.42. And if the local organic
farmers are linked directly to the retailers, it will cost Rs.57.84 per kg of tomato. This shows
Rs.12.68 which is the money consumers are spending in purchasing one kg of tomato from the
retailers which will be the producer’s share. Ultimately, the Producer’s share in consumer’s
rupee will be Rs.78, 679.4 per year for purchasing 17kg of tomato per day. The major cause
for this producers share is because of procuring organic vegetables at premium prices and
reduced transportation cost. Similarly, procuring onion and Okra from the local organic farmers
will give producers share in consumers rupee Rs.12.23 and Rs.4.44 per kg of the produce
respectively. Ultimately, if the proposed linkage of the retailers and local farmers is
implemented, the farmers will get their share in consumer’s rupee i.e., Rs.75, 887.15 for onion
and Rs.16, 206 for Okra. These results are shown briefly in the above table.
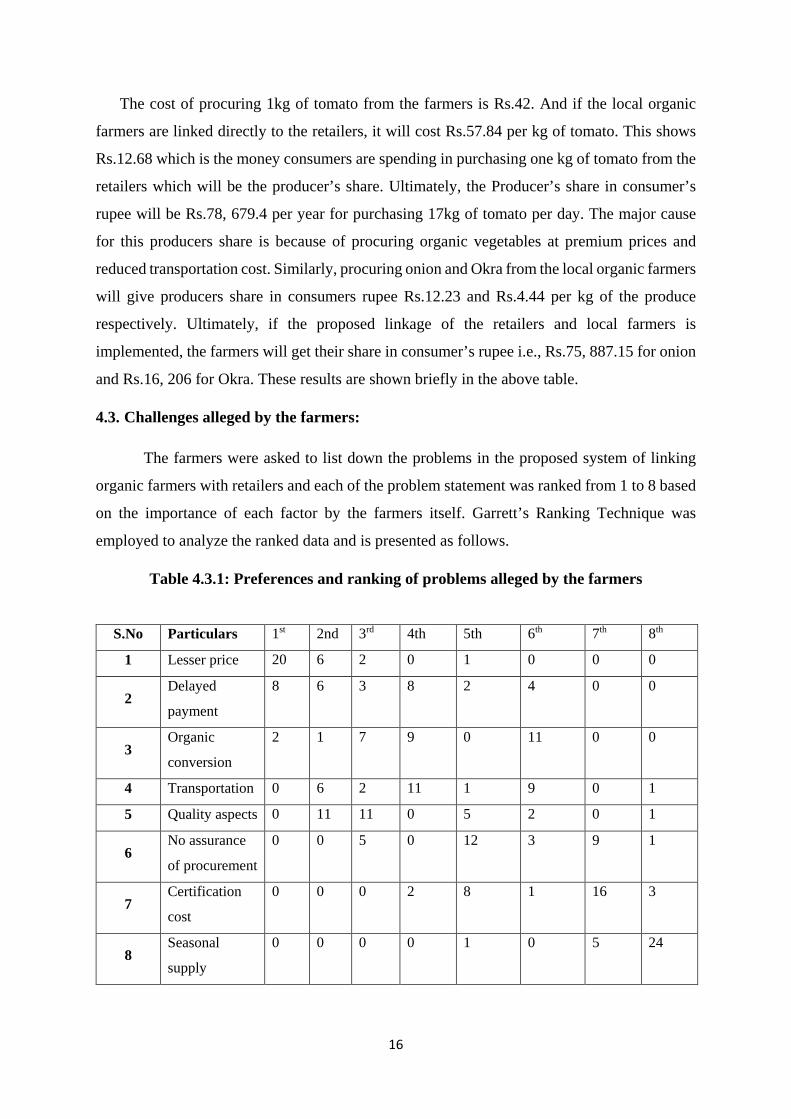
4.3. Challenges alleged by the farmers:
The farmers were asked to list down the problems in the proposed system of linking
organic farmers with retailers and each of the problem statement was ranked from 1 to 8 based
on the importance of each factor by the farmers itself. Garrett’s Ranking Technique was
employed to analyze the ranked data and is presented as follows.
Table 4.3.1: Preferences and ranking of problems alleged by the farmers
S.No Particulars 1st 2nd 3rd 4th 5th 6th 7th 8th
1 Lesser price 20 6 2 0 1 0 0 0
2 Delayed
payment
8 6 3 8 2 4 0 0
3 Organic
conversion
2 1 7 9 0 11 0 0
4 Transportation 0 6 2 11 1 9 0 1
5 Quality aspects 0 11 11 0 5 2 0 1
6 No assurance
of procurement
0 0 5 0 12 3 9 1
7 Certification
cost
0 0 0 2 8 1 16 3
8 Seasonal
supply
0 0 0 0 1 0 5 24
17
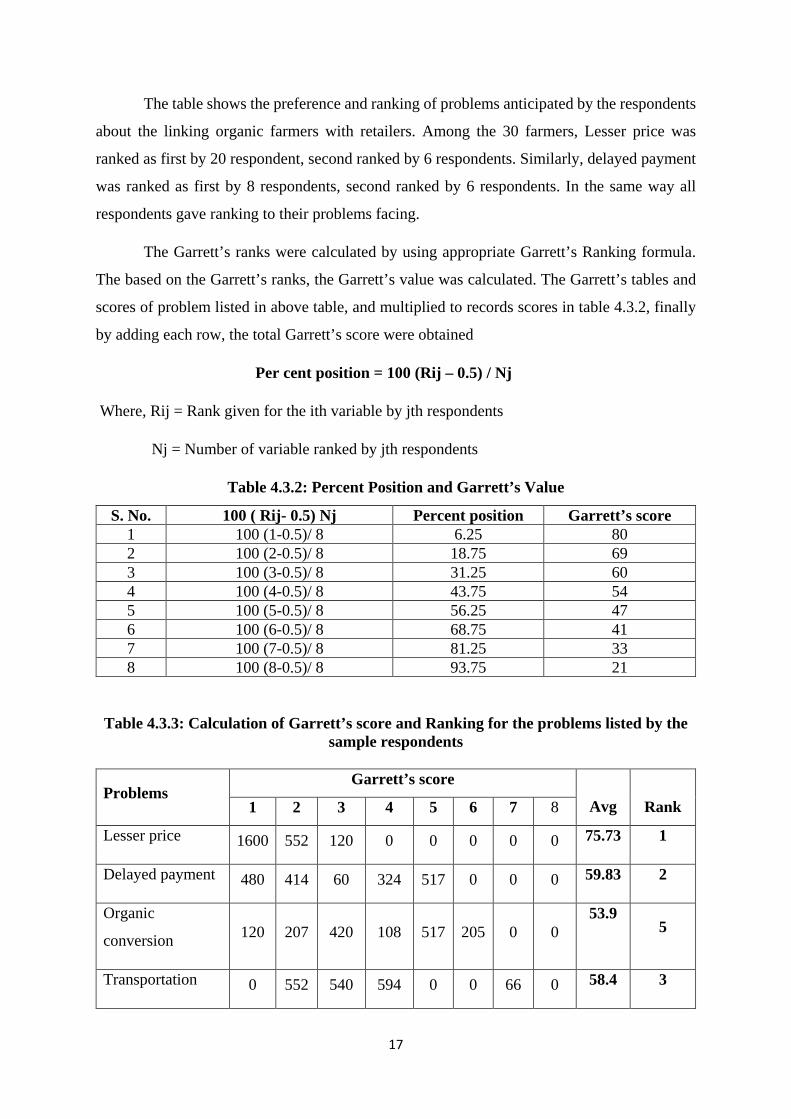
The table shows the preference and ranking of problems anticipated by the respondents
about the linking organic farmers with retailers. Among the 30 farmers, Lesser price was
ranked as first by 20 respondent, second ranked by 6 respondents. Similarly, delayed payment
was ranked as first by 8 respondents, second ranked by 6 respondents. In the same way all
respondents gave ranking to their problems facing.
The Garrett’s ranks were calculated by using appropriate Garrett’s Ranking formula.
The based on the Garrett’s ranks, the Garrett’s value was calculated. The Garrett’s tables and
scores of problem listed in above table, and multiplied to records scores in table 4.3.2, finally
by adding each row, the total Garrett’s score were obtained
Per cent position = 100 (Rij – 0.5) / Nj
Where, Rij = Rank given for the ith variable by jth respondents
Nj = Number of variable ranked by jth respondents
Table 4.3.2: Percent Position and Garrett’s Value
S. No. 100 ( Rij- 0.5) Nj Percent position Garrett’s score 1 100 (1-0.5)/ 8 6.25 80 2 100 (2-0.5)/ 8 18.75 69 3 100 (3-0.5)/ 8 31.25 60 4 100 (4-0.5)/ 8 43.75 54 5 100 (5-0.5)/ 8 56.25 47 6 100 (6-0.5)/ 8 68.75 41 7 100 (7-0.5)/ 8 81.25 33 8 100 (8-0.5)/ 8 93.75 21
Table 4.3.3: Calculation of Garrett’s score and Ranking for the problems listed by the sample respondents
Problems Garrett’s score
Avg
Rank 1 2 3 4 5 6 7 8
Lesser price 1600 552 120 0 0 0 0 0 75.73 1
Delayed payment 480 414 60 324 517 0 0 0 59.83 2
Organic
conversion 120 207 420 108 517 205 0 0 53.9
5
Transportation 0 552 540 594 0 0 66 0 58.4 3
18
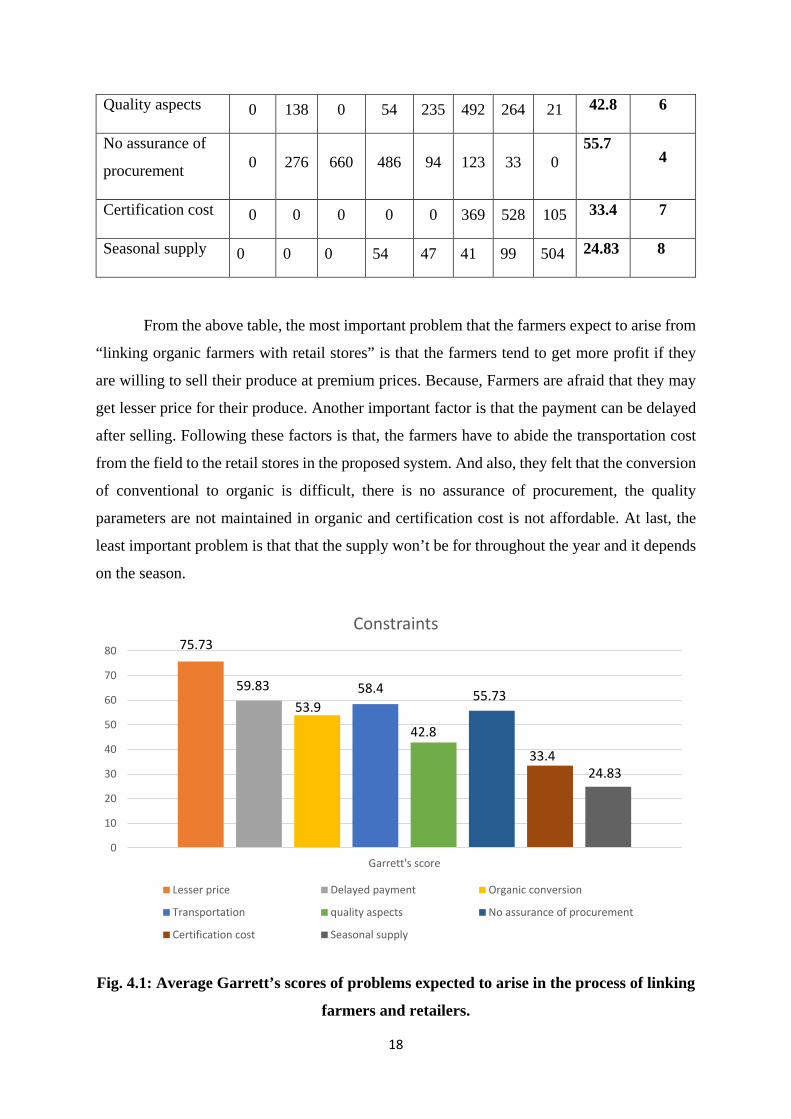
Quality aspects 0 138 0 54 235 492 264 21 42.8 6
No assurance of
procurement 0 276 660 486 94 123 33 0 55.7
4
Certification cost 0 0 0 0 0 369 528 105 33.4 7
Seasonal supply 0 0 0 54 47 41 99 504 24.83 8
From the above table, the most important problem that the farmers expect to arise from
“linking organic farmers with retail stores” is that the farmers tend to get more profit if they
are willing to sell their produce at premium prices. Because, Farmers are afraid that they may
get lesser price for their produce. Another important factor is that the payment can be delayed
after selling. Following these factors is that, the farmers have to abide the transportation cost
from the field to the retail stores in the proposed system. And also, they felt that the conversion
of conventional to organic is difficult, there is no assurance of procurement, the quality
parameters are not maintained in organic and certification cost is not affordable. At last, the
least important problem is that that the supply won’t be for throughout the year and it depends
on the season.
Fig. 4.1: Average Garrett’s scores of problems expected to arise in the process of linking
farmers and retailers.
0
10
20
30
40
50
60
70
80
Garrett's score
Constraints
Lesser price Delayed payment Organic conversion
Transportation quality aspects No assurance of procurement
Certification cost Seasonal supply
75.73
24.8333.4
55.73
42.8
58.453.9
59.83
19
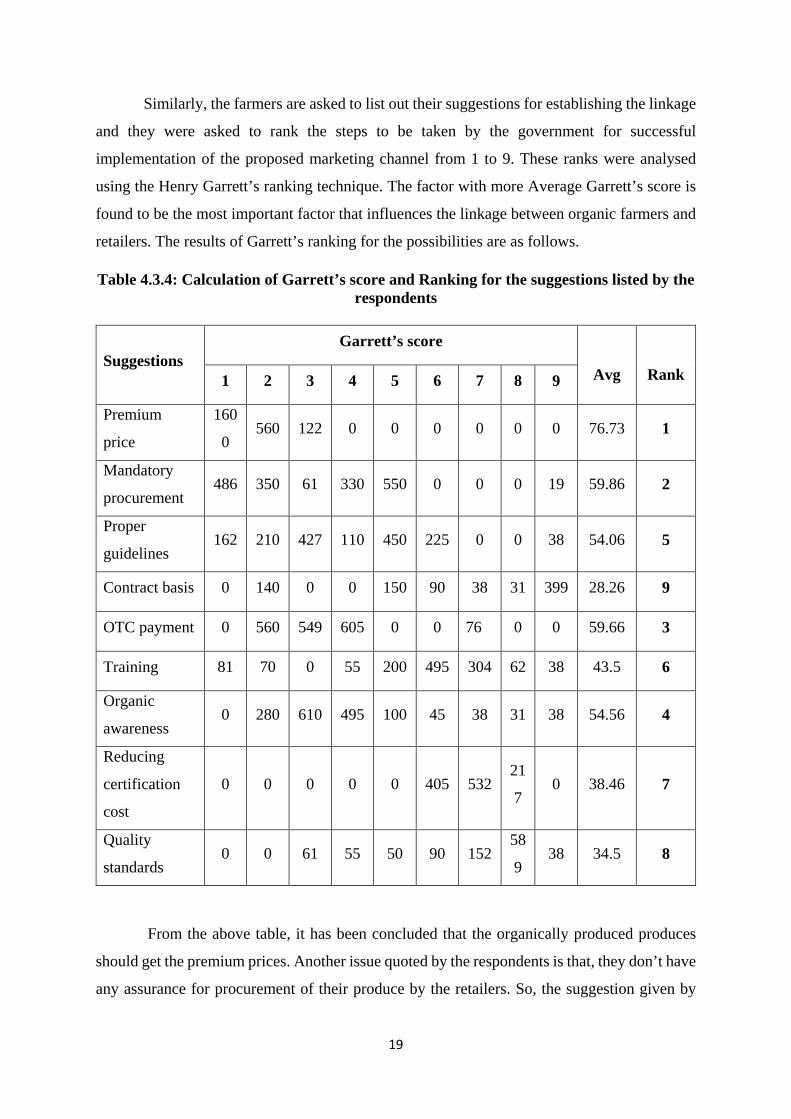
Similarly, the farmers are asked to list out their suggestions for establishing the linkage
and they were asked to rank the steps to be taken by the government for successful
implementation of the proposed marketing channel from 1 to 9. These ranks were analysed
using the Henry Garrett’s ranking technique. The factor with more Average Garrett’s score is
found to be the most important factor that influences the linkage between organic farmers and
retailers. The results of Garrett’s ranking for the possibilities are as follows.
Table 4.3.4: Calculation of Garrett’s score and Ranking for the suggestions listed by the respondents
Suggestions Garrett’s score
Avg
Rank 1 2 3 4 5 6 7 8 9
Premium
price
160
0 560 122 0 0 0 0 0 0 76.73 1
Mandatory
procurement 486 350 61 330 550 0 0 0 19 59.86 2
Proper
guidelines 162 210 427 110 450 225 0 0 38 54.06 5
Contract basis 0 140 0 0 150 90 38 31 399 28.26 9
OTC payment 0 560 549 605 0 0 76 0 0 59.66 3
Training 81 70 0 55 200 495 304 62 38 43.5 6
Organic
awareness 0 280 610 495 100 45 38 31 38 54.56 4
Reducing
certification
cost
0 0 0 0 0 405 532 21
7 0 38.46 7
Quality
standards 0 0 61 55 50 90 152
58
9 38 34.5 8
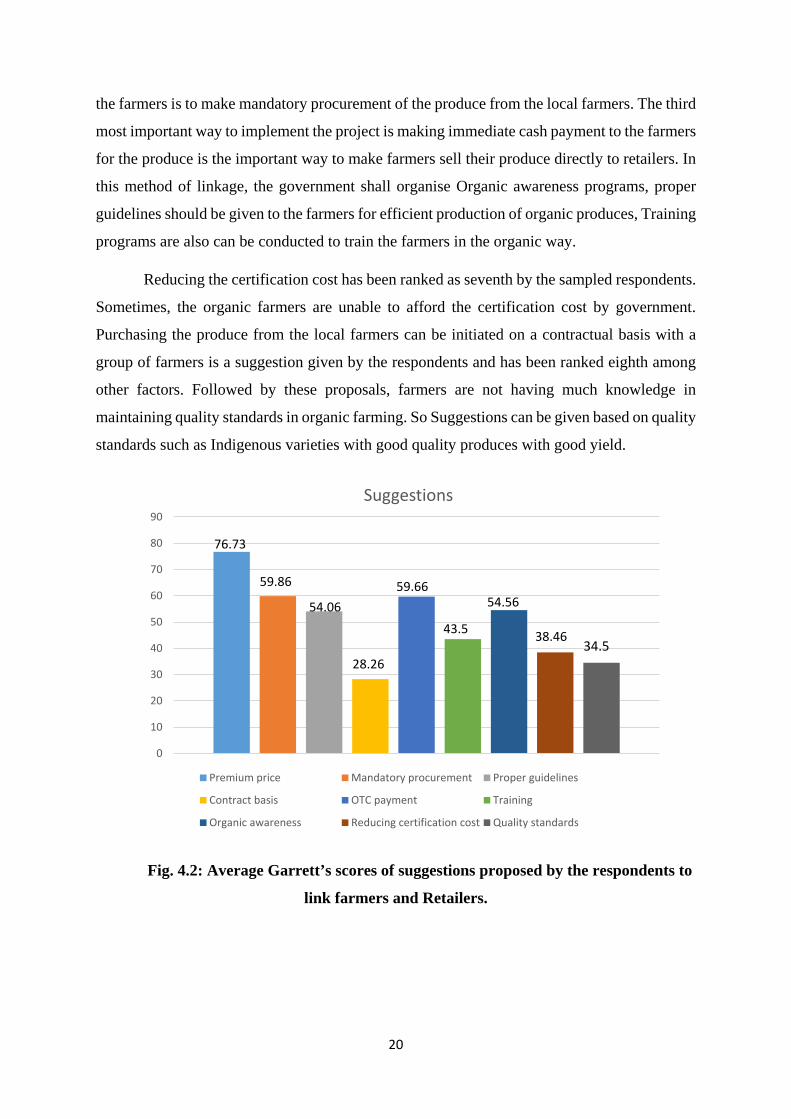
From the above table, it has been concluded that the organically produced produces
should get the premium prices. Another issue quoted by the respondents is that, they don’t have
any assurance for procurement of their produce by the retailers. So, the suggestion given by
20
the farmers is to make mandatory procurement of the produce from the local farmers. The third
most important way to implement the project is making immediate cash payment to the farmers
for the produce is the important way to make farmers sell their produce directly to retailers. In
this method of linkage, the government shall organise Organic awareness programs, proper
guidelines should be given to the farmers for efficient production of organic produces, Training
programs are also can be conducted to train the farmers in the organic way.
Reducing the certification cost has been ranked as seventh by the sampled respondents.
Sometimes, the organic farmers are unable to afford the certification cost by government.
Purchasing the produce from the local farmers can be initiated on a contractual basis with a
group of farmers is a suggestion given by the respondents and has been ranked eighth among
other factors. Followed by these proposals, farmers are not having much knowledge in
maintaining quality standards in organic farming. So Suggestions can be given based on quality
standards such as Indigenous varieties with good quality produces with good yield.
Fig. 4.2: Average Garrett’s scores of suggestions proposed by the respondents to
link farmers and Retailers.
0
10
20
30
40
50
60
70
80
90
Suggestions
Premium price Mandatory procurement Proper guidelines
Contract basis OTC payment Training
Organic awareness Reducing certification cost Quality standards
76.73
38.46
54.56
43.5
59.66
28.26
54.06
59.86
34.5
21
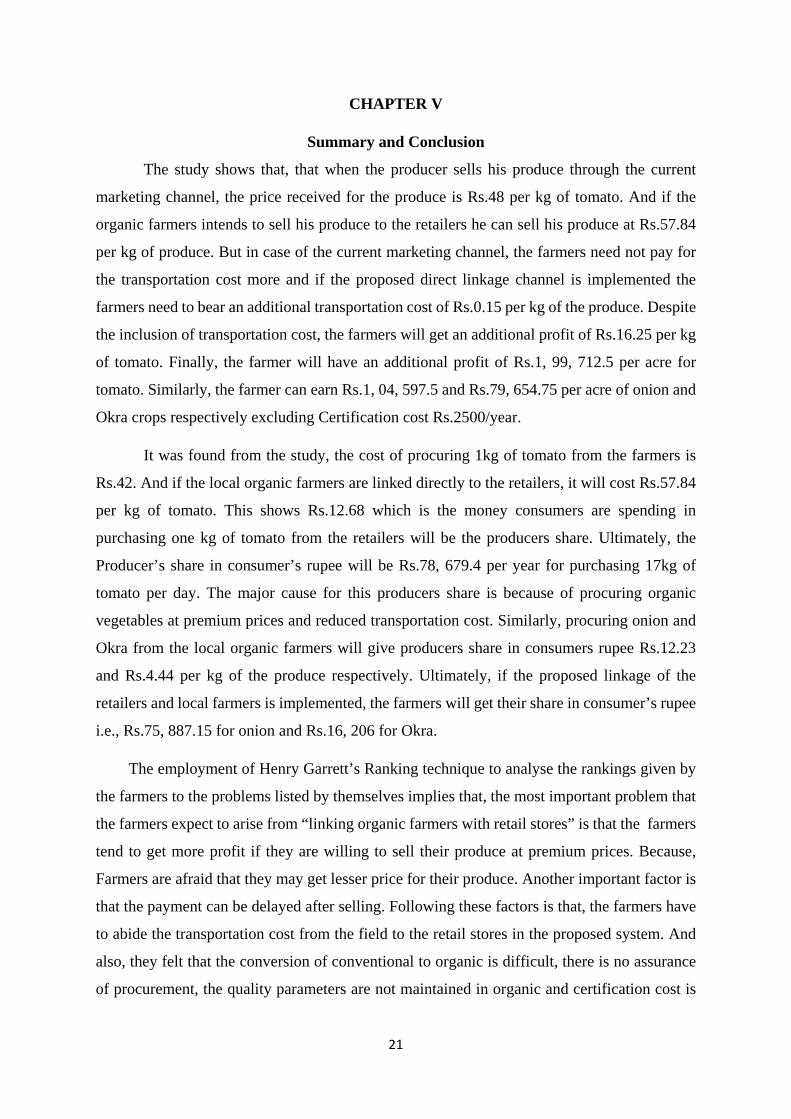
CHAPTER V
Summary and Conclusion
The study shows that, that when the producer sells his produce through the current
marketing channel, the price received for the produce is Rs.48 per kg of tomato. And if the
organic farmers intends to sell his produce to the retailers he can sell his produce at Rs.57.84
per kg of produce. But in case of the current marketing channel, the farmers need not pay for
the transportation cost more and if the proposed direct linkage channel is implemented the
farmers need to bear an additional transportation cost of Rs.0.15 per kg of the produce. Despite
the inclusion of transportation cost, the farmers will get an additional profit of Rs.16.25 per kg
of tomato. Finally, the farmer will have an additional profit of Rs.1, 99, 712.5 per acre for
tomato. Similarly, the farmer can earn Rs.1, 04, 597.5 and Rs.79, 654.75 per acre of onion and
Okra crops respectively excluding Certification cost Rs.2500/year.
It was found from the study, the cost of procuring 1kg of tomato from the farmers is
Rs.42. And if the local organic farmers are linked directly to the retailers, it will cost Rs.57.84
per kg of tomato. This shows Rs.12.68 which is the money consumers are spending in
purchasing one kg of tomato from the retailers will be the producers share. Ultimately, the
Producer’s share in consumer’s rupee will be Rs.78, 679.4 per year for purchasing 17kg of
tomato per day. The major cause for this producers share is because of procuring organic
vegetables at premium prices and reduced transportation cost. Similarly, procuring onion and
Okra from the local organic farmers will give producers share in consumers rupee Rs.12.23
and Rs.4.44 per kg of the produce respectively. Ultimately, if the proposed linkage of the
retailers and local farmers is implemented, the farmers will get their share in consumer’s rupee
i.e., Rs.75, 887.15 for onion and Rs.16, 206 for Okra.
The employment of Henry Garrett’s Ranking technique to analyse the rankings given by
the farmers to the problems listed by themselves implies that, the most important problem that
the farmers expect to arise from “linking organic farmers with retail stores” is that the farmers
tend to get more profit if they are willing to sell their produce at premium prices. Because,
Farmers are afraid that they may get lesser price for their produce. Another important factor is
that the payment can be delayed after selling. Following these factors is that, the farmers have
to abide the transportation cost from the field to the retail stores in the proposed system. And
also, they felt that the conversion of conventional to organic is difficult, there is no assurance
of procurement, the quality parameters are not maintained in organic and certification cost is

22
not affordable. At last, the least important problem is that that the supply will not be for
throughout the year and it is depends on the season.
Similarly, upon analysing the rankings given by the farmers to the suggestions listed
by them, it has been concluded that that the organically produced produces should get the
premium prices. Another issue quoted by the respondents is that, they don’t have any assurance
for procurement of their produce by the retailers. So, the suggestion given by the farmers is to
make mandatory procurement of the produce from the local farmers. The third most important
way to implement the project is making immediate cash payment to the farmers for the produce
is the important way to make farmers sell their produce directly to retailers. In this method of
linkage, the government shall organise Organic awareness programs, proper guidelines should
be given to the farmers for efficient production of organic produces, Training programs are
also can be conducted to train the farmers in the organic way.
Reducing the certification cost has been ranked as seventh by the sampled respondents.
Sometimes, the organic farmers are unable to afford the certification cost by government.
Purchasing the produce from the local farmers can be initiated on a contractual basis with a
group of farmers is a suggestion given by the respondents and has been ranked eighth among
other factors. Followed by these proposals, farmers are not having much knowledge in
maintaining quality standards in organic farming. So Suggestions can be given based on quality
standards such as Indigenous varieties with good quality produces with good yield.
5.1. Policy Suggestions:
The following policy implications may be considered for further research and development
based on above results.
The study clearly shows that the organic farmers earn more profit when linked to the
Organic retail stores than the existing marketing channel. But the Farmers presume that they
would get lower prices in the alternative channel. This indicates the deficit awareness about
the market information of organic produces among the farmers. So, there is a pressing need to
promote market information of organic produces among the farmers.
As proposed by the farmers, the proposed channel must be made more efficient that
inspections can be conducted in retail stores for checking procurement price, payment method,
whether the produces are certified are not and by that, linkage between the local farmers and
retailers can be initiated through these inspections by Organic certification inspectors.

23
To meet out the losses, subsidy can be given because the farmers will meet lesser yield
and higher cost of cultivation during their organic conversion period (3-4 years).
Many changes are needed if India is to overcome the constraints and achieve its rich potential
in organic agriculture.
Developing appropriate and strong extension services.
Reducing the cost of certification and easily approachable to farmer.
Providing subsidies and other financial support during organic conversion period.
Providing regular training on cultivation techniques of organic agriculture from seed to
grain.
Promoting market information of organic produces among the farmers
Conducting inspections in retail stores for checking procurement price, payment
method, whether the produces are certified are not.
Suggesting organic farmers to follow integrated farming system to protect themselves
from undesired situations.
Create new FPOs and link with Retail shops.
Providing awareness about supplying organic produces to e-commerce. Organic
Farmers can also sell their produce to nearby collection centres of e-commerce stores.
For example, Big Basket. These collections are located in Metropolitan cities such as
Chennai, Bangalore, Mumbai, etc. Farmers can sell directly or through FPOs.
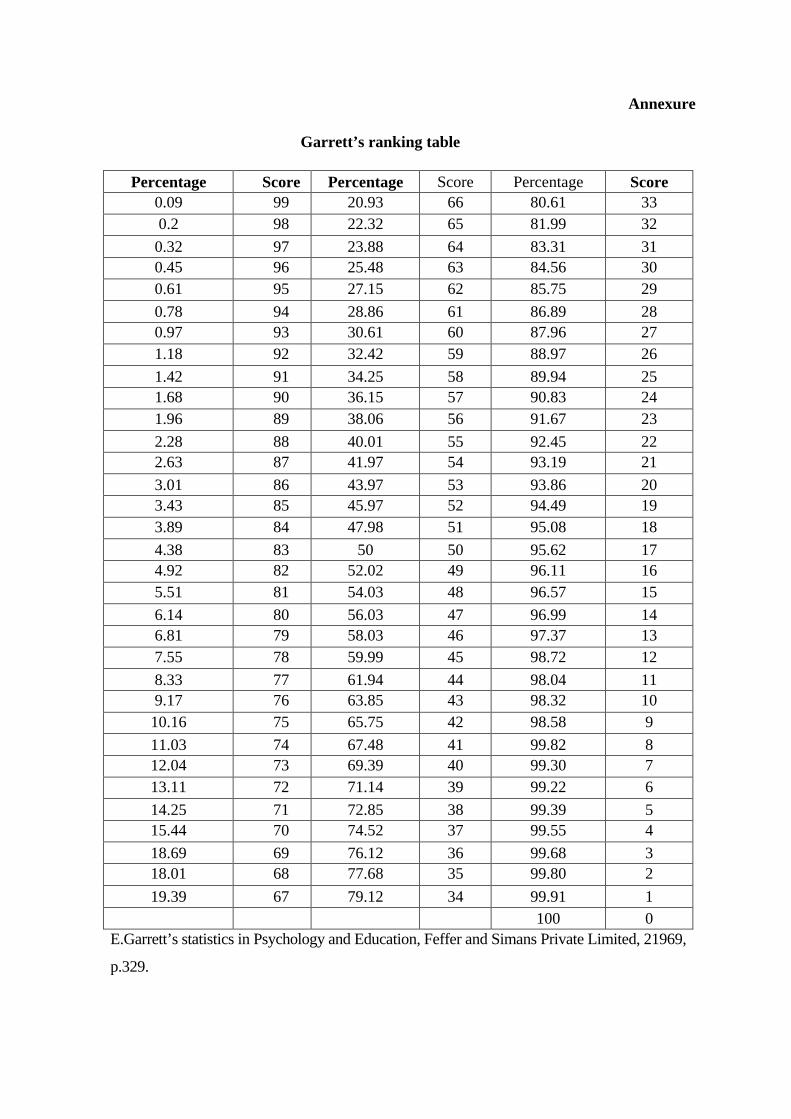
Annexure
Garrett’s ranking table
Percentage Score Percentage Score Percentage Score 0.09 99 20.93 66 80.61 33 0.2 98 22.32 65 81.99 32 0.32 97 23.88 64 83.31 31 0.45 96 25.48 63 84.56 30 0.61 95 27.15 62 85.75 29 0.78 94 28.86 61 86.89 28 0.97 93 30.61 60 87.96 27 1.18 92 32.42 59 88.97 26 1.42 91 34.25 58 89.94 25 1.68 90 36.15 57 90.83 24 1.96 89 38.06 56 91.67 23 2.28 88 40.01 55 92.45 22 2.63 87 41.97 54 93.19 21 3.01 86 43.97 53 93.86 20 3.43 85 45.97 52 94.49 19 3.89 84 47.98 51 95.08 18 4.38 83 50 50 95.62 17 4.92 82 52.02 49 96.11 16 5.51 81 54.03 48 96.57 15 6.14 80 56.03 47 96.99 14 6.81 79 58.03 46 97.37 13 7.55 78 59.99 45 98.72 12 8.33 77 61.94 44 98.04 11 9.17 76 63.85 43 98.32 10 10.16 75 65.75 42 98.58 9 11.03 74 67.48 41 99.82 8 12.04 73 69.39 40 99.30 7 13.11 72 71.14 39 99.22 6 14.25 71 72.85 38 99.39 5 15.44 70 74.52 37 99.55 4 18.69 69 76.12 36 99.68 3 18.01 68 77.68 35 99.80 2 19.39 67 79.12 34 99.91 1
100 0 E.Garrett’s statistics in Psychology and Education, Feffer and Simans Private Limited, 21969,
p.329.

FARMERS INTERVIEW SCHEDULE (Organic Type)
A. General Particulars:
1. Name of the farmer: Age:
2. Address: Village:
3. Educational Qualification:
i) Below matric ii) Matric iii) Graduate iv) Others
4. Annual Household Income (Gross in Rs.):
i) Below 1.5 lakh ii) 1.5 – 3 lakh iii) 3 – 5 lakh iv) Above 5 lakh
5. Land Resources:
S. No.
Land Area in acre
Owned Leased in Leased out Total operated area
1. Wet land
2. Garden land
3. Dry land
Farmer type: Marginal / Small / Medium / Large
6. Farming Experience (in years) :
Experience in organic farming :
7. Income obtained from organic farming :
8. Particulars of agriculture allied activities :
Particulars Numbers Total Production
Total Cost (Rs.)
Value of output
Net income
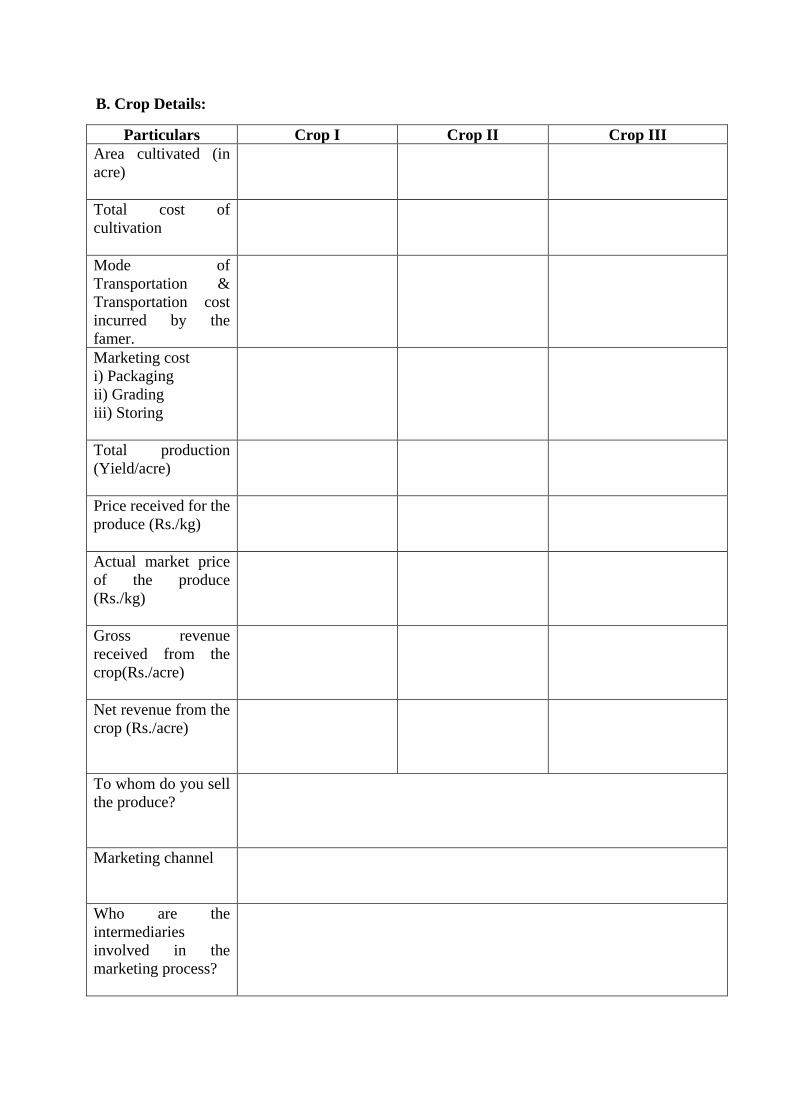
B. Crop Details:
Particulars Crop I Crop II Crop III Area cultivated (in acre)
Total cost of cultivation
Mode of Transportation & Transportation cost incurred by the famer.
Marketing cost i) Packaging ii) Grading iii) Storing
Total production (Yield/acre)
Price received for the produce (Rs./kg)
Actual market price of the produce (Rs./kg)
Gross revenue received from the crop(Rs./acre)
Net revenue from the crop (Rs./acre)
To whom do you sell the produce?
Marketing channel
Who are the intermediaries involved in the marketing process?
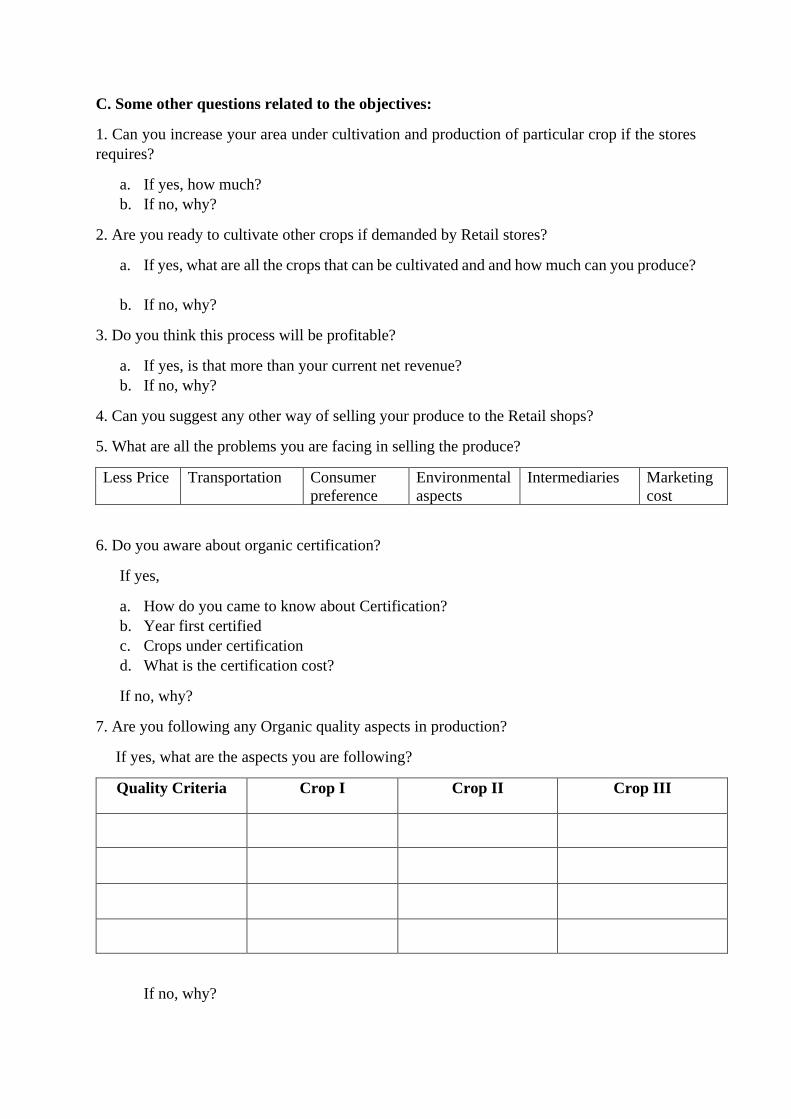
C. Some other questions related to the objectives:
1. Can you increase your area under cultivation and production of particular crop if the stores requires?
a. If yes, how much? b. If no, why?
2. Are you ready to cultivate other crops if demanded by Retail stores?
a. If yes, what are all the crops that can be cultivated and and how much can you produce?
b. If no, why?
3. Do you think this process will be profitable?
a. If yes, is that more than your current net revenue? b. If no, why?
4. Can you suggest any other way of selling your produce to the Retail shops?
5. What are all the problems you are facing in selling the produce?
Less Price Transportation Consumer preference
Environmental aspects
Intermediaries Marketing cost
6. Do you aware about organic certification?
If yes,
a. How do you came to know about Certification? b. Year first certified c. Crops under certification d. What is the certification cost?
If no, why?
7. Are you following any Organic quality aspects in production?
If yes, what are the aspects you are following?
Quality Criteria Crop I Crop II Crop III
If no, why?
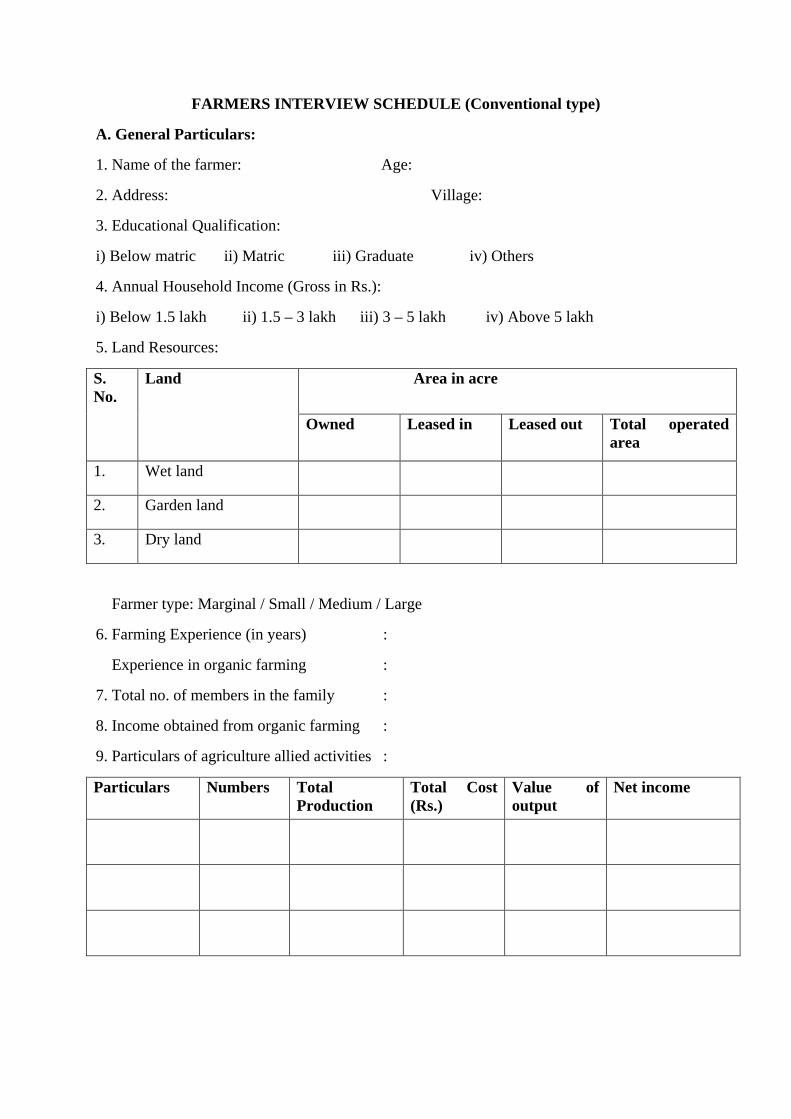
FARMERS INTERVIEW SCHEDULE (Conventional type)
A. General Particulars:
1. Name of the farmer: Age:
2. Address: Village:
3. Educational Qualification:
i) Below matric ii) Matric iii) Graduate iv) Others
4. Annual Household Income (Gross in Rs.):
i) Below 1.5 lakh ii) 1.5 – 3 lakh iii) 3 – 5 lakh iv) Above 5 lakh
5. Land Resources:
S. No.
Land Area in acre
Owned Leased in Leased out Total operated area
1. Wet land
2. Garden land
3. Dry land
Farmer type: Marginal / Small / Medium / Large
6. Farming Experience (in years) :
Experience in organic farming :
7. Total no. of members in the family :
8. Income obtained from organic farming :
9. Particulars of agriculture allied activities :
Particulars Numbers Total Production
Total Cost (Rs.)
Value of output
Net income
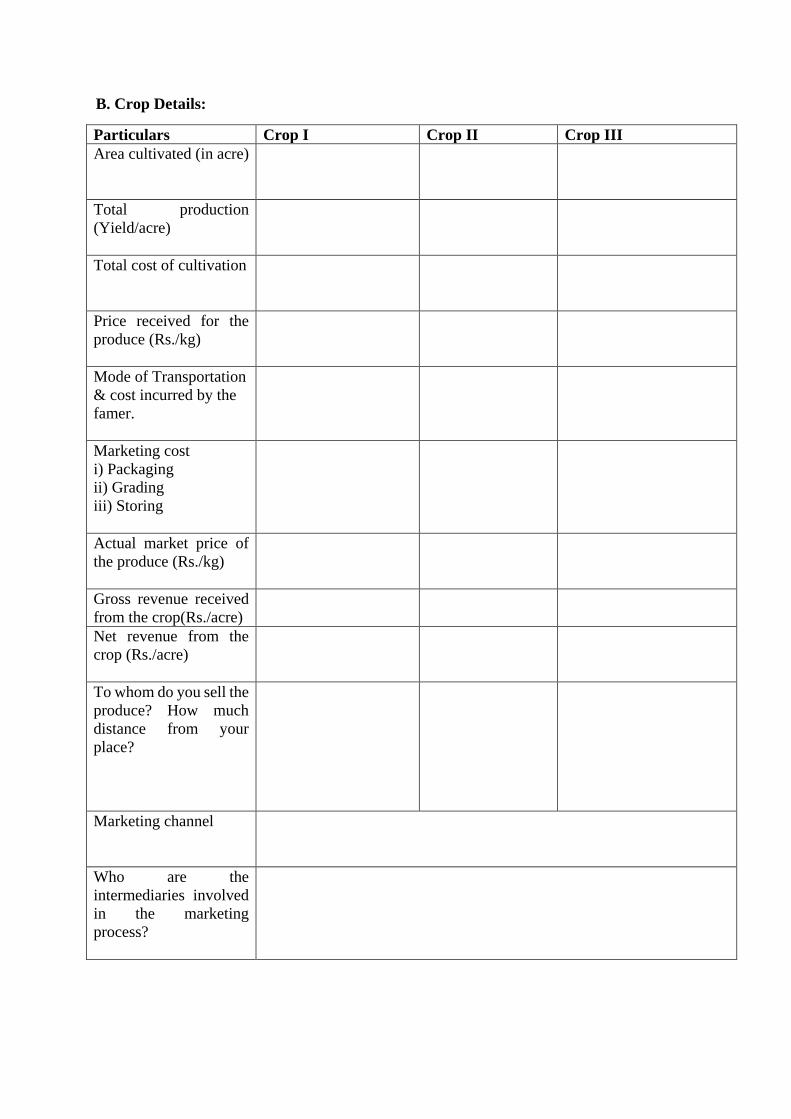
B. Crop Details:
Particulars Crop I Crop II Crop III Area cultivated (in acre)
Total production (Yield/acre)
Total cost of cultivation
Price received for the produce (Rs./kg)
Mode of Transportation & cost incurred by the famer.
Marketing cost i) Packaging ii) Grading iii) Storing
Actual market price of the produce (Rs./kg)
Gross revenue received from the crop(Rs./acre)
Net revenue from the crop (Rs./acre)
To whom do you sell the produce? How much distance from your place?
Marketing channel
Who are the intermediaries involved in the marketing process?
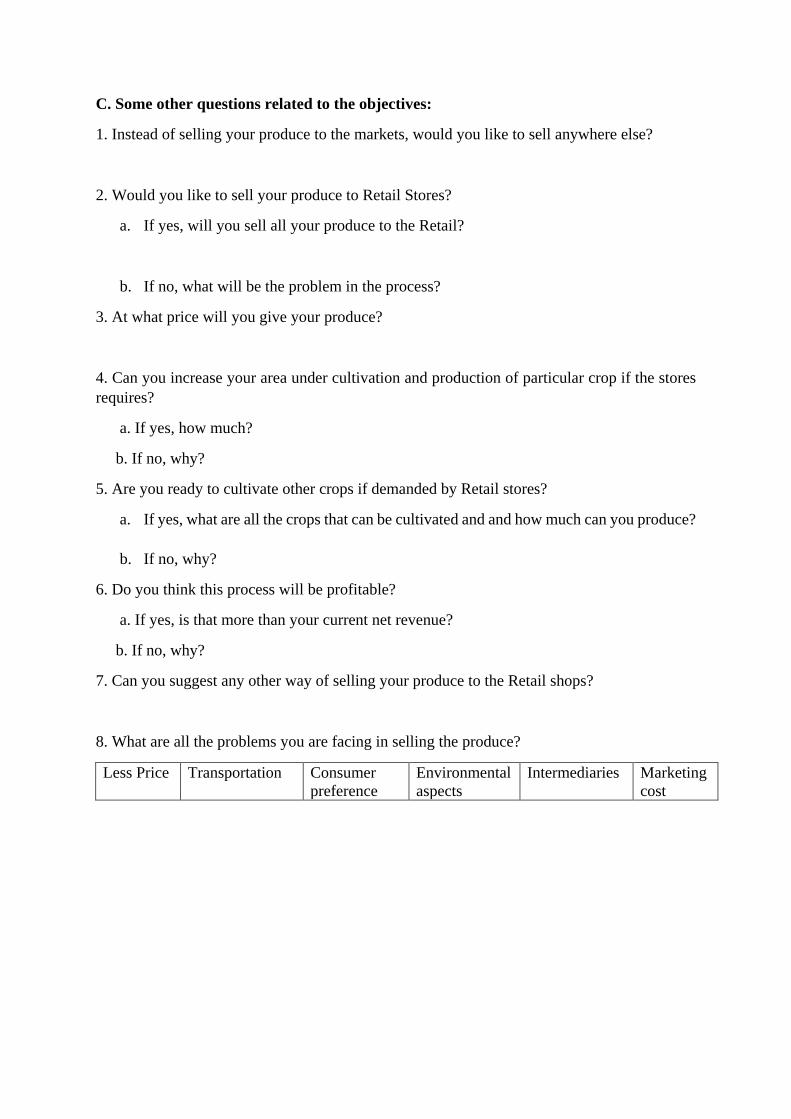
C. Some other questions related to the objectives:
1. Instead of selling your produce to the markets, would you like to sell anywhere else?
2. Would you like to sell your produce to Retail Stores?
a. If yes, will you sell all your produce to the Retail?
b. If no, what will be the problem in the process?
3. At what price will you give your produce?
4. Can you increase your area under cultivation and production of particular crop if the stores requires?
a. If yes, how much?
b. If no, why?
5. Are you ready to cultivate other crops if demanded by Retail stores?
a. If yes, what are all the crops that can be cultivated and and how much can you produce?
b. If no, why?
6. Do you think this process will be profitable?
a. If yes, is that more than your current net revenue?
b. If no, why?
7. Can you suggest any other way of selling your produce to the Retail shops?
8. What are all the problems you are facing in selling the produce?
Less Price Transportation Consumer preference
Environmental aspects
Intermediaries Marketing cost
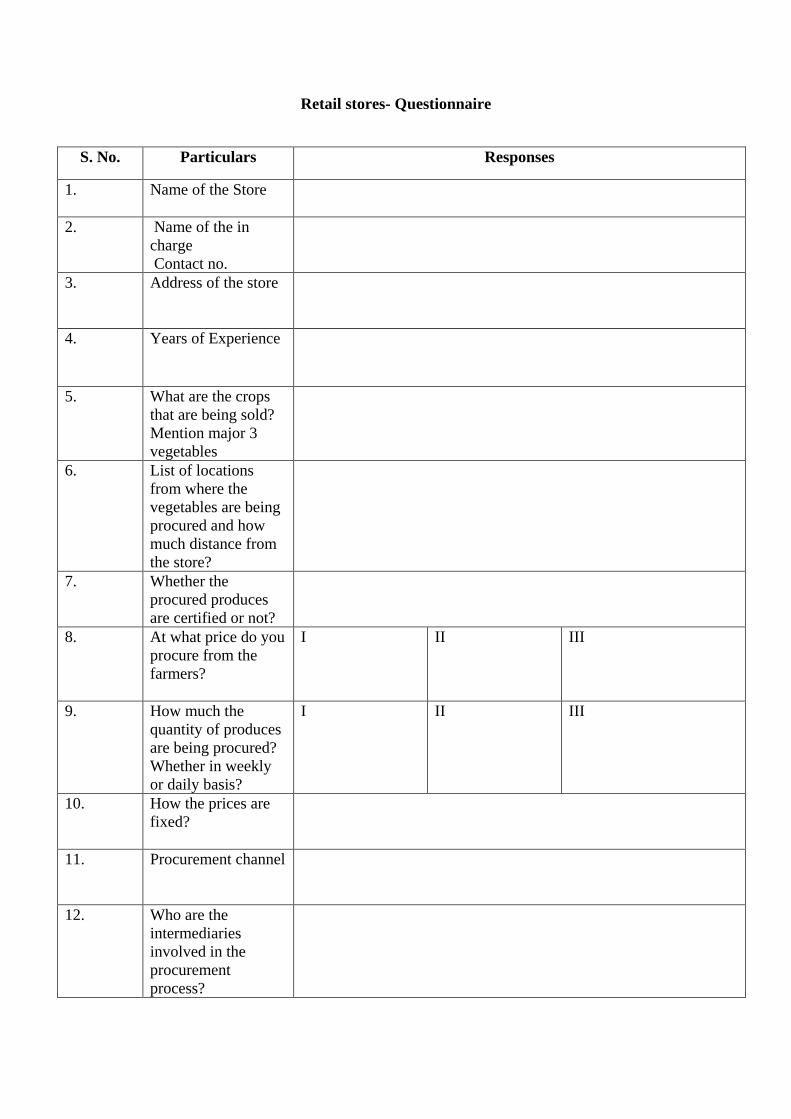
Retail stores- Questionnaire
S. No. Particulars Responses
1. Name of the Store
2. Name of the in charge Contact no.
3. Address of the store
4. Years of Experience
5. What are the crops that are being sold? Mention major 3 vegetables
6. List of locations from where the vegetables are being procured and how much distance from the store?
7. Whether the procured produces are certified or not?
8. At what price do you procure from the farmers?
I II III
9. How much the quantity of produces are being procured? Whether in weekly or daily basis?
I
II III
10. How the prices are fixed?
11. Procurement channel
12. Who are the intermediaries involved in the procurement process?

13. What is the purchasing price of the commodity from intermediary (cost and margin)
I II III
14. Is there any storage facility available in the shop? (Duration for which commodity can be stored)
15. Is there any cold storage facility available in the shop? If yes, give area details
16. What are the quality standards do you expecting from farmers?
a. Size b. Shape c. Colour d. Uniformity in
ripening e. Shelf life
I
II
III
17.
How quality standards are maintained in the shop?
18. Do you find any difficulty in procurement of produce?
19. Payment pattern
20. Who are all your major consumers?
21. At what prices do you sell to the consumers? (Rs./kg)
I
II
III

22. How much profit will you get? (Rs./kg)
23. How much turn over you are getting? (Monthly/yearly)
24. What is the mode of transportation and cost incurred in it? (Rs./kg)
25. Marketing cost incurred in it (Rs./kg) (packaging, grading)
26. Would you like to buy from local farmers?
Reference
Arpita Mukherjee, Avantika Kapoor & Souvik Dutta. (2018). Organic Food Business in India: A Survey of Companies. Indian Council for Research on International Economic Relations, New Delhi, India. Balasubramanian (2005): “Going Organic: Problems of Upscaling and Extension”, presentation at the National Planning Workshop on Technical Co-operation Programme on Organic Agriculture, July 18-19, MoA/FAO, NCOF, Ghaziabad. Pandey, J., & Singh, A. (2012). Opportunities and constraints in organic farming: An Indian perspective. Journal of Scientific Research, 56, 47-72. Ramesh, P., Panwar, N. R., Singh, A. B., Ramana, S., Yadav, S. K., Shrivastava, R., & Rao, A. S. (2010). Status of organic farming in India. Current Science, 98(9), 1190-1194. Sharma, S., Shukla, R., Leua, A., Parmar, G., & Chaudhari, B. (2016). Consumers’ awareness and opinion regarding organic food products in south Gujarat. International Journal of Farm Sciences, 6(3), 206-215. Sukhpal singh, (2006). Organic produce supply chains in India. Centre for Management in Agriculture (CMA), Indian Institute of Management, Ahmedabad. Thompson, G D (1998): “Consumer Demand for Organic Foods: What We Know and What We Need to Know”, American Journal of Agricultural Economics, 80 (4), 1113-1118. Vijayalakshmi, K (2005): “Organic farming initiatives in Tamilnadu: A bird‟s eye view”, a presentation at the National Planning Workshop on Technical Co-operation Programme on Organic Agriculture, July 18-19, MoA/FAO, NCOF, Ghaziabad. Willer, H., & Lernoud, J. (2017). The World of Organic Agriculture: Statistics and Emerging Trends. Research Institute of Organic Agriculture (FiBL) and International Federation of Organic Agriculture Movements (IFOAM), Germany. TNAU Agritech portal, Agricultural marketing & Agribusiness http://agritech.tnau.ac.in/agricultural_marketing/agrimark_Marketing%20channels.html About Big Bazar, https://en.wikipedia.org/wiki/Big_Bazar About Reliance fresh, https://en.wikipedia.org/wiki/Reliance_fresh About Easy day, https://en.wikipedia.org/wiki/Easy_day https://apeda.gov.in/apedawebsite/organic/NewTariff/Fee_Structure_of_TNOCD.pdf https://en.m.Wikipedia.org/wiki/IFOAM_-_Organics_International&ved https://www.iscoporganiccertification.org https://unstats.un.org/unsd/methods/m49/m49regin.htm.
UYIR organic Farmers market
SMK Organic food store
Sugam organic
Packaging materials

Tamil Nadu Organic Certification Department
ADH office
District Statistical Office
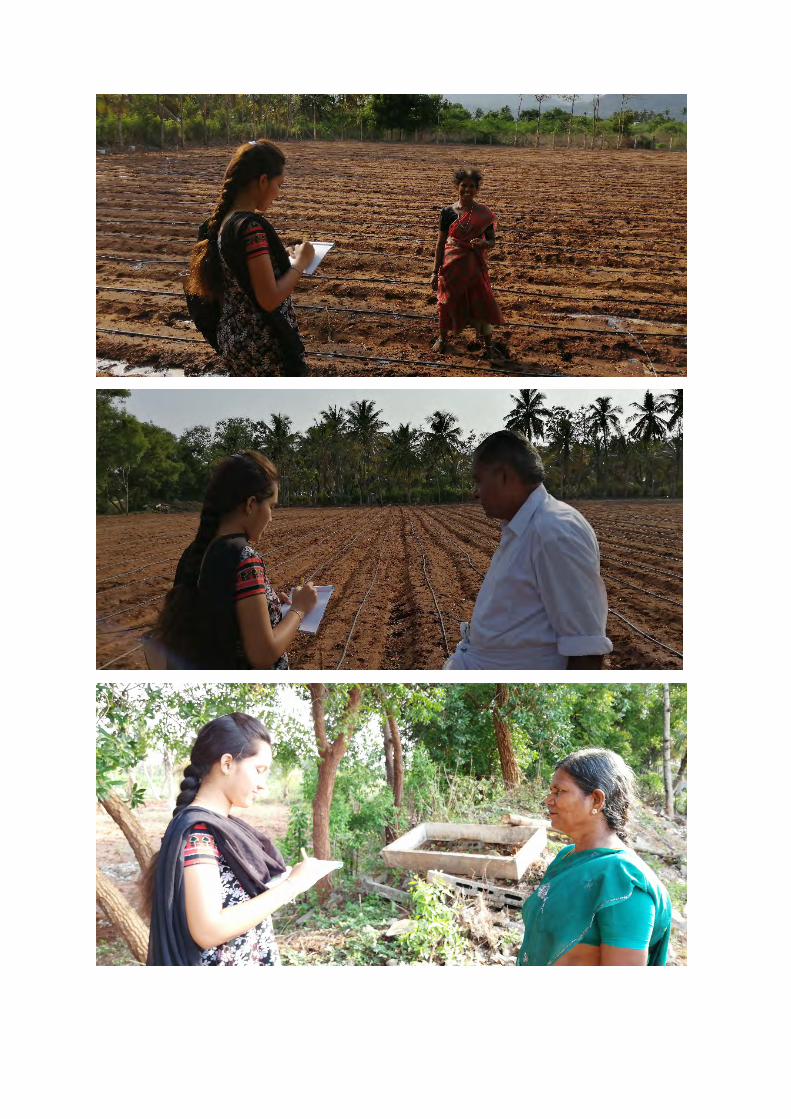
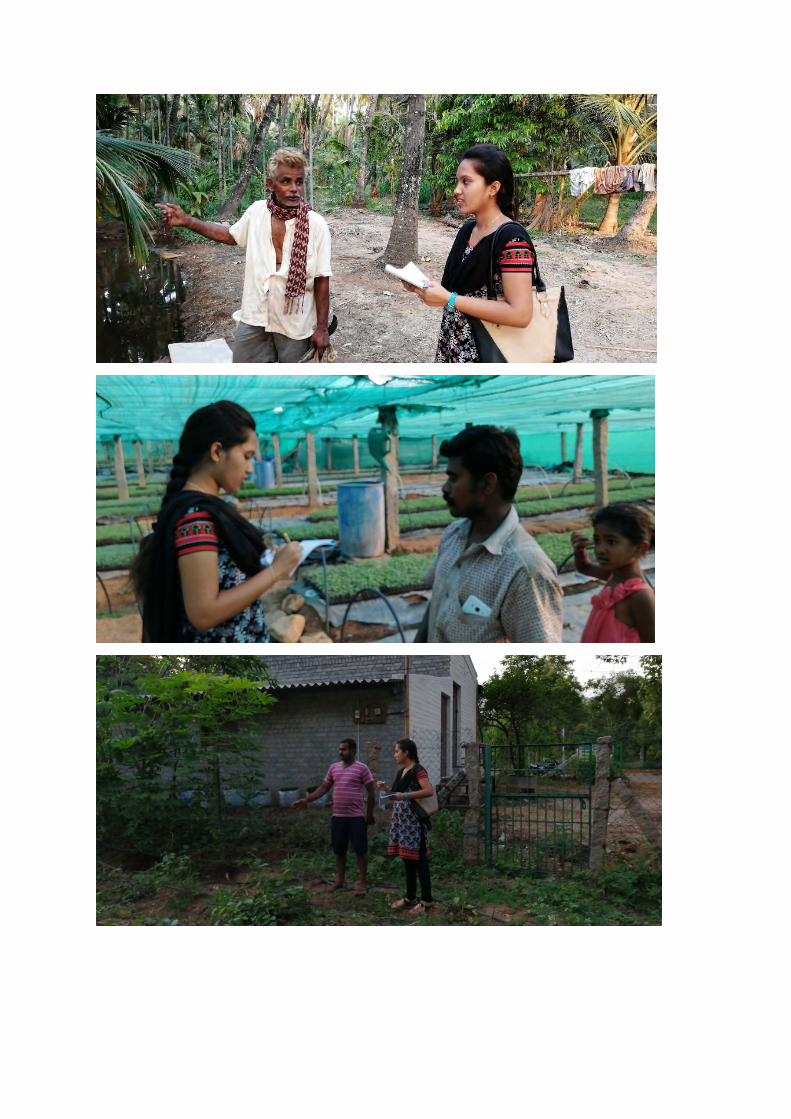
Farmer’s Survey