Mapping Literacy-Rich Environments: Geospatial Perspectives on Literacy and Education (2013)
24
Teachers College Record Volume 115, 060305, June 2013, 24 pages Copyright © by Teachers College, Columbia University 0161-4681 1 Mapping Literacy-Rich Environments: Geospatial Perspectives on Literacy and Education KORINA M. JOCSON Washington University in St. Louis ELIZABETH THORNE-WALLINGTON Washington University in St. Louis Background: Literacy-rich environments (LREs) reflect characteristics such as abundance of materials, daily literacy routine, and layout conducive for reading and writing. Shifting from previous conceptualizations, LREs are not confined to schools but are ubiquitous in formal and informal educational settings; they include libraries, museums, bookstores, and community-based organizations. An ecological approach is important for understanding how literacy is embedded in social life and everyday practice, particularly in relation to literacy learning and development. It recognizes the multitude of practices in various communities and accounts for institutional and social structures that shape everyday practice. Purpose/Objective/Research Question/Focus of Study: The purpose of the study is to examine LREs as part of a broader ecology of literacy and to identify the factors that may influence proximity and accessibility to LREs. An ecological approach paired with geographic information systems (GIS) can yield various types of data visualization about spatial context. St. Louis metropolitan area serves as a viable example in the study. Research Design: The authors employed a mixed methods approach and collected data from several sources. Purposeful sampling was used to identify a number of educational and cultural institutions. GIS tools were central to the creation of maps. Using spatial analysis and data visualization, the authors paid attention to the emerging relationships between spatial patterns and represented demographics, evident on the maps as distance and clustering. Findings/Results: Findings indicate that an uneven geography of opportunity among underserved student populations is further compounded by a fragmented ecology of literacy.
Transcript of Mapping Literacy-Rich Environments: Geospatial Perspectives on Literacy and Education (2013)
Teachers College Record Volume 115, 060305, June 2013, 24 pagesCopyright © by Teachers College, Columbia University0161-4681 1
Mapping Literacy-Rich Environments: Geospatial Perspectives on Literacy and Education
KoRina M. JoCson
Washington University in St. Louis
ELizabETh ThoRnE-WaLLinGTon
Washington University in St. Louis
Background: Literacy-rich environments (LREs) reflect characteristics such as abundance of materials, daily literacy routine, and layout conducive for reading and writing. Shifting from previous conceptualizations, LREs are not confined to schools but are ubiquitous in formal and informal educational settings; they include libraries, museums, bookstores, and community-based organizations. An ecological approach is important for understanding how literacy is embedded in social life and everyday practice, particularly in relation to literacy learning and development. It recognizes the multitude of practices in various communities and accounts for institutional and social structures that shape everyday practice.Purpose/Objective/Research Question/Focus of Study: The purpose of the study is to examine LREs as part of a broader ecology of literacy and to identify the factors that may influence proximity and accessibility to LREs. An ecological approach paired with geographic information systems (GIS) can yield various types of data visualization about spatial context. St. Louis metropolitan area serves as a viable example in the study.Research Design: The authors employed a mixed methods approach and collected data from several sources. Purposeful sampling was used to identify a number of educational and cultural institutions. GIS tools were central to the creation of maps. Using spatial analysis and data visualization, the authors paid attention to the emerging relationships between spatial patterns and represented demographics, evident on the maps as distance and clustering.Findings/Results: Findings indicate that an uneven geography of opportunity among underserved student populations is further compounded by a fragmented ecology of literacy.
Teachers College Record, 115, 060305 (2013)
2
The spatial arrangements of LREs suggest an uneven distribution of resources, particularly educational and cultural institutions that shape everyday life. Findings suggest that factors such as race, median household income, and transportation routes influence proximity and accessibility to LREs.Conclusions/Recommendations: This investigation of LREs extends current conversations about literacy and various ecologies of literacy. GIS tools provided a means to examine the geospatial relationships between LREs, schools, and neighborhoods in a particular metropolitan area. Focusing on St. Louis was key not only because of the researchers’ growing knowledge of the place but also because there are good reasons to believe that St. Louis, with its uneven and fragmented geography, may exemplify similar phenomena taking place in other metropolitan areas.
inTRoDUCTion
in the past, literacy-rich environments have been most associated with early literacy education. Educational reformers and psychologists such as Johann Pestalozzi, Friedrich Froebel, Jean Piaget, and Lev Vygotsky iden-tified the important role of context, or physical environment, as an agent in children’s learning. it was argued that, in the classroom, literacy-rich environments with embedded play activities allow children to practice literacy behaviors such as reading and writing and the use of language to make sense of their everyday surroundings (Roskos & neuman, 2002). in essence, a literacy-rich environment promotes the use of oral and written language across the curriculum, both by the physical surroundings of the room itself and by the learning opportunities presented there. according to McGee and Richgels (1996), nine characteristics of literacy-rich envi-ronments support young readers and writers: abundance of high-quality materials (i.e., books and other types of texts); assessment to guide instruction; daily literacy routines, including read-alouds, independent reading, writing, and sharing; culturally sensitive curricula; curricula inte-grating disciplines; curricula integrating language arts; variety of instruc-tion; layout that encourages reading and writing; and variety of groups.
While such characteristics hold true and remain central to classroom literacy learning and instruction, it is also important to consider the role of information and communication technologies (iCTs) in shaping tra-ditional and new literacies, both in and outside of school (alvermann, 2010; hull & schultz, 2002; ito, 2010; Leu, Kinzer, Coiro, & Cammack, 2004). in the digital age, iCTs have become central to everyday human interaction. Today, it is not uncommon to see users on desktops, laptops, mobile phones, or other portable devices such as iPads who are engaging in reading and writing (broadly construed) in literacy-rich environments. For this article, literacy-rich environments that reflect similar character-
TCR, 115, 060305 Geospatial Perspectives
3
istics, such as abundance of materials, daily literacy routine, and layout conducive for reading and writing, include the following: libraries, museums, bookstores, and community-based organizations. We expand our conceptualization of literacy-rich environments (LREs) as no lon-ger confined to classrooms and schools. instead, they are ubiquitous in formal and informal educational settings as part of what we are calling an ecology of literacy that influences the dynamic relationship between individuals and their environment (barton, 2007; Pahl, 2008). in many cases, these formal and informal settings also include homes, faith-based institutions, and certain places of employment. an ecological approach is important for understanding how literacy is embedded in social life and everyday practice, particularly in relation to literacy learning and devel-opment. it recognizes the multitude of practices in various communities and accounts for institutional and social structures that shape everyday practice. Recently, for instance, there is increased attention nationwide to creating learning labs at libraries and museums intended to innovate education through digital media (Macarthur Foundation, 2010). it is in line with President obama’s campaign to re-envision learning in the twenty-first century.
shifting away from previous definitions, LREs, then, are significant not only to children but also to adults across the lifespan who engage in dif-ferent literacy practices for different purposes. LREs provide participants with tools and resources for meaning making. These can range from ana-log to digital technologies, from print- to screen-based texts, and from sin-gle to multiple languages or sign systems. in our conceptualization, we also take into account wired networks and Wi-Fi access via anytime-anywhere technology that allow for the physical and the virtual to converge in (un)structured settings (i.e., cafés, airports, parks). Mobile phones and other portable devices have become important portals to cyberspace within a growing participatory culture (Jenkins, 2006; Watkins, 2009). We identify these (un)structured settings as increasingly common aspects of some educational and cultural institutions. however, these settings—along with homes, faith-based institutions, and places of employment—are not the focus of our current examination. in our research, we consider libraries, museums, bookstores, and community-based organizations, with their respective iCTs, to be important resources for shaping everyday practice. our interests lie in understanding LREs as part of a broader ecology of literacy and in understanding the factors that may influence proximity and accessibility to LREs.
We employed a geographic and spatial approach to locate LREs in rela-tion to schools and neighborhoods. similar to current trends in the learning sciences, taking an ecological approach offers a more complex
Teachers College Record, 115, 060305 (2013)
4
understanding of where learning with technology happens and the role that culture plays in human development (barron, 2006; Lee, spencer, & harpalani, 2003). an ecological approach paired with geographic infor-mation systems (Gis) can yield various types of data visualization about spatial context. We selected the st. Louis metropolitan area as a viable example for several reasons. First, there is a growing body of research that pertains to the st. Louis urban core and region with an emphasis on science and biotechnology (Tate, 2008; Tate & hogrebe, 2011). This research has provided a foundational geospatial framing to inform our examination of LREs. baseline trends in education and patterns of dis-parity among historically marginalized populations have indicated an uneven geography of opportunity (Gordon, 2009). second, and relatedly, existing studies suggest the value of a visual literacy project to promote civic dialogue as engineered by community-university relationships (Tate & hogrebe, 2011). similar approaches using Gis tools have the potential to produce new insights into literacy and education. The effort would not only expand current research but also encourage further dialogue among local stakeholders. Finally, st. Louis, known as the “Gateway City,” boasts that it is second only to Washington D.C. in its number of free major attractions, including the zoo, museums, and historic sites (Convention and Visitors Commission, 2011). While tourism may promote economic development, it is important to the local population to have open access to several of the city’s educational and cultural institutions. Taking tour-ism into account necessitated asking whether proximity or accessibility to LREs was spatially organized in some fashion. in other words, what would a visual display of LREs illustrate about the distribution of educational and cultural resources? What would it illuminate that would add to the results of existing studies that employ geospatial approaches in educa-tion? We proceeded to answer these questions with the st. Louis metro-politan area serving as a case study. Examining the geospatial relationship between LREs, schools, and neighborhoods offers new ways of thinking about practice, research, and policy in literacy and education. before we turn to our study, we draw on key works in spatial theory and make con-nections to literacy studies.
sPaTiaL ThEoRY anD LiTERaCY sTUDiEs
in The Production of Space, Lefebvre (1974/1991) argues that space is socially produced and embodies social relationships shaped by values and meanings. he proposes a triad of spatial practice (lived), represen-tations of space (conceived), and representational spaces (perceived) to describe space either as a tool for thought and action or as a means of
TCR, 115, 060305 Geospatial Perspectives
5
control and domination. if every society produces its own space, he asks, then how does the production of space operate and give rise to uneven relations of power? in his work on urbanization, he articulates the need for spatial reappropriation in everyday urban life (Lefebvre, 1996; 2003). That is, central to the “right to the city” is an insistence on struggles for equality. in short, space is political and ideological. There are inequita-ble and unjust distributions of resources in the city with consequential geographies, which further reproduce social relations of production that maintain socially and economically advantaged positions.
in Social Justice and the City, harvey (1973) contends that there are social processes and spatial forms that exemplify characteristic problems of urban systems. his focus on labor, housing, and consumer resources reveals hidden mechanisms with distributive and redistributive effects on costs and benefits to different regions and, thus, different populations. in harvey’s view, spatial organization is about the allocation of material, cul-tural, and social goods, which tends toward a redistribution of real income in favor of the rich. Two features are key to any urban system: accessibility and proximity. on the one hand, accessibility to goods, resources, and services tends to come with a price, “and this price is generally equated with the cost of overcoming distance, of using time, and the like”; on the other, proximity to something with material, cultural, or social value (or not) tends to impose actual costs upon individuals and households (p. 57). in subsequent works, harvey (1996, 2000, 2001) expands his analysis of inherently unjust processes in urban development and calls for hopeful possibilities in the struggle for human rights and environmental justice. For him, the geography of the city creates a built environment, or relative fixity, that can stimulate or limit capital accumulation, shaping the very nature of capitalist development itself. harvey’s analysis of socio-spatial tension in the city has been important to understanding urban renewal, geopolitical fragmentation, and increasing poverty, among other urban issues.
in Postmodern Geographies, soja (1989) states the importance of space in contemporary social theory and puts emphasis on the spatial form in social research. his expansive study of Los angeles, for example, builds on the socio-spatial dialectic to suggest that relations of production are simultaneously social and spatial. That is, “there exists a corresponding spatial homology to traditionally defined class relations and hence to the contingencies of class conflict and structural transformation”; the structure of organized space is divided in “socially created and polarized spatial relations of production which are captured with greater precision in the concept of geographically uneven development” (p. 78). Following this conceptualization, soja (1996) moves beyond spatiality as material
Teachers College Record, 115, 060305 (2013)
6
and mental construct; he revisits Lefebvre’s triad and offers a theory of “thirdspace” to account for different modes of spatial thinking, one that is attentive to hybridization, ruptures, and discontinuities within a dynamic space (see also bhabha, 1994). With a multiscalar approach, soja (2010) takes the spatial turn in critical human geography to advance a spatial the-ory of justice on the local and global level. he adopts a view “that spatiality of (in)justice affects society and social life just as much as social processes shape the spatiality on specific geography of (in)justice” (p. 5). his larger scholarly project of “seeking spatial justice” maintains that
the spatiality of human life must be interpreted and understood as fundamentally, from the start, a complex social product, a collectively created and purposeful configuration and socializa-tion of space that defines our contextual habitat, the human and humanized geography in which we all live out our lives. such socialized lived space, constructed out of physical and natural spatial forms, mentally and materially intertwines with our socialized lived space to create our biographies and geo-his-tories. human life is consequently and consequentially spatial, temporal, and social, simultaneously and interactively real and imagined (p. 17-18).
The perspectives of Lefebvre, harvey, and soja on space have been influ-ential to our thinking about literacy. For us, it is important to consider spatial theory and to pay attention to spatial-human relations in under-standing the distribution of cultural resources via educational and cul-tural institutions. This consideration was helpful in refining our research questions to focus on proximity and accessibility. Most relevant in our thinking has been the production of space and how spatial-human rela-tions are infused into the ecology of literacy. structural transformation and human agency in social processes are central to understanding how literacy is embedded in social life and everyday practice. First, it is neces-sary to explain key literacy concepts linked to emerging literacy research.
our interest in mapping LREs builds on an area called new literacy studies. The perspective we offer on LREs demonstrates the geospatial arrangements of educational and cultural institutions that extend the view of literacy in context as also contoured and bounded by space. Certain junctures in theory and practice have posited a broader conceptualization of literacy that goes beyond intellectual development and psychological approaches to reading and writing (Luke & Freebody, 1997). in their groundbreaking work on the Vai of Liberia, scribner and Cole (1981) assert that certain patterns in the use of language as well as reading and
TCR, 115, 060305 Geospatial Perspectives
7
writing systems achieved specific purposes in people’s everyday practices. Literacy is deemed as recurring and goal-oriented with certain functions organized around particular systems of knowledge and applied within context. beginning in the 1980s, new literacy studies offered a view of literacy as situated in social, institutional, cultural, and historical contexts. in her study of language, heath (1982) shows how members of commu-nities have different ways with words. heath coins the concept of literacy events, or “occasions in which written language is integral to the nature of participants’ interactions and their interpretive processes and strategies” (p. 50). in other words, literacy manifests through an event or a particular time and space (occasion) where people (participants) interact with or interpret texts. The emphasis on written language (i.e., print), however, raises questions about what constitutes a literacy event in the digital era.
Within new literacy studies, literacy has been defined as a social prac-tice whereby readers and writers use language and its tools differently. noteworthy in the conceptualization of literacy as a social practice is street’s (1984) ideological model of literacy. it differs from the auton-omous model, which suggests literacy as neutral in any environment. instead, street claims that literacy is embedded in the practices of every-day life. Literacy practices, then, are the cultural behaviors associated with reading and writing upon which people draw in their lives. Further, street (1995) suggests that literacy involves power, authority, and social differentiation within sites of tension and has the potential to reproduce or challenge structures of domination. street’s view of literacy practice is important to our examination of LREs, particularly when spatial-human relations are considered. We will point out how an uneven geography of educational and cultural institutions may influence the literacy practices of particular groups.
subsequent works from new literacy studies to new literacies have advanced the treatment of literacy. Within the area of new literacies, what counts as literacy in the digital era is more broadly defined, with attention to multiliteracies and multimodalities (Cope & Kalantzis, 2000; Kress, 2003). Central to the ideas are designs (complex systems of peo-ple, environments, technologies, values, and texts), as well as modes of representation and communication. Literacy events and literacy practices now encompass the use of digital tools and other media technologies. Examples include navigating the internet, do-it-yourself media produc-tion, video gaming, online fiction writing, and instant messaging, among others (black, 2008; Gee, 2003; Lankshear & Knobel, 2010; Leu et al., 2004; Lewis & Fabos, 2005). along with an expanded definition of liter-acy, spatializing literacy (Leander & Rowe, 2006; Moje, 2004), hybridity (Gutierrez, 2008; Jocson, 2006; Kirkland, 2009), and digital geographies
Teachers College Record, 115, 060305 (2013)
8
(Vasudevan, 2010) are recent developments in research. The focus on space contributes to understanding space-time dimensions of literacy, new types of literacies shaped by digital technologies, and literacy prac-tices that occur within cyberspace. as in new literacy studies, current research in new literacies views digital tools and other media technolo-gies as laden with meanings based on the social, institutional, cultural, and historical contexts of different groups of people. The link between new literacy studies and new literacies indicates the continued interest of interdisciplinary scholars in investigating the changing nature of literacy in real and virtual spaces. This continued interest, along with influence from situated cognition, has given rise to an emerging area called dig-ital media and learning, which includes game designs, modding, and problem solving within participatory cultures (Gee, 2010). it is outside the scope of this article to elaborate on digital media and learning, but it is important to mention given the direction literacy research is taking. at a moment of converged developments in literacy studies, a geospatial approach using Gis tools provides new insights into how literacy as a social practice is situated within socio-spatial relations of production. Visualizing the location of LREs such as libraries, museums, bookstores, and community-based organizations in relation to schools and neighbor-hoods offers a broader understanding of literacy in social, institutional, cultural, and historical context. it is to this line of work that we now turn.
REsEaRCh QUEsTions, METhoDs anD anaLYsis
our research is guided by the following questions:
1. how are literacy-rich environments (libraries, museums, bookstores, and community-based organizations) spatially distributed?
2. What factors influence proximity to or accessibility of literacy-rich environments?
To answer these questions, we employed a mixed methods approach and collected data from several sources, including the U.s. Census, national assessment of Educational Progress (Reading and Writing), Missouri Department of Elementary and secondary Education (Communication arts), and saint Louis Public schools. We began with an interest in schools as centers for our thinking about LREs. With this in mind, we created maps using address geocoding along with relevant school data. however, as our research took shape, we realized that part of our design was a consideration of LREs beyond schools. based on our growing knowledge of the region, we used purposeful sampling to identify educational and cultural insti-
TCR, 115, 060305 Geospatial Perspectives
9
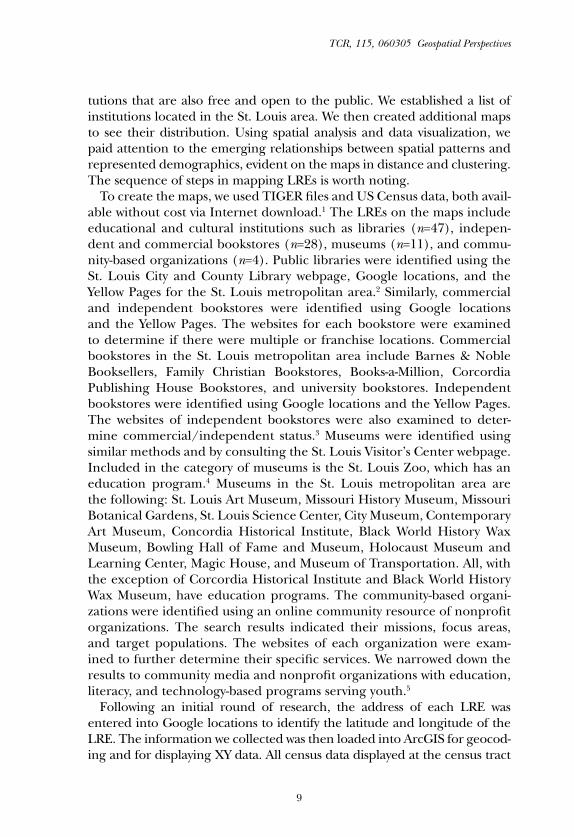
tutions that are also free and open to the public. We established a list of institutions located in the st. Louis area. We then created additional maps to see their distribution. Using spatial analysis and data visualization, we paid attention to the emerging relationships between spatial patterns and represented demographics, evident on the maps in distance and clustering. The sequence of steps in mapping LREs is worth noting.
To create the maps, we used TiGER files and Us Census data, both avail-able without cost via internet download.1 The LREs on the maps include educational and cultural institutions such as libraries (n=47), indepen-dent and commercial bookstores (n=28), museums (n=11), and commu-nity-based organizations (n=4). Public libraries were identified using the st. Louis City and County Library webpage, Google locations, and the Yellow Pages for the st. Louis metropolitan area.2 similarly, commercial and independent bookstores were identified using Google locations and the Yellow Pages. The websites for each bookstore were examined to determine if there were multiple or franchise locations. Commercial bookstores in the st. Louis metropolitan area include barnes & noble booksellers, Family Christian bookstores, books-a-Million, Corcordia Publishing house bookstores, and university bookstores. independent bookstores were identified using Google locations and the Yellow Pages. The websites of independent bookstores were also examined to deter-mine commercial/independent status.3 Museums were identified using similar methods and by consulting the st. Louis Visitor’s Center webpage. included in the category of museums is the st. Louis zoo, which has an education program.4 Museums in the st. Louis metropolitan area are the following: st. Louis art Museum, Missouri history Museum, Missouri botanical Gardens, st. Louis science Center, City Museum, Contemporary art Museum, Concordia historical institute, black World history Wax Museum, bowling hall of Fame and Museum, holocaust Museum and Learning Center, Magic house, and Museum of Transportation. all, with the exception of Corcordia historical institute and black World history Wax Museum, have education programs. The community-based organi-zations were identified using an online community resource of nonprofit organizations. The search results indicated their missions, focus areas, and target populations. The websites of each organization were exam-ined to further determine their specific services. We narrowed down the results to community media and nonprofit organizations with education, literacy, and technology-based programs serving youth.5
Following an initial round of research, the address of each LRE was entered into Google locations to identify the latitude and longitude of the LRE. The information we collected was then loaded into arcGis for geocod-ing and for displaying XY data. all census data displayed at the census tract

Teachers College Record, 115, 060305 (2013)
10
level are from 2010, with the exception of median household income, which is from 1999, the most current year available. additionally, 4th and 8th grade communication arts data from the Missouri Department of Elementary and secondary Education were entered into Excel and then displayed on the maps. The Missouri assessment Program test results for both proficient and advanced were combined for reporting. While the test results include elementary and secondary grade levels, we focused on eighth grade commu-nication arts in 2009 and narrowed the schools that appear on the maps to middle schools and high schools to complement our interest in adolescent literacy. The decision also dissimulated crowding data points on the maps.
To make sense of the census tract data and LREs as data points, we performed density analysis using arcGis software. Density analysis is a method to help determine whether clustering is statistically significant (Mitchell, 2005). We used the nearest neighbor tool to calculate the dis-tance from each LRE to its single nearest neighbor. The nearest neighbor tool computes the average distance and creates a hypothetical set of data with the same number of features (here, the features are LREs). The average distance is calculated for these features and compared to the real data. The calculation yields a nearest neighbor index, that is, the ratio of the observed distance divided by the distance from the hypothetical data (allen, 2009). The nearest neighbor index is standardized to produce a z score (z=-3.48), which indicates statistically significant clustering (p<0.01). Checking z scores provides the basis for determining the probability that clustering is not due to random chance. With the significance level of 0.01, the value indicates that there is less than a 0.01 chance that the clustering of the LREs could occur by random chance. The directional distance tool was then used to demonstrate the direction trend of the LRE cluster; it produced a standard deviational ellipse oriented to the south and west. To be clear, the standard deviational ellipse does not test for statistically significant clustering, but rather shows the directional ori-entation of a group of features, in this case LREs. The nearest neighbor index along with a z score verifies that the LREs are clustered in a partic-ular area. With spatial analysis as an iterative process, it was important to return to our research questions and to make pragmatic decisions along the way about our analytic methods (Mitchell, 2005). sometimes, it meant seesawing to re-evaluate our decisions. our analytical approach pushed us to examine each step, create additional maps, and check for misleading results to arrive at our interpretation.

TCR, 115, 060305 Geospatial Perspectives
11
Figure 1. Population by race at census tract level, including LREs, 2010
(source: 2010 Us Census, http://factfinder2.census.gov)
LREs, sChooLs, anD nEiGhboRhooDs
Findings in our study suggest a geospatial relationship between LREs, schools, and neighborhoods. While disparities in education are not news, the maps produced indicate spatial patterns that forced us to rethink literacy in social, institutional, cultural, and historical context. Difference by race and median household income in the st. Louis metropolitan area is made apparent, and the patterns relating these variables to schools and
Teachers College Record, 115, 060305 (2013)
12
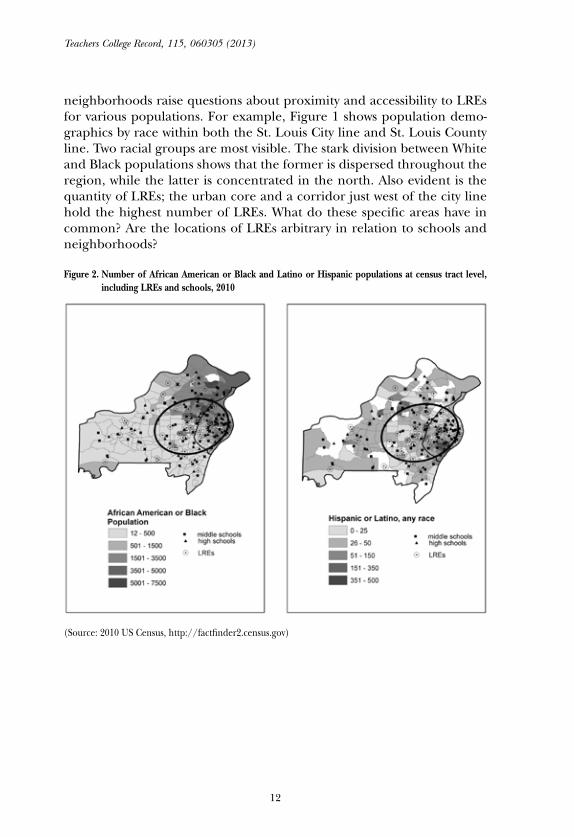
neighborhoods raise questions about proximity and accessibility to LREs for various populations. For example, Figure 1 shows population demo-graphics by race within both the st. Louis City line and st. Louis County line. Two racial groups are most visible. The stark division between White and black populations shows that the former is dispersed throughout the region, while the latter is concentrated in the north. also evident is the quantity of LREs; the urban core and a corridor just west of the city line hold the highest number of LREs. What do these specific areas have in common? are the locations of LREs arbitrary in relation to schools and neighborhoods?
Figure 2. Number of African American or Black and Latino or Hispanic populations at census tract level, including LREs and schools, 2010
(source: 2010 Us Census, http://factfinder2.census.gov)
TCR, 115, 060305 Geospatial Perspectives
13
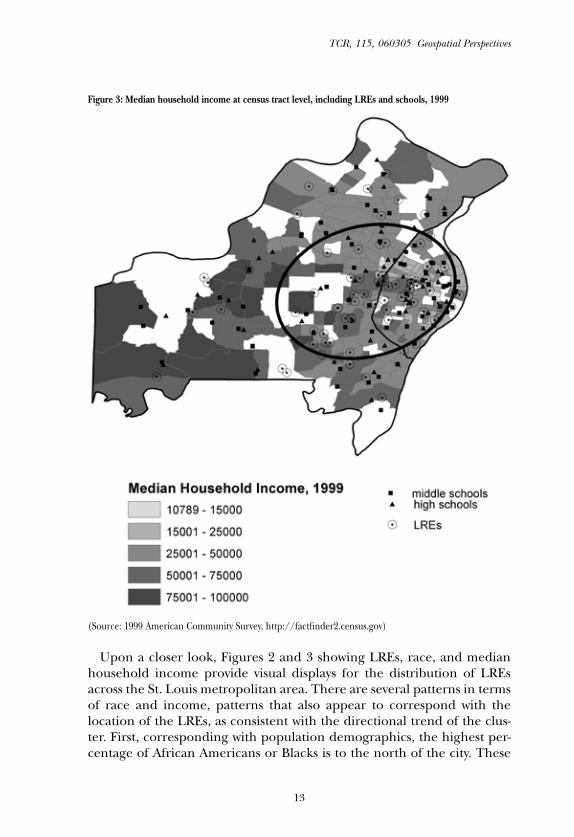
Figure 3: Median household income at census tract level, including LREs and schools, 1999
(source: 1999 american Community survey, http://factfinder2.census.gov)
Upon a closer look, Figures 2 and 3 showing LREs, race, and median household income provide visual displays for the distribution of LREs across the st. Louis metropolitan area. There are several patterns in terms of race and income, patterns that also appear to correspond with the location of the LREs, as consistent with the directional trend of the clus-ter. First, corresponding with population demographics, the highest per-centage of african americans or blacks is to the north of the city. These
Teachers College Record, 115, 060305 (2013)
14
demographic patterns have been true historically in large part because of residential covenants based on race that prevented african americans or blacks from buying or renting properties in other parts of the city (Gordon, 2009). While LREs are centrally located within the city, there appear to be fewer LREs to the north. This pattern also appears to hold for a growing hispanic or Latino population to the south of the city. The organization of space, according to critical human geography, is divided in polarized spatial relations of production (soja, 1989).
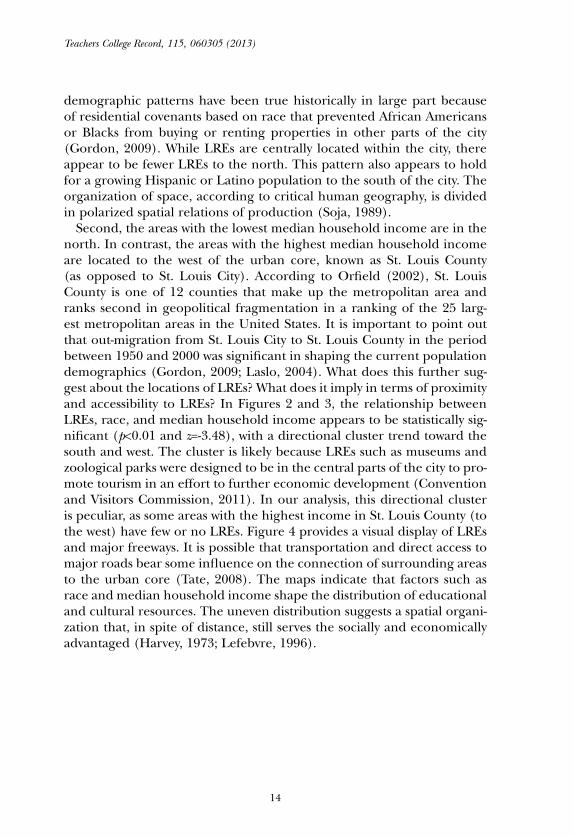
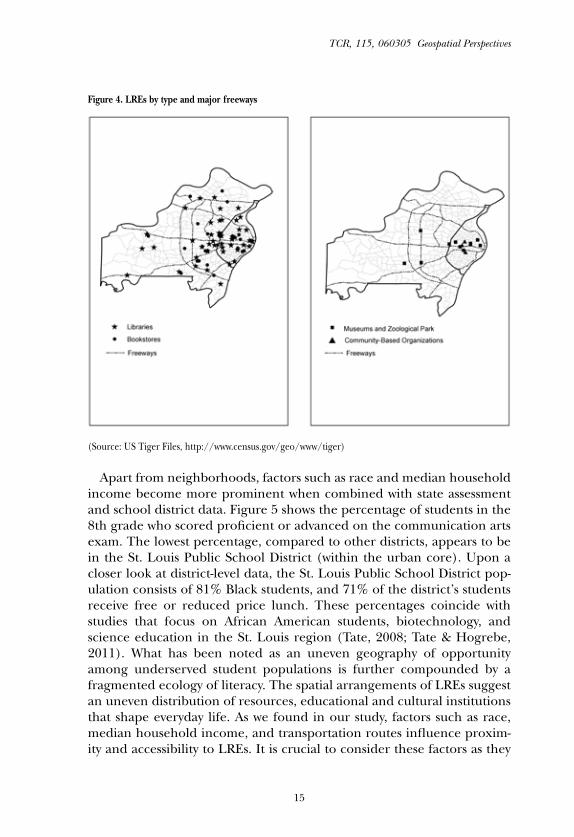
second, the areas with the lowest median household income are in the north. in contrast, the areas with the highest median household income are located to the west of the urban core, known as st. Louis County (as opposed to st. Louis City). according to orfield (2002), st. Louis County is one of 12 counties that make up the metropolitan area and ranks second in geopolitical fragmentation in a ranking of the 25 larg-est metropolitan areas in the United states. it is important to point out that out-migration from st. Louis City to st. Louis County in the period between 1950 and 2000 was significant in shaping the current population demographics (Gordon, 2009; Laslo, 2004). What does this further sug-gest about the locations of LREs? What does it imply in terms of proximity and accessibility to LREs? in Figures 2 and 3, the relationship between LREs, race, and median household income appears to be statistically sig-nificant (p<0.01 and z=-3.48), with a directional cluster trend toward the south and west. The cluster is likely because LREs such as museums and zoological parks were designed to be in the central parts of the city to pro-mote tourism in an effort to further economic development (Convention and Visitors Commission, 2011). in our analysis, this directional cluster is peculiar, as some areas with the highest income in st. Louis County (to the west) have few or no LREs. Figure 4 provides a visual display of LREs and major freeways. it is possible that transportation and direct access to major roads bear some influence on the connection of surrounding areas to the urban core (Tate, 2008). The maps indicate that factors such as race and median household income shape the distribution of educational and cultural resources. The uneven distribution suggests a spatial organi-zation that, in spite of distance, still serves the socially and economically advantaged (harvey, 1973; Lefebvre, 1996).
TCR, 115, 060305 Geospatial Perspectives
15
Figure 4. LREs by type and major freeways
(source: Us Tiger Files, http://www.census.gov/geo/www/tiger)
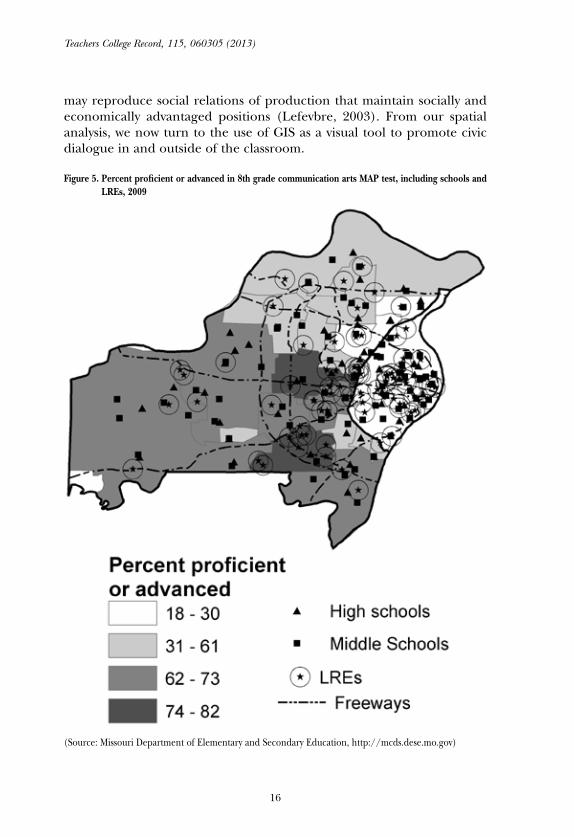
apart from neighborhoods, factors such as race and median household income become more prominent when combined with state assessment and school district data. Figure 5 shows the percentage of students in the 8th grade who scored proficient or advanced on the communication arts exam. The lowest percentage, compared to other districts, appears to be in the st. Louis Public school District (within the urban core). Upon a closer look at district-level data, the st. Louis Public school District pop-ulation consists of 81% black students, and 71% of the district’s students receive free or reduced price lunch. These percentages coincide with studies that focus on african american students, biotechnology, and science education in the st. Louis region (Tate, 2008; Tate & hogrebe, 2011). What has been noted as an uneven geography of opportunity among underserved student populations is further compounded by a fragmented ecology of literacy. The spatial arrangements of LREs suggest an uneven distribution of resources, educational and cultural institutions that shape everyday life. as we found in our study, factors such as race, median household income, and transportation routes influence proxim-ity and accessibility to LREs. it is crucial to consider these factors as they
Teachers College Record, 115, 060305 (2013)
16
may reproduce social relations of production that maintain socially and economically advantaged positions (Lefevbre, 2003). From our spatial analysis, we now turn to the use of Gis as a visual tool to promote civic dialogue in and outside of the classroom.
Figure 5. Percent proficient or advanced in 8th grade communication arts MAP test, including schools and LREs, 2009
(source: Missouri Department of Elementary and secondary Education, http://mcds.dese.mo.gov)
TCR, 115, 060305 Geospatial Perspectives
17
Gis as a VisUaL TooL FoR TEaChinG anD LEaRninG
scholarship on literacy studies maintains the importance of the envi-ronment in examining literacy as situated in context. Using Gis offers multilayered visuals and macro-level data on the environment to extend perspectives on literacy and education. Given the potential of Gis as a visual tool, we proceeded to combine our geospatial approach with qualitative methods in a collaborative effort to study literacy in context. The latter builds on our initial examination of LREs described above. a classroom-based example is illustrative here.
at Washington University in st. Louis, the Center for inquiry in science Teaching and Learning (CisTL) has created a regional database con-taining information from 57 school districts representing the states of Missouri and illinois.6 CisTL not only has comparable data but also hosts a public website equipped with Gis to render the data into interactive maps. as literacy researchers and educators, we realized that an opportu-nity presented itself to study the relationship between LREs, schools, and neighborhoods.7 in a literacy-focused education course, we employed an ecological approach and asked undergraduate students to conduct a four-week-long case study of a specific LRE, to situate its location within the st. Louis metropolitan area, and to investigate its literacy or technol-ogy-based programs serving youth. students were also asked to examine two nearby schools, using CisTL data. Many of these undergraduate stu-dents were interested in teaching as a profession or working with youth in the nonprofit sector.
in what we called a “mapping literacies” project, students produced an analytic paper as well as poster maps to present their findings. all eight of the group projects in the fall of 2010 also identified the significance of race, median household income, and state assessment test results, along with teacher salary and suspension rate—separately or in combination with each other. The discussions of these social factors in their analyses often led to more questions than answers regarding proximity, accessi-bility, and function of the LREs. The following excerpts from two group projects using participant observation, mapping, and data analysis offer a closer look at two LREs. The descriptions provide a window into literacy events and literacy practices that involve youth in respective LREs that had been previously identified in our examination. it is important to note that the interpretations in the group projects suggest simple dichot-omies between racial groups and informal and formal learning settings that were further interrogated in class. Key in the interpretations is the socio-spatial tension in relations of production.
Teachers College Record, 115, 060305 (2013)
18
Project 1:
“our first visit to the [st. Louis art] museum gave us some sur-prising, albeit compelling, insight. The majority of the museum’s patrons on a saturday morning in late september was predom-inantly white. Whether it was the father introducing his toddler to thousand-year-old Ming Dynasty figurines or the senior citizens following a guided tour through the post-modernism exhibit, most—if not all—of the white patrons, regardless of age, seemed to be strolling through the museum. in contrast, the few black patrons we encountered [seemed to have] the only literacy arti-facts we saw produced by patrons. With notebook and pencil in hand, one middle-school-aged boy took notes on the displayed mummies in the Egyptian art exhibit while his mother patiently observed nearby hieroglyphic scrolls. We also saw a troop of Girl scouts, whose members were all black, on the steps of the museum preparing to enter the building and fill out the blank worksheets they held in their hands . . . it is still unclear whether enthusiasm or appreciation for the artwork (or perhaps both) motivated their visits in the same way as the middle-aged white patrons we encoun-tered. our visit [implies] the museum can successfully attract all racial demographics [with] varying incentives.”
Project 2:
“Race was a key factor in our analysis of two schools and the lit-eracy-rich environment . . . The data we collected from our visit to the st. Louis science Center varied drastically from the data collected from our mapping of the area. according to the map analysis, the science Center is located in an area of the city where the nearest public schools (a middle and a high school) have approximately 70% black student enrollment . . . [during our visit to the science Center] the patrons on a Monday morning were mostly white parents or grandparents with small children younger than school age. all of the patrons who were there [seemingly] to observe the exhibits were white male and female adults accompanying children. on the contrary, a group of ele-mentary school children came to the science Center for a field trip and all of the students and teachers were black except for one. in short, the only black students who visited the museum [appeared] not [to be] there by choice . . . but rather for an organized event as a field trip.”
TCR, 115, 060305 Geospatial Perspectives
19
The possibilities for social, cultural, and educative connections are present in the LREs. however, it is difficult to assess the consequence of proximity and use of these LREs without more in-depth observation and interviews of participants. To us, what the group projects reveal is the importance of Gis as a visual tool to be blended with qualitative meth-ods in literacy research. They also impress upon us that in the process of engaging students in a case study of LREs, we were also extending teaching and learning opportunities in the classroom. We were taking part in a larger conversation and shaping a visual literacy project to pro-mote civic dialogue (Tate & hogrebe, 2011). at a minimum, “mapping literacies” offered a lens for understanding literacy in new ways. Upon completion of the group projects, a public exhibit of student-produced poster maps was held at a local community center (a learning resource for one of the LREs shown in Figure 4). There, university and community members, including high school students, teachers, and administrators, continued the discussion about each of the represented LREs. a number of those in attendance noted the various possibilities of Gis tools for classroom learning. others posed provocative questions about the nature of public education and how educational and cultural institutions could work collaboratively to better increase access and learning opportunities for underserved student populations. There are certainly many places where learning through informal or comprehensive education happens (bekerman, burbules, & silberman-Keller, 2006; Varenne, Gordon, & Lin, 2009). in addition to existing partnerships and outreach programs, as some of us there at the event recognized, what else could be done to promote literacy learning and development in libraries, bookstores, museums, and community-based organizations? What would literacy events integrating youth literacy practices look like there? What learning opportunities would be generated with or without digital technology? The potential for answers seemed to have been unfolding before us.
iMPLiCaTions FoR REsEaRCh anD PoLiCY
Mapping LREs takes a fresh approach to understanding ecologies of lit-eracy. The use of Gis tools provides unique geospatial perspectives on lit-eracy and education that not only have implications for research but also bring to light critical questions about human geography and spatial justice in the lives of historically marginalized populations (harvey, 1973; soja, 2010). a multifaceted lens that takes into account the structural organi-zation of space and the allocation of material, cultural, and social goods in the digital era remains key. how might researchers, practitioners, and local stakeholders work together to improve accessibility to educational
Teachers College Record, 115, 060305 (2013)
20
and cultural institutions? in what ways might geospatial perspectives on literacy and education promote civic dialogue and inform policy at the local, regional, and national level? The creation of learning labs in libraries and museums across the Us, in support of President obama’s “innovate to Educate” campaign, is underway. building the capacity of new and existing literacy or technology programs has the potential to increase learning opportunities for underserved student populations in and outside of school.
our findings affirm the need for more research in the area of literacy and human geography. For the purposes of this article, we limited LREs to physical environments such as libraries, bookstores, museums, and community-based organizations with education, literacy, and technolo-gy-based programs. While we consider LREs to be vital across the lifespan, we focused on those that target youth in order to illustrate more fully the complex ecology of literacy as shaped by socio-spatial organization. We also examined communication arts test results at the district level, which we interpret as the subject area with the best indication for reading and writing proficiency. There are other possibilities for expanding this work. Future studies may elect to focus on virtual environments, particularly with today’s rise in the use of and preference for mobile technology over computers. based on our research, new sets of questions have surfaced. For example, what are the physical environments that extend access to and participation in virtual LREs? Where are they located? how does human geography further our understanding of access to virtual LREs? What other physical environments aside from the educational and cul-tural institutions mentioned here should be considered? how might mapping public transit, such as bus or subway routes, further situate LREs in relation to schools and neighborhoods? how do youth actually arrive at the LREs? in what ways do they participate in select LREs? Depending on the program, how is their participation sustained over time? What is the academic or social impact of their actual participation in the LREs? These and other questions continue to challenge us as literacy research-ers to seek sophisticated tools and methods to provide some answers. as we have found in our work with undergraduate students, a participatory mixed method approach that combines quantitative and qualitative data lends itself to new directions in literacy studies. To do so requires collab-orative engagement (Campbell & Lassiter, 2010) with a mode of inquiry that involves multiple researchers and research sites.
We hope that our investigation of LREs extends current conversations about literacy and various ecologies of literacy. Gis tools provided a means to examine the relationship between LREs, schools, and neighbor-hoods in a particular metropolitan area. Focusing on st. Louis was key
TCR, 115, 060305 Geospatial Perspectives
21
not only because of our growing knowledge of the place and immediate access to CisTL but also because there are good reasons to believe that st. Louis, with its uneven and fragmented geography, may exemplify similar phenomena taking place in other metropolitan areas.
Acknowledgments
The authors would like to thank William F. Tate iV and Mark hogrebe for supporting this work at different stages. special thanks to participating community members, local organizations, and students at Washington University in st. Louis for their collective effort in exploring literacy across settings. any errors are ours alone.
Notes
1. TiGER stands for Topographically integrated Geographic Encoding and Referencing.
2. at the writing of this article, two st. Louis City public libraries were temporarily closed down for renewal and restoration. Relatedly, borders bookstores permanently closed down three locations in early 2011, followed by six more in the st. Louis area, reflecting closures nationwide due to bankruptcy.
3. The independent bookstores are: Left bank books-Downtown, Left bank books-Central West End, big sleep books, Transformation Christian bookstore, Dunaway books, book house, inc., hammonds books & antiques, Pudd’n head books, Webster Groves book shop, Pauline books & Media, subterranean books, star Clipper, a-1 book Exchange, Fantasy shop, and Legacy books and Cafe.
4. The Metropolitan zoological Park and Museum District, established in 1972, is a tax-supported cultural district made up of the st. Louis zoo, st. Louis art Museum, st. Louis science Center, Missouri botanical Garden, and Missouri history Museum. it is reported that approximately 85% of the tax revenues come from the st. Louis County taxpayers, while City residents provide 15% of the District’s tax revenues, an estimated total of $72 million in 2009 (www.mzdstl.org).
5. The community-based organizations are: st. Louis beacon, KDhX, Youth Learning Center, and bWorks. There are many other nonprofit organizations relevant to youth and education with focus areas inclusive of arts and culture, health and medicine, crisis support, homeless and housing, and sports and recreation. however, we found that the number of organizations with computer and technology as a focus area was limited in comparison.
6. at the time of the study, CisTL was phasing out the Center for the study of Regional Competitiveness in science and Technology (CsRCisT) was being established. We refer to CisTL here but also acknowledge CsRCisT.
7. Previously, in another education course, the use of Gis tools was part of a pedagog-ical design that positioned undergraduate students to draw on CisTL data in their study of social contexts of education and urban schools.
Teachers College Record, 115, 060305 (2013)
22
References
allen, D. (2009). GIS Tutorial II: Spatial Analysis Workbook. Redlands, Ca: EsRi Press.alvermann, D. (Ed.). (2010). Adolescents’ online literacies: Connecting classrooms, digital media,
and popular culture. new York: Peter Lang.barron, b. (2006). Learning ecologies for technological fluency: Gender and experience
differences. Journal of Educational Computing Research, 31(1), 1-36.barton, D. (2007). Literacy: An introduction to ecology of written language. Malden, Ma:
blackwell.bekerman, z., burbules, n, & silberman-Keller, D. (Eds.). (2006). Learning in places: The
informal education reader. new York: Peter Lang.bhabha, h. (1994). The location of culture. London and new York: Routledge.black, R. (2008). Adolescents and online fiction. new York: Peter Lang.Campbell, E., & Lassiter, L.E. (2010). From collaborative ethnography to collaborative
pedagogy: Reflections on the other side of Middleton project and community-university research. Anthropology & Education Quarterly, 41(4), 370-385.
Convention and Visitors Commission. (2011). Explore st. Louis. Retrieved July 25, 2011, from http://explorestlouis.com
Cope, b., & Kalantzis, M. (Eds.). (2000). Multiliteracies: Literacy learning and the design of social futures. new York, nY: Routledge.
Gee, J. (2003). What video games have to teach us about learning and literacy. new York, nY: Palgrave Macmillan.
Gee, J. (2010). New digital media and learning as an emerging area and “worked examples” as one way forward. Cambridge, Ma: The MiT Press.
Gordon, C. (2009). Mapping decline: St. Louis and the fate of the American city. Philadelphia, Pa: University of Pennsylvania Press.
Gutierrez, K. (2008). Developing a sociocritical literacy in the third space. Reading Research Quarterly, 43(2), 148-164.
harvey, D. (1973). Social justice and the city. London: Edward arnold.harvey, D. (1996). Justice, nature, and the geography of difference. oxford, UK: blackwell.harvey, D. (2000). Spaces of hope. berkeley, Ca: University of California Press.harvey, D. (2001). Spaces of capital: Towards a critical geography. new York, nY: Routledge.heath, s.b. (1982). What no bedtime story means: narrative skills at home and at school.
Language in Society, 11(2), 49-76.hull, G., & schultz, K. (Eds.). (2002). School’s out: Bridging out-of-school literacies with classroom
practice. new York, nY: Teachers College Press.ito, M. (2010). Hanging out, messing around, and geeking out: Kids living and learning with new
media. Cambridge, Ma: MiT Press/Macarthur Foundation.Jenkins, h. (2006). Confronting the challenges of participatory culture: Media education for the 21st
century. Chicago, iL: Macarthur Foundation, Digital Media and Learning.Jocson, K.M. (2006). “bob Dylan and hip hop”: intersecting literacy practices in youth
poetry communities. Written Communication, 23(3), 231-259.Kirkland, D. (2009). Researching and teaching English in the digital dimension. Research in
the Teaching of English, 44(1), 8-22.Kress, G. (2003). Literacy in the new media age. London and new York, nY: Routledge.Lankshear, C., & Knobel, M. (Eds.). (2010). DIY media: Creating, sharing, and learning with new
technologies. new York: Peter Lang.Laslo, D. (2004). The st. Louis region, 1950–2000: how we have changed. in b. baybeck &
E. T. Jones (Eds.), St. Louis metromorphosis: Past trends and future directions (pp. 1–23). st. Louis, Mi: Missouri historical society Press.
TCR, 115, 060305 Geospatial Perspectives
23
Leander, K., & Rowe, D. (2006). Mapping literacy spaces in motion: a rhizomatic analysis of a classroom literacy performance. Reading Research Quarterly, 41(4), 428–460.
Lee, C.D., spencer, M.b., & harpalani, V. (2003). “Every shut eye ain’t sleep”: studying how people live culturally. Educational Researcher, (32)5, 6–13.
Lefebvre, h. (1974/1991). The production of space (D. nicholson-smith, Trans.). oxford, UK and Cambridge, Ma: blackwell.
Lefebvre, h. (1996). Writings on cities/Henri Lefebvre (E. Kaufman & E. Lebas, Trans.). oxford, UK: blackwell.
Lefebvre, h. (2003). The urban revolution (R. bononno, Trans.). Minneapolis, Mn: University of Minnesota Press.
Leu, D., Kinzer, C., Coiro, J., & Cammack, D. (2004). Toward a theory of new literacies emerging from the internet and other information and communication technologies. in n. Unrau & R. Ruddell (Eds.), Theoretical models and processes of reading (pp. 1570-1613). international Reading association.
Lewis, C., & babos, b. (2005). instant messaging, literacies, and social identities. Reading Research Quarterly, 40(4), 470-501.
Luke, a., & Freebody, P. (1997). shaping the social construction of reading. in in s. Muspratt, a. Luke, and P. Freebody (Eds.), Constructing critical literacies: Teaching and learn-ing textual practice (pp. 185-225). st Leonards, new south Wales: allen & Unwin.
Macarthur Foundation. (2010). Macarthur & iMLs announce plans to create 30 new learn-ing labs at libraries and museums across the country (press release). Retrieved on July 24, 2011, from http://www.macfound.org
McGee, L., & Richgels, D. (1996). Literacy’s beginnings: Supporting young readers and writers (2nd Ed.). boston: allyn & bacon.
Mitchell, a. (2005). The ESRI guide to GIS analysis: Vol. 2. Spatial measurement and statistics. Redlands, Ca: EsRi Press.
Moje, E. (2004). Powerful spaces: Tracing the out-of-school literacy spaces of Latino/a youth. in K. Leander & M. sheehy (Eds.), Spatializing literacy research and practice (pp. 15-38). new York, nY: Peter Lang.
orfield, M. (2002). American metropolitics: The new suburban reality. Washington, DC: brookings institution Press.
Pahl, K. (2008). The ecology of literacy and language: Discourses, identities and practices in homes, schools and communities. in a. Creese, P. Martin, & n. hornberger (Eds.), Ecology of language, Encyclopedia of language and education (pp. 305-315). new York, nY: springer.
Roskos, K., & neuman, s. (2002). Environment and its influences for early literacy teaching and learning. in s. neuman & D. Dickinson (Eds.), Handbook of early literacy research (pp. 281-292). new York, nY: Guilford.
soja, E. (1989). Postmodern geographies: The reassertion of space in critical social theory. London, UK: Verso.
soja, E. (1996). Thirdspace: Journeys to Los Angeles and other real-and-imagined places. Malden, Ma: blackwell.
soja, E. (2010). Seeking spatial justice. Minneapolis, Mn: University of Minnesota Press.street, b. (1984). Literacy in theory and practice. Cambridge, UK: Cambridge University Press.Tate. W.F. (2008). “Geography of opportunity”: Poverty, place, and educational outcomes.
Educational Researcher, 37(7), 397–411.Tate, W.F., & hogrebe, M. (2011). From visuals to vision: Using Gis to inform civic dialogue
about african american studies. Race Ethnicity and Education, 14(1), 51-71.Varenne, h., Gordon, E., & Lin, L. (Eds.). (2009). Theoretical perspectives on comprehensive
education: The way forward. Lewiston, nY: Edwin Mellen Press.
Teachers College Record, 115, 060305 (2013)
24
Vasudevan, L. (2010). Education remix: new media, literacies, and the emerging digital geographies. Digital Culture & Education, 2(1), 62-82.
Watkins, C. (2009). The Young and the digital: What the migration to social network sites, games, and anytime, anywhere media means for our future. boston, Ma: beacon.
KoRina M. JoCson is assistant Professor of education at Washington University in st. Louis. her research interests focus on youth and literacy development across educational settings. she is the author of Youth Poets: Empowering Literacies In and Out of Schools (Peter Lang, 2008) and editor of Cultural Transformations: Youth and Pedagogies of Possibility (harvard Education Press, forthcoming).
ELizabETh ThoRnE-WaLLinGTon is a doctoral student in the Department of Education at Washington University in st. Louis. her research interests include literacy and education policy.