
Non-commercial use only - Geospatial Health
11
Abstract Tick-borne diseases and especially those caused by protozoa of the genus Babesia, are gaining increasing attention as emerging zoonotic pathogens. Zoonotic species like B. venatorum and B. microti have wild animals as main reservoir hosts. We propose a habitat suitability model for Babesia spp. to better understand the entity of Babesia presence, to improve diagnostic awareness and to optimize screening and preventive actions. The probability of Babesia spp. presence was estimated by investigation of potential correlation between this protozoa in wild ruminants and the envi- ronmental factors that can favour or limit vector and host avail- ability. We developed two separate models to evaluate the separate roles of cervids and alpine chamois for Babesia spp. epidemiolo- gy. A comprehensive model using all presence data from all ungu- lates species was also developed. The overall area suitable for Babesia spp. in this simulation was found to be 3,723 km 2 , which corresponds to 15.51% of the background regional territory. The model developed was empirically validated assessing tick abun- dance in randomly chosen areas classified by the model as moder- ately or highly suitable for Babesia spp. Collected Ixodidae ticks analysed for Babesia infection by molecular analysis, to confirm the model predictions, indicated a significantly higher prevalence of this infection in areas identified by the model as highly suitable compared to areas classified as only moderately so (X 2 = 5.05, p<0.05, Odds Ratio= 2.12, Confidence Interval 95%= 1.1-4.1). Introduction Piroplasmosis, caused by protozoa of the genus Babesia, is gaining increasing attention globally as an emerging zoonosis (Hong et al., 2019; Svensson et al., 2019). Babesia is the most fre- quent parasite transmitted by blood transfusion in North America (Vannier and Krause, 2012; Ryan et al., 2020) and it causes high morbidity and mortality in livestock in endemic tropical and sub- tropical areas (Kivaria et al., 2007; Pfeffer et al., 2018). Despite the economic and public health importance, little information is available regarding the parasite-host-vector-environment interface (Pérez De León et al., 2010). The epidemiology of a disease may be complex, especially if a vector is required (e.g., Ixodidae ticks for Babesia spp.) and if many species can be reservoirs or dead- end hosts. To better understand the epidemiology of circulating tick-borne piroplasms, we modelled Babesia spp. occurrence in wild ruminants that are among the main hosts of Ixodes ricinus and also play the role of a viable platform for systemic and non- systemic pathogens transmission among co-feeding ticks (Kiffner et al., 2010). We targeted three host species: roe deer (Capreolus capreolus), red deer (Cervus elaphus) and alpine chamois (Rupicapra rupicapra) for which prevalence data of Babesia spp. infection, within the study area, were available (Zanet et al., 2014). C. capreolus is the host species with the highest rates of infection, ranging from 12.6% to 83.6% (Bonnet et al., 2007; Tampieri et al., 2008; Malandrin et al., 2010; Zanet et al., 2014; Razanske et al., 2019). It is the reservoir host of B. capreoli (Yabsley and Shock, 2013) and of the zoonotic B. venatoroum (Malandrin et al., 2010). Red deer and chamois are highly suscep- tible to Babesia infection (Yabsley and Shock, 2013). In alpine chamois frequent fatal cases have been reported (Hoby et al., 2007, 2009) as consequences of spillover from sympatric roe deer (Hoby et al., 2007, 2009; Tampieri et al., 2008). In north-western Italy (the Piedmont region) the roe deer population is experiencing a steady increase and territorial expansion (Carnevali et al., 2009) that have driven a concomitant increase of ticks, especially I. rici- nus which is the most common tick of temperate regions (Vor et al., 2010; Rizzoli et al., 2014). Correspondence: Stefania Zanet, Department of Veterinary Sciences, Università degli Studi di Torino, Largo Braccini 2, 10095 Grugliasco (TO), Italy Tel.: +39 0116708442 E-mail: [email protected] Key words: Habitat suitability models; Piroplasms; Babesia spp.; wild ungulates; MaxEnt. Conflict of Interest: The authors declare no potential conflicts of interest. Acknowledgments: The authors would like to acknowledge the Piedmont Regional Office that provided hunting-bag data, ALT and LandCover raster maps used during this work. The study was partially founded by Regione Piemonte – Convenzione smaltimento animali vaganti. Contributions: SZ: methodology, formal analysis, writing; EF: Conceptualization, Supervision, Funding Acquisition; EB: investiga- tion, writing, review, editing; PT: methodology, formal analysis, soft- ware, writing, review, editing. Received for publication: 12 February 2019. Accepted for publication: 4 February 2020. ©Copyright: the Author(s), 2020 Licensee PAGEPress, Italy Geospatial Health 2020; 15:843 doi:10.4081/gh.2020.843 This article is distributed under the terms of the Creative Commons Attribution Noncommercial License (CC BY-NC 4.0) which permits any noncommercial use, distribution, and reproduction in any medium, pro- vided the original author(s) and source are credited. Ecological niche modelling of Babesia spp. infection in wildlife experimentally evaluated in northern Italy with reference to questing Ixodes ricinus ticks Stefania Zanet, Ezio Ferroglio, Elena Battisti, Paolo Tizzani Department of Veterinary Sciences, Università degli Studi di Torino, Grugliasco (TO), Italy [page 60] [Geospatial Health 2020; 15:843] Geospatial Health 2020; volume 15:843 Non-commercial use only
-
Upload
khangminh22 -
Category
Documents
-
view
5 -
download
0
Transcript of Non-commercial use only - Geospatial Health
AbstractTick-borne diseases and especially those caused by protozoa
of the genus Babesia, are gaining increasing attention as emergingzoonotic pathogens. Zoonotic species like B. venatorum and B.microti have wild animals as main reservoir hosts. We propose ahabitat suitability model for Babesia spp. to better understand theentity of Babesia presence, to improve diagnostic awareness andto optimize screening and preventive actions. The probability ofBabesia spp. presence was estimated by investigation of potentialcorrelation between this protozoa in wild ruminants and the envi-ronmental factors that can favour or limit vector and host avail-ability. We developed two separate models to evaluate the separateroles of cervids and alpine chamois for Babesia spp. epidemiolo-gy. A comprehensive model using all presence data from all ungu-
lates species was also developed. The overall area suitable forBabesia spp. in this simulation was found to be 3,723 km2, whichcorresponds to 15.51% of the background regional territory. Themodel developed was empirically validated assessing tick abun-dance in randomly chosen areas classified by the model as moder-ately or highly suitable for Babesia spp. Collected Ixodidae ticksanalysed for Babesia infection by molecular analysis, to confirmthe model predictions, indicated a significantly higher prevalenceof this infection in areas identified by the model as highly suitablecompared to areas classified as only moderately so (X2= 5.05,p<0.05, Odds Ratio= 2.12, Confidence Interval 95%= 1.1-4.1).
IntroductionPiroplasmosis, caused by protozoa of the genus Babesia, is
gaining increasing attention globally as an emerging zoonosis(Hong et al., 2019; Svensson et al., 2019). Babesia is the most fre-quent parasite transmitted by blood transfusion in North America(Vannier and Krause, 2012; Ryan et al., 2020) and it causes highmorbidity and mortality in livestock in endemic tropical and sub-tropical areas (Kivaria et al., 2007; Pfeffer et al., 2018). Despitethe economic and public health importance, little information isavailable regarding the parasite-host-vector-environment interface(Pérez De León et al., 2010). The epidemiology of a disease maybe complex, especially if a vector is required (e.g., Ixodidae ticksfor Babesia spp.) and if many species can be reservoirs or dead-end hosts. To better understand the epidemiology of circulatingtick-borne piroplasms, we modelled Babesia spp. occurrence inwild ruminants that are among the main hosts of Ixodes ricinusand also play the role of a viable platform for systemic and non-systemic pathogens transmission among co-feeding ticks (Kiffneret al., 2010). We targeted three host species: roe deer (Capreoluscapreolus), red deer (Cervus elaphus) and alpine chamois(Rupicapra rupicapra) for which prevalence data of Babesia spp.infection, within the study area, were available (Zanet et al.,2014). C. capreolus is the host species with the highest rates ofinfection, ranging from 12.6% to 83.6% (Bonnet et al., 2007;Tampieri et al., 2008; Malandrin et al., 2010; Zanet et al., 2014;Razanske et al., 2019). It is the reservoir host of B. capreoli(Yabsley and Shock, 2013) and of the zoonotic B. venatoroum(Malandrin et al., 2010). Red deer and chamois are highly suscep-tible to Babesia infection (Yabsley and Shock, 2013). In alpinechamois frequent fatal cases have been reported (Hoby et al.,2007, 2009) as consequences of spillover from sympatric roe deer(Hoby et al., 2007, 2009; Tampieri et al., 2008). In north-westernItaly (the Piedmont region) the roe deer population is experiencinga steady increase and territorial expansion (Carnevali et al., 2009)that have driven a concomitant increase of ticks, especially I. rici-nus which is the most common tick of temperate regions (Vor etal., 2010; Rizzoli et al., 2014).
Correspondence: Stefania Zanet, Department of Veterinary Sciences,Università degli Studi di Torino, Largo Braccini 2, 10095 Grugliasco(TO), Italy Tel.: +39 0116708442E-mail: [email protected]
Key words: Habitat suitability models; Piroplasms; Babesia spp.; wildungulates; MaxEnt.
Conflict of Interest: The authors declare no potential conflicts of interest.
Acknowledgments: The authors would like to acknowledge thePiedmont Regional Office that provided hunting-bag data, ALT andLandCover raster maps used during this work. The study was partiallyfounded by Regione Piemonte – Convenzione smaltimento animalivaganti.
Contributions: SZ: methodology, formal analysis, writing; EF:Conceptualization, Supervision, Funding Acquisition; EB: investiga-tion, writing, review, editing; PT: methodology, formal analysis, soft-ware, writing, review, editing.
Received for publication: 12 February 2019.Accepted for publication: 4 February 2020.
©Copyright: the Author(s), 2020Licensee PAGEPress, ItalyGeospatial Health 2020; 15:843doi:10.4081/gh.2020.843
This article is distributed under the terms of the Creative CommonsAttribution Noncommercial License (CC BY-NC 4.0) which permits anynoncommercial use, distribution, and reproduction in any medium, pro-vided the original author(s) and source are credited.
Ecological niche modelling of Babesia spp. infection in wildlife experimentallyevaluated in northern Italy with reference to questing Ixodes ricinus ticksStefania Zanet, Ezio Ferroglio, Elena Battisti, Paolo TizzaniDepartment of Veterinary Sciences, Università degli Studi di Torino, Grugliasco (TO), Italy
[page 60] [Geospatial Health 2020; 15:843]
Geospatial Health 2020; volume 15:843
gh-2020_1 .qxp_Hrev_master 05/06/20 19:14 Pagina 60
Non-co
mmercial
use o
nly
The modelling effort of the present study was focused on theenvironmental requirements of this tick species (Estrada-Peña,2001a). Species Distribution Models (SDM) are produced by relat-ing species occurrence data (i.e. Babesia infection) to a set of envi-ronmental variables reflecting key factors for species occurrence,such as climate, topography, geology or land-cover. EcologicalNiche Models (ENMs) describe the niche of a species by describ-ing its most suitable habitat (Pulliam, 2000; Sillero, 2011). Wedeveloped separate models for cervids (roe deer and red deer) andchamois to account for the different roles of reservoir and spilloverhosts, respectively. The proposed ENM for Babesia spp. can serveas tool in human and veterinary health to understand the distribu-tion of Babesia spp. presence, to improve diagnosis of cryptic clin-ical cases in humans and to facilitate the efficacy of monitoring,control and preventive efforts. The developed ENM was experi-mentally evaluated by assessing tick abundance in the environmentand by analysing ticks collected in areas identified by the model asmoderately or highly suitable for Babesia spp.
Materials and Methods
Study site
Species distribution modelling Factors affecting the distribution of Babesia spp. were estimat-
ed using MaxEnt 3.3.3 (Phillips et al., 2006). The algorithm imple-mented in MaxEnt estimates a target probability distribution (i.e.Babesia spp.) by finding the probability distribution of maximumentropy (i.e. most spread out or closest to uniform) within a set ofconstraints that represent the available information about the envi-ronmental requirements of our target distribution (Phillips et al.,2006). We adhered to the default settings for the regularizationmultiplier, maximum number of iterations, convergence thresholdand maximum number of background points that were limited tothe Piedmont administrative division with exclusion of all urbanareas as unsuitable for piroplasms hosts and vectors (Hirzel et al.,2006; Elith et al., 2011). We generated models randomly assigning75% of occurrences as training data with the remaining 25% usedas test data. We ran five cross-validate replicates for each model.Selection of ‘features’ (predictors) was carried out automaticallyfollowing the default rules dependent on the number of presencerecords (Phillips et al., 2006; Elith et al., 2011). We used the logis-tic output format conditioned on the environmental variables ineach grid cell with suitability values ranging from 0 (unsuitable
environmental condition) to 1 (optimal environmental condition)(Hu and Jiang, 2011). The threshold value above which there is asubstantial probability of presence of Babesia spp. was set for eachmodel to the value that maximizes training sensitivity and speci-ficity (Phillips et al., 2006; Elith et al., 2011). Values of habitatsuitability above the threshold were divided in four quartiles forgraphical visualization and further on-field validation. Model eval-uation and best-model selection were carried out using the AreaUnder the receiver-operator Curve (AUC) (Merow et al., 2013)and lower model complexity (Elith and Leathwick, 2009). The bestperforming model (ΔAUC≤2) and lower number of covariates waschosen. Covariates to be retained were selected by backward step-wise model selection excluding the feature with the lowest permu-tation importance at each step (Merow et al., 2013).
Infection: presence only dataA total of 61 animals, positive by the polymerase chain reac-
tion (PCR) for Babesia spp., were used as Presence Points (PP) totrain the MaxEnt model. Specifically, roe deer (n=30), red deer(n=23) and alpine chamois (n=8) are the three ungulate speciesincluded in the model. Positivity to Babesia spp. in these animalshas been assessed previously (Zanet et al., 2014). The PP weregeoreferenced by Global Positioning System (GPS) coordinates(UTM, datum ED50, Fuse 32N) which refer to the location wherethe animals were killed by hunting or found dead. We developedthree models to estimate the probability of presence of Babesiaspp. in Piedmont. The first one considered only cervids (Model 1)as target hosts, and we used PP data of Babesia spp. isolated fromeither red deer or roe deer. Presence of red deer and roe deer habitatcan overlap, whereby tick-borne diseases are shared among bothspecies (Duh et al., 2005; Tampieri et al., 2008; Bastian et al.,2012). Cervids are the primary source of blood meals for nymphsand adult I. ricinus (Cadenas et al., 2007; Humair et al., 2007) andtheir abundance is directly related to deer presence and abundancein the area (Wilson et al., 1990). The second model was trainedwith alpine chamois PP data only, as this species is usually foundat higher elevations and in an environment different from wherecervids are typically found, even if a partial overlap between thetwo species can occur (Model 2). For Babesia spp, chamois is pri-marily a dead-end, spillover host. (Hoby et al., 2009). The thirdmodel used all PP records from cervids and chamois together tosummarize Babesia spp. circulation in the three most frequentlyinfected wild ungulate species in Piedmont (Model 3).
Candidate predictorsA total of 21 predictors were selected based on the ecological
requirements of Babesia definitive hosts and vectors (Table 1).
Article
[Geospatial Health 2020; 15:843] [page 61]
Table 1. Candidate modelling predictors.
Host species predictor Tick vector predictor
Roe deer hunting bag consistency AltitudeRed deer hunting bag consistency Land coverChamois hunting bag consistency Annual solar exposureUngulate hunting bag consistency Summer/winter brightness temperature (min, max, mean) Summer/winter NDVI (min, max, mean) Surface aspect Surface slopeA total of 21 host (n=4) and environmental (n=17) factors were evaluated as potential predictors for MaxEnt models.
gh-2020_1 .qxp_Hrev_master 05/06/20 19:14 Pagina 61
Non-co
mmercial
use o
nly
Biotic and abiotic factors influencing the presence of I. ricinuswere chosen considering the available information on piroplasmidinfections in wild ungulates in Europe (Duh et al., 2005; Hoby etal., 2007, 2009; Tampieri et al., 2008; Malandrin et al., 2010; Zintlet al., 2011; Bastian et al., 2012; Overzier et al., 2013; Rizzoli etal., 2014; Ebani et al., 2016; Cézanne et al., 2017; Kauffmann etal., 2017; Remesar et al., 2019). The spatial resolution of all pre-dictors as well as of that of the final model was 1000 m.
Host species predictors Presence and hunting bag numerical consistency (roe deer, red
deer and chamois) were inferred from the Official Hunting dataset(Osservatorio Faunistico Regione Piemonte).
Tick vector predictorsFive abiotic candidate priors were included in the model: i)
altitude (ALT); ii) annual solar exposure (total KWatthour/m2
received during a year period (SOLAR); iii) surface aspect (slopedirection of the maximum rate of change in value from each cell toits neighbours (ASPECT); iv) slope (steepness of land surfacemeasured in degrees from the horizontal (SLOPE) - original reso-lution 250 m (http://webgis.arpa.piemonte.it); and v) BrightnessTemperature (BT) - resolution 1000 m (http://glovis.usgs.gov).Among the biotic priors, the performance of the NormalizedDifference Vegetation Index (NDVI) and land cover were tested.NDVI was considered separately for two periods: i) from May toSeptember (vegetation peak season, n=34 Landsat images) and ii)from November to March (minimum vegetation presence, n=29Landsat images) - resolution 1000 m (http://glovis.usgs.gov). Foreach season, we evaluated the fit of PP data on the minimum, max-imum and mean NDVI that was used as indicator of vegetationcoverage and soil relative humidity (Estrada-Peña, 2001a). Thesame Landsat image collection was used for calculating summerand winter BT (minimum, maximum and mean BT) as indicator ofthe relative ground temperature (Eisen et al., 2010; Hönig et al.,2011). The land cover raster map (http://www.ruparpiemonte.it/geocatalogorp/main/?sezione=catalogo) was also evaluated as amodel covariate (LAND COVER). To exclude autocorrelationamong covariates (cor), independence was assessed using a corre-lation matrix.
Output analysis and visualizationMaxEnt graphical outputs were analyzed and visualized using
QuantumGIS 3.4 (QGIS Developmental Team, 2018). The statisti-cal analysis was performed using R 3.4.4 (R Development CoreTeam, 2018).
Experimental model evaluation of questing ticks
Tick collection and biomolecular analysisTo experimentally confirm the validity of the model, we ran-
domly selected 8 locations uniformly distributed across the studyarea which were classified by Model 3 as moderately suitable(locations Q2 - 4) and highly so (locations Q4 - 4) for Babesia spp.Model 3 was used as reference for empirical validation to includethe broadest possible range for Babesia spp. circulation within thestudy area. In each of these areas, we sampled monthly for quest-ing Ixodidae ticks by dragging. Forty transects (5 transects for eachlocation, each transect covering an area of 100 m2) were sampledeach month from May to October. Before each sampling sessionthe exact coordinates of the sampled transect, temperature and
humidity were recorded. Collected ticks were preserved in 70%ethanol and identified with reference to species, life-stage and gen-der under a stereomicroscope using appropriate morphologicalkeys (Walker, 2003; Estrada-Peña et al., 2017). Identified tickswere divided into pools comprising specimens collected from thesame transect and homogeneous for species, developmental stageand sex. The tick pools were mechanically homogenized usingQiagen TissueLyser LT (Qiagen, Milan, Italy). Total genomicDNA was extracted according to Maurelli et al. (2018) and the V4hypervariable region of the 18S rDNA amplified by a semi-nestedPCR methodology (Zanet et al., 2017). All PCR-positive ampli-cons were purified using a commercial kit (Nucleospin Extract IIKit, Macherey-Nagel, Düren, Germany) and both strandssequenced (Macrogen Europe, Spain) for species identification.The resulting nucleotide sequences were analyzed using MEGA Xsoftware (Kumar et al., 2018) and compared to those available inGenBank (http://www.ncbi.nlm.nih.gov/genbank). The PCRresults were expressed as a minimum infection rate (MIR) or theminimum percentage of ticks in a pool with detectable DNA ofBabesia spp. (Kramer et al., 1999).
Statistical analysisMean tick abundance in the Q2 and Q4 locations was com-
pared using Student’s T test for paired data. To identify variablesassociated with Babesia spp. infection in ticks collected in theenvironment we calculated using Chi Square test (X2) and OddRatio (OR). Differences were considered significant at p<0.05. Allanalysis was performed using R 3.5.3 (R Development Core Team,2018).
Results
Assessment of covariate independence The correlation matrix of covariates dependence allowed us to
exclude from contemporary use in MaxEnt analysis SLOPE andALT (cor=0.71), maximum summer BT and ALT (cor=0.70).
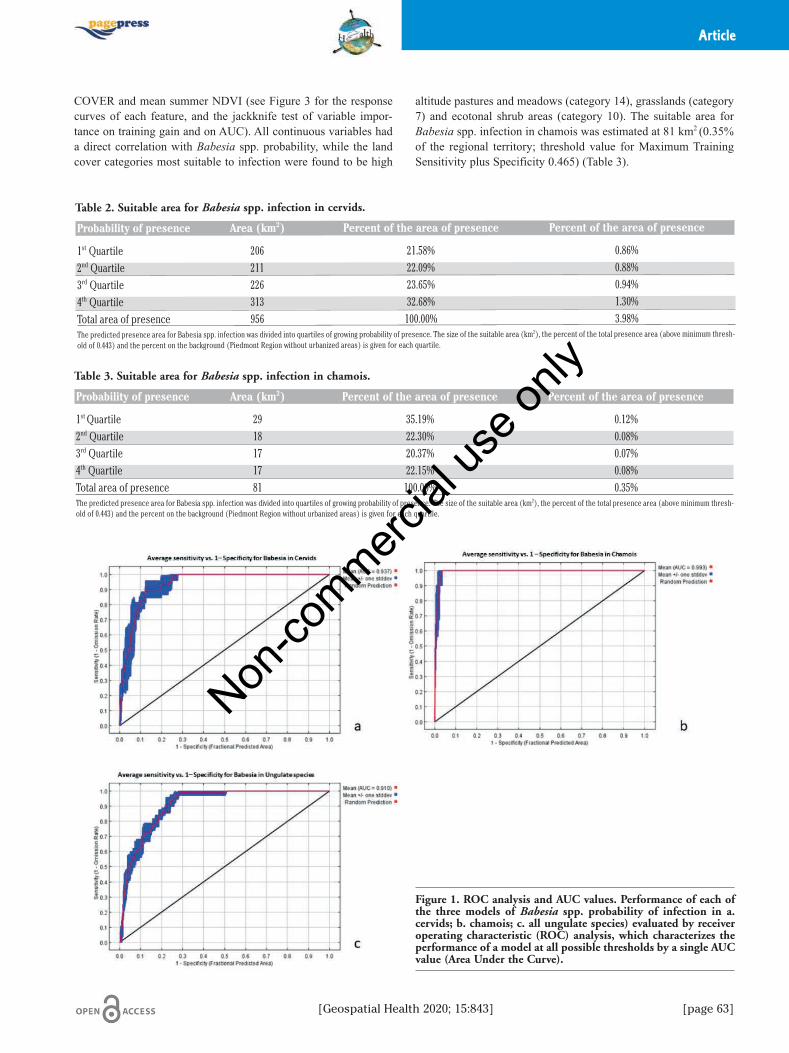
Model 1 - Babesia spp. distribution in cervidsThe best performing model (AUC= 0.937, Figure 1) for
Babesia spp. occurrence in cervids was generated using the follow-ing parameters as covariates: roe deer and red deer abundance,mean summer NDVI, SLOPE, SOLAR and LAND COVER (seeFigure 2 for the response curves of each feature and for the jack-knife test of variable importance on training gain and on AUC).Red deer abundance, together with mean summer NDVI, SLOPEand SOLAR had a direct correlation with Babesia spp. occurrenceprobability. Babesia spp. suitability peaked with roe deer abun-dance of 4 individuals/km2 and the most suitable land use cate-gories were found to be broad-leaved forest (category 9), ecotonalshrub areas (category 10), high altitude pastures and meadows(category 14) and grasslands (category 7). The suitable area forBabesia spp. infection in wild cervids was estimated at 956 km2
(about 4% of the regional territory; threshold value for MaximumTraining Sensitivity plus Specificity 0.443) (Table 2, Figure 3).
Model 2- Babesia spp. distribution in alpine chamoisThe best performing model (AUC= 0.993, Figure 1) for
Babesia spp. in Alpine chamois was generated using the followingparameters as covariates: chamois density, ALT, SOLAR LAND
Article
[page 62] [Geospatial Health 2020; 15:843]
gh-2020_1 .qxp_Hrev_master 05/06/20 19:14 Pagina 62
Non-co
mmercial
use o
nly
COVER and mean summer NDVI (see Figure 3 for the responsecurves of each feature, and the jackknife test of variable impor-tance on training gain and on AUC). All continuous variables hada direct correlation with Babesia spp. probability, while the landcover categories most suitable to infection were found to be high
altitude pastures and meadows (category 14), grasslands (category7) and ecotonal shrub areas (category 10). The suitable area forBabesia spp. infection in chamois was estimated at 81 km2 (0.35%of the regional territory; threshold value for Maximum TrainingSensitivity plus Specificity 0.465) (Table 3).
Article
[Geospatial Health 2020; 15:843] [page 63]
Figure 1. ROC analysis and AUC values. Performance of each ofthe three models of Babesia spp. probability of infection in a.cervids; b. chamois; c. all ungulate species) evaluated by receiveroperating characteristic (ROC) analysis, which characterizes theperformance of a model at all possible thresholds by a single AUCvalue (Area Under the Curve).
Table 2. Suitable area for Babesia spp. infection in cervids.
Probability of presence Area (km2) Percent of the area of presence Percent of the area of presence
1st Quartile 206 21.58% 0.86%
2nd Quartile 211 22.09% 0.88%
3rd Quartile 226 23.65% 0.94%
4th Quartile 313 32.68% 1.30%
Total area of presence 956 100.00% 3.98%The predicted presence area for Babesia spp. infection was divided into quartiles of growing probability of presence. The size of the suitable area (km2), the percent of the total presence area (above minimum thresh-old of 0.443) and the percent on the background (Piedmont Region without urbanized areas) is given for each quartile.
Table 3. Suitable area for Babesia spp. infection in chamois.
Probability of presence Area (km2) Percent of the area of presence Percent of the area of presence
1st Quartile 29 35.19% 0.12%2nd Quartile 18 22.30% 0.08%3rd Quartile 17 20.37% 0.07%4th Quartile 17 22.15% 0.08%Total area of presence 81 100.00% 0.35%The predicted presence area for Babesia spp. infection was divided into quartiles of growing probability of presence. The size of the suitable area (km2), the percent of the total presence area (above minimum thresh-old of 0.443) and the percent on the background (Piedmont Region without urbanized areas) is given for each quartile.
gh-2020_1 .qxp_Hrev_master 05/06/20 19:14 Pagina 63
Non-co
mmercial
use o
nly
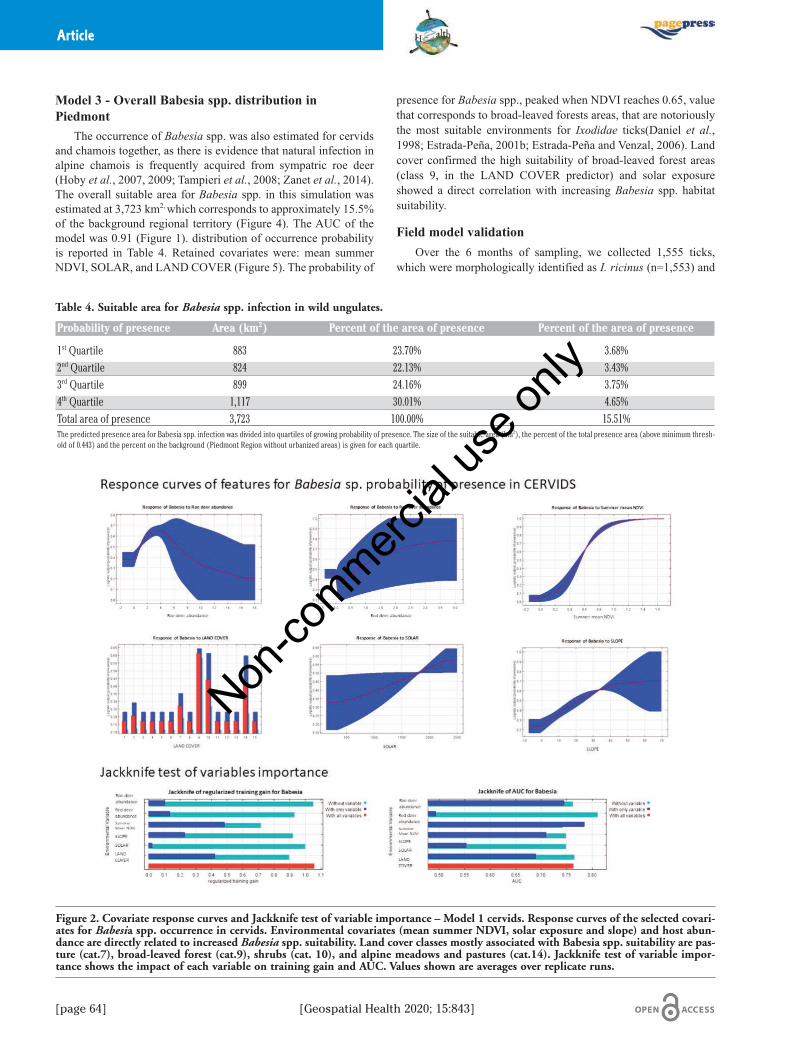
Model 3 - Overall Babesia spp. distribution inPiedmont
The occurrence of Babesia spp. was also estimated for cervidsand chamois together, as there is evidence that natural infection inalpine chamois is frequently acquired from sympatric roe deer(Hoby et al., 2007, 2009; Tampieri et al., 2008; Zanet et al., 2014).The overall suitable area for Babesia spp. in this simulation wasestimated at 3,723 km2, which corresponds to approximately 15.5%of the background regional territory (Figure 4). The AUC of themodel was 0.91 (Figure 1). distribution of occurrence probabilityis reported in Table 4. Retained covariates were: mean summerNDVI, SOLAR, and LAND COVER (Figure 5). The probability of
presence for Babesia spp., peaked when NDVI reaches 0.65, valuethat corresponds to broad-leaved forests areas, that are notoriouslythe most suitable environments for Ixodidae ticks(Daniel et al.,1998; Estrada-Peña, 2001b; Estrada-Peña and Venzal, 2006). Landcover confirmed the high suitability of broad-leaved forest areas(class 9, in the LAND COVER predictor) and solar exposureshowed a direct correlation with increasing Babesia spp. habitatsuitability.
Field model validationOver the 6 months of sampling, we collected 1,555 ticks,
which were morphologically identified as I. ricinus (n=1,553) and
Article
Figure 2. Covariate response curves and Jackknife test of variable importance – Model 1 cervids. Response curves of the selected covari-ates for Babesia spp. occurrence in cervids. Environmental covariates (mean summer NDVI, solar exposure and slope) and host abun-dance are directly related to increased Babesia spp. suitability. Land cover classes mostly associated with Babesia spp. suitability are pas-ture (cat.7), broad-leaved forest (cat.9), shrubs (cat. 10), and alpine meadows and pastures (cat.14). Jackknife test of variable impor-tance shows the impact of each variable on training gain and AUC. Values shown are averages over replicate runs.
[page 64] [Geospatial Health 2020; 15:843]
Table 4. Suitable area for Babesia spp. infection in wild ungulates.
Probability of presence Area (km2) Percent of the area of presence Percent of the area of presence
1st Quartile 883 23.70% 3.68%2nd Quartile 824 22.13% 3.43%3rd Quartile 899 24.16% 3.75%4th Quartile 1,117 30.01% 4.65%Total area of presence 3,723 100.00% 15.51%The predicted presence area for Babesia spp. infection was divided into quartiles of growing probability of presence. The size of the suitable area (km2), the percent of the total presence area (above minimum thresh-old of 0.443) and the percent on the background (Piedmont Region without urbanized areas) is given for each quartile.
gh-2020_1 .qxp_Hrev_master 05/06/20 19:14 Pagina 64
Non-co
mmercial
use o
nly

I. hexagonus (n=2). The number of ticks collected from each loca-tion is reported in Table 5. Larvae were the most abundant life-stage in all sampling locations (n=1302), followed by nymphs(n=250) and adults (n=3). Identified ticks were divided, for molec-ular analysis, in 161 homogeneous pools (pools of adult ticks n=3,nymphs n=74 and larvae n=84). Babesia spp. DNA was detected in59 pools (MIR=36.65%; 95% CI 29.6-44.32). The highest MIR(p<0.05) was recorded in adults (MIR=100.00%; 95% CI 43.85-100) followed by larvae (MIR=36.90%; 95% CI 27.37-47.58) andnymphs (MIR=33.78%; 95% CI 24.05-45.12). From locationsmoderately suitable for Babesia spp. (Q2) we consistently recov-ered a lower number of ticks compared to highly suitable areas(Q4) with exception of one Q4 location (location F, Table 5) whereno ticks were recovered. Results from location F were possiblyimpaired by the use of part of the sampling area as pasture for cat-tle. Babesia spp. MIR was significantly higher in Q4 areas than inQ2 areas (X2=5.05 p<0.05) with OR=2.12 (95% CI 1.10-4.10). The
zoonotic B. venatorum was the most prevalent species with a MIRof 23.60% (95% CI 17.71 – 30.73). B. capreoli was reported withan overall MIR of 3.11% (95% CI 1.33 – 7.06) followed by B.microti and B. vulpes, which were both detected with a MIR of2.48% (95% CI 0.97 – 6.21%). Protozoa of the genus Theileria (T.buffeli group) were detected in 8 pooled samples with a MIR of4.97% (95% CI 2.54 – 9.50%). All species were detected with ahigher prevalence in Q4 areas compared to Q2 (Table 6).
DiscussionThe models presented are intended as a tool to better under-
stand the geographical occurrence and epidemiology of Babesiapiroplasms infecting wild ungulates. Babesiosis plays a keypathogenic role in livestock (Criado-Fornelio et al., 2003;Schnittger et al., 2003; Bock et al., 2008) and as emerging disease
Article
[Geospatial Health 2020; 15:843] [page 65]
Figure 3. Covariate response curves and Jackknife test of variable importance – Model 2 chamois. Response curves of the selected covari-ates for Babesia spp. occurrence in chamois. Environmental covariates (mean summer NDVI, solar exposure and elevation) and hostabundance (chamois) are directly related to higher Babesia spp. suitability. Land Cover classes mostly associated to Babesia spp. suit-ability are pastures and Alpine meadows (cat.7 and 14), and shrubs (cat. 10). Jackknife test of variable importance show the impact ofeach variable on training gain and AUC. Values shown are averages over replicate runs. The environmental variable with highest gainwhen used in isolation is Land Cover, which therefore appears to have the most useful information by itself, and it is the environmentalvariable that decreases the gain the most when omitted. Therefore it has most information that is not present in the other variables.
gh-2020_1 .qxp_Hrev_master 05/06/20 19:14 Pagina 65
Non-co
mmercial
use o
nly

[page 66] [Geospatial Health 2020; 15:843]
in humans (Ryan et al., 2020). Babesia infections are still verymuch unknown, especially with respect to epidemiology inwildlife hosts and wildlife-related ticks and environments (Yabsleyand Shock, 2013). The model covers a variety of different environ-ments: from low-altitude broadleaved forest and agricultural areas,to high-altitude Alpine areas. The resolution of the model was high(1000 m) in order to correctly describe and predict suitable areasfor highly selective tick vectors which can persist only in particularareas where a set of environmental characteristics has to occurtogether with the presence of suitable animal hosts. Biotic and abi-otic priors were selected and modelled with regard to the require-ments of I. ricinus, which is associated with rural environmentsand wild ungulates (Rizzoli et al., 2014). I. ricinus was also thespecies that was most often recovered (P=99.87%, 95% CI 99.53 –99.96) from the study region.
All three models fitted the variance of our data well (AUC val-ues ≥0.91). All the covariates included in the models are biologi-
cally sound and highly responsive in depicting suitable presenceareas. NDVI (with the mean value computed during summermonths), slope, solar exposure, altitude and land cover were themost informative environmental features. Each of the three modelswas best described by different priors, although the response of allvariables in each model indicates how areas more exposed to sunlight, with a rich vegetation coverage (shrub and broad-leaf forestareas), are the most suitable areas for Babesia infections to occur.Pastures and alpine meadows were also found to be suitable forBabesia spp., but this is due to the presence in the model of alpinechamois, whose typical home range includes high-altitude openareas. The suitable area for Babesia to occur is overall extensiveand corresponds to 15% of the territory considered in model devel-opment. Human infection occurs mostly in rural or natural envi-ronments due to the changes in social and economic behaviours(increase of outdoor activities and re-naturalization of rural areasand territorial expansion of wildlife) (Randolph, 2010; Semenza et
Article
Figure 4. Babesia spp. Habitat Suitability Model and empiric validation sampling points. Predicted geographical distribution of thesuitable areas for Babesia spp. in the three ungulate species. The unsuitable area (below the threshold value of minimum probabilityof presence) in white, while the suitable area (above the threshold) is divided into quartiles of growing suitability from 1st Q- minimum(light green) to 4th Q- maximum suitability (blue). Tick sampling areas shown in insert (Q2 - from A to D and Q4 - from E to F).
gh-2020_1 .qxp_Hrev_master 05/06/20 19:14 Pagina 66
Non-co
mmercial
use o
nly

Article
[Geospatial Health 2020; 15:843] [page 67]
Figure 5. Covariate response curves and Jackknife test of variable importance – Model 3 ungulates. Response curves of the selectedcovariates for overall Babesia spp. occurrence in the three studies species of ungulates. Environmental covariates (mean summer NDVIand solar exposure) are directly related to increased Babesia spp. suitability, while Land Cover classes mostly associated with Babesiaspp. suitability are pasture (cat.7), broad-leaved forest (cat.9), shrubs (cat. 10), and alpine meadows and pastures (cat.14). Jackknifetest of variable importance show the impact of each variable on training gain and AUC. Values shown are averages over replicate runs.
Table 5. Ticks and Babesia spp. infection of field model validation.
Site Gepgraphic Number MIR Babesia Number MIR Babesia Number of MIR Babesia Total MIR identification of larvae (95% CI) of nymphs (95% CI) adults (95% CI) (95% CI) (coordinates) [no. of pools] [no. of positive [no. of positive [no. of positive [no. of [no. of [total no. of pools] pools] pools] positive pools] positive pools] positive pools]
Q2 224 [38] 26.32% (14.97-42.01) [10] 8 [37] 27.03% (15.4-42.98) [10] 1 [1] 100%(20.65-100) [1] 27.63% (18.84-38.58)[21/76]A 45°01'03.9"N 6°48'44.8"E 0 [0] - 2 [2] 0.00% (0.00-65.76) [0] 0 [0] - B 44°28'50.0"N 7°20'47.5"E 22 [8] 0.00% (0.00-32.44) [0] 27 [11] 18.18% (0.51-47.7) [2] 0 [0] - C 45°04'56.2"N 7°20'35.0"E 34 [9] 44.44% (18.87-73.33) [4] 43 [13] 46.15% (23.21-70.86) [6] 1 [1] 100% (20.65-100) [1] D 44°31'45.0"N 8°25'26.7"E 168 [21] 28.57% (13.81-49.96) [6] 15 [11] 18.18% (5.14-47.7) [2] 0 [0] - Q4 1,078 [46] 45.65% (32.15-59.82) [21] 163 [37] 40.54% (26.35-56.51) 15] 2 [2] 100% (34.24-100) [2] 44.71% (34.59-55.28) [38/85]E 45°06'13.3"N 6°55'04.3"E 284 [19] 31.58% (15.36-53.99) [6] 54 [13] 15.38% (4.33-42.23) [2] 1 [1] 100% (20.65-100) [1] F 44°29'17.8"N 7°02'22.4"E 0 [0] - 0 [0] - 0 [0] - G 45°01'46.7"N 7°17'12.7"E 238 [15] 73.33% (40.05-89.10) [11] 70 [16] 68.75% (44.4-85.84) [11] 1 [1] 100% (20.65-100) [1] H 44°31'02.4"N 8°26'53.3"E 556 [12] 33.33% (13.81-60.94) [4] 39 [8] 25% (7.15-59.07) [2] 0 [0] - Total 1,302 [84] 36.90% (27.37-47.58) [31] 250 [74] 33.78% (24.05-45.12) [25] 3 [3] 100% (43.85-100) [3] 36.65% (29.6-44.32) [59/161]For each geographically marked location (A to H) identified by Model 1 as moderately suitable (Q2) or highly suitable (Q4), the number of larvae, nymphs and adults of Ixodidae ticks collected and the number of homo-geneous pools are reported. MIR = minimum infection rate (%); CI = confidence intervals.
Table 6. Babesia species identification.
Species Total no. of positive Number of positive pools Number of positive pools Query Percent GenBank pools (MIR) [95% CI] at Q2 (MIR) [95% CI] at Q4 (MIR) [95% CI] coverage identity accession number
Babesia venatorum 38 (23.60%) [17.71-30.73] 14 (18.42%) [11.30-28.58] 24 (28.24%) [19.77-38.58] 100% 99.5 % KX857480Babesia microti 4 (2.48%) [0.97-6.21] 1 (1.32%) [0.23-7.08] 3 (3.53%) [1.21-9.87] 100% 100% FJ608739Babesia vulpes 4 (2.48%) [0.97-6.21] 1 (1.32%) [0.23-7.08] 3 (3.53%) [1.21-9.87] 100% 100% KI175166Babesia capreoli 5 (3.11%) [1.33-7.06] 2 (2.63%) [0.72-9.10] 3 (3.53%) [1.21-9.87] 100% 100% KU145465Theileria spp. 8 (4.97%) [2.54-9.50] 3 (3.95%) [1.35-10.97] 5 (5.88%) [2.54-13.04] 100% 100% MH327771, AJ616717, KX965721Number of homogeneous tick pools positive for each species. MIR = minimum infection rate (%); CI = confidence intervals.
gh-2020_1 .qxp_Hrev_master 05/06/20 19:14 Pagina 67
Non-co
mmercial
use o
nly
[page 68] [Geospatial Health 2020; 15:843]
al., 2016). In the last decades, the population of wild ungulates,especially that of roe deer in Italy, has been growing at increasingrates (26% between the years 2000 and 2005; Carnevali et al.,2009). Together with ungulates, the number of ticks has alsoincreased and their geographical range has expanded to includeareas at higher latitude and/or altitudes, possibly due to the influ-ence of climate changes on tick habitats (Tälleklint and Jaenson,1998; Lindgren et al., 2000; Daniel et al., 2003; Estrada-Peña andVenzal, 2006; Materna et al., 2008; Jore et al., 2014). A study byStainforth et al. (2013) documents a decrease between 5% and10% of the number of winter nights below zero in the study area.Higher winter temperatures favour overwintering and extend theactivity season of the vector ticks (Materna et al., 2008) thusincreasing the risk of tick-borne diseases.
Field sampling of Ixodidae ticks in the study area was used tovalidate the Babesia spp. occurrence model with empirical data.Results highlighted a significant positive association (p<0.05)between Babesia spp. MIR in collected ticks and highly suitableareas for parasite occurrence (Q4 areas), thus confirming the abil-ity of the model to correctly predict habitat-suitability for Babesiaspp. The higher prevalence of infection in the Q4 area than the Q2areas was confirmed for each of the piroplasmid species identifiedby sequencing. Most of the species of Babesia identified in sam-pled ticks had been previously reported for the study area. The roedeer used as PP, were infected with B. venatorum, B. capreoli andB. bigemina (Zanet et al., 2014). Roe deer is the main reservoirhost for both B. venatorum and B. capreoli (Malandrin et al., 2010;Michel et al., 2014), while B. bigemina, together with B. divergens,is mainly associated with bovine babesiosis (Zintl et al., 2003;Hilpertshauser et al., 2007). B. capreoli was the most prevalentspecies found in red deer used as PP followed by Theileria spp., ashas been shown previously (Zanet et al., 2014); this species wasalso detected in the ticks used for empirical validation. All chamoisused as PP were infected with B. capreoli, as has also been shownpreviously (Zanet et al., 2014). B. vulpes has been reported toinfect Red foxes and horses in the same study area (Zanet et al.,2014, 2017). This species is also recognized as a pathogenic indogs resulting in symptoms of clinical infection ranging from palemucous membranes, anorexia, apathy to fever with severe macro-cytic/hypochromic regenerative anaemia and thrombocytopenia(Guitián et al., 2003; Baneth et al., 2019). Two zoonotic piroplasmspecies were detected in ticks, namely B. venatorum and B.microti. I. ricinus is the main vector for both these species (Gray etal., 2002; Bonnet et al., 2007). B. venatorum was detected in 6 outof the 8 sampling locations, both in Q2 and Q4 areas. It was notdetected only at sites B (Q2) and F (Q4) where Babesia spp. weregenerally detected with lower MIR values or no ticks collected atall. B. microti was instead reported only at locations C (Q2) and G(Q4) where Babesia spp. with the highest MIR in larvae andnymphs pools were also found.
Conclusions The use of ecological niche modelling for infectious diseases
is a useful tool that allows identifying and prioritizing interven-tions for disease surveillance, prevention and control. This kind ofmodelling is highly recommendable for decision makers, man-agers and politician as it contributes to better use of limitedresources.
ReferencesBaneth G, Cardoso L, Brilhante-Simões P, Schnittger L, 2019.
Establishment of Babesia vulpes n. sp. (Apicomplexa:Babesiidae), a piroplasmid species pathogenic for domesticdogs. Parasite Vector 12:1–8. doi.org/10.1186/s13071-019-3385-z
Bastian S, Jouglin M, Brisseau N, Malandrin L, Klegou G,L’Hostis M, Chauvin A, 2012. Antibody prevalence andmolecular identification of Babesia spp. in roe deer in France.J Wildl Dis 48:416–24. doi.org/10.7589/0090-3558-48.2.416
Bock RE, Jackson LA, de Vos AJ, Jorgensen WK, 2008.Babesiosis of cattle, in: Ticks: Biology, Disease and Control.doi.org/10.1017/CBO9780511551802.014
Bonnet S, Jouglin M, L’Hostis M, Chauvin A, 2007. Babesia sp.EU1 from roe deer and transmission within Ixodes ricinus.Emerg Infect Dis 13(8):1208. doi.org/10.3201/eid1308.061560
Cadenas FM, Rais O, Humair PF, Douet V, Moret J, Gern L, 2007.Identification of host bloodmeal source and Borrelia burgdor-feri sensu lato in field-collected Ixodes ricinus ticks inChaumont (Switzerland). J Med Entomol 44, 1109–1117.doi.org/10.1093/jmedent/44.6.1109
Carnevali L, Pedrotti L, Riga F, Toso S, 2009. Banca DatiUngulati. Status, distribuzione, consistenza, gestione e prelie-vo venatorio delle popolazioni di ungulati in Italia. Rapporto2001-2005 [Ungulates in Italy. Status, distribution, abundance,management and hunting of ungulate populations in Italy].Biol Cons Fauna 117, 1-168.
Cézanne R, Mrowietz N, Eigner B, Duscher GG, Glawischnig W,Fuehrer HP, 2017. Molecular analysis of Anaplasma phagocy-tophilum and Babesia divergens in red deer (Cervus elaphus)in Western Austria. Mol Cell Probes 31, 55–58. doi.org/10.1016/j.mcp.2016.07.003
Criado-Fornelio A, Martinez-Marcos A, Buling-Saraña A, Barba-Carretero JC, 2003. Molecular studies on Babesia, Theileriaand Hepatozoon in southern Europe: Part I. Epizootiologicalaspects. Vet Parasitol 113, 189–201. doi.org/10.1016/S0304-4017(03)00078-5
Daniel M, Danielová V, Kříž B, Jirsa A, Nožička J, 2003. Shift ofthe tick Ixodes ricinus and tick-borne encephalitis to higheraltitudes in Central Europe. Eur J Clin Microbiol Infect Dis 22,327–328. doi.org/10.1007/s10096-003-0918-2
Daniel M, Kol J, Zeman P, Pavelka K, Sadlo J, 1998. Predictivemap of Ixodes ricinus high-incidence habitats and a tick-borneencephalitis risk assessment using satellite data. Exp ApplAcarol 22, 417–433. doi.org/10.1023/a:1006030827216
Duh D, Petrovec M, Bidovec A, Avsic-Zupanc T, 2005. Cervids asBabesiae hosts, Slovenia. Emerg Infect Dis 11, 1121–1123.doi.org/10.3201/eid1107.040724
Ebani VV, Rocchigiani G, Bertelloni F, Nardoni S, Leoni A,Nicoloso S, Mancianti F, 2016. Molecular survey on the pres-ence of zoonotic arthropod-borne pathogens in wild red deer(Cervus elaphus). Comp Immunol Microbiol Infect Dis 47,77–80. doi.org/10.1016/j.cimid.2016.06.003
Eisen RJ, Eisen L, Girard YA, Fedorova N, Mun J, Slikas B,Leonhard S, Kitron U, Lane RS, 2010. A spatially-explicitmodel of acarological risk of exposure to Borrelia burgdorferi-infected Ixodes pacificus nymphs in northwestern Californiabased on woodland type, temperature, and water vapor. TicksTick-borne Dis 1, 35–43. doi.org/10.1016/j.ttbdis.2009.12.002
Elith J, Leathwick JR, 2009. Species Distribution Models: ecolog-
Article
gh-2020_1 .qxp_Hrev_master 05/06/20 19:14 Pagina 68
Non-co
mmercial
use o
nly

ical explanation and prediction across space and time. AnnuRev Ecol Evol Syst 40, 677–697. doi.org/10.1146/annurev.ecolsys.110308.120159
Elith J, Phillips SJ, Hastie T, Dudík M, Chee YE, Yates CJ, 2011.A statistical explanation of MaxEnt for ecologists. DiversDistrib 17, 43–57. doi.org/10.1111/j.1472-4642.2010.00725.x
Estrada-Peña A, 2001a. Forecasting habitat suitability for ticks andprevention of tick-borne diseases. Vet Parasitol 98, 111–132.doi.org/10.1016/S0304-4017(01)00426-5
Estrada-Peña A, 2001b. Distribution, abundance and habitat pref-erences of Ixodes ricinus (Acari: Ixodidae) in Northern Spain.J Med Entomol 38, 361–370. doi.org/10.1603/0022-2585-38.3.361
Estrada-Peña A, Venzal JM, 2006. Changes in habitat suitabilityfor the tick Ixodes ricinus (Acari: Ixodidae) in Europe (1900-1999). Ecohealth 3, 154–162. doi.org/10.1007/s10393-006-0036-6
Estrada-Peña A, Mihalca AD, Petney T, 2017. Ticks of Europe andNorth Africa: A guide to Species Identification.doi.org/10.1007/978-3-319-63760-0
Gray J, Von Stedingk LV, Gürtelschmid M, Granström M, 2002.Transmission studies of Babesia microti in Ixodes ricinus ticksand gerbils. J Clin Microbiol doi.org/10.1128/JCM.40.4.1259-1263.2002
Guitián FJ, Camacho AT, Telford SR, 2003. Case-control study ofcanine infection by a newly recognised Babesia microti-likepiroplasm. Prev Vet Med 61, 137–145. doi.org/10.1016/S0167-5877(03)00164-8
Hilpertshauser H, Deplazes P, Meli ML, Hofmann-Lehmann R,Lutz H, Mathis A, 2007. Genotyping of Babesia bigeminafrom cattle from a non-endemic area (Switzerland). VetParasitol 145, 59–64. doi.org/10.1016/j.vetpar.2006.12.006
Hirzel AH, Le Lay G, Helfer V, Randin C, Guisan A, 2006.Evaluating the ability of habitat suitability models to predictspecies presences. Ecol Modell 199, 142–152.doi.org/10.1016/j.ecolmodel.2006.05.017
Hoby S, Mathis A, Doherr MG, Robert N, Ryser-Degiorgis MP,2009. Babesia capreoli infections in alpine chamois (Rupicapra R . Rupicapra ), roe Deer ( Capreolus C . Capreolus)and red Deer (Cervus elaphus) from Switzerland. J Wildl Dis45, 748–753. doi.org/10.7589/0090-3558-45.3.748
Hoby S, Robert N, Mathis A, Schmid N, Meli ML, Hofmann-Lehmann R, Lutz H, Deplazes P, Ryser-Degiorgis MP, 2007.Babesiosis in free-ranging chamois (Rupicapra r. rupicapra)from Switzerland. Vet Parasitol 148, 341–345.doi.org/10.1016/j.vetpar.2007.06.035
Hong SH, Kim SY, Song BG, Rho JY, Cho CR, Kim CN, Um TH,Kwak YG, Cho SH, Lee SE, 2019. Detection and characteriza-tion of an emerging type of Babesia sp. similar to Babesiamotasi for the first case of human babesiosis and ticks inKorea. Emerg Microbes Infect 8, 869–878.doi.org/10.1080/22221751.2019.1622997
Hönig V, Vec PŠ, Masař O, Grubhoffer L, 2011. Tick-borne dis-eases risk model for south Bohemia (Czech Republic ). GISOstrava 2011 1, 23–26. Available at: gis.vsb.cz/gis2011/
Hu J, Jiang Z, 2011. Climate change hastens the conservationurgency of an endangered ungulate. PLoS One 6(8), 322873.doi.org/10.1371/journal.pone.0022873
Humair PF, Douet V, Moran Cadenas F, Schouls LM, Van De PolI, Gern L, 2007. Molecular identification of blood meal sourcein Ixodes ricinus ticks using 12S rDNA as a genetic marker. J
Med Entomol 44, 869–880. Jore S, Vanwambeke SO, Viljugrein H, Isaksen K, Kristoffersen
AB, Woldehiwet Z, Johansen B, Brun E, Brun-Hansen H,Westermann S, Larsen IL, Ytrehus B, Hofshagen M, 2014.Climate and environmental change drives Ixodes ricinus geo-graphical expansion at the northern range margin. ParasitVector 7, 1–14. doi.org/10.1186/1756-3305-7-11
Kauffmann M, Rehbein S, Hamel D, Lutz W, Heddergott M,Pfister K, Silaghi C, 2017. Anaplasma phagocytophilum andBabesia spp. in roe deer (Capreolus capreolus), fallow deer(Dama dama) and mouflon (Ovis musimon) in Germany. MolCell Probes 31, 46–54. doi.org/10.1016/j.mcp.2016.08.008
Kiffner C, Lödige C, Alings M, Vor T, Rühe F, 2010. Abundanceestimation of Ixodes ticks (Acari: Ixodidae) on roe deer(Capreolus capreolus). Exp Appl Acarol 52, 73–84.doi.org/10.1007/s10493-010-9341-4
Kivaria FM, Ruheta MR, Mkonyi PA, Malamsha PC, 2007.Epidemiological aspects and economic impact of bovine thei-leriosis (East Coast fever) and its control: a preliminary assess-ment with special reference to Kibaha district, Tanzania. Vet J173, 384–390. doi.org/10.1016/j.tvjl.2005.08.013
Kramer V, Randolph M, Hui L, Irwin W, Gutierrez A, Duc J, 1999.Detection of the agents of Human Ehrlichioses in Ixodid ticksfrom California. Am J Trop Med Hyg 60, 62–65.doi.org/10.4269/ajtmh.1999.60.62
Kumar S, Stecher G, Li M, Knyaz C, Tamura K, 2018. MEGA X:Molecular Evolutionary Genetics Analysis across computingplatforms. Mol Biol Evol 35, 1547–1549. doi.org/10.1093/molbev/msy096
Lindgren E, Tälleklint L, Polfeldt T, 2000. Impact of climaticchange on the northern latitude limit and population density ofthe disease-transmitting European tick Ixodes ricinus. EnvironHealth Perspect 108, 119–123. doi.org/10.1289/ehp.00108119
Malandrin L, Jouglin M, Sun Y, Brisseau N, Chauvin A, 2010.Redescription of Babesia capreoli (Enigk and Friedhoff, 1962)from roe deer (Capreolus capreolus): isolation, cultivation,host specificity, molecular characterisation and differentiationfrom Babesia divergens. Int J Parasitol 40, 277–284.doi.org/10.1016/j.ijpara.2009.08.008
Materna J, Daniel M, Metelka L, Harcarik J, 2008. The verticaldistribution, density and the development of the tick Ixodesricinus in mountain areas influenced by climate changes. Int JMed Microbiol 298, 25–37. doi.org/10.1016/j.ijmm.2008.05.004
Maurelli MP, Pepe P, Colombo L, Armstrong R, Battisti E,Morgoglione ME, Counturis D, Rinaldi L, Cringoli G,Ferroglio E, Zanet S, 2018. A national survey of Ixodidae tickson privately owned dogs in Italy. Parasite Vector 11, 420.doi.org/10.1186/s13071-018-2994-2
Merow C, Smith MJ, Silander JA, 2013. A practical guide toMaxEnt for modeling species’ distributions: what it does, andwhy inputs and settings matter. Ecography 36, 1058–1069.doi.org/10.1111/j.1600-0587.2013.07872.x
Michel AO, Mathis A, Ryser-Degiorgis MP, 2014. Babesia spp. inEuropean wild ruminant species: parasite diversity and riskfactors for infection. Vet Res 45, 1–11. doi.org/10.1186/1297-9716-45-65
Overzier E, Pfister K, Herb I, Mahling M, Böck G, Silaghi C,2013. Detection of tick-borne pathogens in roe deer (Capreoluscapreolus), in questing ticks (Ixodes ricinus), and in ticksinfesting roe deer in southern Germany. Ticks Tick-Borne Dis
Article
[Geospatial Health 2020; 15:843] [page 69]
gh-2020_1 .qxp_Hrev_master 05/06/20 19:14 Pagina 69
Non-co
mmercial
use o
nly
[page 70] [Geospatial Health 2020; 15:843]
4, 320–328. doi.org/10.1016/j.ttbdis.2013.01.004Pérez De León AA, Strickman DA, Knowles DP, Fish D, Thacker
E, De La Fuente J, Krause PJ, Wikel SK, Miller RS, WagnerGG, Almazn C, Hillman R, Messenger MT, Ugstad PO,Duhaime RA, Teel PD, Ortega-Santos A, Hewitt DG, BowersEJ, Bent SJ, Cochran MH, McElwain TF, Scoles GA, SuarezCE, Davey R, Howell Freeman JM, Lohmeyer K, Li AY,Guerrero FD, Kammlah DM, Phillips P, Pound JM, 2010. Onehealth approach to identify research needs in bovine andhuman babesioses: Workshop report. Parasit Vector 3, 1–12.doi.org/10.1186/1756-3305-3-36
Pfeffer M, Krol N, Obiegala A, 2018. Prevention and control oftick-borne anaplasmosis, cowdriosis and babesiosis in the cat-tle industry, in: Ecology and Control of Vector-Borne Diseases.Wageningen Academic Pub, 175–194.
Phillips SJ, Anderson RP, Schapire RE, 2006. Maximum entropymodeling of species geographic distributions. Ecol Modell190, 231–259. doi.org/10.1016/j.ecolmodel.2005.03.026
Pulliam HR, 2000. On the relationship between niche and distribu-tion. Ecol Lett 3, 349–361. doi.org/10.1046/j.1461-0248.2000.00143.x
Randolph SE, 2010. Human activities predominate in determiningchanging incidence of tick-borne encephalitis in Europe. EuroSurveill 15, 24–31. doi.org/10.2807/ese.15.27.19606-en
Razanske I, Rosef O, Radzijevskaja J, Bratchikov M, GriciuvieneL, Paulauskas A, 2019. Prevalence and co-infection with tick-borne Anaplasma phagocytophilum and Babesia spp. in reddeer (Cervus elaphus) and roe deer (Capreolus capreolus) inSouthern Norway. Int J Parasitol Parasites Wildl.8, 127–134.doi.org/10.1016/j.ijppaw.2019.01.003
Remesar S, Fernández PD, Venzal JM, Pérez-Creo A, Prieto A,Estrada-Peña A, López CM, Panadero R, Fernández G, Díez-Baños P, Morrondo P, 2019. Tick species diversity and popula-tion dynamics of Ixodes ricinus in Galicia (north-westernSpain). Ticks Tick- Borne Dis 10, 132–137.doi.org/10.1016/j.ttbdis.2018.09.006
Rizzoli A, Silaghi C, Obiegala A, Rudolf I, Hubalek Z, Faldvari G,Plantard O, Vayssier-Taussat M, Bonnet S, Åitalska E, Kazim -rova M, 2014. Ixodes ricinus and its transmitted pathogens inurban and peri-urban areas in Europe: new Hhzards and rele-vance for public health. Front Public Health 2, 251.doi.org/10.3389/fpubh.2014.00251
Ryan ET, Hill DR, Solomon T, Aronson NE, Endy TP, 2020.Hunter’s tropical medicine and emerging infectious diseases(10th ed.).
Schnittger L, Yin H, Gubbels MJ, Beyer D, Niemann S, JongejanF, Ahmed JS, 2003. Phylogeny of sheep and goat Theileria andBabesia parasites. Parasitol Res 91, 398–406.doi.org/10.1007/s00436-003-0979-2
Semenza JC, Lindgren E, Balkanyi L, Espinosa L, Almqvist MS,Penttinen P, Rocklöv J, 2016. Determinants and drivers ofinfectious disease threat events in europe. Emerg Infect Dis 22,
581–589. doi.org/10.3201/eid2204.151073Sillero N, 2011. What does ecological modelling model? A pro-
posed classification of ecological niche models based on theirunderlying methods. Ecol Modell 222, 1343–1346. doi.org/10.1016/j.ecolmodel.2011.01.018
Stainforth DA, Chapman SC, Watkins NW, 2013. Mapping climatechange in European temperature distributions. Environ ResLett 8, 034031. doi.org/10.1088/1748-9326/8/3/034031
Svensson J, Hunfeld KP, Persson KEM, 2019. High seropreva-lence of Babesia antibodies among Borrelia burgdorferi-infect-ed humans in Sweden. Ticks Tick-Borne Dis 10, 186–190.doi.org/10.1016/j.ttbdis.2018.10.007
Tälleklint L, Jaenson TGT, 1998. Increasing geographical distribu-tion and density of Ixodes ricinus (Acari: Ixodidae) in Centraland Northern Sweden. J Med Entomol 35, 521–526.doi.org/10.1093/jmedent/35.4.521
Tampieri MP, Galuppi R, Bonoli C, Cancrini G, Moretti A,Pietrobelli M, 2008. Wild ungulates as Babesia hosts inNorthern and Central Italy. Vector-Borne Zoonotic Dis. 8,667–674. doi.org/10.1089/vbz.2008.0001
Vannier E, Krause PJ, 2012. Human babesiosis. N Engl J Med 366,2397–2407. doi.org/10.1016/j.ijpara.2018.11.007
Vor T, Kiffner C, Hagedorn P, Niedrig M, Rühe F, 2010. Tick bur-den on European roe deer (Capreolus capreolus). Exp ApplAcarol 51, 405–417. doi.org/10.1007/s10493-010-9337-0
Walker A, 2003. Ticks of domestic animals in Africa. Edinburgh:Bioscience Reports.
Wilson ML, Ducey AM, Litwin TS, Gavin TA, Spielman A, 1990.Microgeographic distribution of immature Ixodes damminiticks correlated with that of deer. Med Vet Entomol 4, 151–159. doi.org/10.1111/j.1365-2915.1990.tb00273.x
Yabsley MJ, Shock BC, 2013. Natural history of ZoonoticBabesia: role of wildlife reservoirs. Int J Parasitol ParasitesWildl 2, 18–31. doi.org/10.1016/j.ijppaw.2012.11.003
Zanet S, Bassano M, Trisciuoglio A, Taricco I, Ferroglio E, 2017.Horses infected by Piroplasms different from Babesia caballiand Theileria equi: species identification and risk factors anal-ysis in Italy. Vet Parasitol 236, 38–41. doi.org/10.1016/j. vet-par.2017.01.003
Zanet S, Trisciuoglio A, Bottero E, De Mera IGF, Gortazar C,Carpignano MG, Ferroglio E, 2014. Piroplasmosis in wildlife:Babesia and Theileria affecting free-ranging ungulates and car-nivores in the Italian Alps. Parasite Vector 7, 1–7.doi.org/10.1186/1756-3305-7-70
Zintl A, Finnerty EJ, Murphy TM, De Waal T, Gray JS, 2011.Babesias of red deer (Cervus elaphus) in Ireland. Vet Res 42,1–6. doi.org/10.1186/1297-9716-42-7
Zintl A, Mulcahy G, Skerrett HE, Taylor SM, Gray JS, 2003.Babesia divergens, a bovine blood parasite of veterinary andzoonotic importance. Clin Microbiol Rev 16, 622–636.doi.org/10.1128/CMR.16.4.622
Article
gh-2020_1 .qxp_Hrev_master 05/06/20 19:14 Pagina 70
Non-co
mmercial
use o
nly


![sequential.ppt [Read-Only]](https://static.fdokumen.com/doc/165x107/6319ca5fc51d6b41aa04902b/sequentialppt-read-only.jpg)

