
ENABLING WORKFLOWS - Geospatial World
67
Y O U R G E O S P A T I A L I N D U S T R Y M A G A Z I N E www.geospatialworld.net MAY 2014 » VOLUME 04» ISSUE 10 | ISSN 2277–3134 WORLD GEOSPATIAL ENABLING WORKFLOWS ACROSS BUSINESSES The progressively complex and accelerating pace of change in the geospatial industry offers exciting possibilities for meeting sophisticated demands from businesses, as geospatial information and technology become integral to workflows. P | 22 TM R.N.I No - UPENG/2010/34153; Registration no: UP/GBD-136/2014-16 Publication: 10 th of every month I Posting: 15 th / 20 th of every month
-
Upload
khangminh22 -
Category
Documents
-
view
3 -
download
0
Transcript of ENABLING WORKFLOWS - Geospatial World
Y o u r G e o s p a t i a l i n d u s t r Y M a G a z i n e
www.geospatialworld.netMay 2014 » VOLuMe 04» ISSue 10 | ISSN 2277–3134
WORLDGEOSPATIAL
ENABLINGWORKFLOWSACROSS BUSINESSESThe progressively complex and accelerating pace of change in the geospatial industry offers exciting possibilities for meeting sophisticated demands from businesses, as geospatial information and technology become integral to workflows. P | 22
TM
R.N
.I No - U
PE
NG
/2010/34153; Registration no: U
P/G
BD
-136/2014-16P
ublication: 10th of every m
onth I Posting: 15
th / 20th of every m
onth
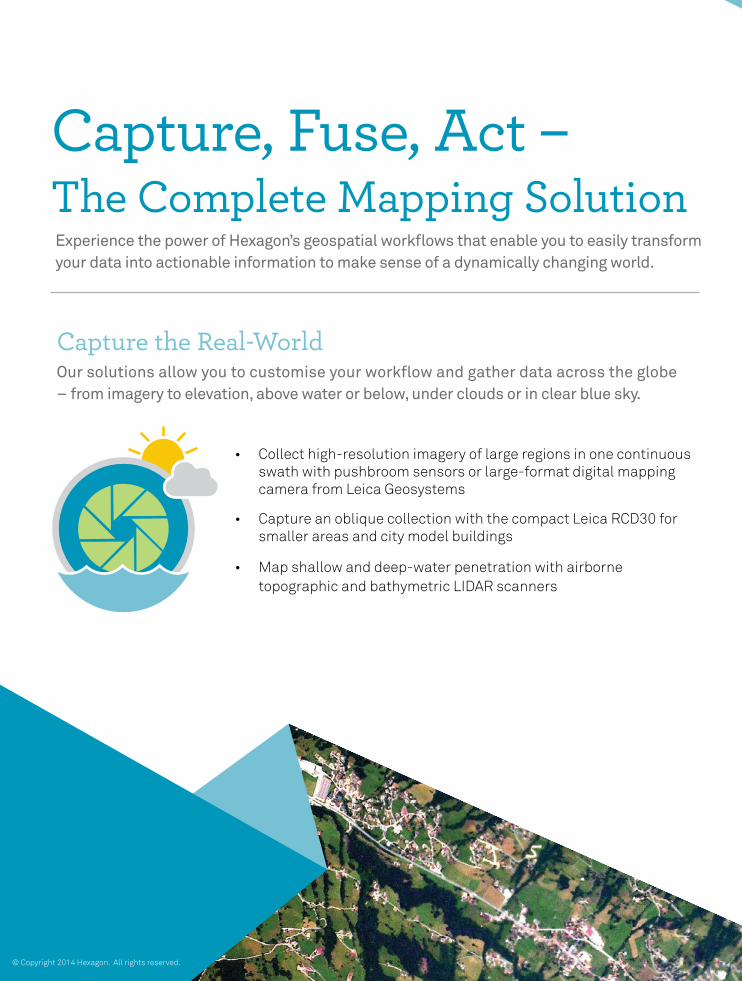
Capture, Fuse, Act –The Complete Mapping Solution
Capture the Real-World Our solutions allow you to customise your workflow and gather data across the globe – from imagery to elevation, above water or below, under clouds or in clear blue sky.
Experience the power of Hexagon’s geospatial workflows that enable you to easily transform your data into actionable information to make sense of a dynamically changing world.
© Copyright 2014 Hexagon. All rights reserved.
• Collect high-resolution imagery of large regions in one continuous swath with pushbroom sensors or large-format digital mapping camera from Leica Geosystems
• Capture an oblique collection with the compact Leica RCD30 for smaller areas and city model buildings
• Map shallow and deep-water penetration with airborne topographic and bathymetric LIDAR scanners
HX2100-AD-0415
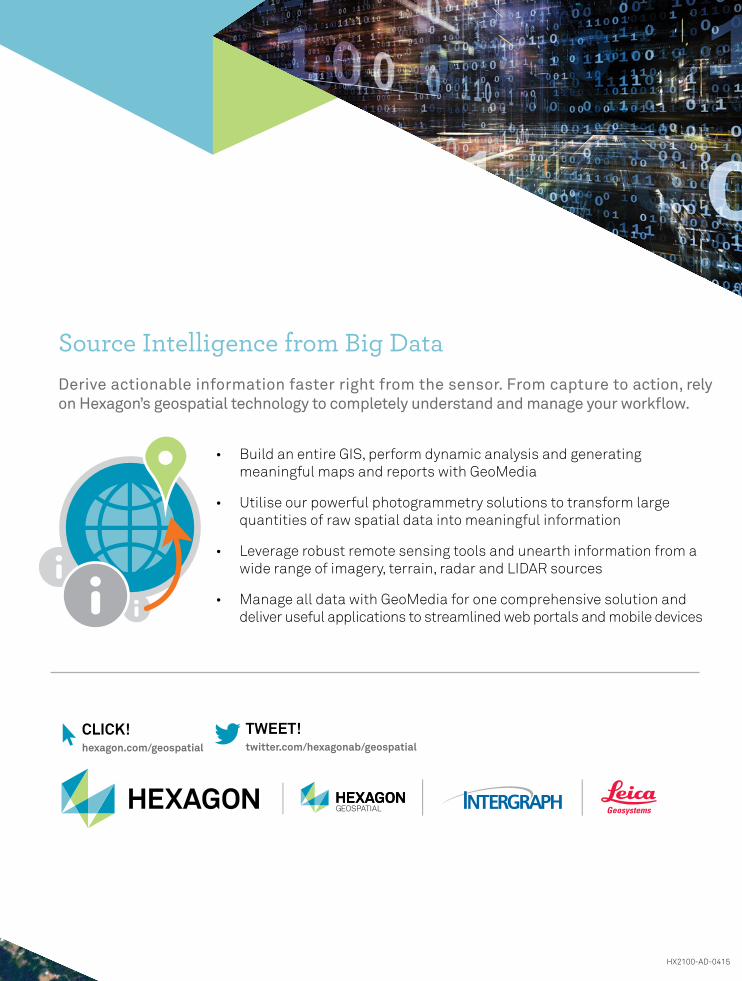
Source Intelligence from Big DataDerive actionable information faster right from the sensor. From capture to action, rely on Hexagon’s geospatial technology to completely understand and manage your workflow.
CliCk!hexagon.com/geospatial
tweet!twitter.com/hexagonab/geospatial
• Build an entire GIS, perform dynamic analysis and generating meaningful maps and reports with GeoMedia
• Utilise our powerful photogrammetry solutions to transform large quantities of raw spatial data into meaningful information
• Leverage robust remote sensing tools and unearth information from a wide range of imagery, terrain, radar and LIDAR sources
• Manage all data with GeoMedia for one comprehensive solution and deliver useful applications to streamlined web portals and mobile devices
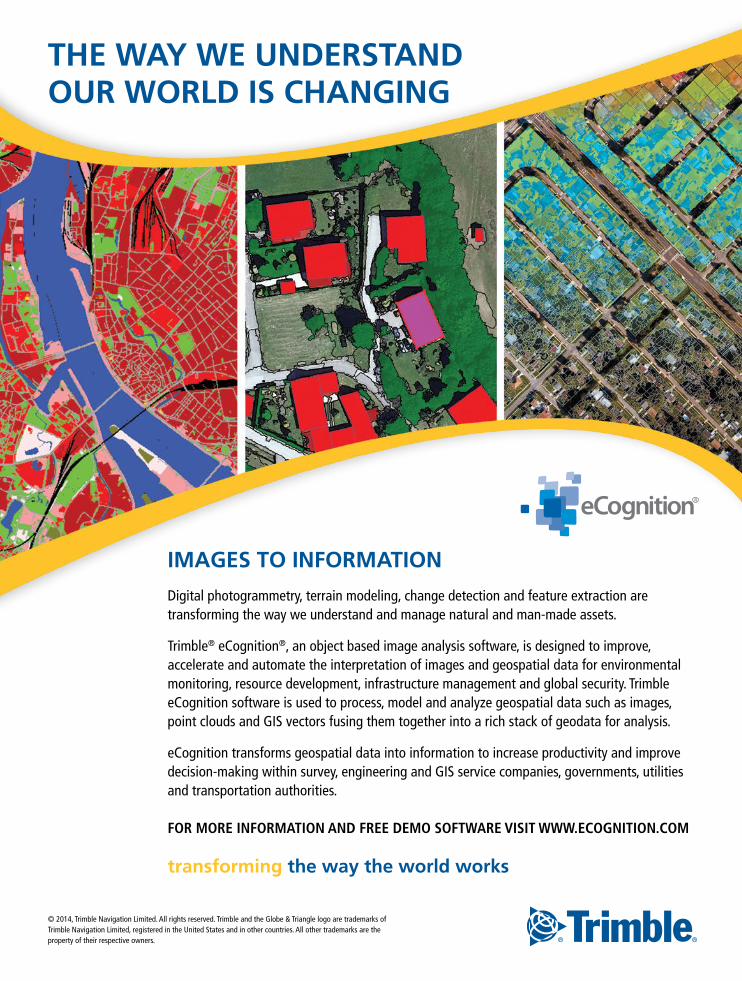
THE WAY WE UNDERSTANDOUR WORLD IS CHANGING
transforming the way the world works
© 2014, Trimble Navigation Limited. All rights reserved. Trimble and the Globe & Triangle logo are trademarks of Trimble Navigation Limited, registered in the United States and in other countries. All other trademarks are the property of their respective owners.
IMAGES TO INFORMATION
Digital photogrammetry, terrain modeling, change detection and feature extraction are transforming the way we understand and manage natural and man-made assets. Trimble® eCognition®, an object based image analysis software, is designed to improve, accelerate and automate the interpretation of images and geospatial data for environmental monitoring, resource development, infrastructure management and global security. Trimble eCognition software is used to process, model and analyze geospatial data such as images, point clouds and GIS vectors fusing them together into a rich stack of geodata for analysis. eCognition transforms geospatial data into information to increase productivity and improve decision-making within survey, engineering and GIS service companies, governments, utilities and transportation authorities.
FOR MORE INFORMATION AND FREE DEMO SOFTWARE VISIT WWW.ECOGNITION.COM

Inside
Aida Opoku MensahSpecial Advisor: Post 2015 Development Agenda, UN Economic Commission for Africa
Barbara RyanSecretariat Director, Group on Earth Observations
Bryn FosburghSector Vice-President, Executive Committee Member, Trimble Navigation
Derek ClarkeChief Director-Survey and Mapping & National Geospatial Information, Rural Development & Land Reform, South Africa
Kamal K SinghChairman and CEO,Rolta Group
Lisa CampbellVice President, Engineering & Infrastructure, Autodesk
Mark ReichardtPresident and CEO,Open Geospatial Consortium
Matthew O’Connell CEO, Adhoc Holdings
Ramon Pastor Vice-President and General Manager, Large Format Printing Business, Hewlett-Packard
Stephen LawlerChief Technology Officer, Bing Maps, Microsoft
Dr Swarna Subba Rao Surveyor General of India
Vanessa Lawrence Secretary General, Ordnance Survey International, UK
Ed ParsonsGeospatial Technologist, Google
Dawn J. Wright Chief Scientist, Esri
Adv
isor
y Bo
ard
Greg BentleyCEO, Bentley Systems
Prof. Ian DowmanFirst Vice President,ISPRS
Dr. Hiroshi MurakamiDirector-General of Planning Department, Geospatial Information Authority of Japan
Prof. Josef Strobl Chair, Department of Geoinformatics, University of Salzburg, Austria
Juergen DoldPresident Hexagon Geosystems
Mohd Al RajhiAsst Deputy Minister for Land & Surveying,Ministry of Municipal & Rural Affairs, Saudi Arabia
Dorine BurmanjeChair-Executive Board, Cadastre, Land Registry and Mapping Agency (Kadaster), The Netherlands
CHAIRMAN M P Narayanan
Publisher Sanjay Kumar
PublICAtIoNS teAMManaging editor Prof. Arup Dasgupta
editor — building & energy Geoff Zeiss
editor — Agriculture Mark Noort
editor — Geospatial World Weekly (Hon) Dr. Hrishikesh Samant
executive editor bhanu Rekha
Deputy executive editor Anusuya Datta
Product Manager Harsha Vardhan Madiraju
Sub-editor Ridhima Kumar
Graphic Designer Debjyoti Mukherjee
Geospatial World / May 2014 / 5
May 2014 • Vol 4 • Issue 10
DisclaimerGeospatial World does not necessarily subscribe to the views expressed in the publication. All views expressed in this issue are those of the contributors. Geospatial World is not responsible for any loss to anyone due to the information provided.
Owner, Publisher & Printer Sanjay Kumar Printed at M. P. Printers B - 220, Phase-II, Noida - 201 301, Gautam Budh Nagar (UP) India Publication Address A - 92, Sector - 52, Gautam Budh Nagar, Noida, IndiaThe edition contains 68 pages including cover
Geospatial World Geospatial Media and Communications Pvt. Ltd.(formerly GIS Development Pvt. Ltd.)A - 145, Sector - 63, Noida, India Tel + 91-120-4612500 Fax +91-120-4612555 / 666Price: INR 150/US$ 15
THEME: Geospatial Workflows
Cover Story22 Geospatial Technology Enabling WorkflowsProf. Arup Dasgupta
Articles29 Transportation: On a Rapid TransitChris Gibson, Trimble
37 Integrated Technologies Open a New Horizon for Oil & Gas IndustryJess Kozman, Mubadala Petroleum
40 Insuring the FutureChris Ewing, Aon Benfield
43 Geospatial Arsenal for Homeland SecurityDavid J. Alexander, US Department of Homeland Security
46 Location Analytics Changing the Game for RetailersEsri, Galigeo
48 Vale Mines Geoinformation to Gaze into FuturePatrícia Moreira Procópio Calazans, Vale, & Luiz Henrique Guimarães Castiglione, University of State of Rio de Janeiro
52 Powering Geospatial Data ManagementBrad Skelton, Hexagon Geospatial
Country Focus: Nigeria56 Highway to DevelopmentVaibhav Arora
07 Editorial
08 News
16 Product Watch
62 ICA ANGLE
Corner Office18 Jay W. Freeland, CEO, FARO Technologies

ULS
FOV330°
VUX-1_Inserat_full-page_207x270.indd 2 10.04.2014 13:41:50

Geospatial World / May 2014 / 7
From the Editor’s Desk
Prof Arup DasguptaManaging [email protected]
The ‘G’ must become a part of every hybrid workflow
A ny data has a location context, perhaps explicit but more often implicit. For example, an address is a group of words but it is associated with a person living in a flat of a building in a group of build-
ings on a road in a postal district of a town in a country. The postman does not need a GPS to get the coordinates of this address. The famous London cabby can get you to any place in the city because the geography of London’s streets, lanes and by-lanes are imprinted in his memory as much as it would be in a GIS. Equally famous is the Mumbai dabbawalla who navigates the roads of Mumbai to collect packed lunchboxes from homes, and through a system of arcane notations and the use of local transport services, delivers each of them to the intended recipient in their offices at lunch time with six sigma reliability. In each of these exam-ples the geographic content is implicit and, what is more important, the latent geographical knowledge is used in a complex process or set of processes to achieve the desired result — the delivery of a letter, arrival at a desired destination or the delivery of a lunchbox.
Today, geospatial data is more formal and explicit, but still it requires different processes to be able to turn the data into actionable information. Actionable information is used in other management processes to achieve the desired action and result. Welcome to the world of workflows. As geospatial technology spreads into different areas of human endeavour it is the workflows that are critical in achieving results. In this issue we have examples from exploration and mining to business intelli-
gence to illustrate how important workflows have become in different application areas. These work-flows are not only geospatial but involve IT and management workflows and decision making. In sum, for geospatial to be effective it must become a part of every hybrid workflow.
Industry has recognised this truth in two ways. One way is the spate of buy-outs and mergers by companies to bring all the elements of the work-flows under a single banner, perhaps even under a single GUI. The other is the recognition of the importance of standards and interoperability and the positioning of products highlighting their adherence to these standards and their interoperability with a wide variety of geospatial and IT products and systems.
Among the application groups there is a reali-sation that SDIs will play a big role in workflows. SDIs have concentrated on data standards but a grey area is standards for processes. Geospatial Web Ser-vices do provide some standardisation for the data transfer processes but as workflows become mobile and personal, other processes will become server based and attention will have to be paid to them.
As we enter the age of the Internet of Things (some also refer to it as the Web of Things), we will begin to see automated workflows which will be automatic, heterogeneous, fast and ubiquitous. This seems to be the next frontier.
Americas News
8 / Geospatial World / May 2014
Business
Google outbids Facebook, buys Titan AerospaceGoogle has acquired Mexico-based drone maker Titan Aerospace for an undisclosed amount. The technology could be used to collect images and offer online access to remote areas. Google said Titan would work closely with its Project Loon, which is building large, high-altitude balloons that send Internet signals to areas of the world that are currently offline. Facebook had been in talks to buy Titan earlier this year, but according to reports, Google offered to top any Facebook offer. Facebook later agreed to pay $20 million for Ascenta, a UK-based aerospace company that has been working on solar-powered unmanned aerial vehicles.
USSCOM seeks geospatial data on 12 countriesUS Special Operations Command (USSCOM) is seeking geospatial data on countries of interest for which there is a critical need but non-existent data. The announcement names 12 critical countries of interest — Jordan, Djibouti, Burma, Honduras, Iran, Morocco, Nigeria, Trinidad & Tobago, Burkina Faso, South Sudan, North Korea, and China (Guangdong). The contractor would be required to provide geo-spatially referenced and rectified socio-cultural data. In addition, the contractor would be required to furnish geotagged infrastructure and points of interest data, socio-demographic statistics, refugee and polling data, and data on foreign investment projects.
HoneyComb gets funding for UAS researchNew funding of $150,000 from Oregon BEST and the Portland Development Commission (PDC) to a startup company, HoneyComb, could help Oregon become a national leader in the development and use of Unmanned Aerial Systems (UAS) in precision agriculture and forestry applications. The HoneyComb system measures reflectance in the visible and near-infrared spectrum, which can be used to calculate the normalised difference vegetation in-dex (NDVI), an indicator of crop stress. The funding will also enable HoneyComb to add thermal imaging technology to the system, which will indicate moisture levels in plants and show where irrigation needs adjustment.
Pentagon may spend $2.45-bn on UAVs The US Department of Defense (DoD) is seeking $2.45 billion in fiscal year 2015 to fund acquisition and research in the field of un-manned aerial vehicles (UAVs). This is 15.8% greater than the fiscal 2014 UAV budget. The US military plans to procure both the Northrop Grumman-built RQ-4 Global Hawk aircraft for imagery and signals intelligence gathering and the MQ-4 Triton maritime surveil-lance vehicle for a combined sum of $855.79million. The Pentagon has also proposed $607.1 million funds to purchase 12 General Atomics MQ-9 Reaper aircraft and
$150,000funding secured
12 ground control stations, as well as $270.1 million in MQ-1 Predator spending for FY 2015. DoD also wants to spend $403 million on the Unmanned Carrier-Launched Airborne Surveillance and Strike, a US Navy programme to launch a UAV from carrier that has a scheduled draft request for proposal release.
Altus Group acquires Maltais GeomaticsAltus Group has acquired business assets of Maltais Geomatics (MGI). The acquisition increases market share and broadens the service of-ferings of the Altus Geomatics’ busi-ness unit. MGI is a privately owned, Alberta-based geomatics company with a 35-year track record in land surveying, survey engineering, remote sensing, aerial and satellite imagery, GNSS technologies, geo-matics engineering, 3D laser scan-ning, etc. Altus provides customised services such as mapping, construc-tion surveys, legal/municipal land surveys, land development, Light Detection and Ranging (LiDAR), 3D laser scanning, Geographic Informa-tion Systems (GIS), and Environmen-tal & Forestry, etc. The acquisition of MGI intensifies Altus’ market position in geomatics services in Western Canada, and will result in revenue growth from the broad-ened service offering and increased market share.
Lockheed wins $245-mn GPS III satellite contractThe US Air Force has awarded Lock-heed Martin more than $245 million in contract options to complete

Americas News
Geospatial World / May 2014 / 9
production of its seventh and eighth next-generation GPS III satellites. The first two contracted GPS III satellites are already progressing through sequential integration and test work stations at Lockheed Martin’s GPS III Processing Facility in Littleton, Colorado. GPS III satellites will deliver three times better accuracy; provide up to eight times improved anti-jamming capabilities; and include enhancements which extend spacecraft life 25% further than the prior GPS block. It will be the first GPS satellite with a new L1C civil signal designed to make it interoperable with other international global navigation satellite systems.
Miscellaneous
Landsat imagery to monitor Greenland ice sheetsA UCLA (University of California at Los Angeles) graduate student has used Landsat imagery to quantify the amount of water draining from Greenland’s melting ice sheet after other approaches failed to provide conclusive result. The new approach relies exclusively on the measure-ments of a river’s width over time,
UrtheCast releases first earth imagery from ISSUrtheCast has released two images of earth, captured by its medium-resolution camera (MRC) onboard the International Space Station (ISS). The image is focused around the city of Moneague in Jamaica, and has a 6-metre ground sampling distance). The original imagery is approximately 3,200x8,000 pixels, and covers approximately 300 sqkm. The com-pany is now geared up to unveil up to 150 videos of 60 seconds each (at 30 frames per second speed) of earth in 4,000-resolution.
which can be obtained from freely available satellite imagery. The discovery was highlighted in the online edition of Proceedings of the National Academy of Sciences (PNAS). Since submitting the article for publication, Colin Gleason and Laurence C Smith, co-authors of the paper, have tested the method on an additional 19 rivers worldwide.
NASA, JAXA release first images from EO missionNASA and Japan Aerospace Exploration Agency (JAXA) have to-gether released the first images from their earth-observing satellite, the Global Precipitation Measurement (GPM) Core Observatory. Launched in February, the mission studies rain and snow from the tropics to the southern edge of the Polar Regions. GPM also anchors an international network of satellites that make
global precipitation observations roughly every three hours. GPM has the first satellite sensors specifically designed to measure falling snow and light rainfall.
USGS makes NLCD 2011 land cover map data publicUSGS has made the latest edition of the National Land Cover Database (NLCD 2011) public. The database provides information about land conditions at regional to nationwide scales. With this, NLCD has updated its previous database version, NLCD 2006. Based on Landsat satellite im-ages, the programme is designed to provide five-year cyclical updating of the nation’s land cover. Additionally, NLCD editions from 2001 to 2011 have been integrated to provide a 10-year land cover change compari-son. NLCD 2011 products will be also released for Alaska later this year.
GPS III satellites will deliver signals three times more accurate than current GPS spacecraft

Europe News
10 / Geospatial World / May 2014
the engineering and construction markets.
Sweden
Revenues from LBS to touch €2.3bn by 2018Revenues from mobile location-based services (LBS) in Europe are forecasted to grow from €735-mn ($ 1015.7mn) in 2013 at a compound annual growth rate (CAGR) of 25.8% to reach €2.3bn ($3.18bn) by 2018. The report was published by Berg Insight, an analyst firm which pro-vides business intelligence services to the telecom industry. The North American LBS market is forecasted to grow at a CAGR of 16.1% from $1.8 billion in 2013 to reach $3.8 billion in 2018.
Germany
Innovative stereo approach to bathymetry surveyingAn innovative approach has been developed for deriving bathymetry
from space by simultaneously using differential spectral attenuation and stereo-information from satellite
UK
Dr Vanessa Lawrence maps a new career directionDr Vanessa Lawrence CB, who has led Britain’s national mapping authority for almost 14 years as its Director General and Chief Execu-tive, has taken over as the Secretary General of Ordnance Survey Inter-national. Dr Lawrence will formally exit Ordnance Survey at the end of 2014. The UK government has asked her to continue to be part of the United Nations Committee of Ex-perts on Global Geospatial Informa-tion Management (UN-GGIM) for as long as the Member States wish her to be their elected Co-chair.
Leeds secures £5-million-fund for EO researchThe UK Natural Environment Research Council has awarded the University of Leeds £5 million ($6.91 million) to host and lead two national centres for studying the earth from space. The two centres are Centre for the Observation and Modelling of Earthquakes, Volcanoes and Tecton-ics (COMET), and Centre for Polar Observation & Modelling (CPOM). Scientists in CPOM are gearing up to analyse the first images to be acquired by the European Space Agency’s EO satellite Sentinel-1A, which was launched in April. The images will give scientists the first glimpse of how the polar ice sheets have changed.
LiDAR maps rainforest height for the first timeCarbomap, a forest mapping com-pany has collaborated with l’Avion
Jaune S.A.R.L and IRD (Institut de recherche pour le développe-ment) to complete the first canopy height model of a rainforest using data from the first true UAV-ready LiDAR system (called YellowScan).IRD is a French research organisa-tion that addresses development issues in Africa, Mediterranean, Latin America, Asia and the French tropical overseas territories. L’Avion Jaune is a development and service company based on UAV technology. The project has a range of different objectives linked to many aspects of forest mapping, and Carbomap was involved in the generation of the canopy height model using a very high-density point cloud. Data for the canopy height model was col-lected by mounting the YellowScan system on a manned helicopter.
Hungary
Trimble acquires assets of GeoDesy and GeoDesy FSOThe assets of privately held GeoDesy and GeoDesy Free Space Optics (FSO) of Budapest, Hungary, have been acquired by Trimble. GeoDesy is a European engineering and develop-ment company focused on delivering accessories for the geomatics, sur-veying, mapping, and construction industries. GeoDesy FSO designs, manufactures and distributes laser-based free space optical communica-tion devices. GeoDesy complements Trimble’s current portfolio of prod-ucts acquired from SECO and Crain Enterprises in 2008. The purchase of GeoDesy allows Trimble to provide products and support services as part of its positioning solutions in
GAF’s ‘bathymetry from space’ approach was used to map the Caspian Sea

Europe News
imagery for hydrocarbon explora-tion and for the performance of seismic surveys. The solution, devel-oped by GAF, was recently used to map a large area in the Caspian Sea for RWE Dea Azerbaijan, an interna-tional oil and gas company head-quartered in Hamburg, Germany..Switzerland
Hexagon buys SAFEmineHexagon has signed an agreement to acquire SAFEmine, a company providing solutions for mine safety operations. Headquartered in Baar, Switzerland, SAFEmine provides traffic safety solutions for vehicles
operating in open-pit mines. SAFEm-ine will continue to manage its own brands, and embed them into the Hexagon Mining Division, working alongside Devex and Leica Geosys-tems Mining.
Global maritime piracy mappedThe United Nations Institute for Training and Research (UNITAR), through its Operational Satellite Applications Programme (UNOSAT), has released a global report on global maritime piracy. The report conducted detailed analyses of the maritime piracy between the period 2006 and 2013. The analysis in the
How we build reality
report includes the added cost of piracy for the maritime industry at a global level and how these are linked to anti-piracy initiatives. The study started with identifying captured ships delivering humanitarian assis-tance and other goods using satellite imagery, and was later expanded to regional geospatial analyses for the western Indian Ocean region.
Map depicting maritime circulation and acts of piracy and armed robbery

Asia News
12 / Geospatial World / May 2014
Afghanistan
Maps provide fingerprint of natural resourcesA coalition of scientists from the United States and Afghanistan has released 60 maps developed using hyperspectral imagery. The coali-tion of the US Geological Survey, the Afghanistan Ministry of Mines and Petroleum,and the Task Force for Business and Stability Operations (TFBSO), was created by the US Department of Defenceas a strategic tool for promoting eco-nomic development. Researchersused hyperspectral imaging spec-trometer data to identify and charac-terise mineral deposits, vegetation, and other land surface features.
Data was collected in 28 flights that commenced from Kandahar Air Field in 2007. Scientists using data have mapped an area that covers more than 70% of Afghanistan. The maps are the newest and most detailed addition to a series of hyperspectral data from the USGS and the TFBSO.
China
Alibaba buys AutoNaviAlibaba Group has agreed to acquire AutoNavi Holdings in a deal that values the Chinese company at $1.5 billion, bolstering its Internet mapping tools ahead of a possible initial public offering. AutoNavi will give Alibaba control of China’s mobile mapping service. The deal
is expected to be completed in the third quarter. AutoNavi shareholders still need to vote on the takeover.
China mulls over global satellite surveillanceChina is considering to massively increase its network of surveillance and observation satellites to monitor the entire planet. According to reports, the government is now planning to build more than 50 orbiting probes, which Chinese researchers said would bring the nation’s satellite surveil-lance network at par with, or even larger than, that of the United States. The total budget for the project is estimated to be around 20 billion yuan ($3.2 billion approximately).
Saudi Arabia
UNDP, GCS sign capacity development projectThe UN Development Program (UNDP) and the General Commission for Survey (GCS) have signed a capacity development project with the main objective of developing Saudi Arabia’s capacities in conducting geospatial and marine surveys and the produc-tion of maps,marine navigational electronic and paper systems as well as geospatial information. The project is also expected to mobilise expertise and purchase technically sophisticated survey equipment and devices for the marine hydrographical surveys in the Red Sea and the Gulf of Aqaba area.
Oman
NSA establishes new geodetic datum ONGD14Oman established a new geocentric
Ukraine
Satellite imagery counters Russia’s claimsThe tension between NATO and Russia escalated to a new high as the Supreme Headquarters Allied Powers Europe (SHAPE) released a package of DigitalGlobe’s satellite imagery. The images show details of the location and type of Russian units NATO has observed along its border with Ukraine. The pictures show rows of hundreds of tanks and armoured vehicles appar-ently waiting for orders in fields and other temporary locations around 30 miles (50km) from the frontier. SHAPE, is the Headquarters of Allied Com-mand Operations (ACO), one of NATO’s two strategic military commands. NATO alleges that the imagery reveals Russian military buildup on Ukraine’s eastern border, and gives telltale signs of an invading force, and not merely troops on exercise.
Russian fighterjets and helicopters at Primorsko-Akhtarsk airbase
near Ukraine

Asia News
President; Raghu Ganeshan, Secre-tary; and Atanu Pattanayak, Treasurer. AGI has also announced five new working committees focused on land and mapping agencies, utilities, oil & gas, e-Governance, location & business intelligence, and transport & infrastructure.
Rajesh C Mathur
Chinese High Resolution Satellite Image-TH-1
Reseller Recruiting We are BSEI (Beijing Space Eye Innovation Tech. Co.,Ltd.), a leading remote sensing private �rm from China. As the TH-1 Master Distributor, we would like to build long-term and mutual bene�cial partnership with you.
http://www.bsei.com.cn
Phone/Fax:+86 10 82257160;13601127050
5m Triplet Stereo
10m MSI
Battery
2m PAN
Data transmission antenna
GPS
Satellite sensitive unit
E-mail:[email protected]
北京天目创新科技有限公司Beijing Space Eye Innovation Technology Co., Ltd.
100 Million sq km fresh archival data and new tasking service (3 million sq km per day/no tasking fee) are available with competitive price of 1 USD (2m Panchromatic), 0.5 USD (10m MSI) and 3 USD (5m triplet stereo) per sq km.
We are capable to be your distributor in Chinese market with rich experiences of distributing 20 million sq km high resolution satellite imagery and 1000 sets of imagery processing software to 3000 customers in China in the last 15 years.
Let’s distribute your remote sensing products in China
Please Use and Promote TH-1 Data
Global Channel PartnerMaster Distributor
Archive images online search: th.bsei.com.cn
TH-1 BSEI
datum, Oman National Geodetic Datum (ONGD14) based on ITRF2008 system. The National Survey Author-ity (NSA) chose to update the existing WGS84 (ITRF89) system estab-lished in 1994 and replace it with ONGD14 built on geocentric datum of ITRF2008 epoch 2013. The revi-sion of the datum was necessitated considering that satellite positioning systems would have widespread use in this millennium and the positions referenced to the existing datum would not be compatible with such updated satellite derived positions. ONGD14 would allow the implemen-tation of Network Based Real-Time GNSS Services (RTKNET) as a single standard for the acquisition, storage and the use of geographic data, thus
ensuring compatibility across various GIS applications.
India
Rajesh Mathur elected as new President of AGIThe Association of Geospatial Indus-tries (AGI), an association of geospa-tial companies in India, has elected Rajesh C. Mathur, Vice Chairman at NIIT GIS as its new President of Gov-erning Council 2014-16. Mathur had served as the First Vice President in the General Council of 2012-14. Other Governing Council office bearers for 2014-2016 are: KK Singh, Honor-ary Chairman; Sanjay Kumar, Senior Vice President; Kaushik Chakraborty, Secretary General; Rajan Aiyer, Vice

14 / Geospatial World / May 2014
Australia/Oceania News
Bees with sensors to study environmental changesCommonwealth Scientific and Indus-trial Research Organisation (CSIRO)’s new research project is using tiny sensors and attaching them to the backs of honey bees in anticipation of understanding changes in environ-ment and its effect on bee popula-tion and agriculture. These tiny 2.5 x 2.5mm chips relay data to recorders placed around hives and known food sources. The research will also look at the impacts of agricultural
pesticides on honey bees by moni-toring insects that feed at sites with trace amounts of commonly used chemicals. A total of 5,000 tags are currently being attached to honey bees in Hobart and released into the natural environment.
Mapping quake-prone subduction zonesGeophysicist Dr Wouter Schel-lart from Monash University in Melbourne and seismologist Prof Nick Rawlinson at the University of Aberdeen in Scotland, have created a global map identifying which subduc-tion zones are capable of generating earthquakes greater than magnitude 8.5. Subduction zones are the points
at which one tectonic plate forces another one under it. In this study, Wouter’s team divided the active subduction zones into 241 segments, each 200-km-long and assessed 24 key characteristics. The team then ranked each segment accord-ing to these six characteristics and mapped them. The results indicated that giant earthquakes only occur at subduction zones with particular geometric characteristics and states of stress. The research was published in the journal Physics of the Earth and Planetary Interiors.
Vanuatu elevation data aids in coastal planningAustralian Government has collected topographic and bathymetric data through LiDAR technology on behalf of the Government of Vanuatu to facilitate better coastal planning and management. Data was captured via a series of aerial surveys undertaken in 2012 and 2013, resulting in the col-lection of billions of individual 3D data points. The LiDAR survey data have been further processed to derive two different elevation models: a ‘bare earth’ Digital Elevation Model (DEM) based solely on the topographic and bathymetry data; and a Digital Surface Model (DSM) incorporating elevations of above-ground features such as trees, buildings and other structures.
Sparx Systems, CSIRO sign collaboration agreementCommonwealth Scientific and Industrial Research Or-ganisation (CSIRO) has signed a commercialisation deal with Sparx Systems for the development of geospatial modelling tools. The new deal will see the ongoing development of model registry features and functionality for Sparx’s Enterprise Architect UML modelling tool. Key development components include the CSIRO Model Registries research and the Solid Ground Enterprise Architect extension along with Sparx Systems’ Cloud Service and Reusable Asset Service (RAS) solutions and existing components of the recently released Enterprise Architect 11. Fugro acquires 3D mapping company RoamesFugro has completed the acquisition of Brisbane-based Roames Asset Ser-vices from Ergon Energy Corporation. Roames (previously a services unit within Ergon) specialises in high-resolution mapping services and solutions for the electricity distribution sector. Roames uses air-borne sensors to generate accurate 3D models of electric power trans-mission networks and surrounding vegetation. The data collected through LiDAR and digital imagery are processed in a highly automated way. Fugro’s agreement with Ergon includes a five-year service contract (plus a five-year option). With this acquisition, Fugro acquires technol-ogy that can be used to build cost efficient 3D mapping solutions for additional business areas.
The map highlights various subjuction zones of the world
Geospatial World / May 2014 / 15
Africa News
Guinea
Geoweb community unites to combat Ebola outbreakAs the Ebola outbreak expanded in neighbouring countries of Guinea, the Humanitarian OpenStreetMap Team (HOT) launched a crowdsourced mapping effort to aid efforts in the region. Over 360 contributors mapped over 1.5 million objects on the digital map. CartONG, an NGO specialising in humanitarian mapping, contributed maps of Guekédou, Macenta and Kissidougou. DigitalGlobe and Airbus Defense & Space contributed their bit for the cause. In addition, A Pléiades image of Foya in Liberia and four free SPOT 6 images covering 14,000 sqkm of southern Guinea were provided free of charge.
Ethiopia
Satellite maps forest’s CO2 absorption capacityA project aimed at supporting
Ethiopia’s REDD (Reducing Emis-sions from Degradation and De-forestation) Monitoring, Reporting and Validation (MRV) activities has been launched. The project worth $552,480 will be carried out by the Ethiopia Ministry of Forestry in col-laboration with German partners BlackBridge, RSS (Remote Sens-ing Solutions) as well as GIZ. The images will help scientists to know the storage capacity of the forest of 900,000 hectares of land in all parts of the country. Upon comple-tion, the project will help develop-ing a national system to measure carbon absorption capacity as well as report and validate the data.
Nigeria
Ondo to spend $620K for forest reserves monitoringThe Ondo State Government, Nigeria will spend around $620,000 on GIS to monitor its forest reserves. The GIS device will be stationed at
strategic positions in all forests and be controlled from Akure to monitor both legal activities and nefarious activities of encroachers.
Ghana
Ghana to setup national Fundamental StationGhana Space Science and Technol-ogy Institute (GSSTI) is setting-up a national Fundamental Station in Ghana. The facility will play an important role in the mainte-nance of the Geodetic Reference Networks on the continent of Africa including the United African Reference Frame (AFREF). As an integral component of the Funda-mental Station, the Institute plans to establish a Continuously Operat-ing Reference Station (CORS), for which it has approached Accra based Geo-Tech Systems. The facility will complement the efforts of the only Fundamental Station (HartRAO) located in South Africa.

Leica ScanStation P15 for precise laser scanning
Leica Geosystems has released its versatile 3D laser scanner, the ScanStation P15. The device can help businesses by offering 3D scanning presentations to customers. Suitable for a wide range of non-surveying applications, including interior and short-range uses, the model offers a simplified user interface and optimised workflow, with no prior surveying knowledge or training required for operation. It is reliable, robust and suitable for a range of environmental conditions and delivers high-quality data fast.
Key features• It achieves a fast million-points-per-second scan rate
and delivers the highest quality possible in 3D data for project scans with ranges of up to 40m.
• With an environmental rating of IP54, it operates at temperatures ranging from –20° C to +50° C and also enables 3D scanning in full sunlight or complete darkness.
• It also features an intuitive and user-friendly touch screen interface.
Product Watch
MobileMapper 20 extends GIS capabilities in field
Spectra Precision has introduced the MobileMapper 20 GIS handheld. It offers a new bright VGA colour touch screen display, a 5 MP camera for higher resolution images, doubled memory capacity and 3.5G cellular performance. The MobileMapper 20 also comes with a standard 2-year warranty.
Key features• It provides
real-time GPS accuracy of better than 2 meters and post-pro-cessed accu-racy of half a meter using MobileMa-pper Office software.
• It incor-porates a variety of commu-nication technolo-gies, including Bluetooth, WiFi and a 3.5 G cellular modem, to keep mobile workers connected and more efficient while in the field.
• It runs Windows Embedded Hand-held 6.5 and offers the flexibility to support a broad range of third-party software applications.
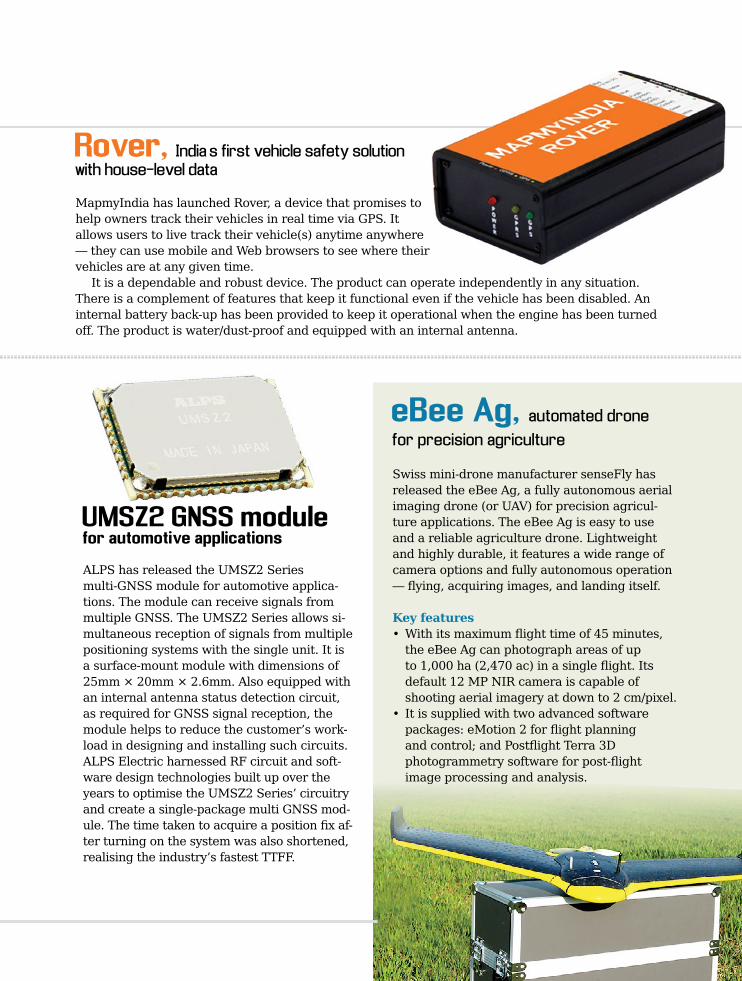
Rover, India’s first vehicle safety solution with house-level data
MapmyIndia has launched Rover, a device that promises to help owners track their vehicles in real time via GPS. It allows users to live track their vehicle(s) anytime anywhere — they can use mobile and Web browsers to see where their vehicles are at any given time.
It is a dependable and robust device. The product can operate independently in any situation. There is a complement of features that keep it functional even if the vehicle has been disabled. An internal battery back-up has been provided to keep it operational when the engine has been turned off. The product is water/dust-proof and equipped with an internal antenna.
eBee Ag, automated drone
for precision agriculture
Swiss mini-drone manufacturer senseFly has released the eBee Ag, a fully autonomous aerial imaging drone (or UAV) for precision agricul-ture applications. The eBee Ag is easy to use and a reliable agriculture drone. Lightweight and highly durable, it features a wide range of camera options and fully autonomous operation — flying, acquiring images, and landing itself.
Key features• With its maximum flight time of 45 minutes,
the eBee Ag can photograph areas of up to 1,000 ha (2,470 ac) in a single flight. Its default 12 MP NIR camera is capable of shooting aerial imagery at down to 2 cm/pixel.
• It is supplied with two advanced software packages: eMotion 2 for flight planning and control; and Postflight Terra 3D photogrammetry software for post-flight image processing and analysis.
UMSZ2 GNSS module for automotive applications
ALPS has released the UMSZ2 Series multi-GNSS module for automotive applica-tions. The module can receive signals from multiple GNSS. The UMSZ2 Series allows si-multaneous reception of signals from multiple positioning systems with the single unit. It is a surface-mount module with dimensions of 25mm × 20mm × 2.6mm. Also equipped with an internal antenna status detection circuit, as required for GNSS signal reception, the module helps to reduce the customer’s work-load in designing and installing such circuits.ALPS Electric harnessed RF circuit and soft-ware design technologies built up over the years to optimise the UMSZ2 Series’ circuitry and create a single-package multi GNSS mod-ule. The time taken to acquire a position fix af-ter turning on the system was also shortened, realising the industry’s fastest TTFF.
18 / Geospatial World / May 2014
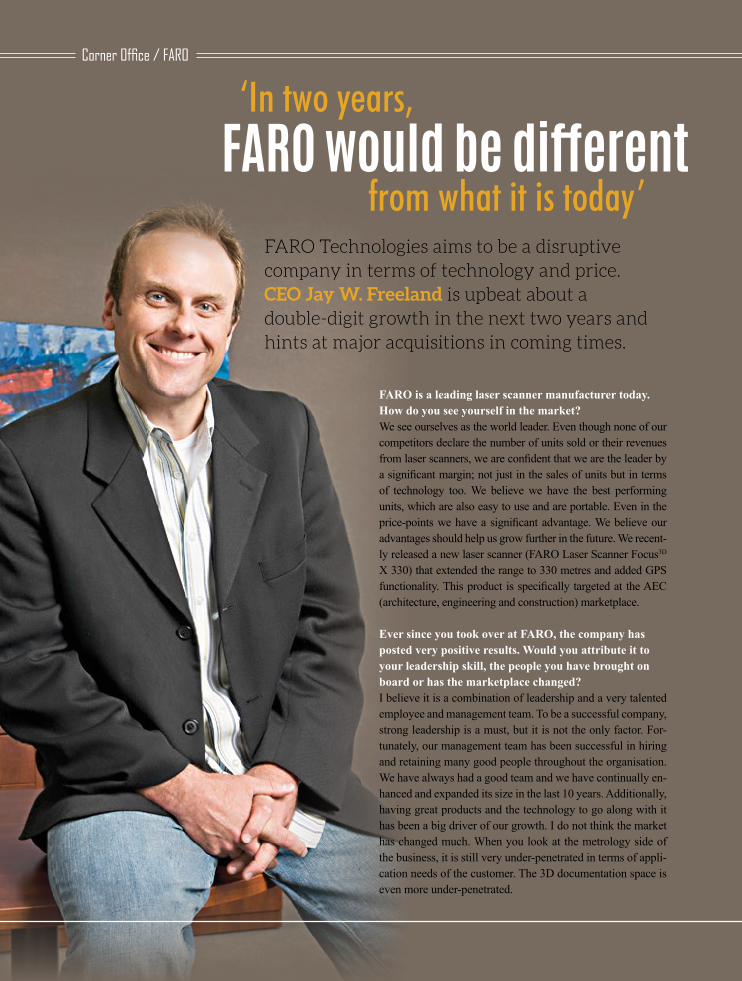
‘In two years, FARO would be different
from what it is today’FARO Technologies aims to be a disruptive company in terms of technology and price. CEO Jay W. Freeland is upbeat about a double-digit growth in the next two years and hints at major acquisitions in coming times.
FARO is a leading laser scanner manufacturer today. How do you see yourself in the market?We see ourselves as the world leader. Even though none of our competitors declare the number of units sold or their revenues from laser scanners, we are confident that we are the leader by a significant margin; not just in the sales of units but in terms of technology too. We believe we have the best performing units, which are also easy to use and are portable. Even in the price-points we have a significant advantage. We believe our advantages should help us grow further in the future. We recent-ly released a new laser scanner (FARO Laser Scanner Focus3D X 330) that extended the range to 330 metres and added GPS functionality. This product is specifically targeted at the AEC (architecture, engineering and construction) marketplace.
Ever since you took over at FARO, the company has posted very positive results. Would you attribute it to your leadership skill, the people you have brought on board or has the marketplace changed?I believe it is a combination of leadership and a very talented employee and management team. To be a successful company, strong leadership is a must, but it is not the only factor. For-tunately, our management team has been successful in hiring and retaining many good people throughout the organisation. We have always had a good team and we have continually en-hanced and expanded its size in the last 10 years. Additionally, having great products and the technology to go along with it has been a big driver of our growth. I do not think the market has changed much. When you look at the metrology side of the business, it is still very under-penetrated in terms of appli-cation needs of the customer. The 3D documentation space is even more under-penetrated.
Corner Office / FARO
One of our goals is to be highly disruptive in terms of technology and price. Disruptive companies have always won the market. There are lot of different ways to be disruptive. For instance, the last-generation scanners — be-fore we delivered the first true disruptive scanner FARO La-ser Scanner Focus3D in 2010 — were big, expensive, hard to use and difficult to bring on to the field. Focus3D was an instant hit because of the ease of use, portability and price.
To really address the early popularity, we needed to bring price and technology together and expect to continue fol-lowing this path going forward. We will continue to bring in new technology to simplify operations, reduce price and improve portability.
Leadership at the top, a great team, and a marketplace that is under-penetrated and willing to accept new technol-ogy are the three key factors that would contribute to our future success.
What are the current market trends that are shaping your business strategies?AEC is a huge space which is not properly serviced by la-ser scanner manufacturers. It should be and will be looked at closely in the future. That is an opportunity of which we intend to take full advantage. The price point is another trend that we continue to drive as we intend to penetrate a vast majority of the market. In order to serve both ends of the market we need products and price points that are attractive. Features such as improved accuracy, range, ease of use, etc., will continue to be the prominent trends. The capturing and utilisation of the data should also become important distinguishing features. These would continue to improve with automated sketching, scan-ning, etc., so that the product can be used by lesser trained pro-fessionals. More and more companies will offer customers the ability to access data from a highly protected cloud network. There are customers who are already doing it. I believe there is going to be a shift in the engagement with data and that laser scanners will be the number one selling product for FARO at some point in the future.
We were assuming it is your highest selling product... It is currently the second-highest selling product. It goes back and forth between the second and third place in our portfo-lio. The FaroArm, which is a high-precision measuring tool for the industry, is our number one product. The laser scan-ners — since the launch of the Focus3D range — very quickly went from being immaterial in our revenue to becoming num-ber-two product over the span of three quarters. However, I am confident it will be number-one at some point in the future based on its growth trajectory and market potential. From a growth perspective, there are other sides of our business that
are growing at double-digits as well. If other products were not growing at this pace, laser scanners would have become the top-selling product in a much lesser period.
What sets you apart from your competitors in this market? What is the secret behind the lower pricing?Price is one factor that sets us apart. If all of the tactical chang-es we made to the device — to make it smaller and easier to use — would have been done without keeping the cost of manufacturing low, we would not have captured the market. It took us a lot of time to bring the price point down. When we acquired iQvolution, the plans were already in place for what later became the Focus3D scanner. Although the founders of the company had a vision of the product, they were not in a posi-tion to develop it. We looked at several laser scanning compa-nies between 2002 and 2004 before settling on iQvolution. It took us a lot of creativity and work in the engineering phase to not only cut the cost but also cut the product’s size and weight. Now you can put a FARO laser scanner in a backpack and go. It is truly meant to be used in the field. Our goal is to make the best technology and offer it at the best price point.
FARO has always been best in serving its customers as a problem solving and product development organisation. As we grew, we kept on becoming more aggressive and attack-ing in the AEC and forensic space. This attitude is an inte-gral part of our culture and will continue to be our approach going forward.
What verticals you are focusing on other than AEC?We are highly focused on law enforcement and forensics. We are focused on spatial applications and are taking proactive steps to expand it. A lot of our customers are using our prod-ucts for facility management, asset management, layout, etc. We also have customers in energy, and oil and gas sectors. Each segment by itself provides substantial opportunity for growth. The laser scanner alone is not going to replace all other equipment. AEC should be at least a billion-dollar
We have agressively attacked the AEC and forensic space.
This attitude is an integral part of our culture and will
continue to be our approach going forward
Geospatial World / May 2014 / 19

opportunity, if all the problems are solved the right way. Nobody is there 100% yet. FARO believes forensics is a $400-million market opportunity. We have not been able to put a value yet to other industrial segments and are currently doing research on these markets to understand the custom-ers, usage and the right technology they require.
Which are the geographies that interest you?There is tremendous opportunity in the developed countries like the US, Germany, France, UK, Japan and China. We have a sig-nificant presence in China. A lot of our activities are clustered around the eastern sea board there. We believe China will pro-vide us great experience. We are also seeing good opportunities in the Middle East market. Western Europe and North America, which were the traditional growth markets, will also continue to expand through new applications and markets.
Do you agree that the growing interest in 3D visualis-ation is said to have changed the laser scanning market? Many government agencies and insurance companies are looking for 3D models of the properties that they are look-ing to insure. For instance, in the AEC sector in developed countries, much of it is not about new construction but de-veloping a 3D model of an existing building, which may be used for facility planning, emergency planning, etc. We know that many facilities after construction do not match the actual blueprint. Therefore, 3D scanning can also be used as a starting point for redesigning building space. 3D tech-nology has definitely developed and over the last couple of years, people have started thinking in three-dimensions. This has been a major driving factor in the laser scanning market.
Do you see laser scanning becoming a standard tool in the AEC market in the coming days?Yes. It will not only be used in AEC but in significantly large number of other applications in the next two to three years.
Some of the projects that are underway at FARO should be key enablers in this pro-cess. In forensics, it is going to be a more standard tool. It is be-ing effectively used in court cases, and is becoming an accepted technology in proving a crime or moving vi-
olation. We expect lawyers, accident in-vestigators, police, etc., will start using this
technology more and more. The gaming industry too has start-ed using this technology. EA Sports used our laser scanners to scan all the football stadiums for their NCAA football version this year to give gamers the look and feel of the well-known football grounds. In the field heritage preservation, we have seen customers in Rome scanning all the important artefacts.
While these are smaller market opportunities, each time somebody in the unexplored markets uses the equipment, it opens the eyes of a few other markets as well.
There is a trend in the larger geospatial industry towards complementing each other’s technologies and marketplaces instead of competing with each other. How do you see this happening? It is important that technologies complement each other since we are trying to displace the existing technology with the newer ones. There is a huge gap between the applica-tions for laser scanning which are used today, versus applica-tions which should be used. We are confident that we should be able to achieve this. A laser scanner is not the only tool available but we will soon see that more and more industries will start adopting it as it makes the task easier. I would like every police officer to have a laser scanner. While this may be unrealistic, what is not unrealistic is the thought that at least each police district should have enough laser scanners to adequately serve their communities.
Has FARO been involved in such business partnerships?We have been, but more from the sales perspective. That does not necessarily mean that our products are perfectly complementing their products. That was not necessarily the goal either. We have worked with Trimble and Topcon. With Topcon we had a distributor-to-distributor regional agree-ment, and with Trimble we had a global agreement for resell-ing our FARO Laser Scanner Focus3D, which was privately labelled for Trimble as a TX5 unit. We have not reached any definitive agreement for the new Focus3D X 330 or X 130. We are aggressively selling these products through our own channel and distributors. It is less about trying to set up a structure that is complementary and more about accessing the customer and solving their problems.
Didn’t it worry you that a Focus scanner wearing Trimble or Topcon colours would have given you head-to-head competition?When Trimble was marketing the TX5, there were some instances where Topcon and Trimble had a head-to-head competition. But if you look at how their distribution network is spread across the world, each has got strength in different regions. However, there were places where there would have
Corner Office / FARO

been an overlap. Going forward, for Focus3D X 330 and X 130, if we decide against working with Trimble on a global level, and instead work only at a distributor level, we should have a much better ability to steer the product away from head-to-head competition.
What according to you has been the biggest breakthrough in terms of technology in this market? We are only focused on the terrestrial laser scanning pro-cesses and products since we feel that airborne has limited application. Taking spatial technology and merging it with speed, accuracy, image clarity and the form factor such as size, weight and integrated touch-screen has been the biggest breakthroughs in terms of market adoption. In addition, we continue to improve the products and the price points. Price points are tricky because there have been significant ad-vancements in technology that we have made. For instance, there are lots of technical changes that we have made in the optics and the structural design.
FARO has been the driving force behind the movement in laser scanning marketplace. Even if you compare all our com-petitive products, they do not have the same size, features and price point advantages. If we had not taken the first step of in-troducing a disruptive technology like Focus3D and taken the next steps. I think laser scanning would still continue to be an interesting market but would have been predominantly limited to its early adopters. Keeping in mind the changes that would come with the products that are in the developments stages at FARO, I am confident those products will take the marketplace into a much broader bell-curve. It is all about access and getting it into the hands of the masses versus the smaller niche market.
Diversification is a buzzword these days with companies. Is FARO planning to diversify in terms of its product offerings or does it plan to stick to its core strength and continue innovating around that?When we think about diversification, it starts with our vision, which is to be the world’s most trusted source in 3D measurement. Outside the 3D measurement market, we feel that there is a significant lower likelihood of diversification for us. But never say never.
That being said, the umbrella that we are currently func-tioning under is huge. Are there other technologies and inno-vative products under this umbrella that we are open to acquire or develop? We have been very open about the fact that we have been aggressively looking at potential acquisitions over the last year and half now. We have a large amount of cash on the balance sheet and zero debt, which means we have great flexibility to target acquisitions regardless of their size. If the technology fits in the umbrella and is potentially disruptive or
problem solving, or complementary to something that we are doing — even if they have not developed the revenue stream yet. In the past, we have acquired companies which were in the early stages of developing a technology and helped them to complete those projects. My view is that it is not a matter of ”if” but a matter of “when”. If it’s 3D measurement, imaging or realisation, we will be interested in diversifying.
What innovations can we expect from FARO in the coming months?We plan to do more work in the field of optical technologies. For example, there are few applications where customers would like to use optical technology but nobody is serving the market in the right way yet. There is a lot of focus from R&D or acquisition standpoint for optical technologies, which can be potentially applied in scanning as well. There is a lot on the software side, whether it is application layers that help improve the ease of use or solving the problem for the cus-tomer. There are some core underlined software opportunities focused at continued improvement in performance.
Where do you see FARO in two to five years from now?We are highly confident about our ability to continuously grow our revenue in double-digits every year going forward, even without acquisitions. If we have acquisitions, we should or could accelerate that growth profile. In two years time, I expect FARO will be different from what we are today because we are not how we used to be two years ago. We have continued to grow and evolve and further penetrate in all market segments. We are fairly confident that we will be a billion-dollar revenue company in the future; we already have a market cap that is around a billion dollars. Whether that will take five years is hard to say but we expect it to be there before 10 years. And if we have inorganic growth through acquisitions, we might be there much sooner. In five years, I fully expect you will see us as a significantly bigger player in the AEC space. Not just in the niche applications but in much larger application uses too.
Geospatial World / May 2014 / 21
We are fairly confident that we will be a billion dollar revenue
company; we already have a market cap that is around a
billion dollars. Whether that will take 5 years is hard to say
22 / Geospatial World / May 2014
Cover Story/Enabling Businesses
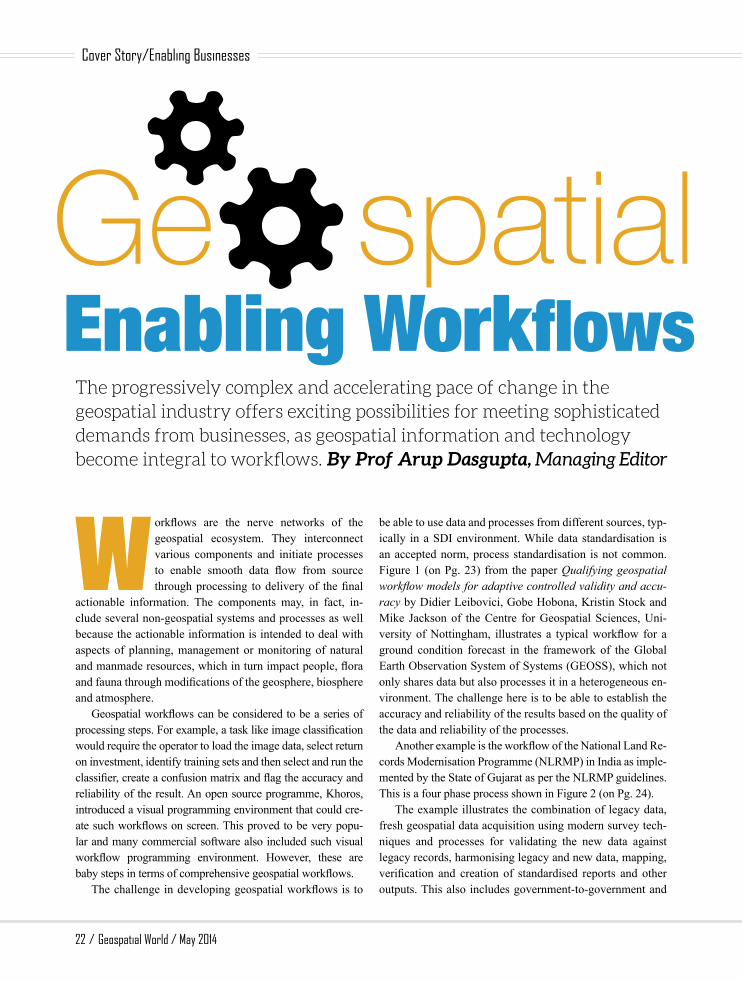
The progressively complex and accelerating pace of change in the geospatial industry offers exciting possibilities for meeting sophisticated demands from businesses, as geospatial information and technology become integral to workflows. By Prof Arup Dasgupta, Managing Editor
W orkflows are the nerve networks of the geospatial ecosystem. They interconnect various components and initiate processes to enable smooth data flow from source through processing to delivery of the final
actionable information. The components may, in fact, in-clude several non-geospatial systems and processes as well because the actionable information is intended to deal with aspects of planning, management or monitoring of natural and manmade resources, which in turn impact people, flora and fauna through modifications of the geosphere, biosphere and atmosphere.
Geospatial workflows can be considered to be a series of processing steps. For example, a task like image classification would require the operator to load the image data, select return on investment, identify training sets and then select and run the classifier, create a confusion matrix and flag the accuracy and reliability of the result. An open source programme, Khoros, introduced a visual programming environment that could cre-ate such workflows on screen. This proved to be very popu-lar and many commercial software also included such visual workflow programming environment. However, these are baby steps in terms of comprehensive geospatial workflows.
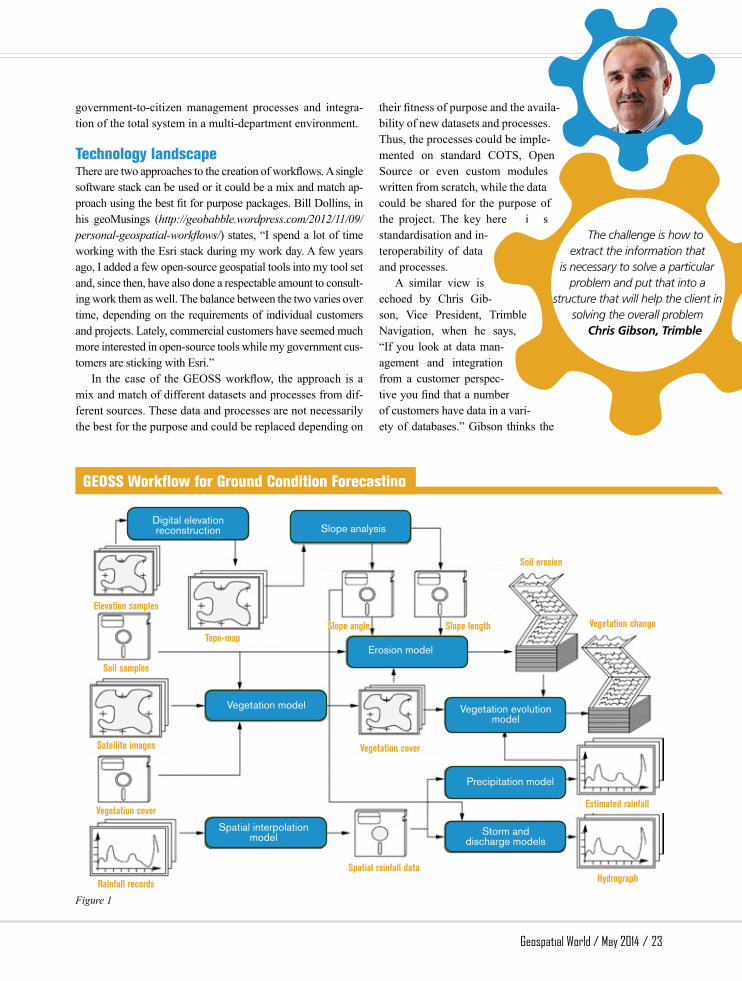
The challenge in developing geospatial workflows is to
be able to use data and processes from different sources, typ-ically in a SDI environment. While data standardisation is an accepted norm, process standardisation is not common. Figure 1 (on Pg. 23) from the paper Qualifying geospatial workflow models for adaptive controlled validity and accu-racy by Didier Leibovici, Gobe Hobona, Kristin Stock and Mike Jackson of the Centre for Geospatial Sciences, Uni-versity of Nottingham, illustrates a typical workflow for a ground condition forecast in the framework of the Global Earth Observation System of Systems (GEOSS), which not only shares data but also processes it in a heterogeneous en-vironment. The challenge here is to be able to establish the accuracy and reliability of the results based on the quality of the data and reliability of the processes.
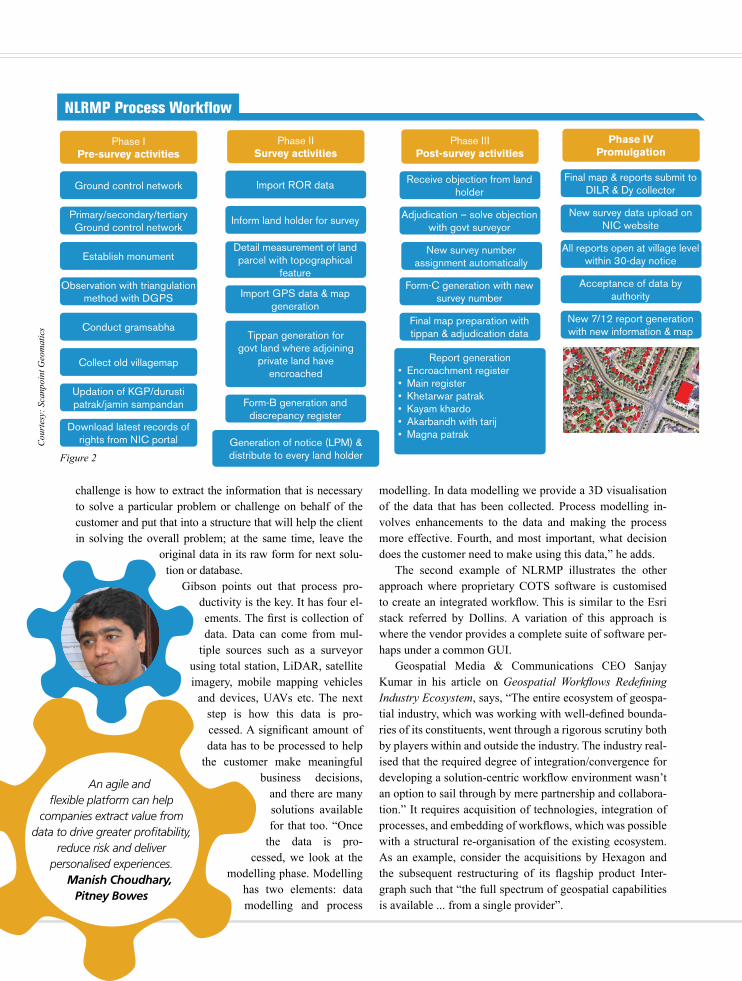
Another example is the workflow of the National Land Re-cords Modernisation Programme (NLRMP) in India as imple-mented by the State of Gujarat as per the NLRMP guidelines. This is a four phase process shown in Figure 2 (on Pg. 24).
The example illustrates the combination of legacy data, fresh geospatial data acquisition using modern survey tech-niques and processes for validating the new data against legacy records, harmonising legacy and new data, mapping, verification and creation of standardised reports and other outputs. This also includes government-to-government and
Enabling Workflows
Geospatial World / May 2014 / 23
government-to-citizen management processes and integra-tion of the total system in a multi-department environment.
Technology landscapeThere are two approaches to the creation of workflows. A single software stack can be used or it could be a mix and match ap-proach using the best fit for purpose packages. Bill Dollins, in his geoMusings (http://geobabble.wordpress.com/2012/11/09/personal-geospatial-workflows/) states, “I spend a lot of time working with the Esri stack during my work day. A few years ago, I added a few open-source geospatial tools into my tool set and, since then, have also done a respectable amount to consult-ing work them as well. The balance between the two varies over time, depending on the requirements of individual customers and projects. Lately, commercial customers have seemed much more interested in open-source tools while my government cus-tomers are sticking with Esri.”
In the case of the GEOSS workflow, the approach is a mix and match of different datasets and processes from dif-ferent sources. These data and processes are not necessarily the best for the purpose and could be replaced depending on
their fitness of purpose and the availa-bility of new datasets and processes. Thus, the processes could be imple-mented on standard COTS, Open Source or even custom modules written from scratch, while the data could be shared for the purpose of the project. The key here i s standardisation and in-teroperability of data and processes.
A similar view is echoed by Chris Gib-son, Vice President, Trimble Navigation, when he says, “If you look at data man-agement and integration from a customer perspec-tive you find that a number of customers have data in a vari-ety of databases.” Gibson thinks the
Elevation samples
Digital elevation reconstruction Slope analysis
Vegetation model
Erosion model
Vegetation evolution model
Storm and discharge models
Spatial interpolation model
Precipitation model
Topo-mapSlope angle Slope length
Soil erosion
Vegetation change
Soil samples
Satellite images
Vegetation cover
Rainfall records
Spatial rainfall dataHydrograph
Estimated rainfall
Vegetation cover
Figure 1
GEOSS Workflow for Ground Condition Forecasting
The challenge is how to extract the information that
is necessary to solve a particular problem and put that into a
structure that will help the client in solving the overall problem
Chris Gibson, Trimble
challenge is how to extract the information that is necessary to solve a particular problem or challenge on behalf of the customer and put that into a structure that will help the client in solving the overall problem; at the same time, leave the
original data in its raw form for next solu-tion or database.
Gibson points out that process pro-ductivity is the key. It has four el-ements. The first is collection of data. Data can come from mul-
tiple sources such as a surveyor using total station, LiDAR, satellite imagery, mobile mapping vehicles
and devices, UAVs etc. The next step is how this data is pro-cessed. A significant amount of data has to be processed to help
the customer make meaningful business decisions,
and there are many solutions available for that too. “Once
the data is pro-cessed, we look at the
modelling phase. Modelling has two elements: data modelling and process
modelling. In data modelling we provide a 3D visualisation of the data that has been collected. Process modelling in-volves enhancements to the data and making the process more effective. Fourth, and most important, what decision does the customer need to make using this data,” he adds.
The second example of NLRMP illustrates the other approach where proprietary COTS software is customised to create an integrated workflow. This is similar to the Esri stack referred by Dollins. A variation of this approach is where the vendor provides a complete suite of software per-haps under a common GUI.
Geospatial Media & Communications CEO Sanjay Kumar in his article on Geospatial Workflows Redefining Industry Ecosystem, says, “The entire ecosystem of geospa-tial industry, which was working with well-defined bounda-ries of its constituents, went through a rigorous scrutiny both by players within and outside the industry. The industry real-ised that the required degree of integration/convergence for developing a solution-centric workflow environment wasn’t an option to sail through by mere partnership and collabora-tion.” It requires acquisition of technologies, integration of processes, and embedding of workflows, which was possible with a structural re-organisation of the existing ecosystem. As an example, consider the acquisitions by Hexagon and the subsequent restructuring of its flagship product Inter-graph such that “the full spectrum of geospatial capabilities is available ... from a single provider”.
Phase IPre-survey activities
Ground control network
Primary/secondary/tertiaryGround control network
Establish monument
Observation with triangulation method with DGPS
Conduct gramsabha
Collect old villagemap
Updation of KGP/durusti patrak/jamin sampandan
Download latest records of rights from NIC portal
Phase IVPromulgation
Final map & reports submit to DILR & Dy collector
New survey data upload on NIC website
All reports open at village level within 30-day notice
Acceptance of data by authority
New 7/12 report generation with new information & map
Phase IIIPost-survey activities
Receive objection from land holder
Adjudication – solve objection with govt surveyor
Form-C generation with new survey number
Final map preparation with tippan & adjudication data
Report generation• Encroachment register• Main register• Khetarwar patrak• Kayam khardo• Akarbandh with tarij• Magna patrak
Phase IISurvey activities
Import ROR data
Inform land holder for survey
Detail measurement of land parcel with topographical
feature
Import GPS data & map generation
Tippan generation for govt land where adjoining
private land have encroached
Form-B generation and discrepancy register
Generation of notice (LPM) & distribute to every land holderFigure 2
NLRMP Process Workflow
Cou
rtes
y: S
canp
oint
Geo
mat
ics
An agile and flexible platform can help
companies extract value from data to drive greater profitability,
reduce risk and deliver personalised experiences.
Manish Choudhary, Pitney Bowes
New survey number assignment automatically

Geospatial World / May 2014 / 25
Dr. Siva Ravada, Senior Director of Development at Oracle, highlights the disappearing line between geospatial technologies and IT, while noting that they both share the same platform. Every database has an implicit spatial con-text, therefore can contribute to spatial analysis. The Oracle Spatial product therefore, not only includes spatial analytics in applications and tools, fusion middleware MapViewer, event processing, Oracle Spatial and Graph database and bundled and Cloud-based map content but also provides in-teroperability with a host of other geospatial and IT products.
“An agile and flexible platform can help organisations extract more value from their data to drive greater profita-bility, reduce risk and deliver more personalised and contex-tually relevant customer experiences,” says Manish Choud-hary, Vice President, WW Engineering, Pitney Bowes, which offers products that can be integrated with client busi-ness data and powerful spatial algorithms can be applied to enhance existing processes. Globally, telecommunications companies use Pitney Bowes MapInfo products to optimise network coverage and increase revenue through identifying where they can drive broader adoption.
Choudhary adds that the challenge faced by businesses in today’s fast-paced and competitive environment is to draw ac-tionable insights from growing datasets locked in internal and external sources that may not be properly utilised by all or-ganisations and is often trapped in rigid parts of the business.
Customer information is a business asset and competi-tive differentiator. An enabling technology is that which helps clients understand the value of their data — revealing insights into customer relationships and preferences. An apt example is Esri’s ArcGIS which integrates into a compa-ny’s existing business and data architecture. It has all the characteristics of a platform — data management, analysis, workflow templates, mobile apps, development frameworks and information products. Simon Thompson, Director, Com-mercial Industry, points out that the power of the Cloud to deliver location analytics makes maps widely accessible to many different users and business problems. It extends and enriches business intelligence, and ERP and Office, so it is easily accessible to people familiar with those systems.
Because of this, location analytics will become more than just a technology; it is going to be a widely adopted pattern for enhancing organisational efficiency and individual effec-tiveness. “It is more than “dots on maps”; it’s a way to create understanding from spreadsheets and tables, to visualise data in different ways to convert results into decisions and deci-sions into benefits,” says Thompson.
Implementing workflowsGeospatial workflows can be found in many application ar-
eas in government, such as disaster management, oil and gas exploration, infrastructure, transportation man-agement, and e-governance; in industries like insurance, utilities management, design and engi-neering, and auditing; and in the public domain like location-based ser-vices to name a few. The incentives to adopt geospatial workflows are differ-ent in different situations.
According to Gibson, the adoption rate of ge-ospatial workflows and the factors influencing it vary across regions. For instance, in US, lot of geospatial workflow adoption relates to productivity improve-ments such as in workforce, materials quality or the safety of the finished products. It is about how we can be more effective and efficient. “The key element here is to under-stand the customer needs,” he adds.
The geospatial industry thinks better management of business processes and making geographical knowledge available to citizens are two of the most important trends impacting stakeholders. It is the realisation about usefulness and long-term cost effectiveness of using geospatial tools and technologies that has led the geospatial industry to grow at a fast pace, feels Choudhary.
From a manufacturer’s perspective, it is about building re-lationships with customers, getting deep into their workflows and migrating them from task productivity to process produc-tivity. This entails understanding the challenges that they are trying to solve, and working with them to solve the challenges for them. For instance, when it comes to deformation moni-toring of mines, it is about integrating a number of geological and geospatial sensors and technologies into a total solution that will provide an early warning system on the stability and slope of the mines. So if there is a possibility of a slide, a min-ing company can move the human assets and take corrective measures before the catastrophe happens. The same can be im-plemented on dams, bridges and other structures. So the criti-cal thing is to understand the customer and what he is trying to do, and build a solution accordingly.
Kaushik Chakraborty, Vice President, Hexagon India, cites the example of security agencies adopting geospatial work-flows to circumvent the shortage of manpower. By creating a
Cost-effective ways to process new sources of
data will fuel the next wave of spatial information management.
Predictive solutions will be the next big category of geospatial
applications.Siva Ravada, Oracle
Cover Story/Enabling Businesses
geo-tagged database of all the crime and incidents that happen in an area and subjecting the data to geospatial analysis, service providers and police can spatially profile the incidents. For ex-ample, on studying the profile of a particular area they might concur that Friday evenings are more prone to a particular type of crime in that area, so they may deploy more force there. Ge-ospatial technology helps police to not only collect the crime data according to location, but also offers a complete chain of solutions which helps them in preventing or solving crime cases. Similarly, the technology is used extensively for border control and monitoring.
Likewise, utilities need to know the geographic location of their assets which include their customer base to be able to provide efficient services through better load balancing for distribution of power among different areas according to their load. Power outage information is relayed to the com-pany via a consumer’s phone call or through an automated system. The utility company then determines the location, and the number of consumers affected through an integrat-ed SCADA and GIS based system. Automatic meter reading through smart meters is another application.
Interestingly, geoinformation and technologies also play a major part when businesses are interdependent on each oth-er. For instance, Chakraborty points out that use of geospatial technology in agriculture and manufacturing companies goes as far back as the 1970s, when the manufacturer of the famous Mars chocolate bars, which had signed a contract with peanut growers of the Georgia, wanted to test if they could predict the
yield of peanut using geospatial technology. Today, agriculture companies around the world not only use the entire
chain of geospatial solutions throughout the workflow, but also have significant investments
in earth observations companies. For example, RapidEye has sig-nificant investment from insurance
companies which want to know forecast crop yields, and the degree of damage in case of a natural calamity; and the cost
to the insurance company in terms of claims. The
workflow includes analysis of vari-ous factors using
IT tools. The use of GIS as a horizontal in-
formation asset layer across IT systems is now a
standard in organisations and businesses around the world.Economic development and changing demographics,
wealth, social mobility and access to technology are driving large scale investments in GIS to support growth and develop-ment. Retailers are using it to plan and open stores or launch smarter campaigns, manufacturers to site production facilities and optimise warehousing and distribution, transport compa-nies to ship and store goods, insurance companies to evaluate risk based on local demographics and weather patterns, real estate companies to site offices, leisure, shopping, hotels and other lifestyle centres, while other business are modelling the goods and services we need, how much and where.
According to Thompson, these models require predictive analytics, with a historic view, near-real-time data and pre-scriptive insight and lots of geographic data — traffic pat-terns, past sales, store competition, demographics, buying behaviour, and events. “The technology has gone indoors in-side stores to help track merchandise, offer coupons to mobile users, and model customer and shopping patterns to improv-ing product placement. New innovations including ‘click and collect’ and e-tailing that are turning stores into distribution centres, forcing supply chains to optimise and reformat. GIS assists by helping them understand and streamline networks for higher efficiency and improved employee performance. Excess banks, stores, and ATMs can be removed successfully without impacting profitability or service,” he adds.
The architecture and engineering occupations group which includes surveyors, cartographers, photogram-metrists, and surveying technicians is also one industry which is increasingly using these technologies.
Evolving trends & the futureThe progressively complex and accelerating pace of change in geospatial technology industry offers various possibilities for meeting the increasingly sophisticated geospatial infor-mation demands of the government, private industry, scien-tists and the public. Once a tool that was affordable only to the largest organisations, geospatial systems have become a worthwhile option for even the smallest organisations.
Thompson points to the two big recent trends — big data and GIS and the consumerisation of IT in business. Today, GIS data and analysis is available anywhere to anyone, on any device. It has become part of the app culture but operates as a secure platform in the company’s offices, in the Cloud or a combination of the two. This means that companies are going beyond analytics; they are getting specific answers to questions, intelligence which drives operational perfor-mance and improved results.
With the availability of personal devices like smart-phones, phablets and tablets, and the proliferation of Web-
The use of GIS as a horizontal information asset layer across IT systems is now
a standard in organisations and businesses around the world.
Kaushik Chakraborty, Hexagon India


Cover Story/Enabling Businesses
based geospatial services the access to geospatial informa-tion has become ubiquitous. Neo-geographers can not only contribute volunteered geographical information (VGI) but also use the services in their day-to-day activities. “As per-sonal and business interactions take flight globally on tablets and smartphones, a company’s ability to instantaneously talk, text, market, sell and delight their customers with rel-evant content has come to be expected,” says Choudhary. This recent trend, known as the consumerisation of GIS, increasingly requires non-GIS experts to build and sup-port location-based applications and services in order to meet the consumer demand for heightened engagement and interaction. The key is to use standards-based Web Services
technology that is simple, intuitive and user friendly.
Social media has become an im-portant vehicle where the pub-lic can express their views and concerns. Businesses are using
social media as an important way of remaining connected with their customers. Social media compa-nies are able to give their users
a better social experience while marketers and advertisers can target their messages to the
right audience resulting in an increased likelihood
of action. “Loca-tion will become a cornerstone
for social media marketing and social
media networks like Face-book, Twitter etc. have
become channels for users to broadcast location and senti-ment,” thinks Choudhary.
Thompson has an interesting way of looking at the fu-ture: “New technology and consumer innovations have a big impact on how we live, work, shop, dine and spend our lei-sure time. Successful companies are now moving to under-standing the third place — somewhere else other than where we live or work — in order to outperform the competition.” The third place is an important concept linked to peoples’ behaviourial patterns. Everything about it involves location. GIS is the best way to understand it and place-based activi-ties have become more important to many companies, even more than online behaviour. Companies that have the best understanding of the third place are the most profitable, re-sponsive and innovative.
Ravada considers the future to be shaped by the Internet of Things. Technology will be infused by location. Billions of devices will generate enormous amounts of geographic and attribute data, which will be carried on the Internet. This will lead to new data products for consumers, government and industry and the rise of a new set of data consumers. Cost-effective ways to process new sources of data will fuel the next wave of spatial information management. Predictive solutions will be the next big category of geospatial applica-tions. Government and authoritative sources will not only be consumers of cloud services, they will deliver the cloud.
However, as Gibson points out, standards and interoper-ability are a critical part of ensuring a smooth workflow. “It is important that we all work with organisations like OGC and develop standards that are universally acceptable and adoptable. As we progress in future, we will see much of data integration and data interoperability happening.”
Prof Arup Dasgupta, Managing Editor, [email protected]
Successful companies are now moving to
understanding the third place — somewhere else other than where
we live or work. GIS is the best way to understand it.
Simon Thompson, Esri
Cou
rtes
y O
racl
eConsists of using a device to capture an
event
That is relayed through a network
to an application translating the captured event into meaningful
information
The Future of Geospatial Workflows
The New Infrastructure
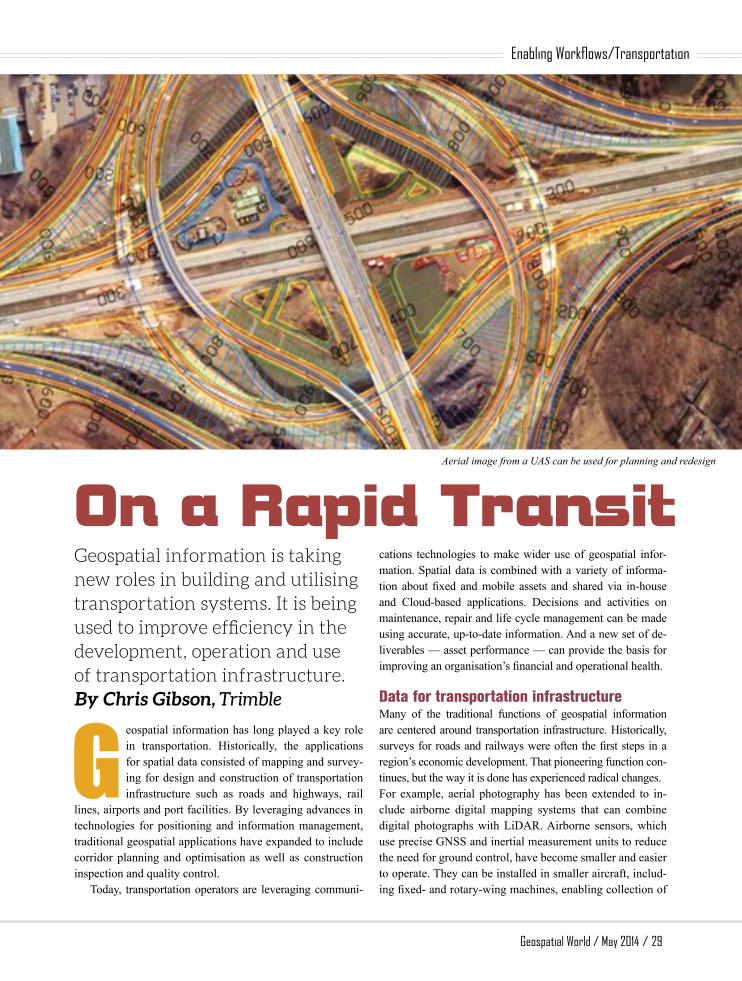
Geospatial World / May 2014 / 29
G eospatial information has long played a key role in transportation. Historically, the applications for spatial data consisted of mapping and survey-ing for design and construction of transportation infrastructure such as roads and highways, rail
lines, airports and port facilities. By leveraging advances in technologies for positioning and information management, traditional geospatial applications have expanded to include corridor planning and optimisation as well as construction inspection and quality control.
Today, transportation operators are leveraging communi-
cations technologies to make wider use of geospatial infor-mation. Spatial data is combined with a variety of informa-tion about fixed and mobile assets and shared via in-house and Cloud-based applications. Decisions and activities on maintenance, repair and life cycle management can be made using accurate, up-to-date information. And a new set of de-liverables — asset performance — can provide the basis for improving an organisation’s financial and operational health.
Data for transportation infrastructureMany of the traditional functions of geospatial information are centered around transportation infrastructure. Historically, surveys for roads and railways were often the first steps in a region’s economic development. That pioneering function con-tinues, but the way it is done has experienced radical changes. For example, aerial photography has been extended to in-clude airborne digital mapping systems that can combine digital photographs with LiDAR. Airborne sensors, which use precise GNSS and inertial measurement units to reduce the need for ground control, have become smaller and easier to operate. They can be installed in smaller aircraft, includ-ing fixed- and rotary-wing machines, enabling collection of
On a Rapid TransitGeospatial information is taking new roles in building and utilising transportation systems. It is being used to improve efficiency in the development, operation and use of transportation infrastructure. By Chris Gibson, Trimble
Aerial image from a UAS can be used for planning and redesign
Enabling Workflows/Transportation
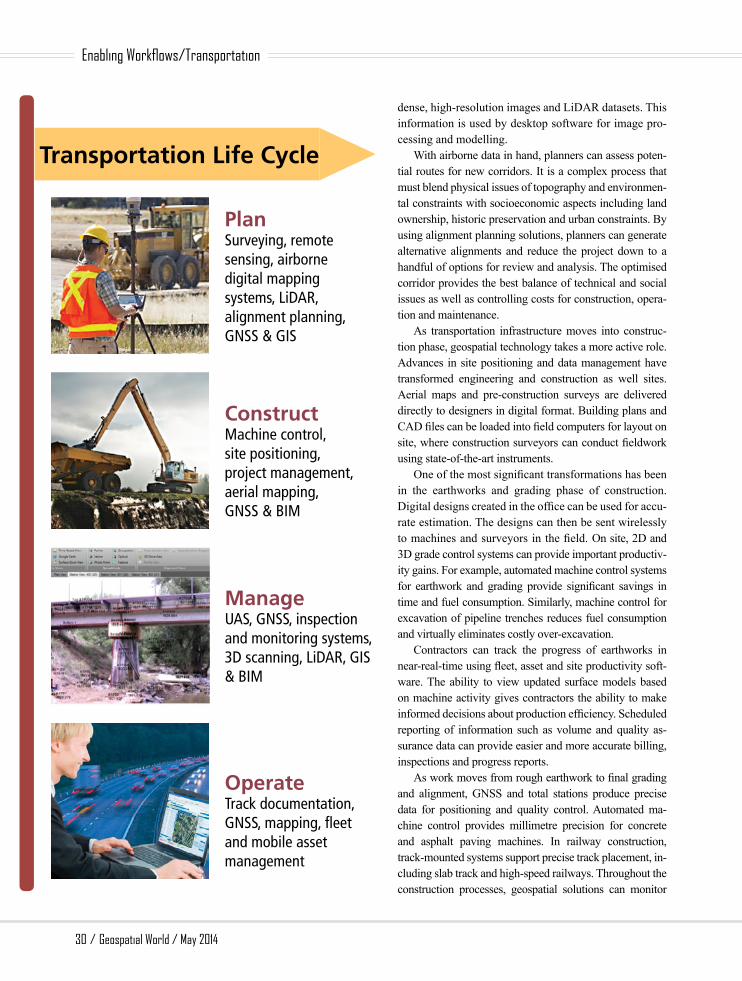
30 / Geospatial World / May 2014
Enabling Workflows/Transportation
dense, high-resolution images and LiDAR datasets. This information is used by desktop software for image pro-cessing and modelling.
With airborne data in hand, planners can assess poten-tial routes for new corridors. It is a complex process that must blend physical issues of topography and environmen-tal constraints with socioeconomic aspects including land ownership, historic preservation and urban constraints. By using alignment planning solutions, planners can generate alternative alignments and reduce the project down to a handful of options for review and analysis. The optimised corridor provides the best balance of technical and social issues as well as controlling costs for construction, opera-tion and maintenance.
As transportation infrastructure moves into construc-tion phase, geospatial technology takes a more active role. Advances in site positioning and data management have transformed engineering and construction as well sites. Aerial maps and pre-construction surveys are delivered directly to designers in digital format. Building plans and CAD files can be loaded into field computers for layout on site, where construction surveyors can conduct fieldwork using state-of-the-art instruments.
One of the most significant transformations has been in the earthworks and grading phase of construction. Digital designs created in the office can be used for accu-rate estimation. The designs can then be sent wirelessly to machines and surveyors in the field. On site, 2D and 3D grade control systems can provide important productiv-ity gains. For example, automated machine control systems for earthwork and grading provide significant savings in time and fuel consumption. Similarly, machine control for excavation of pipeline trenches reduces fuel consumption and virtually eliminates costly over-excavation.
Contractors can track the progress of earthworks in near-real-time using fleet, asset and site productivity soft-ware. The ability to view updated surface models based on machine activity gives contractors the ability to make informed decisions about production efficiency. Scheduled reporting of information such as volume and quality as-surance data can provide easier and more accurate billing, inspections and progress reports.
As work moves from rough earthwork to final grading and alignment, GNSS and total stations produce precise data for positioning and quality control. Automated ma-chine control provides millimetre precision for concrete and asphalt paving machines. In railway construction, track-mounted systems support precise track placement, in-cluding slab track and high-speed railways. Throughout the construction processes, geospatial solutions can monitor
Plan Surveying, remotesensing, airbornedigital mappingsystems, LiDAR, alignment planning, GNSS & GIS
Construct Machine control, site positioning, project management, aerial mapping, GNSS & BIM
ManageUAS, GNSS, inspection and monitoring systems, 3D scanning, LiDAR, GIS & BIM
OperateTrack documentation, GNSS, mapping, fleet and mobile asset management
Transportation Life Cycle

Geospatial World / May 2014 / 31
buildings and landforms to detect motion or subsidence related to excavations and tunnelling.
In addition to heavy civil construction, geospatial technologies have moved into building construction. De-sign-build systems utilise building information management (BIM) and modern construction techniques for stations, maintenance facilities and support buildings. Tradesmen can use geospatial technology such as robotic total stations to en-sure accurate layout and installation. The same systems can capture as-installed information for payment, quality control and facilities management applications.
Regardless of the stage or type of construction, contractors are turning to cloud-based information management systems. Taking advantage of an array of wireless communications tech-nologies, contractors can create connected project sites that enable information to flow freely among project stakeholders. By using the cloud for information management and exchange, contractors can ensure that accurate, timely information is available for functions such as planning, layout and grading, quality control and inspections.
Managing the infrastructure life cycleFaced with long life cycles, aging infrastructure and limited funding, transportation agencies must make complex deci-sions on repair, upgrades or replacement of their facilities and assets. Activities surrounding routine inspection and maintenance use geospatial systems to identify and docu-ment areas where repairs are needed. By using an array of geospatial information, planners can set priorities for repair, remodelling and replacement.
For example, bridge inspectors must follow established protocols to collect information that provide a consistent pic-ture of a structure over time. Digital forms running on rugged field computers help gather accurate information, which can be quickly checked and recorded into maintenance and planning databases. Visual information is important for inspections as well. Imaging systems can capture high-resolution panoramic images that can be georeferenced using GNSS or optical meth-ods. Office software uses the images and photogrammetric pro-cesses to produce the individual points, objects and dimensions needed for detailed analyses. For inspection or cataloguing of larger areas, geospatial professionals can use mobile mapping systems to gather images and LiDAR data to produce 3D infor-mation along transportation corridors.
The rapid growth of unmanned aerial systems (UAS) adds another dimension to aerial data for transportation corridors and infrastructure. Aerial imagery support projects from plan-ning stages through the operations and maintenance phases. For example, a UAS can be used to photograph damage to railway tracks caused by a landslide. In addition to images of
the track, the UAS can capture images of the entire slide area to provide valuable information for geotechnical analysis and mitigation work. Because the UAS flies at low altitudes, it can operate in cloudy or rainy weather. The small, autonomous UX5 can take-off and land in small areas and requires no spe-cial facilities or personnel for operations and fuelling.
Many infrastructure maintenance applications require spe-cialised information. For example, railway operators need to maintain precise alignment of track, which often shifts under the load of passing trains. Trolley-based track measurement systems capture precise information on track conditions to be analyzed and output to tamping machines. The machines then adjust the track and ballast to meet design specifications. In ad-dition to improving speed and reducing errors in track measure-ments, this approach reduces track downtime for inspection and tamping. On a project in Germany, the system reduced staffing costs for pre-and post-tamping measurement by 80%.
As transportation managers consider upgrades and im-provements, they can use geospatial information throughout the decision and design processes. 3D laser scanning provides data on existing structures to help facilitate analyses on clearances, encroachments and constructability. Land administration sys-tems provide cadastral information in areas where road or rail alignments need to be moved or expanded. Environmental data can be managed using GIS to protect sensitive areas and avoid encroaching into hazard zones. And 3D geotechnical monitor-ing systems provide data on the behaviour of bridges, retaining walls, cut slopes and tunnels.
Geospatial info & transportation enterpriseWhile the creation and life cycle management of transportation infrastructure is essential, one must remember that transporta-tion infrastructure exists to enable the movement of people and goods. In addition to the general public, this ‘user segment’ includes public and private organisations such as bus lines, trucking and freight companies and railway operators. These organisations increasingly blend geospatial information into
In addition to optimising a vehicle’s route, fleet
management solutions can manage information
ranging from maintenance to the emergence of
mechanical problems

32 / Geospatial World / May 2014
Enabling Workflows/Transportation
their operations management and enterprise resource planning. While large differences exist among transportation com-
panies, they share a number of common challenges. Compa-nies must manage fleets of assets such as rail cars, delivery vans or long-haul trucks that may be spread over large ge-ographic areas. By using geospatial information with data from on-board sensors, fleet managers can track the location and status of a mobile asset. Routing and scheduling systems have demonstrated the ability to improve asset utilisation while reducing fuel consumption and overall transportation costs. In addition to route optimisation, fleet management solutions can manage information ranging from scheduled maintenance to the emergence of mechanical problems. Data from vehicles in the field can be gathered and managed to reduce breakdowns and unexpected downtime.
In many cases, efficient operation depends on the per-formance of individual drivers or operators. Mobile fleet solutions such as the PeopleNet system use GPS, real-time communications and onboard engine diagnostic information to monitor the movement of long-haul trucks. In-cab sys-tems provide route guidance and automated communication, eliminating manual paper processes and reducing fuel usage from out-of-route miles. The PeopleNet system has shown to improve fuel economy by 5 to 15%, while also reducing accidents and compliance issues.
Geospatially enabled fleet management extends to ser-vice industries as well, including organisations such as tel-ecommunications (cable providers), waste management, construction, utilities and HVAC and facilities maintenance. Using real-time information, cloud-based systems support faster response times and easier dispatch, communication and coordination. Fleet vehicles are equipped with on-board in-cab displays that route mobile workers and field technicians to customer sites for service calls. In addition to improving response times, the systems help reduce fuel consumption and emissions while vehicles are in the field, ultimately lowering operating costs and ensuring optimised vehicle utilisation.
In the rail sector, railway operators are working to meet new requirements for train safety. For example, new laws for positive train control (PTC) in the United States require
real-time monitoring of a train’s location and speed. In addi-tion to position sensors on trains, meeting the requirements will call for equipment to determine the status of signals, switch positions and operating conditions. To fully imple-ment the system, railways will need to develop accurate spatial information of all tracks and facilities and keep up-to-date information loaded in the computers that will be onboard each PTC-equipped train. Gathering and managing this information is an enormous task that will require both airborne and ground-based geospatial technologies.
RoI: the value of measurementWhen discussing geospatial technology as a measurement tool, most people think of it as measuring positions and di-mensions in two or three dimensions. But geospatial sys-tems support other, equally tangible types of measurement as well. By combining position with other data such as time, driver logs, inventories, vehicle information and customer feedback, an organisation can develop a detailed picture on the activities and productivity of its assets and human re-sources. This ability to measure performance is one of the most important new deliverables of geospatial technology.
Many organisations may not understand the myriad of sources that contribute to operating costs. With detailed data in hand, an organisation can gain a deeper understanding of its cost structure. In an era of rising costs and constrained reve-nues, even small improvements in performance can affect the bottom line. This ability to quantify details of business’s oper-ations illustrates a unique capability of geospatial technology — it can measure the impact it has on an operation.
Geospatial information can be used to improve efficiency in the development, operation and use of transportation infra-structure. Data from the same systems that helped facilitate the improvements can be used to determine how well they are working. By serving as the hub for this cycle of measure-im-prove-remeasure, geospatial technologies become the driver for continuous improvement in the transportation sector.
Christopher W. Gibson, Vice President,Executive Committee Member, [email protected]
A trolley system captures precise information on train tracks in Germany. The data is fed to the tamping machine to adjust the tracks to the design parametres
Mobile mapping systems provide data on roadway alignment and condition as well as adjacent objects. The systems can collect image and LiDAR data while moving at highway speeds

Spatial information—the location of a feature, its attri-butes, and its relationship to things around it—is a valuable core component of the information an organization uses to manage its assets and resources. By combining spatial data with a broad array of information and applications, organizations can reduce costs and improve their return on investment. By engineering innovations around core tech-nologies in positioning, communications and information management, Trimble® solutions deliver precision, accuracy and real-time information when and where it is needed to make timely and informed decisions.
Trimble solutions enable users to apply spatial information in a growing array of applications. In the agriculture industry, Trimble technology provides increased efficiency in farm operations, water and soil management and performance analysis for increased crop yield and smarter resource use. Integrated Trimble solutions for building construction help to optimize design-build-maintain cycles while reducing
rework and operating costs. And Trimble imaging technologies are enabling new opportunities for visual and geospatial information in surveying, engineering and infrastructure management.
Rapid Dataflow Improves Farm ProductivityThe use of geospatial data for operations management has delivered significant positive impacts in the agricul-ture industry. In addition to GNSS-based control of farm machinery, Trimble agricultural solutions provide systems for collection and analysis of data such as yield, moisture and equipment status. The information forms the basis for timely, data-based decisions on farm operations and resource utilization. Trimble technology enables rapid sharing of infor-mation between field and office.
On large farms, fields can be great distances from the farm office, introducing logistical challenges in collecting and managing data from machine-mounted sensors.
Geospatial information has become an essential tool for modern enterprise management in a wide spectrum of industries. Successful organizations place Trimble technologies at the core of their operations to gather, share and utilize information.
The Intelligent Workflow—The Path From Data to Results
Geospatial World / May 2014 / 33
Adv
erto
rial

Harvest results have proven the value of the Connected Farm solution. By receiving data directly from on-machine yield sensors, Farm Works can quickly develop yield maps for each field and crop. The information enables farm man-agers to adjust fertilizer prescriptions on the same day the yield data arrives in the office. With the yield maps in hand, farm managers can make better decisions. The timing allows their applicator to apply the right amount of fertilizer the next day.
Rapid Data Delivery Saves Time and CostAs a result of implementing the Connected Farm solu-tion, modern farms have streamlined data management and reduced the need for physical storage devices. When a combine operator completes a harvest job, the data appears on the farm manager’s computer as soon as the job is completed.
A second critical benefit from the Connected Farm solution lies in rapid verification of farm data. Because field data is quickly sent back to the office, personnel can quickly diagnose and fix problems before they become worse. For example, a failed moisture sensor on a harvester could pro-vide inaccurate data for the rest of the season. The problem might not be discovered until the storage devices are col-lected and carried to the office. With the Trimble Connect-ed Farm solution, harvest data is wirelessly sent back to the office where the problem can be quickly discovered. The farm manager can then contact the harvester operator to fix the problem before harvesting additional fields.
Trimble solutions for sharing information between field and office extend well beyond agriculture. Information movement is also an essential part of modern building construction.
Success by Design—The Virtual Construction ProjectMoving from a set of construction plans to a finished build-ing is a complex, difficult task. It requires close cooperation among trades and professionals under the direction of a general contractor and project manager. As part of the effort to reduce a project’s risk, contractors must develop intimate knowledge of a building and how it will be constructed. A successful project demands that everyone share a common view of the project and have access to identical information.
Trimble technology helps contractors and owners in-crease success and profitability in building projects. This is achieved through the use of building information manage-ment (BIM) approaches such as Trimble’s Tekla software, accompanied by virtual construction workflows. For exam-ple, a building design usually begins as a series of 2D draw-ings and 3D models developed by architects, engineers and other professionals. These designers may use different tools and techniques to develop their parts of the build-ing design. In spite of their sometimes-disparate origin, the plans are tightly interrelated—a change in a structural component may require changes to architectural drawings as well as the building’s mechanical, electrical and plumb-ing systems. The ever-tightening demands for speed and cost control led contractors to find new ways to plan and execute their projects.
Earlier precision farming approaches could capture data on removable storage devices, which needed to be retrieved and carried to the farm office. This delay prevented farm managers from receiving field operations data in a timely manner.
By implementing the Trimble Connected Farm™ solution, farmers can collect and share information through wire-less data transfer. The solution provides communications between field and office and between individual vehicles operating in the same field. The farmer can transfer guid-ance lines, drainage designs, variety maps, yield data and variable rate prescription maps. The rapid communications enables a farm manager to quickly access data in the office using Trimble Farm Works™ software to assist in decision making and improve field record keeping.
The Trimble Connected Farm includes data links to connect office and field operations. Real-time information transfer helps improve perfor-mance of mobile assets.
34 / Geospatial World / May 2014
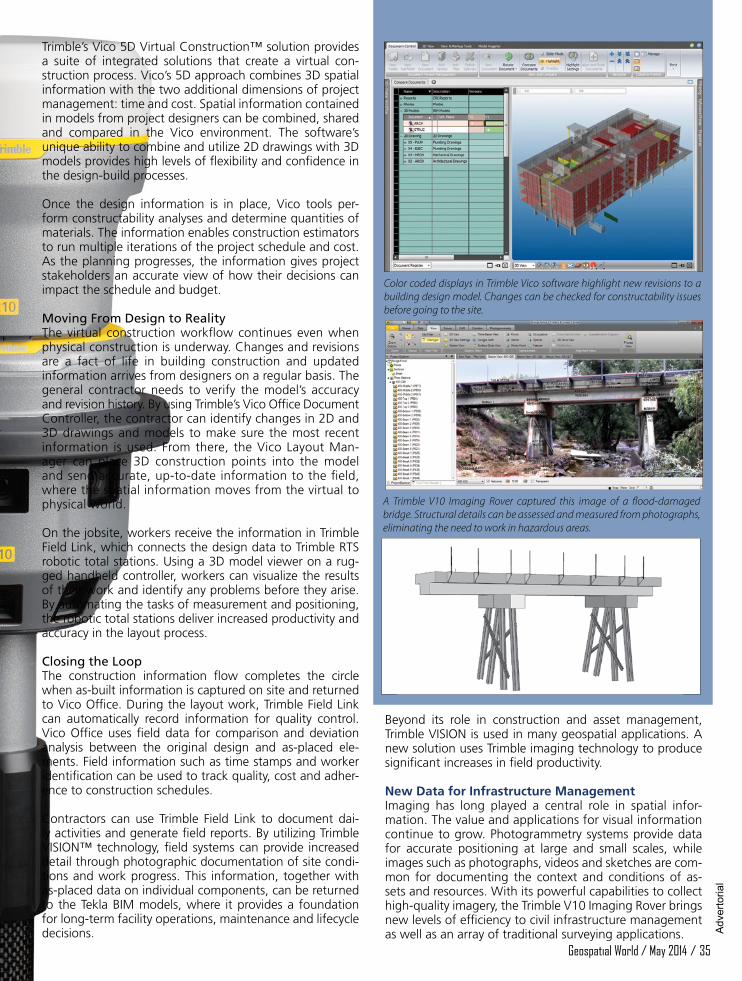
Trimble’s Vico 5D Virtual Construction™ solution provides a suite of integrated solutions that create a virtual con-struction process. Vico’s 5D approach combines 3D spatial information with the two additional dimensions of project management: time and cost. Spatial information contained in models from project designers can be combined, shared and compared in the Vico environment. The software’s unique ability to combine and utilize 2D drawings with 3D models provides high levels of flexibility and confidence in the design-build processes.
Once the design information is in place, Vico tools per-form constructability analyses and determine quantities of materials. The information enables construction estimators to run multiple iterations of the project schedule and cost. As the planning progresses, the information gives project stakeholders an accurate view of how their decisions can impact the schedule and budget.
Moving From Design to RealityThe virtual construction workflow continues even when physical construction is underway. Changes and revisions are a fact of life in building construction and updated information arrives from designers on a regular basis. The general contractor needs to verify the model’s accuracy and revision history. By using Trimble’s Vico Office Document Controller, the contractor can identify changes in 2D and 3D drawings and models to make sure the most recent information is used. From there, the Vico Layout Man-ager can place 3D construction points into the model and send accurate, up-to-date information to the field, where the spatial information moves from the virtual to physical world.
On the jobsite, workers receive the information in Trimble Field Link, which connects the design data to Trimble RTS robotic total stations. Using a 3D model viewer on a rug-ged handheld controller, workers can visualize the results of their work and identify any problems before they arise. By automating the tasks of measurement and positioning, the robotic total stations deliver increased productivity and accuracy in the layout process.
Closing the LoopThe construction information flow completes the circle when as-built information is captured on site and returned to Vico Office. During the layout work, Trimble Field Link can automatically record information for quality control. Vico Office uses field data for comparison and deviation analysis between the original design and as-placed ele-ments. Field information such as time stamps and worker identification can be used to track quality, cost and adher-ence to construction schedules.
Contractors can use Trimble Field Link to document dai-ly activities and generate field reports. By utilizing Trimble VISION™ technology, field systems can provide increased detail through photographic documentation of site condi-tions and work progress. This information, together with as-placed data on individual components, can be returned to the Tekla BIM models, where it provides a foundation for long-term facility operations, maintenance and lifecycle decisions.
A Trimble V10 Imaging Rover captured this image of a flood-damaged bridge. Structural details can be assessed and measured from photographs, eliminating the need to work in hazardous areas.
Color coded displays in Trimble Vico software highlight new revisions to a building design model. Changes can be checked for constructability issues before going to the site.
Beyond its role in construction and asset management, Trimble VISION is used in many geospatial applications. A new solution uses Trimble imaging technology to produce significant increases in field productivity.
New Data for Infrastructure Management Imaging has long played a central role in spatial infor-mation. The value and applications for visual information continue to grow. Photogrammetry systems provide data for accurate positioning at large and small scales, while images such as photographs, videos and sketches are com-mon for documenting the context and conditions of as-sets and resources. With its powerful capabilities to collect high-quality imagery, the Trimble V10 Imaging Rover brings new levels of efficiency to civil infrastructure management as well as an array of traditional surveying applications.
Geospatial World / May 2014 / 35
Adv
erto
rial
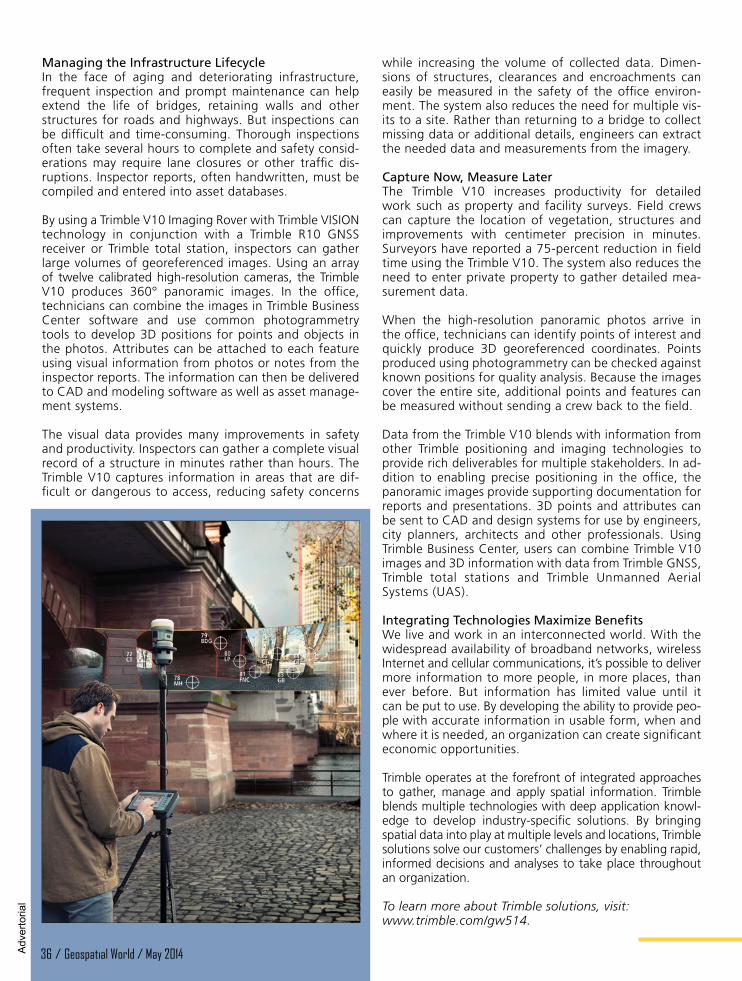
Managing the Infrastructure LifecycleIn the face of aging and deteriorating infrastructure, frequent inspection and prompt maintenance can help extend the life of bridges, retaining walls and other structures for roads and highways. But inspections can be difficult and time-consuming. Thorough inspections often take several hours to complete and safety consid-erations may require lane closures or other traffic dis-ruptions. Inspector reports, often handwritten, must be compiled and entered into asset databases.
By using a Trimble V10 Imaging Rover with Trimble VISION technology in conjunction with a Trimble R10 GNSS receiver or Trimble total station, inspectors can gather large volumes of georeferenced images. Using an array of twelve calibrated high-resolution cameras, the Trimble V10 produces 360° panoramic images. In the office, technicians can combine the images in Trimble Business Center software and use common photogrammetry tools to develop 3D positions for points and objects in the photos. Attributes can be attached to each feature using visual information from photos or notes from the inspector reports. The information can then be delivered to CAD and modeling software as well as asset manage-ment systems.
The visual data provides many improvements in safety and productivity. Inspectors can gather a complete visual record of a structure in minutes rather than hours. The Trimble V10 captures information in areas that are dif-ficult or dangerous to access, reducing safety concerns
while increasing the volume of collected data. Dimen-sions of structures, clearances and encroachments can easily be measured in the safety of the office environ-ment. The system also reduces the need for multiple vis-its to a site. Rather than returning to a bridge to collect missing data or additional details, engineers can extract the needed data and measurements from the imagery.
Capture Now, Measure LaterThe Trimble V10 increases productivity for detailed work such as property and facility surveys. Field crews can capture the location of vegetation, structures and improvements with centimeter precision in minutes. Surveyors have reported a 75-percent reduction in field time using the Trimble V10. The system also reduces the need to enter private property to gather detailed mea-surement data.
When the high-resolution panoramic photos arrive in the office, technicians can identify points of interest and quickly produce 3D georeferenced coordinates. Points produced using photogrammetry can be checked against known positions for quality analysis. Because the images cover the entire site, additional points and features can be measured without sending a crew back to the field.
Data from the Trimble V10 blends with information from other Trimble positioning and imaging technologies to provide rich deliverables for multiple stakeholders. In ad-dition to enabling precise positioning in the office, the panoramic images provide supporting documentation for reports and presentations. 3D points and attributes can be sent to CAD and design systems for use by engineers, city planners, architects and other professionals. Using Trimble Business Center, users can combine Trimble V10 images and 3D information with data from Trimble GNSS, Trimble total stations and Trimble Unmanned Aerial Systems (UAS).
Integrating Technologies Maximize BenefitsWe live and work in an interconnected world. With the widespread availability of broadband networks, wireless Internet and cellular communications, it’s possible to deliver more information to more people, in more places, than ever before. But information has limited value until it can be put to use. By developing the ability to provide peo-ple with accurate information in usable form, when and where it is needed, an organization can create significant economic opportunities.
Trimble operates at the forefront of integrated approaches to gather, manage and apply spatial information. Trimble blends multiple technologies with deep application knowl-edge to develop industry-specific solutions. By bringing spatial data into play at multiple levels and locations, Trimble solutions solve our customers’ challenges by enabling rapid, informed decisions and analyses to take place throughout an organization.
To learn more about Trimble solutions, visit: www.trimble.com/gw514.
36 / Geospatial World / May 2014 Adv
erto
rial

Geospatial World / May 2014 / 37
The oil and gas industry utilises state-of-the-art geospatial technology in its entire workflow, from the inception of an exploration idea, to all the way through to consumption of hydrocarbon products at a petrol station, burner tips or as chemical feedstock at a manufacturing plant. By Jess Kozman, Mubadala Petroleum
Open a New HorizonIntegrated Geospatial Technologies
In the 1890’s a purely manual geospatial workflow cre-ated a map showing 31 natural oil seeps in Borneo that locals had hand-dug for lamp oil. In 1907, this same map was carried by hand to the offices of an oil compa-ny in London. A branch manager in the office liked the
map, and three years later Royal Dutch Shell was drilling into what would be the first oil field in Malaysia. These early maps used hand-drawn geologic field observations to sup-port the geospatial oil and gas workflows that are still used today to explore for a new oil field.
Today, as every major petroleum company such as Royal Dutch Shell, Exxon Mobill, BP, Mubadala Petroleum con-tinue to explore for oil and gas in geologic basins around the world, automated geospatial workflows start at the early frontier and basin exploration stage for each of them, bring-ing geologic and geophysical data together in desktop GIS tools and geoscience interpretation applications. In the case of integrated energy companies like Qatar Petroleum, they can extend all the way to delivery of compressed natural gas
to power a metropolitan taxi fleet, using real-time GPS and thematic mapping tools for fleet logistics.
Drilling deepThe most visible of these uses is in the maps that drive prospecting and exploration, or what the industry refers to as ‘upstream’. Almost every geologic structural modelling, petrophysical analysis, rock mechanics, or geophysical in-terpretation package has a built-in geospatial mapping func-tion, and many oil and gas applications also provide plugins or links to GIS database products.
Prospecting and exploration for new areas in which to search and drill for oil and gas requires bringing data to-gether on maps from many different disciplines. The plotting of existing wells on maps has become more complex with the advent of technologies such as multiple wellbores from a single surface location and long-reach horizontal drilling. State-owned oil companies like the Mexico’s PEMEX report 80% reduction in data capture times and 60% improvements
Enabling Workflows/Oil & Gas
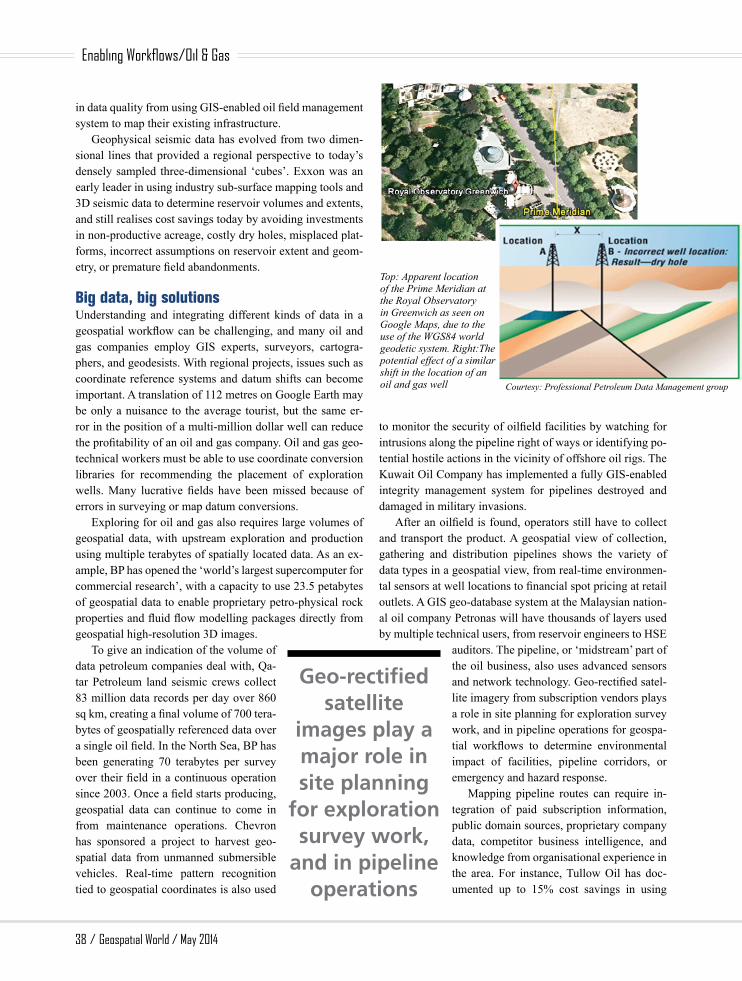
38 / Geospatial World / May 2014
Enabling Workflows/Oil & Gas
in data quality from using GIS-enabled oil field management system to map their existing infrastructure.
Geophysical seismic data has evolved from two dimen-sional lines that provided a regional perspective to today’s densely sampled three-dimensional ‘cubes’. Exxon was an early leader in using industry sub-surface mapping tools and 3D seismic data to determine reservoir volumes and extents, and still realises cost savings today by avoiding investments in non-productive acreage, costly dry holes, misplaced plat-forms, incorrect assumptions on reservoir extent and geom-etry, or premature field abandonments.
Big data, big solutionsUnderstanding and integrating different kinds of data in a geospatial workflow can be challenging, and many oil and gas companies employ GIS experts, surveyors, cartogra-phers, and geodesists. With regional projects, issues such as coordinate reference systems and datum shifts can become important. A translation of 112 metres on Google Earth may be only a nuisance to the average tourist, but the same er-ror in the position of a multi-million dollar well can reduce the profitability of an oil and gas company. Oil and gas geo-technical workers must be able to use coordinate conversion libraries for recommending the placement of exploration wells. Many lucrative fields have been missed because of errors in surveying or map datum conversions.
Exploring for oil and gas also requires large volumes of geospatial data, with upstream exploration and production using multiple terabytes of spatially located data. As an ex-ample, BP has opened the ‘world’s largest supercomputer for commercial research’, with a capacity to use 23.5 petabytes of geospatial data to enable proprietary petro-physical rock properties and fluid flow modelling packages directly from geospatial high-resolution 3D images.
To give an indication of the volume of data petroleum companies deal with, Qa-tar Petroleum land seismic crews collect 83 million data records per day over 860 sq km, creating a final volume of 700 tera-bytes of geospatially referenced data over a single oil field. In the North Sea, BP has been generating 70 terabytes per survey over their field in a continuous operation since 2003. Once a field starts producing, geospatial data can continue to come in from maintenance operations. Chevron has sponsored a project to harvest geo-spatial data from unmanned submersible vehicles. Real-time pattern recognition tied to geospatial coordinates is also used
to monitor the security of oilfield facilities by watching for intrusions along the pipeline right of ways or identifying po-tential hostile actions in the vicinity of offshore oil rigs. The Kuwait Oil Company has implemented a fully GIS-enabled integrity management system for pipelines destroyed and damaged in military invasions.
After an oilfield is found, operators still have to collect and transport the product. A geospatial view of collection, gathering and distribution pipelines shows the variety of data types in a geospatial view, from real-time environmen-tal sensors at well locations to financial spot pricing at retail outlets. A GIS geo-database system at the Malaysian nation-al oil company Petronas will have thousands of layers used by multiple technical users, from reservoir engineers to HSE
auditors. The pipeline, or ‘midstream’ part of the oil business, also uses advanced sensors and network technology. Geo-rectified satel-lite imagery from subscription vendors plays a role in site planning for exploration survey work, and in pipeline operations for geospa-tial workflows to determine environmental impact of facilities, pipeline corridors, or emergency and hazard response.
Mapping pipeline routes can require in-tegration of paid subscription information, public domain sources, proprietary company data, competitor business intelligence, and knowledge from organisational experience in the area. For instance, Tullow Oil has doc-umented up to 15% cost savings in using
Geo-rectified satellite
images play a major role in site planning
for exploration survey work,
and in pipeline operations
Top: Apparent location of the Prime Meridian at the Royal Observatory in Greenwich as seen on Google Maps, due to the use of the WGS84 world geodetic system. Right:The potential effect of a similar shift in the location of an oil and gas well Courtesy: Professional Petroleum Data Management group

Geospatial World / May 2014 / 39
GIS routing systems for pipeline planning. Often a com-petitive advantage in a market driven by commodity pric-es can be gained by delivering the right geospatial data, to the right person, at the right time. At Mubadala Petroleum, for instance, multiple layers of exploration and production geospatial information are delivered to end users over a net-worked desktop GIS system with a query-based table of con-tents. This allows users to very easily answer questions like; “what scouting data do we have within 20 km of our recently completed pipeline?”
The scope of this data has led other disciplines within petroleum organisations to ask how they can glean value from geospatial workflows, including human resources and health, safety and environment (HSE). Shell has pointed out that increasing attention to unconventional resources such as shale gas and coal bed methane is adding to the types of ge-ospatial data that need to be processed and analysed. These new data types can include high-resolution images from well logs, videos of fluid flow from hydraulic fractures, acoustic data from down-hole drilling and completion processes, and unstructured text from field operator’s notes on mobile de-vices. These data types can be accessed from GIS enabled Web portals, and fed into geospatial workflows to support business decisions.
In the operations of pipelines and production facilities, geospatial workflows have a much more direct impact on operating profits and revenues. For example, geospatial
workflows using demographic and spatial analysis can be applied to decisions about how much of aging natural gas distribution networks under major cities should be replaced in a given year. Without accurate geospatial workflows to present information about proximity and routing, attempts to assess the risk and set priorities could be misinformed.
Downstream effectWhile many oil and gas companies only follow the value chain as far as refining and processing, others are integrated energy companies and run their own retail outlets for fuels. This is known as the ‘downstream’ end of the business. Many national oil companies and global super-majors fall into this category, and are the brandnames that can be seen at petrol stations. These companies continue to use geospatial data with their products, and many are exploring alternative energy resources. So, an integrated energy company such as Iran Gas Company might use geospatial workflows that overlay multiple thematic layers to evaluate the business potential and competitive environment for wind energy in the same area that they are marketing natu-ral gas. Total Energy also uses geospatial workflows with data retrieved by satellite from GPS-located ground stations to eval-uate the potential solar energy available in its SHAMS concen-trated solar power field in Abu Dhabi.
Oil and gas companies with global integrated operations such as Saudi Aramco may use workflows in GIS desktop tools for 3D proximity analysis and buffering to bring together demographic, transportation and infrastructure maps to deter-mine the best location for a new petrol station or convenience stores in locations such as China. ExxonMobil can enable workflows using advanced 3D smart city technology to per-form urban design simulations and visualise different scenarios for efficient location of their Esso petrol stations in Singapore.
Oil and gas geospatial data managers realise that their indus-try shares many challenges and approaches with other geospa-tially data intensive industries, such as aerospace, military intel-ligence and climate modelling. However, the range of contexts in which geospatial workflows are enabled are much broader. This is reinforced when GIS forums allow oil and gas GIS pro-fessionals to recognise that many of the geospatial workflows presented by the GIS users in government agencies and e-com-merce will not scale to the environment of deliberate uncertain-ty that pervades oil and gas exploration. The ability to track, analyse and manage large datasets that support global oil and gas exploration efforts continues to improve with increasingly complex geospatial workflows.
Jess Kozman, Manager, E&P Applications – Information Management, SEA, Mubadala Petroleum [email protected]
Prospecting
Environment Assessment
Production
Logistics
Exploration
Oil and gas operations that depend on geospatial workflows
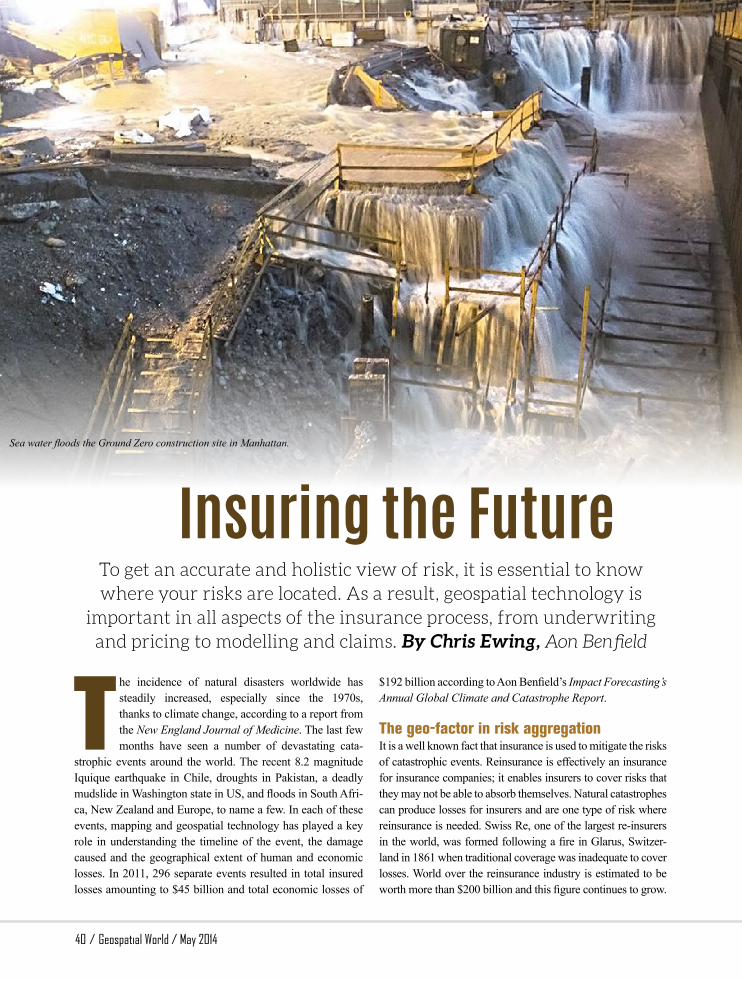
40 / Geospatial World / May 2014
Enabling Workflows/Reinsurance
To get an accurate and holistic view of risk, it is essential to know where your risks are located. As a result, geospatial technology is
important in all aspects of the insurance process, from underwriting and pricing to modelling and claims. By Chris Ewing, Aon Benfield
T he incidence of natural disasters worldwide has steadily increased, especially since the 1970s, thanks to climate change, according to a report from the New England Journal of Medicine. The last few months have seen a number of devastating cata-
strophic events around the world. The recent 8.2 magnitude Iquique earthquake in Chile, droughts in Pakistan, a deadly mudslide in Washington state in US, and floods in South Afri-ca, New Zealand and Europe, to name a few. In each of these events, mapping and geospatial technology has played a key role in understanding the timeline of the event, the damage caused and the geographical extent of human and economic losses. In 2011, 296 separate events resulted in total insured losses amounting to $45 billion and total economic losses of
$192 billion according to Aon Benfield’s Impact Forecasting’s Annual Global Climate and Catastrophe Report.
The geo-factor in risk aggregation It is a well known fact that insurance is used to mitigate the risks of catastrophic events. Reinsurance is effectively an insurance for insurance companies; it enables insurers to cover risks that they may not be able to absorb themselves. Natural catastrophes can produce losses for insurers and are one type of risk where reinsurance is needed. Swiss Re, one of the largest re-insurers in the world, was formed following a fire in Glarus, Switzer-land in 1861 when traditional coverage was inadequate to cover losses. World over the reinsurance industry is estimated to be worth more than $200 billion and this figure continues to grow.
Sea water floods the Ground Zero construction site in Manhattan.
Insuring the Future

Property catastrophe cover is increasing in prevalence as peo-ple seek to cover themselves against potential natural disasters. Analytical capability is helping behind the scenes,with many of the leading insurance companies spending hundreds of millions each year on their analytical capabilities.
To get an accurate view of risk, it is essential to know where the risks are located. No wonder then that location is a key component in determining risk: knowing with accuracy where risks are located, the prevalence of catastrophic events, the topography and geology of the area and data regarding the types of buildings in an area. Much of this information has a geographical component and can be placed on a map and viewed together in a GIS or other geospatial technologies. Such technologies are important for insurers as they seek to understand where their exposure is located in relation to other factors and to help them quantify their risk. Geospatial tech-nology is used extensively in all parts of the insurance process from underwriting and pricing to modelling and claims. Map-based underwriting platforms allow the user to add a prospec-tive customer’s property to a map and determine the premium or amount which should be charged based on a number of factors including location and proximity to risk-prone areas and other information such as demographic data.
A catastrophe model estimates the potential loss of prop-erty and life following a major disaster, and is very impor-tant for the reinsurance industry, having been used for the last 15-20 years. The model helps with pricing catastrophe reinsurance cover for different types of events or perils, in-cluding windstorm, earthquake, flood, tsunami and storm surge. Catastrophe models became significant in the early 1990s following two large hurricanes in the US — Hugo and Andrew. Reinsurance capacity was low and many com-
panies became insolvent following the disasters. The need for risk assessment was realised and catastrophe models be-came important. Until a few years ago only natural perils were modelled, but in the recent years (following the World Trade Centre attacks in 2001) terrorism and other man-made catastrophes are also being modelled.
Risk modelling firms usually use multiple data sources such as land-use information, field surveys, satellite image-ry, digital elevation models, and combine these data sources with their own expertise from wide-ranging fields like seis-mologists, meteorologists, hydrologists, engineers, mathe-maticians, finance, risk management and insurance profes-sionals.
It goes without saying that the location or spatial aspect is an inherent part of catastrophe modelling. Catastrophe models generally contain four core components — hazard, vulnerabili-ty, loss and exposure — and spatial and locational data is a vital factor in each. The hazard component represents the frequen-cy and severity of the peril with regard to spatial and temporal data. This is usually based on a stochastic event set. The vulner-ability component classifies the susceptibility of the portfolio to the hazard. For property (re) insurance the building type, main use, construction material, age, etc. may all be modelled to give an accurate description of the building. The exposure data rep-resents the information within the risk portfolio such as total insured values (TIVs), deductible and limit information and re-insurance application. The loss component calculates financial losses based on information supplied in the exposure data.
Aggregating and disaggregating risks is a geographic problem. Often, when looking at property risks, the insur-ance underwriter will aggregate their risks when describing these to the re-insurer or reinsurance broker. This can lead
Hazard MappingA hazard map highlights areas that are affected or vulnerable of a particular hazard. They are typically created for natural hazards, such as earthquakes, volcanoes, landslides, flooding and tsunamis. Hazard maps help prevent serious damage and deaths
Catastrophe ModellingCatastrophe risk models help insurers, reinsurers, brokers, financial markets and corporations price and manage risk due to natural hazards.
Risk ModellingRisk modeling uses a variety of techniques such as market risk, value at risk, historical simulation, or extreme value theory to analyse a portfolio and make forecasts of the likely losses
Process IntegrationInsurance companies are seeking to integrate existing business processes with evolving technologies and legacy applications
Quick Look
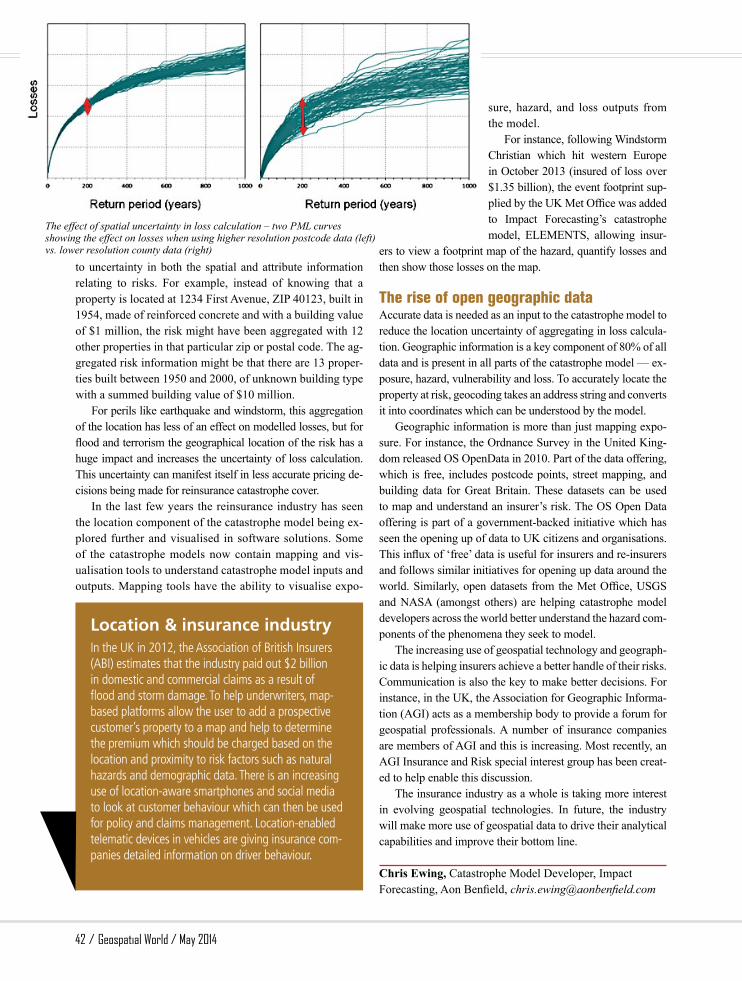
42 / Geospatial World / May 2014
Enabling Workflows/Reinsurance
to uncertainty in both the spatial and attribute information relating to risks. For example, instead of knowing that a property is located at 1234 First Avenue, ZIP 40123, built in 1954, made of reinforced concrete and with a building value of $1 million, the risk might have been aggregated with 12 other properties in that particular zip or postal code. The ag-gregated risk information might be that there are 13 proper-ties built between 1950 and 2000, of unknown building type with a summed building value of $10 million.
For perils like earthquake and windstorm, this aggregation of the location has less of an effect on modelled losses, but for flood and terrorism the geographical location of the risk has a huge impact and increases the uncertainty of loss calculation. This uncertainty can manifest itself in less accurate pricing de-cisions being made for reinsurance catastrophe cover.
In the last few years the reinsurance industry has seen the location component of the catastrophe model being ex-plored further and visualised in software solutions. Some of the catastrophe models now contain mapping and vis-ualisation tools to understand catastrophe model inputs and outputs. Mapping tools have the ability to visualise expo-
sure, hazard, and loss outputs from the model.
For instance, following Windstorm Christian which hit western Europe in October 2013 (insured of loss over $1.35 billion), the event footprint sup-plied by the UK Met Office was added to Impact Forecasting’s catastrophe model, ELEMENTS, allowing insur-
ers to view a footprint map of the hazard, quantify losses and then show those losses on the map.
The rise of open geographic dataAccurate data is needed as an input to the catastrophe model to reduce the location uncertainty of aggregating in loss calcula-tion. Geographic information is a key component of 80% of all data and is present in all parts of the catastrophe model — ex-posure, hazard, vulnerability and loss. To accurately locate the property at risk, geocoding takes an address string and converts it into coordinates which can be understood by the model.
Geographic information is more than just mapping expo-sure. For instance, the Ordnance Survey in the United King-dom released OS OpenData in 2010. Part of the data offering, which is free, includes postcode points, street mapping, and building data for Great Britain. These datasets can be used to map and understand an insurer’s risk. The OS Open Data offering is part of a government-backed initiative which has seen the opening up of data to UK citizens and organisations. This influx of ‘free’ data is useful for insurers and re-insurers and follows similar initiatives for opening up data around the world. Similarly, open datasets from the Met Office, USGS and NASA (amongst others) are helping catastrophe model developers across the world better understand the hazard com-ponents of the phenomena they seek to model.
The increasing use of geospatial technology and geograph-ic data is helping insurers achieve a better handle of their risks. Communication is also the key to make better decisions. For instance, in the UK, the Association for Geographic Informa-tion (AGI) acts as a membership body to provide a forum for geospatial professionals. A number of insurance companies are members of AGI and this is increasing. Most recently, an AGI Insurance and Risk special interest group has been creat-ed to help enable this discussion.
The insurance industry as a whole is taking more interest in evolving geospatial technologies. In future, the industry will make more use of geospatial data to drive their analytical capabilities and improve their bottom line.
Chris Ewing, Catastrophe Model Developer, Impact Forecasting, Aon Benfield, [email protected]
Location & insurance industry In the UK in 2012, the Association of British Insurers (ABI) estimates that the industry paid out $2 billion in domestic and commercial claims as a result of flood and storm damage. To help underwriters, map-based platforms allow the user to add a prospective customer’s property to a map and help to determine the premium which should be charged based on the location and proximity to risk factors such as natural hazards and demographic data. There is an increasing use of location-aware smartphones and social media to look at customer behaviour which can then be used for policy and claims management. Location-enabled telematic devices in vehicles are giving insurance com-panies detailed information on driver behaviour.
The effect of spatial uncertainty in loss calculation – two PML curves showing the effect on losses when using higher resolution postcode data (left) vs. lower resolution county data (right)
Geospatial World / May 2014 / 43
Geospatial Arsenal For
Geolocation awareness is critical to homeland security in today’s complex and fast-paced world. Rapid advancements in geolocation technology provide unprecedented transparency of hazards, threats, and vulnerabilities to security missions. By David J. Alexander, US Department of Homeland Security
Enabling Workflows/Homeland Security
Geospatial capabilities offer tremendous potential for driving new cost efficiencies and operational effectiveness for homeland security missions. Ge-ospatial data and technology improve the ability of information technology applications and systems
to enhance public security and provide for more effective situational awareness and delivery of a common operating picture. Geospatial information is often the common denom-inator that links disparate information together to reveal the necessary context and understanding required to connect the dots, and generate actionable information vital for effective decision-making.
Location is everything to homeland security. Without geospatial context, we cannot understand where and how events are occurring, nor can we rationalise why they are occurring. The location component is the ‘make or break’ for nearly all homeland security operations from back office functions such as facilities management, to frontline opera-tions in disaster response, border security, customs enforce-ment, critical infrastructure and threat reduction.
However, speed, fidelity and information vectors have introduced new challenges to the transformation of homeland security capabilities, culture and comprehension required to overcome the failures of policy, imagination and capabili-ties, like they were redlined in the 9/11 Commission Report in the United States. The homeland security geospatial com-munity needs to deliver capabilities that are fast, reliable,
interoperable, easy-to-use and integrated with the mission. It must focus on delivering the right technology at the right time to the right users and place the power of geospatial in-telligence in the hands of homeland security operators. From a pragmatic standpoint, the geospatial community needs to develop a culture of preparedness — First Responder Mind-set — fight like you train; train like you fight; correct what does not work. This will build trust between geospatial prac-titioners and frontline users, increase technology adoption, and ensure that geospatial information is better understood. While the geospatial community must remain cognizant of how geospatial data and tools are being used, vigilance in homeland security demands placing situational awareness capability in the hands of the mission operators and frontline responders. No longer is it acceptable to keep a close hold on geospatial information and technology; especially, given the ubiquity and success of consumer offerings such as Google Earth and OpenStreetMap.
US Homeland Security geospatial strategyHomeland security for all intensive purpose is the expression of the nation. It is an amalgamation of policy and functions that encompass a diverse set of missions spanning public safety, law enforcement, emergency management, intelli-gence and analysis, cyber and maritime security, risk miti-gation and homeland defence. This broad homeland security enterprise requires interactions across the entire spectrum of

44 / Geospatial World / May 2014
Enabling Workflows/Homeland Security
Public laws/US codes OMB circulars Presidential directivesExecutive orders
National System for Geospatial
National Spatial Data Infrastructure
(NSDI)
National Preparedness
System (PPD 8)Critical
Infrastructure/Cyber Security (PPD 21)
National Information Sharing Strategy
(ISE)Federal Geographic
Data Committee (OMBA-16)
Digital Governance Strategy (data.gov)
National Geospatial Policy Landscape
a nation — among federal, state, and local governments, pri-vate sector and community organisations, between academ-ia and the research and development industry; and perhaps most importantly, participation from citizens.
In the United States, geospatial strategy for homeland security, perhaps one of the best in the world, is based on a whole of nation approach. It encompasses a national geospa-tial policy landscape that is cross-domain (unclassified and classified), incorporates collaborative governance between the civilian and defence/intelligence communities, lever-ages a national spatial data infrastructure that incorporates all sectors, relies on shared resources and capabilities from the whole of community, and establishes a standards-based architecture that supports data and system interoperability.
This national geospatial framework is aligned to the homeland security mission and business functions through a Geospatial Concept of Operations (GeoCONOPS) that serves as a mission blueprint for understanding the points of coordination across the geospatial ecosystem supporting the
homeland security enterprise. The GeoCONOPS describes the who, what, and the how of the geospatial community as well as what geospatial activities, data, best practices and technical capabilities are needed to be successful. This fu-sion of geospatial capabilities with business requirements is leading to a transformation in geospatial technical archi-tecture that is based on authoritative and trusted geospatial data sources supplemented by derivative geospatial analytic products and volunteered geographic data. The geospatial information sharing components of this emerging homeland security geospatial architecture are grounded in the prin-ciples of data and system interoperability that encompass the doctrine of responsible and safe geospatial information sharing that recognises the need for data portability and data stewardship. Homeland security operations transfix harsh operating environments. Any geospatial architecture must provide support for disconnected access and offer identity credentialing and access management controls to facilitate data safeguarding. The emerging geospatial interoperability

Geospatial World / May 2014 / 45
reference architecture provides the means to integrate geo-spatial strategy with national strategies for: identity, creden-tialing, and access management (i.e. GFIPM); information sharing (i.e. NIEM and OGC specifications); and technology and standards (i.e. NIST, S&T R&D).
The delivery infrastructure supporting this geospatial information sharing strategy is based on the notion of core capabilities expressed through the GeoCONOPS. These core capabilities are realised as shared resources with integrated, federated search capabilities that are orches-trate-able across network domains. This Web-based geo-spatial delivery infrastructure includes federal resources such as the Homeland Security Geospatial Information Infrastructure (GII), the Department of Interior Geospa-tial platform, the Intelligence Community Geospatial-In-telligence Online that are linked to resources such as the National States Geographic Information Council (NSGIC) GIS inventory and other private sectors offerings. Sup-porting a ‘no wrong door policy’, through the establish-ment of a geospatial resource federation provides for more immediate access to the most relevant geospatial informa-tion and ensures location-based information is based on reliable, trusted data sources.
Effective homeland security is not about prescribing a single map viewer; it is about enabling integrated opera-tions through an information Web that better ensures our shared missions are working off a common set of infor-mation that is consumable within respective situational awareness solutions. This approach values the importance of geospatial metadata and geo-tagging to facilitate near real-time information exchange and the search, discovery, and retrieval of geospatial data best suited to a user’s need.
Emerging trends Homeland security is already starting to apply new advanc-es in geospatial capability to employ more effective hazard mitigation and risk management strategies and detect and respond to terrorism and disaster related threats with more speed and agility. Emergent areas such as big data, social media/crowdsourced information, Internet of Things, First-net, next generation 911, secure information exchange, zero trust networks, smart analytics, full motion video, drones and unmanned aerial surveillance, remote sensing and Li-DAR, and 3D landscape and geospatial immersion offer tremendous opportunities for new science and technology research initiatives and practitioner-based innovations.
Homeland security geospatial practitioners, technology firms, and data providers are moving beyond maps and cartog-raphy toward location-based decision support. There is a wave of geospatial analytic and location-based services represent-ing innovations across wireless, sensor, data management and feature extraction technologies. These innovations combined with advanced manufacturing techniques will usher in a new renaissance for geographers and a golden age of actionable information sharing in homeland security. Sustaining this geospatial renaissance will require geospatial tradecraft that relies on geospatial competencies and skills. Geospatial tech-niques such as agent-based modelling, terrestrial simulation, remotely sensed differential change detection, geofencing and near real-time geo-alerting that are plugged into the Internet of Things (sensor web), supported by crowdsourced information and built through the democratisation of situational awareness. This transformation in geospatial intelligence compels a Na-tional Spatial Data Infrastructure (NSDI) that leverages public and private sector contributions, includes participation from all sectors, and ensures representation from operators (users), data
providers, university and research labs, and ordinary citizens.
The Homeland Security geo-spatial community is a microcosm of a larger geospatial marketplace comprised of multiple communi-ties of practice with overlapping communities of interest that bene-fit from cross-fertilisation to stim-ulate creativity.
David J. Alexander, Federal Homeland Security Expert & Director, Geospatial Management Office, US Department of Homeland Security [email protected]
Common Operating and
Foundational Data

46 / Geospatial World / May 2014
Enabling Workflows/Retail
A French multinational retailer utilises geomarketing application for improving its development strategy and optimising direct-marketing actions
Businesses traditionally have relied on graphs and charts to analyse crucial information. But these basic visualisations have a propensity to miss two of the most important aspects of a retailer’s data — where things are located and what is happening
around them. Imagine being able to better understand where customers live, what they buy, what they do and why they do.
Location analytics is a game changer. It helps organisa-tions see where data is, not just what it is. Location analytics brings together dynamic, interactive mapping; sophisticated spatial analytics; and rich, complementary data to enhance the overall picture of business operations. Best of all, it is available from within already-established analytics soft-ware, so there is no need to say goodbye to familiar business tools or workflows.
Gaining new insight into businessThe Carrefour Group is one major retailer that has realised tremendous benefits from being an early adopter of location analytics. With operations in 33 countries, more than 475,000 employees, and a turnover of €107 billion, the France-based group is a world leader in distribution and retail through more than 15,000 company-operated or franchise stores. It currently runs four main grocery store formats: hypermarkets, super-markets, hard-discount stores, and convenience stores.
Unlike other players in the retail industry, the Carrefour Group has been using geomarketing tools for many years. It wanted a solution that would provide different users within the company a set of reports fully adapted to their profiles.
Users came from across all functions within the company, from the expert in marketing studies, the site acquisition specialist, and the marketing and communications director to the controller, the top manager and the store manager.
It implemented a worldwide platform for geomarketing using the Esri ArcGIS platform with Esri partner Galigeo’s location intelligence software solution. The geomarketing solution was first deployed in France, then extended to other countries including Belgium, Spain, Greece, and Taiwan.
“Carrefour Group selected Galigeo because of its ease of implementation and its ability to meet technical requirements of Carrefour’s data centres,” said Francis Rivière, geomar-keting manager at Carrefour Group.
Spatial location improves store performanceThe combined solution joins key business intelligence (BI) data with spatial location, resulting in improved store performance driven by better marketing decisions. With more than a hundred users throughout the world, Galigeo’s GeoDashboard application covers all stores operated by the group to guide expansion and development strategy, optimise direct marketing actions such as distribution of weekly circulars, monitor store performance, and gain a better understanding of the sales territory.
Changing the GameChanging the GameLocation AnalyticsLocation Analytics

Geospatial World / May 2014 / 47
The application uses the Esri ArcGIS platform for view-ing and analysing data, including traditional retail informa-tion such as trade and mailing areas, competition analysis, customer locations, and advertising hoardings. Geographic data used includes Bing Maps, Nokia data, and aerial and satellite images. Carrefour Group staff was also able to ge-ocode information on the fly.
The dynamic and interactive maps were linked to busi-ness data, either directly in reports as a complement to tables and charts or as an interactive map viewer. The latter offers advanced navigation and spatial query features, such as buff-er and included points. The GeoDashboard application is a
standalone Web cartographic portal for viewing, analysing, and querying business data. A BI map service’s bi-direction-al link provides a unique and dynamic integration solution between the mapping and BI systems.
Data can be uploaded directly from operational levels through structured forms and used easily with external data such as NAVTEQ, Bing, and Esri data. Analysis can then be done, including calculating as-the-crow-flies and walking distances to a point of sale, and using territory management, which creates new sector analysis and makes it accessible according to various criteria. Complex filters make it possi-ble to filter large volumes of spatial data.
Users can also create and view formatted reports and then print them or export them to PDF or to other Microsoft Office applications through a Flex API and a robust web architecture.
Access to data worldwideFeedback is very positive. The geomarketing solution is more user-friendly and offers the opportunity to integrate new content directly into the database. This innovative functionality lets the store level operations feed and enrich the database with information related to its store.
By representing and displaying data on interactive maps, the geomarketing application identifies hidden trends that are not discernible in tables, charts, or other dashboard widgets traditionally used in business intelligence solutions. This data about customers and marketing operations is turned into knowledge that provides greater insight to enhance operational performance.
ArcGIS, when combined with solutions such as Galigeo’s, assists users with different needs and frequencies of geospatial business analysis, from the store manager who needs reports to operate the store to the expert in charge of site selection. By representing and displaying business intelligence on maps, businesses can identify hidden trends and customer relationships and behaviour, as well as obtain deeper marketing analysis and improve business outcomes.
The geomarketing application is used for many strategic activities such as guiding expansion and development strat-egy of the company and optimising direct-marketing actions including distributing weekly circulars store performance can be monitored and a better understanding of territories can be provided. All this information feeds one database and can be shared across the enterprise.
Location analytics is enabling a refined and deeper understanding of how to improve marketing and other store-lev-el operations. It enriches data for a more intimate understanding of customer relationships, behaviour, and need.
Courtesy: Esri, Galigeo
Business intelligence on maps help retailers to identify hidden trends and customer relationships and behaviour, as well as get deeper marketing analysis

48 / Geospatial World / May 2014
Enabling Workflows/Mining
to gaze into future
Vale minesgeoinformation
Planning, design and implementation of mining activities require geographic databases that are accurate and representative. Brazil-based Vale, the world’s second largest mining company, uses end-to-end geo-based solutions as part of its workflow. By Patrícia Moreira Procópio Calazans, Vale & Luiz Henrique Guimarães Castiglione, University of State of Rio de Janeiro
L ocation is an integral part of mining operations — the primary question being where to dig. Mining activ-ities require geoinformation in good quality, much more accurate and detailed as the projects progress. It is but natural that the geological and mineral data are
regularly expressed in three dimensions because it becomes closer to the actual conformation of the bodies of interest.
Planning, design and implementation of mining activities require geographic databases that are representative and accu-rate. This representativeness is important because it brings to the table the arrangement of natural and cultural objects existing on the land in question, what is vital for clear and accurate iden-tification of interferences, and the resulting environmental con-straints. As for accuracy, its importance is related to the grow-ing demand for environmental interventions for more rigorous modelling of the land.
Vale, as the second largest mining company in the world with operations in multiple countries, believes the techno-
logical changes taking place in the geoinformation field need to be explored in all its potential, so that the responses brought to planning, design, implementation and manage-ment activities can be utilised to the fullest. It becomes important to explore the development of more accurate and richer forms of data acquisition and geo-visualisation, faced with the increasingly important challenges like envi-ronmental issues, sustainable development and operational effectiveness. Vale uses the most advanced technology in all its mines and has gone for end-to-end solutions in many cases, which not only ensures smooth operations and safe-ty, but also cuts down production costs.
At the centre of all transformation in Vale is GIS, which plays a strategic role in the integration and management of data from various sources. The GISMineral Vale enables the implementation of more sophisticated analyses, including the establishment of demands for a higher qualification of geo-graphic data. It also gives valuable inputs to the activities in CAD environment that have been quite sophisticated with the increasing adoption of 3D geoviewers.
In this sense, the strategic vision of Vale gives special at-tention to all the possibilities created by geovisualisations and analyses undertaken in 3D in virtual reality environments, and in the extensive integration of historical data that allow anal-ysis in four dimensions, incorporating the historical series of transformations to the analysis context. The emergence of 3D modelling technologies such as LiDAR, the digital ultra-high resolution imaging and monitoring of dynamic activities by GNSS, among others, must be exploited to the limit, to enhance the ability to produce best quality geoinformation for manage-ment and decision-making processes.
Use of hi-res digital images, generation of DTMs through the LiDAR and integration of data from diverse sources in GIS are basic elements to consolidate sophisticated geovisualisation environs

Geospatial World / May 2014 / 49
Geoinformation solutions adoptedThe general orientation of research and activities developed by Vale is facing a generation of data and information pro-duction for analysis and geovisualisation in virtual reality and 4D. These environ-ments, though still in the developing stag-es, relate to the general operation routine of Vale. The guidelines for the production of geographic data is already referred to these environments, so that it is possible in future to give substance to the wider use of these solutions.
Vale has adopted state-of-the-art technologies and solutions since the ear-ly 2000s. The use of digital images of high resolution, the generation of digi-tal terrain models through the LiDAR and the integration of data from diverse sources in the GIS environment are basic elements to consolidate most sophisticat-ed geovisualisation environments.
As a company that has been operating since the mid-twentieth century, Vale implemented a large part of its operations before the widespread use of GNSS solutions for the establishment of horizontal and vertical reference systems. As a result, there is a great effort to unify systems depending on the peculiarity of each of its mineral provinc-es throughout Brazil. For the georeferencing of spatial data acquisition, Vale established its own networks of reference with orthometric heights determined by geometric levelling from official Brazilian references and determination of geo-detic coordinates within the GNSS system, with provisions for determining high precision. Each Vale network had di-rectly determined the value of the geoidal undulation owing to the ellipsoidal height with the orthometric height of basic levelling using GNSS systems.
In terms of vector databases for analysis in GISMineral, compilations using digital photogrammetry are produced on the GIS with representation of all elements of special interest such as roads, rivers etc. These vector data, associated with photogrammetric and satellite orthoimages of high resolution, are very important to environmental and territorial monitor-ing, to asset management and to support associated activities in charge of health and safety in Vale’s operations, both in mining areas and in the transport infrastructure. The guideline of Vale’s operations, which runs through all its initiatives, is to reduce the risk exposure, of all people associated directly or indirectly to its activities.
Vale has generated orthoimages and compilations based on aerial photo-graphs taken before the installation of its mining ventures. Thus, it is simulta-neously looking into the past through its image collection and representations, and looking into the future with the virtual reality and modelling software. The concern over acquisition and anal-ysis of spatial data has been one of the most important historical characteristics of the company. Vale also keeps a keen eye on the state-of-the-art in technologies and operating workflows, and 3D environments would be in-corporated in everyday GIS environment and CAD solutions in the near future.
Vale indeed showed the way in using innovative technol-ogies in mining operations. As one of the pioneers in auto-mation, it invested $8 billion for a GPS-enabled ‘truckless’
The new plant starts here, but mining activity begins before, with the removal of ore from pit face and its transportation to the first crushing stage
This facility smoothens out the production rhythm, so that the plant can work for up to four days without receiving ore directly from the mine. While one pile is being formed, the other is available to feed the plant
It sends iron ore particles retained in screens to the tertiary crushing facility and then receives it back for further screening. The particles that go through the screens need to be transported to the products stockyard
The circuit for dispatching ore stored in the products stockyard is interconnected with the railway loading system. This interconnection takes place through embarkation line conveyor belt systems
Silo IV, which features innovative “clamshell” technology, will expand Vale’s capacity to load the trains that transport ore
Ore carried along a conveyor belt is unloaded into the secondary crushing facility, feeding two sizer crushers each capable of processing up to 4,000 metric tons of material per hour
1 2
3 4
5
6
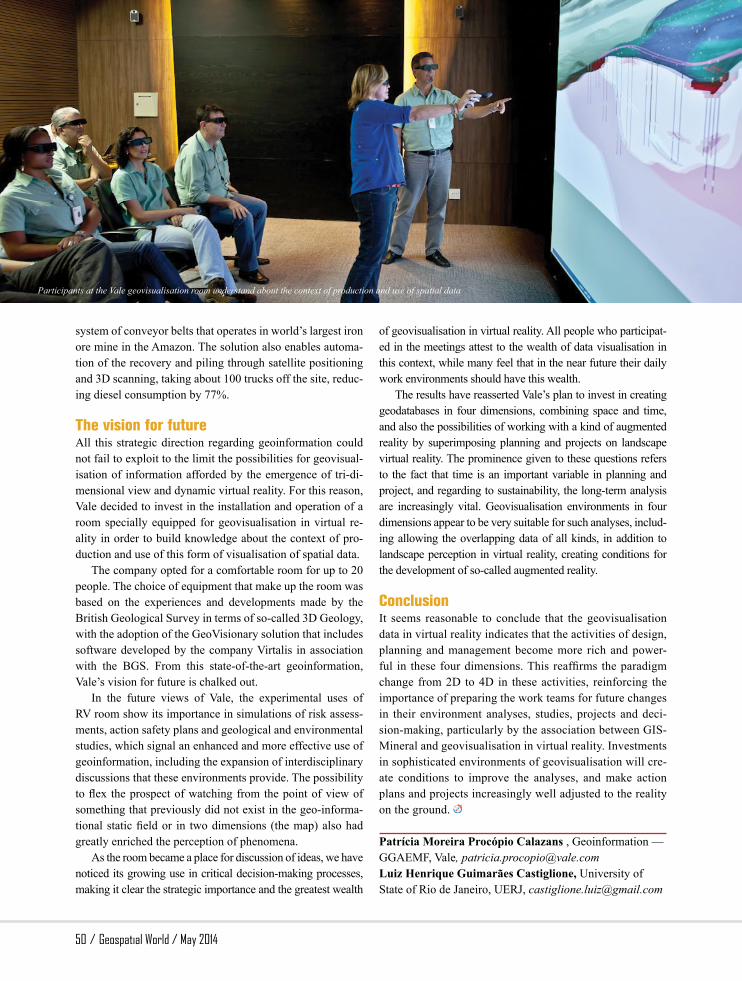
50 / Geospatial World / May 2014
Enabling workflows/Mining
system of conveyor belts that operates in world’s largest iron ore mine in the Amazon. The solution also enables automa-tion of the recovery and piling through satellite positioning and 3D scanning, taking about 100 trucks off the site, reduc-ing diesel consumption by 77%.
The vision for futureAll this strategic direction regarding geoinformation could not fail to exploit to the limit the possibilities for geovisual-isation of information afforded by the emergence of tri-di-mensional view and dynamic virtual reality. For this reason, Vale decided to invest in the installation and operation of a room specially equipped for geovisualisation in virtual re-ality in order to build knowledge about the context of pro-duction and use of this form of visualisation of spatial data.
The company opted for a comfortable room for up to 20 people. The choice of equipment that make up the room was based on the experiences and developments made by the British Geological Survey in terms of so-called 3D Geology, with the adoption of the GeoVisionary solution that includes software developed by the company Virtalis in association with the BGS. From this state-of-the-art geoinformation, Vale’s vision for future is chalked out.
In the future views of Vale, the experimental uses of RV room show its importance in simulations of risk assess-ments, action safety plans and geological and environmental studies, which signal an enhanced and more effective use of geoinformation, including the expansion of interdisciplinary discussions that these environments provide. The possibility to flex the prospect of watching from the point of view of something that previously did not exist in the geo-informa-tional static field or in two dimensions (the map) also had greatly enriched the perception of phenomena.
As the room became a place for discussion of ideas, we have noticed its growing use in critical decision-making processes, making it clear the strategic importance and the greatest wealth
of geovisualisation in virtual reality. All people who participat-ed in the meetings attest to the wealth of data visualisation in this context, while many feel that in the near future their daily work environments should have this wealth.
The results have reasserted Vale’s plan to invest in creating geodatabases in four dimensions, combining space and time, and also the possibilities of working with a kind of augmented reality by superimposing planning and projects on landscape virtual reality. The prominence given to these questions refers to the fact that time is an important variable in planning and project, and regarding to sustainability, the long-term analysis are increasingly vital. Geovisualisation environments in four dimensions appear to be very suitable for such analyses, includ-ing allowing the overlapping data of all kinds, in addition to landscape perception in virtual reality, creating conditions for the development of so-called augmented reality.
ConclusionIt seems reasonable to conclude that the geovisualisation data in virtual reality indicates that the activities of design, planning and management become more rich and power-ful in these four dimensions. This reaffirms the paradigm change from 2D to 4D in these activities, reinforcing the importance of preparing the work teams for future changes in their environment analyses, studies, projects and deci-sion-making, particularly by the association between GIS-Mineral and geovisualisation in virtual reality. Investments in sophisticated environments of geovisualisation will cre-ate conditions to improve the analyses, and make action plans and projects increasingly well adjusted to the reality on the ground.
Patrícia Moreira Procópio Calazans , Geoinformation — GGAEMF, Vale, [email protected] Luiz Henrique Guimarães Castiglione, University of State of Rio de Janeiro, UERJ, [email protected]
Participants at the Vale geovisualisation room understand about the context of production and use of spatial data
Boost Your GIS Capabilities
Featuresn Compact, lightweight and
rugged design n Real-time 1 to 2 meter accuracy n Several days of battery life n Complete ready-to-use
mapping solutionn Two Year warranty
MobileMapper 20Expanded capabilities for any GIS application
With MobileMapper 20, Spectra Precision makes it possible to deploy a professional GIS receiver to any field work force.
MobileMapper 20 is the ideal tool for a huge range of positioning applications, from initial data collection to asset inspection and maintenance.
It is the easy-to-use mapping solution for real-time collection of meter accurate data. Extend your GIS possibilities with the new MobileMapper 20: more memory, higher display resolution, bigger camera and improved communications.
As a compact, easy-to-deploy receiver, MobileMapper 20 is the essential solution for GIS data maintenance and asset management. Discover the full range of Spectra Precision MobileMapper tools at www.spectraprecision.com.
MobileMapper: Essential tools for GIS applications
©2014, Trimble Navigation Limited. All rights reserved. MobileMapper and Spectra Precision are trademarks of Trimble Navigation Limited, registered in the United States Patent and Trademark office and in other countries. All other trademarks are the property of their respective owners.
SCAN THIS CODE FOR MORE
INFORMATION
AMERICAS
Spectra Precision Division10368 Westmoor DriveWestminster, CO 80021, USA
+1-720-587-4700 Phone888-477-7516 (Toll Free in USA)
EUROPE, MIDDLE EAST AND AFRICA
Spectra Precision DivisionRue Thomas EdisonZAC de la Fleuriaye44474 Carquefou (Nantes), France
+33 (0)2 28 09 38 00 Phone
ASIA-PACIFIC
Spectra Precision Division80 Marine Parade Road #22-06, Parkway Parade Singapore 449269
+65-6348-2212 Phone

52 / Geospatial World / May 2014
Geospatial Workflows/Enabling Businesses
Geospatial industry is focused on gathering data and getting it to the customer in a usable form, but few are concerned with the process. It is why decision-makers have an increasing number of geospatial specialists, and why those specialists are turning to workflows. By Brad Skelton, Hexagon Geospatial
Geospatial Data Management
Life Cycle Approach to
P roblems are easy to find. Seek out the enemy, help the ally. Define the customer, define the product and define the link between the two. Make a job easier, safer and more cost effective.Problems are opportunities for geospatial solu-
tions. They are reasons for professionals in our sector to de-velop sensors and other technology, and techniques for using that technology to process, exploit and disseminate the data from those sensors, to analyse and store it.
Back in 2012, Hexagon President and CEO Ola Rollén had outlined the geospatial workflow in its simplest terms: “From the real world to the digital world and back.” Expand-ing, he said, “Capture the real world in real time, using all kinds of sensors. Bring that information into a system where you can sort the information, then present it back to the real world in a comprehensive way so that it’s usable.”
The path between data and the customer is paved with details the geospatial industry continues to address in var-ious ways, too often in silos spawned by competition that inhibit the ability to derive real, comprehensive and creative solutions. Closed workflows can prevent exchanging data to meet needs that can change from minute to minute in a crisis.
At the GEOINT 2013 symposium, Adm. William McRa-ven, who heads the United States Special Operations Com-mand (USSCOM), spoke of the frustration his forces expe-rience stemming from systems that do not coalesce. As the USSOCOM builds its global mission, it is constructing an intelligence, surveillance and reconnaissance support system
that has geospatial aspects, with an emphasis on signals in-telligence and human geography as its foundation. But that system has experienced root issues of data gathering and processing incompatibility, slowing geospatial workflows until those issues are overcome. Slow workflows in war endanger people who operate on the edge of conflict, and Special Operations is trying to find ways to knock down data walls between competitors’ systems.
“I think it is about building systems that naturally collabo-rate with each other,” McRaven said of competing companies creating technology that does not coexist. “This may sound a little Pollyannaish, but I am working on a number of projects now where I have asked my industry partners to be prepared to share their intellectual property with others in a way they hav-en’t done before. I think I can show them on the back end that, if you assume that risk, your return in the end will be better.” It certainly would be better for Special Forces troops whose risk is already high without complete or conflicting data.
It started with warThe impact of geospatial intelligence on war is nothing new. Hannibal used eyewitness accounts of troop movements and encampment fires to lure the Romans into a trap at Lake Trasimene, killing 15,000 and capturing 15,000 more during the June 217 B.C. battle in the Second Punic War.
William became the conqueror only after waiting for in-telligence that told him that King Harold had withdrawn Sax-on troops who had been defending the English coastline to

Geospatial World / May 2014 / 53
send them against Norwegian invaders from the north. After a sexton hung two lanterns in the belfry of Old North Church in Boston, Paul Revere and William Dawes rode through the countryside to warn that the British were coming — by sea — to begin the American Revolution at Lexington and Concord.
Even today, much of what we have in geospatial intelli-gence had its genesis in war, including the use of full-motion video and 3D imagery from sensors mounted in drones used in Iraq and Afghanistan, and the technology needed to fuse their products into a usable picture.
With government austerity programmes inhibiting addi-tional development, the geospatial industry and its customers are taking up the investment mantle to improve technology and add to it, including products that can be mounted on smaller and less expensive drones in a regulatory environment that’s evolving to allow for their increased commercial use. They also are developing satellites that are getting smaller and cheap enough to send constellations aloft, with each satellite per-forming a single or a few functions, and the constellation add-ing those functions together to derive a comprehensive system.
In a circular effect, the defence industry is leveraging the advancing commercial technology to reap the additional bene-fit of new sensors — including those satellites — and workflow enablers to derive solutions to problems that can no longer be mapped on a single country, or region or even continent.
Workflow to the worldThe US National Geospatial-Intelligence Agency, the largest single information consumer on the globe, is building a ‘Map of the World’ on which geospatial data from a myriad of sensors and bases can be layered to offer a common operating picture from which disparate customers can work. Its goal is to offer such fidelity and such a complete presentation, that it gives the operator a sensory experience with the data that provides a fourth dimension, according to NGA Director Letitia Long.
“In the not-too-distant future, I hope that analysts are able to live within the data … immersed in a multi-sensory, fully
Life or deathOne does not have to wear a uniform to find the poten-tial for slow or irregular workflows endangering lives. In their book, Age of Context, Robert Scoble and Shel Israel write of the “connected human”: an interaction between man and machines in a geospatial chain that can prolong life and make that life better lived.
In one scenario, a Redwood City, Calif., firm, Pro-teus Digital Health, has developed a sensor the size of a grain of sand that is embedded into a pill that is swallowed.
“When the chip mixes with stomach acids, the processor is powered by the body’s electricity and transmits data to a patch worn on the skin,” Sco-ble and Israel write. “That patch, in turn, transmits the data via Bluetooth to a mobile app, which then transmits the data to a central database, where a health technician can verify if a patient has taken her medications.”
They add that not taking medications as pre-scribed cost $258 billion in medical costs in 2012. An average of 130,000 Americans and hundreds of thousands of others around the world die each year because they didn’t follow prescription regi-mens properly.
It’s not difficult to see the importance of geo-spatial workflows in lowering those costs. Nor is it difficult to see where siloes that inhibit data shar-ing can shorten lives.
integrated environment,” she said. “They may be equipped with advanced visual, auditory tactical tools and technologies.”
The ‘Map of the World’ uses a data amalgamation from sources as simple as human geography interviews and obser-vations, to social media inputs such as those used to map the
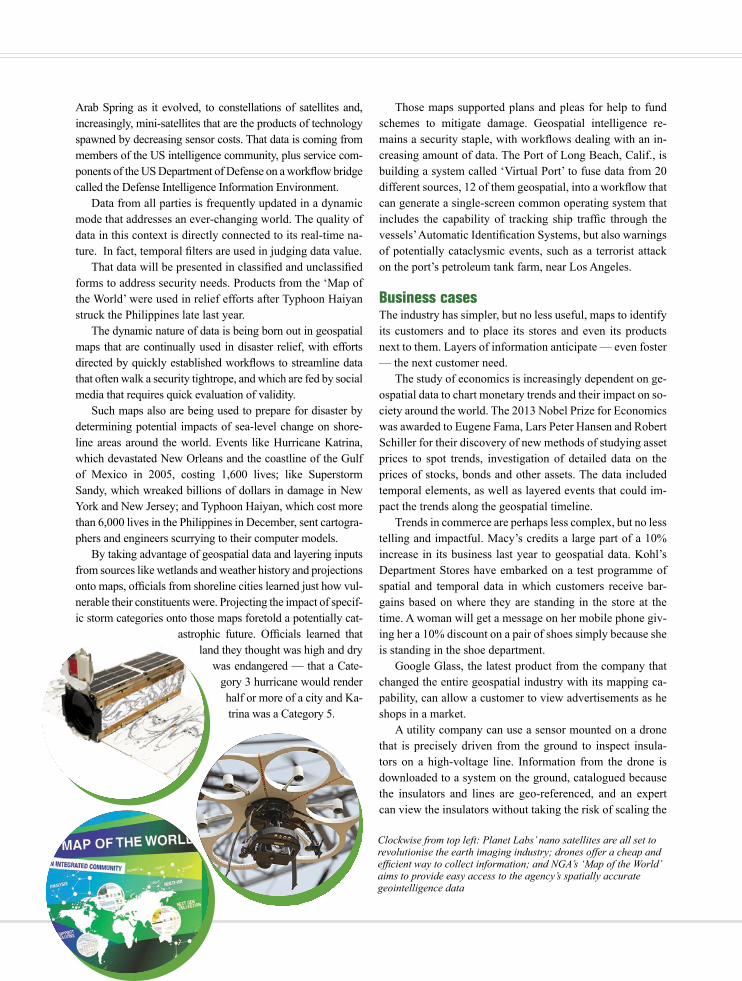
Clockwise from top left: Planet Labs’ nano satellites are all set to revolutionise the earth imaging industry; drones offer a cheap and efficient way to collect information; and NGA’s ‘Map of the World’ aims to provide easy access to the agency’s spatially accurate geointelligence data
Arab Spring as it evolved, to constellations of satellites and, increasingly, mini-satellites that are the products of technology spawned by decreasing sensor costs. That data is coming from members of the US intelligence community, plus service com-ponents of the US Department of Defense on a workflow bridge called the Defense Intelligence Information Environment.
Data from all parties is frequently updated in a dynamic mode that addresses an ever-changing world. The quality of data in this context is directly connected to its real-time na-ture. In fact, temporal filters are used in judging data value.
That data will be presented in classified and unclassified forms to address security needs. Products from the ‘Map of the World’ were used in relief efforts after Typhoon Haiyan struck the Philippines late last year.
The dynamic nature of data is being born out in geospatial maps that are continually used in disaster relief, with efforts directed by quickly established workflows to streamline data that often walk a security tightrope, and which are fed by social media that requires quick evaluation of validity.
Such maps also are being used to prepare for disaster by determining potential impacts of sea-level change on shore-line areas around the world. Events like Hurricane Katrina, which devastated New Orleans and the coastline of the Gulf of Mexico in 2005, costing 1,600 lives; like Superstorm Sandy, which wreaked billions of dollars in damage in New York and New Jersey; and Typhoon Haiyan, which cost more than 6,000 lives in the Philippines in December, sent cartogra-phers and engineers scurrying to their computer models.
By taking advantage of geospatial data and layering inputs from sources like wetlands and weather history and projections onto maps, officials from shoreline cities learned just how vul-nerable their constituents were. Projecting the impact of specif-ic storm categories onto those maps foretold a potentially cat-
astrophic future. Officials learned that land they thought was high and dry
was endangered — that a Cate-gory 3 hurricane would render half or more of a city and Ka-trina was a Category 5.
Those maps supported plans and pleas for help to fund schemes to mitigate damage. Geospatial intelligence re-mains a security staple, with workflows dealing with an in-creasing amount of data. The Port of Long Beach, Calif., is building a system called ‘Virtual Port’ to fuse data from 20 different sources, 12 of them geospatial, into a workflow that can generate a single-screen common operating system that includes the capability of tracking ship traffic through the vessels’ Automatic Identification Systems, but also warnings of potentially cataclysmic events, such as a terrorist attack on the port’s petroleum tank farm, near Los Angeles.
Business casesThe industry has simpler, but no less useful, maps to identify its customers and to place its stores and even its products next to them. Layers of information anticipate — even foster — the next customer need.
The study of economics is increasingly dependent on ge-ospatial data to chart monetary trends and their impact on so-ciety around the world. The 2013 Nobel Prize for Economics was awarded to Eugene Fama, Lars Peter Hansen and Robert Schiller for their discovery of new methods of studying asset prices to spot trends, investigation of detailed data on the prices of stocks, bonds and other assets. The data included temporal elements, as well as layered events that could im-pact the trends along the geospatial timeline.
Trends in commerce are perhaps less complex, but no less telling and impactful. Macy’s credits a large part of a 10% increase in its business last year to geospatial data. Kohl’s Department Stores have embarked on a test programme of spatial and temporal data in which customers receive bar-gains based on where they are standing in the store at the time. A woman will get a message on her mobile phone giv-ing her a 10% discount on a pair of shoes simply because she is standing in the shoe department.
Google Glass, the latest product from the company that changed the entire geospatial industry with its mapping ca-pability, can allow a customer to view advertisements as he shops in a market.
A utility company can use a sensor mounted on a drone that is precisely driven from the ground to inspect insula-tors on a high-voltage line. Information from the drone is downloaded to a system on the ground, catalogued because the insulators and lines are geo-referenced, and an expert can view the insulators without taking the risk of scaling the

Geospatial World / May 2014 / 55
Clockwise from top: Smartphones and tablets are driving the demand for location data; Google Glass enables a customer to view advertisements as and when he shops in a market; and Hexagon Geospatial 2014 emphasises how each part of the workflow integrates to offer end-to-end solutions
poles. Information is everywhere, and the use of processed data is proceeding in lockstep with that information in an expanding geospatial ecosystem.
The geospatial industry is leading — albeit occasionally — in helping develop and use new geospatial genres and in knock-ing down siloes that inhibit those genres. More agile workflows are required as the genres develop and combine, and systems with more capacity are needed as the numbers of users and the information they generate and demand expand.
Power to the solutionA democratisation of geography must be accommodated to in-clude increased input from social media that can offer real-time data, often more readily than other sensors. This democratisa-tion was exemplified in a demonstration in Denmark in which its citizens were urged to use their iPhones to take pictures of potholes on the nation’s roads. The geo-referenced photos were sent to a government system as inputs that were used to established plans, priorities and funding for road repair.
Socialisation of geography should come from a fusion of the Web, mobile, the cloud and crowdsourcing. As govern-ments and industries find new uses for geospatial intelligence and demand increases capabilities, the geospatial industry has to adapt from a “here’s the sensor and here’s the software to process it” stance. We have to understand that customers are concerned with the end results: getting the data and advice they need to make decisions. To get that advice, others along the decision chain have to get much of the same data.
The power, then, comes from the solution itself and not the technology. To the decision maker, and therefore to us, the solution should drive the technology to create it, rather than the other way around. The days of the one-size-fits-all workflow are over, if they ever really existed at all.
Our industry is focused on gathering that data and getting it to the customer in a usable form, but few at the end of the chain are as concerned with the process. It is why decision-makers have an increasing number of geospatial specialists, and why those specialists are turning to workflows trending from the horizontal to the vertically focused to get data to more people in the decision chain. The adage that knowledge is power as a reason to withhold information is being replaced by an under-standing that knowledge is power only when the people who need it to make their decisions have that knowledge.
The geospatial industry is developing templates to use with existing and developing technology to adapt to this vertical trend. Hexagon Geospatial, for example, is fusing sensors and software needed for specific vertical solutions in industries
such as mining, agriculture and urban planning, with more applicable industries — such as government property tax assessment — on the horizon. Other companies have gathered capabili-ties to bring together various steps along the workflow path, but there remains opportunity for ideas from entrepreneurial innovators working in open-source systems to become part of what is estimated to be a $100-billion business.
Indeed, small and medium-sized companies are generat-ing half of this business. Major geospatial companies would do well to combine all their the products and capabilities to form a technology umbrella to enable workflow from end to end, from sensor to finished product. For instance, Hex-agon’s Geospatial 2014 emphasises how each part of the workflow integrates and interacts with every other part to offer dynamic solutions to dynamic problems.
These capabilities include continual development of sen-sors from high range video, plus photogrammetry and non-tra-ditional optical sensors, including LiDAR, as well as hyper-spectral sensors for satellites to see at night and through clouds.
Sensor evolution is going to push more people into cloud computing. Desktop processing remains, but it’s coupled with mobile capacity driven by an increasing number of smartphones and tablet computers.
Geospatial industry is recognising that opportunity comes through need. It is heeding the challenge thrown down by Rollén at the Geospatial World Forum two years ago, “We must find new ways to promote our technologies and enable people … enable and empower billions of people. Empower the people to create a do-it-yourself system, where you pick and choose.” And educate them to realise the options they have in picking and choosing now and in the future.
Brad Skelton, Chief Technology Strategist, Hexagon Geospatial, [email protected]

56 / Geospatial World / May 2014
Geospatial technology can help Nigeria unlock its tremendous wealth and potential, and advance the developmental objectives. But what is lacking is a well-defined geospatial policy. By Vaibhav Arora
Back in the year 2000, when The Economist pub-lished a story on Africa titled The Hopeless Con-tinent, very few people would have predicted that just a decade later the same publication will come out with another article and term Africa as A Hope-
ful Continent. No other country in Africa echoes this senti-ment as Nigeria. Referred to as the ‘Giant of Africa’, Nige-ria recently pipped South Africa to become Africa’s largest economy after the government announced a long-overdue rebasing of the country’s gross domestic product.
The data indicated that the economy grew to $453 billion in 2012, instead of $264 billion as measured by the World Bank for the year. South Africa’s economy was at $384 billion in 2012. Estimates for 2013 indicated further expansion to $510 billion, Nigeria’s chief statistician, Yemi Kale, told a news con-ference in the capital, Abuja, recently. The new calculations take into account changes in production and consumption since the
Country Focus / Nigeria
Highway toHighway toDevelopmentDevelopment
last time the exercise was carried out in 1990. Nigeria, a land of 170 million people and measuring about
three times the size of South Africa, had enjoyed high rates of growth in the recent years, notwithstanding widespread cor-ruption, poor governance, rampant oil theft and raging insur-gency in the north. During 2005-2013, the average growth was 6.8%, according to the International Monetary Fund, which is projected to grow this year at a rate of 7.4%.Global investors have been eyeing Nigeria as a potential boom market, along the lines of the BRIC countries (Brazil, Russia, India and China) 10 years ago.
The Government of Nigeria has been following a policy of greater economic reforms, which seeks to transfer state owner-ship of institutions to the private sector in order to improve pro-ductivity and thus boost the overall economy. However, experts believe that things could have been much better with firm gov-ernment policies that promote the use of modern technologies.

Geospatial World / May 2014 / 57
The realisation is setting in now and most sectors in the country have begun to deploy new-age technologies to streamline their functioning. The concept of ‘smart governance’ is on the rise and organisations are looking at greater efficiency, community leadership, mobile working, improved citizen services and con-tinuous improvement through innovation. All this offers the ge-ospatial community in the region a reason to cheer and a perfect launching ground from where it can take off to the next level.
“Geospatial technology can help to promote economic and social development in Nigeria. This is because geo-spatial technology has advanced from a “nice-to-have” to a necessity in the management of resources, to promote good governance,” says Anthony Adeoye, Managing Director, AAC Consulting, a local geospatial company.
Geospatial technology in NigeriaThe history of geospatial technology in Nigeria, particular-ly its use in land management, dates back several decades. However, it was during the ’80s that its popularity increased substantially. This is when the authorities realised that for meaningful developments to happen in the country, geospa-tial information structures have to be created.
The National Space Research and Development Agency (NASRDA) was established in 1999 with a mandate to coordi-nate all space science and technology related activities in order to accelerate developmental activities in Nigeria. The agency has also been selected as the coordinating body for develop-ing Nigeria’s National Geospatial Data Infrastructure. Close on the heels, the National Space Policy and Programme was approved in 2001, which created an enabling environment for the achievement of the country’s space agenda.
Nigeria has been extremely active with its space pro-gramme and has successfully launched five satellites into orbit since the launch of NigeriaSat-1 back in 2003. Continuing with its extremely successful satellite programme, Nigeria plans to design, build and launch a satellite of its own by 2020.
Geospatial technologies and the industry has contributed immensely to the economy in Nigeria by empowering various sectors in making better decisions based on location, business and intelligent geographic information, points out Adeoye. But the industry as a whole feels it is still at its nascent stages.
“We still do not have enough data and geospatial struc-tures in the country,” says Abiodun Awofeko, CEO, Quest Consolidated, a leading geospatial company in Nigeria. However, he is quick to add that with changes in policies and availability of the required manpower, the situation is changing rapidly and more and more departments have start-ed to implement the technology in their functioning.
It is commendable that the country already ranks one of the most prominent users of spatial technologies across
various departments in Africa. A recent study conducted by the University of Cape Town on the status of SDI imple-mentation in Africa gave Nigeria the highest score for its initiatives. “Although the size and composition of the Ni-gerian geospatial industry are unclear, but considering the increasing number of stakeholders and potential users plan-ning to embark on geospatial project, the industry has a high projection rate,” adds Adeoye.
Being one of the biggest countries in Africa, Nigeria is considered to be an important market by the bigger indus-try players. Many giants from the geospatial industry have appointed their distributors and resellers in Nigeria and are executing a number of major projects. Highlighting their activities in the country, Louis Darko, General Manager, SAMBUS Geospatial, which distributes Esri products in Nigeria, says “Nigeria is one of the biggest markets for us. We have several major projects going on here including a project with the Lagos State government where we are trying to inculcate GIS into the functioning of various insti-tutions, companies and ministries. The National Commu-nication Commission of Nigeria is also executing a major project using our software.”
Some experts, however, believe that things could have been much better with firm government policies that pro-mote the use of modern technologies. “Although we do have policies in place, there are very little or no efforts on their enforcement,” says Awofeko.
Sectors that hold promiseUse of geospatial technology in Nigeria is vast and spans across various verticals. For example, the Ministry of Hous-ing and Urban Development is legally mandated to use geo-spatial technology extensively as part of its functioning. The
GDP growth of selected countries in Africa (source: World Bank) e=estimate, f=forecast
GROWING & HOW
9
8
765
43
210
2012 2013e 2014f 2015f
BotswanaNigeriaAngolaSub-Saharan

58 / Geospatial World / May 2014
Country Focus / Nigeria
ministry has different data management departments which collate all the records from different surveys as well as all information about title land and title plan of federal govern-ment properties, so that the data can be shared by all de-partments across various states in the country. Besides, other departments such as the environment, utilities, defence etc. also make use of this technology. “Now, with the spatial data infrastructure in place, all departments in the country have begun to use spatial data and benefit from it without having to incur the cost of producing their own data,” says Awofeko.
Geospatial applications is known to play a significant role in providing solutions to problems associated with disaster management, environmental control, disease con-trol and management, demographic conflict resolution and providing education for all, explains Emmanuel Okogbue, Associate Professor at the Federal University of Technology. Some of the other potential verticals include mapping, min-ing and flood assessment.Land management: Land is a subject that has always intrigued the people of Nigeria. Properly defined property rights administered in a transparent land administration sys-tem with the right policy framework is the first step towards the socio-economic development of a country. For a country like Nigeria, where more than half of the population is de-pendent on agriculture to earn its livelihood, it becomes even more crucial to ensure proper land management systems. Nigeria already has its Federal Land Information System in place and all the states have their own Land Information
Systems, which contribute to the country’s spatial data infra-structure. Some of the major agencies across various states of Nigeria include the Abuja Geographic Information Sys-tems (AGIS), Lagos State Geographic Information System, Bayelsa State GIS and Land Information System (BGIS), Bauchi State GIS and Land Information System (BAGIS), Kwara Land and Property Management System (KWAG-IS), Kaduna Land and Property System (KADLAPS) and Benue Land Information Management System (BenLIMS). The land-use law that Nigeria has been using is based on the old system. But Awofeko says the federal government set up a Presidential Technical Committee for Land Reform in 2009 to review the provisions of the land use law and make it more flexible. Town planning: The process of managing modern cities is becoming increasingly complex and requires the appli-cation of robust science and technology. The integration of modern technologies would help planners to spatially ena-ble the models for implementation, which would inculcate a more scientific and systematic approach. With an ever-grow-ing population and increasing pace of urbanisation, experts believe accurate data can help Nigeria to better manage its cities as well as rural area.
“Geospatial information has become indispensable for urban planning because the management and planning of urban space requires accurate and specifically timed infor-mation on land use change pattern,” believes Steve Onu, President of the Nigerian Institute of Town Planners. He was recently said that the continuous change in settlement patterns had made urban and regional planning a lot more complex and required timely checks on the different meth-ods involved in the practice.
“Local government, utilities and environment and energy are amongst the most potential verticals for the use of geo-spatial technology in the region and that is where most of the market comes from. Besides, defence is another area to look out for in the future,” says Darko.Disaster management: The government is using geo-spatial technologies in this area to great effect. According to estimates, around 20% of the country’s population is at risk of flooding and around 100 people are killed every year as a result of heavy rainstorm and flooding. The National Emergency Management Agency (NEMA) was established in 1999 to mitigate disasters and handle post-disaster ramifi-cation. NEMA is also responsible for formulating policy on
On the list of Top 10 African FDI destinations since 2003
4On the Top 10 list of African countries for infrastructure projects
2Projects in line to the tune of $95,480 million106
A recent study conducted by the University of Cape Town on the status of SDI implementation in Africa gave Nigeria the highest score. Source: Study by Prestige Makanga and Dr. Julian Smit, University of Cape Town
No Data Available
Not all the data available (2-5)
Low Score (5-28)
High Score (28-52)

60 / Geospatial World / May 2014
Country Focus / Nigeria
most African countries, including Nigeria, are awareness about modern technologies, poor quality of data collection, lack of organisation and management practices, lack of adequate infra-structure and the unavailability of skilled workforce.
The challenges faced by Nigeria, when it comes to the poor application of geospatial technologies across various verticals, are majorly the same as encountered by most other countries in the developing world. Lack of awareness on part of the decision makers, which has resulted in the lack of firm policies, is perhaps the biggest issue which needs to be re-solved urgently. “We have the policies to enable easy sharing of data and information but no way to enforce the provisions of these policies,” says Awofeko.
According to Darko, “Lack of manpower and miscon-ception about the supposedly high cost of geospatial soft-ware are the biggest challenges that our region is facing at the moment. Another major constraint is the unavailability of suitable GIS data.” He feels Ghana is a bit ahead of Ni-geria and other neighbouring countries in terms of availa-bility of databases.
Nigeria has acute shortage of skilled spatial scientists and surveyors. As of 2011, the country, which has a population of over 150 million, had just 2088 registered surveyors. Thus, there is a need to establish more institutes that can impart spe-cialised training in the field of geospatial science. Besides, ge-ospatial education has to be introduced at school and college level. The efforts of the Nigerian government, the surveyors’ council of Nigeria, NASRDA and other agencies must be con-centrated towards the building up of a geo-enabled workforce and spatially enabled society. “When it comes to capacity train-ing, we have the manpower, but what is lacking is the training or specialisation that can create the next level of experts in the geospatial industry,” explains Awofeko. Also, since the technol-ogy is changing rapidly, what was okay two years ago might be different today.
Despite the numerous challenges and constraints that face the further promotion and propagation of these tech-nologies, Nigeria sure promises to be the hub of all activity during the coming decade and geospatial technology will be a major driver of this growth. As Adeoye says, “Geo-spatial technology is set to be the skill of the 21st century in Nigeria.”
Vaibhav Arora, Regional Product Manager, Middle East & Africa, Geospatial Media & Communications, [email protected]
all activities related to disaster management and to collate data from relevant agencies to enhance planning, forecast-ing and field operation of disaster management. The agency boasts of a well equipped GIS lab which collects spatial data, analyses the same and prepares useful information that helps to aid disaster response.Agriculture: A few years ago, land-use and land cover analysis was carried out in south east Nigeria using Nige-riaSat imagery, which revealed massive changes during the past couple of decades. The NSRDA has also used remote sensing to develop an early warning system to estimate soil erosion. Experts say precision farming holds potential in the country, especially in the production of wheat, rice, cotton, onion, sugar beet and potato among field crops and grape, coffee, tea and apple among horticultural crops.Oil & Gas: Nigeria joined the ranks of oil producers in 1958 after discoveries in 1956 at Oloibiri in the Niger Del-ta. Today, petroleum production and export play a dominant role in its economy and account for nearly 90% of the coun-try’s gross earnings. The sector uses a lot of geospatial tech-nology. Some of the major activities in which investment opportunities abound include surveying, civil works, seis-mic data acquisition and interpretation, geological activities, drilling operations, exploration and production etc.
The other major sectors which are failing to use these tech-nologies but have immense potential are infrastructure, energy, water resources, which suffer from poor planning, implemen-tation as well as operation. The satellites could be used to ad-dress mapping of vast uncultivated farmlands, thus promoting sustainable agriculture; security surveillance of the regularly vandalised gas pipelines and power lines; mapping of other municipal water, electricity and telecoms infrastructure etc.
“Geospatial community in Nigeria holds the key to unlock the wealth of this country through its application in agriculture, mining of our numerous neglected non-oil mineral resources, adequate housing and landed property tax collection, proper planning of our cities, solving the numerous security problems confronting us as a nation including the problem of gas pipeline and power vandalisation etc,” says Okogbue. This cannot be achieved unless there is proper synergy — a constant sharing of data, cross fertilisation of ideas through regular conferences and workshops and collaborations with relevant industries, minis-tries and agencies of government.
Challenges and the way forwardSome of the major reasons for the extremely slow progress of
Investment to be made for power generation over the next decade
$40.9 bn
Investment needed for infrastructure over next three decades
$2 trn
To be invested into water resources management
$2.18 bn

GEO-033_Geospatial World_May 2014 Print Ad_Buildings_7.75in x 10.25in_0414.indd 1 4/17/2014 10:11:30 AM
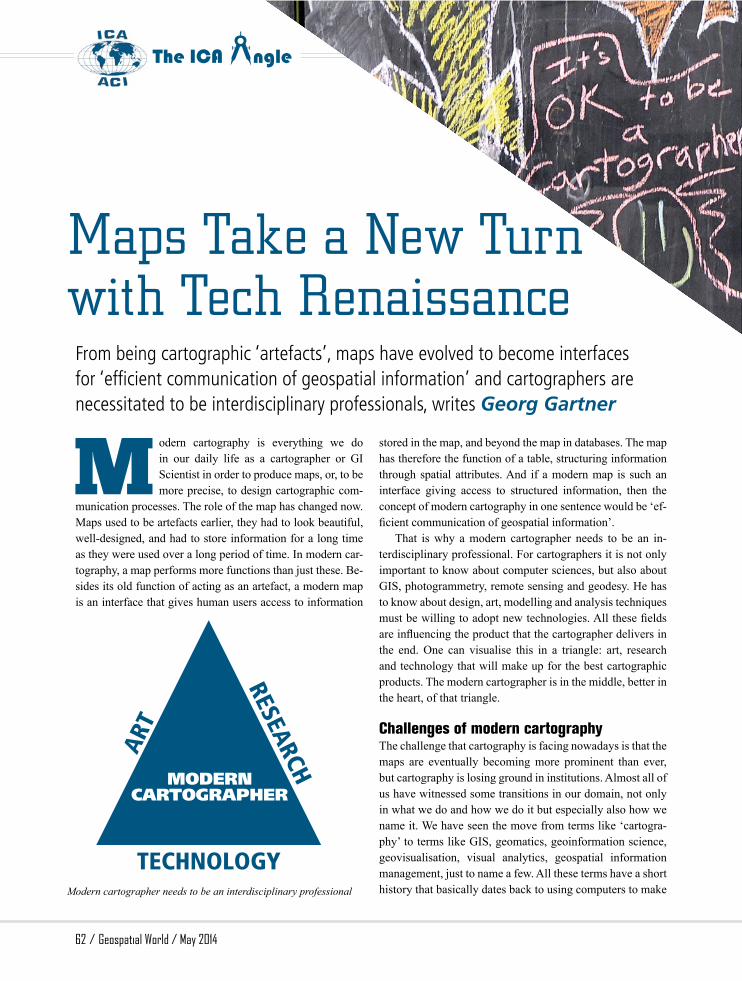
62 / Geospatial World / May 2014
The ICA ngle
Maps Take a New Turn with Tech Renaissance
M odern cartography is everything we do in our daily life as a cartographer or GI Scientist in order to produce maps, or, to be more precise, to design cartographic com-
munication processes. The role of the map has changed now. Maps used to be artefacts earlier, they had to look beautiful, well-designed, and had to store information for a long time as they were used over a long period of time. In modern car-tography, a map performs more functions than just these. Be-sides its old function of acting as an artefact, a modern map is an interface that gives human users access to information
stored in the map, and beyond the map in databases. The map has therefore the function of a table, structuring information through spatial attributes. And if a modern map is such an interface giving access to structured information, then the concept of modern cartography in one sentence would be ‘ef-ficient communication of geospatial information’.
That is why a modern cartographer needs to be an in-terdisciplinary professional. For cartographers it is not only important to know about computer sciences, but also about GIS, photogrammetry, remote sensing and geodesy. He has to know about design, art, modelling and analysis techniques must be willing to adopt new technologies. All these fields are influencing the product that the cartographer delivers in the end. One can visualise this in a triangle: art, research and technology that will make up for the best cartographic products. The modern cartographer is in the middle, better in the heart, of that triangle.
Challenges of modern cartographyThe challenge that cartography is facing nowadays is that the maps are eventually becoming more prominent than ever, but cartography is losing ground in institutions. Almost all of us have witnessed some transitions in our domain, not only in what we do and how we do it but especially also how we name it. We have seen the move from terms like ‘cartogra-phy’ to terms like GIS, geomatics, geoinformation science, geovisualisation, visual analytics, geospatial information management, just to name a few. All these terms have a short history that basically dates back to using computers to make
From being cartographic ‘artefacts’, maps have evolved to become interfaces for ‘efficient communication of geospatial information’ and cartographers are necessitated to be interdisciplinary professionals, writes Georg Gartner
ART
RESEARCH
TECHNOLOGY
MODERN CARTOGRAPHER
Modern cartographer needs to be an interdisciplinary professional
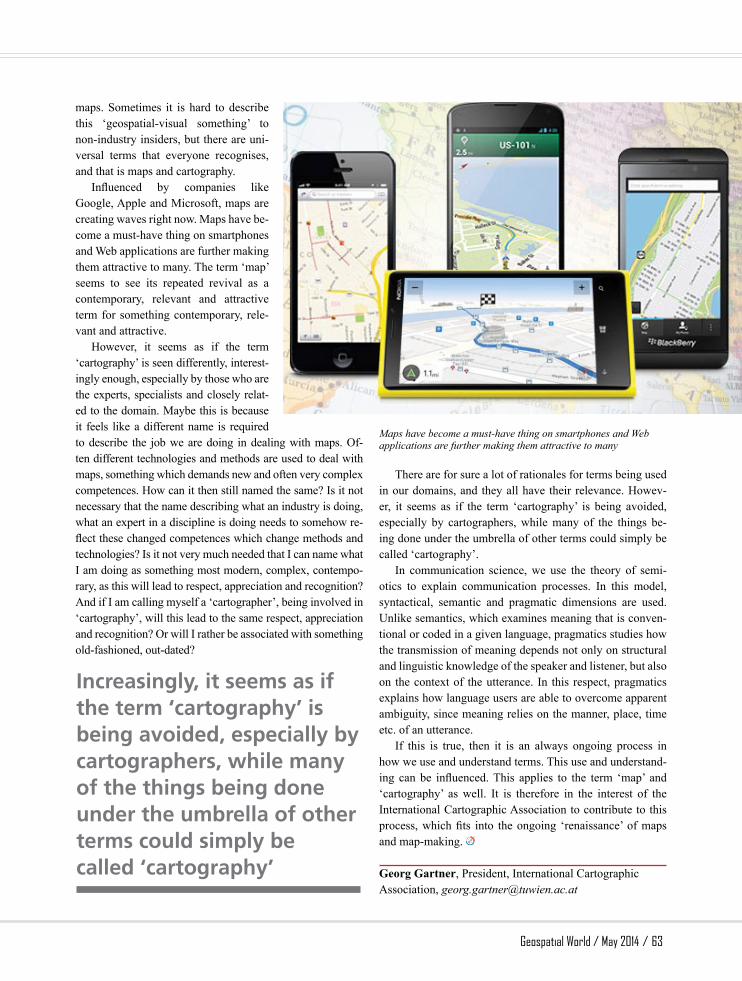
Geospatial World / May 2014 / 63
maps. Sometimes it is hard to describe this ‘geospatial-visual something’ to non-industry insiders, but there are uni-versal terms that everyone recognises, and that is maps and cartography.
Influenced by companies like Google, Apple and Microsoft, maps are creating waves right now. Maps have be-come a must-have thing on smartphones and Web applications are further making them attractive to many. The term ‘map’ seems to see its repeated revival as a contemporary, relevant and attractive term for something contemporary, rele-vant and attractive.
However, it seems as if the term ‘cartography’ is seen differently, interest-ingly enough, especially by those who are the experts, specialists and closely relat-ed to the domain. Maybe this is because it feels like a different name is required to describe the job we are doing in dealing with maps. Of-ten different technologies and methods are used to deal with maps, something which demands new and often very complex competences. How can it then still named the same? Is it not necessary that the name describing what an industry is doing, what an expert in a discipline is doing needs to somehow re-flect these changed competences which change methods and technologies? Is it not very much needed that I can name what I am doing as something most modern, complex, contempo-rary, as this will lead to respect, appreciation and recognition? And if I am calling myself a ‘cartographer’, being involved in ‘cartography’, will this lead to the same respect, appreciation and recognition? Or will I rather be associated with something old-fashioned, out-dated?
There are for sure a lot of rationales for terms being used in our domains, and they all have their relevance. Howev-er, it seems as if the term ‘cartography’ is being avoided, especially by cartographers, while many of the things be-ing done under the umbrella of other terms could simply be called ‘cartography’.
In communication science, we use the theory of semi-otics to explain communication processes. In this model, syntactical, semantic and pragmatic dimensions are used. Unlike semantics, which examines meaning that is conven-tional or coded in a given language, pragmatics studies how the transmission of meaning depends not only on structural and linguistic knowledge of the speaker and listener, but also on the context of the utterance. In this respect, pragmatics explains how language users are able to overcome apparent ambiguity, since meaning relies on the manner, place, time etc. of an utterance.
If this is true, then it is an always ongoing process in how we use and understand terms. This use and understand-ing can be influenced. This applies to the term ‘map’ and ‘cartography’ as well. It is therefore in the interest of the International Cartographic Association to contribute to this process, which fits into the ongoing ‘renaissance’ of maps and map-making.
Georg Gartner, President, International Cartographic Association, [email protected]
Increasingly, it seems as if the term ‘cartography’ is being avoided, especially by cartographers, while many of the things being done under the umbrella of other terms could simply be called ‘cartography’
Maps have become a must-have thing on smartphones and Web applications are further making them attractive to many

Solving the World’s Most Pressing Challenges, One Story at a TimeGreat stories can have a profound impact. They shape our perspective. They create history and determine the future. HxGN LIVE brings together Hexagon’s global brand network to exchange ideas and explore solutions that shape the way we work and live. Taking place 2–5 June 2014 at MGM Grand in Las Vegas, NV, HxGN LIVE combines the strengths of Hexagon Geospatial, Hexagon Metrology, Hexagon Solutions, Intergraph and Leica Geosystems to create a platform of great stories that are inspiring a global movement of change. At HxGN LIVE, you’ll preview must-see technologies, attend exclusive presentations by industry experts, participate in targeted tracks, breakout sessions and hands-on training, hear inspiring keynotes from today's thought leaders and network with peers from around the world.
Experience it LIVE. Don’t wait – register now at hxgnlive.com
GWF-advertorial.indd 1 4/18/14 4:37 PM

EXCITING INNOVATIONSThe Zone will house 45,000 feet of the most advanced and trusted technologies from our global brand network and partner community. Take a stroll through our bustling hub of innovation and learn how to take your business to the next level.
UNLIMITED NETWORKINGWith more than 3,000 attendees expected to take part in HxGN LIVE, there are countless opportunities to share best practices and learn how others are successfully steering their businesses towards the future.
VISIONARY SPEAKERSHexagon’s management team is comprised of renowned industry leaders. Daily keynotes will o� er fi rst-hand knowledge of the latest business strategies and groundbreaking technologies within our brand network.
CUSTOMER AND PARTNER EXPERTISE Not only will you hear from leaders within the Hexagon network, but also from Hexagon customers and partners who are esteemed in their fi elds. Experience their insight in a content-rich agenda that will leave you wanting more.
What to Expect at HxGN LIVE
Great stories await – register now at hxgnlive.com
CONFERENCE COVERAGE AS IT HAPPENSTune in to HxGN LIVE TV for more than 24 hours of keynotes, sessions, demos and expert insight — right from your computer or mobile device.
Tune in at hxgnlive.com/tv
GWF-advertorial.indd 2 4/18/14 4:37 PM

www.africageospatialforum.org www.lagf.org www.asiageospatialforum.org
19 - 20 August 2014Lagos, Nigeria
22 - 25 september 2014Hotel Hilton, mexico reforma
mexico City
25-27 November 2014Hotel mulia, Jakarta
Indonesia
Log on to www.geospatialmedia.net for full calendar of events
UsersTechnology Providers AcAdemiAPolicy mAkers
in Different Parts of the WorlDConneCting geosPatial Communities
Organiser
Advt. 7.75 x 10.25 Inch.indd 1 4/28/2014 10:34:11 AM