
Aeromedical Evacuation Planning Using Geospatial Decision ...
Upload
khangminh22Category
view
6download
0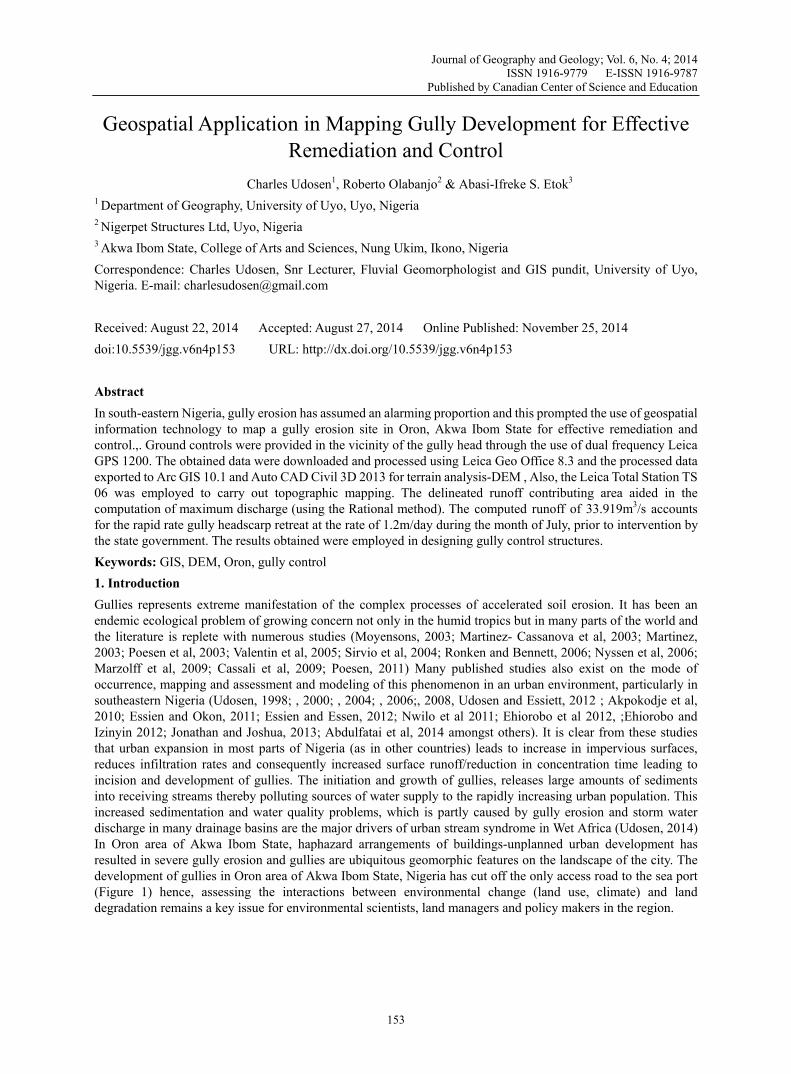
Journal of Geography and Geology; Vol. 6, No. 4; 2014 ISSN 1916-9779 E-ISSN 1916-9787
Published by Canadian Center of Science and Education
153
Geospatial Application in Mapping Gully Development for Effective Remediation and Control
Charles Udosen1, Roberto Olabanjo2 & Abasi-Ifreke S. Etok3 1 Department of Geography, University of Uyo, Uyo, Nigeria 2 Nigerpet Structures Ltd, Uyo, Nigeria 3 Akwa Ibom State, College of Arts and Sciences, Nung Ukim, Ikono, Nigeria
Correspondence: Charles Udosen, Snr Lecturer, Fluvial Geomorphologist and GIS pundit, University of Uyo, Nigeria. E-mail: [email protected]
Received: August 22, 2014 Accepted: August 27, 2014 Online Published: November 25, 2014
doi:10.5539/jgg.v6n4p153 URL: http://dx.doi.org/10.5539/jgg.v6n4p153
Abstract
In south-eastern Nigeria, gully erosion has assumed an alarming proportion and this prompted the use of geospatial information technology to map a gully erosion site in Oron, Akwa Ibom State for effective remediation and control.,. Ground controls were provided in the vicinity of the gully head through the use of dual frequency Leica GPS 1200. The obtained data were downloaded and processed using Leica Geo Office 8.3 and the processed data exported to Arc GIS 10.1 and Auto CAD Civil 3D 2013 for terrain analysis-DEM , Also, the Leica Total Station TS 06 was employed to carry out topographic mapping. The delineated runoff contributing area aided in the computation of maximum discharge (using the Rational method). The computed runoff of 33.919m3/s accounts for the rapid rate gully headscarp retreat at the rate of 1.2m/day during the month of July, prior to intervention by the state government. The results obtained were employed in designing gully control structures.
Keywords: GIS, DEM, Oron, gully control
1. Introduction
Gullies represents extreme manifestation of the complex processes of accelerated soil erosion. It has been an endemic ecological problem of growing concern not only in the humid tropics but in many parts of the world and the literature is replete with numerous studies (Moyensons, 2003; Martinez- Cassanova et al, 2003; Martinez, 2003; Poesen et al, 2003; Valentin et al, 2005; Sirvio et al, 2004; Ronken and Bennett, 2006; Nyssen et al, 2006; Marzolff et al, 2009; Cassali et al, 2009; Poesen, 2011) Many published studies also exist on the mode of occurrence, mapping and assessment and modeling of this phenomenon in an urban environment, particularly in southeastern Nigeria (Udosen, 1998; , 2000; , 2004; , 2006;, 2008, Udosen and Essiett, 2012 ; Akpokodje et al, 2010; Essien and Okon, 2011; Essien and Essen, 2012; Nwilo et al 2011; Ehiorobo et al 2012, ;Ehiorobo and Izinyin 2012; Jonathan and Joshua, 2013; Abdulfatai et al, 2014 amongst others). It is clear from these studies that urban expansion in most parts of Nigeria (as in other countries) leads to increase in impervious surfaces, reduces infiltration rates and consequently increased surface runoff/reduction in concentration time leading to incision and development of gullies. The initiation and growth of gullies, releases large amounts of sediments into receiving streams thereby polluting sources of water supply to the rapidly increasing urban population. This increased sedimentation and water quality problems, which is partly caused by gully erosion and storm water discharge in many drainage basins are the major drivers of urban stream syndrome in Wet Africa (Udosen, 2014) In Oron area of Akwa Ibom State, haphazard arrangements of buildings-unplanned urban development has resulted in severe gully erosion and gullies are ubiquitous geomorphic features on the landscape of the city. The development of gullies in Oron area of Akwa Ibom State, Nigeria has cut off the only access road to the sea port (Figure 1) hence, assessing the interactions between environmental change (land use, climate) and land degradation remains a key issue for environmental scientists, land managers and policy makers in the region.

www.ccsenet.org/jgg Journal of Geography and Geology Vol. 6, No. 4; 2014
154
Figure 1. A section of the road destroyed by an impressive gully channel
It is obvious from the available literature on gully erosion that estimating runoff, which is the best predictor of gully erosion remains the most significant contemporary challenges in designing gully control structures. In this regards, the study is aimed at estimating catchment runoff based on detailed field survey and GIS mapping of the gully catchment for appropriate remedial/control measures. The study involves the integration of GPS with total station, remote sensing and GIS-DEM.
Study area Oron is a Local Government Area (LGA) of Nigeria and is located between latitude 4o501011 North and longitude 8o 141 011 East at the right bank of the lower estuary of the Cross River (Figure 2). The people are predominantly fishermen, farmers, and merchants who trade across the Gulf of Guinea frontiers. It is found in the flood plain of South Eastern Nigeria, with the land mainly intersected by numerous streams and tributaries flowing into Cross River. The region is extremely fertile and is known for its Oil Palm from the tropical rainforest. The physiography of this LG A comprises of the Beach ridge complex and the Mangrove swamps From the shoreline with a wide sandy surf beach, to about I0kms inland, is a strip of recently deposited marine sand characterized by a succession of sub parallel sand ridges, which is loose, friable and highly susceptible to erosion once the vegetation is removed. The rainy season begins about March – April and lasts until mid - November. Oron receives relatively higher rainfall amounts than other parts of southern Nigeria. The total annual rainfall varies from over 4000mm along the coast {the study area} to 2000mm inland. Heavy rainstorms make up over 80% of total annual rainfall along the coastal towns.
2. Methodology
Rainfall Analysis: Available rainfall data at Oron station, lat. 4o501 0111 N and longitude 8o1410211E was collected from QIT Meteorological Station). Detailed statistical analysis was carried out to determine the mean total annual, mean monthly, variability in monthly and inter-annual as well as the distribution of rainstorms in the study area. Line and bar graphs were employed to depict temporal variations in rainfall pattern at Oron.
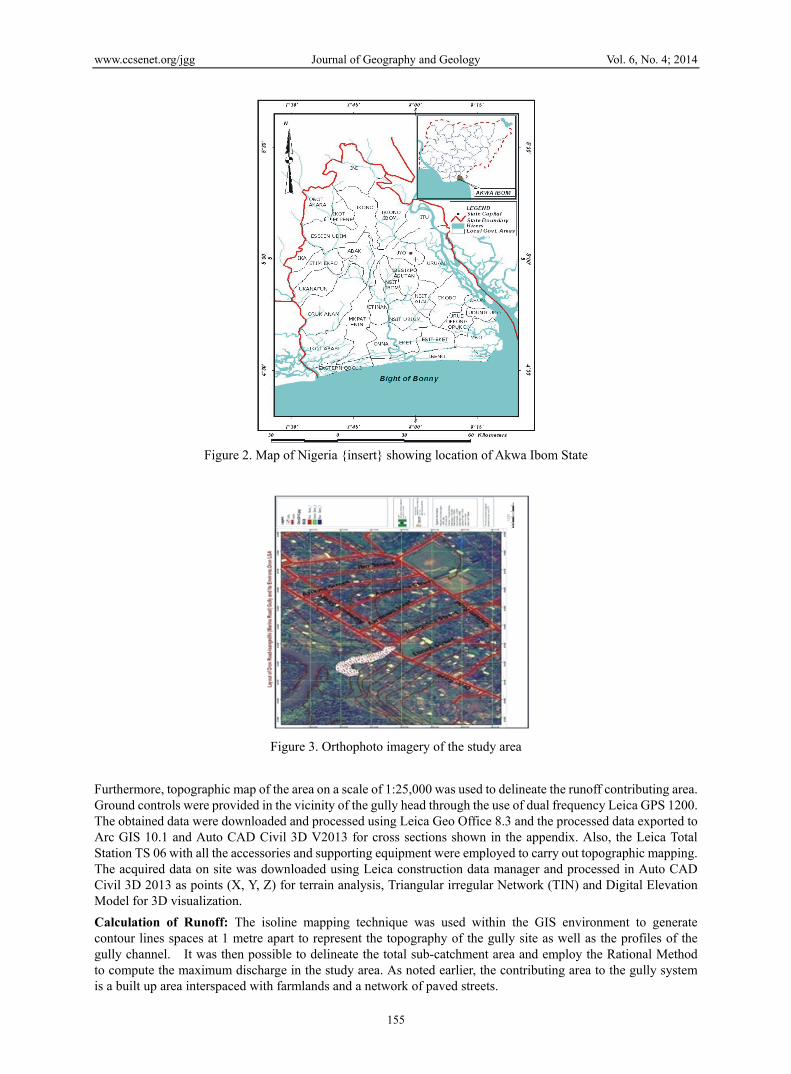
Topographic mapping, GIS and landuse analysis from remotely sensed data
Orthophoto imagery of the gully site and its environs on a scale of 1:10,000 (Figure 3) was digitized and integrated with the field acquired data to determine housing density.
www.ccsenet.org/jgg Journal of Geography and Geology Vol. 6, No. 4; 2014
155
Figure 2. Map of Nigeria {insert} showing location of Akwa Ibom State
Figure 3. Orthophoto imagery of the study area
Furthermore, topographic map of the area on a scale of 1:25,000 was used to delineate the runoff contributing area. Ground controls were provided in the vicinity of the gully head through the use of dual frequency Leica GPS 1200. The obtained data were downloaded and processed using Leica Geo Office 8.3 and the processed data exported to Arc GIS 10.1 and Auto CAD Civil 3D V2013 for cross sections shown in the appendix. Also, the Leica Total Station TS 06 with all the accessories and supporting equipment were employed to carry out topographic mapping. The acquired data on site was downloaded using Leica construction data manager and processed in Auto CAD Civil 3D 2013 as points (X, Y, Z) for terrain analysis, Triangular irregular Network (TIN) and Digital Elevation Model for 3D visualization.
Calculation of Runoff: The isoline mapping technique was used within the GIS environment to generate contour lines spaces at 1 metre apart to represent the topography of the gully site as well as the profiles of the gully channel. It was then possible to delineate the total sub-catchment area and employ the Rational Method to compute the maximum discharge in the study area. As noted earlier, the contributing area to the gully system is a built up area interspaced with farmlands and a network of paved streets.

www.ccsenet.org/jgg Journal of Geography and Geology Vol. 6, No. 4; 2014
156
Figure 4. TIN of the sub catchment
A vector based representation TIN (Figure 4) was used instead of the more robust DEM to visualize the configuration of the surface since the catchment is relatively small. The square method was used to compute the gully catchment in cm2 and then multiplied by the scale factor and the gully-catchment expressed in km2. Furthermore, the computed area was converted to hectares by multiplying it with 0.0001ha The Rational Method was employed in estimating maximum discharge in the area. Rainfall intensity was calculated as 304.65mm/hr; length of longest axis was computed from sketch map; the difference in elevation was calculated too, while bare fallow was assumed in the study. The total area was converted to hectares.
The rational formula is expressed as follows;
Run-off Estimates, Q:
Q = 0.278CIA (1)
Q = quantity of run-off in cubic meter per second (m3/s)
C = coefficient of run-off expressed as a percentage of imperviousness of the watershed surface = 0.9
I = intensity of rate of rainfall expressed in mm/hr for a selected frequency and duration equal to certain time of
concentration = 304.65mm/hr
A = area of the watershed (Catchment) = 0.445 km2
The maximum discharge was estimated by first computing the time of concentration of runoff. Time of concentration Tc is defined as the time required for water to flow from the most remote[in time of flow] point of the area to the outlet once the soil has become saturated and minor depressions filled. Using the Kirpich equation (1940) is given by; (2)
Tc = 0.0195 L 0.77 S-0.385 (2) Where
Tc = time of concentration of runoff
L = maximum length
S = Slope
Global water flow probe was used to determine the water velocity and depth of discharge in road side drain that runs into the gully. The recorded velocity was 2.4cm/s.
3. Results and Discussions
3.1 Rainfall Analysis
The pattern of monthly rainfall depicts a unimodal shape with very high rainfall in the months of June to September and some years do not show the little dry season in August, known locally as August break (Udosen,

www.ccsenet.org/jgg Journal of Geography and Geology Vol. 6, No. 4; 2014
157
2008b). It is quite evident that the duration of rainy season ranges from eleven to eight months (Figure 5) based on the periods of records i.e. 1995 to 2002.
Figure 5. Monthly rainfall at Oron (1995-2002)
The available records of total annual rainfall in the coastal town of Akwa Ibom State, as recorded in Oron shows that it ranges from 3668.2mm observed in 1998 to 5286.6mm recorded in the previous year, 1997. On the average the total annual rainfall expected is over 4000mm, compared to about 2540mm at Uyo, the state capital located north of the study area (Udosen, 2008b). In a sharp contrast, the inter-annual variability of rainfall recorded between 1992 and 2008 shows slight departure from the mean value as shown in Figure 6. It clearly indicates high degree of reliability of rainfall during the rainy season, unlike the continental towns such as Uyo.
Table 1. Rainfall at Oron (1992-2008)
YEAR TOTAL ANNUAL MAXIMUM MONTHLY 1992 4351.1 885.3 in August 1993 3799.0 719.7 in August 1994 4939.0 1098 in July 1995 4367.0 836.6 in September 1996 4574.0 836.6 in September 1997 5286.4 1033.8 in July 1998 3668.3 704.7 in September 1999 4206.2 642.7 in September 2000 4597.5 904.8 in August 2001 3782.8 623 in May 2002 5159.0 1262.8 in August 2003 4757.8 - 2004 4356.7 752.7 in June 2005 4679.4 865.6 in June 2006 4717.9 866.o in September 2007 4556.9 816.2 in September 2008 4562.1 972.1 in July Mean value 4318.4mm
Source: NDDC (2011) and QIT Meteorological station, Mobil Unltd.
Analysis of frequency of occurrence of maximum monthly rainfall indicates that the month of August has the highest frequency of 37.5% followed in descending order by September (25%), July (18.75%), June (12.5%) and
0200400600800
100012001400
Jan
Feb
Mar Ap
rM
ay Jun Jul
Aug
Sept Oct
Nov De
c
Monthly Variation in Rainfall Amount[1995-2002
1995
1996
1997
1998
1999
2000
2001

www.ccsenet.org/jgg Journal of Geography and Geology Vol. 6, No. 4; 2014
158
finally May (6.25%), Table 2 and (Figure 7). The implication is that the gully at Oron, which has already advanced across the road will continue to expand at an alarming rate before the end of the wet season in 2013, if nothing is done and would have devoured the building of Access Bank and a Petrol filling station, presently under constant threat.
Table 2. Frequency of maximum monthly rainfall along the Coast
MONTH FREQUENCY PERCENTAGE
May 1 6.25
June 2 12.5
July 3 18.75
August 6 37.5
September 4 25
Source: Rainfall Data at Oront1992-2008).
Figure 6. Inter-annual variability of total rainfall from 1992 to 2008
Figure 7. Frequency of occurrence of maximum monthly rainfall
Apart from mean total annual rainfall, its inter annual variability and monthly distribution, engineers and hydrologists require information on the distribution of rainstorms, probable maximum rainfall and the relationship between intensity, duration, and frequency of rainstorms[IDF] for the design of storm drains, culverts, and gully erosion control. The design of such structures must be based on the magnitude of flows which the structures will likely have to withstand during its estimated economic life considering that gully erosion is caused by intense and/or prolonged rainfall. Table 1 of the appendix indicates that severe gully erosion is intensified in the months of April to October.
TOTAL ANNUAL0
2000
4000
6000
1992
1994
1996
1998
2000
2002
2004
2006
2008
TOTAL ANNUAL
6% 12%
19%
38%
25%
frequencyMay June July August September

www.ccsenet.org/jgg Journal of Geography and Geology Vol. 6, No. 4; 2014
159
3.2 Computation of Runoff
Gully erosion has continued to wreak havoc in Oron LGA of Akwa Ibom State, as ravaging awe-inspiring chasm has tore the city into two. The gully system is located within the built up area, where the building density is up to 40 / ha. Gullies in the area became pronounced since 2011 while the rapid advancement towards the buildings (Figure 8) became obvious since the onset of 2013 wet season. The mostly trapezoidal shaped gully channel (Figure 9) which was initiated barely eighteen years ago has assumed an endemic proportion. It is more than 124m long, highly variable in shoulder width ranging from 8m to 20m, while the bedwidth varies from 2m to >13m with an average depth of 8.3m (cf Figure 8).
Figure 8. These buildings have been abandoned by the residents
Figure 9. Cross sections of the gully channel

www.ccsenet.org/jgg Journal of Geography and Geology Vol. 6, No. 4; 2014
160
The base level of erosion relative to Etim Inyang River is 40m and most of the adjoining streets i.e Etienam, Awolowo, Isangedighi, and Amwanaba contribute with enormous volume of runoff to the gully channel (cf Figs 3 and 4.). For instance, our field observation on the discharge drain adjacent to Access Bank with dimension 1.2m by 1.2m gave a reading through the use of Flow meter, -of 1.2m/s two hours after rainfall and this particular drain overflowed during most of the rainstorms. Gullies in the area became pronounced since 2011 while the rapid advancement towards the buildings became obvious since the onset of the wet season in 2013. All the streets/roads studied were also poorly provided with drainage systems. Therefore significant proportion of the surface runoff flows along the untarred roads and the unpaved drains. In some areas, where concrete drains and culverts are constructed, runoff drains directly into the gully head, as shown in orthophoto imagery of the gully site (cf Figure 3). Fig 4 shows that the catchment area is almost circular, with a very short concentration time of 7minutes. Another interesting feature is that virtually all the adjoining streets contribute with surface runoff to the gully head at the same time, thereby reducing the time of concentration of surface runoff. Often during rainstorms the process of basal undercutting at the gully headscarp is enhanced and subsequently the gully side collapses and the debris at the gully floor is swept by ephemeral flow of water on gully floor. Similarly, the computed maximum discharge of 33.919m3/s explains the spasmodic nature of gully headscarp retreat at the rate of 1.2m/day during the month of July, prior to intervention by the state government. It then means that a rainfall event that lasts for an hour will generate a maximum discharge of 33.919 x 3600m3/s into the deep gully system. It is true that without the intervention, the entire residential buildings including a bank and a petrol filling station would have caved in between July and September 2013, bearing in mind the severity of rainfall in these months. Presently, about ten buildings including a church are at the edge of another gully system radiating from Etim Inyang River on the same Oron road at Awolowo/Oron road junction.
Detailed base map analysis shows that the gully complex is intricately linked to the major drainage systems i.e Etim Inyang River, which is laden with sediments sourced mainly from the nine metres deep gully channel. According to a resident in the area, the owner of the building that collapsed following heavy downpour in Oron, lost everything, The victim, whose house built 16 years ago collapsed into the ravine, blamed the disaster on gully erosion that went unchecked. Furthermore, he claimed that when he moved to the area, there was no gully, adding that what later developed to become a gully occurred less than two years ago. He explained that the little crack on the ground, which they tried to check using sandbags, later grew to become the awe-inspiring chasm.
At the time of the study, about 25 of houses cling precariously to the edge of the gully system. Observations showed that some buildings in the gully affected area have been abandoned, and many of those still occupied were at the verge of collapsing into the channels. Most severe damage to properties was observed in gully headscarp which is broadly–loped.
Another salient reason why Oron is prone to gully erosion is due to the weak, unconsolidated and porous coarse-textured sandy soils formed from the Coastal Plains Sands. These soils are unstable to raindrop impact and slake on quick wetting. The catchment lithology is primarily Coastal Plain Sands with loamy sand to sandy surface materials. Granulometrical composition of soils are; coarse Sand, 55-86%, Clay, 2-15%, Silt, 0-17%. The infiltration rate ranges from 5mm/hr, 19mm/hr to 111.3mm/hr for bare, scanty vegetation and forest cover respectively (Udosen, 2008a). The increasing rate of destruction of natural vegetation in the course of farming, through unwise clearing and burning of vegetation and indiscriminate farming on slopes also complicate issues of soil degradation.
Figure 10. Rock filling to re-grade the wide gully channel

www.ccsenet.org/jgg Journal of Geography and Geology Vol. 6, No. 4; 2014
161
In conclusion, the gully complex at Oron is caused by heavy rainfall exceeding the capacity of the drainage systems which include the outfall drains, the culverts, the outfall structures, and the estimated catchment area; Increased paved area giving rise to increased run-off; other anthropogenic activities in the vicinity of the gully; the weak and unconsolidated coarse-textured coastal plains sand. This soil type is prone to erosion as it is unstable to raindrop impact and slides easily while wet. The application of geospatial technology and the computation of the maximum discharge facilitated the design of gully stabilization structures (appendix 2). These erosion control structures consist of an efficient outfall drainage systems which will improve underground and surface drainage, re-grading the gully through rock filling (Figure 10) and construction of stabilized runoff channel and slope stabilization.
Acknowledgements
Nigerpet Structures Nigeria Limited is acknowledged for appointing the corresponding author- Dr C.E Udosen as a consultant Hydrologist in erosion/flood control projects.
References
Abdulfatai, I. A., Okunrola, I. A., Akande, N. G., Momoh, L. O., & Ibrahim, K. O. (2014). Review of Gully erosion in Nigeria, Causes, Impacts and Possible Solutions. Journal of Geosciences and Geomatics, 125-12.
Akpokodje, E. G., Tse, A. C., & Ekeocha, N. (2010). Gully Erosion Geohazards in South eastern Nigeria and Management Implications, Scientia Africasia 9 91) 20-36.
Assefa, D., Zegeye, T., Tebebu, Y., Anteneh, Z. A., Helen, E. D., Eric, D. W., … Tamnos, S. S. (2010). Assessment of Hydrological and landscape controls on gully formation and upland erosion near Lake Tana’ CP Project Workshop Proceedings, pp. 162-169.
Casali, J. Gimenez, R., & Bennett, S. (2009). Gully erosion Processes and modeling. Proc. Fourth Int. Sympossium on Gully Erosion, Pamplona, Spain, Sept. 2007. Earth Surface Processes and Landforms, 34, 1839-1984.
Ehiorobo, J. O., & Audu, H. A. P. (2012). Monitoring of Gully Erosion in an Urban Area Using Geoinformation Technology. Journal of Emerging Trends in Engineering and Applied Sciences [JETEAS], 3(2), 270-275.
Ehiorobo, J. O., & Izinyon, O. C. (2012). ‘Monitoring Gully Formation and Development for Effective Remediation and Control’ FIG Working week 2012 knowing to manage the territory, protect the environment, evaluate the cultural heritage, Rome, Italy, 6-10 May, 2012.
Essien, O. E., & Essen, I. A. (2012). Gully Growth Pattern and soil Loss under Rainfall at Urban Underground Drainage Construction Site, Uyo’ Research Journal of Applied Sciences. Engineering and Technology, 4(16), 2616-2625.
Essien, O. E., & Okon, E. G. (2011). Rainfall Characteristics, runoff rate and traffic flow on gully morphometric parameter growth and soil loss in sand-mined peri-urban, Uyo. Nigeria’ Journal of Geology and Mining Research, 3(7), 180-187.
Jonathan, O., & Joshua, B. (2013). Geospatial Application in Mapping Gully Erosion Sites in Jos Plateau State, Nigeria. Scholarly Journal of Scientific Research and Essay (SJSRE), 2(6), 85-95.
Martinez- Cassanova, J. A., Ramos, M. C., & Poesen, J. (2003). Assessment of sidewall erosion I large gullies using multi-temporal DEMs and logistic regression analysis. Geomorphology, 58(1-4), 305-321.
Martinez-Cassanova, J. A. (2003). A Spatial Information Technology approach for the mapping and quantification of gully erosion. Catena 50(2-4), 293-300.
Marzolff, I., & Poesen, J. (2009). The Potential of 3D Gully monitoring with GIS using high- resolution aerial Photography and a digital photogrammetry system. Geomorphology, 111, 4-60. http://dx.doi.org/10.1016/j.geomorph.2008.05.047
Moyersons, J. (2003). The topographic thresholds of hillslope incisions I south western Rwanda. Catena, 50(2-4), 381-400.
NDDC (2011). EIA of Construction and Upgrade of 17km Eket-Ibeno-QIT Road, Akwa Ibom State.
Nwilo, P. C., Olayinka, D. N., Uwadiegwu, I., & Adzandehi, A. E. (2011). An Assessment and Mapping of Gully Erosion Hazards in Abia State. A GIS Approach Journal of Sustainable Development, 4(5).
Nyssen, J., Poesen, J., Veeyret-Picot, M., Moeyersons, J., Haile, M., Deckers, J., … Govers, G. (2006). Assessment of gully erosion rates through interviews and measurements: A case study from northern

www.ccsenet.org/jgg Journal of Geography and Geology Vol. 6, No. 4; 2014
162
Ethiopia. Earth Surface Processes and Landforms, 30, 167-185.
Poesen, J. (2011). Challenges in Gully Erosion Research. Landform Analysis, 16, 5-9.
Poesen, J., Nachterhaile, J., Verstraeten, G., & Valentin, C. (2003). Gully erosion and environmental change : importance and research needs. Catena, 50(2-4), 91-133.
Romkens, M. J. M., & Bennett, S. J. (2005). Gully Erosion. Proc. Third Int. Sympossium on Gully Erosion, Oxford, MS, USA, April 2004. Int. JOUR. Of Sediment Research, 20(3), 157-280.
Sirvio, T. A., Rebeiro, H., & Pelikka, P. (2004). Geoinformation in gully erosion studies in Taita Hills, SE-Kenja, Preliminary Results. In the Proceedings of the Assiciation of Remote Sensing of the Environment Conference, 17-22 Oct. 2004.
Udosen, C. E. (1998). Accelerated Erosion in a Rapidly Urbanizing Watershed in Uyo Area Akwa Ibom State. In I. E. Ukpong (Ed.), Geography and the Nigerian Environment (Afanide & Bros Publishing Co. Uyo pp. 230-238).
Udosen, C. E. (2000). Thresholds of Gully Erosion in the Coastal Plains Sands of Eastern Nigeria: A Case Study of Ikpa River Basin. Unpublished Ph.D. Dissertation, Department of Geography, University of Ibadan, Oct., 2000.
Udosen, C. E. (2004). A Multivariate Approach for Predicting Gully Initiation and Development in South Eastern Nigeria. Nigerian Journal of Agriculture, Food & Environment, 1(1), 40-47. Faculty of Agriculture, University of Uyo.
Udosen, C. E. (2006). Relief, Land Use and Erosion Risk in Ikpa River Basin. Nigerian Journal of Agriculture, Food and Environment, 2(2), 51-57. Faculty of Agriculture, University of Uyo.
Udosen, C. E. (2008a). Gully Erosion in Ikpa River Basin: A threshold phenomenon. Published by Time Communications. Lagos, Nigeria. p295.
Udosen, C. E. (2008b). Rainfall analysis and forecasting in Akwa Ibom State. Published by Unwana Press, Uyo, Nigeria.
Udosen, C. E. (2012). Digital Elevation Model as a tool for Monitoring and Evaluating gully Development in a Humid Tropical Environment. Online Journal of Earth Sciences, 6(2-6), 6-14.
Udosen, C. E. (2014). The impact of land-use and human perturbation on urban stream water quality in the humid tropical environment’ Presented at Third Sympossium on Urbanization and Stream Ecology SUSE3 – Crowne Plaza Portland-Downtown Convention Centre Hotel, Portland, Oregon (USA), May 15–17, 2014.
Valentin, C., Poesen, J., & Li, Y. (2005). Gully Erosion: A Global Issue. Proc. Seond Int. Sympossium on Gully Erosion, Chengdu, China, May 2002. Catena, 6 (2-3), 129-330.
Appendix 1
Monthly Rainfall at Oron Recorded Between 1995 and 2002
MONTH 1995 1996 1997 1998 1999 2000 2001 2002 Jan 0.2 112.3 146.0 23.1 59.7 111.7 56.2 10.9 Feb 43.9 253.9 26.3 14.8 135.5 1.8 20.8 88.8 Mar 346.2 311.7 323.1 145.3 215.5 176.7 259.2 175.2 Apr 180.2 177.8 372.6 335.5 245.9 300.6 355.3 249.9 May 587.0 507.5 570.3 345.4 320.7 336.2 623.0 272.5 Jun 543.1 513.1 043.5 328.6 559.4 443.9 477.3 728.8 Jul 617.9 617.9 1033.8 380.4 482.0 661.9 502.7 585.8 Aug 679.6 679.6 619.0 333.2 586.2 904.8 614.3 1262.8 Sept 836.6 830.2 387.7 704.7 642.7 707.9 461.1 615.9 Oct 440.8 342.1 429.7 636.9 559.1 641.3 58.4 666.5 Nov 31.4 65.3 298.2 351.6 358.5 210.4 317.2 343.5 Dec 60.1 9.2 136.2 68.8 41.0 100.3 37.1 158.4
Source: Analyzed from data recorded at QIT Meteorological station.

www.ccsenet.org/jgg Journal of Geography and Geology Vol. 6, No. 4; 2014
163
Appendix 2
Gully erosion control Structures
Copyright © 2022 FDOKUMEN