
Geomorphic threshold conditions for gully erosion in Southwestern Iran (Boushehr-Samal watershed
Upload
khangminh22Category
view
1download
0
Utah State University Utah State University
DigitalCommons@USU DigitalCommons@USU
All Graduate Theses and Dissertations Graduate Studies
5-1975
The Effects of Gully Plugs and Contour Furrows on Erosion and The Effects of Gully Plugs and Contour Furrows on Erosion and
Sedimentation in Cisco Basin, Utah Sedimentation in Cisco Basin, Utah
Dee B. Thomas Utah State University
Follow this and additional works at: https://digitalcommons.usu.edu/etd
Part of the Life Sciences Commons
Recommended Citation Recommended Citation Thomas, Dee B., "The Effects of Gully Plugs and Contour Furrows on Erosion and Sedimentation in Cisco Basin, Utah" (1975). All Graduate Theses and Dissertations. 3493. https://digitalcommons.usu.edu/etd/3493
This Thesis is brought to you for free and open access by the Graduate Studies at DigitalCommons@USU. It has been accepted for inclusion in All Graduate Theses and Dissertations by an authorized administrator of DigitalCommons@USU. For more information, please contact [email protected].


ACKNOWLEIXlMENTS
It is with sincere appreciation that I thank those persona who
contributed to the completion of this thesis. I am especially grateful
to Dr. George B. Coltharp for his patience, guidance, and understanding
throughout my graduate program. I wish to thank the other members of
my committee, Dr. Gerald F. Gifford and Dr . Alv in Sout hard, for their
guidance in my course work and their critical review of this thesis.
To my wife, Elisabeth, I express my appreciation and gratitude for
her encouragement, assistance, and understanding throughout this study.
S.u-Ja ~ Dee B. Thomas
11

!ABLE 07 CONTINTS
A CKNOWL EDG JIM lllNTS
LIST OJ' TABLJ:S
LIST OF J'~GURJ:S
ABSTRACT •••
INTROIXJCTION AND OllJlPTIVJ:S
REVIJCW OF LITER.ATliR:E • • •
D:ESCRIPTION OJ!' AREA AND TR:EATMENTS
Location Cli-te Geology Vegetation SoU ••• 'l'reatmente
Contour J'urroW11 Gully P1uge
M Jl'l'HODS AND PROC:EDURJ:S
Zroeion Transect• ll!roeion Stake• • Pit Stakes ••• Micro-Watershed• •
R:ESULTS AND DISCUSSION
General Dilcuesion Analylie of Reaulta Discussion of Area I Diacussion of Area II Micro-Watersheds • Diacualion of Area III Diacueeion of Area IV
SUMMARY AND CONCLUSIONS
LITERATUR:E CITE
VITA ••••••
iii
Page
11
iv
v
vi
1
3
?
? ? 8 8 9
10
12 14
1?
1? 19 21 22
25
25 26 28 35 39 45 48
50
52
54

LIST or T.ABLD!
Table Page
1. Sediment deposition in furrows and soil loss from furrow throw September, 1966 to September, 1969 29
2. Furrow storage and life expectancy 29
). Average soil loss from control areas ae determined by erosion transects • • • • • • • • • • • • • • • • • JO
4. Average change in soil surface elevation , as determined by eroeion atakea • • • • • • • • • • • • • • • • JJ
5. Ranking of independent variables in order of importance for predicting aoil lose J4
6. Pit storage and life expectancy J?
7. Compariaon of average yearly aoil loss from treated and control plota based on 1966 to 1968 data 39
B. Sediment deposition meaaured in micro-watershed pita and evidence of soil lose measured by erosion stakes on micro-watersheds
iv
4J

LIST OF FIGURES
Figure Page
l. Location of study areas ll
2. Sketch of contour furrows and gully pluga lJ
J. Furrows in Area II with pits showing i n background 16
4. Gully plug with pit transect - Area I I I 16
5· Control erosion transect - Area IV • 18
6. Measurement of erosion stakes - Area IV 20
?. Pit with pit stake - Area III 21
8. Micro-watershed 2J
9. Micro-watershed 2 2J
10. Plotting of the change in soil profile on control erosion tranaect - Area II • . Jl
11. Pit filled to capacity (three-fourths full) J8
12. Soil moieture depletion curves • • • • . 41
lJ. Soil elevation response to soil moisture change 42
v

ABSTRACT
The lf!ecte of Gully Pluge and Contour
1urrove on Jroe1on and Sedimentation
in Cieco Basin, Utah
by
Dee B. Thomas, Master of Science
Utah State Univers ity, 19?5
Major Pro!euor: George B. Coltharp Department: Range Science
Soil surface treatment• consisting of gully plugs and contour
furrows were constructed aa a mean• of reducing erosion and holding
sediment on aite.
To measure the effectiveness of the gully plug& and furrows,
angle iron stakea and profile tranaecta were installed to measure
soil loss and accompanying change i n the soil profile. The profile
transects gave a reliable measure of the change in the height of the
soil surface in constructed pits and acroes contour furrows. Because
of th~ shrinking and swelling of the soil, the change in height of the
angle iron atakes was found to be much more than the reduction in soil
surface caused by eroaion.
High intensity thunderstorms, occuring mostly during July, August,
and September, cause moat of the erosion from this semi-arid land.
The gully plugs and contour furrows were effective in holding
runoff and sediment on aite, but the life expectancy of the treatments
is only about fifteen years. (60 pages)
vi

INTRODUCTION AND OBJECTIVES
Erosion has been a natural geologic process of nature s ince the
beginning of time . Si nce the advent of man , erosion has been accel
erated in many areas due to his activities. Only when man begins to
be affected adversely does he look for a cause-and-ef fect r elationship
and seek for a solution to the problem.
The last Desert of Utah is similar to millions of acres of semi
arid desert land in the Western United States. Much of this area has
scant vegetative cover and is eroding severely at the present time .
Areas of this type have been termed "frail lands" by the BLM, the
agency which administer• much of this land (Turcott, 1966).
It hal been eatimated that this area contributes about 44 per cent
of the transportable sediment but only 5 per cent of the water yield of
the upper Colorado River, which drainl the area (Coltharp, 1967). It
has also been estimated that the annual sediment production from the
40 per cent of the upper Colorado River Basi n adm i nis t ered by the BLM
would cover the 69 square mile District of Columbia to a depth of 19
inches (Turcott, 1966). Moat of the sediment or igi na ting from t hese
lands is deposited in Lake Powell. Because of t his rate of sedimenta
tion the Bureau of Reclamation is interested in these sediment source
areas. The BLM is also concerned about these deteriorated range lands
because of the reduced forage yields and unstable watershed conditions.
The interest of t hese two agencies in seeking solutions to this
problem resulted in a plan of action for treating some of the more
active sediment source areas. The areas selected for treatment are

in the vicinity of Cisco, utah (see location map, Figure 9).
To accomplish the goals of reducing sedimentation in reservoirs
and improving watershed conditions of the "!rail lands", the BLM
constructed a number of contour furrows and gully checks (also known
as gully plugs, check dams, bulldozer pits, and crescents). The
general objective of this study was to evaluate the effects of these
soil treatments on erosion and sedimentation in the study area.
Specific objectives were as follows:
1. To determin~ the rate of soil loss for each area.
2. To determine the amount of sediment being trapped by the
furrova and gully plugs.
). To determine the life expectancy of the treatments.
2

UVIJ:W OF LI~EIIA~lil
Thousands of acres of land i n the Colorado Plateau physiographic
province contribute large quantities of sediment and very little water
to downstream reaches of the Colorado River and its tributaries. This
sediment yield and flash-type runoff not only perpetuates the low
productivity of the rangelands. but damages farmland i rrigation works,
and flood-control projects downstream (Lusby, 1970).
3
Historical records show that many valleys that are now cut by deep
arroyos contained shallow, perennial streams at the time of settlement
by white man (Lusby, 1967). Judson and Ritter (1964) have determined
the regional erosion rate to be 1255 tons per square mile per year or
6.5 inches per thouaand years.
Soils in the area are poorly developed and generally consist of
a shallow weathered mantle overlying the Mancos shale (Lusby, 1970).
Since 1958 the BLM and Bureau of Reclamation have cooperatively
treated about 6,000 acres in the Cisco area. These t r eatments consisted
of constructing approximately 25,000 gully plugs and furrows (Cox, 1972).
Osborn (1968) indicate• that convective storms cause almost all of
the annual surface runoff from small semi-arid watersheds in the inter
mountain areas of Southwestern United States. These storms occur as
high intensity, short duration, widely scattered thunder storms princi
pally during the months of July, August, and September (Fogel and
Duckstein, 1969).
Luaby (1970) reported that runoff at Badger Wash, an area to the
east of Cisco in extreme western Colorado, occurs almost wholly in re-

aponae to aummer rains. Very infrequently, rain storm• that produce
some runoff may occur during the winter. Snow generally does not
accumulate enough to cause runoff in the spring.
4
Soils having high montmorillonite clay content are subject to
extreme shrinking and swelling. Lucas (1972) reports that i n Siskiyou
County in northern California, t he soil i a a type of clay that expands
when wet and contracts when dry i ng. The s oil moves a nd cracks severely
whe n it dries. Cracks up to 3 inches wide a nd 4 or 5 feet deep a~pear.
The soil rises and falls several inches i n the course of wetting and
drying a nd does so unevenly . This causes areas to develop high and low
spots.
Soils at Badger Waah in western Colorado were found by Lusby (1970)
to be aubject to shrinking and swelling to auch an extent that the soil
surface was found to be higher in 1966 than i n 1954 in two of t he un
grazed watersheds. Oulliea in grazed watersheds were found to have
about twice aa much erosion as thoae in ungrazed watersheds.
Over the past 35 years many types of l a nd surface treatment& have
been applied as soil and water conaervation measures. Over a million
acres of pasture and range land were contour furrowed betwee n 19)4 and
1940 (Caird and McCorkle, 1964).
Biawell (1969), in reporting on range management practices to con
trol surface runoff, states that small contour furrows, from 4 to 6
i nches in cross-section, and spaced not more than 5 feet apart, are
usually more effective than larger or more widely spaced furrowe, Be
also states that range pitting i s an effective water conservation
practice in arid regions where rainfall is sporadic.
The manner in which treatments are constructed has a considerable

effect on the response of an area to treatment. Hubbard and Smoliak
(1953), in Canada, indicated that furrove spaced more than 10 feet
apart and only 4 to 5 inches deep were ineffective. The size and
spacing of furrows would have an obvious effect on the longevity of
the treatment. Caird and McCorkle (1946) found that listed furrova
in Texas were effective for about 7 years. Brown and EVerson (1952)
reported that furrows were distinguishable after 10 years in southern
Arizona.
5
Hickey and Dortignac (1965), working in New Mexico, found that
soil ripping was highly effective in reducing surface runoff. No
annual rate of decline of the effectiveness was determined. They found
that soil pitting was not as effective in reducing erosion as was rip
ping. Pitting had lost ita effectiveness in 3 years. Th~ also found
the pitting and ripping had, in some casea, penetrated the parent
material (Mancos shale) and had thus initiated piping . This phenomenon
of soil piping is described by Raaking (1967), Heede (1971), and Jones
(1970). Since Cisco Basin is nearly all shallow soils over Mancos
shale, the same phenomenon could easily occur.
King (1967) reports that ~Illy plugs are quite effective in terms
of catching and holding surface runoff and sediment. A small basin in
south central Utah treated with gully plugs during 1954 significantly
reduced runoff and sediment production during the following 10-year
period.
Peterson and Branson (1962) found that earthfill dams (gully plugs)
built in the 19J0 1s soon failed by breaching, piping, or washing out
of inadequate or poorly protected spillw&¥•· These failures were
generally attributed to low construction standards which required

6
little or no moisture control or compaction.

DJ:SCRIPT I ON OJ' THE ARlilA AND TRlilATMENTS
Location
The areas selected for study are located approximately five miles
to the west and south of the village of Cisco, Grand County, utah
(see J'igure 9). Thi s area, known as Ci s co Basin , i s bounded on t he
north by the Book Cliffe and the south by the Colorado River . It i s
typical of the upper Colorado River Drainage basin of western Colorado
a nd much of Carbon, Jmery, Garfield, Grand, Kane , Ban Juan, Uintah and
Wayne Counties i n eastern Utah (Parker, 1965). Mean elevation above
sea level is 1280 to 1)40 meter• (m) (4100 to 4400 feet).
The climate of the Ciaco Baain is semi-arid , characterized by
erratic precipitation occuring largely from thunderstorms during late
summer and early fall, as shown by U. S. Weather Bureau records for
Cisco, utah. Precipitation important for vegetation growth comes
during late winter and early spring but drops off to t he driest months
of June and July. Hancock (1968) aummarized the precipitation reported
by the Cisco Poet Office station. Annual precipitation varied from a
lov of 4.11 centimeter• (em) (1.61 inches) in the year 1900 to a high
7
of J5.5J em (1).99 inches) in 1957· It ia, therefore, obvious that the
precipitation at Ciaco ia highly variable. Annual precipitation at Cisco
baaed on 27 years of record is 15.59 em (6.14 inches) (Hancock, 1968).

8
n.e geology of Cia co Basin has been summarized by Ibrahim (1963).
·rhis area is part of the Colorado Plateau Province which is character
ized by an intricate system of highly disected table lands of horizontal
or slightly inclined sedimentary strata. Cisco Basin is l ocated mainly
on the top formation of Mancos shale, a t hi ck format ion of lead-gray
marine shale which contains vei nlet s of gypsum.
Characteristi c of the area are t he remnants of three ext ens i ve
pediment levels, eloping from the Book Cliffe, whi ch indicate the
different epi-cycles of erosion (Ibrahim, 196J) . These pediment
remnants have been incised and reshaped by many intermittent streams
and gullies resulting from the local thunderstorms on t he nearly bare
soil.
Cisco Basin is in t he shadecale zone which i s domi nated by dif
ferent Atriplex species. There are four vegetation types i n the Cisco
Basin, each of which is an edaphically controlled climax community
(Ibrahim, 196J ). The shadacale-galleta grass (Atriplli_ confertifolia,
Rilaria lamesii) community is found on the uppermost pediment remnants.
Ground cover ts more dense than in the other three communities and the
soil is sandy loam in texture.
The other three plant communities are Nuttall Saltbuah-galleta
grass (AtriPlex nutto11H var. nuttallii-Hilaria lamesii) , saltsage
voo~y aster (Atriplex nutta1lii var. gardneri-Aster xylorrhiza), and
mat saltbush (Atriplex corrugata) . TheBe three plant communities are

developed on soils derived from the Mancos shale, vhich is leas fertile
than the soils of the shadscale-galleta grass community and they are
highly erodible. The soil surface is 85 to 95 per cent barren, 4 to 5
per cent has vegetative cover, vith the remainder being litter and rock
(Coltharp and West, 1966).
9
Other important native plant species vithin the plant communities
previously described include bud sage (Artemisia apineacena), winterfat
(~ ~). and Indian ricegraas (Orxzopeis hvmenoides). lilphem
eral plants (Desert trumpet) ~in~~ and halogeton (Halogeton
glomeratus) are conspicuous during part of the year. While these
ephemerals are unimportant in the native plant cover, they may be
extremely important when the soil has been disturbed by grazing ani
mala or by surface land. treatment•.
The soils of the utah !Bet Desert are of the following three Orders:
Aridisols, Entiaols, and Vertisols. Parent material i n the study areas
is typically Mancos shale except for the shadscale-galleta grass community
which is sandstone. These soils have been described fully by Ibrahim
(196J). The soils are generally leas than 10 centimeters (em) deep
and undeveloped, though the mat saltsage area has soil approximately
25 em deep. Mancos shale and the soils derived from it are highly
unstable in water and easily eroded. The soils in the mat saltaage
area are especially suaceptable to cracking and all areas are subject
to soil swelling and shrinking as the moisture content of the soil
changes, vith maximum swelling occuring when the soils are wet. Soil
texture varied from sandy loam on Area I to silty clay loam on Areas

10
II and IV, to silty cl~ on Area III.
Treatments
In 1958 the BLM, in cooperation with the Bureau of Reclamation,
started doing surface land treatments in t he Cisco Basin area to retard
surface runoff and decreaae erosion.
There are four areas which were used for study in this project
(Figure 1). Study Areas I and IV were treated wi th contour furrows
only, while Areas II and III were treated with both contour furrows
and gully pluge. Study Area I is located in the shadscale plant
community and was treated by the BLM in the spring of 1966. Area II
was treated in the spring of 1964 and ia in the Nutall saltbush
coiiDlunity. Area III is in the mat saltsage COimnunity and was treated
in the spring of 1962. Area IV, the aaltsage-woody aster community,
was treated in the spring of 1966 along with Area I.
At the time of treatment the areas were broadcast seeded to created
wheatgraae (Agropyron criatatuml and Indian ricegrass (Oryzopeie
hymenoidee) in an effort to provide a good protective plant cover, ae
opposed. to the ephemeral plants which would otherwise come into the
disturbed areas. Generally, only the crested wheatgraes became estab
lished around the treatments, although occasionally the native Indian
ricegrase did well.
On study Areas II and III where dieection by gullies was moat severe,
indicating extreme erosion, both gully plugs and contour furrows were
installed ae a means of land treatment to reduce the accelerated rate
of erosion. On Area II the gully plugs were installed at a density of
4.2 per hectare (per h&) while the contour furrove were installed at

11
I II Control
D II
I
CJ p r
c:~~=- ==·~' ======~1 Kilometer
~igure 1 · Location of study areas .

a density of 1,650 meter• per hectare (m/na). On Area III the gully
plugs were inltalled at a rate of 8.65 per ha and contour furrows were
installed at a rate of 1,162 m/ha. See Figure 2 for a sketch of the
contour furrows and gully plugs.
12
Study Areas I and IV are not nearly as diaected by gully patterns,
hence it was decided that only contour furrows would be necessary to
reduce the erosion. On Area I, which is located on the pediment top
with a greater percentage of vegetative cover , sandier soil , and lower
slope gradient than the other three areas, the density of furrows is
only 440 m/ha. Area IV ia more similar to Areas II and III, but it
has lower elope gradient and slightly better ground cover and fewer
gullies. The density of furrows on this site is 849 m/ha.
The balic objectives in applying these land treatments were to
hold the overland flow of water on site, to reduce the erosion of t he
soil and, conaequently, the deposition of sediment in Lake Powell,
while at the same time increasing forage production for domestic
livestock.
At each of Areas I, II, and IV, there was an area left untreated
which was used ae a control. Ae all of the land around Area II was
already treated, there wae no area in the i mmediate vicinity to use ae
a control. Consequently, an area was selected a few miles away, which
had soil, vegetative type, and topograp~ similar to that in Area III,
to serve as the control for Area III.
The contour furrows for the study were constructed with a Holt
trencher pulled behind a D-6 crawler tractor. This piece of equip-

Original ground level
Figure 2. Sketch of contour !urrowe and gully plugs.
bank or throw
13

ment haa dual discs mounted one behind the other a nd slightly offset.
The disce can be raised and lowered as deeired to form ehort sections
of furrova. A dam was formed at one end of a furrow section as the
trencher was raised. The purpose for raising the trencher every J to
10 m vas to form a aeries of catchments or detention storage basins
acroea a hillside.
The furrows were designed for a zero gradient and are on the
contour as much as possible. The actual furrow s ize when first con
structed was about 0 . 15 m deep by 0.45 m wi de by .3 to 10 m in length.
The spacing of the furrows varied between areas according to elope,
established gully or rill patterns, and infiltration capacity. These
furrows were intended to intercept and hold surface runoff, thereby
providing needed time for infiltraticn of the water and trap sediment
on site. See 1igure J for a view of constructed fur rows.
Some of the problema associated with this treatment were : 1) the
difficulty of following the contour stakes set out by the surveying
crew when the contour linee curved excessively around a elope; 2) the
trencher had a tendency to pull downhill, thus causing the furrows to
have a slight elope. Jven a alight slope of t percent within a furrow
is sufficient to result in early failure.
The gully plugs or checks were made by a D-7 bulldozer which
pushed up a soil dam in a gully or on a aide slope from the uphill
aide. The gully plugs in Area III were made by only a few pushes of
the bulldozer. They averaged J,4 m wide, 4 m long, and 0,5 m deep.
The dam vas pushed up eo that it left a bank about 1 m above the
14

ground level. An example is shown in ligure 4. The gully plugs in
Area II average 4.7 m wide, 5.3 m long, and 0.9 m deep and more oval
in shape than in Area III. The dams were built more 1n the shape of
a crescent and were compacted by the tracks during construction.
15

16
Figure J. J'urrowe in Area II with pits showing in background.
Jigure 4. Gully Plug with Pit Transect - Area III.
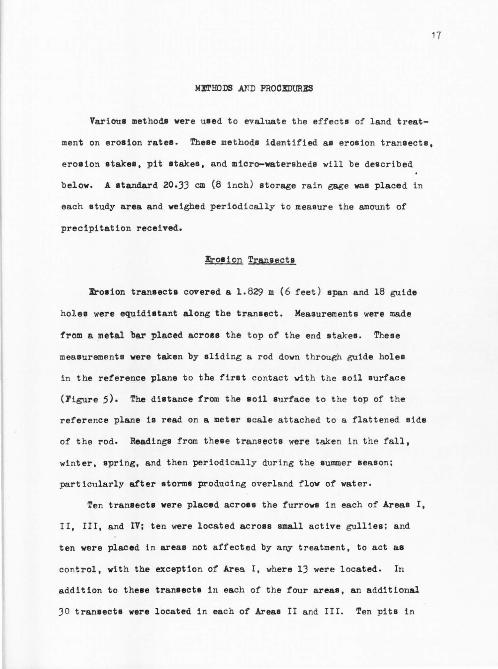
Mll1l'HODS .UTD PROCEDURli:S
Various methods were used to evaluate t he effects of land treat
ment on erosion rates. These methods ident i fied as erosion transects,
erosion stakes, pit stakes, and micro-watersheds will be described
below. A atandard 20.33 em (8 inch) storage rain gage was placed in
each study area and weighed periodically to measure the amount of
precipitation received.
Erosion Transects
Erosion transects covered a 1.829 m (6 feet) span and 18 guide
holes were equidistant along the transect. Measurements were made
from a metal bar placed across the top of the end stakes. These
measurements vere taken by sliding a rod down t hrough guide holes
in the reference plane to the first contact with the soil surface
(Figure 5). The diatance frQm the soil sur face to the top of the
reference plane is read on a meter scale a t tached to a flattened aide
of the rod. Readings from these transects were taken in the fall,
winter, spring, and then periodically dur i ng the summer season;
particularly after storms producing overland flow of water.
Ten transect• were placed across the furrows in each of Areas I,
II, III, and IV; ten were located acroaa small active gullies; and
ten were placed in areas not affected by any treatment, to act aa
control, with the exception of Area I, where 13 were located. In
addition to these traneects in each of the four areas, an additional
JO transect& were located in each of Areas II and III. Ten pits in

each area were selected for erosion transect measurement&. In the
bottom of these pits, three transects were located in the form of a
18
T. These above described erosion transects were referred to as furrow
transect•, gully transects, control transects and~ transects. The
transects were placed in representative locations to sample the furrows,
gullies. control, and pits.
The purpose of the furrow transects was to measure the rate and
amount of sediment being trapped in the furrows as well as the rate
of sloughing of soil from the spoil bank. Gully transects were estab
lished to measure the rate of enlargement of the gullies. The purpose
of the control transects was to measure the natural rate of soil loss
from the area in general. The pit transects were established to measure
the amount and distribution of sediment being trapped within the pits.
Figure 5· Control erosion transect - Area III.

19
During the initial phases of this project the vegetation response
resulting from the applied treatments was to be evaluated. To do this,
many angle iron stakes approximately 75 em (30 inches) in length were
installed as corner markers for vegetative plots. Aa the second phase
of this project got unde~, it wao decided that the same stakes used
to mark vegetative plots could be used as point measurements for erosion
determination. Aa the vegetation measurements were made only once each
5 years, there was no disturbance of the stakes except by the measure
ment of the stakes to determine soil loss. The stakes that were used
for both purposes are referred to as erosion stakes.
The selection of location for the erosion stakes was made by a
random sampling method. (Seventy transects were located in each of
the treated and control portions of Areas II, III, and IV. Fifty-six
transects were located in Area treated.) Each transect consisted of
4 stakes, placed on corners of a rectangle 6 m by 15m, providing a
total of 280 stakes in each treated and each control part of Areas II,
III, and IV; and 224 stakes in Area I treated.
The heights of these atakea were measured by means of rode with
meter scales attached to one side and a 3.81 em (1! inch) diameter
round foot on the end of the rods. The foot is attached to an end
of the rod with a ball and socket swivel to allow the foot to conform
to the contour of the grOUAd by each stake. A 90 degree pie-shaped wedge
was cut out of each foot to allow a close fit and accurate measurement
to be made at the outside corner of the angle iron stake (Figure 6).
By reading horizontally across the top of each stake to the scale on

20
the rod, a precise measurement could be made of the height of each stake.
The stakes were measured in the fall, winter, spring, and periodi
cally throughout the summer season. The purpose of measuring these
stakes was to determine the change in stake height resulting from
erosion or sedimentation.
Since the stakes were inStalled on a random basis, it is apparent
that they would be scattered throughout the treatments. Some would be
located in the furrows or pita, some on the top or aides of the spOil
banks or gully plugs, some directly in the drainage system of the area,
and moat falling someplace between the furrows and gully plugs. Due
to the wide distribution of stakes, the interpretation of the results
of the average change in stake heights is made difficult. The average
change of the stakes includes some of them showing deposition while
7igure 6. Measurement of erosion stake- Area lV.

most show a loss of soil. The total change of all the stakes in an
area will be referred to as the net change. For the three areas with
controls containing stakes, a direct comparison of treated and control
portions can be made.
~ St&kes
In each of Areas II and III, 40 pits were randomly selected. In
each of the selected pits a steel fence poat was driven into the ground
in the lowest part of the basin and a measurement of the stake height
was made (Jigure ?). Measurements were taken during fall, winter,
spring, and after summer storms. The stakes were measured by use of
a steel carpenter's rule and the measurement taken from the top of the
stake to the ground surface at the base of the stake. The purpose of
Jigure ?. Pit with pit stake - Area III.

these stakes was to determine the rate at which the pits were being
filled in with sediment so that total sediment trapped could be deter
mined as well as life expectancy of the pit treatments.
Micro-Watersheds
Three small watersheds approximately 0.1 ha in size were selected
for study in Area II. These were called micro-watersheds. Each water
shed was a definitely identifiable area that drained i nto a gully plug.
These watersheds were mapped so that the size of the drainage and
collection area could be determined.
On the drainage areas of micro-watersheds 1 and 2, angle-iron
stakes were systematically located to provide measurements of soil
loss. In the pit bottom of micro-watershed 1, lOJ stakes were
installed in rows and measured periodically a nd after runoff producing
storms to determine the amount of sediment deposited in the pit (Figure
8). The bottom of the pit on micro-watershed 2 was smoothed out, and
a large sheet of plastic was placed to cover the bottom of the pit
(Figure 9). The edges of the sheet were buried a few inches so that
water entering the pit would not rJn under the plastic. After a runoff
producing rain, the water was drained off and the sediment allowed to
dry, after which it was collected, oven-dried, and weighed to compute
the quantity of sediment deposited by the storm.
The pit on micro-watershed J was lined with plastic as described
above, but stakes were not placed on the drainage area.
The purpose of these micro-watersheds was to measure more accur
ately, on a limited area, the amount of sediment moved and deposited in
gully plugs by runoff producing storms. Stakes and plastic lining were

~igure 8. Micro-watershed 1.
Figure 9. Micro-watershed 2.

used to determine which method gave the most accurate measure of sedi
ment collected.
On micro-watersheds l and 2 the stakes were placed on the watershed
collection area for the purpose of measuring the amount of soil loss
from the area and to compare this measurement vith the quantity of
sediment that vas actually collected in the pita and measured either
by a aeries of stakes or dried a nd weighed.

25
RISULTS AND DISCUSSION
General Discussion
A direct comparison of the results of erosion measurements cannot
be made between the control erosion transects method and the erosion
stake method. As noted from a comparison of results shown i n Table 3
a nd Table 4 it can be seen that the control erosion transect method
gave approximately twice the amount of soil loss as that shown by the
erosion stake method. The explanation for this is that the control
erosion transects were located i n the molt open, exposed sites so as
to represent the greatest change possible in soil elevation. The
erosion stakes, as explained earlier, were located at random and were,
therefore, affected much more by the vegetation of t he area, with the
stakes in many cases being i n spots of deposition and protection,
rather than erosion. Not only could the stakes be located i n spots
where erosion would not be evident, but the stake itself could, in
many cases, provide protection to the soils immediately at the base
of the stake. An additional factor vas also found to be important.
Intenae rains cauae much eoil eplaahing, due to raindrop impact, a nd
this caueed soil to be splashed up on the etakes to a height of approxi
mately 10 em. This soil splash could result in deposition of sediment
at the base of the stake. Due to these factors it is concluded that
no direct comparison could be made between the results of the two
different methode of measurement of erosion. The main purpoee of the
erosion atakee was to compare the effects of treatment between the

26
treated areas a nd the control areas and also to evaluate the various
parameters thought to be significant in influencing erosion at the
ata.ke. This waa done by means of a stepwise multiple regreeeion analy
sis. When expressing Boil loss, the results of the Control Erosion
Transect method was used, as this method showed more nearly the rate
of soil loss from the area in general.
It became obvious that there wao a discrepancy between the amount
of soil measured as moving from the locations of the control erosion
transects and that which was actually measured in the furrows and pits.
There were several factors which appeared to contribute to this dis
crepancy. 7irlt, the control erosion transects were located on the
area where the moat severe conditions for erosion were present. These
locations were unaffected by vegetation and were located where t he
gradient of the elope was the greatest. Second, as the transects were
located close to the tops of the small ridges, there was a considerable
area lower on the 1lope for 1ediment to be deposited in depresaion
storage before it would finally s how up as sediment in a pit or furrow.
Third, as mentioned earlier, the cracks in the soil on Areas II, III,
and IV were able to trap a considerable amount of sediment as it moved
down elope aa part of overland flow. Fourth, there are periods when
the wind acts as an erosive agent on these desert soils. Thil means
of soil lose was observed at times, but no determination was made of
the extent of wind erosion.
Analya its of Results
Data from this study is given as follows: l) the changes in stake
heights between all measurement dates are shown as the mean change;

2) the changes in the contour furrow, control and pit transects are
gi~en as profile changes with the mean change of the transects in a
gi~en area computed; J) a stepwise multiple regression analysis was
used to show the significance of ~arious factors influenc ing the change
in ele~ation at the erosion stakes. This analysis is baaed on the
classification of factors thought to influence erosion at the stake
locations. These factors are: per cent of desert pa~ement, cloaest
plant species, distance to nearest plant, direction from stake to
nearest plant, distance to plant mounds, plant mounds li~e or dead,
di stance from nearest drainage, slope aspect at stake, direction the
a ngle of the stake points, slope at the stake, position of the stake
on the slope, and location of the stake i n relation to treatments.
All of these factors were e~aluated i n t he analysis by means of t he
change in the stake height between the measurement dates of September,
1966 to September, 1969. A eecond analysis was made with the same
factors, but between the dates of September, 1966 and September, 1968.
September measurements were selected for comparison becauae soil
moisture was generally at a minimum during this time. However, in
September of 1969, the soils contained more soil moisture than in
September of the preceding three years due to rains which increased
the moisture content and thus caused the soil to swell. Because of
this, the second analyeis between September, 1966 and September, 1968
will be used in the results and discussion; 4) an analysis of variance
was used to compare soil loss from treated and control plots. This
analyais was made on dat~ from erosion stakes.

Diecunion 2f_ ArB I
Area I i s in the ahadacale-galleta graea plant commun i t y . This
plant community has a greater amount of ground cover than the other
communities, also sandier and more productive soils. This area was
contour furrowed in the spring of 1966. Since the area has alight
relief, t he linear density of t he f urrows is 440 m/ha. Soil texture
analysis by t he Bouyoucoe method (Bouyoucoe, 1962) s howed the surface
soil texture to be sandy loam.
When first constructed, the av erage width of the furrows vas 0.73
m and t he average depth vas 0.10 m. The sandy texture of the soil
allowed relatively rapid sloughing of soil from the sides of the
furrow. The erosion transects were initially measured on July 10,
1966. Over the measurement period of September, 1966, to September,
1969, the furrow transects showed an average deposition of· 0.42 em
in t he furrow bottoms and an average decrease of 0.98 em from the top
of the spoil bank (Table 1). The deposition in the furrowe amounted
to a total of 5.7 metric ton (MT) of sediment caught per ha or an
average of 1.9 MT/ha/yr (Table 2).
The furrows in this area remained intact better than in some
areas because the infiltration capacity of t he soil vas greater,
allowing more of the precipitation t o infiltrate which reduced the
total available for runoff. The furrowe which crossed t he natural
drainages of t he site were broken frequently by excessive runoff, t hus
allowing an unknown quantity of sediment to be lost from the site.
The average loss per year from t he 13 control erosion transects
was 0.09 em. If this were an actual loss from the entire area, it
28

Table 1. Sediment depoaited in furrows and soil loss from furrow throw September, 1966 to September, 1969.
Deposition Soil loas from throw
29
Date Area treatments
installed Total (em)
Average per year (em)
Total (em)
Average per year (em)
II
III
IV
1966
1964
1962
1966
1.26
l.J2
1.46
0.42
0.44
0.49
0,85
Table 2. Furrow storage and life expectancy.
lffective Area Total storage••
01'1'/ha)• storage•••
(MT/ha)•
45.6 22.8
II 168.7 84.4
III 120.J 60.2
IV 82.8 41.4
•Metric tons per hectare
2. 94-
1.87
4.6J
Rate of filling (MT/ha)*
1.9
7.2
5·7
6.0
0.98
0.97
0.61
1.55
Life expectancy
(Yrs.)
12
12
11
6
••Total storage is the volume of sediment the furrows could hold if they could be completely filled with sediment.
•••Jtfective storage is the total volume of sediment the furrows are capable of holding due to the slight slope of the furrowa.

30
would result in a loss of 12.8 MT/ba/yr (Table J). This cannot be con-
sidered an actual loes, however, as the area has a fair ground cover;
and · the areas protected by plantl, litter, and erosion pavement would
protect the soil from eroeion much more than in the bare areae where
the eroeion traneects were located. Also, some of the soil loat !rom
the erosion transects would be caught and deposited in depreseion
storage and in the present ground cover and not be lost from the site.
See Figure 10 !or a plotting of the change in soil profile on a con-
trol erosion transect.
Table J. Average soil loss from control areas, as determined by erosion traneecta.
2 Year average Area s~~t. 66 tQ s~~;· 68
em change MT ha•
-0.41
II -0.32
III -O.Jl
IV -0.50
•Metric tons per hectare -Erosion or shrinking +Deposition or swelling
5?.8
40.J
J5.8
64.J
J Year average Se~t. 66 to S~:~t . 62 em change MT/ba•
-0.09 12.8
-0. 16 20.2
+0.19
-0.15 19.3
While the original storage capacity of the furrows seemed quite
adequate to hold the overland flow, it soon became evident that due to
sloughing of the upper bank and the lower spoil bank into the trench,

31
1
0 No measurement•
j -1
---------\__ u
-2
June Sept Dec Mar June Sept Dec Mar June Sept 66 66 66 67 67 67 67 68 68 68
Figure 10. Plotting of the change in soil profilE! on a control erosion transect - Area II.
the atorage capacity vae soon reduced. It is l ikel y the furrow• in this
study will continue to be effective in accumulat ing sediment until they
are filled to one-half their capacity . This is due to the furrows not
being installed exactly on the contour. ~en a slight slope of i percent
ie enough to cause early failure of the furrowe. The fu rrows that are
overtopped due to slope will continue to trap sediment but not as effect-
ively aa furrows without any elope. The slope also reduces the total
sediment that they are deeigned to hold, which in turn reduces the life
expectancy of the furrows. The furrows in this area, filling at the
rate of 0.42 cm/yr, will be filled to one-half their capacity in 12
years, which will be coneidered the life expectancy of the treatment
{Table 2).

The erosion stake& were first measured on July 23, 1966. Since
the stakes were installed on a random basis it is apparent that the
stakes would be scattered throughout the treatments; some located in
the furrows, some on top or sides of the spoil bank, some directly in
the drainage system and moat falling somewhere between the furrows.
Due to the varied locations of the stakes, the interpretation of the
average change in stake heights is difficult.
32
The average change in stake heights over the 3 year period
(September, 1966 to September, 1969) was a decrease in surface eleva
tion of 0,06 em Considering this to be representative, it would give
a net soil loss of 8.5 MT/ha/yr. The average decrease in soil depth
for the period September, 1966 to September, 1968 waa 0.22 em If this
is considered representative,the average Boil loss per year would be
30.9 MT/b&/yr (Table 4),
As there are no control erosion stakes in Area I, there is no way
to compare the effect of treatment on erosion rates through the erosion
stake measurements.
Through the technique of stepwise multiple regression the factor•
affecting erosion at the individual stakes were examined (Table 5).
The total of all factor• combined resulted in an R2 of 0.45. The
ranking of the independent variables, in importance to the total con
tribution to the R2, is ahown (Table 5),
An examination of the stepwise multiple regression (Table 5) shows
that all evaluated factors combined did not result in very good pre
dictors of soil loss. This is evidenced by the low R2 values obtained.
There are, however, a few factors that show up as either being impor
tant or not important predictors. Location in relation to treatment

Table 4. Average change in aoil surface elevation, as determined by eroa ion ete.kea.
Area
zt
rvt
IV0
tTreated °Control
2 Year average S§Pt· 66 to Se:11t· 68 em change MT/ha*
-0.22 30.9
0.0 o.o
-0.66 7.6
-0.10 11·. 6
-0.20 2).J
-O.JO J8.5
-0.26 3J.4
*Metric tone per hectare
3 Year average S~}1t. 66 tQ Se}1t. 62 em change MT/ha*
-0.06 8.5
+0.03 ---·· o.o o.o
+o.3o -·· -0.15 17.5
-0.12 15.5
-0.09 11.6
••Higher surface elevation than at beginning of study.
+Depoaition or •welling -~osion or shrinking
33

Table 5· Ranking of independent variables in order of importance for predicting soil loaa.
Independent Variable Area Area II Area III Area IV T T c T c T c
Per cent pavement 7 8 7 X 4 10 9
Closest plant species 9 11 9 2 11 6 11
Distance to nearest plant 4 7 10 9 10 9 5
Direction from etake to nearest plant 8 3 6 8 7 5 1
Distance to neareet plant mound 3 2 11 3 3 X 8
Mound plant live or dead 5 4 4 X 9 3 10
:B:xpoaure of stake 2 9 5 6 6 8 4
Direction angle of stake pointe 6 6 1 5 5 4 6
Slope 1 12 8 10 l 1 2
DiBtance to Drair1B€e X 5 3 4 2 2 7
Poe it ion on a lope X 10 2 7 8 7 3
Location in relation to treatment 10 1 X 1 X 11 X
R2 0.45 0.29 0.26 0.29 0.42 0.26 o. 'Z1
T- Treated c - Control X- Not evaluated

35
vas a good predictor on Areas II and III; however on Areas I and IV
this variable vaa a poor predictor. Slope vas a good predictor on
Areas I, III control, a nd IV treated and control . Distance to nearest
plant mound appears to be a pretty good indicator on most areas.
Per cent pavement, closest plant species, and distance to nearest
plant turned out to be poor predictors of soil loaa in moat of the
areas. No other consistant patterns in the regression analysis are
obvious in the rest of the independent variables.
Discussion of ~ 1l
Area II ts in the Nuttall saltbush plant community. The soil
texture in this area ia a silty clay loam. The area ia highly disected
by small gullies and rilla and has only 3 to 5 per cent ground cover
(Ibrahim, 1963). The area had contour furrow• a nd gully pluga installed
in the spring of 1964. The contour furrows were installed at the rate
of 1,640 m/ha and the gully plugs vere installed at the rate of 4.2
pu ha.
When furrow tranaects were first installed the average width a nd
depth vas 0.67 m by 0,10 m respectively. Furrows of this average size
would provide a total potential storage of 168.7 MT/ha of sediment.
This amount of sediment would completely fill the furrows and render
them ineffective. The furrow transects shoved a n average deposition
of 0.44 em in the furrow bottoms and an average decrease of 0.97 em
from the top of the spoil bank. The deposition i n the furrows amounts
to a total of 21.6 MT/ha of sediment or an average of 7.2 MT/ha/yr.
With the furrove filling at the rate of 0.44 em per year, it will take
12 years for the furrows to fill to one-half of their capacity and

reach their life expectancy (Table 2).
Many of the furrows in this area have already failed because the
detention storage has been reduced by sediment and this has resulted
in failures at the low point of the furrow, which is usually at one
end. As a result of furrow failure the sediment in many furrows is
now being removed slowly and the furrows are no longer as effective
as they were originally. The pita are, however, still effective in
this area and are catching the sediment which ia now being released
as a result of furrow failure.
36
The control erosion transects in this area show an average yearly
decrease in soil elevation of 0.16 em . This is equivalent to 20.2
MT/ ha/yr (Table 3).
The pita in this area are curre~tly catching and retaining
virtually all of tho sediment which is moving on this area. There
is evidence that some of the pits have been filled to the point of
overflowing since their construction, but since the transects were
installed there has been no storms which have resulted in overflowing
of the measured pita.
The pita have an average width of 4.7,3 m and length of 5·34 m
by 0.85 m deep which gives an average storage capacity per pit of
21.5 cubic meters (m3) of sediment which is equal to 31.9 MT of
sediment per pit, if the pita were completely filled. At the rate
of 4.2 pita per ha this would give a total pit storage of 90.4 m3
or 1)4.0 MT/ha of aediment.
Since the results from the pit stakes represent an average of
40 pita and the pit transect data is the average of 10 pita only,
the data from the pit stakes will be used. The pit transects show

37
that the deposition is nearly uniform aver the bottom of the pita.
The measurements of pit stakes over a period of four years from
September, 1965 to September, 1969 shows an average deposition of
4.5J em per year which is equivalent to 1.7 MT of sediment per year
per pit or 7.1 MT/ha/yr (Table 6). At this rate of filling of the
pita they would be expected to last for 19 years before being com-
pletely filled. This assumption ia erroneous, however, since the
pita remain capable of holding all of the overland flow resulting
from storm runoff. Once the pita fill to the point that they cannot
hold the runoff then the rate of sediment retention begins to decrease
and total sediment is no longer retained on the area.
Table 6. Pit storage and life expectancy.
Area
II
III
Pita per hectare
4.2
8.6
:mt'fective storage MT/ha•
100.0
•Metric tone per hectare,
7.1
1.8
Rate of filline em/yr. Life expect
ancy in yra.••
4.5J
1.12
14
JJ
••Baaed on filling to three-fourths pit capacity.
From observation of pita in the areas treated prior to the study
(north of Cisco) it is apparent that when a pit fills with sediment to
approximately three-fourths of ita storage capacity that ita life
expectancy is reached (figure 11). This is evidenced by the fact that

)8
the pit is breached and ita holding capacity is reduced. At this point
very little additional sediment is trapped within the pit. Therefore,
the useful life of the pit will be considered to be when the pit fills
with sediment to three-fourths of ita storage capacity.
Figure 11. Pit filled to capacity (three-fourths full).
With the pits in this area filling at the rate of 4.5) em per
year, it will take 14 years to fill to their useful capacity (Table 6).
The total storage capacity of the furrows and pits in Area II is )67.0
MT/ha. At the present rate of sedimentation the structures are accumu
lating a total of 14.) MT/ha of sediment per year.
The factors affecting erosion at individual stake locations on
Area II control were evaluated by means of stepwise multiple regression
(Table 5). It is obvious that even with all factors evaluated the
amount of variance explained is very low. All factors together result

39
i n an R2 of 0.26. Table 5 also shove the factors affecting erosion on
Area II treated. All factors together give an R2 of 0.29. On Area II
treated, the location of the stakes in relation to treatment, ie
shown to be the moat important factor evaluated in contribution to
the total R2.
An analysis of variance was made to see if there were significant
differences in soil lose between the treated and control portions of
Areas II, III, and IV. The results of this analysis (Table 7) ehowe
no significant difference in aoil loaa between the treated and control
portions of Area II.
Table 7. Comparison of average yearly aoil loae from treated and control plots baaed on 1966 to 1968 data.
Treatment II
Treated o.oo
Control 0.66 ~
Difference 1.00
-soil loae average per year. *Significant at the 0.05 level.
Aren III
-0.10
-0.20
5.20*
Micro- Watersheds
IT
em -O. J O
~ -0.26
1.21
~
~
The three micro-watersheds were located in Area II for the follow-
lng reaeona: 1) the pita receive more runoff as there are fever pita

40
per hectare than Area III; 2) the soils in the area do not crack as
much as the soils in Area III, t herefore, more water reaches the pits;
and 3) the watershed boundaries were easier to identify on the ground.
None of the area on the three micro-watersheds was treated with
contour furrows; hence, the runoff and resulting sediment production
should be typical of the area in general prior to treatment.
Micro-watersheds 1 and 2 were prepared for study with stakes and
plastic on August 4 and 5, 1968. On August 13, a storm occured which
resulted in runoff and water was collected in t he pits of the micro
watersheds. The storm produced 0.75 em (0.3 in.) of precipitation.
The duration of the precipitation and intensity were not known.
On August 15, the stakes on the two watersheds were measured and
i t was determined that on watersheds 1 and 2 the so i l had raised 0.22
em and 0.15 em respectively. Instead of measuring the amount of
erosion, as had been expected, the amount of soil swelling due to the
increased moisture content of the soil was being measured. At this
point, 10 soil samples were taken on each of t he watershed areas to
determi ne the per cent soil moisture. The stakes were agai n measured
on August 18, 20, 27, and September 2, and on each measurement date,
soil moisture content was also determined. Yigure 12 shows the change
i n soil moisture as the soil dried. It can be seen that after 12 days
the soil had dried to minimum soil moisture without oven dry ing.
Figure 13 shows the soil also had shrunk back to nearly its original
level. After the pits had dried the stakes in t he pit for micro
watershed 1 were measured and the sediment from micro-watershed 2 was
collected, oven dried, and weighed. Measurement of the pit stakes in

0
""
?0
~ 1 0 0
"' +-'
" Q) 0
" Q)
0..
0
I \ \ \ \ \
" "" "'-.. ....._ --------
Time (de.ys stnce rai n)
r.H c ro - Hn.tershed No. Micro - h'atershed No .
i<':i. &'llre 12 . Soi] mYisture d.Jplet i on c trve .
41

" '-< Q) .., ~ . 20 .., c Q)
0
~
.05
0
\
14icro -!hero -
\ \ \
\
5
" "' Time
"latershen No . ''atershed No .
"--.. ........... ......_ -----
10 15 (days since rain)
----- -
Fig~re 13 . So il elevat ion r~sponse to soil moisture cnange .

43
micro-watershed 1 indicated l. 0 'Wr/ba bad been deposited from the
storm. The sediment collected a nd weighed from mlcro-waterahed 2
amounted to 0.4 MT / ha (Table 8). During the remainder of the fall
of 1968 the soil did not shrink to the level it was just prior to the
storm.
Table 8. Sediment deposition measured in micro-watershed pita and evidence of soil loss measured by erosion stakes on microwatersheds.
Sediment Deposition MT/ha
Watershed
1
---- .. 'd<> 'd-+> 'd "' .. .:: .. ~ ~ ., ~
Rain ... ., .. " .i!l .. , ... .i!l Storm No. Storm I'e.te em 0 •• ol'd HIll ol'd .. ., I> >. ., " X,. BP X ,.
1 8-lJ-68 0,?6 1.0 I 1J 0,4
2 7-20..69 0.9? ~0 4.3 0. 6
3 8-29-69 2.51 J.J I 10.4 1.5
l/- Stakes indicated no soil loss. ~- Pit atakea did not show any deposition. lf- No stakes were installed in the watershed.
2
. 'd I>
"~ .. .. 8., 0 "' .. H "' " >. B P
1J 8.4
8.1
~- This watershed was not installed for storms 1 and 2
J
il.., 9 ., .. !I ol'd I>.,
X "'
'!/
'!/ 2.2
.. .. 'd "' ~~
Ill ,., 0 ....
H ~ >. BP
'!/ !!}
;j
This experiment aupporta the hypothesis t hat the meaaurement of
stakes results in the measurement of swelling and shrinking of these
soils more than in the meaaurement of erosion. To further exemplify
thie, the lose of 0.10 em of soil over one hectare of land would be
equivalent to the lose of 10 mJ or 14.7 MT/ba of sediment. With the
equ ipment used, it was only possible to measure to t he nearest 0. 10 em:
hence, rounding off to the nearest 0.10 em, the error could be as
great as ?.4 MT/ha, even if erosion could be measured without any
influence due to the change cauaed by soil moisture fluctuation.
It has been concluded, therefore, that the beat way to use the
stake measurement data thus collected in this research project is to
compare data from the period of the year when soil moisture is at a
minimum level. This was considered to be in September. This, however,
can be quite variable from one September to the next.
The second storm which was monitored, occured on July 20, 1969.
The storm produced 0.96 em (O.JB in.) of precipitation. No record
of intensity or duration is available. No determination of sediment
could be made on micro-watershed l by the measurement of stakes ae
the soil in the pit bottom bad shrunk below the measured level prior
to t he storm. The sediment from watershed 2 was collected, oven
dried, and weighed. Sediment deposited in the pit from this storm
was equivalent to 0.6 MT/ha (Table 8).
The third storm which was monitored, occured on Auguet 29, 1969.
By this date a third micro-watershed had been selected and prepared.
Erosion stakes were not installed on this watershed. No record of
rainfall was obtained from the site for this storm. It was noted,
however, that the rainfall had been much more than for the preceding
two storms monitored. Rainfall from this storm measured 2.51 em

(0.99 in.) at Devey, approximately 8 milee south of Area II.
Measurement of the pit stakes in micro-watershed 1 indicated
that the equivalent of J.J MT/ha had been deposited in the pit.
Sediment collected, oven dried, and weighed from micro-watersheds
2 and J was equivalent to 1.5 and 2.2 MT/ ha respectively.
A comparison of the sediment collected in the pita with the
results of the erosion stake measurements on micro-watersheds 1 and
2 (Table 8) showed that the erosion stake measurements indicated up
to 15 times as muc h soil loss as was actually measured in the pita.
This points out the degree of error that can result from t he measure
ment of atakes only. It ia concluded from this study that the moat
accurate method of meaauring the rate of sedimentation is to actually
collect or measure tho 1ediment where it is deposited, auch as in a
pit or furrow.
Discussion of ~ !ll
Area three ia in the mat saltbush plant community. The soil
texture in thi s area is ailty clay with the subsoil b~ir~ clay. The
area is disected with a well-established drainage pattern. The slope
over moat of the area iB generally more steep than Area II. The
soils, having a high clay content are subject to much cracking and
alao exhibit a high ahrink-awell coefficient. The area was treated
with contour furrows and gully pluge in the spring of 1962. C.'he con
tour furrovs vere installed at a density of 1160 m/ha and the gully
plugs were installed at a density of 8.6 per ha. The gully plugs
were smaller and more numerous in thia area than in Area II.

46
The average size of the furrows, when studies were first started
in the area in June, 1966, was 0.72 m wide by 0.10 m deep. Furrowe
of this average size, if filled to capacity, would be able to bold a
total of 120.) MT/ha of sediment. The furrow tranaects showed an
average deposition in the furrows of 0.49 em and an average decrease
of 0.61 em from the top of the spoil bank. The deposition in the
furrows amounts to 17.1 MT/ha of sediment caught and an average rate
of 5.7 MT/ha of sediment per year (Table 2).
As in Area II, many furrows had already failed by the end of the
study due to poor construction methode (furrows not on the contour).
Severe cracking of the soil in this area caused many furrows to fail
due to piping out through the cracks in the soil. 'f/ J. th the furrowe
in this area filling at the rate of 0,49 cm/yr, (based o~ 4 years'
data) the life expectancy of the furrows is 11 years (Table 2).
The average size of pita in Area III is ),4 m wi de by lf.O m long
by 0.49 m i n depth. This gives a storage capacity of 6.7 mJ of sedi
ment. This pit storage volume is equal to 9.) MT of sediment per pit.
At the rate of 8.6 pits per ha, the gross pit storage capacity is
80. 6 MT/ha of sediment. The effective storage at three-fourths
capacity is 60.5 MT/ba of sediment (Table 6).
With the pits in Area III filling at t he rE.te of 1.12 cm/yr, as
determined by measurements of t he pit stekee, it will take JJ years to
reach the three-fourths capacity mark which ~s ~onsidered the effective
life of the treatment as discussed for Area II.
Duri~ the study period the pits filled at the average rate of
0.2 MT/pit/yr, or 1.8 MT/ba of sediment per year (Table 6). The

47
alower rate of filling is probably due to t he fact that there are more
pita per unit area than in Area II. There is another reason, however,
which is felt to be significant on this area. As mentioned previously,
this soil is subject to extensive ahrinkicg and swelling a nd when the
soil is dry, numerous cracks of 2 to 2.5 em in width occur over the
surface. Some of these cracks have been probed and found to be one
meter and greater in depth. The runoff producing storm• usually occur
when the soile are very dry during July, August, and September. It
has been observed that etorm runoff water will follow a emall rill
until it is intercepted by a crack, at which time •he runoff water
will enter the crack and disappear. It is concluded, t herefore, that
erosion may take place from any given spot but sedimentation may be
difficult to measure as it may not be deposited in a constructed pit,
furrow or crack. AI in Area II, the pita in this area are catching
and holding virtually all of the sediment that moves because of intenee
atorms. The control erosion transect& in Area III show an average soil
loss of 0.31 cm/yr which is equivalent to 35.8 MT/ha/yr (Table 3). The
total •~niment caught by both furrows and pita is 6.9 MT/ha/yr with the
furrows catching nearly six times as much sediment as the pits are
collecting at the present time. Area III treated showed a net yearly
soil loss of 0.10 em as meaaured by erosion atakes. Compared to this,
the control portion showed a net yearly soil loss of 0.20 em. Thia
shows a reduction in sediment loss of 50 percent as a result of the
land treatment.
The results of the regression analysis for Area III control are
shown in Table 5· The total of all factors combined resulted in &n

a2 of 0.42. Per cent slope was shown to be the single moat important
factor.
Table 5 also shows the results of regression analysis for Area
48
III treated. All factors together gave an R2 of 0.29, As in Area II,
location in relation to treatment, waa found to be t he single moat
important factor. The analysis of variance on Area III shove a signifi
cant difference in the amount of soil lost between the treated and
control portions (Table ?).
Discussion Qt Area IV
Area IV io in the aalteage-voody aster cownunity. The soil
texture i n this area is silty clay. The drainage pattern is well
defined, but the area is not as deeply disected by gullies as in
Area II. Thif area was contour furrowed wit h a Holt trenc her in the
spring of 1966 along with Area I. As there were no deep gullies in
the area,it was concluded that contour furrowing was all that would be
needed to control surface runoff on the area.
It soon became evident, however, t hat contour furrows would not
hold all of the water moving across the area, as they were soon over
topped and broken along the main drainage pattern that crosses both
the treated and untreated portion of Area IV. The furrows which are
located across the smaller secondary drainages on the area did hold,
hovever, and are apparently sufficient to hold the water originating
from within the area.
Area IV is located on the pediment level below the shadacale
plant community and runoff f rom this steep, barren area l.e concen-

trated and crosses both treated and untreated portions of Area IV by
way of rather shallow gullies. The contour furrows which were con
structed across these gullies were the ones that were overtopped and
broken.
49
The average soil loss from Area IV as measured by the control
erosion transects vas 0.50 cm/yr, which is equivalent to 64.) MT/ha/yr
(Table J). The contour furrows in Area IV were installed at the rate
of 850 m/ha. The average size of furrows on this area is 9.30 m long
by 0.62 m vide by 0.10 m in depth. The total holding capacity of these
furrows is 56.3 m3jba or 82.8 MT/ha. The life expectancy of these
furrows will be reached when they have filled to 50 percent of their
constructed capacity. When filled to this capacity they will hold41.4
MT/ha of sediment. At this present time these structures are filling
at the rate of 0.85 em per year. This is the fastest rate of filling
of any of the furrows on the four treated areas. At t his rate of
filling, the furrows will reach their life expectancy in juat 6 years
as ahown in Table 2. ~ea IV treated shows a net yearly soil lose
of 0.)0 em as measured by erosion atuY.os. The factors affecting
erosion on Area IV treated as determl.ned by the stepwise multiple
regression analysis are shown in Table 5· The total of all factors
combined gave an R2 of 0.26. The Bingle most important factor was
percent slope.
The analysis of variance comparing soil loss between the treated
and control portions showed no significant difference (Table ?).

SUMMARY AND CONCLUSIONS
Rapid erosion of "frail lands" in the Upper Colorado River
Drainage, of which the eastern Utah desert is typical, results in
rapid sedimentation of Lake Powell and other man-made structures on
the Colorado River. The sedimentation of these reservoirs will
materially reduce their storage capacity and useful life. To reduce
the rapid rate of sedimentation, the BLM construct~d contour furrav8
and gully plugs on some of the more seriously eroding lands i n the
Cisco Basin area to hold the sediment on site.
Contour furrova and gully plugs were found to be effective in
catching and holding sediment; however, difficulties in constructing
the furrows on the contour resulted in a shortened useful life of
the structures. The constructed pits provide adequate storage for
both water and sediment to keep overland flow from leaving a treated
site. Areas II and III treated with both contour furrows and gully
plugs held all runoff and sediment on site, while Areas and IV
treated with contour furrows alone, held only a portion of the run
off and sediment. It was apparent from the study that the greater
the density of furrows and gully plugs, the longer the life expectancy
of the treatmenta. It was alao apparent that the amount of sediment
moving in an area has a substantial effect on the life expectancy of
the treatments. The rate of sediment accumulation in gully plugs and
furrows combined varied from 1.9 MT/ha/yr on Area I to 14.3 MT/ta/yr
on Area II.
Interpretation of the data from the measurement of changes in
so

51
stake height and alao changes in soil profile was made difficult due
to the shrinking and swelling of t he soils resulting from changes in
soil moisture. The soils were found to expand over the wir.ter months
when they became wet and frozen. As they would dry out in the summer,
they would shrink and settle again. As the soils becnmc wet with indi
vidual summer storms, they were found to expand, then shrink after
approximately two weeks drying time.
The change i n the soil profile caused by swelling and shrinking
was found to be more pronounced than the change resulting from soil
erosion. The study of micro-watersheds showed that the collection
and measurement of sediment in plastic-lined pits gave a more reliable
measure of soil lose from an area than did the measurement of erosion
stakes or control proaion transects.

LITERATURE CITJID
Biswell, Harold H. 1969. Water control br rangeland management. 22, (4): 227-z.JO.
52
Bouyoucos, A. J. 1962. HYdrometer method improved for making particle she analytis of soils. Agronomy Journal. 54: 464-465.
Brown, A. L., and A. C. Everson. 1952. Longevity of ripped furrows in southern Arizona desert gra88land. Journal of Range Management. 5: 415-419.
Caird, R. W., and J. S. McCorkle. 1946. Contour furrow studies near Amarillo, Texas. Journal of Forestry. 44: 5-37-592.
Coltharp, George B. 1967. How effective are gully plugs and contour furrows on frail lands in utahT Proc. 22 Annual Meeting, Soil Conservation Society of America: pp. 82-88.
Coltharp, George B., and Neil E. West. 1966. Effects of surface soil treatments on soil, water, and vegetation in Utah's !nat Desert area. .In Proc. Salt Desert Shrub Symp. U. s. Dept. Int., BLM PP• 88-97.
Cox, Lois M. 1972. Getting answers from Utah's salt desert. Utah Science, Agriculture !kperiment station, Sept. 1972. 33: (3): 73-?4.
Fogel, Martin M., and Lucien Duckstein. frequencies in convective storms. 5, (6): 1229-12:37.
1969. Point rainfall Water Resources Research.
Hancock, Valdon B. 1968. Effects of certain soil surface treatments on the soil moisture regime in the Cisco Basin, Utah. Unpublished MS thesis, utah State University. ·
Reede, Burchard H. 1971. piping in gullies.
Characteristics and processes of soil USDA Forest Service Research Paper. RM-68.
Hickey, Wayne C. Jr., and E. J. Dortignac. 1965. An evaluation of soil ripping and soil pitting on runoff and erosion in the semi-arid Southwest. ~tract of publication no. 65 of the I.A.S.H. Land Brosion, Precipitations, Hydrometry, Soil Moisture. pp. 22-33.
Hosking, Peter L. 1967. Tunneling erosion in New Zealand. Journal of Soil and Water ConserTation. 22, {4): 179-251·

Hubbard, W. A., and S. Smoliak. 1953· furrows on short grass prairie. 6: 55-62.
Effect of contour dikes and Journal of Range Management.
5)
Ibrahim, Kamal M. 196). Ecological factors influencing plant distribution in the shadecale zone of southeastern Utah. Unpublished Ph.D. thesis. Utah State University.
Jones, Anthony. 1971. Soil piping and stream channel initiation. Water Resources Research. 7, (J): 602-610.
Judson, Sheldon, and Dale F. Ritter. 1964. Rates of regional denudation in the United States. Journal of Geophysical Research. 69, (16): ))95-)401.
King, Norman J. 1966. Erosion characteristics of salt desert shrub areas. In Proc. Salt Desert Shrub Symp. U.S. Dept. Int., :BLM. pp:-69-87.
Lucas, Donald L. 1972. Dream house becomes haunted house. Soil Conservation . P• 106.
Lusby, Gregg C., George T. Turner, J. R. Thompson, and Vincent H. Reid. 1963. ~drologic and biotic characteristics of grazed and ungrazed watersheds of the Badger Wash Basin i n Weeterr1 Colorado, 1953-58. u.s. Geologic Survey, Water-Supply Paper. 1532-B.
Lusby, G. C. and R. F. Hadley. 1967. Deposition behind low dame and barriers in the Southwestern United States. Journal of Hydrology (N.Z.). 6, (2): 89-105.
Lusby, Gregg C., 1970. Hydrologic and biotic effects of grazing versus nongrazing near Grand Junction, Colorado. U.S. Geologic Survey, Professional Paper 700-B. pp. B 2)2-B 2)6.
Osborn, H, B. 1968. Persistance of summer rainy and drought period& on a semiarid rangeland watershed. Bulletin of International Association of Scientific ~drology. 13, (1): 14-19.
Parker, Karl G. 1965. Why "Crazy Diggings" in Desert. Utah Farmer. 85: 10-12.
Peterson, H.V. and F. A. Branson. 1962. Effects of land treatments on erosion and vegetatio~ on range lands in parte of Arizona and New Mexico. Journal of Range Management. 15, (4): 220-226.
Turcott, George L. 1966. Cover for frail lands. U.S. Dept. Int., BLM. Our Public Lands. 15 , (J): 20-21.
Turcott, George L. 1966. Gone with t he water. U.S. Dept . Int., BLM. Our Public Lande. 15, (5): 12-15.

VITA
Dee Browning Thoma•
Candidate for the Degree of
Maeter of Science
Thesis: The lffects of Gully Plugs and Contour Furrows on Erosion · and Sedimentation in Cisco Basin, Utah
Major Field: Watershed Science
Biographical Information:
Personal Data: Born at Rexburg, Idaho, August 27, 1934, eon
54
of Clyde L. and Geneva B. Thomas; married Elizabeth Stucki October 22, 1954; four children, Kenneth, Sheralyn, Va1ene, and Kevin.
Education: Attended elementary school in Lorenzo, Sugar City, and Rexburg, Idaho; graduated from Madison High School in 1952; attended Ricks College for 2 years, receiving A,S. degree in Zoology; attended utah State University and received the Bachelor of Science degree in ForestRange Management, in 1960; returned to Utah State University in 1968 to do graduate work. Will receive Master of Science degree in Watershed Science in 1975.
Professional Experience: 1960 to 1963 worked on the Targhee National Forest as Forester, then as Range Conservationist; 1963 to 1968 worked on Caribou National Forest as Assistant Ranger; 1970 to 1972 worked on Manti LaSal National Forest as Hydrologist; 1972 to present, assigned to Fiehlake National Forest as Forest Hydrologist.
Copyright © 2022 FDOKUMEN