The Effects of Gully Plugs and Contour Furrows on Erosion ...
Journal of Asian Earth Sciences 35 (2009) 180–189
Contents lists available at ScienceDirect
Journal of Asian Earth Sciences
journal homepage: www.elsevier .com/ locate/ jaes
Geomorphic threshold conditions for gully erosion in SouthwesternIran (Boushehr-Samal watershed)
Aliakbar Nazari Samani a,*, Hassan Ahmadi b, Mohammad Jafari b, Guy Boggs c,Jamal Ghoddousi d, Arash Malekian e
a Faculty of Natural Resources, University of Tehran, Karaj, P.O. Box 31585-3314, Iranb Faculty of Natural Resources, University of Tehran, Karaj, Iranc School of Science and Primary Industries, Charles Darwin University, Darwin, NT 0909, Australiad Soil Conservation and Watershed Management Research Institute, Tehran, Irane International Desert Research Center, University of Tehran, Tehran, Iran
a r t i c l e i n f o
Article history:Received 31 December 2007Received in revised form 25 January 2009Accepted 2 February 2009
Keywords:Gullying processesErosionArea–slopeLanduse impactThresholdTopographySoil attributesIran
1367-9120/$ - see front matter � 2009 Elsevier Ltd. Adoi:10.1016/j.jseaes.2009.02.004
* Corresponding author. Tel.: +98 261 2249313; faxE-mail address: [email protected] (A. Nazari Saman
a b s t r a c t
Globally, a large amount of research has been dedicated to furthering our understanding of the factorsand mechanisms affecting gully erosion. However, despite the importance of gully erosion in arid andsemi arid regions of Iran there has been no comprehensive study of the geomorphic threshold conditionsand factors influencing gully initiation. The aim of this article is to investigate the gullying processes andthreshold conditions of permanent gullies in an arid region of Iran based upon examination of the slope–area (S = aA�b) relationship. The data were collected through field and laboratory studies as well as Dig-ital Elevation Model (DEM) analyses. In total, 97 active headcuts were identified across the three studysites and classified based on dominant initiation process including piping, landsliding and overland flow.Soil properties, including EC, SAR and soil texture, as well as landuse practices were found to be the majorfactors initiating piping and bank gullies. All gullies initiated by landsliding and seepage processes werefound to be located in steep areas (28–40% slope) with their distribution further influenced by the lithol-ogy and presence of a cohesionless sand layer within the soil profile. An inverse relationship betweenupslope area (A) and local slope (S), in which the a and b coefficients varied, was further investigatedbased on the dominant gullying process and land use. Gullies occurring in the rangelands that were dom-inated by overland flow had the strongest relationship while landsliding dominated gullies did not have astatistically significant S–A relationship. In comparison to theoretical and literature based relationshipsfor gully initiation, relatively low values for b were obtained (�0.182 to �0.266), possibly influencedby the presence of seepage and subsurface processes in many gullies. However, this is consistent withother studies in arid regions and may reflect greater potential for gullying in arid zones due to low veg-etation cover and high variation in rainfall. In addition, the soil attributes together with land use practicesinfluenced gully initiation thresholds. Application of the solved S–A relation for predicting vulnerableareas to gullying indicates that it is possible to predict the location of gullies with an acceptable levelof accuracy; however other environmental factors should be integrated with the S–A relationship to moreaccurately identify the location of permanent gullies in arid regions.
� 2009 Elsevier Ltd. All rights reserved.
1. Introduction
Gully erosion is recognised as a major land degradation issue,causing both impacts on-site, through direct soil loss and off-site,through sediment deposition in downstream environments. Gul-lies are formed by water erosion and consist of several characteris-tics including a steep incised channel with an active headcut,unstable side wall and temporary water flow (Nordstrom, 1988;Poesen et al., 2003).
ll rights reserved.
: +98 261 2227765.i).
A great deal of research has been undertaken on the contribu-tion of gully erosion to overall soil loss and sediment productionin a wide range of environmental and climatic conditions and ata variety of temporal and spatial scales. Although the relativeimportance of gully erosion has been well documented in the liter-ature (Patton and Schumm, 1975; Vandaele et al., 1996; Poesenet al., 2003; Sidorchuk, 1999; Wasson et al., 2002), most soil lossequations and erosion models do not include the soil loss causedby gully erosion (Poesen et al., 2003).
More than 60% of Iran’s area is located in arid and semi arid re-gions, with about 100 million ha at high risk of desertification(Ahmadi, 2004). The spatial and temporal variability of rainfall,
A. Nazari Samani et al. / Journal of Asian Earth Sciences 35 (2009) 180–189 181
prolonged drought periods over past decades and intensive exploi-tation of agricultural lands as well as overgrazing of rangelands arethe main causes of the desertification trend in Iran, leading to in-creased soil erosion and deterioration of ecosystems (Forest andRangeland Organization, 2004). The vast area of Iran (1.6 millionkm2) combined with the presence of both wind and water as majorerosion processes means that there is no particular and reliable soilerosion rate at a national level. However, based on estimation of137Cs measurements and suspended sediment gauging data for se-ven major dam watersheds of Iran, the water erosion rate in agri-cultural lands varies between 7.6 and 32 ton ha�1 Y�1 and 4.3–22 ton ha�1 Y�1 in rangelands (cited by Hakimkhani, 2006). Theselarge variations have been attributed to the wide range of environ-mental characteristics across Iran. Modelling of soil erosion in Iranhas been based on empirical prediction models (e.g. PSIAC1, EPM2,and USLE3) considering the uncertainty subjected to such methods.Much more research is therefore required to understand the roleof gully erosion in Iran. Gully erosion is particularly important inthe Boushehr province located in Southwestern Iran (the study areaof this research), which contains the biggest gas field of the world(Asalouyeh). In this region, gullies can undercut gas pipe lines andother related infrastructure, commonly causing them to subsideand major damage to occur.
Gully erosion is regarded as a threshold phenomenon controlledby a wide range of factors (Patton and Schumm 1975; Vandaeleet al., 1996; Bull and Kirkby, 2002; Poesen et al., 2003; Valentinet al., 2005). The importance of threshold conditions is differentin various climates and under different landuses, soil and land cov-er conditions. However, in different regions, researchers havefound that there is a common inverse relationship between theupslope drainage area (A) and local slope gradient (S) of gully headlocations ðS ¼ aA�bÞ, as first defined by Patton and Schumm (1975).They stated that channel initiation is based on the kinetic energy ofconcentrated overland flow, which in turn is a function of runoffand slope (where upslope drainage area is used as a surrogate forrunoff volume (Leopold et al., 1964)). This relationship has subse-quently been applied to examine gully formation under a variety ofconditions around the world, with regional differences being ex-pressed in different values for the constant and exponent of themodel (a and �b, respectively) (Begin and Schumm, 1979; Mont-gomery and Dietrich, 1988, 1994; Prosser and Abernethy, 1996;Vandaele et al., 1996; Poesen et al., 1998; Vandekerckhove et al.,2000a,b; Desmet et al., 1999; Morgan and Mngomezulu, 2003).Comparison of the results of existing research indicates that varia-tion of a and, b factors is independent, but depends on local envi-ronment characteristics and data collection methods. Furthermore,for most studies, values for the exponent b are more constant andvary between �0.2 and �0.4, while the constant a is more variable(0.0035–0.35). Variations in the value of b are commonly linked tothe dominant process operating in the catchment. Values less than�0.2 are associated with overland flow while values greater than�0.2 commonly indicate that subsurface processes and massmovement are dominant (Morgan, 2005). Vandekerckhove et al.(2000b) showed that the trend of the threshold line is often clearerwhen data from mass movement dominated gullies is separatedfrom hydraulic erosion dominance (changing�b as slope of thresh-old line), while the constant ‘a’ varies by changing environmentalattributes. Moreover, Montgomery and Dietrich (1994) considerAS2 as a suitable indicator for gully initiation and found a rangein values of between 500 and 4000 m2, but Cheng et al. (2007)reported much smaller values (41–814 m2) and suggested that
1 Pacific Southwest Interagency Committee.2 Erosion Potential Method.3 Universal Soil Loss Equation.
AS2 does vary among regions and needs to be checked before appli-cation to an area.
Although considerable research has been carried out on gullyingprocesses and thresholds, much of this has been in humid to semiarid regions and has mostly focussed on ephemeral gullies in agri-cultural lands (Poesen et al., 2003; Vandekerckhove et al. 2000a,b).However, less effort has been applied to arid regions, particularlythe rangelands of western and southern Asia. In Iran, Ghoddousi(2002) used environmental characteristics to predict the morphol-ogy of gullies through correlation analysis, while Adelpour et al.(2004) applied an experimental flume in the field to identify criti-cal shear stress for channel initiation. However, no studies havingbeen conducted to examine the geomorphic threshold conditionsof gully initiation. This study therefore investigates gullying pro-cesses and threshold conditions for permanent gullies in a regionof arid rangelands in Iran based upon examination of the slope–area (S = aA�b) relationship, field study of dominant erosive pro-cesses and examination of associated environmental conditions,including soil characteristics and land use conditions.
2. Study area
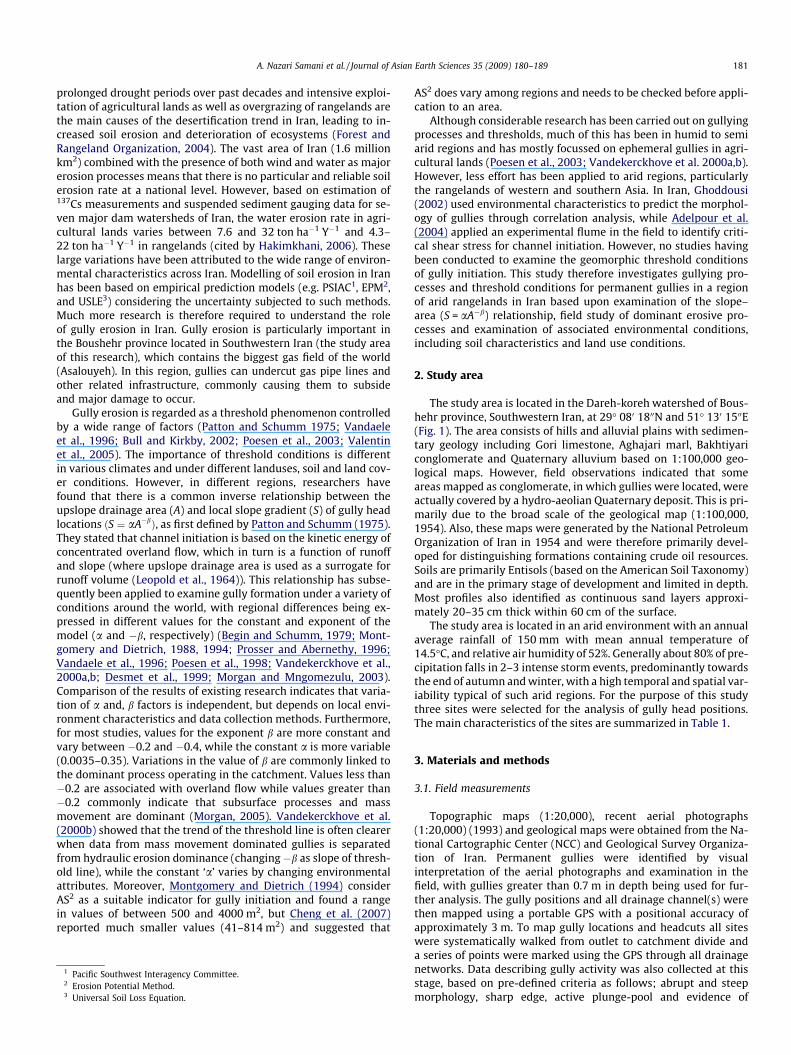
The study area is located in the Dareh-koreh watershed of Bous-hehr province, Southwestern Iran, at 29� 080 1800N and 51� 130 1500E(Fig. 1). The area consists of hills and alluvial plains with sedimen-tary geology including Gori limestone, Aghajari marl, Bakhtiyariconglomerate and Quaternary alluvium based on 1:100,000 geo-logical maps. However, field observations indicated that someareas mapped as conglomerate, in which gullies were located, wereactually covered by a hydro-aeolian Quaternary deposit. This is pri-marily due to the broad scale of the geological map (1:100,000,1954). Also, these maps were generated by the National PetroleumOrganization of Iran in 1954 and were therefore primarily devel-oped for distinguishing formations containing crude oil resources.Soils are primarily Entisols (based on the American Soil Taxonomy)and are in the primary stage of development and limited in depth.Most profiles also identified as continuous sand layers approxi-mately 20–35 cm thick within 60 cm of the surface.
The study area is located in an arid environment with an annualaverage rainfall of 150 mm with mean annual temperature of14.5�C, and relative air humidity of 52%. Generally about 80% of pre-cipitation falls in 2–3 intense storm events, predominantly towardsthe end of autumn and winter, with a high temporal and spatial var-iability typical of such arid regions. For the purpose of this studythree sites were selected for the analysis of gully head positions.The main characteristics of the sites are summarized in Table 1.
3. Materials and methods
3.1. Field measurements
Topographic maps (1:20,000), recent aerial photographs(1:20,000) (1993) and geological maps were obtained from the Na-tional Cartographic Center (NCC) and Geological Survey Organiza-tion of Iran. Permanent gullies were identified by visualinterpretation of the aerial photographs and examination in thefield, with gullies greater than 0.7 m in depth being used for fur-ther analysis. The gully positions and all drainage channel(s) werethen mapped using a portable GPS with a positional accuracy ofapproximately 3 m. To map gully locations and headcuts all siteswere systematically walked from outlet to catchment divide anda series of points were marked using the GPS through all drainagenetworks. Data describing gully activity was also collected at thisstage, based on pre-defined criteria as follows; abrupt and steepmorphology, sharp edge, active plunge-pool and evidence of
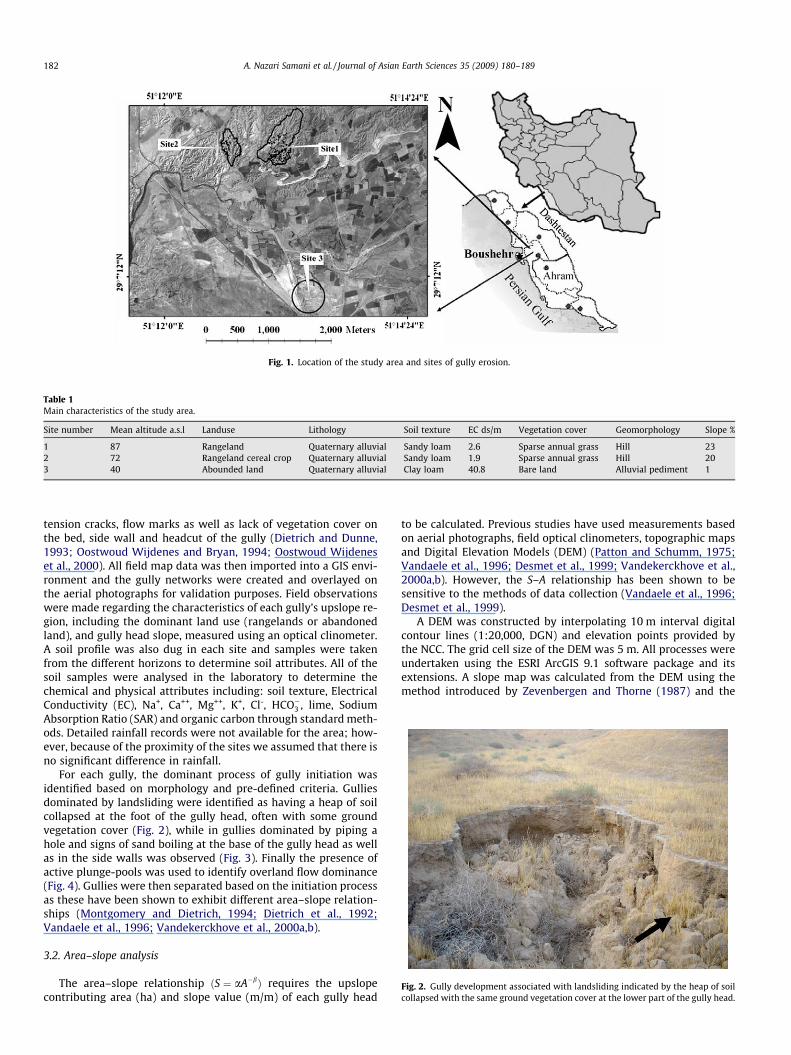
Fig. 1. Location of the study area and sites of gully erosion.
Table 1Main characteristics of the study area.
Site number Mean altitude a.s.l Landuse Lithology Soil texture EC ds/m Vegetation cover Geomorphology Slope %
1 87 Rangeland Quaternary alluvial Sandy loam 2.6 Sparse annual grass Hill 232 72 Rangeland cereal crop Quaternary alluvial Sandy loam 1.9 Sparse annual grass Hill 203 40 Abounded land Quaternary alluvial Clay loam 40.8 Bare land Alluvial pediment 1
Fig. 2. Gully development associated with landsliding indicated by the heap of soilcollapsed with the same ground vegetation cover at the lower part of the gully head.
182 A. Nazari Samani et al. / Journal of Asian Earth Sciences 35 (2009) 180–189
tension cracks, flow marks as well as lack of vegetation cover onthe bed, side wall and headcut of the gully (Dietrich and Dunne,1993; Oostwoud Wijdenes and Bryan, 1994; Oostwoud Wijdeneset al., 2000). All field map data was then imported into a GIS envi-ronment and the gully networks were created and overlayed onthe aerial photographs for validation purposes. Field observationswere made regarding the characteristics of each gully’s upslope re-gion, including the dominant land use (rangelands or abandonedland), and gully head slope, measured using an optical clinometer.A soil profile was also dug in each site and samples were takenfrom the different horizons to determine soil attributes. All of thesoil samples were analysed in the laboratory to determine thechemical and physical attributes including: soil texture, ElectricalConductivity (EC), Na+, Ca++, Mg++, K+, Cl-, HCO�3 , lime, SodiumAbsorption Ratio (SAR) and organic carbon through standard meth-ods. Detailed rainfall records were not available for the area; how-ever, because of the proximity of the sites we assumed that there isno significant difference in rainfall.
For each gully, the dominant process of gully initiation wasidentified based on morphology and pre-defined criteria. Gulliesdominated by landsliding were identified as having a heap of soilcollapsed at the foot of the gully head, often with some groundvegetation cover (Fig. 2), while in gullies dominated by piping ahole and signs of sand boiling at the base of the gully head as wellas in the side walls was observed (Fig. 3). Finally the presence ofactive plunge-pools was used to identify overland flow dominance(Fig. 4). Gullies were then separated based on the initiation processas these have been shown to exhibit different area–slope relation-ships (Montgomery and Dietrich, 1994; Dietrich et al., 1992;Vandaele et al., 1996; Vandekerckhove et al., 2000a,b).
3.2. Area–slope analysis
The area–slope relationship ðS ¼ aA�bÞ requires the upslopecontributing area (ha) and slope value (m/m) of each gully head
to be calculated. Previous studies have used measurements basedon aerial photographs, field optical clinometers, topographic mapsand Digital Elevation Models (DEM) (Patton and Schumm, 1975;Vandaele et al., 1996; Desmet et al., 1999; Vandekerckhove et al.,2000a,b). However, the S–A relationship has been shown to besensitive to the methods of data collection (Vandaele et al., 1996;Desmet et al., 1999).
A DEM was constructed by interpolating 10 m interval digitalcontour lines (1:20,000, DGN) and elevation points provided bythe NCC. The grid cell size of the DEM was 5 m. All processes wereundertaken using the ESRI ArcGIS 9.1 software package and itsextensions. A slope map was calculated from the DEM using themethod introduced by Zevenbergen and Thorne (1987) and the
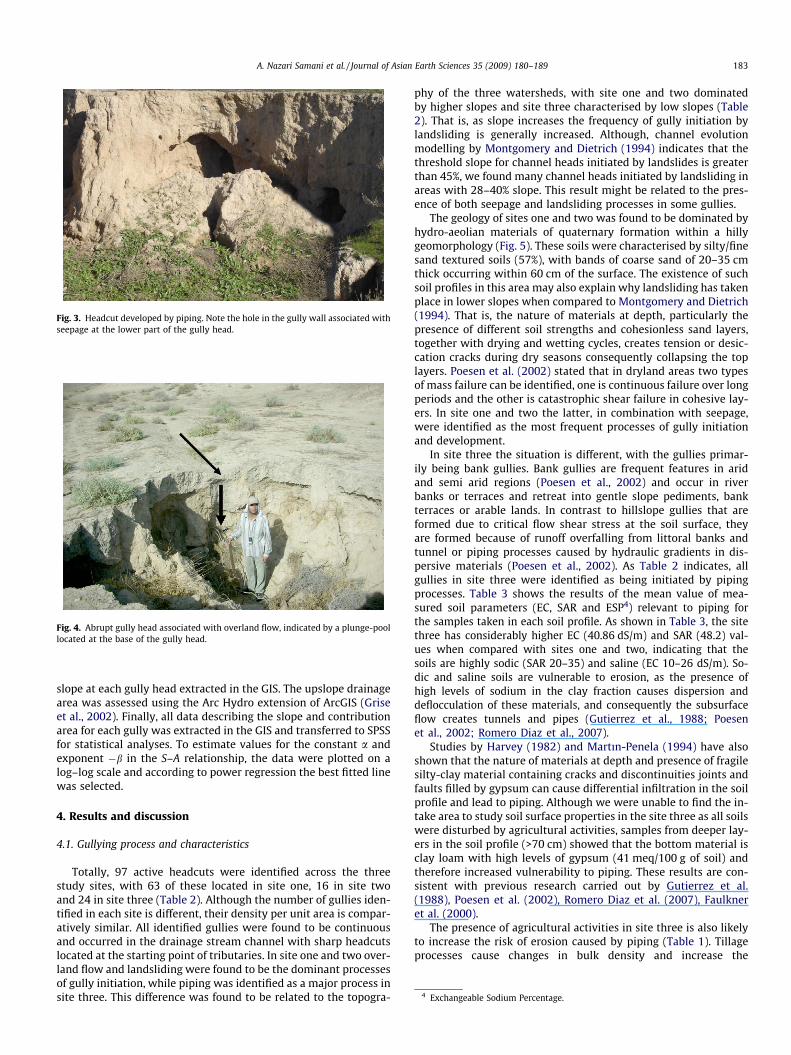
Fig. 3. Headcut developed by piping. Note the hole in the gully wall associated withseepage at the lower part of the gully head.
Fig. 4. Abrupt gully head associated with overland flow, indicated by a plunge-poollocated at the base of the gully head.
4 Exchangeable Sodium Percentage.
A. Nazari Samani et al. / Journal of Asian Earth Sciences 35 (2009) 180–189 183
slope at each gully head extracted in the GIS. The upslope drainagearea was assessed using the Arc Hydro extension of ArcGIS (Griseet al., 2002). Finally, all data describing the slope and contributionarea for each gully was extracted in the GIS and transferred to SPSSfor statistical analyses. To estimate values for the constant a andexponent �b in the S–A relationship, the data were plotted on alog–log scale and according to power regression the best fitted linewas selected.
4. Results and discussion
4.1. Gullying process and characteristics
Totally, 97 active headcuts were identified across the threestudy sites, with 63 of these located in site one, 16 in site twoand 24 in site three (Table 2). Although the number of gullies iden-tified in each site is different, their density per unit area is compar-atively similar. All identified gullies were found to be continuousand occurred in the drainage stream channel with sharp headcutslocated at the starting point of tributaries. In site one and two over-land flow and landsliding were found to be the dominant processesof gully initiation, while piping was identified as a major process insite three. This difference was found to be related to the topogra-
phy of the three watersheds, with site one and two dominatedby higher slopes and site three characterised by low slopes (Table2). That is, as slope increases the frequency of gully initiation bylandsliding is generally increased. Although, channel evolutionmodelling by Montgomery and Dietrich (1994) indicates that thethreshold slope for channel heads initiated by landslides is greaterthan 45%, we found many channel heads initiated by landsliding inareas with 28–40% slope. This result might be related to the pres-ence of both seepage and landsliding processes in some gullies.
The geology of sites one and two was found to be dominated byhydro-aeolian materials of quaternary formation within a hillygeomorphology (Fig. 5). These soils were characterised by silty/finesand textured soils (57%), with bands of coarse sand of 20–35 cmthick occurring within 60 cm of the surface. The existence of suchsoil profiles in this area may also explain why landsliding has takenplace in lower slopes when compared to Montgomery and Dietrich(1994). That is, the nature of materials at depth, particularly thepresence of different soil strengths and cohesionless sand layers,together with drying and wetting cycles, creates tension or desic-cation cracks during dry seasons consequently collapsing the toplayers. Poesen et al. (2002) stated that in dryland areas two typesof mass failure can be identified, one is continuous failure over longperiods and the other is catastrophic shear failure in cohesive lay-ers. In site one and two the latter, in combination with seepage,were identified as the most frequent processes of gully initiationand development.
In site three the situation is different, with the gullies primar-ily being bank gullies. Bank gullies are frequent features in aridand semi arid regions (Poesen et al., 2002) and occur in riverbanks or terraces and retreat into gentle slope pediments, bankterraces or arable lands. In contrast to hillslope gullies that areformed due to critical flow shear stress at the soil surface, theyare formed because of runoff overfalling from littoral banks andtunnel or piping processes caused by hydraulic gradients in dis-persive materials (Poesen et al., 2002). As Table 2 indicates, allgullies in site three were identified as being initiated by pipingprocesses. Table 3 shows the results of the mean value of mea-sured soil parameters (EC, SAR and ESP4) relevant to piping forthe samples taken in each soil profile. As shown in Table 3, the sitethree has considerably higher EC (40.86 dS/m) and SAR (48.2) val-ues when compared with sites one and two, indicating that thesoils are highly sodic (SAR 20–35) and saline (EC 10–26 dS/m). So-dic and saline soils are vulnerable to erosion, as the presence ofhigh levels of sodium in the clay fraction causes dispersion anddeflocculation of these materials, and consequently the subsurfaceflow creates tunnels and pipes (Gutierrez et al., 1988; Poesenet al., 2002; Romero Diaz et al., 2007).
Studies by Harvey (1982) and Martın-Penela (1994) have alsoshown that the nature of materials at depth and presence of fragilesilty-clay material containing cracks and discontinuities joints andfaults filled by gypsum can cause differential infiltration in the soilprofile and lead to piping. Although we were unable to find the in-take area to study soil surface properties in the site three as all soilswere disturbed by agricultural activities, samples from deeper lay-ers in the soil profile (>70 cm) showed that the bottom material isclay loam with high levels of gypsum (41 meq/100 g of soil) andtherefore increased vulnerability to piping. These results are con-sistent with previous research carried out by Gutierrez et al.(1988), Poesen et al. (2002), Romero Diaz et al. (2007), Faulkneret al. (2000).
The presence of agricultural activities in site three is also likelyto increase the risk of erosion caused by piping (Table 1). Tillageprocesses cause changes in bulk density and increase the
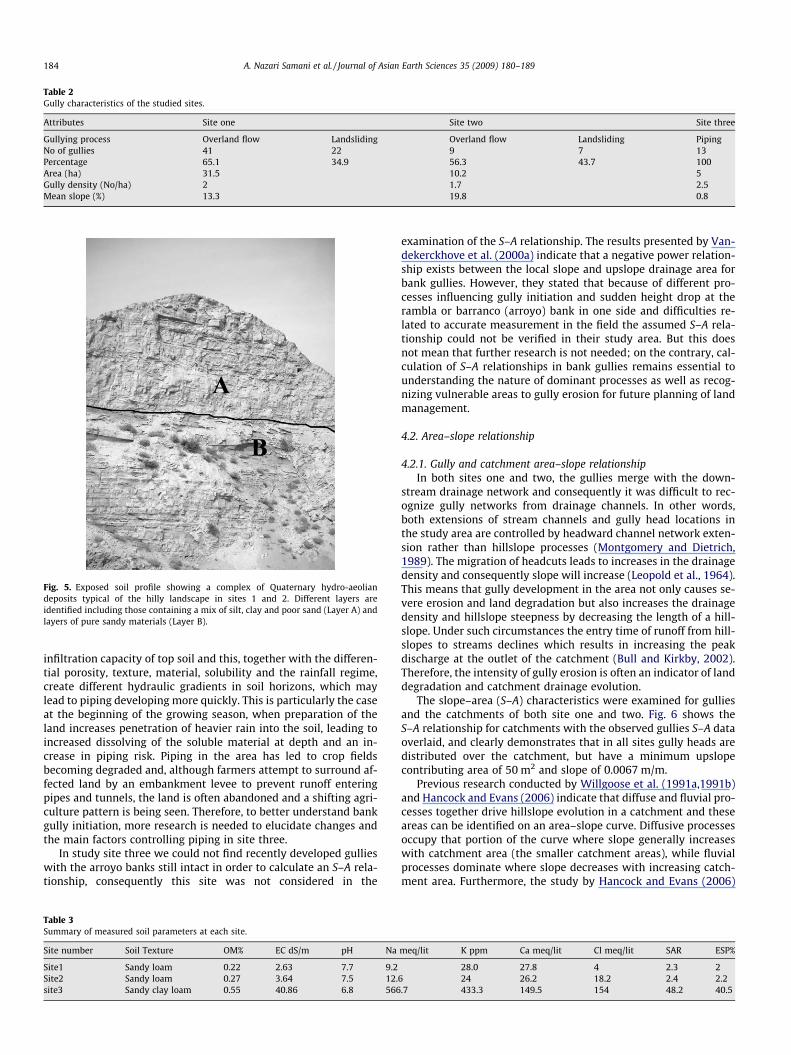
Table 2Gully characteristics of the studied sites.
Attributes Site one Site two Site three
Gullying process Overland flow Landsliding Overland flow Landsliding PipingNo of gullies 41 22 9 7 13Percentage 65.1 34.9 56.3 43.7 100Area (ha) 31.5 10.2 5Gully density (No/ha) 2 1.7 2.5Mean slope (%) 13.3 19.8 0.8
Fig. 5. Exposed soil profile showing a complex of Quaternary hydro-aeoliandeposits typical of the hilly landscape in sites 1 and 2. Different layers areidentified including those containing a mix of silt, clay and poor sand (Layer A) andlayers of pure sandy materials (Layer B).
184 A. Nazari Samani et al. / Journal of Asian Earth Sciences 35 (2009) 180–189
infiltration capacity of top soil and this, together with the differen-tial porosity, texture, material, solubility and the rainfall regime,create different hydraulic gradients in soil horizons, which maylead to piping developing more quickly. This is particularly the caseat the beginning of the growing season, when preparation of theland increases penetration of heavier rain into the soil, leading toincreased dissolving of the soluble material at depth and an in-crease in piping risk. Piping in the area has led to crop fieldsbecoming degraded and, although farmers attempt to surround af-fected land by an embankment levee to prevent runoff enteringpipes and tunnels, the land is often abandoned and a shifting agri-culture pattern is being seen. Therefore, to better understand bankgully initiation, more research is needed to elucidate changes andthe main factors controlling piping in site three.
In study site three we could not find recently developed gullieswith the arroyo banks still intact in order to calculate an S–A rela-tionship, consequently this site was not considered in the
Table 3Summary of measured soil parameters at each site.
Site number Soil Texture OM% EC dS/m pH Na
Site1 Sandy loam 0.22 2.63 7.7 9.2Site2 Sandy loam 0.27 3.64 7.5 12.site3 Sandy clay loam 0.55 40.86 6.8 566
examination of the S–A relationship. The results presented by Van-dekerckhove et al. (2000a) indicate that a negative power relation-ship exists between the local slope and upslope drainage area forbank gullies. However, they stated that because of different pro-cesses influencing gully initiation and sudden height drop at therambla or barranco (arroyo) bank in one side and difficulties re-lated to accurate measurement in the field the assumed S–A rela-tionship could not be verified in their study area. But this doesnot mean that further research is not needed; on the contrary, cal-culation of S–A relationships in bank gullies remains essential tounderstanding the nature of dominant processes as well as recog-nizing vulnerable areas to gully erosion for future planning of landmanagement.
4.2. Area–slope relationship
4.2.1. Gully and catchment area–slope relationshipIn both sites one and two, the gullies merge with the down-
stream drainage network and consequently it was difficult to rec-ognize gully networks from drainage channels. In other words,both extensions of stream channels and gully head locations inthe study area are controlled by headward channel network exten-sion rather than hillslope processes (Montgomery and Dietrich,1989). The migration of headcuts leads to increases in the drainagedensity and consequently slope will increase (Leopold et al., 1964).This means that gully development in the area not only causes se-vere erosion and land degradation but also increases the drainagedensity and hillslope steepness by decreasing the length of a hill-slope. Under such circumstances the entry time of runoff from hill-slopes to streams declines which results in increasing the peakdischarge at the outlet of the catchment (Bull and Kirkby, 2002).Therefore, the intensity of gully erosion is often an indicator of landdegradation and catchment drainage evolution.
The slope–area (S–A) characteristics were examined for gulliesand the catchments of both site one and two. Fig. 6 shows theS–A relationship for catchments with the observed gullies S–A dataoverlaid, and clearly demonstrates that in all sites gully heads aredistributed over the catchment, but have a minimum upslopecontributing area of 50 m2 and slope of 0.0067 m/m.
Previous research conducted by Willgoose et al. (1991a,1991b)and Hancock and Evans (2006) indicate that diffuse and fluvial pro-cesses together drive hillslope evolution in a catchment and theseareas can be identified on an area–slope curve. Diffusive processesoccupy that portion of the curve where slope generally increaseswith catchment area (the smaller catchment areas), while fluvialprocesses dominate where slope decreases with increasing catch-ment area. Furthermore, the study by Hancock and Evans (2006)
meq/lit K ppm Ca meq/lit Cl meq/lit SAR ESP%
28.0 27.8 4 2.3 26 24 26.2 18.2 2.4 2.2.7 433.3 149.5 154 48.2 40.5
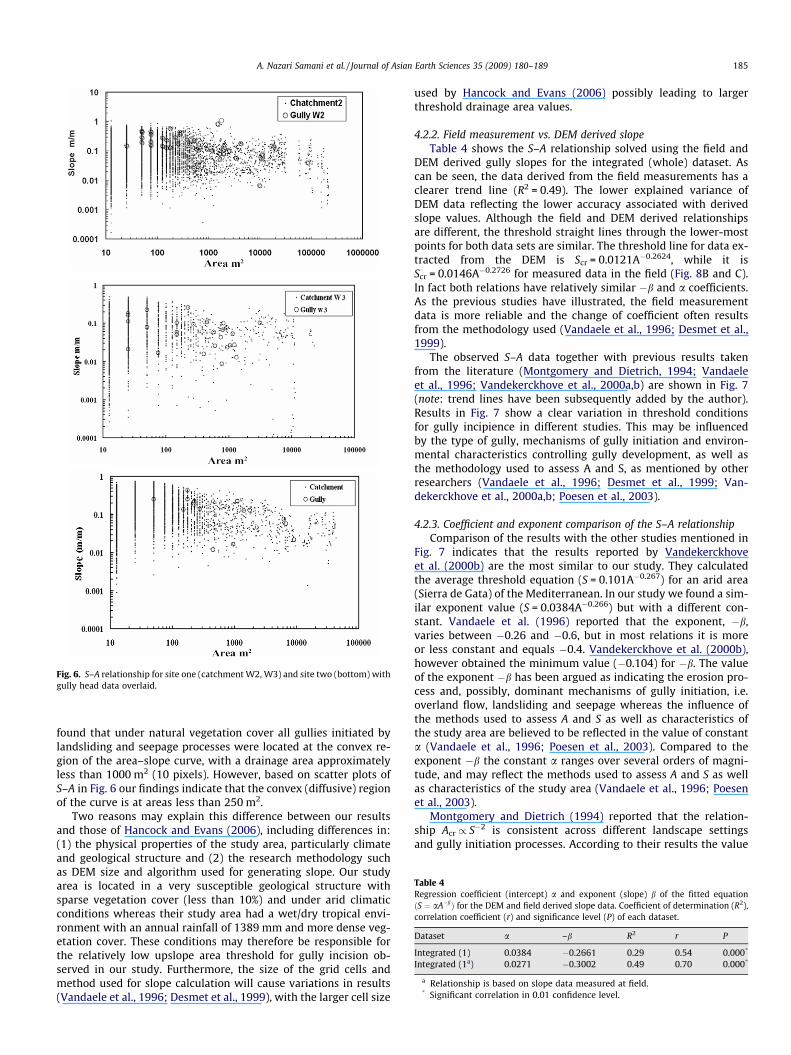
Fig. 6. S–A relationship for site one (catchment W2, W3) and site two (bottom) withgully head data overlaid.
Table 4Regression coefficient (intercept) a and exponent (slope) b of the fitted equationðS ¼ aA�bÞ for the DEM and field derived slope data. Coefficient of determination (R2),correlation coefficient (r) and significance level (P) of each dataset.
Dataset a –b R2 r P
Integrated (1) 0.0384 �0.2661 0.29 0.54 0.000*
Integrated (1a) 0.0271 �0.3002 0.49 0.70 0.000*
a Relationship is based on slope data measured at field.* Significant correlation in 0.01 confidence level.
A. Nazari Samani et al. / Journal of Asian Earth Sciences 35 (2009) 180–189 185
found that under natural vegetation cover all gullies initiated bylandsliding and seepage processes were located at the convex re-gion of the area–slope curve, with a drainage area approximatelyless than 1000 m2 (10 pixels). However, based on scatter plots ofS–A in Fig. 6 our findings indicate that the convex (diffusive) regionof the curve is at areas less than 250 m2.
Two reasons may explain this difference between our resultsand those of Hancock and Evans (2006), including differences in:(1) the physical properties of the study area, particularly climateand geological structure and (2) the research methodology suchas DEM size and algorithm used for generating slope. Our studyarea is located in a very susceptible geological structure withsparse vegetation cover (less than 10%) and under arid climaticconditions whereas their study area had a wet/dry tropical envi-ronment with an annual rainfall of 1389 mm and more dense veg-etation cover. These conditions may therefore be responsible forthe relatively low upslope area threshold for gully incision ob-served in our study. Furthermore, the size of the grid cells andmethod used for slope calculation will cause variations in results(Vandaele et al., 1996; Desmet et al., 1999), with the larger cell size
used by Hancock and Evans (2006) possibly leading to largerthreshold drainage area values.
4.2.2. Field measurement vs. DEM derived slopeTable 4 shows the S–A relationship solved using the field and
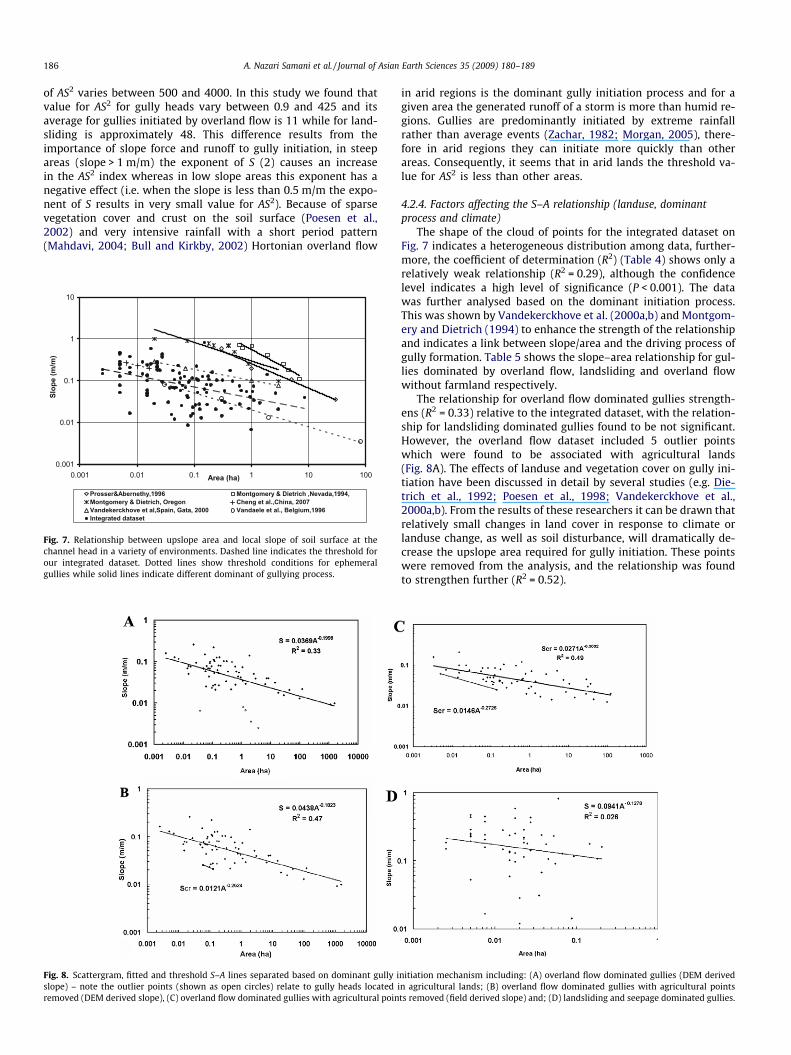
DEM derived gully slopes for the integrated (whole) dataset. Ascan be seen, the data derived from the field measurements has aclearer trend line (R2 = 0.49). The lower explained variance ofDEM data reflecting the lower accuracy associated with derivedslope values. Although the field and DEM derived relationshipsare different, the threshold straight lines through the lower-mostpoints for both data sets are similar. The threshold line for data ex-tracted from the DEM is Scr = 0.0121A�0.2624, while it isScr = 0.0146A�0.2726 for measured data in the field (Fig. 8B and C).In fact both relations have relatively similar �b and a coefficients.As the previous studies have illustrated, the field measurementdata is more reliable and the change of coefficient often resultsfrom the methodology used (Vandaele et al., 1996; Desmet et al.,1999).
The observed S–A data together with previous results takenfrom the literature (Montgomery and Dietrich, 1994; Vandaeleet al., 1996; Vandekerckhove et al., 2000a,b) are shown in Fig. 7(note: trend lines have been subsequently added by the author).Results in Fig. 7 show a clear variation in threshold conditionsfor gully incipience in different studies. This may be influencedby the type of gully, mechanisms of gully initiation and environ-mental characteristics controlling gully development, as well asthe methodology used to assess A and S, as mentioned by otherresearchers (Vandaele et al., 1996; Desmet et al., 1999; Van-dekerckhove et al., 2000a,b; Poesen et al., 2003).
4.2.3. Coefficient and exponent comparison of the S–A relationshipComparison of the results with the other studies mentioned in
Fig. 7 indicates that the results reported by Vandekerckhoveet al. (2000b) are the most similar to our study. They calculatedthe average threshold equation (S = 0.101A�0.267) for an arid area(Sierra de Gata) of the Mediterranean. In our study we found a sim-ilar exponent value (S = 0.0384A�0.266) but with a different con-stant. Vandaele et al. (1996) reported that the exponent, �b,varies between �0.26 and �0.6, but in most relations it is moreor less constant and equals �0.4. Vandekerckhove et al. (2000b),however obtained the minimum value (�0.104) for �b. The valueof the exponent �b has been argued as indicating the erosion pro-cess and, possibly, dominant mechanisms of gully initiation, i.e.overland flow, landsliding and seepage whereas the influence ofthe methods used to assess A and S as well as characteristics ofthe study area are believed to be reflected in the value of constanta (Vandaele et al., 1996; Poesen et al., 2003). Compared to theexponent �b the constant a ranges over several orders of magni-tude, and may reflect the methods used to assess A and S as wellas characteristics of the study area (Vandaele et al., 1996; Poesenet al., 2003).
Montgomery and Dietrich (1994) reported that the relation-ship Acr / S�2 is consistent across different landscape settingsand gully initiation processes. According to their results the value
186 A. Nazari Samani et al. / Journal of Asian Earth Sciences 35 (2009) 180–189
of AS2 varies between 500 and 4000. In this study we found thatvalue for AS2 for gully heads vary between 0.9 and 425 and itsaverage for gullies initiated by overland flow is 11 while for land-sliding is approximately 48. This difference results from theimportance of slope force and runoff to gully initiation, in steepareas (slope > 1 m/m) the exponent of S (2) causes an increasein the AS2 index whereas in low slope areas this exponent has anegative effect (i.e. when the slope is less than 0.5 m/m the expo-nent of S results in very small value for AS2). Because of sparsevegetation cover and crust on the soil surface (Poesen et al.,2002) and very intensive rainfall with a short period pattern(Mahdavi, 2004; Bull and Kirkby, 2002) Hortonian overland flow
Fig. 8. Scattergram, fitted and threshold S–A lines separated based on dominant gully islope) – note the outlier points (shown as open circles) relate to gully heads located iremoved (DEM derived slope), (C) overland flow dominated gullies with agricultural poin
0.001
0.01
0.1
1
10
0.001 0.01 0.1 1 10 100Area (ha)
Slop
e (m
/m)
Prosser&Abernethy,1996 Montgomery & Dietrich ,Nevada,1994,Montgomery & Dietrich, Oregon Cheng et al.,China, 2007Vandekerckhove et al,Spain, Gata, 2000 Vandaele et al., Belgium,1996Integrated dataset
Fig. 7. Relationship between upslope area and local slope of soil surface at thechannel head in a variety of environments. Dashed line indicates the threshold forour integrated dataset. Dotted lines show threshold conditions for ephemeralgullies while solid lines indicate different dominant of gullying process.
in arid regions is the dominant gully initiation process and for agiven area the generated runoff of a storm is more than humid re-gions. Gullies are predominantly initiated by extreme rainfallrather than average events (Zachar, 1982; Morgan, 2005), there-fore in arid regions they can initiate more quickly than otherareas. Consequently, it seems that in arid lands the threshold va-lue for AS2 is less than other areas.
4.2.4. Factors affecting the S–A relationship (landuse, dominantprocess and climate)
The shape of the cloud of points for the integrated dataset onFig. 7 indicates a heterogeneous distribution among data, further-more, the coefficient of determination (R2) (Table 4) shows only arelatively weak relationship (R2 = 0.29), although the confidencelevel indicates a high level of significance (P < 0.001). The datawas further analysed based on the dominant initiation process.This was shown by Vandekerckhove et al. (2000a,b) and Montgom-ery and Dietrich (1994) to enhance the strength of the relationshipand indicates a link between slope/area and the driving process ofgully formation. Table 5 shows the slope–area relationship for gul-lies dominated by overland flow, landsliding and overland flowwithout farmland respectively.
The relationship for overland flow dominated gullies strength-ens (R2 = 0.33) relative to the integrated dataset, with the relation-ship for landsliding dominated gullies found to be not significant.However, the overland flow dataset included 5 outlier pointswhich were found to be associated with agricultural lands(Fig. 8A). The effects of landuse and vegetation cover on gully ini-tiation have been discussed in detail by several studies (e.g. Die-trich et al., 1992; Poesen et al., 1998; Vandekerckhove et al.,2000a,b). From the results of these researchers it can be drawn thatrelatively small changes in land cover in response to climate orlanduse change, as well as soil disturbance, will dramatically de-crease the upslope area required for gully initiation. These pointswere removed from the analysis, and the relationship was foundto strengthen further (R2 = 0.52).
nitiation mechanism including: (A) overland flow dominated gullies (DEM derivedn agricultural lands; (B) overland flow dominated gullies with agricultural pointsts removed (field derived slope) and; (D) landsliding and seepage dominated gullies.
Table 5Regression coefficient (intercept) a and exponent (slope) b of the fitted equation ðS ¼ aA�bÞ for the separated datasets. Coefficient of determination (R2), Correlation coefficient (r)and significance level (P) of the dataset separated based on dominant gully initiation mechanism.
Dataset a –b R2 r P
Overland flow (2) 0.0369 �0.1998 0.33 0.6 0.000*
Landsliding (3) 0.0941 �0.1278 0.026 0.16 0.252ns
Overland flow without farmland (4) 0.0438 �0.1823 0.52 0.72 0.000*
ns: Non significant.* Significant correlation in 0.01 confidence level.
Table 6S–A threshold relationships reported in the literature. To compare the results, the relation is transformed in the far right column to S = aA�b in which the area is expressed inhectares.
Reference Region Vegetation Geology Annual rainfall(mm)
Relation Parameterunits
Transformedrelation
A S
Montgomery and Dietrich, 1988 SierraNevada
Open wood land Granite 260 S = 0.35A�0.6 ha m/m
S = 0.35A�0.6
Montgomery and Dietrich, 1992 – – – – AS2 = 500–4000 m2 m/m
S = 0.05A�0.5
Vandaele et al., 1996 Belgium Agriculture Loess belt 700 S = 0.025A�0.4 ha m/m
S = 0.025A�0.4
Vandekerckhove et al. 2000b Sierra deGata
Rangeland Alluvial Fan Litic andEutric soil
182 S = 0.101A�0.267 ha m/m
S = 0.101A�0.267
Cheng et al., 2007 LoessPlateau
Changed cropland tograssland
Loess 900 S = 0.058A�0.3 ha m/m
S = 0.058A�0.3
Vandekerckhove et al. (2000a,b) Lesvos Rangeland Volcanic Rock andEutric Leptisol
405 S = 0.218A�0.211 ha m/m
S = 0.218A�0.211
Willgoose et al., (cited by Hancockand Evans, 2007)a
NorthernAustralia
Forest ERA (Uranium) 1389 2.5A0.4S0.3 P 25 m2 m/m
S P 0.01A�1.33
a The source relation introduced by Willgoos et al. (1991a) is 2.5A0.4S0.3 P at and Hancock and Evans (2007) used it for evaluation gully position by taking into account thevalue of 25 as at.
A. Nazari Samani et al. / Journal of Asian Earth Sciences 35 (2009) 180–189 187
Montgomery and Dietrich (1992) and Dietrich et al. (1992) havedivided the landscape into overland flow, seepage and saturationerosion as well as landsliding based on the dominant processresponsible for channel initiation. They have reported that the rela-tion between A and critical S in all cases is a linear inverse one, butit is not true for saturated soil and seepage erosion often associatedwith landsliding (Vandekerckhove et al., 2000a,b). This is consis-tent with our findings, with no statistically significant S–A relation-ship found for gullies dominated by landsliding. This isexacerbated in our study by the lithology, and particularly thepresence of a variable cohesionless-sand layer (Fig. 5).
Table 6 shows S–A relationships and environmental characteris-tics of studies undertaken by other researchers. Comparison of Ta-bles 5 and 6 illustrate that our findings are different from mostprevious research, except Vandekerckhove et al. (2000a,b). This ismost likely attributable to the environmental characteristics ofthe study area, as well as methodologies used because none ofthe cited studies are located in arid conditions. Montgomery andDietrich (1988) stated that in dry regions the thresholds line plotsabove wet regions and concluded that for a given local slope, thesource area required to initiate a channel head should increasewith increasing aridity to produce the same critical combinationof runoff and local slope at the channel head (Montgomery andDietrich, 1988). In contrast, Vandekerckhove et al. (2000a,b) indi-cated that this does not apply in their study area and consequentlystated that the relative position of the threshold line is controlledby other factors beyond climatic condition. In our study, we alsofound a relatively low threshold line. In arid regions, this may indi-cate that sparse vegetation cover, and the intense, albeit sporadic,nature of the rainfall can generate sufficient runoff from smallcatchments for gully initiation.
The value of the exponent of �b for the integrated dataset(�0.266) is similar to that of Sierra de Gata (�0.267) and Lesvos(�0.211). Both studies are located in rangelands, although the Les-vos study area is considerably wetter. Although the study area ofMontgomery and Dietrich (1988) is also located in an arid region(Sierra Nevada) the �b is higher. This is likely to be because thearea is more heavily vegetated (open oak woodland and grassland)and has a less erosive geology (old granite) than our study area.However, similar to their results we found that overland flow isthe dominant process in gentle gradients and landsliding is respon-sible for channel initiation in steep regions. These researchers illus-trated that overland flow and landsliding gullies can be separatedbased on slope (i.e. S > 50% for landsliding), but this was not possi-ble in our study due to the combined effect of the processes inmany gullies.
4.2.5. Application of threshold to predict areas vulnerable to gullyinitiation
Identifying the potential for gully initiation in the study areacan help land managers to better understand the potential damageof gullying and inform the development of soil conservation pro-jects. The S–A relationship can be applied to distinguish the areasprone to gully erosion (Vandaele et al., 1996; Desmet et al.,1999), given similar geomorphology, climate and soil conditions.A small catchment (16.3 ha) located approximately 1800 m fromthe existing sites was identified for model application. All gullyhead locations were mapped (12 identified) and a DEM was usedto extract the upslope drainage area and slope for each grid cell.Most previous studies (Patton and Schumm, 1975; Vandaeleet al., 1996; Cheng et al., 2007) used a straight fitted line throughthe lower-most points of data. This line is the conservative
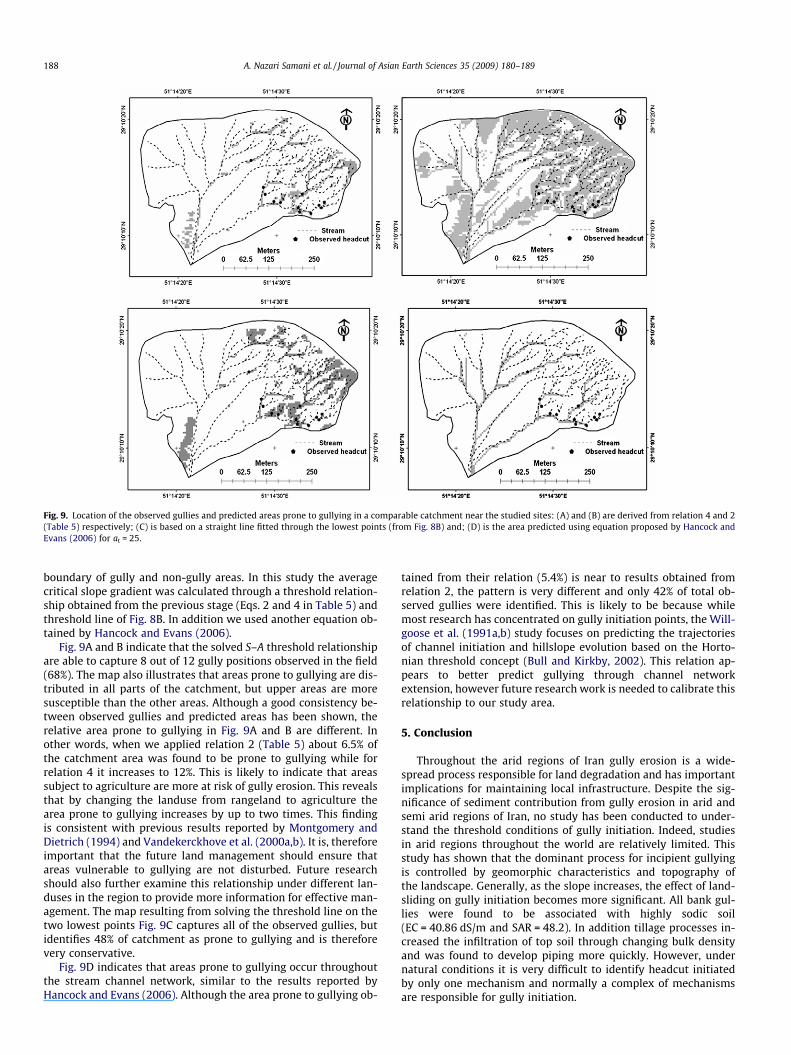
Fig. 9. Location of the observed gullies and predicted areas prone to gullying in a comparable catchment near the studied sites: (A) and (B) are derived from relation 4 and 2(Table 5) respectively; (C) is based on a straight line fitted through the lowest points (from Fig. 8B) and; (D) is the area predicted using equation proposed by Hancock andEvans (2006) for at = 25.
188 A. Nazari Samani et al. / Journal of Asian Earth Sciences 35 (2009) 180–189
boundary of gully and non-gully areas. In this study the averagecritical slope gradient was calculated through a threshold relation-ship obtained from the previous stage (Eqs. 2 and 4 in Table 5) andthreshold line of Fig. 8B. In addition we used another equation ob-tained by Hancock and Evans (2006).
Fig. 9A and B indicate that the solved S–A threshold relationshipare able to capture 8 out of 12 gully positions observed in the field(68%). The map also illustrates that areas prone to gullying are dis-tributed in all parts of the catchment, but upper areas are moresusceptible than the other areas. Although a good consistency be-tween observed gullies and predicted areas has been shown, therelative area prone to gullying in Fig. 9A and B are different. Inother words, when we applied relation 2 (Table 5) about 6.5% ofthe catchment area was found to be prone to gullying while forrelation 4 it increases to 12%. This is likely to indicate that areassubject to agriculture are more at risk of gully erosion. This revealsthat by changing the landuse from rangeland to agriculture thearea prone to gullying increases by up to two times. This findingis consistent with previous results reported by Montgomery andDietrich (1994) and Vandekerckhove et al. (2000a,b). It is, thereforeimportant that the future land management should ensure thatareas vulnerable to gullying are not disturbed. Future researchshould also further examine this relationship under different lan-duses in the region to provide more information for effective man-agement. The map resulting from solving the threshold line on thetwo lowest points Fig. 9C captures all of the observed gullies, butidentifies 48% of catchment as prone to gullying and is thereforevery conservative.
Fig. 9D indicates that areas prone to gullying occur throughoutthe stream channel network, similar to the results reported byHancock and Evans (2006). Although the area prone to gullying ob-
tained from their relation (5.4%) is near to results obtained fromrelation 2, the pattern is very different and only 42% of total ob-served gullies were identified. This is likely to be because whilemost research has concentrated on gully initiation points, the Will-goose et al. (1991a,b) study focuses on predicting the trajectoriesof channel initiation and hillslope evolution based on the Horto-nian threshold concept (Bull and Kirkby, 2002). This relation ap-pears to better predict gullying through channel networkextension, however future research work is needed to calibrate thisrelationship to our study area.
5. Conclusion
Throughout the arid regions of Iran gully erosion is a wide-spread process responsible for land degradation and has importantimplications for maintaining local infrastructure. Despite the sig-nificance of sediment contribution from gully erosion in arid andsemi arid regions of Iran, no study has been conducted to under-stand the threshold conditions of gully initiation. Indeed, studiesin arid regions throughout the world are relatively limited. Thisstudy has shown that the dominant process for incipient gullyingis controlled by geomorphic characteristics and topography ofthe landscape. Generally, as the slope increases, the effect of land-sliding on gully initiation becomes more significant. All bank gul-lies were found to be associated with highly sodic soil(EC = 40.86 dS/m and SAR = 48.2). In addition tillage processes in-creased the infiltration of top soil through changing bulk densityand was found to develop piping more quickly. However, undernatural conditions it is very difficult to identify headcut initiatedby only one mechanism and normally a complex of mechanismsare responsible for gully initiation.
A. Nazari Samani et al. / Journal of Asian Earth Sciences 35 (2009) 180–189 189
Gullies were found to have formed throughout the catchment,with a large range in drainage area and slope. Grouping datadescribing upslope drainage area and local slope based on domi-nant gullying process indicated a significant relationship betweenA and S for gullies initiated by overland flow, but not for landslid-ing. Data discussed in this paper clearly indicated that landusechanges, that increase the effective rainfall intensity and runoffproperties, decrease the topographic threshold and acceleratechannel network expansion. Comparison of the threshold linefound for overland flow gullies in this study with other studies sug-gests that it is relatively low. However, this is consistent with otherstudies in arid regions and indicates that arid regions may be moresusceptible to gullying due to the low vegetation cover and highvariation of rainfall. This study has also shown that the thresholdS–A relationship can be used to predict vulnerable areas to gullyingwith an acceptable accuracy in order to examine the potential im-pact of different land cover. However, due to the complexity ofgully erosion mechanisms and the limited amount of researchundertaken in arid regions more research effort is needed to under-stand gullying processes and gully hazard zonation.
Acknowledgments
The research for this paper was funded by the Iran National Sci-ence Foundation (INSF) and this support is gratefully acknowl-edged. The authors would like to thank anonymous reviewersand Dr. Tim Kusky, associate editor of the Journal of Asian EarthSciences for their helpful suggestions and comments. Specialthanks are due to Professor Robert J. Wasson, Charles Darwin Uni-versity, for his fruitful comments on an earlier draft and thoroughreview. The aerial photographs were provided by the National Car-tographic Center of Iran.
References
Adelpour, A.A., Soufi, M., Behnia, A.K., 2004. Channel erosion thresholds for differentland uses assessed by concentrated overland flow on a silty loam. In:Conserving Soil and Water for Society: Sharing Solutions. ISCO 200-13thInternational Soil Conservation Organisation Conference, Brisbane, Australia.
Ahmadi, H., 2004. Introduction to Iranian Model of Desertification Assessment(IMDPA), Unpubl. Technical Report for presenting in Committee of Science andTechnology, United Nation Convention to combat desertification, The 7thSession of Conference of Parties (COP7), Nairobi, Kenya, 56 pp.
Begin, Z.B., Schumm, S.A., 1979. Instability of alluvial valley floors: a method for itsassessment. Trans. Am. Soc. Agric. Eng. 22, 347–350.
Bull, L.J., Kirkby, M.J., 2002. Channel heads and channel extension. In: Bull, L.J.,Kirkby, M.J. (Eds.), Dryland Rivers: Hydrology and Geomorphology of Semi-aridChannels. Wiley, Chichester, UK, pp. 265–298.
Cheng, H., Zou, X., Wu, Y., Zhang, C., Zheng, Q., Jiang, Zh., 2007. Morphologyparameters of ephemeral gully in characteristics hillslopes on the Loess Plateauof China. Soil & Tillage Research 94, 4–14.
Desmet, P.J.J., Poesen, J., Govers, G., Vandaele, K., 1999. Importance of slope gradientand contributing area for optimal prediction of the initiation and trajectory ofephemeral gullies. Catena 37, 377–392.
Dietrich, W.E., Wilson, C.J., Montgomery, D.R., McKean, J., Bauer, R., 1992. Erosionthresholds and land surface morphology. Geology 20, 675–679.
Dietrich, W.E., Dunne, T., 1993. The channel head. In: Beven, K., Kirkby, M.J. (Eds.),Channel Network Hydrology. Wiley, Chichester, pp. 175–219.
Faulkner, H., Spivey, D., Alexander, R., 2000. The role of some site geochemicalprocesses in the development and stabilisation of three badland sites inAlmería, Southern Spain. Geomorphology 35, 87–99.
Forest and Rangeland Organization, 2004. National Activities Program, TechnicalReport for United Nation Convention of Combat Desertification. I. R. Iran, 75 pp.
Ghoddousi, J., 2002. Gully erosion morphology modelling and hazard zonation(Study area: Zanjanrood drainage basin), Unpubl. Ph.D thesis, Department ofArid and Mountainous Region Reclamation, University of Tehran, 368 pp,(abstract in English).
Grise, S., Arctur, D., Booth, B., 2002. Implementing Arc Hydro. In: Maidment, D.R.(Ed.), Arc Hydro, GIS for Water Resources. ESRI Press, pp. 176–201.
Gutierrez, M., Benito, G., Rodriguez, J., 1988. Piping in badland areas of the MiddleEbro Basin, Spain, In: Harvey, A.M., Sala, M. (Eds.), Geomorphic Processes in
Environments with Strong Seasonal Contrasts. Geomorphic Systems, CatenaSupplement 13 II, pp. 49–60.
Hakimkhani, Sh., 2006. An Investigation on using tracers in fluvial fine sedimentsources fingerprinting (case study: the basin of Pouldasht flood spreadingsystem, Makoo township), Unpubl. PhD thesis, Department of Arid andMountainous Region Reclamation, University of Tehran, 255 pp, (abstract inEnglish).
Hancock, G.R., Evans, K.G., 2006. Gully position, characteristics and geomorphicthresholds in an undisturbed catchment in northern Australia. HydrologicalProcesses 20, 2935–2951.
Harvey, A., 1982. The role of piping in the development of badlands and gullysystems in Southeast Spain. In: Bryan, R., Yair, A. (Eds.), BadlandGeomorphology and Piping. Geo Books Geo Abstracts, Norwich, pp. 317–355.
Leopold, L.B., Wolman, M.G., Miller, J.P., 1964. Fluvial Processes in Geomorphology.W.H. Freeman, San Francisco. 525 pp.
Mahdavi, M., 2004. Applied Hydrology, vol. 2, fifth ed. University of Tehran Press,Iran (In Persian), 420 pp.
Martın-Penela, A.J., 1994. Pipe and gully systems development in the Almanzorabasin (Southeast Spain). Zeitschrift fur Geomorphology 38, 207–222.
Montgomery, D.R., Dietrich, W.E., 1988. Where do channels begin? Nature 336,232–234.
Montgomery, D.R., Dietrich, W.E., 1989. Source areas, drainage density, and channelinitiation. Water Resources Research 25 (8), 1907–1918.
Montgomery, D.R., Dietrich, W.E., 1992. Channels initiation and the problem oflandscape scale. Science 255, 826–830.
Montgomery, D.R., Dietrich, W.E., 1994. Landscape dissection and drainage area–slope thresholds. In: Kirkby, M.J. (Ed.), Process Models and TheoreticalGeomorphology. Wiley, Chichester, UK, pp. 221–246.
Morgan, R.P.C., 2005. Soil Erosion and Conservation, third ed. Blackwell, Malden,USA. 299 pp.
Morgan, R.P.C., Mngomezulu, D., 2003. Threshold conditions for initiation of valley-side gullies in the Middle Veld of Swaziland. Catena 50, 401–414.
Nordstrom, K.F., 1988. Dune grading along the Oregon coast, USA: a changingenvironmental policy. Applied Geography 8, 101–116.
Oostwoud Wijdenes, D.J., Bryan, R.B., 1994. The significance of gully headcuts as asource of sediment on low-angle slopes at Baringo, Kenya, and initial controlmeasures. Adv. Geoecol. 27, 205–231.
Oostwoud Wijdenes, D.J., Poesen, J., Vandekerckhove, L., Ghesquiere, M., 2000.Spatial distribution of gully head activity and sediment supply along anephemeral channel in a Mediterranean environment. Catena 39, 147–167.
Patton, P.C., Schumm, S.A., 1975. Gully erosion, Northwestern Colorado: a thresholdphenomenon. Geology 3, 88–90.
Poesen, J., Vandaele, K., van Wesemael, B., 1998. Gully erosion: importance andmodel implications. In: Boardman J., Favis-Mortlock D. (Eds.), Modelling SoilErosion by Water. NATO ASI Series, vol I 55, Spinger-Verlag, Berlin.
Poesen, J., Vandekerckhove, L., Nachtergaele, J., Oostwoud Wijdenes, D., Verstraeten,G., van Wesemael, B., 2002. Gully erosion in dryland environments. In: Bull, L.J.,Kirkby, M.J. (Eds.), Dryland Rivers: Hydrology and Geomorphology of Semi-AridChannels. Wiley, Chichester, UK, pp. 229–262.
Poesen, J., Nachtergale, J., Vertstraeten, G., Valentin, C., 2003. Gully erosion andenvironmental change: importance and research needs. Catena 50 (2–4), 91–134.
Prosser, I.P., Abernethy, B., 1996. Predicting the topographic limits to a gullynetwork using a digital terrain model and process thresholds. Water ResourcesResearch 32 (7), 2289–2298.
Romero Diaz, A., Marin Sanleandro, P., Sanchez Soriano, A., Belmonte Serrato, F.,Faulkner, H., 2007. The causes of piping in a set of abandoned agriculturalterraces in southeast Spain. Catena 69, 282–293.
Sidorchuk, A., 1999. Dynamic and static models of gully erosion. Catena 37, 401–414.
Valentin, C., Yong Poesen, J., Li., 2005. Gully erosion: impacts, factors and control.Catena 63, 132–153.
Vandaele, K., Poesen, J., Govers, G., van Wesemael, B., 1996. Geomorphic thresholdconditions for ephemeral gully incision. Geomorphology 16 (2), 161–173.
Vandekerckhove, L., Poesen, J., Oostwoud Wijdenes, D., Gyssels, G., Beuselinck, L., DeLuna, E., 2000a. Characteristics and controlling factors of bank gullies in twosemi-arid Mediterranean environments. Geomorphology 33, 37–58.
Vandekerckhove, L., Poesen, J., Oostwoud Wijdenes, D., Nachtergaele, J., Kosmas, C.,Roxo, M.J., Figueiredo, T.DE., 2000b. Thresholds for gully initiation andsedimentation in Mediterranean Europe. Earth Surface Processes andLandforms 25, 1201–1220.
Wasson, R.J., Caitcheon, G., Murray, A.S., McCulloch, M., Quade, J., 2002. Sourcingsediment using multiple tracers in the catchment of Lake Argyle, NortwesternAustralia. Environmental Management 29 (5), 634–646.
Willgoose, G.R., Bras, R.L., Rodriguez-Iturbe, I., 1991a. A physical explanation of anobserved link area–slope relationship. Water Resources Research 27 (7), 1697–1702.
Willgoose, G.R., Bras, R.L., Rodriguez-Iturbe, I., 1991b. Results from a new model ofriver basin evolution. Earth Surface Processes and Landforms 16, 237–254.
Zachar, D., 1982. Soil Erosion. Elsevier Science Publication, North Holland. 522 pp.Zevenbergen, L.W., Thorne, C.R., 1987. Quantitative analysis of land surface
topography. Earth Surface processes and Landforms 12, 47–56.
Copyright © 2022 FDOKUMEN