CONTOURING AND THE CONTOUR MAP: A NEW PERSPECTIVE
17
CONTOURING AND THE CONTOUR MAP: A NEW PERSPECTIVE* BY A. E. WREN** ABSTRACT WREN, A. E., 1975, Contouring and the Contour Map,: A New Perspective, Geophysical Prospecting 23, 1-17. With few exceptions, traditional approaches to contouring have been too subjective. Contouring and contour maps are too often discussed in terms more appropriate to art than to science. With hand contouring there is some justification for this attitude; with machine (i.e. programmed) contouring there is none. Hand contouring is highly’ susceptible to interpretive judgement and the interpreter is not bound by rigid mathematical constraints. Hence, in allowing for the interpreter’s “freedom of expression” it may be difficult to evaluate hand contouring in a totally analytical and objective manner. Machine contouring, however, is based upon mathe- matical formulation. It is therefore a consistent and objective procedure, ideally suited to objective definition and analysis. It can be demonstrated that the combined process of sampling plus contouring con- stitutes a two-dimensional filter. The contouring component is that part which introduces “distortion” or wavenumber discrimination. An ideal contour package is one that acts as an all-pass filter where the distortion is zero. The application of filter theory to the evaluation of a machine contour package and its performance permits description in the more convenient language and terminology of the wavenumber domain, rather than that of the space domain. A more important advantage is that the contour package can be subjected to the various standards of filter evaluation such as amplitude and phase response. The practical application, as well as the benefit, of this approach is revealed through the comparison, in both the space and wavenumber domains, of contour maps generated from various machine contour packages. Earth scientists have been using contour maps for many years as a funda- mental tool to represent a variety of data sets. In recent years the advent of computers has led to attempts to duplicate interpretive contouring techniques by machine methods (Walters 1969, p. 2324). Although considerable progress has been made in developing an understanding of the human logic of contouring ,* Paper presented at the 42nd Annual International Meeting of the S.E.G., Anaheim, California, November 26-30, 1972. ** Amoco Canada Petroleum Company Ltd., Calgary, Alberta, Canada. Geophysical Prospecting, Vol. 23
-
Upload
independent -
Category
Documents
-
view
8 -
download
0
Transcript of CONTOURING AND THE CONTOUR MAP: A NEW PERSPECTIVE

CONTOURING AND THE CONTOUR MAP: A NEW PERSPECTIVE*
BY
A. E. WREN**
ABSTRACT
WREN, A. E., 1975, Contouring and the Contour Map,: A New Perspective, Geophysical Prospecting 23, 1-17.
With few exceptions, traditional approaches to contouring have been too subjective. Contouring and contour maps are too often discussed in terms more appropriate to art than to science. With hand contouring there is some justification for this attitude; with machine (i.e. programmed) contouring there is none.
Hand contouring is highly’ susceptible to interpretive judgement and the interpreter is not bound by rigid mathematical constraints. Hence, in allowing for the interpreter’s “freedom of expression” it may be difficult to evaluate hand contouring in a totally analytical and objective manner. Machine contouring, however, is based upon mathe- matical formulation. It is therefore a consistent and objective procedure, ideally suited to objective definition and analysis.
It can be demonstrated that the combined process of sampling plus contouring con- stitutes a two-dimensional filter. The contouring component is that part which introduces “distortion” or wavenumber discrimination. An ideal contour package is one that acts as an all-pass filter where the distortion is zero.
The application of filter theory to the evaluation of a machine contour package and its performance permits description in the more convenient language and terminology of the wavenumber domain, rather than that of the space domain. A more important advantage is that the contour package can be subjected to the various standards of filter evaluation such as amplitude and phase response.
The practical application, as well as the benefit, of this approach is revealed through the comparison, in both the space and wavenumber domains, of contour maps generated from various machine contour packages.
Earth scientists have been using contour maps for many years as a funda- mental tool to represent a variety of data sets. In recent years the advent of computers has led to attempts to duplicate interpretive contouring techniques by machine methods (Walters 1969, p. 2324). Although considerable progress has been made in developing an understanding of the human logic of contouring
,* Paper presented at the 42nd Annual International Meeting of the S.E.G., Anaheim, California, November 26-30, 1972.
** Amoco Canada Petroleum Company Ltd., Calgary, Alberta, Canada. Geophysical Prospecting, Vol. 23

2 A. E. WREN
and many computer programs are now available to produce “reasonable” contour maps, a technique to evaluate the reliability of the final map within the context of the data itself has not yet been developed.
This paper will discuss one measure of how faithfully the final contour map depicts the actual surface from which the sample data points have been obtained. The “actual surface” is represented by some finite number of observations from discrete data points x, y, z in the region R concerned. The contouring process then becomes the construction by some operator (human or machine) of a hypothetical surface which is admissible. It can be argued that the classification of surfaces derived from a machine contour package can only be accomplished empirically and intuitively by one who is familiar with the region, the data, and the conceptual situation, or by a machine programmed to play by a prespecified set of rules pertaining to predetermined geological models.
With few exceptions, traditional approaches to contouring have been too subjective and contouring and contour maps are usually discussed in terms more appropriate to art than to science. With hand contouring there may be some justification for this attitude; with machine, or programmed, contouring there is none. Hand contouring is highly susceptible to interpretive judgement or, as may be, to interpretive license where an interpreter is not bound by rigid mathematical constraints. Hence, in allowing for an interpreter’s “free- dom of expression” it is difficult to evaluate contouring in a totally analytical and objective manner. Machine contouring, however, is based on mathematical formulation and is ideally suited to objective definition and analysis.
CASE HISTORY
The thesis is developed in the manner of a case history where a series of machine contoured maps from a common set of data are examined. These maps are produced from several different machine programs. Some of these are available commercially, the others are “in-house”. The performance of each package is compared in both the space and wavenumber domains. A set of aeromagnetic data from Western Canada is used to illustrate the technique but it should be emphasized that any type of data set would suffice.
The flight line pattern is shown on figure I. The mean spacing between east- west lines is one mile while the mean spacing between north-south tie-lines is approximately four miles. The field data were. recorded at one sample per second which, at the survey flight speed, corresponds to ‘a spatial horizontal sample interval of 61 m (zoo feet). The limited available core of the computer necessitated resampling and this involved taking every sixth value, corre- sponding to a spatial interval of 366 m (IZOO feet). After the necessary correc- tions were applied, an x,y rectangular coordinate grid system was superim-


G A. E. WREN
posed on the location data. The input work tape thus lists the sampled data in x, y, z format, where z is the total magnetic intensity in gamma defined at a point in the x-y plane. The non-randomness of the spatial distribution coupled with the high density along flight lines is identical to a typical seismic sample distribution.
THE ANALYSIS
Figure 2 ,illustrates the first contoured map generated from the program referred to as A. Inspection of this map shows that much of the high wavenumber, or detailed information (signal and noise) apparent on the analog flight records had been eliminated in the contour process. Accordingly, the work tape was input to a second program referred to as B and the data re-contoured as shown on figure 3. The control parameters (cell size, smoothing factor, etc.) are of the same order, but visual comparisons between the two maps indicated major differences in anomaly amplitudes and wavenumber. This suggests the need for a more objective and rigorous analysis to determine the precise nature of the differences between the maps, and the true relationship of the maps to the input data.
The first step is to make the analysis comparative. This is achieved by contouring the same data set with a series of different programs (Cl, CZ, D). The results are shown on figures 4 to 6. The difference between Ci and CZ is one of cell size only. The second step is to determine an objective evaluation procedure.
Existing Map Analysis Techniques
Until recently, the comparison of contour maps has been visual and sub- jective. Now, with various quantitative techniques readily available and easily applicable to computers, more rigorous and sophisticated map com- parisons can be made (Merriam and Sneath 1966, p. 1105). For example, since derivative, residual, and continuation techniques are mathematically equi- valent to linear filtering in two spatial dimensions, it is possible to make quantitative evaluations of the effects of two different filter coefficient sets without resorting to empirical tests on actual data.
However, in evaluating a contour map per se, the optimum approach is not a comparative one. To say something is “better” is not to say that it is good or even satisfactory. The contour procedure itself should be evaluated in terms of an input-output relationship.
A New Concept of Contoukg -
A contour map is often thought of as a projected and/or scaled replica of a physical surface. This is not exact. The map is an approximation created by


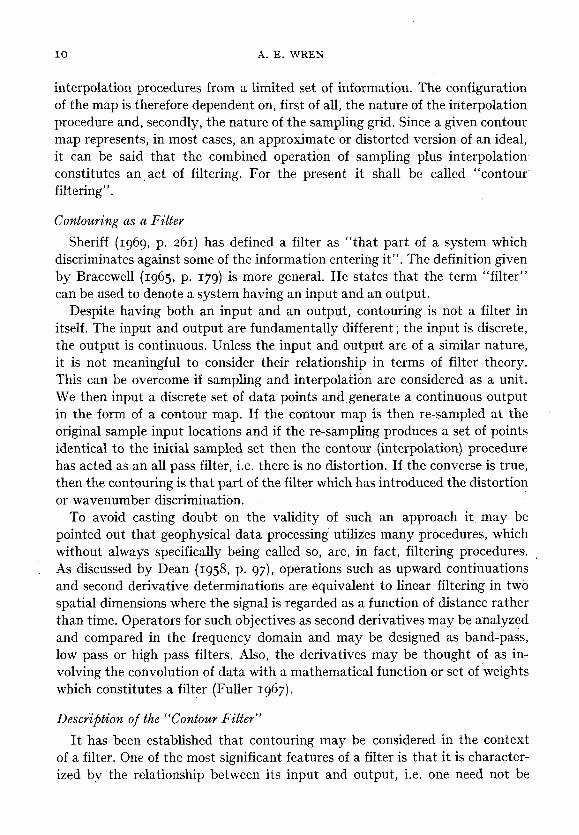
IO A. E. WREN
interpolation procedures from a limited set of information. The configuration of the map is therefore dependent on, first of all, the nature of the interpolation procedure and, secondly, the nature of the sampling grid. Since a given contour map represents, in most cases, an approximate or distorted version of an ideal, it can be said that the combined operation of sampling plus interpolation, constitutes an ,act of filtering. For the present it shall be called “contour filtering”.
Contowing as a Filter
Sheriff (1969, p. 261) has defined a filter as “that part of a system which discriminates against some of the information entering it”. The definition given by Bracewell (1965, p. 179) is more general. He states that the term “filter” can be used to denote a system having an input and an output.
Despite having both an input and an output, contouring is not a filter in itself. The input and output are fundamentally different ; the input is discrete, the output is continuous. Unless the input and output are of a similar nature, it is not meaningful to consider their relationship in terms of filter theory. This can be overcome if sampling and interpolation are considered as a unit. We then input a discrete set of data points and generate a continuous output in the form of a contour map. If the contour map is then re-sampled at the original sample input locations and if the re-sampling produces a set of points identical to the initial sampled set then the contour (interpolation) procedure has acted as an all pass filter, i.e. there is no distortion. If the converse is true, then the contouring is that part of the filter which has introduced the distortion or wavenumber discriminatibn.
To avoid casting doubt on the validity of such an approach it may be pointed out that geophysical data processing utilizes many procedures, which without always specifically being called so, are, in fact, filtering procedures. , As discussed by Dean (1958, p. g7), operations such as upward continuations and second derivative determinations are equivalent to linear filtering in two spatial dimensions where the signal is regarded as a function of distance rather than time. Operators for such objectives as second derivatives may be analyzed and compared in the frequency domain and may be designed as band-pass, low pass or high pass filters. Also, the derivatives may be thought of as in- volving the convolution of data with a mathematical function or set of weights which constitutes a filter (Fuller 1967).
Description of the “Contour Filter”
It has been established that contouring may be considered in the context of a filter. One of the most significant features of a filter is that it is character- ized by the relationship between its input and output, i.e. one need not be

EVALUATION OF CONTOURINGPROGRAMS II
concerned with the interior of the filter per se, only with its terminal properties (Yapoulis 1962, pp. 81-168). The input and output may be related in several ways and, in the case of exploration maps, in either the space or wavenumber domains which are uniquely related through the Fourier transform.
The advantage of this approach is that it permits description of the “contour filter” in the more convenient language and terminology of the wavenumber domain. A second, and more important advantage is that the contour package may be subjected to the various standards of filter evaluation, such as am- plitude and phase response.
THE EVALUATION
Introduction
In evaluating a contour package there are obvious advantages in utilizing both the space and wavenumber domains. Ideally, this evaluation would incorporate two-dimensional Fourier analysis. As this facility was available only for gridded data at the time of the analysis, it was found expedient to utilize an available one-dimensional Fourier analysis program to analyze the filtering effects of the various contour packages on selected profiles, rather than on the entire map.
Space Domain Comparisons
The first step in the analysis is to plot selected profiles of total intensity in gamma versus horizontal distance. The flight lines chosen are indicated by A-A’ and B-B’ on figure I. It can be seen from the map of figure 3 that these two profiles best illustrate the varied magnetic relief of the area.
Four profiles were constructed for the north-south line A-A’. The first was plotted from the original flight line data and the second from the re-sampled data. The degree to which these match is of the highest importance because with re-sampling comes the possibility of aliasing, if the sampling interval is greater than the Nyquist interval. (aliasing may also be thought of as filtering since the aliased sample set will result in a frequency output different from the frequency input). The spatial sample interval of the original data is 61 m (zoo feet) and that of the re-sampled data is 366 m (IZOO feet). The original data are therefore definitive of a profile whose component wavelengths are greater than 122 m (400 feet), whereas the re-sampled data are definitive only of those profiles whose component wavelengths are greater than 732 m (2400 feet). Equivalently, the aliasing spatial frequencies are .00077 cycles/meter and .000126 cycles/meter respectively. However, as shown on figure 7 the re; sampled profile is a close fit to the original profile suggesting a .predominance of low wavenumber features and reducing the concern for aliasing.

12 A. E. WREN
The third profile on figure 7 is constructed from the map of program A (figure 2) and the fourth from the map of program B (figure 3). The profile from map B offers an excellent comparison with the resampled input. However, the profile from map A bears only a vague relationship to the other three and ap- pears as a moving average type of profile where the spatial amplitude spectrum has been considerably distorted since the contour package A has acted as a low-pass filter.
A 165 SAMPLES
- ORIGINAL DATA - ORIGINAL DATA --SAMPLED DATA --SAMPLED DATA 0 00 0 CONTOUR MAPA 0 00 0 CONTOUR MAPA ****CONTOUR MAPB ****CONTOUR MAPB
\
57,500 1 I I I I I I I I I
0 2000 4000 6000 6000 l0,000 METRES METRES
Fig. 7. Space domain profile comparisons (line A-A’).
It could be emphasized at this point that in interpreting magnetic data from the point of view of depth-to-basement determinations, the amplitudes and gradients of the flanks of an anomaly are the critical parameters. Consequently, if depth-to-basement calculations were made on map A, the calculated depths would be a factor of 4 times the true depth. The severe filtering imposed by package A has rendered the map useless for interpretation. The effects are more forcibly demonstrated in figure 8 where the magnetic relief is more eccentric. Figure 9 illustrates the comparisons of profiles B-B’ reconstructed from maps ‘Cl, CZ and D (figures 4-6 respectively). In each case it can be seen that the spatial amplitude spectrum of the input is well preserved by each package.

EVALUATION OF CONTOURING PROGRAMS I3
56,500
2 z d
i= c5 56,000 z I- r
g
g;;;;[ yizE!~;, ‘11 ; , ;, ( , , , , , , 0 2000 4000 6000 6000 l0,000 12,000 14,000 16,000 16,000
METRES
Fig. 8. Space domain profile comparisons (line B-B’).
B B’
58,600 t
t 51,0000 2000 4000 6000 6000 10,000 12,000 14,000 16,000 16,000 20,OOC
--SAMPLED DATA AAA~ CONTOUR MAP D ----CONTOUR MAP [email protected]) 0 D 0 0 CONTOUR MAP C2h3.5x1.0)
I I I I I I I 1 1
METRES
Fig. 9. Space domain profile comparisons (line B-B’).
Waventmber Domaim Analysis
The second step in the overall analysis is the determination of the various input and output wavenumber spectra. Accordingly, the analysis of the

14 A. E. WREN
profiles was carried further by the application of a harmonic analysis program. Both amplitude and power spectra were produced for each profile. The pro- gram, unfortunately, did not have an option for phase spectra, thus these are not available. Their significance is therefore not appreciated at this time.
- ORIGINAL DATA --SAMPLED DATA 0 0 0 0CONTOUR MAPA ****CONTOUR MAPB
CYCLES /64 KILOMETRES
Fig. IO. Amplitude spectra (line A-A’).
- ORIGINAL DATA -- SAMPLED DATA 0 0 0 0 CONTOUR MAP A l l l l CONTOUR MAP B
00
00 o**o l ‘*
OO I I I
o &o.** I I I I I I I
20 40 CYCLES/64%LOMETRES '
60 100 I
Fig. I I. Amplitude spectra (line B-B’).
Figure IO shows the amplitude spectra for the originaldata, there-sampleddata and the profiles from maps A and B along line A-A’. It is therefore the wave- number transform illustration of Figure 7. Figure II is the equivalent of Figure 8, along profile B-B’. Figure 12 is the amplitude spectrum equivalent of figure g

EVALUATION OF CONTOUkINGPROGRAMS I5
along profile B-B’ from maps Cl, CZ and D (figures 4-6). It is obvious that programs Cl, CZ and D do an excellent job in maintaining the input wave- number spectra. Any further considerations in the context of these data as to which is the “best” would involve an analysis of the phase-shift characteristics of each package, since it is difficult to separate them on the basis of their amplitude spectra alone.
--SAMPLED DATA ~AAA CONTOUR MAP D ----CONTOUR MAP Cl(O.25x0.75) m II D 0 CONTOUR MAP C2(0.5x1.01
CYCLES/64 KILOMETRES
Fig. 12. Amplitude spectra (line B-B’).
Summary of the Analysis This paper is in the nature of a reconnaissance. It sets out ‘to emphasize
more of a method than a result. Hence, the comparative aspects need not be considered in full detail. Visual inspection of map A (figure 2) inspires doubt as to its reliability. This leads to a comparison with map B (figure 3) which points out the differences but establishes nothing. An objective analysis can only be made by utilizing the input and output profiles in both the space and wavenumber domains. This analysis does not depend on having the data contoured by other packages; it is self-definitive, i.e. map A could be stamped inadequate on the basis of its amplitude characteristics in the space and wavenumber domains.
CONCLUSIONS
The quantitative comparison of a suite of contour maps produced from a common data set is a somewhat tentative objective. At the present time it is not possible to stipulate the ultimate criteria on which such comparisons might be made. However, the application of spectral analysis constitutes an objective approach, regardless how obvious it might seem in retrospect.

16 A. E. WREN
At this stage the following conclusions can be made:
I. Par the first time a technique has been implemented which provides a quantitative assessment of the reliability of the map in the context of the input data.
2. It is obvious that the choice of input parameters is critical. For example, the difference in input cell size leads to the difference between maps Cl and CZ (figures 4, 5). The parameter determines the nature of the applied filter. Different cell dimensions will produce different filter responses. The use of the smaller cell in map CZ has apparently forced more detail into the contours and stressed trends which are somewhat artificial.
3. The amplitude spectrum of the output data could be illustrated on the map alongside the amplitude spectrum of the input data. Ideally, these should be two-dimensional. If the frequency response of the program is then unacceptable, the input parameters can be redesigned and the map re- contoured.
4. Although this analysis has dealt with aeromagnetic data, it can be applied to contour maps generated from any data set.
5. At the present time, for most two-dimensional studies, it is a prerequisite that the data be input on a regular grid. Nonuniformly sampled data introduces the necessity for gridding. Although there are programs available which can produce gridded data from randomly distributed data, they are restricted to a fairly small matrix generation. Also, gridding and inter- polation lead to filtering. Therefore, the application of these techniques prior to spectral analysis is discouraged. This stresses the need for more sophisticated programs which will perform two-dimensional harmonic analysis on irregularly spaced data directly. Such programs are now com- mercially available.
6. Contour filtering is, in most cases, low-pass filtering. This is due primarily to the discriminating properties of sampling.
7, Interpolation contouring is a linear filter where the wavenumber response depends on the initial data arrangement and interpolation interval in gridding.
8. A current problem in machine contouring is bias, or lack of it, in some certain direction. The only way to attack this is to perform a two-dimen-
. sional analysis. If the predominant strike is at some angle to the traverse lines, is one package preferable to another for maintaining the bias if desir- able, or alternatively eliminating if undesirable ?
ACKNOWLEDGEMENTS
I would like to express my thanks to Amoco Canada Petroleum Company Ltd. for permission to publish this paper. I also gratefully acknowledge the

EVALUATION OF CONTOURING PROGRAMS I7
cooperation of two colleagues, Bob Smith with whom the initial study was undertaken and Eric Dahlberg for providing much stimulating discussion. Thanks are also extended to the Drafting Department at Amoco for the excellent quality of the diagrams.
REFERENCES
BRACEWELL, R., 1965, The Fourier Transform and its Applications. McGraw Hill Book Co., New York.
DEAN, W. C., 1958, Frequency analysis for gravity and magnetic interpretation: Geo- physics 23, 97-127.
FULLER, B. D., 1967, Two-dimensional frequency analysis and design of grid operators: Mining Geophysics, v. II, Theory, The Society of Exploration Geophysicists, 658-708.
MERRIAM, D. F. and SNEATH P. H. A., 1966, Quantitative comparison of contour maps: Jour. Geophys. Res. 71, 1105-1115.
PAPOULIS, A., 1962, The Fourier Integral and its Applications: McGraw-Hill Book Co., New York.
SHERIFF, R. E., 1969, Addendum to glossary of terms used in geophysical exploration: Geophysics 34, 255-270.
WALTERS, R. F., 1969, Contouring by machine: a user’s guide: A.A.P.G. Bulletin 53, 2324-2340.
Geophysical Prospecting, Vol 23 2