The spatial range of contour integration deficits in schizophrenia
9
RESEARCH ARTICLE The spatial range of contour integration deficits in schizophrenia Brian P. Keane • Steven M. Silverstein • Deanna M. Barch • Cameron S. Carter • James M. Gold • Ilona Kova ´cs • Angus W. MacDonald III • J. Daniel Ragland • Milton E. Strauss Received: 5 October 2011 / Accepted: 21 May 2012 Ó Springer-Verlag 2012 Abstract Contour integration (CI) refers to the process that represents spatially separated elements as a unified edge or closed shape. Schizophrenia is a psychiatric dis- order characterized by symptoms such as hallucinations, delusions, disorganized thinking, inappropriate affect, and social withdrawal. Persons with schizophrenia are impaired at CI, but the specific mechanisms underlying the deficit are still not clear. Here, we explored the hypothesis that poor patient performance owes to reduced feedback or impaired longer-range lateral connectivity within early visual cortex—functionally similar to that found in 5- to 6-year old children. This hypothesis predicts that as target element spacing increases from .7 to 1.4° of visual angle, patient impairments will become more pronounced. As a test of the prediction, 25 healthy controls and 36 clinically stable, asymptomatic persons with schizophrenia com- pleted a CI task that involved determining whether a subset of Gabor elements formed a leftward or rightward pointing shape. Adjacent shape elements were spaced at either .7 or 1.4° of visual angle. Difficulty in each spacing condition depended on the number of noise elements present. Patients performed worse than controls overall, both groups per- formed worse with the larger spacing, and the magnitude of the between-group difference was not amplified at the larger spacing. These results show that CI deficits in B. P. Keane (&) S. M. Silverstein Division of Schizophrenia Research, University Behavioral HealthCare, University of Medicine and Dentistry of New Jersey, 151 Centennial Ave, Piscataway, NJ 08854, USA e-mail: [email protected] B. P. Keane S. M. Silverstein Department of Psychiatry, UMDNJ—Robert Wood Johnson Medical School, 671 Hoes Lane, Piscataway, NJ 08854, USA B. P. Keane Center for Cognitive Science, Rutgers University, New Brunswick, 152 Frelinghuysen Road, Piscataway, NJ 08854, USA D. M. Barch Departments of Psychology, Psychiatry, and Radiology, Washington University in St. Louis, One Brookings Drive, Box 1125, St. Louis, MO 63130, USA C. S. Carter J. D. Ragland University of California, Davis, 4701 X Street, Sacramento, CA 95817, USA J. M. Gold Maryland Psychiatric Research Center, University of Maryland School of Medicine, P.O. Box 21247, Baltimore, MD 21228, USA I. Kova ´cs Department of Cognitive Science, Budapest University of Technology and Economics, 1 Egry J. u., Bldg T., Budapest 1111, Hungary A. W. MacDonald III Department of Psychology, University of Minnesota, N426 Elliott Hall, 75 E. River Rd., Minneapolis, MN 55455, USA M. E. Strauss Department of Psychological Sciences, Case Western Reserve University, 10900 Euclid Avenue, Cleveland, OH 44106-7123, USA 123 Exp Brain Res DOI 10.1007/s00221-012-3134-4
-
Upload
independent -
Category
Documents
-
view
0 -
download
0
Transcript of The spatial range of contour integration deficits in schizophrenia

RESEARCH ARTICLE
The spatial range of contour integration deficits in schizophrenia
Brian P. Keane • Steven M. Silverstein • Deanna M. Barch •
Cameron S. Carter • James M. Gold • Ilona Kovacs •
Angus W. MacDonald III • J. Daniel Ragland • Milton E. Strauss
Received: 5 October 2011 / Accepted: 21 May 2012
� Springer-Verlag 2012
Abstract Contour integration (CI) refers to the process
that represents spatially separated elements as a unified
edge or closed shape. Schizophrenia is a psychiatric dis-
order characterized by symptoms such as hallucinations,
delusions, disorganized thinking, inappropriate affect, and
social withdrawal. Persons with schizophrenia are impaired
at CI, but the specific mechanisms underlying the deficit
are still not clear. Here, we explored the hypothesis that
poor patient performance owes to reduced feedback or
impaired longer-range lateral connectivity within early
visual cortex—functionally similar to that found in 5- to
6-year old children. This hypothesis predicts that as target
element spacing increases from .7 to 1.4� of visual angle,
patient impairments will become more pronounced. As a
test of the prediction, 25 healthy controls and 36 clinically
stable, asymptomatic persons with schizophrenia com-
pleted a CI task that involved determining whether a subset
of Gabor elements formed a leftward or rightward pointing
shape. Adjacent shape elements were spaced at either .7 or
1.4� of visual angle. Difficulty in each spacing condition
depended on the number of noise elements present. Patients
performed worse than controls overall, both groups per-
formed worse with the larger spacing, and the magnitude of
the between-group difference was not amplified at the
larger spacing. These results show that CI deficits in
B. P. Keane (&) � S. M. Silverstein
Division of Schizophrenia Research, University
Behavioral HealthCare, University of Medicine and
Dentistry of New Jersey, 151 Centennial Ave,
Piscataway, NJ 08854, USA
e-mail: [email protected]
B. P. Keane � S. M. Silverstein
Department of Psychiatry, UMDNJ—Robert Wood
Johnson Medical School, 671 Hoes Lane,
Piscataway, NJ 08854, USA
B. P. Keane
Center for Cognitive Science, Rutgers University,
New Brunswick, 152 Frelinghuysen Road,
Piscataway, NJ 08854, USA
D. M. Barch
Departments of Psychology, Psychiatry, and
Radiology, Washington University in St. Louis,
One Brookings Drive, Box 1125, St. Louis,
MO 63130, USA
C. S. Carter � J. D. Ragland
University of California, Davis, 4701 X Street,
Sacramento, CA 95817, USA
J. M. Gold
Maryland Psychiatric Research Center,
University of Maryland School of Medicine,
P.O. Box 21247, Baltimore,
MD 21228, USA
I. Kovacs
Department of Cognitive Science, Budapest University
of Technology and Economics, 1 Egry J. u., Bldg T.,
Budapest 1111, Hungary
A. W. MacDonald III
Department of Psychology, University of Minnesota,
N426 Elliott Hall, 75 E. River Rd., Minneapolis,
MN 55455, USA
M. E. Strauss
Department of Psychological Sciences, Case Western
Reserve University, 10900 Euclid Avenue, Cleveland,
OH 44106-7123, USA
123
Exp Brain Res
DOI 10.1007/s00221-012-3134-4

schizophrenia cannot be explained in terms of a reduced
spatial range of integration, at least not when the shape
elements are spaced within 1.5�. Later-developing, low-
level integrative mechanisms of lateral connectivity and
feedback appear not to be differentially impaired in the
illness.
Keywords Schizophrenia � Contour integration �Visual integration � Spatial range � Perceptual
organization � Grouping
Introduction
Schizophrenia is a devastating psychiatric disorder that is
characterized by hallucinations, delusions, disorganized
thinking, flat or inappropriate affect, social withdrawal, and a
decline in role functioning. Converging evidence indicates
that schizophrenia disrupts not only higher-level cognition
but also the entirety of mental life, including sensation and
perception (Silverstein and Keane 2011b; Green et al. 2011;
Javitt 2009). One kind of processing specifically affected is
perceptual organization, which refers to the ability to
transform a spatiotemporally disjointed retinal image into a
veridical representation of the structure and coherency of the
external world. Perceptual organization dysfunction in
schizophrenia has been demonstrated in over 50 studies
(Silverstein and Keane 2011a; Uhlhaas and Silverstein
2005), and examples include: reduced contrast enhancement
between collinear elements (Must et al. 2004); weakened
shape-based and location-based grouping (Place and
Gilmore 1980; Silverstein et al. 1996); and lessened sus-
ceptibility to contextually induced size illusions (Uhlhaas
et al. 2006), among others. Such abnormalities are likely not
a function of psychiatric medication, and typically cannot be
attributed to generalized deficits (Silverstein and Keane
2011a; Knight and Silverstein 2001).
Contour integration and schizophrenia
The form of perceptual organization that is of greatest
interest in the present paper is contour integration (here-
after CI; Field et al. 1993). When orientated elements form
a collinear (or co-circular) contour, and when those ele-
ments are embedded in a field of similar but randomly
oriented elements, the target contour pops-out of the array.
The ability strongly depends on low-level stimulus factors
such as the relative orientation, spatial separation, and
alignment of the target elements (Braun 1999; Field et al.
1993); and may also depend on the inhibition of spurious
connections made between adjacent noise elements (Li
et al. 2006). Monkeys can integrate contours with presen-
tation times as short as 30 ms, suggesting that the capacity
is phylogenetically primitive and physiologically early
(Mandon and Kreiter 2005). CI tasks have provided
insights into a range of issues in visual neuroscience,
including the effects of aging (Del Viva and Agostini
2007), development (Kovacs et al. 1999), and amblyopia
(Chandna et al. 2001) on early- to mid-level vision.
The anatomical substrate of CI is furnished partly by long-
range horizontal connections between orientation-tuned
spatial frequency detectors in early visual cortex (Kapadia
et al. 1995; Li and Gilbert 2002). These axonal connections
are excitatory and span coaxial pyramidal cells that are
separated by up to 2� of visual angle (or about 3 mm of cortex
at eccentricities of 4–6�) in V1 (Dresp and Grossberg 1997;
Grossberg and Raizada 2000; Kapadia et al. 1995; Loffler
2008; Stettler et al. 2002; Mandon and Kreiter 2005).
Feedback from higher cortical areas is also important for
mediating top-down influence, especially for more distantly
separated elements (Angelucci et al. 2002; Zhang and von
der Heydt 2010; Ciaramelli et al. 2007). When elements are
spaced within 2�, modulatory feedback downstream from V2
probably does not play an important role because: (1) persons
with frontal and temporal lobe lesions integrate normally
with (at least) 2� spacing (Ciaramelli et al. 2007); (2) back-
ward-masked contours spaced within 2� can be integrated
with only 30 ms of presentation, which is too brief for sig-
nificant top-down modulation (Mandon and Kreiter 2005);
and (3) visual agnosic patients with damaged occipital areas
beyond V1 normally integrate closely spaced elements
(Giersch et al. 2000). However, the relative contributions of
intrinsic horizontal connections and feedback mechanisms
to CI continue to be an active topic of investigation (De
Meyer and Spratling 2009; Hess et al. 2003).
Persons with schizophrenia have been consistently shown
to be poor at CI (Silverstein and Keane 2011a; Uhlhaas and
Silverstein 2005). The deficit correlates with poor premorbid
functioning, poor outcome, and disorganization (Silverstein
and Keane 2011a); it is also associated with reduced BOLD
signal response (fMRI) in areas V2-V4 (Silverstein et al.
2009a)—the same areas implicated in prior studies of inte-
gration in healthy humans and non-human primates (Kourtzi
et al. 2003). But what is it about CI that causes problems in
schizophrenia? One simple possibility is spacing—patients
are simply not able to coordinate complex contextual inter-
actions between segregated pieces of the proximal array and
this inability becomes more apparent as those pieces are
strewn further apart. Children exhibit this tendency. Kovacs
and colleagues showed that as Gabors of a target shape
become more distantly spaced (from .9 to 1.7�), children
(ages 5–6) became worse relative to adults (ages 19–35) in
detecting an enclosed integrated surface. Such results imply
that either (1) integrating more distantly spaced elements
requires greater reliance on feedback connections (espe-
cially from V2) and these are not functioning in full capacity;
Exp Brain Res
123
or (2) integrating distantly spaced elements requires greater
reliance on longer-range horizontal axonal connections,
which again may be poorly developed or underutilized.
Either of these possibilities may describe schizophrenia. The
illness has been characterized as involving aberrant func-
tional connectivity (Lynall et al. 2010), which would pre-
sumably be more apparent when coordinating more distant
retinotopic areas. Moreover, visual dysfunction in schizo-
phrenia has been attributed to compromised top-down visual
feedback (van Assche and Giersch 2011; Gold et al. 2007),
which again would imply worse CI performance at larger
spacings.
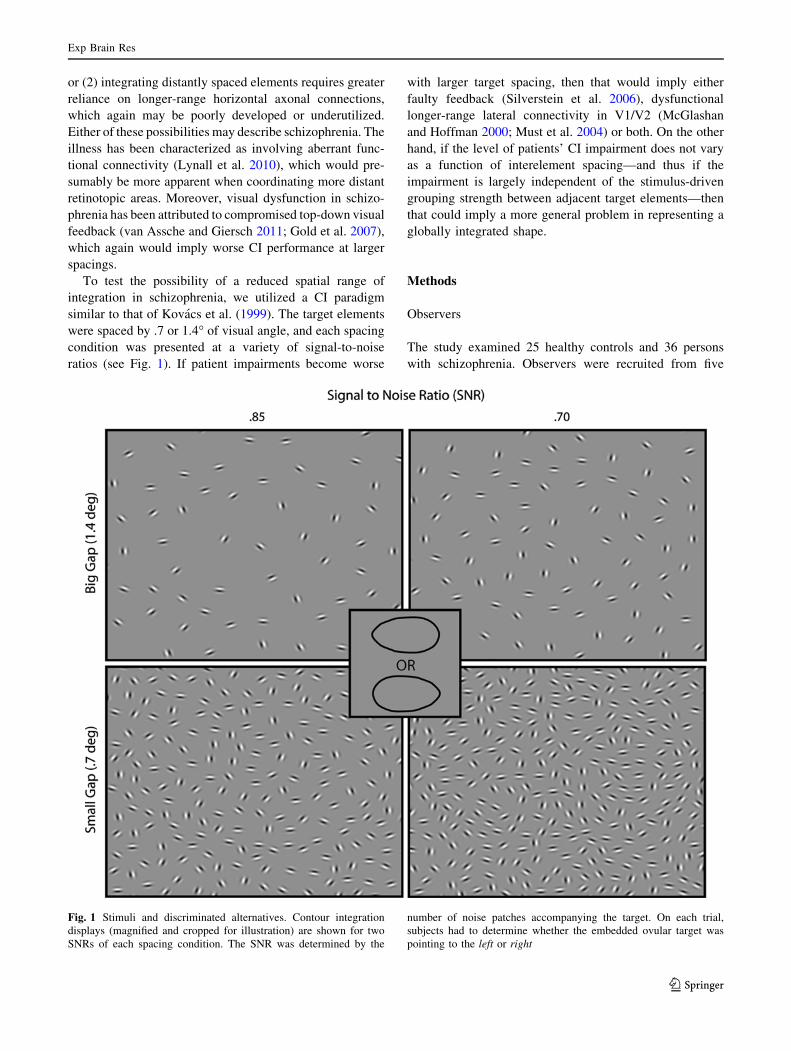
To test the possibility of a reduced spatial range of
integration in schizophrenia, we utilized a CI paradigm
similar to that of Kovacs et al. (1999). The target elements
were spaced by .7 or 1.4� of visual angle, and each spacing
condition was presented at a variety of signal-to-noise
ratios (see Fig. 1). If patient impairments become worse
with larger target spacing, then that would imply either
faulty feedback (Silverstein et al. 2006), dysfunctional
longer-range lateral connectivity in V1/V2 (McGlashan
and Hoffman 2000; Must et al. 2004) or both. On the other
hand, if the level of patients’ CI impairment does not vary
as a function of interelement spacing—and thus if the
impairment is largely independent of the stimulus-driven
grouping strength between adjacent target elements—then
that could imply a more general problem in representing a
globally integrated shape.
Methods
Observers
The study examined 25 healthy controls and 36 persons
with schizophrenia. Observers were recruited from five
Fig. 1 Stimuli and discriminated alternatives. Contour integration
displays (magnified and cropped for illustration) are shown for two
SNRs of each spacing condition. The SNR was determined by the
number of noise patches accompanying the target. On each trial,
subjects had to determine whether the embedded ovular target was
pointing to the left or right
Exp Brain Res
123

different sites: University of California—Davis, Maryland
Psychiatric Research Center at the University of Maryland,
University of Medicine and Dentistry of New Jersey,
University of Minnesota—Twin Cities, and Washington
University in St Louis. All were recruited from outpatient
clinics, community centers, and local settings (e.g., grocery
stores) via flyers and online advertisements. Monetary
compensation was provided for participation. The study
was approved by the Institutional Review Boards at all
participating institutions; written informed consent was
obtained from all subjects after explanation of the nature
and possible consequences of the study. The research fol-
lowed the tenets of the Declaration of Helsinki.
For both controls and schizophrenia patients, the inclu-
sion/exclusion criteria included: (1) age 18–65 years; (2)
no clinically significant head injury (loss of consciousness
for 20 min or overnight hospitalization) or neurological
disease; (3) no diagnosis of mental retardation or pervasive
developmental disorder; (4) no substance dependence in
the past 6 months and no substance abuse in the past
month; (5) sufficient spoken English so as to be able to
complete testing validity, (6) a score of six or higher on the
Wechsler Test of Adult Reading (WTAR) as a measure of
premorbid IQ (Wechsler 2001); (7) ability to give valid
informed consent; and (8) passed alcohol and drug testing
on each day of testing. Additional criteria for schizophrenia
patients were the following: (1) Diagnostic and Statistical
Manual of Mental Disorders, Fourth Edition (DSM-IV)
diagnosis of schizophrenia or schizoaffective disorder
(based on SCID interview, see below); (2) no medication
changes in the prior month or anticipated in the upcoming
month; and (3) stable outpatient or partial hospital status.
Additional criteria for controls were the following: (1) no
history of schizophrenia or any other psychotic disorder,
including bipolar disorder; (2) no current major depression;
and (3) no current psychotropic- or cognition-enhancing
medication. All subjects reported normal or corrected-to-
normal vision and were naıve to the purposes of the task.
The final schizophrenia and control groups were matched
at the group level for gender, age, race, and parental
socioeconomic status SES, the last of which was measured
using the Hollingshead Index (Hollingshead and Redlich
1958). Demographic and clinical information for partici-
pants is shown in Table 1.1
A masters-level clinician conducted or supervised
diagnostic assessments using the Structured Clinical
Interview for DSM-IV-Text Revision (First et al. 2002) and
the 24-item Brief Psychiatric Rating Scale (Overall and
Gorham 1962; Ventura et al. 1993a, b). Assessments of
functional capacity included the following: the Brief ver-
sion of the University of California, San Diego, Perfor-
mance-based Skills Assessment (Patterson et al. 2001,
UPSA-B); and the Specific Levels of Functioning Scale
(‘‘Participant’’ version; Schneider and Struening 1983,
SLOF).
Table 1 Demographic and
symptom characteristics of
study sample
Averages (and SDs) are shown,
except where indicated. SZ,schizophrenia or schizoaffective
disorder; SES, socioeconomic
status as measured with the
Barratt Simplified Measure of
Social Status based on the
Hollingshead Index. SLOF,Specific Levels of Functioning
Scale; UPSA-B, UCSD
performance-based skills
assessment-brief; BPRS, Brief
Psychiatric Rating Scale, BPRSvalues denote average scores
per item for each scale and
range from 1 to 7 (with 1
indicating no symptoms).
Medication information was
missing for two patients. A chi-
square test compared gender
and ethnic composition; all
other p values derived from
uncorrected t tests
Variables SZ (N = 36) Healthy controls (N = 25) p value
Age 38 (11) 41 (12) .38
Education, self 13.6 (2.4) 14.9 (1.8) .006
Education, father 14.1 (3.4) 11.5 (2.5) .003
Education, mother 12.7 (2.7) 12.4 (2.5) .63
Gender, % male 60 52 .54
SES, parental 44.5 (13.5) 40.3 (12.0) .22
SES, participant 28.0 (9.3) 34.2 (9.0) .01
SLOF, total 4.2 (.3) 4.8 (.15) \.001
UPSA-B, total 78.8 (14.5) 84.4 (8.6) .07
WTAR 35.5 (10.9) 36.4 (8.6) .72
% Caucasian 68.6 48 .07
BPRS positive 2.3 (1.2) NA
BPRS disorganized 1.4 (.6) NA
BPRS negative 1.8 (.8) NA
BPRS mania 1.2 (.5) NA
BPRS depressed 2.1 (.9) NA
Chlorpromazine, equivalent (mg/day) 457 (374) NA
Neuroleptics: typical/atypical/both 2/28/4 NA
Schizophrenia/schizoaffective 25/11 NA
1 For more information on strategies for recruitment, inclusion/
exclusion criteria, clinical rater training, clinical assessment of
participants, and general testing procedures, see Henderson et al.
(2012).
Exp Brain Res
123
Apparatus
The apparatus was the same at each of five sites. The stimuli
were presented on Samsung 2243BWX LCD monitors,
which had a resolution of 1,680 9 1,050 pixels, a viewable
screen of 47.5 by 29.8 cm, and a refresh rate of 60 Hz.
Subjects were positioned 61 cm from the screen. The stimuli
were generated with a Dell computer (3.0 GHz, 6 M,
1,333 MHz FSB), and the task was implemented in E-prime
2.0. Displays were standardized across sites using Spyder 3.0
Elite. Standard overhead fluorescent lights were used with no
additional lamp lighting.
Stimulus and procedure
Stimuli consisted of target Gabor elements on a square
background (13.3� on a side) that had a luminance of
23 cd/m2. Each Gabor’s Gaussian envelope size (SD) and
wavelength was equal to .2�. All Gabors were identical
except for their positions and orientations. The number of
Gabor elements composing the targets for the small and
large gap conditions was 12 and 24, respectively. Target
Gabors were separated by 0.7 or 1.4� of visual angle for the
small and large gap conditions, respectively. The distance
between adjacent distractors divided by the distance
between adjacent contour elements—which reflects the
actual signal-to-noise ratio (SNR)—varied between .5 and
.9 (in steps of .5). More simply, SNR was varied by adding
or subtracting noise patches (with more noise patches
making the task harder).
On each trial, the stimulus was presented for 3 s and
subjects were told to try to respond during that period.
Subjects pressed one of two keys to indicate whether the
shape was leftward or rightward pointing. A black screen
appeared immediately after the 3 s or subject response
(whichever came first). Presentation of the different spac-
ing and signal-to-noise ratio conditions was randomized.
For each spacing condition, there were 9 SNRs, each of
which incorporated eight unique trials. Thus, each subject
completed 144 trials.
A practice session preceded the actual experiment and
proceeded as follows. First, two left-and right-pointing
demonstration stimuli (of each gap size) were sequentially
shown on the screen until the subject reported seeing the
oval shape. Next, subjects viewed a shape for 3 s, and a
luminance-defined black line was then drawn around that
shape immediately after response or after 3 s (whichever
came first). Afterward, 8 scored practice trials were given
to further familiarize subjects with the task. If subjects did
not respond correctly (and within the time limit) in at least
5 out of 8 of these trials, another block of practice trials
was given. Up to 5 practice blocks (40 trials) were given.
Only 1 control and 3 patients needed more than 1 practice
block. The two groups were undifferentiated in the number
of practice trials received (p = .49).
Data analysis
Prior to carrying out all analyses, every other timed-out
trial was coded as a correct response, so that chance per-
formance would be 50 % regardless of whether a subject
chose to guess or time-out on a trial. We next calculated the
total percent correct at each SNR for each subject and
spacing condition. We removed 4 subjects (3 patients)
whose overall proportion correct was less than or equal to
50 % on the task. For each subject and spacing condition,
the data were smoothed with a one-dimensional [1 2 1]
convolution filter to decrease volatility between adjacent
SNR accuracy values (and to improve the curve fitting
process). The two outer SNR values (50 and 90) could not
be assigned a weighted average in the convolution process
and thus were not used in the subsequent analyses. These
smoothed accuracy data were fit with a cumulative Weibull
(Wichmann and Hill 2001) function:
Wðx; a; b; c; kÞ ¼ cþ ð1� c� kÞð1� expð�ðx=aÞbÞÞ
W corresponds to the predicted probability correct, x
denotes the SNR; a and b determine the threshold and
slope of the psychometric function; c is the guessing rate
and was fixed at .5; and k refers to the upper asymptote of
the fitted curve and traditionally corresponds to the stim-
ulus-independent error rate. A threshold for a Weibull
curve corresponds to the SNR needed to produce 81.6 %
accuracy; this accuracy percentage is lower if the subject
has a positive k value. Data for one control could not be fit
with a curve for either spacing condition; data for one
patient could not be fit with a curve for the large spacing
condition only. (Parameter estimates for these subjects did
not converge because the proportion correct did not
improve with increased SNR.) The proportions of excluded
patients (4/36) and controls (2/25) did not differ signifi-
cantly (Fisher’s Exact Test, one-sided = .523). Finally, we
compared the a and b parameter estimates with a 2 (gap
size) x 2 (subject group) mixed-model ANOVA. The
thresholds were log-transformed (base 10) to be rendered
approximately normal. The a parameters were compared
directly since a corresponds to different percentages cor-
rect at different lapse rates (Kingdom and Prins 2009) The
k parameters were not analyzed because they are unreliable
unless a large number of trials are collected at the easiest
difficulty levels. (The purpose of including k as a free
parameter is mainly to improve the estimates of a and b;
(Wichmann and Hill 2001; Kingdom and Prins 2009.)
Exp Brain Res
123

Results
Results are depicted in Fig. 2. The curves fit the accuracy
data well for controls (median R-squared [.92 for each
condition) and were acceptable for patients (median R-
squared [.82 for each condition). For the b analysis, there
were no main effects or interactions (all ps [ .10). For the
threshold (a) analysis, patients had lower thresholds than
controls overall (F(1,53) = 6.8, p = .01, g2p ¼ :114) and
the large spacing stimuli were more difficult to discrimi-
nate than the smaller spaced stimuli, F(1,53) = 11.7,
p = .001, g2p ¼ :181. Most importantly, increasing the
spacing did not make patients perform worse relative to
controls, F(1,53) = .37, p = .55, g2p ¼ :007). These results
were robust and remained, for example, if the fitted
parameters had different boundary conditions, if two out-
lier values (both patients) were removed, if a cumulative
logistic function were fit to the same data, or if the data
were unsmoothed. To be sure that the lack of interaction
did not change with the kind of analysis performed, we also
examined the integral of the distribution functions and the
total percent correct across SNR. Each of these two anal-
yses yielded between-group differences (ps \ .02), a main
effect of gap size (ps \ .001), but no interaction (ps [ .37).
Furthermore, there were no correlations among patients
between symptomatology (scores of each BPRS category,
see Table 1) and log threshold for either the small or large
spacing condition (all ps [ .12), which is not surprising
being that the patient group was largely asymptomatic.
Threshold and medication dosage did not significantly
correlate for the small spacing condition (p = .07, Spear-
man’s q = .34), the large spacing condition (p = .10,
q = .31), or the threshold difference (p = .47, q = .14).
The same three threshold values did not correlate with
premorbid IQ (as measured by the WTAR) for patients
alone, or for all subjects (all ps [ .13).
Discussion
Our results replicate numerous past studies (Kozma-Weibe
et al. 2006; Silverstein et al. 2009b; for a review, see Sil-
verstein and Keane 2011a) in demonstrating that patients are
not as adept at integrating and combining elements to rep-
resent global shape. Moreover, performance worsened for
both groups as target elements spacing increased. Finally,
and most importantly, even when the target spacing was
doubled to 1.4� of visual angle—and thus even when sub-
jects needed to rely more on later-developing mechanisms
of long-range lateral connectivity and top-down feedback—
the magnitude of patient deficits did not increase.
Explaining the effects of gap size and patient group
The advantage of smaller spacing was expected on the
ground that physically specifying a larger portion of a
contour—that is, increasing a contour’s ‘‘support ratio’’—
Fig. 2 Results. a Average accuracy and fitted cumulative Weibull
curves are shown for patients (SZ) and controls (C) for two spacing
conditions (Big = 1.4�; Small = .7�). Black circles and squares are
for patients and controls, respectively. Open and filled symbols are for
small and large gap conditions, respectively. Errors show ± SEM.
Subjects who could not be fit with a curve or whose accuracy was
below chance were not included in the graph data. b Colored symbolsdepict variability of log thresholds for each group and spacing
condition (with two outliers removed). As shown, patients performed
worse than controls for each spacing condition, and this difference did
not significantly change as the spacing increased from .7 to 1.4
degrees
Exp Brain Res
123
increases the precision with which that contour is repre-
sented (Hadad et al. 2010; Pillow and Rubin 2002; Shipley
and Kellman 1992). It is important to note, however, that
Kovacs et al. (1999) and others did not find a deleterious
effect of target spacing on adult performance (Braun 1999).
The discrepancy can be reconciled by the fact that these
studies required only contour detection, while the present
study required shape discrimination. Whereas efficiently
detecting an integrated shape can occur even when the
enclosing contour is poorly specified (Pillow and Rubin
2002), discrimination of similarly appearing alternatives
requires relatively precise edge representation.
An objection is that subjects did not necessarily have to
integrate a whole shape to perform the task; they could
have just integrated only a diagnostic part of the shape
(Mandon and Kreiter 2005). This possibility is not prob-
lematic because subjects would still need to integrate
multiple patches in both distance conditions, and the data
provide no evidence that the larger spacings were espe-
cially difficult for patients.
Can generalized deficits in motivation or visual acuity
explain our results? We deem it unlikely. In a study with
the same exclusion/inclusion criteria and the same
recruitment sites as the present, controls (N = 132) had an
average logMAR acuity of .114 (20/26) and patients
(N = 104) had an average acuity of .168 (20/29) (Strauss
et al. in preparation). Such differences would doubtfully be
significant in a study of our size. Moreover, as can be
guessed from Fig. 2, there was no group difference on the
three easiest SNRs of the small spacing condition (p [ .6),
indicating that patients were properly understanding the
task and seeing the Gabor stimuli. In addition, the three-
parameter curve fitting procedure takes into account
attentional errors (‘‘lapsing errors’’) by essentially making
it easier for a subject to reach threshold as the lapse rate
increases (Wichmann and Hill 2001). Lastly and most
importantly, even if generalized deficits altered patient
behavior, there is no reason to think that such deficits
would suppress an otherwise significant interaction
between spacing and subject group.
The lack of interaction between gap size and subject
group implies that cortical mechanisms that combine
information over larger distal ranges are not differentially
impaired in schizophrenia. That is, the longer-range facil-
iatory interactions between orientation-tuned spatial fre-
quency channels in V1/V2 and the low-level feedback
mechanisms that span larger cortical areas do not play a
special role in patients’ CI dysfunction.
The lack of interaction leaves open an interesting pos-
sibility, viz., that the patient deficits in the CI task are
independent of low-level linking. In other words, it is at
least possible that poor performance owes not to local
element linking but to a higher-level inability to form a
global shape representation from the individually con-
nected elements. There is some evidence for this view.
When four sectored circles form a single ‘‘Kanizsa’’ (illu-
sory) shape, people with schizophrenia show a normal
sensitivity to perturbances of the filled-in path, but a poor
ability to discriminate the overall shape (Keane et al.
2012b). In an EEG study, when schizophrenia patients
attempted to detect a Kanizsa shape, there was an intact
early ventral stream response (106–194 ms) for contour
filling-in but a subsequent abnormal frontal response
(240–400 ms) (Foxe et al. 2005). A related EEG study
showed that—when attempting to name objects depicted
by line drawings—patients were more adversely affected
by fragmentation of the drawings than controls, and this
effect corresponded to a differential neural response at
relatively late stages in processing (Doniger et al. 2002).
Other studies have also dissociated local contour interpo-
lation from global shape perception (Giersch et al. 2000;
Keane et al. 2012a). More generally, it has been supposed
that the latest stages in object perception are those that are
most acutely affected (Uhlhaas and Silverstein 2005),
perhaps as a result of hypofunctioning NMDA glutamate
receptors (Phillips and Silverstein 2003). Of course, the
foregoing is not meant to imply that all high-level abilities
are compromised in schizophrenia. Patients can suppress or
enhance selected input (Luck and Gold 2008) or adapt to
certain regularities in interelement grouping (Giersch and
Rhein 2008). Future studies will need to test CI of closed
and open contours (Kovacs and Julesz 1993) to see whether
CI deficits can be explained in terms of global shape pro-
cessing (or ‘‘closure’’) deficits.
Limitations and future directions
Conclusions drawn from our data must be qualified in
several important ways. One is that because all subjects
were highly asymptomatic and clinically stable (see
Table 1), the results may not generalize to other segments
of the schizophrenia population. In particular, there remains
the possibility that more disorganized patients would
exhibit a differential deficit at larger element spacings, since
they are the most susceptible to perceptual organization
impairments (Phillips and Silverstein 2003; Uhlhaas and
Silverstein 2005; Silverstein and Keane 2011a; Silverstein
et al. 2000). Relatedly, more severely disabled patients
display posteriorization of gray matter loss in the occipital
lobe (Mitelman and Buchsbaum 2007), and the later-
developing low-level circuitry in these individuals may be
especially compromised as Gabors are distributed over
larger spatial gaps. Another limitation is that all patients in
our study were on medication at the time of testing. While
medication effects cannot be ruled out, we do not regard
them as particularly troubling because: (1) our results did
Exp Brain Res
123

not correlate with dosage; (2) other visual integration
studies failed to find dosage correlations (Foxe et al. 2005;
Doniger et al. 2002; Silverstein et al. 2009b); and (3)
unmedicated patients with at least a 3-week washout period
exhibit visual integration dysfunction (Must et al. 2004).
A final noteworthy limitation is that our spacing con-
ditions were restricted to .7 and 1.4� of visual angle. Even
though similar spacings caused children and adult perfor-
mance to diverge in an detection study (Kovacs et al.
1999), the large spacing value may not have been insuffi-
cient to produce patient differences. For example, persons
with frontal lobe injuries integrate normally at 2�, but not at
3 or 4� (Ciaramelli et al. 2007). Considering the well-
documented frontal cortex abnormalities in schizophrenia
(Volk and Lewis 2010), increasing the gap size past 2� may
well produce the interaction of interest. Importantly, if such
large spacings were necessary, the implicated visual path-
way in schizophrenia would be qualitatively different from
that considered in the present study, involving much later
stages in processing, more susceptibility to attention and
memory, and little dependency on connectivity in primary
visual cortex (Loffler 2008, p. 2114). The result, if
obtained, would reveal more about the ability to generate
and deploy cognitive strategies than it would about the
capacity to reflexively unify elements in occipital cortex,
which was the goal of the present study. In sum, our results
provide evidence that higher-functioning patients with
schizophrenia have a relatively constant level of CI dys-
function for elements spaced within 1.5�. This indicates
that, in schizophrenia, the mechanisms of low-level feed-
back and lateral connectivity that develop in middle
childhood and early adolescence are no more impaired
relative to those that mature by age 5 or 6.
Acknowledgments We would like to thank the following Research
Assistants for helping to bring this project to completion: Robin S.
Lyons, Yushi Wang, Jamie Joseph (UMDNJ); Emily Thomason,
Cindy Feldt, Jennifer Shuite, Melissa Cornejo (Washington Univer-
sity, St. Louis); Sharon August, Leeka Hubzin, Samual Kaiser,
Tatyanna Matveeva (MPRC); Dori Henderson, Madelyn Steen, Anna
Schnurrer, Joe Lowinske, Lindsay Swanson (Minnesota); and Brit-
taney Haley (UC-Davis). We also appreciate the input of four anon-
ymous reviewers whose extensive comments improved the
manuscript. Funding for this research was provided by the following
collaborative RO1s: MH084828-01 to SMS (UMDNJ), MH84840 to
DMB (Washington University, St. Louis), MH084826 to CSC and
JDR (UC Davis), MH084821 to JG (MPRC), and MH084861 to AM
(Minnesota). Support from an F32 (MH094102-01A1) was provided
to BPK (UMDNJ/Rutgers) during the write-up of the manuscript.
References
Angelucci A, Levitt JB, Walton EJ, Hupe JM, Bullier J, Lund JS
(2002) Circuits for local and global signal integration in primary
visual cortex. J Neurosci 22(19):8633–8646
Braun J (1999) On the detection of salient contours. Spat Vis 12(2):
211–225
Chandna A, Pennefather PM, Kovacs I, Norcia AM (2001) Contour
integration deficits in anisometropic amblyopia. Invest Ophthal-
mol Vis Sci 42(3):875–878
Ciaramelli E, Leo F, Del Viva MM, Burr DC, Ladavas E (2007) The
contribution of prefrontal cortex to global perception. Exp Brain
Res 181(3):427–434. doi:10.1007/s00221-007-0939-7
De Meyer K, Spratling MW (2009) A model of non-linear interac-
tions between cortical top-down and horizontal connections
explains the attentional gating of collinear facilitation. Vision
Res 49(5):553–568. doi:10.1016/j.visres.2008.12.017
Del Viva MM, Agostini R (2007) Visual spatial integration in the
elderly. Invest Ophthalmol Vis Sci 48(6):2940–2946. doi:10.
1167/iovs.06-0729
Doniger GM, Foxe JJ, Murray MM, Higgins BA, Javitt DC (2002)
Impaired visual object recognition and dorsal/ventral stream
interaction in schizophrenia. Arch Gen Psychiatry 59(11):
1011–1020
Dresp B, Grossberg S (1997) Contour integration across polarities and
spatial gaps: from local contrast filtering to global grouping. Vis
Res 37(7):913–924
Field DJ, Hayes A, Hess RF (1993) Contour integration by the human
visual system: evidence for a local ‘‘association field’’. Vis Res
33(2):173–193
First MB, Spitzer RL, Miriam G, Williams JBW (2002) Structured
clinical interview for DSM-IV-TR Axis I disorders, research
version, non-patient edition (SCID-I/NP). Biometrics Research,
New York State Psychiatric Institute, New York, NY
Foxe JJ, Murray MM, Javitt DC (2005) Filling-in in schizophrenia: a
high-density electrical mapping and source-analysis investiga-
tion of illusory contour processing. Cereb Cortex 15(12):
1914–1927. doi:10.1093/cercor/bhi069
Giersch A, Rhein V (2008) Lack of flexibility in visual grouping in
patients with schizophrenia. J Abnorm Psychol 117(1):132–142.
doi:10.1037/0021-843X.117.1.132
Giersch A, Humphreys G, Boucart M, Kovacs I (2000) The
computation of occluded contours in visual agnosia: evidence
for early computation prior to shape binding and figure-ground
coding. Cogn Neuropsychol 17(8):731–759
Gold JM, Fuller RL, Robinson BM, Braun EL, Luck SJ (2007)
Impaired top-down control of visual search in schizophrenia.
Schizophr Res 94(1–3):148–155. doi:10.1016/j.schres.2007.
04.023
Green MF, Lee J, Wynn JK, Mathis KI (2011) Visual masking in
schizophrenia: overview and theoretical implications. Schizophr
Bull 37(4):700–708. doi:10.1093/schbul/sbr051
Grossberg S, Raizada R (2000) Contrast-sensitive perceptual group-
ing and object-based attention in the laminar circuits of primary
visual cortex. Vis Res 40(10–12):1413–1432
Hadad B-S, Maurer D, Lewis TL (2010) The development of contour
interpolation: evidence from subjective contours. J Exp Child
Psychol 106(2–3):163–176. doi:10.1016/j.jecp.2010.02.003
Henderson D, Poppe AB, Barch DM, Carter CS, Gold JM, Ragland
JD, Silverstein SM, Strauss ME, MacDonald AW III (2012)
Optimization of a goal maintenance task for use in clinical
applications. Schizophr Bull 38(1):104–113. doi:10.1093/schbul/
sbr172
Hess RF, Hayes A, Field DJ (2003) Contour integration and cortical
processing. J Physiol Paris 97(2–3):105–119. doi:10.1016/j.
jphysparis.2003.09.013
Hollingshead AD, Redlich FC (1958) Social class and mental illness.
Wiley, New York
Javitt DC (2009) Sensory processing in schizophrenia: neither simple
nor intact. Schizophr Bull 35(6):1059–1064. doi:10.1093/schbul/
sbp110
Kapadia MK, Ito M, Gilbert CD, Westheimer G (1995) Improvement
in visual sensitivity by changes in local context: parallel studies
Exp Brain Res
123

in human observers and in V1 of alert monkeys. Neuron 15(4):
843–856
Keane BP, Lu H, Papathomas TV, Silverstein SM, Kellman PJ (2012a)
Is interpolation cognitively encapsulated? Measuring the effects of
belief on Kanizsa shape discrimination and illusory contour
formation. Cognition. doi:10.1016/j.cognition.2012.02.004
Keane BP, Mikkilineni D, Papathomas TV, Silverstein SM (2012b)
Impaired shape integration but normal illusory contour formation
in schizophrenia: evidence for a high level grouping deficit.
Poster at Vision Sciences Society Conference, May, Naples, FL,
vol 123, pp 404–418
Kingdom FAA, Prins N (2009) Psychophysics: a practical introduc-
tion. Academic Press, New York
Knight RA, Silverstein SM (2001) A process-oriented approach for
averting confounds resulting from general performance deficien-
cies in schizophrenia. J Abnorm Psychol 110(1):15–30
Kourtzi Z, Tolias AS, Altmann CF, Augath M, Logothetis NK (2003)
Integration of local features into global shapes: monkey and
human FMRI studies. Neuron 37(2):333–346
Kovacs I, Julesz B (1993) A closed curve is much more than an
incomplete one: effect of closure in figure-ground segmentation.
Proc Natl Acad Sci USA 90(16):7495–7497
Kovacs I, Kozma P, Feher A, Benedek G (1999) Late maturation of
visual spatial integration in humans. Proc Natl Acad Sci USA
96(21):12204–12209
Kozma-Weibe P, Silverstein SM, Feher A, Kovacs I, Uhlhaas P,
Wilkniss SM (2006) Development of a world-wide web based
contour integration test. Comput Hum Behav 22:971–980. doi:
10.1016/j.chb.2004.03.017
Li W, Gilbert CD (2002) Global contour saliency and local colinear
interactions. J Neurophysiol 88(5):2846–2856. doi:10.1152/jn.
00289.2002
Li W, Piech V, Gilbert CD (2006) Contour saliency in primary visual
cortex. Neuron 50(6):951–962. doi:10.1016/j.neuron.2006.04.035
Loffler G (2008) Perception of contours and shapes: low and
intermediate stage mechanisms. Vis Res 48(20):2106–2127. doi:
10.1016/j.visres.2008.03.006
Luck SJ, Gold JM (2008) The construct of attention in schizophrenia.
Biol Psychiatry 64(1):34–39. doi:10.1016/j.biopsych.2008.02.014
Lynall ME, Bassett DS, Kerwin R, McKenna PJ, Kitzbichler M,
Muller U, Bullmore E (2010) Functional connectivity and brain
networks in schizophrenia. J Neurosci 30(28):9477–9487. doi:
10.1523/JNEUROSCI.0333-10.2010
Mandon S, Kreiter AK (2005) Rapid contour integration in macaque
monkeys. Vis Res 45(3):291–300. doi:10.1016/j.visres.2004.
08.010
McGlashan TH, Hoffman RE (2000) Schizophrenia as a disorder of
developmentally reduced synaptic connectivity. Arch Gen Psy-
chiatry 57(7):637–648
Mitelman SA, Buchsbaum MS (2007) Very poor outcome schizo-
phrenia: clinical and neuroimaging aspects. Int Rev Psychiatry
19(4):345–357. doi:10.1080/09540260701486563
Must A, Janka Z, Benedek G, Keri S (2004) Reduced facilitation
effect of collinear flankers on contrast detection reveals impaired
lateral connectivity in the visual cortex of schizophrenia patients.
Neurosci Lett 357(2):131–134. doi:10.1016/j.neulet.2003.12.046
Overall JE, Gorham DR (1962) The brief psychiatric rating scale.
Psychol Rep 10:799
Patterson TL, Goldman S, McKibbin CL, Hughs T, Jeste DV (2001)
UCSD performance-based skills assessment: development of a
new measure of everyday functioning for severely mentally ill
adults. Schizophr Bull 27(2):235–245
Phillips WA, Silverstein SM (2003) Convergence of biological and
psychological perspectives on cognitive coordination in schizo-
phrenia. Behav Brain Sci 26(1):65–82; discussion 82–137
Pillow J, Rubin N (2002) Perceptual completion across the vertical
meridian and the role of early visual cortex. Neuron 33(5):805–813
Place EJ, Gilmore GC (1980) Perceptual organization in schizophre-
nia. J Abnorm Psychol 89(3):409–418
Schneider LC, Struening EL (1983) SLOF: a behavioral rating scale
for assessing the mentally ill. Soc Work Res Abstr 19:9–21
Shipley TF, Kellman PJ (1992) Strength of visual interpolation
depends on the ratio of physically specified to total edge length.
Percept Psychophys 52(1):97–106
Silverstein SM, Keane BP (2011a) Perceptual organization impair-
ment in schizophrenia and associated brain mechanisms: review
of research from 2005 to 2010. Schizophr Bull 37(4):690–699.
doi:10.1093/schbul/sbr052
Silverstein SM, Keane BP (2011b) Vision science and schizophrenia
research: toward a re-view of the disorder editors’ introduction
to special section. Schizophr Bull 37(4):681–689. doi:10.1093/
schbul/sbr053
Silverstein SM, Knight RA, Schwarzkopf SB, West LL, Osborn LM,
Kamin D (1996) Stimulus configuration and context effects in
perceptual organization in schizophrenia. J Abnorm Psychol
105(3):410–420
Silverstein SM, Kovacs I, Corry R, Valone C (2000) Perceptual
organization, the disorganization syndrome, and context pro-
cessing in chronic schizophrenia. Schizophr Res 43(1):11–20
Silverstein SM, Hatashita-Wong M, Schenkel LS, Wilkniss S, Kovacs I,
Feher A, Smith T, Goicochea C, Uhlhaas P, Carpiniello K, Savitz A
(2006) Reduced top-down influences in contour detection in
schizophrenia. Cogn Neuropsychiatry 11(2):112–132. doi:10.1080/
13546800444000209
Silverstein SM, Berten S, Essex B, Kovacs I, Susmaras T, Little DM
(2009) An fMRI examination of visual integration in schizo-
phrenia. J Integr Neurosci 8(2):175–202
Stettler DD, Das A, Bennett J, Gilbert CD (2002) Lateral connectivity
and contextual interactions in macaque primary visual cortex.
Neuron 36(4):739–750
Strauss ME, Barch DM, Carter CS, Keane BP, Gold JM, Ragland JD,
Silverstein SM, MacDonald AW III (in preparation) Test-retest
reliability for cognitive psychometric tests in schizophrenia
Uhlhaas PJ, Silverstein SM (2005) Perceptual organization in
schizophrenia spectrum disorders: empirical research and theo-
retical implications. Psychol Bull 131(4):618–632. doi:10.1037/
0033-2909.131.4.618
Uhlhaas PJ, Phillips WA, Mitchell G, Silverstein SM (2006)
Perceptual grouping in disorganized schizophrenia. Psychiatry
Res 145(2–3):105–117. doi:10.1016/j.psychres.2005.10.016
van Assche M, Giersch A (2011) Visual organization processes in
schizophrenia. Schizophr Bull 37(2):394–404. doi:10.1093/
schbul/sbp084
Ventura J, Green MF, Shaner A, Liberman RP (1993a) Training and
quality assurance on the Brief Psychiatric Rating Scale: the
‘‘drift busters’’. Int J Methods Psychiatric Res 3:221–226
Ventura J, Lukoff D, Nuechterlein KH, Liberman RP, Green MF,
Shaner A (1993b) Brief Psychiatric Rating Scale (BPRS)
expanded version: scales, anchor points, and administration
manual. Int J Methods Psychiatric Res 3:227–243
Volk DW, Lewis DA (2010) Prefrontal cortical circuits in schizo-
phrenia. Curr Top Behav Neurosci 4:485–508
Wechsler D (2001) Wechsler test of adult reading. The Psychological
Corporation, San Antonio
Wichmann F, Hill N (2001) The psychometric function: I. Fitting,
sampling, and goodness of fit. Percept Psychophys 63(8):1293–1313
Zhang NR, von der Heydt R (2010) Analysis of the context
integration mechanisms underlying figure-ground organization
in the visual cortex. J Neurosci 30(19):6482–6496. doi:10.1523/
JNEUROSCI.5168-09.2010
Exp Brain Res
123