Familial collapsing glomerulopathy: Clinical, pathological and immunogenetic features
Upload
khangminh22Category
view
5download
0
1 | P a g e
Characterising metabolic deficits in sporadic and
familial Alzheimer’s disease to identify new
therapeutic targets
Simon Michael Bell
BSc(Hons), MB ChB, PG Dip(Health Research), MRCP
Department of Neuroscience
September 2020
A thesis submitted to the
University of Sheffield
for the degree of
Doctor of Philosophy

2 | P a g e
One never notices what has been done; one can only
see what remains to be done.
Professor Marie Curie, November 7, 1867 - July 4, 1934
3 | P a g e
Contents Acknowledgements ................................................................................................................................. 8
Abstract ................................................................................................................................................... 9
Abbreviations ........................................................................................................................................ 10
List of Figures ........................................................................................................................................ 14
List of Tables ......................................................................................................................................... 16
Chapter 1: Introduction ........................................................................................................................ 18
1.1 Alzheimer’s disease and Dementia ............................................................................................. 18
1.2 Alzheimer’s disease pathology.................................................................................................... 18
1.2.1 Amyloid Cascade Hypothesis ............................................................................................... 22
1.3 Clinical Features of Alzheimer’s disease and diagnosis .............................................................. 25
1.4 Diagnosis of Alzheimer’s disease ................................................................................................ 26
1.5 Treatment options for Alzheimer’s disease ................................................................................ 27
1.6 Therapeutic challenges in AD ...................................................................................................... 28
1.7 Metabolism and Alzheimer’s disease ......................................................................................... 29
1.8 Mitochondrial Structure and Function ....................................................................................... 29
1.8.1 Mitochondrial ATP generation and the electron transport chain ....................................... 29
1.8.2 Mitochondrial control of Cellular Calcium ........................................................................... 34
1.8.3 Reactive oxygen species and mitochondria ......................................................................... 37
1.8.4 Mitophagy and cell death .................................................................................................... 39
1.9 Mitochondrial changes seen AD ................................................................................................. 41
1.9.1 Electron Transport Chain Disruption in AD .......................................................................... 41
1.9.2 Mitochondrial Calcium Signaling in AD ................................................................................ 46
1.9.3 Mitochondrial ROS production in AD ................................................................................... 47
1.9.4 Mitophagy and cell death in AD ........................................................................................... 49
1.9.5 Mitochondrial Trafficking in AD ........................................................................................... 50
1.9.6 Mitochondrial abnormalities in AD Summary ..................................................................... 51
1.10 Glycolysis ................................................................................................................................... 53
1.11 Glycolysis in AD ......................................................................................................................... 54
1.11.2 Changes to glycolysis in AD ................................................................................................ 54
1.11.3 Changes to the pentose phosphate shunt in AD ............................................................... 57
1.11.4 Glycolysis in AD summary .................................................................................................. 58
1.12 Other metabolic pathways affected in AD ................................................................................ 58
1.12.1 Malate-Aspartate shunt ..................................................................................................... 58
1.12.2 Fatty acid metabolism ........................................................................................................ 58
1.13 Metabolic cooperation within the brain ................................................................................... 59

4 | P a g e
1.14 The astrocyte in AD ................................................................................................................... 61
1.14.1 The astrocyte and glucose storage in AD ........................................................................... 64
1.14.2 Astrocyte AD summary ...................................................................................................... 65
1.15 Inducible pluripotent stem cell models of Neurodegenerative disease ................................... 66
1.15.1 iPSC Models of Alzheimer’s Disease .................................................................................. 67
1.15.2 iPSC AD Neurons ................................................................................................................ 67
1.15.3 iPSCs AD Astrocytes ........................................................................................................... 70
1.15.4 iPSC Summary and iNPC research ...................................................................................... 72
1.16 Introduction Summary .............................................................................................................. 73
1.17 PhD Hypothesis, Aims and Objectives ...................................................................................... 74
1.17.1 Aims and Objectives: .......................................................................................................... 74
Chapter 2: Methods .............................................................................................................................. 75
2.1 Materials ..................................................................................................................................... 75
2.2 Methods ...................................................................................................................................... 75
2.2.1 Patient selection and characterisation ................................................................................ 75
2.2.2 Skin biopsy ........................................................................................................................... 76
2.2.3 Skin Biopsy set up and fibroblast culture ............................................................................. 76
2.2.4 Freezing Down Fibroblasts/iNPCs ........................................................................................ 77
2.2.5 Fibroblast reprogramming ................................................................................................... 77
2.2.6 iNPC differentiation into Astrocytes .................................................................................... 78
2.2.7 Immunohistochemistry ........................................................................................................ 79
2.2.8 ATP Assay ............................................................................................................................. 80
2.2.9 Mitochondrial Membrane Potential Assay .......................................................................... 80
2.2.10 Lactate Assay ...................................................................................................................... 81
2.2.11 Mitochondrial Stress Test Assay ........................................................................................ 82
2.2.12 Glycolysis Assay .................................................................................................................. 82
2.2.13 ATP Substrate Assay ........................................................................................................... 83
2.2.14 Bradford Assay ................................................................................................................... 84
2.2.15 Glutamine/Glutamate Assay .............................................................................................. 84
2.2.16 Quantitative Polymerase Chain Reaction (qPCR) .............................................................. 85
2.2.17 Glucose Uptake Assay ........................................................................................................ 85
2.2.18 Glutamate Uptake Assays .................................................................................................. 86
2.2.19 Drug Treatment Assays ...................................................................................................... 87
2.2.20 MRI Acquisition .................................................................................................................. 87
2.2.21 Neuropsychology testing ................................................................................................... 87
2.3 Statistical analysis ....................................................................................................................... 88
5 | P a g e
2.4 Media Constituents ..................................................................................................................... 89
Chapter 3: Ursodeoxycholic Acid improves mitochondrial function and redistributes Drp1 in
fibroblasts from patients with either sporadic or familial Alzheimer's disease ................................... 94
3.1 Introduction ................................................................................................................................ 94
3.1.2 Mitochondrial Fission and Fusion ........................................................................................ 94
3.1.3 Apoε gene and its effect on metabolism in AD .................................................................... 95
3.1.4 Assessment of oxidative phosphorylation using the seahorse XF analyser ........................ 96
3.1.5 Reason for presenting additional results ............................................................................. 97
3.1.6 Published Paper contributions by PhD Candidate ............................................................... 98
3.2 Published Paper .......................................................................................................................... 99
3.3 Additional results ...................................................................................................................... 100
3.3.1 Mitochondrial fusion mRNA is not changed in sporadic or familial AD fibroblasts ........... 101
3.3.2 Fibroblasts with the ApoE ε4/4 genotype have a more severe mitochondrial morphology
disease phenotype ...................................................................................................................... 102
3.3.3 Fibroblasts with the ApoE ε4/4 have reduced levels of ATP which can be corrected with
the application of UDCA .............................................................................................................. 107
3.3.4 All sporadic AD fibroblasts independent of ApoE genotype have a deficit in mitochondrial
spare respiratory capacity........................................................................................................... 107
3.3.5 Mitochondrial Spare Respiratory Capacity was the only element of the Mito Stress test to
show differences between AD and control fibroblasts .............................................................. 111
3.4 Discussion .................................................................................................................................. 112
3.4.1 Mitochondrial morphology is altered in AD....................................................................... 112
3.4.2 Fibroblasts with ApoE ε4/4 genotype produce less ATP and have altered mitochondrial
morphology ................................................................................................................................. 113
3.4.3 All Fibroblasts independent of ApoE genotype have a decreased mitochondrial spare
respiratory capacity .................................................................................................................... 114
3.4.4 Study limitations ................................................................................................................ 115
3.5 Chapter Conclusions ................................................................................................................. 116
Chapter 4: Deficits in Mitochondrial Spare Respiratory Capacity Contribute to the
Neuropsychological Changes of Alzheimer’s Disease ......................................................................... 117
4.1 Introduction .............................................................................................................................. 117
4.1.1 Structural Neuroimaging changes in AD ............................................................................ 117
4.1.2 Neuropsychological changes in early AD ........................................................................... 118
4.1.3 The Default Mode Network ............................................................................................... 119
4.1.4 Assessment of glycolysis using the Agilent XF seahorse analyser ..................................... 120
4.1.4 Reasoning for additional results ........................................................................................ 121
4.1.5 Published Paper contributions by PhD Candidate ............................................................. 122
4.2 Published Paper ........................................................................................................................ 123
6 | P a g e
4.3 Additional results ...................................................................................................................... 124
4.3.1 No significant difference was seen in glycolytic parameters based on fibroblast ApoE
genotype ..................................................................................................................................... 125
4.3.2 Sporadic AD fibroblasts use OxPHOS more than glycolysis in a glucose starved state ..... 125
4.3.3 Extracellular Lactate levels are not different in sporadic AD fibroblasts based on ApoE
genotype ..................................................................................................................................... 129
4.3.4 The connectivity of the default mode network is altered in sporadic AD ......................... 130
4.3.5 Fibroblast spare capacity correlates with Bilateral pre-frontal cortex connectivity ......... 132
4.3.6 Fibroblast MMP correlates with Bilateral Posterior Cortex Connectivity .......................... 134
4.4 Discussion .................................................................................................................................. 136
4.4.1 Fibroblasts from sporadic AD patients have reductions in glycolytic capacity and
extracellular lactate independent of Apoε genotype. ................................................................ 136
4.4.2 Connectivity of the DMN is altered in sporadic AD ........................................................... 137
4.4.3 Fibroblast spare capacity and MMP correlates with elements of DMN connectivity ....... 138
4.4.4 Chapter Limitations ............................................................................................................ 139
4.5 Chapter Conclusions ................................................................................................................. 139
Chapter 5 Astrocytes derived from human fibroblasts show deficits in both mitochondrial function
and glucose metabolism in sporadic and familial Alzheimer’s disease .............................................. 141
5.1 Introduction .............................................................................................................................. 141
5.1.2 Induced neuronal progenitor cell (iNPC) reprogramming ................................................. 141
5.1.3 Selection of drugs assessed in chapter paper .................................................................... 142
5.1.4 Reasoning for additional results ........................................................................................ 143
5.1.5 Candidates paper contributions......................................................................................... 143
5.2 Paper in preparation for submission ........................................................................................ 144
5.2.1 Abstract .................................................................................................................................. 145
5.2.2 Highlights ............................................................................................................................... 145
5.2.3Research In Context ................................................................................................................ 145
5.2.4 Background ............................................................................................................................ 146
5.2.5 Methods ................................................................................................................................. 148
5.2.6 Results .................................................................................................................................... 155
5.2.6 Discussion............................................................................................................................... 182
5.2.1 The AD astrocyte metabolic phenotype ............................................................................ 182
5.2.2 Astrocyte metabolism correlations with neuropsychological changes ............................. 185
5.2.3 Small molecule compounds correct astrocyte metabolic deficits ..................................... 186
5.2.7 Conclusions ............................................................................................................................ 187
5.2.8 Supplementary figures ....................................................................................................... 187
5.3 Additional results ...................................................................................................................... 192
7 | P a g e
5.3.1 Total cellular ATP levels are lower in ApoE ε4/4 genotype astrocytes .............................. 192
5.3.2 Astrocyte glycolytic and mitochondrial abnormalities are independent of ApoE genotype
.................................................................................................................................................... 192
5.3.3 Extracellular lactate levels correlate with DMN connectivity changes .............................. 196
5.3.4 Astrocytes derived using the iNPC method maintain an aged phenotype ......................... 198
5.4 Discussion .................................................................................................................................. 200
5.4.1 ApoE genotype does not differentiate all metabolic abnormalities in AD sporadic
Astrocytes, but may influence ATP levels ................................................................................... 200
5.4.2 Extracellular lactate levels correlate with connectivity of the DMN ................................. 201
5.4.3 Astrocyte deficits are more pronounced in galactose-based media ................................. 201
5.4.4 Astrocytes have an aged phenotype based on RNA expression ........................................ 202
5.5 Chapter limitations ................................................................................................................... 202
5.6 Chapter Conclusions ................................................................................................................. 203
Chapter 6 Discussion ........................................................................................................................... 205
6.1 Fibroblasts and Astrocytes have similar mitochondrial and glycolytic abnormalities in sporadic
and familial AD ................................................................................................................................ 205
6.2 Astrocyte changes seen in other iNPC/iPSC models of neurodegenerative disease ................ 208
6.3 Mitochondrial dysfunction and its importance to AD .............................................................. 209
6.4 Glycolytic dysfunction and its importance to AD ...................................................................... 211
6.5 ApoE genotype may contribute to mitochondrial and glycolytic impairment in AD ................ 213
6.6 Developing a metabolic biomarker for AD ............................................................................... 213
6.7 Metabolism as a target for therapeutic intervention in AD ..................................................... 215
6.8 Further Directions ..................................................................................................................... 217
6.9 Final Conclusion ........................................................................................................................ 218
References .......................................................................................................................................... 219

8 | P a g e
Acknowledgements
Over the past 4 years I have been supported by several research charities to which I am eternally
grateful. The charities are the Wellcome 4ward North Research Academy (Grant Number:
216340/Z/19/Z), The National Institute of Health Research Sheffield Biomedical Research Centre,
and Alzheimer’s Research UK Yorkshire Network Centre Small Grant Scheme (Ref: ARUK-PCRF2016A-
1). I have also been supported by an Alzheimer Research UK preparatory grant in the work that led
up to the development of this PhD thesis.
I wanted to start this thesis with a quote from Professor Curie who was a visionary scientist, mother,
and wife who changed our understanding of the world on multiple levels. I have been fortunate
enough throughout my life to have been influenced by many women who have similarities with
Professor Curie. My supervisors, Dr Heather Mortiboys, Dr Laura Ferraiuolo and Professor Dame
Pamela Shaw have given me the scientific skills needed to perform, critic and analyse the data
needed to complete this PhD. Professor Annalena Venneri has been both a trusted advisor for my
research and fundamental influence in my understanding of Alzheimer’s disease. Without their
many hours of support I would not be the researcher I am today. My mother Marjorie Bell who has
given me the determination and perseverance skills needed to be a clinical academic, My sister Katie
Bell who has often prevented episodes of doubt with well-placed jibes. My wife Dr Sarah Jones who
has had to listen to multiple research presentations, read many a first draft and pick me up when
things haven’t gone to plan in the lab, and my daughter Grace Bell, who has been a smiling loving
presence in my life, and always forgives me for missed times at the park while I work on my
research.
I will always be in the debt of my supervisor Dr Daniel Blackburn who took me under his wing nearly
6 years ago. With his constant support and guidance both clinically and scientifically, he has guided
me through the challenges of being a clinical academic. Dr Matteo De Marco has spent many hours
developing my knowledge of both statistical methods and neuropsychological tests which has made
me a better scientist, and I also need to acknowledge Professor Tim Chico, my pastoral supervisor,
for his excellent advise both on funding, doing a PhD and life in general.
Finally, I would like to acknowledge my Great Aunt Jennie Watson and her husband Victor Watson,
who represent the people and families of people with Alzheimer’s disease. Watching her change
whilst living AD, and how this effected both her and her husband, has made me want to devote my
career to fighting dementia and stopping this disease effecting future generations. Hopefully, this
PhD will help in some way to achieve this aim.
9 | P a g e
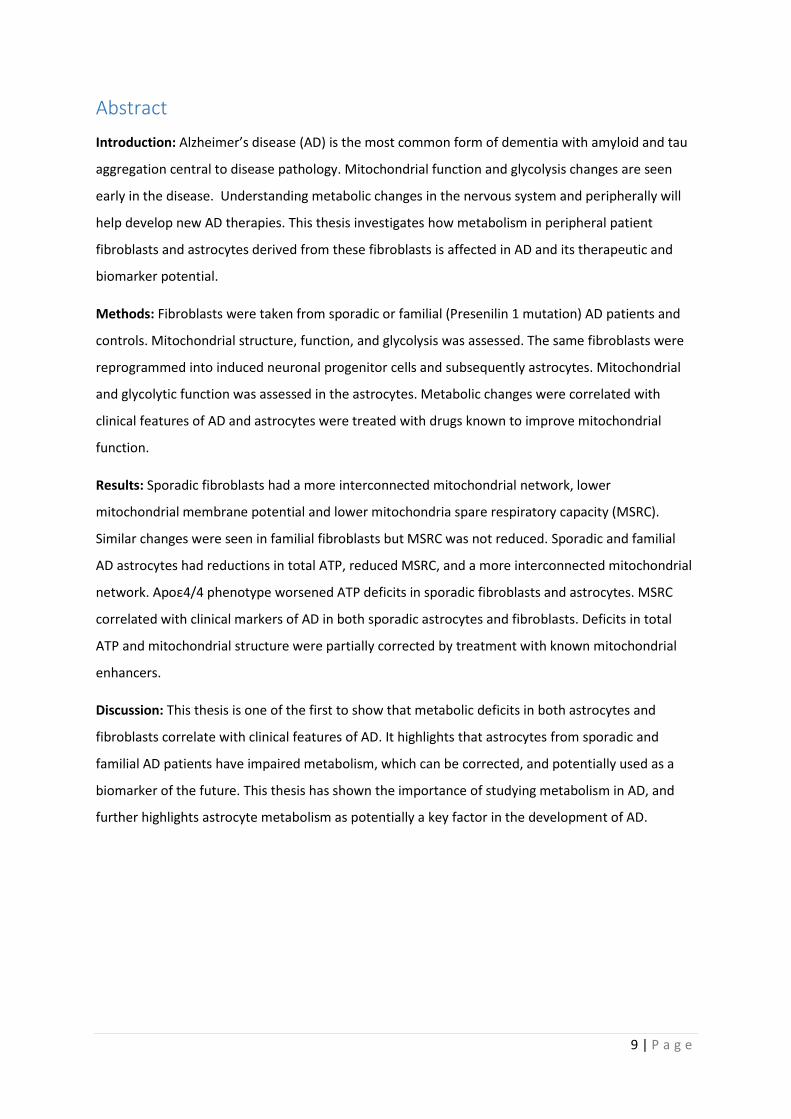
Abstract
Introduction: Alzheimer’s disease (AD) is the most common form of dementia with amyloid and tau
aggregation central to disease pathology. Mitochondrial function and glycolysis changes are seen
early in the disease. Understanding metabolic changes in the nervous system and peripherally will
help develop new AD therapies. This thesis investigates how metabolism in peripheral patient
fibroblasts and astrocytes derived from these fibroblasts is affected in AD and its therapeutic and
biomarker potential.
Methods: Fibroblasts were taken from sporadic or familial (Presenilin 1 mutation) AD patients and
controls. Mitochondrial structure, function, and glycolysis was assessed. The same fibroblasts were
reprogrammed into induced neuronal progenitor cells and subsequently astrocytes. Mitochondrial
and glycolytic function was assessed in the astrocytes. Metabolic changes were correlated with
clinical features of AD and astrocytes were treated with drugs known to improve mitochondrial
function.
Results: Sporadic fibroblasts had a more interconnected mitochondrial network, lower
mitochondrial membrane potential and lower mitochondria spare respiratory capacity (MSRC).
Similar changes were seen in familial fibroblasts but MSRC was not reduced. Sporadic and familial
AD astrocytes had reductions in total ATP, reduced MSRC, and a more interconnected mitochondrial
network. Apoε4/4 phenotype worsened ATP deficits in sporadic fibroblasts and astrocytes. MSRC
correlated with clinical markers of AD in both sporadic astrocytes and fibroblasts. Deficits in total
ATP and mitochondrial structure were partially corrected by treatment with known mitochondrial
enhancers.
Discussion: This thesis is one of the first to show that metabolic deficits in both astrocytes and
fibroblasts correlate with clinical features of AD. It highlights that astrocytes from sporadic and
familial AD patients have impaired metabolism, which can be corrected, and potentially used as a
biomarker of the future. This thesis has shown the importance of studying metabolism in AD, and
further highlights astrocyte metabolism as potentially a key factor in the development of AD.
10 | P a g e
Abbreviations
Abeta-binding alcohol dehydrogenase ABAD
Adenine Nucleotide Translocator ANT
Adenosine Diphosphate ADP
Adenosine Triphosphate ATP
Alzheimer’s disease AD
Amyloid Beta Protein Aβ
Amyloid Plaques AP
Amyloid Precursor Protein APP
Astrocyte neuron lactate shuttle ANSL
Blood Brain Barrier BBB
Blood Oxygenation Level Dependent BOLD
Bridging integrator 1 B1N1
Carbonyl cyanide-4-(trifluoromethoxy) phenylhydrazone FCCP
Central nervous system CNS
Cerebro-Spinal Fluid CSF
Clustered Regularly Interspaced Short Palindromic Repeats CRISPR
Clusterin CLU
Complement receptor 1 CRI
Computed Tomography CT
Cyclophilin D CypD
Default Mode Network DMN
Deoxyribonucleic Acid DNA
Down’s Syndrome DS
Dimethyl sulfoxide DMSO
Dulbecco's Modified Eagle Medium DMEM
Dynamin-related protein Drp1
Eagle's Minimum Essential Medium EMEM
Electron Transport Chain ETC
Endoplasmic Reticulum ER
11 | P a g e
Epidermal growth factor EGF
Ephrin type-A receptor 1 EPHA1
Extracellular acidification rate ECAR
Fibroblast growth factor beta FGF-b
Flavin mononucleotide FMN
Fluoro-2-Deoxy-D-glucose FDG
Genome Wide Association Studies GWAS
Glial fibrillary acidic protein GFAP
Glucose transporters 1 and 2 GLUT1 & 3
Glyceraldehyde-3-phosphate dehydrogenase G3PDH
Hanks' Balanced Salt solution HBSS
Hexokinase HK
Hypoxia-inducible factor-1alpha HIF-1alpha
Induced neuronal progenitor cell iNPC
induced pluripotent stem cell models iPSC
inositol-1,4,5-triphosphate receptor-voltage-dependent anion channel IP3R3-VDAC
Lactate dehydrogenase LDH
Laminin subunit alpha 3A LAMA3A
Long-term depression LTD
Long-term potentiation LTP
Malate-aspartate shunt MAS
Magnetic Resonance imaging MRI
Membrane-spanning 4-domains, subfamily A MS4A
Mild Cognitive Impairment MCI
Mini Mental State Examination MMSE
Mitochondrial calcium uniporter MCU
Mitochondrial Deoxyribonucleic acid mtDNA
Mitochondrial dynamics protein 49 MiD49
Mitochondrial dynamics protein 51 MiD51
Mitochondrial fission factor Mff
Mitochondrial fission 1 protein Fis1
12 | P a g e
Mitochondrial Membrane Potential MMP
Mitochondrial Permeability Transition Pore MPTP
Mitochondrial Spare Respiratory Capacity MSRC
Mitofusin 1 Mfn1
Mitofusin 2 Mfn2
Monoclonal Antibody MAB
Motor Neuron Disease MND
Neurofibrillary Tangles NFT
Nicotinamide Adenine Dinucleotide NAD
Nicotinamide adenine dinucleotide phosphate NADPH
Non-Steroidal Anti-inflammatory Drugs NSAIDs
Optic atrophy 1 Opa1
Oxidative phosphorylation OxPHOS
Oxygen Consumption Rate OCR
P1 P5-di(adenosine) pentaphosphate PPAP
Parkinson’s disease PD
PBS and TWEEN20 PBST
Pentose phosphate shunt PPS
Phosphate Buffered Saline PBS
Phosphatidylinositol binding clathrin assembly protein PICALM
Phosphofructokinase PFK
Polyglucosan bodies PGB
Positron-emission tomography PET
Post-mortem PM
Presenilin 1 PSEN1
PTEN-induced kinase 1 PINK1
Pyruvate dehydrogenase kinase PDK
Pyruvate kinase PK
Quantitative Polymerase Chain Reaction qPCR
RAN binding protein 17 RanBP17
Reactive Oxygen Species ROS

13 | P a g e
Single Nucleotide Polymorphisms SNP
Sodium/calcium exchanger NCX
Sporadic Alzheimer’s disease sAD
Superoxide ion O2ׄ●-
Telomeric repeat-binding factor 2 TERF2
Tetramethlyrhodamine TMRM
Tricarboxylic acid enzymes TCA
Triggering receptor expressed on myeloid cells 2 TREM2
United Kingdom UK
Ursodeoxycholic acid UDCA
Voltage dependent anion-selective channels VDAC
14 | P a g e
List of Figures
Figure 1.1| The cleavage of the APP protein
Figure 1.2 | The Amyloid Cascade Hypothesis
Figure 1.3| Mitochondrial structure and ETC changes in the brain in AD
Figure 1.4| Mitochondrial Calcium Homeostasis
Figure 1.5| Mitochondrial ROS Production
Figure 1.6| Mitophagy
Figure 1.7| Changes to mitochondrial function seen in AD
Figure 1.8| Glycolysis and other glucose metabolic pathways
Figure 1.9| Astrocyte neuronal co-operation
Figure 2.1| Fibroblast Set Up
Figure 2.2|Fibroblast Reprogramming
Figure 2.3| ATPlite kit reaction
Figure 3.1| Mitochondrial Stress Test Seahorse Trace graph
Figure 3.2| Mitochondrial Fusion protein RNA qPCR results
Figure 3.3| Mitochondrial morphology results split by sporadic AD fibroblast Apoε genotype
Figure 3.4| Variance in mitochondrial morphology of control fibroblast based on ApoE genotype
Figure 3.5| Total cellular ATP and Mitochondrial Spare Respiratory Capacity split by AD fibroblast
Apoε genotype
Figure 4.1| Glycolysis Assessment using the Agilent Glycolysis Stress Test
Figure 4.2| Fibroblast glycolytic function split based on Apoε genotype and OCAR/ECAR ratios
Figure 4.3| Glycolytic parameters for sporadic fibroblast controls split based on ApoE genotype
Figure 4.4| Fibroblast extracellular lactate split on Apoε genotype
Figure 4.5| DMN connectivity after network compartmentalization
Figure 4.6| DMN connectivity correlations with MSRC
15 | P a g e
Figure 4.7| DMN connectivity correlations with MMP
Figure 5.1 |Astrocyte characterization
Figure 5.2 |Astrocyte and iNPC total cellular ATP|
Figure 5.3 |Astrocyte Mitochondrial Function and Morphology
Figure 5.4| Astrocyte Oxidative Phosphorylation Assessment
Figure 5.5| Astrocyte glycolysis assessment
Figure 5.6| Astrocyte Lactate excretion and Glucose uptake
Figure 5.7| MSRC and MMP correlations with Neuropsychological tests
Figure 5.8| Glycolytic reserve and extracellular lactate correlations with Neuropsychological tests
Figure 5.9|Compound A & B treatment of control, sporadic and familial AD astrocytes
Figure 5.10| Compound C & D treatment of control, sporadic and familial AD astrocytes
Figure 5.11| Compound E & F treatment of control, sporadic and familial AD astrocytes
Figure 5.12| Compound G & H treatment of control, sporadic and familial AD astrocytes
Supplementary Figure 1| Glucose media Total Cellular ATP
Supplementary Figure 2| Mitochondrial Morphology Glucose Media
Supplementary Figure 3| Astrocyte Oxidative Phosphorylation in glucose media
Supplementary Figure 4| Astrocyte Glycolysis in glucose media
Figure 5.13| Astrocyte metabolic parameter split via sporadic Apoε genotype
Figure 5.14| Control Astrocytes separated based on ApoE status
Figure 5.15| Metabolic DMN correlations
Figure 5.16| qPCR data for aging related gene expression
16 | P a g e
List of Tables Table 1.1| ATN Classification criteria
Table 2.1| DMEM Media
Table 2.2| EMEM Media
Table 2.3| PBS
Table 2.4| iNPC Media
Table 2.5| Astrocyte Media
Table 2.6| Antibodies used for Immunochemistry
Table 2.7| Galactose Media
Table 2.8| Seahorse XF media
Table 2.9| Seahorse experiments drug locations
Table 2.10| ATP Substrate Assay Buffer A
Table 2.11| ATP Substrate Assay Complex Mixtures
Table 2.12| qPCR forward and reverse primers
Table 2.13| Glutamate Detection Reagent
Table 2.14| Krebs-Ringer-Phosphate-Hepes (KRPH) buffer (pH 7.4)
Table 2.15| Drugs used in drug treatment assays
Table 3.1| Fibroblast line demographics
Table 3.2| Mitochondrial Stress Test parameters
Table 4.1| Fibroblast line demographics
Table 5.1| Drugs used in chapter and mechanisms of action
Table 5.2| Antibodies used for Immunochemistry
Table 5.3| Patient Demographic Information and contemporary treatment status
Table 5.4| Patient demographics for Familial AD presenilin 1 lines and associated controls
Table 5.5| Astrocyte neuropsychological metabolic correlations

17 | P a g e
Table 5.6| Effects of drug compounds of ATP and mitochondrial morphology
Table 5.7| Aging qPCR cell lines
18 | P a g e
Chapter 1: Introduction
1.1 Alzheimer’s disease and Dementia
Alzheimer’s disease (AD) is both the most common neurodegenerative disease and most prevalent
form of dementia worldwide[1]. It is calculated that around 50 million people globally have
dementia [2, 3], with between 60-80% of cases thought to be due to AD [4]. In 2016 Dementia was
the fifth leading cause of death worldwide[1], and in 2018 it was estimated that the total cost of
dementia care to the world economy was $1 Trillion dollars [3].
Two thirds of the people that have dementia live in low and middle income countries [5], which have
less developed healthcare systems [6]. This is a particular problem for the future due to the lack of
disease modifiable therapies and the high care costs for people with dementia [7].
Increasing age is the biggest risk factor for developing both AD and dementia, but low educational
attainment, cardiovascular disease, obesity and diabetes have all been associated with an increased
risk of developing dementia[8]. Interestingly, it has been suggested that up to a third of dementia
cases could be prevented by amelioration of modifiable risk factors [8].
As AD is by far the most common form of dementia, the vast majority of dementia research has
focused on developing treatments for and understanding the underlying mechanisms that lead to
people developing this condition.
1.2 Alzheimer’s disease pathology
The condition was originally identified in 1906 by the German pathologist and psychiatrist Dr Alois
Alzheimer [9, 10]. In his original paper, Alzheimer offered the first description for both extracellular
plaques (AP) comprising mainly of the amyloid beta protein (Aβ); and intracellular neurofibrillary
tangles (NFT) made mainly of the cytoskeletal protein tau [11].
Aβ that contributes to the AP is cleaved by the secretase enzymes from the amyloid precursor
protein (APP) in a sequential way. Beta and gamma secretase cleave APP to produce Aβ
(amyloidogenic pathway) and alpha and gamma secretase cleave the protein to produce P3 (non-
amyloidogenic pathway). The amyloidogenic pathway can produce several different isoforms of the
Aβ protein, with the most common form found in AP being Aβ1-42. What causes the AP to develop in
AD is unknown. At some point prior to the development of the clinical syndrome the balance
between the production of Aβ and its removal from the brain is altered. Deposition of amyloid
within the brain is the leading theory for what is likely to be the key pathological mechanism that
leads to the development of AD, and is referred to as the amyloid cascade hypothesis [12-15]. The
amyloid cascade hypothesis though has been challenged, as several aspects of the AD clinical

19 | P a g e
syndrome do not appear to be causally linked with amyloid deposition. It has been shown that the
pattern of deposition of AP through the brain does not correlate well with clinical disease severity
[16, 17], and several studies have shown that advancing age can often be a better predictor of the
AP density than having a diagnosis of AD [18, 19]. Clinical trials of therapeutics that remove amyloid
from the brain have not been able to reverse the progression of the disease, which has further
questioned if amyloid deposition is the key pathological step in the development of AD [20-22].
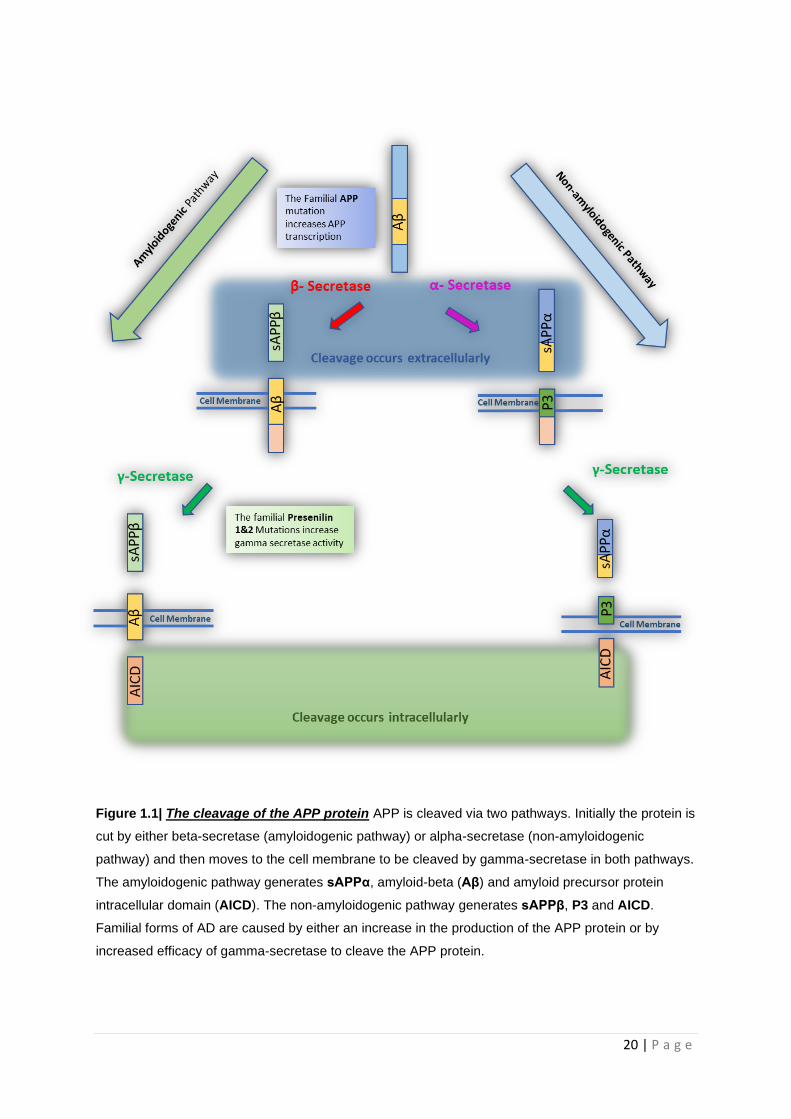
Figure 1.1 shows the sequential cleavage pattern and cellular location of APP and its breakdown
products. The amyloid cascade hypothesis is discussed in more detail in section 1.2.1
20 | P a g e
Figure 1.1| The cleavage of the APP protein APP is cleaved via two pathways. Initially the protein is
cut by either beta-secretase (amyloidogenic pathway) or alpha-secretase (non-amyloidogenic
pathway) and then moves to the cell membrane to be cleaved by gamma-secretase in both pathways.
The amyloidogenic pathway generates sAPPα, amyloid-beta (Aβ) and amyloid precursor protein
intracellular domain (AICD). The non-amyloidogenic pathway generates sAPPβ, P3 and AICD.
Familial forms of AD are caused by either an increase in the production of the APP protein or by
increased efficacy of gamma-secretase to cleave the APP protein.
21 | P a g e
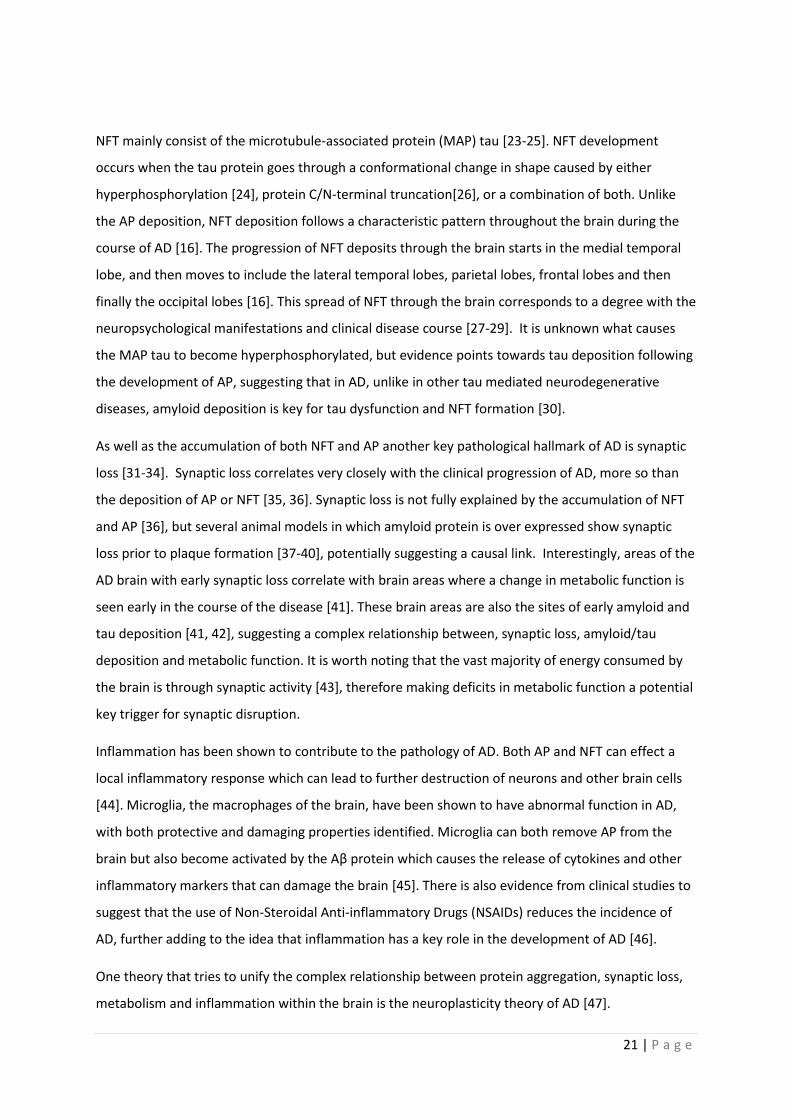
NFT mainly consist of the microtubule-associated protein (MAP) tau [23-25]. NFT development
occurs when the tau protein goes through a conformational change in shape caused by either
hyperphosphorylation [24], protein C/N-terminal truncation[26], or a combination of both. Unlike
the AP deposition, NFT deposition follows a characteristic pattern throughout the brain during the
course of AD [16]. The progression of NFT deposits through the brain starts in the medial temporal
lobe, and then moves to include the lateral temporal lobes, parietal lobes, frontal lobes and then
finally the occipital lobes [16]. This spread of NFT through the brain corresponds to a degree with the
neuropsychological manifestations and clinical disease course [27-29]. It is unknown what causes
the MAP tau to become hyperphosphorylated, but evidence points towards tau deposition following
the development of AP, suggesting that in AD, unlike in other tau mediated neurodegenerative
diseases, amyloid deposition is key for tau dysfunction and NFT formation [30].
As well as the accumulation of both NFT and AP another key pathological hallmark of AD is synaptic
loss [31-34]. Synaptic loss correlates very closely with the clinical progression of AD, more so than
the deposition of AP or NFT [35, 36]. Synaptic loss is not fully explained by the accumulation of NFT
and AP [36], but several animal models in which amyloid protein is over expressed show synaptic
loss prior to plaque formation [37-40], potentially suggesting a causal link. Interestingly, areas of the
AD brain with early synaptic loss correlate with brain areas where a change in metabolic function is
seen early in the course of the disease [41]. These brain areas are also the sites of early amyloid and
tau deposition [41, 42], suggesting a complex relationship between, synaptic loss, amyloid/tau
deposition and metabolic function. It is worth noting that the vast majority of energy consumed by
the brain is through synaptic activity [43], therefore making deficits in metabolic function a potential
key trigger for synaptic disruption.
Inflammation has been shown to contribute to the pathology of AD. Both AP and NFT can effect a
local inflammatory response which can lead to further destruction of neurons and other brain cells
[44]. Microglia, the macrophages of the brain, have been shown to have abnormal function in AD,
with both protective and damaging properties identified. Microglia can both remove AP from the
brain but also become activated by the Aβ protein which causes the release of cytokines and other
inflammatory markers that can damage the brain [45]. There is also evidence from clinical studies to
suggest that the use of Non-Steroidal Anti-inflammatory Drugs (NSAIDs) reduces the incidence of
AD, further adding to the idea that inflammation has a key role in the development of AD [46].
One theory that tries to unify the complex relationship between protein aggregation, synaptic loss,
metabolism and inflammation within the brain is the neuroplasticity theory of AD [47].
22 | P a g e
Neuroplasticity refers to how the brain modulates connections between neurons via synapses. This
physiological process is integral to memory formation. When connections are increased in strength
between 2 neurons, thought to be fundamental in the development of memories, this is described
as long-term potentiation (LTP) [48]. When the connections between 2 neurons are weakened or
lost this is referred to as long term depression (LTD) [49]. The brain constantly modulates the
connections between neurons via LTP and LTD which in turn allows for the development of
functional networks within the brain. The neuroplasticity theory for AD suggests that memory
impairment develops in AD because the brain can no longer meet the energetic of neuroplastic
process in the brain. Inflammation, protein aggregation, metabolism failure and synaptic loss all
contribute to impairments in synaptic plasticity, and therefore AD develops because the fine balance
between LTP/LTD is lost and neuronal connections start to breakdown [50].
Other pathological aggregates are seen in the AD brain such as Hirano bodies, Granulovacuolar
Degeneration [11], and the choroid plexus inclusion called the Biondi body [51]. The contribution to
the pathophysiological cause of each of these lesions is as yet not well understood in AD. Amyloid
can also become deposited in the blood vessel walls of the brain leading to several different
pathological processes such as microhaemorrhages and big lobar haemorrhages [11].
1.2.1 Amyloid Cascade Hypothesis
As already discussed in the above section the amyloid cascade hypothesis was originally proposed
predominantly by Professors John Hardy and Dennis Selkoe in the early 1990’s [12-15]. Although this
has been the main theory for the cause of AD, it is not without its caveats, and criticisms. To
understand both the reasoning behind the hypothesis and criticisms that have been made of this
proposal a discussion is first needed around both the production of Aβ and AP from the APP protein,
and the processes that lead to the accumulation of tau as NFT throughout the brain.
The APP protein is cleaved by 3 secretase enzymes. β and γ-secretase cleave the APP protein to
produce Aβ. α and γ-secretase cleave APP to produce a protein called sAPPα, which is thought to
have roles in protecting neurons from glucose and oxygen deficit by stablising membrane potentials,
synaptogenesis, neurite outgrowth and cell adhesion. The exact identity of both β and α-secretase
enzymes is not completely known [52]. There is evidence that α-secretase is a member of the A
Disintegrin and metalloproteinase (ADAM) family of enzymes with ADAM’s 9, 10, 17, and 19 all
suggested [53, 54]. The identity of β-secretase is also unknown, but Beta-site APP cleaving enzyme 1
(BACE1) is major secretase found within the brain and thought to be the most likely candidate
enzyme that leads to amyloidogenic processing [55]. Cathepsin B also has β-secretase [56], but
23 | P a g e
BACE1 is by far the strongest candidate to cause the APP enzymatic processing that leads to AP
formation. γ-secretase is a collection of 4 enzyme subunits called Presenilin 1 &2, Nicastrin and Aph1
[57]. All four subunits are need for γ-secretase activity. It has been shown that Nicastrin and aph1
come together first in the cell membrane and then attract presenilin 1 and then presenilin 2. The
cleavage of APP is performed by the presenilin proteins, with presenilin 1 the dominant aspartyl
protease in the human neurons [57]. All three enzymes have multiple substrates as well as the APP
protein, making therapeutic targeting of these enzymes difficult.
NFT are mainly composed of the cytoskeletal protein tau which has become hyperphosphorylated.
The tau protein is a microtubule binding protein, which to a certain extent, can control microtubule
assembly based on its phosphorylation status. Several enzymes can phosphorylate tau in the human
cells. The most important when considering the amyloid cascade hypothesis are glycogen synthase
kinase 3β (GSK3β), cyclin-dependent kinase 5 (Cdk5), and c-Jun amino terminal kinases (JNKs) (JNK).
GSK3β is constitutively active within a cell and inhibitory phosphorylation is used as a method of
controlling this activity [58]. Insulin dependent phosphorylation via the action of the proto-oncogene
protein kinase B (PKB, also known as Akt/RAC) at serine-9 [59], and wnt signaling dependent
phosphorylation are the thought to be the main inhibitory phosphorylation pathways [60]. Cdk5 is a
kinase that is activated by its regulatory subunit p35 which allows phosphorylation. P35 can be
metabolized by calpain to another protein called p25. This protein can constitutively activate Cdk5,
which can increase is ability to phosphorylate proteins [61]. JNK can phosphorylate tau, and has
been shown to have increased activity with increased levels of Aβ induced ROS stress [62].
The amyloid cascade hypothesis states that the deposition of amyloid within the brain is the key step
in the development of AD and that synaptic loss, NFT formation and vascular damage occur as a
consequence of this [13]. The evidence that supports this hypothesis comes from several sources.
Firstly, familial forms of AD are caused by mutations in one of three proteins (APP, Presenilin 1&2)
which lead to an increase in the production of the longer aggregatory forms of Aβ such as Aβ1-42 [63].
This produces in familial AD patients a form of pathology that is almost identical to that seen in
sporadic forms for the disease. Secondly, amyloid itself has been shown to be toxic to synapses in its
oligomeric form, leading to synapse loss in multiple animal models of AD [34]. Thirdly, accumulation
of Aβ leads to tau hyperphosphorylation through the increased activation of the above-mentioned
kinases. GSK3β can lose it wnt mediated inhibitory phosphorylation via the actions of Aβ on the wnt
inhibitor Dickkopf-1 (Dkk1) allowing the GSK3β to hyperphosphorylate tau [64]. Aβ also increases
intracellular calcium levels which activates calpain therefore increasing the production of p25
increasing Cdk5 tau phosphorylating ability [65]. Furthermore, AD is common in people with Down’s
24 | P a g e
syndrome a condition which results for trisomy of chromosome 21, leading to an over expression of
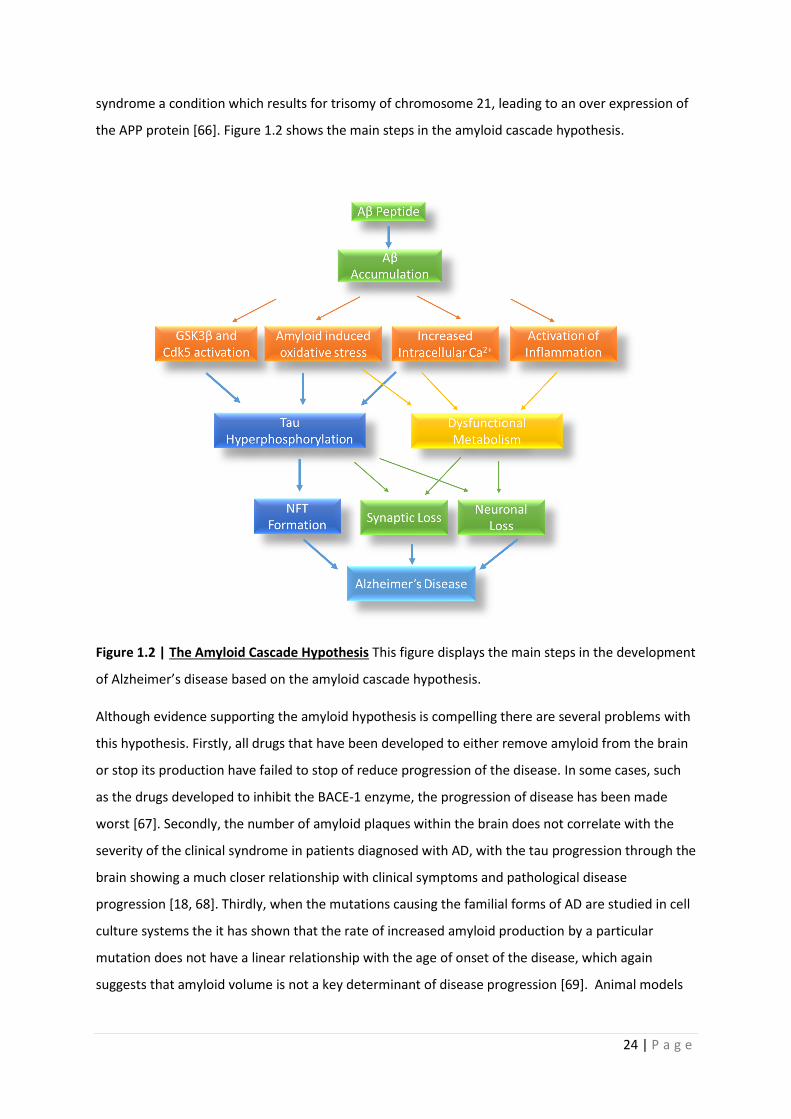
the APP protein [66]. Figure 1.2 shows the main steps in the amyloid cascade hypothesis.
Figure 1.2 | The Amyloid Cascade Hypothesis This figure displays the main steps in the development
of Alzheimer’s disease based on the amyloid cascade hypothesis.
Although evidence supporting the amyloid hypothesis is compelling there are several problems with
this hypothesis. Firstly, all drugs that have been developed to either remove amyloid from the brain
or stop its production have failed to stop of reduce progression of the disease. In some cases, such
as the drugs developed to inhibit the BACE-1 enzyme, the progression of disease has been made
worst [67]. Secondly, the number of amyloid plaques within the brain does not correlate with the
severity of the clinical syndrome in patients diagnosed with AD, with the tau progression through the
brain showing a much closer relationship with clinical symptoms and pathological disease
progression [18, 68]. Thirdly, when the mutations causing the familial forms of AD are studied in cell
culture systems the it has shown that the rate of increased amyloid production by a particular
mutation does not have a linear relationship with the age of onset of the disease, which again
suggests that amyloid volume is not a key determinant of disease progression [69]. Animal models
25 | P a g e
have also suggested that amyloid is not necessary for the development of NFT, again suggesting that
amyloid accumulation maybe one of several pathological steps needed to develop AD [70].
1.3 Clinical Features of Alzheimer’s disease and diagnosis
Clinically, AD presents with cognitive symptoms that effect a person’s ability to perform the usual
functions of daily life [71]. Classically, episodic memory (the ability to remember dates, and events)
is the cognitive process affected earliest in AD. Semantic fluency (the ability to remember lists of
objects) is another area of cognition affected very early in the course of AD [72]. More and more
cognitive domains are affected as AD progresses. As described above, clinically the disease affects
the medial temporal lobe structures first then moves to involve parietal, frontal and occipital lobes.
The patterns in neuropsychological performance reflect this progression [73].
The disease progresses with a person’s cognitive functions becoming gradually worse, until almost
inevitably institutionalised care is needed [74]. During the course of the illness it is common for
patients to lose the ability to talk, become incontinent, lose the desire to eat and drink and in the
later stages the ability to swallow [75]. The average life expectancy after diagnosis is between 3-9
years depending mainly on the age at onset of symptoms [76].
Prior to the development of deficits in cognitive performance that would be severe enough to
diagnose a person with AD, a pre-Alzheimer or mild cognitive impairment (MCI) stage of the disease
is described [77]. The group of people that would be described as having MCI are more
heterogenous than the people who have a diagnosis of AD. This is in part due to the fact the term
encompasses both people who will eventually develop a diagnosis of dementia, and also people that
will remain with MCI or even have an improvement in cognitive performance [78]. This makes
prediction of transition from the MCI state to AD difficult. If a person presents with a more amnestic
form of MCI, they are more likely to progress to AD [79]. People with a diagnosis of MCI who are
positive of certain biomarkers of AD pathology such as increased brain amyloid, increased brain tau
and signs of neuronal injury on brain imaging are also at an increased risk of developing AD from the
MCI state [80].
AD has both sporadic (95%) and familial forms (5%) [81]. The familial forms are caused by mutations
in the genes that encode APP [82-86], or the presenilin (PSEN) 1&2 protein subunits of the gamma
secretase enzyme [83, 87, 88]. In general, patients with familial forms of AD develop cognitive
symptoms much earlier than sporadic cases. Patients with familial mutations can develop cognitive
impairment from the age of 30 years, whereas sporadic cases of AD typically present after the age of
26 | P a g e
60 [81]. Apart from age of onset, the disease course for both familial and sporadic AD is very similar.
Animal models show that the mutations causing familial AD lead to an increased production in the
Aβ, and AP pathology [89].
Sporadic forms of AD have gene alleles associated with an increased risk of developing the condition.
The gene allele most strongly associated with an increased risk of developing sporadic AD is the
Apoε4 allele [90]. Having two copies of the Apoε4 gene increases the risk of developing AD 10 fold
for males, and 12-fold for females above the general population risk [91]. This Apoε gene is a
cholesterol transport gene with roles in both lipid transport and cell repair [92]. Genome wide
association studies (GWAS) have identified ten other genes which have single nucleotide
polymorphisms (SNP) associated with an increased risk of developing sporadic AD. These genes are
ABCA7, bridging integrator 1(B1N1), triggering receptor expressed on myeloid cells 2 (TREM2), CD33,
clusterin (CLU), complement receptor 1 (CRI), ephrin type-A receptor 1 (EPHA1), membrane-
spanning 4-domains, subfamily A (MS4A) and phosphatidylinositol binding clathrin assembly protein
(PICALM) [93]. These extra ten genes have functions in lipid metabolism, cellular endocytosis and
immune response. None of the genes confers as great a risk of developing AD as the Apoε4 gene
allele.
1.4 Diagnosis of Alzheimer’s disease
A clinical diagnosis of AD is made based on characteristic changes in neuropsychological tests that
suggest a pathology that starts by affecting the medial temporal lobe structures, and then spreads to
involve other brain regions [73]. The neuropsychological diagnosis of AD is further supported by
structural brain imaging abnormalities, which include atrophy of the medial temporal lobe
structures, specifically the hippocampus [94] and changes in the expression of tau and amyloid
proteins. Cerebrospinal fluid (CSF) analysis in AD shows a reduction in Aβ levels and an increase in
hyperphosphorylated tau as compared to neurologically healthy controls [95]. Amyloid-PET brain
imaging can also be used to identify increased deposition of amyloid within the brain, in
characteristic patterns suggestive of AD [71, 96].
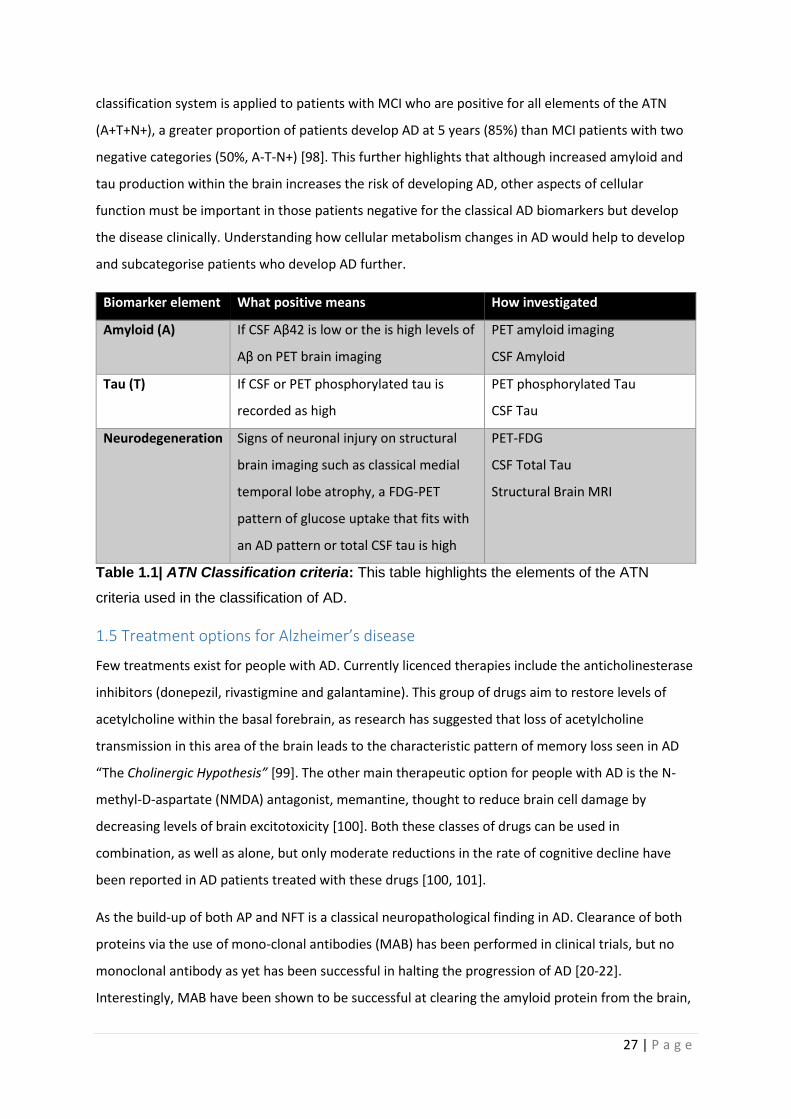
Several of these biomarkers have been incorporated into a binary AD biomarker classification system
which is likely to be used more often in clinical practice in the coming years [97]. This biomarker
system referred to as “ATN” (see table 1.1) is used to subcategorise patients with
neuropsychological profiles consistent with AD. As already explained in the above sections when a
patient develops a neuropsychological profile consistent with AD this does not always correlate with
presence of amyloid and tau pathology [18]. Therefore, the aim of the ATN classification system is to
deepen the understanding of other factors that may contribute to the development of AD. When the
27 | P a g e
classification system is applied to patients with MCI who are positive for all elements of the ATN
(A+T+N+), a greater proportion of patients develop AD at 5 years (85%) than MCI patients with two
negative categories (50%, A-T-N+) [98]. This further highlights that although increased amyloid and
tau production within the brain increases the risk of developing AD, other aspects of cellular
function must be important in those patients negative for the classical AD biomarkers but develop
the disease clinically. Understanding how cellular metabolism changes in AD would help to develop
and subcategorise patients who develop AD further.
Biomarker element What positive means How investigated
Amyloid (A) If CSF Aβ42 is low or the is high levels of
Aβ on PET brain imaging
PET amyloid imaging
CSF Amyloid
Tau (T) If CSF or PET phosphorylated tau is
recorded as high
PET phosphorylated Tau
CSF Tau
Neurodegeneration Signs of neuronal injury on structural
brain imaging such as classical medial
temporal lobe atrophy, a FDG-PET
pattern of glucose uptake that fits with
an AD pattern or total CSF tau is high
PET-FDG
CSF Total Tau
Structural Brain MRI
Table 1.1| ATN Classification criteria: This table highlights the elements of the ATN
criteria used in the classification of AD.
1.5 Treatment options for Alzheimer’s disease
Few treatments exist for people with AD. Currently licenced therapies include the anticholinesterase
inhibitors (donepezil, rivastigmine and galantamine). This group of drugs aim to restore levels of
acetylcholine within the basal forebrain, as research has suggested that loss of acetylcholine
transmission in this area of the brain leads to the characteristic pattern of memory loss seen in AD
“The Cholinergic Hypothesis” [99]. The other main therapeutic option for people with AD is the N-
methyl-D-aspartate (NMDA) antagonist, memantine, thought to reduce brain cell damage by
decreasing levels of brain excitotoxicity [100]. Both these classes of drugs can be used in
combination, as well as alone, but only moderate reductions in the rate of cognitive decline have
been reported in AD patients treated with these drugs [100, 101].
As the build-up of both AP and NFT is a classical neuropathological finding in AD. Clearance of both
proteins via the use of mono-clonal antibodies (MAB) has been performed in clinical trials, but no
monoclonal antibody as yet has been successful in halting the progression of AD [20-22].
Interestingly, MAB have been shown to be successful at clearing the amyloid protein from the brain,
28 | P a g e
but this has not led to a reduction in disease progression, or symptom improvement [102, 103]. The
most recent trials on the MAB Aducanumab suggest a possible benefit on cognitive function in a
specific subset of patients, but original trials on this drug were stopped early due to primary trial
endpoints not being achieved [104].
1.6 Therapeutic challenges in AD
AD has proven difficult to treat for many reasons. Most therapies are given to patients when the
disease is well established both clinically and pathologically [105]. There is evidence that the
pathological processes that lead to the development of AP occur many decades before any clinical
features of AD are seen [106, 107]. This means that any anti-amyloid therapy potentially would need
to correct many years of pathological changes before any benefits are seen. Another factor that
potentially plays a role in why current therapeutic strategies have failed to control AD, is that AP
accumulation does not correlate with the neuropsychological manifestations that define the disease
well [16, 18]. NFT do follow a course of deposition within the brain that corresponds to the
neuropsychological deficits seen, but tau accumulation alone cannot account for the clinical features
of the disease. It is very likely that earlier diagnosis, perhaps even at the preclinical stage, and
identification of other key pathophysiological processes is needed in AD before effective disease
modifying therapeutics can be developed.
Developing therapeutic strategies for AD is further hampered by the fact that there is a relatively
low concordance between pathological and clinical diagnoses of AD. Of the patients that receive a
clinical diagnosis of AD concordance with a confirmed pathological AD ranges from 62-90% [108-
113]. This suggests that in some patient cohorts nearly a third of patients with a clinical diagnosis of
AD do not have the pathological hallmarks, therefore making therapies targeted at amyloid and tau
pathology unlikely to have an effect. The problem of targeting pathological aggregates as a
treatment option in AD is further compounded by the fact the cognitively normal individuals can
have a pathological diagnosis of AD [113-115], suggesting that in this group at least the memory
impairment is not caused by amyloid and tau aggregates. Pathologically the presence of pure AD in
PM specimens is rare, with one study suggesting that only 36% of pathologically confirmed AD cases
have purely AD pathology [111], with both vascular disease and Lewy body pathology common
additional findings is patients diagnosed with AD [108, 109, 111].
Together this pathological/clinical discordance suggests either the clinical diagnosis of AD is not
accurate enough to truly diagnose the condition, or that the clinical entity that we think of as AD is
actually a group of diseases which have a combination of pathological substrates and
pathophysiological drivers that lead to the disease.
29 | P a g e
To aid early diagnosis of AD looking at processes other that protein accumulation is potentially
beneficial. As already stated, changes in brain metabolism occur in areas of the brain where both
synaptic loss and AP build up is seen early. Having a deeper understanding of the pathophysiological
changes in metabolism within the brain, is therefore likely to aid both early diagnosis and future
therapeutic development. This may also allow for subcategories of clinical AD to be developed,
which is very likely to improved targeted therapies.
1.7 Metabolism and Alzheimer’s disease
Cellular metabolic changes within the brains of people with AD are seen very early in the condition,
and often precede the development of both amyloid plaques and NFT. Abnormalities have been
shown in many metabolic pathways in AD [116]. Mounting evidence suggests that deficits in the
function of mitochondria, specifically how they control oxidative phosphorylation (OxPHOS) and
changes in the process of glycolysis [117], are likely to be key in the development and establishment
of AD. In fact, an alternative mitochondrial hypothesis for the aetiology of AD states that people who
inherit mitochondrial genes that predispose them to lower mitochondrial respiration rates are more
likely to develop the condition [118]. The following sections will first describe the structure, function
of mitochondria and the glycolytic pathway, and then focus on how AD has been shown to affect
mitochondrial function and glycolysis.
1.8 Mitochondrial Structure and Function
Mitochondria are double membraned organelles abundant in almost all types of mammalian cells
[119]. They are very dynamic organelles and are transported throughout the cell. Mitochondria are
in a constant state of flux; altering morphology and localization depending on energy demands or
metabolic stresses within the cell [120]. Mitochondria have multiple biochemical roles within a cell,
which are detailed in the next sections.
1.8.1 Mitochondrial ATP generation and the electron transport chain
The main pathway by which mitochondria generate ATP is OxPHOS. This process occurs in the inner
mitochondrial membrane via the reduction of oxygen. Electrons move down an electrochemical
gradient via four proteins complexes that form the electron transport chain (ETC), the final step in
this chain is the reduction of oxygen. Electrons are transported to the ETC via the universal cofactor
Nicotinamide Adenine Dinucleotide (NAD). NAD gains 2 electrons and a proton from different
enzymatic steps of the tricarboxylic acid cycle (TCA) to become NADH. The NADH molecule is
oxidized by complex I, releasing the electrons into the ETC [121]. Electrons are then passed between
the four complexes of the ETC which allows complexes I, III and IV to move protons from the
mitochondrial matrix into the intermembrane space. Protons then flow back into the mitochondrial
30 | P a g e
matrix via a fifth complex (complex V or, F0F1-ATP Synthase). This flow of protons though complex V
causes a conformational change in shape that generates ATP from a phosphate molecule and
adenosine diphosphate. The rate at which ATP can be produced by mitochondria is determined by
the electrochemical gradient established across the inner mitochondrial membrane via the
movement of protons. The movement of protons is in turn dependent on the number of electrons
available to the ETC to reduce, therefore the NAD/NADH ratio is key to the level of ATP that can be
produced by mitochondria. The 5 complexes that form the ETC are comprised of 97 different genes
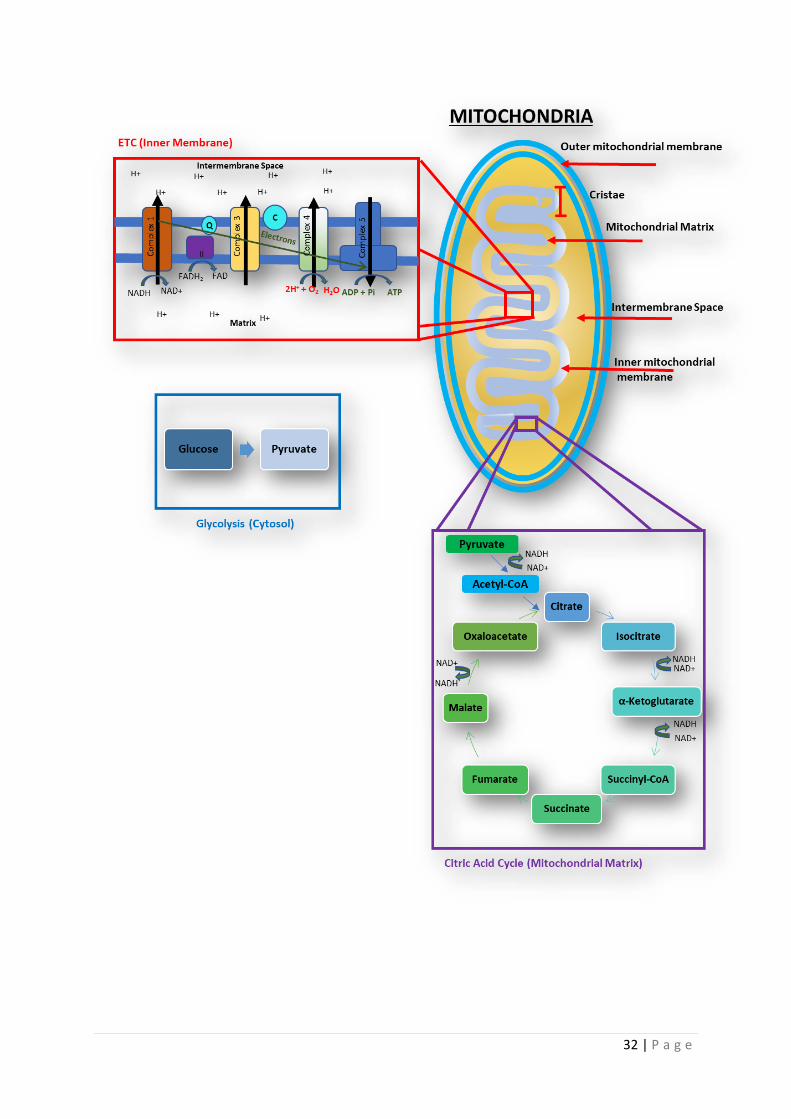
(84 nuclear genes and 13 mitochondrial) [122]. The process of OxPHOS is detailed in figure 2.1. The
citric acid cycle generates the majority of the substrates for OxPHOS within the mitochondrial matrix
[123]. Glycolysis occurs in the cytoplasm, and feeds substrates into the citric acid cycle for OxPHOS
[124]. Figure 2.1 shows the gross morphological structure of mitochondria, and how ATP is
generated.
The ETC complexes are very mobile within the inner membrane of the mitochondria. The movement
of electrons through the complexes is improved by different complexes joining together to form
super-complexes [125], although they can function separately within the phospholipid membrane.
The stability of complex I has been shown to be improved by forming super-complexes with complex
III [126]. Evidence from animal models suggests that as the cortex ages there is an increase in
reactive oxygen species (ROS) produced, and a reduction in super-complex formation [127]. From
this observation is has been suggested that a reduction in super-complex formation increases the
tendency of the ETC to produce ROS, as the reducing ability of the mitochondria becomes impaired
[127]. A decrease in the reductive capacity of the mitochondria leads to increased oxidative damage
to the organelle. The oxidative damage can lead to dysfunction of the ETC proteins which can
decrease the OxPHOS capability of the mitochondria [125].
Depending on the ATP demands of the cell, mitochondria can undergo both fission and fusion events
to control ATP production. Mitochondria will often fuse together within a cell in times of increased
energy demand, or metabolic stress [119]. An example of metabolic stress would be stress induced
mitochondrial hyperfusion (SIMH) [128]. In SIMH mitochondria fuse together to increase ATP
production as a mechanism to combat cellular stress induced by such factors as UV radiation.
Mitochondrial fusion allows the transfer of ETC complexes between mitochondria, which can
enhance ATP production. Mitochondrial fission is less directly linked to managing the ATP demands
of the cell, but is used as a way of identifying defective mitochondria that need to be removed and
destroyed to protect the whole mitochondrial cell network [129]. Mitochondrial fission is also
important in the trafficking of mitochondria to the correct cellular location [130], and therefore
allowing mitochondria to meet the local energy demands of a cell. A complex cascade of protein
31 | P a g e
interactions controls both mitochondrial fission and fusion, but 4 key proteins are essential for
mitochondrial remodelling. Mitochondrial fusion is controlled by 3 proteins: mitofusin 1 & 2 (MFN1
& 2) and optic atrophy protein 1 (OPA1). Mitochondrial fission is mainly controlled by dynamin
related peptide-1 (DRP1) [131]. Mitochondrial fission and fusion dynamics have been reviewed
extensively by Chan (2020) [132].
Mitochondrial density within many different cell types in not uniform which is thought to be caused
by the differing ATP demands in different cellular localities. An example of how the density of
mitochondria can differ in one cell type would be the neuron, were synaptic terminals are generally
enriched in mitochondria compared to the rest of the cell. Studies have shown that mitochondria
within the synapse of a neuron have increased DNA mutations, reduced bioenergetic function [133],
and decreased complex activity [134], when compared to mitochondria closer to the cell nucleus.
Potentially, differences in metabolic function seen in different brain regions in neurodegenerative
diseases such as AD, are explained by the heterogeneity of mitochondrial distribution within
different brain cell types [135]. Mitochondrial heterogeneity is difficult to study in human
neurodegenerative disease without using model systems that have human mitochondria.
32 | P a g e
33 | P a g e
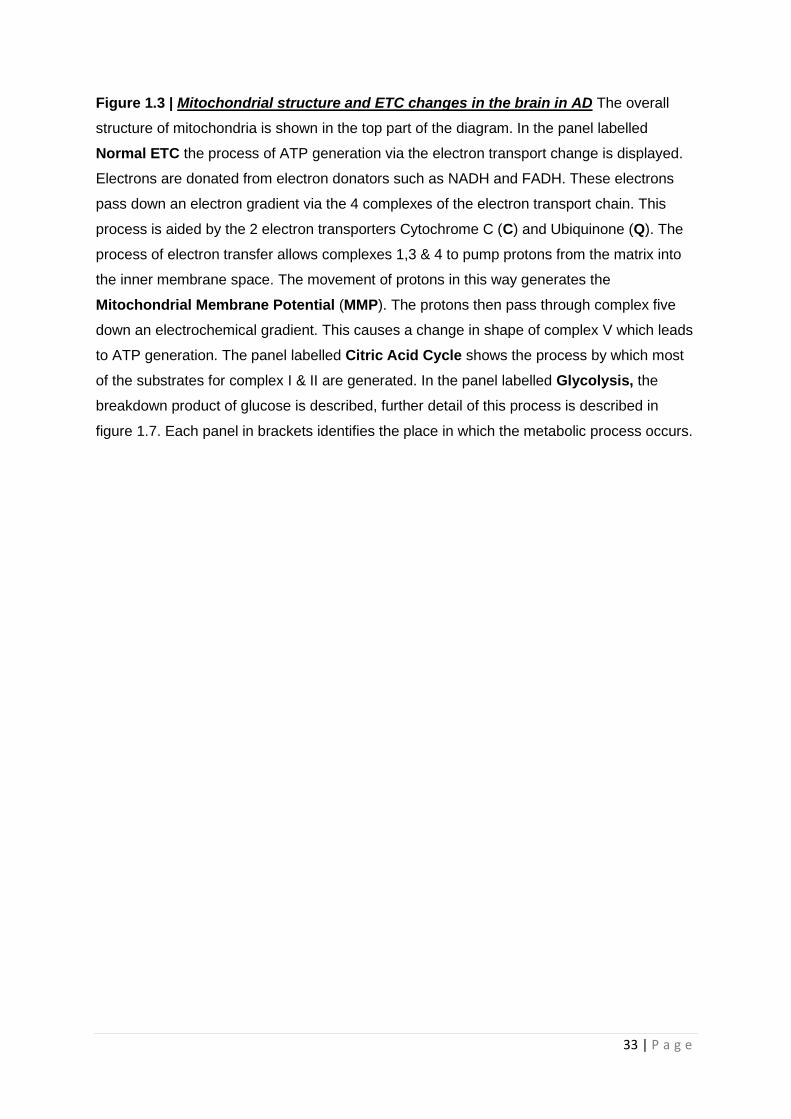
Figure 1.3 | Mitochondrial structure and ETC changes in the brain in AD The overall
structure of mitochondria is shown in the top part of the diagram. In the panel labelled
Normal ETC the process of ATP generation via the electron transport change is displayed.
Electrons are donated from electron donators such as NADH and FADH. These electrons
pass down an electron gradient via the 4 complexes of the electron transport chain. This
process is aided by the 2 electron transporters Cytochrome C (C) and Ubiquinone (Q). The
process of electron transfer allows complexes 1,3 & 4 to pump protons from the matrix into
the inner membrane space. The movement of protons in this way generates the
Mitochondrial Membrane Potential (MMP). The protons then pass through complex five
down an electrochemical gradient. This causes a change in shape of complex V which leads
to ATP generation. The panel labelled Citric Acid Cycle shows the process by which most
of the substrates for complex I & II are generated. In the panel labelled Glycolysis, the
breakdown product of glucose is described, further detail of this process is described in
figure 1.7. Each panel in brackets identifies the place in which the metabolic process occurs.

34 | P a g e
1.8.2 Mitochondrial control of Cellular Calcium
All human cells rely on calcium currents within the cell to affect different biological processes.
Cellular calcium signalling is very diverse and has the potential to lead to both cell proliferation and
death [136]. The concentration of cytosolic calcium is under tight control by many different cellular
organelles, with mitochondria having a fundamental role in this process. Rises in cytosolic calcium
lead to movement of calcium into the mitochondrial matrix via the mitochondrial calcium uniporter
(MCU) on the inner mitochondrial membrane [137, 138]. Calcium can freely diffuse through the
outer mitochondrial membrane, and can also move through the voltage dependent anion-selective
channels (VDAC), but the inner membrane is impermeable to this ion [139]. If the cytosolic calcium
concentration exceeds 1mM then the MCU is opened by two proteins activated by the increased
calcium concentration called MICU 1&2. Usually the cytosolic calcium would not reach a
concentration of 1mM as this would be toxic, but this can occur in small areas adjacent to the
endoplasmic reticulum (ER) when it releases calcium. MICU1 also has a role in controlling the influx
of calcium into the mitochondrial matrix at low cytosolic calcium concentrations [140]. Due to the
large negative electrical potential within the mitochondrial matrix generated by the complexes of
the ETC even at low cytosolic calcium concentrations, the continual movement of calcium down its
electrochemical gradient could lead to mitochondrial calcium overload. The MICU proteins work as
“gate keepers” for the MCU allowing the regulation of matrix calcium influx [141]. This in turn
ensures that a wide range of cellular cytoplasmic calcium concentrations can be buffered by the
mitochondria.
The flow of calcium into the mitochondrial matrix down an electrochemical gradient highlight how
the mitochondrial membrane potential is important in setting the amount of calcium that can enter
the organelle. Potentially, in disease states, where membrane potential is low, cellular calcium
homeostasis could be significantly affected. Once calcium has entered the matrix it can act as a
signalling molecule activating the mitochondrial dehydrogenases; pyruvate dehydrogenase, α-
ketoglutarate and isocitrate dehydrogenase [142]. This has the effect of increasing ATP generation
by the mitochondria, and also highlights how increased cytosolic calcium concentrations caused by
increased calcium signalling within the cell can upregulate ATP production when the calcium
eventually enters the mitochondria. ATP production in this sense, could be seen as a positive
feedback loop as entry of calcium into the cell requires the activation of certain ATP dependent ion
pumps to return cytosolic calcium to a normal concentration. The actions of these ATP dependent
pumps are particularly important at neuronal synapses, as they allow the synapse to maintain ion
gradients that are essential for transmission across the synaptic clef. This also highlights how
important optimal mitochondrial ETC function is in maintaining synaptic function.
35 | P a g e
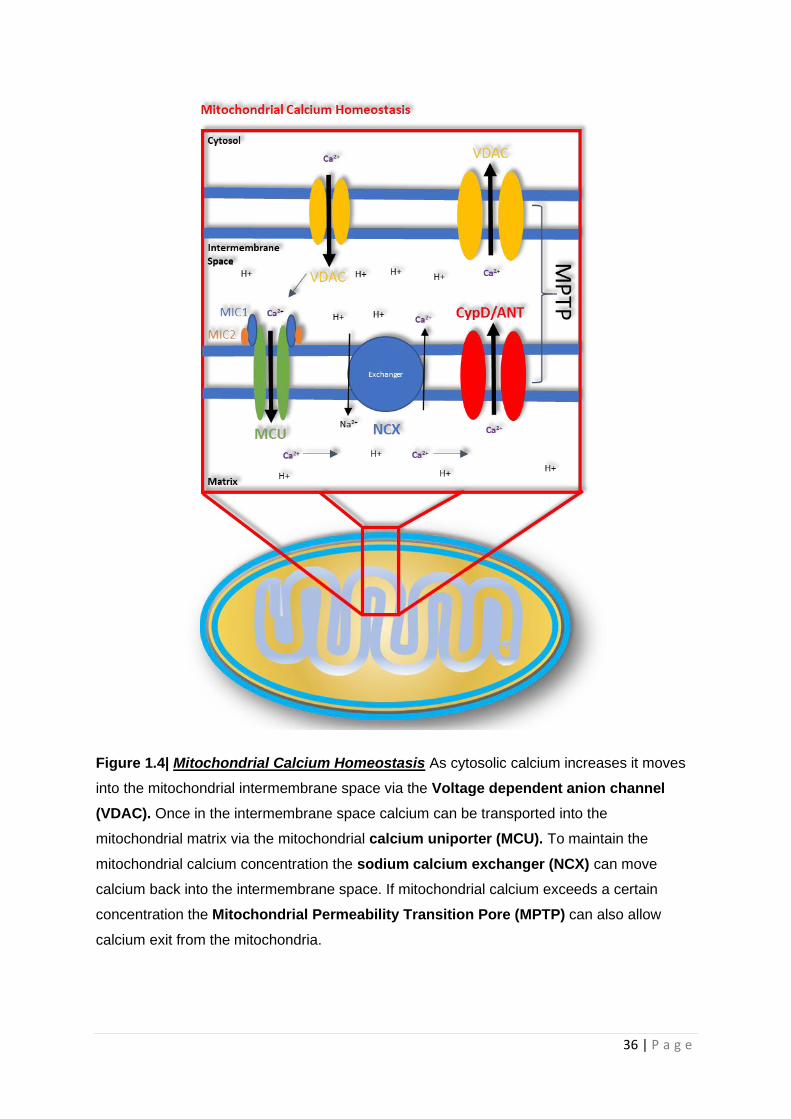
Export of calcium from the mitochondrial matrix is controlled by a sodium/calcium exchanger (NCX),
and potentially a transporter that can move both hydrogen ions and calcium. This allows the
mitochondria to keep a steady state concentration of calcium within the matrix of 0.25‐1.0μm [143].
The mitochondrial permeability transition pore (MPTP) can also aid with the efflux of calcium, but
this is usually when the mitochondria has become overloaded with calcium [144]. The MPTP is a
complex ion pore that is made of a combination of proteins found in the matrix, inner mitochondrial
membrane and outer mitochondria membrane. The identity of the proteins that come together to
form the MPTP, to a certain extent, is still debated but are very likely to include Cyclophilin D (CypD),
Adenine Nucleotide Translocator (ANT) and VDAC [145]. In response to increase ROS production or
high calcium concentrations, CypD moves from the matrix to the inner mitochondrial membrane and
binds with ANT to form a pore that allows the movement of calcium and other ions/proteins from
the matrix to the intermembrane space. Calcium can then flow out of the mitochondria via VDAC.
MPTP opening can be the first stage in the development of cellular death cascades as described
below, but the pore also has roles in cellular signalling pathways. Figure 1.3 highlights the proteins
involved in calcium homeostasis in mitochondria.
36 | P a g e
Figure 1.4| Mitochondrial Calcium Homeostasis As cytosolic calcium increases it moves
into the mitochondrial intermembrane space via the Voltage dependent anion channel
(VDAC). Once in the intermembrane space calcium can be transported into the
mitochondrial matrix via the mitochondrial calcium uniporter (MCU). To maintain the
mitochondrial calcium concentration the sodium calcium exchanger (NCX) can move
calcium back into the intermembrane space. If mitochondrial calcium exceeds a certain
concentration the Mitochondrial Permeability Transition Pore (MPTP) can also allow
calcium exit from the mitochondria.
37 | P a g e
1.8.3 Reactive oxygen species and mitochondria
Mitochondria are one of the major sites within a cell for the production of ROS. Initially ROS were
thought of as a necessary by-product of processes such as OxPHOS, but recently research has
revealed that these molecules are active in cellular signalling pathways. The main ROS produced by
the mitochondria is the superoxide ion (O2ׄ●-). The main site of O2ׄ
●- production within the
mitochondria is complex I of the ETC, but complex III, α-ketoglutarate dehydrogenase and α-
glycerol-3-phosphate dehydrogenase can all produce O2ׄ●-, to a lesser extent [146]. Complex II is also
a suggested site of ROS generation, but is currently debated as to whether complex II ROS has
significant biological effects [147] .
The O2ׄ●- ion is produced by the addition of an electron to a molecule of O2. The site for this reaction
within complex I is thought to be the Flavin mononucleotide (FMN) motive. The protein is the site at
which NADH passes electrons to complex I to be used in the active process of proton pumping across
the inner mitochondrial membrane. O2ׄ●- ions are generally produced by complex I in one of 3 ways i)
when the NADH/NAD ratio is high, ii) when Co-Enzyme Q is fully reduced or, iii) when the
mitochondria are synthesizing ATP [146]. States 1 and 2 produce far more O2ׄ●- than ATP synthesis.
As mitochondria are generally in a state of ATP production, this pathway for generating O2ׄ●- is likely
to be the most important in determining the superoxide production by the mitochondria [146].
Other ROS include hydrogen peroxide and the hydroxyl radical, both of which can also be produced
in the mitochondria. Hydrogen peroxide is produced by the dismutation of the O2ׄ●- ion either
spontaneously or through the action of the superoxide dismutase enzymes [147]. The hydroxyl
radical is produced via the breakdown of the hydrogen peroxide and O2ׄ●- ROS, or via ultra-violet
radiation’s effect on water molecules. The hydroxyl radical is the ROS mostly likely to cause oxidative
damage to DNA structures [148].
Mitochondrial ROS have a role in adapting the cell response to certain stressors such as hypoxia,
starvation and pathogen infection. Certain ROS molecules, such as hydrogen peroxide, have been
shown to have a role in many different signalling pathways including autophagy, immune response
(pathogen neutralization), cell differentiation, cell aging and adaptation to hypoxia [149]. Although
often the exact site of ROS action in a metabolic pathway is not fully understood. Of note, when
considering the cellular response to hypoxia ROS increase the stabilization of hypoxia-inducible
factor-1alpha (HIF-1alpha), which has been shown to upregulate glycolytic pathway enzymes
including hexokinase and 6-phosphofructokinase in tumour cells [150]. This shows how intricately
linked OxPHOS, glycolysis and hypoxia are within a cell, and how changes in one pathway are likely
to affect cellular metabolism in multiple ways. This biochemical pathway link also highlights how

38 | P a g e
different cell stressors can affect change in metabolism both directly and indirectly. Figure 1.4
displays the most common site of ROS production in mitochondria, and how they are released into
the rest of the cell.
Figure 1.5| Mitochondrial ROS Production The main sources of mitochondrial ROS
production are complex I and III of the ETC. Sites of ROS production are highlighted in pink
(O2ׄ●-). ROS production can open the MPTP which allows ROS to be used as a signalling
molecule or in times of excess lead to oxidative damage in other cellular organelles.
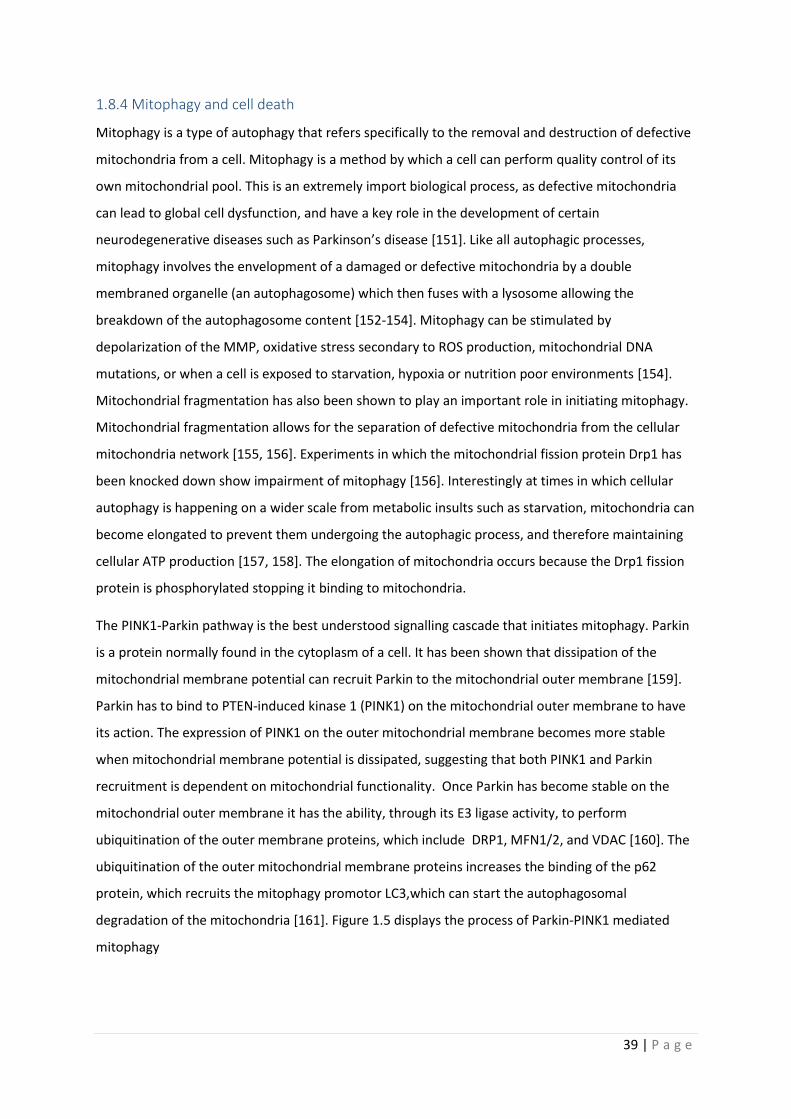
39 | P a g e
1.8.4 Mitophagy and cell death
Mitophagy is a type of autophagy that refers specifically to the removal and destruction of defective
mitochondria from a cell. Mitophagy is a method by which a cell can perform quality control of its
own mitochondrial pool. This is an extremely import biological process, as defective mitochondria
can lead to global cell dysfunction, and have a key role in the development of certain
neurodegenerative diseases such as Parkinson’s disease [151]. Like all autophagic processes,
mitophagy involves the envelopment of a damaged or defective mitochondria by a double
membraned organelle (an autophagosome) which then fuses with a lysosome allowing the
breakdown of the autophagosome content [152-154]. Mitophagy can be stimulated by
depolarization of the MMP, oxidative stress secondary to ROS production, mitochondrial DNA
mutations, or when a cell is exposed to starvation, hypoxia or nutrition poor environments [154].
Mitochondrial fragmentation has also been shown to play an important role in initiating mitophagy.
Mitochondrial fragmentation allows for the separation of defective mitochondria from the cellular
mitochondria network [155, 156]. Experiments in which the mitochondrial fission protein Drp1 has
been knocked down show impairment of mitophagy [156]. Interestingly at times in which cellular
autophagy is happening on a wider scale from metabolic insults such as starvation, mitochondria can
become elongated to prevent them undergoing the autophagic process, and therefore maintaining
cellular ATP production [157, 158]. The elongation of mitochondria occurs because the Drp1 fission
protein is phosphorylated stopping it binding to mitochondria.
The PINK1-Parkin pathway is the best understood signalling cascade that initiates mitophagy. Parkin
is a protein normally found in the cytoplasm of a cell. It has been shown that dissipation of the
mitochondrial membrane potential can recruit Parkin to the mitochondrial outer membrane [159].
Parkin has to bind to PTEN-induced kinase 1 (PINK1) on the mitochondrial outer membrane to have
its action. The expression of PINK1 on the outer mitochondrial membrane becomes more stable
when mitochondrial membrane potential is dissipated, suggesting that both PINK1 and Parkin
recruitment is dependent on mitochondrial functionality. Once Parkin has become stable on the
mitochondrial outer membrane it has the ability, through its E3 ligase activity, to perform
ubiquitination of the outer membrane proteins, which include DRP1, MFN1/2, and VDAC [160]. The
ubiquitination of the outer mitochondrial membrane proteins increases the binding of the p62
protein, which recruits the mitophagy promotor LC3,which can start the autophagosomal
degradation of the mitochondria [161]. Figure 1.5 displays the process of Parkin-PINK1 mediated
mitophagy
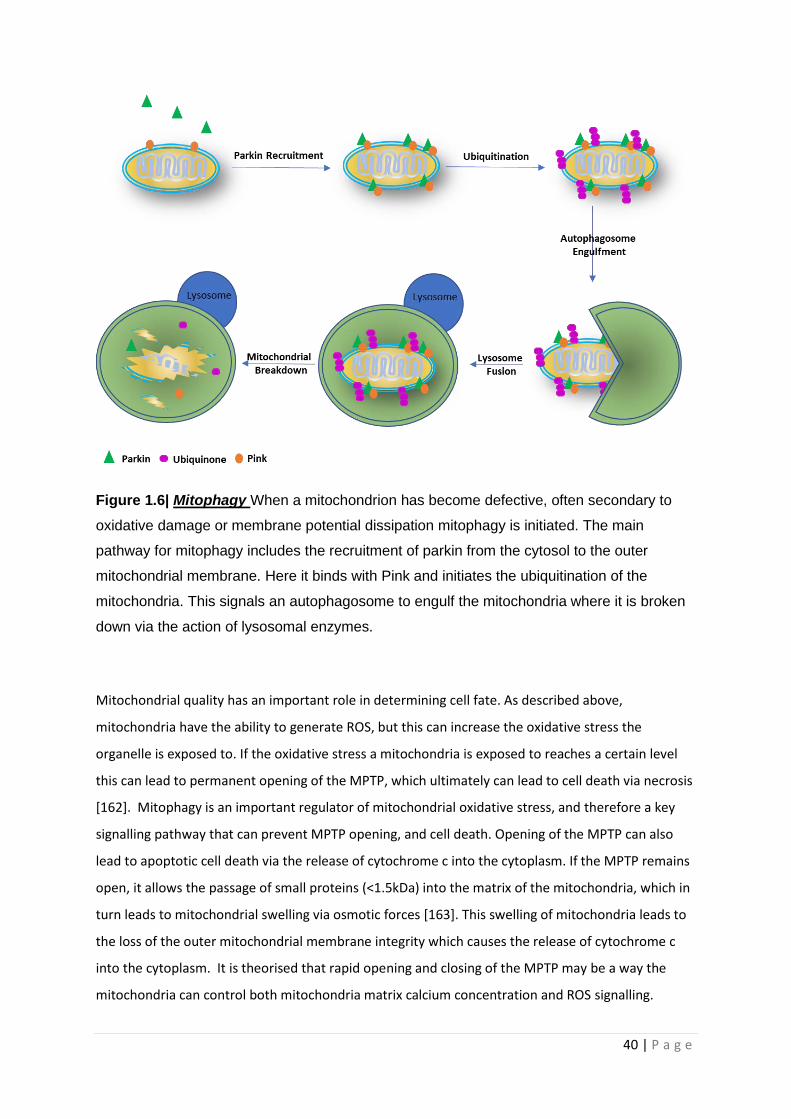
40 | P a g e
Figure 1.6| Mitophagy When a mitochondrion has become defective, often secondary to
oxidative damage or membrane potential dissipation mitophagy is initiated. The main
pathway for mitophagy includes the recruitment of parkin from the cytosol to the outer
mitochondrial membrane. Here it binds with Pink and initiates the ubiquitination of the
mitochondria. This signals an autophagosome to engulf the mitochondria where it is broken
down via the action of lysosomal enzymes.
Mitochondrial quality has an important role in determining cell fate. As described above,
mitochondria have the ability to generate ROS, but this can increase the oxidative stress the
organelle is exposed to. If the oxidative stress a mitochondria is exposed to reaches a certain level
this can lead to permanent opening of the MPTP, which ultimately can lead to cell death via necrosis
[162]. Mitophagy is an important regulator of mitochondrial oxidative stress, and therefore a key
signalling pathway that can prevent MPTP opening, and cell death. Opening of the MPTP can also
lead to apoptotic cell death via the release of cytochrome c into the cytoplasm. If the MPTP remains
open, it allows the passage of small proteins (<1.5kDa) into the matrix of the mitochondria, which in
turn leads to mitochondrial swelling via osmotic forces [163]. This swelling of mitochondria leads to
the loss of the outer mitochondrial membrane integrity which causes the release of cytochrome c
into the cytoplasm. It is theorised that rapid opening and closing of the MPTP may be a way the
mitochondria can control both mitochondria matrix calcium concentration and ROS signalling.
41 | P a g e
1.9 Mitochondrial changes seen AD
Multiple mitochondrial abnormalities have been described in AD [164-167]. Detailed below is
evidence for what effects AD has on the biological roles of mitochondria as described above.
1.9.1 Electron Transport Chain Disruption in AD
Much of our knowledge of AD mitochondrial dysfunction in human tissue comes from post-mortem
(PM) brain samples from patients with the condition. Studies investigating the expression of OxPHOS
proteins and mitochondrial DNA have revealed potentially conflicted results. Gene expression
micro-array analysis of PM frozen hippocampal samples has revealed a global decrease in nuclear
encoded OxPHOS protein subunits and no change in mitochondrial DNA (mtDNA) encoded subunits
when total RNA from AD brains was compared to both aged-matched controls and patients with MCI
[168]. A study investigating RNA levels in the mid temporal gyrus has revealed a decrease in the
RNA that encodes subunits 1&2 of complex IV within the mid-temporal lobe [169]. A similar
reduction in RNA of subunit 3 of complex IV has been shown in the same brain areas by a different
group [170]. These subunits are all mitochondrially encoded [171], but do not appear to be
associated with a loss in mitochondrial number, or correlate with amyloid brain levels [172, 173].
RNA from subunit 2 of complex IV has also been shown to be decreased in the hippocampus of the
AD brain, but in the same study no change was seen in the RNA of nuclear encoded subunits of the
complex IV [173]. In contrast, both total cellular mtDNA and complex IV protein levels in the AD
hippocampus, frontal and temporal lobes has been shown to be increased in AD [174]. This study
reports that the majority of the mtDNA and complex IV protein is not found within the mitochondria
but in the cytoplasm, suggesting a greater turnover of mitochondria or a decrease in their
proteolytic breakdown [174]. This study does not mention if the mtDNA that encodes OxPHOS
complexes has a change in expression level, and reports no difference in mtDNA expression in glial
cells or neurons in areas of the brain not classically affected by AD. Further studies have suggested
that the RNA for the mitochondrially encoded subunits of complexes III and IV is increased in the AD
brain whereas the mitochondrially encoded subunits for complex I are decreased [175, 176].
Together these reports suggest that the turnover of mitochondria is altered in the AD brain, and that
the expression of ETC proteins is potentially altered.
The apparent conflicting nature of the results across the papers described above may be explained
by the fact that each study has small numbers of participants and uses different techniques to
preserve the brain samples used for analysis. RNA is known to be unstable when being prepared
from tissue samples, which potentially may also affect results. It has been shown that the AD brain
has a higher load of both mtDNA and nuclear DNA mutations, which may also help to explain the
42 | P a g e
differences in results seen here [177-179]. The increased mutation frequency is likely to mean the
changes in RNA and protein expression could occur by chance meaning results between studies
could vary. Changes seen in these studies are not specific to AD, with similar changes also seen in
the brains of people with autism [180]. The fact that differing expression profiles of the ETC RNA and
protein subunits differs between these studies may also highlight the heterogenicity of AD, and how
in sporadic AD there are likely to be multiple factors that affect the expression of ETC proteins.
These studies focus on cases that are towards the end of the disease process, and therefore changes
may not be triggers of AD but more consequences of the progression of the disease. The changes
seen in PM studies may be a consequence of disease progression and may not be present at the
start of disease. This would potentially make these changes unsuitable of biomarker and therapeutic
development. The hippocampal mitochondrial changes are reported more in AD than the other
conditions suggesting disease selectivity, but mitochondrial ETC complex expression abnormalities
are present in multiple neurodegenerative diseases suggesting a common pathological site across
this disease group.
Functional assessment of human nervous system mitochondria is difficult when using PM tissue as
the cells are no longer active. But several studies on frozen PM brain samples from patients with
sporadic AD have shown a decrease in the activity of complex IV [181-186]. The frontal, temporal
and parietal lobes in certain studies show selective reduction in the activity of complex IV [181, 182],
but this finding is not consistent across the whole body of evidence, with studies using very similar
techniques showing deficits in complex IV activity throughout the whole brain [183, 184, 186]. The
reason for the reduction in complex IV activity seen in the AD brain is not known but the structure of
the complex IV protein is changed in AD, potentially as a result of oxidative stress [185]. The loss of
neurons seen as AD progresses has also be suggested as a cause for the apparent reduction in
complex IV activity[186]. A theory corroborated by evidence from animal models show complex IV
activity reduction as a consequence of loss of neuronal activation [187-189]. A loss of
neuron/synaptic number though, would not fully account for the selective loss of activity of complex
IV over the other ETC complexes reported in these studies, although it puts forward the hypothesis
that OxPHOS demand may modulate ETC activity and expression [190]. Interestingly, the activity of
the other ETC complexes has been reported to be reduced in AD PM brain samples [183, 184], but
this finding is not repeated across all studies. Through PM brain samples it is difficult to ascertain if
the changes seen in complex IV activity are present from birth or are the consequence of another
pathological process in AD such as protein aggregation, or synapse loss.
Study of blood cells in AD patients has revealed functional changes in the OxPHOS pathway.
Peripheral blood mononuclear cells (PBMCs) show decreased basal oxygen consumption rates (OCR)
43 | P a g e
and proton leak in AD but no change in mitochondrial maximum respiratory capacity when
compared to age matched controls [191]. This work is complemented by work specifically in
lymphocytes (a type of PBMC) which shows a reduction in basal OCR, but also a reduction in
maximum respiratory capacity [192]. Lymphoblastic-cell-lines (LCL) from AD and Down’s Syndrome
(DS) patients have a low MMP in both old and young DS patients, but ATP loss is not seen until later
in the disease, when AD had developed [193]. This suggests that the loss of ATP maintenance is
developed through the course of AD as opposed to blood cells having a lower level of cellular ATP
prior to disease onset. In whole blood samples from people with AD or MCI the OxPHOS genes that
are nuclear encoded are down regulated and those that are mitochondrially encoded are
upregulated [194]. It is unclear if this affects the function of the ETC, but it is interesting that
differences in the expression of mtDNA genes are seen between peripheral and CNS tissue samples.
This may suggest different mechanisms are present in a particular cell type to combat the effects of
altered OxPHOS gene expression and may go some way to explaining why AD does not manifest
itself in non-CNS tissues. These changes in OxPHOS seen in AD blood cells may be the cause of the
decreased MMP and reduction in total cellular ATP levels that have also been reported in PBMCs
[192, 195].
Platelets have also been shown to have abnormalities in the ETC in AD, and are often suggested to
be a good peripheral cell model for the disease [196]. Platelets contain the enzymatic pathways
needed to produce Aβ from the APP protein, and have been shown to secrete Aβ into the blood
stream [197, 198]. The basal OCR for platelets from patients with AD is similar to controls, until
platelets become activated through exposure to substances such as collagen, thromboxane or
monoamine neurotransmitters [198, 199]. Reductions in basal and maximum OxPHOS capacity
thought to be due to a combination of reductions in complex I substrates, lower activities of complex
IV, increased activities of complex I and reduced concentrations of Ubiquinone, have been reported
in platelets from AD patients once activated [195]. The evidence that platelets only start to show
deficits in ETC function when activated suggests capacity deficits in the ETC function in AD that may
only be measurable at times of physiological stress. Several studies have shown both a decrease in
the activity and the expression of the complex IV enzyme and its subunits in the platelets of patients
with AD [199-201]. The changes seen in the metabolism of blood cells in AD could be an example of
inherent deficits in mitochondrial function, but some evidence from animal models suggests that the
changes in blood cell ETC function may be precipitated by the development of the pathological
aggregates of AD within the brain [199]. A proinflammatory environment within the brain is
established which then activates platelets leading to the OxPHOS deficits [199]. The changes in
44 | P a g e
metabolic function seen in PMBCs may also be a direct consequence of the changes seen within the
brain, but this has not yet been shown.
Fibroblasts from patients with both sporadic and familial AD have been extensively studied for both
functional and structural abnormalities in AD. Like platelets, fibroblasts can produce Aβ, and this is
increased in fibroblasts from patients with AD [173, 202]. The function of the ETC of fibroblasts from
patients with AD shows more variable results than those from blood cells. ATP and MMP levels have
been shown to be low in some studies of both sporadic and familial AD fibroblasts [203-205]. But
normal and higher than control levels have also been seen in AD fibroblasts [206, 207]. Alterations in
the NAD/NADH ratio, and how this is maintained is seen in fibroblasts from patients with sporadic
AD who have high OCR and MMP compared to controls [207]. This suggests that the functional
changes seen in the mitochondria of AD fibroblasts may not be a direct consequence of ETC activity
but caused by the substrates that interact with the different complexes. The design of each of these
studies on AD fibroblasts is quite different, with control group comparators ranging from being
completely disease free to having other forms of dementia and neurological illness. This may explain
why fibroblast studies reach less of a consensus about the functional mitochondrial alterations seen
in AD. All these studies agree that there are deficits in the function of the ETC, which may not
necessarily affect mitochondrial function until a stressor is added [206]. As with PM samples and
blood cells inhibition of the complex IV enzyme in fibroblasts is also stipulated to cause the changes
in ETC function [206].
It remains unclear if the functional and structural changes to the ETC seen in AD are a result of a
primary mitochondrial change, as suggested in the mitochondrial hypothesis of AD [208], or as a
consequence of the build up of amyloid within the brain and body of AD patients. Evidence from
animal and cell models suggests that both amyloid and tau have a direct effect on the function of the
ETC. In triple transgenic 3xTg-AD mice (human APPSWE, TauP301L, and PS1M146V genes)
abnormalities in mitochondrial function are seen in the embryonic stage and in young mice long
before the build up of amyloid [209]. In this AD mouse model most of the subunits of complexes I &
IV are down regulated and complexes III & V are up regulated when the mitochondria are isolated
and examined at 6 months [210]. Interestingly in the APP23 mouse upregulation of both glycolysis
and OxPHOS is seen before amyloid deposition, and this seems to increase the oxidative stress
within cells [211]. This appears to be opposite to the metabolic changes that are seen in the
transgenic 3xTg-AD mice. PSEN2 plays a role in maintaining MMP, as knock down of PSEN2 in mouse
embryos reduces MMP [212, 213]. Showing that 2 of the key mutations that cause familial AD may
have a link to the altered metabolism seen in AD models. This is also a reason for studying both
familial and sporadic disease when investigating mitochondrial function in AD. Other studies using
45 | P a g e
triple transgenic mice that have mutations in the APP gene and an increased propensity to develop
tau pathology (human APPSWE, TauP301L, and PS1NI41) have shown deficits in MMP, total cellular
ATP, mitochondrial spare respiratory capacity and OCR. This paper shows that the tau preferentially
disrupts complex I of the ETC whereas amyloid preferentially disrupts complex IV [214]. The effect
tau has on complex I has also been highlighted in studies looking at the effects of the plant poison
Annonacin, which has a structure very similar to tau and can also cause complex I deficits [215]. This
study shows that reduced complex I activity leads to a redistribution of tau towards the cell stoma,
which can potentiate the development of NFT and cell death, suggesting that tau pathology can also
be exacerbated by poor mitochondrial function. The tau and amyloid effects on the ETC have also
been shown to work synergistically to increase the speed at which mitochondrial dysfunction
happens in animal models [216]. It has been shown the tau’s effects on the function of the ETC are
propagated by the addition of amyloid [217].
Multiple cell line experiments have shown that over expression of the APP protein affects the
activity and structure of mitochondria. APP over expression has revealed that complexes I,II & IV all
have reduced expression in the presence of Aβ [218, 219] leading to reduced MMP and ATP
production. The trafficking around the cell and structure of mitochondria is also affected by Aβ
[166], with mitochondria shown to be more fragmented and to have a reduced MMP [167]. Removal
of the mitochondria from a cell line has also been shown to stop the toxic effect of Aβ on the cell line
[219], again linking metabolism to Aβ pathology.
Limited evidence for a definitive primary mitochondrial OxPHOS pathology has been identified so far
in AD, but a recent study has shown that a point mutation in the PTCD1 protein, encoded by nuclear
DNA, is much more prevalent in people with AD [220]. This protein is essential for the normal
assembly of mitochondria and this mutation has been shown to cause deficits in OxPHOS.
Interestingly, cybrids (SH-SY5Y cell line with mtDNA removed and human platelet mtDNA added)
created from patients with AD and controls also reveal reductions in the activities of complexes I, II
& IV, an increase in reactive oxygen species production, and a 40-50% reduction in ATP generation
[221]. Changes in mitochondrial structure including shorter length, increased fragmentation, and a
collapse of the mitochondrial network were also seen. This is without the presence of APP
suggesting that the Aβ protein may exacerbate a mitochondrial phenotype that already exists in AD.
Research into mitochondrial ETC deficits seen in AD reveals mixed results depending on the situation
in which the mitochondria are observed or the tissue in which they are studied (e.g. PM brain,
peripheral blood cells in people living with AD or animal models). Interestingly the changes to ETC
gene expression in peripheral cells are often associated with a reduction in ATP production,
46 | P a g e
suggesting a reliance on OxPHOS for ATP production in the periphery, but in most studies glycolysis
and other metabolic pathways are not investigated therefore the contribution to ATP deficits is not
known. Inconsistency in findings could be explained by differences in experimental techniques.
Constituents of media, such as concentration of metabolic substrates, can affect mitochondrial
function and may explain differences among studies. The dynamic nature of mitochondria will also
contribute to the conflicting results, and highlights the need to study mitochondrial functional
dynamics in a human CNS model of sporadic as well as familial AD. This type of model system would
enable observations of the interaction of different CNS cell types in order to highlight which
mitochondrial abnormalities potentially contribute to AD.
1.9.2 Mitochondrial Calcium Signaling in AD
The tight control of both intracellular calcium and intramitochondrial calcium has been shown to be
affected in AD. PM samples from AD patient frontal cortex tissue show that the Na/Ca exchanger
that maintains mitochondria matrix calcium is remodelled, and has reduced expression [222]. This
leads to an increase in the matrix calcium concentration. In the same paper a transgenic mouse
(3xTg-AD) with the Na/Ca exchanger deleted is shown to have an accelerated amyloid and tau
pathology as well as increased memory loss. The cognitive deficit seen in the mouse model can be
corrected by the normal expression of the Na/Ca exchanger, suggesting that high levels of
mitochondrial matrix calcium are essential to the development of the pathology of AD. Aβ has also
been shown to increase intracellular calcium levels, which can increase cellular vulnerability to
excitotoxicity [223]. This will also influence mitochondrial function as the calcium buffering capacity
of the mitochondria is challenged by an increased intracellular calcium. A recent study using an
animal model of AD (the APPswe/PSEN1∆E9 (APP/PS1) Tg mouse) has suggested that Aβ increases
mitochondrial calcium levels via its actions on the mitochondrial calcium uniporter [224]. The same
study shows that in the PM AD brain, the expression of influx calcium transporters is reduced, and
efflux transporters increased suggesting an adaptive mechanism by neuronal cells to manage the
increased mitochondrial calcium load caused by Aβ. The efflux of calcium from mitochondria has
been shown to be further impaired by the presence of misfolded tau [225, 226], giving further
evidence of the synergistic effect that both tau and amyloid aggregates have on the dysfunction of
mitochondria in AD.
The buffering of calcium by the mitochondria and endoplasmic reticulum is particularly affected by
mutations in the PSEN 1&2 genes that are seen in AD, with an increase in mitochondrial calcium
seen in PSEN1&2 gene mutations that cause AD [227-229]. The presenilin proteins have a role in
regulating ER calcium release and maintaining cytosolic calcium concentrations [230]. The presenilin
mediated release of calcium has been shown to have a direct effect on reducing MMP, which in turn
47 | P a g e
can predispose cells to increased autophagy [227]. The presenilin-1&2 proteins are enriched in a
specialized part of the ER called the mitochondrial associated ER membrane (MAM). The MAM sites
are where the mitochondria and ER directly interact, and as they are enriched in presenilin proteins,
the catalytic core of the γ-secretase enzyme, this may explain why mitochondria accumulate Aβ and
why presenilin mediated calcium release leads to reduced MMP [231]. Presenilin mediated calcium
release by the ER my lead to an increase in amyloid entering the mitochondria, which subsequently
effects MMP. In cell models, application of Aβ to neurons has been shown to increase mitochondrial
calcium levels via upregulating the inositol-1,4,5-triphosphate receptor-voltage-dependent anion
channel (IP3R3-VDAC) contacts, also part of MAMs, [232]. This same paper showed that the IP3R3-
VDAC contacts are increased in PM AD brain samples, although it is not stated if the PM samples
come from patients with the familial or sporadic forms of the disease.
The fact the presenilin proteins are a key part of the MAMs highlights what is very likely to be an
important difference in what determines the pathogenesis of the mitochondrial dysfunction in
familial and sporadic forms of AD. Currently literature appears to suggest that the abnormal
mitochondrial calcium concentration and signalling seen in AD is a direct effect of the Aβ and Tau
proteins or caused by the presence of mutations with the PSEN1 &2 genes associated with familial
AD. Evidence of an inherent change in calcium concentration, or signalling abnormality is yet to be
found, although as most models that investigate calcium signalling in AD rely on the pre-exposure to
Aβ, then inherent calcium changes would be difficult to identify. It has been shown that MMP is
reduced in both sporadic and familial AD patient cells, therefore as mitochondrial calcium
concentration is dependent on MMP this may indicate that mitochondrial calcium concentrations
are affected independently of the effect of amyloid and tau.
1.9.3 Mitochondrial ROS production in AD
Mitochondria are the main source of ROS production within a cell accounting for 90% of all ROS
production [233]. As mentioned previously, ROS are used by cells as signalling molecules, but in AD
the tight balance between production of ROS and breakdown is altered. As ROS molecules are
difficult to study directly, often evidence of ROS activity is identified via the oxidization of biological
molecules. In AD there is evidence of increased lipid, protein, DNA and RNA oxidation both centrally
[234-237] and peripherally [238, 239] suggesting an increase in ROS production associated with the
disease. As a result of the increased oxidation, cell physiology in AD is put under strain as the
oxidized molecules either cease to function or develop abnormal function.
Studying patients with DS has shown that oxidative stress in AD is an early event. The brains of
patients with DS develop oxidative damage years prior to the build up of the amyloid and tau
48 | P a g e
aggregates [240, 241]. This finding is also replicated in animal and cell models of AD which show
increased oxidative damage prior to amyloid deposition [167, 242, 243]. In human PM brain tissue a
greater level of oxidative stress is seen when compared to controls, but as the disease progresses
and the build up of both amyloid and tau aggregates increases, the level of oxidative damage
appears to reduce [236, 244, 245]. This has led researchers to suggest that the amyloid protein may
have an increased expression in AD because it acts as an antioxidant against mitochondrially induced
oxidative stress [234-236, 246]. This is an interesting theory, as it links several aspects of AD
pathology together (mitochondrial dysfunction, oxidative stress, and protein aggregation) and also
gives a physiological role to the amyloid protein, which has to a certain extent remained elusive.
Conversely, oxidative stress has been shown to be highest around AP within the brain of a mouse
model of AD [243], although this does potentially contradict the findings from PM human brain
studies showing less oxidative damage in brain areas with high amyloid load [235]. Fragments of the
Aβ protein have been shown to have the ability to cause ROS production [247], and both β secretase
activity and tau hyperphosphorylation have been shown to be increased by the activity of ROS [245,
247]. This suggests that mitochondrial ROS production may actually exacerbate the accumulation of
amyloid and tau aggregates, as opposed to these proteins being produced as antioxidants. The Aβ
protein can also interact with A beta-binding alcohol dehydrogenase (ABAD), a dehydrogenase which
has roles in controlling mitochondrial exposure to oxidative stress [248]. Binding of Aβ to ABAD
distorts the dehydrogenase’s shape stopping the binding of NAD and increasing mitochondrial
oxidative stress in both mouse models and human neuronal tissue. ABAD would normally bind to
CypD, but in the presence of Aβ this reaction is impaired which can also lead to increased MPTP
opening in AD neurons, and therefore increased risk of cellular death cascades being initiated [248,
249].
Mitochondrial efficiency in AD is likely to significantly affected by the increased damage seen by the
production of ROS. It could be postulated that the AD brain expresses less dismutase enzymes,
which are involved in the reduction of ROS. However, work on PM specimens has shown that the
expression of these enzymes in AD brains is the same as found in control samples, with differential
expression occurring in places of higher oxidative stress [244]. The ETC is the main site of ROS
production in the mitochondria, which links the production of ATP with the production of ROS. The
altered balance of ROS and oxidative stress within the AD brain further highlights the importance of
understanding how the function of the ETC changes in AD. As the Aβ protein has been shown to
potentially have both positive and negative effects on the level of ROS production in AD, this could
be another example of how the capacity of mitochondrial function is key to the development of AD
pathology. The Aβ protein may have an antioxidant role at the start of the disease but as the
49 | P a g e
capacity of mitochondrial function is already impaired, the antioxidant role of Aβ may not be able to
rescue the established mitochondrial AD phenotype, leading to increased Aβ accumulation and to
the development of more ROS.
1.9.4 Mitophagy and cell death in AD
There is a significant body of literature showing that the dynamics of mitophagy are altered in AD
[250-258]. Most of these reports focus on the Pink-Parkin mitophagy pathway, but abnormalities in
cardiolipin induced mitophagy have also been reported in AD mouse models [257]. It has been
shown in several studies that there is an increased recruitment of Parkin to defective mitochondria
in both CNS and peripheral cells in AD, but the mitophagic destruction of these mitochondria is
impaired [255, 256, 259]. As the disease progresses, markers of mitophagy are shown to increase in
both animal models and PM brain tissue, but the amount of Parkin available for mitophagy is
reduced in the cytosol [259]. The reason for the build up of mitochondria signalled for mitophagy is
not fully understood in the current literature, but there is evidence of lysosomal dysfunction (a key
part of mitochondrial clearance) in cells that have either the PSEN1 mutations that cause AD [260],
or express the ApoE 4 allele [261]. The cause for the increased recruitment of Parkin to the
mitochondria is not fully understood but is very dependent on the depolarization of the MMP which,
as described above, can be caused by amyloid interacting with the mitochondria. Amyloid also has a
propensity to increase ROS production, which may also lead to increased Parkin recruitment, as a
further signal to initiate mitophagy. Tau has an effect on mitophagy but experiments from animal
and cell models have shown that tau can both increase Parkin recruitment to mitochondria [251] or
stop its translocation from the cytoplasm [252, 253].
The literature on mitophagy in AD depends on research from PM brain samples or animal and mouse
models which overexpress either the amyloid or tau protein. This means that understanding the
changes in mitophagy that happen at the start of the disease, or if deficits in mitophagy occur prior
to the onset of symptoms of AD is difficult. This is an important shortfall in the literature that is
starting to be answered by using induced pluripotent stem cell models (iPSC) of AD.
As both ROS production and the dissipation of MMP can be key factors in determining whether a
mitochondrion should undergo mitophagy, the function of the MPTP also has a key role in
determining both the level of cellular mitophagy and cellular death. The function of the MPTP has
been shown to be altered in AD with some studies showing a more constant activation of the pore in
AD fibroblasts when compared to controls [262]. Constant opening of the MPTP exposes the
cytoplasm to increased ROS and calcium release which can be signals for mitophagy and cell death.
The Aβ protein has been shown to directly interact with CypD which increases the activation of the
50 | P a g e
MPTP [263, 264]. There is also evidence that the increased calcium concentration mitochondria are
exposed to in AD, due to the increased number of MAM contacts, causes the MPTP to open more
frequently to normalize matrix calcium concentration [262]. Inhibiting or knocking down the CypD
protein in mouse and cell models, which essentially stops the formation of the MPTP, removes the
toxic effect that Aβ has on the mitochondria [263]. This has led to the suggestion that blockage of
the MPTP could be used as a therapeutic target in AD, but this negates the fact that MPTP has a
physiological role. It is interesting that blocking of the MPTP stops the effect amyloid has on the
mitochondria, but this work has only been performed in mouse models of a relatively young age. It is
reasonable to conclude that blockage of the MPTP does not take into account any potential effects
that minor changes in mitochondrial function may have on the development of AD, and also does
not account for the other effects outside of the mitochondria that the amyloid has on many different
cell organelles. Cell death can be mediated in many ways in AD via the actions of Aβ. As well as
MPTP mediated cell death, Aβ has a direct effect on caspase signalling highlighting the complex
nature of the disease [265].
1.9.5 Mitochondrial Trafficking in AD
As well as the described changes to both mitochondrial structure and function mentioned above, the
trafficking of mitochondria within AD is affected [266]. Mitochondrial movement throughout the cell
is performed by a specialized group of molecular motor proteins that use the cellular network of
microtubules. The 2 major protein that perform this mitochondrial trafficking are Kinesin 1 and
Dynein [267]. In general Kinesin 1 traffics proteins and organelles in an anterograde motion. In
neurons this means movement away from the cell body and towards the synapse. Dynein in general
moves cargos in a retrograde motion (towards the cell body) [268]. This movement of cargos via
these molecular motors is ATP dependent, and sensitive to cellular calcium concentrations .
In AD the trafficking of mitochondria is affected in several ways. Oligomeric forms of Aβ have been
shown to reduce both the anterior and retrograde movement of mitochondrial in neuronal cells,
with anterograde movement effected to a greater extent than retrograde [266]. This has the effect
of decreasing the number of mitochondria at neuronal synapses, which is thought to be one of the
reasons for synaptic loss in AD. Mutations in the presenilin 1 gene which lead to the development of
familial AD have been shown to impair axonal transport of mitochondria via increased
phosphorylation of Kinesin 1 [269]. Tau hyperphosphorylation has also been shown to effect
intracellular trafficking as increase phosphorylation and increased tau recruitment to the
microtubule network affects the binding of the molecular motor proteins which again has the effect
of reducing the movement of mitochondria through cells [270]. Increased calcium concentrations
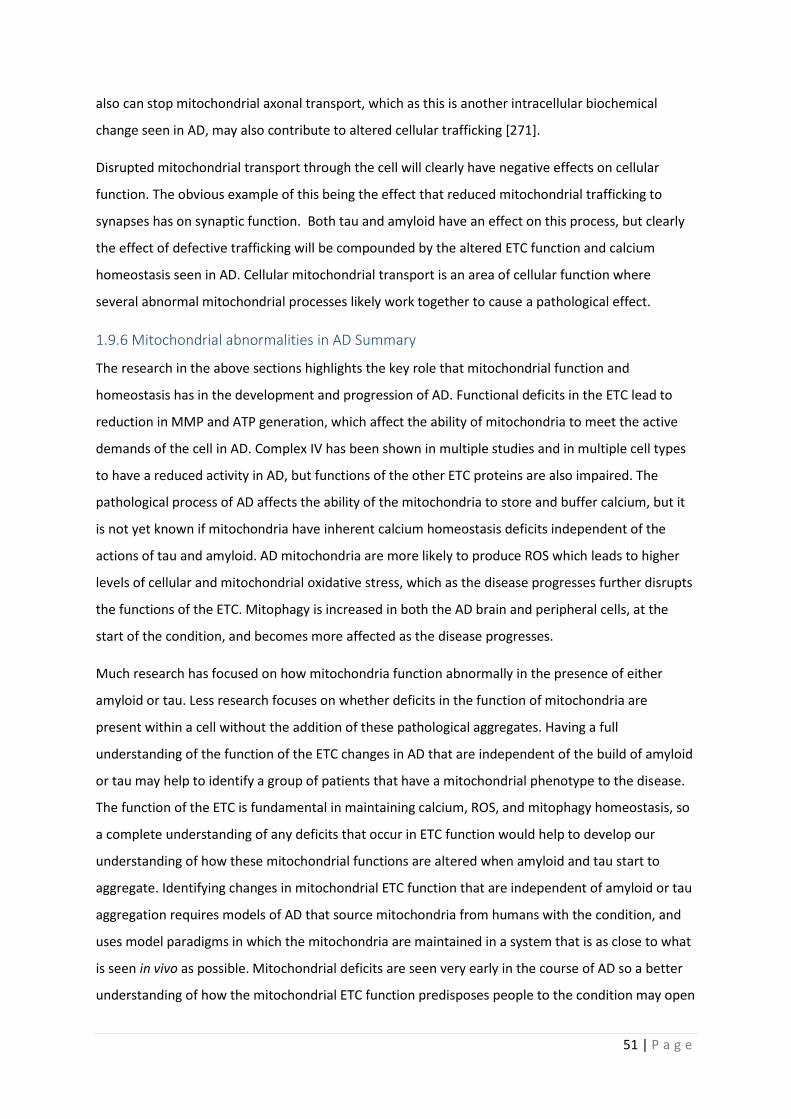
51 | P a g e
also can stop mitochondrial axonal transport, which as this is another intracellular biochemical
change seen in AD, may also contribute to altered cellular trafficking [271].
Disrupted mitochondrial transport through the cell will clearly have negative effects on cellular
function. The obvious example of this being the effect that reduced mitochondrial trafficking to
synapses has on synaptic function. Both tau and amyloid have an effect on this process, but clearly
the effect of defective trafficking will be compounded by the altered ETC function and calcium
homeostasis seen in AD. Cellular mitochondrial transport is an area of cellular function where
several abnormal mitochondrial processes likely work together to cause a pathological effect.
1.9.6 Mitochondrial abnormalities in AD Summary
The research in the above sections highlights the key role that mitochondrial function and
homeostasis has in the development and progression of AD. Functional deficits in the ETC lead to
reduction in MMP and ATP generation, which affect the ability of mitochondria to meet the active
demands of the cell in AD. Complex IV has been shown in multiple studies and in multiple cell types
to have a reduced activity in AD, but functions of the other ETC proteins are also impaired. The
pathological process of AD affects the ability of the mitochondria to store and buffer calcium, but it
is not yet known if mitochondria have inherent calcium homeostasis deficits independent of the
actions of tau and amyloid. AD mitochondria are more likely to produce ROS which leads to higher
levels of cellular and mitochondrial oxidative stress, which as the disease progresses further disrupts
the functions of the ETC. Mitophagy is increased in both the AD brain and peripheral cells, at the
start of the condition, and becomes more affected as the disease progresses.
Much research has focused on how mitochondria function abnormally in the presence of either
amyloid or tau. Less research focuses on whether deficits in the function of mitochondria are
present within a cell without the addition of these pathological aggregates. Having a full
understanding of the function of the ETC changes in AD that are independent of the build of amyloid
or tau may help to identify a group of patients that have a mitochondrial phenotype to the disease.
The function of the ETC is fundamental in maintaining calcium, ROS, and mitophagy homeostasis, so
a complete understanding of any deficits that occur in ETC function would help to develop our
understanding of how these mitochondrial functions are altered when amyloid and tau start to
aggregate. Identifying changes in mitochondrial ETC function that are independent of amyloid or tau
aggregation requires models of AD that source mitochondria from humans with the condition, and
uses model paradigms in which the mitochondria are maintained in a system that is as close to what
is seen in vivo as possible. Mitochondrial deficits are seen very early in the course of AD so a better
understanding of how the mitochondrial ETC function predisposes people to the condition may open
52 | P a g e
a pathway to earlier diagnosis and treatment. Figure 1.6 summarises the changes seen in
mitochondria in AD.
Figure 1.7| Changes to mitochondrial function seen in AD Highlighted in this figure are
the different pathological changes that occur to the mitochondria through the course of AD.
Mitophagy changes are highlighted in orange, calcium metabolism in blue, electron
transport chain (ETC) changes in green and changes to the Mitochondrial Permeability
Transition Pore (MPTP) in yellow.
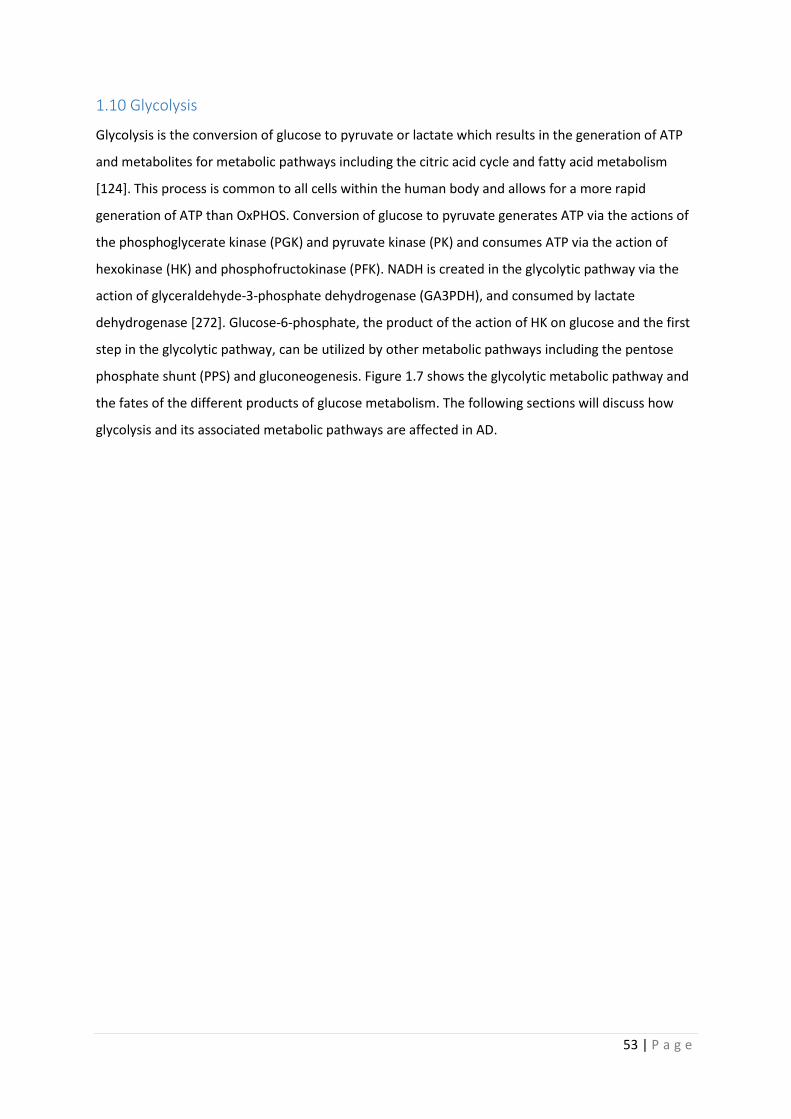
53 | P a g e
1.10 Glycolysis
Glycolysis is the conversion of glucose to pyruvate or lactate which results in the generation of ATP
and metabolites for metabolic pathways including the citric acid cycle and fatty acid metabolism
[124]. This process is common to all cells within the human body and allows for a more rapid
generation of ATP than OxPHOS. Conversion of glucose to pyruvate generates ATP via the actions of
the phosphoglycerate kinase (PGK) and pyruvate kinase (PK) and consumes ATP via the action of
hexokinase (HK) and phosphofructokinase (PFK). NADH is created in the glycolytic pathway via the
action of glyceraldehyde-3-phosphate dehydrogenase (GA3PDH), and consumed by lactate
dehydrogenase [272]. Glucose-6-phosphate, the product of the action of HK on glucose and the first
step in the glycolytic pathway, can be utilized by other metabolic pathways including the pentose
phosphate shunt (PPS) and gluconeogenesis. Figure 1.7 shows the glycolytic metabolic pathway and
the fates of the different products of glucose metabolism. The following sections will discuss how
glycolysis and its associated metabolic pathways are affected in AD.
54 | P a g e
Figure 1.8| Glycolysis and other glucose metabolic pathways Highlighted in this figure
are the different enzymes and substrates involved in the metabolism of glucose via,
glycolysis (green box), glycogenolysis (blue box) and in the pentose phosphate shunt
(orange box). Sites of ATP, NADPH, NADH, and ADP generation are shown. Sites of
transfer of glucose products between metabolic pathways are highlighted with blue arrows
for movement into glycogenolysis and orange for movement though the pentose phosphate
shunt.
1.11 Glycolysis in AD
1.11.2 Changes to glycolysis in AD
Glycolysis is a metabolic pathway utilized to great effect by the brain. At times of increased brain
activity glycolysis can offer a rapid supply of ATP, even though glycolysis produces less molecules of
ATP per glucose molecule consumed when compared to OXPHOS [273]. Unlike OxPHOS, glycolysis
can be directly observed in the human brain using radioactive forms of glucose such as 2-[18F]
fluoro-2-Deoxy-D-glucose (FDG). Using -[18F]fluoro-2-Deoxy-D-glucose positron emission
tomography (FDG-PET) a reduction in glucose metabolism has been seen in both ageing and AD
[274], although this shift accounts for glucose consumed in both glycolysis and other metabolic
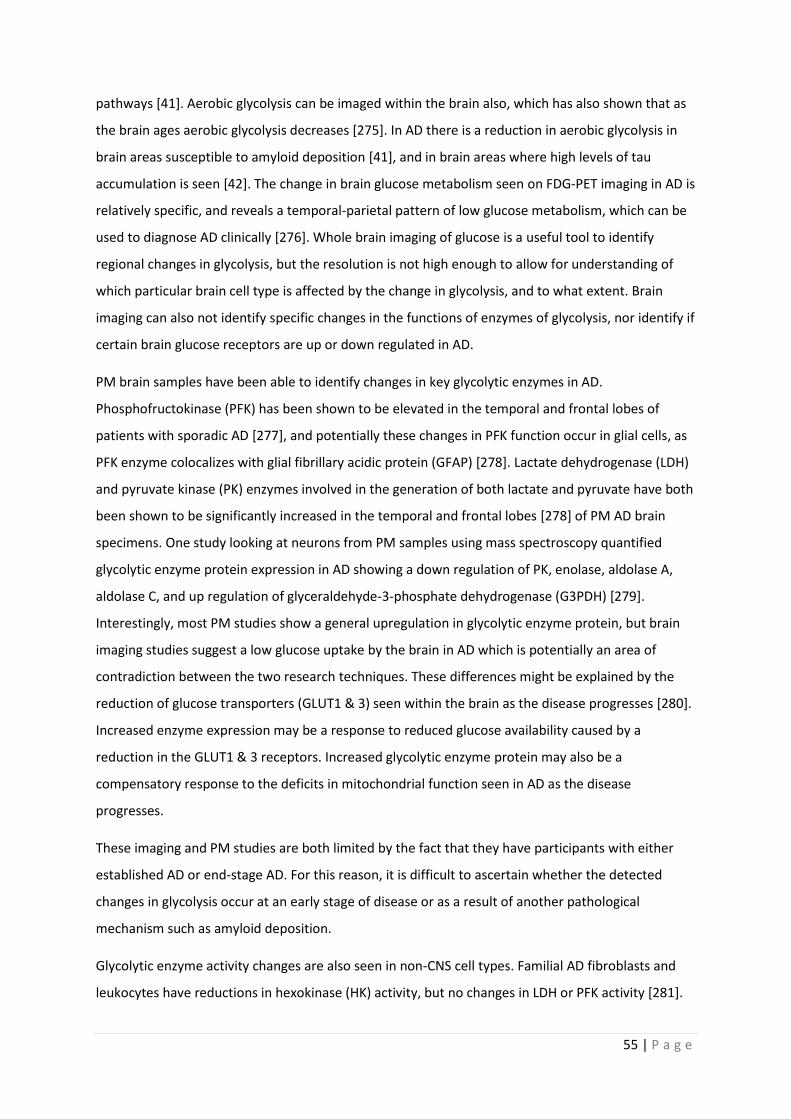
55 | P a g e
pathways [41]. Aerobic glycolysis can be imaged within the brain also, which has also shown that as
the brain ages aerobic glycolysis decreases [275]. In AD there is a reduction in aerobic glycolysis in
brain areas susceptible to amyloid deposition [41], and in brain areas where high levels of tau
accumulation is seen [42]. The change in brain glucose metabolism seen on FDG-PET imaging in AD is
relatively specific, and reveals a temporal-parietal pattern of low glucose metabolism, which can be
used to diagnose AD clinically [276]. Whole brain imaging of glucose is a useful tool to identify
regional changes in glycolysis, but the resolution is not high enough to allow for understanding of
which particular brain cell type is affected by the change in glycolysis, and to what extent. Brain
imaging can also not identify specific changes in the functions of enzymes of glycolysis, nor identify if
certain brain glucose receptors are up or down regulated in AD.
PM brain samples have been able to identify changes in key glycolytic enzymes in AD.
Phosphofructokinase (PFK) has been shown to be elevated in the temporal and frontal lobes of
patients with sporadic AD [277], and potentially these changes in PFK function occur in glial cells, as
PFK enzyme colocalizes with glial fibrillary acidic protein (GFAP) [278]. Lactate dehydrogenase (LDH)
and pyruvate kinase (PK) enzymes involved in the generation of both lactate and pyruvate have both
been shown to be significantly increased in the temporal and frontal lobes [278] of PM AD brain
specimens. One study looking at neurons from PM samples using mass spectroscopy quantified
glycolytic enzyme protein expression in AD showing a down regulation of PK, enolase, aldolase A,
aldolase C, and up regulation of glyceraldehyde-3-phosphate dehydrogenase (G3PDH) [279].
Interestingly, most PM studies show a general upregulation in glycolytic enzyme protein, but brain
imaging studies suggest a low glucose uptake by the brain in AD which is potentially an area of
contradiction between the two research techniques. These differences might be explained by the
reduction of glucose transporters (GLUT1 & 3) seen within the brain as the disease progresses [280].
Increased enzyme expression may be a response to reduced glucose availability caused by a
reduction in the GLUT1 & 3 receptors. Increased glycolytic enzyme protein may also be a
compensatory response to the deficits in mitochondrial function seen in AD as the disease
progresses.
These imaging and PM studies are both limited by the fact that they have participants with either
established AD or end-stage AD. For this reason, it is difficult to ascertain whether the detected
changes in glycolysis occur at an early stage of disease or as a result of another pathological
mechanism such as amyloid deposition.
Glycolytic enzyme activity changes are also seen in non-CNS cell types. Familial AD fibroblasts and
leukocytes have reductions in hexokinase (HK) activity, but no changes in LDH or PFK activity [281].
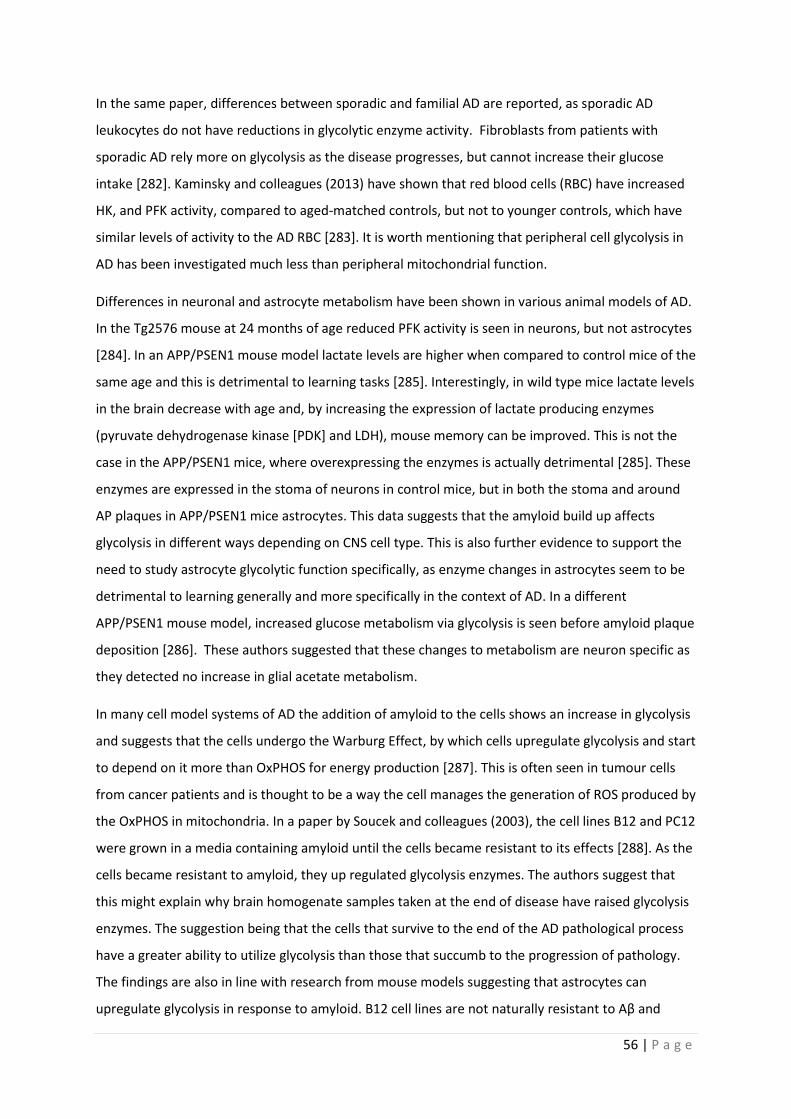
56 | P a g e
In the same paper, differences between sporadic and familial AD are reported, as sporadic AD
leukocytes do not have reductions in glycolytic enzyme activity. Fibroblasts from patients with
sporadic AD rely more on glycolysis as the disease progresses, but cannot increase their glucose
intake [282]. Kaminsky and colleagues (2013) have shown that red blood cells (RBC) have increased
HK, and PFK activity, compared to aged-matched controls, but not to younger controls, which have
similar levels of activity to the AD RBC [283]. It is worth mentioning that peripheral cell glycolysis in
AD has been investigated much less than peripheral mitochondrial function.
Differences in neuronal and astrocyte metabolism have been shown in various animal models of AD.
In the Tg2576 mouse at 24 months of age reduced PFK activity is seen in neurons, but not astrocytes
[284]. In an APP/PSEN1 mouse model lactate levels are higher when compared to control mice of the
same age and this is detrimental to learning tasks [285]. Interestingly, in wild type mice lactate levels
in the brain decrease with age and, by increasing the expression of lactate producing enzymes
(pyruvate dehydrogenase kinase [PDK] and LDH), mouse memory can be improved. This is not the
case in the APP/PSEN1 mice, where overexpressing the enzymes is actually detrimental [285]. These
enzymes are expressed in the stoma of neurons in control mice, but in both the stoma and around
AP plaques in APP/PSEN1 mice astrocytes. This data suggests that the amyloid build up affects
glycolysis in different ways depending on CNS cell type. This is also further evidence to support the
need to study astrocyte glycolytic function specifically, as enzyme changes in astrocytes seem to be
detrimental to learning generally and more specifically in the context of AD. In a different
APP/PSEN1 mouse model, increased glucose metabolism via glycolysis is seen before amyloid plaque
deposition [286]. These authors suggested that these changes to metabolism are neuron specific as
they detected no increase in glial acetate metabolism.
In many cell model systems of AD the addition of amyloid to the cells shows an increase in glycolysis
and suggests that the cells undergo the Warburg Effect, by which cells upregulate glycolysis and start
to depend on it more than OxPHOS for energy production [287]. This is often seen in tumour cells
from cancer patients and is thought to be a way the cell manages the generation of ROS produced by
the OxPHOS in mitochondria. In a paper by Soucek and colleagues (2003), the cell lines B12 and PC12
were grown in a media containing amyloid until the cells became resistant to its effects [288]. As the
cells became resistant to amyloid, they up regulated glycolysis enzymes. The authors suggest that
this might explain why brain homogenate samples taken at the end of disease have raised glycolysis
enzymes. The suggestion being that the cells that survive to the end of the AD pathological process
have a greater ability to utilize glycolysis than those that succumb to the progression of pathology.
The findings are also in line with research from mouse models suggesting that astrocytes can
upregulate glycolysis in response to amyloid. B12 cell lines are not naturally resistant to Aβ and
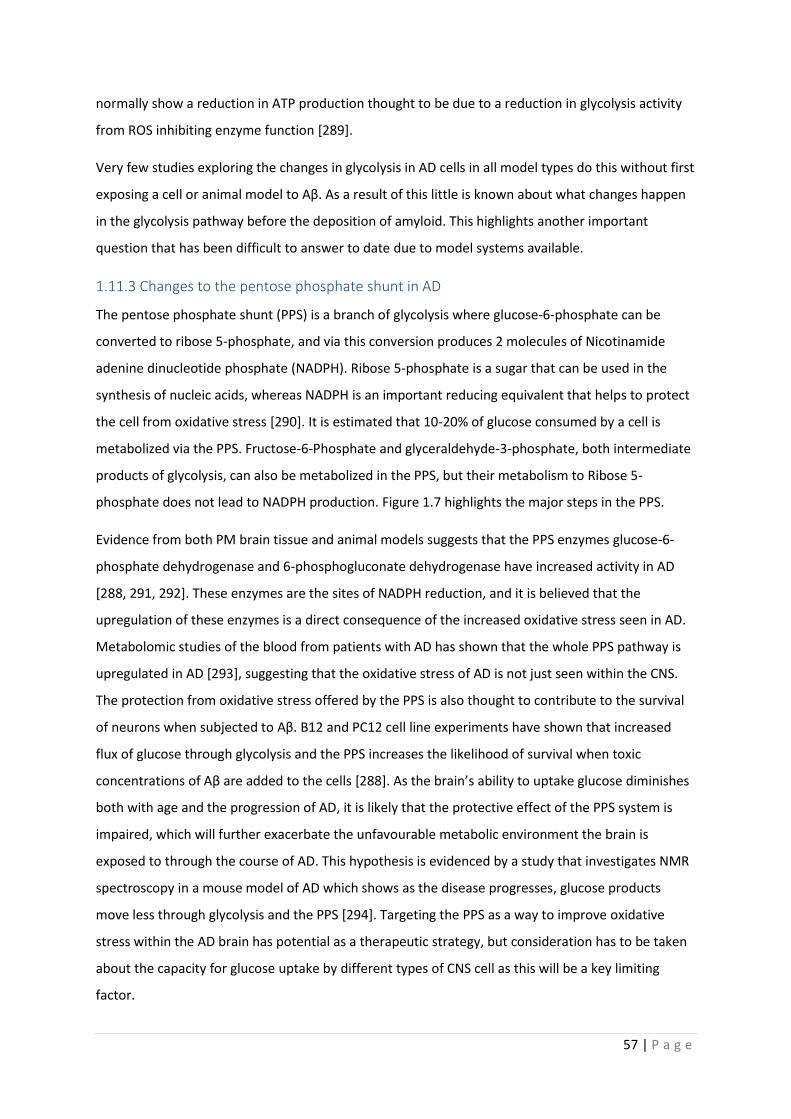
57 | P a g e
normally show a reduction in ATP production thought to be due to a reduction in glycolysis activity
from ROS inhibiting enzyme function [289].
Very few studies exploring the changes in glycolysis in AD cells in all model types do this without first
exposing a cell or animal model to Aβ. As a result of this little is known about what changes happen
in the glycolysis pathway before the deposition of amyloid. This highlights another important
question that has been difficult to answer to date due to model systems available.
1.11.3 Changes to the pentose phosphate shunt in AD
The pentose phosphate shunt (PPS) is a branch of glycolysis where glucose-6-phosphate can be
converted to ribose 5-phosphate, and via this conversion produces 2 molecules of Nicotinamide
adenine dinucleotide phosphate (NADPH). Ribose 5-phosphate is a sugar that can be used in the
synthesis of nucleic acids, whereas NADPH is an important reducing equivalent that helps to protect
the cell from oxidative stress [290]. It is estimated that 10-20% of glucose consumed by a cell is
metabolized via the PPS. Fructose-6-Phosphate and glyceraldehyde-3-phosphate, both intermediate
products of glycolysis, can also be metabolized in the PPS, but their metabolism to Ribose 5-
phosphate does not lead to NADPH production. Figure 1.7 highlights the major steps in the PPS.
Evidence from both PM brain tissue and animal models suggests that the PPS enzymes glucose-6-
phosphate dehydrogenase and 6-phosphogluconate dehydrogenase have increased activity in AD
[288, 291, 292]. These enzymes are the sites of NADPH reduction, and it is believed that the
upregulation of these enzymes is a direct consequence of the increased oxidative stress seen in AD.
Metabolomic studies of the blood from patients with AD has shown that the whole PPS pathway is
upregulated in AD [293], suggesting that the oxidative stress of AD is not just seen within the CNS.
The protection from oxidative stress offered by the PPS is also thought to contribute to the survival
of neurons when subjected to Aβ. B12 and PC12 cell line experiments have shown that increased
flux of glucose through glycolysis and the PPS increases the likelihood of survival when toxic
concentrations of Aβ are added to the cells [288]. As the brain’s ability to uptake glucose diminishes
both with age and the progression of AD, it is likely that the protective effect of the PPS system is
impaired, which will further exacerbate the unfavourable metabolic environment the brain is
exposed to through the course of AD. This hypothesis is evidenced by a study that investigates NMR
spectroscopy in a mouse model of AD which shows as the disease progresses, glucose products
move less through glycolysis and the PPS [294]. Targeting the PPS as a way to improve oxidative
stress within the AD brain has potential as a therapeutic strategy, but consideration has to be taken
about the capacity for glucose uptake by different types of CNS cell as this will be a key limiting
factor.
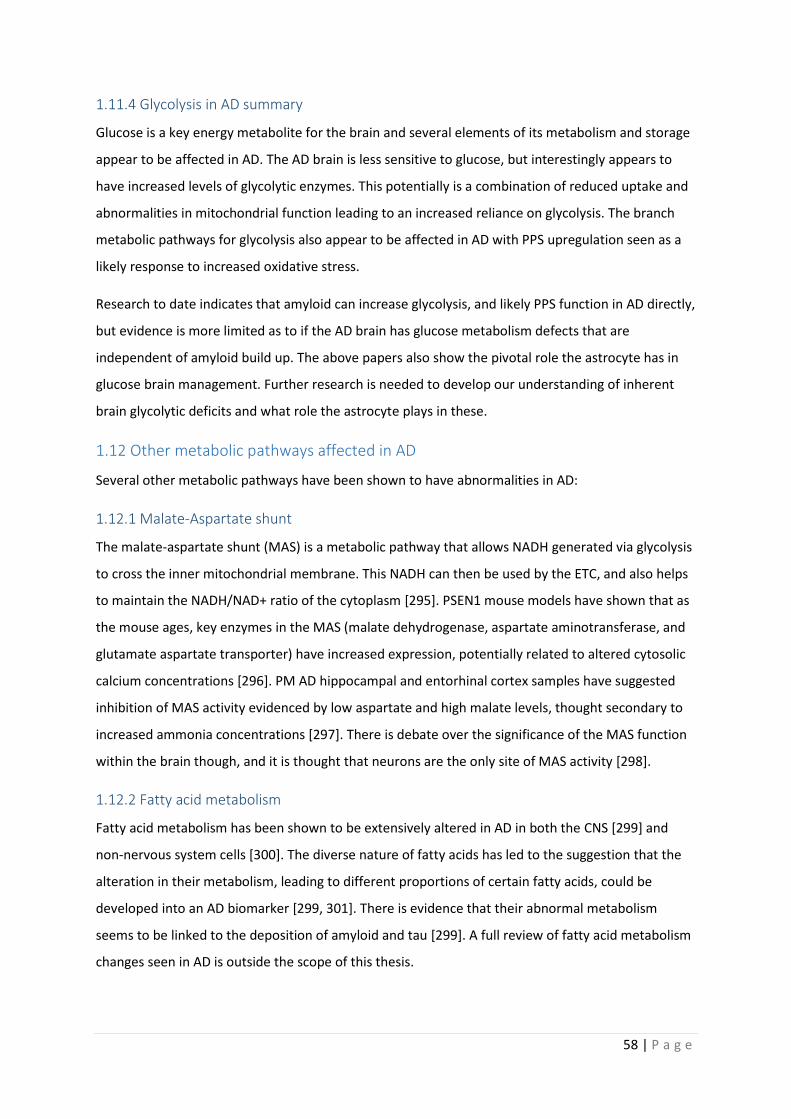
58 | P a g e
1.11.4 Glycolysis in AD summary
Glucose is a key energy metabolite for the brain and several elements of its metabolism and storage
appear to be affected in AD. The AD brain is less sensitive to glucose, but interestingly appears to
have increased levels of glycolytic enzymes. This potentially is a combination of reduced uptake and
abnormalities in mitochondrial function leading to an increased reliance on glycolysis. The branch
metabolic pathways for glycolysis also appear to be affected in AD with PPS upregulation seen as a
likely response to increased oxidative stress.
Research to date indicates that amyloid can increase glycolysis, and likely PPS function in AD directly,
but evidence is more limited as to if the AD brain has glucose metabolism defects that are
independent of amyloid build up. The above papers also show the pivotal role the astrocyte has in
glucose brain management. Further research is needed to develop our understanding of inherent
brain glycolytic deficits and what role the astrocyte plays in these.
1.12 Other metabolic pathways affected in AD
Several other metabolic pathways have been shown to have abnormalities in AD:
1.12.1 Malate-Aspartate shunt
The malate-aspartate shunt (MAS) is a metabolic pathway that allows NADH generated via glycolysis
to cross the inner mitochondrial membrane. This NADH can then be used by the ETC, and also helps
to maintain the NADH/NAD+ ratio of the cytoplasm [295]. PSEN1 mouse models have shown that as
the mouse ages, key enzymes in the MAS (malate dehydrogenase, aspartate aminotransferase, and
glutamate aspartate transporter) have increased expression, potentially related to altered cytosolic
calcium concentrations [296]. PM AD hippocampal and entorhinal cortex samples have suggested
inhibition of MAS activity evidenced by low aspartate and high malate levels, thought secondary to
increased ammonia concentrations [297]. There is debate over the significance of the MAS function
within the brain though, and it is thought that neurons are the only site of MAS activity [298].
1.12.2 Fatty acid metabolism
Fatty acid metabolism has been shown to be extensively altered in AD in both the CNS [299] and
non-nervous system cells [300]. The diverse nature of fatty acids has led to the suggestion that the
alteration in their metabolism, leading to different proportions of certain fatty acids, could be
developed into an AD biomarker [299, 301]. There is evidence that their abnormal metabolism
seems to be linked to the deposition of amyloid and tau [299]. A full review of fatty acid metabolism
changes seen in AD is outside the scope of this thesis.
59 | P a g e
1.13 Metabolic cooperation within the brain
Neurons as a cell type are highly dependent on OxPHOS to meet their energy needs. Originally it was
believed that the vast majority of energy consumption by neurons was as a result of action potential
transmission. It has since been shown that the vast majority of energy expenditure for neurons and
the brain as a whole is to maintain ion gradients within cells, and also to recycle neurotransmitters
[302]. In order to be able to maintain these crucial functions, the brain relies on the metabolic
function of astrocytes. The primary example of this co-operative metabolic relationship is at
glutamatergic synapses [303].
Glutamatergic synapses are the major excitatory synapse found within the brain and account for
80% of all synapses [304]. A synapse in its most basic form is a connection between 2 neurons, which
is extensively covered by the end feet processes of an astrocyte “the tri-partite synapse”. When
glutamate is released into the synapse, this causes an increase in the concentration of potassium at
the synapse. To maintain the potassium and glutamate synaptic concentrations, astrocytes take up
both substances in exchange for a sodium ion [303]. When a neurotransmitter such as glutamate is
released from a neuron, this activates a calcium wave within the surrounding astrocyte, which via
gap junctions, can be propagated through many astrocytes. The process of glutamate uptake by
astrocytes is ATP dependent and the calcium influx into the cell may stimulate ATP generation for
this uptake. The rate of glutamate uptake by the astrocyte controls the rate of post synaptic
signalling, so has a direct effect on LTP and LTD.
Once inside the astrocyte, the glutamate has several potential fates. It can be converted to
glutamine, at the expense of another molecule of ATP and then transported back to neurons to
replenish glutamate and γ-aminobutyric acid (GABA) stores. The glutamate can be also converted
into alpha-ketoglutarate, and metabolized via the TCA cycle to produce ATP for the astrocyte [305].
The ATP used in the metabolism of glutamate has been shown to come from glycolysis, with an
estimated 80-90% of all brain glycolysis utilized to maintain glutamate synaptic balance [306]. The
glucose used by the astrocyte for glycolysis comes from the blood stream, with several studies
showing that as brain activity increases, blood flow is diverted by astrocytes to the active brain
regions [307]. This research has shown that FDG-PET signalling is directly measuring the function of
glutamatergic synapses.
As stated, neurons are very OxPHOS dependent, and in fact if glycolysis is increased in neurons, they
develop increased oxidative stress from lack of PPS usage. At times when neurons need to increase
their energy expenditure instead of increasing the utilization of glycolysis, TCA substrates are
generated from lactate, which allows glucose consumed by the neuron to be used for PPS pathway
60 | P a g e
metabolism and antioxidant production [308]. The main source of lactate within the brain has been
shown to be the astrocyte, with a large body of evidence now suggesting that lactate made by the
astrocyte is shuttled to neurons via an astrocyte neuron lactate shuttle (ANSL) [309, 310], allowing
the neuron to maintain physiological function at times of increased energy demand, without
upregulating neuronal glycolysis. Glycogen is a source of glucose for astrocytic glycolysis and lactate
for potential neuronal usage. As described above astrocytic glycogen has been shown to be a
necessity for LTP and memory formation [311, 312]. The role the astrocyte has in maintaining
neuronal synaptic homeostasis is likely to be the reason glycogen is critical to memory formation.
Figure 1.8 shows the metabolic cooperation that exists between the astrocyte and neuron at a
glutamatergic synapse.
As the astrocyte has a key role in maintaining neuronal metabolism at glutamatergic synapses any
deficits in its metabolic function are likely to precipitate brain disease states. The astrocyte has been
shown to be extensively altered in AD, however its metabolic function has been difficult to
investigate due to the limitation of animal and PM models. The next section will describe the role of
the astrocyte in AD and how astrocytic metabolism could be investigated in a human cell model
system.
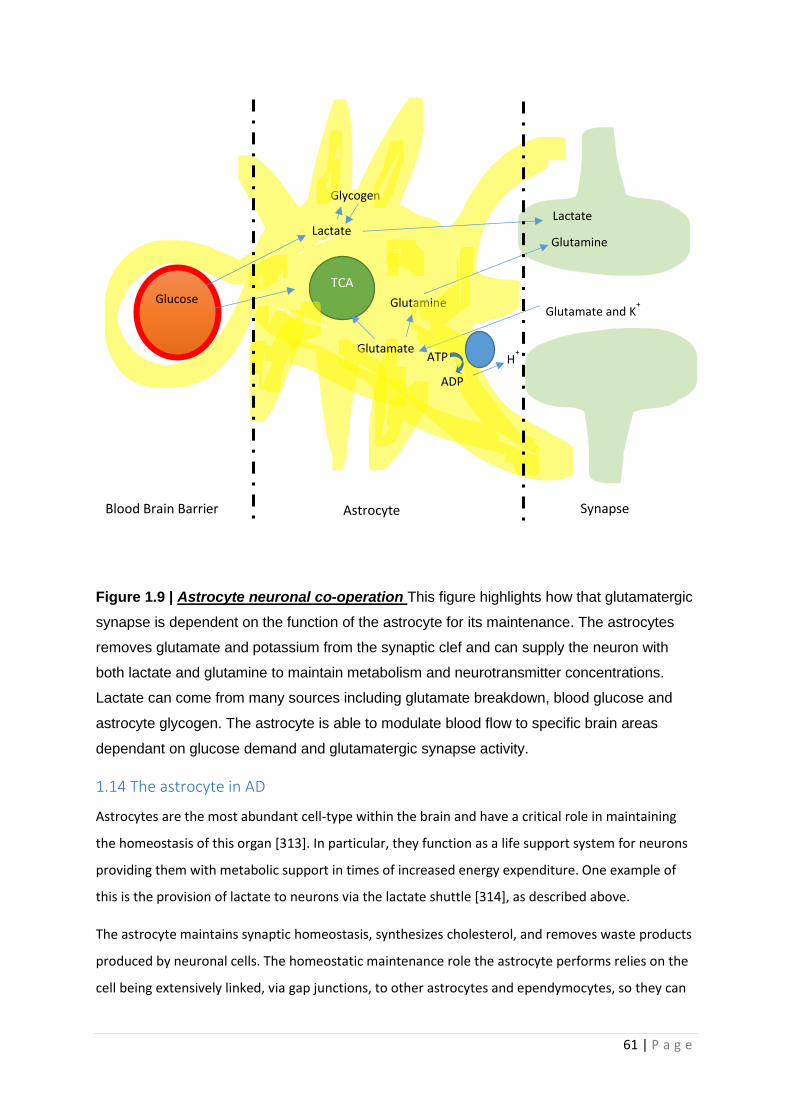
61 | P a g e
Figure 1.9 | Astrocyte neuronal co-operation This figure highlights how that glutamatergic
synapse is dependent on the function of the astrocyte for its maintenance. The astrocytes
removes glutamate and potassium from the synaptic clef and can supply the neuron with
both lactate and glutamine to maintain metabolism and neurotransmitter concentrations.
Lactate can come from many sources including glutamate breakdown, blood glucose and
astrocyte glycogen. The astrocyte is able to modulate blood flow to specific brain areas
dependant on glucose demand and glutamatergic synapse activity.
1.14 The astrocyte in AD
Astrocytes are the most abundant cell-type within the brain and have a critical role in maintaining
the homeostasis of this organ [313]. In particular, they function as a life support system for neurons
providing them with metabolic support in times of increased energy expenditure. One example of
this is the provision of lactate to neurons via the lactate shuttle [314], as described above.
The astrocyte maintains synaptic homeostasis, synthesizes cholesterol, and removes waste products
produced by neuronal cells. The homeostatic maintenance role the astrocyte performs relies on the
cell being extensively linked, via gap junctions, to other astrocytes and ependymocytes, so they can
Glutamate and K+
Glutamate
Glutamine TCA
Glucose
Lactate
Glycogen
Glutamine
Lactate
H+
ADP
ATP
Blood Brain Barrier Astrocyte Synapse
62 | P a g e
deposit unwanted neurotransmitters, and ions to distant sites outside of the central nervous system
[315]. Astrocytes can have a wide variety of shapes, with some processes that surround neuronal
synapses being so narrow in diameter that mitochondria cannot pass into them [305]. This clearly
will have consequences with regard to metabolic processes that can function in this specialized area
of the cell. As described above, astrocytes are particularly important in processes such as
maintaining synaptic function and form [316-318]. The astrocyte also has a key role in recycling
synaptic content and provides multiple metabolic substrates for neuronal use. This functionally
diverse cell also forms part of the Blood Brain Barrier (BBB) and regulates the immune response
[319].
In vitro studies have shown that the astrocyte has a role in Amyloid Precursor Protein (APP)
metabolism [320], and removal of Aβ [321]. When astrocytes are treated with amyloid beta this up
regulates glucose uptake, glycolysis and tricarboxylic acid cycle activity [322]. In mouse AD models it
has been shown that increased astrocyte Aβ uptake effects the astrocytes ability to support
neuronal survival in co-culture, which is thought in part to be due to the observed increase in
glycolysis [322]. It appears that when the astrocyte uptakes Aβ this increases the astrocyte oxidative
stress, which it then employs glycolytic pathways which generate NADH reducing equivalents to
protect itself. This leads to an increase in astrocyte glucose utilization which is at the expense of
passage of glycolytic substrates to the neuron. Uptake of Aβ by astrocytes also makes them develop
an inflammatory/activated phenotype which correlates better with memory impairment in mouse
models of AD than the deposition of Aβ alone [323]. A proinflammatory phenotype for an astrocyte
also increases its glycolytic pathway usage as the intracellular proinflammatory environment within
the cell leads again to increased ROS production and deploying of mechanisms to control this [324].
Transgenic mice studies suggest defects in astrocyte metabolism as an initiating factor in AD [325]. In
this study the astrocytes from an AD mouse model are shown to have reduced glycogen stores,
which may be as a result of the increased glycolysis seen in AD mouse astrocyte models described
above. By replenishing this glycogen, the AD mice do not develop elements of the pathology induced
by over expression of Aβ. These in vitro studies highlight how two key pathological markers of AD,
that of amyloid build up and increased brain inflammation have potential to affect key metabolic
pathways within astrocytes, which then lead to an inability to support neuronal function.
Consideration has to be made for the fact that these studies are performed in mice, which have very
functionally different astrocytes to those found in humans, which may affect result interpretation.
The implementation of these results in describing how sporadic AD affects astrocyte function in the
human brain may not be appropriate as these models depend on a starting point of increased
amyloid expression. Studies on human astrocytes would help to confirm that these in vitro findings
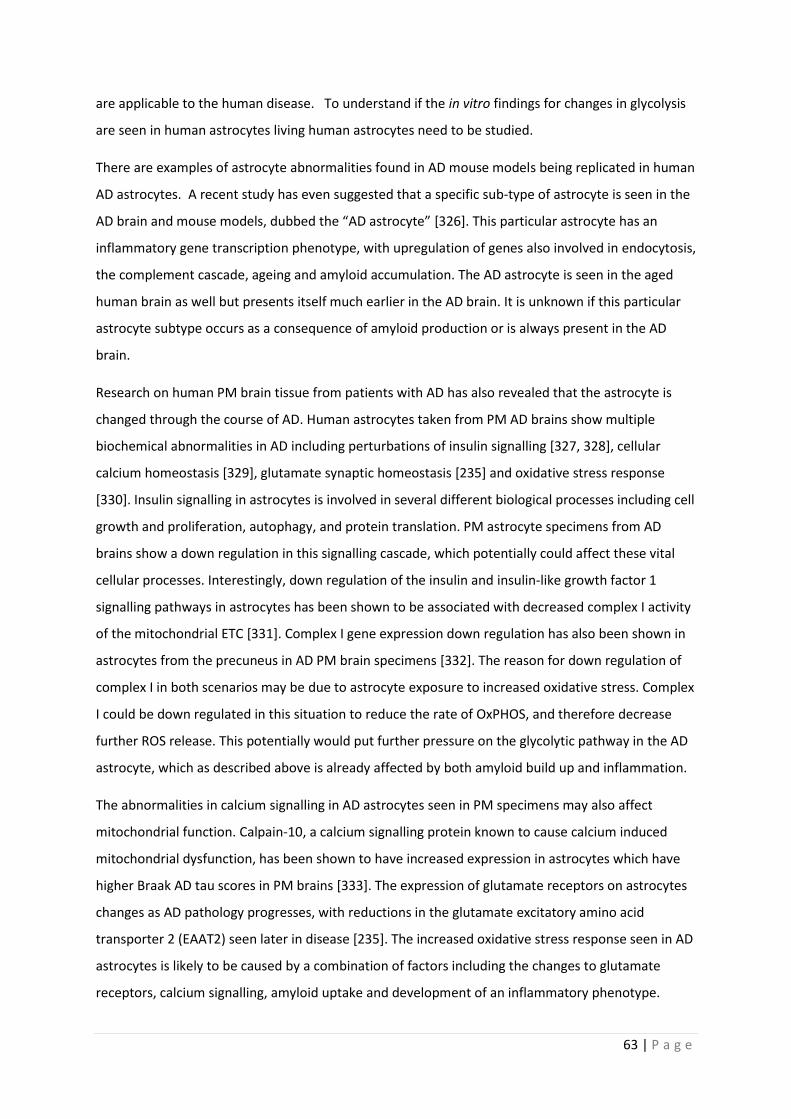
63 | P a g e
are applicable to the human disease. To understand if the in vitro findings for changes in glycolysis
are seen in human astrocytes living human astrocytes need to be studied.
There are examples of astrocyte abnormalities found in AD mouse models being replicated in human
AD astrocytes. A recent study has even suggested that a specific sub-type of astrocyte is seen in the
AD brain and mouse models, dubbed the “AD astrocyte” [326]. This particular astrocyte has an
inflammatory gene transcription phenotype, with upregulation of genes also involved in endocytosis,
the complement cascade, ageing and amyloid accumulation. The AD astrocyte is seen in the aged
human brain as well but presents itself much earlier in the AD brain. It is unknown if this particular
astrocyte subtype occurs as a consequence of amyloid production or is always present in the AD
brain.
Research on human PM brain tissue from patients with AD has also revealed that the astrocyte is
changed through the course of AD. Human astrocytes taken from PM AD brains show multiple
biochemical abnormalities in AD including perturbations of insulin signalling [327, 328], cellular
calcium homeostasis [329], glutamate synaptic homeostasis [235] and oxidative stress response
[330]. Insulin signalling in astrocytes is involved in several different biological processes including cell
growth and proliferation, autophagy, and protein translation. PM astrocyte specimens from AD
brains show a down regulation in this signalling cascade, which potentially could affect these vital
cellular processes. Interestingly, down regulation of the insulin and insulin-like growth factor 1
signalling pathways in astrocytes has been shown to be associated with decreased complex I activity
of the mitochondrial ETC [331]. Complex I gene expression down regulation has also been shown in
astrocytes from the precuneus in AD PM brain specimens [332]. The reason for down regulation of
complex I in both scenarios may be due to astrocyte exposure to increased oxidative stress. Complex
I could be down regulated in this situation to reduce the rate of OxPHOS, and therefore decrease
further ROS release. This potentially would put further pressure on the glycolytic pathway in the AD
astrocyte, which as described above is already affected by both amyloid build up and inflammation.
The abnormalities in calcium signalling in AD astrocytes seen in PM specimens may also affect
mitochondrial function. Calpain‐10, a calcium signalling protein known to cause calcium induced
mitochondrial dysfunction, has been shown to have increased expression in astrocytes which have
higher Braak AD tau scores in PM brains [333]. The expression of glutamate receptors on astrocytes
changes as AD pathology progresses, with reductions in the glutamate excitatory amino acid
transporter 2 (EAAT2) seen later in disease [235]. The increased oxidative stress response seen in AD
astrocytes is likely to be caused by a combination of factors including the changes to glutamate
receptors, calcium signalling, amyloid uptake and development of an inflammatory phenotype.
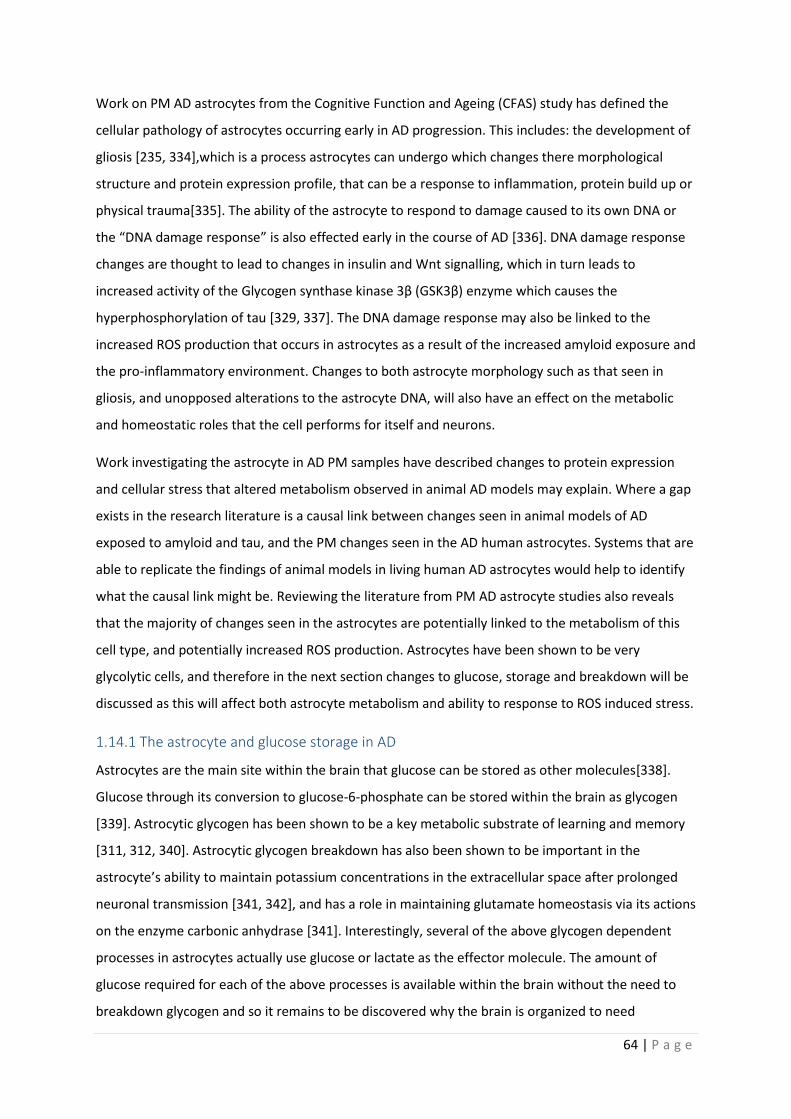
64 | P a g e
Work on PM AD astrocytes from the Cognitive Function and Ageing (CFAS) study has defined the
cellular pathology of astrocytes occurring early in AD progression. This includes: the development of
gliosis [235, 334],which is a process astrocytes can undergo which changes there morphological
structure and protein expression profile, that can be a response to inflammation, protein build up or
physical trauma[335]. The ability of the astrocyte to respond to damage caused to its own DNA or
the “DNA damage response” is also effected early in the course of AD [336]. DNA damage response
changes are thought to lead to changes in insulin and Wnt signalling, which in turn leads to
increased activity of the Glycogen synthase kinase 3β (GSK3β) enzyme which causes the
hyperphosphorylation of tau [329, 337]. The DNA damage response may also be linked to the
increased ROS production that occurs in astrocytes as a result of the increased amyloid exposure and
the pro-inflammatory environment. Changes to both astrocyte morphology such as that seen in
gliosis, and unopposed alterations to the astrocyte DNA, will also have an effect on the metabolic
and homeostatic roles that the cell performs for itself and neurons.
Work investigating the astrocyte in AD PM samples have described changes to protein expression
and cellular stress that altered metabolism observed in animal AD models may explain. Where a gap
exists in the research literature is a causal link between changes seen in animal models of AD
exposed to amyloid and tau, and the PM changes seen in the AD human astrocytes. Systems that are
able to replicate the findings of animal models in living human AD astrocytes would help to identify
what the causal link might be. Reviewing the literature from PM AD astrocyte studies also reveals
that the majority of changes seen in the astrocytes are potentially linked to the metabolism of this
cell type, and potentially increased ROS production. Astrocytes have been shown to be very
glycolytic cells, and therefore in the next section changes to glucose, storage and breakdown will be
discussed as this will affect both astrocyte metabolism and ability to response to ROS induced stress.
1.14.1 The astrocyte and glucose storage in AD
Astrocytes are the main site within the brain that glucose can be stored as other molecules[338].
Glucose through its conversion to glucose-6-phosphate can be stored within the brain as glycogen
[339]. Astrocytic glycogen has been shown to be a key metabolic substrate of learning and memory
[311, 312, 340]. Astrocytic glycogen breakdown has also been shown to be important in the
astrocyte’s ability to maintain potassium concentrations in the extracellular space after prolonged
neuronal transmission [341, 342], and has a role in maintaining glutamate homeostasis via its actions
on the enzyme carbonic anhydrase [341]. Interestingly, several of the above glycogen dependent
processes in astrocytes actually use glucose or lactate as the effector molecule. The amount of
glucose required for each of the above processes is available within the brain without the need to
breakdown glycogen and so it remains to be discovered why the brain is organized to need
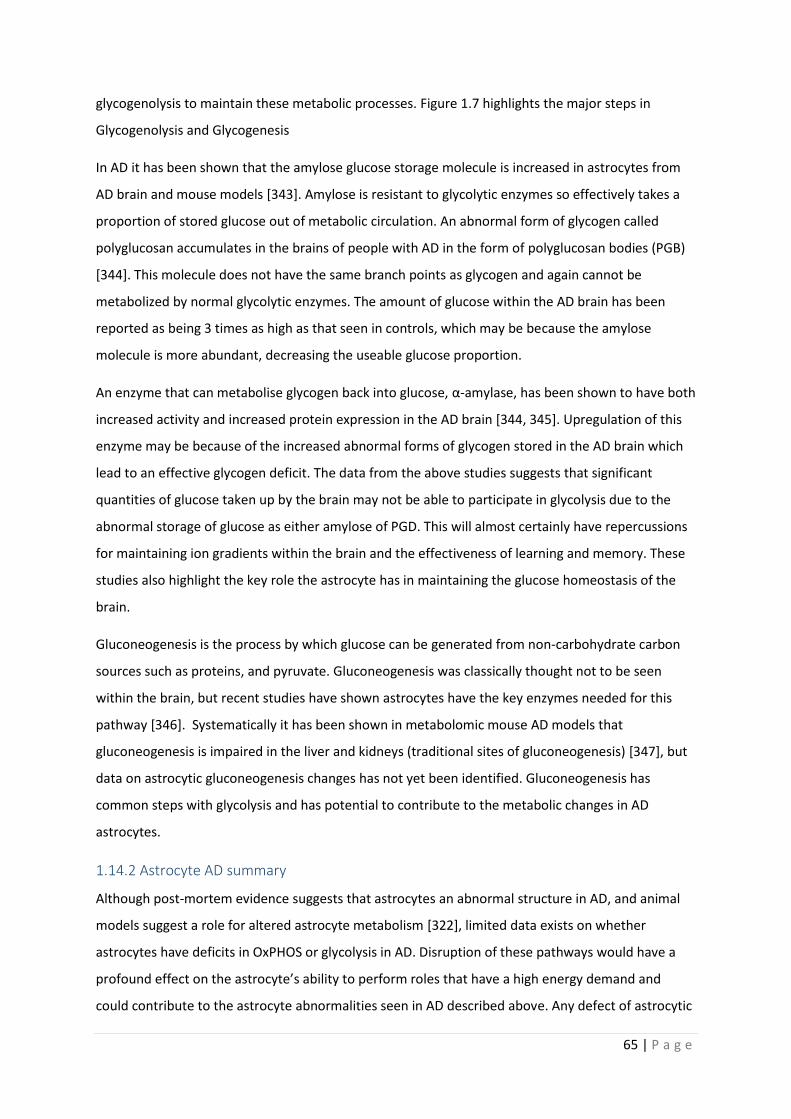
65 | P a g e
glycogenolysis to maintain these metabolic processes. Figure 1.7 highlights the major steps in
Glycogenolysis and Glycogenesis
In AD it has been shown that the amylose glucose storage molecule is increased in astrocytes from
AD brain and mouse models [343]. Amylose is resistant to glycolytic enzymes so effectively takes a
proportion of stored glucose out of metabolic circulation. An abnormal form of glycogen called
polyglucosan accumulates in the brains of people with AD in the form of polyglucosan bodies (PGB)
[344]. This molecule does not have the same branch points as glycogen and again cannot be
metabolized by normal glycolytic enzymes. The amount of glucose within the AD brain has been
reported as being 3 times as high as that seen in controls, which may be because the amylose
molecule is more abundant, decreasing the useable glucose proportion.
An enzyme that can metabolise glycogen back into glucose, α-amylase, has been shown to have both
increased activity and increased protein expression in the AD brain [344, 345]. Upregulation of this
enzyme may be because of the increased abnormal forms of glycogen stored in the AD brain which
lead to an effective glycogen deficit. The data from the above studies suggests that significant
quantities of glucose taken up by the brain may not be able to participate in glycolysis due to the
abnormal storage of glucose as either amylose of PGD. This will almost certainly have repercussions
for maintaining ion gradients within the brain and the effectiveness of learning and memory. These
studies also highlight the key role the astrocyte has in maintaining the glucose homeostasis of the
brain.
Gluconeogenesis is the process by which glucose can be generated from non-carbohydrate carbon
sources such as proteins, and pyruvate. Gluconeogenesis was classically thought not to be seen
within the brain, but recent studies have shown astrocytes have the key enzymes needed for this
pathway [346]. Systematically it has been shown in metabolomic mouse AD models that
gluconeogenesis is impaired in the liver and kidneys (traditional sites of gluconeogenesis) [347], but
data on astrocytic gluconeogenesis changes has not yet been identified. Gluconeogenesis has
common steps with glycolysis and has potential to contribute to the metabolic changes in AD
astrocytes.
1.14.2 Astrocyte AD summary
Although post-mortem evidence suggests that astrocytes an abnormal structure in AD, and animal
models suggest a role for altered astrocyte metabolism [322], limited data exists on whether
astrocytes have deficits in OxPHOS or glycolysis in AD. Disruption of these pathways would have a
profound effect on the astrocyte’s ability to perform roles that have a high energy demand and
could contribute to the astrocyte abnormalities seen in AD described above. Any defect of astrocytic
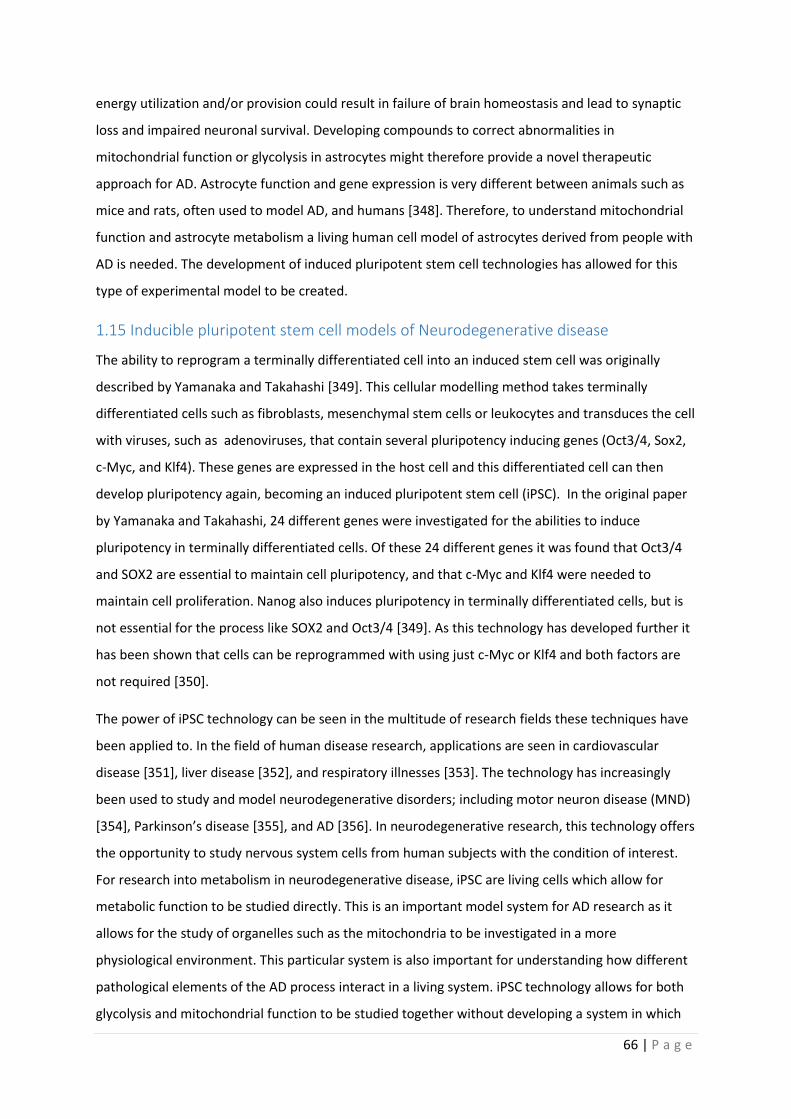
66 | P a g e
energy utilization and/or provision could result in failure of brain homeostasis and lead to synaptic
loss and impaired neuronal survival. Developing compounds to correct abnormalities in
mitochondrial function or glycolysis in astrocytes might therefore provide a novel therapeutic
approach for AD. Astrocyte function and gene expression is very different between animals such as
mice and rats, often used to model AD, and humans [348]. Therefore, to understand mitochondrial
function and astrocyte metabolism a living human cell model of astrocytes derived from people with
AD is needed. The development of induced pluripotent stem cell technologies has allowed for this
type of experimental model to be created.
1.15 Inducible pluripotent stem cell models of Neurodegenerative disease
The ability to reprogram a terminally differentiated cell into an induced stem cell was originally
described by Yamanaka and Takahashi [349]. This cellular modelling method takes terminally
differentiated cells such as fibroblasts, mesenchymal stem cells or leukocytes and transduces the cell
with viruses, such as adenoviruses, that contain several pluripotency inducing genes (Oct3/4, Sox2,
c-Myc, and Klf4). These genes are expressed in the host cell and this differentiated cell can then
develop pluripotency again, becoming an induced pluripotent stem cell (iPSC). In the original paper
by Yamanaka and Takahashi, 24 different genes were investigated for the abilities to induce
pluripotency in terminally differentiated cells. Of these 24 different genes it was found that Oct3/4
and SOX2 are essential to maintain cell pluripotency, and that c-Myc and Klf4 were needed to
maintain cell proliferation. Nanog also induces pluripotency in terminally differentiated cells, but is
not essential for the process like SOX2 and Oct3/4 [349]. As this technology has developed further it
has been shown that cells can be reprogrammed with using just c-Myc or Klf4 and both factors are
not required [350].
The power of iPSC technology can be seen in the multitude of research fields these techniques have
been applied to. In the field of human disease research, applications are seen in cardiovascular
disease [351], liver disease [352], and respiratory illnesses [353]. The technology has increasingly
been used to study and model neurodegenerative disorders; including motor neuron disease (MND)
[354], Parkinson’s disease [355], and AD [356]. In neurodegenerative research, this technology offers
the opportunity to study nervous system cells from human subjects with the condition of interest.
For research into metabolism in neurodegenerative disease, iPSC are living cells which allow for
metabolic function to be studied directly. This is an important model system for AD research as it
allows for the study of organelles such as the mitochondria to be investigated in a more
physiological environment. This particular system is also important for understanding how different
pathological elements of the AD process interact in a living system. iPSC technology allows for both
glycolysis and mitochondrial function to be studied together without developing a system in which
67 | P a g e
only the presence of amyloid defines it as an AD model. The following sections will describe the use
of iPSC technology in AD research.
1.15.1 iPSC Models of Alzheimer’s Disease
1.15.2 iPSC AD Neurons
iPSC technology has been applied to AD research for at least the last 8 years. Several different types
of neurons have been created from patients with both sporadic and familial forms of AD. Standard
neuronal differentiation protocols have been used which generate cells positive for the neuronal
markers β3-tubulin and Microtubule-associated protein 2 (MAP2) [356-359], but protocols based on
that described by Shi et al (2012) [360]have also been used to develop cortical neurons [361-363],
and basal fore brain cholinergic neurons[364]. Both two dimensional [356-359] and three
dimensional cultures have been created from AD iPSCs [361, 365, 366], and to try and understand
how the passage of time effects the secretion of AD associated protein aggregates, cortical neurons
have been created from patients with DS prior to the development of dementia [358, 367].
As this technique is relatively new the majority of early AD iPSC research focused on whether this
cell model can recreate the pathology of AD in neurons. Multiple groups have shown that iPSCs used
to generate neurons from AD patients can express the pathological proteins seen in AD, and have a
similar gene expression profile to PM AD neurons [368, 369]. iPSC AD neurons have been shown to
have an increased Aβ 42/40 ratio [356, 359, 361, 367, 370-372], show hyper phosphorylated tau
molecules [356, 358, 360, 371, 373-376], have both beta-secretase and Glycogen synthase kinase 3
beta activity [358, 374, 377], and can secrete Aβ into the extracellular space [356, 360, 378]. Using
iPSC derived neurons has developed our understanding of how tau might propagate in the AD brain.
Mis-folded tau, as seen in AD and many other neurodegenerative diseases, has been shown to
spread from one neuron to another through neuronal activity in iPSC neuronal models. Once in the
new neuron the mis-folded tau can then cause the normally structured tau in the recipient neuron
to become mis-folded, suggesting that tau spread through the brain may occur in a prion like
way[379]. Although this work was not performed in neurons generated from patients with AD this
work shows how the iPSC model system can be manipulated to understand the cause of pathological
process seen at autopsy.
Although many elements of AD pathology are replicated in iPSC derived AD neurons, monolayer cell
cultures of AD iPSC neurons have not been shown to develop AP or NFT. The reason for this is
unknown, and is a potential limitation of the model system, but three dimensional neuronal cultures
using the same technology have shown aggregates that would be consistent with AP and NFT [365,
366]. Three dimensional neuronal and organoid culture systems appear to reduce the diffusion
68 | P a g e
ability of Aβ and tau, which is thought to partly explain why these culture models develop the
aggregated protein structures seen in AD. Using three dimensional cultures though also have
drawbacks as to study single cell metabolism in these structures is difficult due to the difficultly with
identifying the margins on a singular cell. Studying cellular organoids can also be difficult in three
dimensional structures made of many cell types for the same reasons. Understanding how to
attribute a particular metabolic change to a particular cell type can be difficult in this system. 2D
cultures are more suitable for investigating changes to mitochondrial function and glycolysis, which
can then be further explored in 3D systems which express aggregated forms of amyloid and tau.
The majority of AD iPSC studies have small numbers of cell lines, which is likely to be due to the fact
that iPSC generation can be expensive. The factors needed to reprogram the donor cells, and the
long differentiation times (sometimes >100 days) needed to develop cells that express neuronal
markers and exhibit neuronal function are the main costs. The majority of the AD iPSC neuronal
work has focused on familial AD mutations which has led to the observation that some APP mutants
have increased efficacy for β-secretase activity due to a conformational change in the APP β-
secretase active site [377]. AD iPSCs generated from Presenilin mutants have revealed that in
multiple mutations of the PSEN1 or 2 genes, a loss of function of the γ-secretase enzyme is
observed, which leads to a propensity for neurons to cleave APP to produce Aβ1-42 and not Aβ1-40
[361, 376, 380]. The mutations associated with developing AD lead to a reduced function of γ-
secretase enzyme leading to a total reduction in Aβ, but also a more significant reduction Aβ1-40
which leads, in some mutations to an increase in the Aβ42/40 ratio [381, 382]. These are clearly
very important findings when trying to understand the mechanism of protein accumulation in
familial AD, and may also suggest that different mechanisms precipitate protein accumulation in
sporadic AD.
A more limited number of studies have created iPSC neurons from sporadic AD patients which have
shown interesting findings with regards to Aβ ratios, and Aβ secretion. iPSC generated from sporadic
AD patients have been shown in multiple studies to have either an increase in Aβ expression, or have
levels similar to control cell lines [357, 362, 364, 374, 383]. This potentially highlights how in sporadic
AD Aβ and tau accumulation may not be the first step in disease initiation in a proportion of
patients. Exploring this further using iPSC technology has the potential to develop a personalized
medicine approach to AD, as it will allow for a selective deconstruction of each of the separate
pathophysiological processes that contribute to AD.
Several papers have investigated the mitochondrial functional change in iPSC derived AD neurons.
One study has reported a reduction in cellular ATP levels in sporadic (n=1) and familial (n=1 APP
69 | P a g e
mutation) AD neurons [363]. Decreased MMP has also be reported in PSEN1 mutant neurons (n=1)
[384]. Four studies have reported an increase in ROS production in both sporadic and familial AD
iPSC neurons [362, 370, 384, 385], but numbers in these studies were relatively small. Study size is
likely to an important factor to consider when studying metabolism in any iPSC work devoted to
sporadic AD as mitochondrial functional changes are likely to be part of a spectrum as seen when
studying Aβ levels in these models. Larger sized sporadic AD iPSC studies are needed so a full
understanding is gathered about what proportion of sporadic AD patients’ neurons or astrocytes
have mitochondrial deficits.
Interestingly it has been shown in sporadic AD iPSC neurons that increased ROS production is seen
without the presence of increased amyloid or tau aggregates, suggesting a amyloid independent
mechanism [362]. The increased ROS has been reported in PSEN1 iPSC derived neurons as well, but
this is thought to be caused by amyloid accumulation within the mitochondria. PSEN1 neurons
develop a stressed mitochondrial phenotype with mitochondria showing increased fission, increased
Drp1 and reduced MFA1 and OPA1 [373]. These two papers further highlight how mitochondrial
dysfunction in AD may have different or multiple precipitants in sporadic and familial disease.
Mitophagy impairment in both sporadic and familial AD neurons has been reported [255, 363], as
have abnormalities in lysosomal function [386] in PSEN1 lines. All these findings suggest altered
mitochondrial function or structure in AD iPSC neurons. Several processes that lead to the
elimination of amyloid and tau from the brain are active processes, therefore they depend on ATP.
Dysfunctional mitochondria could lead to a reduction in ATP production which could affect protein
clearance. Increased ROS production may also be a result of increased intracellular calcium
concentration or ER stress, which has been seen in sporadic and PSEN1 iPSC neurons [370, 372, 387].
When considering the changes in mitochondrial function seen in AD iPSC lines it has to be
remembered that the neurons developed often have a foetal phenotype. Although changes in
mitochondrial function seen are consistent with work performed in aged cells from PM and animal
models, further understanding is needed of how the reprogramming process affects both
mitochondrial gene expression and cell reprogramming viability. As the reprogramming process can
alter the dependency on different metabolic pathways in a cell, this may affect which cells complete
the reprogramming process. Potentially cells with more abnormal mitochondria may never reach full
pluripotency, and therefore are never selected for clonal expansion and study. The fact that the
neurons developed have a foetal phenotype to start with may also effect the dominant metabolic
pathway used by the cell, and may also mean that any mitochondrial or glycolytic changes that
develop over time in AD may be reset, and so cannot be studied. It could also be the case that a
particular mitochondrial pathological change effects the function of a cells to the extent that
70 | P a g e
pluripotency cannot be established. If this was the case, then certain mitochondrial abnormalities
would never be seen in iPSC model systems. This particular problem could to a certain extent be
controlled for by investigating changes seen in mitochondrial function in the donor cell types prior to
reprogramming.
Although limited, the research on mitochondrial functional changes seen in AD iPSC derived neurons
also highlights the complexity of the pathophysiology of the condition. Studies that have employed
clustered regularly interspaced short palindromic repeat (CRISPR) genome editing show that removal
of familial AD mutations in certain studies, corrects the mitochondrial abnormalities [372].
Therefore, even though mitochondrial abnormalities are seen without the presence of Aβ, Aβ may
also be the cause of the mitochondrial and ROS abnormalities seen in neurons. Potentially sporadic
AD mitochondria are already predisposed to have increased ROS production, which is then
exacerbated by increased amyloid and tau expression. Deconstructing whether mitochondrial
dysfunction or amyloid accumulation is the most important factor in generation of ROS in sporadic
AD neurons is an ideal question to be answered by iPSC model systems.
The work on iPSC derived neurons from patients with AD has highlighted several new aspects of
amyloid processing especially in familial derived neurons. Although the work is still in its infancy, the
majority of findings related to AD pathology correlate with experiments performed in peripheral
tissue, PM studies and animal experiments. Further work is needed to understand how metabolic
pathways are affected by the reprogramming process, and to understand why monolayer cell
cultures do not develop AD protein aggregates like three dimensional ones.
1.15.3 iPSCs AD Astrocytes
Astrocyte differentiation from iPSCs has been achieved, but in the majority of cases astrocytes are
generated after a neuronal like cell colony has first been established. This can mean that astrocytes
generated using iPSC can have very long differentiation times which can be expensive [388].
Originally deriving astrocytes using this technology led to poor yields of pure astrocytes, although
more recent differentiation techniques have meant that purities above 90% have now been
established [388, 389]. Importantly several studies have been able to show that iPSC derived
astrocytes can uptake glutamate, an important functional property of astrocytes, and a key
component of the astrocyte-neuronal relationship [388, 390].
The majority of literature for iPSC AD astrocyte work focuses on PSEN1 mutations. As with iPSC
derived neurons, iPSC derived astrocytes express a gene profile very similar to astrocytes collected
from PM AD brains [388, 390, 391]. Several studies have shown that astrocytes from patients with
AD secrete more Aβ than controls [370, 389, 391], and one study has used iPSC derived astrocytes to
71 | P a g e
identify new genes that influence the increased Aβ levels, tau hyperphosphorylation and increased
cytokine production seen in AD astrocytes. One of the genes identified, FERMT2, was shown to alter
Aβ secretion in both neurons and astrocytes, but when knocked down in both cell types decreased
tau phosphorylation in astrocytes, and increased the Aβ42/40 ratio in neurons [391]. This work has
shown how studying astrocytes specifically in AD can not only identify new therapeutic targets for
the condition, but that consequences of gene expression in astrocytes and neurons are different
meaning that to understand the pathology of AD better full characterization is need of all nervous
system cells.
One study has looked at mitochondrial function in iPSC derived AD astrocytes with a PSEN1 mutation
[389]. In this study astrocytes were created from 3 patients with a PSEN1 mutation. The study shows
an increase in OCR in the PSEN lines and a trend towards an increase in mitochondrial spare
respiratory capacity. The PSEN1 astrocytes have decreased calcium currents and increased calcium
uptake, although it is not discussed, if these changes are due to mitochondrial functional changes.
The increased mitochondrial function, evidenced by the high OCR, seen in the astrocytes in this
study is thought to be a consequence of reduced capability for the astrocytes to perform glycolysis.
Both glycolytic reserve and extracellular lactate levels are decreased in the PSEN1 astrocytes which
suggests decreased glycolytic function. The study also highlights that in co-culture with neurons from
control cell lines, these astrocytes do not support neuronal survival to the extent that control
astrocytes can. Using CRIPSR techniques to remove the PSEN1 mutation alleviates the disease
phenotype [389]. The fact that both changes in glycolysis and OxPHOS are seen in astrocytes in this
study has developed a precedence for further work to understand not only how the two metabolic
pathways interact, but specifically how they are affected in astrocytes in AD.
Sporadic AD astrocytes have been created using iPSC technology which have shown an increased Aβ
excretion by the astrocytes from one of 2 lines created, again highlighting the potential
heterogeneity of sporadic AD [370]. One study has created iPSC astrocytes from control subjects
with apoƐ4/4 phenotype, showing that in co-culture these astrocytes support survival of neurons to
a lesser extent than astrocytes with the apoƐ3/3 phenotype [392]. This finding clearly has
implications for sporadic AD astrocyte function and may compound any underlying metabolic
functional changes seen.
These studies show that iPSC technology can create astrocytes from AD patients, and changes in
gene expression are similar to that seen in PM astrocytes. Research in this area has started to
identify the potential possibilities of using iPSC derived astrocytes to study AD, but this research is
still confined to a relatively small number of studies. There is clearly a need to develop the
72 | P a g e
understanding of metabolic functional changes seen in AD astrocytes created using this technology.
The majority of iPSC astrocyte work has focused on familial AD, meaning that a gap in the
understanding of how astrocytes are affected in sporadic AD needs to be addressed with iPSC
research. Studies already performed using iPSC derived AD astrocytes all have relatively small
sample sizes, which as mentioned in the above section, may affect result interpretation when
considering sporadic AD. Studies would also benefit from comparing derived astrocyte function to
the function of the donor cell type from the same person. This would help to develop the
understanding of how the reprogramming process affects derived cell function, but also open up the
opportunity to perform experiments in larger cohorts of cell types that have fewer financial
constraints, if changes seen in iPSC derived cells mirror those seen in parent donor cells. Patient cell
reprograming has much potential in developing our understanding of how the astrocyte neuron
relationship is affected in AD.
1.15.4 iPSC Summary and iNPC research
iPSC technology offers huge potential to develop our understanding of different brain cell
interactions, but also the ability to test drugs identified through drug screening in a CNS setting. The
fact that these cells come from human patients with the disease is critical as it allows for the study of
AD cell homeostasis, without the need to over express the amyloid or tau proteins. This is a
particular strength of this model system that can be exploited to study mitochondrial function in AD,
as we can study mitochondria from patients with the condition in cell types that the disease effects.
This, to a certain extent, is a unique feature of this model system when compared to others available
to study mitochondrial and metabolic change in AD.
A limitation of using this model system is that the neurons and glia differentiated from iPSC’s display
a phenotype which most closely represents that seen in foetal neuronal cells. After prolonged
differentiation of more than 200 days, the neurons can then become “aged”. Since the original
development of this reprogramming technique, alterations have been made that allow cells
generated from the reprogramming methods to maintain an aged phenotype and enable more
direct reprogramming [393]. One such method is direct reprogramming which creates induced
neuronal progenitor cells (iNPCs) that maintain an aged phenotype [350, 394]. Once iNPCs have
been generated, iAstrocytes can be differentiated in 7 days, and neurons usually within a month.
This reduces the time needed for differentiation when compared to iPSC techniques. As the body
makes the transition to the adult state, the metabolic pathways relied upon to generate ATP also
change. For this reason, it is import to study brain cellular metabolism in age appropriate cells and
understand the contribution of each metabolic pathway in the model being used.
73 | P a g e
For this thesis, a similar direct reprogramming method is employed to that described by Mertens et
al above [393]. Using this particular reprogramming technique iNPCs have been generated from
patients with both sporadic and familial motor neuron disease (MND) [395-400] and sporadic and
familial PD [396, 401], which have in turn been differentiated into astrocytes. Importantly it has
been shown that this version of iNPC reprogramming generates neurons and astrocytes that have
gene expression profiles similar to primary cells, and that diseased MND astrocytes can recapitulate
motor neuron damage seen within the MND CNS [350]. iNPC models have identified that the
pathological effect of astrocytes on neurons in MND is in part mediated via extravesical micro-RNA
release leading to motor neuron network degeneration [400]. iNPC astrocytes have also been shown
to modulate the expression of major histocompatibility complexes on neurons, which again has
highlighted how MND astrocytes have pathological functions that affect neuronal survival [402].
Metabolic changes have also been reported in iNPC astrocytes generated from familial MND patients
with decreased metabolic flexibility, and altered glycogen and fructose metabolism reported [396].
Deficits in mitochondrial capacity, and glycolytic function have also been reported in familial and
sporadic MND iNPC astrocytes, without the need for the over expression of pathological protein
aggregates [395]. This research is evidence that iNPC derived cells are a good model system to
identify changes in cellular metabolic function.
This thesis is the first to describe the use of this particular iNPC reprogramming technique to create
astrocytes from patients with sporadic and familial AD.
1.16 Introduction Summary
Data suggest that the process of OxPHOS in mitochondria is affected early in AD. Evidence from both
animal and cell models of AD suggests that changes in oxidative metabolism occur long before the
deposition of amyloid plaques. Very similar conclusions can be reached from the data presented in
experiments interrogating the process of glycolysis in AD. Changes in OxPHOS and glycolysis occur in
multiple cells outside the central nervous system, again without the build up of amyloid, suggesting
that these changes may be of fundamental importance in the disease process. Non-CNS model
systems though cannot reveal how these changes in metabolism affect processes unique to CNS cells
such as synapse formation and electrochemical signal transmission. Data from PM tissue can show
metabolic changes within the brain, but samples gained in this way are often at the end stage of the
disease and therefore causality between different pathological events cannot be established. A
model system allowing comparison between peripheral cell metabolic abnormalities and CNS cells
derived from these peripheral cells would help the development of our understanding of the
condition. This type of model system would also allow for the investigation of maximum capacity of
74 | P a g e
human OxPHOS and glycolysis within the CNS, and how this may affect cellular functions uniquely in
these cells.
Limited research has been performed using iPSC astrocytes to study the astrocytic component to AD
and to date no research has been published using iNPC derived astrocytes to study AD. This project
describes the metabolic abnormalities seen in fibroblasts and astrocytes differentiated from iNPCs
from patients with both sporadic and familial AD.
1.17 PhD Hypothesis, Aims and Objectives
Hypothesis: Fibroblasts and Astrocytes derived from patients with AD have impairments in glycolysis
and mitochondrial function that can be corrected by repurposing FDA approved compounds.
1.17.1 Aims and Objectives:
Aims:
To characterise metabolic deficits in human derived astrocytes and their parental fibroblasts, which
could be used as potential drug targets or biomarkers for AD in the future.
To correlate metabolic findings with established clinical markers of AD.
Objectives:
1. Characterise patient derived iAstrocyte and parental fibroblast impairments in glycolysis and
mitochondrial structure and function.
2. Explore possible mechanisms that may be responsible for the altered glycolysis and mitochondrial
structure and function.
3. Determine if pre-selected compounds, known to improve mitochondrial function, improve AD
patient derived iAstrocyte mitochondria function.
4. Correlate iAstrocyte metabolic deficits against established clinical markers of AD.

75 | P a g e
Chapter 2: Methods
2.1 Materials
All materials used in this project where supplied by SIGMA-ALDRICH company ltd, UK, unless
otherwise stated.
2.2 Methods
2.2.1 Patient selection and characterisation
All sporadic patients and controls included in this study were collected as part of the Virtual
Physiological Human – DementiA RESearch Enabled by IT (VPH-DARE@IT; http://www.vph-dare.eu/)
initiative, a multicentre project funded by the EU (Framework Programme 7). A total of 10 patients
with a clinical diagnosis of sporadic AD (the criteria by McKhann et al., 2011[403]) were selected. A
diagnosis of Alzheimer dementia was made after assessment by both a consultant neurologist with a
specialist interest in cognitive disorders, and a professor of neuropsychology had assessed the
patients. The diagnosis was made on clinical grounds and did not incorporate amyloid or tau
biomarkers. Each patient had undergone a brain MRI and cognitive profiling. The cognitive domains
characterised by the tests were selected based on their susceptibility to neurodegeneration of the
AD type. Patients were not eligible if there were the potential for a non-degenerative cause of their
cognitive symptoms. Specific exclusion criteria were set as follows: medical diagnoses of clinical
concern which could otherwise justify the potential presence of cognitive difficulties; MRI images
showing abnormalities other than the effects of ageing and/or neurodegeneration; medical or
radiological evidence of acute or chronic cerebrovascular disease; history of transient ischemic
attacks, cardiovascular disease, uncontrolled seizures, peptic ulcer, sick sinus syndrome, or
neuropathy with conduction defects; abnormal levels of folate, vitamin B12, or thyroid-stimulating
hormone; treatments with medications for research purposes or with significant toxic effects on
internal organs; evidence of a psychiatric or psychological cause of cognitive impairment.
A second cohort of sporadic patients, and a cohort of familial PSEN1 mutation patients, was selected
from the Coriell cell repository. In sporadic AD patients a diagnosis was made using clinical criteria
alone. For all PSEN1 patients included in the study, the PSEN1 gene was sequenced and PSEN1
mutation identified. Table 3.1 in chapter 3 highlights the demographic details for the patients
included in this thesis.

76 | P a g e
2.2.2 Skin biopsy
Skin biopsies were taken from patients and controls recruited from the Sheffield young onset
memory clinic, Sheffield, UK. Ethical approval for biopsy was gained from the NHS Yorkshire & The
Humber - Bradford Leeds Research Ethics Committee (Reference: 16/YH/0155). Biopsies where
taken from the non-dominant arm of all participants. The area for biopsy was cleaned with alcohol
based cleaning solution, anaesthetised with 2% lidocaine (2mls), and then 2, 3mm diameter biopsies
were taken with a punch biopsy (Stiefel). The biopsies were removed from the skin using a scalpel
(Swann-Morton) and 1 was placed in Minimum Essential Medium (EMEM), the other in Dulbecco's
Modified Eagle Medium (DMEM) based fibroblast culture media (See table 2.1&2.2 for media
constituents). All patients biopsied had first been selected to be part of the VPH-DARE@IT project.
2.2.3 Skin Biopsy set up and fibroblast culture
Biopsies where dissected into 6 pieces and then placed into a T25cm2 (Greiner bio-one) tissue
culture flask containing 0.5mls of media that consisted of 50% EMEM or DMEM and 50% FBS
(Biosera). 0.5mls of the same media was added to the T25cm2 flasks on alternate days until the
biopsies had grown epithelial and fibroblast cells. This was usually for 1 week from setting up the
biopsy. Once biopsies had started to grow additional cells the media was changed to EMEM or
DMEM only, without the extra FBS. Skin biopsies where grown in the T25cm2 flasks until they
became confluent with fibroblasts. At this stage the biopsies were washed in Phosphate Buffered
Saline solution (PBS) (see table 2.3 for constituents) twice (2.5mls each wash) and then lifted from
the biopsies using 1X Trypsin-Versene (Lonza) 2.5mls. The lifted fibroblasts were seeded in a new
T25cm2 flask. The biopsy was then re-fed with media and this process was repeated until the biopsy
flask becomes confluent with fibroblasts again. The fibroblasts taken from the biopsies were then
grown until confluent and split into a T75cm2 tissue culture flask (Thermofisher). Once fibroblasts
had become confluent they were trypsinised and early passages (up to passage 4) were then frozen
down for future studies (see 2.2.3 for freezing down method). Subsequent fibroblasts are used for
experimental work. Figure 2.1 show examples of skin biopsy cell growth and cultured fibroblasts.
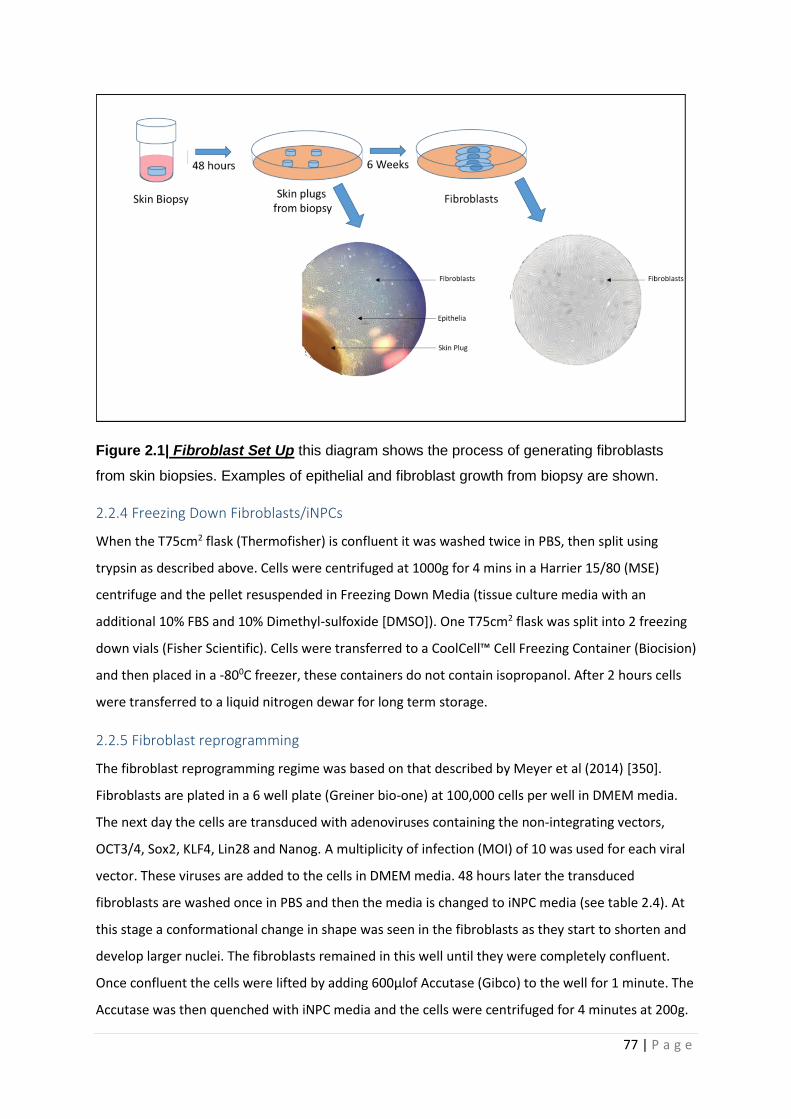
77 | P a g e
Figure 2.1| Fibroblast Set Up this diagram shows the process of generating fibroblasts
from skin biopsies. Examples of epithelial and fibroblast growth from biopsy are shown.
2.2.4 Freezing Down Fibroblasts/iNPCs
When the T75cm2 flask (Thermofisher) is confluent it was washed twice in PBS, then split using
trypsin as described above. Cells were centrifuged at 1000g for 4 mins in a Harrier 15/80 (MSE)
centrifuge and the pellet resuspended in Freezing Down Media (tissue culture media with an
additional 10% FBS and 10% Dimethyl-sulfoxide [DMSO]). One T75cm2 flask was split into 2 freezing
down vials (Fisher Scientific). Cells were transferred to a CoolCell™ Cell Freezing Container (Biocision)
and then placed in a -800C freezer, these containers do not contain isopropanol. After 2 hours cells
were transferred to a liquid nitrogen dewar for long term storage.
2.2.5 Fibroblast reprogramming
The fibroblast reprogramming regime was based on that described by Meyer et al (2014) [350].
Fibroblasts are plated in a 6 well plate (Greiner bio-one) at 100,000 cells per well in DMEM media.
The next day the cells are transduced with adenoviruses containing the non-integrating vectors,
OCT3/4, Sox2, KLF4, Lin28 and Nanog. A multiplicity of infection (MOI) of 10 was used for each viral
vector. These viruses are added to the cells in DMEM media. 48 hours later the transduced
fibroblasts are washed once in PBS and then the media is changed to iNPC media (see table 2.4). At
this stage a conformational change in shape was seen in the fibroblasts as they start to shorten and
develop larger nuclei. The fibroblasts remained in this well until they were completely confluent.
Once confluent the cells were lifted by adding 600µlof Accutase (Gibco) to the well for 1 minute. The
Accutase was then quenched with iNPC media and the cells were centrifuged for 4 minutes at 200g.
78 | P a g e
The cells were replated into 2 wells of a 6 well plate pre-coated with Fibronectin (Millipore)
(concentration 1mg/ml diluted 1:200 in PBS). The reprogrammed cells were split into 3 wells of a six
well plate and then a 10cm petri dish (Thermo Scientific). The 10cm dish split was repeated until the
cells developed a morphology consistent with iNPC’s. At this stage the cells were stained for PAX6
and Nestin (see table 6 for antibody concentrations, and section 2.2.6 for immunochemistry
method) to establish iNPC conversion was successful. Once cells were confirmed to be iNPCs they
were split at a ratio of 1:5 and frozen down until passage 4 was reached. At this point they can be
used for experimental work. The freezing process uses media used for iNPC’s culture with the
addition of 10% DMSO. The process is the same as described above for fibroblasts, but without
washing steps.
2.2.6 iNPC differentiation into Astrocytes
Once iNPCs become confluent they were split as described above and then plated in a 10cm petri
dish (Thermo Scientific) coated with Fibronectin (Concentration 1mg/ml diluted 1:400 in PBS). For
astrocyte differentiation 50,000-100,000 iNPCs were then plated into 10mls of Astrocyte growth
medium (see table 5). The cells were cultured for four days in this media, with replacement of the
media happening on day 4 after seeding. Day 5 post seeding the astrocytes were lifted using
Accutase (1ml/ dish) and plated for experiments. Experimental work is done at day 7. Changes to
galactose media were made at day 6. Figure 2.2 shows examples of iNPC’s and astrocytes
differentiated from fibroblasts.
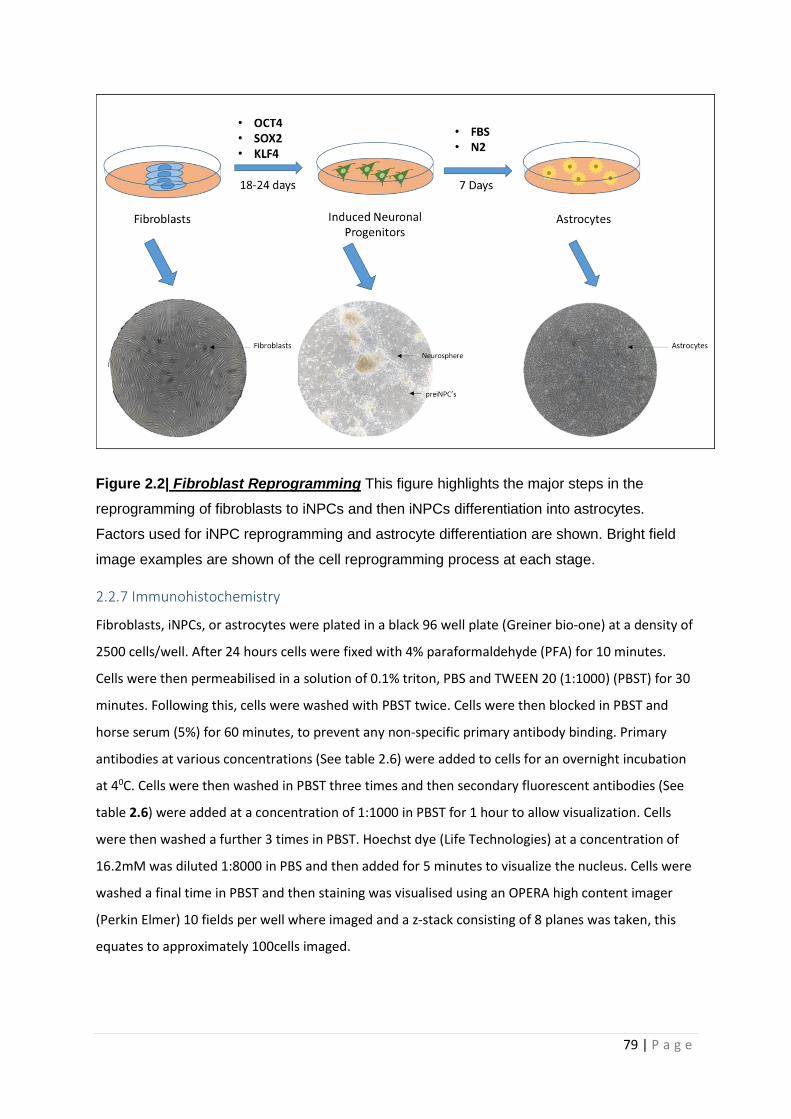
79 | P a g e
Figure 2.2| Fibroblast Reprogramming This figure highlights the major steps in the
reprogramming of fibroblasts to iNPCs and then iNPCs differentiation into astrocytes.
Factors used for iNPC reprogramming and astrocyte differentiation are shown. Bright field
image examples are shown of the cell reprogramming process at each stage.
2.2.7 Immunohistochemistry
Fibroblasts, iNPCs, or astrocytes were plated in a black 96 well plate (Greiner bio-one) at a density of
2500 cells/well. After 24 hours cells were fixed with 4% paraformaldehyde (PFA) for 10 minutes.
Cells were then permeabilised in a solution of 0.1% triton, PBS and TWEEN 20 (1:1000) (PBST) for 30
minutes. Following this, cells were washed with PBST twice. Cells were then blocked in PBST and
horse serum (5%) for 60 minutes, to prevent any non-specific primary antibody binding. Primary
antibodies at various concentrations (See table 2.6) were added to cells for an overnight incubation
at 40C. Cells were then washed in PBST three times and then secondary fluorescent antibodies (See
table 2.6) were added at a concentration of 1:1000 in PBST for 1 hour to allow visualization. Cells
were then washed a further 3 times in PBST. Hoechst dye (Life Technologies) at a concentration of
16.2mM was diluted 1:8000 in PBS and then added for 5 minutes to visualize the nucleus. Cells were
washed a final time in PBST and then staining was visualised using an OPERA high content imager
(Perkin Elmer) 10 fields per well where imaged and a z-stack consisting of 8 planes was taken, this
equates to approximately 100cells imaged.
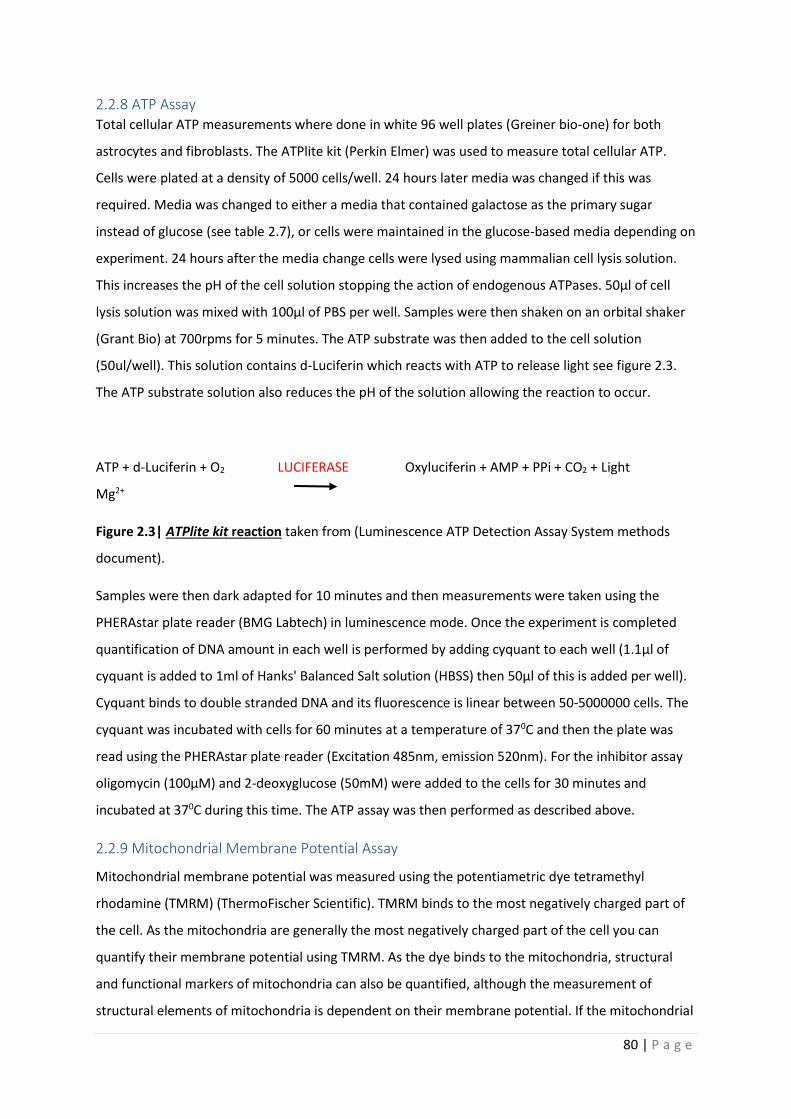
80 | P a g e
2.2.8 ATP Assay Total cellular ATP measurements where done in white 96 well plates (Greiner bio-one) for both
astrocytes and fibroblasts. The ATPlite kit (Perkin Elmer) was used to measure total cellular ATP.
Cells were plated at a density of 5000 cells/well. 24 hours later media was changed if this was
required. Media was changed to either a media that contained galactose as the primary sugar
instead of glucose (see table 2.7), or cells were maintained in the glucose-based media depending on
experiment. 24 hours after the media change cells were lysed using mammalian cell lysis solution.
This increases the pH of the cell solution stopping the action of endogenous ATPases. 50µl of cell
lysis solution was mixed with 100µl of PBS per well. Samples were then shaken on an orbital shaker
(Grant Bio) at 700rpms for 5 minutes. The ATP substrate was then added to the cell solution
(50ul/well). This solution contains d-Luciferin which reacts with ATP to release light see figure 2.3.
The ATP substrate solution also reduces the pH of the solution allowing the reaction to occur.
ATP + d-Luciferin + O2 LUCIFERASE Oxyluciferin + AMP + PPi + CO2 + Light
Mg2+
Figure 2.3| ATPlite kit reaction taken from (Luminescence ATP Detection Assay System methods
document).
Samples were then dark adapted for 10 minutes and then measurements were taken using the
PHERAstar plate reader (BMG Labtech) in luminescence mode. Once the experiment is completed
quantification of DNA amount in each well is performed by adding cyquant to each well (1.1µl of
cyquant is added to 1ml of Hanks' Balanced Salt solution (HBSS) then 50µl of this is added per well).
Cyquant binds to double stranded DNA and its fluorescence is linear between 50-5000000 cells. The
cyquant was incubated with cells for 60 minutes at a temperature of 370C and then the plate was
read using the PHERAstar plate reader (Excitation 485nm, emission 520nm). For the inhibitor assay
oligomycin (100µM) and 2-deoxyglucose (50mM) were added to the cells for 30 minutes and
incubated at 370C during this time. The ATP assay was then performed as described above.
2.2.9 Mitochondrial Membrane Potential Assay
Mitochondrial membrane potential was measured using the potentiametric dye tetramethyl
rhodamine (TMRM) (ThermoFischer Scientific). TMRM binds to the most negatively charged part of
the cell. As the mitochondria are generally the most negatively charged part of the cell you can
quantify their membrane potential using TMRM. As the dye binds to the mitochondria, structural
and functional markers of mitochondria can also be quantified, although the measurement of
structural elements of mitochondria is dependent on their membrane potential. If the mitochondrial
81 | P a g e
membrane potential is low, then it will be difficult to visualise structural elements of the
mitochondria. The TMRM dye excess is washed off after one hour of incubation. This was done to
stop the TMRM quenching its own fluorescence, and hence maintaining the linear relationship
between fluorescence and membrane potential [404]. Prior to performing MMP experiments an
assessment has to be made of whether the TMRM dye is being used in a quenched or de-quenched
state. A quenched state refers to when a cationic dye becomes so concentrated in the mitochondrial
matrix that molecules of the dye aggregate and stop fluorescing [405]. When a rapid loss of
membrane potential occurs, such as that seen when FCCP is added to the cells then if the matrix is
overloaded with dye “quenched” an increased TMRM signal is seen as in the quenched state the
TMRM dye is released slower by the mitochondrial matrix. In the de-quenched state, the TMRM
signal will be completely dissipated when FCCP is added to the cells [406]. Prior to performing MMP
assessment of fibroblasts and astrocytes FCCP was added to the cells to show that the dye was being
used in the de-quenched state.
Fibroblasts or astrocytes were plated in a black 96-well plate at a density of 2500 cells/well. 24 hours
later media was changed as described in the ATP assay section. 24 hours after this incubation, media
was replaced with phenol red-free media (ThermoFischer Scientific) containing TMRM
(concentration 80nM) and hoescht (concentration 10nM) (Sigma Aldrich). The cells were then
incubated for 1 hour at 370C. After this, dyes were removed, and the cells were placed in phenol red-
free media alone. The mitochondria were then visualised using an InCell 2000 high content imager,
25 fields with an average number of 500 cells were visulised. Collected images were then assessed
for mitochondrial morphology parameters using the InCell Developer software and segmentation
protocols [407]. Parameters assessed include mitochondrial form factor. This is a combined
measurement of both a mitochondria’s perimeter length and area (Form Factor=
(Perimeter2/4π.area). It is a measure of how round a mitochondrion appears to be, but also gives an
indication of how interconnected the mitochondrial network is. The measurement is similar to the
more commonly used aspect ratio.
2.2.10 Lactate Assay
Media lactate was measured when fibroblasts or astrocytes had reached confluency. An L-Lactate
assay kit (abcam ab65331) protocol was followed whilst performing this experiment. In summary,
total cellular lactate was measured by oxidising lactate through the actions of lactate
dehydrogenase. This produces NAD+ which then reacts with formazan, a chromogenic dye, which
produces a light signal.
82 | P a g e
1µl of fibroblasts or astrocyte media was added to 49µl of lactate assay buffer (LAB) Costar 3590, 96-
well clear flat bottom plate (Corning). After this a further 46µl of LAB was added to each well with
2µl of substrate (formazan) and 2µl of enzyme (lactate dehydrogenase) from resuspended aliquots
supplied with the assay kit. Samples were then gently mixed on an Orbital Shaker at 100rpm for 30
minutes at room temperature. The plate was then read on a PHERAstar Plate reader absorbance
filter at 570nm. To measure the lactate a standard curve was created (2-10nmol range of lactate
concentrations), and background lactate measurements were made. Disease samples were
normalised to the controls of the day for lactate readings.
2.2.11 Mitochondrial Stress Test Assay
Cells were plated in a Seahorse XF24 Cell Culture Microplate (Aglient) at a density of 60,000
cells/well for fibroblasts and 10,000 cells/well for astrocytes. 24 hours later media was changed as
described above in ATP sections. On the same day Seahorse XF Calibrant Solution at a volume of
1ml/well was added to each well of the Seahorse XF24 sensor cartridge plate (Aglient). This plate
was then incubated at 370C for 24 hours. 48 hours after plating cells the media was changed to
Seahorse XF assay media (See table 2.8). This media change was done to increase measurement
consistency, as the XF Media has a set buffering capacity allowing for inter-plate comparisons. The
cells were then incubated for 60 minutes at 370C in a CO2 concentration found in air. Prior to running
the assay oligomycin, FCCP and rotenone were then added to ports A, B, and C on the sensor
cartridge plate respectively. Table 2.9 lists drug concentrations and ports. The Seahorse XF24 Cell
Culture Microplates were then read in the Seahorse XF24 machine. The XF24 analyser first calibrates
the culture plate and then mixes each well in the plate for 3 minutes, the machine then pauses for 2
minutes and a reading was taken for 3 minutes. This protocol was repeated three times and then the
contents of port A were injected into the media. The same process was followed for 3 cycles and
then port B was injected. Port C was injected into the media after a further 3 cycles. This is the same
protocol as described by Mortiboys et al (2015) [408]. Measurements of the oxygen consumption
rate (OCR), as a surrogate measure of OxPHOS, and extracellular acidification rate (ECAR), a
surrogate measure of glycolysis, were taken at each reading point. Once readings were gathered a
cell count for each plate was performed by first fixing the seahorse plate with 4% PFA and then
adding hoescht (concentration 20mM diluted 1:8000) to each well. Cell count readings were
performed on an INCELL2000 high content imager.
2.2.12 Glycolysis Assay
The glycolysis assay uses the same principals to measure cellular glycolysis as the mitochondrial
stress test by measuring the change of pH (ECAR) in the cell media caused by lactate production as
part of glycolysis. Cells were plated in a Seahorse XF24 Cell Culture Microplate (Aglient) at a density
83 | P a g e
of 60,000 cells/well for fibroblasts and 10,000 cells/well for astrocytes. The next 48 hours of the
glycolysis experiment were identical to the mitochondrial stress test assay. When the media was
replaced with Seahorse XF assay media, there was no glucose added to the media. Ports A, B and C
on the sensor cartridge plate contained glucose, oligomycin and 2-deoxyglucose respectively (See
table 2.9). The protocol for the running of the seahorse XF24 machine is the same as used for the
mitochondrial stress test. Cell counts were performed in the same way as the mitochondrial stress
test.
2.2.13 ATP Substrate Assay
The ATP substrate assay was used to investigate impairments in ETC complex function. 500,000 cells
are collected at day 7 of astrocyte differentiation. Cells were suspended in 250µl buffer A (see table
2.10). Buffer A is used at a pH of 7.4. Cells were then permeabilised with histone 2ug/ml for 5
minutes. After permeabilization 5 volumes of buffer A (1250mls) are added to the cell suspension.
The suspension was then centrifuged for 5 minutes at 10,000rpm. Cells were then resuspended in
150µl of Buffer A. 50µl of the resuspension was taken for Bradford assay (see section 2.2.14). 550µl
of buffer A was then added to the remaining 100µl of suspension for use in the substrate assay. The
assessment of complex linked ATP production at this stage must be performed with 15 minutes of
adding the 550µl of buffer A to samples.
A PHERAstar plate reader (BMG Labtech) in luminescence mode was used to read ATP levels after
addition of complex I or complex II substrates. The plate reader was set to perform an ATP kinetics
assay. A background luminescence reading was made of each well on the assay plate containing
160µl of cell suspension and one of either the complex I, or II substrate mixture (see table 2.11).
Both complex I&II conditions were repeated with the addition of 2µl of oligomycin (per well). This is
done to confirm that the luminescence recorded was a production of ETC complex activity. Addition
of oligomycin stopped any increase in luminescence above background, therefore the increased
luminescence generated from addition of the ATP substrate was due to ETC complex activity. After
baseline kinetics were measured the machine was paused and 5uls of Adenosine diphosphate (ADP)
(0.1mM) and 10µl of The ATP substrate solution, described above in the ATP assay section (5.2.7)
were added to each well. The kinetics assay was then resumed and measurements of substrate use
were made every 30 seconds for 10 minutes. P1 P5-di(adenosine) pentaphosphate (PPAP) is added to
wells before the measurement of substrate use to block the luminescence generated by adenylate
kinase activity which occurs before luminescence is generated from OxPHOS [409]. Without the
addition of PPAP the signal generated would not represent substrate usage by the ETC.
84 | P a g e
Once the assay is completed a kinetics curve is constructed and gradient was measured. Protein
content estimation (via Bradford assay see section 2.2.14) was performed which gradient readings
were then normalised to.
2.2.14 Bradford Assay
A Bradford assay was performed in certain experiments to estimate the amount of protein
contained within a particular sample. A standard curve was created from a BSA standard (Curve
protein concentrations 0ug/ml to 10 ug/ml). 5µl of each of the protein standards was plated on a
Costar 3590 96-well clear flat bottom plate (Corning) well plate in triplicate. For the ATP substrate
assay 1µl of sample was added to 4µl of deionized water and then place in separate wells in the 96-
well plate in triplicate. 250µl of Comassie blue solution (Thermo Scientific) was then added to each
well. Readings of protein concentration were then made using a PHERAstar plate reader, absorbance
595nm (BMG Labtech). A standard curve was created to calculate protein concentration.
2.2.15 Glutamine/Glutamate Assay
A Glutamine/Glutamate-Glo™ Assay (Promega) was used to measure intracellular concentrations of
glutamine and glutamate. A 10cm dish of Astrocytes (≈ 2,000,000 cells) was washed 3 times in 5mls
of PBS for 5 minutes per wash. Cells were then immersed in Inactivation solution (2mls of HCL 0.3N
and 1ml PBS) for 5 minutes. After this the dish was scraped using a cell scraper (Corning) and 1ml of
Tris solution (2-Amino-2-(hydroxymethyl)-1,3-propanediol, 450mM at pH 8.0) was added to the cells.
200µl of this solution was then added to 200uls of PBS. 25µl of this dilution was then placed in a well
of a white 96-well greiner plate. For the assay 4 wells of cell solution were needed per astrocyte line.
2 wells had 25µl of glutaminase buffer (Promega) added only, and 2 wells had 25µl of glutaminase
buffer with 0.125µl of glutaminase (100u/ml, Promega) added. A glutamate concentration curve was
set up with glutamate concentrations starting at 0µM to 50µM. Glutamate for the concentration
curve was sourced from Promega. 25µl of the glutamate standards were then added to wells on the
96-well plate. 25µls of glutaminase buffer was added to each of the glutamate standard wells. The
plate was then shaken for 1 minute (700rpm) and samples were incubated at room temperature for
35 minutes.
After incubation 50µl of Glutamate Detection Reagent (See table 2.15) was added to each of the
sample and concentration curve wells. The plate was shaken for another minute (700rpm) and then
incubated at room temperature for one hour. Measurements of luminescence were then taken
using a PHERAstar plate reader (Excitation 485nm, emission 520nm) (BMG Labtech). The ratio of
glutamate to glutamine was calculated by subtracting the measurements of the wells with only
glutaminase buffer in them from the wells that have glutaminase and glutaminase buffer in them.
85 | P a g e
The result of the subtraction gave the glutamine amount and the remainder was the glutamate
measurement.
2.2.16 Quantitative Polymerase Chain Reaction (qPCR)
For qPCR approximately 750,000 fibroblast cells or 2,000,000 astrocytes were harvested. For
fibroblast UDCA experiments, fibroblasts were treated with UDCA at a concentration of 10µM or
100nM 24 hours prior to harvest. The RNeasy Mini Kit (Qiagen) was used to extract RNA from
samples. RNA extraction was performed as described in the kit protocol. 350µl of RLT buffer was
added to the collected cells and then using a needle and syringe the sample was homogenised.
350µl of 70% ethanol was then added to the sample and mixed by pipetting the sample up and
down. 700µl of the prepared sample was then placed in a RNeasy spin column (Qiagen) and placed
in a 2ml collection tube. The spin column was then spun for 15 seconds at 8000g using a Sigma 1K15
centrifuge. 700µl of RW1 buffer is then added to the spin column and the sample is then spun again
for 15 seconds at 8000g. The same process is then repeated with 2 volumes of 500µl of RPE buffer
discarding the column flow through at each step. The spin column was then transferred to a new
collection tube and 30µl of RNase-free water is added before the column was spun for 1 minute at
8000g to elute RNA. RNA mass and purity were then measured using a spectrophotometer
(NanoDrop ND-1000 machine). RNA purity was calculated using the 260/280nm absorbance ratio.
Only samples that had a ratio reading of 2 or above were accepted for qPCR. A ratio of less than 2
suggests protein contamination from the isolation procedure.
After calculating RNA purity and mass, RNA levels were measured using a Stratgene PCR machine. A
High-Capacity cDNA Reverse Transcription Kit (Thermofisher scientific) was used to prepare samples
for qPCR. Samples were loaded on to a PCR plate (Bio-Rad) at 12.5ng/µl. 10µl of sample, 2µl of 10Xrt
Buffer, 0.8µl of 25xdNTP Mix(100nM), 2µl of 10xRT random primers, 10µl Sybr Green detection dye
(Thermo Scientific) and 4.2µl RNase-free water was added to each well. The plate was spun on an
ALC PK1200 centrifuge at 3000rpm for 2 minutes prior to starting qPCR. Samples were prepared on
ice. The PCR machine was set to run a cycle that had 3 steps. Step 1 was 10 minutes long at a
temperature of 250C, step 2 120 minutes at 370C and step 3, 5 minutes at 850C. 40 amplification
cycles were performed. Table 2.12 displays the forward and reverse primer sequences used for each
gene assessed. Disease samples were normalised to the controls of the day.
2.2.17 Glucose Uptake Assay
Glucose uptake of astrocytes was measured using the Glucose Uptake Assay Kit (Fluorometric)
(Abcam, ab136956). For this assay cells were treated with 2-deoxyglucose a molecule identical to
glucose, except 2 hydroxyl groups have been replaced by hydrogen atoms. This prevents the sugar
86 | P a g e
from being metabolised when it is taken up by cells. 2-Deoxyglucose is transported into cells using
the same transporters as glucose. It has an identical uptake pathway into cells and therefore
measurement of 2-deoxyglucose is equivalent to measuring cell glucose uptake.
Astrocytes were plated at a density of 2500 cells per well in a 96 well black griener plate. At day 7
after differentiation the astrocytes were washed 3 times in PBS and then incubated for 40 minutes in
a 100µl of Krebs-Ringer-Phosphate-Hepes (KRPH) buffer with 2% bovine serum albumen added pH
7.4 (see table 2.14). After this the astrocytes were washed again 3 times in PBS and then 2-
deoxyglucose at a concentration of 50mM was added to the cells for 20minutes suspended in KRPH
(volume 100µl per well). Cells were then washed again 3 times in PBS and then 90µl of Extraction
buffer (Abcam) was added. Astrocytes were pipetted up and down in the well and then snap frozen
in liquid nitrogen. After freezing samples were left to thaw on ice.
Once samples have been warmed 10µl of Neutralisation buffer (Abcam) was added to each sample.
Samples were then mixed in a centrifuge at 500rpm for 2 minutes. 25µl of sample was then placed in
a black 96-well plate, with the volume made up to 50µl with glucose uptake assay buffer (Abcam).
Using the 2-deoxyglucose standard a standard curve was created with concentrations between 0µM-
20µM of 2-Deoxyglucose. 50µl of each standard was plated on the black 96-well plate. 50µl of
reaction mix (47µl Glucose uptake assay buffer, 2µl of enzyme mix and 1µl of PicoProbe, all supplied
by Abcam) was added to each sample and standard well. Samples were then incubated in an
incubator for 40 minutes at 370C. measurements of Fluorescence at Ex/Em=535/587nm were then
taken using PHERAstar plate reader (Excitation 485nm, emission 520nm) (BMG Labtech).
2.2.18 Glutamate Uptake Assays
An Abcam colorimetric Glutamate Assay kit (ab83389) was used to measure astrocyte glutamate
uptake. Assay was performed as per manufacturers guidance. Astrocytes were plated on a black 96
well plate (Griener) at a density of 10,000 cells/well at day 5 of differentiation. On day 7 of
differentiation the astrocyte media was changed to HBSS (Gibco), without calcium or magnesium for
30 minutes. This media was then changed to HBSS containing magnesium and calcium for 3 hours
which also contained 100µl of glutamate at a concentration of 1:1000. After this the cells were
washed in PBS and resuspended in glutamate assay buffer (100µl/well). Samples where
homogenised by pipetting the sample quickly up and down and then snap frozen in liquid nitrogen.
Samples were either then stored or defrosted on ice. After the samples had defrosted, they were
centrifuged for 5 minutes at 17000G at a temperature of 40C, supernatant was collected and for
each samples 50µl was added to a black 96-well plate (Griener). To each sample 100µl of reaction
mix was added (Glutamate assay buffer 90µl, Glutamate developer 8µl and Glutamate enzyme mix
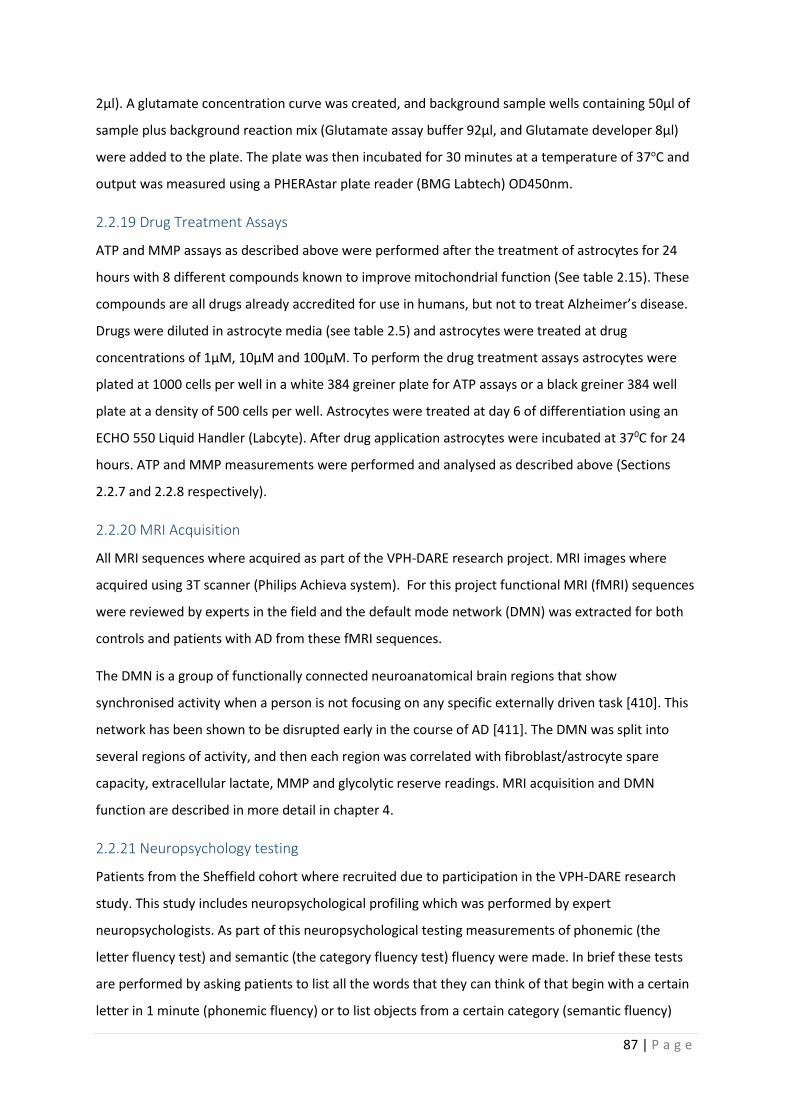
87 | P a g e
2µl). A glutamate concentration curve was created, and background sample wells containing 50µl of
sample plus background reaction mix (Glutamate assay buffer 92µl, and Glutamate developer 8µl)
were added to the plate. The plate was then incubated for 30 minutes at a temperature of 37oC and
output was measured using a PHERAstar plate reader (BMG Labtech) OD450nm.
2.2.19 Drug Treatment Assays
ATP and MMP assays as described above were performed after the treatment of astrocytes for 24
hours with 8 different compounds known to improve mitochondrial function (See table 2.15). These
compounds are all drugs already accredited for use in humans, but not to treat Alzheimer’s disease.
Drugs were diluted in astrocyte media (see table 2.5) and astrocytes were treated at drug
concentrations of 1µM, 10µM and 100µM. To perform the drug treatment assays astrocytes were
plated at 1000 cells per well in a white 384 greiner plate for ATP assays or a black greiner 384 well
plate at a density of 500 cells per well. Astrocytes were treated at day 6 of differentiation using an
ECHO 550 Liquid Handler (Labcyte). After drug application astrocytes were incubated at 370C for 24
hours. ATP and MMP measurements were performed and analysed as described above (Sections
2.2.7 and 2.2.8 respectively).
2.2.20 MRI Acquisition
All MRI sequences where acquired as part of the VPH-DARE research project. MRI images where
acquired using 3T scanner (Philips Achieva system). For this project functional MRI (fMRI) sequences
were reviewed by experts in the field and the default mode network (DMN) was extracted for both
controls and patients with AD from these fMRI sequences.
The DMN is a group of functionally connected neuroanatomical brain regions that show
synchronised activity when a person is not focusing on any specific externally driven task [410]. This
network has been shown to be disrupted early in the course of AD [411]. The DMN was split into
several regions of activity, and then each region was correlated with fibroblast/astrocyte spare
capacity, extracellular lactate, MMP and glycolytic reserve readings. MRI acquisition and DMN
function are described in more detail in chapter 4.
2.2.21 Neuropsychology testing
Patients from the Sheffield cohort where recruited due to participation in the VPH-DARE research
study. This study includes neuropsychological profiling which was performed by expert
neuropsychologists. As part of this neuropsychological testing measurements of phonemic (the
letter fluency test) and semantic (the category fluency test) fluency were made. In brief these tests
are performed by asking patients to list all the words that they can think of that begin with a certain
letter in 1 minute (phonemic fluency) or to list objects from a certain category (semantic fluency)

88 | P a g e
this includes listing animals, fruits and cities. Immediate and delayed memory (via the prose memory
test) was also chosen to be correlated with mitochondrial spare capacity.
These tests were chosen as 3 of the neuropsychological measures (semantic, immediate and delayed
recall) are shown to be affected early in AD [412]. The final test, phonemic fluency, was chosen as a
test that is not affected early in the course of AD [413]. For these 4 tasks a score was generated
which was then compared with mitochondrial functional markers or glycolytic markers listed in the
MRI section. Further details on neuropsychological assessment in AD are described in chapter 4.
2.3 Statistical analysis For comparing disease groups to controls for mitochondrial and glycolysis experiments a Student’s t-
test was used. For correlations between fibroblast spare capacity readings and neuropsychological
and neuroimaging data a Spearman's Rank correlation coefficient was used as the data were not
normally distributed.
89 | P a g e
2.4 Media Constituents
Table 2.1| DMEM Media
Media Constituent Concentration/Volume Supplier
Dulbecco’s Modified Eagle’s Medium with L-Glutamine and 4.5g/L Glucose
500mls Lonza
Fetal Bovine Serum 50mls in 500mls of media Biosera
Penicillin 100IU/ml in 500mls of media
Sigma Aldrich
Streptomycin 100IU/ml in 500mls of media
Sigma Aldrich
Sodium Pyruvate 5mls of 1mM stock in 500mls of media
Sigma life sciences
Table 2.2| EMEM Media
Media Constituent Concentration/Volume Supplier
Minimum Essential Medium with Earle’s essential salts and L-glutamine
500mls Corning, USA
Fetal Bovine Serum 50mls in 500mls of media Biosera
Penicillin 100IU/ml in 500mls of media
Sigma Aldrich
Streptomycin 100IU/ml in 500mls of media
Sigma Aldrich
Sodium Pyruvate 5mls of 1mM stock in 500mls of media
Sigma life sciences
Non-essential Amino Acids 5mls of 0.1mM stock in 500mls of media
Lonza
Multi-vitamins 5mls in 500mls of media Lonza
Uridine 50ug/ml in 500mls of media Sigma
Table 2.3| Phosphate Buffered Saline
Media Constituent Concentration/Volume Supplier
Phosphate Buffered Saline Tablets
1 tablet ThermoFischer
Deionised Water 100mls NA

90 | P a g e
Table 2.4 |iNPC Media
Media Constituent Concentration/Volume Supplier
DMEM/F12 Glutamax 500mls Gibco
B27 5mls Gibco
N2 Supplement (100X) 5mls Gibco
FGF 5µl of 1mg/ml stock Gibco
Streptomycin 100IU/ml Sigma Aldrich
Penicillin 100IU/ml Sigma Aldrich
Table 2.5| Astrocyte Media
Media Constituent Concentration/Volume Supplier
Dulbecco’s Modified Eagle’s Medium with L-Glutamine and 4.5g/L Glucose
500mls Lonza
Fetal Bovine Serum 50mls Biosera
Penicillin 100IU/ml Sigma Aldrich
Streptomycin 100IU/ml Sigma Aldrich
N2 Supplement (100X) 5mls Gibco
Table 2.6| Antibodies used for Immunochemistry
Antibody Species Dilution Supplier
Vimentin chicken 1:200 Abcam (AB5733)
Nestin Mouse 1:200 Abcam (AB18102)
CD44 Rabbit 1:200 Abcam (AB157107)
S100β Rabbit 1:200 Abcam (AB868)
PAX6 Rabbit 1:1000 Abcam (AB5790)
GFAP Rabbit 1:200 Dako (Z0334)
NDGR2 Mouse 1:200 Santacruz (sc-376202)
ALDH1L1 Rabbit 1:1000 Abcam (AB87117)
Secondary Antibodies
Alexia 488 Rabbit 1:1000 Invitrogen
Alexia 488 Mouse 1:1000 Invitrogen
Alexia 488 Chicken 1:1000 Invitrogen
Alexia 568 Rabbit 1:1000 Invitrogen
Alexia 568 Mouse 1:1000 Invitrogen
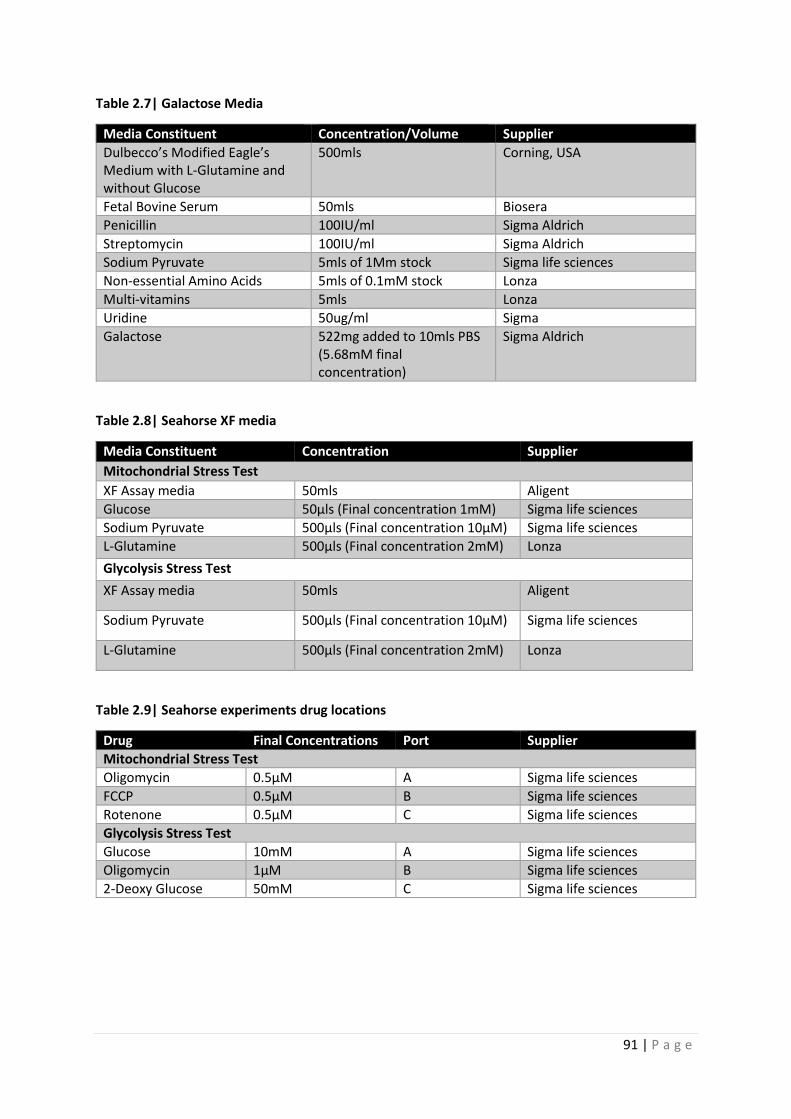
91 | P a g e
Table 2.7| Galactose Media
Media Constituent Concentration/Volume Supplier
Dulbecco’s Modified Eagle’s Medium with L-Glutamine and without Glucose
500mls Corning, USA
Fetal Bovine Serum 50mls Biosera
Penicillin 100IU/ml Sigma Aldrich
Streptomycin 100IU/ml Sigma Aldrich
Sodium Pyruvate 5mls of 1Mm stock Sigma life sciences
Non-essential Amino Acids 5mls of 0.1mM stock Lonza
Multi-vitamins 5mls Lonza
Uridine 50ug/ml Sigma
Galactose 522mg added to 10mls PBS (5.68mM final concentration)
Sigma Aldrich
Table 2.8| Seahorse XF media
Media Constituent Concentration Supplier
Mitochondrial Stress Test
XF Assay media 50mls Aligent
Glucose 50µls (Final concentration 1mM) Sigma life sciences
Sodium Pyruvate 500µls (Final concentration 10µM) Sigma life sciences
L-Glutamine 500µls (Final concentration 2mM) Lonza
Glycolysis Stress Test
XF Assay media 50mls Aligent
Sodium Pyruvate 500µls (Final concentration 10µM) Sigma life sciences
L-Glutamine 500µls (Final concentration 2mM) Lonza
Table 2.9| Seahorse experiments drug locations
Drug Final Concentrations Port Supplier
Mitochondrial Stress Test
Oligomycin 0.5µM A Sigma life sciences
FCCP 0.5µM B Sigma life sciences
Rotenone 0.5µM C Sigma life sciences
Glycolysis Stress Test
Glucose 10mM A Sigma life sciences
Oligomycin 1µM B Sigma life sciences
2-Deoxy Glucose 50mM C Sigma life sciences
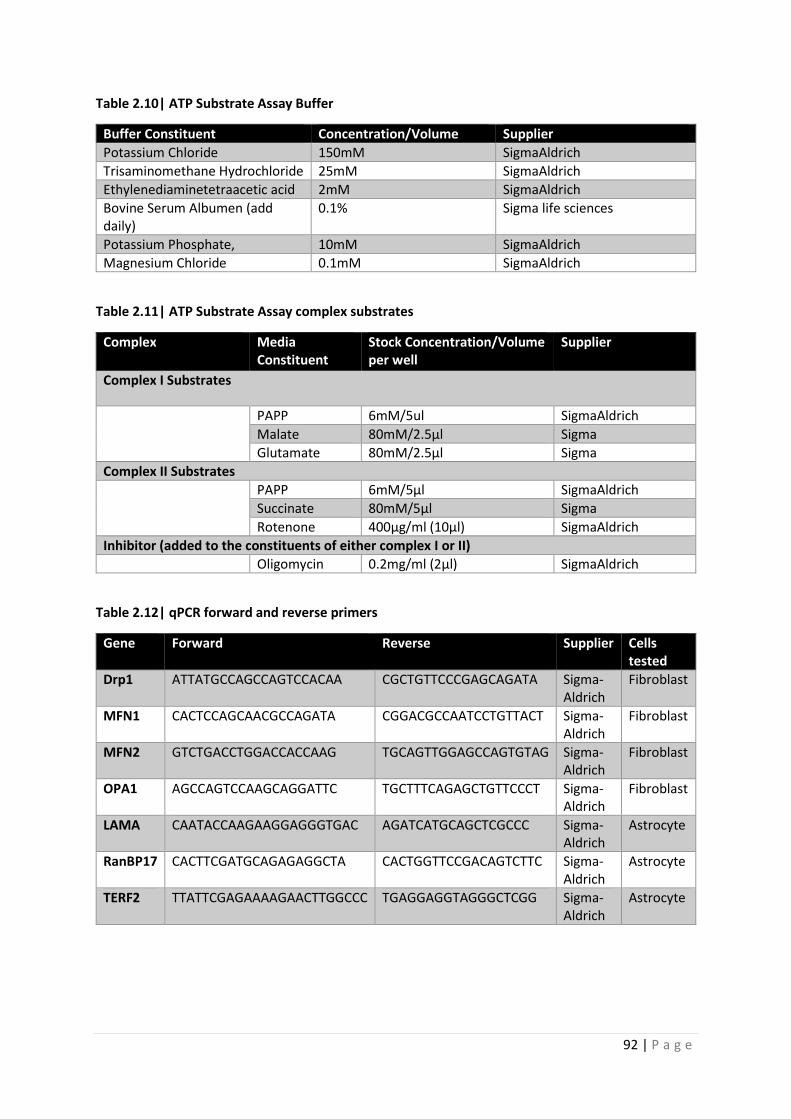
92 | P a g e
Table 2.10| ATP Substrate Assay Buffer
Buffer Constituent Concentration/Volume Supplier
Potassium Chloride 150mM SigmaAldrich
Trisaminomethane Hydrochloride 25mM SigmaAldrich
Ethylenediaminetetraacetic acid 2mM SigmaAldrich
Bovine Serum Albumen (add daily)
0.1% Sigma life sciences
Potassium Phosphate, 10mM SigmaAldrich
Magnesium Chloride 0.1mM SigmaAldrich
Table 2.11| ATP Substrate Assay complex substrates
Complex Media Constituent
Stock Concentration/Volume per well
Supplier
Complex I Substrates
PAPP 6mM/5ul SigmaAldrich
Malate 80mM/2.5µl Sigma
Glutamate 80mM/2.5µl Sigma
Complex II Substrates
PAPP 6mM/5µl SigmaAldrich
Succinate 80mM/5µl Sigma
Rotenone 400µg/ml (10µl) SigmaAldrich
Inhibitor (added to the constituents of either complex I or II)
Oligomycin 0.2mg/ml (2µl) SigmaAldrich
Table 2.12| qPCR forward and reverse primers
Gene Forward Reverse Supplier Cells tested
Drp1 ATTATGCCAGCCAGTCCACAA CGCTGTTCCCGAGCAGATA Sigma-Aldrich
Fibroblast
MFN1 CACTCCAGCAACGCCAGATA CGGACGCCAATCCTGTTACT Sigma-Aldrich
Fibroblast
MFN2 GTCTGACCTGGACCACCAAG TGCAGTTGGAGCCAGTGTAG Sigma-Aldrich
Fibroblast
OPA1 AGCCAGTCCAAGCAGGATTC TGCTTTCAGAGCTGTTCCCT Sigma-Aldrich
Fibroblast
LAMA CAATACCAAGAAGGAGGGTGAC AGATCATGCAGCTCGCCC Sigma-Aldrich
Astrocyte
RanBP17 CACTTCGATGCAGAGAGGCTA CACTGGTTCCGACAGTCTTC Sigma-Aldrich
Astrocyte
TERF2 TTATTCGAGAAAAGAACTTGGCCC TGAGGAGGTAGGGCTCGG Sigma-Aldrich
Astrocyte
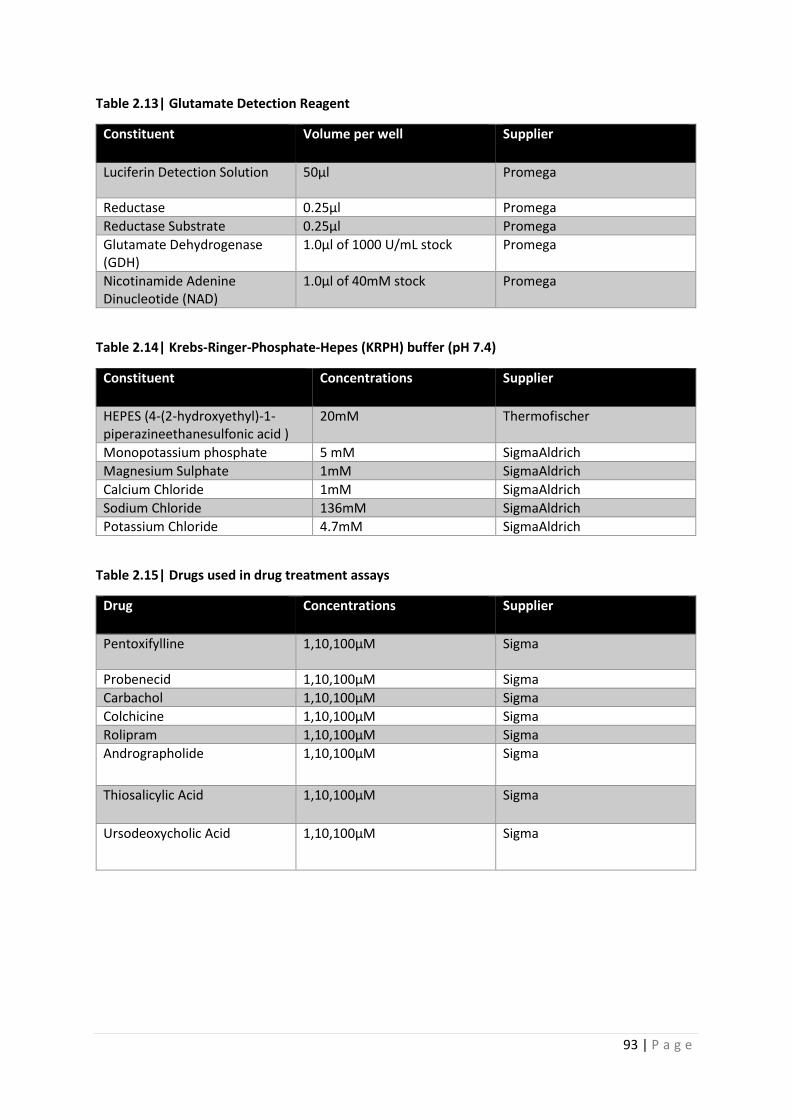
93 | P a g e
Table 2.13| Glutamate Detection Reagent
Constituent Volume per well Supplier
Luciferin Detection Solution 50μl Promega
Reductase 0.25μl Promega
Reductase Substrate 0.25μl Promega
Glutamate Dehydrogenase (GDH)
1.0μl of 1000 U/mL stock Promega
Nicotinamide Adenine Dinucleotide (NAD)
1.0μl of 40mM stock Promega
Table 2.14| Krebs-Ringer-Phosphate-Hepes (KRPH) buffer (pH 7.4)
Constituent Concentrations Supplier
HEPES (4-(2-hydroxyethyl)-1-piperazineethanesulfonic acid )
20mM Thermofischer
Monopotassium phosphate 5 mM SigmaAldrich
Magnesium Sulphate 1mM SigmaAldrich
Calcium Chloride 1mM SigmaAldrich
Sodium Chloride 136mM SigmaAldrich
Potassium Chloride 4.7mM SigmaAldrich
Table 2.15| Drugs used in drug treatment assays
Drug Concentrations Supplier
Pentoxifylline 1,10,100µM Sigma
Probenecid 1,10,100µM Sigma
Carbachol 1,10,100µM Sigma
Colchicine 1,10,100µM Sigma
Rolipram 1,10,100µM Sigma
Andrographolide 1,10,100µM Sigma
Thiosalicylic Acid 1,10,100µM Sigma
Ursodeoxycholic Acid 1,10,100µM Sigma
94 | P a g e
Chapter 3: Ursodeoxycholic Acid improves mitochondrial function and
redistributes Drp1 in fibroblasts from patients with either sporadic or
familial Alzheimer's disease
3.1 Introduction
In this chapter mitochondrial function and morphology are assessed in sporadic and familial AD
patient fibroblasts. An alteration in the mitochondrial morphology is identified in both sporadic and
familial AD fibroblasts. Mitochondrial functional changes are also identified which suggest a deficit in
MMP in both sporadic and familial AD fibroblasts and a reduced efficiency by which the
mitochondria consume oxygen as part of OxPHOS. These functional changes, and some of the
morphological changes can be altered by the application of Ursodeoxycholic Acid (UDCA). The effect
of UDCA appears to be mediated via an alteration in the proteins that control mitochondrial fission
and fusion. This is the broad conclusion of the published paper that forms part of this chapter. Work
on mitochondrial fission and fusion protein expression was performed by another co-author Katy
Barnes.
In extra data sections of this chapter how mitochondrial morphology and function is affected by
ApoE genotype in AD, the total cellular ATP levels in AD fibroblasts, and how the application of UDCA
corrects ATP deficits will be presented. In this chapter introduction, mitochondrial fission and fusion
will be discussed in more detail, as well as the effect the ApoE gene has on metabolic function in AD.
3.1.2 Mitochondrial Fission and Fusion
As discussed in chapter 1 mitochondrial fission and fusion are controlled by four main proteins.
Mitochondrial fission is initiated by Drp1, whereas mitochondrial fusion is activated by the outer
mitochondrial membrane proteins MFN1 & MFN2 and the inner mitochondrial membrane protein
OPA1 [414].
For fission to occur Drp1 has to move from the cytoplasm to the mitochondria. It is recruited to the
mitochondria by one of 4 different mitochondrial proteins collectively referred to as the DRP1
binding proteins. They are Mitochondrial fission 1 protein (Fis1), Mitochondrial fission factor (Mff),
Mitochondrial dynamics protein 49 (MiD49) and Mitochondrial dynamics protein 51(MiD51), [415].
Once Drp1 has bound the mitochondria, it forms a ring like structure around the mitochondrion. The
identified mitochondrial can then be removed from the mitochondrial network and either
transported to another part of the cell, or broken down if identified as damaged. Mitochondrial
fission has multiple roles within a cell including quality control of the mitochondrial network, and
allowing the redistribution of mitochondria throughout a cell [132]. Mitochondrial distribution is
95 | P a g e
particularly important in a cell type like the neuron, due to the size of the cell, and the fact that
synapses require high densities of mitochondria that function appropriately [416].
Mitochondrial fusion also has a role in maintenance of the cell mitochondrial network.
Mitochondrial fusion allows different mitochondria to exchange mitochondrial DNA and ETC
proteins. This means that these mitochondrial resources can be used most efficiently [417].
Changes in mitochondrial dynamics have been reported both in nervous system cells and peripheral
cells in people with AD. Both increased fusion [418], and increased fission [204] of the fibroblast
mitochondrial network has been observed in AD, which may reflect the dynamic nature of this
organelle. Mitochondrial dynamics in neurons from patients or models of AD tend to report that the
network is fragmented, and that all main fission and fusion proteins are down regulated [167, 419].
The CNS changes in mitochondrial fission and fusion may represent the end stage of the disease, or
be a consequence of the over expression of amyloid in animal models. It has been shown that
increased Aβ production increases nitric oxide expression. The nitric oxide can increase the activity
of Drp1 through S-nitrosylation which can lead to increased mitochondrial network fragmentation
[420]. It is not known if neurons from people with AD start with a fused mitochondrial network, like
that seen in some fibroblast studies, and then develop the more fragmented network as a result of
the presence of Aβ. The differences in mitochondrial network structure seen between the periphery
and CNS may represent different responses by cells to energetic demands, cellular stress, or
metabolite availability.
3.1.3 Apoε gene and its effect on metabolism in AD
Apoε gene encodes a 34 kDa protein involved in the metabolism and distribution of lipids. The
protein has 3 isoforms (ε2 ε3, ε4), with the presence of the ApoE ε4 allele conferring an increased
risk of sporadic AD development 12 times the general population risk [421]. Within the nervous
system the protein is mainly distributed in astrocytes and has a central role in the passage of lipids
and cholesterol to neurons [422]. ApoE ε4 containing astrocytes have a reduced ability to uptake
amyloid when compared to ApoE ε3 astrocytes [423]. This potentially explains why the presence of
the ApoE ε4 allele causes early deposition of amyloid within the brain as well as impaired Aβ
clearance [424].
The ApoE protein has been shown to effect both synaptic strength and integrity and can affect brain
glucose metabolism and insulin signalling [422]. The exact mechanism by which the ApoE protein
affects both synaptic integrity and glucose metabolism is not known, but the effects on glucose
metabolism are believed to be mediated through the action on the Peroxisome Proliferator
96 | P a g e
activated receptor γ (PPARγ) [425]. PPAR γ pathway becomes inactive in the ApoE ε4 brain which
leads to a reduction in glucose transporters and HK activity.
Potentially the ApoE ε4 allele also has an effect on mitochondrial dynamics with reductions in DRP1
and increases in MFN1 seen in the hippocampi of mice expressing 2 ε4 alleles leading to a fused
mitochondrial network [426]. The fused mitochondrial network seen in this model has a reduced
membrane potential and increased mitochondrial Parkin recruitment which may affect the ability of
the mitochondria to produce ATP. It is not addressed in this paper though if the changes in
mitochondrial function and dynamics are separate to, or a consequence of, the potential alteration
that ApoE ε4 can cause to the delivery and metabolism of glucose. This is an important point to
understand as the mitochondrial structural changes could be a result of reduced metabolite
availability as opposed to a direct effect of ApoE genotype.
3.1.4 Assessment of oxidative phosphorylation using the seahorse XF analyser
This chapter describes different components of oxidative phosphorylation in detail. The main
experiment used to assess fibroblast oxidative phosphorylation was the Agilent sea horse XF
analyser. A mitochondrial stress test was used for this. In this experiment oxygen consumption is
measured after the application of different mitochondrial inhibitors. Oxygen is consumed by
oxidative phosphorylation at complex IV. Twelve separate readings of the media oxygen
concentration are made during the experiment. 3 are taken firstly to measure the basal level of
mitochondrial oxygen consumption. This is the amount of oxygen that is consumed by the
fibroblasts when oxidative phosphorylation is working at its basal rate. The next 3 measurements are
taken after the addition of oligomycin to the cell media. Oligomycin is an inhibitor of the ATP
synthase enzyme. This decreases the oxygen consumption and allows for the calculation of the
amount of oxygen consumed by the cells to generate ATP. This is referred to as the ATP linked
respiration. The next 3 measurements are made after the addition of FCCP. This drug increases the
permeability of the inner mitochondrial membrane, which allows protons to move from the inter-
membrane space to the matrix. The movement of protons dissipates the MMP, which forces
complexes I, III, IV of the ETC to work at their maximum rate. This allows for the measurement of the
maximum rate of oxidative phosphorylation that the cells under assessment can achieve (Maximum
mitochondrial respiration), but also the mitochondrial spare respiratory capacity (MSRC) which is the
difference between basal mitochondrial oxygen consumption rates and maximum mitochondrial
oxygen consumption rates. It is a measure of how much oxidative phosphorylation can be increased
if the ATP demands of the cell increase. The final 3 measurement are taken after the addition of
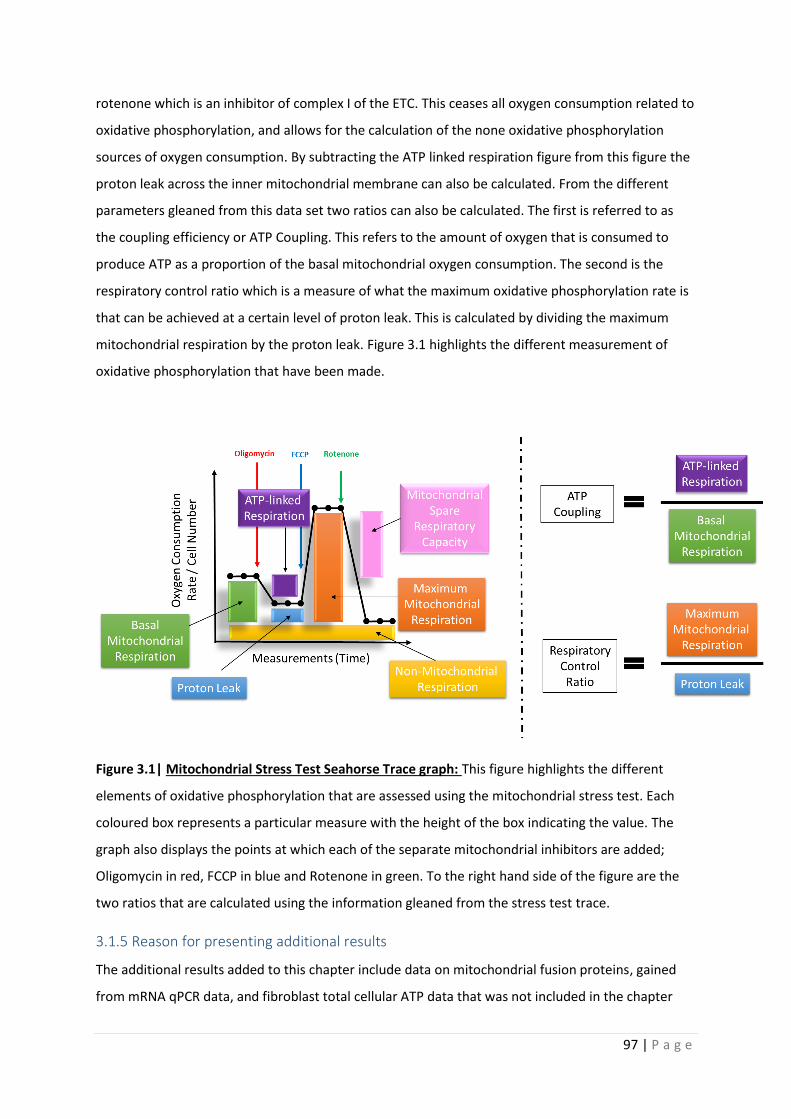
97 | P a g e
rotenone which is an inhibitor of complex I of the ETC. This ceases all oxygen consumption related to
oxidative phosphorylation, and allows for the calculation of the none oxidative phosphorylation
sources of oxygen consumption. By subtracting the ATP linked respiration figure from this figure the
proton leak across the inner mitochondrial membrane can also be calculated. From the different
parameters gleaned from this data set two ratios can also be calculated. The first is referred to as
the coupling efficiency or ATP Coupling. This refers to the amount of oxygen that is consumed to
produce ATP as a proportion of the basal mitochondrial oxygen consumption. The second is the
respiratory control ratio which is a measure of what the maximum oxidative phosphorylation rate is
that can be achieved at a certain level of proton leak. This is calculated by dividing the maximum
mitochondrial respiration by the proton leak. Figure 3.1 highlights the different measurement of
oxidative phosphorylation that have been made.
Figure 3.1| Mitochondrial Stress Test Seahorse Trace graph: This figure highlights the different
elements of oxidative phosphorylation that are assessed using the mitochondrial stress test. Each
coloured box represents a particular measure with the height of the box indicating the value. The
graph also displays the points at which each of the separate mitochondrial inhibitors are added;
Oligomycin in red, FCCP in blue and Rotenone in green. To the right hand side of the figure are the
two ratios that are calculated using the information gleaned from the stress test trace.
3.1.5 Reason for presenting additional results
The additional results added to this chapter include data on mitochondrial fusion proteins, gained
from mRNA qPCR data, and fibroblast total cellular ATP data that was not included in the chapter
98 | P a g e
publication. The sporadic AD fibroblast metabolic parameters that are presented in the chapter
publication are separated based on ApoE genotype in the extra results section. These results have
been added as in sporadic AD the presence of the ApoE ε4 alone has a huge effect on a person’s risk
of developing AD, therefore as the allele has been shown to affect metabolism, it is important to
understand how the changes in mitochondrial function and ApoE ε4 genotype interact.
Included in the extra results section in this thesis chapter are a further 6 sporadic AD lines that were
not included in the chapter paper. They have been added to the ApoE ε4 analysis at this stage to
help develop the understanding of how ApoE and metabolism interact. These lines were not
included in the original paper as they were collected after the time of publication.
Data on how total cellular ATP is affected by UDCA is also added to this section as these results were
not included in the original paper.
3.1.6 Published Paper contributions by PhD Candidate
My contributions to this paper included:
• Gaining ethical approval for all Sheffield biopsies to be performed.
• Taking all biopsies for Sheffield cohorts.
• Performing ATP assays on 1 familial line and 4 sporadic AD lines and associated controls
discussed in the paper, and the extra 6 Sheffield sporadic AD and control fibroblast lines
discussed in the additional results.
• Performing mitochondrial morphology assays on 1 familial line and 4 sporadic AD lines and
associated controls discussed in the paper, and the extra 6 Sheffield sporadic AD and control
fibroblast lines discussed in the additional results.
• Performing all seahorse mitochondrial stress test assays.
• Performing all Quantitative Polymerase Chain Reaction (qPCR) experiments.
• Performing all UDCA treatment MMP/ATP assays for 1 familial line and 4 sporadic AD lines
and associated controls, and performed all UDCA treatment seahorse-based assays for all
fibroblast lines.
• Culturing and performing assays for Drp1 knock down experiment, but I did not perform
westerns or perform data analysis for this section.
• Contributed to writing the manuscript and data analysis.

99 | P a g e
3.2 Published Paper
This Paper was published in the Journal of Molecular Biology The citation is
Bell, S. M., K. Barnes, H. Clemmens, A. R. Al-Rafiah, E. A. Al-Ofi, V. Leech, O. Bandmann, P. J. Shaw,
D. J. Blackburn, L. Ferraiuolo and H. Mortiboys (2018). "Ursodeoxycholic Acid Improves
Mitochondrial Function and Redistributes Drp1 in Fibroblasts from Patients with Either Sporadic or
Familial Alzheimer's Disease." J Mol Biol 430(21): 3942-3953.
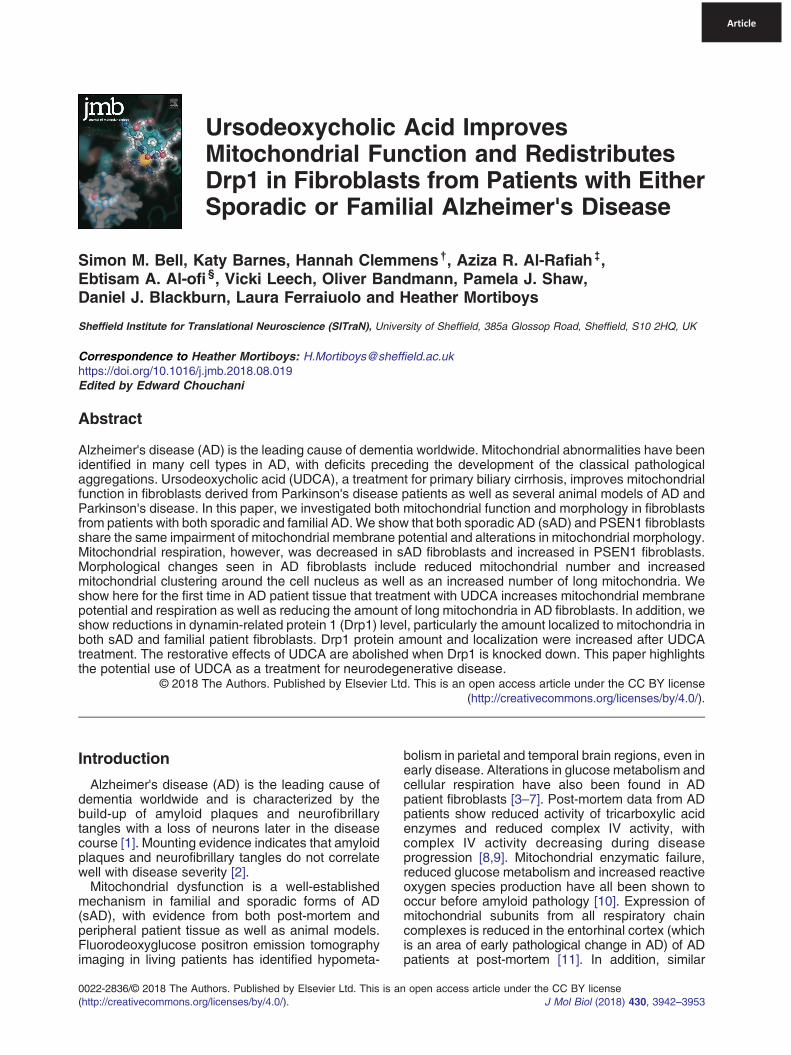
Article
UrsodeoxycholicMitochondrial FuDrp1 in FibroblaSporadic or Fam
Simon M. Bell, Katy Barnes, Hannah Cle§
0022-2836/© 2018 The Au(http://creativecommons.org
Acid Improvesnction and Redistributessts from Patients with Eitherilial Alzheimer's Disease
mmens †, Aziza R. Al-Rafiah ‡,Ebtisam A. Al-ofi , Vicki Leech, Oliver Bandmann, Pamela J. Shaw,Daniel J. Blackburn, Laura Ferraiuolo and Heather Mortiboys
Sheffield Institute for Translational Neuroscience (SITraN), University of Sheffield, 385a Glossop Road, Sheffield, S10 2HQ, UK
Correspondence to Heather Mortiboys: [email protected]://doi.org/10.1016/j.jmb.2018.08.019Edited by Edward Chouchani
Abstract
Alzheimer's disease (AD) is the leading cause of dementia worldwide. Mitochondrial abnormalities have beenidentified in many cell types in AD, with deficits preceding the development of the classical pathologicalaggregations. Ursodeoxycholic acid (UDCA), a treatment for primary biliary cirrhosis, improves mitochondrialfunction in fibroblasts derived from Parkinson's disease patients as well as several animal models of AD andParkinson's disease. In this paper, we investigated both mitochondrial function and morphology in fibroblastsfrom patients with both sporadic and familial AD. We show that both sporadic AD (sAD) and PSEN1 fibroblastsshare the same impairment of mitochondrial membrane potential and alterations in mitochondrial morphology.Mitochondrial respiration, however, was decreased in sAD fibroblasts and increased in PSEN1 fibroblasts.Morphological changes seen in AD fibroblasts include reduced mitochondrial number and increasedmitochondrial clustering around the cell nucleus as well as an increased number of long mitochondria. Weshow here for the first time in AD patient tissue that treatment with UDCA increases mitochondrial membranepotential and respiration as well as reducing the amount of long mitochondria in AD fibroblasts. In addition, weshow reductions in dynamin-related protein 1 (Drp1) level, particularly the amount localized to mitochondria inboth sAD and familial patient fibroblasts. Drp1 protein amount and localization were increased after UDCAtreatment. The restorative effects of UDCA are abolished when Drp1 is knocked down. This paper highlightsthe potential use of UDCA as a treatment for neurodegenerative disease.
© 2018 The Authors. Published by Elsevier Ltd. This is an open access article under the CC BY license(http://creativecommons.org/licenses/by/4.0/).
Introduction
Alzheimer's disease (AD) is the leading cause ofdementia worldwide and is characterized by thebuild-up of amyloid plaques and neurofibrillarytangles with a loss of neurons later in the diseasecourse [1]. Mounting evidence indicates that amyloidplaques and neurofibrillary tangles do not correlatewell with disease severity [2].Mitochondrial dysfunction is a well-established
mechanism in familial and sporadic forms of AD(sAD), with evidence from both post-mortem andperipheral patient tissue as well as animal models.Fluorodeoxyglucose positron emission tomographyimaging in living patients has identified hypometa-
thors. Published by Elsevier Ltd. This is an/licenses/by/4.0/).
bolism in parietal and temporal brain regions, even inearly disease. Alterations in glucose metabolism andcellular respiration have also been found in ADpatient fibroblasts [3–7]. Post-mortem data from ADpatients show reduced activity of tricarboxylic acidenzymes and reduced complex IV activity, withcomplex IV activity decreasing during diseaseprogression [8,9]. Mitochondrial enzymatic failure,reduced glucose metabolism and increased reactiveoxygen species production have all been shown tooccur before amyloid pathology [10]. Expression ofmitochondrial subunits from all respiratory chaincomplexes is reduced in the entorhinal cortex (whichis an area of early pathological change in AD) of ADpatients at post-mortem [11]. In addition, similar
open access article under the CC BY licenseJ Mol Biol (2018) 430, 3942–3953
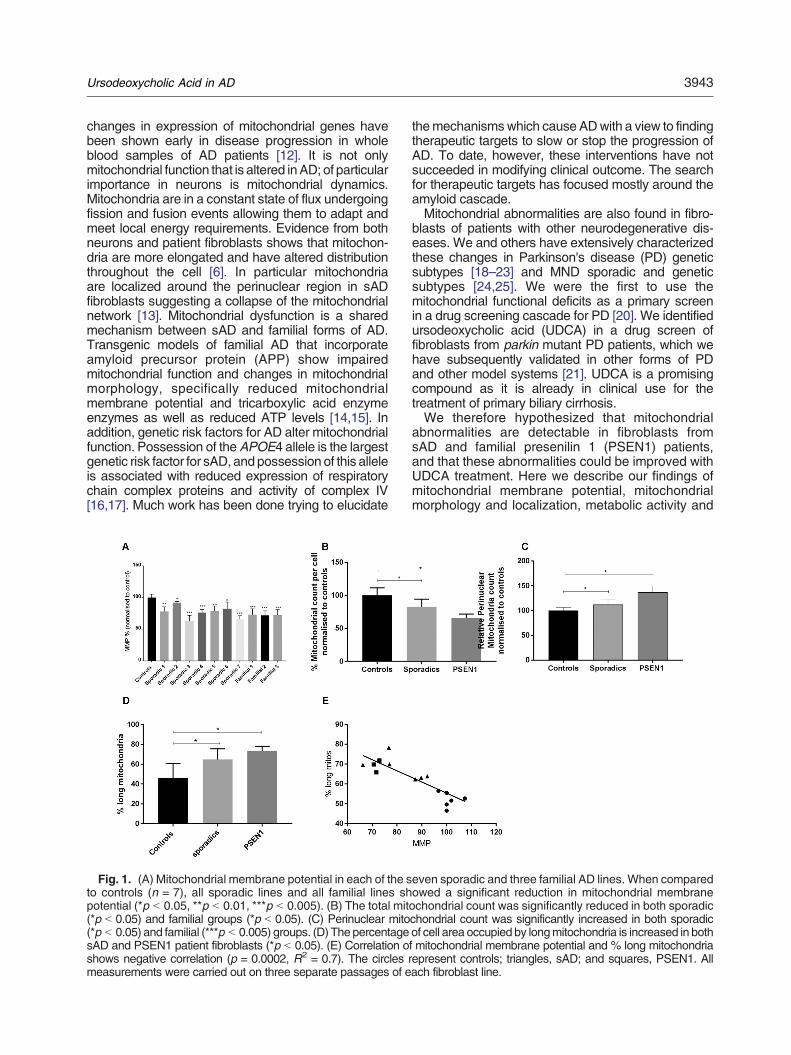
3943Ursodeoxycholic Acid in AD
changes in expression of mitochondrial genes havebeen shown early in disease progression in wholeblood samples of AD patients [12]. It is not onlymitochondrial function that is altered inAD; of particularimportance in neurons is mitochondrial dynamics.Mitochondria are in a constant state of flux undergoingfission and fusion events allowing them to adapt andmeet local energy requirements. Evidence from bothneurons and patient fibroblasts shows that mitochon-dria are more elongated and have altered distributionthroughout the cell [6]. In particular mitochondriaare localized around the perinuclear region in sADfibroblasts suggesting a collapse of the mitochondrialnetwork [13]. Mitochondrial dysfunction is a sharedmechanism between sAD and familial forms of AD.Transgenic models of familial AD that incorporateamyloid precursor protein (APP) show impairedmitochondrial function and changes in mitochondrialmorphology, specifically reduced mitochondrialmembrane potential and tricarboxylic acid enzymeenzymes as well as reduced ATP levels [14,15]. Inaddition, genetic risk factors for AD alter mitochondrialfunction. Possession of theAPOE4 allele is the largestgenetic risk factor for sAD, and possession of this alleleis associated with reduced expression of respiratorychain complex proteins and activity of complex IV[16,17]. Much work has been done trying to elucidate
Fig. 1. (A) Mitochondrial membrane potential in each of the sto controls (n = 7), all sporadic lines and all familial lines shpotential (*p b 0.05, **p b 0.01, ***p b 0.005). (B) The total mit(*p b 0.05) and familial groups (*p b 0.05). (C) Perinuclear mito(*p b 0.05) and familial (***p b 0.005) groups. (D) The percentagesAD and PSEN1 patient fibroblasts (*p b 0.05). (E) Correlation oshows negative correlation (p = 0.0002, R2 = 0.7). The circles rmeasurements were carried out on three separate passages of e
themechanismswhich cause ADwith a view to findingtherapeutic targets to slow or stop the progression ofAD. To date, however, these interventions have notsucceeded in modifying clinical outcome. The searchfor therapeutic targets has focused mostly around theamyloid cascade.Mitochondrial abnormalities are also found in fibro-
blasts of patients with other neurodegenerative dis-eases. We and others have extensively characterizedthese changes in Parkinson's disease (PD) geneticsubtypes [18–23] and MND sporadic and geneticsubtypes [24,25]. We were the first to use themitochondrial functional deficits as a primary screenin a drug screening cascade for PD [20]. We identifiedursodeoxycholic acid (UDCA) in a drug screen offibroblasts from parkin mutant PD patients, which wehave subsequently validated in other forms of PDand other model systems [21]. UDCA is a promisingcompound as it is already in clinical use for thetreatment of primary biliary cirrhosis.We therefore hypothesized that mitochondrial
abnormalities are detectable in fibroblasts fromsAD and familial presenilin 1 (PSEN1) patients,and that these abnormalities could be improved withUDCA treatment. Here we describe our findings ofmitochondrial membrane potential, mitochondrialmorphology and localization, metabolic activity and
even sporadic and three familial AD lines. When comparedowed a significant reduction in mitochondrial membraneochondrial count was significantly reduced in both sporadicchondrial count was significantly increased in both sporadicof cell area occupied by longmitochondria is increased in bothf mitochondrial membrane potential and % long mitochondriaepresent controls; triangles, sAD; and squares, PSEN1. Allach fibroblast line.
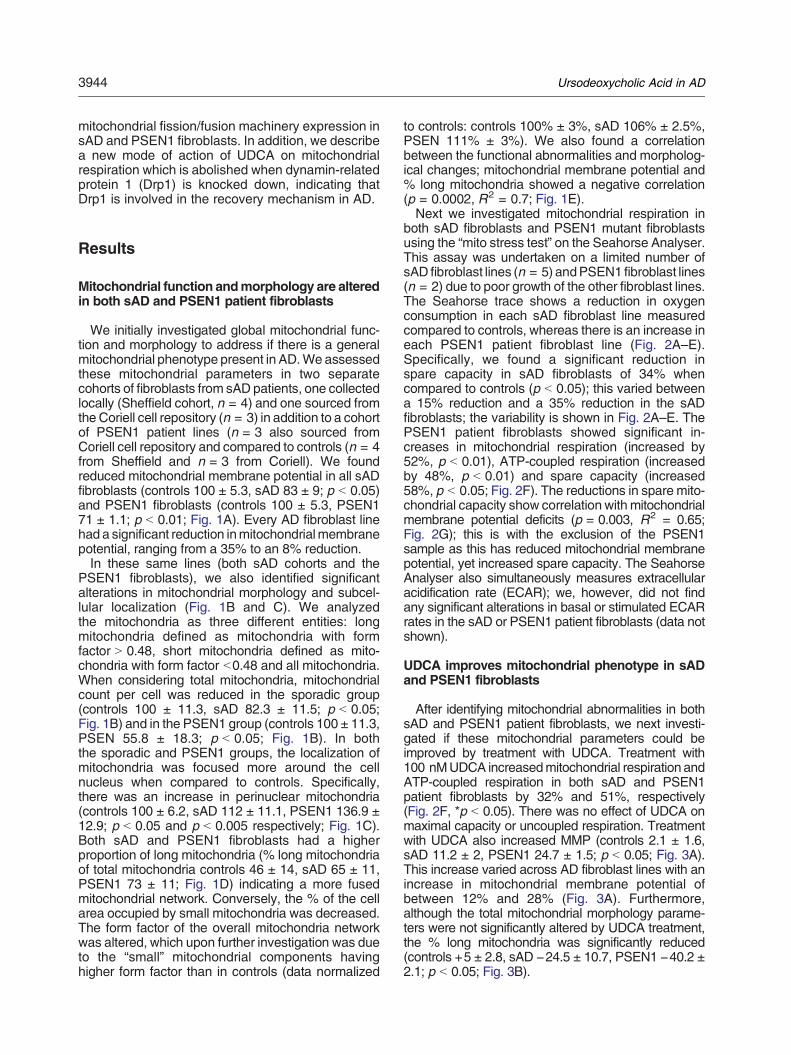
3944 Ursodeoxycholic Acid in AD
mitochondrial fission/fusion machinery expression insAD and PSEN1 fibroblasts. In addition, we describea new mode of action of UDCA on mitochondrialrespiration which is abolished when dynamin-relatedprotein 1 (Drp1) is knocked down, indicating thatDrp1 is involved in the recovery mechanism in AD.
Results
Mitochondrial function andmorphology are alteredin both sAD and PSEN1 patient fibroblasts
We initially investigated global mitochondrial func-tion and morphology to address if there is a generalmitochondrial phenotype present in AD.We assessedthese mitochondrial parameters in two separatecohorts of fibroblasts from sAD patients, one collectedlocally (Sheffield cohort, n = 4) and one sourced fromthe Coriell cell repository (n = 3) in addition to a cohortof PSEN1 patient lines (n = 3 also sourced fromCoriell cell repository and compared to controls (n = 4from Sheffield and n = 3 from Coriell). We foundreduced mitochondrial membrane potential in all sADfibroblasts (controls 100 ± 5.3, sAD 83 ± 9; p b 0.05)and PSEN1 fibroblasts (controls 100 ± 5.3, PSEN171 ± 1.1; p b 0.01; Fig. 1A). Every AD fibroblast linehad a significant reduction inmitochondrialmembranepotential, ranging from a 35% to an 8% reduction.In these same lines (both sAD cohorts and the
PSEN1 fibroblasts), we also identified significantalterations in mitochondrial morphology and subcel-lular localization (Fig. 1B and C). We analyzedthe mitochondria as three different entities: longmitochondria defined as mitochondria with formfactor N 0.48, short mitochondria defined as mito-chondria with form factor b0.48 and all mitochondria.When considering total mitochondria, mitochondrialcount per cell was reduced in the sporadic group(controls 100 ± 11.3, sAD 82.3 ± 11.5; p b 0.05;Fig. 1B) and in the PSEN1 group (controls 100 ± 11.3,PSEN 55.8 ± 18.3; p b 0.05; Fig. 1B). In boththe sporadic and PSEN1 groups, the localization ofmitochondria was focused more around the cellnucleus when compared to controls. Specifically,there was an increase in perinuclear mitochondria(controls 100 ± 6.2, sAD 112 ± 11.1, PSEN1 136.9 ±12.9; p b 0.05 and p b 0.005 respectively; Fig. 1C).Both sAD and PSEN1 fibroblasts had a higherproportion of long mitochondria (% long mitochondriaof total mitochondria controls 46 ± 14, sAD 65 ± 11,PSEN1 73 ± 11; Fig. 1D) indicating a more fusedmitochondrial network. Conversely, the % of the cellarea occupied by small mitochondria was decreased.The form factor of the overall mitochondria networkwas altered, which upon further investigation was dueto the “small” mitochondrial components havinghigher form factor than in controls (data normalized
to controls: controls 100% ± 3%, sAD 106% ± 2.5%,PSEN 111% ± 3%). We also found a correlationbetween the functional abnormalities and morpholog-ical changes; mitochondrial membrane potential and% long mitochondria showed a negative correlation(p = 0.0002, R2 = 0.7; Fig. 1E).Next we investigated mitochondrial respiration in
both sAD fibroblasts and PSEN1 mutant fibroblastsusing the “mito stress test” on the Seahorse Analyser.This assay was undertaken on a limited number ofsAD fibroblast lines (n = 5) andPSEN1 fibroblast lines(n = 2) due to poor growth of the other fibroblast lines.The Seahorse trace shows a reduction in oxygenconsumption in each sAD fibroblast line measuredcompared to controls, whereas there is an increase ineach PSEN1 patient fibroblast line (Fig. 2A–E).Specifically, we found a significant reduction inspare capacity in sAD fibroblasts of 34% whencompared to controls (p b 0.05); this varied betweena 15% reduction and a 35% reduction in the sADfibroblasts; the variability is shown in Fig. 2A–E. ThePSEN1 patient fibroblasts showed significant in-creases in mitochondrial respiration (increased by52%, p b 0.01), ATP-coupled respiration (increasedby 48%, p b 0.01) and spare capacity (increased58%, p b 0.05; Fig. 2F). The reductions in spare mito-chondrial capacity show correlation with mitochondrialmembrane potential deficits (p = 0.003, R2 = 0.65;Fig. 2G); this is with the exclusion of the PSEN1sample as this has reduced mitochondrial membranepotential, yet increased spare capacity. The SeahorseAnalyser also simultaneously measures extracellularacidification rate (ECAR); we, however, did not findany significant alterations in basal or stimulated ECARrates in the sAD or PSEN1 patient fibroblasts (data notshown).
UDCA improves mitochondrial phenotype in sADand PSEN1 fibroblasts
After identifying mitochondrial abnormalities in bothsAD and PSEN1 patient fibroblasts, we next investi-gated if these mitochondrial parameters could beimproved by treatment with UDCA. Treatment with100 nMUDCA increasedmitochondrial respiration andATP-coupled respiration in both sAD and PSEN1patient fibroblasts by 32% and 51%, respectively(Fig. 2F, *p b 0.05). There was no effect of UDCA onmaximal capacity or uncoupled respiration. Treatmentwith UDCA also increased MMP (controls 2.1 ± 1.6,sAD 11.2 ± 2, PSEN1 24.7 ± 1.5; p b 0.05; Fig. 3A).This increase varied across AD fibroblast lines with anincrease in mitochondrial membrane potential ofbetween 12% and 28% (Fig. 3A). Furthermore,although the total mitochondrial morphology parame-ters were not significantly altered by UDCA treatment,the % long mitochondria was significantly reduced(controls +5 ± 2.8, sAD −24.5 ± 10.7, PSEN1 −40.2 ±2.1; p b 0.05; Fig. 3B).
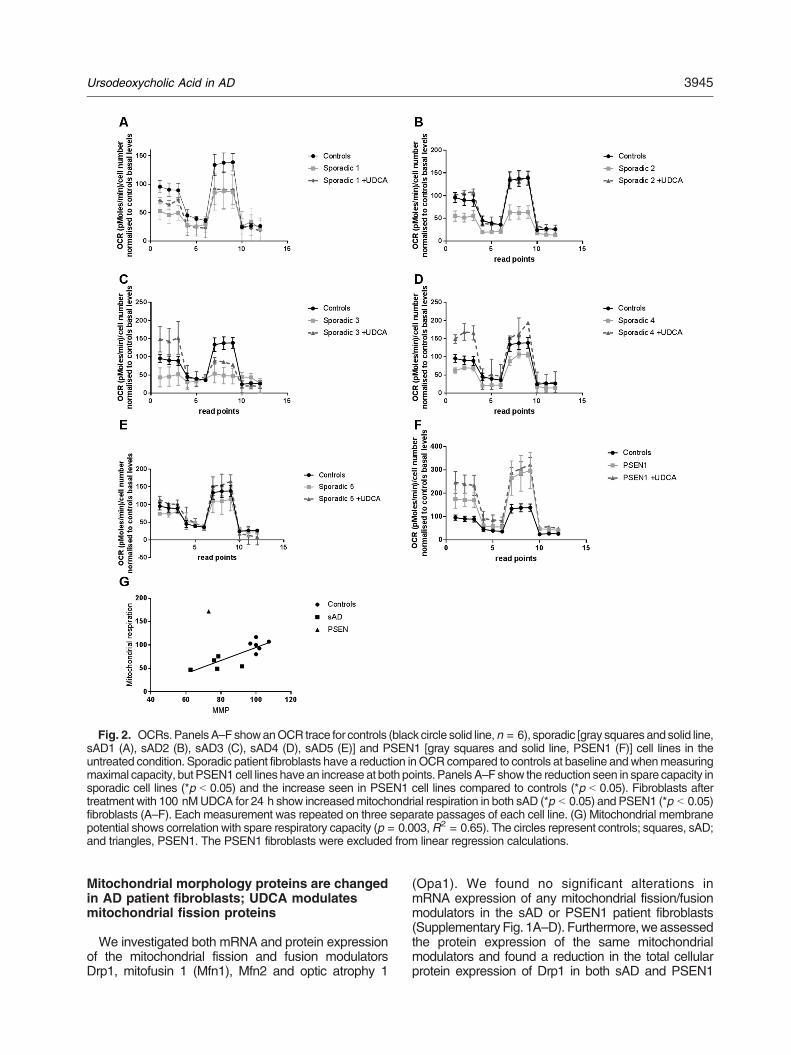
Fig. 2. OCRs.PanelsA–FshowanOCR trace for controls (black circle solid line,n = 6), sporadic [gray squares andsolid line,sAD1 (A), sAD2 (B), sAD3 (C), sAD4 (D), sAD5 (E)] and PSEN1 [gray squares and solid line, PSEN1 (F)] cell lines in theuntreated condition. Sporadic patient fibroblasts have a reduction inOCR compared to controls at baseline andwhenmeasuringmaximal capacity, but PSEN1 cell lines havean increase at both points. Panels A–F show the reduction seen in spare capacity insporadic cell lines (*p b 0.05) and the increase seen in PSEN1 cell lines compared to controls (*p b 0.05). Fibroblasts aftertreatment with 100 nMUDCA for 24 h show increasedmitochondrial respiration in both sAD (*p b 0.05) and PSEN1 (*p b 0.05)fibroblasts (A–F). Each measurement was repeated on three separate passages of each cell line. (G) Mitochondrial membranepotential shows correlation with spare respiratory capacity (p = 0.003,R2 = 0.65). The circles represent controls; squares, sAD;and triangles, PSEN1. The PSEN1 fibroblasts were excluded from linear regression calculations.
3945Ursodeoxycholic Acid in AD
Mitochondrial morphology proteins are changedin AD patient fibroblasts; UDCA modulatesmitochondrial fission proteins
We investigated both mRNA and protein expressionof the mitochondrial fission and fusion modulatorsDrp1, mitofusin 1 (Mfn1), Mfn2 and optic atrophy 1
(Opa1). We found no significant alterations inmRNA expression of any mitochondrial fission/fusionmodulators in the sAD or PSEN1 patient fibroblasts(Supplementary Fig. 1A–D). Furthermore,weassessedthe protein expression of the same mitochondrialmodulators and found a reduction in the total cellularprotein expression of Drp1 in both sAD and PSEN1
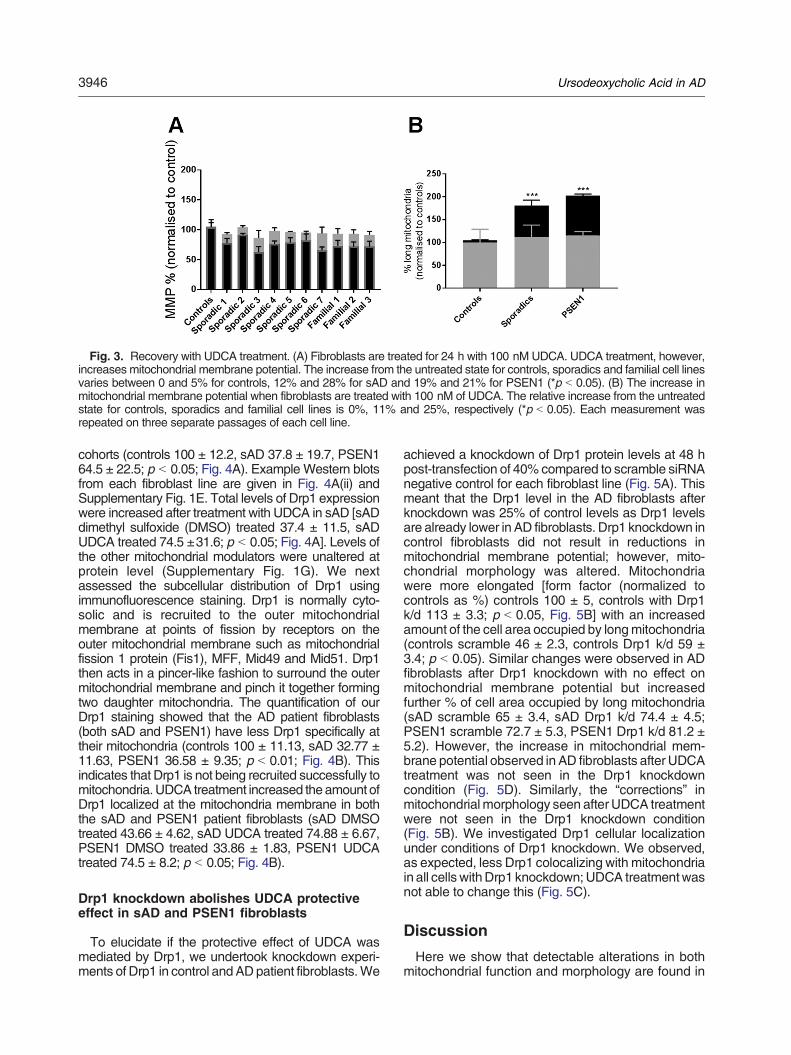
Fig. 3. Recovery with UDCA treatment. (A) Fibroblasts are treated for 24 h with 100 nM UDCA. UDCA treatment, however,increases mitochondrial membrane potential. The increase from the untreated state for controls, sporadics and familial cell linesvaries between 0 and 5% for controls, 12% and 28% for sAD and 19% and 21% for PSEN1 (*p b 0.05). (B) The increase inmitochondrial membrane potential when fibroblasts are treated with 100 nM of UDCA. The relative increase from the untreatedstate for controls, sporadics and familial cell lines is 0%, 11% and 25%, respectively (*p b 0.05). Each measurement wasrepeated on three separate passages of each cell line.
3946 Ursodeoxycholic Acid in AD
cohorts (controls 100 ± 12.2, sAD 37.8 ± 19.7, PSEN164.5 ± 22.5; p b 0.05; Fig. 4A). Example Western blotsfrom each fibroblast line are given in Fig. 4A(ii) andSupplementary Fig. 1E. Total levels of Drp1 expressionwere increased after treatment with UDCA in sAD [sADdimethyl sulfoxide (DMSO) treated 37.4 ± 11.5, sADUDCA treated 74.5 ±31.6; p b 0.05; Fig. 4A]. Levels ofthe other mitochondrial modulators were unaltered atprotein level (Supplementary Fig. 1G). We nextassessed the subcellular distribution of Drp1 usingimmunofluorescence staining. Drp1 is normally cyto-solic and is recruited to the outer mitochondrialmembrane at points of fission by receptors on theouter mitochondrial membrane such as mitochondrialfission 1 protein (Fis1), MFF, Mid49 and Mid51. Drp1then acts in a pincer-like fashion to surround the outermitochondrial membrane and pinch it together formingtwo daughter mitochondria. The quantification of ourDrp1 staining showed that the AD patient fibroblasts(both sAD and PSEN1) have less Drp1 specifically attheir mitochondria (controls 100 ± 11.13, sAD 32.77 ±11.63, PSEN1 36.58 ± 9.35; p b 0.01; Fig. 4B). Thisindicates that Drp1 is not being recruited successfully tomitochondria. UDCA treatment increased theamount ofDrp1 localized at the mitochondria membrane in boththe sAD and PSEN1 patient fibroblasts (sAD DMSOtreated 43.66 ± 4.62, sAD UDCA treated 74.88 ± 6.67,PSEN1 DMSO treated 33.86 ± 1.83, PSEN1 UDCAtreated 74.5 ± 8.2; p b 0.05; Fig. 4B).
Drp1 knockdown abolishes UDCA protectiveeffect in sAD and PSEN1 fibroblasts
To elucidate if the protective effect of UDCA wasmediated by Drp1, we undertook knockdown experi-ments of Drp1 in control andADpatient fibroblasts.We
achieved a knockdown of Drp1 protein levels at 48 hpost-transfection of 40% compared to scramble siRNAnegative control for each fibroblast line (Fig. 5A). Thismeant that the Drp1 level in the AD fibroblasts afterknockdown was 25% of control levels as Drp1 levelsare already lower in AD fibroblasts. Drp1 knockdown incontrol fibroblasts did not result in reductions inmitochondrial membrane potential; however, mito-chondrial morphology was altered. Mitochondriawere more elongated [form factor (normalized tocontrols as %) controls 100 ± 5, controls with Drp1k/d 113 ± 3.3; p b 0.05, Fig. 5B] with an increasedamount of the cell area occupied by longmitochondria(controls scramble 46 ± 2.3, controls Drp1 k/d 59 ±3.4; p b 0.05). Similar changes were observed in ADfibroblasts after Drp1 knockdown with no effect onmitochondrial membrane potential but increasedfurther % of cell area occupied by long mitochondria(sAD scramble 65 ± 3.4, sAD Drp1 k/d 74.4 ± 4.5;PSEN1 scramble 72.7 ± 5.3, PSEN1 Drp1 k/d 81.2 ±5.2). However, the increase in mitochondrial mem-brane potential observed in AD fibroblasts after UDCAtreatment was not seen in the Drp1 knockdowncondition (Fig. 5D). Similarly, the “corrections” inmitochondrial morphology seen after UDCA treatmentwere not seen in the Drp1 knockdown condition(Fig. 5B). We investigated Drp1 cellular localizationunder conditions of Drp1 knockdown. We observed,as expected, less Drp1 colocalizing with mitochondriain all cells withDrp1 knockdown; UDCA treatmentwasnot able to change this (Fig. 5C).
Discussion
Here we show that detectable alterations in bothmitochondrial function and morphology are found in
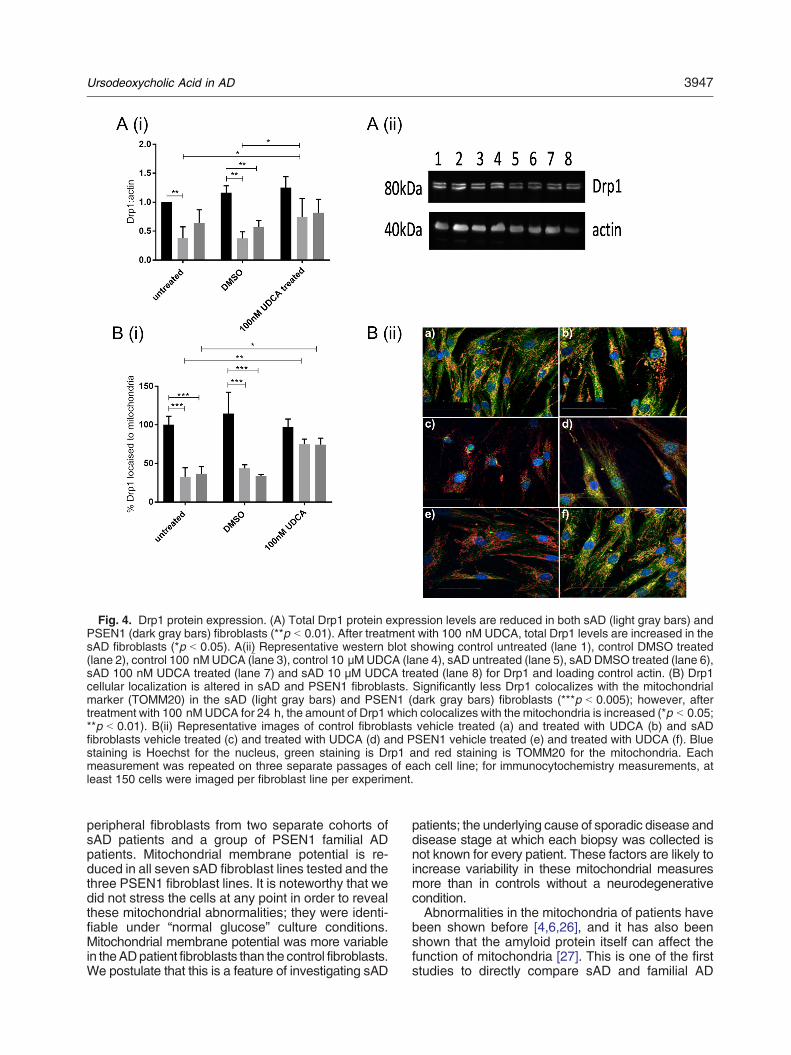
Fig. 4. Drp1 protein expression. (A) Total Drp1 protein expression levels are reduced in both sAD (light gray bars) andPSEN1 (dark gray bars) fibroblasts (**p b 0.01). After treatment with 100 nM UDCA, total Drp1 levels are increased in thesAD fibroblasts (*p b 0.05). A(ii) Representative western blot showing control untreated (lane 1), control DMSO treated(lane 2), control 100 nMUDCA (lane 3), control 10 μMUDCA (lane 4), sAD untreated (lane 5), sAD DMSO treated (lane 6),sAD 100 nM UDCA treated (lane 7) and sAD 10 μM UDCA treated (lane 8) for Drp1 and loading control actin. (B) Drp1cellular localization is altered in sAD and PSEN1 fibroblasts. Significantly less Drp1 colocalizes with the mitochondrialmarker (TOMM20) in the sAD (light gray bars) and PSEN1 (dark gray bars) fibroblasts (***p b 0.005); however, aftertreatment with 100 nMUDCA for 24 h, the amount of Drp1 which colocalizes with the mitochondria is increased (*p b 0.05;**p b 0.01). B(ii) Representative images of control fibroblasts vehicle treated (a) and treated with UDCA (b) and sADfibroblasts vehicle treated (c) and treated with UDCA (d) and PSEN1 vehicle treated (e) and treated with UDCA (f). Bluestaining is Hoechst for the nucleus, green staining is Drp1 and red staining is TOMM20 for the mitochondria. Eachmeasurement was repeated on three separate passages of each cell line; for immunocytochemistry measurements, atleast 150 cells were imaged per fibroblast line per experiment.
3947Ursodeoxycholic Acid in AD
peripheral fibroblasts from two separate cohorts ofsAD patients and a group of PSEN1 familial ADpatients. Mitochondrial membrane potential is re-duced in all seven sAD fibroblast lines tested and thethree PSEN1 fibroblast lines. It is noteworthy that wedid not stress the cells at any point in order to revealthese mitochondrial abnormalities; they were identi-fiable under “normal glucose” culture conditions.Mitochondrial membrane potential was more variablein theADpatient fibroblasts than the control fibroblasts.We postulate that this is a feature of investigating sAD
patients; the underlying cause of sporadic disease anddisease stage at which each biopsy was collected isnot known for every patient. These factors are likely toincrease variability in these mitochondrial measuresmore than in controls without a neurodegenerativecondition.Abnormalities in the mitochondria of patients have
been shown before [4,6,26], and it has also beenshown that the amyloid protein itself can affect thefunction of mitochondria [27]. This is one of the firststudies to directly compare sAD and familial AD
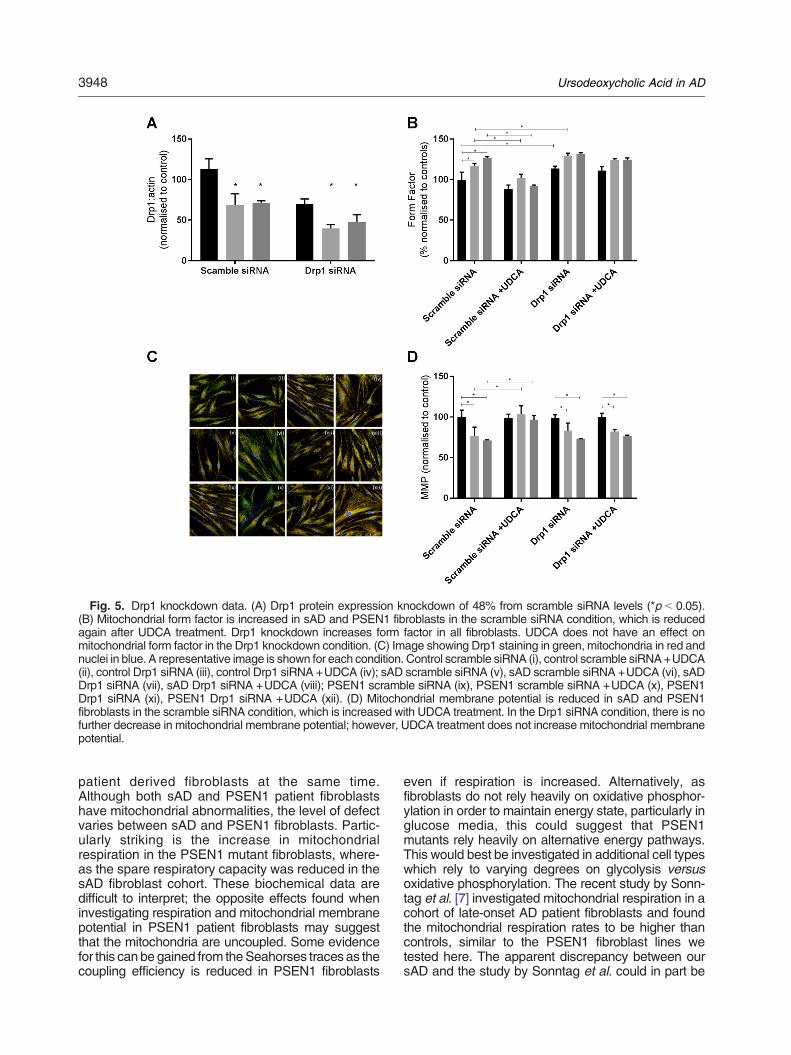
Fig. 5. Drp1 knockdown data. (A) Drp1 protein expression knockdown of 48% from scramble siRNA levels (*p b 0.05).(B) Mitochondrial form factor is increased in sAD and PSEN1 fibroblasts in the scramble siRNA condition, which is reducedagain after UDCA treatment. Drp1 knockdown increases form factor in all fibroblasts. UDCA does not have an effect onmitochondrial form factor in the Drp1 knockdown condition. (C) Image showing Drp1 staining in green, mitochondria in red andnuclei in blue. A representative image is shown for each condition. Control scramble siRNA (i), control scramble siRNA+UDCA(ii), control Drp1 siRNA (iii), control Drp1 siRNA +UDCA (iv); sAD scramble siRNA (v), sAD scramble siRNA +UDCA (vi), sADDrp1 siRNA (vii), sAD Drp1 siRNA +UDCA (viii); PSEN1 scramble siRNA (ix), PSEN1 scramble siRNA +UDCA (x), PSEN1Drp1 siRNA (xi), PSEN1 Drp1 siRNA +UDCA (xii). (D) Mitochondrial membrane potential is reduced in sAD and PSEN1fibroblasts in the scramble siRNA condition, which is increased with UDCA treatment. In the Drp1 siRNA condition, there is nofurther decrease in mitochondrial membrane potential; however, UDCA treatment does not increase mitochondrial membranepotential.
3948 Ursodeoxycholic Acid in AD
patient derived fibroblasts at the same time.Although both sAD and PSEN1 patient fibroblastshave mitochondrial abnormalities, the level of defectvaries between sAD and PSEN1 fibroblasts. Partic-ularly striking is the increase in mitochondrialrespiration in the PSEN1 mutant fibroblasts, where-as the spare respiratory capacity was reduced in thesAD fibroblast cohort. These biochemical data aredifficult to interpret; the opposite effects found wheninvestigating respiration and mitochondrial membranepotential in PSEN1 patient fibroblasts may suggestthat the mitochondria are uncoupled. Some evidencefor this can be gained from theSeahorses traces as thecoupling efficiency is reduced in PSEN1 fibroblasts
even if respiration is increased. Alternatively, asfibroblasts do not rely heavily on oxidative phosphor-ylation in order to maintain energy state, particularly inglucose media, this could suggest that PSEN1mutants rely heavily on alternative energy pathways.This would best be investigated in additional cell typeswhich rely to varying degrees on glycolysis versusoxidative phosphorylation. The recent study by Sonn-tag et al. [7] investigated mitochondrial respiration in acohort of late-onset AD patient fibroblasts and foundthe mitochondrial respiration rates to be higher thancontrols, similar to the PSEN1 fibroblast lines wetested here. The apparent discrepancy between oursAD and the study by Sonntag et al. could in part be
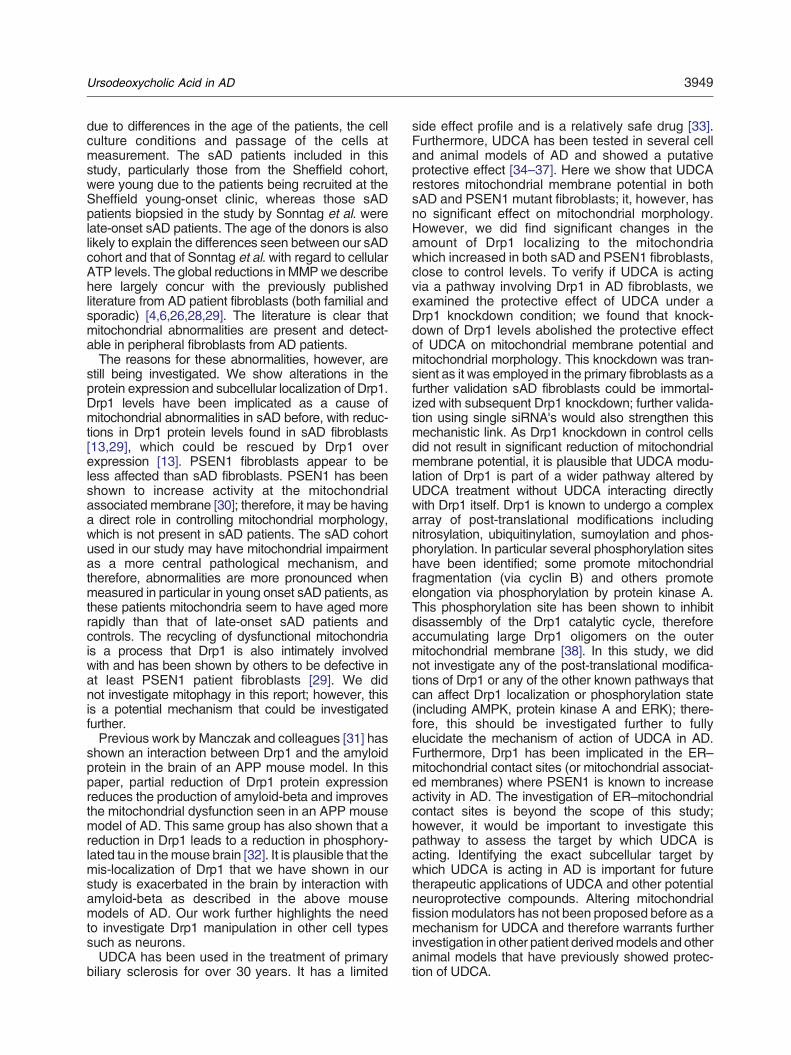
3949Ursodeoxycholic Acid in AD
due to differences in the age of the patients, the cellculture conditions and passage of the cells atmeasurement. The sAD patients included in thisstudy, particularly those from the Sheffield cohort,were young due to the patients being recruited at theSheffield young-onset clinic, whereas those sADpatients biopsied in the study by Sonntag et al. werelate-onset sAD patients. The age of the donors is alsolikely to explain the differences seen between our sADcohort and that of Sonntag et al. with regard to cellularATP levels. The global reductions inMMPwe describehere largely concur with the previously publishedliterature from AD patient fibroblasts (both familial andsporadic) [4,6,26,28,29]. The literature is clear thatmitochondrial abnormalities are present and detect-able in peripheral fibroblasts from AD patients.The reasons for these abnormalities, however, are
still being investigated. We show alterations in theprotein expression and subcellular localization of Drp1.Drp1 levels have been implicated as a cause ofmitochondrial abnormalities in sAD before, with reduc-tions in Drp1 protein levels found in sAD fibroblasts[13,29], which could be rescued by Drp1 overexpression [13]. PSEN1 fibroblasts appear to beless affected than sAD fibroblasts. PSEN1 has beenshown to increase activity at the mitochondrialassociated membrane [30]; therefore, it may be havinga direct role in controlling mitochondrial morphology,which is not present in sAD patients. The sAD cohortused in our study may have mitochondrial impairmentas a more central pathological mechanism, andtherefore, abnormalities are more pronounced whenmeasured in particular in young onset sAD patients, asthese patients mitochondria seem to have aged morerapidly than that of late-onset sAD patients andcontrols. The recycling of dysfunctional mitochondriais a process that Drp1 is also intimately involvedwith and has been shown by others to be defective inat least PSEN1 patient fibroblasts [29]. We didnot investigate mitophagy in this report; however, thisis a potential mechanism that could be investigatedfurther.Previous work by Manczak and colleagues [31] has
shown an interaction between Drp1 and the amyloidprotein in the brain of an APP mouse model. In thispaper, partial reduction of Drp1 protein expressionreduces the production of amyloid-beta and improvesthe mitochondrial dysfunction seen in an APP mousemodel of AD. This same group has also shown that areduction in Drp1 leads to a reduction in phosphory-lated tau in themouse brain [32]. It is plausible that themis-localization of Drp1 that we have shown in ourstudy is exacerbated in the brain by interaction withamyloid-beta as described in the above mousemodels of AD. Our work further highlights the needto investigate Drp1 manipulation in other cell typessuch as neurons.UDCA has been used in the treatment of primary
biliary sclerosis for over 30 years. It has a limited
side effect profile and is a relatively safe drug [33].Furthermore, UDCA has been tested in several celland animal models of AD and showed a putativeprotective effect [34–37]. Here we show that UDCArestores mitochondrial membrane potential in bothsAD and PSEN1 mutant fibroblasts; it, however, hasno significant effect on mitochondrial morphology.However, we did find significant changes in theamount of Drp1 localizing to the mitochondriawhich increased in both sAD and PSEN1 fibroblasts,close to control levels. To verify if UDCA is actingvia a pathway involving Drp1 in AD fibroblasts, weexamined the protective effect of UDCA under aDrp1 knockdown condition; we found that knock-down of Drp1 levels abolished the protective effectof UDCA on mitochondrial membrane potential andmitochondrial morphology. This knockdown was tran-sient as it was employed in the primary fibroblasts as afurther validation sAD fibroblasts could be immortal-ized with subsequent Drp1 knockdown; further valida-tion using single siRNA's would also strengthen thismechanistic link. As Drp1 knockdown in control cellsdid not result in significant reduction of mitochondrialmembrane potential, it is plausible that UDCA modu-lation of Drp1 is part of a wider pathway altered byUDCA treatment without UDCA interacting directlywith Drp1 itself. Drp1 is known to undergo a complexarray of post-translational modifications includingnitrosylation, ubiquitinylation, sumoylation and phos-phorylation. In particular several phosphorylation siteshave been identified; some promote mitochondrialfragmentation (via cyclin B) and others promoteelongation via phosphorylation by protein kinase A.This phosphorylation site has been shown to inhibitdisassembly of the Drp1 catalytic cycle, thereforeaccumulating large Drp1 oligomers on the outermitochondrial membrane [38]. In this study, we didnot investigate any of the post-translational modifica-tions of Drp1 or any of the other known pathways thatcan affect Drp1 localization or phosphorylation state(including AMPK, protein kinase A and ERK); there-fore, this should be investigated further to fullyelucidate the mechanism of action of UDCA in AD.Furthermore, Drp1 has been implicated in the ER–mitochondrial contact sites (or mitochondrial associat-ed membranes) where PSEN1 is known to increaseactivity in AD. The investigation of ER–mitochondrialcontact sites is beyond the scope of this study;however, it would be important to investigate thispathway to assess the target by which UDCA isacting. Identifying the exact subcellular target bywhich UDCA is acting in AD is important for futuretherapeutic applications of UDCA and other potentialneuroprotective compounds. Altering mitochondrialfission modulators has not been proposed before as amechanism for UDCA and therefore warrants furtherinvestigation in other patient derivedmodels and otheranimal models that have previously showed protec-tion of UDCA.
3950 Ursodeoxycholic Acid in AD
In conclusion, our study has shown for the first timethat reduced mitochondrial membrane potential in ADpatient fibroblasts can be corrected with the treatmentof UDCA via a pathway, which includes Drp1. Ourstudy has identified a potential novel pathway by whichUDCA has mitochondrial protective effects and furtherbuilds the case for the use of UDCA as a potentialneuroprotective therapy for neurodegenerativedisease.
Methods and Materials
Patient details
Fibroblasts from patients with sporadic and PSEN1mutations were obtained from the NIGMS HumanGenetic Cell Repository at the Coriell Institute forMedical Research: GM08243, GM07375, andGM07376 (all male, mean age 67.6 years, SD 6.65)and ND41001, ND34733, and ND34730 (2 male,1 female, mean age 48.33 years, SD 11.06). Thesefibroblasts were compared with control fibroblasts(mean age 59.3 years, SD 6.35) from the samerepository [GM07924, GM02189, GM23967 (all male)].A second cohort of sporadic patient fibroblasts
(2 male, 2 female, mean age 59.25 years, SD 5.37)and two aged matched controls (3 male, 1 female,mean age 60.66 years, SD 2.08) were also sampledfrom a local population of patients involved in theMODEL-AD research study (Research and EthicsCommittee number: 16/YH/0155). The McKhannn etal. [39] criteria were used to diagnose AD, andparticipants took part in the European wide VirtualPhysiological Human: Dementia Research Enabled byIT (VPH-DARE@IT).
Cell culture
Primary fibroblast cells were cultured continuouslyusing methods performed essentially as describedby Mortiboys et al [24]. Cells were grown in EMEM(4500 g/L glucose), supplemented with 10% FBS,100 UI/ml penicillin, 100 μg/ml streptomycin, 50 μg/mluridine and 1 mM sodium pyruvate, 0.1 mM aminoacids, and 0.1 × MEM vitamins. For mitochondrialmembrane potential,morphology cellswereplated at adensity of 2500 cells per well in a black 96-well plate.UDCA (Sigma-Aldrich Ltd) was added to culturemedia(10 mM and 100 nM) 24 h prior to assay. DMSO wasused as vehicle control.
Mitochondrial morphology
Mitochondrial membrane potential and mitochondri-al morphological parameters were measured usingtetramethlyrhodamine staining of live fibroblasts.Briefly, 24 h after drug treatment, cells were incubated
with 80 nM tetramethlyrhodamine and 10 μMHoeschtin phenol red-free media for 1 h. Cells were washedand imaged using the InCell Analyzer 2000 high-content imager (GE Healthcare). Raw images wereprocessed and parameters obtained using a customprotocol in InCell Developer software (GE Healthcare)allowing for segmentation of mitochondria, nuclei andcell boundaries.
Western blots
Cell pellets from patient and control fibroblasts werelysed using RIPA buffer and Protein Inhibitor Cocktailon ice, and protein levels were measured using aBradford Assay. Twenty micrograms of protein wasrun on a 12% SDS-PAGE gel and transferred to apolyvinylidene fluoride membrane. Membranes wereincubated overnight at 4 °C, with mouse anti-Drp1(Abcam; 1:1000), mouse anti-OPA1 (BD Biosciences;1:1000), mouse anti-Mfn1 (Abcam; 1:1000) or rabbitanti-Mfn2 (St Johns Laboratory; 1:500). Membraneswere also probed for β actin as a loading control(St Johns Laboratory; 1:1000). Membranes were thenincubated with goat anti-mouse HRP (Abcam;1:10,000) or goat anti-rabbit HRP (Dako; 1:5000),as appropriate. Membranes were imaged using theG box chemi system using GeneSnap software(Syngene). Densitometry was analyzed using Gene-Tools software (Syngene).
RNA extraction and qPCR
Fibroblasts were treated with UDCA 10uM and100 nM 24 h prior to harvesting. Approximately750,000 cells where harvested for each RNA extrac-tion. RNAextractionwas performed using anRNAeasyPlus Mini Kit (Qiagen) and by following Quick-startsupplied protocol. RNA was converted into compli-mentary DNA using the QuantiTect Reverse Tran-scription Kit (Qiagen), standard Quick-Start suppliedprotocols were followed. qPCR was performed on aStratgene PCR machine. Samples were loaded at12.5 ng/μl per well. Sybr Green was used as the de-tection dye for the chain reaction, and a standard two-step program with 40 amplification cycles was usedduring the PCR. Primer sequences were as follows:Drp1: forward ATTATGCCAGCCAGTCCACAA, re-verse CGCTGTTCCCGAGCAGATA; Mfn1: forwardCACTCCAGCAACGCCAGATA, reverse CGGACGCCAATCCTGTTACT; Mfn2: forward GTCTGACCTGGACCACCAAG, reverse TGCAGTTGGAGCCAGTGTAG; and Opa1: forward AGCCAGTCCAAGCAGGATTC, reverse TGCTTTCAGAGCTGTTCCCT.
Metabolic flux assay
Oxygen consumption rate (OCR) and ECAR weremeasured using a 24-well Agilent seahorse XFanalyzer machine (Agilent). Human fibroblasts where
3951Ursodeoxycholic Acid in AD
plated at a density of 60,000 cells per well. Cells wheretreated with UDCA 100 nM for 24 h prior to measure-ment. Three measurements of OCR and ECAR weretaken in each state: basal state, after the additionof oligomycin (0.5 μM), FCCP (0.5 μM) and rotenone(1 μM). A cell count was then done on a fixed assayplate using a Hoechst dye (1 μM). Data presented inthis paper are normalized to cell number.
Immunocytochemistry
Cells were fixed in 4% paraformaldehyde and thenpermeabilized with 0.1% Triton. After blocking, cellswere incubatedwith anti-mouseDrp1 (BDBiosciences;1:1000) and anti-rabbit TOM20 (Santa Cruz Biotech-nology; 1:1000). Cells were then incubated with AlexaFluor anti-rabbit 568 and Alexa Fluor anti-mouse 488and 1 μMHoechst. Cells were imaged using theOperaPhenix high-content imager (PerkinElmer). z Stackswere collected and analyzed using Harmony software(PerkinElmer).
Drp 1 knockdown experiments
Cells were plated as above for the mitochondrialmembrane potential and morphology assays. Cellswere treated with either 100 nM Drp1 siRNA SMARTpool Accell probes (Horizon Discovery) or 100 nMscramble siRNA-negative Accell probes in Accelldelivery media. After 24 h, 100 nM UDCA wasadded to the treatment conditions, and 24 h later, theassays carried out.
Statistical tests
Data are presented as normalized mean ± SDunless otherwise stated. For UDCA-treated parame-ters (ATP and MMP), data are presented as percent-age increase from untreated basal levels. Data wereanalyzed using GraphPad Prism Software (V7.02):one-way ANOVA with Tukey's multiple comparisonsposttest or, for UDCA-treated data, two-way ANOVAwith Tukey's multiple comparisons posttest. In addi-tion, t test was used to compare each individual ADfibroblast line to the control group for MMP.Supplementary data to this article can be found
online at https://doi.org/10.1016/j.jmb.2018.08.019.
Acknowledgments
We would like to thank all research participantsfor their help with this study. Grant support fromParkinson's UK (Grant No. F1301), Alzheimer Re-search UK (Grant No. ARUK-PCRF2016A-1), Alzhei-mer research UK Yorkshire network and the NationalInstitute for Health Research Sheffield Biomedical
Research Centre (Translational Neuroscience) isgratefully acknowledged.
Received 12 January 2018;Received in revised form 8 August 2018;
Accepted 14 August 2018Available online 29 August 2018
Keywords:UDCA;
presenilin;treatment;
neurodegeneration;mitochondrial morphology
†Academic Unit of Oral and Maxillofacial Pathology,School of Clinical Dentistry, University of Sheffield, 19
Claremont Crescent, Sheffield, S10 2TA.
‡Department of Laboratory Technology, Faculty ofApplied Medical Sciences, King Abdulaziz University
Jeddah 201,589, Kingdom of Saudi Arabia.
§Department of Physiology, Faculty of Medicine, KingAbdulaziz University Jeddah 201,589, Kingdom of
Saudi Arabia.
Abbreviations used:Drp1, dynamin-related protein; PSEN1, presenilin 1; Mfn1,
mitofusin 1; Mfn2, mitofusin 2; Opa1, optic atrophy 1.
References
[1] D.P. Perl, Neuropathology of Alzheimer's disease, Mt Sinai J.Med. 77 (2010) 32–42, https://doi.org/10.1002/msj.20157.Neuropathology.
[2] G. Forster, B. Sc, F.E. Matthews, D. Ph, C. Brayne, Age,Neuropathology, and Dementia, 2009.
[3] A. Leuzy, E. Rodriguez-Vieitez, L. Saint-Aubert, K. Chiotis,O. Almkvist, I. Savitcheva, M. Jonasson, M. Lubberink, A.Wall, G. Antoni, A. Nordberg, Longitudinal uncoupling ofcerebral perfusion, glucose metabolism, and tau depositionin Alzheimer's disease, Alzheimers Dement. (2017) 1–12,https://doi.org/10.1016/j.jalz.2017.11.008.
[4] M.J. Pérez, D.P. Ponce, C. Osorio-Fuentealba, M.I. Behrens,R.A. Quintanilla, Mitochondrial bioenergetics is altered infibroblasts from patients with sporadic Alzheimer's disease,Front. Neurosci. 11 (2017)https://doi.org/10.3389/fnins.2017.00553.
[5] C. Cadonic, M.G. Sabbir, B.C. Albensi, Mechanisms ofmitochondrial dysfunction in Alzheimer's disease, Mol.Neurobiol. 53 (2016) 6078–6090, https://doi.org/10.1007/s12035-015-9515-5.
[6] N.E. Gray, J.F. Quinn, Alterations in mitochondrial numberand function in Alzheimer's disease fibroblasts, Metab. BrainDis. 30 (2015) 1275–1278, https://doi.org/10.1007/s11011-015-9667-z.
[7] K.C. Sonntag, W.I. Ryu, K.M. Amirault, R.A. Healy, A.J.Siegel, D.L. McPhie, B. Forester, B.M. Cohen, Late-onset
3952 Ursodeoxycholic Acid in AD
Alzheimer's disease is associated with inherent changes inbioenergetics profiles,Sci. Rep. 7 (2017) 1–13, https://doi.org/10.1038/s41598-017-14420-x.
[8] S.J. Kish, C. Bergeron, A. Rajput, S. Dozic, F. Mastrogiacomo,L.-J. Chang, J.M. Wilson, L.M. Distefano, J.N. Nobrega, Braincytochrome oxidase in Alzheimer's disease, J. Neurochem. 59(1992) 776–779, https://doi.org/10.1111/j.1471-4159.1992.tb09439.x.
[9] E.M. Mutisya, A.C. Bowling, M.F. Beal, Cortical cytochromeoxidase activity is reduced in Alzheimer's disease,J. Neurochem. 63 (1994) 2179–2184, https://doi.org/10.1046/j.1471-4159.1994.63062179.x.
[10] L.A. Demetrius, J. Driver, Alzheimer's as a metabolicdisease, Biogerontology 14 (2013) 641–649, https://doi.org/10.1007/s10522-013-9479-7.
[11] F.I, M. Armand-Ugon, B. Ansoleaga, S. Berjaoui, Reducedmitochondrial activity is early and steady in the entorhinalcortex but it is mainly unmodified in the frontal cortex inAlzheimer's disease, Curr. Alzheimer Res. 14 (12) (2017)1327–1334.
[12] K. Lunnon, A. Keohane, R. Pidsley, S. Newhouse, J.Riddoch-Contreras, E.B. Thubron, M. Devall, H. Soininen, I.Kłoszewska, P. Mecocci, M. Tsolaki, B. Vellas, L. Schalkwyk,R. Dobson, A.N. Malik, J. Powell, S. Lovestone, A. Hodges,Mitochondrial genes are altered in blood early in Alzheimer'sdisease, Neurobiol. Aging 53 (2017) 36–47, https://doi.org/10.1016/j.neurobiolaging.2016.12.029.
[13] X. Wang, B. Su, H. Fujioka, X. Zhu, Dynamin-like protein 1reduction underlies mitochondrial morphology anddistribution abnormalities in fibroblasts from sporadicAlzheimer's disease patients, Am. J. Pathol. 173 (2008)470–482, https://doi.org/10.2353/ajpath.2008.071208.
[14] S. Hauptmann, I. Scherping, S. Dröse, U. Brandt, K.L.Schulz, M. Jendrach, K. Leuner, A. Eckert, W.E. Müller,Mitochondrial dysfunction: an early event in Alzheimerpathology accumulates with age in AD transgenic mice,Neurobiol. Aging 30 (2009) 1574–1586, https://doi.org/10.1016/j.neurobiolaging.2007.12.005.
[15] U. Keil, A. Bonert, C.A. Marques, I. Scherping, J.Weyermann, J.B. Strosznajder, F. Müller-Spahn, C. Haass,C. Czech, L. Pradier, W.E. Müller, A. Eckert, Amyloid β-induced changes in nitric oxide production and mitochondrialactivity lead to apoptosis, J. Biol. Chem. 279 (2004)50310–50320, https://doi.org/10.1074/jbc.M405600200.
[16] H.K. Chen, Z.S. Ji, S.E. Dodson, R.D. Miranda, C.I. Rosenblum,I.J. Reynolds, S.B. Freedman, K.H.Weisgraber, Y. Huang, R.W.Mahley, Apolipoprotein E4 domain interaction mediatesdetrimental effects on mitochondria and is a potential thera-peutic target for Alzheimer disease, J. Biol. Chem. 286 (2011)5215–5221, https://doi.org/10.1074/jbc.M110.151084.
[17] H.M. Wilkins, J.D. Mahnken, P. Welch, R. Bothwell, S.Koppel, R.L. Jackson, J.M. Burns, R.H. Swerdlow, A mitochon-drial biomarker-based study of S-equol in Alzheimer's diseasesubjects: results of a single-arm, pilot trial, J. Alzheimers Dis. 59(2017) 291–300, https://doi.org/10.3233/JAD-170077.
[18] W. Haylett, C. Swart, F. Van Der Westhuizen, H. Van Dyk, L.Van Der Merwe, C. Van Der Merwe, B. Loos, J. Carr, C.Kinnear, S. Bardien, Altered mitochondrial respiration andother features of mitochondrial function in parkin-mutantfibroblasts from Parkinson's disease patients, ParkinsonsDis. 2016 (2016)https://doi.org/10.1155/2016/1819209.
[19] T.D. Papkovskaia, K.-Y. Chau, F. Inesta-Vaquera, D.B.Papkovsky, D.G. Healy, K. Nishio, J. Staddon, M.R. Duchen,J. Hardy, A.H.V. Schapira, J.M. Cooper, G2019S leucine-
rich repeat kinase 2 causes uncoupling protein-mediatedmitochondrial depolarization, Hum. Mol. Genet. 21 (2012)4201–4213, https://doi.org/10.1093/hmg/dds244.
[20] H. Mortiboys, J. Aasly, O. Bandmann, Ursocholanicacid rescues mitochondrial function in common forms offamilial Parkinson's disease, Brain 136 (2013) 3038–3050,https://doi.org/10.1093/brain/awt224.
[21] H. Mortiboys, R. Furmston, G. Bronstad, J. Aasly, C. Elliott,O. Bandmann, UDCA exerts beneficial effect on mitochon-drial dysfunction in LRRK2(G2019S) carriers and in vivo,Neurology 85 (2015) 846–852, https://doi.org/10.1212/WNL.0000000000001905.
[22] H. Mortiboys, K.K. Johansen, J.O. Aasly, O. Bandmann,Mitochondrial impairment in patients with Parkinson diseasewith the G2019S mutation in LRRK2, Neurology 75 (2010)2017–2020, https://doi.org/10.1212/WNL.0b013e3181ff9685.
[23] H. Mortiboys, K.J. Thomas, W.J.H. Koopman, P. Abou-Sleiman, S. Olpin, N.W. Wood, P.H.G.M. Willems, J.A.M.Smeitink, M.R. Cookson, NIH Public Access, 64, 2009555–565, https://doi.org/10.1002/ana.21492.Mitochondrial.
[24] S.P. Allen, S. Rajan, L. Duffy, H. Mortiboys, A. Higginbottom,A.J. Grierson, P.J. Shaw, Superoxide dismutase 1 mutationin a cellular model of amyotrophic lateral sclerosis shiftsenergy generation from oxidative phosphorylation to glycol-ysis, Neurobiol. Aging 35 (2014) 1499–1509, https://doi.org/10.1016/j.neurobiolaging.2013.11.025.
[25] E. Onesto, C. Colombrita, V. Gumina, M.O. Borghi, S. Dusi,A. Doretti, G. Fagiolari, F. Invernizzi, M. Moggio, V. Tiranti, V.Silani, A. Ratti, Gene-specific mitochondria dysfunctionsin humanTARDBPandC9ORF72 fibroblasts,ActaNeuropathol.Commun. 4 (2016), 47. https://doi.org/10.1186/s40478-016-0316-5.
[26] H.M. Huang, C. Fowler, H. Xu, H. Zhang, G.E. Gibson,Mitochondrial function in fibroblasts with aging in culture and/or Alzheimer's disease, Neurobiol. Aging 26 (2005) 839–848,https://doi.org/10.1016/j.neurobiolaging.2004.07.012.
[27] C.S. Casley, L. Canevari, J.M. Land, J.B. Clark, M.A. Sharpe,Beta-amyloid inhibits integrated mitochondrial respirationand key enzyme activities, J. Neurochem. 80 (2002)91–100, https://doi.org/10.1046/j.0022-3042.2001.00681.x.
[28] P. Martín-Maestro, R. Gargini, G. Perry, J. Avila, V. García-Escudero, PARK2 enhancement is able to compensatemitophagy alterations found in sporadic Alzheimer's disease,Hum. Mol. Genet. 25 (2016) 792–806, https://doi.org/10.1093/hmg/ddv616.
[29] P. Martín-Maestro, R. Gargini, E. García, G. Perry, J. Avila, V.García-Escudero, Slower dynamics and aged mitochondriain sporadic Alzheimer's disease, Oxidative Med. Cell.Longev. 2017 (2017), 9302761. https://doi.org/10.1155/2017/9302761.
[30] E. Area-Gomez, M. Carmen, L. Castillo, M.D. Tambini, C.Guardia-Laguarta, A.J.C. De Groof, M. Madra, J. Ikenouchi, M.Umeda, T.D.Bird,S.L.Sturley, E.A.Schon,Upregulated functionof mitochondria-associated ER membranes in Alzheimer dis-ease, EMBO J. 31 (2012) 4106–4123, https://doi.org/10.1038/emboj.2012.202.
[31] M.Manczak, R. Kandimalla, D. Fry, H. Sesaki, P. HemachandraReddy, Protective effects of reduced dynamin-related protein 1against amyloid beta-induced mitochondrial dysfunction andsynaptic damage in Alzheimer's disease, Hum. Mol. Genet. 25(2016) 5148–5166, https://doi.org/10.1093/hmg/ddw330.
[32] R. Kandimalla, M. Manczak, D. Fry, Y. Suneetha, H. Sesaki,P.H. Reddy, Reduced dynamin-related protein 1 protectsagainst phosphorylated Tau-induced mitochondrial
3953Ursodeoxycholic Acid in AD
dysfunction and synaptic damage in Alzheimer's disease,Hum. Mol. Genet. 25 (2016) 4881–4897, https://doi.org/10.1093/hmg/ddw312.
[33] G. Paumgartner, U. Beuers, Ursodeoxycholic acid in cholestaticliver disease: mechanisms of action and therapeutic userevisited, Hepatology 36 (2002) 525–531, https://doi.org/10.1053/jhep.2002.36088.
[34] R.M. Ramalho, P.M. Borralho, R.E. Castro, S. Solá, C.J.Steer, C.M.P. Rodrigues, Tauroursodeoxycholic acid modu-lates p53-mediated apoptosis in Alzheimer's disease mutantneuroblastoma cells, J. Neurochem. 98 (2006) 1610–1618,https://doi.org/10.1111/j.1471-4159.2006.04007.x.
[35] A.C. Lo, Z. Callaerts-Vegh, A.F. Nunes, C.M.P. Rodrigues, R.D'Hooge, Tauroursodeoxycholic acid (TUDCA) supplementa-tion prevents cognitive impairment and amyloid deposition inAPP/PS1mice, Neurobiol. Dis. 50 (2013) 21–29, https://doi.org/10.1016/j.nbd.2012.09.003.
[36] P.A.Dionísio, J.D.Amaral,M.F.Ribeiro, A.C. Lo,R.D'Hooge,C.M.P. Rodrigues, Amyloid-β pathology is attenuated by taur-oursodeoxycholic acid treatment inAPP/PS1mice after disease
onset, Neurobiol. Aging 36 (2015) 228–240, https://doi.org/10.1016/j.neurobiolaging.2014.08.034.
[37] R.J.S. Viana, a F. Nunes, R.E. Castro, R.M. Ramalho, J.Meyerson, S. Fossati, J.Ghiso,A.Rostagno,C.M.P.Rodrigues,Tauroursodeoxycholic acid prevents E22Q Alzheimer s abtoxicity in human cerebral endothelial cells, Cell.Mol. LifeSci. 66(2009) 1094–1104, https://doi.org/10.1007/s00018-009-8746-x.
[38] R.A. Merrill, R.K. Dagda, A.S. Dickey, J.T. Cribbs, S.H. Green,Y.M. Usachev, S. Strack, Mechanism of neuroprotectivemitochondrial remodeling by pka/akap1, PLoS Biol. 9 (2011)https://doi.org/10.1371/journal.pbio.1000612.
[39] G. McKhann, D.S. Knopman, H. Chertkow, B. Hymann, C.R.Jack, C. Kawas, W. Klunk, W. Koroshetz, J. Manly, R. Mayeux,R. Mohs, J. Morris, M. Rossor, P. Scheltens, M. Carrillo, S.Weintrub, C. Phelphs, The diagnosis of dementia due toAlzheimer's disease: recommendations from the NationalInstitute on Aging–Alzheimer's Association workgroups ondiagnostic guidelines for Alzheimer's disease, AlzheimersDement. 7 (2011) 263–269, https://doi.org/10.1016/j.jalz.2011.03.005.The.
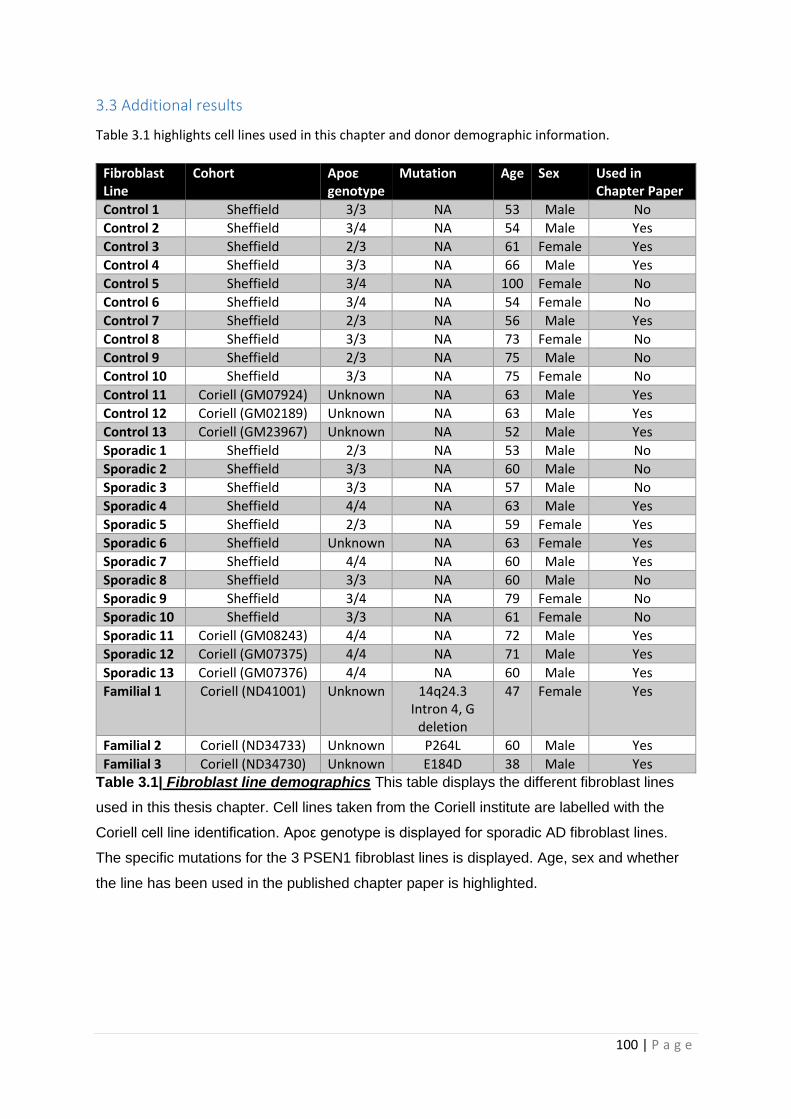
100 | P a g e
3.3 Additional results
Table 3.1 highlights cell lines used in this chapter and donor demographic information.
Fibroblast Line
Cohort Apoε genotype
Mutation Age Sex Used in Chapter Paper
Control 1 Sheffield 3/3 NA 53 Male No
Control 2 Sheffield 3/4 NA 54 Male Yes
Control 3 Sheffield 2/3 NA 61 Female Yes
Control 4 Sheffield 3/3 NA 66 Male Yes
Control 5 Sheffield 3/4 NA 100 Female No
Control 6 Sheffield 3/4 NA 54 Female No
Control 7 Sheffield 2/3 NA 56 Male Yes
Control 8 Sheffield 3/3 NA 73 Female No
Control 9 Sheffield 2/3 NA 75 Male No
Control 10 Sheffield 3/3 NA 75 Female No
Control 11 Coriell (GM07924) Unknown NA 63 Male Yes
Control 12 Coriell (GM02189) Unknown NA 63 Male Yes
Control 13 Coriell (GM23967) Unknown NA 52 Male Yes
Sporadic 1 Sheffield 2/3 NA 53 Male No
Sporadic 2 Sheffield 3/3 NA 60 Male No
Sporadic 3 Sheffield 3/3 NA 57 Male No
Sporadic 4 Sheffield 4/4 NA 63 Male Yes
Sporadic 5 Sheffield 2/3 NA 59 Female Yes
Sporadic 6 Sheffield Unknown NA 63 Female Yes
Sporadic 7 Sheffield 4/4 NA 60 Male Yes
Sporadic 8 Sheffield 3/3 NA 60 Male No
Sporadic 9 Sheffield 3/4 NA 79 Female No
Sporadic 10 Sheffield 3/3 NA 61 Female No
Sporadic 11 Coriell (GM08243) 4/4 NA 72 Male Yes
Sporadic 12 Coriell (GM07375) 4/4 NA 71 Male Yes
Sporadic 13 Coriell (GM07376) 4/4 NA 60 Male Yes
Familial 1 Coriell (ND41001) Unknown 14q24.3 Intron 4, G
deletion
47 Female Yes
Familial 2 Coriell (ND34733) Unknown P264L 60 Male Yes
Familial 3 Coriell (ND34730) Unknown E184D 38 Male Yes
Table 3.1| Fibroblast line demographics This table displays the different fibroblast lines
used in this thesis chapter. Cell lines taken from the Coriell institute are labelled with the
Coriell cell line identification. Apoε genotype is displayed for sporadic AD fibroblast lines.
The specific mutations for the 3 PSEN1 fibroblast lines is displayed. Age, sex and whether
the line has been used in the published chapter paper is highlighted.
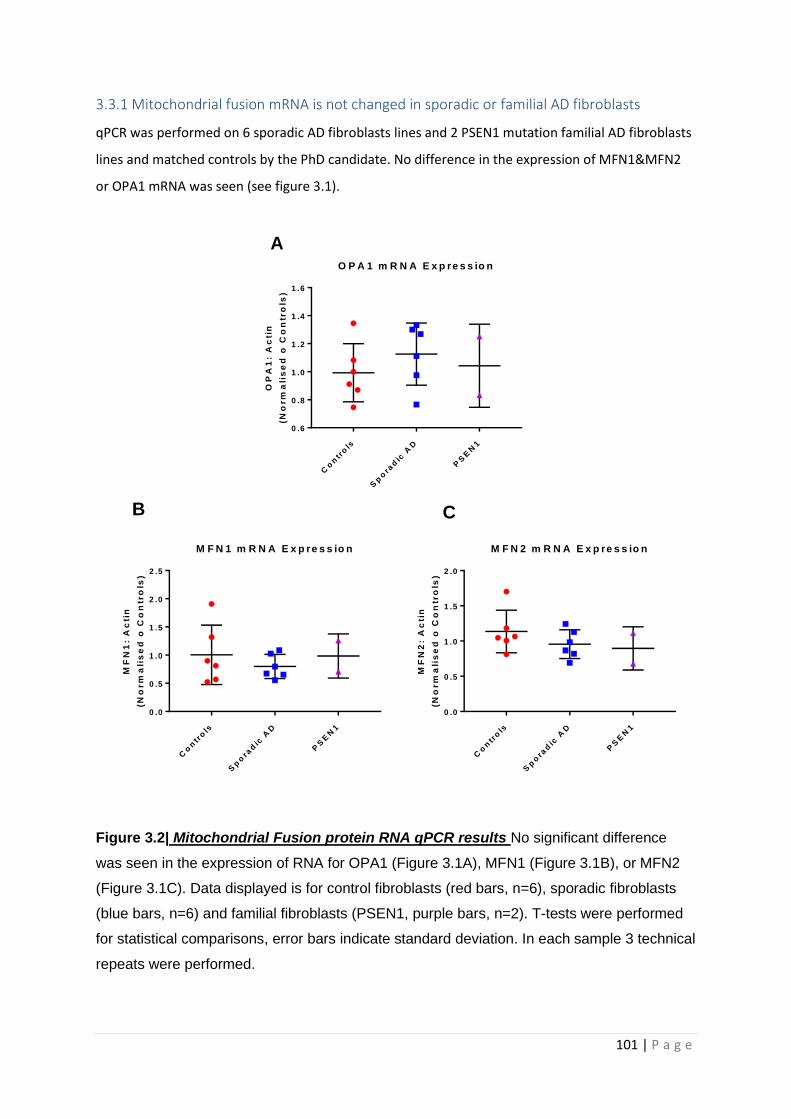
101 | P a g e
3.3.1 Mitochondrial fusion mRNA is not changed in sporadic or familial AD fibroblasts
qPCR was performed on 6 sporadic AD fibroblasts lines and 2 PSEN1 mutation familial AD fibroblasts
lines and matched controls by the PhD candidate. No difference in the expression of MFN1&MFN2
or OPA1 mRNA was seen (see figure 3.1).
Figure 3.2| Mitochondrial Fusion protein RNA qPCR results No significant difference
was seen in the expression of RNA for OPA1 (Figure 3.1A), MFN1 (Figure 3.1B), or MFN2
(Figure 3.1C). Data displayed is for control fibroblasts (red bars, n=6), sporadic fibroblasts
(blue bars, n=6) and familial fibroblasts (PSEN1, purple bars, n=2). T-tests were performed
for statistical comparisons, error bars indicate standard deviation. In each sample 3 technical
repeats were performed.
Co
ntr
ols
Sp
ora
dic
AD
PS
EN
1
0 .6
0 .8
1 .0
1 .2
1 .4
1 .6
O P A 1 m R N A E x p re s s io nO
PA
1:
Ac
tin
(No
rm
ali
se
d o
Co
ntr
ols
)
Co
ntr
ols
Sp
ora
dic
AD
PS
EN
1
0 .0
0 .5
1 .0
1 .5
2 .0
2 .5
M F N 1 m R N A E x p re s s io n
MF
N1
: A
cti
n
(No
rm
ali
se
d o
Co
ntr
ols
)
Co
ntr
ols
Sp
ora
dic
AD
PS
EN
1
0 .0
0 .5
1 .0
1 .5
2 .0
M F N 2 m R N A E x p re s s io n
MF
N2
: A
cti
n
(No
rm
ali
se
d o
Co
ntr
ols
)
A
B C
102 | P a g e
3.3.2 Fibroblasts with the ApoE ε4/4 genotype have a more severe mitochondrial
morphology disease phenotype
Mitochondrial morphology was reviewed for the larger cohort of sporadic AD lines (n=13) which
included the fibroblast lines presented in the chapter paper (n=7). On a group level there was still a
statistically significant increase in mitochondrial length (9% increase, p=0.031) in sporadic AD
fibroblasts (Figure 3.2A). A significant reduction was also seen in MMP in sporadic AD fibroblasts
(16% reduction, p= 0.002) in the extended cohort (Figure 3.2B). Form factor, or how interconnected
the mitochondrial network is, was decreased in both the larger cohort of sporadic fibroblast lines
(3.7% reduction, p= 0.004) (Figure 3.2 C) and the smaller cohort presented in the chapter paper. The
equation used to calculate the form factor is inverted, therefore a lower value for a group suggests
greater interconnectedness. In the small cohort of sporadic AD fibroblasts lines presented in the
chapter paper, a significant reduction in mitochondrial count was seen, as was a significant increase
in the percentage of mitochondria found in close proximity to the nucleus. In this larger cohort of
sporadic AD fibroblast lines, the same trends were seen as in the smaller group, but the changes to
mitochondrial count (p=0.189) and percentage of mitochondria in close proximity to the nucleus
(p=0.323) were not significant (Figures 3.2D&E).
The larger cohort of sporadic AD fibroblasts, lines were split based on ApoE genotype. This showed
that having an ApoE ε4/4 genotype in the fibroblasts exacerbates the pathological morphological
changes seen in AD mitochondria. AD fibroblasts with ApoE ε4/4 genotype had a significantly higher
percentage of long mitochondria (16% increase, p=0.013) (Figure 3.2F), and a significantly reduced
MMP (26% reduction, p=0.0001) when compared to controls (Figure 3.2G). A trend towards a lower
form factor (Figure 3.2H), lower mitochondria number (Figure 3.2G) and greater percentage of
mitochondria in the perinuclear region (Figure 3.2H) when compared to controls was also seen in
the ApoE ε4/4 genotype, but these changes were not significant. A significant reduction (27%
reduction, p=0.0009) in MMP was also seen in ApoE ε2/3 AD fibroblasts when compared to controls
(Figure 3.2F). A trend to an increased percentage of long mitochondria (Figure 3.2E), and reduced
form factor was also seen in the sporadic AD fibroblast ApoE ε2/3 genotype (Figure 3.2H). For
sporadic fibroblasts with the ApoE ε 3/3 or 3/4 genotypes, the percentage of long mitochondria was
only slightly increased when compared to controls and MMP showed no difference when compared
to controls. Trends toward a reduced form factor was seen in both ApoE ε 3/4 and 3/3 genotypes,
with no real change in perinuclear mitochondria or mitochondrial count seen in either genotype.
For each morphological parameter the sporadic AD fibroblast groups were compared based on ApoE
genotype using one-way Analysis of variance (ANOVA). No significant differences were seen
between sporadic AD fibroblast ApoE genotypes except for the in the MMP parameter. Both ApoE
103 | P a g e
ε4/4 (p=0.007) and ApoE ε2/3 (p=0.022) groups has significant reductions in MMP when compared
to the sporadic AD fibroblasts with the ApoE ε3/3 genotype (Figure 3.2G).
For the above analysis control fibroblast lines were presented as one group not split according to
ApoE genotype. For each of the above described mitochondrial morphological parameters the effect
of ApoE genotype was assessed for differences in the control group prior to comparing to the sAD
fibroblast group. Using an ordinary ANOVA no statistical difference in any of the five morphological
parameters investigated was seen when ApoE genotype groups were compared in the control
cohort. Therefore, to increase statistical power when comparing controls with sporadic AD
fibroblasts, the control cohort were assessed with all ApoE groups combined. Figures 3.3A-E display
the control group split by ApoE status for each of the five mitochondrial morphological parameters.
Only 10 fibroblast lines are presented as the ApoE genotypes for the Coriell control fibroblasts was
not known.
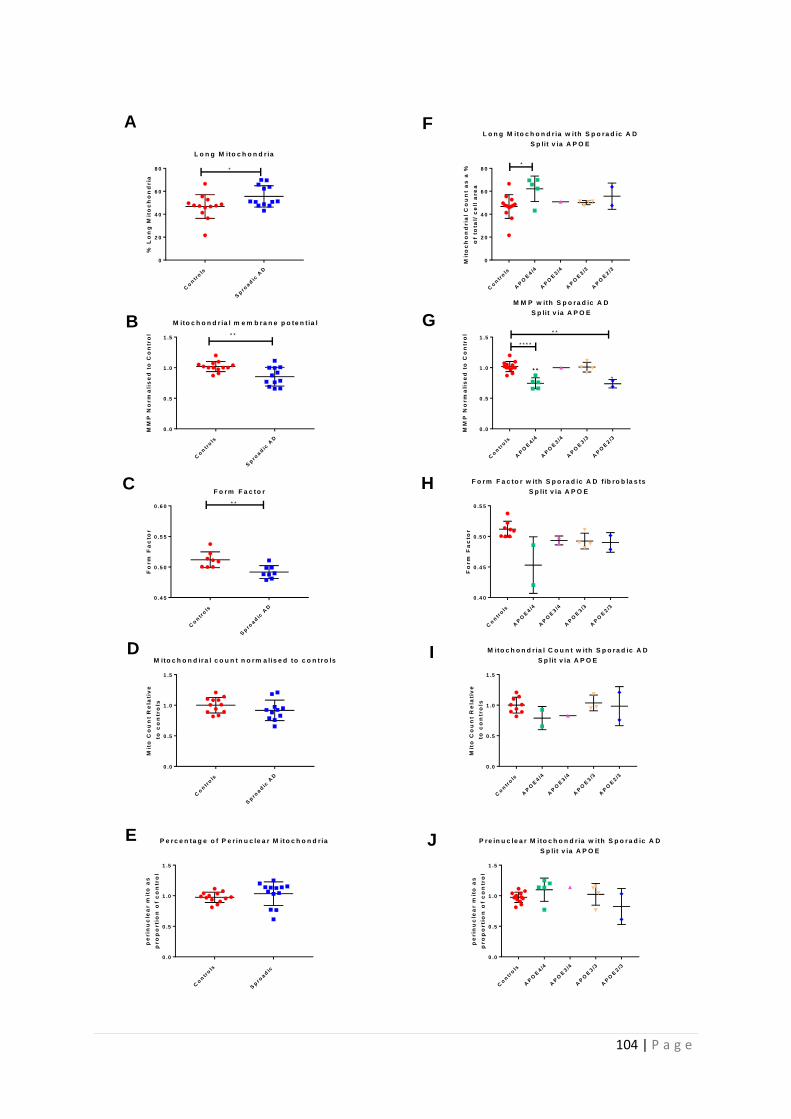
104 | P a g e
Co
ntr
ols
Sp
road
ic A
D
0
2 0
4 0
6 0
8 0
L o n g M ito c h o n d r ia%
Lo
ng
Mit
oc
ho
nd
ria
*
Co
ntr
ols
AP
OE
4/4
AP
OE
3/4
AP
OE
3/3
AP
OE
2/3
0
2 0
4 0
6 0
8 0
L o n g M ito c h o n d r ia w ith S p o ra d ic A D
S p lit v ia A P O E
Mit
oc
ho
nd
ria
l C
ou
nt
as
a %
of
tota
l/ c
ell
are
a
*
Co
ntr
ols
Sp
road
ic A
D
0 .0
0 .5
1 .0
1 .5
M ito c h o n d r ia l m e m b ra n e p o te n t ia l
MM
P N
orm
ali
se
d t
o C
on
tro
l * *
Co
ntr
ols
AP
OE
4/4
AP
OE
3/4
AP
OE
3/3
AP
OE
2/3
0 .0
0 .5
1 .0
1 .5
M M P w ith S p o ra d ic A D
S p lit v ia A P O E
MM
P N
orm
ali
se
d t
o C
on
tro
l
* * * *
* *
* *
*
Co
ntr
ols
Sp
road
ic A
D
0 .4 5
0 .5 0
0 .5 5
0 .6 0
F o rm F a c to r
Fo
rm
Fa
cto
r
* *
Co
ntr
ols
AP
OE
4/4
AP
OE
3/4
AP
OE
3/3
AP
OE
2/3
0 .4 0
0 .4 5
0 .5 0
0 .5 5
F o rm F a c to r w ith S p o ra d ic A D f ib ro b la s ts
S p lit v ia A P O E
Fo
rm
Fa
cto
r
Co
ntr
ols
Sp
road
ic A
D
0 .0
0 .5
1 .0
1 .5
M ito c h o n d ira l c o u n t n o rm a lis e d to c o n tro ls
Mit
o C
ou
nt
Re
lati
ve
to
co
ntr
ols
Co
ntr
ols
AP
OE
4/4
AP
OE
3/4
AP
OE
3/3
AP
OE
2/3
0 .0
0 .5
1 .0
1 .5
M ito c h o n d r ia l C o u n t w ith S p o ra d ic A D
S p lit v ia A P O E
Mit
o C
ou
nt
Re
lati
ve
to
co
ntr
ols
Co
ntr
ols
Sp
road
ic
0 .0
0 .5
1 .0
1 .5
P e rc e n ta g e o f P e r in u c le a r M ito c h o n d r ia
pe
rin
uc
lea
r m
ito
as
pro
po
rti
on
of
co
ntr
ol
Co
ntr
ols
AP
OE
4/4
AP
OE
3/4
AP
OE
3/3
AP
OE
2/3
0 .0
0 .5
1 .0
1 .5
P re in u c le a r M ito c h o n d r ia w ith S p o r a d ic A D
S p lit v ia A P O E
pe
rin
uc
lea
r m
ito
as
pro
po
rti
on
of
co
ntr
ol
A F
B G
C H
D I
E J
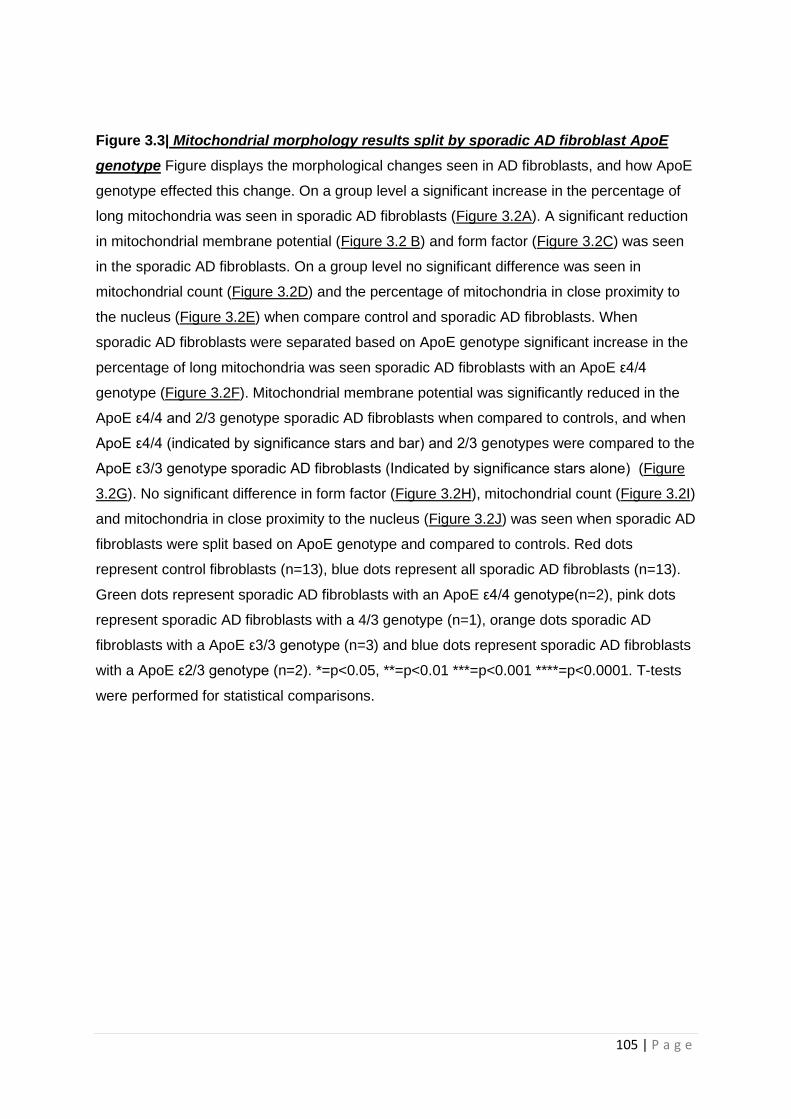
105 | P a g e
Figure 3.3| Mitochondrial morphology results split by sporadic AD fibroblast ApoE
genotype Figure displays the morphological changes seen in AD fibroblasts, and how ApoE
genotype effected this change. On a group level a significant increase in the percentage of
long mitochondria was seen in sporadic AD fibroblasts (Figure 3.2A). A significant reduction
in mitochondrial membrane potential (Figure 3.2 B) and form factor (Figure 3.2C) was seen
in the sporadic AD fibroblasts. On a group level no significant difference was seen in
mitochondrial count (Figure 3.2D) and the percentage of mitochondria in close proximity to
the nucleus (Figure 3.2E) when compare control and sporadic AD fibroblasts. When
sporadic AD fibroblasts were separated based on ApoE genotype significant increase in the
percentage of long mitochondria was seen sporadic AD fibroblasts with an ApoE ε4/4
genotype (Figure 3.2F). Mitochondrial membrane potential was significantly reduced in the
ApoE ε4/4 and 2/3 genotype sporadic AD fibroblasts when compared to controls, and when
ApoE ε4/4 (indicated by significance stars and bar) and 2/3 genotypes were compared to the
ApoE ε3/3 genotype sporadic AD fibroblasts (Indicated by significance stars alone) (Figure
3.2G). No significant difference in form factor (Figure 3.2H), mitochondrial count (Figure 3.2I)
and mitochondria in close proximity to the nucleus (Figure 3.2J) was seen when sporadic AD
fibroblasts were split based on ApoE genotype and compared to controls. Red dots
represent control fibroblasts (n=13), blue dots represent all sporadic AD fibroblasts (n=13).
Green dots represent sporadic AD fibroblasts with an ApoE ε4/4 genotype(n=2), pink dots
represent sporadic AD fibroblasts with a 4/3 genotype (n=1), orange dots sporadic AD
fibroblasts with a ApoE ε3/3 genotype (n=3) and blue dots represent sporadic AD fibroblasts
with a ApoE ε2/3 genotype (n=2). *=p<0.05, **=p<0.01 ***=p<0.001 ****=p<0.0001. T-tests
were performed for statistical comparisons.
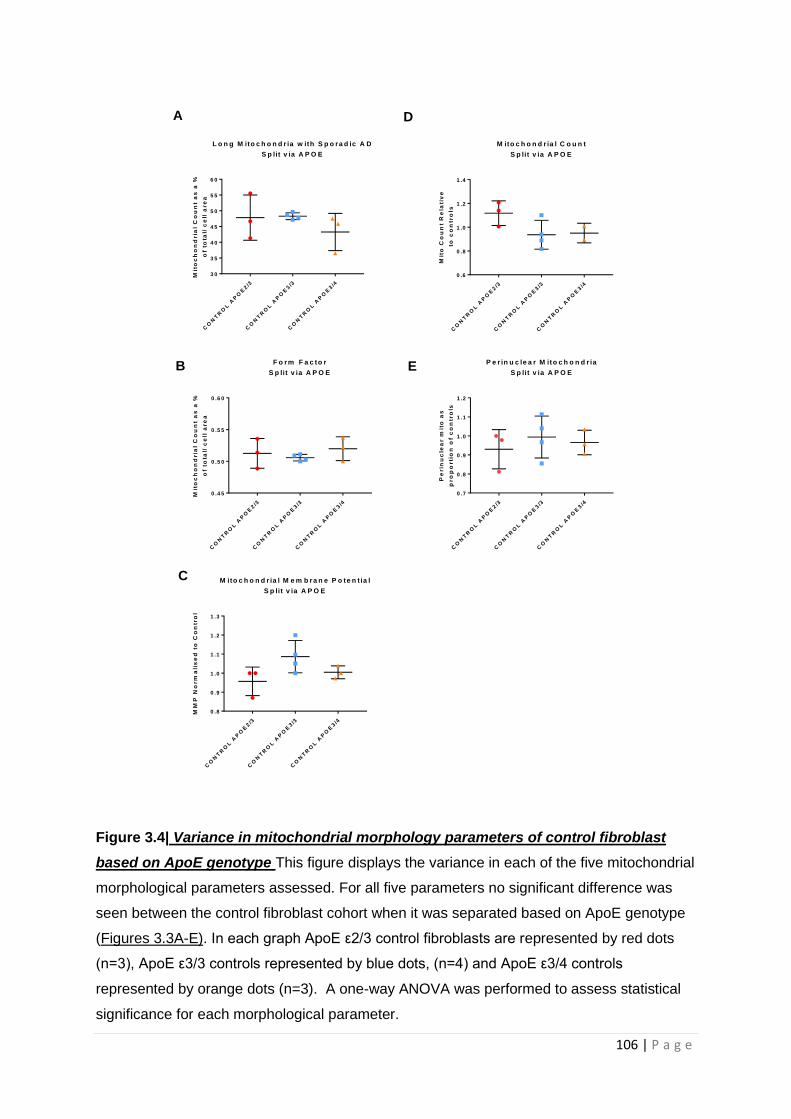
106 | P a g e
Figure 3.4| Variance in mitochondrial morphology parameters of control fibroblast
based on ApoE genotype This figure displays the variance in each of the five mitochondrial
morphological parameters assessed. For all five parameters no significant difference was
seen between the control fibroblast cohort when it was separated based on ApoE genotype
(Figures 3.3A-E). In each graph ApoE ε2/3 control fibroblasts are represented by red dots
(n=3), ApoE ε3/3 controls represented by blue dots, (n=4) and ApoE ε3/4 controls
represented by orange dots (n=3). A one-way ANOVA was performed to assess statistical
significance for each morphological parameter.
CO
NT
RO
L A
PO
E2/3
CO
NT
RO
L A
PO
E3/3
CO
NT
RO
L A
PO
E3/4
3 0
3 5
4 0
4 5
5 0
5 5
6 0
L o n g M ito c h o n d r ia w ith S p o ra d ic A D
S p lit v ia A P O E
Mit
oc
ho
nd
ria
l C
ou
nt
as
a %
of
tota
l/ c
ell
are
a
CO
NT
RO
L A
PO
E2/3
CO
NT
RO
L A
PO
E3/3
CO
NT
RO
L A
PO
E3/4
0 .6
0 .8
1 .0
1 .2
1 .4
M ito c h o n d r ia l C o u n t
S p lit v ia A P O E
Mit
o C
ou
nt
Re
lati
ve
to
co
ntr
ols
CO
NT
RO
L A
PO
E2/3
CO
NT
RO
L A
PO
E3/3
CO
NT
RO
L A
PO
E3/4
0 .4 5
0 .5 0
0 .5 5
0 .6 0
F o rm F a c to r
S p lit v ia A P O E
Mit
oc
ho
nd
ria
l C
ou
nt
as
a %
of
tota
l/ c
ell
are
a
CO
NT
RO
L A
PO
E2/3
CO
NT
RO
L A
PO
E3/3
CO
NT
RO
L A
PO
E3/4
0 .7
0 .8
0 .9
1 .0
1 .1
1 .2
P e r in u c le a r M ito c h o n d r ia
S p lit v ia A P O E
Pe
rin
uc
lea
r m
ito
as
pro
po
rti
on
of
co
ntr
ols
CO
NT
RO
L A
PO
E2/3
CO
NT
RO
L A
PO
E3/3
CO
NT
RO
L A
PO
E3/4
0 .8
0 .9
1 .0
1 .1
1 .2
1 .3
M ito c h o n d r ia l M e m b ra n e P o te n t ia l
S p lit v ia A P O E
MM
P N
orm
ali
se
d t
o C
on
tro
l
A D
B E
C
107 | P a g e
3.3.3 Fibroblasts with the ApoE ε4/4 have reduced levels of ATP which can be corrected with
the application of UDCA
The ability of the AD fibroblasts to maintain a control level of total cellular ATP was assessed. A
reduction in total cellular ATP was seen in both sporadic (18% reduction, p=0.009) and PSEN1
familial AD fibroblasts (22% reduction) when compared to controls, although the reduction in
familial AD fibroblast total cellular ATP was not significant (p=0.07) (Figure 3.4A). On closer
inspection of the familial fibroblast AD lines revealed that 2 fibroblasts lines had a significant
reduction in total ATP, whereas one line had a higher level of total cellular ATP when compared to
controls. When the sporadic lines were split based on apoε genotype, only sporadic AD fibroblasts
that had a 4/4 genotype had a significant reduction in total cellular ATP (36% reduction, p<0.0001)
(Figure 3.4B). The data presented for the total cellular ATP includes all sporadic AD lines for which
apoε genotype was available for (Sporadic n=12).
Next, whether treatment with 100µM of UDCA could correct the deficits seen in sporadic and
familial AD fibroblasts total cellular ATP levels was assessed. Application of UDCA increased total
cellular ATP in all AD fibroblasts lines (Figure 3.4C). A significant increase in total cellular ATP was
seen in the sporadic AD fibroblasts treated with UDCA when compared to sporadic AD fibroblasts
treated with the drug vehicle only, Dimethyl sulfoxide (DMSO) (65% increase, p= 0.012). Familial AD
fibroblasts show a non-significant increase in total cellular ATP when compared to DMSO (45%
increase, p= 0.166), and controls also showed a non-significant increase when compared to DMSO
(5% increase, p=0.963). The data presented here for total cellular ATP levels after UDCA treatment
represents the fibroblast lines used in the chapter paper (sporadic n=7, familial n=3). The sporadic
fibroblast lines used in this part of the study were a mixture of ApoE ε4 positive and negative lines,
see table 3.1.
3.3.4 All sporadic AD fibroblasts independent of ApoE genotype have a deficit in
mitochondrial spare respiratory capacity
Mitochondrial spare respiratory capacity (MSRC) was assessed again with the increased number of
cell lines. For these experiments the whole Sheffield cohort of sporadic AD lines was used as well as
1 Coriell sporadic fibroblast line. (n=11). The other 2 Coriell sporadic lines were not used due to poor
growth. The familial cell line reported in the chapter paper was included in this analysis. In this
extended sporadic AD fibroblast cohort, we saw a significant reduction in MSRC (33.7% reduction,
p=0.002) this was similar to that reported in the smaller chapter paper cohort (Figure 3.4D).
MSRC in the sporadic AD fibroblasts was investigated with cell lines split based on Apoε genotype. A
trend towards a reduction was seen in all ApoE genotypes when comparing MRSC to controls,

108 | P a g e
suggesting that apoε genotype does not have a specific affect MRSC in AD. (Figure 3.4E). A significant
difference was only seen between controls and sporadic fibroblasts with an ApoE ε3/3 (34%
reduction, p=0.03) genotype, both ApoE ε4/4 (30% reduction, p=0.15) and ApoE ε2/3 (37.9%
reduction, p=0.07) were not significant.
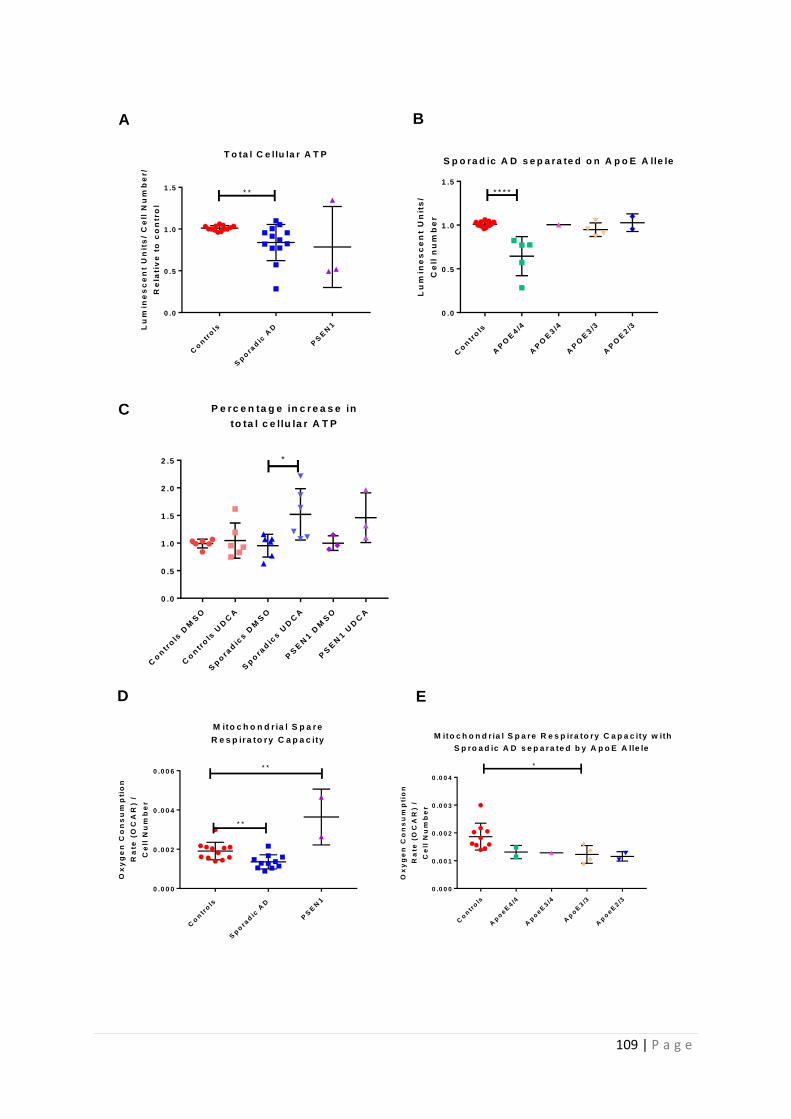
109 | P a g e
Co
ntr
ols
Sp
ora
dic
AD
PS
EN
1
0 .0
0 .5
1 .0
1 .5
T o ta l C e llu la r A T P
Lu
min
es
ce
nt
Un
its
/ C
ell
Nu
mb
er/
Re
lati
ve
to
co
ntr
ol
* *
Co
ntr
ols
AP
OE
4/4
AP
OE
3/4
AP
OE
3/3
AP
OE
2/3
0 .0
0 .5
1 .0
1 .5
S p o ra d ic A D s e p a ra te d o n A p o E A lle le
Lu
min
es
ce
nt
Un
its
/
Ce
ll n
um
be
r
* * * *
Co
ntr
ols
Sp
ora
dic
AD
PS
EN
1
0 .0 0 0
0 .0 0 2
0 .0 0 4
0 .0 0 6
M ito c h o n d r ia l S p a r e
R e s p ira to ry C a p a c ity
Ox
yg
en
Co
ns
um
pti
on
Ra
te (
OC
AR
) /
Ce
ll N
um
be
r
* *
* *
Co
ntr
ols
Ap
oeE
4/4
Ap
oeE
3/4
Ap
oE
3/3
Ap
oeE
2/3
0 .0 0 0
0 .0 0 1
0 .0 0 2
0 .0 0 3
0 .0 0 4
M ito c h o n d r ia l S p a re R e s p ira to ry C a p a c ity w ith
S p ro a d ic A D s e p a ra te d b y A p o E A lle le
Ox
yg
en
Co
ns
um
pti
on
Ra
te (
OC
AR
) /
Ce
ll N
um
be
r
*
Co
ntr
ols
DM
SO
Co
ntr
ols
UD
CA
Sp
ora
dic
s D
MS
O
Sp
ora
dic
s U
DC
A
PS
EN
1 D
MS
O
PS
EN
1 U
DC
A
0 .0
0 .5
1 .0
1 .5
2 .0
2 .5
P e rc e n ta g e in c r e a s e in
to ta l c e llu la r A T P
*
A B
C
D E
110 | P a g e
Figure 3.5| Total cellular ATP and Mitochondrial Spare Respiratory Capacity split by
AD fibroblast Apoε genotype This figure displays the total cellular ATP and MSRC
changes seen in AD fibroblasts, and how ApoE genotype affected this change. A reduction
in total cellular ATP was seen in both sporadic AD fibroblasts and familial AD fibroblasts
when compared to controls, but the reduction in the sporadic AD fibroblasts total cellular
ATP was significant (Figure 3.4A). When sporadic AD fibroblasts were split based on ApoE
genotype only sporadic AD fibroblasts with a 4/4 genotype had a reduction in total cellular
ATP when compared to controls (Figure 3.4B). When fibroblasts were treated with UDCA an
increase in total cellular ATP was seen in all cell lines when compared to fibroblasts treated
with the drug vehicle dimethyl sulphoxide (DMSO) alone. Only sporadic AD fibroblasts saw a
significant increase in total cellular ATP (Figure 3.4C). A significant decrease in
mitochondrial spare respiratory capacity (MSRC) was seen in sporadic AD fibroblasts and a
significant increase in MSRC in familial AD fibroblasts was seen when compared to controls
(Figure 3.4D). All sporadic AD fibroblasts irrespective of ApoE genotype had a reduction in
MSRC (Figure 3.4E). Red dots represent control fibroblasts (n=12, and n=7 in figure 3.4C),
blue dots represent all sporadic AD fibroblasts (n=11, and n=7 in figure 3.4C) purple dots
represent familial (PSEN1) AD fibroblasts (n=3, or n=2 in figure 3.4D). Green dots represent
sporadic AD fibroblasts with an ApoE ε4/4 genotype (n=2), pink dots represent sporadic AD
fibroblasts with a 4/3 genotype (n=1), orange dots sporadic AD fibroblasts with a ApoE ε3/3
genotype (n=3) and blue dots represent sporadic AD fibroblasts with a ApoE ε2/3 genotype
(n=2). *=p<0.05, **=p<0.01, ****=p<0.0001. T-tests were performed for statistical
comparisons.
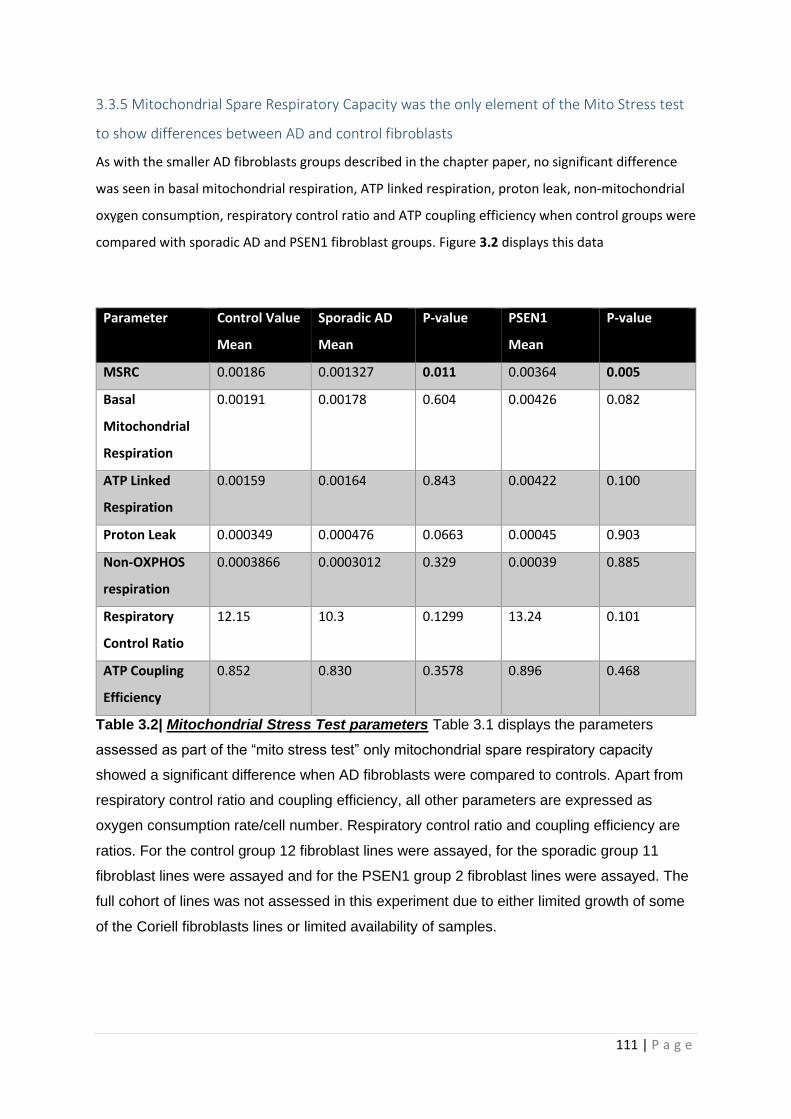
111 | P a g e
3.3.5 Mitochondrial Spare Respiratory Capacity was the only element of the Mito Stress test
to show differences between AD and control fibroblasts
As with the smaller AD fibroblasts groups described in the chapter paper, no significant difference
was seen in basal mitochondrial respiration, ATP linked respiration, proton leak, non-mitochondrial
oxygen consumption, respiratory control ratio and ATP coupling efficiency when control groups were
compared with sporadic AD and PSEN1 fibroblast groups. Figure 3.2 displays this data
Parameter Control Value
Mean
Sporadic AD
Mean
P-value PSEN1
Mean
P-value
MSRC 0.00186 0.001327 0.011 0.00364 0.005
Basal
Mitochondrial
Respiration
0.00191 0.00178 0.604 0.00426 0.082
ATP Linked
Respiration
0.00159 0.00164 0.843 0.00422 0.100
Proton Leak 0.000349 0.000476 0.0663 0.00045 0.903
Non-OXPHOS
respiration
0.0003866 0.0003012 0.329 0.00039 0.885
Respiratory
Control Ratio
12.15 10.3 0.1299 13.24 0.101
ATP Coupling
Efficiency
0.852 0.830 0.3578 0.896 0.468
Table 3.2| Mitochondrial Stress Test parameters Table 3.1 displays the parameters
assessed as part of the “mito stress test” only mitochondrial spare respiratory capacity
showed a significant difference when AD fibroblasts were compared to controls. Apart from
respiratory control ratio and coupling efficiency, all other parameters are expressed as
oxygen consumption rate/cell number. Respiratory control ratio and coupling efficiency are
ratios. For the control group 12 fibroblast lines were assayed, for the sporadic group 11
fibroblast lines were assayed and for the PSEN1 group 2 fibroblast lines were assayed. The
full cohort of lines was not assessed in this experiment due to either limited growth of some
of the Coriell fibroblasts lines or limited availability of samples.
112 | P a g e
3.4 Discussion
The results in this chapter reveal that mitochondrial function and morphology are altered in both
sporadic and familial AD fibroblast lines. These functional and morphological alterations can be
corrected with the application of UDCA. The mechanism by which UDCA ameliorates the
mitochondrial functional abnormalities appears to be Drp1 dependent. The mechanism of action of
UDCA was identified through worked performed by the myself, and paper co-author Katy Barnes. As
well as the mentioned discussion points in the chapter paper the following discussion points are
presented from the additional data in this section.
3.4.1 Mitochondrial morphology is altered in AD
In this chapter it has been shown that the mitochondrial network in both sporadic and PSEN1 AD
fibroblasts is more fused when compared to controls. It has been suggested that a more fused
mitochondrial network can occur in a cell to improve the efficiency of ATP production [417], and also
work as a defensive mechanism employed against oxidative damage [427]. Increased levels of ROS
are reported in AD fibroblasts in the studies by Wang et al and Perez et al which show altered
mitochondrial dynamics [204, 418]. The level of increased ROS is very different in both studies,
which could suggest that the differences reported in mitochondrial dynamic change in the above
studies are a result of studying different time points in the course of the fibroblast’s response to
ROS. ROS were not measured as a part of the results presented in this chapter. Combining the
results of this chapter with that of the cited papers highlights the importance of measuring
mitochondrial stress parameters when investigating mitochondrial dynamics, as the level of
metabolic stress a fibroblast is exposed is likely to affect its mitochondrial dynamics. Further
experiments investigating mitochondrial dynamics in AD fibroblasts or other cell types should
control for disease length, age of fibroblast donor, level of oxidative stress and metabolic stress as all
these factors may confound results, and may also explain the heterogeneity reported in the
literature so far.
Both sporadic and familial AD fibroblasts showed no reduction in the amount of Drp1 mRNA
identified by myself and a reduction in Drp1 protein identified by chapter paper co-author Katy
Barnes, but no change was seen in the mitochondrial fusion proteins/mRNA of MFN1&2 and OPA1.
This finding has been reported by other groups [418]. This result though is not consistently reported
across the AD fibroblast literature with some groups suggesting that MFN1 is increased, OPA1 is
decreased, and Drp1 levels remain unchanged in AD fibroblasts [204]. As described above amyloid
can affect the function of mitochondrial fission proteins, and it is known that fibroblasts can produce
Aβ. Fibroblast Aβ levels where not measured in these studies, but potentially differences reported
113 | P a g e
with regard to mitochondrial fission and fusion proteins, may be dependent on the expression level
of Aβ within the fibroblast [414].
3.4.2 Fibroblasts with ApoE ε4/4 genotype produce less ATP and have altered mitochondrial
morphology
Deficits in total cellular ATP and changes to the mitochondrial morphology were seen in both
sporadic and familial AD fibroblasts, although these changes were not uniform across both groups.
An ATP deficit was only seen in sporadic AD fibroblasts that had an ApoE ε4/4 genotype. The
mitochondrial morphological changes seen in sporadic AD fibroblasts, including an increased
percentage of long mitochondria, more mitochondria focused around the cell nucleus, decreased
MMP, decreased form factor and decreased mitochondrial count, were more pronounced in the
ApoE ε4/4 genotype AD fibroblasts. The separate ApoE genotype group sizes were very small in this
study, and when interpreting these results this must be considered. It is well known that the ApoE
ε4/4 genotype increases the likelihood of developing sporadic AD and also reduces the age of onset,
so the finding that ApoE ε4/4 genotype AD fibroblasts have a more affected mitochondrial
phenotype than other ApoE genotypes is consistent with current literature describing the effect of
ApoE in AD.
It is unclear as to how the ApoE ε4/4 genotype may affect mitochondrial morphology and total
cellular ATP levels. The pattern of mitochondrial morphological changes and deficit in total cellular
ATP seen in the AD fibroblasts suggests a stressed mitochondrial network not meeting the energy
demands of the cell. Studies looking at brain glucose metabolism of people with ApoE ε4/4 genotype
have shown a reduced ability to uptake glucose [428]. Mice with the ApoE ε4/4 genotype have also
been shown to have increased expression of complex III of the ETC, and decreased MMP. It could be
postulated that fibroblasts with the ApoE ε4/4 have a reduced ability to use glucose, which means
that glycolysis is impaired and therefore other substrates for metabolism and other ATP generating
pathways such as OxPHOS have increased activity to meet cellular energy demands. This would
increase the metabolic stress placed on OxPHOS which eventually may affect the shape and function
of the mitochondrial network as the disease progresses. The more exacerbated mitochondrial
morphology changes seen in ApoE ε4/4 genotype in this chapter may have been precipitated by
increased demands on OxPHOS from reduced glycolysis function. The glycolytic function of the
fibroblasts is discussed in detail in chapter 4. The ApoE changes seen in this chapter may also be
dependent on the length of time the patient has had AD. Fibroblasts from patients with MCI or early
AD, and an ApoE ε4/4 genotype, may have a mitochondrial morphology and functional changes that
are not as severe as those seen when AD is well established. In this chapter it has been identified
that other ApoE genotypes have mitochondrial morphological changes similar to that seen in the
114 | P a g e
ApoE ε4/4 genotype group. The ApoE ε2/3 genotype also showed changes in mitochondrial
morphology. This could be evidence that in AD a background mitochondrial inefficiency may be
compounded by the presence of the ApoE ε4/4 genotype, meaning that both factors work
synergistically to effect mitochondrial function. ApoE ε4/4 genotype has been associated with
increased MAM contacts which may affect the calcium balance within the mitochondria. This may
also impact the mitochondria’s ability to meet the energetic requirements of the cell [429].
It is an interesting finding that ApoE genotype may affect mitochondrial function, but further work is
needed in studies with much larger sample sizes to fully understand the effect ApoE has on cellular
energetic properties. Experiments in which the ApoE ε4/4 genotype is changed using CRISPR would
also develop the understanding of the interaction between mitochondrial function and ApoE.
Only 2 of the 3 PSEN1 familial AD fibroblasts lines tested had a deficit in total cellular ATP. The 2 cell
lines that had deficits in total cellular ATP were both male patients, whereas the PSEN1 fibroblasts
without a deficit came from a female donor. Several mutations have been identified within the
PSEN1 gene which cause AD [88, 89, 430, 431], all of which may have a different effect on total
cellular ATP. Each PSEN1 fibroblast line in this study has a different PSEN1 mutation, this may explain
the variability in results. There was a uniform change in mitochondrial morphology markers in PSEN1
fibroblasts, which may suggest that mitochondrial morphology is effected by all PSEN1 gene
mutations that cause AD, but only certain mutations cause these changes in morphology to affect
total cellular ATP. It is also important to mention that the PSEN1 fibroblast group is small (n=3) so
study in a larger patient group is warranted to confirm the hypotheses for the discrepancies seen in
the 3 PSEN1 fibroblast lines.
3.4.3 All Fibroblasts independent of ApoE genotype have a decreased mitochondrial spare
respiratory capacity
MSRC was found to be low in all sporadic AD fibroblasts, and this appears to be independent of ApoE
genotype. This is an interesting finding, as it suggests that in sporadic AD mitochondrial changes may
be independent of one of the main genetic risk factors that determines the disease presentation.
MRSC is a measure of the capacity of a mitochondrial network to increase OxPHOS above the rate
needed for unstressed ATP production. In non-disease states it is very unlikely that MRSC is reached
by a cell, therefore total cellular ATP demands can be met by the metabolic pathways within the cell.
In a disease state several factors probably combine to increase the ATP demand on a cell, such as
ROS damage and calcium homeostasis failure and this is likely to be when MSRC plays an important
part in maintaining cellular ATP demands. The sporadic fibroblasts studied in this chapter without an
ApoE ε4/4 genotype could match total cellular ATP production of controls. Fibroblasts used in this
115 | P a g e
study were maintained in an optimum environment, so the presence of metabolic or oxidative stress
would be unlikely. ATP deficits may be seen in AD fibroblasts without the ApoE ε4/4 genotype if
grown in a media, or environment that exposes them to metabolic stress, as their MSRC is lower
than controls.
Further work is needed to understand what the cause of the reduced MSRC seen in sporadic AD
fibroblasts is. Interestingly, Familial AD fibroblasts studied in this chapter had an increased MSRC,
which could suggest that the MSRC deficits are independent of amyloid production. Evidence from
studying cardiac myocytes and SOD2 deficient mice has suggested the MSRC is dependent on the
activity of complex II of the ETC [432, 433], therefore investigating the activity of the ETC complexes
individually in AD would be logical next step to identify the mechanism behind low and high MSRC
seen in the AD fibroblasts.
3.4.4 Study limitations
The data presented in this chapter has several limitations, the analysis based on ApoE is based on
very small numbers of patient’s fibroblasts, with the ApoE ε3/3 genotype limited to only one cell
line. This means that the statistical analysis is very likely to be underpowered due to the small
sample sizes. This needs to be considered when interpreting the results with regard to mitochondrial
morphology and total cellular ATP. The low numbers of separate ApoE genotypes may also explain
why the results seem to suggest that having ApoE ε2/3 genotype has similar pathological properties
to having the ApoE ε4/4 genotype. Based on previous literature it would be expected that the ApoE
ε2/3 genotype may have a positive effect on the morphological and functional mitochondrial
parameters, as this genotype protects a person from developing AD. It is also important to mention
that the expression of Apo ε within fibroblasts is debated, with sources claiming that fibroblasts
express the protein [434] but others claiming they do not [435]. Lack of expression of Apo ε within
fibroblasts would mean that differences seen in metabolism are likely not caused by this protein.
Future work investigating differences in metabolic function in fibroblasts separated by Apo ε
genotype should immunoblot samples first to identify if fibroblasts used do express the protein.
Within the published paper the presentation of control and disease group data is different in figures
1A and 3A. It was requested that control data was presented as a group mean whereas data was
given separately for each disease line under assessment. This means that error bars in the control
group represent the standard deviation of the whole cohort but error bars for disease represent the
standard deviation of the technical repeats. Although this presentation of the data is misleading, it
was requested by the reviewers of the article. Ideally data should have been presented as grouped
means and standard deviations for each cohort. Furthermore, it was requested in figure 4B by the
116 | P a g e
reviewer that UDCA treatment statistics were compared to the untreated condition and not DMSO.
The more experimentally appropriate comparison would be DMSO alone (the drug vehicle that
UDCA was dissolved in) to the UDCA treated condition. When comparing the effect of DMSO alone
and UDCA on Drp1 protein location, there was a statistically significant increase in Drp1 localised to
the mitochondria in the UDCA treatment group suggesting that the effect of Drp1 localisation is
mediated through the actions of UDCA and not through the drug vehicle DMSO.
Results on mitochondrial dynamics are based on one particular time point, which is the nature of the
experimental paradigm used for investigation here. The dynamic nature of the fibroblast
mitochondrial network would benefit from being studied over many time points in both an
untreated and UDCA treated situation. This would help to understand the natural cycle of
mitochondrial fusion and fission dynamics in AD and if this is affected by the application of UDCA.
Evidence from APP over expression animal models in which mitochondrial dynamics are assessed at
several time points would suggest that abnormalities in the rate of mitochondrial fusion are present
[418]. This is likely to have a significant effect on the function of the mitochondrial network.
3.5 Chapter Conclusions
1. Sporadic AD fibroblasts have morphological changes suggestive of a stressed mitochondrial
network. This includes elongated mitochondria, decreased MMP and a trend towards
decreased mitochondrial count and a perinuclear focusing of the mitochondrial network.
2. The mitochondrial morphology changes may be exacerbated by the ApoE ε4/4 genotype.
3. Sporadic AD fibroblasts have a reduced MSCR which appears to be independent of ApoE
genotype.
4. Familial PSEN1 AD fibroblasts have similar changes to their mitochondrial morphology when
compared with sporadic AD fibroblasts but have an increased MSRC which may be the result
of uncoupling of their mitochondria.
5. Reductions in total cellular ATP are seen in AD fibroblasts with the ApoE ε4/4 genotype but
not in other ApoE genotypes.
6. UDCA can correct the deficits in ATP production, MMP and mitochondrial elongation when
applied to both sporadic and familial fibroblasts for 24 hours at a concentration of 100µM.
7. UDCA can correct the deficit in MRSC in sporadic AD fibroblasts.
117 | P a g e
Chapter 4: Deficits in Mitochondrial Spare Respiratory Capacity
Contribute to the Neuropsychological Changes of Alzheimer’s Disease
4.1 Introduction In chapter 3 it was identified that mitochondria have morphological and functional deficits in
sporadic and familial AD fibroblasts. In sporadic fibroblasts, deficits in Mitochondrial Spare
Respiratory Capacity (MSRC) and Mitochondrial Membrane Potential (MMP) were common to all cell
lines. As sporadic AD fibroblasts have mitochondrial deficits that may predispose them to metabolic
failure when challenged by multiple stressors, this may lead to the fibroblasts having to rely on other
metabolic pathways for ATP generation. For this reason, in this chapter the glycolytic ability of
sporadic AD fibroblasts has been assessed.
As well as further characterising the glycolysis pathway within the sporadic AD fibroblasts, this
chapter also investigates if the mitochondrial and glycolytic abnormalities seen in sporadic AD
fibroblasts correlate with neuropsychological and neuroimaging changes seen early in the course of
AD. Ideally this chapter would also include the PSEN1 familial AD fibroblast lines, but due to the lack
of clinical phenotypic data available these lines were excluded. The Coriell sporadic AD lines were
also excluded for the same reasons.
The following introductory sections will discuss the early changes seen in neuroimaging and
neuropsychological testing in AD.
4.1.1 Structural Neuroimaging changes in AD
Structural brain imaging was one of the first brain imaging modalities used to aid in the diagnosis of
AD. Computed Tomography (CT) and Magnetic Resonance imaging (MRI) are both used depending
on clinical setting and resource availability [436]. The main brain structural imaging change used to
identify AD is selective cortical atrophy. Cortical atrophy develops in a characteristic pattern in AD
that starts in the medial temporal lobe, specifically the entorhinal cortex, and then moves through
the brain in a pattern that corresponds with the deposition of NFT [437]. Temporal lobe atrophy
progression follows the clinical progression of the disease, and is good marker for differentiating AD
from normal ageing related cognitive changes [438]. The pattern of cortical atrophy in AD can
resemble that seen in other forms of dementia, such as vascular dementia, and there are certain AD
presentations that do not have a classical pattern of cortical atrophy [94], which impedes using
cortical atrophy alone as a biomarker for AD.
Cortical atrophy represents a pathological loss of neurons, and therefore suggests an already
established pathological process. This is exemplified by studies showing 20-30% of entorhinal
118 | P a g e
cortical atrophy in AD patients when only mild deficits on neuropsychological testing are present
[439]. It is also important to consider that cortical atrophy is a pathological demonstration of
neuronal loss, but as to what is causing the neuronal loss is difficult to ascertain. Amyloid and tau
accumulation clearly play a role in neuronal loss, but metabolic failure is also likely to be implicated
as a cause of atrophy and subsequently cell death [440]. Chronic hypoperfusion of the brain in AD
likely contributes to the development of atrophy as well [441]. Hypoperfusion may cause atrophy by
accelerating metabolic deficits, or exacerbating amyloid and tau pathology [442].
4.1.2 Neuropsychological changes in early AD
Neuropsychological assessment has been used as a tool to diagnose AD for at least the last 30 years.
Neuropsychological assessment involves examining different cognitive functions that relate to
neuroanatomical brain regions to develop a profile of cognitive impairment. Classical patterns of
cognitive impairment are seen at the start of many dementias, allowing for the differentiation
between different subtypes. In AD the earliest neuropsychological abnormalities are typically seen in
episodic memory and semantic memory [73]. Episodic and semantic memory are both types of
declarative or explicit memory which concerns the retaining of facts and information. Semantic
memory refers to memory associated with encyclopaedic or conceptual knowledge, such as names
of animals and types of fruit, whereas episodic memory refers to the remembering of certain
autobiographical events, such as birthdays [443]. Episodic and semantic memory are encoded in the
medial temporal lobe. Episodic memory does decline with age naturally, but semantic memory has
been shown to improve with normal ageing [444]. The rate of decline of episodic memory has been
associated with a high degree of accuracy in diagnosing AD with studies performing delayed recall
memory tests (i.e. recalling of information given 10 minutes prior) having a 90% accuracy in
differentiating normal ageing from dementia [445]. It is thought that in AD the organization of
semantic memory within the brain is lost, which causes the memory retrieval deficits [446].
Phonemic fluency is a type of executive functioning that describes the ability to list words without
semantic context (letter fluency). Phonemic fluency is characteristically affected later in the course
of AD [447]. As AD progresses and the traditional pathological aggregates spread to the rest of the
brain, impairments in executive function and working memory become apparent. These memory
functions are sustained by the prefrontal cortex and which is the main reason they are affected later
in the disease course.
Semantic memory is a good example of a memory function that has representation in multiple brain
regions. As well as the medial temporal lobe, the temporal neocortex is important in the storage of
semantic information, suggesting a network of brain regions that work together to sustain semantic
memory functions [448]. Neuropsychology has advanced as a field to correlate cognitive functioning
119 | P a g e
with brain networks. This includes neuroanatomical and functional neural networks and is often
exploited while investigating how disease affects different aspects of cognition. Several brain
functional networks exist including the salience network, thought to be involved with integrating
emotional and sensory stimuli [449], and the visual network involved with the processing of visual
information [450]. Switching between different functional networks has metabolic complications,
and is therefore affected by the metabolic functions of brain cells. One functional network that has
been studied extensively in AD in the default mode network (DMN) [451-453]
4.1.3 The Default Mode Network
The DMN refers to a network of functionally connected brain areas that have been shown to have
increased blood flow, and glucose metabolism when a person is involved in quiet introspective
thought [454]. Examples of the cognitive processes being performed when the DMN is most active
would be autobiographical memory retrieval, envisaging the future, or considering the perspective
of others [410]. The anatomical regions that are part of the DMN network include [410]:
• The ventral medial prefrontal cortex
• Posterior cingulate and retrosplenic cortex
• Inferior Parietal lobule
• Lateral Temporal cortex
• Dorsal medial prefrontal cortex
• Hippocampal formation
The DMN should be thought of as a group level pattern of statistical regularities identified after
functional brain image processing. This means that the DMN is difficult to interpret as a
phenomenon when thinking about a single person, with most techniques used to create a DMN map
based on comparisons between a cohort of disease individuals and controls, or a single cohort of
participants. The pattern of the DMN will change based on sample size, and group under
investigation, but multiple studies using different MRI machines and different cohorts of patients
have reported a consistent pattern of brain activation that represents the DMN [455]. There is
evidence that functional connectivity patterns created using a group level analysis are seen
consistently in individual subjects [456], which suggests that viewing the DMN connectivity pattern
for a single participant in a study is an appropriate methodology.
The DMN is of interest in the study of AD as changes in the functional connectivity of this network
are seen very early in the condition. When considering the brain areas that are part of the DMN it is
obvious why this is the case. The functional connections between different areas of the DMN do not
necessarily decrease as AD progresses, with some studies showing increased connectivity between
120 | P a g e
regions of the DMN [451]. There is also evidence that in AD increased DMN connectivity is seen as a
maladaptive mechanism to compensate for poor semantic memory performance [457]. The theory
for increased connectivity within the DMN in certain disease states is thought to relate to a
reduction of efficiency in the functional network, meaning that either new brain regions, or
increased activity is needed to maintain the DMN overall function. As neurodegenerative diseases
progress it has been shown that the functional connectivity maps for different brain networks start
to merge together. The inter-network inhibition that exists in healthy brain networks becomes
impaired in neurodegenerative states leading to separate brain networks needing to rely on more
brain regions to maintain connectivity [457].
A landmark paper in 2005 showed that the anatomical areas of the DMN are the same areas of the
brain that are most affected by amyloid deposition, cortical atrophy and decreased glucose
metabolism in AD [452]. This paper also showed that the DMN was active in the acquisition of stored
memories, therefore linking amyloid pathology, brain atrophy, abnormal metabolism and memory
acquisition together in a specific pattern of areas affected in AD. The observation that DMN is
disrupted by amyloid deposition has been confirmed by other groups [458, 459]. The idea that the
connected brain regions that form the DMN are specifically targeted in AD has been taken further by
groups exploring the deposition of tau throughout the brain showing a pattern of tau deposition that
corresponds with DMN brain areas [460]. The areas of the DMN have a disproportionately high
glucose and oxygen consumption compared to other brain regions [461-463]. This has led to the
hypothesis that due to the continual high metabolic rate of the DMN regions, AD may be initiated by
metabolic failure when the capacity of these regions to maintain network homeostasis (forming and
switching between different brain networks) starts to fail. [440, 452] For this reason, understanding
the relationship between cellular metabolism and DMN changes in AD is of significant interest.
4.1.4 Assessment of glycolysis using the Agilent XF seahorse analyser
In this chapter the assessment of glycolysis is discussed using the glycolysis stress test devised to be
performed with an Agilent Seahorse analyser. Assessment is performed in a very similar way to that
described in chapter 3 (section 3.1.4) when discussing the mitochondrial stress test. The process of
glycolysis releases hydrogen ions via the actions of glyceralghyde-3-phosphate dehydrogenase this
increases the acidity of the media that the cells being assessed are grown in. As a result of this for
this experiment extracellular acidification rate is measured instead of oxygen consumption. The cells
being assessed are initially cultured in a media that does not contain glucose. After this stage the
rate of glycolysis is measured by adding glucose to the cell media. Once the rate of glycolysis has
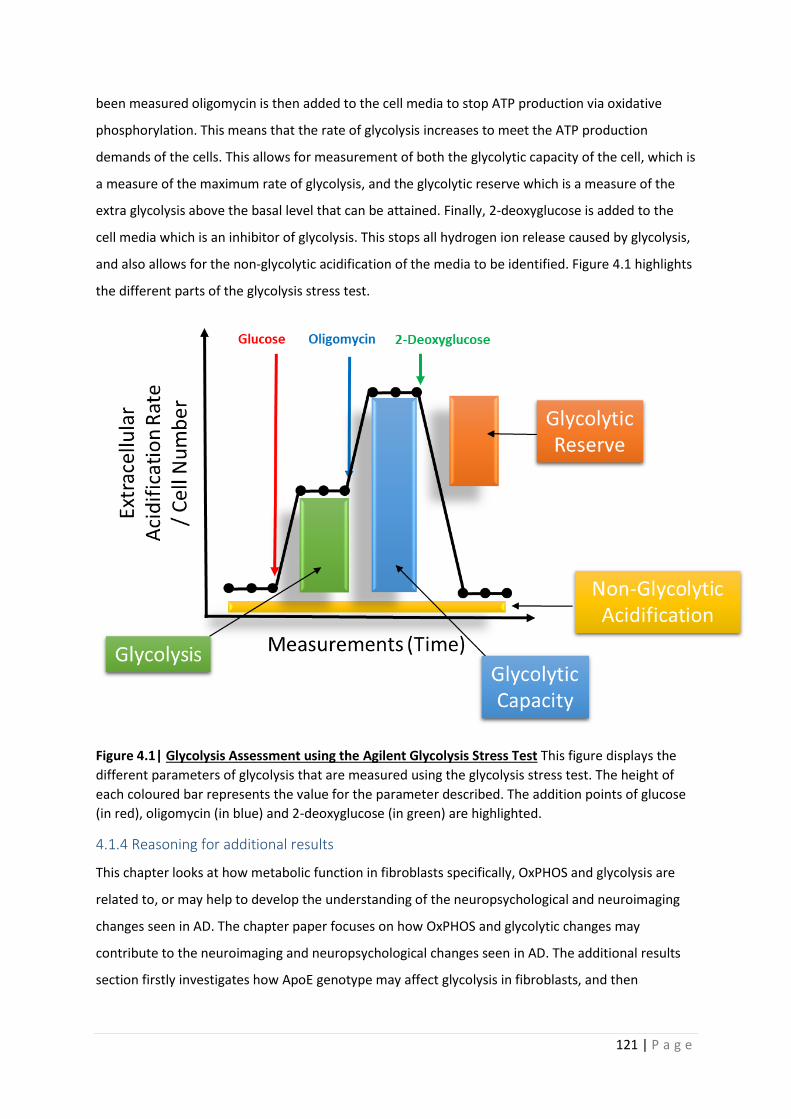
121 | P a g e
been measured oligomycin is then added to the cell media to stop ATP production via oxidative
phosphorylation. This means that the rate of glycolysis increases to meet the ATP production
demands of the cells. This allows for measurement of both the glycolytic capacity of the cell, which is
a measure of the maximum rate of glycolysis, and the glycolytic reserve which is a measure of the
extra glycolysis above the basal level that can be attained. Finally, 2-deoxyglucose is added to the
cell media which is an inhibitor of glycolysis. This stops all hydrogen ion release caused by glycolysis,
and also allows for the non-glycolytic acidification of the media to be identified. Figure 4.1 highlights
the different parts of the glycolysis stress test.
Figure 4.1| Glycolysis Assessment using the Agilent Glycolysis Stress Test This figure displays the
different parameters of glycolysis that are measured using the glycolysis stress test. The height of
each coloured bar represents the value for the parameter described. The addition points of glucose
(in red), oligomycin (in blue) and 2-deoxyglucose (in green) are highlighted.
4.1.4 Reasoning for additional results
This chapter looks at how metabolic function in fibroblasts specifically, OxPHOS and glycolysis are
related to, or may help to develop the understanding of the neuropsychological and neuroimaging
changes seen in AD. The chapter paper focuses on how OxPHOS and glycolytic changes may
contribute to the neuroimaging and neuropsychological changes seen in AD. The additional results
section firstly investigates how ApoE genotype may affect glycolysis in fibroblasts, and then
122 | P a g e
investigates if OxPHOS markers shown to correlate with neuropsychological changes in AD, correlate
with connectivity changes seen in the DMN.
4.1.5 Published Paper contributions by PhD Candidate
• Performed all mitochondrial stress test and glycolysis stress test seahorse assays.
• Performed all extracellular lactate assays.
• Performed MMP assays on 14 of 20 fibroblasts lines used in this paper.
• Performed ATP assays on 14 of 20 fibroblast lines used in this paper.
• Performed all correlations and covariate analyses of data sets.

123 | P a g e
4.2 Published Paper
This Paper was published in the Journal of Personalised Medicine The citation is
Bell, M. S., M. De Marco, K. Barnes, J. P. Shaw, L. Ferraiuolo, J. D. Blackburn, H. Mortiboys and A.
Venneri (2020). "Deficits in Mitochondrial Spare Respiratory Capacity Contribute to the
Neuropsychological Changes of Alzheimer’s Disease." Journal of Personalized Medicine 10(2).
Journal of
Personalized
Medicine
Article
Deficits in Mitochondrial Spare Respiratory CapacityContribute to the Neuropsychological Changes ofAlzheimer’s Disease
Simon M. Bell , Matteo De Marco, Katy Barnes, Pamela J. Shaw, Laura Ferraiuolo,Daniel J. Blackburn , Heather Mortiboys *,† and Annalena Venneri *,†
Sheffield Institute for Translational Neuroscience (SITraN), University of Sheffield, 385a Glossop Road,Sheffield S10 2HQ, UK; [email protected] (S.M.B.); [email protected] (M.D.M.);[email protected] (K.B.); [email protected] (P.J.S.); [email protected] (L.F.);[email protected] (D.J.B.)* Correspondence: [email protected] (H.M.); [email protected] (A.V.);
Tel.: +44-(0)114-222-2259 (H.M.); +44-(0)114-271-3430 (A.V.)† These two authors are joint senior authors.
Received: 30 March 2020; Accepted: 24 April 2020; Published: 29 April 2020�����������������
Abstract: Alzheimer’s disease (AD) is diagnosed using neuropsychological testing, supported byamyloid and tau biomarkers and neuroimaging abnormalities. The cause of neuropsychologicalchanges is not clear since they do not correlate with biomarkers. This study investigated if changesin cellular metabolism in AD correlate with neuropsychological changes. Fibroblasts were takenfrom 10 AD patients and 10 controls. Metabolic assessment included measuring total cellularATP, extracellular lactate, mitochondrial membrane potential (MMP), mitochondrial respirationand glycolytic function. All participants were assessed with neuropsychological testing and brainstructural MRI. AD patients had significantly lower scores in delayed and immediate recall, semanticmemory, phonemic fluency and Mini Mental State Examination (MMSE). AD patients also hadsignificantly smaller left hippocampal, left parietal, right parietal and anterior medial prefrontalcortical grey matter volumes. Fibroblast MMP, mitochondrial spare respiratory capacity (MSRC),glycolytic reserve, and extracellular lactate were found to be lower in AD patients. MSRC/MMPcorrelated significantly with semantic memory, immediate and delayed episodic recall. Correlationsbetween MSRC and delayed episodic recall remained significant after controlling for age, educationand brain reserve. Grey matter volumes did not correlate with MRSC/MMP. AD fibroblast metabolicassessment may represent an emergent disease biomarker of AD.
Keywords: Alzheimer’s disease; mitochondrial spare respiratory capacity; mitochondrial;membrane potential; glycolytic reserve; semantic memory; phonemic fluency; episodic memory;neuropsychology; neuroimaging
1. Background
Alzheimer’s disease (AD) is the most common cause of dementia worldwide and in 2018 wasestimated to cost the global economy 1 trillion US dollars [1]. The clinical symptoms of the diseaseare the progressive loss of different aspects of cognitive function until a patient becomes completelydependent on the care of family members and healthcare workers [2]. Median survival after diagnosisis 7 to 10 years for people in their 60s to 70s, and 3 years for people in their 90s [3].
The disease is characterized pathologically by the presence of extracellular amyloid plaquescomprising mainly of the amyloid beta protein; and intracellular neurofibrillary tangles (NFT) mademainly of the cytoskeletal protein tau [4]. To date the cause of AD still remains poorly understood.
J. Pers. Med. 2020, 10, 32; doi:10.3390/jpm10020032 www.mdpi.com/journal/jpm
J. Pers. Med. 2020, 10, 32 2 of 16
As the buildup of amyloid appears to be a key step in the development of both familial and sporadicforms of the disease, the amyloid cascade hypothesis has become the leading theory for the cause ofthe condition [5]. In brief, this hypothesis states that the key step in developing AD is the accumulationof amyloid beta through reduced breakdown and clearance, and/or increased production. Strategiesaimed at reducing the amyloid load in the brain, however, have failed to control the disease [6] and haveresulted in a large number of clinical trials that have failed to achieve primary outcome measures [7].Even in pre-clinical carriers of dominantly inherited AD mutations, amyloid removal therapies havenot slowed disease progression [8]. Furthermore, brain amyloid load does not correlate with clinicalsymptoms [9]. This has led researchers to investigate alternative pathophysiological mechanisms [10].
AD is clinically defined by distinctive changes in cognitive status identified by neuropsychologicalassessment. Brain imaging changes and amyloid and tau protein levels in the cerebrospinal fluid areused to confirm the diagnosis in vivo [11]. The changes seen in a patient’s ability to perform a cognitivetask are often difficult to explain from a cellular perspective. Tau deposition does explain elementsof the observed neuropsychological abnormalities [12], but does not fully account for all cognitivechanges observed in AD patients [13,14].
Cognitive processing, such as that required while performing memory tasks, puts an increasedmetabolic demand on the brain [15]. This is evidenced by neuroimaging studies of the brain whichuse tracers of metabolism such as 2-[18F]fluoro-2-Deoxy-D-glucose (FDG) that have shown poorglucose utilization in patients who perform poorly on memory tasks [16,17]. Positron-emissiontomography (PET) imaging studies that use oxygen-15 labelled water also show reduced uptake whenAD patients perform cognitive tasks [18]. These imaging studies suggest that any deficit in metabolicfunction, such as deficits in mitochondrial respiration or glycolysis, are likely to affect an individual’sperformance on cognitive tasks. It is therefore possible that mitochondrial respiration or glycolyticdysfunction might contribute to cognitive deficits in AD, making these cellular processes suitablepharmacological targets to improve the cognitive symptoms of AD.
Cellular metabolic changes within the brains of patients with AD and in peripheral cell populationsare seen very early in the condition, and often precede the development of both amyloid plaques andNFT. Abnormalities have been shown in many metabolic pathways in AD [19]. Mounting evidencesuggests that deficits in glycolysis and the function of mitochondria, specifically how they controloxidative phosphorylation, are likely to be key in the development and establishment of AD [20–22].
A mitochondrial cascade hypothesis has been suggested for the aetiology of AD, and states thatpeople who inherit mitochondrial genes that predispose them to lower mitochondrial respiration ratesmay be more likely to develop the condition [23]. In animal models of AD, changes in mitochondrialfunction are seen prior to amyloid deposition [20,24], and cell models show changes in mitochondrialfunction and oxidative stress without the presence of amyloid [25], giving further evidence for the keyrole of mitochondrial dysfunction in AD.
Impairment of glycolysis is also seen early in patients with AD. A 2-[18F]fluoro-2-Deoxy-D-glucosepositron-emission tomography (FDG-PET) imaging of the brain shows a reduction in glucosemetabolism [26]. In particular, there is a reduction in aerobic glycolysis in brain areas susceptible toamyloid deposition [27], and in those regions where high levels of tau accumulation are seen [28].
We have previously shown that fibroblasts from sporadic AD (sAD) patients have multiplemitochondrial structural and functional abnormalities, and that these can be ameliorated by treatmentwith ursodeoxycholic acid (UDCA) [29]. Other studies have shown that glycyl-l-histidyl-l-lysine(GHK-Cu), by increasing gene expression, has an effect on improving mitochondrial activity andinfluencing cognitive decline [30]. In our previous study we showed sAD fibroblasts to have deficits inmitochondrial membrane potential (MMP) and mitochondrial spare respiratory capacity (MSRC). MSRCrefers to the difference in oxidative phosphorylation rates between the basal level of mitochondrialrespiration and the maximal level a cell can achieve [31]. In essence, MSRC measures the cellularreserve respiratory capacity. In animal models of AD it has been shown that deficits in MSRC causecognitive deficits that treatment with the antioxidant pyrroloquinoline quinone can improve [32]. It has
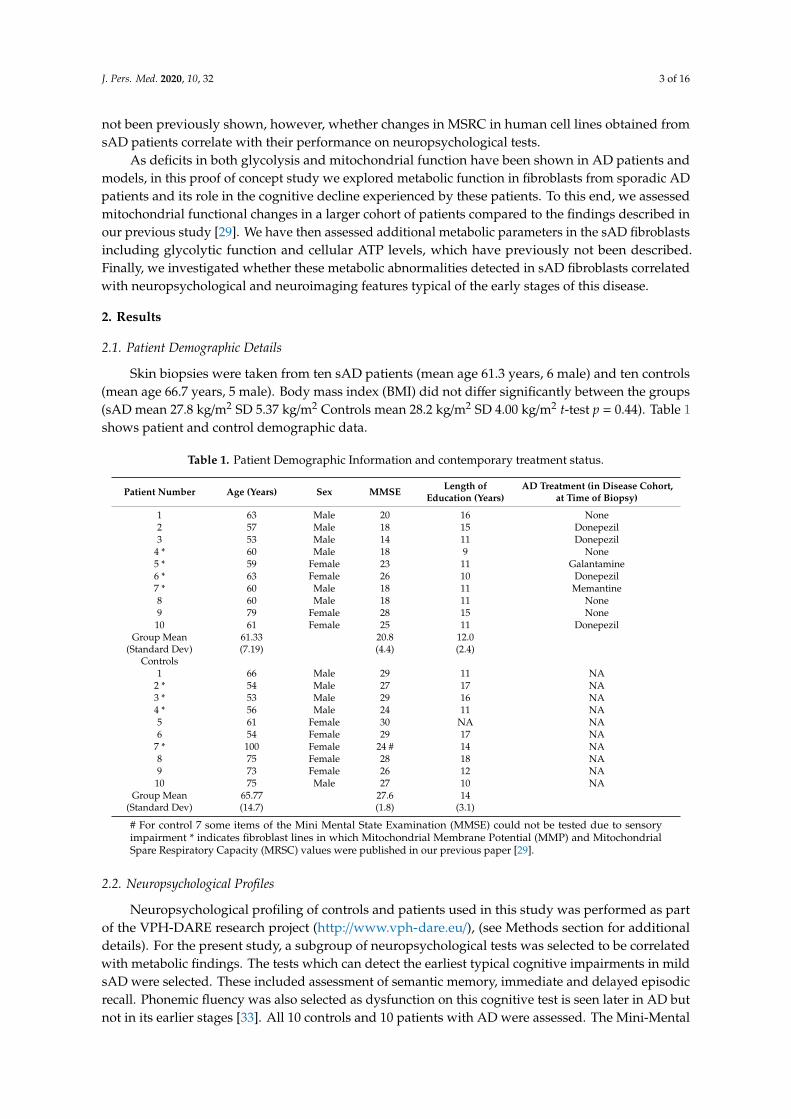
J. Pers. Med. 2020, 10, 32 3 of 16
not been previously shown, however, whether changes in MSRC in human cell lines obtained fromsAD patients correlate with their performance on neuropsychological tests.
As deficits in both glycolysis and mitochondrial function have been shown in AD patients andmodels, in this proof of concept study we explored metabolic function in fibroblasts from sporadic ADpatients and its role in the cognitive decline experienced by these patients. To this end, we assessedmitochondrial functional changes in a larger cohort of patients compared to the findings described inour previous study [29]. We have then assessed additional metabolic parameters in the sAD fibroblastsincluding glycolytic function and cellular ATP levels, which have previously not been described.Finally, we investigated whether these metabolic abnormalities detected in sAD fibroblasts correlatedwith neuropsychological and neuroimaging features typical of the early stages of this disease.
2. Results
2.1. Patient Demographic Details
Skin biopsies were taken from ten sAD patients (mean age 61.3 years, 6 male) and ten controls(mean age 66.7 years, 5 male). Body mass index (BMI) did not differ significantly between the groups(sAD mean 27.8 kg/m2 SD 5.37 kg/m2 Controls mean 28.2 kg/m2 SD 4.00 kg/m2 t-test p = 0.44). Table 1shows patient and control demographic data.
Table 1. Patient Demographic Information and contemporary treatment status.
Patient Number Age (Years) Sex MMSE Length ofEducation (Years)
AD Treatment (in Disease Cohort,at Time of Biopsy)
1 63 Male 20 16 None2 57 Male 18 15 Donepezil3 53 Male 14 11 Donepezil
4 * 60 Male 18 9 None5 * 59 Female 23 11 Galantamine6 * 63 Female 26 10 Donepezil7 * 60 Male 18 11 Memantine8 60 Male 18 11 None9 79 Female 28 15 None10 61 Female 25 11 Donepezil
Group Mean(Standard Dev)
61.33(7.19)
20.8(4.4)
12.0(2.4)
Controls1 66 Male 29 11 NA
2 * 54 Male 27 17 NA3 * 53 Male 29 16 NA4 * 56 Male 24 11 NA5 61 Female 30 NA NA6 54 Female 29 17 NA
7 * 100 Female 24 # 14 NA8 75 Female 28 18 NA9 73 Female 26 12 NA10 75 Male 27 10 NA
Group Mean(Standard Dev)
65.77(14.7)
27.6(1.8)
14(3.1)
# For control 7 some items of the Mini Mental State Examination (MMSE) could not be tested due to sensoryimpairment * indicates fibroblast lines in which Mitochondrial Membrane Potential (MMP) and MitochondrialSpare Respiratory Capacity (MRSC) values were published in our previous paper [29].
2.2. Neuropsychological Profiles
Neuropsychological profiling of controls and patients used in this study was performed as partof the VPH-DARE research project (http://www.vph-dare.eu/), (see Methods section for additionaldetails). For the present study, a subgroup of neuropsychological tests was selected to be correlatedwith metabolic findings. The tests which can detect the earliest typical cognitive impairments in mildsAD were selected. These included assessment of semantic memory, immediate and delayed episodicrecall. Phonemic fluency was also selected as dysfunction on this cognitive test is seen later in AD butnot in its earlier stages [33]. All 10 controls and 10 patients with AD were assessed. The Mini-Mental
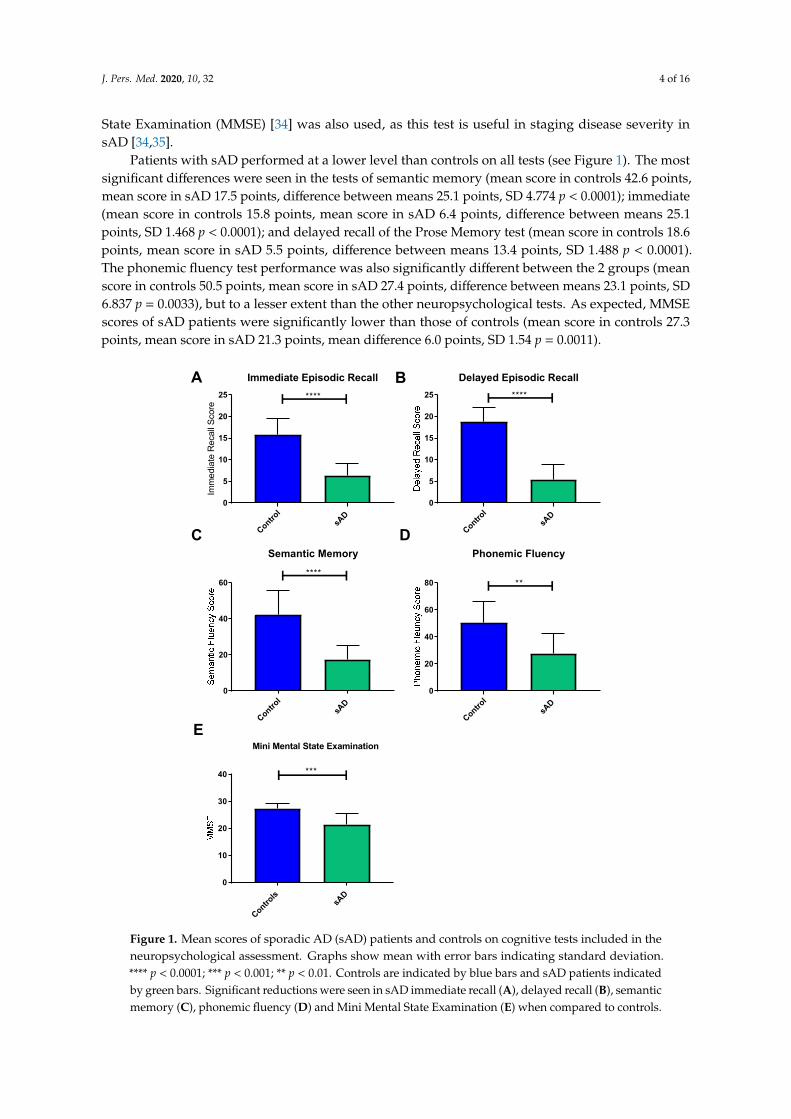
J. Pers. Med. 2020, 10, 32 4 of 16
State Examination (MMSE) [34] was also used, as this test is useful in staging disease severity insAD [34,35].
Patients with sAD performed at a lower level than controls on all tests (see Figure 1). The mostsignificant differences were seen in the tests of semantic memory (mean score in controls 42.6 points,mean score in sAD 17.5 points, difference between means 25.1 points, SD 4.774 p < 0.0001); immediate(mean score in controls 15.8 points, mean score in sAD 6.4 points, difference between means 25.1points, SD 1.468 p < 0.0001); and delayed recall of the Prose Memory test (mean score in controls 18.6points, mean score in sAD 5.5 points, difference between means 13.4 points, SD 1.488 p < 0.0001).The phonemic fluency test performance was also significantly different between the 2 groups (meanscore in controls 50.5 points, mean score in sAD 27.4 points, difference between means 23.1 points, SD6.837 p = 0.0033), but to a lesser extent than the other neuropsychological tests. As expected, MMSEscores of sAD patients were significantly lower than those of controls (mean score in controls 27.3points, mean score in sAD 21.3 points, mean difference 6.0 points, SD 1.54 p = 0.0011).
J. Pers. Med. 2020, 10, x; doi: FOR PEER REVIEW www.mdpi.com/journal/jpm
J. Pers. Med. 2020, 10, x; doi: FOR PEER REVIEW www.mdpi.com/journal/jpm
5
Figure 1. Mean scores of sporadic AD (sAD) patients and controls on cognitive tests included in the neuropsychological assessment. Graphs show mean with error bars indicating standard deviation. ****p < 0.0001; ***p < 0.001; **p < 0.01. Controls are indicated by blue bars and sAD patients indicated by green bars.
2.3. Neuroimaging Profiles
Volumetric structural MRI scans were acquired on 9 controls and 10 patients with sAD. One control did not complete their MRI scan as an incidental finding (of no diagnostic significance for
Control
sAD
0
5
10
15
20
25
Immediate Episodic Recall
Imm
edia
te R
ecal
l Sco
re
****
Control
sAD
0
5
10
15
20
25
Delayed Episodic Recall****
Control
sAD
0
20
40
60
Semantic Memory
****
Control
sAD
0
20
40
60
80
Phonemic Fluency
**
Controls
sAD
0
10
20
30
40 ***
Mini Mental State Examination
A B
DC
E
Figure 1. Mean scores of sporadic AD (sAD) patients and controls on cognitive tests included in theneuropsychological assessment. Graphs show mean with error bars indicating standard deviation.**** p < 0.0001; *** p < 0.001; ** p < 0.01. Controls are indicated by blue bars and sAD patients indicatedby green bars. Significant reductions were seen in sAD immediate recall (A), delayed recall (B), semanticmemory (C), phonemic fluency (D) and Mini Mental State Examination (E) when compared to controls.
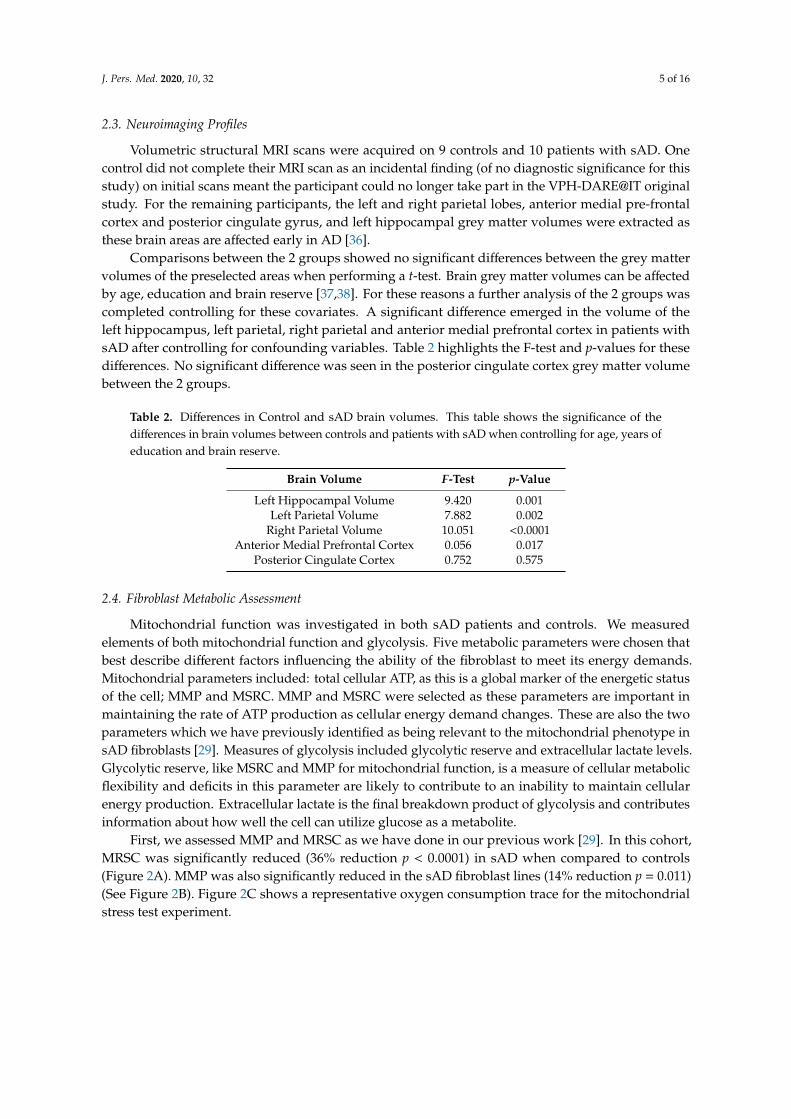
J. Pers. Med. 2020, 10, 32 5 of 16
2.3. Neuroimaging Profiles
Volumetric structural MRI scans were acquired on 9 controls and 10 patients with sAD. Onecontrol did not complete their MRI scan as an incidental finding (of no diagnostic significance for thisstudy) on initial scans meant the participant could no longer take part in the VPH-DARE@IT originalstudy. For the remaining participants, the left and right parietal lobes, anterior medial pre-frontalcortex and posterior cingulate gyrus, and left hippocampal grey matter volumes were extracted asthese brain areas are affected early in AD [36].
Comparisons between the 2 groups showed no significant differences between the grey mattervolumes of the preselected areas when performing a t-test. Brain grey matter volumes can be affectedby age, education and brain reserve [37,38]. For these reasons a further analysis of the 2 groups wascompleted controlling for these covariates. A significant difference emerged in the volume of theleft hippocampus, left parietal, right parietal and anterior medial prefrontal cortex in patients withsAD after controlling for confounding variables. Table 2 highlights the F-test and p-values for thesedifferences. No significant difference was seen in the posterior cingulate cortex grey matter volumebetween the 2 groups.
Table 2. Differences in Control and sAD brain volumes. This table shows the significance of thedifferences in brain volumes between controls and patients with sAD when controlling for age, years ofeducation and brain reserve.
Brain Volume F-Test p-Value
Left Hippocampal Volume 9.420 0.001Left Parietal Volume 7.882 0.002
Right Parietal Volume 10.051 <0.0001Anterior Medial Prefrontal Cortex 0.056 0.017
Posterior Cingulate Cortex 0.752 0.575
2.4. Fibroblast Metabolic Assessment
Mitochondrial function was investigated in both sAD patients and controls. We measuredelements of both mitochondrial function and glycolysis. Five metabolic parameters were chosen thatbest describe different factors influencing the ability of the fibroblast to meet its energy demands.Mitochondrial parameters included: total cellular ATP, as this is a global marker of the energetic statusof the cell; MMP and MSRC. MMP and MSRC were selected as these parameters are important inmaintaining the rate of ATP production as cellular energy demand changes. These are also the twoparameters which we have previously identified as being relevant to the mitochondrial phenotype insAD fibroblasts [29]. Measures of glycolysis included glycolytic reserve and extracellular lactate levels.Glycolytic reserve, like MSRC and MMP for mitochondrial function, is a measure of cellular metabolicflexibility and deficits in this parameter are likely to contribute to an inability to maintain cellularenergy production. Extracellular lactate is the final breakdown product of glycolysis and contributesinformation about how well the cell can utilize glucose as a metabolite.
First, we assessed MMP and MRSC as we have done in our previous work [29]. In this cohort,MRSC was significantly reduced (36% reduction p < 0.0001) in sAD when compared to controls(Figure 2A). MMP was also significantly reduced in the sAD fibroblast lines (14% reduction p = 0.011)(See Figure 2B). Figure 2C shows a representative oxygen consumption trace for the mitochondrialstress test experiment.
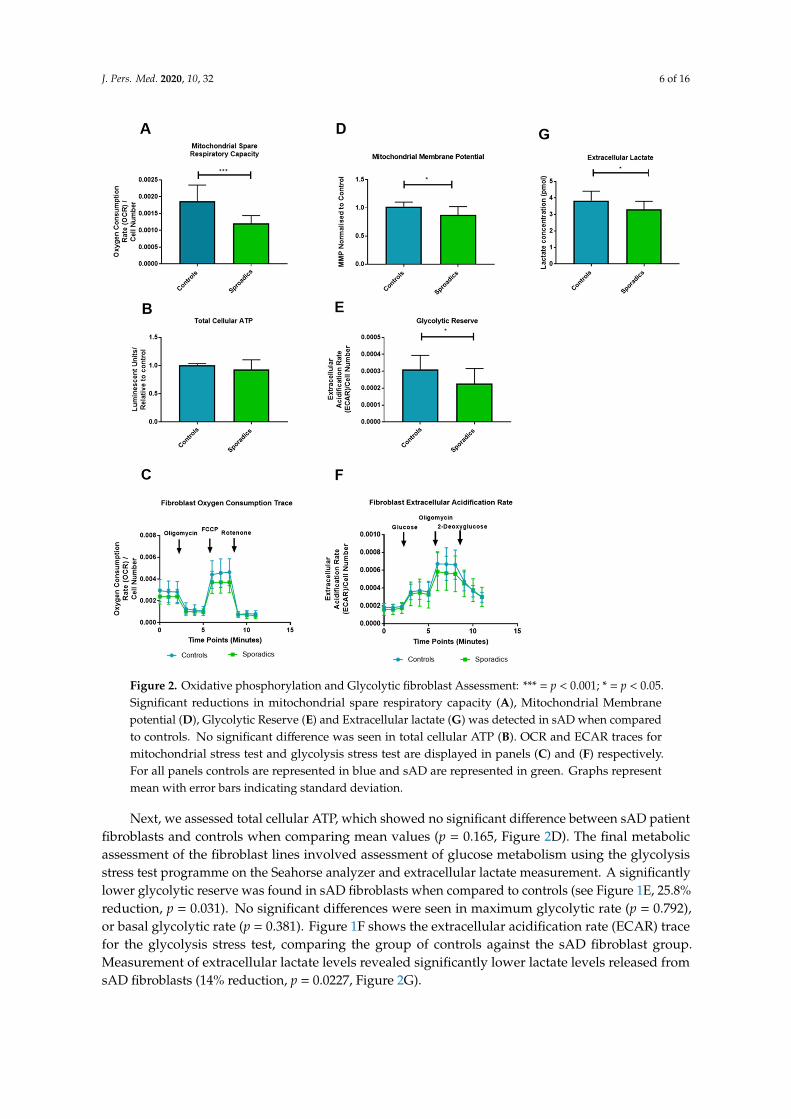
J. Pers. Med. 2020, 10, 32 6 of 16
J. Pers. Med. 2020, 10, x; doi: FOR PEER REVIEW www.mdpi.com/journal/jpm
J. Pers. Med. 2020, 10, x; doi: FOR PEER REVIEW www.mdpi.com/journal/jpm
7
significantly lower glycolytic reserve was found in sAD fibroblasts when compared to controls (see Figure 1E, 25.8% reduction, p = 0.031). No significant differences were seen in maximum glycolytic rate (p = 0.792), or basal glycolytic rate (p = 0.381). Figure 1F shows the extracellular acidification rate (ECAR) trace for the glycolysis stress test, comparing the group of controls against the sAD fibroblast group. Measurement of extracellular lactate levels revealed significantly lower lactate levels released from sAD fibroblasts (14% reduction, p = 0.0227, Figure 2I).
Figure 2. Oxidative phosphorylation and Glycolytic fibroblast Assessment: *** = p < 0.001; * = p < 0.05. Significant reductions in mitochondrial spare respiratory capacity (A), Mitochondrial Membrane potential (D), Glycolytic Reserve (E) and Extracellular lactate (G) was detected in sAD when compared to controls. No significant difference was seen in total cellular ATP (B). OCR and ECAR traces for mitochondrial stress test and glycolysis stress test are displayed in panels C and F respectively. For all panels controls are represented in blue and sAD are represented in green. Graphs represent mean with error bars indicating standard deviation.
Figure 2. Oxidative phosphorylation and Glycolytic fibroblast Assessment: *** = p < 0.001; * = p < 0.05.Significant reductions in mitochondrial spare respiratory capacity (A), Mitochondrial Membranepotential (D), Glycolytic Reserve (E) and Extracellular lactate (G) was detected in sAD when comparedto controls. No significant difference was seen in total cellular ATP (B). OCR and ECAR traces formitochondrial stress test and glycolysis stress test are displayed in panels (C) and (F) respectively.For all panels controls are represented in blue and sAD are represented in green. Graphs representmean with error bars indicating standard deviation.
Next, we assessed total cellular ATP, which showed no significant difference between sAD patientfibroblasts and controls when comparing mean values (p = 0.165, Figure 2D). The final metabolicassessment of the fibroblast lines involved assessment of glucose metabolism using the glycolysisstress test programme on the Seahorse analyzer and extracellular lactate measurement. A significantlylower glycolytic reserve was found in sAD fibroblasts when compared to controls (see Figure 1E, 25.8%reduction, p = 0.031). No significant differences were seen in maximum glycolytic rate (p = 0.792),or basal glycolytic rate (p = 0.381). Figure 1F shows the extracellular acidification rate (ECAR) tracefor the glycolysis stress test, comparing the group of controls against the sAD fibroblast group.Measurement of extracellular lactate levels revealed significantly lower lactate levels released fromsAD fibroblasts (14% reduction, p = 0.0227, Figure 2G).
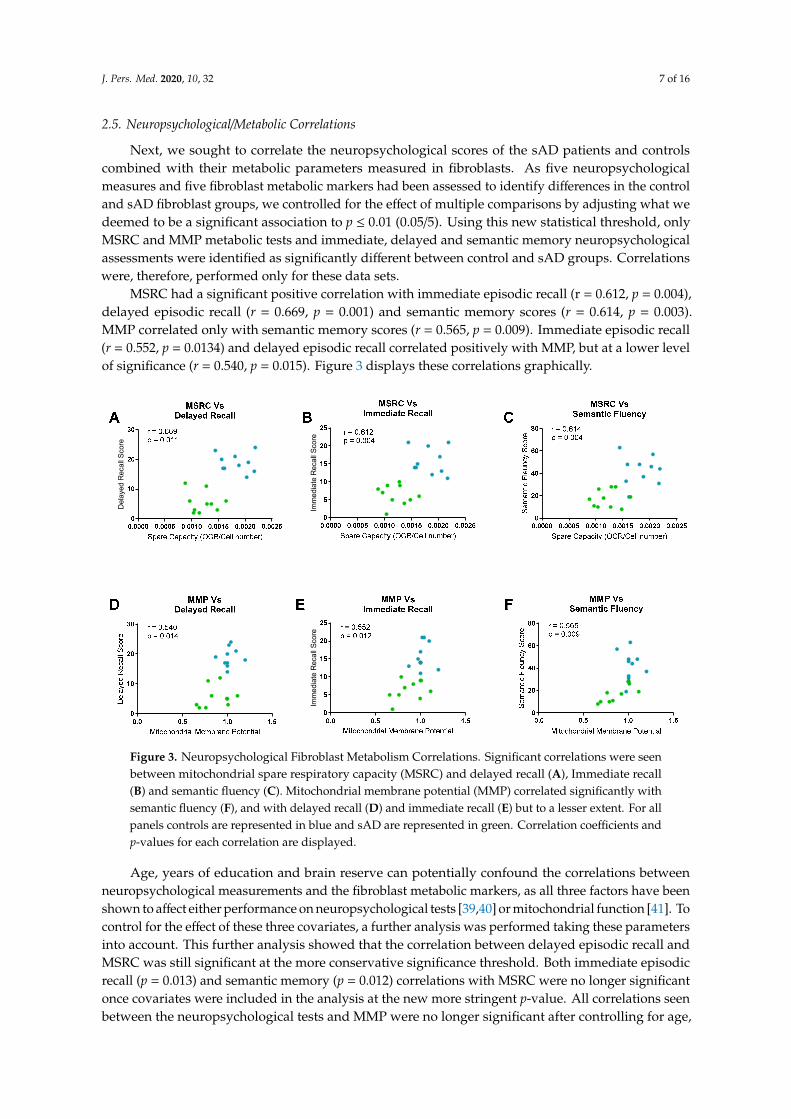
J. Pers. Med. 2020, 10, 32 7 of 16
2.5. Neuropsychological/Metabolic Correlations
Next, we sought to correlate the neuropsychological scores of the sAD patients and controlscombined with their metabolic parameters measured in fibroblasts. As five neuropsychologicalmeasures and five fibroblast metabolic markers had been assessed to identify differences in the controland sAD fibroblast groups, we controlled for the effect of multiple comparisons by adjusting what wedeemed to be a significant association to p ≤ 0.01 (0.05/5). Using this new statistical threshold, onlyMSRC and MMP metabolic tests and immediate, delayed and semantic memory neuropsychologicalassessments were identified as significantly different between control and sAD groups. Correlationswere, therefore, performed only for these data sets.
MSRC had a significant positive correlation with immediate episodic recall (r = 0.612, p = 0.004),delayed episodic recall (r = 0.669, p = 0.001) and semantic memory scores (r = 0.614, p = 0.003).MMP correlated only with semantic memory scores (r = 0.565, p = 0.009). Immediate episodic recall(r = 0.552, p = 0.0134) and delayed episodic recall correlated positively with MMP, but at a lower levelof significance (r = 0.540, p = 0.015). Figure 3 displays these correlations graphically.
J. Pers. Med. 2020, 10, x; doi: FOR PEER REVIEW www.mdpi.com/journal/jpm
J. Pers. Med. 2020, 10, x; doi: FOR PEER REVIEW www.mdpi.com/journal/jpm
8
2.5 Neuropsychological/Metabolic Correlations
Next, we sought to correlate the neuropsychological scores of the sAD patients and controls combined with their metabolic parameters measured in fibroblasts. As five neuropsychological measures and five fibroblast metabolic markers had been assessed to identify differences in the control and sAD fibroblast groups, we controlled for the effect of multiple comparisons by adjusting what we deemed to be a significant association to p ≤ 0.01 (0.05/5). Using this new statistical threshold, only MSRC and MMP metabolic tests and immediate, delayed and semantic memory neuropsychological assessments were identified as significantly different between control and sAD groups. Correlations were, therefore, performed only for these data sets.
MSRC had a significant positive correlation with immediate episodic recall (r = 0.612, p = 0.004), delayed episodic recall (r = 0.669, p = 0.001) and semantic memory scores (r = 0.614, p =0.003). MMP correlated only with semantic memory scores (r = 0.565, p = 0.009). Immediate episodic recall (r = 0.552, p = 0.0134) and delayed episodic recall correlated positively with MMP, but at a lower level of significance (r = 0.540, p = 0.015). Figure 3 displays these correlations graphically.
Age, years of education and brain reserve can potentially confound the correlations between neuropsychological measurements and the fibroblast metabolic markers, as all three factors have been shown to affect either performance on neuropsychological tests [39,40] or mitochondrial function [41]. To control for the effect of these three covariates, a further analysis was performed taking these parameters into account. This further analysis showed that the correlation between delayed episodic recall and MSRC was still significant at the more conservative significance threshold. Both immediate episodic recall (p = 0.013) and semantic memory (p = 0.012) correlations with MSRC were no longer significant once covariates were included in the analysis at the new more stringent p-value. All correlations seen between the neuropsychological tests and MMP were no longer significant after controlling for age, education and brain reserve. Table 3 displays the new correlation coefficients and p-values for the neuropsychological data.
Del
ayed
Rec
all S
core
Imm
edia
te R
ecal
l Sco
reIm
med
iate
Rec
all S
core
Figure 3. Neuropsychological Fibroblast Metabolism Correlations. Significant correlations were seenbetween mitochondrial spare respiratory capacity (MSRC) and delayed recall (A), Immediate recall(B) and semantic fluency (C). Mitochondrial membrane potential (MMP) correlated significantly withsemantic fluency (F), and with delayed recall (D) and immediate recall (E) but to a lesser extent. For allpanels controls are represented in blue and sAD are represented in green. Correlation coefficients andp-values for each correlation are displayed.
Age, years of education and brain reserve can potentially confound the correlations betweenneuropsychological measurements and the fibroblast metabolic markers, as all three factors have beenshown to affect either performance on neuropsychological tests [39,40] or mitochondrial function [41]. Tocontrol for the effect of these three covariates, a further analysis was performed taking these parametersinto account. This further analysis showed that the correlation between delayed episodic recall andMSRC was still significant at the more conservative significance threshold. Both immediate episodicrecall (p = 0.013) and semantic memory (p = 0.012) correlations with MSRC were no longer significantonce covariates were included in the analysis at the new more stringent p-value. All correlations seenbetween the neuropsychological tests and MMP were no longer significant after controlling for age,
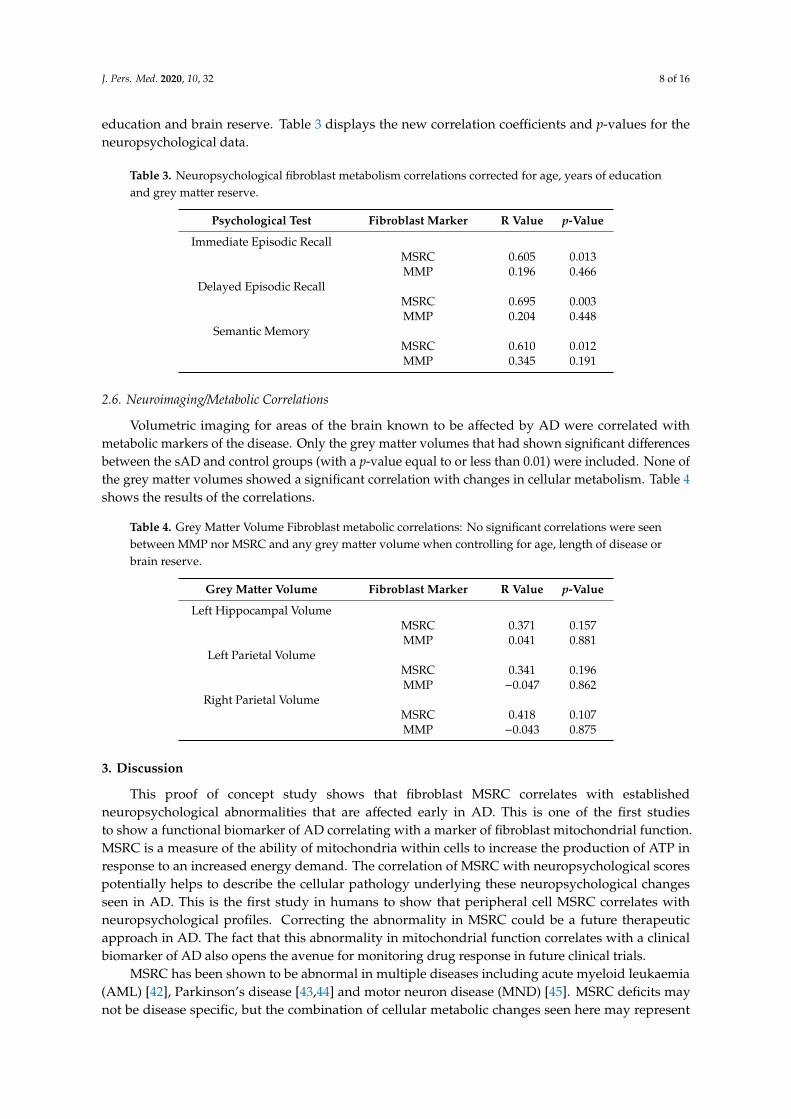
J. Pers. Med. 2020, 10, 32 8 of 16
education and brain reserve. Table 3 displays the new correlation coefficients and p-values for theneuropsychological data.
Table 3. Neuropsychological fibroblast metabolism correlations corrected for age, years of educationand grey matter reserve.
Psychological Test Fibroblast Marker R Value p-Value
Immediate Episodic RecallMSRC 0.605 0.013MMP 0.196 0.466
Delayed Episodic RecallMSRC 0.695 0.003MMP 0.204 0.448
Semantic MemoryMSRC 0.610 0.012MMP 0.345 0.191
2.6. Neuroimaging/Metabolic Correlations
Volumetric imaging for areas of the brain known to be affected by AD were correlated withmetabolic markers of the disease. Only the grey matter volumes that had shown significant differencesbetween the sAD and control groups (with a p-value equal to or less than 0.01) were included. None ofthe grey matter volumes showed a significant correlation with changes in cellular metabolism. Table 4shows the results of the correlations.
Table 4. Grey Matter Volume Fibroblast metabolic correlations: No significant correlations were seenbetween MMP nor MSRC and any grey matter volume when controlling for age, length of disease orbrain reserve.
Grey Matter Volume Fibroblast Marker R Value p-Value
Left Hippocampal VolumeMSRC 0.371 0.157MMP 0.041 0.881
Left Parietal VolumeMSRC 0.341 0.196MMP −0.047 0.862
Right Parietal VolumeMSRC 0.418 0.107MMP −0.043 0.875
3. Discussion
This proof of concept study shows that fibroblast MSRC correlates with establishedneuropsychological abnormalities that are affected early in AD. This is one of the first studiesto show a functional biomarker of AD correlating with a marker of fibroblast mitochondrial function.MSRC is a measure of the ability of mitochondria within cells to increase the production of ATP inresponse to an increased energy demand. The correlation of MSRC with neuropsychological scorespotentially helps to describe the cellular pathology underlying these neuropsychological changesseen in AD. This is the first study in humans to show that peripheral cell MSRC correlates withneuropsychological profiles. Correcting the abnormality in MSRC could be a future therapeuticapproach in AD. The fact that this abnormality in mitochondrial function correlates with a clinicalbiomarker of AD also opens the avenue for monitoring drug response in future clinical trials.
MSRC has been shown to be abnormal in multiple diseases including acute myeloid leukaemia(AML) [42], Parkinson’s disease [43,44] and motor neuron disease (MND) [45]. MSRC deficits maynot be disease specific, but the combination of cellular metabolic changes seen here may represent
J. Pers. Med. 2020, 10, 32 9 of 16
a cellular metabolic profile specific to sAD. This metabolic phenotype could potentially represent abiomarker that can stratify and define a specific subset of sAD patients that might then respond to apersonalised therapeutic approach. Previous research has shown that the metabolic profile identifiedin fibroblasts from sporadic Parkinson’s disease patients differs from that identified here in fibroblastsfrom sAD [46,47].
Reductions in MSRC and MMP were seen in all sAD fibroblast lines when compared to controlsat a group level. These data reinforce and extend the findings reported in our previous paper [29], andshow that the finding of reduced MSRC and MMP is reproducible and more robust in sporadic ADfibroblasts when sample size is increased. Extracellular lactate levels and cellular glycolytic reserves,both markers of glycolytic function, were significantly reduced in all sAD fibroblasts. These measures,however, did not meet the statistical significance for correlation with neuropsychological markers ofthe disease. The deficits in markers of mitochondrial function and glycolysis in the fibroblasts reflect alack of flexibility of metabolic pathways in sAD. This lack of flexibility is likely to be very importantwhen performing cognitive tasks that depend on the coordination of multiple brain regions. Takentogether, these results suggest that sAD fibroblasts may have limited ability to respond to increasedcellular energy demand.
MMP did correlate with neuropsychological markers, but correlations did not survive thecorrection for confounding factors unlike MSRC, for which correlation with delayed episodic recall(a core feature in the clinical diagnostic criteria for sAD) remained significant. Semantic memoryand immediate episodic memory did not significantly correlate with MSRC at the more conservativesignificance threshold after confounder consideration, but p-values for both of these correlations wereless than 0.02. Potentially, these correlations would reach significance level with an increased samplesize. The difference in MMP between control and sAD groups was much smaller than the differenceseen in MSRC. MMP has a key role in maintaining many pathways in the mitochondria outside that ofATP generation, such as apoptosis fates [48]. It is likely that several mechanisms not affected by sADin the fibroblast cell help to maintain MMP levels, which may explain the reduced variability seen inthis parameter in sAD and the lack of a significant correlation with neuropsychological scores.
Baseline ATP levels were not significantly different between the two groups. These resultssuggest that, in a controlled environment when cells are not stressed, they can maintain ATP levelssimilar to that of controls. Interestingly though, the functional capacity of mitochondria is impaired,as described above, suggesting a potential inability to respond appropriately to increased ATP demand.The measurements of ATP we performed in this study only gives information about the total cellularATP level. We did not investigate the rate of ATP breakdown nor how ATP levels change whenthe cell is under stressed conditions or the ratio of ATP/ADP in the cell. This may explain why nosignificant correlations were seen with ATP measurements, but were seen with the other markers ofmitochondrial respiration.
It is interesting that the correlation between scores on phonemic fluency, a neuropsychologicaltest not affected early in sAD, and cell metabolism markers did not reach significance threshold. It.The medial temporal lobe is important in semantic memory processing [49], an area of cognition thatis impaired very early in sAD [50]. This is not the case for phonemic fluency which is supportedby processes associated with frontal executive regions [51]. It could be that the correlations we seebetween neuropsychological tests and cellular metabolic function may reflect which areas of the brainare more susceptible to metabolic failure. It has been previously shown that areas of the brain that areaffected early in sAD express lower levels of electron transport chain (ETC) genes when comparedto controls [52], suggesting that this might be the case. Data from FDG-PET studies also supportthe concept of focal brain hypometabolism in sAD, with areas such as the medial temporal lobes,precuneus and lateral parietal lobes all preferentially affected [53].
We did not see a significant correlation between mitochondrial function or glycolysis and brainstructural imaging markers of sAD. This may be explained by the fact that multiple factors can affectgrey matter volume such as age, levels of education and brain reserve. It has been previously shown
J. Pers. Med. 2020, 10, 32 10 of 16
that smaller grey matter volumes in the frontal lobes associated with ageing are associated with worseperformance on frontal lobe cognitive tests [54]. The neuropsychological assessment performed in thisstudy mainly focused on temporal lobe cognitive functioning and not frontal lobe function. Potentially,the effect of brain ageing on grey matter volumes may mask any effect metabolic function may have.
The limitations of our study include a small sample size, and the fact that we have used fibroblaststo measure metabolic function. It could also be argued that a correlation between metabolic function ofcentral nervous system cells and neuropsychological parameters would be more meaningful. This isnot the first study, however, to show that the metabolism of peripheral cells outside the nervoussystem is affected in sAD. White blood cells [55], platelets [56] and fibroblasts have been shown to havemetabolic abnormalities in multiple studies [46,47,57,58]. Identifying that fibroblast mitochondrialabnormalities correlate with neuropsychological markers of AD opens up avenues to use fibroblastmetabolic parameters as biomarkers of sAD, and also as a high throughput drug screening model, aswell as potential outcome measures of therapeutic efficacy. Replication of the findings of this studyin larger cohorts and by other groups is needed, however, to consolidate the evidence that fibroblastmetabolic function is a reliable biomarker of sAD.
Our patient cohort were selected at an early stage of sAD to try and reduce group variability.To understand the use of fibroblast metabolic abnormalities as a biomarker, further work investigatingcohorts of patients with amnestic mild cognitive impairment (MCI), the prodromal stage of sAD,would be advantageous as well as investigating these parameters in more advanced sAD patients.
Future work could extend the findings of metabolic-neuropsychological correlations by creatingneuronal lineage cells via cellular reprogramming methods such as that described by Takahashi et al. [59].This type of model would allow for direct comparison between human nervous system cells andhuman nervous system function in a context where reprogrammed cells would maintain their ageingphenotype [60].
4. Methods
4.1. Patient Details
Skin biopsies and fibroblast metabolic assessments were performed as part of the MODEL-ADresearch study (Yorkshire and Humber Research and Ethics Committee number: 16/YH/0155). Dueto the initial success of fibroblast metabolic assessment, the initial cohort of four controls and fourpatients (previously reported in [29]) with sAD was expanded to ten healthy controls (mean age:65.77 years, SD 14.70 years) and 10 patients with sAD (mean age: 61.33 years, SD 7.19 years).All patients had been involved in the EU-funded Framework Programme 7 Virtual PhysiologicalHuman: Dementia Research Enabled by IT (VPH-DARE@IT) initiative (http://www.vph-dare.eu/).A diagnosis of sAD was made based on clinical criteria [11]. Ethical approval for the neuropsychologicaland neuroimaging measures collected was gained from Yorkshire and Humber Regional EthicsCommittee, Reference number: 12/YH/0474. Informed written consent was obtained from eachparticipant. Investigations were carried out following the rules of the Declaration of Helsinki of 1975(https://www.wma.net/what-we-do/medical-ethics/declaration-of-helsinki/), revised in 2013.
4.2. Neuropsychological Testing
A battery of tests was devised to detect impaired performance in the cognitive domains mostsusceptible to sAD neurodegeneration. This included tests of short- and long-term memory, attentionand executive functioning, language and semantics, and visuoconstructive skills. A detailed descriptionof each task is provided elsewhere [61]. Most tests were exclusively used as part of the clinical assessmentof patients and controls. Three tests were also included as part of the experimental protocol. Immediateand delayed recall on the Logical Memory test were used as measures of episodic memory, thecognitive domain centrally defined by diagnostic criteria for a diagnosis of sAD. The performance onthe Category Fluency test was used as an index of semantic memory, the cognitive domain affected by
J. Pers. Med. 2020, 10, 32 11 of 16
the accumulation of neurofibrillary pathology in the transentorhinal cortex [50]. Finally, the LetterFluency test (phonemic fluency) was used as a methodological control, since performance on this taskis often within normal age limits in patients with mild sAD [33,62].
4.3. MRI Acquisition and Processing
An MRI protocol of anatomical scans was acquired on a Philips Ingenia 3 T scanner. Severalacquisitions (including T1-weighted, T2-weighted, FLAIR and diffusion-weighted sequences) wereused for diagnostic purposes. Three-dimensional T1-weighted images (voxel size: 0.94 mm ×0.94 mm × 1.00 mm; repetition time: 8.2 s; echo delay time: 3.8 s; field of view: 256 mm; matrixsize: 256 × 256 × 170) were also used for the calculation of hippocampal volumes. These wereprocessed with the Similarity and Truth Estimation for Propagated Segmentations routine [63].This procedure, available at niftyweb.cs.ucl.ac.uk, allows automated segmentation of the left andright hippocampus in the brain’s native space using multiple reference templates. Hippocampalvolumes were then quantified using Matlab (version R2014a) and the “get totals” script (http://www0.cs.ucl.ac.uk/staff/G.Ridgway/vbm/get_totals.m). Fractional measures were also obtaineddividing hippocampal volumes by the volume of the total intracranial space. The left hippocampalvolume and left hippocampal ratio were chosen as structural markers of AD as evidence suggests theleft hippocampus is affected early in the progression of the disease [64]. Native space maps created toextract hippocampal volume from MRI images are shown in Supplementary Figure S1. Additionalregions of interest (listed in Table 2) were then defined as binary image masks. Segmented grey mattermaps were registered to the Montreal Neurological Institute space, and mask-constrained volumeswere extracted.
4.4. Tissue Culture
Fibroblasts were cultured as described previously [29]. In brief, all 10 control and all 10 sADlines were cultured in EMEM-based media (Corning) incubated at 37 ◦C in a 5% carbon dioxideatmosphere. Sodium pyruvate (1%) (Sigma Aldrich), non-essential amino acids (1%) (Lonza), penicillinand streptomycin (1%) (Sigma Aldrich), multi-vitamins (1%) (Lonza), Fetal Bovine Serum (10%)(Biosera) and 50µg/mL uridine (Sigma Aldrich) were added to the media. All experiments describedwere performed on all 20 cell lines. Fibroblasts were plated at a density of 5000 cells per well in a white96 well plate for ATP assays. For MMP assays fibroblasts were plated at a density of 2500 cells perwell in a black 96 well plate. Each assay was performed on three separate passages of fibroblasts; cellsbetween passages 5–10 were used. All experiments were performed on passage-matched cells.
4.5. Intracellular ATP levels
Cellular adenosine triphosphate (ATP) levels were measured using the ATPlite kit (Perkin Elmer) asdescribed previously [65]. ATP levels were corrected for cell number by using CyQuant (ThermoFisher)measurements, as previously described [29]. These values were then normalised to control levels.
4.6. Mitochondrial Membrane Potential
MMP was measured using tetramethlyrhodamine (TMRM) staining of live fibroblasts,as previously described [29]. Cells were plated in a black 96 well plate, incubated at 37 ◦C for48 h. TMRM dye was added one hour prior to imaging on an InCell Analyzer 2000 high-content imager(GE Healthcare).
4.7. Extracellular Lactate Measurement
Extracellular lactate was measured from confluent flasks of fibroblasts using an L-Lactate assaykit (Abcam ab65331). The assay was performed according to the manufacturer’s instructions.
J. Pers. Med. 2020, 10, 32 12 of 16
4.8. Metabolic Flux Assay
4.8.1. Mito Stress Test
Oxygen consumption rates (OCR) were measured using a 24-well Agilent Seahorse XF analyzeras described previously [29]. In brief, cells were plated at a density of 65,000 cells per well 48 h prior tomeasurement. Three measurements were taken at the basal point: after the addition of oligomycin(0.5 µM), after the addition of carbonyl cyanide-4-(trifluoromethoxy)phenylhydrazone (FCCP) (0.5 µM)and after the addition of rotenone (1 µM). OCR measurements were normalised to cell count asdescribed in [29]. Measurements of basal mitochondrial respiration, maximal mitochondrial respirationand MSRC were also calculated.
4.8.2. Glycolysis Stress Test
Cells were plated in a Seahorse XF24 Cell Culture Microplate (Agilent) at a density of 65,000cells per well 48 h prior to measurement. The glycolysis stress test standard protocol was used [66].This is a completely separate assay to the mitochondrial stress test, and allows for the thoroughinterrogation of glycolysis via the addition of supplements and inhibitors of the glycolytic pathway.Three measurements were taken at the basal point: after the addition of glucose (10 µM), after theaddition of oligomycin (1.0 µM) and after the addition of 2-deoxyglucose (50 µM). The glycolysis stresstest can measure several aspects of cellular glycolysis. These include the basal glycolytic rate of thecell, the maximum level of glycolysis the cell can achieve and the glycolytic reserve which refers to thedifference between maximum level of glycolysis and the basal level of glycolysis. The different aspectsof glycolysis are calculated by measuring the extracellular acidification rate (ECAR). ECAR rates werenormalised to cell count as described above.
4.9. Statistical Analysis
For comparing each neuropsychological, neuroimaging and metabolic functional markers,a Student’s t-test was used, comparing the means of the control group for each parameter to the diseasegroup. Statistics were calculated using GraphPad Prism Software (V7.02). Analyses of covariancewere also used for group comparisons including confounding variables. For covariate analysis whencomparing control and disease group grey matter volumes, or when correlating neuropsychological andneuroimaging sAD markers with fibroblast functional markers, the IBM SPSS Statistics suite (Version26; https://www.ibm.com/uk-en/products/spss-statistics) was used as this function was not available inthe GraphPad Prism Software. Significance levels were adjusted to account for multiple comparisons.
5. Conclusions
These data highlight how in-depth analysis of mitochondrial and glycolytic function in sADfibroblasts identifies metabolic abnormalities that parallel changes seen in neuropsychological featuresdistinctive of the early stages of sporadic Alzheimer’s disease. This model system could be usedto develop biomarkers useful in early detection as well as in the development of novel therapeuticapproaches for sAD.
Supplementary Materials: The following are available online at http://www.mdpi.com/2075-4426/10/2/32/s1,Figure S1: Quantification of hippocampal volumes from T1-weighted MRI scans.
Author Contributions: Conceptualization, S.M.B., D.J.B., H.M., L.F., A.V., M.D.M. and P.J.S.; Methodology, S.M.B.,M.D.M., K.B., H.M. and A.V.; Software, S.M.B., and M.D.M.; Validation, S.M.B., D.J.B., K.B., H.M., L.F., A.V.,M.D.M. and P.J.S.; Formal Analysis, S.M.B., D.J.B., K.B., H.M., L.F., A.V., M.D.M. and P.J.S.; Investigation, S.M.B.,M.D.M., and K.B.; Resources, S.M.B., D.J.B., K.B., H.M., L.F., A.V., M.D.M. and P.J.S.; Data Curation, S.M.B.,D.J.B., K.B., H.M., L.F., A.V., M.D.M. and P.J.S.; Writing—Original Draft Preparation, S.M.B.; Writing—Reviewand Editing, S.M.B., D.J.B., K.B., H.M., L.F., A.V., M.D.M. and P.J.S.; Visualization, S.M.B., D.J.B., K.B., H.M., L.F.,A.V., M.D.M. and P.J.S.; Supervision, H.M., P.J.S., A.V., L.F. and D.J.B.; Project Administration, S.M.B.; FundingAcquisition, S.M.B., D.J.B., K.B., H.M., L.F., A.V. and P.J.S. All authors have read and agreed to the publishedversion of the manuscript.
J. Pers. Med. 2020, 10, 32 13 of 16
Funding: This research was funded by Wellcome 4ward north (216340/Z/19/Z), ARUK Yorkshire NetworkCentre Small Grant Scheme (Ref: ARUK-PCRF2016A-1), Parkinson’s UK (F1301), European Union SeventhFramework Programme (FP7/2007 – 2013) under grant agreement no. 601055, NIHR Sheffield Biomedical ResearchCentre award.
Acknowledgments: We would like to thank all research participants involved in this study. This research wassupported by the Wellcome 4ward North Academy and ARUK Yorkshire Network Centre Small Grant Scheme (toSMB), Parkinson’s UK (to HM, F1301) and the NIHR Sheffield Biomedical Research Centre. This is a summary ofindependent research carried out at the NIHR Sheffield Biomedical Research Centre (Translational Neuroscience).The views expressed are those of the author(s) and not necessarily those of the NHS, the NIHR or the Department ofHealth and Social Care (DHSC). Support of the European Union Seventh Framework Programme (FP7/2007–2013)under grant agreement no. 601055, VPH-DARE@IT to AV is acknowledged. PJS is supported by an NIHRSenior Investigator award. The support of the NIHR Clinical Research Facility—Sheffield Teaching Hospital isalso acknowledged.
Conflicts of Interest: The authors have no financial or personal relationships with other people/organizationsthat could inappropriately influence (bias) their work.
References
1. Wimo, A.; Guerchet, M.; Ali, G.-C.; Wu, Y.-T.; Prina, A.M.; Winblad, B.; Jönsson, L.; Liu, Z.; Prince, M.The worldwide costs of dementia 2015 and comparisons with 2010. Alzheimer’s Dement. 2017, 13, 1–7.[CrossRef]
2. Scheltens, P.; Blennow, K.; Breteler, M.M.B.; de Strooper, B.; Frisoni, G.B.; Salloway, S.; Van der Flier, W.M.Alzheimer’s disease. Lancet 2016, 388, 505–517. [CrossRef]
3. Brookmeyer, R.; Corrada, M.M.; Curriero, F.C.; Kawas, C. Survival following a diagnosis of Alzheimerdisease. Arch. Neurol. 2002, 59, 1764–1767. [CrossRef]
4. Perl, D.P. Neuropathology of Alzheimer’s Disease. Mt. Sinai J. Med. 2010, 77, 32–42. [CrossRef] [PubMed]5. Hardy, J.; Selkoe, D.J. The Amyloid Hypothesis of Alzheimer’s Disease: Progress and Problems on the Road
to Therapeutics. Science 2002, 297, 353. [CrossRef] [PubMed]6. Honig, L.S.; Vellas, B.; Woodward, M.; Boada, M.; Bullock, R.; Borrie, M.; Hager, K.; Andreasen, N.; Scarpini, E.;
Liu-Seifert, H.; et al. Trial of Solanezumab for Mild Dementia Due to Alzheimer’s Disease. N. Engl. J. Med.2018, 378, 321–330. [CrossRef] [PubMed]
7. Cummings, J.L.; Morstorf, T.; Zhong, K. Alzheimer’s disease drug-development pipeline: Few candidates,frequent failures. Alzheimers Res. Ther. 2014, 6, 37. [CrossRef]
8. ALZFORUM. Topline Result for First DIAN-TU Clinical Trial: Negative on Primary. Availableonline: https://www.alzforum.org/news/research-news/topline-result-first-dian-tu-clinical-trial-negative-primary (accessed on 29 March 2020).
9. Savva, G.M.; Wharton, S.B.; Ince, P.G.; Forster, G.; Matthews, F.E.; Brayne, C. Age, neuropathology, anddementia. N. Engl. J. Med. 2009, 360, 2302–2309. [CrossRef]
10. Le Couteur, D.G.; Hunter, S.; Brayne, C. Solanezumab and the amyloid hypothesis for Alzheimer’s disease.BMJ 2016, 355, i6771. [CrossRef]
11. McKhann, G.M.; Knopman, D.S.; Chertkow, H.; Hyman, B.T.; Jack, C.R., Jr.; Kawas, C.H.; Klunk, W.E.;Koroshetz, W.J.; Manly, J.J.; Mayeux, R.; et al. The diagnosis of dementia due to Alzheimer’s disease:Recommendations from the National Institute on Aging-Alzheimer’s Association workgroups on diagnosticguidelines for Alzheimer’s disease. Alzheimers Dement. J. Alzheimers Assoc. 2011, 7, 263–269. [CrossRef]
12. Braak, H.; Braak, E. Neuropathological stageing of Alzheimer-related changes. Acta Neuropathol. 1991, 82,239–259. [CrossRef] [PubMed]
13. Haroutunian, V.; Schnaider-Beeri, M.; Schmeidler, J.; Wysocki, M.; Purohit, D.P.; Perl, D.P.; Libow, L.S.;Lesser, G.T.; Maroukian, M.; Grossman, H.T. Role of the neuropathology of Alzheimer disease in dementia inthe oldest-old. Arch. Neurol. 2008, 65, 1211–1217. [CrossRef] [PubMed]
14. Weintraub, S.; Wicklund, A.H.; Salmon, D.P. The neuropsychological profile of Alzheimer disease. ColdSpring Harb. Perspect. Med. 2012, 2, a006171. [CrossRef] [PubMed]
15. Magistretti, P.J.; Allaman, I. A Cellular Perspective on Brain Energy Metabolism and Functional Imaging.Neuron 2015, 86, 883–901. [CrossRef]
J. Pers. Med. 2020, 10, 32 14 of 16
16. Ewers, M.; Brendel, M.; Rizk-Jackson, A.; Rominger, A.; Bartenstein, P.; Schuff, N.; Weiner, M.W. Alzheimer’sDisease Neuroimaging I Reduced FDG-PET brain metabolism and executive function predict clinicalprogression in elderly healthy subjects. NeuroImage. Clin. 2013, 4, 45–52. [CrossRef]
17. Kalpouzos, G.; Eustache, F.; de la Sayette, V.; Viader, F.; Chételat, G.; Desgranges, B. Working memory andFDG–PET dissociate early and late onset Alzheimer disease patients. J. Neurol. 2005, 252, 548–558. [CrossRef]
18. Ishii, K.; Sasaki, M.; Yamaji, S.; Sakamoto, S.; Kitagaki, H.; Mori, E. Demonstration of decreased posteriorcingulate perfusion in mild Alzheimer’s disease by means of H215O positron emission tomography. Eur. J.Nucl. Med. 1997, 24, 670–673.
19. Morgen, K.; Frolich, L. The metabolism hypothesis of Alzheimer’s disease: From the concept of centralinsulin resistance and associated consequences to insulin therapy. J. Neural Transm. 2015, 122, 499–504.[CrossRef]
20. Yao, J.; Irwin, R.W.; Zhao, L.; Nilsen, J.; Hamilton, R.T.; Brinton, R.D. Mitochondrial bioenergetic deficitprecedes Alzheimer’s pathology in female mouse model of Alzheimer’s disease. Proc. Natl. Acad. Sci. USA2009, 106, 14670. [CrossRef]
21. Blass, J.P.; Sheu, R.K.; Gibson, G.E. Inherent abnormalities in energy metabolism in Alzheimer disease.Interaction with cerebrovascular compromise. Ann. N. Y. Acad. Sci. 2000, 903, 204–221. [CrossRef]
22. Baik, S.H.; Kang, S.; Lee, W.; Choi, H.; Chung, S.; Kim, J.I.; Mook-Jung, I. A Breakdown in MetabolicReprogramming Causes Microglia Dysfunction in Alzheimer’s Disease. Cell Metab. 2019, 30, 493–507.e496.[CrossRef] [PubMed]
23. Swerdlow, R.H.; Khan, S.M. A “mitochondrial cascade hypothesis” for sporadic Alzheimer’s disease. Med.Hypotheses 2004, 63, 8–20. [CrossRef]
24. Hartl, D.; Schuldt, V.; Forler, S.; Zabel, C.; Klose, J.; Rohe, M. Presymptomatic Alterations in EnergyMetabolism and Oxidative Stress in the APP23 Mouse Model of Alzheimer Disease. J. Proteome Res. 2012, 11,3295–3304. [CrossRef]
25. Gan, X.Q.; Huang, S.B.; Wu, L.; Wang, Y.F.; Hu, G.; Li, G.Y.; Zhang, H.J.; Yu, H.Y.; Swerdlow, R.H.; Chen, J.X.;et al. Inhibition of ERK-DLP1 signaling and mitochondrial division alleviates mitochondrial dysfunctionin Alzheimer’s disease cybrid cell. Biochim. Biophys. Acta Mol. Basis Dis. 2014, 1842, 220–231. [CrossRef][PubMed]
26. Mosconi, L.; Tsui, W.H.; De Santi, S.; Li, J.; Rusinek, H.; Convit, A.; Li, Y.; Boppana, M.; de Leon, M.J.Reduced hippocampal metabolism in MCI and AD: Automated FDG-PET image analysis. Neurology 2005,64, 1860–1867. [CrossRef] [PubMed]
27. Vlassenko, A.G.; Vaishnavi, S.N.; Couture, L.; Sacco, D.; Shannon, B.J.; Mach, R.H.; Morris, J.C.; Raichle, M.E.;Mintun, M.A. Spatial correlation between brain aerobic glycolysis and amyloid-beta (Abeta) deposition.Proc. Natl. Acad. Sci. USA 2010, 107, 17763–17767. [CrossRef]
28. Vlassenko, A.G.; Gordon, B.A.; Goyal, M.S.; Su, Y.; Blazey, T.M.; Durbin, T.J.; Couture, L.E.; Christensen, J.J.;Jafri, H.; Morris, J.C.; et al. Aerobic glycolysis and tau deposition in preclinical Alzheimer’s disease. Neurobiol.Aging 2018, 67, 95–98. [CrossRef]
29. Bell, S.M.; Barnes, K.; Clemmens, H.; Al-Rafiah, A.R.; Al-Ofi, E.A.; Leech, V.; Bandmann, O.; Shaw, P.J.;Blackburn, D.J.; Ferraiuolo, L.; et al. Ursodeoxycholic Acid Improves Mitochondrial Function andRedistributes Drp1 in Fibroblasts from Patients with Either Sporadic or Familial Alzheimer’s Disease.J. Mol. Biol. 2018, 430, 3942–3953. [CrossRef]
30. Pickart, L.; Vasquez-Soltero, J.M.; Margolina, A. The Effect of the Human Peptide GHK on Gene ExpressionRelevant to Nervous System Function and Cognitive Decline. Brain Sci. 2017, 7, 20. [CrossRef]
31. Desler, C.; Hansen, T.L.; Frederiksen, J.B.; Marcker, M.L.; Singh, K.K.; Juel Rasmussen, L. Is There a Linkbetween Mitochondrial Reserve Respiratory Capacity and Aging? J. Aging Res. 2012, 2012, 192503. [CrossRef]
32. Martino Adami, P.V.; Quijano, C.; Magnani, N.; Galeano, P.; Evelson, P.; Cassina, A.; Do Carmo, S.; Leal, M.C.;Castaño, E.M.; Cuello, A.C.; et al. Synaptosomal bioenergetic defects are associated with cognitive impairmentin a transgenic rat model of early Alzheimer’s disease. Off. J. Int. Soc. Cereb. Blood Flow Metab. 2017, 37,69–84. [CrossRef] [PubMed]
33. Capitani, E.; Rosci, C.; Saetti, M.C.; Laiacona, M. Mirror asymmetry of Category and Letter fluency intraumatic brain injury and Alzheimer’s patients. Neuropsychologia 2009, 47, 423–429. [CrossRef] [PubMed]
34. Folstein, M.F.; Folstein, S.E.; McHugh, P.R. “Mini-mental state”. A practical method for grading the cognitivestate of patients for the clinician. J. Psychiatr. Res. 1975, 12, 189–198. [CrossRef]
J. Pers. Med. 2020, 10, 32 15 of 16
35. Doody, R.S.; Massman, P.; Dunn, J.K. A method for estimating progression rates in Alzheimer disease. Arch.Neurol. 2001, 58, 449–454. [CrossRef] [PubMed]
36. Scahill, R.I.; Schott, J.M.; Stevens, J.M.; Rossor, M.N.; Fox, N.C. Mapping the evolution of regional atrophy inAlzheimer’s disease: Unbiased analysis of fluid-registered serial MRI. Proc. Natl. Acad. Sci. USA 2002, 99,4703–4707. [CrossRef] [PubMed]
37. Boller, B.; Mellah, S.; Ducharme-Laliberte, G.; Belleville, S. Relationships between years of education, regionalgrey matter volumes, and working memory-related brain activity in healthy older adults. Brain ImagingBehav. 2017, 11, 304–317. [CrossRef]
38. Rzezak, P.; Squarzoni, P.; Duran, F.L.; de Toledo Ferraz Alves, T.; Tamashiro-Duran, J.; Bottino, C.M.; Ribeiz, S.;Lotufo, P.A.; Menezes, P.R.; Scazufca, M.; et al. Relationship between Brain Age-Related Reduction in GrayMatter and Educational Attainment. PLoS ONE 2015, 10, e0140945. [CrossRef]
39. Harada, C.N.; Natelson Love, M.C.; Triebel, K.L. Normal cognitive aging. Clin. Geriatr. Med. 2013, 29,737–752. [CrossRef]
40. Stern, Y. Cognitive reserve: Implications for assessment and intervention. Folia Phoniatr. Logop. Off. Organ.Int. Assoc. Logop. Phoniatr. IALP 2013, 65, 49–54. [CrossRef]
41. Schniertshauer, D.; Gebhard, D.; Bergemann, J. Age-Dependent Loss of Mitochondrial Function in EpithelialTissue Can Be Reversed by Coenzyme Q10. J. Aging Res. 2018, 2018, 6354680. [CrossRef] [PubMed]
42. Sriskanthadevan, S.; Jeyaraju, D.V.; Chung, T.E.; Prabha, S.; Xu, W.; Skrtic, M.; Jhas, B.; Hurren, R.; Gronda, M.;Wang, X.; et al. AML cells have low spare reserve capacity in their respiratory chain that renders themsusceptible to oxidative metabolic stress. Blood 2015, 125, 2120–2130. [CrossRef] [PubMed]
43. Yadava, N.; Nicholls, D.G. Spare Respiratory Capacity Rather Than Oxidative Stress Regulates GlutamateExcitotoxicity after Partial Respiratory Inhibition of Mitochondrial Complex I with Rotenone. J. Neurosci.2007, 27, 7310–7317. [CrossRef] [PubMed]
44. Mortiboys, H.; Johansen, K.K.; Aasly, J.O.; Bandmann, O. Mitochondrial impairment in patients withParkinson disease with the G2019S mutation in LRRK2. Neurology 2010, 75, 2017–2020. [CrossRef] [PubMed]
45. Tan, W.; Pasinelli, P.; Trotti, D. Role of mitochondria in mutant SOD1 linked amyotrophic lateral sclerosis.Biochim. Biophys. Acta 2014, 1842, 1295–1301. [CrossRef]
46. Carling, P.J.; Mortiboys, H.; Green, C.; Mihaylov, S.; Sandor, C.; Schwartzentruber, A.; Taylor, R.; Wei, W.;Hastings, C.; Wong, S.; et al. Deep phenotyping of peripheral tissue facilitates mechanistic diseasestratification in sporadic Parkinson’s disease. Prog. Neurobiol. 2020, 187, 101772. [CrossRef]
47. Milanese, C.; Payán-Gómez, C.; Galvani, M.; Molano González, N.; Tresini, M.; Nait Abdellah, S.; vanRoon-Mom, W.M.; Figini, S.; Marinus, J.; van Hilten, J.J.; et al. Peripheral mitochondrial function correlateswith clinical severity in idiopathic Parkinson’s disease. Mov. Disord. 2019, 34, 1192–1202. [CrossRef][PubMed]
48. Gottlieb, E.; Armour, S.M.; Harris, M.H.; Thompson, C.B. Mitochondrial membrane potential regulates matrixconfiguration and cytochrome c release during apoptosis. Cell Death Differ. 2003, 10, 709–717. [CrossRef]
49. Grogan, A.; Green, D.W.; Ali, N.; Crinion, J.T.; Price, C.J. Structural correlates of semantic and phonemicfluency ability in first and second languages. Cereb. Cortex 2009, 19, 2690–2698. [CrossRef]
50. Venneri, A.; Jahn-Carta, C.; De Marco, M.; Quaranta, D.; Marra, C. Diagnostic and prognostic role of semanticprocessing in preclinical Alzheimer’s disease. Biomark. Med. 2018, 12, 637–651. [CrossRef]
51. Baldo, J.V.; Schwartz, S.; Wilkins, D.; Dronkers, N.F. Role of frontal versus temporal cortex in verbal fluencyas revealed by voxel-based lesion symptom mapping. J. Int. Neuropsychol. Soc. 2006, 12, 896–900. [CrossRef]
52. Liang, W.S.; Reiman, E.M.; Valla, J.; Dunckley, T.; Beach, T.G.; Grover, A.; Niedzielko, T.L.; Schneider, L.E.;Mastroeni, D.; Caselli, R.; et al. Alzheimer’s disease is associated with reduced expression of energymetabolism genes in posterior cingulate neurons. Proc. Natl. Acad. Sci. USA 2008, 105, 4441–4446. [CrossRef][PubMed]
53. Mosconi, L. Brain glucose metabolism in the early and specific diagnosis of Alzheimer’s disease. FDG-PETstudies in MCI and AD. Eur. J. Nucl. Med. Mol. Imaging 2005, 32, 486–510. [CrossRef] [PubMed]
54. Ramanoël, S.; Hoyau, E.; Kauffmann, L.; Renard, F.; Pichat, C.; Boudiaf, N.; Krainik, A.; Jaillard, A.; Baciu, M.Gray Matter Volume and Cognitive Performance During Normal Aging. A Voxel-Based Morphometry Study.Front. Aging Neurosci. 2018, 10, 235. [CrossRef] [PubMed]
J. Pers. Med. 2020, 10, 32 16 of 16
55. Maynard, S.; Hejl, A.M.; Dinh, T.S.T.; Keijzers, G.; Hansen, Å.M.; Desler, C.; Moreno-Villanueva, M.; Bürkle, A.;Rasmussen, L.J.; Waldemar, G.; et al. Defective mitochondrial respiration, altered dNTP pools and reducedAP endonuclease 1 activity in peripheral blood mononuclear cells of Alzheimer’s disease patients. Aging2015, 7, 793. [CrossRef]
56. Fisar, Z.; Hroudová, J.; Hansíková, H.; Lelková, P.; Wenchich, L.; Jirák, R.; Zeman, J.; Martásek, P.; Raboch, J.Mitochondrial Respiration in the Platelets of Patients with Alzheimer’s Disease. Curr. Alzheimer Res. 2016,13, 930–941. [CrossRef]
57. Martin-Maestro, P.; Gargini, R.; Garcia, E.; Perry, G.; Avila, J. Slower Dynamics and Aged Mitochondria inSporadic Alzheimer’s Disease. Oxid. Med. Cell. Longev. 2017, 2017, 9302761. [CrossRef]
58. Sonntag, K.C.; Ryu, W.I.; Amirault, K.M.; Healy, R.A.; Siegel, A.J.; McPhie, D.L.; Forester, B.; Cohen, B.M.Late-onset Alzheimer’s disease is associated with inherent changes in bioenergetics profiles. Sci. Rep. 2017,7, 14038. [CrossRef]
59. Takahashi, K.; Yamanaka, S. Induction of pluripotent stem cells from mouse embryonic and adult fibroblastcultures by defined factors. Cell 2006, 126, 663–676. [CrossRef]
60. Mertens, J.; Paquola, A.C.; Ku, M.; Hatch, E.; Böhnke, L.; Ladjevardi, S.; McGrath, S.; Campbell, B.; Lee, H.;Herdy, J.R.; et al. Directly Reprogrammed Human Neurons Retain Aging-Associated TranscriptomicSignatures and Reveal Age-Related Nucleocytoplasmic Defects. Cell Stem Cell 2015, 17, 705–718. [CrossRef]
61. Wakefield, S.J.; McGeown, W.J.; Shanks, M.F.; Venneri, A. Differentiating normal from pathological brainageing using standard neuropsychological tests. Curr. Alzheimer Res. 2014, 11, 765–772. [CrossRef]
62. De Marco, M.; Duzzi, D.; Meneghello, F.; Venneri, A. Cognitive Efficiency in Alzheimer’s Disease is Associatedwith Increased Occipital Connectivity. J. Alzheimers Dis. 2017, 57, 541–556. [CrossRef] [PubMed]
63. Cardoso, M.J.; Leung, K.; Modat, M.; Keihaninejad, S.; Cash, D.; Barnes, J.; Fox, N.C.; Ourselin, S.STEPS: Similarity and Truth Estimation for Propagated Segmentations and its application to hippocampalsegmentation and brain parcelation. Med. Image Anal. 2013, 17, 671–684. [CrossRef] [PubMed]
64. Vijayakumar, A.; Vijayakumar, A. Comparison of hippocampal volume in dementia subtypes. ISRN Radiol.2013, 2013, 174524. [CrossRef] [PubMed]
65. Mortiboys, H.; Thomas, K.J.; Koopman, W.J.; Klaffke, S.; Abou-Sleiman, P.; Olpin, S.; Wood, N.W.;Willems, P.H.; Smeitink, J.A.; Cookson, M.R. Mitochondrial function and morphology are impaired inparkin-mutant fibroblasts. Ann. Neurol. 2008, 64, 555–565. [CrossRef] [PubMed]
66. Agilent Technologies, Agilent Seahorse XF Glycolysis Stress Test Kit. Available online: https://www.agilent.com/cs/library/usermanuals/public/XF_Glycolysis_Stress_Test_Kit_User_Guide.pdf (accessed on29 March 2020).
© 2020 by the authors. Licensee MDPI, Basel, Switzerland. This article is an open accessarticle distributed under the terms and conditions of the Creative Commons Attribution(CC BY) license (http://creativecommons.org/licenses/by/4.0/).

124 | P a g e
4.3 Additional results
Table 4.1. Highlights the fibroblast cell lines used in the additional experiments in this chapter
Fibroblast Line Cohort Apoε genotype Age Sex Used in Chapter
Paper
Control 1 Sheffield 3/3 53 Male Yes
Control 2 Sheffield 3/4 54 Male Yes
Control 3 Sheffield 2/3 61 Female Yes
Control 4 Sheffield 3/3 66 Male Yes
Control 5 Sheffield 3/4 100 Female Yes
Control 6 Sheffield 3/4 54 Female Yes
Control 7 Sheffield 2/3 56 Male Yes
Control 8 Sheffield 3/3 73 Female Yes
Control 9 Sheffield 2/3 75 Male Yes
Control 10 Sheffield 3/3 75 Female Yes
Sporadic 1 Sheffield 2/3 53 Male Yes
Sporadic 2 Sheffield 3/3 60 Male Yes
Sporadic 3 Sheffield 3/3 57 Male Yes
Sporadic 4 Sheffield 4/4 63 Male Yes
Sporadic 5 Sheffield 2/3 59 Female Yes
Sporadic 6 Sheffield Unknown 63 Female Yes
Sporadic 7 Sheffield 4/4 60 Male Yes
Sporadic 8 Sheffield 3/3 60 Male Yes
Sporadic 9 Sheffield 3/4 79 Female Yes
Sporadic 10 Sheffield 3/3 61 Female Yes
Table 4.1| Fibroblast line demographics: Data for Apoε genotype, age, sex and whether
the line was used in the chapter paper is listed.
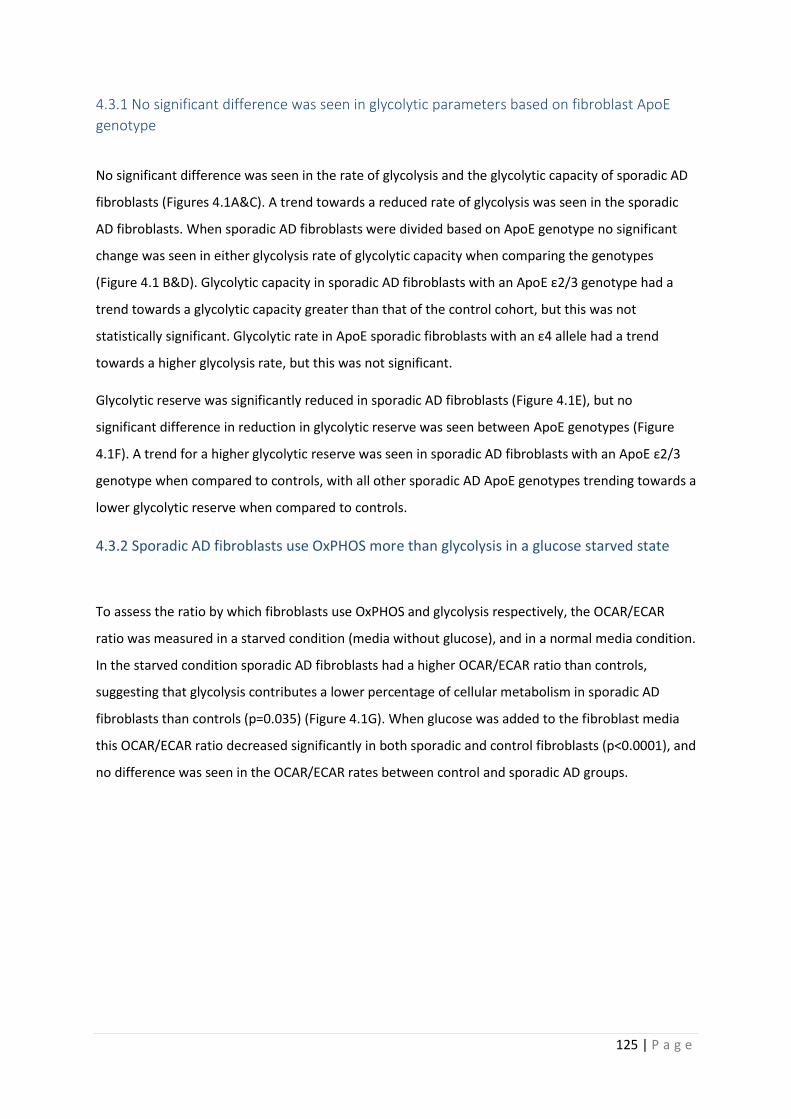
125 | P a g e
4.3.1 No significant difference was seen in glycolytic parameters based on fibroblast ApoE
genotype
No significant difference was seen in the rate of glycolysis and the glycolytic capacity of sporadic AD
fibroblasts (Figures 4.1A&C). A trend towards a reduced rate of glycolysis was seen in the sporadic
AD fibroblasts. When sporadic AD fibroblasts were divided based on ApoE genotype no significant
change was seen in either glycolysis rate of glycolytic capacity when comparing the genotypes
(Figure 4.1 B&D). Glycolytic capacity in sporadic AD fibroblasts with an ApoE ε2/3 genotype had a
trend towards a glycolytic capacity greater than that of the control cohort, but this was not
statistically significant. Glycolytic rate in ApoE sporadic fibroblasts with an ε4 allele had a trend
towards a higher glycolysis rate, but this was not significant.
Glycolytic reserve was significantly reduced in sporadic AD fibroblasts (Figure 4.1E), but no
significant difference in reduction in glycolytic reserve was seen between ApoE genotypes (Figure
4.1F). A trend for a higher glycolytic reserve was seen in sporadic AD fibroblasts with an ApoE ε2/3
genotype when compared to controls, with all other sporadic AD ApoE genotypes trending towards a
lower glycolytic reserve when compared to controls.
4.3.2 Sporadic AD fibroblasts use OxPHOS more than glycolysis in a glucose starved state
To assess the ratio by which fibroblasts use OxPHOS and glycolysis respectively, the OCAR/ECAR
ratio was measured in a starved condition (media without glucose), and in a normal media condition.
In the starved condition sporadic AD fibroblasts had a higher OCAR/ECAR ratio than controls,
suggesting that glycolysis contributes a lower percentage of cellular metabolism in sporadic AD
fibroblasts than controls (p=0.035) (Figure 4.1G). When glucose was added to the fibroblast media
this OCAR/ECAR ratio decreased significantly in both sporadic and control fibroblasts (p<0.0001), and
no difference was seen in the OCAR/ECAR rates between control and sporadic AD groups.
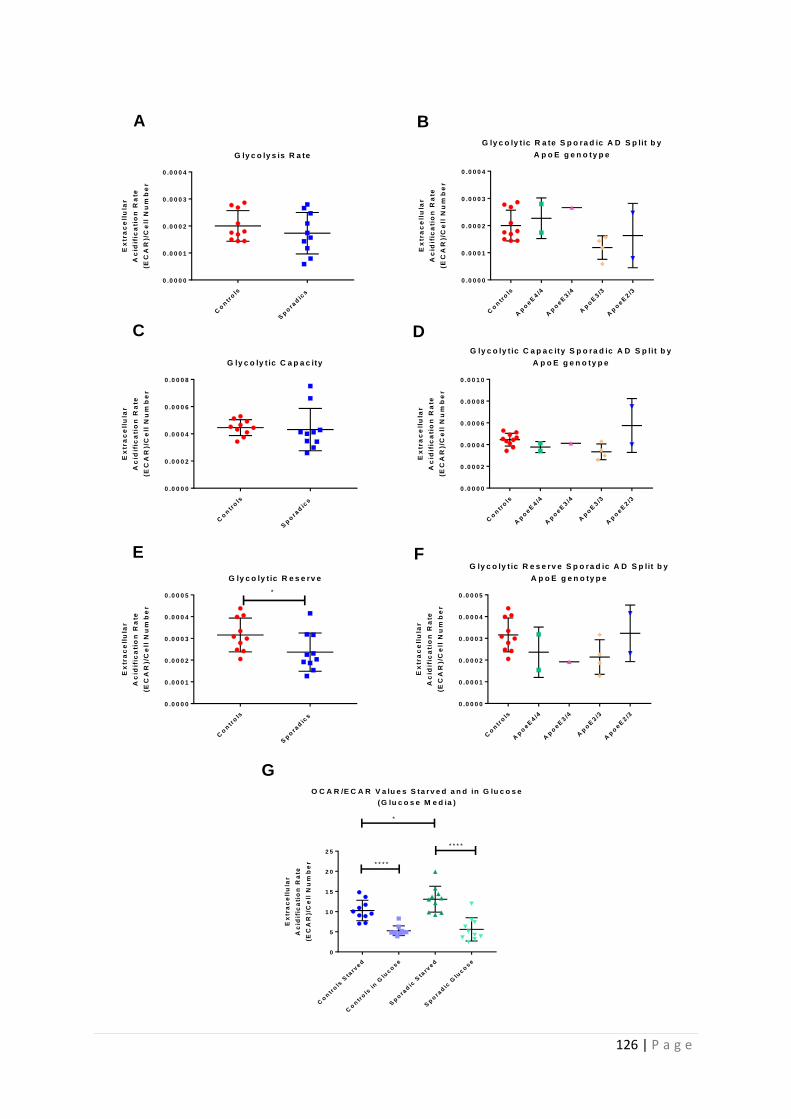
126 | P a g e
Co
ntr
ols
Sp
ora
dic
s
0 .0 0 0 0
0 .0 0 0 1
0 .0 0 0 2
0 .0 0 0 3
0 .0 0 0 4
G ly c o ly s is R a te
Ex
tra
ce
llu
lar
Ac
idif
ica
tio
n R
ate
(EC
AR
)/C
ell
Nu
mb
er
Co
ntr
ols
Ap
oeE
4/4
Ap
oeE
3/4
Ap
oE
3/3
Ap
oeE
2/3
0 .0 0 0 0
0 .0 0 0 1
0 .0 0 0 2
0 .0 0 0 3
0 .0 0 0 4
G ly c o ly t ic R a te S p o ra d ic A D S p lit b y
A p o E g e n o ty p e
Ex
tra
ce
llu
lar
Ac
idif
ica
tio
n R
ate
(EC
AR
)/C
ell
Nu
mb
er
Co
ntr
ols
Sp
ora
dic
s
0 .0 0 0 0
0 .0 0 0 2
0 .0 0 0 4
0 .0 0 0 6
0 .0 0 0 8
G ly c o ly t ic C a p a c ity
Ex
tra
ce
llu
lar
Ac
idif
ica
tio
n R
ate
(EC
AR
)/C
ell
Nu
mb
er
Co
ntr
ols
Ap
oeE
4/4
Ap
oeE
3/4
Ap
oE
3/3
Ap
oeE
2/3
0 .0 0 0 0
0 .0 0 0 2
0 .0 0 0 4
0 .0 0 0 6
0 .0 0 0 8
0 .0 0 1 0
G ly c o ly t ic C a p a c ity S p o ra d ic A D S p lit b y
A p o E g e n o ty p e
Ex
tra
ce
llu
lar
Ac
idif
ica
tio
n R
ate
(EC
AR
)/C
ell
Nu
mb
er
Co
ntr
ols
Sp
ora
dic
s
0 .0 0 0 0
0 .0 0 0 1
0 .0 0 0 2
0 .0 0 0 3
0 .0 0 0 4
0 .0 0 0 5
G ly c o ly t ic R e s e rv e
Ex
tra
ce
llu
lar
Ac
idif
ica
tio
n R
ate
(EC
AR
)/C
ell
Nu
mb
er
*
Co
ntr
ols
Ap
oeE
4/4
Ap
oeE
3/4
Ap
oE
3/3
Ap
oeE
2/3
0 .0 0 0 0
0 .0 0 0 1
0 .0 0 0 2
0 .0 0 0 3
0 .0 0 0 4
0 .0 0 0 5
G ly c o ly t ic R e s e rv e S p o ra d ic A D S p lit b y
A p o E g e n o ty p e
Ex
tra
ce
llu
lar
Ac
idif
ica
tio
n R
ate
(EC
AR
)/C
ell
Nu
mb
er
A B
C D
E F
G
Co
ntr
ols
Sta
rved
Co
ntr
ols
in
Glu
co
se
Sp
ora
dic
Sta
rved
Sp
ora
dic
Glu
co
se
0
5
1 0
1 5
2 0
2 5
O C A R /E C A R V a lu e s S ta rv e d a n d in G lu c o s e
(G lu c o s e M e d ia )
Ex
tra
ce
llu
lar
Ac
idif
ica
tio
n R
ate
(EC
AR
)/C
ell
Nu
mb
er
*
* * * *
* * * *
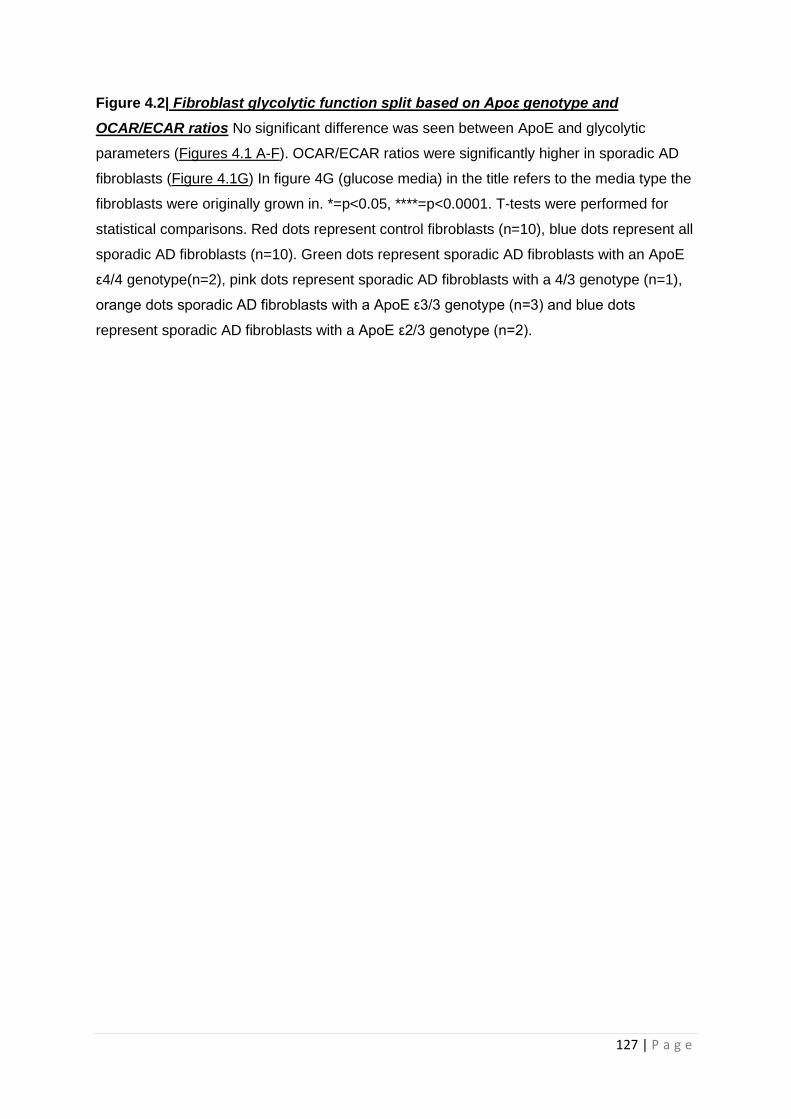
127 | P a g e
Figure 4.2| Fibroblast glycolytic function split based on Apoε genotype and
OCAR/ECAR ratios No significant difference was seen between ApoE and glycolytic
parameters (Figures 4.1 A-F). OCAR/ECAR ratios were significantly higher in sporadic AD
fibroblasts (Figure 4.1G) In figure 4G (glucose media) in the title refers to the media type the
fibroblasts were originally grown in. *=p<0.05, ****=p<0.0001. T-tests were performed for
statistical comparisons. Red dots represent control fibroblasts (n=10), blue dots represent all
sporadic AD fibroblasts (n=10). Green dots represent sporadic AD fibroblasts with an ApoE
ε4/4 genotype(n=2), pink dots represent sporadic AD fibroblasts with a 4/3 genotype (n=1),
orange dots sporadic AD fibroblasts with a ApoE ε3/3 genotype (n=3) and blue dots
represent sporadic AD fibroblasts with a ApoE ε2/3 genotype (n=2).
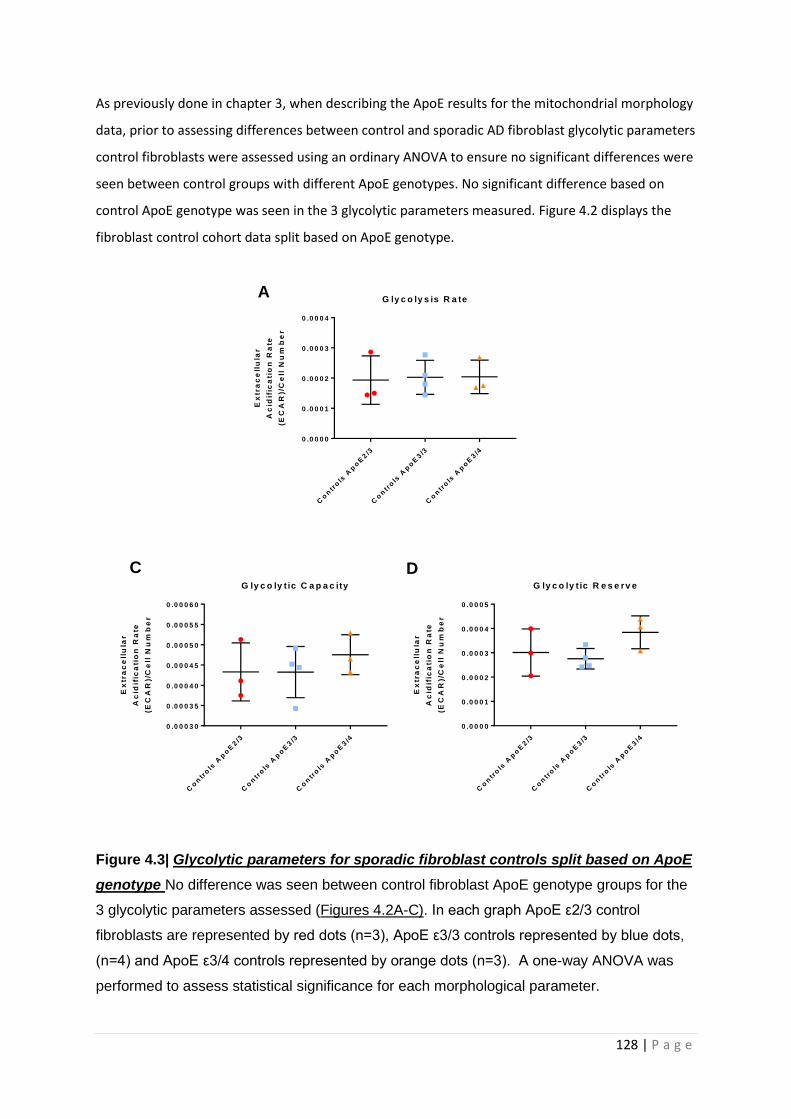
128 | P a g e
As previously done in chapter 3, when describing the ApoE results for the mitochondrial morphology
data, prior to assessing differences between control and sporadic AD fibroblast glycolytic parameters
control fibroblasts were assessed using an ordinary ANOVA to ensure no significant differences were
seen between control groups with different ApoE genotypes. No significant difference based on
control ApoE genotype was seen in the 3 glycolytic parameters measured. Figure 4.2 displays the
fibroblast control cohort data split based on ApoE genotype.
Figure 4.3| Glycolytic parameters for sporadic fibroblast controls split based on ApoE
genotype No difference was seen between control fibroblast ApoE genotype groups for the
3 glycolytic parameters assessed (Figures 4.2A-C). In each graph ApoE ε2/3 control
fibroblasts are represented by red dots (n=3), ApoE ε3/3 controls represented by blue dots,
(n=4) and ApoE ε3/4 controls represented by orange dots (n=3). A one-way ANOVA was
performed to assess statistical significance for each morphological parameter.
Co
ntr
ols
Ap
oE
2/3
Co
ntr
ols
Ap
oE
3/3
Co
ntr
ols
Ap
oE
3/4
0 .0 0 0 0
0 .0 0 0 1
0 .0 0 0 2
0 .0 0 0 3
0 .0 0 0 4
G ly c o ly s is R a te
Ex
tra
ce
llu
lar
Ac
idif
ica
tio
n R
ate
(EC
AR
)/C
ell
Nu
mb
er
Co
ntr
ols
Ap
oE
2/3
Co
ntr
ols
Ap
oE
3/3
Co
ntr
ols
Ap
oE
3/4
0 .0 0 0 3 0
0 .0 0 0 3 5
0 .0 0 0 4 0
0 .0 0 0 4 5
0 .0 0 0 5 0
0 .0 0 0 5 5
0 .0 0 0 6 0
G ly c o ly t ic C a p a c ity
Ex
tra
ce
llu
lar
Ac
idif
ica
tio
n R
ate
(EC
AR
)/C
ell
Nu
mb
er
Co
ntr
ols
Ap
oE
2/3
Co
ntr
ols
Ap
oE
3/3
Co
ntr
ols
Ap
oE
3/4
0 .0 0 0 0
0 .0 0 0 1
0 .0 0 0 2
0 .0 0 0 3
0 .0 0 0 4
0 .0 0 0 5
G ly c o ly t ic R e s e rv e
Ex
tra
ce
llu
lar
Ac
idif
ica
tio
n R
ate
(EC
AR
)/C
ell
Nu
mb
er
A
C D
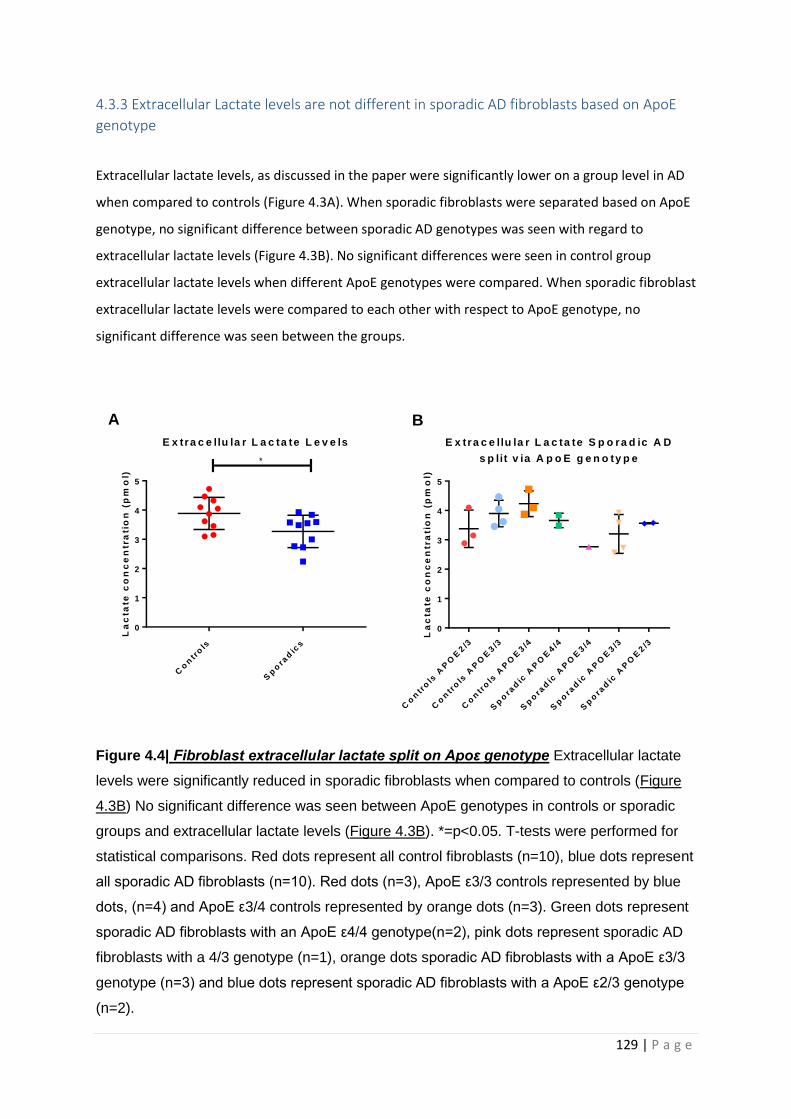
129 | P a g e
4.3.3 Extracellular Lactate levels are not different in sporadic AD fibroblasts based on ApoE
genotype
Extracellular lactate levels, as discussed in the paper were significantly lower on a group level in AD
when compared to controls (Figure 4.3A). When sporadic fibroblasts were separated based on ApoE
genotype, no significant difference between sporadic AD genotypes was seen with regard to
extracellular lactate levels (Figure 4.3B). No significant differences were seen in control group
extracellular lactate levels when different ApoE genotypes were compared. When sporadic fibroblast
extracellular lactate levels were compared to each other with respect to ApoE genotype, no
significant difference was seen between the groups.
Figure 4.4| Fibroblast extracellular lactate split on Apoε genotype Extracellular lactate
levels were significantly reduced in sporadic fibroblasts when compared to controls (Figure
4.3B) No significant difference was seen between ApoE genotypes in controls or sporadic
groups and extracellular lactate levels (Figure 4.3B). *=p<0.05. T-tests were performed for
statistical comparisons. Red dots represent all control fibroblasts (n=10), blue dots represent
all sporadic AD fibroblasts (n=10). Red dots (n=3), ApoE ε3/3 controls represented by blue
dots, (n=4) and ApoE ε3/4 controls represented by orange dots (n=3). Green dots represent
sporadic AD fibroblasts with an ApoE ε4/4 genotype(n=2), pink dots represent sporadic AD
fibroblasts with a 4/3 genotype (n=1), orange dots sporadic AD fibroblasts with a ApoE ε3/3
genotype (n=3) and blue dots represent sporadic AD fibroblasts with a ApoE ε2/3 genotype
(n=2).
Co
ntr
ols
Sp
ora
dic
s
0
1
2
3
4
5
E x tra c e llu la r L a c ta te L e v e ls
La
cta
te c
on
ce
ntr
ati
on
(p
mo
l)
*
Co
ntr
ols
AP
OE
2/3
Co
ntr
ols
AP
OE
3/3
Co
ntr
ols
AP
OE
3/4
Sp
ora
dic
AP
OE
4/4
Sp
ora
dic
AP
OE
3/4
Sp
ora
dic
AP
OE
3/3
Sp
ora
dic
AP
OE
2/3
0
1
2
3
4
5
E x tra c e llu la r L a c ta te S p o ra d ic A D
s p lit v ia A p o E g e n o ty p e
La
cta
te c
on
ce
ntr
ati
on
(p
mo
l)A B
130 | P a g e
4.3.4 The connectivity of the default mode network is altered in sporadic AD
As discussed in the introduction the DMN is the outcome of a group level analysis of functionally
connected brain areas. To perform a correlation with MRSC and MMP readings as done with
neuropsychological and neuroimaging parameters discussed in the paper chapter, a method needed
to be devised to express the connectivity of the DMN in the form of a global index (rather than a
map) per single participant in the study. In this study DMN was identified using blood oxygenation
level dependent (BOLD) imaging.
The images were initially preprocessed one by one following a standardized procedure which
included five basics sequential processing steps: slice timing, realignment, normalization, filtering
and smoothing. Matlab (Mathworks Inc., UK) and Statistical Parametric Mapping 12 2 (Wellcome
Centre for Human Neuroimaging, 166 London, UK) were used for this purpose, this process is the
same as described in the chapter paper. An independent component analysis was then run on the
entire set of preprocessed images [464] using the GIFT toolbox
(http://mialab.mrn.org/software/gift/). This served to calculate group-level component maps, which
were visualized and interpreted according to their topography. The DMN was identified based on its
typical posteromedial-biparietal pattern. To obtain subject-specific regional estimates of DMN
strength we focused on its computational cores namely the posterior cingulate cortex, the left and
right inferior parietal lobule and the anteromedial prefrontal cortex. The Automated Atlas Labelling
atlas [465] was used to draw these regions in the MNI space. Three DMN subregions were thus
defined: an anterior section comprising the anteromedial prefrontal cortex bilaterally and three
posterior sections, i.e., a left one (left posterior cingulate and left inferior parietal lobule), a right one
(right posterior cingulate and right inferior parietal lobule) and a central one (bilateral posterior
cingulate). Network strength within each subregion was quantified averaging the voxel-related DMN
beta scores for all voxels within each submap. The creation of the DMN subregion maps and fMRI
analysis described here was not done by the candidate but performed by Dr Matteo DeMarco, Non-
Clinical Lecturer in the Neuroscience of dementia at the University of Sheffield.
Analysis of the connectivity of the separate parts of the DMN showed that connectivity between the
bilateral medial prefrontal cortex was significantly higher in sporadic AD patients (p=0.015)
compared to controls (Figure 4.4A). No significant difference was seen in the connectivity between
the bilateral posterior cingulate areas (Figure 4.4B), Left inferior parietal lobule connectivity (Figure
4.4C) and right inferior parietal lobule connectivity (Figure 4.4D). The overall network connectivity of
the DMN was higher in sporadic AD participants (p=0.048) compared to controls (Figure 4.4E).
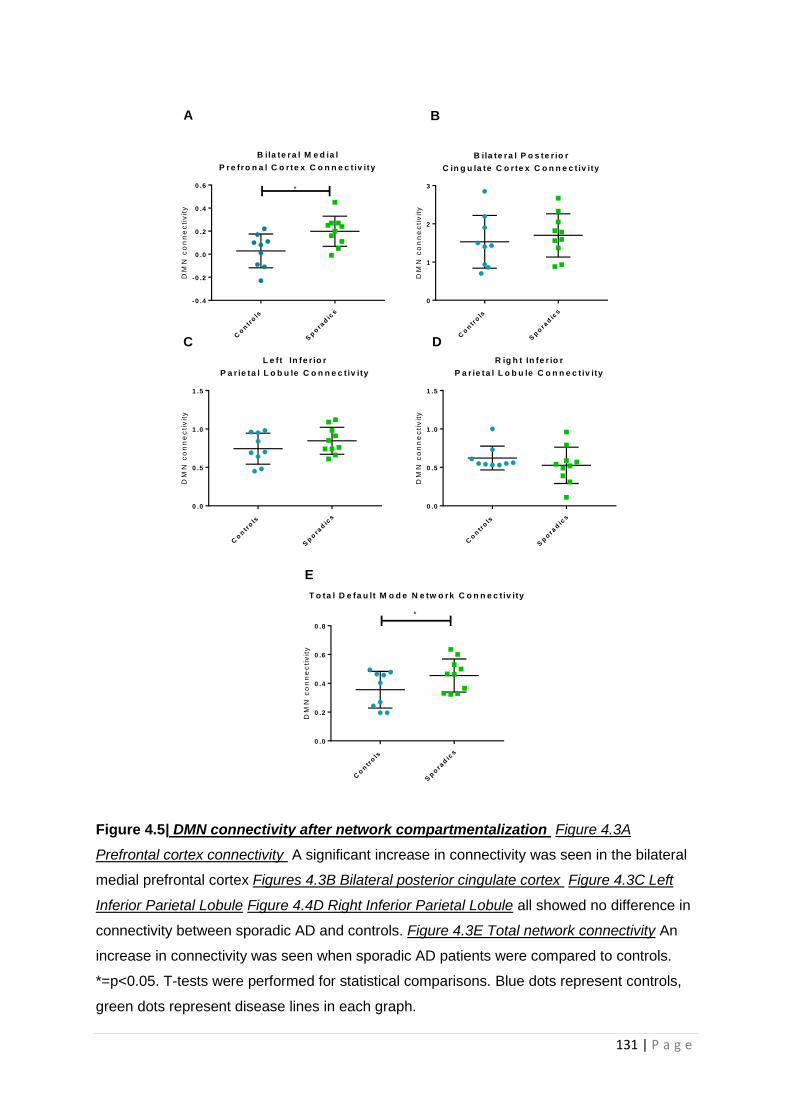
131 | P a g e
Figure 4.5| DMN connectivity after network compartmentalization Figure 4.3A
Prefrontal cortex connectivity A significant increase in connectivity was seen in the bilateral
medial prefrontal cortex Figures 4.3B Bilateral posterior cingulate cortex Figure 4.3C Left
Inferior Parietal Lobule Figure 4.4D Right Inferior Parietal Lobule all showed no difference in
connectivity between sporadic AD and controls. Figure 4.3E Total network connectivity An
increase in connectivity was seen when sporadic AD patients were compared to controls.
*=p<0.05. T-tests were performed for statistical comparisons. Blue dots represent controls,
green dots represent disease lines in each graph.
Co
ntr
ols
Sp
ora
dic
s
0
1
2
3
B ila te ra l P o s te r io r
C in g u la te C o r te x C o n n e c t iv ity
DM
N c
on
ne
cti
vit
y
Co
ntr
ols
Sp
ora
dic
s
-0 .4
-0 .2
0 .0
0 .2
0 .4
0 .6
B ila te ra l M e d ia l
P re fro n a l C o r te x C o n n e c t iv ity
DM
N c
on
ne
cti
vit
y*
Co
ntr
ols
Sp
ora
dic
s
0 .0
0 .5
1 .0
1 .5
L e ft In fe r io r
P a r ie ta l L o b u le C o n n e c t iv ity
DM
N c
on
ne
cti
vit
y
Co
ntr
ols
Sp
ora
dic
s
0 .0
0 .5
1 .0
1 .5
R ig h t In fe r io r
P a r ie ta l L o b u le C o n n e c t iv ity
DM
N c
on
ne
cti
vit
y
Co
ntr
ols
Sp
ora
dic
s
0 .0
0 .2
0 .4
0 .6
0 .8
T o ta l D e fa u lt M o d e N e tw o rk C o n n e c t iv ity
DM
N c
on
ne
cti
vit
y
*
A B
C D
E

132 | P a g e
4.3.5 Fibroblast spare capacity correlates with Bilateral pre-frontal cortex connectivity
Correlations were performed between each of the separate DMN connectivity areas defined above
and MSRC and MMP. MRSC and MMP were picked to perform correlations for the same reasons
stated in the chapter paper. A significant negative correlation was seen between MSRC and the
connectivity of the bilateral medial prefrontal cortex (Figure 4.5A). No significant correlations were
seen between MSRC and any other element of the DMN (Figure 4.5B-E).
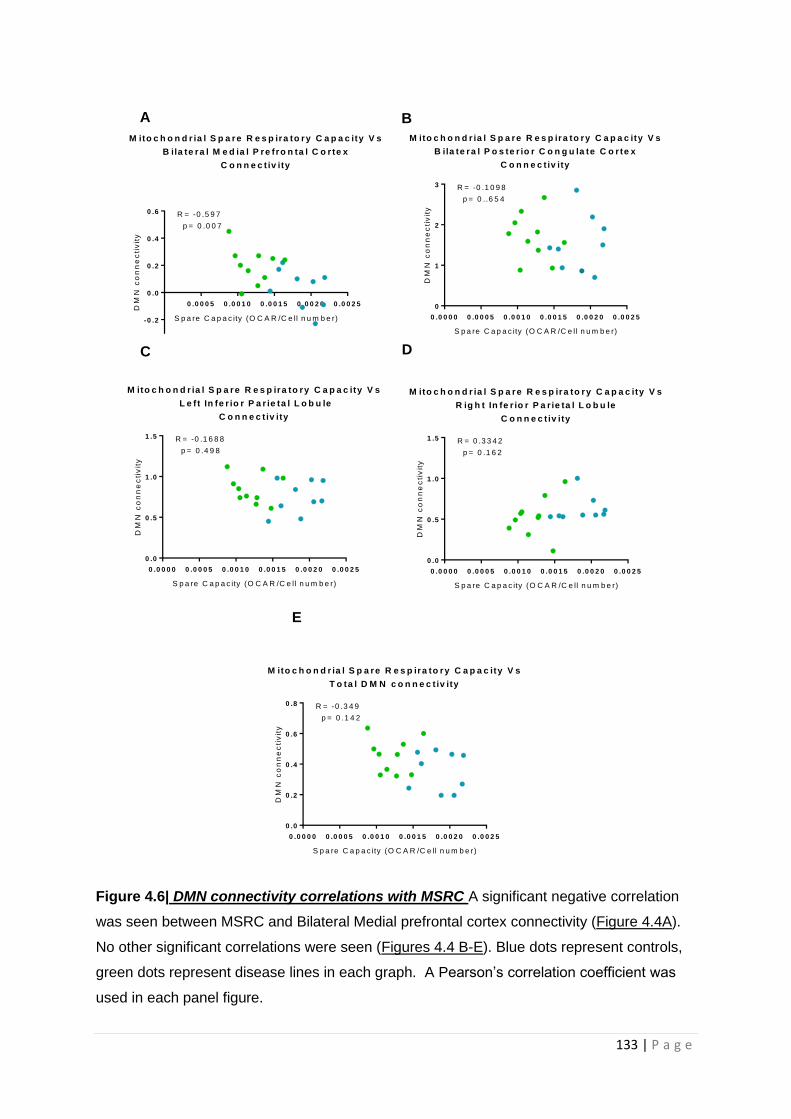
133 | P a g e
Figure 4.6| DMN connectivity correlations with MSRC A significant negative correlation
was seen between MSRC and Bilateral Medial prefrontal cortex connectivity (Figure 4.4A).
No other significant correlations were seen (Figures 4.4 B-E). Blue dots represent controls,
green dots represent disease lines in each graph. A Pearson’s correlation coefficient was
used in each panel figure.
0 .0 0 0 0 0 .0 0 0 5 0 .0 0 1 0 0 .0 0 1 5 0 .0 0 2 0 0 .0 0 2 5
0
1
2
3
M ito c h o n d r ia l S p a re R e s p ira to ry C a p a c ity V s
B ila te ra l P o s te r io r C o n g u la te C o r te x
C o n n e c t iv ity
S p a re C a p a c ity (O C A R /C e ll n u m b e r)
DM
N c
on
ne
cti
vit
y
R = -0 .1 0 9 8
p = 0 ..6 5 4
0 .0 0 0 5 0 .0 0 1 0 0 .0 0 1 5 0 .0 0 2 0 0 .0 0 2 5
-0 .2
0 .0
0 .2
0 .4
0 .6
M ito c h o n d r ia l S p a re R e s p ira to ry C a p a c ity V s
B ila te ra l M e d ia l P re fro n ta l C o r te x
C o n n e c t iv ity
S p a re C a p a c ity (O C A R /C e ll n u m b e r)
DM
N c
on
ne
cti
vit
y
R = -0 .5 9 7
p = 0 .0 0 7
0 .0 0 0 0 0 .0 0 0 5 0 .0 0 1 0 0 .0 0 1 5 0 .0 0 2 0 0 .0 0 2 5
0 .0
0 .5
1 .0
1 .5
M ito c h o n d r ia l S p a re R e s p ira to ry C a p a c ity V s
L e f t In fe r io r P a r ie ta l L o b u le
C o n n e c t iv ity
S p a re C a p a c ity (O C A R /C e ll n u m b e r)
DM
N c
on
ne
cti
vit
y
R = -0 .1 6 8 8
p = 0 .4 9 8
0 .0 0 0 0 0 .0 0 0 5 0 .0 0 1 0 0 .0 0 1 5 0 .0 0 2 0 0 .0 0 2 5
0 .0
0 .5
1 .0
1 .5
M ito c h o n d r ia l S p a re R e s p ira to ry C a p a c ity V s
R ig h t In fe r io r P a r ie ta l L o b u le
C o n n e c t iv ity
S p a re C a p a c ity (O C A R /C e ll n u m b e r)
DM
N c
on
ne
cti
vit
y
R = 0 .3 3 4 2
p = 0 .1 6 2
0 .0 0 0 0 0 .0 0 0 5 0 .0 0 1 0 0 .0 0 1 5 0 .0 0 2 0 0 .0 0 2 5
0 .0
0 .2
0 .4
0 .6
0 .8
M ito c h o n d r ia l S p a re R e s p ira to ry C a p a c ity V s
T o ta l D M N c o n n e c t iv ity
S p a re C a p a c ity (O C A R /C e ll n u m b e r)
DM
N c
on
ne
cti
vit
y
R = -0 .3 4 9
p = 0 .1 4 2
A B
C D
E

134 | P a g e
4.3.6 Fibroblast MMP correlates with Bilateral Posterior Cortex Connectivity
For the separate parts of the DMN connectivity maps no significant correlation was seen between
MMP and bilateral medial prefrontal cortex (Figure 4.6A), bilateral posterior cingulate cortex (Figure
4.6B), and left posterior DMN connectivity (Figure 4.6C). A significant positive correlation was seen
between right posterior DMN connectivity and MMP (figure 4.6D). No significant correlation was
seen between whole DMN connectivity and MMP (Figure 4.6E).
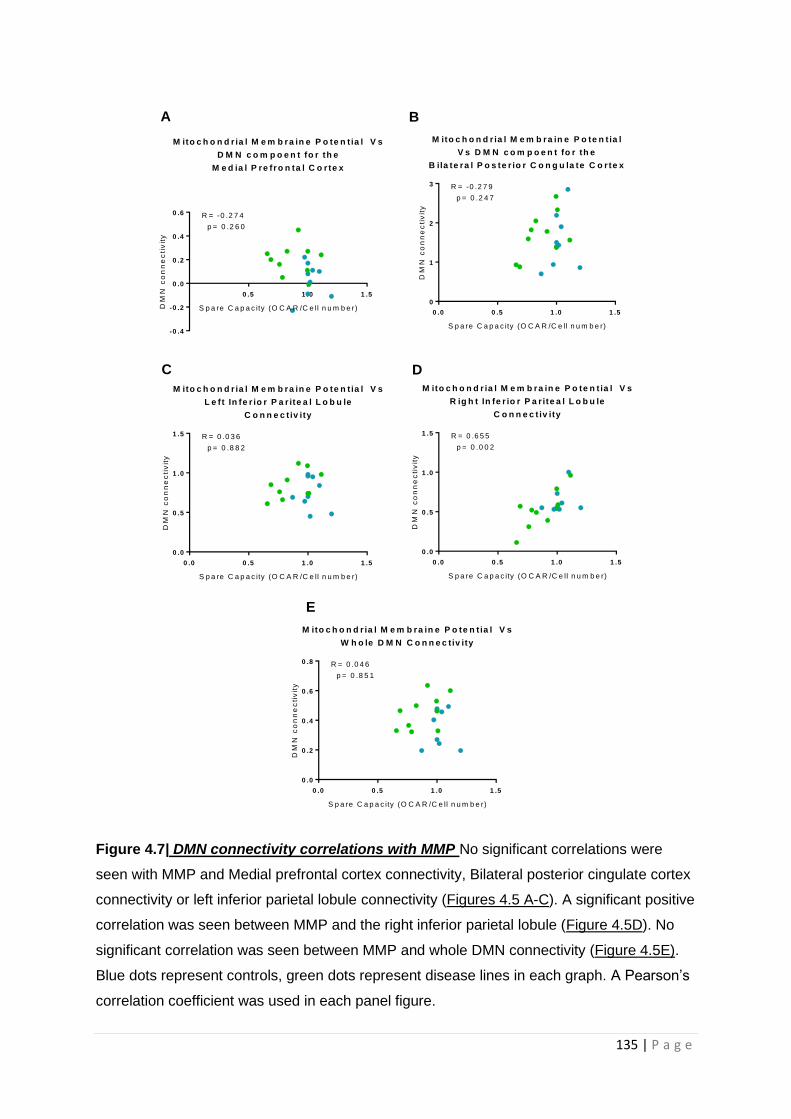
135 | P a g e
Figure 4.7| DMN connectivity correlations with MMP No significant correlations were
seen with MMP and Medial prefrontal cortex connectivity, Bilateral posterior cingulate cortex
connectivity or left inferior parietal lobule connectivity (Figures 4.5 A-C). A significant positive
correlation was seen between MMP and the right inferior parietal lobule (Figure 4.5D). No
significant correlation was seen between MMP and whole DMN connectivity (Figure 4.5E).
Blue dots represent controls, green dots represent disease lines in each graph. A Pearson’s
correlation coefficient was used in each panel figure.
0 .0 0 .5 1 .0 1 .5
0
1
2
3
M ito c h o n d r ia l M e m b ra in e P o te n t ia l
V s D M N c o m p o e n t fo r th e
B ila te ra l P o s te r io r C o n g u la te C o r te x
S p a re C a p a c ity (O C A R /C e ll n u m b e r)
DM
N c
on
ne
cti
vit
y
R = -0 .2 7 9
p = 0 .2 4 7
0 .5 1 .0 1 .5
-0 .4
-0 .2
0 .0
0 .2
0 .4
0 .6
M ito c h o n d r ia l M e m b ra in e P o te n t ia l V s
D M N c o m p o e n t fo r th e
M e d ia l P re fr o n ta l C o r te x
S p a re C a p a c ity (O C A R /C e ll n u m b e r)DM
N c
on
ne
cti
vit
y
R = -0 .2 7 4
p = 0 .2 6 0
0 .0 0 .5 1 .0 1 .5
0 .0
0 .5
1 .0
1 .5
M ito c h o n d r ia l M e m b ra in e P o te n t ia l V s
L e ft In fe r io r P a r ite a l L o b u le
C o n n e c t iv ity
S p a re C a p a c ity (O C A R /C e ll n u m b e r)
DM
N c
on
ne
cti
vit
y
R = 0 .0 3 6
p = 0 .8 8 2
0 .0 0 .5 1 .0 1 .5
0 .0
0 .5
1 .0
1 .5
M ito c h o n d r ia l M e m b ra in e P o te n t ia l V s
R ig h t In fe r io r P a r ite a l L o b u le
C o n n e c t iv ity
S p a re C a p a c ity (O C A R /C e ll n u m b e r)
DM
N c
on
ne
cti
vit
y
R = 0 .6 5 5
p = 0 .0 0 2
0 .0 0 .5 1 .0 1 .5
0 .0
0 .2
0 .4
0 .6
0 .8
M ito c h o n d r ia l M e m b ra in e P o te n t ia l V s
W h o le D M N C o n n e c tiv ity
S p a re C a p a c ity (O C A R /C e ll n u m b e r)
DM
N c
on
ne
cti
vit
y
R = 0 .0 4 6
p = 0 .8 5 1
A B
C D
E
136 | P a g e
4.4 Discussion
In this chapter it has been identified that fibroblasts from sporadic AD patients have a reduction in
their glycolytic reserve when compared to controls. Sporadic AD fibroblasts also have a reduction in
extracellular lactate compared to controls. Both these measures suggest that glycolysis is impaired in
fibroblasts of patients with sporadic AD. These markers were not assessed for correlations with
neuroimaging and neuropsychological markers of AD because they did not meet the significance
threshold of p<0.01 that was set as the level of significance for correlations to safeguard for false
positive results, given the multiple models of correlation assessed in this study. The assessment of
glycolytic function performed in the glycolysis stress test used in the study depends on stressing the
cell line under investigation by either starvation or the addition of inhibitors. As fibroblasts are not
very metabolically active when compared to other cell types such as astrocytes and neurons, the
experimental paradigm used in this study may have not comprised fibroblast glycolysis enough to
show the full extent of the glycolytic changes seen in AD. Future experiments would benefit from
increased inhibitor concentrations or prolonged glucose starvation regimes.
The chapter paper also highlights how MSRC and MMP both correlate with neuropsychological
changes seen in AD, and the correlation between MSRC and delayed episodic recall remains even
after controlling for age, level of education and cognitive brain reserve. This is the first time that
MSRC has been correlated with neuropsychological scores and found to correlate with a functional
marker of the disease. In the chapter paper due to sample size sporadic AD and control groups were
grouped together. Further work investigating correlations between mitochondrial functional
parameters and neuropsychology test changes in AD would benefit from having a larger cohort of
solely AD patients.
4.4.1 Fibroblasts from sporadic AD patients have reductions in glycolytic capacity and
extracellular lactate independent of Apoε genotype.
In the extra results section, it is highlighted that both extracellular lactate levels and glycolytic
function, as assessed via the seahorse glycolysis stress test, do not show a significant difference
between sporadic AD fibroblast lines when they are separated based on ApoE genotype. It is again
worth highlighting that the separate ApoE groups have a very small sample size. As with
investigating the relationship between ApoE and mitochondrial function, as done in chapter 3, these
results should be interpreted with caution.
Previously it has been identified that glucose metabolism within the brain is altered by the presence
of the different ApoE genotypes, with the ApoE ε4/4 associated with reduced Hexokinase (HK)
activity and decreased GLUT4 expression [425, 466]. It is interesting that our results did not show a
137 | P a g e
difference in glycolysis based on ApoE genotype. Sample size and fibroblast metabolic activity may
account for this apparent discrepancy in brain metabolism findings seen between fibroblast
glycolytic function and the existing literature. Of note both glycolytic capacity and glycolytic reserve
show a trend towards a higher than control level in the ApoE ε2/3 fibroblasts. This would be
consistent with the results on how ApoE genotype effects glucose metabolism in the brain [425].
Further work could focus on looking at the expression of the GLUT4 receptor and HK activity in
fibroblasts to see if ApoE genotype affects their expression.
An alternative explanation for the group level reduction in extracellular lactate and glycolytic reserve
seen in this study could be that an ApoE genotype independent mechanism exists that is
contributing to altered glycolysis in sporadic AD fibroblasts. Altered glycolysis in sporadic AD
fibroblasts has been reported previously but thought secondary to dysfunction of the ETC [207].
Sonntag et al (2017) [207] report an increase in glycolytic capacity in AD fibroblasts but do not
measure glycolytic reserve. These findings are opposite to what is described in this chapter. The
Sonntag study does not split sporadic AD fibroblasts based on ApoE genotype, making comparisons
with the work presented in this chapter and other papers more difficult. The study does report an
effect of age on the rate of glycolysis in fibroblasts, which is seen to increase in both AD and control
lines as they age, which maybe an example of the Warburg effect. The mean age of the AD
fibroblasts (70.1 years) used in Sonntag et al 2017 is approximately ten years older that the AD
fibroblast cell lines used in this chapter (61.5 years). Experimental paradigms were different
between Sonntag et al and this chapter, which may also explain the difference in results.
Alternatively the divergence in results on glycolytic performance between those presented in this
chapter and those presented by Sonntag et al (2017) [207] may reflect the heterogeneous pathology
that can cause sporadic AD, and are an example of the need for large scale studies on fibroblast
metabolism with appropriate sample size that can give adequate statistical power. Future work
should also focus on identifying the mechanism for the change in glycolysis rates identified in these
studies, and if this is affected by ApoE status.
4.4.2 Connectivity of the DMN is altered in sporadic AD
In this new method proposed in this chapter to investigate the DMN, an increased connectivity of
the DMN as a whole was seen in AD as was an increased connectivity in the bilateral prefrontal
cortex areas. Increased connectivity in the DMN can be a sign of disease, as stated within the
chapter introduction [451, 457]. This is the first study to offer this particular method for analysis of
the DMN, so is difficult to compare with other techniques. A previous study has investigated
whether age and ApoE genotype affect the connectivity within the DMN, by breaking the DMN down
into separate nodes [467]. In this study the authors showed a decrease in connectivity when viewing
138 | P a g e
the whole DMN in older participants with an ApoE ε4/4 genotype, with lower scores on
neurocognitive testing. In the results of the present chapter, an increased connectivity is seen, which
is the opposite result to that in the published paper. The subjects in the published study did not have
a diagnosis of AD, but share neurocognitive deficits. Experimental structural differences may explain
the difference between the chapter results and this published study with change in connectivity
likely to be very dependent on the study sample. A joint conclusion that can be made from both
studies is that abnormalities in cognitive function modulate brain connectivity of the DMN in an
attempt, of the affected system, to support performance. This has been previously suggested by the
study of cognitive efficiency in early sporadic AD patients by De Marco et al (2017) [468]. Further
work is needed to investigate if this method of analysing DMN has any clinical significance.
4.4.3 Fibroblast spare capacity and MMP correlates with elements of DMN connectivity
MSRC and MMP each correlated with levels of connectivity in separate regions of the DMN. MSRC
correlated negatively with the bilateral medial prefrontal cortex. This particular area of the DMN
showed an increased connectivity in the AD group compared to the controls. It could be
hypothesized that the increased connectivity seen in this particular region of the DMN in sporadic
AD is a result of the reduced mitochondrial capacity, evidenced by the low MSRC. If the reduced
mitochondrial capacity seen in fibroblasts is also seen in the cells of this particular brain region,
upregulation of regional connectivity levels may be needed to maintain function in this network.
MMP correlated positively with the connectivity of the right inferior parietal lobule. Potentially MMP
level is what determines the integrity of the network connections. It could be postulated that if the
level of MMP in the neurons of a particular brain region starts to drop this leads to reduced
connections between this region and other brain regions, as the metabolic change that comes with a
drop in MMP cannot meet local network metabolic demands.
It must be stated that MSRC and MMP correlated significantly with the connectivity of only one area
of the DMN, and there were no significant correlations detected with other DMN regions. This could
suggest that the statistically significant correlations might be artefactual, but they could also reflect
metabolic diversity within different brain regions. Several studies have shown that mitochondrial
ETC gene and protein expression is not homogenous across the brain [168-170, 174], the same can
also be said for glycolysis enzyme activity [277, 278]. The correlations between DMN connectivity
and mitochondrial function seen in this chapter may reflect how changes in brain cell metabolism in
AD lead to the changes in DMN connectivity. It would be interesting to perform correlations in a
larger group of participants without AD to investigate if the connectivity changes are secondary to
the AD process or are directly linked to metabolic function.
139 | P a g e
4.4.4 Chapter Limitations
The neuropsychological MRSC and MMP correlations described in this chapter are interesting but
performing the same correlations in cells from the central nervous system would advance the
understanding of how mitochondrial function may impact cognitive function. That being said the
accessibility of fibroblasts allows for larger cohorts of patients to be studied, which would be an
appropriate model if the correlations seen in this study are retained when central nervous system
tissue is examined. The metabolic correlation results would benefit from comparison with a familial
AD group, as this may also help to understand the relationship the correlations highlighted in this
chapter have with amyloid, although this was not possible in this study. The correlations described in
this chapter should be thought of as a proof of principle study rather than a fully explained cellular
metabolic reasoning behind neuropsychological changes seen in AD. The sample used for the
correlation element of this paper included both sporadic AD patients and controls. The correlations
would be further improved if examined in a cohort of only sporadic AD patients. This was not done
in this thesis as the sample size was thought too small to make reasonable conclusions. It should also
be considered that the correlations may only be present because we have identified two variables
that are altered in AD, as opposed to the notion that cellular metabolism alterations lead to
neuropsychological change. Repeating these experiments in a much larger sample, and possibly in
mouse models of AD in which metabolic abnormalities have been corrected genetically would help
strengthen the argument for a metabolic basis to neuropsychological change in AD.
Performance on the neuropsychological tests used in this chapter is affected early in AD, and the
chapter results suggest that there are potential correlations with mitochondrial function. Performing
a wider battery of neuropsychological tests might be helpful in determining if the identified
metabolic abnormalities correlate with different neuropsychological tests in different dementia
subtypes.
Although these correlations between neuropsychological tests and metabolic markers are
interesting, a causal link cannot be determined using this experimental system. Further work using
animal models with deficits in MSRC or glycolytic reserve that can be corrected could be
neuropsychological assessed. If deficits in neuropsychological performance can be corrected by
correcting metabolic deficits this may show a causal link between metabolism change and
neuropsychology performance.
4.5 Chapter Conclusions
1. Fibroblasts from patients with sporadic AD have a reduction in glycolytic reserve when
compared to controls
140 | P a g e
2. Sporadic AD fibroblasts have a reduction in extracellular lactate when compared to controls.
3. Both MMP and MSRC are reduced in sporadic AD fibroblasts when compared to controls.
4. MSRC correlates with Semantic memory, Immediate recall and delayed recall. These
correlations remain between MSRC and delayed recall after controlling for age, level of
education, and cognitive reserve.
5. Changes in sporadic AD glycolysis in AD fibroblasts appear to be independent of ApoE
genotype.
6. Reductions in sporadic AD fibroblast extracellular lactate levels appear to be independent of
ApoE genotype
7. When the DMN is separated into different connectivity nodes, increased connectivity is seen
in the bilateral medial prefrontal cortex connectivity and in the total DMN connectivity.
8. MSRC correlates negatively with bilateral medial prefrontal cortex connectivity, and MMP
correlates positively with right inferior parietal lobule connectivity.
9. These correlations may suggest that the altered connectivity seen within the DMN is a result
of changes in mitochondrial function, or that DMN connectivity may be affected by changes
in cell metabolism.
141 | P a g e
Chapter 5 Astrocytes derived from human fibroblasts show deficits in
both mitochondrial function and glucose metabolism in sporadic and
familial Alzheimer’s disease
5.1 Introduction
In this chapter the mitochondrial and glycolytic functional abnormalities identified in fibroblasts
from patients with sporadic and familial AD are investigated in astrocytes derived from the same
group of patients. The astrocyte was chosen for metabolic functional interrogation, due to the
prominent role it has in maintaining the tripartite synapse, cerebral blood flow and neuron
metabolism as discussed in the introduction [304, 307].
Assessment of astrocyte metabolic function has been difficult in the past due to limitations of model
systems. PM sample assessment can assess enzyme function but differentiating between different
cell types in PM specimens can be difficult [469, 470]. Animal models can offer astrocytes to
investigate, but as highlighted previously, AD patients appear to have inherent metabolic
abnormalities, which are difficult to study without access to human cells. Mouse astrocytes have
been shown to have very different gene expression profiles to human astrocytes, which will affect
how metabolic changes seen in this type of model system are interpreted [471]. iPSC technology
does offer human astrocytes for study, however to develop truly aged astrocytes for investigation in
neurodegenerative disease requires long differentiation protocols, which can be costly [388].
In this chapter astrocytes have been differentiated using a direct reprogramming method that allows
for the aged phenotype of the donor cell, in this case a fibroblast, to be expressed in the
differentiated astrocyte. After identifying metabolic deficits in the differentiated astrocytes, they
were treated with compounds previously identified to boost cellular ATP levels. In this chapter
introduction iNPC generation is again briefly summarized, and reasoning behind drug compound
selection is discussed.
5.1.2 Induced neuronal progenitor cell (iNPC) reprogramming
The iNPC direct reprogramming method used in this study produces neuronal progenitors faster
than iPSC methods, has a high reprogramming efficiency, and produces iNPCs that are not clonal
copies of each other. The polyclonal nature of iNPCs means multiple experiments on different cell
colonies derived from the initial neural progenitors are not needed. In brief, the reprogramming
method includes transducing fibroblasts with viruses containing the vectors OCT3/4, Sox2, Lin28 and
KLF4 for 12 hours (modified from [350]). 48 hours after transduction, the cells are treated with
142 | P a g e
neuronal precursor cell inducing factors FGF-b, and EGF. iNPCs are generated in approximately 6
weeks post transduction, with astrocyte differentiation taking 7 days after iNPCs are created (see
figure 5.1A chapter 5 paper). Neurons do not need to be differentiated prior to astrocyte
differentiation. This makes this particular method of cell reprogramming cheaper than most iPSC
methods.
The main benefit of direct reprogramming, such as described here, is the ability for differentiated
cells that maintain the aged phenotype of the donor cell. This has been previously shown by
Mertens et al 2015, who report that RAN binding protein 17 (RanBP17) and laminin subunit alpha 3A
(LAMA3A) are expressed in directly reprogrammed neurons, but not in iPSC derived cells [393].
These proteins, along with telomeric repeat-binding factor 2 (TERF2) have been shown to have
decreased expression in several tissue types as the body ages [393, 472, 473]. As ageing plays an
important role in the development of most neurodegenerative conditions, having cells that express
an aged phenotype allows for a more physiological model system in which to study disease.
The direct reprogramming used in this study was developed approximately 6 years ago initially to
study the astrocyte motor neuron interaction in MND [350]. Study of metabolism in astrocytes
derived from patients with familial MND and sporadic MND and PD has shown deficits in astrocyte
metabolic flexibility and loss of the enzyme glycogen phosphatase, an enzyme used in the
breakdown of glycogen [395, 396]. The interaction between neurons and astrocytes in MND has also
been investigated, highlighting changes in vesicular cargoes given to neurons via astrocytes, which
may mediate astrocyte induced toxicity [400]. iNPC derived neuronal models have also identified
deficits in lactate transport to neurons in MND [397], and impairment of neuronal mitophagy in
familial forms of MND and PD [401, 474]. This is the first study in which this particular differentiation
protocol has been used to derive astrocytes from sporadic and familial AD patients.
5.1.3 Selection of drugs assessed in chapter paper
In the chapter paper the results of 8 compounds selected as they are known to improve metabolic
function are discussed with regards to their ability to improve total cellular ATP levels in AD
astrocytes. All 8 compounds are drug repurposing candidates, as they are already in clinical use for
other conditions. The mechanism of improving cellular ATP is not already known, but was identified
during a drug repurposing screen undertaken in the candidate’s supervisor’s lab.
Development of a completely new therapeutic is expensive, with some estimates suggesting costs
close to $2 billion dollars [475]. Drug repurposing is more cost effective way to search for
therapeutics for neurodegenerative conditions, with the potential to speed up the process of
medication development [476]. Drug repurposing though does have unique challenges when
143 | P a g e
developing drugs for central nervous system use. Passage through the blood brain barrier for a
systemically administered therapeutic can often be difficult, and off target systemic effects need to
be considered. Repurposing of drugs though, does allow for identification of these issues relatively
early in the drug development process. The drug re-purposing screen undertaken in the supervisor’s
lab, first in silico ranked the compounds on their ability to cross the BBB; and only the compounds
that ranked highly in this metric were screened in the laboratory. This strategy allows only
compounds with either high known BBB permeability or a high chance of BBB permeability to be
screened and progressed along the drug discovery pipeline. If a positive effect of a particular drug is
seen during drug repurposing, the mechanism of action and chemical structure of the drug can be
investigated, which may lead to development of compounds with reduced off target effects, or high
brain penetrance. As there are currently no disease modifying drugs available to treat AD,
repurposing of old therapeutics is an important way to increase the speed at which the first of this
type of therapy can be developed. The 8 drugs selected for use in this thesis were the ones shown to
have the greatest effect on mitochondrial function in the initial drug repurposing screen.
5.1.4 Reasoning for additional results
In the extra results section differences in mitochondrial function and glycolysis in sporadic AD
astrocytes separated based on ApoE genotype are reported. Correlations of astrocyte metabolic
function with DMN connectivity, first discussed in chapter 4 in regard to fibroblast metabolic
function, are also presented due to the potential importance the DMN areas of the brain have in the
initiation of the pathology of AD. As displaying an aged phenotype is a key feature of this model
system, qPCR results are shown for RanBP, LAMA3 and TERF2 genes for astrocytes derived from
young (≤3 years old) and old (greater than 40 years old) donors, to highlight the maintenance of the
aged phenotype in iNPC derived astrocytes.
5.1.5 Candidates paper contributions
• Reprogrammed all sporadic AD, Sporadic Controls and PSEN1 iNPC lines
• Differentiated all astrocytes for experiments
• Performed all mitochondrial morphology and ATP assays on astrocyte lines
• Performed all seahorse assays on astrocyte lines
• Performed all glucose uptake, and ETC substrate experiments
• Performed neuropsychological metabolic data correlations
• Performed all astrocyte drugging experiments
• Performed all qPCR experiments.
• Wrote paper manuscript, created all figures.
144 | P a g e
5.2 Paper in preparation for submission
This paper is currently intended to be submitted to Alzheimer’s Disease and Dementia
Astrocytes derived from human fibroblasts show
deficits in both mitochondrial function and glucose
metabolism in sporadic and familial Alzheimer’s
disease
145 | P a g e
5.2.1 Abstract
INTRODUCTION; Metabolic abnormalities have been shown in imaging and postmortem studies of
Alzheimer’s disease (AD) patients. Understanding the contribution of different brain cell types to
these abnormalities has been difficult due to model limitations. This study uses human derived
neuronal progenitor cells to metabolically profile astrocytes in AD.
METHODS; Fibroblasts from controls (n=10), Sporadic AD (n=7) and familial AD patients (Presenilin 1
mutation, n=3) were reprogrammed in to neuronal progenitor cells and differentiated into
astrocytes. Mitochondrial and glycolytic functional assessment was performed.
RESULTS; Deficits in total cellular ATP, Mitochondrial morphology, spare respiratory capacity,
glycolytic reserve, and extracellular lactate were seen in both sporadic and familial astrocytes.
Changes correlated with neuropsychological scores and could be corrected with metabolism
enhancing drugs.
DISCUSSION; Astrocytes derived from both familial and sporadic AD patients have multiple
metabolic deficits which may both contribute to the disease and offer a new avenue for therapeutic
investigation.
Key words: Sporadic, Presenilin 1, Astrocyte, Mitochondria, Glycolysis, Mitochondrial Spare
Respiratory Capacity, Glycolytic Capacity, induced Neuronal Progenitor Cells, Human, Alzheimer’s
5.2.2 Highlights
• AD Astrocytes have reductions in mitochondrial spare respiratory capacity.
• AD Astrocytes have reductions in extracellular lactate and glycolytic reserve.
• These changes correlate with neuropsychological scores effected early in AD.
• Deficits in ATP can be corrected we drugs known to enhance metabolism.
5.2.3Research In Context
• Literature Review: The authors performed a literature review of metabolic
abnormalities in Alzheimer’s disease, focusing on the role the astrocyte plays in the
metabolic disruption seen in AD. PubMed, Google Scholar, and research gate were
all used as sources of literature. We identified that metabolic abnormalities had
been shown in PM studies in astrocytes, but functional assessment had proved
difficult due to limitations with previous model systems. We decided to differentiate
astrocytes from human fibroblasts of patients who had sporadic and familial AD to
try and identify functional metabolic deficits.
146 | P a g e
• Interpretation: We have shown abnormalities in both mitochondrial function and
glucose metabolism in AD astrocytes from both sporadic and familial patients. These
deficits may help to explain the functional imaging changes seen in patients with AD,
but also help to understand post-mortem study findings.
• Future Directions: Further work is needed to identify the mechanistic cause of the
astrocyte metabolic abnormalities, and to develop therapeutics that could
potentially correct them.
5.2.4 Background
Alzheimer’s disease (AD) is the most common cause of dementia worldwide [1]. It is estimated that
over 44 million people have the condition across the globe, with numbers of patients with the
condition expected to triple by 2050 [4]. The sporadic form of AD accounts for the majority of cases
of the disease, with familial disease accounting for roughly 5% of cases [81]. All familial forms of AD
lead to an increase in the production and deposition of amyloid beta (Aβ) within the brain [82-86,
89]. As amyloid deposition within the brain is also seen in sporadic forms of AD, this led to the
development of the amyloid hypothesis for the initiation of the pathogenesis of AD [12-15].
Research has focused on familial models for AD, which have allowed for a deep exploration of the
role that tau and amyloid play in AD.
Amyloid and tau aggregates within the brain are clearly an important part of the pathology of AD
however therapeutics designed to remove amyloid from the brain have unfortunately not led to
improvements in clinical outcomes for people with AD [20-22]. Aducanumab an amyloid clearance
monoclonal antibody developed by Biogen has shown some initial success in improving cognitive
performance in patients with AD, but failed to meet primary end points in randomised control trials
[104]. This has led to the suggestion that other pathophysiological processes maybe important in
the establishment of the clinical phenotype of AD [22].
Metabolic changes are seen early within the brain of people with AD, and brain areas of high glucose
metabolism have been shown to be the same areas of brain which are effected by Aβ aggregates,
tau accumulation, and cortical atrophy first in the disease [452, 460]. This has led to the suggestion
that metabolic failure, or reductions in metabolic efficiencies of brain cells may be a key step in the
development of AD [208].
We and other groups have shown that the nervous system is not the only site of both mitochondrial
dysfunction and glycolytic change in AD, with fibroblasts [205, 207, 418, 477-479], platelets[184] and
white blood cells [238] all showing metabolic abnormalities. We have also shown that the
147 | P a g e
parameters of mitochondrial function; mitochondrial spare respiratory capacity (MRSC) and
mitochondrial membrane potential (MMP) in fibroblasts correlate with neuropsychological changes
seen in AD [478]. This suggests that both central and peripheral metabolism changes have an
important role in AD.
In our previous work we have shown that the capacity for both OxPHOS and glycolysis is impaired in
the fibroblasts of patients with sporadic and familial AD [477, 478]. The changes we report are
associated with a reduction in MMP, which may lead to ATP reduction in times of stress. If the
metabolic capacity of CNS cells becomes impaired in the same way then this could lead to the
development of metabolic failure of the brain in times of increased energy expenditure. Imaging
studies undertaken in people with AD suggest that metabolic failure occurs early in AD, as the brain
is less able to uptake glucose as the disease progresses [276, 480-483].
The two main cell types which account for the vast majority of brain metabolism are the neuron and
the astrocyte. These two cell types form a metabolic relationship, which sees the astrocyte play a
pivotal role in maintaining many cellular functions within the neuron [302, 304, 305, 484]. Astrocytes
provide neurons with metabolic substrates such as lactate, maintain the concentration of ion
gradients and neurotransmitters at neuronal synapses, and can divert blood flow to brain areas with
high metabolic activity allowing increased oxygen and glucose uptake [319, 485, 486]. Astrocyte
glucose metabolism has been shown to have a key role in learning and memory with astrocytic
glycogen shown to be a key metabolic substrate of memory encoding [311, 312, 340]. This
dependent relationship that the neuron has on the astrocyte puts specific metabolic demands on
this cell type meaning that any abnormalities in the function of mitochondria, or the ability to
metabolise glucose will affect both that astrocyte and neuron function.
Multiple studies have shown that pathological changes occur in astrocytes in AD. Altered insulin
signalling has been identified [487], as have changes in calcium homeostasis [488, 489], and the
ability of astrocytes to metabolise amyloid [490]. As astrocytes have a key role in neuronal support,
memory acquisition, and the AD pathological process, a thorough understanding of their metabolic
properties may highlight new AD therapeutic targets or biomarkers. Metabolic change in astrocytes
has been difficult to study in human AD astrocytes until recently due the lack of living human
metabolically active astrocytes available for experimentation.
Over the last 10 years induced pluripotent stem cell (iPSC) technology has revolutionized
neuroscience research, as it allows the creation of multiple nervous system cell linages from patients
who have the condition under investigation [349, 491-493]. This technology reprograms terminally
differentiated human cells, usually fibroblasts, into stem cells, which can then be differentiated into
148 | P a g e
many different cell types. An initial criticism of this technique when applied to neuroscience
research was that neuronal lineage cells created shared gene expression profiles, and functions
more similar to foetal cells than adult ones [494, 495]. Recent advances in iPSC technology have
meant that direct reprogramming of terminally differentiated cells can now be performed without
returning cells to a true stem cell phase [350, 393]. This reprogramming method has been shown to
allow cells to maintain the aged phenotype of their parent cell. This is obviously a big advantage to
studying AD, as increasing age is the greatest risk factor for developing the disease.
In this paper we use induced neuronal progenitor cell technology [397, 400, 401] to derive
astrocytes from patients with sporadic and familial (Presenilin 1 mutations) AD. We investigated
glycolysis and mitochondrial function, and how this correlates with neuropsychological changes seen
early in AD. Finally, we treated the astrocytes with compounds known to improve cellular ATP levels
and mitochondrial function to investigate if the metabolic changes seen in AD astrocytes can be
targeted as a future therapeutic site.
5.2.5 Methods
Patient Details
Sporadic AD (sAD) Patients and matched controls were recruited as part of the MODEL-AD study
(Yorkshire and Humber Research and Ethics Committee number: 16/YH/0155) for fibroblast biopsy.
All sporadic patients and matched controls who were selected for biopsy had previously participated
in the European EU-funded Framework Programme 7 Virtual Physiological Human: Dementia
Research Enabled by IT (VPH-DARE@IT) initiative (http://www.vph-dare.eu/). A diagnosis of
Alzheimer’s disease was made in sAD patients based on clinical guidelines [71]. Table 5.2 shows the
demographic details of the sporadic patients.
Presenilin 1 AD patient fibroblasts (fAD) and matched controls were acquired from the NIGMS
Human Genetic Cell Repository at the Coriell Institute for Medical Research: (ND41001, ND34733,
AGO6848, GMO2189), and a cohort from a Sheffield based MND study (155 and 161). All Presenilin
1 AD patients had a confirmed pathological mutation in the presenilin 1 gene (See Table 5.3)
Tissue Culture
Fibroblasts were cultured in a DMEM based media (Corning) incubated at 370C in a 5% carbon
dioxide atmosphere. Sodium pyruvate (1%) [Sigma Aldrich], penicillin & streptomycin (1%) [Sigma
Aldrich], and Fetal Bovine Serum (10%) [Biosera] was added to the media. Cells were cultured in
T75cm2 (Greiner bio-one) culture flask until they reached confluency. Fibroblasts were split twice
149 | P a g e
before plating for reprogramming. Splitting was performed using 5mls of 1X Trypsin-Versene (Lonza)
which was placed on the cells for 5 minutes.
Fibroblast Reprogramming
Fibroblast reprogramming into iNPCs and astrocyte differentiation has been previously described,
[350]. In brief, fibroblasts were plated at a density of 250,000 cells per well. 24 hours after plating
fibroblasts were transduced with adenoviral non-integrating vectors (OCT3, Sox2, KLF4, Lin28 and
Nonog). 48 hours after transduction, cells were treated with neuronal progenitor cell (NPC) inducing
factors (FGF-b, and EGF). Once iNPCs lines were established expression of the neuronal progenitor
markers PAX-6 and Nestin was confirmed through immunohistochemistry. Induced Neuronal
Progenitor Cells (iNPCs) were maintained for ~30 passages.
After iNPCs were established, to differentiate them into astrocytes, iNPCs were seeded on a 10cm
dish coated with fibronectin (5 µg/ml, Millipore) in DMEM media (Lonza) containing 10% FBS
(Biosera), and 0.3% N2 (Gibco) and differentiated for 7 days. After differentiation expression of
several astrocyte cell markers was confirmed using immunohistochemistry (details described in
section below). This included GFAP, Vimentin, CD44, ALDHL1 and NDGR2. A key functional ability of
astrocytes is the ability to uptake glutamate. This was confirmed in our astrocyte cell populations
through performing a glutamate uptake assay (see below). We have also previously published
evidence highlighting that astrocytes differentiated in this way maintain an aged cell phenotype,
which is essential for studying diseases such as AD[496].
Immunohistochemistry
For immunohistochemistry astrocytes or iNPCs were plated on a black 96-well plate (Greiner bio-
one) at a density of 2500 cells/well. After 24 hours cells were fixed with 4% paraformaldehyde (PFA)
for 10 minutes. Cells were permeabilised in a solution of 0.1% triton, PBS and TWEEN 20 (1:1000)
(PBST) for 30 minutes. Following this, cells were washed with PBST twice. Cells were then blocked in
PBST and horse serum (5%) for 60 minutes. Fixed cells were incubated with primary antibodies
overnight (see table 5.2). Secondary antibodies were added at a concentration of 1:1000 for 1 hour,
then Hoechst dye (Life Technologies) at a concentration of 1:8000 for 10minutes. Staining was
visualised using an OPERA high content imager (Perkin Elmer).
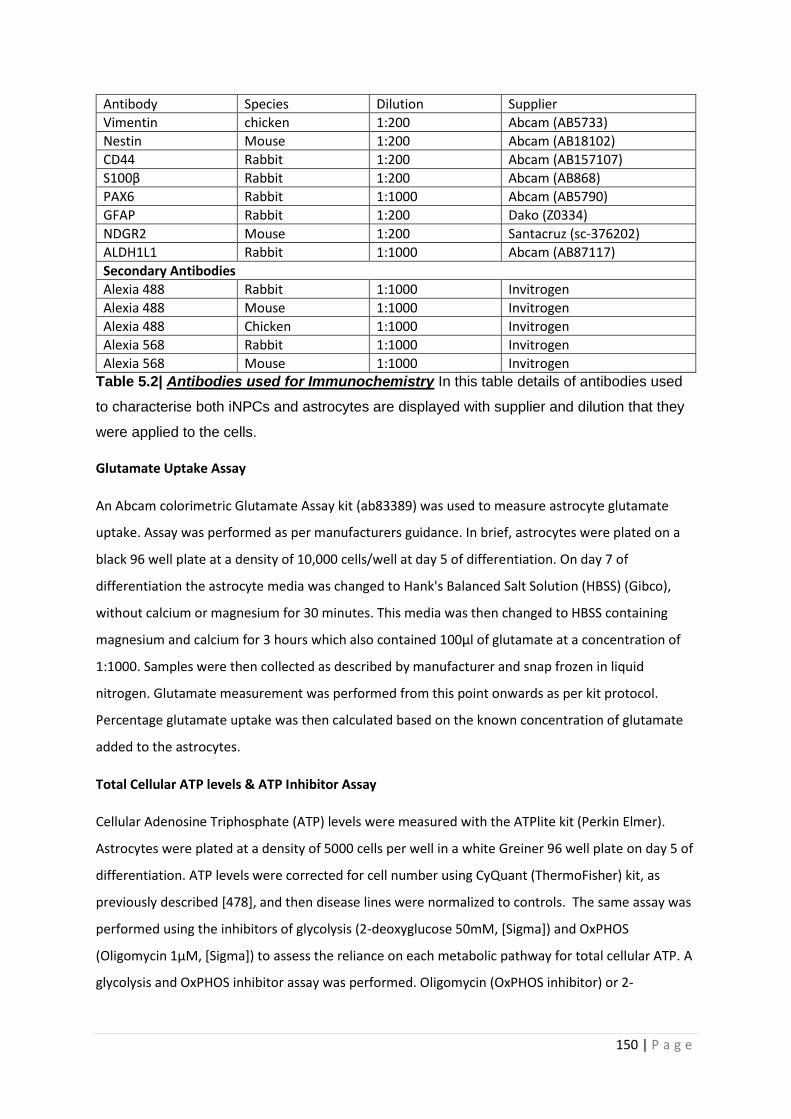
150 | P a g e
Antibody Species Dilution Supplier
Vimentin chicken 1:200 Abcam (AB5733)
Nestin Mouse 1:200 Abcam (AB18102)
CD44 Rabbit 1:200 Abcam (AB157107)
S100β Rabbit 1:200 Abcam (AB868)
PAX6 Rabbit 1:1000 Abcam (AB5790)
GFAP Rabbit 1:200 Dako (Z0334)
NDGR2 Mouse 1:200 Santacruz (sc-376202)
ALDH1L1 Rabbit 1:1000 Abcam (AB87117)
Secondary Antibodies
Alexia 488 Rabbit 1:1000 Invitrogen
Alexia 488 Mouse 1:1000 Invitrogen
Alexia 488 Chicken 1:1000 Invitrogen
Alexia 568 Rabbit 1:1000 Invitrogen
Alexia 568 Mouse 1:1000 Invitrogen Table 5.2| Antibodies used for Immunochemistry In this table details of antibodies used
to characterise both iNPCs and astrocytes are displayed with supplier and dilution that they
were applied to the cells.
Glutamate Uptake Assay
An Abcam colorimetric Glutamate Assay kit (ab83389) was used to measure astrocyte glutamate
uptake. Assay was performed as per manufacturers guidance. In brief, astrocytes were plated on a
black 96 well plate at a density of 10,000 cells/well at day 5 of differentiation. On day 7 of
differentiation the astrocyte media was changed to Hank's Balanced Salt Solution (HBSS) (Gibco),
without calcium or magnesium for 30 minutes. This media was then changed to HBSS containing
magnesium and calcium for 3 hours which also contained 100µl of glutamate at a concentration of
1:1000. Samples were then collected as described by manufacturer and snap frozen in liquid
nitrogen. Glutamate measurement was performed from this point onwards as per kit protocol.
Percentage glutamate uptake was then calculated based on the known concentration of glutamate
added to the astrocytes.
Total Cellular ATP levels & ATP Inhibitor Assay
Cellular Adenosine Triphosphate (ATP) levels were measured with the ATPlite kit (Perkin Elmer).
Astrocytes were plated at a density of 5000 cells per well in a white Greiner 96 well plate on day 5 of
differentiation. ATP levels were corrected for cell number using CyQuant (ThermoFisher) kit, as
previously described [478], and then disease lines were normalized to controls. The same assay was
performed using the inhibitors of glycolysis (2-deoxyglucose 50mM, [Sigma]) and OxPHOS
(Oligomycin 1µM, [Sigma]) to assess the reliance on each metabolic pathway for total cellular ATP. A
glycolysis and OxPHOS inhibitor assay was performed. Oligomycin (OxPHOS inhibitor) or 2-
151 | P a g e
deoxyglucose (glycolysis inhibitor), or both inhibitors were added to the cells for 30 minutes and
incubated at 370C during this time. The ATP assay was then performed as described above.
Mitochondrial Membrane Potential
Astrocytes were plated at a density of 2500 cells per well in a black griener 96-well plate at day five
after the start of differentiation. On day 7 of differentiation cells were incubated with
tetramethlyrhodamine (TMRM) for 1 hour (concentration 80nM) and hoescht (concentration 10nM)
(Sigma Aldrich). Cells were incubated at 370C during this time. TMRM was then removed and
astrocytes were maintained in MEM media whilst imaging using an InCell Analyzer 2000 high-
content imager (GE Healthcare). 25 fields with an average number of 500 cells per well at an
emission/excitation spectra of 543/604m was imaged. Mitochondrial morphological parameters and
cell area were quantified using an INCELL developer protocol[407].
Extracellular Lactate Measurement
Extracellular lactate was measured using an L-Lactate assay kit (Abcam ab65331). At day 7 of
differentiation 1µl of media was removed from a 10cm dish containing confluent astrocytes and
used in the assay as per the manufacturer’s instructions. Briefly, 1µl of media was added to 49µl of
lactate assay buffer, to this 50µl reaction mix was then added and the samples are then incubated at
room temperature for 30minutes. Lactate measurements are then made on a PHERAstar Plate
reader absorbance filter at 570nm. To calculate the lactate concentration a standard curve was
created (2-10nmol range of lactate concentrations), and background lactate measurements were
made. Measurements were normalized to controls on each separate day of experimentation.
ATP Substrate Assay
The ATP substrate assay was used to investigate mitochondrial ATP production in the presence of
complex I and II substrates. 500,000 were cells are collected at day 7 of astrocyte differentiation.
Methods have been previously described by Manfredi et al 2002, [409]. In brief, cells are suspended
in 250µl of buffer A (KCL 150mM, Tris HCL 25mM, EDTA 2mM, BSA 0.1%, K3PO4 10mM, and MgCL
0.1mM, pH 7.4). Cells were then permeabilised with histone 2ug/ml for 5 minutes. After
permeabilization 5 volumes of buffer A (1250mls) was added to the cell suspension. The suspension
was then centrifuged for 5 minutes at 10,000rpm. Cells were then resuspended in 150µl of Buffer A.
550µl of buffer A was added to the remaining 100µl of suspension for use in the substrate assay. The
assessment of total cellular ATP at this stage must be performed with 15minutes of adding the 550µl
of buffer A to samples.
152 | P a g e
A PHERAstar plate reader (BMG Labtech) in luminescence mode was used to read complex activity. A
background luminescence reading is made of each well on the assay plate containing 160µl of cell
suspension then one of either the complex I substrates (malate 1.25mM and galactose 1.25mM), or
complex II substrates (succinate 1.25mM, rotenone 1µM added as complex I inhibitor) is added.
After baseline kinetics were measured the machine was paused and 5µls of Adenosine diphosphate
(ADP, 4µM) and 10µl of the ATP substrate solution, described above in the ATP assay section were
added to each well. The kinetics assay is then resumed and measurements of substrate use are
made for approximately the next 30 minutes. The gradient of the kinetics curve is then calculated
and normalised to protein content using a Bradford assay. Disease samples are normalised to
controls of the day.
Metabolic flux assay
Mitochondrial Stress Test
Astrocyte OxPHOS was assessed by measuring oxygen consumption rates (OCR) using a 24-well
Agilent Seahorse XF analyzer. Astrocytes were plated at a density of 10,000 cells per well at day 5 of
differentiation. At day 6 of differentiation cells were either switched to a galactose containing media
or continued to be maintained in glucose. At day 7 of differentiation astrocytes were switched to XF
media (Aligent) and then assessed using the previously described Mitochondrial Stress Test Protocol
[477]. During this protocol measurements were taken at the basal point: after the addition of
oligomycin (0.5µM), after the addition of carbonyl cyanide-4-(trifluoromethoxy)phenylhydrazone
(FCCP) (0.5µM) and after the addition of rotenone (1µM). OCR measurements were normalized to
cell count, as previously described [477]. ATP linked respiration, Mitochondrial respiration,
Mitochondrial Spare Respiratory Capacity, Respiratory control ratio and ATP couple respiration are
all calculated from this experiment.
Glycolysis Stress Test
Astrocyte glycolysis was measured using the glycolysis stress test protocol on a 24-well Agilent
Seahorse XF analyzer. Astrocytes were plated at a density of 10,000 cell per well at day 5 of
differentiation. At day 7 of differentiation as with the mitochondrial stress test astrocytes were
transfered to XFmedia (Aligent) and glycolysis was assessed. The glycolysis stress test was used to
assess glycolysis, this has been described previously, [478]. In brief, three measurements were taken
at the basal point: after the addition of glucose (10µM), after the addition of oligomycin (1.0µM) and
after the addition of 2-deoxyglucose (50µM). Basal rate of glycolysis, Glycolytic capacity, Glycolytic
153 | P a g e
reserve and non-glycolytic acidosis are all measured during the glycolysis stress test. Measurements
were normalized to cell count, as previously described [477]
Glucose Uptake
Glucose uptake of astrocytes was measured using the Glucose Uptake Assay Kit (Fluorometric)
(Abcam, ab136956). Astrocytes were plated at a density of 2500 cells per well in a 96 well black
griener plate on day 5 of differentiation. On day 7 of differentiation the astrocytes were incubated
for 40 minutes in a 100µl of Krebs-Ringer-Phosphate-Hepes (KRPH) buffer with 2% bovine serum
albumen added pH 7.4. Astrocytes were then treated with 2-deoxyglucose at a concentration of
50mM for 20minutes suspended in KRPH (volume 100µl per well). Cells were then treated with 90µl
of Extraction buffer (Abcam), snap frozen in liquid nitrogen, and then thawed on ice. 25µl of sample
was then placed in a black 96-well plate, with the volume made up to 50µl with glucose uptake assay
buffer (Abcam). The assay from this point onwards was performed according to the manufacturer’s
instructions. Briefly, Using the 2-deoxyglucose standard a standard curve was created with
concentrations between 0µM-20µM of 2-Deoxyglucose. 50µl of each standard was plated on the
black 96-well plate. 50µl of reaction mix (47µl Glucose uptake assay buffer, 2µl of enzyme mix and
1µl of PicoProbe, all supplied by Abcam) was added to each sample and standard well. Samples were
then incubated for 40 minutes at 370C. Measurements of Fluorescence at Ex/Em=535/587nm were
then taken using PHERAstar plate reader (BMG Labtech).
Glutamine/Glutamate assessment
A Glutamine/Glutamate-Glo™ Assay (Promega) was used to measure intracellular concentrations of
glutamine and glutamate. A 10cm dish of Astrocytes (≈ 2,000,000 cells) was immersed in Inactivation
solution (2mls of HCL 0.3N and 1ml PBS) for 5 minutes on day 7 of differentiation. After this the dish
was scraped and 1ml of Tris solution (2-Amino-2-(hydroxymethyl)-1,3-propanediol, 450mM at pH
8.0) was added to the cells. 200µl of this solution was then added to 200µls of PBS. 25µl of this
dilution is then placed in a well of a white 96-well greiner plate. After sample preparation the assay
was performed as per the protocol provided by Promega.
Drug treatment assay
Astrocytes were treated with 8 different compounds known to improve mitochondrial function.
Doses of 1,10,100µM were assessed after 24 hours of treatment. Astrocytes were plated at a density
of 1000 cell per well for ATP assays, and 500 cells per well MMP assays on day 5 of differentiation.
Drugs were dispensed onto astrocytes using an ECHO 550 Liquid Handler (Labcyte) machine. ATP and
MMP assays were performed as described above on day 7 of differentiation.

154 | P a g e
Metabolic neuropsychological correlations
Correlations between metabolic parameters and neuropsychological tests were performed as
described previously [478].
Statistical Analysis
Statistical analysis for this data set is the same as detailed in [478]. In brief metabolic comparisons
between AD group and control groups are compared using t-tests. A pearson correlation was
performed for metabolic neuropsychological correlations. Statistics were calculated using the
GraphPad v8 software and IBM SPSS statistics version 25.
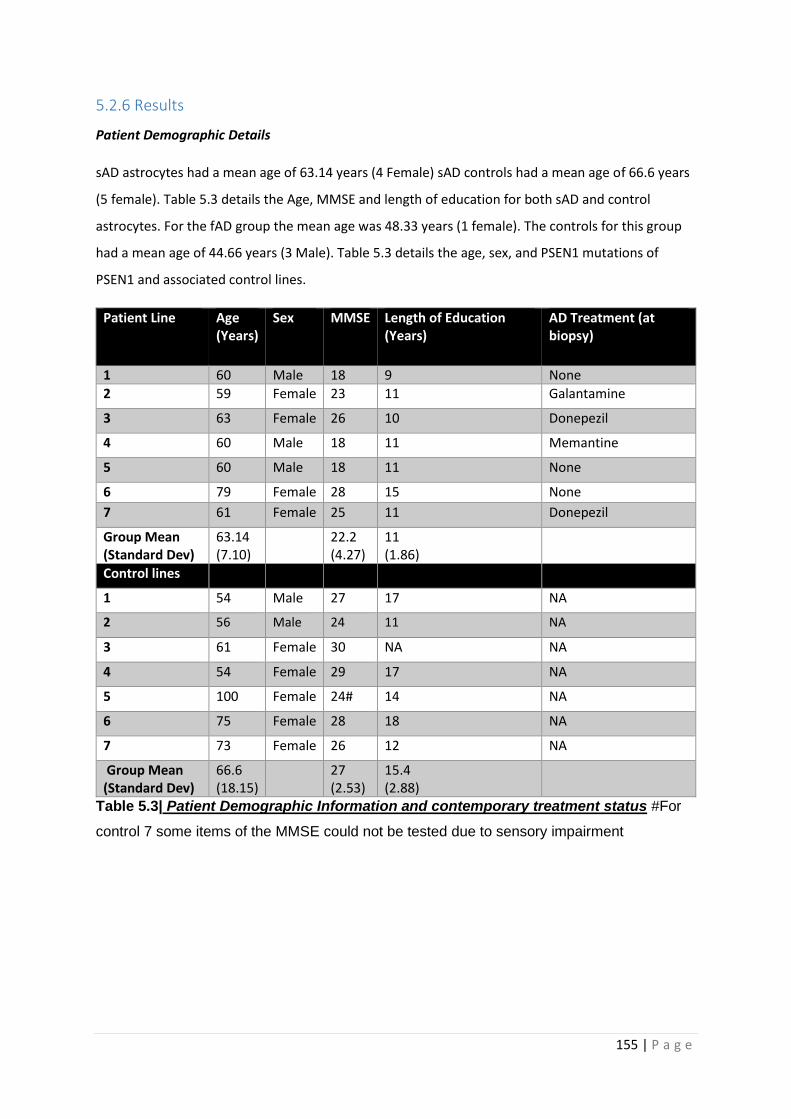
155 | P a g e
5.2.6 Results
Patient Demographic Details
sAD astrocytes had a mean age of 63.14 years (4 Female) sAD controls had a mean age of 66.6 years
(5 female). Table 5.3 details the Age, MMSE and length of education for both sAD and control
astrocytes. For the fAD group the mean age was 48.33 years (1 female). The controls for this group
had a mean age of 44.66 years (3 Male). Table 5.3 details the age, sex, and PSEN1 mutations of
PSEN1 and associated control lines.
Patient Line Age (Years)
Sex MMSE Length of Education (Years)
AD Treatment (at biopsy)
1 60 Male 18 9 None
2 59 Female 23 11 Galantamine
3 63 Female 26 10 Donepezil
4 60 Male 18 11 Memantine
5 60 Male 18 11 None
6 79 Female 28 15 None
7 61 Female 25 11 Donepezil
Group Mean (Standard Dev)
63.14 (7.10)
22.2 (4.27)
11 (1.86)
Control lines
1 54 Male 27 17 NA
2 56 Male 24 11 NA
3 61 Female 30 NA NA
4 54 Female 29 17 NA
5 100 Female 24# 14 NA
6 75 Female 28 18 NA
7 73 Female 26 12 NA
Group Mean (Standard Dev)
66.6 (18.15)
27 (2.53)
15.4 (2.88)
Table 5.3| Patient Demographic Information and contemporary treatment status #For
control 7 some items of the MMSE could not be tested due to sensory impairment
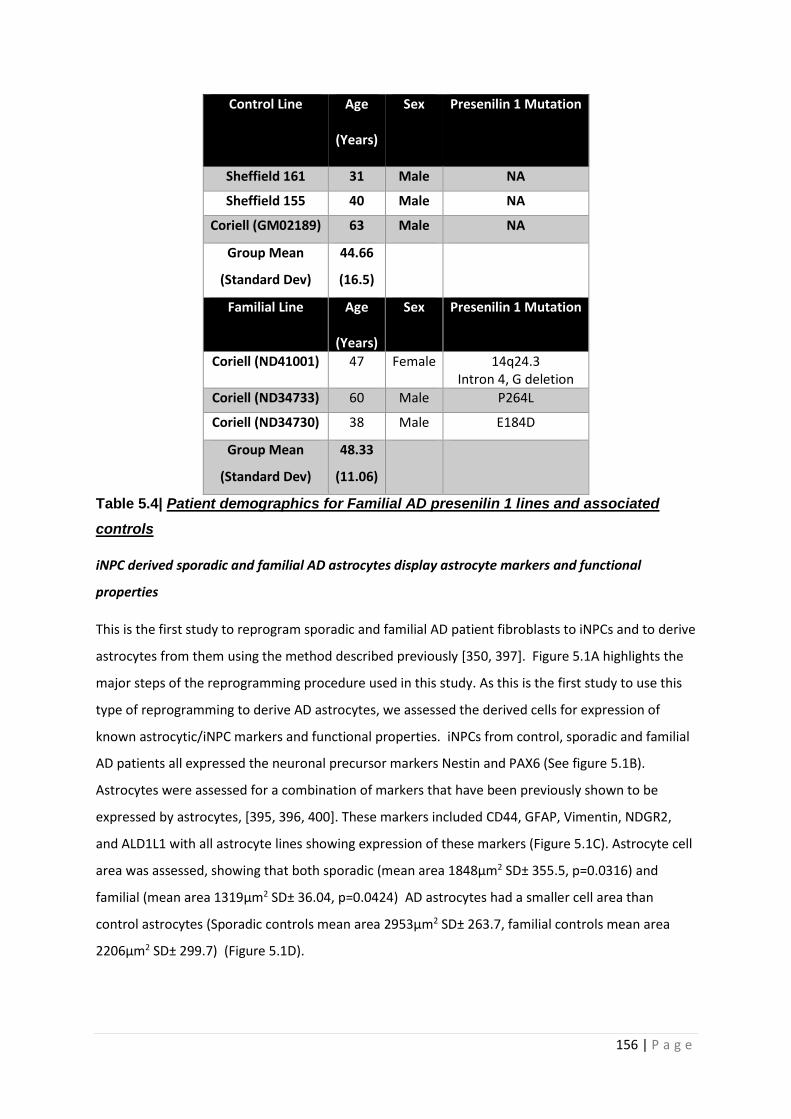
156 | P a g e
Control Line Age
(Years)
Sex Presenilin 1 Mutation
Sheffield 161 31 Male NA
Sheffield 155 40 Male NA
Coriell (GM02189) 63 Male NA
Group Mean
(Standard Dev)
44.66
(16.5)
Familial Line Age
(Years)
Sex Presenilin 1 Mutation
Coriell (ND41001) 47 Female 14q24.3 Intron 4, G deletion
Coriell (ND34733) 60 Male P264L
Coriell (ND34730) 38 Male E184D
Group Mean
(Standard Dev)
48.33
(11.06)
Table 5.4| Patient demographics for Familial AD presenilin 1 lines and associated
controls
iNPC derived sporadic and familial AD astrocytes display astrocyte markers and functional
properties
This is the first study to reprogram sporadic and familial AD patient fibroblasts to iNPCs and to derive
astrocytes from them using the method described previously [350, 397]. Figure 5.1A highlights the
major steps of the reprogramming procedure used in this study. As this is the first study to use this
type of reprogramming to derive AD astrocytes, we assessed the derived cells for expression of
known astrocytic/iNPC markers and functional properties. iNPCs from control, sporadic and familial
AD patients all expressed the neuronal precursor markers Nestin and PAX6 (See figure 5.1B).
Astrocytes were assessed for a combination of markers that have been previously shown to be
expressed by astrocytes, [395, 396, 400]. These markers included CD44, GFAP, Vimentin, NDGR2,
and ALD1L1 with all astrocyte lines showing expression of these markers (Figure 5.1C). Astrocyte cell
area was assessed, showing that both sporadic (mean area 1848µm2 SD± 355.5, p=0.0316) and
familial (mean area 1319µm2 SD± 36.04, p=0.0424) AD astrocytes had a smaller cell area than
control astrocytes (Sporadic controls mean area 2953µm2 SD± 263.7, familial controls mean area
2206µm2 SD± 299.7) (Figure 5.1D).

157 | P a g e
To assess if the derived astrocytes have key functional properties seen in in vivo astrocytes, the
ability to uptake glutamate, and the concentrations of intracellular glutamate and glutamine in the
astrocyte was assessed. Glutamate uptake from the synaptic cleft is a key functional property of in
vivo astrocytes [497], and is a key measure in showing in vitro astrocytes are functionally active [498,
499]. Glutamate uptake in sAD astrocytes was similar to that seen in controls (Figure 5.1E). fAD
astrocyte glutamate uptake was not assessed due to limited resources. Control, sporadic and familial
AD astrocytes all had similar intracellular proportions of glutamine and glutamate (Figure 5.1F). No
significant differences were seen between controls and AD astrocytes with regard to intracellular
glutamate and glutamine amounts.
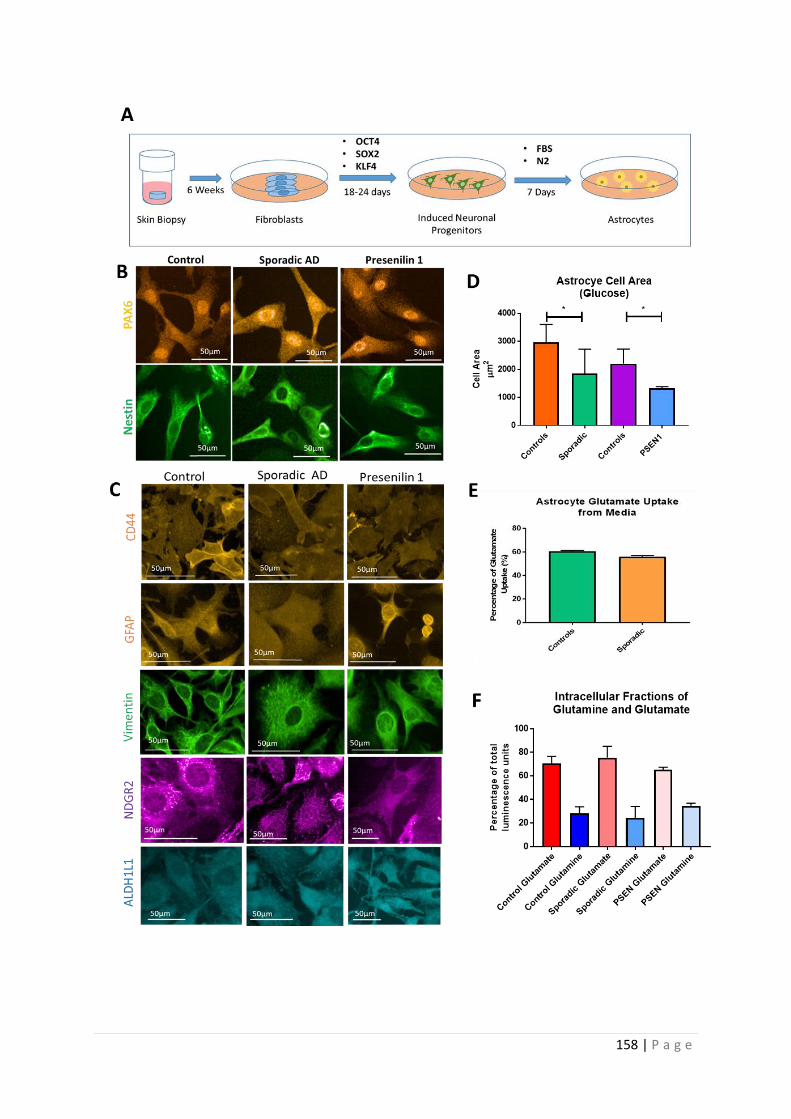
158 | P a g e
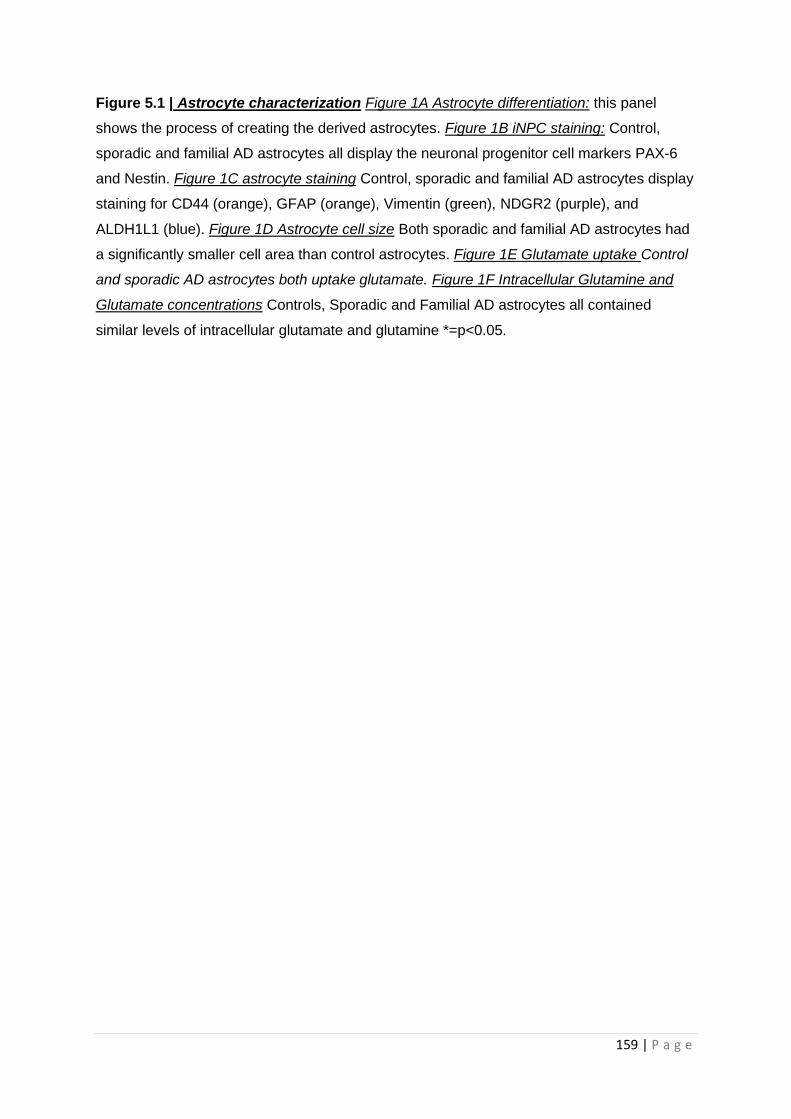
159 | P a g e
Figure 5.1 | Astrocyte characterization Figure 1A Astrocyte differentiation: this panel
shows the process of creating the derived astrocytes. Figure 1B iNPC staining: Control,
sporadic and familial AD astrocytes all display the neuronal progenitor cell markers PAX-6
and Nestin. Figure 1C astrocyte staining Control, sporadic and familial AD astrocytes display
staining for CD44 (orange), GFAP (orange), Vimentin (green), NDGR2 (purple), and
ALDH1L1 (blue). Figure 1D Astrocyte cell size Both sporadic and familial AD astrocytes had
a significantly smaller cell area than control astrocytes. Figure 1E Glutamate uptake Control
and sporadic AD astrocytes both uptake glutamate. Figure 1F Intracellular Glutamine and
Glutamate concentrations Controls, Sporadic and Familial AD astrocytes all contained
similar levels of intracellular glutamate and glutamine *=p<0.05.
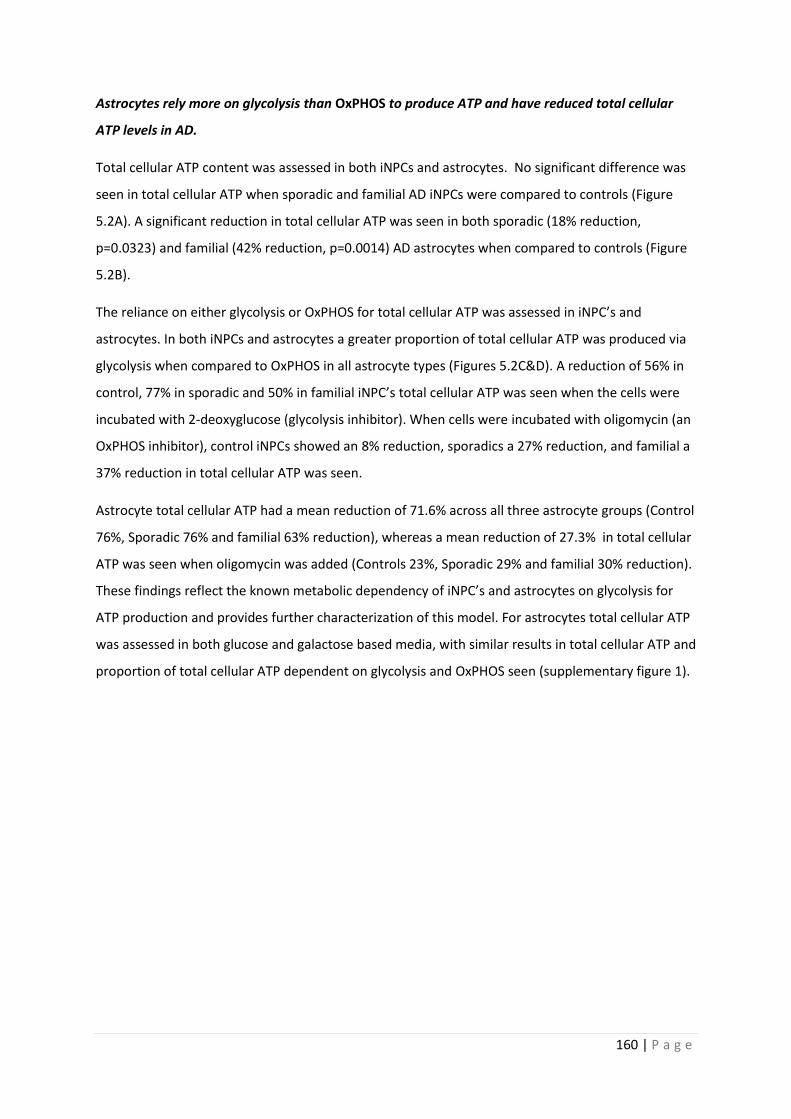
160 | P a g e
Astrocytes rely more on glycolysis than OxPHOS to produce ATP and have reduced total cellular
ATP levels in AD.
Total cellular ATP content was assessed in both iNPCs and astrocytes. No significant difference was
seen in total cellular ATP when sporadic and familial AD iNPCs were compared to controls (Figure
5.2A). A significant reduction in total cellular ATP was seen in both sporadic (18% reduction,
p=0.0323) and familial (42% reduction, p=0.0014) AD astrocytes when compared to controls (Figure
5.2B).
The reliance on either glycolysis or OxPHOS for total cellular ATP was assessed in iNPC’s and
astrocytes. In both iNPCs and astrocytes a greater proportion of total cellular ATP was produced via
glycolysis when compared to OxPHOS in all astrocyte types (Figures 5.2C&D). A reduction of 56% in
control, 77% in sporadic and 50% in familial iNPC’s total cellular ATP was seen when the cells were
incubated with 2-deoxyglucose (glycolysis inhibitor). When cells were incubated with oligomycin (an
OxPHOS inhibitor), control iNPCs showed an 8% reduction, sporadics a 27% reduction, and familial a
37% reduction in total cellular ATP was seen.
Astrocyte total cellular ATP had a mean reduction of 71.6% across all three astrocyte groups (Control
76%, Sporadic 76% and familial 63% reduction), whereas a mean reduction of 27.3% in total cellular
ATP was seen when oligomycin was added (Controls 23%, Sporadic 29% and familial 30% reduction).
These findings reflect the known metabolic dependency of iNPC’s and astrocytes on glycolysis for
ATP production and provides further characterization of this model. For astrocytes total cellular ATP
was assessed in both glucose and galactose based media, with similar results in total cellular ATP and
proportion of total cellular ATP dependent on glycolysis and OxPHOS seen (supplementary figure 1).
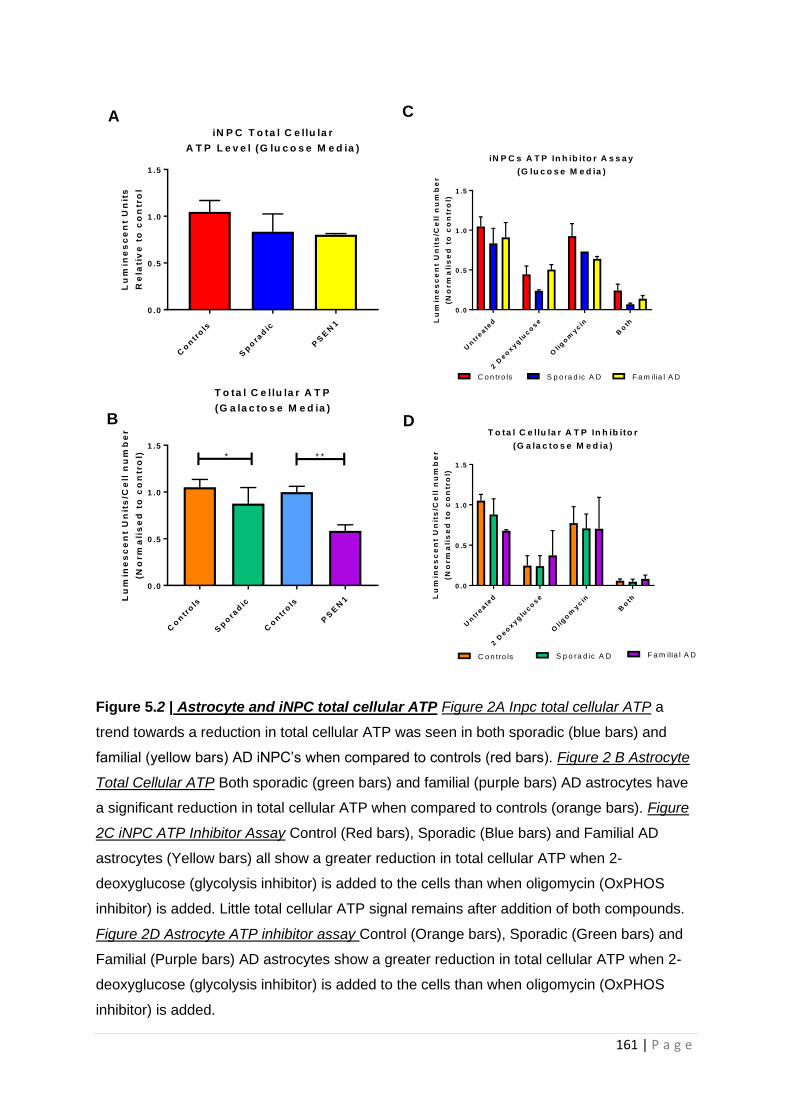
161 | P a g e
Figure 5.2 | Astrocyte and iNPC total cellular ATP Figure 2A Inpc total cellular ATP a
trend towards a reduction in total cellular ATP was seen in both sporadic (blue bars) and
familial (yellow bars) AD iNPC’s when compared to controls (red bars). Figure 2 B Astrocyte
Total Cellular ATP Both sporadic (green bars) and familial (purple bars) AD astrocytes have
a significant reduction in total cellular ATP when compared to controls (orange bars). Figure
2C iNPC ATP Inhibitor Assay Control (Red bars), Sporadic (Blue bars) and Familial AD
astrocytes (Yellow bars) all show a greater reduction in total cellular ATP when 2-
deoxyglucose (glycolysis inhibitor) is added to the cells than when oligomycin (OxPHOS
inhibitor) is added. Little total cellular ATP signal remains after addition of both compounds.
Figure 2D Astrocyte ATP inhibitor assay Control (Orange bars), Sporadic (Green bars) and
Familial (Purple bars) AD astrocytes show a greater reduction in total cellular ATP when 2-
deoxyglucose (glycolysis inhibitor) is added to the cells than when oligomycin (OxPHOS
inhibitor) is added.
Co
ntr
ols
Sp
ora
dic
PS
EN
1
0 .0
0 .5
1 .0
1 .5
iN P C T o ta l C e llu la r
A T P L e v e l (G lu c o s e M e d ia )
Lu
min
es
ce
nt
Un
its
Re
lati
ve
to
co
ntr
ol
Un
treate
d
2 D
eo
xyg
luco
se
Olig
om
ycin
Bo
th
0 .0
0 .5
1 .0
1 .5
iN P C s A T P In h ib ito r A s s a y
(G lu c o s e M e d ia )
Lu
min
es
ce
nt
Un
its
/Ce
ll n
um
be
r
(No
rm
ali
se
d t
o c
on
tro
l)
C o n tro ls S p o ra d ic A D F a m ilia l A D
Co
ntr
ols
Sp
ora
dic
Co
ntr
ols
PS
EN
1
0 .0
0 .5
1 .0
1 .5
T o ta l C e llu la r A T P
(G a la c to s e M e d ia )
Lu
min
es
ce
nt
Un
its
/Ce
ll n
um
be
r
(No
rm
ali
se
d t
o c
on
tro
l) * * *
A C
B D
Un
treate
d
2 D
eo
xyg
luco
se
Olig
om
ycin
Bo
th
0 .0
0 .5
1 .0
1 .5
T o ta l C e llu la r A T P In h ib ito r
(G a la c to s e M e d ia )
Lu
min
es
ce
nt
Un
its
/Ce
ll n
um
be
r
(No
rm
ali
se
d t
o c
on
tro
l)
C o n tro ls S p o ra d ic A D F a m ilia l A D
162 | P a g e
AD astrocytes have an altered mitochondrial morphology and MMP.
After characterising the AD astrocytes and determining ATP levels, we next assessed mitochondrial
morphology and function. Sporadic AD astrocytes had a significant reduction in their MMP when
compared to controls (26% reduction, p=0.048), whereas familial AD astrocytes had a higher MMP
then controls (52% increase, p=0.032) (Figure 5.3A). Mitochondrial morphology was also altered in
AD, with both sporadic and familial AD astrocytes showing an increased number of elongated
mitochondria (Sporadic Astrocytes 4.9% increase, p= 0.032, familial astrocytes 7.2% increase,
p=0.030) , and a significantly reduced form factor (Sporadic astrocytes 5.01% reduction, p= 0.031,
familial astrocytes 7.2% reduction, p=0.039) (Figures 5.3B&C). Form factor in this situation refers to
how interconnected the mitochondrial network is, with a lower number suggesting a more
interconnected network.
The percentage of small mitochondria in the mitochondrial network showed a trend towards a
reduction in both sporadic (p=0.409) and familial (p= 0.114) AD astrocytes when compared to
controls, but this was not significant (Figure 5.3D). A trend towards an increase in the percentage of
perinuclear mitochondria was seen in both sporadic and familial AD astrocytes when compared to
controls (Figure 5.3E), but no change in mitochondrial number was seen in AD astrocytes when
compared to controls (Figure 5.3F). The same changes in mitochondrial function and morphology
were seen when experiments were performed in glucose based media (Supplementary figure 2).
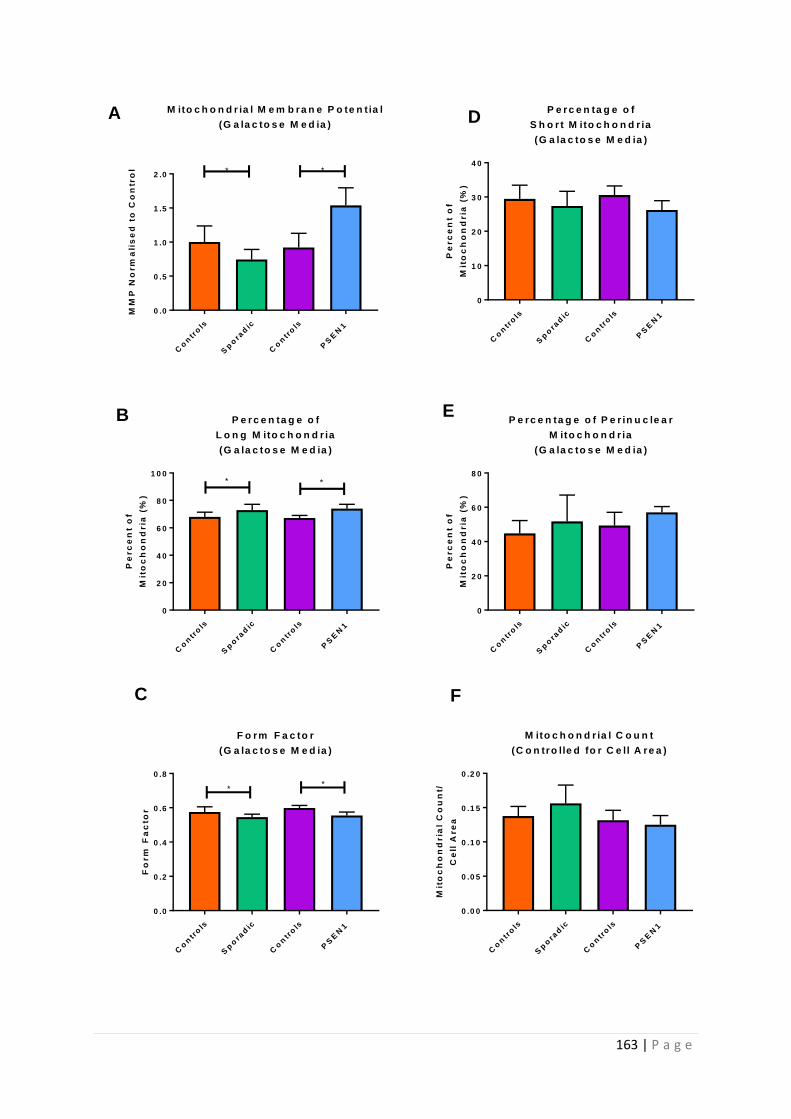
163 | P a g e
Co
ntr
ols
Sp
ora
dic
Co
ntr
ols
PS
EN
1
0 .0
0 .5
1 .0
1 .5
2 .0
M ito c h o n d r ia l M e m b ra n e P o te n t ia l
(G a la c to s e M e d ia )M
MP
No
rm
ali
se
d t
o C
on
tro
l **
Co
ntr
ols
Sp
ora
dic
Co
ntr
ols
PS
EN
1
0
1 0
2 0
3 0
4 0
P e r c e n ta g e o f
S h o r t M ito c h o n d r ia
(G a la c to s e M e d ia )
Pe
rc
en
t o
f
Mit
oc
ho
nd
ria
(%
)
Co
ntr
ols
Sp
ora
dic
Co
ntr
ols
PS
EN
1
0
2 0
4 0
6 0
8 0
1 0 0
P e r c e n ta g e o f
L o n g M ito c h o n d r ia
(G a la c to s e M e d ia )
Pe
rc
en
t o
f
Mit
oc
ho
nd
ria
(%
)
* *
Co
ntr
ols
Sp
ora
dic
Co
ntr
ols
PS
EN
1
0
2 0
4 0
6 0
8 0
P e rc e n ta g e o f P e r in u c le a r
M ito c h o n d r ia
(G a la c to s e M e d ia )P
erc
en
t o
f
Mit
oc
ho
nd
ria
(%
)
Co
ntr
ols
Sp
ora
dic
Co
ntr
ols
PS
EN
1
0 .0
0 .2
0 .4
0 .6
0 .8
F o rm F a c to r
(G a la c to s e M e d ia )
Fo
rm
Fa
cto
r
**
Co
ntr
ols
Sp
ora
dic
Co
ntr
ols
PS
EN
1
0 .0 0
0 .0 5
0 .1 0
0 .1 5
0 .2 0
M ito c h o n d r ia l C o u n t
(C o n tro lle d fo r C e ll A re a )
Mit
oc
ho
nd
ria
l C
ou
nt/
Ce
ll A
re
a
A D
B E
C F
164 | P a g e
Figure 5.3 | Astrocyte Mitochondrial Function and Morphology Figure 3A Mitochondrial
Membrane Potential a significant decrease was seen in sporadic AD astrocyte MMP and a
significant increase was seen in familial astrocyte MMP. Figure 3B Percentage of Long
Mitochondria A significant increase in long mitochondria was seen in both sporadic and
familial AD astrocytes. Figure 3C Form Factor A significant reduction in form factor was seen
in both sporadic and familial AD astrocytes when compared to controls. Figure 3D
Percentage of short mitochondria, Figure 3E Perinuclear Mitochondria Figure 3F
Mitochondrial Count all three of these measures were not significantly different between
control and disease astrocytes *=p<0.05. In all panels sporadic controls are represented in
orange, sporadic AD lines in green, Familial controls in purple and familial AD astrocyte lines
in blue.
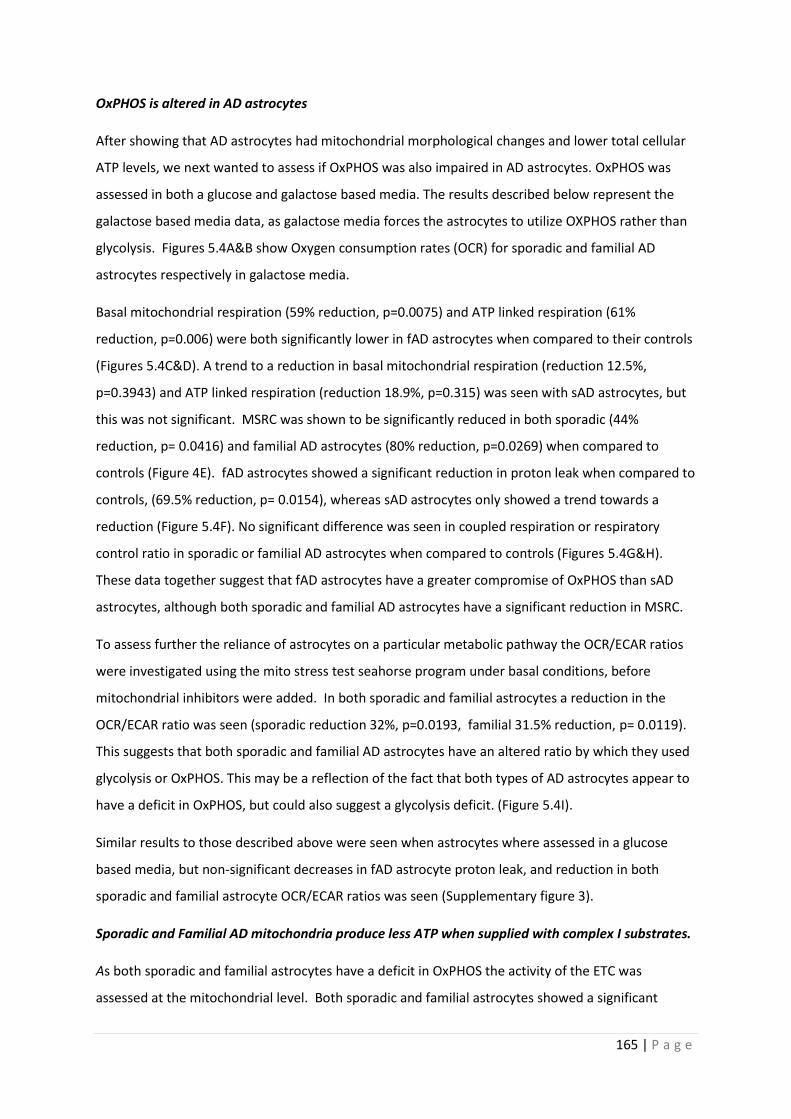
165 | P a g e
OxPHOS is altered in AD astrocytes
After showing that AD astrocytes had mitochondrial morphological changes and lower total cellular
ATP levels, we next wanted to assess if OxPHOS was also impaired in AD astrocytes. OxPHOS was
assessed in both a glucose and galactose based media. The results described below represent the
galactose based media data, as galactose media forces the astrocytes to utilize OXPHOS rather than
glycolysis. Figures 5.4A&B show Oxygen consumption rates (OCR) for sporadic and familial AD
astrocytes respectively in galactose media.
Basal mitochondrial respiration (59% reduction, p=0.0075) and ATP linked respiration (61%
reduction, p=0.006) were both significantly lower in fAD astrocytes when compared to their controls
(Figures 5.4C&D). A trend to a reduction in basal mitochondrial respiration (reduction 12.5%,
p=0.3943) and ATP linked respiration (reduction 18.9%, p=0.315) was seen with sAD astrocytes, but
this was not significant. MSRC was shown to be significantly reduced in both sporadic (44%
reduction, p= 0.0416) and familial AD astrocytes (80% reduction, p=0.0269) when compared to
controls (Figure 4E). fAD astrocytes showed a significant reduction in proton leak when compared to
controls, (69.5% reduction, p= 0.0154), whereas sAD astrocytes only showed a trend towards a
reduction (Figure 5.4F). No significant difference was seen in coupled respiration or respiratory
control ratio in sporadic or familial AD astrocytes when compared to controls (Figures 5.4G&H).
These data together suggest that fAD astrocytes have a greater compromise of OxPHOS than sAD
astrocytes, although both sporadic and familial AD astrocytes have a significant reduction in MSRC.
To assess further the reliance of astrocytes on a particular metabolic pathway the OCR/ECAR ratios
were investigated using the mito stress test seahorse program under basal conditions, before
mitochondrial inhibitors were added. In both sporadic and familial astrocytes a reduction in the
OCR/ECAR ratio was seen (sporadic reduction 32%, p=0.0193, familial 31.5% reduction, p= 0.0119).
This suggests that both sporadic and familial AD astrocytes have an altered ratio by which they used
glycolysis or OxPHOS. This may be a reflection of the fact that both types of AD astrocytes appear to
have a deficit in OxPHOS, but could also suggest a glycolysis deficit. (Figure 5.4I).
Similar results to those described above were seen when astrocytes where assessed in a glucose
based media, but non-significant decreases in fAD astrocyte proton leak, and reduction in both
sporadic and familial astrocyte OCR/ECAR ratios was seen (Supplementary figure 3).
Sporadic and Familial AD mitochondria produce less ATP when supplied with complex I substrates.
As both sporadic and familial astrocytes have a deficit in OxPHOS the activity of the ETC was
assessed at the mitochondrial level. Both sporadic and familial astrocytes showed a significant

166 | P a g e
reduction in mitochondrial ATP production when supplied with complex I substrates (sAD: 34%
reduction, p=0.0468, familial AD: 56% reduction, p=0.0485) (Figure 4J). No differences in
mitochondrial ATP production were seen when complex II substrates were supplied to the
permeabilised cells, suggesting no deficit in complex II activity (Figure 5.4K). These data suggest a
specific deficit in complex I activity, rather than global respiratory chain dysfunction.
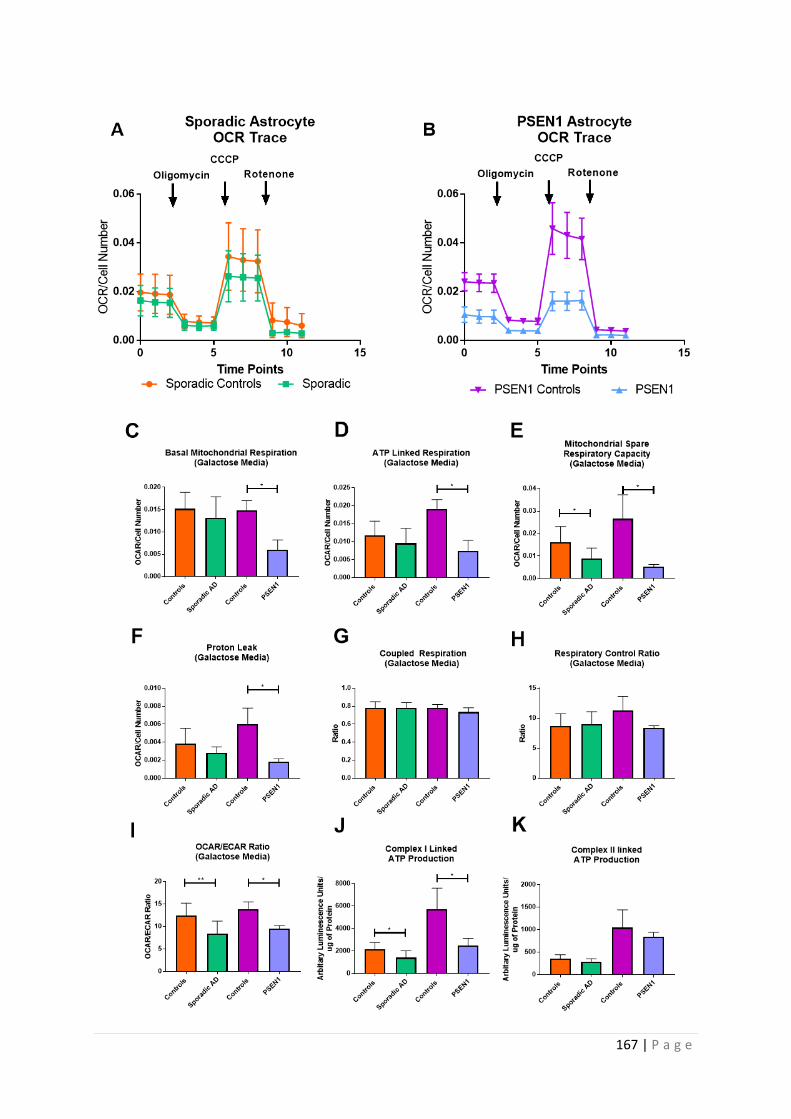
167 | P a g e
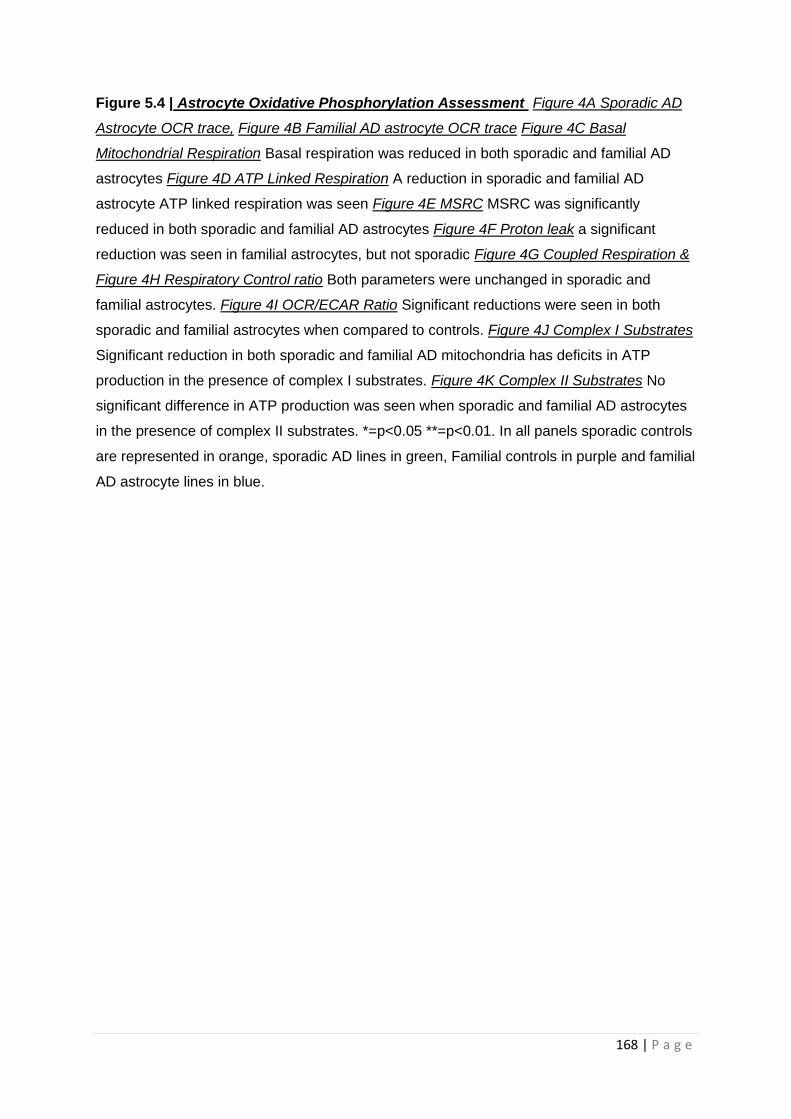
168 | P a g e
Figure 5.4 | Astrocyte Oxidative Phosphorylation Assessment Figure 4A Sporadic AD
Astrocyte OCR trace, Figure 4B Familial AD astrocyte OCR trace Figure 4C Basal
Mitochondrial Respiration Basal respiration was reduced in both sporadic and familial AD
astrocytes Figure 4D ATP Linked Respiration A reduction in sporadic and familial AD
astrocyte ATP linked respiration was seen Figure 4E MSRC MSRC was significantly
reduced in both sporadic and familial AD astrocytes Figure 4F Proton leak a significant
reduction was seen in familial astrocytes, but not sporadic Figure 4G Coupled Respiration &
Figure 4H Respiratory Control ratio Both parameters were unchanged in sporadic and
familial astrocytes. Figure 4I OCR/ECAR Ratio Significant reductions were seen in both
sporadic and familial astrocytes when compared to controls. Figure 4J Complex I Substrates
Significant reduction in both sporadic and familial AD mitochondria has deficits in ATP
production in the presence of complex I substrates. Figure 4K Complex II Substrates No
significant difference in ATP production was seen when sporadic and familial AD astrocytes
in the presence of complex II substrates. *=p<0.05 **=p<0.01. In all panels sporadic controls
are represented in orange, sporadic AD lines in green, Familial controls in purple and familial
AD astrocyte lines in blue.
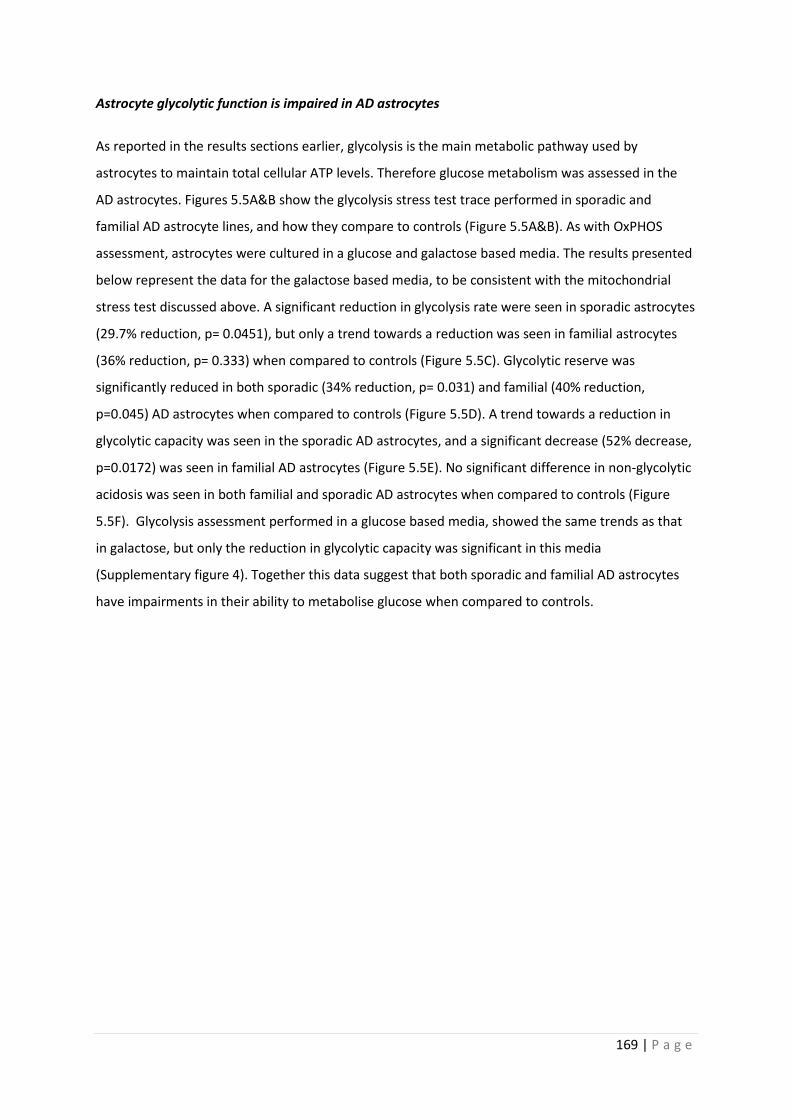
169 | P a g e
Astrocyte glycolytic function is impaired in AD astrocytes
As reported in the results sections earlier, glycolysis is the main metabolic pathway used by
astrocytes to maintain total cellular ATP levels. Therefore glucose metabolism was assessed in the
AD astrocytes. Figures 5.5A&B show the glycolysis stress test trace performed in sporadic and
familial AD astrocyte lines, and how they compare to controls (Figure 5.5A&B). As with OxPHOS
assessment, astrocytes were cultured in a glucose and galactose based media. The results presented
below represent the data for the galactose based media, to be consistent with the mitochondrial
stress test discussed above. A significant reduction in glycolysis rate were seen in sporadic astrocytes
(29.7% reduction, p= 0.0451), but only a trend towards a reduction was seen in familial astrocytes
(36% reduction, p= 0.333) when compared to controls (Figure 5.5C). Glycolytic reserve was
significantly reduced in both sporadic (34% reduction, p= 0.031) and familial (40% reduction,
p=0.045) AD astrocytes when compared to controls (Figure 5.5D). A trend towards a reduction in
glycolytic capacity was seen in the sporadic AD astrocytes, and a significant decrease (52% decrease,
p=0.0172) was seen in familial AD astrocytes (Figure 5.5E). No significant difference in non-glycolytic
acidosis was seen in both familial and sporadic AD astrocytes when compared to controls (Figure
5.5F). Glycolysis assessment performed in a glucose based media, showed the same trends as that
in galactose, but only the reduction in glycolytic capacity was significant in this media
(Supplementary figure 4). Together this data suggest that both sporadic and familial AD astrocytes
have impairments in their ability to metabolise glucose when compared to controls.
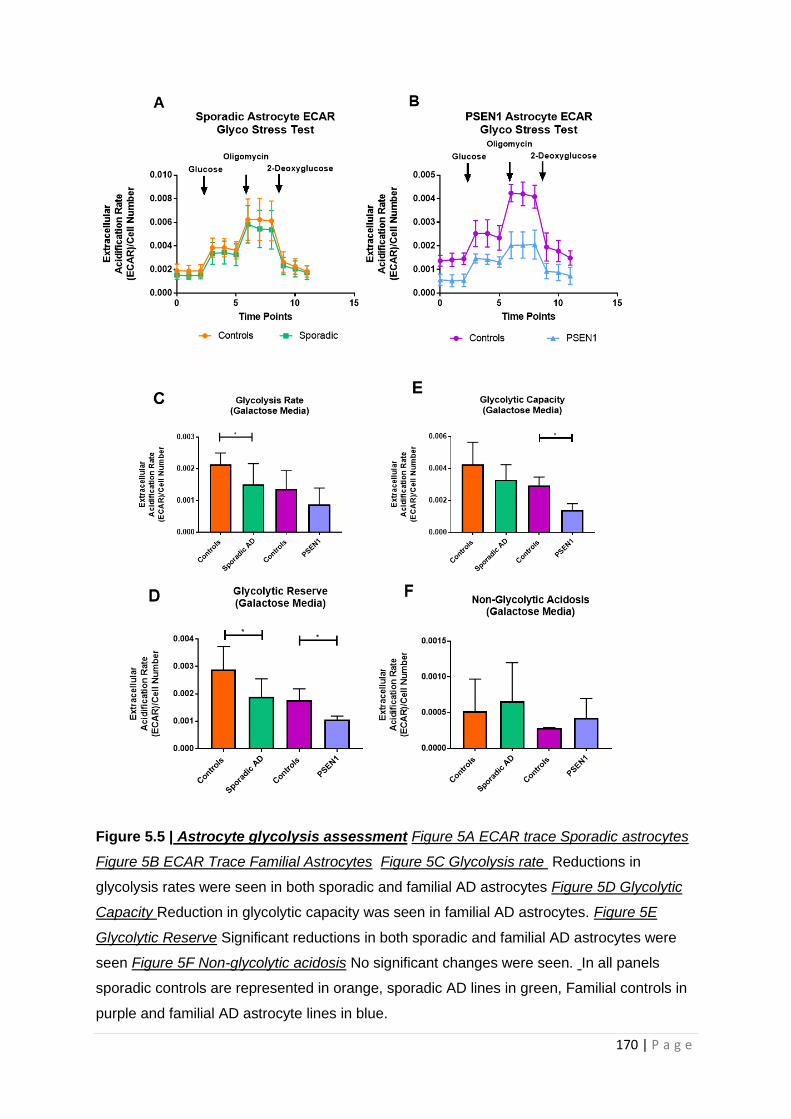
170 | P a g e
Figure 5.5 | Astrocyte glycolysis assessment Figure 5A ECAR trace Sporadic astrocytes
Figure 5B ECAR Trace Familial Astrocytes Figure 5C Glycolysis rate Reductions in
glycolysis rates were seen in both sporadic and familial AD astrocytes Figure 5D Glycolytic
Capacity Reduction in glycolytic capacity was seen in familial AD astrocytes. Figure 5E
Glycolytic Reserve Significant reductions in both sporadic and familial AD astrocytes were
seen Figure 5F Non-glycolytic acidosis No significant changes were seen. In all panels
sporadic controls are represented in orange, sporadic AD lines in green, Familial controls in
purple and familial AD astrocyte lines in blue.
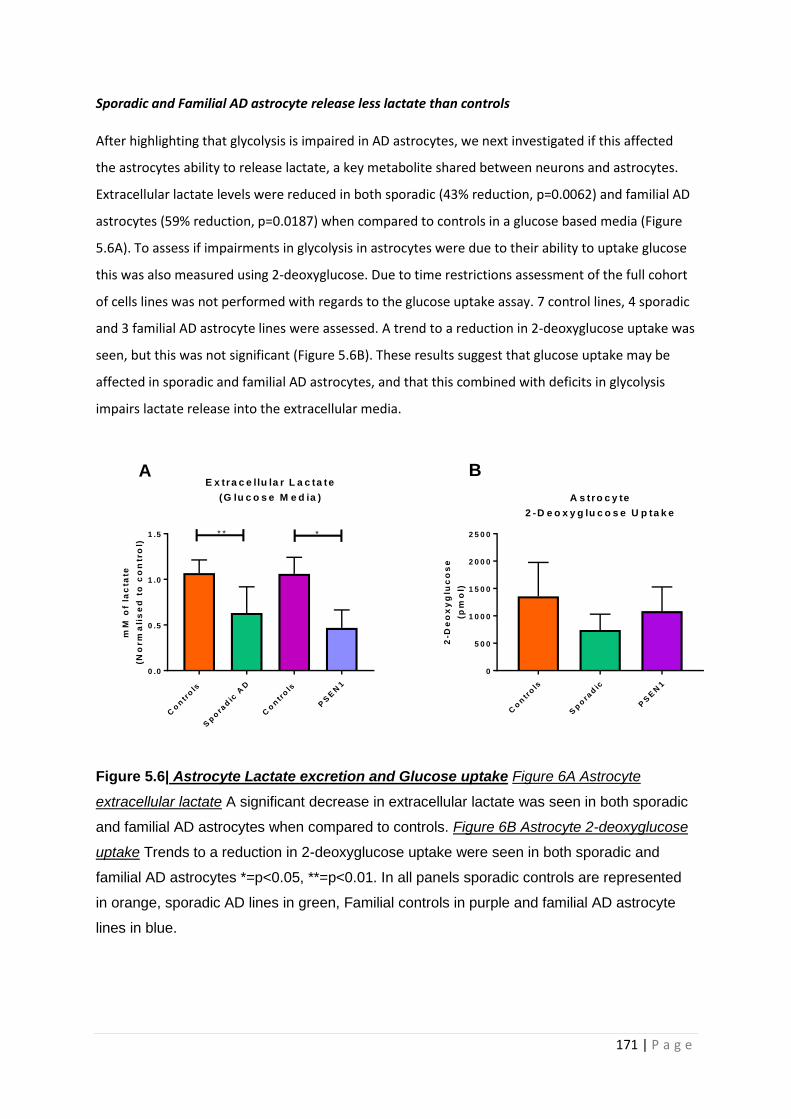
171 | P a g e
Sporadic and Familial AD astrocyte release less lactate than controls
After highlighting that glycolysis is impaired in AD astrocytes, we next investigated if this affected
the astrocytes ability to release lactate, a key metabolite shared between neurons and astrocytes.
Extracellular lactate levels were reduced in both sporadic (43% reduction, p=0.0062) and familial AD
astrocytes (59% reduction, p=0.0187) when compared to controls in a glucose based media (Figure
5.6A). To assess if impairments in glycolysis in astrocytes were due to their ability to uptake glucose
this was also measured using 2-deoxyglucose. Due to time restrictions assessment of the full cohort
of cells lines was not performed with regards to the glucose uptake assay. 7 control lines, 4 sporadic
and 3 familial AD astrocyte lines were assessed. A trend to a reduction in 2-deoxyglucose uptake was
seen, but this was not significant (Figure 5.6B). These results suggest that glucose uptake may be
affected in sporadic and familial AD astrocytes, and that this combined with deficits in glycolysis
impairs lactate release into the extracellular media.
Figure 5.6| Astrocyte Lactate excretion and Glucose uptake Figure 6A Astrocyte
extracellular lactate A significant decrease in extracellular lactate was seen in both sporadic
and familial AD astrocytes when compared to controls. Figure 6B Astrocyte 2-deoxyglucose
uptake Trends to a reduction in 2-deoxyglucose uptake were seen in both sporadic and
familial AD astrocytes *=p<0.05, **=p<0.01. In all panels sporadic controls are represented
in orange, sporadic AD lines in green, Familial controls in purple and familial AD astrocyte
lines in blue.
Co
ntr
ols
Sp
ora
dic
AD
Co
ntr
ols
PS
EN
1
0 .0
0 .5
1 .0
1 .5
E x tra c e llu la r L a c ta te
(G lu c o s e M e d ia )
mM
of
lac
tate
(No
rm
ali
se
d t
o c
on
tro
l)
** *
Co
ntr
ols
Sp
ora
dic
PS
EN
1
0
5 0 0
1 0 0 0
1 5 0 0
2 0 0 0
2 5 0 0
A s tro c y te
2 -D e o x y g lu c o s e U p ta k e
2-D
eo
xy
glu
co
se
(pm
ol)
A B
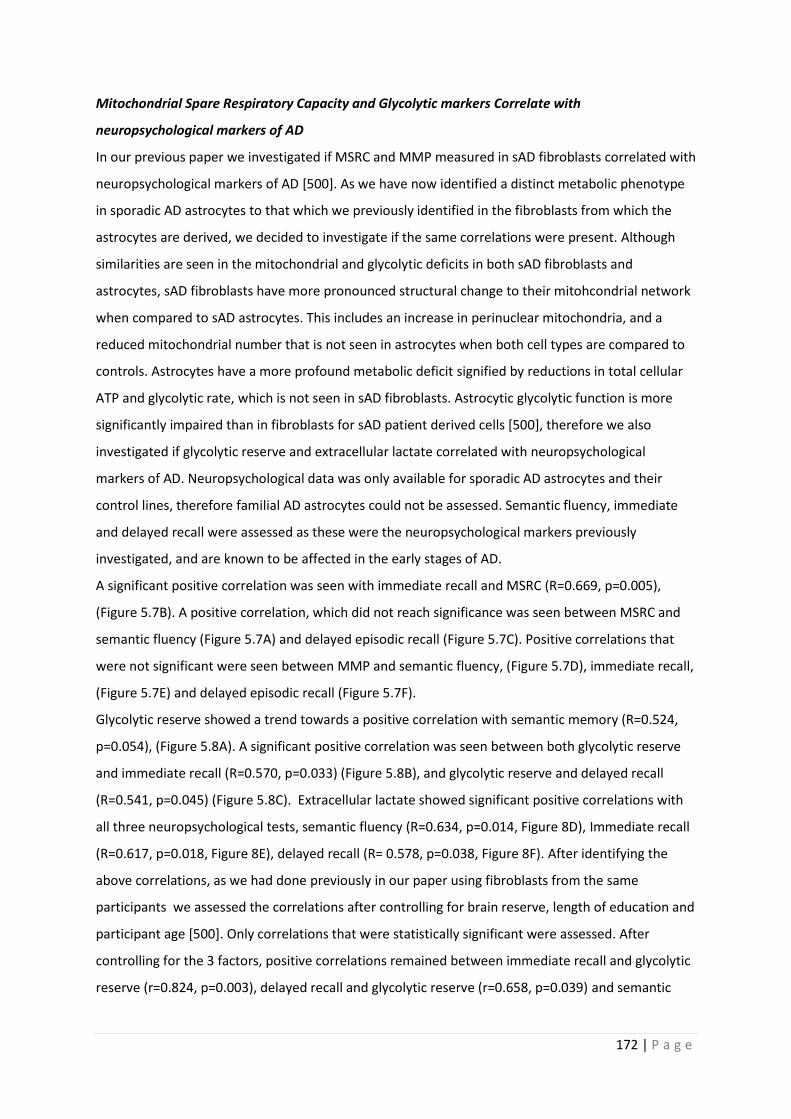
172 | P a g e
Mitochondrial Spare Respiratory Capacity and Glycolytic markers Correlate with
neuropsychological markers of AD
In our previous paper we investigated if MSRC and MMP measured in sAD fibroblasts correlated with
neuropsychological markers of AD [500]. As we have now identified a distinct metabolic phenotype
in sporadic AD astrocytes to that which we previously identified in the fibroblasts from which the
astrocytes are derived, we decided to investigate if the same correlations were present. Although
similarities are seen in the mitochondrial and glycolytic deficits in both sAD fibroblasts and
astrocytes, sAD fibroblasts have more pronounced structural change to their mitohcondrial network
when compared to sAD astrocytes. This includes an increase in perinuclear mitochondria, and a
reduced mitochondrial number that is not seen in astrocytes when both cell types are compared to
controls. Astrocytes have a more profound metabolic deficit signified by reductions in total cellular
ATP and glycolytic rate, which is not seen in sAD fibroblasts. Astrocytic glycolytic function is more
significantly impaired than in fibroblasts for sAD patient derived cells [500], therefore we also
investigated if glycolytic reserve and extracellular lactate correlated with neuropsychological
markers of AD. Neuropsychological data was only available for sporadic AD astrocytes and their
control lines, therefore familial AD astrocytes could not be assessed. Semantic fluency, immediate
and delayed recall were assessed as these were the neuropsychological markers previously
investigated, and are known to be affected in the early stages of AD.
A significant positive correlation was seen with immediate recall and MSRC (R=0.669, p=0.005),
(Figure 5.7B). A positive correlation, which did not reach significance was seen between MSRC and
semantic fluency (Figure 5.7A) and delayed episodic recall (Figure 5.7C). Positive correlations that
were not significant were seen between MMP and semantic fluency, (Figure 5.7D), immediate recall,
(Figure 5.7E) and delayed episodic recall (Figure 5.7F).
Glycolytic reserve showed a trend towards a positive correlation with semantic memory (R=0.524,
p=0.054), (Figure 5.8A). A significant positive correlation was seen between both glycolytic reserve
and immediate recall (R=0.570, p=0.033) (Figure 5.8B), and glycolytic reserve and delayed recall
(R=0.541, p=0.045) (Figure 5.8C). Extracellular lactate showed significant positive correlations with
all three neuropsychological tests, semantic fluency (R=0.634, p=0.014, Figure 8D), Immediate recall
(R=0.617, p=0.018, Figure 8E), delayed recall (R= 0.578, p=0.038, Figure 8F). After identifying the
above correlations, as we had done previously in our paper using fibroblasts from the same
participants we assessed the correlations after controlling for brain reserve, length of education and
participant age [500]. Only correlations that were statistically significant were assessed. After
controlling for the 3 factors, positive correlations remained between immediate recall and glycolytic
reserve (r=0.824, p=0.003), delayed recall and glycolytic reserve (r=0.658, p=0.039) and semantic
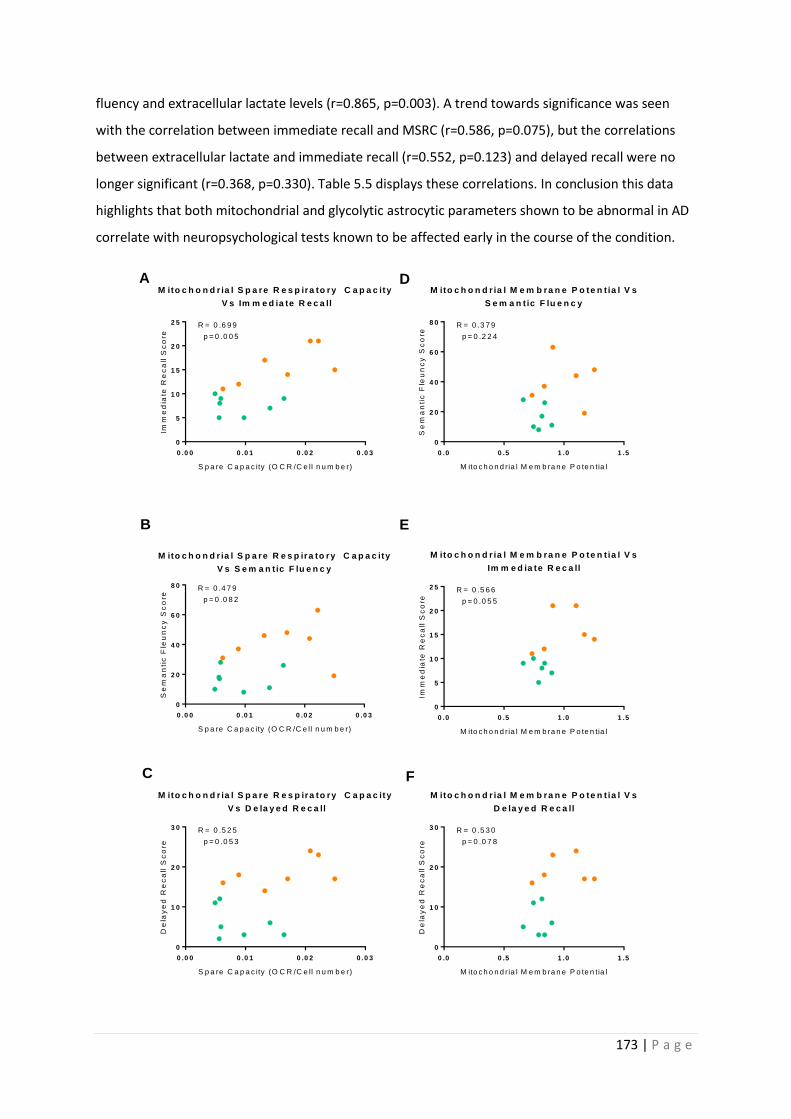
173 | P a g e
fluency and extracellular lactate levels (r=0.865, p=0.003). A trend towards significance was seen
with the correlation between immediate recall and MSRC (r=0.586, p=0.075), but the correlations
between extracellular lactate and immediate recall (r=0.552, p=0.123) and delayed recall were no
longer significant (r=0.368, p=0.330). Table 5.5 displays these correlations. In conclusion this data
highlights that both mitochondrial and glycolytic astrocytic parameters shown to be abnormal in AD
correlate with neuropsychological tests known to be affected early in the course of the condition.
0 .0 0 0 .0 1 0 .0 2 0 .0 3
0
2 0
4 0
6 0
8 0
M ito c h o n d r ia l S p a re R e s p ira to ry C a p a c ity
V s S e m a n t ic F lu e n c y
S p a re C a p a c ity (O C R /C e ll n u m b e r)
Se
ma
nti
c F
leu
nc
y S
co
re
R = 0 .4 7 9
p = 0 .0 8 2
0 .0 0 .5 1 .0 1 .5
0
2 0
4 0
6 0
8 0
M ito c h o n d r ia l M e m b ra n e P o te n t ia l V s
S e m a n t ic F lu e n c y
M ito c h o n d ria l M e m b ra n e P o te n tia l
Se
ma
nti
c F
leu
nc
y S
co
re
R = 0 .3 7 9
p = 0 .2 2 4
0 .0 0 0 .0 1 0 .0 2 0 .0 3
0
5
1 0
1 5
2 0
2 5
M ito c h o n d r ia l S p a re R e s p ira to ry C a p a c ity
V s Im m e d ia te R e c a ll
S p a re C a p a c ity (O C R /C e ll n u m b e r)
Imm
ed
iate
Re
ca
ll S
co
re
R = 0 .6 9 9
p = 0 .0 0 5
0 .0 0 .5 1 .0 1 .5
0
5
1 0
1 5
2 0
2 5
M ito c h o n d r ia l M e m b ra n e P o te n t ia l V s
Im m e d ia te R e c a ll
M ito c h o n d ria l M e m b ra n e P o te n tia l
Imm
ed
iate
Re
ca
ll S
co
re
R = 0 .5 6 6
p = 0 .0 5 5
0 .0 0 0 .0 1 0 .0 2 0 .0 3
0
1 0
2 0
3 0
M ito c h o n d r ia l S p a re R e s p ira to ry C a p a c ity
V s D e la y e d R e c a ll
S p a re C a p a c ity (O C R /C e ll n u m b e r)
De
lay
ed
Re
ca
ll S
co
re
R = 0 .5 2 5
p = 0 .0 5 3
0 .0 0 .5 1 .0 1 .5
0
1 0
2 0
3 0
M ito c h o n d r ia l M e m b ra n e P o te n t ia l V s
D e la y e d R e c a ll
M ito c h o n d ria l M e m b ra n e P o te n tia l
De
lay
ed
Re
ca
ll S
co
re
R = 0 .5 3 0
p = 0 .0 7 8
A
B
C
D
E
F
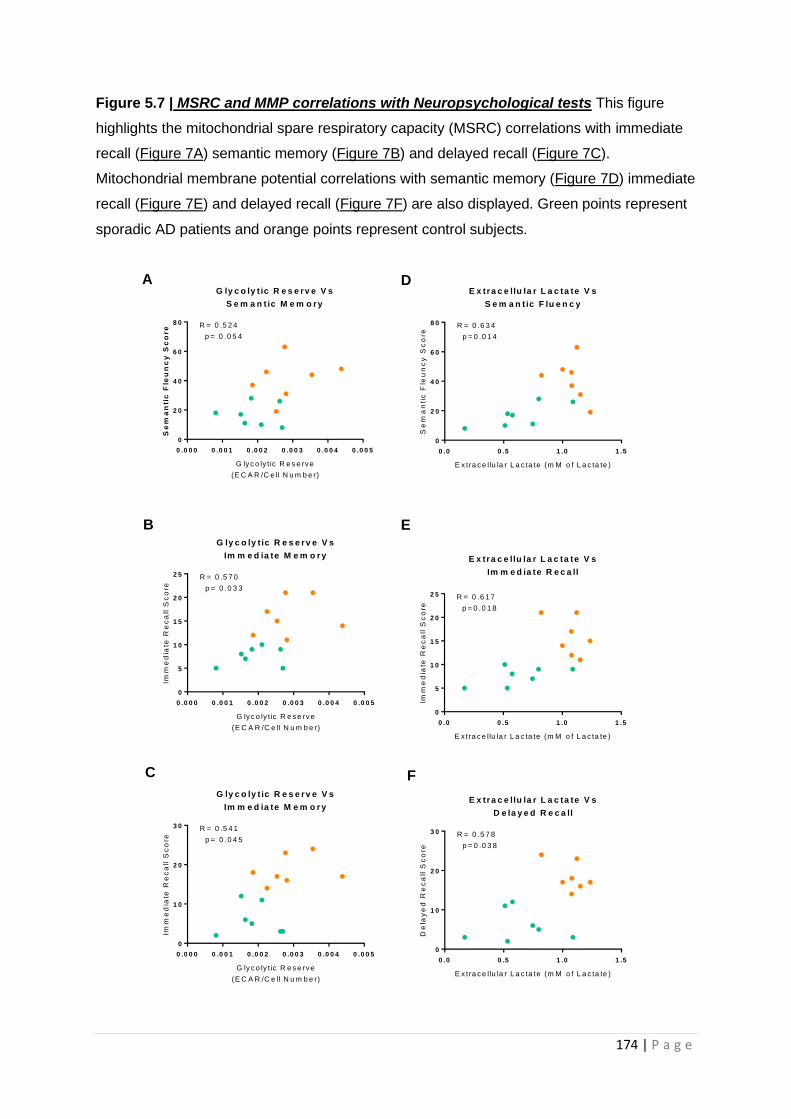
174 | P a g e
Figure 5.7 | MSRC and MMP correlations with Neuropsychological tests This figure
highlights the mitochondrial spare respiratory capacity (MSRC) correlations with immediate
recall (Figure 7A) semantic memory (Figure 7B) and delayed recall (Figure 7C).
Mitochondrial membrane potential correlations with semantic memory (Figure 7D) immediate
recall (Figure 7E) and delayed recall (Figure 7F) are also displayed. Green points represent
sporadic AD patients and orange points represent control subjects.
0 .0 0 0 0 .0 0 1 0 .0 0 2 0 .0 0 3 0 .0 0 4 0 .0 0 5
0
2 0
4 0
6 0
8 0
G ly c o ly t ic R e s e rv e V s
S e m a n t ic M e m o r y
G ly c o ly t ic R e s e rv e
(E C A R /C e ll N u m b e r)
Se
ma
nti
c F
leu
nc
y S
co
re R = 0 .5 2 4
p = 0 .0 5 4
0 .0 0 .5 1 .0 1 .5
0
2 0
4 0
6 0
8 0
E x tra c e llu la r L a c ta te V s
S e m a n t ic F lu e n c y
E x tra c e llu la r L a c ta te (m M o f L a c ta te )
Se
ma
nti
c F
leu
nc
y S
co
re
R = 0 .6 3 4
p = 0 .0 1 4
0 .0 0 0 0 .0 0 1 0 .0 0 2 0 .0 0 3 0 .0 0 4 0 .0 0 5
0
5
1 0
1 5
2 0
2 5
G ly c o ly t ic R e s e rv e V s
Im m e d ia te M e m o r y
G ly c o ly t ic R e s e rv e
(E C A R /C e ll N u m b e r)
Imm
ed
iate
Re
ca
ll S
co
re
R = 0 .5 7 0
p = 0 .0 3 3
0 .0 0 .5 1 .0 1 .5
0
5
1 0
1 5
2 0
2 5
E x tra c e llu la r L a c ta te V s
Im m e d ia te R e c a ll
E x tra c e llu la r L a c ta te (m M o f L a c ta te )
Imm
ed
iate
Re
ca
ll S
co
re
R = 0 .6 1 7
p = 0 .0 1 8
0 .0 0 0 0 .0 0 1 0 .0 0 2 0 .0 0 3 0 .0 0 4 0 .0 0 5
0
1 0
2 0
3 0
G ly c o ly t ic R e s e rv e V s
Im m e d ia te M e m o r y
G ly c o ly t ic R e s e rv e
(E C A R /C e ll N u m b e r)
Imm
ed
iate
Re
ca
ll S
co
re
R = 0 .5 4 1
p = 0 .0 4 5
0 .0 0 .5 1 .0 1 .5
0
1 0
2 0
3 0
E x tra c e llu la r L a c ta te V s
D e la y e d R e c a ll
E x tra c e llu la r L a c ta te (m M o f L a c ta te )
De
lay
ed
Re
ca
ll S
co
re
R = 0 .5 7 8
p = 0 .0 3 8
A
B
C
D
E
F
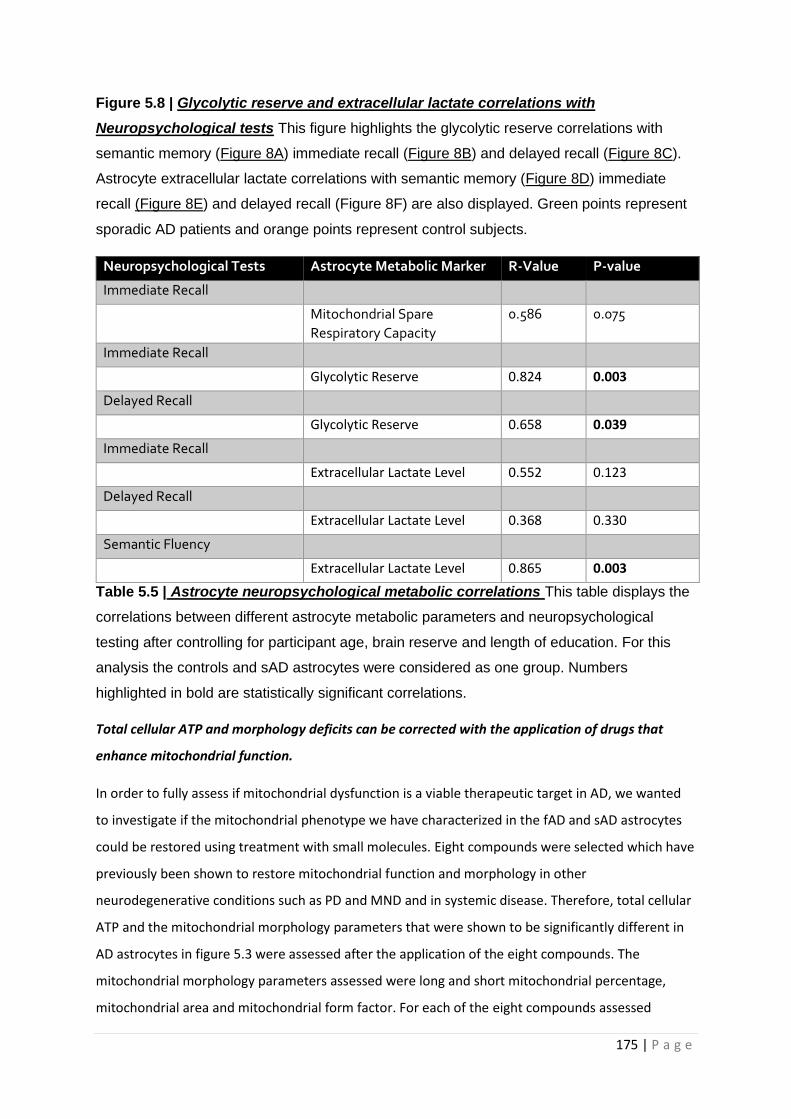
175 | P a g e
Figure 5.8 | Glycolytic reserve and extracellular lactate correlations with
Neuropsychological tests This figure highlights the glycolytic reserve correlations with
semantic memory (Figure 8A) immediate recall (Figure 8B) and delayed recall (Figure 8C).
Astrocyte extracellular lactate correlations with semantic memory (Figure 8D) immediate
recall (Figure 8E) and delayed recall (Figure 8F) are also displayed. Green points represent
sporadic AD patients and orange points represent control subjects.
Neuropsychological Tests Astrocyte Metabolic Marker R-Value P-value
Immediate Recall
Mitochondrial Spare
Respiratory Capacity
0.586 0.075
Immediate Recall
Glycolytic Reserve 0.824 0.003
Delayed Recall
Glycolytic Reserve 0.658 0.039
Immediate Recall
Extracellular Lactate Level 0.552 0.123
Delayed Recall
Extracellular Lactate Level 0.368 0.330
Semantic Fluency
Extracellular Lactate Level 0.865 0.003
Table 5.5 | Astrocyte neuropsychological metabolic correlations This table displays the
correlations between different astrocyte metabolic parameters and neuropsychological
testing after controlling for participant age, brain reserve and length of education. For this
analysis the controls and sAD astrocytes were considered as one group. Numbers
highlighted in bold are statistically significant correlations.
Total cellular ATP and morphology deficits can be corrected with the application of drugs that
enhance mitochondrial function.
In order to fully assess if mitochondrial dysfunction is a viable therapeutic target in AD, we wanted
to investigate if the mitochondrial phenotype we have characterized in the fAD and sAD astrocytes
could be restored using treatment with small molecules. Eight compounds were selected which have
previously been shown to restore mitochondrial function and morphology in other
neurodegenerative conditions such as PD and MND and in systemic disease. Therefore, total cellular
ATP and the mitochondrial morphology parameters that were shown to be significantly different in
AD astrocytes in figure 5.3 were assessed after the application of the eight compounds. The
mitochondrial morphology parameters assessed were long and short mitochondrial percentage,
mitochondrial area and mitochondrial form factor. For each of the eight compounds assessed
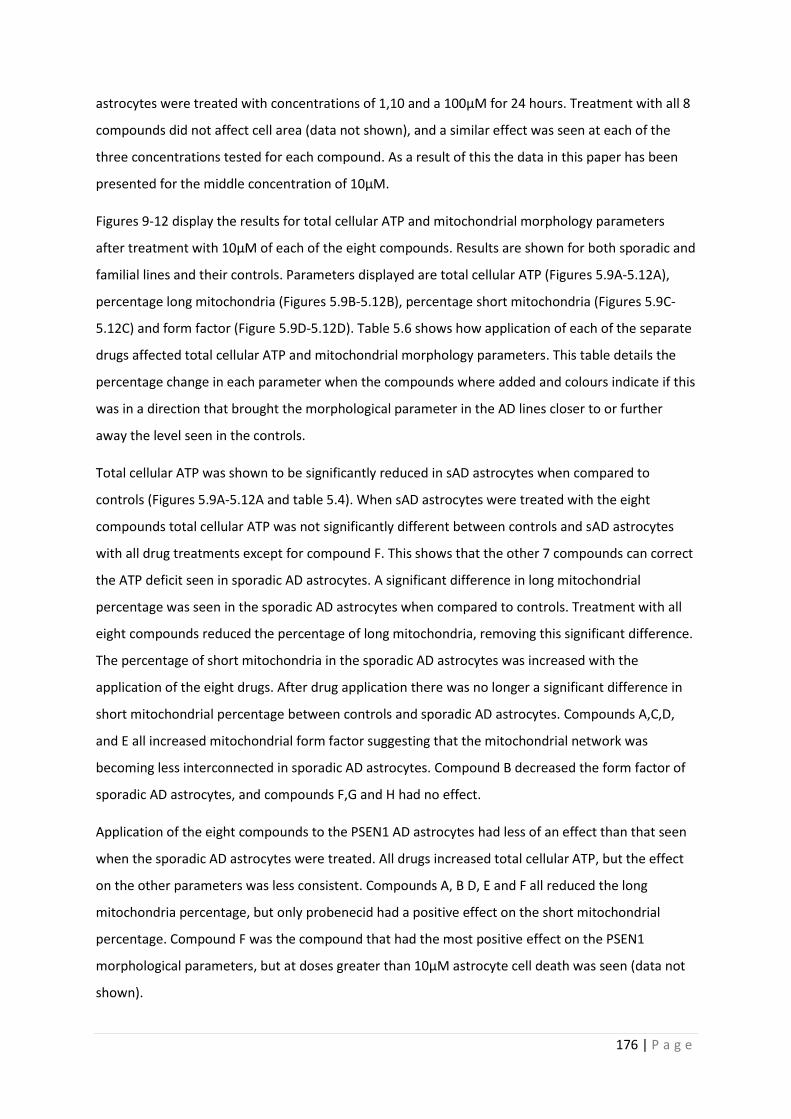
176 | P a g e
astrocytes were treated with concentrations of 1,10 and a 100µM for 24 hours. Treatment with all 8
compounds did not affect cell area (data not shown), and a similar effect was seen at each of the
three concentrations tested for each compound. As a result of this the data in this paper has been
presented for the middle concentration of 10µM.
Figures 9-12 display the results for total cellular ATP and mitochondrial morphology parameters
after treatment with 10µM of each of the eight compounds. Results are shown for both sporadic and
familial lines and their controls. Parameters displayed are total cellular ATP (Figures 5.9A-5.12A),
percentage long mitochondria (Figures 5.9B-5.12B), percentage short mitochondria (Figures 5.9C-
5.12C) and form factor (Figure 5.9D-5.12D). Table 5.6 shows how application of each of the separate
drugs affected total cellular ATP and mitochondrial morphology parameters. This table details the
percentage change in each parameter when the compounds where added and colours indicate if this
was in a direction that brought the morphological parameter in the AD lines closer to or further
away the level seen in the controls.
Total cellular ATP was shown to be significantly reduced in sAD astrocytes when compared to
controls (Figures 5.9A-5.12A and table 5.4). When sAD astrocytes were treated with the eight
compounds total cellular ATP was not significantly different between controls and sAD astrocytes
with all drug treatments except for compound F. This shows that the other 7 compounds can correct
the ATP deficit seen in sporadic AD astrocytes. A significant difference in long mitochondrial
percentage was seen in the sporadic AD astrocytes when compared to controls. Treatment with all
eight compounds reduced the percentage of long mitochondria, removing this significant difference.
The percentage of short mitochondria in the sporadic AD astrocytes was increased with the
application of the eight drugs. After drug application there was no longer a significant difference in
short mitochondrial percentage between controls and sporadic AD astrocytes. Compounds A,C,D,
and E all increased mitochondrial form factor suggesting that the mitochondrial network was
becoming less interconnected in sporadic AD astrocytes. Compound B decreased the form factor of
sporadic AD astrocytes, and compounds F,G and H had no effect.
Application of the eight compounds to the PSEN1 AD astrocytes had less of an effect than that seen
when the sporadic AD astrocytes were treated. All drugs increased total cellular ATP, but the effect
on the other parameters was less consistent. Compounds A, B D, E and F all reduced the long
mitochondria percentage, but only probenecid had a positive effect on the short mitochondrial
percentage. Compound F was the compound that had the most positive effect on the PSEN1
morphological parameters, but at doses greater than 10µM astrocyte cell death was seen (data not
shown).
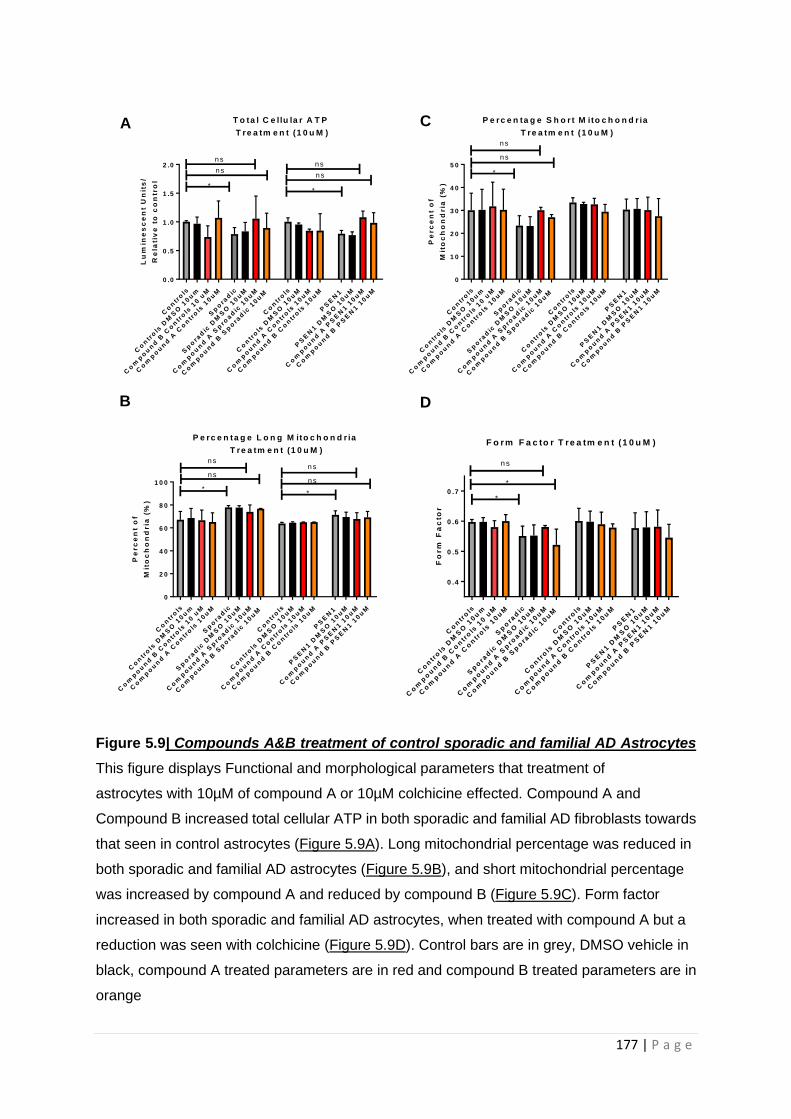
177 | P a g e
Figure 5.9| Compounds A&B treatment of control sporadic and familial AD Astrocytes
This figure displays Functional and morphological parameters that treatment of
astrocytes with 10µM of compound A or 10µM colchicine effected. Compound A and
Compound B increased total cellular ATP in both sporadic and familial AD fibroblasts towards
that seen in control astrocytes (Figure 5.9A). Long mitochondrial percentage was reduced in
both sporadic and familial AD astrocytes (Figure 5.9B), and short mitochondrial percentage
was increased by compound A and reduced by compound B (Figure 5.9C). Form factor
increased in both sporadic and familial AD astrocytes, when treated with compound A but a
reduction was seen with colchicine (Figure 5.9D). Control bars are in grey, DMSO vehicle in
black, compound A treated parameters are in red and compound B treated parameters are in
orange
Co
ntr
ols
Co
ntr
ols
DM
SO
10u
m
Co
mp
ou
nd
B C
on
tro
ls 1
0 u
M
Co
mp
ou
nd
A C
on
tro
ls 1
0u
M
Sp
ora
dic
Sp
ora
dic
DM
SO
10u
M
Co
mp
ou
nd
A S
pro
ad
ic 1
0u
M
Co
mp
ou
nd
B S
po
rad
ic 1
0u
M
Co
ntr
ols
Co
ntr
ols
DM
SO
10u
M
Co
mp
ou
nd
A C
on
tro
ls 1
0u
M
Co
mp
ou
nd
B C
on
tro
ls 1
0u
M
PS
EN
1
PS
EN
1 D
MS
O 1
0u
M
Co
mp
ou
nd
A P
SE
N1 1
0u
M
Co
mp
ou
nd
B P
SE
N1 1
0u
M
0 .4
0 .5
0 .6
0 .7
F o r m F a c to r T re a tm e n t (1 0 u M )F
orm
Fa
cto
r
*
ns
*
A
B
C
D
Co
ntr
ols
Co
ntr
ols
DM
SO
10u
m
Co
mp
ou
nd
B C
on
tro
ls 1
0 u
M
Co
mp
ou
nd
A C
on
tro
ls 1
0u
M
Sp
ora
dic
Sp
ora
dic
DM
SO
10u
M
Co
mp
ou
nd
A S
pro
ad
ic 1
0u
M
Co
mp
ou
nd
B S
po
rad
ic 1
0u
M
Co
ntr
ols
Co
ntr
ols
DM
SO
10u
M
Co
mp
ou
nd
A C
on
tro
ls 1
0u
M
Co
mp
ou
nd
B C
on
tro
ls 1
0u
M
PS
EN
1
PS
EN
1 D
MS
O 1
0u
M
Co
mp
ou
nd
A P
SE
N1 1
0u
M
Co
mp
ou
nd
B P
SE
N1 1
0u
M
0 .0
0 .5
1 .0
1 .5
2 .0
T o ta l C e llu la r A T P
T re a tm e n t (1 0 u M )L
um
ine
sc
en
t U
nit
s/
Re
lati
ve
to
co
ntr
ol
*
ns
ns
*
ns
ns
Co
ntr
ols
Co
ntr
ols
DM
SO
10u
m
Co
mp
ou
nd
B C
on
tro
ls 1
0 u
M
Co
mp
ou
nd
A C
on
tro
ls 1
0u
M
Sp
ora
dic
Sp
ora
dic
DM
SO
10u
M
Co
mp
ou
nd
A S
pro
ad
ic 1
0u
M
Co
mp
ou
nd
B S
po
rad
ic 1
0u
M
Co
ntr
ols
Co
ntr
ols
DM
SO
10u
M
Co
mp
ou
nd
A C
on
tro
ls 1
0u
M
Co
mp
ou
nd
B C
on
tro
ls 1
0u
M
PS
EN
1
PS
EN
1 D
MS
O 1
0u
M
Co
mp
ou
nd
A P
SE
N1 1
0u
M
Co
mp
ou
nd
B P
SE
N1 1
0u
M
0
1 0
2 0
3 0
4 0
5 0
P e rc e n ta g e S h o r t M ito c h o n d r ia
T re a tm e n t (1 0 u M )
Pe
rc
en
t o
f
Mit
oc
ho
nd
ria
(%
)
*
ns
ns
Co
ntr
ols
Co
ntr
ols
DM
SO
10u
m
Co
mp
ou
nd
B C
on
tro
ls 1
0 u
M
Co
mp
ou
nd
A C
on
tro
ls 1
0u
M
Sp
ora
dic
Sp
ora
dic
DM
SO
10u
M
Co
mp
ou
nd
A S
pro
ad
ic 1
0u
M
Co
mp
ou
nd
B S
po
rad
ic 1
0u
M
Co
ntr
ols
Co
ntr
ols
DM
SO
10u
M
Co
mp
ou
nd
A C
on
tro
ls 1
0u
M
Co
mp
ou
nd
B C
on
tro
ls 1
0u
M
PS
EN
1
PS
EN
1 D
MS
O 1
0u
M
Co
mp
ou
nd
A P
SE
N1 1
0u
M
Co
mp
ou
nd
B P
SE
N1 1
0u
M
0
2 0
4 0
6 0
8 0
1 0 0
P e rc e n ta g e L o n g M ito c h o n d r ia
T re a tm e n t (1 0 u M )
Pe
rc
en
t o
f
Mit
oc
ho
nd
ria
(%
)
*
ns
ns
*
ns
ns

178 | P a g e
Figure 5.10| Compounds C&D treatment of control, sporadic and familial AD
Astrocytes This figure displays functional and morphological parameters that treatment of
astrocytes with 10µM of compounds C or D effected. Compounds C & D increased total
cellular ATP in both sporadic and familial AD fibroblasts towards that seen in control
astrocytes (Figure 5.10A). Long mitochondrial percentage was reduced in both sporadic and
familial AD astrocytes (Figure 5.10B), and short mitochondrial percentage was increased by
compound C and reduced by compound D (Figure 5.10C). Compound C and compound D
had no effect on form factor in familial AD but showed an increase in sporadic AD astrocytes
(Figure 5.10D). Control bars are in grey, DMSO vehicle in black, compound C treated
parameters are in mint and compound D treated parameters are in green.
Co
ntr
ols
Co
ntr
ols
DM
SO
10u
m
Co
mp
ou
nd
D C
on
tro
ls 1
0u
M
Co
mp
ou
nd
C C
on
tro
ls 1
0u
M
Sp
ora
dic
Sp
ora
dic
DM
SO
10u
M
Co
mp
ou
nd
C S
pro
ad
ic 1
0u
M
Co
mp
ou
nd
D S
po
rad
ic 1
0u
M
Co
ntr
ols
Co
ntr
ols
DM
SO
10u
M
Co
mp
ou
nd
C C
on
tro
ls 1
0u
M
Co
mp
ou
nd
D C
on
tro
ls 1
0u
M
PS
EN
1
PS
EN
1 D
MS
O 1
0u
M
Co
mp
ou
nd
C P
SE
N1 1
0u
M
Co
mp
ou
nd
D P
SE
N1 1
0u
M
0 .4
0 .5
0 .6
0 .7
F o r m F a c to r T re a tm e n t (1 0 u M )F
orm
Fa
cto
r
*
ns
*
Co
ntr
ols
Co
ntr
ols
DM
SO
10u
m
Co
mp
ou
nd
D C
on
tro
ls 1
0u
M
Co
mp
ou
nd
C C
on
tro
ls 1
0u
M
Sp
ora
dic
Sp
ora
dic
DM
SO
10u
M
Co
mp
ou
nd
C S
pro
ad
ic 1
0u
M
Co
mp
ou
nd
D S
po
rad
ic 1
0u
M
Co
ntr
ols
Co
ntr
ols
DM
SO
10u
M
Co
mp
ou
nd
C C
on
tro
ls 1
0u
M
Co
mp
ou
nd
D C
on
tro
ls 1
0u
M
PS
EN
1
PS
EN
1 D
MS
O 1
0u
M
Co
mp
ou
nd
C P
SE
N1 1
0u
M
Co
mp
ou
nd
D P
SE
N1 1
0u
M
0
1 0
2 0
3 0
4 0
5 0
P e rc e n ta g e S h o r t M ito c h o n d r ia
T re a tm e n t (1 0 u M )
Pe
rc
en
t o
f
Mit
oc
ho
nd
ria
(%
)
*
ns
ns
ns
Co
ntr
ols
Co
ntr
ols
DM
SO
10u
m
Co
mp
ou
nd
D C
on
tro
ls 1
0u
M
Co
mp
ou
nd
C C
on
tro
ls 1
0u
M
Sp
ora
dic
Sp
ora
dic
DM
SO
10u
M
Co
mp
ou
nd
C S
pro
ad
ic 1
0u
M
Co
mp
ou
nd
D S
po
rad
ic 1
0u
M
Co
ntr
ols
Co
ntr
ols
DM
SO
10u
M
Co
mp
ou
nd
C C
on
tro
ls 1
0u
M
Co
mp
ou
nd
D C
on
tro
ls 1
0u
M
PS
EN
1
PS
EN
1 D
MS
O 1
0u
M
Co
mp
ou
nd
C P
SE
N1 1
0u
M
Co
mp
ou
nd
D P
SE
N1 1
0u
M
0
2 0
4 0
6 0
8 0
1 0 0
P e rc e n ta g e L o n g M ito c h o n d r ia
T re a tm e n t (1 0 u M )
Pe
rc
en
t o
f
Mit
oc
ho
nd
ria
(%
)
*
ns
ns
*
ns
ns
Co
ntr
ols
Co
ntr
ols
DM
SO
10u
m
Co
mp
ou
nd
D C
on
tro
ls 1
0u
M
Co
mp
ou
nd
C C
on
tro
ls 1
0u
M
Sp
ora
dic
Sp
ora
dic
DM
SO
10u
M
Co
mp
ou
nd
C S
pro
ad
ic 1
0u
M
Co
mp
ou
nd
D S
po
rad
ic 1
0u
M
Co
ntr
ols
Co
ntr
ols
DM
SO
10u
M
Co
mp
ou
nd
C C
on
tro
ls 1
0u
M
Co
mp
ou
nd
D C
on
tro
ls 1
0u
M
PS
EN
1
PS
EN
1 D
MS
O 1
0u
M
Co
mp
ou
nd
C P
SE
N1 1
0u
M
Co
mp
ou
nd
D P
SE
N1 1
0u
M
0 .0
0 .5
1 .0
1 .5
T o ta l C e llu la r A T P
T re a tm e n t (1 0 u M )L
um
ine
sc
en
t U
nit
s/
Re
lati
ve
to
co
ntr
ol
* *
ns
ns
*
ns
ns
B D
A C
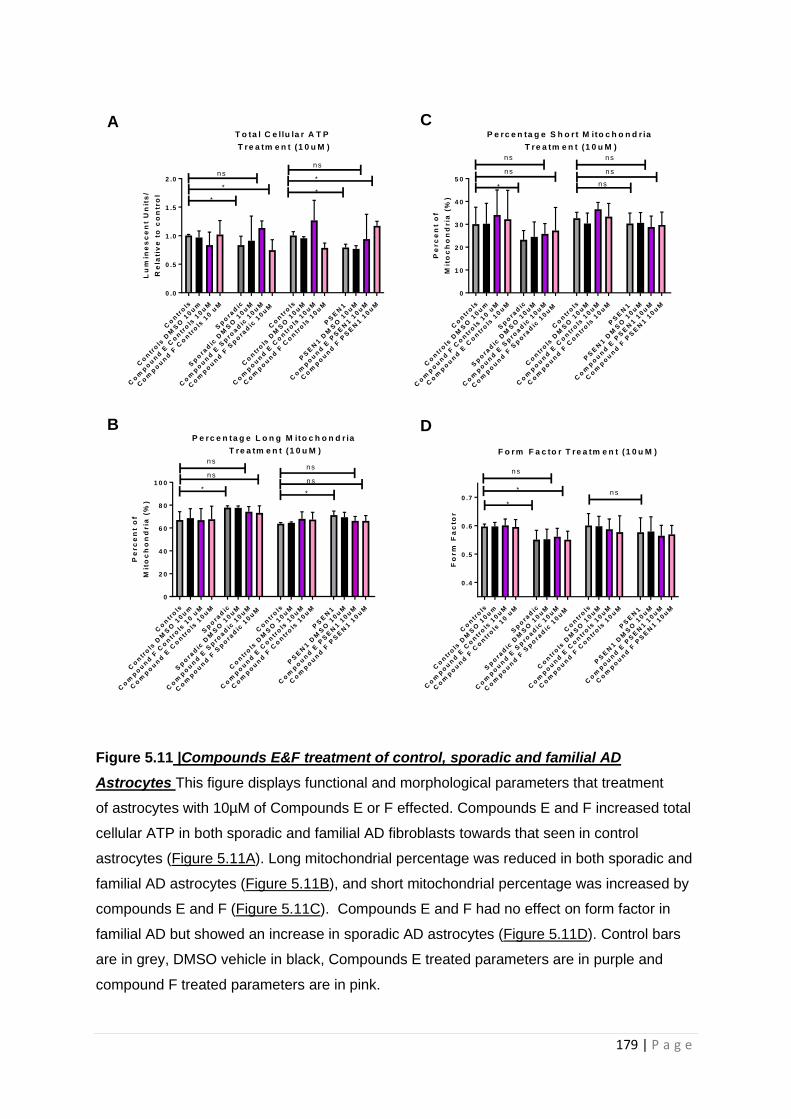
179 | P a g e
Figure 5.11 |Compounds E&F treatment of control, sporadic and familial AD
Astrocytes This figure displays functional and morphological parameters that treatment
of astrocytes with 10µM of Compounds E or F effected. Compounds E and F increased total
cellular ATP in both sporadic and familial AD fibroblasts towards that seen in control
astrocytes (Figure 5.11A). Long mitochondrial percentage was reduced in both sporadic and
familial AD astrocytes (Figure 5.11B), and short mitochondrial percentage was increased by
compounds E and F (Figure 5.11C). Compounds E and F had no effect on form factor in
familial AD but showed an increase in sporadic AD astrocytes (Figure 5.11D). Control bars
are in grey, DMSO vehicle in black, Compounds E treated parameters are in purple and
compound F treated parameters are in pink.
Co
ntr
ols
Co
ntr
ols
DM
SO
10u
m
Co
mp
ou
nd
E C
on
tro
ls 1
0u
M
Co
mp
ou
nd
F C
on
tro
ls 1
0 u
M
Sp
ora
dic
Sp
ora
dic
DM
SO
10u
M
Co
mp
ou
nd
E S
pro
ad
ic 1
0u
M
Co
mp
ou
nd
F S
po
rad
ic 1
0u
M
Co
ntr
ols
Co
ntr
ols
DM
SO
10u
M
Co
mp
ou
nd
E C
on
tro
ls 1
0u
M
Co
mp
ou
nd
F C
on
tro
ls 1
0u
M
PS
EN
1
PS
EN
1 D
MS
O 1
0u
M
Co
mp
ou
nd
E P
SE
N1 1
0u
M
Co
mp
ou
nd
F P
SE
N1 1
0u
M
0 .0
0 .5
1 .0
1 .5
2 .0
T o ta l C e llu la r A T P
T re a tm e n t (1 0 u M )L
um
ine
sc
en
t U
nit
s/
Re
lati
ve
to
co
ntr
ol
*
ns
**
ns
*
Co
ntr
ols
Co
ntr
ols
DM
SO
10u
m
Co
mp
ou
nd
F C
on
tro
ls 1
0 u
M
Co
mp
ou
nd
E C
on
tro
ls 1
0u
M
Sp
ora
dic
Sp
ora
dic
DM
SO
10u
M
Co
mp
ou
nd
E S
pro
ad
ic 1
0u
M
Co
mp
ou
nd
F S
po
rad
ic 1
0u
M
Co
ntr
ols
Co
ntr
ols
DM
SO
10u
M
Co
mp
ou
nd
E C
on
tro
ls 1
0u
M
Co
mp
ou
nd
F C
on
tro
ls 1
0u
M
PS
EN
1
PS
EN
1 D
MS
O 1
0u
M
Co
mp
ou
nd
E P
SE
N1 1
0u
M
Co
mp
ou
nd
F P
SE
N1 1
0u
M
0
1 0
2 0
3 0
4 0
5 0
P e rc e n ta g e S h o r t M ito c h o n d r ia
T re a tm e n t (1 0 u M )
Pe
rc
en
t o
f
Mit
oc
ho
nd
ria
(%
)
*
ns
ns
ns
ns
ns
Co
ntr
ols
Co
ntr
ols
DM
SO
10u
m
Co
mp
ou
nd
F C
on
tro
ls 1
0 u
M
Co
mp
ou
nd
E C
on
tro
ls 1
0u
M
Sp
ora
dic
Sp
ora
dic
DM
SO
10u
M
Co
mp
ou
nd
E S
pro
ad
ic 1
0u
M
Co
mp
ou
nd
F S
po
rad
ic 1
0u
M
Co
ntr
ols
Co
ntr
ols
DM
SO
10u
M
Co
mp
ou
nd
E C
on
tro
ls 1
0u
M
Co
mp
ou
nd
F C
on
tro
ls 1
0u
M
PS
EN
1
PS
EN
1 D
MS
O 1
0u
M
Co
mp
ou
nd
E P
SE
N1 1
0u
M
Co
mp
ou
nd
F P
SE
N1 1
0u
M
0
2 0
4 0
6 0
8 0
1 0 0
P e rc e n ta g e L o n g M ito c h o n d r ia
T re a tm e n t (1 0 u M )
Pe
rc
en
t o
f
Mit
oc
ho
nd
ria
(%
)
*
ns
ns
*
ns
ns
Co
ntr
ols
Co
ntr
ols
DM
SO
10u
m
Co
mp
ou
nd
E C
on
tro
ls 1
0u
M
Co
mp
ou
nd
F C
on
tro
ls 1
0 u
M
Sp
ora
dic
Sp
ora
dic
DM
SO
10u
M
Co
mp
ou
nd
E S
pro
ad
ic 1
0u
M
Co
mp
ou
nd
F S
po
rad
ic 1
0u
M
Co
ntr
ols
Co
ntr
ols
DM
SO
10u
M
Co
mp
ou
nd
E C
on
tro
ls 1
0u
M
Co
mp
ou
nd
F C
on
tro
ls 1
0u
M
PS
EN
1
PS
EN
1 D
MS
O 1
0u
M
Co
mp
ou
nd
E P
SE
N1 1
0u
M
Co
mp
ou
nd
F P
SE
N1 1
0u
M
0 .4
0 .5
0 .6
0 .7
F o r m F a c to r T re a tm e n t (1 0 u M )F
orm
Fa
cto
r
*
ns
* ns
B D
A C
180 | P a g e
Figure 5.12| Compound G & H treatment of control, sporadic and familial AD
Astrocytes This figure displays functional and morphological parameters that treatment of
astrocytes with 10µM of Compound G & H effected. Compound H decreased and compound
G increased total cellular ATP in both sporadic and familial AD astrocytes (Figure 5.12A).
Long mitochondrial percentage was reduced in both sporadic and familial AD astrocytes
(Figure 5.12B). Short mitochondrial percentage was increased by Compound G & H (Figure
5.12C). Compound G & H had no effect on form factor in familial AD but showed an increase
in sporadic AD astrocytes (Figure 5.12D). Control bars are in grey, DMSO vehicle in black,
compound H treated parameters are in light blue and compound G treated parameters are in
dark blue.
Co
ntr
ols
Co
ntr
ols
DM
SO
10u
m
Co
mp
ou
nd
G C
on
tro
ls 1
0u
M
Co
mp
ou
nd
H C
on
tro
ls 1
0 u
M
Sp
ora
dic
Sp
ora
dic
DM
SO
10u
M
Co
mp
ou
nd
G S
pro
ad
ic 1
0u
M
Co
mp
ou
nd
H S
po
rad
ic 1
0u
M
Co
ntr
ols
Co
ntr
ols
DM
SO
10u
M
Co
mp
ou
nd
G C
on
tro
ls 1
0u
M
Co
mp
ou
nd
H C
on
tro
ls 1
0u
M
PS
EN
1
PS
EN
1 D
MS
O 1
0u
M
Co
mp
ou
nd
G P
SE
N1 1
0u
M
Co
mp
ou
nd
H P
SE
N1 1
0u
M
0 .0
0 .5
1 .0
1 .5
2 .0
T o ta l C e llu la r A T P
T re a tm e n t (1 0 u M )
Lu
min
es
ce
nt
Un
its
/
Re
lati
ve
to
co
ntr
ol
*
ns
ns
*
*
ns
Co
ntr
ols
Co
ntr
ols
DM
SO
10u
m
Co
mp
ou
nd
H C
on
tro
ls 1
0 u
M
Co
mp
ou
nd
G C
on
tro
ls 1
0u
M
Sp
ora
dic
Sp
ora
dic
DM
SO
10u
M
Co
mp
ou
nd
G S
pro
ad
ic 1
0u
M
Co
mp
ou
nd
H S
po
rad
ic 1
0u
M
Co
ntr
ols
Co
ntr
ols
DM
SO
10u
M
Co
mp
ou
nd
G C
on
tro
ls 1
0u
M
Co
mp
ou
nd
H C
on
tro
ls 1
0u
M
PS
EN
1
PS
EN
1 D
MS
O 1
0u
M
Co
mp
ou
nd
G P
SE
N1 1
0u
M
Co
mp
ou
nd
H P
SE
N1 1
0u
M
0
1 0
2 0
3 0
4 0
5 0
P e rc e n ta g e S h o r t M ito c h o n d r ia
T re a tm e n t (1 0 u M )
Pe
rc
en
t o
f
Mit
oc
ho
nd
ria
(%
)
ns
ns
ns
ns
ns
ns
Co
ntr
ols
Co
ntr
ols
DM
SO
10u
m
Co
mp
ou
nd
H C
on
tro
ls 1
0 u
M
Co
mp
ou
nd
G C
on
tro
ls 1
0u
M
Sp
ora
dic
Sp
ora
dic
DM
SO
10u
M
Co
mp
ou
nd
G S
pro
ad
ic 1
0u
M
Co
mp
ou
nd
H S
po
rad
ic 1
0u
M
Co
ntr
ols
Co
ntr
ols
DM
SO
10u
M
Co
mp
ou
nd
G C
on
tro
ls 1
0u
M
Co
mp
ou
nd
H C
on
tro
ls 1
0u
M
PS
EN
1
PS
EN
1 D
MS
O 1
0u
M
Co
mp
ou
nd
G P
SE
N1 1
0u
M
Co
mp
ou
nd
H P
SE
N1 1
0u
M
0
2 0
4 0
6 0
8 0
1 0 0
P e rc e n ta g e L o n g M ito c h o n d r ia
T re a tm e n t (1 0 u M )
Pe
rc
en
t o
f
Mit
oc
ho
nd
ria
(%
)
*
ns
ns
*
ns
ns
Co
ntr
ols
Co
ntr
ols
DM
SO
10u
m
Co
mp
ou
nd
H C
on
tro
ls 1
0 u
M
Co
mp
ou
nd
G C
on
tro
ls 1
0u
M
Sp
ora
dic
Sp
ora
dic
DM
SO
10u
M
Co
mp
ou
nd
G S
pro
ad
ic 1
0u
M
Co
mp
ou
nd
H S
po
rad
ic 1
0u
M
Co
ntr
ols
Co
ntr
ols
DM
SO
10u
M
Co
mp
ou
nd
G C
on
tro
ls 1
0u
M
Co
mp
ou
nd
H C
on
tro
ls 1
0u
M
PS
EN
1
PS
EN
1 D
MS
O 1
0u
M
Co
mp
ou
nd
G P
SE
N1 1
0u
M
Co
mp
ou
nd
H P
SE
N1 1
0u
M
0 .4
0 .5
0 .6
0 .7
F o r m F a c to r T re a tm e n t (1 0 u M )
Fo
rm
Fa
cto
r
*
ns
ns
ns
ns
ns
B D
A C
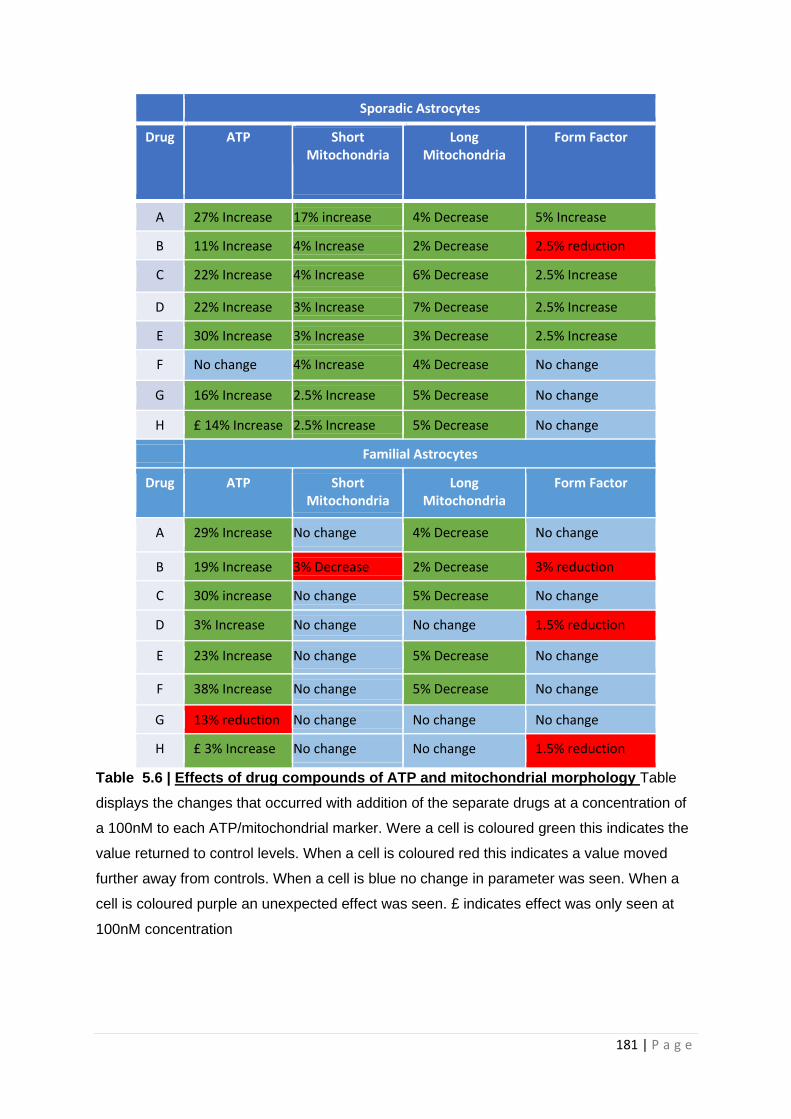
181 | P a g e
Table 5.6 | Effects of drug compounds of ATP and mitochondrial morphology Table
displays the changes that occurred with addition of the separate drugs at a concentration of
a 100nM to each ATP/mitochondrial marker. Were a cell is coloured green this indicates the
value returned to control levels. When a cell is coloured red this indicates a value moved
further away from controls. When a cell is blue no change in parameter was seen. When a
cell is coloured purple an unexpected effect was seen. £ indicates effect was only seen at
100nM concentration
Sporadic Astrocytes
Drug ATP Short Mitochondria
Long Mitochondria
Form Factor
A 27% Increase 17% increase 4% Decrease 5% Increase
B 11% Increase 4% Increase 2% Decrease 2.5% reduction
C 22% Increase 4% Increase 6% Decrease 2.5% Increase
D 22% Increase 3% Increase 7% Decrease 2.5% Increase
E 30% Increase 3% Increase 3% Decrease 2.5% Increase
F No change 4% Increase 4% Decrease No change
G 16% Increase 2.5% Increase 5% Decrease No change
H £ 14% Increase 2.5% Increase 5% Decrease No change
Familial Astrocytes
Drug ATP Short Mitochondria
Long Mitochondria
Form Factor
A 29% Increase No change 4% Decrease No change
B 19% Increase 3% Decrease 2% Decrease 3% reduction
C 30% increase No change 5% Decrease No change
D 3% Increase No change No change 1.5% reduction
E 23% Increase No change 5% Decrease No change
F 38% Increase No change 5% Decrease No change
G 13% reduction No change No change No change
H £ 3% Increase No change No change 1.5% reduction
182 | P a g e
5.2.6 Discussion
In this study we have shown that astrocytes derived from patients with both sporadic and familial
AD have deficits in key metabolic pathways, including several mitochondrial abnormalities and
glycolytic abnormalities. That some of these abnormalities correlate with neuropsychological
abnormalities seen early AD, and that certain small molecule compounds can correct these
abnormalities. In the discussion we will discuss the three elements of the paper separately.
5.2.1 The AD astrocyte metabolic phenotype
Our study builds upon limited studies available to date of metabolism in astrocytes derived from AD
patients. One of the few published studies utilizing astrocytes derived from AD patients, found
decreased rate of glycolysis, decreased glycolytic reserve and lower extracellular lactate levels in
astrocytes derived from 3 PSEN1 mutation carriers when compared to controls [389]. Here we
confirm the same changes in glycolytic pathways in astrocytes derived via an alternative
reprogramming method and different PSEN1 patients; furthermore we add to the literature finding
this same glycolytic profile in sporadic AD astrocytes. Other studies that have investigated glycolysis
in AD astrocytes have used cells from either PM brain tissue, or animal models of disease, although
specific data about astrocyte glycolysis is limited. The activity of Phosphofructokinase (PFK), the
enzyme that converts fructose-6-phosphate into fructose-1,6-bisphosphate is thought to have
increased activity in the astrocytes of people with AD [278]. There is also evidence that several other
enzymes of the glycolytic pathway are upregulated in the PM AD brain including lactate
dehydrogenase and pyruvate kinase [277, 279]. In this study we have shown parameters that focus
on the overall rate of glycolysis are lower in AD astrocytes, this could be consistent with several
enzymes of the pathway having increased activity. Both the results from our study and the evidence
of increased enzyme activity could be explained by a reduced glucose uptake by the astrocyte. There
is evidence that the glucose transporters GLUT1&3 have reduced expression as AD progresses [280],
which could lead a situation in which astrocytes have lower overall rates of glycolysis, but increase
enzyme activity to compensate. Human imaging studies also suggest that the brain has a reduced
glucose uptake in both ageing and AD [274] this could be explained by a reduced number of glucose
receptors in the brain, or a decreased ability to perform glycolysis in astrocytes as seen here.
Studies of enzyme activity in fibroblasts from patients with sporadic AD have shown a reduction in
the activity of hexokinase, the first enzyme in the glycolytic pathway, [281]. It has also been shown
that fibroblasts from sporadic AD patients rely more on glycolysis than controls, but have a limited
ability to increase glucose uptake [282]. These abnormalities in fibroblasts from patients with AD
may explain the changes we see here in the glycolytic function of our astrocytes derived from
183 | P a g e
fibroblasts. It could be argued that the changes in glycolytic function seen in this study are an
expression of changes in fibroblast glycolysis and may not be found in true primary astrocytes. The
astrocyte cells produced in this study though have a completely different expression profile to that
their parent fibroblasts. The metabolic profile of the astrocytes produced in this project is also
different to that of the fibroblasts that they are reprogrammed from. The parent fibroblasts do not
have deficits in glycolytic capacity or glycolysis rate and on a group level total cellular ATP is effected
much less [477, 478]. Therefore, it is reasonable to assume that the changes seen in this in vitro
astrocyte model reflect changes that would be present in vivo. Further evidence to support that
these changes may reflect in vivo astrocytes metabolic change in AD comes from data highlighting
that the brain becomes less sensitive to glucose uptake through the course of AD, and the fact that
the majority glucose metabolism within the brain is thought to be linked to astrocytic maintenance
of glutamatergic synapses [306] These are strong indicators that the abnormalities seen in this study,
and that by Oksanen [389] are reflective of changes to glycolysis in primary astrocytes and not just
tessellations of fibroblast glycolytic function.
It has previously been shown that astrocytes can shuttle lactate to neurons as a fuel source, with
neurons having a preference for lactate over glucose in times of increased energy expenditure [308-
310]. In this study we have shown that astrocytes from both sporadic and familial AD patients have
reduced extracellular lactate levels, which has potential consequences for the neuron astrocyte
relationship. Neurons rely mainly on OxPHOS to meet their energy requirements [302], as a result of
this they are at high risk of oxidative damage from free radicals produced via the electron transport
chain. It has been shown that lactate preference, as an energy source, in neurons allows for the
utilization of neuronal glucose to produce antioxidant molecules such as glutathione via the
pentose-phosphate shunt (PPS) [308]. If the supply of astrocyte lactate is impaired to neurons, as the
results from this study would suggest is the case in AD, then there would be an increase in oxidative
damage to neurons in AD, as a result of glucose being diverted away from the PPS . Oxidative
damage to neurons has been reported when AD astrocytes are co-cultured with non-AD neurons
[389], and in multiple PM studies of the AD brain [337, 501, 502]. This suggests that decreased
release of lactate from astrocytes, may have a pivotal role in the pathogenesis of AD, and therefore
would make a suitable future therapeutic target.
In this study as well as deficits in astrocyte glycolysis we have also identified changes in
mitochondrial function and morphology. Previous work on human derived fAD astrocytes has
suggested that the oxygen consumption rate (OCR) is higher than that of matched controls [389].
Trends towards deficits in MSRC have also been identified but have not been shown to be significant
[503]. Both these studies focus on the same 3 PSEN1 astrocyte lines. The changes in MSRC are
184 | P a g e
consistent with what we found in this study, although we found a significant decrease. The basal
OCR in our study was significantly lower in AD astrocytes which is the opposite finding seen by
Oksanen and colleagues [389]. The difference seen here may be explained by the fact that we have
studied point mutations in the PSEN1 gene that cause AD, whereas the Oksanen group have studied
astrocytes created from an exon 9 deletion model of AD. In this study we have shown that astrocytes
are more dependent on glycolysis than OxPHOS for ATP production. Potentially the exon 9 deletion
causes a more severe glycolysis deficit than the point mutations that we have investigated in this
study. This would lead to a greater reliance on OxPHOS, and my lead to higher OCR rates.
The morphology of the mitochondrial network is altered in both sporadic and familial AD astrocytes
showing longer mitochondria that are more interconnected. Potentially these changes could suggest
that the astrocyte is under metabolic stress, and the trend towards an increase in the percentage of
perinuclear mitochondria would suggest a collapsing mitochondrial network. As the AD astrocytes
have a deficit in glycolysis as well as OxPHOS, it is difficult to know if the mitochondrial changes seen
are a consequence of glucose metabolism failure, leading to an increased need for OxPHOS, or if the
astrocytes have inherent deficits in mitochondrial function. The fact that MSRC and glycolytic
reserve were significantly reduced in both sporadic and familial AD astrocytes, suggests primary
deficits in both metabolic pathways, as opposed to the glycolysis defect causing a secondary
mitochondrial functional change. The reduction in mitochondrial cellular ATP production when
complex I substrates are supplied to astrocytes, is also further evidence of a primary deficit in
OxPHOS.
In our previous work in AD fibroblasts using the same sporadic lines we see very similar
mitochondrial morphological changes [477]. The changes we see to the astrocyte mitochondrial
network in AD in this study are likely to lead to increased production of reactive oxygen species, as
they are very suggestive of a stressed mitochondrial network. Astrocytes are exposed to increased
amounts of oxidative stress in AD due to the accumulation of amyloid beta within them [370].
Potentially, the changes in mitochondrial structure and changes to OxPHOS and glycolysis reported
here would be able to propagate a cycle of increasing oxidative damage and decreased metabolic
function in a brain exposed to increased amounts of amyloid beta.
This study offers further characterisation of astrocyte OxPHOS and glycolysis in both sporadic and
familial AD. We have highlighted that glycolysis is significantly impaired in AD astrocytes, and that
this is likely to affect their ability to support neuronal function. Further work is needed to identify
the mechanistic basis of the OxPHOS, and glycolysis deficits identified in the study. This would
include examination of glycolytic enzyme function, quantification of GLUT receptors on the
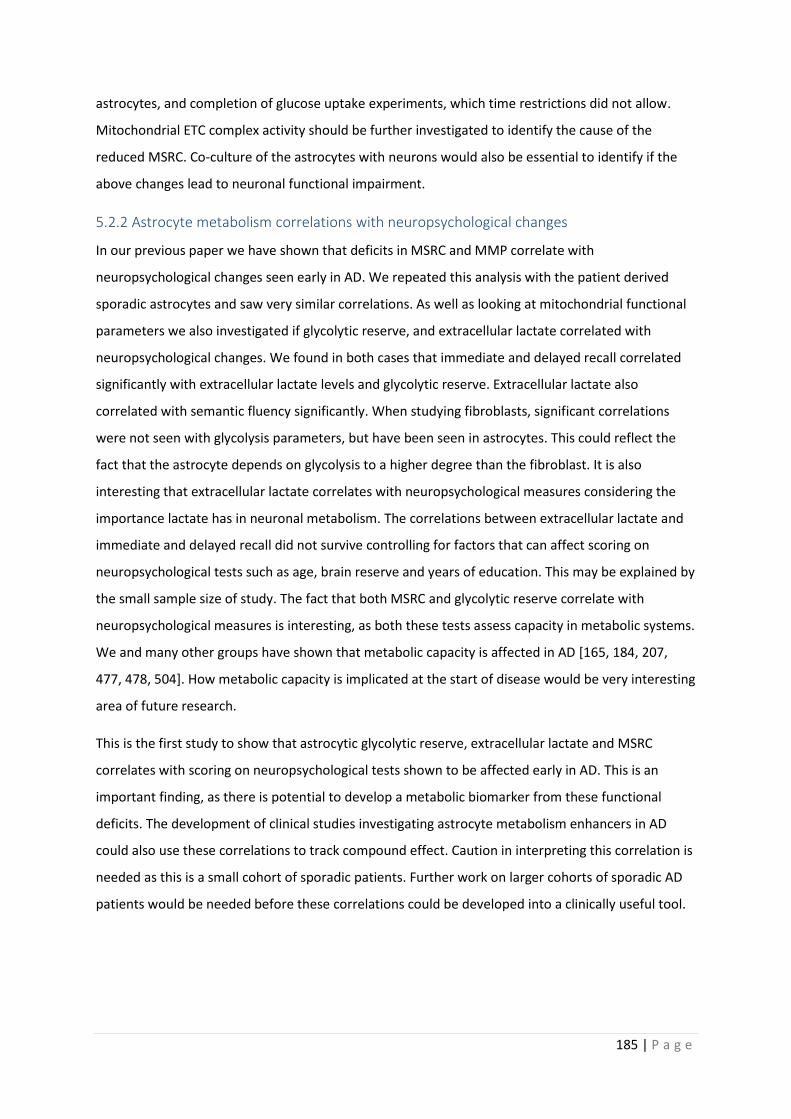
185 | P a g e
astrocytes, and completion of glucose uptake experiments, which time restrictions did not allow.
Mitochondrial ETC complex activity should be further investigated to identify the cause of the
reduced MSRC. Co-culture of the astrocytes with neurons would also be essential to identify if the
above changes lead to neuronal functional impairment.
5.2.2 Astrocyte metabolism correlations with neuropsychological changes
In our previous paper we have shown that deficits in MSRC and MMP correlate with
neuropsychological changes seen early in AD. We repeated this analysis with the patient derived
sporadic astrocytes and saw very similar correlations. As well as looking at mitochondrial functional
parameters we also investigated if glycolytic reserve, and extracellular lactate correlated with
neuropsychological changes. We found in both cases that immediate and delayed recall correlated
significantly with extracellular lactate levels and glycolytic reserve. Extracellular lactate also
correlated with semantic fluency significantly. When studying fibroblasts, significant correlations
were not seen with glycolysis parameters, but have been seen in astrocytes. This could reflect the
fact that the astrocyte depends on glycolysis to a higher degree than the fibroblast. It is also
interesting that extracellular lactate correlates with neuropsychological measures considering the
importance lactate has in neuronal metabolism. The correlations between extracellular lactate and
immediate and delayed recall did not survive controlling for factors that can affect scoring on
neuropsychological tests such as age, brain reserve and years of education. This may be explained by
the small sample size of study. The fact that both MSRC and glycolytic reserve correlate with
neuropsychological measures is interesting, as both these tests assess capacity in metabolic systems.
We and many other groups have shown that metabolic capacity is affected in AD [165, 184, 207,
477, 478, 504]. How metabolic capacity is implicated at the start of disease would be very interesting
area of future research.
This is the first study to show that astrocytic glycolytic reserve, extracellular lactate and MSRC
correlates with scoring on neuropsychological tests shown to be affected early in AD. This is an
important finding, as there is potential to develop a metabolic biomarker from these functional
deficits. The development of clinical studies investigating astrocyte metabolism enhancers in AD
could also use these correlations to track compound effect. Caution in interpreting this correlation is
needed as this is a small cohort of sporadic patients. Further work on larger cohorts of sporadic AD
patients would be needed before these correlations could be developed into a clinically useful tool.
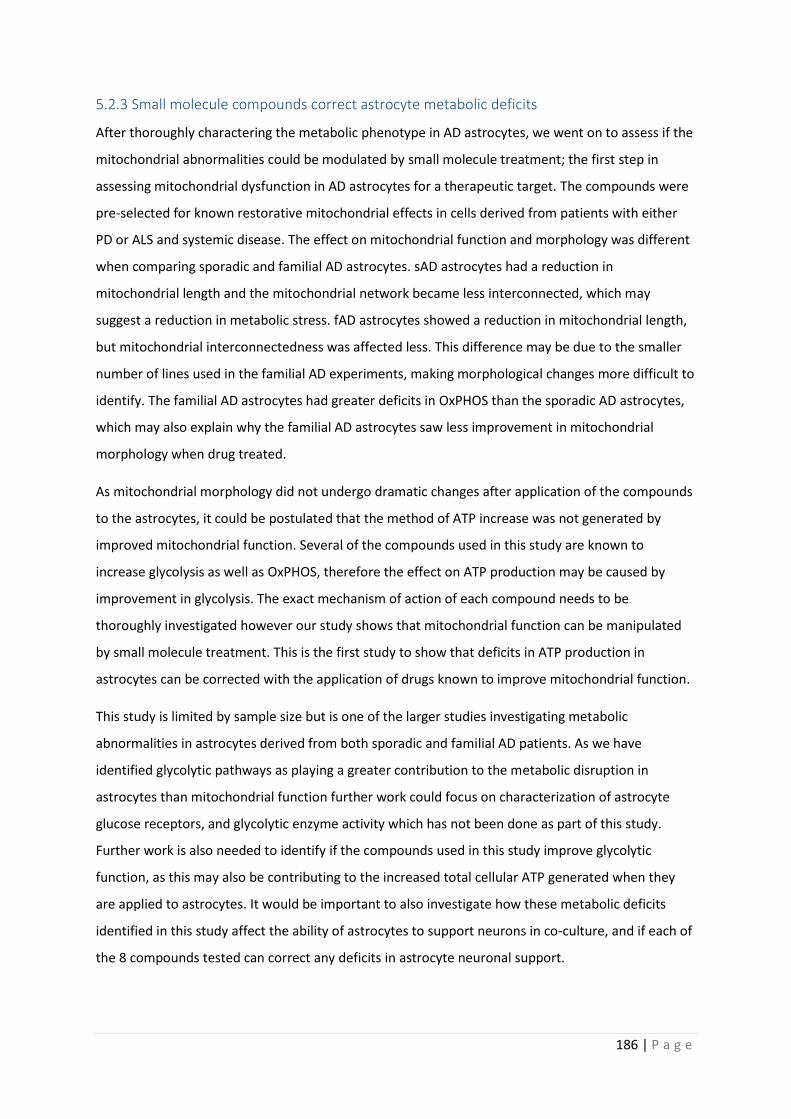
186 | P a g e
5.2.3 Small molecule compounds correct astrocyte metabolic deficits
After thoroughly charactering the metabolic phenotype in AD astrocytes, we went on to assess if the
mitochondrial abnormalities could be modulated by small molecule treatment; the first step in
assessing mitochondrial dysfunction in AD astrocytes for a therapeutic target. The compounds were
pre-selected for known restorative mitochondrial effects in cells derived from patients with either
PD or ALS and systemic disease. The effect on mitochondrial function and morphology was different
when comparing sporadic and familial AD astrocytes. sAD astrocytes had a reduction in
mitochondrial length and the mitochondrial network became less interconnected, which may
suggest a reduction in metabolic stress. fAD astrocytes showed a reduction in mitochondrial length,
but mitochondrial interconnectedness was affected less. This difference may be due to the smaller
number of lines used in the familial AD experiments, making morphological changes more difficult to
identify. The familial AD astrocytes had greater deficits in OxPHOS than the sporadic AD astrocytes,
which may also explain why the familial AD astrocytes saw less improvement in mitochondrial
morphology when drug treated.
As mitochondrial morphology did not undergo dramatic changes after application of the compounds
to the astrocytes, it could be postulated that the method of ATP increase was not generated by
improved mitochondrial function. Several of the compounds used in this study are known to
increase glycolysis as well as OxPHOS, therefore the effect on ATP production may be caused by
improvement in glycolysis. The exact mechanism of action of each compound needs to be
thoroughly investigated however our study shows that mitochondrial function can be manipulated
by small molecule treatment. This is the first study to show that deficits in ATP production in
astrocytes can be corrected with the application of drugs known to improve mitochondrial function.
This study is limited by sample size but is one of the larger studies investigating metabolic
abnormalities in astrocytes derived from both sporadic and familial AD patients. As we have
identified glycolytic pathways as playing a greater contribution to the metabolic disruption in
astrocytes than mitochondrial function further work could focus on characterization of astrocyte
glucose receptors, and glycolytic enzyme activity which has not been done as part of this study.
Further work is also needed to identify if the compounds used in this study improve glycolytic
function, as this may also be contributing to the increased total cellular ATP generated when they
are applied to astrocytes. It would be important to also investigate how these metabolic deficits
identified in this study affect the ability of astrocytes to support neurons in co-culture, and if each of
the 8 compounds tested can correct any deficits in astrocyte neuronal support.
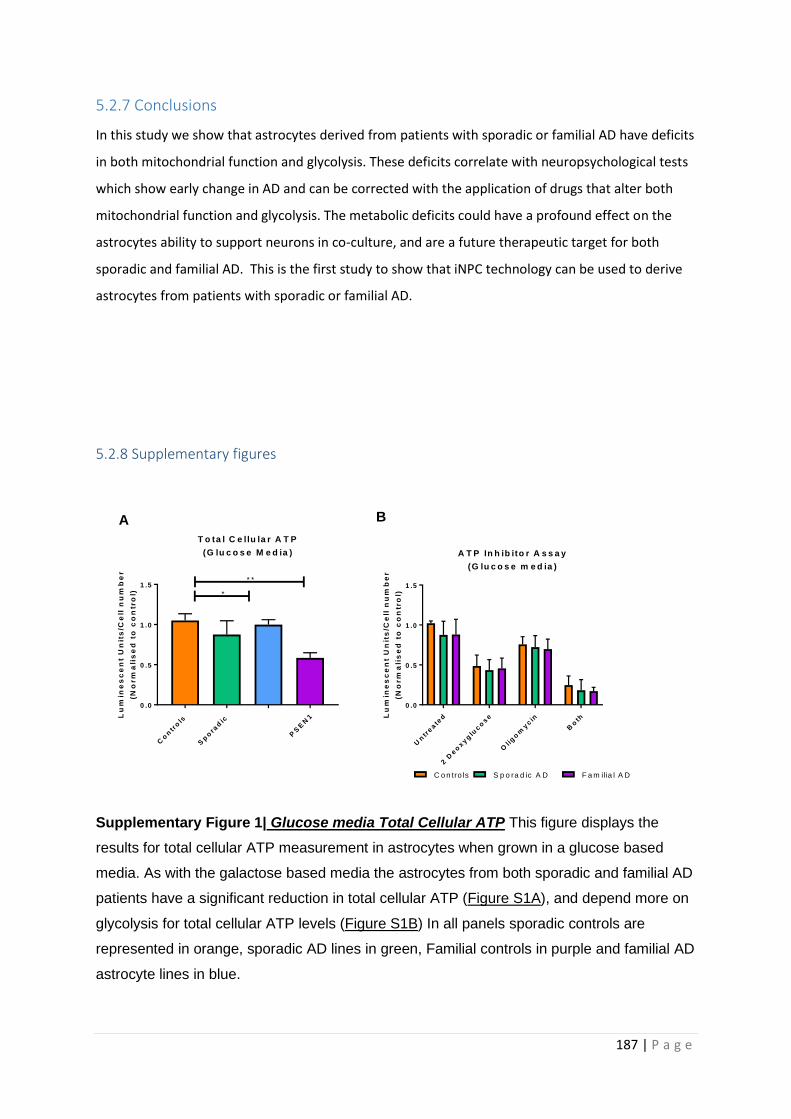
187 | P a g e
5.2.7 Conclusions
In this study we show that astrocytes derived from patients with sporadic or familial AD have deficits
in both mitochondrial function and glycolysis. These deficits correlate with neuropsychological tests
which show early change in AD and can be corrected with the application of drugs that alter both
mitochondrial function and glycolysis. The metabolic deficits could have a profound effect on the
astrocytes ability to support neurons in co-culture, and are a future therapeutic target for both
sporadic and familial AD. This is the first study to show that iNPC technology can be used to derive
astrocytes from patients with sporadic or familial AD.
5.2.8 Supplementary figures
Supplementary Figure 1| Glucose media Total Cellular ATP This figure displays the
results for total cellular ATP measurement in astrocytes when grown in a glucose based
media. As with the galactose based media the astrocytes from both sporadic and familial AD
patients have a significant reduction in total cellular ATP (Figure S1A), and depend more on
glycolysis for total cellular ATP levels (Figure S1B) In all panels sporadic controls are
represented in orange, sporadic AD lines in green, Familial controls in purple and familial AD
astrocyte lines in blue.
Un
treate
d
2 D
eo
xyg
luco
se
Olig
om
ycin
Bo
th
0 .0
0 .5
1 .0
1 .5
A T P In h ib ito r A s s a y
(G lu c o s e m e d ia )
Lu
min
es
ce
nt
Un
its
/Ce
ll n
um
be
r
(No
rm
ali
se
d t
o c
on
tro
l)
C o n tro ls S p o ra d ic A D F a m ilia l A D
Co
ntr
ols
Sp
ora
dic
PS
EN
1
0 .0
0 .5
1 .0
1 .5
T o ta l C e llu la r A T P
(G lu c o s e M e d ia )
Lu
min
es
ce
nt
Un
its
/Ce
ll n
um
be
r
(No
rm
ali
se
d t
o c
on
tro
l) *
* *
A B
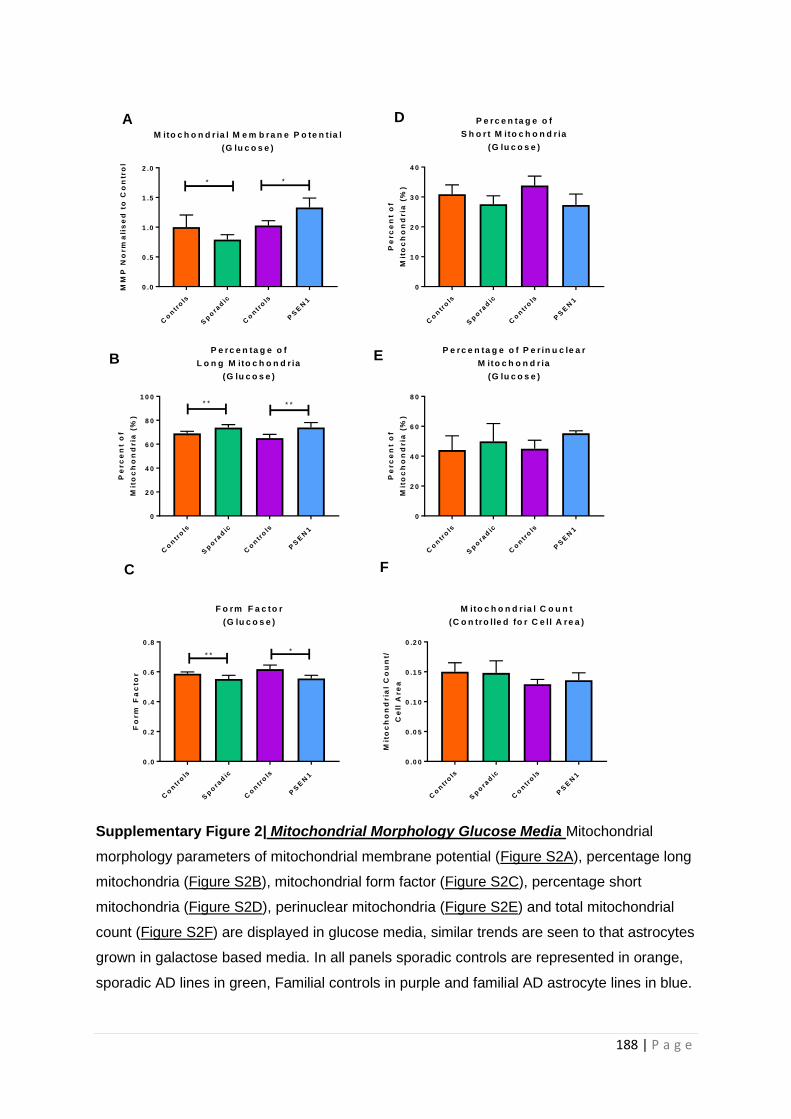
188 | P a g e
Supplementary Figure 2| Mitochondrial Morphology Glucose Media Mitochondrial
morphology parameters of mitochondrial membrane potential (Figure S2A), percentage long
mitochondria (Figure S2B), mitochondrial form factor (Figure S2C), percentage short
mitochondria (Figure S2D), perinuclear mitochondria (Figure S2E) and total mitochondrial
count (Figure S2F) are displayed in glucose media, similar trends are seen to that astrocytes
grown in galactose based media. In all panels sporadic controls are represented in orange,
sporadic AD lines in green, Familial controls in purple and familial AD astrocyte lines in blue.
Co
ntr
ols
Sp
ora
dic
Co
ntr
ols
PS
EN
1
0 .0
0 .5
1 .0
1 .5
2 .0
M ito c h o n d r ia l M e m b ra n e P o te n t ia l
(G lu c o s e )
MM
P N
orm
ali
se
d t
o C
on
tro
l
**
Co
ntr
ols
Sp
ora
dic
Co
ntr
ols
PS
EN
1
0
2 0
4 0
6 0
8 0
1 0 0
P e r c e n ta g e o f
L o n g M ito c h o n d r ia
(G lu c o s e )
Pe
rc
en
t o
f
Mit
oc
ho
nd
ria
(%
)
* * * *
Co
ntr
ols
Sp
ora
dic
Co
ntr
ols
PS
EN
1
0
1 0
2 0
3 0
4 0
P e r c e n ta g e o f
S h o r t M ito c h o n d r ia
(G lu c o s e )
Pe
rc
en
t o
f
Mit
oc
ho
nd
ria
(%
)
Co
ntr
ols
Sp
ora
dic
Co
ntr
ols
PS
EN
1
0
2 0
4 0
6 0
8 0
P e rc e n ta g e o f P e r in u c le a r
M ito c h o n d r ia
(G lu c o s e )
Pe
rc
en
t o
f
Mit
oc
ho
nd
ria
(%
)
Co
ntr
ols
Sp
ora
dic
Co
ntr
ols
PS
EN
1
0 .0
0 .2
0 .4
0 .6
0 .8
F o rm F a c to r
(G lu c o s e )
Fo
rm
Fa
cto
r
* **
A D
B E
C F
Co
ntr
ols
Sp
ora
dic
Co
ntr
ols
PS
EN
1
0 .0 0
0 .0 5
0 .1 0
0 .1 5
0 .2 0
M ito c h o n d r ia l C o u n t
(C o n tro lle d fo r C e ll A re a )
Mit
oc
ho
nd
ria
l C
ou
nt/
Ce
ll A
re
a
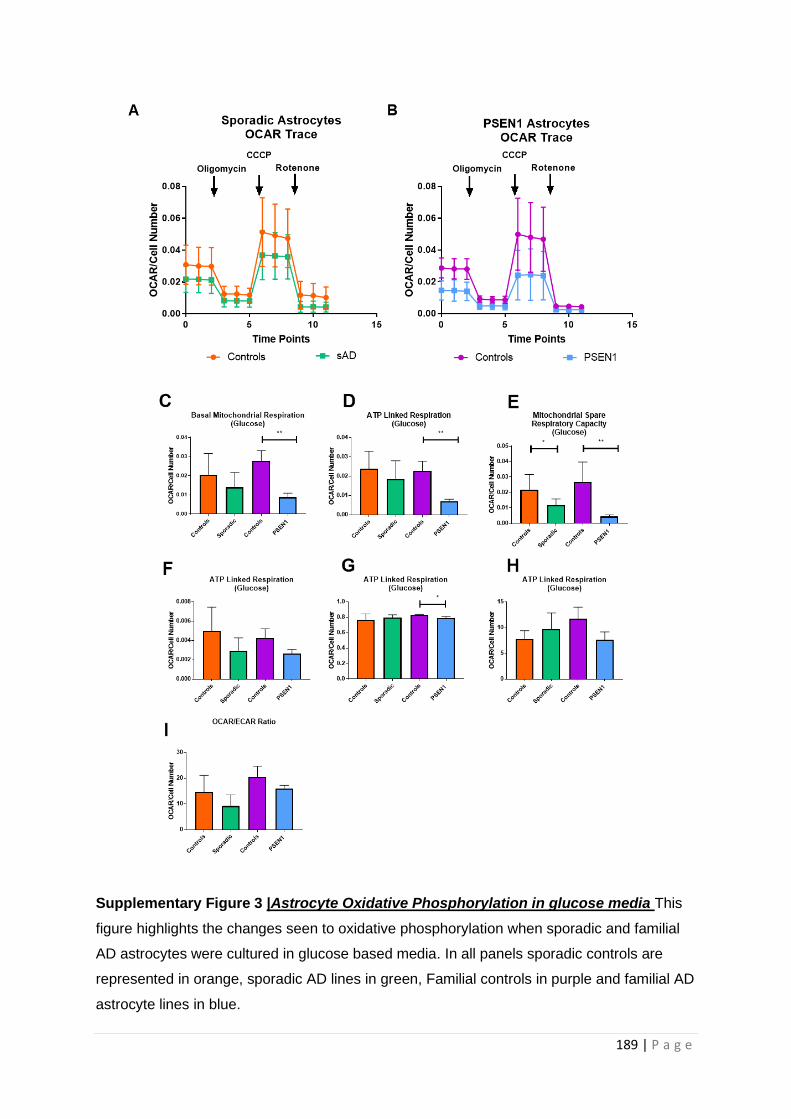
189 | P a g e
Supplementary Figure 3 |Astrocyte Oxidative Phosphorylation in glucose media This
figure highlights the changes seen to oxidative phosphorylation when sporadic and familial
AD astrocytes were cultured in glucose based media. In all panels sporadic controls are
represented in orange, sporadic AD lines in green, Familial controls in purple and familial AD
astrocyte lines in blue.
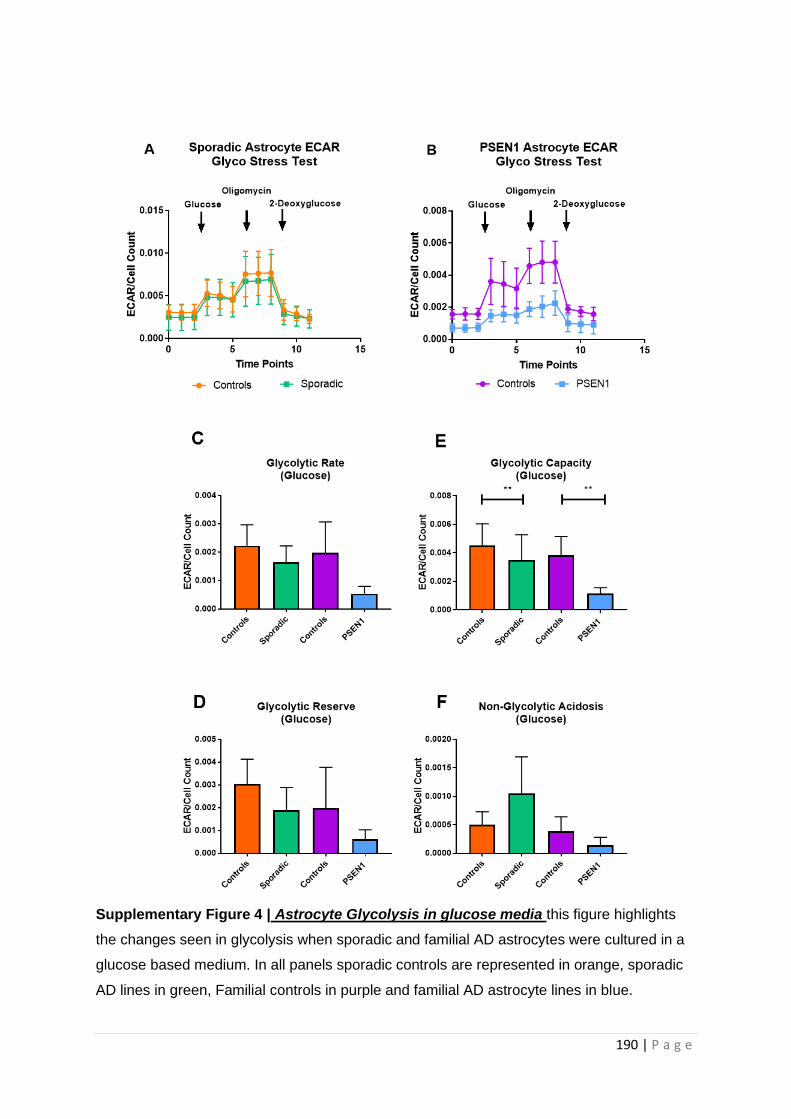
190 | P a g e
Supplementary Figure 4 | Astrocyte Glycolysis in glucose media this figure highlights
the changes seen in glycolysis when sporadic and familial AD astrocytes were cultured in a
glucose based medium. In all panels sporadic controls are represented in orange, sporadic
AD lines in green, Familial controls in purple and familial AD astrocyte lines in blue.

191 | P a g e
END OF CHAPTER PAPER
192 | P a g e
5.3 Additional results
5.3.1 Total cellular ATP levels are lower in ApoE ε4/4 genotype astrocytes
Astrocyte sporadic lines were divided based on ApoE genotype which showed a significant reduction
in total cellular ATP in the ApoE ε4/4 genotype group (36% reduction p=0.001) when compared to
controls (Figure 5.11A). A non-significant reduction in total cellular ATP was seen in the 3/4 and 2/3
genotypes but not in the 3/3 genotype. Of note ApoE genotype was not available for one of the sAD
astrocyte lines.
5.3.2 Astrocyte glycolytic and mitochondrial abnormalities are independent of ApoE
genotype
A reduction in MSRC and MMP was seen in all sporadic ApoE genotypes, but no particular genotype
showed a greater deficit than another. When comparing each separate group of sAD lines split by
ApoE to controls no significant differences were seen. This is a similar finding to that seen in the
sporadic fibroblast group as discussed in chapter 3 in sections 3.3.3 and 3.3.4 (Figures 5.11 B&C).
Glycolysis markers were also investigated for differences based on ApoE genotype. No significant
difference in sAD astrocyte glycolytic reserve was seen when lines were split via ApoE genotype
(Figure 5.11D). This finding was the same in the sAD fibroblasts. When investigating extracellular
lactate levels there was a significant reduction in extracellular lactate in the ApoE ε4/4 genotype
when compared to controls (75% reduction 0=0.0007, see Figure 5.11E). All sAD ApoE genotypes
showed a reduction in extracellular lactate levels in sAD astrocytes, with the ApoE ε2/3 genotype
having a similar reduction in extracellular lactate to that seen in the 4/4 genotype. No significant
difference based on ApoE ε3/4 or 3/3 genotype was seen in extracellular lactate in sporadic AD
fibroblasts. Glycolysis rate was also investigated, but no difference in ApoE was seen (data not
shown). Sporadic AD astrocyte groups split based on ApoE genotype where compared using a one-
way ANOVA to look for genotype differences. No significant difference was seen between sporadic
AD astrocytes with different ApoE genotypes, when compared to each other.
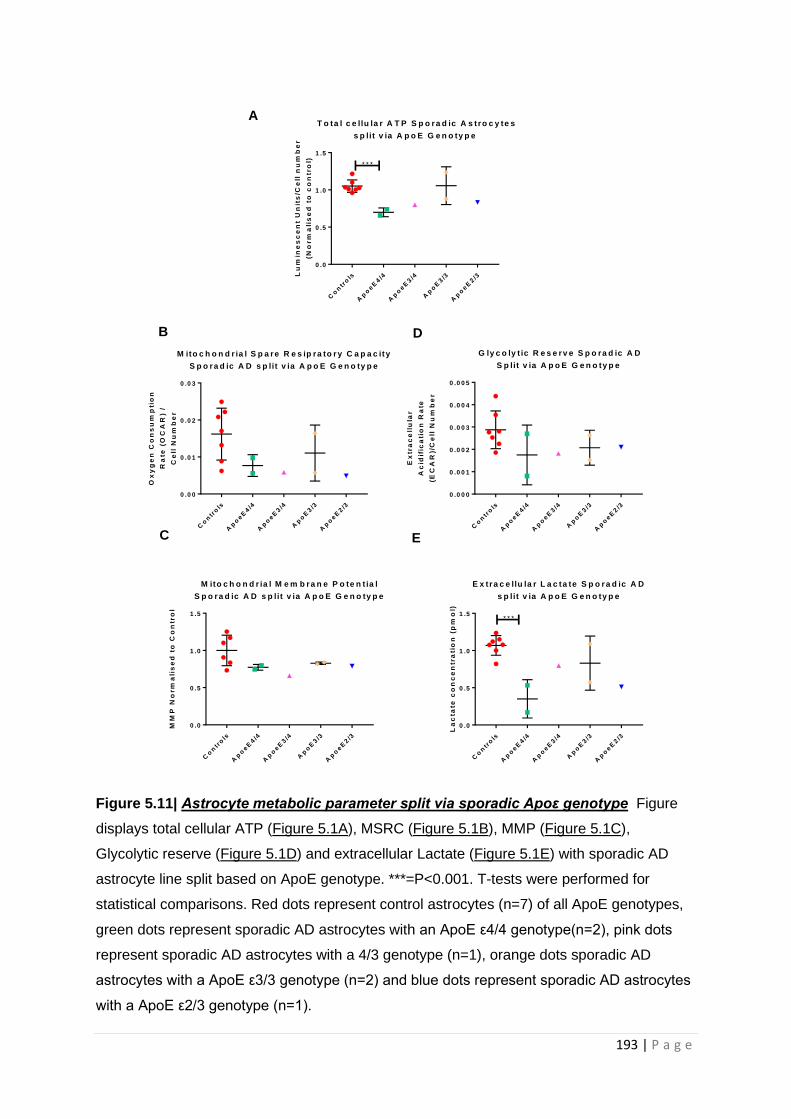
193 | P a g e
Figure 5.11| Astrocyte metabolic parameter split via sporadic Apoε genotype Figure
displays total cellular ATP (Figure 5.1A), MSRC (Figure 5.1B), MMP (Figure 5.1C),
Glycolytic reserve (Figure 5.1D) and extracellular Lactate (Figure 5.1E) with sporadic AD
astrocyte line split based on ApoE genotype. ***=P<0.001. T-tests were performed for
statistical comparisons. Red dots represent control astrocytes (n=7) of all ApoE genotypes,
green dots represent sporadic AD astrocytes with an ApoE ε4/4 genotype(n=2), pink dots
represent sporadic AD astrocytes with a 4/3 genotype (n=1), orange dots sporadic AD
astrocytes with a ApoE ε3/3 genotype (n=2) and blue dots represent sporadic AD astrocytes
with a ApoE ε2/3 genotype (n=1).
Co
ntr
ols
Ap
oeE
4/4
Ap
oeE
3/4
Ap
oE
3/3
Ap
oeE
2/3
0 .0
0 .5
1 .0
1 .5
T o ta l c e llu la r A T P S p o ra d ic A s tro c y te s
s p lit v ia A p o E G e n o ty p e
Lu
min
es
ce
nt
Un
its
/Ce
ll n
um
be
r
(No
rm
ali
se
d t
o c
on
tro
l)
* * *
Co
ntr
ols
Ap
oeE
4/4
Ap
oeE
3/4
Ap
oE
3/3
Ap
oeE
2/3
0 .0 0
0 .0 1
0 .0 2
0 .0 3
M ito c h o n d r ia l S p a re R e s ip ra to r y C a p a c ity
S p o ra d ic A D s p lit v ia A p o E G e n o ty p e
Ox
yg
en
Co
ns
um
pti
on
Ra
te (
OC
AR
) /
Ce
ll N
um
be
r
Co
ntr
ols
Ap
oeE
4/4
Ap
oeE
3/4
Ap
oE
3/3
Ap
oeE
2/3
0 .0
0 .5
1 .0
1 .5
M ito c h o n d r ia l M e m b ra n e P o te n t ia l
S p o ra d ic A D s p lit v ia A p o E G e n o ty p e
MM
P N
orm
ali
se
d t
o C
on
tro
l
Co
ntr
ols
Ap
oeE
4/4
Ap
oeE
3/4
Ap
oE
3/3
Ap
oeE
2/3
0 .0 0 0
0 .0 0 1
0 .0 0 2
0 .0 0 3
0 .0 0 4
0 .0 0 5
G ly c o ly t ic R e s e rv e S p o ra d ic A D
S p lit v ia A p o E G e n o ty p e
Ex
tra
ce
llu
lar
Ac
idif
ica
tio
n R
ate
(EC
AR
)/C
ell
Nu
mb
er
Co
ntr
ols
Ap
oeE
4/4
Ap
oeE
3/4
Ap
oE
3/3
Ap
oeE
2/3
0 .0
0 .5
1 .0
1 .5
E x tra c e llu la r L a c ta te S p o ra d ic A D
s p lit v ia A p o E G e n o ty p e
La
cta
te c
on
ce
ntr
ati
on
(p
mo
l)
* * *
A
B
C
D
E

194 | P a g e
For control astrocytes the variance between different ApoE genotypes was assessed prior to
investigating the effect of ApoE genotype on sporadic AD astrocytes. As with control fibroblasts,
described in chapters 3&4, no significant difference between control astrocyte genotypes was seen
when comparing ApoE groups. Figure 5.13 displays this data.
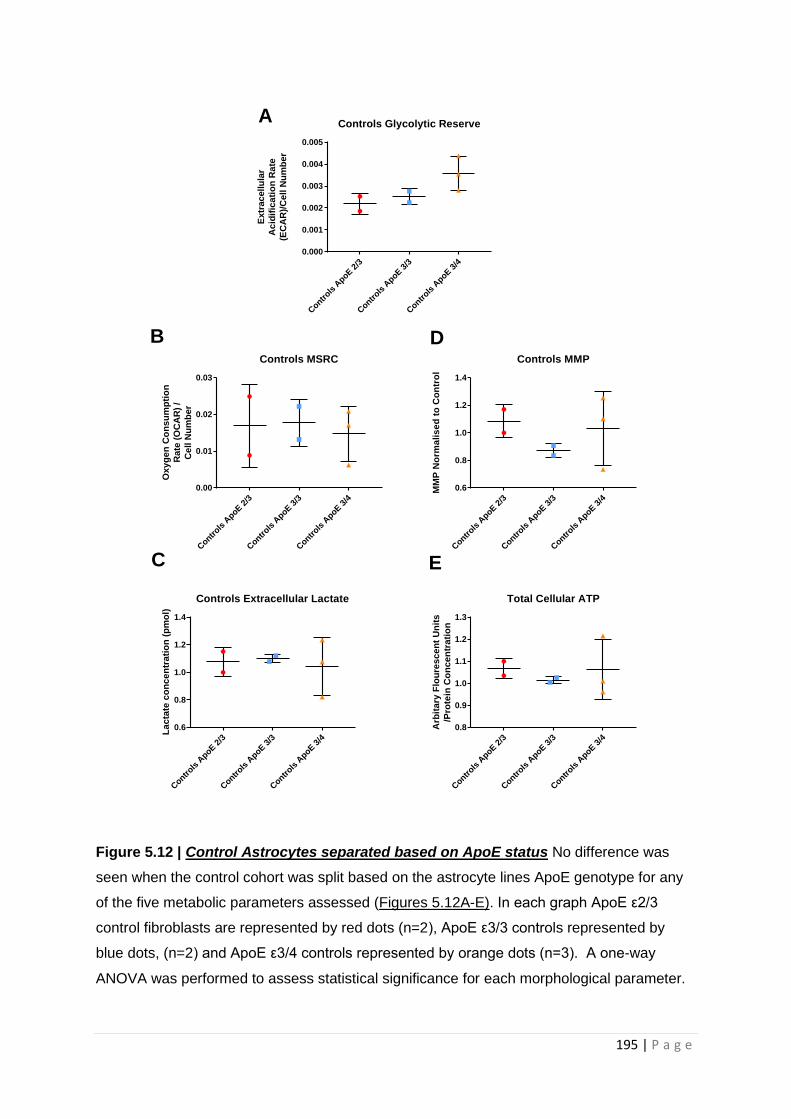
195 | P a g e
Figure 5.12 | Control Astrocytes separated based on ApoE status No difference was
seen when the control cohort was split based on the astrocyte lines ApoE genotype for any
of the five metabolic parameters assessed (Figures 5.12A-E). In each graph ApoE ε2/3
control fibroblasts are represented by red dots (n=2), ApoE ε3/3 controls represented by
blue dots, (n=2) and ApoE ε3/4 controls represented by orange dots (n=3). A one-way
ANOVA was performed to assess statistical significance for each morphological parameter.
Contr
ols A
poE 2/3
Contr
ols A
poE 3/3
Contr
ols A
poE 3/4
0.000
0.001
0.002
0.003
0.004
0.005
Controls Glycolytic Reserve
Extr
ac
ellu
lar
Ac
idif
ica
tio
n R
ate
(EC
AR
)/C
ell N
um
ber
Contr
ols A
poE 2
/3
Contr
ols A
poE 3
/3
Contr
ols A
poE 3
/4
0.00
0.01
0.02
0.03
Controls MSRC
Ox
yg
en
Co
ns
um
pti
on
Rate
(O
CA
R)
/
Ce
ll N
um
ber
Contr
ols A
poE 2
/3
Contr
ols A
poE 3
/3
Contr
ols A
poE 3
/4
0.6
0.8
1.0
1.2
1.4
Controls MMP
MM
P N
orm
ali
se
d t
o C
on
tro
l
Contr
ols A
poE 2
/3
Contr
ols A
poE 3
/3
Contr
ols A
poE 3
/4
0.6
0.8
1.0
1.2
1.4
Controls Extracellular Lactate
La
cta
te c
on
ce
ntr
ati
on
(p
mo
l)
Contr
ols A
poE 2
/3
Contr
ols A
poE 3
/3
Contr
ols A
poE 3
/4
0.8
0.9
1.0
1.1
1.2
1.3
Total Cellular ATP
Arb
ita
ry F
lou
res
ce
nt
Un
its
/Pro
tein
Co
nc
en
tra
tio
n
A
B
C
D
E
196 | P a g e
5.3.3 Extracellular lactate levels correlate with DMN connectivity changes
DMN connectivity was investigated in the same way as previously described for fibroblasts detailed
in chapter 4. MSRC, Glycolytic reserve and Extracellular Lactate were assessed for DMN correlations,
as these parameters had correlations with neuropsychological parameters described in the chapter 5
paper. Bilateral prefrontal connectivity and right inferior parietal lobule connectivity were assessed
for each metabolic parameter, as these connectivity areas showed positive correlations in
fibroblasts. No significant correlations were seen between MSRC and bilateral frontal connectivity,
or right inferior parietal lobule connectivity (Figures 5.13 A&B). No significant correlations were seen
between glycolytic reserve and bilateral frontal connectivity, or right inferior parietal lobule
connectivity (Figure 5.13 C&D). With extracellular lactate levels no significant difference was seen
with and bilateral frontal connectivity, (Figure 5.13E), but a significant positive correlation was seen
between extracellular lactate levels and right inferior parietal lobule connectivity (R=0.788, p=0.001
see Figure 5.13F).
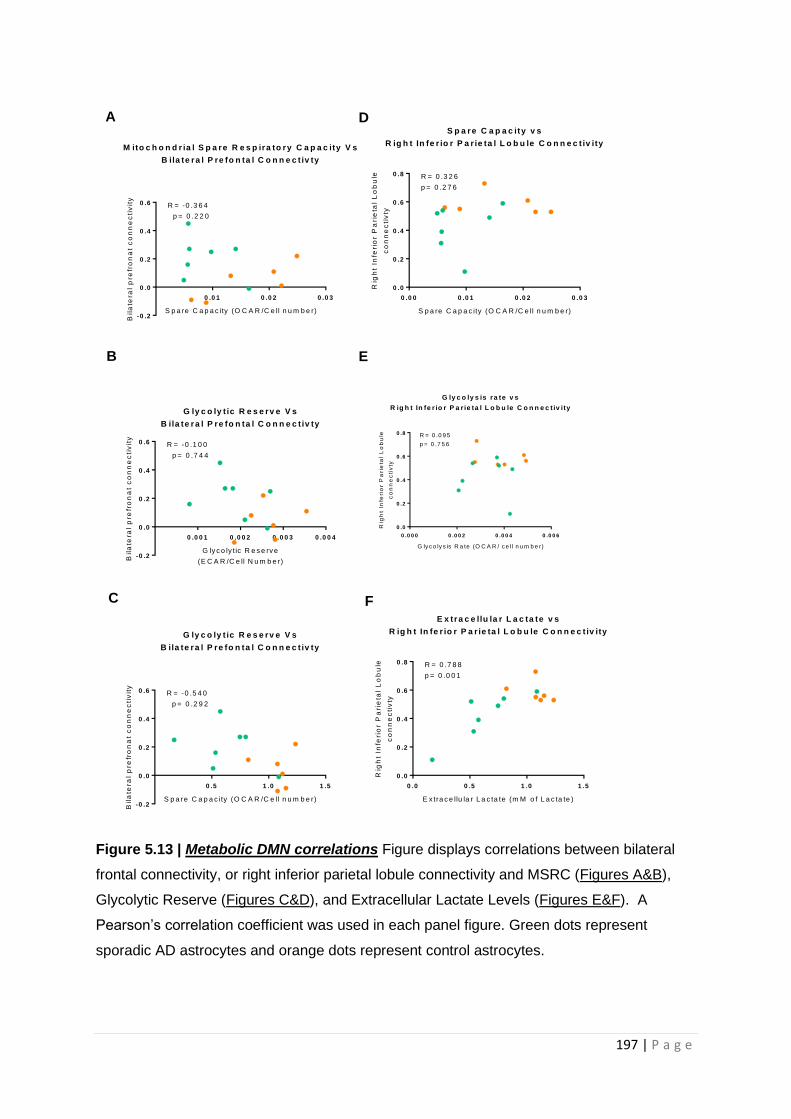
197 | P a g e
Figure 5.13 | Metabolic DMN correlations Figure displays correlations between bilateral
frontal connectivity, or right inferior parietal lobule connectivity and MSRC (Figures A&B),
Glycolytic Reserve (Figures C&D), and Extracellular Lactate Levels (Figures E&F). A
Pearson’s correlation coefficient was used in each panel figure. Green dots represent
sporadic AD astrocytes and orange dots represent control astrocytes.
0 .0 1 0 .0 2 0 .0 3
-0 .2
0 .0
0 .2
0 .4
0 .6
M ito c h o n d r ia l S p a re R e s p ira to ry C a p a c ity V s
B ila te ra l P re fo n ta l C o n n e c t iv ty
S p a re C a p a c ity (O C A R /C e ll n u m b e r)
Bil
ate
ral
pre
fro
na
t c
on
ne
cti
vit
y
R = -0 .3 6 4
p = 0 .2 2 0
0 .0 0 0 .0 1 0 .0 2 0 .0 3
0 .0
0 .2
0 .4
0 .6
0 .8
S p a re C a p a c ity v s
R ig h t In fe r io r P a r ie ta l L o b u le C o n n e c t iv ity
S p a re C a p a c ity (O C A R /C e ll n u m b e r)
Rig
ht
Infe
rio
r P
ari
eta
l L
ob
ule
co
nn
ec
tiv
ty
R = 0 .3 2 6
p = 0 .2 7 6
0 .0 0 1 0 .0 0 2 0 .0 0 3 0 .0 0 4
-0 .2
0 .0
0 .2
0 .4
0 .6
G ly c o ly t ic R e s e rv e V s
B ila te ra l P re fo n ta l C o n n e c t iv ty
G ly c o ly t ic R e s e rv e
(E C A R /C e ll N u m b e r)Bil
ate
ral
pre
fro
na
t c
on
ne
cti
vit
y
R = -0 .1 0 0
p = 0 .7 4 4
0 .5 1 .0 1 .5
-0 .2
0 .0
0 .2
0 .4
0 .6
G ly c o ly t ic R e s e rv e V s
B ila te ra l P re fo n ta l C o n n e c t iv ty
S p a re C a p a c ity (O C A R /C e ll n u m b e r)
Bil
ate
ral
pre
fro
na
t c
on
ne
cti
vit
y
R = -0 .5 4 0
p = 0 .2 9 2
0 .0 0 .5 1 .0 1 .5
0 .0
0 .2
0 .4
0 .6
0 .8
E x tra c e llu la r L a c ta te v s
R ig h t In fe r io r P a r ie ta l L o b u le C o n n e c t iv ity
E x tra c e llu la r L a c ta te (m M o f L a c ta te )
Rig
ht
Infe
rio
r P
ari
eta
l L
ob
ule
co
nn
ec
tiv
ty
R = 0 .7 8 8
p = 0 .0 0 1
0 .0 0 0 0 .0 0 2 0 .0 0 4 0 .0 0 6
0 .0
0 .2
0 .4
0 .6
0 .8
G ly c o ly s is ra te v s
R ig h t In fe r io r P a r ie ta l L o b u le C o n n e c t iv ity
G ly c o ly s is R a te (O C A R / c e ll n u m b e r)
Rig
ht
Infe
rio
r P
ari
eta
l L
ob
ule
co
nn
ec
tiv
ty
R = 0 .0 9 5
p = 0 .7 5 6
A
B
C
D
E
F
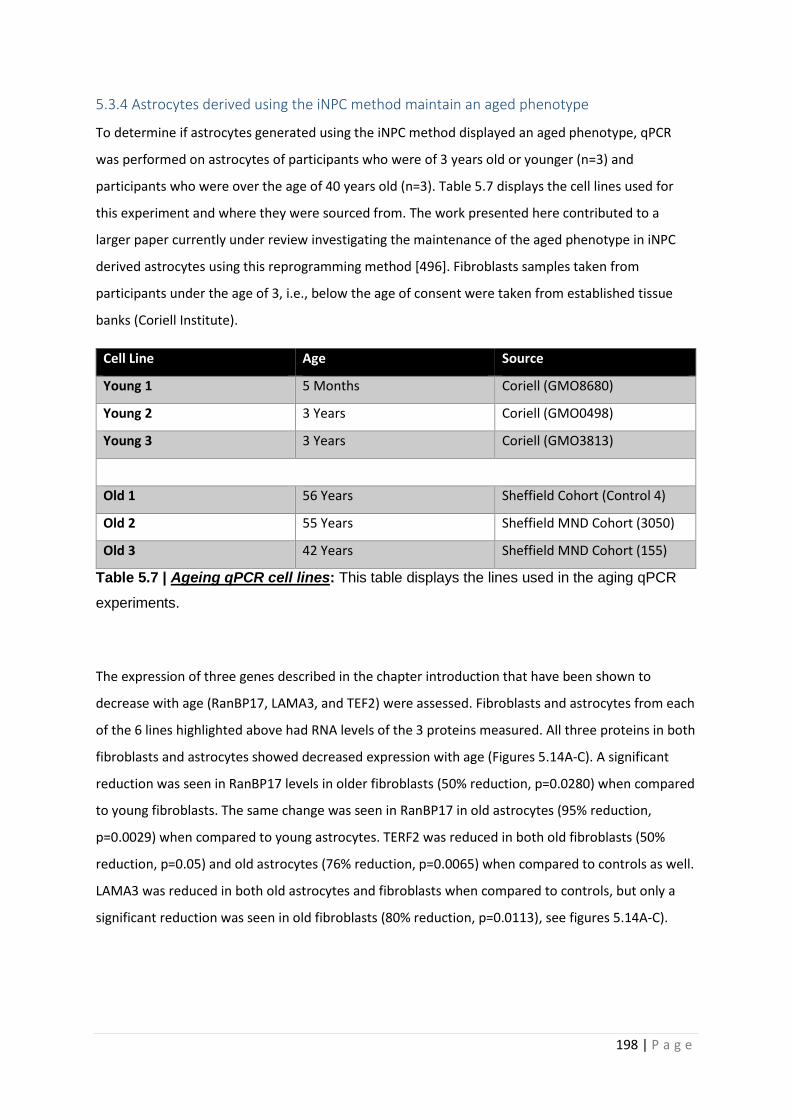
198 | P a g e
5.3.4 Astrocytes derived using the iNPC method maintain an aged phenotype
To determine if astrocytes generated using the iNPC method displayed an aged phenotype, qPCR
was performed on astrocytes of participants who were of 3 years old or younger (n=3) and
participants who were over the age of 40 years old (n=3). Table 5.7 displays the cell lines used for
this experiment and where they were sourced from. The work presented here contributed to a
larger paper currently under review investigating the maintenance of the aged phenotype in iNPC
derived astrocytes using this reprogramming method [496]. Fibroblasts samples taken from
participants under the age of 3, i.e., below the age of consent were taken from established tissue
banks (Coriell Institute).
Cell Line Age Source
Young 1 5 Months Coriell (GMO8680)
Young 2 3 Years Coriell (GMO0498)
Young 3 3 Years Coriell (GMO3813)
Old 1 56 Years Sheffield Cohort (Control 4)
Old 2 55 Years Sheffield MND Cohort (3050)
Old 3 42 Years Sheffield MND Cohort (155)
Table 5.7 | Ageing qPCR cell lines: This table displays the lines used in the aging qPCR
experiments.
The expression of three genes described in the chapter introduction that have been shown to
decrease with age (RanBP17, LAMA3, and TEF2) were assessed. Fibroblasts and astrocytes from each
of the 6 lines highlighted above had RNA levels of the 3 proteins measured. All three proteins in both
fibroblasts and astrocytes showed decreased expression with age (Figures 5.14A-C). A significant
reduction was seen in RanBP17 levels in older fibroblasts (50% reduction, p=0.0280) when compared
to young fibroblasts. The same change was seen in RanBP17 in old astrocytes (95% reduction,
p=0.0029) when compared to young astrocytes. TERF2 was reduced in both old fibroblasts (50%
reduction, p=0.05) and old astrocytes (76% reduction, p=0.0065) when compared to controls as well.
LAMA3 was reduced in both old astrocytes and fibroblasts when compared to controls, but only a
significant reduction was seen in old fibroblasts (80% reduction, p=0.0113), see figures 5.14A-C).
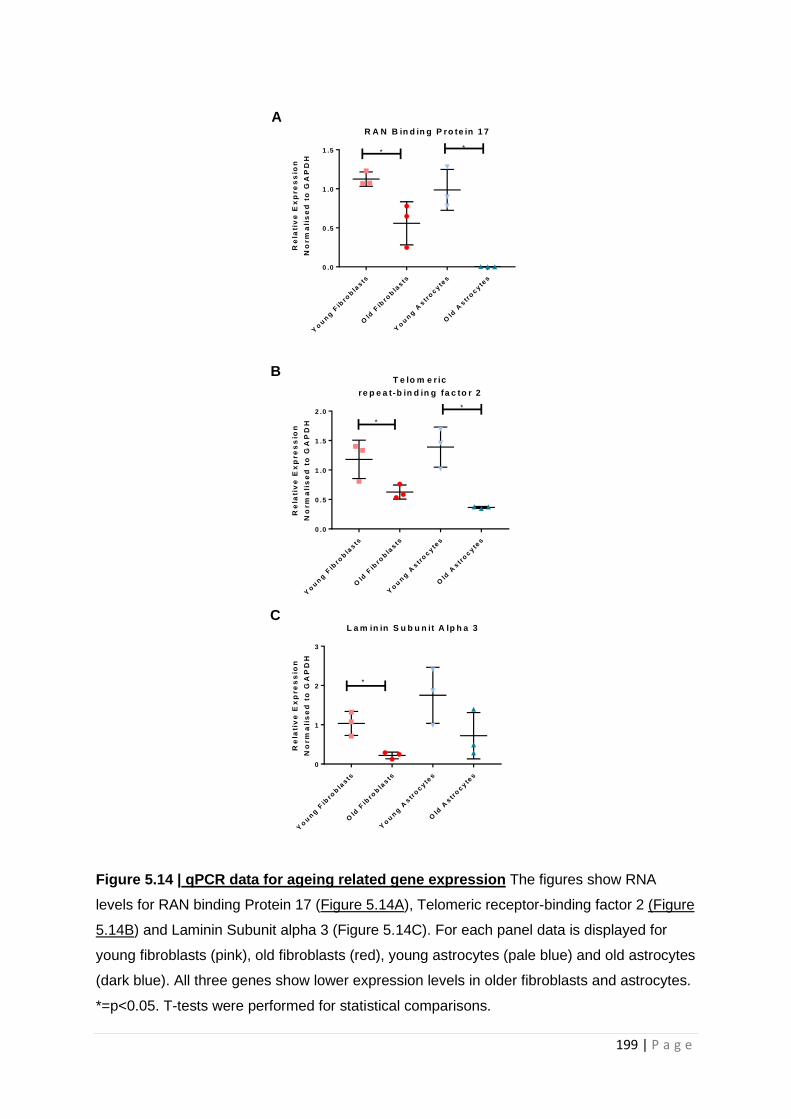
199 | P a g e
Figure 5.14 | qPCR data for ageing related gene expression The figures show RNA
levels for RAN binding Protein 17 (Figure 5.14A), Telomeric receptor-binding factor 2 (Figure
5.14B) and Laminin Subunit alpha 3 (Figure 5.14C). For each panel data is displayed for
young fibroblasts (pink), old fibroblasts (red), young astrocytes (pale blue) and old astrocytes
(dark blue). All three genes show lower expression levels in older fibroblasts and astrocytes.
*=p<0.05. T-tests were performed for statistical comparisons.
Yo
un
g F
ibro
bla
sts
Old
Fib
rob
lasts
Yo
un
g A
str
ocyte
s
Old
Astr
ocyte
s
0 .0
0 .5
1 .0
1 .5
R A N B in d in g P ro te in 1 7
**
Re
lati
ve
Ex
pre
ss
ion
No
rm
ali
se
d t
o G
AP
DH
Yo
un
g F
ibro
bla
sts
Old
Fib
rob
lasts
Yo
un
g A
str
ocyte
s
Old
Astr
ocyte
s
0 .0
0 .5
1 .0
1 .5
2 .0
T e lo m e r ic
re p e a t-b in d in g fa c to r 2
Re
lati
ve
Ex
pre
ss
ion
No
rm
ali
se
d t
o G
AP
DH
*
*
Yo
un
g F
ibro
bla
sts
Old
Fib
rob
lasts
Yo
un
g A
str
ocyte
s
Old
Astr
ocyte
s
0
1
2
3
L a m in in S u b u n it A lp h a 3
Re
lati
ve
Ex
pre
ss
ion
No
rm
ali
se
d t
o G
AP
DH
*
A
B
C
200 | P a g e
5.4 Discussion
In this chapter astrocytes derived from patients with both sporadic and familial AD have been
metabolically characterized. The astrocytes were derived using iNPC technology. The astrocytes
were shown to have deficits in mitochondrial function, form and glycolysis when compared to
controls in both AD disease types. The main deficits appeared to be in glycolysis, which was shown
to be the main metabolic pathway used by astrocytes to produce ATP. Astrocytes had a reduced
capacity to perform both OxPHOS and glycolysis in both types of AD. These metabolic deficits
correlated with neuropsychological changes seen early in AD, and the reduced total ATP seen in the
AD astrocytes could be corrected by compounds that have a mechanism of action that can alter both
glycolysis and OxPHOS. This is one of the first studies to show metabolic deficits in astrocytes
derived from patients with sporadic and familial AD. The rest of the chapter discussion will mainly
focus on the extra chapter results.
5.4.1 ApoE genotype does not differentiate all metabolic abnormalities in AD sporadic
Astrocytes, but may influence ATP levels
As with sporadic AD fibroblasts, sporadic AD astrocytes with the ε4/4 ApoE genotype appear to have
more of a total cellular ATP deficit than AD astrocytes with other ApoE genotypes. This is an
interesting finding and consistent with the idea that the ApoE ε4/4 causes metabolic deficits [422,
425]. As already mentioned though, separate ApoE genotype groups are very small in this study, and
the study was not powered to identify metabolic deficits in specific ApoE genotypes in AD.
Interestingly, the majority of other metabolic markers shown to be effected on a group level in
sporadic AD, except for extracellular lactate, did not show a disease effect of ApoE ε4/4 genotype.
Sample size could be the reason for this, but it should also be considered that the metabolic deficits
are independent of ApoE genotype, and may be a separate contributing factor to the development
of AD when investigating metabolic change in astrocytes.
Both MSRC and extracellular lactate levels in sporadic AD astrocytes showed the greatest reductions
when compared to controls, in the ApoE ε4/4 and 2/3 genotypes. Having a ApoE ε2 allele has been
shown to be protective against AD in many studies, so this is an interesting finding [509, 510]. This
may be further evidence that ApoE does not cause all the metabolic changes seen in AD but may
also be a consequence of having allele heterogeneity. The ApoE ε3 allele may be driving the reduced
metabolic function in the ApoE ε2/3 genotype, but a caveat to this idea is that the ApoE ε3/3
genotype appears to be least effected in regard to both MSRC and extracellular lactate. In this study
fatty acid metabolism, and lipid transport have not been studied, which are the main effector sites
for the ApoE gene [422]. To understand the interaction between ApoE and metabolism, further work
201 | P a g e
in bigger cohorts of sporadic AD patients controlled for ApoE genotype, which also investigates lipid
metabolism, is required.
5.4.2 Extracellular lactate levels correlate with connectivity of the DMN
Of all the metabolic markers shown to be abnormal in AD astrocytes extracellular lactate level was
the only marker that correlated with connectivity within the DMN. A strong positive correlation was
seen between extracellular lactate levels and the connectivity within the inferior right parietal
lobule. The inferior right parietal lobule is a component of the posterior DMN, an area of the DMN
shown to be effected the most by the progression of AD [453, 511, 512]. As glucose metabolism
alterations are one of the changes seen in the posterior DMN in AD, this may explain why
extracellular lactate levels correlated with this DMN area. As already discussed, lactate is a major
metabolic substrate produced by the astrocyte that is exported to the neuron. It would therefore be
logical that astrocyte extracellular lactate levels would correlate with a marker of neuronal activity.
PM studies investigating the expression of LDH and PK, enzymes involved with the metabolism of
glucose to lactate, show increased levels of these enzymes in frontal and temporal regions but not in
parietal regions in the AD brain [278]. This may highlight that the parietal lobe has an inability to
increase lactate production in patients with AD when compared to frontal and temporal lobes, and
may be the reason for the correlation between DMN connectivity and extracellular lactate levels.
This relationship between extracellular lactate level and DMN connectivity could be studied further
by investigating glucose metabolism, and other metabolic pathways in this particular area of the
brain using PM AD samples.
5.4.3 Astrocyte deficits are more pronounced in galactose-based media
In the case of both OxPHOS and glycolysis assessment in this study, a more pronounced metabolic
deficit was seen in galactose based media than a glucose based one. This would be expected with
the OxPHOS deficits, as the metabolism of galactose consumes as much ATP as it generates,
therefore cellular ATP demands rely more on OxPHOS. The experiments that investigated glycolysis
in a glucose based media, were more variable than the glycolysis experiments performed in a
galactose based media. This finding may be explained by the diverse nature of glucose metabolic
fates in astrocytes. When an astrocyte is grown in an abundance of glucose it has several different
sources of glucose that can be metabolised to meet the energy requirements of the cell. These
include the media glucose, glucose stored as glycogen within the astrocyte, and lactate generated
from neurotransmitter turnover and the PPS. In a galactose based media, the media galactose will
not contribute to ATP output of the astrocytes, and so it will rely on other glucose sources. This may
reduce variability when investigating glycolysis as the glucose sources that can be drawn upon have
been decreased. As the most significant deficit in glycolysis in the galactose based media was a
202 | P a g e
reduction in glycolytic reserve this may also suggest that the AD astrocytes have a reduced storage
capacity for glucose, and the reduction in reserve may be driven by either decreased glycogen stores
or deficits in neurotransmitter metabolism. Further work investigating glycogen storage in astrocytes
in a glucose and galactose based media would help answer this question.
5.4.4 Astrocytes have an aged phenotype based on RNA expression
One of the benefits of using a direct reprogramming method is that differentiated cells maintain an
aged phenotype. The differentiation protocol used in this study produces astrocytes that maintain
an aged phenotype evidenced by the fact that qPCR identified 3 genes (RanBP17, LAMA3 and TRF2)
that have reduced expression as we age. This is consistent with literature of other direct
reprogramming techniques which shows that RanBP17 and LAMA3 both have reduced expression in
cells derived from older individuals [393], and that reduced telomere length, a sign of ageing, is to a
certain extent, controlled by the expression of TERF2 [473]. Although these gene expression changes
are a compelling argument of the retained aged phenotype of the astrocytes further investigation of
the aged phenotype is warranted. Unpublished work from another group member has shown that
astrocytes derived using this technique have altered nuclear compartmentalization, changes to
nucleocytoplasmic shuttling properties, increased oxidative stress response and DNA damage
response [496]. These are all features of cellular change seen in ageing.
Using a model system with an aged phenotype is important for this particular study as the
metabolism of glucose changes as we age [480, 513]. Mitochondrial function is also known to
change with the ageing process, with reduced ETC efficiency, increased mitochondrial DNA
mutations, and decreased quality control all reported [514]. The fact that we have seen
abnormalities in astrocyte function when AD lines have been compared to aged-matched controls
shows that metabolism changes identified are likely to be a factor independent of the changes to
metabolism seen during ageing.
5.5 Chapter limitations
Although powered to show group level differences in glycolysis and OxPHOS, a larger sample size to
that studied here is needed to fully understand relationship between AD, ApoE, and metabolism
changes. As stated in chapter 3 the study is underpowered to fully understand the relationship
between apo ε expression and cellular metabolic changes. It is not debated however that astrocytes
express the Apo ε, unlike in fibroblasts, so further work with an increased sample size split based on
Apo ε status would be of merit. An increased sample size would also help to develop the
understanding of the DMN correlations seen in this study. As discussed in chapter 4 when the same
correlations were performed in fibroblasts, this element of the study should be considered a proof
203 | P a g e
of principle analysis, with further work needed in different model systems to link metabolism
dysfunction to neuropsychological deficits more convincingly. As both mitochondrial and glycolytic
deficits have now been identified, further work is needed to understand the mechanistic side to
these changes in metabolism. This would include interrogation of the function of each of the
separate ETC complexes in the mitochondria to identify the cause for the reduced MSRC and MMP.
Further work needs to be performed on mitochondrial dynamics, with investigation of the proteins
that control mitochondrial fission in particular. Investigation of glucose uptake into astrocytes via
understanding of glucose transporter expression, and further characterisation of the different
metabolic pathways involved in glucose metabolism is needed. This should include the investigation
of glycogen storage, function of the PPS, and glycolysis enzyme activity.
Although astrocytes derived from patients with AD clearly have significant deficits in metabolic
function, important future work would need to focus on how these astrocytic metabolic changes
effect neuron support in co-culture, and if the drugs that improve ATP production in astrocytes
effect this co-culture support relationship.
5.6 Chapter Conclusions
1. Astrocytes derived from sporadic and familial AD patients have reductions in total cellular
ATP when compared to controls and are more reliant on glycolysis than OxPHOS for total
cellular ATP.
2. Astrocytes derived from both sporadic and familial AD patients have reductions in MSRC
when compared to controls.
3. Sporadic AD astrocytes have a reduction in MMP whereas familial AD astrocytes have an
increase in MMP when compared to controls
4. Both sporadic and familial AD astrocytes have a more interconnected mitochondrial
network, with longer mitochondria when compared to controls.
5. Both sporadic and familial AD astrocytes have reductions in glycolytic reserve and
extracellular lactate when compared to controls.
6. Total cellular ATP and extracellular lactate levels may be affected by the ApoE ε4/4
genotype, with sporadic AD astrocytes displaying this phenotype having greater deficits
compared to controls.
7. MSRC, glycolytic reserve and extracellular lactate levels correlate with neuropsychological
tests which show changes early in the course of AD
8. Extracellular lactate levels correlate with changes in DMN connectivity seen in AD.
9. 8 different drugs assessed could correct total cellular ATP deficits in both familial and
sporadic AD astrocytes and alter mitochondrial morphology to a less diseased state.

204 | P a g e
10. Astrocytes derived using this reprogramming method maintain the expression of genes
known to decrease with aging.
205 | P a g e
Chapter 6 Discussion
The aim of this PhD thesis was to characterize deficits in glycolysis, mitochondrial structure and
function in fibroblasts and astrocytes derived from patients with both sporadic and familial AD.
Secondary aims were to investigate if highlighted metabolic abnormalities correlated with
established clinical biomarkers of AD, and whether the deficits identified could be corrected with
drugs known to improve mitochondrial ATP production.
I have shown that deficits in glycolysis and mitochondrial function are present in the astrocytes and
fibroblasts from patients with sAD and fAD (PSEN1 mutations). Specifically, the work in the thesis
shows the capacity of the mitochondrial ETC and glycolysis are affected in both fibroblasts and
astrocytes, with correlations between MSRC, glycolytic reserve, extracellular lactate production and
neuropsychological tests shown to be abnormal early in AD identified. This research identifies that
mitochondrial and glycolytic abnormalities in both astrocytes and fibroblasts from patients with AD
are a potential future biomarker.
Mitochondrial functional and structural abnormalities identified in AD fibroblasts were corrected
with the application of the drug UDCA. When AD astrocytes were treated with UDCA and an
expanded cohort of compounds known to improve mitochondrial function, deficits in total cellular
ATP and mitochondrial functional and structural abnormalities were also restored. This highlights
how the metabolic deficits identified in this thesis have the capacity to be restored using small
molecule treatments and are therefore potential therapeutic targets.
In the following sections these metabolic abnormalities will be discussed in greater detail.
6.1 Fibroblasts and Astrocytes have similar mitochondrial and glycolytic abnormalities
in sporadic and familial AD
The abnormal metabolic profile is similar across both fibroblasts and astrocytes from both sAD and
fAD patients, but difference in each cell group are present. Mitochondrial and glycolytic changes in
the AD fibroblast groups were not as pronounced as those seen in the astrocytes. Defects common
to both sporadic fibroblasts and astrocytes included reduced MSRC, an elongated, more
interconnected mitochondrial network, and reduced glycolytic reserve. Familial fibroblasts and
astrocytes showed similar changes but MSRC was not reduced in fAD fibroblasts. The markers of
abnormal mitochondrial function and glycolysis common to both fibroblasts and astrocytes reflect
deficits in the reserve capacity of mitochondrial function, and the reserve capacity of the glycolysis
pathway. This appears not to affect the fibroblasts significantly, as without the presence of a known
modulator of metabolic function (ApoE ε4/4) no reduction in total cellular ATP is seen. It could be
206 | P a g e
postulated that the deficits in mitochondrial and glycolytic reserve capacity seen in fibroblasts and
astrocytes are likely to reflect a reduced ability to manage metabolic stress, this could explain why
the astrocytes which are a more metabolically active cell type than the fibroblasts, start to develop
group level reductions in total cellular ATP that are independent of ApoE allele status. It has been
shown in fibroblasts from patients with late-onset AD that deficits in mitochondrial OxPHOS are
compensated for by increasing glycolytic function which increases fibroblast glycolytic capacity
[207]. Astrocyte glycolysis is also known to be increased when astrocytes are exposed to amyloid
[322]. Both these studies show how in AD cellular glycolytic capacity needs to increase to manage
the metabolic cellular demand caused by increased amyloid presence and reduced mitochondrial
efficiency. Although not direct evidence these studies do highlight how a reduced glycolytic reserve
may affect cellular glycolytic capacity and therefore impair cellular responses to metabolic stress.
The results from both AD fibroblasts and astrocytes suggest that deficits in metabolic capacity are
common to both peripheral non-neuronal and CNS cells, which may be evidence that dysfunctional
metabolism affects the whole body and not just the CNS in AD. This theory is supported by other
studies that have shown mitochondrial and glycolytic changes in multiple cell types in AD [184, 204,
206, 207], but may also be supported by the fact that patients with AD are more prone to systemic
infections [515] and have a reduced risk of developing certain malignancies [516]. MSRC reductions
have been linked to an increased risk of developing infection [517], and established malignant cells
are shown to have high glycolysis rates when compared to other cell types [518]. Therefore, deficits
in glycolysis may protect an organ from malignancy developing, but deficits in MSRC may predispose
to infection.
sAD fibroblasts and astrocytes both had a reduction in MMP, but fAD astrocytes had an increase and
fAD fibroblasts had a decrease in MMP. This difference between the two AD cohorts may be
explained by calcium concentration within the mitochondria. As the Presenilin mutations have been
shown to increase mitochondrial calcium content [227-229], this potentially would increase the
polarity of the mitochondria, which may lead to increased TMRM signal. Due to the changes to
glycolysis and mitochondrial function in fAD astrocytes they may not be able to maintain calcium
homeostasis as well as fAD fibroblasts due to the increased metabolic demand. This may explain why
only fAD astrocytes had a raised MMP. Another discrepancy seen between fAD astrocytes and
fibroblasts was the OCR. Sporadic and familial astrocytes had a decreased OCR when compared to
controls, whereas fAD fibroblasts had significant increase in OCR when compared to control
fibroblasts. The familial fibroblasts may be able to redirect substrates for metabolism via OxPHOS
which would normally be consumed in glycolytic pathways, which may increase the OCR rate. As
astrocytes have a greater metabolic demand than fibroblasts, and so greater need for glycolytic
207 | P a g e
substrates they may not be able to devote substrates common to both metabolic processes away
from glycolysis utilization, and therefore have a lower OCR when compared to controls. fAD
fibroblasts appear to have less efficient mitochondria when considering total cellular ATP as fAD
have lower total cellular ATP levels, but higher OCR consumption when compared to control
fibroblasts this relationship is also seen in fAD astrocytes. As fibroblasts need less ATP that
astrocytes the inefficiencies of the OxPHOS pathway will have less energetic consequences and so
the fibroblast cell can tolerate the reduced OxPHOS efficiency better than the astrocyte.
As both mitochondrial ETC function and glycolysis are interlinked metabolic pathways it has to be
considered that the deficits seen in sporadic and familial AD may be a combination of deficits in both
metabolic pathways, or that changes in one pathway lead to the deficits in capacity seen in the
other. It is very likely that both astrocytes and fibroblasts have a primary deficit in glycolysis, as this
metabolic pathway is upstream of mitochondrial OxPHOS, and hence the glycolysis deficits identified
in this thesis are unlikely to be caused by the changes seen in mitochondrial function. The
mitochondrial deficits on the other hand could be caused by the glycolysis changes. MSRC and MMP
are determined by the function of ETC complexes I, III, & IV pumping protons across the inner
mitochondrial membrane. In chapter 5 it was identified that astrocytes have a deficit in total cellular
ATP when supplied with complex I substrates which suggests a complex I deficit. Complex I requires
NADH to pump protons across the inner mitochondrial membrane. NADH can be sourced from both
glycolysis and the TCA. Therefore, the deficits seen could be caused by a true complex I deficit or due
to a reduced supply of NADH to complex I from either glycolysis or the TCA cycle. The fact that the
assessment of complex I activity performed in this study uses an experimental paradigm were cells a
supplied with an excess of complex I substrates points towards a glycolysis independent mechanism
for the changes seen in OxPHOS.
Observing changes in fibroblasts metabolic function that correlate with changes in astrocyte
metabolic function, which may lead to a drop in ATP levels, allows for the promotion of fibroblasts
from patients with AD to be used as both a drug screening model, and a model for identify metabolic
functional changes which may be important in AD. Using fibroblasts would be more cost effective
than reprogramming the same number of astrocytes lines to test a hypothesis. When a drug target
has been identified in the fibroblast lines this would then allow for further experimental work of
target suitability to be performed in the reprogrammed astrocytes.
208 | P a g e
6.2 Astrocyte changes seen in other iNPC/iPSC models of neurodegenerative disease
Altered mitochondrial function and glycolysis has been reported in other iPSC models of
neurodegenerative diseases. In both sporadic and familial MND a reduction in metabolic flexibility of
astrocytes has been reported [396]. In this study the ability of astrocytes to create NADH when
supplied with one of 91 different substrates was assessed. Astrocytes from sporadic and familial
MND patients had a reduced number of substrates that they could create NADH from (10 vs 16). This
was thought in the familial MND lines to be due to the C9orf72 protein expansion reducing the
permeability of the cell membrane, but deficits in glycogen and fructose metabolism were also
reported. The same group has also suggested that this lack of metabolic flexibility may be secondary
to a deficit in adenosine deaminase in MND astrocytes [395]. Both these studies suggest that
mitochondrial and glycolytic dysfunction may be a consequence of reduced supply of substrates to
produce ATP. A deficit in MSRC is corrected and increased glycolysis are reported in C9orf72 familial
MND lines when the effects of adenosine deaminase are by-passed [395]. Potentially the changes
seen in this thesis in the function of astrocytes in sAD and fAD could be explained by a lack of
metabolic flexibility with regard to the substrates that AD astrocytes can use to generate ATP.
Performing similar experiments assessing the ability for AD astrocytes to use metabolic substrates
would allow for comparison between different neurodegenerative conditions looking for common
and unique metabolic signatures. These studies have not investigated if mitochondria from MND
astrocytes have deficits in function or structure which might predispose them to have less metabolic
flexibility. These studies have shown that astrocytes from the familial MND group have a normal
expression of astrocyte glucose transporters, which would suggest against a lack of supply of glucose
to the astrocyte causing the deficits seen in glycolytic rate. Interestingly, these studies look for the
same metabolic changes in the fibroblasts for patient with C9orf72 mediated MND and find that the
metabolic characterization of the fibroblasts is not as distinct as what is seen in the astrocytes,
further showing the importance of cell specific study in neurodegenerative disease.
Mid-brain astrocytes derived from patients with familial mutations causing PD have been shown to
have a more fragmented mitochondrial network, excess mitochondrial calcium release and a
reduced MSRC [519]. In this study 3 familial forms of PD were studied, but only 2 showed reductions
in MSRC, in this thesis a reduction in MSRC was seen in both sAD and fAD astrocytes, which is
suggests that reduced MSRC is a common abnormality seen in astrocytes in several
neurodegenerative diseases. Whether the cause of the reduction in MSRC is caused by a common
pathway between both disease states is unknown and needs further investigation. There is a
possibility that the mitochondrial deficits seen in a particular neurodegenerative disease are caused
209 | P a g e
by astrocyte reliance on specific metabolic substrates which non-neurodegenerative disease
astrocytes do not depend on as much.
Work that has investigated astrocytes in co-culture with a human neuronal model of PD potentially
highlights how abnormal metabolism in an astrocyte may propagate pathology in neurons. It has
been shown that complex I and IV of the ETC have functional deficits in a PD neuronal model which
can be corrected when co-cultured with iPSC astrocytes derived from a control cell lines [520]. The
mechanism by which the astrocytes improve the PD neuron mitochondrial function is thought to be
related to the astrocytes reducing the level of ROS present within the neuron. How the astrocyte
performs this role may be by providing metabolic substrates to the astrocyte that bypass the
function of the mitochondria and therefore reduce ROS production, or provide the neuron with
antioxidant molecules such as glutathione, which remove the ROS generated. In either case, both
processes are dependent on both astrocyte mitochondrial function and glycolysis performing within
a boundary that allows for the energy demands of the astrocyte and neuron to be met. In this thesis
it has been shown that both mitochondrial function and glycolysis are abnormal, which as shown in
this PD model could worsen neuronal functional deficits.
These studies together show that similarities in astrocyte metabolic disturbance are seen across
multiple neurodegenerative diseases, but potentially a specific pattern of metabolite usage may
provide a disease specific signature. Limited numbers of studies have investigated human astrocyte
metabolism across multiple diseases, which the above studies and this thesis highlight would be
beneficial for understanding pathogenic metabolic mechanisms.
6.3 Mitochondrial dysfunction and its importance to AD
In both astrocytes and fibroblasts changes to the mitochondrial network are seen in this study. They
include elongated mitochondria that are more interconnected, and are more focused around the cell
nucleus. These changes in the structure of the mitochondria suggest that the cell is under metabolic
stress, which is evidenced by the low ATP and MMP reported. A stressed mitochondrial network is
more likely to produce ROS which can cause further stress and damage to the mitochondrial
network by increasing mitochondrial DNA mutations. The particular changes in network structure
may also have implications for cells with long projections, as the contraction of the mitochondrial
network towards the nucleus may lead to these projections becoming devoid of mitochondria, or be
left with not enough mitochondria to meet local cellular energy demands. The mitochondrial
network changes may be caused by a changes in mitochondrial fission and fusion proteins, as
described in chapter 3, which may mean that the pathology driving the change in network shape is
protein expression abnormality as opposed to an inability of the mitochondrial network to maintain
210 | P a g e
cellular energy demands. Potentially both these explanations could be the reason for the change
seen in mitochondrial network structure, as both decreased ATP demands and altered mitochondrial
dynamics have both been reported in AD [418, 420, 479, 521].
The changes seen in MMP in this study are consistent with results from previous work on fibroblasts
in both sporadic and familial AD, and astrocytes exposed to Aβ [522]. A reduced MMP could have
significant implications for astrocytes as it will affect the ability of the mitochondria to buffer calcium
currents produced in the astrocyte in response to several key physiological roles such as blood flow
diversion, neurotransmitter metabolism and synaptic plasticity [523]. Altered blood flow and
decreased synaptic plasticity are both seen in AD, and are potentially related to astrocyte
mitochondrial dysfunction. A high MMP was seen in the fAD astrocytes, but if as hypothesed this is a
consequence of already increased mitochondrial calcium concentrations, then the buffering capacity
of the mitochondrial would be similarly affected to a state in which a low MMP is seen. Although
astrocytes were shown in this study to be mainly dependent on glycolysis for total cellular ATP
levels, it is also very likely that a reduction in MMP would contribute to this decreased ATP seen,
which could compound the problems that a reduced mitochondrial calcium buffering capacity can
cause, as ATP available for active pumping is reduced.
The cause for the reduced MMP seen in the sAD astrocytes in this study is likely related to the
activity of the ETC complexes. It was shown in chapter 5 that sAD and fAD astrocyte mitochondria
produce less ATP when supplied with complex I of the ETC substrates, suggesting a deficit in complex
I function. Decreased expression of the mitochondrial subunits of complex I has been previously
reported in the AD literature in PM specimens [175, 176], but by far more commonly reported are
changes in the activity of complex IV [181-186]. Further work is needed to determine if the
fibroblasts and astrocytes in this study have a complex IV deficit. Complex I activity deficits may
drive reductions in MMP in astrocytes but not neurons and other brain cell types. As most data
looking at complex activity comes from PM samples or studies focused on neurons, this deficit may
have been missed. Further work is needed to clarify what the mechanism is that leads to the
reduction in ATP production seen in AD astrocyte mitochondria in this thesis. This could be done by
performing complex assays measuring the function of the ETC complexes separately. This would also
reveal if the astrocytes used in this thesis have a complex IV deficit, as complex IV activity was not
directly measured. If no deficit was found in ECT complex activity then this would also help develop
our understanding of the mitochondrial deficits seen in AD astrocytes. Normal ETC function, and the
already identified reduction in ATP production when cells are examined in complex I substrate
excess may suggest that the intermediate metabolites passed between complexes are not in high
enough supply.
211 | P a g e
It is possible that the changes to mitochondrial structure and function seen in this study are also
seen in neurons from patients with AD. If neurons were shown to have the same mitochondrial
deficits highlighted here in astrocytes and fibroblasts, then this would have a significant effect on
their function as the main source of energy production in neurons is OxPHOS. Having a reduced
MMP, and decreased MSRC would expose the neuron to increased ROS due to the need to divert
glucose metabolites to OxPHOS to maintain ATP production. ROS production would increase as PPS
metabolism would likely reduce. Therefore, the mitochondrial changes identified in the study are
likely to have varying degrees of impact depending on cell type that they are expressed in.
6.4 Glycolytic dysfunction and its importance to AD
Impairments in glucose metabolism were seen in all cell types in this study. Glycolytic reserve and
extracellular lactate levels were shown to be reduced in fibroblasts and astrocytes from both
sporadic and fAD patients. Astrocytes from both sporadic and fAD patients also had deficits in basal
glycolysis rate and glycolytic capacity, although not all these reductions were significant when
compared to the astrocytes from healthy controls. Glucose is the main metabolite of the brain with
astrocyte metabolism known to account for a large proportion of its utilization, therefore any
reduction in the ability to metabolise glucose by the brain is likely to have functional implications. As
already mentioned, astrocyte glucose metabolism has been shown to have a role in learning and
memory [311, 312, 340], the results of this study suggest a decreased efficiency for glucose
metabolism in astrocytes, which may have the consequence of making memory acquisition more
difficult. Memory retrieval is also dependent, to a certain extent, on increased blood flow to
particular brain areas [524]. As both blood redirection and glucose metabolism decrease during the
course of AD, this could be explained by the glycolytic deficits seen here in astrocytes. If the same
deficits were seen in neurons as well, the risk of neuronal oxidative damage is likely to increase,
potentially making the deficits seen here key to the pathogenesis of AD.
Astrocyte glycolytic dysfunction is likely to be compounded by other aspects of AD pathology as well.
Astrocytes have been shown to uptake Aβ with the aim of metabolising the protein and excreting it
from the brain [321, 525]. Astrocyte uptake of Aβ has been shown to both increase astrocyte
glycolysis, and also have a detrimental effect to neurons when they are co-cultured with Aβ primed
astrocytes [526, 527]. The glycolysis deficits identified in AD astrocytes in this thesis may impair
astrocytic ability to metabolise Aβ secondary to not being able to upregulate glycolysis, as is seen
when Aβ is added to non-AD astrocytes. Glycolysis is also upregulated in neurons exposed to Aβ
[288, 528] which is presumed to be a response to the increase in ROS production by mitochondria
when exposed to Aβ. If glycolytic deficits seen in fibroblasts and astrocytes in this study are also
common to neurons, this will also exacerbate the effect Aβ has on this cell type. Potentially in an AD-
212 | P a g e
susceptible brain a situation arises where increased amyloid production occurs which leads to
mitochondrial stress meaning the brain relies more on glycolysis for energy production. Alzheimer’s
disease may progress in people who have a reduced brain glycolytic efficiency; resulting in impaired
or reduced astrocytic clearance of Aβ , leading to further accumulation of Aβ, and loss of
homeostatic mechanisms that exacerbates the effect Aβ has on mitochondrial function, and other
neuronal processes. This hypothesis, whereby glycolysis efficiency determines Aβ mediated
pathophysiology may explain why brain amyloid burden (as measured by amyloid PET scan or
reduced CSF Aβ) does not correlate with the stage of Alzheimer’s disease or predict disease
progression. A brain with effective and efficient glycolysis would cope with the increased demand
associated with increased Aβ levels in the brain better than in a brain with less efficient glycolysis (of
whatever aetiology). The idea that glycolysis efficiency is key in the pathogenesis of AD is also
supported by the fact that FDG-PET imaging data show areas of the brain at risk of developing early
AD pathology, and loss of DMN connectivity, are the same brain areas that have the highest
glycolysis requirements [452]. In the study by Buckner et al 2005 [452], the link between glycolysis
demand and amyloid deposition was made by showing that areas of the brain with high glucose
requirements in young people, are the same areas of the brain that develop amyloid deposition
early in more elderly participants. This is a particularly good methodology to show this correlation,
as normal ageing also reduces the brain glucose uptake [274]. Cell models of AD also suggest that
glycolytic capacity may be protective against the negative effect of amyloid. When B12 and PC12 cell
lines are grown in an amyloid rich media the cells that are able to utilize glycolysis better have
greater survival than those that depend more on OxPHOS [288]. Animal models of AD also suggest
that glycolysis is increased in response to amyloid build up [286], and evidence also exists which
suggests that tau deposition in the human brain is increased in areas of lower aerobic glycolysis
[483], adding further weight to the idea the glycolytic capacity and efficiency are a key mediator of
AD pathology. In this study brain imaging of glucose usage, oxygen consumption and tau deposition
was measured showing areas with low aerobic glycolysis had increased amounts of tau aggregation,
[483]. Although glycolytic capacity has been shown to be important in all the above studies, a causal
relationship between amyloid and tau deposition and glycolytic capacity is yet to be developed. To
understand if brain glycolytic capacity is a protective factor against AD or a consequence of amyloid
deposition is still to be established, but several points of evidence, including the results of this thesis
point towards the importance of glycolytic capacity in AD.
213 | P a g e
6.5 ApoE genotype may contribute to mitochondrial and glycolytic impairment in AD
All three results chapters in this thesis have looked at the effect ApoE allele frequency has on
mitochondrial and glycolytic function in AD. In sAD fibroblasts the mitochondrial structural changes
appeared to be exacerbated by ApoE ε4/4 genotype, but the same effect was not seen in the
mitochondrial markers shown to be statistically different from controls in sAD astrocytes. The
relationship between ApoE genotype, metabolism and AD has not been fully identified by this thesis,
but there is a suggestion that certain metabolic changes seen in both AD fibroblasts and astrocytes,
such as MSRC and glycolytic reserve, are independent of the effect of ApoE.
Understanding how metabolism and ApoE interact is important for sporadic AD as it is very likely
several different physiological changes occur in cells to propagate the pathology of AD.
Understanding if ApoE and cellular metabolism each have a separate influence on the development
of AD will allow for further development of the idea that sporadic AD is a group of diseases in which
different physiological parameters, such as increased Aβ production, the ApoE ε4/4 genotype or the
presence of deficits in metabolic capacity, combine to cause the disease. In one group of at-risk
patients metabolism change may be the main driver of AD, whereas increased Aβ production may be
the main driver in another group. This research is vital in order to progress a personalised-medicine
approach to diagnosing and treating people with AD; in order to test new therapies in more
homogeneous groups with rational drug design. This study was not able to answer the question
about the effects of ApoE on metabolism but future work should control for ApoE genotype (and
potentially other genetic risk factors for sporadic AD) when studying metabolism in AD.
6.6 Developing a metabolic biomarker for AD
A biomarker is defined as a biological parameter which can be objectively measured to characterise
a normal or pathological biological process [529]. When studying disease, or in the clinical realm
biomarkers can be used to identify a condition, track a disease response to intervention, or help to
prognosticate the eventual outcome of a patient with a particular condition. As deficits in
mitochondrial function and glycolysis seem to be common to several cell types and present in both
sporadic and familial AD there is potential that a metabolic biomarker could be developed for AD
which could be used in any of the three scenarios described above. In any of the three scenarios, the
approach to developing a metabolic biomarker could be done by taking a particular marker of
mitochondrial function, or glycolysis and investigating if this is affected in large cohorts of AD
patients. MSRC, or glycolytic reserve would be appropriate choices for the development of this type
of biomarker, as deficits in both these parameters were present in fibroblasts and astrocytes,
suggesting a deficit common to several cell types. A common metabolic deficit is particularly
214 | P a g e
important when developing a metabolic biomarker of AD, as a systemic change in metabolism must
reflect a change in the CNS that leads to disease. If a biomarker can be developed through taking
peripheral samples this would be beneficial over sampling tissue or fluid from the CNS. A difficultly
with using either or both of these particular parameters of metabolic function when developing a
biomarker would be the way each parameter is measured. Assessment of MSRC and glycolytic
reserve performed in this thesis required several weeks of processing of biological samples from
patients. This would be both expensive and time consuming on a large scale, making the
development of a practical widely available biomarker difficult. If metabolic dysfunction did however
improve the specificity of AD diagnosis or provide a robust marker of treatment response then this
may be an appropriate time frame to wait. The time needed to process samples and certain
elements of cost could be reduced if peripheral blood mononuclear cells were used to assess reserve
metabolic capacity as opposed to fibroblasts. Previous research has shown that from fresh samples
peripheral blood mononuclear cell MSRC and glycolytic reserve can be measured using the same
techniques that have been used in this thesis [530].
Alternatively, measuring expression within the blood of a protein marker known to cause the
abnormalities in either MSRC or glycolytic reserve could be developed into a surrogate metabolic
biomarker. In chapter 5 data from astrocytes suggested that the activity complex I of the ETC may be
reduced, potentially being the cause the deficit in MSRC. Complex I protein expression could be
measured, although this would not be a direct measure of function or MSRC. An alternative
measurement could be to investigate the NADH/NAD+ ratio in different systemic cells as this also
may play a role in determining MSRC. Measurement of complex II levels may also be a useful
surrogate marker of MSRC, as complex II activity has been shown to be directly linked to MSRC
[433].
Determining a biomarker for glycolytic reserve is also likely to be difficult, as multiple enzyme
functions in several glycolysis pathways are likely to contribute to the glycolytic reserve of a cell. One
technique that may be able to deliver a relatively quick way to measure glycolytic reserve would be
metabolomics analysis [531]. Further work would be needed to find the metabolic blueprint that
corresponds to a low glycolytic reserve, but once found this could potentially provide a relatively
quick measurement technique. To develop a biomarker based on a functional change in glycolysis or
mitochondria function requires further work to determine a physical property of either pathway
(such as enzyme protein content reduction) which causes the observed functional deficit.
Another approach to develop the changes in glycolysis and mitochondrial function seen in this study
into a future biomarker would be to include mitochondrial or glycolytic assessment as part of a
215 | P a g e
battery of biomarkers for AD. This methodology would include performing multiple tests of
metabolism in AD patient cells to define an AD metabolic phenotype. In chapters 4&5 it was shown
that MSRC, glycolytic reserve and extracellular lactate levels correlate with neuropsychological
testing affected early in AD, which suggests this is a feasible assessment. The clinical biomarker
system referred to as the “ATN” system has been developed to help characterize people with a
diagnosis of AD [97]. As discussed in chapter 1, this system is based on the presence of absence of
amyloid (A), tau (T) or signs of neuronal injury (N) on brain imaging or CSF testing. Since the
development of the ATN system it has been applied to patients with MCI with the aim of assessing
progression to developing AD [80]. By adding metabolic assessment to the ATN biomarker system,
this may increase the reliability of an Alzheimer disease diagnosis at the prodromal or preclinical
stage when therapeutic engagement may be more effective at halting disease progression.
Potentially adding cellular metabolic assessment to the biomarkers performed in MCI patients may
help to predict which patients, and at what time point they will develop dementia. There is already
evidence that combining different biomarkers of AD increases the accuracy of diagnosis [532],
therefore an assessment in another biological property of people with AD may further improve this.
Understanding the full range of metabolic abnormalities that are common to all cell types in AD may
also be a way to develop metabolic functional assessment into risk stratification tool for people
known to be at risk of AD. ApoE ε4/4 genotype [533] and CSF amyloid and tau levels [534, 535] can
predict to a certain extent progression to AD in cognitively normal subjects. Performing a full
metabolic assessment of peripheral cells in people who are at risk of AD may again be able to
improve diagnostic accuracy.
Before peripheral assessment of metabolic function can be developed into a clinically useful
diagnostic test much larger patient cohorts are need to validate the findings of this thesis and other
papers in the field that have shown metabolic compromise in AD. Very few papers that study
metabolism in AD have a large cohort of patients sampled, therefore further investigation of
metabolism on a large scale is needed to identify deficits that are common to the majority of AD
patients.
6.7 Metabolism as a target for therapeutic intervention in AD
Having identified deficits in both mitochondrial function and glycolysis it has to be considered if
these metabolic changes can be utilized as drug targets for therapeutics in AD. In Chapter 5 it was
shown that compounds known to modulate the function of mitochondria can improve total cellular
ATP in sAD and fAD astrocytes, and in chapter 3 UDCA was shown to improve fibroblast
mitochondrial function in both sporadic and familial disease.
216 | P a g e
Targeting metabolic function has already been attempted in AD therapeutic development with both
metformin and insulin shown to improve cognition in patients with AD and MCI in phase 1&2 clinical
trials [536-538]. Interestingly the potential effects of metformin may be mediated through
improving glycolysis in astrocytes, with studies in animal models shown to increase astrocyte
glycolytic flux and lactate production [539, 540]. Insulin may have an effect on glucose uptake by the
brain, but insulin-independent glucose uptake is present throughout the brain so this may not be
how insulin improves cognitive performance [541]. Insulin can impair tau phosphorylation, which
may be the method of action in decreasing cognitive impairment [542]. In this thesis glycolysis has
been shown to be impaired in astrocytes in patients with AD, which may be of importance when
considering using insulin as a treatment for AD. Astrocytic insulin release in the hypothalamus has
been shown to reduce systemic blood glucose levels [543]. If astrocytes are effectively starved of
glucose because of their glucose insensitivity, then this may lead to a reduction in astrocyte insulin
release, which would allow for a higher blood glucose, making more available for insulin-
independent glucose uptake. This highlights the importance of time of intervention of a therapy in a
long-term condition. Insulin as a therapeutic may have very different effects on the progression of
AD, if administered during different disease stages.
This should be also considered when developing new therapeutics targeting metabolism in AD. In
the development of any therapy the timing on intervention, and cohort targeted is key for success.
Metabolism changes are seen early in AD, [41] but may not drive disease progression when tau and
amyloid pathology is established. Therefore, intervention may have to be in the prodromal stage or
earlier to be effective. This is where the development of metabolic deficits into a biomarker of AD
would be beneficial. It must also be considered that metabolism deficits may not drive disease in all
patients with AD so applying a personalized medicine approach would again be important when
designing a metabolic therapy for AD. Using a personalized medicine approach in AD treatment is
likely to involve screening patients with either MCI, or even cognitively normal adults who are at risk
of AD. Cellular metabolic function would be assessed, as would amyloid and tau burden, brain
vascular damage and presence of dementia risk factors such as diabetes and obesity. A personalised
therapeutic regime would be then developed to address each of this AD contributing factors.
Another hurdle to the development of a metabolic therapeutic targeting the abnormalities identified
in this study would be monitoring of drug effect in clinical trials. In chapters 4&5 the correlations
between metabolic dysfunction and neuropsychological testing was described. This correlation
potentially could be developed for use to monitor response to drug therapies targeted at
metabolism in clinical trials. FDG-PET imaging would also be another potential method for tracking
response to metabolic targeted drug therapies.
217 | P a g e
6.8 Further Directions
As discussed previously in the results chapters larger cohorts of cell lines are needed to explore the
relationship between metabolism, ApoE genotype and AD. This thesis has shown though that
elements of this investigation could be performed in fibroblasts from patients with AD as similar
deficits are seen in both astrocytes and fibroblasts.
The functional changes seen in both mitochondria and glycolysis need to be understood on the
enzymatic level. Interrogation of the different enzymes and receptors involved in the metabolism of
glucose is needed to discover what causes the reduced glycolytic reserve and low extracellular
lactate in AD cells. Individual assessment of ETC complex activities and distribution within the
mitochondria needs to be performed to understand how MSRC and MMP are affected in AD. Further
work is also needed to explore how mitochondrial dynamics in AD are affected, and if this is a
potential therapeutic target of the future.
Astrocyte metabolism changes need to be understood in relationship to changes in metabolism in
neurons from patients with AD, but also with regard to how astrocyte metabolism affects neuronal
support. This can be done with co-culture work using the same iNPC technologies employed in this
study. Co-cultures systems that combine the iNPC generated astrocytes discussed in this thesis with
neurons derived from Lund human mesencephalic cells, or cells lines such as the PC12 line would
also be useful to study the ability for astrocyte neuronal support.
As all dementia types can present very summarily at the beginning of disease, performing the same
experiments described here in other dementia types, and in patients with prodromal dementia
would answer the question as to whether the changes seen here are unique to AD or are a global
feature of dementias and neurodegenerative disease. The in-depth metabolic assessment that has
been employed in this study may highlight certain metabolic patterns that are specific to dementia
subtypes. In addition to studying mitochondrial function and glycolysis, fatty acid and protein
metabolism could be added to the experimental battery to characterize AD and dementia metabolic
deficits further.
It would also be important to explore further if the clinical correlation work performed in this study
could be developed into a biomarker for AD, or a way of tracking cellular metabolic function
clinically. Performing these experiments in patients with MCI and who are cognitively normal would
help address this.
Finally, the utility of exploiting the deficits in metabolic function identified in this study as targets for
drug treatments needs to be assessed. Drug screening assays focusing on improving MSRC, glycolytic
218 | P a g e
reserve and extracellular lactate levels would be a logical way to develop disease modifying
therapies for patients with AD.
6.9 Final Conclusion
This thesis has shown that mitochondrial function and glycolysis are abnormal in both sporadic and
familial AD, and that these abnormalities are not confined to the central nervous system. The
functional reserve capacity of both OxPHOS and glycolysis is impaired in multiple cell types in AD and
this impairment correlates with scores on neuropsychological tests shown to be abnormal early in
AD.
This is one of the first studies to show that human derived astrocytes from both sporadic and familial
AD patients have metabolic deficits, and that the main pathway by which astrocytes produce ATP is
impaired. Impaired astrocyte metabolism is likely to affect neuronal astrocytic support, synaptic
plasticity and memory acquisition which makes this finding of key importance in the understanding
of the pathology of AD.
Both astrocyte and fibroblast mitochondrial deficits can be corrected with the application of certain
already developed therapeutics, which combined with the correlation data between
neuropsychological biomarkers of AD and metabolic dysfunction, suggests that the abnormalities
identified in this thesis could be used as both a therapeutic target for AD and the development of a
metabolic biomarker.
This thesis has shown the importance of studying metabolism in AD, and has also highlighted that
the astrocyte, a cell not always considered a key player in the pathology of AD potentially has an
important role.
219 | P a g e
References
1. Global, regional, and national burden of neurological disorders, 1990-2016: a systematic analysis for the Global Burden of Disease Study 2016. Lancet Neurol, 2019. 18(5): p. 459-480.
2. Wu, Y.T., et al., The changing prevalence and incidence of dementia over time - current evidence. Nat Rev Neurol, 2017. 13(6): p. 327-339.
3. Prince, M. World Alzheimer report 2015: the global impact of dementia. 2015. 2015 [cited 2020 06/05/2020].
4. Association, A. What is Dementia. 2020 7/05/20]; Available from: https://www.alz.org/alzheimers-dementia/what-is-dementia.
5. Mukadam, N., et al., Population attributable fractions for risk factors for dementia in low-income and middle-income countries: an analysis using cross-sectional survey data. Lancet Glob Health, 2019. 7(5): p. e596-e603.
6. Ferri, C.P. and K.S. Jacob, Dementia in low-income and middle-income countries: Different realities mandate tailored solutions. PLoS medicine, 2017. 14(3): p. e1002271-e1002271.
7. Jonsson, L., et al., Determinants of costs of care for patients with Alzheimer's disease. Int J Geriatr Psychiatry, 2006. 21(5): p. 449-59.
8. Livingston, G., et al., Dementia prevention, intervention, and care. Lancet, 2017. 390(10113): p. 2673-2734.
9. Strassnig, M. and M. Ganguli, About a peculiar disease of the cerebral cortex: Alzheimer's original case revisited. Psychiatry (Edgmont (Pa. : Township)), 2005. 2(9): p. 30-33.
10. Alzheimer, A., Uber eine eigenartige Erkrankung der Hirnrinde. Zentralbl. Nervenh. Psych., 1907. 18: p. 177-179.
11. Perl, D.P., Neuropathology of Alzheimer's disease. The Mount Sinai journal of medicine, New York, 2010. 77(1): p. 32-42.
12. Hardy, J. and D.J. Selkoe, The Amyloid Hypothesis of Alzheimer's Disease: Progress and Problems on the Road to Therapeutics. Science, 2002. 297(5580): p. 353-356.
13. Hardy, J.A. and G.A. Higgins, Alzheimer's disease: the amyloid cascade hypothesis. Science, 1992. 256(5054): p. 184-5.
14. Hardy, J. and D. Allsop, Amyloid deposition as the central event in the aetiology of Alzheimer's disease. Trends Pharmacol Sci, 1991. 12(10): p. 383-8.
15. Selkoe, D.J., The molecular pathology of Alzheimer's disease. Neuron, 1991. 6(4): p. 487-98. 16. Braak, H. and E. Braak, Neuropathological stageing of Alzheimer-related changes. Acta
Neuropathol, 1991. 82(4): p. 239-59. 17. Terry, R.D., The pathogenesis of Alzheimer disease: an alternative to the amyloid hypothesis.
J Neuropathol Exp Neurol, 1996. 55(10): p. 1023-5. 18. Savva, G.M., et al., Age, neuropathology, and dementia. N Engl J Med, 2009. 360(22): p.
2302-9. 19. Iacono, D., et al., The Nun study: clinically silent AD, neuronal hypertrophy, and linguistic
skills in early life. Neurology, 2009. 73(9): p. 665-673. 20. van Dyck, C.H., Anti-Amyloid-beta Monoclonal Antibodies for Alzheimer's Disease: Pitfalls
and Promise. Biol Psychiatry, 2018. 83(4): p. 311-319. 21. Gold, M., Phase II clinical trials of anti-amyloid β antibodies: When is enough, enough?
Alzheimer's & dementia (New York, N. Y.), 2017. 3(3): p. 402-409. 22. Le Couteur, D.G., S. Hunter, and C. Brayne, Solanezumab and the amyloid hypothesis for
Alzheimer's disease. Bmj, 2016. 355: p. i6771. 23. Grundke-Iqbal, I., et al., Microtubule-associated protein tau. A component of Alzheimer
paired helical filaments. J Biol Chem, 1986. 261(13): p. 6084-9. 24. Grundke-Iqbal, I., et al., Abnormal phosphorylation of the microtubule-associated protein tau
(tau) in Alzheimer cytoskeletal pathology. Proc Natl Acad Sci U S A, 1986. 83(13): p. 4913-7.
220 | P a g e
25. Wood, J.G., et al., Neurofibrillary tangles of Alzheimer disease share antigenic determinants with the axonal microtubule-associated protein tau (tau). Proceedings of the National Academy of Sciences, 1986. 83(11): p. 4040-4043.
26. Binder, L.I., et al., Tau, tangles, and Alzheimer's disease. Biochimica et Biophysica Acta (BBA) - Molecular Basis of Disease, 2005. 1739(2): p. 216-223.
27. Ghoshal, N., et al., Tau Conformational Changes Correspond to Impairments of Episodic Memory in Mild Cognitive Impairment and Alzheimer's Disease. Experimental Neurology, 2002. 177(2): p. 475-493.
28. Arriagada, P.V., et al., Neurofibrillary tangles but not senile plaques parallel duration and severity of Alzheimer's disease. Neurology, 1992. 42(3 Pt 1): p. 631-9.
29. Mitchell, T.W., et al., Parahippocampal tau pathology in healthy aging, mild cognitive impairment, and early Alzheimer's disease. Ann Neurol, 2002. 51(2): p. 182-9.
30. Hardy, J., et al., Genetic dissection of Alzheimer's disease and related dementias: amyloid and its relationship to tau. Nat Neurosci, 1998. 1(5): p. 355-8.
31. Masliah, E., et al., Immunohistochemical quantification of the synapse-related protein synaptophysin in Alzheimer disease. Neuroscience Letters, 1989. 103(2): p. 234-239.
32. Perdahl, E., et al., Synapsin I (protein I) in different brain regions in senile dementia of Alzheimer type and in multi-infarct dementia. J Neural Transm, 1984. 60(2): p. 133-41.
33. Davies, C.A., et al., A quantitative morphometric analysis of the neuronal and synaptic content of the frontal and temporal cortex in patients with Alzheimer's disease. J Neurol Sci, 1987. 78(2): p. 151-64.
34. Spires-Jones, T.L. and B.T. Hyman, The intersection of amyloid beta and tau at synapses in Alzheimer's disease. Neuron, 2014. 82(4): p. 756-771.
35. DeKosky, S.T. and S.W. Scheff, Synapse loss in frontal cortex biopsies in Alzheimer's disease: correlation with cognitive severity. Ann Neurol, 1990. 27(5): p. 457-64.
36. Scheff, S.W., et al., Hippocampal synaptic loss in early Alzheimer's disease and mild cognitive impairment. Neurobiol Aging, 2006. 27(10): p. 1372-84.
37. Selkoe, D.J., Alzheimer's disease is a synaptic failure. Science, 2002. 298(5594): p. 789-91. 38. Hsia, A.Y., et al., Plaque-independent disruption of neural circuits in Alzheimer's disease
mouse models. Proc Natl Acad Sci U S A, 1999. 96(6): p. 3228-33. 39. Mucke, L., et al., High-level neuronal expression of abeta 1-42 in wild-type human amyloid
protein precursor transgenic mice: synaptotoxicity without plaque formation. J Neurosci, 2000. 20(11): p. 4050-8.
40. Chen, G., et al., A learning deficit related to age and beta-amyloid plaques in a mouse model of Alzheimer's disease. Nature, 2000. 408(6815): p. 975-9.
41. Vlassenko, A.G., et al., Spatial correlation between brain aerobic glycolysis and amyloid-beta (Abeta ) deposition. Proc Natl Acad Sci U S A, 2010. 107(41): p. 17763-7.
42. Vlassenko, A.G., et al., Aerobic glycolysis and tau deposition in preclinical Alzheimer's disease. Neurobiol Aging, 2018. 67: p. 95-98.
43. Harris, J.J., R. Jolivet, and D. Attwell, Synaptic energy use and supply. Neuron, 2012. 75(5): p. 762-77.
44. Akiyama, H., et al., Inflammation and Alzheimer's disease. Neurobiology of aging, 2000. 21(3): p. 383-421.
45. Mandrekar-Colucci, S. and G.E. Landreth, Microglia and inflammation in Alzheimer's disease. CNS & neurological disorders drug targets, 2010. 9(2): p. 156-167.
46. Broe, G.A., et al., Anti-inflammatory Drugs Protect Against Alzheimer Disease at Low Doses. Archives of Neurology, 2000. 57(11): p. 1586-1591.
47. Mesulam, M.M., Neuroplasticity failure in Alzheimer's disease: bridging the gap between plaques and tangles. Neuron, 1999. 24(3): p. 521-9.
48. Bliss, T.V. and G.L. Collingridge, A synaptic model of memory: long-term potentiation in the hippocampus. Nature, 1993. 361(6407): p. 31-9.
221 | P a g e
49. Collingridge, G.L., et al., Long-term depression in the CNS. Nature Reviews Neuroscience, 2010. 11(7): p. 459-473.
50. Shankar, G.M. and D.M. Walsh, Alzheimer's disease: synaptic dysfunction and Abeta. Molecular neurodegeneration, 2009. 4: p. 48-48.
51. Miklossy, J., et al., Curly fiber and tangle-like inclusions in the ependyma and choroid plexus--a pathogenetic relationship with the cortical Alzheimer-type changes? J Neuropathol Exp Neurol, 1998. 57(12): p. 1202-12.
52. Chow, V.W., et al., An overview of APP processing enzymes and products. Neuromolecular Med, 2010. 12(1): p. 1-12.
53. Tanabe, C., et al., ADAM19 is tightly associated with constitutive Alzheimer's disease APP alpha-secretase in A172 cells. Biochem Biophys Res Commun, 2007. 352(1): p. 111-7.
54. Fahrenholz, F., et al., Alpha-secretase activity of the disintegrin metalloprotease ADAM 10. Influences of domain structure. Ann N Y Acad Sci, 2000. 920: p. 215-22.
55. Vassar, R., et al., Beta-secretase cleavage of Alzheimer's amyloid precursor protein by the transmembrane aspartic protease BACE. Science, 1999. 286(5440): p. 735-41.
56. Wu, Z., et al., Cathepsin B plays a critical role in inducing Alzheimer’s disease-like phenotypes following chronic systemic exposure to lipopolysaccharide from Porphyromonas gingivalis in mice. Brain, Behavior, and Immunity, 2017. 65: p. 350-361.
57. Iwatsubo, T., The gamma-secretase complex: machinery for intramembrane proteolysis. Curr Opin Neurobiol, 2004. 14(3): p. 379-83.
58. Hernández, F. and J. Avila, The role of glycogen synthase kinase 3 in the early stages of Alzheimers’ disease. FEBS Letters, 2008. 582(28): p. 3848-3854.
59. Cross, D.A., et al., Inhibition of glycogen synthase kinase-3 by insulin mediated by protein kinase B. Nature, 1995. 378(6559): p. 785-9.
60. Aberle, H., et al., beta-catenin is a target for the ubiquitin-proteasome pathway. Embo j, 1997. 16(13): p. 3797-804.
61. Patrick, G.N., et al., Conversion of p35 to p25 deregulates Cdk5 activity and promotes neurodegeneration. Nature, 1999. 402(6762): p. 615-622.
62. Tamagno, E., et al., H2O2 and 4-hydroxynonenal mediate amyloid beta-induced neuronal apoptosis by activating JNKs and p38MAPK. Exp Neurol, 2003. 180(2): p. 144-55.
63. Karran, E. and B. De Strooper, The amyloid cascade hypothesis: are we poised for success or failure? J Neurochem, 2016. 139 Suppl 2: p. 237-252.
64. Elliott, C., et al., A role for APP in Wnt signalling links synapse loss with β-amyloid production. Translational psychiatry, 2018. 8(1): p. 179-179.
65. Dolan, P.J. and G.V.W. Johnson, The role of tau kinases in Alzheimer's disease. Current opinion in drug discovery & development, 2010. 13(5): p. 595-603.
66. Rumble, B., et al., Amyloid A4 protein and its precursor in Down's syndrome and Alzheimer's disease. N Engl J Med, 1989. 320(22): p. 1446-52.
67. Das, B. and R. Yan, A Close Look at BACE1 Inhibitors for Alzheimer's Disease Treatment. CNS drugs, 2019. 33(3): p. 251-263.
68. Patzwald, G.A. and S.C. Wildt, The use of convent archival records in medical research: the School Sisters of Notre Dame archives and the nun study. Am Arch, 2004. 67(1): p. 86-106.
69. Citron, M., et al., Mutant presenilins of Alzheimer's disease increase production of 42-residue amyloid β-protein in both transfected cells and transgenic mice. Nature Medicine, 1997. 3(1): p. 67-72.
70. Lewis, J., et al., Neurofibrillary tangles, amyotrophy and progressive motor disturbance in mice expressing mutant (P301L) tau protein. Nat Genet, 2000. 25(4): p. 402-5.
71. McKhann, G.M., et al., The diagnosis of dementia due to Alzheimer's disease: recommendations from the National Institute on Aging-Alzheimer's Association workgroups on diagnostic guidelines for Alzheimer's disease. Alzheimers Dement, 2011. 7(3): p. 263-9.
222 | P a g e
72. Aronoff, J.M., et al., Information content versus relational knowledge: semantic deficits in patients with Alzheimer's disease. Neuropsychologia, 2006. 44(1): p. 21-35.
73. Weintraub, S., A.H. Wicklund, and D.P. Salmon, The neuropsychological profile of Alzheimer disease. Cold Spring Harbor perspectives in medicine, 2012. 2(4): p. a006171-a006171.
74. Luppa, M., et al., Prediction of institutionalisation in dementia. A systematic review. Dement Geriatr Cogn Disord, 2008. 26(1): p. 65-78.
75. Kai, K., et al., Relationship between eating disturbance and dementia severity in patients with Alzheimer's disease. PloS one, 2015. 10(8): p. e0133666-e0133666.
76. Brookmeyer, R., et al., Survival following a diagnosis of Alzheimer disease. Arch Neurol, 2002. 59(11): p. 1764-7.
77. Lopez, O.L., Mild cognitive impairment. Continuum (Minneapolis, Minn.), 2013. 19(2 Dementia): p. 411-424.
78. Langa, K.M. and D.A. Levine, The diagnosis and management of mild cognitive impairment: a clinical review. JAMA, 2014. 312(23): p. 2551-2561.
79. Kelley, B.J. and R.C. Petersen, Alzheimer's disease and mild cognitive impairment. Neurologic clinics, 2007. 25(3): p. 577-v.
80. Ekman, U., D. Ferreira, and E. Westman, The A/T/N biomarker scheme and patterns of brain atrophy assessed in mild cognitive impairment. Scientific Reports, 2018. 8(1): p. 8431.
81. Bekris, L.M., et al., Genetics of Alzheimer disease. Journal of geriatric psychiatry and neurology, 2010. 23(4): p. 213-227.
82. Chartier-Harlin, M.C., et al., Early-onset Alzheimer's disease caused by mutations at codon 717 of the beta-amyloid precursor protein gene. Nature, 1991. 353(6347): p. 844-6.
83. Citron, M., et al., Mutant presenilins of Alzheimer's disease increase production of 42-residue amyloid beta-protein in both transfected cells and transgenic mice. Nat Med, 1997. 3(1): p. 67-72.
84. Goate, A., et al., Segregation of a missense mutation in the amyloid precursor protein gene with familial Alzheimer's disease. Nature, 1991. 349(6311): p. 704-6.
85. Mullan, M., et al., A pathogenic mutation for probable Alzheimer's disease in the APP gene at the N-terminus of beta-amyloid. Nat Genet, 1992. 1(5): p. 345-7.
86. Murrell, J., et al., A mutation in the amyloid precursor protein associated with hereditary Alzheimer's disease. Science, 1991. 254(5028): p. 97-9.
87. Bird, T., Early-Onset Familial Alzheimer Disease. 2012, University of Washington. 88. Campion, D., et al., A novel presenilin 1 mutation resulting in familial Alzheimer's disease
with an onset age of 29 years. Neuroreport, 1996. 7(10): p. 1582-4. 89. Duff, K., et al., Increased amyloid-beta42(43) in brains of mice expressing mutant presenilin
1. Nature, 1996. 383(6602): p. 710-3. 90. Corder, E.H., et al., Gene dose of apolipoprotein E type 4 allele and the risk of Alzheimer's
disease in late onset families. Science, 1993. 261(5123): p. 921-3. 91. Ungar, L., A. Altmann, and M.D. Greicius, Apolipoprotein E, gender, and Alzheimer's disease:
an overlooked, but potent and promising interaction. Brain imaging and behavior, 2014. 8(2): p. 262-273.
92. Liu, C.-C., et al., Apolipoprotein E and Alzheimer disease: risk, mechanisms and therapy. Nature reviews. Neurology, 2013. 9(2): p. 106-118.
93. Misra, A., S.S. Chakrabarti, and I.S. Gambhir, New genetic players in late-onset Alzheimer's disease: Findings of genome-wide association studies. The Indian journal of medical research, 2018. 148(2): p. 135-144.
94. Johnson, K.A., et al., Brain imaging in Alzheimer disease. Cold Spring Harbor perspectives in medicine, 2012. 2(4): p. a006213-a006213.
95. Niemantsverdriet, E., et al., Alzheimer's disease CSF biomarkers: clinical indications and rational use. Acta neurologica Belgica, 2017. 117(3): p. 591-602.
223 | P a g e
96. Fleisher, A.S., et al., Positron Emission Tomography Imaging With [18F]flortaucipir and Postmortem Assessment of Alzheimer Disease Neuropathologic Changes. JAMA Neurology, 2020.
97. Jack, C.R., Jr., et al., A/T/N: An unbiased descriptive classification scheme for Alzheimer disease biomarkers. Neurology, 2016. 87(5): p. 539-547.
98. Allegri, R.F., et al., Prognostic value of ATN Alzheimer biomarkers: 60-month follow-up results from the Argentine Alzheimer's Disease Neuroimaging Initiative. Alzheimer's & Dementia: Diagnosis, Assessment & Disease Monitoring, 2020. 12(1): p. e12026.
99. Cummings, J.L. and C. Back, The cholinergic hypothesis of neuropsychiatric symptoms in Alzheimer's disease. Am J Geriatr Psychiatry, 1998. 6(2 Suppl 1): p. S64-78.
100. Areosa, S.A., F. Sherriff, and R. McShane, Memantine for dementia. Cochrane Database Syst Rev, 2005(2): p. Cd003154.
101. Birks, J., Cholinesterase inhibitors for Alzheimer's disease. Cochrane Database Syst Rev, 2006(1): p. Cd005593.
102. Rinne, J.O., et al., 11C-PiB PET assessment of change in fibrillar amyloid-beta load in patients with Alzheimer's disease treated with bapineuzumab: a phase 2, double-blind, placebo-controlled, ascending-dose study. Lancet Neurol, 2010. 9(4): p. 363-72.
103. Sperling, R., et al., Amyloid-related imaging abnormalities in patients with Alzheimer's disease treated with bapineuzumab: a retrospective analysis. Lancet Neurol, 2012. 11(3): p. 241-9.
104. Schneider, L., A resurrection of aducanumab for Alzheimer's disease. Lancet Neurol, 2020. 19(2): p. 111-112.
105. Makin, S., The amyloid hypothesis on trial. Nature, 2018. 559(7715): p. S4-s7. 106. Perrin, R.J., A.M. Fagan, and D.M. Holtzman, Multimodal techniques for diagnosis and
prognosis of Alzheimer's disease. Nature, 2009. 461(7266): p. 916-22. 107. Jansen, W.J., et al., Prevalence of Cerebral Amyloid Pathology in Persons Without Dementia:
A Meta-analysis. JAMA, 2015. 313(19): p. 1924-1938. 108. Selvackadunco, S., et al., Comparison of clinical and neuropathological diagnoses of
neurodegenerative diseases in two centres from the Brains for Dementia Research (BDR) cohort. Journal of Neural Transmission, 2019. 126(3): p. 327-337.
109. Grandal Leiros, B., et al., Prevalence and concordance between the clinical and the post-mortem diagnosis of dementia in a psychogeriatric clinic. Neurología (English Edition), 2018. 33(1): p. 13-17.
110. Rasmusson, D.X., et al., Accuracy of clinical diagnosis of Alzheimer disease and clinical features of patients with non-Alzheimer disease neuropathology. Alzheimer Dis Assoc Disord, 1996. 10(4): p. 180-8.
111. Lim, A., et al., Clinico-neuropathological correlation of Alzheimer's disease in a community-based case series. J Am Geriatr Soc, 1999. 47(5): p. 564-9.
112. Mok, W., et al., Clinicopathological concordance of dementia diagnoses by community versus tertiary care clinicians. American journal of Alzheimer's disease and other dementias, 2004. 19(3): p. 161-165.
113. Gauthreaux, K., et al., Concordance of Clinical Alzheimer Diagnosis and Neuropathological Features at Autopsy. Journal of Neuropathology & Experimental Neurology, 2020. 79(5): p. 465-473.
114. Danner, D.D., D.A. Snowdon, and W.V. Friesen, Positive emotions in early life and longevity: findings from the nun study. J Pers Soc Psychol, 2001. 80(5): p. 804-13.
115. Snowdon, D.A., Healthy aging and dementia: findings from the Nun Study. Ann Intern Med, 2003. 139(5 Pt 2): p. 450-4.
116. Morgen, K. and L. Frolich, The metabolism hypothesis of Alzheimer's disease: from the concept of central insulin resistance and associated consequences to insulin therapy. J Neural Transm (Vienna), 2015. 122(4): p. 499-504.
224 | P a g e
117. Johnson, E.C.B., et al., Large-scale proteomic analysis of Alzheimer’s disease brain and cerebrospinal fluid reveals early changes in energy metabolism associated with microglia and astrocyte activation. Nature Medicine, 2020. 26(5): p. 769-780.
118. Swerdlow, R.H. and S.M. Khan, A "mitochondrial cascade hypothesis" for sporadic Alzheimer's disease. Med Hypotheses, 2004. 63(1): p. 8-20.
119. Youle, R.J. and A.M. van der Bliek, Mitochondrial fission, fusion, and stress. Science (New York, N.Y.), 2012. 337(6098): p. 1062-1065.
120. Friedman, J.R. and J. Nunnari, Mitochondrial form and function. Nature, 2014. 505(7483): p. 335-343.
121. Stein, L.R. and S.-i. Imai, The dynamic regulation of NAD metabolism in mitochondria. Trends in endocrinology and metabolism: TEM, 2012. 23(9): p. 420-428.
122. Kyriakouli, D.S., et al., Progress and prospects: gene therapy for mitochondrial DNA disease. Gene Ther, 2008. 15(14): p. 1017-23.
123. Cadonic, C., M.G. Sabbir, and B.C. Albensi, Mechanisms of Mitochondrial Dysfunction in Alzheimer's Disease. Molecular Neurobiology, 2016. 53(9): p. 6078-6090.
124. Hames, B.D.H., N.M, Instant notes in Biochemistry, F. Kingston, Editor. 2000. p. 278-288. 125. Lenaz, G., et al., Mitochondrial respiratory chain super-complex I–III in physiology and
pathology. Biochimica et Biophysica Acta (BBA) - Bioenergetics, 2010. 1797(6): p. 633-640. 126. Diaz, F., et al., Cytochrome c oxidase is required for the assembly/stability of respiratory
complex I in mouse fibroblasts. Mol Cell Biol, 2006. 26(13): p. 4872-81. 127. Dencher, N.A., et al., Proteome alterations in rat mitochondria caused by aging. Ann N Y
Acad Sci, 2007. 1100: p. 291-8. 128. Tondera, D., et al., SLP-2 is required for stress-induced mitochondrial hyperfusion. Embo j,
2009. 28(11): p. 1589-600. 129. Baker, M.J., T. Tatsuta, and T. Langer, Quality control of mitochondrial proteostasis. Cold
Spring Harbor perspectives in biology, 2011. 3(7): p. a007559. 130. Fukumitsu, K., et al., Mitochondrial fission protein Drp1 regulates mitochondrial transport
and dendritic arborization in cerebellar Purkinje cells. Mol Cell Neurosci, 2016. 71: p. 56-65. 131. van der Bliek, A.M., Q. Shen, and S. Kawajiri, Mechanisms of mitochondrial fission and fusion.
Cold Spring Harb Perspect Biol, 2013. 5(6). 132. Chan, D.C., Mitochondrial Dynamics and Its Involvement in Disease. Annual Review of
Pathology: Mechanisms of Disease, 2020. 15(1): p. 235-259. 133. Stauch, K.L., P.R. Purnell, and H.S. Fox, Quantitative proteomics of synaptic and nonsynaptic
mitochondria: insights for synaptic mitochondrial vulnerability. J Proteome Res, 2014. 13(5): p. 2620-36.
134. Kiebish, M.A., et al., Lipidomic analysis and electron transport chain activities in C57BL/6J mouse brain mitochondria. J Neurochem, 2008. 106(1): p. 299-312.
135. Menacho, C. and A. Prigione, Tackling mitochondrial diversity in brain function: from animal models to human brain organoids. The International Journal of Biochemistry & Cell Biology, 2020. 123: p. 105760.
136. Contreras, L., et al., Mitochondria: The calcium connection. Biochimica et Biophysica Acta (BBA) - Bioenergetics, 2010. 1797(6): p. 607-618.
137. De Stefani, D., M. Patron, and R. Rizzuto, Structure and function of the mitochondrial calcium uniporter complex. Biochimica et Biophysica Acta (BBA) - Molecular Cell Research, 2015. 1853(9): p. 2006-2011.
138. Kirichok, Y., G. Krapivinsky, and D.E. Clapham, The mitochondrial calcium uniporter is a highly selective ion channel. Nature, 2004. 427(6972): p. 360-4.
139. Csordás, G., et al., Calcium transport across the inner mitochondrial membrane: molecular mechanisms and pharmacology. Molecular and cellular endocrinology, 2012. 353(1-2): p. 109-113.
225 | P a g e
140. Perocchi, F., et al., MICU1 encodes a mitochondrial EF hand protein required for Ca(2+) uptake. Nature, 2010. 467(7313): p. 291-296.
141. Mallilankaraman, K., et al., MICU1 is an essential gatekeeper for MCU-mediated mitochondrial Ca(2+) uptake that regulates cell survival. Cell, 2012. 151(3): p. 630-44.
142. Denton, R.M., Regulation of mitochondrial dehydrogenases by calcium ions. Biochim Biophys Acta, 2009. 1787(11): p. 1309-16.
143. Rizzuto, R., P. Bernardi, and T. Pozzan, Mitochondria as all-round players of the calcium game. The Journal of Physiology, 2000. 529(1): p. 37-47.
144. Bernardi, P., The mitochondrial permeability transition pore: a mystery solved? Frontiers in Physiology, 2013. 4(95).
145. Du, H. and S.S. Yan, Mitochondrial permeability transition pore in Alzheimer's disease: cyclophilin D and amyloid beta. Biochim Biophys Acta, 2010. 1802(1): p. 198-204.
146. Murphy, M.P., How mitochondria produce reactive oxygen species. The Biochemical journal, 2009. 417(1): p. 1-13.
147. Zorov, D.B., M. Juhaszova, and S.J. Sollott, Mitochondrial reactive oxygen species (ROS) and ROS-induced ROS release. Physiological reviews, 2014. 94(3): p. 909-950.
148. Valko, M., et al., Role of oxygen radicals in DNA damage and cancer incidence. Mol Cell Biochem, 2004. 266(1-2): p. 37-56.
149. Sena, Laura A. and Navdeep S. Chandel, Physiological Roles of Mitochondrial Reactive Oxygen Species. Molecular Cell, 2012. 48(2): p. 158-167.
150. Marin-Hernandez, A., et al., HIF-1alpha modulates energy metabolism in cancer cells by inducing over-expression of specific glycolytic isoforms. Mini Rev Med Chem, 2009. 9(9): p. 1084-101.
151. Johri, A. and M.F. Beal, Mitochondrial dysfunction in neurodegenerative diseases. J Pharmacol Exp Ther, 2012. 342(3): p. 619-30.
152. Cecconi, F. and B. Levine, The role of autophagy in mammalian development: cell makeover rather than cell death. Dev Cell, 2008. 15(3): p. 344-57.
153. De Duve, C. and R. Wattiaux, Functions of lysosomes. Annu Rev Physiol, 1966. 28: p. 435-92. 154. Ding, W.-X. and X.-M. Yin, Mitophagy: mechanisms, pathophysiological roles, and analysis.
Biological chemistry, 2012. 393(7): p. 547-564. 155. Twig, G., et al., Fission and selective fusion govern mitochondrial segregation and elimination
by autophagy. Embo j, 2008. 27(2): p. 433-46. 156. Gomes, L.C. and L. Scorrano, High levels of Fis1, a pro-fission mitochondrial protein, trigger
autophagy. Biochim Biophys Acta, 2008. 1777(7-8): p. 860-6. 157. Gomes, L.C., G. Di Benedetto, and L. Scorrano, During autophagy mitochondria elongate, are
spared from degradation and sustain cell viability. Nat Cell Biol, 2011. 13(5): p. 589-98. 158. Rambold, A.S., et al., Tubular network formation protects mitochondria from
autophagosomal degradation during nutrient starvation. Proc Natl Acad Sci U S A, 2011. 108(25): p. 10190-5.
159. Narendra, D., et al., Parkin is recruited selectively to impaired mitochondria and promotes their autophagy. J Cell Biol, 2008. 183(5): p. 795-803.
160. Lavie, J., et al., Ubiquitin-Dependent Degradation of Mitochondrial Proteins Regulates Energy Metabolism. Cell Reports, 2018. 23(10): p. 2852-2863.
161. Ding, W.-X., et al., Nix is critical to two distinct phases of mitophagy, reactive oxygen species-mediated autophagy induction and Parkin-ubiquitin-p62-mediated mitochondrial priming. The Journal of biological chemistry, 2010. 285(36): p. 27879-27890.
162. Halestrap, A.P., What is the mitochondrial permeability transition pore? J Mol Cell Cardiol, 2009. 46(6): p. 821-31.
163. Kinnally, K.W., et al., Is mPTP the gatekeeper for necrosis, apoptosis, or both? Biochimica et biophysica acta, 2011. 1813(4): p. 616-622.
226 | P a g e
164. Trushina, E., et al., Defects in mitochondrial dynamics and metabolomic signatures of evolving energetic stress in mouse models of familial Alzheimer's disease. PLoS One, 2012. 7(2): p. e32737.
165. Bubber, P., et al., Mitochondrial abnormalities in Alzheimer brain: mechanistic implications. Ann Neurol, 2005. 57(5): p. 695-703.
166. Trimmer, P.A. and M.K. Borland, Differentiated Alzheimer's disease transmitochondrial cybrid cell lines exhibit reduced organelle movement. Antioxid Redox Signal, 2005. 7(9-10): p. 1101-9.
167. Wang, X., et al., Amyloid-beta overproduction causes abnormal mitochondrial dynamics via differential modulation of mitochondrial fission/fusion proteins. Proc Natl Acad Sci U S A, 2008. 105(49): p. 19318-23.
168. Mastroeni, D., et al., Nuclear but not mitochondrial-encoded oxidative phosphorylation genes are altered in aging, mild cognitive impairment, and Alzheimer's disease. Alzheimers & Dementia, 2017. 13(5): p. 510-519.
169. Chandrasekaran, K., et al., Impairment in mitochondrial cytochrome oxidase gene expression in Alzheimer disease. Brain Res Mol Brain Res, 1994. 24(1-4): p. 336-40.
170. Hatanpää, K., et al., No association between Alzheimer plaques and decreased levels of cytochrome oxidase subunit mRNA, a marker of neuronal energy metabolism. Molecular Brain Research, 1998. 59(1): p. 13-21.
171. Anderson, S., et al., Sequence and organization of the human mitochondrial genome. Nature, 1981. 290: p. 457.
172. Cottrell, D.A., et al., The role of cytochrome c oxidase deficient hippocampal neurones in Alzheimer's disease. Neuropathol Appl Neurobiol, 2002. 28(5): p. 390-6.
173. Simonian, N.A. and B.T. Hyman, Functional Alterations in Alzheimer's Disease: Selective Loss of Mitochondrial-encoded Cytochrome Oxidase mRNA in the Hippocampal Formation. Journal of Neuropathology & Experimental Neurology, 1994. 53(5): p. 508-512.
174. Hirai, K., et al., Mitochondrial abnormalities in Alzheimer's disease. J Neurosci, 2001. 21(9): p. 3017-23.
175. Manczak, M., et al., Differential expression of oxidative phosphorylation genes in patients with Alzheimer's disease: implications for early mitochondrial dysfunction and oxidative damage. Neuromolecular Med, 2004. 5(2): p. 147-62.
176. Fukuyama, R., et al., Gene expression of ND4, a subunit of complex I of oxidative phosphorylation in mitochondria, is decreased in temporal cortex of brains of Alzheimer's disease patients. Brain Res, 1996. 713(1-2): p. 290-3.
177. de la Monte, S.M., et al., Mitochondrial DNA damage as a mechanism of cell loss in Alzheimer's disease. Lab Invest, 2000. 80(8): p. 1323-35.
178. Lin, F.H., et al., Detection of point mutations in codon 331 of mitochondrial NADH dehydrogenase subunit 2 in Alzheimer's brains. Biochem Biophys Res Commun, 1992. 182(1): p. 238-46.
179. Linnane, A., et al., MITOCHONDRIAL DNA MUTATIONS AS AN IMPORTANT CONTRIBUTOR TO AGEING AND DEGENERATIVE DISEASES. The Lancet, 1989. 333(8639): p. 642-645.
180. Griffiths, K.K. and R.J. Levy, Evidence of Mitochondrial Dysfunction in Autism: Biochemical Links, Genetic-Based Associations, and Non-Energy-Related Mechanisms. Oxidative Medicine and Cellular Longevity, 2017. 2017: p. 4314025.
181. Chagnon, P., et al., Distribution of brain cytochrome oxidase activity in various neurodegenerative diseases. Neuroreport, 1995. 6(5): p. 711-5.
182. Kish, S.J., et al., Brain cytochrome oxidase in Alzheimer's disease. J Neurochem, 1992. 59(2): p. 776-9.
183. Mutisya, E.M., A.C. Bowling, and M.F. Beal, Cortical cytochrome oxidase activity is reduced in Alzheimer's disease. J Neurochem, 1994. 63(6): p. 2179-84.
227 | P a g e
184. Parker, W.D., et al., Electron transport chain defects in Alzheimer's disease brain. Neurology, 1994. 44(6): p. 1090-1096.
185. Parker, W.D. and J.K. Parks, Cytochrome C Oxidase in Alzheimer's Disease Brain. Purification and Characterization, 1995. 45(3): p. 482-486.
186. Wong-Riley, M., et al., Cytochrome oxidase in Alzheimer's disease: Biochemical, histochemical, and immunohistochemical analyses of the visual and other systems. Vision Research, 1997. 37(24): p. 3593-3608.
187. Hevner, R.F. and M.T. Wong-Riley, Mitochondrial and nuclear gene expression for cytochrome oxidase subunits are disproportionately regulated by functional activity in neurons. J Neurosci, 1993. 13(5): p. 1805-19.
188. Wong-Riley, M.T., Cytochrome oxidase: an endogenous metabolic marker for neuronal activity. Trends Neurosci, 1989. 12(3): p. 94-101.
189. Wong-Riley, M.T., et al., Maintenance of neuronal activity by electrical stimulation of unilaterally deafened cats demonstrable with cytochrome oxidase technique. Ann Otol Rhinol Laryngol Suppl, 1981. 90(2 Pt 3): p. 30-2.
190. Chandrasekaran, K., et al., Evidence for Physiological Down-regulation of Brain Oxidative Phosphorylation in Alzheimer's Disease. Experimental Neurology, 1996. 142(1): p. 80-88.
191. Maynard, S., et al., Defective mitochondrial respiration, altered dNTP pools and reduced AP endonuclease 1 activity in peripheral blood mononuclear cells of Alzheimer's disease patients. Aging-Us, 2015. 7(10): p. 793-+.
192. Leuner, K., et al., Peripheral mitochondrial dysfunction in Alzheimer's disease: focus on lymphocytes. Mol Neurobiol, 2012. 46(1): p. 194-204.
193. Coskun, P., et al., Metabolic and Growth Rate Alterations in Lymphoblastic Cell Lines Discriminate Between Down Syndrome and Alzheimer's Disease. Journal of Alzheimers Disease, 2017. 55(2): p. 737-748.
194. Lunnon, K., et al., Mitochondrial genes are altered in blood early in Alzheimer's disease. Neurobiology of Aging, 2017. 53: p. 36-47.
195. Fisar, Z., et al., Mitochondrial Respiration in the Platelets of Patients with Alzheimer's Disease. Current Alzheimer Research, 2016. 13(8): p. 930-941.
196. Talib, L.L., H.P. Joaquim, and O.V. Forlenza, Platelet biomarkers in Alzheimer's disease. World J Psychiatry, 2012. 2(6): p. 95-101.
197. Casoli, T., et al., Release of beta-amyloid from high-density platelets: implications for Alzheimer's disease pathology. Ann N Y Acad Sci, 2007. 1096: p. 170-8.
198. Smith, C.C., Stimulated release of the beta-amyloid protein of Alzheimer's disease by normal human platelets. Neurosci Lett, 1997. 235(3): p. 157-9.
199. Prestia, F.A., et al., Platelets Bioenergetics Screening Reflects the Impact of Brain Aβ Plaque Accumulation in a Rat Model of Alzheimer. Neurochemical Research, 2019. 44(6): p. 1375-1386.
200. Parker, W.D., Jr., C.M. Filley, and J.K. Parks, Cytochrome oxidase deficiency in Alzheimer's disease. Neurology, 1990. 40(8): p. 1302-3.
201. Valla, J., et al., Impaired platelet mitochondrial activity in Alzheimer’s disease and mild cognitive impairment. Mitochondrion, 2006. 6(6): p. 323-330.
202. Citron, M., et al., Excessive production of amyloid beta-protein by peripheral cells of symptomatic and presymptomatic patients carrying the Swedish familial Alzheimer disease mutation. Proceedings of the National Academy of Sciences of the United States of America, 1994. 91(25): p. 11993-11997.
203. Gray, N.E. and J.F. Quinn, Alterations in mitochondrial number and function in Alzheimer's disease fibroblasts. Metabolic brain disease, 2015. 30(5): p. 1275-1278.
204. Pérez, M.J., et al., Mitochondrial Bioenergetics Is Altered in Fibroblasts from Patients with Sporadic Alzheimer's Disease. Frontiers in neuroscience, 2017. 11: p. 553-553.
228 | P a g e
205. Sorbi, S., et al., Alterations in metabolic properties in fibroblasts in Alzheimer disease. Alzheimer Dis Assoc Disord, 1995. 9(2): p. 73-7.
206. Curti, D., et al., Oxidative metabolism in cultured fibroblasts derived from sporadic Alzheimer's disease (AD) patients. Neurosci Lett, 1997. 236(1): p. 13-6.
207. Sonntag, K.-C., et al., Late-onset Alzheimer’s disease is associated with inherent changes in bioenergetics profiles. Scientific Reports, 2017. 7(1): p. 14038.
208. Swerdlow, R.H., J.M. Burns, and S.M. Khan, The Alzheimer's disease mitochondrial cascade hypothesis. Journal of Alzheimer's disease : JAD, 2010. 20 Suppl 2(Suppl 2): p. S265-S279.
209. Yao, J., et al., Mitochondrial bioenergetic deficit precedes Alzheimer's pathology in female mouse model of Alzheimer's disease. Proceedings of the National Academy of Sciences of the United States of America, 2009. 106(34): p. 14670-14675.
210. Chou, J.L., et al., Early dysregulation of the mitochondrial proteome in a mouse model of Alzheimer's disease. Journal of Proteomics, 2011. 74(4): p. 466-479.
211. Hartl, D., et al., Presymptomatic Alterations in Energy Metabolism and Oxidative Stress in the APP23 Mouse Model of Alzheimer Disease. Journal of Proteome Research, 2012. 11(6): p. 3295-3304.
212. Behbahani, H., et al., Differential role of Presenilin-1 and -2 on mitochondrial membrane potential and oxygen consumption in mouse embryonic fibroblasts. J Neurosci Res, 2006. 84(4): p. 891-902.
213. Contino, S., et al., Presenilin 2-Dependent Maintenance of Mitochondria! Oxidative Capacity and Morphology. Frontiers in Physiology, 2017. 8: p. 11.
214. Rhein, V., et al., Amyloid-β and tau synergistically impair the oxidative phosphorylation system in triple transgenic Alzheimer's disease mice. Proceedings of the National Academy of Sciences, 2009. 106(47): p. 20057-20062.
215. Escobar-Khondiker, M., et al., Annonacin, a natural mitochondrial complex I inhibitor, causes tau pathology in cultured neurons. J Neurosci, 2007. 27(29): p. 7827-37.
216. Eckert, A., et al., Soluble beta-amyloid leads to mitochondrial defects in amyloid precursor protein and tau transgenic mice. Neurodegener Dis, 2008. 5(3-4): p. 157-9.
217. Eckert, A., K. Schmitt, and J. Götz, Mitochondrial dysfunction - the beginning of the end in Alzheimer's disease? Separate and synergistic modes of tau and amyloid-β toxicity. Alzheimer's Research & Therapy, 2011. 3(2): p. 15.
218. Sanchez, M., et al., Amyloid precursor protein drives down-regulation of mitochondrial oxidative phosphorylation independent of amyloid beta. Scientific Reports, 2017. 7: p. 10.
219. Cardoso, S.M., et al., Functional mitochondria are required for amyloid beta-mediated neurotoxicity. Faseb Journal, 2001. 15(6): p. 1439-+.
220. Fleck, D., et al., PTCD1 Is Required for Mitochondrial Oxidative-Phosphorylation: Possible Genetic Association with Alzheimer's Disease. The Journal of Neuroscience, 2019. 39(24): p. 4636-4656.
221. Gan, X.Q., et al., Inhibition of ERK-DLP1 signaling and mitochondrial division alleviates mitochondrial dysfunction in Alzheimer's disease cybrid cell. Biochimica Et Biophysica Acta-Molecular Basis of Disease, 2014. 1842(2): p. 220-231.
222. Jadiya, P., et al., Impaired mitochondrial calcium efflux contributes to disease progression in models of Alzheimer's disease. Nature communications, 2019. 10(1): p. 3885-3885.
223. Mattson, M.P., et al., beta-Amyloid peptides destabilize calcium homeostasis and render human cortical neurons vulnerable to excitotoxicity. The Journal of neuroscience : the official journal of the Society for Neuroscience, 1992. 12(2): p. 376-389.
224. Calvo-Rodriguez, M., et al., Increased mitochondrial calcium levels associated with neuronal death in a mouse model of Alzheimer’s disease. Nature Communications, 2020. 11(1): p. 2146.
225. Britti, E., et al., Tau inhibits mitochondrial calcium efflux and makes neurons vulnerable to calcium-induced cell death. Cell Calcium, 2020. 86: p. 102150.
229 | P a g e
226. Pérez, M.J., C. Jara, and R.A. Quintanilla, Contribution of Tau Pathology to Mitochondrial Impairment in Neurodegeneration. Frontiers in neuroscience, 2018. 12: p. 441-441.
227. Guo, Q., et al., Alzheimer's presenilin mutation sensitizes neural cells to apoptosis induced by trophic factor withdrawal and amyloid beta-peptide: involvement of calcium and oxyradicals. J Neurosci, 1997. 17(11): p. 4212-22.
228. Guo, Q., et al., Calbindin D28k blocks the proapoptotic actions of mutant presenilin 1: reduced oxidative stress and preserved mitochondrial function. Proc Natl Acad Sci U S A, 1998. 95(6): p. 3227-32.
229. Sarasija, S., et al., Presenilin mutations deregulate mitochondrial Ca(2+) homeostasis and metabolic activity causing neurodegeneration in Caenorhabditis elegans. eLife, 2018. 7: p. e33052.
230. Begley, J.G., et al., Altered calcium homeostasis and mitochondrial dysfunction in cortical synaptic compartments of presenilin-1 mutant mice. J Neurochem, 1999. 72(3): p. 1030-9.
231. Area-Gomez, E., et al., Presenilins are enriched in endoplasmic reticulum membranes associated with mitochondria. Am J Pathol, 2009. 175(5): p. 1810-6.
232. Hedskog, L., et al., Modulation of the endoplasmic reticulum-mitochondria interface in Alzheimer's disease and related models. Proc Natl Acad Sci U S A, 2013. 110(19): p. 7916-21.
233. Wang, X., et al., Oxidative stress and mitochondrial dysfunction in Alzheimer's disease. Biochimica et Biophysica Acta (BBA) - Molecular Basis of Disease, 2014. 1842(8): p. 1240-1247.
234. Nunomura, A., et al., Neuronal RNA oxidation in Alzheimer's disease and Down's syndrome. Ann N Y Acad Sci, 1999. 893: p. 362-4.
235. Simpson, J.E., et al., Population variation in oxidative stress and astrocyte DNA damage in relation to Alzheimer-type pathology in the ageing brain. Neuropathol Appl Neurobiol, 2010. 36(1): p. 25-40.
236. Tayler, H., et al., Oxidative balance in Alzheimer's disease: relationship to APOE, Braak tangle stage, and the concentrations of soluble and insoluble amyloid-β. J Alzheimers Dis, 2010. 22(4): p. 1363-73.
237. Wang, J., et al., Increased oxidative damage in nuclear and mitochondrial DNA in Alzheimer's disease. J Neurochem, 2005. 93(4): p. 953-62.
238. Cecchi, C., et al., Oxidative stress and reduced antioxidant defenses in peripheral cells from familial Alzheimer’s patients. Free Radical Biology and Medicine, 2002. 33(10): p. 1372-1379.
239. Moreira, P.I., et al., Lipoic acid and N-acetyl cysteine decrease mitochondrial-related oxidative stress in Alzheimer disease patient fibroblasts. J Alzheimers Dis, 2007. 12(2): p. 195-206.
240. Nunomura, A., et al., Oxidative damage is the earliest event in Alzheimer disease. J Neuropathol Exp Neurol, 2001. 60(8): p. 759-67.
241. Odetti, P., et al., Early Glycoxidation Damage in Brains from Down's Syndrome. Biochemical and Biophysical Research Communications, 1998. 243(3): p. 849-851.
242. Melov, S., et al., Mitochondrial oxidative stress causes hyperphosphorylation of tau. PloS one, 2007. 2(6): p. e536-e536.
243. Xie, H., et al., Rapid cell death is preceded by amyloid plaque-mediated oxidative stress. Proc Natl Acad Sci U S A, 2013. 110(19): p. 7904-9.
244. Aksenov, M.Y., et al., The expression of key oxidative stress-handling genes in different brain regions in Alzheimer's disease. J Mol Neurosci, 1998. 11(2): p. 151-64.
245. Santa-María, I., et al., Quinones Facilitate the Self-Assembly of the Phosphorylated Tubulin Binding Region of Tau into Fibrillar Polymers. Biochemistry, 2004. 43(10): p. 2888-2897.
246. Kontush, A., et al., Amyloid-β is an antioxidant for lipoproteins in cerebrospinal fluid and plasma. Free Radical Biology and Medicine, 2001. 30(1): p. 119-128.
230 | P a g e
247. Hensley, K., et al., A model for beta-amyloid aggregation and neurotoxicity based on free radical generation by the peptide: relevance to Alzheimer disease. Proc Natl Acad Sci U S A, 1994. 91(8): p. 3270-4.
248. Lustbader, J.W., et al., ABAD directly links Abeta to mitochondrial toxicity in Alzheimer's disease. Science, 2004. 304(5669): p. 448-52.
249. Yan, S.D. and D.M. Stern, Mitochondrial dysfunction and Alzheimer's disease: role of amyloid-beta peptide alcohol dehydrogenase (ABAD). International journal of experimental pathology, 2005. 86(3): p. 161-171.
250. Cai, Q. and Y.Y. Jeong, Mitophagy in Alzheimer's Disease and Other Age-Related Neurodegenerative Diseases. Cells, 2020. 9(1).
251. Corsetti, V., et al., NH2-truncated human tau induces deregulated mitophagy in neurons by aberrant recruitment of Parkin and UCHL-1: implications in Alzheimer's disease. Hum Mol Genet, 2015. 24(11): p. 3058-81.
252. Cummins, N., et al., Disease-associated tau impairs mitophagy by inhibiting Parkin translocation to mitochondria. The EMBO journal, 2019. 38(3): p. e99360.
253. Hu, Y., et al., Tau accumulation impairs mitophagy via increasing mitochondrial membrane potential and reducing mitochondrial Parkin. Oncotarget, 2016. 7(14): p. 17356-68.
254. Kerr, J.S., et al., Mitophagy and Alzheimer’s Disease: Cellular and Molecular Mechanisms. Trends in Neurosciences, 2017. 40(3): p. 151-166.
255. Martín-Maestro, P., et al., Mitophagy Failure in Fibroblasts and iPSC-Derived Neurons of Alzheimer's Disease-Associated Presenilin 1 Mutation. Frontiers in molecular neuroscience, 2017. 10: p. 291-291.
256. Martín-Maestro, P., et al., PARK2 enhancement is able to compensate mitophagy alterations found in sporadic Alzheimer's disease. Hum Mol Genet, 2016. 25(4): p. 792-806.
257. Monteiro-Cardoso, V.F., et al., Cardiolipin profile changes are associated to the early synaptic mitochondrial dysfunction in Alzheimer's disease. J Alzheimers Dis, 2015. 43(4): p. 1375-92.
258. Moreira, P.I., et al., Increased autophagic degradation of mitochondria in Alzheimer disease. Autophagy, 2007. 3(6): p. 614-5.
259. Ye, X., et al., Parkin-mediated mitophagy in mutant hAPP neurons and Alzheimer's disease patient brains. Human molecular genetics, 2015. 24(10): p. 2938-2951.
260. Cataldo, A.M., et al., Presenilin mutations in familial Alzheimer disease and transgenic mouse models accelerate neuronal lysosomal pathology. J Neuropathol Exp Neurol, 2004. 63(8): p. 821-30.
261. Ji, Z.S., et al., Reactivity of apolipoprotein E4 and amyloid beta peptide: lysosomal stability and neurodegeneration. J Biol Chem, 2006. 281(5): p. 2683-92.
262. Pérez, M.J., et al., Mitochondrial permeability transition pore contributes to mitochondrial dysfunction in fibroblasts of patients with sporadic Alzheimer's disease. Redox Biol, 2018. 19: p. 290-300.
263. Du, H., et al., Cyclophilin D deficiency attenuates mitochondrial and neuronal perturbation and ameliorates learning and memory in Alzheimer's disease. Nat Med, 2008. 14(10): p. 1097-105.
264. Du, H., et al., Cyclophilin D deficiency improves mitochondrial function and learning/memory in aging Alzheimer disease mouse model. Neurobiol Aging, 2011. 32(3): p. 398-406.
265. Mattson, M.P., J. Partin, and J.G. Begley, Amyloid β-peptide induces apoptosis-related events in synapses and dendrites. Brain Research, 1998. 807(1): p. 167-176.
266. Correia, S.C., G. Perry, and P.I. Moreira, Mitochondrial traffic jams in Alzheimer's disease - pinpointing the roadblocks. Biochimica et Biophysica Acta (BBA) - Molecular Basis of Disease, 2016. 1862(10): p. 1909-1917.
267. Smith, E.F., P.J. Shaw, and K.J. De Vos, The role of mitochondria in amyotrophic lateral sclerosis. Neuroscience Letters, 2019. 710: p. 132933.
231 | P a g e
268. Saxton, W.M. and P.J. Hollenbeck, The axonal transport of mitochondria. Journal of Cell Science, 2012. 125(9): p. 2095.
269. Pigino, G., et al., Alzheimer's Presenilin 1 Mutations Impair Kinesin-Based Axonal Transport. The Journal of Neuroscience, 2003. 23(11): p. 4499-4508.
270. Mandelkow, E.M., et al., Clogging of axons by tau, inhibition of axonal traffic and starvation of synapses. Neurobiology of Aging, 2003. 24(8): p. 1079-1085.
271. MacAskill, A.F., et al., Miro1 Is a Calcium Sensor for Glutamate Receptor-Dependent Localization of Mitochondria at Synapses. Neuron, 2009. 61(4): p. 541-555.
272. Dashty, M., A quick look at biochemistry: Carbohydrate metabolism. Clinical Biochemistry, 2013. 46(15): p. 1339-1352.
273. Dienel, G.A. and N.F. Cruz, Aerobic glycolysis during brain activation: adrenergic regulation and influence of norepinephrine on astrocytic metabolism. J Neurochem, 2016. 138(1): p. 14-52.
274. Mosconi, L., et al., Reduced hippocampal metabolism in MCI and AD: automated FDG-PET image analysis. Neurology, 2005. 64(11): p. 1860-7.
275. Goyal, M.S., et al., Loss of Brain Aerobic Glycolysis in Normal Human Aging. Cell Metab, 2017. 26(2): p. 353-360.e3.
276. Marcus, C., E. Mena, and R.M. Subramaniam, Brain PET in the diagnosis of Alzheimer's disease. Clinical nuclear medicine, 2014. 39(10): p. e413-e426.
277. Bigl, M., et al., Changes of activity and isozyme pattern of phosphofructokinase in the brains of patients with Alzheimer's disease. Journal of Neurochemistry, 1996. 67(3): p. 1164-1171.
278. Bigl, M., et al., Activities of key glycolytic enzymes in the brains of patients with Alzheimer's disease. Journal of Neural Transmission, 1999. 106(5-6): p. 499-511.
279. Hashimoto, M., et al., Analysis of microdissected neurons by 18O mass spectrometry reveals altered protein expression in Alzheimer's disease. Journal of Cellular and Molecular Medicine, 2012. 16(8): p. 1686-1700.
280. Simpson, I.A., et al., Decreased concentrations of GLUT1 and GLUT3 glucose transporters in the brains of patients with Alzheimer's disease. Ann Neurol, 1994. 35(5): p. 546-51.
281. Sorbi, S., et al., ALTERED HEXOKINASE-ACTIVITY IN SKIN CULTURED FIBROBLASTS AND LEUKOCYTES FROM ALZHEIMERS-DISEASE PATIENTS. Neuroscience Letters, 1990. 117(1-2): p. 165-168.
282. Sonntag, K.C., et al., Late-onset Alzheimer's disease is associated with inherent changes in bioenergetics profiles. Scientific Reports, 2017. 7: p. 13.
283. Kaminsky, Y.G., et al., Age-Related Defects in Erythrocyte 2,3-Diphosphoglycerate Metabolism in Dementia. Aging and Disease, 2013. 4(5): p. 244-255.
284. Bigl, M., et al., Cortical glucose metabolism is altered in aged transgenic Tg2576 mice that demonstrate Alzheimer plaque pathology. Journal of Neural Transmission, 2003. 110(1): p. 77-94.
285. Harris, R.A., et al., Aerobic Glycolysis in the Frontal Cortex Correlates with Memory Performance in Wild-Type Mice But Not the APP/PS1 Mouse Model of Cerebral Amyloidosis. Journal of Neuroscience, 2016. 36(6): p. 1871-1878.
286. Andersen, J.V., et al., Alterations in Cerebral Cortical Glucose and Glutamine Metabolism Precedes Amyloid Plaques in the APPswe/PSEN1dE9 Mouse Model of Alzheimer's Disease. Neurochemical Research, 2017. 42(6): p. 1589-1598.
287. Atlante, A., et al., A disease with a sweet tooth: exploring the Warburg effect in Alzheimer's disease. Biogerontology, 2017. 18(3): p. 301-319.
288. Soucek, T., et al., The Regulation of Glucose Metabolism by HIF-1 Mediates a Neuroprotective Response to Amyloid Beta Peptide. Neuron, 2003. 39(1): p. 43-56.
289. Pereira, C., M.S. Santos, and C. Oliveira, Involvement of oxidative stress on the impairment of energy metabolism induced by A beta peptides on PC12 cells: Protection by antioxidants. Neurobiology of Disease, 1999. 6(3): p. 209-219.

232 | P a g e
290. Wamelink, M.M., E.A. Struys, and C. Jakobs, The biochemistry, metabolism and inherited defects of the pentose phosphate pathway: a review. J Inherit Metab Dis, 2008. 31(6): p. 703-17.
291. Martins, R.N., et al., Increased Cerebral Glucose-6-Phosphate Dehydrogenase Activity in Alzheimer's Disease May Reflect Oxidative Stress. Journal of Neurochemistry, 1986. 46(4): p. 1042-1045.
292. Palmer, A.M., The activity of the pentose phosphate pathway is increased in response to oxidative stress in Alzheimer's disease. J Neural Transm (Vienna), 1999. 106(3-4): p. 317-28.
293. Orešič, M., et al., Metabolome in progression to Alzheimer's disease. Translational Psychiatry, 2011. 1(12): p. e57-e57.
294. Tiwari, V. and A.B. Patel, Pyruvate Carboxylase and Pentose Phosphate Fluxes are Reduced in AβPP-PS1 Mouse Model of Alzheimer's Disease: A 13C NMR Study. Journal of Alzheimer's Disease, 2014. 41: p. 387-399.
295. Wang, C., et al., Malate-aspartate shuttle mediates the intracellular ATP levels, antioxidation capacity and survival of differentiated PC12 cells. International journal of physiology, pathophysiology and pharmacology, 2014. 6(2): p. 109-114.
296. Fu, Y.-J., et al., Quantitative proteomic analysis of mitochondria in aging PS-1 transgenic mice. Cellular and molecular neurobiology, 2009. 29(5): p. 649-664.
297. Xu, J., et al., Graded perturbations of metabolism in multiple regions of human brain in Alzheimer's disease: Snapshot of a pervasive metabolic disorder. Biochimica et Biophysica Acta (BBA) - Molecular Basis of Disease, 2016. 1862(6): p. 1084-1092.
298. McKenna, M.C., et al., Neuronal and astrocytic shuttle mechanisms for cytosolic-mitochondrial transfer of reducing equivalents: current evidence and pharmacological tools. Biochem Pharmacol, 2006. 71(4): p. 399-407.
299. Snowden, S.G., et al., Association between fatty acid metabolism in the brain and Alzheimer disease neuropathology and cognitive performance: A nontargeted metabolomic study. PLoS medicine, 2017. 14(3): p. e1002266-e1002266.
300. Goozee, K., et al., Alterations in erythrocyte fatty acid composition in preclinical Alzheimer’s disease. Scientific Reports, 2017. 7(1): p. 676.
301. Montine, T.J. and J.D. Morrow, Fatty acid oxidation in the pathogenesis of Alzheimer's disease. The American journal of pathology, 2005. 166(5): p. 1283-1289.
302. Attwell, D. and S.B. Laughlin, An energy budget for signaling in the grey matter of the brain. J Cereb Blood Flow Metab, 2001. 21(10): p. 1133-45.
303. Magistretti, P.J., et al., Energy on Demand. Science, 1999. 283(5401): p. 496-497. 304. Bélanger, M., I. Allaman, and Pierre J. Magistretti, Brain Energy Metabolism: Focus on
Astrocyte-Neuron Metabolic Cooperation. Cell Metabolism, 2011. 14(6): p. 724-738. 305. Hertz, L., L. Peng, and G.A. Dienel, Energy metabolism in astrocytes: high rate of oxidative
metabolism and spatiotemporal dependence on glycolysis/glycogenolysis. J Cereb Blood Flow Metab, 2007. 27(2): p. 219-49.
306. Sibson, N.R., et al., Stoichiometric coupling of brain glucose metabolism and glutamatergic neuronal activity. Proceedings of the National Academy of Sciences, 1998. 95(1): p. 316-321.
307. Falkowska, A., et al., Energy Metabolism of the Brain, Including the Cooperation between Astrocytes and Neurons, Especially in the Context of Glycogen Metabolism. Int J Mol Sci, 2015. 16(11): p. 25959-81.
308. Herrero-Mendez, A., et al., The bioenergetic and antioxidant status of neurons is controlled by continuous degradation of a key glycolytic enzyme by APC/C-Cdh1. Nat Cell Biol, 2009. 11(6): p. 747-52.
309. Brooks, G.A., Cell-cell and intracellular lactate shuttles. J Physiol, 2009. 587(Pt 23): p. 5591-600.
233 | P a g e
310. Pellerin, L. and P.J. Magistretti, Glutamate uptake into astrocytes stimulates aerobic glycolysis: a mechanism coupling neuronal activity to glucose utilization. Proceedings of the National Academy of Sciences, 1994. 91(22): p. 10625-10629.
311. Gibbs, M.E., D.G. Anderson, and L. Hertz, Inhibition of glycogenolysis in astrocytes interrupts memory consolidation in young chickens. Glia, 2006. 54(3): p. 214-22.
312. Suzuki, A., et al., Astrocyte-neuron lactate transport is required for long-term memory formation. Cell, 2011. 144(5): p. 810-23.
313. Sofroniew, M.V. and H.V. Vinters, Astrocytes: biology and pathology. Acta Neuropathol, 2010. 119(1): p. 7-35.
314. Suzuki, A., et al., Astrocyte-Neuron Lactate Transport Is Required for Long-Term Memory Formation. Cell, 2011. 144(5): p. 810-823.
315. Belanger, M. and P.J. Magistretti, The role of astroglia in neuroprotection. Dialogues Clin Neurosci, 2009. 11(3): p. 281-95.
316. Blackburn, D., et al., Astrocyte function and role in motor neuron disease: a future therapeutic target? Glia, 2009. 57(12): p. 1251-64.
317. Nishida, H. and S. Okabe, Direct astrocytic contacts regulate local maturation of dendritic spines. J Neurosci, 2007. 27(2): p. 331-40.
318. Pellerin, L. and P.J. Magistretti, Glutamate uptake into astrocytes stimulates aerobic glycolysis: a mechanism coupling neuronal activity to glucose utilization. Proc Natl Acad Sci U S A, 1994. 91(22): p. 10625-9.
319. Garwood, C.J., et al., Review: Astrocytes in Alzheimer's disease and other age-associated dementias: a supporting player with a central role. Neuropathol Appl Neurobiol, 2017. 43(4): p. 281-298.
320. Haass, C., A.Y. Hung, and D.J. Selkoe, Processing of beta-amyloid precursor protein in microglia and astrocytes favors an internal localization over constitutive secretion. J Neurosci, 1991. 11(12): p. 3783-93.
321. Wyss-Coray, T., et al., Adult mouse astrocytes degrade amyloid-beta in vitro and in situ. Nat Med, 2003. 9(4): p. 453-7.
322. Allaman, I., et al., Amyloid-beta Aggregates Cause Alterations of Astrocytic Metabolic Phenotype: Impact on Neuronal Viability. Journal of Neuroscience, 2010. 30(9): p. 3326-3338.
323. DaRocha-Souto, B., et al., Brain oligomeric beta-amyloid but not total amyloid plaque burden correlates with neuronal loss and astrocyte inflammatory response in amyloid precursor protein/tau transgenic mice. J Neuropathol Exp Neurol, 2011. 70(5): p. 360-76.
324. Gavillet, M., I. Allaman, and P.J. Magistretti, Modulation of astrocytic metabolic phenotype by proinflammatory cytokines. Glia, 2008. 56(9): p. 975-89.
325. Zilberter, M., et al., Dietary energy substrates reverse early neuronal hyperactivity in a mouse model of Alzheimer's disease. J Neurochem, 2013. 125(1): p. 157-71.
326. Habib, N., et al., Disease-associated astrocytes in Alzheimer’s disease and aging. Nature Neuroscience, 2020. 23(6): p. 701-706.
327. Garwood, C.J., et al., Insulin and IGF1 signalling pathways in human astrocytes in vitro and in vivo; characterisation, subcellular localisation and modulation of the receptors. Mol Brain, 2015. 8: p. 51.
328. Moloney, A.M., et al., Defects in IGF-1 receptor, insulin receptor and IRS-1/2 in Alzheimer's disease indicate possible resistance to IGF-1 and insulin signalling. Neurobiol Aging, 2010. 31(2): p. 224-43.
329. Simpson, J.E., et al., Microarray analysis of the astrocyte transcriptome in the aging brain: relationship to Alzheimer's pathology and APOE genotype. Neurobiol Aging, 2011. 32(10): p. 1795-807.
330. Cabezas-Opazo, F.A., et al., Mitochondrial Dysfunction Contributes to the Pathogenesis of Alzheimer's Disease. Oxid Med Cell Longev, 2015. 2015: p. 509654.
234 | P a g e
331. Ratcliffe, L.E., et al., Loss of IGF1R in Human Astrocytes Alters Complex I Activity and Support for Neurons. Neuroscience, 2018. 390: p. 46-59.
332. Sekar, S., et al., Alzheimer’s disease is associated with altered expression of genes involved in immune response and mitochondrial processes in astrocytes. Neurobiology of aging, 2015. 36(2): p. 583-591.
333. Garwood, C., et al., Calcium dysregulation in relation to Alzheimer-type pathology in the ageing brain. Neuropathology and Applied Neurobiology, 2013. 39(7): p. 788-799.
334. Wharton, S.B., et al., Population variation in glial fibrillary acidic protein levels in brain ageing: relationship to Alzheimer-type pathology and dementia. Dement Geriatr Cogn Disord, 2009. 27(5): p. 465-73.
335. Pekny, M. and M. Pekna, Reactive gliosis in the pathogenesis of CNS diseases. Biochimica et Biophysica Acta (BBA) - Molecular Basis of Disease, 2016. 1862(3): p. 483-491.
336. Simpson, J.E., et al., A neuronal DNA damage response is detected at the earliest stages of Alzheimer's neuropathology and correlates with cognitive impairment in the Medical Research Council's Cognitive Function and Ageing Study ageing brain cohort. Neuropathol Appl Neurobiol, 2015. 41(4): p. 483-96.
337. Simpson, J.E., et al., Neuronal DNA damage response-associated dysregulation of signalling pathways and cholesterol metabolism at the earliest stages of Alzheimer-type pathology. Neuropathol Appl Neurobiol, 2016. 42(2): p. 167-79.
338. Cataldo, A.M. and R.D. Broadwell, Cytochemical identification of cerebral glycogen and glucose-6-phosphatase activity under normal and experimental conditions. II. Choroid plexus and ependymal epithelia, endothelia and pericytes. J Neurocytol, 1986. 15(4): p. 511-24.
339. Bak, L.K., et al., Astrocytic glycogen metabolism in the healthy and diseased brain. The Journal of biological chemistry, 2018. 293(19): p. 7108-7116.
340. Newman, L.A., D.L. Korol, and P.E. Gold, Lactate produced by glycogenolysis in astrocytes regulates memory processing. PLoS One, 2011. 6(12): p. e28427.
341. Hertz, L., et al., Astrocytic glycogenolysis: mechanisms and functions. Metab Brain Dis, 2015. 30(1): p. 317-33.
342. Sickmann, H.M., et al., Functional significance of brain glycogen in sustaining glutamatergic neurotransmission. J Neurochem, 2009. 109 Suppl 1: p. 80-6.
343. Huang, L., et al., Accumulation of high-molecular-weight amylose in Alzheimer's disease brains. Glycobiology, 2004. 14(5): p. 409-16.
344. Byman, E., et al., Brain alpha-amylase: a novel energy regulator important in Alzheimer disease? 2018. 28(6): p. 920-932.
345. Byman, E., et al., A Potential Role for α-Amylase in Amyloid-β-Induced Astrocytic Glycogenolysis and Activation. J Alzheimers Dis, 2019. 68(1): p. 205-217.
346. Yip, J., et al., Cerebral Gluconeogenesis and Diseases. Frontiers in pharmacology, 2017. 7: p. 521-521.
347. González-Domínguez, R., et al., Metabolomic investigation of systemic manifestations associated with Alzheimer's disease in the APP/PS1 transgenic mouse model. Mol Biosyst, 2015. 11(9): p. 2429-40.
348. Vasile, F., E. Dossi, and N. Rouach, Human astrocytes: structure and functions in the healthy brain. Brain Structure and Function, 2017. 222(5): p. 2017-2029.
349. Takahashi, K. and S. Yamanaka, Induction of pluripotent stem cells from mouse embryonic and adult fibroblast cultures by defined factors. Cell, 2006. 126(4): p. 663-76.
350. Meyer, K., et al., Direct conversion of patient fibroblasts demonstrates non-cell autonomous toxicity of astrocytes to motor neurons in familial and sporadic ALS. Proc Natl Acad Sci U S A, 2014. 111(2): p. 829-32.
351. Musunuru, K., et al., Induced Pluripotent Stem Cells for Cardiovascular Disease Modeling and Precision Medicine: A Scientific Statement From the American Heart Association. Circulation: Genomic and Precision Medicine, 2018. 11(1): p. e000043.
235 | P a g e
352. Maepa, S.W. and H. Ndlovu, Advances in generating liver cells from pluripotent stem cells as a tool for modeling liver diseases. STEM CELLS, 2020. 38(5): p. 606-612.
353. Ahmed, E., et al., Differentiation of Induced Pluripotent Stem Cells (iPSC) into human bronchial epithelium from healthy and severe COPD patients. European Respiratory Journal, 2018. 52(suppl 62): p. OA504.
354. Devlin, A.-C., et al., Human iPSC-derived motoneurons harbouring TARDBP or C9ORF72 ALS mutations are dysfunctional despite maintaining viability. Nature Communications, 2015. 6(1): p. 5999.
355. Schweitzer, J.S., et al., Personalized iPSC-Derived Dopamine Progenitor Cells for Parkinson’s Disease. New England Journal of Medicine, 2020. 382(20): p. 1926-1932.
356. Israel, M.A., et al., Probing sporadic and familial Alzheimer's disease using induced pluripotent stem cells. Nature, 2012. 482(7384): p. 216-220.
357. Armijo, E., et al., Increased susceptibility to Aβ toxicity in neuronal cultures derived from familial Alzheimer’s disease (PSEN1-A246E) induced pluripotent stem cells. Neuroscience Letters, 2017. 639: p. 74-81.
358. Dashinimaev, E.B., et al., Neurons Derived from Induced Pluripotent Stem Cells of Patients with Down Syndrome Reproduce Early Stages of Alzheimer’s Disease Type Pathology in vitro. Journal of Alzheimer's Disease, 2017. 56: p. 835-847.
359. Koch, P., et al., Presenilin-1 L166P mutant human pluripotent stem cell-derived neurons exhibit partial loss of γ-secretase activity in endogenous amyloid-β generation. Am J Pathol, 2012. 180(6): p. 2404-16.
360. Shi, Y., et al., A human stem cell model of early Alzheimer's disease pathology in Down syndrome. Sci Transl Med, 2012. 4(124): p. 124ra29.
361. Arber, C., et al., Familial Alzheimer’s disease patient-derived neurons reveal distinct mutation-specific effects on amyloid beta. Molecular Psychiatry, 2019.
362. Birnbaum, J.H., et al., Oxidative stress and altered mitochondrial protein expression in the absence of amyloid-β and tau pathology in iPSC-derived neurons from sporadic Alzheimer's disease patients. Stem Cell Research, 2018. 27: p. 121-130.
363. Fang, E.F., et al., Mitophagy inhibits amyloid-β and tau pathology and reverses cognitive deficits in models of Alzheimer’s disease. Nature Neuroscience, 2019. 22(3): p. 401-412.
364. Duan, L., et al., Stem cell derived basal forebrain cholinergic neurons from Alzheimer’s disease patients are more susceptible to cell death. Molecular Neurodegeneration, 2014. 9(1): p. 3.
365. Choi, S.H., et al., A three-dimensional human neural cell culture model of Alzheimer's disease. Nature, 2014. 515(7526): p. 274-278.
366. Gonzalez, C., et al., Modeling amyloid beta and tau pathology in human cerebral organoids. Mol Psychiatry, 2018. 23(12): p. 2363-2374.
367. Sproul, A.A., et al., Characterization and molecular profiling of PSEN1 familial Alzheimer's disease iPSC-derived neural progenitors. PloS one, 2014. 9(1): p. e84547-e84547.
368. Hossini, A.M., et al., Induced pluripotent stem cell-derived neuronal cells from a sporadic Alzheimer's disease donor as a model for investigating AD-associated gene regulatory networks. BMC Genomics, 2015. 16(1): p. 84.
369. Meyer, K., et al., REST and Neural Gene Network Dysregulation in iPSC Models of Alzheimer's Disease. Cell Rep, 2019. 26(5): p. 1112-1127.e9.
370. Kondo, T., et al., Modeling Alzheimer's disease with iPSCs reveals stress phenotypes associated with intracellular Aβ and differential drug responsiveness. Cell Stem Cell, 2013. 12(4): p. 487-96.
371. Muratore, C.R., et al., Cell-type Dependent Alzheimer's Disease Phenotypes: Probing the Biology of Selective Neuronal Vulnerability. Stem Cell Reports, 2017. 9(6): p. 1868-1884.
236 | P a g e
372. Ortiz-Virumbrales, M., et al., CRISPR/Cas9-Correctable mutation-related molecular and physiological phenotypes in iPSC-derived Alzheimer’s PSEN2N141Ineurons. Acta Neuropathologica Communications, 2017. 5(1): p. 77.
373. Li, L., et al., iPSC Modeling of Presenilin1 Mutation in Alzheimer's Disease with Cerebellar Ataxia. Experimental neurobiology, 2018. 27(5): p. 350-364.
374. Ochalek, A., et al., Neurons derived from sporadic Alzheimer's disease iPSCs reveal elevated TAU hyperphosphorylation, increased amyloid levels, and GSK3B activation. Alzheimer's research & therapy, 2017. 9(1): p. 90-90.
375. Ovchinnikov, D.A., et al., The Impact of APP on Alzheimer-like Pathogenesis and Gene Expression in Down Syndrome iPSC-Derived Neurons. Stem Cell Reports, 2018. 11(1): p. 32-42.
376. Woodruff, G., et al., The presenilin-1 ΔE9 mutation results in reduced γ-secretase activity, but not total loss of PS1 function, in isogenic human stem cells. Cell reports, 2013. 5(4): p. 974-985.
377. Muratore, C.R., et al., The familial Alzheimer's disease APPV717I mutation alters APP processing and Tau expression in iPSC-derived neurons. Hum Mol Genet, 2014. 23(13): p. 3523-36.
378. Yagi, T., et al., Modeling familial Alzheimer's disease with induced pluripotent stem cells. Hum Mol Genet, 2011. 20(23): p. 4530-9.
379. Wu, J.W., et al., Neuronal activity enhances tau propagation and tau pathology in vivo. Nature neuroscience, 2016. 19(8): p. 1085-1092.
380. Moreno, C.L., et al., iPSC-derived familial Alzheimer’s PSEN2 N141I cholinergic neurons exhibit mutation-dependent molecular pathology corrected by insulin signaling. Molecular Neurodegeneration, 2018. 13(1): p. 33.
381. Sun, L., et al., Analysis of 138 pathogenic mutations in presenilin-1 on the in vitro production of Aβ42 and Aβ40 peptides by γ-secretase. Proc Natl Acad Sci U S A, 2017. 114(4): p. E476-e485.
382. Xia, D., et al., Presenilin-1 knockin mice reveal loss-of-function mechanism for familial Alzheimer's disease. Neuron, 2015. 85(5): p. 967-81.
383. Foveau, B., et al., Stem Cell-Derived Neurons as Cellular Models of Sporadic Alzheimer’s Disease. Journal of Alzheimer's Disease, 2019. 67: p. 893-910.
384. Oka, S., et al., Human mitochondrial transcriptional factor A breaks the mitochondria-mediated vicious cycle in Alzheimer’s disease. Scientific Reports, 2016. 6(1): p. 37889.
385. Hou, Y., et al., Permeability transition pore-mediated mitochondrial superoxide flashes mediate an early inhibitory effect of amyloid beta1-42 on neural progenitor cell proliferation. Neurobiol Aging, 2014. 35(5): p. 975-89.
386. Lee, J.K., et al., Acid sphingomyelinase modulates the autophagic process by controlling lysosomal biogenesis in Alzheimer's disease. J Exp Med, 2014. 211(8): p. 1551-70.
387. Mairet-Coello, G., et al., The CAMKK2-AMPK kinase pathway mediates the synaptotoxic effects of Aβ oligomers through Tau phosphorylation. Neuron, 2013. 78(1): p. 94-108.
388. Krencik, R., et al., Specification of transplantable astroglial subtypes from human pluripotent stem cells. Nature biotechnology, 2011. 29(6): p. 528-534.
389. Oksanen, M., et al., PSEN1 Mutant iPSC-Derived Model Reveals Severe Astrocyte Pathology in Alzheimer's Disease. Stem Cell Reports, 2017. 9(6): p. 1885-1897.
390. Shaltouki, A., et al., Efficient generation of astrocytes from human pluripotent stem cells in defined conditions. Stem Cells, 2013. 31(5): p. 941-52.
391. Sullivan, S.E., et al., Candidate-based screening via gene modulation in human neurons and astrocytes implicates FERMT2 in Aβ and TAU proteostasis. Human molecular genetics, 2019. 28(5): p. 718-735.
392. Zhao, J., et al., APOE ε4/ε4 diminishes neurotrophic function of human iPSC-derived astrocytes. Human molecular genetics, 2017. 26(14): p. 2690-2700.
237 | P a g e
393. Mertens, J., et al., Directly Reprogrammed Human Neurons Retain Aging-Associated Transcriptomic Signatures and Reveal Age-Related Nucleocytoplasmic Defects. Cell stem cell, 2015. 17(6): p. 705-718.
394. Mertens, J., et al., Directly Reprogrammed Human Neurons Retain Aging-Associated Transcriptomic Signatures and Reveal Age-Related Nucleocytoplasmic Defects. Cell Stem Cell, 2015. 17(6): p. 705-718.
395. Allen, S.P., et al., Astrocyte adenosine deaminase loss increases motor neuron toxicity in amyotrophic lateral sclerosis. Brain, 2019. 142(3): p. 586-605.
396. Allen, S.P., et al., C9orf72 expansion within astrocytes reduces metabolic flexibility in amyotrophic lateral sclerosis. Brain, 2019. 142(12): p. 3771-3790.
397. Ferraiuolo, L., et al., Oligodendrocytes contribute to motor neuron death in ALS via SOD1-dependent mechanism. Proceedings of the National Academy of Sciences of the United States of America, 2016. 113(42): p. E6496-E6505.
398. Glajch, K.E., et al., MicroNeurotrophins Improve Survival in Motor Neuron-Astrocyte Co-Cultures but Do Not Improve Disease Phenotypes in a Mutant SOD1 Mouse Model of Amyotrophic Lateral Sclerosis. 2016. 11(10): p. e0164103.
399. Hautbergue, G.M., et al., SRSF1-dependent nuclear export inhibition of C9ORF72 repeat transcripts prevents neurodegeneration and associated motor deficits. 2017. 8: p. 16063.
400. Varcianna, A., et al., Micro-RNAs secreted through astrocyte-derived extracellular vesicles cause neuronal network degeneration in C9orf72 ALS. EBioMedicine, 2019. 40: p. 626-635.
401. Schwartzentruber, A., et al., Oxidative switch drives mitophagy defects in dopaminergic <em>parkin</em> mutant patient neurons. bioRxiv, 2020: p. 2020.05.29.115782.
402. Song, S., et al., Major histocompatibility complex class I molecules protect motor neurons from astrocyte-induced toxicity in amyotrophic lateral sclerosis. Nat Med, 2016. 22(4): p. 397-403.
403. McKhann, G.M., et al., The diagnosis of dementia due to Alzheimer's disease: recommendations from the National Institute on Aging-Alzheimer's Association workgroups on diagnostic guidelines for Alzheimer's disease. Alzheimer's & dementia : the journal of the Alzheimer's Association, 2011. 7(3): p. 263-269.
404. Iannetti, E.F., et al., Multiplexed high-content analysis of mitochondrial morphofunction using live-cell microscopy. Nature Protocols, 2016. 11: p. 1693.
405. Duchen, M.R., Mitochondria in health and disease: perspectives on a new mitochondrial biology. Molecular Aspects of Medicine, 2004. 25(4): p. 365-451.
406. Nicholls, D.G. and M.W. Ward, Mitochondrial membrane potential and neuronal glutamate excitotoxicity: mortality and millivolts. Trends Neurosci, 2000. 23(4): p. 166-74.
407. Diot, A., et al., A novel quantitative assay of mitophagy: Combining high content fluorescence microscopy and mitochondrial DNA load to quantify mitophagy and identify novel pharmacological tools against pathogenic heteroplasmic mtDNA. Pharmacol Res, 2015. 100: p. 24-35.
408. Mortiboys, H., et al., UDCA exerts beneficial effect on mitochondrial dysfunction in LRRK2(G2019S) carriers and in vivo. Neurology, 2015. 85(10): p. 846-52.
409. Manfredi, G., et al., Measurements of ATP in mammalian cells. Methods, 2002. 26(4): p. 317-26.
410. Buckner, R.L., J.R. Andrews-Hanna, and D.L. Schacter, The brain's default network: anatomy, function, and relevance to disease. Ann N Y Acad Sci, 2008. 1124: p. 1-38.
411. Greicius, M.D., et al., Default-mode network activity distinguishes Alzheimer's disease from healthy aging: evidence from functional MRI. Proc Natl Acad Sci U S A, 2004. 101(13): p. 4637-42.
412. Weintraub, S., A.H. Wicklund, and D.P. Salmon, The Neuropsychological Profile of Alzheimer Disease. Cold Spring Harbor Perspectives in Medicine, 2012. 2(4): p. a006171.
238 | P a g e
413. Clark, L.J., et al., Longitudinal verbal fluency in normal aging, preclinical, and prevalent Alzheimer's disease. Am J Alzheimers Dis Other Demen, 2009. 24(6): p. 461-8.
414. Wang, X., et al., The role of abnormal mitochondrial dynamics in the pathogenesis of Alzheimer's disease. J Neurochem, 2009. 109 Suppl 1(Suppl 1): p. 153-9.
415. Palmer, C.S., et al., Adaptor proteins MiD49 and MiD51 can act independently of Mff and Fis1 in Drp1 recruitment and are specific for mitochondrial fission. J Biol Chem, 2013. 288(38): p. 27584-93.
416. Misgeld, T. and T.L. Schwarz, Mitostasis in Neurons: Maintaining Mitochondria in an Extended Cellular Architecture. Neuron, 2017. 96(3): p. 651-666.
417. Mishra, P. and D.C. Chan, Metabolic regulation of mitochondrial dynamics. The Journal of cell biology, 2016. 212(4): p. 379-387.
418. Wang, X., et al., Dynamin-like protein 1 reduction underlies mitochondrial morphology and distribution abnormalities in fibroblasts from sporadic Alzheimer's disease patients. The American journal of pathology, 2008. 173(2): p. 470-482.
419. Wang, X., et al., Impaired balance of mitochondrial fission and fusion in Alzheimer's disease. The Journal of neuroscience : the official journal of the Society for Neuroscience, 2009. 29(28): p. 9090-9103.
420. Cho, D.H., et al., S-nitrosylation of Drp1 mediates beta-amyloid-related mitochondrial fission and neuronal injury. Science, 2009. 324(5923): p. 102-5.
421. Strittmatter, W.J., et al., Apolipoprotein E: high-avidity binding to beta-amyloid and increased frequency of type 4 allele in late-onset familial Alzheimer disease. Proc Natl Acad Sci U S A, 1993. 90(5): p. 1977-81.
422. Yamazaki, Y., et al., Apolipoprotein E and Alzheimer disease: pathobiology and targeting strategies. Nature reviews. Neurology, 2019. 15(9): p. 501-518.
423. Lin, Y.T., et al., APOE4 Causes Widespread Molecular and Cellular Alterations Associated with Alzheimer's Disease Phenotypes in Human iPSC-Derived Brain Cell Types. Neuron, 2018. 98(6): p. 1141-1154.e7.
424. Deane, R., et al., apoE isoform-specific disruption of amyloid beta peptide clearance from mouse brain. J Clin Invest, 2008. 118(12): p. 4002-13.
425. Wu, L., X. Zhang, and L. Zhao, Human ApoE Isoforms Differentially Modulate Brain Glucose and Ketone Body Metabolism: Implications for Alzheimer's Disease Risk Reduction and Early Intervention. J Neurosci, 2018. 38(30): p. 6665-6681.
426. Simonovitch, S., et al., The Effects of APOE4 on Mitochondrial Dynamics and Proteins in vivo. J Alzheimers Dis, 2019. 70(3): p. 861-875.
427. Picard, M., et al., Mitochondrial morphology transitions and functions: implications for retrograde signaling? American Journal of Physiology-Regulatory, Integrative and Comparative Physiology, 2013. 304(6): p. R393-R406.
428. Nielsen, H.M., et al., Peripheral apoE isoform levels in cognitively normal APOE ε3/ε4 individuals are associated with regional gray matter volume and cerebral glucose metabolism. Alzheimers Res Ther, 2017. 9(1): p. 5.
429. Tambini, M.D., et al., ApoE4 upregulates the activity of mitochondria-associated ER membranes. EMBO Rep, 2016. 17(1): p. 27-36.
430. Schellenberg, G.D., et al., Genetic linkage evidence for a familial Alzheimer's disease locus on chromosome 14. Science, 1992. 258(5082): p. 668-71.
431. St George-Hyslop, P., et al., Genetic evidence for a novel familial Alzheimer's disease locus on chromosome 14. Nat Genet, 1992. 2(4): p. 330-4.
432. Flynn, J.M., et al., Impaired spare respiratory capacity in cortical synaptosomes from Sod2 null mice. Free Radic Biol Med, 2011. 50(7): p. 866-73.
433. Pfleger, J., M. He, and M. Abdellatif, Mitochondrial complex II is a source of the reserve respiratory capacity that is regulated by metabolic sensors and promotes cell survival. Cell Death & Disease, 2015. 6(7): p. e1835-e1835.
239 | P a g e
434. Quinn, C.M., et al., Induction of fibroblast apolipoprotein E expression during apoptosis, starvation-induced growth arrest and mitosis. The Biochemical journal, 2004. 378(Pt 3): p. 753-761.
435. Atlas, T.H.P. https://www.proteinatlas.org/ENSG00000130203-APOE/tissue/skin. [Webpage] 2020 [cited 2020 09.12.20]; Available from: https://www.proteinatlas.org/ENSG00000130203-APOE/tissue/skin.
436. Scheltens, P.H., Structural neuroimaging of Alzheimer's disease and other dementias. Aging (Milano), 2001. 13(3): p. 203-9.
437. Scahill, R.I., et al., Mapping the evolution of regional atrophy in Alzheimer's disease: unbiased analysis of fluid-registered serial MRI. Proc Natl Acad Sci U S A, 2002. 99(7): p. 4703-7.
438. Scheltens, P., et al., Atrophy of medial temporal lobes on MRI in "probable" Alzheimer's disease and normal ageing: diagnostic value and neuropsychological correlates. J Neurol Neurosurg Psychiatry, 1992. 55(10): p. 967-72.
439. Chan, D., et al., Change in rates of cerebral atrophy over time in early-onset Alzheimer's disease: longitudinal MRI study. Lancet, 2003. 362(9390): p. 1121-2.
440. Mosconi, L., Glucose metabolism in normal aging and Alzheimer's disease: Methodological and physiological considerations for PET studies. Clinical and translational imaging, 2013. 1(4): p. 10.1007/s40336-013-0026-y.
441. Suter, O.-C., et al., Cerebral Hypoperfusion Generates Cortical Watershed Microinfarcts in Alzheimer Disease. Stroke, 2002. 33(8): p. 1986-1992.
442. Bannai, T., et al., Chronic cerebral hypoperfusion shifts the equilibrium of amyloid β oligomers to aggregation-prone species with higher molecular weight. Scientific Reports, 2019. 9(1): p. 2827.
443. Squire, L.R. and S.M. Zola, Episodic memory, semantic memory, and amnesia. Hippocampus, 1998. 8(3): p. 205-11.
444. Venneri, A., M. Mitolo, and M. De Marco, Paradigm shift: semantic memory decline as a biomarker of preclinical Alzheimer's disease. Biomarkers in Medicine, 2015. 10(1): p. 5-8.
445. Welsh, K., et al., Detection of abnormal memory decline in mild cases of Alzheimer's disease using CERAD neuropsychological measures. Arch Neurol, 1991. 48(3): p. 278-81.
446. Nebes, R.D., Semantic memory in Alzheimer's disease. Psychol Bull, 1989. 106(3): p. 377-94. 447. Henry, J.D., J.R. Crawford, and L.H. Phillips, Verbal fluency performance in dementia of the
Alzheimer's type: a meta-analysis. Neuropsychologia, 2004. 42(9): p. 1212-22. 448. Hodges, J.R. and K. Patterson, Is semantic memory consistently impaired early in the course
of Alzheimer's disease? Neuroanatomical and diagnostic implications. Neuropsychologia, 1995. 33(4): p. 441-59.
449. Seeley, W.W., The Salience Network: A Neural System for Perceiving and Responding to Homeostatic Demands. The Journal of Neuroscience, 2019. 39(50): p. 9878.
450. Yang, Y.-L., et al., Brain functional network connectivity based on a visual task: visual information processing-related brain regions are significantly activated in the task state. Neural regeneration research, 2015. 10(2): p. 298-307.
451. Badhwar, A., et al., Resting-state network dysfunction in Alzheimer's disease: A systematic review and meta-analysis. Alzheimer's & Dementia: Diagnosis, Assessment & Disease Monitoring, 2017. 8: p. 73-85.
452. Buckner, R.L., et al., Molecular, structural, and functional characterization of Alzheimer's disease: evidence for a relationship between default activity, amyloid, and memory. J Neurosci, 2005. 25(34): p. 7709-17.
453. Greicius, M.D., et al., Default-mode network activity distinguishes Alzheimer's disease from healthy aging: evidence from functional MRI. Proceedings of the National Academy of Sciences of the United States of America, 2004. 101(13): p. 4637-4642.
240 | P a g e
454. Greicius, M.D. and V. Menon, Default-mode activity during a passive sensory task: uncoupled from deactivation but impacting activation. J Cogn Neurosci, 2004. 16(9): p. 1484-92.
455. Raichle, M.E., The Brain's Default Mode Network. Annual Review of Neuroscience, 2015. 38(1): p. 433-447.
456. Damoiseaux, J.S., et al., Consistent resting-state networks across healthy subjects. Proceedings of the National Academy of Sciences, 2006. 103(37): p. 13848-13853.
457. Gardini, S., et al., Increased functional connectivity in the default mode network in mild cognitive impairment: a maladaptive compensatory mechanism associated with poor semantic memory performance. J Alzheimers Dis, 2015. 45(2): p. 457-70.
458. Pasquini, L., et al., Individual Correspondence of Amyloid-β and Intrinsic Connectivity in the Posterior Default Mode Network Across Stages of Alzheimer's Disease. J Alzheimers Dis, 2017. 58(3): p. 763-773.
459. Sperling, R.A., et al., Amyloid deposition is associated with impaired default network function in older persons without dementia. Neuron, 2009. 63(2): p. 178-88.
460. Hoenig, M.C., et al., Networks of tau distribution in Alzheimer's disease. Brain, 2018. 141(2): p. 568-581.
461. Gusnard, D.A., M.E. Raichle, and M.E. Raichle, Searching for a baseline: functional imaging and the resting human brain. Nat Rev Neurosci, 2001. 2(10): p. 685-94.
462. Minoshima, S., et al., Metabolic reduction in the posterior cingulate cortex in very early Alzheimer's disease. Ann Neurol, 1997. 42(1): p. 85-94.
463. Raichle, M.E., et al., A default mode of brain function. Proc Natl Acad Sci U S A, 2001. 98(2): p. 676-82.
464. Calhoun, V.D., et al., A method for making group inferences from functional MRI data using independent component analysis. Hum Brain Mapp, 2001. 14(3): p. 140-51.
465. Tzourio-Mazoyer, N., et al., Automated Anatomical Labeling of Activations in SPM Using a Macroscopic Anatomical Parcellation of the MNI MRI Single-Subject Brain. NeuroImage, 2002. 15(1): p. 273-289.
466. Keeney, J.T., S. Ibrahimi, and L. Zhao, Human ApoE Isoforms Differentially Modulate Glucose and Amyloid Metabolic Pathways in Female Brain: Evidence of the Mechanism of Neuroprotection by ApoE2 and Implications for Alzheimer's Disease Prevention and Early Intervention. J Alzheimers Dis, 2015. 48(2): p. 411-24.
467. Lu, H., et al., Aberrant interhemispheric functional connectivity within default mode network and its relationships with neurocognitive features in cognitively normal APOE ε 4 elderly carriers. Int Psychogeriatr, 2017. 29(5): p. 805-814.
468. De Marco, M., et al., Cognitive Efficiency in Alzheimer's Disease is Associated with Increased Occipital Connectivity. J Alzheimers Dis, 2017. 57(2): p. 541-556.
469. Bigl, M., et al., Altered phosphofructokinase mRNA levels but unchanged isoenzyme pattern in brains from patients with Alzheimer's disease. Brain Res Mol Brain Res, 2000. 76(2): p. 411-4.
470. Bigl, M., et al., Activities of key glycolytic enzymes in the brains of patients with Alzheimer's disease. J Neural Transm (Vienna), 1999. 106(5-6): p. 499-511.
471. Oberheim, N.A., et al., Uniquely hominid features of adult human astrocytes. The Journal of neuroscience : the official journal of the Society for Neuroscience, 2009. 29(10): p. 3276-3287.
472. Godin, L.M., et al., Decreased Laminin Expression by Human Lung Epithelial Cells and Fibroblasts Cultured in Acellular Lung Scaffolds from Aged Mice. PLoS One, 2016. 11(3): p. e0150966.
473. Martínez, P., et al., Essential role for the TRF2 telomere protein in adult skin homeostasis. Aging Cell, 2014. 13(4): p. 656-68.
474. Webster, C.P., et al., The C9orf72 protein interacts with Rab1a and the ULK1 complex to regulate initiation of autophagy. The EMBO journal, 2016. 35(15): p. 1656-1676.
241 | P a g e
475. Adams, C.P. and V.V. Brantner, Estimating the cost of new drug development: is it really 802 million dollars? Health Aff (Millwood), 2006. 25(2): p. 420-8.
476. Xue, H., et al., Review of Drug Repositioning Approaches and Resources. International journal of biological sciences, 2018. 14(10): p. 1232-1244.
477. Bell, S.M., et al., Ursodeoxycholic Acid Improves Mitochondrial Function and Redistributes Drp1 in Fibroblasts from Patients with Either Sporadic or Familial Alzheimer's Disease. J Mol Biol, 2018. 430(21): p. 3942-3953.
478. Bell, S.M., et al., Deficits in Mitochondrial Spare Respiratory Capacity Contribute to the Neuropsychological Changes of Alzheimer's Disease. 2020. 10(2).
479. Martín-Maestro, P., et al., Slower Dynamics and Aged Mitochondria in Sporadic Alzheimer's Disease. 2017. 2017: p. 9302761.
480. Vlassenko, A.G. and M.E. Raichle, Brain aerobic glycolysis functions and Alzheimer's disease. Clinical and translational imaging, 2015. 3(1): p. 27-37.
481. Cunnane, S., et al., Brain fuel metabolism, aging, and Alzheimer's disease. Nutrition (Burbank, Los Angeles County, Calif.), 2011. 27(1): p. 3-20.
482. An, Y., et al., Evidence for brain glucose dysregulation in Alzheimer's disease. Alzheimers Dement, 2018. 14(3): p. 318-329.
483. Vlassenko, A.G., et al., Aerobic glycolysis and tau deposition in preclinical Alzheimer's disease. Neurobiology of Aging, 2018. 67: p. 95-98.
484. Kuijlaars, J., et al., Sustained synchronized neuronal network activity in a human astrocyte co-culture system. Scientific Reports, 2016. 6(1): p. 36529.
485. Bosworth, A.P. and N.J. Allen, The diverse actions of astrocytes during synaptic development. Curr Opin Neurobiol, 2017. 47: p. 38-43.
486. Weber, B. and L.F. Barros, The Astrocyte: Powerhouse and Recycling Center. Cold Spring Harb Perspect Biol, 2015. 7(12).
487. Garwood, C.J., et al., Insulin and IGF1 signalling pathways in human astrocytes in vitro and in vivo; characterisation, subcellular localisation and modulation of the receptors. Molecular Brain, 2015. 8(1): p. 51.
488. Jones, V.C., et al., Aberrant iPSC-derived human astrocytes in Alzheimer's disease. Cell Death Dis, 2017. 8(3): p. e2696.
489. Oksanen, M., et al., PSEN1 Mutant iPSC-Derived Model Reveals Severe Astrocyte Pathology in Alzheimer's Disease. Stem Cell Reports, 2017. 9(6): p. 1885-1897.
490. Fu, W., et al., Bioenergetic mechanisms in astrocytes may contribute to amyloid plaque deposition and toxicity. J Biol Chem, 2015. 290(20): p. 12504-13.
491. Malik, N. and M.S. Rao, A review of the methods for human iPSC derivation. Methods in molecular biology (Clifton, N.J.), 2013. 997: p. 23-33.
492. Nakagawa, M., et al., Generation of induced pluripotent stem cells without Myc from mouse and human fibroblasts. Nat Biotechnol, 2008. 26(1): p. 101-6.
493. Takahashi, K., et al., Induction of pluripotent stem cells from adult human fibroblasts by defined factors. Cell, 2007. 131(5): p. 861-72.
494. Baxter, M., et al., Phenotypic and functional analyses show stem cell-derived hepatocyte-like cells better mimic fetal rather than adult hepatocytes. Journal of hepatology, 2015. 62(3): p. 581-589.
495. Mertens, J., et al., Aging in a Dish: iPSC-Derived and Directly Induced Neurons for Studying Brain Aging and Age-Related Neurodegenerative Diseases. Annual review of genetics, 2018. 52: p. 271-293.
496. Gatto, N., et al., Directly converted astrocytes retain the ageing features of the donor fibroblasts and elucidate the astrocytic contribution to human CNS health and disease. Aging Cell, UNDER REVIEW.
497. Hassel, B., et al., Glutamate uptake is reduced in prefrontal cortex in Huntington's disease. Neurochem Res, 2008. 33(2): p. 232-7.
242 | P a g e
498. Hedegaard, A., et al., Pro-maturational Effects of Human iPSC-Derived Cortical Astrocytes upon iPSC-Derived Cortical Neurons. Stem Cell Reports, 2020. 15(1): p. 38-51.
499. Ferraiuolo, L., et al., Dysregulation of astrocyte-motoneuron cross-talk in mutant superoxide dismutase 1-related amyotrophic lateral sclerosis. Brain : a journal of neurology, 2011. 134(Pt 9): p. 2627-2641.
500. Bell, S.M., et al., Deficits in Mitochondrial Spare Respiratory Capacity Contribute to the Neuropsychological Changes of Alzheimer's Disease. J Pers Med, 2020. 10(2).
501. Nunomura, A., et al., The earliest stage of cognitive impairment in transition from normal aging to Alzheimer disease is marked by prominent RNA oxidation in vulnerable neurons. J Neuropathol Exp Neurol, 2012. 71(3): p. 233-41.
502. Nunomura, A., et al., RNA oxidation is a prominent feature of vulnerable neurons in Alzheimer's disease. J Neurosci, 1999. 19(6): p. 1959-64.
503. Konttinen, H., et al., PPARβ/δ-agonist GW0742 ameliorates dysfunction in fatty acid oxidation in PSEN1ΔE9 astrocytes. Glia, 2019. 67(1): p. 146-159.
504. Zhang, C., R.A. Rissman, and J. Feng, Characterization of ATP alternations in an Alzheimer's disease transgenic mouse model. Journal of Alzheimer's disease : JAD, 2015. 44(2): p. 375-378.
505. Hansson, H.-A., A histochemical study of retinal changes induced by treatment with colchicine. Experimental Eye Research, 1971. 12(2): p. 198-205.
506. Lu, J., et al., Effect of cholinergic signaling on neuronal cell bioenergetics. Journal of Alzheimer's disease : JAD, 2013. 33(4): p. 1135-1146.
507. Rees, J.M., W.C. Ford, and M.G. Hull, Effect of caffeine and of pentoxifylline on the motility and metabolism of human spermatozoa. J Reprod Fertil, 1990. 90(1): p. 147-56.
508. Ye, J.-H., et al., Pentoxifylline ameliorates non-alcoholic fatty liver disease in hyperglycaemic and dyslipidaemic mice by upregulating fatty acid β-oxidation. Scientific Reports, 2016. 6(1): p. 33102.
509. Conejero-Goldberg, C., et al., APOE2 enhances neuroprotection against Alzheimer’s disease through multiple molecular mechanisms. Molecular Psychiatry, 2014. 19(11): p. 1243-1250.
510. Reiman, E.M., et al., Exceptionally low likelihood of Alzheimer’s dementia in APOE2 homozygotes from a 5,000-person neuropathological study. Nature Communications, 2020. 11(1): p. 667.
511. Palmqvist, S., et al., Earliest accumulation of β-amyloid occurs within the default-mode network and concurrently affects brain connectivity. Nature communications, 2017. 8(1): p. 1214-1214.
512. Hodgetts, C.J., et al., Increased posterior default mode network activity and structural connectivity in young adult APOE-ε4 carriers: a multimodal imaging investigation. Neurobiology of Aging, 2019. 73: p. 82-91.
513. Hipkiss, A.R., Aging, Alzheimer's Disease and Dysfunctional Glycolysis; Similar Effects of Too Much and Too Little. Aging and disease, 2019. 10(6): p. 1328-1331.
514. Sun, N., R.J. Youle, and T. Finkel, The Mitochondrial Basis of Aging. Molecular cell, 2016. 61(5): p. 654-666.
515. Lim, S.L., C.J. Rodriguez-Ortiz, and M. Kitazawa, Infection, systemic inflammation, and Alzheimer's disease. Microbes and Infection, 2015. 17(8): p. 549-556.
516. Driver, J.A., et al., Inverse association between cancer and Alzheimer’s disease: results from the Framingham Heart Study. BMJ, 2012. 344: p. e1442.
517. van der Windt, G.J.W., et al., Mitochondrial respiratory capacity is a critical regulator of CD8+ T cell memory development. Immunity, 2012. 36(1): p. 68-78.
518. Ganapathy-Kanniappan, S. and J.-F.H. Geschwind, Tumor glycolysis as a target for cancer therapy: progress and prospects. Molecular Cancer, 2013. 12(1): p. 152.
519. Barbuti, P.A., et al., IPSC-derived midbrain astrocytes from Parkinson’s disease patients carrying pathogenic <em>SNCA</em> mutations exhibit alpha-synuclein
243 | P a g e
aggregation, mitochondrial fragmentation and excess calcium release. bioRxiv, 2020: p. 2020.04.27.053470.
520. Du, F., et al., Astrocytes Attenuate Mitochondrial Dysfunctions in Human Dopaminergic Neurons Derived from iPSC. Stem cell reports, 2018. 10(2): p. 366-374.
521. Baloyannis, S.J., Mitochondrial alterations in Alzheimer's disease. J Alzheimers Dis, 2006. 9(2): p. 119-26.
522. Abramov, A.Y., L. Canevari, and M.R. Duchen, Beta-amyloid peptides induce mitochondrial dysfunction and oxidative stress in astrocytes and death of neurons through activation of NADPH oxidase. J Neurosci, 2004. 24(2): p. 565-75.
523. Jackson, J.G. and M.B. Robinson, Regulation of mitochondrial dynamics in astrocytes: Mechanisms, consequences, and unknowns. Glia, 2018. 66(6): p. 1213-1234.
524. Birdsill, A.C., et al., Low cerebral blood flow is associated with lower memory function in metabolic syndrome. Obesity (Silver Spring, Md.), 2013. 21(7): p. 1313-1320.
525. Pihlaja, R., et al., Transplanted astrocytes internalize deposited beta-amyloid peptides in a transgenic mouse model of Alzheimer's disease. Glia, 2008. 56(2): p. 154-63.
526. Allaman, I., et al., Amyloid-beta aggregates cause alterations of astrocytic metabolic phenotype: impact on neuronal viability. J Neurosci, 2010. 30(9): p. 3326-38.
527. Fu, W., et al., Bioenergetic mechanisms in astrocytes may contribute to amyloid plaque deposition and toxicity. The Journal of biological chemistry, 2015. 290(20): p. 12504-12513.
528. Andersen, J.V., et al., Alterations in Cerebral Cortical Glucose and Glutamine Metabolism Precedes Amyloid Plaques in the APPswe/PSEN1dE9 Mouse Model of Alzheimer's Disease. 2017. 42(6): p. 1589-1598.
529. Mayeux, R., Biomarkers: potential uses and limitations. NeuroRx : the journal of the American Society for Experimental NeuroTherapeutics, 2004. 1(2): p. 182-188.
530. Jones, N., et al., Bioenergetic analysis of human peripheral blood mononuclear cells. Clinical and experimental immunology, 2015. 182(1): p. 69-80.
531. TeSlaa, T. and M.A. Teitell, Techniques to monitor glycolysis. Methods in enzymology, 2014. 542: p. 91-114.
532. Humpel, C., Identifying and validating biomarkers for Alzheimer's disease. Trends in biotechnology, 2011. 29(1): p. 26-32.
533. Bookheimer, S. and A. Burggren, APOE-4 genotype and neurophysiological vulnerability to Alzheimer's and cognitive aging. Annual review of clinical psychology, 2009. 5: p. 343-362.
534. Hampel, H., et al., Value of CSF beta-amyloid1-42 and tau as predictors of Alzheimer's disease in patients with mild cognitive impairment. Mol Psychiatry, 2004. 9(7): p. 705-10.
535. Bos, I., et al., Amyloid-β, Tau, and Cognition in Cognitively Normal Older Individuals: Examining the Necessity to Adjust for Biomarker Status in Normative Data. Frontiers in aging neuroscience, 2018. 10: p. 193-193.
536. Chapman, C.D., et al., Intranasal insulin in Alzheimer's disease: Food for thought. Neuropharmacology, 2018. 136: p. 196-201.
537. Koenig, A.M., et al., Effects of the Insulin Sensitizer Metformin in Alzheimer Disease: Pilot Data From a Randomized Placebo-controlled Crossover Study. Alzheimer disease and associated disorders, 2017. 31(2): p. 107-113.
538. Luchsinger, J.A., et al., Metformin in Amnestic Mild Cognitive Impairment: Results of a Pilot Randomized Placebo Controlled Clinical Trial. Journal of Alzheimer's disease : JAD, 2016. 51(2): p. 501-514.
539. Westhaus, A., E.M. Blumrich, and R. Dringen, The Antidiabetic Drug Metformin Stimulates Glycolytic Lactate Production in Cultured Primary Rat Astrocytes. Neurochem Res, 2017. 42(1): p. 294-305.
540. Zhu, X., et al., Metformin improves cognition of aged mice by promoting cerebral angiogenesis and neurogenesis. bioRxiv, 2020: p. 2020.03.25.006767.

244 | P a g e
541. Blázquez, E., et al., Insulin in the brain: its pathophysiological implications for States related with central insulin resistance, type 2 diabetes and Alzheimer's disease. Frontiers in endocrinology, 2014. 5: p. 161-161.
542. Morris, J.K. and J.M. Burns, Insulin: an emerging treatment for Alzheimer's disease dementia? Current neurology and neuroscience reports, 2012. 12(5): p. 520-527.
543. García-Cáceres, C., et al., Astrocytic Insulin Signaling Couples Brain Glucose Uptake with Nutrient Availability. Cell, 2016. 166(4): p. 867-880.
Copyright © 2022 FDOKUMEN