Characterising Entrants Into the University System in Uganda
14
1 CHARACTERISING ENTRANTS INTO THE UNIVERSITY SYSTEM IN UGANDA Nshemereirwe V. Connie Senior Lecturer, Uganda Martyrs University, P.O. Box 5498, Kampala, Uganda PhD Student, University of Twente, P.O. Box 217, 7500AE, Enschede, The Netherlands Tel: +256 78 254 3549, Fax: +256 38 241 0100 E-mail address: [email protected] PAPER TO BE PRESENTED AT THE 29 TH ASSOCIATION FOR EDUCATIONAL ASSESSMENT IN AFRICA (AEAA) CONFERENCE TO BE HELD IN NAIROBI, KENYA CONFERENCE THEME: BEST PRACTICES IN EDUCATIONAL ASSESSMENT FOR REGIONAL INTEGRATION Sub-Theme: Educational Assessment and Regional Quality Assurance Issues Abstract The Inter-University Council of East Africa, together with the National Higher Education Quality Assurance bodies of the East African countries, has been developing a joint quality assurance framework for Higher Education in the region. Among the objectives of this framework is improved student mobility, as well as bridging the gap between disparate educational systems. A key quality concern for Ugandan Higher Education is the validity of the scores from the high stakes Advanced Level examinations, upon which Universities largely base their admission. The study that I will report on is part of a wider PhD study investigating the predictive validity of the A-Level scores of entrants‟ success at University. I will focus on the preliminary study that seeks to characterise the University entrant in terms of their knowledge and skill base as reflected by their A-Level subject combinations and grades. The study was carried out at two public and six private universities in Uganda, and focused on three study programmes: Development Studies, Information Technology and Business Administration. The major outcome of this study is to identify the subjects that University entrants study at A-Level, and their scores in the final examination. This will form a basis for the follow-up study to determine the predictive validity of entry scores with relation to performance at University; this validity is expected to be variable, and my thesis is that it will depend greatly on the specific teaching and examination practices at the entrants‟ previous high schools; the follow-up study will focus on these schools.
-
Upload
cavendishug -
Category
Documents
-
view
1 -
download
0
Transcript of Characterising Entrants Into the University System in Uganda
1
CHARACTERISING ENTRANTS INTO THE UNIVERSITY SYSTEM IN UGANDA
Nshemereirwe V. Connie
Senior Lecturer, Uganda Martyrs University, P.O. Box 5498, Kampala, Uganda
PhD Student, University of Twente, P.O. Box 217, 7500AE, Enschede, The Netherlands
Tel: +256 78 254 3549, Fax: +256 38 241 0100
E-mail address: [email protected]
PAPER TO BE PRESENTED AT THE 29TH ASSOCIATION FOR EDUCATIONAL ASSESSMENT IN
AFRICA (AEAA) CONFERENCE TO BE HELD IN NAIROBI, KENYA
CONFERENCE THEME: BEST PRACTICES IN EDUCATIONAL ASSESSMENT FOR REGIONAL
INTEGRATION
Sub-Theme: Educational Assessment and Regional Quality Assurance Issues
Abstract
The Inter-University Council of East Africa, together with the National Higher Education
Quality Assurance bodies of the East African countries, has been developing a joint
quality assurance framework for Higher Education in the region. Among the objectives
of this framework is improved student mobility, as well as bridging the gap between
disparate educational systems. A key quality concern for Ugandan Higher Education is
the validity of the scores from the high stakes Advanced Level examinations, upon which
Universities largely base their admission.
The study that I will report on is part of a wider PhD study investigating the predictive
validity of the A-Level scores of entrants‟ success at University. I will focus on the
preliminary study that seeks to characterise the University entrant in terms of their
knowledge and skill base as reflected by their A-Level subject combinations and grades.
The study was carried out at two public and six private universities in Uganda, and
focused on three study programmes: Development Studies, Information Technology and
Business Administration.
The major outcome of this study is to identify the subjects that University entrants study
at A-Level, and their scores in the final examination. This will form a basis for the
follow-up study to determine the predictive validity of entry scores with relation to
performance at University; this validity is expected to be variable, and my thesis is that
it will depend greatly on the specific teaching and examination practices at the entrants‟
previous high schools; the follow-up study will focus on these schools.
2
1.0 Introduction
1.1 Quality of Higher Education
While it is widely acknowledged that Primary and Secondary Education is fundamental to
shaping a literate and productive labour force, it is increasingly apparent that a quality
higher education is essential to creating more sustainable, longer term growth within
the Sub-Saharan Africa (SSA) region, as well as narrowing the gap between the SSA and
other regions (World Bank, 2008 (a)). However, given that primary and secondary
education serves the purpose of preparing students for higher education, the quality of
the two is intimately linked so dealing with one necessarily requires dealing with the
other. As such, in the specific context of East African Regional Integration and Higher
Educational quality, a pertinent quality indicator is the particular characteristics
(knowledge, skills, etc.) of entrants into the various universities in the region.
1.2 Examinations and Educational Outcomes
Taking a closer look at the quality and relevance of secondary education as it relates to
higher education reveals the fact that it is clearly linked to examination and assessment
practices. Students will direct their energies within the learning process towards the
knowledge and skills necessary to enable them to score as highly on the final
examinations as possible. Teachers, Schools and Parents, for themselves, are not
immune from this influence as they all derive credit from examination success. In
Uganda, the fierce competition for limited places at the Public and Private Universities
within the country has further magnified the role that examinations play in the teaching
and learning process in pre-university education. From the view point of higher
education quality, therefore, it is necessary to focus attention on the specific way in
which this interaction prepares (or fails to prepare) students for Higher Education.
An indication that things are not as they should be is the results of national and
international assessments at both primary and secondary level which have shown that
actual achievement is generally in the lowest knowledge levels. For instance, the
National Assessments of Progress in Education (NAPE 1999, 2003, 2005, 2006, 2007,
2008, 2010) report that achievement for grade 3 and grade 6 students of primary
school in mathematics and language has generally been on the decline since the
introduction of Universal Primary Education in 1996. NAPE studies carried out at
Secondary School level show a similar trend in Mathematics, Biology and Language for
students in the second year of secondary school. As is to be expected, the shortcomings
at lower levels of education extend to higher levels, leading to a “spiral build-up of
learning matter” (pp. xii, World Bank, 2008(b)), which means learning material from
lower levels has to be repeated at the higher levels, which in turn leads to less time on
the material for those higher levels. The implications for Higher Education are clear.
3
1.3 Match between Pre-University and University Curricula
One of the stated objectives of Primary and Secondary schooling in Uganda is to prepare
students for Higher Education (Government White Paper, 1992). However, as a result of
a high influx of students through the Universal Primary Education (UPE) and Universal
Secondary Education (USE), the whole system is under great stress; the physical
infrastructure and human resources cannot keep up. This influx is also at odds with a
curriculum originally designed to filter out the most academically fit to create an
administrative and managerial elite. With its many subjects and examination hurdles, it
has not kept pace with the emerging fields of knowledge and attendant pedagogies, nor
does it address the current needs of either the students entering it, or the needs of the
country at large (CURASSE1 Draft Report, 2007). It is true that there have been attempts
at reform in the primary education sector, with initiatives like introducing a thematic
curriculum that better reflects the needs of students and local communities, but
implementation is still a problem (Altinyelken, 2010).
Universities, on the other hand, have been much more responsive to the changes within
their environment, as evidenced by the changes in pedagogy, the study programmes on
offer and their international outlook. However, they still depend almost wholly on the
examination grades of students in the high school leaving national examinations to
carry out their entry selections; the question here is: what knowledge and skills are
reflected by the scores in these examinations, and is this what is needed to successfully
take on university education? Certainly, as far as quality of higher education goes, the
universities themselves are not without short comings; some of their curricula are not
well matched to National needs, and some teaching methodology is out-dated.
Nevertheless, Universities perceive that students entering University have low levels of
requisite knowledge and skills, and that this contributes greatly to the eventual quality
of graduates.
1.4 Teaching to the Test
To access higher education, students must overcome the hurdles presented by national
examinations at various stages of the educational system. Given that there are
proportionately fewer and fewer places in higher levels of education the national
examinations have become higher stakes than ever before. With teachers under pressure
to prepare students for the national examinations and complete the syllabus, it is no
wonder that they end up concentrating only on the topics that are expected on the final
examination. This “teaching to the test” leads to an emphasis on learning strategies, on
the part of students, that lend themselves best to passing examinations such as
memorisation and rote learning (Kellaghan & Greaney, 2004), learning strategies that do
not lend themselves to success in higher education.
1 CURASSE: Uganda Secondary Education & Training Curriculum, Assessment & Examination - Roadmap for
Reform
4
2.0 Investigating the Effect of Teaching and Assessment Practices in Pre-University
Education on Entrants into the University System in Uganda
2.1 Background of Study
There is widespread concern about the quality and relevance of University graduates in
Uganda, both within and without the University sector. Not much, however, is
documented about the extent of this problem. At one interuniversity workshop held at
Uganda Martyrs University in December 2004 to discuss this phenomenon, educators
from various Universities perceived the problem as consisting of the following facets
(among others):
i) Infrastructure (lecture halls, laboratory space, equipment, library, ICT, etc.)
ii) Curriculum (design, regularity of review, relevance, etc.)
iii) Academic Staff (teaching skills, disciplinary/professional skills, motivation, etc.)
iv) Students (attitudes, learning strategies, previous education, etc.)
(C. Nshemereirwe, 2005)
A major recommendation from this workshop was a call for more research into the
nature of these facets so as to find viable solutions to the quality issue. As a participant
at this workshop, and through my experience as a University educator since then, I was
drawn to investigate the oft repeated claim that Universities are limited in what they can
do with entrants who lack the necessary fundamental knowledge and skills (facet iv).
This, participants felt, was a direct result of the high emphasis on passing examinations
in pre-university education, which then produced high school graduates ill-prepared to
take on university study.
2.2 The Problem
Although Universities in Uganda recognise the possible effect of “teaching to the test”
on the scores of students in the national examinations, most of them still rely on these
scores for entry selection. It is still perceived as the simplest and most straightforward
way to select entrants from a large number of applicants, and implicitly assumes that
the students with higher scores are more suited for the university studies. However,
there is no evidence to support this assumption, hence the need for this study. One way
to test this assumption is to compare University entry grades to interim and exit grades,
and this study sets out to do that.
2.3 Preliminary Study
Before embarking upon this study, however, it was found that very little information
existed on the population of interest: entrants into the university; as such, it was
necessary to carry out a preliminary study to characterise this population. The purpose
of this paper is to report on this study.
5
3.0 Entrants into the University System
3.1 University Education in Uganda
There has been an unprecedented growth within the Ugandan University Education
sector in the past two decades: from one public University in the late 1980s to almost
thirty today. Of these, only twelve have received full accreditation to date: five Public
and eight Private2 universities. Makerere University, Kampala (MUK) is the oldest and
largest University, and as a public University receives the bulk of government
scholarships; as such, MUK has the most competitive entry requirements, and therefore
receives among the best performers in high school leaving examinations (Uganda
Advanced Certificate of Education (UACE)).
Due to the economic difficulties facing the country throughout the 1980s, the
Government cut some of the funding to higher education, and in order to survive MUK
introduced the “Private Sponsorship Scheme” in 1992. Through this scheme, students
not eligible for government funding could apply separately and pay for their own tuition
and board. At first, these students could only enrol in specially designed programmes,
but later they could also enrol in the regular programmes and study alongside the
government sponsored students. This development led to an explosion in student
population at MUK: between 1993 and 1999, for instance, undergraduate enrolments at
MUK more than quadrupled, with 80% of the 10,000 new students being fee-paying at
the end of this period (Musisi & Muwanga, 2003). The same period also saw the
establishment of various private universities, and by 2005 there were almost 70,000
students enrolled at various Universities around the country.
3.2 Admission to University
The minimum requirement for admission to university in Uganda is two principle passes
obtained in any subjects at the same sitting. A principle pass is a score of between A
and E, and students typically attempt examinations in three or four subjects.
3.2.1 Admission to Public Universities
Admission to all public university and non-university tertiary institutes is carried out
through the Joint Admission Board (JAB). The JAB publishes information on the
requirements to enter the various programmes on offer, and lists so-called “essential”
and “desirable” UACE subjects for admission to each university study programme. Prior
to sitting the UACE examinations, all registered candidates are then required to apply to
the public tertiary institutions of their choice. During the admission process, the scores
in the various examination subjects receive either weighting of 3,2,1 or 0.5, depending
on their “relevance”. Performance at the lower secondary school Uganda Certificate of
Education (UCE) examinations is also considered.
2 There are two categories of private universities: faith based not-for-profit, and for-profit universities
6
3.2.2 Admission to Private Universities
As opposed to application to programmes at public Universities, applications to
programmes offered at the Private Universities are often received after the applicants
have received their UACE examination results. Entry requirements at most of these
Universities are usually less stringent, and in many cases applicants are admitted to the
study programme of their choice independent of the subjects they attempted at the
UACE examinations. Some consideration of UCE performance is also made here.
3.3 The Study Population
For the purposes of this study, information on entrants into the University system was
sought from the twelve chartered public and private universities. To ease comparison, it
was decided to limit the study population to entrants into the following three study
programmes: Bachelor of Business Administration (BBA), Bachelor of Development
Studies (BDS) and Bachelor of Information Technology (BIT). Limiting the study to these
programs presented two advantages: they are offered at almost all Universities, and
they provided a balance between social, business and technical studies.
Of the 12 chartered universities contacted, information was obtained from the Registry
Departments of eight. Of the four remaining ones, Busitema University did not offer the
programmes selected, Gulu University and the Islamic University in Uganda were
contacted rather late and the information could not be obtained, and the Uganda
Christian University declined to participate. The main information sought about entrants
was the following:
a) Subjects done and scores obtained in the UACE Examinations
b) Students‟ former schools
c) Split by University Study Programs into which they were admitted
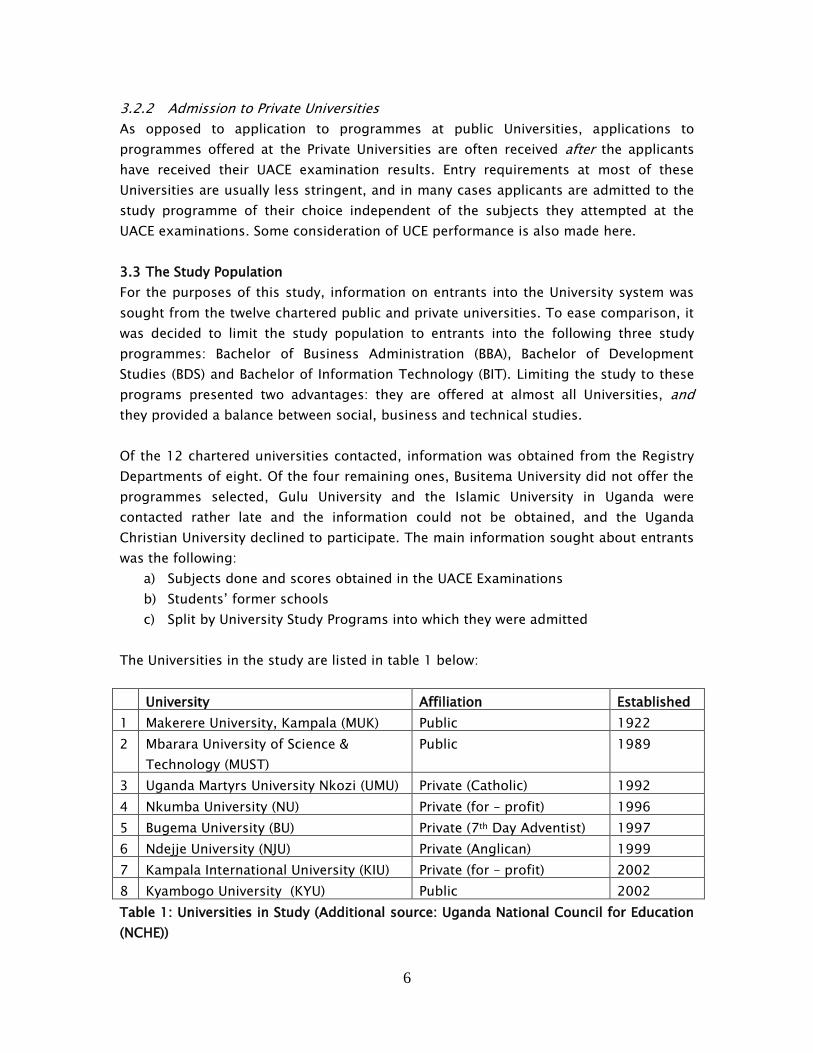
The Universities in the study are listed in table 1 below:
University Affiliation Established
1 Makerere University, Kampala (MUK) Public 1922
2 Mbarara University of Science &
Technology (MUST)
Public 1989
3 Uganda Martyrs University Nkozi (UMU) Private (Catholic) 1992
4 Nkumba University (NU) Private (for – profit) 1996
5 Bugema University (BU) Private (7th Day Adventist) 1997
6 Ndejje University (NJU) Private (Anglican) 1999
7 Kampala International University (KIU) Private (for – profit) 2002
8 Kyambogo University (KYU) Public 2002
Table 1: Universities in Study (Additional source: Uganda National Council for Education
(NCHE))
7
3.4 Methodology
Permission to access the registry data on admitted students was sought by writing
letters to the Deputy Vice Chancellor, Academic Affairs of each of the selected
Universities. The purpose to which the data was to be put was explained, and an
undertaking made to uphold the necessary ethical standards. Once permission was
granted, a visit was made to the Registry department of each University to determine the
form in which the data was stored so as to decide a on strategy for retrieving it. At three
of the universities, the data was not available in digital form so research assistants had
to manually convert the data from the student paper files into digital form. All the other
Universities had the data in digital form, although to varying degrees of completeness.
Where available, data was collected for up to five academic years, i.e. from the
2006/2007 academic year to the 2010/2011 academic year. The data from all the
Universities was then merged and an analysis carried out to determine the following:
a) The secondary schools contributing the highest number of entrants
b) The subjects done by the students admitted into the three programmes
c) The best performed out of those subjects.
As earlier mentioned, the Uganda Government only awards scholarships to students
admitted to public universities, and apart from a few awarded on a quota system to
students from less advantaged areas, the bulk are awarded to the best performing
students country-wide. With regard to fee-paying students, public universities also get
their pick because they perceived as being of better quality. This was considered in the
analysis so as to detect the differences, if any, between these groups of students.
3.5 Results
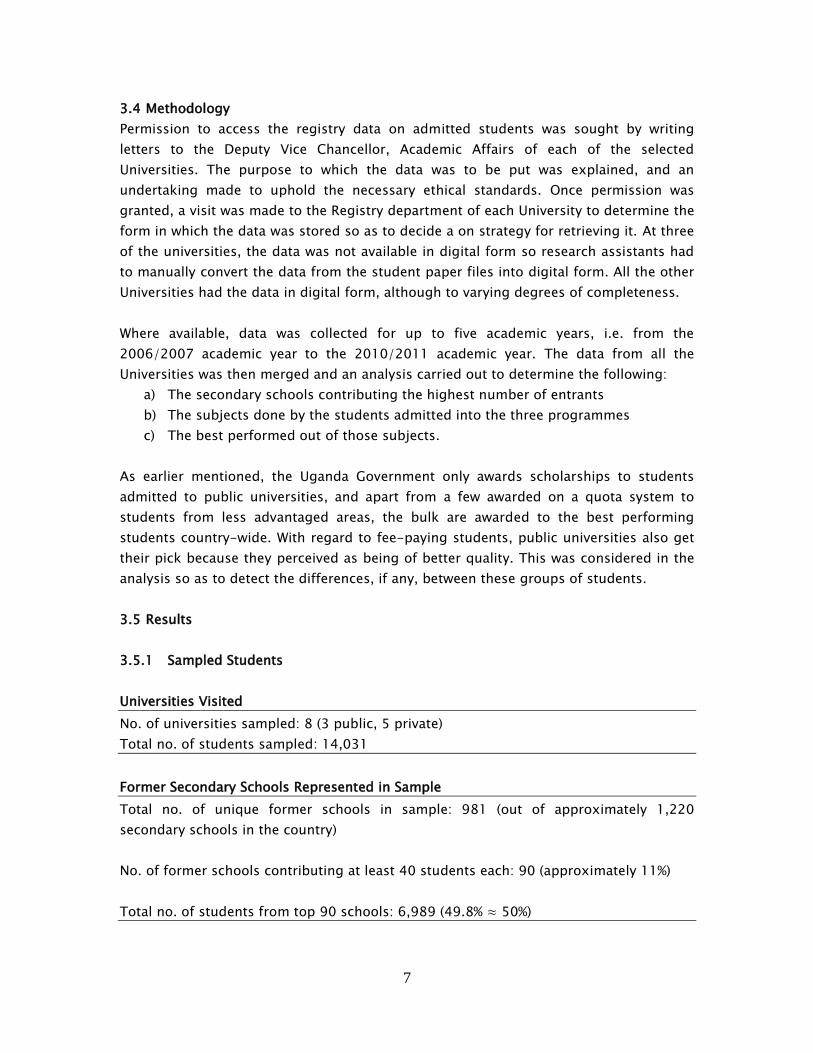
3.5.1 Sampled Students
Universities Visited
No. of universities sampled: 8 (3 public, 5 private)
Total no. of students sampled: 14,031
Former Secondary Schools Represented in Sample
Total no. of unique former schools in sample: 981 (out of approximately 1,220
secondary schools in the country)
No. of former schools contributing at least 40 students each: 90 (approximately 11%)
Total no. of students from top 90 schools: 6,989 (49.8% ≈ 50%)
8
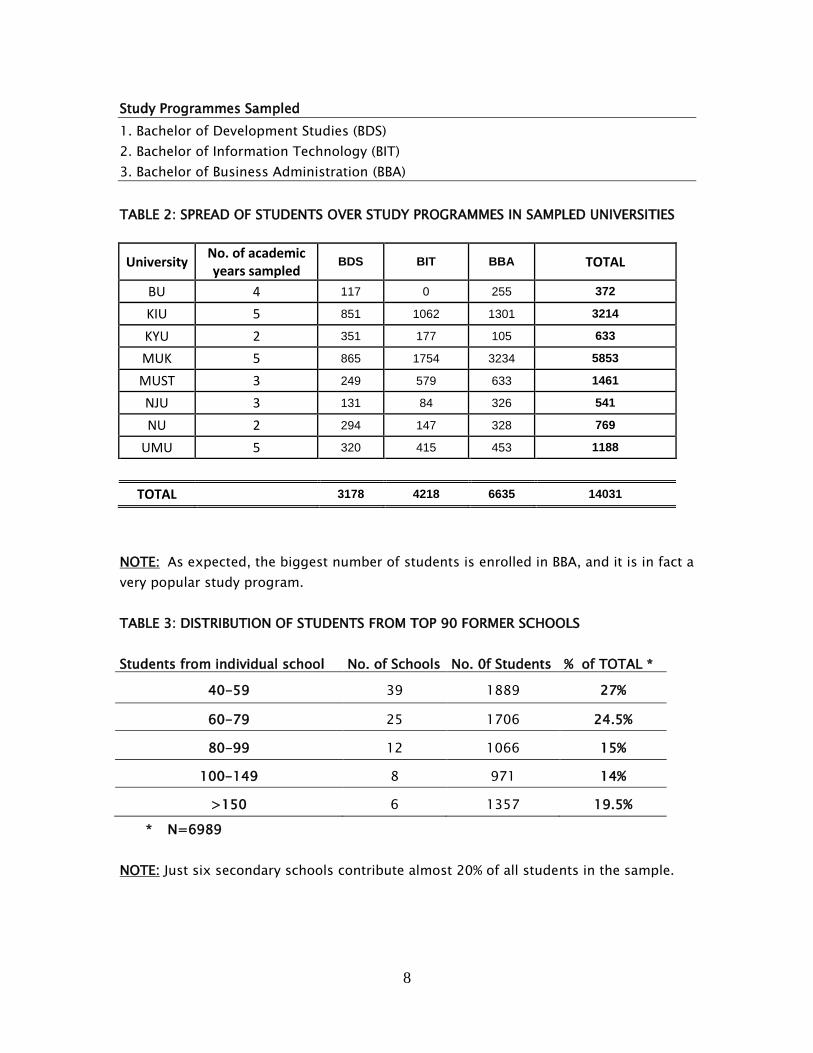
Study Programmes Sampled
1. Bachelor of Development Studies (BDS)
2. Bachelor of Information Technology (BIT)
3. Bachelor of Business Administration (BBA)
TABLE 2: SPREAD OF STUDENTS OVER STUDY PROGRAMMES IN SAMPLED UNIVERSITIES
University No. of academic years sampled
BDS BIT BBA TOTAL
BU 4 117 0 255 372
KIU 5 851 1062 1301 3214
KYU 2 351 177 105 633
MUK 5 865 1754 3234 5853
MUST 3 249 579 633 1461
NJU 3 131 84 326 541
NU 2 294 147 328 769
UMU 5 320 415 453 1188
TOTAL 3178 4218 6635 14031
NOTE: As expected, the biggest number of students is enrolled in BBA, and it is in fact a
very popular study program.
TABLE 3: DISTRIBUTION OF STUDENTS FROM TOP 90 FORMER SCHOOLS
Students from individual school No. of Schools No. 0f Students % of TOTAL *
40-59 39 1889 27%
60-79 25 1706 24.5%
80-99 12 1066 15%
100-149 8 971 14%
>150 6 1357 19.5%
* N=6989
NOTE: Just six secondary schools contribute almost 20% of all students in the sample.
9
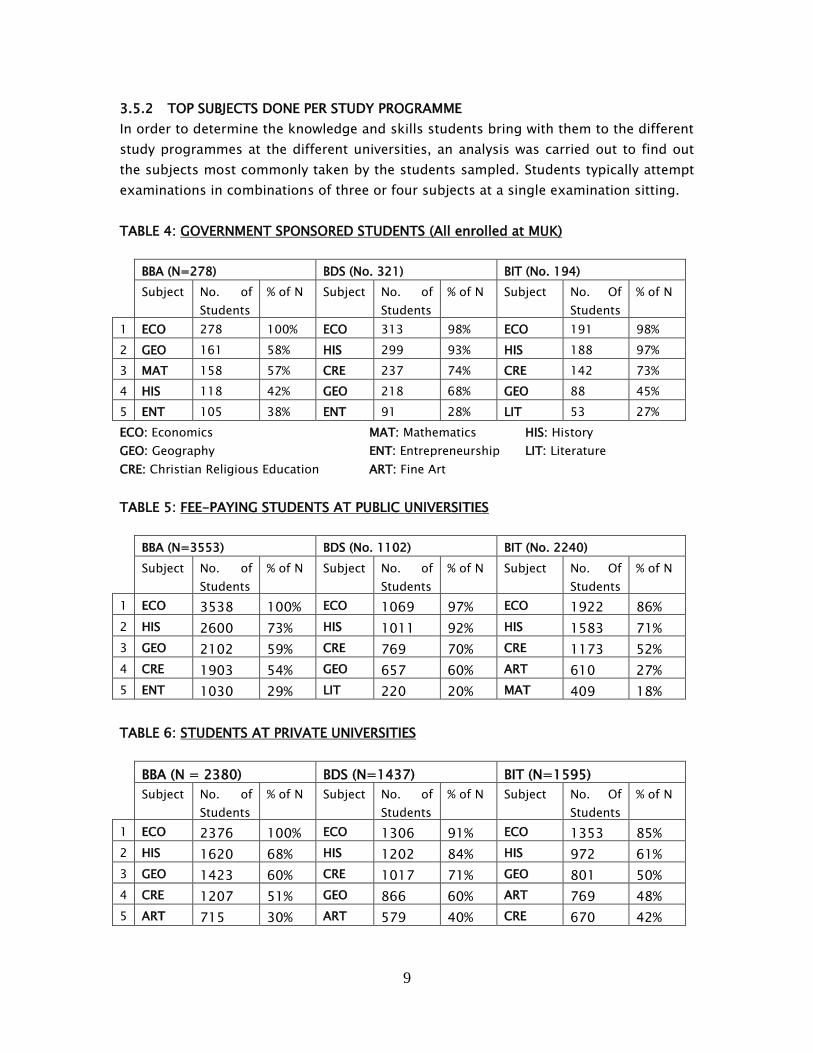
3.5.2 TOP SUBJECTS DONE PER STUDY PROGRAMME
In order to determine the knowledge and skills students bring with them to the different
study programmes at the different universities, an analysis was carried out to find out
the subjects most commonly taken by the students sampled. Students typically attempt
examinations in combinations of three or four subjects at a single examination sitting.
TABLE 4: GOVERNMENT SPONSORED STUDENTS (All enrolled at MUK)
BBA (N=278) BDS (No. 321) BIT (No. 194)
Subject No. of
Students
% of N Subject No. of
Students
% of N Subject No. Of
Students
% of N
1 ECO 278 100% ECO 313 98% ECO 191 98%
2 GEO 161 58% HIS 299 93% HIS 188 97%
3 MAT 158 57% CRE 237 74% CRE 142 73%
4 HIS 118 42% GEO 218 68% GEO 88 45%
5 ENT 105 38% ENT 91 28% LIT 53 27%
ECO: Economics MAT: Mathematics HIS: History
GEO: Geography ENT: Entrepreneurship LIT: Literature
CRE: Christian Religious Education ART: Fine Art
TABLE 5: FEE-PAYING STUDENTS AT PUBLIC UNIVERSITIES
BBA (N=3553) BDS (No. 1102) BIT (No. 2240)
Subject No. of
Students
% of N Subject No. of
Students
% of N Subject No. Of
Students
% of N
1 ECO 3538 100% ECO 1069 97% ECO 1922 86%
2 HIS 2600 73% HIS 1011 92% HIS 1583 71%
3 GEO 2102 59% CRE 769 70% CRE 1173 52%
4 CRE 1903 54% GEO 657 60% ART 610 27%
5 ENT 1030 29% LIT 220 20% MAT 409 18%
TABLE 6: STUDENTS AT PRIVATE UNIVERSITIES
BBA (N = 2380) BDS (N=1437) BIT (N=1595)
Subject No. of
Students
% of N Subject No. of
Students
% of N Subject No. Of
Students
% of N
1 ECO 2376 100% ECO 1306 91% ECO 1353 85%
2 HIS 1620 68% HIS 1202 84% HIS 972 61%
3 GEO 1423 60% CRE 1017 71% GEO 801 50%
4 CRE 1207 51% GEO 866 60% ART 769 48%
5 ART 715 30% ART 579 40% CRE 670 42%
10
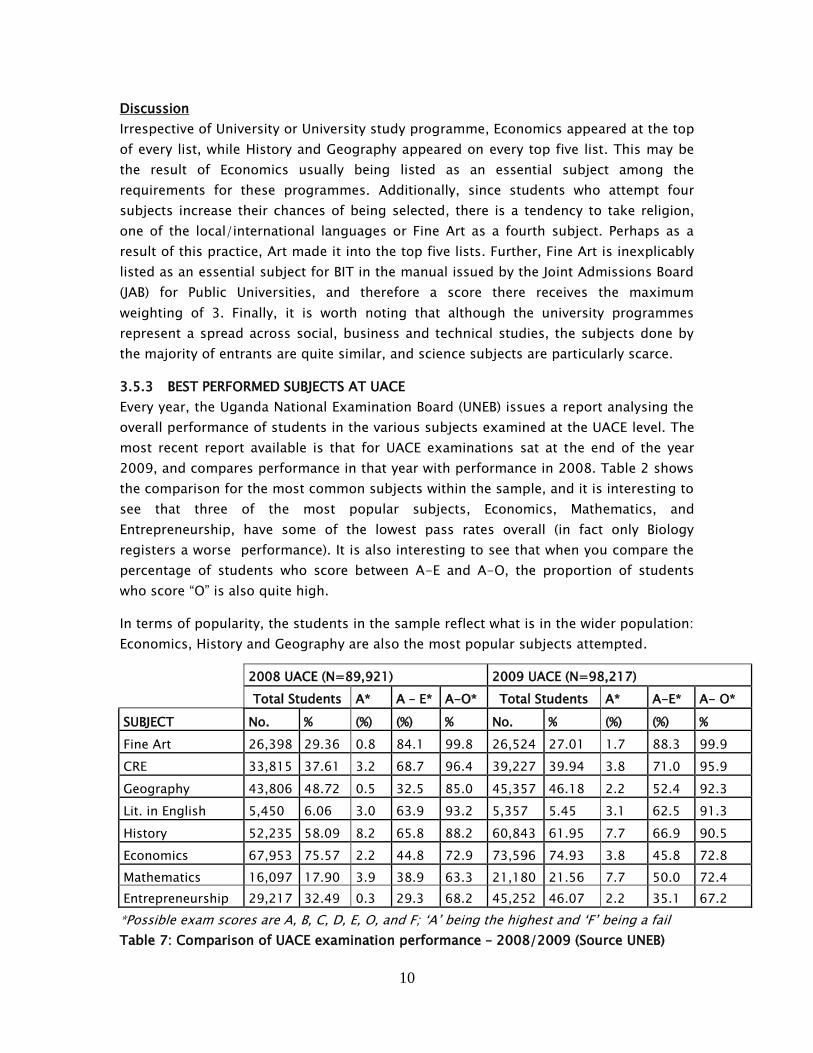
Discussion
Irrespective of University or University study programme, Economics appeared at the top
of every list, while History and Geography appeared on every top five list. This may be
the result of Economics usually being listed as an essential subject among the
requirements for these programmes. Additionally, since students who attempt four
subjects increase their chances of being selected, there is a tendency to take religion,
one of the local/international languages or Fine Art as a fourth subject. Perhaps as a
result of this practice, Art made it into the top five lists. Further, Fine Art is inexplicably
listed as an essential subject for BIT in the manual issued by the Joint Admissions Board
(JAB) for Public Universities, and therefore a score there receives the maximum
weighting of 3. Finally, it is worth noting that although the university programmes
represent a spread across social, business and technical studies, the subjects done by
the majority of entrants are quite similar, and science subjects are particularly scarce.
3.5.3 BEST PERFORMED SUBJECTS AT UACE
Every year, the Uganda National Examination Board (UNEB) issues a report analysing the
overall performance of students in the various subjects examined at the UACE level. The
most recent report available is that for UACE examinations sat at the end of the year
2009, and compares performance in that year with performance in 2008. Table 2 shows
the comparison for the most common subjects within the sample, and it is interesting to
see that three of the most popular subjects, Economics, Mathematics, and
Entrepreneurship, have some of the lowest pass rates overall (in fact only Biology
registers a worse performance). It is also interesting to see that when you compare the
percentage of students who score between A-E and A-O, the proportion of students
who score “O” is also quite high.
In terms of popularity, the students in the sample reflect what is in the wider population:
Economics, History and Geography are also the most popular subjects attempted.
2008 UACE (N=89,921) 2009 UACE (N=98,217)
Total Students A* A – E* A-O* Total Students A* A-E* A- O*
SUBJECT No. % (%) (%) % No. % (%) (%) %
Fine Art 26,398 29.36 0.8 84.1 99.8 26,524 27.01 1.7 88.3 99.9
CRE 33,815 37.61 3.2 68.7 96.4 39,227 39.94 3.8 71.0 95.9
Geography 43,806 48.72 0.5 32.5 85.0 45,357 46.18 2.2 52.4 92.3
Lit. in English 5,450 6.06 3.0 63.9 93.2 5,357 5.45 3.1 62.5 91.3
History 52,235 58.09 8.2 65.8 88.2 60,843 61.95 7.7 66.9 90.5
Economics 67,953 75.57 2.2 44.8 72.9 73,596 74.93 3.8 45.8 72.8
Mathematics 16,097 17.90 3.9 38.9 63.3 21,180 21.56 7.7 50.0 72.4
Entrepreneurship 29,217 32.49 0.3 29.3 68.2 45,252 46.07 2.2 35.1 67.2
*Possible exam scores are A, B, C, D, E, O, and F; „A‟ being the highest and „F‟ being a fail
Table 7: Comparison of UACE examination performance – 2008/2009 (Source UNEB)
11
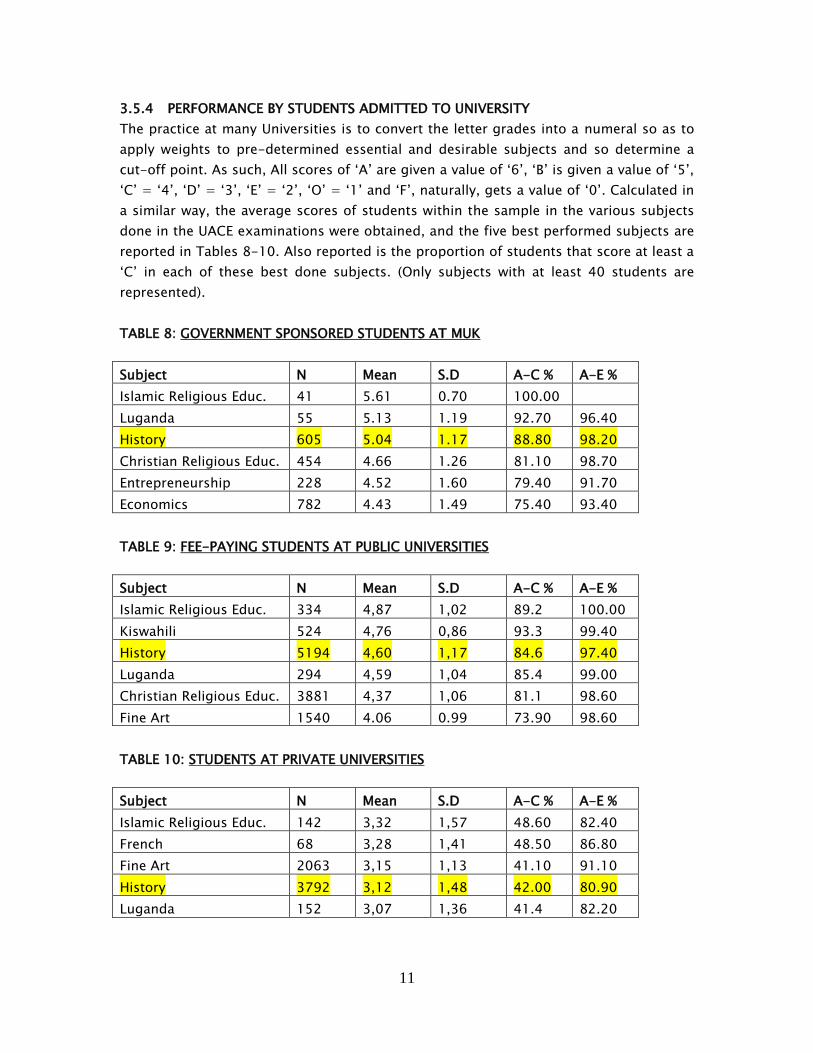
3.5.4 PERFORMANCE BY STUDENTS ADMITTED TO UNIVERSITY
The practice at many Universities is to convert the letter grades into a numeral so as to
apply weights to pre-determined essential and desirable subjects and so determine a
cut-off point. As such, All scores of „A‟ are given a value of „6‟, „B‟ is given a value of „5‟,
„C‟ = „4‟, „D‟ = „3‟, „E‟ = „2‟, „O‟ = „1‟ and „F‟, naturally, gets a value of „0‟. Calculated in
a similar way, the average scores of students within the sample in the various subjects
done in the UACE examinations were obtained, and the five best performed subjects are
reported in Tables 8-10. Also reported is the proportion of students that score at least a
„C‟ in each of these best done subjects. (Only subjects with at least 40 students are
represented).
TABLE 8: GOVERNMENT SPONSORED STUDENTS AT MUK
Subject N Mean S.D A-C % A-E %
Islamic Religious Educ. 41 5.61 0.70 100.00
Luganda 55 5.13 1.19 92.70 96.40
History 605 5.04 1.17 88.80 98.20
Christian Religious Educ. 454 4.66 1.26 81.10 98.70
Entrepreneurship 228 4.52 1.60 79.40 91.70
Economics 782 4.43 1.49 75.40 93.40
TABLE 9: FEE-PAYING STUDENTS AT PUBLIC UNIVERSITIES
Subject N Mean S.D A-C % A-E %
Islamic Religious Educ. 334 4,87 1,02 89.2 100.00
Kiswahili 524 4,76 0,86 93.3 99.40
History 5194 4,60 1,17 84.6 97.40
Luganda 294 4,59 1,04 85.4 99.00
Christian Religious Educ. 3881 4,37 1,06 81.1 98.60
Fine Art 1540 4.06 0.99 73.90 98.60
TABLE 10: STUDENTS AT PRIVATE UNIVERSITIES
Subject N Mean S.D A-C % A-E %
Islamic Religious Educ. 142 3,32 1,57 48.60 82.40
French 68 3,28 1,41 48.50 86.80
Fine Art 2063 3,15 1,13 41.10 91.10
History 3792 3,12 1,48 42.00 80.90
Luganda 152 3,07 1,36 41.4 82.20
12
Discussion:
The best performed subjects overall show a significant tendency to local languages,
religious studies and Fine Art, raising the question of how useful knowledge and skills in
these as best done subjects is to the programmes in which students are enrolled.
Conversely, Economics, the most popular subject for students enrolled in all the
programmes, only appears at the very bottom of the best performed subjects list for
government sponsored students, and not at all on the other two top five lists. Given that
over 90% of all students in the sample do this subject at the UACE, and given that it is
listed as an “essential‟ subject for both BBA and BIT, this low performance is worth
noting.
The other thing that is evident is that the mean scores in the best performed subjects
are highest for the students enrolled at MUK under Government Sponsorship, and lowest
for students enrolled at Private Universities. Additionally, it is interesting to note that
four out of the five best performed subjects are also the most popular subjects for
Government sponsored students, meaning that these Government sponsored students
do well on the subjects that they do choose. Conversely, only two out of the five most
popular subjects for the fee-paying students at public universities, and just one for
those at private universities, appear on the lists of the best performed subjects. This
means that fee paying students, on the whole, do not perform that well on the subjects
that they do choose; no wonder their overall mean scores are also lower.
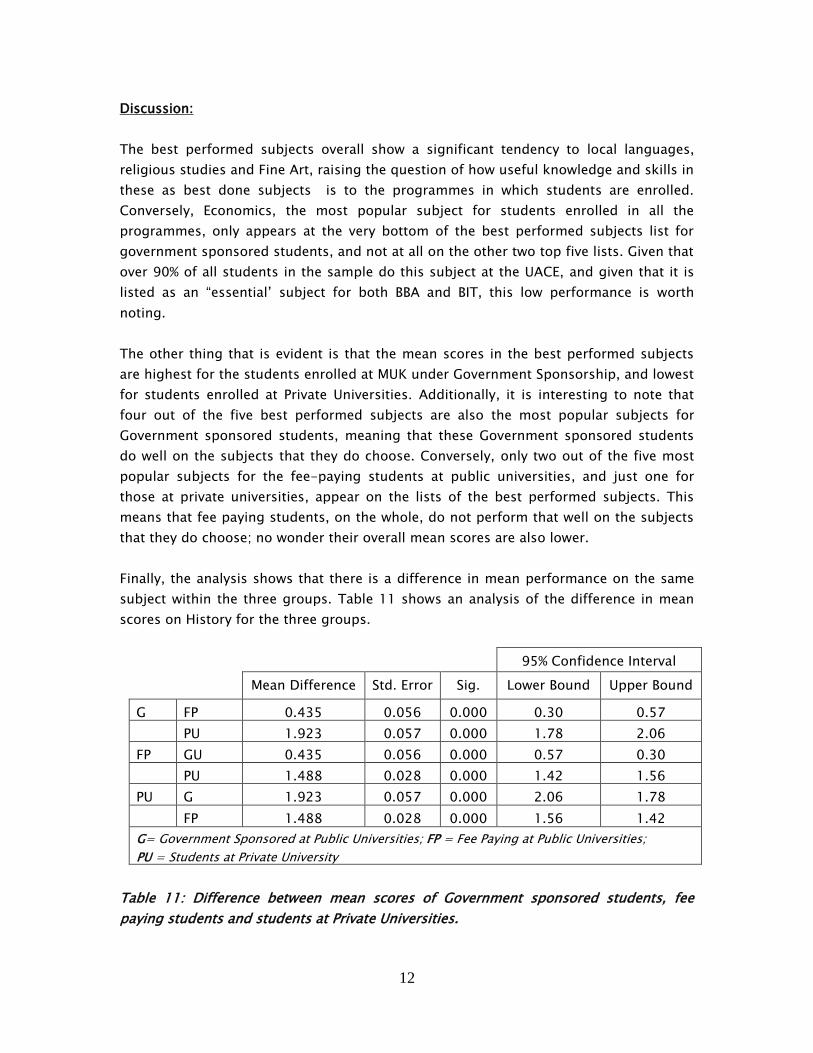
Finally, the analysis shows that there is a difference in mean performance on the same
subject within the three groups. Table 11 shows an analysis of the difference in mean
scores on History for the three groups.
95% Confidence Interval
Mean Difference Std. Error Sig. Lower Bound Upper Bound
G FP 0.435 0.056 0.000 0.30 0.57
PU 1.923 0.057 0.000 1.78 2.06
FP GU 0.435 0.056 0.000 0.57 0.30
PU 1.488 0.028 0.000 1.42 1.56
PU G 1.923 0.057 0.000 2.06 1.78
FP 1.488 0.028 0.000 1.56 1.42
G= Government Sponsored at Public Universities; FP = Fee Paying at Public Universities;
PU = Students at Private University
Table 11: Difference between mean scores of Government sponsored students, fee
paying students and students at Private Universities.
13
4.0 CONCLUSION
4.1.1 OVERVIEW OF STUDY RESULTS
The aim of this preliminary study was to build up a picture of the student who enters
Universities in Uganda. Data was collected from eight of the twelve chartered public and
private universities in the Business Administration, Information Technology and
Development Studies study programmes. Data was collected on cohorts of entrants for
at least two, and up to five academic years, including 2010/2011. An attempt was made
to take samples from all chartered universities in the country but due to logistical
difficulties no data was obtained from the three universities located in the East and
North of the country, while one other university declined to participate.
On the whole, it was found that most students in the sampled study programmes do
Arts subjects at the UACE examinations, which is also reflected in the wider population
of examinees at the UACE. Further, it was found that the scores in these subjects,
differed significantly, with students attending the public Universities on scholarship
scoring highest, then fee paying students at public Universities, and finally students at
private universities. It was also found that about half of the students within the were
from just over 10% of secondary schools represented in the entire sample. Of this 50%,
almost 20% came just from six schools, representing 10% of the entire sample.
4.1.2 FOLLOW-UP QUESTIONS
The preliminary study reported here is part of a larger study, and has motivated the
pursuit of the following goals:
a) Are the scores in the National Examinations (still) valid as a basis to select
students for University study in Uganda
b) Investigate the belief that secondary schools that are most successful in sending
students to University are also more likely to “teach to the test”
c) Test the hypothesis that: students who score low on “teaching to the test” have
higher 1st year GPA and CGPA scores at university than those who score high on
“teaching to the test”
The findings from this initial study have helped build up a picture of the entrant into
University in Uganda, and will enable the design of this study to proceed. The findings
have also motivated a closer look at the particular knowledge and skills gained through
the most popular subjects, and their relevance to the programmes into which students
are enrolled. A match of the two curricula will be an interesting dimension to the study.
The overarching aim of this entire study is that by establishing the characteristics of
entrants into the University system, the issue of Higher Education quality can be
addressed in a more focussed and informed manner.
14
REFERENCES
1. The World Bank, (2008 (a)), Accelerating Catch up: Tertiary Education for Growth in
Sub-Saharan Africa, Africa Region Human Development Department, World Bank,
Washington.
2. Republic of Uganda, (1992), Government White Paper on the Education Policy Review
Commission Report on Education for National Integration and Development. Uganda
Printing & Publishing Unit, Kampala.
3. Clegg, A., Bregman, J. & Ottevanger, W., (2007), Uganda Secondary Education &
Training Curriculum, Assessment & Examination (CURASSE) - Roadmap for Reform;
the World Bank, retrieved 17 May 2011,
<http://siteresources.worldbank.org/INTAFRREGTOPSEIA/Resources/Uganda_Curass
e.pdf>.
4. Altinyelken, K. H. (2010), Curriculum Change in Uganda: Teacher Perspectives on the
New Thematic Curriculum; International Journal of Educational Development Volume
30, Issue 2, March 2010, Pages 151–161, Elsevier, Amsterdam.
5. World Bank, (2008 (b)), Curricula, Examinations, and Assessment in Secondary
Education in Sub-Saharan Africa; World Bank Working Paper No. 128, Africa Human
Working Development Series, World Bank, Washington.
6. Kellaghan T. & Greaney V., (2004), Assessing Student Learning in Africa. World Bank,
Washington.
7. Nshemereirwe, C., (2005), Improving Teaching and Learning in Higher Education in
Uganda: A Report on the First Inter-University Workshop. Paper presented at the
South African Association for Research and Development in Higher Education
(SAARDHE) conference held at the University of Kwa-Zulu Natal, Durban, South
Africa, June 27-29.
8. Musisi, B. N & Muwanga, K. N., (2003), Makerere University in Transition 1993–
2000: Opportunities & Challenges, Makerere University, retrieved 22 May 2011
<http://mak.ac.ug/documents/Makfiles/pdf/2003_05_20_N.B.Musisi_et_al_uganda.
pdf.>