Factors characterising the maturity of BPR programmes
40
1 Factors characterising the maturity of BPR programmes 1 Dr R S Maull School of Business and Economics, University of Exeter, Exeter EX4 4PU Professor D R Tranfield Cranfield School of Management, Cranfield, Beds MK43 0AL Dr W Maull School of Education and Life Long Learning, University of Exeter, Exeter. Abstract This paper addresses the implementation of Business Process Re-engineering programmes in 33 public and private organisations wishing to improve performance. By reviewing the existing literature, the research presented here began by identifying 10 dimensions along which BPR projects might be measured. This research then uses these dimensions to investigate two research questions Firstly, it examines the relationships between these ten dimensions to reveal whether or not configurational approaches to BPR programme exist. Secondly, it examines the relationship between these ten dimensions and the maturity of a BPR implementation. The paper uses factor analysis based on quantitative data to address these questions. The factor analysis identified three independent aspects of BPR implementation: strategy, process and cost. We then used these terms in labelling three characteristic approaches, Strategic BPR, Process focussed BPR and Cost focussed BPR. To investigate causality we re-visited seven of the original organisations which had been in the early stages of implementation. Preliminary results indicate that managers might avoid the naturalistic tendency towards slow or stalled BPR maturity by intervening in a strategic sense at an earlier stage of implementation, thus bringing an organisation to a mature BPR programme more quickly. INTRODUCTION Business Process Re-engineering (BPR) as an approach to performance improvement was established in 1990 (Hammer 1990, Davenport and Short 1990). It is a controversial approach with many authors highly critical of some of its methods and assumptions. For example, Grint and Case (1998) in their critique of the bellicose language associated with BPR, claim that it is a US led management consultancy approach that is a reaction against the dominant Japanese management practices. For Grint and Case BPR is associated with a violent 1 This paper results from research work carried out on two EPSRC grants, GR/K67328, ‘UK experiences in business process re-engineering: a scoping study’ and GR/L41479 “A methodology for the re-engineering of business processes”. We acknowledge the considerable amount of work carried out by Drs Stephen Childe and Barry Mills in collecting some of this data.
Transcript of Factors characterising the maturity of BPR programmes

1
Factors characterising the maturity of BPR programmes1
Dr R S Maull
School of Business and Economics, University of Exeter, Exeter EX4 4PU
Professor D R Tranfield
Cranfield School of Management, Cranfield, Beds MK43 0AL
Dr W Maull
School of Education and Life Long Learning, University of Exeter, Exeter.
Abstract
This paper addresses the implementation of Business Process Re-engineering programmes in 33 public and
private organisations wishing to improve performance. By reviewing the existing literature, the research
presented here began by identifying 10 dimensions along which BPR projects might be measured. This research
then uses these dimensions to investigate two research questions Firstly, it examines the relationships between
these ten dimensions to reveal whether or not configurational approaches to BPR programme exist. Secondly, it
examines the relationship between these ten dimensions and the maturity of a BPR implementation. The paper
uses factor analysis based on quantitative data to address these questions. The factor analysis identified three
independent aspects of BPR implementation: strategy, process and cost. We then used these terms in labelling
three characteristic approaches, Strategic BPR, Process focussed BPR and Cost focussed BPR. To investigate
causality we re-visited seven of the original organisations which had been in the early stages of implementation.
Preliminary results indicate that managers might avoid the naturalistic tendency towards slow or stalled BPR
maturity by intervening in a strategic sense at an earlier stage of implementation, thus bringing an organisation
to a mature BPR programme more quickly.
INTRODUCTION
Business Process Re-engineering (BPR) as an approach to performance
improvement was established in 1990 (Hammer 1990, Davenport and Short 1990). It
is a controversial approach with many authors highly critical of some of its methods
and assumptions. For example, Grint and Case (1998) in their critique of the
bellicose language associated with BPR, claim that it is a US led management
consultancy approach that is a reaction against the dominant Japanese
management practices. For Grint and Case BPR is associated with a violent
1 This paper results from research work carried out on two EPSRC grants, GR/K67328, ‘UK experiences in business process
re-engineering: a scoping study’ and GR/L41479 “A methodology for the re-engineering of business processes”. We acknowledge the considerable amount of work carried out by Drs Stephen Childe and Barry Mills in collecting some of this data.

2
rhetoric. They quote Hammer as using phrases such as “taking an axe and a
machine gun to your existing organisation”… “re-engineering will require a lobotomy”
and “if senior management is serious about reengineering they will shoot you”. This
is then somewhat paradoxically linked to a utopian view “re-engineering can lead
you to a promised land”. De Cock (1997) also draws heavily on the discourse of
BPR. He claims that if BPR is to influence organisations its “meaning must be
socially negotiated within the context of particular concrete activities”. Critically
appraising the discourse and rhetoric of BPR is important, for it contributes to
definition and scoping of the field. This research can be seen as complementary in
that it adopts a practitioner sensitive view, using terminology drawn from extensive
empirical work in a variety of public and private organisations . In this sense the
work reflects a distinctly managerial perspective.
Further controversy surrounds whether or not BPR, as an approach to performance
improvement has been successful. Some claim success given the right conditions
(Harvey 1994) whilst others claim failure rates as high as 70% (Laudon and Laudon
1998). Unsurprisingly, some have described it as nothing more than a passing fad
(Verespej 1995), a view not shared by Francis and Macintosh (1997). In their view
this was because organisations were being required to move away from the
hierarchical, functional, command and control management model which had been
dominant, and BPR was a fundamental tool contributing to that re-organisation.
They foresaw that BPR would undergo name changes and modifications to its
structure and approach, but concluded “it cannot be ignored” (p361).
As Francis and Macintosh (op cit) predicted, interest in BPR has remained high in
both academic and practitioner communities. In 1998 IJOPM produced a special
edition on BPR (vol 18 no 9&10). Through 2000 to 2002 there have continued to be
regular contributions in the journal relating to BPR in (see for example, Belmiro,
Gardiner, Simmons, and Rentes (2000), Kuwaiti and Kay (2000), Silvestro and
Westley (2002)). Overall, there have been over 200 academic papers related to BPR
since 1999 across a range of journals and from several different management
disciplines and themes, including change management, quality management and
logistics. The practitioner community has also continued to adopt BPR. For example,

3
McCabe and Knights (2000) state that “far from having died, re-engineering is
increasingly being used by management to rationalise and describe a variety of
innovations irrespective of their content.” (p 74)
However, much of the recent reported work (not least those views reported in the
special edition of IJOPM) concentrates on different facets of BPR. Predominately
this has tended to focus on the ‘technology push’ aspects, for example the many
articles on Enterprise Resource Planning and BPR (Soliman and Youseff, 1998;
Martin and Cheung, 2000; Al-Mashari and Zairi, 2000), or has taken a strong
organisational change/human factor perspective (McAdam and Donaghy, 1999;
Zucchi and Edwards, 2000; Bright, 1999). Research integrating the various aspects
of BPR, such as Evans, Mason-Jones and Towill, 1998; Al-Mashari and Zairi, 2000,
has tended to take a theoretical approach, typically providing comprehensive
checklists with little empirical evidence, yet offering guidance for practitioners
seeking to implement BPR.
This research attempts to fill a gap in the literature on BPR which has tended to
focus on discrete aspects of BPR implementation and where it has taken a more
integrated theme has not embedded that approach with an investigation into what
has taken place in practice. This relative lack of empirical research into the
integration of the elements of BPR implementation was the inspiration for the
research reported in this paper
In some ways our study and results might be interpreted as a further example of the
importance of strategic issues in change management using a particular change
introduction vehicles. We explore this in discussion later. However, the prime focus
on business process change, which may be distinctive to BPR leads us to caution.
For example Belmiro et al (2000) found that many practitioners misunderstood the
business process element and used the term when describing generic reengineering
activities. We set out specifically to address BPR issues, and the extent to which
our results might be generalised and applied to other change vehicles remains
problematic.

4
Themes and dimensions of BPR implementation
In their brief history of BPR Francis and Macintosh (1997) review some of the
discussion points associated with a BPR project. These include; labels, approaches,
tools, techniques, the definition of a business process, the role of IT and the scope
and timing of BPR projects. All of this is predicated on their view that BPR as a
subject area has yet to mature and there is still “much debate on what constitutes
BPR”. In the following year Motwani et al (1998), in an extensive review and
classification of the BPR literature, classified BPR research into four streams.
1. Definitions and overview of BPR
2. Normative studies of BPR – mainly produced by practitioners
3. Conceptual models for assessing and implementing BPR
4. Assessment and successful implementation of BPR across sectors
Motwani et al (1998) concluded by pointing out some directions for future BPR
research, stating that “managers need to know the levers of BPR that they can
manipulate to make organisational wide improvements.” To enable managers to
know this, they identified the need for further work in all four streams. We have
focussed this work on streams three and four. This paper attends to both of these
areas of need.
In examining the literature, we extracted five themes each of which has been argued
to be central to effective implementation:
Taking a strategic approach
Integrating performance measurement
Creating business process architecture
Involving human and organisational factors
Identifying the role of information technology
Each of these is discussed below.

5
Taking a strategic approach
The importance of aligning any BPR project with business strategy has been
strongly emphasised in the literature. For example Guha et al (1993), Kaplan and
Murdock (1991), Harrison and Pratt (1993) and Parnaby (1993), all specify the
importance of this view.
More recent authors agree. For example Attaran and Wood (1999) in their review of
BPR case examples of success state, as a useful guideline for other firms to follow
that the “Re-engineering effort should be driven by a clearly defined strategic
mission” (p754). Pritchard and Armistead (1999) in their lessons from European
business suggest opportunities from which the practitioner community could benefit.
They place primary importance on the linking of Business Process Management
(BPM) with strategic programmes, citing BT as good practice in this area. Al-Mashari
and Zairi (1999), in their considerable review of success factors in BPR
implementation, point out that a “consideration of the strategic context of growth and
expansion, creating a top-level strategy to guide change and a careful alignment of
corporate strategy with BPR strategy are crucial to the success of the BPR efforts”
(p 93)
We considered two dimensions to be important in strategic alignment. The first was
the alignment of the BPR project within the overall business strategy (Attaran and
Wood 1999, Pritchard and Armistead 1999, Al-Mashari and Zairi 1999). This was
reflected by the degree of involvement in the project.
Dimension 1 - Strategy: (1) Localised involvement - (5) broad involvement: the
extent to which the BPR programme was a company-wide strategic initiative or a
more localised relatively low-level programme (such as one that which was
undertaken in one department or site).
The second dimension concerns the extent of the alignment of the overall business
strategy with the business environment. Strategic advantage may be seen as
predominantly determined ‘outside-in’, largely by market positioning (the “competitive
forces” perspective; Porter, 1980) or predominantly ‘inside-out’, largely by the

6
exploitation of firm-specific resources (the “resource-based view”; Penrose 1959;
Rumelt 1984; Teece, 1984; Wernerfelt, 1984). This latter view has been explored in
a manufacturing context by Tranfield and Smith 1998 and Gagnon 1999).
Dimension 2 - Strategy: (1) Single point - (5) dual point: the extent to which
across the company the programme was seeking to address solely external
requirements (e.g. customer need, market need) or was also focussed on exploiting
internal competencies and developing future capabilities.
Integrating performance measurement
The requirement to develop an integrated set of performance measures that spans
all the business processes within the organisation has been proposed by Guha et al
(1993), Jones (1994) Rummler and Brache (1990) and Kaplan and Murdock (1991).
Without an integrated set of measures it is possible to optimise one area of the
business process but not the system overall. This has the effect of simply moving
the bottleneck to other business areas.
More recently Kuwaiti and Kay (2000), in an empirical study based in Bahrain,
looked at the importance of Performance Measurement Systems (PMS) in the
introduction of BPR. They suggest that “a relevant PMS (Performance Measurement
System) in the BPR context is one that takes into account the fact that people work
in teams and produce final output for a customer”. In effect, this is arguing for a PMS
that spans the whole process. They conclude their empirical study by summarising
that their results, “confirm previously unsubstantiated beliefs that any organisation
should seriously consider the development of a PMS that focuses on strategic aims
before embarking on any re-engineering projects” (p1425).
In addition to the strategic alignment of the performance measures a secondary
issue is the driving force and focus of the BPR project. For example, Chan and Peel
(1998), in their investigation into the cause and impact of re-engineering, point in
thirty-seven re-engineered organisations to the importance of both the external and
internal focus of the BPR project. In their view organisations need to rethink their
strategies to recognise that whilst the customer has the “upper hand in the

7
customer/producer relationship”, this places an increasing emphasis on service
quality. Further, they recognise the importance of cost reduction in BPR, noting that
“corporate giants like GE and IBM, right down to the small entrepreneur, are looking
for ways to reduce costs”. Similarly, Attaran and Wood (1999) point out the need
and opportunities for both cost reduction and revenue growth as drivers for re-
engineering efforts.
Our review identified three dimensions under the theme of performance
measurement. The first concerns the importance of aligning performance measures
with strategic measures (Guha 1993, Jones 1994, Rummler and Brache 1990,
Kaplan and Murdoch 1991, Kuwaiti and Kay 2000)
Dimension 3 - Performance measures: (1) Localised - (5) strategic: the extent to
which the BPR project measures of performance were integrated with a company’s
critical success factors or were project based and largely independent of strategic
direction.
The second and third dimensions within performance measurement relate to the key
drivers of BPR projects, for many projects have a strong focus on either cost
reduction and/or service improvements (Chan and Peel 1998 Attaran and Wood
1998).
Dimension 4 - Cost focus: (1) little focus on cost reduction - (5) strong focus
on cost reduction: the extent to which the BPR programme was focused on cost
reduction.
Dimension 5 - Service improvement: (1) little service focus - (5) strong service
focus: the extent to which the company was explicitly intending to improve customer
service through their BPR programme.

8
Creating business processes architecture
BPR differs from many other approaches to performance improvement because it
recognises that business processes span both internal and external organisational
boundaries. Indeed, the focus on business process appears to be a crucial aspect of
the novelty in BPR (Belmiro et al, 2000). A major means of extending business
process knowledge within an organisation is through business process architecture,
with such an architecture viewing all the business processes in an organisation
systemically. There are two alternative approaches to developing business process
architectures: company specific architectures and generic architectures (sometimes
sector specific). Whatever approach is adopted the emphasis is on integration
Rhodes (1994). Many have recognised the importance of defining a business
process architecture include Meyer (1993), Kaplan and Murdock (1991), Davenport
(1993) and Harvey (1994). In recent years a number of more generic business
process architectures have been made available. In a wide-ranging discussion of
enterprise reference architectures, Smart et al (2000) point out that “examples of
reference architectures can be found for Computer Integrated Manufacturing (CIM)
initiatives (AMICE 1993, Williams 1994), Integrated Information Systems projects
(Scheer 1992), and for Enterprise Modelling (CEN 1990). While the application
areas of these architectures are different, the unifying factor of ‘integration’ can be
identified” (p471).
Two dimensions stood out as important in creating process architecture in BPR
projects. The first concerned the extent of deployment (Belmiro 2000, Meyer 1993.
Kaplan and Murdoch 1991, Davenport 1993, Harvey 1994)
Dimension 6 - Process architecture: (1) none - (5) widely deployed: the extent to
which a company had defined and deployed a process architecture.
The second dimension concerned the extent to which the design of the architecture
was system-wide (Smart 2000, Rhodes 1994).
Dimension 7 - Process architecture: (1) Isolated unit - (5) Systemic: the extent
to which a company had designed a process architecture that encompassed the

9
whole organisation and the interconnections between business processes, or had
only emphasised a local and isolated process architecture.
Involving human and organisational factors
Al-Mashari and Zairi (1999) state that “successful BPR implementation requires
fundamental organisational change in terms of organisational structure, culture and
management processes”. Changes in organisational structure and management
have been addressed by Kaplan and Murdock (1991), Hirschhorn & Gilmore (1992),
Earl (1994), and Harrison and Pratt (1993). Suggested improvements include the
creation of Process Owner Teams (POTs), changes in organisational structure and
new work methods. Biazzo (1998) also suggests that one aspect of BPR is that
“change is revolutionary” consisting of “the passage from functional units to process
teams”. He goes on to point out that “the process team represents the application of
classical organizational theory through the creation of self-contained tasks” (p1004)
A second dimension associated with human and organisational factors in BPR is the
issue of changing organisational culture (see for example McCabe,1998). Al-
Mashari and Zairi (1999) advocate that one of the key factors in incorporating BPR
within an organisation is the “cultural adjustment techniques needed by
management to facilitate the insertion of newly designed processes and structures
into working practice”. They argue that empowerment as part of a BPR project will
push decisions down the levels of the organisation and “establish a culture in which
staff feel more responsible and accountable”(p89). Ahmed and Simintiras (1996)
agree, concluding that BPR programmes are likely to lead to “changed
organisational culture; a culture driven by a new agenda and behaviour” (p86)
We concluded that two key dimensions were important concerning human factors.
The first concerned changes to the organisational structure (Al-Mashari and Zairi
1999, Kaplan and Murdoch 1991, Hirschhorn and Gilmore 1992, Earl 1994, Harrison
and Pratt 1993, Biazzo 2000).

10
Dimension 8 - Structural reconfiguration: (1) sustain existing - (5) change
existing: the extent to which the BPR programme aimed to change the reporting
structure of the organisation.
The second dimension addressed the deeper underlying platform, the organisational
culture and its relationship to the BPR programme (McCabe 1998, Al-Mashari and
Zairi 1999, Ahmed and Simintiras 1996). The concept of culture is a complex and
potentially problematic construct. Consequently, we adopted Schein’s (1984);
definition of culture “the pattern of basic assumptions that a given group has
invented, discovered or developed in learning to cope with its problems of internal
integration and external adaptation” (p3).
Dimension 9 - Cultural change: (1) sustain existing - (5) change existing: the
extent to which a company sought to change culture through the BPR programme.
Identifying the role of information technology
The crucial role of Information Technology (IT) in BPR programmes has been
identified by many authors. Davenport and Short [1990], Grover et al [1993] and
Dennis et al [1994], have all approached BPR from an IT perspective. In case
studies Cole et al [1993], Housel et al [1993] and Short and Venkatraman [1992]
describe successful applications of IT underpinning the business processes in
Milacron, Pacific Bell and Baxter's Healthcare respectively.
On the whole, the role of IT in BPR implementation has been thought important but
also contentious. For example, Soliman and Youssef (1998) have pointed to the
crucial importance of IT within the BPR implementation. They argue that “BPR relies
heavily on the use of it to create radically different working methods to achieve
improvements”, and that “in BPR IT is an active agent of change” (p886). On the
other hand, however, Ahmed and Simintiras (1996) point out “increasingly studies
have found that information technology does not feature as a critical enabler of re-
engineering success” (p86).

11
Given that our investigation centred on the success of the implementation of BPR
programmes, we concluded that our focus should be on the extent to which IT
actually enabled or constrained programmes (Ahmed and Simintiras 1996).
Dimension 10 - Effect of IT: (1) did not enable - (5) enabler: this indicates the
extent to which IT had or had not been used to enable the BPR programme.
BPR MATURITY
The final object of the study was BPR maturity. We grouped the organisations into
one of five positions:
Group 1 – represented those organisations who were in the early phase of project
planning. These organisations were typified by one company who reported that “Big
boy consultants were telling organisations to re-engineer their processes”. They
were considering what type of project to launch and which components the project
should have. In their case Information Technology was crucial and they were still
thinking about the appropriate strategy.
Alternatively, some BPR projects were at an early stage because they had become
bogged down by internal political issues. One typical company complained that “we
are dealing with different cultures, one definition of a process will be different to
another, and that doesn’t matter on paper but when we want to bring two big
departments together we are going to have a problem. It’s not something we can
enforce, we must think of it as a business opportunity”.
Organisations in this grouping constituted the least mature group insofar as they
were in the first phase of their BPR project. They were developing the project plan,
defining the project goals and objectives, specifying tasks, resources and budgets.
They were considering the potential obstacles and barriers and the general scope of
the project.
Group 2 – these organisations had moved on from project definition and had begun
executing their programme. This grouping represented organisations which we

12
characterised as ‘work-in-progress’ in that they had carried out some activity but
which had not yet gone on to complete the project.
A typical example was a company who had recently begun a 14 month project
looking at the feasibility of BPR. In their case consultants had recently completed
four months As-Is modelling and identified some costs and potential bottlenecks.
This had been a limited feasibility study which had stalled slightly “as the board
cannot see their jobs in the new process oriented structure”.
Group 3 – these organisations had moved on from execution and had recently
completed the BPR project or were in the final stages of implementation.
A typical example was a company whose BPR programme had developed from a
previous Total Quality Management programme. Since then they had tried to adopt
what they termed managing performance through processes. They were heavily
focusing on deploying the process architecture and target measures for processes.
Due to the size of the business this was complicated and time consuming. They
were completing the roll-out of the new process and the associated employee
training at the time of our data gathering.
Group 4 – these organisations had moved on from a completed BPR project and
were in the process of capturing the knowledge gained.
A good example of this was an organisation that had already achieved significant
benefits of £4.5m from the re-engineering of their order fulfilment process. They
were now taking this forward and considering the implications for process owners,
process team leaders, process re-engineering managers, process metrics and the
effect on customer relations. However their biggest concern was the impact on
organisational culture. They described their organisation as 2000 employees who all
think for themselves, where if they spot an opportunity the will take it and run with it.
Their concern was that a complete re-engineering of the whole business might ruin
that culture.

13
Group 5 – these organisations had moved beyond assessing what they had learnt
from their BPR project and were using the knowledge gained to re-engineer the
whole business.
A typical example was the company who had very recently completed a large-scale
business wide re-engineering programme. In their terms the project attacked
process and culture at the same time. That is their re-engineering had the technical
elements of a process wide infrastructure, strongly underpinned with an object
based IT system. This had also affected the organisation structural arrangements.
They explained “there were 36 grades, 20 layers of management, now there are 4
role types”. All of this was driven from a clear mission of improved customer service.
There are some limitations associated with the notion of project maturity as outlined
and defined above. Firstly, the categorisation is necessarily imprecise. Ideally, we
would have preferred to tightly define maturity using an objective measure such as
elapsed time, number of staff involved, size of budget etc. However, some
organisations had been considering their project plans, budgets, staffing, facilities
etc for many months, whilst others in the same timescale had pushed through to
implementation. Some organisations with large teams and budgets were still at the
outset, other organisations had a complete implementation with a smaller tighter knit
team. For some this might be explained as a function of organisational size, whilst
for others, such variation may have more to do with an organisations readiness to
change. In considering how maturity might be measured, we toyed with the idea of
combining elapsed time, size of team etc with some weighting for readiness to
change. However, this led to even further definitional problems and would have
added considerable complexity to the research design and resulting instrumentation.
In the event we opted to take a phenomenological approach and asked individual
organisations to estimate their own assessment on programme maturity using the
structure and definitions provided above. This gave an overall judgement which we
checked later from our interview data. In only one case of the thirty-three responses
was a significant incompatibility found between these two datasets.

14
The second problem was that the movement along the maturity axis may not be
linear. Thus, for example, if a variable doubled on average for each step in the
maturing process the linear correlation would be weak. Any assumption that the
phases of the maturing process are equispaced on the maturity axis must therefore
be treated with some caution, the axis representing an ordinal measure only.
Recognising this, we rejected the mechanistic methods of linear correlation for the
more sophisticated approach of analysing the scatter plots, grouped by maturity
category, and plotting the movement of the group mean. This was then plotted
against the three independent axis which resulted from the factor analysis (see
later). In short we made no assumptions about the linearity of maturity or otherwise
and have carried out no analysis which depends on the assumption of linearity.
RESEARCH METHOD
Research questions
Given that we set out to identify empirically the characteristics of BPR
implementation we developed two research questions.
What are the relationships (if any) between the dimensions identified?
That is, are all the dimensions independent or do they group, and if they group
what are the characteristics of these groups.
What are the relationships (if any) between the dimensions identified
and the maturity of a BPR implementation?
If the dimensions group, are there any relationships between the groups and the
maturity of the BPR implementation.
Answers to these questions are important for both industry and academia. For
industry they may provide some guidance on why some BPR implementations are
more successful than others. For academia answers to these questions might
integrate the various dimensions of BPR to go beyond the rather piecemeal and
discrete approaches which have so far focused on IT, human factors, process
architectures etc.

15
Sample of organisations
A wide variety of organisations that had identified themselves as implementing BPR
(either by presenting experiences at commercial conferences, publishing in the daily
or business press, or sending representatives to BPR practitioner workshops) were
selected. These included organisations from the service, construction and
manufacturing sectors, as well as organisations from the public sector. Sizes of
company ranged from 500 to over 170,000 employees, although most of the
organisations were large (> 1000 employees). The sample included both
organisations with programmes of considerable longevity (over 5 years old) and
those who were at the earliest planning stages.
Because this research was essentially exploratory in nature, it was thought
appropriate to use organisations drawn from a range of sectors (Motwani et al,1998)
to search for more significant issues which might have general significance for those
initiating and implementing BPR projects. However, given the limited nature of the
sample, we thought it not appropriate to examine our data from a sectoral
perspective, focusing instead on the relationship between project maturity and the
ten dimensions outlined earlier.
The list of participating organisations by sector is shown in Table 2 below:
Process Industries 7
Manufacturing 9
Service Sector 11
Public Sector 3
Retail 1
Utility 1
Construction 1
Table 1 by Industry Sector
Unit of analysis
The Unit of analysis was the individual company and specifically the BPR project
within the individual company.

16
Data collection
We used the ten dimensions as variables in a data collection instrument. We asked
representatives from each organisation to locate their organisation on a five-point
ordinal scale with respect to each dimension. Further discussion of how the data
was collected and moderated is provided below (see research methods). An
example of using the Ordinal scale to develop a comparison for business process
architecture is given in Figure 1.
INSERT FIGURE 1 HERE
This fieldwork was conducted in thirty-three organisations. In all, it consisted of an
interview with an individual or team who had overall responsibility for the BPR
project within the organisation. The purpose of the fieldwork was twofold, each
company visit enabled us to build a brief case study, and also to gather the
information to locate the company on each of the ten dimensions.
Within each organisation representatives of the BPR team were asked to describe
their project using a ‘time-line’, beginning with an explanation of why they began the
project and outlining the major stages within it. If any of the ten key dimensions had
not been covered by the end of the interview, then the respondents were asked to
comment on those specifically, with respondents self-reporting their position. ‘Time-
line’ data was recorded and extensive fieldnotes were kept.
The ‘time line’ method focused on which activities were undertaken and when, and
the perceived rationale and purpose for each. Where possible, this perceptual data
was checked and validated with company documentation and historical record. The
advantage of such a data collection technique was that it allowed respondents to
unveil their implementation data in a natural fashion by ‘telling the BPR story’.
Recording the data also facilitated validation at the end of the interview when
respondents were asked to check through the research material for factual
inaccuracies or other required changes. This served to increase the quality of data
collected.

17
To structure the data gathering we also used a set of pro-formas based on the ten
dimensions. A team of three experienced researchers carried out the whole data
collection exercise. This ensured considerable consistency within the data collection
process, and helped the research team in contrasting perceptions of programmes
one with another, thus introducing a further element of validation into the research.
It is also important to note that in the first instance, it was left to the organisations
themselves to decide their position on each scale. Later, the research team
examined these responses, and based on comparisons across organisations
assessed their relative positions. However, only in one case was a company’s
maturity reclassified, a re-categorisation from a ‘three’ to a ‘one’. This company saw
themselves as having completed a BPR project, but the consensus within the
research team was that the project was considered to be still at the project planning
stage. Further, there were five other minor changes to company results on the
dimensions (i.e. a change of one scale point). In total, something less than 2% of
the data (six scores of 360) was adjusted.
Data Analysis
Factor analysis
Factor analysis is a technique both for detecting underlying patterns of correlation in
data, i.e. for grouping the variables, and for reducing a large number of variables to
a smaller number of components. In this case, these may be used to re-examine the
cases. It is an excellent tool in theory building, since it does not need any a priori
assumptions about the cases or variables involved, and deals robustly with a diverse
sample. For these reasons, we adopted factor analysis to address the two research
questions identified earlier.
The ten variables were analysed using Principal Component Analysis within the
software package SPSS. The correlation and significance matrices are shown in
Appendix 1 and Appendix 2.

18
The standard tests for sampling adequacy were applied and yielded a value of .668
for the Kaiser-Meyer-Olkin Measure of Sampling Adequacy and an approximate Chi-
Square of 190.652 for Bartlett's Test of Sphericity, which, with df of 45 is significant
at p<0.001. The data was thus accepted as suitable. (Hair et al, 1984).
Three components corresponded to eigenvalues of greater than unity, so a rotated
solution of three components was obtained using VARIMAX. The loadings of the
rotated solution are shown in Appendix 3, with values <0.3 suppressed. Figure 2
below shows the factor composition in graphic form. Appendix 3 shows that
Strategy: dual/single point loads negatively on Factor 3, so for the purposes of the
diagram only, (and to help understanding considerably) the signs of the variables
composing this component have been reversed. The discussion which follows has
the direction of Factor 3 in the same sense as in Appendix 3.
HF: Culture Strategy: Loc/all PM: Service
HF: OD PA: red/sys
( - ) PM: Cost IT
Strategy: single/dual
point
PM: loc/strat PA: deploy
Factor 2: Process - based BPR
Factor 3: Cost BPR
Factor 1: Strategic BPR
Key to abbreviations HF: Human Factors Loc/all: localised all PM: Performance Measures Loc/strat: localised strategic PA deploy: Process architecture extent of deployment HF OD: Human Factors organisational design PA red/sys: Process architecture reductionist/systemic
Figure 2 Venn diagram showing factor composition
From Figure 2, we can identify three types of BPR project from the factor analysis of
the data.
Type 1 we have called strategic BPR (SBPR). SBPR combines a focus on the
changing of organisational culture, with an inclusive approach to developing the
strategic objectives of the project and a BPR project focused on improving service

19
delivery. Additionally, the performance measures for the project are strategically
aligned, and the business process architecture is widely deployed. Also, but of
lesser importance, the strategic focus includes an element of competency
development.
In short, a strategically aligned project with a focus on improving service delivery
which includes everyone in changing their attitudes and behaviour.
Type 2 we have called Process focused BPR (PBPR). PBPR includes an attempt to
change the organisational design to focus more on the business process (e.g. the
use of process owner teams) with a systemic process architecture – a clear
concentration on the process. This is combined with two less important issues, the
performance measures for the project are strategically aligned and the business
process architecture is widely deployed and to a lesser extent again the strategic
focus includes an element of competency development.
Type 3 we have termed Cost reduction BPR (CBPR). CBPR has a focus on cost
reduction, where IT is a considerable constraint and the strategic focus is single
point, i.e. responding to market requirements. In effect, this might be understood as
the much criticised downsizing BPR approach, focusing on an immediate market
need.
Integrating factors with groups
Next, we brought together the factor analysis with the analysis of company project
maturity. These results are shown in the scatter plots in Appendix 4.
We developed a mean for each of the factors, SBPR, PBPR and CBPR for each
group. To re-iterate;
Group 1 - represented “still thinking”
Group 2 - organisations which had carried out some activity
Group 3 - organisations which had very recently finished a BPR programme
Group 4 - organisations which had finished a programme and were in the process of
capturing the knowledge gained

20
Group 5 - organisations which were using the knowledge gained from the BPR
programme to re-engineer the whole business.
Applying the results of the factor analysis to the maturity of BPR groupings produces
the following summary tables.
Group Mean
Factor 1
score
(SBPR)
Mean
Factor 2
score
(PBPR)
Mean
Factor 3
score
(CBPR)
1 -0.99 -0.84 -0.04
2 -0.19 0.10 0.17
3 -0.08 -0.10 0.23
4 0.67 0.55 0.27
5 0.92 0.31 -0.88
Table 2 Group mean factor scores
SBPR PBPR CBPR
Group 1 Low Low Medium
Group 2 Medium Medium Medium- High
Group 3 Medium Medium Medium- High
Group 4 Medium High Medium - High
Group 5 High High Low
Table 3 Summary of Findings
Tables 2 and 3 show that as organisations move along the maturity axis they
increase the extent of SBPR and PBPR whilst decreasing the extent of CBPR. This
indicates that the more mature BPR projects have a strategic alignment and a
process focus (through process architecture and Process Owner Teams) whilst the
less mature programmes are focusing on responding to market needs and cost
reduction.
21
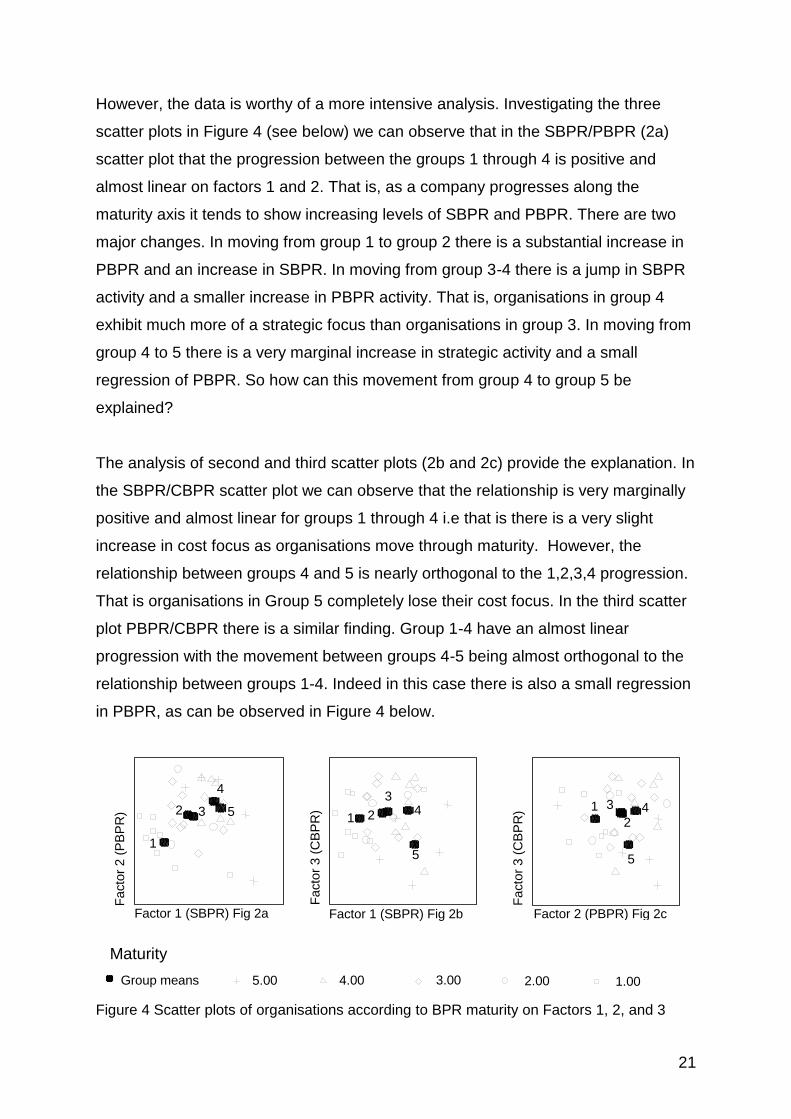
However, the data is worthy of a more intensive analysis. Investigating the three
scatter plots in Figure 4 (see below) we can observe that in the SBPR/PBPR (2a)
scatter plot that the progression between the groups 1 through 4 is positive and
almost linear on factors 1 and 2. That is, as a company progresses along the
maturity axis it tends to show increasing levels of SBPR and PBPR. There are two
major changes. In moving from group 1 to group 2 there is a substantial increase in
PBPR and an increase in SBPR. In moving from group 3-4 there is a jump in SBPR
activity and a smaller increase in PBPR activity. That is, organisations in group 4
exhibit much more of a strategic focus than organisations in group 3. In moving from
group 4 to 5 there is a very marginal increase in strategic activity and a small
regression of PBPR. So how can this movement from group 4 to group 5 be
explained?
The analysis of second and third scatter plots (2b and 2c) provide the explanation. In
the SBPR/CBPR scatter plot we can observe that the relationship is very marginally
positive and almost linear for groups 1 through 4 i.e that is there is a very slight
increase in cost focus as organisations move through maturity. However, the
relationship between groups 4 and 5 is nearly orthogonal to the 1,2,3,4 progression.
That is organisations in Group 5 completely lose their cost focus. In the third scatter
plot PBPR/CBPR there is a similar finding. Group 1-4 have an almost linear
progression with the movement between groups 4-5 being almost orthogonal to the
relationship between groups 1-4. Indeed in this case there is also a small regression
in PBPR, as can be observed in Figure 4 below.
4.00
Maturity
Group means 5.00 3.00 2.00 1.00
Factor 1 (SBPR) Fig 2b
Fa
cto
r 3 (
CB
PR
)
1 2
3 4
5
Fa
cto
r 3 (
CB
PR
)
Factor 2 (PBPR) Fig 2c
1 3 4
5
2
Fa
cto
r 2 (
PB
PR
) 2
1
3
4
5
Factor 1 (SBPR) Fig 2a
Figure 4 Scatter plots of organisations according to BPR maturity on Factors 1, 2, and 3

22
In summary, as organisations progress through stages of maturity 1, 2 and 3 then
they increase their strategic and process focus substantially whilst slightly increasing
their cost focus. Organisations in this stage of progression are focusing on strategic
alignment and organising around business processes. From 3 to 4 the major
movement is in the extent of the strategic focus with some increase in process
focus. From 4 to 5 there is effectively no increase in strategic focus and slight fall
back in process focus and a major regression in cost focus. Our view was that these
issues were particularly interesting in that they resonated and have similarities with
research and practitioner accounts concerning the maturity of performance initiatives
over the last 25 years in manufacturing (see discussion below).
There main limitation with factor analysis is that it essentially static. It provides a
correlation analysis which enables an explanation of a snapshot of the phenomenon
under investigation. It does not suggest causation and so is in no sense predictive.
These are important concerns, for if a company wishes to become more mature in
its BPR project what steps should it take?
Further interviews
We decided to revisit organisations and re-interview their management teams to see
whether or not they had made any progress on their projects since our initial contact.
We chose our organisations on the basis of theoretical sampling, including some
who had a low score (level 1) and some who had scored at the intermediate level (2
or 3) on the maturity axis. Our rationale for this was that there would be little point in
further exploring organisations with higher scores (fully mature programmes) as they
would have had little opportunity to progress further. However, our intention was to
include both low and intermediate scoring organisations in order to identify whether
or not there was a difference in the final performance between the two.
Choosing organisations for the follow-up research reflects the nature and difficulty of
empirical research in organisations. Eleven out of the original thirty-three
organisations had either merged or been taken over. A further three organisations
were excluded as they were already in group 4 or 5. Of the remaining Nineteen we
23
chose seven organisations who were in a variety of different positions from their
group means on the factors. We looked for outliers. Appendix 5 shows initial
positions of organisations revisited relative to group means on factors 1, 2 and 3.
Organisations A-G all have differences from the group mean on at least one factor,
except for company F. This company provided a model for a typical group 3
company.
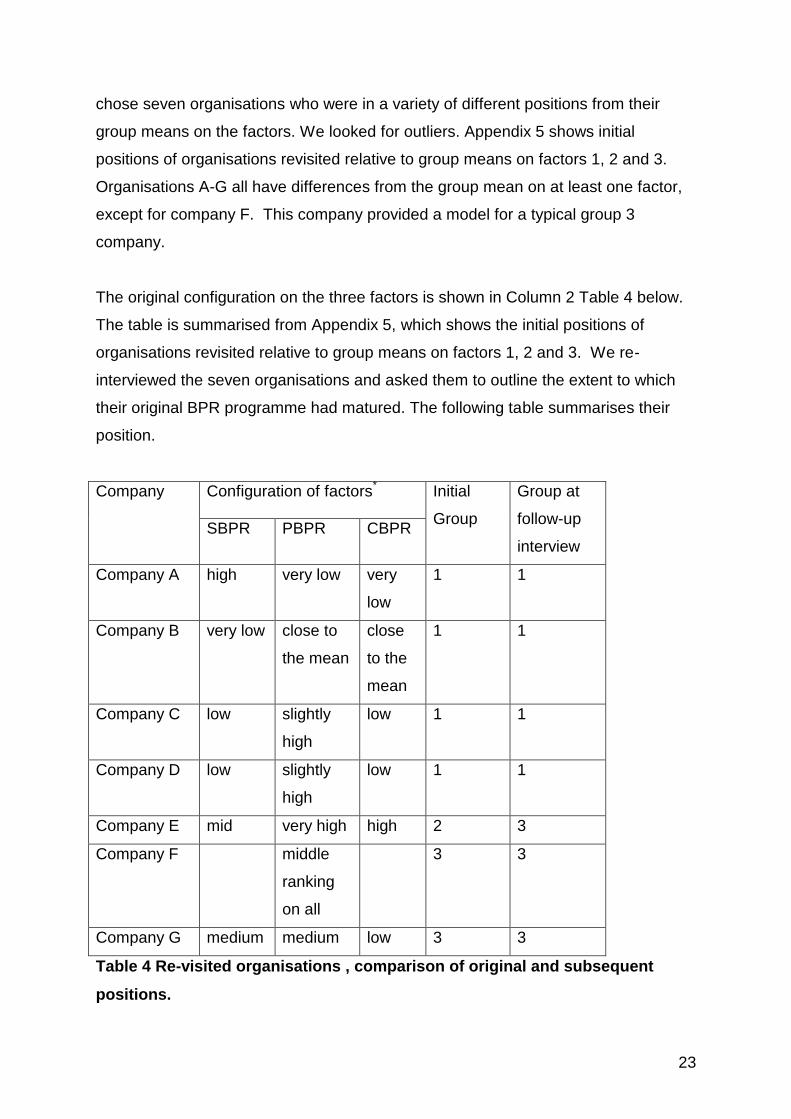
The original configuration on the three factors is shown in Column 2 Table 4 below.
The table is summarised from Appendix 5, which shows the initial positions of
organisations revisited relative to group means on factors 1, 2 and 3. We re-
interviewed the seven organisations and asked them to outline the extent to which
their original BPR programme had matured. The following table summarises their
position.
Company Configuration of factors*
Initial
Group
Group at
follow-up
interview SBPR PBPR CBPR
Company A high very low very
low
1 1
Company B very low close to
the mean
close
to the
mean
1 1
Company C low slightly
high
low 1 1
Company D low slightly
high
low 1 1
Company E mid very high high 2 3
Company F middle
ranking
on all
3 3
Company G medium medium low 3 3
Table 4 Re-visited organisations , comparison of original and subsequent
positions.

24
Taken as a whole, organisations A, B, C and D did not progress on the maturity of
their projects, although their combination of factors is interesting. On the original
analysis Organisations B, C and D were close to the mean or higher than their group
mean on PBPR, whilst being lower on SBPR. Company A was the opposite, higher
than its group mean on SBPR and lower on PBPR. This suggests that for
progression it is necessary to have latent potential in both SPBR and PBPR. It is
insufficient to have potential in just one of these.
Company E had a high PBPR and had completed a project, moving on to stage 3.
Looking at Figure 5 it can be seen that compared to their group mean they were a
strong outlier on PBPR and slightly backward of the group 2 mean on SBPR. This
suggests that they compensated for their mid ranking in strategic alignment with a
focus on process changes and cost reduction. Whilst this has led to progression, it
will be interesting to re-visit this company yet again, as this research has indicated
that a dynamic more toward SBPR is crucial for the movement from maturity stages
3-4.
Company F, which ranked very much in the middle of the maturity classification, had
stayed still and not progressed. An analysis of its position suggests that this is as a
consequence of a lack of sufficient strategic direction and alignment.
Company G achieved a medium score on SBPR and PBPR and low on CBPR. From
the earlier analysis our prediction would have been that it had insufficient latent
potential to move group 3 to group 4. The follow-up work indicated that it had
remained as a group 3 company. The key to the group 4 from group 3 movement is
the increase in SBPR. That is, organisations in group 4 exhibit much more of a
strategic focus than organisations in group 3. Company G had just not put enough
effort into their SBPR activity.
There are some tentative conclusions we can draw about this investigation into
causality. For organisations at the outset of their BPR project, the results suggest
that having a latent potential in either PBBR (Company C) or SBPR (Company A) is

25
insufficient in itself. It is necessary to have latent potential in both. For organisations
in the middle of implementation (groups 2 and 3) having a latent potential in PBPR
has led one company to progress. For the others we would have predicted that they
would remain in the same maturity group and they have done so.
What issues for management can we draw from this? Any conclusions must be
tentative given the difficulties in re-visiting programmes after 2-3 years (although
most of the four that were active had only recently closed the project), and the
constraints of a small sample. However we believe there are a number of points
worthy of discussion.
DISCUSSION
This research has investigated the phenomenon of BPR from a change
management perspective, using empirical work to examine the ways in which
managers have re-engineered their organisations toward the end of
performance improvement. It has identified three key factors, combinations
of which can be used to characterise sub-types of BPR. In this sense the
findings offer a first step in ‘mapping the field’ of approaches to BPR
implementation. The three factors offer a language which characterises BPR
programmes through the identification of predominant characteristics, in much
the same way that other performance improvement initiatives have been
‘mapped’ for academic and practitioner use (e.g. Smith, Tranfield et al 1994,
Bessant and Francis 1999). The purpose and potential outcome of taking
such a ‘strategic’ research approach is to facilitate understanding and
discussion among both academic and practitioner communities.
Whilst the factor analysis and the associated taxonomy process is significant
and important, the most interesting aspect of this work concerns the relative
movement and strength of these factors in the maturing of BPR programmes.
In other words, what is of critical importance is an identification and
discussion of the maturity dynamics of BPR programmes, their foci at
different stages of development, and the evolutionary trajectories upon which
they embark.

26
A further point to be made concerning this research, and particularly its
implications for managers, results from the empirically led nature of the work.
The taxonomy of approaches developed is essentially context free. We had
no preconceptions about the types of BPR project we might find (if any) in
practice. Indeed, the classification of types of BPR project was completed
after all the data had been collected. We were therefore unable to anticipate
which combinations of the three types of BPR project were deployed (other
than post-hoc) or in what circumstances, or to take any view on whether or
not any specific approach to BPR was appropriate. In this sense this research
has investigated the natural evolutionary paths taken by organisations when
using the BPR as a theme for performance improvement, rather than
adopting a contingency perspective.
From this perspective, this research can be interpreted as one of numerous
thematic approaches to performance improvement which have been
undertaken by organisations over the last 25 – 30 years. Other well
documented themes have included, advanced technology, integrated
systems, TQM, teamworking etc. The dynamics of BPR maturity outlined in
Figure 4 indicate what might be described as the results of a ‘natural’
evolution rather than a ‘rational’ (Scott 1981) system of interventions. The
factor analysis emphasizes the importance of taking a strategy focus in
moving between stages 3 and 4, and the complete movement out of a cost
focus in moving from stage 4 to 5. In reporting from this empirical research
base the ‘naturalistic orientation’ taken by practitioners, this does not, and
should not be taken as normative prescription. Our view is that organisations
appeared to follow the particular path outlined implicitly, learning as they
went, focusing initially on taking a cost reduction / process orientation and
only later ‘discovering’ the importance of the more strategic implications of
their undertaking. Having ‘discovered’ this, then they often dropped their
initial emphasis on cost reduction as they uncovered a more complete
understanding of the strategic significance of the changes envisaged.

27
To those who have been engaged for many years in understanding and
researching strategic change in organisations, the parallels with early
performance improvement activities, particularly in manufacturing, are
immediate. For example, Waterlow and Monniot (1986) in their study of the
state of the art in computer aided production management found that whilst
modular applications aimed at cost reduction were largely successful and had
led to widespread adoption, full exploitation was proving problematic and a
more strategic approach was required in order to facilitate this end. Also,
Barrar et al (1989) in their study of MRP2, concluded that success in
implementation was dependent upon the recognition of more strategic
changes in ideology, organisation and management process. Buckingham
and Bessant (1989) concur ‘ … only by moving beyond seeing technology as
a substitution device can organisations develop the flexibility necessary to
fully benefit from integrated technologies’. Bessant and Francis (1999) in their
investigation of policy deployment look at levels of continuous improvement in
practice. They too have 5 levels, of which levels 4 and 5 are described in
terms of strategic benefits and strategic innovation.
In addition to this academic work, consultants have also indicated the ‘patchy
success’ of performance improvement initiatives. For example, as long ago
as 1986 Ingersoll Engineers surveyed companies introducing CIM, reporting
that only approximately a half were seen as successful in terms of profitability
and overall impact on performance. Likewise, A T Kearney (1989) reported in
the conclusions of their survey of computer integrated manufacturing ‘ … to
be effective as a means of achieving competitive advantage, it (CIM) must be
introduced as part of a new strategic thrust in the organisation’.
In all of these examples of the management of the introduction of
performance improvement using a variety of technologies, techniques and
interventions, an initial focus on efficiency gain had been replaced with a
growing realization of the importance of a strategic approach. Our research
reinforces this general picture in terms of BPR implementation, whereby
management teams seemingly initiate performance improvement driven by

28
the need to increase local efficiencies, and only later discover the strategic
significance of their actions. This general view might be interpreted as both
disappointing on the one hand, yet providing an opportunity on the other.
It is disappointing in so far as learning which was painstakingly achieved in
the 1980s and 90s concerning the importance of taking a strategic
perspective at the outset of performance improvement programmes seems to
have not been transferred immediately to the particular case of BPR.
However, on the other hand, there is no reason why this could not be the
case. Our enquiry into unveiling the ‘naturalistic’ progression of BPR
interventions towards maturity, leads us to the view that there is no reason
why, once the natural dynamics are understood, managers cannot intervene
earlier and more purposefully to progress BPR in a more strategic sense
rather more quickly. In the same way that organisations in the 1980’s and
90’s were able to learn from experience concerning the downside of
‘naturalistic’ progression, including extended implementation timescales and
lack of exploitation pay off, so managers can choose to intervene to increase
both the timeliness and strategic effectiveness of BPR implementation.
Intervening as purposeful agents in their configurational roles of
organisational architects and systems engineers in order to obtain speedy
and full benefit from BPR programmes requires, in our view, a distinct
emphasis on taking a strategic approach to BPR implementation from the
outset. Changing mindset (Gear, Liendo and Scott, 1989) from a cost
reduction / processed focused view to a more strategic perspective, facilitates
the ‘rational’ design of BPR programmes. This can be contrasted with the
more ‘naturalistic’ orientation revealed by our research which we believe to be
the more usual and implicit pattern of implementation.
CONCLUSIONS
This paper set out to address two research questions. What are the relationships (if
any) between the discussions of a BPR programme? What are the relationships (if
any) between these dimensions and the maturity of a BPR implementation?

29
With regard to the first question we conducted a factor analysis on the data and the
results indicated that there is indeed a relationship between those ten issues that we
had identified in the literature. The factor analysis suggests that the data combines
together to form three forms of BPR. The first form we have called strategic BPR
(SBPR). SBPR combines a BPR project focused on improving service delivery, an
organisation wide approach to developing the strategic objectives of the project with
changes to the organisational culture. The performance measures are strategically
aligned, and the business process architecture is widely deployed.
The second type we have called Process focused BPR (PBPR). PBPR has as its
main focus the business process. It includes the management of the organisational
infrastructure surrounding the business processes, and the development of a widely
deployed systemic process architecture.
The third type we have termed Cost reduction BPR (CBPR). CBPR has a focus on
cost reduction, in organisations where IT is a considerable constraint and they are
responding to an urgent market requirement. In short it has all the components of
the downsizing BPR approach of which Grint and Case (1998) and De Cock (1997)
were so heavily critical.
The second research question addressed the dynamics of BPR implementation,
focusing on the maturity of BPR programme, where maturity was the dependent
variable. This produced some interesting results. As organisations moved through
maturity phases 1 to 3, a focus on SBPR and PBPR appeared dominant. The
movement from maturity phases 3 to 4 was characterised by a considerable
increase in strategic focus and some increase in process focus. Subsequently, the
movement from maturity phase 4 to 5 was not characterised by SBPR or PBPR but
by a significant reduction in CBPR. The relationship between those organisations
grouped under maturity phases 4 and 5 was almost orthogonal to the 1,2,3,4
progression. Moving from phase 4-5 is typically characterised by organisations
drastically reducing the emphasis on cost reduction that is so clear in the first 4
phases.

30
Factor analysis shows relationships not causality. To gain insight into causal
developmental issues, in the second phase of the project we re-visited some of the
organisations we had visited earlier, to see whether or not those organisations that
had latent potential in SPBR and PBPR had moved along the maturity axis. For this
follow up phase we chose organisations that had either a low or intermediate level of
BPR maturity. Those organisations in group one of BPR maturity had not
progressed. The results indicated that to progress from group one it is not sufficient
to have either latent potential on SBPR or PBPR it is necessary to have latent
potential on both. For those organisations at the intermediate levels that had no
latent potential, as predicted, had not progressed. The company that had latent
potential in PBPR had progressed. The conclusions from such a small sample can
be only tentative, however they do tend to agree with findings from research into
other thematic change programmes. It is also interesting to note that of our original
sample of 33 organisations, a third had either merged or had been involved in a
takeover. It is conceivable that those organisations carrying out BPR projects were
doing so because of some difficulty, or that carrying out a BPR project then made
them an excellent target for merger or takeover. From this restricted sample we can
draw no firm conclusions on the potential of BPR organisations for takeover,
however this does seem worthy of extended future research.
These results resonate with conclusions from research into other performance
improvement themes such as continuous improvement, TQM, teamworking, MRPII,
CIM etc., confirming findings that advanced implementation and full exploitation
require the adoption of a ‘strategic’ approach. It follows from this that guidance for
practicing managers implementing BPR programmes is that if they wish to progress
toward full implementation maturity, and avoid the criticism of participating in yet
another fad or fashion, they should put considerable effort early in the
implementation into developing a strategically aligned project. Integrating such an
orientation with a concentration on the issues of process architecture offers the
potential for speedy progression along the maturity axis. Although for many cost
reduction may well be the basis on which many projects are originally founded,
gaining full benefit and progressing toward maturity requires a fundamental shift both

31
in managerial mindset and in the consequential prescribed format of the BPR
programme.
REFERENCES
A T Kearney (1989) CIM Competitive advantage or technological dead end? Consultant report Ahmed and Simintiras (1996) Conceptualizing business process re-engineering Business Process re-engineering and Management journal Vol 2 no 2 pp73-92 Al-Mashari M and Zairi M (1999) BPR Implementation process: an analysis of key success and failure factors, Business Process Management Journal Vol. 5 No 1 pp87-112 Al-Mashari M and Zairi M (2000) Supply-chain re-engineering using enterprise resource planning (ERP) systems: an analysis of a SAP R/3 implementation case. International Journal of Physical Distribution & Logistics Management; 30:3/4 pp. 296-313; Al-Mashari M and Zairi M (2000) Revisiting BPR: a holistic view of practice and development, Business Process Management journal. Vol 6 number 1 AMICE. (1993), CIM-OSA: Open System Architecture for CIM, Springer-Verlag, Berlin. Attaran M and Wood G (1999) How to succeed at re-engineering. Management decision. Vol 37 number 10 Barrar P, Lockett G and Tanner L (1989) Decision processes in the design implementation and use of CAPM systems in medium sized organisations. Final Report to SERC/ACME directorate Grant GR/E 21278 Belmiro T, Gardiner P, Simmons J and Rentes A (2000) Are BPR practioners really addressing business processes. International Journal of Operations and Production Management Vol 20 no 10 Bessant and Francis 1999 Developing strategic continuous improvement capability. International Journal of Operations and Production Management Vol 19 (11) 1999 Biazzo S, 1998,A critical examination of the business process re-engineering phenomenon. International Journal of Operations and Production Management Vol 18 number 9/10 pp1000-1016 Bright V, 1999, Delivering BPR via task groups Work Study, Vol. 48 Issue 7 Buckingham J and Bessant J (1989) beyond substitution organisational implications for the successful use of integrated technology, a flexible future? Prospects for employment and organisation in the 1990’s. Cardiff Business School Conference Chan and Peel (1998) Causes and impact of re-engineering, Business Process Management journal vol 4 number 1 1998 pp44-55 Childe. S & Maull R and Mills (1996) UK Experiences in Business Process Re-engineering IMI A Scoping study produced for the Innovative Manufacturing Initiative. Report to the Engineering and Physical Sciences Research Council Grant No. GR/K67328. Report available from the Business Processes Resource Centre, University of Warwick. Cole C C, Clark M L, Nemec C, (1993), Reengineering information systems at Cincinnati Milacron, Planning Review, May/June Davenport T H, (1993), Process Innovation: Re-engineering Work Through Information Technology, Harvard Business School Press

32
Davenport T H and Short J E, (1990), The new industrial engineering: information technology and Business Process Redesign, Sloan Management Review, Summer De Cock C (1997), It seems to fill my head with ideas Journal of Management Inquiry Vol 7 No 2 June pp 144-153 Dennis A, Daniels R, Hayes G, Kelly G, Lange D, Massman L, (1994), Business Process Re-engineering with Groupware, Working Paper, Department of Management, Terry College of Business, University of Georgia, Athens, USA Earl M J, (1994), The new and the old of business process redesign, Journal of Strategic Information Systems, Vol.3 No.4 Evans G N, Mason-Jones R and Towill D R (1998) The Scope paradigm of business process re-engineering, Business Process Management Journal Vol5 No 2 pp121-135 Francis A and Macintosh R (1997) The Market, technological and industry context of business process re-engineering in the UK, International Journal of Operations and Production Management Vol 17 No 4 Gagnon S (1999) Resource based competition and the new operation strategy International Journal of Operations and Production Management 19 Vol 2 pp125-138 Gear M C, Liendo E C, Scott L L (1989), Changing mind-sets:the role of the potential unconscious, New York University Press Grint K and Case P (1998) The Violent Rhetoric of Re-engineering: Management Consultancy on the Offensive Journal of Management Studies Vol 35:5 pp 557-577 Grover V, Teng J T C, Fiedler K D, (1993), Information Technology enabled Business Process Redesign, Omega International Journal of Management Science, Vol 21 No4 Guha S, Kettinger W J, Teng J T C, (1993), Business Process Reengineering: Building a comprehensive methodology, Information Systems Management, Summer Hair JF, Anderson RE, Tatham RL and Black WC (1984) Multivariate data analysis with readings 4
th ed Prentice Hall International London Chapter 7 Factor Analysis pp
364-420 Hammer M (1990) Re-engineering work: don’t automate, obliterate. Harvard Business Review, July-August 104-12 Harrison D B, Pratt M D, (1993), A methodology for reengineering businesses, Planning Review, March/April Harvey D, (1994), Re-engineering: The critical success factors, Business Intelligence Hirschhorn L & Gilmore T, (1992), The new boundaries of the "Boundary less Company", Harvard Business Review, May-June Housel T J, Morris C J, Westland C, (1993), Business Process Reengineering at Pacific Bell, Planning Review, May/June Ingersol Engineers (1986) Management attitudes to change results of a MORI survey. Jones C R, (1994), Improving your key business processes, The TQM Magazine, Vol 6 No 2 Kaplan R B, Murdock L, (1991), Rethinking the corporation: core process redesign, The McKinsey Quarterly , No.2 Kuwaiti and Kay (2000) The role of performance measurement in business process re-engineering International Journal of Operations and Production Management Vol 20 number 12

33
Laudon KC and Laudon JP (1998) Management Information Systems new approaches to organisation and technology 4
th Ed Prentice hall New Jersey
Martin I and Cheung Y (2000) SAP and Business process Re-engineering Business process management journal Vol 6 Number 2 pp113-121 McAdam R and Donaghy J (1999); Business process re-engineering in the public sector A study of staff perceptions and critical success factors Business Process Management Journal, Vol. 5 Issue 1 McCabe,D. (1998) 'A land of Milk and Honey'?: BPR Equals Culture Change' EGOS International conference in Maastricht, Netherlands, July 1998 McCabe, D and Knights D (2000) The human face of re-engineering in financial services Managing Service Quality, Vol. 10 Issue 2 Meyer C, (1993), Fast Cycle Time, The Free Press, NY Motwani J, Kumar A, Jiang j and Youssef M (1998) Business process Re-engineering: a theoretical framework and integrated model, International Journal of Operations and Production Management, Vol 18 Number 9/10 Parnaby J, (1993), Business Process Systems Engineering, Lucas Industries plc, November Penrose E (1959); The theory of the growth of the firm Basic Blackwell Oxford Porter ME (1980) Competitive Strategy, Free Press New York Pritchard and Armistead (1999), Business process management – lessons from European business, Business Process Management journal vol 5 number 1 pp10-32 Rhodes D, (1994), The business process model of enterprise, Control, BPICS, February/March
Rumelt RP (1994) Toward a strategic theory of the firm in competitive strategic management Prentice Hall Englewood Cliffs New jersey Rummler G A & Brache A P, 1990, Improving Performance: How to manage the white space in the organization chart, Jossey-Bass Publishers, Oxford Scheer, A. W. (1992), Architecture of Integrated Information Systems: foundations for enterprise modelling, Springer-Verlag, Berlin. Schein E H 1984, Coming to a new awareness of organisational culture, Sloan Management Review, winter 1984, pp. 3-16 Scott, W.R., Developments in Organisational Theory 1960-1980, American Behavioural Scientist, 24, 3, 1981. Short J E & Venkatraman N, 1992, Beyond Business Process Redesign: Redefining Baxter's Business Network, Sloan Management Review, Fall Silvestro R and Westley C 2002, Challenging the paradigm of the process enterprise: a case study analysis of BPR implementation The International Journal of Management Science Vol 30 No 3 pp 215-225 Smart P A, Maull R S, Childe S J, 1999, A reference model of ‘operate’ processes for process-based change, International Journal of Computer Integrated Manufacturing, Vol.12, No.6, pp471-482 Smith S, Tranfield D Foster M and Whittle S 1994, Strategies for managing the TQ agenda International Journal of Operations and Production Management Vol 14 Number 1 pp75-88 Soliman F and Youseff MA, 1998 The role of SAP software in Business process Re-engineering. International Journal of Operations and Production Management Vol 18 Number 9/10 pp 886-896 Teece D J (1984), Economic analysis and strategic management, California Management Review, vol 26, no 3

34
Tranfield D and Smith S (1998), The strategic regeneration of manufacturing by changing routines, International Journal of Operations & Production Management, Vol. 18 Issue 2, pp 114-130 Verespej M (1995) Reengineering isn’t going away Industry week, Feb 20, p42 Waterlow G and Monniot JP 1986 A study of the state of the art in Computer Aided production management in UK industry ACME directorate SERC Wernerfelt, (1984), A resource based view of the firm, Strategic Management Journal, Strategic Management Journal vol 5, pp171-80 Williams, T. J. (1994), The Purdue Enterprise Reference Architecture, Computers in Industry, vol. 24, no. 2-3, pp 141-158. Zucchi F and Edwards, JS 2000; How similar are human resource management practices in re-engineered organisations? Business Process Management Journal, Vol. 6 Issue 3

35
Figure 1 – An example of a categorisation for process architecture
Red Proc.
Arch.
Systemic
Proc. Arch.
Widely Deployed
No Process
Architecture
L
YJ B
V
P
G S
K M
A5
Q A7N
A
C
A2
A1B1
B3
A4E B2
W
T
H
A9
F
Z
A3R
A8
Definitions
The X Axis
Systemic Proc. Arch. (Systemic Process Architecture) ranges broadly across the business. It is holistic in scope.
Red Proc. Arch. (Reductionist Process Architecture) is confined to a specific business area. It is limited in scope.
The Y Axis
Widely deployed reflects a broad dissemination across the organisation.
No Process architecture reflects very restricted deployment or no process architecture in place.
The letters refer to individual organisations from our sample. Each company could be in one of five positions on the X Axis and also in one of five positions on the Y Axis.

36
Appendix 1
Principal Components Analysis correlation matrices Correlation Matrix
Strategy: local - all
strategy: single point -
dual point
performance measures: localised - strategic
performance measures: cost focus
performance measures:
service focus
process architecture: reductionist - systematic
process architecture: deployment
human factors: culture
human factors: organisational
design
information technology
Strategy: local - all
1.000 .634 .617 -.342 .671 .367 .488 .654 .428 .070
strategy: single point -
dual point
.634 1.000 .530 -.400 .499 .573 .521 .524 .550 .153
performance measures: localised - strategic
.617 .530 1.000 .011 .347 .573 .725 .688 .574 .004
performance measures: cost focus
-.342 -.400 .011 1.000 -.483 -.220 .050 -.124 .069 -.328
performance
measures: service focus
.671 .499 .347 -.483 1.000 .373 .433 .690 .179 .277
process architecture: reductionist - systematic
.367 .573 .573 -.220 .373 1.000 .531 .260 .635 .109
process architecture: deployment
.488 .521 .725 .050 .433 .531 1.000 .707 .579 .022
human factors: culture
.654 .524 .688 -.124 .690 .260 .707 1.000 .333 .064
human factors: organisational
design
.428 .550 .574 .069 .179 .635 .579 .333 1.000 .104
information technology
.070 .153 .004 -.328 .277 .109 .022 .064 .104 1.000

37
Appendix 2 Correlation Matrix Significance. (1-tailed)
Strategy: local - all
strategy: single point -
dual point
performance measures: localised - strategic
performance measures: cost focus
performance measures:
service focus
process architecture: reductionist - systematic
process architecture: deployment
human factors: culture
human factors: organisational
design
information technology
Strategy: local - all
.000 .000 .026 .000 .018 .002 .000 .006 .350
strategy: single point -
dual point
.000 .001 .011 .002 .000 .001 .001 .000 .198
performance measures: localised - strategic
.000 .001 .477 .024 .000 .000 .000 .000 .491
performance measures: cost focus
.026 .011 .477 .002 .110 .392 .245 .352 .031
performance measures:
service focus
.000 .002 .024 .002 .016 .006 .000 .160 .059
process architecture:
reductionist - systematic
.018 .000 .000 .110 .016 .001 .072 .000 .273
process architecture: deployment
.002 .001 .000 .392 .006 .001 .000 .000 .452
human factors: culture
.000 .001 .000 .245 .000 .072 .000 .029 .363
human factors: organisational
design
.006 .000 .000 .352 .160 .000 .000 .029 .282
information technology
.350 .198 .491 .031 .059 .273 .452 .363 .282

38
Appendix 3
Rotated Component Loading Matrix
Component 1 2 3 Variable SBPR PBPR CBPR
human factors: culture
.909
Strategy: local - all
.786
performance measures:
service focus
.780 -.455
human factors:
organisational design
.891
process architecture: reductionist - systematic
.827
performance measures: localised - strategic
.595 .635
process architecture: deployment
.599 .610
strategy: single point -
dual point
.493 .571 -.356
performance measures: cost focus
.837
information technology
-.704

39
Appendix 4
Scatter plots of organisations according to BPR maturity on Factors 1, 2, and 3
Facto
r 1 (
SB
PR
) F
acto
r 2 (
PB
PR
)
Factor 1 (SBPR)
Facto
r 3 (
CB
PR
)
Factor 2 (PBPR) Factor 3 (CBPR)
Maturity
Group means
5.00
4.00
3.00
2.00
1.00
1 1
1
1
1
1
2
2
2
3
3
3
3
3
3
4
4 4
4
4 5
4
5
5
5
5
5
2
2
2

40
Appendix 5 Chart showing initial positions of organisations revisited relative
to group means on factors 1, 2 and 3
Facto
r 1 (
SB
PR
)
5 4
3 2
1
G A E
F
B
C D
5 4
3 2
1
G A E
F
B
C D
5
4
3 2
1
G
A
E
F B
C D
Facto
r 2 (
PB
PR
)
5 4
3 2
1
G
A
E
F B
C D
5
4 3
2 1
G A
E
F
B
C D
Factor 1 (SBPR)
Facto
r 3 (
CB
PR
)
5
4 3 2 1
G A
E
F
B
C D
Factor 2 (PBPR) Factor 3 (CBPR)
Maturity
Group means
3.00
2.00
1.00