IMPROVING OUTAGE PROCESS MATURITY LEVEL USING ...
204
IMPROVING OUTAGE PROCESS MATURITY LEVEL USING A PROCESS MATURITY MODEL by Mervyn Petersen Thesis submitted in fulfillment of the requirements for the degree Master of Technology: Quality in the Faculty of Engineering at the Cape Peninsula University of Technology Supervisor: Mr. A. Bester Co-supervisor: Prof M. Moll Bellville September 2016
-
Upload
khangminh22 -
Category
Documents
-
view
2 -
download
0
Transcript of IMPROVING OUTAGE PROCESS MATURITY LEVEL USING ...

IMPROVING OUTAGE PROCESS MATURITY LEVEL USING A
PROCESS MATURITY MODEL
by
Mervyn Petersen
Thesis submitted in fulfillment of the requirements for the degree
Master of Technology: Quality
in the Faculty of Engineering
at the Cape Peninsula University of Technology
Supervisor: Mr. A. Bester
Co-supervisor: Prof M. Moll
Bellville
September 2016

ii
DECLARATION
I, Mervyn Petersen, declare that the contents of this dissertation represent
my own unaided work, and that the dissertation has not previously been
submitted for academic examination towards any qualification.
Furthermore, it represents my own opinions and not necessarily those of
the Cape Peninsula University of Technology or Eskom.
_________________________ ____________
Signed Date

iii
ABSTRACT
Author: Mervyn Petersen
Degree: Magister Technologiae in Quality
Title: Improving Outage Processes using a Process
Maturity Model
University or Institution: Cape Peninsula University of Technology
Faculty: Engineering
Date: September 2016
Key words: Outage, process maturity, improvement,
electrical industry
The research study establishes the maturity level of the outage process of
the Outage Management Department at Eskom. The outage process
started in 2012 to contribute to the effective planning and execution of
outages. The successful completion of outages depends on effective
planning and execution of an outage. At the time of the research study,
poor outage performance at Eskom’s power stations contributed to load
shedding of electricity in South Africa.
The research problem statement reads as follows: The absence of an
outage process maturity indicator diminishes the ability of the Outage
Management Department (OMD) to comprehend the current process
maturity level. The research question: Will the Outage Management
Department be able to identify improvement opportunities if the maturity
level of the outage process is established?
iv
The key research objectives are:
To consider how process maturity enables improvement.
To identify critical elements in an outage process.
To determine what is included in outage planning, control and
improvement.
To identify a suitable process maturity model.
To identify a measurement instrument to determine the maturity
level of Eskom’s outage process
The research study uses a descriptive research design and applies the
survey research method. Greener and Martelli’s (2015: Online) Business
Research Process (Sources: Greener & Martelli, 2015: Online) is used
together with Farooq’s Research Steps for Survey Research (2015,
Online). The survey questionnaire adopted from Smith’s Maintenance
Planning and Scheduling Maturity Matrix (2013: Online) was used to
develop the survey questionnaire. The author developed the Outage
Management Maturity Framework by combining Business Process
Management Maturity model and a Maintenance Planning and Scheduling
Maturity Matrix.
The research finding is that a process maturity model can determine the
maturity level of the outage process and is useful as a process
improvement tool. The research findings rank the maturity level of the
outage process at Level 2, Experimenting.

v
ACKNOWLEDGEMENTS
Firstly, I thank my heavenly Father God, Jesus Christ my savior and our
sweet Holy Spirit for opening this door of opportunity and giving me the
strength and insight to see it to its completion.
I thank the following people for the support and encouragement during this
journey. Emerson said that Life is a journey, not a destination. What a
journey it’s been.
Thank you Lynn for releasing me to pursue this goal and your support
during this journey. To my son Jesse, for asking what my teacher said
when I return from class with review comments all marked up in red pen
and for commenting on my feedback, you are awesome. And to new born
son Nicholas, who joined our family towards the end of this journey,
arriving ahead of time and encouraged me to work towards completing this
journey to spend time with you guys. Thanks to my father, Ronald and
mother Mary for believing in me and for the encouragement.
I want to express my gratitude to Mr. Andre Bester (AKA Mr. B) for the
support, encouragement and for always being there to guide me. Mr. B
you never gave up on me and always saw me walking over that stage as a
sign of the end! Thanks to Prof Moll for the break through that plotted the
course for the research. Thanks to Noel and Rowena for paving the way
and for making the road ahead a lot easier.
Thanks to Hennie and Dhiraj for supporting the research. Thanks to
Simangele Mehlomakulu for being a sounding board during this process.
Thanks to all my friends and family for their support and to the Outage
Management Department for supporting the research.

vi
TABLE OF CONTENT
DECLARATION II
ABSTRACT III
ACKNOWLEDGEMENTS V
TABLE OF CONTENT VI
LIST OF TABLES X
LIST OF FIGURES XIII
GLOSSARY TERMS XV
CHAPTER 1: SCOPE OF THE DISSERTATION 1
1.1. INTRODUCTION 1
1.2. MOTIVATION 1
1.3 BACKGROUND TO THE RESEARCH PROBLEM 2
1.4 STATEMENT OF THE RESEARCH PROBLEM 2
1.5 RESEARCH QUESTION 2
1.6 RESEARCH INVESTIGATIVE QUESTIONS 2
1.7 PRIMARY RESEARCH OBJECTIVE 3
1.8 THE RESEARCH PROCESS 3
1.9 RESEARCH DESIGN AND METHODOLOGY 4
1.10 DATA COLLECTION DESIGN AND METHODOLOGY 4
1.11 ETHICS STATEMENT 4
1.12 RESEARCH CONSTRAINTS 6
1.13 SIGNIFICANCE OF THE RESEARCH 6

vii
1.14 CHAPTER AND CONTENT OUTLINE 7
1.15 CONCLUSION 8
CHAPTER 2: BACKGROUND TO THE RESEARCH ENVIRONMENT: A GENERAL PERSPECTIVE OF ESKOM’S OUTAGE MANAGEMENT DEPARTMENT 9
2.1 INTRODUCTION 9
2.2 THE CHALLENGES FACING ESKOM’S OUTAGE MANAGEMENT
DEPARTMENT 9
2.3 AN OVERVIEW OF ESKOM’S OUTAGE MANAGEMENT
DEPARTMENT 13
2.4 OUTAGES DEFINED IN POWER STATIONS CONTEXT 14
2.5 RESEARCH PROBLEM IDENTIFICATION 22
2.6 CONCLUSION 23
CHAPTER 3: LITERATURE REVIEW – THE PROCESS MATURITY MODEL AS A QUALITY IMPROVEMENT APPROACH 24
3.1 INTRODUCTION 24
3.2 PROCESS MATURITY 25
3.3 OUTAGE PROCESS 38
3.4 OUTAGE PLANNING 42
3.5 OUTAGE CONTROL 56
3.6 OUTAGE IMPROVEMENT 59
3.7 MEASUREMENT INSTRUMENT TO DETERMINE OUTAGE
MATURITY LEVEL 62
3.8 CONCLUSION 72

viii
CHAPTER 4: RESEARCH DESIGN AND METHODOLOGY 74
4.1 INTRODUCTION 74
4.2 THE TWO MAJOR RESEARCH APPROACHES 74
4.3 RESEARCH DESIGN AND RESEARCH METHODOLOGY 78
4.4 RESEARCH ASSUMPTIONS 84
4.5 RESEARCH CONSTRAINTS 85
4.6 THE RESEARCH QUESTIONNAIRE 86
4.7 CONCLUSION 94
CHAPTER 5: DATA COLLECTION, ANALYSIS AND INTERPRETATION OF RESULTS 95
5.1 INTRODUCTION 95
5.2 DATA COLLECTION 95
5.3 DATA ANALYSIS 101
5.4 DATA VALIDITY AND RELIABILITY 103
5.5 THE RESEARCH STUDY DATA ANALYSIS 108
5.6 INTERPRETATION OF THE RESEARCH DATA 138
5.7 CONCLUSION 140
CHAPTER 6: CONCLUSION AND RECOMMENDATION 142
6.1 INTRODUCTION 142
6.2 THE RESEARCH THUS FAR 142
6.3 REFLECTION ON THE RESEARCH QUESTION 143

ix
6.4 THE RESEARCH QUESTIONS REVISITED 147
6.5 THE KEY RESEARCH OBJECTIVES REVISITED 148
6.6 THE RESEARCH DESIGN AND METHODOLOGY REVISITED 149
6.7 CONCLUSION AND RECOMMENDATIONS 149
BIBLIOGRAPHY 152
APPENDIX A: OUTAGE MANAGEMENT MATURITY FRAMEWORK EXCLUDING THE SMITH’S PLANNING AND SCHEDULING MATURITY MATRIX ELEMENTS 163
APPENDIX B: SURVEY RESULTS 167
APPENDIX C: SMITH’S MAINTENANCE PLANNING AND SCHEDULING MATURITY MATRIX 177
APPENDIX D – INDIVIDUAL POWER STATION MATURITY LEVELS 183

x
LIST OF TABLES
TABLE 2.1: 5 WHY ANALYSIS FOR POSSIBLE CONTRIBUTING FACTORS TO LOAD
SHEDDING 10
TABLE 2.2: CAUSES FOR OUTAGE EXTENSION / SLIPS AS FOUND BY IAEA 16
TABLE 3.1: QUALITY MANAGEMENT MATURITY GRID 30
TABLE 3.2: QUALITY MANAGEMENT MATURITY GRID POINTS GUIDE 31
TABLE 3.3: ADVANTAGE OF USING EACH MODEL REPRESENTATION 37
TABLE 3.4: MANAGING FOR QUALITY 45
TABLE 3.5: DMAIC PROJECT STRUCTURE 47
TABLE 3.6: COMPARING QUALITY IMPROVEMENT PHASES 49
TABLE 3.7: PLAN-DO-CHECK-IMPROVE MODEL 49
TABLE 3.8: MAINTENANCE PLANNING AND SCHEDULING MATURITY MATRIX 64
TABLE 3.9: OUTAGE ORGANISATION 66
TABLE 3.10: OUTAGE PROCESS 67
TABLE 3.11: OUTAGE PLANNING 67
TABLE 3.12: OUTAGE SCOPE DEVELOPMENT 68
TABLE 3.13: SCOPE MANAGEMENT AND OUTAGE PROGRESS 68
TABLE 3.14: SINGLE OUTAGE PLAN 69
TABLE 3.15: WORK ORDER USAGE DURING OUTAGE 69
TABLE 3.16: WORK ORDER CLOSEOUT 70
TABLE 3.17: OUTAGE LESSONS LEARNT 70

xi
TABLE 3.18: % PLANNED VS % UNPLANNED WORK 71
TABLE 3.19: SCHEDULE ADHERENCE 71
TABLE 3.20: RISK ANALYSIS 72
TABLE 4.1: CHARACTERISTICS OF THE QUANTITATIVE AND QUALITATIVE
APPROACHES 77
TABLE 4.2: RESEARCH METHODS 81
TABLE 5.1: DATA COLLECTION METHODS 96
TABLE 5.2: UNIT OF ANALYSIS QUESTIONS AND ANSWERS 98
TABLE 5.3: VARIABLES USED FOR THE RELIABILITY CHECK FOR INTERNAL
CONSISTENCY OF THE SCALE 107
TABLE 5.4: CRONBACH’S ALPHA RELIABILITY STATISTIC 107
TABLE 5.5: RESPONDENTS NUMBER OF YEARS IN ESKOM SERVICE 110
TABLE 5.6: RESPONDENT’S TASK GRADE 110
TABLE 5.7: RESPONDENTS PER POWER STATION 111
TABLE 5.8: CROSS-TABULATION COMPARING THE YEARS IN ESKOM SERVICE PER
POWER STATION 112
TABLE 5.9: SUMMARY OF THE RESPONDENTS TO THE OUTAGE ORGANISATION
SECTION OF THE SURVEY 116
TABLE 5.10: SUMMARY OF THE RESPONDENTS TO THE OUTAGE PROCESS
SECTION OF THE SURVEY 118
TABLE 5.11: SUMMARY OF THE RESPONDENTS TO THE OUTAGE PLANNING
SECTION OF THE SURVEY 119

xii
TABLE 5.12: SUMMARY OF THE RESPONDENTS TO THE OUTAGE PLANNING START
(OUTAGE STARTS) SECTION OF THE SURVEY 120
TABLE 5.13: SUMMARY OF THE RESPONDENTS TO THE OUTAGE SCOPE
DEVELOPMENT SECTION OF THE SURVEY 121
TABLE 5.14: SUMMARY OF THE RESPONDENTS TO THE SINGLE OUTAGE PLAN
SECTION OF THE SURVEY 122
TABLE 5.15: SUMMARY OF THE RESPONDENTS TO THE SCOPE DEVELOPMENT
SECTION OF THE SURVEY 124
TABLE 5.16: SUMMARY OF THE RESPONDENTS TO THE OUTAGE PROGRESS
SECTION OF THE SURVEY 125
TABLE 5.17: SUMMARY OF THE RESPONDENTS TO THE OUTAGE WORK ORDER
USAGE SECTION OF THE SURVEY 127
TABLE 5.18: SUMMARY OF THE RESPONDENTS TO THE WORK ORDER CLOSEOUT
SECTION OF THE SURVEY 128
TABLE 5.19: SUMMARY OF THE RESPONDENTS TO THE PERCENTAGE PLANNED
VERSUS UNPLANNED WORK SECTION OF THE SURVEY 130
TABLE 5.20: SUMMARY OF THE RESPONDENTS TO THE OUTAGE SCHEDULE
ADHERENCE SECTION OF THE SURVEY 130
TABLE 5.21: SUMMARY OF THE RESPONDENTS TO THE WORK ORDER
COORDINATION DELAYS SECTION OF THE SURVEY 132
TABLE 5.22: SUMMARY OF THE RESPONDENTS TO THE LESSONS LEARNT
SECTION OF THE SURVEY 133
TABLE 5.23: SUMMARY OF THE RESPONDENTS TO THE RISK ASSESSMENT
SECTION OF THE SURVEY 135
TABLE 5.24: SUMMARY OF THE RESPONDENTS TO THE RISK MITIGATION
SECTION OF THE SURVEY 136

xiii
LIST OF FIGURES
FIGURE 2.1: IMPACT OF KEEPING THE LIGHT ON APPROACH ADOPTED BY ESKOM
12
FIGURE 2.2: OUTAGE MANAGEMENT DEPARTMENT 13
FIGURE 2.3: HISTOGRAM OF CAUSES CATEGORISED INTO OPERATIONAL AND
ORGANISATION EFFECTIVENESS 17
FIGURE 2.4: PARETO ANALYSIS OF THE CONTRIBUTING CAUSES FOR OUTAGE
SLIPS 17
FIGURE 2.5: BREAKDOWN OF THE FAILED CONTROLS 18
FIGURE 2.6: ICEBERG EFFECT ON OUTAGE MANAGEMENT 19
FIGURE 2.7: OUTAGE READINESS INDEX SCORES 21
FIGURE 3.1: LITERATURE REVIEW MODEL 24
FIGURE 3.2: NOLAN’S STAGES OF GROWTH MODEL 26
FIGURE 3.3: HISTORY OF MATURITY MODELS 27
FIGURE 3.4: BASIC PROCESS MATURITY MODEL 33
FIGURE 3.5: MATURITY MODELS – CONTINUOUS REPRESENTATION VS STAGED
REPRESENTATION 35
FIGURE 3.6: MATURITY MODELS – STAGED REPRESENTATION 36
FIGURE 3.7: BASIC OUTAGE PROCESS 39
FIGURE 3.8: ESKOM OUTAGE PROCESS 40
FIGURE 3.9: OUTAGE MANAGEMENT MATURITY FRAMEWORK 65
FIGURE 4.1: QUANTITATIVE RESEARCH APPROACH AND DATA COLLECTION 75
FIGURE 4.2: QUALITATIVE RESEARCH APPROACH AND DATA COLLECTION 76
FIGURE 4.3: THE BUSINESS RESEARCH PROCESS 80
FIGURE 4.4: THE BUSINESS RESEARCH PROCESS 80
FIGURE 4.5: RESEARCH APPROACH 84

xiv
FIGURE 5.1: WORK EXPERIENCE PRIOR TO JOINING THE OUTAGE DEPARTMENT
113
FIGURE 5.2: SUMMARY INDICATING THE DEPARTMENT THE RESPONDENTS
WORKED IN PRIOR TO JOINING THE OUTAGE MANAGEMENT DEPARTMENT 114
FIGURE 5.3: OUTAGE ORGANISATION 117
FIGURE 5.4: OUTAGE PROCESS 118
FIGURE 5.5: OUTAGE PLANNING 119
FIGURE 5.6: OUTAGE SCOPE DEVELOPMENT 121
FIGURE 5.7: SINGLE OUTAGE PLAN 122
FIGURE 5.8: SCOPE MANAGEMENT 124
FIGURE 5.9: OUTAGE PROGRESS 126
FIGURE 5.10: OUTAGE ORDER USAGE 127
FIGURE 5.11: OUTAGE ORDER USAGE 129
FIGURE 5.12: OUTAGE SCHEDULE ADHERENCE 131
FIGURE 5.13: WORK ORDER COORDINATION DELAYS 132
FIGURE 5.14: LESSONS LEARNT 134
FIGURE 5.15: RISK MITIGATION 136
FIGURE 5.16: OUTAGE MANAGEMENT MATURITY LEVEL JULY 2016 139

xv
GLOSSARY TERMS
Outage: A predetermined repair, overhaul or
maintenance endeavor undertaken during
a power station life cycle to ensure optimal
production (Eskom Internal Document 32-
1312, 2015: 5)
Outage Management: A complicated task involving the
co-ordination of available resource,
regulatory, technical and safety
requirements, together with all activities
and work prior and during the outage
(IAEA, 2002: Online).
Outage Slip: Outage taking longer than scheduled
(Eskom Internal Document 32-1312, 015).
Outage Readiness Index: Outage Readiness Index (ORI) is a
standard approach to evaluate the
readiness of an outage at predetermined
stages prior before it start (Eskom Internal
Standard 240-47532542: 2013:4).

1
CHAPTER 1: SCOPE OF THE DISSERTATION
1.1. INTRODUCTION
In 2012 Eskom’s Outage Management Department implemented a
quality management system certified to ISO 9001: 2008. According to
SANS 9004 standard continued success is achieved by implementing a
quality management system (SANS 9004: Online). Quality
improvement is a planned approach explained by the Plan-Do-Check-
Act (PDCA) model (SANS 9004: Online).
The aim of the research study is to establish the maturity level of the
outage process at Eskom’s Outage Management process. This would
enable the Outage Management Department to establish a baseline
maturity level for the outage process. The baseline maturity level
should include all power stations and enable benchmarking across the
fleet.
1.2. MOTIVATION
In 2012, Eskom adopted a process approach to outage planning and
execution. Boutros and Purdie (2014: Online), point out that it is vital to
monitor and measure organisational process maturity. Organisations
are able to find improvement opportunities and identify crucial tasks that
may put the organisation at risk if the processes are not at the suitable
maturity level (Boutros & Purdie, 2014: Online).
Improving the planning and execution of outages contributes to
improved electricity supply to South Africa. The use of a process
management maturity instrument enables the Outage Management
Department to identify opportunities for process improvement and
possible risk during planning and execution of outages.

2
1.3 BACKGROUND TO THE RESEARCH PROBLEM
The research environment is Eskom’s Outage Management
Department. At the time of this research study Eskom was working to
reduce load shedding of electricity in South Africa. Eskom established
an Outage Management Department in 2012 to focus on the planning
and execution of outages of its generation fleet. During the year of April
2014 to May 2015 Eskom’s outage readiness showed an average
readiness of 33 percent (see figure 2.7).
1.4 STATEMENT OF THE RESEARCH PROBLEM
The research problem statement in the ambit of the research study
reads as follow: The absence of an outage process maturity indicator
diminishes the ability of the Outage Management Department (OMD) to
comprehend the current process maturity level.
1.5 RESEARCH QUESTION
The primary research question for this research study reads as follows:
Will the Outage Management Department be able to identify
improvement opportunities if the maturity level of the outage process is
established?
1.6 RESEARCH INVESTIGATIVE QUESTIONS
The research investigative questions are listed below:
How would process maturity enable improvement?
What are the critical elements in an outage process?
What is included in outage planning, control and improvement?
What measurement instrument is able to determine the outage
process maturity level?
What is the current maturity level of the outage process at Eskom?

3
By answering the research questions and investigative questions the
researcher seeked to determine if a process maturity model can be
used as an instrument to enable quality improvement.
1.7 PRIMARY RESEARCH OBJECTIVE
The primary research objective in the ambit of the research study reads
as follows:
Primary Research Objective: The primary research objective is
to establish the maturity level of Eskom’s outage process using a
process maturity model.
Secondary Research Objectives: The secondary research
objectives read as follows:
To consider how process maturity enables improvement.
To identify critical elements in an outage process.
To determine what is included in outage planning, control
and improvement.
To identify a measurement instrument to determine the
maturity level of Eskom’s outage process
To establish the current maturity level of the outage process
at Eskom.
1.8 THE RESEARCH PROCESS
The research study adopted the approach by Greener and Martelli
(2015: Online). The research commenced with a review of the Outage
Management Department’s performance. The Outage Management
Department’s performance was analysed and the research problem
statement identified.
The research design followed the descriptive research design.
Research questions and objectives were developed. The survey
questionnaire was developed and sent out to the staff in the Outage
Management Department. The duration of the data collection started in
April 2016 and ended in May 2016.

4
The research study used descriptive statistics to analyse the research
data. Descriptive statistics was used to describe the current maturity
level of the outage process. The data interpretation determined the
maturity level of the outage process. The research study makes
recommendations to assist with the improvement of the outage process.
1.9 RESEARCH DESIGN AND METHODOLOGY
Mouton (2001: 55) points out that the research design as a blueprint or
plan explains the process to follow when conducting research. The
research study adopted a quantitative research approach. The
research design chosen for the research study is a descriptive research
design. The research study employed the survey research method and
used Greener and Martelli’s (2015: Online) Business Research
Process.
1.10 DATA COLLECTION DESIGN AND METHODOLOGY
The data collection method used was a survey. Survey questions
developed for the research study is based on the Maintenance Planning
and Scheduling Maturity Matrix (Smith, 2013: Online). Kwiksurveys
online survey was used to create the survey questionnaire.
An electronic survey was disseminated via email using the Kwiksurveys
online tool to all the employees in the Outage Management
Department. Employees had the option to respond or refrain from
responding to the survey. Employees had one month to respond to the
survey. Kwiksurveys online tool provided basic descriptive statistics.
1.11 ETHICS STATEMENT
According to Greener and Martelli (2015: Online), ethics is concerned
with moral choices influencing decisions, behavior and standards.
Mouton (2001: 238) found that ethics in science is concerned with the
wrong and right when conducting research. Mouton (2001: 238) further
mentions that scientists hold the right to search the truth, while not to

5
the detriment of others. Research involves the study of some being
(Mouton, 2001: 243). Mouton (2001: 243) asserts that research
subjects have basic rights and these include:
The right to confidentiality and the right to decline to take part in
research.
The right to anonymity and confidentiality.
The right to full disclosure about the research (informed consent).
The right not to be harmed in any manner (physical, psychological
or emotional).
Trochim (2006: Online), points out that the rule of voluntary
involvement in research is essential when people take part in the
research. Greener and Martelli (2015: Online), refer to some ethical
criteria used in higher education:
Avoid deception and be honest.
Follow an ethical code of a professional body as appropriate.
Fully disclose information about the study and the author’s role
and status.
Do not cause harm by an act or omission of the research study.
Obtain informed permission to take part in the research.
Respecting the right to refuse to take part.
Respect the need for anonymity and confidentiality.
Clarify to the participants and gatekeepers potential limitations in
confidentiality and anonymity.
The criteria mentioned by Greener and Martelli (2015: Online) along
with the basic rights as mentioned by Mouton (2001: 243) are
recommendations to be considered for inclusion in the ethics statement
for the research.
When the data is presented the names of power station will be renamed
as Power Station -1 and the support departments will be renamed as
Support Departments.

6
1.12 RESEARCH CONSTRAINTS
The following research limitations and delimitations are relevant to this
study. Research constraints listed below:
Limitations related to the research are:
The Outage Management Department makes up the
population selected for the research study.
Not all power stations will respond to the survey.
The level of skill and experience of participants in planning
and execution of outages may vary, affecting the outcome of
the maturity level.
De-limitations related to the research are:
The research outcome may have a generalised application in
the planning and execution of outages and online
maintenance processes.
1.13 SIGNIFICANCE OF THE RESEARCH
The research study assumptions and limitations identified provide a
method to determine the maturity level of the outage process. The
research establishes a baseline maturity level of the outage process.
Great understanding of the process maturity level could enable the
Outage Management Department to identify improvement opportunities
and enable benchmarking across the fleet.
Possible future research opportunities include the development of a
maturity model for the online maintenance or work management
process within the Eskom power station fleet and facilitate a structured
improvement approach for the outage processes.

7
1.14 CHAPTER AND CONTENT OUTLINE
The literature review investigates the research question in the next
chapter:
Chapter 1: This chapter introduces the research subject and
provides the motivation for the research.
Chapter 2: A background of the research environment is
presented in this chapter. The background leads the reader to
understanding the research environment and identifies the
research problem statement.
Chapter 3: The chapter’s primary focus is to understand process
maturity models and the outage process. The author explores the
applicable literature concentrated on the primary theme of the
research study. The literature identifies an instrument to measure
the outage process maturity level. The literature provides the
context to answer the research questions.
Chapter 4: The research process presents a structured research
approach. The chapter looks at the research approach, the
research design, methodology, assumptions and constraints.
Chapter 5: Data collection, analysis and interpretation of results
forming the central part of this chapter and will facilitate the arrival
to a conclusion.
Chapter 6: The author revisits the research questions and key
objectives, ensuring the research has effectively addressed its
objectives. Conclusions are drawn from the result and
recommendations to mitigate the research problem that could
proof beneficial to the organisation.

8
1.15 CONCLUSION
The research study creates an opportunity for the Outage Management
Department to establish a baseline maturity level, identify best practice
within the fleet to recognise improvement opportunities. The chapter:
Reviews the motivation and background to the research
environment.
Determines the research problem statement and research
questions.
Establishes the research objectives.
Reviews the research process, design and methodology.
Reviews the data collection design and methodology.
Discusses the research ethics statement.
Reviews the research constraints.
Discusses the significance of the research.
Provides a chapter and content outline.
Chapter 2 reviews the background to the research environment.

9
CHAPTER 2: BACKGROUND TO THE RESEARCH
ENVIRONMENT: A GENERAL PERSPECTIVE OF
ESKOM’S OUTAGE MANAGEMENT DEPARTMENT
2.1 INTRODUCTION
The research environment is Eskom Holdings State Owned Company
(SOC) Ltd, South Africa’s primary supplier of electricity owned by the
South African Government (Eskom Internal Document 240-56927206,
2015: 2). Eskom distributes, transmits and generates electricity to the
mines, residential, industrial, commercial and agricultural customers
(Eskom Internal Document 240-56927206, 2015: 2). Eskom owns and
operates 27 power stations in South Africa (Eskom Internal Document
240-56927206, 2015: 2). Eskom contributes to around 95% of the
electricity consumed in South Africa (Eskom Intranet, s.a., Online).
The research focuses on Eskom’s Outage Management Department
and the outage process. The author is part of the Outage Management
Department that focus on planning and scheduling of outages for
Peaking power stations. This chapter presents:
The challenges Eskom faced during April 2014 to May 2015.
An overview of Eskom’s Outage Management Department.
An outage in context of power stations.
The Eskom outage process.
The research problem statement.
The background to the research study starts by presenting the
challenges Eskom faced during April 2014 and May 2015.
2.2 THE CHALLENGES FACING ESKOM’S OUTAGE
MANAGEMENT DEPARTMENT
This section presents the challenges Eskom faced from April 2014 to
May 2015. In the internal report (Eskom Internal Document 240-
56927206, 2015: 4), Eskom acknowledged that it faces a number of

10
challenges, most notably load shedding. In an attempt to comprehend
possible reasons for load shedding, a Five Why analysis was completed
to assist in determining the possible contributing factors to load
shedding. Table 2.1 captures the results of the Five Why analysis.
Table 2.1: 5 Why Analysis for possible contributing factors to Load Shedding
(Source: Own Source adapted from Eskom Integrated Report, 2015: Online)
5 Why Analysis for Load Shedding
Performance Categories Possible Contributing Factors
Plant Availability Low
Unplanned Outages
Planned Outages
Outages slip / not completed on time/
Increased breakdowns on completion of outages
Maintenance Execution
Plant Breakdowns
Increased Maintenance to reduce the Maintenance Backlog
Plant Failures
Lack of Maintenance
Keeping the lights on in 2010 Soccer World Cup
Increase in deferred maintenance
Outages Slip
Scope Increase
Rework
Poor Outage Readiness
Poor Outage scoping development
Increased Outage Scope Flawed Maintenance Execution Programmes
Scope Growth – Work included late
The Five Why analysis found possible contributing factors and observed
the following important contributing factors:
A lack of maintenance: Increase in equipment breakdowns
contributing to poor performance and a decrease in the plant
availability to produce electricity.
Poor outage readiness and poor outage scope development:
Outage is executed even when the plants prepared. The scope is
not accurate resulting in scope increase based on the as found
inspections at the start of the outage.

11
Flawed maintenance execution programs: The maintenance
programmes are incomplete or out dated therefore accurate
outage execution scopes cannot be developed.
A decline in the plant performance of its power stations
resulting in an increase in unplanned breakdowns: The power
stations are operated beyond its recommended maintenance
times to keep the lights on placing more strain of already stressed
power stations. This increased the unplanned breakdowns as
equipment failure surge under these conditions.
Limited opportunities to execute planned maintenance,
leading to increased unplanned maintenance: With limited
maintenance opportunities contributes to increased equipment
failure.
The deferment of maintenance and urgent repairs results in
an increase in cost and the risk for load shedding: Delaying
maintenance increase the equipment failure and unplanned
maintenance cost.
The main causes of these challenges are the result of a practice
adopted by Eskom in 2010, committed to keeping the lights on in
support of the Soccer World Cup (eNCA, 2015: Online). The Eskom
Integrated Report (2015: Online) mentions deferment of maintenance,
resulting in delays of critical maintenance and refurbishment of
generating equipment and contributing to an escalation in breakdowns
of generation plants (Eskom Integrated Report, 2015: Online). The risk
captured in the Eskom Integrated Report (2015: Online) refer to the
decrease in generating capacity caused by maintenance backlog and a
decline in the generating plant’s technical performance.
Figure 2.1 provides an overview of the impact of the approach adopted
by Eskom that spirals into a cycle starting with keeping the lights on
followed by deferring critical maintenance, resulting in an increase in
maintenance backlog. The lack of maintenance increases the plant
breakdowns, reducing plant availability, placing strain on the electricity

12
supplier that results in load shedding to prevent a grid collapse. Eskom
implemented controlled load shedding and scheduled power cuts by
rotating load shedding between all consumers when demand is high to
avoid total blackouts in the supply area (Eskom Internal Document 240-
56927206, 2015:258).
In an attempt to address the cycle in Figure 2.1, Eskom has placed
great focus on improving plant performance and executing critical
outages to improve electricity supply and reduce load shedding (Eskom
Integrated Report, 2015: Online).
Figure 2.1: Impact of keeping the light on approach adopted by Eskom (Source: Own Source adopted from the Eskom Integrated report, 2015: Online)
Eskom maintained focus on its Corporate Plan to achieve its mission: to
provide sustainable electricity solutions to grow the economy and
improve the quality of life of the people in South Africa and the region
(Eskom Internal Document 240-56927206, 2015: 22). In addition to its
Corporate Plan, Eskom implemented a structured approach to enable
further improvement by adopting a quality management system certified
to ISO 9001: 2008 on 31 March 2013 (Eskom Integrated Report, 2015:
Online). In 2012, Eskom established an Outage Management
Department.
1. Keeping the Lights on
2. Defer Critical Maintenance
3. Increased Maintenance Backlog
4. Increased Generating Plant Breakdowns
5. Reduced generating capacity
6. Scheduled Load Schedding
7. Execute much needed Maintenace
8. Limited Generating Capacity

13
The implementation of an ISO 9001: 2008 management system, along
with the establishment of a department focused on outage planning and
execution is a clear indication of Eskom’s commitment to improve and
realise its business objectives. An overview of the Outage
Management Department is discussed in the following section.
2.3 AN OVERVIEW OF ESKOM’S OUTAGE MANAGEMENT
DEPARTMENT
This section provides an overview of the Outage Management
Department. The Outage Management Department is accountable for
the outage planning and execution.
This section provides a briefly overview of the Outage Management
Department, and describes its primary mandate.
The Outage Management Department forms part of the Technology
Division and consists of four primary operating units (OU) seen in
Figure 2.2 (Eskom Intranet, s.a.: Online).
Figure 2.2: Outage Management Department (Source: Own Source adopted from Eskom Intranet s.a.: Online)
Each OU is responsible for the planning and execution of outages for a
number of power stations in the OU. Coal 2 has seven power stations,
which includes some of the mid aged power station. Coal 3 has six
power stations and includes the oldest in the fleet as well as return to
service power stations. Peaking OU have nine power stations
consisting gas and hydro power stations.
Outage Management Department
Outage Centre of Excellence
Outage Execution and Support - Coal 2
Outage Execution and Support - Coal 3
Outage Execution and Support -
Peaking

14
The Nuclear OU is not included in the Outage Management Department
but has its own Outage Management Department managed with in the
Nuclear OU.
The mandate for the Outage Management Department including the
Nuclear OU is to provide an end-to-end outage management service
standardising outages across the fleet of power stations with the focus
on high quality and timely completion of outages (Eskom Intranet, s.a.,
Online). The mandate includes the outage planning, execution and
close phases discussed in the following section.
The following section turns to an outage in a power station context to
establish the basic outage process.
2.4 OUTAGES DEFINED IN POWER STATIONS CONTEXT
The technology categories under consideration include fossil fuel,
hydro, gas, nuclear and renewable energy and focus on the following:
Define an outage within power station context.
Identify the challenges experienced by the Outage Management
Department.
The following section defines an outage to create a uniform
understanding of an outage.
2.4.1 Definition of term outage
This section presents definitions for an outage by considering
recognised international bodies involved in power generation. It
includes Eskom’s definition on an outage.

15
The United States Nuclear Regulatory Commission (USNRC) (2015:
Online) defines outages as a time when a generating unit, transmission
line, or other facility is out of service. The Eskom definition of outages
is a predetermined repair/overhaul/maintenance endeavour undertaken
during a power station life cycle to ensure optimal production (Eskom
Internal Document 32-1312, 2015: 5).
The following section presents the basic outage process and identifies
the phases that make up the outage process.
2.4.2 Challenges in the Outage Management Department
The challenges facing the Outage Management Department have an
adverse consequence on the consistent electricity supply to the South
African economy. This section presents:
The contributing causes to Outage slips.
The Outage Readiness Performance.
The following section reveals the contributing cause to outage slips,
quantify, and categorise the identified causes.
2.4.2.1 Contributing causes to outage slips
This section present the contributing causes to outage slips in an
attempt to contextualise the challenges facing the Outage Management
Department.

16
The International Atomic Energy Agency (IAEA) (2002: Online),
mention some causes for outage extensions or slips included in Table
2.2.
Table 2.2: Causes for Outage Extension / Slips as found by IAEA (Source: Adopted from IAEA, 2002: Online)
Category Sub-Category
Non identification of system, equipment and component defects
Deficiency in plant condition monitoring and trending Equipment breakdown in the course of outage execution
Quality of work completed Absence of quality awareness and procedure use Poor material quality Deficiency in skills or trained staff Inappropriate control of work execution Unconcerned attitude to work execution causing in waste of working time
Lack of outage management
Deficiency of leadership and control over the planned activities Lack of motivation Deficiency of budgeting Equipment, material and spares are ordered late Inadequate collaboration among the stakeholders
Deficient outage planning
Under estimation of activity durations and labour Inappropriate scheduling of work activities Supporting activities (scaffolding, rigging, etc.), materials, tools are not well-defined. Plant isolations, permit to work and approvals not defined. Lessons learnt and operational experience feedback not considered or effectively implemented.
The primary and secondary causes to outage slips are presented using
Histograms and Pareto diagrams. Eskom’s Outage Management
Department investigated the reasons for the outage slips using pre-
determine barriers. The pre-determined barriers are Organisational
Effectiveness and Operational Effectiveness barriers (Eskom Internal
Report, 2015: 20150815). The Eskom Organisational Effectiveness is
primary barriers are:
Engineering Control.
Formal Controls.
Management, Assurance and Oversight Controls.
Cultural Controls.
Figure 2.3 identified the major contributor to the outage slips as 390
failures in the Organisational Effectiveness controls (Eskom Internal
Report, 2015: 20150815).

17
The Operational Effectiveness contributes to 211 failures. The Pareto
analysis determined the causes within the seven sub-categories
identified in Figure 2.3.
Figure 2.3: Histogram of Causes categorised into Operational and Organisation Effectiveness (Source: Own source adopted from Eskom Internal Report
20150805)
The Pareto analysis in Figure 2.3 combines the organisational and
operational causes to find the primary contributing causes and identifies
the major contributing cause was the 390 failures in the organisation
effectiveness barrier (Eskom Internal Report, 2015: 20150815).
Figure 2.4 identifies Engineering controls as the main contributing
cause followed by Work Preparation and Formal Controls.
Figure 2.4: Pareto Analysis of the Contributing Causes for Outage Slips (Source:
Own source adopted from Eskom Internal Report 20150805)
211 147
47 14 3
390
195
96 58 41
Operational Effectiveness Work Prep (WPC)
Perform (PC) Feedback
Act Err (AE) Organisational Effectiveness
Engineered Controls (EC) Formal Controls (FC)
Mgnt, Assur and Oversight (MC) Cultural Controls (CC)
Operational Effectiveness Organisational Effectiveness
195
147
96
58 47 41
14 3
0%10%20%30%40%50%60%70%80%90%100%
020406080
100120140160180200
EngineeredControls
(EC)
Work Prep(WPC)
FormalControls
(FC)
Mgnt, Assurand
Oversight(MC)
Perform(PC)
CulturalControls
(CC)
Feedback Act Err (AE)
Pareto Analysis of the Contributing Causes for Outage Slips

18
The Pareto analysis shows the 20 percent of the contributing causes
that contribute to 80 percent of the outage slips are Engineered
Controls, Work Preparation, Formal Control and Management
Assurance and Oversight. Figure 2.4 indicates that the primary cause
of outage slips are the failure of Organisational controls.
The analysis in Figure 2.5 further identifies the sub-categories enabling
a better understanding of the failures within the Engineered Controls,
Work Preparation Controls, Formal Control and Management
Assurance and Oversight Controls (Eskom Internal Report, 2015:
20150815).
Figure 2.5 identifies failures in 11 sub-categories (Eskom Internal
Report, 2015: 20150815). Work Planning and Scheduling and Work
Co-Ordination account for 143 failures. Equipment Failures, Equipment
Conditions and Maintenance Programs account for 150 failures.
Figure 2.5: Breakdown of the Failed Controls (Source: Own source adopted from Eskom Internal Report 20150805)
98
87
58
45
45
28
27
26
21
19
18
14
14
14
12
020406080100120
Work Planning + Scheduling (WP1)
Maintenance Program (E5)
HR Management Related (F5)
Equipment Performance (E1)
Work Co-ordination (WP2)
Op Tech Specs, W-Packs + Instrs (F3)
Supervisory Oversight (P3)
Individual Accountability (C6)
Management Planning (M1)
Assurance Management (M6)
Equipment Condition (E2)
Inspection and Testing (E4)
Job Observations (P1)
Performance Feedback (PF3)
Equip Specs, Mnftg + Const (E3)
Breakdown of the Four Failed Controls

19
Human Resources Management Related, Operational Technical
Specifications and work packages and instructions account for 86
failures. The areas of Supervisory oversight, Management Planning
and Assurance account for 67 failures.
Gryna (2001: 27) uses an Iceberg model to show the effects of the cost
of poor quality. In Figure 2.6, the author uses the Iceberg model to
show a number of factors that have an effect on the effectiveness of the
outage process, including outage readiness.
Figure 2.6: Iceberg Effect on Outage Management (Source: Own Source adopted from Gryna, 2001: 27)
The Outage Management Department uses the Outage Readiness
Indicator (ORI) as a measure to determine outage readiness. It is a
control and documented process and is discussed in the following
section.
High Outage slip frequency
Poor outage readiness
Lack of maintenance
Declined plant performance
Increased unplanned breakdowns
Increased unplanned maintenance
Poor work planning &scheduling
Flawed maintenance programs
Low equipment reliability
Low Outage readiness Failed Engineering Controls
Lack of Management, Assurance &
Oversight Failure in Formal Controls
Not implementing lessons learnt
Poorly resourced outage organisations Poor understanding & Adherence to
Outage planning process Poor Schedule adherence during execution
Load Shedding
Inadequate risk analysis
Poor detail in work packages and work instructions
Poor scope development
Unseen Causes
Seen Causes

20
2.4.2.2 Review Eskom’s outage readiness
The section reviews the Outage Readiness Index results from April
2014 to April 2015 to determine the status of outage planning. Outage
Readiness Index (ORI) is a standard approach used by Eskom to
evaluate the readiness of an outage at predetermined stages prior to its
start (Eskom Internal Standard 240-47532542: 2013:4):
The detail captured in the ORI: The outage planning process
starts 24 months prior to the start of an outage and readiness
outage readiness reviews are complete at pre-determine intervals
(Eskom Internal Standard 240-47532542: 2013:4). The ORI
standard further establishes a 90 percent ORI readiness score
prior outage execution (Eskom Internal Standard 240-47532542:
2013:4).
Evaluation of the ORI readiness: A review of the ORI scores
from April 2014 to April 2015 in Figure 2.7, show an average ORI
readiness 33 percent compared to an internal target of 80 percent.
The target used by the Outage Management Department is ten
percent less than the required 90 percent specified in the ORI
standard (Eskom Internal Standard 240-47532542: 2013:5). The
Outage Management Department does not include a minimum
ORI score in any procedure, which can be used as a guide to
delay the start of an outage. The 33 percent Outage readiness is
an indication of outage poor planning and readiness and is
therefore best captured by Baumler (2010: Online), considers
Winston Churchill’s comment; the one that fails to plan, plans to
fail. The use of a lower readiness target could assist in
determining the minimum readiness for an outage to continue.
With a known upper and lower-limit, creates an opportunity to
apply statistical process control (SPC).
Consider the use of Statistical Process Control: The use of
SPC could prove valuable in the monitoring of outage readiness.
Early identification of process variance can lead to an investigation
and resolution of causes early in the process.

21
Gryna (2001:495) describes SPC as the application of statistical
methods to the measure and analysis process variation. The
control chart in Figure 2.7 includes an upper control limit of 80
percent and no lower control limit. The ORI score process control
chart show an average readiness of 33 percent at the time of the
research.
Figure 2.7: Outage Readiness Index Scores (Source: Own Source adopted from Eskom Internal Report, 20150805: GEXCO)
The low ORI scores point to problems in the outage planning resulting
in process variation. With the gap between the actual score and target
score the variations and problems will persist. The ORI scores in
Figure 2.7 are an indication that the ORI planning process is out of
control. The failure to understand the underlying causes have a
negative impact on the ORI score and results in continued poor outage
readiness. The use of SPC may well prove to be a valuable tool to
identify process variance and assist with maintaining internal process
controls.
0%
10%
20%
30%
40%
50%
60%
70%
80%
90%
100%
01 A
pril
2014
01 M
ay 2
014
01 J
une
2014
01 J
uly
2014
01 A
ugus
t 201
4
01 S
epte
mbe
r 20
14
01 O
ctob
er 2
014
01 N
ovem
ber
2014
01 D
ecem
ber
2014
01 J
anua
ry 2
015
01 F
ebru
ary
2015
01 M
arch
201
5
01 A
pril
2015
01 M
ay 2
015
ORI Standard Target Internal Outage Target Actual Score Ave ORI Score
Outage Readniess Indicator April 2014 to April 2015
OR
I Sco
re

22
Mauch (2010, Online) found that the last phase in process quality
planning is to establish the internal controls that would stabilise the
process. Defeo and Juran (2014: Online) explain that a strategic plan
is the logical method to define a long-term goal and planning ways to
achieve them. Boutros and Purdie (2014: Online) found that
simultaneous change are required in the process system, technical
systems, management and behavioral system when pursuing process
improvement.
Boutros and Purdie (2014: online) explain that the pursuit of process
improvement is a continuous and long-term goal. Knowles (2012:
Online) states that if quality management focuses on anything, it is
focused on change, and change for the better, while emphasising that
learning is essential if a company wants to achieve a degree of
excellence.
The research problem statement follows in the next section.
2.5 RESEARCH PROBLEM IDENTIFICATION
The aim of this section is to identify the research problem. The outage
process uses Organisational Effectiveness and Operational
Effectiveness codes to categorise failures when investigating outage
slips. The Eskom Internal Report (Eskom Internal Report, 2015:
20150805) indicates a failure in the sub-categories, but omits to report
which major category (Organisational Effectiveness or Operational
Effectiveness) is the main contributor. The major contributor to outage
slips is failures in the Organisational Effectiveness as shown in Figure
2.3.
A secondary consideration in the Eskom Report (Eskom Internal
Report, 2015: 20150805) is the outage readiness indicator. The low
ORI scores shown in Figure 2.7 provide evidence of outage processes
are not in a state of control.

23
The lack of organisational effectiveness is the primary contributor to
outage slips, followed by failures in certain operational controls.
The research problem statement reads as follow; the absence of an
The absence of an outage process maturity indicator diminishes the
ability of the Outage Management Department (OMD) to comprehend
the current process maturity level.
2.6 CONCLUSION
The Outage Management Department captures and communicates
data and figures in reports on the ORI scores and outage slips, but do
not provide the methods to improve the current process performance.
According to Deming (2000:15), figures indicate how processes are
performing, but it does not demonstration how to improve processes.
The Outage Management Department has many figures indicating how
the process outage process performs, but these figures do not show
how to improve the outage process.
This chapter provided the background to the research environment and
included:
The challenges Eskom faced.
An Over view of Eskom’s Outage Management Department.
Outage Defined in the power station context.
Identification of the research problem.
In Chapter 3 the literature review focuses on the use of the Process
Maturity Model as a Quality Improvement approach.

24
CHAPTER 3: LITERATURE REVIEW – THE PROCESS
MATURITY MODEL AS A QUALITY IMPROVEMENT
APPROACH
3.1 INTRODUCTION
The aim of the literature review was to find an academic point of view to
answer the research questions. According to Leedy and Ormrod
(2014:51), the literature reviews the theoretical perspective and
considers former research relating to the research problems. The
literature review attempts to provide a comprehensive explanation of a
process maturity model, the outage process that includes its planning,
execution and improvement.
The approach to the literature review is a structured approach and
follows the literature review model seen in Figure 3.1 developed by
author and the research supervisor. The Literature Review Model has
three phases. The review focuses on the theory of process maturity.
Figure 3.1: Literature Review Model (Source: Own Source)
The detailed literature review will focus on:
Review Process Maturity.
Review the Outage Process.
Review Outage Planning Process.
Review Outage Control Process.
Review Outage Improvement Process.
Review the measurement instrument to determine outage maturity
level.
Identify the System &
Measurement Instrument
System
Review the theory on the system and instrument
Theory
Apply the System,
Instrument and Theory to a
Scenario
Application

25
3.2 PROCESS MATURITY
This section reviews the process maturity and focuses on:
The history of maturity models.
Crosby’s Quality Management Maturity Grid.
Process Maturity.
Continuous and Staged representation of process maturity.
3.2.1 History of maturity models
The aim is to look at the history of maturity models and to gain an
understanding of how maturity models evolved focusing on:
Nolan’s Stages of Growth Model.
The evolution to the process maturity framework.
History summary of maturity models.
3.2.1.1 Nolan’s Stages of Growth Model
According to Prananto, McKay and Marshall (2003: Online), the
Nolan’s stage hypothesis first appeared in the 1970’s. Hollyhead and
Robson (2012: Online) found that Richard L. Nolan designed the
Stages of Growth Model for IT systems in the 1970. Gibson and Nolan
(1979: Online) explain the purpose of the Stages of Growth Model is to
describes each stage, listing key characteristics for each stage and
explains the underlying organisational forces at work in each.
Gibson and Nolan (1974: Online) introduce a Four Stage Growth Model
and point out that three types of growth would be required as maturity
increases:
A growth in computer application.
A growth in specialisation of staff.
A growth in formal management techniques and organisation.
Thakur (s.a.: Online) return that Nolan’s model helps organisations
understand the role of information systems and the models evolutionary
route has six-stages as shown in Figure 3.2.

26
Figure 3.2: Nolan’s Stages of Growth Model: (Source: Thakur, s.a.: Online)
Hollyhead and Robson (2012: Online) explain that other models have
been created founded on Nolan’s Stages of Growth model. Hollyhead
and Robson (2012: Online) found that Nolan’s Stages of Growth model
is a useful tool to assist with identifying long-term strategic plans and
find improvement opportunities.
A brief discussion of the evolution to the Process Maturity Framework
follows in the next section.
3.2.1.2 Evolution to the process maturity model
The evolution from Nolan’s Growth Model includes a number of
contributions from various individuals and organisations. Two
contributors include Crosby (1979: 25) and Humphrey (1987: Online).
In 1979, Crosby (1979: 25) proposed the Quality Management Maturity
Grid (QMMG) with five maturity stages and six management groups.
Humphrey’s (1987: Online) contribution was during his time at Software
Engineering Institute (SEI) and this contribution resulted in the
development of the Process Maturity Framework, which provided a way
of characterising the capabilities of software developers.
Humphrey (1987: Online), supported by Van Dyk & Schutte (2012:
Online), explain that the process maturity framework can be used to
assess the process capability of a given organisation and identify
Initiation
Contagion
Control
Integration
Data Administration
Maturity

27
important areas for improvement. Alden and Curtis (2006: Online)
describe the history of maturity models in Figure 3.3. They
acknowledge the contribution made by Shewart’s Statistical Process
Control approach, Deming PDCA model and Crosby’s Quality
Management Grid as contributors to the development of Humphrey’s
Process Maturity Framework.
Figure 3.3 shows that Humphrey’s Process Maturity Framework
contributed to the Capability Maturity Model with its variations leading to
the development of the Business Process Maturity Model.
Figure 3.3: History of Maturity Models (Source: Alden & Curtis, 2006: Online)
The history of the maturity models seen in Figure 3.3 was not the end of
the evolution of the maturity models. The next section provides an
overview of various maturity models.
3.2.2 Crosby’s Quality Management Maturity Grid
According to Crosby (1979:23), the Quality Management Maturity Grid
(QMMG) enables any manager to determine the maturity level of any
operation in terms of quality concepts. The review focuses on:
The background to the QMMG.
Using the QMMG as an Improvement Tool.
Description of the QMMG.
The working of the QMMG.
Crosby's quality Maturity Gird
Humphrey's Process Maturity Framework
Shewart's SPC and Deming's PDCA
System Eng - CMM System Eng - CMM System Eng - CMM
System Eng - CMM CMM for Sotfware CMMI

28
3.2.2.1 Background to the Quality Management Maturoty Grid
According to Maier, Moultrie and Clarkson (2012: Online), Crosby’s
Quality Management Maturity Grid is a pioneering example, promoting
progress across five stages: uncertainty, awakening, enlightenment,
wisdom and certainty. Wilson (2013: Online) developed a Quality
Maturity Model closely founded on the Capability Maturity Model (CMM)
used in software development. The five stages in the maturity model by
Wilson (2013: Online) are similar to the Capability Maturity Model:
Initial, repeatable, defined, managed and optimising.
3.2.2.2 Quality Management Maturoty Grid as an improvement
tool
According to Maier, Moultrie and Clarkson (2012: Online), a maturity
grid can be used as an assessment or improvement tool. Crosby
(1979:25) point out that the Quality Management Maturity Grid is used
to pinpoint the “as is” state of a process and enable improvement by
referring to the next stages to identify actions to be taken for
improvement. The grid can help identify the last success point and
reading backwards to determine where established programs
deteriorated.
De Bruin, Freeze, Kaulkarni and Rosemann (2005: Online) mention
that maturity models are used to assess the maturity level of selected
processes based on a comprehensive set of criteria.
De Paula, Fogliatto and Cristofari (2012: Online) maintain that the
maturity grid method provides a qualitative description of each process
area. Pöppelbuß and Roglinger (2011: Online) found that maturity
models are expected to make known the current and desired maturity
levels and to include relevant improvement measures.

29
3.2.2.3 Explanation of the Quality Management Maturoty Grid
De Paula, Fogliatto and Cristofari (2012: Online) explain that the grid
cell has text descriptions of typical performance expected at various
maturity levels. The detail of the Quality Management Maturity Grid
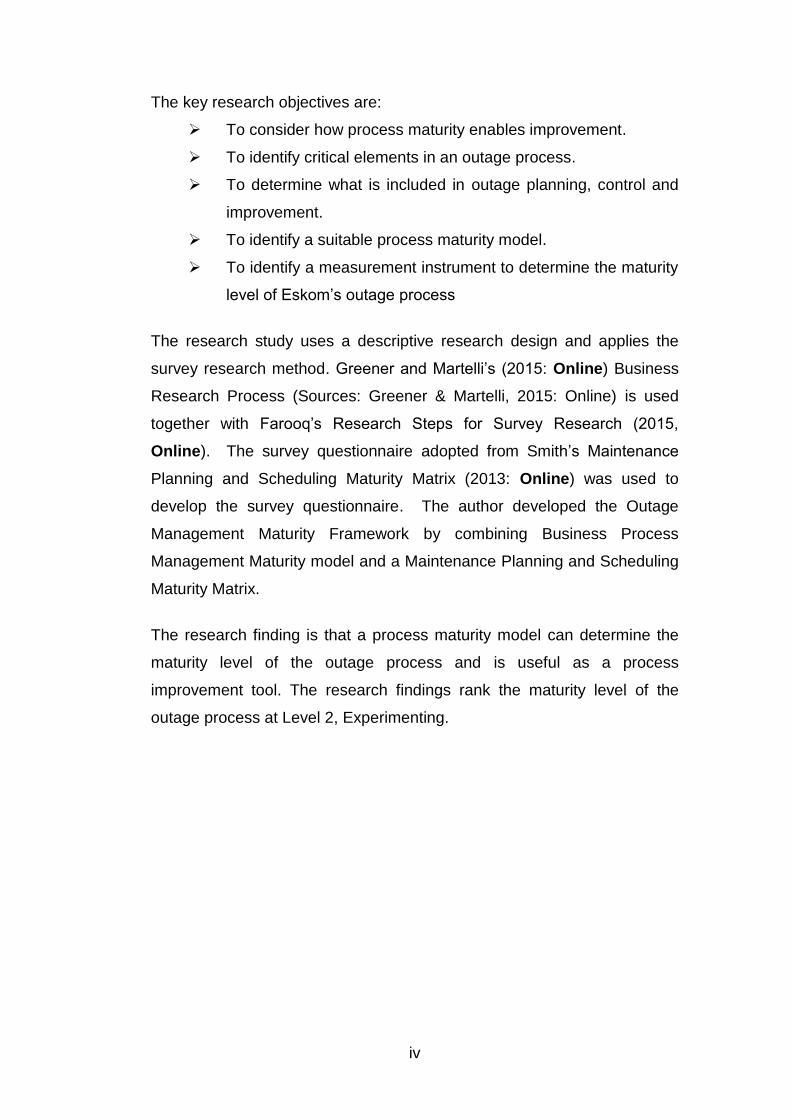
developed by Crosby (1979: 32-33) is provided in Table 3.1.
Maier, Moultrie and Clarkson (2012: Online) explain the process for
determining maturity uses a matrix or grid design seen in the QMMG
shown in Table 3.1. The maturity level is assigned against key
performance characteristics thereby creating a series of cells.
Crosby’s QMMG shown in Table 3.1 clearly define six measurement
categories and five stages ranging from uncertainty to certainty. Table
3.1 of Crosby’s QMMG has a clearly defined requirement for each
measurement category and the corresponding stage.
30
Table 3.1: Quality Management Maturity Grid (QMMG) (Source: Crosby, 1979: 32-33)
Quality Management Maturity Grid
Measurement Categories
Stage 1: Uncertainty
Stage 2: Awakening
Stage 3: Enlightenment
Stage 4: Wisdom
Stage 5: Certainty
Management understanding and attitude
Do not comprehend quality as a management tool. Tend to blame quality department for quality problems
Recognise the value of quality management, but will not provide time of money to make it happen
While going through quality improvement, learn more about quality management and become supportive and helpful
Participate. Understand the absolutes of quality management and recognise their role continuing emphasis
Consider quality management as a vital part of the company system
Quality Organisation Status
Quality is hidden in manufacturing and engineering department. Inspection probably not part of organisation. Emphasis on assessment and sorting.
A strong quality leader is appointed but the main emphasis is still on assessment and moving production. Still part of manufacturing and others.
Quality Department reports to top management, all assessment is incorporated and manager has role in management of company.
Quality manager is an officer of company; effective status reporting and preventive action. Involved with consumer affairs and special assignments.
Quality manager on board of directors. Prevention is main concern. Quality is a thought leader.
Problem Handling
Problems are fought as they occur; no resolution, inadequate definition, lots of yelling and accusation
Teams are set up to attack major problems. Long range solutions are not solicited
Corrective action communication established. Problems are faced openly and resolved in an orderly way
Problems are identified early in their development. All functions are open to suggestions and improvement.
Except in the most unusual cases, problems are prevented.
Cost of Quality as % of sales
Reported: Unknown. Actual: 20%
Reported: 3%
Actual: 18%
Reported: 8%.
Actual: 12%
Reported: 6.5%
Actual: 8%
Reported: 2.5%
Actual: 2.5%
Quality Improvement Actions
No Organised activities. No understanding of such activities.
Truing obvious “motivational” short-range efforts.
Implementation of the 14 step program with thorough understanding and establishment of each step
Continuing the 14 step program and starting Make Certain
Quality Improvement is normal and continued activity.
Summation of company quality posture
“We don’t know why we have problems with quality.”
“Is it absolutely necessary to always have problems with quality?”
“Through management commitment and quality improvement we are identifying and resolving our problems.”
“Defects prevention is a routine part of our operations.”
“We know why we do not have problems with quality.”
The working of the QMMG is discussed in the following section.

31
3.2.2.4 The working of the Quality Management Maturity Grid
The use of the QMMG to determine the quality maturity level is
explained by Crosby (1979: 31) finding that the correct use of the Grid’s
assessment result could encourage quality improvement.
According to Crosby (1979: 31), the first step is to ask the managers to
check the stage they think their operation is in for each of the six
measurement categories, and score it in accordance with Table 3.2.
The managers add up the score and obtain a result out of 25 providing
a quantifiable measure that represents a certain maturity level.
Table 3.2: Quality Management Maturity Grid Points Guide. (Source: Own Source Adopted from Crosby, 1979: 31)
Quality Management Maturity Grid Point Grid
Measurement Categories
Stage 1: Uncertainty
Stage 2: Awakening
Stage 3: Enlightenment
Stage 4: Wisdom
Stage 5: Certainty
Points Allocation
1 Point 2 Points 3 Points 4 Points 5 Points
The following section describes process maturity and shows at how it is
utilised.
3.2.3 Process maturity
The author seeks to understand a Process Maturity Model and
consulted literature on the subject that includes:
The description of the process maturity models.
Identifying the basic levels observed in a process maturity model.
Three ways to utilise maturity models.
3.2.3.1 Description of the Process Maturity Model
This section describes the Process Maturity Model. Paulk, Curtis,
Chrissis and Weber (s.a., Online) defines process maturity as: Process
maturity is the degree to which a particular process is well defined,
controlled, evaluated and successful.

32
According to Boutros and Purdie (2014: Online), a process maturity
model is a set of well-defined structured stages that explain how well
the practice, behavior and process of an organisation can consistently
produce the predetermined outcome. Jochem, Geers and Heinze
(2011: Online) consider the maturity model as a specific competency
model that point out various degrees of maturity.
Dijkman, Lammers, and De Jong (2015, Online) explain that Business
Process Management (BPM) is a contemporary management practice
centered on managing the organisations ‘business processes’. Pešić,
Milić and Anđelković (2012, Online), citing Oliveira, Ladeira and
McCormack (2012), describe BPM as a complete management
approach focused on identifying, defining, implementing, measuring
monitoring, analysing and continual improvement of business
processes. Maier, Moultrie and Clarkson (2012: Online) found that the
focus on quality management and process improvement programs often
encourage the organisations to assess their capability against
improvement frameworks.
3.2.3.2 The basic levels of process maturity models
Paulk, Curtis, Chrissis and Weber (s.a., Online), Song, Zhu, Danilovic
and Hoveskog (2011, Online) and Boutros and Purdie (2014: Online),
support the view of Humphrey (1987: Online), that the process maturity
model has five levels.
Figure 3.4 presents the basic process maturity levels. Pešić, Milić and
Anđelković (2012, Online) find that the models developed by
Rosemann and De Bruin (2004) include five factors influencing five
phases that an enterprise has to go through to improve the maturity of
the Business Process Management.

33
According to Rosemann and De Bruin (2005: Online), the BPM have
five maturity levels which is similar to Capability Maturity Model (CMM)
and are:
Initial Stage,
defined,
repeatable,
managed; and
optimised.
Figure 3.4: Five Levels of Process Maturity (Source: Own Source adopted from
Humphrey 1987: Online)
Figure 3.4 presents Humphrey’s (1987: Online) detailed description of
the five levels of a process maturity model are:
Initial: The process is not under statistical control; therefore, no
systematic process improvement is likely.
Repeatable: To achieve a process that is stable and repeatable,
statistical controlled; introduce accurate project management of
responsibilities, cost, schedule and changes.
Defined: The process definition is essential to assure consistent
implementation and to provide a foundation for better
comprehension of the process.
Managed: Subsequent to the defined phase, it is possible to start
process measurement. At this phase significant quality
improvement begins to emerge
Optimise: The measured process is the foundation for continuing
improvement and process Optimisation.
Level 1 - No organised processes
Level 2 - Some organised processes
Level 3 - Most processes organised
Level 4 - Processes are organised and
managed
Level 5 - Processes
are continuously
improved

34
With a basic understanding of the Quality Management Maturity Grid
and a Process Maturity Model, the following section focuses on the
three approaches used to utilise maturity models.
3.2.3.3 Three ways to utilise maturity models
De Bruin, Freeze, Kaulkarni and Rosemann (2005: Online) mention
that maturity models can be used as a descriptive, prescriptive or
comparative nature briefly described in the following text.
Descriptive Approach: According to De Bruin, Freeze, Kaulkarni and
Rosemann (2005: Online), the descriptive approach assists to
determine the current state of a process and makes no provision for
improvement. De Bruin, Freeze, Kaulkarni and Rosemann (2005:
Online) explain that a model is descriptive to gain a deeper
understanding of the current situation.
Prescriptive Approach: De Bruin, Freeze, Kaulkarni and Rosemann
(2005: Online) found that the prescriptive approach enables the
development of a roadmap for improvement. The prescriptive approach
enables repeatable improvement and with the understanding of the
current, “as is” situation (De Bruin, Freeze, Kaulkarni & Rosemann,
2005: Online).
Comparative Approach: De Bruin, Freeze, Kaulkarni and Rosemann
(2005: Online) explain that the comparative approach permits
benchmarking across industries, comparing similar practices across
various originations.
3.2.4 Continuous and Stage Representation of maturity models
This section review differences between two types of representations of
maturity models and present the advantages for each representation.
Shrum (1999: Online) mention continuous and staged representations
as two representation applied in the Capability Maturity Model (CMM).
35
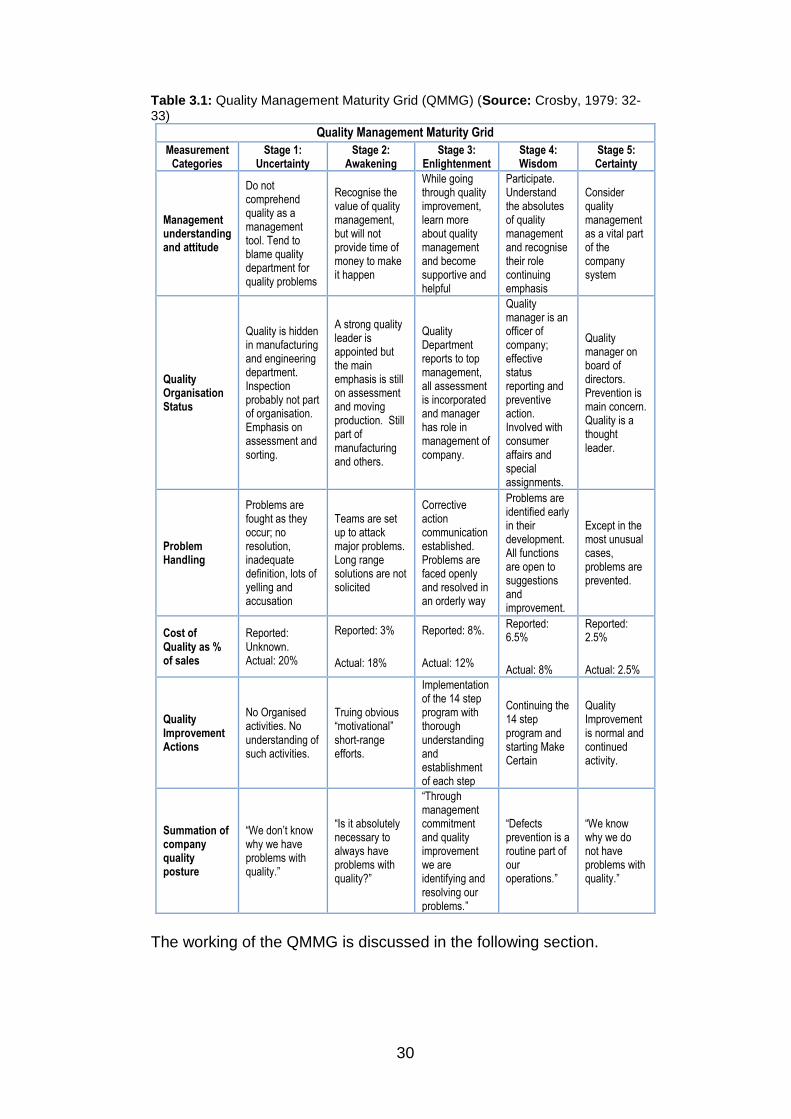
3.2.4.1 Continuous Representation
According to Cepeda (2005: Online), continuous representation uses
capability levels to measure an organisation’s process improvement.
Shrum (1999: Online) summarises the continuous representation as a
capability level applied to achieve process improvement in a specific
organisational process. Rungta (2007: Online) mention that continuous
representation is used by organisations that want to improve processes
most important to the need of the organisation. Rungta (2007: Online)
offers a second use of continuous representation stating that allows
organisations to improve the maturity of processes at different rates.
Rungta (2007: Online) point out that an organisation gains the best
value from selecting the continuous representation approach if they
know which processes require improvement.
According to Shrum (1999: Online), continuous representation has
specific process areas as summary component as shown in Figure 3.5.
The processes need specific practices to achieve predetermined goals
and generic practices that achieve generic goals. Each goal and
practice is linked to a specific capability level as seen in Figure 3.5
(Bourne & Tuffley, 2007: Online). Rungta (2007: Online) explains that
continuous representation enables an organisation to prove process
capability.
Figure 3.5: Maturity Models – Continuous Representation Vs Staged Representation (Source: Bourne & Tuffley, 2007: Online)

36
3.2.4.2 Staged Representation
Shrum (1999: Online) found that the staged representation is chosen
when an organisation needs to enhance the complete process
capability and observed several integrated process parts that require
improvement. Cepeda (2005: Online) mention that stage
representation makes use of maturity levels to measure an
organisation’s process improvement. Shrum (1999: Online)
summarises the staged representation as an approach to determine
process maturity level focus on the overall organisational process
improvement. Cepeda (2005: Online) explains that this approach uses
pre-determined process areas to define an organisation’s improvement
path.
According to Rungta (2007: Online), the stage representation matures
an organisation as a whole. Shrum (1999: Online) found that in staged
representation the summary elements are maturity levels with each
maturity level having its own process areas, goals and practices as
seen in Figure 3.6. Shrum (1999: Online) mention that the practices
are guides on what to do to achieve the goals for those specific process
areas.
Figure 3.6: Maturity Models – Staged Representation (Source: Bourne & Tuffley, 2007: Online)
OptimisedFocus on process improvement
Process measured and controlled
Process characterised for the organisation and is
proactive
Process characterised for projects and
is often reactive
Stage Representation
Performed
Managed
Defined
Quantitatively
Managed
Process unpredictable
poorly controlled and
reactive
5
4
3
2
1

37
The last part of this section reviews the advantages of the two
representations.
3.2.4.3 Advantages of Continuous and Staged Representations
Shrum (1999: Online) and Cepeda (2005: Online) find that each
representation has its advantages. Table 3.3 provides a combined list
of advantages for each representation as found by Shrum (1999:
Online) and Cepeda (2005: Online).
Table 3.3: Advantage of using each Model Representation (Source: Own Source adopted from Shrum: 1999: Online & Cepeda, 2005: Online)
Continuous Representation Staged Representation
Grants explicit freedom to select the order of improvement that best meets the organisation’s
business objectives
Enables organisations to have a predefined and proven path
Enables increased visibility into the capability achieved within each individual process area.
Builds on a relatively long history of use
Supports a focus on risks specific to individual process areas.
Case studies and data exist that show return on investment.
Affords a more direct comparison of process improvement to ISO 15504 because the
organisation of process areas is derived from 15504.
Permits comparisons across and among organisations.
Allows the generic practices from higher capability levels to be more evenly and completely applied to
all of the process areas.
Introduces a sequence of improvements, beginning with basic management practices and
progressing through successive levels, each serving as a foundation for the next
Maximum flexibility for prioritising process improvement and aligning it with the business
objectives.
Predefined and proven path with case study – reduce guesswork.
Enable increased visibility of improvement within process areas
Quick wins can be easily defined to increase buy-in. Increases focus on risk specific to each process
area
Focuses on organisational improvement
Improvement of processes can occur in different rates
Less upfront investment required
Overall results summarised in a Maturity Level
Provides familiar benchmarking capability
Considering the literature reviewed in this section, the author is of the
opinion that capability precedes maturity.

38
3.3 OUTAGE PROCESS
This section examines the basic outage process within the context of a
power station and:
Review the outage process.
Identify the critical elements of the outage process.
3.3.1 Define the outage process
The objective of this section is to understand the basic outage process
in the context of power station. The review of the basic outage process
seeks to:
explains the basic outage phases; and
reviews the Eskom outage process.
3.3.1.1 The universal outage process
The review of the basic outage process is derived from recognised
international bodies involved in power generation, and includes
Eskom’s definition on an outage.
Electric Power Research Institute (EPRI) (2006: Online), find that an
outage process consists of three phases and starts long before the
outage start date, and includes both budget and resource planning.
Outage improvement is greatly depended on attention paid to the
manner and timeliness of achieving set goals and objectives (EPRI
2006: Online).

39
The International Atomic Energy Agency (IAEA) (IAEA, 2002: Online)
supports the view of EPRI (2006: Online), acknowledging that the
outage process has three phases.
Figure 3.7: Universal outage process (Source: Own Source adopted from IAEA,
2002: Online)
The Eskom Outage process are in line with the IAEA (2002: Online)
outage process and includes the three phase of an outage as illustrate
in Figure 3.7. The review of the Eskom outage process follows.
3.3.1.2 Eskom outage process
This section briefly looks at the Eskom outage process and includes a
summary of the process.
The Eskom outage process represented Figure 3.8, consists of the
Planning phase, Execution Phase and the Post Outage Review phase
(Eskom Internal PCM 32-1312). The Eskom Outage Management
Department documented the outage processes in the Process Control
Manuals (PCM). The PCM’s documents the Outage planning,
execution and post outage review. The PCM focus on the planning and
execution of outages is the Conduct Planned Outages PCM (Eskom
Internal Document, 2015: 32-1312).
Outage Planning and Preparation
• Focus on planning and preparing all activities before and during the outage execution
Outage Execution
• Execute the outage accordance to the schedule, budget and safety requirements
Post Outage Review
• Review the entire planning and execution process
• Identify opportunities for improvement

40
Figure 3.8: Eskom Outage Process (Source: Own Source adopted from Eskom Internal PCM 32-1312)
The planning phase includes Outage Readiness Reviews (refer to
Chapter 2, section 2.4.2.2). Figure 3.8 indicate the pre-determined
outage readiness reviews required by the Outage Planning PCM.
Outage readiness reviews are conducted 18 Months prior to the start of
the outage. Then again at twelve months, nine months, six months,
three months and one month prior to the start of the outage.
The execution phase clearly state what should be managed during the
execution of an outage and includes scope growth, managing the cost,
quality and the critical path, monitoring outage execution and reporting
on progress, risk management and commissioning.
The post outage review phase focuses on post outage reviews for each
plan area, compile a post outage review reports, capture lessons learnt
and compile an effectiveness report.
The following section identifies characteristics of a good outage
process.
Outage Planning
• 18 Months prior to Outage Start: Outage Philosophy, Maintenance Strategy, Master Task List
• 12 Months prior to Outage Start: User Requirement Specification, Scope confirmed
• 9 Months prior to Outage Start: Scope confirmed, Identify Long Lead Material
• 6 Months prior to Outage Start: Scope freeze, Review status of Long Lead Items, Monitor Emergent Work
• 3 Months prior to Outage Start: Budget , Risk and Integrated Execution Schedule
• 1 Months prior to Outage Start: Stakeholder buy-in on Execution Schedule
Outage Execution
• Manage Outage Execution
• Manager Outage Scope Growth
• Manage Cost, Quality and Critical Path
• Monitor outage execution schedule and update/report progress
• Manage Risk
• Commision Plant
• Hand Over on completion of Outage
Post Outage Review
• Finalise Planned Outage
• Post Outage Review per Plant Area
• Compile a Post Outage Review Report
• Record Lessons Learnt
• Evaluate and Compile an effectiveness Report

41
3.3.2 Critical elements in outage processes
This sections search for the characteristics for a good outage process,
and look over literature commencing with the basic planning process.
According to Mauch (2010: Online), the planning process offers
uniformity of purpose and direction of the actions required to
accomplish the department goals. Holpp (1999: Online) mention that
the guidelines for success in planning requires some measurement of
the progress, identify difficulties, goal setting, decisions concerning
actions, put the plans to work continuous evaluation of the situation and
a focus on success.
Boutros and Purdie (2014: Online) found that advancing the objectives
of an organisation requires some sort of structure plan, called strategic
planning. The senior leaders, managers, and required process owners
determine the strengths, weaknesses, opportunities and threats
(Boutros & Purdie, 2014: Online).
The IAEA (IAEA, 2002: Online) provides a detailed description of the
three phases of outages in some detail:
Outage Planning and Preparation: Consists of all activities
before and during outage execution and includes co-ordination of
resource, regulatory, safety and technical requirements and
scheduling.
Outage Execution: Execute the outage accordance to the
schedule, budget and good industrial safety performance, to
ensure the next cycle is disturbance free.
Post Outage Review: Review the entire process to evaluate the
completed work and provide feedback to improve the next
outages.
According to the IAEA (IAEA, 2006: Online), an outage is part of the
normal operation of a power station and are integrated into the power
station business processes.

42
The IAEA (IAEA, 2006: Online) recommend that a monitoring method
for outages be used that tracks all critical and fundamental activities
and due dates in every phase of the outage.
The outage process should meet the required business objectives if
these characteristics are included. The following section focuses on
outage planning.
3.4 OUTAGE PLANNING
The Outage Planning section focuses on the planning phase of the
outage process and assimilates to the Juran’s Quality Planning Phase,
which is to define the scope, goals, objectives, processes and
improvement actions. Say what you are doing to do. This section goes
through:
Quality planning.
Outage organistion.
Outage process readiness.
Outage planning.
Outage management plan.
Scope development.
3.4.1 Quality planning
The objective of this section is to understand the quality planning
process and identify the phases that enable quality improvement. The
approach reviews various improvement approaches, identify, and
compare similarities within the improvement phases. The review
includes:
Brief definition of Quality Improvement.
Juran Trilogy.
Quality Improvement by Plan, Do, Study, Act (PDSA) and Plan,
Do, Check, Act (PDCA) Models.
The Six Sigma (DMAIC) approach.
Comparison of the above mentioned approaches.

43
3.4.1.1 Define quality improvement
This section briefly seeks definitions for quality improvement. The
review considers definitions by a few authors starting with a view
expressed by Juran and De Feo (2010: Online).
According to Juran and De Feo (2010: Online), defining and agreeing
on the meaning of the word quality within an organisation assists in
knowing how to manage “it”. They further point out that if one can
manage it, one can fulfill the customer requirements. The organisation
cannot manage quality if it does not share a common meaning of the
quality term (Juran and De Feo, 2010: Online).
Boutros and Purdie (2014: Online) explain that process or quality
improvement is a continuous effort to enhance services, products and
processes with the aim of meeting new goals and objectives. Grutter
(2010: 285) defines process improvement as a systematic identification
and removal of waste in a process. Gryna (2001: 51) describes quality
improvement as verifying the need and mission of the improvement
project, diagnosing the causes, and a providing solution. Juran and De
Feo (2010: Online) mention that quality is a moving target with aim to
the improvement process driven by a business plan which includes
goals for improvement.
Boutros and Purdie (2014: Online) assert that the most vital element to
successful process improvement is to ensure that participants are
trained in their discipline, they understand the critical interfaces with
other departments and understand the basic terminology. This
approach helps in reducing communication gaps, while speeding up
execution efforts. The World Health Organisation (2009: Online) found
that the important principle underpinning quality improvement focused
on quality throughout the entire process and not as something
completed at the end of the line.

44
Grutter (2010: 288) identifies helpful techniques for process
improvement and includes:
Collection of information concerning what is really happening.
Analysis of the information collected to comprehend the root
causes.
Recommends actions to correct causes.
The following section focuses on various quality improvement
approaches starting with the review of the Juran Trilogy and its
contribution to quality improvement.
3.4.1.2 Juran Trilogy
The focus in this section is on the Juran Trilogy. The review provides
an overview of the Juran Trilogy and seeks to identify the elements
included in the improvement phase.
Tcherpokov and Foster (2006: Online) found that the Juran Trilogy is a
universal, systematic approach to quality. Tcherpokov and Foster
(2006: Online) point out that the Trilogy has a universal application to
any process and consists of three consecutive and logical activity
groups, quality planning, quality control and quality improvement.
According to Juran (1999: Online), a number of projects executed
during the 1980’s and 1990’s prove that quality improvement is
applicable to the service industry, manufacturing industry, business and
manufacturing processes, support activities and software and hardware
industries. The quality improvement process is a structured approach
and should be executed as improvement projects. The organisation will
select a team to execute the projects. The project team should be
suitably trained and have the required resources and equipment to
execute the project.
De Feo and Juran (2014: Online) suggest that the Juran Trilogy holds
the core managerial processes that an organisation requires to manage
quality; planning, control and improvement. Tcherpokov and Foster

45
(2006: Online) support the view expressed by De Feo and Juran (2014:
Online) and point out that the processes in the Juran Trilogy are
performed by top and middle management.
Juran’s Trilogy shown in Table 3.4 provides the details in the quality
planning, control and improvement phases.
Table 3.4: Managing for Quality (Source: Defeo & Juran, 2014: Online)
Quality Planning Quality Control Quality Improvement
Establish Goals Determine the control subjects Prove the need with a business case
Identify who the customers are Measure actual performance Establish a project infrastructure
Determine the needs of the customer
Compare actual performance to targets and goals
Identify the improvement projects
Develop features which respond to customers’ needs
Take action on the difference Establish the project team
Develop process able to produce the product
Continue to measure and maintain performance
Provide the team with resources, training and motivation to Diagnose the causes and Stimulate remedies
Establish process controls Establish controls to hold the gains
Transfer the plan to operating forces
Tcherpokov and Foster (2006: Online), citing Juran and Gibbons
further explain the Juran Trilogy:
Quality Planning: Creating a process with the ability to meet the
well-known objectives and to do so under operating conditions.
Quality Control: The management process used to assess
factual performance, comparing real performance to objectives
and take action on the difference.
Quality Improvement: Is a well thought out formation of positive
adjustment, the realisation of unparalleled levels of performance.
The final task is to institute controls to maintain the gains. Juran (1999:
Online) find that there is no mention of general improvement and
pointed out that improvements take place project by project.
Tcherpokov and Foster (2006: Online) emphasise the importance of
the control phase and ascribe this responsibility to top and middle
management.

46
The following section considers the Plan, DO, Check, Act (PDCA) cycle
developed by Deming.
3.4.1.3 Plan, Do, Check Act (PDCA) Model
The review focuses on the PDCA model then evaluates and describes
each phase the models.
Grutter (2010: 285) refers to Walter Shewhart as the one who originally
proposed the Plan, Do, Check and Act (PDCA) cycle and Edward
Deming is responsible for its further development. Many process
improvement methods are based on the PDCA model. The South
African National Standard (SANS 9001: 2008: Online) suggest the
implementation of a process approach to develop, implement and
improve quality management systems. The model for process-based
quality management is the Plan-Do-Check-Act (PDCA) model (SANS
9001: 2008, Online).
The SANS 9001: 2008 (SANS 9001: 2008: Online) describe process
steps of the PDCA model include:
Plan: Establish the required processes and goals.
Do: Carry out the process.
Check: Measure and keep an eye on the process and product and
assess it against the policy, objective and product requirement and
report the result.
Act: Take action that would continuously improve the process
performance.
Wilson (2015: Online) agrees with Knowles (2012: Online), and
contend that the Plan, Do, Check portion of the PDCA model adopts a
scientific approach and enables continuous improvement when going
into the Act stage of the model. Wilson (2015: Online) further explains
that Act means a thoughtful action which includes careful consideration
to act or not to act.

47
Wilson (2015: Online) conclude that the Act stage could focus on the
results of the Plan, Do, Check stages or focus on the means (skills,
techniques and tactics) used to achieve the results.
The following quality improvement approach also follows a structured
approach and includes planning or defining, measurement, analysis and
control to achieve quality improvement. The following section
discusses the Six Sigma or DMAIC approach to quality improvement.
3.4.1.4 The Six Sigma (DMAIC) approach
The Six Sigma approach, like the Juran Trilogy and the PDCA model
follows a structured approach to achieve improvement. The section
reviews the Six Sigma approach and unpacks the DMAIC phases.
According to Cavinato, Flynn and Kauffman (2006: Online), the
implementation of Six Sigma projects are called DMAIC; define,
measure, analyse, improve and control. Grutter (2010: 278) explains
that Six Sigma derive its name from the goal to achieve a high enough
process capability so that the process variability is low enough for three
standard deviations on both sides of the target value. Table 3.5
provides the requirements and brief explanation for each of the DMAIC
phases.
Table 3.5: DMAIC Project Structure (Source: Own Source adopted from Cavinato, Flynn & Kauffman, 2006: Online)
DMAIC Phase Phase Requirement
Define Clearly define what needs to be improved
Measure Measure the baseline performance of the process.
Define the process flow
Measure the process capability
Evaluate the measurement system
Analysis Analysis the data
Development of an improvement plan
Improve Improvement are made to the current process and measured for success
Control A control plan is put in place to sustain improvements
48
The measurement phase in Table 3.5 in the Six Sigma approach
enables the measurement of the process capability. According to Juran
and De Feo (2010: Online), measurements were developed to enable
senior managers to monitor the organisations ability to meet customer
requirements and quality improvement. Juran and De Feo (2010,
Online) resolve that managing for quality is the senior managers
responsibility and certain responsibilities were not delegated.
Table 3.5 shows the analysis phase to include data analysis and the
development of an improvement plan. This means that improvement
requires planning and supports Wilson’s (2015: Online) view of the
requirement of thoughtful action. The last two phases of the DMAIC
approach are the Improve and Control phases. The Improvement
phase focuses on improvement of current processes and the
measurement of success. The Control phase is developed and put in
place to ensure that the improvements are sustained.
The review of the Six Sigma approach to quality improvement follows a
structured approach much similar to the Juran Trilogy and PDCA
model. The following section considers the Six Sigma (DMAIC), Juran
Trilogy, and PDCA approaches described in ISO 9001:2008 and
compares the models to identify similarities.
3.4.1.5 Comparison of the above mentioned approached
This section compares the quality improvement approaches discussed
in the previous sections to identify the phases of quality improvement.
The review identifies the phases of each approach and draws
comparisons and similarities of the three approaches. Table 3.6
identifies and compares phases for quality improvement to identify any
common elements to quality improvements.

49
Table 3.6: Comparing Quality Improvement Phases (Source: Own Source)
Improvement Approach
Phase 1 Phase 2 Phase 3 Phase 4 Phase 5
Juran Trilogy
Motivate the need for a project & define scope
Diagnose the causes
Simulate the remedy
Establish the controls to maintain the gains
Six Sigma (DMAIC)
Define
Clearly define what needs to be improved
Measure
Measure process baseline performance
Define process flow
Measure process capability
Evaluate measurement system
Analysis
Analysis data
Develop an improvement plan
Improve
Improvement are made to the current process and measured for success
Control
Put a control plan in place to sustain the improvement
PDCA
Plan
Establish required processes & objectives
Do
Implement the process
Check
Monitor & measure against requirements
Report results
Act
Take action to continuously improve the process performance
The improvement approaches in Table 3.6 identified a common theme
of Plan, Do, Check and Improve in the three approaches. Table 3.7
summarises the general theme of Juran Trilogy, Six Sigma and PDCA
approaches. The Plan, Do, Check, Improvement approach is shown in
Table 3.7.
Table 3.7: Plan-Do-Check-Improve Model (Source: Own Source)
Improvement Approach
Plan Do Check Improve
PDCI
Define the scope, goals, objectives,
process and actions
Implement the predetermined actions and record outcome against goals and
objectives
Analyse the results, determine the effectiveness
against of the action compared to the
goals and objectives
Establish suitable controls to sustain the improvement
gained while seeking new
improvements opportunities.
Goldstein’s (2006: Online) statement state; say what you going to do,
do what you said you will do, prove that you did it and then improve it.

50
The author’s rendition of Goldstein’s statement in the PDCI context
reads:
Plan: Say what you going to do.
Do: Do what you said you going to do.
Check: Prove that you did it.
Improve: Improve it.
The important elements required to achieve process improvement
follows a structured approach, have clean goals and objectives,
measure and analyse the results, identify, establish and implement
control to maintain the improvement.
3.4.2 Outage organisation
The literature published on the outage process is limited. From the
literature that was sourced the following significant conclusions can be
drawn.
Feigenbaum (s.a., Online), states that an organisational structures
within a company defines the roles and departments that make up the
function and show how the organisations fit together. Feigenbaum
(s.a., Online) find that understanding the organisational structure allows
staff to perform their roles, feel secure and enable people to work
together. Feigenbaum (s.a., Online) mention that job descriptions help
staff identify the scope, limits and functions of their roles and clearly
indicate what tasks and outcomes are their responsibilities.
Organisation structures aim to ensure that every function and task has
someone allocated to perform the task, minimising the possibility of
duplication and unnecessary overlap (Feigenbaum, s.a.: Online).
Bashir (2011: Online), mentions that an organisation should have
administrative procedures that define the organisation, responsibilities
and processes for preparing, executing and cost of outages. Kovan
(2005: Online) found a number of people and organisations within the
power station working together to plan an outage. Bashir (2011,

51
Online) mention that the required interfaces between the different
groups and contractors be defined to ensure focus on safety, quality,
scheduling activities and coordination is maintained between the
applicable stakeholders.
Bashir (2011: Online) suggests that the key outage management staff
be identified and appoint 11 months prior to the start of an outage.
Kovan (2005, online) mentions that the groups that form part of the
outage organisation range from and include support groups that include
the unit managers and specialists, outage control and coordination,
operating, training, modifications, quality control, maintenance planning,
projects and design, mechanical, instrumentation and control and
electrical maintenance and area services and logistics. Bashir (2011:
Online) explains that the Outage execution organisation should be
established five to six months before the start of the outage.
Kovan (2005: Online), emphasise that the planning, coordinating and
monitoring of outages are the responsibility of the plant personnel.
Kovan (2005: Online) provides a detailed diagram known as the
Controlling model that provides person’s responsible and their area of
responsibility along with an organisational chart with the same details
as the Controlling model. Kovan (2005: Online) explains that the
outage meetings are chaired by the Outage and Project Group that
involves about 25 to 30 people. These people represent technology,
safety, operations, maintenance and security.
The important element of an organisation is that every person should
understand their role and responsibility. Hessler (2011: Online) point
out that management personnel with solid outage experience are in
short supply and mentioned two reasons. The first is due to the
retirement of older managers along with a lack of successors to create
a new pipeline of possible replacement for older manager. The second
reason is the short supply is due to experienced staff moving on to seek
greener pastures.

52
Hessler (2011: Online) maintain that the organisation should ensure
that the person charged with executing the outage should have the skill
level.
3.4.3 Outage process readiness
As stated by Boutros and Purdie (2014: Online), a process is set of
activities that uses people, tools and systems to convert inputs into
value-added outputs. Gryna (2001:143) defines a process as a group
of actions that transforms inputs into results or outputs. Singh and
Singh (2015: Online) observe that a process approach is when the
desired result or outcome is realised more effectively when related
actions and resources are managed as a process. Defoe and Juran
(2014: Online) explain that a business process includes the logical
organisation of information, equipment, energy, materials and people
into work actions intended to yield a necessary product or service.
3.4.3.1 International outage readiness practice
This section briefly explores Outage Readiness practice, identifies when
outage planning should comment and determine the purpose of the
Outage Readiness Index.
Drew (2015: Online) point to an Outage Readiness Index (ORI) as a
instrument to examine the readiness and progress of the outage one
year prior to when the outage starts. Hessler (2011: Online) refers to
an approach to determine outage readiness by scoring a process to aid
in establishing the potential success. Hessler (2011: Online) continues
by stating that this is done by identifying the items critical to the outage
start and rating its preparedness. The items are weighted according to
importance and their impact on the outage readiness is calculated
based on the individual rating with a ORI target score is 84% (Hessler
,2011: Online). Sanders and Cook (s.a. Online) see the readiness
review as an effective method to ensure that all employees involved in
outage planning and execution understand the outage goals and the

53
plan set out to achieve the goals. Drew (2015: Online) point out that a
good ORI process reduces the number of surprises by ensuring that
actions are complete on time and during discussions the identified risk
is evaluated.
Sanders and Cook (s.a. Online) recommend that the supervisors and
the contractors be included in the readiness reviews as it lays the
foundation for a successful outage. Drew (2015: Online) point out that
progress meetings should be planned, responsibilities should be
assigned and the delivery schedule should be reviewed.
3.4.3.2 Eskom’s outage readiness approach
The Outage Readiness Indicator (ORI) is a standard approach to
evaluate the readiness of an outage at predetermined stages prior to its
start (Eskom Internal Standard 240-47532542: 2013:4).
According to the Eskom Outage Readiness Standard (Eskom Internal
Standard 240-47532542: 2013:4), the ORI is defined as the standard
approach to evaluate the readiness of an outage at predetermined
stages prior to its start. The outage planning process starts 24 months
prior to the start of an outage (Eskom Internal Standard 240-47532542:
2013:4). The ORI standard further establishes a 90 percent ORI
readiness score prior outage execution (Eskom Internal Standard 240-
47532542: 2013:4). Hessler (2011: Online), concludes that a good
outage readiness is the key to achieving a successful outage.
3.4.4 Outage planning
According to the IAEA (2006: Online), an outage management indicator
should be used to continuously monitor and evaluate the outage
planning and execution processes. IAEA (2006: Online) found that a
planned outage are effective when it meets amongst other
requirements: no significant unscheduled events, least impact on
personnel, optimising the work scope, adherence to the schedule, no

54
re-work, and effective usage of material, human and financial
resources.
McMahon (2015: Online) found that experienced contractors could
assist in pre-outage planning to ensure that activities are managed well.
McMahon (2015: Online) point out that contractors can add further
value to the pre-outage planning if they are thorough and develop
predictable work plans.
When considering the planning of outage activities Bashir (2011:
Online) recommends that the following assessment be made. Assess
the required manpower, the activity duration, spares and materials or
consumables required for the task, cost, procedures, training, special
tools and equipment as well as pre- and post-maintenance testing,
foreign material exclusion (FME) and temporary services and facilities.
Bashir (2011: Online) also mentions the importance of Quality
Assurance audits and surveillance activities.
Kovan (2005: Online) mentions monthly outage meetings which starts
ten months prior to the start of the outage. These meeting are chaired
by the head of Outages and Projects and involves about thirty people
representing the main units, technology or engineering, safety,
operating, maintenance and security. The content of these meetings
include:
Discuss the main work with the people in charge.
The planning in all maintenance groups and the degree of
readiness of the design work.
Status of the manufactured spare parts.
Special tools and equipment.
Selection and availability of contractors.
New work orders pertaining to the critical path or activities
affecting the total outage duration.
The following year’s outages.

55
Spring (2010: Online) supports the view of Drew (2010: Online), finding
that the site team and its internal support should start with outage
planning a least 12 months in advance. Spring (2010: Online),
mentioned that some outages types may require outage planning to
start up to 24 months prior to the execution date. Bashir (2011:
Online), expresses the opinion that outage preparation work should
start 12 months before the outage starts. The IAEA (2006: Online),
found that an important element of outage planning is identifying and
monitoring pre-outage indicators.
3.4.5 Outage management plan
Hessler (2011: Online) highlight the following challenges experienced
during the outage planning process:
Pre-Outage Milestones: The milestone verifies if the scope cut-
off dates were established and adhered to, if the budget is
approved, if lessons from previous outages were reviewed, does
the schedule include resources and are the activity logic ties
completed and were the outage readiness reviews completed.
Labour Resources: The labour forming the heart of an outage in
fossil and nuclear power station outages and requires very
specialised skills.
3.4.6 Scope development
EPRI (2006: Online) explains that the anticipated scope for inclusion
into an outage ranges from inspections, testing and operations date
collection, monitoring the performance of equipment, corrective action,
cost and follow up reports, retaining and accessing historical data and
the initial planning steps for the coming outage.
Bashir (2011: Online) and Shahi (s.a.: Online) share the view that the
outage scope should be frozen six months prior to the start of the
outage. Drew (2015: Online), also mentions a best practice; where
every year starts with a Maintenance Technology Meeting where the

56
outage scope of 43 power plants are discussed for the outages due in
the next year and a budget allocated.
Sanders and Cook (s.a., Online) say that effective, data-driven
preventative maintenance (PM) programs leads to more reliable plant
performance and reduces emergent work that requires repairs. Shahi
(s.a.: Online) find that the scope which should be derived from the
Work Orders with Task List, ought to clearly define the labor, material,
equipment and permit that would be required. IAEA (2006: Online)
point to scope of outage work as a possible indictor to measure during
the planning phase and includes work requests, work orders and
packages and permits to complete the work. (Shahi, s.a.: Online)
observes that the collections of Work Orders and Task Lists are used to
calculate the budget. Shahi (s.a.: Online) recommend that all
stakeholders be involved early in the process to minimise any risk while
reducing changes to the scope.
3.5 OUTAGE CONTROL
The Outage control section focuses on the execution phase of the
outage process and assimilates to the Juran’s Quality-Control Phase.
Do Phase focuses on implementing the predetermined actions and
measurement of the outcome. Do what you said you going to do and
prove it.
McMahon (2015: Online) contest that effective execution of outages is
challenging and requires years of experience and the proper resources
ensure that the outage work stay within budget and on schedule. The
IAEA (2006: Online) emphasise the importance of tight controls of the
work and good communication between the team member when an
outage starts. The section reviews:
Outage schedule.
Scope management.
Outage progress monitoring.
Outage work orders.

57
3.5.1 Outage schedule
McMahon (2015: Online) point to an old project management adage
that says ‘plan the work and work the plan’. This approach to plan the
work then work the plan is important to ensure an outage is completed
on time. McMahon (2015: Online), finds the practice simple but
difficult.
Bashir (2011: Online) point out that the level 1 and 2 outage execution
schedule should be developed one month prior the start of the outage.
The Level 1 schedule provides the detailed sub-activities for the critical
path while the Level 2 schedule provides the implementation schedule
for all the outage jobs, which includes all the maintenance activities,
modifications and tests. The required pre-outage work should be
completed 15 days prior the start of the outage (Bashir, 2011: Online).
According to Canada’s Nuclear Regulator’s Maintenance Program for
Nuclear Power Plants (NPP) of 2012 (2012: Online), all the groups are
required to review the outage plan in the areas they are responsible for.
McMahon (2015: Online) supports the view by Canada’s Nuclear
Regulator’s Maintenance Program for NPP highlighting the importance
of effective partnerships between the plant team and the contractor.
Kovan (2005: Online) considers process logic as a basic priority of
outage planning. The process logic is used to devise effective overall
outage duration. The process logic diagram shows the outage process
with all the outage activities and can assist staff to see that the work is
completed at an appropriate time.
3.5.2 Scope management
According to the IAEA (2006: Online), work scope stability is a metric to
measure work planning effectiveness. Kovan (2005: Online) presents
a practice used in Loviisa Power Plant (USA) when problems occur.

58
If a problem poses a threat to the outage or is so significant that the line
organisation cannot resolve it, the Outage Support Group gets involved.
This is a multi-disciplined group focused on problem solving.
3.5.3 Outage progress monitoring
According to EPRI (2004: Online), How smoothly the outage progress
will be a reflection of how well it was planned. The outage execution
indicators assess the outage progress and monitor the schedule
adherence while this technique enables effective outage management
and decision-making (IAEA, 2006: Online).
Bashir (2011: Online) point out that measuring outage progress should
include:
Daily outage coordination meetings.
Daily planning meetings.
Daily progress meetings.
Weekly progress meetings.
Canada’s Nuclear Regulator’s Maintenance Program for Nuclear Power
Plants of 2012 (2012: Online), recommends that the organisation
ensure that effective communication is exercised between the work
groups. The IAEA (2004: Online) propose daily meetings and action
lists as a means to coordinate work. The outage manager should
conduct the meeting and the planning group should maintain the action
list (IAEA, 2004: Online).
Kovan (2005: Online) shares a practice used at Loviisa Power Plant;
meetings are held twice a week and involve the same people that were
involved in the outage-planning phase. During the meetings the actual
conditions on the plant are compared to the outage process logic and
the main work progress is reviewed. The line managers which include
operations, mechanical maintenance, instrumentation and control and
electrical provide short explanations in response to the outage process
logic and an update of the progress of the work orders that have been

59
issued, finished and not started. Allowance are made for the review of
the work and schedules.
Bashir (2011: Online) also recommends that the outage schedule
should be updated on a daily basis and a three day rolling schedule be
issued daily. Kovan (2005: Online) mention that all preventative and
corrective maintenance as well as periodic testing should be completed
within a specific scheduled period.
3.5.4 Outage work orders
According to the Canada’s Nuclear Regulator’s Maintenance Program
for Nuclear Power Plants (2012: Online), maintenance activities should
be evaluated to ensure that the relevant maintenance activities are
complete and that the work is completed by appropriately qualified staff.
Kovan (2005: Online) found that the main activities in an outage are
made up of work packages. Time information in the work packages is
transferred to the work order system; this ensures that all outage
activities have planned start and finish dates. When the work packages
are completed, filed in the computerised maintenance management
system. Kovan (2005: Online) explains that all work orders are
checked and printed along with the work package isolation
requirements.
3.6 OUTAGE IMPROVEMENT
The Outage Improvement section focuses on the improvement phase of
the outage process and assimilates to the Juran’s Quality-Improvement
Phase. The Improvement Phase focuses on the analysis the results to
determine its effectiveness and the establishment suitable controls to
sustain the improvement gains while seeking new improvement
opportunities. The review focuses on:
Post outage reviews.
Outage risk.

60
3.6.1 Post outage review
According to the IAEA (2006: Online), the post-outage reviews are
applied to the entire outage process with the aim to recognise and
consider likely risks in future outages.
Bashir (2011: Online) put emphasis on outage follow-up experience
feedback reports from the work organisations and the contractors,
critique meetings that captured problems encountered and lessons
learnt. McMahon (2015: Online) found the benefits from a post outage
review on completion of the outage when the contractor and the outage
team reviews the performance indicators and identify good practices
and areas for improvement. McMahon (2015: Online) explains that
both parties will gain a significant advantage in future outages when
they incorporate good practices and address the areas for
improvement.
Bashir (2011: Online) point out information that should be included in
an outage report and includes:
The outage preparation and execution,
outage job statistics, major work completed, compare planned
versus achieved outage goals,
objectives, critical path milestone,
major problems experienced and the corrective actions taken; and
any good practices and lessons learned.
Kovan (2005: Online) recommends that the experience and lessons
learned are collected and captured in a report directly after every
outage to provide information and feedback required to update the
Computerised Maintenance Management System (CMMS).

61
Canada’s Nuclear Regulator’s Maintenance Program for Nuclear Power
Plants (2012: Online) assert that the organisation should establish an
assessment process to review and continuously improve the
maintenance program to ensure effectiveness of the maintenance
strategy and integrate any improvement into the maintenance-training
program.
3.6.2 Outage risk
According to Canada’s Nuclear Regulator’s Maintenance Program for
Nuclear Power Plants (2012: Online), activities that form part of the
outage planning include developing written contingency plans to
manage recall times. According to Hessler (2011: Online), outage risk
assessment is not only an improvement tool but can be used as an
outage readiness indicator.
Hessler (2011: Online) employ a formal, documented question and
answer process. The team meets several months prior to the start of
the outage for a period of up to two days to consider a generic list of
outage risks or obstacles. With the assistance of a trained facilitator,
the team considers the outage risk and brainstorm to identify possible
issues and then capture the risks and issues in a document, considers
its impact, and completes a severity and probability analysis raking the
issues. The issues are identified during the team meeting is addressed
one at a time.
A mitigation plan is developed detailing each issue and a specific
person selected to take ownership for resolving the issue. The owner
provides a target date for resolution of the issue. The team repeats the
assessment process before the outage starts verifying that the identified
issues were resolved or that the issues have a workable mitigation plan.

62
3.7 MEASUREMENT INSTRUMENT TO DETERMINE OUTAGE
MATURITY LEVEL
This section concentrates identifying a measurement instrument to
determine the outage process maturity and focus on:
the Business Process Management Maturity Model,
the Maintenance Planning and Scheduling Maturity Matrix; and
Outage Management Maturity Framework.
3.7.1 Business Process Maturity Model
The Business Process Management Maturity Model in Figure 3.9 has
five maturity levels known as the Stage and six elements known as the
Factor and Scope (Rosemann and de Bruin: s.a., Online). The Stage
describes the process maturity levels and the Scope comprises the
information on the organisation, its divisions and a time element. This
model permits for analysis across the models factors and the stages as
well as the scope. Therefore, the maturity level of each element can be
presented individually, or per division within the organisation and at a
particular point in time. The Scope of the model focuses on Strategic
Alignment, Governance, Methods, Information Technology or
Information Systems, People and Culture. The Business Process
Management Maturity Model then presents the maturity level of the
organisation based on the models Scope.

63
Figure 3.9: Business Process Management Maturity Model (Source: Rosemann and de Bruin (s.a., Online)
While the scope of the Business Process Management Maturity Model
does not address an outage process, the model’s structure proves
valuable as it presents the maturity level across various departments at
a specific point in time.
3.7.2 Maintenance Planning and Scheduling Maturity Matrix
Smith (2013: Online) developed the Maintenance Planning and
Scheduling Maturity Matrix, a grid type maturity model when applied to
determine the Planning and Scheduling maturity. The Maintenance
Planning and Scheduling Maturity Matrix have five levels and three
main elements (See Appendix C):
Outage planning
work control; and
metrics / scorecards.
The three main elements have sub-elements as shown in Table 3.8.
The Outage Planning element is divided into four sub-elements; the
Work Control and the Metrics/Scorecard element both have six sub-
CoverageProficiency
Str
ate
gic
Alig
nm
ent
Govern
ance
5 Optimised
4 Managed
3 Repeated
2 Defined
1 Initial
Stage
Meth
od
IT/I
S
People
Culture
Key
Org
anis
ation
Div
isio
n B
Tim
e
Poin
t of
Tim
e A
Poin
t of
Tim
e B
Div
isio
n A
Stage

64
elements. A detail of the Planning and Scheduling Maturity Matrix is in
Appendix B.
Table 3.8: Maintenance Planning and Scheduling Maturity Matrix (Source: Own Source adopted from Smith, 2013: Online)
Main Element
Outage Planning Work Control Metrics/Scorecard
Su
b-E
lem
ents
Outage Organisation.
Single Outage Plan. Risk Analysis. Outage Processes.
Work Requests. Work Order Prioritisation. Work Order Usage. Work Order Status. Work Order Close Out. Backlog Management and
Measurement. Work Order History.
% Planned vs Unplanned
Ready Backlog Wrench/Tool Time % Estimated vs Actual
Hours % Available Labor
Scheduled Schedule Compliance
The Maintenance Planning and Scheduling Maturity Matrix developed
by Smith (2013: Online), focuses on the elements seen in Table 3.8.
The literature review identified additional characteristics important to
outage planning as found by Kister (2009: Online), Shahi (s.a.:
Online), Spring (2010, Online), Drew (2015: Online) and Sanders and
Cook (s.a., Online). The following section includes the findings from
the literature review as inputs to developing an Outage Management
Maturity Framework.
3.7.3 Outage Management Maturity Framework
The aim of this section is to develop an Outage Management Maturity
Framework (OMMF). The framework is based on Smith’s (2013:
Online) Maintenance Planning and Scheduling Maturity Matrix and the
Business Process Management Maturity Rosemann and de Bruin (s.a.,
Online).
The author expands on Smith’s framework by including the outage
characteristics seen as important by Kister (2009: Online), Shahi (s.a.:
Online), Spring (2010, Online), Drew (2015: Online) and Sanders and
Cook (s.a., Online). The Outage Management Maturity Framework
seen in Figure 3.10 has five levels of maturity and twelve elements.

65
Each element has a detailed description at each level of maturity (see
Appendix A).
Figure 3.10: Outage Management Maturity Framework (Source: Own Source adopted from Rosemann and de Bruin (s.a., Online) and Smith, 2013: Online)
The Outage Management Maturity Framework is made up of three
sections. The Framework presented in Figure 3.10 is the first part. The
second section is the Outage Management Maturity Framework Criteria
shown in Appendix A and the final section is the survey questionnaire
with determined questions (Section 4.6) and statements based on the
context of Appendix A. It is vital to state that the maturity level of the
outage process is determined based on the staff’s perception.
The OMMF is the instrument developed assist the outage management
organisation to determine the current maturity level of the outage
management process. The initial assessment will enable the Outage
Management Department to determine baseline maturity level. The
OMMF enables improvement of the organisation in the twelve elements
by investigating the elements with low maturity levels, identify the gaps
that if closed will move the process to the following maturity level,
Level 5
Level 4
Level 3
Level 2
Level 1
3.
Ou
tag
e P
lan
nin
g
4.
Ou
tag
e S
co
pe
De
ve
lop
me
nt
5.
Sc
op
e M
an
ag
em
en
t
6.
Ou
tag
e P
rog
res
s
7.
Sin
gle
Ou
tag
e P
lan
Mid
dle
Ma
na
ge
me
nt
Ba
rga
inin
g U
nit
Ma
turi
ty L
ev
els
(P
ers
pe
cti
ve
)
Sc
op
e
Maturity Elements
Po
we
r S
tati
on
No
1
Po
we
r S
tati
on
No
2
Ex
ec
uti
ve
12
. R
isk
An
aly
sis
Org
an
isa
tio
n
8.
Ou
tag
e W
ork
Ord
er
Us
ag
e
9.
Wo
rk O
rde
r C
los
eo
ut
10
. W
ork
Ord
er–
Co
ord
ina
tio
n
11
. S
ch
ed
ule
Ad
he
ren
ce
1.
Ou
tag
e O
rga
nis
ati
on
2.
Ou
tag
e P
roc
es
s

66
develop a corrective action plan, implement actions and reassess the
element to verify increased maturity. Tables 3.9 to 3.20 provide the
detail for each of the twelve maturity elements.
Table 3.9 focuses on the Outage Organisation and seeks to determine
if the outage organisation is fully integrated, roles and responsibilities
defined, the organisation is working as a team, adhering to processes
and checks for evidence of seamless communication and decision-
making.
Table 3.9: Outage Organisation (Source: Own Source adopted from Smith, 2013: Online)
Ele
men
t
Level 1 – Not Engaged
Level 2 – Experimenting
Level 3 – Enlightened
Level 4 – Good Practice
Level 5 – Best Practice
1. O
uta
ge
Org
anis
atio
n
No formal outage organisation defined. Decisions regarding outages are made by individuals, independent of the big picture.
Outage leader implied by job title, but authority and centralisation of communication and leadership not recognised. Still a high degree of individual decision making with no coordination to the big picture
Outage leadership role defined with responsibilities for communication and decision making. Organisation not further defined. Leader is tied to a high number of decision making, resulting in slow progress and independent decision making with no coordination to the big picture
Formal Outage organisation with responsibilities defined for areas such as materials management, safety, mobile equipment, contractor interface and overhaul outage leadership. Team still challenged with communication gaps, delaying decisions and progress
Fully integrated outage organisation with specific roles and responsibilities defined. Clear evidence that this team works in a cooperative manner and adhere to processes. Communication and decision making is largely seamless
Table 3.10 focuses on Outage Processes and conclude if the outage
processes are established and adhered to, outage readiness review
process is implemented with roles and responsibilities defined and
adhered to and improvement is evident over a period of time.

67
Table 3.10: Outage Process (Source: Own Source adopted from Smith, 2013: Online)
Ele
men
t Level 1 – Not Engaged
Level 2 – Experimenting
Level 3 – Enlightened
Level 4 – Good Practice
Level 5 – Best Practice
2. O
uta
ge
Pro
cess
No formal process for outage planning, Resources allocation as “just-in-time” immediately prior to outage. Outage readiness reviews does not form part of the planning process. Greatly diminished outage performance.
An outage process established and cut-off dates have been established, but cut-off dates are not enforced. No formal Outage readiness review process but informal reviews are completed on an adhoc basis. Outage performance is poor, organisation struggles to recover outages
Formal outage process established and routinely adhered to, covering only critical elements of outage planning process – Identification, Prepare and execute. Formal Outage Readiness review is part of the planning process and adhered too some times. The Outage Readiness Reviews only includes those directly impacted.
Level III and Formal Outage Readiness review process established, with review due dates established and adhered too. The Outage readiness review involves the entire organisation
Level IV and Heavy reliance on the Outage readiness review element with lessons learned integrated into future outages. The Outage Readiness Reviews leads to a measurable and quantitative improvements to outage performance over time. Formal Outage Readiness review process established, with responsibilities identified and review due dates established and adhered too.
Table 3.11 focuses on Outage Planning and establish if the outage
planning starts 24 months prior to the outage start utilise a standard
outage management plan with clear roles and responsibilities and if the
organisation adheres to the outage management plan.
Table 3.11: Outage Planning (Source: Own Source adopted from Smith, 2013: Online)
Ele
men
t
Level 1 – Not Engaged
Level 2 – Experimenting
Level 3 – Enlightened
Level 4 – Good Practice
Level 5 – Best Practice
3. O
uta
ge
Pla
nn
ing
No or very little outage planning done. Outage Planning 3 months prior to the start of the outage date
Some outage planning done, but no Outage Management Plan developed or used to plan outages. Outage Planning starts 3-6 months prior to the start of the outage date
Outage planning follows a standard outage management plan (roles and responsibilities are not clearly specified). Outage planning starts 12 months prior to the start of the outage date.
Outage planning starts 18 months prior to the start of the outage date. Uses a standard outage management plan with clear roles and responsibilities for all stakeholders established, and mostly adhere too.
Outage planning starts 24 months prior to the start of the outage date. Uses a standard outage management plan with clear roles and responsibilities for all stakeholders are established and adhered too.

68
Table 3.12 focuses on Outage Scope Development and confirm that the
scope development consider maintenance programs, corrective
maintenance, inspection reports are used as part of scope
development, engineering programs, modifications and lessons learnt.
Table 3.12: Outage Scope Development (Source: Own Source adopted from Smith, 2013: Online)
Ele
men
t
Level 1 – Not Engaged
Level 2 – Experimenting
Level 3 – Enlightened
Level 4 – Good Practice
Level 5 – Best Practice
4. O
uta
ge
Sco
pe
Dev
elo
pm
ent
No basis for outage scope
Outage scope developed based on previous outage scope.
Based on Corrective Maintenance, Preventative Maintenance Programs and Inspection Reports.
Preventative Maintenance Programs, Corrective Maintenance, Inspection Reports and Modifications Program
Input Maintenance Programs, Corrective Maintenance, Inspection Reports, Engineering Programs and Modifications Program, lessons learnt
Table 3.13 focuses on Outage Progress and establish if an Enterprise
Resource Planning system is used, captures actuals, real time updates
are obtained and that the schedule is used to report actual progress as
well as a work control tool.
Table 3.13: Scope Management and Outage Progress (Source: Own Source adopted from Smith, 2013: Online)
Ele
men
t
Level 1 – Not Engaged
Level 2 – Experimenting
Level 3 – Enlightened
Level 4 – Good Practice
Level 5 – Best Practice
5. S
cop
e M
anag
emen
t an
d 6
.
Ou
tag
e P
rog
ress
Verbal feedback on Outage progress updates provided weekly. No scope management process in place.
Verbal feedback on Outage progress updates provided daily. Scope management process in place but not adhered too.
Verbal progress feedback on Outage progress provided at the end of each shift. Scope management process in place and adhered too.
Enterprise Resource Planning (ERP) systems (captures actual progress performance data i.e. cost and hours worked). Scheduling tools is used to scope and accurately capture start and finish information.
Level 3 and Real time updates per shift. Schedule is used to report actual progress and to control work.
Table 3.14 focuses on a Single Outage Plan and ascertain the level of
detail in the outage plan, checks if the plan is communicated and
understood across the organisation and identify schedule conflicts.

69
Table 3.14: Single Outage Plan (Source: Own Source adopted from Smith, 2013: Online)
Ele
men
t
Level 1 – Not Engaged
Level 2 – Experimenting
Level 3 – Enlightened
Level 4 – Good Practice
Level 5 – Best Practice
7. S
ing
le O
uta
ge
Pan
Outage plan not formal or published. Outage work is executed using informal lists. Multiple plans for the outage exist (maintenance, engineering, operating)
Single outage plan developed in a scheduling tool, but quality of the plan is severely lacking. Plan consists largely of simple work lists developed with inadequately detailed job plans. Knowledge of plans resides largely with maintenance leaders
Single outage plan developed cooperatively in a scheduling tool, with input and oversight from all affected disciplines and no critical path identified. All jobs are considered equal. No consistent view on priority.
Level III + critical path of the outage defined and lower priority jobs arranged around it. The schedule enjoys a higher degree of understanding across the organisation.
Level of detail on the plan is supported by hour-to-hour breakdown. Plan is communicated clearly across the organisation and universally understood. Schedule conflict between task are very rare.
Table 3.15 focuses on Work Order Usage during and Outage and verify
if tasks have individual work orders and if work orders are created for
emergent work additional work.
Table 3.15: Work Order Usage during Outage (Source: Own Source adopted from Smith, 2013: Online)
Ele
men
t
Level 1 – Not Engaged
Level 2 – Experimenting
Level 3 – Enlightened
Level 4 – Good Practice
Level 5 – Best Practice
8. W
ork
Ord
er U
sag
e
Du
rin
g O
uta
ges
Work order rarely or never used
Task specific work orders are rarely used.
Task specific work orders are used for routine outage work. Reactive /Emergent work is covered under blanket work orders
All proactive and reactive jobs have individual work orders. Repairs/follow-up work performed under parent work order or PM work order.
All proactive and reactive jobs have individual work orders. Emergent and additional work receive a separate follow-up work order.
Table 3.16 focuses on Work Order Closeout and determine if the
required detail are captured when work orders are close out, work
orders are raised for follow up work, and if 90% of the work orders have
some type of written feedback provided during the same shift.

70
Table 3.16: Work Order Closeout (Source: Own Source adopted from Smith, 2013: Online)
Ele
men
t
Level 1 – Not Engaged
Level 2 – Experimenting
Level 3 – Enlightened
Level 4 – Good Practice
Level 5 – Best Practice
9. W
ork
Ord
er C
lose
ou
t
When the work is complete, work orders remains in an open status for a long periods of time. No parts codes identified. Little or no feedback provided and no coordination delays recorded.
Work orders are closed with some part codes identified. Coordination delays know but not recorded. Verbal feedback at best, but poor performance.
Work orders are closed with part, some problems, and some reason codes identified. All coordination delays greater than 60 minutes recorded. Written feedback provided on less than 50% of work orders
Work orders closed with all part codes and some problem identified and some reason codes identified. All coordination delays over 30 minutes recorded. Written feedback on more than 50% of work
Work orders are closed with all part codes and problem identified as well as most reason codes identified. Required follow-up work is noted and new work order created. More than 90% of all work orders have some form of written feedback provided on the same shift.
Table 3.17 focuses on Outage Lessons Learnt and if the lessons learnt
are captured in an information management system, shared throughout
the organisation and cycled back into the planning for future outages.
Table 3.17: Outage Lessons Learnt (Source: Own Source adopted from Smith, 2013: Online)
Ele
men
t
Level 1 – Not Engaged
Level 2 – Experimenting
Level 3 – Enlightened
Level 4 – Good Practice
Level 5 – Best Practice
I10
Ou
tag
e L
esso
ns
Lea
rnt
Lessons Learnt are not recorded
Discuss lessons Learnt, but are not documented or poorly documents.
Lessons Learnt are discussed and accurately documented, but not cycled into future outage planning.
Level 3 and Lessons Learnt are captured in an information management system and shares throughout the organisation
Level 4 and lessons learnt are cycled into the planning of future outage
Table 3.18 focuses on the Percentage Planned work versus Percentage
Unplanned Work and indicate what percentage work is the work
planned and which percentage of the work is unplanned.
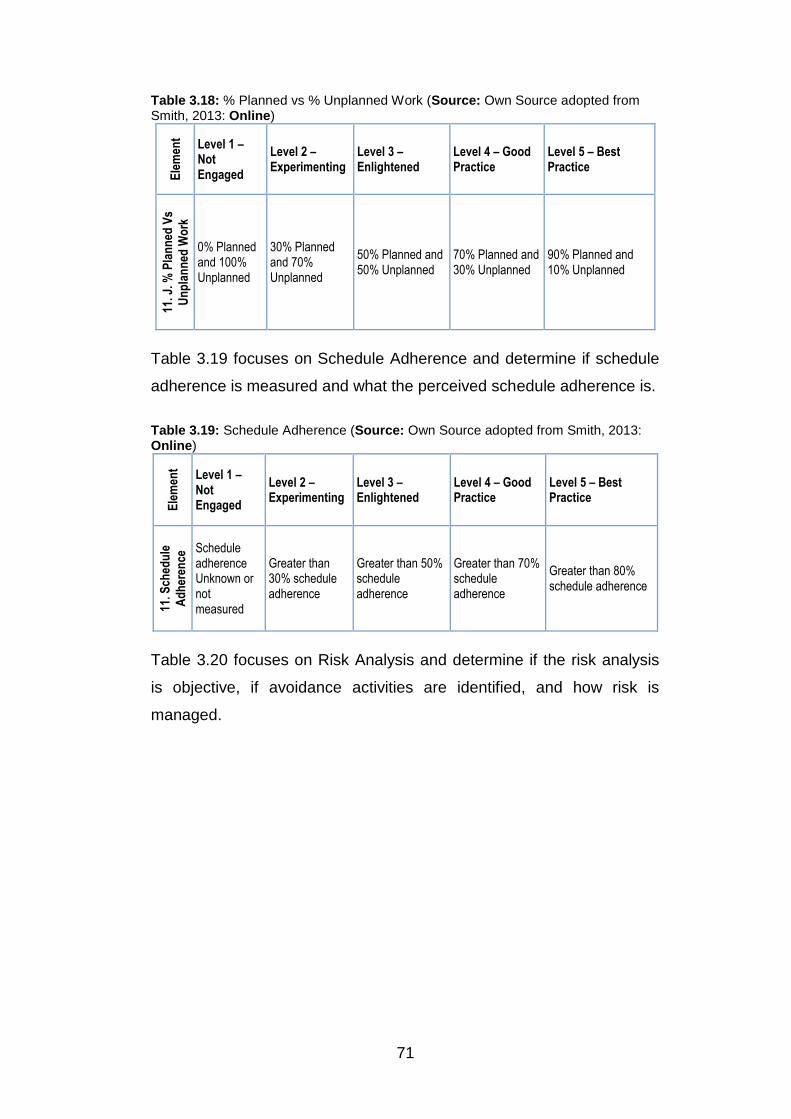
71
Table 3.18: % Planned vs % Unplanned Work (Source: Own Source adopted from Smith, 2013: Online)
Ele
men
t
Level 1 – Not Engaged
Level 2 – Experimenting
Level 3 – Enlightened
Level 4 – Good Practice
Level 5 – Best Practice
11. J
. % P
lan
ned
Vs
Un
pla
nn
ed W
ork
0% Planned and 100% Unplanned
30% Planned and 70% Unplanned
50% Planned and 50% Unplanned
70% Planned and 30% Unplanned
90% Planned and 10% Unplanned
Table 3.19 focuses on Schedule Adherence and determine if schedule
adherence is measured and what the perceived schedule adherence is.
Table 3.19: Schedule Adherence (Source: Own Source adopted from Smith, 2013: Online)
Ele
men
t
Level 1 – Not Engaged
Level 2 – Experimenting
Level 3 – Enlightened
Level 4 – Good Practice
Level 5 – Best Practice
11. S
ched
ule
Ad
her
ence
Schedule adherence Unknown or not measured
Greater than 30% schedule adherence
Greater than 50% schedule adherence
Greater than 70% schedule adherence
Greater than 80% schedule adherence
Table 3.20 focuses on Risk Analysis and determine if the risk analysis
is objective, if avoidance activities are identified, and how risk is
managed.

72
Table 3.20: Risk Analysis (Source: Own Source adopted from Smith, 2013: Online)
Ele
men
t
Level 1 – Not Engaged
Level 2 – Experimenting
Level 3 – Enlightened
Level 4 – Good Practice
Level 5 – Best Practice
12. R
isk
An
alys
is
No Risk analysis performed
Basic risk analysis performed. Some jobs are identified to be “watched more closely”.
Formal risk analysis performed but largely subjective. Level of detail do not drill down to specific recovery or avoidance actions to be taken. Largely a prioritisation exercise based on risk, little or no action taken from analysis results.
Formal objective risk analysis performed and specific factors for critical jobs defined. Organisation still struggles with execution of avoidance and recovery actions. Emergencies occur and focus is on quick recovery.
Formal objective risk analysis performed and specific factors for critical jobs defined. Both recovery and avoidance activities identified and personnel responsibilities assigned for most critical jobs. Emergencies still occur, but they are rare and organisation is well prepared for them.
The criteria listed in Tables 3.9 to 3.20 will be used to interpret the
outcome when the perceived maturity of the Outage process is
determined.
3.8 CONCLUSION
This section concludes the literature review chapter. The literature
review shows that a process maturity model is a suitable approach to
determine the maturity level of Eskom’s outage process. The literature
considered the history of maturity models and found that maturity
models when used can be used to determine the current state of a
process, or when the processes’ current state is known, prescribe
improvement path as well as compare or bench mark across similar
organisations and industries.
The literature further provides an international view of the outage
process. Literature on the outage process is very limited and consults
no more than a few authors and found that an outage process consists
of the planning, control and improvement phases with the
characteristics for each phase clearly defined.

73
The last section of Chapter 3 presents the combined work of Rosemann
and de Bruin’s (s.a.: Online) Business Process Maturity Model and
Smith’s (2013, Online) Maintenance Planning and Scheduling Maturity
Matrix providing a suitable maturity model for this research project. The
Outage Management Maturity Framework wil be used to determine the
maturity level of Eskom’s outage process.
The following section is Chapter 4 and focuses on the Research design
and Methodology.

74
CHAPTER 4: RESEARCH DESIGN AND METHODOLOGY
4.1 INTRODUCTION
The aim of the chapter is to explore the research design and
methodologies that support the objective of the research project.
According to Greener and Martelli (2015:Online), research methods are
the specific activities used to gather data and include questionnaires,
interviews, observations and focus groups while research methodology
refers to the strategy and approach chosen to answer the research
questions.
This chapter will describe the following:
The two major research approaches.
Research design and methodology.
The research assumptions and constraints.
The research questionnaire.
4.2 THE TWO MAJOR RESEARCH APPROACHES
This section discusses the two major research approaches. Greener
and Martelli (2015: Online) support the view of Welman, Mitchell, and
Kruger (2005:6), finding that the two major research approaches are the
qualitative and quantitative approach.
According to Creswell (2009: 22), the difference between qualitative
and quantitative research is framed in terms of using words (qualitative)
rather than numbers (quantitative), or using closed-ended questions
(quantitative hypotheses) rather than open-ended questions (qualitative
interview questions). Insightlink Communication (s.a., Online),
supports the view expressed by Creswell (2009: 22) that there are two
basic methodologies for any research exercise; the quantitative and
qualitative approaches.

75
This section explores:
quantitative research,
qualitative research; and
compares of quantitative and qualitative research.
4.2.1 Quantitative research
According to Greener and Martelli (2015: Online), the quantitative
research is associated with a deductive approach to test theories, using
numbers or facts and therefore being positivist or natural science
model. Greener and Martelli (2015: Online) explain that the deductive
reasoning moves from the general theory or process to a specific theory
or process.
Figure 4.1: Quantitative Research Approach and Data Collection (Source: Own Source adopted from Greener & Martelli (2015, Online) and Insight
Communication (s.a., Online))
Creswell (2009:22) describes quantitative research as a method to test
an objective theory by assessing the connection between variables.
Jackson (2008: 88) explains that the quantitative researcher starts with
the testing of a hypothesis, followed by observing and collecting data,
completing statistical analysis of the data and draws conclusions. Huff
(2009:348) finds that the quantitative method: draw inferences from a
number of things and their relationship. According to Welman, Mitchell
and Kruger (2005:8), the quantitative research evaluates objective data
made up of numbers.
Quantitative Research
Deductive Approach
Positivist Survey
Questionnaires

76
4.2.2 Qualitative research
According to Greener and Martelli (2015: Online), qualitative research
is likely to be related to an inductive research that generates theories,
using an interpretivist approach permitting multiple subjective
perspectives focused on constructing knowledge rather than seeking
facts or reality. Insightlink Communication (s.a., Online), found that
qualitative research is an exploratory research approach. It makes use
of non-numeric data like open-end interview, naturally occurring
conversations and discussions and focus groups to identify and
describe themes, norms, beliefs, patterns and decision processes and
systems.
Figure 4.2: Qualitative Research Approach and Data Collection (Source: Own Source adopted from Greener & Martelli, (2015: Online) and Insight
Communication,(s.a., Online))
Creswell (2009: 125) supports the view expressed by Insightlink
Communication (s.a., Online), stating that qualitative research explores
the complicated series of factors about the central occurrences and
represents the diverse perspective or meanings that contributors hold.
According to Walliman (2001: 247), qualitative research makes an effort
to understand a phenomenon, moving as close to the research subject
as possible to collect meaningful data that enables the development of
a common concept through the dynamic research process. Huff
(2009:348) find that the qualitative method has a quality focus and often
observes or infers relationship of things.
Welman, Mitchell, and Kruger (2005:8) found that qualitative research
focuses on subjective data produced by respondents through
interviews.
Qualitative Research
Inductive Approach
Interpretivist Open-ended Interviews

77
Jackson (2008: 88) adds that qualitative research focus on experiences
in a natural environment, and the data analysis excludes statistical
analysis. Coldwell and Herbst (2004: 13), expresses the opinion that
qualitative research suggests that research findings are not exposed to
prescribed quantification or quantitative analysis.
The following section present Leedy and Ormrod’s comparison between
quantitative and qualitative research approaches.
4.2.3 Comparison of quantitative and qualitative approach
Leedy and Ormrod (2014: 98), compares the distinguishing
characteristics the quantitative and qualitative approaches in Table 4.1.
Table 4.1: Characteristics of the Quantitative and Qualitative Approaches (Source: Leedy and Ormrod, 2014: 98)
Question Qualitative Quantitative
Define the research
purpose
Describe and explain
Explore and interpret
Build theory
Explain and predict
Confirm and validate
Test hypothesis
The nature of the
research process
Holistic
Unknown variables
Flexible guidelines
Emergent methods
Context-bound
Personal review
Focused
Known variables
Established guidelines
Predetermine methods
Somewhat context-free
Detached view
Data collection
Textual and/or image-based data
Information, small sample
Loosely structured or non-standardised
observations and interviews
Numeric Data
Representative large sample
Standardised instruments
Data analysis and
interpretation
Search for themes and categories
Acknowledge that analysis is subjective
and potentially biased
Inductive reasoning
Statistical analysis
Stress on objectivity
Deductive reasoning
Communicating the
Outcome
Words
Narratives, individual quotes
Personal voice, literary style (in some
disciplines)
Numbers
Statistics, aggregated data
Formal voice, scientific style
Table 4.1 pose five questions and are answered in light of the two
approaches.
78
The brief comparison of the quantitative and qualitative research
approaches creates the foundation for the review of the research
process.
The quantitative research approach is adopted. Insightlink
Communication (s.a., Online) assert that the quantitative research
applies structured data collection techniques which includes closed-
ended survey questions, measures the intensity and frequency and
counting events to assist in determining demographic and
psychographic distribution of beliefs, behaviors and opinions. This
research study employs a structured data collection technique that uses
statements in the form of a survey and that measured the maturity of
the outage process.
4.3 RESEARCH DESIGN AND RESEARCH METHODOLOGY
The research design and methodology delve into research process.
There are many research designs and methodologies with many
describes for each deign and methodology. The section briefly
describes:
The research design.
Briefly review of research methods.
Review the survey research approach.
The research approach.
4.3.1 Research design
Welman, Mitchell, and Kruger (2005:2) describe research as a process,
which consist of finding scientific information using numerous objective
approaches and procedures. Huff (2009: 348) explains that research is
a meticulous and systematic examination or investigation into a subject
to determine or revise facts, theories and applications. Weathington,
Cunningham and Pittenger (2012: 6) define research methods as a
process for gathering information.

79
According to Weathington, Cunningham and Pittenger (2012: 100-101),
the objective when selecting a research design is to generate the best
data to allow the researcher to answer the research questions. Hofstee
(2006:113) notes that research design describes the general approach
for testing the thesis statement. Huff (2009: 348) is of the opinion that
research design is a plan for focused academic activity.
Greener and Martelli (2015: Online) describe each research design in
detail to enhance the reader’s understanding:
Exploratory Research: This approach identifies or clarifies
problems. The approach is often a qualitative, divergent and
inductive approach resulting in a better definition or understanding
of a problem.
Descriptive Research: This approach tends to answer
questions, which are largely factual in nature. The how, what,
where, when, how much and how often are usually answered.
Correlation Research: Looks for the relationship between two
variables. The relationship may show a correlation in a statistical
sense, meaning one variable has an effect on the other, not
necessarily in the same direction.
Experimental Research: The approach tests hypothesis and are
designed to describe “why” something occurs.
The research design selected for the research study makes is a
descriptive research design as it seeks to answer the “what” question:
What is the maturity level of the outage process?
Greener and Martelli’s (2015: Online) research approach is adopted
and is seen in Figure 4.3. Greener and Martelli (2015: Online)
describes a systematic approach to research. The process includes the
analysis, design, implementation, interpretation and action stages.

80
This research approach has a five step, two-dimensional graphical
presentation that appears to be a linear approach and should be
consider as a line of best fit to business research (Greener & Martelli,
2015: Online).
Figure 4.3: The Business Research Process (Sources: Greener & Martelli, 2015:
Online)
Figure 4.4 describes the research process for this research study using
Greener and Martelli’s (2015: Online) Business Research Process.
Figure 4.4: The Business Research Process (Sources: Adopted from Greener &
Martelli, 2015: Online)
The following chapters in the research study deals with each phase of
the research process. Chapter 2 of this research study deals with the
analysis phase the research process. Chapter 1 states the research
questions and objectives.
Analysis
Recognise organisational performance discrepancy
Conduct front - end analysis
State the problem
Design
Develop research
questions and hypothesis
Select appropriate
reserach design
Implementation
Conduct research and collect data
Interpretation
Run statistics
Answer research questions and test hypotjesis
Prepare research report
Act
Make appropriate
informed management
decisions
Analysis
Review Outage Perfomance
Analysis shows poor
performance
Identify Problem Statement
Design
Develop research
questions and objectives
Description research
approach - Survey
Research
Implementation
Develop and send out survey questionnaire
Start Data Collection
Interpretation
Analysis and interpret data
using Descriptive Statistics
Determine maturity level
Prepare research report
Act
Recommend actions to move to the next level
of maturity

81
Chapter 4 describes the research approach and Chapter 3 deals with
the development of the survey questionnaire. The data interpretation
phase is covers in Chapter 5 and the act phase makes
recommendations in Chapter 6. The following section focus on the
research method.
4.3.2 Research methods
This section selects a research method for the research study, reviews
the research methods and provides a brief explanation for each
method. Table 4.2 lists various research methods including a brief
explanation of each research method. The research methods included
in the table are Creative or Experimental research, Survey research,
Case Studies, Action research, Evaluation or Implementation
Evaluation research, Descriptive research and Correlation research.
Table 4.2: Research Methods (Source: Own Source)
Research Methods Explanation
Experimental designs/ Creative
Research
Experiments – Test hypothesis or theories, or observe effects of a given intervention (Hofstee, 2006: 120-131)
Permits researchers to define, forecast and decide whether there is a cause-and-effect connection between variables (Jackson, 2008: 19).
Survey Research
Obtains information from relevant people and the people should represent the greater population (Hofstee, 2006: 120-131)
Questioning people on a specific topic followed by a description of their responses (Jackson, 2008: 17).
Case Study Research
The study of a specific phenomenon to determine if a general theory exist or to see if specific situations can birth to existing theories (Goddard & Melville, 2001:9)
Action Research A small scale study in the working of the real world and a careful scrutiny of the effects of the intervention (Walliman, 2001: 115 citing Robson (1993))
Evaluation Research –
Implementation Evaluation
Aimed at answering the question to determine if a process been properly implemented and if the intervention was implemented correctly (Mouton, 2001: 159)
Systematic review of information to present useful feedback about a process, program or activity (Trochim, 2006: Online).
Descriptive Research
An attempt to study situations to establish the norm – Predict what can happen again under the similar circumstances (Walliman, 2001: 115).
Correlation Research
Describe the measure of relationship between two events (Walliman, 2001: 116).
Evaluate the relationship between two measured variables. (Jackson, 2008: 18).

82
The research process in Figure 4.4 refers to survey research method in
the design phase; therefore, the research method selected for the
research study is the survey research method. Survey research
questions people on a particular subject followed by a description of
their response (Jackson, 2008:17).
The staff in the Outage Management Department is invited to response
to a survey questionnaire on the outage process as they are assumed
to have the required knowledge of the outage process.
4.3.3 Survey research method
This section looks at the survey research method, reviews the purpose
of survey research and review the step to conduct survey research.
Farooq (2015: Online) find that survey research collects information by
collecting data from a specific sample of a particular population through
personal or impersonal means to research its characteristics. The
personal method uses interviews and impersonal means are
questionnaires via email or telephone. The findings are analysed and
the outcome generalised.
Insightlink Communication (s.a., Online) lists a number of benefits
when using a systematic program of employee surveys. These benefits
include:
Demonstrating a real interest in the employees.
Identify strengths and weaknesses in the performance of
management, organisation policies, procedures and technologies,
which will improve operational efficiency and improve employee
satisfaction.
Improve the retention of employees, reducing recruitment cost and
making the company or department a more attractive employment
proposition.
Identify the key contributors and barriers to delivering excellence,
soliciting very useful improvement opportunities.

83
Farooq (2015: Online) highlights import steps in conducting survey
research. These steps:
Define the research purpose and objective, stating the problem,
specify the reason of the research, define the value of the
research and clarify the research objectives.
Define and select the target population on which the research will
focus.
Choose the technique for data collection by considering the
instruments like interviews or questionnaires.
Ensure that representative sample of the population is taken.
The data gathering process (conducting the research), where the
questionnaires or interviews are used should have pre-designed
questions.
Gather the data, analysed and interpreted then conclusions are
formulated and generalising the findings.
The entire study is presented in a survey research report.
The research study follows the steps for survey research by Farooq
(2015: Online). Figure 4.5 provides the research method adapted from
the Farooq’s Research Steps for Survey Research (2015, Online).
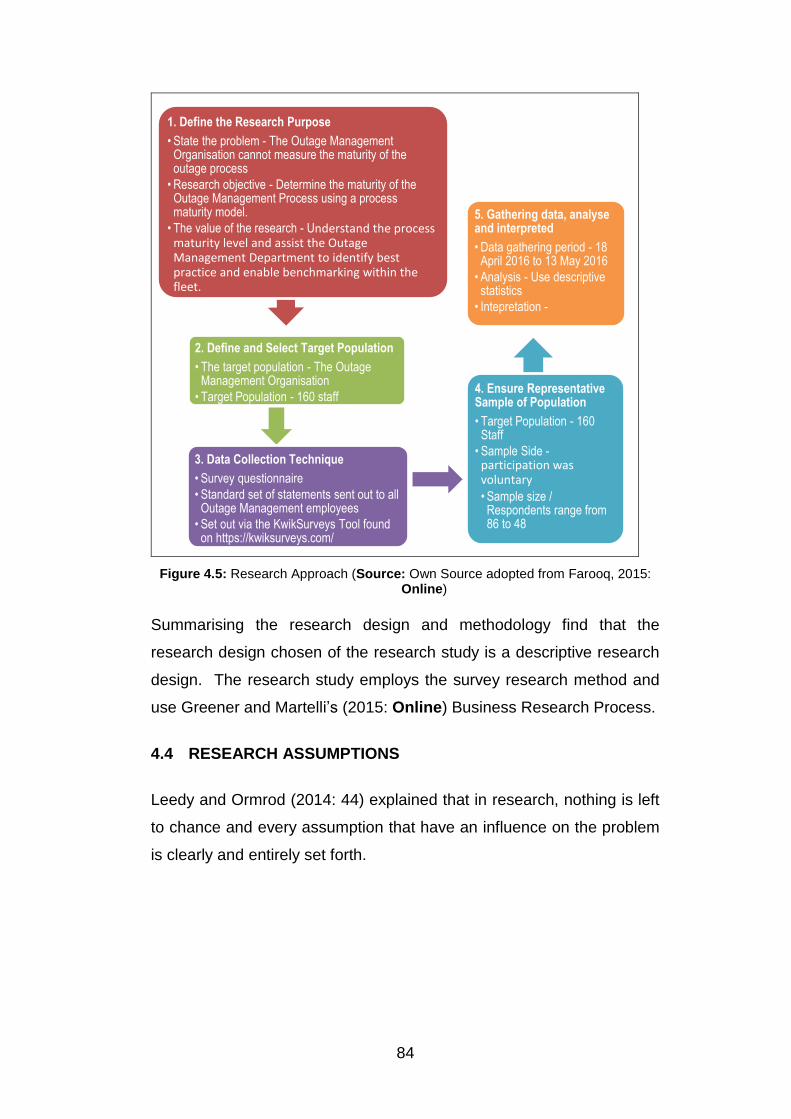
84
Figure 4.5: Research Approach (Source: Own Source adopted from Farooq, 2015: Online)
Summarising the research design and methodology find that the
research design chosen of the research study is a descriptive research
design. The research study employs the survey research method and
use Greener and Martelli’s (2015: Online) Business Research Process.
4.4 RESEARCH ASSUMPTIONS
Leedy and Ormrod (2014: 44) explained that in research, nothing is left
to chance and every assumption that have an influence on the problem
is clearly and entirely set forth.
1. Define the Research Purpose
• State the problem - The Outage Management Organisation cannot measure the maturity of the outage process
• Research objective - Determine the maturity of the Outage Management Process using a process maturity model.
• The value of the research - Understand the process maturity level and assist the Outage Management Department to identify best practice and enable benchmarking within the fleet.
2. Define and Select Target Population
• The target population - The Outage Management Organisation
• Target Population - 160 staff
3. Data Collection Technique
• Survey questionnaire
• Standard set of statements sent out to all Outage Management employees
• Set out via the KwikSurveys Tool found on https://kwiksurveys.com/
4. Ensure Representative Sample of Population
• Target Population - 160 Staff
• Sample Side - participation was voluntary
• Sample size / Respondents range from 86 to 48
5. Gathering data, analyse and interpreted
• Data gathering period - 18 April 2016 to 13 May 2016
• Analysis - Use descriptive statistics
• Intepretation -

85
The following assumptions are considered and are listed below:
All participants received training on the outage management
processes.
Participants understand the outage processes and the interrelated
processes.
Participants have experienced in power station maintenance,
engineering, operating or project management processes and
practices.
Participants will provide objective, honest feedback.
All participants are able to read and understand English.
4.5 RESEARCH CONSTRAINTS
This section identifies research limitations and delimitations. Leedy and
Ormrod (2014: 316, 318, 330), mentioned that limitations can be found
in the in a number of areas including but limited to data collection and
analysis, research design methodology and measurement instruments.
The research observes the constraints listed below:
Limitations related to the research are:
The Outage Management Department makes up the
population selected for the research study.
No all power stations will response to the survey.
The level of skill and experience of participants in planning
and execution of outages may vary, affecting the outcome of
the maturity level.
De-limitations related to the research are:
The research outcome may have a generalised application in
the planning and execution of outages and online
maintenance processes.
The research outcome may form a foundation for developing other
process maturity models applicable to the power generation
environment.

86
4.6 THE RESEARCH QUESTIONNAIRE
According to Malhotra and Grover (1998: Online), there are three
distinct characteristics identified of survey research:
First: It consists of collecting data by requesting individuals for
information in an arranged manner. The data can be collected
using mailed questionnaires, telephone or face-to-face interviews.
The people surveyed could represent themselves, their
organisation, a project or their expertise, pending on the unit or
analysis.
Second: The survey research method is normally a quantitative
method requiring stand information to define variables and its
relationships.
Third: The data is gathered using a sample of the greater
population. The sample findings with be generalised to the
population.
The purpose of the survey questionnaire is to determine the perceptions
of the employees in the Outage Management department on the
maturity level of the outage process. According to Weathington,
Cunningham and Pittenger (2012:186) recommend the use of
questionnaires if a perception is required.
The survey questionnaire uses a Likert format. Weathington,
Cunningham and Pittenger (2012:191), find is a preferred option for
closed-response questionnaires. The Likert scale provides a clear and
unambiguous ordinal measure scale and can be used for many different
questions (Weathington, Cunningham & Pittenger, 2012: 191).
Weathington, Cunningham and Pittenger (2012:191) find the 5-option
response as the most popular response option ranging from strongly
disagrees, disagree, neutral, agree and strongly agree.

87
The survey questionnaire, excluding the group demographic, is based
on a combination an edited version of Smith’s (2013: Online)
Maintenance Planning and Scheduling Maturity Matrix and literature
review on the outage process.
4.6.1 The group demographic
The survey seeks to obtain the perception of the respondents and
therefore included a request for the respondent’s demographic
information which includes the task grade to distinguish between
management and staff (Insightlink Communication, s.a., Online).
Respondents were further asked to indicate which power station they
are working at as this would allow for benchmarking across the various
power stations.
Question 1 Do you work in the Outage Management Organisation?
Question 2 How many years do you have in Eskom service?
Question 3 What is your TASK grade level?
Question 4 Which Power Station do you fall under?
Question 5 What departments did you work in before joining Outage
Management?

88
4.6.2 Outage organisation
Question 6.1 Formal outage organisation defined.
Question 6.2 Individuals make decisions regarding outages
considering the big picture.
Question 6.3 The outage management leadership is recognised.
Question 6.4 The Outage leadership roles are defined with
responsibilities for communication and decision-making.
Question 6.5 Outage leaders are faced with making a small number of
decision.
Question 6.6 The responsibilities for areas like materials management,
maintenance, engineering, operating, project
management, safety and the contractor interface are
defined.
Question 6.7 Fully integrated outage organisation with specific roles
and responsibilities are defined.
Question 6.8 Outage teams and stakeholders work in a cooperative
manner and adhere to processes.
Question 6.9 Communication and decision making is largely seamless.
4.6.3 Outage progress
Question 7.1 A formal process for outage planning is in place.
Question 7.2 The outage process identifies and adhere cut-off dates.
Question 7.3 The outage process only covers critical elements of
outage planning process– Prepare and Execute.
Question 7.4 Outage Readiness Review process is established, with
review due dates established and adhered too.
Question 7.5 The outage management team depends on readiness
reviews and lessons learned integrated into future
outages.

89
4.6.4 Outage planning
Question 8.1 Outage Management Plan (OMP) developed and used to
add the outages planning.
Question 8.2 The Outage Management Plan clearly established roles
and responsibilities for all stakeholders and the OMP is
adhered too.
Question 9
Outage Planning starts 3 months prior to the start of the
outage date.
Outage Planning starts 3-6 months prior to the start of the
outage date.
Outage planning starts 12 months prior to the start of the
outage date.
Outage planning starts 18 months prior to the start of the
outage date.
Outage planning starts 24 months prior to the start of the
outage date.
4.6.5 Outage scope development
Question 10.1 The outage scope considers previous outage scope.
Question 10.2 The outage scope considers Preventative Maintenance
Programs.
Question 10.3 The outage scope considers Corrective Maintenance,
and Inspection Reports.
Question 10.4 The outage scope considers the Modification Programs.
Question 10.5 The outage scope considers Engineering Programs and
lessons learnt.

90
4.6.6 Scope management
Question 11.1 A scope management process in place.
Question 11.2 Scope management process is adhered too.
Question 11.3 Reactive/Emergent work uses a new work orders.
Question 11.4 Repairs/follow-up work performed uses new work order.
Question 11.5 Emergent and additional work receives a separate follow-
up work order.
Question 11.6 A new work order created for rework with the duration
and cost quantified.
4.6.7 Outage progress
Question 12.1 Outage progress updated in real time updates per shift.
Question 12.2 Scheduling tools accurately capture start and finish
information.
Question 12.3 The outage execution schedule provides actual progress
feedback and controls work.
Question 12.4 Enterprise Resource Planning (ERP) systems (captures
actual progress performance data i.e. cost and hours
worked).
Question 13.1 Provide weekly verbal feedback on Outage progress.
Question 13.2 Provide daily verbal feedback on Outage progress.
Question 13.3 Provide verbal progress feedback on Outage progress at
the end of each shift.

91
4.6.8 Single outage plan
Question 14.1 Single outage plan is formal, universally understood and
published to all stakeholders.
Question 14.2 Single outage plan developed in a scheduling tool.
Question 14.3 Single outage plan includes the input and oversight from
all affected disciplines.
Question 14.4 The critical path of the outage defined and lower priority
jobs arranged around it.
Question 14.5 Level of detail on the plan supports an hour-to-hour
breakdown.
4.6.9 Outage work order usage
Question 15.1 Each activity executed in the outage has an outage work
orders.
Question 15.2 The outage work orders are task specific.
Question 15.3 Routine outage work has task specific work orders.
Question 15.4 All proactive and reactive jobs have individual work
orders.

92
4.6.10 Work order closeout
Question 16.1 Work orders remains in an open status for a long periods
after work is completed.
Question 16.2 Work orders history captures all part codes identified.
Question 16.3 Work orders history captures all problems and reason
codes identified.
Question 16.4 Written feedback provided on less than 15% of work
orders.
Question 16.5 Written feedback provided on less than 50% of work
orders.
Question 16.6 Written feedback provided on more than 50% of work
orders.
Question 16.7 More than 90% of all work orders have written feedback
provided on the same shift.
4.6.11 Work order – coordination delays
Question 17.1 Coordination are known delays are recorded.
Question 17.2 All coordination delays greater than 60 minutes recorded.
Question 17.3 All coordination delays over 30 minutes recorded.
4.6.12 Outage lessons learnt
Question 18.1 Outage team records lessons learnt.
Question 18.2 Outage team discusses and accurately document
lessons learnt.
Question 18.3 Outage team cycles lessons learnt into future outage
planning.
Question 18.4 Outage team captures lessons learnt in an information
management system and shares throughout the
organisation.

93
4.6.13 % Planned vs % Unplanned
Question 19
0% Planned Work and 100% Unplanned Work
30% Planned Work and 70% Unplanned Work
50% Planned Work and 50% Unplanned Work
70% Planned Work and 30% Unplanned Work
90% Planned Work and 10% Unplanned Work
4.6.14 Outage schedule adherence
Question 20.1 Outage schedule adherence is known and measured.
Question 20.2 Outage schedule adherence is greater than 30%.
Question 20.3 Outage schedule adherence is than 50% schedule.
Question 20.4 Outage schedule adherence is than 70% schedule.
Question 20.5 Outage schedule adherence is than 80% schedule.
4.6.15 Risk analysis
Question 21.1 Risk analysis performed.
Question 21.2 Risk analyses are objective.
Question 21.3 Risk analysis identifies specific factors for critical jobs
defined.
Question 21.4 Risk mitigation measures drills down to specific recovery
or avoidance actions to be taken.
Question 21.5 Organisation executes risk avoidance and recovery
actions.
Question 21.6 Personal responsibilities assigned to both recovery and
avoidance activities identified.

94
4.6.16 Risk mitigation
Question 22.1 Some jobs are identified to be “watched more closely”.
Question 22.2 Level of detail drills down to specific recovery or
avoidance actions to be taken.
Question 22.3 Organisation executes avoidance and recovery actions.
Question 22.4 Both recovery and avoidance activities identified and
personnel responsibilities assigned for most critical jobs.
4.7 CONCLUSION
The chapter describes the research design and methodology used in
the research study. The chapter reviewed:
Major research approaches.
Research design and methodology.
The research assumptions and constraints.
Research questions.
The research study adopts a descriptive research design and a
quantitative research approach, employing a structured data collection
technique using statements in the form of a survey. The survey
questionnaire is chosen to determine the respondents’ perception of the
maturity level of the outage process.
It is assumed that respondents have been trained and understand the
outage process. The respondents should be experienced in power
station maintenance engineering operations or project management.
The survey outcome should confirm or refute these assumptions.
Smith’s (2013: Online) Maintenance Planning and Scheduling Maturity
Matrix forms the basis for the survey statements. The survey is divided
into sixteen subsections and incorporates a 5-option Likert scale.
The following chapter focuses on data collection, analysis and
interpretation.

95
CHAPTER 5: DATA COLLECTION, ANALYSIS AND
INTERPRETATION OF RESULTS
5.1 INTRODUCTION
Leedy and Ormrod (2014:282) assert that data is worthless unless we
examine and understand the data in order to disclose the truth that lies
beneath the data. The data is meaningless without analysis and
interpretation. The chapter describes the data collection, analysis and
provides an interpretation of the results thus answering the research
question. The chapter:
Describes the process used to collect data.
Describes the analysis of the data.
Presents data validation and reliability.
Provides an interpretation of the results.
The chapter begins with an explanation the process for data collection.
5.2 DATA COLLECTION
According to Creswell (2009: 166), the data collection steps set
boundaries for the study. The data collection sections:
Describes the data collection process used for the research
project.
Describes the unit of analysis for the data collected.
Identify research variables.
5.2.1 Data collection process
Punch (2003: 40), contends that the means used for data collect can
greatly influence the quality of the data. Punch (2003:41), returned that
a realistic data collection strategy and appropriate period should be
chosen.

96
According to Creswell (2009: 166), data collection includes the stages
of gathering information using unstructured or semi-structured
interviews and observations, documentation, and graphic material, and
established procedure for documenting information. Table 5.1 sums up
a number of data collection methods.
Table 5.1: Data Collection Methods (Source: Own Source adopted from Coldwell & Herbst, 2004)
Data Collection Methods Source
Observation Surveys
Interviews Checklists
Documents Focus Groups
Questionnaires Case Studies
According to Weathington, Cunningham and Pittenger (2012: 125), they
highlight three subsections that describe (i) how to identify and obtain
the sample for the study, (ii) provide the measures, material and
equipment used to collect the data and (ii) the research procedure used
during the research.
Weathington, Cunningham and Pittenger (2012: 125) data collection
method states:
The research environment focuses on outage process at Eskom.
The Outage Management Department is responsible for planning
and executing outage. The employees of the Outage
Management Department were invited to participate in the
research study by completing a survey questionnaire done so on a
voluntary basis.
The material used to develop the structured survey questionnaire
was based on the Maintenance Planning and Scheduling Maturity
Matrix by Smith (2013: Online). The equipment used to develop
the survey was the Kwiksurveys online survey tool. The staff in
the Outage Management Department received an emailed with a
URL to access and completes the survey. Responses are
captured in the survey tool and did not record the respondent’s
email address, maintaining their anonymity.

97
A URL to access the research survey questionnaire was included
in an email to all the employees of the Outage Management
Department. The email requested the employees to participate in
the research study and completing the survey questionnaire by
clicking the link included in the email. The employees had one
month to respond to the survey questionnaire. A weekly following
up email was sent to all employees as a reminder of the survey
questionnaire. The feedback email provided feedback on the
areas that completed the survey. After one month the survey
questionnaire was closed in Kwiksurveys online tool and the data
downloaded into a Microsoft Excel spreadsheet for analysis. The
author sent an email to all employees thanking them for their
participation.
The Kwiksurveys online survey tool presented the data in two formats.
The first format was a 20 page Quick Report in a PDF format. The
report presents the survey questions, the number of respondents per
question, standard deviation (the tool uses a population standard
deviation) and weighted average. The Quick Report provides a
selection of graphs to present the data. A second data source was a
Microsoft Excel Spreadsheet that provides the same information set out
in the Quick Report, but the data format allows for further data analysis.
SPSS Statistical tool was used to complete additional descriptive
statistics.
The data collected during the survey requires a unit of analysis and the
following section considers the unit of analysis identifies applicable
variables and determine a suitable the sample type.
5.2.2 Data collection – unit of analysis
Malhotra and Grover (1998: Online), emphasise the importance the
defining unit of analysis at the start stating that all information should be
at a consistent unit of analysis, whether industry, project function,
working group or individual.

98
The respondent being an individual should clearly state the unit of
analysis it represents and the measuring instrument should constantly
reflect the unit of analysis (Malhotra & Grover: 1998: Online).
Malhotra and Grover (1998: Online) highlight an important point to
consider when the individual answers a question with an organisation
as the unit of analysis; points out that possible bias depending on the
organisational hierarchy.
The example presented by Malhotra and Grover (1998: Online) point to
a research question direction to functional worker focused on
organisation level change Malhotra and Grover (1998: Online) citing
Huber and Power (1985), conclude that the most knowledgeable person
of the focus area should be selected. Malhotra and Grover (1998:
Online) asks the following questions:
Is the unit of analysis unmistakably clear for the research study?
Does the measurement instrument constantly consider the unit of
analysis?
Are the selected respondents suitable for the research question?
Table 5.2 provides the questions and answers used to assist in
determining the unit of analysis of the research project.
Table 5.2: Unit of Analysis Questions and Answers (Source: Own Source adopted from Malhotra & Grover, 1998: Online)
Unit of Analysis Questions and Answers
1. What is the unit of analysis for the research study/
The unit of analysis is the individual’s response to the survey questionnaire.
2. Does the measurement instrument consistently reflect the unit of analysis?
The survey questionnaire is completed by an individual and seeks to determine the individual’s perception.
3. Are the respondents appropriate for the research questions
The respondents are within the Outage Management Department and it is assumed that there are knowledgeable about outage process.
4. How was the respondents selected
The survey questionnaire was sent to all the employees in the Outage Management Department and their participation was voluntarily.
With the unit of analysis determined the following section reviews the
data collection variable.

99
5.2.3 Data collection – variable
This section explains and identifies various types of variables. Creswell
(2009:59), citing Creswell (2007), explains that variables refers to the
attributes or characteristics for one person or a group that can be
determined or perceived and that differs amongst the people or group
being studied. Creswell (2009: 59) found that variables frequently
assessed in research studies include age, gender, behaviors attitudes
or behaviors such as leadership, political power, social control and
racism.
Creswell (2009: 59) explains that variables have two characteristics:
one is a time-based order and the other is their observation and
measurement. Creswell (2009: 59) returns that temporal order or time-
based variables mean that one variable precedes the other in time; the
one variable brings about the other variable. Creswell (2009: 60), found
two types of variables namely, independent and dependent variables.
5.2.3.1 Independent variable
Weathington, Cunningham and Pittenger (2012: 45), refer to an
independent variable as the variable responsible that causes or
accounts for the change observed in the dependent variable. Creswell
(2009: 60) defines an independent variable as the variables that cause,
impact, or affects the outcome of a study, also known as treatments,
manipulated, predecessors or predictor variables.
Weathington, Cunningham and Pittenger (2012: 45) point out that
different types of independent variables namely manipulated and
subject variables. Weathington, Cunningham and Pittenger (2012: 45)
find that manipulated variables enable the research to manipulate or
control the intensity of the independent variable. Subject variable is a
condition or characteristic and cannot be controlled or changed by the
researcher.

100
Weathington, Cunningham and Pittenger (2012: 45) highlight an
important point; every time people take part in a research study, they
bring exclusive features to the study.
5.2.3.2 Dependent variable
According to Weathington, Cunningham and Pittenger (2012: 45),
dependent variable is the focal point of the study; the condition that the
research wants to explain. Weathington, Cunningham and Pittenger
(2012: 45) mention other terms used to describe dependent variables
and these terms include response variable or outcome variable.
Creswell (2009: 60) defines dependent variable as variables that are
dependent on the independent variables; the results impact the
independent variables and are also known as criterion, outcome or
effect variables.
Final Weathington, Cunningham and Pittenger (2012: 45) maintain that
while researchers cannot change the characteristic of the people
involved in the research project, uses these features as focus variables
to forecast results.
The variables identified within the ambit of the research study are
included in the demographic section of the survey questionnaire. The
variables are:
The number of years the respondents is in Eskom’s service.
Respondents task grade.
The respondents power station.
The departments the respondent worked in prior to joining the
Outage Management Department.
5.2.4 Data collection – sample type
According to Weathington, Cunningham and Pittenger (2012: 170), a
population is defined as the individuals the researcher wants to
describe. The employees in the Outage Management Department
made up the target population.

101
Weathington, Cunningham and Pittenger (2012: 170) mention that a
researcher will draw a sample from the subset of the population.
Weathington, Cunningham and Pittenger (2012: 170) further describe a
sample population as an accessible group of people who work in the in
the same area and have share the same characteristics of the target
population. The employees in the Outage Management Department
work in the same area and are assumed to have the same training and
relevant experience of the outage process.
The sample for the research study was drawn using the sample frame
concept. According to Weathington, Cunningham and Pittenger (2012:
170), a sample frame is a group of people in a target populace that can
be contacted for a particular research purpose. The employees in the
Outage Management Department are reachable for the research
purpose. The employees that chose to respond to the survey make up
the research sample. The employees were informed that their
participation were voluntary and was encouraged take part in the survey
questionnaire. When the data collection is completed, the following
step is the data analysis.
5.3 DATA ANALYSIS
Creswell (2009: 171) return that the data analysis process makes sense
out of text and images. Creswell (2009: 171) point out that the process
includes arranging the data, performing various analyses, getting a
better grasp of the data and represents the data, and drawing
conclusions.
Leedy and Ormrod (2014: 286), mention the electronic spreadsheets an
important tool when processing large amounts of data. Leedy and
Ormrod (2014: 286) found that the use of spreadsheets to sort and
recode, create formulas and graphs as well as explore by trial and error.

102
Denscombe (2007: 288) explains a logical order for analysing
qualitative data:
Prepare the data.
Become familiar with and interpreting the data.
Verify the data.
Present the data.
The outcomes of data analysis are the development of graphs and
tables (Leedy & Ormrod, 2014: 15). These presentations of tables and
graphs are part of the final research report.
5.3.1 Data preparation
The data collection tools used to conduct the research is the
KwikSurveys online free survey tool. KwikSurveys produces a report
that includes descriptive statistical analysis shown in Appendix B. The
quick report states each research question along with the number of
responses, standard deviation and number of respondents. The
standard deviation in the quick report assumes the respondents
represent the population. The sample standard deviation needs to be
recalculated and can be captured in the excel spreadsheet. The data
collected was exported into a spreadsheet, which enabled further
analysis.
5.3.2 Data intepretation
In an endeavor to become acquainted with the data, the author
reviewed the data in the two formats. The quick report in the PDF
format provided a quick overview of the data and provides basic
descriptive statistics. The one format exported into a spreadsheet
enables further analysis within the spreadsheet program while the
second format can be imported into a statistical program.

103
Crosby (1979: 31) identified the initial step necessary when using his
Quality Management Maturity Grid was to ask managers indicate which
stage they think their processes were at for each of the measurement
categories, then to score it. The employees of the Outage Management
Department are asked to rank each element of the outage process
based on their perception. This research study makes use of data
collected from the survey question then applies descriptive statistics to
describe the current perception of the maturity level of the outage
process.
5.3.3 Data presention
The Kwiksurveys online tool provides various methods of presenting the
data. The online survey tool presents data in a number of graphs, as
well as the export formats allow for expansion of the basic graphs
available from Kwiksurveys. The Microsoft Excel format was selected
as method to present the survey data.
The Microsoft Excel report presents the questionnaire in a table with the
Likert scale, the standard deviation, responses and the weighted
average. At the bottom of each set of questions, an average weighted
average is calculated. The Outage Management Maturity Framework
instrument is applied in this research study to determine the as is state
of and gain a deeper understanding of the outage process (De Bruin,
Freeze, Kaulkarni & Rosemann, 2005: Online).
5.4 DATA VALIDITY AND RELIABILITY
According to Leedy and Ormrod (2014: 91), the reliability and validity of
a measurement instrument influences the degree to which a researcher
can understand the phenomenon under investigation, gain statistical
significance in the data, and have an effect on the extent to which
researchers draw meaningful conclusions from the data.

104
The section provides a brief overview of the following:
Validity of the data; and
reliability of the data.
5.4.1 Data validity
Jackson (2008: 71) and Bell (2005: 117), found that validity confirms
that the measuring instrument measures what it says it measures.
Greener and Martelli (2015: Online), return that validity speaks to the
correctness of measurements and observations. Green and Martelli
(2015: Online), point out the importance of research having face,
construct and internal validity.
Greener and Martelli (2015: Online) briefly explain the terms as:
Face Validity: Non-researcher or a layperson can broadly identify
the research method as valid and makes sense.
Construct Validity: are a more complicated idea and means that
the method must essentially measure what you assume it
measures.
Internal Validity: Refers to the cause and effect, does Factor A
have an impact on Factor B.
According Weathington, Cunningham and Pittenger (2012: 102),
internal validity is the degree to which it is assumed that any variations
in the independent variable cause variation in the dependent variable.
Weathington, Cunningham and Pittenger (2012: 102), describes
external validity as the extent to which the outcomes can be generalised
and conclusion is reached using the sample to the population.
The Outage Management Maturity Framework is adopted from Smith’s
(2013: Online) Maintenance Planning and Scheduling Maturity Matrix
and Rosemann and de Bruin’s (s.a.: Online) Business Process Maturity
Model.

105
The face validity by Greener and Martelli (2015: Online) is satisfied
when considering Smith’s (2013: Online) Maintenance Planning and
Scheduling maturity matrix in Appendix C, the outage planning forms
part of the matrix. Smith (2013: Online) states that the Maintenance
Planning and Scheduling maturity Matrix is used to assess the present
status of maintenance planning and scheduling within an organisation.
The outage scope forms part of this maturity matrix. The Outage
Management Maturity Framework intends to measure the maturity of
the outage processes. The results of the survey research measures the
maturity level of the outage process.
The review of data reliability follows in the next section.
5.4.2 Data reliability
According to Bell (2005: 117), reliability is the degree to which a
procedure or test produces a related result in the same circumstances
when repeated. Jackson (2008: 67) states that reliability is the
consistency or stability of a measuring instrument. Greener and Martelli
(2015: Online), describe reliability as being consistent and repeatable.
Greener and Martelli (2015: Online), find that just because something is
repeatable does not mean it is also valid. Greener and Martelli (2015:
Online), highlight participant errors and bias along with observer error
and bias as factors which can affect reliability and validity of data
collections in research.
The reliability checks are usually introduced during the development of
questions and its wording (Bell, 2005: 117). According to Creswell
(2009: 143), the researcher should complete a reliability check for the
internal consistency of the scale and refers to the Cronbach’s Alpha
statistic.

106
5.4.3 Cronbach’s Alpha
According to Tavakol and Dennick (2011: Online) and Goforth (2015:
Online), the Cronbach’s Alpha measures of the internal consistency of
a scale or test and is expressed in a number between zero and one.
Tavakol and Dennick (2011: Online), the internal consistency described
the degree to which all elements in a test measure similar construct.
Gliem and Gliem (2003: Online) found the nearer the alpha is to one
the better the internal consistency. , Gliem and Gliem (2003: Online)
cites George and Mallery (2003), offers the next rule of thumb:
Excellent is greater than 0.9.
Good is greater than 0.8.
Acceptable is greater than 0.7.
Questionable is greater than 0.6.
Poor is greater than 0.5.
SPSS Data Analysis tool was used to complete the Cronbach’s Alpha
reliability test based on the selected variables seen in Table 5.3. The
Cronbach’s Alpha was completed on the survey questions that used the
Likert-type scale with the results shown in Table 5.4.

107
Table 5.4 shows results of the Cronbach’s Alpha test with a 95,3%
reliability.
Table 5.3: Variables used for the Reliability Check for Internal Consistency of the Scale (Source: Own Source)
RELIABILITY for VARIABLES=
Question 6 – Outage organisation Q6.1 Q6.2 Q6.3 Q6.4 Q6.5 Q6.6 Q6.7 Q6.8 Q6.9
Question 7 – Outage process Q7.1 Q7.2 Q7.3 Q7.4 Q7.5
Question 8 – Outage planning Q8.1 Q8.2
Question10 – Outage scope development
Q10.1 Q10.2 Q10.3 Q10.4 Q10.5
Question 11 – Scope management Q11.1 Q11.2 Q11.3 Q11.4 Q11.5 Q11.6
Question 12 – Outage progress Q12.2 Q12.3 Q12.4
Question 14 – Single outage plan Q14.1 Q14.2 Q14.3 Q14.4 Q14.5
Question15 – Outage work order usage
Q15.1 Q15.2 Q15.3 Q15.4
Question16 – work order closeout Q16.1 Q16.2 Q16.3 Q16.4 Q16.5 Q16.6 Q16.7
Question 17 – Work order – coordination delays
Q17.1 Q17.2 Q17.3
Question18 – Outage lessons learnt Q18.1 Q18.2 Q18.3 Q18.4
Question 20 – Outage schedule adherence
Q20.1 Q20.2 Q20.3 Q20.4 Q20.5
Question 21 – Risk analysis Q21.1 Q21.2 Q21.3 Q21.4 Q21.5 Q21.6
Question 22 – Risk mitigation Q22.1 Q22.2 Q22.3 Q22.4
/SCALE(‘ALL VARIABLES’) ALL
/MODEL=ALPHA.
According to Gliem and Gliem (2003: Online) citing the rule of thumb
from George and Mallery (2003), the Cronbach’s Alpha Excellent as the
scope shown in Table 5.4 is above 0.9.
Table 5.4: Cronbach’s Alpha Reliability Statistic (Source: Own Source)
Reliability Statistics
Cronbach’s Alpha N of Items
.953 68

108
5.5 THE RESEARCH STUDY DATA ANALYSIS
Farooq (2015: Online) explains that data is collected to analyse the
behavior, opinions, attitude, desired, habits, values and beliefs of a
certain population being studied. University of Reading (2001: Online),
mentioned a number of methods of analysing surveys and includes
One-Way Tables and Cross-Tabulation.
According to University of Reading (2001: Online), considers the One-
Way Tables as the straightforward analysis. Roberts (2016: Online),
found that the One-Way table is data from graphs put into a table
format. University of Reading (2001: Online) found that One-Way
Tables provide for most of the basic information needs as it tabulates
results question by question and is useful to determine the frequency of
responses to questions. Roberts (2016: Online), observed that One-
Way tables works with one category variable.
The University of Reading (2001: Online) explains that at its most basic
level, cross-tabulation breaks down the sample into two-way table
presentation the response categories of one question as headings of a
row those of another question as column headings.
Weathington, Cunningham and Pittenger, (2012:47) describes
descriptive statistics as a number of some sort that helps to arrange,
summarise and explain data. The research study used the descriptive
statistics to describe the current situation of the outage process.
The survey questionnaire started with gathering data on:
The demographic of the Outage Management Organisation,
then continues to focus on the Outage Planning,
Outage Control; and
Outage Improvement phase.

109
These outage phases make up the twelve elements of the Outage
Management Maturity Framework. The outage process maturity is
determined using a staged representation. Ulster University (s.a.,
Online) shared the view on staged representation and found that in
order for an organisation to be at a particular level of maturity it must
have satisfied the goals of all the process areas associated with that
level of maturity and all of the goals of the processes associated with
any lesser levels of maturity. The maturity level of the element in the
Outage Management Maturity Framework is determined by the
weighted average of the lowest scoring sub-element within that
element.
5.5.1 Demographic information
The survey focused on the entire Outage Management Department.
The population stands at 160 staff. The survey gathered information on
the staff demographic.
The Demographic information included:
The respondents number of years in the service of Eskom.
The respondents task grade.
The respondents and the power stations they represent.
The departments the respondents work in prior to joining the
Outage Management Department.
5.5.1.1 Respondents years of service with Eskom
The objective of this section is to review the work experience of the staff
employed in the Outage Management Department.
A notable aspect in Table 5.5 show 33.7% of the respondents with 0-5
years’ service with Eskom and 60% of the respondents have less than
eleven years’ service within Eskom.

110
Table 5.5 indicates that 30.2% of the respondents have more than
fifteen-year service. The other 25.6% of the respondents have between
five to ten years’ service with Eskom.
Table 5.5: Respondents number of years in Eskom service (Source: Own Source)
How many years do you have in Eskom service?
Frequency Percent Valid Percent
Cumulative
Percent
Valid 0-5 years 29 33.7 33.7 33.7
5-10 years 22 25.6 25.6 59.3
11-15 years 9 10.5 10.5 69.8
Greater than 15 years 26 30.2 30.2 100.0
Total 86 100.0 100.0
The data suggests that the Outage Management Department shows an
even spread in the years of service of the employees in the department.
The following section reviews the respondents’ job grades.
5.5.1.2 Respondents task grade
Table 5.6 presents the respondent for each task grade. The number of
respondents is 86 of a possible 160 respondents to the demographic
section of the survey questionnaire. Table 5.6 also indicates that 57%
of the responses were from the bargaining unit employees.
Table 5.6: Respondent’s Task Grade (Source: Own Source)
What is your TASK grade level?
Frequency Percent Valid Percent
Cumulative
Percent
Valid Bargaining Unit 49 57.0 57.0 57.0
Management 22 25.6 25.6 82.6
Middle Management 9 10.5 10.5 93.0
Executive Management 6 7.0 7.0 100.0
Total 86 100.0 100.0
Respondents from management made up 25.6%, with 10% respondent
from middle management and seven percent from executive
management.

111
This indicates that the employees in the Outage Management
Department showed interest in completing the survey. The next section
reviews the responses from the various power stations.
5.5.1.3 Respondents from various Power Stations
Table 5.7 shows the responses from the various power stations
representing the Outage Management Department. Responses include
respondents that are from various power stations.
Notice that the largest number of respondents in this category is from
Support Department - 14, accounting for 27.9% of the respondents.
The second highest number of respondents was from Power Station 7
with 20.9% followed by Power Stations 1, 6 and 12 with 8.1%. Table 5.7
shows that 27.9% of the respondents were not placed at a power
station.
Table 5.7: Respondents per Power Station (Source: Own Source)
Which Power Station do you fall under?
Frequency Percent Valid Percent Cumulative Percent
Power Station - 1 7 8.1 8.1 8.1
Power Station - 2 3 3.5 3.5 11.6
Power Station - 3 1 1.2 1.2 12.8
Power Station - 4 1 1.2 1.2 14.0
Power Station - 5 1 1.2 1.2 15.1
Power Station - 6 7 8.1 8.1 23.3
Power Station - 7 18 20.9 20.9 44.2
Power Station - 8 6 7.0 7.0 51.2
Power Station - 9 1 1.2 1.2 52.3
Power Station - 10 2 2.3 2.3 54.7
Power Station - 11 6 7.0 7.0 61.6
Power Station - 12 7 8.1 8.1 69.8
Power Station - 13 2 2.3 2.3 72.1
Support Department- 14 24 27.9 27.9 100.0
Total 86 100.0 100.0
The cross tabulation in Table 5.8 shows the spread of the years of
service for each group of respondents.

112
The data in Table 5.8 indicates that 29 respondents to this survey
question indicate that the most experienced employees are from
Support - 14.
Table 5.8: Cross-Tabulation comparing the years in Eskom Service per Power Station (Source: Own Source)
Crosstabulation – Power Station and Eskom Service
0-5 years 5-10 years 11-15 years
Greater than
15 years
Total Number of
Respondents
Power Station- 1 1 2 3 1 7
Power Station - 2 1 2 3
Power Station - 3 1 1
Power Station - 4 1 1
Power Station - 5 1 1
Power Station - 6 5 1 1 7
Power Station - 7 1 8 2 7 18
Power Station - 8 5 1 6
Power Station - 9 1 1
Power Station - 10 1 1 2
Power Station - 11 5 0 1 6
Power Station - 12 3 4 7
Power Station - 13 1 1 2
Support Department -14 5 2 2 15 24
Total 29 22 9 26 86
The Support Department - 14 have 15 employees with more than 15
years of service more than double of the closes power station. Power
Station 7 has seven employees with more than 15 year service and
eight employees with between 5-10 years of service. The notable
observation is that the most experience respondents to the survey do
not work at a power station.
The following section reviews the work experience of the respondents
prior to joining the outages.
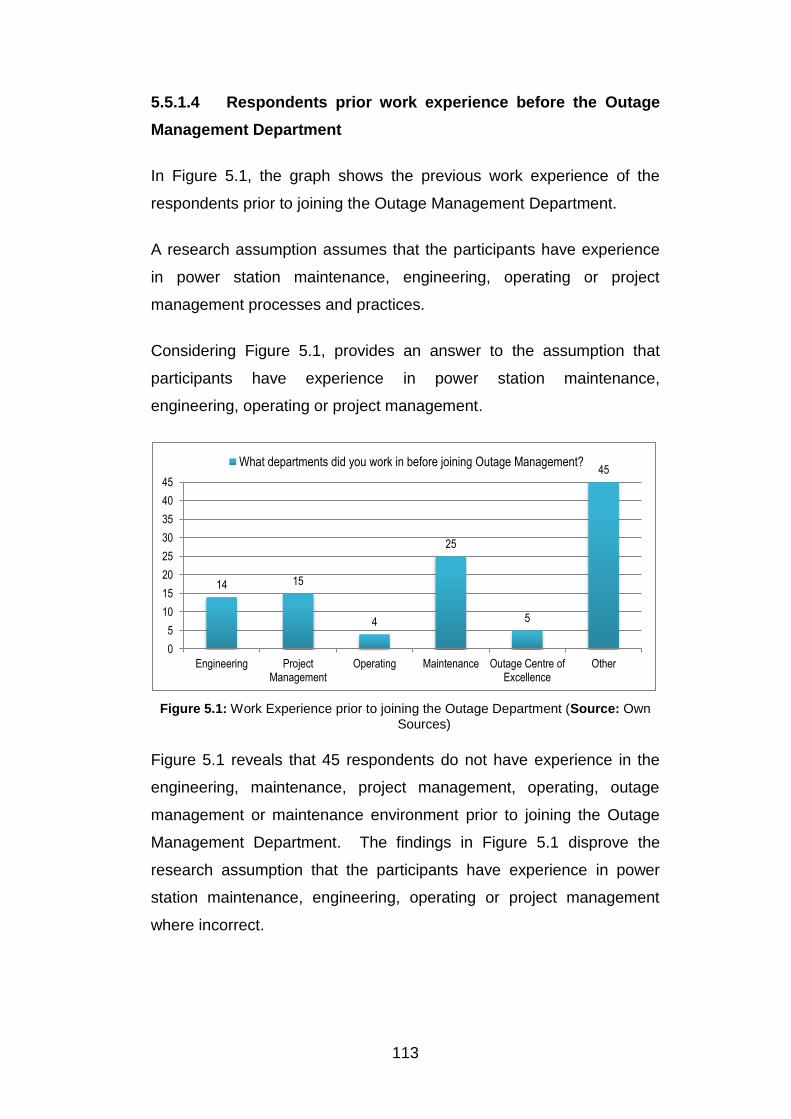
113
5.5.1.4 Respondents prior work experience before the Outage
Management Department
In Figure 5.1, the graph shows the previous work experience of the
respondents prior to joining the Outage Management Department.
A research assumption assumes that the participants have experience
in power station maintenance, engineering, operating or project
management processes and practices.
Considering Figure 5.1, provides an answer to the assumption that
participants have experience in power station maintenance,
engineering, operating or project management.
Figure 5.1: Work Experience prior to joining the Outage Department (Source: Own Sources)
Figure 5.1 reveals that 45 respondents do not have experience in the
engineering, maintenance, project management, operating, outage
management or maintenance environment prior to joining the Outage
Management Department. The findings in Figure 5.1 disprove the
research assumption that the participants have experience in power
station maintenance, engineering, operating or project management
where incorrect.
14 15
4
25
5
45
0
5
10
15
20
25
30
35
40
45
Engineering ProjectManagement
Operating Maintenance Outage Centre ofExcellence
Other
What departments did you work in before joining Outage Management?

114
Figure 5.2 uses cross tabulation to present the respondents previous
work experience and their current power station.
Figure 5.2: Summary indicating the department the respondents worked in prior to Joining the Outage Management Department (Source: Own Source)
The data presented in Figure 5.2 shows that the respondents to the
survey do not have the assumed experience required to work in the
Outage Management Department. The Outage Management
Department should consider previous experience of the potential
employees before introducing new employees to the Outage
Management Department. The following section focuses on Outage
Processes and starts with the Outage Planning process.

115
5.5.2 Outage planning
The data analysis continues with a review of the Outage Planning
portion of the survey. The elements that form part of Outage Planning
include:
Outage Organisation.
The Outage Process.
Outage Planning.
Outage Planning Start.
Outage Scope Development.
Single Outage Plan.
The elements of Outage Planning are analysed using the results of the
survey starting with the Outage Organisation element.
5.5.2.1 Outage organisation
This section reviews the respondents’ perception of the outage
organisation. An Outage Organisation with a high level of maturity will
satisfy the requirements of Level 5, the Best Practice criteria of the
Outage Management Maturity Framework. The Outage Organisation
section of the survey showed 64 respondents.

116
Table 5.9 shows a portion of the Kwiksurveys Report.
Table 5.9: Summary of the respondents to the Outage Organisation Section of the Survey (Source: Own Source)
Outage Organisation Responses Weighted Ave Standard Deviation
Formal outage organisation defined. 64 4.06 15.45 Individuals make decisions regarding outages considering the big picture. 64 3.23 11.01 The outage management leadership is recognised. 64 3.44 11.82
The Outage leadership roles are defined with responsibilities for communication and decision-making.
64 3.78 17.15
Outage leaders are faced with making a small number of decisions. 64 2.52 10.03
The responsibilities for areas like materials management, maintenance, engineering, operating, project management, safety and the contractor interface are defined.
64 3.66 16.63
Fully integrated outage organisation with specific roles and responsibilities are defined. 64 3.52 12.91 Outage teams and stakeholders work in a cooperative manner and adhere to processes.
64 2.89 8.84
Communication and decision making is largely seamless. 64 2.80 7.63
Total Average
3.32 12.39
The data in Table 5.9 shows a total weighted average of 3.32 for the
Outage Organisation. The Average Standard Deviation is 12.39.
The high standard deviation is an indication that the understanding of
the perceived maturity of this section spread over a wide range.

117
Figure 5.3 presents the responses to the Outage Organisation with the
Likert scale of each statement with most of the statements in the Agree
selection though one sub-element showed a Disagree selection.
Figure 5.3: Outage Organisation (Source: Own Source)
Table 5.9 shows three sub-elements of the Outage Organisation that
has a weighted average less 3. The Outage Organisation element is
ranked at a Level 2 maturity, Experimenting.
5.5.2.2 Outage process
This section reviews the respondents’ perception of the outage process.
An Outage Organisation with a high maturity level in the outage process
element will satisfy the requirements of Level 5, the Best Practice
criteria of the Outage Management Maturity Framework. The Outage
Process section of the survey showed 63 respondents. Table 5.10
shows a portion of the Kwiksurveys Report.
The data in Table 5.10 shows a total weighted average for 3.61 for the
Outage Process. The Average Standard Deviation is 12.45. The high
standard deviation is an indication that the understanding of the
perceived maturity of this section spread over a wide range.
4
23
10
7
27
10
10
23
21
5
7
15
7
19
5
11
13
11
38
26
32
43
8
42
35
20
20
17
0 20 40 60
Formal outage organisation defined.
Individuals make decisions regarding outagesconsidering the big picture.
The outage management leadership is recognized.
The Outage leadership roles are defined withresponsibilities for communication and decision-…
Outage leaders are faced with making a smallnumber of decision.
The responsibilities for areas like materialsmanagement, maintenance, engineering,…
Fully integrated outage organisation with specificroles and responsibilities are defined.
Outage teams and stakeholders work in acooperative manner and adhere to processes.
Communication and decision making is largelyseamless.
Outage Organisation
Strongly Disagree Disagree Neutral Agree Strongly Agree
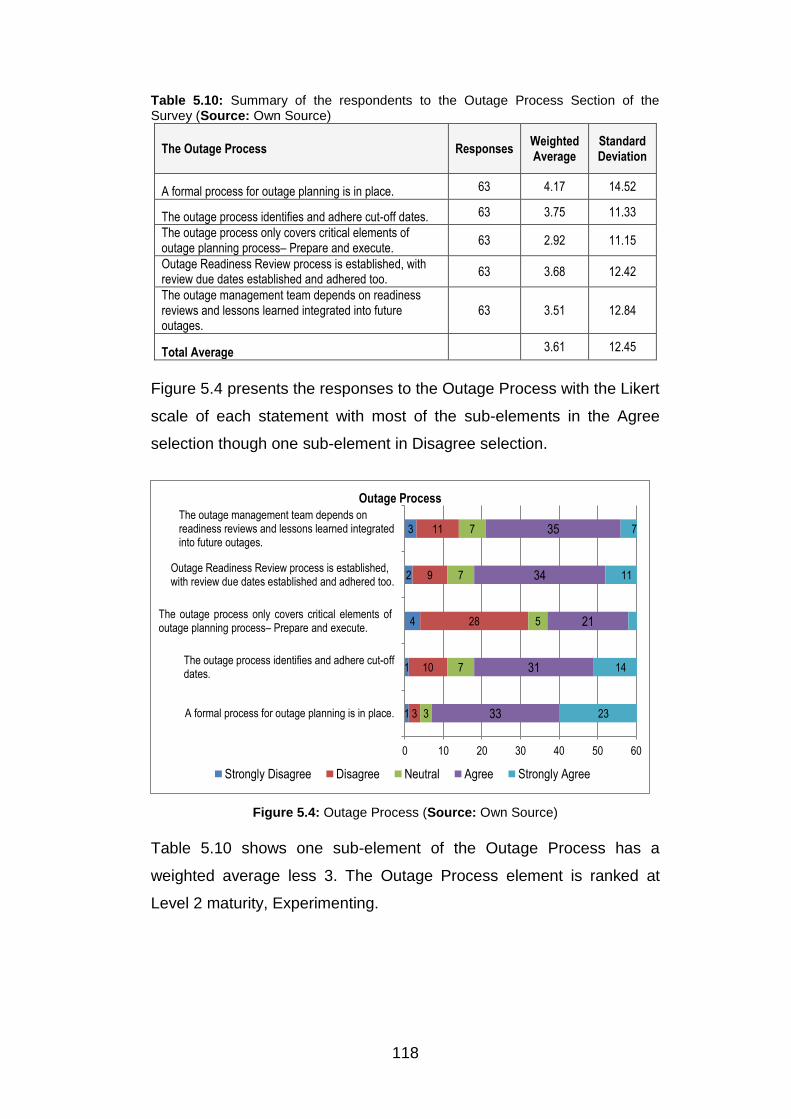
118
Table 5.10: Summary of the respondents to the Outage Process Section of the Survey (Source: Own Source)
The Outage Process Responses Weighted Average
Standard Deviation
A formal process for outage planning is in place. 63 4.17 14.52
The outage process identifies and adhere cut-off dates. 63 3.75 11.33
The outage process only covers critical elements of outage planning process– Prepare and execute.
63 2.92 11.15
Outage Readiness Review process is established, with review due dates established and adhered too.
63 3.68 12.42
The outage management team depends on readiness reviews and lessons learned integrated into future outages.
63 3.51 12.84
Total Average 3.61 12.45
Figure 5.4 presents the responses to the Outage Process with the Likert
scale of each statement with most of the sub-elements in the Agree
selection though one sub-element in Disagree selection.
Figure 5.4: Outage Process (Source: Own Source)
Table 5.10 shows one sub-element of the Outage Process has a
weighted average less 3. The Outage Process element is ranked at
Level 2 maturity, Experimenting.
1
1
4
2
3
3
10
28
9
11
3
7
5
7
7
33
31
21
34
35
23
14
11
7
0 10 20 30 40 50 60
A formal process for outage planning is in place.
The outage process identifies and adhere cut-offdates.
The outage process only covers critical elements of outage planning process– Prepare and execute.
Outage Readiness Review process is established,with review due dates established and adhered too.
The outage management team depends onreadiness reviews and lessons learned integratedinto future outages.
Outage Process
Strongly Disagree Disagree Neutral Agree Strongly Agree

119
5.5.2.3 Outage planning and outage planning start
This section reviews the respondents’ perception of outage planning.
The Outage Organisation with a high level of maturity in outage
planning will satisfy the requirements of Level 5, the Best Practice
criteria of the Outage Management Maturity Framework. The Outage
Planning section of the survey showed 62 respondents.
The data in Table 5.11 shows a total weighted average of 3.56 for
Outage Planning. The Average Standard Deviation is 12.97 showing
that the understanding of the perceived maturity of this section spread
over a wide range.
Table 5.11: Summary of the respondents to the Outage Planning Section of the Survey (Source: Own Source)
Outage Planning Responses Weighted Ave Standard Deviation
Outage Management Plan (OMP) developed and used to add the outages planning.
62 3.61 15.60
The Outage Management Plan clearly established roles and responsibilities for all stakeholders and the OMP is adhered too.
62 3.50 10.99
Total Average
3.56 12.97
Figure 5.5 presents the responses to the Outage Process with the Likert
scale of each statement with most of the sub-elements in the Agree
selection.
The Outage Planning Starts form part of the Outage Planning section,
and with a high level of maturity will satisfy the requirements of Level 5,
the Best Practice criteria of the Outage Management Maturity
Framework.
Figure 5.5: Outage Planning (Source: Own Source)
2
3
8
8
7
13
40
31
5
7
0 20 40 60
Outage Management Plan (OMP) developed andused to add the outages planning.
The Outage Management Plan clearly establishedroles and responsibilities for all stakeholders and the
OMP is adhered too.
Outage Planning
Strongly Disagree Disagree Neutral Agree Strongly Agree

120
The data in Table 5.12 shows the Outage Planning Start section of the
survey showed 62 respondents. The total weighted average of 4.37 for
the Outage Planning. The Average Standard Deviation is 17.73
showing that the understanding of the perceived maturity of this section
is spread over a wide range.
Table 5.12: Summary of the respondents to the Outage Planning Start (Outage Starts) Section of the Survey (Source: Own Source)
Outage Planning starts 3 months prior to the start
of the
outage.
Outage Planning starts 3 to 6 months prior to the start
of the
outage.
Outage Planning starts 12 months prior to the start
of the
outage.
Outage Planning starts 18 months prior to the start
of the
outage.
Outage Planning starts 24 months prior to the start
of the
outage.
Responses Weighted
Ave Standard Deviation
2 5 5 6 44 62 4.37 17.73
The data in Table 5.11 and Table 5.12, shows the Outage Planning and
Outage Planning Start have a combined weighted average of greater
than 3. The Outage Planning and Outage Planning Start elements is
ranked at Level 3, Enlightened.
5.5.2.4 Outage scope development
This section reviews the respondents’ perception of outage scope
development. The Outage organisation with a high outage scope
development maturity level will satisfy the requirements of Level 5, the
Best Practice criteria of the Outage Management Maturity Framework.
The Outage Scope Development section of the survey showed 62
respondents.
The data in Table 5.13 shows a total weighted average of 3.56 for the
Outage Scope Development. The Average Standard Deviation is 12.97
showing that the understanding of the perceived maturity of this section
spread over a wide range.

121
Table 5.13: Summary of the respondents to the Outage Scope Development Section of the Survey (Source: Own Source)
Outage scope is developed based on: Responses Weighted
Ave Standard Deviation
The outage scope considers previous outage scope. 62 3.40 12.46
The outage scope considers Preventative Maintenance Programs.
62 3.44 10.04
The outage scope considers Corrective Maintenance, and Inspection Reports.
62 3.65 10.78
The outage scope considers the Modification Programs. 62 3.79 15.27
The outage scope considers Engineering Programs and lessons learnt.
62 3.55 11.39
Total Average 3.56 11.99
Figure 5.6 presents the responses to the Outage Scope Development
with the Likert scale of each statement with most of the sub-elements in
the Agree selection.
Figure 5.6: Outage Scope Development (Source: Own Source)
The data presented in Table 5.13 indicates that the Outage Scope
Development has a sub-element weighted average of greater than 3.
The Outage Scope Development element is ranked at Level 3,
Enlightened.
5.5.2.5 Single outage plan
This section reviews the respondents’ perception of the single outage
plan. The Outage Organisation with a high level of maturity for the
single outage plan will satisfy the requirements of Level 5, the Best
4
1
1
1
1
9
13
8
4
9
11
13
13
10
14
34
28
30
39
31
4
7
10
8
7
0 10 20 30 40 50 60
The outage scope considers previous outage scope.
The outage scope considers PreventativeMaintenance Programs.
The outage scope considers CorrectiveMaintenance, and Inspection Reports.
The outage scope considers the ModificationPrograms.
The outage scope considers Engineering Programsand lessons learnt.
Outage Scope Development
Strongly Disagree Disagree Neutral Agree Strongly Agree

122
Practice criteria of the Outage Management Maturity Framework. The
Single Outage Plan section of the survey showed 57 respondents.
The data in Table 5.14 shows a total weighted average of 3.83 for the
Outage Scope Development. The Average Standard Deviation is 12.84
showing that the understanding of the perceived maturity of this section
spread over a wide range.
Table 5.14: Summary of the respondents to the Single Outage Plan Section of the Survey (Source: Own Source)
Single Outage Plan Responses Weighted
Ave Standard Deviation
Single outage plan is formal, universally understood and published to all stakeholders.
57 3.84 13.15
Single outage plan developed in a scheduling tool. 57 4.07 16.64
Single outage plan includes the input and oversight from all affected disciplines.
57 3.74 11.63
The critical path of the outage defined and lower priority jobs arranged around it.
57 4.05 13.50
Level of detail on the plan supports an hour-to-hour breakdown.
57 3.46 9.26
Total Average 3.83 12.84
Figure 5.7 presents the responses to the Single Outage Plan with the
Likert scale of each statement with most of the sub-elements in the
Agree selection.
Figure 5.7: Single Outage Plan (Source: Own Source)
0
0
0
0
2
6
3
7
5
14
7
2
10
3
6
34
40
31
33
26
10
12
9
16
9
0 20 40
Single outage plan is formal, universally understoodand published to all stakeholders.
Single outage plan developed in a scheduling tool.
Single outage plan includes the input and oversightfrom all affected disciplines.
The critical path of the outage defined and lowerpriority jobs arranged around it.
Level of detail on the plan supports an hour-to-hourbreakdown.
Singel Outage Plan
Strongly Disagree Disagree Neutral Agree Strongly Agree

123
Table 5.14, Single Outage Plan has a weighted average of greater than
3. The Single Outage Plan element is ranked at Level 3, Enlightened.
The Outage Planning Phase consists of five elements. The Outage
Planning and Planning Start, the Scope Development and Single
Outage Plan are all ranked at level 3, Enlightened. However, the
Outage Organisation and Outage Process elements are ranked at Level
2, Experimenting.
The Outage Planning Phase is ranked at level 2, Experimenting. The
followed section covers the data analysis for the Outage Control Phase.
5.5.3 Outage control
The data analysis continues with a review of the Outage Control Phase
of the survey and includes:
Scope management.
Outage progress.
Outage progress feedback.
Outage work order usage.
Work order closeout.
Percentage planned versus unplanned work.
Outage schedule adherence.
The elements of outage control are analysed using the results of the
survey starting with the Scope Management.
5.5.3.1 Scope management
This section reviews the respondents’ perception of scope
management. The Outage Organisation with a high maturity level for
scope management will satisfy the requirements of Level 5, the Best
Practice criteria of the Outage Management Maturity Framework. The
Scope Management section of the survey showed 64 respondents.

124
The data in Table 5.15 shows a total weighted average of 3.36 for the
Scope Management. The Average Standard Deviation is 10.85
showing that the understanding of the perceived maturity of this section
spread over a wide range.
Table 5.15: Summary of the respondents to the Scope Development Section of the Survey (Source: Own Source)
Scope Management Responses Weighted
Ave Standard Deviation
A scope management process in place. 59 3.95 12.95
Scope management process is adhered too. 59 3.02 8.76
Reactive/Emergent work uses a new work orders. 59 3.47 11.82
Repairs/follow-up work performed uses new work order. 59 3.25 12.11
Emergent and additional work receives a separate follow-up work order.
59 3.42 11.03
A new work order created for rework with the duration and cost quantified.
59 3.05 8.41
Total Average 3.36 10.85
Figure 5.8 presents the responses to the Scope Management with the
Likert scale of each statement with most of the sub-elements in the
Agree selection.
Figure 5.8: Scope Management (Source: Own Source)
Table 5.15, Scope Management has a weighted average of greater
than 3 for all sub-elements. The Scope Management element is ranked
at Level 3, Enlightened.
0
3
1
3
1
3
3
18
9
7
10
18
10
15
14
21
15
14
33
21
31
28
29
21
13
0 20 40
A scope management process in place.
Scope management process is adhered too.
Reactive/Emergent work uses a new work orders.
Repairs/follow-up work performed uses new workorder.
Emergent and additional work receives a separatefollow-up work order.
A new work order created for rework with the durationand cost quantified.
Scope Management
Strongly Disagree Disagree Neutral Agree Strongly Agree

125
5.5.3.2 Outage progress
This section reviews the respondents’ perception of outage progress.
The Outage Organisation with a high level of maturity in outage
progress will satisfy the requirements of Level 5, the Best Practice
criteria of the Outage Management Maturity Framework.
The Outage Progress section of the survey showed 59 respondents.
The data in Table 5.16 shows the total weighted average of 3.28 for the
Outage Progress is 3.28. The Average Standard Deviation is 10.85
showing that the understanding of the perceived maturity of this section
spread over a wide range.
Table 5.16: Summary of the respondents to the Outage Progress Section of the Survey (Source: Own Source)
Outage Progress Responses Weighted Ave Standard Deviation
Outage progress updated in real time updates per shift.
59 3.37 10.03
Scheduling tools accurately capture start and finish information.
59 3.44 10.83
The outage execution schedule provides actual progress feedback and controls work.
59 3.41 10.52
Enterprise Resource Planning (ERP) systems (captures actual progress performance data i.e. cost and hours worked).
59 2.88 8.70
Total Average 3.28 10.02

126
Figure 5.9 presents the responses to the Outage Progress with the
Likert scale of each statement with most of the sub-elements in the
Agree selection with one sub-element with a Neutral selection.
Figure 5.9: Outage Progress (Source: Own Source)
One sub-element in Table 5.16 of the Outage Progress has a weighted
average less than 3. The Outage Progress element is ranked at a Level
2 maturity, Experimenting.
5.5.3.3 Outage work order usage
This section reviews the respondents’ perception of outage work order
usage. The Outage Organisation with a high outage work order usage
maturity level will satisfy the requirements of Level 5, the Best Practice
criteria of the Outage Management Maturity Framework. The Outage
Work Order Usage section of the survey showed 51 respondents.
0
2
1
3
19
12
16
20
7
9
7
22
25
30
28
9
8
0 10 20 30 40 50
Outage progress updated in real time updates pershift.
Scheduling tools accurately capture start and finishinformation.
The outage execution schedule provides actualprogress feedback and controls work.
Enterprise Resource Planning (ERP) systems(captures actual progress performance data i.e. cost
and hours worked).
Outage Progress
Strongly Disagree Disagree Neutral Agree Strongly Agree

127
The data in Table 5.17 shows a total weighted average of 3.32 for the
Outage Work Order Usage. The Average Standard Deviation is 8.04
showing that the understanding of the perceived maturity of this section
is spread over a wide range and is only two standard deviations from
six standard deviations.
Table 5.17: Summary of the respondents to the Outage Work Order Usage Section of the Survey (Source: Own Source)
Outage Work Order Usage Responses Weighted Ave Standard Deviation
Each activity executed in the outage has an outage work orders.
51 3.33 7.50
The outage work orders are task specific. 51 3.33 9.04
Routine outage work has task specific work orders. 51 3.53 9.71
All proactive and reactive jobs have individual work orders.
51 3.10 5.93
Total Average 3.32 8.04
Figure 5.10 presents the responses to the Outage Work Order Usage
with the Likert scale of each statement with most of the sub-elements in
the Agree selection.
Figure 5.10: Outage Order Usage (Source: Own Source)
Table 5.17, Outage Work Order Usage, all sub-elements have a
weighted average of greater than 3. The Outage Work Order Usage
element is ranked at Level 3, Enlightened.
4
5
4
4
10
7
4
12
8
9
10
14
23
26
27
17
6
4
6
4
0 5 10 15 20 25 30 35 40 45 50
Each activity executed in the outage has an outagework orders.
The outage work orders are task specific.
Routine outage work has task specific work orders.
All proactive and reactive jobs have individual workorders.
Outage Work Order Usage
Strongly Disagree Disagree Neutral Agree Strongly Agree

128
5.5.3.4 Work order closeout
This section reviews the respondents’ perception of work order
closeout. The Outage Organisation with a high work order closeout
maturity level will satisfy the requirements of Level 5, the Best Practice
criteria of the Outage Management Maturity Framework. The Work
Order Closeout section of the survey showed 51 respondents.
The data in Table 5.18 shows the total weighted average of 2.97 for the
Work Order Closeout. The Average Standard Deviation is 7.67
showing that the understanding of the perceived maturity of this section
is spread over a range with less than 2 standard deviations from a
normal distribution.
Table 5.18: Summary of the respondents to the Work Order Closeout Section of the Survey (Source: Own Source)
Work Order Closeout Responses Weighted
Ave Standard Deviation
Work orders remains in an open status for a long periods after work is completed.
51 3.18 5.85
Work orders history captures all part codes identified. 51 3.16 7.89
Work orders history captures all problems and reason codes identified.
51 3.12 7.76
Written feedback provided on less than 15% of work orders. 51 2.84 8.29
Written feedback provided on less than 50% of work orders. 51 2.75 8.29
Written feedback provided on more than 50% of work orders.
51 2.88 8.26
More than 90% of all work orders have written feedback provided on the same shift.
51 2.90 7.33
Total Average 2.97 7.67

129
Figure 5.11 presents the responses to the Work Order Closeout with
the Likert scale of each statement with most of the sub-elements in the
Neutral selection with two sub-elements with an Agreed selection.
Figure 5.11: Outage Order Usage (Source: Own Source)
The Work Order Usage element Table 5.18 has four elements with a
weighted average less 3. The Work Order Usage element is ranked at a
Level 2 maturity, Experimenting.
5.5.3.5 Percentage planned versus unplanned work
This section reviews the respondents’ perception of percentage planned
versus unplanned work. The Outage Organisation with a high
percentage planned versus unplanned work maturity level will satisfy
the requirements of Level 5, the Best Practice criteria of the Outage
Management Maturity Framework.
6
3
3
4
4
3
4
11
10
10
13
16
14
13
8
16
18
21
21
22
21
20
20
18
13
9
10
10
6
2
2
2
3
0 5 10 15 20 25 30 35 40 45 50
Work orders remains in an open status for a longperiods after work is completed.
Work orders history captures all part codes identified.
Work orders history captures all problems and reasoncodes identified.
Written feedback provided on less than 15% of workorders.
Written feedback provided on less than 50% of workorders.
Written feedback provided on more than 50% of workorders.
More than 90% of all work orders have writtenfeedback provided on the same shift.
Work Order Closeout
Strongly Disagree Disagree Neutral Agree Strongly Agree

130
The Percentage Planned versus Unplanned Work section of the survey
showed 50 respondents.
Table 5.19: Summary of the respondents to the Percentage Planned versus Unplanned Work Section of the Survey (Source: Own Source)
0% Planned and 100%
Unplanned Work
30% Planned and
40% Unplanned
Work
50% Planned and
50% Unplanned
Work
70% Planned and
30% Unplanned
Work
0% Planned and 10%
Unplanned Work
Responses Weighted
Ave
0 2 7 40 1 50 3.80
The total weighted average for the Percentage Planned versus
Unplanned Work is 3.80 ranking it at level 3, Enlightened.
5.5.3.6 Outage schedule adherence
This section reviews the respondents’ perception of outage schedule
adherence. The Outage Organisation with a high outage schedule
adherence maturity level will satisfy the requirements of Level 5, the
Best Practice criteria of the Outage Management Maturity Framework.
The Outage Schedule Adherence section of the survey showed 49
respondents.
The data in Table 5.20 shows the total weighted average of 3.23 for the
Outage Schedule Adherence. The Average Standard Deviation is 7.56
showing that the understanding of the perceived maturity of this section
is spread over a range with less than 2 standard deviations from a
normal distribution.
Table 5.20: Summary of the respondents to the Outage Schedule Adherence Section of the Survey (Source: Own Source)
Outage Schedule Adherence Responses Weighted
Ave Standard Deviation
Outage schedule adherence is known and measured. 49 3.61 9.83
Outage schedule adherence is greater than 30% 49 3.47 7.40
Outage schedule adherence is greater than 50% 49 3.12 7.19
Outage schedule adherence is greater than 70% 49 3.06 6.53
Outage schedule adherence is greater than 80% 49 2.90 6.83
Total Average 3.23 7.56

131
Figure 5.12 presents the responses to the Outage Schedule Adherence
with the Likert scale of each statement with three of the sub-elements in
the Agreed selection with two sub-elements in the Disagreed selection.
Figure 5.12: Outage Schedule Adherence (Source: Own Source)
The Outage Schedule Adherence element Table 5.20 has one sub-
element with a weighted average less 3. The Outage Schedule
Adherence element is ranked at a Level 2 maturity, Experimenting.
The Outage Control Phase consists of six elements. The Scope
Management, Outage Work Order Usage and Percentage Planned
versus Unplanned Work are all ranked at level 3, Enlightened.
However, the Outage Progress, Work Order Closeout and Outage
Schedule Adherence are ranked at Level 2, Experimenting. Therefore,
the Outage Control Phase is ranked at level 2, Experimenting.
5.5.4 Outage improvement
The data analysis continues with a review of the Outage Improvement
Phase of the survey and includes:
Work order: coordination delays.
Lessons learnt.
Risk assessmen.t
Risk mitigation.
The elements of Outage Improvement will be analysed using the results
of the survey starting with the Work Order Coordination Delays.
2
1
1
3
3
7
12
19
16
21
6
7
8
9
9
27
21
15
17
10
8
0 10 20 30 40
Outage schedule adherence is known andmeasured.
Outage schedule adherence is greater than 30%
Outage schedule adherence is greater than 50%
Outage schedule adherence is greater than 70%
Outage schedule adherence is greater than 80%
Outage Schedule Adherence
Strongly Disagree Disagree Neutral Agree Strongly Agree

132
5.5.4.1 Work order coordination delays
This section reviews the respondents’ perception of work order
coordination delays. The Outage Organisation with a high work order
coordination delay maturity level will satisfy the requirements of Level 5,
the Best Practice criteria of the Outage Management Maturity
Framework. The Work Order Coordination Delays section of the survey
showed 51 respondents.
The data in Table 5.21 shows a total weighted average of 3.08 for the
Work Order Coordination Delays. The Average Standard Deviation is
7.92 showing that the understanding of the perceived maturity of this
section is spread over a range with less than 2 standard deviations from
a normal distribution.
Table 5.21: Summary of the respondents to the Work Order Coordination Delays Section of the Survey (Source: Own Source)
Work Order - Coordination Delays
Responses Weighted Ave Standard Deviation
Coordination delays are known and recorded.
51 3.18 5.72
All coordination delays greater than 60 minutes are recorded.
51 2.90 7.12
All coordination delays greater than 30 minutes are recorded.
51 2.57 7.36
Total Average 3.08 7.92
Figure 5.13 presents the responses to the Work Order Coordination
Delays with the Likert scale of each statement. The responses are
balanced between Agree and Disagree for two of the three sub-
elements.
Figure 5.13: Work Order Coordination Delays (Source: Own Source)
3
5
7
14
17
22
11
9
10
17
18
10
6
2
2
0 5 10 15 20 25 30 35 40 45 50
Coordination delays are known and recorded.
All coordination delays greater than 60 minutes arerecorded.
All coordination delays greater than 30 minutes arerecorded.
Work Order Co-Ordination Delays
Strongly Disagree Disagree Neutral Agree Strongly Agree

133
The Work Order Coordination Delays sub-element shown in Table 5.21
has two sub-elements with a weighted average less than 3. The Work
Order Coordination Delays element is ranked at a Level 2 maturity,
Experimenting.
5.5.4.2 Lessons learnt
This section reviews the respondents’ perceptions of lessons learnt.
The Outage Organisation with a high lessons learnt maturity level will
satisfy the requirements of Level 5, the Best Practice criteria of the
Outage Management Maturity Framework. The Lessons Learnt section
of the survey showed 51 respondents.
The data in Table 5.22 shows a total weighted average of 3.70 for the
Lessons Learnt. The Average Standard Deviation is 10.31 showing that
the understanding of the perceived maturity of this section spread over
a wide range.
Table 5.22: Summary of the respondents to the Lessons Learnt Section of the Survey (Source: Own Source)
Lessons Learnt: Responses Weighted Ave Standard Deviation
Outage team records lessons learnt. 50 4.16 13.86
Outage team discusses and accurately document lessons learnt.
50 3.76 12.08
Outage team cycles lessons learnt into future outage planning.
50 3.50 8.60
Outage team captures lessons learnt in an information management system and shares throughout the organisation.
50 3.38 6.71
Total Average
3.70 10.31

134
Figure 5.14 presents the responses to the Lessons Learnt with the
Likert scale of each statement with all of the sub-elements the Agree
selection.
Figure 5.14: Lessons Learnt (Source: Own Source)
The Lessons Learnt sub-elements shown in Table 5.22, all have a
weighted average of greater than 3. The Lessons Learnt element is
ranked at Level 3, Enlightened.
5.5.4.3 Risk assessment
This section reviews the respondents’ perception of risk assessment.
The Outage Organisation with a high risk assessment maturity level will
satisfy the requirements of Level 5, the Best Practice criteria of the
Outage Management Maturity Framework. The Risk Assessment
section of the survey showed 48 respondents.
0
0
1
3
1
7
11
10
3
5
7
9
33
31
24
21
13
7
7
7
0 5 10 15 20 25 30 35 40 45 50
Outage team records lessons learnt.
Outage team discusses and accurately documentlessons learnt.
Outage team cycles lessons learnt into future outageplanning.
Outage team captures lessons learnt in an informationmanagement system and shares throughout the
organisation.
Lessons Learnt
Strongly Disagree Disagree Neutral Agree Strongly Agree

135
The data in Table 5.23 shows a total weighted average of 3.62 for the
Risk Assessment. The Average Standard Deviation is 10.31 showing
that the understanding of the perceived maturity of this section spread
over a wide range.
Table 5.23: Summary of the respondents to the Risk Assessment Section of the Survey (Source: Own Source)
Risk Assessments: Responses Weighted Ave Standard Deviation
Risk analysis performed. 48 3.83 12.24
Risk analyses are objective. 48 3.69 9.24
Risk analysis identifies specific factors for critical jobs defined.
48 3.79 12.76
Risk mitigation measures drills down to specific recovery or avoidance actions to be taken.
48 3.50 9.50
Organisation executes risk avoidance and recovery actions.
48 3.38 8.59
Personal responsibilities assigned to both recovery and avoidance activities identified.
48 3.54 9.56
Total Average
3.62 10.31
The Risk Assessment sub-elements shown in Table 5.23, have all sub-
elements with a weighted average of greater than 3 and therefore the
Risk Assessment element is ranked at Level 3, Enlightened.
5.5.4.4 Risk mitigation
This section reviews the respondents’ perception of the risk mitigation.
The Outage Organisation with a high risk mitigation maturity level will
satisfy the requirements of Level 5, the Best Practice criteria of the
Outage Management Maturity Framework. The Risk Mitigation section
of the survey showed 48 respondents.
The data in Table 5.24 shows a total weighted average of 3.69 for the
Risk Mitigation.

136
The Average Standard Deviation is 11.47 showing that the
understanding of the perceived maturity of this section spread over a
wide range.
Table 5.24: Summary of the respondents to the Risk Mitigation Section of the Survey (Source: Own Source)
Risk Mitigation Responses Weighted
Ave Standard Deviation
Some jobs are identified to be “watched more closely”. 48 4.04 14.54
Level of detail drills down to specific recovery or avoidance actions to be taken.
48 3.52 9.29
Organisation executes avoidance and recovery actions. 48 3.56 10.69
Both recovery and avoidance activities identified and personnel responsibilities assigned for most critical jobs.
48 3.63 11.37
Total Average 3.69 11.47
Figure 5.15 presents the responses to the Lessons Learnt with the
Likert scale of each statement with all of the sub-elements in the Agree
selection.
Figure 5.15: Risk Mitigation (Source: Own Source)
The Risk Mitigation sub-elements shown in Table 5.24,have a weighted
average of greater than 3 and therefore the Risk Assessment element
is ranked at Level 3, Enlightened.
The Outage Improvement Phase consists of four elements. The
Lessons Learnt, Risk Assessment and Mitigation elements are all
ranked at level 3, Enlightened. However, the Work Order Coordination
Delays is ranked at Level 2, Experimenting.
0
0
0
0
1
6
6
4
4
15
12
13
35
23
27
28
8
0 5 10 15 20 25 30 35 40 45
Some jobs are identified to be “watched more closely”.
Level of detail drills down to specific recovery oravoidance actions to be taken.
Organisation executes avoidance and recoveryactions.
Both recovery and avoidance activities identified andpersonnel responsibilities assigned for most critical…
Risk Mitigation
Strongly Disagree Disagree Neutral Agree Strongly Agree

137
Therefore, the Outage Improvement Phase is ranked at level 2,
Experimenting. The following section summarises the Outage
Planning, Control and Improvement phases.
5.5.5 Summary of the data analysis
The sections summarised the data analysis and provides the maturity
level for the Outage Planning, Outage Control and Outage Improvement
phases.
5.5.5.1 Outage planning phase
The Outage Planning phase had of five elements. Three elements
where ranked at level 3, Enlightened but the Outage Organisation and
Outage Process elements where ranked at Level 2, Experimenting.
The Outage Planning Phases final ranking is level 2, Experimenting.
5.5.5.2 Outage control phase
The Outage Control Phase had six elements. Three elements where
ranked at level 3, Enlightened but the Outage Progress, Work Order
Closeout and Outage Schedule Adherence where ranked at Level 2,
Experimenting. The Outage Control Phases final ranking is level 2,
Experimenting.
5.5.5.3 Outage improvement phase
The Outage Improvement Phase had of four elements. Three elements
where ranked at level 3, Enlightened but the Work Order Coordination
Delays is ranked at Level 2, Experimenting. The Outage Improvement
Phases final ranking is level 2, Experimenting.
The following section interprets the research data and draws a
conclusion.

138
5.6 INTERPRETATION OF THE RESEARCH DATA
The research question inquired if the Outage Management Department
is able to identify improvement opportunities if the maturity level of the
outage process is established.
By determining the outage process maturity level the Outage
Management Department established the “as is” state of the outage
process. The instrument to determine the process maturity level
developed for this research study is the Outage Management Maturity
Framework. This instrument established that the outage process
maturity is ranked at Level 2, Experimenting.
The data analysed in section 5.5 was used as is inputs to determine the
maturity level of the Outage Process. The interpretation considers the
maturity of each element.

139
5.6.1 Outage management maturity
Figure 5.16 showed the maturity levels for the twelve outage process
elements in the Outage Management Maturity Framework. The Outage
Planning, Outage Scope Development, Scope Management, Single
Outage Plan, Work Order Usage and Risk Analysis are rated at a level
3, maturity level.
Figure 5.16: Outage Management Maturity Level July 2016 (Source: Own Source)
The Outage Organisation, Outage Process, Outage Progress, Work
Order Closeout, Work Order Coordination Delays and Schedule
Adherence are rated under level 3 maturities. Therefore, the Outage
Process Maturity is at Level 2, Experimenting.
2.52
2.92
3.5 3.4
3.02 2.88
3.46
3.1 2.75
2.57 2.9
3.38
0
1
2
3
4
5
Maturity Levels for the Twelve Outage Process Elements
Weighted Average Lowest Weigthed Average Level 2 Maturity Level

140
5.6.2 Overview of the Level 2 maturity
The section briefly explains the characteristics of the elements at a level
2 maturity (see Appendix A):
Outage Organisation Level 2: Outage leader implied by job title,
but authority and centralisation of communication and leadership
not recognised. Still have a high degree of individual decision
making with no coordination to the big picture.
Outage Process Level 2: An outage process established and cut-
off dates established, but cut-off dates are not enforced. No
formal Outage readiness review process but informal reviews are
completed on an adhoc basis. Outage performance is poor and
organisation struggles to recover outages.
Outage Progress Level 2: Verbal feedback on Outage progress
updates provided daily.
Work Order Closeout Level 2: Work orders are closed with some
part codes identified. Verbal feedback provided at best, but poor
performance.
Work Order Coordination Delays Level 2: Know coordination
delays but do not record the delays.
Schedule Adherence Level 2: Greater than 30% schedule
adherence.
5.7 CONCLUSION
The chapter expanded on the following:
Data collection methods.
Data analysis.
Data validity and reliability.
Complete the data analysis of the research study.
Interpret the research data and determine the outage process
maturity level.

141
The research established the overall outage process maturity level of
Eskom’s outage process as well as identified the low ranking sub-
elements as possible improvement opportunities. The Outage
Management Maturity Framework was further used to determine the
individual maturity level at power station level. Appendix D provides the
maturity level of individual power stations with the lowest ranking
element(s) clearly identifiable. The data in Appendix D provides the
opportunity for bench marking best practice across the power stations.
The conclusion and recommendations are discussed in the last chapter.

142
CHAPTER 6: CONCLUSION AND RECOMMENDATION
6.1 INTRODUCTION
A process maturity model is a set of well-defined structured levels that
illustrate how well the practice, behavior and processes of an
organisation can consistently and sustainably produce the
predetermined result (Boutros & Purdie, 2014: Online). The Outage
Management Department contributes to reliable electricity supply when
they can consistently and sustainably complete outages on time and in
budget. The research outcome provided an approach that supports the
mandate of the Outage Management Department.
This chapter presents the research conclusion and offers
recommendations based on the research findings.
6.2 THE RESEARCH THUS FAR
The research established the perceived maturity level of Eskom’s
outage process. Improving the outage process has a direct impact in
Eskom’s ability to provide reliable electricity supplier to power the South
African economy. The Outage Management Maturity Framework
provides a structured improvement approach that if implemented,
resulting in process improvement of the outage process. Eskom should
consider applying the process maturity approach to the online
maintenance process and identify potential areas where this approach
could add value.
The research thus far consisted of:
Chapter 1: This chapter highlights the research problem
statement, the research questions and the research objectives.
Chapter 2: This chapter describes the research environment
highlighting the background to the research.
Chapter 3: This chapter reviews literature related to the research
objectives. The content of this chapter includes:
143
Process maturity.
Outage process.
Outage planning.
Outage control.
Outage improvement.
Measurement instrument to determine outage maturity.
Chapter 4: This chapter explains how the research design and
methodology is selected.
Chapter 5: This chapter analyses and interprets the research
data.
Chapter 6: This is the final chapter of the research study and
provides the final analogies and recommendations to mitigate the
research problem.
6.3 REFLECTION ON THE RESEARCH QUESTION
The section reflects on the research question.
6.3.1 Research question: How would process maturity enable
improvement?
The literature review described the process maturity model and found it
useful as a descriptive approach to determine the current state of a
process, prescriptive approach provides a roadmap for improvement
and a comparative approach allows benchmarking (De Bruin, Freeze,
Kaulkarni & Rosemann, 2005: Online). The literature review found that
the Crosby’s Quality Management Maturity Grid is used as an
assessment and improvement tool (Maier, Moultrie & Clarkson ,2012:
Online).
Consider the research finding that ranked the outage process maturity
at Level 2, Experimenting, and the Outage Management Department at
Eskom is now able to describe its outage process. The Outage
Management Maturity Framework also provides a structured path to
improve the outage process across 12 elements as it identified six

144
elements ranked at Level 2 and six elements ranked at Level 3,
Enlightened. To move to Level 3 Eskom should focus the improvement
efforts on the six Level 2 elements.
6.3.2 Research question: What are the critical elements in an
outage process?
Electric Power Research Institute (EPRI) (2006: Online), found that an
outage process consists of three phases and starts long before the
outage start date, and includes both budget and resource planning.
The literature explored the outage process and found that the three
outage phases are outage planning and preparation, outage execution
and post outage reviews (IAEA, 2002: Online).
Eskom’s outage process consist of the same three phase and includes
the outage preparation and planning phase, the outage execution
phase and the post outage review phase.
12 critical elements that make up the Outage Management Maturity
Framework and that is important to the outage process was adapted
from Smith’s Maintenance Planning and Scheduling Maturity Matrix,
supported by the literature from international publications namely:
Outage Organisation
Outage Process
Outage Planning
Outage Scope Development
Scope Management
Outage Progress
Single Outage Plan
Outage Work Order Usage
Work Order Closeout
Work Order Coordination Delays
Schedule Adherence
Risk Analysis

145
6.3.3 Research question: What is included in outage planning,
contol and improvement?
According to Spring (2010: Online) some outage types may require
outage planning to start up to 24 months prior to the execution date.
Bashir (2011: Online), recommend that outage preparation work should
start 12 months before the outage starts. The IAEA (2006: Online),
found that an important element of outage planning is identifying and
monitoring pre-outage indicators.
The outage planning phase included the elements listed below and the
research findings ranked these elements at:
The outage organisation - Level 2 maturity.
The outage process - Level 2 maturity.
Outage planning and outage planning start - Level 3.
Outage scope development - Level 3.
Single outage plan - Level 2.
McMahon (2015: Online) contests that effective execution of outages is
challenging and requires years of experience and the proper resources
ensure that the outage work stay within budget and on schedule. The
IAEA (2006: Online) emphasises the importance of tight controls of the
work and good communication between the team member when an
outage starts. Bashir (2011: Online) points out that the level 1 and 2
outage execution schedule should be developed one month prior the
start of the outage. Use outage execution indicators to assess the
outage progress and monitor the schedule adherence while this
technique enables effective outage management and decision-making
(IAEA, 2006: Online). Bashir (2011: Online) point out that measuring
outage progress should include daily outage coordination meetings,
daily planning meetings, daily progress meetings and weekly progress
meetings.

146
The outage control phase included the elements listed below and the
research findings ranked these elements at:
Scope management - Level 3
Outage progress - Level 2.
Outage work order usage – Level 3.
Outage work closeout - Level 2.
Percentage planned versus unplanned work – Level 3.
Outage schedule adherence – Level 2.
IAEA (2006: Online), mentions that a post-outage evaluation be used
on the entire outage process with the aim to identify and consider
possible risks in future outages. Bashir (2011: Online) puts emphasis
on outage follow-up experience feedback reports from the work
organisations and the contractors, critique meetings that captured
problems encountered and lessons learnt. McMahon (2015: Online)
found the benefits from a post outage review on completion of the
outage when the contractor and the outage team reviews the
performance indicators and identify good practices and areas for
improvement.
The outage improvement phase included the elements listed below and
the research findings ranked these elements at:
Work order coordination delays – Level 2.
Lessons learnt – Level 3.
Risk assessment – Level 3.
Risk mitigation – Level 3.
6.3.4 Research question: What measurement instrument is able
to determine the outage process maturity level?
Smith (2013: Online) developed the Maintenance Planning and
Scheduling Maturity Matrix, a grid type maturity model when applied to
determine the Planning and Scheduling maturity. The Outage
Management Maturity Framework draws on the work of Smith’s (2013:
Online) Maintenance Planning and Scheduling Maturity Matrix and the

147
Business Process Management Maturity Rosemann and de Bruin (s.a.,
Online).
The Outage Management Maturity Framework was then used as the
measurement instrument to determine the outage process maturity
level. Outage Management Maturity Framework ranked Eskom’s
outage process at Level 2, Experimenting.
6.3.5 Research question: What is the current maturity level of the
outage process at Eskom?
The aim of the research was to establish the maturity level of Eskom’s
outage process as Eskom had no indictor to measure the process
maturity level. The outcome of the research established Eskom’s
outage process was ranked at Level 2, Experimenting with 6 elements
ranked at Level 2 and six elements ranked at Level 3. The research
findings quantified the process maturity level in addition to identified 6
improvement areas to move its process maturity level to Level 3,
Enlightened.
6.4 THE RESEARCH QUESTIONS REVISITED
The research question for this research study read: Will the Outage
Management Department be able to identify improvement opportunities
if the maturity level of the outage process is established?
Eskom implemented an outage process in 2012 and by 2016 had no
measure of the process performance. Eskom collected data during
post outage reviews and was trending outage readiness but had no
indicator the processes’ maturity.
The research set out to establish maturity level of Eskom’s outage
process and found that Rosemann and de Bruin’s Business Process
Maturity Model as a suitable model to establish the maturity level of a
process. The content of Rosemann and de Bruin’s Business Process
Maturity Model did not address the outage process honing the research

148
to identify literature on the outage process. The literature review
considered the views from international bodies, articles and found that
Smith’s Maintenance Planning and Scheduling Maturity Matrix provided
the contents to outage process. The Outage Management Maturity
Framework drew on the work of Rosemann and de Bruin’s Business
Process Maturity Model and Smith’s Maintenance Planning and
Scheduling Maturity Matrix. This Framework not only established the
maturity level of Eskom’s outage process and ranked it at Level 2,
Experimenting but identified improvement opportunities to Eskom’s
outage process.
6.5 THE KEY RESEARCH OBJECTIVES REVISITED
The research objective read as follows:
Primary Research Objective: The primary research objective is
to establish the maturity level of Eskom’s outage process using a
process maturity model.
The research objective to establish the maturity level of the outage
process of Eskom’s outage process was achieved using a Outage
Management Maturity Framework. Establishing the initial maturity level
enables the Outage Management Maturity Framework to identify an
improvement plan focusing on by identifying the low ranking elements.
Secondary Research Objectives:
To consider how process maturity enables improvement
To identify critical elements in an outage process
To determine what is included in outage planning, control
and improvement
To identify a measurement instrument to determine the
maturity level of Eskom’s outage process
To establish the current maturity level of the outage process
at Eskom.

149
6.6 THE RESEARCH DESIGN AND METHODOLOGY REVISITED
The research set out to establish the maturity level of Eskom’s outage
process and describe the current state of the outage process.
Therefore the research adopted the descriptive research design. The
survey research method was selected as the focused on Eskom’s
Outage Management Department and its staff and collected data by
requested the staff to respond to a survey questionnaire to obtain the
staff’s perceptions on the twelve elements of the Outage Management
Maturity Framework.
6.7 CONCLUSION AND RECOMMENDATIONS
The following conclusions are drawn and recommendations made for
consideration by the Outage Management Department:
Conclusion 1: The Outage Management Maturity Framework has
proven effective in determining the outage process maturity level
of Eskom’s outage process which was ranked it at Level 2,
Experimenting.
Recommendation 1: Eskom should focus its improvement plan
on the six Level 2 elements to improve the outage process
maturity level to Level 3.
Conclusion 2: The outage process ranked at Level 2 of five
possible levels. Eskom’s outage process is in an experimental
stage. Six elements are at Level 2 are:
Outage Organisation Level 2: Outage leader inferred by job
title, but authority and centralisation of communication and
leadership not recognised. Still have a high degree of
individual decision making with no coordination to the big
picture.
Outage Process Level 2: An outage process established
and cut-off dates established, but cut-off dates are not
enforced. No formal Outage readiness review process but
informal reviews are completed on an adhoc basis. Outage

150
performance is poor and organisation struggles to recover
outages.
Outage Progress Level 2: Verbal feedback on Outage
progress updates provided daily.
Work Order Closeout Level 2: Work orders are closed with
some part codes identified. Verbal feedback provided at
best, but poor performance.
Work Order Coordination Delays Level 2: Know
coordination delays but do not record the delays.
Schedule Adherence Level 2: Greater than 30% schedule
adherence.
Recommendation 2: It is recommended that Eskom consider
developing an improvement plan for the six Level 2 elements
referred to in Conclusion 1 and address the gaps to move the six
elements to Level 3, Enlightened.
Conclusion 3: The outage process has six elements ranked at
Level 3, Enlightened.
Recommendation 3: Develop an improvement plan for the six
Level 3 elements to address the gaps to move these six elements
to Level 4, Good practice.
Conclusion 4: The Outage Management Maturity Framework
enables benchmarking among power stations (see Appendix D)
Recommendation 4: Identify best performing power stations (see
Appendix D) in each element and establish benchmark
opportunities.
Conclusion 5: The use of Outage Management Maturity
Framework as a process maturity indicator increases the ability of
the Outage Management Department to comprehend the outage
process maturity level.
Recommendation 5: Outage Management should use the
Outage Management Maturity Framework as an indicator to
understand the outage process maturity level at least twice yearly.

151
The Outage Management Department plays an integral part in Eskom’s
mandate to provide a sustainable electricity supply. The effectiveness
of the outage process depends on the effective planning, execution and
closeout of outages.
The research demonstrated that the use of the Outage Management
Maturity Framework assisted Eskom in establishing the maturity level of
the outage process and as well as identifying opportunities to improve
outage process from Level 2, Experimenting to Level 3, Enlightened.
The Outage Management Maturity Framework is an appropriate
instrument to assist with the continues improvement of the outage
process and can further aid in developing an improvement plan to
improve Eskom’s outage process to Level 4, Good Practice, or even to
Level 5, Best Practice.
152
BIBLIOGRAPHY
Alden, J. & Curtis, B. 2006. The Business Process Maturity Model: An Overview for OMG Members. [Online]. Available from: http://slideplayer.com/slide/3097807/ [Accessed 24/11/2015].
Bashir, S. 2011. Effective Outage Management: Outage Planning & Execution at C-2. [Online]. Available from: https://www.iaea.org/NuclearPower/Downloadable/Meetings/2011/2011-10-17-10-21-TM-NPE/2.4.pdf [Accessed 05/06/2016].
Baumler, J. 2010. Who said Falling to plan is planning to fail? [Online]. Available from: http://forums.bellaonline.com/ubbthreads.php/topics/610384/Re_Who_said_Failing_to_plan_is [Accessed 18/05/2015].
Bell, J. 2005. Doing your Research Project: A guide for first time researchers in education, health and social science. 4th Edition. Open University Press. McGraw-Hill Education.
Bourne, L. & Tuffley, A. 2007. Comparing Maturity Models: CMMI, OPM3 and P3M3. [Online]. Available from: http://www.mosaicprojects.com.au/PDF_Papers/P052_Modelling_Your_Maturity.pdf [Accessed 25/11/2015].
Boutros, T., & Purdie, T. 2014. Process Improvement Handbook: A Blueprint for Managing Change and Increasing Organizational Performance. [Online]. Available from: http://accessengineeringlibrary.com/browse/process-improvement-handbook-a-blueprint-for-managing-change-and-increasing-organizational-performance. [Accessed 25/07/2015].
Canada’s Nuclear Regulator. 2012. Maintenance Programs for Nuclear Power Plants. [Online]. Available from: http://nuclearsafety.gc.ca/pubs_catalogue/uploads/20121212-RDGD-210-maintenance-programs-nuclear-power-plants-eng.pdf
[Accessed 08/10/2015].
Cavinato, J., L., Flynn, A., E., & Kauffman, R., G. 2006. Supply Management Handbook, 7th Edition. [Online], Available from: http://accessengineeringlibrary.com/browse/supply-management-handbook-7th-ed [Accessed 17/11/2015].

153
Cepeda, S., L. 2005. CMMI – Staged or Continuous? [Online]. Available from: http://www.cepedasystems.com/documents/CMMIStagedVContinuous.pdf [Accessed 08/03/2016].
Coldwell, D., & Herbst, F. 2004. Business Research. Juta Academic.
Creswell, J., W. 2009. Research design: Qualitative, quantitative, and mixed methods approaches. Sage Publications, Inc. (e-book).
Crosby, P., B. 1979. Quality is Free: The Art of Making Quality Certain. Penguin Group.
De Bruin, T., Freeze, R., Kaulkarni, U., & Rosemann, M. 2005. Understanding the Main Phases of Developing a Maturity Assessment Model. [Online]. Available from: http://eprints.qut.edu.au/25152/ [Accessed 08/07/2015].
De Paula, I.C., Fogliatto, F.S., & Cristofari, C. A. 2012. Methods for assessing the maturity of product development management: A proposal. [Online]Available from: http://www.academicjournals.org/AJBM [Accessed 21/09/2015].
Defeo, J., A & Juran, J., M. 2014: Juran’s Quality Essentials for Leaders. [Online]. Available from: http://accessengineeringlibrary.com/browse/jurans-quality-essentials-for-leaders [Accessed 09/11/2015].
Deming, W.E. 2000. Out of the Crisis. The MIT Press, Cambridge, Massachusetts London, England.
Denscombe, M. 2007. The Good Research Guide for small-scale social research projects. Third Edition. Open University Press. McGraw-Hill Education.
Dijkman, R., Lammers, S., V., & De Jong, A. 2015: Properties that influence business process management maturity and its effect on organizational performance. [Online]. Available from: http://rd.springer.com/article/10.1007%2Fs10796-015-9554-5#page-1 [Accessed 13/10/2015].

154
Drew, S. 2015. 14th Annual Outage Management for Power Plants Conference. [Online]. Available from: http://www.appro.org/media/ScottD_FinalInterview.pdf
[Accessed 15/02/2016].
Electric Power Research Institute (EPRI) 2006. Outage Management Guidelines for Fossil-Fuelled Power Plants. [Online]. Available from http://www.epri.com/abstracts/Pages/ProductAbstract.aspx?ProductId=000000000001012281 [Accessed 14/08/2015].
Electric Power Research Institute (EPRI) 22-Dec-2006. Outage Management Guidelines for Fossil-Fueled Power Plants. [Online]. Available from http://www.epri.com/abstracts/Pages/ProductAbstract.aspx?ProductId=000000000001012281 [Accessed 14/08/2015].
Electric Power Research Institute (EPRI). 2004. Outage Effectiveness Measurement Methodology [Online]. Available from http://www.epri.com/abstracts/Pages/ProductAbstract.aspx?ProductId=000000000001004830 [Accessed 14/08/2015].
eNCA. 2015. “Keeping the lights on’ policy unsustainable, says Eskom. [Online]. Available from http://www.enca.com/south-africa/eskoms-keep-lights-policy-contributing-bad-air-quality [Accessed 18/08/2015].
Eskom Integrated Report. 2015. Integrated Report 31 March 2015. [Online]. Available from: http://www.eskom.co.za/IR2015/Documents/EskomIR2015spreads.pdf [Accessed 18/08/2015].
Eskom Internal Document 240-56927206. 2015. Eskom Holdings Corporate Plan Financial years 2015/2016 to 20192020: Stabilising the business and Re-energising for longer term sustainability and growth.
Eskom Internal Document 32-1312. 2015. Process Control Manual (PCM) for Conduct Planned Outages. Eskom Technology, Internal Process Documents.
Eskom Internal Procedure, 240-47532542. 2013. Outage Readiness Review Stand. Eskom Technology, Internal Process Documents.

155
Eskom Internal Report. 2015. 2015 08 05 GEXCO Outage Performance
Presentation. Eskom Technology, Internal Report.
Eskom Internal Report. 2015. Outage Management: Trending of Causal Factors and Additional Findings from 29 Outage Slip Investigations. Eskom Technology, Internal Process Documents.
Eskom Intranet. s.a. Welcome to the Outage Management – Revving
up Outage Results. [Online]. Available from:
http://technology.eskom.co.za/OM/Pages/Outage%20Management.asp
x [Accessed 18/08/2015].
Farooq, U. 2015: Survey Research Definition, Steps & Research Design. [Online]. Available from: http://www.studylecturenotes.com/social-research-methodology/survey-research-definition-steps-research-design [Accessed 18/01/2016].
Feigenbaum, E. s.a. The Role of Organizational Structure in an Organization. [Online] Available from: http://smallbusiness.chron.com/role-organizational-structure-organization-3794.html [Accessed 09/06/2016].
Gibson, C., F. & Nolan, R. 1974. Managing the Four Stages of EDP Growth. [Online]. Available from: https://hbr.org/1974/01/managing-the-four-stages-of-edp-growth [Accessed 14/07/2016].
Gliem, J., A. & Gliem, R., R. 2003. Calculating, Interpreting, and Reporting Cronbach’s Alpha Reliability Coefficient for Likert-Type Scale. [Online]. Available from: http://www.ssnpstudents.com/wp/wp-content/uploads/2015/02/Gliem-Gliem.pdf [Accessed 08/08/2016].
Goddard, W., & Melville, S. 2001. Research Methodology: An Introduction Second Edition. Juta and Co, Ltd.
Goforth, C. 2015. Using and Interpreting Cronbach’s Alpha. [Online]. Available from: http://data.library.virginia.edu/using-and-interpreting-cronbachs-alpha/ [Accessed 08/08/2016].

156
Goldstein, J. 2006. ISO 9001: Say what you do. Do what you say. Prove that you have done it. [Online]. Available from: http://www.reverselogisticstrends.com/rlmagazine/edition02p61.php
[Accessed 10/11/2015].
Greener, S. & Martelli, J. 2015: An introduction to Business Research Methods. [Online]. Available from: http://bookboon.com/en/introduction-to-research-methods-ebook [Accessed 02/07/2015].
Grutter, A. 2010. Introduction to Operations Management: A Strategic Approach. Pearson Education, South Africa.
Gryna, M. M. 2001. Quality Planning & Analysis: From Production Development through Use. Fourth Edition. McGraw-Hill Irwin.
Hessler, P.G. 2011. Outage Readiness Assessment. [Online]. Available from: http://www.power-eng.com/articles/print/volume-115/issue-11/features/outage-readiness-assessment.html [Accessed 05/06/2016].
Hofstee, E. 2006. Constructing a Good Dissertation: A Practical Guide to Finishing a Mater’s, MAB or PHD on Schedule. EPE.
Hollyhead, A. & Robson, A. 2012. A Little Bit of History Repeating Itself – Nolan’s Stage Theory and the Modern IS Auditor. [Online]. Available from: http://www.isaca.org/Journal/archives/2012/Volume-5/Documents/12v5-A-Little-Bit-of-History.pdf [Accessed 14/07/2016].
Holpp, L. 1999. Managing Teams. [Online]. Available from: http://accessengineeringlibrary.com/browse/managing-teams
[Accessed 09/11/2015].
Huff, A., S. 2009. Design Research for Publication. Sage Publication,
Inc.
Humphrey, W. S. 1987. Characterizing the Software Process: A Maturity Framework. [Online]. Available from: http://www.sei.cmu.edu/reports/87tr011.pdf [Accessed: 18/06/2015].
157
Insightlink Communication, s.a. A Guide to Successful Employee Survey Research. [Online]. Available from: www.insightlink.com/employee-survey-guide.pdf
[Accessed 18/01/2016].
International Atomic Energy Agency (IAEA). 2002. Nuclear power plant outages optimisation strategy. [Online]. Available from: http://www-pub.iaea.org/mtcd/publications/pdf/te_1315_web.pdf.
[Accessed 17/08/2015].
International Atomic Energy Agency (IAEA). 2006. Indicators for management of planned outages in nuclear power plants. [Online]. Available from: http://www-pub.iaea.org/MTCD/publications/PDF/te_1490_web.pdf
[Accessed 06/06/2016].
Jackson, S. L. 2008. Research Methods: A Modular Approach. Thomas
Wadsworth.
Jochem, R., Geers, D. & Heinze, P. 2011. Maturity measurement of knowledge-intensive business processes. [Online]. Available from http://www.emeraldinsight.com/EC31BE3D-1F00-4FFC-86DF-2C45D1F29A01/FinalDownload/DownloadId-FF71CDA091ECA1F2BAE4492BD3CD6D55/EC31BE3D-1F00-4FFC-86DF-2C45D1F29A01/doi/pdfplus/10.1108/17542731111139464 [Accessed 25/07/2015].
Juran, J.,M & De Foe, J., A. 2010. Juran’s Quality Handbook: The Complete Guide to Performance Excellence, Sixth Edition. [Online]. Available from: http://accessengineeringlibrary.com/browse/jurans-quality-handbook-the-complete-guide-to-performance-excellence-sixth-edition#fullDetails [Accessed 02/12/2015].
Juran, J.,M. 1999: The Quality Improvement Process. [Online]. Available from: http://hairball.bumba.net/~rwa2/school/ense627/TelecomQuality/4003X_05.pdf [Accessed 16/11/2015].
Kister, T. 2009: Optimizing Outages Through Effective Task Planning. [Online]. Available from: https://www.lce.com/Optimizing-Outages-Through-Effective-Task-Planning-1170.html [Accessed 15/02/2016].

158
Knowles, G. 2012: Managing Quality in the 21st Century: Principles and Practice. [Online]. Available from: http://bookboon.com/en/managing-quality-in-the-21st-century-ebook. [Accessed 02/07/2015].
Kovan, D. 2005. Organizing outages at Loviisa. [Online]. Available from: http://www2.ans.org/pubs/magazines/nn/docs/2005-4-3.pdf [Accessed 05/06/2016].
Leedy, P. D & Ormrod, J. E. 2014. Practical Research Planning and Design. Tenth Edition. Pearson Education Limited.
Maier, A., M., Moultrie, J. & Clarkson, P., J. 2012. Assessing Organizational Capabilities: Reviewing and Guiding the Development of Maturity Grids. [Online]. Available from: http://www.iff.ac.at/oe/full_papers/Maier%20Anja_Moultrie_Clarkson.pdf
[Accessed 19/11/2015].
Malhotra, M., K. & Grover, V. 1998: An assessment of survey research in POM: from constructs to theory. [Online]. Available from: http://www.ln.edu.hk/mkt/staff/gcui/Survey%20research%20in%20POM.pdf [Accessed 18/01/2016].
Mauch, P., D. 2010. Quality Management: Theory and Application. [Online]. Available from: http://pqm-online.com/assets/files/lib/books/mouch.pdf [Accessed 11/11/2015].
McMahon, M. 2015. The Six Key Areas of Outage Management Value Creation. [Online]. Available from: http://www.power-eng.com/articles/print/volume-119/issue-11/features/the-six-key-areas-of-outage-management-value-creation.html [Accessed 08/06/2016].
Mouton, J. 2001. How to succeed in your Master’s & Doctoral Studies: A South African Guide and Resource Book. Van Schaik Publishers.
Paulk, M., C., Curtis, B., Chrissis, M., B. & Weber, C., V. s.a. The Capability Model for Software. [Online]. Available from: http://homepages.inf.ed.ac.uk/dts/pm/Papers/cmm.pdf
[Accessed 18/06/2015].

159
Pešić, M., A., Milić, V., J., & Anđelković, A. 2012. Business Process Management Maturity Model – Serbian Enterprises Maturity Level. [Online]. Available from:http://www.ses.org.rs/ekonomika-preduzeca/2012-3-4-06.pdf. [Accessed 13/10/2015].
Pöppelbuß, J. & Röglinger, M. 2011. What makes a useful maturity model? A Framework of General Design Principles for Maturity Models and its demonstration in Business Process Management. [Online]. Available from: http://aisel.aisnet.org/ecis2011 [Accessed 08/07/2015].
Prananto, A., McKay, J. & Marshall, P. 2003. A Study of the Progression of E-Business Maturity in Australian SME’s: Some Evidence of the Applicability of the Stage of Growth for E-Business Model. [Online]. Available from: http://aisel.aisnet.org/cgi/viewcontent.cgi?article=1004&context=pacis2003&sei-redir=1&referer=http%3A%2F%2Fscholar.google.co.za%2Fscholar%3Fq%3Dnolan%2Bstages%2Bof%2Bgrowth%2Bmodel%26hl%3Den%26as_sdt%3D0%252C5%26as_ylo%3D2000%26as_yhi%3D2016#search=%22nolan%20stages%20growth%20model%22 [Accessed 18/07/2016].
Punch, K., F. 2003. Survey Research: The Basics. Sage Publications.
Roberts, D. 2016. Two-Way Frequency Tables. [Online]. Available: http://mathbitsnotebook.com/Algebra1/StatisticsReg/ST2TwoWayTable.html [Accessed 23/05/2016].
Rosemann, M. & De Bruin, T. 2005. Application of a Holistic Model for Determining BPM Maturity. [Online]. Available from: http://bptrends.com-www.bptrends.com/publicationfiles/02-05%20WP%20Application%20of%20a%20Holistic%20Model-%20Rosemann-Bruin%20-%E2%80%A6.pdf [Accessed 04/11/2015].
Rosemann, M., & De Bruin, T. s.a. Toward a Business Process Management Maturity Model. [Online]. Available from: http://citeseerx.ist.psu.edu/viewdoc/download?doi=10.1.1.130.1146&rep=rep1&type=pdf [Accessed 13/10/2015].
Rungta, A. 2007. Continuous and Staged Representation of CMMI. [Online]. Available from: https://www.indusnet.co.in/buzz/2007/02/continous-and-staged-representation-of-cmmi/ [Accessed 08/03/2016].
160
Sanders, M., C., & Cook, J. s.a. Revisiting Planned Outage Execution Practices. [Online]. Available from: http://www.altran-na.com/fileadmin/medias/US.altran-na.com/files/Literature/Revisiting_Planned_Outage_Execution_Practices.pdf [Accessed 22/02/2016].
Shahi, A. s.a. Best Practice for the Planning and Execution of Outage Projects in Power Plants. [Online]. Available from: http://www.coreworx.com/wp-content/uploads/2013/07/Coreworx-Best-Practices-for-Planning-and-Executing-Outage-Projects-Power-Plants-wp.pdf [Accessed 15/02/2016].
Shrum, S. 1999. SEI interactive. Volume 2. Issue 4. December 1999. [Online]. Available from: http://www.sei.cmu.edu/library/abstracts/news-at-sei/spotlightdec99.cfm [Accessed 08/03/2016].
Singh, J., & Singh, H. 2015. Continuous improvement philosophy – literature review and direction. [Online]. Available from: http://dx.doi.org/10.1108/BIJ-06-2012-0038 [Accessed 24/02/2015].
Smith, R. 2013. Maintenance Planning and Scheduling Maturity Matrix # 2 of 2. [Online]. Available from: http://www.slideshare.net/rickysmithcmrp/maintenance-planning-and-scheduling-maturity-matrix [Accessed 22/02/2016].
Song, N., Zhu, J., Danilovic, M. & Hoveskog, M. 2011. Evaluating Business Process Management Maturity: A Case study on a Chinese electronics company. [Online]. Available from: http://www.diva-portal.org/smash/get/diva2:425628/fulltext01 [Accessed 13/10/2015].
South African National Standard SANS 9001: 2008. Quality Management Systems Requirements.[Online]. Available from: http://intranetupdate.eskom.co.za/library/sabs_docs/pdf/SANS9001.pdf
[Accessed 17/11/2015].
South African National Standard SANS 9004: 2010. Managing for the sustained success of an organization — A quality management approach, ISO (the International Organisation for Standardization). [Online]. Available from: http://intranetupdate.eskom.co.za/library/sabs_docs/pdf/SANS9004.pdf [Accessed 02/06/2015].

161
Spring, N. 2010: Outage Management Continues to Improve. [Online] Available from: http://www.power-eng.com/articles/print/volume-114/issue-5/Features/outage-management-continues-to-improve.html [Accessed 15/02/2016].
Tavakol, M. & Dennick, R. 2011. Making Sense of Cronbach’s alpha. [Online]. Available from: https://www.ijme.net/archive/2/cronbachs-alpha.pdf [Accessed 08/08/2016].
Tcherpokov, M & Foster, T. 2006. Juran Trilogy: A Training Tool on the Trilogy Quality Model. [Online]. Available from: http://www.slideserve.com/tyne/juran-trilogy [Accessed 22/12/2015].
Thakur, D. s.a. Nolan’s Six –stage Model. [Online]. Available from: http://ecomputernotes.com/mis/information-and-system-concepts/nolanssixstagemodel [Accessed 25/11/2015].
Trochim, W. M. K. 2006. Research Methods Knowledge Base. [Online]. Available from: http://www.socialresearchmethods.net/kb/index.php [Accessed 16/07/2015].
Ulster University. s.a. Staged vs Continuous Representation. [Online]. Available from: http://scm.ulster.ac.uk/~e62901/SVsC2.pdf
[Accessed 26/06/2016].
United States Nuclear Regulatory Commission (USNRC). 2015. Outage. [Online]. Available from: http://www.nrc.gov/reading-rm/basic-ref/glossary/outage.html [Accessed 17/08/2015].
University of Reading Statistical Service Centre UK. 2001. Approach to the Analysis of Survey Data. Boimetrics Advisory and Support Service to DFID. [Online]. Available from: http://www.ilri.org/biometrics/TrainingResources/Documents/University%20of%20Reading/Guides/Guides%20on%20Analysis/ApprochAnalysis.pdf [Accessed 18/05/2016].
Van Dyk, L. & Schutte, C. S .L. 2012. Development of a Maturity Model for Telemedicine. [Online]. Available from: http://sajie.journals.ac.za/pub/article/view/330/275
[Accessed 06/08/2015].
162
Walliman, N. 2001. Your Research Project – A Step-By –Step Guide for
the First-Time Research. Sage Publications.
Weathington, B., L., Cunningham, C., J., L., & Pittenger, D., J. 2012: Understanding Business Research. John Wiley & Sons, Inc., Hoboken, New Jersey.
Welman, C., Mitchell, B., & Kruger, F. 2005. Research Methodology 3rd Edition. Cape Town: Oxford University Press.
Wilson, F. 2013. The Quality Maturity Model: Assessing Organisational Quality Culture in Academic Libraries. [Online]. Available from: http://bura.brunel.ac.uk/bitstream/2438/8747/1/FulltextThesis.pdf [Accessed 12/11/2015].
Wilson, L. 2015. How to Implement Lean Manufacturing, Second Edition. [Online]. Available from: http://accessengineeringlibrary.com/browse/how-to-implement-lean-manufacturing-second-edition#fullDetails [Accessed 02/12/2015].
World Health Organisation. 2009. WHO Patient Safety: Curriculum Guide for Medical School. [Online]Available from: http://www.who.int/patientsafety/activities/technical/who_ps_curriculum.pdf [Accessed 10/11/2015].

163
APPENDIX A: OUTAGE MANAGEMENT MATURITY
FRAMEWORK EXCLUDING THE SMITH’S PLANNING
AND SCHEDULING MATURITY MATRIX ELEMENTS E
lem
en
t
Level 1 Not
Engaged
Level 2 Experimenting
Level 3 Enlightened
Level 4 Good
Practice
Level 5 Best Practice
Ou
tag
e O
rga
nis
ati
on
No formal outage organisation defined.
Decisions regarding outages are made by individuals, independent of the big picture.
Outage leader implied by job title, but authority and centralization of communication and leadership not recognized.
Still a high degree of individual decision making with no coordination to the big picture
Outage leadership role defined with responsibilities for communication and decision making.
Organisation not further defined.
Leader is tied to a high number of decision making, resulting in slow progress and independent decision making with no coordination to the big picture
Formal Outage organisation with responsibilities defined for areas such as materials management, safety, mobile equipment, contractor interface and overhaul outage leadership.
Team still challenged with communication gaps, delaying decisions and progress
Fully integrated outage organisation with specific roles and responsibilities defined.
Clear evidence that this team works in a cooperative manner and adhere to processes.
Communication and decision making is largely seamless
Sin
gle
Ou
tag
e P
lan
Outage plan not formal or published.
Groups work off informal lists.
Multiple plans for the outage exist (maintenance, Engineering, Operating).
Single Outage plan developed, but the quality of the plan is severely lacking.
Plan consists largely simple work lists developed with spotty job plans.
Knowledge of plan resides largely with maintenance leaders.
Single Outage plan developed cooperatively with inputs and oversight from all affected disciplines.
No critical path identified.
All jobs are consider equal; no consistent view on priority.
Level III + Critical path job for the outage identified and lower priority jobs arranged around.
Higher degree of understanding across the organisation.
Level of detail on the plan to support an hour-by-hour breakdown.
Plan is communicated clearly across the organisation and universally understood.
Scheduling conflicts between tasks is extremely rare.

164
Ris
k A
na
lys
is
No Risk analysis performed
Rudimentary risk analysis performed.
Some jobs are identified to be “watched more closely”.
Formal risk analysis performed but largely subjective.
Level of detail do not drill down to specific recovery or avoidance actions to be taken.
Largely a prioritization exercise based on risk, little or no action taken from analysis results.
Level III + Specific factors for critical jobs defined.
Organisation still struggles with execution of avoidance and recovery actions.
Emergencies occur and focus is on quick recovery.
Level IV + Both recovery and avoidance activities identified and personnel responsibilities assigned for most critical jobs.
Emergencies still occur, but they are rare and organisation is well prepared for them.
Ou
tag
e P
roc
es
s
No formal process for outage planning; resources allocated as ‘just-in-time’ immediately prior to outage.
Greatly diminished outage performance.
An Outage process and cut-off dates have been stablished, but cut-off dates are not enforced.
Outage performance is poor; organisation struggles to recover from outages.
Formal Outage process established and routinely adhered to, covering only critical elements of the outage planning process – Identification, Prepare and Execute.
Process only includes those directly impacted.
Level III +
Check Readiness and Review processes incorporated.
Process includes total organisation involvement.
Level IV +
Heavy reliance on the review element with lessons learnt integrated into future outages.
Measureable and quantifiable improvements to outage performance over time.
Wo
rk R
eq
ues
t
Work Request are not used, work reporting is extremely informal (verbal).
Work is requested informally in most cases.
A formal system for reporting work exists, but is overlooked and people prefer to use face-to-face requests.
All requested work is reported via some formal system, but only certain individuals have access to the system.
Delays in requesting work occurs.
Limited feedback to the requestor.
Individuals reports all requests work within the same shift as the problem is noted, but multiple systems for reporting work may still exist.
Some consolation issues prevail.
Every individual is able to use a single reporting system for reporting work with detailed information and reports work when problem is noted.
Feedback to requestor is ensured.
Wo
rk o
rde
r
Pri
ori
tiza
tio
n
Not Applicable to Outages

165
Wo
rk O
rde
r U
sa
ge
Work orders are rarely or never used.
Individual work orders are rarely issued.
Blanket work orders are commonplace.
Individual work orders are used for proactive work.
Reactive work is covered under blanket work orders.
All proactive and reactive jobs have individual work orders.
Repairs/follow-up work performed under parent work order or PM work order.
All proactive and reactive jobs have individual work orders.
Scope creep and additional work receive a separate follow-up work order.
Wo
rk
Ord
er
Sta
tus
Not applicable to Outages
Wo
rk O
rde
r C
los
eo
ut
When the work is complete, work orders are often left in an open status for a long period of time, with little or no feedback provided
Work orders are closed with some part codes identified.
No coordination delays recorded.
Verbal feedback at best, but poor performance.
Work orders are closed with part, some problems, and some reason codes identified.
All coordination delays greater than 60 minutes recorded.
Written feedback provided on less than 50% of work orders
Work orders are closed with part, and problem identified as well as some reason codes.
All coordination delays over 30 minutes recorded.
Written feedback on more than 50% of work
Work orders closed with part and problem identified.
Required follow-up work is noted and new work order created.
All work orders have some form of written feedback provided on the same shift.
Bac
klo
g
Ma
na
ge
men
t &
Me
asu
rem
en
t
Not Applicable to Outages
Wo
rk O
rde
r H
isto
ry
Failure data is not tracked.
Failure codes exist, but usage spotty.
Some artisans record them diligently, most do not.
Failure codes are entered for most work orders, but little or no data analysis done.
Poor knowledge of failure codes.
Level III +
Organisation does proper analyses and understands codes, struggles with corrective action follow-up.
Level IV +
The Organisation gains benefit from the solutions executed as a result of the Failure Reporting and Corrective Action System.
% P
lan
ne
d V
s
Un
pla
nn
ed
0% Planned
100% Unplanned
30% Planned
70% Unplanned
50% Planned
50% Unplanned
70% Planned
30% Unplanned
90% Planned
10% Unplanned

166
Re
ad
y
Ba
ck
log
Not Applicable to Outages
Wre
nc
h/T
oo
l
Tim
e
Less than 25%
25-35% 35-45% 45-55% Greater than 55%
% E
sti
ma
ted
vs
Ac
tual
Ho
urs
Unknown or not measured
50% Accuracy 60% Accuracy 70% Accuracy 80% Accuracy
% A
va
ilab
le
La
bo
r
Sc
he
du
led
Unknown or not measured
30% 50% 75% 100%
Sc
he
du
le
Co
mp
lia
nc
e
Unknown or not measured
Greater than 30%
Greater than 50%
Greater than 70%
Greater than 80%

167
APPENDIX B: SURVEY RESULTS
1 Do you work in the Outage Management Organisation? Yes NO
84 2
Q2 How many years do you have in Eskom service? 0-5 years 5-10 years 11-15 years Greater than15 years
29 22 9 26
Q3 What is your TASK grade level? Bargaining Unit Management Middle Management
Executive Management
49 22 9 6
Q4
Which Power Station do you fall under?
Arnot Kendal Hendrina Matla Tutuka Majuba Matimba Peaking Koeberg Grootvlei Komati Camden Lethabo Duvha Kriel Other Support Department
0 7 3 1 1 1 0 7 18 6 1 2 6 7 2 24

168
Q5 What departments did you work in before joining Outage Management?
Q5.1 Engineering Q5.2 Project Management
Q5.3 Operating Q5.4 Maintenance Q5.5 Outage Centre of Excellence
Q5.6 Other
14 15 4 25 5 45
Q6 Outage organisation. Strongly Disagree Disagree Neutral Agree Strongly Agree
Q6.1 Formal outage organisation defined. 0 4 5 38 17
Q6.2 Individuals make decisions regarding outages considering the big picture.
1 23 7 26 7
Q6.3 The outage management leadership is recognized.
2 10 15 32 5
Q6.4 The Outage leadership roles are defined with responsibilities for communication and decision-making.
0 7 7 43 7
Q6.5 Outage leaders are faced with making a small number of decision.
8 27 19 8 2
Q6.6
The responsibilities for areas like materials management, maintenance, engineering, operating, project management, safety and the contractor interface are defined.
1 10 5 42 6
Q6.7 Fully integrated outage organisation with specific roles and responsibilities are defined.
2 10 11 35 6
Q6.8 Outage teams and stakeholders work in a cooperative manner and adhere to processes.
5 23 13 20 3
Q6.9 Communication and decision making is largely seamless.
9 21 11 20 3

169
Q7 The Outage Process: Strongly Disagree Disagree Neutral Agree Strongly Agree
Q7.1 A formal process for outage planning is in place.
1 3 3 33 23
Q7.2 The outage process identifies and adhere cut-off dates.
1 10 7 31 14
Q7.3 The outage process only covers critical elements of outage planning process– Prepare and execute.
4 28 5 21 5
Q7.4 Outage Readiness Review process is established, with review due dates established and adhered too.
2 9 7 34 11
Q7.5 The outage management team depends on readiness reviews and lessons learned integrated into future outages.
3 11 7 35 7
Q8 Outage Planning Strongly Disagree Disagree Neutral Agree Strongly Agree
Q8.1 Outage Management Plan (OMP) developed and used to add the outages planning.
2 8 7 40 5
Q8.2 The Outage Management Plan clearly established roles and responsibilities for all stakeholders and the OMP is adhered too.
3 8 13 31 7

170
Q9 Outage Planning Start
Outage Planning starts 3 months prior to the start of the outage.
Outage Planning starts 3 to 6 months prior to the start of the outage.
Outage Planning starts 12 months prior to the start of the outage.
Outage Planning starts 18 months prior to the start of the outage.
Outage Planning starts 24 months prior to the start of the outage.
2 5 5 6 44
Q10 Outage scope is developed based on: Strongly Disagree Disagree Neutral Agree Strongly Agree
Q10.1 The outage scope considers previous outage scope.
4 9 11 34 4
Q10.2 The outage scope considers Preventative Maintenance Programs.
1 13 13 28 7
Q10.3 The outage scope considers Corrective Maintenance, and Inspection Reports.
1 8 13 30 10
Q10.4 The outage scope considers the Modification Programs.
1 4 10 39 8
Q10.5 The outage scope considers Engineering Programs and lessons learnt.
1 9 14 31 7

171
Q11 Scope Management Strongly Disagree Disagree Neutral Agree Strongly Agree
Q11.1 A scope management process in place. 0 3 10 33 13
Q11.2 Scope management process is adhered too. 3 18 15 21 2
Q11.3 Reactive/Emergent work uses a new work orders.
1 9 14 31 4
Q11.4 Repairs/follow-up work performed uses new work order.
3 7 21 28 0
Q11.5 Emergent and additional work receives a separate follow-up work order.
1 10 15 29 4
Q11.6 A new work order created for rework with the duration and cost quantified.
3 18 14 21 3
Q12 Outage Progress Strongly Disagree Disagree Neutral Agree Strongly Agree
Q12.1 Outage progress updated in real time updates per shift.
0 19 7 25 8
Q12.2 Scheduling tools accurately capture start and finish information.
2 12 9 30 6
Q12.3 The outage execution schedule provides actual progress feedback and controls work.
1 16 7 28 7
Q12.4 Enterprise Resource Planning (ERP) systems (captures actual progress performance data i.e. cost and hours worked).
3 20 22 9 5

172
Q13 Outage Progress Feedback
Provide weekly verbal feedback on Outage progress.
Provide daily verbal feedback on Outage progress.
Provide verbal progress feedback on Outage progress at the end of each shift.
7 42 26
Q14 Single Outage Plan Strongly Disagree Disagree Neutral Agree Strongly Agree
Q14.1 Single outage plan is formal, universally understood and published to all stakeholders.
0 6 7 34 10
Q14.2 Single outage plan developed in a scheduling tool.
0 3 2 40 12
Q14.3 Single outage plan includes the input and oversight from all affected disciplines.
0 7 10 31 9
Q14.4 The critical path of the outage defined and lower priority jobs arranged around it.
0 5 3 33 16
Q14.5 Level of detail on the plan supports an hour-to-hour breakdown.
2 14 6 26 9
Q15 Outage Work Order Usage Strongly Disagree Disagree Neutral Agree Strongly Agree
Q15.1 Each activity executed in the outage has an 4 10 8 23 6

173
outage work orders.
Q15.2 The outage work orders are task specific. 5 7 9 26 4
Q15.3 Routine outage work has task specific work orders.
4 4 10 27 6
Q15.4 All proactive and reactive jobs have individual work orders.
4 12 14 17 4
Q16 Work Order Closeout Strongly Disagree Disagree Neutral Agree Strongly Agree
Q16.1 Work orders remains in an open status for a long periods after work is completed.
6 11 8 20 6
Q16.2 Work orders history captures all part codes identified.
3 10 16 20 2
Q16.3 Work orders history captures all problems and reason codes identified.
3 10 18 18 2
Q16.4 Written feedback provided on less than 15% of work orders.
4 13 21 13 0
Q16.5 Written feedback provided on less than 50% of work orders.
4 16 21 9 1
Q16.6 Written feedback provided on more than 50% of work orders.
3 14 22 10 2
Q16.7 More than 90% of all work orders have written feedback provided on the same shift.
4 13 21 10 3
Q17 Work Order - Coordination Delays Strongly Disagree Disagree Neutral Agree Strongly Agree
Q17.1 Coordination delays are known and recorded. 3 14 11 17 6

174
Q17.2 All coordination delays greater than 60 minutes are recorded.
5 17 9 18 2
Q17.3 All coordination delays greater than 30 minutes are recorded.
7 22 10 10 2
Q18 Lessons Learnt: Strongly Disagree Disagree Neutral Agree Strongly Agree
Q18.1 Outage team records lessons learnt. 0 1 3 33 13
Q18.2 Outage team discusses and accurately document lessons learnt.
0 7 5 31 7
Q18.3 Outage team cycles lessons learnt into future outage planning.
1 11 7 24 7
Q18.4 Outage team captures lessons learnt in an information management system and shares throughout the organisation.
3 10 9 21 7
Q19 What is the % planned vs % unplanned work? 0% Planned and 100% Unplanned
30% Planned and 70% Unplanned
50% Planned and 50% Unplanned
70% Planned and 30% Unplanned
(0% Planned and 10% Unplanned
0 2 7 40 1

175
Q20 Outage Schedule Adherence Strongly Disagree Disagree Neutral Agree Strongly Agree
Q20.1 Outage schedule adherence is known and measured.
2 7 6 27 7
Q20.2 Outage schedule adherence is greater than 30% 1 12 7 21 8
Q20.3 Outage schedule adherence is greater than 50% 1 19 8 15 6
Q20.4 Outage schedule adherence is greater than 70% 3 16 9 17 4
Q20.5 Outage schedule adherence is greater than 80% 3 21 9 10 6
Q21 Risk Assessments: Strongly Disagree Disagree Neutral Agree Strongly Agree
Q21.1 Risk analysis performed. 1 5 3 31 8
Q21.2 Risk analyses are objective. 0 8 7 25 8
Q21.3 Risk analysis identifies specific factors for critical jobs defined.
0 6 4 32 6
Q21.4 Risk mitigation measures drills down to specific recovery or avoidance actions to be taken.
0 9 10 25 4
Q21.5 Organisation executes risk avoidance and recovery actions.
0 9 15 21 3
Q21.6 Personal responsibilities assigned to both recovery and avoidance activities identified.
0 5 16 23 4

176
Q22 Risk Mitigation Strongly Disagree Disagree Neutral Agree Strongly Agree
Q22.1 Some jobs are identified to be “watched more closely”.
0 1 4 35 8
Q22.2
Level of detail drills down to specific recovery or avoidance actions to be taken.
0 6 15 23 4
Q22.3 Organisation executes avoidance and recovery actions.
0 6 12 27 3
Q22.4
Both recovery and avoidance activities identified and personnel responsibilities assigned for most critical jobs.
0 4 13 28 3

177
APPENDIX C: SMITH’S MAINTENANCE PLANNING AND SCHEDULING MATURITY MATRIX
Elements Your Score (1-5
Maturity) LEVEL 1
NOT ENGAGED LEVEL 2
EXPERIMENTING LEVEL 3
ENLIGHTENED LEVEL 4
GOOD PRACTICE LEVEL 5
BEST PRACTICE
PLA
NN
ING
Pla
nnin
g E
duca
tion
No formal training provided. Planners have attended a
formal planner training course or workshop.
Planners have been formally trained. Affected individuals
have been provided awareness training but nothing related to
specific expectations.
Processes are well defined, with maintenance and
operations leaders given specific training on
expectations with additional on-the-job coaching.
All affected individuals have received specific training to
expectations. Training is ongoing for new hires. All
personnel modeling expected behaviors.
Pla
nner
Rol
e an
d
Res
pons
ibili
ties
No planner role identified.
Role and responsibilities not clearly defined. Planner
is involved with reactive work and parts chasing. No
dedicated planner.
Planners develop and assemble limited job packages. Dedicated planner as a full-time resource.
Unclear expectations.
Expectations of full-time planners well defined. Still an
excessive amount of time spent on non-core activities.
Planners strictly focused on future work. Zero involvement with reactive work. Roles and
responsibilities are clearly adhered to.
Sta
ndar
d W
ork
Pro
cedu
res
No effective work procedures
or accurate time estimates developed by planner.
High level work procedures developed for large jobs
and outages. Heavily dependent on OEM
manuals. Standard set of expectations for job plan content not established.
Standardized format for job plans established; expectations
on quality and content are subjective. No clear
expectations for which jobs should have a detailed plan
developed.
Formal expectations developed for job plan format and content that is generally
followed. Job plans are developed for work on critical
assets. Moving towards quantitative vs. subjective
inspection criteria.
Level IV + Evidence of continuous improvement system in place. Craftspersons involved in review and approval process.
Labo
r E
stim
atio
n
Job plans have no estimated
labor hours assigned.
Jobs are grossly overestimated (1/2 shift or
full shift) and not taken seriously in scheduling
process. No formal estimating techniques are
used.
Job estimates are generally more accurate; basic estimating process applied. Estimates are
usually accepted as being accurate but are often
overridden.
Jobs are broken down into steps and tasks with a time
estimate rolled up into a total. Accepted as accurate and
utilized in building the weekly schedule.
Level IV + Job plan includes estimates for coordination and
other outside resources. Estimates adjusted based on
history/craft feedback.
Job
Site
Vis
its
Job site visits are rare or non-existent while “planning” work.
Planner visits job sites for “high profile” jobs only while
planning work.
Planner visits large or complex job sites during planning only when no pre-existing job plan
exists.
Planner reviews some job plans with maintenance
supervisors and technicians at the job site to ensure
completeness.
Job site visits and significant interaction with those who will perform the work is a standard
practice.

178
Iden
tific
atio
n of
S
afet
y
Req
uire
men
ts
No identification of Safety/Tag
out/Permit requirements by the planner.
Planner includes high-level references to site safety policies on work order.
Planner makes reference to generic safety procedures or
requirements on the work order based on the equipment
type/environment.
Planner prepares detailed list of safety hazards and
references permits required based on job task breakdown
and site visit.
Level IV + Methods to address these hazards are provided. Permits are pre-populated as
much as possible and included in the work packet.
Bill
of M
ater
ials
(B
OM
) M
anag
emen
t
Equipment-specific BOMs do
not existent.
Some BOMs developed, but only for a small portion
of equipment. Most are incomplete or inaccurate;
almost never formally reviewed or
corrected/updated.
Level II + Some BOMs are linked to drawings, item number,
and lead time for delivery.
Level III + Formal plan in place to address
shortcomings on BOMs. Focus on equipment level.
Plan is clearly being executed with results of efforts evident.
BOMs developed to the component level with minor
exceptions. Continuous improvement and corrections a standard process. BOMs are
standard part of CAPEX process.
Det
erm
inat
ion
of
Req
uire
d M
ater
ials
No predetermination of needed materials. Materials acquisition is entirely up to
technicians “on the fly” while executing job.
Technicians identify their own materials and the
planner places the order. List is quite often
inaccurate. Job delays from missing material are
common.
Planners work with maintenance supervisors and technicians along with past job history to develop list. Storeroom runs
during job execution still common.
BOMs and job history utilized, but gaps exist. Planner
expends a significant amount of time researching materials.
Job delays from missing materials only occasionally
occur.
BOMs and past job history leveraged extensively. Delays in
job execution due to missing materials are a very rare
occurrence.
Mat
eria
ls K
ittin
g
No kitting process in place. Materials acquired “on the fly”
by technicians and supervisors.
Materials lay down areas exist in storeroom; informal process, much confusion
and inaccuracy.
Materials kitting and staging occurs for most outage jobs and
only ad hoc for weekly/daily work. Technicians drive the
process.
Materials kitting and staging occurs for all outage jobs and
most weekly/daily work. Storeroom personnel receive pick-lists and assemble the
kits.
Kitting is standard practice with few errors. Kits are kept in a
secure area, verified for accuracy against the work order
and easily identified.
Wor
k O
rder
Clo
seou
t
Work orders are not returned to the planner for closeout.
Work orders are returned to planner for closeout, but contain very little if any
useful feedback (“Fixed, Done, Complete”).
Work orders are returned to planner with hours (actual
almost always matches estimate) and no indication of
missing materials. Planner occasionally makes updates.
Level III + Improvement suggestions, materials
consumed, and actual hours spent. History allows
management reporting on MTBF and Planned vs. Actual
hours.
Level IV + Component codes and failure codes. Failure
information can be discerned from work order history to drive
reliability improvements.
SC
HE
DU
LIN
G
Sch
edul
ing
Mee
ting
Par
ticip
atio
n
Scheduling meetings not held.
Organization completely reactive.
Scheduling meeting only occurs for outages attended
only by maintenance personnel. Production
does not attend.
Scheduling meeting occurs with a standard agenda, date, time,
and required attendees. Production attends meetings on
occasion, but not actively engaged when present.
Schedule not taken seriously.
Level III + Attendees are on time and actively engaged in
the scheduling meeting. Moderate level of confidence
exists in the developed schedule. Maintenance
driven.
Scheduling meeting occurs like clockwork and is efficient -
standard time, place, agenda. Operations drives meetings.
Formal approval process (Maintenance and Operations).
Senior Management sponsorship.

179
Ope
ratio
ns/M
aint
enan
ce
Use
of B
ackl
og fo
r
Sch
edul
ing
Backlog is not considered when developing a schedule.
Daily reactive coordination occurs vs. weekly scheduling.
Backlog largely inaccurate and not taken seriously. Next week’s schedule
originates from both the backlog and on-the-spot
production requests. Many very old (>90 days) jobs on
the backlog; backlog is large.
Schedule is developed using a combination of backlog and last minute emergency lists. Team understands the importance of
scheduling from the backlog, but still struggles with execution.
Backlog is generally considered accurate and most jobs are only scheduled from
backlog, not necessarily strictly from the ready backlog
(total backlog as well).
Ready backlog is the primary driver for building the schedule.
Backlog size and age appropriate.
Sch
edul
e C
omm
unic
atio
n
Largely verbal agreements and informal lists. Shared only
between small subset of workforce.
Schedule is published on a network drive or emailed.
Rarely viewed/passive communication/small subset of organization
aware of existence.
Schedule is passively posted and displayed in maintenance
shops/areas only. Frequency of updates sporadic and rarely paid
attention to.
Schedule is published and displayed in all areas.
Schedule is regularly posted at set date/time/place; awareness of schedule
content/importance varies.
Level IV + Schedule is regularly and actively reviewed with
personnel at set date/time/place; published at least one week in advance. Minimal coordination
delays.
Res
ourc
e U
tiliz
atio
n
Personnel react entirely to radio/trouble calls from production/maintenance supervisors. Resource availability not known.
Available resources not taken into consideration
during scheduling. Personnel select their jobs
from an assignment box; no names listed. Resource
utilization low.
Scheduling based on availability of resources; significant portion
of schedule empty to accommodate “emergencies”. Resources not scheduled to
100% availability.
Labor Hours formally scheduled to 100%. Front line supervisors react to schedule
breakers, but no formal process exists. Resource
utilization is moderate. Jobs assigned to personnel the day
prior to work.
Level IV + Formal process in place for “schedule breakers”.
Resource utilization is very high. Personnel assigned to jobs the
week before. Schedule breakers analyzed for improvement.
Mea
surin
g S
ched
ule
Com
plia
nce
Not measured. No
accountabilities set.
Number of work orders completed is tracked.
Numbers are suspect to manipulation; methods of
measurement are sporadic and variable. No system of
accountability.
Only tracking work order completion rate. Formal standard in place but not
consistently followed. Measurement published
regularly; results not used to drive improvement.
Compliance measured by dividing the total number of
labor hours completed by the total number of labor hours scheduled. Measurements formalized and trended, but
not always followed.
Level IV + Method formalized and consistently followed.
Organization regularly tracks and seeks out improvement
opportunities.
OU
TA
GE
PLA
NN
ING
Out
age
Org
aniz
atio
n
No formal outage organization defined. Decisions regarding
the outage are made by individuals, independent of
the big picture.
Outage leader implied by job title, but authority and
centralization of communication and
leadership not recognized. Still a high degree of
individual decision making with no coordination to the
big picture.
Outage leadership role defined with responsibility for
communication and decision making. Organization not further
defined. Leader tied to high number of decisions, resulting in slow progress and independent
decision making with no coordination to the big picture.
Formal outage organization with responsibilities defined for areas such as materials
management, safety, mobile equipment, contractor
interface, and overall outage leadership. Team still
challenged with communication gaps, delaying
Fully integrated outage organization with specific roles
and responsibilities defined. Clear evidence that this team
works in a cooperative manner and adheres to the process. Communication and decision making is largely seamless.

180
decisions and progress. S
ingl
e O
utag
e P
lan
Outage plan not formal or published. Groups work off of informal lists. Multiple plans
for the outage exist (maintenance, engineering,
operations, etc.).
Single outage plan developed, but the quality
of the plan is severely lacking. Plan consists
largely of simple work lists developed with spotty job plans. Knowledge of plan
resides largely with maintenance leaders.
Single outage plan developed cooperatively with input and oversight from all affected disciplines. No critical path
identified. All jobs are considered equal; no consistent
view on priorities.
Level III + Critical path job for the outage identified and
lower priority jobs arranged around it. Higher degree of understanding across the
organization.
Level of detail on the plan to support an hour-by-hour
breakdown. Plan is communicated clearly across
the organization and universally understood. Scheduling conflicts between tasks is
extremely rare.
Ris
k A
naly
sis
Per
form
ed
No risk analysis performed.
Rudimentary risk analysis performed. Some jobs are identified to be “watched
more closely”.
Formal risk analysis performed, but largely subjective. Level of
detail does not drill down to specific recovery or avoidance actions to be taken. Largely a
prioritization exercise based on risk; little or no action taken from
analysis results.
Level III + Specific factors for critical jobs defined.
Organization still struggles with execution of avoidance
and recovery actions. Emergencies occur and focus
is on quick recovery.
Level IV + Both recovery and avoidance activities identified and personnel responsibilities assigned for most critical jobs.
Emergencies still occur, but they are rare and organization is well
prepared for them.
Out
age
Pro
cess
No formal process for outage planning; resources allocated as “just-in-time” immediately
prior to outage. Greatly diminished outage
performance.
An outage process and cut-off dates have been
established, but cut-off dates are not enforced. Outage performance is
poor; organization struggles to recover from outages.
Formal outage process established and routinely
adhered to, covering only critical elements of the outage planning process - Identification, Prepare,
and Execute. Process only includes those directly impacted.
Level III + Check Readiness and Review processes incorporated. Process
includes total organization involvement.
Level IV + Heavy reliance on the review element with lessons learned integrated into future
outages. Measurable and quantifiable improvements to
outage performance over time.
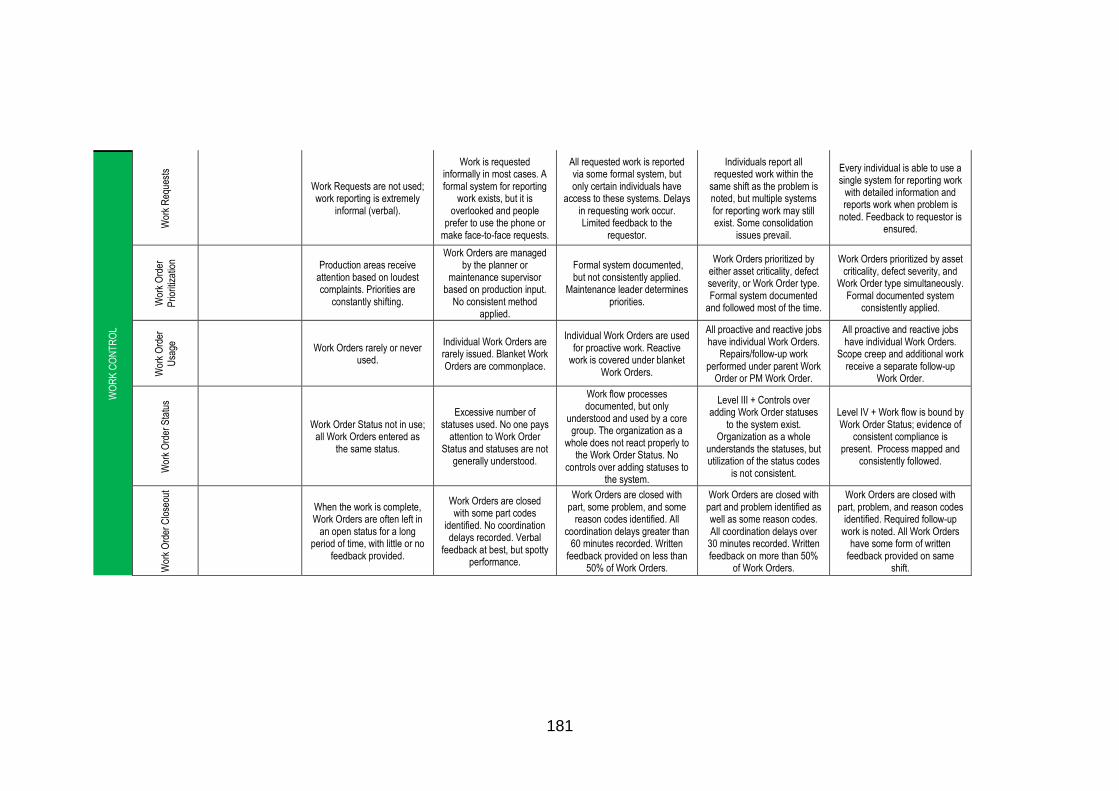
181
WO
RK
CO
NT
RO
L
Wor
k R
eque
sts
Work Requests are not used; work reporting is extremely
informal (verbal).
Work is requested informally in most cases. A formal system for reporting
work exists, but it is overlooked and people
prefer to use the phone or make face-to-face requests.
All requested work is reported via some formal system, but only certain individuals have
access to these systems. Delays in requesting work occur. Limited feedback to the
requestor.
Individuals report all requested work within the
same shift as the problem is noted, but multiple systems for reporting work may still exist. Some consolidation
issues prevail.
Every individual is able to use a single system for reporting work
with detailed information and reports work when problem is
noted. Feedback to requestor is ensured.
Wor
k O
rder
P
riorit
izat
ion
Production areas receive attention based on loudest complaints. Priorities are
constantly shifting.
Work Orders are managed by the planner or
maintenance supervisor based on production input.
No consistent method applied.
Formal system documented, but not consistently applied.
Maintenance leader determines priorities.
Work Orders prioritized by either asset criticality, defect severity, or Work Order type. Formal system documented
and followed most of the time.
Work Orders prioritized by asset criticality, defect severity, and
Work Order type simultaneously. Formal documented system
consistently applied.
Wor
k O
rder
U
sage
Work Orders rarely or never
used.
Individual Work Orders are rarely issued. Blanket Work Orders are commonplace.
Individual Work Orders are used for proactive work. Reactive
work is covered under blanket Work Orders.
All proactive and reactive jobs have individual Work Orders.
Repairs/follow-up work performed under parent Work
Order or PM Work Order.
All proactive and reactive jobs have individual Work Orders.
Scope creep and additional work receive a separate follow-up
Work Order.
Wor
k O
rder
Sta
tus
Work Order Status not in use;
all Work Orders entered as the same status.
Excessive number of statuses used. No one pays
attention to Work Order Status and statuses are not
generally understood.
Work flow processes documented, but only
understood and used by a core group. The organization as a
whole does not react properly to the Work Order Status. No
controls over adding statuses to the system.
Level III + Controls over adding Work Order statuses
to the system exist. Organization as a whole
understands the statuses, but utilization of the status codes
is not consistent.
Level IV + Work flow is bound by Work Order Status; evidence of
consistent compliance is present. Process mapped and
consistently followed.
Wor
k O
rder
Clo
seou
t
When the work is complete, Work Orders are often left in
an open status for a long period of time, with little or no
feedback provided.
Work Orders are closed with some part codes
identified. No coordination delays recorded. Verbal
feedback at best, but spotty performance.
Work Orders are closed with part, some problem, and some
reason codes identified. All coordination delays greater than
60 minutes recorded. Written feedback provided on less than
50% of Work Orders.
Work Orders are closed with part and problem identified as well as some reason codes. All coordination delays over
30 minutes recorded. Written feedback on more than 50%
of Work Orders.
Work Orders are closed with part, problem, and reason codes
identified. Required follow-up work is noted. All Work Orders
have some form of written feedback provided on same
shift.

182
Bac
klog
Man
agem
ent
and
Mea
sure
men
t
Backlog is not measured or
understood.
Backlog is understood and actual performance is known by a few select
people. Backlog calculations largely
inaccurate. No reaction to current performance.
Work Orders have estimated hours assigned and backlog is known in total number of hours.
Organization struggles to do anything with this information,
but it is generally accurate.
Work Order backlog is calculated in “crew weeks”.
“Ready to Schedule” backlog is easily identified.
Appropriate reaction to backlog calculations by
leaders in the organization.
Level IV + Management closely monitors backlog trends to
determine proper staffing and contract labor needs. Constantly seeking ways to expand "Ready"
backlog.
Wor
k O
rder
H
isto
ry: F
ailu
re
Rep
ortin
g an
d C
orre
ctiv
e
Act
ion
Sys
tem
(FR
AC
AS
)
Failure data is not tracked.
Failure codes exist, but usage is spotty. Some
craftspersons record them diligently, most do not.
Failure codes are entered for most Work Orders, but little or no data analysis is done. Poor
knowledge of failure codes.
Level III + Organization does proper analyses and
understands codes; struggles with corrective action follow
up.
Level IV + The organization gains great benefit from the
solutions executed as a result of the FRACAS process.
ME
TR
ICS
/ S
CO
RE
CA
RD
S
% P
lann
ed
vs.
Unp
lann
ed
0% Planned
100% Unplanned 30% Planned
70% Unplanned 50% Planned
50% Unplanned 70% Planned
30% Unplanned 90% Planned
10% Unplanned
Rea
dy
Bac
klog
Unknown or not measured. Less than 1 week Ready
Backlog. 1 week Ready Backlog. 2 weeks Ready Backlog. 4 weeks Ready Backlog.
Wre
nch
Tim
e
Less than 25%. 25 - 35% 35 - 45% 45 - 55% Greater than 55%.
%
Est
imat
ed
vs. A
ctua
l
Hou
rs
Unknown or not measured. 50% accuracy. 60% accuracy. 70% accuracy. 80% accuracy.
% A
vaila
ble
Labo
r
Sch
edul
ed
Unknown or not measured. 30% 50% 75% 100%
Sch
edul
e C
ompl
ianc
e
Unknown or not measured. Greater than 30%. Greater than 50%. Greater than 70%. Greater than 80%.

183
APPENDIX D – INDIVIDUAL POWER STATION MATURITY LEVELS
OutageOrganis
ation
OutageProcess
OutagePlanning
OutageScope
Development
OutageScope
Management
OutageProgress
SingleOutage
Plan
OutageWorkOrderUsage
WorkOrder
Closeout
WorkOrder -Coordin
ationDelays
LessonsLearnt
%Planned
Vs %Unplann
ed
OutageSchedul
eAdheren
ce
RiskAssessm
ents
RiskMitigati
on
Accumulative
Average
Average 3.58 3.92 3.80 3.72 3.57 3.85 3.84 3.45 3.06 3.20 3.75 4.00 3.90 4.08 4.00 3.71
0.00
1.00
2.00
3.00
4.00
5.00
Power Station - 1

184
OutageOrganis
ation
OutageProcess
OutagePlanning
OutageScope
Development
OutageScope
Management
OutageProgress
SingleOutage
Plan
OutageWorkOrderUsage
WorkOrder
Closeout
WorkOrder -Coordin
ationDelays
LessonsLearnt
%Planned
Vs %Unplann
ed
OutageSchedul
eAdheren
ce
RiskAssessm
ents
RiskMitigati
on
Accumulative
Average
Average 3.02 3.73 3.17 3.87 3.33 3.38 3.83 3.38 2.93 3.28 3.54 4.00 3.27 3.53 3.63 3.46
0.00
1.00
2.00
3.00
4.00
5.00
Power Station - 6

185
OutageOrganis
ation
OutageProcess
OutagePlannin
g
OutageScope
Development
OutageScope
Management
OutageProgres
s
SingleOutage
Plan
OutageWorkOrderUsage
WorkOrder
Closeout
WorkOrder -Coordin
ationDelays
LessonsLearnt
%Planned
Vs %Unplan
ned
OutageSchedul
eAdhere
nce
RiskAssessm
ents
RiskMitigati
on
Accumulative
Average
Average 3.19 3.34 3.55 3.94 3.78 3.13 3.90 4.00 3.20 3.17 3.84 4.00 2.73 3.83 3.88 3.56
0.00
1.00
2.00
3.00
4.00
5.00
Power Station - 7
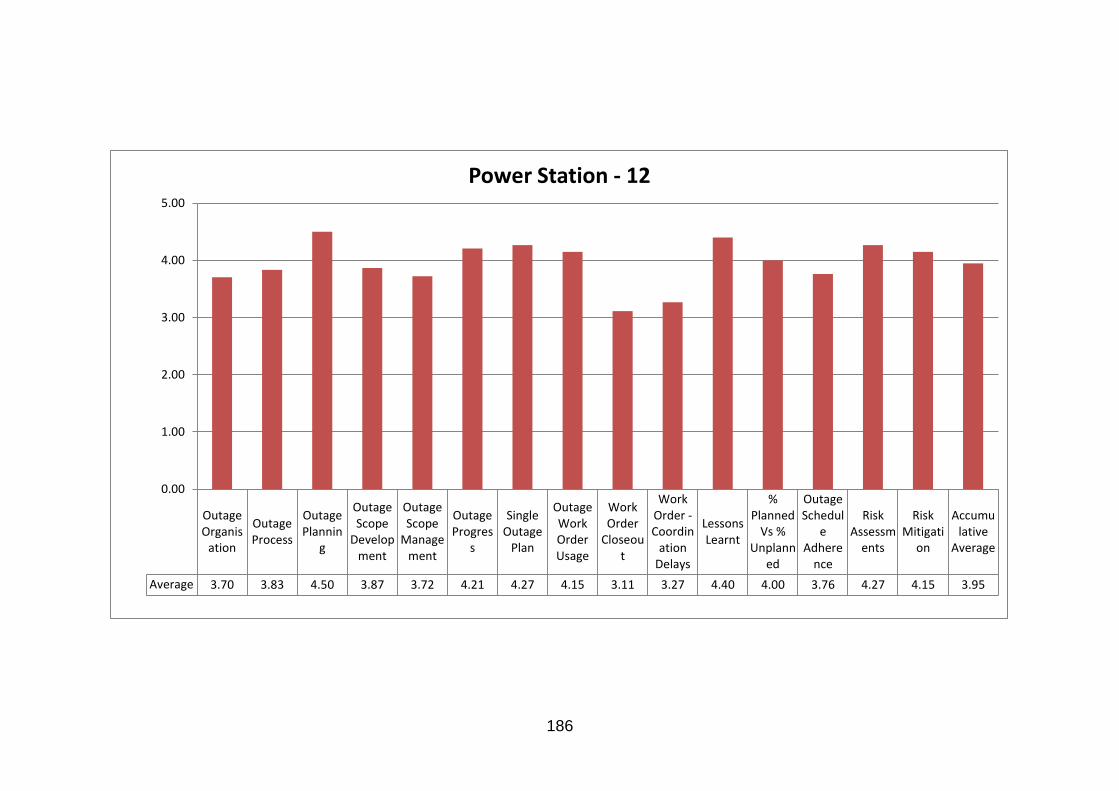
186
OutageOrganis
ation
OutageProcess
OutagePlannin
g
OutageScope
Development
OutageScope
Management
OutageProgres
s
SingleOutage
Plan
OutageWorkOrderUsage
WorkOrder
Closeout
WorkOrder -Coordin
ationDelays
LessonsLearnt
%Planned
Vs %Unplann
ed
OutageSchedul
eAdhere
nce
RiskAssessm
ents
RiskMitigati
on
Accumulative
Average
Average 3.70 3.83 4.50 3.87 3.72 4.21 4.27 4.15 3.11 3.27 4.40 4.00 3.76 4.27 4.15 3.95
0.00
1.00
2.00
3.00
4.00
5.00
Power Station - 12

187
OutageOrganis
ation
OutageProcess
OutagePlannin
g
OutageScope
Development
OutageScope
Management
OutageProgres
s
SingleOutage
Plan
OutageWorkOrderUsage
WorkOrder
Closeout
WorkOrder -Coordin
ationDelays
LessonsLearnt
%Planned
Vs %Unplan
ned
OutageSchedul
eAdhere
nce
RiskAssessments
RiskMitigati
on
Accumulative
Average
Average 3.58 4.36 3.50 3.25 3.21 3.94 4.15 3.67 3.05 2.78 4.25 4.00 4.20 4.06 3.83 3.72
0.00
1.00
2.00
3.00
4.00
5.00
Power Station - 11

188
OutageOrganisa
tion
OutageProcess
OutagePlanning
OutageScope
Development
OutageScope
Management
OutageProgress
SingleOutage
Plan
OutageWorkOrderUsage
WorkOrder
Closeout
WorkOrder -Coordin
ationDelays
LessonsLearnt
%Planned
Vs %Unplann
ed
OutageSchedul
eAdheren
ce
RiskAssessm
ents
RiskMitigati
on
Accumulative
Average
Average 3.24 3.56 3.50 3.44 3.39 3.17 3.73 3.50 3.43 3.22 3.83 3.13 3.13 3.56 3.75 3.44
0.00
1.00
2.00
3.00
4.00
5.00
Power Station - 8

189
OutageOrganisa
tion
OutageProcess
OutagePlanning
OutageScope
Development
OutageScope
Management
OutageProgress
SingleOutage
Plan
OutageWorkOrderUsage
WorkOrder
Closeout
WorkOrder -Coordin
ationDelays
LessonsLearnt
%Planned
Vs %Unplann
ed
OutageScheduleAdheren
ce
RiskAssessm
ents
RiskMitigati
on
Accumulative
Average
Average 3.31 3.46 3.36 3.41 3.09 2.69 3.64 2.69 2.76 2.50 3.28 3.5 2.79 3.04 3.34 3.12
0.00
1.00
2.00
3.00
4.00
5.00
Suppport Department - 14