ASSESSING PROJECT MANAGEMENT MATURITY
23
1 ASSESSING PROJECT MANAGEMENT MATURITY Professor C. William Ibbs Dept. of Civil & Environmental Engineering University of California Berkeley, CA 94720 Mailing Address: 213 McLaughlin Hall University of California Berkeley, CA 94720 Ph: 510-643-8067 Fx: 510-643-8919 [email protected] and Prof. Young Hoon Kwak Dept. of Construction Management Florida International University 10555 West Flagler Street CEAS 2767 Miami, FL 33178 P & F 305/640-1913 [email protected]
-
Upload
independent -
Category
Documents
-
view
9 -
download
0
Transcript of ASSESSING PROJECT MANAGEMENT MATURITY

1
ASSESSING PROJECT MANAGEMENT MATURITY
Professor C. William Ibbs Dept. of Civil & Environmental Engineering
University of California Berkeley, CA 94720
Mailing Address: 213 McLaughlin Hall
University of California Berkeley, CA 94720 Ph: 510-643-8067 Fx: 510-643-8919
and
Prof. Young Hoon Kwak Dept. of Construction Management
Florida International University 10555 West Flagler Street CEAS 2767
Miami, FL 33178 P & F 305/640-1913

2
ASSESSING PROJECT MANAGEMENT MATURITY by
Young Hoon Kwak, Ph.D.1 and C. William Ibbs, Ph.D.2
1. ABSTRACT This paper summarizes the results of research conducted by investigators from the University of California at Berkeley, with support and sponsorship from PMI’s Education Foundation and PMI’s Northern California Chapter. The principal goal of this study was to determine the financial and organizational impacts of Project Management (PM). This is one in a series papers that summarize this research investigation. This study began with the development of a PM Maturity Model and an analysis methodology to assess the maturity of PM processes. This analysis methodology is what we call a benchmarking tool. It consists of 148 multiple choice questions that measure PM Maturity. Those questions cover eight Knowledge Areas and six Project Phases. This PM Maturity Model and methodology were then applied by benchmarking 38 different companies and government agencies in four different industries. The PM Maturity assessment for all companies averaged 3.26 on a relative scale of 1 (lowest) to 5 (highest). Overall the Engineering-Construction (EC) industry had the highest score, and the Information Systems (IS) application area had the lowest. Company scores varied considerably, so industry-wide composite averages are somewhat misleading. Even industries and companies with the highest scores have substantial opportunity to improve. Risk Management and the Project Execution Phase are areas of low maturity and Cost Management and the Project Planning Phase are areas of high maturity.
We conclude that this PM Maturity assessment methodology provides solid and comparative studies on PM practices across industries and companies within an industry. The result is that this study methodology provides a set of tools for organizations to use in identifying key areas of opportunity for improvement in project management. Keywords: Project Management, Project Management Maturity, Maturity Models, Assessment, Benchmarking, Project Management Processes
1 Assistant Professor, Dept. of Construction Management, Florida International University, 10555 West Flagler Street CEAS 2767, Miami, FL 33178; [email protected] 2 Professor of Construction Management, Dept. of Civil & Environmental Engr., University of California, Berkeley, CA 94720; [email protected]

3
2. INTRODUCTION
2.1 BACKGROUND OF STUDY Many organizations are projectizing their operations and processes to plan, manage, and complete their projects successfully. As is well known, a driving reason for such projectizing is the growing pressure on managers to integrate, plan and control schedule-intensive and one-of-a-kind endeavors. However it is fair to say that many organizations are uncertain, perplexed and even mis-directed about the status of current application of Project Management (PM). Moreover, the financial investment in PM tools, practices, and processes is quite difficult to justify. One of the reasons for this complication is that there are no universally-accepted methodologies or well-defined processes for impartially measuring PM practices in any one organization or across different industries. As an example, the Guide to the PMBOK, while an industry-accepted, authoritative source of PM information, lacks this level of detail. The upshot is that many companies are having major problems implementing or improving their PM processes. This is especially important to managers who must justify in a rigorous manner the funding of implementing PM processes and practices in their organizations. Earlier research has identified some of the benefits of PM practices and processes, albeit usually in qualitative and anecdotal fashion. Most of these studies are based on quick surveys of industrial professionals and academics. Such work tends to focus on the qualitative and narrative evaluation of prior experiences on PM tools and practices, rather than be factually measured [Al-Sedairy 94][Boznak 88][Bu-Bushait 89][CII 90][Cleland 93][Deutsch 91][Gross 90][Kwak 95][Ziomek 84]. Other studies mainly focused on the productivity impact of using project-driven organizational structures which only deals with one aspect of PM practices [Donnelly 93][Gobeli 86][Larson 89][Lundin 94][McCollum 91][Might 85]. More recently Dooley has investigated the relevance of maturity and best practices to new product development [Dooley 98]. None of these prior studies though examined an organization’s overall PM processes or practices in way that permitted evaluation of the business case of PM adaptation. This is a serious shortcoming and obstacle to the progress of the project management profession.
2.2 GOAL OF THE STUDY To address the shortcoming identified in the prior section, we embarked on research with the goal of determining the financial and organizational impacts of Project Management. In

4
particular, the Berkeley research team with its Industry Advisory group concluded that the profession needs an analysis methodology that can be used reliably to assess organizations’ current level of PM practices and processes quantitatively. Ideally, this methodology would provide solid and comparative studies on PM practices across industries and companies within an industry. It would also support any organization that wanted to evaluate the business case for adopting PM. A key objective of the investigation thus became to develop and provide managers a procedure for measuring PM processes and the value of incorporating those processes in their business practices. This analysis would assist managers in assessing which, if any, PM practices would be best for organizations. It would assist also companies in promoting improved PM practice.
3. RESEARCH METHODOLOGY
3.1 RESEARCH STEPS
The following steps represent the action plan taken in this research:
1. Examine past and current studies related to PM and, as appropriate, build on that prior research through a literature review.
2. Develop a 5-Level Project Management Process Maturity (PM)2 Model to position an organization’s current PM level.
3. Develop a comprehensive (PM)2 Assessment Methodology to evaluate an organization’s current PM level and actual project performance.
4. Select target organizations/industries to investigate. 5. Measure an organization’s PM level and actual project performance with a 3-part
(PM)2 Assessment Questionnaire. 6. Analyze collected information to evaluate and benchmark an organization’s PM
processes and practices level using specific criteria. 7. Identify organizational strengths and weaknesses in terms of PM practices and
processes. 8. Search for any “success drivers” by testing for correlations between an organization’s
PM level and actual project cost and schedule performance. 9. Develop a calculation procedure to estimate an organization’s order-of-magnitude PM
Return on Investment (PM/ROI). That is, develop a technique that can be used to estimate, in approximate way, PM’s financial return for companies.
10. Provide suggestions and recommendations for continuous PM improvement. One of the advantages of this particular process is that it can be repeated on a regular basis to assess and compare an organization’s PM practices and to improve organizational PM effectiveness continuously. A more thorough description and discussion of the 5-level Project Management Process Maturity (PM)2 Model and calculation procedure to estimate

5
organization’s PM/ROI (research steps 1, 8, and 9) are presented in the companion article [Ibbs 98].
3.2 PM PROCESS MATURITY (PM)2 ASSESSMENT METHODOLOGY A (PM)2 Assessment Methodology was developed that uses statistical techniques to assess the maturity of PM processes and practices among these different industries. The purpose of the (PM)2 Assessment Methodology is to assess PM strengths and weaknesses and to enable organizations to compare themselves with similar organizations (a peer group). It also tests for correlations between an organization’s PM level and actual project performance. As explained in a companion paper [Ibbs 98], it allows us to derive and calculate an order-of-magnitude estimate of PM/ROI. Exhibit 1 summarizes the characteristics of the (PM)2 Assessment Methodology. Before developing our (PM)2 Assessment Methodology, we reviewed and considered the SEI Capability Maturity Model, which is quite popular among IS organizations. However, we felt that it was insufficient for our purposes because it is heavily slanted toward IS companies and because it does not easily allow for measuring a ROI.
Targeted Industries
Variables/ Factors
Model/ Procedure
Research Methodology
Contribution
PM Process Maturity
(PM)2 Assessment Methodology
- EC - IMM - IS - HTM
- 8 PM Knowledge Areas - 6 PM Processes - schedule and cost indexes (SI, CI) - percentage of PM spending - order of magnitude PM/ROI estimates
- 5-level (PM)2 Model - PM maturity vs. CI&SI Model - PM/ROI calculation Procedure
- 3-section (PM)2
Assessment Questionnaire - general statistical analysis - correlation analysis - regression analysis
- better understanding of the financial and organizational benefits of using PM tools and practices in organizations
Exhibit 1 Characteristics of (PM)2 Assessment Methodology
Design of this (PM)2 Assessment Methodology made use of a comprehensive and itemized questionnaire for data collection. Integrated Project Systems of San Carlos, California donated its benchmarking questionnaire for this task, and the University of California researchers amended it to meet the specific needs of this particular study. As a result, a 3-

6
section (PM)2 Assessment Questionnaire was developed to measure any organization’s PM maturity level. This procedure is used to evaluate an organization’s current PM Maturity status related to the 5-Level (PM)2 Model. Three objectives are achieved using this 3-section (PM)2 Assessment Questionnaire.
• Organizations’ PM maturity can be benchmarked in various terms. PM strengths, weaknesses, and improvements are identified by eight PM Knowledge Areas and six PM Phases.
• Return on investment of PM (PM/ROI) can be calculated on an order-of-magnitude basis using statistical relationships between PM maturity and project performance [Ibbs 98].
• This 3-section (PM)2 Assessment Questionnaire can help to improve an organization’s PM processes and practices in very specific ways.
The 3-section (PM)2 Assessment Questionnaire is clustered into three major sections: General Organizational Information (section 1), Organizational PM Process Maturity Assessment (section 2), and Actual Project Performance Assessment (section 3). Participating companies are coded to preserve confidentiality of specific responses. Organizational PM Maturity Levels are defined as a 1 to 5 point Likert Scale, with a 1 being the lowest level of PM Maturity and a 5 being the highest level. The scores for each deliverable are averaged to determine one score for each PM Knowledge Area and PM Process. The scores are then combined and analyzed to calculate an Overall PM Maturity level. The scores are then logged into a database and compared against other organizations and industries. There are 148 multiple choice questions in section 2 of the questionnaire. The study team used the Guide to the Project Management Body of Knowledge [PMBOK 94] as a primary reference. The study team also decided to add an additional PM Process called the Project-driven Organization Environment which supports sustaining project-driven organization. The numbers in the cells of Exhibit 2 show how the 148 multiple choice questions in section 2 of the questionnaire were distributed across the six PM Phases and eight PM Knowledge Areas. The entire questionnaire is too lengthy to publish. An example of one of the 148 questions is: Question #56: How a Schedule’s Critical Path Is Identified.
No critical path calculation done. Each sub-project identifies critical tasks independently and
sets work priorities……...…...……………………………….………..…………….1

7
Critical path based on committed milestone dates. No CPM calculation performed, or CPM
used on individual sub-projects..………………….………………………..…..….2
Key critical tasks identified through non-quantifiable means, and used to drive the critical path
calculation………...………………………...………………….…………………...3
Critical path calculated through integrated schedule, but only key milestone dates communicated
back to sub-projects…………………………..………………………….4
All critical tasks identified and indicated in each individual sub-project schedule. Critical path
determined through integrated schedule...……..……………………………..……5
To calculate the overall (PM)2 Maturity, the scores of all 148 questions was averaged. To calculate the specific maturity of the eight PM Knowledge Areas and the six PM Phases, the selected row or column of Exhibit 2 was averaged. To calculate the PM maturity of industry’s specific PM Knowledge Areas, each score of the selected areas within the same industry were averaged.
6 PM Phases &
8 PM Knowledge Areas
Initiating
Planning
Executing
Controlling
Closing
Project-driven Organization Environment
Scope (30) 6 7 8 3 3 3 Time (18) 1 2 12 1 1 1 Cost (11) 2 2 2 1 1 3
Quality (13) 1 2 3 3 3 1 Human Resource
(22) 2 4 5 2 2 7
Communications (30)
5 3 12 7 2 1
Risk (17) 1 1 7 6 1 1 Procurement (7) 1 1 1 1 1 2
Total (148) 19 22 50 24 14 19
Exhibit 2 Distribution of the 148 Questions in the Organizational PM Process Maturity Assessment Questionnaire (section 2)

8
3.3 DATA COLLECTION TECHNIQUE Data collection was one of the major challenges in this study. The main reason was that PM tools and practices were still relatively new to many organizations that were studied, and it was difficult to recruit organizations to participate in this research. Invitation letters were sent out to potential participants and announcements were made in PM-related magazines and meetings to promote the needs and importance of this study. Companies were then carefully chosen since this study requires a substantial amount of time and effort from participating organizations. A pilot test was conducted with two selected organizations. The purpose of a pilot test was to confirm the validity of the (PM)2 Assessment Methodology. The results of the pilot test confirmed that the (PM)2 Assessment Methodology was appropriate and the overall research methodology was valid. Particular effort was made to collect objective, non-biased, and representative PM processes and practices data. To ensure the confidentiality of the data, we signed and delivered to the companies a non-disclosure agreement that allows us to report only “high level data” in a forum such as this. Finally, all of the participating companies were anonymously coded. Also, all of the proprietary information including cost and schedule of the participating organizations were kept confidential and only used in the data analysis process. Only the principal researchers knew the identity of the organizations.
3.4 TARGETED INDUSTRIES This research selected four different industries and application areas to collect PM practices information. A total of thirty-eight large international companies including private and public sector organizations participated in this study. These four industries are: Engineering and Construction (E-C), Information Management and Movement (IMM), also known as Telecommunications, Information Systems (IS), also known as Software Development, and Hi-Tech Manufacturing (HTM). Project Management in the E-C industry emphasizes development, engineering, procurement, and construction processes for projects involving buildings and facilities in the residential, commercial, and industrial sectors worldwide. The IMM industry is comprised of companies and individuals focused on technologies, primarily voice-data-video transmission and switching (e.g. analog, digital, terrestrial, satellite, microwave, fiber-optic); services to the users of these deliverables; and network infrastructure providers. The IS industry or application area manages software development projects to deliver a quality product to the customer on time, within budget, and which meets performance specifications. The HTM industry is involved in the project planning, development, control, and execution of

9
hi-tech products, processes, and services. A Hi-Tech product may include computer hardware, semiconductors, and related equipment and accessories.
3.5 RESEARCH LIMITATIONS There were still some concerns about collecting information on PM tools and practices. The primary concern was the accuracy of information that organizations provided. Ideally, the PM level should be measured by visiting each participating organization and conducting an in-depth interview with each organization’s project managers to determine current PM practices. However, this was impossible because of limited time and resources. Instead, the (PM)2 Assessment Questionnaires were distributed to the organization’s project managers to complete. Generally, people tend to score higher when they self-critique themselves. Four steps were taken to collect more accurate data. First, there was a thorough pre-screening process to choose participating companies. Companies were carefully recruited and selected that are willing to share their current PM knowledge and performance data. Second, we stressed to each company’s respondent how important is was to be candid. A major point of persuasion was that it was in their own best interests to respond honestly because that was how they could best learn about their practices vis a vis other firms. Third, any unclear questions or concepts were discussed with the researchers at the organization’s request. Effort has been made to understand all 148 questions in the (PM)2 Assessment Questionnaire easily. Also, a Glossary section was provided to explain and to clarify any unfamiliar concepts or terminology used in the questionnaire. Lastly, the Berkeley researchers reviewed the completed questionnaires with a number of the companies, typically with in-depth telephone interviews. Though these four actions cannot guarantee perfection, the research team does believe that reasonably accurate information was collected. Another issue was that there were questions that required several project managers’ knowledge to answer. For example, suggestions were made in the (PM)2 Assessment Questionnaire to encourage asking several people in the organization to respond jointly, if possible. This enabled collection of collaborative and self-critiquing information, which the firms generally found to be a valuable exercise. Typically, 6-8 person-hours were required from each company to compile the information requested.

10
4. ASSESSMENT RESULTS
4.1 ORGANIZATIONAL DEMOGRAPHICS This study required considerably more time than originally planned – nearly two years. The main reasons for this were that many companies did not see the true value in this research or they were reluctant to share the details of their PM practices. Some were simply embarrassed by their current PM practices and processes. Others believed they had something special that they did not want to share with other companies. As mentioned, a total of thirty-eight companies have participated in this study: fifteen Engineering and Construction (E-C) companies, ten Information Management and Movement (IMM) companies, ten Information Systems (IS) companies, and three Hi-Tech Manufacturing (HTM) companies. First, organizations were classified by their size. Forty-eight percent of the organizations employed between 1-100 people and 52% of the companies had more than 100 employees. Second, organizations were divided by years of experience in PM practices. Overall, the answers ranged from 1 to 50 years, with averages of 15.4 years for E-C, 10.7 years for HTM, 8.0 years for IS, and 6.8 years for IMM. The average for all companies was 10.7 years. Sixty-one percent of the organizations had fewer than 10 years of experience with PM. Clearly, companies have only recently begun to implement PM and it may still be too early to recognize all its benefits.
4.2 ANNUALIZED COST OF PM SERVICES Another key question this research wanted to explore was the cost of PM services as a percentage of total project cost. These costs were computed as a percentage of a company or department’s project-based revenues or sales. A list of items that are classified as a PM-related expenditure was developed by us and provided to the company managers to help them more accurately and consistently estimate the average cost of PM services in the organization. There are instances, of course, where other items should be included. Admittedly this question is difficult to answer precisely. Exhibit 3 presents a checklist of PM expenditures.
PM Expenditures Checklist
- Professional, Technical, and Administrative Personnel Salaries - Fringe Benefits of PM Personnel - Training Costs - Travel and Transportation Costs - PM-related Consulting Services Costs - Hardware and Software Purchase and Network Installation, Maintenance, and Upgrade Costs - Moving, Storage and Rental Costs - Office, Supply and Equipment Costs

11
- Utilities, Telecommunications, Mailing, and Shipping Costs - Professional Associates and Society membership Costs
Exhibit 3 PM Expenditures Checklist
The average cost of PM services was 6%. This figure is the sum of the costs listed in Exhibit 3 divided by the final cost of their project. This result was actually higher than previously reported by earlier sources [Archibald 67]. Exhibit 4 shows the result of twenty organizations that provided the information. Eighty percent of the companies responding to this question indicated that they spend less than 10% of total project cost for utilizing PM practices. It was generally higher in EC companies: 9.3% vs. 2.0% for all other types of companies.
PM Cost as a %of Total Project Cost Number of Organizations Percentage 0 to 1% 3 15%
1.1 to 3% 5 25% 3.1 to 6% 5 25% 6.1 to 10% 3 15% Over 10% 4 20%
Total 20 100%
Exhibit 4 Average Total Cost of PM Services
4.3 ASSESSING OVERALL PM MATURITY The Overall Average PM Maturity of the companies and the industries ranged from a low of 3.06 for IS to a high of 3.36 for E-C. Average Overall PM Maturity for all companies was 3.26. Since the rating scale ranged from 1 to 5, this means that there is still substantial opportunity for improvement of PM practices in all four industries. Company E-C2 scored the highest Overall PM Maturity (4.60) and IS1 scored the lowest (1.77). Exhibits 5 and 6 contain detailed information on the Overall Average PM Maturity of all organizations.
E-C IMM IS HTM All 38 Companies PM Maturity 3.36 3.30 3.06 3.34 3.26
Standard Deviation 0.66 0.77 0.88 0.87 0.74
Exhibit 5 Overall Average PM Maturity (4 industries)

12
4.26
4.60
3.33
2.26
2.55
4.02
3.69
3.16
2.872.77
3.683.74
2.93
3.66
2.89
3.07
4.00
3.66
2.49
3.95
2.18
3.88
4.33
2.39
3.01
1.77
2.10
3.73
2.45
3.36
4.00
3.08
2.59
4.57
2.91
2.51
4.26
3.26
1.5
2.0
2.5
3.0
3.5
4.0
4.5
5.0
EC1
EC2
EC3
EC4
EC5
EC6
EC7
EC8
EC9
EC10
EC11
EC12
EC13
EC14
EC15
IMM1
IMM2
IMM3
IMM4
IMM5
IMM6
IMM7
IMM8
IMM9
IMM10
IS1
IS2
IS3
IS4
IS5
IS6
IS7
IS8
IS9
IS10
HTM1
HTM2
HTM3
PM Maturity
Exhibit 6 Overall Average PM Maturity (All 38 organizations)
The E-C (3.36), HTM (3.34), and IMM (3.30) industries all have relatively high PM Maturity compared to IS (3.06). However, the PM Maturity of HTM should be de-emphasized because only 3 HTM companies participated in the study.
4.4 ASSESSING THE PM KNOWLEDGE AREAS MATURITY LEVELS Also of interest are the details of how companies and industries compared. One way to examine the data was to investigate the PM Maturity Levels according to each of the eight PM Knowledge Areas. Exhibit 7 contains those details.
PM Knowledge Areas E-C IMM IS HTM All 38 Companies Scope 3.52 3.45 3.25 3.37 3.42 Time 3.55 3.41 3.03 3.50 3.37 Cost 3.74 3.22 3.20 3.97 3.48
Quality 2.91 3.22 2.88 3.26 3.06 Human Resources 3.18 3.20 2.93 3.18 3.12 Communications 3.53 3.53 3.21 3.48 3.44
Risk 2.93 2.87 2.75 2.76 2.85 Procurement 3.33 3.01 2.91 3.33 3.14
Overall PM Knowledge Areas Maturity
3.34 3.24 3.02 3.36 3.24

13
Exhibit 7 Eight Knowledge Areas PM Maturity
In general, IS had the lowest PM Maturity score and E-C and HTM had the highest. The following paragraphs briefly discuss each of the PM Knowledge Areas Assessment Results.
Project Scope Management
There were no significant differences in Scope Management maturity among the four industries and application areas. E-C was the highest (3.62) and IS was the lowest (3.25). E-C’s relatively high score indicates that this industry puts more emphasis on Scope Management than other industries and application areas. IS also had the most variability (Standard Deviation = 0.82). According to the data IS industry is still behind in Scope Management practices.
Project Time Management
Again E-C scored the highest and IS scored the lowest. Conversely, E-C’s Time Management Maturity has the smallest standard deviation and IS has the largest. A favorable Time Management index should help organizations deliver projects closer to the delivery dates promised to the client. Of course, a project’s scope is sometimes altered to allow its schedule to be met so both Scope and Schedule Management need to coordinated.
Project Cost Management
The Cost Management area had the highest PM Maturity Levels. It seems that all four industries and application areas are very concerned about cost. HTM received the highest score in Cost Management Maturity. The rise of new management practices such as lean production and activity-based costing may have contributed to this high maturity level. Cost Management Maturity of IS and IMM was relatively low compared to E-C and HTM. One possible interpretation of this result is that Cost Management may not be as important in these industries as other PM Knowledge Areas. This is probably because an IS or IMM company makes money not from finishing within budget but, rather, by completing their project quickly and selling it to potential customers. Construction contractors, on the other hand, generally earn a profit by finishing a project for less money than their budget. That means that Cost Management has substantially different perspectives and emphases for different industries.
Project Quality Management
The Quality Management’s PM Maturity Level had the highest standard deviation of all PM Knowledge Areas, indicating a very high dispersion among these companies. E-C and IS organizations consistently had low levels of Quality Management Maturity. HTM companies, which scored the highest in Quality Maturity, also scored highest in standard deviation. The

14
standard deviation values implies that IMM (SD = 1.10) is relatively consistent compared to HTM (SD = 2.00) which shows inconsistency. Application of quality assurance, quality control, and Total Quality Management (TQM) principles might increase the Quality Management Maturity over time.
Project Human Resource (H/R) Management
On the whole, Human Resource Management (and Risk Management) had the lowest standard deviation of all eight Knowledge Areas. E-C companies were extremely consistent in terms of their Human Resource Maturity. Industries should put more emphasis on managing and dealing with project personnel and team because these people are intensively involved from the beginning to the end of the entire project.
Project Communications Management
The Communications Management Maturity for the companies was very high, ranking second only to Cost Management among the eight PM Knowledge Areas. E-C scored the highest Communications Maturity with tight consistency among four industries. Since most E-C projects are carried out by many subcontractors and suppliers, communication flow seems to be better established than other industries.
Project Risk Management
Risk Management’s PM Maturity Level was the lowest among all eight Knowledge Areas. Risk Management was the only Knowledge Area where overall PM Maturity rating was less than 3.00. Consequently, companies should put more effort on Risk Management Area. This area has a potential for substantial improvement.
Project Procurement Management
Both E-C and HTM scored the highest among the four industries. This is understandable since supplying and buying materials and services are such major parts of their businesses. On the other hand, IMM and IS scored low on Procurement Management.

15
4.5 ASSESSING THE PM PHASES This research also investigated the details of how companies, industries, and application areas compared with the Maturity of six PM Phases. This analysis reveals which of the PM Phases are mature and less mature; see Exhibit 8.
PM Phase E-C IMM IS HTM All 38 Companies Initiating Maturity 3.25 3.34 3.57 3.60 3.39 Planning Maturity 3.61 3.49 3.43 3.55 3.53 Executing Maturity 3.31 3.27 2.90 3.32 3.19
Controlling Maturity 3.55 3.31 2.98 3.25 3.31 Closing Maturity 3.28 3.43 2.90 3.05 3.2
Project-driven Organization Environment
Maturity
3.14 2.99 2.73 3.25 3.00
Overall Average PM Processes Maturity
3.36 3.31 3.09 3.34 3.28
Exhibit 8 Six PM Phases Maturity
Again, IS had the lowest PM Maturity rating, and E-C and HTM had the highest. Note that HTM only had 3 companies, therefore the result should be de-emphasized. The details are summarized in following sections.
Initiating Phase
Initiating Processes are those very early steps – usually conducted by a project sponsor – to determine the financial feasibility of a project and to start defining project scope. For this process category, HTM had the highest maturity index, and E-C scored the lowest. Conversely, they had the lowest and highest standard deviations respectively. One interpretation of this is that HTM and IS are very sensitive and proactive to market needs, whereas the competitive bid nature of E-C encourages a more reactive response to client needs especially at the Initiating Processes.
Planning Phase
Planning Processes scored the highest among the 6 PM Processes, and had one of the lowest standard deviations. Companies evidently are convinced this is important to the overall success of the project and thus devote substantial attention to this step. The four industries were relatively consistent for this process.
Executing Phase

16
HTM and E-C have a comparatively strong degree of PM Maturity. E-C had a high Executing Maturity because generally construction projects are very complicated and completing one requires thorough planning to allocate appropriate resources. On the contrary, IS has a relatively low Executing Maturity. This is frequently exhibited by the numerous software development projects with late releases.
Controlling Phase
Again, E-C has a high PM Maturity for this specific process and IS has a low maturity score. The standard deviation of IS was also quite high, and E-C’s was low. This result is not surprising since Controlling Processes have been a forte of the E-C industry for a number of years.
Closing Phase
On balance IMM is relatively strong in Closing Processes, however IS needs improvement. IMM is strong because competition is high and they are very concerned about time-to-market. The IS companies scored low. Again, numerous software development projects have late releases deviating from the authorized schedule. This explains low PM Maturity in the Closing Processes. Another interpretation is that only a few major software development companies dominate the whole IS application area. Consequently, they are not really concerned about project delays or high competition.
Project-Driven Organization Environment Phase
At the outset of this study, we decided that we wanted to assess the PM “Infrastructure” of an organization; namely, processes that cover training, career development and other, similar functions that a company must perform to insure that its Project Managers are ready to manage. We called this collection of activities Project-Driven Organization Environment Processes. The Project-driven Organization Environment Processes are, for all companies taken together, the least mature processes. And because they have the lowest standard deviation of all the processes, the data suggests that all the companies in all the industries have substantial room to improve.
4.6 COMMENTARY ON THE DATA ANALYSIS To complement (and in some cases to substantiate) analysis of the assessing data, a series of lengthy, detailed interviews were conducted with several representatives of the organizations that participated in the study. Generally, those people interviewed were senior “managers of project managers”.
17
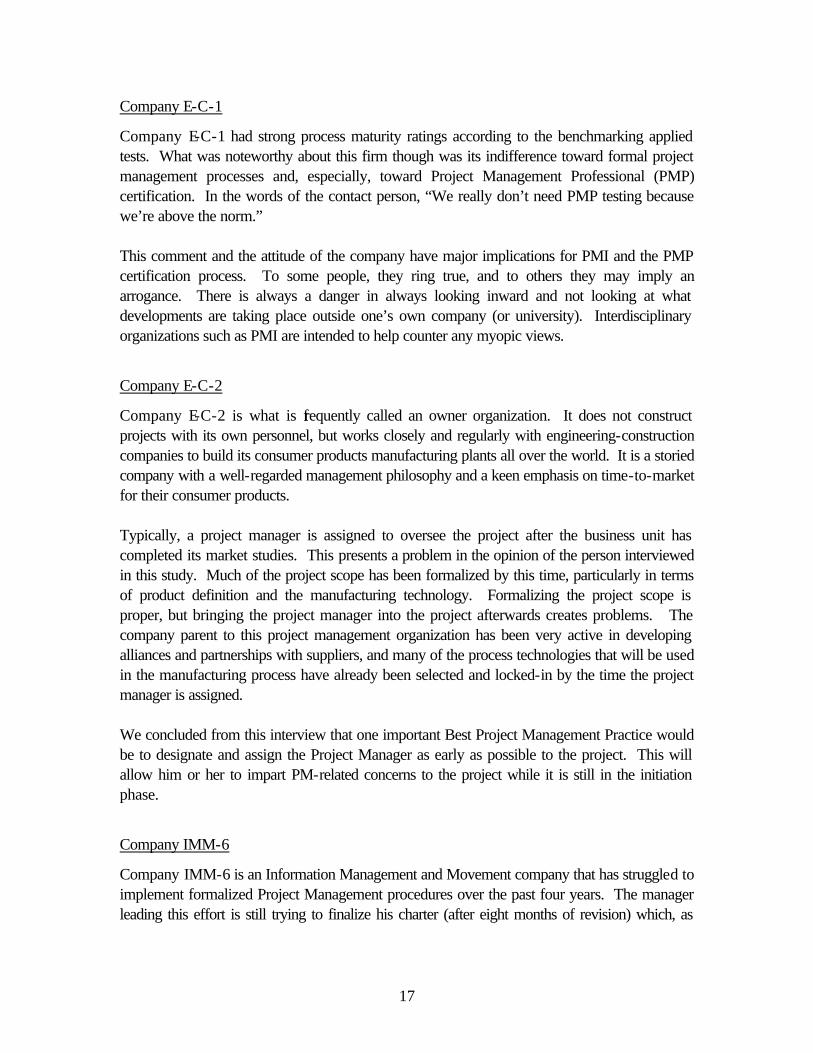
Company E-C-1
Company E-C-1 had strong process maturity ratings according to the benchmarking applied tests. What was noteworthy about this firm though was its indifference toward formal project management processes and, especially, toward Project Management Professional (PMP) certification. In the words of the contact person, “We really don’t need PMP testing because we’re above the norm.” This comment and the attitude of the company have major implications for PMI and the PMP certification process. To some people, they ring true, and to others they may imply an arrogance. There is always a danger in always looking inward and not looking at what developments are taking place outside one’s own company (or university). Interdisciplinary organizations such as PMI are intended to help counter any myopic views.
Company E-C-2
Company E-C-2 is what is frequently called an owner organization. It does not construct projects with its own personnel, but works closely and regularly with engineering-construction companies to build its consumer products manufacturing plants all over the world. It is a storied company with a well-regarded management philosophy and a keen emphasis on time-to-market for their consumer products. Typically, a project manager is assigned to oversee the project after the business unit has completed its market studies. This presents a problem in the opinion of the person interviewed in this study. Much of the project scope has been formalized by this time, particularly in terms of product definition and the manufacturing technology. Formalizing the project scope is proper, but bringing the project manager into the project afterwards creates problems. The company parent to this project management organization has been very active in developing alliances and partnerships with suppliers, and many of the process technologies that will be used in the manufacturing process have already been selected and locked-in by the time the project manager is assigned. We concluded from this interview that one important Best Project Management Practice would be to designate and assign the Project Manager as early as possible to the project. This will allow him or her to impart PM-related concerns to the project while it is still in the initiation phase.
Company IMM-6
Company IMM-6 is an Information Management and Movement company that has struggled to implement formalized Project Management procedures over the past four years. The manager leading this effort is still trying to finalize his charter (after eight months of revision) which, as

18
currently written, is too customer-oriented in his opinion. It did not surprise this manager that his department’s overall PM Maturity score was significantly below average: 2.18 vs. 3.26. PM Training is performed with an outside consultant. Another consultant was used until recently, but that company was too software-development oriented for this company’s needs, which are more inclined toward system integration. The PM Training is more “employee-pull, than supervisor-push”; i.e. the employee, not the employer, chooses which of eight modules to study and when. There are sixty people in his group who are dispersed throughout the U.S. and Canada, complicating communication and changing the basis for lessons learned between the group members. This company did not perform Risk Management very well when measured by our benchmarking analysis, so a large portion of the interview focused on this PM knowledge area. Essentially this group’s approach to Risk Management is to make extensive use of technology partners and alliances; i.e. contract the risk to other parties. Disaster Recovery Groups are also used, however these are normally formed after the problem has arisen, which is too late. Procurement Management was rated as being weak for a variety of reasons, including the fact that often the PM group is brought into the project after the customer has essentially selected which products/services will be supplied by outsider entities. This, in turn, often dictates or limits the range of procurement options for the project manager because of standard industry practices in these different areas. Sometimes the customer may even have already selected the technology partner, further limiting procurement options. Our contact person for this company is a manager of project managers, and he has a goal of having his project managers billable at least 60% of their time to projects. It was especially difficult for this manager to calculate the his cost of PM services because very frequently his personnel do not finish the project. The customer may cancel the project in mid-stream, or he may decide that he can finish it with his own personnel. Our conclusions from this interview were that: • The project manager should be brought into the Project early, as was the conclusion with
the previous company. In this instance, procurements may be handled more effectively. • Conducting risk management retroactively is far less effective than conducting it proactively.
Establishing Disaster Recovery Groups to solve problems are often necessary, but it is much more effective to conduct a risk assessment and develop contingency actions before the project begins.
Company IMM-10
Company IMM-10 is distinguished by having a progressive PM Center of Excellence (PMCoE), though it is seems to be understaffed (2 full-time equivalent people to support 40+
19
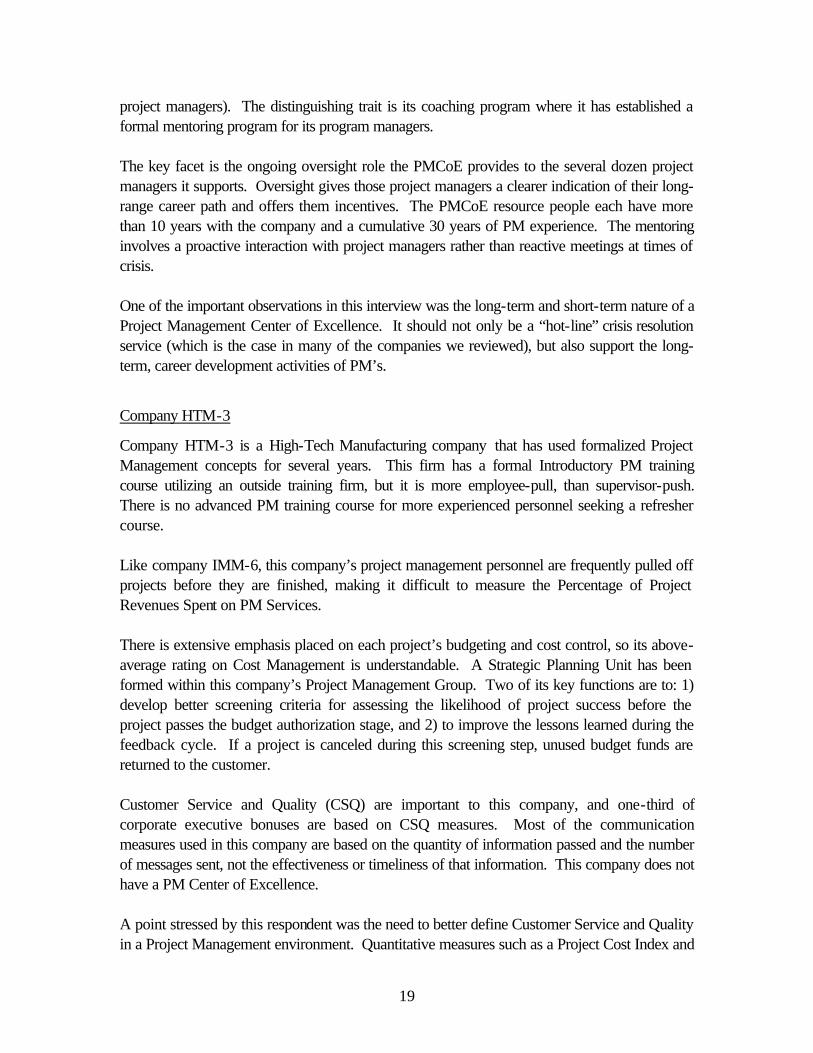
project managers). The distinguishing trait is its coaching program where it has established a formal mentoring program for its program managers. The key facet is the ongoing oversight role the PMCoE provides to the several dozen project managers it supports. Oversight gives those project managers a clearer indication of their long-range career path and offers them incentives. The PMCoE resource people each have more than 10 years with the company and a cumulative 30 years of PM experience. The mentoring involves a proactive interaction with project managers rather than reactive meetings at times of crisis. One of the important observations in this interview was the long-term and short-term nature of a Project Management Center of Excellence. It should not only be a “hot-line” crisis resolution service (which is the case in many of the companies we reviewed), but also support the long-term, career development activities of PM’s.
Company HTM-3
Company HTM-3 is a High-Tech Manufacturing company that has used formalized Project Management concepts for several years. This firm has a formal Introductory PM training course utilizing an outside training firm, but it is more employee-pull, than supervisor-push. There is no advanced PM training course for more experienced personnel seeking a refresher course. Like company IMM-6, this company’s project management personnel are frequently pulled off projects before they are finished, making it difficult to measure the Percentage of Project Revenues Spent on PM Services. There is extensive emphasis placed on each project’s budgeting and cost control, so its above-average rating on Cost Management is understandable. A Strategic Planning Unit has been formed within this company’s Project Management Group. Two of its key functions are to: 1) develop better screening criteria for assessing the likelihood of project success before the project passes the budget authorization stage, and 2) to improve the lessons learned during the feedback cycle. If a project is canceled during this screening step, unused budget funds are returned to the customer. Customer Service and Quality (CSQ) are important to this company, and one-third of corporate executive bonuses are based on CSQ measures. Most of the communication measures used in this company are based on the quantity of information passed and the number of messages sent, not the effectiveness or timeliness of that information. This company does not have a PM Center of Excellence. A point stressed by this respondent was the need to better define Customer Service and Quality in a Project Management environment. Quantitative measures such as a Project Cost Index and

20
Schedule Index are part, but certainly not all of the issue. We need better metrics for Customer Satisfaction.
5. SUMMARY, CONCLUSIONS, AND RECOMMENDATIONS This study is one in a series of papers reporting the results of our investigation into the value of Project Management. In this particular paper we show that there are some perceptions of project management that are not confirmed by our actual data. For instance, the actual average cost of PM. On the other hand, there are many suppositions that have been substantiated; e.g. the IS industry is less mature than other fields such as construction. To be academically credible, a professional field depends upon a set of first principles and body of knowledge that is replicable. This study showed that we have a start in understanding and forming a theory of project management, yet there are still many gaps in our knowledge base. Though this research is only the first step of many steps in coming to an understanding of the quantitative benefits of PM. The contributions of this research are:
• The development of a systematic (PM)2 assessment methodology was a major contribution for this study. The methodology is specifically suited to assess an organization’s PM level. It provides a means for identifying and measuring different PM levels by analyzing eight PM Knowledge Areas with six PM Phases under a quantified scheme.
• This study presents and analyzes the strengths and weaknesses of PM practices among
various diverse companies and industries. It also identifies problem areas hindering PM’s use within the PM process.
• Companies should benchmark their operations using factual, impartial techniques such as
those contained in the (PM)2 Assessment Questionnaire. This gives them a legitimate and sustainable reference point from which to begin making process improvements..
• This study is one of the few, if not the first attempt to truly integrate PM Knowledge Areas
and PM Phases against actual project performance data. In doing so, this study is a step toward a factual and quantitative way to measure PM practices and performance.
The study team is convinced that the quantitative (PM)2 Assessment Methodology can be applied to other industries and companies to further our understanding of PM in the future. It could also be reapplied to the companies that participated in the first phase of this study at a later time. This would allow them to determine the impacts of changes that have occurred since their first benchmarking. By collecting and sharing this information, PM organizations can benefit and continuously improve their PM practices.

21
Also, the (PM)2 Assessment Questionnaire should be continuously refined to reflect advances in our PM knowledge base. This refined (PM)2 Assessment Questionnaire could further determine and evaluate an organization’s PM Maturity more effectively. Finally, there is more research is needed to fully understand the PM Practices and Processes more thoroughly to achieve a true project-driven organization environment in the business world.
ACKNOWLEDGMENTS
This research was sponsored by the Project Management Institute Educational Foundation (PMI/EF) and the PMI Northern California Chapter (PMI/NCC). In particular, we thank Dan Ono, Jim McFarlin, Mike McCauley, Paul Nelson, Bill Ruggles, Ahmet Taspinar, Bob Thompson, and Cathy Tonne. We also appreciate the participation received from the 38 companies that provided the data. The IPS assessment tool served as a basis for building the Berkeley assessment tool.
REFERENCES
[Al-Sedairy 94] Al-Sedairy, Salman T. “Project Management Practices in Public Sector Construction: Saudi Arabia.”, Project Management Journal, December 1994, pp. 37-44. [Archibald 67] Archibald, Russell D. and Villoria, Richard L., Network Based Management Systems (PERT/CPM), Wiley, 1967. [Boznak 88] Boznak, Rudolph G., “Project Management- Today’s Solution For Complex Project Engineering.”, IEEE, 1988. [Bu-Bushait 89] Bu-Bushait, K. A., “The Application of Project Management Techniques To Construction and R&D Projects.”, Project Management Journal, June, 1989, pp. 17-22. [CII 90] Construction Industry Institute, “Assessment of Owner Project Management Practices and Performance,” Special CII Publication, April, 1990. [Cleland 93] Cleland, David, “The Future of Project Management”, PM Network, September 1993, pp. 6-8. [Deutsch 91] Deutsch, Michael S., “An Exploratory Analysis Relating the Software Project Management Process to Project Success.”, IEEE Transactions on Engineering Management, Vol. 38, No. 4, November 1991.

22
[Donnelly 93] Donnelly, Richard G. and Kezsbom, Deborah S., “Overcoming the Responsibility-Authority Gap: An Investigation of Effective Project Team Leadership for a New Decade”, 1993 AACE Transactions, 1993. [Dooley 98] Dooley, K., Subra, A., and Anderson, J., “The Impact of Maturity and Best Practices in New Product Development,” Quality Management Conference, Arizona State University, February 1998. [Gobeli 86] Gobeli, David H. and Larson Erik W., “Matrix Management: More than a Fad,” Engineering Management International, Vol. 4, 1986. [Gross 90] Gross, Robert L. and Price David, “Common Project Management Problems and How They Can be Avoided Through The Use of Self Managing Teams,” 1990 IEEE International Engineering Management Conference, 1990. [Ibbs 97] Ibbs, C.W. and Kwak, Young-Hoon, The Benefits of Project Management- Financial and Organizational Rewards to Corporations. Project Management Institute, ISBN: 1-880410-32-X, September 1997. [Ibbs 98] Ibbs, C.W. and Kwak, Young-Hoon, “Calculating Project Management’s Return on Investment”, forthcoming in Project Management Journal. [Kwak 95] Kwak, Clark, Grilo, Betts, and Ibbs., “Contemporary Strategic Planning Tools and Applications for Construction Managers”, First International Conference on Construction Project Management, Singapore, January, 1995, pp. 25-40. [Kwak 97] Kwak, Young Hoon, A Systematic Approach to Evaluate Quantitative Impacts of Project Management (PM), Ph.D. Dissertation, Department of Civil Engineering, University of California, Berkeley, May 1997. [Larson 89] Larson, Erik W. and Gobeli, David H., “Significance of Project Management Structure on Development Success”, IEEE Transactions on Engineering Management, Vol. 36, No. 2, May 1989. [Lundin 94] Lundin, Rolf A., and Soderholm, Anders, “Conceptualization and Learning- The Black Environment of PM”, PMI 25th Annual Seminar/Symposium, Vancouver, Canada, October 1994. [McCollum 91] McCollum, James K. and Sherman J. Daniel, “ The Effects of Matrix Organization Size and Number of Project Assignments on Performance.”, IEEE Transactions on Engineering Management, Vol. 38, No. 1, February 1991.

23
[Might 85] Might, Robert J. and Fischer, William A., “The Role of Structural Factors in Determining Project Management Success.”, IEEE Transactions on Engineering Management, Vol. EM-32, No. 2, May 1985. [PMBOK 94] A Guide to the Project Management Body of Knowledge (PMBOK), Exposure Draft, The PMI Standards Committee, PMI, August, 1994 [Ziomek 84] Ziomek, N. L., and Meneghin, G. R., “Training- A Key Element In Implementing Project Management.”, Project Management Journal, August, 1984, pp. 76-83.