Decreasing wind speed and weakening latitudinal surface pressure gradients in the Tibetan Plateau
Upload
independentCategory
view
0download
0
Assessing population maturity of three perennialgrass species: Influence of phenology and tillerdemography along latitudinal and altitudinalgradients
N. Rossignol*,†, D. Andueza*,†, P. Carr�ere‡, P. Cruz§, M. Duru§, J.-L. Fiorelli¶,
A. Michaud*,†, S. Plantureux**,††, E. Pottier‡‡ and R. Baumont*,†
*INRA, UMR1213 Herbivores, Saint-Gen�es-Champanelle, France, †Clermont Universit�e, VetAgro Sup, UMR
Herbivores, Clermont-Ferrand, France, ‡INRA, UR874 Ecosyst�eme Prairial, Crou€el, Clermont-Ferrand, France,
§INRA, UMR 1248 AGIR, Castanet-Tolosan, France, ¶INRA, UR 0055 ASTER, Mirecourt, France,**Universit�e de Lorraine, LAE, UMR1121 Agronomie et Environnement, Vandoeuvre, France, ††INRA, LAE,
UMR1121 Agronomie et Environnement, Vandoeuvre, France, ‡‡Institut de l’Elevage/CIIRPO, Site
exp�erimental du Mourier, Saint-Priest-Ligoure, France
Abstract
To assess the whole-sward maturity, which is a pri-
mary concern for grassland managers, we studied
three forage grass species with contrasting phenology
over a range of climatic conditions among sites. We
considered two main issues: (i) How is grass popula-
tion maturity related to population phenology, and is
this relation affected by environmental factors? and
(ii) Is the sum of temperatures a good index to
describe phenological development under contrasting
climates? To explore the role of temperature accumu-
lation in species population development, we
described the phenological development of popula-
tions of three grass species along latitudinal and altitu-
dinal gradients at eight locations across France. We
used a numerical index of tiller development to quan-
tify sward morphological structure and discriminate
phenological peak from average maturity. We report
that phenological development rates were similar
among sites for each species, but required fewer grow-
ing degree days to start at higher latitudes and alti-
tudes. However, we found that population maturity
and phenological peak differed significantly due to
among-site variability in vegetative tiller percentage in
whole-population biomass. Our results underlined the
importance of considering tiller distribution among
phenological stages, especially tiller development syn-
chrony, together with phenology to assess sward
maturity in semi-natural permanent grasslands.
Keywords: phenology, perennial grasses, growing
degree days, tiller development synchrony, sward
maturity, sward morphological structure
Introduction
The species richness of semi-natural grasslands pro-
vides many benefits for ecosystem function and agri-
cultural production (Hector et al., 1999). Ecosystem
services vary over the year due to vegetation phenol-
ogy. Taking into account grassland vegetation phenol-
ogy appears critical to assess appropriate management
practices for balancing ecological and agronomic goals
such as grassland sustainability or forage productivity
and quality (Pontes et al., 2007; Gaujour et al., 2012).
However, the prediction of vegetation phenology in
permanent grassland is complex due to plant diversity
(Mart�ınkov�a et al., 2002; Huyghe et al., 2008) and
phenological variability with climate and weather pat-
tern variability (Bloor et al., 2010).
Plant phenology is the seasonal timing of life cycle
events such as flowering or seed maturity. The pheno-
logical pattern of a population can be defined quanti-
tatively as a statistical distribution characterized by
mean, mode, i.e. peak (time of occurrence), variance
(synchrony among individuals) and skewness (Rath-
cke and Lacey, 1985; Forrest and Miller-Rushing,
2010). Plant phenology can vary widely between
species and is influenced by environment (reviewed
Correspondence to: R. Baumont, INRA, UMR1213 Herbi-
vores, Theix, F–63122 Saint-Gen�es-Champanelle, France.
E-mail: [email protected]
Received 15 October 2012; revised 8 February 2013
doi: 10.1111/gfs.12067 © 2013 John Wiley & Sons Ltd. Grass and Forage Science 1
Grass and Forage Science The Journal of the British Grassland Society The Official Journal of the European Grassland Federation
by Rathcke and Lacey, 1985; Fenner, 1998). Hence,
average timing of phenological stages at community
scale depends mainly on floristic composition in tem-
perate grasslands (Mart�ınkov�a et al., 2002; Ansquer
et al., 2009). Air temperature is shown to be a major
environmental factor for plant phenology in temper-
ate systems (Sparks et al., 2000; Fitter and Fitter,
2002; Cleland et al., 2006). Relations between plant
development rates and temperature led to the use of
growing degree days (GDD) as a tool to assess the tim-
ing of phenological events among locations on a tem-
perature basis (Bonhomme, 2000) and to study year-
on-year variability in response to climate change (Cle-
land et al., 2007). For example, Jenkins et al. (2002)
found that onset of vegetation activity in forests can
be predicted by mean GDD sum across a large climate
range in the USA. The GDD method accurately pre-
dicted the start of pollination period of oak popula-
tions across different regions in Spain (Garc�ıa-Mozo
et al., 2002). As vegetative material is economically
important for livestock production (Moore et al.,
1991), studies that relate grassland vegetation devel-
opment to temperature are often restricted to the veg-
etative stage (White et al., 1997; Bartholomew and
Williams, 2005). The phenological development of
dominant perennial grass species is notoriously under-
documented in semi-natural European temperate
grasslands. Recently, Ansquer et al. (2009) reported
that the GDD method can be used to satisfactorily
predict the flowering time of different grassland spe-
cies in France.
It is well established that the quantity and quality
of forage grass production are affected by variations in
plant morphology during growth and phenological
development (Moore and Moser, 1995; Buxton,
1996). Flowering coincides with the peak of biomass
production (Robson et al., 1988), whereas many forage
quality traits such as leaf/stem ratio (Duru et al.,
2000), digestibility (Valente et al., 2000), crude protein
and fibre contents (Mitchell et al., 2001) all change
unfavourably for animal feeding as the vegetation
increases in maturity. Furthermore, the morphological
development of a plant influences both accessibility
and palatability for herbivores (Briske, 1991). This
relation between forage quality and plant develop-
ment has led to the use of population-scale sward
phenology to guide management practices (Huyghe
et al., 2008). However, as developmental morphology
can vary strongly within a tiller population of forage
grasses, the occurrence of main phenological peaks is
not necessarily a pertinent descriptor of sward matu-
rity when defined as the average level of development
of the tiller population. Accordingly, individual tillers
do not respond similarly to environmental cues, which
can result in a skewed distribution of tillers among
phenological stages – notably in the presence of a pro-
portion of non-flowering tillers depending on species
strategies and requirements (Laterra et al., 1997; Mat-
thew et al., 2000). Bahmani et al. (2000, 2002)
reported that in temperate areas, there appear to be
effects of latitude, with development of higher propor-
tions of flowering tillers at higher latitudes.
Research on plant population phenology has lar-
gely focused on the average timing of a target pheno-
logical stage of interest, such as flowering. The role of
individual-level phenology on variance and skewness
of overall phenological distribution at population scale
has received little attention (Forrest and Miller-Rush-
ing, 2010) despite its ecological implications (Elzinga
et al., 2007). Moore et al. (1991) proposed a numerical
index of individual tiller development that makes it
possible to quantitatively describe tiller distribution
among phenological stages and to express sward matu-
rity as the average phenological stage in the tiller pop-
ulation. Here, we applied this method to assess the
impact of development synchrony among tillers (vari-
ance) on the relation between phenology (distribution
mode or peak) and maturity (distribution mean) of
perennial grass populations along latitude and altitude
gradients. It also remains unclear whether phenologi-
cal stages follow each other at constant time intervals
for a given species or whether they are controlled
independently by environmental factors (Rathcke and
Lacey, 1985). Hence, while it has been shown that in
temperate systems flowering time is related to temper-
atures (Sparks et al., 2000; Fitter and Fitter, 2002),
there is also evidence (Ansquer et al., 2009) for corre-
lations in the timings of successive phenological stages
of different grass species.
In this study, we considered two main issues: (i)
how is grass population maturity related to population
phenology, and is this relation affected by environ-
mental factors? and (ii) is the sum of temperatures a
good index to describe phenological development
under contrasting climates? We described the pheno-
logical development of populations of three grass
species along latitude and altitude gradients to obtain
contrasting climates. For each species studied, the
same cultivars were grown for 2 years in pure stands
at eight locations across France. We used a numerical
index of phenological stages to quantify phenological
distributions and to assess whether site location
affected development synchrony among tillers and
subsequently the relation between phenological peak
and average maturity of populations. This study was
an attempt to test whether relations between GDD
and population development differed among locations
for each species, focusing specifically on whether this
variation can be explained by the latitude or altitude
of the population sites.
© 2013 John Wiley & Sons Ltd. Grass and Forage Science
2 N. Rossignol et al.

Material and methods
Study sites
The experimental design was established at eight loca-
tions in France (Figure 1). Six sites formed a latitude
gradient: S1 (Le Pin, 48°44′N; 00°08′E; altitude 204 m
a.s.l; mean 2010 temperature 9.7°C; mean 2010 rainfall:
626 mm), S2 (Mirecourt, 48°18′N; 06°08′E; 289 m a.s.l;
temp. 9.0°C; rainfall 808 mm), S3 (Jalogny, 46°25′N;04°38′E; 250 m a.s.l; temp. 10.2°C; rainfall 921 mm),
S4 (Crouel, 45°46′N; 03°09′E; 350 m a.s.l; temp.
10.7°C; rainfall 728 mm), S5 (Le Mourier, 45°40′N;01°18′E; 280 m a.s.l; temp. 10.5°C; rainfall 877 mm)
and S6 (Toulouse, 43°36′N; 01°26′E; 150 m a.s.l; temp.
12.9°C; rainfall 695 mm). Three sites in close proximity
formed an altitude gradient: S4 (Crouel, 350 m a.s.l.),
S7 (Theix, 45°43′N; 03°01′E; 850 m a.s.l.; temp. 7.22°C;rainfall 885 mm) and S8 (Laqueuille, 45°39′N; 02°44′E;1100 m a.s.l.; temp. 5.8°C; rainfall 1142 mm). Climate
is temperate for all sites. Climatic data were collected
from the INRA database Climatik.
Experimental design: monospecific grassstands
At each site, three perennial grass species with con-
trasting phenology were sown in pure stands in
autumn 2008, with three 6 m 9 1.5 m plots per
species: meadow foxtail (Alopecurus pratensis L., cv.
Levocska), an early flowering species; cocksfoot (Dacty-
lis glomerata L., cv. Starly), an intermediate species,
and timothy (Phleum pratense L., cv. Rasant), a late-
flowering species. To avoid any confounding effect of
site and fertility, a non-limiting nutrient status was
obtained by applying phosphorous (100 kg ha�1
year�1) and potassium (150 kg ha�1 year�1) in 2009
and nitrogen (120 kg ha�1 year�1) in 2009 and 2010
at 150° GDD.During the experiment, plots were kept pure by
hand-weeding, and spaces between plots were kept
mown at ground level. Experimental plots were cut in
October 2009. In 2010, samples of grass biomass were
collected at each site using a thermic calendar (tem-
perature accumulation) around 400°, 500°, 600°,800°, 1000°, 1200° and 1400° GDD. Temperature
accumulation was calculated as the sum of mean daily
temperatures (°C) since 1 February, with temperatures
bounded to a minimum of 0°C and a maximum of
18°C. At each site, plant biomass was sampled when
the GDD thresholds were reached (Figure 2). Biomass
sampling was carried out by cutting the whole above-
ground biomass at 5 cm above ground level in a
10 cm 9 150 cm area within each experimental plot.
Plant biomass was then stored at �18°C until analysis.
At site S3, sampling was performed on only four dates.
At each site, 63 biomass samples were harvested (3
species 9 3 replicates 9 7 dates), except for S3 where
36 samples were harvested, resulting in a total of 477
biomass samples.
Numerical index of tiller development
Tiller development was described using an index
adapted from Moore et al. (1991). The numerical
index (Table 1) used in the present study consisted of
twelve successive phenological events (stages) ranging
from vegetative (1.5) to mature seed (4.8). For each
sample, 40–50 tillers were randomly chosen and
sorted by phenological stage and characterized by phe-
nological index value (Table 1). Sampled tillers were
then dried (at 60°C, 72 h) and weighed.
Data analysis
As each individual stage has an associated numerical
index (Table 1), the growth stages can be easily quan-
tified at the population scale by averaging the index
value attributed to each individual tiller. Mean Stage
by Count (MSC) and the associated standard deviation
were calculated as the mean and standard deviation of
all numerical indices of the tillers within a population
formed by the three replicates for a given site 9 spe-
cies 9 date combination. MSC was used as an index
S1 S2
S3
S4-7-8S5
S6
100 km
Figure 1 Location of experimental sites. Six sites formed a
latitude gradient: S1 (Le Pin, 48°44′N), S2 (Mirecourt, 48°18′N), S3 (Jalogny, 46°25′N), S4 (Crouel, 45°46′N), S5 (Le Mou-
rier, 45°40′N) and S6 (Toulouse, 43°36′N). Three close-by
sites formed an altitude gradient: S4 (Crouel, 350 m a.s.l.), S7
(Theix, 850 m a.s.l.) and S8 (Laqueuille, 1100 m a.s.l.). Other
site information is given in the Methods section.
© 2013 John Wiley & Sons Ltd. Grass and Forage Science
Maturity of grass species along latitudinal and altitudinal gradients 3

of average population maturity, and the associated
standard deviation was used to assess level of develop-
ment synchrony among tillers within the population.
Mean stage by weight (MSW) of the populations was
calculated the same way as for MSC but on a weight
basis:
MSW ¼X4:8i¼1:5
SiWi
Wð1Þ
where Si and Wi are the growth stage and the weight
of tiller i, respectively, and W is total weight of the til-
ler population. As MSW accounts for the contribution
of each stage to whole-population grass biomass, it
gives more importance to mature tillers in the calcula-
tion of whole-sward maturity.
Three distinct classes of tillers, i.e. vegetative,
reproductive and elongating vegetative tillers, can
co-occur in a population (Virkaj€arvi et al., 2012),
potentially resulting in a bimodal distribution of tillers
among development stages. To gain descriptive insight
into the morphological structure of the population and
discriminate for phenological peak of reproductive til-
lers, we tested whether bimodality can be evidenced
in tiller biomass distribution. Each distribution was
studied over the three replicates for a given site 9 spe-
cies 9 date combination. For each tiller biomass distri-
bution, we estimated (1) a single Gaussian distribution
(with a mean m and standard deviation s) with density
function f(x):
f ðxÞ ¼ 1
sffiffiffi2
ppexp � 1
2
x �m
s
� �2� �
¼ Nðx;m; sÞ ð2Þ
and (2) a double Gaussian distribution, i.e. mixture of
two Gaussian distributions (with means m1 and m2,
400
600
800
1000
1200
1400
Gro
win
g de
gree
s da
ys
Le Pin (S1)Mirecourt (S2)Jalogny (S3)Crouel (S4)Le Mourier (S5)
Toulouse (S6)Theix (S7)
Laqueuille (S8)
Figure 2 Temperature accumulation over time according to study site.
Table 1 Numerical indices of 12 phenological stages recorded on individual tillers (Adapted from Moore et al., 1991)
Phase
Numerical index
Stage Index Description
Vegetative (Leaf development) V 1.5 Presence of leaves
Elongation (Stem elongation) E1 2.0 First node palpable
E2 2.5 Two or more nodes palpable
E3 2.9 Flag leaf emergence
Reproductive (Floral development) R1 3.1 Inflorescence emergence/Spikelets enclosed or partially emerged
R2 3.3 Spikelets fully emerged, peduncle not emerged
R3 3.5 Spikelets fully emerged, peduncle fully elongated
R4 3.8 Anther emergence/anthesis
Seed ripening (Seed development) S1 4.0 Caryopsis visible
S2 4.1 Milk
S3 4.4 Soft dough
S4 4.8 Physiological maturity and seed ripe
© 2013 John Wiley & Sons Ltd. Grass and Forage Science
4 N. Rossignol et al.

associated standard deviations s1 and s2 and p the rela-
tive proportion of the two distributions) with density
function f(x):
f ðxÞ ¼ p:Nðx;m1; s1Þ þ ð1� pÞ:Nðx;m2; s2Þ ð3Þ
Estimations of the theoretical distribution parame-
ters were performed using the maximized log-likeli-
hood method. To assess which of the two distributions
best fit the empirical data, we calculated a contrast
value K, defined as:
K ¼X
Xi � Yið Þ2 ð4Þ
where Xi is the tiller biomass observed at a stage i,
and Yi the tiller biomass expected under the estimated
distribution in stage i. K gave a more accurate mea-
sure of the goodness-of-fit to our discontinuous data
(data can only take the value of one of the twelve
stage classes) than more classical indices like Akaike’s
criterion that are supposedly better adapted to contin-
uous data. We defined the MSWr index (r for ‘repro-
ductive’) either as the mean m of the single Gaussian
distribution or as the mean m2 of the double Gaussian
distribution, i.e. the right-side peak of the distribution,
depending on whether the single or double Gaussian
distribution best fits empirical distribution respectively.
Mean stage by weight was used to assess whole-
sward maturity on a weight basis, and MSWr was
used to assess the actual phenological stage reached by
reproductive tillers. Parameter p of the double Gauss-
ian distribution was used to estimate the relative
percentage of tiller biomass in vegetative and repro-
ductive tiller groups. To assess how whole-sward
maturity (MSW index) and the phenological develop-
ment of reproductive tillers (MSWr index) of each
species were related to temperature accumulation
according to site, we separately assessed relations for
the latitude gradient (site S1–S6) and altitude gradient
(sites S4, S7 and S8). We used ANCOVA analyses with
GDD as covariate and sites as categorical variable. Lin-
ear regressions of MSW or MSWr with GDD were
then calculated. Statistical analyses and distribution
estimations were performed using GNU-project R soft-
ware (R 2.13.2, R Foundation for Statistical Comput-
ing, http://www.R-project.org).
Results
MSC of tiller populations
At the beginning of the season (400° GDD), the MSC of
populations of D. glomerata and P. pratense was close to
1.5 (Figure 3c,e), indicating that tillers were almost all
at vegetative stage, whereas populations of A. pratensis
showed higher values ranging from 1.62 � 0.378 (site
S6) to 1.98 � 0.697 (site S5; Figure 3a), indicating a
development that ranged from vegetative stage
(MSC = 1.5) to first stage of elongation (MSC = 2.1).
As expected, MSC values increased for all three spe-
cies over time. Most of the A. pratensis populations
reached peak MSC values at 1200° GDD, except for S7populations which peaked at 1400° GDD. Depending
on sites, the peak MSC values (�SD) for A. pratensis
populations ranged from 2.30 � 0.917 (S4) to
3.48 � 1.11 (S6). Depending on sites, the MSC of
D. glomerata populations increased from 500°, 600° or
800° GDD and peaked at 1200° or 1400° GDD, rangingfrom 1.72 � 0.593 (S5) to 4.22 � 0.809 (S3). The MSC
of P. pratense populations increased from 500°, 600° or
800° GDD and peaked at 1400° GDD, ranging from
2.89 � 0.352 (S4) to 3.59 � 0.569 (S1). Overall, the
range of variation for the MSC recorded between sites
for each grass species studied was large, whereas the
increase in MSC over time appeared rather weak (Fig-
ure 3): only two of the 24 populations studied showed
an MSC value higher than 3.5, which corresponds to
the end of inflorescence development just before the
anthesis stage.
Variance in the MSC values (Figure 3b,d,f) reveals
the variability in maturity that exists within a popula-
tion of tillers, i.e. the synchrony of development among
tillers. At the beginning of the season, MSC variance
was low for D. glomerata and P. pratense because the
populations consisted mainly of vegetative-stage tillers.
A. pratensis populations showed variance from the
beginning of the season. Overall, the eight P. pratense
populations displayed relatively low levels of variance,
ranging from 0% to 7% (coefficient of variation) at
400° and from 9% to 25% at 1400°, revealing high syn-
chrony in tiller development within each population. In
contrast, A. pratensis and D. glomerata populations dis-
played high levels of variance, revealing that tiller devel-
opment was not synchronous within these populations.
Distribution of tiller biomass amongdevelopment stages: bimodality
Analysis of tiller biomass distribution among develop-
ment stages revealed that part of the asynchronous
development among tillers was due to the occurrence
of two groups with distinct average development stages
within populations. To illustrate this, at 1065 °GDD on
site S1 (Figure 4), for A. pratensis and D. glomerata pop-
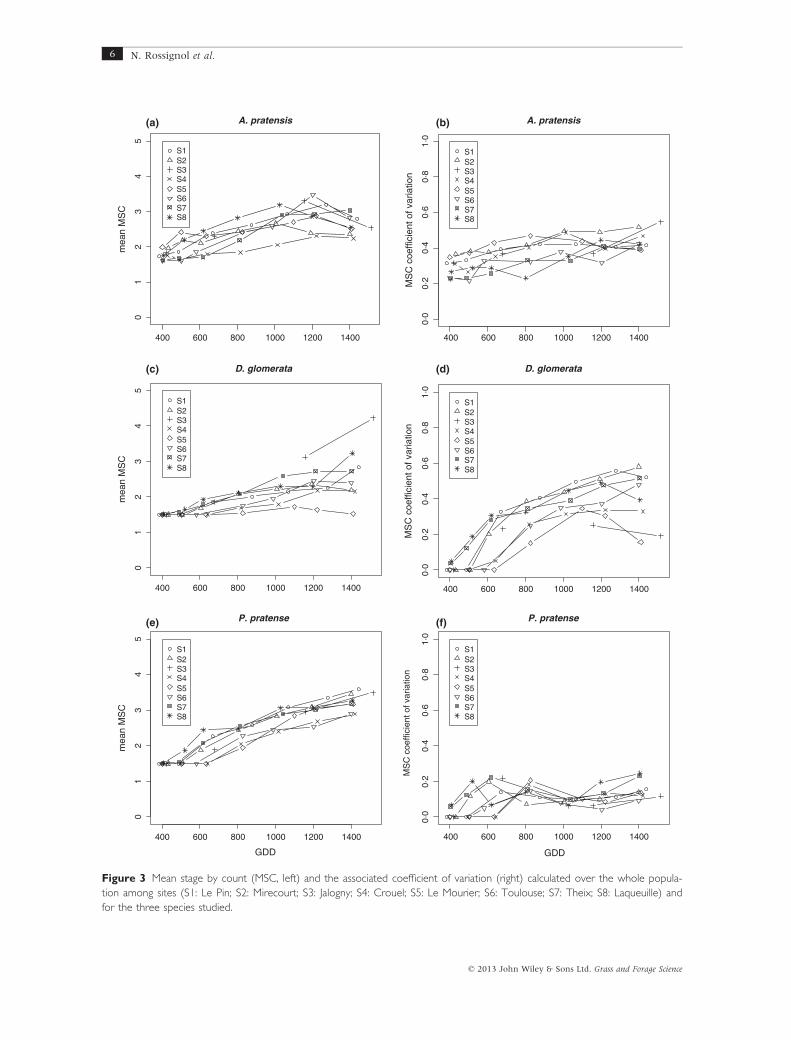
ulations, about 50% of the tiller biomass was found in
the reproductive development stages, with the remain-
der in the vegetative stage. Consequently, the MSW
calculated over the whole population did not reflect
the actual stage of development of most tillers. In
© 2013 John Wiley & Sons Ltd. Grass and Forage Science
Maturity of grass species along latitudinal and altitudinal gradients 5
A. pratensism
ean
MS
C
S1S2S3S4S5S6S7S8
400 600 800 1000 1200 1400
01
23
45
0·0
0·2
0·4
0·6
0·8
1·0
A. pratensis
MS
C c
oeffi
cien
t of v
aria
tion
S1S2S3S4S5S6S7S8
D. glomerata
mea
n M
SC
S1S2S3S4S5S6S7S8
D. glomerata
MS
C c
oeffi
cien
t of v
aria
tion
S1S2S3S4S5S6S7S8
01
23
45
01
23
45
P. pratense
GDD
mea
n M
SC
S1S2S3S4S5S6S7S8
P. pratense
GDD
MS
C c
oeffi
cien
t of v
aria
tion
S1S2S3S4S5S6S7S8
400 600 800 1000 1200 1400
400 600 800 1000 1200 1400 400 600 800 1000 1200 1400
400 600 800 1000 1200 1400
400 600 800 1000 1200 1400
0·0
0·2
0·4
0·6
0·8
1·0
0·0
0·2
0·4
0·6
0·8
1·0
(a) (b)
(c) (d)
(e) (f)
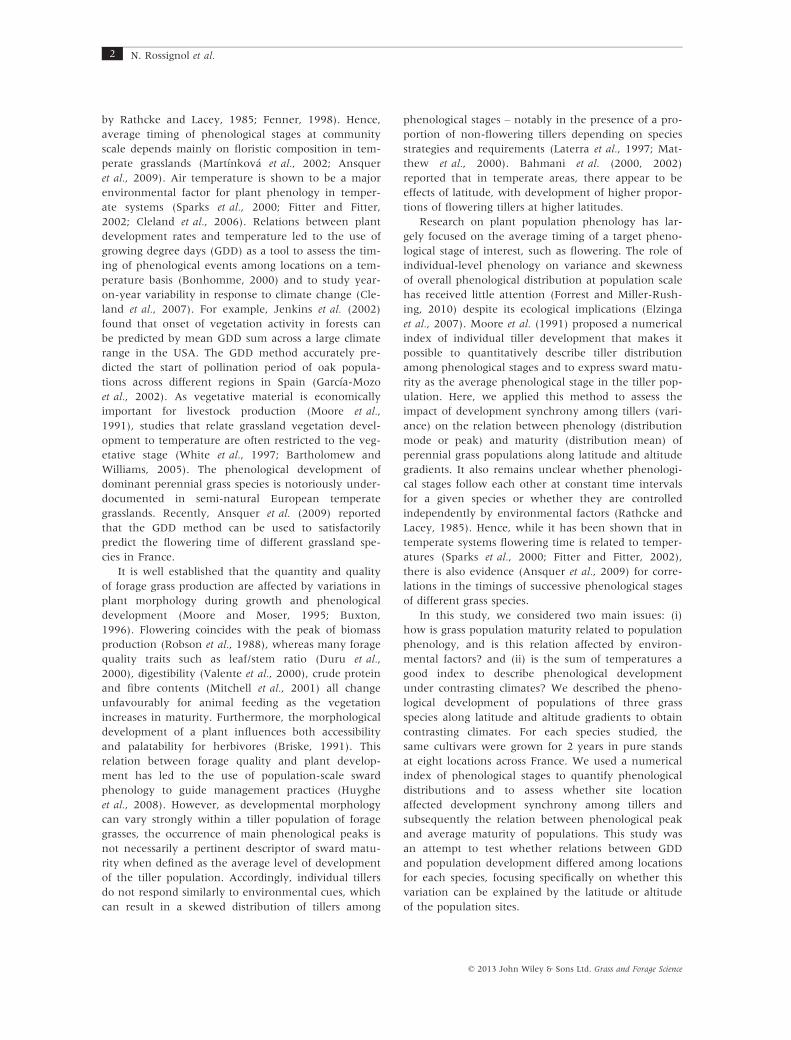
Figure 3 Mean stage by count (MSC, left) and the associated coefficient of variation (right) calculated over the whole popula-
tion among sites (S1: Le Pin; S2: Mirecourt; S3: Jalogny; S4: Crouel; S5: Le Mourier; S6: Toulouse; S7: Theix; S8: Laqueuille) and
for the three species studied.
© 2013 John Wiley & Sons Ltd. Grass and Forage Science
6 N. Rossignol et al.
P. pratense populations, however, reproductive tillers
accounted for 95% of the total tiller biomass.
The occurrence of two groups having different aver-
age stages of maturity was detectable from the start of
the experiment for all eight populations of A. pratensis
studied, and it was detected consistently over the course
of the experiment (Appendix 1). On average, the less
mature group represented half of the whole tiller popu-
lation, with variations ranging from 21% (S1) to 69%
(S2) at the end of experiment (data not shown). For
D. glomerata populations, two groups of tillers with dis-
tinct average maturity levels were identifiable later than
for A. pratensis depending on site (from 600°GDD to
1200°GDD), but once identified, the presence of two
groups was then consistently detected until the end of
the experiment (Appendix 1). On average, vegetative
populations accounted for about 30% of the tiller bio-
mass, but with significant variations among sites, rang-
ing from just 5% (S3) to 82% (S5) (data not shown).
For P. pratense populations, the point at which two
groups were detected varied from 600°GDD to
1200°GDD depending on site studied, but unlike
D. glomerata populations, it was not always evident over
the course of the experiment (Appendix 1). Proportions
of the vegetative-stage tiller group were less than 20%
on average (data not shown). Overall, tiller biomass
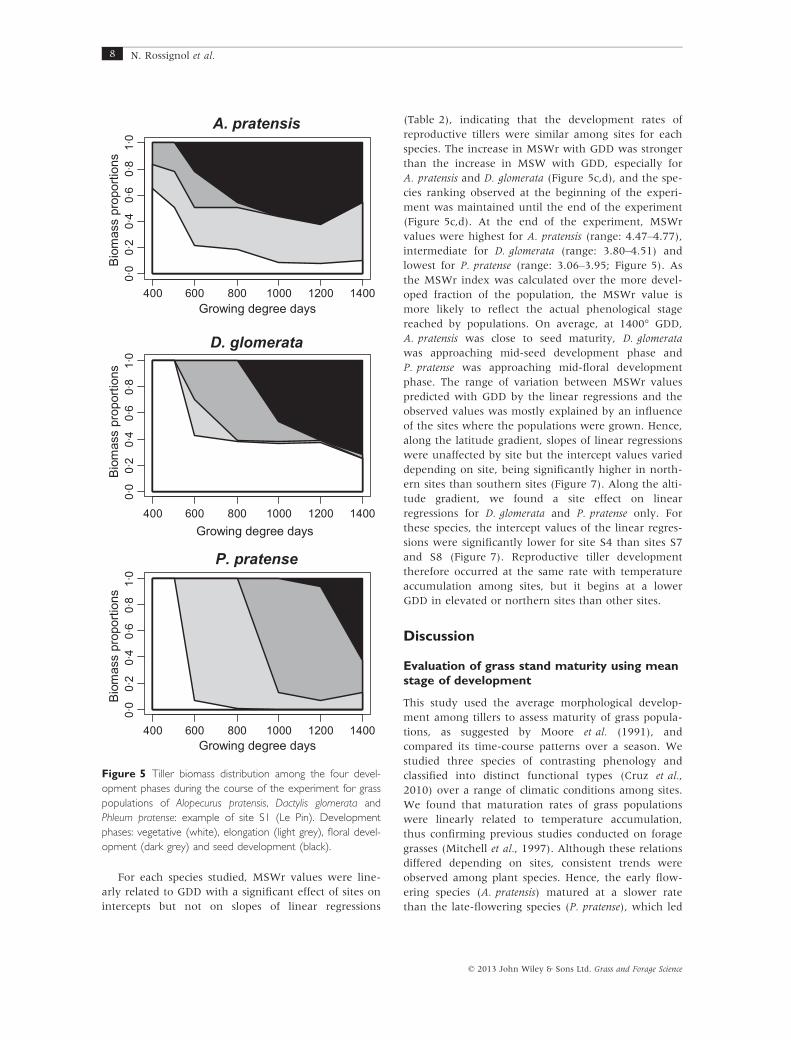
distribution among development stages contrasted
between A. pratensis and D. glomerata populations com-
pared with P. pratense populations. For P. pratense, the
four tiller development phases (vegetative, elongation,
floral and seed development) occurred successively
and, at the end of the experiment, floral and seed devel-
opment phases were the major groups, whereas the
vegetative phase never co-occurred (Figure 5, example
of site S1). In contrast, for A. pratensis and D. glomerata,
vegetative phase growth was still present within the til-
ler population until the end of the experiment and co-
occurred with the final development phase, i.e. seed
development (Figure 5).
Relationship between mean tillers populationdevelopment and growing degree days
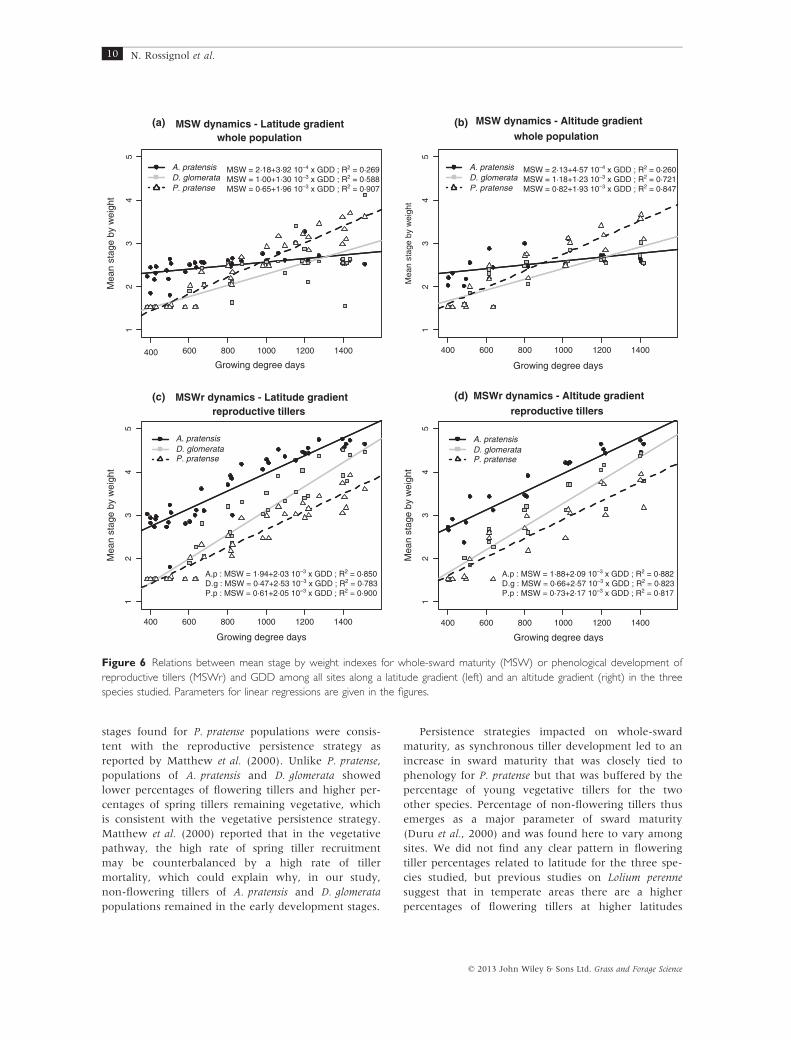
Overall, we found that mean stage by weight (MSW)
was significantly related to GDD for all three species
(Table 2). The MSW of A. pratensis populations
increased very slightly over time, whereas the MSW
of P. pratense increased via a much steeper slope
compared with the two other species (Figure 6). Con-
sequently, the three linear regressions crossed each
other during the season, thus showing a complete
inversion of the species ranking based on whole-popu-
lation maturity (Figure 6a,b). The same trend was also
found along the latitude and altitude gradients. How-
ever, linear regressions between MSW and GDD
explained the global variance of the data sets for
A. pratensis and D. glomerata populations rather weakly
(Figure 6a,b). Hence, MSW increased with tempera-
ture accumulation but the rate of whole-population
maturation differed significantly among sites for
A. pratensis and D. glomerata along the latitude gradient
(i.e. differences in slopes of regressions among sites;
Table 2). Maturation rate was higher at site S6 than
S5 for A. pratensis and D. glomerata. Maturation rates
were higher (steeper slopes) for P. pratense populations
than for the other two species and did not differ
among sites (no slope differences among sites;
Table 2).
MSWr = 4·53 (0·53)
A. pratensis
Development stages
Till
ers
biom
ass
(g)
1·5 2·1 2·5 2·9 3·3 3·75 4·2 4·75
020
4060
80 MSC = 2·92 (SD 1·239)MSW = 2·77
MSWr =3·90 (0·59)
D. glomerata
MSC = 2·16 (SD 1·068)MSW = 2·57
Development stages
Till
ers
biom
ass
(g)
1·5 2·1 2·5 2·9 3·3 3·75 4·2 4·75
020
4060
80
MSWr =3·21 (0·95)
P. pratense
Development stages
Till
ers
biom
ass
(g)
MSC = 3·07 (SD 0·301)MSW = 3·17
1·5 2·1 2·5 2·9 3·3 3·75 4·2 4·75
020
4060
80
Figure 4 Tiller biomass distributions among development stages for Alopecurus pratensis, Dactylis glomerata and Phleum pratense
populations: example of site S1 (Le Pin) at 1065 growing degree days (14 June). Mean stage by count (MSC) and mean stage by
weight (MSW) calculated for the whole population are shown on top of figure. Mean stage by weight of the reproductive frac-
tion of the population (MSWr) is indicated near each of the corresponding peak, with its proportion of whole biomass given in
brackets. Bar shading indicates the stage development phase: vegetative (white), elongation (light grey), floral development (dark
grey) and seed development (black).
© 2013 John Wiley & Sons Ltd. Grass and Forage Science
Maturity of grass species along latitudinal and altitudinal gradients 7
For each species studied, MSWr values were line-
arly related to GDD with a significant effect of sites on
intercepts but not on slopes of linear regressions
(Table 2), indicating that the development rates of
reproductive tillers were similar among sites for each
species. The increase in MSWr with GDD was stronger
than the increase in MSW with GDD, especially for
A. pratensis and D. glomerata (Figure 5c,d), and the spe-
cies ranking observed at the beginning of the experi-
ment was maintained until the end of the experiment
(Figure 5c,d). At the end of the experiment, MSWr
values were highest for A. pratensis (range: 4.47–4.77),intermediate for D. glomerata (range: 3.80–4.51) and
lowest for P. pratense (range: 3.06–3.95; Figure 5). As
the MSWr index was calculated over the more devel-
oped fraction of the population, the MSWr value is
more likely to reflect the actual phenological stage
reached by populations. On average, at 1400° GDD,
A. pratensis was close to seed maturity, D. glomerata
was approaching mid-seed development phase and
P. pratense was approaching mid-floral development
phase. The range of variation between MSWr values
predicted with GDD by the linear regressions and the
observed values was mostly explained by an influence
of the sites where the populations were grown. Hence,
along the latitude gradient, slopes of linear regressions
were unaffected by site but the intercept values varied
depending on site, being significantly higher in north-
ern sites than southern sites (Figure 7). Along the alti-
tude gradient, we found a site effect on linear
regressions for D. glomerata and P. pratense only. For
these species, the intercept values of the linear regres-
sions were significantly lower for site S4 than sites S7
and S8 (Figure 7). Reproductive tiller development
therefore occurred at the same rate with temperature
accumulation among sites, but it begins at a lower
GDD in elevated or northern sites than other sites.
Discussion
Evaluation of grass stand maturity using meanstage of development
This study used the average morphological develop-
ment among tillers to assess maturity of grass popula-
tions, as suggested by Moore et al. (1991), and
compared its time-course patterns over a season. We
studied three species of contrasting phenology and
classified into distinct functional types (Cruz et al.,
2010) over a range of climatic conditions among sites.
We found that maturation rates of grass populations
were linearly related to temperature accumulation,
thus confirming previous studies conducted on forage
grasses (Mitchell et al., 1997). Although these relations
differed depending on sites, consistent trends were
observed among plant species. Hence, the early flow-
ering species (A. pratensis) matured at a slower rate
than the late-flowering species (P. pratense), which led
A. pratensis
D. glomerata
P. pratense
400 600 800 1000 1200 1400
0·0
0·2
0·4
0·6
0·8
1·0
0·0
0·2
0·4
0·6
0·8
1·0
0·0
0·2
0·4
0·6
0·8
1·0
400 600 800 1000 1200 1400
400 600 800 1000 1200 1400
Growing degree days
Growing degree days
Growing degree days
Bio
mas
s pr
opor
tions
Bio
mas
s pr
opor
tions
Bio
mas
s pr
opor
tions
Figure 5 Tiller biomass distribution among the four devel-
opment phases during the course of the experiment for grass
populations of Alopecurus pratensis, Dactylis glomerata and
Phleum pratense: example of site S1 (Le Pin). Development
phases: vegetative (white), elongation (light grey), floral devel-
opment (dark grey) and seed development (black).
© 2013 John Wiley & Sons Ltd. Grass and Forage Science
8 N. Rossignol et al.

to an inversion of species ranking for average maturity
over time. These population-scale differences in matu-
ration dynamics were consistent with a study by
Michaud et al. (2011) on French permanent grasslands
showing that differences in dominant plant functional
types drive the rate of decline in herbage quality
over time. The slow maturation rate of A. pratensis
populations compared with P. pratense populations was
not due to slow tiller development rate but rather to
high heterogeneity in morphological sward structure.
For example, we report that at 1065°GDD on site S1
(Figure 4), A. pratensis and P. pratense populations both
showed a maturity equivalent to a homogeneous pop-
ulation with all tillers at the flower emergence stage
(stage 3). Phleum pratense populations, however, were
characterized by a high development synchrony
among tillers, with most tillers effectively nearing the
flower emergence stage, whereas A. pratensis popula-
tions showed weak development synchrony among til-
lers, a percentage of which were approaching the seed
maturity stage while the other percentage was still in
vegetative stage. In this case, the use of all-population
phenological peak (seed maturity) as a descriptor of
whole-sward maturity led to an overestimation com-
pared to the MSW index, thus underlining the impor-
tance of taking into account both phenology and tiller
demography parameters such as percentage of flower-
ing tillers (Jonsdottir, 1991; Brock et al., 1996) for
understanding how grass population maturity evolves
over time (Duru, 2008). As forage quality is related to
morphological development, the MSW index could be
used to assess average nutritive value of a species pop-
ulation. It should be noted, however, that low devel-
opment synchrony among tillers can indicate the
presence of mature plant parts, which were shown to
limit herbivore selection for a feeding patch (Flores
et al., 1993), mixed with palatable vegetative tillers.
Tiller population demography and persistencestrategies
Permanent grasslands are characterized by a dominant
vegetation of perennial grasses (Louault et al., 2005;
Benot et al., 2011) that can persist for several years in
the sward by vegetative multiplication (Briske, 1991;
Murphy and Briske, 1992; Zobel et al., 2010) with a
potentially very low annual percentage of seedling
establishment (Benson and Hartnett, 2006). Seasonal
patterns of tiller replacement reveal that different grass
species employ different persistence strategies. Mat-
thew et al. (1993) proposed a categorization into two
classes. In the reproductive pathway, most of the
replacement tillers are formed from decapitated flow-
ering tillers in late summer, and tiller demography is
characterized by a high percentage of flowering tillers
and a low percentage of spring tillers remaining as
vegetative tillers in late summer. Here, the seasonal
patterns of tiller distribution among development
Table 2 Results of ANCOVA testing for the effects of growing degree days (GDD) and site on Mean Stage by Weight index for
the whole population (MSW) and for reproductive tillers (MSWr) along latitude and altitude gradients
Alopecurus pratensis Dactylis glomerata Phleum pratense
Latitude
MSW
GDD F1,27 = 22.01*** F1,27 = 35.08*** F1,27 = 53.51***
Site F5,27 = 0.47 F5,27 = 7.62*** F5,27 = 9.10***
GDD 9 site F5,27 = 3.70* F5,27 = 5.11** F5,27 = 2.49
MSWr
GDD F1,27 = 253.84*** F1,26 = 632.94*** F1,27 = 870.61***
Site F5,27 = 2.74* F5,26 = 5.86*** F5,27 = 8.94***
GDD 9 site F5,26 = 0.54 F5,26 = 1.82 F5,27 = 1.99
Altitude
MSW
GDD F1,15 = 11.08** F1,15 = 62.05*** F1,15 = 12.52***
Site F2,15 = 4.16* F2,15 = 3.65 F2,15 = 18.57***
GDD 9 site F2,15 = 1.45 F2,15 = 0.01 F2,15 = 0.80
MSWr
GDD F1,15 = 176.48*** F1,15 = 372.38*** F1,15 = 240.76***
Site F2,15 = 1.77 F2,15 = 12.87*** F2,15 = 16.63***
GDD 9 site F2,15 = 1.90 F2,15 = 2.59 F2,15 = 1.28
*, P < 0.05; **, P < 0.01; ***P, < 0.001.
© 2013 John Wiley & Sons Ltd. Grass and Forage Science
Maturity of grass species along latitudinal and altitudinal gradients 9
stages found for P. pratense populations were consis-
tent with the reproductive persistence strategy as
reported by Matthew et al. (2000). Unlike P. pratense,
populations of A. pratensis and D. glomerata showed
lower percentages of flowering tillers and higher per-
centages of spring tillers remaining vegetative, which
is consistent with the vegetative persistence strategy.
Matthew et al. (2000) reported that in the vegetative
pathway, the high rate of spring tiller recruitment
may be counterbalanced by a high rate of tiller
mortality, which could explain why, in our study,
non-flowering tillers of A. pratensis and D. glomerata
populations remained in the early development stages.
Persistence strategies impacted on whole-sward
maturity, as synchronous tiller development led to an
increase in sward maturity that was closely tied to
phenology for P. pratense but that was buffered by the
percentage of young vegetative tillers for the two
other species. Percentage of non-flowering tillers thus
emerges as a major parameter of sward maturity
(Duru et al., 2000) and was found here to vary among
sites. We did not find any clear pattern in flowering
tiller percentages related to latitude for the three spe-
cies studied, but previous studies on Lolium perenne
suggest that in temperate areas there are a higher
percentages of flowering tillers at higher latitudes
400 600 800 1000 1200 1400
A. pratensisD. glomerataP. pratense
MSW dynamics - Latitude gradientwhole population
Growing degree days
Mea
n st
age
by w
eigh
t
A. pratensisD. glomerataP. pratense
MSW dynamics - Altitude gradient
whole population
Growing degree days
Mea
n st
age
by w
eigh
t
A. pratensisD. glomerataP. pratense
MSWr dynamics - Latitude gradientreproductive tillers
Growing degree days
Mea
n st
age
by w
eigh
t
12
34
5
12
34
5
12
34
5
12
34
5
A. pratensisD. glomerataP. pratense
MSWr dynamics - Altitude gradientreproductive tillers
Growing degree days
Mea
n st
age
by w
eigh
t
A.p : MSW = 1·94+2·03 10–3 x GDD ; R2 = 0·850D.g : MSW = 0·47+2·53 10–3 x GDD ; R2 = 0·783P.p : MSW = 0·61+2·05 10–3 x GDD ; R2 = 0·900
A.p : MSW = 1·88+2·09 10–3 x GDD ; R2 = 0·882D.g : MSW = 0·66+2·57 10–3 x GDD ; R2 = 0·823P.p : MSW = 0·73+2·17 10–3 x GDD ; R2 = 0·817
MSW = 2·18+3·92 10–4 x GDD ; R2 = 0·269MSW = 1·00+1·30 10–3 x GDD ; R2 = 0·588MSW = 0·65+1·96 10–3 x GDD ; R2 = 0·907
MSW = 2·13+4·57 10–4 x GDD ; R2 = 0·260MSW = 1·18+1·23 10–3 x GDD ; R2 = 0·721MSW = 0·82+1·93 10–3 x GDD ; R2 = 0·847
400 600 800 1000 1200 1400
400 600 800 1000 1200 1400400 600 800 1000 1200 1400
(a) (b)
(c) (d)
Figure 6 Relations between mean stage by weight indexes for whole-sward maturity (MSW) or phenological development of
reproductive tillers (MSWr) and GDD among all sites along a latitude gradient (left) and an altitude gradient (right) in the three
species studied. Parameters for linear regressions are given in the figures.
© 2013 John Wiley & Sons Ltd. Grass and Forage Science
10 N. Rossignol et al.

(Bahmani et al., 2000, 2002). Management practices
(e.g. cutting date, residue removal) and climatic events
in late summer and autumn affecting vegetative tiller
population are also reported to affect percentage of
flowering tillers the following year (Young et al., 1998;
Loeppky and Coulman, 2001; Hendrickson et al.,
2005), which may make this percentage difficult to
predict. The three grass species studied are character-
ized by resource acquisition strategies with abilities for
rapid exploitation of nutrients in fertile grasslands
(Grime et al., 1997; Cruz et al., 2010). The high per-
centage of vegetative tillers associated with the high
variability among sites found for A. pratensis and
D. glomerata may be linked to their ability to rapidly
exploit the soil resource in heterogeneous environ-
ments (Laterra et al., 1997). Moreover, early flowering
is often associated with quick resource accumulation
(Rathcke and Lacey, 1985). The late phenology and
low variability in tiller demography observed for
P. pratense would tend to suggest competitive ability in
low-disturbance environments. These results confirm
that P. pratense is better suited for utilization as a hay
crop than for grazing.
Clonal traits contribute to syndromes of plant strat-
egies related to nutrient acquisition–retention (Rusch
et al., 2011), and competition for light and nutrients
can affect rate of tillering and also percentage of flow-
ering tillers (Laterra et al., 1997), which raises the
question of how percentages of flowering tillers in
pure stands could be modified by interspecific compe-
tition.
Relations between grass population phenologyand growing degree days
Average phenological development of reproductive til-
lers over time gave estimated timings of successive phe-
nological events (heading, flowering, etc.) across the
population. Phenological development of reproductive
tillers was linearly related to temperature accumulation.
Unlike the observed results for whole-population matu-
ration rates, the slopes of these relations did not differ
significantly among sites for each species studied, which
showed that the interval in growing degree days
required between two successive phenological events
was unaffected by site location. These results confirm
that the GDD method can predict the occurrence of
phenological events in plant populations as shown in
previous studies (Sparks et al., 2000; Garc�ıa-Mozo et al.,
2002; Jenkins et al., 2002). They suggest, however, that
phenological stages are not controlled independently by
environmental factors but follow each other at constant
GDD intervals for each species (Rathcke and Lacey,
1985). Ansquer et al. (2009) reported correlations
between dates of elongation start, flowering and seed
ripening for several permanent grassland species in
France and suggested that the impact of growing condi-
tions on the start of stem elongation may explain the
timing of flowering. Our results support the view that
A. pratensis
D. glomerata
P. pratense
S1 S2 S3 S4 S5 S6 S4 S7 S8
Latitude gradient Altitude gradient
S1 S2 S3 S4 S5 S6 S4 S7 S8
S1 S2 S3 S4 S5 S6 S4 S7 S8
2·5
2·0
1·5
1·0
0·5
0·0
2·5
2·0
1·5
1·0
0·5
0·0
2·5
2·0
1·5
1·0
0·5
0·0
b
ab ab
a
ab
a
abca
a
aba
b ab ab ab ab a N.S.
b b b b
c bc b b
a
MS
W -
Inte
rcep
t val
ueM
SW
- In
terc
ept v
alue
MS
W -
Inte
rcep
t val
ue
Latitude gradient Altitude gradient
Latitude gradient Altitude gradient
Figure 7 Intercept values for MSWr index according to site
(S1: Le Pin; S2: Mirecourt; S3: Jalogny; S4: Crouel; S5: Le
Mourier; S6: Toulouse; S7: Theix; S8: Laqueuille). Models for
latitude (left side of the figure) and altitude (right side of the
figure) data sets. Identical letters indicate absence of signifi-
cant among-site differences for latitude or altitude gradients
(multiple comparisons: Tukey’s HSD post hoc test.) Left side,
from S1 to S6: North–South latitude gradient; Right side,
from S4 to S8: increasing altitude gradient.
© 2013 John Wiley & Sons Ltd. Grass and Forage Science
Maturity of grass species along latitudinal and altitudinal gradients 11
phenological development rate of reproductive tillers
was constant among sites for the three grass species
studied, but with significant delay among sites in terms
of the timing of phenological stages. Indeed, a given
phenological stage required less accumulated tempera-
ture at higher latitude (e.g. S1, 48°N) than at lower lati-
tude (e.g. S6, 43°N) for all three species and at higher
altitude (e.g. S8, 1100 m a.s.l.) than lower altitude (e.g.
S4, 350 m a.s.l.) for D. glomerata and P. pratense. These
results contrast with the findings of Ansquer et al.
(2009) who found little evidence for an altitude effect
on flowering time at species level. Grass species phenol-
ogy is known to be influenced by abiotic factors other
than temperature, such as day-length photoperiod, pre-
cipitation or resource availability (Hovenden et al.,
2008; Martiniello and Teixeira da Silva, 2011). Indeed,
the fact that grass species are characterized by day-
length requirements for flowering initiation may
explain the latitudinal and altitudinal effects observed
here (Heide et al., 1985; Wu et al., 2004; Martiniello
and Teixeira da Silva, 2011). Integrating photoperiod
should, therefore, improve the accuracy of grass
phenology predictions based on temperature (Bloor
et al., 2010).
Conclusions
This study found that phenological development
required less GDD to be triggered in higher latitudes
and altitudes among sites, but that the rates of devel-
opment were similar for each species among sites, i.e.
GDD intervals between stages were unaffected by site
location. We thus concluded that the GDD method
can satisfactorily describe species phenological devel-
opment in different locations in France and may prove
useful for a generic model of seasonal herbage quality
(Duru et al., 2000; Jouven et al., 2006; Duru, 2008).
This study also clearly demonstrated, however, that
the phenological stage (phenological peak) of the pop-
ulation cannot be used as a reliable indicator of sward
maturity (average development) due to the presence
of a percentage of vegetative tillers in the population.
The percentage of vegetative tillers was found to be
species dependent but was also highly variable among
sites. The accuracy of taking into account the biomass
investment in vegetative and reproductive tillers at
population scale may thus remain a challenge for
modelling.
This work conducted in pure stands could also pro-
vide baseline data for further research on the adapta-
tions of native grass populations to latitudinal and
altitudinal gradients and on the impact of species mix-
tures of contrasting phenology on the evolution of for-
age quality at plant community scale in permanent
grasslands.
Acknowledgments
This experiment was conducted as part of the ‘CASDAR
Prairies permanentes’ project funded by the French
Ministry for Agriculture. N.R. received a postdoctoral
grant from the Conseil R�egional d’Auvergne. The
authors wish to thank A. Torrent (Theix), E. Lecloux
(Toulouse), P. Note (Laqueuille), G. Leau, D. Leconte
(Le Pin), J. Renon (Jalogny) and D. Ragon (Le Mourier)
for their skilful assistance with the experiment.
References
ANSQUER P., AL HA J KHAL ED R., CRUZ P., THEAU J.-P.,
THEROND O. and DURU M. (2009) Characterizing and
predicting plant phenology in species-rich grasslands.
Grass and Forage Science, 64, 57–70.BAHMAN I I., VAR L E T -GRANCHER C., HAZARD L.,
MAT TH EW C., BE T I N M., LANGLA I S A., LEMA I R E G.
and THOM E.R. (2000) Post-flowering tillering in
contrasting light environments of two New Zealand
perennial ryegrass cultivars with different perennation
strategies. Grass and Forage Science, 55, 367–371.BAHMAN I I., THOM E.R., MAT THEW C. and LEMA I R E G.
(2002) Flowering propensity of two New Zealand
perennial ryegrass cultivars originating from different
ecotypes. New Zealand Journal of Agricultural Research,
45, 129–137.BARTHOLOMEW P.W. and WI L L I AMS R.D. (2005) Cool-
season grass development response to accumulated
temperature under a range of temperature regimes.
Crop Science, 45, 529–534.BENO T M.-L., MONY C., MERL I N A., MAR ION B.,
BOU Z I L L �E J.-B. and BON I S A. (2011) Clonal growth
strategies along flooding and grazing gradients in
Atlantic coastal meadows. Folia Geobotanica, 46, 219–235.
BENSON E.J. and HARTN E T T D.C. (2006) The role of seed
and vegetative reproduction in plant recruitment and
demography in tallgrass prairie. Plant Ecology, 187, 163–177.
BLOOR J.M.G., P I CHON P., FA LC IMAGNE R., LEAD L E Y P.
and SOUS SANA J.-F. (2010) Effects of warming,
summer drought, and CO2 enrichment on aboveground
biomass production, flowering phenology, and
community structure in an upland grassland ecosystem.
Ecosystems, 13, 888–900.BONHOMME R. (2000) Bases and limits to using ‘degree.
day’ units. European Journal of Agronomy, 13, 1–10.BR I SK E D.D. (1991) Developmental morphology and
physiology of grasses. In: Heitschmidt R.K. and Stuth
J.W. (eds) Grazing management: An ecological perspective,
pp. 85–108. Portland, OR: Timber Press.
BROCK J.L., HUME D.E. and FLE TCHER R.H. (1996)
Seasonal variation in the morphology of perennial
ryegrass (Lolium perenne) and cocksfoot (Dactylis
glomerata) plants and population in pastures under
intensive sheep grazing. The Journal of Agricultural
Science, 126, 37–51.
© 2013 John Wiley & Sons Ltd. Grass and Forage Science
12 N. Rossignol et al.
BUXTON D.R. (1996) Quality-related characteristics of
forages as influenced by plant environment and
agronomic factors. Animal Feed Science Technology, 59,
37–49.CLE LAND E.E., CH I A R I E L LO N.R., LOAR I E S.R., MOONEY
H.A. and F I E LD C.B. (2006) Diverse responses of
phenology to global changes in a grassland ecosystem.
PNAS, 103, 13740–13744.CLE LAND E.E., CHU I N E I., MENZE L A., MOONEY H.A.
and SCHWART Z M.D. (2007) Shifting plant phenology
in response to global change. Trends in Ecology and
Evolution, 22, 357–365.CRUZ P., THEAU J.-P., L EC LOUX E., JOUANY C. and
DURU M. (2010) Typologie fonctionnelle de gramin�ees
fourrag�eres p�erennes: une classification multitraits
[Functional typology of perennial forage grasses: a
classification based on several characteristics]. Fourrages,
201, 11–17.DURU M. (2008) Improvement of time-driven models of
lamina Cocksfoot digestibility by a process-based
model to take account of plant N nutrition and
defoliation. Journal of Agronomy and Crop Science, 194,
401–412.DURU M., DEL PRA T V., FABRE C. and FEU I L L E RAC E.
(2000) Effect of nitrogen fertiliser supply and winter
cutting on morphological composition and herbage
digestibility of a Dactylis glomerata L. sward in spring.
Journal of the Science of Food and Agriculture, 80, 33–42.EL Z I NGA J.A., AT LAN A., B I E R E A., G IGORD L., WE I S
A.E. and BERNA SCON I G. (2007) Time after time:
flowering phenology and biotic interactions. Trends in
Ecology and Evolution, 22, 432–439.FENNER M. (1998) The phenology of growth and
reproduction in plants. Perspectives in Plant Ecology,
Evolution and Systematics, 1, 78–91.F I T T E R A.H. and F I T T E R R.S.R. (2002) Rapid changes in
flowering time in British plants. Science, 296, 1689–1691.
F LORE S E.R., LACA E.A., GR IGG S T.C. and DEMMENT
M.W. (1993) Sward height and vertical morphological
differentiation determine cattle bite dimensions.
Agronomy Journal, 85, 527–532.FORR E S T J. and MI L L ER -RUSH I NG A.J. (2010) Toward a
synthetic understanding of the role of phenology in
ecology and evolution. Philosophical Transactions of the
Royal Society B., 365, 3101–3112.GARC�IA -MOZO H., GAL �AN C., A I RA M.J., BE LMONTE J.,
D�IA Z D E LA GUARD I A C., FERN �ANDE Z D., GUT I E RR E Z
A.M., RODR I GUE Z F.J., TR I GO M.M. and DOM INGUE Z -
V I L CH E S E. (2002) Modelling start of oak pollen season
in different climatic zones in Spain. Agricultural and
Forest Meteorology, 110, 247–257.GAU JOUR E., AM IAUD B., M IGNO LE T C. and
PLANTUR EUX S. (2012) Factors and processes affecting
plant biodiversity in permanent grasslands A review.
Agronomy for Sustainable Development, 32, 133–160.GR IME J.P., THOMP SON K., HUN T R., HODG SON J.G.,
CORNE L I S S EN J.H.C., ROR I SON I.H., HENDRY G.A.F.,
ASHENDEN T.W., ASKEW A.P., BAND S.R., BOOTH
R.E., BOS SARD C.C., CAMPBE L L B.D., COOPER J.E.L.,
DAV I SON A.W., GUP TA P.L., HAL L W., HAND D.W.,
HANNAH M.A., H I L L I E R S.H., HODK I N SON D.J., JA L I L I
A., L I U Z., MACKEY J.M.L., MAT THEWS N.,
MOWFORTH M.A., NEAL A.M., READER R.J., RE I L I NG K.,
ROS S -FRAS ER W., S P ENC ER R.E., SU T TON F.,
TA SKER D.E., THOR P E P.C. and WH I T EHOUS E J.
(1997) Integrated screening validates primary axes of
specialisation in plants. Oikos, 79, 259–281.HEC TOR A., SCHM I D B., BE I E RKUHNL E I N C., CALDE I RA
M.C., D I EMER M., D IM I T RAKOPOU LOS P.G., F I NN J.A.,
FRE I T A S H., G I L L E R P.S., GOOD J., HARR I S R.,
H €OGB ERG P., HUS S -DANE L L K., JO SH I J., JUMP PONEN
A., K €ORNER C., LEAD LE Y P.W., LOREAU M., MINN S A.,
MULDER C.P.H., O ’DONOVAN G., OTWAY S.J.,
P ERE I R A J.S., PR I N Z A., READ D.J., SCHERER -
LOREN Z EN M., SCHUL Z E E.-D., S I AMANT Z I OURA S
A.-S.D., S P EHN E.M., TERRY A.C., TROUMB I S A.Y.,
WOODWARD F.I., YACH I S. and LAWTON J.H. (1999)
Plant diversity and productivity experiments in
European grasslands. Science, 286, 1123–1127.HE I D E O.M., HAY R.K.M. and BAUGER €OD H. (1985)
Specific daylength effects on leaf growth and dry-matter
production in high-latitude grasses. Annals of Botany, 55,
579–586.HENDR I CK SON J.R., BERDAHL J.D., L I E B I G M.A. and
KARN J.F. (2005) Tiller persistence of eight
intermediate wheatgrass entries grazed at three
morphological stages. Agronomy Journal, 97, 1390–1395.HOVENDEN M.J., WI L L S K.E., VAN DER SCHOOR J.K.,
WI L L I AMS A.L. and NEWTON P.C.D. (2008) Flowering
phenology in a species-rich temperate grassland is
sensitive to warming but not elevated CO2. New
Phytologist, 178, 815–822.HUYGHE C., BAUMONT R. and I S S E L S T E I N J. (2008) Plant
diversity in grasslands and feed quality. Grassland Science
in Europe, 13, 375–386.J ENK I N S J.P., BRASWEL L B.H., FROLK I NG S.E. and ABER
J.D. (2002) Detecting and predicting spatial and
interannual patterns of temperate forest springtime
phenology in the eastern US. Geophysical Research Letters,
29, 54.1–54.4, Article no. 2201.
JONSDOT T I R G.A. (1991) Tiller demography in seashore
populations of Agrostis stolonifera, Festuca rubra and Poa
irrigata. Journal of Vegetation Science, 2, 89–94.JOUVEN M., CARRERE P. and BAUMONT R. (2006) A
model predicting biomass, structure and quality
dynamics in managed permanent grasslands: 1- Model
description. Grass and Forage Science, 61, 125–133.LAT ERRA P., DEREG I BU S V.A. and MACE I RA N.O.
(1997) Demographic variability in populations of two
perennial pampa grasses. Journal of Vegetation Science, 8,
369–376.LOE P PKY H.A. and COULMAN B.E. (2001) Residue
removal and nitrogen fertilization affects tiller
development and flowering in meadow bromegrass.
Agronomy Journal, 93, 891–895.LOUAUL T F., P I L LAR V.D., AUFR �ERE J., GARN I E R E. and
SOU SSANA J.F. (2005) Plant traits and functional types
in response to reduced disturbance in a semi-natural
grassland. Journal of Vegetation Science, 16, 151–160.
© 2013 John Wiley & Sons Ltd. Grass and Forage Science
Maturity of grass species along latitudinal and altitudinal gradients 13
MART I N I E L LO P. and TE I X E I RA DA S I L VA J.A. (2011)
Physiological and bioagronomical aspects involved in
growth and yield components of cultivated forage species
in Mediterranean environments: a review. The European
Journal of Plant Science and Biotechnology, 5, 64–98.MART�IN KOV �A J., �SM I LAU ER P. and MIHULKA S. (2002)
Phenological pattern of grassland species: relation to the
ecological and morphological traits. Flora, 197, 290–302.MAT TH EW C., BLACK C.K. and BUTL ER B.M. (1993)
Tiller dynamics of perennation in three grasses.
Proceedings of the 17th International Grassland Congress, pp.
141–143. Wellington, NZ: SIR publishing.
MAT TH EW C., AS SUERO S.G., BLACK C.K. and
SACKV I L L E HAM I L TON N.R. (2000) Tiller Dynamics of
Grazed Swards. In: Lemaire G., Hodgson J., Moraes A.,
de Nabinger C. and Carvalho P.C. de F. (eds) Grassland
ecophysiology and grazing ecology, pp.127–150.Wallingford, UK: CAB International.
MI CHAUD A., ANDUE ZA D., P I CARD F., P LAN TUREUX S.
and BAUMONT R. (2011) Seasonal dynamics of biomass
production and herbage quality of three grasslands with
contrasting functional compositions. Grass and Forage
Science, 67, 64–76.MI TCHE L L R.B., MOORE K.J., MOSER L.E., FR I T Z J.O.
and RED F EARN D.D. (1997) Predicting developmental
morphology in switchgrass and big bluestem. Agronomy
Journal, 89, 827–832.MI TCHE L L R., FR I T Z J., MOORE K., MOSER L., VOGE L
K., RED F EARN D. and WES T ER D. (2001) Predicting
forage quality in switchgrass and big bluestem.
Agronomy Journal, 93, 118–124.MOORE K.J. and MOSER L.E. (1995) Quantifying
developmental morphology of perennial grasses. Crop
Science, 35, 37–43.MOORE K.J., MOSER L.E., VOGE L K.P., WAL LER S.S.,
JOHNSON B.E. and PEDER S EN J.F. (1991) Describing
and quantifying growth stages of perennial forage
grasses. Agronomy Journal, 83, 1073–1077.MURPHY J.S. and BR I SK E D.D. (1992) Regulation of
tillering by apical dominance: chronology, interpretative
value, and current perspectives. Journal of Range
Management, 45, 419–430.PON TE S L.S., CARR �ERE P., ANDUE ZA D., LOUAUL T F. and
SOU SSANA J.F. (2007) Seasonal productivity and
nutritive value of temperate grasses found in semi-
natural pastures in Europe: responses to cutting
frequency and N supply. Grass and Forage Science, 62,
485–496.RATHCKE B. and LACEY E.P. (1985) Phenological patterns
of terrestrial plants. Annual Review of Ecology and
Systematics, 16, 179–214.ROBSON M.J., RY LE G.J.A. and WOLEDGE J. (1988) The
grass plant – its form and function. In: Jones M.B. and
Lazenby A. (eds) The grass crop, the physiological basis of
production, pp. 25–84. London, UK: Chapman and Hall.
RUSCH G.M., WI LMANN B., KL IME �SOV �A J. and EV JU M.
(2011) Do clonal and bud bank traits vary in
correspondence with soil properties and resource
acquisition strategies? Patterns in Alpine communities
in the Scandian mountains. Folia Geobotanica, 46, 237–254.
S PARK S T.H., J E F FR E E E.P. and JE F F R E E C.E. (2000) An
examination of the relationship between flowering
times and temperature at the national scale using long-
term phenological records from the UK. International
Journal of Biometeorology, 44, 82–87.VALEN T E M.E., BORREAN I G., PE I R E T T I P.G. and
TABACCO E. (2000) Codified morphological stage for
predicting digestibility of Italian ryegrass during the
spring cycle. Agronomy Journal, 92, 967–973.V I RKA J €ARV I P., PAKAR I N EN K., HYRK €AS M., SE P P €ANEN
M. and B �ELANGER G. (2012) Tiller characteristics of
timothy and tall fescue in relation to herbage mass
accumulation. Crop Science, 52, 970–980.WH I T E M.A., THOMTON P.E. and RUNN ING S.W.
(1997) A continental phenology model for
monitoring vegetation responses to interannual
climatic variability. Global Change Biogeochemical Cycles,
11, 217–234.WU W., SK J E L VAG A.O. and BAADSHAUG O.H. (2004)
Quantification of photoperiodic effects on growth of
Phleum pratense. Annals of Botany, 94, 535–543.YOUNG W.C.III., YOUNGBERG H.W. and S I L B ER S T E I N
T.B. (1998) Management studies on seed production of
turf-type tall fescue: II Seed yield components.
Agronomy Journal, 90, 478–483.ZOBE L M., MOORA M. and HERBEN T. (2010) Clonal
mobility and its implications for spatio-temporal
patterns of plant communities: what do we need to
know next? Oikos, 119, 802–806.
© 2013 John Wiley & Sons Ltd. Grass and Forage Science
14 N. Rossignol et al.
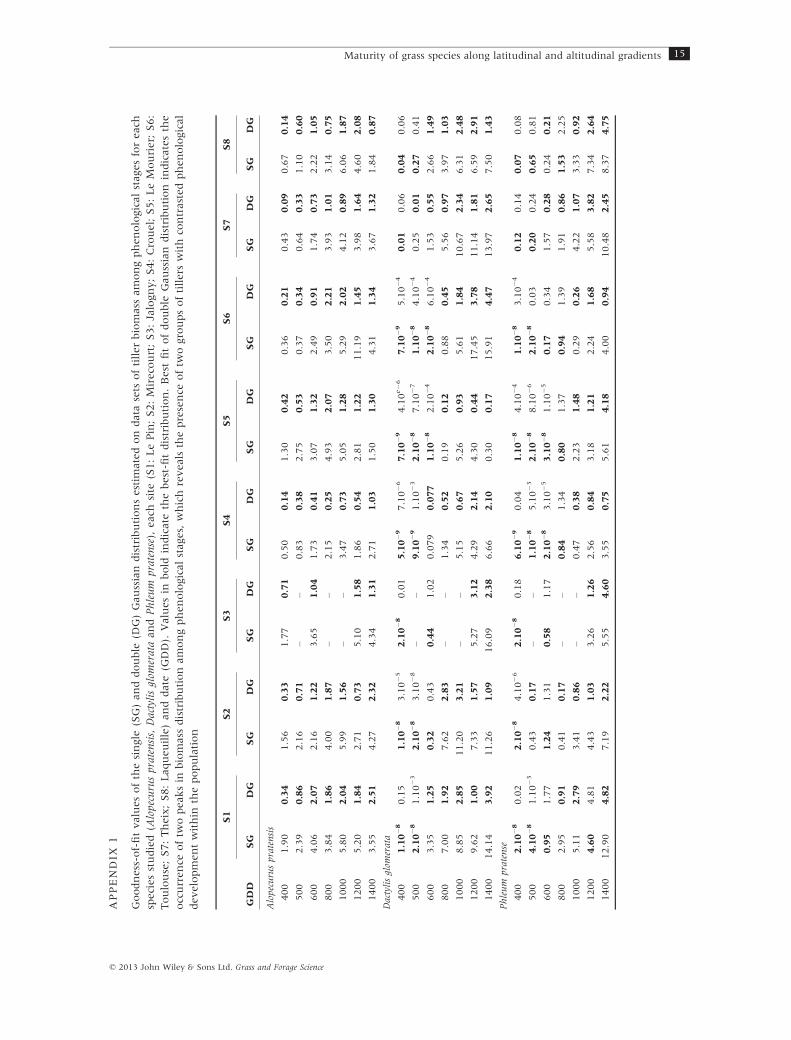
APPENDIX
1
Goodness-of-fitvaluesofthesingle
(SG)anddouble
(DG)Gaussiandistributionsestim
atedondata
sets
oftillerbiomass
amongphenologicalstagesforeach
speciesstudied(A
lopecuruspratensis,Dactylisglom
erata
andPhleum
pratense),
each
site
(S1:LePin;S2:Mirecourt;S3:Jalogny;S4:Crouel;S5:LeMourier;
S6:
Toulouse;S7:Theix;S8:Laqueuille)anddate
(GDD).
Valuesin
bold
indicate
thebest-fitdistribution.Best
fitofdouble
Gaussiandistributionindicatesthe
occurrence
oftw
opeaksin
biomass
distributionamongphenologicalstages,
whichrevealsthepresence
oftw
ogroupsoftillers
withcontrastedphenological
developmentwithin
thepopulation
GDD
S1
S2
S3
S4
S5
S6
S7
S8
SG
DG
SG
DG
SG
DG
SG
DG
SG
DG
SG
DG
SG
DG
SG
DG
Alopecuruspratensis
400
1.90
0.34
1.56
0.33
1.77
0.71
0.50
0.14
1.30
0.42
0.36
0.21
0.43
0.09
0.67
0.14
500
2.39
0.86
2.16
0.71
––
0.83
0.38
2.75
0.53
0.37
0.34
0.64
0.33
1.10
0.60
600
4.06
2.07
2.16
1.22
3.65
1.04
1.73
0.41
3.07
1.32
2.49
0.91
1.74
0.73
2.22
1.05
800
3.84
1.86
4.00
1.87
––
2.15
0.25
4.93
2.07
3.50
2.21
3.93
1.01
3.14
0.75
1000
5.80
2.04
5.99
1.56
––
3.47
0.73
5.05
1.28
5.29
2.02
4.12
0.89
6.06
1.87
1200
5.20
1.84
2.71
0.73
5.10
1.58
1.86
0.54
2.81
1.22
11.19
1.45
3.98
1.64
4.60
2.08
1400
3.55
2.51
4.27
2.32
4.34
1.31
2.71
1.03
1.50
1.30
4.31
1.34
3.67
1.32
1.84
0.87
Dactylisglom
erata
400
1.10�8
0.15
1.10�8
3.10�5
2.10�8
0.01
5.10�9
7.10�6
7.10�9
4.10e�6
7.10�9
5.10�4
0.01
0.06
0.04
0.06
500
2.10�8
1.10�3
2.10�8
3.10�8
––
9.10�9
1.10�3
2.10�8
7.10�7
1.10�8
4.10�4
0.25
0.01
0.27
0.41
600
3.35
1.25
0.32
0.43
0.44
1.02
0.079
0.077
1.10�8
2.10�4
2.10�8
6.10�4
1.53
0.55
2.66
1.49
800
7.00
1.92
7.62
2.83
––
1.34
0.52
0.19
0.12
0.88
0.45
5.56
0.97
3.97
1.03
1000
8.85
2.85
11.20
3.21
––
5.15
0.67
5.26
0.93
5.61
1.84
10.67
2.34
6.31
2.48
1200
9.62
1.00
7.33
1.57
5.27
3.12
4.29
2.14
4.30
0.44
17.45
3.78
11.14
1.81
6.59
2.91
1400
14.14
3.92
11.26
1.09
16.09
2.38
6.66
2.10
0.30
0.17
15.91
4.47
13.97
2.65
7.50
1.43
Phleum
pratense
400
2.10�8
0.02
2.10�8
4.10�6
2.10�8
0.18
6.10�9
0.04
1.10�8
4.10�4
1.10�8
3.10�4
0.12
0.14
0.07
0.08
500
4.10�8
1.10�3
0.43
0.17
––
1.10�8
5.10�3
2.10�8
8.10�6
2.10�8
0.03
0.20
0.24
0.65
0.81
600
0.95
1.77
1.24
1.31
0.58
1.17
2.10�8
3.10�5
3.10�8
1.10�5
0.17
0.34
1.57
0.28
0.24
0.21
800
2.95
0.91
0.41
0.17
––
0.84
1.34
0.80
1.37
0.94
1.39
1.91
0.86
1.53
2.25
1000
5.11
2.79
3.41
0.86
––
0.47
0.38
2.23
1.48
0.29
0.26
4.22
1.07
3.33
0.92
1200
4.60
4.81
4.43
1.03
3.26
1.26
2.56
0.84
3.18
1.21
2.24
1.68
5.58
3.82
7.34
2.64
1400
12.90
4.82
7.19
2.22
5.55
4.60
3.55
0.75
5.61
4.18
4.00
0.94
10.48
2.45
8.37
4.75
© 2013 John Wiley & Sons Ltd. Grass and Forage Science
Maturity of grass species along latitudinal and altitudinal gradients 15
Copyright © 2022 FDOKUMEN