
Education technology: exploring digital maturity in schools
114
Education technology: exploring digital maturity in schools Research report March 2022 CooperGibson Research
-
Upload
khangminh22 -
Category
Documents
-
view
1 -
download
0
Transcript of Education technology: exploring digital maturity in schools

Education technology: exploring digital maturity in schools Research report
March 2022 CooperGibson Research

2
Contents List of figures .............................................................................................................. 4
List of tables ............................................................................................................... 5
Executive summary .................................................................................................... 7
1. Introduction ....................................................................................................... 11
1.1 Exploring digital maturity in schools ................................................................ 12
1.2 Structure of this report .................................................................................... 12
2. Approach to developing a digital maturity metric ............................................... 13
2.1 Defining digital maturity .................................................................................. 13
2.2 Developing the digital maturity metric ............................................................. 16
2.3 Data preparation ............................................................................................. 17
2.4 Methodological considerations........................................................................ 17
3. Levels of digital maturity in schools ................................................................... 19
3.1 Digital maturity pillar scores ............................................................................ 19
4. Exploratory testing of the digital maturity metric ................................................ 22
4.1 Analysis methodology .................................................................................... 23
4.2 Hypotheses to be tested ................................................................................. 23
4.3 Methodological limitations ............................................................................... 23
4.4 Analysis results of primary school data ........................................................... 24
4.4.1 Analysis for Hypothesis A (KS2) .............................................................. 24
4.4.2 Exploring the strength of correlations ....................................................... 27
4.4.3 Aggregated correlations ........................................................................... 28
4.5 Exploring the digital maturity hierarchy (KS2) ................................................. 28
4.6 Analysis for Hypothesis B (KS2) – confounding variables .............................. 34
4.7 Analysis results of secondary school (KS4) data ............................................ 47
4.8 Summary of key findings ................................................................................ 49
4.8.1 Findings for primary phase data (KS2) ..................................................... 50
4.8.2 Findings for secondary phase data (KS4) ................................................ 51
5. Digital maturity tiers and characteristics of schools ........................................... 52
5.1 Digital maturity tiers ........................................................................................ 52
3
5.2 Digital maturity tiers and school characteristics ........................................... 55
6. Understanding the context of digital maturity .................................................... 57
6.1 Approach to exploring high and low digital maturity ........................................ 57
6.1.1 Sampling approach .................................................................................. 58
6.2 Progress in embedding technology in school ................................................. 59
6.3 Use of education technology .......................................................................... 61
6.4 Storage solutions ........................................................................................... 62
6.5 Education technology strategies ..................................................................... 62
6.6 Investing in education technology ................................................................... 65
6.7 Training and support ....................................................................................... 68
6.8 Success factors and barriers to use ................................................................ 69
6.8.1 Success factors ........................................................................................ 70
6.8.2 Barriers .................................................................................................... 70
6.9 Plans for further developing use of technology ............................................... 71
6.10 Perceived impact of technology use ............................................................. 72
6.10.1 Cost savings ........................................................................................... 72
6.10.2 Pupil attainment and outcomes .............................................................. 74
6.10.3 Teacher workload and well-being ........................................................... 75
7. Conclusions ...................................................................................................... 77
7.1 A digital maturity metric and schools’ progress towards digital maturity ......... 77
7.2 Exploratory testing of the digital maturity metric ............................................. 78
7.3 Key learnings for developing a digital maturity metric ..................................... 80
7.4 Future considerations ..................................................................................... 81
Appendix 1: Details of the Education Technology 2020-21 survey of schools ......... 83
Appendix 2: Digital maturity pillars, indicators (survey questions) and scoring system, .......................................................................................................................... 85
Appendix 3: Pillar data (school characteristics) ........................................................ 92
Appendix 4: Crosstabulations of digital maturity tiers and school characteristics ... 104
Appendix 5: Profile of schools involved in the qualitative interviews ...................... 109
Appendix 6: SPSS syntax to calculate pillar scores ............................................... 110

4
List of figures Figure 1: Distribution of schools’ technology pillar scores ........................................ 20
Figure 2: Distribution of schools’ capability pillar scores .......................................... 20
Figure 3: Distribution of schools’ strategy pillar scores ............................................. 21

5
List of tables Table 1: Statistics for the technology, capability and strategy pillar scores .............. 19
Table 2: DfE KS2 data – measures of pupil attainment ............................................ 24
Table 3: Correlations between KS2 attainment and digital maturity pillar data ......... 26
Table 4: Summary statistics for digital maturity pillar correlations with KS2 attainment measures ................................................................................................................. 28
Table 5: Average correlations between pillars and KS2 attainment categories ........ 28
Table 6: Thresholds for grouping digital maturity pillar scores ................................. 29
Table 7: Average KS2 attainment scores across technology pillar hierarchical groups .......................................................................................................................... 30
Table 8: Average KS2 attainment scores across capability pillar hierarchical groups .. .......................................................................................................................... 32
Table 9: Average KS2 attainment scores across strategy pillar hierarchical groups 33
Table 10: Technology pillar, KS2 attainment, and profile variable correlations ........ 35
Table 11: Capability pillar, KS2 attainment, and profile variable correlations ........... 38
Table 12: Strategy pillar, KS2 attainment, and profile variable correlations ............. 43
Table 13: Correlations between 12 KS4 attainment measures and four profiling variables and digital maturity pillar data ................................................................... 47
Table 14: Summary statistics for digital maturity pillar correlations with KS4 attainment measures and profiling data ................................................................... 49
Table 15: Schools by individual pillar rating and digital maturity tier ........................ 53
Table 16: Digital maturity tiers by school characteristics .......................................... 55
Table 17: Qualitative interview sample profile .......................................................... 59
Table 18: Responses received by survey/respondent type and school phase ......... 84
Table 19: Technology pillar relevant survey questions and scoring system ............. 85
Table 20: Capability pillar relevant survey questions and scoring system ................ 88
Table 21: Strategy pillar relevant survey questions and scoring system .................. 90
Table 22: Pillar score statistics for primary and secondary schools ......................... 92
Table 23: Pillar score statistics for types of schools ................................................. 93
Table 24: Pillar score statistics for phase and type of school ................................... 93
Table 25: Pillar score statistics across England Government Office Regions .......... 95
Table 26: Pillar score statistics across Ofsted ratings .............................................. 97
6
Table 27: Pillar score statistics across geographic type ........................................... 98
Table 28: Pillar score statistics across Free School Meal bands .............................. 99
Table 29: Pillar score statistics by school phase and size ...................................... 100
Table 30: Pillar score statistics by school trust flag ................................................ 101
Table 31: Digital maturity tiers by phase ................................................................ 104
Table 32: Digital maturity tiers by school type ........................................................ 105
Table 33: Digital maturity tiers by school phase and type ...................................... 105
Table 34: Digital maturity tiers by region ................................................................ 105
Table 35: Digital maturity tiers by Ofsted rating ...................................................... 106
Table 36: Digital maturity tiers by geographic location ........................................... 107
Table 37: Digital maturity tiers by FSM level .......................................................... 107
Table 38: Digital maturity tiers by school size relative to phase ............................. 107
Table 39: Sample profile of (high) digitally mature schools .................................... 109
Table 40: Sample profile of low digitally mature schools ........................................ 109

7
Executive summary The Education Technology Survey (EdTech) 2020-21 (published in June 2021) aimed to establish the current state and use of technology across schools in England. The Department for Education (DfE) commissioned CooperGibson Research (CGR) to conduct further exploratory research using the survey data.
The primary aim of this research was to use the Education Technology Survey 2020-21 data to establish a hierarchy of technology use in schools, as an indicator of their digital maturity. This metric was then used to investigate the relationship between digital maturity and attainment. To understand schools’ experiences of technology use in more depth, qualitative research with a small number of survey respondents was also undertaken, exploring the reasons for schools’ use of technology, and the barriers and enablers to using technology in school.
Developing a measure of digital maturity in schools The digital maturity metric was developed using a range of the Education Technology Survey 2020-21 survey questions. In discussions with the DfE, it was decided that digital maturity should encompass three key ‘pillars’: Technology, Capability and Strategy. Once survey questions were allocated to each pillar a scoring system was developed which enabled schools to accumulate scores for question responses in each pillar, therefore producing a digital maturity metric score.
Using the scoring system and data collected in November 2020, the analysis found that schools had made more progress towards digital maturity in technology and capability than strategy; schools’ average scores in terms of their strategy (mean score of 0.27) was lower than their progress in terms of technology and capability (mean scores of 0.58 and 0.62 respectively).1 These findings were supported by the qualitative research which identified that schools’ understanding of a technology strategy was quite varied, as was implementation (even for digitally mature schools).
As an overall measure of digital maturity, the analysis found that around 9% of the schools surveyed were classified as high in digitally maturity, 31% were categorised as being low and the remaining 60% were moderately digitally mature (medium category). Further analysis found that low digitally mature schools were more likely to be in rural areas, primary phase, local authority-maintained schools or with a
1 Each response in an answer scale was assigned a score (or data value) between 0 and 1. Zero was typically assigned to the lowest point on the answer scales and means ‘not at all digitally mature’. The highest point on the scale would be interpreted as ‘fully digitally mature’ and was given a score of 1.

8
‘good’ Ofsted rating. By contrast, high digitally mature schools were more likely be in urban areas, or secondary academies.
Exploratory testing of the digital maturity metric Statistical analysis explored whether there were any relationships between schools’ digital maturity pillar scores and their levels of pupil attainment. The analysis found:
• Across the three pillars (technology, capability and strategy) there were some statistically significant correlations between the digital maturity pillar scores (for primary schools) and a range of Key Stage 2 (KS2) attainment measures. To explore further any association between the pillar scores and attainment, schools’ scores were put into three tiers: high, medium and low. The average attainment measures were then calculated for the three groups and some of the differences showed statistically significant increases in attainment scores. However, as with the correlations, these differences between groups are mostly small in absolute terms so caution is needed when reviewing these findings to assess the strength of any relationship between digital maturity in schools and pupil attainment. Small correlations or minor changes in average scores do not necessarily imply a meaningful or important difference or association for attainment levels across the maturity tiers.
• The technology pillar had the lowest correlation with KS2 attainment measures and may be confounded by school profiling variables.
• There was no evidence of confounding between the capability pillar and the profiling measures used in this primary school analysis. There was also no evidence of confounding between the strategy pillar and profiling measures.
• No Key Stage 4 (KS4) attainment measures (and only one profiling indicator) had a significant correlation with any of the digital maturity pillars. This is largely because the analysis is based on just 146 secondary schools. No further conclusions have been made on the KS4 data.
Several limitations in the approach have been highlighted throughout the report, including the retrospective design of the digital maturity metric using survey questions not purposively designed as a measure of digital maturity, and the nature of attainment data (collated at a different time point to the survey data) used in the exploratory testing of the metric. As such, care should be taken in the interpretation of these findings. Further details regarding the limitations can be found in Sections 2.4 and 4.3 and the conclusions provide key learnings from this exploratory research.

9
Schools’ experiences of digital maturity Qualitative interviews were conducted with 20 schools using the high, medium and low tiers of digital maturity developed through the quantitative strand of the research to select schools. Ten digitally mature schools with “high” scores (5 primary, 5 secondary) and 10 “low” digitally mature schools (5 primary, 5 secondary) according to the matrix assessment were involved in the interviews. Key messages from the 20 telephone interviews included:
• Digitally mature schools were more likely to say they had a formal technology strategy in place with a focus on improving pupil outcomes and the meaningful use of technology in the classroom. Digitally mature and low digitally mature schools without a technology strategy were more reactive, making decisions about technology as needed.
• Digitally mature schools had been successful in embedding technology through a clear focus on how technology could be used to improve pupil outcomes. A strong leadership focus on technology, with a clear steer and direction from the senior leadership team (SLT) on technology use was important.
• Other success factors that had supported schools in becoming digitally mature included strong staff buy-in, expertise of staff (and availability of technical experts), having the capacity to know what technology is available and what has the most impact, and a strong reliable infrastructure.
• Affordability, costs, suitability of technology for the setting, accessibility for pupils and staff, and required investment in staff time and training, were all key factors that schools considered when deciding which technology to invest in.
• Where schools were deciding to invest in technology, it was due to a need to upgrade current infrastructure, widening staff and pupils’ access to technology, enhancing teacher and learning practices, increasing efficiencies of systems or as a response to the COVID-19 pandemic to support remote education.
• Most schools interviewed provided training and support to staff using various approaches including, through INSET days, staff drop-ins and CPD sessions.
• Low digitally mature schools were finding budgets and funding a challenge in being able to invest in new technology or maintain existing technology. A few low digitally mature schools thought that their staff lacked confidence to drive technology use forward in school.

10
• Technical ability, funding and concerns about the security of documents and systems were all challenges for schools that were not yet fully cloud-based.
• Schools found it difficult to comment on the impact of technology use on pupil attainment, cost savings or teacher workload. Although they were able to give some illustrative examples of impact, schools generally did not measure the impact of technology use and they found it difficult to differentiate any impacts from other practices and approaches in school.
Concluding comments In conclusion, just 9% of schools were classified as being digitally mature according to the metric and tiers developed for this exploratory research. Nearly one-third (31%) of schools have put a few fundamentals in place necessary to embed digital technology within their school (low digital maturity). The majority (60%) were somewhere in the middle in terms of their digital maturity journey. This indicates that there is some distance to go before schools are making the best use of technology available.
Furthermore, the metric developed from this survey did not provide clear evidence of the relationship between schools’ level of digital maturity and pupil attainment. Statistical analysis has identified some confounding variables, such as pupil characteristics, which are likely to have a stronger association with pupil attainment than the digital maturity pillars within the metric2. In addition, the interviews with schools identified other factors at play, such as, funding levels, senior leadership buy-in, ability to enthuse and encourage staff, and training and development. Whilst the metric used in this research has been a useful tool to assess schools’ progress towards digital maturity, there were methodological limitations and as such, further research which is specifically designed around exploring this concept and constructing a measure of digital maturity that is both valid and reliable, would ensure that digital maturity is comprehensively defined and measured.
2 See for example, DfE (2020) Key stage 4 performance, 2019 (revised) which explores the disadvantage gap in attainment; research by the Sutton Trust (Our Research - Sutton Trust) including Kirby, P. and Cullinane, C. (2016) Class differences: ethnicity and disadvantage; and Treadaway, M. (2019) How attainment gaps emerge from Foundation Stage to Key Stage 4, part one – Fisher Family Trust Education Datalab.

11
1. Introduction Education Technology (EdTech) refers to the practice of using technology to support teaching and the effective day-to-day management of education institutions. It includes hardware, software, digital resources and services that aid teaching, help meet specific needs, and support the daily running of education institutions (such as management information systems).
The use of technology in education has the potential to support reductions in teacher workload, cost savings, inclusive teaching practice and improved pupil outcomes, both within classrooms and to support remote teaching practice during emergency measures, such as COVID-19 related closures. In 2019, the Department for Education (DfE) published an Education Technology (EdTech) Strategy, Realising the potential for technology in education3. This set out DfE’s vision to support schools and colleges to embed technology effectively by helping schools to better understand the opportunities and help tackle the barriers to effective adoption and use of EdTech.
To support the EdTech Strategy and to inform future technology policy development, the DfE commissioned CooperGibson Research (CGR) to conduct research to establish the state of technology across schools in England.
A survey of primary and secondary schools was conducted between 25th November 2020 and 29th January 2021. The aim of the survey was to understand the current state of technology in schools, in order to: inform the steps government should take to helps schools embed and use technology to support cost savings, workload reductions and improved pupil outcomes; and to help the EdTech sector to understand the technology landscape of the school sector so that they can adapt and develop their tools in ways that reflect the current conditions within schools.
The Education Technology Survey 2020-21 generated a large volume of evidence across just over 1000 schools broadly representing the range of primary and secondary schools in England. A headteacher, teacher and a technical lead were encouraged to respond to the survey from each school.4
3 Realising the potential of technology in education: a strategy for education providers and the technology industry (2019). 4 The published survey report can be found here. A summary of the sample and method can be found in Appendix 1 of this report.

12
1.1 Exploring digital maturity in schools Following the Education Technology Survey 2020-21 and compilation of the report, the DfE requested that further research and analysis was undertaken to maximise the potential of the evidence that had been collated.
Three additional tasks were agreed:
1) Additional analysis to investigate the potential of developing a typology/hierarchy of schools’ use of EdTech (a digital maturity metric), drawing on the survey data that has been collected from schools.
2) Use of the developed digital maturity metric to explore the characteristics of schools with high/low digital maturity (or EdTech ‘readiness’), and to undertake an exploratory statistical analysis looking at the relationship between digital maturity and learner attainment.
3) Qualitative research with a small sample of schools to explore and understand schools’ digital maturity scores on the hierarchy/typology of digital maturity, including barriers and enablers.
This report summarises the approach and findings across all three tasks.
1.2 Structure of this report Section 2 of this report outlines how the survey data were used to develop a digital maturity metric. It explains how survey questions were grouped under three key pillars used to define digital maturity - technology, capability and strategy.
Section 3 provides a summary of schools’ digital maturity scores across the three pillars.
Section 4 explores the relationship between the digital maturity metric and pupil attainment. It examines a variety of attainment measures and potential confounding variables.
Section 5 identifies three tiers of digital maturity and schools’ characteristics within those tiers.
Section 6 provides an analysis of 20 interviews conducted with senior leaders in primary and secondary schools to further explore experiences of digital maturity across different contexts.
Section 7 gives brief concluding comments.
13
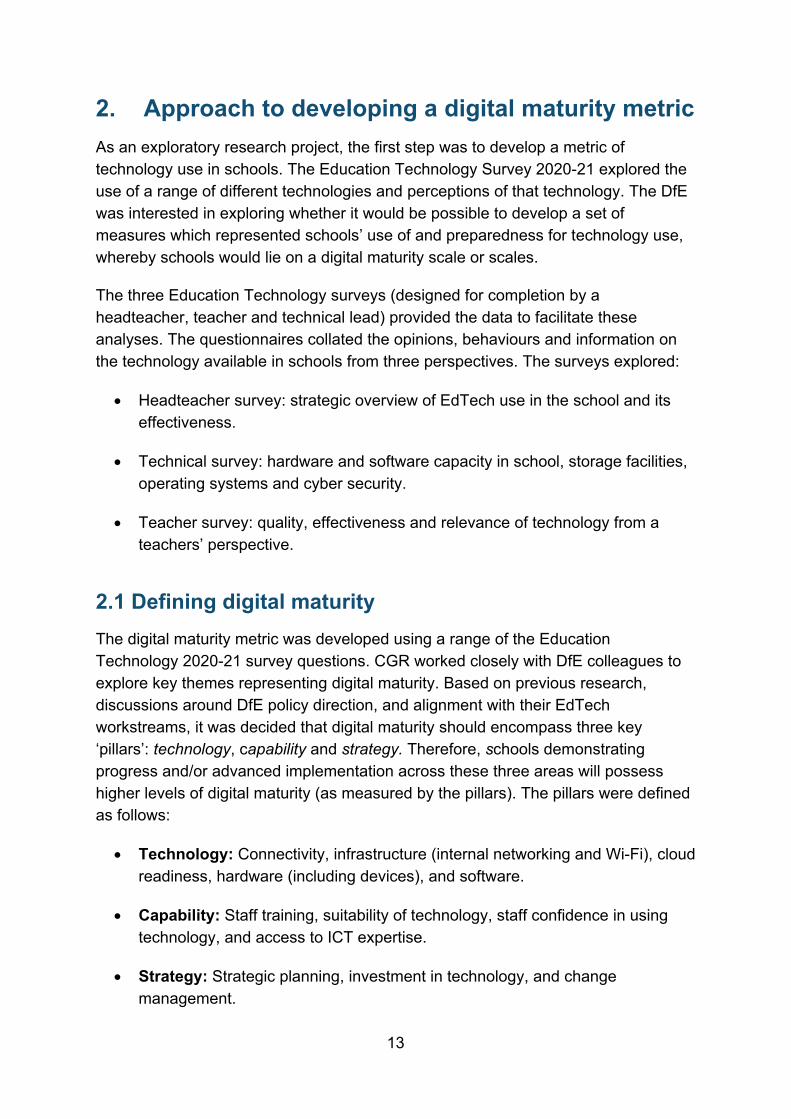
2. Approach to developing a digital maturity metric As an exploratory research project, the first step was to develop a metric of technology use in schools. The Education Technology Survey 2020-21 explored the use of a range of different technologies and perceptions of that technology. The DfE was interested in exploring whether it would be possible to develop a set of measures which represented schools’ use of and preparedness for technology use, whereby schools would lie on a digital maturity scale or scales.
The three Education Technology surveys (designed for completion by a headteacher, teacher and technical lead) provided the data to facilitate these analyses. The questionnaires collated the opinions, behaviours and information on the technology available in schools from three perspectives. The surveys explored:
• Headteacher survey: strategic overview of EdTech use in the school and its effectiveness.
• Technical survey: hardware and software capacity in school, storage facilities, operating systems and cyber security.
• Teacher survey: quality, effectiveness and relevance of technology from a teachers’ perspective.
2.1 Defining digital maturity The digital maturity metric was developed using a range of the Education Technology 2020-21 survey questions. CGR worked closely with DfE colleagues to explore key themes representing digital maturity. Based on previous research, discussions around DfE policy direction, and alignment with their EdTech workstreams, it was decided that digital maturity should encompass three key ‘pillars’: technology, capability and strategy. Therefore, schools demonstrating progress and/or advanced implementation across these three areas will possess higher levels of digital maturity (as measured by the pillars). The pillars were defined as follows:
• Technology: Connectivity, infrastructure (internal networking and Wi-Fi), cloud readiness, hardware (including devices), and software.
• Capability: Staff training, suitability of technology, staff confidence in using technology, and access to ICT expertise.
• Strategy: Strategic planning, investment in technology, and change management.

14
The process of developing a digital maturity measure involved a review of all survey questions to understand:
• Their compatibility and fit with the three pillars – whether questions were relevant to the definitions and would sit within a pillar.
• The type of question and response option – see guiding principles.
• Fit with DfE policy direction, key interests and alignment with wider research/programmes, such as the EdTech Demonstrator programme5.
• Preference of questions/topic/focus – to help streamline the selection of questions to a manageable and workable group within the three pillars.
Some guiding principles were adopted when determining which questions to use to create summary metrics for each pillar and digital maturity overall. These include:
• The metrics for each pillar include questions which are considered sources (not outcomes) of digital maturity.
Factual questions tend to be sources of digital maturity, for example, “For each of the following systems, does your school currently use on-premises or cloud systems [for data storage]?” Whereas attitudinal questions, asking for a respondent’s opinion, tend to measure the impact of digital maturity, for example, “Which of the following best expresses your views on the relationship between technology and pupil attainment in your school?” (1 – Technology has contributed negatively to pupil attainment; 2 – Technology has not contributed to pupil attainment and is not expected to do so in the future; 3 - Technology has not contributed to pupil attainment but is expected to do so in the future; or 4 – Technology has already contributed to improved pupil attainment). The differences between questions that are sources and outcomes of digital maturity can be difficult to distinguish. Sources can sometimes be thought of as a cause or root of digital maturity whereas outcomes may be seen as an effect or consequence.
• Each question within a pillar, is given equal weight or contribution to the overall score for the pillar.
Questions typically elicit responses that are ordinal and may cover the use of technology in multiple areas within a school. For example, the use of software and how it meets schools’ needs in different areas. The responses for these
5 The EdTech Demonstrator programme was developed by the Department for Education to ensure schools and colleges could access free, expert advice on educational technology from a network of 42 demonstrator schools and college.

15
questions will be scored and averaged to give an overall measure for ‘software deployment’ within the technology pillar. Additionally, each pillar will contribute equally to the overall digital maturity score.
• Any COVID-19 specific questions were not included.
These were considered outside of normal circumstances. For example, any questions in the survey about adapting or investing in technology for remote learning use, or barriers around remote technology use, were excluded. Although these were useful for understanding how schools had responded to COVID-19, they were less useful in the digital maturity metric.6
• Where questions were replicated across the surveys, one of the survey questions was selected.
This decision was based on the nature of the question and what was considered the most reliable and useful respondent. Typically, infrastructure and technical questions were drawn from the technical survey and questions relating to strategy or capability were drawn from the headteacher survey.
As a result of this process, a selection of questions (see Appendix 2) was made. As the surveys had been designed prior to this process, there were some differences in the focus/themes of questions and the definitions of pillars provided by DfE. For the purpose of this analysis, questions were selected that most closely matched the pillar definitions provided by DfE. For the purpose of the statistical analysis, digital maturity and its three component pillars were defined (using the survey questions), as:
• Technology: Connectivity, infrastructure (internal networking and Wi-Fi), use of on-premise or cloud storage, hardware (including devices), and software, threat protection, fitness for purpose of software.
• Capability: Staff training, suitability of technology to meet administration and teaching needs, staff confidence in using technology, delivery of curriculum remotely, suitable support for pupils to use accessibility features.
• Strategy: Plans for investment in technology, barriers to use of education technology, strategic planning.
The elements of each pillar were measured directly using responses to questions from the headteachers’ and technical surveys. Responses from the teachers’ survey have not been used as most of the questions relate to individual teachers and so do
6 However, it is recognised that remote learning remains an important delivery mechanism for some schools.

16
not necessarily reflect the circumstances for all teachers in the school, nor schools as an individual establishment. Details of the questions used within each pillar as indicators of digital maturity and their relative response options, are presented in Appendix 2.
2.2 Developing the digital maturity metric Once survey questions had been selected, a scoring system based on question response options needed to be developed as part of the metric. This would enable schools to accumulate scores for question responses in each pillar, therefore, producing a digital maturity pillar score. Survey questions use different response scales which in turn create various data types, such as discrete or continuous counts, binary, nominal, ordinal, ratio etc. Combing these data values builds the overall metrics or scores for each pillar.
Two approaches to scoring were discussed:
1. To count affirmative response(s) to each of the pillar questions that indicate digital maturity. This creates a ratio variable which is standardised to create a percentage score for each element of the pillar. The average (mean) of these scores is then the overall pillar score.
2. Each response in an answer scale is assigned a score (or data value) between 0 and 1. Zero is typically assigned to the lowest point on the answer scale and means ‘not at all digitally mature’. The highest point on the scale can be interpreted as ‘fully digitally mature’ and is given a score of 1 (or 100%). For ordinal scale responses the middle range replies are assigned values between 0 and 1 by making subjective interpretations of the labels used (e.g., ‘rarely’, ‘sometimes’, ‘mostly’ etc). For example, a question about software meeting the schools’ needs has response categories book-ended between, ‘Rarely meeting needs’ and ‘Always meeting needs’. Each response option might be coded as: ‘Not using software’ (0), ‘Rarely meeting needs’ (0.25), ‘Sometimes meeting needs’ (0.5), ‘Mostly meeting needs’ (0.75), and ‘Always meeting needs’ (1).
The second of these methodologies was preferred by the DfE, to be consistent with DfE’s approach to scoring for the EdTech Demonstrator Programme evaluation (also being conducted by the Department).
Based on the approach described in point 2 above, response options on all questions were given a score between 0 and 1. The optimal ‘digitally mature’ response was given a value of 1 and the least ‘digitally mature’ response, a value of zero. Middle values on the answer scale were given scores that were equally spaced

17
between 0 and 1. DfE were keen to include scores within the 0 and 1 scale to show a level of progress to digital maturity (as illustrated in point 2 above).
2.3 Data preparation The Education Technology Survey 2020-21 data (as detailed in Appendix 1), formed three datafiles (headteachers, teachers and technical leads) as the surveys were administered separately. These datasets were matched and combined using the school Unique Reference Number (URN), to provide one source dataset.
A total of 654 schools were included in the analysis and this data was weighted to the same specifications as used in the survey (see Appendix 1).
2.4 Methodological considerations In designing the methodology to develop a digital maturity metric, the following considerations must be borne in mind:
• Measures for each pillar have been developed post survey fieldwork and the elements of each pillar can of course only be measured from existing survey questions. It is reasonable to assume that had a definition been prescribed and the pillars been defined prior to fieldwork, additional questions (or different questions) may have been asked to determine the overall metric for schools and each pillar.
• There is an element of subjectivity in designing the digital maturity metric – in terms of questions/indicators selected and the scoring system adopted. For instance, an approach involving a scoring continuum for each question (0 through to 1) provides the opportunity for schools to accumulate some scores where they may not be fully digitally mature, or their approach may be underdeveloped. In the example provided in section 2.2 (point 2), schools are attributed a score of 0.25 when they have said that technology is ‘Rarely meeting needs’. The definition of rarely meeting needs and its relative scoring is open to interpretation.
• As an exploratory piece of research, and to align with the EdTech Demonstrator programme, each question within a pillar and each pillar within the digital maturity metric was given equal weighting. If the project was to be replicated, differential weighting might be considered.
• Schools were asked to opt-in to the survey process and to nominate staff to take part in each of the three surveys. The findings, therefore, may be subject

18
to self-selection bias. For example, schools which were more advanced users of educational technology or were more supportive and positive about the use of education technology may have been more likely to respond to the survey. This may have implications for interpretation of the digital maturity metric since it is based on the survey sample and responses.

19
3. Levels of digital maturity in schools Based on the approach described in Section 2, schools’ responses to selected survey questions for each of the three pillars - technology, capability and strategy - were given a score between 0 (least ‘digitally mature’ response) and 1 (optimal ‘digitally mature’ response). This section provides a summary of schools’ digital maturity scores for each of the three pillars, and as an overall measure. Further details regarding school classifications across the pillar scores are provided in Appendix 37.
3.1 Digital maturity pillar scores Table 1 shows the summary average and distributional statistics for the three pillars. The averages (both mean and median) for the three pillars are very similar. Technology and capability both have mean scores of approximately 0.6, indicating that in general, schools have made a similar amount of progress (as measured by this methodology) towards digital maturity in these two pillars. The average for strategy is lower, just below 0.3, indicating that schools in general, have made less progress towards digital maturity in this aspect of technology use. The spread of scores is widest for the strategy pillar, with a little more variability in school scores in the capability pillar than in the technology pillar.
Table 1: Statistics for the technology, capability and strategy pillar scores
Overall Technology pillar Capability pillar Strategy pillar
Mean 0.58 0.62 0.27
Standard deviation 0.13 0.14 0.18
Range 0.82 0.76 0.89
Minimum 0.08 0.24 0.00
10th percentile 0.41 0.42 0.00
Lower quartile 0.51 0.52 0.17
Median 0.59 0.62 0.28
Upper quartile 0.67 0.72 0.39
90th percentile 0.73 0.82 0.50
Maximum 0.90 1.00 0.89
Number of schools 654 654 654
7 The source for all analysis presented in tables and charts is the Education Technology Survey 2020-21.

20
Distribution of scores for the three digital maturity pillars are shown in Figures 1, 2 and 3. Scores closer to zero, the lowest score on the scale, indicate lower digital maturity in a school, whilst scores nearer to 1 indicate higher digital maturity. The figures in the bar charts represent the percentage of schools in each score grouping.
Three-quarters (77%) of schools have a technology pillar score between 0.5 and 0.8. No schools achieved the highest (i.e., maximum) score on the technology pillar.
Figure 1: Distribution of schools’ technology pillar scores
Figure 2: Distribution of schools’ capability pillar scores
0% 0% 0% 2%6%
12%
29%
34%
14%
3%0%
0
10
20
30
40
Perc
enta
ge o
f sch
ool s
core
s
Distribution of school technology pillar scores
0% 0% 0% 1%4%
15%
25% 26%
17%
10%
3%
0
10
20
30
40
Perc
enta
ge o
f sch
ool s
core
s
Distribution of school capability pillar scores

21
Approximately two-thirds (65%) of schools have a capability pillar score between 0.5 and 0.8. No school achieved the highest (i.e., maximum) score on the capability pillar.
The distribution of scores for strategy is quite different to that of the technology and capability pillars. Higher proportions of schools have achieved lower scores. Fourteen percent of schools have a score of zero on the strategy pillar and 71% of schools have a score under 0.5.
Figure 3: Distribution of schools’ strategy pillar scores
The statistics in Table 1 above are reported by school characteristics in Appendix 3 of the report.
14%
0%
22%
10%
25%
16%
7%4%
1% 0% 0%0
10
20
30
40
Perc
enta
ge o
f sch
ool s
core
s
Distribution of school strategy pillar scores

22
4. Exploratory testing of the digital maturity metric The first phase of this research established three pillars which together summarise a measure of the construct ‘digital maturity’ for schools. The three pillars, technology, capability and strategy and, how they are defined, are discussed at length in the methodology section (Section 2). The distribution of digital maturity scores for the three pillars is provided in Section 3.
The second phase of the project was to undertake an exploratory analysis to examine whether there was a statistical relationship between the three digital maturity pillars and various measures of pupil attainment in schools. The DfE provided attainment data for the purposes of these analyses. Data from the 2017/18 and 2018/19 academic years were the two most recent years where attainment data was available and the closest to the survey fieldwork period (25th November 2020 to 29th January 2021). DfE also provided measures about schools which provide a socio-economic profile of the pupil population within each school. This included, for example, data about the number of pupils eligible for free school meals (FSM), the number of disadvantaged pupils on roll8, or the number of pupils for whom English is a second language. Throughout this report these measures in the data are referred to as profiling variables or profiling data.
There are three typologies of variables in the data which are used for analysis: (i) the three pillar metrics; (ii) school attainment measures provided by DfE9; and lastly, (iii) the school profiling variables (including four prior attainment variables10).
The aim of this analysis phase was to better understand what, if any, correlation exists between each of the digital maturity pillars and the attainment measures, whilst recognising that there were limitations with both the design of the metric (Section 2.4) and the attainment data used in the analysis (Section 4.3). In other words, where there is significant correlation there is a relationship between the level of a school’s digital maturity and the attainment level of the school’s pupils. Furthermore, where pillar and attainment measures were correlated, additional analyses checked whether this association between pillars and attainment was not confounded with the correlation between the pillars and profiling data (in other words, the association between a pillar and attainment is spurious and that the observed association/correlation with attainment actually stems from profiling variables).
8 Pupils are defined as disadvantaged if they are known to have been eligible for free school meals in the past six years, if they are recorded as having been looked after (LA care) for at least one day or if they are recorded as having been adopted from care. 9 12 attainment measures for KS2 and 16 for KS4 were provided. 10 Prior attainment levels are KS1 measures for primary schools and KS2 measures for secondary schools.

23
4.1 Analysis methodology As this research has not been conducted previously, the statistical analyses used were exploratory and based initially on correlation analysis; then, depending on the magnitude of the correlations between the pillars and attainment metrics, these were followed by regression analyses. The proposed approach for linear regression was to model the data using different attainment metrics as the dependent variables and use the pillar measures, alongside some profiling variables, as the independent variables.11
Attainment measures are different for Key Stage 2 (KS2) and Key Stage 4 (KS4), and consequently separate analyses were conducted for primary and secondary school data. The analyses were based on data from 508 primary and 146 secondary schools. It should be noted that the smaller sample size for secondary schools does limit the capacity to detect statistically significant correlations between attainment and the digital maturity pillars.
The analysis was weighted to ensure that the samples used were representative of the population of all schools. The data was weighted to the same specifications as used in the survey (see Appendix 1).12
4.2 Hypotheses to be tested The analyses presented in this report has tested two hypotheses:
A. Is there a link between a school’s digital maturity (as measured by each school’s three pillar scores) and the attainment levels of their pupils (measured using DfE supplied data)?
B. Where significant correlation exists between the digital maturity pillars and pupil attainment measures, is there higher correlation between the pillars and profiling measures that may confound the digital maturity/attainment association?
4.3 Methodological limitations When considering the findings of the statistical analysis exploring the relationship between schools’ digital maturity pillar scores and pupil attainment, a number of
11 A causal relationship between two variables is often described as the way in which the independent variable affects the dependent variable. 12 Sources of data used for this analysis were Education Technology Survey 2020-21 and DfE supplied attainment data.

24
methodological limitations should be considered (see Section 2.4 and the limitations highlighted in the following paragraph).
There is an unknown ‘lag factor’ in all the analyses of the digital maturity pillar scores and pupil attainment in 2017/18 and 2018/19 which may cloud any relationship between the digital maturity construct and attainment measures. The survey data provides a snapshot of digital maturity (as measured by the pillar scores), but it is unclear how long each school has been at that level of digital maturity. There may also be an effect of the COVID-19 pandemic which has led to schools having to increase their digital capacity at an accelerated rate. Assuming there is a delayed impact between a school’s level of digital maturity and its consequential impact on pupil attainment, the analyses conducted will not be able to control for this unknown time lag which will inevitably vary across schools.
There is an unknown amount of ‘measurement error13’ in all survey-based measures and this will be present in the digital maturity pillar scores and may dilute the magnitude of the correlations between the pillars and attainment data. This is further explained in the methodology section (Section 2).
4.4 Analysis results of primary school data
4.4.1 Analysis for Hypothesis A (KS2)
The DfE provided data with 12 measures of attainment for primary schools, which are listed in Table 2.
Table 2: DfE KS2 data – measures of pupil attainment
DfE variable name Variable description
ptmat_exp_KS2 Percentage of pupils reaching the expected standard in maths – 2019
mat_average_KS2 Average scaled score in maths – 2019
matprog_KS2 Maths progress measure – 2019
ptmat_exp_KS2_2018 Percentage of pupils reaching the expected standard in maths – 2018
mat_average_KS2_2018 Average scaled score in maths – 2018
matprog_KS2_2018 Maths progress measure – 2018
13 Each pillar represents a construct, which is measured by the metric created using survey data. Inevitably the metrics have some imprecision in their measurement as the analysis uses observed data to measure a latent construct.

25
DfE variable name Variable description
ptread_exp_KS2 Percentage of pupils reaching the expected standard in reading – 2019
read_average_KS2 Average scaled score in reading – 2019
readprog_KS2 Reading progress measure – 2019
ptread_exp_KS2_2018 Percentage of pupils reaching the expected standard in reading – 2018
read_average_KS2_2018 Average scaled score in reading – 2018
readprog_KS2_2018 Reading progress measure – 2018
Table 3 shows the correlation between each of the 12 KS2 attainment measures and the three pillars (i.e., 36 correlations).
Interpreting the analysis results
Correlation explores the ‘linear association’ between two measurements (or quantities) and the measure is called the correlation coefficient and is scored on a scale between – 1 to +1:
• Positive correlation: a correlation of 1 indicates that two measures are ‘perfectly’ correlated and an increase in one of the measures will result in a commensurate increase in the other.
• Negative correlation: Two quantities can be negatively correlated, and negative correlation implies that as one measure increase the other decreases.
• No correlation: Correlation values close to zero imply that the two quantities are uncorrelated and therefore have no linear association.
These measures are very rarely precisely related or have a perfect correlation of 1 or -1. Correlation coefficients somewhere between -1 and 1 are the norm in data analysis and these indicate ‘imperfect’ correlation between two measures. Correlations with a value in between (-1 and 1) are interpreted subjectively depending on the nature of the data being analysed. Knowledge of the data being correlated informs how their correlations will be described, for example, as ‘strong’ or ‘weak’ correlation.
The actual correlations between each digital maturity pillar and attainment scores across all schools are unknown, but are estimated, from the combined survey and

26
schools’ attainment data, by the statistics in Table 3. Prior to analysing the data, the initial hypothesis is that across all primary schools the correlation between each pillar and attainment measure is zero (called the null hypothesis). The larger (than zero) the correlations are, the more the initial hypotheses of ‘no correlation’ is questionable and indicates that there is evidence of some correlation between a particular digital maturity pillar and attainment score across all primary schools (see Table 3).
For the sample of 508 primary schools, each of the 36 correlations in Table 3 have been tested to identify correlations that are significantly different from zero. In conclusion, all correlations of at least 0.09 in magnitude are significantly different from zero.
Table 3: Correlations between KS2 attainment and digital maturity pillar data
Variable name and attainment measure description (* Denotes statistical
significance) Technology Capability Strategy
ATTAIN_ptmat_exp_KS2 Percentage of pupils reaching the expected standard in maths – 2019
0.07 0.19* 0.11*
ATTAIN_mat_average_KS2 Average scaled score in maths – 2019
0.06 0.17* 0.08
ATTAIN_matprog_KS2 Maths progress measure – 2019
0.07 0.11* 0.14*
ATTAIN_ptmat_exp_KS2_2018 Percentage of pupils reaching the expected standard in maths – 2018
0.03 0.13* 0.14*
ATTAIN_mat_average_KS2_2018 Average scaled score in maths – 2018
0.09* 0.16* 0.12*
ATTAIN_matprog_KS2_2018 Maths progress measure – 2018
0.05 0.12* 0.17*
ATTAIN_ptread_exp_KS2 Percentage of pupils reaching the expected standard in reading – 2019
0.01 0.18* 0.09*
ATTAIN_read_average_KS2 Average scaled score in reading – 2019
0.01 0.22* 0.05
ATTAIN_readprog_KS2 Reading progress measure – 2019
0.04 0.16* 0.14*

27
Variable name and attainment measure description (* Denotes statistical
significance) Technology Capability Strategy
ATTAIN_ptread_exp_KS2_2018 Percentage of pupils reaching the expected standard in reading – 2018
-0.02 0.12* 0.07
ATTAIN_read_average_KS2_2018 Average scaled score in reading – 2018
0.00 0.10* 0.04
ATTAIN_readprog_KS2_2018 Reading progress measure – 2018
-0.05 0.08 0.07
Around half (19/36) of the correlations in Table 3 are therefore significant, suggesting there is some association between a school’s digital maturity pillar score and some of their pupil’s attainment metrics.
Whilst there are many statistically significant correlations in Table 3, caution is advised when interpreting these correlations because statistical significance does not necessarily imply a meaningful, workable, or impactful level of association between digital maturity and attainment.
4.4.2 Exploring the strength of correlations
When considering correlation as a building block for regression analyses, correlations observed in the data, above 0.09 but with a highest of 0.22, are very weak and too small to build robust regression models even if the correlations are statistically significant. The r2 (or model fit) for regression models based on these attainment correlations are less than 5%, meaning that only a very small amount of the variation across school attainment levels can be explained by, or attributed to, digital maturity14. The magnitude of these correlations, summarised in Table 4, confirms that the pillar and attainment correlations are too weak to provide meaningful regression insights.
14 In the context of these data, to enable regression analysis to provide meaningful analysis, it is reasonable to expect an r2 of at least 0.4 and, for this to be observed, correlations between the digital maturity pillars and attainment would need to be at least 0.6. None of the correlations in Table 4 are close to 0.6 in magnitude and, as a result, the magnitude of correlations between pillars and attainment are too small for regression to provide robust insights into the relationship between digital maturity and attainment

28
4.4.3 Aggregated correlations
Table 4: Summary statistics for digital maturity pillar correlations with KS2 attainment measures
Summary statistics Technology Capability Strategy
Minimum correlation -0.05 0.08 0.04
Maximum correlation 0.09 0.22 0.17
Average (magnitude) of correlations 0.04 0.15 0.10
Percentage of attainment/pillar correlations that are significant
8% 92% 58%
Table 4 shows summary statistics for the correlations in Table 3. Overall, more than half (19/36) of the 36 correlation measures in Table 3 are significantly different from zero. However, for the technology pillar, only 8% of the correlations are significant whilst the corresponding figures for capability and strategy are 92% and 58%.
As noted in Table 4, the technology pillar has significant correlations with the fewest attainment measures. The KS2 attainment measures broadly cover two areas: six measures each for progress/attainment in reading and progress/attainment in maths. The attainment scores across these two areas are averaged in Table 5. This shows that each digital maturity pillar correlates with different categories of attainment: Capability with both maths and reading; and Strategy with maths.
Table 5: Average correlations between pillars and KS2 attainment categories
Category Technology Capability Strategy
Maths 0.06 0.15 0.13
Reading 0.02 0.14 0.08
4.5 Exploring the digital maturity hierarchy (KS2) The impact of pillar scores was evaluated by grouping the scores together into three categories – low, medium, and high (in digital maturity) – to assess their impact on attainment. This placed each school into one of the three groupings for each digital maturity pillar. The thresholds for the three groupings are subjective. The approach used is rationalised by the following discussion.
• All three pillar scores are between 0 and 1 for all schools. A score of zero means the school is not digitally mature for that pillar, having none of the

29
requisite measures in place. Similarly, a score of 1 means a school has answered optimally to all questions and has all measures in place to demonstrate their digital maturity on a pillar.
• A pillar score of 0.75 or more suggests questionnaire responses from a school for the pillar questions are typically either the highest or second highest option on the ordinal response scales. Similarly, the threshold for either of the bottom two responses is 0.4.
Interpretation of these group thresholds in this way classifies the high group as demonstrating being digitally mature and similarly, schools in the lowest group do not demonstrate digital maturity. Schools in the middle group are somewhere in between.
The group thresholds vary slightly across the pillars depending on the scoring system for the questions used within each pillar – the defined boundaries for each are in the Table 6. The three categories are labelled, Low, Medium, and High.
• Low: Answers mostly lowest two categories on answer scale – i.e., not digitally mature.
• Medium: Answers mostly in middle of scale – low to moderate digital maturity.
• High: Answers mostly highest two categories on scale – high or complete digital maturity.15
Table 6: Thresholds for grouping digital maturity pillar scores16
Pillar Low Medium High
Technology 0 to 0.33 0.33+ to 0.70 0.70+ to 1
Capability 0 to 0.40 0.40+ to 0.75 0.75+ to 1
Strategy 0 to 0.17 0.17+-0.50 0.50+ to 1
For attainment measures that are correlated with the technology pillar, the mean attainment scores are expected to be higher in the medium and high categories, than
15 These pillar groupings were later used to select schools for the qualitative interviews. 16 The thresholds for the groupings vary slightly across the pillars. This reflects the different answer scales used across questions within each pillar. Some questions are binary, others have three, four or more response options. The DfE assigned weighting for these responses and this differed for each question (depending on the number of response options). Figures shown to two decimal places only.

30
the bottom group (see Table 7). This is similar for capability pillar groups in Table 8.17
Table 7: Average KS2 attainment scores across technology pillar hierarchical groups
Attainment measure Low (20) Medium (402) High (86)
Percentage of pupils reaching the expected standard in maths – 2019
75 80 79
Average scaled score in maths – 2019 104 105 105
Maths progress measure – 2019 -1 0 0
Percentage of pupils reaching the expected standard in maths – 2018
75 78 78
Average scaled score in maths – 2018 103 104 105
Maths progress measure – 2018 -1 0 0
Percentage of pupils reaching the expected standard in reading – 2019
74 76 75
Average scaled score in reading – 2019 104 105 104
Reading progress measure – 2019 0.2 0.2 0.3
Percentage of pupils reaching the expected standard in reading – 2018
75 79 77
Average scaled score in reading – 2018 104 106 105
Reading progress measure – 2018 0.1 0.5 0.1 The absence of significant differences in Table 7 between the medium and high technology pillar groups and their average KS2 attainment scores, reinforces the finding of low correlation between this pillar and attainment metrics seen in Table 3. Significance testing has compared means in the top two groups (medium and high digital maturity) because of their larger sample sizes. Some of the absolute differences between means are small, even though they are statistically significant. A note of caution is therefore, advised. As mentioned previously, statistically significant differences do not necessarily mean the differences are meaningful.
17 For there to be a correlation then you would normally expect higher attainment scores in the High category compared to Low or Medium categories. However, this may not be the case where there is a small sample size.

31
Where significant correlation exists between KS2 attainment and the digital maturity pillars, Tables 7, 8 and 9 show significant differences (in mean scores) across at least two of the three digital maturity categories.
Table 8 indicates that most of the significant differences between the top two groups (marked with a ⱽ) are in attainment scores for maths and reading. This is consistent with the findings from the correlation analysis. Significant differences are shown predominantly when comparing with the 2018/19 data rather than 2017/18 attainment. The fact that most significant differences are for progress scores (controlling for prior attainment) and within the capability pillar (which amongst the pillars is expected to measure teacher know-how and use of technology in the lessons) suggests a potential link between this digital maturity pillar and some measures of pupil attainment. There are two caveats with this finding, however: as discussed statistically significant differences do not necessarily provide evidence of educationally meaningful differentiation; secondly, the differences may be the result of confounding with school profile characteristics, which are discussed in the next section (see Section 4.6).

32
Table 8: Average KS2 attainment scores across capability pillar hierarchical groups
Attainment measure Low (30) Medium (379) High (99)
Percentage of pupils reaching the expected standard in maths – 2019
73.7 79.3 83.0ⱽ
Average scaled score in maths – 2019 103.5 104.9 105.7ⱽ
Maths progress measure – 2019 -0.8 -0.2 0.5ⱽ
Percentage of pupils reaching the expected standard in maths – 2018
72.0 77.7 79.2
Average scaled score in maths – 2018 103.4 104.4 105.1ⱽ
Maths progress measure – 2018 -1.0 0.1 0.5
Percentage of pupils reaching the expected standard in reading – 2019
70.3 74.8 79.4ⱽ
Average scaled score in reading – 2019
103.1 104.5 105.6ⱽ
Reading progress measure – 2019 -0.5 0.1 0.9ⱽ
Percentage of pupils reaching the expected standard in reading – 2018
72.2 78.3 79.1
Average scaled score in reading – 2018
104.4 105.4 105.7
Reading progress measure – 2018 -0.8 0.5 0.5 For attainment measures that are correlated with the strategy pillar, the mean KS2 attainment scores are expected to be lowest in the bottom and middle digitally mature categories (see Table 9).
Table 9 shows significantly higher scores in the middle group compared with the lowest group (marked with a ⱽ). This is in part because most schools are classified in the bottom two hierarchical groups on this strategy pillar. The lower and middle groups are the two largest for the strategy pillar and so most significant differences occur when comparing these two groups. Schools in the lowest group have significantly lower scores in four of the KS2 maths attainment scores and three KS2 reading measures, than schools in the middle band.

33
Table 9: Average KS2 attainment scores across strategy pillar hierarchical groups
Attainment measure Low (201) Medium (239) High (68)
Percentage of pupils reaching the expected standard in maths – 2019
77.5ⱽ 81.0 81.4
Average scaled score in maths – 2019
104.6 105.1 105.2
Maths progress measure – 2019 -0.4 0.0 0.8
Percentage of pupils reaching the expected standard in maths – 2018
75.4ⱽ 78.5 80.9
Average scaled score in maths – 2018
104.0ⱽ 104.6 105.0
Maths progress measure – 2018 -0.3ⱽ 0.2 0.9
Percentage of pupils reaching the expected standard in reading – 2019
73.5ⱽ 76.8 76.4
Average scaled score in reading – 2019
104.3ⱽ 104.9 104.5
Reading progress measure – 2019 -0.2ⱽ 0.3 0.7
Percentage of pupils reaching the expected standard in reading – 2018
77.0 78.7 79.3
Average scaled score in reading – 2018
105.2 105.5 105.7
Reading progress measure – 2018 0.2 0.4 0.9
34
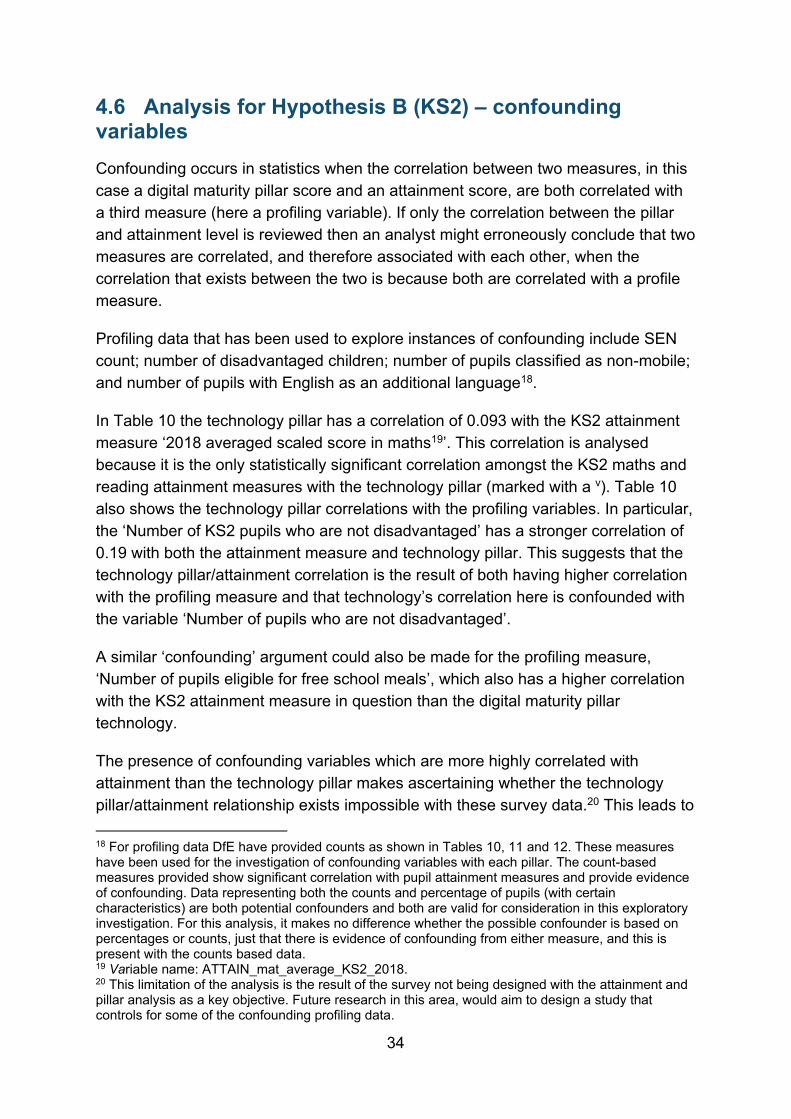
4.6 Analysis for Hypothesis B (KS2) – confounding variables Confounding occurs in statistics when the correlation between two measures, in this case a digital maturity pillar score and an attainment score, are both correlated with a third measure (here a profiling variable). If only the correlation between the pillar and attainment level is reviewed then an analyst might erroneously conclude that two measures are correlated, and therefore associated with each other, when the correlation that exists between the two is because both are correlated with a profile measure.
Profiling data that has been used to explore instances of confounding include SEN count; number of disadvantaged children; number of pupils classified as non-mobile; and number of pupils with English as an additional language18.
In Table 10 the technology pillar has a correlation of 0.093 with the KS2 attainment measure ‘2018 averaged scaled score in maths19’. This correlation is analysed because it is the only statistically significant correlation amongst the KS2 maths and reading attainment measures with the technology pillar (marked with a ⱽ). Table 10 also shows the technology pillar correlations with the profiling variables. In particular, the ‘Number of KS2 pupils who are not disadvantaged’ has a stronger correlation of 0.19 with both the attainment measure and technology pillar. This suggests that the technology pillar/attainment correlation is the result of both having higher correlation with the profiling measure and that technology’s correlation here is confounded with the variable ‘Number of pupils who are not disadvantaged’.
A similar ‘confounding’ argument could also be made for the profiling measure, ‘Number of pupils eligible for free school meals’, which also has a higher correlation with the KS2 attainment measure in question than the digital maturity pillar technology.
The presence of confounding variables which are more highly correlated with attainment than the technology pillar makes ascertaining whether the technology pillar/attainment relationship exists impossible with these survey data.20 This leads to
18 For profiling data DfE have provided counts as shown in Tables 10, 11 and 12. These measures have been used for the investigation of confounding variables with each pillar. The count-based measures provided show significant correlation with pupil attainment measures and provide evidence of confounding. Data representing both the counts and percentage of pupils (with certain characteristics) are both potential confounders and both are valid for consideration in this exploratory investigation. For this analysis, it makes no difference whether the possible confounder is based on percentages or counts, just that there is evidence of confounding from either measure, and this is present with the counts based data. 19 Variable name: ATTAIN_mat_average_KS2_2018. 20 This limitation of the analysis is the result of the survey not being designed with the attainment and pillar analysis as a key objective. Future research in this area, would aim to design a study that controls for some of the confounding profiling data.

35
the conclusion that there is no evidence of meaningful correlation between the technology pillar and any of the KS2 attainment measures.
Table 10: Technology pillar, KS2 attainment, and profile variable correlations
Pillars & profiling variables
ATTAIN_mat_average_KS2_2018 Average scaled score in maths –
2018
Technology
TECH_PILLAR 0.093 ⱽ * 1.00
CAPABILITY_PILLAR 0.16* 0.01
STRATEGY_PILLAR 0.12* 0.16*
tsenelse_Census Number of SEN pupils with an EHC plan – 2019
-0.12* 0.08
tsenelk_Census Number of eligible pupils with SEN support – 2019
-0.10* 0.07
numeal_Census No. pupils where English not first language – 2019
0.02 0.07
numengfl_Census No. pupils with English first language – 2019
0.03 0.12*
numfsm_Census No. pupils eligible for free school meals – 2019
-0.20* 0.06
numfsmever_Census Number of pupils eligible for FSM at any time during the past 6 years – 2019
-0.18* 0.06
tfsm6cla1a_KS2 Number of key stage 2 disadvantaged pupils (those who were eligible for free school meals in last 6 years or are looked after by the LA for a day or more or who have been adopted from care) – 2019
-0.12* 0.05
t_not_fsm6cla1a_KS2 Number of key stage 2 pupils who are not disadvantaged – 2019
0.186 ⱽ* 0.193 ⱽ*
tealgrp2_KS2 Number of eligible pupils with English as additional language (EAL) – 2019
0.05 0.06
tmobn_KS2 Number of eligible pupils classified as non-mobile – 2019
0.10* 0.17*

36
Pillars & profiling variables
ATTAIN_mat_average_KS2_2018 Average scaled score in maths –
2018
Technology
tsenelk_KS2 Number of eligible pupils with SEN support – 2019
-0.06 0.07
tsenele_KS2 Number of eligible pupils with EHC plan – 2019
-0.08 0.05
tealgrp2_KS2_2018 Number of eligible pupils with English as additional language (EAL) – 2018
0.04 0.08
tmobn_KS2_2018 Number of eligible pupils classified as non-mobile – 2018
0.09* 0.16*
ATTAIN_tks1average_KS2 Cohort level key stage 1 average points score – 2019
0.33 0.05
ATTAIN_tks1group_l_KS2 Number of pupils in cohort with low KS1 attainment – 2019
-0.16* 0.07
ATTAIN_tks1group_m_KS2 Number of pupils in cohort with medium KS1 attainment – 2019
0.02 0.15*
ATTAIN_tks1group_h_KS2 Number of pupils in cohort high KS1 attainment – 2019
0.21* 0.00
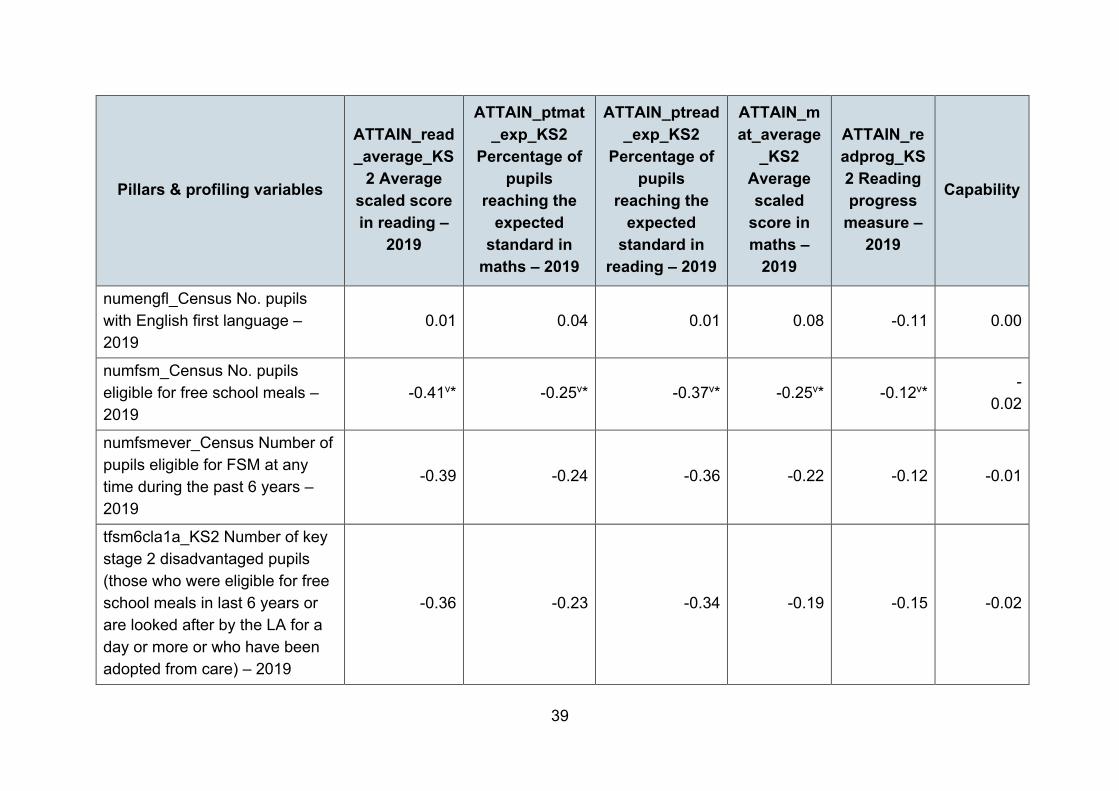
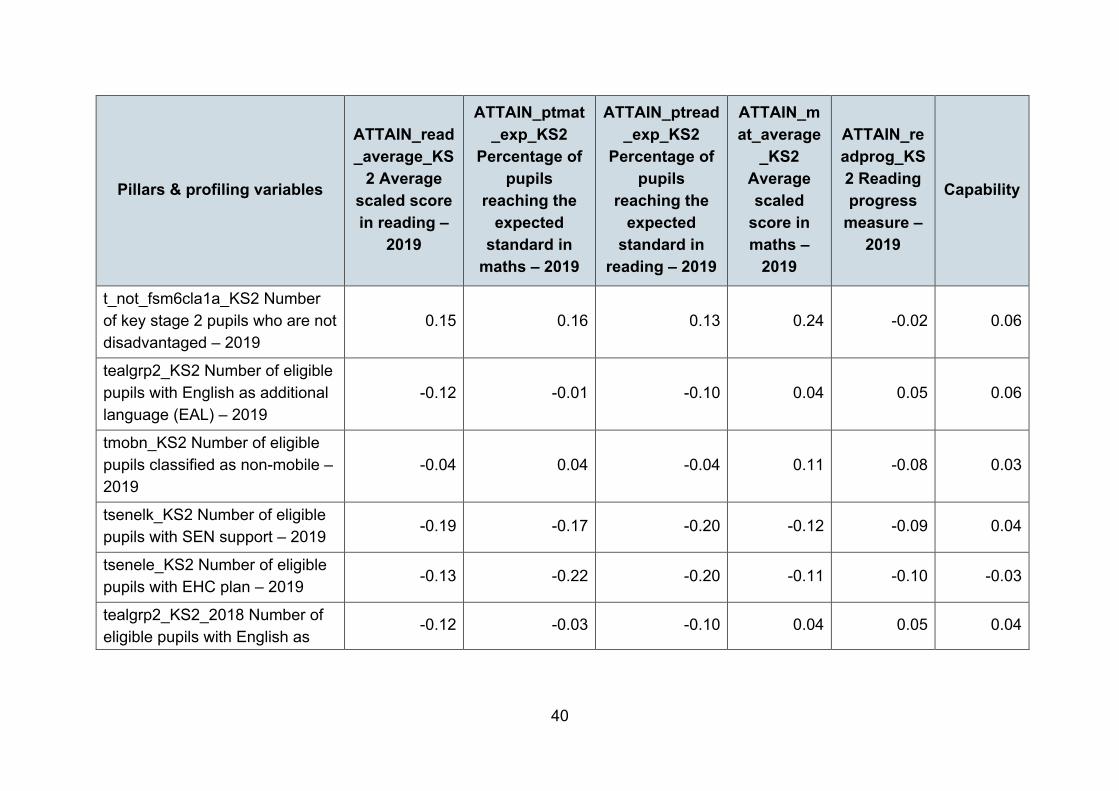
Table 11 shows the correlation between the digital maturity capability pillar, selected KS2 attainment scores21, profiling measures and prior attainment metrics. In contrast (to the technology pillar), the profiling variables have much smaller correlations with capability and hence, there is no evidence of confounding between capability and profiling variables. As a result, the correlation between digital maturity capability and attainment, and the profiling variable ‘Number of pupils eligible for free school meals’ and attainment are both significant and can be interpreted as being independent of each other. Although there is no confounding between capability and the free school meals variable, and both have a relationship with attainment, the free school meals correlation is so much higher than for capability. Whilst there is no evidence here of confounding between school profiling measures and this pillar, absence of evidence does not provide evidence of absence, and other factors not measured in this data
21 The largest five significant correlations between capability and attainment have been included in the table.

37
(for example teacher level data) may underpin any underlying relationship with capability and pupil attainment measures.

38
Table 11: Capability pillar, KS2 attainment, and profile variable correlations
Pillars & profiling variables
ATTAIN_read_average_KS
2 Average scaled score in reading –
2019
ATTAIN_ptmat_exp_KS2
Percentage of pupils
reaching the expected
standard in maths – 2019
ATTAIN_ptread_exp_KS2
Percentage of pupils
reaching the expected
standard in reading – 2019
ATTAIN_mat_average
_KS2 Average scaled
score in maths –
2019
ATTAIN_readprog_KS2 Reading progress
measure – 2019
Capability
TECH_PILLAR 0.01 0.07 0.01 0.06 0.04 0.01
CAPABILITY_PILLAR 0.22ⱽ* 0.19ⱽ* 0.18ⱽ* 0.17ⱽ* 0.16ⱽ* 1.00
STRATEGY_PILLAR 0.05 0.11 0.09 0.08 0.14 0.26
tsenelse_Census Number of SEN pupils with an EHC plan – 2019
-0.16 -0.18 -0.21 -0.10 -0.13 -0.03
tsenelk_Census Number of eligible pupils with SEN support – 2019
-0.24 -0.15 -0.22 -0.11 -0.10 0.05
numeal_Census No. pupils where English not first language – 2019
-0.14 -0.03 -0.12 0.02 0.06 0.04
39
Pillars & profiling variables
ATTAIN_read_average_KS
2 Average scaled score in reading –
2019
ATTAIN_ptmat_exp_KS2
Percentage of pupils
reaching the expected
standard in maths – 2019
ATTAIN_ptread_exp_KS2
Percentage of pupils
reaching the expected
standard in reading – 2019
ATTAIN_mat_average
_KS2 Average scaled
score in maths –
2019
ATTAIN_readprog_KS2 Reading progress
measure – 2019
Capability
numengfl_Census No. pupils with English first language – 2019
0.01 0.04 0.01 0.08 -0.11 0.00
numfsm_Census No. pupils eligible for free school meals – 2019
-0.41ⱽ* -0.25ⱽ* -0.37ⱽ* -0.25ⱽ* -0.12ⱽ* -
0.02
numfsmever_Census Number of pupils eligible for FSM at any time during the past 6 years – 2019
-0.39 -0.24 -0.36 -0.22 -0.12 -0.01
tfsm6cla1a_KS2 Number of key stage 2 disadvantaged pupils (those who were eligible for free school meals in last 6 years or are looked after by the LA for a day or more or who have been adopted from care) – 2019
-0.36 -0.23 -0.34 -0.19 -0.15 -0.02
40
Pillars & profiling variables
ATTAIN_read_average_KS
2 Average scaled score in reading –
2019
ATTAIN_ptmat_exp_KS2
Percentage of pupils
reaching the expected
standard in maths – 2019
ATTAIN_ptread_exp_KS2
Percentage of pupils
reaching the expected
standard in reading – 2019
ATTAIN_mat_average
_KS2 Average scaled
score in maths –
2019
ATTAIN_readprog_KS2 Reading progress
measure – 2019
Capability
t_not_fsm6cla1a_KS2 Number of key stage 2 pupils who are not disadvantaged – 2019
0.15 0.16 0.13 0.24 -0.02 0.06
tealgrp2_KS2 Number of eligible pupils with English as additional language (EAL) – 2019
-0.12 -0.01 -0.10 0.04 0.05 0.06
tmobn_KS2 Number of eligible pupils classified as non-mobile – 2019
-0.04 0.04 -0.04 0.11 -0.08 0.03
tsenelk_KS2 Number of eligible pupils with SEN support – 2019
-0.19 -0.17 -0.20 -0.12 -0.09 0.04
tsenele_KS2 Number of eligible pupils with EHC plan – 2019
-0.13 -0.22 -0.20 -0.11 -0.10 -0.03
tealgrp2_KS2_2018 Number of eligible pupils with English as
-0.12 -0.03 -0.10 0.04 0.05 0.04

41
Pillars & profiling variables
ATTAIN_read_average_KS
2 Average scaled score in reading –
2019
ATTAIN_ptmat_exp_KS2
Percentage of pupils
reaching the expected
standard in maths – 2019
ATTAIN_ptread_exp_KS2
Percentage of pupils
reaching the expected
standard in reading – 2019
ATTAIN_mat_average
_KS2 Average scaled
score in maths –
2019
ATTAIN_readprog_KS2 Reading progress
measure – 2019
Capability
additional language (EAL) – 2018
tmobn_KS2_2018 Number of eligible pupils classified as non-mobile – 2018
-0.02 0.06 -0.01 0.13 -0.06 0.03
tsenelk_KS2_2018 Number of eligible pupils with SEN support – 2018
-0.10 -0.09 -0.11 -0.06 -0.04 0.08
tsenele_KS2_2018 Number of eligible pupils with EHC plan – 2018
-0.02 -0.01 -0.05 0.02 0.01 -0.04
ATTAIN_tks1average_KS2 Cohort level key stage 1 average points score – 2019
0.58 0.49 0.53 0.33 -0.05 0.12
ATTAIN_tks1group_l_KS2 Number of pupils in cohort with low KS1 attainment – 2019
-0.41 -0.34 -0.41 -0.16 -0.03 -0.07

42
Pillars & profiling variables
ATTAIN_read_average_KS
2 Average scaled score in reading –
2019
ATTAIN_ptmat_exp_KS2
Percentage of pupils
reaching the expected
standard in maths – 2019
ATTAIN_ptread_exp_KS2
Percentage of pupils
reaching the expected
standard in reading – 2019
ATTAIN_mat_average
_KS2 Average scaled
score in maths –
2019
ATTAIN_readprog_KS2 Reading progress
measure – 2019
Capability
ATTAIN_tks1group_m_KS2 Number of pupils in cohort with medium KS1 attainment – 2019
-0.16 -0.05 -0.13 0.02 -0.07 0.02
ATTAIN_tks1group_h_KS2 Number of pupils in cohort high KS1 attainment – 2019
0.20 0.20 0.16 0.21 -0.11 0.07
Table 12 shows the correlation between the strategy pillar, selected attainment scores22, and profiling measures. The magnitude of correlations between the strategy pillar and attainment are generally slightly larger than those between this pillar and the profiling measures, so there is no evidence of confounding. However, the correlation between strategy and attainment scores in Table 12, whilst significant, are small in analytical terms and do not suggest a strong association between the digital maturity strategy pillar and attainment. Again, as for the capability pillar, there is no evidence here of confounding between school profiling measures and the pillar, but that does not deny other factors may exist, not measured in this data, that may underpin any underlying relationship with strategy and pupil attainment measures.
22 The top five significant correlations between strategy and attainment have been included in the table.

43
Table 12: Strategy pillar, KS2 attainment, and profile variable correlations
Pillars & profiling variables
ATTAIN_matprog_KS2_2018
Maths progress
measure – 2018
ATTAIN_ptmat_exp_KS2_2018 Percentage of
pupils reaching the expected standard in
maths – 2018
ATTAIN_matprog_KS2
Maths progress
measure – 2019
ATTAIN_readprog_KS2
Reading progress
measure – 2019
Strategy
TECH_PILLAR 0.05 0.03 0.07 0.04 0.16
CAPABILITY_PILLAR 0.12 0.13 0.11 0.16 0.26
STRATEGY_PILLAR 0.17ⱽ* 0.14ⱽ* 0.14ⱽ* 0.14ⱽ* 1.00
tsenelse_Census Number of SEN pupils with an EHC plan – 2019
0.01 -0.13 -0.05 -0.13 0.04
tsenelk_Census Number of eligible pupils with SEN support – 2019
0.07 -0.06 0.03 -0.10 0.12
numeal_Census No. pupils where English not first language – 2019
0.20 0.00 0.18 0.06 0.11
numengfl_Census No. pupils with English first language – 2019
-0.02 0.05 -0.01 -0.11 0.03
numfsm_Census No. pupils eligible for free school meals – 2019
0.13 -0.14 0.03 -0.12 0.12

44
Pillars & profiling variables
ATTAIN_matprog_KS2_2018
Maths progress
measure – 2018
ATTAIN_ptmat_exp_KS2_2018 Percentage of
pupils reaching the expected standard in
maths – 2018
ATTAIN_matprog_KS2
Maths progress
measure – 2019
ATTAIN_readprog_KS2
Reading progress
measure – 2019
Strategy
numfsmever_Census Number of pupils eligible for FSM at any time during the past 6 years – 2019
0.13 -0.13 0.03 -0.12 0.13
tfsm6cla1a_KS2 Number of key stage 2 disadvantaged pupils (those who were eligible for free school meals in last 6 years or are looked after by the LA for a day or more or who have been adopted from care) – 2019
0.12 -0.11 0.01 -0.15 0.13
t_not_fsm6cla1a_KS2 Number of key stage 2 pupils who are not disadvantaged – 2019
0.02 0.11 0.10 -0.02 0.05
tealgrp2_KS2 Number of eligible pupils with English as additional language (EAL) – 2019
0.21 0.02 0.19 0.05 0.12
tmobn_KS2 Number of eligible pupils classified as non-mobile – 2019
0.08 0.04 0.09 -0.08 0.10

45
Pillars & profiling variables
ATTAIN_matprog_KS2_2018
Maths progress
measure – 2018
ATTAIN_ptmat_exp_KS2_2018 Percentage of
pupils reaching the expected standard in
maths – 2018
ATTAIN_matprog_KS2
Maths progress
measure – 2019
ATTAIN_readprog_KS2
Reading progress
measure – 2019
Strategy
tsenelk_KS2 Number of eligible pupils with SEN support – 2019
0.02 -0.06 -0.01 -0.09 0.14
tsenele_KS2 Number of eligible pupils with EHC plan – 2019
-0.01 -0.09 -0.07 -0.10 0.03
tealgrp2_KS2_2018 Number of eligible pupils with English as additional language (EAL) – 2018
0.20 0.01 0.18 0.05 0.11
tmobn_KS2_2018 Number of eligible pupils classified as non-mobile – 2018
0.07 0.05 0.09 -0.06 0.12
tsenelk_KS2_2018 Number of eligible pupils with SEN support – 2018
0.02 -0.08 0.01 -0.04 0.10
tsenele_KS2_2018 Number of eligible pupils with EHC plan – 2018
0.04 -0.07 0.06 0.01 -0.10
ATTAIN_tks1average_KS2 Cohort level key stage 1 average points score – 2019
-0.10 0.26 -0.07 -0.05 -0.05

46
Pillars & profiling variables
ATTAIN_matprog_KS2_2018
Maths progress
measure – 2018
ATTAIN_ptmat_exp_KS2_2018 Percentage of
pupils reaching the expected standard in
maths – 2018
ATTAIN_matprog_KS2
Maths progress
measure – 2019
ATTAIN_readprog_KS2
Reading progress
measure – 2019
Strategy
ATTAIN_tks1group_l_KS2 Number of pupils in cohort with low KS1 attainment – 2019
0.13 -0.16 0.08 -0.03 0.09
ATTAIN_tks1group_m_KS2 Number of pupils in cohort with medium KS1 attainment – 2019
0.10 -0.01 0.09 -0.07 0.10
ATTAIN_tks1group_h_KS2 Number of pupils in cohort high KS1 attainment – 2019
-0.02 0.14 0.01 -0.11 0.06

47
4.7 Analysis results of secondary school (KS4) data In the primary school data, around half of the correlations between digital maturity pillars and attainment were significantly different from zero. It is key to remember that the significance of the statistics for the correlation depends on the magnitude of the correlation, and more importantly on the sample size. As noted in KS2 data analysis, with a large sample, even what might be considered small or weak correlations can be statistically significant. The sample size for KS4 schools is only 146 and consequently whereas in the KS2 data, correlations larger than 0.09, were significant, in the KS4 data, correlations of 0.2 or more are required for statistical significance to be evident.
Table 13 shows that none of the correlations between the pillars and the 12 attainment measures are statistically significant, and between the pillars and the four profiling variables, only one correlation is statistically significant with a magnitude of just 0.2.
Table 13: Correlations between 12 KS4 attainment measures and four profiling variables and digital maturity pillar data
Variable name and attainment measure description Technology Capability Strategy
KS4_ATTAIN_att8scr_KS4_2018 Average Attainment 8 score per pupil – 2018
0.03 -0.01 0.11
KS4_ATTAIN_p8mea_KS4_2018 Progress 8 measure after adjustment for extreme scores – 2018
0.10 -0.07 0.11
KS4_ATTAIN_ptebaceng_94_KS4_2018 % of pupils achieving the Ebacc English subject area with a standard 9-4 pass – 2018
0.02 -0.09 0.05
KS4_ATTAIN_ptebacmat_94_KS4_2018 % of pupils achieving the Ebacc Maths subject area with a standard 9-4 pass – 2018
-0.03 -0.06 0.08
KS4_ATTAIN_att8screng_KS4_2018 Average Attainment 8 score per pupil for English element – 2018
0.03 0.00 0.09
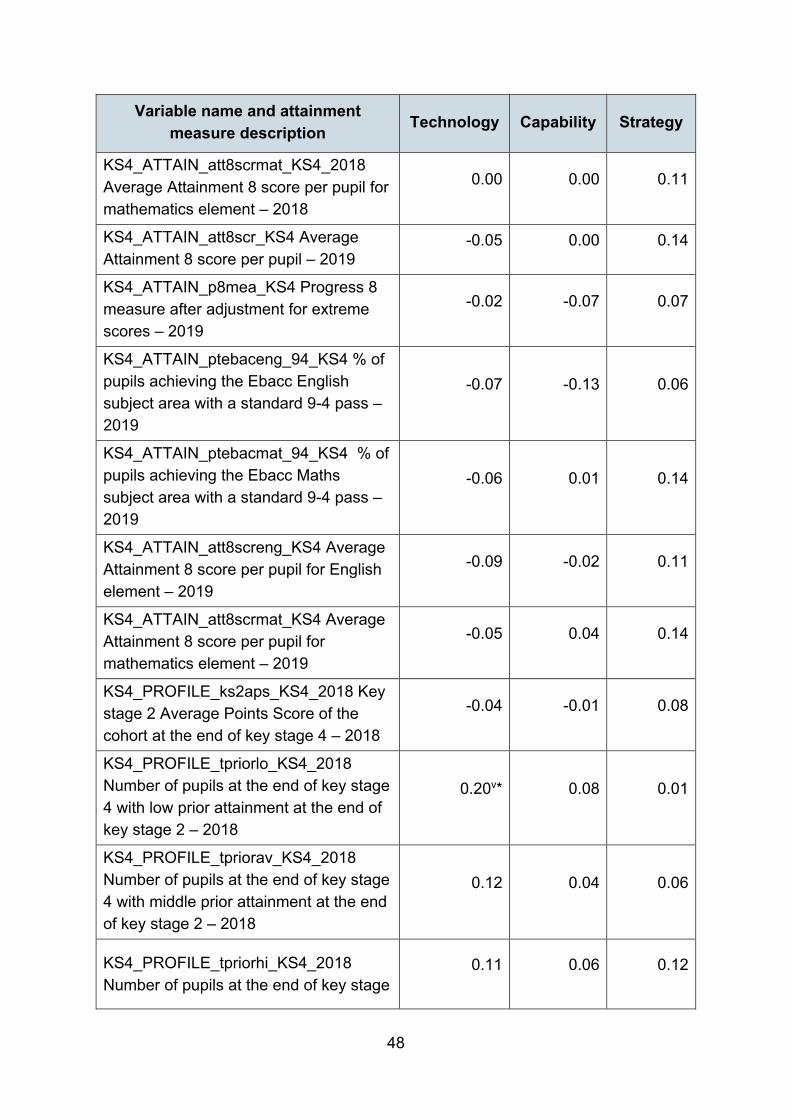
48
Variable name and attainment measure description Technology Capability Strategy
KS4_ATTAIN_att8scrmat_KS4_2018 Average Attainment 8 score per pupil for mathematics element – 2018
0.00 0.00 0.11
KS4_ATTAIN_att8scr_KS4 Average Attainment 8 score per pupil – 2019
-0.05 0.00 0.14
KS4_ATTAIN_p8mea_KS4 Progress 8 measure after adjustment for extreme scores – 2019
-0.02 -0.07 0.07
KS4_ATTAIN_ptebaceng_94_KS4 % of pupils achieving the Ebacc English subject area with a standard 9-4 pass – 2019
-0.07 -0.13 0.06
KS4_ATTAIN_ptebacmat_94_KS4 % of pupils achieving the Ebacc Maths subject area with a standard 9-4 pass – 2019
-0.06 0.01 0.14
KS4_ATTAIN_att8screng_KS4 Average Attainment 8 score per pupil for English element – 2019
-0.09 -0.02 0.11
KS4_ATTAIN_att8scrmat_KS4 Average Attainment 8 score per pupil for mathematics element – 2019
-0.05 0.04 0.14
KS4_PROFILE_ks2aps_KS4_2018 Key stage 2 Average Points Score of the cohort at the end of key stage 4 – 2018
-0.04 -0.01 0.08
KS4_PROFILE_tpriorlo_KS4_2018 Number of pupils at the end of key stage 4 with low prior attainment at the end of key stage 2 – 2018
0.20ⱽ* 0.08 0.01
KS4_PROFILE_tpriorav_KS4_2018 Number of pupils at the end of key stage 4 with middle prior attainment at the end of key stage 2 – 2018
0.12 0.04 0.06
KS4_PROFILE_tpriorhi_KS4_2018 Number of pupils at the end of key stage
0.11 0.06 0.12

49
Variable name and attainment measure description Technology Capability Strategy
4 with high prior attainment at the end of key stage 2 – 2018
Table 14 summarises the correlations for secondary (KS4) schools. The average correlations with attainment and profiling, although low, are highest amongst the strategy pillar. The correlations between all three digital maturity pillars and KS4 attainment are not significant and so no findings emerge in the KS4 data. Furthermore, because the pillar correlations are low with both the attainment and profiling data this supports the conclusion, as highlighted previously, the absence of findings with the KS4 data is due to the small sample size available for the analysis.
Table 14: Summary statistics for digital maturity pillar correlations with KS4 attainment measures and profiling data
Technology Capability Strategy
Minimum correlation -0.09 -0.13 0.01
Maximum correlation 0.20 0.08 0.14
Average (magnitude) of correlations 0.06 0.04 0.09
Percentage of attainment measure with correlation under 0.2
94% 100% 100%
4.8 Summary of key findings There were two hypotheses being considered within the analyses:
A. Is there a link between a school’s digital maturity (as measured by each school’s three digital maturity pillar scores) and the attainment levels of their pupils (measured using DfE data)?
B. Where significant correlation exists between the digital maturity pillars and pupil attainment measures, is there higher correlation between the pillars and profiling measures that may confound the digital maturity/attainment association?

50
4.8.1 Findings for primary phase data (KS2)
In relation to Hypothesis A:
• The three digital maturity pillars generally have low correlation with the range of KS2 attainment measures used, although half of the correlations are statistically significantly different from zero, suggesting that there is a relationship. Correlations above 0.096 are statistically significant. However, it should be noted that although correlations are significant, the magnitude of associations may not be meaningful or impactful.
• In addition, none of the pillar/KS2 attainment correlations are large enough for multiple linear regression to provide robust insights into the relationship between digital maturity and attainment.
• The technology pillar does not correlate highly with any attainment metrics, whilst capability correlates with both the maths and reading attainment metrics; and strategy with just the maths attainment metrics.
• Profiling variables generally correlate positively with attainment measures based on progress, but negatively with simple average attainment levels23.
• This pattern is confirmed when dividing digital maturity pillar scores into high, medium, and low groupings and allocating schools to one of the three groups (for each pillar). Numbers of schools in the lowest category of digital maturity in technology and capability are small, but higher for the strategy pillar. This suggests, overall that schools in general have made more progress in terms of their technology and capability than in the strategy dimension (based on the methodology employed for this analysis and use of Education Technology Survey 2020-21 data).
• Across the three groups (low, medium, and high) with ascending levels of pillar maturity, the attainment scores show statistically significant increase in attainment scores (where pillar and attainment scores are correlated). However, statistical significance does not necessarily imply a meaningful or importance difference.
• Correlations for the capability pillar appear higher with 2018/19 attainment than 2017/18. This may be because the survey fieldwork was conducted during the
23 The following prior attainment measures were also used as school profiling variables as part of the confounding analysis: tks1average_KS2 - Cohort level KS1 average points score; tks1group_l_KS2 - Number of pupils in cohort with low KS1 attainment; tks1group_m_KS2 - Number of pupils in cohort with medium KS1 attainment; tks1group_h_KS2 - Number of pupils in cohort high KS1 attainment.

51
academic year 2020/21 and so data is not directly comparable (refer to Section 4.3 on methodological considerations).
In relation to Hypothesis B:
• The evidence of confounding between the technology pillar and profiling data leads to the conclusion that there is no evidence of meaningful correlation between the technology pillar and any of the KS2 attainment measures. Furthermore, the technology pillar has higher correlation with school profiling data than with school attainment scores.
• There is no evidence of confounding between capability and profiling measures. However, generally the correlations between attainment and the free school meal profiling data are much higher than between attainment and capability; so both are associated with attainment, the free school meal data have a much larger impact on attainment, as could be expected.24 Although there is no evidence of confounding with the profiling variables used in this research – there may be other measures, external to the study, that underpin the correlations between digital maturity capability and measures of attainment.
• Again, there is no evidence of confounding between the strategy pillar and profiling measures, however, the strategy/attainment correlations that are significant are small in absolute terms and perhaps do not suggest a strong (or meaningful) association between this pillar and attainment
4.8.2 Findings for secondary phase data (KS4)
• No KS4 attainment measures (and only one profiling indicator) had a significant correlation with any of the digital maturity pillars. This is largely because the analysis is based on just 146 secondary schools. No further conclusions have been made on the KS4 data.
24 See for example, DfE (2020) Key stage 4 performance, 2019 (revised) which explores the disadvantage gap in attainment; research by the Sutton Trust (Our Research - Sutton Trust) including Kirby, P. and Cullinane, C. (2016) Class differences: ethnicity and disadvantage; and Treadaway, M. (2019) How attainment gaps emerge from Foundation Stage to Key Stage 4, part one – Fisher Family Trust Education Datalab.

52
5. Digital maturity tiers and characteristics of schools
In order to understand schools’ progress in embedding technology use and establishing digital maturity, it was necessary to develop a means of categorising schools into different levels of digital maturity. A tiered system was therefore developed, and schools classified within a high, medium or low grouping of digital maturity. These tiers/groupings were then used for the qualitative aspect of the research which aimed to gather feedback from schools at each end of the digital maturity spectrum – of low and high digital maturity (see Section 6).25
5.1 Digital maturity tiers There were three tiers developed providing an overall indicator of digital maturity, as a combination of the pillar scores (across all 654 primary and secondary schools). Schools were assigned to one of three tier classifications on each of the three pillars – low (category ‘1’), medium (category ‘2’) and high (category ‘3’). These pillar classifications were then collated for each school to derive an overall digital maturity classification, again based on three tiers: low, medium, and high. Table 15 illustrates all possible pillar classification combinations and how these were then combined to establish a tiered system of the three digital maturity levels26.
At the two ends of the digital maturity spectrum are schools that rate highly for all three pillars (the pillar combination 333 in Table 15) and at the other end, schools whose rating was low for all three pillars (the pillar combination 111 in Table 15). The following explains how schools in between are assigned to a tier – the general rule being schools in the lowest category have mostly low ratings (1s) across the three pillars; schools in the middle tier schools have mostly medium ratings (2s) and schools in the top rating have mostly high ratings (3s) across the pillars. The tier classification for the 27 pillar combinations are detailed in Table 15.
To summarise: schools in the lowest category for digital maturity have no ‘3’ ratings and have at least one pillar score of ‘1’.
• Low digital maturity tier includes schools that have no top rating (3) and one or more low rating (1) across the three pillars. The low classification includes seven of the 27 different pillar combinations.
25 Source of data used for this analysis were Education Technology Survey 2020-21. 26 The middle tier of 401 schools was split into lower middle and upper middle groups of 234 and 167 schools, respectively, making four tiers altogether. However, when profiling school characteristics between the four groups there were few characteristic differences between the lower and upper tiers and so three tiers were adopted for the approach.

53
The low tier had 185 schools (28% of the schools included in the analysis). In this low category the modal combination is 221 (i.e., technology – ‘2’, capability – ‘2’, and strategy – ‘1’), which was achieved by 147 schools or 75% of the tier.
• High digital maturity tier includes schools that have two or more top ratings (3) and no low rating (1) across the three pillars. The high classification includes four of the 27 different pillar combinations.
The high tier has 68 schools (10% of the schools included in the analysis). Amongst ‘high’ schools – 29 achieved 233 (i.e., technology – ‘2’, capability – ‘3’, and strategy – ‘3’) which is 43% of schools in the tier.
• Schools not classified by either the highest or lowest definitions above fit into the medium tier. The medium classification includes 16 of the 27 different pillar combinations.
The medium tier had 401 schools (61% of the schools included in the analysis). In this category, 182 schools achieved a combination of 222 (i.e., technology – ‘2’, capability – ‘2’, and strategy – ‘2’) which is 45% of schools in the tier.
Table 15 provides the three tiers with their range of possible pillar combinations alongside the number of schools (total sample of 654), with those combinations.
Table 15: Schools by individual pillar rating and digital maturity tier
Digital maturity tier
Technology rating
Capability rating
Strategy rating
Pillar combination
Number of
schools
1 (Low tier) 1 1 1 111 0
1 (Low tier) 1 1 2 112 1
1 (Low tier) 1 2 1 121 9
1 (Low tier) 1 2 2 122 8
1 (Low tier) 2 1 1 211 17
1 (Low tier) 2 1 2 212 9
1 (Low tier) 2 2 1 221 141
2 (Medium tier) 1 1 3 113 0
2 (Medium tier) 1 3 3 133 0
2 (Medium tier) 1 2 3 123 1
2 (Medium tier) 1 3 1 131 1

54
Digital maturity tier
Technology rating
Capability rating
Strategy rating
Pillar combination
Number of
schools
2 (Medium tier) 1 3 2 132 2
2 (Medium tier) 2 1 3 213 1
2 (Medium tier) 2 2 2 222 182
2 (Medium tier) 2 2 3 223 63
2 (Medium tier) 2 3 1 231 21
2 (Medium tier) 2 3 2 232 54
2 (Medium tier) 3 2 2 322 45
2 (Medium tier) 3 1 1 311 1
2 (Medium tier) 3 1 2 312 2
2 (Medium tier) 3 1 3 313 2
2 (Medium tier) 3 2 1 321 23
2 (Medium tier) 3 3 1 331 3
3 (High tier) 2 3 3 233 29
3 (High tier) 3 2 3 323 15
3 (High tier) 3 3 2 332 14
3 (High tier) 3 3 3 333 10

55
5.2 Digital maturity tiers and school characteristics
Further analysis was conducted to identify the types of schools likely to fall into the low, medium and high digital maturity tiers. Table 16 presents a summary of the key differences between the three digital maturity groups across the school characteristics. Only statistically significant differences27 are listed. As shown low digitally mature schools were significantly more likely to be rural, primary, local authority-maintained schools with a good Ofsted rating. By contrast, high digitally mature schools were significantly more likely to be secondary academies in urban locations.
Table 16: Digital maturity tiers by school characteristics
Low digital
maturity schools – more likely to
be..
Medium digital
maturity schools – more likely to
be..
High digital
maturity schools – more likely to
be..
Low digital
maturity schools
– less likely to
be..
Medium digital
maturity schools
– less likely to
be..
High digital
maturity schools
– less likely to
be..
Phase Primary Secondary Secondary Secondary Primary Primary
Type LA Maintained
Academies Academies Academies LA Maintained
LA Maintained
Phase by type
Primary LA Maintained
Secondary Academies
Secondary Academies
and Secondary
LA Maintained
Primary LA Maintained
Primary LA Maintained
Region None None
Ofsted28 Rated Good
Rated Good
Geography Rural Urban Rural
FSM None None
27 Significant differences quoted from SPSS software “column percentage” test statistics output. 28 Schools which form the reference category here include: ‘Outstanding’, ‘Good’, ’Requires Improvement’ ‘Serious weakness’ and ‘Special Measures’ rated schools. Refer to Table 35 in Appendix 4 for further detail on digital maturity tiers by Ofsted rating.

56
Appendix 4 provides further details with tables showing crosstabulations between the digital maturity tiers and each of school profiling characteristics: phase; type; type by phase; region; Ofsted rating; geography; and free school meals’ prevalance level.

57
6. Understanding the context of digital maturity This section of the report summarises key findings from 20 interviews undertaken with senior leaders to understand more about how technology is being used in schools.
6.1 Approach to exploring high and low digital maturity The quantitative strand of the research explored whether it would be possible to develop a set of measures which represented schools’ use of and preparedness for technology use. This metric was developed from the questions used in the Education Technology Survey 2020-21. Three pillars were established through the quantitative strand (technology, capability and strategy) which together summarised a measure of the construct ‘digital maturity’.
Schools were assigned to one of three tier classifications on each of the three pillars – low (category ‘1’), medium (category ‘2’) and high (category ‘3’). These pillar classifications were then collated for each school to establish a ‘digital maturity’ classification. Those schools that scored highest on the digital maturity scale were schools that scored highly for all three pillars (a combination of 3,3,3 across the pillars). By contrast, those school that scored lowest on the digital maturity scale were schools that scored lowest for all three pillars (a combination of 1,1,1 across the pillars). Appendix 4 provides details of this tiered system used for sample selection and analysis of characteristics of schools within these tiers.
The purpose of the qualitative interviews was to explore the experiences of schools classified as ‘digitally mature’ (high grouping) and ‘low digitally mature’ (low grouping), and to understand their journey to embedding technology, the facilitators, and challenges of doing so, and the perceived benefits and impact of using technology. For an overarching view of technology use in schools and insights into decisions made (for example, investment choices), a senior leader perspective was sought. It was clear from the Education Technology Survey 2020-21 that school leaders found it more challenging to offer their view on the technical aspects of implementing technologies. As such, apart from the interviews briefly exploring storage approaches, the technical aspects of technology use were not discussed.

58
6.1.1 Sampling approach
For the purposes of sampling schools to participate in the interviews, the tiers used in the quantitative strand of the research were used to select schools (see Section 5). Twenty interviews were conducted with:29
• 10 digitally mature schools (5 primary, 5 secondary), including schools which had scored higher in the ‘digital maturity’ metric.
• 10 low digitally mature schools (5 primary, 5 secondary): includes schools which had a lower score in the ‘digital maturity’ metric.
A mix of headteachers, deputy and assistant headteachers and other senior leadership team representatives (such as, computing lead, school improvement lead), were involved in the interviews.
The senior leaders involved were not asked to prepare for the interviews, although when invited to take part they were given broad information on areas that would be covered in the interviews.
For schools identified as low in digitally maturity, the sample included a small number of secondary schools which had consented to take part in the interviews. Due to challenges in recruiting low digitally mature secondary schools for the interviews, it was necessary to broaden the sample criteria to include schools that were ‘medium’ in terms of the ‘digital maturity’ metric. Two secondary schools with this rating were involved in interviews. For the purposes of the analysis these have been combined and included as a ‘low digitally mature school’.
The profile of schools involved in the interviews is as follows:
29 The sample of schools used for the interviews were drawn from tiers 1 (low digital maturity) and 3 (high digital maturity). Where the sample criteria needed to be broadened (for example, due to there being no schools scoring low (111) in all three pillars), the next best option was taken (for example, 112/121/211). See Section 5 for further details of the pilar scores and three tiers.

59
Table 17: Qualitative interview sample profile30
Digitally mature schools
Low digitally mature schools
School type
Local authority-maintained 5 7
Academy 5 3
Geography
Urban 9 8
Rural 1 2
Ofsted rating
Outstanding 2 1
Good 3 6
Requires improvement - 1
Unknown 5 2
6.2 Progress in embedding technology in school Schools’ progress in embedding technology was variable. Whereas most digitally mature schools spoke confidently about the progress they had made, most low digitally mature schools recognised that they still had some way to go. A few low digitally mature schools thought they were progressing well in certain areas (for example, with the deployment of hardware), but were keen to develop their technology use in other areas such as using technology more within teaching and learning. Digitally mature schools cited their clear strategy, technology being integral to classroom practice and pupils having good access to technology as indicators of progress in embedding technology. Other digitally mature schools thought they had made good progress but still had improvements to make; they were conscious of keeping up to date with technology developments or reported that there needed to be more consistency in the use of technology across different areas of the school.
I think we are very far along, but there is some inconsistency in some areas of school. Some areas of school work in a way that would almost make us an Apple school31, other areas are engaging
30 Source of school profile information - Education Technology Survey 2020-21. 31 Apple schools are considered centres of leadership and educational excellence that use Apple products. For more details please see Apple Distinguished Schools Program Overview 2019-2022-UK.

60
less with technology. In some subjects all their resources are online, they are highly interactive, they have architecture for downloading and saving work. Other departments are still just showing PowerPoints and children are working on paper – Headteacher, Digitally mature secondary school
The COVID-19 pandemic had accelerated the progress of low digitally mature schools’ use of technology, particularly for technology used to deliver and support remote teaching (for example, remote teaching platforms and visualisers). They felt they were now much further ahead than they had been prior to the COVID-19 pandemic and had established practices with technology that they were keen to continue (for example, remote parents’ evenings).
We’ve ended up with visualizers that allowed us to deliver live lessons effectively. But I’d also say [they] had a number of additional benefits around modelling and ensuring that pupils can see what a high-quality answer looks like, teachers can annotate while the whole class watches on screen. So, our staff are still using visualizers even though we’re not necessarily teaching as many live lessons. – Headteacher, Low digitally mature primary school
For digitally mature schools the impact of the COVID-19 pandemic had been more minimal. Most had been able to adapt to remote learning easily, having the software in place already with the necessary functionality; allowing them to quickly utilise and build on these systems to develop and implement their remote education offer. A few digitally mature schools felt that the COVID-19 pandemic had affected their technology focus within school as it had reduced their ability to maintain momentum around key priorities and areas of development, or there had not been sufficient time to reflect on or rationalise their use of technology, as they would usually. However, they were confident about being able to progress more quickly this year.
We moved to online learning very comfortably and some staff almost preferred online teaching…for example, for A level maths there was almost no difference in the way it was taught. Others missed the face-to-face aspect, but nobody failed or struggled to deliver. It was not as hard as people thought it might be. We could do it again tomorrow without batting an eyelid. – Headteacher, Digitally mature secondary school
All low digitally mature schools felt that they had the ability to move forward with embedding the use of technology in school. Secondary schools were more confident about this, mentioning good infrastructure (such as laptops, good internet

61
connection, and having specialist Information Technology (IT) staff) and senior leadership buy-in (including through setting priorities in their school improvement plans), as facilitators in achieving this. Low digitally mature primary schools appeared more cautious about their ability to move forward, identifying funding, technical capacity and expertise as challenges in being able to achieve this.
But the reality is.. I suspect I’m going to hit stumbling blocks, because the budget is under pressure… our time is under pressure. If I’ve got to decide between focusing staff CPD on the development of early reading and oracy, or using Microsoft Teams, then to be honest with you, it’s a bit of a no brainer. - Headteacher, Low digitally mature primary school
6.3 Use of education technology Schools gave examples of the types of technology that they had in place across key functions in school at a hardware, software and infrastructure level. There were generally minimal differences between the types of technology that digitally mature and low digitally mature schools were using, although the volume of technology that digitally mature schools were using was greater. Schools’ rationale for using technology was to make processes less time-consuming, more efficient and to support teaching and learning. Key functions that schools were using technology for included:
• Hardware (such as laptops, tablets, projectors, visualisers or interactive whiteboard) for pupils and/or staff to use in the classroom to support teaching and learning and enhance accessibility.
• Teaching and learning software (such as for pupils to practice timetables or phonics), that could be used in lessons to support teaching often with in-built assessment (for example, quizzes).
• Online multi-purpose platforms that can be used to deliver remote education, with functions including video conferencing, setting homework, storing documentation.
• Systems to support administration functions including finance, parent communication, timetabling.
• Systems to support pastoral functions including attendance, behaviour management and safeguarding including software or systems for registration, rewards, managing behavioural incidents and exclusions.

62
6.4 Storage solutions The schools interviewed were at different stages of transitioning to the cloud. Around one half were fully cloud based and the other half were using a mix of cloud and on-site storage. Where the schools had a mixed approach, most found it difficult to supply details on which systems were on-site or cloud32 based. As the interviews were with headteachers or other senior leaders, it is likely that they did not have this level of technical knowledge.
Many schools with mixed storage had a desire to become fully cloud-based, and although most were considering it, they were not able to set timescales for achieving this. Schools mentioned challenges to becoming fully cloud-based: including having the internal technical ability to make this move, funding, and concerns about the security of documents and systems. Having the infrastructure in place (such as sufficient Wi-Fi speed) to be able to support being fully cloud-based was also a concern and a few schools (mainly low digitally mature schools) mentioned concerns about the practicalities of being able to manage a fully cloud-based system and being able to deal with any technical issues with it (such as, a drop in Wi-Fi, documents not syncing), without having the technical ability on how to deal with such issues.
Schools cited accessibility as the main benefit of being cloud-based as it strengthened the ease of access for staff and pupils off-site. Senior leaders felt this supported flexible working practices, along with being able to deliver remote education more effectively if required (for example, for staff or pupils isolating and having to work at home). Other benefits mentioned included using less paper, streamlining systems (for example, through storing documents in one place, being able to edit documents collaboratively, see Sections 6.10.1 and 6.10.3), increased storage capacity, better security and the cloud being General Data Protection Regulation (GDPR) compliant.
6.5 Education technology strategies The quantitative analysis highlighted that schools scored lowest on the strategy pillar33, indicating that they had made less progress towards digital maturity in this area (see Section 3.1). Although there were some differences between digitally mature and low digitally mature schools in the qualitative interviews in relation to
32 One secondary school interviewed had an internal hard drive to store classroom materials and all other systems were held on the cloud. A primary school mentioned that all systems for teachers and pupils were cloud-based, and all administration and senior leadership team systems were held on the on-site server. 33 The average score for the strategy pillar was 0.27, compared to 0.62 for the capability pillar and 0.58 for the technology pillar.

63
their strategy around technology, it must be noted that the interviewees tended to focus specifically on whether they had a formal digital strategy in place. By contrast, the questions included in the strategy pillar for the quantitative analysis were broader than this (see Appendix 2), encompassing also, barriers to uptake of technology and plans for investment. The strategy pillar within the digital maturity metric was therefore a broader definition of strategy than was used by interviewees.
Most (six out of ten) of the digitally mature schools interviewed had a formal technology strategy in place and most low digitally mature schools did not (eight out of 10). The remaining two low digitally mature schools reported that they had a form of strategy in place but referred to this as a less formalised subject action plan or an action plan for computing that they used to identify gaps in technology use. A recent change in the senior leadership team and a lack of funding to purchase technology were given as reasons by both these schools as to why they had not undertaken more work on their strategy.
For a few digitally mature schools, a strategy had been in place for several years (up to 10 years in one school); others had developed a strategy more recently. Two EdTech Demonstrator schools (interviewed as digitally mature schools) had established a strategy over five years ago and were able to articulate a clear whole-school approach to using technology within teaching and learning to improve pupil outcomes.
The school’s strategy is about using technology to improve pupil outcomes. Our focus is on investing in staff time to ensure that they feel successful, that they understand what they’re trying to achieve with their learning. I feel that technology fails when it’s used just for the sake of it and that should never be what it’s about. It should be about, if this lesson is better off using a pencil and a piece of paper, then we’ll stick with a pencil and piece of paper. But if this lesson can be enhanced by the use of digital creativity, then we will definitely use it. – Headteacher, Digitally mature primary school, EdTech Demonstrator school
Digitally mature schools reported on the features of their technology strategy including:
• A focus on improving pupil outcomes and ensuring the non-tokenistic meaningful use of technology within the teaching environment.
• Technology featuring within their school improvement or development plans.

64
• The use of structures such as Trust steering groups, to identify priorities for technology, and consider how it should be rolled out and driven forward in learning.
• Implement technology in a phased manner, allowing time for staff to be trained and to adjust to any new technology use.
• A focus on hardware including priorities around changing or upgrading devices (such as a move away from IT suites to hand-held devices) or a planned wider roll out of devices within the school (such as a move towards one-to-one device deployment for pupils and staff). For example, one EdTech Demonstrator school interviewed mentioned having a three-year strategy that focused on technical infrastructure, training staff and a planned change in their pupil ‘bring your own device’ scheme.
Where digitally mature schools thought they needed to develop their strategy further this related to integrating it more fully with curriculum delivery and making decision-making about technology more integrated at different levels (such as across curriculum managers, the senior leadership team, and IT services procurement).
Generally, having a technology strategy in place in digitally mature schools informed and drove forward the use of technology by:
• Supporting a whole-school approach to technology use, ensuring that decisions and approaches aligned with wider school processes such as the teaching and learning framework, behaviour management and safeguarding.
• Supporting staff, parent and governor buy-in to technology across the school and ensuring all stakeholders are clear on the vision and their role within that.
• Offering staff autonomy in their teaching to use technology as they see best, to enhance the quality of their teaching.
Schools without a technology strategy in place adopted a more reactive approach, making decisions about technology in school as needed. These schools still had priorities for technology infrastructure or use, such as setting actions in the school development plan, or developing a yearly action plan for hardware and software (for example focusing on hardware upgrades, streamlining online platforms and reopening a suite of desktop computers).
The focus in the school development plan is to create an environment where ICT is used across the curriculum. What I want to do is to create an environment, which enables teachers to be confident to deliver ICT computing across the curriculum. But I also

65
want us to consider how we use technology more generally, to make us as efficient as possible and harness the benefits of it… to reduce workload and increased productivity. – Headteacher, Low digitally mature primary school
Schools’ plans for developing a technology strategy in the future were varied, and only a few low digitally mature schools were planning on doing this, although without clear timescales for doing so. Reasons for not having a strategy in place or a reluctance to develop one included:
• Feeling that a formal strategy was unnecessary because the school already had a strong technology offer (mentioned by digitally mature schools).
• Uncertainty about how to develop a strategy or losing specialist technology staff (network managers or computing specialists/leads) who would support this process.
• Concerns about the relevance of having a strategy because of technology changing quickly.
• A lack of funding inhibiting ability to prioritise investment in technology. Low digitally mature primary schools appeared most affected by financial pressures and budget constraints which were affecting their ability to prioritise technology investments (such as replacing old hardware) and as such, developing a technology strategy felt futile as they did not have the available monies to support any investments.
• Lack of priority for school context. Low digitally mature schools mentioned a technology strategy not being a priority for their school context (for example, because they were a small school or in a ‘requires improvement’ Ofsted category and other aspects needed to take priority above technology).
6.6 Investing in education technology Schools were considering many factors when deciding which technology to invest in, although cost and suitability (for pupils, staff and the learning context) were often key considerations. Budget and cost were mentioned most commonly by low digitally mature schools as being a factor in their investment decisions. For example, there were mentions of buying reconditioned devices as these were cheaper and allowed for a greater volume to be purchased.
It was common for schools to research their options for investment, and they mentioned visiting trade fairs or educational shows such as Bett, speaking to

66
specialist network or IT staff (particularly when investing in hardware or infrastructure), or seeking recommendations from other schools to help inform their decisions. For example, two low digitally mature schools were having an audit and RAG (red, amber, green) rating of their technology (mainly hardware) conducted so that they knew where they should be prioritising investments. Generally, decisions about investments appeared to be a collaborative process in most schools involving headteachers or other senior leadership team representatives with specialist IT staff being involved in those decisions, as necessary.
The factors schools considered when making decisions about investments included:
• Suitability of technology for the setting, schools wanted consistency in the technology they used (not having lots of different types of devices and software), that was relevant for their setting and that integrated or complemented existing technology used in the school or within the multi-academy trust.
• Affordability and cost, potential investments were often constrained by school finances, and schools were conscious of the need to consider value for money, for example, whether they could purchase in bulk and achieve economies of scale, whether there was training that accompanied the investment, and how many pupils would be able to utilise it (for example, whether it could be used across year groups and curriculum areas).
• The required investment in staff time and training to implement new technology against the expected educational benefits. Schools wanted their investment in technology to offer added value, that could not be achieved another way and felt that in order to get the best value of technology they needed to have the time to invest in training.
• Sustainability and longevity of technology, for example consideration of how long devices would last before they need replacing or upgrading and how sustainability may differ across different brands.
We invested £50-60k in iPads around 8 years ago and we would never do that again as they are now unusable. I think we ended up with just under 100 iPads, but they are almost worthless now, and almost unusable. So, when you look back at that investment, I just think I really wish we’d not done it – Headteacher, Low digitally mature primary school

67
• Functionality and accessibility of technology for pupils and staff and the ability for them to adapt to use the technology. For example, how easy it is for pupils to be able to use certain hardware.
It is all about the children, we always try and pick things that are most user friendly, we got Chromebooks and the children didn’t get on with them like they did with normal laptops. It could be our children or teachers’ knowledge. It is mainly about what children find easy to use, we opted for tablets as they are easier to use. They [pupils] are more familiar with how they work, it doesn’t require them to log on or type like on a computer. – Deputy Head, Digitally mature primary school
Digitally mature and low digitally mature schools had made investments in many areas in recent years including across infrastructure (for example laptops for staff, devices for pupils, Wi-Fi upgrades, cloud storage), teaching and learning (online teaching platforms to support remote education, video conferencing software, programmes that allowed for collaboration online more easily, and software for specific subjects) and pastoral support (digital platform for rewards, safeguarding systems).
The reasons for schools deciding to invest included:
• A need to upgrade current infrastructure due to it not being fit for purpose, for example, replacing obsolete devices or other hardware that needed replacing due to wear and tear, or enhancing the Wi-Fi connection.
• Widening staff access to technology to allow for more flexible working practices (within and outside of schools) and greater collaboration.
• Widening pupils’ access to technology within school and opportunities to develop their skills such as by increasing the number of devices for pupils or introducing a one-to-one device approach.
• Enhancing teaching and learning practices in school, introducing new subject-specific software to support pupils’ learning such as a new computing scheme of work (using online software) to improve consistency in teaching.
• Increasing efficiencies of systems for administration or pastoral functions such as registration, reward systems, managing behaviour or allowing staff to communicate with parents (one school mentioned investing in an internet-based telephone system to reduce the cost of telephone calls when teachers were remote-working).

68
• In response to the COVID-19 pandemic to support remote education. Digitally mature schools (particularly secondary schools) mentioned investing in laptops for staff and/or pupils to allow them to access learning or investing in more visualisers for teachers to use in their delivery of live remote teaching. Low digitally mature schools were more likely to have invested in technology and examples included staff being given laptops, subscriptions to teaching and learning software, investing in online video conferencing functions, and software to deliver virtual parents evenings.
6.7 Training and support Schools’ approach to training and support around technology was driven by the type of technology they were using in school and there were no noticeable differences in the approach taken between digitally mature and low digitally mature schools. Most schools provided training and support to staff as new technology was introduced, with a focus on the purpose of the technology and how to use it. Where required, schools provided training on specific devices or software for different functions within school (such as for remote teaching platforms, teaching and learning software and administration systems). For many schools, the COVID-19 pandemic had triggered the need to upskill staff to deliver remote education and schools had responded by offering training on how to use online platforms to teach live lessons, record lessons or set work online.
Schools often supplemented this by offering ongoing face-to-face opportunities for training and support including through an in-service training day (INSET) focused on technology use, staff drop-ins and regular continuing professional development (CPD) sessions. Where required, schools offered bespoke and tailored support to staff. Secondary phase digitally mature schools mentioned departmental level training for staff on hardware or software that was subject specific. Less structured support mechanisms included dedicated digital champions to promote technology use in school. These tended to be staff at a school or department level who championed technology use, advising staff on how they were using technology, with the aim of encouraging other staff to use it within their practice. Learning walks for early career teachers (ECTs) to look at the use of technology in school, developing user-guides for how to use certain technologies, and asking teachers to share aspects of their technology use that had worked well with pupils, were also mentioned by schools.
We have a staff meeting every week for a half-term focusing on upskilling ourselves and having a growth mindset about what worked and what didn’t work. We gave staff a responsibility, for example one staff member went off to learn about Skype and looked

69
at all the things that Skype could be used for. – Headteacher, Digitally mature primary school
Schools made decisions about which staff to involve in technology training depending on whether it was a whole-school technology system (for example, an assessment or reward system), or technology that was to be used in a more targeted way (for example, only relevant for a specific subject or department or function within the school). Whilst most schools supplied the training and support internally, support from external organisations was utilised if required (for example, to offer training on specific software/apps).
A few low digitally mature schools found it challenging to provide as much training on technology as they would like. These schools were either lacking the expertise internally to provide the training (because of a lack of specialist IT staff), or because they felt that there were many other CPD priorities that they needed to focus on. A small number of low digitally mature schools mentioned that they had received training or support from an EdTech Demonstrator school.
Digitally mature and low digitally mature schools thought that training and support on technology use had worked well where it had included:
• Pairing less confident staff with others who were more capable, to make sure everyone was brought on the journey together and to make staff feel more comfortable.
It worked really well, because they could have a go with a friend. And it didn’t matter if it was a complete disaster because you had someone else there who kind of thought about it in advance. So that kind of gave people a little bit of a safety net in front of the students. – Headteacher, Digitally mature secondary school
• Collaboration with external companies to agree the focus of training to ensure the content was appropriately focused and not overwhelming for staff.
• Workshops for staff who needed help with technology issues, or to share insights into applications or devices. Schools that used these thought that staff responded well to them, as they were less formal and pressured.
6.8 Success factors and barriers to use This section details success factors and barriers to schools’ use of technology identified through the interviews.

70
6.8.1 Success factors
Digitally mature schools felt that they had been successful in embedding technology through developing a clear vision for how technology could improve pupil outcomes, and how that was achievable within the available resources. At a leadership level, schools discussed creating a culture of professional learning, with a clear steer and direction for staff on upskilling and supporting them to use technology effectively. Digitally mature schools considered it to be important to have an open and responsive senior leadership team who were driving the vision for technology use from the top, because it supported wider staff buy-in.
At an infrastructure and classroom level, digitally mature schools mentioned several success factors including:
• Strong buy-in and commitment from staff, with them ‘not being afraid to have a go’.
• Having the capacity (for example through the use of dedicated staff such IT technicians, digital leads) within the school or Trust to know what technology is available, where best practice lies and what is having the most impact.
• Strong, reliable infrastructure (such as good connectivity, secure reliable storage) to support the use of technology and give staff the confidence to use it.
• Identifying which staff are the innovators for technology and utilising that enthusiasm, such as having staff promoters of technology who can support or train other staff, whilst supporting their own professional development.
• Giving ownership to middle leaders to make decisions about technology to use in their departments/areas whilst still having accountability and oversight from the senior leadership team about school priorities.
6.8.2 Barriers
Budgets and funding were recurrent themes across the interviews as a barrier to investing in technology and embedding technology within schools. This appeared to be particularly pertinent for the majority of low digitally mature schools, although was also mentioned by a few digitally mature schools. Budget deficits, a lack of available funding and the need to prioritise funding on other things were some of the key challenges in using technology within school. Schools were facing challenges in being able to either make new investments within available finances or replace technology when it breaks or becomes outdated, including the viability of asking

71
families to fund or subsidise devices for use in schools (such as for one-to-one devices).
It is important to note that the impact of funding (either school budget, or funding per pupil) was not something that was addressed in the quantitative analysis in terms of how it related to pupil attainment or digital maturity pillar scores. Qualitatively, the evidence is clear that available funding has a key role in relation to how schools are able to use technology, and therefore it is worth considering how this is represented in any ‘digital maturity’ metric going forward.
The following barriers to embedding technology use across the school were mentioned by both digitally mature and low digitally mature schools:
• Parental engagement and having the skills and willingness to support their children at home with online platforms for homework.
• Mindset, willingness and confidence of staff to use technology and drive it forward in school (mostly reported by low digitally mature schools).
We have to be mindful of the workload agenda. And you know, so unless capacity is going to be put into the system in the future, to allow teachers to develop their understanding and develop their use of these things, then it won’t happen. Just, it won’t happen just because of goodwill, teachers are already overstretched. – Headteacher, Low digitally mature primary school
• Balance of using technology in learning with the need for pupils to have sufficient time to develop the skills they need for exams (for example, extended written writing tasks).
• Equality of access to technology for pupils outside of school including having the devices and Wi-Fi to be able to access the platforms they need to do homework, and making sure that pupils are not left behind.
6.9 Plans for further developing use of technology
There were mixed views across schools as to whether they had any plans to further develop their technology use. A number of digitally mature and low digitally mature schools felt that due to budget constraints, focusing on recovery and catch-up from COVID-19, or because they had invested so much in technology recently, they had no immediate plans to further develop their use of technology. A few digitally mature

72
schools were focusing on consolidating the technology they had in place, reviewing practices, and ensuring that technology was being used as it should be in school.
However, for some of the digitally mature schools there was a clear desire to maintain momentum around technology use and continue to embed or further develop how they were using technology as a school. Examples given by the digitally mature schools included continuing to roll-out devices for pupils, removing ICT suites (because of their need becoming redundant due to one-to-one devices being used), working to become a Microsoft school34 and building a digital suite so pupils can create, write podcasts and have their own filming studio.
Low digitally mature schools mentioned having plans to undertake an audit of technology use in school, replacing hardware, and integrating homework into an online platform.
6.10 Perceived impact of technology use This section provides discussion on the perceived impact of technology use in schools on cost savings, pupil attainment and teacher workload.
6.10.1 Cost savings
Most schools interviewed were uncertain as to whether there were any cost savings from the use of technology. Although a few were able to give examples of areas where they felt there had been cost savings, these were generally based on their perceptions rather than from any clear evidence.
Where schools were able to offer examples of cost savings these tended to be as result of wider school systems (for example administration or pastoral systems) becoming more efficient from using technology, rather than teaching and learning systems. Schools thought that introducing more efficient online systems had possibly led to cost savings in staff time (for example, an online registration approach reducing an administrator’s time) and physical resources (for example the use of paper, photocopying and printing).
I would say that the effective use of visualisers is a good example.. because everybody can see what the teacher is doing, the teacher no longer needs to print out 32 copies of the resource, and the children [are] actually following what the teacher is doing. Without a
34 Microsoft Showcase Schools are described as being a global community of schools that use digital transformation to create experiences that empower pupils to achieve more. For further details: Microsoft_Showcase_Schools_Directory_9-2021.pdf (azureedge.net)

73
doubt, technology can have savings over time. – Headteacher, Low digitally mature secondary school
Other illustrative examples of areas in schools where perceived cost savings had been made included:
• Whole-school data management systems allowing all data to be in one place (such as assessment, behaviour reports, exclusions etc), making the processes for collecting, monitoring and reporting on this information easier.
The good thing about an online system is that you can go to them [providers] and say, ‘why is there no report for that’, they will then look at it. It [the system] can evolve. It is the providers of the system who change it. You can do an online chat with them and say I want to do pupil premium versus XXX, and they tell you what to click on. It is less time consuming. – Deputy Head, Digitally mature primary school
• Using an online platform to upload policies, risk assessments and then asking staff to sign through an online form makes the process quicker.
• Systems introduced as a result of COVID-19 (such as technology to allow virtual parents evenings or video conferencing or lessons) had led to more efficient or time-saving processes which schools were keen to continue.
• Parent communication through apps or other technology (such as text messages, large screens or social media) reduces the need for paper communication methods (letters home, newsletters etc.).
• An online reward system for students which had saved costs of producing a physical student planner. The school thought this saved them approximately £3,500 a year.
A few schools felt that cost savings were not seen because of the schools’ wider financial situation, or because a recent investment in technology meant that any cost savings had not been realised. A few schools thought that they might see cost savings in the future (from technology that they had recently introduced) or were still considering whether investing in certain technology would lead to cost savings. For example, one digitally mature secondary school was looking at investing in e-books but was unsure whether it would lead to any cost savings.
I am not sure that I expected the use of tech to save money. It might help you to be more efficient and deliver learning more effectively.

74
We want value and cost effectiveness, not to save money. Engaging pupils with learning, helping them reach potential, making it more interesting. – Headteacher, Digitally mature secondary school
6.10.2 Pupil attainment and outcomes
Many of the digitally mature and low digitally mature schools found it challenging to offer their views on the impact of technology use on pupil attainment. They viewed technology as being one of many tools that teachers could use within the classroom to bolster learning, support pupil engagement, and raise standards in teaching and learning.
A few digitally mature schools were able to provide illustrative examples of impact on pupil attainment, whilst emphasising that attribution to technology use was difficult. Schools provided specific examples of where they had improvements in attainment from data that they collected routinely. Specific examples from primary schools included an increase in pupils’ progress in computing, KS2 and progress results. Secondary schools mentioned increases in Progress 8 and Achievement 8 over several years and above average Spanish GCSE results (which was attributed in part to the online platform used).
Digitally mature schools (both primary and secondary) were more confident in giving examples of the wider impact of technology use on pupils, identifying improvements in pupils’ confidence and engagement with learning, improvements in subject specific knowledge (such as reading, comprehension) and other academic skills (research and retention). Digitally mature primary schools using one-to-one devices thought they helped pupils to develop their skills on devices earlier, encouraged pupils to work independently, more at their own pace, and were appealing to a wider range of pupils. A secondary school thought that giving pupils access to learning materials through an online platform empowered them to make good choices about revision and the most effective use of time, offering the ability for learning to become boundless.
Although low digitally mature schools gave examples of improvements in pupils’ engagement, skills, and subject knowledge, this was minimal, and they generally found it challenging to comment on the impact of technology on pupils.
For children who have special learning needs or for those who have social needs, technology can be a really good tool… supporting specific leaning areas. For example, a boy in school has autism and couldn’t talk. Through the technology and service we could access for him, he’s been able to develop speech and language which has

75
been amazing and enabled him to be in a maintained school, not a special school. – Headteacher, Low digitally mature primary school
A few secondary digitally mature schools cited features of technology that they felt worked well including it being visual, interactive, encouraging competitiveness and allowing students to learn independently (such as allowing students to move on to further tasks). They were reported be good for engaging pupils, reinforcing learning, and encouraging collaboration between pupils (through the use of devices). Primary schools found it more difficult to identify technology that they felt had contributed to pupil attainment, although one school did mention reader pens which they felt had been helpful for pupils with dyslexia.
6.10.3 Teacher workload and well-being
Most schools interviewed perceived that that technology contributed to a reduction in teachers’ workload; although schools recognised that workload could increase initially as teachers familiarised themselves with new systems or technology and developed their skills in how to use them. Low digitally mature schools thought unreliable infrastructure (poor Wi-Fi, hardware that was not fit-for-purpose) could have a negative impact on teacher workload and increase teacher stress.
A few schools were unsure about the impact of technology on teacher workload, mainly as they felt any time savings would be offset by investment and time needed to train staff when introducing new technology. There was no evidence that schools had measured the impact of technology on teacher workload, either because they had not considered it or felt that it was too difficult to measure.
We did a survey and all teachers in that said was that they had a good work-life. I think that the technology supported [work-life balance] because they didn’t have to stay at school, they could go home and it worked…[with a] management system in place, you can do things at home that helps with work life balance. - School improvement lead, Digitally mature primary school
Digitally mature and low digitally mature schools thought that technology provided teachers with greater opportunities for collaboration and working together. Schools gave examples of staff being able to use online platforms to plan lessons or collaborate on documents in real-time with colleagues, reducing the time it would take to complete such tasks; or allowing for planning to be shared more easily across staff teams.

76
At a classroom level, the use of teaching and learning software supported assessment, feedback and marking in a few schools and could save teachers’ time on these tasks. Digitally mature schools mentioned using in-built quizzes as formative assessment tools that quickly allowed teachers to change the direction of a lesson or test pupils’ misconceptions about a particular topic.
Using technology was also supporting digitally mature schools to set up more flexible learning practices for staff, which helped improve well-being and helped teachers manage their workload better. There were examples of teachers being able to work at home more (such as for planning, preparation and assessment cover) if they had appropriate hardware (a device or laptop), and remote access to school systems. Many schools had retained practices established through the COVID-19 pandemic, including virtual meetings to help reduce staff travel time, or a blended approach to parents’ evenings (virtual and face-to-face) which had been retained considering staff well-being. Digitally mature schools reported that providing staff with new devices made them feel valued which also had well-being benefits.
I think the [staff] felt quite valued to be given a brand-new iPad. There was a bit of a buzz about it. I think staff felt that we were investing in them as well as investing in students. – Headteacher, Digitally mature secondary school

77
7. Conclusions This research has highlighted some insightful findings and important considerations for developing a digital maturity metric.
7.1 A digital maturity metric and schools’ progress towards digital maturity Using 654 of the survey responses from the Education Technology Survey 2020-21, the statistical analysis found that around 9% of the schools surveyed were classified as high in digitally maturity, 31% were categorised as being low and the remaining 60% were moderately digitally mature (medium category). Using the metric developed for this research, this indicates that many schools are at early stages of their digital maturity journeys with substantial development potential. Further analysis found that low digitally mature schools were more likely to be in rural areas, primary phase, local authority-maintained schools or with a ‘good’ Ofsted rating35. By contrast, high digitally mature schools were more likely be in urban areas, or secondary academies.
When looking at schools’ progress for each of the three pillars (technology, capability, strategy), schools in general had made a similar amount of progress on the technology and capability pillars (mean scores of 0.58 and 0.62 respectively). Schools had made less progress on the strategy pillar (mean score of 0.27).
However, these findings are considered with caution since the digital maturity construct is based on survey data and interpretation of the three key pillars (see methodological considerations in Section 2.4).
The qualitative interviews were used to explore the experiences of schools that were deemed either high or low in digitally maturity. There were parallels with the quantitative element of the project in that low digitally mature primary schools in particular were finding it challenging to embed technology use. The qualitative research highlighted that schools’ understanding of a technology strategy was quite varied, as was implementation (even for digitally mature schools). This supported the quantitative finding that the strategy pillar was the pillar where schools were scoring the lowest.
Key messages from the qualitative research included:
35 Schools which form the reference category here include: ‘Outstanding’, ‘Good’, ’Requires Improvement’ ‘Serious weakness’ and ‘Special Measures’ rated schools. Refer to Table 35 in Appendix 4 for further detail on digital maturity tiers by Ofsted rating.

78
• Digitally mature schools interviewed were more likely to say they have a formal technology strategy in place with a focus on improving pupil outcomes and the meaningful use of technology in the classroom.
• Digitally mature schools had been successful in embedding technology through a clear focus on how technology could be used to improve pupil outcomes. A strong leadership focus on technology, with a clear steer and direction from SLT on technology use was important.
• Other success factors that had supported schools in becoming digitally mature included strong staff buy-in; having the capacity to know what technology is available and what has the most impact; and a strong reliable infrastructure.
• Affordability, costs, suitability of technology for the setting, accessibility for pupils and staff, and required investment in staff time and training, were all key factors that schools considered when deciding which technology to invest in.
• Most schools interviewed reported providing training and support to staff using various approaches, including through INSET days, staff drop-ins and CPD sessions.
• Low digitally mature schools were finding budgets and funding a challenge in being able to invest in new technology or maintain existing technology. A few low digitally mature schools thought that their staff lacked confidence to drive technology use forward in school.
• Technical ability, funding and concerns about the security of documents and systems were all challenges for schools that were not yet fully cloud-based.
7.2 Exploratory testing of the digital maturity metric Exploratory statistical analysis was conducted to explore whether there were any relationships between where schools were on the digital maturity scale and their levels of pupil attainment. It must be recognised, however, that there were methodological limitations (see Section 2.4 and Section 4.3) with the approach taken and therefore care should be taken in the interpretation of these findings. While the analysis showed that there were statistically significant correlations between the three digital maturity pillars (technology, capability and strategy) and Key Stage 2 (KS2) attainment measures, these were not strong associations and therefore, may not be meaningful. No Key Stage 4 (KS4) attainment measure had a significant correlation with any of the digital maturity pillars.

79
However, there were some differentiating findings: the technology pillar had the lowest (of the three pillars) correlation with attainment and any correlations found may be confounded with school profiling variables; capability had no evidence of confounding with profiling variables although wider factors could be influential, such as teacher confidence and technology expertise (but which could not be explored through the statistical analysis); and the strategy pillar had the lowest average score of the three pillars, low correlation, and no evidence of confounding.
Qualitatively, digitally mature schools were able to provide illustrative examples of impact on pupil attainment (examples included an increase in computing, KS2, Progress 8 and Achievement 8 scores). Digitally mature schools reported wider impacts on pupils’ confidence, and engagement with technology; improvement in subject specific-knowledge (for example, reading and comprehension) and research and retention skills.
Most schools interviewed were unsure as to the impact of technology use on cost savings. Where examples were provided, they focused on school systems becoming more efficient from using technology which had probably led to cost savings in staff time (for example, an online registration approach reducing an administrator’s time) and physical resources (for example the use of paper, photocopying and printing).
There was some broad qualitative feedback on the impact of technology use on teacher workload including offering greater opportunities for collaboration and supporting assessment, feedback and marking processes. There were also felt to be well-being benefits through being able to establish more flexible working practices at school from using technology (for example, giving staff laptops, or remote access to school systems).
However, schools participating in interviews generally found it difficult to comment on the impact of technology use on pupil attainment, cost savings or teacher workload. Although they were able to give some illustrative examples of impact, schools generally do not measure the impact of technology use and they found it difficult to differentiate any impacts from other practices and approaches in school. This finding confirms limitations identified through the statistical analysis. Several confounding variables made it difficult for the analysis to conclude if there is a relationship between digital maturity and pupil attainment. For example, although the correlation between the digital maturity metric and attainment was strongest in terms of school capability in technology, it is unclear whether this is solely due to staff confidence or whether it is also related to the quality of teaching and how teachers deliver within the classroom.

80
7.3 Key learnings for developing a digital maturity metric The process of designing a measure of digital maturity was retrospective in nature since it used pre-determined survey questions alongside consideration of DfE’s policy priorities and ongoing programmes and research. The metric, therefore, was not purposefully designed and as such, would require further exploration and development to ensure it is relevant to schools, clearly defined and comprehensive.
The qualitative research with schools suggests that the questions used to develop the metric may not always lend themselves well to fully understanding where schools are in terms of their digital maturity. For example, the strategy pillar included questions on whether schools have a technology strategy in place, barriers to uptake to technology and plans for infrastructure investments. However, in the qualitative research (see Section 6) it was clear that schools’ approach to developing a technology strategy, or how they were progressing with technology without a strategy, was much more nuanced.
The qualitative research was also beneficial in identifying other factors which may influence schools’ level of digital maturity, which were not currently covered in the existing metric. Having sufficient budget to invest in technology was a major driving factor in how schools were progressing, and low digitally mature primary schools reported that a lack of budget was limiting the technology they were able to invest in. These schools often did not feel that it was appropriate to establish a technology strategy which they thought would be difficult to implement. This was supported through the quantitative analysis where local authority-maintained primary schools in rural areas were less likely to be a digitally mature school. The impact of funding to be able to progress a school in terms of their digital maturity, therefore, should not be under-estimated and is something that could not be captured within the current metric.
Senior leadership buy-in to technology use was also identified in the qualitative research as an important factor in how schools were progressing. A school-level drive to move technology use forward (with or without a dedicated technology strategy), in addition to other staff being given responsibility to enthuse others (at a middle leader level or through a staff member who had a particular passion for technology), was identified as a key success factor by digitally mature schools. However, these factors could not be captured through the metric developed for this research.
The expertise of staff was also an important factor in driving forwards digital maturity. Schools recognised the importance of training staff in the use of technology and utilised a range of approaches for achieving this, supporting staff buy-in and confidence. However, there was also a wider issue in some schools of having the

81
technical expertise in-house to support technology roll-out and the schools’ technology infrastructure. Primary schools were sometimes lacking dedicated information technology (IT) support or lacked staff capacity to deal with simple IT issues, meaning that this could be off-putting for staff, or leadership were hesitant about introducing new technology without having the infrastructure in place to support any further roll-out.
Further research would be helpful therefore in ensuring that school digital maturity is appropriately defined and measured.
7.4 Future considerations As exploratory research, this study has provided some useful insights into the design of a metric to identify levels of digital maturity in schools, and into schools’ experiences and progress towards making best use of technology to support their pupils and staff. It has however, also highlighted some areas for improvement. Future research on digital maturity in schools should consider:
• Having a clear pre-determined definition of ‘digital maturity’. This will help with the design of any research questions or areas for exploration and would also support the design and implementation of any metric going forward. This includes consideration of appropriate survey questions to ensure all facets of digital maturity are measured.
• The impact of COVID-19 on schools’ technology use. The research was conducted at a time during the pandemic when there were significant changes for schools in terms of their technology capabilities and emphasis. The longevity and sustainability of any changes may impact on any future measures of digital maturity.
• Developing an approach that controls for the confounding variables which were found to be more highly correlated with pupil attainment than technology use, and consideration of wider factors explored during the interviews.
• Follow-up research to explore how schools’ use, investment and approach to technology changes over time.
In conclusion, the metrics developed from this survey did not provide clear evidence of the relationship between schools’ level of digital maturity and pupil attainment. Statistical analysis has identified some confounding variables, such as pupil

82
characteristics, which as could be expected36, have a stronger association with pupil attainment than the digital maturity pillars identified through this research. This finding confirms limitations identified through the statistical analysis, as noted earlier. In addition, the interviews with schools identified other factors at play, such as, funding levels, senior leadership buy-in, ability to enthuse and encourage staff, and training and development. Whilst the metric used in this research has been a useful tool to assess schools’ progress towards digital maturity, there were methodological limitations and as such, further research which is specifically designed around exploring this concept and constructing a measure of digital maturity that is both valid and reliable, would ensure that digital maturity is comprehensively defined and measured.
36 See for example, DfE (2020) Key stage 4 performance, 2019 (revised) which explores the disadvantage gap in attainment; research by the Sutton Trust (Our Research - Sutton Trust) including Kirby, P. and Cullinane, C. (2016) Class differences: ethnicity and disadvantage; and Treadaway, M. (2019) How attainment gaps emerge from Foundation Stage to Key Stage 4, part one – Fisher Family Trust Education Datalab.

83
Appendix 1: Details of the Education Technology 2020-21 survey of schools The research, commissioned by the Department for Education (DfE), aimed to understand the current technology landscape in schools to help inform steps taken to better support:
• Schools to embed and use technology well in ways that promote cost savings, workload reductions, improved pupil outcomes and resilience to future system shocks.
• The EdTech sector to understand the technology landscape of the school sector so that they can better adapt and develop their tools in ways that reflect the current conditions within schools.
The research was designed around the following objectives:
• Provide a nationally representative estimate of the scale of technology use in schools.
• Provide baseline data, against which the impact of policy can be measured going forwards.
• Identity statistically significant differences between school phase (primary and secondary schools) and respondent role (headteacher, teacher, technical lead) where relevant, to ensure that activity can be targeted appropriately.
Methodology The decision was taken to focus on maintained primary and secondary schools and to exclude colleges and special schools.
An online survey approach was utilised for the research. Due to the range of issues being addressed, three surveys were developed in partnership with the DfE: a headteacher survey, a teacher survey and a technical survey.
Sample An engagement stage was used to provide schools with the opportunity to opt into the survey process. A sample of 12,000 schools was selected from the register of schools and colleges in England, ‘Get information about schools’ (GIAS), using a stratified random sampling approach. The sample of 12,000 was drawn randomly, stratified by region and school phase.

84
Each school was contacted by email to request their participation and nomination of appropriate members of staff who would be able to participate. Schools were asked to nominate up to five members of staff to take part:
• Headteacher survey: the headteacher or other senior leader with strategic overview of technology use within the school.
• Technical survey: a staff member with knowledge of technology capacity in school.
• Teacher survey: up to three teachers, with a mix of length of teaching experience, subject expertise and perceived proficiency with technology.
To minimise potential bias in the teacher survey (where those more IT proficient were nominated), schools were asked to nominate a mix of up to three teachers (as described above). The research team then purposively selected one teacher per school to be included in the survey sample, to ensure a spread of length of service, subject area and perception of IT skill level.
The recruitment of schools to the survey was undertaken between Monday 12th October and Friday 11th December 2020. As a result of the engagement stage, 1,012 schools agreed to take part in the survey.
Fieldwork The survey fieldwork period ran from the 25th November 2020 to 29th January 2021. As shown in the Table 18, 897 headteacher surveys, 854 teacher surveys and 804 technical surveys were received.
Table 18: Responses received by survey/respondent type and school phase
Survey type Primary Secondary Total
Headteacher survey 687 210 897
Technical survey 619 185 804
Teacher survey 661 193 854
Data was weighted to match the national profile of schools for region within phase and size of school within phase.37
37 Further details of the Education Technology Survey 2020-21 methodology can be found in the published report.

85
Appendix 2: Digital maturity pillars, indicators (survey questions) and scoring system38,39
Table 19: Technology pillar relevant survey questions and scoring system
SPSS variable name40
Single or multiple
response Question wording Response
options Recoding for
pillars
IT_Q1_Lr4r1, IT_Q1_Lr5r1 & IT_Q1_Lr6r1 each divided by enrol number and then summed.
SINGLE
How many digital devices of the following type are available for teachers and pupils to use (including those provided on loan)?
Calculated
(0 thru 0.2=0) (0.2 thru 0.4=0.25) (0.4 thru 0.6=0.5) (0.6 thru 0.8=0.75) (0.8 thru max=1) (sysmis=0)
IT_Q9 SINGLE
Which of the following does your school currently use for ADMIN STORAGE?
(1) On-premise only; (2) Cloud-based only; (3) Mixture of on-premise and cloud-based; (4) Don't know.
(1=0) (2=1) (3=.5) (4=0)
IT_Q10 SINGLE
Does your school have plans to implement cloud-based admin storage in the future
(1 ) Yes – in the next 12 months; (2) Yes – in more than 12 months’ time; (3) No; (4) Don’t know.
(1=1) (2=.5) (3=0) (4=0)
IT_Q11 SINGLE
Which of the following does your school currently use for CURRICULUM STORAGE?
(1) On-premise only; (2) Cloud-based only; (3) Mixture of on-premise and cloud-based; (4) Don't know.
(1=0) (2=1) (3=.5) (4=0)
IT_Q12 SINGLE
Does your school have plans to implement cloud-based admin storage in the future
(1 ) Yes – in the next 12 months; (2) Yes – in more than 12 months’ time; (3) No; (4) Don’t know.
(1=1) (2=.5) (3=0) (4=0)
IT_Q22 SINGLE X5
How confident are you that the following aspects of your Unified Threat Protection is adequate to protect your network?
(1) Very confident; (2) Fairly confident; (3) Not very confident; (4) Not at all confident; (5) Don’t know
(1=1) (2=.67) (3=.33) (4=0) (5=0)
IT_Q22R1 MULTIPLE (SINGLE X5) Up to date patching Confidence scale (1=1) (2=.67)
(3=.33) (4=0) (5=0)
IT_Q22R2 MULTIPLE (SINGLE X5) Email filtering Confidence scale (1=1) (2=.67)
(3=.33) (4=0) (5=0)
38 Responses to questions 9 & 10, 11 & 12, and 13 & 14 are combined together to create a breakdown for schools reporting that they currently only have on-premise storage to the first question but have plans to use cloud storage in the future. The logic used in SPSS is fully detailed in the syntax (Appendix 6). 39 Source of question details is Education Technology Survey 2020-21. 40 IT denotes technical survey, HD denotes headteacher survey.

86
SPSS variable name40
Single or multiple
response Question wording Response
options Recoding for
pillars
IT_Q22R3 MULTIPLE (SINGLE X5)
Web filtering and monitoring Confidence scale (1=1) (2=.67)
(3=.33) (4=0) (5=0)
IT_Q22R4 MULTIPLE (SINGLE X5) User logging Confidence scale (1=1) (2=.67)
(3=.33) (4=0) (5=0)
IT_Q22R5 MULTIPLE (SINGLE X5)
Multi-factor authentication Confidence scale (1=1) (2=.67)
(3=.33) (4=0) (5=0)
IT_Q13 SINGLE X4
For each of the following systems, does your school currently use on-premise or cloud systems?
(1) On-premise only; (2) Cloud-based only; (3) Mixture of on-premise and cloud-based; (4) Don't know.
(1=0) (2=1) (3=.5) (4=0)
IT_Q13R1 MULTIPLE (SINGLE X4) Finance Cloud systems usage
scale (1=0) (2=1) (3=.5) (4=0)
IT_Q13R2 MULTIPLE (SINGLE X4)
Management information systems
Cloud systems usage scale
(1=0) (2=1) (3=.5) (4=0)
IT_Q13R3 MULTIPLE (SINGLE X4) Human resources Cloud systems usage
scale (1=0) (2=1) (3=.5) (4=0)
IT_Q13R4 MULTIPLE (SINGLE X4) Library management Cloud systems usage
scale (1=0) (2=1) (3=.5) (4=0)
IT_Q14 SINGLE
Does your school have plans to implement any cloud-based systems in the future?
(1 ) Yes – in the next 12 months; (2) Yes – in more than 12 months’ time; (3) No; (4) Don’t know.
(1=1) (2=.5) (3=0) (4=0)
IT_Q19 SINGLE Do you retain offline backups of critical data?
(1) Yes; (2) No; (3) Don't know. (1=1) (2=0) (3=0)
HD_Q4 MULTIPLE (SINGLE X5)
How fit for purpose are the following devices at your school?
(1) Completely fit for purpose; (2) Mostly fit for purpose; (3) Partially fit for purpose; (4) Not at all fit for purpose; (5) Don’t know; (6) We do not have any of these.
(1=1) (2=.67) (3=.33) (4=0) (5=0) (6=0)
IT_Q4R1 MULTIPLE (SINGLE X5) Desktop computer Fit for Purpose (FfP)
Scale
(1=1) (2=.67) (3=.33) (4=0) (5=0) (6=sysmis)
IT_Q4R2 MULTIPLE (SINGLE X5) Tablet computers Fit for Purpose (FfP)
Scale
(1=1) (2=.67) (3=.33) (4=0) (5=0) (6=sysmis)
IT_Q4R3 MULTIPLE (SINGLE X5) Laptops /notebooks Fit for Purpose (FfP)
Scale
(1=1) (2=.67) (3=.33) (4=0) (5=0) (6=sysmis)
IT_Q4R4 MULTIPLE (SINGLE X5)
Interactive whiteboards / blackboards
Fit for Purpose (FfP) Scale
(1=1) (2=.67) (3=.33) (4=0) (5=0) (6=0)
IT_Q4R6 MULTIPLE (SINGLE X5)
Specialised assistive devices, e.g. Braille devices, digital communication aids
Fit for Purpose (FfP) Scale
(1=1) (2=.67) (3=.33) (4=0) (5=0) (6=0)

87
IT_Q6 SINGLE X5 How fit for purpose are the following at your school?
(1) Completely fit for purpose; (2) Mostly fit for purpose; (3) Partially fit for purpose; (4) Not at all fit for purpose; (5) Don’t know; (6) We do not have any of these.
(1=1) (2=.67) (3=.33) (4=0) (5=0) (6=0)
IT_Q6R1 MULTIPLE (SINGLE X5) WIFI Fit for Purpose (FfP)
Scale
(1=1) (2=.67) (3=.33) (4=0) (5=0) (6=0)
IT_Q6R2 MULTIPLE (SINGLE X5)
Broadband connectivity
Fit for Purpose (FfP) Scale
(1=1) (2=.67) (3=.33) (4=0) (5=0) (6=0)
IT_Q6R3 MULTIPLE (SINGLE X5) Servers Fit for Purpose (FfP)
Scale
(1=1) (2=.67) (3=.33) (4=0) (5=0) (6=0)
IT_Q6R4 MULTIPLE (SINGLE X5)
Digital storage (on-site and cloud-based)
Fit for Purpose (FfP) Scale
(1=1) (2=.67) (3=.33) (4=0) (5=0) (6=0)
IT_Q6R5 MULTIPLE (SINGLE X5) Local area network Fit for Purpose (FfP)
Scale
(1=1) (2=.67) (3=.33) (4=0) (5=0) (6=0)
IT_Q18_1 MULTIPLE X12
What are the main operating systems (OS) your school is currently using for the following? Select all that apply.
(1) Windows XP (Home, Pro, or EDU); (2) Windows Vista (Home, Pro, or EDU); (3) Windows 10 (Home, Pro, or EDU); (4) Windows 8; (5) Windows 7; (6) Mac OS Mojave; (7) Mac OS High Sierra; (8) Mac OS El Capitan; (9) Mac OS Other; (10) Linux (Ubuntu, Lubuntu, etc); (11) Google Chrome OS; (12) Other; (13) Do not know.
(3=.75) (6=1) (ELSE=0)
IT_Q18_2 MULTIPLE
What are the main operating systems (OS) your school is currently using for the following? Select all that apply.
(1) Windows Server 2008 (Foundation, Essentials, Standard, Enterprise, Datacentre); (2) Windows Server 2008 R2 (Foundation, Essentials, Standard, Enterprise, Datacentre); (3) Windows Server 2012 (Foundation, Essentials, Standard, Datacentre); (4) Windows Server 2012 R2 (Foundation, Essentials, Standard,
(6=1) (5=.5) (7=.5) (8=.5) (9=.5) (10=.5) (ELSE=0)

88
Datacentre); (5) Windows Server 2016 (Hyper-V, Essentials, Standard, Datacentre); (6) Windows Server 2019 (Hyper-V, Essentials, Standard, Datacentre); (7) Linux (Ubuntu, Red Hat, SUSE, CentOS, Debian, Oracle, ClearOS, Other); (8) Mac Server OS (Various, please specify); (9) Other (please specify); (10) Don't Know.
Table 20: Capability pillar relevant survey questions and scoring system
SPSS variable
name
Single or multiple
response Question wording Response options Recoding for
pillars
IT_Q21 SINGLE
Do school staff undergo any cyber security awareness training?
(1) Yes, it’s compulsory for all staff; (2) Yes, it’s compulsory for certain staff; (3) Yes, it’s optional; (4) No; (5) Don’t know.
(1=1) (2=.5) (3=.25) (4=0) (5=0)
HD_Q16R1 MULTIPLE (SINGLE X1)
To what extent do any of the following represent a barrier to increased uptake of education technology? Staff willingness to use technology
(1) Big barrier; (2) Small barrier; (3) Not a barrier; (4) Don’t know.
(3=1) (2=.5) (1=0) (4=0)
0 SINGLE X6
Thinking first about the software used in your school. On balance, to what extent are they meeting your school’s needs in each of the following [SCHOOL ADMINISTRATION] areas?
(1) Always; (2) Mostly; (3) Sometimes; (4) Rarely; (5) Not used / not applicable; (6) Don’t know.
(1=1) (2=.75) (3=.5) (4=.25) (5=0) (6=0)
HD_Q1R1 MULTIPLE SINGLE X6 Timetabling Meets needs scale (1=1) (2=.75) (3=.5)
(4=.25) (5=0) (6=0)
HD_Q1R2 MULTIPLE SINGLE X6 Financial management Meets needs scale (1=1) (2=.75) (3=.5)
(4=.25) (5=0) (6=0)
HD_Q1R3 MULTIPLE SINGLE X6
Pupil data management Meets needs scale (1=1) (2=.75) (3=.5)
(4=.25) (5=0) (6=0)
HD_Q1R4 MULTIPLE SINGLE X6
Parental engagement /communication Meets needs scale (1=1) (2=.75) (3=.5)
(4=.25) (5=0) (6=0)
HD_Q1R5 MULTIPLE SINGLE X6
Supporting flexible working practices (e.g. part-time working)
Meets needs scale (1=1) (2=.75) (3=.5) (4=.25) (5=0) (6=0)

89
SPSS variable
name
Single or multiple
response Question wording Response options Recoding for
pillars
HD_Q1R6 MULTIPLE SINGLE X6
Communication with and delivery of governance
Meets needs scale (1=1) (2=.75) (3=.5) (4=.25) (5=0) (6=0)
HD_Q2 SINGLE X11
Thinking first about the software used in your school. On balance, to what extent are they meeting your school’s needs in each of the following TEACHING areas?
(1) Always; (2) Mostly; (3) Sometimes; (4) Rarely; (5) Not used / not applicable; (6) Don’t know.
(1=1) (2=.75) (3=.5) (4=.25) (5=0) (6=0)
HD_Q2R1 MULTIPLE SINGLE X11
Planning lessons / curriculum content Meets needs scale (1=1) (2=.75) (3=.5)
(4=.25) (5=0) (6=0)
HD_Q2R2 MULTIPLE SINGLE X11 Delivering lessons Meets needs scale (1=1) (2=.75) (3=.5)
(4=.25) (5=0) (6=0)
HD_Q2R3 MULTIPLE SINGLE X11
Conducting formative assessment Meets needs scale (1=1) (2=.75) (3=.5)
(4=.25) (5=0) (6=0)
HD_Q2R4 MULTIPLE SINGLE X11
Conducting summative assessment Meets needs scale (1=1) (2=.75) (3=.5)
(4=.25) (5=0) (6=0)
HD_Q2R5 MULTIPLE SINGLE X11
Tracking pupil progress Meets needs scale (1=1) (2=.75) (3=.5)
(4=.25) (5=0) (6=0)
HD_Q2R6 MULTIPLE SINGLE X11
Offering independent / online learning (including in class)
Meets needs scale (1=1) (2=.75) (3=.5) (4=.25) (5=0) (6=0)
HD_Q2R7 MULTIPLE SINGLE X11
Supporting remote teaching and learning Meets needs scale (1=1) (2=.75) (3=.5)
(4=.25) (5=0) (6=0)
HD_Q2R8 MULTIPLE SINGLE X11
Supporting blended learning and innovative teaching (i.e. combining face-to-face and digital teaching)
Meets needs scale (1=1) (2=.75) (3=.5) (4=.25) (5=0) (6=0)
HD_Q2R9 MULTIPLE SINGLE X11
Collaborating and sharing resources with other teachers
Meets needs scale (1=1) (2=.75) (3=.5) (4=.25) (5=0) (6=0)
HD_Q2R10 MULTIPLE SINGLE X11
Delivering teacher training/CPD Meets needs scale (1=1) (2=.75) (3=.5)
(4=.25) (5=0) (6=0)
HD_Q2R11 MULTIPLE SINGLE X11
Supporting pupils with SEND (Supporting pupils with SEND (e.g. assistive technology that supports pupils to learn / improve independence / wellbeing)
Meets needs scale (1=1) (2=.75) (3=.5) (4=.25) (5=0) (6=0)
HD_Q28 SINGLE
On balance, how much of the regular curriculum are you / will you be able to deliver to pupils who are learning from home?
(1) All of it; (2) Most of it; (3) Some of it; (4) None of it.
(1=1) (2=.75) (3=.5) (4=0)

90
SPSS variable
name
Single or multiple
response Question wording Response options Recoding for
pillars
HD_Q9 SINGLE
Does your school provide support for pupils to enable them to use accessibility features built into mainstream devices and software (e.g. computers, laptops and browsers)?
(1) Yes; (2) Not yet, but we plan to; (3) No; (4) Don’t know.
(1=1) (2=.5) (3=0) (4=0)
HD_Q17 SINGLE
In your view, approximately what proportion of teaching staff in your school are confident about using education technology in the classroom?
(1) All; (2) Most; (3) Some; (4) Few; (5) None; (6) Don't Know
(1=1) (2=.75) (3=.5) (4=.25) (5=0) (6=0)
Table 21: Strategy pillar relevant survey questions and scoring system
SPSS variable
name
Single or multiple
response Question wording Response
options Recoding for
pillars
IT_Q14 SINGLE
Does your school have plans to implement any cloud-based systems in the future?
(1 ) Yes – in the next 12 months; (2) Yes – in more than 12 months’ time; (3) No; (4) Don’t know.
(1=1) (2=.5) (3=0) (4=0)
HD_Q16 SINGLE X10
To what extent do any of the following represent a barrier to increased uptake of education technology? (1) Staff willingness to use technology; (2) Staff skills and confidence with technology; (3) Safeguarding and data concerns; (4) The benefits of technology are unclear; (5) Limited procurement guidance; (6) Broadband connectivity in school; (7) Wireless connectivity in school; (8) Availability of technology in school; (9) Cost of technology; (10) Budgetary constraints.
(1) Big barrier; (2) Small barrier; (3) Not a barrier; (4) Don’t know.
(3=1) (2=.5) (1=0) (4=0)
HD_Q16r9 SINGLE (9) Cost of technology Barrier scale above (3=1) (2=.5) (1=0) (4=0)

91
SPSS variable
name
Single or multiple
response Question wording Response
options Recoding for
pillars
HD_Q16r10 SINGLE (10) Budgetary constraints Barrier scale above (3=1) (2=.5) (1=0)
(4=0)
HD_Q10 SINGLE
Is there a digital technology strategy for your school? Select one only
(1) Yes - we have a school-specific strategy; (2) Yes - we have a Trust-wide strategy; (3) Yes – we have a local authority strategy; (4) Not yet - in development / planning; (5) No; (6) Don't know.
(1=1) (0=0)
IT_Q8 MULTIPLE X3
Do you currently have plans to invest in any of the following in the next 3 years?
Yes (1); No (0) (1=1) (0=0)
IT_Q8r1 MULTIPLE SINGLE X3 Broadband Plans Yes or No scale (1=1) (0=0)
IT_Q8r2 MULTIPLE SINGLE X3 Networking Plans Yes or No scale (1=1) (0=0)
IT_Q8r3 MULTIPLE SINGLE X3 Cyber Security Plans Yes or No scale (1=1) (0=0)

92
Appendix 3: Pillar data (school characteristics)41 Table 22: Pillar score statistics for primary and secondary schools
Technology pillar Capability pillar Strategy pillar
Primary Secondary Primary Secondary Primary Secondary Mean 0.58 0.62 0.62 0.65 0.27 0.42
Standard deviation
0.13 0.57 0.14 0.60 0.18 0.83
Range 0.82 0.57 0.76 0.60 0.89 0.83
Minimum 0.08 0.29 0.24 0.36 0.00 0.00
10th percentile
0.41 0.48 0.42 0.45 0.00 0.17
Lower quartile
0.51 0.56 0.52 0.55 0.17 0.33
Median 0.59 0.64 0.62 0.65 0.28 0.44
Upper quartile
0.67 0.68 0.72 0.76 0.39 0.56
90th percentile
0.73 0.76 0.82 0.83 0.50 0.61
Maximum 0.90 0.86 1.00 0.96 0.89 0.83
Number of schools
508 146 508 146 508 146
The mean scores for primary and secondary schools, across each of the three pillars, are shown in the above table. The three differences, between primary and secondary (0.58 vs 0.62 (technology difference 0.04); 0.62 vs 0.65 (capability difference 0.03); and (0.27 vs 0.42 (strategy difference 0.15)) are all statistically significant. The question remains whether these statistically significant differences are ‘meaningfully’ different. Questions have mostly been coded on an equally spaced scale between 0 and 1, so differences between adjacent points on a five-point ordinal scale would typically be 0.25, or on a four-point ordinal scale 0.33. The observed differences on the means for the technology and capability pillars are only a small fraction of the difference expected if one group had on average been one point higher on the ordinal scales.
41 Source of data used for this analysis were Education Technology Survey 2020-21.

93
Table 23: Pillar score statistics for types of schools
Technology pillar Capability pillar Strategy pillar
Academies / Free Schools
LA Maintaine
d
Academies / Free Schools
LA Maintaine
d
Academies / Free Schools
LA Maintaine
d Mean 0.60 0.58 0.63 0.62 0.36 0.27
Standard Deviation
0.12 0.13 0.15 0.14 0.19 0.18
Range 0.76 0.82 0.72 0.74 0.89 0.78
Minimum 0.10 0.08 0.24 0.26 0.00 0.00
10th Percentile
0.47 0.40 0.43 0.43 0.11 0.00
Lower quartile
0.53 0.51 0.51 0.52 0.22 0.17
Median 0.62 0.59 0.63 0.62 0.33 0.28
Upper quartile
0.68 0.67 0.74 0.72 0.50 0.39
90th Percentile
0.74 0.73 0.83 0.81 0.56 0.50
Maximum 0.86 0.90 0.96 1.00 0.89 0.78
Number of Schools
252 402 252 402 252 402
The mean scores for the technology and strategy pillars for academies/free schools and local authority (LA) maintained schools are significantly different (see comment regarding making comparisons between primary and secondary schools for Table 22).
Table 24: Pillar score statistics for phase and type of school
Phase/type Statistics Technology pillar
Capability pillar
Strategy pillar
1. Primary academies/Free schools
Mean 0.59 0.61 0.31
Range 0.71 0.71 0.89
Minimum 0.10 0.24 0.00
Median 0.62 0.60 0.33

94
Phase/type Statistics Technology pillar
Capability pillar
Strategy pillar
Maximum 0.81 0.95 0.89
Std. deviation
0.13 0.15 0.18
N 139 139 139
2. Primary LA maintained
Mean 0.58 0.62 0.26
Range 0.83 0.74 0.78
Minimum 0.08 0.26 0.00
Median 0.58 0.62 0.28
Maximum 0.90 1.00 0.78
Std. deviation
0.13 0.14 0.18
N 404 404 404
3. Secondary academies/Free schools
Mean 0.62 0.65 0.43
Range 0.57 0.59 0.83
Minimum 0.29 0.36 0.00
Median 0.63 0.66 0.44
Maximum 0.86 0.96 0.83
Std. deviation
0.10 0.14 0.17
N 83 83 83
4. Secondary LA maintained
Mean 0.61 0.64 0.37
Range 0.46 0.53 0.67
Minimum 0.31 0.41 0.00
Median 0.65 0.65 0.36
Maximum 0.77 0.94 0.67
Std. deviation
0.12 0.13 0.17
N 28 28 28 1 = Primary academies/Free schools; 2 = Primary LA maintained; 3 = Secondary academies/Free schools; 4 = Secondary LA maintained.

95
Significant differences amongst means: 1 v 2, strategy only; 1 v 3, capability and strategy; 2 v 4, strategy only; 3 v 4, None. (See comment regarding making comparisons under Table 22).
Table 25: Pillar score statistics across England Government Office Regions
Region Statistics Technology pillar
Capability pillar
Strategy pillar
1. East of England
Mean 0.59 0.60 0.28
Range 0.59 0.62 0.75
Minimum 0.27 0.29 0.00
Median 0.60 0.59 0.28
Maximum 0.86 0.91 0.75
N 78 78 78
2. East Midlands
Mean 0.60 0.57 0.26
Range 0.75 0.53 0.67
Minimum 0.08 0.31 0.00
Median 0.63 0.57 0.28
Maximum 0.83 0.84 0.67
N 62 62 62
3. London Mean 0.60 0.63 0.31
Range 0.50 0.74 0.69
Minimum 0.32 0.26 0.00
Median 0.61 0.62 0.33
Maximum 0.82 1.00 0.69
N 76 76 76
4. North East Mean 0.60 0.66 0.34
Range 0.59 0.60 0.72
Minimum 0.28 0.31 0.00
Median 0.61 0.66 0.33
Maximum 0.87 0.91 0.72
N 33 33 33
5. North West Mean 0.55 0.66 0.30
Range 0.61 0.59 0.89

96
Region Statistics Technology pillar
Capability pillar
Strategy pillar
Minimum 0.20 0.36 0.00
Median 0.56 0.67 0.33
Maximum 0.80 0.95 0.89
N 95 95 95
6. South East Mean 0.58 0.61 0.29
Range 0.63 0.62 0.83
Minimum 0.28 0.31 0.00
Median 0.58 0.60 0.28
Maximum 0.90 0.93 0.83
N 100 100 100
7. South West Mean 0.59 0.63 0.28
Range 0.63 0.65 0.61
Minimum 0.25 0.30 0.00
Median 0.60 0.64 0.33
Maximum 0.88 0.95 0.61
N 71 71 71
8. West Midlands
Mean 0.59 0.61 0.31
Range 0.70 0.68 0.83
Minimum 0.10 0.24 0.00
Median 0.61 0.63 0.33
Maximum 0.80 0.92 0.83
N 71 71 71
9. Yorkshire and the Humber
Mean 0.61 0.64 0.30
Range 0.74 0.68 0.72
Minimum 0.14 0.27 0.00
Median 0.64 0.62 0.33
Maximum 0.88 0.96 0.72
N 68 68 68
Total Mean 0.59 0.62 0.30
Range 0.83 0.76 0.89
Minimum 0.08 0.24 0.00

97
Region Statistics Technology pillar
Capability pillar
Strategy pillar
Median 0.60 0.63 0.33
Maximum 0.90 1.00 0.89
N 654 654 654
Significance testing was not conducted for regional analysis due to low bases.
Table 26: Pillar score statistics across Ofsted ratings
Rating Statistics Technology pillar
Capability pillar
Strategy pillar
1. Good Mean 0.58 0.61 0.28
Range 0.80 0.71 0.83
Minimum 0.08 0.24 0.00
Median 0.59 0.61 0.32
Maximum 0.88 0.95 0.83
Std. deviation
0.13 0.14 0.18
N 421 421 421
2. Outstanding Mean 0.61 0.67 0.31
Range 0.58 0.60 0.72
Minimum 0.32 0.40 0.00
Median 0.61 0.66 0.33
Maximum 0.90 1.00 0.72
Std. deviation
0.11 0.13 0.17
N 101 101 101
3. Requires improvement
Mean 0.60 0.63 0.28
Range 0.31 0.67 0.72
Minimum 0.45 0.27 0.00
Median 0.58 0.60 0.32
Maximum 0.77 0.94 0.72

98
Rating Statistics Technology pillar
Capability pillar
Strategy pillar
Std. deviation
0.08 0.17 0.20
N 35 35 35
4. Serious Weaknesses
Mean 0.67 0.80 0.42
Range 0.35 0.46 0.22
Minimum 0.51 0.50 0.33
Median 0.72 0.91 0.44
Maximum 0.86 0.96 0.56
Std. deviation
0.16 0.20 0.09
N 3 3 3
5. Special Measures
Mean 0.55 0.64 0.33
Range 0.45 0.41 0.39
Minimum 0.27 0.42 0.17
Median 0.58 0.65 0.33
Maximum 0.73 0.83 0.56
Std. deviation
0.15 0.13 0.15
N 8 8 8 Samples sizes were only large enough for significance testing for the ‘Good’ and ‘Outstanding’ ratings. Mean scores for technology and capability pillars are significantly different between ‘Good’ and ‘Outstanding’ schools (see comment regarding making comparisons under Table 22).
Table 27: Pillar score statistics across geographic type
Technology pillar Capability pillar Strategy pillar
Rural Urban Rural Urban Rural Urban Mean 0.59 0.59 0.62 0.62 0.27 0.31
Standard deviation 0.12 0.13 0.13 0.15 0.19 0.19
Range 0.63 0.82 0.62 0.76 0.67 0.89
Minimum 0.25 0.08 0.33 0.24 0.00 0.00

99
Technology pillar Capability pillar Strategy pillar
10th percentile 0.40 0.42 0.45 0.42 0.00 0.00
Lower quartile 0.52 0.52 0.53 0.52 0.11 0.17
Median 0.59 0.60 0.63 0.63 0.28 0.33
Upper quartile 0.66 0.68 0.70 0.73 0.43 0.44
90th percentile 0.75 0.73 0.79 0.83 0.50 0.56
Maximum 0.88 0.90 0.95 1.00 0.67 0.89
Number of schools 146 508 146 508 146 508
The mean scores for the strategy pillar for urban and rural locations are significantly different (see comment regarding making comparisons under Table 22).
Table 28: Pillar score statistics across Free School Meal bands
Technology pillar Capability pillar Strategy pillar
Low Mid High Low Mid High Low Mid High Mean 0.59 0.59 0.58 0.63 0.63 0.61 0.29 0.29 0.30
Standard deviation
0.12 0.12 0.14 0.14 0.15 0.14 0.18 0.19 0.19
Range 0.80 0.58 0.79 0.66 0.66 0.76 0.83 0.83 0.78
Minimum 0.10 0.28 0.08 0.28 0.30 0.24 0.00 0.00 0.00
10th percentile
0.41 0.43 0.40 0.44 0.43 0.42 0.00 0.00 0.00
Lower quartile
0.52 0.52 0.51 0.54 0.52 0.53 0.17 0.17 0.17
Median 0.60 0.60 0.59 0.64 0.62 0.61 0.33 0.33 0.33
Upper quartile
0.67 0.68 0.67 0.73 0.73 0.71 0.44 0.44 0.44
90th percentile
0.73 0.74 0.74 0.81 0.84 0.81 0.56 0.56 0.56
Maximum 0.90 0.86 0.87 0.94 0.96 1.00 0.83 0.83 0.78
Number of schools
229 200 217 229 200 218 229 200 218
No differences in means are significant.

100
Table 29: Pillar score statistics by school phase and size
Phase/size Statistics Technology pillar
Capability pillar
Strategy pillar
1. Primary small
Mean 0.56 0.60 0.24
Range 0.68 0.65 0.67
Minimum 0.20 0.26 0.00
Median 0.58 0.61 0.28
Maximum 0.88 0.91 0.67
Std. deviation 0.14 0.13 0.19
N 181 181 181
2. Primary medium
Mean 0.57 0.64 0.28
Range 0.83 0.67 0.89
Minimum 0.08 0.28 0.00
Median 0.57 0.63 0.28
Maximum 0.90 0.95 0.89
Std. deviation 0.14 0.14 0.17
N 178 178 178
3. Primary large
Mean 0.61 0.61 0.29
Range 0.69 0.76 0.78
Minimum 0.14 0.24 0.00
Median 0.63 0.60 0.33
Maximum 0.83 1.00 0.78
Std. deviation 0.11 0.16 0.19
N 185 185 185
4. Secondary small
Mean 0.62 0.63 0.36
Range 0.50 0.59 0.72
Minimum 0.29 0.36 0.00
Median 0.66 0.64 0.33
Maximum 0.79 0.96 0.72
Std. deviation 0.12 0.16 0.18
N 36 36 36
Mean 0.60 0.66 0.43

101
Phase/size Statistics Technology pillar
Capability pillar
Strategy pillar
5. Secondary medium
Range 0.53 0.55 0.83
Minimum 0.33 0.36 0.00
Median 0.61 0.70 0.44
Maximum 0.86 0.91 0.83
Std. deviation 0.11 0.13 0.16
N 37 37 37
6. Secondary large
Mean 0.64 0.67 0.46
Range 0.47 0.54 0.83
Minimum 0.39 0.40 0.00
Median 0.64 0.66 0.44
Maximum 0.85 0.94 0.83
Std. deviation 0.08 0.13 0.17
N 37 37 37
1 = Small primary; 2 = Medium primary; 3 = Large primary. Significant difference in means: 1 v 2, capability only; 2 v 3, technology only; 1 v 3, technology and strategy.
No significance testing was conducted of secondary schools due to small sample sizes. (See comment regarding making comparisons under Table 22).
Table 30: Pillar score statistics by school trust flag
Technology pillar
Capability pillar
Strategy pillar
Not applicable
Mean 0.58 0.62 0.27
Range 0.83 0.74 0.78
Minimum 0.08 0.26 0.00
Median 0.59 0.62 0.28
Maximum 0.90 1.00 0.78
N 372 372 372
Mean 0.55 0.63 0.34
Range 0.46 0.57 0.44

102
Technology pillar
Capability pillar
Strategy pillar
Not supported by a trust
Minimum 0.31 0.31 0.11
Median 0.53 0.64 0.28
Maximum 0.78 0.88 0.56
N 13 13 13
Supported by a multi-academy trust
Mean 0.62 0.63 0.37
Range 0.76 0.72 0.89
Minimum 0.10 0.24 0.00
Median 0.63 0.63 0.33
Maximum 0.86 0.96 0.89
N 196 196 196
Supported by a single-academy trust
Mean 0.59 0.65 0.34
Range 0.39 0.57 0.72
Minimum 0.41 0.37 0.00
Median 0.60 0.67 0.33
Maximum 0.80 0.93 0.72
N 56 56 56
Supported by a trust
Mean 0.62 0.63 0.31
Range 0.46 0.48 0.67
Minimum 0.41 0.42 0.00
Median 0.61 0.65 0.33
Maximum 0.87 0.91 0.67
N 17 17 17
Total Mean 0.59 0.63 0.31
Range 0.83 0.76 0.89
Minimum 0.08 0.24 0.00
Median 0.60 0.63 0.33
Maximum 0.90 1.00 0.89
N 654 654 654
Significance tests completed on differences between means for ‘Supported by a multi-academy trust’ and ‘Not applicable’ categories. Technology and strategy

103
differences are significant. (See comment regarding making comparisons under Table 22).

104
Appendix 4: Crosstabulations of digital maturity tiers and school characteristics See Section 5 for details of how digital maturity tiers were developed.42
Differences across tiers are provided for each school characteristic variable in the Table 31 through Table 38. Low, medium and high classifications refer to the combination of pillar scores as shown in Table 31:
• Low digital maturity tier includes schools that have no top rating (3) and one or more low rating (1) across the three pillars.
• High digital maturity tier includes schools that have two or more top ratings (3) and no low rating (1) across the three pillars.
• Schools not classified by either the highest or lowest definitions above fit into the medium tier.
Note that each subscript letter denotes a subset of tier categories whose column proportions do not differ significantly from each other at the .05 level (for ease of interpretation, where the letters (a,b,c) are shown, if the letters are different across two columns (a/b) then there is statistical significance. If the letters are the same (a/a), there is no significance).
Table 31: Digital maturity tiers by phase
Phase Low digital maturity
Medium digital maturity
High digital maturity Total
Primary 191a 314b 38c 543
95% 80% 64% 83%
Secondary 10a 80b 21c 111
5% 20% 36% 17%
Total 201 394 59 654
42 Source of data used for this analysis were Education Technology Survey 2020-21.

105
Table 32: Digital maturity tiers by school type
Type Low digital maturity
Medium digital
maturity High digital
maturity Total
Academies/ Free schools 47a 146b 29b 222
24% 37% 49% 34%
LA Maintained 153a 249b 30b 432
77% 63% 51% 66%
Total 200 395 59 654
Table 33: Digital maturity tiers by school phase and type
School phase & type Low digital maturity
Medium digital
maturity
High digital maturity Total
Primary Academies/ Free 41a 85a 13a 139
20% 22% 22% 21%
Primary LA Maintained 150a 229b 25b 404
75% 58% 42% 62%
Secondary Academies/ Free
6a 60b 16b 82
3% 15% 27% 13%
Secondary LA Maintained 4a 19a, b 5b 28
2% 5% 9% 4%
Total 201 393 59 653
Table 34: Digital maturity tiers by region
Region Low
digital maturity
Medium digital
maturity
High digital maturity Total
East of England 28a 42a 8a 78
14% 11% 14% 12%
East Midlands 24a 36a 1a 61

106
Region Low
digital maturity
Medium digital
maturity
High digital maturity Total
12% 9% 2% 9%
London 18a 47a 11a 76
9% 12% 19% 12%
North East 8a 24a 2a 34
4% 6% 3% 5%
North West 26a 58a 11a 95
13% 15% 19% 15%
South East 33a 59a 8a 100
16% 15% 14% 15%
South West 23a 44a 4a 71
11% 11% 7% 11%
West Midlands 25a 38a 8a 71
12% 10% 14% 11%
Yorkshire and the Humber
16a 45a 6a 67
8% 12% 10% 10%
Total 201 393 59 653
Table 35: Digital maturity tiers by Ofsted rating
Ofsted Low digital maturity
Medium digital
maturity
High digital maturity Total
Good 143a 251a, b 27b 421
79% 73% 60% 74%
Outstanding 23a 66a 12a 101
13% 19% 27% 18%
Requires improvement 12a 19a 4a 35
7% 6% 9% 6%
Serious Weaknesses 0a 3a 1a 4
0% 1% 2% 1%

107
Ofsted Low digital maturity
Medium digital
maturity
High digital maturity Total
Special Measures 3a 4a 1a 8
2% 1% 2% 1%
Total 181 343 45 569
Table 36: Digital maturity tiers by geographic location
Geography Low digital maturity
Medium digital
maturity
High digital maturity Total
Rural 64a 102a, b 7b 173
32% 26% 12% 27%
Urban 137a 292a, b 52b 481
68% 74% 88% 74%
Total 201 394 59 654
Table 37: Digital maturity tiers by FSM level
FSM percentage categorised
Low digital maturity
Medium digital maturity
High digital maturity Total
Low 73a 146a 17a 236
37% 37% 29% 37%
Medium 57a 117a 19a 193
29% 30% 33% 30%
High 68a 127a 22a 217
34% 33% 38% 34%
Total 198 390 58 646
Table 38: Digital maturity tiers by school size relative to phase
Size by phase Low digital maturity
Medium digital maturity
High digital maturity Total
Primary small 81a 98b 2c 181
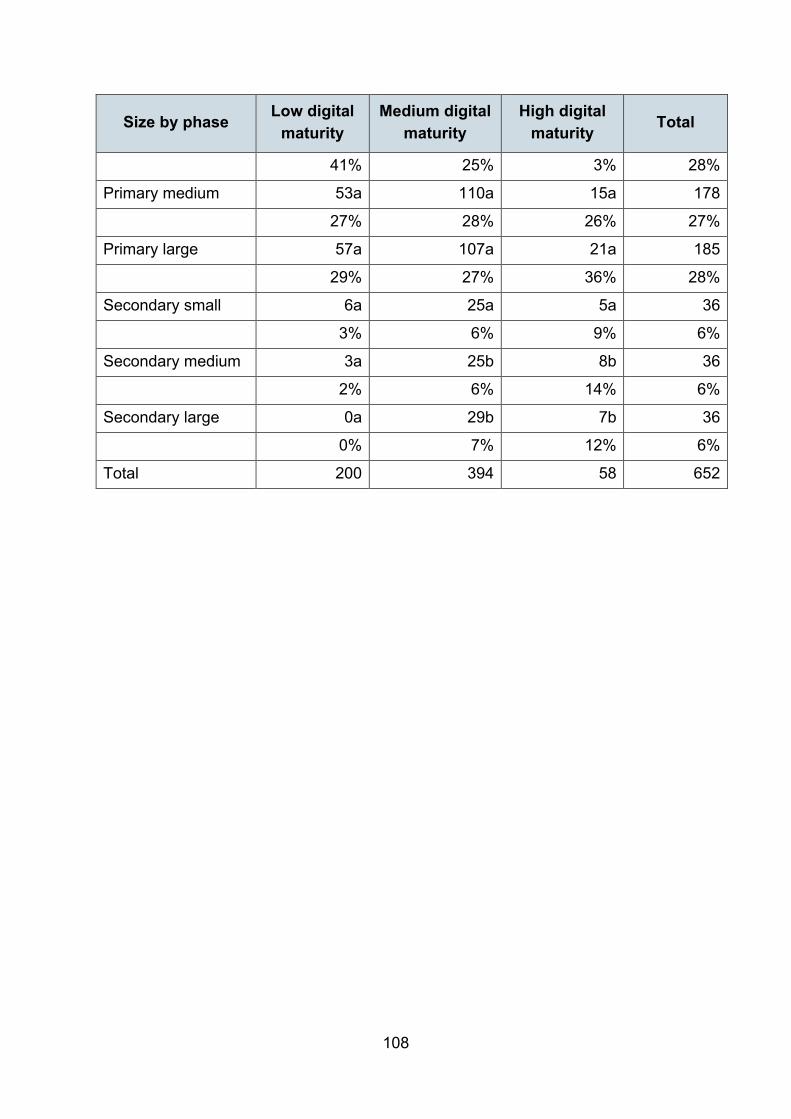
108
Size by phase Low digital maturity
Medium digital maturity
High digital maturity Total
41% 25% 3% 28%
Primary medium 53a 110a 15a 178
27% 28% 26% 27%
Primary large 57a 107a 21a 185
29% 27% 36% 28%
Secondary small 6a 25a 5a 36
3% 6% 9% 6%
Secondary medium 3a 25b 8b 36
2% 6% 14% 6%
Secondary large 0a 29b 7b 36
0% 7% 12% 6%
Total 200 394 58 652

109
Appendix 5: Profile of schools involved in the qualitative interviews
Table 39: Sample profile of (high) digitally mature schools
High digitally mature
School phase Technology pillar
Capability pillar
Strategy pillar
School A Primary 3 3 3
School B Primary 3 3 3
School C Secondary 3 3 3
School D Secondary 3 3 3
School E Secondary 3 3 3
School F Secondary 3 3 3
School G Primary 3 3 2
School H Secondary 3 2 3
School I Primary 3 3 2
School J Primary 2 3 3
Table 40: Sample profile of low digitally mature schools
Low digitally mature
School phase Technology pillar
Capability pillar
Strategy pillar
School K Primary 2 1 1
School L Primary 2 1 1
School M Secondary 2 2 1
School N Secondary 2 1 2
School O Secondary 2 2 1
School P Secondary 2 2 1
School Q Primary 2 1 1
School R Primary 2 2 1
School S Primary 2 1 1
School T Secondary 2 2 2

110
Appendix 6: SPSS syntax to calculate pillar scores SPSS SYNTAX to calculate Pillar Scores **********DfE INTERVAL CODING - TECHNOLOGY**************. RECODE IT_Q9 (1=0) (2=1) (3=.5) (4=0) INTO IT_Q9_INT_S. RECODE IT_Q11 (1=0) (2=1) (3=.5) (4=0) INTO IT_Q11_INT_S. RECODE IT_Q22R1 (1=1) (2=.67) (3=.33) (4=0) (5=0) INTO IT_Q22R1_INT_M. RECODE IT_Q22R2 (1=1) (2=.67) (3=.33) (4=0) (5=0) INTO IT_Q22R2_INT_M. RECODE IT_Q22R3 (1=1) (2=.67) (3=.33) (4=0) (5=0) INTO IT_Q22R3_INT_M. RECODE IT_Q22R4 (1=1) (2=.67) (3=.33) (4=0) (5=0) INTO IT_Q22R4_INT_M. RECODE IT_Q22R5 (1=1) (2=.67) (3=.33) (4=0) (5=0) INTO IT_Q22R5_INT_M. RECODE IT_Q13R1 (1=0) (2=1) (3=.5) (4=0) INTO IT_Q13R1_INT_M. RECODE IT_Q13R2 (1=0) (2=1) (3=.5) (4=0) INTO IT_Q13R2_INT_M. RECODE IT_Q13R3 (1=0) (2=1) (3=.5) (4=0) INTO IT_Q13R3_INT_M. RECODE IT_Q13R4 (1=0) (2=1) (3=.5) (4=0) INTO IT_Q13R4_INT_M. RECODE IT_Q19 (1=1) (2=0) (3=0) INTO IT_Q19_INT_S. RECODE IT_Q4R1 (1=1) (2=.67) (3=.33) (4=0) (5=0) (6=sysmis) INTO IT_Q4R1_INT_M. RECODE IT_Q4R2 (1=1) (2=.67) (3=.33) (4=0) (5=0) (6=sysmis) INTO IT_Q4R2_INT_M. RECODE IT_Q4R3 (1=1) (2=.67) (3=.33) (4=0) (5=0) (6=sysmis) INTO IT_Q4R3_INT_M. RECODE IT_Q4R4 (1=1) (2=.67) (3=.33) (4=0) (5=0) (6=0) INTO IT_Q4R4_INT_M. RECODE IT_Q4R6 (1=1) (2=.67) (3=.33) (4=0) (5=0) (6=0) INTO IT_Q4R6_INT_M. RECODE IT_Q6R1 (1=1) (2=.67) (3=.33) (4=0) (5=0) (6=0) INTO IT_Q6R1_INT_M. RECODE IT_Q6R2 (1=1) (2=.67) (3=.33) (4=0) (5=0) (6=0) INTO IT_Q6R2_INT_M. RECODE IT_Q6R3 (1=1) (2=.67) (3=.33) (4=0) (5=0) (6=0) INTO IT_Q6R3_INT_M. RECODE IT_Q6R4 (1=1) (2=.67) (3=.33) (4=0) (5=0) (6=0) INTO IT_Q6R4_INT_M. RECODE IT_Q6R5 (1=1) (2=.67) (3=.33) (4=0) (5=0) (6=0) INTO IT_Q6R5_INT_M. COUNT IT_Q18_1_CT = IT_Q18_1r1 IT_Q18_1r2 IT_Q18_1r3 IT_Q18_1r4 IT_Q18_1r5 IT_Q18_1r6 IT_Q18_1r7 IT_Q18_1r8 IT_Q18_1r9 IT_Q18_1r10 IT_Q18_1r11 (1). COUNT IT_Q18_2_CT = IT_Q18_2r1 IT_Q18_2r2 IT_Q18_2r3 IT_Q18_2r4 IT_Q18_2r5 IT_Q18_2r6 IT_Q18_2r7 IT_Q18_2r8 (1). COMPUTE IT_Q18_1_SUM_M=(IT_Q18_1r3+ IT_Q18_1r6 + 0.75*IT_Q18_1r10 + IT_Q18_1r11)/IT_Q18_1_CT. COMPUTE IT_Q18_2_SUM_M= IT_Q18_2r6/IT_Q18_2_CT. EXECUTE. RECODE IT_Q18_1_SUM_M (SYSMIS=0) (ELSE=COPY). RECODE IT_Q18_2_SUM_M (SYSMIS=0) (ELSE=COPY). EXECUTE. COUNT IT_Q13_CT3= IT_Q13R1 IT_Q13R2 IT_Q13R3 IT_Q13R4 (3). COUNT IT_Q13_CT1= IT_Q13R1 IT_Q13R2 IT_Q13R3 IT_Q13R4 (1). COUNT IT_Q13_CT2= IT_Q13R1 IT_Q13R2 IT_Q13R3 IT_Q13R4 (2). EXEC. COMPUTE IT_Q13_Q14_COMBINED=-1. IF IT_Q13_CT2>0 IT_Q13_Q14_COMBINED=1. IF IT_Q13_CT2=0 & IT_Q13_CT3>0 IT_Q13_Q14_COMBINED=0.75.

111
IF IT_Q13_CT2=0 & IT_Q13_CT3=0 & IT_Q14=1 IT_Q13_Q14_COMBINED=0.50. IF IT_Q13_CT2=0 & IT_Q13_CT3=0 & IT_Q14=2 IT_Q13_Q14_COMBINED=0.25. IF IT_Q13_CT2=0 & IT_Q13_CT3=0 & IT_Q14>2 IT_Q13_Q14_COMBINED=0. IF IT_Q13_CT2=0 & IT_Q13_CT3=0 & SYSMIS(IT_Q14) IT_Q13_Q14_COMBINED=0. EXECUTE. COMPUTE IT_Q9_10=IT_Q9_INT_S. IF IT_Q9=1 & IT_Q10=1 IT_Q9_10=.5. IF IT_Q9=1 & IT_Q10=2 IT_Q9_10=.25. IF IT_Q9=1 & (IT_Q10=3 OR IT_Q10=4) IT_Q9_10=0. EXEC. COMPUTE IT_Q11_12=IT_Q11_INT_S. IF IT_Q11=1 & IT_Q12=1 IT_Q11_12=.5. IF IT_Q11=1 & IT_Q12=2 IT_Q11_12=.25. IF IT_Q11=1 & (IT_Q12=3 OR IT_Q12=4) IT_Q11_12=0. EXEC. COMPUTE IT_Q22_MEAN_5=MEAN(IT_Q22R1_INT_M, IT_Q22R2_INT_M, IT_Q22R3_INT_M, IT_Q22R4_INT_M, IT_Q22R5_INT_M). COMPUTE IT_Q13_MEAN_4=MEAN(IT_Q13R1_INT_M, IT_Q13R2_INT_M, IT_Q13R3_INT_M, IT_Q13R4_INT_M). COMPUTE IT_Q4_MEAN_5=MEAN(IT_Q4R1_INT_M, IT_Q4R2_INT_M, IT_Q4R3_INT_M, IT_Q4R4_INT_M, IT_Q4R6_INT_M). COMPUTE IT_Q6_MEAN_5=MEAN(IT_Q6R1_INT_M, IT_Q6R2_INT_M, IT_Q6R3_INT_M, IT_Q6R4_INT_M, IT_Q6R5_INT_M). COMPUTE IT_Q9_Q10_Q11_Q12_Q13_Q14_MEAN=MEAN(IT_Q13_Q14_COMBINED, IT_Q9_10, IT_Q11_12). EXECUTE. COMPUTE TECH_PILLAR=MEAN(IT_Q22_MEAN_5, IT_Q13_MEAN_4, IT_Q19_INT_S, IT_Q4_MEAN_5, IT_Q6_MEAN_5, IT_Q18_1_SUM_M, IT_Q18_2_SUM_M,IT_Q9_Q10_Q11_Q12_Q13_Q14_MEAN). EXECUTE. **********DfE INTERVAL CODING - CAPABAILITY**************. RECODE IT_Q21 (1=1) (2=.5) (3=.25) (4=0) (5=0) INTO IT_Q21_INT_S. RECODE HD_Q16R1 (3=1) (2=.5) (1=0) (4=0) INTO HD_Q16R1_INT_M. RECODE HD_Q1R1 (1=1) (2=.75) (3=.5) (4=.25) (5=0) (6=0) INTO HD_Q1R1_INT_M. RECODE HD_Q1R2 (1=1) (2=.75) (3=.5) (4=.25) (5=0) (6=0) INTO HD_Q1R2_INT_M. RECODE HD_Q1R3 (1=1) (2=.75) (3=.5) (4=.25) (5=0) (6=0) INTO HD_Q1R3_INT_M. RECODE HD_Q1R4 (1=1) (2=.75) (3=.5) (4=.25) (5=0) (6=0) INTO HD_Q1R4_INT_M.

112
RECODE HD_Q1R5 (1=1) (2=.75) (3=.5) (4=.25) (5=0) (6=0) INTO HD_Q1R5_INT_M. RECODE HD_Q1R6 (1=1) (2=.75) (3=.5) (4=.25) (5=0) (6=0) INTO HD_Q1R6_INT_M. RECODE HD_Q2R1 (1=1) (2=.75) (3=.5) (4=.25) (5=0) (6=0) INTO HD_Q2R1_INT_M. RECODE HD_Q2R2 (1=1) (2=.75) (3=.5) (4=.25) (5=0) (6=0) INTO HD_Q2R2_INT_M. RECODE HD_Q2R3 (1=1) (2=.75) (3=.5) (4=.25) (5=0) (6=0) INTO HD_Q2R3_INT_M. RECODE HD_Q2R4 (1=1) (2=.75) (3=.5) (4=.25) (5=0) (6=0) INTO HD_Q2R4_INT_M. RECODE HD_Q2R5 (1=1) (2=.75) (3=.5) (4=.25) (5=0) (6=0) INTO HD_Q2R5_INT_M. RECODE HD_Q2R6 (1=1) (2=.75) (3=.5) (4=.25) (5=0) (6=0) INTO HD_Q2R6_INT_M. RECODE HD_Q2R7 (1=1) (2=.75) (3=.5) (4=.25) (5=0) (6=0) INTO HD_Q2R7_INT_M. RECODE HD_Q2R8 (1=1) (2=.75) (3=.5) (4=.25) (5=0) (6=0) INTO HD_Q2R8_INT_M. RECODE HD_Q2R9 (1=1) (2=.75) (3=.5) (4=.25) (5=0) (6=0) INTO HD_Q2R9_INT_M. RECODE HD_Q2R10 (1=1) (2=.75) (3=.5) (4=.25) (5=0) (6=0) INTO HD_Q2R10_INT_M. RECODE HD_Q2R11 (1=1) (2=.75) (3=.5) (4=.25) (5=0) (6=0) INTO HD_Q2R11_INT_M. RECODE HD_Q28 (1=1) (2=.75) (3=.5) (4=0) INTO HD_Q28_INT_S. RECODE HD_Q9 (1=1) (2=.5) (3=0) (4=0) INTO HD_Q9_INT_S. EXEC. COMPUTE HD_Q1_MEAN_6=MEAN(HD_Q1R1_INT_M, HD_Q1R2_INT_M, HD_Q1R3_INT_M, HD_Q1R4_INT_M, HD_Q1R5_INT_M, HD_Q1R6_INT_M). COMPUTE HD_Q2_MEAN_11=MEAN(HD_Q2R1_INT_M, HD_Q2R2_INT_M, HD_Q2R3_INT_M, HD_Q2R4_INT_M, HD_Q2R5_INT_M, HD_Q2R6_INT_M, HD_Q2R7_INT_M, HD_Q2R8_INT_M, HD_Q2R9_INT_M, HD_Q2R10_INT_M, HD_Q2R11_INT_M). EXECUTE. COMPUTE CAPABILITY_PILLAR=MEAN(IT_Q21_INT_S, HD_Q16R1_INT_M, HD_Q1_MEAN_6, HD_Q2_MEAN_11, HD_Q28_INT_S, HD_Q9_INT_S). EXEC. **********DfE INTERVAL CODING - STRATEGY**************. RECODE HD_Q16r9 (3=1) (2=.5) (1=0) (4=0) INTO HD_Q16r9_INT_S. RECODE HD_Q16r10 (3=1) (2=.5) (1=0) (4=0) INTO HD_Q16r10_INT_S. RECODE HD_Q10 (1=1) (2=1) (3=1) (4=0.5) (5=0) (6=0) INTO HD_Q10_INT_S. RECODE IT_Q8r1 (1=1) (0=0) INTO IT_Q8r1_INT_M. RECODE IT_Q8r2 (1=1) (0=0) INTO IT_Q8r2_INT_M.

113
RECODE IT_Q8r3 (1=1) (0=0) INTO IT_Q8r3_INT_M. EXECUTE. COMPUTE HD_Q16_MEAN=MEAN(HD_Q16r9_INT_S,HD_Q16r10_INT_S). COMPUTE IT_Q8_MEAN=MEAN(IT_Q8r1_INT_M, IT_Q8r2_INT_M, IT_Q8r3_INT_M). COMPUTE STRATEGY_PILLAR=MEAN(HD_Q16_MEAN, HD_Q10_INT_S, IT_Q8_MEAN). EXEC. **********DfE INTERVAL CODING – TECH MATURITY**************. COMPUTE TECH_MATURITY=MEAN(TECH_PILLAR, CAPABILITY_PILLAR, STRATEGY_PILLAR). EXEC.

114
© CooperGibson Research 2022
Reference: DFE-RR1185
ISBN: 978-1-83870-331-8
For any enquiries regarding this publication, contact us at: [email protected] or www.education.gov.uk/contactus
This document is available for download at www.gov.uk/government/publications