Quality Costing and Quality Management Maturity in Greece
47
1 Quality Costing and Quality Management Maturity in Greece: An Exploratory Multi-Dimensional Data Analysis Moschidis Odysseas, Chatzipetrou Evrikleia, Tsiotras George Department of Business Administration, University of Macedonia, Thessaloniki, Greece Abstract Purpose This paper explores how the sophistication of a quality costing system depends on the quality management maturity (QMM) level in Food and Beverage enterprises (F&B). Since no previous research has taken place in this area, the paper aims at analyzing the relationships between quality costing and the specific variables that define the various maturity stages. Research Methodology A structured questionnaire was used to survey 457 F&B companies. This produced 104 usable responses (23% response rate). Multidimensional Correspondence Analysis (MCA) with Hierarchical Cluster Analysis (HCA) were
-
Upload
khangminh22 -
Category
Documents
-
view
2 -
download
0
Transcript of Quality Costing and Quality Management Maturity in Greece
1
Quality Costing and Quality Management Maturity
in Greece: An Exploratory Multi-Dimensional Data
Analysis
Moschidis Odysseas, Chatzipetrou Evrikleia, Tsiotras George
Department of Business Administration,
University of Macedonia, Thessaloniki, Greece
Abstract
Purpose
This paper explores how the sophistication of a quality costing system
depends on the quality management maturity (QMM) level in Food and Beverage
enterprises (F&B). Since no previous research has taken place in this area, the paper
aims at analyzing the relationships between quality costing and the specific variables
that define the various maturity stages.
Research Methodology
A structured questionnaire was used to survey 457 F&B companies. This
produced 104 usable responses (23% response rate). Multidimensional
Correspondence Analysis (MCA) with Hierarchical Cluster Analysis (HCA) were

2
used to detect and represent underlying structures in the categorical data set and to
detect possible clusters between variables.
Findings
The more mature a company’s QMM, the more emphasis they placed on
appraisal quality costs and effective use of quality costs information. Prevention costs
have no statistically significant connection with the level of maturity. A generalized
‘expensive’ use of Quality Costing, with no focus on problematic areas and possible
solutions, does not always lead to the resolution of problems.
Originality/Value
It is the first time that QMM levels of Greek F&B companies have been
reported. The research explores the characteristics that a quality costing system of
Greek F&B organizations develop at the various maturity levels. The analysis uses an
exploratory method – Multiple Correspondence Analysis- which can highlight intense
correspondences of characteristics and clusters, which cannot be predicted in advance.
Research limitations/implications
A complicated - and some think unfair - tax system, combined with limited
cash liquidity constitutes an unstable environment for Greek companies, in which they
have to survive and develop. This environment does not support quality costing, thus
resulting in limited interest by company management in participating in our research.
Furthermore, the Greek Uniform Chart of Accounts and the Greek Accounting
Standards do not include specific quality-related accounts, making it difficult for
companies to measure Quality Costs and for researchers to investigate the quality
costing field.
3
Keywords: Cost of Quality, Quality Management Maturity, Maturity Grid, Greek
Food and Beverage enterprises, Multidimensional Data Analysis, Multiple
Correspondence Analysis, Hierarchical Cluster Analysis.
1. Introduction
The study of Quality Costs plays a fundamental role in Total Quality
Management approach. Τhe major role that TQM and Cost of Quality (CoQ) have in
the continuous improvement process of manufacturing companies has been largely
analyzed in a number of papers (Fu et al, 2015; Ismyrlis and Moschidis, 2015;
Ahmed Al-Dujaili, 2013; Sansalvador and Brotons, 2013; Dale et al., 2001; Dale
and Plunkett, 1999; Carson, 1986). The work of Juran (1951), Feigenbaum (1956,
1991) and other gurus on the Quality Cost models has set the basis for numerous
cases, where researchers focused on Quality Costs and the impact of their analysis in
the manufacturing sector. However, little attention has been paid to the Food and
Beverage (F&B) industry, as far as the Quality Costing analysis is concerned.
Especially in the case of Greece, literature indicates limited implementation
of TQM in general (Fotopoulos and Psomas; 2009) and Quality Costing in the F&B
sector in particular (Chatzipetrou and Moshidis (2016; 2017). According to a recent
survey Chatzipetrou and Moschidis (2016) conducted among 159 Greek
supermarkets, Cost of Quality as a percentage of annual sales was below 5%,

4
although the Greek F&B sector constitutes the larger ‘employer’ of domestic
Manufacturing, since one fourth (25.2%) of the total workforce in Manufacturing is
employed in F&B. (source: Foundation for Economic and Industrial Research,
Food and Beverages Industry, Facts and Figures 2014,www.iobe.gr). Furthermore,
in a survey among Greek F&B enterprises (Chatzipetrou and Moschidis, 2017), it is
concluded that Total Quality Cost Index (TQCI=Total Quality Cost/net sales x 100)
ranges from 1.14 % in micro companies to 4.3% in very large companies, which
falls within the published range of values for the Food industry (1-6%). However,
Chatzipetrou and Moschidis (2017) imply that the low percentage (1.14%) of small
and micro companies does not imply high quality, but rather limited attention to
quality. The absence of a quality-oriented Greek Chart of Accounts, which would
enable companies to monitor and measure Quality Costs in separate accounts rather
than categorize them under the general categories of overheads or other operating
expenses, definitely plays an important role in the implementation process.
It seems that the implementation of Quality Management has not always
achieved successful results (Fu et al, 2015). Many authors have suggested that there is
a need for an appropriate organizational maturity level, to support the implementation
of such an approach (Fu et al, 2015; Sansalvador and Brotons, 2013; Prickett and
Rapley, 2001; Prickett, 1997). Maturity models are useful tools for an organization
and its management to assess their processes, their effectiveness and results. Pullen
(2007) defines maturity models as a structured collection of elements that describes
the characteristics of effective processes at different stages of development. Pullen
(2007) suggests the need for ‘points of demarcation between stages and methods of
transitioning from one stage to another’ (p. 9). A maturity model, as Pullen (2007)

5
further adds, provides a framework for setting priorities and also a way to define
progress and measure improvement, usually by benchmarking with other
organizations.
In order to explore the relationship between the maturity level of F&B
enterprises and its Quality Costing system, emphasis is placed in this paper on
Crosby’s Quality Management Maturity Grid (QMMG), which was developed by
Phillip Crosby (1979) and was one of the first maturity models for the evaluation and
assessment of quality maturity. Given that our aim is to present the stage where the
analyzed F&B enterprises find themselves, we propose that Crosby’s QMMG is the
most simple and appropriate method. It is a straightforward tool which depicts, in a
very expressive way, five stages of system maturity (Uncertainty, Awakening,
Enlightenment, Wisdom, Certainty) in respect to six measurement categories.
Criticism has been exercised (Albliwi et al, 2014; Wendler, 2012) that it is a
straightforward tool, which entails subjective evaluation of maturity. Since our aim is
to present an overall depiction of the maturity level of F&B enterprises, we believe
that it is by definition expected that our tool will have a mechanistic approach.
Furthermore, as mentioned by Tarhan et al, 2016; Wendler, 2012 and Fraser et al.,
2002, Crosby’s QMMG has been the origin of the majority of the subsequent maturity
models (Capability Maturity Model –CMM- for Software, Capability Maturity Model
Integration –CMMI, OMG’s Business Process Maturity Model – BPMM, etc), which
emphasizes its importance and reliability.
Although CMMI is the only “standard” maturity model really noticed within
the academic community (Wendler, 2012), it is a framework representing a path of
improvements recommended for software organizations that want to increase their

6
software development processes to achieve higher quality (Tarhan et al, 2016; Paulk
et al, 1993). However, since the focus of the present paper is the Food Industry and
F&B enterprises, and given the fact that, to the writers’ knowledge, no similar
research has been conducted in Greece before, we chose to use Crosby’s concept of
maturity stages building on each other, as a simple and effective tool for analysis and
measurement. Crosby’s so called quality management process maturity grid fits into
the potential performance perspective (Wendler 2012), which means that it shows the
potential arising of a higher maturity level and the user may decide if it is desirable to
proceed to the next stage (Crosby, 1979). Furthermore, in the food industry, food
safety management and quality management are considered to be closely related
(Röhr et al, 2005), so it can be concluded that the Quality Management Maturity Grid
is a “logical starting point” (Jespersen et al, 2016).
Although major work has been conducted worldwide on Crosby’s model and
its connection to Quality costing, the authors believe that there is limited reference in
the literature, as far as the connection of the PAF model with Crosby’s quality
management maturity stages is concerned. Papers have emphasized the relationship
between general sophistication of the quality system and the PAF model (Prickett,
1997; Prickett and Rapley, 2001), or costing systems in general (Al-Omiri and Drury,
2007), or have proposed a newly developed model on quality level and its relationship
with the PAF model (Ayati and Schiffauerova, 2014). Further work used the Crosby
model in connection with fuzzy logic and a fuzzy Quality Costs estimation method
(Sansalvador and Brotons, 2013; Martinez and Selles, 2015). To the knowledge of the
authors, however, not much emphasis has been placed on studies that can produce
conclusions on the specific cost elements used in each stage, their expenses and
possible interrelations. Our survey is an attempt in this direction. A further objective
7
of this research is to investigate whether the sophistication of quality costing systems
of Greek F&B enterprises is dependent upon the level of maturity where companies
place themselves. The findings may form a framework for management and
practitioners about the role that Greek ‘mature’ enterprises should play in the
implementation process of Cost of Quality. This role becomes even more crucial in
the difficult Greek economic environment, which is characterized by vague financial
prospects and strict restrictions imposed upon companies by the austerity measures.
Mature companies, therefore, could identify their important role and development
potential, in order to lead the process of continuous improvement, with a focus on
costs minimization and quality optimization. Furthermore, the originality of the paper
lies in its suggestion that by simply observing the quality management level of a
company, it is possible to gain knowledge about the characteristics of its quality
costing system. Finally, this research highlights the inability of the Greek Uniform
Chart of Accounts and the Greek Accounting Standards to include quality-related
accounts, which would enable the monitoring and measurement of Quality Costs. The
present research could trigger a discussion among the responsible Chambers, the
academic community and the State, for the necessity of a reformed accounting
framework relevant to the requirements of Quality Costing.
Our exploratory effort focuses on the identification of the large variances from
the Average in a holistic way, for all company characteristics related to the
phenomenon under research. This can be achieved through the investigation of the
directional variance. The most appropriate tool for this purpose and for the nature of
the characteristics is Multiple Correspondence Analysis.
The remainder of the paper is organized as follows: Section 2 provides a
literature review on Quality Costs, self assessment and maturity models, as well an
8
overview of Crosby’s Maturity Grid. Section 3 describes the research methodology
used and Section 4 the analysis of the results. In Section 5 the discussion of the results
is presented. The conclusions, limitations and further research close the paper in
Section 6.
2. Literature Review
Quality costs
The concept of Quality Costs was first introduced in the 1950s by Juran
(1951) and Feigenbaum (1956) and has ever since become the basis for a number of
different definitions (Trehan et al, 2015; Lari and Asllani, 2013; Yang, 2008; Roden
and Dale, 2000; Dale and Plunkett, 1999; Crosby, 1979). Campanella proposed the
following definition, which encompasses the core of most definitions: ‘Quality Costs
are the total of the costs incurred by a)investing in the prevention of non-
conformances to requirements, b) appraising a product or service for conformance to
requirements and c) failure to meet requirements’ (Campanella, 1999, p.4).
One of the most widely spread models of quality costing is the P-A-F Model. The
basic idea originated from the need to organize all costs related to the quality system
and the inspection of products, as well as all costs incurred when the product failed to
meet the requirements. According to BS 6143 (1990), Quality Costs can be
categorized as
- Prevention costs, which depict the costs of all activities that are undertaken in
order to prevent defects in products or services, i.e. costs relevant to the
supplier evaluation or to the maintenance of machinery

9
- Appraisal costs, which are costs incurred during inspections, tests and other
evaluations of products or services, in order to ensure that product quality will
conform to requirements, i.e. calibration of measuring and test equipment or
inspection/test of purchased material.
- Internal failure costs, which describe the costs that occur before a defective
product reaches the customer, that is, the costs of scrap, replacement, rework,
re-inspection.
- External failure costs, which are the costs arising from inadequate quality after
the delivery of the product to the customer i.e. costs in relation to returns,
complaints, warranty claims, loss of sales etc.
The original PAF model has been developed, expanded and enriched. Its
initial categorization, however, has been used as a useful tool in a number of studies,
in an attempt to better depict and re-organize a company’s structure and processes.
Malik et al, 2016; Raßfeld et al, 2015; Kirlioğlu and Çevik, 2013; Tye et al.,
2011; Jafar et al. 2010; Omorgonulsen, 2009; Desai, 2008; Omachonu et al., 2004 are
only a few of the numerous studies that have been conducted, based on the P-A-F
Model. The traditional premise of the above model is that the increment in prevention
and appraisal costs would lead to the decrease in failure costs. It is supported that non-
conformance costs (internal and external failure costs) can only be reduced by
increasing expenditures on conformance activities (Ittner, 1996). The curve “costs of
appraisal plus prevention” rises, therefore, to infinity as perfection is approached, and
the optimal level of quality is somewhere below perfection (Gryna, 1988).
10
This concept has been challenged, however, by an alternative view (Juran and
Gryna, 1993), which claims that perfection is achievable in finite conformance costs.
It represents conditions that evolved later in the twentieth century, when advances in
technology, robotics and automation reduced failure rate in production. Consequently,
the exponential behavior of prevention and appraisal costs is eliminated, while the
cost optimum shifts to the perfect quality level, as perfection can be achieved at finite
costs (Burgess, 1996).
Regardless of the various schools of thoughts about the Quality Costing, Ayati
& Schiffauerova (2014) assert that its advantage is basically that it provides precise
identification and classification of Quality Costs. Moreover, they support that it helps
identify the contribution that each quality cost has, in relation to the total COQ. This
provides useful information on the cost category which needs more attention, in order
to achieve higher quality levels or reduced costs. In this direction stand Chopra and
Singh (2015), whose work proposes that total COQ are directly proportional to total
failure costs. They suggest that if SMEs run their operations at optimized values of
prevention and appraisal costs to keep total failure costs at lowest possible levels, total
COQ will be diminished and profitability and market share raised. Kerfai et al (2016)
also reach a similar conclusion. They suggest that companies with quality cost
systems experience less internal and external failures than others, while they seem to
invest more in prevention and appraisal actions than others, since prevention activities
become an integral part of the management system. Furthermore, they also support
the idea that the adoption of quality costing has positive consequences on the
company’s performance and control of costs, by promoting actions allowing the
reduction of the internal and external failures. On the other hand, Plewa et al (2016)
11
imply that higher levels of quality do not necessarily require increased spending on
prevention and appraisal. They find in their study, among others, that no association
exists between higher prevention and appraisal costs and higher overall quality levels.
Furthermore, they conclude that lower failure cost is not associated with higher
prevention and appraisal costs. They, therefore, reject the notion that lower failure
cost being achieved at the expense of higher prevention and appraisal costs, and
propose a modification of the modern model, which implies that at higher overall
quality levels, CoQ is lower not only in total but also in its components.
Self-assessment
It is widely recognized (Fu et al, 2015; Dellana and Kros, 2014; Balbaster
Benavent et al, 2005; Sturkenboom et al, 2001; Van der Wiele and Brown, 1999;
Brown and Van der Wiele, 1996; Van der Wiele et al, 1996) that quality management
self-assessment processes provide the link between TQM and company business
objectives, while they motivate management to design and implement an
improvement agenda with a set of prescribed actions. According to Balbaster
Benavent et al. (2005) ‘quality management self-assessment is a useful tool for
fostering the continuous improvement of the whole company, comparing its activities
and results with an excellence model’ (p. 432). Ton van der Wiele and Brown have
conducted major research on the use and benefits of self-assessment implementation
and identified various reasons - relevant to the external and internal environment of
the companies – for self-assessment processes. Many benefits of self-assessment have
been highlighted, with an emphasis on the effects of self-assessment on business
results. Among others, it has been made clear that ‘the use of quality maturity matrix
12
correlates with a more positive perception about the relationship between self-
assessment and business results’ (Van der Wiele and Brown, 1999, p. 250).
Maturity Models
Maturity can be represented as ‘a number of cumulative stages, where higher
stages build on the requirements of lower stages’ (Maier et al, 2012, p. 146). The
highest number represents high maturity and the lowest represents low maturity.
Aranda and Márquez (2015) describe maturity models as a sequence of levels that
creates an anticipated, desired or logical path from an initial state to maturity, usually
defining the different levels as follows: Level 1: Initial, Level 2: Managed, Level 3:
Established, Level 4: Predictable/Quantitatively managed, Level 5: Optimised.
According to Fraser (2002), maturity models define a number of dimensions or
process areas at several discrete stages of maturity, with a short description of
characteristic performance at each stage. Through the use of a maturity model, the
current state of a given system is evaluated, in a way that improvement plans are
developed. In a systematic analysis of 237 articles published on the maturity models,
Wendler (2012) identifies a number of benefits created by maturity models. Firstly,
they generate an awareness of the state, importance, potentials, requirements,
complexity, etc. of the analyzed organization. Furthermore, they may serve as
‘reference frame’ to implement a systematic and ‘well directed’ approach for
improvements, to ensure a certain quality, to avoid possible errors and assess one’s
own capabilities on a comparable basis. In the same direction, Jespersen et al (2016)
suggest that a maturity model can help an organization understand how industry peers
are performing and how this performance compares to its own. Acceptable industry
practices can be summarized in a way that an organization can assess the necessary
13
requirements in order to reach a certain level of management and control of these
practices. “Organizations can evolve toward a culture of process improvement
excellence which, in turn, leads to greater efficiency of operations, more accurate
planning, safer decision making, less risks and higher credibility” (Antoniades, 2014,
p. 12). A number of further papers (Albliwi et al, 2014; Maier et al, 2012; Röglinger
et al, 2012; Fraser et al, 2002; Brown and van der Wiele, 1996) have also presented
and compared the most widespread maturity models, which better depict the efforts
towards a proper Quality management system.
Crosby’s Grid
The cornerstone of the majority of maturity models is the Quality
Management Maturity Grid (QMMG), proposed by Phillip Crosby in 1979 in his
seminal work ‘Quality is Free’. A maturity grid describes and codifies, in a few
phases, ‘what might be regarded as good practice (and bad practice), along with some
intermediate or transitional stages’ (Fraser, 2002), while it is typically used as an
instrument of assessment, since it is less complex as diagnostic tool without aspiring
to provide certification (Maier et al, 2012). Given that a maturity grid may be used as
a stand-alone assessment (Maier, 2012; Pricket, 1997), we chose QMMG in our paper
as the basic tool for assessing a company’s quality management maturity level, as
suggested by previous studies conducted worldwide (Sansalvador and Brotons, 2013;
Zhang & Dai, 2013; Prickett & Rapley, 2001; Landin & Persson, 1998, Prickett,
1997). Although many maturity models have developed through time, which measure
the capacity and maturity of other disciplines and practices, such as project
management practice, software maintenance, business processes etc, Crosby’s model
is recognized as the root of all subsequent approaches, which emerged out of quality
14
management and offers a simple and effective tool for analysis and measurement. It
constitutes the most appropriate tool for the recognition of the importance of human
factors, such as leadership, attitude and collaborative work, as well as for the
positioning of the company in the quality management spectrum (Albiwi et al, 2014).
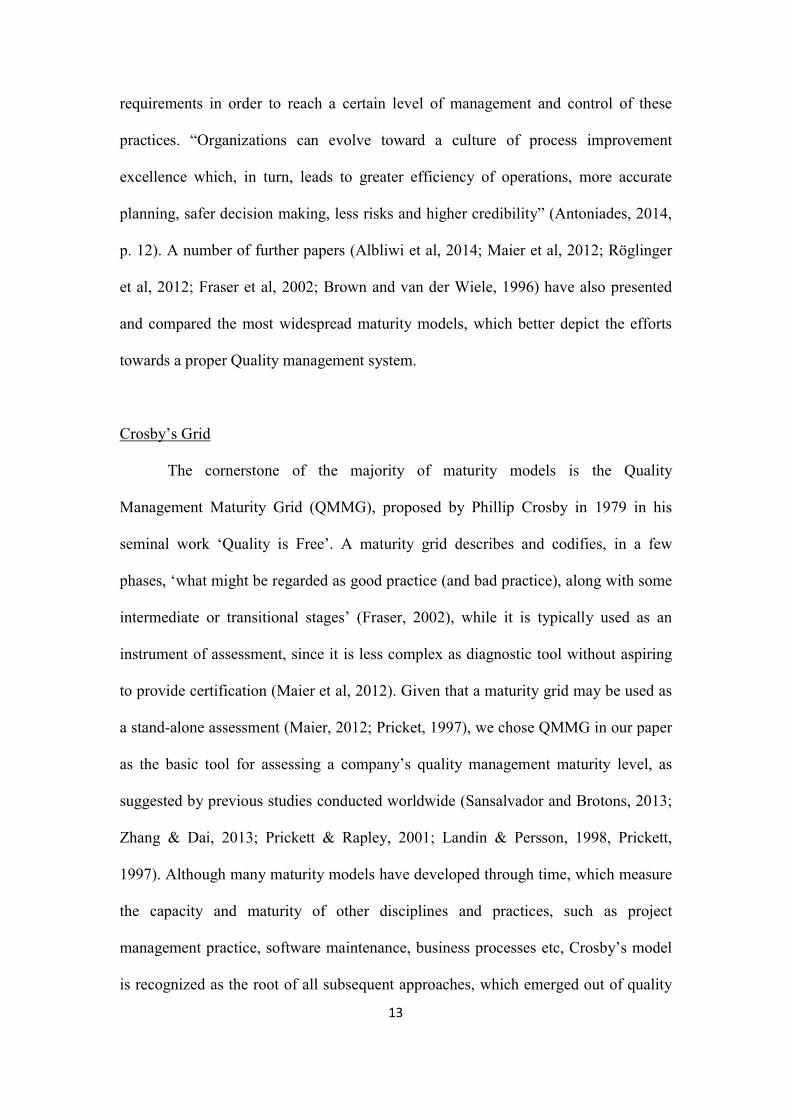
QMMG suggests five phases that a company is likely to evolve through:
‘Uncertainty’, ‘Awakening’, ‘Enlightenment’, ‘Wisdom’ and ‘Certainty’. Although
Crosby later modified this Grid to Uncertainty, Regression, Awakening,
Enlightenment, Certainty (Crosby, 1996), the original QMMG is the most well known
Grid, that produced many derivatives in various scientific areas. The essence of the
QMMG is depicted in Table 1, where only the summation of a company’s quality
posture is included.
Table 1: Crosby P.B, ‘Quality is Free’, 1979, p. 38-39.
Stage 1:Uncertainty
Stage II: Awakening
Stage III: Enlightenment
Stage IV: Wisdom
Stage V: Certainty
Summation of company quality posture
"We don't know why we have problems with quality"
"Is it absolutely necessary to always have problems with quality?"
"Through management commitment ad quality improvement we are identifying and resolving our problems"
"Defect prevention is a routine part of our operation"
"We know why we do not have problems with quality"
According to Crosby (1979), in Stage 1 – ‘Uncertainty’, the company has no
knowledge of Quality as a positive management tool. Cost of Quality is an unknown
term, unsolved problems produce new problems and pressure is put on every level of
15
the organization by a disorganized management team. Improvement is not considered
an option, as ‘the number one symptom is emphatic denial that this condition exists’.
Stage 2 – ‘Awakening’ is the beginning of the realization that quality
management may be useful. Inspection and testing are performed more often,
problems are identified earlier. However, it has not yet been recognized that quality
management is more than adhering to the technical aspect of processes. Long-range
solutions are not considered seriously.
Stage 3- ‘Enlightenment’ appears when management establishes a more
regular quality policy. Problems are faced openly, with the admission that ‘we cause
our own problems’ and task teams are responsible not only for resolving a problem,
but also for preventing it in the future. Cost of Quality is developed in a more
effective way, while management is better organized and quality-oriented.
In Stage 4 – ‘Wisdom’ cost reductions are in effect and problems are handled
effectively. Cost of Quality is more accurately reported and management realizes that
Quality Control is possible. ‘Wisdom is the stage at which the company has the
chance to make the changes permanent’. However, if the new attitude and systems are
taken for granted and further improvement efforts are not applied, then the whole
process can be threatened.
Stage 5 is ‘Certainty’. It is in this stage that quality management has become a
vital part of the organization. Problems hardly ever occur, since the prevention
systems of quality costing are apparent in every department.
3. Research Methodology
In this paper we provide an insight into the relationship between an
organization’s Quality Management Maturity level and the sophistication of its
16
quality costing system. Although there is evidence in international literature of
previous work on this area (Sansalvador and Brotons, 2013; Xiaofen, 2013; Sower et
al, 2007; Prickett and Rapley, 2001; Prickett, 1997), Quality Management Maturity
and the sophistication of Quality Costing are not sufficiently documented in Greek
F&B enterprises (Chatzipetrou & Moschidis, 2016; 2017). Therefore, we decided to
conduct a survey with the use of an online questionnaire.
We had 104 usable responses out of 457 Greek Food and Beverage companies
(23% response rate), which were chosen by simple random sampling in each sub-
sector (dairy, fruit and vegetables, bakery etc) from the members of the Chamber of
Commerce and Industry, in order to achieve representativeness. For the highest
response level possible, we proceeded to personal and phone interviews via structured
questioning using the online survey form, in cases where the returned questionnaires
were incomplete or not returned in time. Furthermore, we contacted 15 randomly
selected companies from the list of non-respondents after the main survey, who
attributed their non-response to lack of relative quality cost data. It would be
interesting to note, however, that, according to published literature (Fulton, 2016;
Peytchev, 2013) surveys with low response rates do not necessarily contain significant
non-response bias. If there are no systematic differences between respondents and
non-respondents, the sample remains representative of the target population and can
provide valid inferences. Thus, when using survey data to make inferences about a
population, response representativeness is more important than the response rate
(Cook et al, 2000).
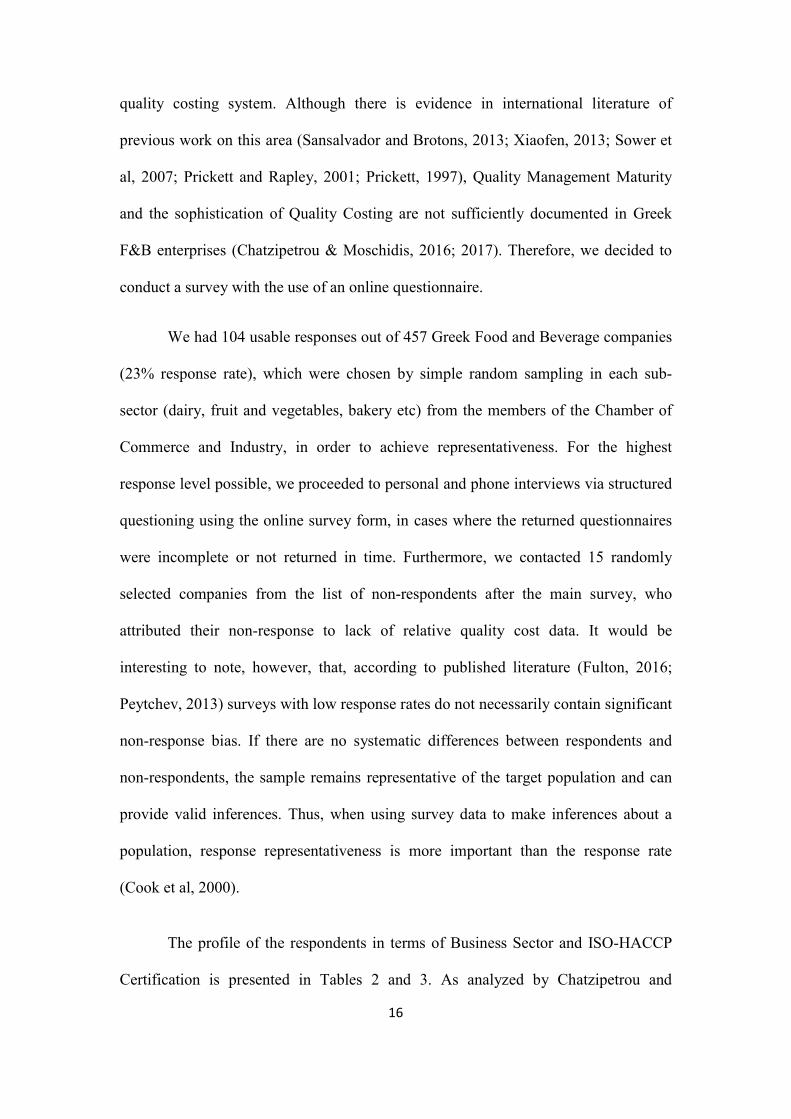
The profile of the respondents in terms of Business Sector and ISO-HACCP
Certification is presented in Tables 2 and 3. As analyzed by Chatzipetrou and
17
Moschidis (2017), the operational costs for ISO/HACCP systems can be measured as
part of the prevention and appraisal quality costs of the companies. The Τotal Quality
Cost Index (TQCI), based on sales and PAF data, reaches 2%, which is an acceptable
value in the literature (Lupin et al, 2010).
Table 2: Profile of respondents (Business Sector)
BUSINESS SECTOR Frequency
Frequency %
Bakery 45 43%
Dairy 7 7%
Fruit - Vegetables 18 17%
Alcoholic Drinks-Refreshments-Water 21 20%
Meat-Fish 13 13%
TOTAL 104 100%
Table 3: Profile of respondents (ISO/HACCP certification in Euros)
The work of Rasamanie and Kanapathy, 2011; Arvaiova et al. 2009; Prickett
and Rapley, 2001, was a useful guide for the structure of our questionnaire, with
categorical and 5-point Likert scale questions. The questionnaire was divided into
four sections: the first section was designed to gather general information about the
participating companies (for example sales turnover, number of employees, annual
ISO-HACCP Frequency Frequency %
not certified 13 13%
up to 500 euros 25 24%
501-1000 euros 27 26%
1001-2000 euros 22 21%
more than 2000 17 16%
TOTAL 104 100%
18
balance sheet total, business sector, ISO-HACCP Certification). The second part of
the questionnaire investigated which prevention-appraisal-failure costs (according to
the PAF Model) were monitored by the respondents and at what annual cost. The
third section included general questions on the organizations’ quality costing system,
investigating the reasons that supported its implementation, the difficulties
encountered, possible benefits or disadvantages, the uses of Quality Information (level
of analysis, departments involved) etc. Finally, the fourth section included questions
in relation to the maturity level of the companies, developed according to Crosby’s
Maturity Grid – QMMG (1979).
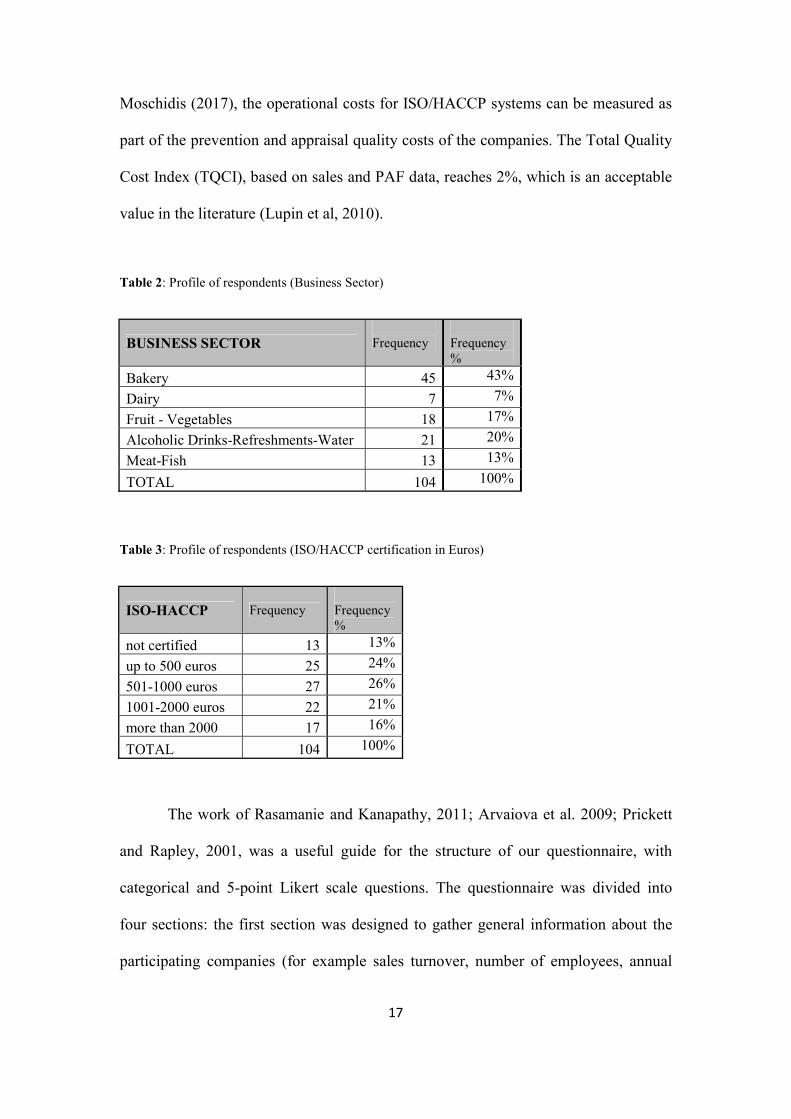
Crosby’s QMMG served as a tool for the identification of the maturity level of
the enterprises. The Financial or/and Quality Manager of the companies were
requested to assess the stage where the analyzed organization found itself, according
to Crosby’s Maturity Grid, by rating each category (Table 4) from 1(=totally disagree)
to 5(= very much agree).
Table 4: Crosby’s Grid Measurement Categories
Each rating represents the stage level on Crosby’s Grid for that category. The
total score for all six categories is then divided by 6, which indicates the Crosby
Maturity Stage the company finds itself (Table 5). Cosby (1979) suggests in his
Measurement Categories
Management understanding and attitude
Quality organization status
Problem handling
Cost of Quality as % of sales
19
original work that the six categories be treated as equivalent. Therefore, we assumed
that all measurement categories are equally weighted, as we did not intend to
introduce any subjective elements in the analysis, in contrast to Sansalvador and
Brotons (2013) and Martínez and Selles, (2015).
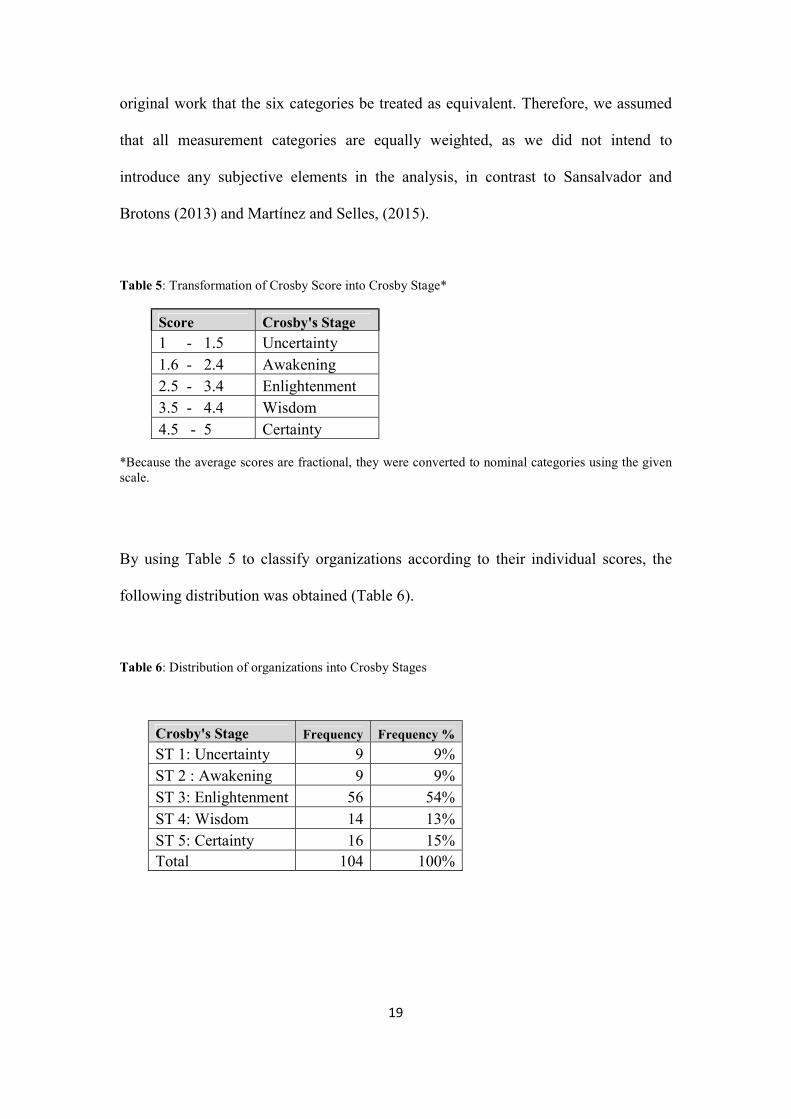
Table 5: Transformation of Crosby Score into Crosby Stage*
Score Crosby's Stage
1 - 1.5 Uncertainty 1.6 - 2.4 Awakening 2.5 - 3.4 Enlightenment 3.5 - 4.4 Wisdom 4.5 - 5 Certainty
*Because the average scores are fractional, they were converted to nominal categories using the given scale.
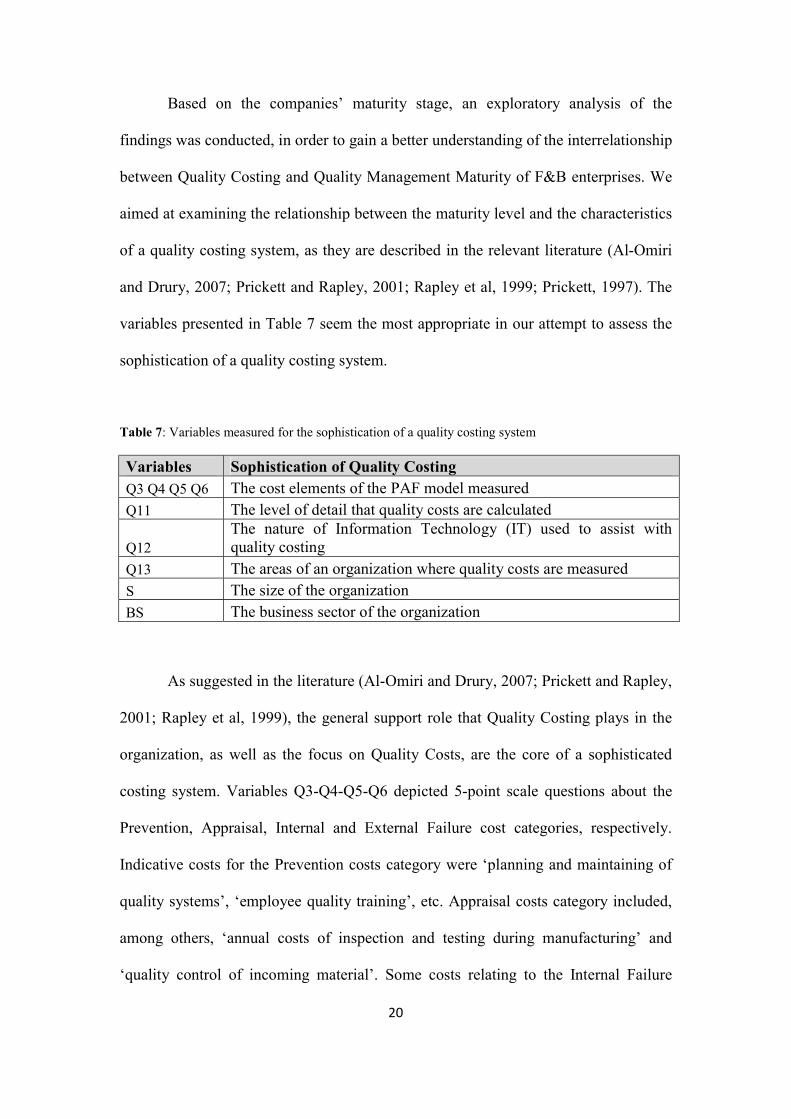
By using Table 5 to classify organizations according to their individual scores, the
following distribution was obtained (Table 6).
Table 6: Distribution of organizations into Crosby Stages
Crosby's Stage Frequency Frequency %
ST 1: Uncertainty 9 9% ST 2 : Awakening 9 9% ST 3: Enlightenment 56 54% ST 4: Wisdom 14 13% ST 5: Certainty 16 15% Total 104 100%
20
Based on the companies’ maturity stage, an exploratory analysis of the
findings was conducted, in order to gain a better understanding of the interrelationship
between Quality Costing and Quality Management Maturity of F&B enterprises. We
aimed at examining the relationship between the maturity level and the characteristics
of a quality costing system, as they are described in the relevant literature (Al-Omiri
and Drury, 2007; Prickett and Rapley, 2001; Rapley et al, 1999; Prickett, 1997). The
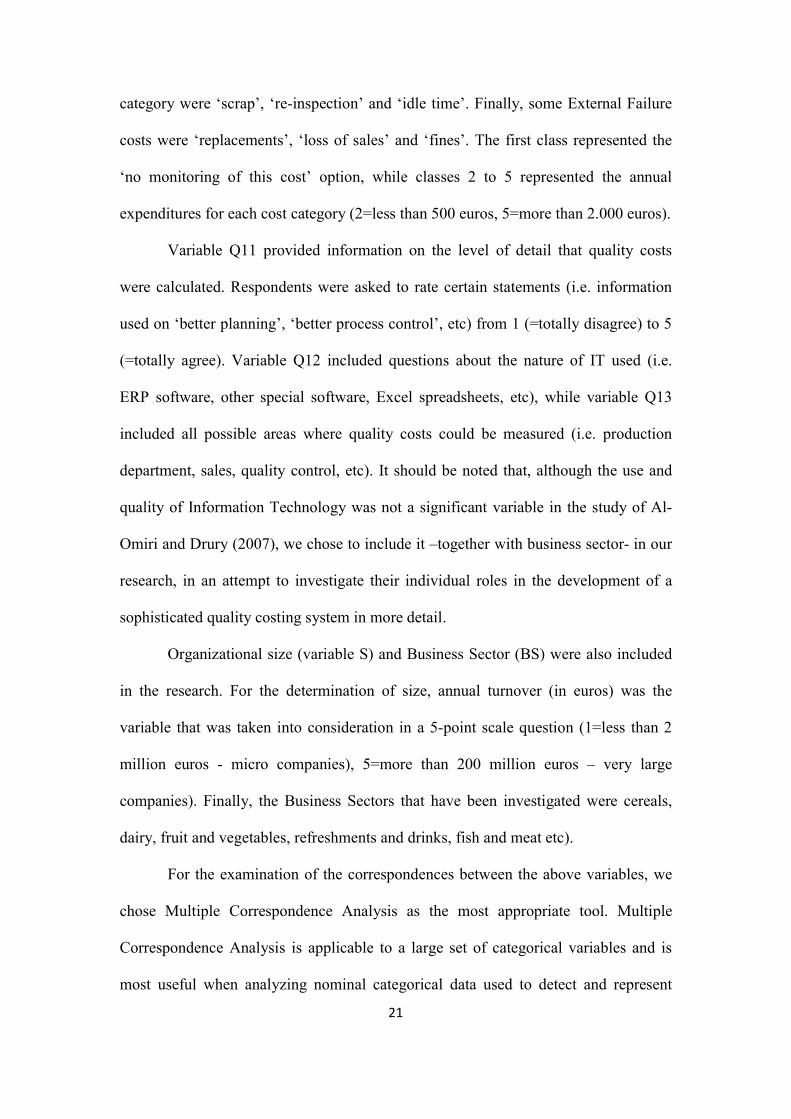
variables presented in Table 7 seem the most appropriate in our attempt to assess the
sophistication of a quality costing system.
Table 7: Variables measured for the sophistication of a quality costing system
Variables Sophistication of Quality Costing Q3 Q4 Q5 Q6 The cost elements of the PAF model measured Q11 The level of detail that quality costs are calculated
Q12 The nature of Information Technology (IT) used to assist with quality costing
Q13 The areas of an organization where quality costs are measured S The size of the organization BS The business sector of the organization
As suggested in the literature (Al-Omiri and Drury, 2007; Prickett and Rapley,
2001; Rapley et al, 1999), the general support role that Quality Costing plays in the
organization, as well as the focus on Quality Costs, are the core of a sophisticated
costing system. Variables Q3-Q4-Q5-Q6 depicted 5-point scale questions about the
Prevention, Appraisal, Internal and External Failure cost categories, respectively.
Indicative costs for the Prevention costs category were ‘planning and maintaining of
quality systems’, ‘employee quality training’, etc. Appraisal costs category included,
among others, ‘annual costs of inspection and testing during manufacturing’ and
‘quality control of incoming material’. Some costs relating to the Internal Failure
21
category were ‘scrap’, ‘re-inspection’ and ‘idle time’. Finally, some External Failure
costs were ‘replacements’, ‘loss of sales’ and ‘fines’. The first class represented the
‘no monitoring of this cost’ option, while classes 2 to 5 represented the annual
expenditures for each cost category (2=less than 500 euros, 5=more than 2.000 euros).
Variable Q11 provided information on the level of detail that quality costs
were calculated. Respondents were asked to rate certain statements (i.e. information
used on ‘better planning’, ‘better process control’, etc) from 1 (=totally disagree) to 5
(=totally agree). Variable Q12 included questions about the nature of IT used (i.e.
ERP software, other special software, Excel spreadsheets, etc), while variable Q13
included all possible areas where quality costs could be measured (i.e. production
department, sales, quality control, etc). It should be noted that, although the use and
quality of Information Technology was not a significant variable in the study of Al-
Omiri and Drury (2007), we chose to include it –together with business sector- in our
research, in an attempt to investigate their individual roles in the development of a
sophisticated quality costing system in more detail.
Organizational size (variable S) and Business Sector (BS) were also included
in the research. For the determination of size, annual turnover (in euros) was the
variable that was taken into consideration in a 5-point scale question (1=less than 2
million euros - micro companies), 5=more than 200 million euros – very large
companies). Finally, the Business Sectors that have been investigated were cereals,
dairy, fruit and vegetables, refreshments and drinks, fish and meat etc).
For the examination of the correspondences between the above variables, we
chose Multiple Correspondence Analysis as the most appropriate tool. Multiple
Correspondence Analysis is applicable to a large set of categorical variables and is
most useful when analyzing nominal categorical data used to detect and represent
22
underlying structures in a data set (Moschidis, 2009; Greenacre, 2007). It is an
exploratory methodology, which aims at a holistic analysis of the data structure. More
specifically, it ranks the largest covariances of the involved variables into axes,
highlighting the most intense interactions (Greenacre, 2007). The statistical
dependency of the multicontingency matrix of the variables has been tested with the
2X test and was found to be statistically significant at a=5%. Because the research
was going to take place in an unknown and vague environment, we chose not to
formulate any hypotheses in advance, but rather let the data “talk”. Multiple
Correspondence Analysis depicted the interactions between the various Crosby stages,
which stand for the maturity variables, and the variables of system sophistication
(Table 7). Hierarchical Clustering (Moschidis, 2015) was used as a separate, more
illustrative part of the research, in order to cluster the sophistication characteristics in
relation to the various variables that define the maturity stages (Table 4). Since the
data was categorical, these methodologies were preferred to Factor analysis, which is
useful mainly in the case of quantitative data, as it does not show the structure of the
dependence in large matrixes with multi-categorical variables (Greenacre, 2007).
4. Analysis of Results
Multiple Correspondence Analysis
The analysis has been conducted by the use of SPAD, a Data Analysis
Software. The analysis is presented in two separate axes, rather than in a combined
plot (factorial level), in order to better de pict the two vertical directions with the
largest dispersion. The presentation of the factorial level with the Multiple
23
Correspondence Analysis (MCA) may lead to the elimination of the different
significance of the findings in the axes. The first factorial axis is the one with the
largest dispersion and the second factorial axis is the one with the second largest
dispersion. MCA displays equivalently in each axis the rows and the columns of the
analyzed contingency matrix (unlike Factor analysis, which displays accurately only
the quantitative variable columns of the matrix).
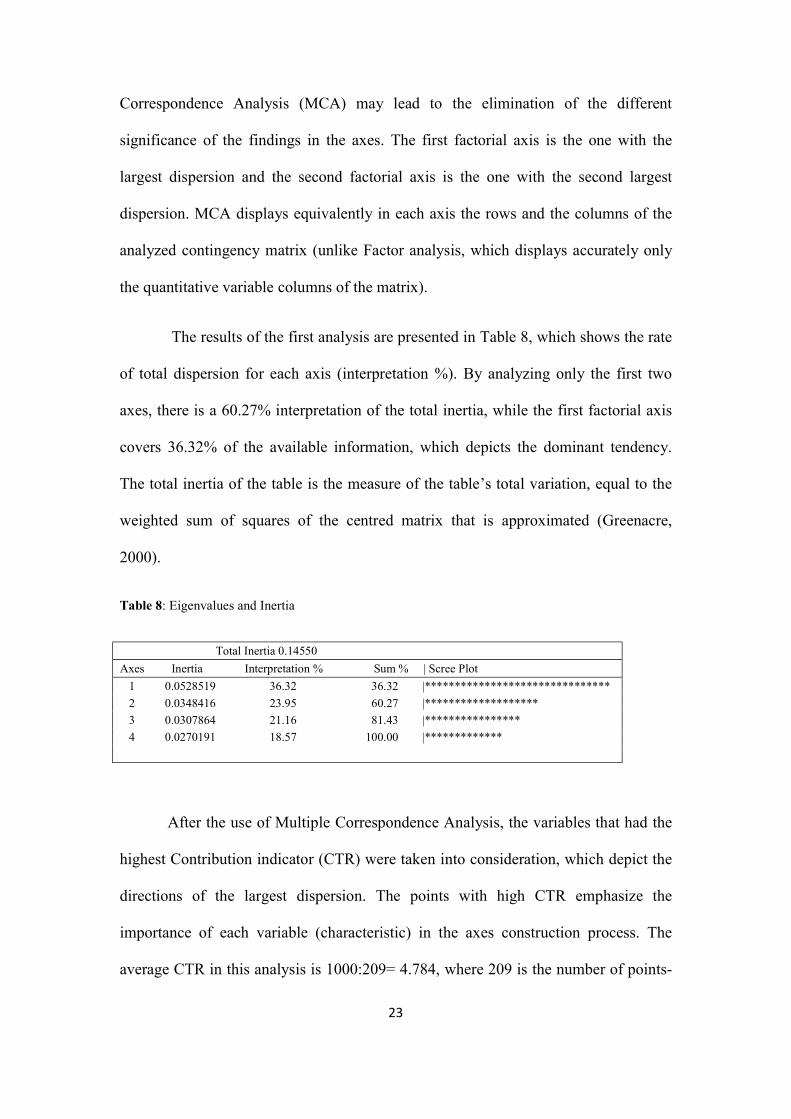
The results of the first analysis are presented in Table 8, which shows the rate
of total dispersion for each axis (interpretation %). By analyzing only the first two
axes, there is a 60.27% interpretation of the total inertia, while the first factorial axis
covers 36.32% of the available information, which depicts the dominant tendency.
The total inertia of the table is the measure of the table’s total variation, equal to the
weighted sum of squares of the centred matrix that is approximated (Greenacre,
2000).
Table 8: Eigenvalues and Inertia
Total Inertia 0.14550
Axes Inertia Interpretation % Sum % | Scree Plot
1 0.0528519 36.32 36.32 |*******************************
2 0.0348416 23.95 60.27 |*******************
3 0.0307864 21.16 81.43 |****************
4 0.0270191 18.57 100.00 |*************
After the use of Multiple Correspondence Analysis, the variables that had the
highest Contribution indicator (CTR) were taken into consideration, which depict the
directions of the largest dispersion. The points with high CTR emphasize the
importance of each variable (characteristic) in the axes construction process. The
average CTR in this analysis is 1000:209= 4.784, where 209 is the number of points-
24
elements. Points of high contribution in axis construction are generally considered
those with CTR value above average. However, in this case, we chose to focus on
CTR>13 in the first 2 factorial levels, in order to highlight the variables that have the
highest possible contribution to the construction of each axis. The first axis presents
the main directions of the largest dispersion, while the second axis presents the second
largest dispersion.
The following analysis is based on the indicators CTR and the Coordinates.
The depictions of the axes are the projections of the points and not the points
themselves. The analysis of the first axis (Figure 1) shows the formation of two
groups of companies at both sides of point zero (0) of the axis, which diversify
themselves in relation to their characteristics. The first group of companies have
placed themselves in maturity stage 1 (St1), while the second group belongs to
maturity stage 4 (St4).
25
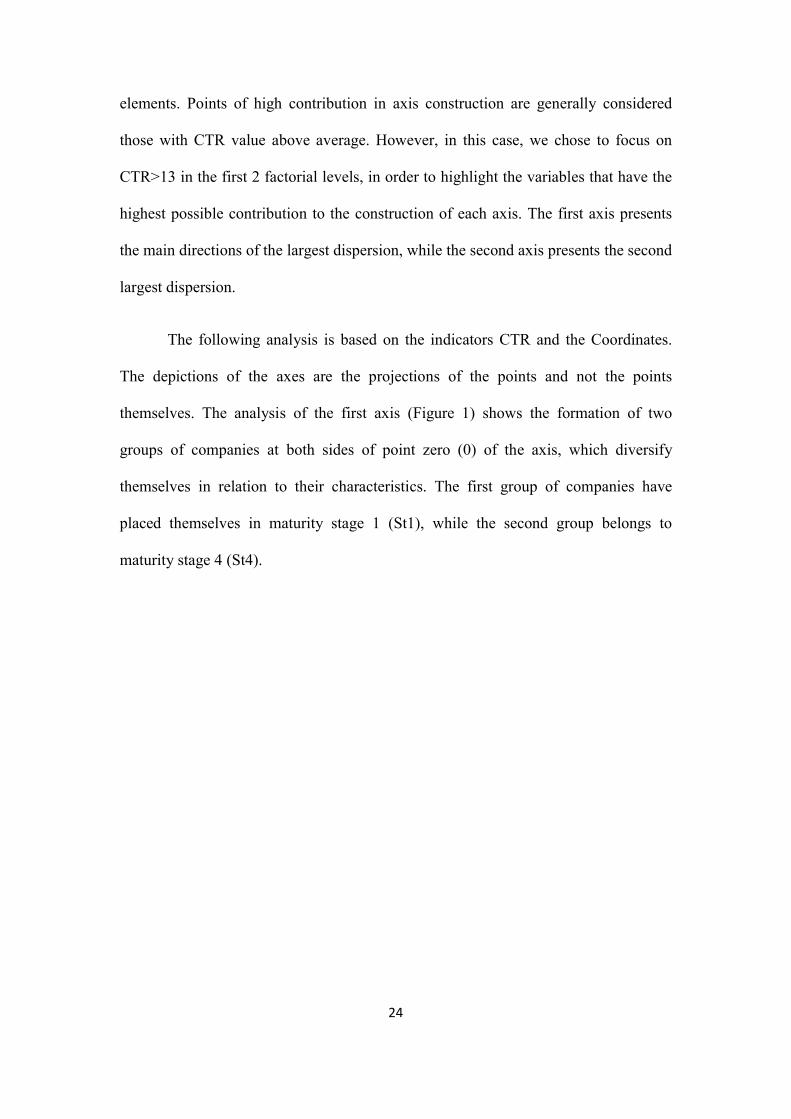
Figure 1: Interpretation Indicators: Coordinates and Highest Contributions (CTR) of the first axis.
Companies in the ‘Uncertainty’ stage (St1) represent the Beverages subsector,
including ‘alcoholic drinks, refreshments and water’ (Bs4). They are characterized by
a low sophistication level, since they invest heavily in external failure costs, in
contrast to the core concept of effective Quality Costing that proposes focus on
conformance activities. Companies spend more than 2000 € annually on external
failure costs, and in particular ‘replacement costs’ (Q6_15), which is the dominant
variable for this maturity stage. A weaker tendency is depicted by appraisal costs, on
26
which companies in the Uncertainty stage annually spend less than 500 € (‘process
control measurements’- Q4_72). In terms of sophistication, it appears they do not use
any special IT for monitoring Cost of Quality (Q12_22). No other relevant variables
appeared in connection to the ‘Uncertainty’ stage.
The group of companies that belong to stage 4 – the ‘Wisdom’ stage (St4),
seem to be large companies located in the Fruit subsector (Bs3). The sophistication
level at this stage is higher, since Quality Costing is implemented with an emphasis
on appraisal costs. Appraisal costs absorb annually 1001-2000 € on ‘inspection and
testing during manufacturing’ (Q4_24) and is the most dominant variable for this
maturity stage. Limited emphasis is put on supplier evaluation (Q4_71), on the
planning and development of control equipment (Q3_31) and the handling costs of
low quality products (Q6_21). The quality costing system sophistication is higher at
the ‘Wisdom’ stage, since companies seem to share common views as to the uses of
quality cost information, as their answers point out that information supplied by
Quality Costing is used towards ‘the comparison between costs in different processes
within the company’ (Q11_55).
As far the analysis of Axis 2 is concerned (Figure 2), there is a distinctive
pattern for companies that have assessed their status in the ‘Awakening’ Stage (St2).
27
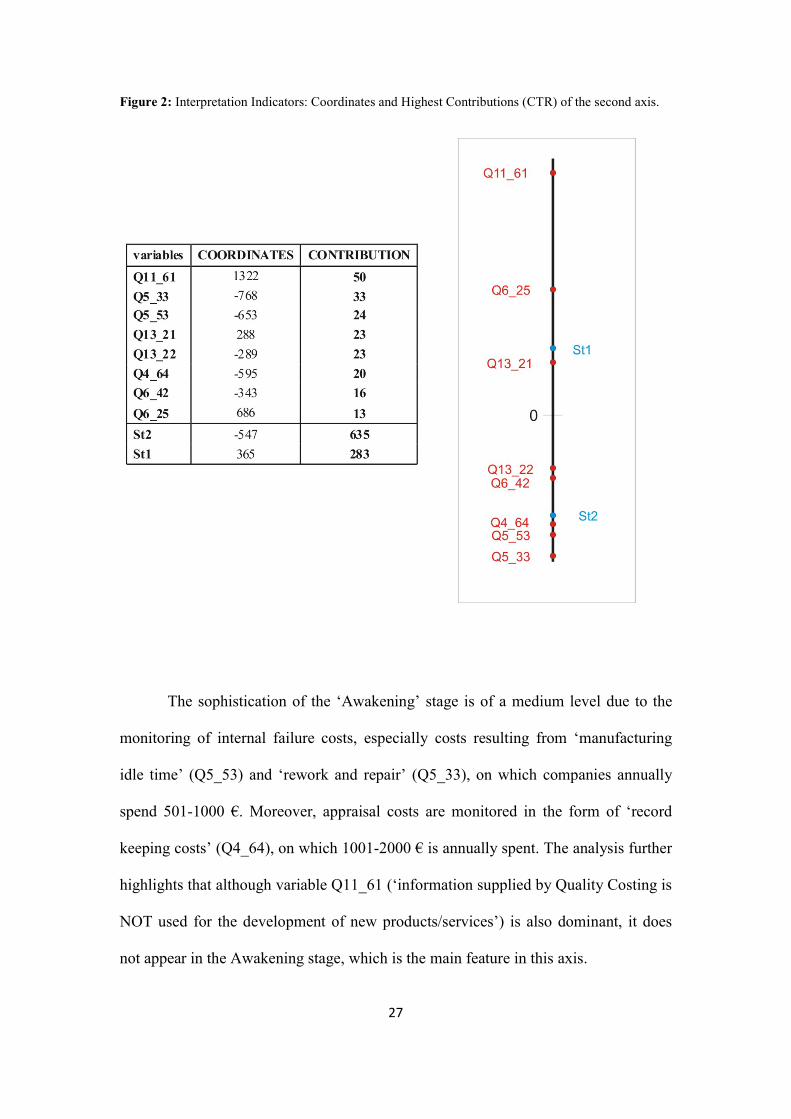
Figure 2: Interpretation Indicators: Coordinates and Highest Contributions (CTR) of the second axis.
The sophistication of the ‘Awakening’ stage is of a medium level due to the
monitoring of internal failure costs, especially costs resulting from ‘manufacturing
idle time’ (Q5_53) and ‘rework and repair’ (Q5_33), on which companies annually
spend 501-1000 €. Moreover, appraisal costs are monitored in the form of ‘record
keeping costs’ (Q4_64), on which 1001-2000 € is annually spent. The analysis further
highlights that although variable Q11_61 (‘information supplied by Quality Costing is
NOT used for the development of new products/services’) is also dominant, it does
not appear in the Awakening stage, which is the main feature in this axis.

28
Hierarchical Cluster Analysis
At this point, we proceeded to a more detailed analysis of our findings. With
the use of Hierarchical Cluster Analysis (HCA), we attempted to cluster the
sophistication characteristics (Table 7) in relation to the variables that define the
maturity stages according to Crosby’s Grid, as presented in Table 4. For the distance
between elements we used metric 2X , since the data table was a contingency table.
The Ward Criterion was used for the formation of the clusters, which is compatible
with Correspondence Analysis and the categorical nature of the data.
Subsequently, we aim at a confirmatory verification of the MCA findings with
more analytic data on the maturity stages, through Hierarchical Cluster Analysis.
This more detailed analysis shows that the most satisfactory clustering forms
four clusters. Cluster characterization took place after a one-sided Z-test at a
significance level of a= 0.05. Only numbers above 1.65 were recorded, which is the
critical value of Z-test at a level of a=0.05. Although all characteristics above 1.65 are
considered statistically significant, we chose to take into consideration the most
dominant characteristics for each cluster.
The analysis concludes that:
- The ‘No sophistication level’ cluster includes almost all PAF components
rated with 4 (more than 1000 € on quality costs) or 5 (more than 2000 € on
quality costs) (Q3_15, Q4_55, Q5_55, Q3_75, Q6_35), which represent an
expensive horizontal implementation of Quality Costing, with no focus on
specific prevention and appraisal activities, which leads to excessive total
costs. In terms of quality management maturity, despite the fact that quality
improvement is a normal and continued activity (Q9_45) and Top
29
management has a role in the quality process (Q9_93), companies have no
idea why they have problems with quality (Q8_81). Teams are set up to attack
major problems, but long-range solutions are not produced (Q8_72). Finally,
the reported percentage of Cost of Quality to sales is 8%, while the actual
seems to be 12% (Q15_3).
- The ‘Low sophistication level’ cluster involves most of the PAF components
rated with 2 (less than 500 €) or 3 (501-1000 € on quality costs) (Q3_13,
Q5_32). Other characteristics also show little or no use of quality cost
information and special IT (Q12_22). Although there are some obvious
‘motivational’ short-range efforts in terms of quality improvement (Q9_42),
turmoil and tension are apparent, without adequately defined problems
(Q8_71, Q8-82).
- The ‘Medium sophistication level’ cluster is characterized by the lack of
prevention and appraisal costing (Q3_11, Q3_31, Q3_61), whereas internal
and external failure costs absorb a considerable amount of money. Quality cost
information is used most effectively (Q11_75). In relation to maturity,
management understands the absolutes of quality and their role in the process
(Q8_14), with an emphasis on Prevention (Q9_95, Q8_75). They seem to have
a clear understanding of how to avoid quality problems (Q8_85).
- Finally, the ‘High sophistication level’ cluster is characterized by high
prevention and appraisal costs (Q3_43, Q4_24), and at the same time by low
investment on internal and external failure costs, which depicts the essence of
successful Quality Costing implementation. Quality costs are measured for
most of the organizational areas and quality cost information is used
30
effectively (Q11_35). The maturity measurement categories in this cluster
show that problems are indeed identified early in their development (Q8_74),
since defect prevention is a routine part of the companies’ operation (Q8_84).
5. Discussion
With the use of Multiple Correspondence Analysis, an interesting relationship
between the maturity level of enterprises and the level of sophistication of their
quality costing system has been identified, enriched with variables of the PAF Model.
The results point out the leading role that the PAF Model plays in the process, not
only as an important element of quality system sophistication, but also as a dominant
variable in relation to the Quality Management Maturity level. In our case certain
Cost of Quality components are interrelated with the maturity stages of ‘Uncertainty’
(stage 1), ‘Awakening’ (stage 2) and ‘Wisdom’ (stage 4), which constitute the most
dominant characteristics. External failure costs seem to be of great importance in the
‘Uncertainty’ stage, followed by appraisal costs. On the contrary, appraisal and
internal failure costs characterize the ‘Awakening stage’, while appraisal costs seem
important in the ‘Wisdom’ stage. Finally, prevention costs do not seem to have any
statistical significance.
The above findings are consistent with the general quality management
assertion, that companies with a weak quality costing system are expected to have
high external and internal failure costs. Meanwhile, in a more mature system the
failure categories are expected to be smaller and the appraisal and prevention
31
categories would either rise (Martínez and Sellés, 2015; Sower et al, 2007; Beecroft,
2001; Montgomery, 1996; Crosby, 1979) or, sometimes surprisingly decrease, as a
result of continuous improvement efforts (Plewa et al, 2016; Ayati & Schiffauerova,
2014; Ittner, 1996). Furthermore, our findings confirm the general characteristics of
each stage, as developed in Crosby’s Grid (Crosby, 1979). Consequently, it is
validated by our research that:
F&B companies at the ‘Uncertainty’ stage appear to have limited
knowledge of Quality as a positive management tool, are unaware of Cost of
Quality and leave problems unsolved, without making any efforts to prevent
poor quality. This stage is characterized by high external failure costs and
spends a minimum amount on appraisal processes, as confirmed by our
results.
in the ‘Awakening’ stage comes the realization that quality management may
be useful, which leads to more regular inspection and testing and earlier
identification of problems, especially in the food manufacturing industry
(Djekic et al, 2014; Lupin et al, 2010; Omurgonulsen, 2009). Our findings
show, accordingly, that companies have significant appraisal and internal
failure costs, which emphasizes their attention to better quality and all types of
control.
F&B companies in the ‘Wisdom’ stage can handle cost reductions and report
Cost of Quality more accurately. Therefore, they use quality cost information
for the comparison between costs and for a detailed monitoring of the
companies΄ processes (Martínez & Selles, 2015), and invest a large amount in
certain appraisal costs, as in our case.
32
quality cost information proved to be actively connected with a company’s
profile in terms of quality management (Pires et al, 2015). Information on
quality-related costs is rarely used by companies in the ‘Uncertainty’ stage for
improvement of their processes or new products’ development, while they
never use it for marketing or pricing strategies. Their answers confirm that a
form of quality costing system is implemented. Companies in the
‘Awakening’ stage do not use information effectively, either. Only companies
in the ‘Certainty’ stage appear to use quality cost information for the
comparison between costs in different processes within the company. As far as
the use of IT is concerned, the results show that companies in the ‘Certainty’
stage use special statistical packages during the monitoring process of Quality
Costs.
although ‘size’ and ‘business sector’ have produced contradictory results in
the literature (Xiaofen, 2013; Trigueros Pina and Sansalvador Sellés, 2008;
Prickett, 1997), both variables appear to be statistically significant in the
present analysis. In relation to ‘size’, medium-sized companies seem to share
the characteristics of ‘Wisdom’ and ‘Certainty’, while smaller companies
belong to the ‘Awakening’ stage. Taking into account that the size of
companies is defined by the number of employees, turnover and/or annual
balance sheet total (Commission Recommendation 2003/361/EC), it can be
deduced that small companies in Greece have limited knowledge, resources,
training and, obviously, motivation in order to focus on continuous
improvement and promotion of quality techniques (Chatzipetrou and
Moschidis, 2017). As far as the ‘Business Sector’ is concerned, there is
evidence that companies in the Beverage sector are characterized by the
33
‘Uncertainty’ stage, while companies in the Fruit sector belong to the
‘Wisdom’ and ‘Certainty’ stage. These results seem reasonable, considering
that the Fruit sector processes very sensitive products, which demand high
levels of preservation and standardization and high degree of quality
awareness.
The use of cluster analysis provides useful identification of groups of
companies with differentiated profiles (as in Pires et al, 2015). With Hierarchical
Clustering as part of the analysis, it was further attempted to form clusters of the
sophistication characteristics of a quality costing systems, in relation to the individual
measurement categories of maturity stages. The clusters that have been formed share
common characteristics with the maturity stages, as described by Crosby. This
detailed analysis in our paper pointed out some interesting results.
It is clear that the expenditure on all Quality Costs by spending large amount
of money does not always lead to the resolution of all problems, as in the case
of clusters with no sophistication or a low sophistication level. Extensive
examination of all procedures and departments is necessary, in order to
identify problematic areas and possible solutions.
It is the quality of the implementation of a Cost of Quality program rather than
its mere existence that affects the results that can be achieved in an
organization (Sower et al, 2007). Implementation of cost of quality techniques
helps companies focus upon the areas that need improvement, gauge the
progress of improvement activities and improve communication within the
organization for better quality control (Kerfai et al, 2016; Őzkan and
Karaibrahimoğlu (2013), Prickett and Rapley, 2001). Furthermore, it has been
34
found that Quality costing sets the priorities for the necessary corrective
actions, so it is not to be implemented as a general ‘expensive' overall
technique, but rather as a focused solution for reduction of defects, reduction
of costs and continuous improvement. As Gupta and Campbell (1995)
interestingly put it, “attending a CoQ seminar has nothing to offer those
searching for a quick fix or an easy answer. But for corporations willing to go
that extra mile, it can set the stage for continuous improvement and cost-
effectiveness” (p. 49).
It was evident from our findings that the intentions of management do not
always depict the reality that exists at lower levels of the organization, as in
the cluster with a medium sophistication level. A quality cost program should
always move from top to bottom i.e. top management should make it a part of
overall production process (Trehan et al, 2015; Prashar, 2015). Management
visions or perception of reality may differ from the actual conditions of their
organization. “If CoQ is used as an accounting measure by unenlightened
management, it becomes a useless pain” (Gupta and Campbell, 1995, p. 47).
Communication may be hindered due to lack of motivation or excessive
pressure on employees, abstract definition of goals or employee resistance.
Good intentions of management are not the sole key to improvement.
6. Conclusions – Limitations- Future Research
The present paper offers a first insight into the Quality Management level of
Greek F&B enterprises, a field that has not been extensively studied in the literature.
35
The paper ranks companies in quality maturity stages and emphasizes the relationship
between the maturity level and the sophistication of their Quality Costing systems.
Evidence shows that Quality Costing, in the form of the PAF model, is directly related
to maturity level. The higher the maturity level, the more companies focus on better
quality and more effective use of information (Jespersen e al, 2016; Ayati and
Schiffauerova, 2014; Gupta and Campbell, 1995). Furthermore, it has been found that
mainly the appraisal and failure costs are evident in our results. Prevention costs,
although present, do not constitute a significant component of the Quality Costs
associated with each maturity level.
The economic restrictions on Greek economy since summer 2015, in the form
of capital controls, unbalanced the Greek economic and manufacturing environment
and disorganized Greek enterprises. This environment does not constitute ‘fertile
ground’ for quality costing techniques. This explains, therefore, why companies and
their management show limited interest in participating in our research. Furthermore,
the Greek Uniform Chart of Accounts and the Greek Accounting Standards do not
cover the topic of Quality Costs by specific quality-related accounts, which
discourages companies from paying any attention to Quality Costs’ monitoring and
measurement, and hinders the efforts of researchers in the depiction and analysis of
Quality Costs’ implementation in Greece.
It seems imperative, therefore, that Greek F&B companies take into account
the general characteristics of the maturity level they are placed in, and evaluate its
general characteristics and attributes. Action can then be taken, in respect to their
attitude towards Quality Costing. The more they focus on quality, the more positive
results they will get, which will lead to a general improvement of all processes within
36
their organizations and a consequent achievement of a higher level of maturity. A
maturity model can, therefore, serve as a framework for companies to approach
problems and defects in a more holistic way, to set priorities and to overcome
difficulties. Quality Costing is indispensable when following this path.
We suggest that further research be done in other business sectors, apart from
Food & Beverage, to generate new knowledge on the implementation of Cost of
Quality in Greece and its interrelation with Quality Management Maturity level. It
would be interesting to expand the area of research, in an effort to examine whether
the results of the present study could apply to other industries as well. The time span
of the research could also be expanded, since a longitudinal study could produce
interesting results on the various relationships and connections. Furthermore, bearing
in mind that the F&B sector in Greece is a dominant component of domestic
Manufacturing, further research could highlight the important contribution that
‘mature’ F&B companies could have in the quality costing implementation process by
the majority of Greek companies. Our research confirmed that a ‘mature’ company is
characterized by consistency, focus on continuous improvement and commitment to
Quality costing. It is for this reason that ‘mature’ companies need to realize their
leading role towards a general wave of quality management implementation and,
thereby, set the foundations for an overall ‘restart’ of the Greek economy. Finally, the
present research could trigger a discussion among the responsible Chambers, the
academic community and the State, for the necessity of a reformed accounting
framework, relevant to the requirements of Quality Costing.
37
References
Ahmed Al-Dujaili Mohammed A., (2013), ‘Study of the Relation between Types of
the Quality Costs and its Impact on Productivity and Costs: A Verification In
Manufacturing Industries’, Total Quality Management & Business Excellence,
vol.24, no.4, p. 397-419.
Albliwi, S. A., Antony, J., & Arshed, N. (2014, December), ‘Critical Literature
Review on Maturity Models for Business Process Excellence’, in 2014 IEEE
International Conference on Industrial Engineering and Engineering
Management, p. 79-83, IEEE Publishing.
Al-Omiri, M., & Drury, C. (2007), ‘A Survey of Factors Influencing the Choice of
Product Costing Systems in UK Organizations’, Management Accounting
Research, vol.18, no.4, p. 399-424.
Antoniades, P. (2014), ‘SOA, Maturity Models, SOA MM and Relevant Work’, in
SOA Maturity Model (pp. 9-17), Springer International Publishing.
Aranda, J. R. G., & Márquez, F. P. G. (2015), ‘Use of Excellence Models as a
Management Maturity Model (3M)’, in Advanced Business Analytics (pp. 165-
179), Springer International Publishing.
Arvaiova, M, Aspinwall E. M. and Walker D.S. (2009), ‘An Initial Survey on the Use
of Costs of Quality Programmes in Telecommunications’, The TQM Journal, vol.
21, no. 1, p. 59-71.
38
Ayati, E., & Schiffauerova, A. (2014, November), ‘Study of Cost of Quality Behavior
in Manufacturing Supply Chain Based on the Quality Maturity Status’, in ASME
2014 International Mechanical Engineering Congress and Exposition (pp.
V014T08A006-V014T08A006), American Society of Mechanical Engineers.
Balbaster Benavent, F., Cruz Ros, S., & Moreno-Luzon, M. (2005), ‘A Model of
Quality Management Self-Assessment: An Exploratory Research’, International
Journal of Quality & Reliability Management, vol. 22, no.5, p. 432-451.
Beecroft, G. (2001), ‘Cost of Quality and Quality Planning affect the Bottom Line’,
The Quality Management Forum, vol. 27, no.1, p, 1-7.
British Standards Institute, BS 6143 (1990), ‘Guide to the Economics of Quality’, part
2, London, BSI.
Brown, A. and Van der Wiele T. (1996), ‘Quality Management Self-Assessment in
Australia’. Total Quality Management, vol. 7. No.3, p. 293-308.
Burgess,T.F, (1996), ‘ Modelling Quality-Cost Dynamics’, International Journal of
Quality and Reliability Management, vol. 13, no. 3, p. 8-26.
Campanella, J (1999), Principles of Quality Costs: Principles, Implementation and
Use (3rd ed).
Carson, J.K (1986), ‘Quality Costing-A Practical Approach’, International Journal of
Quality and Reliability Management, vol. 3, no.1. p.54-63.
Chatzipetrou E and Moschidis O., (2016), ‘Quality Costing: A Survey in Greek Super
Markets using Multidimensional Analysis’, International Journal of Quality
and Reliability Management, vol.33, no. 5, p. 615-632.
39
Chatzipetrou E. and Moschidis O., (2017), ‘An Exploratory Analysis of Quality
Costing in Greek Food & Beverage Enterprises’, The TQM Journal, vol. 29, no.
2, p. (in press).
Chopra, A., & Singh, B. J. (2015), ‘Unleashing a Decisive Approach to Manage
Quality Costs through Behavioural Investigation’, Business Process
Management Journal, vol. 21, no.6, p. 1206-1223.
Commission Recommendation 2003/361/EC, as published in the Official Journal of
the European Union L 124, p. 36 of 20 May 2003.
Cook, C., Heath F. and Thompson R, (2000), ‘A Meta-Analysis of Response Rates in
Web-or Internet-based Surveys’, Educational and Psychological Measurement,
vol. 60, no. 6, p. 821-36.
Crosby, P. B. (1979), ‘Quality is Free: The Art of Making Quality Certain’, McGraw-
Hill, New York.
Crosby, P.B (1996), ‘Quality is still Free: Making Quality Certain in Uncertain
Times’, McGraw-Hill, New York.
Dale B and Plunkett J., (1999), Quality Costing, third Edition, Gower.
Dale B., Y-Wu P., Zairi M., Williams A.R.T and Van Der Wiele T., (2001), “Total
Quality Management and Theory: An Exploratory Study of Contribution”, Total
Quality Management, vol. 12, no. 4, p. 439-449.
Dellana, S., & Kros, J.F. (2014) ‘An Exploration of Quality Management Practices,
Perceptions and Program Maturity in the Supply Chain’, International Journal
of Operations & Production Management, vol. 34, no. 6, p. 786-806.
40
Desai, D.A., (2008), ‘Cost of Quality in Small-and-Medium-Sized Enterprises: Case
of an Indian Engineering Company’, Production Planning and Control, vol.19, no.
1, January, p. 25-34.
Djekic, I., Zaric, V., & Tomic, J. (2014), ‘Quality Costs in a Fruit Processing
Company: A Case Study of a Serbian Company’, Quality Assurance and Safety of
Crops & Foods, vol. 6, no.1, p. 95-103.
Feigebaum, A.V. (1991), Total Quality Control, 3rd ed., McGraw-Hill, New York.
Feigenbaum, A.V. (1956) ‘Total Quality Control’, Harvard Business Review, 34(6),
93- 101.
Fotopoulos, C., & Psomas, E. (2009), ‘The Use of Quality Management Tools and
Techniques in ISO9001:2000 Certified Companies: The Greek Case’,
International Journal of Productivity and Performance Management, vol. 58,
no. 6, p. 564-580.
Foundation for Economic and Industrial Research, Food and Beverages Industry,
Facts and Figures 2014, ISBN 978-960-7536-59-4, www.iobe.gr.
Fraser, P., Moultrie, J., & Gregory, M. (2002), ‘The Use of Maturity Models/Grids as
a Tool in Assessing Product Development Capability’, In Engineering
Management Conference, 2002. IEMC'02. 2002 IEEE International (Vol. 1, pp.
244-249). IEEE.
Fu, S. L., Chou, S. Y., Chen, C. K., & Wang, C. W. (2015), ‘Assessment and
Cultivation of Total Quality Management Organisational Culture – An
41
Empirical Investigation’, Total Quality Management & Business
Excellence, vol. 26, no.1-2, p.123-139.
Fulton, B. R. (2016), ‘Organizations and Survey Research Implementing Response
Enhancing Strategies and Conducting Nonresponse Analyses, Sociological
Methods & Research, DOI: 10.1177/0049124115626169.
Greenacre, M. (2000), ‘Correspondence Analysis of Square Asymmetric
Matrices’, Applied Statistics, vol. 49, no.3, p. 297-310.
Greenacre, M. (2007), Correspondence Analysis in Practice, Chapman and Hall/CRC,
Boca Raton
Gryna, F.M. (1988) “Quality Costs” in The Quality Control Handbook (4th ed.),
Juran, J.M. and Gryna, F.M (Ed), McGraw Hill, New York, p. 4.1-4.30.
Gupta, M., & Campbell, V. S. (1995), ‘The Cost of Quality’, Production and
Inventory Management Journal, vol. 36, no. (3), p. 43-49.
Ismyrlis, V., & Moschidis, O. (2015), ‘The Use of Quality Management Systems,
Tools and Techniques in ISO 9001: 2008 Certified Companies with
Multidimensional Statistics: The Greek Case’, Total Quality Management &
Business Excellence, vol. 26, no.5-6, 497-514.
Ittner, C. D. (1996), ‘Exploratory Evidence on the Behavior of Quality Costs’,
Operations Research, vol.44, no.1, p.114-130.
Jafar, A, Mohamad, T., Fariba, E. and Mehrdad, G.C. (2010), ‘Effect of the Quality
Costing System on Implementation and Execution of Optimum Total Quality
42
Management’, International Journal of Business and Management, vol 5, no. 8,
August, p. 19-26.
Jespersen, L., Griffiths, M., Maclaurin, T., Chapman, B., & Wallace, C. A. (2016),
‘Measurement of Food Safety Culture Using Survey and Maturity Profiling
Tools’, Food Control, vol. 66, p. 174-182.
Juran, J.M. (1951), Quality Control Handbook, McGraw Hill (1st ed.), New York.
Juran, J.M. and Gryna, F.M.(1993), Quality Planning and Analysis: From Product
Development Through Use, McGraw –Hill, New York.
Kerfai, N., Bejar Ghadhab, B., & Malouche, D. (2016), ‘Performance Measurement
and Quality Costing in Tunisian Manufacturing Companies’, The TQM Journal,
vol. 28, no.4, p. 588-596.
Kirlioğlu H. and Çevik Z. (2013), ‘Measuring and Reporting Cost of Quality in a
Turkosh Manufacturing Company: A Case Study in Electric Industry’, Journal of
Economic and Social Studies, vol.3, no. 2, p. 87-100.
Landin, A. M., & Persson, M. H. (1998). Evaluation of quality systems for specialist
contractors. Engineering, Construction and Architectural Management, nol.5,
no.3, p. 210-219.
Lari A. and Asllani A. (2013), ‘Quality Cost Management Support System: An
Effective Tool for Organisational Performance Improvement’, Total Quality
Management, vol. 24, no. 4, p. 432-451.
Lupin H. M., Parin, M. A., & Zugarramurdi, A (2010), ‘HACCP Economics in Fish
Processing Plants’, Food Control, vol. 21, no.8, p.1143-1149.
43
Maier, A. M., Moultrie, J., & Clarkson, P. J. (2012), ‘Assessing Organizational
Capabilities: Reviewing and Guiding the Development of Maturity Grids’,
Engineering Management, IEEE Transactions on, vol. 59, no. 1, 138-159.
Malik, T. M., Khalid, R., Zulqarnain, A., & Iqbal, S. A. (2016), ‘Cost of Quality:
Findings of a Wood Products' Manufacturer’, The TQM Journal, vol. 28, no.1,
p. 2-20.
Martínez, J. M. B., & Selles, M. E. S. (2015). A fuzzy quality cost estimation
method. Fuzzy Sets and Systems, 266, 157-170.
Montgomery, D. (1996), Introduction to Statistical Quality Control, Wiley, New
York, NY.
Moschidis O. (2009), ‘A Different Approach of Multiple Correspondence Analysis
(MCA) than this of Specific MCA’, Mathematics and Social Sciences, vol. 47, no.
186, p. 77-88.
Moschidis, O. (2015), ‘Unified Coding of Qualitative and Quantitative Variables and
their Analysis with Ascendant Hierarchical Classification’, International
Journal of Data Analysis Techniques and Strategies, vol.7, no. 2, p. 114-128.
Omachonu, V. K., Suthummanon, S., & Einspruch, N. G. (2004), ‘The Relationship
between Quality and Quality Cost for a Manufacturing Company’, International
Journal of Quality & Reliability Management, vol. 21, no.3, p.277-290.
Omurgonulsen, M. (2009), ‘A Research on the Measurement of Quality Costs in the
Turkish Food Manufacturing Industry’, Total Quality Management, vol. 20, no.
5, p.547-562.

44
Őzkan S. and Karaibrahimoğlu Y.Z. (2013), ‘Activity-Based Costing Approach in the
Measurement of Cost of Quality in SMEs: A Case Study’, Total Quality
Management, vol. 24, no. 4, p. 420-431.
Paulk, M. C., Curtis, B., Chrissis, M. B., & Weber, C. V. (1993), Capability Maturity
Model, Version 1.1. IEEE Software, vol. 10, no. 4, p. 18-27.
Peytchev, A. (2013), ‘Consequences of Survey Nonresponse’, The ANNALS of the
American Academy of Political and Social Science, vol. 645, no.1, p. 88-111.
Pires, A.R, Novas, J., Saraiva, M., & Coelho, A. (2015), ‘How Companies Use the
Information about Quality-Related Costs, Total Quality Management &
Business Excellence, p. 1-21, http://dx.doi.org/10.1080/14783363.2015.1099427
Plewa, M., Kaiser, G., & Hartmann, E. (2016), ‘Is Quality still Free?–Empirical
Evidence on Quality Cost in modern Manufacturing’, International Journal of
Quality & Reliability Management, vol.33, no.9, p. 1270-1285.
Prashar, A. (2014), ‘Adoption of Six Sigma DMAIC to reduce Cost of Poor
Quality’, International Journal of Productivity and Performance Management,
vol.63, no.1, p. 103-126.
Prickett, T.W (1997), ‘The Use of Quality Costing within Manufacturing
Organizations in the North East of England’, PhD Thesis, University of
Sunderland.
Prickett, T.W and Rapley C.W. (2001), ‘Quality Costing: A Study of Manufacturing
Organizations. Part 2: Main Survey’, Total Quality Management, vol.12, no.2,
p. 211-222.
45
Pullen, W. (2007), “A Public Sector HPT Maturity Model”, Performance
Improvement, vol. 46, no. 4, p. 9-15.
Rapley, C.W, Pricket T.W. and Elliott M.P., (1999), ‘Quality Costing: A study of
Manufacturing Organizations. Part 1: Case Studies and Survey’, Total Quality
Management, vol. 10, no.1, p.85-93.
Rasamanie, M., & Kanapathy, K. (2011), ‘The Implementation of Cost of Quality
(COQ) Reporting System in Malaysian Manufacturing Companies: Difficulties
Encountered and Benefits Acquired’, International Journal of Business and
Social Science, vol. 2, no.6, p. 243-247.
Raßfeld, C., Behmer, F., Dürlich, M., & Jochem, R. (2015), ‘Do Quality Costs Still
Matter?’, Total Quality Management & Business Excellence, vol. 26, no.9-10, p
1071-1082.
Roden S. and Dale B.G. (2000), ‘Understanding the Language of Quality Costing’,
The TQM Magazine, vol. 12, no. 3, p. 179-185.
Röglinger, M., Pöppelbuß, J., & Becker, J. (2012), ‘Maturity Models in Business
Process Management’, Business Process Management Journal, vol. 18, no.2, p.
328-346.
Röhr, A., Lüddecke, K., Drusch, S., Müller, M. J., & Alvensleben, R. V. (2005),
‘Food Quality and Safety –– Consumer Perception and Public Health Concern’,
Food Control, vol. 16, no. 8, p. 649-655.
Sansalvador, M. E., & Brotons, J. M. (2013), ‘Quality Cost Analysis: A Case Study of
a Spanish Organisation’, Total Quality Management & Business Excellence, vol.
24, is.3-4, p. 378-396.
46
Sower, V. E., Quarles, R., and Broussard, E. (2007), ‘Cost of Quality Usage and its
Relationship to Quality System Maturity’, International Journal of Quality &
Reliability Management, vol. 24, no.2, p.121-140.
Sturkenboom, J., Van Der Wiele, T., & Brown, A. (2001), ‘An Action-Oriented
Approach to Quality Management Self-Assessment in Small and Medium-Sized
Enterprises’, Total Quality Management, vol.12, no. 2, p. 231-246.
Tarhan, A., Turetken, O., & Reijers, H. A. (2016), ‘Business Process Maturity
Models: A Systematic Literature Review’, Information and Software
Technology, vol. 75, July 2016, p. 122-134.
Trehan, R., Sachdeva, A., & Garg, R. K. (2015), ‘A Comprehensive Review of Cost
of Quality’, VIVECHAN International Journal of Research, vol. 6, no. 1, p. 70-
88.
Trigueros Pina, J. A., & Sansalvador Sellés, M. E. (2008), ‘Management and
Measurement of Quality in ISO 9000 Organisations: An Empirical Study in
Spain’, Total Quality Management & Business Excellence, vol.19, no.5, p. 481-
492
Tye L.H., Halim, H.A. and Ramayah T. (2011), ‘An Exploratory Study on Cost of
Quality Implementation in Malaysia: The Case of Penang Manufacturing Firms’,
Total Quality Management and Business Excellence, vol. 22, no. 11, p. 1299-1315.
Van der Wiele, T. and Brown A. (1999), ‘Self-Assessment Practices in Europe and
Australia’, International Journal of Quality & Reliability Management, vol. 16
no. 3 p. 238 – 252.
Van der Wiele, T., Williams, A. R. T., Dale, B. G., Carter, G., Kolb, F., Luzon, D. M.,
... & Wallace, M. (1996), ‘Self-Assessment: A Study of Progress in Europe's
47
Leading Organizations in Quality Management Practices’, International Journal
of Quality & Reliability Management, vol. 13, no.1, p. 84-104.
Wendler, R. (2012), ‘The Maturity of Maturity Model Research: A Systematic
Mapping Study’, Information and software technology, vol.54, no. 12, p. 1317-
1339.
Xiaofen, T. (2013). ‘Investigation on Quality Management Maturity of Shanghai
Enterprises’, The TQM Journal, vol. 25. No. 4, p. 417-430.
Yang, C, (2008), ‘Improving the Definition and Quantification of Quality Costs’,
Total Quality Management, vol. 19, no. 3, March, p. 175-191.
Zhang, Z. L., & Dai, F. S. (2013), ‘Application of Quality Management Maturity
Assessment System in Small and Medium-Sized Enterprises’. In International
Asia Conference on Industrial Engineering and Management Innovation
(IEMI2012) Proceedings (pp. 649-656). Springer Berlin Heidelberg.