Financial Model for ABC Costing
69
Cost Model for Data Management Center (DMC) Main Menu Introduction This workbook was developed to assist the Data Management Center (DMC) in gaining In order to better understand costs, the following steps were taken to develop thi 1. Identify all of the resources available to DMC and the associated costs of the 2. Identify all of the major activities of DMC such as setting up IP addresses, in 3. Map a relationship between the resources and activities - referred to as "Resou 4. Map a relationship between the activities and cost objects - referred to as "Ac 5. Determine the costs of each service, product or what-ever you consider your cos Since cost data, activities, and other attributes change, this model should be rev Data Entry Cell > Tab Description Purpose 1 Starting point for using this cost m 2 Some background information on how t 3 Identify resource pools and their re 4 Identify and describe the key activi 5 Based on analysis, determine the out 6 Identify and describe the cost objec 7 Report of costs by cost objects 8 Glossary of terms used related to th Point of Contact Matt H. Evans Main Menu Overview Resource Pools (Step 1) Activity Costing (Step 2) Activity Drivers (Step 3) Cost Objects (Step 4) Final Report (Step 5) Glossary www.exinfm.com
-
Upload
independent -
Category
Documents
-
view
1 -
download
0
Transcript of Financial Model for ABC Costing
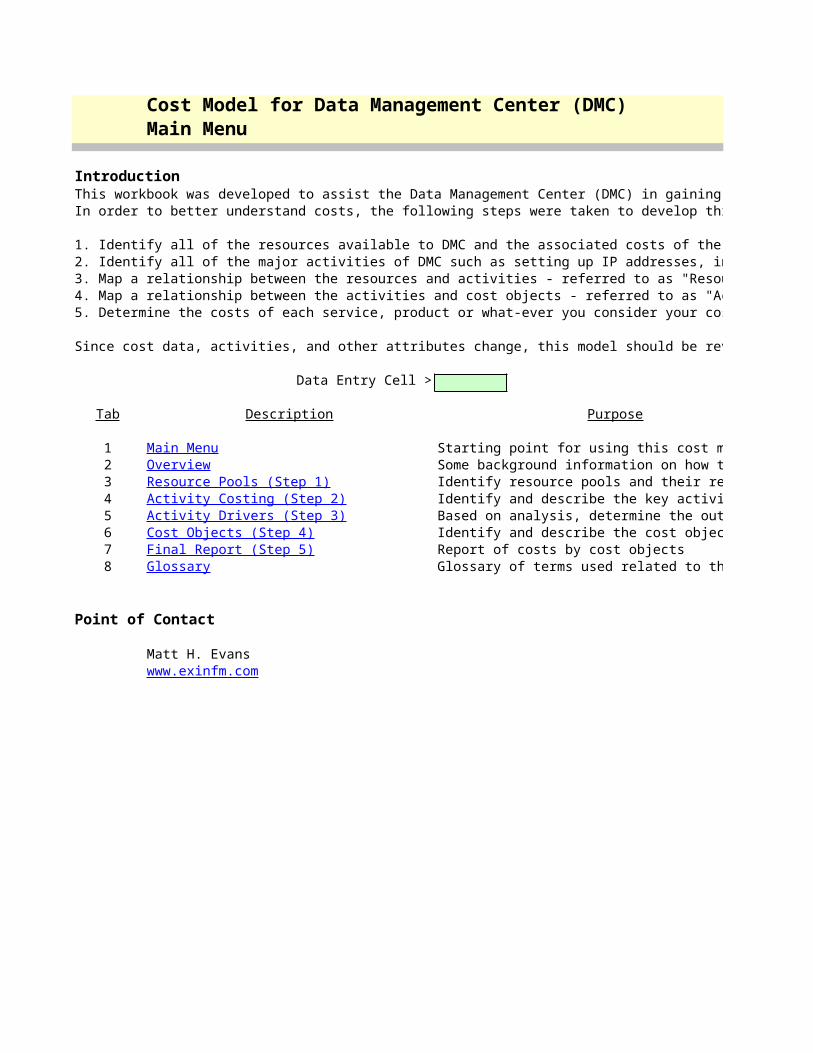
Cost Model for Data Management Center (DMC)Main Menu
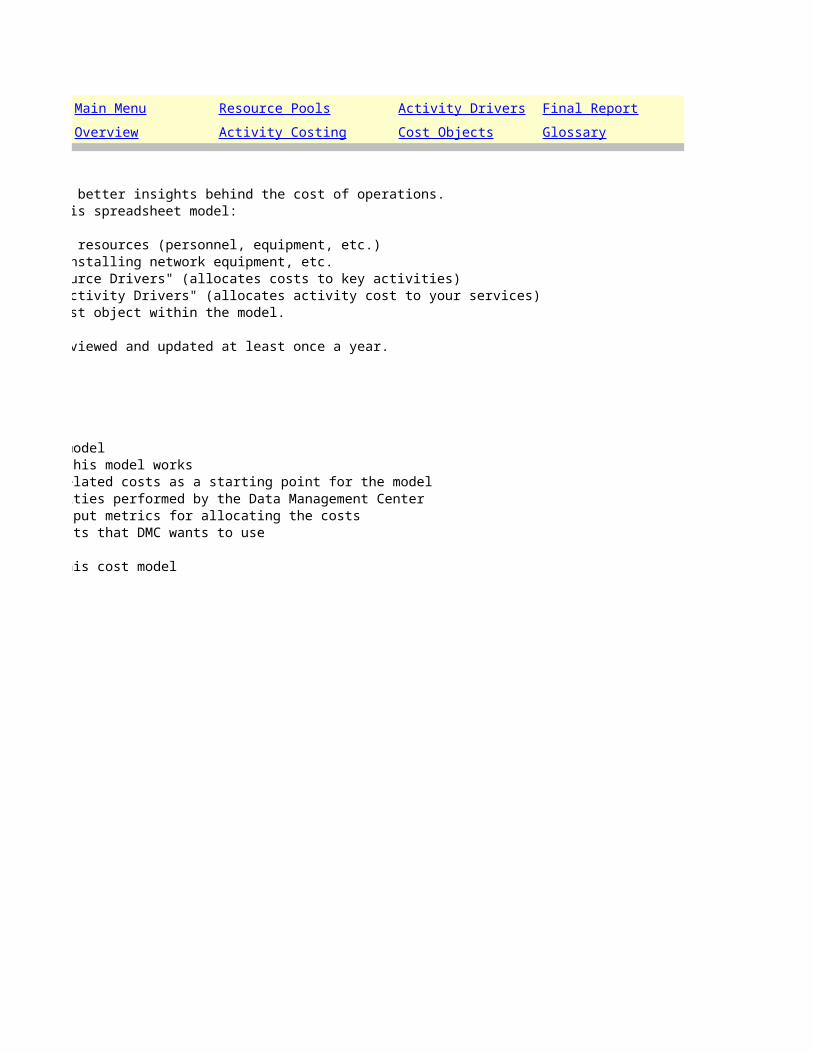
IntroductionThis workbook was developed to assist the Data Management Center (DMC) in gaining better insights behind the cost of operations.In order to better understand costs, the following steps were taken to develop this spreadsheet model:
1. Identify all of the resources available to DMC and the associated costs of the resources (personnel, equipment, etc.)2. Identify all of the major activities of DMC such as setting up IP addresses, installing network equipment, etc.3. Map a relationship between the resources and activities - referred to as "Resource Drivers" (allocates costs to key activities)4. Map a relationship between the activities and cost objects - referred to as "Activity Drivers" (allocates activity cost to your services)5. Determine the costs of each service, product or what-ever you consider your cost object within the model. Since cost data, activities, and other attributes change, this model should be reviewed and updated at least once a year.
Data Entry Cell >
Tab Description Purpose
1 Starting point for using this cost model2 Some background information on how this model works3 Identify resource pools and their related costs as a starting point for the model4 Identify and describe the key activities performed by the Data Management Center5 Based on analysis, determine the output metrics for allocating the costs6 Identify and describe the cost objects that DMC wants to use7 Report of costs by cost objects8 Glossary of terms used related to this cost model
Point of Contact
Matt H. Evans
Main MenuOverviewResource Pools (Step 1)Activity Costing (Step 2)Activity Drivers (Step 3)Cost Objects (Step 4)Final Report (Step 5)Glossary
www.exinfm.com
This workbook was developed to assist the Data Management Center (DMC) in gaining better insights behind the cost of operations.In order to better understand costs, the following steps were taken to develop this spreadsheet model:
1. Identify all of the resources available to DMC and the associated costs of the resources (personnel, equipment, etc.)2. Identify all of the major activities of DMC such as setting up IP addresses, installing network equipment, etc.3. Map a relationship between the resources and activities - referred to as "Resource Drivers" (allocates costs to key activities)4. Map a relationship between the activities and cost objects - referred to as "Activity Drivers" (allocates activity cost to your services)5. Determine the costs of each service, product or what-ever you consider your cost object within the model.
Since cost data, activities, and other attributes change, this model should be reviewed and updated at least once a year.
Purpose
Starting point for using this cost modelSome background information on how this model worksIdentify resource pools and their related costs as a starting point for the modelIdentify and describe the key activities performed by the Data Management CenterBased on analysis, determine the output metrics for allocating the costsIdentify and describe the cost objects that DMC wants to use
Glossary of terms used related to this cost model
Main Menu Resource Pools Activity Drivers Final ReportOverview Activity Costing Cost Objects Glossary
Cost Model for Data Management Center (DMC)Overview of Model
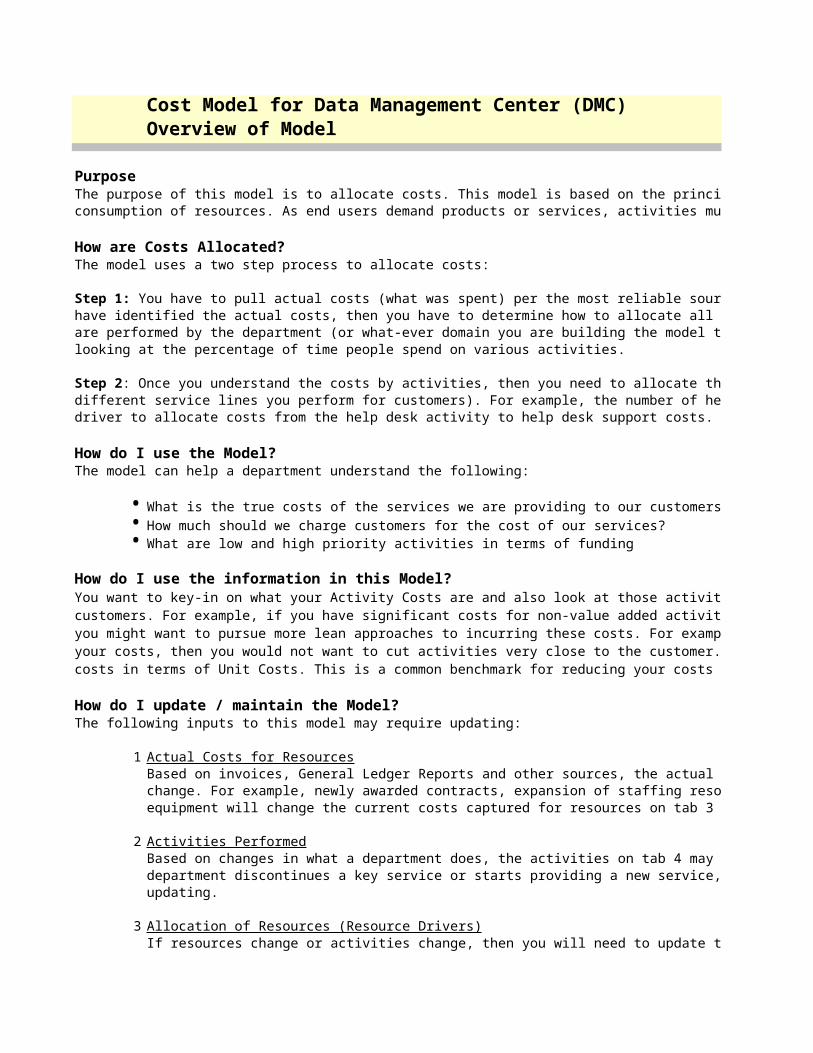
PurposeThe purpose of this model is to allocate costs. This model is based on the principle that activities incur costs through the consumption of resources. As end users demand products or services, activities must be performed.
How are Costs Allocated?The model uses a two step process to allocate costs:
have identified the actual costs, then you have to determine how to allocate all of these costs (resources) to the activities thatare performed by the department (or what-ever domain you are building the model to). Labor costs are typically allocated by looking at the percentage of time people spend on various activities.
different service lines you perform for customers). For example, the number of help desk tickets processed is an output driver to allocate costs from the help desk activity to help desk support costs.
How do I use the Model?The model can help a department understand the following:
• What is the true costs of the services we are providing to our customers?• How much should we charge customers for the cost of our services?• What are low and high priority activities in terms of funding
How do I use the information in this Model?You want to key-in on what your Activity Costs are and also look at those activities that may not be linked to customers. For example, if you have significant costs for non-value added activities (not close to the customer), thenyou might want to pursue more lean approaches to incurring these costs. For example, if you are forced to reduceyour costs, then you would not want to cut activities very close to the customer. Also, you can express yourcosts in terms of Unit Costs. This is a common benchmark for reducing your costs over time.
How do I update / maintain the Model?The following inputs to this model may require updating:
1 Actual Costs for Resources Based on invoices, General Ledger Reports and other sources, the actual costs as of a cut-off period will most likely
change. For example, newly awarded contracts, expansion of staffing resources, and installation of newequipment will change the current costs captured for resources on tab 3 of this model.
2 Activities PerformedBased on changes in what a department does, the activities on tab 4 may change. For example, if a department discontinues a key service or starts providing a new service, then this model will requireupdating.
3 Allocation of Resources (Resource Drivers)If resources change or activities change, then you will need to update the resource drivers involved in
Step 1: You have to pull actual costs (what was spent) per the most reliable source, such as the General Ledger. Once you
Step 2: Once you understand the costs by activities, then you need to allocate these costs to your cost objects (such as the

allocating the costs between the resources and the activities. Additionally, it is a good idea to validate thecurrent allocations used since people may shift in how much time they spend on an activity.
4 New Activities Require New Drivers and Cost ObjectsIn the event a department begins offering a new service to a customer, this will require re-building the model to include new resource costs, drivers, activities, and cost objects.
What are some rules to follow in building the Model?
1Ledger since this is the official system of record for costs.
2in order to keep the model simple and manageable.
3group all of these activities together and allocate using a single driver such as direct labor cost.
Link to General Ledger - Where practical, try to obtain and balance your cost data directly with the General
Prioritize the Activities - If the number of activities is greater than ten, you may want to focus on the vital few activities
Group Non Traceable Activities - Some activities are difficult to trace back to specific resource pools. May want to

The purpose of this model is to allocate costs. This model is based on the principle that activities incur costs through the consumption of resources. As end users demand products or services, activities must be performed.
have identified the actual costs, then you have to determine how to allocate all of these costs (resources) to the activities thatare performed by the department (or what-ever domain you are building the model to). Labor costs are typically allocated by
different service lines you perform for customers). For example, the number of help desk tickets processed is an output
What is the true costs of the services we are providing to our customers?
You want to key-in on what your Activity Costs are and also look at those activities that may not be linked to customers. For example, if you have significant costs for non-value added activities (not close to the customer), thenyou might want to pursue more lean approaches to incurring these costs. For example, if you are forced to reduceyour costs, then you would not want to cut activities very close to the customer. Also, you can express yourcosts in terms of Unit Costs. This is a common benchmark for reducing your costs over time.
Based on invoices, General Ledger Reports and other sources, the actual costs as of a cut-off period will most likelychange. For example, newly awarded contracts, expansion of staffing resources, and installation of newequipment will change the current costs captured for resources on tab 3 of this model.
Based on changes in what a department does, the activities on tab 4 may change. For example, if a department discontinues a key service or starts providing a new service, then this model will require
If resources change or activities change, then you will need to update the resource drivers involved in
Main Menu Resource Pools Activity Drivers Final ReportOverview Activity Costing Cost Objects Glossary
You have to pull actual costs (what was spent) per the most reliable source, such as the General Ledger. Once you
: Once you understand the costs by activities, then you need to allocate these costs to your cost objects (such as the

allocating the costs between the resources and the activities. Additionally, it is a good idea to validate thecurrent allocations used since people may shift in how much time they spend on an activity.
In the event a department begins offering a new service to a customer, this will require re-building the model to include new resource costs, drivers, activities, and cost objects.
group all of these activities together and allocate using a single driver such as direct labor cost.
- Where practical, try to obtain and balance your cost data directly with the General
- If the number of activities is greater than ten, you may want to focus on the vital few activities
- Some activities are difficult to trace back to specific resource pools. May want to
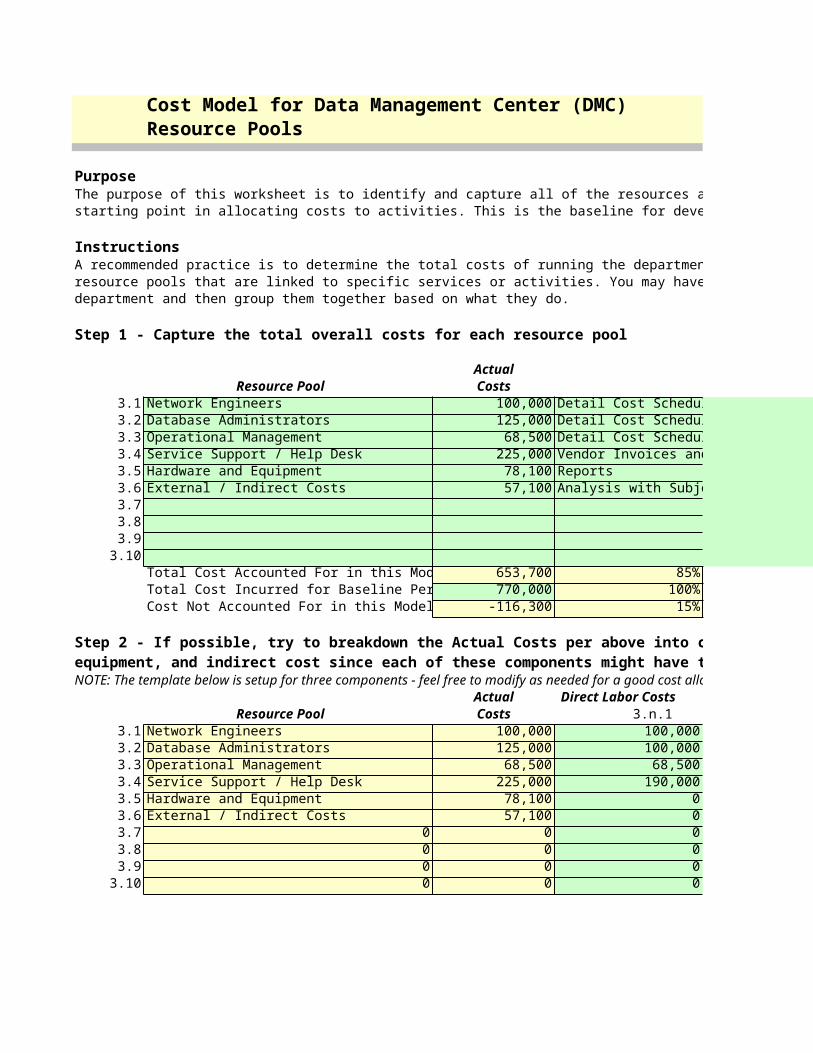
Cost Model for Data Management Center (DMC)Resource Pools
PurposeThe purpose of this worksheet is to identify and capture all of the resources and their associated costs. This represents an importantstarting point in allocating costs to activities. This is the baseline for developing the rest of the model.
InstructionsA recommended practice is to determine the total costs of running the department for one full month and break out this costs into resource pools that are linked to specific services or activities. You may have to start by listing all of the personnel assigned to thedepartment and then group them together based on what they do.
Step 1 - Capture the total overall costs for each resource pool
Actual Resource Pool Costs
3.1 Network Engineers 100,000 Detail Cost Schedule and General Ledger Reports3.2 Database Administrators 125,000 Detail Cost Schedule and General Ledger Reports3.3 Operational Management 68,500 Detail Cost Schedule and General Ledger Reports3.4 Service Support / Help Desk 225,000 Vendor Invoices and General Ledger Reports3.5 Hardware and Equipment 78,1003.6 External / Indirect Costs 57,100 Analysis with Subject Matter Experts3.73.83.9
3.10Total Cost Accounted For in this Mod 653,700 85%Total Cost Incurred for Baseline Per 770,000 100%Cost Not Accounted For in this Model -116,300 15%
Step 2 - If possible, try to breakdown the Actual Costs per above into components such as labor, equipment, and indirect cost since each of these components might have to get allocated differentlyNOTE: The template below is setup for three components - feel free to modify as needed for a good cost allocation.
Actual Direct Labor Costs Resource Pool Costs 3.n.1
3.1 Network Engineers 100,000 100,0003.2 Database Administrators 125,000 100,0003.3 Operational Management 68,500 68,5003.4 Service Support / Help Desk 225,000 190,0003.5 Hardware and Equipment 78,100 03.6 External / Indirect Costs 57,100 03.7 0 0 03.8 0 0 03.9 0 0 0
3.10 0 0 0
Reports

The purpose of this worksheet is to identify and capture all of the resources and their associated costs. This represents an importantstarting point in allocating costs to activities. This is the baseline for developing the rest of the model.
A recommended practice is to determine the total costs of running the department for one full month and break out this costs into resource pools that are linked to specific services or activities. You may have to start by listing all of the personnel assigned to the
TimeFrame
Detail Cost Schedule and General Ledger Reports Jul-07Detail Cost Schedule and General Ledger Reports Jul-07Detail Cost Schedule and General Ledger Reports Jul-07Vendor Invoices and General Ledger Reports Jul-07
Jul-07Analysis with Subject Matter Experts Jul-07
Step 2 - If possible, try to breakdown the Actual Costs per above into components such as labor, equipment, and indirect cost since each of these components might have to get allocated differentlyNOTE: The template below is setup for three components - feel free to modify as needed for a good cost allocation.
Equipment Indirect Costs Out of Balance 3.n.2 3.n.3 Amount
0 0 00 25,000 00 0 00 35,000 0
70,100 8,000 050,100 7,000 0
0 0 00 0 00 0 00 0 0
0
Main Menu Resource PoolsOverview Activity Costing

Activity Drivers Final ReportCost Objects Glossary
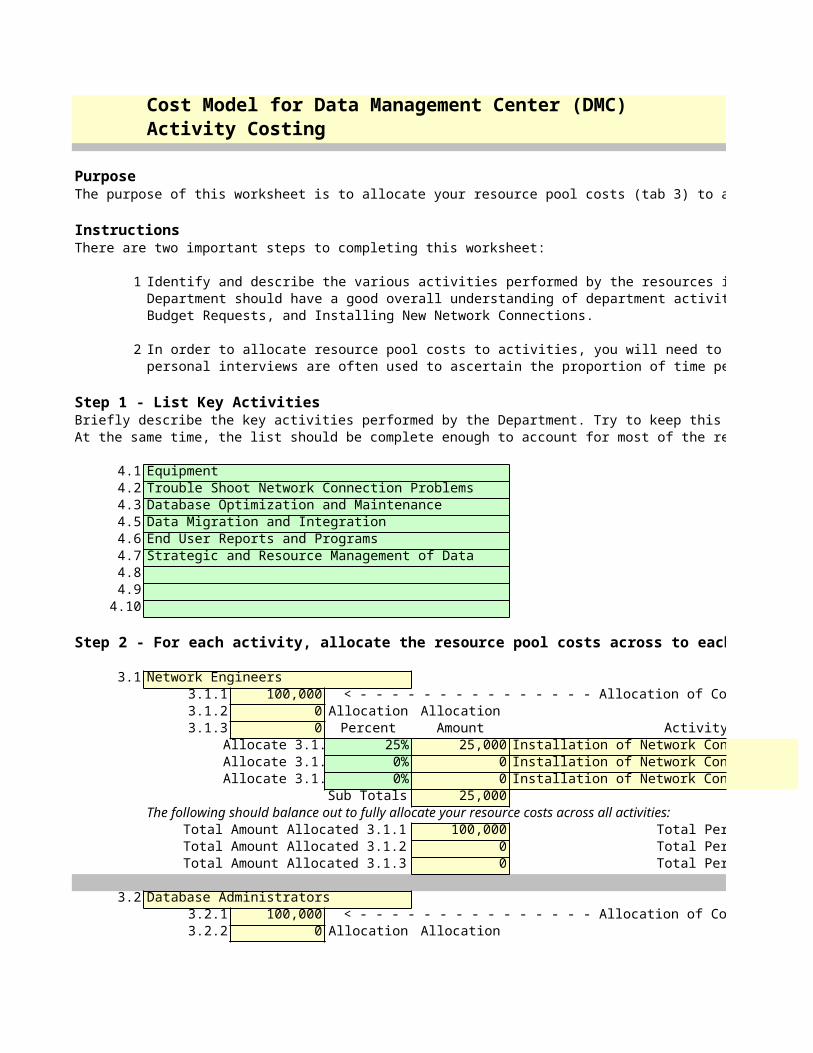
Cost Model for Data Management Center (DMC)Activity Costing
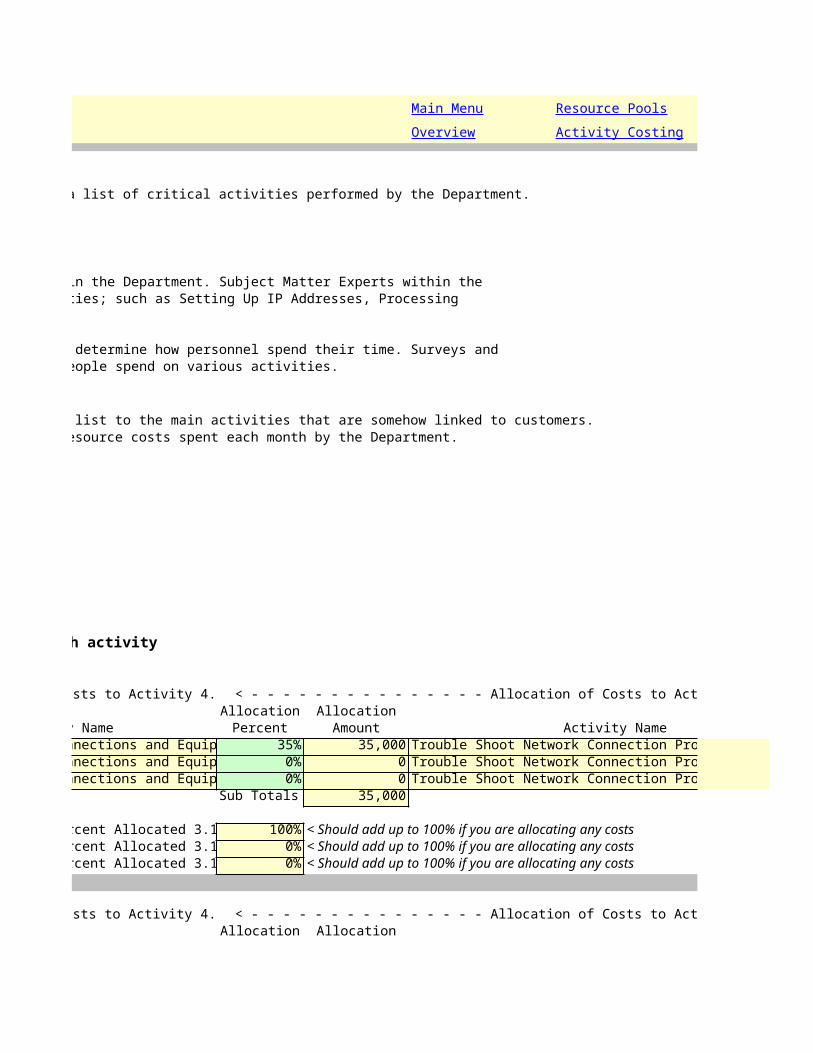
PurposeThe purpose of this worksheet is to allocate your resource pool costs (tab 3) to a list of critical activities performed by the Department. InstructionsThere are two important steps to completing this worksheet:
1 Identify and describe the various activities performed by the resources in the Department. Subject Matter Experts within theDepartment should have a good overall understanding of department activities; such as Setting Up IP Addresses, ProcessingBudget Requests, and Installing New Network Connections.
2 In order to allocate resource pool costs to activities, you will need to determine how personnel spend their time. Surveys and personal interviews are often used to ascertain the proportion of time people spend on various activities.
Step 1 - List Key Activities Briefly describe the key activities performed by the Department. Try to keep this list to the main activities that are somehow linked to customers.At the same time, the list should be complete enough to account for most of the resource costs spent each month by the Department.
4.14.2 Trouble Shoot Network Connection Problems4.3 Database Optimization and Maintenance4.5 Data Migration and Integration 4.6 End User Reports and Programs4.7 Strategic and Resource Management of Data4.84.9
4.10
Step 2 - For each activity, allocate the resource pool costs across to each activity
3.1 Network Engineers 3.1.1 100,000 < - - - - - - - - - - - - - - - Allocation of Costs to Activity 4.
3.1.2 0 Allocation Allocation3.1.3 0 Percent Amount Activity Name Allocate 3.1. 25% 25,000 Installation of Network Connections and Equip Allocate 3.1. 0% 0 Installation of Network Connections and Equip Allocate 3.1. 0% 0 Installation of Network Connections and Equip
Sub Totals 25,000The following should balance out to fully allocate your resource costs across all activities:
Total Amount Allocated 3.1.1 100,000 Total Percent Allocated 3.1Total Amount Allocated 3.1.2 0 Total Percent Allocated 3.1Total Amount Allocated 3.1.3 0 Total Percent Allocated 3.1
3.2 Database Administrators 3.2.1 100,000 < - - - - - - - - - - - - - - - Allocation of Costs to Activity 4.
3.2.2 0 Allocation Allocation
Equipment
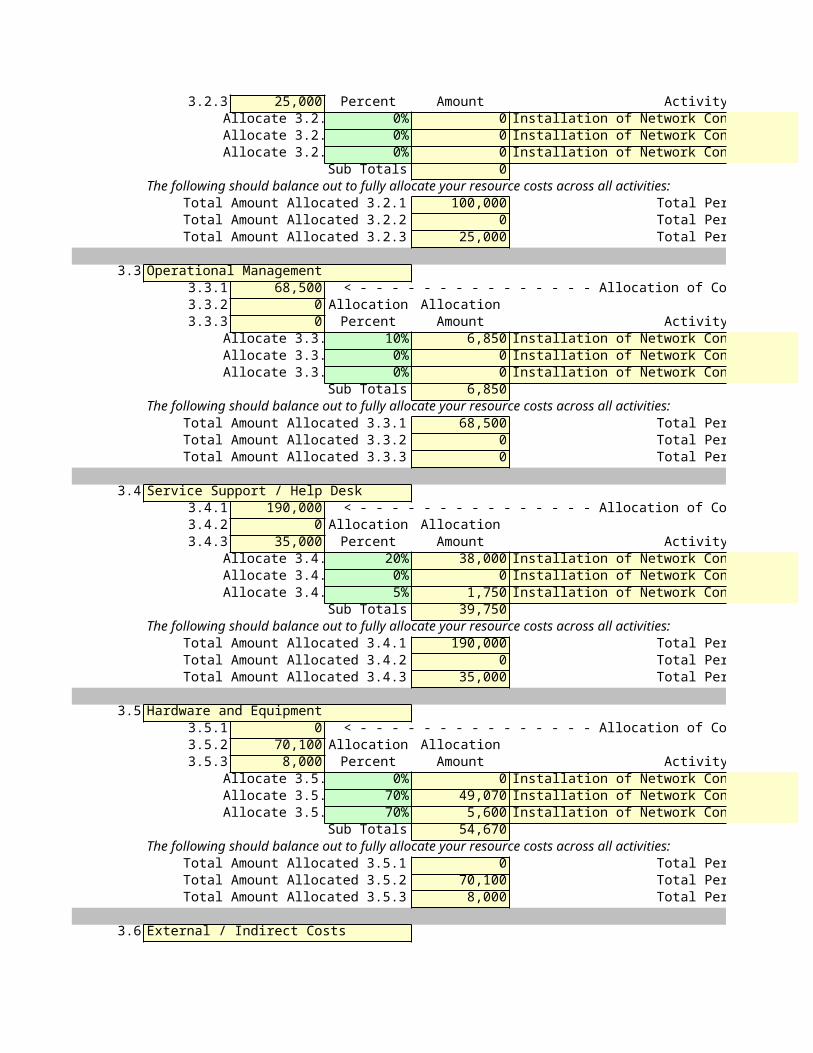
3.2.3 25,000 Percent Amount Activity Name Allocate 3.2. 0% 0 Installation of Network Connections and Equip Allocate 3.2. 0% 0 Installation of Network Connections and Equip Allocate 3.2. 0% 0 Installation of Network Connections and Equip
Sub Totals 0The following should balance out to fully allocate your resource costs across all activities:
Total Amount Allocated 3.2.1 100,000 Total Percent Allocated 3.2Total Amount Allocated 3.2.2 0 Total Percent Allocated 3.2Total Amount Allocated 3.2.3 25,000 Total Percent Allocated 3.2
3.3 Operational Management 3.3.1 68,500 < - - - - - - - - - - - - - - - Allocation of Costs to Activity 4.
3.3.2 0 Allocation Allocation3.3.3 0 Percent Amount Activity Name Allocate 3.3. 10% 6,850 Installation of Network Connections and Equip Allocate 3.3. 0% 0 Installation of Network Connections and Equip Allocate 3.3. 0% 0 Installation of Network Connections and Equip
Sub Totals 6,850The following should balance out to fully allocate your resource costs across all activities:
Total Amount Allocated 3.3.1 68,500 Total Percent Allocated 3.3Total Amount Allocated 3.3.2 0 Total Percent Allocated 3.3Total Amount Allocated 3.3.3 0 Total Percent Allocated 3.3
3.4 Service Support / Help Desk 3.4.1 190,000 < - - - - - - - - - - - - - - - Allocation of Costs to Activity 4.
3.4.2 0 Allocation Allocation3.4.3 35,000 Percent Amount Activity Name Allocate 3.4. 20% 38,000 Installation of Network Connections and Equip Allocate 3.4. 0% 0 Installation of Network Connections and Equip Allocate 3.4. 5% 1,750 Installation of Network Connections and Equip
Sub Totals 39,750The following should balance out to fully allocate your resource costs across all activities:
Total Amount Allocated 3.4.1 190,000 Total Percent Allocated 3.4Total Amount Allocated 3.4.2 0 Total Percent Allocated 3.4Total Amount Allocated 3.4.3 35,000 Total Percent Allocated 3.4
3.5 Hardware and Equipment 3.5.1 0 < - - - - - - - - - - - - - - - Allocation of Costs to Activity 4.
3.5.2 70,100 Allocation Allocation3.5.3 8,000 Percent Amount Activity Name Allocate 3.5. 0% 0 Installation of Network Connections and Equip Allocate 3.5. 70% 49,070 Installation of Network Connections and Equip Allocate 3.5. 70% 5,600 Installation of Network Connections and Equip
Sub Totals 54,670The following should balance out to fully allocate your resource costs across all activities:
Total Amount Allocated 3.5.1 0 Total Percent Allocated 3.5Total Amount Allocated 3.5.2 70,100 Total Percent Allocated 3.5Total Amount Allocated 3.5.3 8,000 Total Percent Allocated 3.5
3.6 External / Indirect Costs

3.6.1 0 < - - - - - - - - - - - - - - - Allocation of Costs to Activity 4.3.6.2 50,100 Allocation Allocation3.6.3 7,000 Percent Amount Activity Name Allocate 3.6. 0% 0 Installation of Network Connections and Equip Allocate 3.6. 40% 20,040 Installation of Network Connections and Equip Allocate 3.6. 40% 2,800 Installation of Network Connections and Equip
Sub Totals 22,840The following should balance out to fully allocate your resource costs across all activities:
Total Amount Allocated 3.6.1 0 Total Percent Allocated 3.6Total Amount Allocated 3.6.2 50,100 Total Percent Allocated 3.6Total Amount Allocated 3.6.3 7,000 Total Percent Allocated 3.6
3.7 0 3.7.1 0 < - - - - - - - - - - - - - - - Allocation of Costs to Activity 4.
3.7.2 0 Allocation Allocation3.7.3 0 Percent Amount Activity Name Allocate 3.7. 0% 0 Installation of Network Connections and Equip Allocate 3.7. 0% 0 Installation of Network Connections and Equip Allocate 3.7. 0% 0 Installation of Network Connections and Equip
Sub Totals 0The following should balance out to fully allocate your resource costs across all activities:
Total Amount Allocated 3.7.1 0 Total Percent Allocated 3.7Total Amount Allocated 3.7.2 0 Total Percent Allocated 3.7Total Amount Allocated 3.7.3 0 Total Percent Allocated 3.7
3.8 0 3.8.1 0 < - - - - - - - - - - - - - - - Allocation of Costs to Activity 4.
3.8.2 0 Allocation Allocation3.8.3 0 Percent Amount Activity Name Allocate 3.8. 0% 0 Installation of Network Connections and Equip Allocate 3.8. 0% 0 Installation of Network Connections and Equip Allocate 3.8. 0% 0 Installation of Network Connections and Equip
Sub Totals 0The following should balance out to fully allocate your resource costs across all activities:
Total Amount Allocated 3.8.1 0 Total Percent Allocated 3.8Total Amount Allocated 3.8.2 0 Total Percent Allocated 3.8Total Amount Allocated 3.8.3 0 Total Percent Allocated 3.8
3.9 0 3.9.1 0 < - - - - - - - - - - - - - - - Allocation of Costs to Activity 4.
3.9.2 0 Allocation Allocation3.9.3 0 Percent Amount Activity Name Allocate 3.9. 0% 0 Installation of Network Connections and Equip Allocate 3.9. 0% 0 Installation of Network Connections and Equip Allocate 3.9. 0% 0 Installation of Network Connections and Equip
Sub Totals 0The following should balance out to fully allocate your resource costs across all activities:
Total Amount Allocated 3.9.1 0 Total Percent Allocated 3.9Total Amount Allocated 3.9.2 0 Total Percent Allocated 3.9Total Amount Allocated 3.9.3 0 Total Percent Allocated 3.9
3.10 0
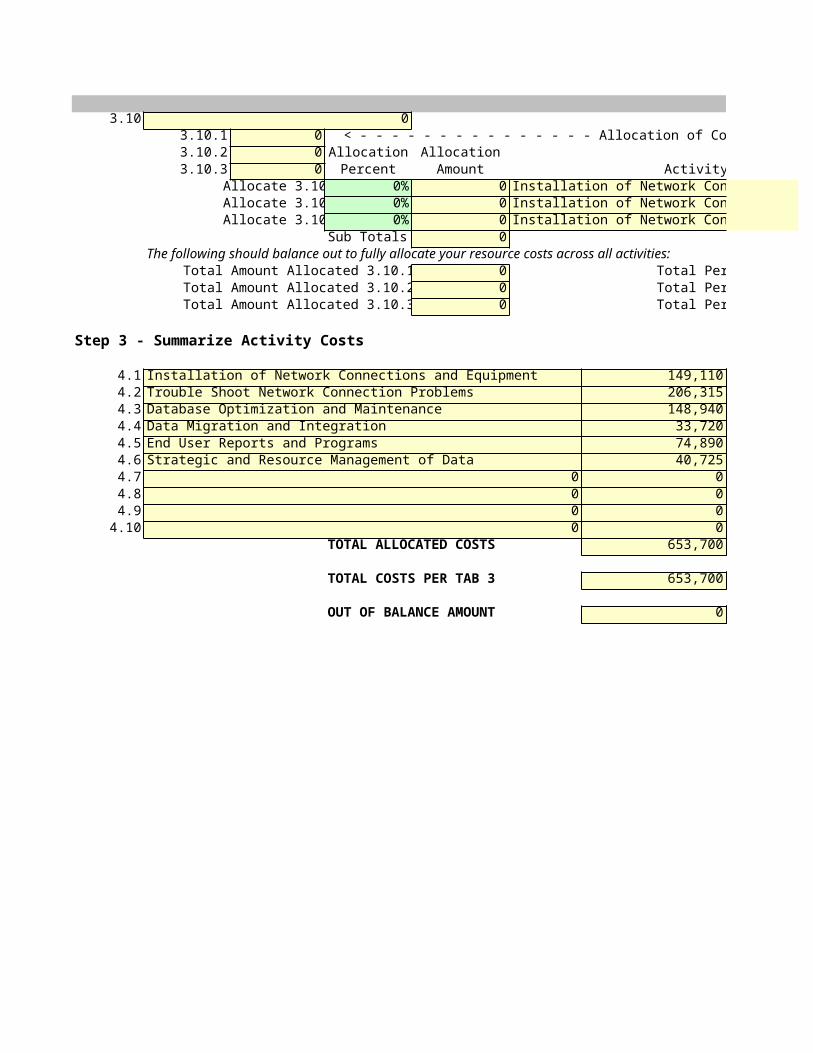
3.10.1 0 < - - - - - - - - - - - - - - - Allocation of Costs to Activity 4.3.10.2 0 Allocation Allocation3.10.3 0 Percent Amount Activity Name Allocate 3.10 0% 0 Installation of Network Connections and Equip Allocate 3.10 0% 0 Installation of Network Connections and Equip Allocate 3.10 0% 0 Installation of Network Connections and Equip
Sub Totals 0The following should balance out to fully allocate your resource costs across all activities:
Total Amount Allocated 3.10.1 0 Total Percent Allocated 3.1Total Amount Allocated 3.10.2 0 Total Percent Allocated 3.1Total Amount Allocated 3.10.3 0 Total Percent Allocated 3.1
Step 3 - Summarize Activity Costs
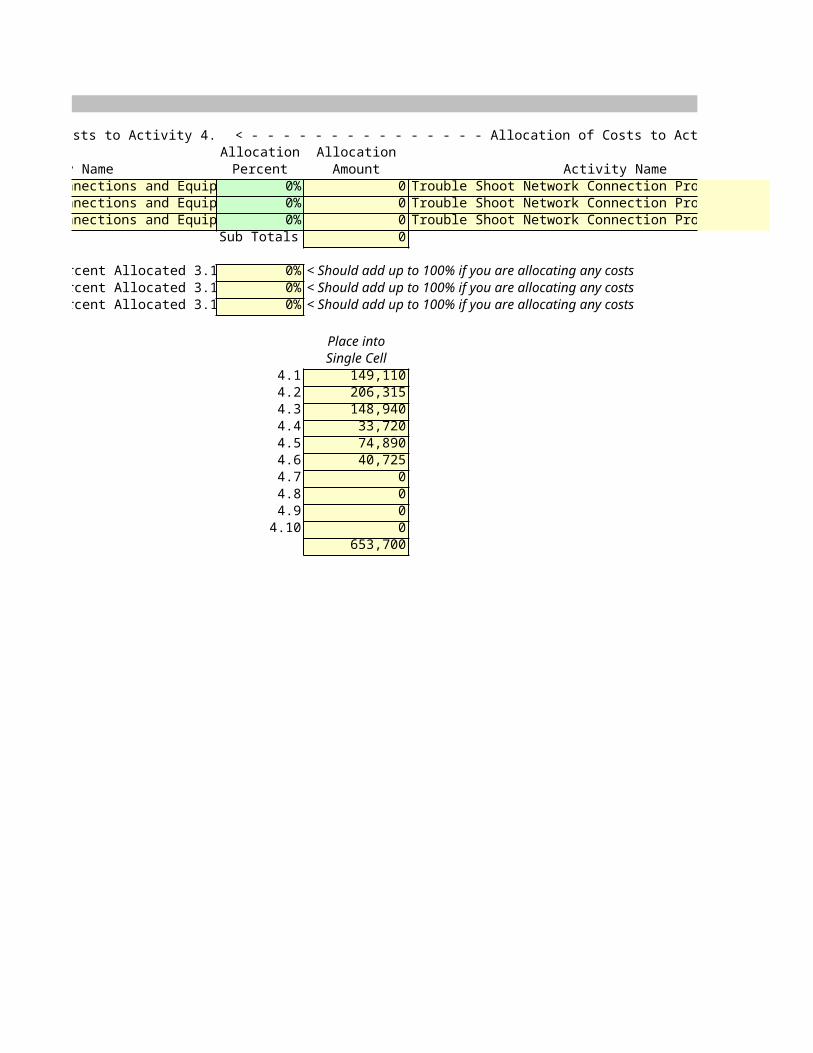
4.1 Installation of Network Connections and Equipment 149,1104.2 Trouble Shoot Network Connection Problems 206,3154.3 Database Optimization and Maintenance 148,9404.4 Data Migration and Integration 33,7204.5 End User Reports and Programs 74,8904.6 Strategic and Resource Management of Data 40,7254.7 0 04.8 0 04.9 0 0
4.10 0 0TOTAL ALLOCATED COSTS 653,700
TOTAL COSTS PER TAB 3 653,700
OUT OF BALANCE AMOUNT 0
The purpose of this worksheet is to allocate your resource pool costs (tab 3) to a list of critical activities performed by the Department.
Identify and describe the various activities performed by the resources in the Department. Subject Matter Experts within theDepartment should have a good overall understanding of department activities; such as Setting Up IP Addresses, Processing
In order to allocate resource pool costs to activities, you will need to determine how personnel spend their time. Surveys and personal interviews are often used to ascertain the proportion of time people spend on various activities.
Briefly describe the key activities performed by the Department. Try to keep this list to the main activities that are somehow linked to customers.At the same time, the list should be complete enough to account for most of the resource costs spent each month by the Department.
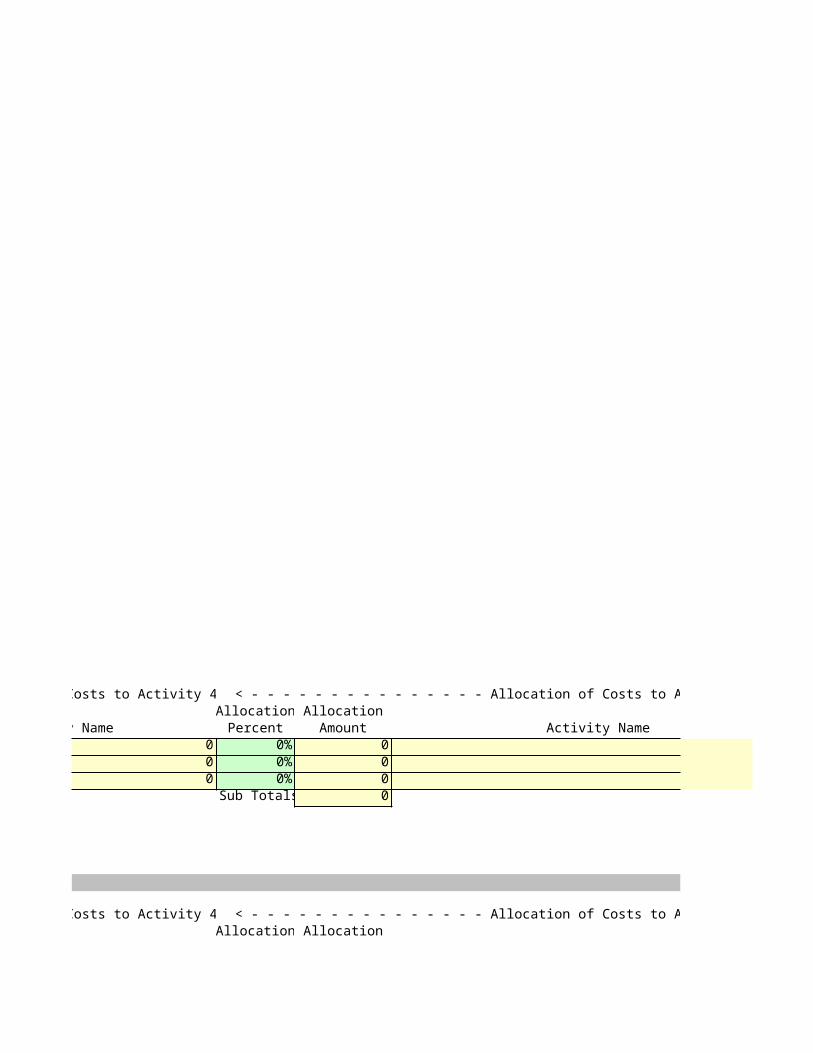
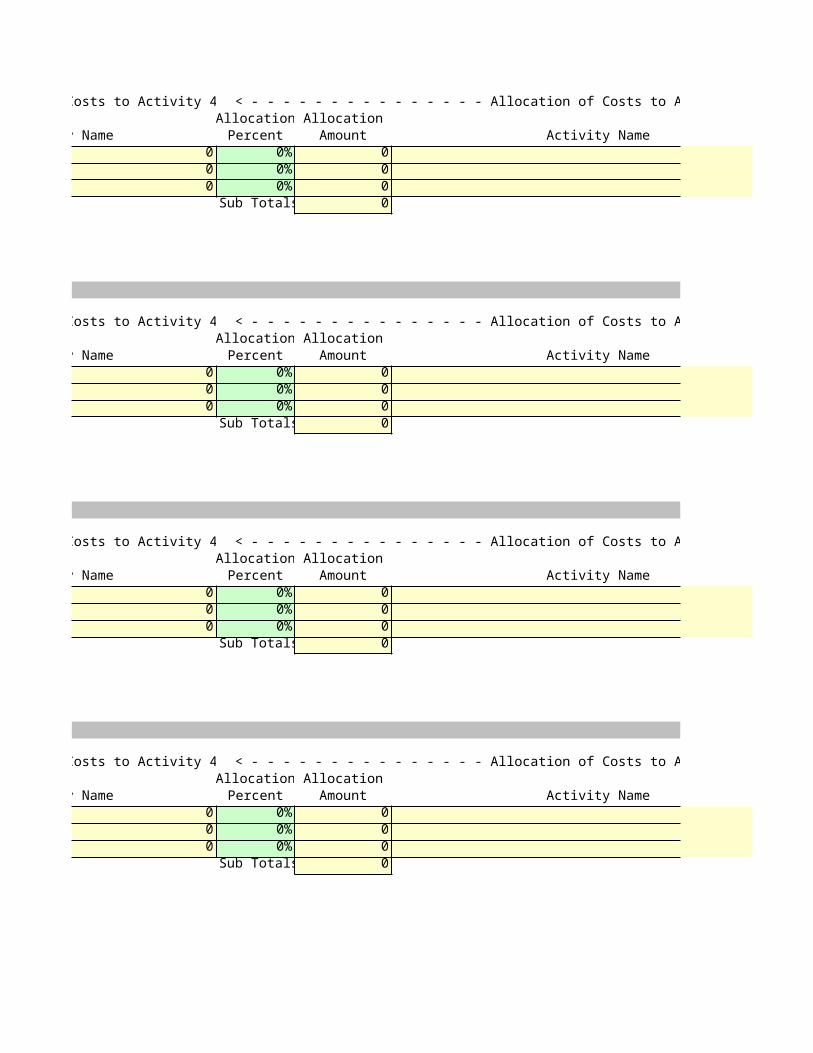
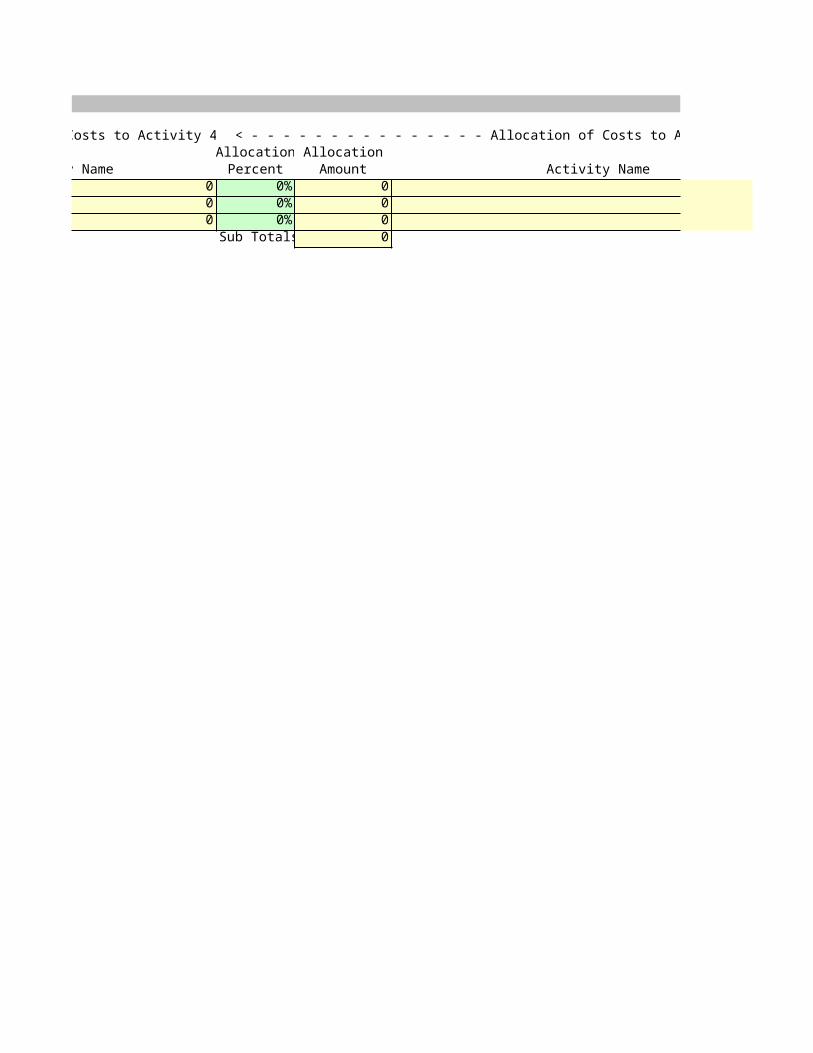
Step 2 - For each activity, allocate the resource pool costs across to each activity
< - - - - - - - - - - - - - - - Allocation of Costs to Activity 4. < - - - - - - - - - - - - - - - Allocation of Costs to Activity 4.2Allocation Allocation
Activity Name Percent Amount Activity NameInstallation of Network Connections and Equip 35% 35,000 Trouble Shoot Network Connection ProblemsInstallation of Network Connections and Equip 0% 0 Trouble Shoot Network Connection ProblemsInstallation of Network Connections and Equip 0% 0 Trouble Shoot Network Connection Problems
Sub Totals 35,000
Total Percent Allocated 3.1 100% < Should add up to 100% if you are allocating any costsTotal Percent Allocated 3.1 0% < Should add up to 100% if you are allocating any costsTotal Percent Allocated 3.1 0% < Should add up to 100% if you are allocating any costs
< - - - - - - - - - - - - - - - Allocation of Costs to Activity 4. < - - - - - - - - - - - - - - - Allocation of Costs to Activity 4.2Allocation Allocation
Main Menu Resource PoolsOverview Activity Costing
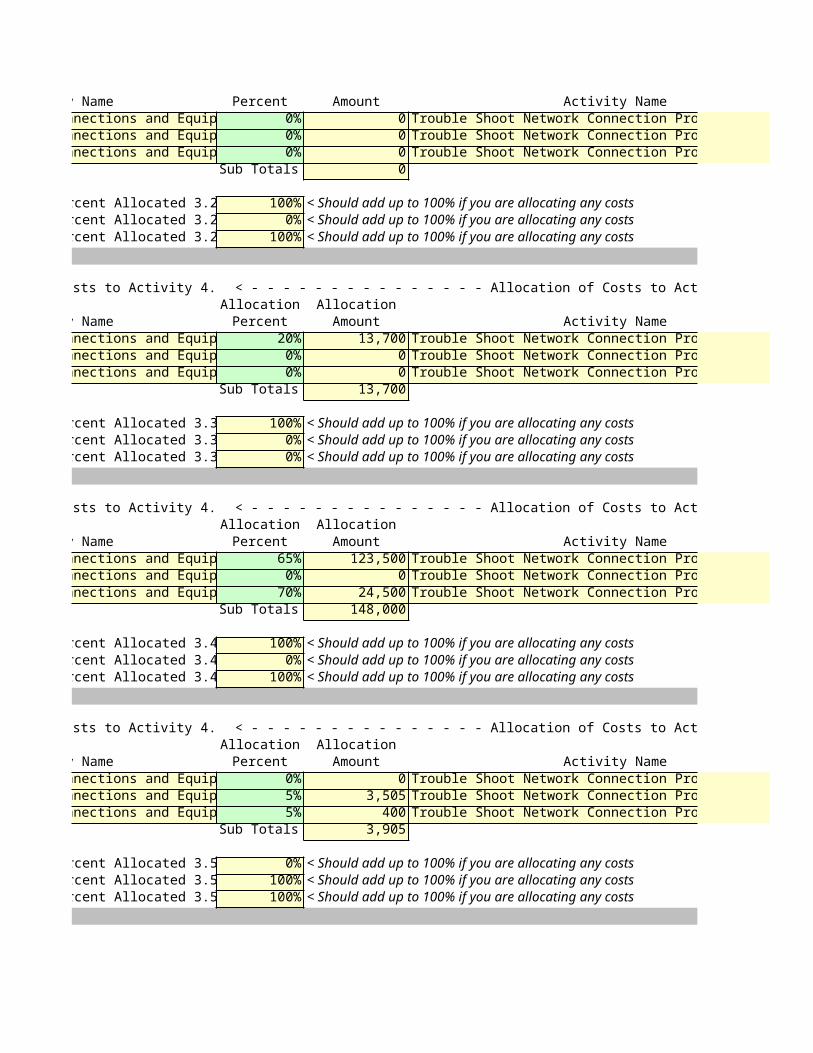
Activity Name Percent Amount Activity NameInstallation of Network Connections and Equip 0% 0 Trouble Shoot Network Connection ProblemsInstallation of Network Connections and Equip 0% 0 Trouble Shoot Network Connection ProblemsInstallation of Network Connections and Equip 0% 0 Trouble Shoot Network Connection Problems
Sub Totals 0
Total Percent Allocated 3.2 100% < Should add up to 100% if you are allocating any costsTotal Percent Allocated 3.2 0% < Should add up to 100% if you are allocating any costsTotal Percent Allocated 3.2 100% < Should add up to 100% if you are allocating any costs
< - - - - - - - - - - - - - - - Allocation of Costs to Activity 4. < - - - - - - - - - - - - - - - Allocation of Costs to Activity 4.2Allocation Allocation
Activity Name Percent Amount Activity NameInstallation of Network Connections and Equip 20% 13,700 Trouble Shoot Network Connection ProblemsInstallation of Network Connections and Equip 0% 0 Trouble Shoot Network Connection ProblemsInstallation of Network Connections and Equip 0% 0 Trouble Shoot Network Connection Problems
Sub Totals 13,700
Total Percent Allocated 3.3 100% < Should add up to 100% if you are allocating any costsTotal Percent Allocated 3.3 0% < Should add up to 100% if you are allocating any costsTotal Percent Allocated 3.3 0% < Should add up to 100% if you are allocating any costs
< - - - - - - - - - - - - - - - Allocation of Costs to Activity 4. < - - - - - - - - - - - - - - - Allocation of Costs to Activity 4.2Allocation Allocation
Activity Name Percent Amount Activity NameInstallation of Network Connections and Equip 65% 123,500 Trouble Shoot Network Connection ProblemsInstallation of Network Connections and Equip 0% 0 Trouble Shoot Network Connection ProblemsInstallation of Network Connections and Equip 70% 24,500 Trouble Shoot Network Connection Problems
Sub Totals 148,000
Total Percent Allocated 3.4 100% < Should add up to 100% if you are allocating any costsTotal Percent Allocated 3.4 0% < Should add up to 100% if you are allocating any costsTotal Percent Allocated 3.4 100% < Should add up to 100% if you are allocating any costs
< - - - - - - - - - - - - - - - Allocation of Costs to Activity 4. < - - - - - - - - - - - - - - - Allocation of Costs to Activity 4.2Allocation Allocation
Activity Name Percent Amount Activity NameInstallation of Network Connections and Equip 0% 0 Trouble Shoot Network Connection ProblemsInstallation of Network Connections and Equip 5% 3,505 Trouble Shoot Network Connection ProblemsInstallation of Network Connections and Equip 5% 400 Trouble Shoot Network Connection Problems
Sub Totals 3,905
Total Percent Allocated 3.5 0% < Should add up to 100% if you are allocating any costsTotal Percent Allocated 3.5 100% < Should add up to 100% if you are allocating any costsTotal Percent Allocated 3.5 100% < Should add up to 100% if you are allocating any costs

< - - - - - - - - - - - - - - - Allocation of Costs to Activity 4. < - - - - - - - - - - - - - - - Allocation of Costs to Activity 4.2Allocation Allocation
Activity Name Percent Amount Activity NameInstallation of Network Connections and Equip 0% 0 Trouble Shoot Network Connection ProblemsInstallation of Network Connections and Equip 10% 5,010 Trouble Shoot Network Connection ProblemsInstallation of Network Connections and Equip 10% 700 Trouble Shoot Network Connection Problems
Sub Totals 5,710
Total Percent Allocated 3.6 0% < Should add up to 100% if you are allocating any costsTotal Percent Allocated 3.6 100% < Should add up to 100% if you are allocating any costsTotal Percent Allocated 3.6 100% < Should add up to 100% if you are allocating any costs
< - - - - - - - - - - - - - - - Allocation of Costs to Activity 4. < - - - - - - - - - - - - - - - Allocation of Costs to Activity 4.2Allocation Allocation
Activity Name Percent Amount Activity NameInstallation of Network Connections and Equip 0% 0 Trouble Shoot Network Connection ProblemsInstallation of Network Connections and Equip 0% 0 Trouble Shoot Network Connection ProblemsInstallation of Network Connections and Equip 0% 0 Trouble Shoot Network Connection Problems
Sub Totals 0
Total Percent Allocated 3.7 0% < Should add up to 100% if you are allocating any costsTotal Percent Allocated 3.7 0% < Should add up to 100% if you are allocating any costsTotal Percent Allocated 3.7 0% < Should add up to 100% if you are allocating any costs
< - - - - - - - - - - - - - - - Allocation of Costs to Activity 4. < - - - - - - - - - - - - - - - Allocation of Costs to Activity 4.2Allocation Allocation
Activity Name Percent Amount Activity NameInstallation of Network Connections and Equip 0% 0 Trouble Shoot Network Connection ProblemsInstallation of Network Connections and Equip 0% 0 Trouble Shoot Network Connection ProblemsInstallation of Network Connections and Equip 0% 0 Trouble Shoot Network Connection Problems
Sub Totals 0
Total Percent Allocated 3.8 0% < Should add up to 100% if you are allocating any costsTotal Percent Allocated 3.8 0% < Should add up to 100% if you are allocating any costsTotal Percent Allocated 3.8 0% < Should add up to 100% if you are allocating any costs
< - - - - - - - - - - - - - - - Allocation of Costs to Activity 4. < - - - - - - - - - - - - - - - Allocation of Costs to Activity 4.2Allocation Allocation
Activity Name Percent Amount Activity NameInstallation of Network Connections and Equip 0% 0 Trouble Shoot Network Connection ProblemsInstallation of Network Connections and Equip 0% 0 Trouble Shoot Network Connection ProblemsInstallation of Network Connections and Equip 0% 0 Trouble Shoot Network Connection Problems
Sub Totals 0
Total Percent Allocated 3.9 0% < Should add up to 100% if you are allocating any costsTotal Percent Allocated 3.9 0% < Should add up to 100% if you are allocating any costsTotal Percent Allocated 3.9 0% < Should add up to 100% if you are allocating any costs
< - - - - - - - - - - - - - - - Allocation of Costs to Activity 4. < - - - - - - - - - - - - - - - Allocation of Costs to Activity 4.2Allocation Allocation
Activity Name Percent Amount Activity NameInstallation of Network Connections and Equip 0% 0 Trouble Shoot Network Connection ProblemsInstallation of Network Connections and Equip 0% 0 Trouble Shoot Network Connection ProblemsInstallation of Network Connections and Equip 0% 0 Trouble Shoot Network Connection Problems
Sub Totals 0
Total Percent Allocated 3.1 0% < Should add up to 100% if you are allocating any costsTotal Percent Allocated 3.1 0% < Should add up to 100% if you are allocating any costsTotal Percent Allocated 3.1 0% < Should add up to 100% if you are allocating any costs
Place intoSingle Cell
4.1 149,1104.2 206,3154.3 148,9404.4 33,7204.5 74,8904.6 40,7254.7 04.8 04.9 04.10 0
653,700

< - - - - - - - - - - - - - - - Allocation of Costs to Activity 4.2 < - - - - - - - - - - - - - - - Allocation of Costs to Activity 4.3Allocation AllocationPercent Amount Activity Name
Trouble Shoot Network Connection Problems 5% 5,000 Database Optimization and MaintenanceTrouble Shoot Network Connection Problems 0% 0 Database Optimization and MaintenanceTrouble Shoot Network Connection Problems 0% 0 Database Optimization and Maintenance
Sub Totals 5,000
< - - - - - - - - - - - - - - - Allocation of Costs to Activity 4.2 < - - - - - - - - - - - - - - - Allocation of Costs to Activity 4.3Allocation Allocation
Activity Drivers Final ReportCost Objects Glossary
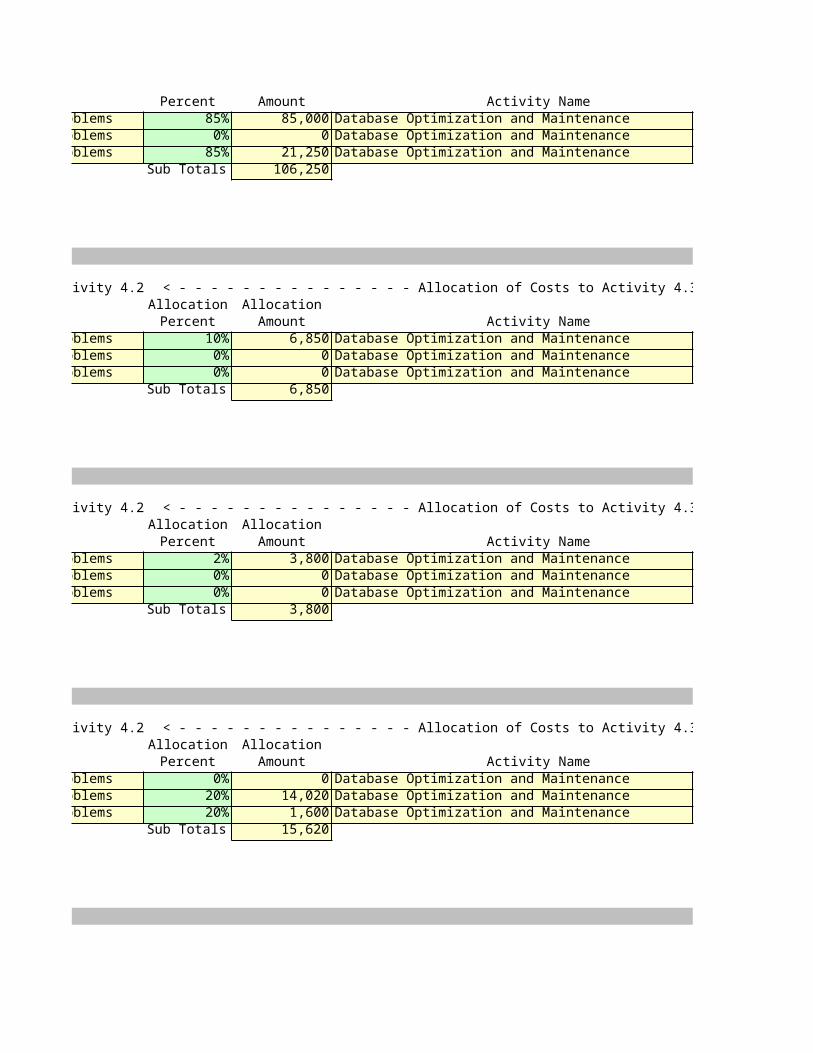
Percent Amount Activity NameTrouble Shoot Network Connection Problems 85% 85,000 Database Optimization and MaintenanceTrouble Shoot Network Connection Problems 0% 0 Database Optimization and MaintenanceTrouble Shoot Network Connection Problems 85% 21,250 Database Optimization and Maintenance
Sub Totals 106,250
< - - - - - - - - - - - - - - - Allocation of Costs to Activity 4.2 < - - - - - - - - - - - - - - - Allocation of Costs to Activity 4.3Allocation AllocationPercent Amount Activity Name
Trouble Shoot Network Connection Problems 10% 6,850 Database Optimization and MaintenanceTrouble Shoot Network Connection Problems 0% 0 Database Optimization and MaintenanceTrouble Shoot Network Connection Problems 0% 0 Database Optimization and Maintenance
Sub Totals 6,850
< - - - - - - - - - - - - - - - Allocation of Costs to Activity 4.2 < - - - - - - - - - - - - - - - Allocation of Costs to Activity 4.3Allocation AllocationPercent Amount Activity Name
Trouble Shoot Network Connection Problems 2% 3,800 Database Optimization and MaintenanceTrouble Shoot Network Connection Problems 0% 0 Database Optimization and MaintenanceTrouble Shoot Network Connection Problems 0% 0 Database Optimization and Maintenance
Sub Totals 3,800
< - - - - - - - - - - - - - - - Allocation of Costs to Activity 4.2 < - - - - - - - - - - - - - - - Allocation of Costs to Activity 4.3Allocation AllocationPercent Amount Activity Name
Trouble Shoot Network Connection Problems 0% 0 Database Optimization and MaintenanceTrouble Shoot Network Connection Problems 20% 14,020 Database Optimization and MaintenanceTrouble Shoot Network Connection Problems 20% 1,600 Database Optimization and Maintenance
Sub Totals 15,620
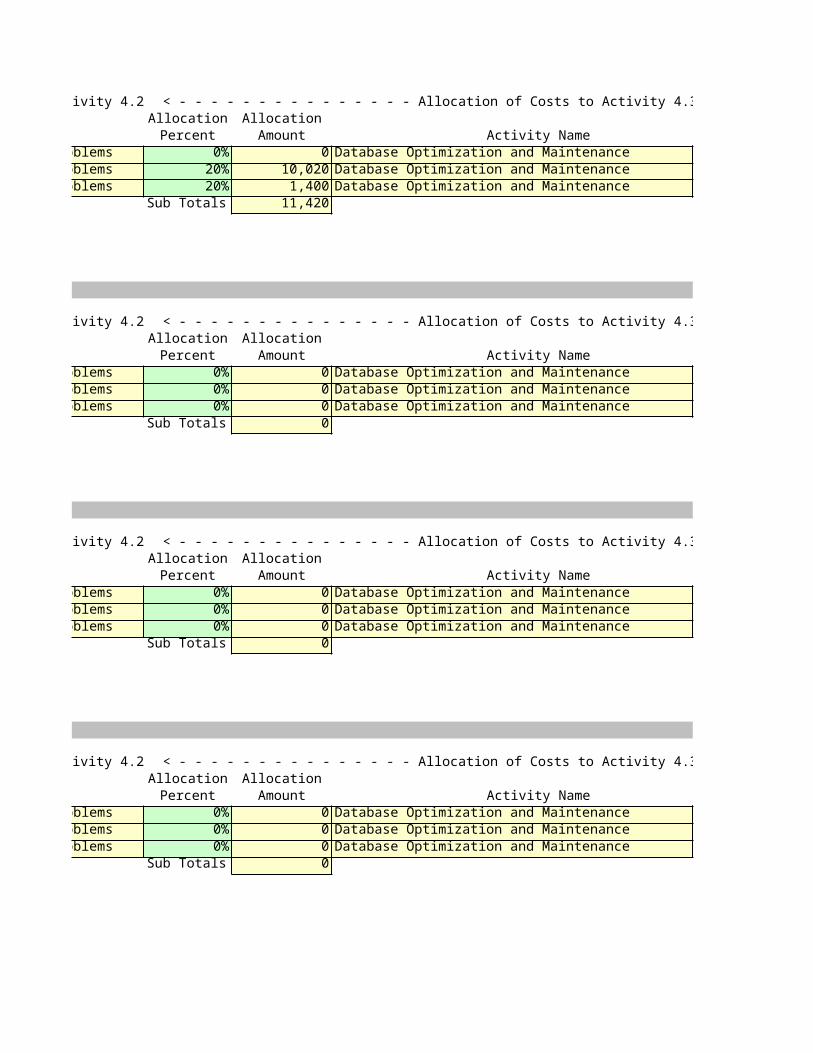
< - - - - - - - - - - - - - - - Allocation of Costs to Activity 4.2 < - - - - - - - - - - - - - - - Allocation of Costs to Activity 4.3Allocation AllocationPercent Amount Activity Name
Trouble Shoot Network Connection Problems 0% 0 Database Optimization and MaintenanceTrouble Shoot Network Connection Problems 20% 10,020 Database Optimization and MaintenanceTrouble Shoot Network Connection Problems 20% 1,400 Database Optimization and Maintenance
Sub Totals 11,420
< - - - - - - - - - - - - - - - Allocation of Costs to Activity 4.2 < - - - - - - - - - - - - - - - Allocation of Costs to Activity 4.3Allocation AllocationPercent Amount Activity Name
Trouble Shoot Network Connection Problems 0% 0 Database Optimization and MaintenanceTrouble Shoot Network Connection Problems 0% 0 Database Optimization and MaintenanceTrouble Shoot Network Connection Problems 0% 0 Database Optimization and Maintenance
Sub Totals 0
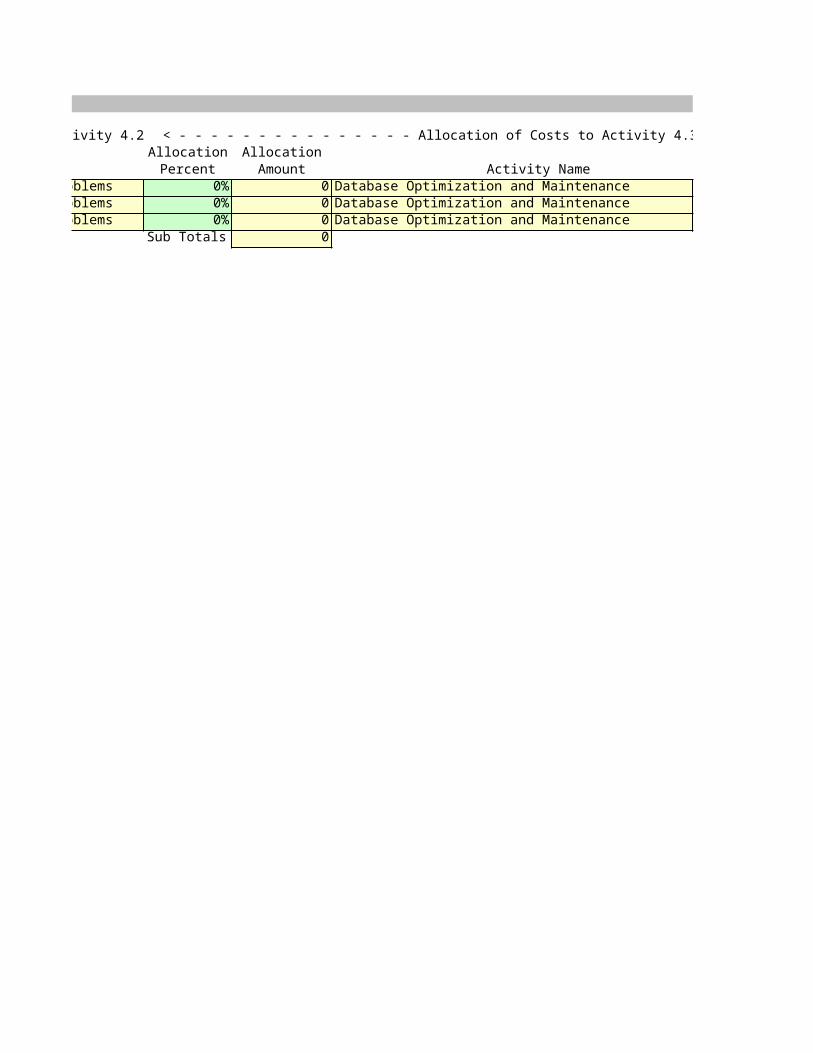
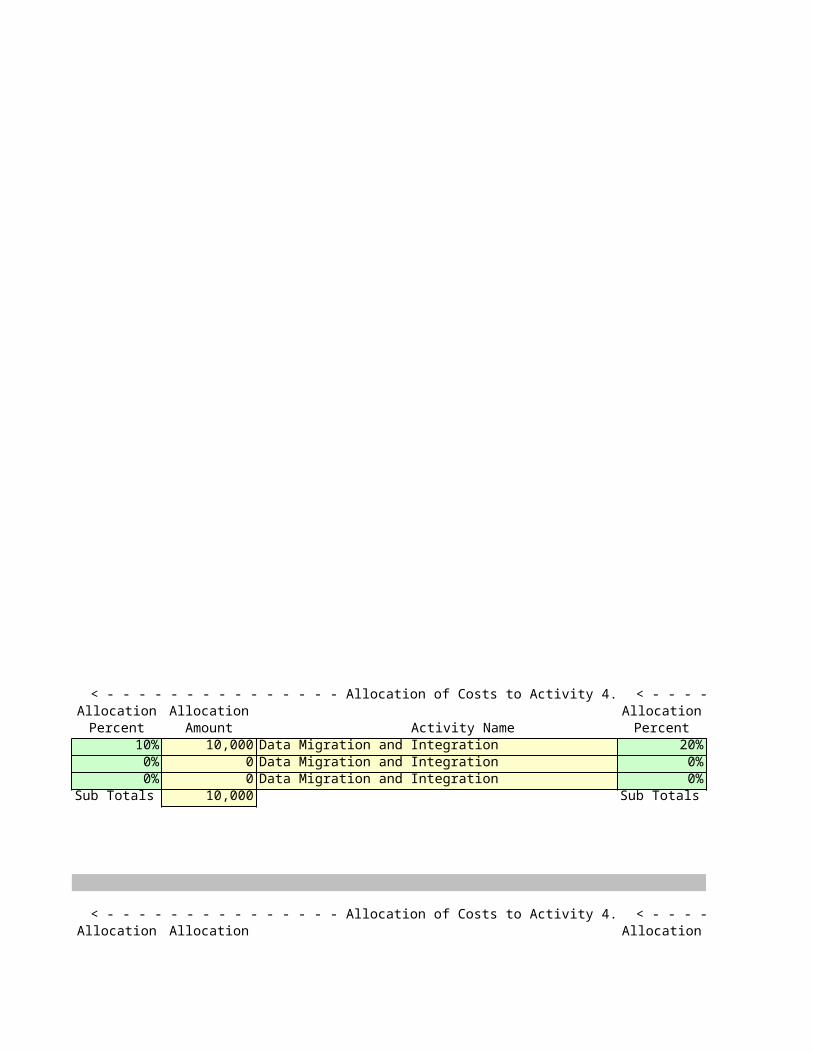
< - - - - - - - - - - - - - - - Allocation of Costs to Activity 4. < - - - - - - - - - - - - - - - Allocation of Costs to Activity 4.5Allocation Allocation AllocationPercent Amount Activity Name Percent
10% 10,000 Data Migration and Integration 20%0% 0 Data Migration and Integration 0%0% 0 Data Migration and Integration 0%
Sub Totals 10,000 Sub Totals
< - - - - - - - - - - - - - - - Allocation of Costs to Activity 4. < - - - - - - - - - - - - - - - Allocation of Costs to Activity 4.5Allocation Allocation Allocation

Percent Amount Activity Name Percent10% 10,000 Data Migration and Integration 5%0% 0 Data Migration and Integration 0%5% 1,250 Data Migration and Integration 5%
Sub Totals 11,250 Sub Totals
< - - - - - - - - - - - - - - - Allocation of Costs to Activity 4. < - - - - - - - - - - - - - - - Allocation of Costs to Activity 4.5Allocation Allocation AllocationPercent Amount Activity Name Percent
0% 0 Data Migration and Integration 15%0% 0 Data Migration and Integration 0%0% 0 Data Migration and Integration 0%
Sub Totals 0 Sub Totals
< - - - - - - - - - - - - - - - Allocation of Costs to Activity 4. < - - - - - - - - - - - - - - - Allocation of Costs to Activity 4.5Allocation Allocation AllocationPercent Amount Activity Name Percent
0% 0 Data Migration and Integration 12%0% 0 Data Migration and Integration 0%0% 0 Data Migration and Integration 20%
Sub Totals 0 Sub Totals
< - - - - - - - - - - - - - - - Allocation of Costs to Activity 4. < - - - - - - - - - - - - - - - Allocation of Costs to Activity 4.5Allocation Allocation AllocationPercent Amount Activity Name Percent
0% 0 Data Migration and Integration 0%5% 3,505 Data Migration and Integration 0%5% 400 Data Migration and Integration 0%
Sub Totals 3,905 Sub Totals

< - - - - - - - - - - - - - - - Allocation of Costs to Activity 4. < - - - - - - - - - - - - - - - Allocation of Costs to Activity 4.5Allocation Allocation AllocationPercent Amount Activity Name Percent
0% 0 Data Migration and Integration 0%15% 7,515 Data Migration and Integration 15%15% 1,050 Data Migration and Integration 15%
Sub Totals 8,565 Sub Totals
< - - - - - - - - - - - - - - - Allocation of Costs to Activity 4. < - - - - - - - - - - - - - - - Allocation of Costs to Activity 4.5Allocation Allocation AllocationPercent Amount Activity Name Percent
0% 0 Data Migration and Integration 0%0% 0 Data Migration and Integration 0%0% 0 Data Migration and Integration 0%
Sub Totals 0 Sub Totals
< - - - - - - - - - - - - - - - Allocation of Costs to Activity 4. < - - - - - - - - - - - - - - - Allocation of Costs to Activity 4.5Allocation Allocation AllocationPercent Amount Activity Name Percent
0% 0 Data Migration and Integration 0%0% 0 Data Migration and Integration 0%0% 0 Data Migration and Integration 0%
Sub Totals 0 Sub Totals
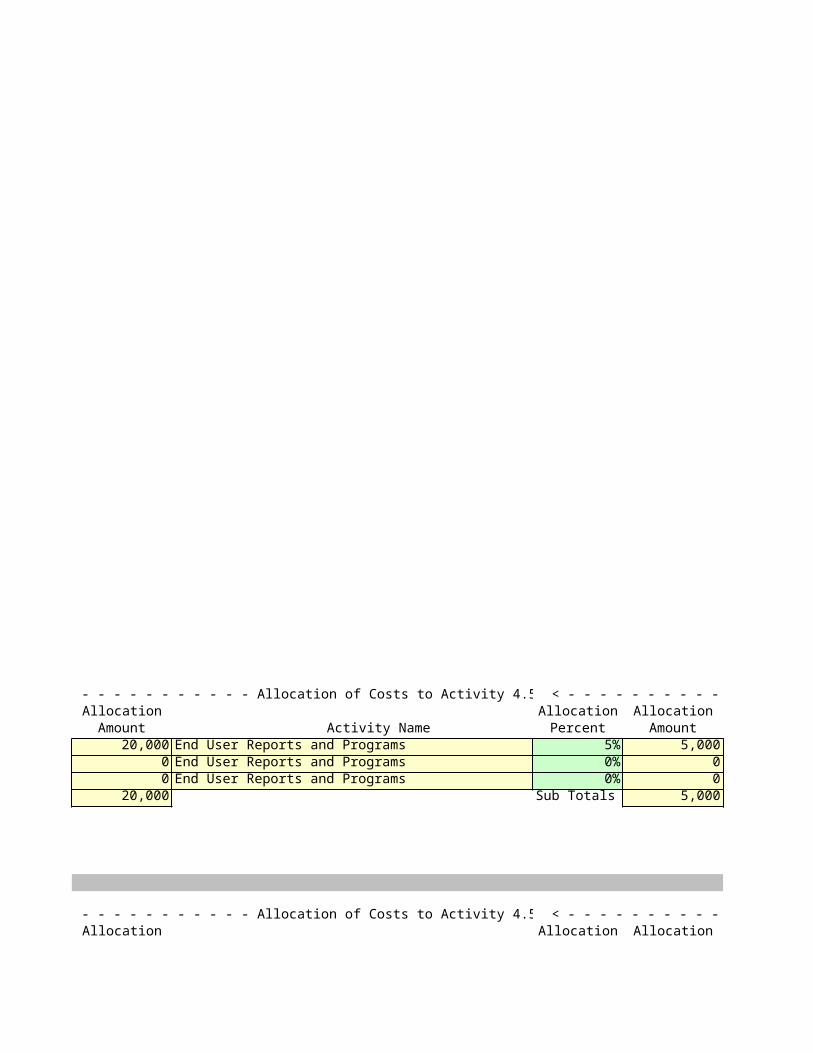
< - - - - - - - - - - - - - - - Allocation of Costs to Activity 4.5 < - - - - - - - - - - - - - - - Allocation of Costs to Activity 4.6Allocation Allocation AllocationAmount Activity Name Percent Amount
20,000 End User Reports and Programs 5% 5,0000 End User Reports and Programs 0% 00 End User Reports and Programs 0% 0
20,000 Sub Totals 5,000
< - - - - - - - - - - - - - - - Allocation of Costs to Activity 4.5 < - - - - - - - - - - - - - - - Allocation of Costs to Activity 4.6Allocation Allocation Allocation

Amount Activity Name Percent Amount5,000 End User Reports and Programs 0% 0
0 End User Reports and Programs 0% 01,250 End User Reports and Programs 5% 1,2506,250 Sub Totals 1,250
< - - - - - - - - - - - - - - - Allocation of Costs to Activity 4.5 < - - - - - - - - - - - - - - - Allocation of Costs to Activity 4.6Allocation Allocation AllocationAmount Activity Name Percent Amount
10,275 End User Reports and Programs 45% 30,8250 End User Reports and Programs 0% 00 End User Reports and Programs 0% 0
10,275 Sub Totals 30,825
< - - - - - - - - - - - - - - - Allocation of Costs to Activity 4.5 < - - - - - - - - - - - - - - - Allocation of Costs to Activity 4.6Allocation Allocation AllocationAmount Activity Name Percent Amount
22,800 End User Reports and Programs 1% 1,9000 End User Reports and Programs 0% 0
7,000 End User Reports and Programs 5% 1,75029,800 Sub Totals 3,650
< - - - - - - - - - - - - - - - Allocation of Costs to Activity 4.5 < - - - - - - - - - - - - - - - Allocation of Costs to Activity 4.6Allocation Allocation AllocationAmount Activity Name Percent Amount
0 End User Reports and Programs 0% 00 End User Reports and Programs 0% 00 End User Reports and Programs 0% 00 Sub Totals 0

< - - - - - - - - - - - - - - - Allocation of Costs to Activity 4.5 < - - - - - - - - - - - - - - - Allocation of Costs to Activity 4.6Allocation Allocation AllocationAmount Activity Name Percent Amount
0 End User Reports and Programs 0% 07,515 End User Reports and Programs 0% 01,050 End User Reports and Programs 0% 08,565 Sub Totals 0
< - - - - - - - - - - - - - - - Allocation of Costs to Activity 4.5 < - - - - - - - - - - - - - - - Allocation of Costs to Activity 4.6Allocation Allocation AllocationAmount Activity Name Percent Amount
0 End User Reports and Programs 0% 00 End User Reports and Programs 0% 00 End User Reports and Programs 0% 00 Sub Totals 0

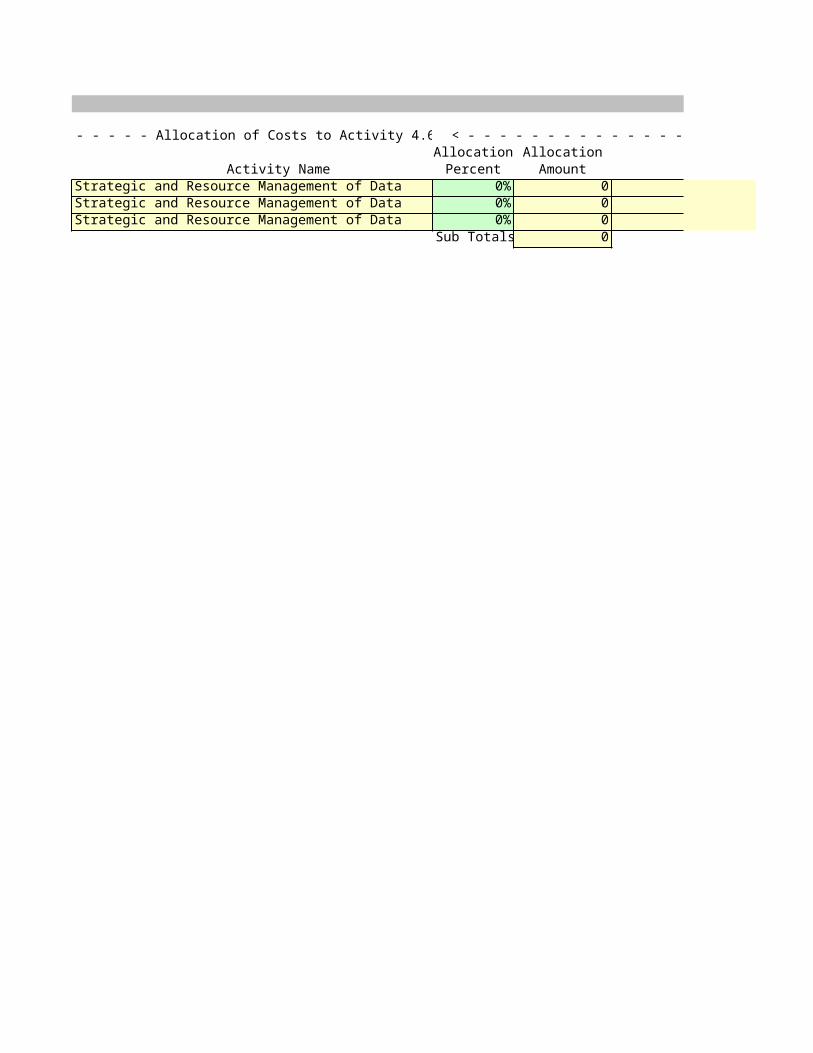
< - - - - - - - - - - - - - - - Allocation of Costs to Activity 4.6 < - - - - - - - - - - - - - - - Allocation of Costs to Activity 4Allocation Allocation
Activity Name Percent AmountStrategic and Resource Management of Data 0% 0 0Strategic and Resource Management of Data 0% 0 0Strategic and Resource Management of Data 0% 0 0
Sub Totals 0
< - - - - - - - - - - - - - - - Allocation of Costs to Activity 4.6 < - - - - - - - - - - - - - - - Allocation of Costs to Activity 4Allocation Allocation
Activity Name Percent AmountStrategic and Resource Management of Data 0% 0 0Strategic and Resource Management of Data 0% 0 0Strategic and Resource Management of Data 0% 0 0
Sub Totals 0

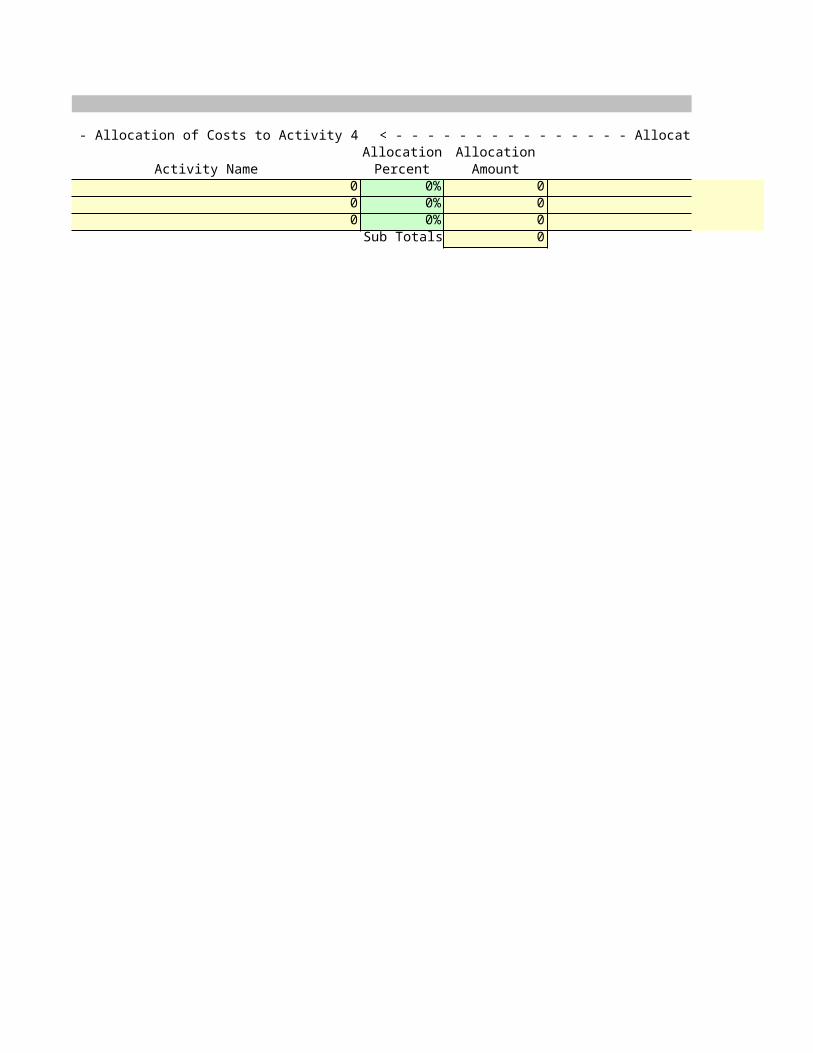
< - - - - - - - - - - - - - - - Allocation of Costs to Activity 4 < - - - - - - - - - - - - - - - Allocation of Costs to Activity 4.Allocation Allocation
Activity Name Percent Amount Activity Name0 0% 0 00 0% 0 00 0% 0 0Sub Totals 0
< - - - - - - - - - - - - - - - Allocation of Costs to Activity 4 < - - - - - - - - - - - - - - - Allocation of Costs to Activity 4.Allocation Allocation

Activity Name Percent Amount Activity Name0 0% 0 00 0% 0 00 0% 0 0Sub Totals 0
< - - - - - - - - - - - - - - - Allocation of Costs to Activity 4 < - - - - - - - - - - - - - - - Allocation of Costs to Activity 4.Allocation Allocation
Activity Name Percent Amount Activity Name0 0% 0 00 0% 0 00 0% 0 0Sub Totals 0
< - - - - - - - - - - - - - - - Allocation of Costs to Activity 4 < - - - - - - - - - - - - - - - Allocation of Costs to Activity 4.Allocation Allocation
Activity Name Percent Amount Activity Name0 0% 0 00 0% 0 00 0% 0 0Sub Totals 0
< - - - - - - - - - - - - - - - Allocation of Costs to Activity 4 < - - - - - - - - - - - - - - - Allocation of Costs to Activity 4.Allocation Allocation
Activity Name Percent Amount Activity Name0 0% 0 00 0% 0 00 0% 0 0Sub Totals 0

< - - - - - - - - - - - - - - - Allocation of Costs to Activity 4 < - - - - - - - - - - - - - - - Allocation of Costs to Activity 4.Allocation Allocation
Activity Name Percent Amount Activity Name0 0% 0 00 0% 0 00 0% 0 0Sub Totals 0
< - - - - - - - - - - - - - - - Allocation of Costs to Activity 4 < - - - - - - - - - - - - - - - Allocation of Costs to Activity 4.Allocation Allocation
Activity Name Percent Amount Activity Name0 0% 0 00 0% 0 00 0% 0 0Sub Totals 0
< - - - - - - - - - - - - - - - Allocation of Costs to Activity 4 < - - - - - - - - - - - - - - - Allocation of Costs to Activity 4.Allocation Allocation
Activity Name Percent Amount Activity Name0 0% 0 00 0% 0 00 0% 0 0Sub Totals 0
< - - - - - - - - - - - - - - - Allocation of Costs to Activity 4 < - - - - - - - - - - - - - - - Allocation of Costs to Activity 4.Allocation Allocation
Activity Name Percent Amount Activity Name0 0% 0 00 0% 0 00 0% 0 0Sub Totals 0
< - - - - - - - - - - - - - - - Allocation of Costs to Activity 4 < - - - - - - - - - - - - - - - Allocation of Costs to Activity 4.Allocation Allocation
Activity Name Percent Amount Activity Name0 0% 0 00 0% 0 00 0% 0 0Sub Totals 0

< - - - - - - - - - - - - - - - Allocation of Costs to Activity 4. < - - - - - - - - - - - - - - - Allocation of Costs to Activity 4Allocation Allocation
Activity Name Percent Amount Activity Name0 0% 0 00 0% 0 00 0% 0 0Sub Totals 0
< - - - - - - - - - - - - - - - Allocation of Costs to Activity 4. < - - - - - - - - - - - - - - - Allocation of Costs to Activity 4Allocation Allocation

Activity Name Percent Amount Activity Name0 0% 0 00 0% 0 00 0% 0 0Sub Totals 0
< - - - - - - - - - - - - - - - Allocation of Costs to Activity 4. < - - - - - - - - - - - - - - - Allocation of Costs to Activity 4Allocation Allocation
Activity Name Percent Amount Activity Name0 0% 0 00 0% 0 00 0% 0 0Sub Totals 0
< - - - - - - - - - - - - - - - Allocation of Costs to Activity 4. < - - - - - - - - - - - - - - - Allocation of Costs to Activity 4Allocation Allocation
Activity Name Percent Amount Activity Name0 0% 0 00 0% 0 00 0% 0 0Sub Totals 0
< - - - - - - - - - - - - - - - Allocation of Costs to Activity 4. < - - - - - - - - - - - - - - - Allocation of Costs to Activity 4Allocation Allocation
Activity Name Percent Amount Activity Name0 0% 0 00 0% 0 00 0% 0 0Sub Totals 0

< - - - - - - - - - - - - - - - Allocation of Costs to Activity 4. < - - - - - - - - - - - - - - - Allocation of Costs to Activity 4Allocation Allocation
Activity Name Percent Amount Activity Name0 0% 0 00 0% 0 00 0% 0 0Sub Totals 0
< - - - - - - - - - - - - - - - Allocation of Costs to Activity 4. < - - - - - - - - - - - - - - - Allocation of Costs to Activity 4Allocation Allocation
Activity Name Percent Amount Activity Name0 0% 0 00 0% 0 00 0% 0 0Sub Totals 0
< - - - - - - - - - - - - - - - Allocation of Costs to Activity 4. < - - - - - - - - - - - - - - - Allocation of Costs to Activity 4Allocation Allocation
Activity Name Percent Amount Activity Name0 0% 0 00 0% 0 00 0% 0 0Sub Totals 0
< - - - - - - - - - - - - - - - Allocation of Costs to Activity 4. < - - - - - - - - - - - - - - - Allocation of Costs to Activity 4Allocation Allocation
Activity Name Percent Amount Activity Name0 0% 0 00 0% 0 00 0% 0 0Sub Totals 0

< - - - - - - - - - - - - - - - Allocation of Costs to Activity 4. < - - - - - - - - - - - - - - - Allocation of Costs to Activity 4Allocation Allocation
Activity Name Percent Amount Activity Name0 0% 0 00 0% 0 00 0% 0 0Sub Totals 0
< - - - - - - - - - - - - - - - Allocation of Costs to Activity 4 < - - - - - - - - - - - - - - - Allocation of Costs to Activity 4.10 - - - - - - - - - - - - - - - >Allocation Allocation
Activity Name Percent Amount Activity Name0 0% 0 00 0% 0 00 0% 0 0Sub Totals 0
< - - - - - - - - - - - - - - - Allocation of Costs to Activity 4 < - - - - - - - - - - - - - - - Allocation of Costs to Activity 4.10 - - - - - - - - - - - - - - - >Allocation Allocation

Activity Name Percent Amount Activity Name0 0% 0 00 0% 0 00 0% 0 0Sub Totals 0
< - - - - - - - - - - - - - - - Allocation of Costs to Activity 4 < - - - - - - - - - - - - - - - Allocation of Costs to Activity 4.10 - - - - - - - - - - - - - - - >Allocation Allocation
Activity Name Percent Amount Activity Name0 0% 0 00 0% 0 00 0% 0 0Sub Totals 0
< - - - - - - - - - - - - - - - Allocation of Costs to Activity 4 < - - - - - - - - - - - - - - - Allocation of Costs to Activity 4.10 - - - - - - - - - - - - - - - >Allocation Allocation
Activity Name Percent Amount Activity Name0 0% 0 00 0% 0 00 0% 0 0Sub Totals 0
< - - - - - - - - - - - - - - - Allocation of Costs to Activity 4 < - - - - - - - - - - - - - - - Allocation of Costs to Activity 4.10 - - - - - - - - - - - - - - - >Allocation Allocation
Activity Name Percent Amount Activity Name0 0% 0 00 0% 0 00 0% 0 0Sub Totals 0
< - - - - - - - - - - - - - - - Allocation of Costs to Activity 4 < - - - - - - - - - - - - - - - Allocation of Costs to Activity 4.10 - - - - - - - - - - - - - - - >Allocation Allocation
Activity Name Percent Amount Activity Name0 0% 0 00 0% 0 00 0% 0 0Sub Totals 0
< - - - - - - - - - - - - - - - Allocation of Costs to Activity 4 < - - - - - - - - - - - - - - - Allocation of Costs to Activity 4.10 - - - - - - - - - - - - - - - >Allocation Allocation
Activity Name Percent Amount Activity Name0 0% 0 00 0% 0 00 0% 0 0Sub Totals 0
< - - - - - - - - - - - - - - - Allocation of Costs to Activity 4 < - - - - - - - - - - - - - - - Allocation of Costs to Activity 4.10 - - - - - - - - - - - - - - - >Allocation Allocation
Activity Name Percent Amount Activity Name0 0% 0 00 0% 0 00 0% 0 0Sub Totals 0
< - - - - - - - - - - - - - - - Allocation of Costs to Activity 4 < - - - - - - - - - - - - - - - Allocation of Costs to Activity 4.10 - - - - - - - - - - - - - - - >Allocation Allocation
Activity Name Percent Amount Activity Name0 0% 0 00 0% 0 00 0% 0 0Sub Totals 0
< - - - - - - - - - - - - - - - Allocation of Costs to Activity 4 < - - - - - - - - - - - - - - - Allocation of Costs to Activity 4.10 - - - - - - - - - - - - - - - >Allocation Allocation
Activity Name Percent Amount Activity Name0 0% 0 00 0% 0 00 0% 0 0Sub Totals 0
< - - - - - - - - - - - - - - - Allocation of Costs to Activity 4.10 - - - - - - - - - - - - - - - >
000
< - - - - - - - - - - - - - - - Allocation of Costs to Activity 4.10 - - - - - - - - - - - - - - - >
000
< - - - - - - - - - - - - - - - Allocation of Costs to Activity 4.10 - - - - - - - - - - - - - - - >
000
< - - - - - - - - - - - - - - - Allocation of Costs to Activity 4.10 - - - - - - - - - - - - - - - >
000
< - - - - - - - - - - - - - - - Allocation of Costs to Activity 4.10 - - - - - - - - - - - - - - - >
000
< - - - - - - - - - - - - - - - Allocation of Costs to Activity 4.10 - - - - - - - - - - - - - - - >
000
< - - - - - - - - - - - - - - - Allocation of Costs to Activity 4.10 - - - - - - - - - - - - - - - >
000
< - - - - - - - - - - - - - - - Allocation of Costs to Activity 4.10 - - - - - - - - - - - - - - - >
000
< - - - - - - - - - - - - - - - Allocation of Costs to Activity 4.10 - - - - - - - - - - - - - - - >
000
< - - - - - - - - - - - - - - - Allocation of Costs to Activity 4.10 - - - - - - - - - - - - - - - >
000
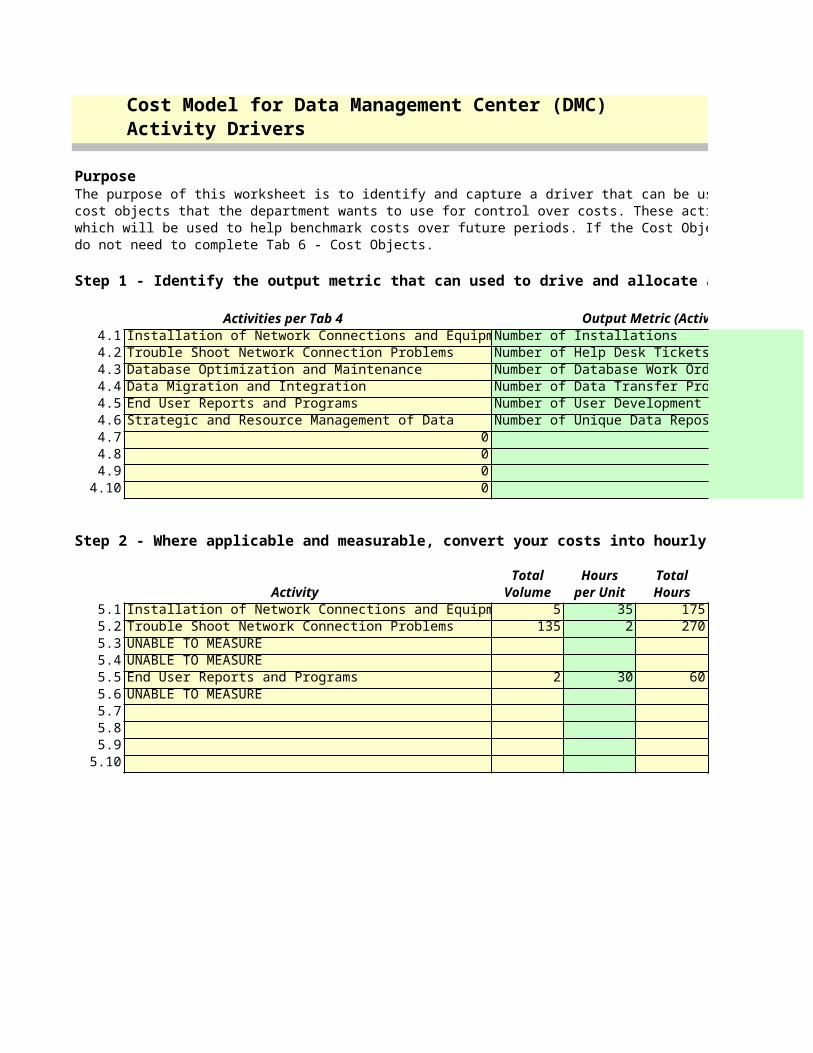
Cost Model for Data Management Center (DMC)Activity Drivers
PurposeThe purpose of this worksheet is to identify and capture a driver that can be used to allocate the Activity Costs per Tab 4 tocost objects that the department wants to use for control over costs. These activity drivers will also help calculate unit costwhich will be used to help benchmark costs over future periods. If the Cost Object is the same as your activities, then youdo not need to complete Tab 6 - Cost Objects.
Step 1 - Identify the output metric that can used to drive and allocate activity costs
Activities per Tab 4 4.1 Installation of Network Connections and EquipmNumber of Installations4.2 Trouble Shoot Network Connection Problems Number of Help Desk Tickets4.3 Database Optimization and Maintenance Number of Database Work Orders4.4 Data Migration and Integration Number of Data Transfer Projects4.5 End User Reports and Programs Number of User Development Requests4.6 Strategic and Resource Management of Data Number of Unique Data Repositories4.7 04.8 04.9 0
4.10 0
Step 2 - Where applicable and measurable, convert your costs into hourly rates based on time involved. Total Hours Total
Activity Volume per Unit Hours5.1 Installation of Network Connections and Equipm 5 35 1755.2 Trouble Shoot Network Connection Problems 135 2 2705.3 UNABLE TO MEASURE 5.4 UNABLE TO MEASURE 5.5 End User Reports and Programs 2 30 605.6 UNABLE TO MEASURE 5.7 5.8 5.9
5.10
Output Metric (Activity Driver)
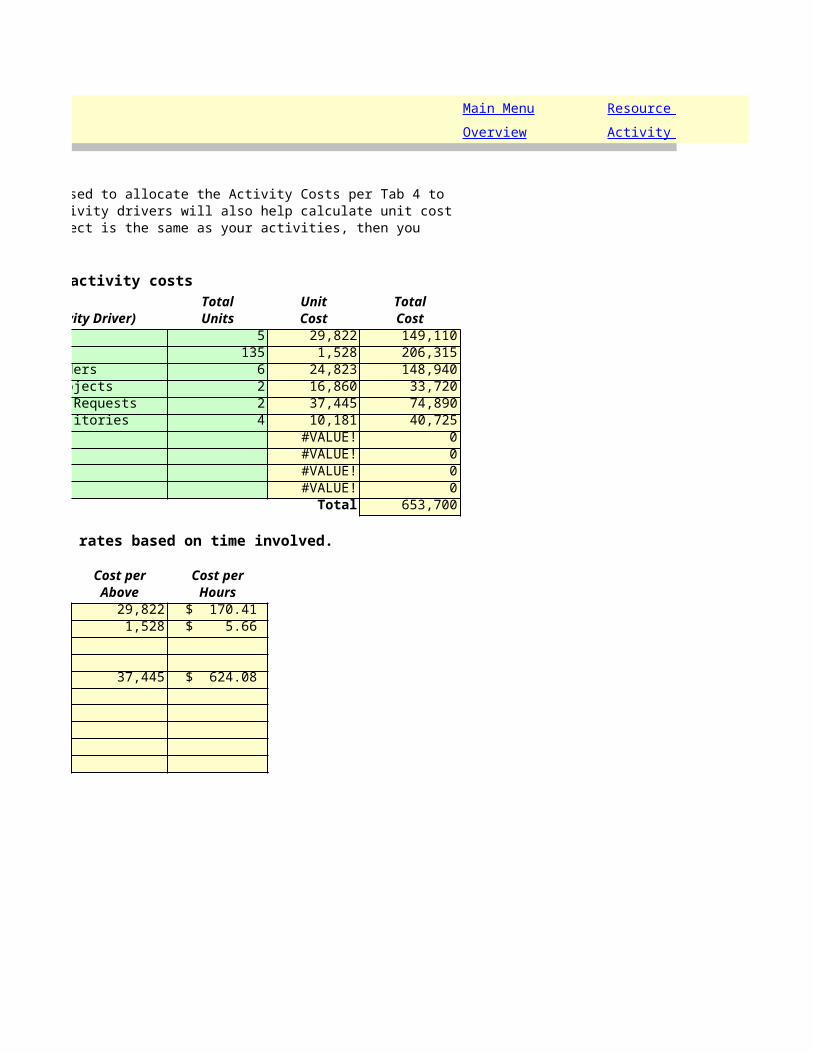
The purpose of this worksheet is to identify and capture a driver that can be used to allocate the Activity Costs per Tab 4 tocost objects that the department wants to use for control over costs. These activity drivers will also help calculate unit costwhich will be used to help benchmark costs over future periods. If the Cost Object is the same as your activities, then you
Step 1 - Identify the output metric that can used to drive and allocate activity costsTotal Unit TotalUnits Cost Cost
Number of Installations 5 29,822 149,110Number of Help Desk Tickets 135 1,528 206,315Number of Database Work Orders 6 24,823 148,940Number of Data Transfer Projects 2 16,860 33,720Number of User Development Requests 2 37,445 74,890Number of Unique Data Repositories 4 10,181 40,725
#VALUE! 0 #VALUE! 0 #VALUE! 0 #VALUE! 0
Total 653,700
Step 2 - Where applicable and measurable, convert your costs into hourly rates based on time involved.
Cost per Cost perAbove Hours
29,822 $ 170.41 1,528 $ 5.66
37,445 $ 624.08
Main Menu Resource PoolsOverview Activity Costing
Output Metric (Activity Driver)
Resource Pools Activity Drivers Final ReportActivity Costing Cost Objects Glossary

Cost Model for Data Management Center (DMC)Cost Objects
PurposeThe purpose of this worksheet is to describe each of the cost objects that the department wants to use formanaging costs. Cost objects may differ from your activities since they can represent anything for which youwant to measure costs. If your activities represent your cost objects, then you do not have to complete this worksheet.
Step 1 - Identify Cost Objects for Each Activity and if different, then allocate theactivity costs and identify the driver used for measuring the Cost Object
Activity % of TimeRef Activity / Cost Object Cost Spent On
4.1 149,1106.4.1.1 New Network Taps 15%6.4.1.2 Setup Local Area Networks - Remote Sites 85%6.4.1.36.4.1.46.4.1.5
Totals 100%
Activity % of TimeCost Spent On
4.2 Trouble Shoot Network Connection Problems 206,3156.4.2.1 ACTIVITIES USED FOR COST OBJECTS 6.4.2.2 REFER BACK TO STEP 3 / TAB 4 6.4.2.36.4.2.46.4.2.5
Totals 0%
Activity % of TimeCost Spent On
4.3 Database Optimization and Maintenance 148,9406.4.3.1 Routine Scheduled Maintenance 65%6.4.3.2 Unscheduled Fixes and Bugs 35%6.4.3.36.4.3.46.4.3.5
Totals 100%
Activity % of TimeCost Spent On
4.4 Data Migration and Integration 33,7206.4.4.1 Design & Develop Interfaces 40%6.4.4.2 Data Extract / Transform / Loads (ETL) 60%6.4.4.36.4.4.46.4.4.5
Equipment

Totals 100%
Activity % of TimeCost Spent On
4.5 End User Reports and Programs 74,8906.4.5.1 One Time Ad Hoc Requests 70%6.4.5.2 New Functional Procedure 30%6.4.5.36.4.5.46.4.5.5
Totals 100%
Activity % of TimeCost Spent On
4.6 Strategic and Resource Management of Data 40,7256.4.6.1 ACTIVITIES USED FOR COST OBJECTS 6.4.6.2 REFER BACK TO STEP 3 / TAB 4 6.4.6.36.4.6.46.4.6.5
Totals 0%
Activity % of TimeCost Spent On
4.7 0 06.4.7.1 6.4.7.2 6.4.7.36.4.7.46.4.7.5
Totals 0%
Activity % of TimeCost Spent On
4.8 0 06.4.8.1 6.4.8.2 6.4.8.36.4.8.46.4.8.5
Totals 0%
Activity % of TimeCost Spent On
4.9 0 06.4.9.1 6.4.9.2 6.4.9.36.4.9.46.4.9.5
Totals 0%
Activity % of TimeCost Spent On
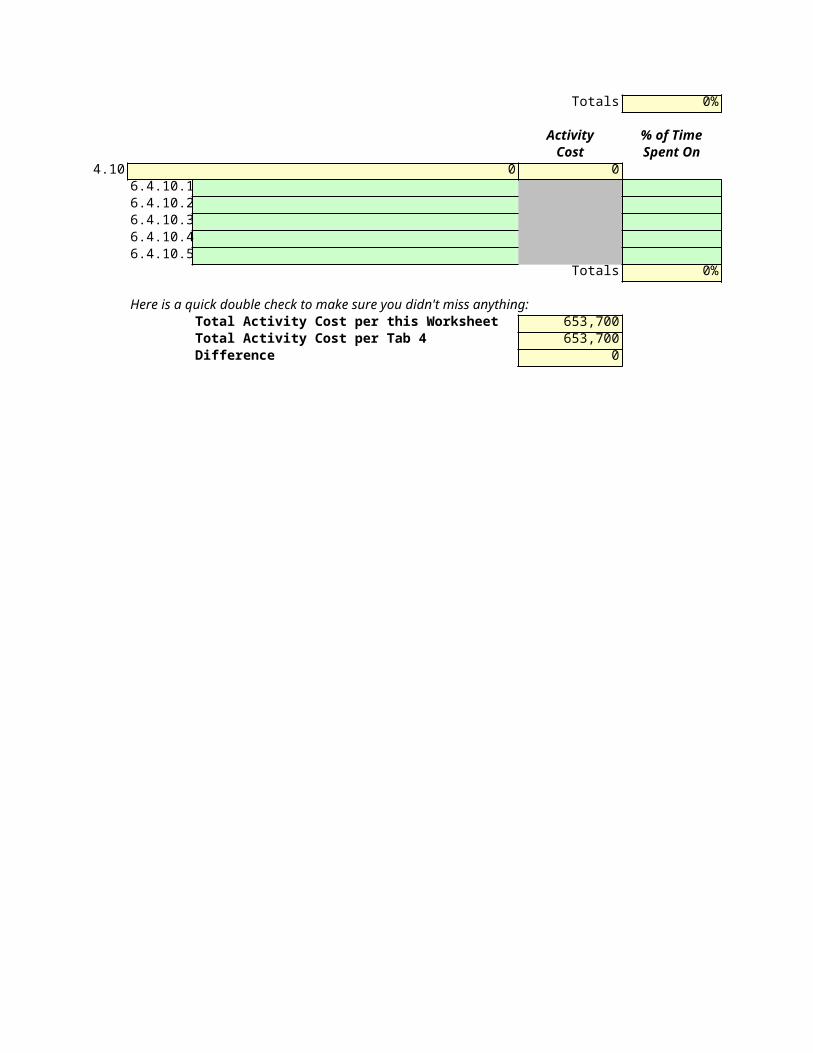
4.10 0 06.4.10.1 6.4.10.2 6.4.10.36.4.10.46.4.10.5
Totals 0%
Here is a quick double check to make sure you didn't miss anything:Total Activity Cost per this Worksheet 653,700Total Activity Cost per Tab 4 653,700Difference 0
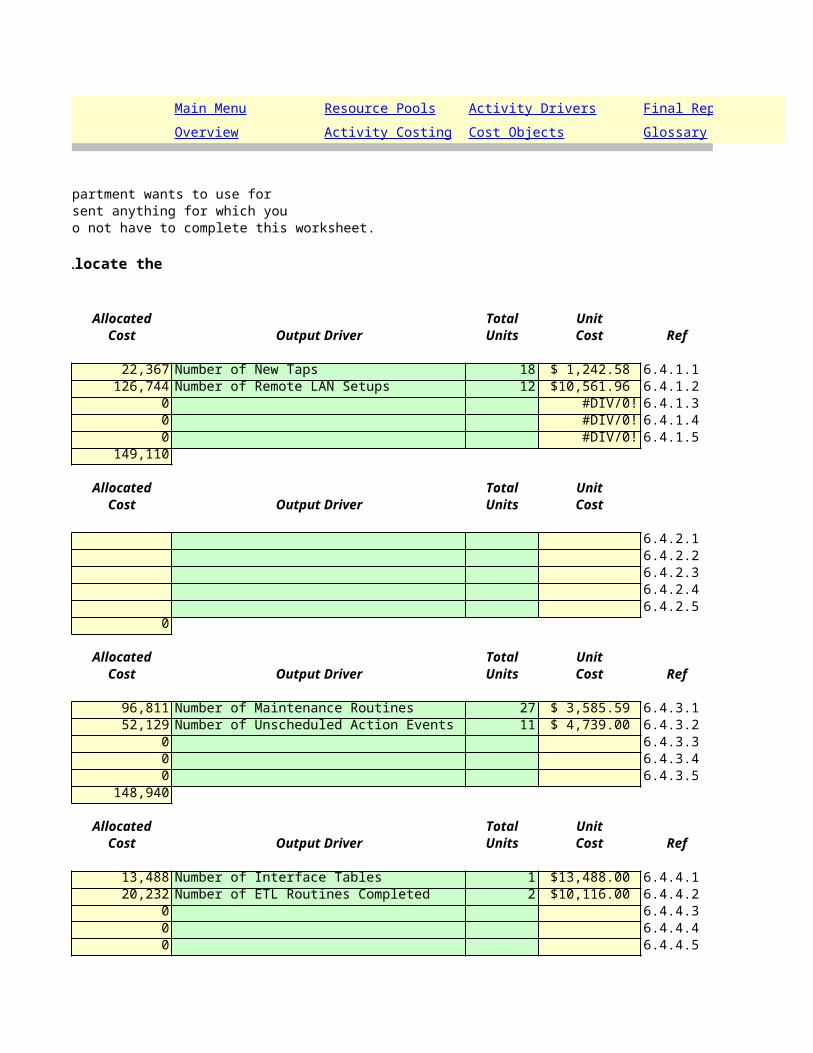
The purpose of this worksheet is to describe each of the cost objects that the department wants to use formanaging costs. Cost objects may differ from your activities since they can represent anything for which youwant to measure costs. If your activities represent your cost objects, then you do not have to complete this worksheet.
Step 1 - Identify Cost Objects for Each Activity and if different, then allocate the
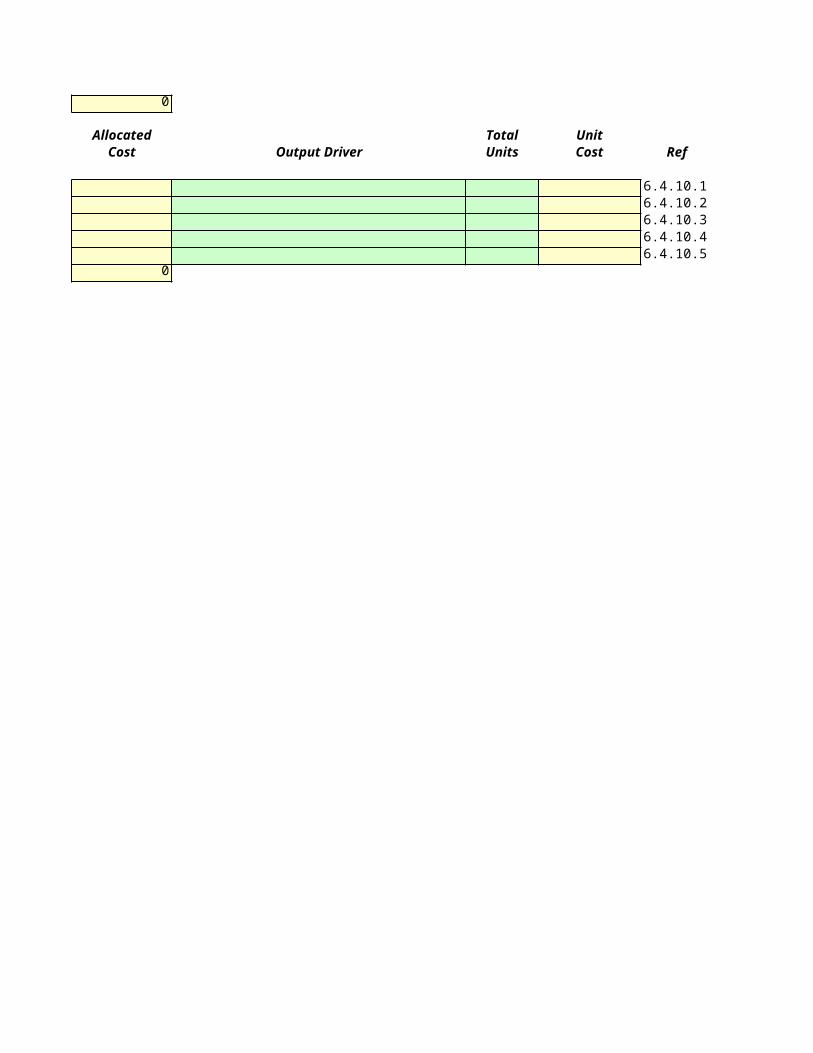
Allocated Total UnitCost Output Driver Units Cost Ref
22,367 Number of New Taps 18 $ 1,242.58 6.4.1.1126,744 Number of Remote LAN Setups 12 $10,561.96 6.4.1.2
0 #DIV/0! 6.4.1.30 #DIV/0! 6.4.1.40 #DIV/0! 6.4.1.5
149,110
Allocated Total UnitCost Output Driver Units Cost
6.4.2.1 6.4.2.2 6.4.2.3 6.4.2.4 6.4.2.5
0
Allocated Total UnitCost Output Driver Units Cost Ref
96,811 Number of Maintenance Routines 27 $ 3,585.59 6.4.3.152,129 Number of Unscheduled Action Events 11 $ 4,739.00 6.4.3.2
0 6.4.3.30 6.4.3.40 6.4.3.5
148,940
Allocated Total UnitCost Output Driver Units Cost Ref
13,488 Number of Interface Tables 1 $13,488.00 6.4.4.120,232 Number of ETL Routines Completed 2 $10,116.00 6.4.4.2
0 6.4.4.30 6.4.4.40 6.4.4.5
Main Menu Resource Pools Activity Drivers Final ReportOverview Activity Costing Cost Objects Glossary

33,720
Allocated Total UnitCost Output Driver Units Cost Ref
52,423 Number of End User Requests 5 $10,484.60 6.4.5.122,467 Number of Functional Reworks 1 $22,467.00 6.4.5.2
0 6.4.5.30 6.4.5.40 6.4.5.5
74,890
Allocated Total UnitCost Output Driver Units Cost Ref
6.4.6.1 6.4.6.2 6.4.6.3 6.4.6.4 6.4.6.5
0
Allocated Total UnitCost Output Driver Units Cost Ref
6.4.7.1 6.4.7.2 6.4.7.3 6.4.7.4 6.4.7.5
0
Allocated Total UnitCost Output Driver Units Cost Ref
6.4.8.1 6.4.8.2 6.4.8.3 6.4.8.4 6.4.8.5
0
Allocated Total UnitCost Output Driver Units Cost Ref
6.4.9.1 6.4.9.2 6.4.9.3 6.4.9.4 6.4.9.5
0
Allocated Total UnitCost Output Driver Units Cost Ref
6.4.10.1 6.4.10.2 6.4.10.3 6.4.10.4 6.4.10.5
0
Final ReportGlossary
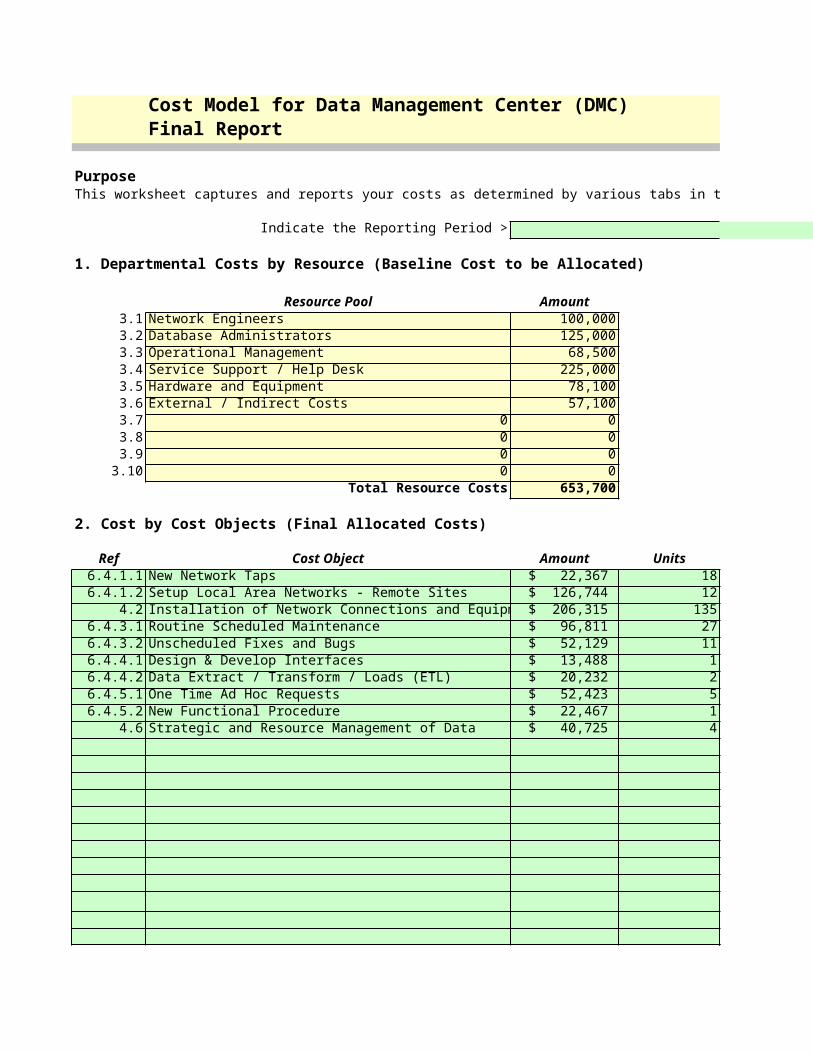
Cost Model for Data Management Center (DMC)Final Report
PurposeThis worksheet captures and reports your costs as determined by various tabs in this workbook.
Indicate the Reporting Period > Jul-07
1. Departmental Costs by Resource (Baseline Cost to be Allocated)
Resource Pool Amount3.1 Network Engineers 100,0003.2 Database Administrators 125,0003.3 Operational Management 68,5003.4 Service Support / Help Desk 225,0003.5 Hardware and Equipment 78,1003.6 External / Indirect Costs 57,1003.7 0 03.8 0 03.9 0 0
3.10 0 0Total Resource Costs 653,700
2. Cost by Cost Objects (Final Allocated Costs)
Ref Cost Object Amount Units6.4.1.1 New Network Taps $ 22,367 186.4.1.2 Setup Local Area Networks - Remote Sites $ 126,744 12
4.2 Installation of Network Connections and Equipm $ 206,315 1356.4.3.1 Routine Scheduled Maintenance $ 96,811 276.4.3.2 Unscheduled Fixes and Bugs $ 52,129 116.4.4.1 Design & Develop Interfaces $ 13,488 16.4.4.2 Data Extract / Transform / Loads (ETL) $ 20,232 26.4.5.1 One Time Ad Hoc Requests $ 52,423 56.4.5.2 New Functional Procedure $ 22,467 1
4.6 Strategic and Resource Management of Data $ 40,725 4
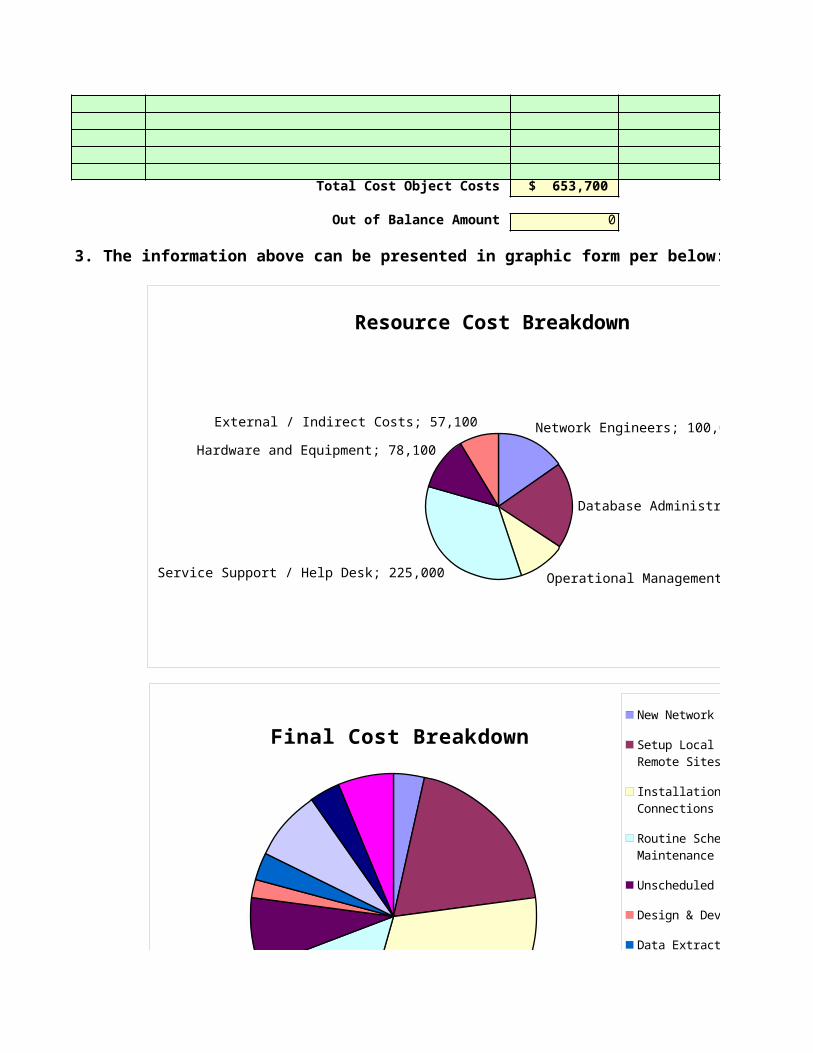
Total Cost Object Costs $ 653,700
Out of Balance Amount 0
3. The information above can be presented in graphic form per below:
Network Engineers; 100,000
Database Administrators; 125,000
Operational Management; 68,500Service Support / Help Desk; 225,000
Hardware and Equipment; 78,100
External / Indirect Costs; 57,100
Resource Cost Breakdown
Final Cost BreakdownNew Network Taps
Setup Local Area Networks - Remote Sites
Installation of Network Connections and Equipment
Routine Scheduled Maintenance
Unscheduled Fixes and Bugs
Design & Develop Interfaces
Data Extract / Transform / Loads (ETL)
One Time Ad Hoc Requests
New Functional Procedure
Strategic and Resource Management of Data

This worksheet captures and reports your costs as determined by various tabs in this workbook.
Jul-07
Unit Cost $ 1,242.58 $ 10,561.96 $ 1,528.26 $ 3,585.59 $ 4,739.00 $ 13,488.00 $ 10,116.00 $ 10,484.60 $ 22,467.00 $ 10,181.25
Main Menu Resource Pools Activity DriversOverview Activity Costing Cost Objects

3. The information above can be presented in graphic form per below:
Network Engineers; 100,000
Database Administrators; 125,000
Operational Management; 68,500Service Support / Help Desk; 225,000
Hardware and Equipment; 78,100
External / Indirect Costs; 57,100
Resource Cost Breakdown
Final Cost BreakdownNew Network Taps
Setup Local Area Networks - Remote Sites
Installation of Network Connections and Equipment
Routine Scheduled Maintenance
Unscheduled Fixes and Bugs
Design & Develop Interfaces
Data Extract / Transform / Loads (ETL)
One Time Ad Hoc Requests
New Functional Procedure
Strategic and Resource Management of Data

Final Cost BreakdownNew Network Taps
Setup Local Area Networks - Remote Sites
Installation of Network Connections and Equipment
Routine Scheduled Maintenance
Unscheduled Fixes and Bugs
Design & Develop Interfaces
Data Extract / Transform / Loads (ETL)
One Time Ad Hoc Requests
New Functional Procedure
Strategic and Resource Management of Data
Final ReportGlossary
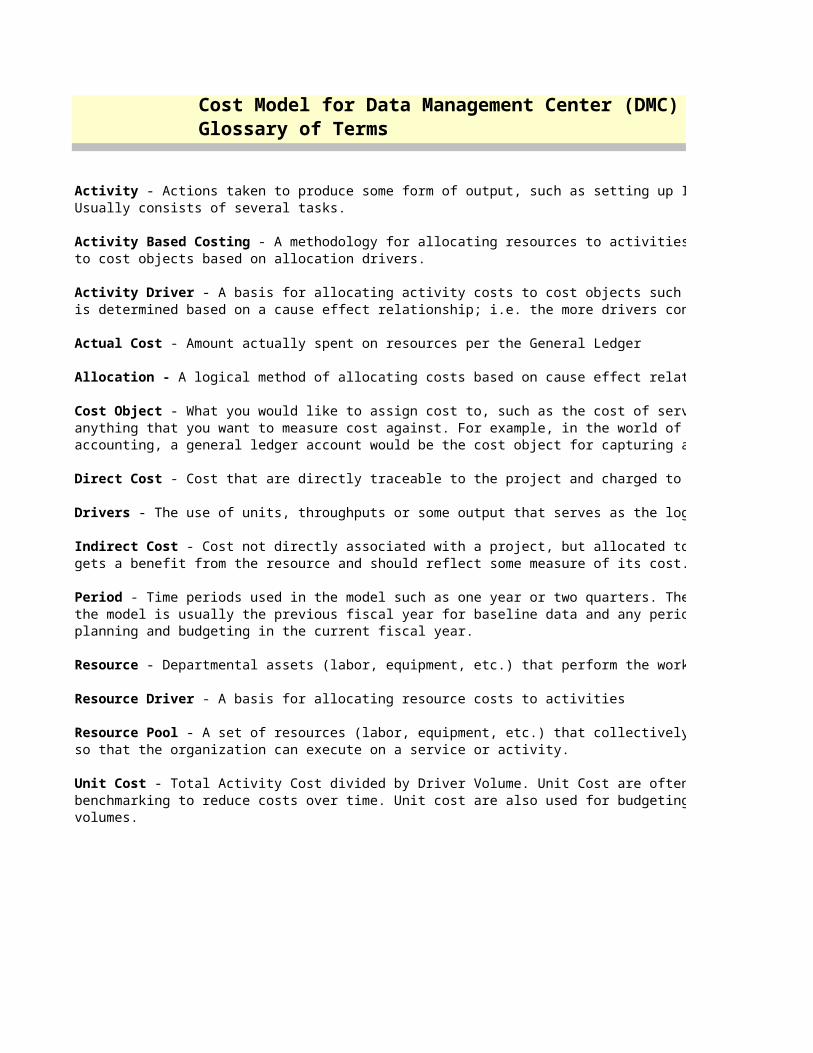
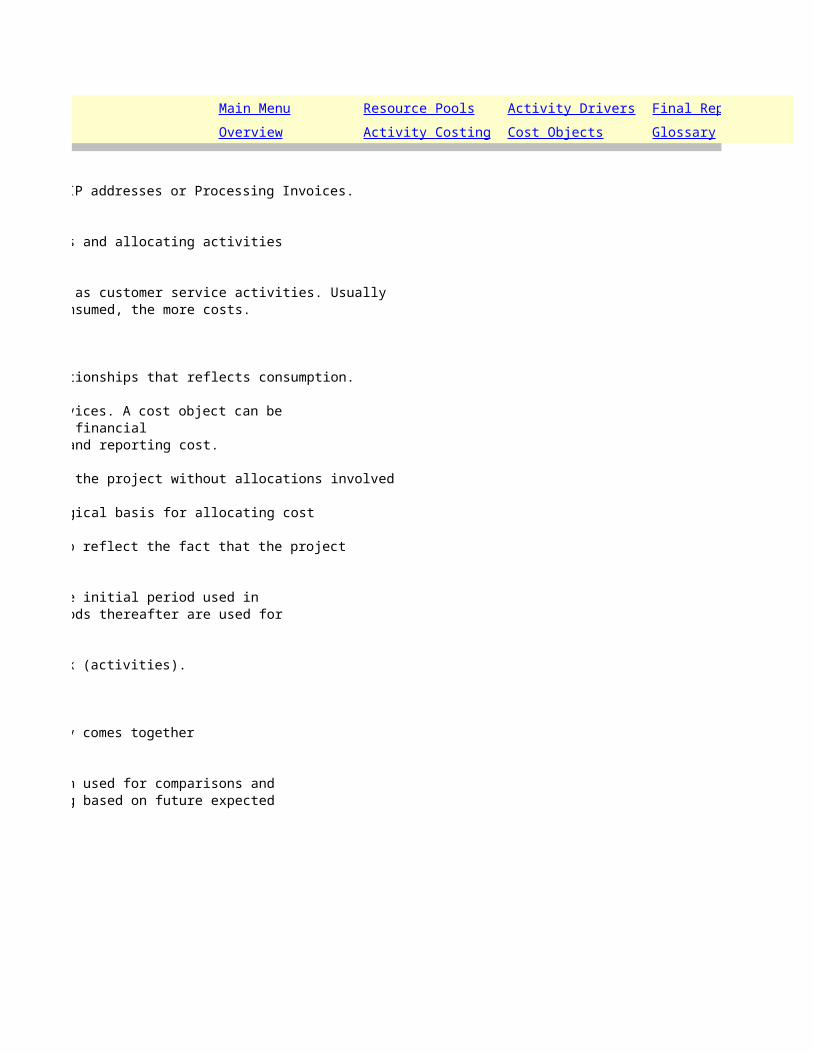
Cost Model for Data Management Center (DMC)Glossary of Terms
Usually consists of several tasks.
to cost objects based on allocation drivers.
is determined based on a cause effect relationship; i.e. the more drivers consumed, the more costs.
anything that you want to measure cost against. For example, in the world of financial accounting, a general ledger account would be the cost object for capturing and reporting cost.
gets a benefit from the resource and should reflect some measure of its cost.
the model is usually the previous fiscal year for baseline data and any periods thereafter are used forplanning and budgeting in the current fiscal year.
so that the organization can execute on a service or activity.
benchmarking to reduce costs over time. Unit cost are also used for budgeting based on future expectedvolumes.
Activity - Actions taken to produce some form of output, such as setting up IP addresses or Processing Invoices.
Activity Based Costing - A methodology for allocating resources to activities and allocating activities
Activity Driver - A basis for allocating activity costs to cost objects such as customer service activities. Usually
Actual Cost - Amount actually spent on resources per the General Ledger
Allocation - A logical method of allocating costs based on cause effect relationships that reflects consumption.
Cost Object - What you would like to assign cost to, such as the cost of services. A cost object can be
Direct Cost - Cost that are directly traceable to the project and charged to the project without allocations involved
Drivers - The use of units, throughputs or some output that serves as the logical basis for allocating cost
Indirect Cost - Cost not directly associated with a project, but allocated to reflect the fact that the project
Period - Time periods used in the model such as one year or two quarters. The initial period used in
Resource - Departmental assets (labor, equipment, etc.) that perform the work (activities).
Resource Driver - A basis for allocating resource costs to activities
Resource Pool - A set of resources (labor, equipment, etc.) that collectively comes together
Unit Cost - Total Activity Cost divided by Driver Volume. Unit Cost are often used for comparisons and
is determined based on a cause effect relationship; i.e. the more drivers consumed, the more costs.
anything that you want to measure cost against. For example, in the world of financial accounting, a general ledger account would be the cost object for capturing and reporting cost.
gets a benefit from the resource and should reflect some measure of its cost.
the model is usually the previous fiscal year for baseline data and any periods thereafter are used for
benchmarking to reduce costs over time. Unit cost are also used for budgeting based on future expected
Main Menu Resource Pools Activity Drivers Final ReportOverview Activity Costing Cost Objects Glossary
- Actions taken to produce some form of output, such as setting up IP addresses or Processing Invoices.
- A methodology for allocating resources to activities and allocating activities
- A basis for allocating activity costs to cost objects such as customer service activities. Usually
A logical method of allocating costs based on cause effect relationships that reflects consumption.
- What you would like to assign cost to, such as the cost of services. A cost object can be
- Cost that are directly traceable to the project and charged to the project without allocations involved
- The use of units, throughputs or some output that serves as the logical basis for allocating cost
- Cost not directly associated with a project, but allocated to reflect the fact that the project
- Time periods used in the model such as one year or two quarters. The initial period used in
- Departmental assets (labor, equipment, etc.) that perform the work (activities).
- A set of resources (labor, equipment, etc.) that collectively comes together
- Total Activity Cost divided by Driver Volume. Unit Cost are often used for comparisons and

Final ReportGlossary