Characterising Effective Teaching† | Nuffield Foundation
92
-
Upload
khangminh22 -
Category
Documents
-
view
0 -
download
0
Transcript of Characterising Effective Teaching† | Nuffield Foundation


Characterising Effective Teaching†
Simon Burgess, University of Bristol Shenila Rawal, Oxford Partnership for Education Research and Analysis
Eric S. Taylor, Harvard University _______________________________________________________________
_________________________
May 2022
† Burgess: [email protected]. Rawal: [email protected]. Taylor: [email protected]. We first thank the Nuffield Foundation for generous financial support of this analysis, and the Education Endowment Foundation for support of the original experiment which collected the data. Thanks for comments and advice to Anna Vignoles, Ellen Greaves, Hans Sievertsen, Julie Cohen, and Matthew Burgess, and to the Department for Education for access to the National Pupil Database.

1
Contents Executive Summary ........................................................................................... 2
Context ........................................................................................................... 2 Approach ........................................................................................................ 3 Results ............................................................................................................ 4 Implications .................................................................................................... 6
1. Introduction .................................................................................................... 9 2. Setting and data ............................................................................................ 13
2.1 Setting and sample ................................................................................. 13 3. Observed teaching practices ........................................................................ 16
3.1 Teachers’ use of different instructional activities .................................. 17 3.2 Observer ratings of teaching effectiveness ............................................ 19 3.3 Observed teaching practices and students in the class ........................... 22
4. Observed teaching practices and student achievement ................................ 23 4.1 Estimation .............................................................................................. 23 4.2 Teaching effectiveness ratings and student test scores .......................... 24 4.3 Different teaching practices and different subject areas ........................ 26 4.4 Instructional activities in class and student test scores .......................... 27 4.5 Combining effectiveness ratings and activities data .............................. 30 4.6 Different predictions for students with different prior achievement ..... 31
5. Sector views on effective teaching practices ............................................... 32 5.1 Teacher peer observation project rubric and the UK QTS teachers’ standards……………………………………………….32 5.2 Teacher educator survey ........................................................................ 34
6. Discussion and conclusion ........................................................................... 38 References ........................................................................................................ 44

2
Executive Summary
Context
Teachers are really important for learning, probably the most important input into educational
achievement outside the family. The metric that economists often use to measure this is teacher
effectiveness, and it is defined precisely but narrowly: the contribution a teacher makes to a student’s
gain in ability and knowledge, as measured by standard tests. This is certainly not all of what teachers
do, but it is surely an important part, arguably the central part.
Unsurprisingly, researchers have analysed many factors that affect an individual’s skills,
including individual, family and school factors. Over recent years a strong consensus has developed
that teacher effectiveness is extremely important in raising pupil attainment; in fact no other school
factor is close to being as important. The quantitative importance of teacher effectiveness has been
vividly illustrated by Hanushek (2011), who argues that using consensus parameters: “replacing the
bottom 5–8 percent of teachers with average teachers [would have] … a present value of $100 trillion”.
Others have found similarly dramatic effects. While such numbers naturally come with a wide
confidence interval and several caveats, nevertheless, it illustrates the very substantial value of
improving average teacher effectiveness. This return to a better understanding of teachers and teaching
is what gives our research particular value.
The research evidence in this field is hindered by the problem that this key concept – teacher
effectiveness – is a black box. It describes the outcome of the phenomenon, without giving researchers
much of a clue as to how to work towards improving it. While evidence continually shows differences
in teachers’ contributions to their students’ outcomes, evidence about why those contributions differ
remains quite scarce.
Our project contributes to un-locking the black box; in the words of our project title, to
characterising effective teaching. The big question which motivates our work is: What teaching
practices matter for student achievement?
The practical aims of our project are, first, to provide teachers and schools with the tools to
improve their teacher effectiveness. Second, our results on which teaching practices raise student

3
achievement should be of use to teacher educators, and to the institutions and governments that manage
them.
Approach
The core of our contribution is based on combining two types of data – detailed classroom
observation of teachers, and the test scores of the students they teach. This has been done before in the
US, but this is unique data for England, involving class observations over a prolonged period, at
significant scale and including a rich set of controls.
We study teachers and students in state secondary schools in England. Our primary data
describe teachers’ classroom practices over a two-year period in 32 schools, collected during
classroom observations conducted by other teachers working in the same school. The sample includes
251 teachers who were observed multiple times and rated, and just over 7,000 year 11 students who
were taught by those teachers. We link 5,211 students to 136 teachers for maths and 4,301 to 120 for
English. The classroom observation data were collected by 231 different peer teachers. The data derive
from an earlier randomised controlled trial we ran; the results of that trial are published (Burgess,
Rawal and Taylor, in-press).
The observation data are of two types. First, peer observers recorded which instructional
activities the teacher used during class and for what amount of time. The list of activities included, for
example, “lecturing or dictation” and “children doing written work alone.” Second, peer observers
rated the teacher’s effectiveness using a detailed rubric (Danielson’s Framework for Teaching, 2007
version). The ratings reflect a combination of a teacher’s skills and effort applied to specific teaching
tasks, judged against a normative standard defined by the rubric. Our outcome measure is pupils’
scores in the high-stakes GCSE exams in maths and English.
We first describe patterns of teaching practices, including how practices covary or cluster
together. We then study how those teaching practices predict student test scores. Last, we examine the
UK teaching standards and report on a survey of teacher trainers, which provide two alternative
perspectives on what teaching practices matter in comparison to our main results.

4
Results
Our work has yielded a number of new results. The relationships we show between teachers’
observed practices and student test scores are educationally and economically meaningful. The results
are presented as the GCSE gain (loss) predicted by a one-standard deviation increase in teacher
effectiveness rating or variation in class time use. While these coefficients are small as a share of the
total variation in test scores, they are large as a share of teachers’ contributions to test scores. For
example, the effect of a one-standard deviation higher teacher effectiveness rating is small as a share
of the total variation in student test scores—just 7-8 percent of the total; but the difference is large as
a share of a teacher’s contribution to student test scores, perhaps one-third of the teacher contribution.
This is what we think of as ‘characterising effective teaching’.
Turning to the specific results:
First, teachers make different choices about how to spend class time: there is considerable
variation in the activities that different teachers deploy. This variation remains even controlling for the
characteristics of their students and the subject (English or maths). For example, some teachers spend
much of class using traditional direct instruction, including lecturing and the use of textbooks, while
other teachers devote more class time to students working with their classmates or individual practice.
In fact, differences in these choices are largely unrelated to observers’ ratings of teacher effectiveness,
to the subject being taught, and to the characteristics of the students in the class.
Second, teachers’ choices on the use of class time matter for their students’ achievement. In
maths classes, for example, students score higher on the GCSE exams when assigned to teachers who
give more time for individual practice. For English exams, by contrast, more time working with
classmates predicts higher scores. This is not simply about the effectiveness of the teacher: class time
use predicts student test scores even after controlling for the quality of teaching, as measured by the
rubric-based ratings.
Third, we find important variation in peer-rated teacher effectiveness. Given the limited
training on teacher observation, and the fact that observers and observees were equal-status coworkers
in the same school, the peer observers might have been likely to simply rate everyone as “highly
effective.” In fact, ratings from peer observers do vary, and more than those from the external trained
observers in prior research. The standard deviation of ratings is 1.8 on the 12-point scale. If we only
compare ratings given by the same observer to different teachers, the standard deviation is 1.3.

5
However, ratings mostly do not reveal differences at the level of specific skills. Observers rated
teachers’ actions in ten different practices or skills, but the average correlation between any two skill
ratings is 0.70. In practice, then, the rubric ratings mostly measure one general dimension of teaching
effectiveness or quality. Peer observers with little training are a distinctive feature of our data. In
comparison to the typical raters and typical ratings, the peer observers in our study gave higher ratings
on average, but the peer ratings also differentiated between teachers more. These differences could
also be a consequence of the 12-point scale used in our data, compared to the typical 4-point scale. As
we show, the 12-point scale also likely reduces ceiling effects in ratings of individual skills.
Fourth, ratings of teaching effectiveness also predict student test score outcomes. A student
assigned a top-quartile teacher, as measured by effectiveness ratings, will score about 0.08 student
standard deviations (σ) higher than a similar student assigned to a bottom-quartile teacher. That
difference predicted by effectiveness ratings is roughly the same magnitude as the difference predicted
by teachers’ use of class time for practice in maths (or for peer interaction in English). The pattern is
largely the same for maths and English, though there is some evidence of potential differences.
Fifth, effective teaching, at least as measured by the rubric ratings, matters less for relatively
higher achieving students and classes. The average student will score 0.06σ higher, by our estimates,
when assigned to a teacher who is one standard deviation higher in the teaching effectiveness
distribution. But that 0.06σ gain shrinks by half to 0.03σ if the student is one standard deviation above
the student average, and similarly grows for students below the average. This difference exists even
between higher and lower achieving students who are in the same class with the same teacher.
Our results alone are not sufficient to make strong conclusions about cause and effect. Still,
our analysis is designed to address several alternative explanations for the correlation between teaching
practices and student test scores. To account for the sorting of students to teachers, we control for
students’ prior scores, exposure to poverty, the prior achievement of their classmates, and school
effects. To account for differences in observer behaviour, we use only within-observer between-
teacher comparisons (observer fixed effects). In looking at teaching practices, we control for rated
effectiveness, so the estimated effect takes account of the skill of the teacher. In looking at teacher
effectiveness, we control for teaching practices, so the estimated effect takes account of what the
teacher does. The main remaining alternative explanation is differences between teachers that are
unobserved, but only if those unobserved differences are correlated with our practices measures and
correlated with student test scores. For example, we cannot control for a teacher’s content knowledge,

6
and math teachers who devote more class time to direct instruction may have stronger math skills
themselves.
Implications These results are potentially valuable to teachers and schools, and so to students.
The process for a school (or an individual teacher) to generate the required data is simple,
cheap, administratively modest, and politically feasible. While classroom observations are not new to
schools, our data are novel in ways that are encouraging for practical application of our results. First,
our observation data were collected by peer teachers, and observers received little training—much
less training than is often described as necessary for “valid” or “reliable” observations. The peer
observers in our data did give higher effectiveness ratings on average, but the ratings were also more
variable, suggesting a willingness to acknowledge differences among their peers’ effectiveness. A
second novel feature of our observation data is the 12-point scale used for effectiveness ratings, as
compared to the more typical 4- or 5-point scale. The 12-point scale likely limited leniency bias and
may well have contributed to the greater variance in ratings. Practically, observers could break the
rating choice into two steps: (a) Choose one of the big categories: ineffective, basic, effective, or
highly effective. Then (b) choose a degree within that category. For example, an observer who felt
the teacher was “effective” could chose a score of 7, 8, or 9, with 7 suggesting “effective” but closer
to “basic” and 9 suggesting “effective” but closer to “highly effective.” Third, observers recorded
how much class time was spent on different instructional activities—for example, “open discussion
among children and teacher” and “use of white board by teacher.” These records of time use are
distinct from the more complex rubric-guided ratings of effectiveness. Observers simply recorded
what activities were happening without judging the appropriateness or quality of the activity.
How might teachers and schools make use of these results? Here we list three potential uses, although
all come with some caution because our data alone are insufficient to make strong conclusions about
cause and effect.
First, these results can help inform teachers’ own decisions and improvement efforts. Or inform
school or government investments in supporting those improvement efforts. For example, our results
emphasize individual student practice for maths, and peer group work for English. Students would
likely benefit from more practice and more peer interactions in both subjects, but time and energy are

7
scarce resources. Our results suggest the typical maths teacher should work on student practice,
perhaps increasing class time for practice or focusing on building related teaching skills. But the typical
English teacher should start with peer group work not individual practice. Another example: we show
that the average maths teacher’s “instruction” ratings are a stronger predictor of her students’ maths
scores than are her “classroom environment” ratings. For English teachers the reverse is true.
At least as important as our specific findings is the fact that teachers and schools need not rely on rules
for “typical” or “average” teachers. This project demonstrates the feasibility of measuring each
individual teacher’s practices and effectiveness, which can then inform individualized decisions about
where to devote scarce time and energy. Moreover, the rubric’s practical language provides implicit
advice on what to do differently. For example, a teacher might agree that group discussion in his class
is correctly rated as “basic” with the rubric’s description of “Some of the teacher’s questions elicit a
thoughtful response, but most are low-level, posed in rapid succession.” Then the rubric also provides
some advice on how to move to “effective” with the description “Most of the teacher’s questions elicit
a thoughtful response, and the teacher allows sufficient time for students to answer.”
A second potential use of these results is in assigning students to classes and teachers. Our
finding is that lower-achieving students’ GCSE scores appear to benefit more from highly-rated
teachers than do their higher-achieving peers’ scores. However, in our setting as elsewhere, lower-
achieving students are less likely to be assigned to teachers rated highly by peer observers. This pattern
emphasizes the importance of thoughtful decisions about assigning students to teachers. Still, our
results alone do not guarantee that matching more lower-achieving students and highly-rated teachers
will necessarily raise student scores; for example, teachers may change their practices in response to
their assigned students, individual students or the mix of students in a class.
Third, our results have implications for schools’ decisions about teacher hiring. One of the
widely recognised issues in the teacher labour market is the lack of reliable pre-hire signals of teacher
effectiveness for schools. This requires a prediction about that person’s often-unobserved job
performance, and our results suggest that feasible classroom observations can predict meaningful
variation in teachers’ contributions, and thus help inform personnel decisions. To be clear, our
suggestion here is not that observation scores should mechanically or solely determine such decisions;
rather the suggestion is that scored observations of teaching are a relatively low-cost way to gather
useful information. Moreover, because such decisions only require a reliable prediction, we can be
somewhat less concerned about the underlying cause and effect relationship. For example, the true
cause of higher student scores may be a teacher’s content knowledge, which is correlated with some
8
predictor measure of how the teacher uses class time. As long as that correlation remains unchanged,
the time use predictor will be useful, but the usefulness may well breakdown over time if teachers
dramatically change their behaviour during observations to game the metric. There is some
encouraging evidence from schools that have begun using this approach in the last decade.
The value of these potential uses of our work rests on the fact that our analysis shows that teachers’
classroom practices are predictive of student achievement. Predict how much? Imagine two students
who are similar except that the first student is assigned to an average maths teacher as measured by
rubric effectiveness rating (50th percentile), while the second student has a maths teacher who is one
standard deviation above average in effectiveness rating (or about the 84th percentile). The second
student will score 0.077 student standard deviations (σ) higher on maths GCSEs (or about 3
percentile points). This difference is small as a share of the total variation in student test scores—just
7-8 percent of the total. However, the difference is large as a share of a teacher’s contribution to
student test scores, perhaps one-third of the teacher contribution. The predictions we find are not all
as strong as 0.077, but they are generally in the range of 0.03-0.08σ.
A different way to think about magnitude is to ask what a 0.03-0.08σ improvement in GCSE scores
would mean for a student’s future. Indeed, GCSE scores are perhaps more relevant for students’
futures, compared to tests at younger ages, because GCSEs come at the end of compulsory schooling
and also inform college admissions. In a new analysis, Hodge, Little, and Weldon (2021) estimate that
a one standard deviation, 1σ, increase in average GCSE scores predicts about a 20 percent increase in
lifetime earnings (discounted to Net Present Value at age 16). Thus from 0.03-0.08σ we would predict
a 0.6-1.6 percent increase in lifetime earnings. Converting that to a rough absolute impact on lifetime
earnings, a teacher increasing scores by 0.06σ for her class of 30 generates an additional £150k of
lifetime income for her students, every year. The predicted earnings gains are perhaps twice that for
maths scores (Hodge, Little, and Weldon 2021). As the impact of teacher effectiveness is greater for
lower ability students, the subsequent earnings gain will also be greater for them.

9
1. Introduction
Teachers’ choices and skills affect their students’ lives. Students assigned to more-effective
teachers learn faster and, as a result, go on to greater success into adulthood. Yet, while evidence
continually shows differences in teachers’ contributions to their students’ outcomes, evidence about
why those contributions differ remains quite scarce.1 In particular, we still know little about the role of
instructional practices. Where “practices” is shorthand for the choices teachers make about how to
teach, and the extent to which they successfully carry out those choices. Practices are constrained by
teaching skills but not synonymous with skills.
In this report we examine new data on teachers’ practices observed in the classroom, combined
with the test scores of their students. The big question which motivates our work is: What teaching
practices matter for student achievement? Our specific contribution is more circumscribed. We first
describe patterns of teaching practices, including how practices covary or cluster together. We then
study how those teaching practices predict student test scores. Our data alone are insufficient to justify
strong claims about which practices cause higher or lower test scores. Still, we can rule out some
important alternative explanations for the correlations between practices and test scores. Last, we
examine the UK teaching standards and report on a survey of teacher trainers, which provide two
alternative perspectives on what teaching practices matter in comparison to our main results.
We study teachers and students in public (state) secondary schools in England. Specifically,
maths and English classes leading up to the General Certificate of Secondary Education (GCSE) exams
typically taken at age 16. Students’ GCSE scores are the main outcome in our analysis. Our data on
teachers’ practices were collected during classroom observations conducted by other teachers working
in the same school. The observation data are of two types. First, peer observers recorded which
instructional activities the teacher used during class and for what amount of time. The list of activities
included, for example, “lecturing or dictation” and “children doing written work alone.” Second, peer
observers rated the teacher’s effectiveness using a detailed rubric. While we mainly use the word
“effectiveness” to match the rubric’s language, these ratings could also be described as measuring “job
1 Jackson, Rockoff, and Staiger (2014) review the literature on teachers. Teachers and schools are not unique in this respect. As Syverson (2011) reviews, evidence from many sectors and industries shows large differences in productivity between firms, plants, etc., but the causes of those differences are only partially understood. Some intuitive potential causes—like “management practices”—get less attention in the literature because they are difficult to measure and difficult to test (quasi-)experimentally (on management see Bloom and van Reenen 2007, Bloom et al. 2013, and Bloom et al. 2015 for schools). Teaching practices are similarly difficult to measure, and difficult to manipulate (quasi-)experimentally.

10
performance.” The ratings reflect a combination of a teacher’s skills and effort applied to specific
teaching tasks, judged against a normative standard defined by the rubric.
The report describes several key patterns. First, teachers make different choices about how to
spend class time. For example, some teachers spend much of class using traditional direct instruction,
including lecturing and the use of textbooks, while other teachers devote more class time to students
working with their classmates or individual practice. However, differences in these choices are largely
unrelated to observers’ ratings of how effectively teachers carry out these activities. Teachers’ choices
are also largely unrelated to the subject being taught, maths or English, or to the characteristics of the
students in the class.
Nevertheless, second, teachers’ choices appear consequential for their students’ achievement.
In maths classes, for example, students score higher on the GCSE exams when assigned to teachers
who give more time for individual practice. For English exams, by contrast, more time working with
classmates predicts higher scores. Moreover, how teachers use class time predicts student test scores
even after controlling for the quality of teaching, as measured by the rubric-based ratings. These
differences in practices by subject stand out among similar research; typically results are limited to
broad relationships (see Pouezevara et al. 2016 for a review).
Our analysis is designed to address other alternative explanations for the correlation between
teaching practices and student test scores. To account for the sorting of students to teachers, we control
for students’ prior scores, exposure to poverty, the prior achievement of their classmates, and school
effects. To account for differences in observer behavior, we use only within-observer between-teacher
comparisons (observer fixed effects). The main remaining alternative explanation is differences
between teachers that are unobserved, but only if those unobserved differences are correlated with our
practices measures and correlated with student test scores. For example, we cannot control for a
teacher’s content knowledge, and math teachers who devote more class time to direct instruction may
have stronger math skills themselves.
Our third result turns to the rubric-based ratings of a teacher’s effectiveness. Given the social
dynamics—observers and observees were equal-status coworkers—and the limited training, the peer
observers may be more prone to simply rate everyone as “highly effective.” In fact, ratings from peer
observers do vary, and more than those from external trained observers. The standard deviation of
ratings is 1.8 on the 12-point scale. If we only compare ratings given by the same observer to different
teachers, the standard deviation is 1.3. However, ratings mostly do not reveal differences at the level

11
of specific skills. Observers rated teachers’ actions in ten different practices or skills, but the average
correlation between any two skill ratings is 0.70. In practice, then, the rubric ratings mostly measure
one general dimension of teaching effectiveness or quality.
Peer observers with little training are a distinctive feature of our data. In related research papers,
the rubric rating is done by researchers or school administrators who receive substantial training and
are often tested for reliability2. In comparison to the typical raters and typical ratings, the peer observers
in our study gave higher ratings on average, but the peer ratings also differentiated between teachers
more. These differences could also be a consequence of the 12-point scale used in our data, compared
to the typical 4-point scale. As we show, the 12-point scale also likely reduces ceiling effects in ratings
of individual skills. However, the high correlation between individual skill ratings is not unique to our
data. Even in data from highly-trained raters, the rubric scores often only measure one general skill
dimension.
Fourth, ratings of teaching effectiveness also predict student test score outcomes. A student
assigned a top-quartile teacher, as measured by effectiveness ratings, will score about 0.08 student
standard deviations (σ) higher than a similar student assigned to a bottom-quartile teacher. That
difference predicted by effectiveness ratings is roughly the same magnitude as the difference predicted
by teachers’ use of class time for practice in maths (or for peer interaction in English). The pattern is
largely the same for maths and English, though there is some evidence of potential differences.
Fifth, effective teaching, at least as measured by the rubric ratings, matters less for relatively
higher achieving students and classes. The average student will score 0.06σ higher, by our estimates,
when assigned to a teacher who is one standard deviation higher in the teaching effectiveness
distribution. But that 0.06σ gain shrinks by half to 0.03σ if the student is one standard deviation above
the student average, and similarly grows for students below the average. This difference exists even
between higher and lower achieving students who are in the same class with the same teacher.
However, in contrast, we do not find differences when the predictor is how teachers use class time.
These relationships—between teachers’ observed practices and student test scores—are
educationally and economically meaningful. The results are presented as the GCSE gain (loss)
2 Sometimes the raters are known as “peer evaluators” but “peer” refers to the fact that the rater had (recently) been a classroom teacher. The evaluator role is a distinct specialized job with substantial training.

12
predicted by a one-standard deviation increase in teacher effectiveness rating or class time use; the
coefficients are all on the order of 0.01 to 0.10 standard deviations of GCSE scores (σ). While these
coefficients are small as a share of total variation in test scores, they are large as a share of teachers’
contributions to test scores. An improvement of 0.05σ, for example, would be about 20 percent of the
standard deviation in teacher contributions to GCSE scores (Slater, Davies and Burgess 2011).
Improvements in GCSE scores also predict future earnings and college going (Mcintosh 2006,
Hayward, Hunt, and Lord 2014, Hodge, Little, and Weldon 2021).
How might teachers and schools make use of these results? In the report we discuss three uses,
although all three come with some caution because our data alone are insufficient to make strong
conclusions about cause and effect. First, these results can help inform teachers’ own decisions and
improvement efforts. For example, our results emphasize individual student practice for maths, and
peer group work for English. Students would likely benefit from more practice and more peer
interactions in both subjects, but time and energy are scarce resources. Our results suggest the typical
maths teacher should work on student practice, perhaps increasing class time for practice or focusing
on building related teaching skills. But the typical English teacher should start with peer group work
not individual practice.
However, teachers and schools need not rely on rules for “typical” teachers. This project
demonstrates the feasibility of measuring individual teachers’ practices and effectiveness, which can
then inform individualized decisions about where to devote scarce time and effort for improvement.
Moreover, the rubric’s practical language provides implicit advice on what to do differently.
A second potential use of these results is in assigning students to classes and teachers. As
mentioned already, lower-achieving students’ GCSE scores appear to benefit more from skilled
teachers than do their higher-achieving peers’ scores. However, in our setting as elsewhere, lower-
achieving students are less likely to be assigned to teachers rated highly by peer observers. This pattern
emphasizes the importance of thoughtful decisions about assigning students to teachers. Still, our
results alone do not guarantee that matching more lower-achieving students and highly-rated teachers
will necessarily raise student scores. For example, teachers may change their practices in response to
their assigned students, individual students or the mix of students in a class.
Third, our results have implications for schools’ decisions about teacher hiring and retention.
Whether to hire someone, or retain an employee, requires a prediction about that person’s often-

13
unobserved job performance. Schools often do not have measures of a teacher’s contributions to
student achievement. Our results suggest feasible classroom observations can predict meaningful
variation in teachers’ contributions, and thus help inform personnel decisions. Moreover, because such
hiring and retention decisions only require a reliable prediction, we can be somewhat less concerned
about the underlying cause and effect relationship. For example, the true cause of higher student scores
may be a teacher’s content knowledge, which is correlated with some predictor measure of how the
teacher uses class time. As long as that correlation remains unchanged, the time use predictor will be
useful. However, the usefulness may well breakdown over time if teachers change their behavior
during observations knowing those observations will inform their employment.
We begin by describing the teachers, students, and schools in our study, along with the
classroom observation data collection and other data. Section 3 describes the differences in teachers’
choices, practices, and skills that were revealed by the observations. Then in Section 4 we examine the
relationship between teachers’ practices and their students’ achievement test scores. In Section 5 we
describe how the practices measured in our observations related to stated expectations of the teachers,
and the opinions of teacher trainers. We conclude with some further discussion of the implications for
schools and teachers.
2. Setting and data 2.1 Setting and sample
We study maths and English teachers working in public (state) secondary schools in England.
The teachers—for whom we have new and detailed classroom observation data—are teaching year 10
and 11 students (roughly ages 14-16). At the end of year 11 students take the GCSE exams, and we
link students’ test scores to their teacher’s observation data.
The classroom observation data used in this report were gathered as part of a prior field
experiment in the 2014-15 and 2015-16 school years. In that experiment the treatment schools began
a new program of teacher peer observation, while control schools continued business as usual. At each
of the treatment schools, some teachers were always the observers, some always the observees, and
some participated in both ways. Schools were randomly assigned to treatment or control, and teachers
were randomly assigned to observer and observee roles. Observers recorded information about the

14
instructional activities used in the class and also rated the teacher’s effectiveness using a structured
rubric. We describe the rubric and other tools in more detail below. While teachers scored each other,
the program did not involve any (formal) incentives or consequences linked to those scores. Further
details and results of the experiment are described in Burgess, Rawal, and Taylor (in-press).
To measure student achievement we use the General Certificate of Secondary Education
(GCSE) exam scores. The GCSE scores data, and all other student data we use, come from the UK
government’s National Pupil Database (NPD). At the end of year 11, students take GCSE exams in
several subjects, but we use only maths and English scores in this analysis. The GCSE exams are high
stakes for students, for example, scores influencing college admissions; and GCSEs predict future
earnings (Mcintosh 2006, Hayward, Hunt, and Lord 2014, Hodge, Little, and Weldon 2021). Besides
GCSE scores, the NPD data provide students’ prior exam scores, demographics, and measures of
exposure to poverty in their families and neighborhoods.
The NPD does not collect data linking students to their specific teachers. During the peer-
observation experiment, schools provided class rosters which we use to link students and teachers. The
rosters use masked teacher ID codes which, unfortunately, we cannot link to any other data on
individual teachers.
Our study sample includes 251 teachers in 32 schools who were observed and rated, and just
over 7,000 year 11 students who were taught by those teachers. We link 5,211 students to 136 teachers
for maths and 4,301 to 120 for English. The classroom observation data were collected by 231 different
peer teachers.
Selection into this sample involved three steps. First, schools volunteered to participate in the
new peer observation program experiment. The research team contacted nearly all high-poverty public
(state) secondary schools and invited them to participate in the experiment.3 Schools were not selected
based on student test scores. In the end, 82 schools participated in the experiment, and 41 were
randomly assigned to the peer observation program treatment.4 Second, within each of the 41 treatment
3 For this purpose “high-poverty schools” were those schools where the percent of students eligible for free school meals was above the median for England. 4 We invited 1,097 schools, and 93 (8.5 percent) initially volunteered. Ten schools subsequently dropped out before randomization, and one additional school in Wales was excluded because the NPD only covers England. School performance levels (test scores) were not used as a criterion for inviting schools. We did exclude, ex-ante, boarding schools, single-gender schools, as well as schools in select geographic areas where the funder was conducting different interventions.

15
schools, a random sample of teachers were selected to be observed and scored. One-third of teachers
in each department, maths or English, were randomly assigned to either the observee role, observer
role, or both roles. Third, teachers chose how much to participate. Thus, our sample of 32 schools and
251 teachers is partly self-selected by the teachers own participation decisions.
Table 1 provides some description of our sample. The schools invited to participate were
intentionally selected to have high poverty rates, and that initial selection is reflected in the IDACI and
free school meals rows of Table 1. Just over 40 percent of students are, or ever have been, eligible for
free school meals, substantially higher than the national average. Comparing across the columns of
Table 1 provides some information on teacher self-selection into our sample. Recall that observee
teachers were selected at random from among the full experiment sample, and that some selected
teachers did not participate in observations. Comparing column 3 to column 1 suggests participating
teachers were teaching higher achieving students, who were more exposed to poverty.
2.2 Classroom observations
The observation data were collected during nearly 2,700 classroom visits, where one observer
scored one of her peer teachers. Visits typically lasted 15-20 minutes, and observers recorded data on
a tablet computer provided by the researchers. Observers rated the teacher’s effectiveness using a
detailed rubric, and also recorded how frequently the teacher used several different instructional
activities.
The typical (median) teacher in our data was observed eight times over the two years, with an
interquartile range of 4-15 observations. The typical teacher was scored by three different peer
observers, and an interquartile range of 2-5.
Teachers received training on the rubric and other aspects of the program. However, the
training was brief in comparison to the training observers have received in other studies and settings
(e.g., Kane et al. 2011, Kane et al. 2013). The typical training process typically involves some formal
test of the trainee’s reliability in scoring; for example, each trainee watches and scores a series of video
tapes until the trainee’s scores are sufficiently consistent with the norm. No such test of reliability was
used in this project.

16
To rate teaching effectiveness, observers used a rubric lightly-adapted from Charlotte
Danielson’s Framework for Teaching (2007, “FFT”). The rubric is widely used by schools and in
research (for example, Kane et al. 2011, Taylor and Tyler 2012, Kane et al. 2013, Bacher-Hicks et al.
2017). The rubric is divided into four groups of tasks and skills, known as “domains.” The “instruction”
and “classroom environment” domains are measured during classroom observations, and for this study
peer observers scored only these two domains.5 Each domain itself is divided into a number of
“standards” corresponding to specific tasks and skills. In Figure 1 the left-hand column lists the ten
standards on which teachers were rated. For each standard, the rubric includes descriptions of what
observed behaviors should be scored as “highly effective” teaching, “effective,” “basic,” and
“ineffective.” In Figure 1 we reproduce the descriptions for “Effective” as an example. The full rubric
is provided in the appendix.
Peer observers assigned a score from 1-12 to each of the ten rubric items. In most settings the
FFT rubric is scored 1-4 corresponding to the four descriptions. In this study observers were trained to
use 1-3 for “ineffective,” 4-6 for “basic,” 7-9 for “effective,” and 10-12 for “highly effective.” Thus,
for example, an observer who felt the teacher was “effective” could chose a score of 7, 8, or 9, with 7
suggesting “effective” but closer to “basic” and 9 suggesting “effective” but closer to “highly
effective.” This adaptation was motivated in part by the tendency for leniency bias in classroom
observation scores like these.
In addition to the rubric ratings, observers also recorded the frequency of several instructional
activities, for example, “open discussion among children and teacher” and “use of white board by
teacher.” The complete list of twelve activities is shown in Figure 2. Peer observers recorded only the
frequency of the activity during the visit; observers were not asked to assess the quality or
appropriateness of the activity. For each of the twelve activities, observers could choose from five
options: none, very little, some of the time, most of the time, full time. We code these as 0-4 with 0
being “none.” The activities list and instrument were adapted from the SchoolTELLS project
(Kingdon, Banerji, and Chaudhary 2008).
3. Observed teaching practices
5 The other two domains are “planning” and “assessment.” When used, these are both are scored based on conversations with the teacher and a review of materials.

17
Classroom observations revealed meaningful differences between teachers in both the
instructional activities teachers chose, and in ratings of teachers’ effectiveness. In this section we
describe what observers recorded. In the next section we relate the observations to student test scores.
3.1 Teachers’ use of different instructional activities
Different teachers spend class time in different ways. Figure 3 shows twelve different
instructional activities and the frequency of their use. For example, in more than one-third of classes
observers recorded “open discussion among children and teacher” during most or all of the class time.
Yet, in one-quarter of classes “open discussion…” was absent or very rare. Teachers were similarly
split on “children doing written work alone.” A contrasting example is use of a textbook, which was
recorded as absent or rare in nearly nine out of ten classes.
The patterns of instructional activities recorded are quite similar in maths and English classes.
The correlation between subjects in the average frequency of activities is 0.96. Appendix Figure A1
shows Figure 3 separately by subject. However, this similarity of time use does not mean the activities
predict students’ maths and English test scores in the same way, as we show later.
These instructional activities can occur simultaneously, of course, and may well be
complementary inputs to student learning. In a simple example, while the teacher is engaged in “one
to one teaching” with specific students, other students are likely to be “doing written work alone.”
Table 2 shows the correlation matrix for the twelve activities. In the lower panel, the correlations use
only within observer variation. Examining the correlations, together with the substance of the
measures, suggests ways to group activities together. Our motivation for grouping activities is partly
to describe patterns of teaching. Dimension reduction will also benefit our later analysis of student test
scores.
Most broadly, the activities fall into two groups: First, activities 8-11 which includes lecturing
or dictation, and use of whiteboards and textbooks. We might think of this first group as “direct
instruction.” Second, activities 1-7 which includes individual and group work, individualized attention
from the teacher, and practice or assessment. We might think of this second group as “student-centered
instruction.” We leave “engaged in non-teaching work” separate.

18
The seven “student-centered” activities can be further divided into three sub-groups: First,
activities 1-2 which involve students interacting with each other (and the teacher). Second, activities
3-4 which involve personalized instruction for students. Third, activities 5-7 which involve student
assessment and practice. Later we show that these three groups predict student scores quite differently
in maths compared to how they predict in English.
Table 3 describes teaching in these groups of activities. The different activity groups are fairly
evenly distributed on average. The most common activity group is student-peer interaction with a mean
of 1.7, where a 2 is “Some of the time” on the scale of 0 “Not at all” to 4 “Full time.” Still, the means
for personalized instruction and practice and assessment are not all that different. In general, observers
of maths classes report more of these activities compared to English.
Simplification involves tradeoffs. This grouping divides the twelve activities into mutually
exclusive and exhaustive categories which are relatively straightforward to label. The tradeoff is that
the simple groups ignore the variation in how activities are correlated within and between the simple
groups. Therefore, to complement the simple grouping, we also do a principal components analysis.
Again, our goal is both dimension reduction and describing patterns of teaching. The tradeoff is that
the principal components are more difficult to label.
Each principal component score is a weighted average of the twelve activities. The weights are
shown in Table 4. The first five principal components together explain just over half of the variation
in the activities observation data; each of the five individually explain 9-13 percent. By construction,
the principal component scores are uncorrelated with each other.6
We use the following labels for the principal component scores, though others may choose
alternative labels. (1) “Student-teacher interaction.” This component score is increasing in the amount
of class time where teacher and students are interacting.7 (2) “Smaller groups vs. whole class.” This
score is increasing in individual and small group activities, and decreasing in whole class activities.
(3) “Practice vs. instruction.” This score is increasing in student assessment and practice, and
decreasing in instruction, especially individualized instruction. (4) “Group vs. individual work.” This
6 Before estimating the principal components we first rescale the activities item data. Observers record the frequency of an activity on a 0-4 scale with 0 “none” of the time to 4 “full time” during the observation. To rescale we divide each of the twelve items by the sum of the items. Thus, the rescaled items measure the proportion of all activity recorded by the observer. In Appendix Table A1 we show principal components results using the un-rescaled data. 7 For expositional purposes we reverse the sign of components (1), (2), and (3).

19
score is increasing in time where students are interacting with classmates, and decreasing in time where
students are working alone or one-on-one with teacher. (5) “Teacher guided learning.” This score is
increasing in gauging understanding and assisting weak students, and use of the white-board, and
decreasing in open discussion, children working alone and one-way lecturing.
Before continuing, we emphasize a feature of these data which is relatively unique and relevant
to interpreting our results; this feature affects both the activities data and the rubric-based ratings we
discuss next. The observation data were collected by other teachers with only minimal training in
conducting observations. Recall that each observer-observee pair were two teachers working in the
same school. In measurement terms, the inter-rater reliability of these observations is likely lower than
it would be when observers are research staff or specialized evaluators. For example, observers may
have differed in their sense of what constitutes “gauging student understanding” or “non-teaching
work,” or the thresholds between “some of the time” and “most of the time.” In response, we focus
mainly on within observer variation, especially in our analysis of how observations predict student test
scores.
3.2 Observer ratings of teaching effectiveness
Teachers differ in the effectiveness of their teaching. To be clear, in this context “teaching
effectiveness” is a measure of a teacher’s observable actions in the classroom. As described in detail
in Section 2, ratings are based on a rubric which provides detailed descriptions of what actions
constitute “highly effective” teaching (a score between 10-12), “effective” (7-9), “basic” (4-6), and
“ineffective” (1-3). While we use the word “effectiveness,” these ratings could also be described as
measuring “job performance.” The ratings reflect a combination of a teacher’s skills and effort applied
to specific teaching tasks, judged against a normative standard defined by the rubric.
Table 5 reports means and standard deviations for the FFT rubric scores. Observers rated
teachers highest, on average, for “managing student behaviour” and lowest for “use of assessment.” In
general, teachers were rated more effective in classroom environment tasks than instruction tasks. “Use
of assessment” also showed the largest differences in effectiveness between-teachers.8 Teachers were
most similar in “communicating with students.”
8 Speckesser et al. (2018) reports experimental evidence on the value of formative assessment in improving student achievement.

20
The potential for leniency bias is an important consideration when interpreting ratings like
these, as it is in job performance ratings across sectors and occupations. Leniency bias may be more
likely in our setting where observers and observees worked together in the same school as peers.
Alternatively, the low-stakes nature of the peer observations may have made the resulting ratings more
accurate. In the end, while ratings are certainly bunched at the top of the scale in our data, there is more
variation than is typical of classroom observations. The top left panel of Figure 4 is a histogram of
item-level ratings with all ten items stacked together. Ratings of 7-12, the “effective” or “highly
effective” range, dominate, but there is much less of a ceiling effect than is often the case in classroom
observations. Moreover, when we take the average across the ten items there is even more variation in
effectiveness scores. The bottom panel of Figure 4 shows the histogram of average scores.
The variation in Figure 4 exists partly because we gave observers a 12-point scale rather than
the conventional 4-point scale. The rubric’s levels did not change, rather the observer could
differentiate scores within levels. For example, the “effective” level could be scored 7, 8, or 9 with 7
roughly “effective but closer to basic” and 9 “effective but closer to highly effective.” The benefit of
the 12-point scale is clear when comparing the top two histograms in Figure 4. Both use the same data,
but in the right panel the 12-point scale is collapsed back to 4 points, e.g., 7-9 become 3, 10-12 become
4, etc.
A teacher’s effectiveness ratings across tasks are strongly correlated, as shown in Table 6.
Teachers who are rated good at one teaching task are likely to be rated good at the other nine. The
average correlation in effectiveness between any two tasks is 0.70, with a range of 0.55 to 0.86. This
correlation in measures partly reflects the fact that the true underlying skills and efforts are correlated.
Indeed, Table 6 may understate the correlation in skills or effort since teachers are observed briefly
and infrequently introducing classical measurement error. However, the correlation is also partly
because all ratings are given by one observer. If we use only within observer variation the average
pairwise correlation falls to 0.60, with a range of 0.44 to 0.79.
In practice, then, the rubric ratings mostly measure one general dimension of teaching
effectiveness. To summarize the correlations in Table 6, Appendix Table A2 shows a principal
components analysis of the item-level ratings.9 The first principal component is effectively just the
9 Appendix Table A2 also shows results using within-observer correlations, but the first two principal components are nearly identical. Using within-observer correlations the first component explains two-thirds of variation.

21
simple average of the ten items. That simple average explains three-quarters of the variation in the
item-level ratings. For comparison, the first principal component of time use activities explains only
13 percent of the activity data.
There are differences between teachers, according to the ratings, in whether a teacher is
relatively more effective in “instruction” tasks or “classroom environment” tasks. The second principal
component is roughly the average of instruction items minus the average of environment. A teacher in
the top quartile of the “instruction – environment” dimension scores two-thirds of a standard deviation
higher in the distribution of instruction scores than she does for environment scores. A teacher in the
bottom quartile scores three-quarters of a standard deviation higher in environment compared to
instruction. The “instruction – environment” dimension only explains about 7 percent of the variation
in item-level ratings. However, as we show later this dimension is useful in explaining student test
scores, even conditional on overall average ratings. Instruction and environment will predict scores in
maths differently from English, but we note here that means and standard deviations are quite similar
across the two subjects.
These patterns of ratings are broadly similar to prior studies using the Framework for Teaching.
The mean ratings for the ten FFT items are correlated 0.72-0.88 with same mean ratings in three prior
studies in U.S. schools (Kane and Staiger 2011, Ho and Kane 2013, Gitomer et al. 2014, ICPSR n.d.).10
Kane et al. (2011) reports similar principal components results. However, in our data rating levels are
consistently higher across items, about 0.9 points on the 4-point scale, and our ratings have higher
variance, about 30 percent larger. Besides the substantive differences in the settings, these higher
means and variances could be partly explained by the 12-point scale.
One final note about the relationship between the effectiveness ratings and the class activities
data. A reasonable concern about such effectiveness ratings is that different classes provide more or
less opportunity to observe and assess a given teaching practice. For example, rating a teacher’s
“questioning and discussion techniques” (FFT 2b) may be easier or more precise if the class spends
more time in “discussion among children and teacher” (activity 1). We can partially test for this
concern in our data; we find that the frequency of activities explains at most 17 percent of the variation
10 Kane and Staiger (2011) describes the Methods of Effective Teaching (MET) project, and both Gitomer et al. (2014) and ICPSR (n.d.) provide item means for MET. Gitomer et al. (2014) also reports on a separate study. In Ho and Kane (2013) the item distributions are shown in Figure 1; Andrew Ho provided the means and standard deviations in a personal communication (May 3, 2019).

22
in average effectiveness ratings, less if we use only within-observer variation. Appendix Table A3
provides correlations among the various aggregate scores based on activities data or effectiveness
ratings; the correlations between activities scores and effectiveness scores range between -0.09 and
0.14.
3.3 Observed teaching practices and students in the class
Differences in observed teaching practices may partly reflect differences in students. First, the
same teacher may choose different skills or strategies for students with different academic needs. Or
students with different needs may be assigned to teachers based on the teachers’ skills and strategies.
Such intentional choices or assignments may well improve a school’s success (Aucejo et al. 2020).
Second, a teacher’s skills improve with experience, and the skills she develops depend on the type of
students she teaches (Ost 2014, Papay and Kraft 2014). Third, the judgements of classroom observers
may be influenced by the students in the class during the observation (Campbell and Rondfeldt 2018).
Our data provide some limited evidence of correlation between observed practices and student
characteristics. In Table 7 we regress observable student and class characteristics on class observation
data—effectiveness ratings and instructional activity choices.11 Here we discuss a few of the results,
but, in general, we find few statistically significant relationships.12
There are some relationships between a teacher’s effectiveness and her students’ prior
achievement. Classes with higher prior test scores have teachers who are more effective in instruction
tasks. However, in maths classes, classes with higher prior scores have teachers who are less effective
in classroom environment tasks. The correlations between maths teacher ratings and student poverty,
as measured by eligibility for free school meals, may reflect the same underlying mechanism. By
contrast, there is essentially no relationship between teacher effectiveness and the amount of variability
in the class’s prior test scores.
11 A regression analysis typically implies a (hypothesized) direction of causality, but that is not our intent in Table 7. Given the mechanisms listed in the previous paragraph, the direction of causality is unclear. The regression specifications in Table 7 were also chosen to parallel our analysis of student test scores. The estimates in Table 7 come from fitting specification 2, except that we omit !!"#" from the right-hand side and the elements of !!"# become the dependent variables. Pooled results are included in Appendix Table A4. 12 The adjusted R-squared values for Table 7 are quite consistent across panels for each outcome. Lowest for female and month of birth at < 0.01. Highest for IDACI score and class standard deviation at roughly 0.30. With 0.07 for prior score and 0.09 for ever FSM. This pattern would suggest more between-school or between-class differences in students are more predictive of teaching practices.

23
There is little relationship between students and the instructional activities teachers use, at least
for the measures of students and activities we have. There are some statistically significant coefficients
scattered through panels C and D of Table 7, but no clear pattern and many coefficients tested. The
strongest pattern seems to be in English classes for “group vs. individual work” activities. That row of
estimates is intriguing: English teachers move from students working individually toward students
interacting with classmates when the class has higher prior scores and less variability, is more female
and older, and less exposed to poverty. But that row is an isolated result which suggests some caution
in drawing conclusions.13
These (potential) relationships—between a teacher’s choices and skills and the students she is
assigned—are a key consideration in describing differences in observed teaching practices. The same
(potential) correlations are also critical to account for in our analysis of how teaching practices relate
to student achievement outcomes. We move to that analysis now.
4. Observed teaching practices and student achievement
The differences in teaching captured in classroom observations predict differences in student
achievement growth. As we detail in this section, students score higher on the GCSE tests when their
teacher is rated higher on the Framework for Teaching rubric’s effectiveness scale. The mix of
instructional activities a teacher uses in class also predicts student GCSE scores, even conditional on
the teacher’s effectiveness ratings.
4.1 Estimation
We combine teacher and student data to test whether a teacher’s observable classroom practices
predict higher or lower student test scores for her students. Our estimates begin with a conventional
statistical model of student test scores
!!"# = #"$ + &!"#' + (# + )!"# (1)
13 We are not adjusting for multiple comparisons in any formal way in this report. Nevertheless, that is the technical motivation for our caution. Table 7 includes 144 estimates, and we would expect to see 7-14 showing up as “statistically significant” just by chance. In fact, more than 7-14 since these are not 144 independent tests.

24
where !!"# is the standardized GCSE score for student * in subject + (maths or English) taught by
teacher , in the school year leading up to the GCSEs.14 The vector #" represents scores or measures
taken from the classroom observations of teacher ,, and our interest is in estimating $. The vector &!"# includes several additional controls: student *’s own prior test scores in maths and English; the class
means and standard deviations of the two prior test scores, leaving out *; and several other student
observables.15 The (# term represents subject fixed effects.
Our preferred estimates of $ also account for differences between observers. Building on
specification 1, we fit
!!"$# = #"$$ + &!"#' + (# + -$ + .!"$# (2)
where #"$ is the scores given to teacher , by observer /. The addition of observer fixed effects, -$,
controls for differences between observers in their expectations, practices, experience, etc. To estimate
specification 2, we first create a new data set with 0" duplicates of each *,+record in the original data,
where 0" is the number of observers who scored teacher ,. To these new data we add the #"$ scores.16
We then estimate 2 weighting by 1 0"⁄ ; this means each *,+ record is given equal weight regardless of
the amount of duplication in the estimation data. Throughout the report we report heteroskedasticity-
cluster robust standard error estimates, where the clusters are teachers ,. We also report estimates of $ separately by subject. We estimate specification 2 but allow all
$ and ' terms to be different by subject. Observer fixed effects, -$, remain cross subject for our main
results, but those results are robust to using observer-by-subject fixed effects (equivalently, estimating
2 separately by subject).
4.2 Teaching effectiveness ratings and student test scores
Students score higher on maths and English GCSEs when taught by teachers rated more
effective by peer observers. Imagine two students in the same school with similar prior achievement
14 Strictly speaking the # index on $!"# and %!"# is redundant because (in our data) every student is assigned to just one teacher per subject and thus #('(). We maintain the # index to facilitate the exposition. Student scores are standardized (mean 0, s.d. 1) by subject and school year within our analysis sample. 15 Prior test scores are Key Stage 2 (KS2) scores. The other characteristics are gender, ever eligible for free school meals, IDACI score, birth month, and the year the student took the GCSEs. We also include an indicator for whether the school is in London. 16 When * observes ( more than once, we use the average measures or scores from * in +"$. Similarly, for +$ in equation 1 we use the average across all observers.
25
and backgrounds. The first student is assigned to a top-quartile teacher, as measured by the Framework
for Teaching, and the second to a bottom-quartile teacher. The first student will score more than 0.08σ
higher than the second student on the GCSEs. Put differently, a one teacher standard deviation increase
in effectiveness predicts a 0.06 student standard deviation (σ) increase in test scores (Table 8 panel A
column 1).
Strong claims about causality are not the goal of this report. Indeed, we should be cautious
about making causal inferences from these estimates. First, it is plausible that students learn more or
less because of the specific teaching practices described by the rubric. However, we cannot rule out
an alternative explanation: that students learn more or less because of something else their teachers do,
and that something else is simply correlated with rubric scores. This omitted variables concern also
limits causal claims in other similar research (e.g., Kane et al. 2011, Taylor 2018, Aucejo et al. 2020),
but may be more of a threat in this setting if the peer observers already have knowledge of their co-
worker’s general effectiveness as teachers.
Second, how students are assigned to teachers may also partly explain the estimates in Table
8. However, the threat of unobserved student characteristics is likely much less than the threat of
unobserved teacher characteristics. Our preferred estimates control for students’ prior test scores, the
distribution of peer prior scores, student backgrounds, and school FE through the observer FE. Both
theory and empirical tests suggest it is plausible to assume student-teacher assignments are ignorable,
in the causal inference sense, conditional on controls like the ones we include (Todd and Wolpin 2007,
Kane and Staiger 2008, Chetty, Friedman, and Rockoff 2014). A closely related concern is that scores
from classroom observations, while designed to measure the teacher, may partly reflect the students
(Campbell and Ronfeldt 2018).
These predictions are useful even if not causal. For example, imagine a school must decide
whether to hire or retain a teacher. Observing and scoring the individual’s teaching may be much more
feasible than obtaining an estimate of the individual’s contribution to student test scores (Kleinberg et
al. 2015, Jacob et al. 2018). Predictions may also help inform how to spend scarce money or time on
teacher training. Omitted variables bias is not irrelevant to predictions. A prediction based on true
causes is likely to be more reliable than a prediction based on imperfect correlates of those causes. In
the end, however, the relevant comparison is between predictors the decision maker has available, not
predictors they would like to have.

26
Whether interpreted as causal or predictive, the relationship between teachers’ rubric scores
and students’ GCSE scores is meaningfully large. One standard deviation higher rubric score predicts
0.06σ higher student test scores, and 0.06σ is about one-fifth to one-quarter of the standard deviation
in total teacher contributions to student test scores.17 A difference of 0.06σ is also roughly similar to
the difference between being assigned to a first year teacher or fifth year teacher (see Jackson, Rockoff,
and Staiger 2014 for a recent review).
Last, we compare this report’s estimate of 0.06σ to other similar estimates from prior research.
Studying teachers and younger students in the United States, but using similar data and regressions,
prior papers report coefficients on FFT score of 0.08-0.09σ (Kane, Taylor, Tyler, and Wooten 2011)
and 0.05-0.11σ (Kane, McCaffrey, Miller, and Staiger 2013). The latter citation is from the large
Methods of Effective Teaching (MET) project, which included measuring teaching using other
observation rubrics besides FFT, and generally the other rubrics also predicted test scores similarly
(Kane and Staiger 2011). A similar study of teachers and kindergartners in Ecuador found coefficients
of 0.05-0.07σ for the CLASS rubric (Araujo et al. 2016). By contrast, (relatively) subjective ratings of
teachers by school leaders are less consisently predictive student scores (Jacob and Lefgren 2008,
Rockoff and Speroni 2010, Rockoff, Staiger, Kane, and Taylor 2012).
4.3 Different teaching practices and different subject areas
To this point we have only discussed a broad, average relationship between teaching and
student scores—the coefficient 0.06σ averages across the ten FFT items and averages across maths
and English tests. But that broad, average relationship masks some differences at the intersection of
teaching practices and subject area. Those differences are shown in panels B and C of Table 8.
In panel B we separate the teacher ratings into two sub-scores: “instruction” and “classroom
environment.” Recall that the rubric designers divided the ten rubric items into these two groups.
Recall also that a factor analysis also divides the items into the same two groups. We adopt the labels
given by the rubric designers, though some might see overlap in the two concepts.
17 Slater, Davies, and Burgess (2011) estimate the standard deviation of teacher contributions to GCSE scores is 0.272 student standard deviations. This estimate comes from English secondary schools and GCSE courses, as in our current study, though the sample in Slater, Davies, and Burgess (2011) is broader. For a general summary of estimates on the teacher value-added distribution see Jackson, Rockoff, and Staiger (2014) and Hanushek and Rivkin (2010), though many estimates of those estimates come from elementary and middle schools in the United States. The 0.272 estimate may be larger than other estimates in part because students often spend two years with their GCSE teacher.

27
The differences are striking: Instruction ratings predict maths scores and environment ratings
predict English scores, but not vice versa.18 Moreover, this pattern shows itself only in the interaction
of subject and sub-score. Compare maths and English with the overall average FFT score (column 2
and 3 in panel A), and compare instruction and environment when subjects are pooled (column 1 in
panel B).
Panel C shows an alternative organization of the teacher ratings as predictors. The first score,
“overall effectiveness,” is the same as in panel A: the simple average of all ten rubric items. The second
score measures the teacher’s relative effectiveness in instructional and environment tasks. It is the
difference between the scores used in panel B, “instruction” average minus “environment” average.
This alternative organization emphasizes that a teacher’s overall effectiveness is important in
both subjects. Still, conditional on overall effectiveness, a teacher’s relative effectiveness in different
teaching tasks is relevant to predicting student test scores. Imagine two English teachers who are both
given the same overall effectiveness rating, but the first teacher is relatively better at environment tasks
than the second. The first teacher’s students will score higher. The opposite is true for maths teachers,
where instruction practices are slightly advantageous, though the difference is far from statistically
significant. While panels B and C are closely related, they provide different, hopefully complementary,
ways to think about what the rubric is measuring about teachers.19
4.4 Instructional activities in class and student test scores
Different teachers spend class time in different ways—lecture, group discussion, individual
practice, etc.—and those different instructional activities partly explain differences in student test
scores. A broad characterization of the results is that activities which require active student
participation are more likely to promote student learning than direct instruction. But the patterns are
not the same for maths and English.
18 The instruction coefficients are statistically significantly different between subjects (, < 0.01), but the environment coefficients are not (, = 0.19). For English, the instruction and environment coefficients are statistically significantly different (, = 0.02), but for math they are not (, = 0.57). 19 Kane et al. (2011) estimate specifications similar to panel C.

28
Students score higher on the maths GCSEs when the teacher’s approach includes more time
for practice and assessment.20 By our estimates, in Table 9 panel B, increasing time for “practice and
assessment” by one standard deviation predicts 0.07σ higher maths test scores. By contrast, the other
class activities are much weaker predictors of maths scores, and we cannot reject that the coefficient
is zero.21
For English GCSEs, however, students score higher when class time includes more student
interaction with their classmates.22 The coefficient on “student peer interaction” is 0.05σ for predicting
English test scores, roughly as large as “practice and assessment” is for maths. But “practice and
assessment” and the other class activities are not statistically significant predictors of English scores;
if anything more time in the other activities predicts lower scores.
These estimates alone are not sufficient to conclude that “practice and assessment” activities,
or “student peer interaction” activities, cause higher test scores. The same threats to causal inference
described above for rubric scores apply to these class activities observations.23 We can address some
threats by combining the rubric scores and class activities, as we describe in the next subsection.
For predicting student test scores, observations of class activities can be as useful as rating
teaching effectiveness. Compare the magnitudes of the activities coefficients in Table 9 with the rubric
score coefficients in Table 8. For example, a teacher’s use of “student peer interaction” predicts
English scores roughly as much as a teacher’s overall effectiveness rating (coefficient estimates of
0.05σ and 0.04σ respectively, but the two estimates are not statistically significantly different).
The groups of activities used in Table 9 are not the only way to characterize the data on
instructional activities recorded by observers. One alternative characterization is the principal
components of the twelve activity items; recall the discussion and results in Section 3.
20 Recall from Section 3, that “practice and assessment” includes the items: (i) “children are doing written work alone,” (ii) “assigning homework or class work to children,” and (iii) “gauging student understanding (e.g., through written or oral assessment).” 21 The estimates in Table 9 use the same specification and covariates as described for equation 2, plus one additional control variable: the class time observers recorded as “engaged in non-teaching work.” 22 Recall from section 3, that “student peer interaction” includes the items: (i) “children are working in groups,” and (ii) “open discussion among children and teacher.” 23 One reminder of the potential for omitted variable bias is the following: For English the coefficient on “engaged in non-teaching work” is positive and significant, 0.032 (st.err. 0.016) in the regression reported in panel A column 3, and similarly 0.042 (st.err. 0.016) for panel B. The same coefficients for maths are negative and null. Presumably not teaching does not itself cause higher English scores, but rather is correlated with other activities imperfectly measured in our data, e.g., other activities where students are working alone or in groups without the need of the teacher.

29
The principal components of class activities also predict student test scores, as shown in Table
10. For English GCSEs, the fourth principal component stands out from the others. The coefficient for
component four is 0.05σ, while all other estimates are less than 0.01σ and far from statistically
significant. Our short-hand label for component four is “group vs. individual work”; it is increasing in
activities where students interact with their classmates and decreasing in activities where students work
alone or one-on-one with the teacher.
Both the principal components approach, in Table 10, and the simpler grouping of activities,
in Table 9, end in a similar substantive conclusion for predicting English test scores. Both emphasize
activities where students interact with their classmates. But these are not two independent tests, and
the general similarity should not be surprising. Both approaches combine activities based on the same
correlation matrix, Table 2. Still, the principal component weights, shown in Table 4, are quite different
from the approach in Table 9 which weights items equally but in mutually exclusive and exhaustive
groups.
There are tradeoffs between the two approaches. The complex weights in the principal
components approach capture (potentially) more-nuanced latent dimensions of teaching practice. The
disadvantage is that the principal components are more difficult to describe in words. Thus the caution
that substantive conclusions should not depend on the “correctness” of short-hand labels attached to
principal components. The results for maths demonstrate these tradeoffs.
Maths GCSE scores are predicted, first, by the third principal component. Our short-hand label
for this component is “practice vs. instruction,” and the coefficient is positive and significant. Again,
this pattern is consistent with the simple groups approach in Table 9. In fact, (i) the third component
“practice vs. instruction” is correlated 0.81 with (ii) the difference “practice and assessment” minus
“personalized instruction.”
Much like the third component, the fifth principal component also predicts student maths
scores. The estimated coefficients for the third and fifth components are similar in magnitude and
precision. The third explains 11 percent of the variation in the activity item data, but the fifth explains
nearly as much at 8 percent. The fifth component suggests some potential additional insight is lurking
in the activities data. However, the fifth principal component is difficult to describe in words. Our best
attempt at a parsimonious description is “teacher guided learning.”

30
To summarize, the instructional activities teachers choose to use in their classes partly explain
student achievement growth. In maths, students score higher when more time is devoted to student
practice and assessment. In English, students score higher when they spend more time working and
talking with their classmates. These patterns are robust to how we go about combining activities into
groups or components.24 Nor do our conclusions rely on the short-hand descriptions we use for groups
or components. Still, these results alone are insufficient for making claims that specific instructional
activities cause higher test scores. In the next section we provide one test of an important threat to
causal claims.
4.5 Combining effectiveness ratings and activities data
Classroom activities predict student test scores even after controlling for the teacher’s
effectiveness ratings, and visa versa. Table 11 shows estimates with both types of measures included
simultaneously. Because our data include both activities and effectiveness measures, we can address
two complications which would otherwise limit interpretation of the test score results.
First, whether or not a given instructional activity benefits student learning should depend, at
least to some extent, on the teacher’s skill in that activity. Consider, for example, “student peer
interactions” which includes open discussions among the class. Perhaps this activity contributes to
higher achievement in English but not maths, as in Table 9, because English teachers are more skilled
in “using questioning and discussion techniques.” This tasks vs. skills perspective raises the threat of
omitted variable bias in estimates like Table 9 which ignore differences in teachers’ skills.
We can test for this potential bias, at least partially, by adding effectiveness ratings as controls,
and examining whether and how the coefficients on activities change. Compare, for example, columns
7 and 9 in Table 11. Student score higher in English when more class time devoted to “student peer
interactions” (column 7). That conclusion does not change when we control for the teacher’s
effectiveness ratings (column 9), which includes ratings of “using questioning and discussion
techniques.” In general, across activities and subjects, there is little change in the patterns of whether
and how activities predict test scores.25
24 In Appendix Table A1 shows results from an alternative principal components analysis. In this alternative, the item level data are left unscaled in their original units. The components themselves are somewhat different, but the substantive predictors of student test scores are similar. 25 One potential change is the maths coefficient on direct instruction which doubles when we control for effectiveness ratings. This would be consistent, perhaps, with lecturing being more productive when the teacher is more effective (see for example Taylor 2018).

31
These results suggest that, separate from the teacher’s skills or effort, some approaches to
classroom instruction are more successful in promoting student learning than others. Though more or
less successful approaches may depend on the subject being taught. This result is a novel contribution
to the literature. Research which combines both measures of instructional activities and measures of
teacher skill to predict student test scores are rare. The closest, of which we are aware, are Aslam and
Kingdon (2011) and Taylor (2018).
A second potential concern is that effectiveness ratings may depend on the instructional
activities used during the observer’s visit. For example, a rating of a teacher’s “questioning and
discussion techniques” may be more accurate or precise if the class spends more time in group
discussion. The estimates in Table 11 show little evidence that this concern affects the conclusions we
draw in this report. The coefficients on rubric effectiveness ratings are largely unchanged when we
control for the mix of activities during the observation.
4.6 Different predictions for students with different prior achievement
Which teaching skills and instructional activities best improve, or at least predict, student
achievement may well depend on who the characteristics of the students in the classroom (Lazear
2001, Lazear 2006, Duflo, Dupas, and Kremer 2011, Aucejo et al. 2020, Graham et al. 2021). In Table
12 and Appendix Table A6 we test for heterogeneity in the correlations between teacher observation
scores and student test scores.
The degree to which teaching effectiveness predicts student achievement growth depends on
students’ prior achievement. For the average student, or the average class, test scores will be 0.06σ
higher when assigned a teacher rated one standard deviation higher in effectiveness. But that positive
correlation shrinks for students with higher prior test scores. Using the estimates in Table 12, for a
student who is two standard deviations above average in prior test scores, the coefficient would fall
from 0.06σ to essentially no correlation (0.060 – 0.027*2 = 0.006 in column 1). Moreover, this
heterogeneity exists within classes, as shown when we add teacher fixed effects. Imagine two students
in the same class with the same teacher, but the first student had lower prior achievement than the
second. The first student will benefit more than the second if their teacher is a more effective teacher.

32
These differences raise the possibility of boosting achievement by changing how students are
assigned to teachers, specifically pairing more effective teachers with lower achieving students. In our
sample, the opposite pairing is occurring. As shown in Table 7, teachers rated higher are matched with
higher achieving students, on average. However, our estimates alone are far from sufficient to justify
such a change management or policy. Among other considerations, the effect of changing student-
teacher assignments will depend on changes in peer effects and changes in teachers’ choices and skills.
Two contemporaneous papers, Aucejo et al. (2020) and Graham et al. (2021), study this idea in further
detail.
Contrasting the results for effectiveness ratings, we find no heterogeneity in how instructional
activities predict student test scores. The full results are provided in Appendix Table A6. The
coefficient signs for the prior test score interaction terms suggest higher achieving students’ scores
may be less correlated with their teacher’s actions, but the differences are small and not statistically
significant.
5. Sector views on effective teaching practices
Our final research question examines how closely sector views match up to our findings.
Therefore, we extend our analysis, further raising its value to the educational policy-making
community by benchmarking our findings against other sources. First, we attempt to map the main
packages of practice we identify on to existing teacher qualification or licensing standards. The main
source for this is the UK QTS teachers’ standards, QTS being Qualified Teacher Status. Our data are
for England only, and so the standards for England are the most relevant and therefore in answering
the above research question we benchmark our results against these QTS teachers’ standards.
Secondly, we undertook supplementary analyses to compare our results to other authorities on teaching
effectiveness. We conducted an online survey of professional teacher educators asking them to
describe their views on effective teaching practices based on the rubric used and activities observed
for the Peer Observation Project.
5.1 Teacher peer observation project rubric and the UK QTS teachers’ standards
The “Teachers’ Standards: Guidance for school leaders, school staff and governing bodies” is
the quality framework that applies to schools in England from September 2012. They were introduced
to set a clear baseline of expectations for the professional practice and conduct of teachers. The

33
standards apply to the vast majority of teachers in the country regardless of their career stage. These
standards define the minimum level of practice expected of teachers and trainee teachers from the point
of being awarded (QTS). They are used to assess trainees working towards QTS as well as the
performance of all teachers with QTS subject to The Education (School Teachers’ Appraisal)
(England) Regulations 2012. Part 1 applies to most teachers regardless of their career stage and part 2
(professional and personal conduct) applies to all teachers irrespective of which sector they work in.
These standards are used to assess teachers’ performance and are applied according to a level that is
considered reasonable to be expected of a teacher in the relevant role and at the relevant stage of their
career. The standards also set out the key areas in which teachers can assess their own practice and
therefore one would assume also the standards on which teachers would be assessed as part of any
lesson observation initiatives within the school.
Overall, there is good alignment across the Teachers’ Standards and both Domains 1 and 2
(those that were used as part of the Peer Observation Project) of the FFT rubric. In particular there is
strong alignment across aspects pertaining to the learning environment, classroom and behaviour
management, respect and rapport, and assessment. One critical area of the Teachers’ Standards that is
not covered in the rubric used for this project pertains to section 1(3) (“Demonstrate good subject and
curriculum knowledge”). There is strong body of evidence that shows that teacher subject matter
knowledge has a strong and positive role in determining student outcomes (Glewwe et al., 2011, Aslam
et al., 2019) and it supports not only the emphasis on this aspect in the Teachers’ standards but also
the “common-sense notion that teachers who better understand the subjects they teach are better at
improving their student learning” (Glewwe et al. 2011:22). Another area of focus of the Teachers’
Standards that is not an area of focus for the rubric pertains to section 8 (Fulfil Wider Professional
Responsibilities). Whilst this is clearly an important element of teaching it was not within the scope of
the Teacher Peer Observation project. Whilst there are elements of Section 4 (lesson planning) of the
Teachers’ Standards covered in Domains 1 and 2 of the rubric used in the Teacher Peer Observation
Projects, lesson planning as a whole is covered more comprehensively in the Danielson (2007) rubric
domain pertaining to Planning and Preparation and this domain did not form part of the Teacher Peer
Observation Project rubric.
Table 13 below presents Part One and Part Two of the Teachers’ Standards and Tables 14 and
15 map the Teacher Peer Observation Rubric Domains 1 and 2 against the relevant elements of the
QTS Teachers’ Standards.

34
5.2 Teacher educator survey
An online survey of professional university-based teacher educators was conducted to garner
their views on effective teaching practices. Our results describe the relationship between teacher
behaviours (as measured against the FFT rubric and through the activities observed) and pupil learning
(as measured by progress from Keystage 2 scores to GCSE scores) and therefore it is valuable to see
how these results correlate with the beliefs of professional teacher educators.
The survey was sent to teacher educators at over 50 of the leading providers of university-based
teacher training in England. The survey took approximately fifteen minutes to complete and aimed to
be brief to maximise response rates. The teacher educators were asked to rank the components within
the rubric and the teaching activities in terms of their importance in boosting GCSE scores (in English
and Maths, for low performing and high performing students and for mixed ability classes). They were
also asked to give their opinions in relation to a wider range of outcomes beyond learning (motivation
and aspirations, peer relations). A total of 52 educators responded from the emails sent both directly
to teacher educators and to faculty heads) at 56 universities.
We ask the expert educators to answer separately for Maths and English, in order to
disaggregate their views by subject and match our data more closely (given our findings differ across
subjects). In the first instance a pilot survey was sent to colleagues at teacher training institutions to
provide feedback. Based on their feedback the questionnaire was adapted. Some key areas where the
pilot provided feedback that resulted in changes were:
• Language (so that it relates more closely to the English context)
• Recognising that aims of education and teacher effectiveness relate to more wide-ranging
outcomes than just test scores in Maths and English and therefore including questions
pertaining to non-cognitive outcomes such as motivation and peer relations
• Grouping of questions and keeping some questions as stand alone
• Recognising that our questions may be limiting, we also included open ended question at the
end to allow for respondents to add any other critical information they wish to include.
Pilot respondents felt that the rubric did cover several pertinent aspects of teacher effectiveness;
however, they found it was a very process-focused rubric and that does not incorporate some aspects
important to effective teaching such as assessing teacher “knowledge” both in terms of subject matter

35
as well as on how young people learn (learning theories), of the school community (e.g. what sort of
backgrounds do the young people come from), of the curriculum, of educational issues and how to
make the subject understandable to students, ability to differentiate teaching for different students etc.).
The survey was completed by 32 females, 16 males and 4 individuals who did not wish to state
their gender. Nearly half of the respondents educate teachers in the primary phase of education (22),
just over a third in secondary (18) and the remainder in both (9). The teacher educators were asked
their views on the importance of the individual components within the rubric as well as the teaching
“activities”, separately for Maths and English and for high and low achieving students as well as for
classes with mixed abilities.
In terms of the FFT rubric, the views of teacher educators were the same across the two domains
for both Maths and English and for all student groups. “Establishing a culture of learning” and
“creating an environment of respect and rapport” were deemed as the most important standard of
domain 1 and “engaging students in learning” the most important for domain 2. “Organizing physical
space” was viewed as the least important aspect for both subjects and for all student types. (see
Appendix Figures A2-A5). Teacher educators were also asked to allocate 100 points across all the
components of the classroom observation rubric to indicate how important they thought each
component is in predicting student test scores for all students. Figure 5 shows on average the number
of points each component received.
“Engaging students in learning”, “use of assessment” and “establishing a culture for learning”
were deemed the most important components as compared to more classroom-management type
components such as “organizing physical space”, “managing classroom procedures” and “managing
student behaviour”. However, findings from the classroom observation data (presented previously)
indicated that in general teachers were rated more effective in classroom environment tasks (deemed
less important by teacher trainers) than in instruction tasks (which teacher educators deemed as more
important). It was found that teachers in the observed classrooms were on average rated highest for
“managing student behaviour” a component according to our survey not regarded as highly by teacher
educators at determining student outcomes. Figure 5 also indicates that teacher educators believed “the
use of assessment” is very important in determining student test scores. As discussed earlier in this
report (section 3.2), this highly regarded component (“use of assessment”) showed the largest
differences in effectiveness between those teachers observed in the classroom observations in the RCT.

36
Respondents were then asked their opinions on the “activities” conducted and observed during
the classroom observations. The views of teacher educators were similar across activities in terms of
how the teacher educators viewed the importance of these activities for all students (high performing
and low performing). In general, “gauging student understanding” and “open discussion” were more
highly valued than “lecturing or dictation” and ‘assigning homework or classwork to children”. “Open
discussion” was deemed more important for high achieving students as compared to low performing
students and “spending special time to assist weak students” as more important for low achieving
students (see Figure 6). The classroom observation data from the RCT and previously presented
illustrated in that in more than one third of classes observed “open discussion” was occurring during
most or all of the class time and in only one quarter of the classes was it absent or rare. The teacher
educator opinions illustrated in Figure 6 also align with the broad characterization presented earlier
from the experimental data analysis that showed that activities which require active student
participation are more likely to promote student learning than direct instruction (see section 4.4). Table
A2 in the Appendix shows the mean rank allocated to each activity for high and low performing
students.
In terms of use of resources, whiteboards were significantly preferred by teacher educators for
all students but in particular for lower performing students (see Figure 7). 92% of teacher educators
viewed whiteboards as more useful for lower performing students and 70% viewed them as more
important for higher performing students. Only 8% of teacher educators found the use of textbooks as
more useful than whiteboards for lower performing students (31% for higher performing students).
This finding is reflected in observed teaching practices: the classroom observation data show that use
of textbooks was recorded as absent or rare in nearly nine out of the ten classes observed. It is important
to note that this lack of textbooks may be related to the high costs of textbooks. This finding is also in
line with some evidence that suggests that textbooks are more useful for the strongest students
(Glewwe, Kremer & Moulin 2009). Whilst earlier studies in the 1980s and 90s showed positive results
on student outcomes of textbook provision more recent studies that have aimed to disentangle the
individual causal effects of various schooling inputs have shown that simply providing textbooks is
not enough (Piper et al. 2018). A randomized control trial in Kenya suggested that this ineffectiveness
of textbook use may be due to the fact that textbooks may not be pitched at a level that is accessible to
all students and in particular weaker students (Glewwe, Kremer and Moulin 2009, Banerjee et al.,
2016). It has been suggested by recent evidence that textbooks are an important ingredient in improved
instruction but can have a more meaningful impact on learning outcomes when combined with other
schooling inputs (Piper et al., 2018). Research in the US reiterates the need for appropriate and high-

37
quality textbooks. A study in California found educationally meaningful impacts of textbooks on
student outcome that can be achieved at low costs suggesting that, in terms of achievement impact,
not-trivial gains can be achieved cost effectively by using suitable curriculum materials (Koedel and
Polikoff, 2017). Therefore the findings of this survey and of the classroom observation may not
necessarily reflect the use of textbooks in and of themselves but the content and quality of those
textbooks that are available. It must also be noted that in many contexts the availability and use of
textbooks is often hindered due to cost issues, as mentioned previously.
Similarly, teacher educators also had strong views regarding students working in groups and
students working alone. 94% of teacher educators stated that students working in groups was more
effective than students doing work alone (for both high and low achieving students).
Respondents in the pilot survey were of the strong opinion that the survey should reflect the
fact that effective teaching relates to a wider range of outcome than test scores. Therefore, the survey
also asked teacher educators their views on the importance of the teaching “activities” for outcomes
relating to peer relations and student motivation/aspirations. Figure 8 illustrates the results.
As Figure 8 shows, “Open discussion” and “Children working in groups”, as expected, feature
as highly important in improving both sets of outcomes according to teacher educators. There are no
statistically significant differences between whether the educators perceived an activity as important
for peer relations as compared to for motivation/aspirations. There are similarities in in the way that
teacher educators view these activities for the outcomes of motivation and peer relations and how they
view them for test scores (as discussed above) with “open discussion” and “one-to-one teaching”
viewed as highly ranked and “lecturing” as low ranked for both the non-test score related outcomes
(motivation and peer relations) as well as for test scores (both low and high performing students).
Table A3 in the Appendix.
It must be noted that these survey results reflect the views of very small sample of teacher
educators and that overall, the teacher educators were of the view that education and effective teaching
would need to take a far more holistic view than this survey allowed. They also noted that whilst they
had given their opinions these may differ depending on the context and student body in question. There
were some areas that the teacher educators felt were lacking in the rubric and in the activities. One
such aspect that several teacher educators deemed as important but lacking in our analysis pertains to
teacher subject matter knowledge. Pilot respondents noted that pedagogical content knowledge was
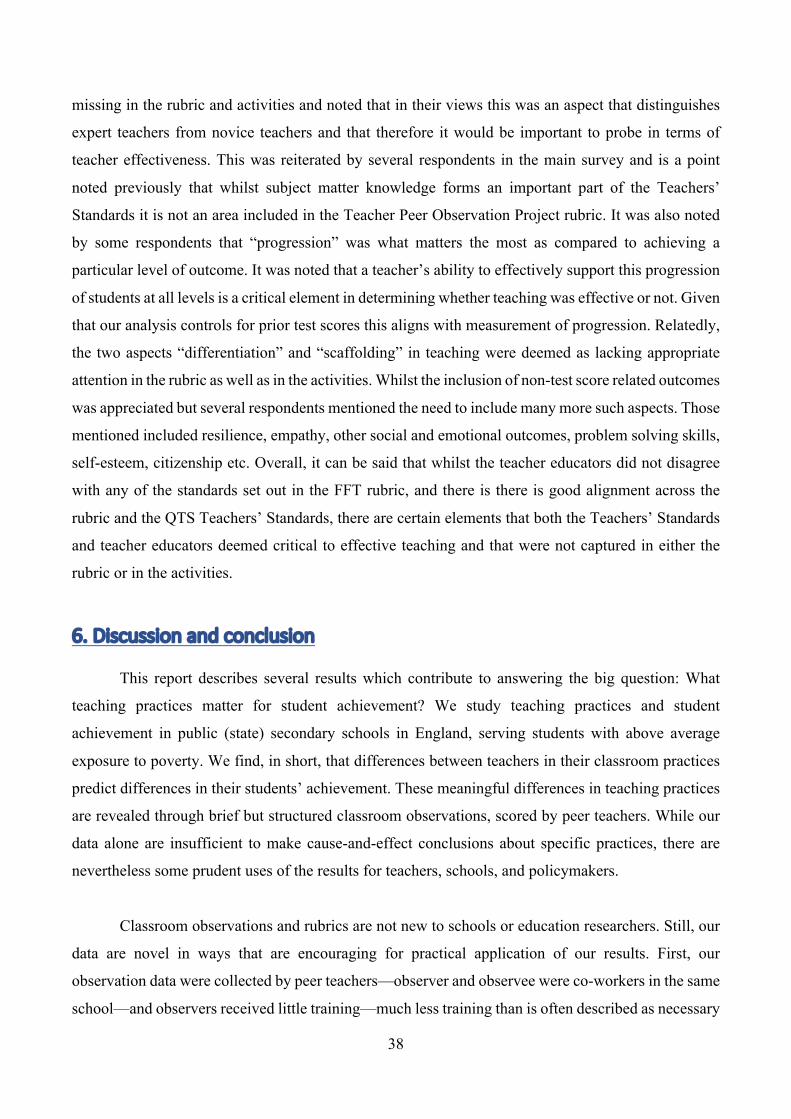
38
missing in the rubric and activities and noted that in their views this was an aspect that distinguishes
expert teachers from novice teachers and that therefore it would be important to probe in terms of
teacher effectiveness. This was reiterated by several respondents in the main survey and is a point
noted previously that whilst subject matter knowledge forms an important part of the Teachers’
Standards it is not an area included in the Teacher Peer Observation Project rubric. It was also noted
by some respondents that “progression” was what matters the most as compared to achieving a
particular level of outcome. It was noted that a teacher’s ability to effectively support this progression
of students at all levels is a critical element in determining whether teaching was effective or not. Given
that our analysis controls for prior test scores this aligns with measurement of progression. Relatedly,
the two aspects “differentiation” and “scaffolding” in teaching were deemed as lacking appropriate
attention in the rubric as well as in the activities. Whilst the inclusion of non-test score related outcomes
was appreciated but several respondents mentioned the need to include many more such aspects. Those
mentioned included resilience, empathy, other social and emotional outcomes, problem solving skills,
self-esteem, citizenship etc. Overall, it can be said that whilst the teacher educators did not disagree
with any of the standards set out in the FFT rubric, and there is there is good alignment across the
rubric and the QTS Teachers’ Standards, there are certain elements that both the Teachers’ Standards
and teacher educators deemed critical to effective teaching and that were not captured in either the
rubric or in the activities.
6. Discussion and conclusion
This report describes several results which contribute to answering the big question: What
teaching practices matter for student achievement? We study teaching practices and student
achievement in public (state) secondary schools in England, serving students with above average
exposure to poverty. We find, in short, that differences between teachers in their classroom practices
predict differences in their students’ achievement. These meaningful differences in teaching practices
are revealed through brief but structured classroom observations, scored by peer teachers. While our
data alone are insufficient to make cause-and-effect conclusions about specific practices, there are
nevertheless some prudent uses of the results for teachers, schools, and policymakers.
Classroom observations and rubrics are not new to schools or education researchers. Still, our
data are novel in ways that are encouraging for practical application of our results. First, our
observation data were collected by peer teachers—observer and observee were co-workers in the same
school—and observers received little training—much less training than is often described as necessary

39
for “valid” or “reliable” observations. The lack of training and social relationships might well have
resulted in strong leniency bias, where observers simply give all their peers the same top scores, or
generated substantial measurement error (Weisberg et al. 2009, Ho and Kane 2013). The peer
observers in our data did give higher effectiveness ratings on average, when compared to ratings from
other studies using the same rubric and trained external observers. But the ratings were also more
variable, suggesting a willingness to acknowledge differences among their peers’ effectiveness.
Alternatively, the higher variance in ratings could simply be greater measurement error, but such error
would make the ratings poor predictors of student test scores, and we find peer ratings predict at least
as well as has been documented in other studies. In summary, peer observation can be a feasible and
effective approach to learning about differences in teaching, even with little additional training for
observers.
A second novel feature of our observation data is the 12-point scale used for effectiveness
ratings, as compared to the more typical 4- or 5-point scale. The 12-point scale likely limited leniency
bias and may well have contributed to the greater variance in ratings, as shown by the comparisons in
Figure 2. Practically, observers could break the rating choice into two steps: (a) Choose one of the big
categories: ineffective, basic, effective, or highly effective. Then (b) choose a degree within that
category. For example, an observer who felt the teacher was “effective” could chose a score of 7, 8, or
9, with 7 suggesting “effective” but closer to “basic” and 9 suggesting “effective” but closer to “highly
effective.”
Third, observers recorded how much class time was spent on different instructional activities—
for example, “open discussion among children and teacher” and “use of white board by teacher.”
These records of time use are distinct from the more complex rubric-guided ratings of effectiveness.
Observers simply recorded what activities were happening without judging the appropriateness or
quality of the activity.
Our analysis shows that teachers’ choices of instructional activities are predictive of student
achievement. In maths classes, for example, students score higher with teachers who give more time
for individual practice. For English exams, by contrast, more time working with classmates predicts
higher scores. Educators and researchers might well be skeptical that simple time use would predict
student scores since teachers likely vary in how effectively they carry out different activities. Our
data—with both time use and effectiveness measures—provides a rare opportunity to test skeptic’s
hypothesis. When we control for effectiveness ratings, class time use still predicts student

40
achievement. The practical implication is that students would likely gain (or loose) from changes in
instructional activities even if teacher skills did not change. Also, classroom observations of time use
are likely even more feasible for schools than rubric-based ratings.
In other respects our data and results are much like similar prior studies. For example, the
magnitude of relationship between rubric ratings and student scores is quite similar. That similarity is
more interesting than it first seems since most prior studies are of elementary and middle school
students in the United States (see for example Kane et al. 2011, Kane and Staiger 2011, Ho and Kane
2013, and Gitomer et al. 2014). A second similarity is the relatively-high correlation of a teacher’s
ratings across different skills or tasks. The tasks being scored are certainly distinct—for example, “use
of assessment” and “organizing physical space”—but empirically the scores are correlated. This
suggests some caution to avoid over interpreting any specific task scores; rubric scores are capturing
more than one thing but probably fewer than the ten things promised. In this report we have focused
mainly on the overall rubric average, though maths and English differ in the relative importance of
instruction and classroom environment tasks.
If observation scores predict student achievement, a natural follow up question is how well or
how much? As a concrete example consider the estimate of 0.077 in Table 8 column 2 row 1. Imagine
two students who are similar except that the first student is assigned to an average maths teacher as
measured by rubric effectiveness rating, while the second student has a maths teacher who is one
standard deviation above average in effectiveness rating (or about the 84th percentile). The second
student will score 0.077 student standard deviations (σ) higher on maths GCSEs (or about 3 percentile
points). This difference is small as a share of the total variation in student test scores—just 7-8 percent
of the total. However, the difference is large as a share of a teacher’s contribution to student test scores,
perhaps 30 percent of the teacher contribution. The predictions we find are not all as strong as 0.077,
but they are generally in the range of 0.03-0.08σ. For example, the coefficient for “practice and
assessment” in maths is 0.068, or about 25 percent as large as the total teacher contribution. For English
the coefficient on “student peer interaction” is 0.053 or about 20 percent.
A different way to think about magnitude is to ask what a 0.03-0.08σ improvement in GCSE
scores would mean for a student’s future. Indeed, GCSE scores are perhaps more relevant for students’
futures, compared to tests at younger ages, because GCSEs come at the end of compulsory schooling
and also inform college admissions. In a new analysis, Hodge, Little, and Weldon (2021) estimate that
a one standard deviation, 1σ, increase in average GCSE scores predicts about a 20 percent increase in

41
lifetime earnings (NPV at age 16). Thus from 0.03-0.08σ we would predict a 0.6-1.6 percent increase
in lifetime earnings, or about £3,000-7,500 in present value at age 16. The predicted earnings gains are
perhaps twice that for maths scores (Hodge, Little, and Weldon 2021).
One important caution is that our data alone are not sufficient to make strong conclusions about
cause and effect. In practical terms, we cannot be sure that a student’s GCSE scores would improve
simply by switching her to a teacher with higher effectiveness ratings, or by raising the ratings of her
current teacher. The actual cause of higher test scores may be something about the teacher not captured
in our data but correlated with the scores we do have. For example, our data do not include a measure
of the teacher’s content knowledge, and math teachers who devote more class time to direct instruction
may have stronger math skills themselves. Unobserved teacher characteristics or actions are the main
threat to a causal interpretation of our results. However, our results do account for the non-random
sorting of students to teachers: we control for students’ prior scores, exposure to poverty, the prior
achievement of their classmates, and school effects. Additionally, we observe both classroom activities
and rubric ratings, the latter a well-established measure of teacher effectiveness. Thus, when we
consider differences in how class time us used, we can control for differences in effectiveness.
To conclude, we discuss some further practical applications of these results for teachers,
schools, and policymakers. First, these results can help inform teachers’ own decisions and
improvement efforts. Or inform school or government investments in supporting those improvement
efforts. As a concrete example, note from Table 8 that the average maths teacher’s “instruction” ratings
are a stronger predictor of her students’ maths scores than are her “classroom environment” ratings.
For English teachers the reverse is true. To reiterate, while this pattern is suggestive we are not
claiming the relationship is causal. Moreover, maths students would benefit from teacher improvement
in environment skills, and English students from teacher improvement in instruction skills.
Nevertheless, time and energy are scarce resources. The practical suggestion from our results is that
the average maths teacher would likely benefit most from focusing first on instruction skills and later
on environment. And the reverse for the average English teacher. We can make a similar application
of the results for instructional activities; clearly class time is a limited resource. The typical maths class
would benefit from more time for student practice, but the typical English class would benefit from
more peer group work.
However, teachers and schools need not rely on rules for “typical” or “average” teachers. This
project demonstrates the feasibility of measuring each individual teacher’s practices and effectiveness,

42
which can then inform individualized decisions about where to devote scarce time and energy.
Moreover, the rubric’s practical language provides implicit advice on what to do differently. For
example, a teacher might agree that group discussion in his class is correctly rated as “basic” with the
rubric’s description of “Some of the teacher’s questions elicit a thoughtful response, but most are low-
level, posed in rapid succession.” Then the rubric also provides some advice on how to move to
“effective” with the description “Most of the teacher’s questions elicit a thoughtful response, and the
teacher allows sufficient time for students to answer.”
There is causal evidence that teachers contributions to student achievement can benefit from
being evaluated in classroom observations. Taylor and Tyler (2012) studying teachers in Cincinnati,
Ohio and Briole and Maurin (2019) studying teacher in France both find improvements in test scores
after such evaluations. Importantly, those improvements lasted for years after the evaluation ended,
and teachers were not incentivized for higher student test scores. Thus, the Cincinnati and France
improvements seems consistent with improvements in teaching skills resulting from rubric-guided
observations. Additional evidence comes from the original experiment that produced our data. In that
experiment the performance of observer teachers improved, as measured by their students’ test scores,
even though the observers were never scored themselves (Burgess, Rawal, and Taylor in-press). One
possible explanation is that the observers learned from the rubric or self-assessed based on the rubric.
A second potential use of these results is in assigning students to classes and teachers. Among
the schools and students in our study, the relatively lower-achieving students benefited more from
skilled teachers than did their higher-achieving peers. However, in our setting as elsewhere, lower-
achieving students are less likely to be assigned to teachers rated highly by peer observers. This pattern
emphasizes the importance of thoughtful decisions about assigning students to teachers.
Matching more lower-achieving students to highly-rated teachers will not guarantee better
outcomes for those students. First, teachers may change their teaching practices in response to the
students they are assigned, either individual students or the mix of students in a class (Lazear 2001,
Duflo, Dupas, and Kremer 2011, but for a counter example see Aucejo et al. 2020). Second, students’
classmates also contribute to outcomes through “peer effects” (Sacerdote 2011). Changing student-to-
teacher assignments also (likely) changes student-to-student assignments. Finally, large changes to
how students and teachers are matched is likely to require moving teachers (or students) to different a
school entirely. There is some encouraging evidence that effective teachers remain effective when they
switch schools to a different student population (Glazerman et al. 2013, Chetty, Friedman, and Rockoff

43
2014), but teachers also experience peer effects from their co-worker teachers (Jackson and
Bruegmann 2009). Predictions become riskier when more factors are changing.
A final potential use is in schools’ decisions about teacher hiring and retention. Whether to hire
someone, or retain an employee, requires a prediction about that person’s often-unobserved job
performance. Schools often do not have measures of a teacher’s contributions to student achievement,
and thus must make informed predictions about those contributions. Our results suggest feasible
classroom observations can predict meaningful variation in teachers’ contributions, and thus help
inform personnel decisions. To be clear, our suggestion here is not that observation scores should
mechanically or solely determine hiring and retention decisions. The management problem we have
in mind is the following: Imagine a school leader who is making a hiring (retention) decision, and has
scarce resources for gathering information about the likely job performance of the applicant (teacher).
Our suggestion is that scored observations of teaching are a relatively low-cost way to gather useful
information.
Moreover, because such hiring and retention decisions only require a reliable prediction, we
can be somewhat less concerned about the underlying cause and effect relationship. For example, the
true cause of higher student scores may be a teacher’s content knowledge, which is correlated with
some predictor measure of how the teacher uses class time. As long as that correlation remains
unchanged, the time use predictor will be useful. However, the usefulness may well breakdown over
time if teachers change their behavior during observations knowing those observations will inform
their employment. Indeed, there is some evidence of this breakdown in how teacher applicants are
currently screened, and the sense that applicants must perform the Ofsted expectations (McVeigh
2020).
Student success depends in part on their teachers. When students are assigned to more-effective
teachers their achievement grows faster. What shapes these differences between teachers in their
students’ achievement? This report has examined the influence of teachers’ instructional practices: the
choices teachers make about how to teach, and the extent to which they successfully carry out those
choices. Using data from peer classroom observations, we document meaningful relationships between
teachers’ observed practices and their students’ test scores. While not necessarily causal relationships,
those relationships can aid in our individual and collective efforts to improve schooling.

44
References Aucejo, Esteban, Patrick Coate, Jane Cooley Fruehwirth, Sean Kelly, and Zachary Mozenter. (2020).
“Match Effects in the Teacher Labor Market: Teacher Effectiveness and Classroom Composition.” Working paper.
Araujo, M. Caridad, Pedro Carneiro, Yyannú Cruz-Aguayo, and Norbert Schady. (2016). “Teacher quality and learning outcomes in kindergarten.” Quarterly Journal of Economics, 131 (3), 1415-1453.
Aslam, Monazza, and Geeta Kingdon. (2011). “What can teachers do to raise pupil achievement?” Economics of Education Review, 30 (3), 559-574
Aslam, M., Malik, R., Rawal, S., Rose, P., Vignoles, A. & L. Whitaker (2019), “Methodological lessons on measuring quality teaching in Southern contexts, with a focus on India and Pakistan”, Research in Comparative and International Education, Vol. 14(1) 77–98
Bacher-Hicks, Andrew, Mark J. Chin, Thomas J. Kane, and Douglas O. Staiger. (2019). “An experimental evaluation of three teacher quality measures: Value-added, classroom observations, and student surveys.” Economics of Education Review, 73, 101919.
Banerjee, A., Banerji, R., Berry, J., Duflo, E., Kannan, H., Mukherji, S., Shotland, M., & Walton, M. (2016). Mainstreaming an effective intervention: Evidence from randomized evaluations of “teaching at the right level” in India. NBER Working Paper No. 22746. Cambridge, MA: National Bureau of Economic Research
Bloom, Nicholas, and John Van Reenen. (2007). “Measuring and Explaining Management Practices Across Firms and Countries.” Quarterly Journal of Economics, 122 (4), 1351–1408.
Bloom, Nicholas, Benn Eifert, Aprajit Mahajan, David McKenzie, and John Roberts. (2013). “Does Management Matter? Evidence from India.” Quarterly Journal of Economics, 128 (1), 1–51.
Bloom, Nicholas, Renata Lemos, Raffaella Sadun, and John Van Reenen. (2015). “Does management matter in schools?” Economic Journal, 125 (584), 647-674.
Burgess, Simon, Shenila Rawal, and Eric S. Taylor. (in press). “Teacher Peer Observation and Student Test Scores: Evidence from a Field Experiment in English Secondary Schools.” Journal of Labor Economics.
Campbell, Shanyce L., and Matthew Ronfeldt. (2018). “Observational Evaluation of Teachers: Measuring More Than We Bargained For?” American Educational Research Journal, 55 (6), 1233–1267.
Chetty, Raj, John N. Friedman, and Jonah E. Rockoff. (2014). “Measuring the impacts of teachers I: Evaluating bias in teacher value-added estimates.” American Economic Review, 104 (9), 2593-2632.
Danielson, Charlotte. (2007). Enhancing professional practice: A framework for teaching. Association for Supervision and Curriculum Development, Alexandria, VA.
Duflo, Esther, Pascaline Dupas, and Michael Kremer. (2011). “Peer effects, teacher incentives, and the impact of tracking: Evidence from a randomized evaluation in Kenya.” American Economic Review, 101 (5), 1739-1774.
Gitomer, Drew, Courtney Bell, Yi Qi, Daniel McCaffrey, Bridget K. Hamre, and Robert C. Pianta. (2014). “The instructional challenge in improving teaching quality: Lessons from a classroom observation protocol.” Teachers College Record, 116 (6), 1–20.

45
Glazerman, S., Protik, A., Teh, B. R., Bruch, J., & Max, J. (2013). Transfer Incentives for High-Performing Teachers: Final Results from a Multisite Randomized Experiment. NCEE 2014-4003. National Center for Education Evaluation and Regional Assistance.
Glewwe, P. W., E. A. Hanushek, S. D. Humpage, and R. Ravina. (2011). “School Resources and Educational Outcomes in Developing Countries: A Review of the Literature from 1990 to 2010” In Education Policy in Developing Countries. Chicago: University of Chicago Press.
Glewwe, Paul, Michael Kremer, and Sylvie Moulin. 2009. "Many Children Left Behind? Textbooks and Test Scores in Kenya." American Economic Journal: Applied Economics 1, no. 1: 112‐35.
Graham, Bryan S., Geert Ridder, Petra Thiemann, and Gema Zamarro. (2021). “Teacher-to-classroom assignment and student achievement.” Working paper.
Hanushek, Eric A., and Steven G. Rivkin. (2010). “Generalizations about using value-added measures of teacher quality.” American Economic Review, 100 (2), 267-271.
Hayward, Hugh, Emily Hunt, and Anthony Lord. (2014). The economic value of key intermediate qualifications: estimating the returns and lifetime productivity gains to GCSEs, A levels and apprenticeships. Department for Education Report DFE-RR398A. London: Department for Education.
Ho, Andrew D., and Thomas J. Kane. (2013). The Reliability of Classroom Observations by School Personnel. Seattle, WA: Bill & Melinda Gates Foundation.
Hodge, Louis, Allan Little, and Matthew Weldon. (2021). GCSE attainment and lifetime earnings. Department for Education Research Report.
ICPSR. (n.d.). “Measures of Effective Teaching: 3c - Base Data: Item-Level Observational Scores, 2009-2011 Variable Description and Frequencies.” ICPSR 34346.
Jackson, C. K., & Bruegmann, E. (2009). “Teaching students and teaching each other: The importance of peer learning for teachers.” American Economic Journal: Applied Economics, 1 (4), 85-108.
Jackson, C. Kirabo, Jonah E. Rockoff, and Douglas O. Staiger. (2014). “Teacher effects and teacher-related policies.” Annual Review of Economics, 6 (1), 801-825.
Jacob, Brian A., and Lars Lefgren. (2008). “Can principals identify effective teachers? Evidence on subjective performance evaluation in education.” Journal of Labor Economics, 26 (1), 101-136.
Jacob, Brian A., Jonah E. Rockoff, Eric S. Taylor, Benjamin Lindy, and Rachel Rosen. (2018). “Teacher applicant hiring and teacher performance: Evidence from DC public schools.” Journal of Public Economics, 166, 81-97.
Kane, Thomas J., Daniel F. McCaffrey, Trey Miller, and Douglas O. Staiger. (2013). Have we identified effective teachers? Validating measures of effective teaching using random assignment. Seattle, WA: Bill & Melinda Gates Foundation.
Kane, Thomas J., and Douglas O. Staiger. (2008). “Estimating teacher impacts on student achievement: An experimental evaluation.” NBER Working Paper no. 14607.
Kane, Thomas J., and Douglas O. Staiger. (2012). Gathering Feedback for Teaching: Combining High-Quality Observations with Student Surveys and Achievement Gains. Seattle, WA: Bill & Melinda Gates Foundation.
Kane, Thomas J., Eric S. Taylor, John H. Tyler, and Amy L. Wooten. (2011). “Identifying effective classroom practices using student achievement data.” Journal of Human Resources, 46 (3), 587-613.

46
Kingdon, Geeta, Rukmini Banerji R and P.K. Chaudhary. (2008). SchoolTELLS Survey of rural primary schools in Bihar and Uttar Pradesh, 2007–08. London: Institute of Education, University of London.
Kleinberg, Jon, Jens Ludwig, Sendhil Mullainathan, and Ziad Obermeyer. (2015). “Prediction Policy Problems.” American Economic Review, 105 (5), 491-495.
Koedel, Cory and Morgan Polikoff, “Big bang for just a few bucks: The impact of math textbooks in California,” The Brookings Institution (January 2017)
Lazear, Edward P. (2001). “Educational production.” Quarterly Journal of Economics, 116 (3), 777-803.
Lazear, Edward P. (2006). “Speeding, terrorism, and teaching to the test.” Quarterly Journal of Economics, 121 (3), 1029-1061.
McIntosh, Steven. (2006). “Further analysis of the returns to academic and vocational qualifications.” Oxford Bulletin of Economics and Statistics, 68 (2), 225-251.
McVeigh, H. (2020). Teaching and the role of Ofsted: An Investigation. London: UCL IOE Press. Ost, Ben. (2014). “How Do Teachers Improve? The Relative Importance of Specific and General
Human Capital.” American Economic Journal: Applied Economics, 6 (2), 127–151. Papay, John P., and Matthew A. Kraft. (2015). “Productivity Returns to Experience in the Teacher
Labor Market.” Journal of Public Economics, 130 (1), 105-119. Piper, B., Zuilkowski, S., Dubeck, M., Jepkemei, E., & King, S. (2018). Identifying the essential
ingredients to literacy and numeracy improvement: Coaching, teacher professional development, improved books, and teachers’ guides. World Development, 106, 324–336.
Pouezevara S, Pflepsen A, Nordstrum L, et al. (2016). Measures of quality through classroom observation for the Sustainable Development Goals: Lessons from low and middle income countries. Background paper for the 2016 Global Education Monitoring Report. Education for people and planet: Creating sustainable futures for all. Available at: https://unesdoc.unesco.org/ark:/48223/pf0000245841
Rockoff, Jonah E., and Cecilia Speroni. (2010). “Subjective and objective evaluations of teacher effectiveness.” American Economic Review, 100 (2), 261-266.
Rockoff, Jonah E., Douglas O. Staiger, Thomas J. Kane, and Eric S. Taylor. (2012). “Information and employee evaluation: Evidence from a randomized intervention in public schools.” American Economic Review, 102 (7), 3184-3213.
Sacerdote, B. (2011). “Peer effects in education: How might they work, how big are they and how much do we know thus far?” In Handbook of the Economics of Education (Vol. 3, pp. 249-277). Elsevier.
Slater, Helen, Neil M. Davies, and Simon Burgess. (2012). “Do teachers matter? Measuring the variation in teacher effectiveness in England.” Oxford Bulletin of Economics and Statistics, 74 (5), 629-645.
Speckesser, S., Runge, J., Foliano, F., Bursnall, M., Hudson-Sharp, N., Rolfe, H., & Anders, J. (2018). Embedding Formative Assessment Evaluation report and executive summary. (Research Report). Education Endowment Foundation.

47
Syverson, Chad. (2011). “What determines productivity?” Journal of Economic Literature, 49 (2), 326-265.
Taylor, Eric S. (2018). “Skills, job tasks, and productivity in teaching: Evidence from a randomized trial of instruction practices.” Journal of Labor Economics, 36 (3), 711-742.
Taylor, Eric S., and John H. Tyler. (2012). “The effect of evaluation on teacher performance.” American Economic Review, 102 (7), 3628-3651.
Todd, Petra E., and Kenneth I. Wolpin. (2003). “On the specification and estimation of the production function for cognitive achievement.” Economic Journal, 113 (485), F3-F33.
Weisberg, D., Sexton, S., Mulhern, J., Keeling, D., Schunck, J., Palcisco, A., & Morgan, K. (2009). The widget effect: Our national failure to acknowledge and act on differences in teacher effectiveness. New York City; The New Teacher Project.

48
Figure 1—Rubric standards and associated description of “Effective”
Domain 1. Classroom Environment
1.a Creating an Environment of Respect and Rapport
Classroom interactions, both between teacher and students and among students, are polite and respectful, reflecting general warmth and caring, and are appropriate to the cultural and developmental differences among groups of students.
1.b Establishing a Culture for Learning
The classroom culture is characterised by high expectations for most students and genuine commitment to the subject by both teacher and students, with teacher demonstrating enthusiasm for the content and students demonstrating pride in their work.
1.c Managing Classroom Procedures
Little teaching time is lost because of classroom routines and procedures for transitions, handling of supplies, and performance of non-teaching duties, which occur smoothly. Group work is well-organised and most students are productively engaged while working unsupervised.
1.d Managing Student Behaviour
Standards of conduct appear to be clear to students, and the teacher monitors student behaviour against those standards. The teacher response to student misbehaviour is consistent, proportionate, appropriate and respects the students’ dignity.
1.e Organising Physical Space
The classroom is safe, and learning is accessible to all students; the teacher ensures that the physical arrangement is appropriate for the learning activities. The teacher makes effective use of physical resources, including computer technology.

49
Figure 1 (cont.)—Rubric standards and associated description of “Effective”
Domain 2. Instruction
2a Communicating with Students
Expectations for learning, directions and procedures, and explanations of content are clear to students. Communications are accurate as well as appropriate for students’ cultures and levels of development. The teacher’s explanation of content is scaffolded, clear, and accurate and connects with students’ knowledge and experience. During the explanation of content, the teacher focuses, as appropriate, on strategies students can use when working independently and invites student intellectual engagement.
2b Using Questioning and Discussion Techniques
Most of the teacher’s questions elicit a thoughtful response, and the teacher allows sufficient time for students to answer. All students participate in the discussion, with the teacher stepping aside when appropriate.
2c Engaging Students in Learning
Activities and assignments, materials, and groupings of students are fully appropriate for the learning outcomes and students’ cultures and levels of understanding. All students are engaged in work of a high level of rigour. The lesson’s structure is coherent, with appropriate pace.
2d Use of Assessment
Assessment is regularly used in teaching, through self- or peer-assessment by students, monitoring of progress of learning by the teacher and/or students, and high-quality feedback to students. Students are fully aware of the assessment criteria used to evaluate their work and frequently do so.
2e Demonstrating Flexibility and Responsiveness
The teacher promotes the successful learning of all students, making adjustments as needed to lesson plans and accommodating student questions, needs, and interests.
Note: Adapted from Framework for Teaching (Danielson 2007) for the current experiment.

50
Figure 2—List of instructional activities a. Lecturing or dictation (One way transaction – teacher was speaking
and children were listening) b. Open discussion among children and teacher
c. One to one teaching
d. Spending special time to assist weak students
e. Gauging student understanding (e.g., through written or oral assessment)
f. Assigning homework or class work to children
g. Teacher was using a textbook during teaching activities (Use of examples from text, taking reference of text, read the lines of chapter)
h. Use of white board by teacher.
i. Children copying from the whiteboard.
j. Children are working in groups
k. Children are doing written work alone
l. Engaged in non-teaching work (maintenance of register, preparation of data, format preparation etc.)
Note: Adapted from the SchoolTELLS project (Kingdon, Banerji, and Chaudhary 2008).

51
Figure 3—Frequency of observed instructional activities
Note: For each activity, the red (left) bar is the proportion of classes where there was “none” or “very little” of the activity. The blue (right) bar is the proportion of classes where the activity was occurring “most of the time” or “full time.” The grey (middle) bar is the “some of the time.” Proportions are of 2,687 observations, each the visit of a peer observer * to the class of teacher (.

52
(A) Item-level, 12-point scale
(B) Item-level, collapsed to 4-point scale
(C) Average of items
Figure 4—Distribution of effectiveness ratings Note: Panel A shows a histogram of the 23,047 item-level scores recorded across the rubric’s ten items. Panel B shows the same item-level data as panel A, except that the 12-point scale for scores has been collapsed to a 4-point scale: scores 1-3 in panel A become a scores of 1 in panel B, 4-6 become 2, 7-9 become 3, and 10-12 become 4. Panel C shows a histogram of 2,687 overall effectiveness scores. Each of the 2,687 observations is the visit of a peer observer * to the class of teacher (. The x-axis is the simple average of the ten item scores for a given observation visit, ignoring missing item scores.

53
Figure 5: Average number of point allocated to each component of the rubric
0 2 4 6 8 10 12 14 16
Creating an Environment of Respect and RapportEstablishing a Culture for Learning
Managing Classroom ProceduresManaging Student Behaviour
Organising Physical SpaceCommunicating with Students
Using Questioning and Discussion TechniquesEngaging Students in Learning
Use of AssessmentDemonstrating Flexibility and Responsiveness
Allocate 100 points across the ten components

54
Figure 6: Average importance score of activities in terms of determining student test scores.
0
1
2
3
4
5
6
Lecturing ordictation
Open discussionamong children
and teacher
One to oneteaching
Spending specialtime to assist
weak students
Gauging studentunderstanding(e.g. through
written or oralassessement)
Assigninghomework orclass work to
children
Higher performing Lower performing

55
Figure 7: Teacher educator preferences for whiteboards as compared to textbook for different student groups
69.39
30.61
91.67
8.330
102030405060708090
100
Use of whiteboard Use of textbook
Use of Resources
Higher performing Lower performing

56
Figure 8: Average importance score of activities for peer relations and student motivation/aspirations
0
1
2
3
4
5
6
7
Lecturing ordictation
Opendiscussion
amongchildren and
teacher
One to oneteaching
Spendingspecial time
to assistweak
students
Assigninghomework
or classwork tochildren
Childrenworking in
groups
Childrendoing
writtenwork alone
Peer relations Motivation

57
Table 1—Descriptive characteristics
Experiment
schools
Schools with any
observation Teachers observed
(1) (2) (3)
Prior English score 0.006 0.009 0.039 (1.00) (1.00) (0.98)
Prior math score 0.007 0.008 0.058 (1.00) (1.00) (0.97)
Female 0.487 0.488 0.480 IDACI 0.276 0.279 0.314
(0.17) (0.17) (0.18) Ever free school meals 0.398 0.402 0.426 Birth month (1-12) 6.569 6.579 6.581
(3.42) (3.42) (3.39) London school 0.162 0.164 0.180
Note: Means and standard deviations (in parentheses) for the samples described by the column headers.

58
Table 2—Correlations among instructional activities (1) (2) (3) (4) (5) (6) (7) (8) (9) (10) (11) (12)
(A) Original units 1. Open discussion among children and teacher 1 2. Children are working in groups 0.27 1 3. One to one teaching 0.19 0.25 1 4. Spending special time to assist weak students 0.26 0.27 0.57 1 5. Children are doing written work alone 0.02 0.00 0.30 0.25 1 6. Gauging student understanding 0.33 0.27 0.17 0.28 0.32 1 7. Assigning homework or class work to children 0.20 0.35 0.27 0.31 0.39 0.41 1 8. Lecturing or dictation 0.07 0.06 0.13 0.07 0.16 0.06 0.34 1 9. Children copying from the whiteboard 0.14 0.13 0.17 0.19 0.16 0.13 0.39 0.54 1 10. Use of white board by teacher 0.16 0.01 0.05 0.12 0.14 0.25 0.25 0.36 0.44 1 11. Using a textbook during teaching activities 0.13 0.34 0.31 0.27 0.26 0.19 0.52 0.36 0.49 0.16 1 12. Engaged in non-teaching work 0.12 0.31 0.28 0.24 0.40 0.26 0.58 0.33 0.41 0.21 0.55 1
(B) Net of observer fixed effects
1. Open discussion among children and teacher 1 2. Children are working in groups 0.19 1 3. One to one teaching 0.01 0.11 1 4. Spending special time to assist weak students 0.08 0.14 0.39 1 5. Children are doing written work alone -0.09 -0.12 0.17 0.14 1 6. Gauging student understanding 0.24 0.17 0.09 0.17 0.22 1 7. Assigning homework or class work to children 0.08 0.14 0.09 0.14 0.20 0.23 1 8. Lecturing or dictation -0.09 -0.11 -0.04 -0.08 0.04 -0.02 0.12 1 9. Children copying from the whiteboard 0.00 -0.06 -0.01 0.01 0.07 0.03 0.12 0.31 1 10. Use of white board by teacher 0.05 -0.08 -0.03 0.00 0.00 0.13 0.09 0.29 0.33 1 11. Using a textbook during teaching activities -0.04 0.04 0.07 0.05 0.10 0.04 0.15 0.10 0.19 0.04 1 12. Engaged in non-teaching work 0.00 0.07 0.08 0.05 0.20 0.08 0.26 0.07 0.13 0.05 0.20 1
Note: Correlations of class time use among twelve instructional activities, using a sample of 2,687 observations. Each of the 2,687 observations is the visit of a peer observer ! to the class of teacher ". Observers recorded time use in five ordered categories: (0) none, (1) very little, (2) some of the time, (3) most of the time, and (4) full time. For panel B, before estimating the correlations, we first calculate observer !’s mean for each item and subtract that mean from all scores ! assigned for that item.

59
Table 3—Instructional activities Correlation matrix Mean (st.dev.) Pooled Pooled Maths English (1) (2) (3) (4) (5) (7) (8) (9)
Direct instruction 1 1.23 1.36 1.06 (0.71) (0.72) (0.66)
Student-centered instruction 0.36 1 1.57 1.66 1.45 (0.68) (0.66) (0.69)
Student peer interaction 0.17 0.67 1 1.68 1.71 1.66 (0.93) (0.91) (0.94)
Personalized instruction 0.21 0.70 0.31 1 1.44 1.52 1.34 (0.92) (0.91) (0.92)
Practice and assessment 0.37 0.82 0.28 0.35 1 1.58 1.73 1.38 (0.91) (0.86) (0.95)
Note: Means and standard deviations (columns 7-9) for, and correlations among (columns 1-2), class time use in five groups of instructional activities, described by row labels. This table uses a sample of 2,687 observations. Each of the 2,687 observations is the visit of a peer observer ! to the class of teacher ". Each of the five measures (rows) is itself the average of several item level scores recorded by peer observers, as described in the text. Time use is measured in ordered categories: (0) none, (1) very little, (2) some of the time, (3) most of the time, and (4) full time.

60
Table 4—Principal components of activities Component 1 2 3 4 5 (1) (2) (3) (4) (4)
Weight in component 1. Open discussion among children and teacher -0.43 0.12 0.05 0.27 -0.45 2. Children are working in groups -0.11 -0.26 -0.02 0.61 0.14 3. One to one teaching 0.04 -0.29 0.55 -0.15 -0.22 4. Spending special time to assist weak students -0.10 -0.20 0.51 -0.22 0.42 5. Children are doing written work alone 0.20 -0.26 -0.26 -0.54 -0.35 6. Gauging student understanding -0.32 -0.19 -0.54 -0.09 0.19 7. Assigning homework or class work to children 0.38 -0.08 -0.22 0.12 0.22 8. Lecturing or dictation 0.14 0.51 0.06 0.04 -0.34 9. Children copying from the whiteboard 0.29 0.48 0.09 0.03 0.14 10. Use of white board by teacher -0.24 0.42 -0.04 -0.31 0.43 11. Using a textbook during teaching activities 0.39 -0.06 0.07 0.27 0.15 12. Engaged in non-teaching work 0.44 -0.12 -0.14 0.01 -0.07
Eigenvalue 1.55 1.48 1.34 1.27 1.06 Proportion of variation explained 0.13 0.12 0.11 0.11 0.09
Note: Principal component analysis of class time use among twelve instructional activities, using a sample of 2,687 observations. Each of the 2,687 observations is the visit of a peer observer ! to the class of teacher ". Observers recorded time use in five ordered categories: (0) none, (1) very little, (2) some of the time, (3) most of the time, and (4) full time. Before the principal component analysis, we first rescaled the data, dividing each of the twelve 0-4 item scores by the sum of the item scores for the observation. The main body of the table reports the component loadings, where loadings are the weights given to each item (rows) in calculating the score for a given component (columns).

61
Table 5—Rubric ratings of teaching effectiveness Pooled Maths English (1) (2) (3)
Overall average 9.09 9.15 9.00 (1.75) (1.80) (1.69)
Classroom environment average 9.27 9.35 9.17 (1.84) (1.88) (1.78)
1a. Creating an environment of respect and rapport 9.32 9.35 9.28 (2.04) (2.09) (1.97)
1b. Establishing a culture for learning 9.20 9.25 9.13 (2.01) (2.04) (1.96)
1c. Managing classroom procedures 9.24 9.31 9.14 (2.04) (2.06) (2.01)
1d. Managing student behaviour 9.41 9.42 9.41 (2.05) (2.12) (1.96)
1e. Organising physical space 9.13 9.29 8.87 (2.18) (2.14) (2.23)
Instruction average 8.90 8.94 8.86 (1.83) (1.87) (1.77)
2a. Communicating with students 9.29 9.31 9.25 (1.91) (1.95) (1.85)
2b. Using questioning and discussion techniques 8.77 8.80 8.72 (2.17) (2.16) (2.18)
2c. Engaging students in learning 8.99 9.03 8.93 (2.00) (2.09) (1.86)
2d. Use of assessment 8.50 8.53 8.46 (2.21) (2.19) (2.23)
2e. Demonstrating flexibility and responsiveness 8.83 8.78 8.90 (2.05) (2.08) (2.01)
Note: Means and standard deviations (in parentheses), using a sample of 2,687 observations in column 1. Each of the 2,687 observations is the visit of a peer observer ! to the class of teacher ". The samples for columns 2 and 3 are 1,510 and 1,177 respectively. For each of the ten numbered items above, observers rated effectiveness on a 1-12 scale: 1-3 ineffective, 4-6 basic, 7-9 effective, and 10-12 highly effective. The three average scores above are the mean of the relevant item level scores, ignoring missing scores.

62
Table 6—Correlations among teaching effectiveness ratings
(1a) (1b) (1c) (1)d (1e) (2a) (2b) (2c) (2d) (2e)
(A) Original units 1a. Creating an environment of respect and rapport 1 1b. Establishing a culture for learning 0.86 1 1c. Managing classroom procedures 0.79 0.81 1 1d. Managing student behaviour 0.79 0.80 0.82 1 1e. Organising physical space 0.68 0.68 0.69 0.67 1 2a. Communicating with students 0.74 0.76 0.72 0.71 0.65 1 2b. Using questioning and discussion techniques 0.65 0.67 0.63 0.61 0.55 0.75 1 2c. Engaging students in learning 0.73 0.77 0.71 0.72 0.61 0.79 0.76 1 2d. Use of assessment 0.62 0.65 0.63 0.59 0.58 0.66 0.68 0.72 1 2e. Demonstrating flexibility and responsiveness 0.70 0.71 0.66 0.66 0.62 0.75 0.74 0.77 0.73 1
(B) Net of observer fixed effects 1a. Creating an environment of respect and rapport 1 1b. Establishing a culture for learning 0.79 1 1c. Managing classroom procedures 0.70 0.72 1 1d. Managing student behaviour 0.69 0.71 0.76 1 1e. Organising physical space 0.54 0.54 0.56 0.53 1 2a. Communicating with students 0.63 0.65 0.61 0.61 0.52 1 2b. Using questioning and discussion techniques 0.55 0.55 0.53 0.51 0.44 0.66 1 2c. Engaging students in learning 0.64 0.68 0.62 0.64 0.50 0.70 0.67 1 2d. Use of assessment 0.51 0.53 0.51 0.48 0.46 0.55 0.54 0.61 1 2e. Demonstrating flexibility and responsiveness 0.59 0.60 0.57 0.56 0.52 0.66 0.64 0.66 0.61 1
Note: Correlations of rubric-based effectiveness ratings among ten practices or skills, using a sample of 2,687observations. Each of the 2,687observations is the visit of a peer observer ! to the class of teacher ". Observers rated effectiveness on a 1-12 scale: 1-3 ineffective, 4-6 basic, 7-9 effective, and 10-12 highly effective. For panel B, before estimating the correlations, we first calculate observer !’s mean for each item and subtract that mean from all scores ! assigned for that item.

63
Table 7—Student characteristics and observation scores
Maths
Prior test
score
Class st.dev.
prior test score Female
Month of birth
Ever free school meals
IDACI score
(1) (2) (3) (4) (5) (6) (A)
Overall effectiveness 0.057+ 0.001 0.005 0.016 -0.008 -0.001 (0.034) (0.016) (0.011) (0.036) (0.009) (0.002)
(B) Instruction 0.165** -0.014 0.004 0.049 -0.034** -0.003
(0.062) (0.025) (0.013) (0.051) (0.012) (0.004) Classroom environment -0.110* 0.016 0.000 -0.023 0.025* 0.003
(0.050) (0.025) (0.011) (0.051) (0.011) (0.003) (C)
Direct instruction 0.002 0.006 -0.004 0.000 0.002 -0.006** (0.039) (0.018) (0.009) (0.042) (0.008) (0.002)
Student peer interaction -0.033 0.017 -0.002 0.010 -0.012 0.002 (0.045) (0.020) (0.009) (0.044) (0.011) (0.002)
Personalized instruction -0.026 -0.014 0.014+ -0.051 0.003 0.001 (0.029) (0.019) (0.007) (0.039) (0.007) (0.002)
Practice and assessment -0.029 0.011 0.007 0.110** 0.008 -0.001 (0.031) (0.019) (0.007) (0.037) (0.009) (0.003)
(D) Student-teacher interaction 0.004 -0.018 -0.019* 0.045 0.006 0.002
(0.037) (0.018) (0.009) (0.044) (0.009) (0.002) Smaller groups vs. whole class -0.009 -0.006 0.013 0.082* -0.004 0.004+
(0.033) (0.015) (0.008) (0.032) (0.009) (0.002) Practice vs. instruction 0.013 -0.016 -0.007 -0.071* -0.010 0.001
(0.027) (0.015) (0.005) (0.033) (0.008) (0.002) Group vs. individual work 0.030 -0.009 0.002 -0.042 0.003 0.001
(0.029) (0.016) (0.006) (0.030) (0.007) (0.002) Teacher guided learning 0.048 -0.028+ -0.004 0.067+ -0.007 -0.003
(0.033) (0.015) (0.006) (0.037) (0.007) (0.002)

64
Table 7 (continued)—Student characteristics and observation scores
English
Prior test
score
Class st.dev. prior test
score Female Month of
birth
Ever free school meals
IDACI score
(7) (8) (9) (10) (11) (12) (A)
Overall effectiveness 0.073* -0.006 0.012 0.033 -0.006 -0.005+ (0.036) (0.016) (0.009) (0.047) (0.010) (0.003)
(B) Instruction 0.051 0.005 -0.012 0.060 -0.005 -0.004
(0.058) (0.021) (0.016) (0.058) (0.013) (0.005) Classroom environment 0.027 -0.014 0.023 -0.014 0.001 0.000
(0.064) (0.024) (0.016) (0.062) (0.016) (0.004) (C)
Direct instruction 0.022 -0.008 -0.012 -0.060 -0.010 -0.006+ (0.043) (0.019) (0.010) (0.050) (0.011) (0.003)
Student peer interaction 0.018 0.026 -0.013 -0.036 -0.011 -0.005 (0.035) (0.017) (0.008) (0.044) (0.012) (0.003)
Personalized instruction -0.024 -0.014 0.005 0.034 0.009 0.003 (0.031) (0.015) (0.009) (0.035) (0.009) (0.002)
Practice and assessment -0.069+ 0.025 -0.026** -0.043 0.007 0.002 (0.040) (0.019) (0.009) (0.051) (0.008) (0.003)
(D) Student-teacher interaction 0.004 0.003 0.007 0.038 0.011 0.004
(0.029) (0.012) (0.008) (0.037) (0.007) (0.003) Smaller groups vs. whole class -0.027 0.012 0.001 -0.022 0.006 0.002
(0.032) (0.012) (0.008) (0.033) (0.007) (0.003) Practice vs. instruction 0.005 -0.003 0.002 0.016 -0.002 -0.002
(0.028) (0.010) (0.008) (0.036) (0.007) (0.003) Group vs. individual work 0.090** -0.028** 0.023** 0.081* -0.028** -0.005*
(0.033) (0.011) (0.008) (0.037) (0.007) (0.002) Teacher guided learning 0.025 -0.003 -0.003 -0.027 -0.013+ -0.003
(0.035) (0.012) (0.008) (0.035) (0.008) (0.003)
Note: Point estimates and cluster (teacher !) corrected standard errors from several least-squares regressions, each with the same estimation sample of 253 teacher observations and 9,512 student-by-subject observations. All estimation details are the same as for Table 8-10 with these exceptions: The dependent variable—described in each column header—is a baseline characteristic of student " or student "’s classmates for subject #. The only controls are observer fixed effects, and time on “non-teaching work” for panel C. + indicates p<0.10, * 0.05, and ** 0.01

65
Table 8—Teaching effectiveness ratings and student test scores
Pooled Maths English (1) (2) (3)
(A) Overall effectiveness 0.061** 0.077** 0.040*
(0.014) (0.017) (0.019) (B)
Instruction 0.033+ 0.054* -0.028 (0.019) (0.025) (0.023)
Classroom environment 0.032+ 0.028 0.070** (0.017) (0.024) (0.023)
(C) Overall effectiveness 0.064** 0.078** 0.043*
(0.015) (0.017) (0.021) Instruction – environment -0.002 0.008 -0.029*
(0.010) (0.014) (0.012)
Note: Point estimates and cluster (teacher !) corrected standard errors from several least-squares regressions, each with the same estimation sample of 253 teacher observations and 9,512 student-by-subject observations. Each panel A-C reports estimates from two separate regressions, one in column 1 and a second in columns 2-3. The dependent variable is a test score for student " in subject # (maths or English) measured in student standard deviation units. The key independent variables—the rows in the table—are observation scores for student "’s teacher ! in subject #, where ! = !("#). Teacher scores are measured in teacher standard deviation units. The scores are rubric-based ratings of teacher !’s effectiveness. Teacher !’s scores do not vary across students but do vary across the observers ( who determined the scores. The data used to fit each regression are student " by teacher !(equivalently subject #) by observer (, but each "! pair is weighted equally, i.e., weighted 1/,! where ,! is the number of observers ( who scored teacher !. All specifications include observer ( fixed effects. All include controls for student "’s prior test scores in both subjects, gender, eligibility for free school meals, IDCACI score, and month of birth; the class mean and standard deviation of prior scores in both subjects; and indicator variables for subject, test year, and schools in London. When a covariate is missing, we fill it in with zero, and include an indicator = 1 for missing on the given characteristic. For each panel, columns 2-3 come from a single regression where all coefficients are allowed to differ by subject except observer effects. + indicates p<0.10, * 0.05, and ** 0.01
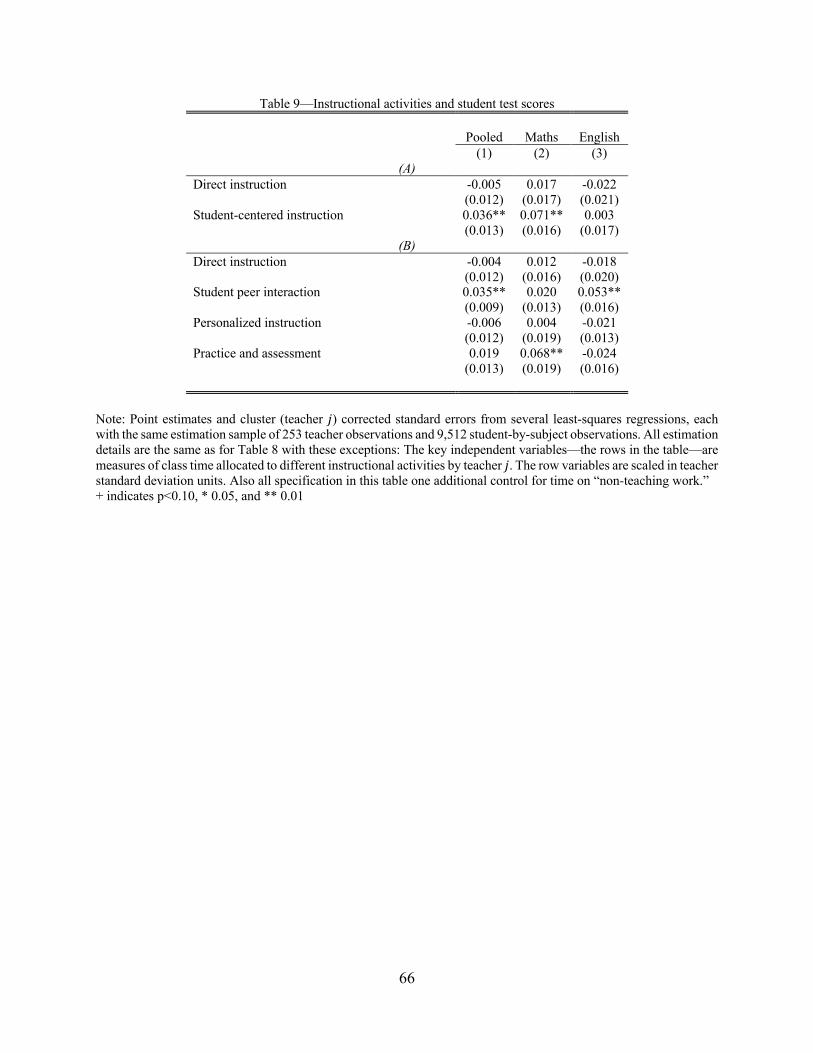
66
Table 9—Instructional activities and student test scores Pooled Maths English (1) (2) (3)
(A) Direct instruction -0.005 0.017 -0.022
(0.012) (0.017) (0.021) Student-centered instruction 0.036** 0.071** 0.003
(0.013) (0.016) (0.017) (B)
Direct instruction -0.004 0.012 -0.018 (0.012) (0.016) (0.020)
Student peer interaction 0.035** 0.020 0.053** (0.009) (0.013) (0.016)
Personalized instruction -0.006 0.004 -0.021 (0.012) (0.019) (0.013)
Practice and assessment 0.019 0.068** -0.024 (0.013) (0.019) (0.016)
Note: Point estimates and cluster (teacher !) corrected standard errors from several least-squares regressions, each with the same estimation sample of 253 teacher observations and 9,512 student-by-subject observations. All estimation details are the same as for Table 8 with these exceptions: The key independent variables—the rows in the table—are measures of class time allocated to different instructional activities by teacher !. The row variables are scaled in teacher standard deviation units. Also all specification in this table one additional control for time on “non-teaching work.” + indicates p<0.10, * 0.05, and ** 0.01

67
Table 10—Activities principal components and student test scores Pooled Maths English (1) (2) (3)
1. Student-teacher interaction 0.010 0.022 -0.009 More time where teacher and students are interacting (0.011) (0.020) (0.013)
2. “Smaller groups vs. whole class” 0.013 0.019 0.007 More time in individual and small group activities, less time in whole class activities
(0.010) (0.016) (0.012)
3. "Practice vs. instruction” 0.024** 0.038* 0.006 More time on student assessment and practice, less time on instruction, especially individualized instruction
(0.009) (0.016) (0.011)
4. “Group vs. individual work” 0.011 -0.014 0.047** More time where students are interacting with classmates, less time working alone or one-on-one with teacher
(0.010) (0.014) (0.011)
5. “Teacher guided learning” 0.019+ 0.048** 0.003 More time using the whiteboard and assisting students, less Time solo working and one-way lecturing.
(0.010) (0.014) (0.014)
Note: Point estimates and cluster (teacher !) corrected standard errors from several least-squares regressions, each with the same estimation sample of 253 teacher observations and 9,512 student-by-subject observations. All estimation details are the same as for Table 8 with these exceptions: The key independent variables—the rows in the table—are principal component scores derived from data on class time allocated to different instructional activities by teacher !. The row variables are scaled in teacher standard deviation units. + indicates p<0.10, * 0.05, and ** 0.01

68
Table 11—Activities and effectiveness measures simultaneously Maths (1) (2) (3) (4) (5)
Effectiveness ratings Instruction 0.054* 0.054* 0.048*
(0.025) (0.025) (0.024) Classroom environment 0.028 0.019 0.027
(0.024) (0.025) (0.024) Instructional activities groups Direct instruction 0.012 0.026+
(0.016) (0.016) Student peer interaction 0.020 0.004
(0.013) (0.014) Personalized instruction 0.004 0.006
(0.019) (0.019) Practice and assessment 0.068** 0.044*
(0.019) (0.019) Instructional activities principal components Student-teacher interaction 0.022 0.001
(0.020) (0.020) Smaller groups vs. whole class 0.019 0.009
(0.016) (0.015) Practice vs. instruction 0.038* 0.031+
(0.016) (0.018) Group vs. individual work -0.014 -0.019
(0.014) (0.014) Teacher guided learning 0.048** 0.041**
(0.014) (0.013)

69
Table 11 (continued)—Activities and effectiveness measures simultaneously English (6) (7) (8) (9) (10)
Effectiveness ratings Instruction -0.028 -0.007 -0.025
(0.023) (0.024) (0.023) Classroom environment 0.070** 0.046+ 0.073**
(0.023) (0.024) (0.024) Instructional activities groups Direct instruction -0.018 -0.006
(0.020) (0.019) Student peer interaction 0.053** 0.041**
(0.016) (0.016) Personalized instruction -0.021 -0.027*
(0.013) (0.013) Practice and assessment -0.024 -0.031+
(0.016) (0.017) Instructional activities principal components Student-teacher interaction -0.009 -0.021+
(0.013) (0.012) Smaller groups vs. whole class 0.007 -0.003
(0.012) (0.012) Practice vs. instruction 0.006 0.001
(0.011) (0.011) Group vs. individual work 0.047** 0.044**
(0.011) (0.011) Teacher guided learning 0.003 0.001
(0.014) (0.014)
Note: Point estimates and cluster (teacher !) corrected standard errors from several least-squares regressions, each with the same estimation sample of 253 teacher observations and 9,512 student-by-subject observations. Columns 1-3 and 6-8 simply repeat estimates from Tables 8-10 for convenience in comparisons. Columns 4 and 9 report estimates from one new specification, and columns 5 and 10 a second new specification. As shown above, the new specifications include both activity time use scores and effectiveness ratings simultaneously, otherwise all estimation details are the same as for Tables 8-10. + indicates p<0.10, * 0.05, and ** 0.01

70
Table 12—Differences by students’ prior test scores
Pooled Math English (1) (2) (3) (4) (5) (6)
Overall effectiveness 0.060** 0.074** 0.039* (0.014) (0.017) (0.019)
Overall effectiveness -0.027* -0.023* -0.030* -0.028+ -0.016 -0.008 * prior test score (0.011) (0.012) (0.015) (0.016) (0.015) (0.014)
Teacher fixed effects √ √ √
Note: Point estimates and cluster (teacher !) corrected standard errors from several least-squares regressions, each with the same estimation sample of 253 teacher observations and 9,512 student-by-subject observations. All estimation details are the same as for Table 8 panel A with these exceptions: We interact teacher !’s effectiveness score with student "’s prior test score in subject #, recall ! = !("#). In even numbered columns, we also include teacher ! fixed effects. + indicates p<0.10, * 0.05, and ** 0.01

71
Table 13: Teachers’ Standards: Guidance for school leaders, school staff and governing bodies

72
Table 14: Domain 1 (The Classroom Environment) and the links to the Teachers’ Standards
Table 15: Domain 2 (Teaching) and the links to the Teachers’ Standards
DOMAIN 1:THE CLASSROOM ENVIRONMENT Teachers' Standards Component Ineffective (1-3) Basic (4-6) Effective (7-9) Highly Effective (10-12)
1a Creating an Environment of Respect and Rapport
Classroom interactions, both between the teacher and students and among students, are negative, inappropriate, or insensitive to students’ cultural backgrounds, ages and developmental levels. Student interactions are characterised by sarcasm, put-downs, or conflict.
Classroom interactions, both between the teacher and students and among students, are generally appropriate and free from conflict, but may reflect occasional displays of insensitivity or lack of responsiveness to cultural or developmental differences among students.
Classroom interactions, both between teacher and students and among students, are polite and respectful, reflecting general warmth and caring, and are appropriate to the cultural and developmental differences among groups of students.
Classroom interactions, both between teacher and students and among students, are highly respectful, reflecting genuine warmth and caring and sensitivity to students’ cultures and levels of development. Students themselves ensure high levels of civility among members of the class.
Part 1 (1a) (5), Part 2
1b Establishing a Culture for Learning
The classroom environment conveys a negative culture for learning, characterised by low teacher commitment to the subject, low expectations for student achievement, and little or no student pride in work.
The teacher’s attempts to create a culture for learning are partially successful, with little teacher commitment to the subject, modest expectations for student achievement, and little student pride in work. Both teacher and students appear to be only “going through the motions.”
The classroom culture is characterised by high expectations for most students and genuine commitment to the subject by both teacher and students, with teacher demonstrating enthusiasm for the content and students demonstrating pride in their work.
High levels of student energy and teacher passion for the subject create a culture for learning in which everyone shares a belief in the importance of the subject and all students hold themselves to high standards of performance they have internalized.
Part 1 (1) (2)
1c Managing Classroom Procedures
Much teaching time is lost because of inefficient classroom routines and procedures for transitions, handling of supplies, and performance of non-teaching duties. Students not working with the teacher are not productively engaged in learning. Little evidence that students know or follow established routines.
Some teaching time is lost because classroom routines and procedures for transitions, handling of supplies, and performance of non-teaching duties are only partially effective. Students in some groups are productively engaged while unsupervised by the teacher.
Little teaching time is lost because of classroom routines and procedures for transitions, handling of supplies, and performance of non-teaching duties, which occur smoothly. Group work is well-organised and most students are productively engaged while working unsupervised.
Teaching time is maximised due to seamless and efficient classroom routines and procedures. Students contribute to the seamless operation of classroom routines and procedures for transitions, handling of supplies, and performance of non-instructional duties. Students in groups assume responsibility for productivity.
Part 1 (4) (7)
1d Managing Student Behaviour
There is no evidence that standards of conduct have been established, and there is little or no teacher monitoring of student behaviour. Response to student misbehaviour is repressive or disrespectful of student dignity.
It appears that the teacher has made an effort to establish standards of conduct for students. The teacher tries, with uneven results, to monitor student behaviour and respond to student misbehaviour.
Standards of conduct appear to be clear to students, and the teacher monitors student behaviour against those standards. The teacher response to student misbehaviour is consistent, proportionate, appropriate and respects the students’ dignity.
Standards of conduct are clear, with evidence of student participation in setting them. The teacher’s monitoring of student behaviour is subtle and preventive, and the teacher’s response to student misbehaviour is sensitive to individual student needs and respects students’ dignity. Students take an active role in monitoring the standards of behaviour.
Part 1 (1c), (7), Part 2
1e Organising Physical Space
The physical environment is unsafe, or some students don’t have access to learning. There is poor alignment between the physical arrangement of furniture and resources and the lesson activities.
The classroom is safe, and essential learning is accessible to most students; the teacher’s use of physical resources, including computer technology, is moderately effective. The teacher may attempt to modify the physical arrangement to suit learning activities, with limited effectiveness.
The classroom is safe, and learning is accessible to all students; the teacher ensures that the physical arrangement is appropriate for the learning activities. The teacher makes effective use of physical resources, including computer technology.
The classroom is safe, and the physical environment ensures the learning of all students, including those with special needs. Students contribute to the use or adaptation of the physical environment to advance learning. Technology is used skilfully, as appropriate to the lesson.
Part 1 (7)
DOMAIN 2: TEACHING Teachers' Standards Component Ineffective (1-3) Basic (4-6) Effective (7-9) Highly Effective (10-12)
2a Communicating with Students
Expectations for learning, directions and procedures,
and explanations of content are unclear or confusing to
students. The teacher’s written or spoken language
contains errors or is inappropriate for students’
cultures or levels of development.
Expectations for learning, directions and procedures, and
explanations of content are clarified after initial confusion;
the teacher’s written or spoken language is correct but may
not be completely appropriate for students’ cultures or
levels of development.
Expectations for learning, directions and procedures, and
explanations of content are clear to students. Communications are
accurate as well as appropriate for students’ cultures and levels of
development. The teacher’s explanation of content is scaffolded,
clear, and accurate and connects with students’ knowledge and
experience. During the explanation of content, the teacher focuses,
as appropriate, on strategies students can use when working
independently and invites student intellectual engagement.
Expectations for learning, directions and procedures, and explanations of content are
clear to students. The teacher links the instructional purpose of the lesson to the wider
curriculum. The teacher’s oral and written communication is clear and expressive,
appropriate to students’ cultures and levels of development, and anticipates possible
student misconceptions. The teacher’s explanation of content is thorough and clear,
developing conceptual understanding through clear scaffolding and connecting with
students’ interests. Students contribute to extending the content by explaining concepts
to their peers and suggesting strategies that might be used.
Part 1 (1) (5)
2b Using Questioning and Discussion
Techniques
The teacher’s questions are of low cognitive challenge
or inappropriate, eliciting limited student participation,
and recitation rather than discussion. A few students
dominate the discussion.
Some of the teacher’s questions elicit a thoughtful response,
but most are low-level, posed in rapid succession. The
teacher’s attempts to engage all students in the discussion
are only partially successful.
Most of the teacher’s questions elicit a thoughtful response, and the
teacher allows sufficient time for students to answer. All students
participate in the discussion, with the teacher stepping aside when
appropriate.
Questions reflect high expectations and are culturally and developmentally appropriate.
Students formulate many of the high-level questions and ensure that all voices are heard.Part 1(2) (4) (5a)
2c Engaging Students in Learning
Activities and assignments, materials, and groupings of
students are inappropriate for the learning outcomes
or students’ cultures or levels of understanding,
resulting in little intellectual engagement. The lesson
has no clearly defined structure or is poorly paced.
Activities and assignments, materials, and groupings of
students are partially appropriate for the learning outcomes
or students’ cultures or levels of understanding, resulting in
moderate intellectual engagement. The lesson has a
recognisable structure but is not fully maintained and is
marked by inconsistent pacing.
Activities and assignments, materials, and groupings of students are
fully appropriate for the learning outcomes and students’ cultures
and levels of understanding. All students are engaged in work of a
high level of rigour. The lesson’s structure is coherent, with
appropriate pace.
Students, throughout the lesson, are highly intellectually engaged in significant learning
and make material contributions to the activities, student groupings, and materials. The
lesson is adapted as needed to the needs of individuals, and the structure and pacing
allow for student reflection and closure.
Part 1 (1) (2)
2d Use of Assessment
Assessment is not used in teaching, either through
monitoring of progress by the teacher or students, or
adequate feedback to students. Students are not aware
of the assessment criteria used to evaluate their work,
nor do they engage in self- or peer-assessment. .
Assessment is occasionally used in teaching, through some
monitoring of progress of learning by the teacher and/or
students. Feedback to students is uneven, and students are
aware of only some of the assessment criteria used to
evaluate their work. Students occasionally assess their own
or their peers’ work.
Assessment is regularly used in teaching, through self- or peer-
assessment by students, monitoring of progress of learning by the
teacher and/or students, and high-quality feedback to students.
Students are fully aware of the assessment criteria used to evaluate
their work and frequently do so.
Assessment is used in a sophisticated manner in teaching, through student involvement
in establishing the assessment criteria, self-or peer assessment by students, monitoring
of progress by both students and the teacher, and high-quality feedback to students
from a variety of sources. Students use self-assessment and monitoring to direct their
own learning.
Part 1 (6)
2e Demonstrating Flexibility and
Responsiveness
The teacher adheres to the lesson plan, even when a
change would improve the lesson or address students’
lack of interest. The teacher brushes aside student
questions; when students experience difficulty, the
teacher blames the students or their home
environment.
The teacher attempts to modify the lesson when needed and
to respond to student questions, with moderate success. The
teacher accepts responsibility for student success but has
only a limited repertoire of strategies to draw upon.
The teacher promotes the successful learning of all students, making
adjustments as needed to lesson plans and accommodating student
questions, needs, and interests.
The teacher seizes an opportunity to enhance learning, building on a spontaneous event
or student interests, or successfully adjusts and differentiates instruction to address
individual student misunderstandings. The teacher ensures the success of all students by
using an extensive repertoire of teaching strategies and soliciting additional resources
from the school or community. .
Part 1 (1) (2) (5)(4d)

73
Appendix A: Additional figures and tables
(A) Maths
(B) English
Appendix Figure A1—Frequency of observed instructional activities, by subject Note: For each activity, the red (left) bar is the proportion of classes where there was “none” or “very little” of the activity. The blue (right) bar is the proportion of classes where the activity was occurring “most of the time” or “full time.” The grey (middle) bar is the “some of the time.” Panel A is for maths classes, and the proportions are of 1,510 observations, each the visit of a peer observer ( to the class of a maths teacher !. Panel B is for English classes and based on 1,177 observations.

74
Appendix Figure A2: Ranking the components of Domain 1
Appendix Figure A3: Ranking the components of Domain 2
00.5
11.5
22.5
33.5
44.5
5
Creating anenvironment of
respect &rapport
Establishing aculture oflearning
Managingclassroom
procedures
Managingstudent
behaviour
Organizingphysical space
Maths
Higher performing Lower performing Mixed ability
00.5
11.5
22.5
33.5
44.5
5
Communicatingwith students
Usingquestioning and
discussiontechniques
Engagingstudents in
learning
Use ofassessment
Demonstratingflexibility and
responsiveness
Maths
Higher performing Lower performing Mixed ability
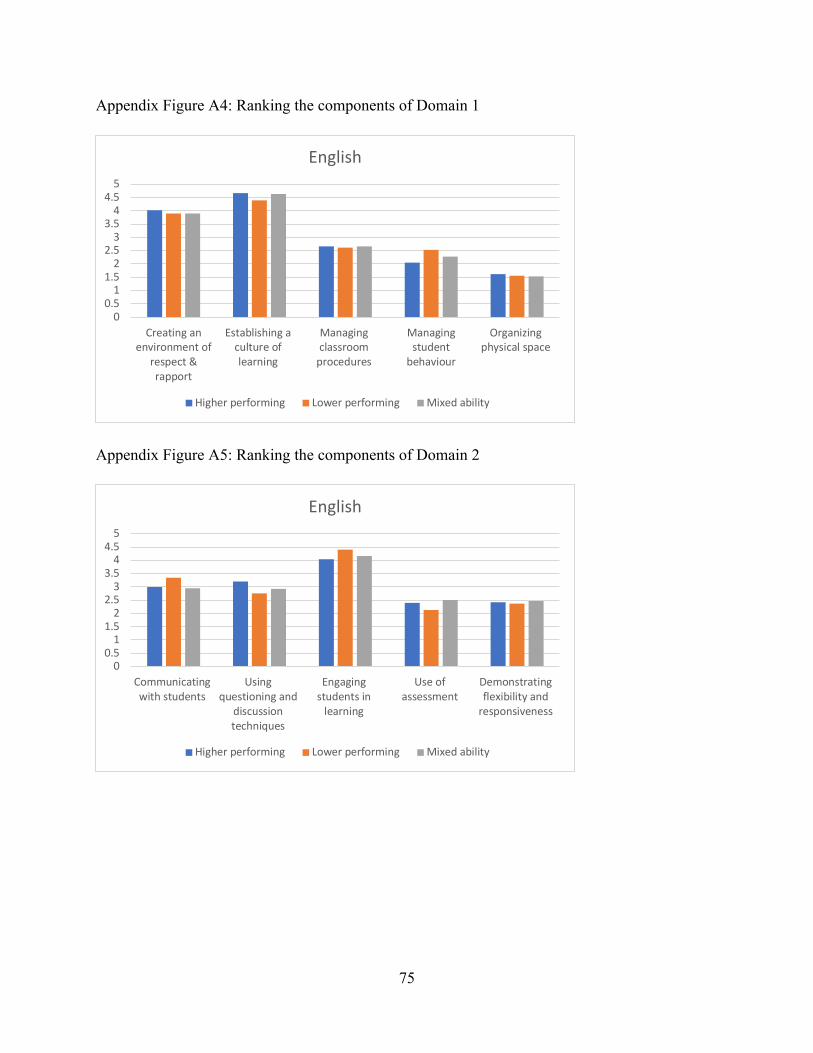
75
Appendix Figure A4: Ranking the components of Domain 1
Appendix Figure A5: Ranking the components of Domain 2
00.5
11.5
22.5
33.5
44.5
5
Creating anenvironment of
respect &rapport
Establishing aculture oflearning
Managingclassroom
procedures
Managingstudent
behaviour
Organizingphysical space
English
Higher performing Lower performing Mixed ability
00.5
11.5
22.5
33.5
44.5
5
Communicatingwith students
Usingquestioning and
discussiontechniques
Engagingstudents in
learning
Use ofassessment
Demonstratingflexibility and
responsiveness
English
Higher performing Lower performing Mixed ability

76
Appendix Table A1—Principal components of activities in original units
(A) Principal components estimates Component 1 2 3 4 5 (1) (2) (3) (4) (4)
Weight in component 1. Open discussion among children and teacher 0.21 0.23 0.57 0.10 -0.09 2. Children are working in groups 0.22 0.34 0.11 0.51 -0.30 3. One to one teaching 0.27 0.35 -0.13 -0.01 0.56 4. Spending special time to assist weak students 0.30 0.38 0.06 -0.05 0.45 5. Children are doing written work alone 0.28 0.04 -0.35 -0.58 -0.05 6. Gauging student understanding 0.29 0.22 0.22 -0.38 -0.41 7. Assigning homework or class work to children 0.38 -0.01 -0.15 0.01 -0.29 8. Lecturing or dictation 0.27 -0.46 0.10 0.09 0.18 9. Children copying from the whiteboard 0.32 -0.42 0.13 0.16 0.19 10. Use of white board by teacher 0.25 -0.33 0.44 -0.28 0.06 11. Using a textbook during teaching activities 0.32 -0.12 -0.29 0.36 -0.02 12. Engaged in non-teaching work 0.33 -0.08 -0.37 0.09 -0.23
Eigenvalue 3.29 1.51 1.14 1.06 1.02 Proportion of variation explained 0.27 0.13 0.10 0.09 0.08
(B) Predicting student test scores
Pooled Maths English (1) (2) (3)
Component #1 0.026+ 0.062** 0.002 (0.013) (0.020) (0.019)
Component #2 0.017+ 0.018 -0.001 (0.009) (0.012) (0.015)
Component #3 0.022* 0.026 0.007 (0.011) (0.017) (0.011)
Component #4 -0.004 -0.040** 0.047** (0.010) (0.013) (0.015)
Component #5 -0.027** -0.031+ -0.035** (0.010) (0.017) (0.012)
Note: Panel A: Principal component analysis of class time use among twelve instructional activities, using a sample of 2,687observations. The details of estimation are identical to Table 4 except that here we do not rescale the data and instead use item scores in the original units.
Panel B: Point estimates and cluster (teacher !) corrected standard errors from several least-squares regressions, each with the same estimation sample of 253 teacher observations and 9,512 student-by-subject observations. All estimation details are the same as for Table 10 with these exceptions: The key independent variables—the rows in the table—are principal component scores from the analysis in Panel A using time use scores in original units. + indicates p<0.10, * 0.05, and ** 0.01

77
Appendix Table A2—Principal components of effectiveness ratings
Original units Net of observer
fixed effects Component Component 1 2 1 2 (1) (2) (3) (4)
Weight in component 1a. Creating an environment of respect and rapport 0.33 -0.27 0.33 -0.28 1b. Establishing a culture for learning 0.33 -0.23 0.34 -0.25 1c. Managing classroom procedures 0.32 -0.34 0.32 -0.37 1d. Managing student behaviour 0.32 -0.37 0.32 -0.38 1e. Organising physical space 0.29 -0.30 0.27 -0.20 2a. Communicating with students 0.33 0.16 0.33 0.18 2b. Using questioning and discussion techniques 0.30 0.44 0.30 0.44 2c. Engaging students in learning 0.33 0.22 0.33 0.21 2d. Use of assessment 0.30 0.39 0.29 0.41 2e. Demonstrating flexibility and responsiveness 0.31 0.33 0.31 0.32
Eigenvalue 7.43 0.69 6.60 0.78 Proportion of variation explained 0.74 0.07 0.66 0.08
Note: Principal component analysis of rubric-based effectiveness ratings among ten practices or skills, using a sample of 2,687observations. Each of the 2,687observations is the visit of a peer observer ( to the class of teacher !. Observers rated effectiveness on a 1-12 scale: 1-3 ineffective, 4-6 basic, 7-9 effective, and 10-12 highly effective. The main body of the table reports the component loadings, where loadings are the weights given to each item (rows) in calculating the score for a given component (columns). Columns 1-2 report components 1-2 using unadjusted effectiveness ratings, as recorded by observer (. Columns 3-4 report components 1-2 using effectiveness ratings net of observer fixed effects. For columns 3-4, before the principal component analysis, we first calculate observer (’s mean for each item and subtract that mean from all scores ( assigned for that item.

78
Appendix Table A3—Correlations among observation measures
(1) (2) (3) (4) (5) (6) (7) (8) (9) (10) (11) (12)
1. Overall average 1 2. Instruction 0.95 1 3. Classroom environment 0.95 0.80 1
4. Direct instruction -0.09 -0.12 -0.06 1 5. Student-centered instruction 0.10 0.10 0.09 0.33 1 6. Student peer interaction 0.12 0.14 0.09 0.15 0.66 1 7. Personalized instruction -0.04 -0.03 -0.04 0.19 0.70 0.30 1 8. Practice and assessment 0.12 0.10 0.12 0.35 0.81 0.26 0.33 1
9. Student-teacher interaction 0.13 0.15 0.08 -0.42 -0.20 0.13 -0.15 -0.34 1 10. Smaller groups vs. whole class 0.06 0.09 0.04 -0.51 0.35 0.16 0.34 0.27 0.02 1 11. Practice vs. instruction 0.11 0.10 0.10 0.03 0.07 0.01 -0.51 0.45 -0.00 0.01 1 12. Group vs. individual work -0.03 -0.01 -0.04 0.00 0.04 0.52 -0.15 -0.18 -0.01 0.01 0.01 1 13. Teacher guided learning 0.07 0.08 0.05 0.25 0.15 0.01 0.19 0.13 -0.00 -0.03 -0.00 0.00
Note: Correlations among the several composite scores, using a sample of 2,687observations. See the text for definitions of each composite score.

79
Appendix Table A4—Student characteristics and observation scores Pooled
Prior test
score
Class st.dev. prior test
score Female Month of birth
Ever free school meals
IDACI score
(1) (2) (3) (4) (5) (6) (A)
Overall effectiveness 0.063* -0.002 0.008 0.023 -0.007 -0.003 (0.027) (0.012) (0.008) (0.031) (0.007) (0.002)
(B) Instruction 0.105* -0.011 -0.002 0.057 -0.020* -0.002
(0.046) (0.018) (0.011) (0.040) (0.010) (0.003) Classroom environment -0.042 0.008 0.009 -0.022 0.013 0.001
(0.040) (0.019) (0.010) (0.040) (0.010) (0.003) (C)
Direct instruction 0.013 0.001 -0.008 -0.023 -0.003 -0.006** (0.029) (0.014) (0.007) (0.032) (0.007) (0.002)
Student peer interaction 0.040+ -0.012 0.009 0.019 -0.006 0.001 (0.023) (0.010) (0.006) (0.026) (0.005) (0.001)
Personalized instruction -0.048+ 0.015 -0.006 0.045 0.007 0.000 (0.025) (0.014) (0.006) (0.032) (0.006) (0.002)
Practice and assessment -0.003 0.021 -0.010 -0.015 -0.011 -0.002 (0.028) (0.013) (0.006) (0.032) (0.009) (0.002)
(D) Student-teacher interaction 0.015 -0.007 -0.002 0.048+ 0.005 0.003
(0.024) (0.010) (0.006) (0.028) (0.006) (0.002) Smaller groups vs. whole class -0.023 0.003 0.006 0.025 0.002 0.003*
(0.023) (0.010) (0.006) (0.024) (0.006) (0.002) Practice vs. instruction 0.011 -0.009 -0.003 -0.025 -0.006 -0.001
(0.019) (0.009) (0.005) (0.025) (0.006) (0.002) Group vs. individual work 0.063** -0.018+ 0.013* 0.021 -0.013* -0.002
(0.022) (0.010) (0.005) (0.025) (0.005) (0.002) Teacher guided learning 0.030 -0.012 -0.003 0.006 -0.011+ -0.003+
(0.025) (0.010) (0.006) (0.026) (0.006) (0.002)
Note: Point estimates and cluster (teacher !) corrected standard errors from several least-squares regressions, each with the same estimation sample of 253 teacher observations and 9,512 student-by-subject observations. All estimation details are the same as for Table 8-10 with these exceptions: The dependent variable—described in each column header—is a baseline characteristic of student " or student "’s classmates for subject #. The only controls are observer fixed effects, and time on “non-teaching work” for panel C. + indicates p<0.10, * 0.05, and ** 0.01

80
Appendix Table A5—Robustness Maths English (1) (2) (3) (4) (5) (6) (7) (8)
(A) Overall effectiveness 0.117** 0.026** 0.050** 0.071** 0.077** 0.026* 0.020 0.027
(0.024) (0.010) (0.013) (0.017) (0.026) (0.010) (0.016) (0.025) (B)
Instruction 0.139** 0.005 0.046* 0.067* 0.001 -0.023+ -0.027 -0.045 (0.035) (0.013) (0.022) (0.028) (0.033) (0.013) (0.018) (0.030)
Classroom environment -0.017 0.024+ 0.008 0.007 0.080* 0.051** 0.050* 0.071* (0.030) (0.013) (0.020) (0.027) (0.035) (0.015) (0.019) (0.027)
(C) Direct instruction 0.020 0.006 0.007 0.013 -0.009 -0.024+ -0.009 0.001
(0.025) (0.007) (0.013) (0.017) (0.027) (0.013) (0.015) (0.021) Student peer interaction 0.022 0.007 0.007 0.025+ 0.080** 0.028** 0.050** 0.040**
(0.016) (0.006) (0.011) (0.013) (0.019) (0.009) (0.015) (0.015) Personalized instruction -0.003 0.003 -0.005 0.007 -0.043* -0.011 -0.023* -0.023
(0.023) (0.008) (0.014) (0.021) (0.021) (0.009) (0.011) (0.014) Practice and assessment 0.059* 0.023** 0.038* 0.052* -0.015 -0.015 -0.012 -0.011
(0.027) (0.008) (0.015) (0.021) (0.021) (0.011) (0.012) (0.018) (D)
Student-teacher interaction 0.014 0.013 0.010 0.021 -0.010 0.012 -0.018+ -0.027* (0.026) (0.009) (0.018) (0.020) (0.017) (0.008) (0.010) (0.013)
Smaller groups vs. 0.018 0.007 0.012 0.016 -0.001 0.006 0.010 0.005 whole class (0.023) (0.006) (0.012) (0.018) (0.018) (0.007) (0.011) (0.012) Practice vs. instruction 0.043+ 0.008 0.027* 0.038* 0.005 0.007 0.006 0.016
(0.022) (0.006) (0.012) (0.018) (0.015) (0.006) (0.008) (0.011) Group vs. individual work 0.000 0.001 -0.014 -0.010 0.077** 0.022** 0.044** 0.040**
(0.018) (0.008) (0.013) (0.015) (0.017) (0.006) (0.010) (0.011) Teacher guided learning 0.069** 0.019** 0.038** 0.033* 0.013 0.002 0.003 0.028*
(0.022) (0.007) (0.013) (0.014) (0.018) (0.009) (0.010) (0.014)
Student controls √ √ √ √ √ √ Student fixed effects √ √ Peer controls √ √ √ √ √ √ Observer fixed effects √ √ √ √ Observer-by-subject fixed effects √ √ School fixed effects √ √
Note: Point estimates and cluster (teacher !) corrected standard errors from several least-squares regressions, each with the same estimation sample of 253 teacher observations and 9,512 student-by-subject observations. All estimation details are the same as for Table 8-10 except with the variations indicated at the bottom of the table. + indicates p<0.10, * 0.05, and ** 0.01

81
Appendix Table A6—Differences by students’ prior test scores
Pooled Math English (1) (2) (3) (4) (5) (6)
(A) Overall effectiveness 0.060** 0.074** 0.039*
(0.014) (0.017) (0.019) Overall effectiveness -0.027* -0.023* -0.030* -0.028+ -0.016 -0.008 * prior test score (0.011) (0.012) (0.015) (0.016) (0.015) (0.014)
(B) Instruction 0.028 0.049* -0.031
(0.018) (0.024) (0.022) Instruction -0.023 -0.011 -0.031 -0.015 0.001 -0.006 * prior test score (0.023) (0.023) (0.031) (0.032) (0.019) (0.018) Classroom environment 0.037* 0.029 0.074**
(0.018) (0.024) (0.023) Classroom environment -0.008 -0.016 -0.001 -0.016 -0.023 -0.007 * prior test score (0.023) (0.023) (0.030) (0.031) (0.023) (0.021)
(C) Overall effectiveness 0.063** 0.074** 0.043*
(0.015) (0.017) (0.021) Overall effectiveness -0.030** -0.027* -0.030* -0.030+ -0.023 -0.014 * prior test score (0.011) (0.012) (0.015) (0.016) (0.015) (0.014) Instruction - environment -0.005 0.006 -0.032**
(0.010) (0.013) (0.012) Instruction - environment -0.004 0.002 -0.009 0.001 0.007 0.000 * prior test score (0.014) (0.013) (0.018) (0.018) (0.012) (0.011)
Teacher fixed effects √ √ √

82
Appendix Table A6 (continued)—Differences by students’ prior test scores Pooled Math English (1) (2) (3) (4) (5) (6)
(D) Direct instruction -0.003 0.013 -0.017
(0.012) (0.015) (0.020) Direct instruction -0.008 -0.002 -0.025 -0.012 0.001 0.002 * prior test score (0.011) (0.011) (0.016) (0.016) (0.015) (0.012) Student peer interaction 0.034** 0.019 0.053**
(0.010) (0.014) (0.016) Student peer interaction -0.001 -0.006 0.002 0.001 -0.001 -0.006 * prior test score (0.013) (0.014) (0.020) (0.022) (0.013) (0.012) Personalized instruction -0.004 0.006 -0.022
(0.012) (0.019) (0.014) Personalized instruction -0.005 -0.010 -0.008 -0.009 -0.001 -0.006 * prior test score (0.013) (0.014) (0.021) (0.023) (0.016) (0.015) Practice and assessment 0.020 0.070** -0.024
(0.014) (0.019) (0.016) Practice and assessment -0.009 -0.007 -0.025 -0.026 0.005 0.004 * prior test score (0.014) (0.015) (0.023) (0.025) (0.014) (0.014)
(E) Student-teacher interaction 0.009 0.025 -0.008
(0.011) (0.019) (0.013) Student-teacher interaction 0.001 -0.003 0.029 0.014 -0.013 -0.010 * prior test score (0.013) (0.013) (0.024) (0.024) (0.010) (0.009) Smaller groups vs. whole class 0.013 0.019 0.007
(0.010) (0.015) (0.012) Smaller groups vs. whole class -0.003 -0.007 -0.001 -0.008 -0.001 -0.005 * prior test score (0.010) (0.010) (0.014) (0.015) (0.014) (0.014) Practice vs. instruction 0.024* 0.038* 0.006
(0.009) (0.016) (0.010) Practice vs. instruction -0.001 0.003 -0.008 -0.008 0.005 0.008 * prior test score (0.011) (0.011) (0.020) (0.022) (0.012) (0.011) Group vs. individual work 0.011 -0.012 0.048**
(0.010) (0.016) (0.011) Group vs. individual work -0.004 -0.006 0.005 -0.004 -0.001 -0.001 * prior test score (0.011) (0.012) (0.023) (0.026) (0.010) (0.011) Teacher guided learning 0.019+ 0.048** 0.002
(0.010) (0.014) (0.014) Teacher guided learning -0.003 -0.003 0.003 0.000 -0.014 -0.007 * prior test score (0.011) (0.012) (0.021) (0.024) (0.010) (0.009)
Teacher fixed effects √ √ √
Note: Point estimates and cluster (teacher !) corrected standard errors from several least-squares regressions, each with the same estimation sample of 253 teacher observations and 9,512 student-by-subject observations. All estimation details are the same as for corresponding estimates in Tables 8-10 with these exceptions: We interact each score for teacher !—the odd rows above—with student "’s prior test score in subject #, recall ! = !("#). In even numbered columns, we also include teacher ! fixed effects. + indicates p<0.10, * 0.05, and ** 0.01

83
Appendix Table A7 Mean Rank allocated to activities for High and Low Performing Students in terms of determining test scores
Appendix Table A8: Mean Rank allocated to activities in terms of determining student motivation and peer relations
Lecturing or dictation
Open discussion
One to one teaching
Spending special time to assist low attaining students
Gauging student understanding (e.g. through written or oral formative assessement)
Assigning homework or class work to children
High performing students (Mean Rank) 5.03 1.64 3.28 4.36 2.08 4.62
95% CI (4.66-5.39) (1.39-1.89) (2.97-3.60) (3.95-4.77) (1.72-2.44) (4.23-5)
Low performing students (Mean Rank) 5.38 2.97 3.11 3.00 1.84 4.70
95% CI (5.04-5.71) (2.5-3.44) (2.73-3.49) (2.61-3.39) (1.52-2.16) (4.27-5.13)
Lecturing or dictation
Open discussion among children and teacher
One to one teaching
Spending special time to assist weak students
Assigning homework or class work to children
Children working in groups
Children doing written work alone
Motivation Mean Rank 5.8 1.63 3.09 3.63 5.49 2.3 5.73
95% CI (5.39-6.21) (1.33-1.93) (2.72-3.46) (3.28-3.98) (5.11-5.87) (1.94-2.66) (5.36-6.10)
Peer Relations Mean Rank 5.69 1.63 4.2 3.93 4.95 1.55 5.85
95% CI (5.26-6.12) (1.43-1.83) (3.85-4.55) (3.54-4.32) (4.55-5.35) (1.37-1.73) (5.45-6.25)
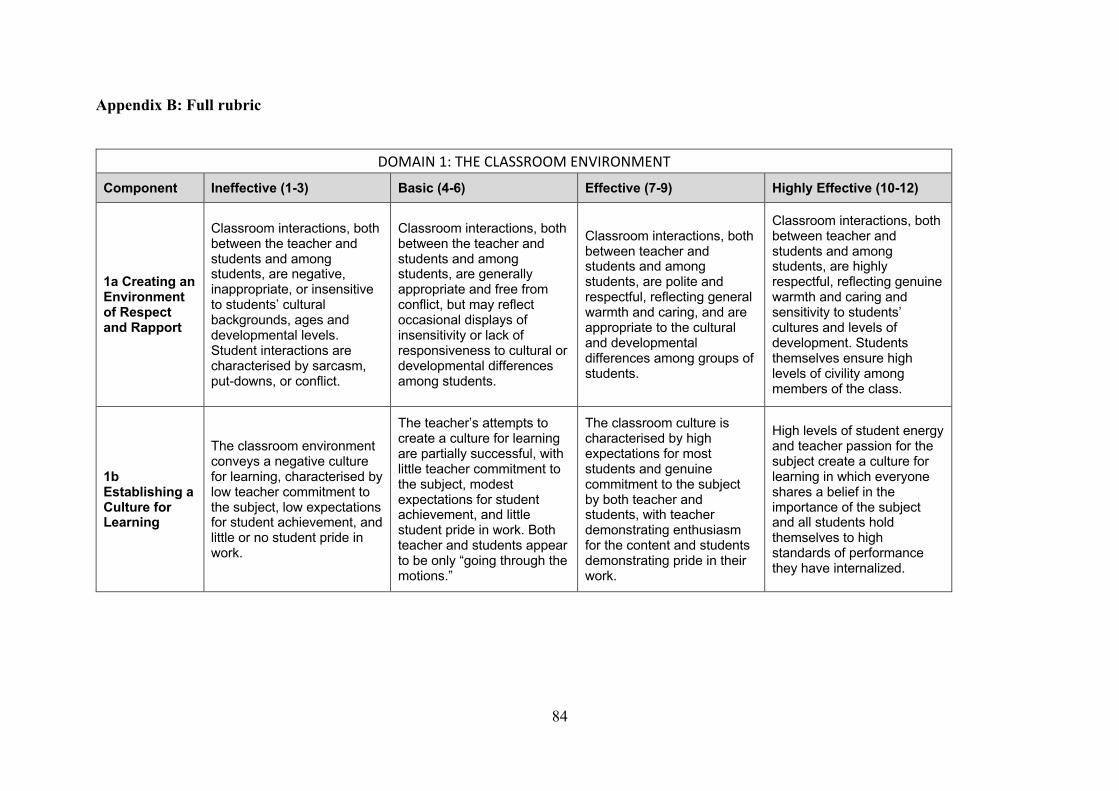
84
Appendix B: Full rubric
DOMAIN 1: THE CLASSROOM ENVIRONMENT
Component Ineffective (1-3) Basic (4-6) Effective (7-9) Highly Effective (10-12)
1a Creating an Environment of Respect and Rapport
Classroom interactions, both between the teacher and students and among students, are negative, inappropriate, or insensitive to students’ cultural backgrounds, ages and developmental levels. Student interactions are characterised by sarcasm, put-downs, or conflict.
Classroom interactions, both between the teacher and students and among students, are generally appropriate and free from conflict, but may reflect occasional displays of insensitivity or lack of responsiveness to cultural or developmental differences among students.
Classroom interactions, both between teacher and students and among students, are polite and respectful, reflecting general warmth and caring, and are appropriate to the cultural and developmental differences among groups of students.
Classroom interactions, both between teacher and students and among students, are highly respectful, reflecting genuine warmth and caring and sensitivity to students’ cultures and levels of development. Students themselves ensure high levels of civility among members of the class.
1b Establishing a Culture for Learning
The classroom environment conveys a negative culture for learning, characterised by low teacher commitment to the subject, low expectations for student achievement, and little or no student pride in work.
The teacher’s attempts to create a culture for learning are partially successful, with little teacher commitment to the subject, modest expectations for student achievement, and little student pride in work. Both teacher and students appear to be only “going through the motions.”
The classroom culture is characterised by high expectations for most students and genuine commitment to the subject by both teacher and students, with teacher demonstrating enthusiasm for the content and students demonstrating pride in their work.
High levels of student energy and teacher passion for the subject create a culture for learning in which everyone shares a belief in the importance of the subject and all students hold themselves to high standards of performance they have internalized.

85
DOMAIN 1: THE CLASSROOM ENVIRONMENT (cont.)
Component Ineffective (1-3) Basic (4-6) Effective (7-9) Highly Effective (10-12)
1c Managing Classroom Procedures
Much teaching time is lost because of inefficient classroom routines and procedures for transitions, handling of supplies, and performance of non-teaching duties. Students not working with the teacher are not productively engaged in learning. Little evidence that students know or follow established routines.
Some teaching time is lost because classroom routines and procedures for transitions, handling of supplies, and performance of non-teaching duties are only partially effective. Students in some groups are productively engaged while unsupervised by the teacher.
Little teaching time is lost because of classroom routines and procedures for transitions, handling of supplies, and performance of non-teaching duties, which occur smoothly. Group work is well-organised and most students are productively engaged while working unsupervised.
Teaching time is maximised due to seamless and efficient classroom routines and procedures. Students contribute to the seamless operation of classroom routines and procedures for transitions, handling of supplies, and performance of non-instructional duties. Students in groups assume responsibility for productivity.
1d Managing Student Behaviour
There is no evidence that standards of conduct have been established, and there is little or no teacher monitoring of student behaviour. Response to student misbehaviour is repressive or disrespectful of student dignity.
It appears that the teacher has made an effort to establish standards of conduct for students. The teacher tries, with uneven results, to monitor student behaviour and respond to student misbehaviour.
Standards of conduct appear to be clear to students, and the teacher monitors student behaviour against those standards. The teacher response to student misbehaviour is consistent, proportionate, appropriate and respects the students’ dignity.
Standards of conduct are clear, with evidence of student participation in setting them. The teacher’s monitoring of student behaviour is subtle and preventive, and the teacher’s response to student misbehaviour is sensitive to individual student needs and respects students’ dignity. Students take an active role in monitoring the standards of behaviour.

86
DOMAIN 1: THE CLASSROOM ENVIRONMENT (cont.)
Component Ineffective (1-3) Basic (4-6) Effective (7-9) Highly Effective (10-12)
1e Organising Physical Space
The physical environment is unsafe, or some students don’t have access to learning. There is poor alignment between the physical arrangement of furniture and resources and the lesson activities.
The classroom is safe, and essential learning is accessible to most students; the teacher’s use of physical resources, including computer technology, is moderately effective. The teacher may attempt to modify the physical arrangement to suit learning activities, with limited effectiveness.
The classroom is safe, and learning is accessible to all students; the teacher ensures that the physical arrangement is appropriate for the learning activities. The teacher makes effective use of physical resources, including computer technology.
The classroom is safe, and the physical environment ensures the learning of all students, including those with special needs. Students contribute to the use or adaptation of the physical environment to advance learning. Technology is used skilfully, as appropriate to the lesson.

87
DOMAIN 2: TEACHING
Component Ineffective (1-3) Basic (4-6) Effective (7-9) Highly Effective (10-12)
2a Communicating with Students
Expectations for learning, directions and procedures, and explanations of content are unclear or confusing to students. The teacher’s written or spoken language contains errors or is inappropriate for students’ cultures or levels of development.
Expectations for learning, directions and procedures, and explanations of content are clarified after initial confusion; the teacher’s written or spoken language is correct but may not be completely appropriate for students’ cultures or levels of development.
Expectations for learning, directions and procedures, and explanations of content are clear to students. Communications are accurate as well as appropriate for students’ cultures and levels of development. The teacher’s explanation of content is scaffolded, clear, and accurate and connects with students’ knowledge and experience. During the explanation of content, the teacher focuses, as appropriate, on strategies students can use when working independently and invites student intellectual engagement.
Expectations for learning, directions and procedures, and explanations of content are clear to students. The teacher links the instructional purpose of the lesson to the wider curriculum. The teacher’s oral and written communication is clear and expressive, appropriate to students’ cultures and levels of development, and anticipates possible student misconceptions. The teacher’s explanation of content is thorough and clear, developing conceptual understanding through clear scaffolding and connecting with students’ interests. Students contribute to extending the content by explaining concepts to their peers and suggesting strategies that might be used.
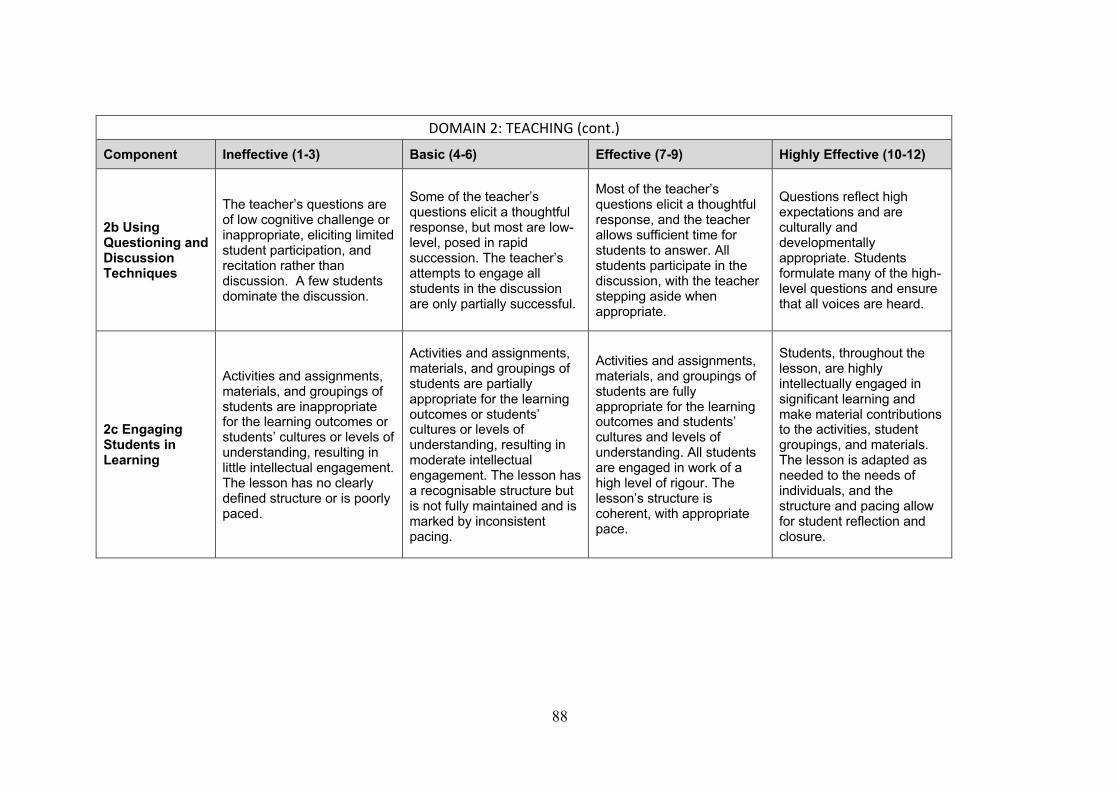
88
DOMAIN 2: TEACHING (cont.)
Component Ineffective (1-3) Basic (4-6) Effective (7-9) Highly Effective (10-12)
2b Using Questioning and Discussion Techniques
The teacher’s questions are of low cognitive challenge or inappropriate, eliciting limited student participation, and recitation rather than discussion. A few students dominate the discussion.
Some of the teacher’s questions elicit a thoughtful response, but most are low-level, posed in rapid succession. The teacher’s attempts to engage all students in the discussion are only partially successful.
Most of the teacher’s questions elicit a thoughtful response, and the teacher allows sufficient time for students to answer. All students participate in the discussion, with the teacher stepping aside when appropriate.
Questions reflect high expectations and are culturally and developmentally appropriate. Students formulate many of the high-level questions and ensure that all voices are heard.
2c Engaging Students in Learning
Activities and assignments, materials, and groupings of students are inappropriate for the learning outcomes or students’ cultures or levels of understanding, resulting in little intellectual engagement. The lesson has no clearly defined structure or is poorly paced.
Activities and assignments, materials, and groupings of students are partially appropriate for the learning outcomes or students’ cultures or levels of understanding, resulting in moderate intellectual engagement. The lesson has a recognisable structure but is not fully maintained and is marked by inconsistent pacing.
Activities and assignments, materials, and groupings of students are fully appropriate for the learning outcomes and students’ cultures and levels of understanding. All students are engaged in work of a high level of rigour. The lesson’s structure is coherent, with appropriate pace.
Students, throughout the lesson, are highly intellectually engaged in significant learning and make material contributions to the activities, student groupings, and materials. The lesson is adapted as needed to the needs of individuals, and the structure and pacing allow for student reflection and closure.

89
DOMAIN 2: TEACHING (cont.)
Component Ineffective (1-3) Basic (4-6) Effective (7-9) Highly Effective (10-12)
2d Use of Assessment
Assessment is not used in teaching, either through monitoring of progress by the teacher or students, or adequate feedback to students. Students are not aware of the assessment criteria used to evaluate their work, nor do they engage in self- or peer-assessment. .
Assessment is occasionally used in teaching, through some monitoring of progress of learning by the teacher and/or students. Feedback to students is uneven, and students are aware of only some of the assessment criteria used to evaluate their work. Students occasionally assess their own or their peers’ work.
Assessment is regularly used in teaching, through self- or peer-assessment by students, monitoring of progress of learning by the teacher and/or students, and high-quality feedback to students. Students are fully aware of the assessment criteria used to evaluate their work and frequently do so.
Assessment is used in a sophisticated manner in teaching, through student involvement in establishing the assessment criteria, self-or peer assessment by students, monitoring of progress by both students and the teacher, and high-quality feedback to students from a variety of sources. Students use self-assessment and monitoring to direct their own learning.
2e Demonstrating Flexibility and Responsiveness
The teacher adheres to the lesson plan, even when a change would improve the lesson or address students’ lack of interest. The teacher brushes aside student questions; when students experience difficulty, the teacher blames the students or their home environment.
The teacher attempts to modify the lesson when needed and to respond to student questions, with moderate success. The teacher accepts responsibility for student success but has only a limited repertoire of strategies to draw upon.
The teacher promotes the successful learning of all students, making adjustments as needed to lesson plans and accommodating student questions, needs, and interests.
The teacher seizes an opportunity to enhance learning, building on a spontaneous event or student interests, or successfully adjusts and differentiates instruction to address individual student misunderstandings. The teacher ensures the success of all students by using an extensive repertoire of teaching strategies and soliciting additional resources from the school or community.

90