Characterising Pavement Surface Damage Caused by Tyre Scuffing Forces
67
Characterising Pavement Surface Damage Caused by Tyre Scuffing Forces Neon Taramoeroa John de Pont TERNZ Ltd, Auckland Land Transport New Zealand Research Report 347
-
Upload
independent -
Category
Documents
-
view
3 -
download
0
Transcript of Characterising Pavement Surface Damage Caused by Tyre Scuffing Forces

Characterising Pavement Surface Damage Caused by Tyre Scuffing Forces
Neon Taramoeroa John de Pont TERNZ Ltd, Auckland
Land Transport New Zealand Research Report 347

2
ISBN 978-0-478-30974-4 ISSN 1177-0600
© 2008, Land Transport New Zealand
PO Box 2840, 44 Victoria St, Wellington, New Zealand Telephone 64-4 894 5400; Facsimile 64-4 894 6100 Email: [email protected] Website: www.landtransport.govt.nz
Taramoeroa, N., de Pont, J. 2008. Characterising pavement surface damage caused by tyre scuffing forces. Land Transport New Zealand Research Report 374. 66 pp. Transport Engineering Research New Zealand (TERNZ) Ltd, PO Box 97 846, South Auckland Mail Centre, Manakau City 1702 Auckland, New Zealand Keywords: directional performance, dual tyres, lateral load transfer, multi-axle groups, pavement scuffing, self-steering axles, tyre scrubbing, tyre scuffing, wide-single tyres

3
An important note for the reader
Land Transport New Zealand is a crown entity established under the Land Transport Management Act 2003. The objective of Land Transport New Zealand is to allocate resources and undertake its functions in a way that contributes to an integrated, safe, responsive and sustainable land transport system. Each year, Land Transport New Zealand invests a portion of its funds on research that contributes to this objective. The research detailed in this report was commissioned by Land Transport New Zealand. While this report is believed to be correct at the time of its preparation, Land Transport New Zealand, and its employees and agents involved in its preparation and publication, cannot accept any liability for its contents or for any consequences arising from its use. People using the contents of the document, whether directly or indirectly, should apply and rely on their own skill and judgement. They should not rely on its contents in isolation from other sources of advice and information. If necessary, they should seek appropriate legal or other expert advice in relation to their own circumstances, and to the use of this report. The material contained in this report is the output of research and should not be construed in any way as policy adopted by Land Transport New Zealand but may be used in the formulation of future policy.

4
Acknowledgments TERNZ Ltd thanks Kerry Arnold from the Road Transport Forum NZ, Don Hutchinson from Land Transport NZ, Dom Kalasih from the Ministry of Transport NZ, Kieran Sharp from ARRB Group Ltd, and Lynn Sleath from Transit NZ for their time and expertise. TERNZ also thanks Rod Mackay from Optimech Services for his assistance with the field trial data acquisition, and thanks Kaye Clark from the Waikato District Council for the use of the field trial venue. Their assistance was critical to the success of this research. The steering group for this report was comprised of Kerry Arnold, Don Hutchinson, Dom Kalasih and Lynn Sleath. The peer reviewers were Dom Kalasih and Kieran Sharp and Lynn Sleath.
Abbreviations and acronyms
CG Centre of Gravity GVM Gross Vehicle Mass LTNZ Land Transport New Zealand LTSA Land Transport Safety Authority of New Zealand, now LTNZ SAE Society of Automotive Engineers TAC Tyre-Axle-Coupling sequence VDM Rule Vehicle Dimensions and Mass 2002 – Rule 41001

5
Contents
Executive summary ...............................................................................................7
Abstract................................................................................................................ 11
1. Introduction ................................................................................................ 13 1.1 Background ........................................................................................... 13 1.3 Structure .............................................................................................. 14
2. Background.................................................................................................. 15 2.1 Cornering force ...................................................................................... 15
2.1.1 Overview...................................................................................... 15 2.1.2 Axles and axes .............................................................................. 18 2.1.3 Coulomb friction ............................................................................ 20
2.2 Load transfer ......................................................................................... 21 2.2.1 Basic definitions ............................................................................ 21 2.2.2 Coupling types .............................................................................. 24 2.2.3 Load transfer v. rollover performance ............................................... 24
2.3 Low-speed v. high-speed directional performance ....................................... 25 2.4 Self-steering axles.................................................................................. 26 2.5 Simulation software ................................................................................ 27
3. Field trial ..................................................................................................... 28 3.1 Location................................................................................................ 28 3.2 Experimental methodology ...................................................................... 29 3.3 Simulation methodology .......................................................................... 31 3.4 Results ................................................................................................. 31 3.5 Discussion............................................................................................. 35
4. Computer simulations .................................................................................. 36 4.1 Model parameters................................................................................... 36 4.2 Simulation methodology .......................................................................... 37
4.2.1 Scuffing force and vertical load ........................................................ 37 4.2.2 Simple-trailer performance maps ..................................................... 38 4.2.3 Vehicle performance maps .............................................................. 38
5. Results......................................................................................................... 40 5.1 Abbreviations......................................................................................... 40 5.2 Simple-trailer performance maps.............................................................. 40 5.3 Vehicle performance maps....................................................................... 47
5.3.1 Diagrams...................................................................................... 47 5.3.2 Scuffing forces .............................................................................. 51 5.3.3 Slip angle, peak scuffing force per unit load, percentage lateral load transfer ................................................................................................ 51 5.3.4 Peak scuffing force and critical axle group shift .................................. 52 5.3.5 Tyre size, dual tyre and wide-single tyres.......................................... 53
6. Discussion ................................................................................................... 54
7. Conclusions.................................................................................................. 57 7.1 Key findings .......................................................................................... 57 7.2 Recommendations .................................................................................. 58
8. References................................................................................................... 59
Appendices ........................................................................................................... 61

6

7
Executive summary Introduction
Over time, the size and weight of heavy vehicles has gradually increased. As weight
increases, pavement wear also increases. This is a concern for road controlling authorities
who need to manage this and provide a serviceable network for their users. The
management of pavement wear has primarily focused on the distress caused by vertical
loads. This includes cracking, rutting and roughness. One of the ways of reducing the
impact of vertical loading is to increase the number of axles and so we have seen an
evolution from single axles to tandem, tridem (tri-axle), and, in some jurisdictions,
quadem axle (quad-axle) groups. Multi-axle groups reduce the peak vertical loading and,
when closely spaced, reduce the magnitude of the strain cycles to which the pavement is
subjected. However, where tight low-speed turns are executed, non-steering axle groups
lead to transverse shear forces at the pavement–tyre interface.
In New Zealand, the most widely used pavement construction is an unbound granular
structure with chipseal surfacing. Asphaltic concrete is used on the more heavily trafficked
sections of pavement, including parts of the State Highway network. With asphaltic
concrete pavements, tensile shear stresses from tyres can cause surface cracking and
ravelling. Thus, the increased use of non-steering axle groups is likely to result in
increased pavement wear in the vicinity of intersections and roundabouts where tight low-
speed turns are executed. Recent research suggests that the damage to chipseal surfaces
increases in proportion to the maximum tensile strain raised to the fifth power. In
New Zealand, concern over these pavement damage effects has resulted in regulators
requiring quad-axle groups to be fitted with two self-steering axles. In cases where self-
steering axles are used, this has been stated explicitly; otherwise, it is assumed that all
axles in the group are non-steering axles. In addition, all axle groups are assumed to be
multi-axle groups unless otherwise stated.
Methodology
The magnitude of the transverse shear forces generated by multi-axle groups depends on
many factors including:
• turn geometry,
• the type of vehicle,
• axle weights,
• tyre size and configuration,
• suspension geometry and compliance, and
• the number of non-steering, self-steering, and actively steered axles.
This study quantifies the impact of some of these parameters on the magnitude of the
transverse pavement shear forces or scuffing forces generated during constant low-speed
turns. This had two main parts:
1. A field trial was undertaken to assess the level of scuffing force required to cause
visible wear on the pavement surface and to validate the computer simulation
software. The physical testing was done on a section of road that was formerly part
of State Highway 1 but is now a local access road. The pavement construction was

CHARACTERISING PAVEMENT SURFACE DAMAGE CAUSED BY TYRE SCUFFING FORCES
8
an unbound granular structure with chipseal surfacing. For this test, a three-axle
full-trailer with a single-axle dolly was jack-knifed. The drawbar was towed at a
constant crawl speed perpendicular to the trailer’s alignment, and the towing force
was measured. This manoeuvre was repeated for different tandem axle group
loads. A similarly configured computer model of a tandem simple-trailer was used
to simulate the forces observed in the field trial.
2. Computer models of a tandem and tridem simple-trailer were used to assess the
effects of axle load, axle group spread, wheelbase, and turn geometry on peak
scuffing forces. Computer models for typical heavy vehicle configurations currently
used in New Zealand were used to simulate various low-speed turns and the
relative impact of the peak scuffing forces for the different vehicles were
determined. The key vehicle and turn parameters that affect the magnitude of the
scuffing forces were identified.
The inter-relationship between scuffing forces, directional stability, lateral load transfer,
and rollover stability is also considered.
Findings
• Axle groups with self-steering axles generate less scuffing forces than
comparable non-steering axle groups. For tight turns, however, these axles can
reach their steer angle limits, at which point they respond like non-steering
axles and thus giving rise to an increase in scuffing forces.
• For the same axle group weight and axle group spread, wide-single tyres
generate higher scuffing forces than dual tyres.
• Scuffing forces increase with increasing axle group spread.
• When laden to the maximum legal weight limits, tridem axle groups produced
higher scuffing forces than tandem axle groups even though the tridem axle
groups have less weight per axle.
• Scuffing forces decrease with increasing turn radius.
• For vehicles without self-steering axles, the highest steady-state scuffing forces
are generated by tractor semi-trailers followed by B-trains, then truck and full-
trailers, and then single-unit trucks.
• Even during low-speed turns with minimal lateral acceleration, significant lateral
load transfer can occur from having an elevated roll centre, thus leading to
higher peak vertical loads. Higher peak scuffing forces result than would be the
case if load transfer did not occur. Lateral load transfer caused by body roll can
also be induced by tow coupling forces applied at a vertical distance offset from
the roll centre, but this effect is only significant for large articulation angles. No
lateral load transfer caused by body roll will occur if the tow coupling is at the
same height as the roll centre of the suspension.
• For small angles of turn (90o or less), shorter wheelbase single-unit vehicles
generate higher scuffing forces than comparable vehicles with longer
wheelbases, but the reverse is true for large turn angles as these vehicles
approach steady-state.

9
• For a given turn radius, the axle group on which the peak scuffing forces occur
can change as the turn angle increases. If a change occurs, in general, the
critical axle group then shifts backward through the vehicle’s more widely spread
axle groups, although not necessarily in succession. The peak scuffing force
generally occurs on the tyres of the lead non-steering axle within the axle group.
• Minor visible abrasion of the chipseal surface was observed in the field trial at
the lowest gross tandem axle group load (a little under 7 tonnes). Small
fragments approximately 1 mm in diameter were broken off the exposed corners
of the chip. The corresponding peak scuffing force is 9% more than that
calculated for the legally configured tridem semi-trailer undergoing the 13.75 m
radius 360o turn. This latter manoeuvre is less severe than the 25 m wall-to-wall
360o turn capability required by the Vehicle Dimensions and Mass Rule.
Conclusions
It is clear from the study that reducing axle weight, axle group spread, and road
curvature (increasing turn radius) reduces scuffing forces and their impact on pavement
wear. The amount of scuffing force also depends on the tyre configuration, the use of self-
steering axles, and on the type of vehicle.
Our findings also validated the general rule found in other research: measures taken to
improve low-speed performance reduce high-speed performance, and vice versa. For
example, wide-single tyres produce higher scuffing forces than dual tyres. However, the
use of wide-single tyres increases the tyre track widths, which can slightly improve
rollover stability. The use of self-steering axles results in lower scuffing forces, but the
lower overall cornering stiffness reduces high-speed directional performance compared
with similar non-steering axle groups. For vehicles without self-steering axles, the highest
steady-state scuffing forces are generated by tractor semi-trailers, followed by B-trains,
and then truck and full-trailers. This ranking of heavy vehicles is similar to that when
ranked, in descending order, according to high-speed directional performance.
The tyre cornering stiffness, and therefore the amount of scuffing force, also depends on
inflation pressure. In the case of truck tyres, the influence of inflation pressure on
cornering stiffness varies and depends on obscure sensitivities to details in the carcass
design. Thus the overall influence of inflation pressure on cornering stiffness cannot be
generalised across all tyre types.
In general, the pavement wear resulting from scuffing forces will depend on many factors
including the overall pavement design, the condition of the pavement, and various
environmental factors.

CHARACTERISING PAVEMENT SURFACE DAMAGE CAUSED BY TYRE SCUFFING FORCES
10
Recommendations
• When designing intersections and roundabouts, the turn radius should be as
large as possible. This will lead to reduced scuffing forces.
• Where tight radius turns are unavoidable, the pavement surface design should
take into account the high level of scuffing forces that will occur.
• Research should be undertaken to determine whether the weight limits on
tridem and quad-axle groups should vary with dual or wide-single tyre
configurations. The Vehicle Dimensions and Mass Rule (VDM Rule) allows for
tandem axle groups to carry more weight when configured with dual tyres than
they could with wide-single tyres. The VDM Rule for tridem and quad-axle
groups permits the same axle weight limit regardless of tyre configuration.
• Research should be undertaken to investigate whether a pavement scuffing force
damage component should be incorporated into the Road User Charges Cost
Allocation Model. The current Cost Allocation Model accounts for the pavement
wear caused by vertical loads but does not account for the impact of pavement
scuffing forces on pavement wear for a given vehicle configuration.

11
Abstract
The transverse shear forces generated by multi-axle groups depends on many factors
including turn geometry, vehicle type, axle weights, tyre size and configuration,
suspension geometry, and the number and type of axles. This study quantifies the impact
of some of these parameters on the transverse pavement shear forces or scuffing forces
generated during constant low-speed turns.
• A field trial on an unbound granular pavement structure with chipseal surfacing
assessed the level of scuffing force that caused visible wear on the pavement
surface. A computer model of a tandem simple-trailer was used to simulate the
forces observed in the field.
• Computer models were used to assess the effects of axle load, axle group
spread, wheelbase, and turn geometry on peak scuffing forces; to simulate
various low-speed turns; and to identify the relative impact of the peak scuffing
forces for the different vehicles.
This study provides data on the level of peak scuffing forces generated by heavy vehicles
in New Zealand, the inter-relationship between scuffing forces, directional stability, lateral
load transfer, and rollover stability. This is fundamental to vehicle size and weight
regulation, and to the design of pavements and turn geometry at intersections.

CHARACTERISING PAVEMENT SURFACE DAMAGE CAUSED BY TYRE SCUFFING FORCES
12

1. Introduction
13
1. Introduction
1.1 Background
Over time, the size and weight of heavy vehicles has gradually increased. As weight
increases, pavement wear also increases. This is a concern for road controlling authorities
who need to manage this and provide a serviceable network for their users. The
management of pavement wear has primarily focused on the distress caused by vertical
loads, such as cracking, rutting, and roughness. One of the ways of reducing the impact
of vertical loading is to increase the number of axles, so we have seen an evolution from
single axles to tandem, tridem (tri-axle), and, in some jurisdictions, quadem (quad-axle)
axle groups. Multi-axle groups reduce the peak vertical loading and, when closely spaced,
reduce the magnitude of the strain cycles to which the pavement is subjected. However,
where tight low-speed turns are executed, non-steering axle groups lead to transverse
shear forces at the pavement–tyre interface.
In New Zealand, the most widely used pavement construction is an unbound granular
structure with chipseal surfacing. Asphaltic concrete is used on more heavily trafficked
sections of pavement, including parts of the State Highway network. With asphaltic
concrete pavements, tensile shear stresses from tyres can cause surface cracking and
ravelling (Jacobs & Moraal 1992). Thus, the increased use of non-steering axle groups is
likely to result in increased pavement wear in the vicinity of intersections and round-
abouts where tight low-speed turns are executed. Recent research suggests that the
damage to chipseal surfaces increases in proportion to the maximum tensile strain raised
to the fifth power (National Transport Commission 2006). In New Zealand, concern over
these pavement damage effects has resulted in regulators requiring quad-axle groups to
be fitted with two self-steering axles. In cases where self-steering axles are used, this has
been stated explicitly; otherwise, it is assumed that all axles in the group are non-
steering axles. In addition, all axle groups are assumed to be multi-axle groups unless
otherwise stated.
The pavement scuffing force is the horizontal shear force that reacts to the applied tyre
scrubbing force. This study focuses on the magnitude of the transverse pavement scuffing
forces or tyre cornering forces generated by vehicles with multi-axle groups undergoing
constant low-speed turns over a horizontal pavement with uniform friction characteristics.
For convenience, in this report, the vertical force per tyre group (dual, single, or wide-
single tyres) shall be referred to as the vertical force, vertical load, or weight. Similarly,
the transverse scrubbing force per tyre group shall be referred to as the scrubbing force.
The transverse pavement scuffing force per tyre group shall be referred to as the scuffing
force or cornering force. The force of friction is considered when shear forces between the
pavement–tyre interfaces are discussed. The scrubbing force and scuffing force are equal
in magnitude but act in the opposite direction to each other. However, this study focuses
on the magnitude of these transverse forces, so they are generally referred to in absolute

CHARACTERISING PAVEMENT SURFACE DAMAGE CAUSED BY TYRE SCUFFING FORCES
14
terms. The use of either of these forces depends on the frame of reference (pavement–
tyre interface, body-fixed or world co-ordinates) and on the context of the discussion. The
magnitude of the slip angle per tyre group is referred to as the slip angle or slip.
1.3 Structure
This report has been structured as follows:
• Chapter 2 presents some background theory and describes the simulation
software used in the study.
• Chapter 3 presents the results of the field trial.
• Chapter 4 outlines the computer simulation study.
• Chapter 5 presents the results of the computer simulation study.
• Chapter 6 discusses the findings in the previous chapters.
• Chapter 7 presents the conclusions and recommendations.
Details of all the relevant vehicle parameters used in the simulation models are given in
Appendix A. Appendix B gives performance maps for the tandem and tridem simple-
trailers. A glossary of the terms used in the equations and the performance maps are
listed in Appendix C.

2. Background
15
2. Background
2.1 Cornering force
2.1.1 Overview
When a rolling pneumatic tyre is oriented in line with its direction of travel, the cornering
force is zero. When the tyre is subjected to a transverse force, an angle is created
between the direction of the tyre heading and the direction of travel. This angle is known
as the slip angle. For small angles of slip, the cornering force increases linearly with slip
angle. For larger slip angles, the cornering force increases nonlinearly with slip angle at a
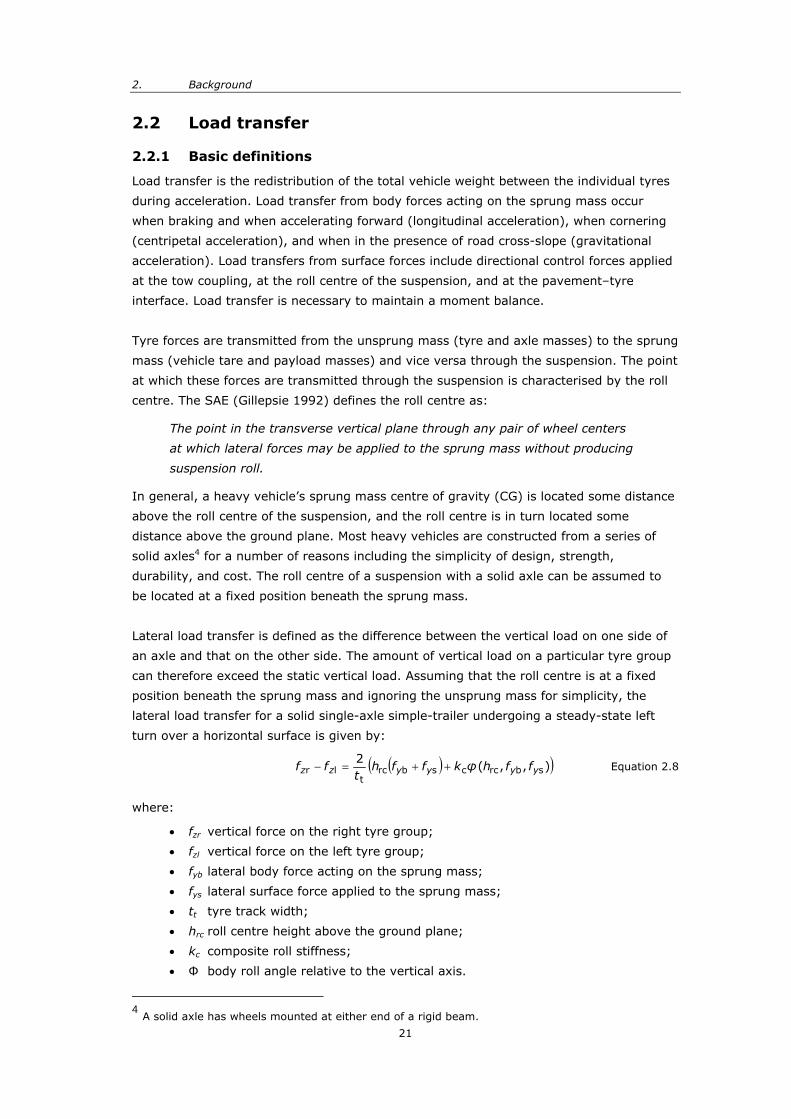
reducing rate. The cornering force also increases nonlinearly with vertical load at a
reducing rate (see Figure 2.1).
385/65R22.5 tyre
0
5
10
15
20
25
30
35
40
1 2 3 4 5 6
Slip angle (deg)
Co
rne
rin
g f
orc
e (
kN
)
24.70kN
41.20kN
61.80kN
Figure 2.1 Relationship between cornering force and slip angle by vertical load for 385/65R22.5 tyres (taken from tyre manufacturers’ data sheets and unpublished data from the University of Michigan Transportation Institute).
A property of primary importance regarding the directional behaviour of a vehicle is the
cornering stiffness. The Society of Automotive Engineers (SAE) (Gillespie 1992) defines
cornering stiffness as:
The negative of the slope of the transverse force versus slip angle curve
evaluated at zero slip angle, where a positive slip angle produces a negative
cornering force on the tyre
CHARACTERISING PAVEMENT SURFACE DAMAGE CAUSED BY TYRE SCUFFING FORCES
16
The cornering stiffness also increases nonlinearly with vertical load at a reducing rate1.
Other variables that influence cornering stiffness include tyre inflation pressure, profile,
and width (Gillespie 1992). Since inflation pressure increases vertical stiffness but
changes contact area, the overall influence on cornering stiffness cannot be generalised
across all tyre types. It is generally accepted that increasing inflation pressure results in
increasing cornering stiffness for passenger car tyres. In the case of truck tyres, the
influence of inflation pressure on cornering stiffness is varied and dependent on obscure
sensitivities to details in the carcass design. Inflation pressure has the most influence on
cornering force production at high vertical loads, and tyres at reduced inflation pressures
arrive at cornering force saturation at substantially higher values of slip angle. The profile
of a tyre is expressed as a percentage of section height to section width. For the same
overall tyre height, increasing the tyre width or rim diameter will lower the profile of the
tyre. Lower profile tyres generally have greater cornering stiffness. Increasing cornering
stiffness is likely to increase scuffing force but can improve high-speed directional
performance.
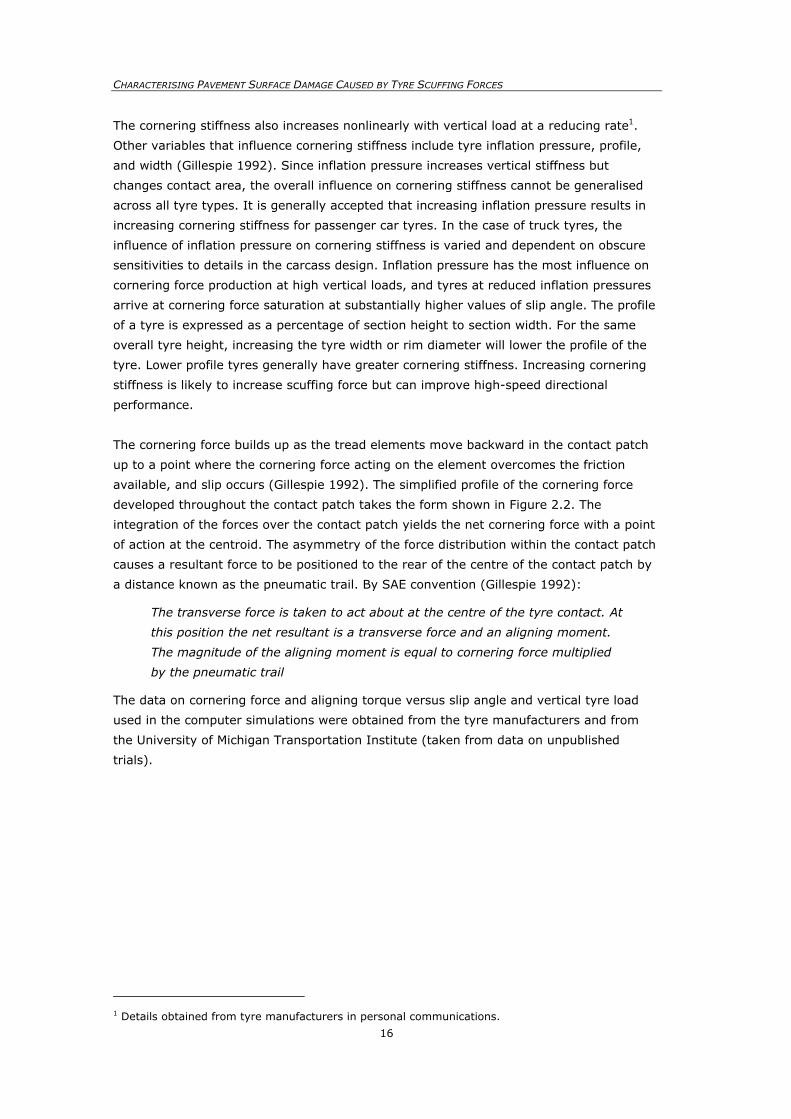
The cornering force builds up as the tread elements move backward in the contact patch
up to a point where the cornering force acting on the element overcomes the friction
available, and slip occurs (Gillespie 1992). The simplified profile of the cornering force
developed throughout the contact patch takes the form shown in Figure 2.2. The
integration of the forces over the contact patch yields the net cornering force with a point
of action at the centroid. The asymmetry of the force distribution within the contact patch
causes a resultant force to be positioned to the rear of the centre of the contact patch by
a distance known as the pneumatic trail. By SAE convention (Gillespie 1992):
The transverse force is taken to act about at the centre of the tyre contact. At
this position the net resultant is a transverse force and an aligning moment.
The magnitude of the aligning moment is equal to cornering force multiplied
by the pneumatic trail
The data on cornering force and aligning torque versus slip angle and vertical tyre load
used in the computer simulations were obtained from the tyre manufacturers and from
the University of Michigan Transportation Institute (taken from data on unpublished
trials).
1 Details obtained from tyre manufacturers in personal communications.

2. Background
17
Figure 2.2 Rolling tyre deformation under a transverse force (Gillespie 1992).
On a two-axle truck with Ackerman steering2 undergoing a low-speed turn, the tyres will
roll with no slip angle and with no cornering force. But when a truck has more than one
non-steering axle in an axle group, as in the tandem-drive group of a three-axle truck, it
is not possible to achieve zero slip and zero cornering force on any of the tyres during the
turn. Figure 2.3 shows a tandem axle group undergoing a low-speed turn. The circular
arcs show the paths of the inner wheels, outer wheels, and the centre of the axle group.
It can be seen that the orientation of the wheels is different from their direction of travel,
i.e. they are rolling with non-zero slip angles and with non-zero cornering or scuffing
forces. If the direction of travel is towards the top of the figure then the upper axle is
dragged towards the centre of the curve and the lower axle is dragged away from the
centre of the curve. As the axle group does not spin out of control, these forces must
balance.
Assuming these axles have the same tyre configuration (the same cornering stiffness),
the slip angle and cornering force on the lead non-steering axle must exceed that of the
other axles in the group to achieve a cornering force balance. Thus the centre of turn
must act at a location that is behind the geometric centre of the axle group. The turning
behaviour of the vehicle can be modelled by replacing the axle group with a single axle
known as the equivalent single axle. The model can be further simplified by eliminating
the axle width and considering a wheel at the mid-point of the equivalent single axle. This
is known as the bicycle model approximation.
2 During low-speed turns over a horizontal surface, Ackerman steering proportions the steer angles
on the left and right wheels of the steer axle so that their axes of rotation pass through the centre of
turn. The centre of turn is located on the axis of rotation of the rear axle. Thus the tyres roll with a
slip angle of zero and with zero cornering force.

CHARACTERISING PAVEMENT SURFACE DAMAGE CAUSED BY TYRE SCUFFING FORCES
18
Figure 2.3 Tandem axle group executing a low-speed turn.
2.1.2 Axles and axes
The definition of the front axis of a vehicle varies with the type of vehicle. It includes the
location of the lead steer axle (for powered units) and the location of the tow coupling (for
simple-trailers and semi-trailers). The rear axis of a vehicle is the geometric centre of the
rear axle group, assuming they have the same tyre configuration as each other. The
geometric wheelbase, which is often just called the wheelbase, is the distance from the
front axis to the rear axis. For simple-trailers and semi-trailers, the wheelbase is also
known as the forward length. As mentioned above, the location of the equivalent single
axle is behind the rear axis and so the equivalent wheelbase is slightly longer than the
geometric wheelbase. Equation 2.5 (see below) shows the relationship between the
geometric wheelbase and the equivalent wheelbase.
Employing the bicycle model, the slip angle and cornering force of the ith axle on the jth
non-steering axle group belonging to the jth vehicle unit can be determined. Under
different cornering conditions, the cornering force can be described by:
⎪⎪⎩
⎪⎪⎨
⎧
=
kinetic,static,nonlinear),,(linear,)(
ij
ij
ijijij
ijij
ij
zyk
zys
zy
zα
y
fμfμαffαfc
f Equation 2.1a, b, c, d
where:
⎟⎟⎠
⎞⎜⎜⎝
⎛ += −
j
jij1ij tan
r
εδα Equation 2.2

2. Background
19
⎟⎟⎟
⎠
⎞
⎜⎜⎜
⎝
⎛= ∑
=
j
1i
2ij
jjj
11N
gδ
Nlε Equation 2.3
2/12k
2k
j
1k
20j )( ⎟
⎟⎠
⎞⎜⎜⎝
⎛−∑−=
=hlrr e Equation 2.4
jjj εll ge += Equation 2.5
j0j rrLSO −= Equation 2.6
and where:
• i axle number;
• j jth non-steering axle group belonging to the jth vehicle unit;
• k kth vehicle unit;
• fy tyre cornering force or pavement scuffing force;
• fz vertical force;
• α slip angle;
• cα cornering stiffness (linear tyre model used for small slip angles only);
• μys transverse pavement–tyre static friction coefficient;
• μyk transverse pavement–tyre kinetic or sliding friction coefficient;
• δij displacement from the jth rear axis to the ith axle (positive distance
forward, negative distance backward);
• ε distance from the rear axis to the equivalent single axle;
• r radius of curvature or instantaneous turn radius of the path followed by
the equivalent single axle;
• r0 reference turn radius or radius of curvature;
• le equivalent wheelbase: distance from the front axis to the equivalent single
axle;
• lg geometric wheelbase: distance from the front axis to the rear axis;
• h distance from the tow coupling to the corresponding equivalent single
axle;
• N number of non-steering axles;
• LSO low-speed steady-state offtracking.
Equations 2.3–6 are based on those given in Fancher & Winkler (2007). Based on
Equations 2.1a and b, and on Equations 2.2–5, it can be seen that a tyre’s slip angle and
cornering force depends on the radius of curvature of its path. This radius of curvature in
turn depends on the tyre’s longitudinal distance from the equivalent single axle; and on
the radius of curvature of the equivalent single axle’s path3.
Equation 2.2 and Equation 2.3 show that the tyres on the lead axle in a group are furthest
from the equivalent single axle compared with the other axles. Hence the slip angle and
cornering force on these tyres are greater than in the other tyres in the group. On very
3 A circle of radius r has curvature 1/r everywhere. A straight line has zero curvature everywhere.

CHARACTERISING PAVEMENT SURFACE DAMAGE CAUSED BY TYRE SCUFFING FORCES
20
tight turns, the tyres on the lead axle are the first to slide, in which case, the cornering
force on this axle can then be described by Equations 2.1c and d. Once the lead axle
starts to slide, the equivalent single axle shifts backward, increasing the equivalent
wheelbase. Increasing the equivalent wheelbases increases low-speed offtracking.
Equation 2.4 is a low-speed steady-state solution and shows that the radius of curvature
of the path followed by the equivalent single axle is mainly determined by the geometry
of the vehicle and the turn. Substituting Equation 2.4 into Equation 2.6 gives an analytical
solution for calculating the amount of low-speed steady-state offtracking.
2.1.3 Coulomb friction
For a given tyre and horizontal pavement surface, the cornering or scuffing force
magnitude increases with increasing slip angle and vertical load (according to the
manufacturers’ data sheets (pers. comm.) and unpublished data from the University of
Michigan Transport Research Institute) but is limited to a value equal to the vertical load
multiplied by the coefficient of friction between the pavement–tyre interface.
The classical approximation of the force of friction between two solid surfaces in shear is
known as Coulomb friction. For a horizontal pavement surface, the Coulomb friction force
is proportional to the vertical load. Equation 2.1c and Equation 2.1d represent the
classical friction model. The differences between these two equations are the constants of
proportionality. Equation 2.1c employs the static friction coefficient and Equation 2.1d
employs the kinetic friction coefficient. The force which is applied to an object that
remains at rest is called the static friction force. The static friction force acts in the
opposite direction to the applied force. As the applied force increases, the static friction
force reaches a limiting value, and the object ‘breaks away’ and is set in motion. The
friction force that then opposes the motion is called the kinetic or sliding friction force.
The static friction force is greater than the kinetic friction force and limits the cornering
force by:
zysyzys fμffμ ≤≤− Equation 2.7
2. Background
21
2.2 Load transfer
2.2.1 Basic definitions
Load transfer is the redistribution of the total vehicle weight between the individual tyres
during acceleration. Load transfer from body forces acting on the sprung mass occur
when braking and when accelerating forward (longitudinal acceleration), when cornering
(centripetal acceleration), and when in the presence of road cross-slope (gravitational
acceleration). Load transfers from surface forces include directional control forces applied
at the tow coupling, at the roll centre of the suspension, and at the pavement–tyre
interface. Load transfer is necessary to maintain a moment balance.
Tyre forces are transmitted from the unsprung mass (tyre and axle masses) to the sprung
mass (vehicle tare and payload masses) and vice versa through the suspension. The point
at which these forces are transmitted through the suspension is characterised by the roll
centre. The SAE (Gillepsie 1992) defines the roll centre as:
The point in the transverse vertical plane through any pair of wheel centers
at which lateral forces may be applied to the sprung mass without producing
suspension roll.
In general, a heavy vehicle’s sprung mass centre of gravity (CG) is located some distance
above the roll centre of the suspension, and the roll centre is in turn located some
distance above the ground plane. Most heavy vehicles are constructed from a series of
solid axles4 for a number of reasons including the simplicity of design, strength,
durability, and cost. The roll centre of a suspension with a solid axle can be assumed to
be located at a fixed position beneath the sprung mass.
Lateral load transfer is defined as the difference between the vertical load on one side of
an axle and that on the other side. The amount of vertical load on a particular tyre group
can therefore exceed the static vertical load. Assuming that the roll centre is at a fixed
position beneath the sprung mass and ignoring the unsprung mass for simplicity, the
lateral load transfer for a solid single-axle simple-trailer undergoing a steady-state left
turn over a horizontal surface is given by:
( )( )),,(2
sbrccsbrct
lr yyyyzz ffhφkffht
ff ++=− Equation 2.8
where:
• fzr vertical force on the right tyre group;
• fzl vertical force on the left tyre group;
• fyb lateral body force acting on the sprung mass;
• fys lateral surface force applied to the sprung mass;
• tt tyre track width;
• hrc roll centre height above the ground plane;
• kc composite roll stiffness;
• Φ body roll angle relative to the vertical axis.
4 A solid axle has wheels mounted at either end of a rigid beam.

CHARACTERISING PAVEMENT SURFACE DAMAGE CAUSED BY TYRE SCUFFING FORCES
22
Equation 2.8 is based on an equation given in Gillespie (1992) and describes the lateral
load transfer affects from both the lateral body and surface forces. Note that the first and
second components on the right-hand side of Equation 2.8 are dependent, i.e. they each
depend on the roll centre location and on the lateral forces defined. The equation
indicates that increasing the tyre track width reduces the amount of lateral load transfer.
Lateral load transfer, in general, arises from two mechanisms (Gillispie 1992):
• the elevated roll centre above the ground plane, and
• body roll.
The elevated roll centre above the ground plane arises from the lateral force imposed on
the axle. It is independent of body roll and the longitudinal roll moment distribution.
Consider a tandem axle group undergoing a low-speed steady-state turn over a horizontal
pavement where the lateral body force can be ignored and thus set equal to zero. The
tyre-spread across the axle group induces transverse shear forces that act at the
pavement–tyre interface. Since the roll centre of the suspension is some distance above
the ground plane, a roll moment is induced at the roll centre. To maintain a moment
balance about the roll centre, load must be transferred laterally from one side of an axle
to the other. This lateral load transfer increases with increasing roll centre height and with
axle group spread.
The effect of body roll is to shift the CG of the sprung mass centre outboard of the roll
centre location. It is directly dependent on the roll moment distribution. Consider a
tandem axle group undergoing a low-speed steady-state turn over a horizontal pavement
where the lateral body force can be ignored and thus set equal to zero. Lateral load
transfer caused by body roll can be induced by tow coupling forces applied at a vertical
distance offset from the roll centre, but this effect is only significant for large articulation
angles. No lateral load transfer caused by body roll will occur if the tow coupling is at the
same height as the roll centre of the suspension, i.e. the lateral load transfer component
caused by body roll is equal to zero in this instance.

2. Background
23
Figure 2.4 Roll centre heights for different suspensions (UMTRI 2000).
Figure 2.5 Composite roll stiffness for different suspensions (UMTRI 2000).
Figure 2.4 gives the roll centre heights and Figure 2.5 gives the composite roll stiffness
for different suspensions. Note that air suspensions cover the greatest range of roll centre
heights and roll stiffness. Suspensions with low roll centres and high composite roll
stiffness produce low amounts of lateral load transfer.
Roll centre height above ground
Air suspensions
0.35
0.4
0.45
0.5
0.55
0.6
0.65
0.7
0.75
0.8
0.85
Ro
ll c
en
tre h
eig
ht
(m)
4-spring suspensions
Single axle leaf spring suspensions
Walking beam suspensions
Front suspensions
Composite roll stiffness
100
300
500
700
900
1100
Co
mp
osi
te r
oll
sti
ffn
ess
(0
00
s N
m/ra
dia
n)
Air suspensions (high roll stiffness type)
Air suspensions (low roll stiffness type)
Walking beam suspensions
4-spring suspensions
Front suspensions
Single axle leafspring suspensions

CHARACTERISING PAVEMENT SURFACE DAMAGE CAUSED BY TYRE SCUFFING FORCES
24
2.2.2 Coupling types
The three main coupling types used to connect individual vehicle units in combination
vehicles are fifth wheel, turntable, and tow-eye couplings. The main difference between
these coupling types is the number of rotational degrees of freedom they permit. The
suspension systems for vehicle units that are roll coupled contribute to the overall roll
moment distribution between these units. Lateral load transfer caused by body roll is
directly dependent on this roll moment distribution.
A fifth wheel coupling is used for semi-trailer connections and is often referred to as a B-
coupling. It consists of a kingpin that interlocks with a U-shaped skid plate. The coupling
allows a semi-trailer to yaw with respect to the towing vehicle. A conventional single
oscillating fifth wheel coupling allows some moments about the roll and pitch axis to be
transmitted between these two vehicles. The magnitude of these components depends on
the articulation between these vehicles, with the roll and pitch components being
proportional to the cosine and sine of the articulation angle, respectively. Thus at zero
articulation angle, only the roll moment is transmitted.
A turntable coupling consists of a ball race system that connects a semi-trailer to a dolly
to form a full-trailer. A turntable allows only yaw motion between these vehicles. Both roll
and pitch moments are transmitted between these units. A pitch hinge connects the
dolly’s bogey to the dolly’s drawbar. This prevents pitch moments generated at the dolly
from applying vertical loads at the tow-eye coupling. The dolly’s turntable, bogey, and
drawbar assembly is often referred to as an A-coupling.
A tow-eye coupling consists of a towing eye that interconnects with a pin or a hook, and
is functionally equivalent to the ball and cup arrangement used on light trailers. The
coupling provides no restraints on rotational motion. It connects two vehicle units
together that are free to yaw, roll, and pitch with respect to one another. No lateral load
transfer caused by body roll occurs between tow-eye coupled units.
2.2.3 Load transfer v. rollover performance
Rollover stability, which is characterised in terms of the Static Roll Threshold (SRT), and
lateral load transfer are directly related. When wheel lift-off occurs at the onset of a
rollover, the load has been transferred completely from one side of an axle to the other
side.
Fully laden heavy vehicles typically have relatively high sprung mass values and sprung
mass CG heights. When heavy vehicles undertake high-speed turns, the lateral body
forces are significant. In this situation, the lateral load transfer component caused by
body roll is usually the more critical of the two lateral load transfer mechanisms. The
effect of body roll is to shift the CG of the sprung mass centre towards the outside of the
turn, unloading the inside wheels and increasing the load on the outside wheels. The
amount of body roll can be reduced by increasing the composite roll stiffness. Lateral load
transfer can be reduced by increasing the tyre track widths. In both cases, an improved
SRT will result.

2. Background
25
2.3 Low-speed v. high-speed directional performance
An analytical solution of a linear two-axle full-trailer model, given in Fancher & Winkler
(2007) shows how longer wheelbases and higher cornering stiffnesses can reduce
rearward amplification. The analysis deduced that longer vehicles have more damping of
yaw motions than comparable vehicles with shorter wheelbases and that this damping
increases with the square of the wheelbase. Fancher & Winkler also found that increasing
the cornering stiffness increases damping in yaw rate and in lateral velocity. Increasing
cornering stiffness is also known to reduce high-speed steady-state offtracking.
Improved low-speed directional performance can be characterised by a vehicle having less
low-speed offtracking. Improved high-speed directional performance can be characterised
by a vehicle having less high-speed steady-state offtracking and more yaw damping. A
vehicle having more yaw damping is typically associated with it having less rearward
amplification and less high-speed transient offtracking. A rule of thumb given by Fancher
& Winkler was:
…what one does to improve low speed performance is likely to degrade high
speed performance and vice versa.
For the same overall vehicle length, combination vehicles with more articulation joints and
shorter wheelbase units generally have good low-speed directional performance, but also
have poor high-speed directional performance than combination vehicles with fewer
articulation joints and longer wheelbase units.
Increasing the number of non-steering axles within a group usually leads to an overall
increase in axle group spread and cornering stiffness. These changes result in higher
scuffing forces but can improve high-speed directional performance. For similar reasons, a
non-steering axle group has a higher overall cornering stiffness, which will generate more
scuffing force, but it will have better high-speed directional performance than a
comparable self-steering axle group.

CHARACTERISING PAVEMENT SURFACE DAMAGE CAUSED BY TYRE SCUFFING FORCES
26
2.4 Self-steering axles
The purpose of self-steering or castoring axles is to reduce the transverse pavement
scuffing and tyre scrubbing forces generated by the tyres of multi-axle groups during low-
speed turns (Latto & Baas 2002). Self-steering axles are steered passively about the
kingpin by the applied cornering force at the pavement–tyre interface at a trailing
distance behind the kingpin.
Many self-steering axles have mechanisms that provide a steering stabilisation or centring
force. Undulating pressure bearings can be used to provide a weight dependent centring
force. In some cases, steel and air springs are used to provide a centring force, the latter
requiring an extraneous power source (Latto & Baas 2002). Air springs have the potential
to provide a variable centring force by altering the airbag pressure. Locking mechanisms
are used to provide very large centring forces and are often used when the vehicle is
reversing, but can also be used at higher speeds. The foremost self-steering axle on
quad-axle groups in New Zealand may be locked in the straight-ahead position at a speed
of 30km/h or more (Land Transport New Zealand (LTNZ) 2007). Having a weight and
speed dependent centring force can provide a mechanism for improved low-speed and
high-speed directional performance. All axle groups on heavy vehicles except for front
twin-steer axle groups on powered units must be load sharing (Land Transport Safety
Authority (LTSA) 2002).
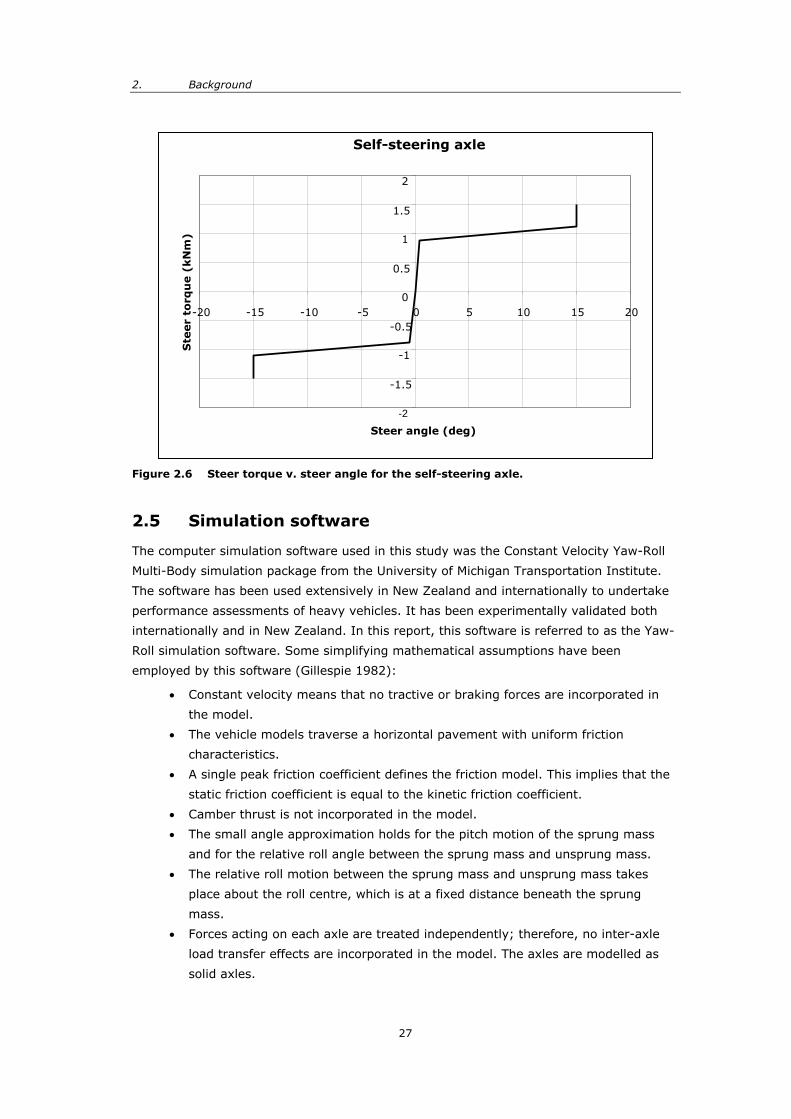
The self-steering axle characteristics used in the analysis are given in Table 2.1 and
Figure 2.6. The figure shows the steering torque as a function of steer angle. The steering
torque is equal in magnitude to the applied centring force multiplied by the trailing
distance behind the kingpin. The axles have steer angle limits of 15°, which is the
minimum required by the Vehicle Dimensions and Mass (VDM) Rule. At this steer angle,
the steering torque increases to a very large value which effectively simulates the self-
steering axles hitting their stops.
Table 2.1 Self-steering axle system parameters.
Parameter Unit Value
Primary stiffness Nm/rad 2 589 422
Coulomb friction Nm 1235
Mechanical trail mm 151
A rigid truck without a heavy tow coupling, or a semi-trailer not belonging to an A or B-
train may have steering axles in the rear axle group so long as no more than half of these
axles steer at any time (LTSA 2002). This means that rear-mounted tandem or tridem
axle groups on conforming vehicles may not have more than one self-steering axle. Quad-
axle groups, which are only permitted on semi-trailers not belonging to an A or B-train,
are required to have two self-steering axles (LTSA 2002). Although these can be either
the first and last axles, or the two trailing axles, the requirements of the bridge formula
and other dimensional constraints mean that on quad-axle groups, the self-steering axles
are almost always the two trailing axles. For similar reasons, the self-steering axle on
rear-mounted tandem and tridem axle groups on conforming vehicles is almost always
the rear axle.
2. Background
27
Figure 2.6 Steer torque v. steer angle for the self-steering axle.
2.5 Simulation software
The computer simulation software used in this study was the Constant Velocity Yaw-Roll
Multi-Body simulation package from the University of Michigan Transportation Institute.
The software has been used extensively in New Zealand and internationally to undertake
performance assessments of heavy vehicles. It has been experimentally validated both
internationally and in New Zealand. In this report, this software is referred to as the Yaw-
Roll simulation software. Some simplifying mathematical assumptions have been
employed by this software (Gillespie 1982):
• Constant velocity means that no tractive or braking forces are incorporated in
the model.
• The vehicle models traverse a horizontal pavement with uniform friction
characteristics.
• A single peak friction coefficient defines the friction model. This implies that the
static friction coefficient is equal to the kinetic friction coefficient.
• Camber thrust is not incorporated in the model.
• The small angle approximation holds for the pitch motion of the sprung mass
and for the relative roll angle between the sprung mass and unsprung mass.
• The relative roll motion between the sprung mass and unsprung mass takes
place about the roll centre, which is at a fixed distance beneath the sprung
mass.
• Forces acting on each axle are treated independently; therefore, no inter-axle
load transfer effects are incorporated in the model. The axles are modelled as
solid axles.
Self-steering axle
-2
-1.5
-1
-0.5
0
0.5
1
1.5
2
-20 -15 -10 -5 0 5 10 15 20
Steer angle (deg)
Ste
er
torq
ue (
kN
m)

CHARACTERISING PAVEMENT SURFACE DAMAGE CAUSED BY TYRE SCUFFING FORCES
28
3. Field trial
3.1 Location
The field trial was undertaken to assess the level of scuffing force required to cause
visible wear on chipseal pavements and to provide some validation of the Yaw-Roll
simulation software. The physical testing was done on a dry section of road that was
formerly part of State Highway 1 but is now a local access road. This location was at the
southern end of Ohinewai South Road which is about 6 km north of Huntly in the central
North Island (marked with a star on the map in Figure 3.1). The pavement construction
was a matured unbound granular structure with chipseal surfacing. The range of
pavement surface temperatures over the course of the trial was 19–21oC.
Figure 3.1 Map showing the location of the field trial.

3. Field trial
29
3.2 Experimental methodology
For this test, a three-axle full-trailer with a single-axle dolly was jack-knifed. The vehicle
had single-leaf steel spring suspension with dual 255/70R22.5 tyres inflated to 100 psi.
The drawbar was towed at a constant crawl speed perpendicular to the trailer’s alignment,
and the towing force was measured. The scuffing forces generated by the tyres of the
trailer’s tandem axle group represent an extreme case of scuffing forces (kinetic or
sliding) where very large slip angles are induced. The mechanism responsible for these
extreme cases of scrubbing forces differs from that generated by a rolling tyre where
much smaller slip angles apply (non-sliding case). This manoeuvre was repeated for three
tandem axle group loads of approximately 7 tonnes, 10 tonnes, and 13 tonnes. The tare
weight of the tandem axle group was 4100 kg and the load consisted of concrete blocks,
each weighing 940 kg on average. A hydraulic hoist (Hiab) attached to the rear of the
truck was used to lift the concrete blocks in and out of the trailer. Figure 3.2 shows the
trailer jack-knifed into position ready to be pulled forward in the thirteen tonne
experiment.
The towing force was measured using a calibrated load cell chained between the towing
eye of the drawbar and the pin coupling of the truck (tow-eye coupling). The load cell in
this arrangement measured tensile forces only. The towing force data sampled at 50 Hz
was passed through a zero-phase low-pass digital Butterworth filter and then zeroed with
respect to the global minimum for that run (see Figure 3.3). The eighth order Butterworth
filter had a cutoff frequency of 4 Hz.
Figure 3.2 The test vehicle jack-knifed into position ready to be driven forward and the towing force measured in the thirteen tonne experiment.

CHARACTERISING PAVEMENT SURFACE DAMAGE CAUSED BY TYRE SCUFFING FORCES
30
The average kinetic scuffing force generated by the tyres of the tandem axle group was
back-calculated from the peak kinetic towing force by employing the bicycle model,
defined in terms of the trailer’s dimensions and the static vertical loads per tyre group.
The bicycle model eliminates the axle width by considering a wheel at the mid-point of the
axle. Moments were balanced about the location of the equivalent single axle of the
tandem axle group and the following relationship was derived:
d0t2
yzyke
y ffμls
f += Equation 3.1
where:
0a zyky fμf = Equation 3.2
and where:
• fyt peak kinetic towing force (vector);
• fz0 static vertical load per tyre group (vector);
• fya average kinetic scuffing force per tyre group (vector);
• fyd drag force of dolly;
• le equivalent wheelbase of 6.15 m;
• s tandem axle group spread of 1.35 m;
• μyk transverse coefficient of kinetic friction.
Equation 3.1 was used to calculate both the dolly’s drag force and the transverse
coefficient of kinetic friction at the pavement–tyre interface. The dolly’s drag force was
calculated by fitting a line to the peak kinetic towing force versus static vertical load data
using linear least-squared regression analysis and retrieving the y-intercept. The slope of
this line was used to calculate the transverse coefficient of kinetic friction. This is shown
in Figure 3.4.

3. Field trial
31
3.3 Simulation methodology
A similarly configured computer model of a tandem simple-trailer was used to simulate
the forces observed in the field trial so we could verify the results. The model’s tare
weight and load mass was centred above the rear axis of the tandem axle group so that
no static vertical load was placed on the coupling. A tow-eye coupling was used to
eliminate any rotational coupling between the truck and trailer. This is functionally
equivalent to the actual full-trailer used in the field trial, where the single-axle dolly (with
pitch hinge) had an articulation angle of 90o with respect to the trailer’s alignment. The
relevant tyre, suspension, and trailer data used in this analysis are given in Appendix A.
The Yaw-Roll simulation software initialises the vehicle model in a straight line and not in
the jack-knifed position as in the field trial. To reproduce the kinetic scuffing forces
observed in the field trial, the tow-eye coupling of the trailer model would ideally
undertake a steady-state cornering manoeuvre with a turn radius equal to the equivalent
wheelbase of the trailer of 6.15 m while travelling at 1.8 km/h. During the turn, however,
the vehicle model could not reach the desired stead-state cornering condition and so the
simulated scuffing forces are slightly underestimated compared with those calculated in
the field trial.
3.4 Results
Figure 3.3 shows the raw and filtered towing force data for the seven tonne gross tandem
axle group mass experiment. Three characteristic towing force extrema are located in this
example at 10.05 seconds (s), 10.15 s, and 14.5 s into the manoeuvre. The local
maximum at located 10.05 s and the local minimum located at 10.15 s into the
manoeuvre are representative of the peak static friction force and the peak kinetic friction
force experienced at the pavement–tyre interface, respectively. Between 10.15 s and
14.5 s, the towing force begins to increase but this increase in towing force is from
accelerating the rearmost trailer unit (excluding the dolly). The global maximum, located
14.5 s into the manoeuvre, is the point where the driver engages the clutch, allowing the
vehicle combination to slow to a stop.

CHARACTERISING PAVEMENT SURFACE DAMAGE CAUSED BY TYRE SCUFFING FORCES
32
Figure 3.3 Extraction of the peak kinetic towing force for the seven tonne gross tandem axle group mass experiment.
Figure 3.4 Line of best fit for the peak kinetic towing force v. static vertical force.
Notes to Figure 3.4: μyk(transverse coefficient of kinetic friction) = 1.15±0.03 fyd = drag force of dolly

3. Field trial
33
Figure 3.4 shows the line of best fit of the peak kinetic towing force versus the static
vertical load. The drag force of 0.9±0.8 kN accounts for the rolling resistance of the single
axle dolly, which had a gross axle weight of 1900 kg. The corresponding rolling resistance
coefficient of 0.05±0.04 is in line with typical values for truck tyres on medium to hard
surfaces of 0.06 (Gillespie 1992). The calculated transverse coefficient of kinetic friction
between the pavement–tyre interface was 1.15±0.03. The drag force, rolling resistance,
and coefficient of friction values are calculated with 68.27% confidence intervals
(assuming normally distributed independent samples). No data were available on the
transverse coefficient of kinetic friction between dry chipseal pavements and heavy trailer
tyres. However, this value does seem reasonable, given that both the chipseal and tyres
were in very good condition.
Figure 3.5 Average kinetic scuffing force v. static vertical force comparing the field trial and simulation data.
Figure 3.5 shows the average kinetic scuffing force versus the static vertical load,
comparing the field trial and simulation data. The field trial and simulation software
results are in good agreement with each other, and they verify that the average kinetic
scuffing force is proportional to the static vertical load. The error bands in the field trial
best fit data represent the uncertainty in the dolly’s drag force calculation, and the error
bands in the simulation data represent the uncertainty in the coefficient of kinetic friction
calculation. Note that the Yaw-Roll software was not designed for severe cornering
manoeuvres, and so the simulated scuffing force data are slight underestimates compared
with those calculated in the field trial.

CHARACTERISING PAVEMENT SURFACE DAMAGE CAUSED BY TYRE SCUFFING FORCES
34
Figure 3.6 Pavement scuffing damage from the seven tonne experiment.
Figure 3.7 Pavement scuffing damage from the thirteen tonne experiment.
Figures 3.6 and 3.7 show the pavement scuffing damage from the seven tonne and
thirteen tonne experiments, respectively. Minor visible abrasion of the chipseal surface
was observed in the field trial even at the lowest gross tandem axle group load of seven
tonnes. Small fragments approximately 1 mm in diameter were broken off the exposed
corners of the chip. Based on the computer simulation data, this damage resulted from a
peak scuffing force of at least 33.2 kN. The corresponding vertical load of 28.9 kN is 70%
above the static vertical load of 17.0 kN. Note that the peak scuffing force of 33.2 kN is
equal to 1.15 multiplied by the vertical load of 28.9 kN. More severe abrasion of the
chipseal surface was observed in the 13 tonne experiment – compare Figures 3.6 and 3.7.

3. Field trial
35
3.5 Discussion
The field trial and simulation software results are in good agreement with each other, and
they verify that scuffing force is proportional to static vertical load. Minor visible abrasion
of the chipseal surface was observed in the field trial at the lowest gross tandem axle
group load (a little under 7 tonnes), where small fragments approximately 1 mm in
diameter were broken off the exposed corners of the chip. Based on the computer
simulation, this damage resulted from a peak scuffing force of at least 33.2 kN. Note that
in general, the pavement wear resulting from scuffing forces will depend on many factors
including:
• the overall pavement design (seal, base, subgrade);
• the condition of the pavement (e.g. age, rehabilitation or replacement); and
• various environmental factors (e.g. temperature, water, ice).

CHARACTERISING PAVEMENT SURFACE DAMAGE CAUSED BY TYRE SCUFFING FORCES
36
4. Computer simulations
4.1 Model parameters
Computer simulations were undertaken to see how scuffing forces are influenced by
changes in turn geometry and vehicle parameters, namely:
• angle of turn,
• turn radius,
• wheelbase,
• number of non-steering and self-steering axles,
• axle group spread,
• axle weight,
• tyre size, and
• dual tyres versus wide-single tyres,
Simple-trailer computer models were used to assess the effects of axle load, axle group
spread, wheelbase, and turn geometry on scuffing forces. Computer models for typical
heavy vehicles, axles, and tyre configurations currently used in New Zealand were used to
simulate various low-speed turns, and the relative impact of scuffing forces for the
different vehicles are identified. The vehicle models used steel spring suspension. The tyre
and suspension data used in this analysis are given in Appendix A.
The couplings of the simple-trailer models and the lead steer axle centres of the vehicle
models were made to follow circular paths with straight entry and exit tangents at a
constant speed of 1.8 km/h. A turn radius5 of 13.75 m was used to construct the simple-
trailer and vehicle performance maps. The simple-trailer and vehicle computer models are
configured with dual 11R22.5 tyres on the drive and trailer axles, and with single 11R22.5
tyres on the steer axles. In addition to these performance maps, four reference vehicles
were used to compare the scuffing forces generated by dual 11R22.5 tyres and dual
245/70R19.5 tyres, and by 385/65R22.5 wide-single trailer tyres. To compare the
scuffing forces generated by the different tyre configurations, the reference vehicles
undertook a turn radius of 18.75 m. The larger 18.75 m radius of turn was needed since
tyre data for the 245/70R19.5 and 385/65R22.5 tyres were only available for slip angles
of up to 6o, whereas tyre data for the 11R22.5 tyres were available for slip angles of up to
12o. Larger radius turns induce smaller angles of slip. Note that the mechanism
responsible for the scuffing forces in this section, which are generated by rolling tyres
(the non-sliding case), differs from that of the field trial where much larger slip angles
5 The turn radius of 13.75 m corresponds to the general minimum radius (i.e. 15 m less half the
nominal heavy vehicle width of 2.5 m) for the design single-unit and semi-trailer turning paths
specified in the AUSTROADS Guide to Traffic Engineering Practice – Intersections at Grade
(AUSTROADS 1995).

4. Computer simulations
37
apply (kinetic or sliding case). Unless otherwise stated, the peak coefficient of friction
used in the computer simulations was 1.0.
4.2 Simulation methodology
4.2.1 Scuffing force and vertical load
For a given computer simulation, the peak scuffing force was found along with the tyre
group’s slip angle, vertical load, and axle number. In addition, the amount of lateral load
transfer expressed as a percentage of the tyre group’s static vertical load was calculated
for the different vehicles by the following equation:
⎟⎟⎠
⎞⎜⎜⎝
⎛−= 1%100
0
pp
z
zz f
fΔ Equation 4.1
where:
• Δzp lateral load transfer expressed as a percentage of the static vertical force;
• fzp vertical force on the tyre group;
• fz0 static vertical force on tyre group.
Four reference vehicles were used to compare the peak scuffing forces generated by dual
245/70R19.5 tyres and by 385/65R22.5 wide-single tyres relative to dual 11R22.5 tyres.
The reference vehicles are described in Table 4.3. The percentage change in peak scuffing
force of a particular tyre configuration relative to dual 11R22.5 tyres is given by:
⎟⎟⎠
⎞⎜⎜⎝
⎛−= 1%100
p0
ptpt
y
yy f
fΔ Equation 4.2
where:
• Δzp percentage change in peak scuffing force of tyre configuration t relative to
dual 11R22.5 tyres;
• fyp0 peak scuffing force of dual 11R22.5 tyres;
• fypt peak scuffing force of tyre configuration t;
• t tyre configuration: dual 11R22.5, dual 245/70R19.5, or wide-single
385/65R22.5 tyres.
The changes in tyre size and configuration resulted in changes in vertical stiffness,
unsprung and sprung mass CG heights, roll centre heights, and tyre track widths – see
Appendix A. The tyre track width depends on the width of the tyre and on the tyre
configuration (single or dual tyre group). The overall tyre track width is conserved. The
overall tyre track width is measured from the outer tyre walls excluding the lower bulge.
The simulation outputs are sampled at 5 Hz and the results passed through a zero-phase
low-pass digital Butterworth filter. The eighth order digital Butterworth filter had a cutoff
frequency of 0.25 Hz.

CHARACTERISING PAVEMENT SURFACE DAMAGE CAUSED BY TYRE SCUFFING FORCES
38
4.2.2 Simple-trailer performance maps
The tandem and tridem simple-trailers are modelled with different weights and
dimensions undergoing various low-speed turns. To eliminate the offtracking effects of the
truck on the trailer, the coupling was made to follow the prescribed turning paths. The
sprung mass of the trailer was centred directly above the rear axis of the axle group so
that no static vertical load was applied to the coupling. A tow-eye coupling was used to
eliminate any rotational coupling between the truck and trailer. The tow coupling height
was set equal to the roll centre height of the suspension so that no lateral load transfer
from body roll was induced.
4.2.3 Vehicle performance maps
Vehicle performance maps were constructed for a range of vehicles undergoing various
low-speed turns. The vehicle models in this study comply with the VDM rule. The
maximum vehicle width permitted by the VDM Rule is 2.5 m. The maximum overall length
permitted by the VDM Rule is 18 m for tractor semi-trailers; 20 m for B-trains, and truck
and full-trailers. The maximum Gross Vehicle Mass (GVM) for these vehicles is 44 tonnes.
For the given axle group spreads, the axle group masses on the five-axle and six-axle
tractor semi-trailers and single-unit truck reflect the maximum axle group mass limits
permitted by the VDM Rule. For the eight-axle tractor semi-trailers, B-trains, and truck
and full-trailer combinations, the GVM requirement of 44 tonnes was the limiting factor
rather than the axle group mass limits. For vehicles where the GVM of 44 tonnes was the
limiting factor, the axle group masses reflect those typically encountered in the transport
industry. The axle group spreads for the tandem, tridem, and quad-axle groups are
1.35 m, 2.70 m, and 4.00 m, respectively. The relevant vehicle and suspension
parameters used in the simulations are given in Appendix A.
To represent the vehicle configurations in a descriptive and compact form, a shorthand
code called the Tyre-Axle-Coupling (TAC) sequence has been developed. The TAC
sequence is a string of case-sensitive context-dependent characters used to encode the
type of couplings, axles, and tyre configurations used throughout a vehicle’s
configuration. Tables 4.1–3 describe the set of characters used in a TAC sequence.
Table 4.1 Description of axle types and tyre configurations with the designated TAC characters.
Tyre configuration Axle type Single Dual
Actively steered axle a A Passively steered axle (self-steering axle) p P Non-steering drive axle d D Non-steering fixed axle f F
Table 4.2 Description of coupling types with the designated TAC character.
Coupling type Coupling Chassis - Fifth wheel, kingpin, and semi-trailer chassis ^ Tow-eye, drawbar, and turntable (dolly) _

4. Computer simulations
39
For example, the TAC sequence aa-DD^pffp denotes a twin-steer tandem-drive tractor in
combination with quad-axle semi-trailer with front and rear-mounted self-steering axles.
The tyres on the drive axles are in dual configuration and the remaining axles are
configured with single tyres. The TAC sequence a-DD_F-FF denotes a three-axle tandem-
drive truck in combination with a three-axle full-trailer with a single-axle dolly. All tyres
on the truck and full-trailer combination are in dual configuration except for the steer
tyres, which are configured as singles. In this study, all tyres on the powered units are
11R22.5 tyres and all single trailer tyres are wide-single tyres since this is the common
tyre configuration on New Zealand’s heavy vehicles. A description of the vehicle models
studied and their TAC sequences are shown in Table 4.3. The reference vehicles in
Table 4.3 include the dual and wide-single trailer tyre variants.
Table 4.3 TAC sequence and vehicle description.
TAC sequence Vehicle description
a-DD three-axle truck a-DD^FF five-axle tractor semi-trailer (tandem-semi) a-DD^FFF & a-DD^fff six-axle tractor semi-trailer (tridem-semi)* a-DD^FFF^FF & a-DD^fff^ff eight-axle B-train* a-DD^FFF^FFF nine-axle B-train
a-DD^FFP six-axle tractor semi-trailer (tridem-semi) with a single rear-mounted self-steering axle
a-DD^FF^FF seven-axle B-train a-DD_F-FF six-axle truck and full-trailer a-DD_FF-FF seven-axle truck and full-trailer
aa-DD^FFPP & aa-DD^ffpp eight-axle tractor semi-trailer (quad-semi) with twin rear-mounted self-steering axles*
aa-DD^PFFP eight-axle tractor semi-trailer (quad-semi) with front and rear-mounted self-steering axles
aa-DD_FF-FF & aa-DD_ff-ff eight-axle truck and full-trailer* * Reference vehicles
Note that A-trains are limited to a GVM of 39 tonnes since they exhibit unfavourable
dynamic stability characteristics. As a result, A-trains have become less popular than
other vehicles, which are permitted to operate at a maximum GVM of 44 tonnes.
Currently, A-trains make up only a very small proportion of the heavy vehicle fleet in
New Zealand and are not considered in this study.

CHARACTERISING PAVEMENT SURFACE DAMAGE CAUSED BY TYRE SCUFFING FORCES
40
5. Results
5.1 Abbreviations
In the performance maps and tables in this chapter, the following abbreviations have
been used:
• lg geometric wheelbase: distance from the front axis to the rear axis,
• r0 reference turn radius,
• Θ turn angle,
• μp peak coefficient of friction at the pavement–tyre interface,
• fz0 static vertical force,
• s axle group spread,
• fyp peak scuffing force,
• fzp vertical force on tyre group,
• Δypt percentage change in peak scuffing force of a tyre configuration t relative
to dual 11R22.5 tyres,
• Δzp lateral load transfer expressed as a percentage of the static vertical load,
and
• αp slip angle of the tyre group on which the peak scuffing force occurred.
5.2 Simple-trailer performance maps
Figures 5.1–5.5 show the response of the tridem simple-trailer undergoing low-speed
turns with a radius of 13.75 m. Figure 5.1 shows the peak vertical force as a function of
the static vertical force and axle group spread. The increased peak vertical force in
Figure 5.1 is caused by the lateral load transfer that results from having an elevated roll
centre above the ground plane. This figure shows that the amount of lateral load transfer
and the rate of lateral load transfer per static vertical load increases as the axle group
spread also increases. When laden with the same static vertical load of 29.0 kN, the peak
vertical force increases from 40.70 kN to 43.20 kN when the axle group spread is
increased from 2.00 m to 3.00 m.

5. Results
41
Figure 5.1 Peak vertical force v. static vertical force by axle group spread (tridem with dual 11R22.5 tyres).
Notes to Figure 5.1: lg = 8.50 m r0 = 13.75 m Θ = 360°
Figure 5.2 gives the slip angle and Figure 5.3 gives the peak scuffing force as functions of
the static vertical force and tridem axle group spread. These figures show that the slip
angle and peak scuffing force increase with increasing axle group spread. When laden
with the same static vertical load of 29.0 kN, the tridem axle group spread of 2.00 m
generates a steady-state peak scuffing force of 24.7 kN compared with the 3.00 m
spread, which generates 31.0 kN. Because of the nonlinear tyre characteristics, the peak
scuffing force increases at a reducing rate with increasing axle group spread and with
increasing vertical load.

CHARACTERISING PAVEMENT SURFACE DAMAGE CAUSED BY TYRE SCUFFING FORCES
42
Figure 5.2 Slip angle v. static vertical force by axle group spread (tridem with dual 11R22.5 tyres).
Notes to Figure 5.2: lg = 8.50 m r0 = 13.75 m Θ = 360°
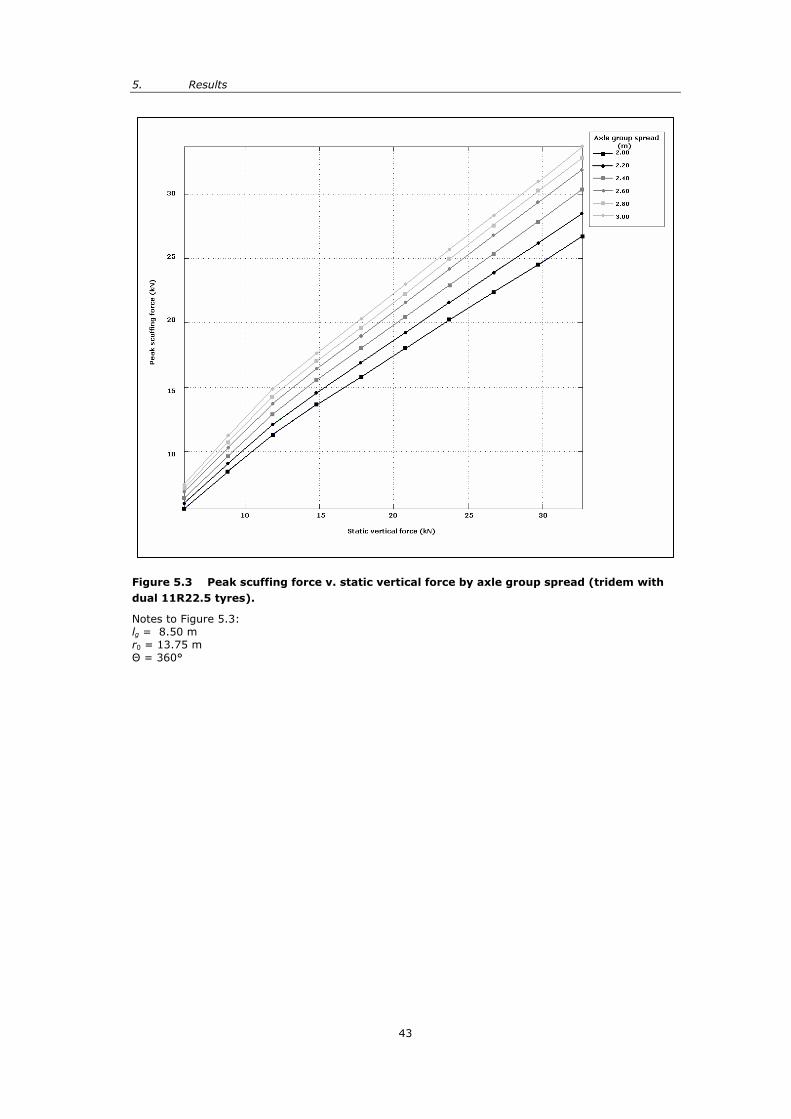
5. Results
43
Figure 5.3 Peak scuffing force v. static vertical force by axle group spread (tridem with dual 11R22.5 tyres).
Notes to Figure 5.3: lg = 8.50 m r0 = 13.75 m Θ = 360°

CHARACTERISING PAVEMENT SURFACE DAMAGE CAUSED BY TYRE SCUFFING FORCES
44
Figure 5.4 Peak scuffing force v. turn angle by axle group spread (tridem with dual 11R22.5 tyres).
Notes to Figure 5.4: fz0 = 29.42 kN lg = 8.50 m r0 = 13.75 m

5. Results
45
Figure 5.5 Peak scuffing force v. turn angle by geometric wheelbase (tridem with dual 11R22.5 tyres).
Notes to Figure 5.5: fz0 = 29.42 kN s = 2.50 m r0 = 13.75 m
Figure 5.4 gives the peak scuffing force as a function of turn angle and tridem axle group
spread, and Figure 5.5 gives the peak scuffing force as a function of turn angle and
geometric wheelbase. These figures show that the peak scuffing force increases with
increasing turn angle, reaching a steady-state value.
Figure 5.4 shows that the peak scuffing force for wide tridem axle group spreads
increases at a greater rate per angle of turn and attains a higher level of steady-state
peak scuffing force than narrower spreads. Regardless of axle group spread, they achieve
steady-state at approximately the same angle of turn (about 250o).
Figure 5.5 shows that the peak scuffing forces on longer wheelbase vehicles increase at a
slower rate per angle of turn than comparable vehicles with shorter wheelbases. However,
the steady-state peak scuffing forces are higher for longer wheelbase vehicles than for
comparable shorter wheelbase vehicles. The cross-over point occurred at about 130o of
turn angle.

CHARACTERISING PAVEMENT SURFACE DAMAGE CAUSED BY TYRE SCUFFING FORCES
46
Figure 5.6 Peak scuffing force v. turn radius by axle group spread (tridem with dual 11R22.5 tyres).
Notes to Figure 5.6: fz0 = 29.42 kN lg = 8.50 m Θ = 360°
Figure 5.6 gives the peak scuffing force of the tridem simple-trailer undertaking 360o low-
speed turns for different turn radii and axle group spreads. This figure shows that the
peak scuffing force tends to zero with decreasing tridem axle group spread and with
increasing turn radius.
The performance maps showing the peak scuffing force as a function of the static vertical
force for both the tandem and tridem axle groups are given in Appendix B. The scuffing
force calculations for the tandem axle group performance map can also be applied to
tridem or quad-axle groups having two non-steering axles within the group, assuming
identical equivalent wheelbases, and assuming that the self-steering axles do not reach
their maximum steer angle limits and that centring force effects are negligible.

5. Results
47
5.3 Vehicle performance maps
5.3.1 Diagrams
The graphs in this section map the performance of typical vehicle types in New Zealand
fitted with 11R22.5 tyres and undergoing a 13.75 m radius low-speed turn for different
angles of turn.
• Figure 5.7 gives the peak scuffing force;
• Figure 5.8 gives the peak scuffing force normalised by the vertical force or the
peak scuffing force per unit vertical load;
• Figure 5.9 gives the amount of lateral load transfer expressed as a percentage of
the static vertical load; and
• Figure 5.10 gives the slip angle.
Normalising the peak scuffing force by the vertical load, as shown in Figure 5.8, reduces
the effect of having different axle weights and presents a clearer picture when considering
equally loaded axles, and it also removes, to some extent, the effects of lateral load
transfer.
Figure 5.7 Peak scuffing force v. turn angle by vehicle type (11R22.5 tyres).
Notes to Figure 5.7: r0 = 13.75 m

CHARACTERISING PAVEMENT SURFACE DAMAGE CAUSED BY TYRE SCUFFING FORCES
48
Figure 5.8 Peak scuffing force normalised by the vertical force v. turn angle by vehicle (11R22.5 tyres).
Notes to Figure 5.8: r0 = 13.75 m

5. Results
49
Figure 5.9 Lateral load transfer v. turn angle by vehicle type (11R22.5 tyres).
Notes to Figure 5.9: r0 = 13.75 m

CHARACTERISING PAVEMENT SURFACE DAMAGE CAUSED BY TYRE SCUFFING FORCES
50
Figure 5.10 Slip angle v. turn angle by vehicle type (11R22.5 tyres).
Notes to Figure 5.10: r0 = 13.75 m
Table 5.1 gives the critical axle on which the peak scuffing force has occurred. For a given
row, the empty boxes in Table 5.1 take on the value of the leftmost non-zero axle
number.
Table 5.1 Vehicle v. peak scuffing force axle number for different angles of turn.
Turn angle Vehicle
11.25o 22.50o 33.75o 45.00o 56.25o 67.50o 78.75o 90.00o 101.25o 112.50o 123.75o a-DD 2 a-DD̂ FF 2 2 2 2 2 2 2 2 2 4 a-DD̂ FFF 4 a-DD̂ FFF̂ FF 4 a-DD̂ FFF̂ FFF 4 4 4 4 4 4 7 a-DD̂ FFP 2 2 2 2 2 2 2 2 2 2 4 a-DD̂ FF̂ FF 2 2 2 2 2 2 2 2 2 6 a-DD_F-FF 2 a-DD_FF-FF 2 2 2 2 2 2 6 aa-DD̂ FFPP 3 3 3 3 3 3 3 3 3 3 5 aa-DD̂ PFFP 3 aa-DD_FF-FF 5 5 5 5 5 5 5 5 5 7

5. Results
51
5.3.2 Scuffing forces
The steady-state peak scuffing forces generated by vehicles without self-steering axles
are presented in Table 5.2.
Table 5.2 Steady-state scuffing force generated by vehicles without self-steering axles.
Vehicle type Level of force generated (kN)
Rankinga
Tractor semi-trailer 25.0–30.5 tridem semi-trailer tandem semi-trailer
B-trains 22.0–24.0 eight-axle B-train nine-axle B-train seven-axle
truck and full-trailersb 19.5–22.0 three-axle single-unit truckc seven-axle truck and full-trailerc eight-axle truck and full-trailer
Notes to Table 5.2: a Vehicles are listed in descending order according to the amount of scuffing force generated. b Included single-unit trucks. c These two vehicles were ranked equally.
The steady-state peak scuffing forces generated by the three tractor semi-trailers with
self-steering axles are between 20.0–24.5 kN, which is similar in magnitude to that
generated by B-trains. The quad-semi with the twin rear-mounted self-steering axles
generated the highest steady-state peak scuffing force, followed by the tridem-semi with
the single rear-mounted self-steering axle, and then by the quad-semi with the front and
rear-mounted self-steering axles. For these vehicles, the peak scuffing forces are similar
in magnitude to each other (19.0 kN) for turn angles less than 112.5o.
5.3.3 Slip angle, peak scuffing force per unit load, percentage lateral load transfer
Of the vehicles without self-steering axles, the results for the greatest slip angles, peak
scuffing forces per unit load, and percentage lateral load transfers are separated distinctly
into two groups depending on whether the vehicle had tridem axle groups or only tandem
axle groups. The first category contains vehicles with tridem axle groups:
• the tractor semi-trailers, and
• B-trains.
The second category consisted of vehicles with tandem axle groups:
• tractor semi-trailers,
• B-trains,
• truck and full-trailers, and
• single-unit trucks.
Table 5.3 shows the slip angle, peak scuffing force per unit load and lateral load transfer
during a steady-state turn for both categories.

CHARACTERISING PAVEMENT SURFACE DAMAGE CAUSED BY TYRE SCUFFING FORCES
52
Table 5.3 Slip angle, peak scuffing force per unit load, and lateral load transfer of the two vehicle categories.
Category Slip angle Peak scuffing force per unit load
Lateral load transfer
Tandem axle groups 3.9°–4.8° 0.47–0.52 25%–33%
Tridem 7.8°–9.8° 0.97–0.73 44%–47%
Of the tractor semi-trailers with self-steering axles, the slip angles, peak scuffing forces
per unit load, and lateral load transfers fall into either the tandem or tridem axle group
categories depending on the angle of turn. The reasons for this are discussed in
Section 5.3.4.
5.3.4 Peak scuffing force and critical axle group shift
The axle group on which the peak scuffing forces occur can change as the turn angle
increases. If a change occurs, in general, the critical axle group shifts backward through
the vehicle’s more widely spread axle groups, although not necessarily in succession.
Consider the tandem-semi and the seven-axle B-train, for example. The peak scuffing
force occurred on the lead drive axles for turn angles less than 101.25o, but shifted
backward to the lead axle on the rearmost tandem axle group at greater angles of turn.
Similar behaviour was observed with the seven-axle truck and full-trailer, with the shift
occurring at a turn angle of 67.50o. The peak scuffing force of the eight-axle truck and
full-trailer occurred on the lead axle of the dolly’s tandem axle group for turn angles less
than 101.25o, but shifted to the lead axle of the rearmost tandem axle group for greater
angles of turn. In the case of the tridem-semi and the eight-axle B-train, the peak
scuffing force occurred on the lead axle of the tridem axle group for all angles of turn.
Thus the tridem axle groups dominated tandem axle groups in terms of peak scuffing
forces even though the tridem axle groups had less weight per axle. In the case of the
nine-axle B-train, the peak scuffing force occurred on the lead axle of the lead tridem axle
group for turn angles less than 67.50o, but shifted to the lead axle of the rearmost tridem
axle group for greater angles of turn. For the six-axle truck and full-trailer, and the
single-unit truck, the peak scuffing force occurred on the lead axles of the tandem-drive
groups for all angles of turn.
The scuffing forces generated by self-steering axle groups depend on the number and
distribution of self-steering axles, the centring force characteristics, and on the maximum
steer angles permitted. For large angles of turn, the axles can reach their steer angle
limits, at which point they respond like non-steering axles. These characteristics can
affect the location of the equivalent single axle, the equivalent wheelbase, the axle group
spread, and ultimately the peak scuffing forces. For example, the peak scuffing forces for
all three vehicles were similar in magnitude (19.0 kN) for turn angles less than 112.5o;
this scuffing occurred on the lead drive axles. For greater angles of turn, the quad-semi
with the twin rear-mounted self-steering axles showed an increase in peak scuffing forces
and, to a lesser extent, so did the tridem-semi with the single rear-mounted self-steering
axle. At these increased angles of turn, the self-steering axles reach their maximum steer
angle limits and these axles respond like non-steering axles. This results in increasing

5. Results
53
peak scuffing forces and in increasing peak scuffing forces per unit load until steady-state
is reached. However, the self-steering axles on the quad-semi with the front and rear-
mounted self-steering axles never reached their maximum steer angle limits for all angles
of turn, and thus had the least amount of peak scuffing force for this type of vehicle. The
peak scuffing forces for this vehicle remained on the lead drive axle for all angles of turn.
5.3.5 Tyre size, dual tyre and wide-single tyres
Table 5.4 shows the effects of having different tyre configurations on the trailers of the
four reference vehicles undergoing a 360o steady-state low-speed turn with a modest turn
radius of 18.75 m. The 11R22.5 and 245/70R19.5 tyres are in dual configuration, and the
385/65R22.5 tyres are configured as wide-singles. Single and dual 11R22.5 tyres are
used on the steer and drive axles of all of the powered units in this analysis. Note the axle
number and the relative magnitudes of the peak slip angles on which the peak scuffing
force has occurred for the different vehicles.
Table 5.4 Effects of different trailer tyres on the reference vehicles undergoing a 360o steady-state turn at a radius of 18.75 m.
Tyres Reference
vehicle fyp
(kN) fzp
(kN) fyp fzp
Δypt (%)
Δzp (%)
αp (deg)
Axle
11R22.5 aa-DD_FF-FF 13.2 36.4 0.362 0 24 2.8 7 245/70R19.5 aa-DD_FF-FF 12.9 35.3 0.366 -2 20 2.8 7 385/65R22.5 aa-DD_ff-ff 13.1 35.6 0.367 -1 21 2.8 7 11R22.5 a-DD^FFF^FF 18.1 32.7 0.554 0 36 5.2 4 245/70R19.5 a-DD^FFF^FF 18.5 31.6 0.584 2 32 5.2 4 385/65R22.5 a-DD^fff^ff 20.1 32.3 0.622 11 35 5.2 4 11R22.5 a-DD^FFF 22.8 40.3 0.567 0 37 5.7 4 245/70R19.5 a-DD^FFF 23.8 39.1 0.608 4 33 5.7 4 385/65R22.5 a-DD^fff 26.1 40.1 0.651 14 36 5.7 4 11R22.5 aa-DD^FFPP 17.1 33.1 0.518 0 35 4.4 5 245/70R19.5 aa-DD^FFPP 17.1 31.6 0.541 0 29 4.6 5 385/65R22.5 aa-DD^ffpp 17.0 31.9 0.534 -1 30 4.2 5
Relative to the dual 11R22.5 tyre configuration, the greatest increase in steady-state
peak scuffing forces occurred on tridem axle groups configured with 385/65R22.5 wide-
single tyres, with the tridem-semi experiencing a 14% increase and the seven-axle B-
train experiencing an 11% increase. When configured with dual 245/70R19.5 tyres, the
tridem-semi generates a 4% increase in steady-state peak scuffing force relative to the
dual 11R22.5 tyre configuration, and the seven-axle B-train generates a 2% increase. The
changes in peak scuffing force for the remaining vehicles are less significant by
comparison.
Relative to the dual 11R22.5 tyre configuration, the greatest reduction in lateral load
transfer occurred on the vehicles fitted with dual 245/70R19.5 tyres, with the quad-semi
experiencing a 6% reduction. The remaining vehicles show a 4% reduction in lateral load
transfer when fitted with dual 245/70R19.5 tyres. When fitted with 385/65R22.5 wide-
single tyres, the quad-semi shows a 5% reduction in lateral load transfer relative to the
dual 11R22.5 tyre configuration, and the eight-axle truck and full-trailer shows a 3%
reduction. The changes in lateral load transfer for the remaining vehicles are less
significant in comparison.

CHARACTERISING PAVEMENT SURFACE DAMAGE CAUSED BY TYRE SCUFFING FORCES
54
6. Discussion
To recap the findings of the previous chapter, for a given tyre and horizontal pavement
surface, the magnitude of the cornering or scuffing force increases with slip angle and
with vertical load. For small slip angles, the cornering force increases linearly with slip
angle. For larger slip angles, the cornering force increases nonlinearly with slip angle at a
reducing rate. The cornering force also increases nonlinearly with vertical load at a
reducing rate.
A number of findings relate to the impact of vehicle and turn parameters on the
magnitude of the peak scuffing forces generated by multi-axle groups during constant
low-speed turns.
• Axle groups with self-steering axles generate lower scuffing forces than
comparable non-steering axle groups. This outcome is the main motivation
behind having self-steering axles. The peak scuffing forces generated by self-
steering axle groups depend on the number and distribution of self-steering
axles, on the centring force characteristics, and on the maximum steer angles
permitted. For tight turns, however, these axles can reach their steer angle
limit, at which point they respond like non-steering axles and thus giving rise to
an increase in scuffing forces. Of the self-steering tractor semi-trailers
undergoing the 13.75 m radius turn, the quad-semi with the twin rear-mounted
self-steering axles generated the highest steady-state peak scuffing forces,
followed by the tridem-semi with the single rear-mounted self-steering axle, and
then by the quad-semi with the front and rear-mounted self-steering axles. But
for turn angles less than 112.5o, the peak scuffing forces are similar in
magnitude to each other (19.0 kN) and occurred on the lead drive axles. For
most on-road low-speed turns, the effects on pavement surface wear from each
of these vehicles are very similar.
• For the same axle group weight and axle group spread, wide-single
tyres generate higher scuffing forces than dual tyres. When undergoing
the modest 18.75 m radius turn, the tridem-semi generated a 14% increase in
steady-state peak scuffing force when fitted with 385/65R22.5 tyres (26.1 kN)
compared to when fitted with dual 11R22.5 tyres (22.8 kN). When fitted with
dual 245/70R19.5 tyres, the same tridem axle group generated a 4% increase in
steady-state peak scuffing force compared to dual 11R22.5 tyres. This result is
consistent with the relative amount of cornering force produced by this particular
tyre configuration. The corresponding lateral load transfers are shown to
increase above the static weight by 4% when changing from dual 245/70R19.5
to dual 11R22.5 tyres, and by 1% when changing from 385/65R22.5 wide-
singles to dual 11R22.5 tyres. These results are consistent with increasing roll
centre and sprung mass CG heights and with reducing tyre track widths,
respectively.

6. Discussion
55
• Scuffing forces increase with increasing axle group spread. Increasing
axle group spread increases an axle’s longitudinal distance from the equivalent
single axle. Increasing this distance increases the curvature of the path and slip
angle experienced by the corresponding tyres. These increases result in
increasing lateral load transfers and scuffing forces.
• When laden to the maximum legal weight limits, tridem axle groups
produce higher scuffing forces than tandem axle groups even though
the tridem axle groups have less weight per axle. At legal axle group
weight limits, tridem axles weigh 6 tonnes each while tandem axles weigh
7.5 tonnes each. Even with this weight difference, tridem axle groups generate
higher scuffing forces than tandems. At these weights and when configured with
dual 11R22.5 tyres, the tridem axle group generated 30.5 kN, which equates to
22% more steady-state peak scuffing than the tandem axle group (25.0 kN)
when undergoing the 13.75 m radius turn. The corresponding load transfers are
32% and 46% above the static vertical loads for the tandem and tridem axle
groups, respectively. The increased scuffing force results from the differences in
axle group spreads, lateral load transfers, and from the nonlinear tyre
characteristics. The axle group spreads were 1.35m and 2.70m for the tandem
and tridem axle groups, respectively.
• Scuffing forces decrease with increasing turn radius. This result is
consistent with the decreasing curvature of the path or with the increasing
radius of curvature experienced by the axle group.
• For vehicles without self-steering axles, the highest steady-state
scuffing forces are generated by tractor semi-trailers, followed by B-
trains, then truck and full-trailers, and then single-unit trucks. When
undergoing the 13.75 m radius turn, the steady-state peak scuffing forces
generated by the tractor semi-trailers, B-trains, and truck and full-trailers
(including single-unit trucks) ranged from 25.0–30.5 kN, 22.0–24.0 kN, and
19.5–22.0 kN, respectively. One reason for this is that tractor semi-trailers are
laden with higher loads for a given axle group configuration than other vehicles
of similar length. A second reason is that the rear axle groups on tractor semi-
trailers experience greater levels of curvature during a steady-state turn than
other vehicles of similar length. A third reason is that axle groups with more
axles have wider axle spreads, so vehicles with tridem axle groups generate
higher scuffing forces and lateral load transfers than vehicles with only tandem
axle groups.
• Even during low-speed turns with minimal lateral acceleration,
significant lateral load transfer can occur from having an elevated roll
centre, thus leading to higher peak vertical loads. The result is that higher
peak scuffing forces occur than would be the case if no load transfer took place.
For a legally configured tridem-semi undergoing a 13.75 m radius 90o turn, this
lateral load transfer can increase the peak vertical load by up to 40% above the
static load. The mechanism responsible for this lateral load transfer depends on
axle group spread and on the roll centre height of the suspension. The tyre-
spread across the axle group induces transverse shear forces that act at the

CHARACTERISING PAVEMENT SURFACE DAMAGE CAUSED BY TYRE SCUFFING FORCES
56
pavement–tyre interface. Since the roll centre of the suspension is some
distance above the ground plane, a roll moment is induced at the roll centre. To
maintain a moment balance about the roll centre, load must be transferred
laterally from one side of an axle to the other. Lateral load transfer caused by
body roll can also be induced by tow coupling forces applied at a vertical
distance offset from the roll centre but this effect is only significant for large
articulation angles. No lateral load transfer caused by body roll will occur if the
tow coupling is at the same height as the roll centre of the suspension.
• For small angles of turn (90o or less), shorter wheelbase single-unit
vehicles generate higher scuffing forces than comparable vehicles with
longer wheelbases but the reverse is true for large turn angles as these
vehicles approach steady-state. This is because, for a given turn radius, the
maximum scuffing forces occur at steady-state when the curvature of the axle
groups are maximal. In steady-state, the axle groups on shorter wheelbase
vehicles experience lower levels of curvature than comparable vehicles with
longer wheelbases, but shorter wheelbase vehicles require smaller angles of turn
to reach steady-state than comparable vehicles with longer wheelbases.
• For a given turn radius, the axle group on which the peak scuffing forces
occur can change as the turn angle increases. If a change occurs, in
general, the critical axle group shifts backward through the vehicle’s more
widely spread axle groups, although not necessarily in succession. This results
from the differences in axle group spreads, static axle weights, and lateral load
transfers, and on the curvature of the path of the axle group. To achieve a
cornering force balance, the peak scuffing forces generally occurs on the tyres of
the lead non-steering axle within the axle group.
• Minor visible abrasion of the chipseal surface was observed in the field
trial at the lowest gross tandem axle group load, which was a little
under 7 tonnes. Small fragments approximately 1 mm in diameter were
broken off the exposed corners of the chip. Based on the computer simulation,
this damage resulted from a peak scuffing force of a least 33.2 kN. A peak
scuffing force of 30.5 kN was calculated for a legally configured tridem semi-
trailer undergoing the 13.75 m radius 360o turn. This latter manoeuvre is less
severe than the 25 m wall-to-wall 360o turn capability required by the VDM Rule.

7. Conclusions
57
7. Conclusions
7.1 Key findings
It is clear from the study that reducing axle weight, axle group spread, and road
curvature (increasing turn radius) reduces scuffing forces and their impact on pavement
wear. The amount of scuffing force also depends on the tyre configuration, the use of self-
steering axles, and on the type of vehicle.
A rule-of-thumb observation which was given in Fancher & Winkler (2007) and is also
conveyed in this study is that:
…what one does to improve low speed performance is likely to degrade high
speed performance and vice versa.
For example, wide-single tyres produce higher scuffing forces than dual tyres. However,
the use of wide-single tyres increases the tyre track width, which can slightly improve
rollover stability. The use of self-steering axles results in lower scuffing forces but the
lower overall cornering stiffness reduces high-speed directional performance compared
with non-steering axle groups. For vehicles without self-steering axles, the highest
steady-state scuffing forces are generated by tractor semi-trailers, followed by B-trains,
and then truck and full-trailers. This ranking of heavy vehicles is similar to that when
ranked, in descending order, of high-speed directional performance.
The tyre cornering stiffness, and therefore the amount of scuffing force, also depends on
inflation pressure. In the case of truck tyres, the influence of inflation on cornering
stiffness varies and depends on obscure sensitivities to details in the carcass design.
Therefore, the overall influence of inflation pressure on cornering stiffness cannot be
generalised across all tyre types.
In general, the pavement wear resulting from scuffing forces will depend on many factors
including the overall pavement design and the condition of the pavement, and on various
environmental factors.
CHARACTERISING PAVEMENT SURFACE DAMAGE CAUSED BY TYRE SCUFFING FORCES
58
7.2 Recommendations
• When designing intersections and roundabouts, the turn radius should be as
large as possible. This will lead to reduced scuffing forces.
• Where tight radius turns are unavoidable, the pavement surface design should
take into account the high levels of scuffing forces that will occur.
• Research should be undertaken to determine whether the weight limits on
tridem and quad-axle groups should vary with dual or wide-single tyre
configurations. The VDM Rule allows for tandem axle groups to carry more
weight when configured with dual tyres than they can with wide-single tyres.
The VDM Rule for tridem and quad-axle groups permits the same axle weight
limit regardless of tyre configuration.
• Research should be undertaken to investigate whether a pavement scuffing force
damage component should be incorporated into the Road User Charges Cost
Allocation Model. The current Cost Allocation Model accounts for the pavement
wear caused by vertical loads but does not account for the impact of pavement
scuffing forces on pavement wear for a given vehicle configuration.

8. References
59
8. References
AUSTROADS. 1995. Guide to Traffic Engineering Practice Intersections at Grade Part 5.
Granville, Australia: Ambassador Press Pty. 67 pp.
Fancher, P.S., Ervin, R.D., Winkler, C.B., Gillespie, T.D. 1986. A Factbook of the
Mechanical Properties of the Components for Single-Unit and Articulated Heavy Trucks.
Washington DC: U.S. Department of Transportation. 184 pp.
Fancher, P., Winkler, C. 2007. Directional performance issues in evaluation and design of
articulated heavy vehicles. International Journal of Vehicle Mechanics and Mobility,
Vehicle System Dynamics, Vol. 45, No. 7–8, July–August 2007: 607–647.
Gillespie, T.D., MacAdam, C.C. 1982. Constant Velocity Yaw/Roll Program User’s Manual.
Ann Arbor, Michigan, United States of America: The University of Michigan
Transportation Research Institute. 117 pp.
Gillespie, T.D. 1992. Fundamentals of Vehicle Dynamics. Warrendale, Pennsylvania:
Society of Automotive Engineers, Inc. 471 pp.
Jacobs, M.M.L., Moraal, J. 1992. The influence of tire characteristics on normal stresses in
asphalt concrete pavements. Pp 218–224 in Third International Symposium on Heavy
Vehicle Weights and Dimensions, Cambridge, UK, 28 June–2 July, 1992.
Latto, D., Baas, C. 2002. Quad-axle Semi Trailer – Field Trial. July 2002. TERNZ report.
Auckland, New Zealand: TERNZ. 41 pp.
LTSA. 2002. Land Transport Rule: Vehicle Dimensions and Mass 2002 – Rule 41001.
Wellington: Land Transport Safety Authority (LTSA). 117 pp.
LTNZ. 2007. Land Transport Rule: Vehicle Dimensions and Mass Amendment (No 2) 2007
– Rule 41001/3. Wellington: Land Transport New Zealand (LTNZ).
National Transport Commission. 2006. Administrative Guidelines, Rules and Codes for
Operation of Performance Based Standards Vehicles. The Standards and Rules for
Assessment of Potential Performance Based Standards Vehicles (Version 1.1).
Melbourne: National Transport Commission. 137 pp.
UMTRI. 2000. The mechanics of heavy-duty trucks and truck combinations. Engineering
Summer Conference. The University of Michigan Transportation Research Institute
(UMTRI). Summer 2000. Volume 2.

CHARACTERISING PAVEMENT SURFACE DAMAGE CAUSED BY TYRE SCUFFING FORCES
60

Appendices
61
Appendix A Model properties
Tables A1–A4 give the tyre properties, relevant suspension parameters, and the coupling
and sprung mass CG heights used in the study. These are based on the values from the
VDM Rule and from Fancher et al. (1986).
Table A1 Tyre properties.
Parameter Vertical stiffness (kN/m)
Rolling radius (m)
Width (m)
Dual spacing (m)
255/70R22.5 (field trial) 874.2332 0.490 0.279 0.300
11R22.5 874.2332 0.490 0.279 0.300
245/70R19.5 874.2332 0.400 0.248 0.280
385/65R22.5 1049.0798 0.490 0.387 0.000
Table A2 Relevant trailer suspension parameters.
Parameter Unit Steer axle ERFc OEMc
steel-leaf
Drive axle DAFc
85CF OEMc steel-leaf
Trailer axle Hutch 9600
steel-leaf
Trailer axle Hutch 9700
(field trial) Auxiliary roll stiffness
Nm/rad 24 800 41 417 38 841 38 841
Overall massa kg 544 1043 798 798
CG height m rrb rr rr 0.49
Roll centre height m rr-0.02 rr+0.2 rr+0.2 0.69
Suspension track width
m 0.80 0.97 0.97 0.97
Overall tyre track width
m 2.3 2.4 2.4 2.4
Notes to Table A2: a Overall mass = axle mass + tyre masses b rr = rolling radius of tyre. c Manufacturers’ names
Table A3 Coupling and sprung mass CG heights for the vehicle models.
Parameter
Value (m)
Fifth wheel coupling height 1.35
Tow-eye coupling height 0.94
Turntable coupling height 1.25
Tractor sprung mass CG height 1.12
Trailer sprung mass CG height rr*+1.76
Truck sprung mass CG height rr+1.61
* rr = rolling radius of tyre.

CHARACTERISING PAVEMENT SURFACE DAMAGE CAUSED BY TYRE SCUFFING FORCES
62
Table A4 Coupling and sprung mass CG heights for the simple-trailer models (including field trial).
Parameter
Value (m)
Tow-eye coupling height 0.69
Trailer sprung mass CG height rr*+1.76
* rr = rolling radius of tyre.
The relevant vehicle parameters are shown in Table A5. ‘Unit wheelbase’ corresponds to
the nominal wheelbase as specified in the VDM Rule, i.e. the length from the front axis to
the rear axis. ‘Unit coupling offset’ is the displacement of the coupling from the rear axis.
By convention, a positive value indicates a displacement forward of this axis, while a
negative sign denotes a backward displacement.
Table A5 Parameters of the vehicles used in the computer model.
Tyre and axle coupling sequence unit
Unit wheelbase
(m)
Unit coupling offset (m)
Axle group spread
(m)
Axle group gross mass
(kg)
a-DD 5.875 0 0 1.35
6000 15 000
a-DD^FF 4.25 8.5
0.275 0 1.35 1.35
6000 15 000 15 000
a-DD^FFF & a-DD^fff 4.25 8.5
0.275 0 1.35 2.7
6000 15 000 18 000
a-DD^FFP 4.25 8.5
0.275 0 1.35 2.7
6000 15 000 18 000
aa-DD^FFPP & aa-DD^ffpp 5.15 8.5
0.70 1.72 1.35
4
9000 15 000 20 000
aa-DD^PFFP 5.15 8.5
0.70 1.72 1.35
4
9000 15 000 20 000
a-DD^FF^FF 4.25 6.5 5.4
0.218–0.675 0 1.35 1.35 1.35
5300 12 900 12 900 12 900
a-DD^FFF^FF & a-DD^fff^ff 4.25 6.5 5.4
0.218–1.35 0 1.35 2.7 1.35
5300 12 000 14 700 12 000
a-DD^FFF^FFF 4.25 6.5 5.4
0.218–1.35 0 1.35 2.7 2.7
5300 12 900 12 900 12 900
a-DD_F-FF 5.875 3.007 5.5
-2.2 0
0 1.35
0 1.35
6000 14 000 8000
14 000 a-DD_FF-FF 4.3
5.5 4.0
-1.72 0
0 1.35 1.35 1.35
6000 12 000 13 000 13 000
aa-DD_FF-FF & aa-DD_ff-ff 5.875 3.007 5.5
-2.2 0
1.72 1.35 1.35 1.35
8000 12 000 12 000 12 000

Appendices
63
Appendix B Tandem and tridem simple-trailer performance maps
Figure B1 Peak scuffing force v. static vertical force by axle group spread (tandem with dual 11R22.5 tyres)
Notes to Figure B1: lg = 8.50 m r0 = 13.75 m Θ= 360° μp = 1.0.
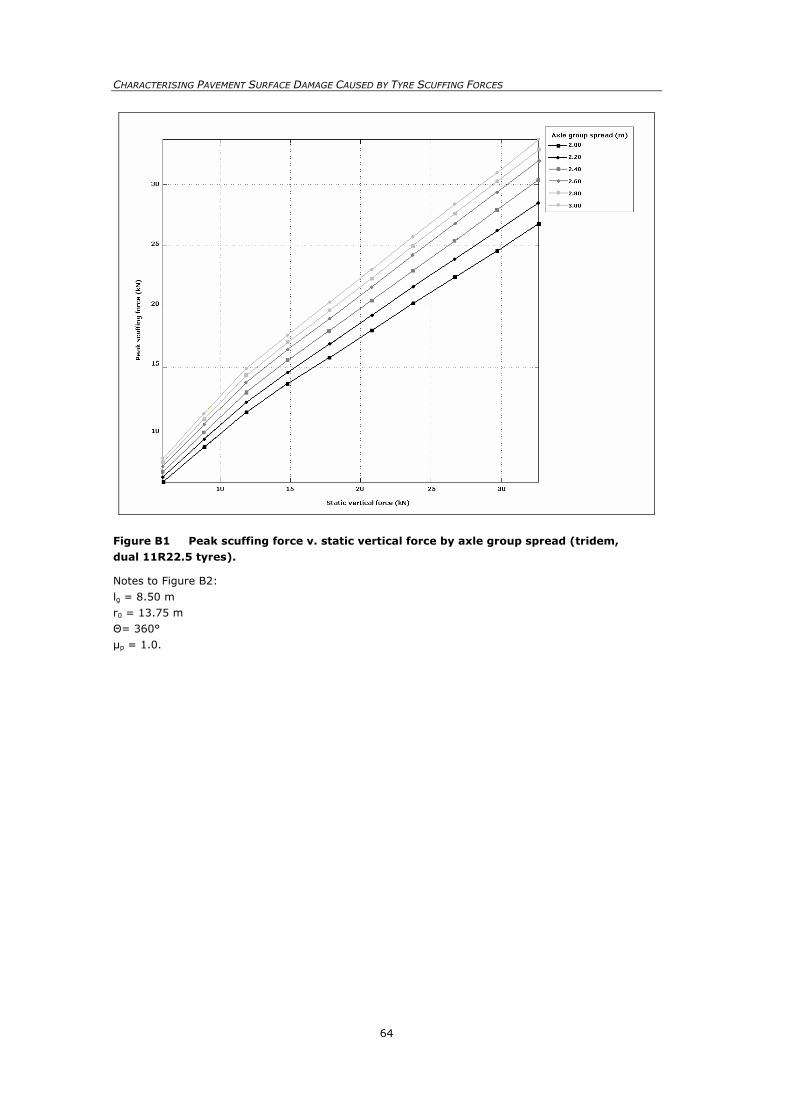
CHARACTERISING PAVEMENT SURFACE DAMAGE CAUSED BY TYRE SCUFFING FORCES
64
Figure B1 Peak scuffing force v. static vertical force by axle group spread (tridem, dual 11R22.5 tyres).
Notes to Figure B2: lg = 8.50 m r0 = 13.75 m Θ= 360° μp = 1.0.

Appendices
65
Appendix C Glossary
C1 Cornering force parameters
i axle number
j jth non-steering axle group belonging to the jth vehicle unit
k kth vehicle unit
fy tyre cornering force or pavement scuffing force
fz vertical force
α slip angle
cα cornering stiffness (linear tyre model used for small slip angles only)
μys transverse pavement–tyre static friction coefficient
μyk transverse pavement–tyre kinetic or sliding friction coefficient
δij displacement from the jth rear axis to the ith axle (positive distance forward,
negative distance rearward)
ε distance from the rear axis to the equivalent single axle
r radius of curvature or instantaneous turn radius of the path followed by the
equivalent single axle
r0 reference turn radius or radius of curvature of the turn
le equivalent wheelbase: distance from the front axis to the equivalent single axle
lg geometric wheelbase: distance from the front axis to the rear axis
h distance from the tow coupling to the corresponding equivalent single axle
N number of non-steering axles
LSO low-speed steady-state offtracking
C2 Lateral load transfer parameters
fzr vertical force on the right tyre group
fzl vertical force on the left tyre group
fyb lateral body force acting on the sprung mass
fys lateral surface force applied to the sprung mass
tt tyre track width
hrc roll centre height above the ground plane
kc composite roll stiffness
Φ body roll angle relative to the vertical axis

CHARACTERISING PAVEMENT SURFACE DAMAGE CAUSED BY TYRE SCUFFING FORCES
66
C3 Field trial parameters
fyt peak kinetic towing force (vector)
fz0 static vertical load per tyre group (vector)
fya average kinetic scuffing force per tyre group (vector)
fyd drag force of dolly
le equivalent wheelbase of 6.15 m
s tandem axle group spread of 1.35 m
μyk transverse coefficient of kinetic friction
C4 Performance map parameters
Δzp lateral load transfer expressed as a percentage of the static vertical load
fzp vertical force on tyre group
fz0 static vertical force on tyre group
Δypt percentage change in peak scuffing force of tyre configuration t relative to dual
11R22.5 tyres
Θ turn angle
fyp0 peak scuffing force of dual 11R22.5 tyres
fypt peak scuffing force of tyre configuration t
t tyre configuration: dual 11R22.5, dual 245/70R19.5, or wide-single 385/65R22.5
tyres
C5 Units of measurement
Hz Hertz (cycles per second)
k kilo (one thousand times more)
kg kilogram
km/h kilometres per hour
m metre
mm millimetre
N Newton
psi pounds per square inch
rad radian
s seconds
° degrees (deg) oC degrees Celsius

Characterising Pavement Surface Damage Caused by Tyre Scuffing Forces
Land Transport New Zealand Research Report 347