
Isolating and characterising human developing cone ...
279
1 Isolating and characterising human developing cone photoreceptors towards a cell replacement therapy for retinal dystrophies Emily Welby UCL GOS Institute of Child Health Developmental Biology and Cancer Programme Stem Cells and Regenerative Medicine Section 2017 Thesis submitted to University College London for the degree of Doctor of Philosophy
-
Upload
khangminh22 -
Category
Documents
-
view
0 -
download
0
Transcript of Isolating and characterising human developing cone ...

1
Isolating and characterising human developing cone photoreceptors
towards a cell replacement therapy for retinal dystrophies
Emily Welby
UCL GOS Institute of Child Health Developmental Biology and Cancer Programme
Stem Cells and Regenerative Medicine Section
2017
Thesis submitted to University College London for the
degree of Doctor of Philosophy

2
I, Emily Welby, confirm that the work presented in this thesis is my own. Where
information has been derived from other sources, I confirm that this has been
indicated in the thesis.

3
Abstract Inherited retinal dystrophies resulting in the death of the light sensitive photoreceptor
cells are a major cause of incurable blindness. Loss of the cone photoreceptor cells,
which are crucial for colour detection, daylight vision and high visual acuity, has the
greatest impact on sight. Retinal differentiation of human pluripotent stem cells (hPSCs)
provides a potential renewable source of cone photoreceptors for cell replacement
therapy. However many critical challenges remain to be addressed, including i) assessing
the similarity between the transcriptomes of bona fide human foetal and in vitro hPSC-
derived cone cells and ii) developing strategies to purify cones prior to transplantation.
The work in this thesis addresses these questions in relation to L/M-opsin
photoreceptors, which form 90% of the total cone population in the human retina.
The onset of cone photoreceptor markers in the developing human retina was
characterised, before using an adeno-associated virus (AAV2/9.pR2.1:GFP) reporter to
specifically label and isolate a foetal L/M-opsin cone population. Total mRNA sequencing
revealed the transcriptome of this human foetal cone population for the first time and
by performing differential gene expression analysis at early and late foetal timepoints, a
novel cone-enriched gene signature was defined. Additionally, single cell transcriptome
analysis revealed a subtle heterogeneity of these cone cells, which deviate based on
maturity. Putative cell surface marker genes and cluster of differentiation (CD) marker
proteins expressed by L/M-opsin cones were profiled, which led to a CD marker
combination allowing for the enrichment of foetal L/M-opsin cones compared to the
unsorted cell population via fluorescence activated cell sorting. Translating these tools
into an hPSC-derived 3D retinal differentiation culture system revealed similarities in
cone gene expression and cone cell enrichment post sorting to human foetal cone cells.
Overall, these data provides vital pre-clinical steps towards generating a cone cell
replacement therapy for retinal dystrophies.

4
Acknowledgements I would firstly like to thank my supervisors, Prof. Jane Sowden, Dr. Jörn Lakowski and
Prof. Robin Ali for providing financial support, intellectual input and experimental
discussions throughout my doctorate study. I would also like to thank them for giving
me the opportunity to begin my research career within the human stem cell and retinal
research fields, which I have found highly stimulating and fascinating.
I cannot thank enough the people I have worked with over the last 4 years, including the
current and old members of the lab, in addition to the adopted members from the
Ferretti lab group: Edu, Vale, Fabiana, Eli, Dim, Aara, Dennis, Lisa, Rachel, Dan H, Dan K,
Jörn, Giulia, Nicola, Camila, Sophie, Olivia and Eleonora. Not only would I have been
unable to achieve my PhD without your constant scientific advice and discussions, your
amazing personalities and cultures have made the lab one of the best places to work.
Thank you for making my time at the ICH one of the most enjoyable and memorable
experiences and for the many, many times you have made me cry with laughter. I am
going to really miss you all but I know I have made friendships for life and I will continue
to keep in contact with you all. A special thank you also goes to my extended friends in
other lab groups of the ICH, particularly Dipa, Veronica and Serena, who have
contributed to making my PhD experience incredible.
I need to say a massive thank you to my flatmates, Nicol, Anna and Ramona, who have
also supported me over the last few years and made my living experience in London the
best. I have loved all the drama, the amazing Italian dinners, the Grey’s Anatomy nights
(with comments) and our vegetable growing. Our flat has felt like home to me, which I
will miss dearly, but once again, I know that we have made friendships for life.
Lastly and most importantly, I need to thank my family who have always provided me
with help, support and love through everything, personally and professionally. I could
not have done it without you all and I know I am incredibly lucky to have you all as my
family.

5
Technical Acknowledgments I am completely grateful to all the people below for providing technical help and
expertise throughout the projects duration.
• Dr. Jörn Lakowski for helping with experimental designing throughout the
project, particularly for the cell surface marker work, and for the contribution of
maintaining the stem cell-derived retinal differentiation cultures.
• Dr. Valentina Di Foggia for helping with experimental designing, providing data
on optic vesicle and photoreceptor efficiency which is featured in this thesis and
helping to culture the stem cell-derived retinal differentiations.
• Mr. Dimitri Budinger for helping with the cell counting featured within the cell
surface marker chapter.
• The Human Developmental Biology Resource team funded by the Wellcome
Trust and Medical Research Council for provided the human foetal samples.
• The NIHR Cambridge BRC hiPSC facility for reprogramming the hiPSC line used in
this study.
• Dr. Anai Gonzalez-Cordero and Miss. Arifa Naeem for providing the hESC-
derived retinal differentiation cultures used for the cell surface marker sorting
experiments.
• Dr. Kamil Kruczek for technical support with the production of the AAV
pR2.1:GFP construct which was critical for the success of this project. I would
also like to acknowledge Miss. Ryea Maswood and Mrs. Selina Azam for
performing the viral purification and quantification of the viral titre. I am
grateful to Prof. Robin Ali for providing access to the virus vector lab.
• Miss. Stephanie Canning and Dr. Ayad Eddaoudi at the UCL ICH FACS facility for
providing flow cytometry training, for technical advice for the experimental
planning of the cell surface marker work and for completing the cell sorting
procedure during experiments featured in this thesis.
• Dr. Mike Hubank, Dr. Tony Brooks and Miss. Paola Niola at UCL Genomics for
technical support on RNA seq matters, testing the RNA sample quality and
performing the cDNA libraries and RNA sequencing for the single cell and bulk
transcriptome work. Dr. Mike Hubank also provided funding for the Fluidigm C1

6
run which was performed at the Genomic Centre at Queen Mary’s University of
London with assistance from Miss Kristie Wood.
• Dr. Bertrand Vernay and Dr. Dale Moulding at the UCL GOSH ICH Imaging Facility
for immunofluorescence experimental design and technical support for all
microscopy matters.
• Dr Aaron Lun, Dr. Michael Epstein and Dr. John Marioni for technical discussions
and completing the single cell RNA seq analysis.
• Prof. David Gamm and his lab group for providing expertise on the retinal
differentiation culture system.
• Dr. Federico Minneci and Prof. David Jones for providing their expertise to
generate the bioinformatics tool used within the cell surface marker analysis.
Funding
• National Institute of Health Research (NIHR) Great Ormond Street Hospital/UCL
Biomedical Research Centre
• Great Ormond Street Hospital Children’s Charity (GOSHCC)
• Medical Research Council (MRC)
• Fight for Sight
• New Life Foundation

7
Contents Abstract ........................................................................................................... 3
Acknowledgements ......................................................................................... 4
Technical Acknowledgments ............................................................................ 5
Funding ........................................................................................................... 6
List of tables .................................................................................................. 11
List of figures ................................................................................................. 13
1. Introduction ............................................................................................... 19
1.1. Structure of the human eye ................................................................................... 19
1.2. Human neural retina and visual phototransduction .............................................. 20
1.3. Properties of human photoreceptor cells .............................................................. 23
1.4. Early development of the human eye and retina .................................................. 27
1.5. Retinal cell birthing ................................................................................................ 28
1.6. Photoreceptor cell genesis ..................................................................................... 31
1.7. Retinal degenerations ............................................................................................ 35
1.8. Therapies towards treating retinal degenerations ................................................ 36
1.8.1. Early stage intervention therapies .................................................................. 36
1.8.2. Late stage intervention therapies ................................................................... 37
1.9. Towards a human photoreceptor cell replacement therapy for retinal degenerations ............................................................................................................... 40
1.9.1. Stem cell sources for photoreceptor generation ............................................ 41
1.9.2. Generation of stem cell-derived photoreceptors via retinal differentiation .. 42
1.10. Photoreceptor cell surface marker sorting strategies ......................................... 47
1.11. Aims ..................................................................................................................... 49
2. Materials and Methods .............................................................................. 50
2.1. Human eye samples ............................................................................................... 50
2.2. hiPSC derivation and maintenance ........................................................................ 50
2.3. hiPSC retinal differentiation ................................................................................... 51
2.4. Total RNA extraction .............................................................................................. 52
2.5. Reverse transcription ............................................................................................. 52
2.6. Reverse transcription quantitative-PCR ................................................................. 53

8
2.7. Histology and immunohistochemistry ................................................................... 54
2.8. Microscopy and image processing ......................................................................... 56
2.9. Culturing human foetal retinal explants ................................................................ 56
2.10. Generation of human cone fluorescent reporters for electroporation ............... 57
2.10.1. Amplification of cone gene promoters ......................................................... 57
2.10.2. Promoter fragment-vector ligation ............................................................... 58
2.10.3. Transformation into competent bacterial cells ............................................ 58
2.10.4. Processing bacterial preps and validating cone promoter vectors............... 59
2.11. Electroporation of human retinal explant ........................................................... 60
2.12. AAV2/9 pR2.1:GFP reporter production .............................................................. 60
2.13. AAV transduction of human foetal retinal explants ............................................ 61
2.14. Dissociation of live retinal samples ...................................................................... 62
2.15. Human BD lyoplate screening panels .................................................................. 62
2.16. Cell preparation for flow cytometry or fluorescence activated cell sorting (FACS) ...................................................................................................................................... 63
2.17. Immunocytochemistry ......................................................................................... 64
2.18. Total mRNA sequencing and bioinformatics........................................................ 65
2.19. Single cell RNA sequencing .................................................................................. 66
3. Analysis of cone photoreceptor markers in the human developing and adult
retina ............................................................................................................ 68
3.1. Introduction ........................................................................................................... 68
3.2. Results .................................................................................................................... 70
3.2.1. Difference in maturity between the central and peripheral retina affects lamination ................................................................................................................. 71
3.2.2. Detection of photoreceptors at 9pcw in the human foetal retina ................. 73
3.2.3. Transcript expression of early and late cone photoreceptor markers in the human developing and adult retina .......................................................................... 75
3.2.4. Protein expression of early and late cone photoreceptor markers in the human developing and adult retina. ......................................................................... 76
3.3. Summary of findings .............................................................................................. 84
3.4. Discussion ............................................................................................................... 84
3.4.1. Expression trends of cone photoreceptor genes within the human retina .... 84
3.4.2. Protein expression profiling of cone markers within the human retina......... 86
4. Using fluorescent reporter constructs to label and isolate human foetal cones
for transcriptome profiling ............................................................................. 90

9
4.1. Introduction ........................................................................................................... 90
4.2. Results .................................................................................................................... 95
4.2.1. Establishing human retinal explant culture systems for reporter delivery .... 95
4.2.2. Transduction of fluorescent reporters into the human developing retina. ... 98
4.2.3. Generating and validating cone-specific fluorescent reporters in the human foetal retina .............................................................................................................. 99
4.2.4. Isolation of human developing L/M-opsin cones via FACS ........................... 111
4.2.5. Total transcriptome analysis of human developing L/M-opsin cones .......... 114
4.2.6. Single cell transcriptome analysis of L/M-opsin cone photoreceptor cells. . 122
4.3. Summary of findings ............................................................................................ 132
4.4. Discussion ............................................................................................................. 132
4.4.1. Culturing and transduction of human foetal cone photoreceptors ............. 133
4.4.2. Transcriptome of developing human cone photoreceptors ......................... 136
5. Identification of cone photoreceptor cell surface markers for cell enrichment
strategy ....................................................................................................... 143
5.1. Introduction ......................................................................................................... 143
5.2. Results .................................................................................................................. 145
5.2.1. Identification of cell surface molecule transcripts upregulated in human foetal cones ............................................................................................................. 145
5.2.2. Identification of cell surface marker proteins expressed by human foetal cones ....................................................................................................................... 146
5.2.3. Developing a CD marker panel for the isolation of human foetal cone photoreceptors ....................................................................................................... 152
5.3. Summary of findings ............................................................................................ 164
5.4. Discussion ............................................................................................................. 164
5.4.1. Profiling of CD markers expression within human foetal pR2.1:GFP+ cones. ................................................................................................................................ 165
5.4.2. Assessment of the CD marker panels for enrichment of L/M-opsin cone photoreceptors ....................................................................................................... 167
5.4.3. Further optimisation of the L/M-opsin cone CD marker panel .................... 169
6. Generation and characterisation of hiPSC-derived cone photoreceptors via a
3D retinal differentiation culture system ...................................................... 170
6.1. Introduction ......................................................................................................... 170
6.2. Results .................................................................................................................. 172

10
6.2.1. Photoreceptor generation from hiPSCs using a retinal differentiation culture system ..................................................................................................................... 174
6.2.2. Cone photoreceptor generation via retinal differentiation of hiPSCs .......... 179
6.2.3. Labelling hiPSC-derived cone photoreceptor using AAV2/9.pR2.1:GFP reporter system ...................................................................................................... 184
6.2.4. Isolation of pR2.1:GFP+ hiPSC-derived cone photoreceptor via FAC-sorting. ................................................................................................................................ 189
6.2.5. Comparative transcriptome analysis of hiPSC-derived and human foetal pR2.1.GFP+ cells. ..................................................................................................... 191
6.2.6. Assessment of cone CD marker expression within hiPSC-derived pR2.1.GFP+ cells. ........................................................................................................................ 195
6.3. Summary of findings ............................................................................................ 204
6.4. Discussion ............................................................................................................. 204
6.4.1. Assessment of cone photoreceptor differentiation from hiPSC-derived retinal cultures ................................................................................................................... 205
6.4.2. Assessment of isolating stem cell-derived cone photoreceptors for cell replacement therapy .............................................................................................. 207
7. Final discussion ........................................................................................ 210
7.1. Main findings and summary of this PhD thesis:................................................... 210
7.2. Future considerations for therapies of retinal dystrophies ................................. 213
7.2.1. iPSC disease modelling to identify disease mechanisms and novel therapeutic target ....................................................................................................................... 214
7.2.2. Feasibility of advancing cell replacement therapy to treat retinal dystrophies ................................................................................................................................ 215
8. Appendix ................................................................................................. 220
8.1. Appendix Figures .................................................................................................. 220
8.2. Appendix Tables ................................................................................................... 228
8.3. Appendix vector sequences ................................................................................. 244
8.3.1. RXRγ.DsRed construct sequence................................................................... 244
8.3.2. THRβ2.GFP construct sequence .................................................................... 246
8.3.3. OPN1SW.GFP construct sequence ................................................................ 248
8.3.4. GNAT2.GFP construct sequence ................................................................... 251
8.3.5. pd10-2.1-eGFP vector sequence ................................................................... 253
Bibliography ................................................................................................ 256
Publications ................................................................................................. 279

11
List of tables
Table 2.1. Staging of human foetal retinal samples based on foetal/gestational weeks
and post conception weeks. ..................................................................................... 50
Table 2.2. TaqMan gene expression assays used for RT qPCR analysis. ....................... 54
Table 2.3. Primary and secondary antibodies, properties, dilutions and company
details used for immunohistochemistry. ................................................................... 56
Table 2.4. Primer sequence, DNA fragment size and PCR cycle conditions for cone
promoter regions ..................................................................................................... 57
Table 2.5. Expected band sizes for correct orientation of insert into pGEM vector after
restriction digestion ................................................................................................. 59
Table 2.6. Expected band sizes for correct orientation of insert into fluorescent
reporter vector after restriction digestion. ................................................................ 59
Table 2.7. Conjugated CD markers antibodies used for FAC-sorting experiments. ....... 64
Table 2.8. Details of primary antibodies using for immunocytochemistry ................... 64
Appendix Table 1. Top 50 significantly upregulated genes in late human foetal GFP+
samples (GFP+ vs GFP-). ......................................................................................... 228
Appendix Table 2. Top 50 significantly upregulated genes in early human foetal GFP+
samples (GFP+ vs GFP-). ......................................................................................... 229
Appendix Table 3. Top 50 significantly upregulated genes in late human foetal GFP+
samples (late GFP+ vs early GFP+). .......................................................................... 230
Appendix Table 4. Top 50 significantly upregulated genes in early human foetal GFP+
samples (early GFP+ vs late GFP+). .......................................................................... 231

12
Appendix Table 5. Top 50 differentially expressed genes in pR2.1:GFP+ single cells
correlated to PC1. .................................................................................................. 232
Appendix Table 6. 93 overlapping genes between cone-enriched gene signature and
significantly differentially expressed genes from single cell RNA Seq. ...................... 233
Appendix Table 7. Putative cone cell surface molecules identified in early foetal GFP+
samples. ................................................................................................................ 237
Appendix Table 8. Putative cone cell surface molecules identified in late foetal GFP+
samples. ................................................................................................................ 243

13
List of figures
Figure 1.1. Anatomy of the human eye and organisation of the retina. ...................... 21
Figure 1.2. Phototransduction pathway in photoreceptor cells. ................................. 22
Figure 1.3. Spatial distribution of rod and cone photoreceptors in the human retina. . 25
Figure 1.4. Comparison of the human L- and M-opsin genes. ..................................... 26
Figure 1.5. Early development of the mammalian eye. .............................................. 29
Figure 1.6. Transcription factors and timing of retinal cell birthing. ............................ 30
Figure 1.7. Transcriptional dominance model for rod and cone photoreceptor
generation based on the mouse retina. ..................................................................... 33
Figure 1.8. Cone and horizontal cell fate specification in the vertebrate retina. .......... 34
Figure 1.9. Photoreceptor cell replacement therapy concept. .................................... 39
Figure 1.10. Retinal differentiation protocols of hPSCs. ............................................. 45
Figure 1.11. CD marker cell sorting strategy for photoreceptor cells. .......................... 48
Figure 3.1. Difference in retinal maturation and lamination in the 19pcw human foetal
retina. ...................................................................................................................... 72
Figure 3.2. Assessment of KI67 expression in different regions of the 19pcw human
developing retina. .................................................................................................... 73
Figure 3.3. Profiling RECOVERIN and CRX expression in the early human foetal retina.
................................................................................................................................ 74
Figure 3.4. RECOVERIN protein expression in the human foetal retina. ...................... 75
Figure 3.5. Transcript profiling of cone photoreceptor markers in the developing and
adult human retina. ................................................................................................. 77

14
Figure 3.6. Protein expression of cone photoreceptor markers in the developing
human retina ........................................................................................................... 78
Figure 3.7. Protein expression of cone opsin in the 19pcw human foetal retina .......... 80
Figure 3.8. Protein expression of cone photoreceptor markers in the 19pcw human
foetal retina ............................................................................................................. 81
Figure 3.9. Protein expression of early and late cone markers in the adult human
retina. ...................................................................................................................... 83
Figure 4.1. Important cis-regulatory regions 5’ upstream of human L-opsin and M-
opsin genes. ............................................................................................................. 94
Figure 4.2. Culturing human retinal explants on filter membranes. ............................ 96
Figure 4.3. Culturing human retinal explants in free floating conditions. .................... 97
Figure 4.4. Transduction of human foetal retinal with ubiquitous fluorescent reporter
constructs. ............................................................................................................. 100
Figure 4.5. Electroporation of human foetal retina explants with fluorescent reporters
driven by cone and pan photoreceptor gene promoters. ......................................... 103
Figure 4.6. Characterisation of OPN1SW.GFP reporter within human foetal retinae. 104
Figure 4.7. Characterisation of THRβ2.GFP reporter within human foetal retinae. .... 106
Figure 4.8. AAV2/9.pR2.1:GFP reporter labels a cell population in human retinal
explants. ................................................................................................................ 108
Figure 4.9. AAV2/9 pR2.1:GFP+ cells in human foetal retinal explants label L/M-opsin
cones. .................................................................................................................... 109
Figure 4.10. Specificity of AAV2/9 pR2.1:GFP+ cells in human foetal retinal explants.
.............................................................................................................................. 110
Figure 4.11. Efficiency of AAV2/9 pR2.1:GFP reporter to label human foetal L/M-opsin
cones. .................................................................................................................... 112
15
Figure 4.12. Isolation of AAV2.9.pR2.1:GFP labelled cells via FACS sorting................ 113
Figure 4.13. Hierarchical clustering analysis of all human foetal samples based on total
gene expression. .................................................................................................... 115
Figure 4.14. Hierarchical clustering analysis based on expression of cone, rod and pan-
photoreceptor gene in human foetal retinal samples. ............................................. 117
Figure 4.15. Differential gene expression analysis between late foetal GFP+ and GFP-
samples. ................................................................................................................ 118
Figure 4.16. Differential gene expression analysis between early foetal GFP+ and GFP-
samples. ................................................................................................................ 119
Figure 4.17. Differential gene expression analysis between early foetal GFP+ and late
GFP- samples. ........................................................................................................ 120
Figure 4.18. Identification of cone-enriched gene signature. .................................... 121
Figure 4.19. Gene ontology analysis of cone-enriched gene signature. ..................... 123
Figure 4.20. Capturing of single pR2.1.GFP+ cells. .................................................... 124
Figure 4.21. Principal component analysis of 15pcw pR2.1:GFP+ cells. ..................... 125
Figure 4.22. Significantly differentially expressed genes from single cell pR2.1:GFP+
analysis. ................................................................................................................. 127
Figure 4.23. Expression profile scatter plots of selected significantly differentially
expressed genes across single cells correlated to PC1. ............................................. 128
Figure 4.24. Scatter plots of pan, cone and rod photoreceptors gene expression across
single cells correlated to PC1. ................................................................................. 129
Figure 4.25. Heatmap of 93 overlapping genes between single cell and bulk
transcriptome datasets. ......................................................................................... 131
Figure 5.1. Isotype controls for BD lyoplate antibody screening panels. ................... 147

16
Figure 5.2. CD marker percentage quantifications and flow traces from BD lyoplate
antibody screening panels. ..................................................................................... 148
Figure 5.3. Transcript expression of CD markers identified from pR2.1.GFP lyoplate
experiment. ........................................................................................................... 151
Figure 5.4. Analysis of CD marker overlap between 17pcw pR2.1:GFP+ lyoplate, 661W
mouse cone like neuroblastoma cell line, NRL.GFP- mouse retinal cell and CRX.GFP+
mouse retinal cells. ................................................................................................ 151
Figure 5.5. Immunocytochemistry of human L/M-opsin+ cells with selected cone CD
markers. ................................................................................................................ 153
Figure 5.6. Single CD marker FAC-sorting of human foetal retinal samples to assess
L/M-opsin cone photoreceptor enrichment. ........................................................... 155
Figure 5.7. Positive CD marker combination with human foetal retina to enrich for
L/M-opsin cone photoreceptors via FAC-sorting. ..................................................... 156
Figure 5.8. SSEA-1 expression from the human pR2.1:GFP+ lyoplate experiments. ... 157
Figure 5.9. Flow cytometry analysis of cell populations labelled by CD133 versus
SSEA1. ................................................................................................................... 160
Figure 5.10. Flow cytometry analysis of cell populations labelled by CD147 versus
SSEA1. ................................................................................................................... 161
Figure 5.11. Flow cytometry analysis of cell populations labelled by CD26 versus
SSEA1. ................................................................................................................... 162
Figure 5.12. FAC-sorting to enrich for L/M-opsin cone photoreceptors using negative
and positive CD marker selection. ........................................................................... 163
Figure 6.1. Pluripotency validation of N7 hiPSC line. ................................................ 173
Figure 6.2. Early retinal differentiation of hiPSCs. .................................................... 175
Figure 6.3. Late retinal differentiation of hiPSCs. .................................................... 178

17
Figure 6.4. Photoreceptor cells expressing outside of optic vesicles. ........................ 178
Figure 6.5. Transcript analysis of early and late cone photoreceptors with hiPSC-
derived retinal differentiation cultures. .................................................................. 182
Figure 6.6. Protein expression of ONECUT1 within hiPSC-derived retinal differentiation
cultures. ................................................................................................................ 182
Figure 6.7. Protein expression of L/M-OPSIN within hiPSC-derived retinal
differentiation cultures. ......................................................................................... 183
Figure 6.8. Comparative qPCR analysis of hiPSC-derived retinal samples and human
foetal retina at age-matched timepoints. ................................................................ 185
Figure 6.9. AAV2/.9.pR2.1.GFP+ cells within hiPSC-derived retinal differentiation
cultures. ................................................................................................................ 186
Figure 6.10. hiPSC-derived retinal structures expressing AAV2/9.pR2.1:GFP+ cells. .. 187
Figure 6.11. Assessment of specificity of AAV2/9.pR2.1:GFP reporter within hiPSC-
derived retinal differentiation cultures. .................................................................. 188
Figure 6.12. Isolation and RNA processing of pR2.1.GFP+ cells from hiPSC-derived
retinal differentiation cultures. ............................................................................... 190
Figure 6.13. Principal component analysis of foetal and hiPSC-derived samples. ...... 192
Figure 6.14. Hierarchical clustering with human foetal and hiPSC-derived retinal
sample based on photoreceptor genes. .................................................................. 193
Figure 6.15. Hierarchical clustering with human foetal and hiPSC-derived retinal
samples based on human foetal cone gene signature. ............................................. 194
Figure 6.16. Comparative transcript analysis of CD markers between human foetal and
hiPSC-derived samples. .......................................................................................... 196
Figure 6.17. Protein expression of CD markers, CD26, CD133, CD147 and SSEA1 within
the iPSC-derived retinal differentiation cultures. ..................................................... 198

18
Figure 6.18. Percentage of cells labelled by CD markers within hiPSC-derived retinal
differentiation cultures. ......................................................................................... 199
Figure 6.19. Flow cytometry analysis of cone CD marker combination within hiPSC-
derived retinal differentiation cultures. .................................................................. 202
Figure 6.20. Flow cytometry analysis of cone CD marker combination within hESC-
derived retinal differentiation cultures. .................................................................. 203
Appendix Figure 1. Screenshots of PDF reports generated from the Vista Gateway
alignment tool for identifying potential cone gene promoter regions. ..................... 220
Appendix Figure 1 (continued). Screenshots of PDF reports generated from the Vista
Gateway alignment tool for identifying potential cone gene promoter regions. ....... 221
Appendix Figure 2: Cloning strategy for generating cone fluorescent reporter
constructs. ............................................................................................................. 222
Appendix Figure 3: RNA seq quality control check of samples pre and post alignment.
.............................................................................................................................. 223
Appendix Figure 4: Quality control check of RNA quality and concentration from
human foetal retinal samples. ................................................................................ 224
Appendix Figure 5. Primary step of QC for single cell RNA seq analysis: Library size,
mitochondrial and ERCC spike in control quality check. ........................................... 225
Appendix Figure 6. Final QC step for single cell RNA seq analysis: Filtering of genes
based on mean count. ............................................................................................ 226
Appendix Figure 7. Using a mean-variance trend to remove technical noise within
single cell RNA seq analysis. ................................................................................... 227

19
1. Introduction 1.1. Structure of the human eye
The human eye is one of the most important sensory organs of the body formed of
different tissue layers, which have a unique organisation and highly specialised function
to enable optimal detection of light resulting in visual perception. Initially, light passes
through the most anterior structures of the eye, which include the cornea, pupil and
lens, before travelling through to the posterior segment containing the vitreous humour
and neural retina (Figure 1.1A) (Fernandez, 1997). The cornea is the outermost tissue
layer of the eye, covered by a protective layer of mucous membrane known as the
conjunctiva. This provides the external window allowing light to enter the eye and is
responsible for the first refraction of light. The iris formed of the coloured circular
muscle is critical in regulating the size of the pupil, which subsequently controls how
much light passes through into the internal eye. For example, in response to greater
light intensity, the iris will contract to make the pupil smaller which in turn limits the
amount of light entering into the eye, providing a protective mechanism to prevent
damaging of delicate underlying neural retina. Together with the cornea, the lens, which
is suspended by ligaments attached to the ciliary body, provides an additional refraction
of light (Fernandez, 1997). These ligaments are directly attached to the ciliary muscles
which regulate the shape of the lens to further optimise the light projection to the
neural retina, particularly to the retinal region responsible for fine detail and focused
vision, known as the fovea (Figure 1.1A).
Additionally, the ciliary body is also formed of the ciliary epithelium, which produces
aqueous humour for the anterior and posterior chambers at the front of the eye,
whereas the posterior segment contains the vitreous humour; the former humour
supplies nutrient, oxygen and regulation of metabolic waste to the cornea and lens due
to their lack of blood supply, while both the aqueous and vitreous humour contribute
towards maintaining ocular pressure of the eye which prevents the neural retina from
detachment. In addition to these tissue structures that form the eye, the eye is held in
place within the orbital cavity by surrounding muscle, ligaments and fascial expansions;
this includes the 6 extra ocular muscles which attach onto the external supporting tissue
layer of the eye known as the sclera to aid in light detection upon central fovea of the
retina allowing for detailed vision (Fernandez, 1997).

20
1.2. Human neural retina and visual phototransduction
Although each ocular structure demonstrates its own important properties, their
coordinated functioning contributes towards to the optimal transmission of light to the
neural retina, the innermost tissue layer of eye vital for the processing of light. The
retina is a 0.5mm sheet formed of an intricate network of glial and neuronal cells types
which are stratified into 3 cell body layers and 2 synaptic layers (Figure 1.1B) (Fernandez,
1997). The segments of the light-responsive rod and cone photoreceptor cells are
located most apically, directly adjacent to the retinal pigment epithelium (RPE), whereas
the cell bodies and synapses are located more basally within the outer nuclear layer
(ONL) and outer plexiform layer (OPL), respectively. The interneurons including the
bipolar, horizontal and amacrine cells are located within the inner nuclear layer (INL);
the bipolar and horizontal cells form synapses with the photoreceptors within the outer
plexiform layer (OPL), while the amacrine and bipolar cells connect with the ganglion
cells within the inner plexiform layer (IPL) (Figure 1.1B). Horizontal cells are coupled to
the output of the photoreceptors cells, providing a negative feedback mechanism to
modulate photoreceptor cell response, whereas amacrine cells performed a similar
regulatory role but are interposed between the photoreceptor and bipolar cells. The
bipolar interneurons, formed of 2 main classifications, ON-centre and OFF-centre,
integrate input from the photoreceptor cells and transmit this to the retinal ganglion
cells, which are located in the most basal layer of the retina (GCL) (Fernandez, 1997).
In order to excite the photoreceptors, light must pass through all the retinal layers in
order to reach the photoreceptor outer segments. Specifically, it is the G-protein
coupled receptor (GPCR) opsin proteins located within the outer segment disks of the
cell, which are activated by light photons to initiate the phototransduction pathway and
converts light into electrical impulses (Figure 1.2) (Fernandez, 1997, Mustafi et al.,
2009). Light stimulates the opsin GPCR through the isomerisation of chromophore 11-
cis-retinal into all-trans-retinal, causing its release from the opsin protein where it is
transported to the cytoplasm by ABCA4, part of the ATP-binding cassette family. The
release of all-trans-retinal changes the confirmation of the opsin GPCR, causing the
activation of the G protein transducin and subsequent phosphodiesterase (PDE)
stimulation. PDE hydrolyses and reduces the level of cytoplasmic GMP (cGMP), which
leads to closure of cGMP-gated channels and prevents the influx of Na+ and Ca2+ into the
photoreceptor outer segments. This reduction in Ca2+ and retention of Na2+ causes

21
hyperpolarisation of the photoreceptor cell, stopping the release of the
neurotransmitter glutamate, which causes the depolarisation of ON bipolar cells. The
neurotransmission is passed onto to ganglion cells, with modulation and integration
from the horizontal and amacrine cells. The ganglion cells then pass the electrical
impulses to the primary visual cortex via their long axons which extend into the optic
nerve, optic chiasm, optic tract and lateral geniculate nucleus within the brain. The
information is finally processed by the primary visual cortex to enable visual perception
(Fernandez, 1997).
Figure 1.1. Anatomy of the human eye and organisation of the retina. (A) Overview schematic of the human eye. (B) Schematic of the neural retina stratification and retinal cell types, excluding the Müller glial cells which extend from the top of the ONL to the bottom of the GCL to form the outer limiting membrane (OLM) and the inner limiting membrane (ILM). Representative images of rod and cone photoreceptor segments are shown. Adapted from Wright et al., 2010 and Mustafi et al., 2009.
In order to restore photoreceptor light sensitivity, the all-trans-retinal is modified by
retinal dehydrogenases to become hydrophobic within the photoreceptor cell before it
is transported by retinoid-binding proteins to the RPE to become esterified by lecithin
retinal acyltransferase (Figure 1.2). The all-trans-retinyl ester is then transformed back
into 11-cis-retinal through trans-isomerisation, performed by RPE65 and 11-cis retinal
dehydrogenase, before being transported back into the photoreceptor outer segment

22
where 11-cis retinal becomes bound to the opsin protein once again (Wright et al.,
2010). The recycling of the 11-cis-retinal highlights the importance of the RPE in
supporting the functioning and survival of the photoreceptor cells. In addition to the
recycling of 11-cis-retinal after photo-absorption, it is also responsible for the
phagocytosis of the constantly renewed photoreceptor outer segments and transporting
metabolites between the retina and the vasculature of the retina, known as the choroid
(Wright et al., 2010, Fernandez et al 1997).
Figure 1.2. Phototransduction pathway in photoreceptor cells. (A) 11-cis-retinal recycling pathway occurring between photoreceptor and RPE cells. Absorption of light by 11-cis-retinal triggers the isomerisation to all-trans-retinal, which is transported into the RPE in order to be transformed back into 11-cis-retinal. 11-cis-retinal/all-trans-retinal is transported to and from the photoreceptor outer segments via IRBP.
(B) Schematic representing the opsin G-protein coupled receptor signalling pathway in the presence of light. Absorption of light and subsequent release of 11-cis-retinal causes a conformational change in opsin GPCR which leads to the activation of transducin (T) and phosphodiesterase (PDE). PDE causes the hydrolysis of cGMP, which leads to the reduction of cGMP and closure of cGMP gated Na+ and Ca2+ channels (in purple). In conjunction with K+ efflux (NCKX exchanger, in green), this causes hyperpolarisation of the photoreceptor and inhibition of glutamate release, which leads to ON bipolar cell depolarisation. Adapted from Wright et al., 2010.
A
B

23
1.3. Properties of human photoreceptor cells
Rods and cones form the two main classes of photoreceptor cells within the human
retina, with rod cells being important for peripheral vision and vision in low light
intensities, while cone cells are critical for colour vision, high visual acuity and optimal
daylight vision. This is reflected by their distribution across the human retina due to a
greater density of rods occurring within peripheral temporal and nasal regions, while
cone photoreceptor density peaks within the centrally located fovea with a complete
absence of rods (Figure 1.3) (Curio et al., 1990). Rods however show their peak density
with the retina surrounding the fovea, approximately 300µm away from the central
fovea (Curcio et al., 1990).
Rhodopsin is the light-sensitive GPCR opsin of rod photoreceptors, which has a peak
sensitivity and light absorbance at a wavelength of 498nm, whereas 3 different cone
opsins exist for human cone photoreceptors, forming the basis of their subclasses. S-
opsin cones, M-opsin cones and L-opsin cones are present within the human retina,
which have a maximal absorption efficiency at short wavelengths (420nm; blue light),
medium wavelengths (534nm; green light) and long wavelengths (564nm; red light) of
light, respectively (Bowmaker and Hunt, 2006, Fernandez, 1997). L-opsin and M-opsin
cones form the majority cone photoreceptor type within the human retina (92-95%),
while S-opsin cones make up the remaining population (Roorda et al., 2001, Curcio et al.,
1991, Ahnelt et al., 1987). Using adaptive optics and retinal densitometry (Roorda and
Williams, 1999, Hofer et al., 2005), the cone mosaic arrangement in the human retina
has been determined including the distinction between L-opsin and M-opsin cones and
their ratios, which vary among individuals but approximately range from 2.1-5:1 L:M
cones (Mollon, 2003) (Figure 1.3). This stands in contrast to their molecular
identification at the genetic level in which L-opsin and M-opsin expressing cones cannot
be distinguished due their 98% gene sequence homology (Figure 1.4) (Nathans et al.,
1986). The 2% variation within the exons of the L-opsin and M-opsin genes leads to
alterations within the amino sequence, which ultimately causes slight differences in the
opsin protein wavelength detection (Figure 1.4). Their genes are located in a head-to-tail
tandem organisation on the X chromosome (Vollrath et al., 1988), with a typical array
beginning with the L-opsin encoding genes (OPN1LW), followed by one or multiple M-
opsin genes (OPN1MW) (Figure 1.4). Individuals with normal colour vision can have

24
varying numbers of OPN1LW and OPN1MW genes (Gegenfurtner, 1999, Macke and
Nathans, 1997, Neitz and Neitz, 1995). The arrangement of these opsin genes arose
from a gene duplication event of an approximately 40 kilo base pair segment (Nathans
et al., 1986, Yokoyama and Yokoyama, 1989, Neitz and Neitz, 2011); however this region
did not include the locus control region (LCR) (Figure 1.4) which is necessary for cone
photoreceptor-specific expression of both opsin genes (Nathans et al., 1989, Wang et
al., 1992). Hence, L and M-opsin genes share this same enhancer region (Neitz and Neitz,
2011). It is thought the genes located most proximally with a small distance from the
LCR will have the most significant expression, hence the L-opsin will be expressed in a
higher percentage of cones, followed by the M-opsin genes (Knau et al., 2002,
Winderickx et al., 1992, Nathans et al., 1989). This is in contrast to the S-opsin gene
which only shares 40% gene sequence homology with the L-opsin and M-opsin genes
(Nathans et al., 1986) and can be readily distinguished at the protein and gene level
from the L-opsin and M-opsin cones (Xiao and Hendrickson, 2000). A small population of
cone co-expressing S-opsin, L-opsin and M-opsin have been reported within the foetal
and adult human retina via immunohistochemistry analysis (Cornish et al., 2004),
however the majority express each cone opsin separately. The distribution of S-opsin
cones are widely spaced across the human retina, presenting at a lower density
compared to L and M cones in the periphery (Williams et al., 1981) and are completely
absent within the central 100µm of the fovea (Bumsted and Hendrickson, 1999, Curcio
et al., 1990, Xiao and Hendrickson, 2000, Curcio et al., 1991). The L-opsin and M-opsin
cone cell arrangement appears to be random and varies between individuals (Roorda
and Williams, 1999, Mustafi et al., 2009) Mustafi et al 2009), but are densely packed in a
hexagonal pattern within the central fovea (Figure 1.4) such that the cones appear much
smaller when compared to cones in the periphery (Purves D, 2001, Mustafi et al., 2009).
The foveal density of L-opsin and M-opsin cones is 200,000 cells/mm2, while in the
periphery their densities decrease 100 fold (Curcio et al., 1990, O'Brien et al., 2003).
In relation to the total human photoreceptor population, rods outnumber cone
photoreceptors by 20:1 with average estimated cell numbers of 92 million rods and 4.6
million cones in the adult human retina (Curcio et al., 1990). This striking difference in
proportion reflects the visual specialisation of these cell types. Rods are extremely
sensitive to light, with the ability to produce a response to one light photon (Fernandez,
1997).

25
Figu
re 1
.3. S
patia
l dis
trib
utio
n of
ro
d an
d co
ne p
hoto
rece
ptor
s in
the
hum
an re
tina.
(A) W
hole
mou
nt o
f an
adu
lt hu
man
retin
a sh
owin
g th
e lo
catio
n of
the
fove
a an
d te
mpo
ral/n
asal
regi
ons o
f the
retin
a (im
age
gene
rate
d in
the
wor
k of
this
thes
is). (
B) D
ensit
y of
ph
otor
ecep
tors
from
the
fove
a (1
)- co
nes c
ells
only
- and
incr
easin
g te
mpo
ral r
egio
ns fr
om th
e fo
vea,
in
clud
ing
the
begi
nnin
g of
the
rod
edge
(2; a
rrow
poi
nts t
o fir
st
appe
aran
ce o
f rod
cel
l) to
per
iphe
ral
regi
ons w
here
rods
out
num
ber
cone
s (3-
5). N
ote
the
tight
ly p
acke
d co
nes i
n th
e fo
vea
com
pare
d to
thei
r la
rge
roun
d ap
pear
ance
in th
e pe
riphe
ral r
egio
n. (C
) Sch
emat
ic
dem
onst
ratin
g ro
d an
d S-
, L -a
nd M
-co
ne c
ell d
ensit
y ac
ross
the
adul
t hu
man
retin
a. (D
) Firs
t de
mon
stra
tion
of a
live
adu
lt hu
man
co
ne m
osai
c sh
owin
g th
e di
strib
utio
n of
S (b
lue)
, L (r
ed) a
nd M
(g
reen
) con
es.
Adap
ted
from
Cur
cio
et a
l., 1
999,
M
usta
fi et
al.,
200
9 an
d Ro
orda
&
Will
iam
s, 19
99.

26
Figure 1.4. Comparison of the human L- and M-opsin genes. (A) The tandem array organisation of the L-opsin and M-opsin genes on the X chromosome with the shared locus control region (LCR) required for the activation of both genes. (B) The schematic shows the L- and M-opsin genes have 6 exons (white bars) with amino acid differences highlighted in the middle. The majority of spectral differences between the genes come from exon 5 encoding amino acid dimorphisms at position 277 and 285, however exons 2, 3 and 4 also contain amino acid dimorphisms which produce additional spectral shifts. Adapted from Neitz and Neitz, 2011.
This is aided by their long outer segments containing separate discs discrete from the
ciliary plasma membrane and convergent circuitry pathway, which is highly optimal for
light sensitivity and detection (Figure 1.1.B) (Fernandez, 1997, Mustafi et al., 2009). On
the other hand, cone photoreceptors are adapted for greater spatial resolution and
visual acuity; their shorter outer segments contain continuous open discs formed from
invaginations of the ciliary plasma membrane (Figure 1.1B) (Arikawa et al., 1992), which
allows for better diffusion and rapid exchange of molecules among different discs.
Additionally, cones do not become saturated at higher levels of light intensity and have
a more linear circuitry especially for central vision, where a one-one relationship is
observed for ganglion cell to bipolar cells to cone cells (Mustafi et al., 2009). This
highlights a complex network of regulatory mechanisms are necessary during the
development of the retina to ensure the correction spatial distribution and optimal
functioning of photoreceptors.

27
1.4. Early development of the human eye and retina
The formation of the human eye (Figure 4) begins during the late gastrula stage of the
embryo at approximately foetal/gestational week (Fwk) 4, where the presumptive eye
field is designated within the developing forebrain neuroectoderm (Adelmann, 1929,
Graw, 2003). Signalling pathways shown to be involved in regulating neuroectoderm
specification during development include fibroblast growth factors (FGF), which prime
cells to become responsive to future bone morphogenetic protein (BMP) signals, while
transforming growth factor beta (TGFβ) and wingless (Wnt) signals act to inhibit the
neural fate (Chang and Hemmati-Brivanlou, 1998, Rogers et al., 2009, Wilson and
Houart, 2004). Subsequently, to induce the forebrain cell fate, BMP signals must be
repressed by antagonists including Chordin, Noggin, Follistatin and Cerberus (Rogers et
al., 2009, Bouwmeester et al., 1996, Wilson and Houart, 2004).
The specification of the eye field is heavily reliant on the gradient of Wnt signalling,
Sonic Hedgehog (Shh), TGF-β and FGF signals which are necessary for the generation of
the bilateral eye fields (Heisenberg et al., 2001, Carl and Wittbrodt, 1999, England et al.,
2006). These signalling molecules act together with intrinsic cell determinants, such as
OTX2 and SOX2, and the eye-field transcription factors, RAX, PAX6, LHX2, SIX3, SIX6,
ET/TBX3 and TLL/NR2E1 (Tucker et al., 2001, Hill et al., 1991, Chow et al., 1999, Loosli et
al., 1999, Zuber et al., 1999) which regulate one another in order to specify the retinal
identity and ensure correct patterning of the eye field (Graw, 2010, Zuber, 2010). The
bilateral eye fields evaginate to create the optic grooves either side of the rostral
neuroectoderm and by the end of Fwk 4, the grooves expand laterally to become the
optic vesicles (Figure 1.5) (Muller and O'Rahilly, 1985, Yun et al., 2009), which are still
physically attached to the primitive forebrain by the optic stalks, later giving rise to the
optic nerves (Graw, 2010). This expansion allows the vesicles to interact with the
adjacent regions of the surface ectoderm known as the lens placode, which initiates the
invagination of the distal neuroectoderm to form the bilayered optic cups between Fwk
4-5 (Viczian, 2015, Graw, 2010, Lamb et al., 2007). Members of the retinoic acid
signalling pathway, including ALDH1A2 (Mic et al., 2004), alongside the transcription
factor LHX2 (Yun et al., 2009) are known to be key for the optic vesicle transition into
the optic cup. The outermost layer becomes the RPE, while the inner layer forms the
neural retina (Figure 1.5). The early formation of the RPE requires signalling of the TGFβ
member, activin A, from the periocular mesenchyme, in addition to the expression of

28
transcription factors, MITF, OTX1/OTX2, and PAX6, whereas FGF from the surface
ectoderm acts to inhibit RPE formation (Martinez-Morales et al., 2004, Graw, 2010). The
retinal progenitor cells (RPCs) within the neural retina begin to proliferate through the
expression of Notch signalling members, whereas their expression of CHX10/VSX2
expression maintains the neuro-retinal identity through the inhibitions of MITF. The
most peripheral regions of the optic cup will give rise to the ciliary body and the iris
(Adler and Canto-Soler, 2007, Zhao et al., 2010, Fuhrmann, 2010). Lens formation
involves a similar invagination process of the lens placode to form a lens pit which
eventually closes to form the lens vesicle. The cornea develops after the detachment of
the lens from the surface epithelium and is formed from the surface ectoderm and
migrating neural crest cells (Streit, 2007, Graw, 2010).
1.5. Retinal cell birthing
All cell types of the neural retina are derived from the RPC population, which
progressively gain and loose competency during development to generate retinal cell
fates (Livesey and Cepko, 2001). The Notch downstream effectors, Hes1 and Hes5,
promote proliferative properties of RPCs and inhibit their ability to differentiate during
early development (Tomita et al., 1996, Ohtsuka et al., 1999, Hatakeyama and
Kageyama, 2004). At the onset of differentiation, which is approximately Fwk 7 in the
human retina, RPCs lose their multipotency and express various basic helix loop helix
(bHLH) and homeobox transcription factors, which are thought to determine cell fate
(Figure 1.6) (Hatakeyama and Kageyama, 2004, Harada et al., 2007, Trimarchi et al.,
2008, Mizeracka et al., 2013). Retinal cell birthing follows a stereotypical order, which is
conserved across many vertebrate species (Figure 1.6). In the majority of species, retinal
cell types are generated across a centro-peripheral gradient; in fact in the human retina,
cells differentiate first within the presumptive fovea and this region remains more
mature throughout development compared to the peripheral regions, where the cell
types are born later (O'Brien et al., 2003, Xiao and Hendrickson, 2000). Birth dating
studies within the mouse retina show the retinal ganglion cells, horizontal cells,
amacrine cells and cone photoreceptors are the first cell types to be formed (Sidman,
1961, Carter-Dawson and LaVail, 1979, Young, 1985), with cone cell genesis beginning at
approximately Fwk 8 in the human retina (Xiao and Hendrickson, 2000, Hendrickson and
Zhang, 2017, Swaroop et al., 2010).

29
Figure 1.5. Early development of the mammalian eye. (A-D) Folding of the rostral neuroectoderm leads to formation of optic grooves within the bilateral specified eye fields, which evaginate to form the optic vesicles (E). This evagination process brings the optic vesicles into close contact with the overlying surface ectoderm within the lens placode region, which causes the optic vesicles to invaginate and create a double layered optic cups, containing the presumptive RPE and neural retina (F,G). Adapted from Lamb et al., 2007.
Although the early and later cell birthing classifications can be distinguished, the waves
of cell genesis continually overlap during retinogenesis suggesting the RPCs can give rise
to multiple cell types at a given timepoint which requires extrinsic and intrinsic
mechanisms of regulation in order to generate the correct cell type and their
proportions (reviewed in (Cepko, 2014, Brzezinski and Reh, 2015). During cell birthing,
the RPCs will move between the outer ventricle surface and inner vitreal surface, before
undergoing mitosis. Upon generation of post-mitotic daughter cells, these will migrate
to their final destination in the retina (Lamb et al., 2007).

30
Figure 1.6. Transcription factors and timing of retinal cell birthing. (A) Schematic showing homeobox genes and basic helix loop helix (bHLH) transcription factors (TFs) involved in cell fate specification. Notch signalling (Hes1) becomes downregulated in retinal progenitor cells at the time of differentiation. Sequential order of retinal cells (B) and cone and rod photoreceptor cells (C) generation in the mouse retina as determined by [3H] thymidine pulses and autoradiography. Adapted from (Cepko et al., 1996, Carter-Dawson and LaVail, 1979).

31
1.6. Photoreceptor cell genesis
The first morphological detection of photoreceptor cells within the developing human
retina has been reported between Fwk 10.5-11; the presumptive fovea, 500µm in
diameter, is the only region showing the distinctive retinal lamination, which includes a
single layer of large cone cells with euchromatic nuclei located within the ONL
(Hendrickson et al., 2008, O'Brien et al., 2003). At this same development stage, small
rods with heterochromatic nuclei can be detected at the edges of the fovea packed in
between the cone cells (Hendrickson et al., 2008). As Notch signalling ceases within
newly post-mitotic photoreceptor precursor cells (Jadhav et al., 2006), they begin to
express key basic helix loop helix (bHLH) genes, such as ASCL1 (MASH1), NEUROD4
(MATH3), NGN2 and NEUROD1 which are thought to be important for photoreceptor
determination (Akagi et al., 2004a, Hatakeyama and Kageyama, 2004). It is likely that
many bHLH are involved in gene regulatory networks (GRNs) for determining all retinal
cell fates, such as the GRN previously described for rod versus bipolar cell fate (Wang et
al., 2014, Cepko, 2015). RAX has been demonstrated previously to be required for
photoreceptor survival and differentiation (Chen and Cepko, 2002, Muranishi et al.,
2011), in addition to OTX2, a transcription factor downstream of Notch signalling which
is essential for photoreceptor differentiation (Nishida et al., 2003, Trimarchi et al., 2008).
OTX2 transactivates the expression of the cone-rod homeobox (CRX) gene in order to
terminally differentiate photoreceptor precursors and promote expression of mature
photoreceptor genes (Chen et al., 1997, Furukawa et al., 1997, Corbo et al., 2010, Koike
et al., 2007). In the human foetal retina, CRX and OTX2 expression is first detected
within the ONL between Fwk 10-13; CRX is readily expressed in the photoreceptor cell
nuclei within the ONL, whereas OTX2 expression is more abundant in the INL (Glubrecht
et al., 2009).
Previous studies conducted in the developing mammalian retina have demonstrated
photoreceptor cell fate plasticity (Akimoto et al., 2006, Oh et al., 2007, Adler and Hatlee,
1989, Ezzeddine et al., 1997), suggesting rods and cones may share a common cell
lineage. Based on these studies, a ‘transcriptional dominance’ model of photoreceptor
cell fate (Figure 1.7) (Swaroop et al., 2010) has been suggested, in which all post-mitotic
photoreceptor precursors can give rise to either type of photoreceptor cell fate,
however this cell fate is dependent upon the rod promoting transcription factor, NRL,
gaining dominance and surpassing thresholds. S-cone photoreceptor differentiation is
32
thought to be the default pathway, regulated together by RAR-related orphan receptor
beta (RORβ) and CRX (Srinivas et al., 2006) which was demonstrated using mouse
models; null mutations in the rod promoting transcription factor, neural retinal-specific
leucine zipper genes (NRL) led to increased S-cone generation instead of M-cones
(Mears et al., 2001, Yoshida et al., 2004). Alongside NRL, the nuclear receptor subfamily
2, group E, member 3 (NR2E3) is another key regulatory of rod vs cone fate
determination, which is completely dependent on the expression of NRL (Chen et al.,
2005, Haider et al., 2009) and acts to suppress cone gene expression in rods. Thyroid
hormone receptor beta 2 (THRβ2) is a well classified marker of early cone photoreceptor
marker (Sjoberg et al., 1992, Ng et al., 2001), which is necessary for the suppression of S-
opsin expression in cones and interacts with retinoid-x-receptor gamma (RXRy), RORα
and E3 SUMO ligase Pias3 to regulate M-opsin cone identity (Figure 1.7) (Roberts et al.,
2005, Ng et al., 2001, Fujieda et al., 2009, Onishi et al., 2010). Together, these
transcription factors are necessary for correct cone photoreceptor patterning across the
retina.
Recent studies have given a greater insight into rod versus cone cell fate specification.
Clonal retroviral lineage tracing showed Olig2 expressing RPCs within the vertebrate
retina generate terminally dividing clones consisting of a limited number of cell types
(Trimarchi et al., 2008, Beier et al., 2011, Hafler et al., 2012). These studies revealed
during early mouse embryonic development (E13.5-E14.5) that Olig2+ RPCs generate
only cone and horizontal cells, whereas at later timepoints between P0 and P3, nearly all
cells generated were rods or amacrine cells (Figure 1.8) (Hafler et al., 2012). In the
chicken retina, it was revealed that Olig2+ RPCs co-express Otx2 and the transcription
factor, Onecut1, only during early embryonic development at the time of cone and
horizontal cell genesis. Otx2 and Onecut1 act together on the Thrβ cis-regulatory
module 1 (CRM1) to regulate the expression of Thrβ within the embryonic Olig2+ RPCs
(Figure 1.8) (Emerson et al., 2013). During further differentiation, cones generated from
this population retain the expression of Otx2 and downregulate the expression of
Onecut1, whereas horizontal cells maintain Onecut1 expression and loose Otx2
expression (Emerson et al., 2013).

33
Figure 1.7. Transcriptional dominance model for rod and cone photoreceptor generation based on the mouse retina. OTX2 is the main driver of photoreceptor cell fate, which activates CRX to terminally differentiate cells into photoreceptor precursors. The default pathway of precursor cells is to become S-opsin cones, which is mediate through interaction of RORβ and CRX. RXRγ, THRβ2 and potentially other chicken ovalbumin upstream promoter (COUP) transcription factors are required to divert the cell fate into M-opsin cones. Expression of NRL and NR2E3 transcription factors within the photoreceptor precursor cells inhibits the cone cell fate and induces rod photoreceptor differentiation. Model based on Swaroop et al., 2010.

34
Figu
re 1
.8. C
one
and
horiz
onta
l cel
l fat
e sp
ecifi
catio
n in
the
vert
ebra
te re
tina.
(A) T
he
Olig
2+ re
tinal
pro
geni
tor c
ell
(RPC
) pop
ulat
ion
durin
g m
ouse
em
bryo
nic
deve
lopm
ent g
ener
ates
co
ne a
nd/o
r hor
izont
al c
ells,
co
ntra
stin
g to
pos
tnat
al
stag
es w
here
rod
and
amac
rine
cells
(AC)
are
pr
oduc
ed. O
lig2-
RPC
pr
ogen
y ca
n al
so fo
rm ro
d ce
lls in
add
ition
to b
ipol
ar
(BP)
and
Mul
ler g
lial (
MG)
ce
lls. (
B) O
lig2+
RPC
pr
oduc
ing
cone
and
ho
rizon
tal c
ells
are
regu
late
d by
Otx
2 an
d O
necu
t1 (O
C1) t
hrou
gh th
e TH
RB C
RM1
elem
ent.
RPC
with
in th
e ze
braf
ish re
tina
also
exi
st w
hich
pro
duce
L-
cone
s and
hor
izont
al c
ells
(C) o
r diff
eren
t typ
es o
f con
e ce
lls (D
) with
out r
od c
ell
form
atio
n.
Adap
ted
from
Cep
ko, 2
015.

35
This concept of cones sharing a lineage with horizontal cells is complimented by a study
conducted in the zebrafish retina using a Thrβ reporter to label a specific RPC population
which produced predominantly L cone photoreceptors in addition to some horizontal
cells and retinal ganglion cells (Suzuki et al., 2013), whereas no clone produced rod and
cone cells. Additionally spalt family transcription factor, Sall3, expression with
developing mouse cone photoreceptors is necessary for the stimulation of cone-specific
genes, particularly for the activation S-opsin. Loss of Sall3 function prevents the
expression of the horizontal cell transcription factor, Lhx1, which together suggests a
regulatory role of Sall3 in cone and horizontal cell development (de Melo et al., 2011).
There is also evidence of clones derived from CRX-expressing RPCs within the zebrafish
which undergo terminal divisions to produce homotypic pairs of cone cells only
expressing L-opsin, M-opsin, S-opsin or UV cones (Liu et al., 2001).These studies
performed in a variety of animal models highlight the regulatory mechanisms
determining cone photoreceptor cell fate versus rod photoreceptors or other early born
cells, including horizontal cells. The molecular markers and mechanisms involved in this
process remains to be fully elucidated, particularly within the human retina which is
understudied due to the limited availability of human material and animal models
demonstrating similar cone photoreceptor organisation and features to the human
retina.
1.7. Retinal degenerations
Photoreceptor cells are highly metabolically active which makes them prone to
dysfunction (Vlachantoni et al., 2011). In the developed world, photoreceptor
degenerations account for approximately 50% of blindness (Bunce et al., 2010), for
which there are 3 main classes including rod, mixed rod/cone and debris-associated
degeneration. The primary causes of photoreceptor degeneration are inherited genetic
mutations and age-related effects; however they can additionally be caused by
underlying conditions such as diabetes. Inherited retinal dystrophies can arise from
mutations within more than 200 different gene (Hartong et al., 2006) RetNet,
http://www.sph.uth.tmc.edu/RetNet/ (Daiger, 1998), with the largest proportion of
causative genes associated with ciliary trafficking, lipid metabolism, phototransduction,
visual cycle and ion channels (Wright et al., 2010) The majority of gene mutations
leading to photoreceptor degeneration are monogenic and have an estimated
prevalence of 1 in 3000 (Rattner et al., 1999, Wright et al., 2010). Retinitis pigmentosa is

36
the most common form of rod degeneration, which leads to the secondary loss of cone
photoreceptors, whereas achromatopsia primarily features aberrant cone
photoreceptor cell functioning (Sundaram et al., 2012). In other forms of hereditary
retinal dystrophies, such as Best disease and Stargardt disease, and in age related
macular degeneration (AMD), the photoreceptors of the macula responsible for central
vision degenerate either due to defects in the photoreceptors, overlying RPE cells or
abnormal vasculature, respectively (Sundaram et al., 2012, Ferris et al., 2013). Leber
congenital amaurosis is the most severe form of childhood dystrophies, with causative
gene mutations acting in the photoreceptors themselves or in the RPE. The death of the
photoreceptors across these retinal degenerations has a debilitating impact on sight as
these cells lack regenerative capabilities to replace the lost cells, rendering the patient
permanently blind. Specifically, it is the loss of cone photoreceptor cells, whether as a
primary or secondary degeneration, which has the greatest impact on vision due to their
critical role in daylight, colour vision and high visual acuity (Mustafi et al., 2009, Shelley
et al., 2009). There are currently no effective treatments for these conditions; however a
number of therapeutic options are being explored which hold potential as future clinical
treatments. These therapies could also be applied to retinal dystrophies which feature in
syndromic conditions, such as Usher’s syndrome and Bardet-Biedl syndrome.
1.8. Therapies towards treating retinal degenerations
Significant progress has been made in therapy development towards treating diseases of
the eye due its many structural advantages which makes it an easy organ to target. For
example, the eye within normal and diseased states are very well characterised due its
easy accessibility and transparency, which is a major advantage for physical
manipulation through surgeries and for reliably monitoring effects during and post
intervention. Ocular structures are relatively compartmentalised and are encased by the
blood-retinal and blood-aqueous barriers, which would prevent systemic dissemination
of the delivered therapy and limit inflammatory immune responses (Sundaram et al.,
2012, Jayakody et al., 2015).
1.8.1. Early stage intervention therapies
Therapies in progress are primarily targeted towards rescuing or restoring the
photoreceptor or RPE cells, as the underlying retinal interneurons, ganglion cells and the
proceeding visual pathway to the brain remains largely intact during retinal
37
degenerations (Damiani et al., 2012, Lin and Peng, 2013). Preventive treatments
involving the administration of neuroprotective or anti-inflammatory agents have been
developed to slow disease progression, which includes delivery of vascular endothelial
growth factor inhibitors for wet AMD and neurotrophic factors such as ciliary
neurotrophic factor to promote the survival of photoreceptors cells (Campochiaro, 2007,
Wen et al., 2006, Jayakody et al., 2015). The most advanced approach towards
translation into the clinic is gene therapy, which uses viral-mediated delivery to re-
introduce healthy and correct copies of the mutated gene into the defective cells. Gene
therapy has shown promising results in restoring the function of defective
photoreceptor and RPE-associated genes in animal models, such as ABCA4 (Kong et al.,
2008), CNGB3 (Komaromy et al., 2010, Carvalho et al., 2011) and RPE65 (Acland et al.,
2001, Narfstrom et al., 2003, Le Meur et al., 2007) and has now progressed into human
clinical trials (Bainbridge et al., 2008, Hauswirth et al., 2008, Han et al., 2014). Similarly,
RPE replacement therapy to prevent secondary photoreceptor cell loss is another
advancing therapy, particularly for the treatment of AMD (Chen et al., 2010, van
Zeeburg et al., 2012, Schwartz et al., 2012) which has also progressed to clinical trials
pioneered by Ocata Therapeutics (Schwartz et al., 2015), The London Project to Cure
Blindness in partnership with Pfizer Neusentis (2015) and the Riken Centre in Japan
(2013) (Cyranoski, 2013). Gene therapy however requires early genetic diagnosis and
intervention, as the defective cells still need to be alive in order to receive the correct
gene copies; the same applies to RPE transplantation, which will require an earlier
intervention for the healthy RPE cells to have a positive effect on the survival of the
photoreceptor cells. Therefore late-stage degenerations would be difficult to target with
these therapies.
1.8.2. Late stage intervention therapies
Other approaches in response to the complete loss of photoreceptor cells include
transplantation of electronic retinal devices which are directly connect to and stimulate
the ganglion cells (Stingl et al., 2013), introducing light sensitive protein to the inner
retinal neurons via optogenetics (Busskamp et al., 2012) to replace the role of the loss
photoreceptors, or to transplant into the sub-retinal space new healthy photoreceptor
cells (MacLaren et al., 2006) or retinal tissue sheets (Assawachananont et al., 2014)
which can connect to the intact inner neurons to aid in vision restoration. Proof of
principle studies conducted in the mouse retina have demonstrated the feasibility of

38
photoreceptor cell replacement therapy. This studies showed the survival and
integration of transplanted Nrl.GFP labelled rod photoreceptor precursor cells into the
wildtype and mutant recipient retina (Figure 1.9) (MacLaren et al., 2006) with later
demonstration of GFP+ cell triad synaptic connectivity to the inner retinal neurons
(bipolar and horizontal cells) and functionality through partial restoration of vision in
mouse models of congenital stationary blindness (Gnat-/-) (Pearson et al., 2012).
Suction-pipette recordings of transplanted GFP+ cells with inner segments, cell bodies
and synaptic terminals present within the host ONL demonstrated light sensitive
properties of these cells, which generated dim-flash kinetics comparable to wild type
mice (Pearson et al., 2012). Additionally, optical intrinsic imaging performed on the
primary visual cortex of Gnat1-/-mice after transplantation of rod precursors showed
robust activity response after scotopic stimulation, which was absence in the sham
injected and untreated Gnat1-/-mice. This suggested signals generated from
transplanted cells are transmitted to higher visual areas of the brain. Visually guided
behavioural experiments, including optokinetic head tracking and water maze tests,
illustrated improved scotopic vision in treated Gnat1-/-mice with a high correlation
observed between the number of GFP+ cells with the host ONL and the ability of the
mice to solve the task (Pearson et al., 2012). Others in the field have also demonstrated
the light sensitive properties and partial vision restoration after the transplantation of
photoreceptor cells into mouse models of retinal degenerations (Lamba et al., 2009,
Barnea-Cramer et al., 2016, Singh et al., 2013, Tucker et al., 2011).
MacLaren et al., 2006 and Pearson et al., 2012 highlighted the importance of
transplanting post-mitotic precursor donor cells, rather than progenitor or mature cell
populations, to achieve optimal outcomes post transplantation. Hence they defined the
precursor cell stage as transplantation competent. Further to this observation, Lakowski
et al., 2010 demonstrated the formation of new cone photoreceptors upon
transplantation of mouse embryonic stage Crx.GFP photoreceptor cells into the
recipient retina, whereas a 10-fold higher number of rod photoreceptors were observed
after transplantation of postnatal stage donor cells. Additionally, the environment of the
recipient retina including the remaining cell architecture during disease progression,
presence of physical barriers, such as the interphotoreceptor matrix and outer limiting
membrane, and recipient-host cellular interactions have all been addressed as key

39
factors affecting the transplantation outcome (Pearson et al., 2010, West et al., 2008,
Barber et al., 2013).
Figure 1.9. Photoreceptor cell replacement therapy concept. Proof of principle studies for a cell replacement therapy for retinal dystrophies FAC-sorted mouse GFP labelled rod precursor cells (Nrl.GFP) and transplanted them into the subretinal space of the recipient degenerate mouse models. 3 weeks after transplantation, analysis of mouse retina show integrated GFP+ cells within the recipient ONL expressing photoreceptor protein missing from the mutant mouse model. Schematics from Dr. Jörn Lakowski, Dr. Mike Baron and data from MacLaren et al., 2006.
Over the last decade, other groups have demonstrated this similar phenomenon of GFP
labelled photoreceptor cells integrating into the host retina, using naive mouse
photoreceptor cells (Bartsch et al., 2008, Gust and Reh, 2011, Barber et al., 2013, Singh
et al., 2013, Santos-Ferreira et al., 2016b), mouse embryonic stem cell (ESC) and induced
pluripotent stem cell (iPSC)-derived photoreceptors (Gonzalez-Cordero et al., 2013,
Decembrini et al., 2014, Tucker et al., 2011, Assawachananont et al., 2014) and human

40
ESC/human iPSC-derived photoreceptor cells (Lamba et al., 2009, Lamba et al., 2010).
However, very recent studies have demonstrated that transplanted donor cells engage
in material transfer with the recipient photoreceptor cells, which results in the
transmission of cytoplasmic RNA and/or proteins, including the green fluorescent
protein (GFP) used to label the donor cells, through an unknown mechanisms (Pearson
et al., 2016, Santos-Ferreira et al., 2016a, Singh et al., 2016). This transfer of material is
thought to only occur between photoreceptor cells, as other studies using mouse
models with severely degenerated retina showed no GFP reporter labelling from the
donor cells within the inner layer of the recipient retina (Eberle et al., 2012, Singh et al.,
2013, Santos-Ferreira et al., 2016b). This process is also thought not to involve fusion of
the donor and recipient cells (Pearson et al., 2016). Previously, this possibility of cell-cell
fusion resulting in the observed donor cell integration into the host retina was
investigated and ruled out through BrdU DNA labelling experiments, which showed
labelled cells only originated from the donor cell source (MacLaren et al., 2006, Bartsch
et al., 2008, Eberle et al., 2011). Nevertheless, the mechanism of material transfer is
currently being further explored, particularly as a novel strategy for the treatment of
retinal degenerations. The cell transplantation approach also still represents a feasible
option for the treatment of late-stage retinal dystrophies featuring a severely
degenerated ONL and loss of photoreceptor cells.
1.9. Towards a human photoreceptor cell replacement therapy for retinal
degenerations
Towards the generation of a clinical photoreceptor cell replacement therapy for late
stage retinal degenerations, several criteria need to be addressed. Firstly, a renewable
and ethical photoreceptor cell source needs to be obtained, in which human embryonic
stem cells (ESCs) and human induced pluripotent stem cells (hiPSCs) could provide
suitable allogeneic and/or autologous sources. The retinal differentiation to support the
generation of photoreceptor cells needs to recapitulate the main developmental events
occurring during human retinogenesis and demonstrate the ability to produce mature
and functional photoreceptor cells that are transplantation competent when applied to
the human retina. Thorough pre-clinical assessments of the stem cell-derived
photoreceptors through comparative analysis with equivalent human bona fide cells
would also be required to assess their authenticity for use in a human clinical therapy.
The cell generation stage should also be economically feasible and robust but simple to

41
allow for the scaling up of photoreceptor production in sufficient numbers to match the
requirement needed for the transplantation and delivery. The delivery of cells would
also require optimisation, particularly to modulate inflammatory responses for the long-
term survival of transplanted cells. Finally, for transplantation of photoreceptor cell
suspension, a stringent non-genetic method of purifying the photoreceptors from
heterogeneous cultures which provides optimal specificity, efficiency and yields of
photoreceptor cells with the removal of proliferating cells would be required.
1.9.1. Stem cell sources for photoreceptor generation
Retinal differentiation of ocular-derived stem cells has been performed for use as a
renewable cell source of photoreceptor cells for transplantation by extracting cells from
regions of the eye and expanding these cells in vitro. These include ciliary epithelium-
derived stem cells (Ahmad et al., 2000, Tropepe et al., 2000, Coles et al., 2004, Gualdoni
et al., 2010), RPE-derived stem cells (Wachs et al., 2003, Engelhardt et al., 2005, Ballios
et al., 2012), iris-derived stem cells (Asami et al., 2007, Akagi et al., 2004b, Akagi et al.,
2005) and Müller glia-derived stem cells (Das et al., 2006, Bhatia et al., 2009, Lawrence
et al., 2007), which all provide evidence of neural or photoreceptor cell differentiation.
Additionally sheets of human foetal retina and/or RPE (Aramant and Seiler, 2002, Radtke
et al., 2008) and dissociated human foetal retina (experiment conducted by Dr. Jorn
Lakowski, unpublished) have been used as tissue sources for transplantation, with
studies demonstrating the survival of these cells with some potential interaction with
the recipient retina. While these cell sources are promising and have demonstrated
important aspects highly relevant towards the progression of a cell replacement
therapy, some questions remain about the stability of photoreceptor cell identity of the
differentiated ocular stem cell populations and the ethical use of human foetal material,
with neither source providing the feasible scale up of material required for a therapy.
Similar controversies surround the use of human embryonic stem cells (ESCs) as a
renewable source of photoreceptor cells in addition to the challenges faced with
transplanting immunologically unmatched donor cells into the patient retina, which may
require long-term immunosuppression (Shufaro and Reubinoff, 2004).
The ground-breaking discovery of iPSCs, demonstrating the reprogramming of fully
differentiated human fibroblasts back into a stem cell-like state using only 4
transcription factors, opened up the possibility of using a new autologous and

42
expandable cell source for cell therapies (Takahashi and Yamanaka, 2006, Takahashi et
al., 2007, Yu et al., 2007), which bypasses the ethical and immunological issues of using
ESC-derived cells. iPSC share many features with ESCs, including cell morphology,
proliferation and self-renewal capabilities, cell surface antigens, ‘stemness’ gene
expression, epigenetics and telomerase activity (Takahashi et al., 2007, Yu et al., 2007).
Recently many different methods of iPSC derivation have also been developed (Kim et
al., 2009, Zhou et al., 2009) to reprogram multiple somatic cell types (Loh et al., 2009,
Aasen et al., 2008). In combination with genome editing, this means new healthy cells
can be derived from and transplanted back into the patient, without the need for use of
embryo-derived material. However, iPSCs also have some of their own disadvantages,
such as the challenging, timely and costly requirements needed to validate individual
iPSC-derived photoreceptor cell lines for use in a clinical therapy (Wiley et al., 2016).
1.9.2. Generation of stem cell-derived photoreceptors via retinal
differentiation
Despite the challenges associated with the parental donor cell source for therapy,
significant progress has been made in generating stem cell-derived photoreceptor cells,
particularly from human ESC and human iPSCs, using different protocols of retinal
differentiation. Multiple culture systems have now been characterised, which use a two
dimensional (2D) adherent culturing method or a three dimensional (3D) approach,
involving embryoid body (EB) formation and free floating culturing, to generate retinal
cells from stem cell sources. Of key importance for the downstream differentiation of
photoreceptor cells is the cocktail of exogenous agent added to the culture, including
growth factors and serum, in addition to the environment of culture and cell
interactions with extracellular matrix.
1.9.2.1. Early progress in forebrain/retinal differentiation of stem cell sources
Based on previously defined neural differentiation protocols, Zhao et al., 2002 were one
of the first to demonstrate retinal cell derivation from ESCs through the demonstration
of Rax and Chx10 expression, which required co-culture with post-natal mouse retina
tissue to induce expression of photoreceptor-associated markers, Crx, Nrl, NeuroD and
Rhodopsin, albeit in low percentages (Zhao et al., 2002). Similarly, Ikeda et al., 2005 had
to use embryonic retinal cell co-culturing techniques in order to generate mouse
photoreceptor cells expressing Rhodopsin and Recoverin photoreceptor markers (Ikeda

43
et al., 2005). This protocol however made use of the previously defined telencephalic
serum-free floating culture of embryoid bodies system with Dickkopf-1 and LeftyA
(SFEB/DL) (Watanabe et al., 2005) to generate forebrain structure before inducing
retinal differentiation (26% efficiency of Rx/Pax6+ cells) using serum and activin-A, after
testing multiple factors known to be key for retinal development (Figure 1.10). Using
this stepwise manner of initiating forebrain differentiation prior to retinal identity,
Lamba et al., 2006 demonstrated retinal differentiation of human ESCs by using Wnt
antagonist, Dkk-1, and BMP antagonists, Noggin and IGF-1, to induce neural
differentiation (Figure 1.10). EBs were continually cultured with these factors once
plated down onto poly(D-lysine) and Matrigel with the addition of basic FGF, which led
to 80% retinal progenitor cell (PAX6+) generation, of which approximately 10% of cell
were positive for CRX, NRL and RECOVERIN by the end of 3 weeks of differentiation;
however only 0.01% of these cells expressed mature photoreceptor markers, such as S-
OPSIN and RHODOPSIN (Lamba et al., 2006). Encouragingly, transplantation of these
cells into wildtype mouse retina and mouse models of retinal degeneration showed
integration (Lamba et al., 2009), however these conclusions need further analysis in light
of the material transfer discovery.
1.9.2.2. Recent progress in forebrain/retinal differentiation of stem cell sources
Based on the SFEB/DL protocol with serum and activin treatment, Osakada et al., 2008
described for the first time defined culture conditions for the derivation of
photoreceptors from mouse, monkey and human ESCs. Here, they demonstrate the
addition of Notch inhibitor, DAPT, and combination of growth factors, including FGFs,
taurine, Shh and retinoic acid, improves photoreceptor differentiation of which 17%
express the mature rod marker, Rhodopsin (Osakada et al., 2008). Despite further
evaluation of these cultures showing gene expression profiles characteristic of mouse
photoreceptor precursor cells in vivo, stem cell-derived photoreceptors did not show the
same level of transplantation competence when introduced into the recipient retina
(West et al., 2012). Over the same period, similar retinal differentiation protocols were
used with the key purpose of illustrating the production of retinal progenitor cells with
the later differentiation into photoreceptors (Hirami et al., 2009). However, it was noted
in some of the protocols the fast generation of these cells which differ from the
equivalent stages of human retina development in vivo, which suggests photoreceptors

44
grown in vitro may not be at an equivalent differentiation stage to those generated
within the foetal retina. The pioneering work of the Gamm lab group were the first to
demonstrate the sequential specification and maturation of retinal cells within optic
vesicle structure from hESC and hiPSC sources, which highly mimics the key
development events occurring during human retinogenesis (Meyer et al., 2009). The
protocol used combined elements of 3D (EB formation and optic vesicle suspension) and
2D (plating down of EBs onto laminin) culture, with very minimal supplementation of the
culture media, highlighting the spontaneous and self-organising manner of the vesicle
formation (Figure 1.10). By day 80 of differentiation, approximately 19% of all structures
contained CRX+ cells and within these structures, 63% of cells expressed CRX of which
46% expressed mature photoreceptor markers, including RECOVERIN and/or CONE
OPSIN (Meyer et al., 2009). Improvements to this protocol detailed in Meyer et al., 2011
and Phillips et al., 2012 allowed for a further manual selection of the optic vesicles from
the neural forebrain structure before culturing for prolonged periods, which improved
the efficiency of generated photoreceptor containing optic vesicles (56% CRX+
structures by Day 80) (Meyer et al., 2011, Phillips et al., 2012). Overall these studies
highlighted the application of this culture method for modelling retinal development
and use in personalised medicine cell therapies.
One of the most ground-breaking studies in the field of stem cell-derived retinal
organoid cultures was the elegant demonstration of self-formation optic cup structures,
initially from mESCs (Eiraku et al., 2011) and later hESCs (Nakano et al., 2012) that not
only recapitulated the timings of retinogenesis in vivo but also the precise stratification
of the neural retina and morphological events leading to the formation of the bilayer
optic cup. This protocol made use of the serum-free culture of embryoid body-like
aggregates with quick aggregation (SFEBq) system, involving the dissociation of hESC
cultures to nearly single cell suspension before quickly aggregating a defined number of
cells (9,000 cells/well) within 96 low attachment V-bottomed conical well plates. The
addition of exogenous agents during the earlier stages of culture (Figure 1.10), including
ROCKi (Y-27632), 10% FBS, hedgehog agonist smoothened (SAG) and Wnt inhibitor
IWR1e, aided to promote cell survival and fine-tune cell fate towards rostral neural
differentiation and eventually improve the percentage of retinal progenitor cells
(RX::venus expressing cells >70% by Day 18) (Nakano et al., 2012).

45
Figure 1.10. Retinal differentiation protocols of hPSCs. Schematic representation of the major events occurring during retinal development in vivo (A) and the important signalling and regulatory elements involved in each stage of development (B). (C) The main differentiation protocols developed to generate retinal tissue, including photoreceptor cells, from hPSCs and the key reagents used to recapitulate human retinogenesis in vitro. Adapted from Jayakody et al., 2015.
To achieve retinal morphogenesis which involves evagination to form the optic vesicle
and invagination to create the double-walled optic cup containing the neural retina and
RPE, the Wnt agonist, CHIR99021, was supplemented in the media to increase the
expression of MITF gene involved in RPE formation. From Day 42 onwards, CRX
photoreceptor precursor cells were present, which eventually expressed pan
(RECOVERIN), rod (NRL; RHODOPSIN) and cone (RXRγ; CONE OPSIN) photoreceptor
markers during prolonged culture. The addition of Notch inhibitor, DAPT, to the culture
system also helped to accelerate photoreceptor differentiation. Other retinal cell types
(ganglion cells, amacrine cells, horizontal cells) were present within the optic cup
structures in a sequential and stratified form (Nakano et al., 2012), which are all
preserved in culture after en bloc cryopreservation. Overall, the pioneering work of the
Sasai and Gamm lab groups has since led to the further progression of retinal organoid
cultures (Boucherie et al., 2013, Homma et al., 2013, Jin et al., 2012, Mellough et al.,
2012, Reichman et al., 2014, Zhong et al., 2014, Zhou et al., 2015). These include

46
derivation of optic cups without the use of Matrigel which generate a ciliary margin-like
zone at the junction between the neural and RPE containing a stem cell niche (Kuwahara
et al., 2015) and CRX-expressing cells from the hESC-derived optic cup protocol have
additionally been isolated and profiled at the transcriptome level (Kaewkhaw et al.,
2015). These recent advancements in retinal differentiation cultures will be discussed
further within the chapters of this thesis.
1.9.2.3. Outer segment generation of stem cell-derived photoreceptors
In terms of maturation, protocols so far have struggled to consistently generate outer
segment structures from stem cell-derived photoreceptors. The original optic cup
protocols reported the lack of outer segment formation (Eiraku et al., 2011, Nakano et
al., 2012), thought to be due to a lack of microenvironment missing from the culture
conditions, which is normally provided by the RPE and intraocular tissue in vivo.
Transplantation of mESC-derived rod photoreceptor precursor cells generated based on
the Eiraku et al., 2011 protocol promisingly showed integration into the recipient retina
when introduced at a comparable ontogenetic stage as previously demonstrated for
postnatal mouse donor cells; in vitro these mESC-derived photoreceptors still lacked
elongated outer segments but post-transplantation, they demonstrated outer-segment
protein expression which was missing from the recipient diseased retina (Gonzalez-
Cordero et al., 2013). Others have also subsequently tested the transplantation
competency of hESC-derived retinal tissue using a modified Nakano et al., 2012 protocol
in nude rats and primate models of retinal degeneration, in which the grafted retinae
show evidence of connection with the recipient retinal cells, in addition to
photoreceptor maturation and some outer segment formation (Shirai et al., 2016).
These studies demonstrate the feasibility of using this differentiation method to
generate transplantation competent ESC-derived photoreceptors and retinal tissue for a
cell replacement therapy; however, this protocol is also ideal for disease modelling of
retinal dystrophies and testing small molecules and therapeutic agents due to the high
recapitulation of human retinogenesis. This was illustrated by Parfitt et al., 2016 who
use a modified Nakano et al., 2012 optic cup protocol to model photoreceptor
dysfunction from a Leber congenital amaurosis patient-derived iPSC line with an intronic
mutation in the centrosomal ciliary protein, CEP290. Importantly this study illustrates
the formation of inner segments, connecting cilium and outer segments with the optic

47
cups and reports ciliary trafficking defects within the patient derived photoreceptor
cells, which can be subsequently alleviated using anti-sense morpholino treatment
(Parfitt et al., 2016).
1.10. Photoreceptor cell surface marker sorting strategies
As stated previously, in addition to defining a suitable cell source for a photoreceptor
cell replacement therapy, a stringent method of cell isolation would be necessary to
remove potential harmful proliferating or contaminating non-photoreceptor cells before
transplantation into the patient. This is particularly crucial for photoreceptors derived
from stem cell sources, which contain multiple cell types at different stages of
differentiation. Previous studies demonstrating the cell transplantation approach have
genetically modified photoreceptor cells to carry GFP reporters (MacLaren et al., 2006,
Lamba et al., 2010), which has aided the isolation of the cells of interest. However,
genetic manipulation of photoreceptors is highly undesirable in a clinical setting due to
the increased risk of potential side effects, such as tumorigenicity. In other research
fields, targeting of cell surface antigens using conjugated monoclonal antibodies has
been employed to purify cells of interest using sorting techniques, including
fluorescence activated cell sorting (FACS) or magnetic activated cell sorting (MACS),
allowing for their selective enrichment without damaging or introducing transgenes to
the cells (Figure 1.11) (Woodward and Sulman, 2008, Takaishi et al., 2009, Yuan et al.,
2011, Turac et al., 2013).
The translation of this application into the retina has led to the identification of cluster
of differentiation (CD) markers expressed by mouse rod photoreceptor cells, which has
been used for their enrichment within cell sorting strategies. CD73 is an established
photoreceptor precursor cell marker in the postnatal mouse retina and labels mature
rods in the adult mouse retina (Koso et al., 2009, Lakowski et al., 2011). Performing
FACS/MACS on the mouse retina using CD73 antibody alone has allowed for the
enrichment of rod photoreceptor precursors and enhanced integration efficiencies upon
transplantation into the mouse retina (Eberle et al., 2011, Eberle et al., 2012, Eberle et
al., 2014). High percentages of rod photoreceptor enrichment has been demonstrated
using this single CD marker, in some cases up to 90% (Eberle et al., 2014), however
enrichment of stem cell-derived photoreceptor from heterogeneous cultures is likely to

48
be more challenging and require a combined isolation strategy to ensure stringent and
robust enrichment for a clinical therapy.
Figure 1.11. CD marker cell sorting strategy for photoreceptor cells. Retinal tissue is dissociated to a single cell suspension and conjugated CD marker antibodies are added to target the cell surface markers expressed on the cells of interest. The cell suspension is subjected to FAC/MAC-sorting, which results in the purification of the targeted cell population without the need for genetic manipulation of the starting material.
While Santos Ferreira et al., 2016 recently demonstrated that CD73 alone applied to
mouse ESC-derived retinal organoid cultures can enrich for photoreceptors prior to
transplantation and Reichman et al., 2014 demonstrate the presence of CD73 labelling
photoreceptors in human iPSC-derived retinal cultures, others have defined a
combination of CD markers to provide a similar enrichment of mouse rod precursors
(Lakowski et al., 2011) and mouse ESC-derived photoreceptors (Lakowski et al., 2015;
work from this thesis contributed to this publication), prior to transplantation. These
cells demonstrate increased transplantation competency compared to the unsorted
population after delivery to the subretinal space of mouse models of retinal dystrophies.
Identification of highly expressing CD markers (CD73, CD24, CD133 and CD47) in mouse
rod precursor cells through microarray and high throughput antibody screening
methods were used for positive selection and were combined together with
CD15/SSEA1, which provides negative selection for proliferative retinal progenitor cells
(Lakowski et al., 2015). While the expression of these cell surface markers are also
conserved within the human foetal retina (Lakowski et al., 2015), there is as need to
develop a similar strategy for human rod and cone photoreceptor cell isolation.

49
1.11. Aims
Optimal visual perception relies heavily on the correct functioning of cone
photoreceptor cells, which are vital for daylight vision, colour perception and high visual
acuity, therefore their loss has the greatest impact on sight in retinal degenerations.
Despite their importance, progress in developing a cone cell replacement therapy is
lacking behind the achievements made for rod cell transplantation. Relatively little is
also known about the genetic developmental profile and cell surface marker expression
of human foetal cone photoreceptors, which will be important for assessing the
authenticity of stem cell-derived cone photoreceptors for use within a clinical therapy.
Therefore the aims of this study are to:
• Analyse the expression profiles of known cone photoreceptor genes in the
human foetal retina in order to develop a reporter system to label and isolate
human foetal cone photoreceptors.
• Perform transcriptome analysis on isolated human foetal cones to profile their
developmental gene expression and cell surface marker expression.
• Develop a cell surface marker sorting strategy to enrich for human foetal cones.
• Apply the cone labelling tools developed in the foetal retina to human stem cell-
derived cones to perform a comparative transcriptome and cell surface marker
analysis.

50
2. Materials and Methods
2.1. Human eye samples
The human foetal material was provided by the Joint MRC (grant #
G0700089)/Wellcome Trust (grant # GR082557) Human Developmental Biology
Resource (http://www.hdbr.org/) and human adult eyes were obtained from Moorfields
Biobank. Full ethical approval for use of foetal material (HDBR project number: 200179)
and adult material (NRES Committee London project reference 08/H0713/29) was
granted for the project’s duration. A total of 64 human foetal eyes and 2 human adult
eyes were used in this study. Current literature of human foetal retinal development
refers to human sample staging in foetal/gestational weeks (Fwk); in this thesis, human
foetal sample are staged based on post conception week (pcw) which is 2 weeks later
than Fwk (see table below for comparison between ages).
Post conception weeks (pcw) Foetal/gestational weeks (Fwk) 11 9 12 10 13 11 14 12 15 13 16 14 17 15 18 16 19 17 20 18 21 19 22 20 23 21 24 22
Table 2.1. Staging of human foetal retinal samples based on foetal/gestational weeks and post conception weeks.
2.2. hiPSC derivation and maintenance
The hiPSC line used in this study was derived from fibroblasts from an unaffected parent
of an Usher Syndrome type 2 patient (heterozygous mutation USH2A c.7595-2144A>G)
by the Cambridge NIHR BRC hiPSC Facility using the Sendai viral reprogramming method
(CytotuneTM-iPS Sendai Reprogramming kit, Life Tech A1378001). Pluripotency was
validated via RT-PCR to confirm the loss of pluripotency expression from reprogramming
51
transgenes and immunocytochemistry to show in vitro differentiation into the 3 germ
layers (endoderm, mesoderm and neuroectoderm).
hiPSCs were cultured on 0.1% w/v gelatine (water for embryo transfer) coated 6 well
plates on a layer of irradiated mouse embryonic fibroblasts (IRR MEFs; GlobalStem). 6
well plates were coated with gelatine solution, before incubating for 20 minutes at room
temperature (RT), removing the gelatin and adding 1ml of MEF media (DMEM, 10% FBS,
2mM L-glutamine). IRR MEFs were gently thawed in a 37°C water bath and transferred
drop wise to 10ml of pre-warmed MEF media, before centrifugation at 200 x g for 4
minutes. Supernatant was removed and MEFs were resuspended in MEF media to a
density of 150,000 cells per ml; 1ml of MEF suspension was added per well and plates
were incubated at 37°C overnight prior to seeding iPSCs on feeder layer the following
day. For passaging of iPSCs, colonies were washed once with 1x PBS, before adding 1ml
of 0.1% w/v collagenase and 1ml of 0.1% w/v dispase (DMEM F12) per well and
incubating for 20-25 minutes at 37°C. Cultures were checked during incubation for the
visible curling of the colony edges; once this occurs colonies are ready to be lifted.
Colonies were lifted by gentle flushing with the enzyme solution and transferred to 5ml
of pre-warmed DMEM/F12 for washing. Colonies were left to sediment, before media
was aspirated and replaced with 7ml of fresh DMEM/F12. While the colonies were left
to sediment, the MEF feeder plates were washed twice with 1x PBS before adding 1ml of
knockout replacement serum (KSR) medium (DMEM/F12, 20% KOSR, 2mM L-glutamine,
1% MEM-NEAA, 0.007% 2-Mercaptoethanol) with 4ng/ml bFGF per well. As much media
as possible was then aspirated from the colonies and replaced with appropriate amount
of KSR media + 4ng/ml bFGF (1ml of media containing colonies per well). Colonies were
triturated until medium-small fragments were observed and 1 ml per well was
transferred into feeder layer plate, before returning to 37°C incubator. Approximately
30-40 colony fragments were plated per well to ensure colonies were confluent for
retinal differentiation procedure. iPSCs were microscopically checked and fed everyday
with 2ml of KSR with 4ng/ml of bFGF.
2.3. hiPSC retinal differentiation
Retinal differentiation protocol was based on the Meyer et al., 2009 protocol. hiPSCs
were grown to 80% confluency before incubating cells with 0.1% w/v dispase (DMEM
F12) for 5-10 minutes at 37°C to lift colonies. Colonies were carefully washed twice with

52
embryoid body (EB) media (KSR media without FGF) to ensure large homogenous
colonies fragments were maintained, before transferring into T25 flask containing 12ml
of EB medium to induce EB formation. 1x 6 well plate of hiPSC colonies was transferred
to 1x T25 flask; this was considered Day 0/Week 0. Medium was changed daily before
substituting to neural induction medium (NIM; 1:1 DMEM/F12, 1% MEM-NEAA, 1% N2
supplement, 0.1% heparin) on Day 4. To initiate neural rosette formation, EB’s were
transferred onto 30% v/v laminin (DMEM/F12) coated plates in NIM on Day 6. Laminin
plates were prepared on Day 5 and incubated overnight at 37°C. Cultures were then fed
every 2 days with NIM until Day 16 and EB’s normally attached to laminin coated plates
by Day 8/9. By Day 16, neural rosettes or small optic vesicles were visible and media was
changed to retinal differentiation medium (RDM; 70% DMEM, 30% F12, 2% B27
supplement). Thereafter, media was changed every 2-3 days and after Week 14 of
culture, RDM was supplemented with 10% v/v FBS.
2.4. Total RNA extraction
Retinae from human foetal and adult samples were dissected from surrounding ocular
tissue using stainless steel 8mm blade curved micro scissors and 0.1mm straight forceps
(World Precision Instruments) and snap frozen on ice dry immediately to promote
preservation of RNA integrity. The same process was carried out for hiPSC-derived
retinal tissue, but tissue was collected with a cell scraper and washed once with 1x PBS
before freezing. Samples were stored at -80°C until processed for RNA extraction using
the mirVana miRNATM isolation kit (Ambion) according to manufacturer’s
recommendations. Briefly this includes a cell lysis stage before the addition of miRNA
homogenate additive to initiate the organic extraction stage. Acid-phenol:chloroform is
added to each sample and centrifuged to separate the aqueous and organic phases. The
upper aqueous phase is removed carefully, washed with different concentrations of
ethanol and filtered multiple times using glass-fibre cartridges. Samples were finally
resuspended in 50ul of DEPC-treated water and stored at -80. 1ul of each sample prior
to freezing is run through the Nanodrop in order to assess RNA concentration and
quality.
2.5. Reverse transcription
cDNA was generated from RNA samples using SuperScript IIITM First-Strand Synthesis
SuperMix for qRT-PCR (Thermo Fisher Scientific) following the manufacturer’s

53
recommendations. Prior to cDNA synthesis, RNA samples underwent DNase treatment
using DNase I, amplification grade (Thermo Fisher Scientific) to remove any DNA
contamination. The DNase treatment was followed according to manufacturer’s
instructions.
2.6. Reverse transcription quantitative-PCR
RT qPCR was carried out in a 96 well plate with a total of 20ul reaction volume per well.
cDNA samples were diluted to 5ng in DEPC-treated water and 2ul of sample was added
per well; 17ul of TaqMan Gene Expression Master Mix (Thermo Fisher) with DEPC-
treated water was added per well, in addition to 1ul of the appropriate TaqMan Assay
(Thermo Fisher; see Table 2.2. for full list of assays). Negative controls were also run for
each assay by replacing the 2ul of sample cDNA with DEPC-treated water. GADPH was
run with all sample cDNA on every plate and used as the internal control for
downstream analysis. RT qPCR reactions were carried out using the Applied Biosystems
7500 Real Time PCR System with the FAM settings. The following cycle was used: Stage
1, 1x cycle, 50.0°C for 2 minutes; Stage 2, 1x cycle, 95.0°C for 10 minutes; Stage 3, 40x
cycles, 95.0°C for 15 seconds, 60.0°C for 60 seconds. The Applied Biosystems 7500 Real
Time PCR System software (v2.0.2) was used to assess quality of sample output, before
exporting data into Microsoft Excel and analysing manually.
TaqMan assays
Genes detected by assays
RefSeq Chromsome locations
Hs00230899_m1
CRX NM_000554.4 Chr.19: 47821842-47843330
Hs00610056_m1
RCVRN NM_002903.2 Chr.17: 9897710-9905367
Hs00199455_m1
RXRG NM_001256570.1 NM_00126571.1 NM_006917.4
Chr.1: 165400922-165445355
Hs00413554_m1
ONECUT1 NM_004498.2 Chr.15: 52756963-52790264
Hs00923915_m1
SALL3 NM_171999.3 Chr.18: 78980275-78998969
AJ20TM1 THRB NM_001252634.1 NM_001128176.2 NM_001128177.1 X74497.1
Chr3: 24206950-24206519

54
Hs00241039_m1
OPN1LW/OPN1MW/ OPN1MW2/OPN1MW3
NM_020061.5 NM_000513.2 NM_001048181.2 XM_003960089.4
Chr. X: 154144224-154159032 Chr. X: 154182596-154196861 Chr. X: 154219734-154233286 Chr. X: 154257620-154271068
Hs00181790_m1
OPN1SW NM_001708.2 Chr. 7: 128772489-128775790
Hs00182888_m1
ARR3 NM_004312.2 Chr. X: 70268335-70281840
Hs00292542_m1
GNAT2 NM_005272.3 Chr. 1: 109603091-109619733
Table 2.2. TaqMan gene expression assays used for RT qPCR analysis.
2.7. Histology and immunohistochemistry
For cryosectioning, whole foetal eyes with the lens removed was fixed overnight at 4°C
in 4% w/v PFA (PBS) whereas foetal retinal explants were fixed for 30mins in 4% w/v PFA
(PBS) at 4°C. Samples were then washed three times 1x PBS and equilibrated in 30% w/v
sucrose (PBS) solution for cryo-protection at RT until eyes has sunk. Samples were
transferred into aluminium foil molds, embedded in optimal cutting temperature-
compound (OCT) and freezing in a methylbutane-dry ice slurry. Eyes were orientated
with the anterior segments facing down and the optic nerve facing up. Tissue sections
were cut to 12-16μm thickness using the Leica CM1900 UV cryostat and collected on
SuperfrostTM plus glass slides (VWR). For immunohistochemistry, retinal sections were
washed in 1x PBS for 10-15 minutes at 37°C to remove the OCT compound and
incubated in blocking solution (10% v/v goat or foetal bovine serum, 1% w/v bovine
serum albumin (PBS) with 0.01% Triton X-100) for 1 hour at RT. Sections were incubated
with primary antibody for 1hr at RT or overnight at 4°C (see Table 2.3. for antibodies
used). Primary antibody was omitted for negative control sections. Sections were
washed three times in 1x PBS for 5 minutes, before applying the secondary antibody for
1 hour at RT (Table 2.3). Sections were washed 3 times with 1x PBS for 5 minutes prior

55
to DAPI (1:3000) incubation at RT for 3-5 minutes, which allows for the visualisation of
cell nuclei. Sections were washed again in PBS, before applying with Citifluor AF-1
mounting medium and 1.5 coverslips. The same immunostaining procedure was
conducted with wholemount foetal retina, however samples were free floating
throughout the whole procedure, before being transferred to microscope slides for
imaging.
Antibody Species Concentration used Company Recoverin Rabbit polyclonal 1:1000 Millipore (AB5585)
CRX Mouse monoclonal (anti-human)
1:800 Abnova (H00001406-M02)
LM-opsin Rabbit polyclonal 1:500 Millipore (AB5405)
S-opsin Rabbit polyclonal 1:500 Millipore (AB5407)
RXRγ Rabbit polyclonal 1:300 Abcam (AB15518)
Cone transducin (GNAT2)
Rabbit polyclonal 1:500 Santa Cruz (sc-390)
Onecut1 Rabbit polyclonal 1:200 Santa Cruz (sc-13050)
Cone arrestin (ARR3)
Rabbit polyclonal 1:100 Novus Bio (NBP1-19629)
Chx10 Sheep polyclonal 1:300 Chemicon (AB9016)
Nr2e3 Goat polyclonal 1:500 R&D Systems
Otx2 Rabbit polyclonal 1:500 Abcam (ab21990)
Ki67 Rabbit polyclonal 1:300 Abcam (ab15580)
OCT3 Goat polyclonal 1:100 R&D Systems (SC008)
Nanog Goat polyclonal 1:100 R&D Systems (SC008)
Tra-1-60 Mouse polyclonal 1:100 Santa Cruz (sc-21705)
Alkaline phosphatase
Mouse monoclonal
1:100 R&D Systems (SC008)
Goat anti-rabbit AlexaFluor 594
Goat 1:800 Invitrogen
Goat anti-mouse AlexaFluor 488
Goat 1:800 Invitrogen
Donkey anti-sheep AlexaFluor 594
Donkey 1:800 Invitrogen

56
Rabbit anti-goat AlexaFluor 594
Rabbit 1:800 Invitrogen
Table 2.3. Primary and secondary antibodies, properties, dilutions and company details used for immunohistochemistry.
2.8. Microscopy and image processing
Immunofluorescence staining was analysed using Axiovert 135 (Zeiss) with a ProgRes
C14 digital camera using OpenLab software (PerkinElmer Life). Z-projection images of
retinal sections, wholemounts and cells were acquired using the Zeiss LSM710 (Zen2009,
Zeiss). Confocal tilescan images (at least 2x2) were also acquired for cell counting
experiments. Images of human retinal explants with fluorescent reporter constructs
were also acquired using the inverted microscope Olympus IX71 (Carl Zeiss, Jena,
Germany) with a Hamamatsu ORCA-ER digital camera (Hamamatsu Corp., Bridgewater,
NJ) and the MZFLIII fluorescence stereomicroscope and the Leica DC500 camera.
Brightfield images of retinal differentiation cultures were captured using EVOS® XL Core
imaging system (Life technologies). Images were processed using Zen2009 (Zeiss),
ImageJ and Illustrator CS6 (Adobe).
2.9. Culturing human foetal retinal explants
Human foetal retinae were isolated under sterile conditions to remove all surrounding
ocular tissue using stainless steel 8mm blade curved micro scissors and 0.1mm straight
forceps (World Precision Instruments). Retinal samples were either cultured as i) small
explants on filter membranes (for electroporation method) or ii) whole retina
submerged in media (for AAV reporter transduction). The first method involved
microdissection of foetal retinae into small pieces (approx. 3-5mm) which were then
placed into 6 well plates containing 2ml of retinal differentiation media 1 (RDM1;
DMEM/F12, 1% Glutamax, 10% FBS, 1% penicillin/streptomycin, 1% B27 and 1% N2
supplement) per well with a porous 4.7cm diameter, 0.4µm pore size polycarbonate
membrane filers (WhatmanTM) floating on the media surface. 100ul of media was added
on top of explants once placed on filter membranes. 3-4 explants were cultured per
filter membrane at 37°C for up to 7 days. 1ml of media was removed and replaced every
3 days of culture. For the second method of culture, whole foetal retina, without RPE,
was transferred to either 24 or 12 well plates containing 1-2mls of RDM1, depending on
the size and age of the samples. Samples greater than 17pcw were cut in half and
cultured in separate wells. Media was changed every 2 days.

57
2.10. Generation of human cone fluorescent reporters for electroporation
2.10.1. Amplification of cone gene promoters
Fluorescent reporter constructs for the following genes were generated and tested via
electroporation: THRB, RXRγ, OPN1SW and GNAT2. Genome comparative tools, Vista
Gateway alignment tool (http://pipeline.lbl.gov/cgi-bin/gateway2) and the Basewise
conservation peaks by PhyloP available on UCSC genome browser
(https://genome.ucsc.edu/), were used to identify conserved regions 5’ UTR upstream
of genes and potential regulatory elements for driving gene expression. Previous
literature characterising cone gene promoter regions was also referred to during the
designing stages (referred to in Chapter 4). Outputs from the Vista Gateway alignment
tool used to design the gene promoters can be found within Appendix Figure 1. Primers
for these fragments were generated using Primer3 (http://primer3.ut.ee/; see Table 2.4.
for primer sequences). These fragments were amplified via PCR from human genomic
DNA and purified using PCR purification kit (Qiagen) according to manufacturer’s
instructions.
Table 2.4. Primer sequence, DNA fragment size and PCR cycle conditions for cone promoter regions
Primer set Fragment size PCR cycle conditions hTHRβF 5’AATTGCTTGGATTTCTGCCTTT 3’ hTHRβR 5’TTTGTTTCCCTGGTTCAGTTTCT 3’
2405bp 95°C for 2 minutes 95°C for 20 seconds 59°C for 20 seconds 72°C for 3 minutes
hRXRγF 5’ TGCCAGTATCATGAGGCTGT 3’ hRXRγR 5’ CGTCAGTTCATGTTCCTCTCC 3’
2404bp
hGNAT2F1 5’ GGATCACCGGTTTGTCTGTT 3’ hGNAT2R 5’ ATTTGCCGTCTTGTCAGCTT 3’
2966bp
hOPN1SWF2 5’ TTCTTTGTGTGGCCGATCTG 3’ hOPN1SWR 5’ CCCACAAAACCCCTCCTCTA 3’
3711bp
x35 cycles

58
The following constructs were generated by the Connie Cepko lab and were purchased
from Addgene (https://www.addgene.org/) for the electroporation work: pCAG.GFP
(chicken beta-actin promoter with CMV enhancer), pEF.GFP (EF1 alpha promoter),
pNrl.DsRed (mouse promoter), and pCrx.DsRed (mouse promoter).
2.10.2. Promoter fragment-vector ligation
After determining DNA concentrations using the Nanodrop Spectrometer, fragments
were TA subcloned into the pGEM T Easy plasmid using the Promega vector system
following the manufacturer’s guidelines in order to use the multiple cloning sites for SalI
and SacII to produce promoters suitable for sticky end cloning into the reporter plasmid
backbone, GFP and DsRed. The reporter plasmids were generated through SalI and SacII
digestion of the pNrl.DsRed and pEF.GFP reporters before performing agarose gel
purification (Qiagen) of the vector backbone only. Fragment:vector ligation ratios of 3:1
were used for the pGEM cloning and 3:1 or 7:1 for cloning inserts into the fluorescent
reporter vectors. Ligation reactions were performed at 4°C overnight using the T4 ligase
kit (Promega).
2.10.3. Transformation into competent bacterial cells
Samples were subsequently transformed into subcloning Efficiency DH5α competent
cells (Invitrogen) using manufacturer’s recommendations. For pGEM vector cloning, 40µl
of 20mg/ml 5-bromo-4-chloro-3-indolyl-β-D-galactopyranoside (X-gal; Sigma-Aldrich)
and 4µl of 200mg/ml Isopropyl β-D-1-thiogalactopyranoside (IPTG; Sigma-Aldrich) was
spread onto agar plates containing 100µg/ml of ampicillin, in order to conduct
blue/white screening of bacterial colonies. 50µl or 100µl of each transformation culture
were then spread onto agar plates and incubated overnight at 37°C. For fluorescence
reporter vector cloning, X-gal and IPTG was omitted from agar plates and bacterial
culture was centrifuged at 200 x g for 10 minutes before resuspending in 200µl of SOC
medium and spreading the total volume onto the agar plates. Addgene reporter vectors
were bought already transformed into competent bacterial cells and so were spread
onto agar plates for colony picking. Colonies were picked and cultured in 4ml of LB broth
inoculated with 100µg/ml of ampicillin overnight at 37°C to create miniprep bacterial
cultures.

59
2.10.4. Processing bacterial preps and validating cone promoter vectors
Minipreps were generated from bacterial cultures using the Qiagen miniprep kit
according to manufacturer’s instructions and samples were eluted in a final volume of
30µl. For determining correct orientation of cone promoter fragment into the pGEM
vector, restriction digestions were completed with the ScaI enzyme for THRβ2, GNAT2
and OPN1SW samples and XmnI enzyme for RXRγ samples. Both enzymes cut twice
within the pGEM vector and produced 2-3 product sizes if insert was correctly
orientated (Table 2.5.). Gel images of diagnostic restriction digests can be found with
Appendix Figure 2.
Reporter Diagnostic digest band sizes after pGEM cloning
THRβ2.pGEM 3200bp, 2100bp
GNAT2.pGEM 2560bp, 3415bp
OPN1SW.pGEM 1977bp, 3030bp, 1707bp
RXRγ.pGEM 3087bp, 2320bp
Table 2.5. Expected band sizes for correct orientation of insert into pGEM vector after restriction digestion
For cloning cone promoter fragments into fluorescent protein vectors, minipreps were
cut with SalI and SacII enzymes to create sticky end. Digestions were incubated at 37°C
in the water bath for 2-3 hours before running on a 1% agarose gel. Bands were then cut
out and DNA was extracted using Qiagen Gel Extraction Kit following the manufacturer’s
instructions, before proceeding with the ligation reaction, transformation, and miniprep
procedures as previously described. Maxipreps were generated from validated miniprep
samples showing correct band sizes from restriction digestions with SallI and SacII (see
Table 2.6). Gel images of diagnostic restriction digests can be found with Appendix
Figure 2.
Reporter Diagnostic digest band sizes after fluorescent reporter cloning
THRβ2.GFP 2405bp, 4000bp
GNAT2.GFP 2966bp, 4000bp
OPN1SW.GFP 3711bp, 4000bp
RXRγ.DsRed 2404bp, 4000bp
Table 2.6. Expected band sizes for correct orientation of insert into fluorescent reporter vector after restriction digestion.

60
200µl of miniprep bacterial cultures was added to 150ml of LB broth inoculated with
100µg/ml of ampicillin and incubated overnight at 37°C to generate maxiprep bacterial
cultures. Maxipreps were prepared using HiSpeed Maixprep Kit (Qiagen) and following
manufacturer’s protocol. Samples were eluted in 600µl of molecular water. Maixprep
were Sanger sequenced using Source Bioscience Services in order to ensure the correct
fragment sequence and orientation into the fluorescent protein vector. The resulting
constructs which were successfully generated included THRβ2.GFP, RXRγ.DsRed and
OPN1SW.GFP; although restriction digests validated the generation of the GNAT2.GFP
construct, the reporter failed to be successfully sequenced. For electroporation,
maxipreps were ethanol precipitated and resuspended in HBSS, as this has been defined
as the optimal solution for the electroporation process.
2.11. Electroporation of human retinal explant
Human foetal retina was dissected into small pieces (approx. 3-5mm) and transferred
into the CUY520P5 electroporation chamber (3mm x 8mm x 5mm; Nepagene),
containing 80-100µl of 1mg/µl fluorescent reporter vector in HBSS. pCAG.GFP vector
was used as a positive control, whereas molecular water or HBSS only was used as a
negative control. Retinal explants were orientated within the chamber using dissecting
forceps so to place the photoreceptor layer adjacent to the negative electrode. Once in
place, forceps was quickly removed and 5 pulses of 25V, 50ms duration and 950ms
intervals (Matsuda and Cepko, 2008) were applied to the samples using the NEPA21
electroporator (Nepagene). Explants were then removed from the chamber and washed
in 1xHBSS before transferring on to polycarbonate filter membranes in 6 well plates for
culturing as previously described.
2.12. AAV2/9 pR2.1:GFP reporter production
AAV2/9.pR2.1.GFP viral vector was generated at the Institute of Ophthalmology in
collaboration with Dr. Kamil Kruczek and Dr. Anai Gonzalez-Cordero. Mammalian 293T
cells were cultured in 150cm plates with D10 medium (DMEM+Glutamax, 10% FBS and
1x penicillin/streptomycin), seeded at 106 cells per plate before growing to 80%
confluency. Polyethylenimine (PEI) was used to transfect 293T cells with the transfection
media, which contained 52.5ml DMEM, 100µg L/M-opsin pR2.1. reporter maxiprep
(pd10-2.1-eGFP, see Appendix for sequence), 30 µg pHGT1 helper plasmid, 100 µg
AAV2/9 capsid and 1.2ml PEI, before incubating for 24hrs at 37°C. Media was removed

61
and replaced the following day. After 72 hours, transfected cells were harvested using a
cell scraper, centrifuged at 2000 x g for 5 minutes and resuspended in TD buffer pH 7.4.
Cell lysate was then subjected to four thaw-vortex (5 minutes)-freeze cycles to release
the virus. For each cycles, the cell lysate was froze at -80°C and thawed at 37°C. Virus
lysate underwent DNase treatment using 50 units of benzonase (Sigma-Aldrich) and was
prepared for purifications through multiple centrifugation steps (20mins at 18,000 x g
and two further 10mins centrifugations at 18,000 x g) and sequential filtering with 5µm,
0.45µm and 0.22µm PES membranes (Millipore). Virus was purified via ion exchange fast
protein liquid chromatography using the AKTATM prime or AKTATM pure FPLC apparatus
(GE Healthcare Ltd) and anionic sephacryl S300 and POROS 50HQ columns before
elution with an increasing salt gradient. The elution (approximately 20mls obtained) was
concentrated using a Vivaspin 4 columns (Sartorius) and final virus prep was
resuspended in 250-430µl of PBS and aliquots were made before storing at -80°C. Viral
genomic titre was determined through RT qPCR using specific primers for viral inverted
terminal repeats, which ranged from 1.48x10¹³-1.01x10¹⁴ in this study.
2.13. AAV transduction of human foetal retinal explants
The amount of virus to add was calculated using the following equation:
Estimated number of cells x multiplicity of infection = volume of virus to add in Titre of virus millilitres
Estimated cell number for early foetal retina (9pcw-14pcw) was between 10x10⁶-40x106
and for late foetal retina (15pcw-22pcw) was between 40x10⁶-15x107 cells based on
dissociation experiments completed in this study. The multiplicity of infection (MOI)
used in this study ranged 40,000-45,000. For human foetal explants, 250ul of RDM1 was
used per well (12 or 24 well plate) for initial incubation with virus and cultured using the
free floating method previously described, whereas 1ml of RDM was used per well for
retinal differentiation cultures (6 well plate). Virus was defrosted on ice and the
according volume was added to RDM. Any remaining media on foetal explants or retinal
differentiation cultures was removed before adding RDM containing virus was to
samples. Samples were incubated at 37°C overnight; plates containing foetal explants
were tilted to ensure explants were completely submerged in virus containing RDM1.
1ml of RDM1 for explants and 2ml of RDM for retinal differentiation cultures was added

62
after the 12hr incubation. The following day, media containing virus was removed and
fresh media was added to samples. Thereafter, media was change every 2 days.
2.14. Dissociation of live retinal samples
Human foetal retinal explants and iPSC-derived retinal differentiation cultures were
dissociated enzymatically into a single cell suspension using the papain dissociation
system (Worthington Biochemical, Lorne Laboratories) following manufacturer’s
protocol. For large foetal retinae (16-22pcw), samples were cut into smaller pieces
(5mm x 5mm) before the addition of papain (approx. 100µl per piece). For retinal
differentiation cultures, tissue was cut into smaller pieces using micro dissection scissors
before adding 1ml of papain per well of 6 well culture plate. 70µm cell strainers were
used to ensure cell single density of cell suspension. For GFP cell isolation, cells were
resuspended in a final volume of 500µl blocking solution (1% (w/v) BSA in PBS), whereas
cells for immunocytochemistry were resuspended in 1ml of blocking solution and
counted using a haemocytometer before being diluted to 1x10⁶ cells per 100µl.
2.15. Human BD lyoplate screening panels
The BD LyoplateTM Screening Panels (BD Biosciences) were used to screen for cone CD
markers via flow cytometry. After papain dissociation, retinal samples were
resuspended in 1ml of BD Pharmingen Stain Buffer +EDTA (BD Biosciences) and counted
using a haemocytometer; the manufacturer’s protocol was then followed. Briefly, it was
recommended cells were resuspended to 500,000-1,000,000 cells per 100µl, however
cells were run at a significantly lower density (35,000-220,000 cell per well) due to the
limited number of cells from the human foetal retinal samples. 100µl of cells were
aliquoted per well of round bottom 96 well plates, before adding 20µl of primary CD
marker monoclonal antibodies reconstituted in PBS. Primary antibody was omitted for
negative control and wells were allocated for IgG/IgM positive controls. Cells were
incubated for 30 minutes on ice, before washing and resuspending in 100μl of secondary
antibody solution (goat anti-mouse or goat anti-rat Alexa Fluor 647 provided with kit)
and incubating for a further 30 minutes on ice in the dark. After washing, cells were
resuspended in 150µl of BD Pharmingen Stain Buffer+EDTA and analysed using the BD
FACSCalibur. Between 15,000-20,000 events were collected per well and results were
analysed using the FlowJo software.

63
2.16. Cell preparation for flow cytometry or fluorescence activated cell sorting
(FACS)
For GFP cell isolation, 10µl of sterile DAPI was added to 500µl cell suspension in order to
determine cell viability. Post dissociation, cells allocated for CD marker sorting and
analysis were incubated for 1hr on ice in blocking solution, before the addition of the
conjugated monoclonal CD marker antibodies following the manufacturer’s protocol
(See Table 2.7. for CD marker antibodies used). For unstained, fluorescence minus one
(FMO) and isotype controls, 100-250k cells were used per control to allow a maximal
number of cells to be processed for the main sort of the experiment. Cells were
incubated for a further hour on ice in the dark, before being centrifuged at 200 x g for 5
minutes. All controls were resuspended in 150µl of blocking solution, whereas as the cell
population for analysis sorting resuspended in 300-500µl of blocking solution. The
FACSAria III Cell Sorter and the MoFlo XDP Cell Sorter (BD Biosciences) were used to
isolate GFP+ cells and sort cells with selected CD marker combinations, respectively.
FITC-A vs PerCP-Cy5-5-A channels were used to detect GFP+ signal, whereas the
according channels matching the fluorophores of the conjugated CD marker antibodies
were used to detected positive signal (see Table 2.7). Cells were collected into
eppendorf tubes containing 500µl of 50% v/v FBS (DMEM). After sorting, cell
populations were collected via centrifugation for 20 minutes at 200 x g; the supernatant
was subsequently removed and cells were resuspended in 15-20ul in RDM for plating
within chamber slides and culture. 8 well chamber slides coated in poly-L-lysine (1 hour
at 37°) and laminin (1:30; incubation for 1 hour at 37°C) were used for culturing cell post
sorting. Cells were resuspended to an approximate cell density of 200k cells per
chamber; for some sorts less than 200k cells were collected and in these cases all cell
were plated out. Cells were added to the centre of each chamber and incubated for 30
minutes at 37°C before adding 300µl of RDM per chamber and incubating overnight at
37°C. The BD LSRII analyser (BD Biosciences) was used for flow analysis of CD markers.
10,000-20,000 events were captured per analysis and the FlowJo programme was used
to analyse flow data post FAC-sorting or flow cytometry.

64
Primary antibody Species Concentration used (per 1x10⁶ of cells)
Company Laser/channel used during flow analysis
CD133 PE-Vio770-conjugated
Mouse 10µl Miltenyi Biotec
PE-Cy7-A
CD26 PE-conjugated
Mouse 20µl
BD Biosciences
PE-A
CD147 PerCP-Cy5.5-conjugated
Mouse 5µl BD Biosciences
PerCP-Cy5-5-A
SSEA-1 APC conjugated
Mouse 10µl Miltenyi Biotec
APC-A
Table 2.7. Conjugated CD markers antibodies used for FAC-sorting experiments.
2.17. Immunocytochemistry
Dissociated retinal cells plated in chamberslides were fixed in 4% (w/v) PFA in PBS for 5
minutes at 37°C before further fixing in 2% (w/v) PFA/ 30% (w/v) sucrose in for 15
minutes at RT. Cells were washed three times in 1x PBS before blocking at RT for 1 hour
in 1% (w/v) BSA in PBS with 0.01% Triton X-100. Primary antibody (see Table 2.8. for
details) incubation with cells was for 1 hour at RT; for CD marker staining, Triton X-100
was omitted from blocking solution. After washing three times in 1x PBS, cells were
further incubated for 1 hour at RT with secondary antibodies (Goat anti-mouse 488 or
Goat anti-rabbit AlexaFluor 594, Invitrogen, 1:800). Cells were then stained for 5
minutes with DAPI (1:3000) in PBS before removing chambers and mounting microscope
slide containing cells with 1.5x coverslips. For analysis of FAC-sorts of foetal and ESC-
derived retina, 3 independent samples were analysed for each CD marker combination
and at least 50 cells were counted for each FAC-sorted cell population.
Primary antibody Species Concentration used Company L/M-OPSIN Rabbit 1:400 Millipore CRX Mouse 1:800 Abcam CONE ARRESTIN Rabbit 1:100 Novusbio CD26 PE-conjugated
Mouse 1:500 BD Biosciences
CD133 PE-Vio770-conjugated
Mouse 1:500 BD Biosciences
CD147 PerCP-Cy5.5-conjugated
Mouse 1:500 BD Biosciences
Table 2.8. Details of primary antibodies using for immunocytochemistry

65
2.18. Total mRNA sequencing and bioinformatics
The concentration and quality of RNA samples for sequencing were assessed using
Agilent Bioanalyzer or Tapestation using a RNA 6000 Pico kit (Agilent Technologies).
Amplification of all RNA samples was performed using the SMART-Seq v4 Ultra Low
Input RNA kit (Clontech Laboratories) and the Nextera XT DNA Library Preparation Kit
(Illumina) was used to make cDNA libraries. The quality of the libraries was assessed
using Qubit dsDNA HS Assay kit and Qubit 2.0 Fluorometer (ThermoFisher). cDNA
libraries were subsequently sequenced with a targeted sequencing depth of 17million
43bp paired end reads per sample using the NextSeq500 system (Illumina). FASTQ files
generated from sequencing were aligned using RNA Seq STAR alignment tool (Illumina,
version 1.1.0) to the reference human genome (GRCh37/hg19), which outputs the BAM
files. Quality control was performed before and after alignment of the FASTQ files using
the RNA-Seq alignment tool in BaseSpace (Illumina). BAM files alongside with gene
annotation file (Homo_sapiens.GRCh37.87.chr.gtf from Ensembl) were uploaded to the
RNA sequencing analysis software, Galaxy (version 17.01). Aligned reads were annotated
to genes and quantified using featureCounts (version 1.4.6.p5) (Liao et al., 2014) to
obtain raw count matrices. These were loaded into Strand NGS (Strand Genomics) and
normalised using DeSeq for hierarchical clustering analysis (Euclidean similarity measure
and Ward’s linkage rule used), Principal Component Analysis (PCA) and generating
heatmap representations. The raw count matrices were additionally run through the
DeSeq2 (Love et al., 2014) pipeline (Galaxy version 2.11.38) in order to perform
differential gene expression analyses, which uses Wald test statistics and Benjamini-
Hochberg correction for multiple testing. log10 adjusted p-values and log2 fold changes
were plotted using R (version 3.2.1 (2015-06-18) to create volcano plots. Venn diagrams
were constructed using Bioinformatics & Evolutionary Genomics tool
(http://bioinformatics.psb.ugent.be/webtools/Venn/). GO analysis was performed using
Enrichr (Chen et al., 2013, Kuleshov et al., 2016) and the semantic space plot tool on
Revigo (Supek et al., 2011) was used to represent enriched GO terms with a combined
score >10. To identify putative cell surface marker genes within the transcriptome data,
a cell surface marker database was created containing predictive information based on
human protein sequences from UniProtKB/Swiss-Prot database (release 2013_04).
Representative proteins with less than 90% pair-wise sequence identity were identified
using the CD-HIT program (Li and Godzik, 2006), which resulted in 19281 proteins

66
contained within the database. Predictions for these proteins were obtained using
MEMSAT-SVM (transmembrane segment prediction (Nugent and Jones, 2009), PredGPI
(GPI anchor prediction, (Pierleoni et al., 2008), the specific Support Vector Machine
trained for GO term GO:0005886 ‘plasma membrane’ within FFPred2 (version 2.0,
(Minneci et al., 2013), and DISOPRED2 (protein disorder prediction) (Ward et al., 2004).
Out of the 19281 proteins present in the database, 3367 were labelled as positive and
15914 as negative. Benchmark testing the tool against a known list of human cluster of
differentiation cell surface markers (206) showed 85% sensitivity in predicting cell
surface markers (168/206).
2.19. Single cell RNA sequencing
FAC-sorting was used to isolate 15pcw AAV2/9.pR2.1:GFP+ cell population, which was
subsequently separated using a medium-sized (10-17µm cell diameter) integrated fluidic
circuit (IFC; Fluidigm), using the Fluidigm C1 system. Before loading onto the IFC, a
standard trypan blue exclusion test was performed and live cells were counted for
resuspension at a concentration of 667cells/µl, total volume 3µl. After separation into
individual chambers, phase-contrast microscopy was used to check for the single cell
status of each chamber. 73 single cells were captured for the experiment, after
excluding chambers containing debris, dead cells and multiple cells. The SMART-Seq v4
Ultra Low Input RNA kit (Clontech Laboratories) and the Nextera XT DNA Library
Preparation Kit (Illumina) was used to amplify and generate cDNA libraries from
individual samples. External RNA Control Consortium (ERCC) RNA spike-in Mix
(ThermoFisher) was added to each samples prior to sequencing to provide an internal
control across samples. The Qubit dsDNA high sensitivity Assay kit and Qubit 2.0
Fluorometer (ThermoFisher) were used to quantify the cDNA library concentrations.
Libraries were then sequenced using the Illumina NextSeq500 system with a sequencing
depth of 2 million reads, 75bp paired-end reads to produce the FASTQ files, which were
obtained from each individual cells and aligned to the hg19 build of the human genome
with ERCC spike-in sequences using subread version 1.5.0-p1 (Liao et al., 2013). A matrix
of gene by cell counts was generated by importing the FASTQ files and gene feature files
from Ensembl GRCh37 version 82 into the featureCounts software (Liao et al., 2014).
The pipeline described in (Lun et al., 2016b) was then used for the downstream RNA seq
analysis. Low quality cells were defined from several quality control metrics, including
the log-library sizes and log-number of expressed features (where small outlier values

67
were removed), and the proportion of reads mapped to the ERCC spike-ins or
mitochondrial genome (where large outliers were removed). This led to the inclusion of
65 cells for the downstream analysis. Outlier values were defined as three
median absolute deviations above or below the median. Low-abundance genes
were defined as those with average counts below 1 and were filtered out, leaving
19,650 genes for downstream analysis. Normalization was performed for endogenous
genes by computing size factors with the deconvolution method (Lun et al., 2016a). For
spike-in transcripts, size factors were computed from the sum of spike-in counts in each
cell. In both cases, the size factors were used to obtain normalized log-expression values
for all genes/transcripts in all cells. To identify highly variable genes (HVGs), a trend was
fitted to the variance of the log-expression values against the mean for the spike-ins.
This was used to decompose the variance for endogenous genes into biological and
technical components. HVGs were defined as those genes where the total variance was
significantly higher than the technical trend (FDR<0.05) and the biological component
was at least 0.5. The log-expression values for the HVGs across all cells were then used
in a principal components analysis. Genes correlated with PC1 were identified using
limma (Ritchie et al., 2015).

68
3. Analysis of cone photoreceptor markers in the human developing and adult retina
3.1. Introduction Cone photoreceptor development and the expression of markers that characterise these
cells in the human foetal retina remains to be fully elucidated, which is largely due to the
rarity of available human tissue, the ethical issues surrounding the use of human tissue
and the inability to explore all time points of human development. Histological studies
that have been able to investigate the early development of the human retina have
demonstrated a unique gradient of maturation between the central and peripheral
regions of the retina (O'Brien et al., 2003, Xiao and Hendrickson, 2000, Hendrickson et
al., 2008). These studies report retinal maturity commences within the central region
located posteriorly within the human developing eye, which will give rise to the
prospective fovea. This central region can be observed from as early as foetal
week/gestation week (Fwk) 10.9, which is fully laminated into the 3 cell layers, the outer
nuclear layer (ONL), inner nuclear layer (INL) and ganglion cell layer (GCL) and the 2
synaptic layers, the outer plexiform layer (OPL) and inner plexiform layer (IPL). This is in
comparison to the immature peripheral regions of the retina, which only shows
lamination and differentiation of retinal cells at later stages of development. Within the
early central region, the ONL consists of a single layer of cone photoreceptors and only
at later stages of development can rod photoreceptors can be detected within the ONL
at the foveal edge (Hendrickson et al., 2008). This discrimination between early cone
and rod photoreceptors is based on cell morphology and nuclei condensation; cones
appear more rectangular in shape and have large less condensed nuclei, compared to
the rods which are smaller and feature dense oval nuclei (Hendrickson et al., 2008).
In terms of identifying cones by molecular markers, FGF4 and TULP1 have been
proposed as early markers of cone photoreceptors in the macaque at foetal day 120
during foveal development and human foetal retina at Fwk 9, respectively (Cornish et
al., 2005, O'Brien et al., 2003). Similar to the interphotoreceptor retinoid binding protein
(IRBP) expression pattern, as development progresses TULP1 expression is detected
within human foetal rods, therefore its expression is only cone specific at very early
stages of development (O'Brien et al., 2003). Cone transducin (GNAT2) has also been

69
suggested as an early marker of human cone photoreceptors, with protein expression
demonstrated within the Fwk18 human retina (Roberts et al., 2005). The most
documented cone-specific proteins explored in the human developing retina are the
light sensitive S-opsin, L-opsin, M-opsin G protein coupled receptors. It has not been
possible to distinguish between human L and M-opsin cones using antibody detection
since these genes are 98% homology (Nathans et al., 1986), hence they are referred to
as L/M-opsin cones throughout the literature and within this thesis. These studies
reveal S-cones are the first cone type present in the human retina at Fwk 11 (Xiao and
Hendrickson, 2000), surrounding the immature fovea in the central retina, which
coincides with the expression onset of the CRX protein between Fwk 10-11 weeks of
development (Glubrecht et al., 2009, O'Brien et al., 2003). This is followed by the L/M-
opsin cones, in addition to a small population of S, L and M-opsin expressing cones,
which arise a few weeks later between Fwk14-15 (Xiao and Hendrickson, 2000).
Immunhistochemical analysis reveals S cones and L/M cones have distinct cell
morphologies from each other throughout development; the S-opsin cones tending to
be more elongated with a thicker cell body, compared to the L/M-opsin cones which
have a goblet shaped morphology (Xiao and Hendrickson, 2000, Cornish et al., 2004).
Compared to this detailed analysis of cone opsin expression, there is very limited
transcript and protein onset profiling of the other cone-associated markers in the
human foetal retina.
Expression profiles of earlier cone-specific markers comes from studying cone
photoreceptor genesis within vertebrate models such as the primate, mouse, zebrafish
and chicken, which have given an insight into the molecular interactions of transcription
factors that underpin this process. Carter-Dawson and LaVail, 1979 determined the
order of retinal cell birthing in the mouse retina using temporal nucleoside analogue
(3H-thymidine) labelling, which revealed cone photoreceptors are one of the earliest
retinal cell types to be born, alongside amacrine and horizontal cells. Lines of evidences
demonstrating rod and cone photoreceptor cell fate plasticity in the mouse retina
(Akimoto et al., 2006, Oh et al., 2007) and the sharing of rod and cone markers (Craft et
al., 2014, Kim et al., 2016), suggest both photoreceptors share a common cell lineage
and specification of photoreceptor cell fate is based on a transcription factor interaction
within a transcriptional dominance model (see Introduction Section 1.5; Figure 1.7). Two
well defined transcription factors, thyroid hormone receptor beta 2 (Thrβ2) and

70
retinoid-x-receptor gamma (Rxrγ), expressed by early cones in the mouse retina are
critical for the patterning and specification of cone cell type; Thrβ2 actively suppresses
differentiation of the default S-cone cell state (Ng et al., 2001, Applebury et al., 2007),
which requires additional input from Rxrγ (Roberts et al., 2005), to promote the
formation of M-opsin expressing cones. Extrapolating from the mouse data, both these
transcription factors should be early markers of human cone photoreceptors, however
the expression of RXRγ has been documented at relatively later stages of development
(Fwk 16) (Roberts et al., 2005) and THRβ2 expression remains to be explored within the
human foetal retina. More recently, Emerson et al., 2013 defined a retinal progenitor
cell population regulated through synergise of Otx2 and Onecut1 transcription factors,
which produces progeny biased towards cone photoreceptors and horizontal cells. The
observation of these two early born cell types sharing similarities in their cell ancestry is
additionally supported by transgenic L-cone tracking study in zebrafish (Suzkui et al.,
2013) and the identification of an additional transcription factor Sall3 in the mouse
retina (de Melo et al., 2011), which is expressed by S-opsin cones and regulates cone
photoreceptor and horizontal cell terminal differentiation (see Introduction Section 1.5;
Figure 1.8). However, the expression of these novel markers which influence cone
photoreceptor cell fate has yet to be explored in the human developing retina.
This review of the literature highlights the need for further investigation of previously
identified and novel marker expression in human developing cone photoreceptors.
Hence, the aim of this first results chapter was to characterise the onset and expression
profile of a set of early and mature cone photoreceptors markers at the transcript and
protein level across sequential developmental timepoints of the human retina. This
would allow for marker expression patterns relative to previously investigated model
organisms to be confirmed and enable the validation of established and potential novel
human cone photoreceptor markers. Subsequently, these marker gene profiles will then
be used to explore cone photoreceptor genesis during retinal differentiation of hPSCs
and guide the development of cone-specific reporter system for labelling and isolating
human foetal and hPSC-derived cone photoreceptors.
3.2. Results 6 human foetal retinal samples (9pcw, 10pcw, 12pcw, 14pcw, 19pcw, 20pcw) were used
for transcript analysis by RT-qPCR and 7 human foetal eyes (9pcw, 10pcw, 12pcw, 13pcw

71
15pcw, 17pcw, 19pcw) were used for immunohistochemical analysis of selected cone
photoreceptor markers. 2 adult human retinal samples were used for transcript and
protein analysis additionally. From the current literature, only OPN1SW, OPN1MW/LW
and RXRγ have been previously studies within the human developing retina, hence the
expression profiles of the following cone photoreceptor markers were assessed:
i) Early markers of human cones: RXRγ, THRβ2, SALL3 and ONECUT1
ii) Mature markers of human cones: OPN1SW (S-opsin), OPN1MW/LW (L/M-
opsin), GNAT2 and ARR3.
3.2.1. Difference in maturity between the central and peripheral retina affects
lamination
Histological analysis of cryosections with DAPI nuclei stain revealed differences in
stratification between the central and peripheral retinal regions, but only at a later
foetal stage of 19pcw (Figure 3.1.A). An intact neuroblastic cell layer (NBL) with a
ganglion cell layer (GCL) below was observed in peripheral regions located closer to the
anterior segment (Figure 3.1.B). The formation of the outer plexiform layer (OPL; Figure
3.1.C yellow arrows) was observed in retinal regions located more centrally towards the
back of the eye, which separates the outer nuclear layer (ONL) containing the
photoreceptor from the interneuron cells located within the inner nuclear layer (INL;
Figure 3.1.C). In the most central regions of the retina, discrete lamination into the 3 cell
layers and 2 synaptic layers, characteristic of the mature adult retina, could be clearly
observed (Figure 3.1.D). The proliferation marker KI67 was used to determine the extent
of proliferation in each retinal region, which revealed positive expression of KI67 in cells
of the neuroblastic layer in the peripheral retina (Figure 3.2.A). This expression was
depleted and eventually absent in more posterior retinal regions (Figure 3.2.B) and
within the central retina (Figure 3.2.C) where the most lamination is present, suggesting
these cells are post-mitotic.
Although this difference in retinal lamination could not be detected in sections at earlier
foetal time points (data not shown), differences in cone protein localisation was
examined in all foetal samples between regions surrounding the optic disk at the back of
the eye and in regions closer to the anterior structures of the eye.

72
Figure 3.1. Difference in retinal maturation and lamination in the 19pcw human foetal retina. (A) Tilescan confocal image of a transverse 19pcw human retinal section stained with DAPI showing the different regions of the eye. Magnified areas of the retina are shown to demonstrate differences in lamination. The peripheral retina (B) contains an intact NBL, IPL and GCL; retinal regions towards the back of the eye begin to show the formation of OPL, which separates the NBL into the ONL and INL (C), whereas the central retinal regions feature the discrete separation into the cell and synaptic layers (D). RPE; retinal pigment epithelium, NBL; neuroblastic layer, ONL; outer nuclear layer, OPL; outer plexiform layer, INL; inner nuclear layer, IPL; inner plexiform layer; GCL, ganglion cell layer. Scale bar 500µm for A; scale bar: 50µm for B, C and D.

73
Figure 3.2. Assessment of KI67 expression in different regions of the 19pcw human developing retina. (A) Immunostaining for the proliferation marker, KI67, demonstrates positive cell expression in the periphery throughout all retinal layers. (B) A reduced number of KI67 positive cells are found within the retinal regions featuring OPL formation and cells within the central retina show a complete absence of KI67 expression (C). Scale bar: 50µm.
3.2.2. Detection of photoreceptors at 9pcw in the human foetal retina
Expression of the established pan-photoreceptor genes, CRX and RCVRN, were used to
determine the earliest developmental stage photoreceptors could be detected in the
human retina. By qRT PCR, expression of both these genes could be detected
throughout the series of foetal retinal samples analysed (9pcw-20pcw) and within the
adult human retina, showing a general trend of upregulation relative to expression
levels at 9pcw (Figure 3.3.A and 3.3.B). Interestingly, RCVRN expression showed a
greater upregulation during within the foetal retinal stages.
Both these markers could also be detected through wholemount immunostaining at the
earlier foetal stage of 9pcw (Figure 3.3.C). All RECOVRIN positive cells were also positive
for CRX expression, but not all CRX positive cells expressed RECOVERIN (Figure 3.3.Ci).
Differences in protein expression across the retina were observed, with a higher density
of highly expressing CRX and RECOVERIN positive cells located in the central retina
(Figure 3.3.Ci), which reduced into peripheral regions of the retina (Figure 3.3.Cii).
RECOVERIN was additionally detected throughout all foetal stages studied in the
peripheral and central retina (Figure 3.4.A and B; example images of 13pcw and 19pcw),
consistently expressed by cells confined to the outer nuclear layer which is the known
location of the photoreceptor cells.

74
Figure 3.3. Profiling RECOVERIN and CRX expression in the early human foetal retina. qPCR analysis of the cone-rod homeobox (CRX; (A) and Recoverin (RECOVRIN; (B) transcripts in the developing (9pcw-20pcw) and adult human retina. Fold change relative to 9pcw. (C) Protein expression of both markers via wholemount immunostaining in 9pcw human retina shows highly expressing CRX and RCVRN positive cells in the central retina (i) compared to the peripheral retina where expression is reduced (ii). Scale bar: 50µm.

75
Figure 3.4. RECOVERIN protein expression in the human foetal retina. RECOVERIN expression is detected specifically in the ONL in the peripheral (i) and central (ii) regions of the 13pcw (A) and 19pcw (B) developing human retina. RPE; retinal pigment epithelium, NBL; neuroblastic layer, ONL; outer nuclear layer, OPL; outer plexiform layer, INL; inner nuclear layer, IPL; inner plexiform layer, GCL; ganglion cell layer. Scale bar: 50µm.
3.2.3. Transcript expression of early and late cone photoreceptor markers in
the human developing and adult retina
The expression profiles of RECOVERIN and CRX demonstrated that photoreceptors were
present throughout all the human retinal stages analysed (9pcw-20pcw), hence the
onset of cone photoreceptor gene expression was subsequently examined via qRT PCR.
Markers involved in early cone photoreceptor development were detected in the 9pcw
human retina and show varied levels of transcript expression across developmental
timepoints, before being downregulated in the adult human retina (Figure 3.5.A). RXRγ
transcript showed upregulated expression into later stages of foetal development
(Figure 3.5.Ai), whereas as THRβ2 and SALL3 gene expression levels were upregulated
relative to 9pcw during early foetal stages between 10-12pcw (Figure 3.5.Aii and iii). The

76
expression level of the novel cone regulator gene, ONECUT1, remained fairly low and
constant throughout the human foetal samples analysed (Figure 3.5.A.iv).
Markers of maturing cone photoreceptors showed a clear upregulation of gene
expression levels across development into later stages of foetal development (19-
20pcw), when compared to expression levels at 9pcw (Figure 3.5.B). This upregulation
was substantial for both the cone opsins, OPN1SW (Figure 3.5Bi) and OPN1MW/LW
(Figure 3.5.Bii) and for cone arrestin (ARR3) (Figure 3.5.Biii), except for cone tranduscin
(GNAT2) (Figure 3.5.Biv) gene expression, which remained more constant across all
foetal samples.
3.2.4. Protein expression of early and late cone photoreceptor markers in the
human developing and adult retina.
Protein distribution of early and late markers of cone photoreceptors was assessed
through fluorescent immunostaining of frozen human retinal sections and intact
wholemount retina. Despite repeated efforts to optimise immunostaining protocols, no
signal was detected in human foetal retinal samples using THRβ2 and CONE ARRESTIN
antibodies. Additionally, no antibody showing clear immunofluorescence signal for
SALL3 could be obtained. ONECUT1 was the earliest marker detected in the human
developing retina at 10pcw, labelling a cell population located throughout the
neuroblastic layer within the peripheral and central retinal neuroblastic layer thought to
be progenitors (Figure 3.6.Ai and ii). This was later followed by the cone opsins; S-OPSIN
protein was detected within the 13pcw central retina (Figure 3.6.Bii) and L/M-OPSIN
protein was observed by 17pcw, again only within the central regions of the retina as
the proteins were completely lacking within the peripheral retinal regions (Figure 3.6.Ci
and ii). Both the cone opsin immunostainings showed more intense signal within the
cytoplasm and outer membrane of the cells. This staining also showed S-OPSIN
expressing cells project small cellular processes (Figure 3.6.Bii), which are not present in
the L/M-OPSIN positive cells. Additionally, a distinct honeycomb spatial distribution of
the cone opsin expressing cells was noted within the central retina, particularly for the
S-OPSIN positive cells.

77
Figure 3.5. Transcript profiling of cone photoreceptor markers in the developing and adult human retina. (A) The transcript expression of early cone markers, (i) retinoid-x-receptor gamma (RXRγ), (ii) thyroid hormone receptor beta (THRβ), (iii) SALL3 and (iv) Onecut1 (OC1) and (B) mature cone markers, (i) S-opsin (OPN1SW), (ii) L/M-opsin (OPN1LW/MW) and (iii) cone transducin (GNAT2) was analysed via RT qPCR at different foetal timepoints (9pcw-20pcw) and in the adult human retina. Fold change relative to 9pcw.

78
Figure 3.6. Protein expression of cone photoreceptor markers in the developing human retina. (A) ONECUT1 protein expression is observed in a cell population spanning the neuroblastic layer of the 9pcw peripheral (i) and central (ii) human retina. Scale bar: 50µm for retinal sections. S-OPSIN (B) and L/M-OPSIN (C) positive are not detected in the periphery (i) and only in the central retinal regions (ii). Scale bar: 100µm for wholemount retina. RPE; retinal pigment epithelium, NBL; neuroblastic cell.

79
By 19pcw of development, S-OPSIN, L/M-OPSIN, RXRγ, GNAT2 and ONECUT1 were
detected at the protein level (Figure 3.7 and 3.8). As previously described in Figure 3.1,
there were clear difference in retinal stratification between the central and peripheral
retina and immunostaining of the cone markers revealed striking differences in cone cell
morphology between these two regions, with a higher density of cells with a mature cell
appearance being labelled by cone markers in the central stratified retina. Interestingly,
immunostaining for the cone opsins revealed a lack of L/M-OPSIN positive cells in
periphery retina (Figure 3.7.Ai), however within the same region, S-OPSIN labelled cells
could be detected along the apical edge of the developing neuroblastic layer (Figure
3.7.Bi). Both L/M-OPSIN cells and S-OPSIN expressing cells showed very distinctive
morphologies within the central retina; the L/M-OPSIN cells are tightly compact
together and display a unique goblet shaped appearance spanning the height of the ONL
(Figure 3.7.Aii). On the other hand, a lower density and more even distribution of S-
OPSIN labelled cells are present in the central retina, which have an elongated cell
morphology (Figure 3.7.Bii), contrasting the small round appearance of S-OPSIN cells
found within the peripheral retina (Figure 3.7.Bi). RXRγ expression was only observed in
the nuclei of cells of the central retina aligned along the top row of the ONL (Figure
3.8.Aii; white arrows) and appeared to be absent in the peripheral retina (Figure 3.8.Ai).
Common to both cone opsin expressing cells in the central retina is the small developing
processes protruding above the apical surface of the ONL (Figure 3.7.Aii and Bii), which
show a similar expression pattern to the GNAT2 staining in this same region, (Figure
3.8.Bii), suggesting the presence of developing outer segments. Protein expression of
ONECUT1 at this later foetal stage in the peripheral retina labelled a cell population
located within the INL surrounding the region of the neuroblastic layer where the
prospective outer plexiform layer will form (Figure 3.8.Ci). Within the central retina,
ONECUT1 is exclusively expressed in the cells restricted to the top row of cells located
within the inner nuclear layer, which is the known location of horizontal cells (Figure
3.8.Cii) (Wu et al., 2013).

80
Figure 3.7. Protein expression of cone opsin in the 19pcw human foetal retina. Both cone opsin proteins, L/M-OPSIN (Ai-ii) and S-OPSIN (Bi-ii) could be detected by 19pcw of development. L/M-OPSIN expression could only be detected within the central retinal region (Aii) whereas S-OPSIN expression was detected in both the peripheral (Bi) and central retina (Bii). RPE; retinal pigment epithelium, NBL; neuroblastic layer, ONL; outer nuclear layer, OPL; outer plexiform layer, INL; inner nuclear layer, IPL; inner plexiform layer, GCL; ganglion cell layer. Scale bar: 50µm. Insets provide higher magnification images of antibody staining.

81
Figure 3.8. Protein expression of cone photoreceptor markers in the 19pcw human foetal retina. Cone photoreceptor markers, RXRγ (Ai-ii), GNAT2 (Bi-ii) and ONECUT1 (Ci-ii) could only be detected with the 19pcw foetal retina. ONECUT1 was the only marker to be detected with the peripheral (Ci) and central retina (Cii). Scale bar: 50µm. Insets provide higher magnification images of antibody staining.
82
Immunohistological analysis of cone photoreceptor markers in the adult human retina
revealed low RXRγ antibody signal within the outer segment layer of the photoreceptors
(Figure 3.9.Ai), whereas ONECUT1 antibody labelled cells aligned on top of the inner
nuclear layer which is the known location of horizontal cells (Figure 3.9.Aii). Positive
controls were performed within the same experiment using 19pcw human retinal
sections, which showed a nuclear expression of RXRγ within the ONL similar to Figure
3.8, suggesting the antibody signal within the photoreceptor segment layer in the
human adult retina is non-specific. RECOVERIN and CRX antibody signal was intensely
observed within the photoreceptor layers of the adult retina (Figure 3.9.Bi), with CRX
localised to the cell nuclei and RECOVERIN signal labelled the photoreceptor cell bodies
(in ONL), synapses (in OPL) and inner and outer segments; some cells within the INL
were also positive for RECOVERIN expression (Figure 3.9.Bi). Within these photoreceptor
layers, mature cone markers L/M-OPSIN (Figure 3.9.Bii), S-OPSIN (Figure 3.9.Biii) and
GNAT2 (Figure 3.9.Biv) labelled a subset of the photoreceptor population. Labelling of
the cone cell bodies, synapses and intense signal with the outer segments were
observed for the L/M-OPSIN (Figure 3.9.Bii) and S-OPSIN antibodies (Figure 3.9.Biii),
while strong GNAT2 signal was detected only within the photoreceptor outer segment
layer (Figure 3.9.Biv).

83
Figure 3.9. Protein expression of early and late cone markers in the adult human retina. (A) Top panel shows the expression of early cone photoreceptor markers RXRγ (i) and ONECUT1 (ii) and bottom panel (B) shows the protein expression of photoreceptor marker (i), RECOVRIN (red) and CRX (green), and late cone photoreceptor markers, L/M-OPSIN (ii), S-OPSIN (iii) and GNAT2 (iv). OS; outer segments, IS; inner segments, ONL; outer nuclear layer, OPL; outer plexiform layer, INL; inner nuclear layer, IPL; inner plexiform layer, GCL; ganglion cell layer. Scale bar: 50µm.

84
3.3. Summary of findings • A central to peripheral gradient of maturation occurs across the developing
human retina, which affects retinal lamination, cell proliferation and cone
photoreceptor cell morphology.
• mRNA and protein expression of pan-photoreceptor markers, CRX and
RECOVERIN, were present in all human foetal (9pcw-20pcw) and adult retinal
samples.
• For cone photoreceptor markers analysed, mRNA was detected in all human
foetal and adult samples. OPN1LW/MW mRNA showed the highest fold
upregulation relative to expression at 9pcw of development.
• S-OPSIN was the first cone marker to be identified via immunofluorescence
staining in the 13pcw human retina, later followed by L/M-OPSIN expression at
17pcw of development.
• Mature markers, S-OPSIN, L/M-OPSIN, and GNAT2 showed specific
immunofluorescence signal within cone cells in the foetal and adult human
retina. Signal from early markers of cones analysed, RXRγ and ONECUT1 were
not detected or were not specific to cones in the adult human retina.
3.4. Discussion
3.4.1. Expression trends of cone photoreceptor genes within the human retina
A dual approach of RT qPCR and immunofluorescence analyses was performed in order
to profile the onset and expression pattern of known and novel markers of cones within
human foetal retinal samples at different developmental timepoints and in the adult
retina. The gene expression analysis showed pan-photoreceptor genes, CRX and
RECOVRIN, in addition to all the cone photoreceptor markers studied were expressed in
the human retina at 9pcw. These data are consistent with previous reports which
describe early expression of CRX gene expression within the Fwk 10 (O'Brien et al., 2003)
and 10.5pcw (Fwk 12.5) (Bibb et al., 2001, Glubrecht et al., 2009) foetal retina, and early
expression of OPN1SW mRNA at Fwk 10.9 via in situ hybridisation (Xiao and
Hendrickson, 2000). However, the observed gene expression of all other markers
analysed (RCVRN, RXRγ, THRβ2, ONECUT1, SALL3, OPN1LW/MW, GNAT2 and ARR3) at
9pcw of development is a novel finding. O’Brien et al., 2003 were not able to detect the

85
cone opsin transcripts using RT-qPCR any earlier than Fwk 16 in the developing human
retina and previous reports into the OPN1LW/MW transcript via in situ hybridisation
only report expression at Fw16.7 of development (Xiao and Hendrickson et al., 2000).
Expression of other markers analysed in this thesis had not been studied at this earlier
timepoint of development previously. Hence, these data reveal expression of cone
photoreceptor regulatory genes, SALL3 and ONECUT1, are expressed early in the human
developing retina alongside the pan-photoreceptor markers, CRX and RECOVRIN. As
expected, OPN1SW, OPN1LW/MW, GNAT2 and ARR3 showed an upregulation from
early to late development and into the adult retina as the cone photoreceptors mature.
This upregulation was substantial with older human samples, particularly for the L/M-
opsin genes (OPN1LW/MW) when compared to expression at 9pcw, which contrasts to
cone transducin (GNAT2) expression which remained more constant from an early stage
of development. Different expression trends were observed the earlier cone genes;
ONECUT1 expression remained constant throughout all human retinal samples, whereas
higher gene expression of RXRγ was observed in the later foetal samples (14pcw and
20pcw) compared to THRβ2 and SALL3, which showed higher levels at earlier foetal
stages, 10pcw and 12pcw. This draws some similarities with the current literature, which
suggests RXRγ is transiently downregulated earlier in development at the onset of S-
opsin expression (Fwk 11), which allows the S-cones to form (Roberts et al., 2005). The
observation of SALL3 showing a similar gene expression trend to THRβ2 is a surprising
finding, as SALL3 has a previously defined role in activating the OPN1SW gene (de Melo
et al., 2011) where as THRβ2 inhibits the S-opsin cone cell fate pathway to promote M-
opsin cone specification (Ng et al., 2001). Due to limited availability of human foetal
tissue, the data shown is from one sample per timepoint, therefore a greater number of
foetal retinal samples for each timepoint studied would be required to increase the
confidence in these findings. The further investigation of additional cone regulatory
genes, such as retinoic acid receptor-related orphan receptor α (RORα) (Fujieda et al.,
2009) and protein inhibitor of activated Stat 3 (Pias3) (Onishi et al., 2010, Campla et al.,
2017) in the human developing retina would also aid validation of cone gene expression
trends observed within this thesis. Hendrickson et al., 2008 previously defined 2 phases
of rod differentiation via immunohistochemistry, with the first detection of early rod-
specific markers, NRL and NR2E3, within the Fwk 11 retina at the edge of the
prospective fovea, suggesting rods are also being born at this early stage of retinal

86
development. Birth-dating studies using tritiated thymidine in the macaque monkey
retina (La Vail et al., 1991), which also features a central-peripheral gradient of maturity,
suggests rods are shortly born after cones, just 10 days apart. Together with the data of
this thesis, this suggests human rod and cone photoreceptor cell genesis has already
commenced between 8-11pcw of development.
3.4.2. Protein expression profiling of cone markers within the human retina
Although RT qPCR analysis is useful to determine the onset of cone gene expression,
critical information about the spatial distribution across the retina is lost, which was
highlighted by the O’Brien et al., 2003 study which used immunohistochemistry to
accurately pinpoint the spatial onset of marker expression. The data of this thesis were
able to validate previous reports demonstrating the maturation gradient across the
developing human retina which commences within the central region. Although regional
differences in retinal stratification were not observed until 19pcw of development,
which contradicts data showing central retinal lamination from Fwk 10.9 (O’Brien et al.,
2003), differences were apparent between these two regions when performing
wholemount immunostaining for pan-photoreceptor and cone photoreceptor markers
in earlier human specimens. Assessment of photoreceptor markers RECOVERIN and CRX,
via wholemount immunostaining revealed a higher density and intense labelling cells
within the central retina at an early stage of development of 9pcw, suggesting these
photoreceptors are more mature and were born earlier compared to cells in the
periphery. This is consistent with previous studies reporting the early appearance of the
pan photoreceptor proteins in the human retina (O'Brien et al., 2003, Glubrecht et al.,
2009, Bibb et al., 2001), however both have been previously described to label a
subpopulation of other retinal cell types; RCVRN mRNA has been detected within human
cone bipolar cells (Wiechmann and Hammarback, 1993) and a small population of
retinal ganglion cells (Yan and Wiechmann, 1997), whereas CRX is thought to be
expressed in cells of the RPEs and within the lower region of the outer neuroblastic layer
during development, suggested to be bipolar cells (Glubrecht et al., 2009). Therefore,
these markers should be used together for analysis of photoreceptor cells, which should
co-express CRX and RECOVERIN. Interestingly, ONECUT1 was the only cone-associated
marker to be detected at the protein level within the early stages of human foetal retina
analysed, along with RECOVERIN and CRX. Antibody staining for ONECUT1 showed
widespread expression throughout the neuroblastic layer, suggesting it could be

87
labelling a progenitor cell population. Additional double labelling immunostainings,
using CRX or OTX2 and ONECUT1 antibody combinations, would be required to validate
this hypothesis.
Using wholemount immunostaining for the cone opsins, it was clear that positive cells
were only present in the central retina at 13pcw for S-OPSIN and 17pcw for L/M-OPSIN.
Due to limited antibody species options, it was not possible to detect the presence of
S/L/M-opsin cone population, which has been reported before within the developing
and adult human retina (Cornish et al., 2004). Compared to the RECOVRIN and CRX
signal, the cone opsin antibodies labelled a subpopulation of these cells and therefore
appeared to be specific to cone photoreceptors. These data are consistent with previous
studies demonstrating the detection of cone opsin transcript before protein
presentation, in addition to S-OPSIN expression preceding L/M-OPSIN expression (Xiao
and Hendrickson, 2000, O'Brien et al., 2003). However the protein detection data within
this thesis is delayed compared to other data sets which described S-OPSIN positive cells
from Fwk 10.9 and L/M-OPSIN expressing cells between Fwk 14-15. Cone opsin protein
expression at these earlier time points could not be detected and differences between
central and peripheral retina in frozen retinal sections could not be observed until a
much later timepoint of 19pcw. There have been reports of delayed translation of opsin
protein, even though mRNA expression can be detected at earlier stages, which could
explain this absence of protein detection at earlier developmental stages (O’Brien et al.,
2003). It is also possible that central retinal region containing cells positive cone opsins
cells were missed due to technical problems during tissue collection; the central mature
retinal region is very small at earlier foetal stages, therefore it is possible the correct
sections were not chosen for immunofluorescence analysis or the sections could have
been lost through the cryosectioning procedure. Approaches taken to avoid these issues
within previous studies have been to perform a serial histological staining with azure
II/methylene blue staining in order to distinguish sections with the central to peripheral
stratification differences (O'Brien et al., 2003, Hendrickson et al., 2008), which a relevant
optimisation step for this thesis data. Within the current data set, another approach to
overcome this problem could be to search peripheral regions of the 19pcw timepoint for
protein expression, which appeared similar to the central retinal region of foetal retina
at an earlier timepoint of development. For example, the cell morphology of S-opsin

88
cones at 13pcw in the central region from the wholemount staining look comparable to
S-opsin cones of the 19pcw peripheral retina.
The cell morphology of the S-OPSIN and L/M-OPSIN, particularly with the central retinal
region of the 19pcw human foetal retina, detected through immunofluorescence
staining is consistent with data from previous studies (Xiao and Hendrickson et al., 2000;
Cornish et al., 2004). Within this thesis, GNAT2 antibody detection can be observed at
this 19pcw timepoint in development along the apical surface of the ONL and within the
adult human retina, where signal is intensely observed within the photoreceptor outer
segment layer. This suggests by 19pcw, cone photoreceptor outer segment formation
has already commenced, therefore further exploration of cone cell maturity at this
development stage to detect other G proteins and components crucial for the light
sensitive properties and phototransduction signalling cascade would be highly
interesting. Recent studies (Hendrickson et al., 2008, Hendrickson and Zhang, 2017)
have reported the expression of pre-synaptic and post-synaptic markers, such as
synaptophysin, synaptic vesicle 2, postsynaptic density protein 95 and vesicular
glutamate transporter 1, in addition to cone transducin (GNAT2) and interphotoreceptor
retinoid binding protein (IRBP) which appear between Fwk 8 and Fwk 13. This suggests
cones begin to express synaptic ribbons, vesicular and transduction protein earlier and
independently of cone opsin expression, which is a phenomenon unique to cones as rod
express synaptic markers 2-4 weeks after the onset of rhodopsin expression
(Hendrickson et al., 2008). The delayed expression of metabotropic glutamate receptor
6 and voltage-gated calcium channel α1.4, which was not observed until Fwk 22 of
development, however suggests cones are not functional at this stage (Hendrickson and
Zhang, 2017).
It was unexpected to find that the established early cone marker, RXRγ, was not
detected at the protein in the peripheral retina at 19pcw and showed expression only
within the ONL of the central retina. Even with previous reports describing RXRγ protein
expression at Fwk 16 in the human foetal retina, this contrasts to the very early
detection of this marker within the mouse retina, around embryonic day 14.5 at the
initial stages of cone genesis (Roberts et al., 2005). Further exploration of this regulatory
cone gene, in addition to THRβ2 gene is required within the human retina in order to

89
compare expression profiles to those previously defined within vertebrate model
organisms.
In this chapter, the onset and expression profile of cone photoreceptor markers have
been explored in the human foetal and adult retina, which can be used to study cone
photoreceptor development during retinal differentiation of hPSCs. Although protein
expression of all markers selected could not be studied due to technical problems, S-
OPSIN and L/M-OPSIN were confirmed as definitive markers of different cone types,
with additional markers, GNAT2 and RXRγ showing cone specific labelling at later stages
of human foetal development. Based on this data and the current literature, the next
aim was to generate cone-specific reporter constructs and test their expression within
human foetal retinal explants in order to label and isolate human cone photoreceptors
for transcriptome analysis and cell surface marker profiling.

90
4. Using fluorescent reporter constructs to label and isolate human foetal cones for transcriptome profiling
4.1. Introduction Defining the transcriptome of human developing cone photoreceptors is a critical, but
understudied, area of research mainly due to the limited availability of human foetal
samples. The ability to label, isolate and determine the gene expression profiles of
human cones would give the exciting possibility to characterise novel cone genes,
allowing for future exploration of unanswered questions regarding human cone cell
specification and development. These include identifying the highly expressed genes
within a developing human cone population, determining whether these genes change
throughout foetal development and if the cone transcriptome expresses molecular
markers reported to be characteristic of other retinal cells, such as rod photoreceptors.
Currently, efforts to analyse the cone cell transcriptome has mainly involved the use of
transgenic lower vertebrate models and hESC-derived photoreceptor cell lines, which
are genetically modified to express fluorescent reporter genes driven by a chosen gene
promoter in order to guide specific expression in the cells of interest. Siegert et al., 2009
conducted a comprehensive characterisation of bacterial artificial chromosome (BAC)
transgenic mouse lines generated from the Gene Expression Nervous System Atlas
(GENSAT) and later in 2012, performed transcriptome analysis to reveal the unique
genetic ‘barcode’ for each labelled retinal cell type, including rod and cone
photoreceptors (Siegert et al., 2009, Siegert et al., 2012). This mouse cell type specific
RNA seq data contrasts to the human retina where only total retinal transcriptomic
analysis has been performed. Microarray (Hornan et al., 2007, Cai et al., 2012, Bowes
Rickman et al., 2006, Sharon et al., 2002) and RNA seq (Whitmore et al., 2014, Li et al.,
2014) data showing the gene expression profile of the adult human macula region,
which is enriched in cone photoreceptor cells, has been generated and used in
differential gene expression analyses to compare between human periphery (temporal)
and central (nasal) retinal regions, in addition to differences between young (age 13-14)
and old (age 62-72) retina (Yoshida et al., 2002). These data, however, are restricted to
the mature adult retina and include all retinal cell types, rather than cone

91
photoreceptors only. Lamba et al., 2011 conducted a comparative microarray-based
analysis with hESC-derived and human foetal retinal cells, which demonstrated
similarities in their gene expression profiles and provided an approach of assessing the
efficiency of generating retinal tissue from stem cell cultures. In particular, a gene
cluster consisting of early markers of photoreceptor cells showed similar expression
onset in both the stem cell-derived and human foetal tissue (Lamba and Reh, 2011),
however the direct comparative analysis of isolated photoreceptor cells at equivalent
developmental stages was not performed. Recently, transcriptome profiling of a hESC-
derived Crx.GFP+ photoreceptors cell population demonstrated temporal changes in
gene signature during culture which recapitulated the gene expression changes
occurring during human retinogenesis (Kaewkhaw et al., 2015). These studies will be
discussed further at the end of this chapter in the context of these thesis findings.
Overall, equivalent data for a human foetal photoreceptor population is absent and
therefore data can only extrapolate from these in vitro hPSC-derived data sets.
Advancing transcriptomic technologies, including single cell RNA sequencing, can
provide a powerful insight into the heterogeneity of rare cell populations (Kolodziejczyk
et al., 2015). This novel approach would be highly applicable to human cone
photoreceptors, which represents a sparse population of the retina, and would allow for
a greater depth of transcriptome analysis.
One possible method of labelling and isolating a human developing cone population is to
generate an ex vivo culture system to allow for the transduction of cone photoreceptors
with a reporter construct. This approach required i) a method of culture that maintains
the viability and integrity of human retinal tissue; ii) an efficient transfection method
able to target human cone; iii) a reporter system able to label cones specifically.
Different approaches to culture mammalian retinal cells have been described, including
cell dissociation (MacDonald et al., 1991), plating retinal explants on filter
membranes/cell inserts (Fernandez-Bueno et al., 2012, Baba et al., 2012), co-culturing
with RPE (Yanai et al., 2015) or a free floating explant culture system (Lamba et al.,
2010). Most relevant to this study is the culturing method of human foetal retina aged
between 82-96 days as free floating explants (Lamba et al., 2010), which demonstrated a
maintenance of retinal integrity for up to 5 days of culture and lentiviral transduction of
photoreceptors. Retinal tissue viability was not specifically assessed by Lamba et al.,
2010, so further analysis would be required for this culture method.

92
Transduction of mammalian retinal tissue with fluorescent reporter constructs has been
demonstrated previously, including methods such as electroporation (Matsuda and
Cepko, 2008) and virally-assisted delivery (Pang et al., 2008). The introduction of
reporter constructs into developing mouse and chicken retinal explants using ex vivo or
in vivo electroporation methods has been developed by the Connie Cepko group and
others (Montana et al., 2011) who use this technique to elucidate the molecular markers
underpinning retinal cell determination and lineage (Matsuda and Cepko, 2004,
Emerson et al., 2013). In relation to cone photoreceptor genesis, Emerson et al., 2013
electroporated a thyroid hormone receptor beta (Thrβ) GFP reporter carrying novel cis
regulatory modules into the chicken retina, which showed specific expression to a
progenitor cell population biased towards generating cone and horizontal cells. This
gave an effective way of studying cone photoreceptor development and specification in
animal models, however translation into the human retina still remains to be explored.
Gene therapies developed for the treatment of retinal dystrophies have advanced the
technology of transduction methods of vectors into the mammalian retina, particularly
adeno-associated viral systems (Buch et al., 2008). Many different serotypes of AAV
have been assessed within the retina for efficiency to target the cell of interest; for
targeting cone photoreceptors AAV2/8 and AAV2/9 were previously shown to transduce
the highest number of cones (75% for both) in the mouse retina compared to other
serotypes tested (Allocca et al., 2007). Towards developing therapies for cone
dystrophies, a number of cone-associated promoters have been previously
characterised and tested in vivo in order to assess promoter specificity and efficiency in
the mammalian retina, including ARR3 (Li et al., 2002), IRBPe/GNAT2 (Dyka et al., 2014)
and OPN1SW (Glushakova et al., 2006, Chen et al., 1994). Depending on the serotype of
the AAV, length of gene promoter sequence and the mammalian species being tested,
these promoters vary in their specificity to cone photoreceptors. For example, Carvalho
et al., 2011 used a 5’ flanking region of the human cone arrestin (ARR3) promoter
sequence to drive the expression of the human CNGB3 gene in a mouse model of
achromatopsia, which showed specific expression in S-opsin and M-opsin cone using a
AAV2/8 virus (Carvalho et al., 2011). Within Dyka et al., 2015, they report some leaky
expression in rod photoreceptors when using the IRBPe/GNAT2 or synGNAT2/GNAT2
GFP reporters when delivered using a recombinant AAV serotype into the mouse retina.
Additionally, varying lengths of the human S-opsin (OPN1SW) gene promoter have been
93
tested in mammalian models, with shorter promoter fragments giving apparent off
target labelling to cone bipolar cells (Chen et al., 1994, Chiu and Nathans, 1994), rod
photoreceptors and L/M-opsin cones in the rat retina (Glushakova et al., 2006) and
retinal pigment epithelium in the canine retina (Komaromy et al., 2008). The use of a
longer promoter region of the S-opsin gene promoter (6.4kb) showed greater specificity
to S-opsin cones, suggesting this larger region contains a greater number of regulatory
elements required for S-cone specificity (Chiu and Nathans, 1994).
One of the most characterised cone-specific promoters tested for gene therapy
applications in a wide range of different mammalian retina, is the L/M-OPSIN pR2.1
sequence (Nathans et al., 1989, Wang et al., 1992). The pR2.1 sequence consists of a
0.5kb promoter region directly upstream of the L-opsin gene fused to a 1.6kb sequence,
which has a high homology between different species (Wang et al., 1992) and contains
an important enhancer region known as locus control region (LCR). The LCR is a 37bp
sequence which was identified in patients with blue cone monochromacy and has been
shown to be a critical in driving the specific expression of both opsin genes (Nathan et al
1989; Figure 4.1).
Larger L/M-opsin promoter sequences of 6.5kb and 6.8kb were shown to label all cone
cell types (both S and M cones), but not all cone cells in transgenic mouse retina (Wang
et al., 1992, Fei and Hughes, 2001, Fei, 2003) , whereas the shorter 2.1kb promoter has
been described to target M-opsin when injected subretinally into the mouse retina
(Alexander et al., 2007). Others have additionally shown specific GFP expression driven
by the 2.1kb promoter to L/M-opsin cones in the canine retina (Komaromy et al., 2008,
Komaromy et al., 2010) and in the rat retina (Li et al., 2008), in addition to brighter GFP
expression (Komaromy et al., 2008) and a more robust rescue of cone function in canine
disease models (Komaromy et al., 2010), compared to modified promoters containing
multiple copies of the LCR. Intriguingly, Mancuso et al., 2007 demonstrated in the
primate retina that the 2.1kb GFP reporter robustly targets cone photoreceptors via
rAAV delivery (Mancuso et al., 2009) and in nonhuman primates it is thought to
primarily target L/M-opsin cones, with some expression in S-cones (Ye et al., 2016).

94
Figure 4.1. Important cis-regulatory regions 5’ upstream of human L-opsin and M-opsin genes. (A) The L-opsin gene is located upstream of the single or multiple M-opsin gene(s) on the q arm band 28 of the X-chromosome in a ‘head-to-tail’ tandem array arrangement. The 0.5kb region directly 5’ upstream of the L-opsin ATG start codon (light green bar; 0 to -496bp) and the 1.6kb region (pink bar) found -3009 to -4564bp upstream of the L-opsin ATG start codon are important sequences required for cone-specific expression of the opsin genes (Wang et al., 1992). The 1.6kb region contains a very highly conserved 0.6kb sequence (blue bar) across human, bovine and murine species and an identical 37pb sequence, known as the locus control region (LCR; orange bar; Nathans et al 1989; Wang et al., 1992). (B) Wang et al 1992 fused together the 0.5kb and 1.6kb regions 5’ upstream of the human L-opsin and M-opsin genes for form a 2.1kb sequence, which was cloned into β-galactosidase (lacZ) reporter vector to drive specific β gal expression within mouse cone photoreceptors. In this thesis and other studies, the 2.1kb region has been cloned into GFP reporter vector (e.g. pD10-eGFP for AAV production in this study) to drive GFP expression in cone photoreceptors.
These AAV constructs could be exploited in order to label cones in human foetal tissue
and further profile and characterise these cells. However an efficient system of culturing
human foetal retinal tissue needs to be developed and validated. Therefore, the aims of
this chapter are to i) establish a viable method of culturing human retinal explants, ii)
generate reporter constructs driven by established human cone gene promoters and
test these by introducing them into the human foetal retina in order to assess their
efficiency and specificity; iii) isolate cones using the tested reporter constructs and
perform RNA seq, which will allow an insight into the human cone photoreceptor
transcriptome.

95
4.2. Results
4.2.1. Establishing human retinal explant culture systems for reporter delivery
For this study, a porous filter membrane system on top of which whole retina or small
retinal explant pieces are placed and a free-floating method where the retina is
completely submerge within the culture media was used (see Methods Section 2.7).
These different culture methods were assessed for their ability to maintain cell viability
and integrity of the human retina for at least a 7 day period, as this is the estimated time
frame which would allow for GFP expression of a reporter construct post-delivery
(Lamba et al., 2013).
Brightfield imaging of intact human foetal neural retina aged 9pcw cultured using the
filter membrane method from Day 0 to Day 11, showed the maintenance of gross tissue
morphology at all stages of culture (Figure 4.2.A). On day 12, retinal explants were
dissociated, stained with DAPI and analysed via flow cytometry, which revealed live cell
percentage of approx. 98% for both samples (Figure 4.2.B). An additional human retinal
explant cultured for 7 days using this same method was fixed for sectioning and staining
with photoreceptor markers. This revealed a preservation of retinal lamination and
photoreceptor marker expression, S-OPSIN (Figure 4.2.C), RECOVERIN (Figure 4.2.D), and
CRX (Figure 4.2.E) post culture. A low magnification image of this sample showed
however that while some areas maintained good stratification (Figure 4.2.E; white
arrows), other regions of the retina formed rosette structures with disorganisation of
retinal layers (Figure 4.2.E; yellow arrows). A similar analysis was conducted for human
retinal explants cultured in free floating conditions for 7 days (Figure 4.3). Similarly,
brightfield images to assess gross morphology of 13pcw retinal explants showed
maintenance of laminated structure at Day 3 and Day 5 of culture (Figure 4.3.A).
However flow cytometry analysis of DAPI staining of the dissociated explants on Day 7
revealed a slightly lower live cell percentage of 80.8% and 84.1% for both explants
compared with the filter membrane method (Figure 4.3.B). Retinal sections from a
12pcw retinal explant cultured in the same free floating conditions showed a
preservation of retinal lamination, which included the distinction between outer
neuroblastic layer (ONBL), inner neuroblastic layer (INBL) and ganglion cell layer (GCL;
Figure 4.3.C-E) and expression of cone photoreceptors markers, S-OPSIN (Figure 4.3.C),
L/M-OPSIN (Figure 4.3.D) and RXRγ (Figure 4.3.E).

96
Figure 4.2. Culturing human retinal explants on filter membranes. (A) Gross morphology of human foetal retinal explants cultured on filter membranes at Day 0, Day 5 and Day 11 of culture. Scale bar 1mm. (B) Assessment of cell viability via DAPI staining and flow cytometry shows filter membrane cultured explant samples contain over 98% of live cells. A 17pcw retinal explant cultured on filter membranes show a maintenance of retinal integrity, lamination (C and D) and photoreceptor marker expression, S-OPSIN (C), RECOVERIN (D) and CRX (E). Although some areas show preservation of retinal layers (E; white arrows), other regions showed rosette formation (E; yellow arrows). Scale bar 50µm.

97
Figure 4.3. Culturing human retinal explants in free floating conditions. (A) Gross morphology of human foetal retinal explants cultured in free floating conditions at Day 3 and Day 5 of culture. Scale bar 1mm. (B) Assessment of cell viability via DAPI staining and flow cytometry shows both cultured retinal explants have a live cell percentage of 80.8% and 84.1% respectively. Retinal tissue sections of 12pcw retina cultured in free floating conditions shows maintenance of retinal layer (C-E) and cone photoreceptor marker expression, S-OPSIN (C), L/M-OPSIN (D), RXRγ (E). Scale bar 50µm.

98
4.2.2. Transduction of fluorescent reporters into the human developing retina.
Having validated the different methods to culture human retinal explants,
electroporation and viral transduction methods were tested in order to deliver
fluorescent reporters into the human retina. Ubiquitous GFP reporters driven by chicken
beta actin promoter with cytomegalovirus enhancer (CAG) or cytomegalovirus (CMV)
gene promoter (Addgene vectors, see Methods Section 2.8), were transduced into
human retinal explants via electroporation or AAV-mediated delivery before being
analysed i) via flow cytometry to assess the method efficiency and ii) via cryosectioning
to establish which retinal cell type was preferentially being targeted for either method.
For the electroporation approach, human foetal neural retinae were dissected into small
piece (2-3mm) and placed into the electroporation chamber containing the CAG.GFP
reporter maxiprep with the photoreceptor orientated facing the negative electrode, as
described in Methods Section 2.9. Post electroporation, explants were cultured using
the filter membrane method. The appearance of GFP+ cells could first be detected from
approx. 17 hours post electroporation of 17pcw human retinal explants (Figure 4.4.A)
and was maintained throughout the culture period (7 days). Dissociation of one explant
for flow cytometry revealed approximately 16% of retinal cells were electroporated with
the CAG.GFP reporter (Figure 4.4.B). This transduction method and ubiquitous reporter
primarily targeted cells of the inner retinal layer as shown by immunohistochemistry of
one of the electroporated explants; the majority of GFP+ cells were located in the same
cell layer location as CHX10 expression, which labels developing bipolar cells in the inner
nuclear layer (Figure 4.4.C), while only a few GFP+ cells are detected within the outer
nuclear layer where the photoreceptor marker, RECOVERIN, can be detected (Figure
4.4.D).
For the AAV2/9.CMV:GFP reporter delivery, human neural retinal explants (13pcw and
11pcw) were kept intact and submerged in retinal differentiation media before the
direct addition of the virus at a multiplicity of infection (M.O.I) of 40,000 (full details are
given in Methods Section 2.11). A pseudotype capsid of AAV2/9 was used, as this has
been previously demonstrated to readily transduce cone photoreceptors (Allocca et al.,
2007). GFP signal from the AAV2/9.CMV.GFP reporter could not be detected until 24
hours post transduction, with the strongest expression observed within the very
peripheral retina regions located anteriorly (Figure 4.4.E; 13pcw). A similar percentage

99
(18%) of GFP+ cells was achieved for the AAV2/9.CMV.GFP virus detected by flow
cytometry analysis (Figure 4.4.F; 13pcw retina) when compared to the electroporation
technique. An 11pcw human neural retina was transduced with the AAV reporter using
the same procedure as previously described for immunohistochemical analysis, in order
to determine the location of the CMV.GFP+ cells. However due to technical problems
with the sample fixation and cryosectioning, this analysis could not be performed.
Watanabe et al., 2013 report similar experiments in the mouse by subretinally injecting
AAV2/9.CAG.mCherry construct into the eye, which revealed intense expression of
mCherry throughout the retina; signal was prominently observed within in
photoreceptor cells, horizontal cells and RPE, with less signal detected within bipolar
and Müller glial cells (Watanabe et al., 2013).
4.2.3. Generating and validating cone-specific fluorescent reporters in the
human foetal retina
Although, the percentage of retinal cells labelled using the ubiquitous promoters was
less than 20%, these data suggest that fluorescent reporter constructs can be
successfully introduced into the human foetal retina via electroporation and by adeno-
associated viral delivery. The next step was to generate fluorescent reporters that can
specifically target human cone photoreceptor cells. Based on the analysis of cone gene
expression and immunostaining in Chapter 3 of this thesis and other current literature
detailing the important regulatory genes involved in cone photoreceptor development,
the following cone gene promoters were selected for cloning into fluorescent reporters:
• Thyroid hormone receptor beta 2 (THRβ2): critical regulatory regions of the
chicken THRβ2 gene (cis-regulatory modules 1 and 2 and intron control region)
have been well characterised and these show conservation upon comparing the
same region in the human genome (Emerson et al., 2013). THRβ2 is also a well-
defined transcription factor involved in cone photoreceptor development and is
expressed by early cone photoreceptors in the mouse retina (Ng et al., 2001).
• Retinoid-x-receptor gamma (RXRG): well-defined gene expression profile within
cone photoreceptors in the mouse embryonic retina (Roberts et al., 2005).
• S-opsin (OPN1SW): light sensitive GPCR of S-cones. Well characterised gene
promoter regions which gives greater labelling specificity to S-cones when using
a large promoter sequence fragment (Chiu and Nathans, 1994).

100
Figure 4.4. Transduction of human foetal retinal with ubiquitous fluorescent reporter constructs. (A) 17pcw retinal explant electroporated with CAG.GFP ubiquitous reporter construct on day 7 of culture. (B) Flow cytometry with dissociated explant reveals 16% of cells from the total retinal explant are CAG.GFP+. Immunohistochemistry of 17pcw electroporated retina explant with CAG.GFP shows most GFP+ cells are located within the inner layer nuclear (INL) in which CHX10+ cells can be observed (C), while only a minority of GFP+ cell are found within the outer nuclear layer (ONL) denoted by RECOVERIN staining (D). (E) 13pcw human retina transduced with AAV2/9.CMV.GFP reporter on day 7 of culture. (F) 18% of cells from the 13pcw culture human retina are labelled with the CMV.GFP reporter virus. FITC-A channel in flow traces was used to determine GFP+ signal.

101
• Cone transducin (GNAT2): promoter previously reported in gene therapy vector
testing (Dyka et al., 2014) . Labelling of mature cones, which would include both
S-opsin and L/M-opsin cones.
• L/M-opsin (OPN1LW/MW): light sensitive GPCR of the L-cones and M-cones. The
human pR2.1 promoter is well defined and has been previously used to target
L/M-opsin cones in several animal species (Wang et al., 1992).
All reporters generated, apart from the L/M-opsin construct, were tested via the
electroporation system, which provided a relative rapid and informative method to
assess if the selected gene promoter region activated GFP expression in cells of the
human foetal retina. The L/M-opsin pR2.1 promoter was previously obtained from the
Nathans’ group (Wang et al., 1992) and was cloned into the AAV vector by Robin Ali’s
group (Kamil Kruczek and Arifa Naeem) at the Institute of Ophthalmology. In
collaboration with this group, the vector was provided for testing in the human foetal
retina by inserting into the AAV2/9 pseudotype capsid rather than being transduced via
electroporation. In addition to testing cone fluorescent reporters, mouse CRX.DsRed and
mouse NRL.DsRed reporters were obtained from Addgene (see Methods Section 2.8.)
which would be used in co-electroporation experiments in order to assess the specificity
of the cone constructs generated.
4.2.3.1. Electroporation of cone reporters into the human foetal retina
Genome comparative tools, including the Vista Gateway alignment tool and the
Basewise conservation peaks by PhyloP available on UCSC genome browser, were used
to identify conserved regions 5’ upstream of the ATG start codon for each of the
selected cone genes, which are likely to be important regulatory elements important for
expression. Published literature of cone gene promoter regions previously characterised
or promoters that have been cloned into reporter vectors were also referred to when
designing the gene promoters to be used in this study. Full details of the promoter
regions selected, including the identification of conserved elements, and the cloning
strategy/diagnostic restriction digests of the promoters into fluorescent reporter vectors
can be found within Methods Section 2.10 and Appendix Figures 1 and 2. Briefly, the
following sequences upstream of the ATG site were selected for each cone gene: THRβ2,
2.4kb region; RXRγ, 2.4kb region; OPN1SW, 3.7kb region; GNAT2, 3kb region. These
fragments were amplified via PCR from human genomic DNA, before subcloning into a

102
pGEM T Easy vector in order to perform sticky end cloning into the fluorescent reporter
backbones, which contained either a green fluorescent protein (GFP) or DsRed reporter
element. These fluorescent reporters were obtained from Addgene (pEF.GFP and
Nrl.DsRed) and promoter regions were removed via restriction digestions and before
inserting the cone gene promoters. Cloning steps were validated via restriction
digestions and gel electrophoresis and Sanger sequencing, which was performed to
validate correct insertion of gene promoter into final fluorescent vector (data not
shown). The resulting constructs which were successfully generated included
THRβ2.GFP, RXRγ.DsRed and OPN1SW.GFP; although restriction digests validated the
generation of the GNAT2.GFP construct, the reporter failed to be successfully
sequenced.
Reporter plasmids were then electroporated into human foetal retinal explants (from
10-20pcw) and cultured on filter membranes for a 7 day period, during which explants
were checked every day for fluorescent signal. GFP+ cells could be readily detected for
all retinal explants electroporated with THRβ2.GFP reporter after 2-5 days of culture
(Figure 4.5.A; n=9). Similarly, GFP expression could be detected in OPN1SW.GFP
electroporated explants between 3-5 days of cultures (Figure 4.5.B; n=3). Crx.DsRed and
Nrl.DsRed were tested in order to distinguish photoreceptor cells and early rod
photoreceptor, respectively; both reporters produced signal 4-5 days after
electroporation (Figure 4.5.C and D; n=4 for each reporter). No fluorescent signal could
be detected upon electroporation of the RXRγ.DsRed construct into human retinal
explants at any stage of development, suggesting the promoter region specified in this
study does not drive RXRγ expression ex vivo (data not shown; n=4).
Human retinal explants electroporated with fluorescent reporter constructs were
sectioned and stained with cone and pan photoreceptor antibodies in order to
determine the specificity of labelled cells. Of note, due to the loss of retinal lamination,
orientation of GFP+ cells could not always be determined. Additionally, the curling of
explants during culture meant that the adjacent side of the explants appeared in some
images.

103
Figure 4.5. Electroporation of human foetal retina explants with fluorescent reporters driven by cone and pan photoreceptor gene promoters. Representative images of electroporations testing transduction of fluorescent reporters into human foetal retinal explants. THRβ2.GFP, OPN1SW.GFP, CRX.DsRED, NRL.DsRED signal was detect (Ai-Di) within retinal explants (Aii-Dii) ranging from 12pcw to 19pcw. Images of explants were capture on Day 3 of in vitro culture. Cryosectioning of explants revealed reporters are able to label cell populations within the human explants (Aiii-Diii). Scale bar: 50µm. ONBL; outer nuclear layer, INBL; inner nuclear layer, NBL; neuroblastic layer.

104
4.2.3.2. Investigating the OPN1SW fluorescent reporter construct
Specificity of the OPN1SW.GFP reporter construct in human foetal retinal explants was
assessed via immunostaining with the S-OPSIN antibody and the pan photoreceptor
marker, RECOVERIN (Figure 4.6.). No co-labelling of GFP signal from the OPN1SW
reporter (yellow arrows) with the S-OPSIN protein expression (white arrows) was
observed, even within regions of the explant where S-OPSIN could be detected (Figure
4.6.A). Additionally, the majority of GFP+ cells from OPN1SW reporter (yellow arrows)
did not co-label with Recoverin (white arrows; Figure 4.6.). Hence the ability of the
reporter to label human foetal S-cones could not be confirmed.
Figure 4.6. Characterisation of OPN1SW.GFP reporter within human foetal retinae. Representative confocal images of immunohistochemistry performed on OPN1SW.GFP labelled human foetal retina with the S-OPSIN (A) and RECOVERIN (B) antibody reveals mutually exclusive between the GFP+ cells (yellow arrows) and marker protein expression (white arrows). Scale bar: 50µm.
4.2.3.3. Investigating the THRβ2 fluorescent reporter construct
Attempts to optimise the Thrβ2 antibody failed and therefore it could not be
determined if the THβR2.GFP+ cells expressed the THRβ2 protein. Some of these GFP+
cells did show co-localisation with RXRy (Figure 4.7.A; white arrows), RECOVERIN (Figure
4.7.B; white arrow), Crx.DsRed (Figure 4.7.C; white arrow) and OTX2 (Figure 4.7.D; white
arrows) expression via immunohistochemistry analysis, suggesting labelling of a
photoreceptor precursor population, which may include early cone photoreceptors.
Intriguingly, some of the THRβ2.GFP+ cells also co-labelled with ONECUT1
immunostaining, which is the transcription factor involved in regulating early cone and
105
horizontal development (Figure 4.7.E; white arrows). Some of the THRβ2.GFP+ cells also
expressed the proliferation marker, KI67 (Figure 4.7.F; white arrows) indicating the
reporter is not restricted to post-mitotic cells. Further analysis showed that some GFP+
cells co-labelled with the early rod photoreceptor marker, Nrl, when co-electroporated
with the Nrl.DsRed reporter (Figure 4.7.G; white arrows), suggesting this reporter is not
only expressed in cone cells. Crx.DsRed and THRβ2.GFP co-electroporation resulted in
the double labelling of cells positive for both GFP and DsRed signal, yet mutually
exclusive labelling of cells could also be observed suggesting the THRβ2.GFP reporter
may also label non-photoreceptors cells (Figure 4.7.H; yellow arrows) or this observation
could be a result of the efficiency of the electroporation.
Due to this promoter fragment conferring an interesting pattern of expression which
may provide an insight into cone genesis, RNA seq was additionally performed on
THRβ2.GFP+ cells isolated from a 19pcw human retinal explant via FACS (Figure 4.7.I) to
further investigate the identity of these cells. RNA was amplified from isolated cells prior
to the generation of cDNA libraries and sequencing due to low concentration yields,
however all quality control checks were passed (see Appendix Figure 3). The top 50
highly expressed genes expressed within this population are represented in the heatmap
shown in Figure 4.7.I, which reveals the expression of one established cone
photoreceptor marker GNB3, in addition to 3 genes involved in early neural and eye
development, such as NEUOD1, NEUROD4, OTX2 and 1 gene that may be implicated in
retinal development, MIAT. A variety of other genes, including those associated with
transcription factor activity (SOX4 and SOX9) and proliferation/cell cycle progression
(MATLAB1, UBC, DDX5, CALM2) were also observed. Gene ontology of the top 100 genes
expressed in THRβ2.GFP+ cells revealed the enrichment of terms associated with
‘protein folding’ and ‘protein refolding’ (Figure 4.7.J). Overall, the
immunohistochemistry and RNA seq data suggests THRβ2.GFP+ cells are of a mixed
retinal cell population, potentially a mitotically active progenitor cell population, rather
than exclusively targeting cone photoreceptors.

106
Figure 4.7. Characterisation of THRβ2.GFP reporter within human foetal retinae. Representative confocal images of immunohistochemistry performed on THRβ2.GFP labelled human foetal retina with retinal cell and proliferation markers (A-H). Heatmap to present the top 50 highly expressed genes based on raw transcript reads in 19pcw THRβ2.GFP+ cell population (I). Bar chart to show the top 12 enriched gene ontology terms associated with the top 100 highly expressed genes in the 19pcw THRβ2.GFP+ sample (J). Scale bar: 50µm.

107
4.2.3.4. Using adeno-associated virus cone reporter to label human L/M-opsin
cones
As analysis of the THRβ2, RXRγ and OPN1SW fluorescent reporter constructs indicated
they did not show specific expression the human cone photoreceptor cells, the L/M-
opsin pR2.1:GFP reporter was next investigated (refer to Figure 4.1 for promoter
schematic). A number of previous studies have attempted to assess the specificity of this
promoter region to drive GFP expression within L/M-opsin cones of animal models using
an AAV system, which has shown some labelling variability between different species.
This study assessed for the first time the efficiency and ability of this construct to label
human L/M-opsin specifically within the human foetal retina, using an AAV2/9 capsid
that has previously shown preferential targeting of cone photoreceptors (Allocca et al.,
2007). The addition of the AAV2/9.pR2.1:GFP viral particles to cultures of human foetal
retinae, ranging from 10pcw to 20pcw, led to the expression of GFP in a cell population
which could be readily detected by fluorescence microscopy at a low magnification
between 3-4 days of culture (Figure 4.8.). GFP+ cells varied in signal intensity; the
majority of highly expressing cells were located within a discrete patch of the retina
(Figure 4.8; white arrows), which could be the prospective fovea, with lower expressing
GFP+ cells distributed around this region (Figure 4.8; black arrows).
Further investigation into the identity of GFP+ cells via cryosectioning and
immunostaining of AAV2/9.pR2.1.GFP transduced foetal retina at 12pcw (+7dic) and
14pcw (+7dic) of development revealed specific co-localisation of GFP expressing cells
with L/M-OPSIN antibody staining in both explants (Figure 4.9.Aiii and Biii; white
arrows), which are located within the developing outer neuroblastic layer (ONBL). A
minority of these cells did not show L/M-OPSIN, hence additional staining with other
photoreceptor markers was completed. All GFP+ cells co-labelled with the early cone
marker, RXRγ (Figure 4.9.Ciii; white arrows), however no expression of S-OPSIN (Figure
4.10.Aiii) nor early rod photoreceptor marker, NR2E3 (Figure 4.10.Biii; white arrows)
could be detected co-labelling with the GFP+ cells. These cells were also negative for
proliferation markers, KI67 (Figure 4.10.Ciii; white arrows), which suggests a post-mitotic
cell status.

108
Figure 4.8. AAV2/9.pR2.1:GFP reporter labels a cell population in human retinal explants. (A) GFP+ expressing cells were detected upon delivery of the AAV2/9.pR2.1:GFP virus to human foetal retinal explants at both early (12pcw+7dic) and later stages of development (19pcw+7dic). Cells with intense GFP expression could be detected within discrete retina regions (white arrows) closely surrounded by cells with a lower GFP+ expression (black arrow). Scale bar: 1mm.
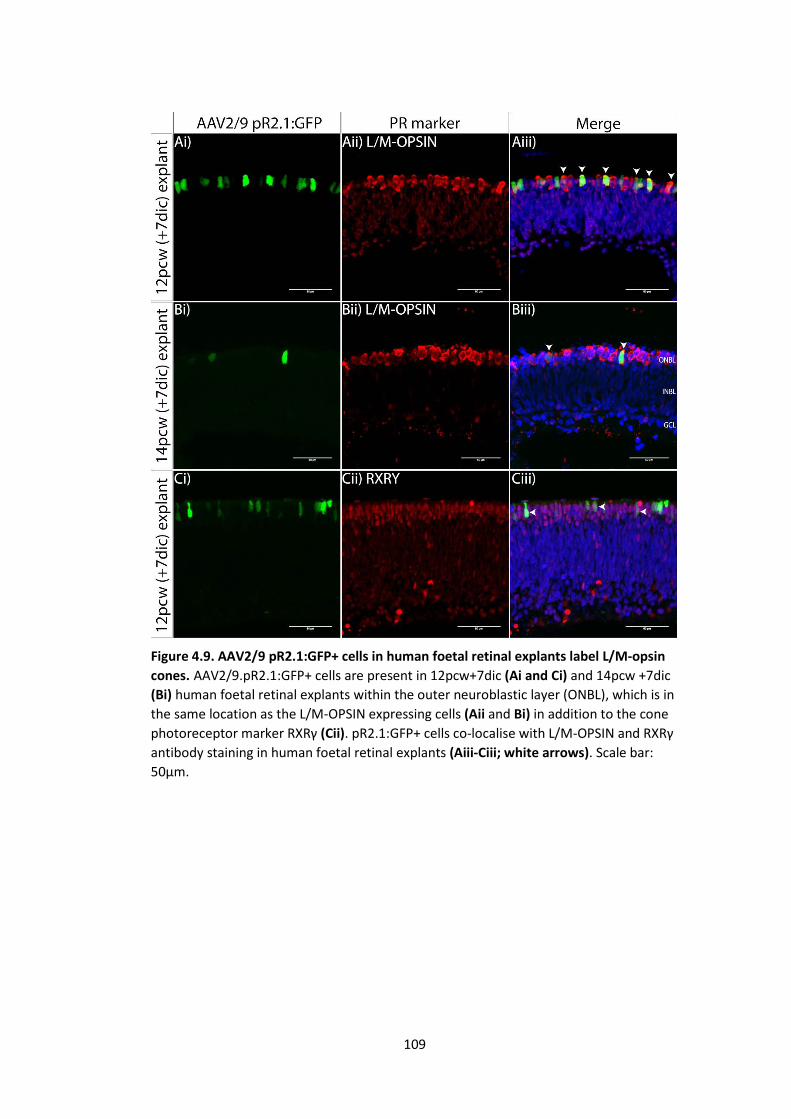
109
Figure 4.9. AAV2/9 pR2.1:GFP+ cells in human foetal retinal explants label L/M-opsin cones. AAV2/9.pR2.1:GFP+ cells are present in 12pcw+7dic (Ai and Ci) and 14pcw +7dic (Bi) human foetal retinal explants within the outer neuroblastic layer (ONBL), which is in the same location as the L/M-OPSIN expressing cells (Aii and Bi) in addition to the cone photoreceptor marker RXRγ (Cii). pR2.1:GFP+ cells co-localise with L/M-OPSIN and RXRγ antibody staining in human foetal retinal explants (Aiii-Ciii; white arrows). Scale bar: 50µm.

110
Figure 4.10. Specificity of AAV2/9 pR2.1:GFP+ cells in human foetal retinal explants. AAV2/9.pR2.1:GFP labelled retinal tissue sections (Ai-Ci) from a 12pcw +7dic human foetal retinal explant stained with markers for S-cones (Aii), rod photoreceptors (NR2E3; Bii), and proliferation (KI67; Cii) showed GFP+ cells located in the outer neuroblastic layer (ONBL) do not co-label with any of these markers (Aiii-Ciii; white arrows). The inset for (Fii) shows the KI67 antibody did work, as expression was detected other areas of the explant. Scale bar: 50µm.

111
To assess the efficiency of the viral construct to label L/M-opsin cone photoreceptors,
retinal explants labelled with the AAV2/9. pR2.1:GFP reporter were dissociated, plated
on coverslips and stained for L/M-OPSIN expression (Figure 4.11A and B). Experiments
using 14pcw (+7idc) and 18pcw (+7dic) retinal explants revealed L/M-OPSIN+ cells form
approximately 15% (214 cells out of 1420 total cells) and 22% (230 cells out of 1055 total
cells) of dissociated cells, respectively (Figure 4.11.B). The percentage of L/M-
OPSIN/pR2.1:GFP+ cells labelled by the AAV2/9 pR2.1:GFP virus was approximately 13%
in the 14pcw human retinal explant, which decreased to 4% in the 18pcw explant (Figure
4.11.B). These experiments suggest the efficiency of the virus is low, however it was
additionally noted that even though not all L/M-OPSIN expressing cones were GFP+, all
pR2.1.GFP+ cells did expressed the L/M-OPSIN protein, suggesting a high specificity
(Figure 4.11.A; white arrows).
4.2.4. Isolation of human developing L/M-opsin cones via FACS
As the AAV2/9.pR2.1:GFP virus labelled human L/M-opsin expressing cells, human foetal
retinal samples transduced with the reporter virus were subjected to fluorescence-
activated cell sorting (FACS) in order to isolate the pR2.1:GFP labelled cell population in
preparation for RNA sequencing. pR2.1:GFP+ cells from early foetal (10pcw-14pcw;
Figure 4.12.A) and later foetal (17pcw-20pcw; Figure 4.12.B) timepoints could be readily
isolated using FAC sorting using the FITC-A channel against the PerCP-Cy5.5A channel to
separate the cells. GFP+ cells (gate P4) were collected in addition to GFP- cells (gate P5)
for each of the human foetal samples so that differential gene analyses could be
complete with the RNA sequencing data. The percentage of cells labelled by the
pR2.1:GFP reporter is greater in the earlier foetal samples (Figure 4.12.C; 12pcw-
14pcw+7dic) compared to the late foetal samples (Figure 4.12.C; 15-20pcw+7dic), which
is in line with the efficiency data (Figure 4.11) suggesting a higher proportion of cells can
be labelled in early foetal retinal tissue. RNA extracted from all GFP+ and GFP- samples
from early foetal retinae (n=4; 10pcw, 11pcw, 12pcw, 14pcw) and late foetal retinae
(n=4; 17pcw, 19pcw, 19pcw, 20pcw) showed non-degraded high quality traces with clear
18S and 28S peaks upon measuring on the Bioanalyser (Figure 4.12.D; see Appendix
Figure 4A for all samples), however this revealed GFP+ samples had very low RNA
concentration (18-510pg/µl) and subsequently amplification was performed on all
samples.

112
Figure 4.11. Efficiency of AAV2/9 pR2.1:GFP reporter to label human foetal L/M-opsin cones. (A) Dissociated AAV2.9.pR2.1:GFP labelled retina from 14pcw +7dic and 18pcw +7dic human foetal retinae were staining with the L/M-OPSIN antibody, which shows co-labelling of GFP+ cells with L/M-OPSIN expression (merge; white arrows). (B) Counting of the L/M-OPSIN labelled cells reveals 15.1% and 21.9% of dissociated cells from the 14pcw +7dic and 18pcw +7dic foetal retinal explants express L/M-OPSIN, respectively. From the total L/M-OPSIN cell population of the dissociated foetal explants, 14.0% and 3.9% express pR2.1.GFP signal in the 14pcw +7dic and 18pcw +7dic foetal explants, respectively.

113
Figure 4.12. Isolation of AAV2.9.pR2.1:GFP labelled cells via FACS sorting. Isolation of pR2.1:GFP+ cells (gate P4) and pR2.1:GFP- cells (gate P5) was achieved using FAC sorting of early (A) and late (B) human foetal retinal samples (representative FACS trace images). (C) FAC sorting revealed the percentage of pR2.1:GFP+ cells are higher in earlier foetal retinal samples (12pcw-14pcw), compared to mid-late samples (15pcw-20pcw). (D) Bioanalyser was used to determine RNA quality and concentration from isolated human foetal samples. Traces used to assess RNA quality showed clear and discrete peaks (marker, 5S, 18S and 28S) which indicate good quality RNA.
Quality control (QC) checks throughout amplification, cDNA synthesis and library
preparation were performed routinely by the ICH Genomics facility, in addition to RNA
sequencing QC pre and post alignment (see Appendix Figures 3 and 4) to which all the
samples passed. In addition to isolated retinal cell populations, total RNA extracted from
2 late foetal retinal samples, 19pcw and 20pcw, were sequenced in order to add extra
samples for the comparative analysis.

114
4.2.5. Total transcriptome analysis of human developing L/M-opsin cones
For downstream transcriptome analysis, raw sequencing data (FASTQ files) were aligned
to the human reference genome (GRCh37/hg19), in order to generated BAM files, which
was performed by Tony Brooks at UCL Genomics. BAM files were subsequently uploaded
to online RNA seq analysis tool, Galaxy (version 17.01), along with gene annotation file
(Homo_sapiens.GRCh37.87.chr.gft) to assign genes to aligned reads. Using the standard
setting available on Galaxy, featureCounts was used to generate raw count matrices,
which were then inputted into StrandNGS software, normalised using the DESeq method
supplied by the software and gene expression outputs were visualised using heatmaps.
For differential gene expression analysis, the DESeq2 pipeline (Love et al., 2014) was
used within Galaxy to generate log10 adjusted p-values and log2 fold changes via Wald
test statistics. These were subsequently imported into the programme ‘R’ in order to
generate volcano plots, which were completed by Aara Patel for this thesis. Samples
were also grouped into categories dependent on their developmental stage; these
included early foetal samples (10pcw, 11pcw, 12pcw 14pcw), late foetal samples
(17pcw, 19pcw, 19pcw, 20pcw) and late total retinal samples (19pcw, 20pcw).
4.2.5.1. Hierarchical clustering based on gene expression
Firstly, a hierarchical clustering analysis based on total gene expression across all human
foetal samples was performed in order to assess differences between the GFP+ and GFP-
cell populations. This analysis revealed all the GFP+ samples cluster together within the
same lineage, which suggests their total gene expression is most similar to each other,
while the GFP- and total foetal retinal samples group into separate clusters (Figure 4.13).
The unbiased hierarchical clustering analysis revealing the similarities between the GFP+
samples prompted a further analysis based on established markers of cone
photoreceptors, rod photoreceptors and pan photoreceptors. This would assess the
similarities in photoreceptor gene expression of GFP+ samples and further elucidate the
identity of the GFP+ samples, which should be developing L/M-opsin cone
photoreceptors based on previous specificity immunostaining data (Figure 4.9.).

115
Figure 4.13. Hierarchical clustering analysis of all human foetal samples based on total gene expression. The hierarchical clustering analysis reveal the separate clustering of GFP+ samples (black box), GFP- samples and total retinal samples based on normalised total gene expression values.

116
Hierarchical clustering analysis was performed with entities (genes) and conditions
(foetal retinal samples) based on normalised expression values of a panel of 28
previously established photoreceptor genes (Figure 4.14). This revealed clustering of all
GFP+ samples (Figure 4.14; black box) based on their high expression of cone and pan-
related photoreceptor genes, which also clustered together at the bottom of the
dendrogram (Figure 4.14; genes in light grey). This is in contrast to the GFP- and total
foetal retinal samples which cluster together based on their higher expression of rod
photoreceptor markers (Figure 4.14; genes in dark grey). Within the GFP+ cluster, later
foetal samples (17pcw, 19pcw (2) and 20pcw) showed the highest expression of all cone
and pan gene, including mature cone markers CNBG3, ARR3, PDE6H, GNAT2 and the L-
opsin (OPN1LW) and M-opsin (OPN1MW and OPN1MW2) genes. Earlier GFP+ samples
(10pcw, 11pcw, 12pcw, 14pcw) showed an overall lower expression of these mature
genes, but still expressed a moderate level of genes characteristic of early cone cells,
including RXRG, THRB and SALL3. Intriguingly, the S-opsin gene (OPN1SW) also showed
varying degrees of expression within the GFP+ samples, particularly within the later
foetal samples. However, these cone genes, alongside ONECUT1 clusters at the top of
the heatmap with the rod photoreceptor genes due to their varied expression across the
GFP+ samples (Figure 4.14)
4.2.5.2. Differential expression analysis with human cone photoreceptor
populations.
The biased hierarchical clustering analysis suggested the human foetal GFP+ samples
labelled by the AAV2/9.pR2.1:GFP reporter construct highly express cone photoreceptor
genes, particularly the OPN1LW, OPN1MW1, OPN1MW2 transcripts. Subsequently,
differential gene expression analyses between GFP+ vs GFP- samples across early and
late stages of development was performed in order to identify significantly upregulated
genes within the GFP+ samples. This should reveal the expression of established cone
photoreceptor genes, further clarifying the cone identity of these samples, in addition to
allowing the exploration of novel genes which are upregulated in early and late human
cone populations. Furthermore, a comparison of differentially expressed genes between
early GFP+ vs late GFP+ samples will reveal genes that are upregulated and
downregulated during the developmental progression of cone photoreceptors. An
adjusted p-value of <0.05 was used to define significantly differentially expressed genes.

117
Figure 4.14. Hierarchical clustering analysis based on expression of cone, rod and pan-photoreceptor gene in human foetal retinal samples. Hierarchical clustering analysis based on expression of established cone, rod and pan photoreceptor genes reveals clustering of GFP+ samples (black box). This is due to their higher expression of cone and pan photoreceptor genes (genes in light grey), contrasting with the GFP- and total retinal samples which cluster together based on their highest expression of rod PR genes (genes in dark grey). Scale bar represents normalised gene expression.

118
DESeq2 analysis (Love et al., 2014) with late GFP+ samples and late GFP- samples
(17pcw, 19pcw (1), 19pcw (2), 20pcw) revealed 4452 significantly differentially
expressed genes, which included 1721 significantly upregulated genes within the late
GFP+ samples (Figure 4.15; red data points on volcano plot). These included a number of
established markers of cone photoreceptors such as THRB, OPN1LW, OPN1MW, PDE6H,
ARR3, GNAT2, and PDE6C. Among the most upregulated differentially expressed genes
with low adjusted p-values and high fold changes included SALL1, LIPG, ASIC1, NPTX1,
CCDC64, MFAP3L, SEMA6D and COL5A1 (Figure 4.15; annotated genes). Rod genes were
significantly downregulated within the late foetal GFP+ samples (NRL -1.84 log2 (FC),
NR2E3 -2.32 log2 (FC), and RHO -3.68 log2 (FC)), and S-opsin (OPN1SW) gene did not
feature within the significantly differentially expressed gene set (adjusted p value=0.07;
top 50 gene differentially expressed genes are shown Appendix Table 1).
Figure 4.15. Differential gene expression analysis between late foetal GFP+ and GFP- samples. Volcano plot representing the 4452 differentially expressed genes between the late foetal GFP+ and GFP- samples identified from the DESeq2 pipeline. Data points in red show genes significantly upregulated in late foetal GFP+ samples (1721 genes) and blue data points represent upregulated genes within the GFP- samples (2731 genes). Adjusted p-values<0.05 were classed as significant.

119
The DESeq2 analysis comparing early GFP+ and GFP- samples also revealed a high
number of significantly differentially expressed genes (2350 genes); 1145 of these were
upregulated within the early GFP+ samples (Figure 4.15.B; red data points). This
upregulated gene set included a number of established cone photoreceptor genes, such
as GNAT2, PDE6H, PDE6C, ARR3 and OPN1LW; however the dataset also featured a large
number of genes not previously identified as enriched with cone photoreceptors.
Examples of genes highly significant and upregulated in the early GFP+ samples
included, PRR15, FAM135B, MCF2, GJD2, MPP4, LMOD1 and SALL1 (Figure 4.16;
annotated genes; top 50 gene differentially expressed genes are shown Appendix Table
2).
Figure 4.16. Differential gene expression analysis between early foetal GFP+ and GFP- samples. Volcano plot representing the 2350 differentially expressed genes between the early foetal GFP+ and GFP- samples identified from the DESeq2 pipeline. Data points in red show genes significantly upregulated in late foetal GFP+ samples (1145 genes) and blue data points represent upregulated genes within the GFP- samples (1205 genes). Adjusted p-values<0.05 were classed as significant.
Lastly, DESeq2 analysis was performed between early GFP+ and late GFP+ samples,
which revealed a lower number of significantly differentially expressed genes (276 genes
in total); 96 genes were upregulated within the later GFP+ samples (Figure 4.17; blue

120
data points) whereas 180 genes were upregulated in the early GFP+ samples (Figure
4.17; red data points). Interestingly, genes described previously within cone
photoreceptors (e.g. ARR3, GUCA1A) in addition to cone opsin genes (OPN1MW and
OPN1SW) showed upregulation within the late GFP+ samples compared to the
equivalent cell population at an earlier development stage. Genes discretely enriched
within the late GFP+ samples (SAMD7, PSKH2, RP11-598F7.1) and early GFP+ samples
(LIMD2, CPLX2, STMN2, DLL3) were also identified from this analysis (Figure 4.17;
annotated genes; top 50 gene differentially expressed genes are shown Appendix Table
3 and 4).
Figure 4.17. Differential gene expression analysis between early foetal GFP+ and late GFP- samples. Volcano plot representing the 276 differentially expressed genes between the early foetal GFP+ and late GFP+ samples identified from the DESeq2 pipeline. Data points in red show genes significantly upregulated in early foetal GFP+ samples (180 genes) and blue data points represent upregulated genes within the late GFP+ samples (96 genes). Adjusted p-values<0.05 were classed as significant.
Due to the identification of a large number of genes from the differential gene
expression analyses, the significantly upregulated genes with the foetal cone
populations (GFP+ samples) were assessed for their degree of overlap. This aimed to

121
increase the validity of genes enriched with late cones, early cones and genes common
to both timepoints for downstream analysis; for example overlapping genes from late
GFP+ vs GFP- and late GFP+ vs early GFP- analyses are more likely to be truly enriched.
From this overlap analysis, 745 common genes featuring in both early and late GFP+
cones were identified, whereas 16 genes were enriched in early GFP+ cones and 37
genes were found to be enriched in late GFP+ cones (Figure 4.16). Overall, this led to the
identification of a 798 cone-enriched gene signature.
Figure 4.18. Identification of cone-enriched gene signature. Significantly upregulated genes within late and early GFP+ samples identified from differential gene expression analyses were cross-referenced into order to identify overlapping genes. This led to the identification of 16 enriched early cone genes, 37 enriched late cone genes and 745 genes expressed in both early and late cone, which forms the cone-enriched gene signature.
Performing gene ontology (GO) analysis using the Enrichr tool with the 798 cone-
enriched gene signature allowed for the determination of biological process terms highly
enriched within this gene set. The top 5 terms included ‘sensory perception of light
stimulus’, ‘visual perception’, ‘detection of light stimulus’, ‘detection of visible light’ and
‘detection of external stimulus’ (Figure 4.19.A; blue sections). A number of terms
associated with steroid hormone signalling containing known cone regulatory
transcription factors, such as RXRγ, THRβ, RORA, were identified. Interestingly, these
122
terms also included transcription factors, BMP7 and NR2F6, which have not been
previously described in cone photoreceptors (Figure 4.19.A; red section, gene in bold).
Terms which had a combined score >10 (top 85 terms) from the Enrichr analysis were
represented within a semantic plot using Revigo (Figure 4.19.B). This tool further
categorised biological process terms from Enrichr, with the highest scoring groups
including visual perception, chemical synaptic transmission, photoreceptor cell
maintenance, detection of external stimulus and regulation of ion transmembrane
transport (Figure 4.17.B).
4.2.6. Single cell transcriptome analysis of L/M-opsin cone photoreceptor cells.
Performing total RNA sequencing on the pR2.1:GFP labelled cell populations has given
the first insight into the transcriptome of a developing human cone photoreceptor
population and revealed a number of upregulated and highly expressed genes that could
be involved in cone photoreceptor development and function. It was noted the AAV2/9
pR2.1.GFP reporter used to label this cell population targets both L-opsin and M-opsin
cone photoreceptors, which are pooled together during FACS isolation prior to
sequencing. From the analysis, there also appears to be some expression of rod
photoreceptor transcripts, in addition to S-OPSIN gene expression, and it is unclear
where this expression originates from with the bulk samples. Hence, in order to further
interrogate the heterogeneity of this human cone population, single cell RNA seq was
performed on pR2.1.GFP+ cells obtained from a 15pcw (+7dic) human foetal retina,
which represents a mid timepoint between the early and late samples of the bulk RNA
seq analysis. Cells were isolated using the same FAC sorting approach as previously
described, before being separated using the Fluidigm C1 (in collaboration with Kristie
Wood based at the Genome Centre, Queen Mary University of London), which uses a
microfluidics system to separate cells into 96 chambers of the integrated fluidic circuit
(IFC; Figure 4.20.). A medium IFC was used and a total of 73 cells were captured within
this experiment, which are lysed within the chamber and undergo amplification and
cDNA preparation prior to sequencing (sequencing performed by Dr. Mike Hubank and
Dr. Tony Brooks at UCL Genomics).

123
Figure 4.19. Gene ontology analysis of cone-enriched gene signature. (A) Top 5 biological process terms enriched within gene signature with highest combined scores and GO terms related to steroid hormone signalling which feature established cone regulatory transcription factors; genes in bold feature in both GO terms. (B) Revigo semantic plot representing Enrichr terms with combined scores>10.

124
Figure 4.20. Capturing of single pR2.1.GFP+ cells. Image shows a single cell captured within a chamber of the integrated fluidic circuit after the addition of the 15pcw pR2.1.GFP+ cells.
The single cell data analysis was performed by Dr. Aaron Lun and Dr. Michael Epstein
under the guidance of Dr. John Marioni (CRUK Cambridge; see Methods section 2.19).
Quality control of the data led to the removal of 6 single cells, therefore 69 individual
cells were included for the downstream analysis. Representative quality control figures
can be seen in Appendix Figures 5-7.
4.2.6.1. Identification of subgroups within pR2.1.GFP+ cell population
In order to identify subgroups within the pR2.1.GFP+ cell population, a principal
component analysis (PCA) was performed using the matrix of expression correlation of
individual cells, which should result in the clustering of cells if they are similar between
the variable components. However the PCA plot shows no instant clustering or definitive
subpopulation of cells and instead showed a continuum of cells with highest variability
correlated to PC1 (Figure 4.21). It should be noted that this variability accordingly to the
first principal component is moderate (5.1%), suggesting only a subtle differences across
cells.

125
Figure 4.21. Principal component analysis of 15pcw pR2.1:GFP+ cells. PCA plot showing 69 single pR2.1:GFP+ cells according to the first and second principal component (PC). The proportions of variance for each PC are shown in brackets and cells are coloured based on their progression through PC1 (left to right=blue to yellow).
To further explore this variability, differential gene expression analysis using limma
(Ritchie et al., 2014) was performed, revealing 503 significant (FDR<0.05) genes vary
based on PC1. Amongst the most significantly differential expressed genes included
KIAA1456, RP1, CKMT1A, SAMD7 and CNGB3 (Appendix Table 5). Notably, the
expression profiles of these genes within individual cells across PC1 either showed an
upregulation or a downregulation (Figure 4.22; top panel and bottom panel,
respectively). A number of genes featuring within the upregulated dataset were
associated with photoreceptor maturation, including primary cilium development gene,
CC2D2A (Tallila et al., 2008), phototransduction genes, CNGB3 (Bonigk et al., 1993),
CNGB1 (Chen et al., 1993), GUCA1A (Cuenca et al., 1998), GUCA1C (Haeseleer et al.,
1999), ARR3 (Sakuma et al., 1998), photoreceptor connecting cilia/outer segment genes,
RP1 (Liu et al., 2002) and PRPH2 (Goldberg et al., 1998), in addition to the light-sensitive
opsin genes, OPN1LW and OPN1MW2 (Figure 4.22). This is in contrast to genes showing

126
a downregulation in individual cells across PC1, which were associated with
development processes, i.e. transcription factor activity and retinal ganglion
cell/sympathetic nervous system development (SOX4 and SOX11) (Jiang et al., 2013,
Potzner et al., 2010), retinoic acid binding (CRABP2) (Ruberte et al., 1992),
cytoskeletal/migratory process and neural differentiation (TMSB4X) (Safer et al., 1991),
(GPM6A) (Michibata et al., 2009), (CRMP4) (Wang and Strittmatter, 1996),
neurodevelopment (THOC6) (Beaulieu et al., 2013) and thyroid hormone regulated cell
migration (SPON2) (Liao et al., 2010) (Figure 4.22). These differences were emphasised
when plotting gene expression (log2 normalised counts) against location of cells along
PC1 with scatterplot representations (Figure 4.23). This is overall suggestive of a
difference in maturation between individual cells along PC1 at this single timepoint in
development. Specifically, as cells move from left to right across PC1, maturation genes
become upregulated, whereas as genes characteristic of early development become
downregulated. Markers of photoreceptor cells (CRX and RCVRN) and early cone
photoreceptors (RXRG and THRB) were highly expressed within cells and were not
significantly differentially expressed when correlated to PC1, which is implies a cone
photoreceptor identity of all cells (Figure 4.24). Interestingly, markers for S-cone
(OPN1SW) and rods (NRL and NR2E3) showed expression within a small number of
individual cones (Figure 4.24).

127
Figure 4.22. Significantly differentially expressed genes from single cell pR2.1:GFP+ analysis. Heatmap shows the expression profiles of the 503 significantly differentially expressed genes across single cells correlated to PC1. Each column represents a single cell and cells are ordered based on their location in PC1 from left to right. Each row represents a gene; the top block of genes show upregulation (blue to red) in cells across PC1, whereas as the bottom group of genes show downregulation (red to blue) in cells across PC1.

128
Figure 4.23. Expression profile scatter plots of selected significantly differentially expressed genes across single cells correlated to PC1. Representative genes which showed an upregulated expression in cells across PC1 (A) or downregulated expression in cells across PC1 (B). PC1 value corresponds to location of individual cells and log2 normalised count of gene of interest is plotted on Y-axis.

129
Figure 4.24. Scatter plots of pan, cone and rod photoreceptors gene expression across single cells correlated to PC1. Pan photoreceptor (RCVRN and CRX) and cone photoreceptor (RXRG and THRB) genes showed expression across all single cells analysed (A). Detection of S-opsin (OPN1SW) and rod (NRL and NR2E3) gene expression within a small number of individual cells (B). Cells are coloured based on their progression through PC1 (left to right) and gene expression is represented as log2 normalised counts.

130
4.2.6.2. Validation of differentially expressed genes within single cell and bulk
RNA seq datasets.
The differential gene expression analysis across individual pR2.1:GFP+ cells from a single
developmental timepoint suggests cells deviate from one another based on subtle
differences in their maturation. If this hypothesis is true and the genes defining this
maturation heterogeneity are enriched within cone cells, this means gene expression
profiles from the single cell analysis should map out on to the early and late samples
used within the bulk transcriptome analysis. The significantly differentially expressed
genes from the single cell analysis were cross referenced against the cone-enriched gene
signature defined by the bulk RNA seq dataset; this led to the identification of 93
overlapping genes which were significantly differentially expressed in both datasets
(Appendix Table 6). When representing these 93 genes within the bulk RNA seq samples,
all genes showed a higher expression in the early and late GFP+ samples, compared to
the GFP- and total retinal samples (Figure 4.25). Hierarchical clustering of the genes
based on their expression within the samples showed two main clusters of genes, i)
those with moderate expression across all GFP+ samples and ii) those with higher
expression within the late GFP+ samples compared to the earlier staged samples (Figure
4.25). Together, these represent a set of genes that are enriched in cone cells and reflect
differences in cone maturation at a single timepoint of development, which are also a
true representation of their developmental trajectory.

131
Figure 4.25. Heatmap of 93 overlapping genes between single cell and bulk transcriptome datasets. 93 genes were defined in both the single cell and bulk cone-enriched gene signature RNA seq datasets. Normalised expression values are shown for these genes within late, early and total retinal samples.

132
4.3. Summary of findings • A viable retinal explant system was established and used to test the specificity of
putative cone promoter constructs.
• A THRβ2:GFP reporter construct directed expression to a human retinal cell
population, which was used to facilitate their isolation and transcriptome
analysis. This revealed the cell population includes putative cones and early
progenitor cells.
• An AAV2/9.pR2.1.GFP reporter virus specifically labelled L/M-opsin expression
cells in the human foetal retina. AAV2/9.pR2.1.GFP+ cells were isolated using
FACS and used for bulk and single cell RNA sequencing.
• Differential gene expression analyses with bulk RNA seq samples allowed for the
definition of a human foetal L/M-opsin cone-enriched gene signature.
• Differential gene expression analyses between single pR2.1:GFP+ cells revealed
a subtle heterogeneity based on maturation.
• Validation of genes within single cell and bulk pR2.1:GFP+ transcriptome
datasets suggests at a single developmental timepoint, cone cells deviate based
on maturation which can be demonstrated by their gene expression profiles and
this variation is representative of their real developmental trajectory.
4.4. Discussion
Transcriptomic studies utilising many different mammalian models have demonstrated
the large degree of homology between species (Brawand et al., 2011), thus these
systems have been informative in studying photoreceptor development and in the
identification of regulatory genes necessary to specify and maintain cone cell fate. Cone
genes have been further characterised in the human foetal retina, such as OPN1SW,
OPN1LW/OPN1MW and RXRγ (Xiao and Hendrickson, 2000, Roberts et al., 2005),
however there has yet to be an in depth transcriptomic profiling of a human developing
cone cell population, which would allow for a further and novel exploration of
mammalian cone gene expression. This also remains a central issue in relation to
generating stem cell-derived cone photoreceptors in vitro and whether these cells are
reminiscent of bona fide human foetal cone photoreceptor, which is critical for disease
modelling and developing cell therapies for retinal dystrophies. The results of this

133
chapter have tried to address this issue by giving the first novel insight into the
transcriptome of a developing human cone photoreceptor population through
establishing the tools to successfully culture and isolate human cones ex vivo using
AAV2/9.pR2.1.GFP reporter for total and single cell RNA sequencing.
4.4.1. Culturing and transduction of human foetal cone photoreceptors
This study showed that the viability and micro-architecture in the human foetal retina
can be maintained for up to 7 days of cultures using either filter membrane or free-
floating culture methods. This is consistent with other studies which report the
preservation of adult human retinal explants using similar polycarbonate filters (Baba et
al., 2012), cell culture insert methods (De Silva et al., 2016) and a free-floating protocol
to culture human foetal retinal explants (Lamba et al., 2010). It was noted that the
explant viability was slightly better maintained within the filter membrane approach,
however, retinal explants showed better lamination morphology within the free-floating
explant as rosettes formation could be observed within retinal explants cultured on the
filters. Other studies report additional culture methods, including co-culturing human
retinal explants with retinal pigment epithelium (Yani et al., 2015) or modifying the
serum content of the medium used for culturing (Johnson and Martin, 2008), which
could be considered to further optimise the culture methods of human foetal retina.
Through immunohistochemistry analysis of cone photoreceptor markers, the data of this
chapter also demonstrate the survival of human cone photoreceptors throughout the
culture period, which is consistent with another study showing the maintenance of cone
photoreceptor cells up until day 9 of culture in mouse retinal explants (Lipinski et al.,
2011).
Within the current study, these cells in the human retinal explants could successfully be
transduced with fluorescent reporter constructs either through using an electroporation
technique previously developed in mammalian retina (Matsuda and Cepko, 2004, Swartz
et al., 2001, Emerson et al., 2013, Donovan and Dyer, 2006) or through ex vivo AAV2/9
delivery within 7 days after transduction. Although the cloning efforts failed to generate
a fluorescent construct that specifically targets human cones via electroporation, it did
raise some interesting questions about the content of regulatory/enhancer elements
within the selected cone gene 5’ flanking regions and which elements were missing that
are important for the specific expression of cone genes in vivo. A primary example of

134
this is the OPN1SW 5’ upstream region selected for the reporter, which showed
expression within human retinal cell population that do not co-label with S-OPSIN or
RECOVERIN expression. Further definition of these regions would require generating
multiple reporter vectors containing larger 5’ non-coding sequence and/or additional
potential regulatory regions, but with sequential deletions to identify important
regulatory sequences required for the cone gene expression, similar to approaches used
to study the promoter region of the human RECOVERIN gene (Wiechmann and Howard,
2003). Although the specificity of the THRβ2.GFP reporter was not restricted to post-
mitotic cone photoreceptors, the immunostaining and RNA seq data points to a mixed
retinal progenitor/precursor cell population containing cells expressing markers
implicated within early cone development such as RXRγ (Roberts et al., 2005) and
ONECUT1 (Emerson et al., 2013). Hence, these data can be used in studying human cone
fate specification and to assess whether the reporter labels a progenitor population with
a restricted cell fate potential to cone photoreceptors. The 5’ non-coding region
included in the reporter contains the human sequence for the previously characterised
cis-regulatory modules 1 and 2, which has been demonstrated to drive the expression of
the THRβ2 genes within the cones (Emerson et al., 2013). Using CRISPR/Cas9 gene
editing approach, this THRβ2.GFP reporter is currently being introduced into a human
embryonic stem cell line and upon retinal differentiation, it will allow for the labelling of
cells expressing the THRβ2 gene, which can be further characterised for identity and
used to study cone photoreceptor development in vitro (Dr Jörn Lakowski; unpublished
data).
Contrastingly, the pR2.1:GFP reporter containing the previously characterised critical
gene regulatory regions required for driving the expression of human L-opsin and M-
opsin genes, was identified as the most cone-specific reporter showing co-labelling
within L/M-opsin cone cells located within the outer nuclear layer within all human
retinal explants studies. By immunohistological analysis all GFP+ cells expressed the
early photoreceptor markers RXRγ, however it was noted that some GFP+ cells labelled
by the reporter did not express L/M-opsin protein. Other studies assessing the specificity
of this reporter within the retinae of different species reported the additional labelling
of S-opsin cones (Wang et al., 1992, Fei and Hughes, 2001, Fei, 2003), therefore analysis
with additional markers was performed. This revealed no co-labelling of GFP+ cells with
S-OPSIN or rod photoreceptor marker, NR2E3, suggesting the pR2.1.GFP reporter does

135
not label any other photoreceptor cell type. Due to the GFP reporter only being driven
by the non-coding promoter sequences upstream of the L-opsin and M-opsin genes, it is
possible that the reporter is labelling cells which express the L-opsin and/or M-opsin
gene transcripts which have not yet translated the genes into the opsin protein (Maier
et al., 2009). This delay has been previously suggesting in the human retina when
studying the onset of photoreceptor markers via PCR (at the transcript level) and
immunohistochemistry (at the protein level) (O’Brien et al., 2003). Nevertheless, this is
the first time human foetal cone photoreceptors have been labelled within an ex vivo
culture system using the AAV2/9.pR2.1:GFP reporter, which can also be readily isolated
via FAC sorting. It was noted that the percentage of cells labelled by the reporter differs
based on age of human foetal retina; more cells can be isolated at an earlier stage
human retina (10-12pcw), compared to later stages (17-20pcw) where less GFP+ cells
are detected. This could be limited by the transduction step of the AAV delivery, as the
virus has a greater number of cells to target within the later foetal retinal samples with a
larger number of other retinal cell types, such as rod photoreceptors, present within
these stages. However, the multiplicity of infection was kept constant across all
experiment to control for this difference and the total cell number of the sample was
used to calculate the amount of virus to add. Additionally, to target cone photoreceptor
cells, the AAV2/9 pseudotype capsid was used which has been previously demonstrated
to preferentially label cone photoreceptors when delivering a ubiquitous reporter
(Allorca et al., 2007). Upon using AAV2/9 pseudotype of virus to deliver the ubiquitous
reporter, CMV.GFP, in the human retina, flow cytometry revealed the efficiency of the
virus was also surprisingly low and equalled the efficiency obtained with the
electroporation method. AAV delivery was expected to give the better mode of
transduction, due its ability to infect non-dividing cells and exist episomally within the
cell allowing for a prolonged and stable expression, compared to electroporation which
gives a more transient reporter expression and preferential targeting of dividing cells at
the time of transduction (Matsuda and Cepko, 2004, Venkatesh et al., 2013). Further
optimisation could be to extend the period of transduction with the AAV to increase the
number of cells transfected, which would additionally require a prolonged culture
system to sustain human retinal explant viability.

136
4.4.2. Transcriptome of developing human cone photoreceptors
Although the efficiency of the AAV2/9.pR2.1.GFP reporter appeared low within the
human foetal retina, enough cells were isolated for bulk and single cell RNA sequencing.
During this doctorate study, further refinements of the L/M-opsin pR2.1 gene promoter
resulting in the generation of a pR1.7 gene promoter, showed a strong and more
efficiency expression of GFP in the primate retina when compared to the pR2.1 activity
(Ye et al., 2016). This reporter therefore could allow for a higher efficiency of cone
transduction in the human retina, which will need to be explored in future studies.
Amplification of the cDNA was performed for both types of RNA sequencing, which is
now an accepted method and reduces the amount of material required for
transcriptome analysis (Wang, 2005). To confirm this multiple quality control checks
were implemented during the process through which all the samples passed. The
available human foetal samples for use in this study ranged from developmental stages
9pcw-20pcw, as it is not possible to obtain samples later than 22pcw from the HDBR.
Additionally, there were only rare opportunities to obtain age-matched material which
could be used as replicates for the RNA sequencing. Therefore samples were grouped
into an early stage (10pcw-14pcw) and a late stage (17pcw-20pcw), which would allow
for greater transcriptome analysis, even though it is acknowledged these samples are
not the perfect replicates and that these age ranges are not necessarily the true
classifications of early and late foetal development.
4.4.2.1 Identity of the pR2.1.GFP+ populations
The unbiased and biased hierarchical clustering analyses based on gene expression and
selected photoreceptor markers, respectively, showed a clear grouping of the human
foetal GFP+ samples, suggesting the transcript expression of these samples are most
similar to each other when compared to GFP- samples or total human retinal samples.
Of most interest was the biased hierarchical analysis based on cone, rod and pan-
photoreceptor gene expression within the samples, which showed a discrete clustering
of all GFP+ samples based on their high expression of cone photoreceptor genes, with
the L/M-opsin genes (OPN1LW, OP1NMW, OPN1MW2) featuring among the top highly
expressed transcripts. It was noted that the earliest GFP+ samples (10pcw and 11pcw)
showed lower expression of cone photoreceptor genes, however their moderate
expression of early-related cone genes and lack of rod gene expression still implied the
labelling of a cone population. This difference could suggest human cones are still

137
relatively immature prior to 12pcw of development, after which they begin to express
more mature cone markers. Intriguingly, a few of these cone photoreceptor populations
showed moderate expression of rod associated genes, particularly at the later stages, in
addition to the S-opsin transcript (OPN1SW). Since rod photoreceptors and S-opsin
cones were not labelled by the pR2.1.GFP virus via immunohistological analysis, the
expression of these transcripts suggests a sharing of molecular markers which could be
due to photoreceptor plasticity, a phenomenon where photoreceptors precursor cells
retain the potential to develop as either rods, S-cones or M-cones (Adler, 1993, Mears et
al., 2001, Haider et al., 2009, Kim et al., 2016). This is also consistent with previous
studies defining a small cone photoreceptor population expressing both S-OPSIN and
L/M-OPSIN proteins that has been previously reported in the developing and adult
human retina (Cornish et al., 2004), providing an explanation for the expression of all
cone opsins in the GFP+ samples. Another study showed developing S-opsin cones of the
primate retina additionally expressing rod arrestin (Craft et al., 2014); along with the
findings within this thesis, human L/M-opsin cones could also share some molecular
markers with rod photoreceptors. This prompted further analysis of rod gene expression
and the OPN1SW transcript within the single cell pR2.1:GFP+ RNA seq dataset, which
identified cells that express NRL and NR2E3, in addition to the cone opsin genes,
OPN1SW, OPN1LW, OPN1MW, and OPN1MW2. Overall, this transcriptome data
suggests the isolation of human cone photoreceptor populations, which highly express
established cone genes and may share molecular markers with other photoreceptor cell
types during development.
4.4.2.2 Novel genes upregulated in human cone photoreceptors
DESeq2 analyses were performed for the bulk transcriptomic analysis in order to give
statistical significance to highly differentially expressed genes and to identify those
upregulated within the GFP+ samples. This test has a low false-positive detection rate
and is suitable for simple comparison of groups with less than 5 biological replicates,
which is applicable to the data of this study (Korpelainen, 2015). A very high number of
significantly differentially expressed genes were obtained through comparing GFP+ and
GFP- samples at the both the late and earlier developmental timepoints, which stands in
contrast to the lower number of genes which varied between early and late cone
populations. These datasets stand alone as highly valuable and informative gene lists,
however for this study an assessment of the overlapping genes was performed in order

138
to increase the validity of significantly differentially expressed genes taken for
downstream analysis. This led to the identification of a 798 cone-enriched gene
signature, containing 16 and 37 genes enriched in early and late cones, respectively, in
addition to 745 common genes enriched in both early and late population. This common
gene set contains a large number of genes with the highest fold changes from both the
early and late datasets, therefore those left out may not be as relevant to include within
downstream analyses. Encouragingly, the high enrichment of visual perception terms
associated with the gene signature from the GO term analysis, in addition to the
inclusion of a large number of established cone and pan-photoreceptor genes, increased
the validity of using this gene signature to explore novel genes expressed by human
developing cone photoreceptors.
Interestingly, disease genes causing congenital stationary night blindness (RGS11) (Van
Schil et al., 2016), and retinitis pigmentosa (RP1, MPP4 and SAMD7) (Sullivan et al.,
1999), which are associated with primary rod photoreceptor loss, were upregulated
within the human cone population. Some novel genes of interest enriched within the
cone gene signature included antagonists previously reported to negatively regulate
BMP signalling (GREM2) (Walsh et al., 2010) and Wnt signalling (AMER2) (Pfister et al.,
2012), (KREMEN2) (Mao et al., 2002). Interestingly, inhibition of both BMP and WNT
pathways has been previously implicated within retinal cell differentiation in vivo (Liu et
al., 2010) and S-cone photoreceptor differentiation in vitro though retinal differentiation
of hESCs (Zhou et al., 2015). Additionally, RNA seq analysis of the primate cone-rich
central retina demonstrated an upregulation of Wnt antagonist, WIF1, and
downregulation of BMP4 signalling protein (Mustafi et al., 2016). Similarly, reduced
BMP/Smad signalling protein was also documented within the cone-enriched mouse Nrl-
/- knockout retina (Yu et al., 2004). This overall suggests a negative regulation of Wnt
and BMP signalling could also be involved in human cone photoreceptor cell
development. The identification of the transcription factor gene, SALL1, was also
intriguing, as the paralog of this gene (SALL3) has been previously implicated in cone
photoreceptor development (Emerson et al., 2013). One study using WERI-Rb1
retinoblastoma cells, characterised as an early stage cone cell line (Shaaban and Deeb,
1998), reported SALL1 as a novel target of THRβ regulation (Liu et al., 2007), in addition
to LIPG and HEG1 genes, which also showed upregulation within the cone-enriched gene
signature. Other cone enriched genes associated with neural differentiation and

139
development included THBS4 (Stenina et al., 2003), TIAM2 (Chiu et al., 1999) and GDPD5
(Rao and Sockanathan, 2005). Many genes associated with neuronal synaptic
neurotransmission and ion transfer homeostasis were also identified, including the
cholinergic receptor, CHRM4 (Resende and Adhikari, 2009), neuronal pentraxin, NPTX1
(Boles et al., 2014), potassium voltage gated ion channel, KCNB2 and membrane
potassium-chloride co-transporter, SLC12A5, which have previously not been associated
with cone photoreceptors.
From cross-referencing the cone-enriched gene signature with the significantly
differentially expressed genes from the single cell analysis, 93 overlapping genes were
identified. Levels of expression of the 93 genes across the bulk transcriptome samples
were much higher in the foetal GFP+ samples compared to the GFP- samples and
interestingly, gene expression profiles changed across GFP+ samples at different
developmental stages. For example, cell adhesion protein, SPON2 (Liao et al., 2010) and
calcium channel regulator, RRAD, showed higher levels of expression within the earlier
GFP+ samples, where as a large majority of remaining genes, including eye
developmental gene and proliferation inhibitor, WFDC1 (Abbasi et al., 2009) and genes
of unknown function, CTD-2521M24.11 and CTD-2034I21.1, showed higher levels of
expression in the later GFP+ samples. From comparing these 93 cone-enriched genes
with other published transcriptome data of the adult human macula, a number of
overlapping genes were identified including the transcription factor NR2F6 (Bowe
Rickman et al., 2006) and the photoreceptor ribbon synapse protein encoding gene,
CPLX4 (Sharon et al., 2002, Bowes Rickman et al., 2006). However, a large percentage of
newly identified 93 cone-enriched genes did not feature within other macula
transcriptome datasets, which could be due to a number of differences relating to the
nature of the samples and transcriptomic technology used for the analysis. Previous
studies have using retinal tissue punches from the macula region of adult human retina
(Hornan et al., 2007, Whitmore et al., 2014), which contain other retinal cells, including
a high proportion of retinal ganglion cells, leading to differences in the observed genes
when compared to an isolated cone photoreceptor population. Transcriptomic
differences have also been reported due to differences in the age of the retina, with
more gene expression being observed in the developing retina compared to the adult
stages (Yoshida et al., 2002, Cai et al., 2012, Young et al., 2013). Lastly, the range of
different transcriptomic technologies used, including microarray (Hornan et al., 2007,

140
Cai et al., 2012), EyeSAGE approaches (Bowes Rickman et al., 2006) and RNA seq
(Whitmore et al., 2014, Li et al., 2014), may cause differences in the genes arising from
the analyses. In addition to human adult macula transcriptome data, clusters of eye-field
and retina-expressed genes identified from transcriptome analysis of Day 47-67 hESC-
derived CRX.GFP expressing cells (Kaewkhaw et al., 2015) were analysed against the
human foetal cone-enriched gene signature. During this culture time window, hESC-
derived CRX.GFP+ cells are demonstrated to express a greater number of cone
photoreceptor markers. Genes including, SLC38A5 and VTN overlapped between the
early CRX.GFP+ samples and the 93 cone genes validated from the bulk and single cells
transcriptome analysis of this thesis. More genes were identified from comparing the
795 cone-enriched gene signature with the early CRX.GFP data, which included
established pan and early photoreceptor genes (CRX, RXRG, GNAT2, RBP3), in addition
to the Wnt signalling antagonist, AMER2. Performing comprehensive comparative
transcriptome analysis with these published gene datasets using the RNA seq pipelines
described in this thesis will aid in the selection of novel cone development gene
candidates for downstream validation.
4.4.2.3 Heterogeneity of human cone photoreceptors
The bulk transcriptome analysis showing a smaller number of significantly differentially
expressed genes between the early and late GFP+ populations is consistent with the
single cell RNA seq analysis. Evaluation of substructures occurring across the individual
15pcw pR2.1.GFP+ cells based on highly variable genes revealed a continuum of cells
rather than separation into discrete subpopulations. The highest percentage of variation
occurring between the cells based on the first principle component was very low (5.1%),
however further differential gene expression analysis based on this variation revealed
cells showed a subtle heterogeneity based on maturation. Mapping genes identified by
the single cell differential gene expression analysis back on to the early and late bulk
transcriptome samples revealed that at a single timepoint in development, cone cells
exist at different stages of their true developmental trajectory and this can be
exemplified by analysing their gene expression profiles. This conclusion is also consistent
with the striking gradient of maturation occurring across the central to periphery foetal
retina shown within the Chapter 3 of this thesis and by previous literature (O’Brien et al.,
2003, Xiao and Hendrickson et al, 2000). It was hypothesised heterogeneity based on
cone opsin gene expression might have been observed within the single cell

141
transcriptome analysis, however it was found that L-opsin and M-opsin expressing cone
cells cannot be distinguished via RNA seq, due to the high homology (98%) of these
genes along the X chromosome (Nathans et al., 1986) causing reads to align to multiple
places within both genes. It was noted that a number of the individual cells at this
developmental stage within the single cell analysis did not express the L-opsin or M-
opsin genes, which could be suggestive of contaminating cells from the FAC-sorting prior
to the separation of cells via microfluidics. However, analysis of pan photoreceptor
genes, CRX and RCVRN, and early cone photoreceptor markers, RXRG and THRB,
revealed all cells expressed a moderate level of these markers, suggesting their cone
photoreceptor cell identity. This analysis did reveal the detection of a small number of
single cells expressing combinations of the S-opsin gene OPN1SW, rod photoreceptor
genes, NRL and NR2E3, and the L-opsin or M-opsin genes, OPN1LW, OPN1MW, and
OPN1MW2. These data could suggest that during this developmental stage, this
population of cone cells demonstrate cell fate plasticity through the expression of genes
associated with other photoreceptor cell fates, providing an explanation for why rod, S-
cone and L/M-cone photoreceptor genes were observed in the same sample within the
bulk transcriptome analysis.
A point to take into consideration regarding the single cell transcriptome data is the
white paper publication from Fluidigm (Fluidigm, White Paper, PN 101-2711 A1), after
the cone cell experiment was performed, reporting a doublet (the capturing of 2 cells
within 1 chamber) rate of approximately 30% within a single run of the medium size IFC.
For the single cell experiment of this study, each chamber of the medium IFC was
imaged via brightfield microscopy after the microfluidic separation of cells and the
content of each chamber was recorded to prevent the inclusion of dead cells, debris and
doublets within the sequencing and downstream analysis. Additionally, data from
individual cells underwent a series of quality control checks prior to analysis, however
the inclusion of doublets within the dataset cannot be completely ruled out. Despite
this, the analysis showed a continuum of cells with very subtle heterogeneity and no
subpopulation clustering, which indicates the presence of doublets may not have
affected this dataset as much as other datasets showing substructural evidence of cells.
Moving forward, sequencing of a greater number of cells at this developmental
timepoint and at different development stages to increase the number of biological
replicates would be informative to further validate the conclusions drawn from this

142
study and confirm the present of doublets has not affected the dataset. This has been
demonstrated in a previous single cell study assessing the transcriptional variation
between different culture methods of mouse embryonic stem cells (Kolodziejczyk et al.,
2015), which use multiple Fluidigm IFC for each culture condition, which ultimately
increases the number of cells analysed and the strength of the conclusions drawn. This
requirement of validation also speaks true for the novel cone-enriched genes identified
within this study, which can be further explored using
immunohistochemical/immunocytochemical techniques, single cell fluorescence in situ
hybridisation and single cell imaging flow cytometry. Another interesting technique
previously applied to the entire mouse retina (Macosko et al., 2015) involved
molecularly barcoding cells captured within microdroplets, which can successfully
distinguish subgroups of cells without the need for prior labelling, i.e. fluorescent
reporter constructs. This would be a future technology to use for human retinal cell
population characterisation and could allow for the analysis of an entire cone population
rather than subsets classified by the cone opsins.
Overall this chapter has allowed a novel insight into the transcriptome of a developing
human cone photoreceptor population, revealing new genes expressed with a human
cone population and providing for the first time an assessment of the heterogeneity of
the cell population at the single cell level. Performing differential expression analysis has
identified gene sets that are significantly upregulated and highly expressed within early
and late human cone populations, which have been analysed in relation to identifying
novel genes expressed in cones. In the next chapter, these transcriptomic data were
used, in conjunction with a proteomic approach, to identify cell surface markers highly
expressed by human cone photoreceptors. This will allow for the development of a cell
sorting strategy for the enrichment of L/M-opsin cone photoreceptors without the need
for genetic manipulation, which is a requirement for developing a clinical cell
transplantation therapy.

143
5. Identification of cone photoreceptor cell surface markers for cell enrichment strategy
5.1. Introduction In order for a cell replacement therapy to progress as a clinical treatment for retinal
dystrophies, it will be crucial to develop an efficient and effective transplantation
strategy to ensure the best clinical outcome. Within this strategy, a critical step will
include the robust isolation and purification of photoreceptor cells prior to
transplantation, which is especially applicable to photoreceptors generated from human
pluripotent stem cell populations via retinal differentiation protocols. These culture
systems are often very heterogeneous, containing photoreceptors at different
developmental stages, other retinal cell types, non-retinal/neural cell types and
proliferating progenitor cell populations. Therefore the cell isolation procedure would
need to ensure the removal of these cell populations in addition to providing
photoreceptor enrichment.
Isolation of human foetal cone has been previously demonstrated through
microdissection of developing foveal regions, prior to excimer laser ablation which
removes interneurons and ganglion cells within the inner retinal cell layers, allowing a
monolayer of cones to be isolated (Salchow et al., 2001). Other studies have used lectin
panning techniques to achieve cone cell isolation by incubating dissociated mammalian
retinal cell on coverslips coated with peanut agglutinin (PNA) lectin, which selectively
binds to cone photoreceptor (Balse et al., 2005, Skaper, 2012). Both methods represent
effective approaches to obtain purified populations of cone photoreceptors, however
the feasibility of these strategies for use in a cell replacement strategy remains to be
defined. Proof of principle studies in the mouse have previously shown the effective
isolation of transplantation-competent photoreceptor donor cells via genetic
manipulation, causing the target cells to express GFP under the control of a
photoreceptor-specific gene (MacLaren et al., 2006, Bartsch et al., 2008, Lakowski et al.,
2010, Decembrini et al., 2017). However, using a similar technique for a human clinical

144
therapy would be undesirable, due to the increased risk of introducing genetic
mutations and tumorigenicity. Another method of cell isolation which has been
employed within clinical applications of immunology and cancer biology (Woodward and
Sulman, 2008, Takaishi et al., 2009, Yuan et al., 2011) involves targeting the cell surface
molecules expressed on the cell population of interest, including those classified as
cluster of differentiation (CD), using fluorophore conjugated monoclonal antibodies.
These antibodies bind to specific epitopes expressed on the cell membrane and can be
used to isolate the desired cell population or deplete unwanted contaminating cells via
fluorescence activated cell sorting (FACS) or magnetic activated cell sorting (MACS)
without the need for genetic manipulation of the cells.
In terms of isolating photoreceptor cells using cell surface antigens, CD73 is the most
characterised CD marker expressed on mouse photoreceptor precursor cells (Koso et al.,
2009) and has previously been used to enrich for mouse rod photoreceptor donor cells
prior to transplantation into the recipient retina (Eberle et al., 2011, Eberle et al., 2014,
Eberle et al., 2012). However, CD73 expression can be detected in other cell types
(Augusto et al., 2013, Jin et al., 2010) and therefore it cannot provide the level of rod
photoreceptor enrichment required for a clinical therapy alone, particularly if it is used
solely to isolate rods from complex heterogeneous stem cell-derived retinal cultures.
Biomarker panels consisting of CD markers useful for positive selection of rod
photoreceptors (CD73, CD133, CD24, CD47) and negative selection to remove
undesirable mitotically active cells (CD15) have been developed to overcome this
problem (Lakowski et al., 2011, Tucker et al., 2011, Lamba et al., 2010). This work has led
to the significant enrichment of rod precursors from mouse native retina and from
mouse embryonic stem cell-derived retinal cultures, which show higher levels of
apparently integrated and mature rod photoreceptors post transplantation compared to
the unsorted cell population (Lakowski et al., 2015, Lakowski et al., 2011). Applying the
biomarker panels on to human foetal retinal samples did not show the same levels of
photoreceptor enrichment, however work conducted within this thesis in collaboration
with Dr. Jörn Lakowski has led to the identification of a novel CD marker combination
(CD73/CD29/SSEA-1), which can isolate a high percentage of photoreceptor cells from
the human foetal retina and from hPSC-derived retinal differentiation cultures.

145
The development of a cell isolation strategy for human foetal and hPSC-derived cone
photoreceptors falls short of the progression made for rod photoreceptors. CD73 has
been used to isolate ‘cone-like’ photoreceptors from Nrl-/-mouse model prior to
transplantation, which are reported to survive and express cone-specific photoreceptor
markers after transplantation into the wildtype and cone mutant recipient retina
(Santos-Ferreira et al., 2015). In addition, Reichman et al., 2017 also suggest the
expression of CD73 within hPSC-derived cells expressing the cone markers, CONE
ARRESTIN, S-OPSIN and L/M-OPSIN, which suggests an overlapping CD marker
expression with rod photoreceptors (Reichman et al., 2017). Putative cell surface
markers of hESC-derived cone photoreceptors have been suggesting from transcriptome
data of early stage CRX-expressing cell, which include RTN4RL1, ST3GAL5, GNGT2 and
EPHA10 (Kaewkhaw et al., 2015). However, the expression of these genes within human
cone cells, in addition to validating the application of CD73 for cone cell purification,
remains to be defined.
The previous chapter characterising the AAV2/9pR2.1:GFP reporter within the human
foetal retina suggests the successful labelling and isolation of a L/M-opsin cone
photoreceptor population. Hence, the aim of this chapter was to identify cell surface
marker expression within this virally labelled human cone photoreceptor population
using a dual approach in order to define a cell surface marker FAC-sorting strategy that
will enrich for human L/M-opsin cones. Firstly, genes encoding cell surface marker that
were significantly upregulated within the human foetal early and late GFP+ samples
were identified within the newly generated transcriptome data. Secondly, commercially
available high throughput antibody plates, known as BD lyoplate screening panels, were
used to detect CD marker antigens expressed with the human pR2.1:GFP+ labelled cones
via flow cytometry analysis .
5.2. Results
5.2.1. Identification of cell surface molecule transcripts upregulated in human
foetal cones
A machine learning bioinformatics tool created by Prof. David Jones and Dr. Federico
Minneci was used to generate a cell surface marker protein query database of 3367
putative cell surface protein (see Methods Section 2.16). This database was used to

146
identify potential cell surface marker genes featured with the significantly upregulated
genes of the human foetal pR2.1:GFP+ samples. This revealed 99 and 170 cell surface
marker genes with early GFP+ samples (Appendix Table 7) and late GFP+ samples
(Appendix Table 8), respectively. Throughout both gene lists, 16 of these genes were
identified as CD markers; 7 of these genes were identified in the early GFP+ samples,
whereas 13 CD marker genes featured within the late GFP+ samples (Appendix Table 7
and 8). 4 CD markers were common to both gene lists, which included DPP4 (CD26),
PROM1 (CD133), ITGA4 (CD49d) and JAM2 (CD322).
5.2.2. Identification of cell surface marker proteins expressed by human foetal
cones
The BD lyoplate screening panels were used to identify CD markers expressed within
human foetal pR2.1:GFP+ cells at two developmental stages; an earlier (12pcw (+7DIV))
and a later (17pcw (+7DIV)) timepoint. pR2.1:GFP labelled samples were dissociated,
applied onto the lyoplate panels containing 242 different CD marker antibodies and
were analysed via flow cytometry (see Methods Section 2.13).
GFP+ signal could be detected within each foetal sample (Figure 5.1.A); the average
percentages of pR2.1.GFP+ cells detected within each well of the panel was 0.97% for
the early sample and 1.85% for the late sample. Gates to determine cell shifting and
indicating CD marker labelling within a retinal cell population were drawn based on
isotype controls (Figure 5.1.B-D). Additional criteria were introduced to determine CD
marker expressed within pR2.1:GFP+ cell population, which included i) causing a discrete
shifting of pR2.1:GFP+ cells based on the FACS trace and ii) labelling at least 50% of the
pR2.1.GFP+ cells determined by the statistics from the analysis. Following these criteria,
6 CD markers labelled 12wk GFP+ cells and 14 CD markers were detected within 17wk
GFP+ cells (Figure 5.2). The 6 CD markers expressed at the earlier stage were also
detected within the later foetal stage (CD57, CD47, CD59, CD151, CD200, CD98), with 8
extra CD markers being expressed within the later 17pcw samples (CD63, CD26, CD147,
CD120a, CD81, CD49c, CD90, CD165). The table in Figure 5.2.A shows the percentage of
pR2.1.GFP+ cells (out of the total pR2.1:GFP+ cell population) labelled by the CD marker
(first columns) and the percentage of other pR2.1:GFP- retinal cells (out of total retinal
cell population) labelled by the CD marker (second column) for each sample. For all CD

147
markers identified within the early 12pcw sample, these labelled a high percentage of
pR2.1:GFP+ cells and high proportion of other retinal cells (Figure 5.2.A and B).
Figure 5.1. Isotype controls for BD lyoplate antibody screening panels. (A) GFP+ signal could be detected within flow cytometry analysis of human foetal retinal cells at the early (12pcw) and late (17pcw) developmental stages. (B-D) Isotype controls were used as negative controls to determine non-specific background noise of antibodies. Gates for analysis of CD marker expression were set based on these controls.
CD markers showing this high labelling of both populations were also identified within
the late 17pcw retinal sample, however some CD markers were observed to label a high
percentage (64-73%) of the pR2.1.GFP+ cell population and a smaller percentage of non-
GFP+ (4.64-32.3%) retinal cells, which included CD26, CD147, CD120a and CD81 (Figure
5.2A). Specifically, CD26 and CD147 labelled a high percentage of pR2.1:GFP+ cells and
also discretely shift this population observed within the FACS traces (Figure 5.2.C; black
box).
CD133 was not featuring within the antibody selection for the BD lyoplate screening
experiment; however the high expression and statistical significance of this marker
within the transcriptome was noted. It’s previous implications in photoreceptor cell
sorting strategies also made it a good candidate to explore within the pR2.1.GFP+
samples. Hence, CD133 expression was investigated via flow cytometry, which revealed

148
the robust labelling of pR2.1.GFP+ cells within the 13pcw and 14pcw (+7DIV) human
foetal retina, with some additional labelling of other retinal cells (Figure 5.2.D).
Figure 5.2. CD marker percentage quantifications and flow traces from BD lyoplate antibody screening panels. (A) The table shows the top 14 CD markers from the late 17pcw experiment which labelled over 50% of pR2.1.GFP+ cells. The 6 CD markers labelling the same proportion of pR2.1.GFP+ cells in the early foetal 12pcw experiment also feature within the list. The pR2.1:GFP+/CD marker+ percentage was calculated based on the pR2.1:GFP+ population only (first column for each sample), whereas the pR2.1:GFP-/CD marker+ percentage is calculated based on all retinal cells (second column for each sample). (B) Flow traces are shown for the common CD markers labelling both early and late pR2.1:GFP+ cell population. (C) Flow traces showing the
149
additional 8 CD markers labelled the pR2.1:GFP+ cells of the 17pcw retinal sample. (D) Flow trace of CD133 expression with pR2.1:GFP labelled 13pcw and 14pcw human foetal retina.
From the BD lyoplate antibody screening experiments, it was clear that only at the later
stage of development (17pcw) could CD markers be identified showing a greater
specificity to pR2.1.GFP+ cells, which is defined as labelling a higher proportion of
pR2.1.GFP+ cells and a lower percentage of other retinal cells. Hence for downstream
analysis, CD markers were chosen from the later foetal timepoint experiment to develop
a cell isolation strategy for cone photoreceptors.
Subsequently, the CD markers identified from the flow cytometry analysis were cross-
referenced with the RNA sequencing data for foetal pR2.1:GFP samples. All CD markers
could be detected within the transcriptomic data, with the exception of CD165 (Figure
5.3). CD26 and CD133 were the only CD markers identified from both the flow cytometry
analysis and within the significantly upregulated pR2.1:GFP+ cone genes from the
transcriptome analysis. Hierarchical clustering analysis with foetal GFP samples was
performed based on CD marker gene expression. This revealed a high expression of
genes encoding CD133 (PROM1), CD26 (DPP4) and CD49c (ITGA3) within the late GFP+
samples compared to the GFP- samples, which cluster the later GFP+ samples together
(Figure 5.4). CD90 (THY1), CD57 (B3GAT1) and CD120a (TNFRSF1A) overall show a higher
expression in the very early GFP+ samples (10pcw and 11pcw), the GFP- samples and the
total foetal retina samples (19pcw and 20pcw). All other CD markers showed a
moderate to low expression across all samples featured on the heatmap. This
highlighted some discrepancies between the protein detection (flow cytometry) and
transcriptome datasets. For additional validation, CD markers identified with the 17pcw
pR2.1:GFP+ cell population were cross-referenced to mouse CD marker lyoplate data
previously performed on a cone-like retinoblastoma cell line (661W), transgenic mouse
Nrl.GFP and Crx.GFP lines (Figure 5.4) (data generated with Dr. Jörn Lakowski and
Nrl.GFP data features within Lakowski et al., 2015). CD markers identified from these
datasets showing positive expression within Crx.GFP and 661W cells but no expression
with Nrl.GFP cells could be potential cell surface markers of mouse cone
photoreceptors. Comparing these lists of CD markers with those identified within the

150
17pcw pR2.1:GFP+ sample revealed 5 overlapping markers, which included CD81, CD47,
CD98, CD200 and CD147 (Figure 5.4; red box).
Based on these data and analysis above, the following CD markers were selected for
further downstream analysis for human cone photoreceptor isolation:
• CD26: features within the significantly upregulated genes with early and late
GFP+ samples and is expressed highly. Labels a high percentage of 17pcw
pR2.1:GFP+ cells via flow cytometry with a low labelling of other retinal cells.
• CD133: features in significantly upregulated genes within early and late GFP+
samples and shows a high transcript expression. Highly expressed in 17pcw
pR2.1:GFP+ cells and labels a proportion of other retinal cells as detected by
flow cytometry analysis. Marker has additionally been used to isolate
photoreceptor cells from the mouse retina (Lakowski et al., 2015).
• CD147: labels a high percentage of 17pcw pR2.1:GFP+ cells and a lower
percentage of other retinal cells. Expression of this marker at the gene level is
low within the foetal pR2.1:GFP+ samples, however is a potential marker of
cone photoreceptors in the mouse retina from the Crx.GFP, Nrl.GFP and 661W
analysis.

151
Figure 5.3. Transcript expression of CD markers identified from pR2.1.GFP lyoplate experiment. Hierarchical clustering analysis with human foetal transcriptome data based on CD markers gene expression identified from lyoplate antibody screening panels.
Figure 5.4. Analysis of CD marker overlap between 17pcw pR2.1:GFP+ lyoplate, 661W mouse cone like neuroblastoma cell line, NRL.GFP- mouse retinal cell and CRX.GFP+ mouse retinal cells. Venn diagram representation of overlapping CD markers identified across the 4 samples. The 5 CD markers highlighted in the red box overlap across all

152
samples (CD81, CD47, CD98, CD200, CD147). The table shows the CD markers that overlap and do not overlap between the different samples.
5.2.3. Developing a CD marker panel for the isolation of human foetal cone
photoreceptors
Expression of selected CD markers, CD26, CD133 and CD147 was analysed via
immunocytochemistry to assess their protein expression within human L/M-opsin foetal
cone photoreceptors. This confirmed the clear labelling of the 3 CD markers within L/M-
OPSIN+ cells (Figure 5.5; white arrows). However, other L/M-OPSIN+ cells could be
observed without the labelling of the CD markers, suggesting not all L/M-OPSIN cells
expressed CD26, CD133 or CD147. Additionally, L/M-OPSIN- cells which were positive for
CD marker expression were detected, hence other retinal cells are labelled by these CD
markers in additional to L/M-opsin cone cells.
5.2.3.1. Single FAC-sorting with selected cone CD markers
Having validated the expression of the selected CD markers within human foetal L/M-
opsin cones, human foetal retinal samples were dissociated and stained within the CD
marker antibodies, before subjecting to fluorescence activated cell sorting (FACS). CD
marker+ and CD marker- cell populations were collected from the sorting before plating
down onto to chamber slides for L/M-OPSIN and CRX immunocytochemistry analysis in
order to determine if any enrichment could be achieved from using the CD markers
singularly. FACS gates were set based on negative control (cells only) and where
available, isotype controls. For these experiments, the extremes of the cell populations
(highly positive and negative) were collected. The FACS traces showed the proportions
of the CD marker+ cell populations collected were approximately 2.9% ±1.6%, 23.1%
±12.4 and 71.1%±7.2 for CD26, CD147 and CD133 respectively (Figure 5.6.A, n=3). Tile
scan images of the cells after immunostaining with L/M-OPSIN and CRX showed double
positive cells could be readily observed within the CD marker+ populations (Figure
5.6.B). From counting the number of double positive cells in the positive and negative
CD marker cell populations, some enrichment of L/M-OPSIN+/CRX+ cells could be
observed within all CD marker+ populations (CD26+ 4.9%±2.23 ; CD133+ 1.38%±0.41;

153
CD147+ 1.67%±1.47) when compared to the CD marker- (CD26- 1.3%±1.41; CD147-
0.5%±0.62; CD133- 0.9%±0.82) and unsorted (0.6%±0.58) cell populations (Figure 5.6.C).
An ANOVA statistic test with Bonferroni correction for multiple testing was performed
between the different cell populations, which revealed the increased percentage of L/M-
OPSIN+/CRX+ cells within the CD26+ population was statistically significant compared
Figure 5.5. Immunocytochemistry of human L/M-opsin+ cells with selected cone CD markers. Dissociated human foetal retinal samples (16pcw-17pcw) were plated down onto chamberslides and stained for L/M-opsin and CD markers, CD26, CD133 and CD147. L/M-opsin+ cells were labelled by each CD markers (white arrows).
to the CD marker- and unsorted cell population (Figure 5.6.C; adjusted p value=0.0044).
No statistical significance was determined for the CD133 and CD147 due to the larger
variability between biological replicates. Additionally, the total number of CRX+ cells was
counted in order to determine the number of photoreceptor cells within each cell
population. A greater percentage of CRX+ cells were detected within the CD26+ cell
population compared to the unsorted cell population and the CD marker- population,
however the percentage of cells expressing CRX varied between the different cell
populations analysed for CD133 and CD147 (Figure 5.6.D).
5.2.3.2. Cone CD marker FAC-sorting with positive selection
Small levels of enrichment of L/M-OPSIN+/CRX+ cells could be achieved used CD26,
CD133 and CD147 antibodies individually, therefore CD markers were subsequently
combined together within a sorting strategy in an attempt to improve the enrichment of
L/M-opsin cone photoreceptors (Figure 5.7). The logic behind the combination sorting
strategy was to firstly set the gates for the CD marker labelling the largest cell
population, which in this case was CD133 (P5; 53.3%±8%), before using the other CD
markers to pull out the smaller cell populations. Due to CD26+ cells showing a higher

154
enrichment of L/M-OPSIN/CRX+ cells compared to the equivalent CD147+ populations,
CD26 was used next in the strategy to pull out CD26+ cells from the CD133+ cell
population (P3; 0.48%±0.28%). This revealed that all CD26+ cells are also positive for
CD133+ (Figure 5.7Ai). CD147 was applied in the final step to the CD133+/CD26+ cell
population, which revealed the total CD133+/CD26+ cell population was also positive for
CD147 (P4; 0.48%±0.28%). Hence a cell population could be isolated from the human
foetal retina that expresses all 3 CD markers (CD133+CD26+CD147+; Figure 5.7Aii, P4). 3
different cell populations were collected from the combination sorting, which included
triple CD marker negative cells (CD133-CD26-CD147-; P7), CD133+ cells (CD133+CD26-
CD147-; P5) and triple CD marker positive cells (CD133+CD26+CD147+; P4). Collected
cells were then plated onto chamberslides, stained for L/M-OPSIN and CRX and imaged
using the same method as previously described for the single CD marker FAC-sorts,
which showed a distinctive enrichment of L/M-OPSIN/CRX+ cells within the
CD133+/CD26+/CD147+ cell population compared to the unsorted cells (Figure 5.7.B).
From counting cells within each collected population across different experiments (n=3,
Figure 5.7C), a greater percentage of L/M-OPSIN/CRX+ cells were observed within the
triple positive cell population (8.69%±9.62), compared to the unsorted (0.45%±0.59) and
other cell populations (CD133-/CD26-/CD147- 1.67%±1.93; CD133+/CD26-/CD147-
0.64%±0.72). For some experiments, up to 21% of L/M-OPSIN/CRX+ cells could be
achieved within the enriched population, however in other experiments this only
increased up to 1.5%, which highlights the elevated degree of variability between
experiments. Due to this variability between replicates, no statistical significance was
detected between cell populations analysis from the triple sorting experiments. From
counting the CRX+ cells, there was a general trend of a greater proportion of CRX+ cells
within the triple positive (P4) and the CD133+/CD26-/CD147 (P5) cell populations,
however this trend is not significant as there was high variability between biological
replicates (Figure 5.7.D).
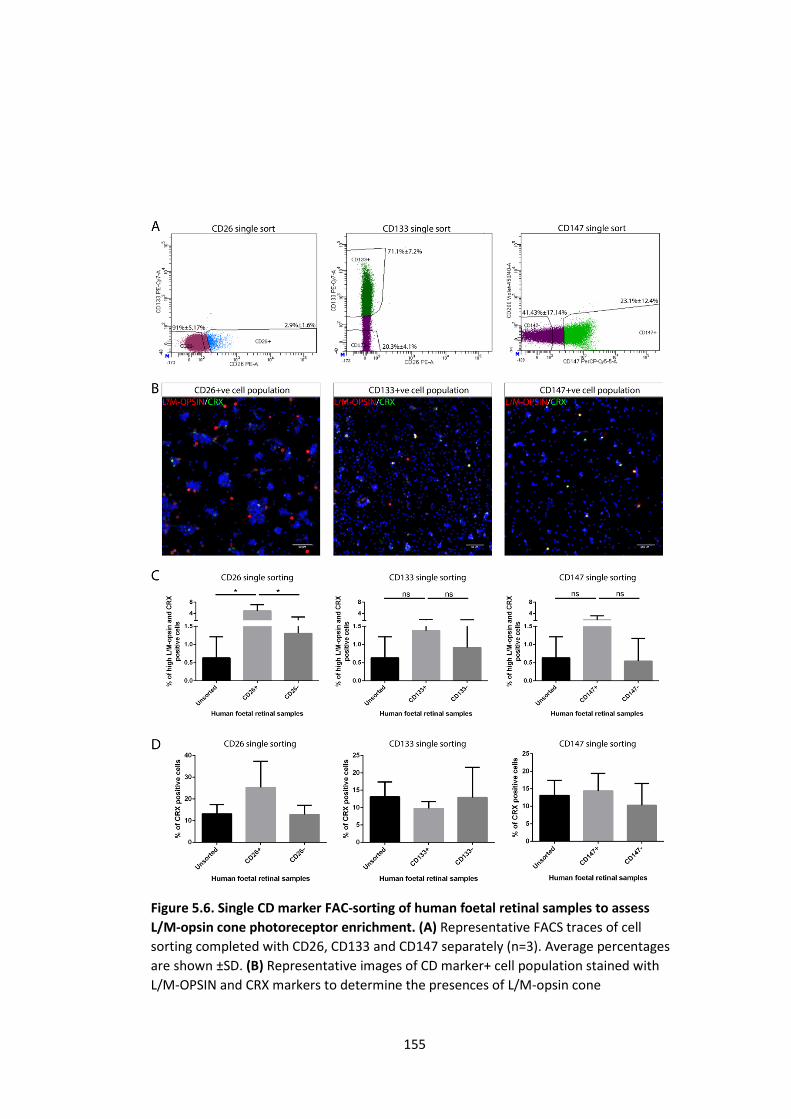
155
Figure 5.6. Single CD marker FAC-sorting of human foetal retinal samples to assess L/M-opsin cone photoreceptor enrichment. (A) Representative FACS traces of cell sorting completed with CD26, CD133 and CD147 separately (n=3). Average percentages are shown ±SD. (B) Representative images of CD marker+ cell population stained with L/M-OPSIN and CRX markers to determine the presences of L/M-opsin cone

156
photoreceptors. Scale bar: 50µm. Highly expressing L/M-OPSIN/CRX double positive cells (C) and CRX+ cells (D) were counted within CD marker+, CD marker- and unsorted cell populations. ANOVA statistical test was performed, adjusted p value=0.0044. At least 350 cells were counted for each cell population. Scalebar: 50µm.
Figure 5.7. Positive CD marker combination with human foetal retina to enrich for L/M-opsin cone photoreceptors via FAC-sorting. (Ai-ii) Representative FAC-sorting traces using the CD26/CD133/CD147 combination on human foetal retinal samples (17pcw-22pcw; n=4). (B) Representative images of L/M-OPSIN/CRX immunocytochemistry of the unsorted cell population and the CD133+CD26+CD147+

157
sorted cell population. Inserts show higher magnification of L/M-OPSIN/CRX+ cells. Scale bar: 100um. Average percentage of highly expressing L/M-OPSIN/CRX+ cells (C) and CRX+ cells (D) within unsorted and sorted cell populations from counting analysis (n=3). ANOVA statistical test was performed, p value=0.1067. At least 900 cells were counted for each cell population.
5.2.3.3. Cone CD marker FAC-sorting with positive and negative selection
In an attempt to further increase the L/M-OPSIN/CRX specificity and enrichment within
the CD133+CD26+CD147+ cell population, an additional CD marker was added to the cell
sorting strategy to be used for negative selection of retinal cells. This would allow for the
depletion of other retinal cells that could be contaminating the CD133+/CD26+/CD147+
enriched cell population. SSEA1 (also known as CD15) WAS a good candidate for
negative selection, as it did not show labelling of 17pcw pR2.1:GFP+ cells from the
human lyoplate experiment (Figure 5.8), but still labelled a retinal cell population. It has
also previously been used in the mouse retina to remove a proliferating retinal
progenitor cell population (Tucker et al., 2011; Lakowski et al., 2015). To ascertain if this
marker could be used in cell sorting combination with CD26, CD133 and CD147, the
relationship based on labelling cell populations was assessed between each of the CD
markers with SSEA1 via flow cytometry. A 17pcw human foetal retina was stained with
all the CD markers before running through the flow cytometer, which enabled the
degree of overlap between the cell populations labelled by CD26/CD133/CD147 versus
SSEA1 to be assessed.
Figure 5.8. SSEA-1 expression from the human pR2.1:GFP+ lyoplate experiments. SSEA1 labels a cell population, 32.4% and 6.27%, within the 17pcw and 12pcw human

158
foetal retina respectively, but does not label the pR2.1:GFP+ cell population in either sample.
For each analysis, controls were used to draw gates for the combination analysis which
included unstained cells, isotype controls, fluorescence minus one (FMO) controls and
single marker controls (Figure 5.9, 5.10, 5.11A-G). The analysis revealed a small
population of cells double positive for CD133 and SSEA1 (Figure 5.9.G), however the
majority of CD133+ cells are not labelled by SSEA1. SSEA1 additionally showed mutually
exclusive staining when compared to CD147 (Figure 5.10.G) and CD26 (Figure 5.11.G),
labelling a different cell population to those labelled by CD147 and CD26. This together
suggests SSEA1 could be used for negative selection to deplete undesired cells in
combination with the CD markers, CD133, CD26 and CD147, which are used for positive
selection of L/M-OPSIN/CRX+ cells.

159

160
Figure 5.9. Flow cytometry analysis of cell populations labelled by CD133 versus SSEA1. Controls for experiment were used to draw gated for downstream analysis of CD133 vs SSEA1 labelled cell population (A-G). The flow trace shows mostly mutually exclusive cell labelling of CD133 (Q5) and SSEA-1 (Q7), with a small overlap (Q6).

161
Figure 5.10. Flow cytometry analysis of cell populations labelled by CD147 versus SSEA1. Controls for experiment were used to draw gated for downstream analysis of CD147 vs SSEA1 labelled cell population (i-v). The flow trace shows mutually exclusive cell labelling of CD147 (Q1) and SSEA1 (Q3), with no double positive cell population (Q2).

162
Figure 5.11. Flow cytometry analysis of cell populations labelled by CD26 versus SSEA1. Controls for experiment were used to draw gated for downstream analysis of CD26 vs SSEA1 labelled cell population (i-v). The flow trace shows mutually exclusive cell labelling of CD26 (Q5) and SSEA1 (Q7), with no double positive cell population (Q6).
Subsequently, SSEA1 was tested within the cell sorting strategy with CD133, CD26 and
CD147 to assess if a further enrichment of L/M-OPSIN/CRX+ cells could be achieved with
the addition of negative selection. SSEA1 was applied on to the total human foetal
retinal cell population first in order to remove cells (SSEA1+, 34.78%±18.5; Figure 5.12
Ai). The remaining SSEA1 negative population was gated ( 22.65%±10.1%; Figure 5.12 Ai;
red box) and became the starting population for the selection of CD133+ cells
(13.0%±8.1%) and CD133+/CD26+ cells (0.025%±0.05; Figure 5.12 Ai; red box), which
were still present after the addition of SSEA1 (Figure 5.12 Aii). Finally CD147 was applied
as previously described to the CD133+/CD26+ cell population in order to define the
CD133+/CD26+/CD147+ cell population (0.025%±0.05; Figure 5.12 Aiii; red box). It was
noted that the addition of SSEA1 to the combination appeared to reduce the total cell
number within the P4 cell population (from 0.48%±0.28% using CD133/CD26/CD147 to
0.025%±0.05% using SSEA1/CD133/CD26/CD147). The same cell populations as before
were collected during the sorting (SSEA1-/CD133-/CD26-/CD147- P6; SSEA1-
/CD133+/CD26-/CD147- P5; SSEA1-/CD133+/CD26+/CD147+ P4) with the addition of an
extra population, SSEA1+, in order to stain for L/M-OPSIN and CRX markers and
determine the level of enrichment of double labelled cells. Due to the small size of the
SSEA1-/CD133+/CD26+/CD147+ cell population, this increased the difficulty of
successfully plating the cells within the chamberslides for staining; however for each
experiment at least 100 cells were imaged for this population. Tilescan images visually
show L/M-OPSIN/CRX+ cells are the majority cell type within this cell population, when
compared to the unsorted cell population (Figure 5.12.B). From counting the highly
expressing L/M-OPSIN/CRX+ cells within each population (Figure 5.12.C), the SSEA1-
/CD133+/CD26+/CD147+ population shows the highest percentage of double labelled
cells (P4; 30%±16.13%), which is statistically significant (adjusted p-value< 0.0001)
compared to the CD133+ population (P5; 0.69%±1.2%), the SSEA-1+ population (P7;
0.27%±0.49%) and the unsorted cell population (0.54%±0.8%). No highly expressing
L/M-OPSIN/CRX+ cells were present in the all negative cell population (P6). Similarly, a
greater percentage of CRX+ cells were present in the SSEA1-/CD133+/CD26+/CD147+

163
population compared to the other cell populations (Figure 5.12.D), however this is
subtle due to the high variability observed between experiments.
Figure 5.12. FAC-sorting to enrich for L/M-opsin cone photoreceptors using negative and positive CD marker selection. (Ai-iii) The sorting strategy involves using SSEA1 to remove retinal cells and CD133/CD26/CD147 for positive selection of L/M-OPSIN/CRX+

164
cells. (B) Representative images of L/M-OPSIN/CRX staining within the unsorted cell population and the SSEA1-/CD133+/CD26+/CD147+sorted cell population. Inserts show higher magnification of L/M-OPSIN/CRX+ cells. Scale bar: 100um. Average percentage of highly expressing L/M-OPSIN/CRX+ cells (C) and CRX+ cell (D) within unsorted and sorted cell populations from counting analysis (n=3). ANOVA statistical test was performed, adjusted p value<0.0001. At least 50 cells were counted for each cell population per experiment.
5.3. Summary of findings • 99 genes encoding cell surface molecules were identified within the significantly
upregulated genes of early foetal pR2.1:GFP+ samples, while 170 cell surface
molecule genes were found to be significantly enriched in late foetal pR2.1:GFP+
samples.
• Using a high throughput CD marker antibody screening approach, 6 CD markers
were defined to be expressed with an early (12pcw) foetal pR2.1:GFP+ cell
population via flow cytometry. The expression of these 6 CD markers in addition
to a further 8 CD markers were identified within a late (17pcw) foetal
pR2.1:GFP+ cell population.
• From the transcriptomic and proteomic datasets, 3 promising CD markers
(CD26, CD133 and CD147) for positive selection of human L/M-opsin cones were
chosen for downstream investigation to develop a cell enrichment strategy.
• A general trend of L/M-OPSIN/CRX+ cell enrichment was observed post FAC-
sorting with individual CD markers using human foetal retina. Combining the 3
CD markers together for FAC-sorting further increased the specificity of L/M-
OPSIN/CRX+ cells with the triple CD marker+ cell population (8.69%±9.62).
• With the addition of SSEA1 to the triple positive CD marker combination, in
order to implement negative selection by depleting unwanted cells from the
initial human foetal retinal cell population, the specificity of L/M-OPSIN/CRX+
cells within the SSEA1-/CD133+/CD26+/CD147+ population increased to
30%±16.13, which was statistically significant compared to the unsorted and
other sorted cell populations.
5.4. Discussion The data presented within this chapter provides the first characterisation of cell surface
molecules expressed by human developing cone photoreceptor cells, which has
165
previously remained largely undefined. The proof of principle studies in the mouse
retina demonstrating increased efficiency of rod photoreceptor transplantation after
sorting with CD marker antibodies compared to unsorted cells (Lakowski et al., 2011,
Eberle et al., 2014; Lakowski et al., 2015), highlights the feasibility of this approach to
provide photoreceptor cell enrichment within a clinical cell replacement therapy for
retinal dystrophies. This strategy has yet to be tested for the enrichment of human cone
photoreceptor cells, which are critical for optimal daylight vision but represent a small
cell population of the mammalian retina that are difficult to purify.
5.4.1. Profiling of CD markers expression within human foetal pR2.1:GFP+
cones.
Using a dual analysis approach, the expression of putative cell surface molecules were
profiled within early and late pR2.1:GFP+ L/M-opsin cone photoreceptors. Noticeably,
within both the gene and protein analyses, a greater number of cell surface markers
were identified within the later pR2.1:GFP+ samples when compared to pR2.1:GFP+
samples at an earlier timepoint in development. From comparing protein versus
transcriptome datasets at both developmental stages, only one cell surface molecule,
DPP4 (CD26), showed overlap between analyses, which highlights the discrepancies
between the different strategies used. mRNA detection of a gene does not necessarily
correlate with the cell surface antigen presentation due to other levels of regulation
interplaying between transcript and protein expression (Maier et al., 2009). Additionally,
the in silico tool, which generated the database of putative cell surface molecule genes,
was based on feature prediction bioinformatics programs, such as MEMSAT-SVM
(transmembrane segment prediction) (Nugent and Jones, 2009) and PredGPI (GPI
anchor prediction) (Pierleoni et al., 2008), to set the selection criteria of ‘positive’ and
‘negative’ hits for cell surface marker detection. Due to this prediction nature of the
tool, this could suggest why some cell surface markers that were identified from the
flow cytometry approach were missed, although attempts were made to avoid this by
performing benchmarking tests with the prediction pipeline, which revealed a sensitivity
of 85%. Similarly, the lyoplate antibody screening panels did not include antibodies for
all the known human CD markers, which is a limitation of the approach and means CD
markers identified from the transcriptome data could have also been missed within the
flow cytometry analysis. This proteomic approach also revealed there are no CD markers
that were exclusively expressed within the pR2.1:GFP+ cell population, as signal from

166
the CD marker antibodies was always detected within some proportion of GFP- retinal
cells. Due to this additional labelling of other retinal cells, these CD markers may not
have necessarily feature within the significantly upregulated gene list for pR2.1:GFP+
cells from the differential gene expression analysis, providing an explanation for the
data discrepancy. Furthermore, it was noted from Chapter 4 of this thesis that the L/M-
opsin cell transduction efficiency of the AAV2/9.pR2.1:GFP reporter was low, suggesting
not all L/M-opsin cone photoreceptors were labelled for the lyoplate experiments.
Therefore, it is possible that non-labelled L/M-opsin cells, which are not labelled by the
AAV2/9.pR2.1:GFP reporter, may feature within the GFP- cell population and were
shifted by the CD markers.
From the cell surface marker profiling, CD26 represented a strong candidate for showing
robust labelling of the pR2.1:GFP+ cone population, since it survived the inconsistencies
between data from the transcriptome and flow cytometry analysis. This was alongside
CD133 (PROM1), which was previously defined to label photoreceptor precursors cells of
the mouse retina and showed strong expression within human pR2.1.GFP+ cells within
this study. Potential cone CD marker data from previous mouse lyoplate antibody
screening panel experiments were compared against the CD markers obtained from the
human pR2.1:GFP analysis in order to certify more CD markers of human cone cells. This
enabled further validation of CD markers, CD81, CD47, CD98, CD200 and CD147, which
featured within the mouse cone 661W cell line, Crx.GFP+, Nrl.GFP- mouse transgenic
cells and human pR2.1:GFP+ lists. Due to the higher percentage labelling of CD147
within human pR2.1.GFP+ cells compared to the GFP- cell population, this CD marker
was also selected for further downstream analysis within this study. Additionally, there
were CD markers identified, such as CD57, CD47, CD59, which showed a very high
labelling percentages of pR2.1:GFP+ cells, however these also appeared to label all other
retinal cell populations (GFP- cells), suggesting their use in a cell sorting strategy was not
suitable. A previous report using CD73 to isolate ‘cone-like’ photoreceptors from Nrl-/-
retina (Santos-Ferreira et al., 2015) contrasted to the findings of this thesis; CD73
labelled only a subpopulation (33%) of pR.2.1:GFP+ cells at the 17pcw stage, which
suggests the incomplete labelling of human L/M-opsin cones. The putative cone cell
surface marker genes, ST3GAL5 and EPHA10, reported by Kaewkhaw et al., 2015, were
found within the significantly upregulated cone genes from the pR2.1.GFP+
transcriptome dataset, however the protein detection of these genes, alongside

167
additional cell surface molecule genes identified within this thesis, remain to be
validated via flow cytometry to assess their ability for isolating human cone
photoreceptors.
5.4.2. Assessment of the CD marker panels for enrichment of L/M-opsin cone
photoreceptors
Having defined a set of cell surface markers expressed on the human pR2.1:GFP+ cells,
the subsequent goal was to develop a cell sorting strategy to enrich for this population
of cone photoreceptors. One of the major challenges faced with this task is the very
small starting population of cone photoreceptors within the human retina, which in the
adult retina is approximately 6 million cells in total (Fernandez, 1997) and this sets the
maximum limit of the number of cone photoreceptor cells that can be isolated from
sorting experiments. Coupled together with the finding of no cell surface markers being
exclusively expressed on L/M-opsin human cone photoreceptors and the high degree of
variability occurring across human foetal biological replicates, this made the
development of a robust cell isolation strategy to obtain a pure cone population very
challenging.
From considering the late human pR2.1:GFP+ transcriptomic and flow cytometry data, in
addition to the comparative analysis with mouse lyoplate data, CD26, CD133 and CD147
were chosen as promising candidates for developing a cone cell isolation strategy. This
was reflected within both the immunocytochemistry analysis, revealing clear labelling of
L/M-OPSIN expressing cells with the CD marker antibodies, and the FAC-sorting
experiments, in which some enrichment levels of L/M-OPSIN+/CRX+ cells could be
provided when using the CD markers individually and in combination with SSEA1. This is
the first time a CD marker cell isolation approach has been developed and tested for
human developing cone photoreceptors and these data provide proof of concept
evidence that this strategy can be applied to cone cells. The use of human foetal retinal
tissue, providing a bona fide cone photoreceptor population to profile cell surface
molecules and test their abilities to isolate cone cells, has been a critical aspect of this
study, which will be important for developing cell sorting strategies for stem cell-derived
cone photoreceptors. Although statistical significance for L/M-OPSIN+/CRX+ cells was
observed within the enriched SSEA1-/CD133+/CD26+/CD147+ population and high fold

168
enrichments were achieved compared to the unsorted cell population (23.7 and 166.8
fold changes for CD133+CD26+CD147+ and CD133+CD26+CD147+SSEA1- combinations
respectively), labelling of other retinal cells which were negative for L/M-OPSIN or CRX
expression could be detected across all experimental data. From counting the CRX+ cell
within the sorted cell populations, which provided an assessment of the total
photoreceptor cell content, approximately 27% and 43% CRX+ cells were detected
within the CD133+CD26+CD147+ and CD133+CD26+CD147+SSEA1- respectively, which
suggests other photoreceptor cell types, including rods and S-cones may also be labelled
by these CD marker combinations, since the CRX+ cell proportions exceeded the L/M-
OPSIN/CRX+ cell percentage (8.69%±9.62 and 30%±16.13, respectively). These
percentages also suggest that other non-photoreceptor cells are being labelled within
the sorting strategy, which means the L/M-opsin cell specificity using these CD marker
combinations will require further characterised. Markers that label other retinal cell
fates, would need to be tested via immunocytochemistry post-sorting to elucidate the
identity of all the cells isolated from the CD133+CD26+CD147+ and
CD133+CD26+CD147+SSEA1- combinations.
It was also noted that increasing the specificity of L/M-OPSIN/CRX+ cells with the
enriched cell population through the addition of SSEA1 decreased the overall efficiency
of this method in its ability to enrich for L/M-opsin cone photoreceptors
(CD133+CD26+CD147+ efficiency: 25.65%±28.24; CD133+CD26+CD147+SSEA1-
efficiency: 2.43%±2.25). This was also reflected within L/M-opsin cone photoreceptor
cell yields obtained post FAC-sorting, which is estimated based on the
immunocytochemistry counting data. These calculations show that the average number
of L/M-opsin cone photoreceptors available to isolate across the human foetal retinal
samples was approximately 300,825 cells (±428,900); post-sorting approximately 6,140
L/M-OPSIN+/CRX+ cells (±5,658) were obtained within the CD133+CD26+CD147+
population and 890 cells (±694) were collected within the CD133+CD26+CD147+SSEA1-
population. Experiments were often limited by the amount of the CD marker antibodies
that could be used for staining the cells prior to FAC-sorting, hence for most
experiments the entire retina could not be used. However, an approximation of cone
cells that could be returned post sorting if the entire retinal samples were used is 35100
(±36066) cones for the CD133+CD26+CD147+ cell population and 9001 (±8914) cones for
the CD133+CD26+CD147+SSEA1- population. These approximations demonstrate how

169
further optimisation is necessary for both combinations in order to maximise the
isolation of all available cone cells within the starting population. Transplantation
studies conducted within the mouse retina subretinally inject approximately 200,000
rod or photoreceptor precursor cells per eye, which have resulted in cell survival and
some partial restoration of vision (Pearson et al., 2012; Lakowski et al., 2010). It still
remains to be determined how many cone cells would need to be transplanted into the
human patient eye in order to achieve optimal clinical outcome, but it is likely the
efficiencies and yields of L/M-opsin cones cells obtained after purification with the
current CD marker combinations would require further optimisation.
5.4.3. Further optimisation of the L/M-opsin cone CD marker panel
A large number of cell surface molecules have been defined within this study, hence
future assessment of these molecules to enrich for L/M-opsin cone cells within different
CD marker combinations needs to be performed. This is true for cell surface markers
that could be used for positive selection of cones or negative selection of unwanted cells
to depletion other retinal cell populations. The consistency of L/M-opsin cone
photoreceptor cell enrichment within this strategy is reliant on similar expression of CD
markers within cone photoreceptors between human foetal retinal samples and the
optimal survival of cells post-sorting. However both aspects greatly depend upon the
viability of the starting material, which varied greatly across biological replicates.
Therefore, parallel studies using hPSC-derived retinal differentiation cultures could be
used as an additional sample source to test CD marker combinations, which would also
be highly applicable optimisation platform for translation into a clinical therapy. The
challenging small number of cone photoreceptors within the starting material of the
human foetal retinal samples was also a limitation of the experiments; modifications of
hPSC-derived retinal differentiation cultures to produce a greater number of cone
photoreceptors, as demonstrated in Zhou et al., 2015, would facilitate increased number
of cone cells for FAC-sorting. Other techniques could also be tested, including magnetic
activated cell sorting (MACS) to assess if better efficiencies and yields of enriching for
cone cells could be improved by applying a different cell isolation technology. In
relation to a clinical cell replacement therapy, it would also be most relevant to define
the ontogenetic stage of the CD marker sorted L/M-opsin cells, test their transplantation
competencies and assess their ability to survive within the recipient retina, which has
been previously defined to be critical for optimal therapeutic outcome (Pearson et al.,

170
2012, MacLaren et al., 2006). This could be achieved through transplanting cells into
mouse models which has been previously performed with human embryonic stem cell-
derived photoreceptors (Zhu et al., 2016, Lamba et al., 2009) or via cell addition to ex
vivo cultured human retina explants to assess their survival (De Silva et al., 2016).
6. Generation and characterisation of hiPSC-derived cone photoreceptors via a 3D retinal differentiation culture system
6.1. Introduction In the field of regenerative medicine, the pluripotent capabilities of human stem cells to
self-renew and differentiate into cell types of the 3 germ layers has made them an
attractive cell source for cell transplantation therapies. In particular, the generation of
induced pluripotent stem cells from somatic cells using different combinations of
reprogramming factors, such as OCT4, c-MYC, KLF-4, SOX2 (Takahashi et al., 2007,
Takahashi and Yamanaka, 2006) or OCT4, SOX2, NANOG and LIN28 (Yu et al., 2007), has
opened up the possibility for autologous cell therapy in which patient derived cells are
driven back into a pluripotent state before re-differentiating into the desired cell type.
This bypasses immunogenic response and rejection associated with transplanting donor
cell sources, enabling the survival of the cells in vivo which has been demonstrated
through proof-of-principle studies, including successful engraftment of hiPSC-derived
neural cells into primate brain (Emborg et al., 2013). Transplantation of photoreceptor
cells into disease models has been demonstrated from various cell sources, including
mouse photoreceptor precursors (MacLaren et al., 2006), human foetal retina (Radtke et
al 2008) and mESC/hESC-derived photoreceptors (Gonzalez-Cordero et al 2013, Shairi et
al., 2016; Lamba et al., 2009) with some restoration of vision in some cases (Pearson et
al 2012, Lamba et al., 2009). These studies have strengthened the feasibility of using a
cell replacement therapy for retinal dystrophies, however the use of photoreceptors
derived from iPSC sources represents an ethical renewable source of cells and alongside
the reduced risk of immuno-rejection and cGMP production of hiPSC-derived
photoreceptors (Wiley et al., 2016), they will help to accelerate the progression towards
developing a clinical therapy. Similar to photoreceptors derived from other cell sources,
iPSC-derived retinal tissue transplantation has been demonstrated (Assawachananont et

171
al., 2014, Tucker et al., 2011), with some functional restoration (Mandai et al., 2017,
Barnea-Cramer et al., 2016, Tucker et al., 2011). In light of the recent cytoplasmic
material transfer discovery occurring between transplanted and host photoreceptor
cells (Pearson et al., 2016, Santos Ferreria et al., 2016, Singh et al., 2016), the
applicability of this approach for treatment of early stages of retinal dystrophies
requires further assessment. However, for late stages of retinal degeneration where the
photoreceptor cells have been lost, transplantation of dissociated or sheets of iPSC-
derived photoreceptors in a replacement strategy could still be used.
These studies have made use of the recent advancements in retinal differentiation
protocols which recapitulate the main developmental events occurs during human
retinogenesis and demonstrate generation of photoreceptor cells with expression of
mature genes, including RHODOPSIN and CONE OPSINS, which has been pioneered by
the Gamm and Sasai groups (Meyer et al., 2009, 2011, Eiraku et al., 2011, Nakano et al.,
2012). These 3D cultures generate human retinal organoid structures, including optic
vesicles, which form the basis of future advancing retinal differentiation protocols.
Depending on the application intended for the stem cell-derived retinal tissue, the
appropriate differentiation protocol should be decided upon. For disease modelling and
basic human retinogenesis research, protocols based on the Sasai optic cup
differentiation are most suitable, due to the excellent structural lamination and
recapitulation of morphogenetic properties of human optic cup development, in
addition to producing a more homogenous culture for retinal cell types (Nakano et al.,
2012, Kaewkhaw et al., 2015, Sharai et al., 2016, Kuwahara et al., 2015). On the other
hand, generating photoreceptors for use in cell transplantation therapies would require
an easily scaled up and cost-effective culture system, in which the Meyer et al., 2009
protocol may be more a feasible method to use due to the reduced number of
exogenous reagents and culture manipulation required. Hence for this thesis, a modified
stem cell-derived retinal differentiation protocol based on the Meyer et al., 2009 was
used to generate cone photoreceptors for the comparative transcriptome and cell
surface marker analysis with the human foetal L/M-opsin cones. Since the beginning of
this PhD, additional modifications of the Meyer et al., 2009 protocol have been
published, which demonstrate enhanced rod and cone photoreceptor generation and
maturation (Zhong et al., 2014, Reichman et al., 2014, refer to Introduction section
1.8.2). This includes a hESC-derived retinal differentiation protocol with enhanced levels

172
of cone differentiation and maturation (Gonzalez-Cordero et al., 2017), which was used
through a collaboration with Dr. Anai Gonzalez-Cordero for the cell surface marker
experiments at the end of the chapter.
The main modification of the hiPSC- derived retinal differentiation protocol used in this
chapter involved the adherent culturing of the optic vesicles generated without a
prolonged suspension/free floating culture stage. This modification increases the cell
heterogeneity of the system as the vesicles are not being mechanically isolated from the
surrounding tissue, however the AAV2/9.pR2.1.GFP reporter methodology was applied
in order to isolate the cone cells of interest for transcriptome profiling, and therefore
the complex nature of the culture system was not a disadvantage. This point is also
relevant to the cell surface marker cell sorting approach developed from human foetal
retina within Chapter 5 of this thesis, which was assessed for the enrichment of the stem
cell-derived cone photoreceptors from the retinal differentiation culture systems.
6.2. Results The characterisation of the retinal differentiation culture system featured within this
section was carried out in collaboration with Dr. Jörn Lakowski and Dr. Valentina Di
Foggia in the Sowden laboratory. For this study, the hiPSC line was derived by the
Cambridge BRC hiPSCs Core Facility. Skin fibroblasts from an unaffected parent of an
Usher Syndrome type 2 patient (USH2A c.7595-2144A>G), who has no disease
phenotype and normal ophthalmological examination, were reprogrammed into hiPSCs
using the Sendai viral method. Additional control hiPSC lines from other genetic
backgrounds were obtained and tested, however these failed to differentiate or lost
pluripotency during maintenance culture. hiPSCs were cultured on irradiated mouse
embryonic feeder (MEFs) layers during the reprogramming stages and for maintenance
culturing.
The pluripotency of the hiPSC line used in this study and the loss of Sendai virus
expression were assessed via immunocytochemistry and PCR respectively. hiPSC
colonies readily expressed pluripotency markers OCT3/4 and NANOG within the cell
nucleus (Figure 6.1.A) and cytoplasmic expression of TRA-1-60 and alkaline phosphatase
(ALPL) was detected (Figure 6.1.A). No signal was observed within the irradiated mouse
embryonic fibroblast feeder layer. As part of the reprogramming service, the hiPSC Core
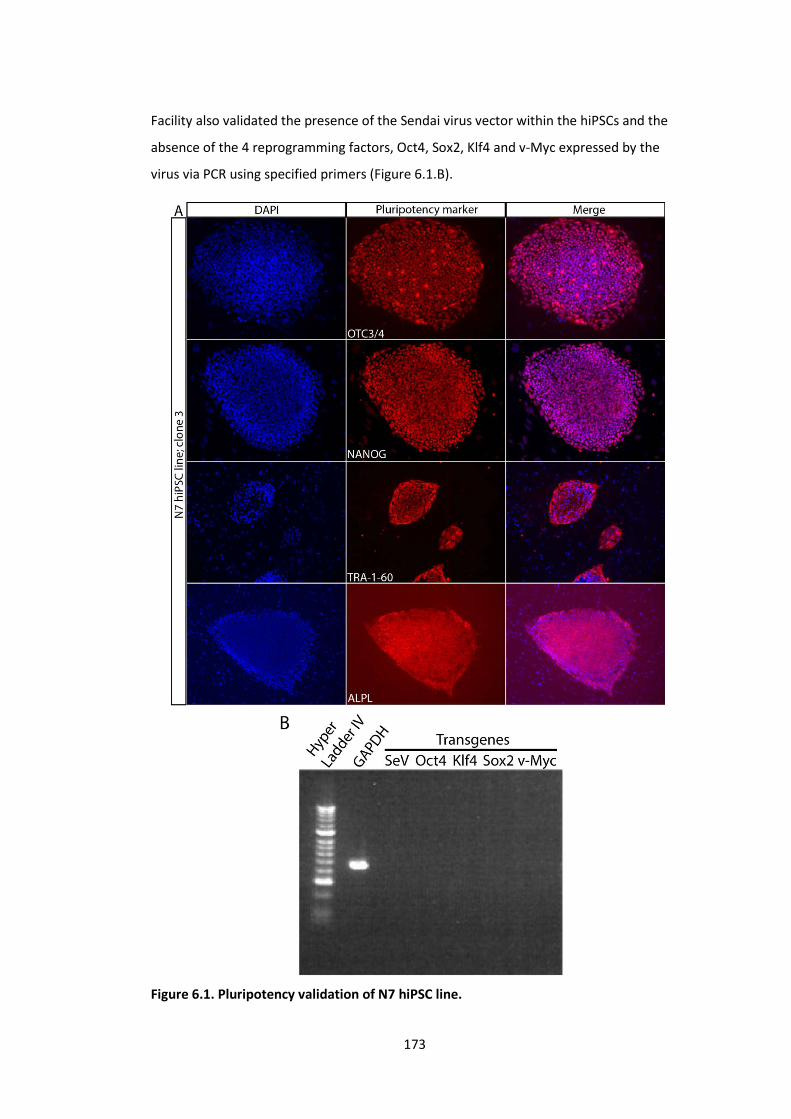
173
Facility also validated the presence of the Sendai virus vector within the hiPSCs and the
absence of the 4 reprogramming factors, Oct4, Sox2, Klf4 and v-Myc expressed by the
virus via PCR using specified primers (Figure 6.1.B).
Figure 6.1. Pluripotency validation of N7 hiPSC line.

174
(A) N7 hiPSC colonies stained for pluripotency markers OCT3/4, NANOG, TRA-1-60 and ALPL show positive expression. (B) PCR using Sendai virus vector (SeV) specific primers shows the absence of the vector and loss of expression of reprogramming factor transgenes (Oct4, Klf4, Sox2, and v-Myc) from hiPSC samples. GAPDH was used as a position control.
6.2.1. Photoreceptor generation from hiPSCs using a retinal differentiation
culture system
6.2.1.1. Early retinal differentiation
hiPSCs were subjected to retinal differentiation in order to generate photoreceptor cells.
As previously stated, the protocol used for this study was based on the Meyer et al.,
2009 retinal differentiation system, which featured the formation of optic vesicle
structures. The initial steps of the differentiation were performed using the same
methodology, which included i) lifting hiPSC colonies and the withdrawal of fibroblastic
growth factor (FGF; Week 0); ii) formation of embryoid bodies (EBs) before plating them
on laminin coated plates and transferring into neural induction media to induce the
formation of neural rosettes (Week 1-2; Figure 6.2.A, white arrows). Using RT qPCR, the
upregulation of early eye field genes, RAX and PAX6, was observed by Week 2, whereas
the pluripotency genes, NANOG and OCT3/4 showed downregulated expression from
Week 0-2 (Figure 6.2.B).
6.2.1.2. Later retinal differentiation
At approximately Week 2 of differentiation (Day 16), Meyer et al., 2009 lift the neural
rosettes and culture free floating in order to form neurospheres and subsequent optic
vesicle structures, which are observed by Week 3. Instead of lifting the rosettes, within
this study the neural rosettes were left adhered to the cell plate for the remaining
period of culture, which also led to the appearance of optic vesicle structures by Week 3
of differentiation (Figure 6.3.A). Vesicle-like structures were observed close to patches
of retinal pigment epithelium (RPE) within the adhered cultures (Figure 6.3.A). Using
immunohistochemistry analysis, cells expressing the photoreceptor markers, CRX and
RECOVERIN, were detected within these structures from Week 6 through to Week 22 of
culture (Figure 6.3.Bi-iv). At the earlier stages, the CRX/RECOVERIN+ cells were diffused
throughout the neuroblastic epithelium (Figure 6.3.Bi) which became more organised
along the apical surface, forming a cell layer reminiscent of the outer nuclear layer
(Figure 6.3.Bii-iv) within the human retina.

175
Figure 6.2. Early retinal differentiation of hiPSCs. (A) Schematic of initial procedure (Week 0-2) to induce retinal differentiation of hiPSC cultures. (B) RT qPCR data reveals upregulated of early eye field markers, RAX and PAX6, in addition to a downregulation of pluripotency markers, NANOG and OCT3/4, in hiPSC samples from Week 0-2. Fold change relative to Week 0.

176
Within the culture system, the presence of CRX expression within RPE cells was readily
detected (Figure 6.3.Bii, white arrows), therefore RECOVERIN and CRX markers were
used in combination to identified photoreceptor cells. At a Week 14 timepoint,
approximately 40 3D structures on average were observed per well, with an average size
of 20,000 µm2 (n=259; data from Dr. Valentina Di Foggia). Approximately 90% of the
optic vesicles picked at this timepoint were positive for CRX expression (n=7), which
contained 60% CRX+/RECOVERIN+ cells per optic vesicle (n=7; data from Dr. Valentina Di
Foggia). Cell expressing photoreceptor markers (CRX and RECOVERIN) within the
remaining tissue of the well surrounding the optic vesicles were also detected, forming
rosette like structures or photoreceptor patches (Figure 6.4).

177

178
Figure 6.3. Late retinal differentiation of hiPSCs. (A) Schematic representing the later retinal differentiation protocol from Week 3-28 of culture. (Bi-iv) Photoreceptor markers, RECOVERIN and CRX, were detected via immunohistochemistry between Week 6-22. Scale bar: 50µm.
Figure 6.4. Photoreceptor cells expressing outside of optic vesicles. Cells expressing CRX and RECOVERIN were detected in the remaining tissue surrounding the optic vesicles. These cells were detected within rosette-like structures (i), associated with region of retinal pigment epithelium (RPE) (ii) or within patches (iii).

179
6.2.2. Cone photoreceptor generation via retinal differentiation of hiPSCs
Cone photoreceptor markers established from RT qPCR and immunohistochemistry
analysis within the human foetal retina (from Chapter 3) were assessed within the
hiPSC-derived retinal differentiation culture system in order to characterise cone
photoreceptor generation. RT qPCR were performed on a time course of hiPSC-derived
samples for early cone photoreceptor genes, RXRγ, THRβ, SALL3 and ONECUT1 (Week 0-
14; samples from Dr. Valentina Di Foggia) and mature cone photoreceptor genes,
OPN1MW/LW, ARR3 and GNAT2 (Week 0-28). Early markers, RXRγ, THRβ and ONECUT1,
showed a general trend of upregulated expression by Week 14 relative to Week 0,
whereas SALL3 expression showed a clear downregulation by Week 14 (Figure 6.5.A).
Overall the expression of mature genes of cone photoreceptors (OPN1MW/LW, ARR3
and GNAT2) showed a significant increase in expression by Week 14; OPN1MW/LW gene
expression showed the highest upregulation at this timepoint relative to Week 0 out of
all the cone genes analysed (Figure 6.5.B). After Week 14, expression of these markers
plateaued and eventually became downregulated into later stages of culture, between
Week 14-28 (Figure 6.5.B).
Subsequently, immunohistochemistry analysis was performed on hiPSC-derived retinal
differentiation cultures to determine the protein expression of early and late cone
photoreceptor markers. In the human foetal retina, cone photoreceptor antibodies
could only be reliably detected at late stages of development (19pcw), therefore later
stages of culture were selected for this analysis (Week 14 (n=3) and Week 19 (n=3)). At
both differentiation timepoints, cells expressing ONECUT1 signal could be detected with
neuroepithelial structures, however these cells were distributed through the structure
and showed no co-labelling with highly CRX positive cells; the latter were located along
the apical surface of the epithelium (Figure 6.6). Conversely, L/M-OPSIN protein was
detected within cells aligned to the apical surface of a Week 14 neuroepithelial structure
which showed co-labelling with the photoreceptor marker CRX (Figure 6.7.A; white
arrows). However, the L/M-OPSIN staining across vesicle structures was very limited.
Similarly, at the later timepoint of differentiation (Week 19), very limited L/M-OPSIN
expression was observed within cells located close to the basal side of the

180
neuroepithelium, suggestive of cell disorganisation (Figure 6.7.B; white arrows).
Potential L/M-OPSIN staining was also observed within cellular processes throughout
the neuroepithelium (Figure 6.7.B; white arrows). These cells showing L/M-OPSIN
expression at both culture timepoints also appeared immature due to their round cell
morphology, which contrasts to the elongated L/M-OPSIN expressing cells of the 19pcw
human foetal retina (Chapter 3). Dissociating the culture systems at a later stage of
culture (Week 21-26) and applying a different fixation method (4% PFA proceeded by
2%PFA in 30% sucrose; see Methods section 2.17) onto the cells allowed for the
detection of L/M-OPSIN expression (Figure 6.7.C). From counting the L/M-OPSIN/CRX+
cells, approx. 17.56%±17.49 (n=3) of the cultures are positive for these markers at this
later stage. All other cone photoreceptor markers tested (RXRγ, GNAT2, S-OPSIN) could
not be detected via immunohistochemistry or immunocytochemistry analysis (data not
shown).

181

182
Figure 6.5. Transcript analysis of early and late cone photoreceptors with hiPSC-derived retinal differentiation cultures. qPCR was performed to determine the expression of early markers, RXRG, THRB, SALL3 and ONECUT1 (A) and late markers, OPN1MW/LW, ARR3 and GNAT2 (B) within hiPSC-derived retinal differentiation culture samples (Week 0-28). Fold change relative to Week 0. Independent cultures (n=3) were used per timepoint.
Figure 6.6. Protein expression of ONECUT1 within hiPSC-derived retinal differentiation cultures. ONECUT1 protein expression was detected within neuroepithelial structures at Week 14 (A) and Week 19 (B) of differentiation via immunohistochemistry. Scalebar: 50µm

183
Figure 6.7. Protein expression of L/M-OPSIN within hiPSC-derived retinal differentiation cultures. By immunohistochemistry, L/M-OPSIN protein could be detected within neuroepithelium of Week 14 (A) and Week 19 (B) retinal differentiation cultures, however the number of positive cells was limited. (C) L/M-OPSIN and CRX expressing cells could be detected in dissociated retinal differentiation cultures using a different fixation method. Scalebar: 50µm

184
6.2.3. Labelling hiPSC-derived cone photoreceptor using AAV2/9.pR2.1:GFP
reporter system
The immunohistochemistry analysis overall suggested some differentiation of cone
photoreceptors could be achieved using this culture system, particularly from the
upregulation of cone photoreceptor gene expression detected via RT qPCR analysis. To
compare the level of cone photoreceptor transcript expression between hiPSC-derived
and human foetal retina, RT qPCR was performed with OPN1MW/LW, GNAT2 and ARR3
on equivalent stages (12-14pcw/Week 14 of culture and 19-22pcw/Week 20 of cultures)
of in vivo and in vitro-derived retinal samples, which revealed similar levels of expression
(Figure 6.8A-C). For each cone transcript, moderately higher levels of expression within
the human foetal samples at the late timepoint analysed was detected, which was
statistically significant when comparing OPN1MW/LW expression between the 19-
22pcw and Week 20 samples (Figure 6.8.A).
Based on this evidence and the high upregulation of OPN1MW/LW gene, the
AAV2/9.pR2.1:GFP reporter previously characterised to label a population of L/M-opsin
cone photoreceptors within the human foetal retina (Chapter 4) was tested within Week
14-15 and Week 19-20 hiPSC-derived retinal differentiation cultures. At both timepoints,
the AAV2/9.pR2.1:GFP reporter labelled a cell population which could be readily
observed via wholemount microscopy within neuroepithelial patches (Figure 6.9.Ai-ii;
white arrows) or within regions close to optic vesicles (Figure 6.9.Bi-ii; white arrows) 7
days post transduction. The GFP+ expressing cells appeared to be distributed
throughout these patches with limited spatial organisation (Figure 6.9.Aiii and Biii).
Cryosectioning of these structures confirmed the wide distribution of the GFP+ cells
throughout the neuroepithelium (Figure 6.10.A) and revealed some GFP+ cells also
within optic vesicle structures aligning along the top of the outermost surface (Figure
6.10.B; inserts and white arrows).
Immunohistochemistry analysis of the Week 14-15 and Week 19-20 retinal
differentiation cultures revealed all pR2.1.GFP+ cells co-labelled with photoreceptor
markers, CRX and RECOVERIN (Figure 6.11.A and B), while no overlap between GFP+

185
cells and KI67 expression was apparent (Figure 6.11.C) . Immunohistochemistry with the
L/M-opsin antibody was tested on sections in order to assess the degree of GFP+ and
L/M-OPSIN co-localisation, however no reliable L/M-OPSIN staining could be observed.
However, dissociation of a later stage culture (Week 26) using the optimised fixation
method and performed immunocytochemistry with L/M-opsin antibody showed some
co-localisation with GFP+ cells (Figure 6.11.D).
Figure 6.8. Comparative qPCR analysis of hiPSC-derived retinal samples and human foetal retina at age-matched timepoints. Transcript expression of cone photoreceptor markers, OPN1MW/LW (A), ARR3 (B) and GNAT2 (C) were assess via RT qPCR across hiPSC-derived retinal samples and human foetal retina at age-matched timepoints (12-14pcw/Week 14 of culture and 19-22pcw/Week 20 of cultures).

186
Figu
re 6
.9. A
AV2/
.9.p
R2.1
.GFP
+ ce
lls w
ithin
hiP
SC-d
eriv
ed re
tinal
diff
eren
tiatio
n cu
lture
s. T
he A
AV2/
9.pR
2.1.
GFP
repo
rter
labe
ls a
cell
popu
latio
n w
ithin
Wee
k 14
(A) a
nd W
eek
19 (B
) ret
inal
diff
eren
tiatio
n cu
lture
s 7 d
ays a
fter a
dditi
on o
f the
viru
s. G
FP+
cells
are
obs
erve
d w
ithin
re
tinal
pat
ches
(Ai-i
i) or
with
in re
gion
clo
sely
ass
ocia
ted
to o
ptic
ves
icle
s (Bi
-ii).
High
er m
agni
ficat
ion
of G
FP+
cells
show
s diso
rgan
isatio
n w
ithin
st
ruct
ures
(Aiii
and
Biii
).

187
Figure 6.10. hiPSC-derived retinal structures expressing AAV2/9.pR2.1:GFP+ cells. An example of a neuroepithelial structure (A) and an optic vesicle (B) containing GFP+ cells labelled by the AAV2.9.pR2.1:GFP reporter at a Week 14 differentiation timepoint.

188
Figure 6.11. Assessment of specificity of AAV2/9.pR2.1:GFP reporter within hiPSC-derived retinal differentiation cultures. Immunohistochemistry analysis of Week 20 culture shows pR2.1.GFP+ cells co-label with photoreceptor marker CRX (A) and

189
RECOVERIN (B), but are negative for KI67 staining (C). Immunocytochemistry of a late stage cultures (Week 26) reveals some evidence of GFP and L/M-OPSIN co-localisation (D).
6.2.4. Isolation of pR2.1:GFP+ hiPSC-derived cone photoreceptor via FAC-
sorting.
Immunohistochemistry to assess specificity of the reporter virus suggested a cell
population expressing photoreceptor markers, CRX and RECOVERIN, can be labelled
within the hiPSC-derived retinal differentiation culture system. Hence, GFP+ cells were
isolated via FAC-sorting and processed for RNA sequencing in order to compare the
transcriptomes of human foetal and hiPSC-derived cells. Using the same FACS protocol
as previously established for pR2.1:GFP labelled human foetal retina, GFP+ cells from
hiPSC-derived retinal samples at Week 14-15 (n=3) and Week 19-20 (n=3) of
differentiation could be readily isolated using the PerCP-Cy5.5 and FITC-A flow
cytometry cell sorting channels (Figure 6.12.A and B). On average, the proportion of
GFP+ cells isolated was approximately 0.69%±0.27 at earlier timepoints of culture (Week
14-15) which increased slightly to 0.75%±0.78% at the later sample timepoints (Week
19-20; Figure 6.12.C) These proportions yielded approx. 120,428±34,167 GFP+ cells and
69,327±68,782 GFP+ cells for the Week 14-15 and Week 19-20 cultures, respectively.
GFP+ and GFP- cells were collected and prepared for RNA sequencing using the same
methodology as previously described for the human foetal retinal samples (Chapter 4).
Figure 6.12.D shows a representative Bioanalyser trace from assessing the RNA quality
of the hiPSC-derived GFP+ samples, which shows clear peaks for the 5S, 18S and 28S
ribosomal units, suggestive of good RNA quality. Additionally, the average RIN across all
GFP+ samples collected was 7.7 (refer to Appendix Figure 4 for individual sample traces
and RINs).

190
Figure 6.12. Isolation and RNA processing of pR2.1.GFP+ cells from hiPSC-derived retinal differentiation cultures. GFP+ cells labelled by the AAV2/9.pR2.1:GFP reporter within Week 14-15 (A) and Week 19-20 (B) hiPSC-derived retinal differentiation cultures were isolated via FAC-sorting. (C) The graph represents the proportion of hiPSC-derived GFP+ cells isolated via FACS from the early and late culture samples. (D) A representative Bioanalyser trace from assessing the RNA quality of the hiPSC-derived GFP+ samples.

191
6.2.5. Comparative transcriptome analysis of hiPSC-derived and human foetal
pR2.1.GFP+ cells.
Total mRNA sequencing was performed on hiPSC-derived pR2.1.GFP+ samples at Week
14-15 and Week 19-20 using the same technology and criteria established for the
human foetal pR2.1.GFP+ samples to ensure compatibility for downstream analysis. For
the comparative analysis, the in vitro generated hiPSC-derived GFP+ samples and the
bona fide GFP+ samples isolated from the human foetal retina were grouped into ‘early’
(Week 14-15 in vitro, n=3; 10pcw, 11pcw, 12pcw, 14pcw in vivo, n=4) and ‘late’ (Week
19-20 in vitro, n=3; 17pcw, 19pcw, 19pcw, 20pcw in vivo; n=4) categories. Additionally,
isolated GFP- samples (10pcw, 11pcw, 12pcw, 14pcw, 17pcw, 19pcw, 19pcw, 20pcw in
vivo, n=8) and total retina human foetal samples (19pcw, 20pcw in vivo, n=2) were
added to the analysis to assess if the stem cell-derived samples were most similar to the
GFP+ or GFP- human foetal samples.
Firstly, the principal component analysis (PCA) showed human foetal and hiPSC-derived
GFP+ samples cluster together, away from the foetal GFP- and total retinal samples
(Figure 6.13). A double hierarchical clustering was then performed based on the sample
expression of cone, pan and rod photoreceptor genes previously used to define the cone
specificity of the human foetal GFP+ samples (Chapter 4). This revealed all early and late
hiPSC-derived samples clustering together with the human foetal GFP+ samples in the
same branch, showing similarities in their upregulated cone gene expression and low
expression of rod genes (Figure 6.14; rod genes bottom cluster, cone genes top cluster).
Interestingly, within the GFP+ sample branch, all the early and late hiPSC-derived
samples clustered together with the late 17pcw, 19pcw, 20pcw foetal GFP+ samples.
Subsequently, a similar hierarchical clustering analysis was performed with genes
identified from the novel human foetal cone enriched gene signature, previously
described in Chapter 4, which determined genes significantly upregulated within cones
of early, late and both developmental stages. Genes featured within the heatmap
(Figure 6.15) were the most highly expressed and significantly upregulated from the
cone-enriched gene signature. The analysis reveals the hiPSC-derived GFP+ samples
showed distinct similarities in their gene expression profiles for genes enriched in the
late foetal GFP+, which is responsible for their clustering within the GFP+ samples
branching (Figure 6.15; top gene cluster; right hand side). No early enriched cone genes
showed high expression within the hiPSC-derived GFP+ samples (Figure 6.15; second

192
cluster; right hand side) and the remaining late cone enriched genes (third cluster; right
hand side) and the common cone enriched genes (forth cluster; right hand side) formed
clusters at the bottom of the heatmap due to their lower expression within the hiPSC-
derived GFP+ samples.
Figure 6.13. Principal component analysis of foetal and hiPSC-derived samples. An unbiased principal component analysis was performed based on all normalised gene reads for each sample, which shows 2 clustering groups; i) the GFP+ samples (red, grey, pink and brown data points) and ii) the GFP- and total retina samples (dark blue, green, light blue).

193
Figure 6.14. Hierarchical clustering with human foetal and hiPSC-derived retinal sample based on photoreceptor genes. Heatmap representation from hierarchical clustering analysis performed with all human foetal samples (early and late GFP+ and GFP-; total retina) and hiPSC-derived GFP+ samples based on normalised expression of cone, pan and rod photoreceptor genes.

194
Figu
re 6
.15.
Hie
rarc
hica
l clu
ster
ing
with
hum
an fo
etal
and
hiP
SC-d
eriv
ed re
tinal
sam
ples
bas
ed o
n hu
man
foet
al c
one
gene
sign
atur
e.
Heat
map
repr
esen
tatio
n of
hie
rarc
hica
l clu
ster
ing
perf
orm
ed w
ith a
ll hu
man
foet
al sa
mpl
es (e
arly
and
late
GFP
+ an
d GF
P-; t
otal
retin
a) a
nd
hiPS
C-de
rived
GFP
+ sa
mpl
es b
ased
on
prev
ious
ly d
efin
ed h
uman
foet
al c
one
gene
sign
atur
e (fe
atur
ed in
Cha
pter
4)

195
6.2.6. Assessment of cone CD marker expression within hiPSC-derived
pR2.1.GFP+ cells.
Having demonstrated the similarities in the transcriptomes of human foetal and hiPSC-
derived pR2.1.GFP+ cells, the gene expression profile of the cell surface markers used to
isolate human foetal L/M-opsin cone photoreceptors were assessed within the retinal
differentiation culture system. Expression of the CD markers identified from flow
cytometry analysis using the foetal pR2.1:GFP+ samples were firstly investigated at the
transcriptome level. Hierarchical clustering analysis revealed hiPSC-derived pR2.1:GFP+
cells cluster together with the later foetal samples based on the expression of CD
markers (Figure 6.16) . Intriguingly, this revealed very similar expression levels of DPP4
(CD26) and ITGA3 (CD49c) between the later foetal and all hiPSC-derived GFP+ sample.
However, the hiPSC-derived GFP+ samples also share common CD marker expression
with early foetal GFP+ samples, as demonstrated by B3GAT1 (CD57) and THY1 (CD90) on
the heatmap (Figure 6.16). Lower expression of PROM1 (CD133) was observed within
the hiPSC-derived samples compared to the foetal GFP+ samples, whereas conversely
TNFRSF1A (CD120a) and SLC3A2 (CD98) showed the opposite trend with higher gene
expression within the stem cell-derived GFP+ samples (Figure 6.16). Other CD markers
showed more exclusive expression to the late hiPSC-derived samples, such as CD81 and
CD151, or to the early hiPSC-derived samples, including CD59 and CD63 (Figure 6.16).
The remaining CD marker genes (CD147;BSG, CD147, CD200 and CD47) showed
moderate and varied expression across GFP+ samples.
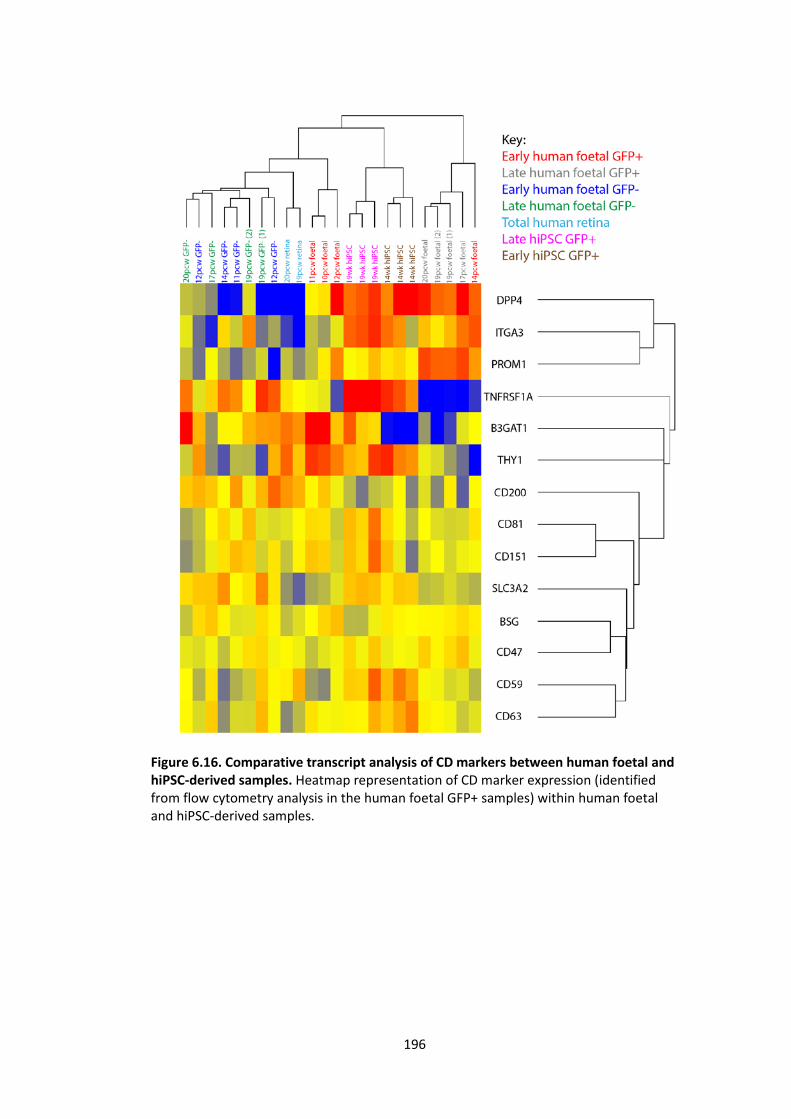
196
Figure 6.16. Comparative transcript analysis of CD markers between human foetal and hiPSC-derived samples. Heatmap representation of CD marker expression (identified from flow cytometry analysis in the human foetal GFP+ samples) within human foetal and hiPSC-derived samples.

197
Due to similarities in CD marker expression being observed between hiPSC-derived and
foetal GFP+ samples, the protein expression of CD markers used to isolate human
developing L/M-opsin cones (CD26, CD133, CD147 and SSEA1) was subsequently
investigated via flow cytometry (Figure 6.17 and 6.18). Due to the limited expression of
L/M-OPSIN being detected within the differentiation cultures, the pR2.1:GFP reporter
was added to the cultures (Figure 6.17) before flow cytometry experiments to allow for
a read out of the number of pR2.1.GFP+ cells shifted by each CD markers. Expression of
all 4 CD markers could be observed within the late hiPSC-derived retinal differentiation
cultures (Week 21-26, n=3); CD26 labelling 38.5%±5.0, CD133 labelling 80.8%±2.0,
CD147 labelling 12.38%±9.7, and SSEA1 labelling 61.5%±8.3 of the total cell population
(Figure 6.17.C and Figure 6.18.A). CD26 and CD133 both showed a strong labelling of the
pR2.1.GFP+ cells, 67.2%±3.6 and 85.1%±11.4, respectively (Figure 6.17.Ci and ii; Figure
6.18.B), whereas a smaller proportion of pR2.1.GFP+ cell were labelled by CD147,
32.8%±19.2 (Figure 6.17.Ciii; Figure 6.18.B). Contrasting to the flow cytometry data of
SSEA1 showing no labelling of foetal pR2.1.GFP+ cells, SSEA1 labelled a moderate
proportion of hiPSC-derived pR2.1.GFP+ cells, 34.0%±15.8 (Figure 6.17.Civ; Figure
6.18.B).

198
Figure 6.17. Protein expression of CD markers, CD26, CD133, CD147 and SSEA1 within the iPSC-derived retinal differentiation cultures. (A) The initial starting population of cells was gated based on previous flow cytometry of human foetal retina. Only single cells were investigated within this analysis. (B) The pR2.1.GFP reporter was added to the retinal differentiation cultures in order to assess CD marker labelling within this cone-like cell population. (Ci-iv) Gates to detect CD marker+ cells were setup using unstained control cells. Representative traces are shown for each of the CD markers demonstrating the shifts observed from the total cell population analysed or within the pR2.1.GFP+cell population.

199
Figure 6.18. Percentage of cells labelled by CD markers within hiPSC-derived retinal differentiation cultures. (A) Percentage of cells labelled within total retinal differentiation samples and (B) within pR2.1.GFP+ cell population.
A
B

200
Flow cytometry analysis was performed to assess the stem cell-derived populations
labelled by combining the CD markers together (Figure 6.19). This revealed that the
majority of SSEA1 cells are either CD133+ or CD26+, and only a very small population is
positive for both CD133 and CD26 (Figure 6.19.Bii). Assessing the expression of CD147
within the CD26+ (Figure 6.19.Ciii) or CD133+ (Figure 6.19.Civ) cell populations revealed
an absence or a very small shifting of cells when applying the CD147 fluorescence
channel. Populations were analysed without the SSEA1 selection and within the SSEA1+
cell population, however the relationship between the CD133+, CD26+ and CD147+ cell
populations remained the same (data not shown). Together, this suggested the cone CD
marker isolation strategy, established within the foetal retina, could not be translated
into this hiPSC-derived retinal differentiation culture system. This could be due to the
limited cone maturation observed from using this hiPSC line or from the differentiation
culture protocol used.
Subsequently, the cone CD marker sorting strategy was tested within retinal cultures
derived from hESCs through collaboration with Dr. Anai Gonzalez-Cordero. These
cultures were generated using a retinal differentiation culture system with greater
evidence of cone differentiation and maturation (Gonzalez-Cordero et al., 2017). Late
stage cultures between 17-18 weeks of differentiation were used due to cone
enrichment being observed from a similar timepoint within the human foetal retina.
Although L/M-OPSIN is readily detected within hESC-derived retinal sections (Gonzalez-
Cordero et al., 2017), the initial testing of the L/M-OPSIN immunocytochemistry
protocol used for counting cone photoreceptors within the human foetal retinal
populations post-sorting showed a lack of staining within dissociated hESC-derived
retinal cells (data not shown). Immunocytochemistry with the cone arrestin antibody
however showed a very clear labelling of cells, which additionally co-labelled with CRX.
Hence for downstream analysis post cell sorting, the cone arrestin and CRX antibodies
were used in combination for detecting hESC-derived cone photoreceptor enrichment.
Immunocytochemistry analysis revealed co-labelling of CD26, CD133 and CD147
expression within CONE ARRESTIN positive cells (Figure 6.20.A). However, not all CONE
ARRESTIN expressing cells co-localised with the CD markers and CD marker expression
was observed in other cells negative for CONE ARRESTIN staining (Figure 6.20.A). Within
FAC-sorting experiments combining the CD markers together, very similar flow
cytometry traces to those obtained for the human foetal retinal samples were observed,
201
including the detection of the SSEA1-/CD133+/CD26+/CD147+ cell population (Figure
6.20.Bi-iii). Between experiments, it was noted that the expression of CD147 was
sometimes very low in the SSSEA1-/CD133+/CD26+/CD147+ cell population (average no.
of collected cells was 18,026±18,329), and therefore a small population of cells were
collected, which was considered when interpreting the downstream counting analysis.
From plating down the sorted cell populations and performing CONE ARRESTIN/CRX
immunocytochemistry, an enrichment of cone photoreceptors was observed within the
SSEA1-/CD133+/CD26+/CD147 (55.01%±30.65) which was overall statistically significant
(p value<0.003) compared to the unsorted (8.42%±3.14) and the other collected cell
populations (SSEA1-/CD133-/CD26-/CD147- 3.71%±1.17; SSEA1-/CD133+/CD26-/CD147
2.29%±0.8; SSEA-1+ 2.36%±1.98; Figure 6.20.C).

202
Figure 6.19. Flow cytometry analysis of cone CD marker combination within hiPSC-derived retinal differentiation cultures. (A) Representative traces to show retinal cell population and the single cells within this population used for analysis. For the combination, SSEA1 was applied first and negative cells were gated on (Bi) within this population, CD133 and CD26 were applied (Bii). Gates for CD147 analysis with CD26 and CD133 were drawn based on the unstained control (Ci-ii); this revealed no cell populations positive for CD26/CD147 or CD133/CD147 (Ciii-iv).

203
Figure 6.20. Flow cytometry analysis of cone CD marker combination within hESC-derived retinal differentiation cultures. (A) Representative images of CD markers and cone arrestin immunocytochemistry with 17.5wk hESC-derived retinal differentiation culture. (Bi-iii) Representative FACS traces from sorting 17-18wk hESC-derived retinal differentiation cultures (n=3); red boxes indicate the cell populations of interest. (C) Immunocytochemistry and counting CONE ARRESTIN/CRX+ cells shows an enrichment of stem cell-derived cones. Statistical test: ANOVA with Bonferroni multiple correction test, adjusted p value<0.003.

204
6.3. Summary of findings • Using a 3D retinal culture system, optic vesicles were generated from hiPSCs
containing photoreceptor cells from Week 6 of differentiation.
• Gene expression of cone photoreceptor markers was upregulated within the
differentiation cultures, with OPN1MW/LW expression showing the highest
upregulation by Week 14 relative to Week 0. ONECUT1 and L/M-OPSIN protein
expression could be detected at Week 14 and 19 timepoints, however limited
antibody signal of other cone makers was detected.
• The AAV2/9.pR2.1:GFP reporter system labelled a hiPSC-derived cell population
expressing CRX, RECOVERIN and L/M-OPSIN. Transcriptome analysis revealed
these cells express similar levels of established cone genes to those identified
within the human foetal GFP+ samples.
• Analysis of the human cone-enriched gene signature within the transcriptome of
hiPSC-derived GFP+ samples suggested these cells are at an intermediate stage
of cone differentiation.
• Applying the foetal cone CD marker cell sorting strategy within the hiPSC-
derived retinal differentiation cultures failed to show cone photoreceptor
enrichment. However, applying the sorting strategy to hESC-derived retinal
cultures with enhanced cone maturation showed significant enrichment of stem
cell-derived cone photoreceptors compared to the unsorted cell population.
6.4. Discussion The data in this chapter provide a novel comparative analysis of equivalent stem cell-
derived and human foetal cone cell populations isolated using the AAV2/9.pR2.1:GFP
reporter system. Previous studies have demonstrated the recapitulation of retinal
differentiation from human stem cell sources by selecting progressive timepoints of
culture and assessing the expression of markers that characterise the different events of
human retinogenesis (Meyer et al., 2009, Nakano et al., 2012). However, this is the first
time an isolated human foetal cone population and an equivalent population from hPSC-
derived retinal cultures have been cross-referenced at age-matched timepoints, with the
analysis revealing similarities in their cone gene expression profiles and CD marker
expression.

205
6.4.1. Assessment of cone photoreceptor differentiation from hiPSC-derived
retinal cultures
The purpose of generating stem cell-derived cone photoreceptor cells in this study was
to determine their authenticity for use within a cell replacement therapy by assessing
their ability to recapitulate the human foetal cone photoreceptors based on their
transcriptomic features and level of enrichment using a foetal-developed cone CD
marker sorting strategy. Due to the therapeutic nature of these aims, a retinal
differentiation protocol was used based on the work of Meyer et al., 2009, which
provides a system which would be cost effective and easy to scale up towards
developing a photoreceptor cell source for clinical therapy. To increase the number of
optic vesicles and photoreceptors available within the cultures, structures were cultured
adherently instead of mechanically lifting. This was due to the observation in some
initial experiments which showed the remaining tissue not mechanically lifted at Day 16
and cultured further, still led to the formation of optic vesicles or generated patches of
ocular tissue containing CRX+RECOVERIN+ cells. This suggested the potential to generate
photoreceptor cells was present within the surrounding tissue, normally discarded in the
Meyer et al., 2009, which could be used advantageously to maximise the production of
these cells. Additionally, it was proposed that the endogenous signalling and interaction
between the surrounding tissue and optic vesicles was useful to support cell survival and
differentiation within the adherent culture, as tissues and organs in vivo do not develop
in isolation.
This culture system showed a promising upregulation of cone photoreceptor transcripts
from Week 0-Week 14 of differentiation and demonstrated comparable levels of cone
gene expression when compared to human foetal retina at equivalent stages of
development. However within later stages of culture (post Week 14), cone gene
expression for the mature markers of cone differentiation (OPN1MW/LW, ARR3 and
GNAT2) showed of levels of downregulation relative to Week 0 and this was coupled
with the limited detection of cone protein expression. This overall suggested cone
photoreceptor differentiation occurs up to Week 14 but then fails to further mature.
This delay in maturation could also be reflected within the transcriptome analysis of
hiPSC-derived cone cells when compared to the equivalent human foetal cones.
Promisingly, genes previously characterised to late foetal GFP+ cones with the cone-
enriched gene signature demonstrated very similar expression profiles within the hiPSC-

206
derived GFP+ samples (21 out of 37 genes), whereas genes defined to the early foetal
GFP+ cones were less expressed in the hiPSC-derived samples. However, not all of the
foetal late and common enriched cone genes showed comparable expression profiles
within the hiPSC-derived GFP+ samples, suggesting an intermediate differentiation stage
of the stem cell-derived cells with additional levels of maturation required.
During the time course of this study, protocols based on the Meyer et al., 2009
differentiation system with added modifications to enhance the differentiation and
maturation of photoreceptors were published. This included the Zhong et al., 2014
protocol, which uses the same initial steps to induce early neural and retinal
differentiation including the embryoid body and neural rosette formation, but leaves the
neural rosette structures adherent for a longer period before lifting the structures later
between Day 21-28. Later stages of the protocol integrate aspects of the Nakano et al.,
2012 protocol, which includes the addition of exogenous growth factors including
taurine, retinoic acid and foetal bovine serum during different time-windows of culture
to promote cell survival and differentiation. Overall, this led to advanced maturation of
photoreceptors cells with some evidence of light-sensitive outer segments within
stratified optic vesicle structures and strong expression of mature photoreceptor
markers, such as RHODOPSIN, S-OPSIN, L/M-OPSIN at advanced stages of culture (Week
21; Zhong et al., 2014). This provides an improved retinal organoid protocol that would
be interesting to use for further transcriptome analysis of stem cell-derived cone
photoreceptors. Other highly relevant recent studies in relation to the work of this
thesis chapter include reports of enhancing the generation of cone photoreceptors
through modulating the supplementation of exogenous factors added to the culture
media at different timepoints of culture (Zhou et al., 2015, Kruczek et al., 2017).
Specifically, the addition of the BMP, Wnt and TGFβ antagonist recombinant protein,
COCO, and the IGF-1 protein was demonstrated to enhance S-cone cell differentiation,
generating 60-80% of hESC-derived S-cones within 4-5 weeks of cultures, which could be
altered through the addition of thyroid hormone to encourage S-opsin cone transition
into S/M-opsin expressing cells (Zhou et al., 2015). In prolonged cultures, this
differentiation culture system led to the formation of self-organised and polarised 3D
cone photoreceptor sheets, therefore the addition of COCO and IGF-1 was tested within
the differentiation protocol used within this doctoral study in order to improve cone
photoreceptor differentiation (data not shown). However, comparative RT qPCR and

207
immunohistochemistry analysis of cultures between the COCO and the original
differentiation samples showed no differences in cone gene or protein expression. More
recently, Kruczek et al., 2017 demonstrate within mouse retinal organoid cultures that
early inhibition of Notch signalling pathway, when cone genesis is still ongoing, through
the addition of DAPT facilitates increases S-cone photoreceptor differentiation, while
cone maturation is regulated through short exposure periods of retinoic acid. This
culture system gives further insight into signalling molecules that are important for
regulating cone photoreceptor differentiation and assessing their modulation within a
human in vitro system could be used to enhance cone photoreceptor differentiation.
6.4.2. Assessment of isolating stem cell-derived cone photoreceptors for cell
replacement therapy
The data of this chapter provides the first evidence of human cone photoreceptor
enrichment from a stem cell-derived retinal differentiation culture system using a CD
marker cell isolation strategy. Towards isolation of hiPSC-derived cone photoreceptors,
CD markers identified within the human foetal proteomic analysis were also observed
labelling cell populations within the retinal differentiation culture system. To assess the
proportion of L/M-opsin cone photoreceptors labelled, the AAV2/9.pR2.1:GFP reporter
was added to the cultures prior to CD marker sorting, however, this may not have
provided the optimal readout of L/M-opsin cone cells as the human foetal analysis
indicated a low efficiency of cone cell labelling. Despite the low number of GFP+ cells
labelled within the differentiation cultures, this population was still observed on the
FACS traces, which revealed CD133, CD26 and CD147 labelling of the cells of interest.
This additionally included SSEA1, which contrasts to the CD marker analysis of
pR2.1.GFP+ cone cells within the human foetal retina. Combining the CD markers
together showed an overall mutually exclusive relationship for the positive CD marker
selection, particularly for CD133 and CD26, which suggests the sorting strategy
developed within the human foetal retina, cannot be translated into the hiPSC-derived
retinal differentiation system. However, using hESC line and a retinal differentiation
system based on the Reichman et al., 2014 and Zhong et al., 2014 protocols
demonstrating a high level of cone photoreceptor maturation (Gonzalez-Cordero et al.,
2017), revealed strikingly similar FAC-sorting traces and cell populations which were
observed to mimic those obtained within the human foetal retina. Additionally, a higher
percentage of CONE ARRESTIN/CRX expressing cells could be achieved within the SSEA1-

208
/CD133+/CD26+/CD147+ population showing an average specificity of 55.07%±30.66,
which was statistically significant compared to the unsorted and other cell populations
collected. Calculating the efficiency and yields of stem cell-derived cone photoreceptors
(defined as CONE ARRETIN+/CRX+ cells) isolated using this CD marker strategy overall
revealed further optimisation is required in order to provide a robust cone enrichment
approach for clinical translation. The number of cone photoreceptor cells within the
starting population, as estimated from cell counting from the unsorted cell population,
was approximately 421,235±97,945 cells from 15-20 optic vesicles, which showed
overall less variability between biological replicates compared to the human foetal
samples. Applying the cone CD marker sorting strategy, SSEA1/CD133/CD26/CD147,
allowed for the isolation of 6,449±4655 cone cells, which demonstrated only a fraction
of the total cone population was isolated using this method. Similar to the foetal sorting
experiments, antibody addition was a limitation of this approach and therefore it was
not possible to use the entire cell sample. With unlimited availability of antibodies and
use of the whole sample, it was estimated the maximum number of cone cells that could
be isolated is 8,171±5897, which gives an efficiency of approximately 2.28%±2.10 for
this CD marker combination. In order to achieved the standard 200,000 cells that has
been previously used for mouse photoreceptor transplantation studies, the
differentiation culture starting material would have to be scaled up 24 fold in order to
obtain enough cells for one transplantation application into one eye. The use of this
combination strategy could still be feasible, especially if future advancements in retinal
organoid cultures allowed for the generation of a higher number of optic vesicles
manipulated to produce a larger number of cone photoreceptor cells. However, further
work into improving the efficiency and yield of this method, without compromising the
cone cell specificity, would still be highly useful.
The discrepancy observed when applying the CD marker sorting strategy to hiPSC and
hESC-derived retinal differentiation cultures could be due to the cell line variability,
which has been previously described and suggested to impact the retinal differentiation
process and photoreceptor cells generated (Wiley et al., 2016; Meyer et al., 2009;
Hirami et al., 2009). Additionally, the differences between the retinal differentiation
culture systems used to generate the hiPSC and hESC-derived cones could have
additionally affected their CD marker expression profiles, therefore leading to different
outcomes during the FAC-sorting. An alternative approach which may be more effective

209
in providing enrichment of stem cell-derived cones, is to firstly establish the CD marker
sorting approach within the stem cell-derived retinal differentiation culture, which can
be validated within the foetal samples through a secondary assessment. This has been
demonstrated within a study which describes the generation of a CD marker
(CD73/CD29/SSEA1) cell sorting strategy to enrich for stem cell-derived photoreceptor
precursor cells, before applying to human foetal retinal samples to assess if the same
level of photoreceptor enrichment can be achieved (Dr. Jorn Lakowski, unpublished).
From the CD marker transcriptome analysis performed within this chapter, some CD
markers were identified which showed more specific expression to the hiPSC-derived
GFP+ samples, including markers such as CD59 and CD63. Assessment of these CD
markers at the protein level using flow cytometry and FAC-sorting analyses could reveal
additional novel cell surface marker combinations that can be used to isolate stem cell-
derived cone photoreceptors from retinal differentiation cultures.

210
7. Final discussion 7.1. Main findings and summary of this PhD thesis:
Cone photoreceptors are critical for optimal daylight vision and despite the loss of these
cells having the greatest impact on sight during retinal degenerations, there has been a
lack of therapeutic advancements towards directly restoring cone cells when compared
to the achievements made for rod cell repair. This is particularly true for the L-opsin and
M-opsin cones, which form 90% of the total human cone photoreceptor population and
are the only photoreceptors present in the fovea, the retinal region responsible for high
visual acuity. Within this thesis, the overall aims of the study were tailored towards
addressing key questions that remained largely unexplored in relation to developing a
stem cell-derived cone cells replacement therapy for retinal dystrophies. The first
question relates to defining the transcriptome of bona fide human developing cone
photoreceptors, which holds key information about cone gene expression profiles
during human retinogenesis. These transcriptome advances will not only aid in the
discovery of novel regulatory gene candidates that could be involved in early cone
specification, they will provide a baseline gene expression reference of a human cone
population. This directly relates to the second question, which is to evaluate the
similarities in gene expression profiles of stem cell-derived cone photoreceptors and
bona fide human cone photoreceptors. A comparative transcriptome analysis will allow
for the pre-clinical assessment of stem cell-derived cones for use in a human clinical
therapy, as these cells are expected to follow a similar development trajectory to human
foetal cone cells. The final translational question involves addressing whether a stem
cell-derived cone photoreceptor population can be isolated from retinal differentiation
cultures without the use of transgenic reporters and genetic modifications, which is a
critical aspect required for the progression of a clinical therapy into patients.
To address these questions, this study firstly analysed a selected panel of cone
photoreceptor markers, based on previous literature of animal model and human retinal
studies, within the human foetal retina in Chapter 3. A previous observation of a centro-
peripheral gradient of maturation occurring across the developing human retina was
validated within this study, which was found to directly affect cone photoreceptor
development. Transcription factors and markers of cone photoreceptors known to be
involved in early cone development within the mammalian retina were also detected

211
within the early human foetal retina at the transcript level, which suggest these factors
may have a conserved role within the human retina. Based on these data, fluorescent
reporter constructs were generated and tested using a human foetal retinal explant
culture system within Chapter 4, in order to label human cone photoreceptors. The
previously characterised pR2.1 gene promoter (Nathans et al., 1986; Wang et al., 1992)
provides specific fluorescent reporter signal to human L/M-opsin expressing cones when
delivered to the human retina using an adeno-associated virus 2/9. This is the first time
a human foetal cone population has been successfully labelled using a fluorescent
reporter. For this study, the reporter facilitated the isolation of these cells for
transcriptome analysis, however these findings also demonstrate the feasibility of using
this gene promoter in human gene therapy approaches. Using total and single cell RNA
sequencing technologies, this study provided the first insight into the human foetal L/M-
opsin cone transcriptome, which led to the identification of a novel cone-enriched gene
signature, including genes upregulated in early, late and at both development
timepoints. This not only led to the exploration of novel genes that could play an
important role in L/M-opsin cone photoreceptor development, but the validation of
known cone photoreceptor genes previously established within animal model studies.
The single cell RNA seq data also revealed that there is a subtle heterogeneity of this
cone population based on cell maturity which can be observed based on the gene
expression profiles of individual cone cells. This led to the hypothesis that at a single
developmental timepoint of the retina, individual cone cells exist at different stages of
maturity, which are representative of their true developmental trajectory as these data
are consistent with the maturation differences occurring across the centro-peripheral
axis of the human foetal retina. These findings contribute towards the basic biology of
human developing cone photoreceptors. Additionally, these transcriptome data were
also used to identify the expression of the cell surface marker genes expressed within
foetal L/M-opsin cone photoreceptors. Combined with a proteomic approach via flow
cytometry, in Chapter 5 a cell surface marker combination was identified that led to the
significant enrichment of human foetal L/M-opsin cones when compared to the
unsorted retinal cell population. This provides a proof-of-concept that a human cone
photoreceptor population can be enriched using cell surface marker monoclonal
antibodies and FACS, which is highly applicable towards developing cell isolation
strategies for clinical therapy.

212
Applying this baseline foetal transcriptomic and cell surface marker expression data to
retinal organoids derived from hPSC in Chapter 6, similarities in cone gene expression
and cone cell enrichment post cell sorting were demonstrated between bona fide and
stem cell-derived cone photoreceptors. This is the first time an isolated human cone
photoreceptor population and an equivalent stem cell-derived cone population have
been directly compared, which led to the conclusion that cone photoreceptors derived
human stem cell sources would require further differentiation/maturation in order to be
used within a human clinical therapy. The comparative data demonstrated an
intermediate level of cone photoreceptor differentiation was achieved within the retinal
differentiation cultures of this study, but ideally highly comparable gene expression
between stem cell-derived and human foetal cone photoreceptors would need to be
demonstrated for cone cell transplantation into the patient. Additionally, the
differences observed regarding the level of cone cell enrichment achieved through CD
marker sorting with hiPSC and hESC-derived retinal cultures highlights important
practical issues regarding variations between stem cell lines, which need to be
addressed for cell replacement therapy. This includes understanding whether common
protocols of photoreceptor differentiation and CD marker cell isolation can be applied to
different human stem cell lines or whether these protocols need to be optimised and
tailored for each patient cell line, which would lead to a personalised medicine
approach.
Therefore, the main findings of this thesis are:
• The human developing retina features a gradient of maturation occurring across
the centro-peripheral axis, which affects cone photoreceptor differentiation.
• The AAV2/9.pR2.1:GFP reporter specifically labels L/M-opsin cone
photoreceptors in the human developing retina and a cone-like photoreceptor
cell population in iPSC-derived retinal differentiation culture system, which
facilitated their isolation via FACS.
• Genes enriched within early foetal L/M-opsin cones, late foetal L/M-opsin cones
and in both populations were identified, which defines a cone-enriched gene
signature. Applying the cone-enriched gene signature onto the transcriptome of
an equivalent iPSC-derived cell population demonstrates an intermediate level
of cone differentiation.

213
• A combination of CD marker antibodies can provide enrichment of L/M-opsin
cone photoreceptors from the human retina at a later foetal timepoint. Applying
the same combination to a later stage of ESC-derived retinal differentiation
culture system also provides enrichment of cone photoreceptor cells.
Future considerations arising from the findings of this study regarding cone cell
transplantation therapy include the optimisation of cone differentiation from human
stem cell cultures, improving the efficiency of the cell surface marker sorting
combination in order to obtain increase the yield of isolating a pure population of cone
cells, in addition to defining the optimal ontogenetic stages of stem cell-derived human
cone photoreceptors for transplantation, all of which will be further discussed in Section
7.2 of this chapter. Additionally, the transcriptome and cell surface markers applications
developed within this study could also be useful for in vitro modelling of retinal
dystrophies and screening of small drug compounds within retinal organoid cultures
assessing cone gene expression and defining mechanisms of disease.
7.2. Future considerations for therapies of retinal dystrophies
A recent report from the Monaciano Symposium (Thompson et al., 2015) details the key
priorities that need to be addressed in order to progress gene and cell therapies for
retinal dystrophies for patient use, which were collated by international scientists and
clinicians. These included: i) the better understanding of the disease mechanisms
causing photoreceptor degeneration during retinal dystrophies; ii) providing widely
available access to genetic testing to allow for earlier therapeutic intervention; iii)
refining the genotype-phenotype relationships in retinal dystrophies to help generate
criteria for patients suitable for clinical trials; iv) defining the therapeutic window for
implementing treatment to ensure optimal therapeutic outcome and v) improving and
standardising outcome measures post intervention. A common theme noted within the
discussions related to the preservation and restoration of cone photoreceptor
functioning, due their critical role in optimal daylight vision. For later stages of retinal
dystrophies or for cone-rod dystrophies where cone cell loss is inevitable, there will be a
need for a cell replacement therapy approach. However, combining this with therapies
to promote rod photoreceptor survival can be used to preserve the health of cone
photoreceptors, as previous studies have demonstrated the presence of the rod-derived
cone viability factor (Leveillard et al., 2004, Mohand-Said et al., 2000).

214
7.2.1. iPSC disease modelling to identify disease mechanisms and novel
therapeutic target
Within the context of the findings of this thesis and with reference to new recent studies
within the current literature, greater understanding of disease mechanisms and
assessing the optimal therapeutic intervention period are critical and require further
exploration. There are now approximately over 200 disease causing genes linked to
inherited retinal dystrophies (RetNet, http://www.sph.uth.tmc.edu/RetNet/ (Daiger,
1998) and characterisation of the normal gene function has allowed for prediction of the
arising phenotype in the disease causing state. However, the pathogenic pathways
which are associated with the mutated genes and the exact molecular mechanisms
involved leading to photoreceptor degeneration remains to be fully elucidated.
The use of small animal models have been pivotal towards unravelling these
mechanisms of retinal degeneration, but there are a lack of models which reliably
recapitulate properties of human photoreceptor cells, including their spatial
distribution, the cone-rich foveal region and presence of a L-opsin cone cell type.
Ground-breaking studies detailing the generation of iPSCs (Takahashi et al., 2006,
Takahashi et al., 2007) has opened the revolutionary possibility to derive tissue/cells of
interest from reprogrammed patient somatic cells, which provides a unique opportunity
to accurately model the cellular phenotype caused by the genetic mutation of the
patient and address outstanding questions regarding mechanisms of disease with
photoreceptor and RPE cells which contribute to the clinical phenotype. Once better
understood and therapeutic targets have been identified, these systems also provide a
platform for drug screening and treatment testing, in addition to offering a unique
alternative to animal models and allows for the significant reduction of animal models
utilised within this research area. Recently, studies within the field have started to
demonstrate the potential of iPSC disease modelling by performing retinal and/or RPE
differentiations with patient-derived iPSC lines, including retinitis pigmentosa (Schwarz
et al., 2015), enhanced S-cone syndrome (Wiley et al., 2016) and Leber congenital
amaurosis (Parfitt et al., 2016). Importantly, these studies were able to define cellular
defects within additional cell types which suggest photoreceptor cells may not be the
primary source of pathology. For example, Schwarz et al., 2015 report the lack of RP2
protein expression with both patient fibroblast cells and iPSC-derived RPE, affecting
pericentriolar vesicle trafficking and intracellular flagellar transport within the RPE cells,

215
and therefore may contribute to the loss of photoreceptor cells within this form of X-
linked retinitis pigmentosa. Parfitt et al., 2016 also demonstrate defects within patient-
derived RPE cells and retinal organoids due to abnormal CEP290 gene splicing causing a
lack of ciliogenesis, which has a more severe phenotype within the photoreceptor cells
compared to the RPE cells. After defining the aberration, both studies apply therapeutic
strategies such as translational read-through inducing drugs (TRIDS) (Schwarz et al.,
2015) or antisense morpholino (Parfitt et al., 2016) to demonstrate rescue of the disease
phenotype.
Another promising approach that can be explored therapeutically is the CRISPR/Cas9
genome editing technique (Cong et al., 2013, Mali et al., 2013), which can allow for
precise genetic manipulation by using homology directed repair. This can be achieved
through the delivery of the Cas9 enzyme with guide RNAs and a repair template, or by
activating/repressing target genes using an inactive Cas9 enzyme (unable to cleave DNA)
with guide RNAs to bind to transcriptional activation or repressor sites to effect the
downstream expression of the gene (Ran et al., 2013). The CRISPR/Cas9 system has
already been explored within the retinal disease modelling field through the generation
of mouse models for retinitis pigmentosa (Arno et al., 2016) and LCA (Zhong et al.,
2015), which further highlights the wide and exciting applications of these novel tools to
further understand disease mechanisms. Further characterisation is required to
understand the off target effects associated with this tool, but so far many advantages
have been highlighted when contrasted to other genome editing tools, including zinc
finger nucleases and transcription activator-like effector nucleases (Ran et al., 2013).
Additionally, it is likely future disease modelling studies will utilise the advancing
transcriptome technologies, particularly RNA sequencing, in order to determine
mechanisms of disease within patient iPSC-derived retinal tissue. Hence the novel
human LM-opsin cone-enriched gene signature defined within this study can be used as
a baseline reference for better defining any differences between bona fide cones and
those generated from patient iPSCs.
7.2.2. Feasibility of advancing cell replacement therapy to treat retinal
dystrophies
Over the last decade, significant progress has been made towards therapy development
for retinal dystrophies, particularly for gene therapy and RPE transplantation therapy.

216
With both approaches now progressing into clinical trials (see Introduction section 1.7.),
advances in cell replacement therapy still needs to be addressed. In light of the new
material transfer discovery (Pearson et al., 2016; Santo-Ferreira et al., 2016), which in
itself represents a novel mechanism to be explored therapeutically, rationales for
utilising photoreceptor transplantation are now focused on using this strategy for late
stages of retinal degenerations, where there is an absence of photoreceptors in the
outer nuclear layer. It is likely that patients fitting these criteria will be the first to
receive the cell replacement therapy within a clinical trial setting, although future
studies will need to better define the optimal time window for therapeutic intervention
which would preferably be at an earlier stage of disease progression to prevent
extensive loss of vision.
7.2.2.1. Generation of clinical grade photoreceptors for from stem cell sources
There are many factors which still require further development before progressing into
human clinical therapy. This begins with addressing the primary stem cell source to be
used for this approach which needs to be i) cultured in xeno-free conditions without the
use of animal derived reagents during maintenance, freezing and expansion procedures
and ii) for iPSC sources, these need to be generated using a fast, efficient and cost
effective approach through an exogenous DNA integration free method to guarantee
genomic stability (Unger et al., 2008, Health)(U.S. Food and Drug Administration
www.fda.gov/Drugs/ScienceResearch/default.htm). Moving towards this goal,
maintenance culture conditions of human stem cells can be moved from irradiated
mouse embryonic feeder layers to basement membrane matrices, including Matrigel
and Geltrex to support stem cell growth, however these still include extracts of
sarcomas from Engelbreth-Holm-swarm mice and can have batch-to-batch variation.
More feasible options of stem cell culturing have now become available, including the
use of recombinant vitronectin, laminin and fibronectin alongside the use of
complimentary media such as Essential 8 and Nutristem, which have a completely
defined reagent composition to promote less variability between cultures (Wiley et al.,
2016). Non-integrative DNA-based methods of iPSC derivation using xeno-free GMP
conditions have now been established (Schlaeger et al., 2015) including Sendai-virus
(Wang et al., 2011), episomal (Awe et al., 2013) and mRNA transfection (Warren et al.,
2012), which should be used as part of a standard protocol to generate high quality
iPSCs for use towards a cell replacement therapy.

217
Many of these cell culturing procedures are also applicable to the retinal differentiation
system in which the photoreceptor cells are generated. Many protocols rely on the
addition of foetal bovine serum or Matrigel in order to enhance retinal organoid
lamination and promote photoreceptor cell survival (Nakano et al., 2012; Zhong et al.,
2014). Recent modifications to retinal differentiation protocols to become compliant
with GMP procedures (Wiley et al., 2016) or without the use of Matrigel (Kuwahara et
al., 2015) have now been demonstrated. Wiley et al., 2016 demonstrate the generation
of GMP grade xeno-free retinal organoids which differentiate to express photoreceptor
cell markers (e.g. NR2E3, NRL, S-OPSIN), while Kuwahara et al., 2015 show the formation
of retinal organoids containing a ciliary margin zone in the peripheral retina through
inducing neural retina-RPE junctions by using a transient treatment of low concentration
of BMP4. These studies provide important progress towards the criteria needed for
therapeutic application, however these protocols in addition to many others in the
current literature demonstrate the long culture period of differentiation (21 weeks)
required in order to achieve some level of photoreceptor maturation. The fast, efficient
and robust generation of photoreceptor cells is a critical requirement needed to make a
success of cell replacement therapy, however this is yet to be achieved. This will require
a good compromise between the quality of the cells produced, the cost effectiveness of
the whole procedure and the speed at which the cells can be produced, due to the
necessary scale up required for cell therapy. Every established retinal differentiation
culture system has their own advantages and disadvantages towards these
requirements, with some requiring less external supplementation of growth factors and
physical manipulation (Meyer et al., 2009), whereas others show better lamination of
retinal organoid structures using more labour intensive protocols which make use of
small molecules cocktails (Nakano et al., 2012).
The generation of photoreceptor cells reliably featuring fully developed outer segments
requires further exploration; however, whether this is a critical requirement necessary
for cell transplantation remains to be investigated. Recent studies have already begun to
demonstrate the formation of mature photoreceptors featuring outer segments can be
achieved through manipulation of the differentiation culture conditions, including
hypoxia culturing at earlier stages and/or supplementation of media with exogenous
factors at later stages (Wahlin et al., 2017, Parfitt et al., 2016). However, previous
studies defining the appropriate cell stages of donor photoreceptors cells for

218
transplantation to promote the optimal therapeutic outcome in mouse models of retinal
dystrophies define a population of immature photoreceptor cells at the precursor cell
stage as being able to survive in vivo and provide partial restoration of vision, compared
to progenitor stages or mature cell stages (MacLaren et al., 2006; Pearson et al., 2012).
Finding the equivalent optimal cell stage within the human system, particularly for those
cells which have been generated from stem cell sources, still remains to be defined, but
it could be possible that the full maturation of photoreceptor cells in vitro is not a
necessary requirement for cell transplantation purposes. In fact, some studies show
levels of further maturation of photoreceptor cells, including the formation of outer
segment-like structures, can be acquired after transplantation in vivo and therefore the
host environment may play an important role in this process (Shirai et al., 2016,
Gonzalez-Cordero et al., 2013). Studies have already achieved hESC-derived
photoreceptor cell transplantation by introducing cell suspensions subretinally into
murine retinal degenerating model (Lamba et al., 2009) or via retinal tissue grafts into
nude rat or primate retinal degenerating models (Shirai et al., 2016). However, further
definition of the number of photoreceptors required in order to restore sufficient vision
and the photoreceptor yields that need to be obtained from stem cell-derived retinal
differentiation are both essential requirements.
7.2.2.2. Effective isolation strategy for stem cell-derived photoreceptors
The early differentiation of cone photoreceptor cells within stem cell-derived retinal
organoid cultures and the potentially smaller number of cells required to achieve a
marked therapeutic outcome increases the feasible of using cone photoreceptor
transplantation to treat patients with cone targeted degenerations such as AMD. This
directly relates to the strategies of photoreceptor cell isolation, which will require a
robust and efficient method for human clinical applications. In addition to providing high
enrichment of photoreceptor cells without the need for genetic manipulation, it will be
important to further characterise potential contaminating cells of the isolated
population post-sorting, particularly when isolating stem cell-derived photoreceptors
from complex heterogeneous culture systems. A cell sorting strategy that ensures the
removal of potentially harmful mitotically active cells will be crucial, as transplantation
of these cells can lead detrimental complications, such as tumourgeneity, which is highly
undesirable. The cone photoreceptor cell surface marker sorting work demonstrated
within this thesis, alongside additional work with hPSC-derived photoreceptor precursor

219
cells (Dr. Jorn Lakowski, unpublished), has provided important evidence demonstrating
levels of enrichment of human photoreceptor cell populations can be achieved using a
combined panel of CD markers. Regarding the cone photoreceptor CD marker isolation
strategy, further work is required towards improving the scale and efficiency of the
approach in order to achieve high yields of pure cone photoreceptors. Further
optimisations include characterising the enriched cell population post sorting for
proliferation markers and rod photoreceptor markers in order to determine the identity
of the cone photoreceptor marker negative cells, in addition to testing more
combinations of CD markers identified from the cone transcriptome and proteomic
datasets for positive enrichment of cone cells, but also negative cell selection to further
deplete unwanted contaminating cells.
7.2.2.3. Optimal delivery of stem cell-derived photoreceptors
Once a robust method of cell isolation can be achieved, efforts towards improving the
success of cell delivery will be another important step. Efficacy assessment of the
delivery approach used with the current RPE transplantation clinical trials in relation to
safety and tolerance will be highly important to consider in order to guide optimal
clinical outcome after photoreceptor transplantation. It will be necessary to establish if a
cell suspension, retinal sheets or cells grown with a biodegradable scaffold, can provide
long term efficacy post transplantation and whether the delivery of these cells alongside
substrates, such as poly (L-lactic acid) and poly(lactic-co-glycolic acid), are required to
reduce adverse immunological responses, fibrosis and retinal detachment (Tomita et al.,
2005). Even substrates which can be exploited in order to increase the chances of
photoreceptor survival and differentiation post transplantation (Tucker et al., 2010)
could be a useful avenue to explore. Ultimately, a combination therapy approach could
also be a feasible treatment option for some patients while progress is still being made
with cell replacement strategies; preventive therapies such as gene therapy or drug
administration are likely to be employed first, with additional therapies, including RPE or
photoreceptor cell transplantation, being used in combination or a secondary therapy to
rescue vision within patients.

220
8. Appendix
8.1. Appendix Figures
Appendix Figure 1. Screenshots of PDF reports generated from the Vista Gateway alignment tool for identifying potential cone gene promoter regions. Chromosome number and position were submitted for each human cone gene (THRB2 (A) and RXRG (B); OPN1SW (C), GNAT2 (D) continued on the next page) in addition to selecting the comparative genome which would allow for the identification of regions of high homology; for this analysis the mouse genome was selected for comparison. This generates an annotated schematic of the human gene of interest and highlights the gene exons (purple peaks) and regions of conserved non-coding sequences (CNS) with the mouse genome (red peaks). Regions around the exon1 of the gene and the immediate 5’ upstream region were analysed for conserved regions, which used to design the cone gene promoter.

221
Appendix Figure 1 (continued). Screenshots of PDF reports generated from the Vista Gateway alignment tool for identifying potential cone gene promoter regions. OPN1SW (C), GNAT2 (D) plots continued from previous page.

222
Appendix Figure 2: Cloning strategy for generating cone fluorescent reporter constructs. (A) Primer pairs were designed for each cone gene promoter region (THRβ2 (2405bp), GNAT2 (2966bp), RXRγ (2404bp) and OPN1SW (3711bp), which were successfully amplified from gDNA via PCR amplification. (B) Gene promoter fragments were then cloning into the pGEM vector to allow for sticky end cloning into fluorescent constructs. Restriction digests were performed on minipreps in order select constructs with correct promoter orientation; bands with white arrows signify the correct orientation. (C) The gene promoters and the fluorescent (GFP/DsRed) reporter were digested to obtain sticky ends before extracting from the agarose gel for downstream ligation. (D) Correct band sizes were obtained from restriction digest of final fluorescent protein vectors THRβ2.GFP, RXRγ.DsRED and GNAT2.GFP constructs.
3087bp 2320bp
3415bp 2560bp
3030bp 1977bp 1707bp
2405bp 4000bp
2406bp 4000bp
2966bp 4000bp
2966bp 4000bp
3200bp 2100bp

223
Appendix Figure 3: RNA seq quality control check of samples pre and post alignment. (A) Quality control summary table of RNA samples using Illumina RNA-Seq alignment tool. (B and C) Representative pre and post-alignment assessment of samples within Strand NGS software, including base and read quality, alignment score, match count, match status and read length distribution.

224
Appendix Figure 4: Quality control check of RNA quality and concentration from human foetal retinal samples. Output traces from Bioanalyser or Tapestation for (A) human foetal samples and (B) hiPSC-derived retinal differentiation samples. These shows peak present for all samples at the 18S and 28S sizes. Height of peak is dependent on RNA concentration, therefore peaks are low because of the low concentration, but are still present.

225
Appendix Figure 5. Primary step of QC for single cell RNA seq analysis: Library size, mitochondrial and ERCC spike in control quality check. Graph showing total counts, total features, proportion of ERCC spike-ins and mitochondrial genes, which were used to identify outliers and facilitate their removal.

226
Appendix Figure 6. Final QC step for single cell RNA seq analysis: Filtering of genes based on mean count. The mean count of each gene across all cells was calculated and a threshold applied in order to select relevant genes. This led to the selection of 19,650 out of 55,627 genes.

227
Appendix Figure 7. Using a mean-variance trend to remove technical noise within single cell RNA seq analysis. A mean-variance trend was fitted to the spike-in (red dots) expression counts for each cell, which should not deviate between cells. If there is deviation, this determines the technical noise to which the biological variation and endogenous gene expression (blue line) can be calculated. The graph shows a good coverage of spike-ins across the mean expression values, and therefore is a reliable method to use to estimate the biological variation.

228
8.2. Appendix Tables
Appendix Table 1. Top 50 significantly upregulated genes in late human foetal GFP+ samples (GFP+ vs GFP-). Log2 fold changes, adjusted p-values (p-adj), and normalised fragments are provided for each genes. All genes are shown are significantly upregulated (p-adj<0.05) and are ordered based on log2 fold change, from highest to lowest value.

229
Appendix Table 2. Top 50 significantly upregulated genes in early human foetal GFP+ samples (GFP+ vs GFP-). Log2 fold changes, adjusted p-values (p-adj), and normalised fragments are provided for each genes. All genes are shown are significantly upregulated (p-adj<0.05) and are ordered based on log2 fold change, from highest to lowest value.

230
Appendix Table 3. Top 50 significantly upregulated genes in late human foetal GFP+ samples (late GFP+ vs early GFP+). Log2 fold changes, adjusted p-values (p-adj), and normalised fragments are provided for each genes. All genes are shown are significantly upregulated (p-adj<0.05) and are ordered based on log2 fold change, from highest to lowest value.

231
Appendix Table 4. Top 50 significantly upregulated genes in early human foetal GFP+ samples (early GFP+ vs late GFP+). Log2 fold changes, adjusted p-values (p-adj), and normalised fragments are provided for each genes. All genes are shown are significantly upregulated (p-adj<0.05) and are ordered based on log2 fold change, from highest to lowest value.

232
Appendix Table 5. Top 50 differentially expressed genes in pR2.1:GFP+ single cells correlated to PC1.

233
93 overlapping genes (cone-enriched gene signature and single cell genes)
UGCG CTD-2034I21.1 PTPN3
RCBTB1 PRCD RP1L1
MYL4 C10orf10 FABP12
CNGB1 SLITRK6 ANKRD33
SLC38A5 ZDBF2 CACNA2D4
TMX4 HEG1 GUCA1A
FASN WWP1 WFDC1
AMN1 ELOVL4 NME1
MFSD11 C16orf74 RHOBTB1
MPP4 STX3 CCDC148
RAB41 AMPH SNCB
CNGB3 TNC SPECC1
USP32 SLC29A4 ARFGEF1
RP11-883G14.1 CC2D2A
RD3 AC007349.7
TRPC7 CKMT1B
ENAH NSF
CROT RP11-538I12.3
DUSP26 PLA2G5
CTD-2521M24.11 THBS4
SAMD7 SLC38A3
RRAD AGL
OPN1MW LEMD1
FMN1 ARL6IP5
SNAP25 AKAP9
RP1 RP11-379K17.4
PCBP3 PRR15
NEDD4L RP4-536B24.2
SLC1A2 CKMT1A
KIF21A OPN1LW
PDE6H NIPAL3
TMEM244 MAP2
ENO2 SPON2
BMP7 ABCA4
ARR3 RGS9
VTN IMPG1
TPM1 GUCA1C
RS1 FAM124A
MEGF9 GAS7
LINC00575 RTBDN
Appendix Table 6. 93 overlapping genes between cone-enriched gene signature and significantly differentially expressed genes from single cell RNA Seq.

234
Putative early cone cell surface molecules Name Gene name CD marker name ATP-binding cassette sub-family G member 4 ABCG4
Acid-sensing ion channel 1 ASIC1
Adenylate cyclase type 1 ADCY1 Adenylate cyclase type 5 ADCY5 Anoctamin-2 ANO2 B-lymphocyte antigen CD19 CD19 CD19 Beta-secretase 1 BACE1 Calsyntenin-1 CLSTN1 Contactin-associated protein-like 5 CNTNAP5 Delta-sarcoglycan SGCD Dipeptidyl peptidase 4 DPP4 CD26 Dopamine beta-hydroxylase DBH
Embigin EMB Excitatory amino acid transporter 2 SLC1A2 Excitatory amino acid transporter 5 SLC1A7 Extended synaptotagmin-3 ESYT3 Gamma-aminobutyric acid receptor subunit rho-2 GABRR2
Gap junction delta-2 protein GJD2 Glutamate receptor ionotropic, kainate 4 GRIK4 Glycerophosphodiester phosphodiesterase domain-containing protein 5
GDPD5
Glypican-5 GPC5 Immunoglobulin superfamily member 1 IGSF1 Immunoglobulin superfamily member 21 IGSF21 Integrin alpha-4 ITGA4 CD49d Junctional adhesion molecule B JAM2 CD322 Junctophilin-3 JPH3 Kremen protein 2 KREMEN2
Leucine-rich repeat and fibronectin type-III domain-containing protein 2
LRFN2
Leucine-rich repeat and fibronectin type-III domain-containing protein 3
LRFN3
Leucine-rich repeat, immunoglobulin-like domain and transmembrane domain-containing protein 2
LRIT2

235
Leucine-rich repeat, immunoglobulin-like domain and transmembrane domain-containing protein 3
LRIT3
Long-wave-sensitive opsin 1 OPN1LW
Membrane transport protein XK XK Membrane-spanning 4-domains subfamily A member 6A
MS4A6A CD20L3
Mesothelin MSLN Metabotropic glutamate receptor 6 GRM6
Metal transporter CNNM4 CNNM4
Monocarboxylate transporter 7 SLC16A6
Monocyte to macrophage differentiation factor 2 MMD2
Multiple epidermal growth factor-like domains protein 9
MEGF9
Muscarinic acetylcholine receptor M4 CHRM4 NIPA-like protein 2 NIPAL2 Netrin-G2 NTNG2 Neurotrimin NTM Olfactory receptor 11H4 OR11H4 Olfactory receptor 1N2 OR1N2 Olfactory receptor 8A1 OR8A1
Palmitoyltransferase ZDHHC2 ZDHHC2
Plexin domain-containing protein 1 PLXDC1
Potassium channel subfamily T member 2 KCNT2
Potassium voltage-gated channel subfamily B member 1
KCNB1
Potassium voltage-gated channel subfamily B member 2
KCNB2
Potassium voltage-gated channel subfamily C member 4
KCNC4

236
Potassium voltage-gated channel subfamily F member 1
KCNF1
Potassium voltage-gated channel subfamily G member 2
KCNG2
Potassium voltage-gated channel subfamily H member 6
KCNH6
Potassium voltage-gated channel subfamily V member 2
KCNV2
Potassium/sodium hyperpolarization-activated cyclic nucleotide-gated channel 1
HCN1
Probable G-protein coupled receptor 62 GPR62 Probable phospholipid-transporting ATPase IA ATP8A1
Probable phospholipid-transporting ATPase IB ATP8A2
Probable phospholipid-transporting ATPase IH ATP11A
Progressive ankylosis protein homolog ANKH
Prominin-1 PROM1 CD133
Protein FAM57B FAM57B
Protein jagged-2 JAG2 Protocadherin alpha-13 PCDHA13 Protocadherin alpha-C2 PCDHAC2 Rhomboid-related protein 1 RHBDL1
SLIT and NTRK-like protein 6 SLITRK6 Seizure protein 6 homolog SEZ6 Semaphorin-6D SEMA6D
Short transient receptor potential channel 7 TRPC7
Signal-regulatory protein beta-1 SIRPB1 CD172b
Sodium channel subunit beta-1 SCN1B Sodium channel subunit beta-3 SCN3B Sodium- and chloride-dependent taurine transporter
SLC6A6
Sodium-coupled neutral amino acid transporter 5 SLC38A5

237
Sodium/potassium/calcium exchanger 2 SLC24A2 Sodium/potassium/calcium exchanger 4 SLC24A4
Solute carrier family 12 member 5 SLC12A5
Solute carrier family 2, facilitated glucose transporter member 11
SLC2A11
Solute carrier family 2, facilitated glucose transporter member 9
SLC2A9
Solute carrier family 23 member 2 SLC23A2
Solute carrier family 26 member 10 SLC26A10
Solute carrier family 40 member 1 SLC40A1
Somatostatin receptor type 5 SSTR5
Synapse differentiation-inducing gene protein 1 SYNDIG1
Synaptic vesicle 2-related protein SVOP
Synaptic vesicle glycoprotein 2B SV2B Synaptophysin SYP
Syntaxin-3 STX3
Tetraspanin-18 TSPAN18
Tetraspanin-9 TSPAN9
Transient receptor potential cation channel subfamily V member 2
TRPV2
Transmembrane protein 132C TMEM132C
Trimeric intracellular cation channel type A TMEM38A
Vesicular glutamate transporter 1 SLC17A7 Zinc transporter ZIP5 SLC39A5
Appendix Table 7. Putative cone cell surface molecules identified in early foetal GFP+ samples.

238
Putative late cone cell surface molecules Name Gene name CD marker name 1-phosphatidylinositol 4,5-bisphosphate phosphodiesterase eta-2
PLCH2
ATP-binding cassette sub-family G member 4
ABCG4
Acid-sensing ion channel 1 ASIC1 Adenylate cyclase type 1 ADCY1 Adenylate cyclase type 9 ADCY9 Anion exchange protein 2 SLC4A2 Anoctamin-2 ANO2 B-lymphocyte antigen CD19 CD19 Beta-secretase 1 BACE1 CD302 antigen CD302 CD302 Calsyntenin-1 CLSTN1 Cation channel sperm-associated protein 2 CATSPER2
Choline transporter-like protein 1 SLC44A1 CD92 Contactin-1 CNTN1 Contactin-associated protein-like 2 CNTNAP2 Contactin-associated protein-like 5 CNTNAP5 Delta-sarcoglycan SGCD
Delta-type opioid receptor OPRD1 Dipeptidyl peptidase 4 DPP4 CD26 Ectonucleoside triphosphate diphosphohydrolase 8
ENTPD8
Embigin EMB Ephrin type-A receptor 10 EPHA10 Equilibrative nucleoside transporter 4 SLC29A4 Erythroid membrane-associated protein ERMAP Excitatory amino acid transporter 2 SLC1A2 Excitatory amino acid transporter 5 SLC1A7 Fibronectin type-III domain-containing transmembrane protein C1orf233
FNDC10
Frizzled-4 FZD4 CD344
Gamma-aminobutyric acid receptor subunit gamma-2
GABRG2
Gap junction delta-2 protein GJD2

239
Glutamate receptor ionotropic, kainate 4 GRIK4
Glycerophosphodiester phosphodiesterase domain-containing protein 5
GDPD5
Glypican-5 GPC5 H(+)/Cl(-) exchange transporter 3 CLCN3
H(+)/Cl(-) exchange transporter 4 CLCN4 Immunoglobulin superfamily DCC subclass member 3
IGDCC3
Immunoglobulin superfamily DCC subclass member 4
IGDCC4
Immunoglobulin superfamily member 21 IGSF21
Integral membrane protein 2C ITM2C
Integral membrane protein GPR155 GPR155
Integrin alpha-4 ITGA4 CD49d Interleukin-13 receptor subunit alpha-1 IL13RA1 CD213a1 Junctional adhesion molecule B JAM2 CD322 Junctophilin-3 JPH3 Kremen protein 2 KREMEN2 Leishmanolysin-like peptidase LMLN Leucine-rich repeat and fibronectin type-III domain-containing protein 2
LRFN2
Leucine-rich repeat and immunoglobulin-like domain-containing nogo receptor-interacting protein 3
LINGO3
Leucine-rich repeat, immunoglobulin-like domain and transmembrane domain-containing protein 1
LRIT1
Leucine-rich repeat, immunoglobulin-like domain and transmembrane domain-containing protein 3
LRIT3
Leucine-rich repeat-containing protein 8B LRRC8B
Lipoma HMGIC fusion partner-like 3 protein
LHFPL3
Lipoma HMGIC fusion partner-like 4 protein
LHFPL4

240
Long-wave-sensitive opsin 1 OPN1LW
Matrix metalloproteinase-15 MMP15
Medium-wave-sensitive opsin 1 OPN1MW
Membrane transport protein XK XK
Mesothelin MSLN
Metabotropic glutamate receptor 6 GRM6 Metal transporter CNNM4 CNNM4
Mitochondrial Rho GTPase 2 RHOT2
Monocarboxylate transporter 7 SLC16A6
Monocyte to macrophage differentiation factor 2
MMD2
Multidrug resistance-associated protein 5 ABCC5
Multiple epidermal growth factor-like domains protein 9
MEGF9
Muscarinic acetylcholine receptor M4 CHRM4 NIPA-like protein 2 NIPAL2 NIPA-like protein 3 NIPAL3 Natural cytotoxicity triggering receptor 3 ligand 1
NCR3LG1
Netrin-G2 NTNG2 Neurensin-2 NRSN2 Neuronal acetylcholine receptor subunit alpha-3
CHRNA3
Neuronal acetylcholine receptor subunit beta-2
CHRNB2
Neuronal acetylcholine receptor subunit beta-4
CHRNB4
Neutral amino acid transporter A SLC1A4 Palmitoyltransferase ZDHHC2 ZDHHC2 Peripherin-2 PRPH2
Phosphatidylinositol N-acetylglucosaminyltransferase subunit Q
PIGQ

241
Podocalyxin PODXL Potassium channel subfamily K member 15 KCNK15
Potassium channel subfamily T member 2 KCNT2
Potassium voltage-gated channel subfamily B member 1
KCNB1
Potassium voltage-gated channel subfamily B member 2
KCNB2
Potassium voltage-gated channel subfamily C member 4
KCNC4
Potassium voltage-gated channel subfamily F member 1
KCNF1
Potassium voltage-gated channel subfamily G member 2
KCNG2
Potassium voltage-gated channel subfamily H member 6
KCNH6
Potassium voltage-gated channel subfamily S member 2
KCNS2
Potassium/sodium hyperpolarization-activated cyclic nucleotide-gated channel 1
HCN1
Probable G-protein coupled receptor 27 GPR27 Probable cation-transporting ATPase 13A2 ATP13A2
Probable phospholipid-transporting ATPase IA
ATP8A1
Probable phospholipid-transporting ATPase IB
ATP8A2
Probable phospholipid-transporting ATPase IH
ATP11A
Probable phospholipid-transporting ATPase IIA
ATP9A
Progestin and adipoQ receptor family member 9
PAQR9
Progressive ankylosis protein homolog ANKH
Prominin-1 PROM1 CD133 Protein ELFN1 ELFN1 Protein FAM57B FAM57B Protein jagged-2 JAG2 Protocadherin alpha-13 PCDHA13 Protocadherin alpha-C1 PCDHAC1

242
Protocadherin alpha-C2 PCDHAC2 Proton-coupled folate transporter SLC46A1 Putative tetraspanin-19 TSPAN19 RELT-like protein 2 RELL2 Receptor-type tyrosine-protein phosphatase N2
PTPRN2
Receptor-type tyrosine-protein phosphatase-like N
PTPRN
Reticulon-4 receptor-like 1 RTN4RL1 Retinal guanylyl cyclase 1 GUCY2D Rhomboid-related protein 1 RHBDL1 Roundabout homolog 2 ROBO2 SLIT and NTRK-like protein 6 SLITRK6 Scavenger receptor cysteine-rich type 1 protein M130
CD163 CD163
Secretin receptor SCTR Secretory carrier-associated membrane protein 5
SCAMP5
Seizure protein 6 homolog SEZ6 Semaphorin-4B SEMA4B Semaphorin-6D SEMA6D Sialin SLC17A5 Sodium channel subunit beta-3 SCN3B Sodium- and chloride-dependent taurine transporter
SLC6A6
Sodium-coupled neutral amino acid transporter 3
SLC38A3
Sodium-coupled neutral amino acid transporter 5
SLC38A5
Sodium/calcium exchanger 1 SLC8A1 Sodium/potassium-transporting ATPase subunit alpha-3
ATP1A3
Sodium/potassium/calcium exchanger 2 SLC24A2 Sodium/potassium/calcium exchanger 4 SLC24A4 Solute carrier family 12 member 5 SLC12A5 Solute carrier family 12 member 6 SLC12A6 Solute carrier family 13 member 2 SLC13A2 Solute carrier family 2, facilitated glucose transporter member 11
SLC2A11
Solute carrier family 23 member 2 SLC23A2 Solute carrier family 26 member 10 SLC26A10 Solute carrier family 40 member 1 SLC40A1 Solute carrier family 46 member 3 SLC46A3

243
Solute carrier organic anion transporter family member 4A1
SLCO4A1
Somatostatin receptor type 5 SSTR5 Sterol regulatory element-binding protein cleavage-activating protein
SCAP
Sushi domain-containing protein 2 SUSD2 Synapse differentiation-inducing gene protein 1
SYNDIG1
Synaptic vesicle 2-related protein SVOP Synaptic vesicle glycoprotein 2B SV2B Synaptogyrin-1 SYNGR1 Synaptophysin SYP Synaptotagmin-14 SYT14 Synaptotagmin-4 SYT4 Syndecan-2 SDC2 CD362 Syntaxin-3 STX3 Tetraspanin-13 TSPAN13 Tetraspanin-33 TSPAN33 Tetraspanin-7 TSPAN7 CD231 Tetraspanin-9 TSPAN9 Thrombopoietin receptor MPL CD110 Transient receptor potential cation channel subfamily V member 2
TRPV2
Transmembrane protein 127 TMEM127 Transmembrane protein 132C TMEM132C Transmembrane protein 151A TMEM151A Transmembrane protein 151B TMEM151B Transmembrane protein 164 TMEM164 Transmembrane protein 175 TMEM175 Transmembrane protein 8A TMEM8A Trimeric intracellular cation channel type A TMEM38A
Tyrosine-protein phosphatase non-receptor type substrate 1
SIRPA CD172a
UNC93-like protein MFSD11 MFSD11 Vesicular glutamate transporter 1 SLC17A7 Voltage-dependent calcium channel gamma-4 subunit
CACNG4
XK-related protein 4 XKR4 Zinc transporter ZIP5 SLC39A5
Appendix Table 8. Putative cone cell surface molecules identified in late foetal GFP+ samples.

244
8.3. Appendix vector sequences
GTCGAC= SaII enzyme restriction site (from pGEM cloning vector)
CTGCAG= PstI enzyme restriction site (from pGEM cloning vector)
GCGGCCGC= NotI enzyme restriction site (from pGEM cloning vector)
GAATTC= EcoRI enzyme restriction site (from pGEM cloning vector)
ACTAGT= SpeI enzyme restriction site (from pGEM cloning vector)
CCGCGG= SacII enzyme restriction site (from pGEM cloning vector)
tgccagt….= human RXRγ promoter sequence (5’ directly upstream of ATG)
aattgct…= human THRβ2 promoter sequence (5’ directly upstream of ATG)
cagaag…= human OPN1SW promoter sequence (5’ directly upstream of ATG)
ggatcacc…=human GNAT2 promoter sequence (5’ directly upstream of ATG)
ATGGCCT…= DsRed sequence (from Nrl.DsRed construct purchased from Addgene,
generated by the Connie Cepko group)
ATGGTG…=GFP sequence (from EF.GFP construct purchased from Addgene, generated
by the Connie Cepko group)
TTACCAAT…= Ampicillin sequence (Addgene vector)
ATGAGCAC…= AmpR (p10-2.1-eGFP vector)
All vector sequences are read 5’-3’
8.3.1. RXRγ.DsRed construct sequence
GTCGACCTGCAGGCGGCCGCGAATTCACTAGTGATTtgccagtatcatgaggctgtaagcagcggaacagggatttgtacccagcaatgttggcttgtgagttggtgagttggtgcttttactatacatatagcctttcaaggccatataactagtgagtagcagagcaaagtgtctaaggcactaatgaatggactttttagtgatataagatgttgtctttgctatgtctatgtcaacatttttatcaatgagtcgaataagatatgaaaaagcagttcatcagattttcagaagtcatgaaataagggtatgaataagaaatattttggacaacagaagcaggatcctaaaagatttgggatgatgaatgaagccaaaaagttttaacttcagaggaatataggaagcatttcatgtaggtcccaaaaccaattgcccaaggatgggatgaagaatatgcataagagaacacaacttaggggaggtaggggtggggagatttttatcgagttagttctacatgaattaacatgcagagctgcccacctaatgcaagtgagcaaatggtcctcctgtattctatattacttatgtccactggactctcatcccagcaacagtcaaggcagctctgggctctccaaagctctttacagtgaaggcctggatatttcttcctcctttgtgacatgcttttgctttgattccccattttggcctcctcctttgtcatcatgactttgttcctgactctggtcttttattctacgtttttgttttggcttctcctagcatttgaatcttgattttttactctgggaccctgatttgacttacctctctggctctctatgtcttatgctgcatcaggagaaaatctcttatcttttttccagcccaacagagctcagcccatgaaacggaccttcaatgggtatgttgacagcaccccatcaccgtgccaacacatataccatgaggaaaaggtttggaccatatctggagtattgcatccaagtctggccaacccccttcctcactgtgagggtatctatgtaaactgaagtacattattagaaaaaggataggttgggaatagacatgaacccttggtgatacatagaattactgaaagagccagagatgcctagggaaagggggattatgggcacagcagatcaatctcaggatttgcagaggatcccactgtgaaagacttttttgtctttcaggcttctcttgtgtggcccctgggagcagtctagcacctgtgggcagaagctgtagggaaaaggagcagattttatctctataagaaa
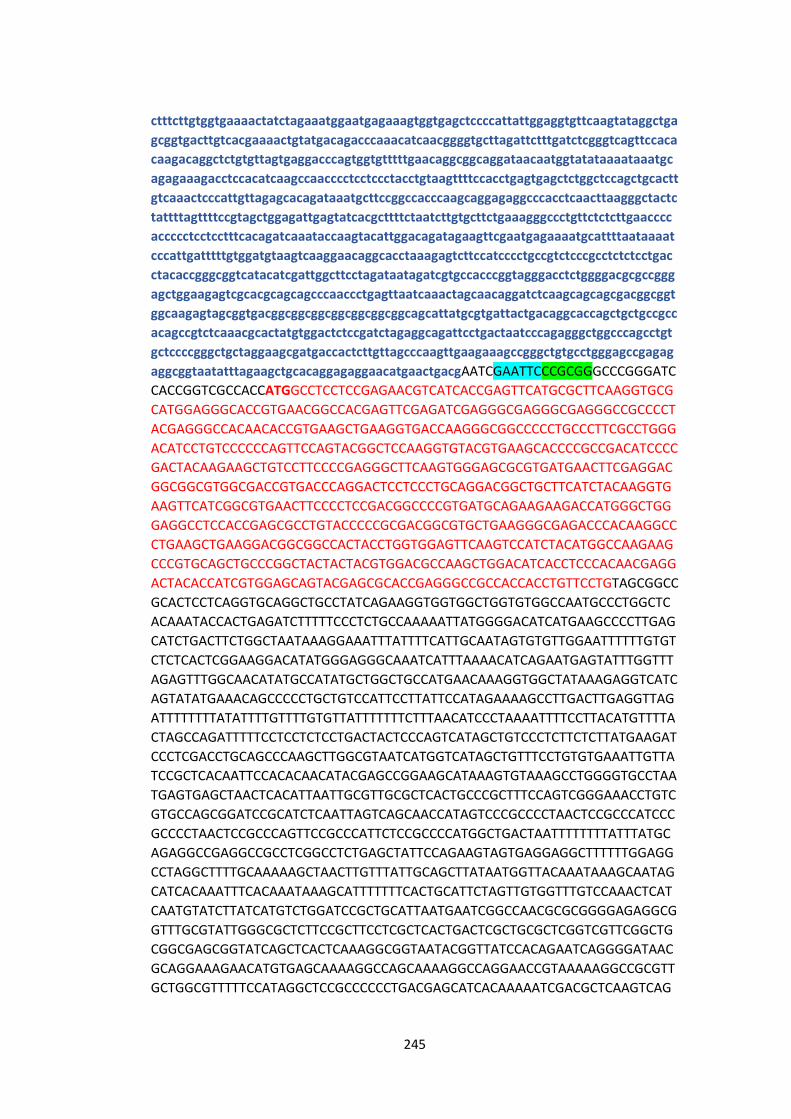
245
ctttcttgtggtgaaaactatctagaaatggaatgagaaagtggtgagctccccattattggaggtgttcaagtataggctgagcggtgacttgtcacgaaaactgtatgacagacccaaacatcaacggggtgcttagattctttgatctcgggtcagttccacacaagacaggctctgtgttagtgaggacccagtggtgtttttgaacaggcggcaggataacaatggtatataaaataaatgcagagaaagacctccacatcaagccaacccctcctccctacctgtaagttttccacctgagtgagctctggctccagctgcacttgtcaaactcccattgttagagcacagataaatgcttccggccacccaagcaggagaggcccacctcaacttaagggctactctattttagttttccgtagctggagattgagtatcacgcttttctaatcttgtgcttctgaaagggccctgttctctcttgaaccccaccccctcctcctttcacagatcaaataccaagtacattggacagatagaagttcgaatgagaaaatgcattttaataaaatcccattgatttttgtggatgtaagtcaaggaacaggcacctaaagagtcttccatcccctgccgtctcccgcctctctcctgacctacaccgggcggtcatacatcgattggcttcctagataatagatcgtgccacccggtagggacctctggggacgcgccgggagctggaagagtcgcacgcagcagcccaaccctgagttaatcaaactagcaacaggatctcaagcagcagcgacggcggtggcaagagtagcggtgacggcggcggcggcggcggcggcagcattatgcgtgattactgacaggcaccagctgctgccgccacagccgtctcaaacgcactatgtggactctccgatctagaggcagattcctgactaatcccagagggctggcccagcctgtgctccccgggctgctaggaagcgatgaccactcttgttagcccaagttgaagaaagccgggctgtgcctgggagccgagagaggcggtaatatttagaagctgcacaggagaggaacatgaactgacgAATCGAATTCCCGCGGGCCCGGGATCCACCGGTCGCCACCATGGCCTCCTCCGAGAACGTCATCACCGAGTTCATGCGCTTCAAGGTGCGCATGGAGGGCACCGTGAACGGCCACGAGTTCGAGATCGAGGGCGAGGGCGAGGGCCGCCCCTACGAGGGCCACAACACCGTGAAGCTGAAGGTGACCAAGGGCGGCCCCCTGCCCTTCGCCTGGGACATCCTGTCCCCCCAGTTCCAGTACGGCTCCAAGGTGTACGTGAAGCACCCCGCCGACATCCCCGACTACAAGAAGCTGTCCTTCCCCGAGGGCTTCAAGTGGGAGCGCGTGATGAACTTCGAGGACGGCGGCGTGGCGACCGTGACCCAGGACTCCTCCCTGCAGGACGGCTGCTTCATCTACAAGGTGAAGTTCATCGGCGTGAACTTCCCCTCCGACGGCCCCGTGATGCAGAAGAAGACCATGGGCTGGGAGGCCTCCACCGAGCGCCTGTACCCCCGCGACGGCGTGCTGAAGGGCGAGACCCACAAGGCCCTGAAGCTGAAGGACGGCGGCCACTACCTGGTGGAGTTCAAGTCCATCTACATGGCCAAGAAGCCCGTGCAGCTGCCCGGCTACTACTACGTGGACGCCAAGCTGGACATCACCTCCCACAACGAGGACTACACCATCGTGGAGCAGTACGAGCGCACCGAGGGCCGCCACCACCTGTTCCTGTAGCGGCCGCACTCCTCAGGTGCAGGCTGCCTATCAGAAGGTGGTGGCTGGTGTGGCCAATGCCCTGGCTCACAAATACCACTGAGATCTTTTTCCCTCTGCCAAAAATTATGGGGACATCATGAAGCCCCTTGAGCATCTGACTTCTGGCTAATAAAGGAAATTTATTTTCATTGCAATAGTGTGTTGGAATTTTTTGTGTCTCTCACTCGGAAGGACATATGGGAGGGCAAATCATTTAAAACATCAGAATGAGTATTTGGTTTAGAGTTTGGCAACATATGCCATATGCTGGCTGCCATGAACAAAGGTGGCTATAAAGAGGTCATCAGTATATGAAACAGCCCCCTGCTGTCCATTCCTTATTCCATAGAAAAGCCTTGACTTGAGGTTAGATTTTTTTTATATTTTGTTTTGTGTTATTTTTTTCTTTAACATCCCTAAAATTTTCCTTACATGTTTTACTAGCCAGATTTTTCCTCCTCTCCTGACTACTCCCAGTCATAGCTGTCCCTCTTCTCTTATGAAGATCCCTCGACCTGCAGCCCAAGCTTGGCGTAATCATGGTCATAGCTGTTTCCTGTGTGAAATTGTTATCCGCTCACAATTCCACACAACATACGAGCCGGAAGCATAAAGTGTAAAGCCTGGGGTGCCTAATGAGTGAGCTAACTCACATTAATTGCGTTGCGCTCACTGCCCGCTTTCCAGTCGGGAAACCTGTCGTGCCAGCGGATCCGCATCTCAATTAGTCAGCAACCATAGTCCCGCCCCTAACTCCGCCCATCCCGCCCCTAACTCCGCCCAGTTCCGCCCATTCTCCGCCCCATGGCTGACTAATTTTTTTTATTTATGCAGAGGCCGAGGCCGCCTCGGCCTCTGAGCTATTCCAGAAGTAGTGAGGAGGCTTTTTTGGAGGCCTAGGCTTTTGCAAAAAGCTAACTTGTTTATTGCAGCTTATAATGGTTACAAATAAAGCAATAGCATCACAAATTTCACAAATAAAGCATTTTTTTCACTGCATTCTAGTTGTGGTTTGTCCAAACTCATCAATGTATCTTATCATGTCTGGATCCGCTGCATTAATGAATCGGCCAACGCGCGGGGAGAGGCGGTTTGCGTATTGGGCGCTCTTCCGCTTCCTCGCTCACTGACTCGCTGCGCTCGGTCGTTCGGCTGCGGCGAGCGGTATCAGCTCACTCAAAGGCGGTAATACGGTTATCCACAGAATCAGGGGATAACGCAGGAAAGAACATGTGAGCAAAAGGCCAGCAAAAGGCCAGGAACCGTAAAAAGGCCGCGTTGCTGGCGTTTTTCCATAGGCTCCGCCCCCCTGACGAGCATCACAAAAATCGACGCTCAAGTCAG

246
AGGTGGCGAAACCCGACAGGACTATAAAGATACCAGGCGTTTCCCCCTGGAAGCTCCCTCGTGCGCTCTCCTGTTCCGACCCTGCCGCTTACCGGATACCTGTCCGCCTTTCTCCCTTCGGGAAGCGTGGCGCTTTCTCAATGCTCACGCTGTAGGTATCTCAGTTCGGTGTAGGTCGTTCGCTCCAAGCTGGGCTGTGTGCACGAACCCCCCGTTCAGCCCGACCGCTGCGCCTTATCCGGTAACTATCGTCTTGAGTCCAACCCGGTAAGACACGACTTATCGCCACTGGCAGCAGCCACTGGTAACAGGATTAGCAGAGCGAGGTATGTAGGCGGTGCTACAGAGTTCTTGAAGTGGTGGCCTAACTACGGCTACACTAGAAGGACAGTATTTGGTATCTGCGCTCTGCTGAAGCCAGTTACCTTCGGAAAAAGAGTTGGTAGCTCTTGATCCGGCAAACAAACCACCGCTGGTAGCGGTGGTTTTTTTGTTTGCAAGCAGCAGATTACGCGCAGAAAAAAAGGATCTCAAGAAGATCCTTTGATCTTTTCTACGGGGTCTGACGCTCAGTGGAACGAAAACTCACGTTAAGGGATTTTGGTCATGAGATTATCAAAAAGGATCTTCACCTAGATCCTTTTAAATTAAAAATGAAGTTTTAAATCAATCTAAAGTATATATGAGTAAACTTGGTCTGACAGTTACCAATGCTTAATCAGTGAGGCACCTATCTCAGCGATCTGTCTATTTCGTTCATCCATAGTTGCCTGACTCCCCGTCGTGTAGATAACTACGATACGGGAGGGCTTACCATCTGGCCCCAGTGCTGCAATGATACCGCGAGACCCACGCTCACCGGCTCCAGATTTATCAGCAATAAACCAGCCAGCCGGAAGGGCCGAGCGCAGAAGTGGTCCTGCAACTTTATCCGCCTCCATCCAGTCTATTAATTGTTGCCGGGAAGCTAGAGTAAGTAGTTCGCCAGTTAATAGTTTGCGCAACGTTGTTGCCATTGCTACAGGCATCGTGGTGTCACGCTCGTCGTTTGGTATGGCTTCATTCAGCTCCGGTTCCCAACGATCAAGGCGAGTTACATGATCCCCCATGTTGTGCAAAAAAGCGGTTAGCTCCTTCGGTCCTCCGATCGTTGTCAGAAGTAAGTTGGCCGCAGTGTTATCACTCATGGTTATGGCAGCACTGCATAATTCTCTTACTGTCATGCCATCCGTAAGATGCTTTTCTGTGACTGGTGAGTACTCAACCAAGTCATTCTGAGAATAGTGTATGCGGCGACCGAGTTGCTCTTGCCCGGCGTCAATACGGGATAATACCGCGCCACATAGCAGAACTTTAAAAGTGCTCATCATTGGAAAACGTTCTTCGGGGCGAAAACTCTCAAGGATCTTACCGCTGTTGAGATCCAGTTCGATGTAACCCACTCGTGCACCCAACTGATCTTCAGCATCTTTTACTTTCACCAGCGTTTCTGGGTGAGCAAAAACAGGAAGGCAAAATGCCGCAAAAAAGGGAATAAGGGCGACACGGAAATGTTGAATACTCATACTCTTCCTTTTTCAATATTATTGAAGCATTTATCAGGGTTATTGTCTCATGAGCGGATACATATTTGAATGTATTTAGAAAAATAAACAAATAGGGGTTCCGCGCACATTTCCCCGAAAAGTGCCACCTG
8.3.2. THRβ2.GFP construct sequence
GTCGACCTGCAGGCGGCCGCGAATTCACTAGTGATTaattgcttggatttctgcctttaatgagaaagagagggagccaggaaatgcactgggcaaaactgcaaaatcgaatggattcaacacgcagctcttaaccagaaaaagagactttggaacatgtgcatttgccaaaaaagaaaactgctttattgaaaggttaattttcagattaggcttgggaaatttgagataaataaatgacatcagacaaaaaaacataaggcctggatcctttttcctggggttttcagaaaatagttattgcttccaatgaaatgttttgacatttccagtagggagaaaatgttaattgtaatattgtgtatgtgttcttagtaacactgaataaatctttcatttgttttaatggtaatcagaaagtaaaaacacgattaaaatgttagctgtgttctttattccttatggtaacttttcatgctttctaggatattgtgattcattttccaggttcaaatatataccaactgacgaacatgcttttgcttgttttatatcagttgcagtttttaaaggagtcttattactatcctccacataggtctgcctgggtctcttttctaattttgtcacatctttagctcattctacaattccccaccttttcccttgagtctatggctcctttactacatttataaaaagtcagcaattaaagacagcacaatggtggtccacttgactgtatatttaatatacatgctattaagctacttattgacagagacggtgattttttttttctgaacagccatctctgtagccaccaactccttgctttgtacttaacagacaccccataatttgttgaatgactgtaataccctccttacttctgccatatgtccctgtcccagaattccacgttgcaattgatgactggagctacatgtccaaagcaaaggtctcactgttgaaaattacagtattacattgttgatggtcctttagagacaaataccaacaaggtcacatgctcatggaccagcaggaagccaaatgtaaacgtaaccacctgaggccgagccctgaaaacaagctgcctaagaaacggaaggaatccctagtgtagaagagcagcatccgcccttcctgatgtcatgatctacaactatgcatatatgtgacatgcacacactggccaccatccacagggagaaaataccattagtaatcatcctagcaagcattcacaatctaatttggtatttgttaactccttagttaaaagatatgatgattcttacagaaaatgctgttccctttttg

247
atcactatctttaagtaagtacatgaataccacttaaatcacattaaatcttgaaaataatctcaaaagcagatttgaatgggaataaagtggtaagtgtttacagttttccacgcactactgatcagagtactgttaagcaccaacagaaaaggaaagctgctatataataggggtattcctcatataggggcattggcatacagtctctcatgcctttataaagaaaacataaattacagaattgaacagttaatgtaagctttaggtctcatgtagattagtgcttatgaagtagaaaataatcatgcgcaaggaacagaataaaactcacttgcagacatcagcagcattttcaaccgtgtacttccttggcatgttttaaaaaccagcgggacctatgtgtcatgggaagatggttggatcctagtatgaaaacccagtcagtaacattcaacaacagattcaaccaccaatatttgcacagctagattaatgttttggagtcagtcagtcatcaggctcattactactggattttctctggttcatgctaataaactagattattgattttaggattttctttgtatccaaggatattctctaagatgtctttataatgtttcatgcttaagctgtcaaccaaaatgacataacaatgagtaatcgttttataatcatgttgaaaggggttaaaaacagcatataaaatgcatcttagcagcttcagagtaacattctcgctgtcacttccctatctgggtggaggtcattcctacctgcctgccatcttccccaggaattaactagctgcatgcacagcttaagacctttgatagtcataaatctgctttccaatatgtttggatggcagaagagctcaaaagacacctcggtctaaataggattttagcacatcaggtgctattacaaagtaaagcaggctgggttgctgtgttggtggtggtgtttattcatcttcccttcgcgtttcatgtgtatgtatgtatgcttctctgcgtatatgcccagctctcagggtgtatggggctggagaatgcatgcgtagactgtgtgtatatgtaaactagaaactgaaccagggaaacaaaAATCGAATTCCCGCGGGCCCGGGATCCACCGGTCGCCACCATGGTGAGCAAGGGCGAGGAGCTGTTCACCGGGGTGGTGCCCATCCTGGTCGAGCTGGACGGCGACGTAAACGGCCACAAGTTCAGCGTGTCCGGCGAGGGCGAGGGCGATGCCACCTACGGCAAGCTGACCCTGAAGTTCATCTGCACCACCGGCAAGCTGCCCGTGCCCTGGCCCACCCTCGTGACCACCCTGACCTACGGCGTGCAGTGCTTCAGCCGCTACCCCGACCACATGAAGCAGCACGACTTCTTCAAGTCCGCCATGCCCGAAGGCTACGTCCAGGAGCGCACCATCTTCTTCAAGGACGACGGCAACTACAAGACCCGCGCCGAGGTGAAGTTCGAGGGCGACACCCTGGTGAACCGCATCGAGCTGAAGGGCATCGACTTCAAGGAGGACGGCAACATCCTGGGGCACAAGCTGGAGTACAACTACAACAGCCACAACGTCTATATCATGGCCGACAAGCAGAAGAACGGCATCAAGGTGAACTTCAAGATCCGCCACAACATCGAGGACGGCAGCGTGCAGCTCGCCGACCACTACCAGCAGAACACCCCCATCGGCGACGGCCCCGTGCTGCTGCCCGACAACCACTACCTGAGCACCCAGTCCGCCCTGAGCAAAGACCCCAACGAGAAGCGCGATCACATGGTCCTGCTGGAGTTCGTGACCGCCGCCGGGATCACTCTCGGCATGGACGAGCTGTACAAGTAAAGCGGCCGCACTCCTCAGGTGCAGGCTGCCTATCAGAAGGTGGTGGCTGGTGTGGCCAATGCCCTGGCTCACAAATACCACTGAGATCTTTTTCCCTCTGCCAAAAATTATGGGGACATCATGAAGCCCCTTGAGCATCTGACTTCTGGCTAATAAAGGAAATTTATTTTCATTGCAATAGTGTGTTGGAATTTTTTGTGTCTCTCACTCGGAAGGACATATGGGAGGGCAAATCATTTAAAACATCAGAATGAGTATTTGGTTTAGAGTTTGGCAACATATGCCATATGCTGGCTGCCATGAACAAAGGTGGCTATAAAGAGGTCATCAGTATATGAAACAGCCCCCTGCTGTCCATTCCTTATTCCATAGAAAAGCCTTGACTTGAGGTTAGATTTTTTTTATATTTTGTTTTGTGTTATTTTTTTCTTTAACATCCCTAAAATTTTCCTTACATGTTTTACTAGCCAGATTTTTCCTCCTCTCCTGACTACTCCCAGTCATAGCTGTCCCTCTTCTCTTATGAAGATCCCTCGACCTGCAGCCCAAGCTTGGCGTAATCATGGTCATAGCTGTTTCCTGTGTGAAATTGTTATCCGCTCACAATTCCACACAACATACGAGCCGGAAGCATAAAGTGTAAAGCCTGGGGTGCCTAATGAGTGAGCTAACTCACATTAATTGCGTTGCGCTCACTGCCCGCTTTCCAGTCGGGAAACCTGTCGTGCCAGCGGATCCGCATCTCAATTAGTCAGCAACCATAGTCCCGCCCCTAACTCCGCCCATCCCGCCCCTAACTCCGCCCAGTTCCGCCCATTCTCCGCCCCATGGCTGACTAATTTTTTTTATTTATGCAGAGGCCGAGGCCGCCTCGGCCTCTGAGCTATTCCAGAAGTAGTGAGGAGGCTTTTTTGGAGGCCTAGGCTTTTGCAAAAAGCTAACTTGTTTATTGCAGCTTATAATGGTTACAAATAAAGCAATAGCATCACAAATTTCACAAATAAAGCATTTTTTTCACTGCATTCTAGTTGTGGTTTGTCCAAACTCATCAATGTATCTTATCATGTCTGGATCCGCTGCATTAATGAATCGGCCAACGCGCGGGGAGAGGCGGTTTGCGTATTGGGCGCTCTTCCGCTTCCTCGCTCACTGACTCGCTGCGCTCGGTCGTTCGGCTGCGGCGAGCGGTATCAGCTCACTCAAAGGCGGTAATACGGTTATCCACAGAATCAGGGGATAACGCAGGAAAGAACATGTGAGCAAAAGGCCAGCAAAAGGCCAGGAACCGTAAAAAGGCCGCGTTGCTGGCGTTTTTCCATAGGCTCCGCCCCCCTGAC
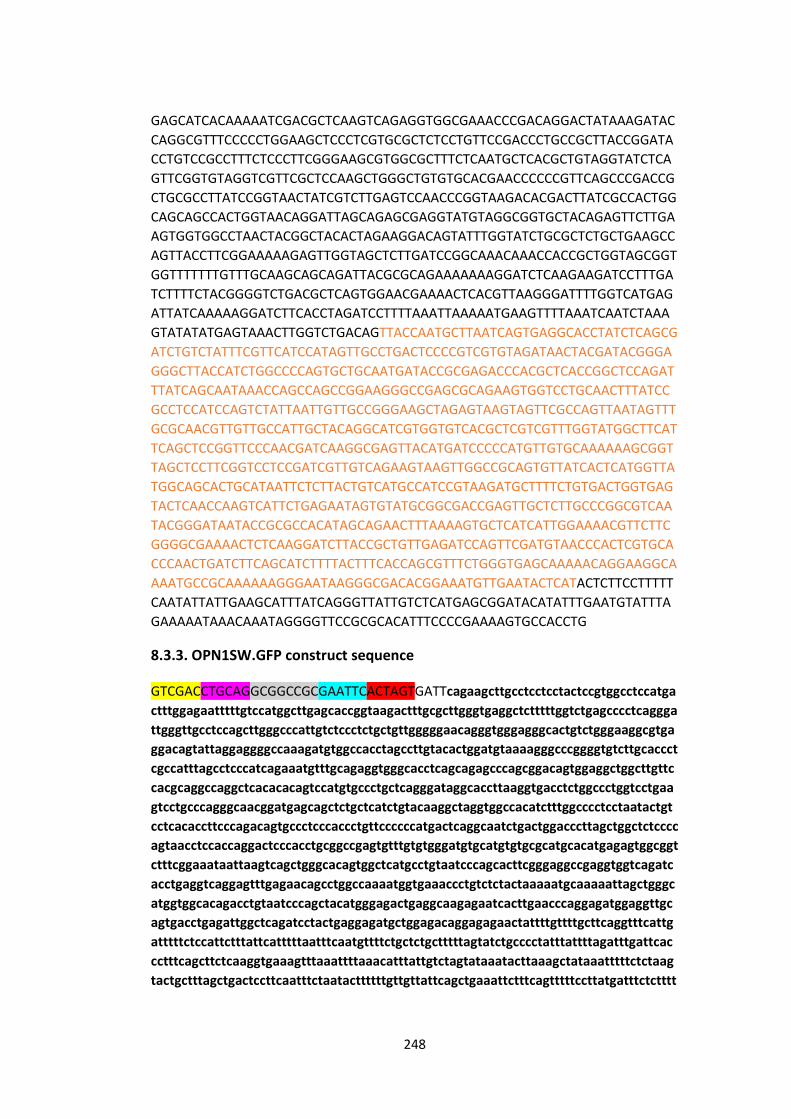
248
GAGCATCACAAAAATCGACGCTCAAGTCAGAGGTGGCGAAACCCGACAGGACTATAAAGATACCAGGCGTTTCCCCCTGGAAGCTCCCTCGTGCGCTCTCCTGTTCCGACCCTGCCGCTTACCGGATACCTGTCCGCCTTTCTCCCTTCGGGAAGCGTGGCGCTTTCTCAATGCTCACGCTGTAGGTATCTCAGTTCGGTGTAGGTCGTTCGCTCCAAGCTGGGCTGTGTGCACGAACCCCCCGTTCAGCCCGACCGCTGCGCCTTATCCGGTAACTATCGTCTTGAGTCCAACCCGGTAAGACACGACTTATCGCCACTGGCAGCAGCCACTGGTAACAGGATTAGCAGAGCGAGGTATGTAGGCGGTGCTACAGAGTTCTTGAAGTGGTGGCCTAACTACGGCTACACTAGAAGGACAGTATTTGGTATCTGCGCTCTGCTGAAGCCAGTTACCTTCGGAAAAAGAGTTGGTAGCTCTTGATCCGGCAAACAAACCACCGCTGGTAGCGGTGGTTTTTTTGTTTGCAAGCAGCAGATTACGCGCAGAAAAAAAGGATCTCAAGAAGATCCTTTGATCTTTTCTACGGGGTCTGACGCTCAGTGGAACGAAAACTCACGTTAAGGGATTTTGGTCATGAGATTATCAAAAAGGATCTTCACCTAGATCCTTTTAAATTAAAAATGAAGTTTTAAATCAATCTAAAGTATATATGAGTAAACTTGGTCTGACAGTTACCAATGCTTAATCAGTGAGGCACCTATCTCAGCGATCTGTCTATTTCGTTCATCCATAGTTGCCTGACTCCCCGTCGTGTAGATAACTACGATACGGGAGGGCTTACCATCTGGCCCCAGTGCTGCAATGATACCGCGAGACCCACGCTCACCGGCTCCAGATTTATCAGCAATAAACCAGCCAGCCGGAAGGGCCGAGCGCAGAAGTGGTCCTGCAACTTTATCCGCCTCCATCCAGTCTATTAATTGTTGCCGGGAAGCTAGAGTAAGTAGTTCGCCAGTTAATAGTTTGCGCAACGTTGTTGCCATTGCTACAGGCATCGTGGTGTCACGCTCGTCGTTTGGTATGGCTTCATTCAGCTCCGGTTCCCAACGATCAAGGCGAGTTACATGATCCCCCATGTTGTGCAAAAAAGCGGTTAGCTCCTTCGGTCCTCCGATCGTTGTCAGAAGTAAGTTGGCCGCAGTGTTATCACTCATGGTTATGGCAGCACTGCATAATTCTCTTACTGTCATGCCATCCGTAAGATGCTTTTCTGTGACTGGTGAGTACTCAACCAAGTCATTCTGAGAATAGTGTATGCGGCGACCGAGTTGCTCTTGCCCGGCGTCAATACGGGATAATACCGCGCCACATAGCAGAACTTTAAAAGTGCTCATCATTGGAAAACGTTCTTCGGGGCGAAAACTCTCAAGGATCTTACCGCTGTTGAGATCCAGTTCGATGTAACCCACTCGTGCACCCAACTGATCTTCAGCATCTTTTACTTTCACCAGCGTTTCTGGGTGAGCAAAAACAGGAAGGCAAAATGCCGCAAAAAAGGGAATAAGGGCGACACGGAAATGTTGAATACTCATACTCTTCCTTTTTCAATATTATTGAAGCATTTATCAGGGTTATTGTCTCATGAGCGGATACATATTTGAATGTATTTAGAAAAATAAACAAATAGGGGTTCCGCGCACATTTCCCCGAAAAGTGCCACCTG
8.3.3. OPN1SW.GFP construct sequence
GTCGACCTGCAGGCGGCCGCGAATTCACTAGTGATTcagaagcttgcctcctcctactccgtggcctccatgactttggagaatttttgtccatggcttgagcaccggtaagactttgcgcttgggtgaggctctttttggtctgagcccctcagggattgggttgcctccagcttgggcccattgtctccctctgctgttgggggaacagggtgggagggcactgtctgggaaggcgtgaggacagtattaggaggggccaaagatgtggccacctagccttgtacactggatgtaaaagggcccggggtgtcttgcaccctcgccatttagcctcccatcagaaatgtttgcagaggtgggcacctcagcagagcccagcggacagtggaggctggcttgttccacgcaggccaggctcacacacagtccatgtgccctgctcagggataggcaccttaaggtgacctctggccctggtcctgaagtcctgcccagggcaacggatgagcagctctgctcatctgtacaaggctaggtggccacatctttggcccctcctaatactgtcctcacaccttcccagacagtgccctcccaccctgttccccccatgactcaggcaatctgactggacccttagctggctctccccagtaacctccaccaggactcccacctgcggccgagtgtttgtgtgggatgtgcatgtgtgcgcatgcacatgagagtggcggtctttcggaaataattaagtcagctgggcacagtggctcatgcctgtaatcccagcacttcgggaggccgaggtggtcagatcacctgaggtcaggagtttgagaacagcctggccaaaatggtgaaaccctgtctctactaaaaatgcaaaaattagctgggcatggtggcacagacctgtaatcccagctacatgggagactgaggcaagagaatcacttgaacccaggagatggaggttgcagtgacctgagattggctcagatcctactgaggagatgctggagacaggagagaactattttgttttgcttcaggtttcattgatttttctccattctttattcatttttaatttcaatgttttctgctctgctttttagtatctgcccctatttattttagatttgattcaccctttcagcttctcaaggtgaaagtttaaattttaaacatttattgtctagtataaatacttaaagctataaatttttctctaagtactgctttagctgactccttcaatttctaatacttttttgttgttattcagctgaaattctttcagtttttccttatgatttctctttt
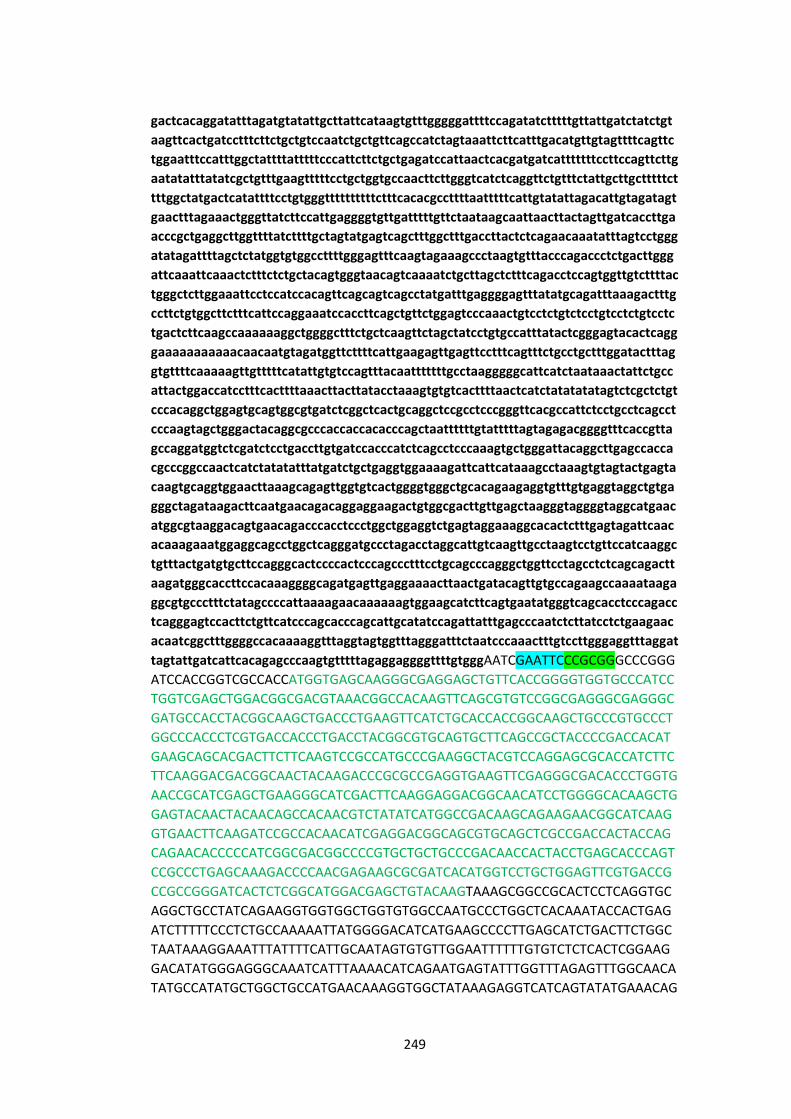
249
gactcacaggatatttagatgtatattgcttattcataagtgtttgggggattttccagatatctttttgttattgatctatctgtaagttcactgatcctttcttctgctgtccaatctgctgttcagccatctagtaaattcttcatttgacatgttgtagttttcagttctggaatttccatttggctattttatttttcccattcttctgctgagatccattaactcacgatgatcatttttttccttccagttcttgaatatatttatatcgctgtttgaagtttttcctgctggtgccaacttcttgggtcatctcaggttctgtttctattgcttgctttttcttttggctatgactcatattttcctgtgggttttttttttctttcacacgccttttaatttttcattgtatattagacattgtagatagtgaactttagaaactgggttatcttccattgaggggtgttgatttttgttctaataagcaattaacttactagttgatcaccttgaacccgctgaggcttggttttatcttttgctagtatgagtcagctttggctttgaccttactctcagaacaaatatttagtcctgggatatagattttagctctatggtgtggccttttgggagtttcaagtagaaagccctaagtgtttacccagaccctctgacttgggattcaaattcaaactctttctctgctacagtgggtaacagtcaaaatctgcttagctctttcagacctccagtggttgtcttttactgggctcttggaaattcctccatccacagttcagcagtcagcctatgatttgaggggagtttatatgcagatttaaagactttgccttctgtggcttctttcattccaggaaatccaccttcagctgttctggagtcccaaactgtcctctgtctcctgtcctctgtcctctgactcttcaagccaaaaaaggctggggctttctgctcaagttctagctatcctgtgccatttatactcgggagtacactcagggaaaaaaaaaaacaacaatgtagatggttcttttcattgaagagttgagttcctttcagtttctgcctgctttggatactttaggtgttttcaaaaagttgtttttcatattgtgtccagtttacaatttttttgcctaagggggcattcatctaataaactattctgccattactggaccatcctttcacttttaaacttacttatacctaaagtgtgtcacttttaactcatctatatatatagtctcgctctgtcccacaggctggagtgcagtggcgtgatctcggctcactgcaggctccgcctcccgggttcacgccattctcctgcctcagcctcccaagtagctgggactacaggcgcccaccaccacacccagctaattttttgtatttttagtagagacggggtttcaccgttagccaggatggtctcgatctcctgaccttgtgatccacccatctcagcctcccaaagtgctgggattacaggcttgagccaccacgcccggccaactcatctatatatttatgatctgctgaggtggaaaagattcattcataaagcctaaagtgtagtactgagtacaagtgcaggtggaacttaaagcagagttggtgtcactggggtgggctgcacagaagaggtgtttgtgaggtaggctgtgagggctagataagacttcaatgaacagacaggaggaagactgtggcgacttgttgagctaagggtaggggtaggcatgaacatggcgtaaggacagtgaacagacccacctccctggctggaggtctgagtaggaaaggcacactctttgagtagattcaacacaaagaaatggaggcagcctggctcagggatgccctagacctaggcattgtcaagttgcctaagtcctgttccatcaaggctgtttactgatgtgcttccagggcactccccactcccagccctttcctgcagcccagggctggttcctagcctctcagcagacttaagatgggcaccttccacaaaggggcagatgagttgaggaaaacttaactgatacagttgtgccagaagccaaaataagaggcgtgccctttctatagccccattaaaagaacaaaaaagtggaagcatcttcagtgaatatgggtcagcacctcccagacctcagggagtccacttctgttcatcccagcacccagcattgcatatccagattatttgagcccaatctcttatcctctgaagaacacaatcggctttggggccacaaaaggtttaggtagtggtttagggatttctaatcccaaactttgtccttgggaggtttaggattagtattgatcattcacagagcccaagtgtttttagaggaggggttttgtgggAATCGAATTCCCGCGGGCCCGGGATCCACCGGTCGCCACCATGGTGAGCAAGGGCGAGGAGCTGTTCACCGGGGTGGTGCCCATCCTGGTCGAGCTGGACGGCGACGTAAACGGCCACAAGTTCAGCGTGTCCGGCGAGGGCGAGGGCGATGCCACCTACGGCAAGCTGACCCTGAAGTTCATCTGCACCACCGGCAAGCTGCCCGTGCCCTGGCCCACCCTCGTGACCACCCTGACCTACGGCGTGCAGTGCTTCAGCCGCTACCCCGACCACATGAAGCAGCACGACTTCTTCAAGTCCGCCATGCCCGAAGGCTACGTCCAGGAGCGCACCATCTTCTTCAAGGACGACGGCAACTACAAGACCCGCGCCGAGGTGAAGTTCGAGGGCGACACCCTGGTGAACCGCATCGAGCTGAAGGGCATCGACTTCAAGGAGGACGGCAACATCCTGGGGCACAAGCTGGAGTACAACTACAACAGCCACAACGTCTATATCATGGCCGACAAGCAGAAGAACGGCATCAAGGTGAACTTCAAGATCCGCCACAACATCGAGGACGGCAGCGTGCAGCTCGCCGACCACTACCAGCAGAACACCCCCATCGGCGACGGCCCCGTGCTGCTGCCCGACAACCACTACCTGAGCACCCAGTCCGCCCTGAGCAAAGACCCCAACGAGAAGCGCGATCACATGGTCCTGCTGGAGTTCGTGACCGCCGCCGGGATCACTCTCGGCATGGACGAGCTGTACAAGTAAAGCGGCCGCACTCCTCAGGTGCAGGCTGCCTATCAGAAGGTGGTGGCTGGTGTGGCCAATGCCCTGGCTCACAAATACCACTGAGATCTTTTTCCCTCTGCCAAAAATTATGGGGACATCATGAAGCCCCTTGAGCATCTGACTTCTGGCTAATAAAGGAAATTTATTTTCATTGCAATAGTGTGTTGGAATTTTTTGTGTCTCTCACTCGGAAGGACATATGGGAGGGCAAATCATTTAAAACATCAGAATGAGTATTTGGTTTAGAGTTTGGCAACATATGCCATATGCTGGCTGCCATGAACAAAGGTGGCTATAAAGAGGTCATCAGTATATGAAACAG

250
CCCCCTGCTGTCCATTCCTTATTCCATAGAAAAGCCTTGACTTGAGGTTAGATTTTTTTTATATTTTGTTTTGTGTTATTTTTTTCTTTAACATCCCTAAAATTTTCCTTACATGTTTTACTAGCCAGATTTTTCCTCCTCTCCTGACTACTCCCAGTCATAGCTGTCCCTCTTCTCTTATGAAGATCCCTCGACCTGCAGCCCAAGCTTGGCGTAATCATGGTCATAGCTGTTTCCTGTGTGAAATTGTTATCCGCTCACAATTCCACACAACATACGAGCCGGAAGCATAAAGTGTAAAGCCTGGGGTGCCTAATGAGTGAGCTAACTCACATTAATTGCGTTGCGCTCACTGCCCGCTTTCCAGTCGGGAAACCTGTCGTGCCAGCGGATCCGCATCTCAATTAGTCAGCAACCATAGTCCCGCCCCTAACTCCGCCCATCCCGCCCCTAACTCCGCCCAGTTCCGCCCATTCTCCGCCCCATGGCTGACTAATTTTTTTTATTTATGCAGAGGCCGAGGCCGCCTCGGCCTCTGAGCTATTCCAGAAGTAGTGAGGAGGCTTTTTTGGAGGCCTAGGCTTTTGCAAAAAGCTAACTTGTTTATTGCAGCTTATAATGGTTACAAATAAAGCAATAGCATCACAAATTTCACAAATAAAGCATTTTTTTCACTGCATTCTAGTTGTGGTTTGTCCAAACTCATCAATGTATCTTATCATGTCTGGATCCGCTGCATTAATGAATCGGCCAACGCGCGGGGAGAGGCGGTTTGCGTATTGGGCGCTCTTCCGCTTCCTCGCTCACTGACTCGCTGCGCTCGGTCGTTCGGCTGCGGCGAGCGGTATCAGCTCACTCAAAGGCGGTAATACGGTTATCCACAGAATCAGGGGATAACGCAGGAAAGAACATGTGAGCAAAAGGCCAGCAAAAGGCCAGGAACCGTAAAAAGGCCGCGTTGCTGGCGTTTTTCCATAGGCTCCGCCCCCCTGACGAGCATCACAAAAATCGACGCTCAAGTCAGAGGTGGCGAAACCCGACAGGACTATAAAGATACCAGGCGTTTCCCCCTGGAAGCTCCCTCGTGCGCTCTCCTGTTCCGACCCTGCCGCTTACCGGATACCTGTCCGCCTTTCTCCCTTCGGGAAGCGTGGCGCTTTCTCAATGCTCACGCTGTAGGTATCTCAGTTCGGTGTAGGTCGTTCGCTCCAAGCTGGGCTGTGTGCACGAACCCCCCGTTCAGCCCGACCGCTGCGCCTTATCCGGTAACTATCGTCTTGAGTCCAACCCGGTAAGACACGACTTATCGCCACTGGCAGCAGCCACTGGTAACAGGATTAGCAGAGCGAGGTATGTAGGCGGTGCTACAGAGTTCTTGAAGTGGTGGCCTAACTACGGCTACACTAGAAGGACAGTATTTGGTATCTGCGCTCTGCTGAAGCCAGTTACCTTCGGAAAAAGAGTTGGTAGCTCTTGATCCGGCAAACAAACCACCGCTGGTAGCGGTGGTTTTTTTGTTTGCAAGCAGCAGATTACGCGCAGAAAAAAAGGATCTCAAGAAGATCCTTTGATCTTTTCTACGGGGTCTGACGCTCAGTGGAACGAAAACTCACGTTAAGGGATTTTGGTCATGAGATTATCAAAAAGGATCTTCACCTAGATCCTTTTAAATTAAAAATGAAGTTTTAAATCAATCTAAAGTATATATGAGTAAACTTGGTCTGACAGTTACCAATGCTTAATCAGTGAGGCACCTATCTCAGCGATCTGTCTATTTCGTTCATCCATAGTTGCCTGACTCCCCGTCGTGTAGATAACTACGATACGGGAGGGCTTACCATCTGGCCCCAGTGCTGCAATGATACCGCGAGACCCACGCTCACCGGCTCCAGATTTATCAGCAATAAACCAGCCAGCCGGAAGGGCCGAGCGCAGAAGTGGTCCTGCAACTTTATCCGCCTCCATCCAGTCTATTAATTGTTGCCGGGAAGCTAGAGTAAGTAGTTCGCCAGTTAATAGTTTGCGCAACGTTGTTGCCATTGCTACAGGCATCGTGGTGTCACGCTCGTCGTTTGGTATGGCTTCATTCAGCTCCGGTTCCCAACGATCAAGGCGAGTTACATGATCCCCCATGTTGTGCAAAAAAGCGGTTAGCTCCTTCGGTCCTCCGATCGTTGTCAGAAGTAAGTTGGCCGCAGTGTTATCACTCATGGTTATGGCAGCACTGCATAATTCTCTTACTGTCATGCCATCCGTAAGATGCTTTTCTGTGACTGGTGAGTACTCAACCAAGTCATTCTGAGAATAGTGTATGCGGCGACCGAGTTGCTCTTGCCCGGCGTCAATACGGGATAATACCGCGCCACATAGCAGAACTTTAAAAGTGCTCATCATTGGAAAACGTTCTTCGGGGCGAAAACTCTCAAGGATCTTACCGCTGTTGAGATCCAGTTCGATGTAACCCACTCGTGCACCCAACTGATCTTCAGCATCTTTTACTTTCACCAGCGTTTCTGGGTGAGCAAAAACAGGAAGGCAAAATGCCGCAAAAAAGGGAATAAGGGCGACACGGAAATGTTGAATACTCATACTCTTCCTTTTTCAATATTATTGAAGCATTTATCAGGGTTATTGTCTCATGAGCGGATACATATTTGAATGTATTTAGAAAAATAAACAAATAGGGGTTCCGCGCACATTTCCCCGAAAAGTGCCACCTG

251
8.3.4. GNAT2.GFP construct sequence
GTCGACCTGCAGGCGGCCGCGAATTCACTAGTGATTggatcaccggtttgtctgtttactaggccatataactttgtttttttgtttttgaaacagagtctcactctgtcacccaggttggagtgcagtggcgcaatctcggctcactgcaacctccacctcccgggttcaagcgattctcatgcctctatctcccaagtagctgggtgcatgccaccatgctgggctttttcttttcttttcttttcttttttttttttttttctgagacggaatcttgctctgttgcccaggctggagtgcagtgcctcccgggttcaagtgattctcctgcctcagcctcccaagtagctgggattacaggtgcctgccaccatgcctggctaatttttgtattttttttaagtagagacagggtttcaccatgttgaccaggctgtctcgaactcctgacctcagatgatctgcccattttggcctcccaaagtgttggaattacaggcgtgagccaccatgcccggcctaatttttgtatttttagtggatacgggatttcaccatgttggccaggaactcctgacctcaggtcatccacccacctcagcctcccaaagtgctgggattacaggcatgcgccactatgcccagctgactttaaatgagttacttaactctcaagtctcagttaatctagtctgtaaattggggacaatagcagttattgtgataattaactggtatgagccacttacattgttcagcagttattaattataataactataacataataattattaatagttccaggcagccccttgaacagtgtagccttcagcatggctctggcctcagtgtgagttaccagtattgtgagtacgctggagcagggctagcagtggggtataattactgaaaccttataaccaagattccaagatagtcacaatttcaaagagactctcctgtttttccttaagtcaataaggacttgccaatttgattgggaaaacatggctaccatggaaagcacctcagcagctgcatatttctccatcagcccctacagtcactgaaaggtggtgcgaaggaggaagataattagctatggctcagggtacctgataggcggggagacctagattctactcctgaccttcccagtcccaactggccactgctgcacaagtccagctctaaaatgaaagagcaaattacatccttcgacctcagtagttctccaccttggctgtacactagaatcagctggggacgtttttaaatccttgtgcctggactgcactccagaccaattaaatcagtattttttaaaaagctctccaggtaaatgccactgtacactaaaagttgagaactgtttcaggccagggtttttcaaacttcacagatgtgataactacctgtattagcttaaaatattttctctggctctggagtttgatgctaacataccatttaaaaacatacactattttaacatctcggaaagcagggtaatcttctagtcagtggcacctaagacttgaggaaacacagacaccagcaacccaggtgattcttaggattaggtaagtttagcggaaaacaggtccctagggcagtacttcccaatctttaatgtctttagagtcacctgagatcttgttaaactgcggattctgaatcagaagttctggattaaagcctgagattctgcatgtctaatgagcttccgggtgatctgatgttgctggctcttgatccacattttgggcaacaaaattctaaaacatctccacctgaggaggctccgccagcaacactcatttaagtaaactgaaataattggcatagaggagtacaacctgtggagtcctaaatgtctgtgaggcagttgctagactgcaccctcatttttcccccaggaaagggcagctgggatgagagccagaaggagagagagctgccccaacctttgagaagccagagtctggagtccaatttcccaaagaagcagagttttttgtgtgaggcagcacaaaccccacactgaataccagcaaagttcatttatgaagtgaagttgggactcagctggctttagtgggccaaagggaagcaaccccattctcttcaccatacacccttttcctgcatttattcattcaccaaaccttttgatccacaaataaactacaagttctgagaggttcaaagatgagtcagatttggtccgttgagctccagggggagaaatgcagtgagggaaaagatttgtaaaacgacgtacaatatgaagtgataagtgctaataacagaagtacaaagagaggggccaatgcaaaggaacaatgctagtagcttcctggagcagcagccactgcgggagctgaaacattcctaatcttcccaaggaagggcaccacccaaaacaaatttcctggccaggaccagcctatggtaaacgagtatgctttgataccctgaagcccttgagatcaagaccttataatctggaggctcaacataaggaatgctttctacatatgtgccagtaatctctagctctatgatgcaaataaatctaaggaagcaagagactttcaggggatgaaccccttaaaggatggaagtagtcgtgcatcctatccttccgtcagaacccagcagatcatttccctagttatagaaacatttgagtctttaccccttgccatattgacaaagctcttaattggcttgacctatcacattgctagatataaaggctacaatccctagactaagaagtaggtctccagttgaagtagggagtctcagtcaatgtaggcagagtacaagaccctacagcctgctctctcacctgccatcgtacagaccagcttttaggggagccaagttgggatactcaatcccaacttttttccttctcttccatctcacatacaggaaaccttacgagagaggattaggggcctgaaaaagctgacaagacggcaaatAATCGAATTCCCGCGGGCCCGGGATCCACCGGTCGCCACCATGGTGAGCAAGGGCGAGGAGCTGTTCACCGGGGTGGTGCCCATCCTGGTCGAGCTGGACGGCGACGTAAACGGCCACAAGTTCAGCGTGTCCGGCGAGGGCGAGGGCGATGCCACCTACGGCAAGCTGACCCTGAAGTTCATCTGCACCACCGGCAAGCTGCCCGTGCCCTGGCCCACCCTCGTGACCACCCTGACCTACGGCGTGCAGTGCTTCAGCCGCTACCCCGACCACATGAAGCAGCACGACTTCTTCAAGTCCGCCATGCCCGAAGGCTACGTCCAGGAGCGCACCATCTTCTTCAAGGACGACGGCAACTACAAGACCCGCGCCGAGGTGAAGTTCGAGGGCGACACCCTGGTGAACCGCATCGAGCTGAAGGGCATCGACTTCAAGGAGGACGGCAACATCCTGGGGCACAAGCTGGAGTACAACTACAACAGCCACA

252
ACGTCTATATCATGGCCGACAAGCAGAAGAACGGCATCAAGGTGAACTTCAAGATCCGCCACAACATCGAGGACGGCAGCGTGCAGCTCGCCGACCACTACCAGCAGAACACCCCCATCGGCGACGGCCCCGTGCTGCTGCCCGACAACCACTACCTGAGCACCCAGTCCGCCCTGAGCAAAGACCCCAACGAGAAGCGCGATCACATGGTCCTGCTGGAGTTCGTGACCGCCGCCGGGATCACTCTCGGCATGGACGAGCTGTACAAGTAAAGCGGCCGCACTCCTCAGGTGCAGGCTGCCTATCAGAAGGTGGTGGCTGGTGTGGCCAATGCCCTGGCTCACAAATACCACTGAGATCTTTTTCCCTCTGCCAAAAATTATGGGGACATCATGAAGCCCCTTGAGCATCTGACTTCTGGCTAATAAAGGAAATTTATTTTCATTGCAATAGTGTGTTGGAATTTTTTGTGTCTCTCACTCGGAAGGACATATGGGAGGGCAAATCATTTAAAACATCAGAATGAGTATTTGGTTTAGAGTTTGGCAACATATGCCATATGCTGGCTGCCATGAACAAAGGTGGCTATAAAGAGGTCATCAGTATATGAAACAGCCCCCTGCTGTCCATTCCTTATTCCATAGAAAAGCCTTGACTTGAGGTTAGATTTTTTTTATATTTTGTTTTGTGTTATTTTTTTCTTTAACATCCCTAAAATTTTCCTTACATGTTTTACTAGCCAGATTTTTCCTCCTCTCCTGACTACTCCCAGTCATAGCTGTCCCTCTTCTCTTATGAAGATCCCTCGACCTGCAGCCCAAGCTTGGCGTAATCATGGTCATAGCTGTTTCCTGTGTGAAATTGTTATCCGCTCACAATTCCACACAACATACGAGCCGGAAGCATAAAGTGTAAAGCCTGGGGTGCCTAATGAGTGAGCTAACTCACATTAATTGCGTTGCGCTCACTGCCCGCTTTCCAGTCGGGAAACCTGTCGTGCCAGCGGATCCGCATCTCAATTAGTCAGCAACCATAGTCCCGCCCCTAACTCCGCCCATCCCGCCCCTAACTCCGCCCAGTTCCGCCCATTCTCCGCCCCATGGCTGACTAATTTTTTTTATTTATGCAGAGGCCGAGGCCGCCTCGGCCTCTGAGCTATTCCAGAAGTAGTGAGGAGGCTTTTTTGGAGGCCTAGGCTTTTGCAAAAAGCTAACTTGTTTATTGCAGCTTATAATGGTTACAAATAAAGCAATAGCATCACAAATTTCACAAATAAAGCATTTTTTTCACTGCATTCTAGTTGTGGTTTGTCCAAACTCATCAATGTATCTTATCATGTCTGGATCCGCTGCATTAATGAATCGGCCAACGCGCGGGGAGAGGCGGTTTGCGTATTGGGCGCTCTTCCGCTTCCTCGCTCACTGACTCGCTGCGCTCGGTCGTTCGGCTGCGGCGAGCGGTATCAGCTCACTCAAAGGCGGTAATACGGTTATCCACAGAATCAGGGGATAACGCAGGAAAGAACATGTGAGCAAAAGGCCAGCAAAAGGCCAGGAACCGTAAAAAGGCCGCGTTGCTGGCGTTTTTCCATAGGCTCCGCCCCCCTGACGAGCATCACAAAAATCGACGCTCAAGTCAGAGGTGGCGAAACCCGACAGGACTATAAAGATACCAGGCGTTTCCCCCTGGAAGCTCCCTCGTGCGCTCTCCTGTTCCGACCCTGCCGCTTACCGGATACCTGTCCGCCTTTCTCCCTTCGGGAAGCGTGGCGCTTTCTCAATGCTCACGCTGTAGGTATCTCAGTTCGGTGTAGGTCGTTCGCTCCAAGCTGGGCTGTGTGCACGAACCCCCCGTTCAGCCCGACCGCTGCGCCTTATCCGGTAACTATCGTCTTGAGTCCAACCCGGTAAGACACGACTTATCGCCACTGGCAGCAGCCACTGGTAACAGGATTAGCAGAGCGAGGTATGTAGGCGGTGCTACAGAGTTCTTGAAGTGGTGGCCTAACTACGGCTACACTAGAAGGACAGTATTTGGTATCTGCGCTCTGCTGAAGCCAGTTACCTTCGGAAAAAGAGTTGGTAGCTCTTGATCCGGCAAACAAACCACCGCTGGTAGCGGTGGTTTTTTTGTTTGCAAGCAGCAGATTACGCGCAGAAAAAAAGGATCTCAAGAAGATCCTTTGATCTTTTCTACGGGGTCTGACGCTCAGTGGAACGAAAACTCACGTTAAGGGATTTTGGTCATGAGATTATCAAAAAGGATCTTCACCTAGATCCTTTTAAATTAAAAATGAAGTTTTAAATCAATCTAAAGTATATATGAGTAAACTTGGTCTGACAGTTACCAATGCTTAATCAGTGAGGCACCTATCTCAGCGATCTGTCTATTTCGTTCATCCATAGTTGCCTGACTCCCCGTCGTGTAGATAACTACGATACGGGAGGGCTTACCATCTGGCCCCAGTGCTGCAATGATACCGCGAGACCCACGCTCACCGGCTCCAGATTTATCAGCAATAAACCAGCCAGCCGGAAGGGCCGAGCGCAGAAGTGGTCCTGCAACTTTATCCGCCTCCATCCAGTCTATTAATTGTTGCCGGGAAGCTAGAGTAAGTAGTTCGCCAGTTAATAGTTTGCGCAACGTTGTTGCCATTGCTACAGGCATCGTGGTGTCACGCTCGTCGTTTGGTATGGCTTCATTCAGCTCCGGTTCCCAACGATCAAGGCGAGTTACATGATCCCCCATGTTGTGCAAAAAAGCGGTTAGCTCCTTCGGTCCTCCGATCGTTGTCAGAAGTAAGTTGGCCGCAGTGTTATCACTCATGGTTATGGCAGCACTGCATAATTCTCTTACTGTCATGCCATCCGTAAGATGCTTTTCTGTGACTGGTGAGTACTCAACCAAGTCATTCTGAGAATAGTGTATGCGGCGACCGAGTTGCTCTTGCCCGGCGTCAATACGGG

253
ATAATACCGCGCCACATAGCAGAACTTTAAAAGTGCTCATCATTGGAAAACGTTCTTCGGGGCGAAAACTCTCAAGGATCTTACCGCTGTTGAGATCCAGTTCGATGTAACCCACTCGTGCACCCAACTGATCTTCAGCATCTTTTACTTTCACCAGCGTTTCTGGGTGAGCAAAAACAGGAAGGCAAAATGCCGCAAAAAAGGGAATAAGGGCGACACGGAAATGTTGAATACTCATACTCTTCCTTTTTCAATATTATTGAAGCATTTATCAGGGTTATTGTCTCATGAGCGGATACATATTTGAATGTATTTAGAAAAATAAACAAATAGGGGTTCCGCGCACATTTCCCCGAAAAGTGCCACCTG
8.3.5. pd10-2.1-eGFP vector sequence
GGGCAAAGCCCGGGCGTCGGGCGACCTTTGGTCGCCCGGCCTCAGTGAGCGAGCGAGCGCGCAGAGAGGGAGTGGCCAACTCCATCACTGATGTAATACGACTCACTAGTGGGCAGATCTTCGAATGCATCGCGCGCACCGTACGTCTCGAGGAATTCGAGCTCGGTACCCCCTACAGCAGCCAGGGTGAGATTATGAGGCTGAGCTGAGAATATCAAGACTGTACCGAGTAGGGGGCCTTGGCAAGTGTGGAGAGCCCGGCAGCTGGGGCAGAGGGCGGAGTACGGTGTGCGTTTACGGACCTCTTCAAACGAGGTAGGAAGGTCAGAAGTCAAAAAGGGAACAAATGATGTTTAACCACACAAAAATGAAAATCCAATGGTTGGATATCCATTCCAAATACACAAAGGCAACGGATAAGTGATCCGGGCCAGGCACAGAAGGCCATGCACCCGTAGGATTGCACTCAGAGCTCCCAAATGCATAGGAATAGAAGGGTGGGTGCAGGAGGCTGAGGGGTGGGGAAAGGGCATGGGTGTTTCATGAGGACAGAGCTTCCGTTTCATGCAATGAAAAGAGTTTGGAGACGGATGGTGGTGACTGGACTATACACTTACACACGGTAGCGATGGTACACTTTGTATTATGTATATTTTACCACGATCTTTTTAAAGTGTCAAAGGCAAATGGCCAAATGGTTCCTTGTCCTATAGCTGTAGCAGCCATCGGCTGTTAGTGACAAAGCCCCTGAGTCAAGATGACAGCAGCCCCCATAACTCCTAATCGGCTCTCCCGCGTGGAGTCATTTAGGAGTAGTCGCATTAGAGACAAGTCCAACATCTAATCTTCCACCCTGGCCAGGGCCCCAGCTGGCAGCGAGGGTGGGAGACTCCGGGCAGAGCAGAGGGCGCTGACATTGGGGCCCGGCCTGGCTTGGGTCCCTCTGGCCTTTCCCCAGGGGCCCTCTTTCCTTGGGGCTTTCTTGGGCCGCCACTGCTCCCGCTCCTCTCCCCCCATCCCACCCCCTCACCCCCTCGTTCTTCATATCCTTCTCTAGTGCTCCCTCCACTTTCATCCACCCTTCTGCAAGAGTGTGGGACCACAAATGAGTTTTCACCTGGCCTGGGGACACACGTGCCCCCACAGGTGCTGAGTGACTTTCTAGGACAGTAATCTGCTTTAGGCTAAAATGGGACTTGATCTTCTGTTAGCCCTAATCATCAATTAGCAGACCGGTGAAGGTGCAGAACCTACCGCCTTTCCAGGCCTCCTCCCACTTTGGCACCTCCACTCTCCTTCCTGGGGATGTGGGGGCTGGCACACGTGTGGCCCAGGGCATTGGTGGGATTGCACTGAGCTGGGTCATTAGCGTAATCCTGGACAAGGGCAGACAGGGCGAGCGGAGGGCCAGCTCCGGGGCTCAGGCAAGGCTGGGGGCTTCCCCCAGACACCCCACTCCTCCTCTGCTGGACCCCCACTTCATAGGGCACTTCGTGTTCTCAAAGGGCTTCCAAATAGCATGGTGGCCTTGGATGCCCAGGGAAGCCTCAGAGTTGCTTATCTCCCTCTAGACAGAAGGGGAATCTCGGTCAAGAGGGAGAGGTCGCCCTGTTCAAGGCCACCCAGCCAGCTCATGGCGGTAATGGGACAAGGCTGGCCAGCCATCCCACCCTCAGAAGGGACCCGGTGGGGCAGGTGATCTCAGAGGAGGCTCACTTCTGGGTCTCACATTCTTGGATCCGGTTCCAGGCCTCGGCCCTAAATAGTCTCCCTGGGCTTTCAAGAGAACCACATGAGAAAGGAGGATTCGGGCTCTGAGCAGTTTCACCACCCACCCCCCAGTCTGCAAATCCTGACCCGTGGGTCCACCTGCCCCAAAGGCGGACGCAGGACAGTAGAAGGGAACAGAGAACACATAAACACAGAGAGGGCCACAGCGGCTCCCACAGTCACCGCCACCTTCCTGGCGGGGATGGGTGGGGCGTCTGAGTTTGGTTCCCAGCAAATCCCTCTGAGCCGCCCTTGCGGGCTCGCCTCAGGAGCAGGGGAGCAAGAGGTGGGAGGAGGAGGTCTAAGTCCCAGGCCCAATTAAGAGATCAGGTAGTGTAGGGTTTGGGAGCTTTTAAGGTGAAGAGGCCCGGGCTGATCCCACAGGCCAGTATAAAGCGCCGTGACCCTCAGGTGATGCGCCAGGGCCGGCTGCCGTCGGGGACAGGGCTTTCCATAGCCATGGTGAGCAAGGGCGAGGAGCTGTTCACCGGGGTGGTGCCCATCCTGGTCGAGCTGGACGGCGACGTAAACGGCCACAAGTTCAGCGTGTCCGGCGAGGGCGAGGGCGATGCCACCTACG

254
GCAAGCTGACCCTGAAGTTCATCTGCACCACCGGCAAGCTGCCCGTGCCCTGGCCCACCCTCGTGACCACCCTGACCTACGGCGTGCAGTGCTTCAGCCGCTACCCCGACCACATGAAGCAGCACGACTTCTTCAAGTCCGCCATGCCCGAAGGCTACGTCCAGGAGCGCACCATCTTCTTCAAGGACGACGGCAACTACAAGACCCGCGCCGAGGTGAAGTTCGAGGGCGACACCCTGGTGAACCGCATCGAGCTGAAGGGCATCGACTTCAAGGAGGACGGCAACATCCTGGGGCACAAGCTGGAGTACAACTACAACAGCCACAACGTCTATATCATGGCCGACAAGCAGAAGAACGGCATCAAGGTGAACTTCAAGATCCGCCACAACATCGAGGACGGCAGCGTGCAGCTCGCCGACCACTACCAGCAGAACACCCCCATCGGCGACGGCCCCGTGCTGCTGCCCGACAACCACTACCTGAGCACCCAGTCCGCCCTGAGCAAAGACCCCAACGAGAAGCGCGATCACATGGTCCTGCTGGAGTTCGTGACCGCCGCCGGGATCACTCTCGGCATGGACGAGCTGTACAAGTAAAGCGGCCGCGACTCTAGATCATAATCAGCCATACCACATTTGTAGAGGTTTTACTTGCTTTAAAAAACCTCCCACACCTCCCCCTGAACCTGAAACATAAAATGAATGCAATTGTTGTTGTTAACTTGTTTATTGCAGCTTATAATGGTTACAAATAAAGCAATAGCATCACAAATTTCACAAATAAAGCATTTTTTTCACTGCATTCTAGTTGTGGTTTGTCCAAACTCATCAATGTATCTTAAGGCCTAGGTGAGCTCTGGTACCCTCTAGTCAAGGATCAGTGATGGAGTTGGCCACTCCCTCTCTGCGCGCTCGCTCGCTCACTGAGGCCGGGCGACCAAAGGTCGCCCGACGCCCGGGCTTTGCCCGGGCGGCCTCAGTGAGCGAGCGAGCGCGCAGCTGCTGCATTAATGAATCGGCCAACGCGCGGGGAGAGGCGGTTTGCGTATTGGGCGCTCTTCCGCTCTAGACTTAATTAAGGATCAATTCACTGGCCGTCGTTTTACAACGTCGTGACTGGGAAAACCCTGGCGTTACCCAACTTAATCGCCTTGCAGCACATCCCCCTTTCGCCAGCTGGCGTAATAGCGAAGAGGCCCGCACCGATCGCCCTTCCCAACAGTTGCGCAGCCTGAATGGCGAATGGCGCCTGATGCGGTATTTTCTCCTTACGCATCTGTGCGGTATTTCACACCGCATATGGTGCACTCTCAGTACAATCTGCTCTGATGCCGCATAGTTAAGCCAGCCCCGACACCCGCCAACACCCGCTGACGCGCCCTGACGGGCTTGTCTGCTCCCGGCATCCGCTTACAGACAAGCTGTGACCGTCTCCGGGAGCTGCATGTGTCAGAGGTTTTCACCGTCATCACCGAAACGCGCGAGACGAAAGGGCCTCGTGATACGCCTATTTTTATAGGTTAATGTCATGATAATAATGGTTTCTTAGACGTCAGGTGGCACTTTTCGGGGAAATGTGCGCGGAACCCCTATTTGTTTATTTTTCTAAATACATTCAAATATGTATCCGCTCATGAGACAATAACCCTGATAAATGCTTCAATAATATTGAAAAAGGAAGAGTATGAGTATTCAACATTTCCGTGTCGCCCTTATTCCCTTTTTTGCGGCATTTTGCCTTCCTGTTTTTGCTCACCCAGAAACGCTGGTGAAAGTAAAAGATGCTGAAGATCAGTTGGGTGCACGAGTGGGTTACATCGAACTGGATCTCAACAGCGGTAAGATCCTTGAGAGTTTTCGCCCCGAAGAACGTTTTCCAATGATGAGCACTTTTAAAGTTCTGCTATGTGGCGCGGTATTATCCCGTATTGACGCCGGGCAAGAGCAACTCGGTCGCCGCATACACTATTCTCAGAATGACTTGGTTGAGTACTCACCAGTCACAGAAAAGCATCTTACGGATGGCATGACAGTAAGAGAATTATGCAGTGCTGCCATAACCATGAGTGATAACACTGCGGCCAACTTACTTCTGACAACGATCGGAGGACCGAAGGAGCTAACCGCTTTTTTGCACAACATGGGGGATCATGTAACTCGCCTTGATCGTTGGGAACCGGAGCTGAATGAAGCCATACCAAACGACGAGCGTGACACCACGATGCCTGTAGCAATGGCAACAACGTTGCGCAAACTATTAACTGGCGAACTACTTACTCTAGCTTCCCGGCAACAATTAATAGACTGGATGGAGGCGGATAAAGTTGCAGGACCACTTCTGCGCTCGGCCCTTCCGGCTGGCTGGTTTATTGCTGATAAATCTGGAGCCGGTGAGCGTGGGTCTCGCGGTATCATTGCAGCACTGGGGCCAGATGGTAAGCCCTCCCGTATCGTAGTTATCTACACGACGGGGAGTCAGGCAACTATGGATGAACGAAATAGACAGATCGCTGAGATAGGTGCCTCACTGATTAAGCATTGGTAACTGTCAGACCAAGTTTACTCATATATACTTTAGATTGATTTAAAACTTCATTTTTAATTTAAAAGGATCTAGGTGAAGATCCTTTTTGATAATCTCATGACCAAAATCCCTTAACGTGAGTTTTCGTTCCACTGAGCGTCAGACCCCGTAGAAAAGATCAAAGGATCTTCTTGAGATCCTTTTTTTCTGCGCGTAATCTGCTGCTTGCAAACAAAAAAACCACCGCTACCAGCGGTGGTTTGTTTGCCGGATCAAGAGCTACCAACTCTTTTTCCGAAGGTAACTGGCTTCAGCAGAGCGCAGATACCAAATACTGTCCTTCTAGTGTAGCCGTAGTTAGGCCACCACTTCAAGAACTCTGTAGCACCGCCTACATACCTCGCTCTGCTAATCCTGTTACCA

255
GTGGCTGCTGCCAGTGGCGATAAGTCGTGTCTTACCGGGTTGGACTCAAGACGATAGTTACCGGATAAGGCGCAGCGGTCGGGCTGAACGGGGGGTTCGTGCACACAGCCCAGCTTGGAGCGAACGACCTACACCGAACTGAGATACCTACAGCGTGAGCTATGAGAAAGCGCCACGCTTCCCGAAGGGAGAAAGGCGGACAGGTATCCGGTAAGCGGCAGGGTCGGAACAGGAGAGCGCACGAGGGAGCTTCCAGGGGGAAACGCCTGGTATCTTTATAGTCCTGTCGGGTTTCGCCACCTCTGACTTGAGCGTCGATTTTTGTGATGCTCGTCAGGGGGGCGGAGCCTATGGAAAAACGCCAGCAACGCGGCCTTTTTACGGTTCCTGGCCTTTTGCTGGCCTTTTGCTCACATGTTCTTTCCTGCGTTATCCCCTGATTCTGTGGATAACCGTATTACCGCCTTTGAGTGAGCTGATACCGCTCGCCGCAGCCGAACGACCGAGCGCAGCGAGTCAGTGAGCGAGGAAGCGGAAGAGCGCCCAATACGCAAACCGCCTCTCCCCGCGCGTTGGCCGATTCATTAATGCAGCTGGCACGACAGGTTTCCCGACTGGAAAGCGGGCAGTGAGCGCAACGCAATTAATGTGAGTTAGCTCACTCATTAGGCACCCCAGGCTTTACACTTTATGCTTCCGGCTCGTATGTTGTGTGGAATTGTGAGCGGATAACAATTTCACACAGGAAACAGCTATGACCATGATTACGCCAAGCTCTAGACTTAATTAAGGATCAATTCACTGGCCGTCGTTTTACAACGTCGTGACTGGGAAAACCCTGGCGTTACCCAACTTAATCGCCTTGCAGCACATCCCCCTTTCGCCAGCTGGCGTAATAGCGAAGAGGCCCGCACCGATCGCCCTTCCCAACAGTTGCGCAGCCTGAATGGCGAATGGCGCCTGATGCGGTATTTTCTCCTTACGCATCTGTGCGGTATTTCACACCGCATATGCGGTGTGAAATACCGCACAGATGCGTAAGGAGAAAATACCGCATCAGGAATTAATTCCAACATCCAATAAATCATACAGGCAAGGCAAAGAATTAGCAAAATTAAGCAATAAAGCCTCAGAGCATAAAGCTAAATCGGTTGTACCAAAAACATTATGACCCTGTAATACTTTTGCGGGAGAAGCCTTTATTTCAACGCAAGGATAAAAATTTTTAGAACCCTCATATATTTTAAATGCAATGCCTGAGTAATGTGTAGGTAAAGATTCAAACGGGTGAGAAAGGCCGGAGACAGTCAAATCACCATCAATATGATATTCAACCGTTCTAGCTGATAAATTCATGCCGGAGAGGGTAGCTATTTTTGAGAGGTCTCTACAAAGGCTATCAGGTCATTGCCTGAGAGTCTGGAGCAAACAAGAGAATCGCTGCGCGCTCGCTCGCTCACTGAGGCCGCCC

256
Bibliography
AASEN, T., RAYA, A., BARRERO, M. J., GARRETA, E., CONSIGLIO, A., GONZALEZ, F., VASSENA, R., BILIC, J., PEKARIK, V., TISCORNIA, G., EDEL, M., BOUE, S. & IZPISUA BELMONTE, J. C. 2008. Efficient and rapid generation of induced pluripotent stem cells from human keratinocytes. Nat Biotechnol, 26, 1276-84.
ABBASI, A. R., KHALAJ, M., TSUJI, T., TANAHARA, M., UCHIDA, K., SUGIMOTO, Y. & KUNIEDA, T. 2009. A mutation of the WFDC1 gene is responsible for multiple ocular defects in cattle. Genomics, 94, 55-62.
ACLAND, G. M., AGUIRRE, G. D., RAY, J., ZHANG, Q., ALEMAN, T. S., CIDECIYAN, A. V., PEARCE-KELLING, S. E., ANAND, V., ZENG, Y., MAGUIRE, A. M., JACOBSON, S. G., HAUSWIRTH, W. W. & BENNETT, J. 2001. Gene therapy restores vision in a canine model of childhood blindness. Nat Genet, 28, 92-5.
ADELMANN, H. B. 1929. Experimental studies on the development of the eye II the eye-forming potencies of the median portions of the urodelan neural plate (triton teniatus and amblystoma punctatum). Journal of Experimental Zoology, 54, 291-317.
ADLER, R. 1993. Plasticity and differentiation of retinal precursor cells. Int Rev Cytol, 146, 145-90.
ADLER, R. & CANTO-SOLER, M. V. 2007. Molecular mechanisms of optic vesicle development: complexities, ambiguities and controversies. Dev Biol, 305, 1-13.
ADLER, R. & HATLEE, M. 1989. Plasticity and differentiation of embryonic retinal cells after terminal mitosis. Science, 243, 391-3.
AHMAD, I., TANG, L. & PHAM, H. 2000. Identification of neural progenitors in the adult mammalian eye. Biochem Biophys Res Commun, 270, 517-21.
AHNELT, P. K., KOLB, H. & PFLUG, R. 1987. Identification of a subtype of cone photoreceptor, likely to be blue sensitive, in the human retina. J Comp Neurol, 255, 18-34.
AKAGI, T., AKITA, J., HARUTA, M., SUZUKI, T., HONDA, Y., INOUE, T., YOSHIURA, S., KAGEYAMA, R., YATSU, T., YAMADA, M. & TAKAHASHI, M. 2005. Iris-derived cells from adult rodents and primates adopt photoreceptor-specific phenotypes. Invest Ophthalmol Vis Sci, 46, 3411-9.
AKAGI, T., INOUE, T., MIYOSHI, G., BESSHO, Y., TAKAHASHI, M., LEE, J. E., GUILLEMOT, F. & KAGEYAMA, R. 2004a. Requirement of multiple basic helix-loop-helix genes for retinal neuronal subtype specification. J Biol Chem, 279, 28492-8.
AKAGI, T., MANDAI, M., OOTO, S., HIRAMI, Y., OSAKADA, F., KAGEYAMA, R., YOSHIMURA, N. & TAKAHASHI, M. 2004b. Otx2 homeobox gene induces photoreceptor-specific phenotypes in cells derived from adult iris and ciliary tissue. Invest Ophthalmol Vis Sci, 45, 4570-5.
AKIMOTO, M., CHENG, H., ZHU, D., BRZEZINSKI, J. A., KHANNA, R., FILIPPOVA, E., OH, E. C., JING, Y., LINARES, J. L., BROOKS, M., ZAREPARSI, S., MEARS, A. J., HERO, A., GLASER, T. & SWAROOP, A. 2006. Targeting of GFP to newborn rods by Nrl promoter and temporal expression profiling of flow-sorted photoreceptors. Proc Natl Acad Sci U S A, 103, 3890-5.
ALEXANDER, J. J., UMINO, Y., EVERHART, D., CHANG, B., MIN, S. H., LI, Q., TIMMERS, A. M., HAWES, N. L., PANG, J. J., BARLOW, R. B. & HAUSWIRTH, W. W. 2007. Restoration of cone vision in a mouse model of achromatopsia. Nat Med, 13, 685-7.

257
ALLOCCA, M., MUSSOLINO, C., GARCIA-HOYOS, M., SANGES, D., IODICE, C., PETRILLO, M., VANDENBERGHE, L. H., WILSON, J. M., MARIGO, V., SURACE, E. M. & AURICCHIO, A. 2007. Novel adeno-associated virus serotypes efficiently transduce murine photoreceptors. J Virol, 81, 11372-80.
APPLEBURY, M. L., FARHANGFAR, F., GLOSMANN, M., HASHIMOTO, K., KAGE, K., ROBBINS, J. T., SHIBUSAWA, N., WONDISFORD, F. E. & ZHANG, H. 2007. Transient expression of thyroid hormone nuclear receptor TRbeta2 sets S opsin patterning during cone photoreceptor genesis. Dev Dyn, 236, 1203-12.
ARAMANT, R. B. & SEILER, M. J. 2002. Transplanted sheets of human retina and retinal pigment epithelium develop normally in nude rats. Exp Eye Res, 75, 115-125.
ARIKAWA, K., MOLDAY, L. L., MOLDAY, R. S. & WILLIAMS, D. S. 1992. Localization of peripherin/rds in the disk membranes of cone and rod photoreceptors: relationship to disk membrane morphogenesis and retinal degeneration. J Cell Biol, 116, 659-67.
ARNO, G., AGRAWAL, S. A., EBLIMIT, A., BELLINGHAM, J., XU, M., WANG, F., CHAKAROVA, C., PARFITT, D. A., LANE, A., BURGOYNE, T., HULL, S., CARSS, K. J., FIORENTINO, A., HAYES, M. J., MUNRO, P. M., NICOLS, R., PONTIKOS, N., HOLDER, G. E., ASOMUGHA, C., RAYMOND, F. L., MOORE, A. T., PLAGNOL, V., MICHAELIDES, M., HARDCASTLE, A. J., LI, Y., CUKRAS, C., WEBSTER, A. R., CHEETHAM, M. E. & CHEN, R. 2016. Mutations in REEP6 Cause Autosomal-Recessive Retinitis Pigmentosa. Am J Hum Genet, 99, 1305-1315.
ASAMI, M., SUN, G., YAMAGUCHI, M. & KOSAKA, M. 2007. Multipotent cells from mammalian iris pigment epithelium. Dev Biol, 304, 433-46.
ASSAWACHANANONT, J., MANDAI, M., OKAMOTO, S., YAMADA, C., EIRAKU, M., YONEMURA, S., SASAI, Y. & TAKAHASHI, M. 2014. Transplantation of embryonic and induced pluripotent stem cell-derived 3D retinal sheets into retinal degenerative mice. Stem Cell Reports, 2, 662-74.
AUGUSTO, E., MATOS, M., SEVIGNY, J., EL-TAYEB, A., BYNOE, M. S., MULLER, C. E., CUNHA, R. A. & CHEN, J. F. 2013. Ecto-5'-nucleotidase (CD73)-mediated formation of adenosine is critical for the striatal adenosine A2A receptor functions. J Neurosci, 33, 11390-9.
AWE, J. P., LEE, P. C., RAMATHAL, C., VEGA-CRESPO, A., DURRUTHY-DURRUTHY, J., COOPER, A., KARUMBAYARAM, S., LOWRY, W. E., CLARK, A. T., ZACK, J. A., SEBASTIANO, V., KOHN, D. B., PYLE, A. D., MARTIN, M. G., LIPSHUTZ, G. S., PHELPS, P. E., PERA, R. A. & BYRNE, J. A. 2013. Generation and characterization of transgene-free human induced pluripotent stem cells and conversion to putative clinical-grade status. Stem Cell Res Ther, 4, 87.
BABA, Y., SATOH, S., OTSU, M., SASAKI, E., OKADA, T. & WATANABE, S. 2012. In vitro cell subtype-specific transduction of adeno-associated virus in mouse and marmoset retinal explant culture. Biochimie, 94, 2716-22.
BAINBRIDGE, J. W., SMITH, A. J., BARKER, S. S., ROBBIE, S., HENDERSON, R., BALAGGAN, K., VISWANATHAN, A., HOLDER, G. E., STOCKMAN, A., TYLER, N., PETERSEN-JONES, S., BHATTACHARYA, S. S., THRASHER, A. J., FITZKE, F. W., CARTER, B. J., RUBIN, G. S., MOORE, A. T. & ALI, R. R. 2008. Effect of gene therapy on visual function in Leber's congenital amaurosis. N Engl J Med, 358, 2231-9.
BALLIOS, B. G., CLARKE, L., COLES, B. L., SHOICHET, M. S. & VAN DER KOOY, D. 2012. The adult retinal stem cell is a rare cell in the ciliary epithelium whose progeny can differentiate into photoreceptors. Biol Open, 1, 237-46.
BALSE, E., TESSIER, L. H., FUCHS, C., FORSTER, V., SAHEL, J. A. & PICAUD, S. 2005. Purification of mammalian cone photoreceptors by lectin panning and the

258
enhancement of their survival in glia-conditioned medium. Invest Ophthalmol Vis Sci, 46, 367-74.
BARBER, A. C., HIPPERT, C., DURAN, Y., WEST, E. L., BAINBRIDGE, J. W., WARRE-CORNISH, K., LUHMANN, U. F., LAKOWSKI, J., SOWDEN, J. C., ALI, R. R. & PEARSON, R. A. 2013. Repair of the degenerate retina by photoreceptor transplantation. Proc Natl Acad Sci U S A, 110, 354-9.
BARNEA-CRAMER, A. O., WANG, W., LU, S. J., SINGH, M. S., LUO, C., HUO, H., MCCLEMENTS, M. E., BARNARD, A. R., MACLAREN, R. E. & LANZA, R. 2016. Function of human pluripotent stem cell-derived photoreceptor progenitors in blind mice. Sci Rep, 6, 29784.
BARTSCH, U., ORIYAKHEL, W., KENNA, P. F., LINKE, S., RICHARD, G., PETROWITZ, B., HUMPHRIES, P., FARRAR, G. J. & ADER, M. 2008. Retinal cells integrate into the outer nuclear layer and differentiate into mature photoreceptors after subretinal transplantation into adult mice. Exp Eye Res, 86, 691-700.
BEAULIEU, C. L., HUANG, L., INNES, A. M., AKIMENKO, M. A., PUFFENBERGER, E. G., SCHWARTZ, C., JERRY, P., OBER, C., HEGELE, R. A., MCLEOD, D. R., SCHWARTZENTRUBER, J., MAJEWSKI, J., BULMAN, D. E., PARBOOSINGH, J. S. & BOYCOTT, K. M. 2013. Intellectual disability associated with a homozygous missense mutation in THOC6. Orphanet J Rare Dis, 8, 62.
BEIER, K. T., SAMSON, M. E., MATSUDA, T. & CEPKO, C. L. 2011. Conditional expression of the TVA receptor allows clonal analysis of descendents from Cre-expressing progenitor cells. Dev Biol, 353, 309-20.
BHATIA, B., SINGHAL, S., LAWRENCE, J. M., KHAW, P. T. & LIMB, G. A. 2009. Distribution of Muller stem cells within the neural retina: evidence for the existence of a ciliary margin-like zone in the adult human eye. Exp Eye Res, 89, 373-82.
BIBB, L. C., HOLT, J. K., TARTTELIN, E. E., HODGES, M. D., GREGORY-EVANS, K., RUTHERFORD, A., LUCAS, R. J., SOWDEN, J. C. & GREGORY-EVANS, C. Y. 2001. Temporal and spatial expression patterns of the CRX transcription factor and its downstream targets. Critical differences during human and mouse eye development. Hum Mol Genet, 10, 1571-9.
BOLES, N. C., HIRSCH, S. E., LE, S., CORNEO, B., NAJM, F., MINOTTI, A. P., WANG, Q., LOTZ, S., TESAR, P. J. & FASANO, C. A. 2014. NPTX1 regulates neural lineage specification from human pluripotent stem cells. Cell Rep, 6, 724-36.
BONIGK, W., ALTENHOFEN, W., MULLER, F., DOSE, A., ILLING, M., MOLDAY, R. S. & KAUPP, U. B. 1993. Rod and Cone Photoreceptor Cells Express Distinct Genes for Cgmp-Gated Channels. Neuron, 10, 865-877.
BOUCHERIE, C., MUKHERJEE, S., HENCKAERTS, E., THRASHER, A. J., SOWDEN, J. C. & ALI, R. R. 2013. Brief report: self-organizing neuroepithelium from human pluripotent stem cells facilitates derivation of photoreceptors. Stem Cells, 31, 408-14.
BOUWMEESTER, T., KIM, S., SASAI, Y., LU, B. & DE ROBERTIS, E. M. 1996. Cerberus is a head-inducing secreted factor expressed in the anterior endoderm of Spemann's organizer. Nature, 382, 595-601.
BOWES RICKMAN, C., EBRIGHT, J. N., ZAVODNI, Z. J., YU, L., WANG, T., DAIGER, S. P., WISTOW, G., BOON, K. & HAUSER, M. A. 2006. Defining the human macula transcriptome and candidate retinal disease genes using EyeSAGE. Invest Ophthalmol Vis Sci, 47, 2305-16.
BOWMAKER, J. K. & HUNT, D. M. 2006. Evolution of vertebrate visual pigments. Curr Biol, 16, R484-9.

259
BRAWAND, D., SOUMILLON, M., NECSULEA, A., JULIEN, P., CSARDI, G., HARRIGAN, P., WEIER, M., LIECHTI, A., AXIMU-PETRI, A., KIRCHER, M., ALBERT, F. W., ZELLER, U., KHAITOVICH, P., GRUTZNER, F., BERGMANN, S., NIELSEN, R., PAABO, S. & KAESSMANN, H. 2011. The evolution of gene expression levels in mammalian organs. Nature, 478, 343-8.
BRZEZINSKI, J. A. & REH, T. A. 2015. Photoreceptor cell fate specification in vertebrates. Development, 142, 3263-73.
BUCH, P. K., BAINBRIDGE, J. W. & ALI, R. R. 2008. AAV-mediated gene therapy for retinal disorders: from mouse to man. Gene Ther, 15, 849-57.
BUMSTED, K. & HENDRICKSON, A. 1999. Distribution and development of short-wavelength cones differ between Macaca monkey and human fovea. J Comp Neurol, 403, 502-16.
BUNCE, C., XING, W. & WORMALD, R. 2010. Causes of blind and partial sight certifications in England and Wales: April 2007-March 2008. Eye (Lond), 24, 1692-9.
BUSSKAMP, V., PICAUD, S., SAHEL, J. A. & ROSKA, B. 2012. Optogenetic therapy for retinitis pigmentosa. Gene Ther, 19, 169-75.
CAI, H., FIELDS, M. A., HOSHINO, R. & PRIORE, L. V. 2012. Effects of aging and anatomic location on gene expression in human retina. Front Aging Neurosci, 4, 8.
CAMPLA, C. K., BREIT, H., DONG, L., GUMERSON, J. D., ROGER, J. E. & SWAROOP, A. 2017. Pias3 is necessary for dorso-ventral patterning and visual response of retinal cones but is not required for rod photoreceptor differentiation. Biol Open, 6, 881-890.
CAMPOCHIARO, P. A. 2007. Molecular targets for retinal vascular diseases. J Cell Physiol, 210, 575-81.
CARL, M. & WITTBRODT, J. 1999. Graded interference with FGF signalling reveals its dorsoventral asymmetry at the mid-hindbrain boundary. Development, 126, 5659-67.
CARTER-DAWSON, L. D. & LAVAIL, M. M. 1979. Rods and cones in the mouse retina. II. Autoradiographic analysis of cell generation using tritiated thymidine. J Comp Neurol, 188, 263-72.
CARVALHO, L. S., XU, J., PEARSON, R. A., SMITH, A. J., BAINBRIDGE, J. W., MORRIS, L. M., FLIESLER, S. J., DING, X. Q. & ALI, R. R. 2011. Long-term and age-dependent restoration of visual function in a mouse model of CNGB3-associated achromatopsia following gene therapy. Hum Mol Genet, 20, 3161-75.
CEPKO, C. 2014. Intrinsically different retinal progenitor cells produce specific types of progeny. Nat Rev Neurosci, 15, 615-27.
CEPKO, C. L. 2015. The Determination of Rod and Cone Photoreceptor Fate. Annu Rev Vis Sci, 1, 211-234.
CEPKO, C. L., AUSTIN, C. P., YANG, X., ALEXIADES, M. & EZZEDDINE, D. 1996. Cell fate determination in the vertebrate retina. Proc Natl Acad Sci U S A, 93, 589-95.
CHANG, C. & HEMMATI-BRIVANLOU, A. 1998. Cell fate determination in embryonic ectoderm. J Neurobiol, 36, 128-51.
CHEN, C. M. & CEPKO, C. L. 2002. The chicken RaxL gene plays a role in the initiation of photoreceptor differentiation. Development, 129, 5363-75.
CHEN, E. Y., TAN, C. M., KOU, Y., DUAN, Q., WANG, Z., MEIRELLES, G. V., CLARK, N. R. & MA'AYAN, A. 2013. Enrichr: interactive and collaborative HTML5 gene list enrichment analysis tool. BMC Bioinformatics, 14, 128.

260
CHEN, F. K., PATEL, P. J., UPPAL, G. S., TUFAIL, A., COFFEY, P. J. & DA CRUZ, L. 2010. Long-term outcomes following full macular translocation surgery in neovascular age-related macular degeneration. Br J Ophthalmol, 94, 1337-43.
CHEN, J., RATTNER, A. & NATHANS, J. 2005. The rod photoreceptor-specific nuclear receptor Nr2e3 represses transcription of multiple cone-specific genes. J Neurosci, 25, 118-29.
CHEN, J., TUCKER, C. L., WOODFORD, B., SZEL, A., LEM, J., GIANELLA-BORRADORI, A., SIMON, M. I. & BOGENMANN, E. 1994. The human blue opsin promoter directs transgene expression in short-wave cones and bipolar cells in the mouse retina. Proc Natl Acad Sci U S A, 91, 2611-5.
CHEN, S., WANG, Q. L., NIE, Z., SUN, H., LENNON, G., COPELAND, N. G., GILBERT, D. J., JENKINS, N. A. & ZACK, D. J. 1997. Crx, a novel Otx-like paired-homeodomain protein, binds to and transactivates photoreceptor cell-specific genes. Neuron, 19, 1017-30.
CHEN, T. Y., PENG, Y. W., DHALLAN, R. S., AHAMED, B., REED, R. R. & YAU, K. W. 1993. A New Subunit of the Cyclic Nucleotide-Gated Cation Channel in Retinal Rods. Nature, 362, 764-767.
CHIU, C. Y., LENG, S., MARTIN, K. A., KIM, E., GORMAN, S. & DUHL, D. M. 1999. Cloning and characterization of T-cell lymphoma invasion and metastasis 2 (TIAM2), a novel guanine nucleotide exchange factor related to TIAM1. Genomics, 61, 66-73.
CHIU, M. I. & NATHANS, J. 1994. Blue cones and cone bipolar cells share transcriptional specificity as determined by expression of human blue visual pigment-derived transgenes. J Neurosci, 14, 3426-36.
CHOW, R. L., ALTMANN, C. R., LANG, R. A. & HEMMATI-BRIVANLOU, A. 1999. Pax6 induces ectopic eyes in a vertebrate. Development, 126, 4213-22.
COLES, B. L., ANGENIEUX, B., INOUE, T., DEL RIO-TSONIS, K., SPENCE, J. R., MCINNES, R. R., ARSENIJEVIC, Y. & VAN DER KOOY, D. 2004. Facile isolation and the characterization of human retinal stem cells. Proc Natl Acad Sci U S A, 101, 15772-7.
CONG, L., RAN, F. A., COX, D., LIN, S., BARRETTO, R., HABIB, N., HSU, P. D., WU, X., JIANG, W., MARRAFFINI, L. A. & ZHANG, F. 2013. Multiplex genome engineering using CRISPR/Cas systems. Science, 339, 819-23.
CORBO, J. C., LAWRENCE, K. A., KARLSTETTER, M., MYERS, C. A., ABDELAZIZ, M., DIRKES, W., WEIGELT, K., SEIFERT, M., BENES, V., FRITSCHE, L. G., WEBER, B. H. & LANGMANN, T. 2010. CRX ChIP-seq reveals the cis-regulatory architecture of mouse photoreceptors. Genome Res, 20, 1512-25.
CORNISH, E. E., MADIGAN, M. C., NATOLI, R., HALES, A., HENDRICKSON, A. E. & PROVIS, J. M. 2005. Gradients of cone differentiation and FGF expression during development of the foveal depression in macaque retina. Vis Neurosci, 22, 447-59.
CORNISH, E. E., XIAO, M., YANG, Z., PROVIS, J. M. & HENDRICKSON, A. E. 2004. The role of opsin expression and apoptosis in determination of cone types in human retina. Exp Eye Res, 78, 1143-54.
CRAFT, C. M., HUANG, J., POSSIN, D. E. & HENDRICKSON, A. 2014. Primate short-wavelength cones share molecular markers with rods. Adv Exp Med Biol, 801, 49-56.
CUENCA, N., LOPEZ, S., HOWES, K. & KOLB, H. 1998. The localization of guanylyl cyclase-activating proteins in the mammalian retina. Invest Ophthalmol Vis Sci, 39, 1243-1250.

261
CURCIO, C. A., ALLEN, K. A., SLOAN, K. R., LEREA, C. L., HURLEY, J. B., KLOCK, I. B. & MILAM, A. H. 1991. Distribution and morphology of human cone photoreceptors stained with anti-blue opsin. J Comp Neurol, 312, 610-24.
CURCIO, C. A., SLOAN, K. R., KALINA, R. E. & HENDRICKSON, A. E. 1990. Human photoreceptor topography. J Comp Neurol, 292, 497-523.
CYRANOSKI, D. 2013. Stem cells cruise to clinic. Nature, 494, 413. DAIGER, S. P., ROSSITER, B.J.F., GREENBERG, J., CHRISTOFFELS, A., HIDE, W. 1998. Data
services and software for identifying genes and mutations causing retinal degeneration. . Invest. Ophthalmol.Vis. Sci., 39.
DAMIANI, D., NOVELLI, E., MAZZONI, F. & STRETTOI, E. 2012. Undersized dendritic arborizations in retinal ganglion cells of the rd1 mutant mouse: a paradigm of early onset photoreceptor degeneration. J Comp Neurol, 520, 1406-23.
DAS, A. V., MALLYA, K. B., ZHAO, X., AHMAD, F., BHATTACHARYA, S., THORESON, W. B., HEGDE, G. V. & AHMAD, I. 2006. Neural stem cell properties of Muller glia in the mammalian retina: regulation by Notch and Wnt signaling. Dev Biol, 299, 283-302.
DE MELO, J., PENG, G. H., CHEN, S. & BLACKSHAW, S. 2011. The Spalt family transcription factor Sall3 regulates the development of cone photoreceptors and retinal horizontal interneurons. Development, 138, 2325-36.
DE SILVA, S. R., CHARBEL ISSA, P., SINGH, M. S., LIPINSKI, D. M., BARNEA-CRAMER, A. O., WALKER, N. J., BARNARD, A. R., HANKINS, M. W. & MACLAREN, R. E. 2016. Single residue AAV capsid mutation improves transduction of photoreceptors in the Abca4-/- mouse and bipolar cells in the rd1 mouse and human retina ex vivo. Gene Ther, 23, 767-774.
DECEMBRINI, S., KOCH, U., RADTKE, F., MOULIN, A. & ARSENIJEVIC, Y. 2014. Derivation of traceable and transplantable photoreceptors from mouse embryonic stem cells. Stem Cell Reports, 2, 853-65.
DECEMBRINI, S., MARTIN, C., SENNLAUB, F., CHEMTOB, S., BIEL, M., SAMARDZIJA, M., MOULIN, A., BEHAR-COHEN, F. & ARSENIJEVIC, Y. 2017. Cone Genesis Tracing by the Chrnb4-EGFP Mouse Line: Evidences of Cellular Material Fusion after Cone Precursor Transplantation. Mol Ther, 25, 634-653.
DONOVAN, S. L. & DYER, M. A. 2006. Preparation and square wave electroporation of retinal explant cultures. Nat Protoc, 1, 2710-8.
DYKA, F. M., BOYE, S. L., RYALS, R. C., CHIODO, V. A., BOYE, S. E. & HAUSWIRTH, W. W. 2014. Cone specific promoter for use in gene therapy of retinal degenerative diseases. Adv Exp Med Biol, 801, 695-701.
EBERLE, D., KURTH, T., SANTOS-FERREIRA, T., WILSON, J., CORBEIL, D. & ADER, M. 2012. Outer segment formation of transplanted photoreceptor precursor cells. PLoS One, 7, e46305.
EBERLE, D., SANTOS-FERREIRA, T., GRAHL, S. & ADER, M. 2014. Subretinal transplantation of MACS purified photoreceptor precursor cells into the adult mouse retina. J Vis Exp, e50932.
EBERLE, D., SCHUBERT, S., POSTEL, K., CORBEIL, D. & ADER, M. 2011. Increased integration of transplanted CD73-positive photoreceptor precursors into adult mouse retina. Invest Ophthalmol Vis Sci, 52, 6462-71.
EIRAKU, M., TAKATA, N., ISHIBASHI, H., KAWADA, M., SAKAKURA, E., OKUDA, S., SEKIGUCHI, K., ADACHI, T. & SASAI, Y. 2011. Self-organizing optic-cup morphogenesis in three-dimensional culture. Nature, 472, 51-6.

262
EMBORG, M. E., LIU, Y., XI, J., ZHANG, X., YIN, Y., LU, J., JOERS, V., SWANSON, C., HOLDEN, J. E. & ZHANG, S. C. 2013. Induced pluripotent stem cell-derived neural cells survive and mature in the nonhuman primate brain. Cell Rep, 3, 646-50.
EMERSON, M. M., SURZENKO, N., GOETZ, J. J., TRIMARCHI, J. & CEPKO, C. L. 2013. Otx2 and Onecut1 promote the fates of cone photoreceptors and horizontal cells and repress rod photoreceptors. Dev Cell, 26, 59-72.
ENGELHARDT, M., BOGDAHN, U. & AIGNER, L. 2005. Adult retinal pigment epithelium cells express neural progenitor properties and the neuronal precursor protein doublecortin. Brain Res, 1040, 98-111.
ENGLAND, S. J., BLANCHARD, G. B., MAHADEVAN, L. & ADAMS, R. J. 2006. A dynamic fate map of the forebrain shows how vertebrate eyes form and explains two causes of cyclopia. Development, 133, 4613-7.
EZZEDDINE, Z. D., YANG, X., DECHIARA, T., YANCOPOULOS, G. & CEPKO, C. L. 1997. Postmitotic cells fated to become rod photoreceptors can be respecified by CNTF treatment of the retina. Development, 124, 1055-67.
FEI, Y. 2003. Development of the cone photoreceptor mosaic in the mouse retina revealed by fluorescent cones in transgenic mice. Mol Vis, 9, 31-42.
FEI, Y. & HUGHES, T. E. 2001. Transgenic expression of the jellyfish green fluorescent protein in the cone photoreceptors of the mouse. Vis Neurosci, 18, 615-23.
FERNANDEZ-BUENO, I., FERNANDEZ-SANCHEZ, L., GAYOSO, M. J., GARCIA-GUTIERREZ, M. T., PASTOR, J. C. & CUENCA, N. 2012. Time course modifications in organotypic culture of human neuroretina. Exp Eye Res, 104, 26-38.
FERNANDEZ, E., NELSON, R., KOLB, H. 1997. Webvision: a World Wide Web resource that summarises the recent advances in knowledge and understanding of the vertebrate retina. Invest. Opthalmol. Vis. Sci, 38, 165-165.
FERRIS, F. L., 3RD, WILKINSON, C. P., BIRD, A., CHAKRAVARTHY, U., CHEW, E., CSAKY, K. & SADDA, S. R. 2013. Clinical classification of age-related macular degeneration. Ophthalmology, 120, 844-51.
FUHRMANN, S. 2010. Eye morphogenesis and patterning of the optic vesicle. Curr Top Dev Biol, 93, 61-84.
FUJIEDA, H., BREMNER, R., MEARS, A. J. & SASAKI, H. 2009. Retinoic acid receptor-related orphan receptor alpha regulates a subset of cone genes during mouse retinal development. J Neurochem, 108, 91-101.
FURUKAWA, T., MORROW, E. M. & CEPKO, C. L. 1997. Crx, a novel otx-like homeobox gene, shows photoreceptor-specific expression and regulates photoreceptor differentiation. Cell, 91, 531-41.
GEGENFURTNER, K. R., SHARPE, L.T. 1999. Color vision: From Genes To Perception, UK, Cambridge University Press.
GLUBRECHT, D. D., KIM, J. H., RUSSELL, L., BAMFORTH, J. S. & GODBOUT, R. 2009. Differential CRX and OTX2 expression in human retina and retinoblastoma. J Neurochem, 111, 250-63.
GLUSHAKOVA, L. G., TIMMERS, A. M., PANG, J., TEUSNER, J. T. & HAUSWIRTH, W. W. 2006. Human blue-opsin promoter preferentially targets reporter gene expression to rat s-cone photoreceptors. Invest Ophthalmol Vis Sci, 47, 3505-13.
GOLDBERG, A. F., LOEWEN, C. J. & MOLDAY, R. S. 1998. Cysteine residues of photoreceptor peripherin/rds: role in subunit assembly and autosomal dominant retinitis pigmentosa. Biochemistry, 37, 680-5.
GONZALEZ-CORDERO, A., KRUCZEK, K., NAEEM, A., FERNANDO, M., KLOC, M., RIBEIRO, J., GOH, D., DURAN, Y., BLACKFORD, S. J. I., ABELLEIRA-HERVAS, L., SAMPSON, R. D., SHUM, I. O., BRANCH, M. J., GARDNER, P. J., SOWDEN, J. C., BAINBRIDGE, J.
263
W. B., SMITH, A. J., WEST, E. L., PEARSON, R. A. & ALI, R. R. 2017. Recapitulation of human retinal development from human pluripotent stem cells generates transplantable populations of cone photoreceptors. Stem Cell Reports (under review).
GONZALEZ-CORDERO, A., WEST, E. L., PEARSON, R. A., DURAN, Y., CARVALHO, L. S., CHU, C. J., NAEEM, A., BLACKFORD, S. J., GEORGIADIS, A., LAKOWSKI, J., HUBANK, M., SMITH, A. J., BAINBRIDGE, J. W., SOWDEN, J. C. & ALI, R. R. 2013. Photoreceptor precursors derived from three-dimensional embryonic stem cell cultures integrate and mature within adult degenerate retina. Nat Biotechnol, 31, 741-7.
GRAW, J. 2003. The genetic and molecular basis of congenital eye defects. Nat Rev Genet, 4, 876-88.
GRAW, J. 2010. Eye development. Curr Top Dev Biol, 90, 343-86. GUALDONI, S., BARON, M., LAKOWSKI, J., DECEMBRINI, S., SMITH, A. J., PEARSON, R. A.,
ALI, R. R. & SOWDEN, J. C. 2010. Adult ciliary epithelial cells, previously identified as retinal stem cells with potential for retinal repair, fail to differentiate into new rod photoreceptors. Stem Cells, 28, 1048-59.
GUST, J. & REH, T. A. 2011. Adult Donor Rod Photoreceptors Integrate into the Mature Mouse Retina. Invest Ophthalmol Vis Sci, 52, 5266-5272.
HAESELEER, F., SOKAL, I., LI, N., PETTENATI, M., RAO, N., BRONSON, D., WECHTER, R., BAEHR, W. & PALCZEWSKI, K. 1999. Molecular characterization of a third member of the guanylyl cyclase-activating protein subfamily. Journal of Biological Chemistry, 274, 6526-6535.
HAFLER, B. P., SURZENKO, N., BEIER, K. T., PUNZO, C., TRIMARCHI, J. M., KONG, J. H. & CEPKO, C. L. 2012. Transcription factor Olig2 defines subpopulations of retinal progenitor cells biased toward specific cell fates. Proc Natl Acad Sci U S A, 109, 7882-7.
HAIDER, N. B., MOLLEMA, N., GAULE, M., YUAN, Y., SACHS, A. J., NYSTUEN, A. M., NAGGERT, J. K. & NISHINA, P. M. 2009. Nr2e3-directed transcriptional regulation of genes involved in photoreceptor development and cell-type specific phototransduction. Exp Eye Res, 89, 365-72.
HAN, Z., CONLEY, S. M. & NAASH, M. I. 2014. Gene therapy for Stargardt disease associated with ABCA4 gene. Adv Exp Med Biol, 801, 719-24.
HARADA, T., HARADA, C. & PARADA, L. F. 2007. Molecular regulation of visual system development: more than meets the eye. Genes Dev, 21, 367-78.
HARTONG, D. T., BERSON, E. L. & DRYJA, T. P. 2006. Retinitis pigmentosa. Lancet, 368, 1795-809.
HATAKEYAMA, J. & KAGEYAMA, R. 2004. Retinal cell fate determination and bHLH factors. Semin Cell Dev Biol, 15, 83-9.
HAUSWIRTH, W. W., ALEMAN, T. S., KAUSHAL, S., CIDECIYAN, A. V., SCHWARTZ, S. B., WANG, L., CONLON, T. J., BOYE, S. L., FLOTTE, T. R., BYRNE, B. J. & JACOBSON, S. G. 2008. Treatment of leber congenital amaurosis due to RPE65 mutations by ocular subretinal injection of adeno-associated virus gene vector: short-term results of a phase I trial. Hum Gene Ther, 19, 979-90.
HEALTH, U. S. F. A. D. A. P. A. P. Y. Available: www.fda.gov/Drugs/ScienceResearch/default.htm [Accessed 23/06/2017 2017].
HEISENBERG, C. P., HOUART, C., TAKE-UCHI, M., RAUCH, G. J., YOUNG, N., COUTINHO, P., MASAI, I., CANEPARO, L., CONCHA, M. L., GEISLER, R., DALE, T. C., WILSON, S. W. & STEMPLE, D. L. 2001. A mutation in the Gsk3-binding domain of zebrafish Masterblind/Axin1 leads to a fate transformation of telencephalon and eyes to diencephalon. Genes Dev, 15, 1427-34.

264
HENDRICKSON, A., BUMSTED-O'BRIEN, K., NATOLI, R., RAMAMURTHY, V., POSSIN, D. & PROVIS, J. 2008. Rod photoreceptor differentiation in fetal and infant human retina. Exp Eye Res, 87, 415-26.
HENDRICKSON, A. & ZHANG, C. 2017. Development of cone photoreceptors and their synapses in the human and monkey fovea. J Comp Neurol.
HILL, R. E., FAVOR, J., HOGAN, B. L., TON, C. C., SAUNDERS, G. F., HANSON, I. M., PROSSER, J., JORDAN, T., HASTIE, N. D. & VAN HEYNINGEN, V. 1991. Mouse small eye results from mutations in a paired-like homeobox-containing gene. Nature, 354, 522-5.
HIRAMI, Y., OSAKADA, F., TAKAHASHI, K., OKITA, K., YAMANAKA, S., IKEDA, H., YOSHIMURA, N. & TAKAHASHI, M. 2009. Generation of retinal cells from mouse and human induced pluripotent stem cells. Neurosci Lett, 458, 126-31.
HOFER, H., CARROLL, J., NEITZ, J., NEITZ, M. & WILLIAMS, D. R. 2005. Organization of the human trichromatic cone mosaic. J Neurosci, 25, 9669-79.
HOMMA, K., OKAMOTO, S., MANDAI, M., GOTOH, N., RAJASIMHA, H. K., CHANG, Y. S., CHEN, S., LI, W., COGLIATI, T., SWAROOP, A. & TAKAHASHI, M. 2013. Developing rods transplanted into the degenerating retina of Crx-knockout mice exhibit neural activity similar to native photoreceptors. Stem Cells, 31, 1149-59.
HORNAN, D. M., PEIRSON, S. N., HARDCASTLE, A. J., MOLDAY, R. S., CHEETHAM, M. E. & WEBSTER, A. R. 2007. Novel retinal and cone photoreceptor transcripts revealed by human macular expression profiling. Invest Ophthalmol Vis Sci, 48, 5388-96.
IKEDA, H., OSAKADA, F., WATANABE, K., MIZUSEKI, K., HARAGUCHI, T., MIYOSHI, H., KAMIYA, D., HONDA, Y., SASAI, N., YOSHIMURA, N., TAKAHASHI, M. & SASAI, Y. 2005. Generation of Rx+/Pax6+ neural retinal precursors from embryonic stem cells. Proc Natl Acad Sci U S A, 102, 11331-6.
JADHAV, A. P., MASON, H. A. & CEPKO, C. L. 2006. Notch 1 inhibits photoreceptor production in the developing mammalian retina. Development, 133, 913-23.
JAYAKODY, S. A., GONZALEZ-CORDERO, A., ALI, R. R. & PEARSON, R. A. 2015. Cellular strategies for retinal repair by photoreceptor replacement. Prog Retin Eye Res, 46, 31-66.
JIANG, Y., DING, Q., XIE, X., LIBBY, R. T., LEFEBVRE, V. & GAN, L. 2013. Transcription factors SOX4 and SOX11 function redundantly to regulate the development of mouse retinal ganglion cells. J Biol Chem, 288, 18429-38.
JIN, D., FAN, J., WANG, L., THOMPSON, L. F., LIU, A., DANIEL, B. J., SHIN, T., CURIEL, T. J. & ZHANG, B. 2010. CD73 on tumor cells impairs antitumor T-cell responses: a novel mechanism of tumor-induced immune suppression. Cancer Res, 70, 2245-55.
JIN, Z. B., OKAMOTO, S., XIANG, P. & TAKAHASHI, M. 2012. Integration-free induced pluripotent stem cells derived from retinitis pigmentosa patient for disease modeling. Stem Cells Transl Med, 1, 503-9.
JOHNSON, T. V. & MARTIN, K. R. 2008. Development and characterization of an adult retinal explant organotypic tissue culture system as an in vitro intraocular stem cell transplantation model. Invest Ophthalmol Vis Sci, 49, 3503-12.
KAEWKHAW, R., KAYA, K. D., BROOKS, M., HOMMA, K., ZOU, J., CHAITANKAR, V., RAO, M. & SWAROOP, A. 2015. Transcriptome Dynamics of Developing Photoreceptors in Three-Dimensional Retina Cultures Recapitulates Temporal Sequence of Human Cone and Rod Differentiation Revealing Cell Surface Markers and Gene Networks. Stem Cells, 33, 3504-18.
KIM, D., KIM, C. H., MOON, J. I., CHUNG, Y. G., CHANG, M. Y., HAN, B. S., KO, S., YANG, E., CHA, K. Y., LANZA, R. & KIM, K. S. 2009. Generation of human induced

265
pluripotent stem cells by direct delivery of reprogramming proteins. Cell Stem Cell, 4, 472-6.
KIM, J. W., YANG, H. J., OEL, A. P., BROOKS, M. J., JIA, L., PLACHETZKI, D. C., LI, W., ALLISON, W. T. & SWAROOP, A. 2016. Recruitment of Rod Photoreceptors from Short-Wavelength-Sensitive Cones during the Evolution of Nocturnal Vision in Mammals. Dev Cell, 37, 520-32.
KNAU, H., KREMERS, J., SCHMIDT, H. J., WOLF, S., WISSINGER, B. & SHARPE, L. T. 2002. M-cone opsin gene number does not correlate with variation in L/M-cone sensitivity. Vision Res, 42, 1888-96.
KOIKE, C., NISHIDA, A., UENO, S., SAITO, H., SANUKI, R., SATO, S., FURUKAWA, A., AIZAWA, S., MATSUO, I., SUZUKI, N., KONDO, M. & FURUKAWA, T. 2007. Functional roles of Otx2 transcription factor in postnatal mouse retinal development. Mol Cell Biol, 27, 8318-29.
KOLODZIEJCZYK, A. A., KIM, J. K., SVENSSON, V., MARIONI, J. C. & TEICHMANN, S. A. 2015. The technology and biology of single-cell RNA sequencing. Mol Cell, 58, 610-20.
KOMAROMY, A. M., ALEXANDER, J. J., COOPER, A. E., CHIODO, V. A., GLUSHAKOVA, L. G., ACLAND, G. M., HAUSWIRTH, W. W. & AGUIRRE, G. D. 2008. Targeting gene expression to cones with human cone opsin promoters in recombinant AAV. Gene Ther, 15, 1049-55.
KOMAROMY, A. M., ALEXANDER, J. J., ROWLAN, J. S., GARCIA, M. M., CHIODO, V. A., KAYA, A., TANAKA, J. C., ACLAND, G. M., HAUSWIRTH, W. W. & AGUIRRE, G. D. 2010. Gene therapy rescues cone function in congenital achromatopsia. Hum Mol Genet, 19, 2581-93.
KONG, J., KIM, S. R., BINLEY, K., PATA, I., DOI, K., MANNIK, J., ZERNANT-RAJANG, J., KAN, O., IQBALL, S., NAYLOR, S., SPARROW, J. R., GOURAS, P. & ALLIKMETS, R. 2008. Correction of the disease phenotype in the mouse model of Stargardt disease by lentiviral gene therapy. Gene Ther, 15, 1311-20.
KORPELAINEN, E., TUIMALA, J., SAMERVUO, P., HUSS, M., WONG, G. 2015. RNA-seq Data Analysis A Practical Approach, CRC Press Taylor & Francis Group.
KOSO, H., MINAMI, C., TABATA, Y., INOUE, M., SASAKI, E., SATOH, S. & WATANABE, S. 2009. CD73, a novel cell surface antigen that characterizes retinal photoreceptor precursor cells. Invest Ophthalmol Vis Sci, 50, 5411-8.
KRUCZEK, K., GONZALEZ-CORDERO, A., GOH, D., NAEEM, A., JONIKAS, M., BLACKFORD, S. J. I., KLOC, M., DURAN, Y., GEORGIADIS, A., SAMPSON, R. D., MASWOOD, R. N., SMITH, A. J., DECEMBRINI, S., ARSENIJEVIC, Y., SOWDEN, J. C., PEARSON, R. A., WEST, E. L. & ALI, R. R. 2017. Differentiation and Transplantation of Embryonic Stem Cell-Derived Cone Photoreceptors into a Mouse Model of End-Stage Retinal Degeneration. Stem Cell Reports, 8, 1659-1674.
KULESHOV, M. V., JONES, M. R., ROUILLARD, A. D., FERNANDEZ, N. F., DUAN, Q., WANG, Z., KOPLEV, S., JENKINS, S. L., JAGODNIK, K. M., LACHMANN, A., MCDERMOTT, M. G., MONTEIRO, C. D., GUNDERSEN, G. W. & MA'AYAN, A. 2016. Enrichr: a comprehensive gene set enrichment analysis web server 2016 update. Nucleic Acids Res, 44, W90-7.
KUWAHARA, A., OZONE, C., NAKANO, T., SAITO, K., EIRAKU, M. & SASAI, Y. 2015. Generation of a ciliary margin-like stem cell niche from self-organizing human retinal tissue. Nat Commun, 6, 6286.
LA VAIL, M. M., RAPAPORT, D. H. & RAKIC, P. 1991. Cytogenesis in the monkey retina. J Comp Neurol, 309, 86-114.

266
LAKOWSKI, J., BARON, M., BAINBRIDGE, J., BARBER, A. C., PEARSON, R. A., ALI, R. R. & SOWDEN, J. C. 2010. Cone and rod photoreceptor transplantation in models of the childhood retinopathy Leber congenital amaurosis using flow-sorted Crx-positive donor cells. Hum Mol Genet, 19, 4545-59.
LAKOWSKI, J., GONZALEZ-CORDERO, A., WEST, E. L., HAN, Y. T., WELBY, E., NAEEM, A., BLACKFORD, S. J., BAINBRIDGE, J. W., PEARSON, R. A., ALI, R. R. & SOWDEN, J. C. 2015. Transplantation of Photoreceptor Precursors Isolated via a Cell Surface Biomarker Panel From Embryonic Stem Cell-Derived Self-Forming Retina. Stem Cells, 33, 2469-82.
LAKOWSKI, J., HAN, Y. T., PEARSON, R. A., GONZALEZ-CORDERO, A., WEST, E. L., GUALDONI, S., BARBER, A. C., HUBANK, M., ALI, R. R. & SOWDEN, J. C. 2011. Effective transplantation of photoreceptor precursor cells selected via cell surface antigen expression. Stem Cells, 29, 1391-404.
LAMB, T. D., COLLIN, S. P. & PUGH, E. N., JR. 2007. Evolution of the vertebrate eye: opsins, photoreceptors, retina and eye cup. Nat Rev Neurosci, 8, 960-76.
LAMBA, D. A., GUST, J. & REH, T. A. 2009. Transplantation of human embryonic stem cell-derived photoreceptors restores some visual function in Crx-deficient mice. Cell Stem Cell, 4, 73-9.
LAMBA, D. A., KARL, M. O., WARE, C. B. & REH, T. A. 2006. Efficient generation of retinal progenitor cells from human embryonic stem cells. Proc Natl Acad Sci U S A, 103, 12769-74.
LAMBA, D. A., MCUSIC, A., HIRATA, R. K., WANG, P. R., RUSSELL, D. & REH, T. A. 2010. Generation, purification and transplantation of photoreceptors derived from human induced pluripotent stem cells. PLoS One, 5, e8763.
LAMBA, D. A. & REH, T. A. 2011. Microarray characterization of human embryonic stem cell--derived retinal cultures. Invest Ophthalmol Vis Sci, 52, 4897-906.
LAWRENCE, J. M., SINGHAL, S., BHATIA, B., KEEGAN, D. J., REH, T. A., LUTHERT, P. J., KHAW, P. T. & LIMB, G. A. 2007. MIO-M1 cells and similar muller glial cell lines derived from adult human retina exhibit neural stem cell characteristics. Stem Cells, 25, 2033-43.
LE MEUR, G., STIEGER, K., SMITH, A. J., WEBER, M., DESCHAMPS, J. Y., NIVARD, D., MENDES-MADEIRA, A., PROVOST, N., PEREON, Y., CHEREL, Y., ALI, R. R., HAMEL, C., MOULLIER, P. & ROLLING, F. 2007. Restoration of vision in RPE65-deficient Briard dogs using an AAV serotype 4 vector that specifically targets the retinal pigmented epithelium. Gene Ther, 14, 292-303.
LEVEILLARD, T., MOHAND-SAID, S., LORENTZ, O., HICKS, D., FINTZ, A. C., CLERIN, E., SIMONUTTI, M., FORSTER, V., CAVUSOGLU, N., CHALMEL, F., DOLLE, P., POCH, O., LAMBROU, G. & SAHEL, J. A. 2004. Identification and characterization of rod-derived cone viability factor. Nat Genet, 36, 755-9.
LI, A., ZHU, X. & CRAFT, C. M. 2002. Retinoic acid upregulates cone arrestin expression in retinoblastoma cells through a Cis element in the distal promoter region. Invest Ophthalmol Vis Sci, 43, 1375-83.
LI, M., JIA, C., KAZMIERKIEWICZ, K. L., BOWMAN, A. S., TIAN, L., LIU, Y., GUPTA, N. A., GUDISEVA, H. V., YEE, S. S., KIM, M., DENTCHEV, T., KIMBLE, J. A., PARKER, J. S., MESSINGER, J. D., HAKONARSON, H., CURCIO, C. A. & STAMBOLIAN, D. 2014. Comprehensive analysis of gene expression in human retina and supporting tissues. Hum Mol Genet, 23, 4001-14.
LI, Q., TIMMERS, A. M., GUY, J., PANG, J. & HAUSWIRTH, W. W. 2008. Cone-specific expression using a human red opsin promoter in recombinant AAV. Vision Res, 48, 332-8.

267
LI, W. & GODZIK, A. 2006. Cd-hit: a fast program for clustering and comparing large sets of protein or nucleotide sequences. Bioinformatics, 22, 1658-9.
LIAO, C. H., YEH, S. C., HUANG, Y. H., CHEN, R. N., TSAI, M. M., CHEN, W. J., CHI, H. C., TAI, P. J., LIAO, C. J., WU, S. M., CHENG, W. L., PAI, L. M. & LIN, K. H. 2010. Positive regulation of spondin 2 by thyroid hormone is associated with cell migration and invasion. Endocr Relat Cancer, 17, 99-111.
LIAO, Y., SMYTH, G. K. & SHI, W. 2013. The Subread aligner: fast, accurate and scalable read mapping by seed-and-vote. Nucleic Acids Res, 41, e108.
LIAO, Y., SMYTH, G. K. & SHI, W. 2014. featureCounts: an efficient general purpose program for assigning sequence reads to genomic features. Bioinformatics, 30, 923-30.
LIN, B. & PENG, E. B. 2013. Retinal ganglion cells are resistant to photoreceptor loss in retinal degeneration. PLoS One, 8, e68084.
LIPINSKI, D. M., SINGH, M. S. & MACLAREN, R. E. 2011. Assessment of cone survival in response to CNTF, GDNF, and VEGF165b in a novel ex vivo model of end-stage retinitis pigmentosa. Invest Ophthalmol Vis Sci, 52, 7340-6.
LIU, Q., ZHOU, J., DAIGER, S. P., FARBER, D. B., HECKENLIVELY, J. R., SMITH, J. E., SULLIVAN, L. S., ZUO, J., MILAM, A. H. & PIERCE, E. A. 2002. Identification and subcellular localization of the RP1 protein in human and mouse photoreceptors. Invest Ophthalmol Vis Sci, 43, 22-32.
LIU, W., LAGUTIN, O., SWINDELL, E., JAMRICH, M. & OLIVER, G. 2010. Neuroretina specification in mouse embryos requires Six3-mediated suppression of Wnt8b in the anterior neural plate. J Clin Invest, 120, 3568-77.
LIU, Y., FU, L., CHEN, D. G. & DEEB, S. S. 2007. Identification of novel retinal target genes of thyroid hormone in the human WERI cells by expression microarray analysis. Vision Res, 47, 2314-26.
LIU, Y., SHEN, Y., REST, J. S., RAYMOND, P. A. & ZACK, D. J. 2001. Isolation and characterization of a zebrafish homologue of the cone rod homeobox gene. Invest Ophthalmol Vis Sci, 42, 481-7.
LIVESEY, F. J. & CEPKO, C. L. 2001. Vertebrate neural cell-fate determination: lessons from the retina. Nat Rev Neurosci, 2, 109-18.
LOH, Y. H., AGARWAL, S., PARK, I. H., URBACH, A., HUO, H., HEFFNER, G. C., KIM, K., MILLER, J. D., NG, K. & DALEY, G. Q. 2009. Generation of induced pluripotent stem cells from human blood. Blood, 113, 5476-9.
LOOSLI, F., WINKLER, S. & WITTBRODT, J. 1999. Six3 overexpression initiates the formation of ectopic retina. Genes Dev, 13, 649-54.
LOVE, M. I., HUBER, W. & ANDERS, S. 2014. Moderated estimation of fold change and dispersion for RNA-seq data with DESeq2. Genome Biol, 15, 550.
LUN, A. T., BACH, K. & MARIONI, J. C. 2016a. Pooling across cells to normalize single-cell RNA sequencing data with many zero counts. Genome Biol, 17, 75.
LUN, A. T., MCCARTHY, D. J. & MARIONI, J. C. 2016b. A step-by-step workflow for low-level analysis of single-cell RNA-seq data with Bioconductor. F1000Res, 5, 2122.
MACDONALD, J. F., BRANDES, L., DEVERILL, M., MODY, I., SALTER, M. W. & THERIAULT, E. 1991. Mammalian neurons in dissociated cultures form clusters in the presence of retinal pigment epithelium. Exp Brain Res, 83, 643-55.
MACKE, J. P. & NATHANS, J. 1997. Individual variation in size of the human red and green visual pigment gene array. Invest Ophthalmol Vis Sci, 38, 1040-3.
MACLAREN, R. E., PEARSON, R. A., MACNEIL, A., DOUGLAS, R. H., SALT, T. E., AKIMOTO, M., SWAROOP, A., SOWDEN, J. C. & ALI, R. R. 2006. Retinal repair by transplantation of photoreceptor precursors. Nature, 444, 203-7.

268
MACOSKO, E. Z., BASU, A., SATIJA, R., NEMESH, J., SHEKHAR, K., GOLDMAN, M., TIROSH, I., BIALAS, A. R., KAMITAKI, N., MARTERSTECK, E. M., TROMBETTA, J. J., WEITZ, D. A., SANES, J. R., SHALEK, A. K., REGEV, A. & MCCARROLL, S. A. 2015. Highly Parallel Genome-wide Expression Profiling of Individual Cells Using Nanoliter Droplets. Cell, 161, 1202-14.
MAIER, T., GUELL, M. & SERRANO, L. 2009. Correlation of mRNA and protein in complex biological samples. FEBS Lett, 583, 3966-73.
MALI, P., YANG, L., ESVELT, K. M., AACH, J., GUELL, M., DICARLO, J. E., NORVILLE, J. E. & CHURCH, G. M. 2013. RNA-guided human genome engineering via Cas9. Science, 339, 823-6.
MANCUSO, K., HAUSWIRTH, W. W., LI, Q., CONNOR, T. B., KUCHENBECKER, J. A., MAUCK, M. C., NEITZ, J. & NEITZ, M. 2009. Gene therapy for red-green colour blindness in adult primates. Nature, 461, 784-7.
MANDAI, M., FUJII, M., HASHIGUCHI, T., SUNAGAWA, G. A., ITO, S. I., SUN, J., KANEKO, J., SHO, J., YAMADA, C. & TAKAHASHI, M. 2017. iPSC-Derived Retina Transplants Improve Vision in rd1 End-Stage Retinal-Degeneration Mice. Stem Cell Reports, 8, 1112-1113.
MAO, B., WU, W., DAVIDSON, G., MARHOLD, J., LI, M., MECHLER, B. M., DELIUS, H., HOPPE, D., STANNEK, P., WALTER, C., GLINKA, A. & NIEHRS, C. 2002. Kremen proteins are Dickkopf receptors that regulate Wnt/beta-catenin signalling. Nature, 417, 664-7.
MARTINEZ-MORALES, J. R., RODRIGO, I. & BOVOLENTA, P. 2004. Eye development: a view from the retina pigmented epithelium. Bioessays, 26, 766-77.
MATSUDA, T. & CEPKO, C. L. 2004. Electroporation and RNA interference in the rodent retina in vivo and in vitro. Proc Natl Acad Sci U S A, 101, 16-22.
MATSUDA, T. & CEPKO, C. L. 2008. Analysis of gene function in the retina. Methods Mol Biol, 423, 259-78.
MEARS, A. J., KONDO, M., SWAIN, P. K., TAKADA, Y., BUSH, R. A., SAUNDERS, T. L., SIEVING, P. A. & SWAROOP, A. 2001. Nrl is required for rod photoreceptor development. Nat Genet, 29, 447-52.
MELLOUGH, C. B., SERNAGOR, E., MORENO-GIMENO, I., STEEL, D. H. & LAKO, M. 2012. Efficient stage-specific differentiation of human pluripotent stem cells toward retinal photoreceptor cells. Stem Cells, 30, 673-86.
MEYER, J. S., HOWDEN, S. E., WALLACE, K. A., VERHOEVEN, A. D., WRIGHT, L. S., CAPOWSKI, E. E., PINILLA, I., MARTIN, J. M., TIAN, S., STEWART, R., PATTNAIK, B., THOMSON, J. A. & GAMM, D. M. 2011. Optic vesicle-like structures derived from human pluripotent stem cells facilitate a customized approach to retinal disease treatment. Stem Cells, 29, 1206-18.
MEYER, J. S., SHEARER, R. L., CAPOWSKI, E. E., WRIGHT, L. S., WALLACE, K. A., MCMILLAN, E. L., ZHANG, S. C. & GAMM, D. M. 2009. Modeling early retinal development with human embryonic and induced pluripotent stem cells. Proc Natl Acad Sci U S A, 106, 16698-703.
MIC, F. A., MOLOTKOV, A., MOLOTKOVA, N. & DUESTER, G. 2004. Raldh2 expression in optic vesicle generates a retinoic acid signal needed for invagination of retina during optic cup formation. Dev Dyn, 231, 270-7.
MICHIBATA, H., OKUNO, T., KONISHI, N., KYONO, K., WAKIMOTO, K., AOKI, K., KONDO, Y., TAKATA, K., KITAMURA, Y. & TANIGUCHI, T. 2009. Human GPM6A is associated with differentiation and neuronal migration of neurons derived from human embryonic stem cells. Stem Cells Dev, 18, 629-39.

269
MINNECI, F., PIOVESAN, D., COZZETTO, D. & JONES, D. T. 2013. FFPred 2.0: improved homology-independent prediction of gene ontology terms for eukaryotic protein sequences. PLoS One, 8, e63754.
MIZERACKA, K., DEMASO, C. R. & CEPKO, C. L. 2013. Notch1 is required in newly postmitotic cells to inhibit the rod photoreceptor fate. Development, 140, 3188-97.
MOHAND-SAID, S., HICKS, D., DREYFUS, H. & SAHEL, J. A. 2000. Selective transplantation of rods delays cone loss in a retinitis pigmentosa model. Arch Ophthalmol, 118, 807-11.
MOLLON, J. D., POKORNY, J. AND KNOBLAUCH, K. 2003. Normal and Defective Colour Vision, Oxford University Press.
MONTANA, C. L., MYERS, C. A. & CORBO, J. C. 2011. Quantifying the activity of cis-regulatory elements in the mouse retina by explant electroporation. J Vis Exp.
MULLER, F. & O'RAHILLY, R. 1985. The first appearance of the neural tube and optic primordium in the human embryo at stage 10. Anat Embryol (Berl), 172, 157-69.
MURANISHI, Y., TERADA, K., INOUE, T., KATOH, K., TSUJII, T., SANUKI, R., KUROKAWA, D., AIZAWA, S., TAMAKI, Y. & FURUKAWA, T. 2011. An essential role for RAX homeoprotein and NOTCH-HES signaling in Otx2 expression in embryonic retinal photoreceptor cell fate determination. J Neurosci, 31, 16792-807.
MUSTAFI, D., ENGEL, A. H. & PALCZEWSKI, K. 2009. Structure of cone photoreceptors. Prog Retin Eye Res, 28, 289-302.
MUSTAFI, D., KEVANY, B. M., BAI, X., GOLCZAK, M., ADAMS, M. D., WYNSHAW-BORIS, A. & PALCZEWSKI, K. 2016. Transcriptome analysis reveals rod/cone photoreceptor specific signatures across mammalian retinas. Hum Mol Genet, 25, 4376-4388.
NAKANO, T., ANDO, S., TAKATA, N., KAWADA, M., MUGURUMA, K., SEKIGUCHI, K., SAITO, K., YONEMURA, S., EIRAKU, M. & SASAI, Y. 2012. Self-formation of optic cups and storable stratified neural retina from human ESCs. Cell Stem Cell, 10, 771-85.
NARFSTROM, K., KATZ, M. L., FORD, M., REDMOND, T. M., RAKOCZY, E. & BRAGADOTTIR, R. 2003. In vivo gene therapy in young and adult RPE65-/- dogs produces long-term visual improvement. J Hered, 94, 31-7.
NATHANS, J., DAVENPORT, C. M., MAUMENEE, I. H., LEWIS, R. A., HEJTMANCIK, J. F., LITT, M., LOVRIEN, E., WELEBER, R., BACHYNSKI, B., ZWAS, F. & ET AL. 1989. Molecular genetics of human blue cone monochromacy. Science, 245, 831-8.
NATHANS, J., THOMAS, D. & HOGNESS, D. S. 1986. Molecular genetics of human color vision: the genes encoding blue, green, and red pigments. Science, 232, 193-202.
NEITZ, J. & NEITZ, M. 2011. The genetics of normal and defective color vision. Vision Res, 51, 633-651.
NEITZ, M. & NEITZ, J. 1995. Numbers and ratios of visual pigment genes for normal red-green color vision. Science, 267, 1013-6.
NG, L., HURLEY, J. B., DIERKS, B., SRINIVAS, M., SALTO, C., VENNSTROM, B., REH, T. A. & FORREST, D. 2001. A thyroid hormone receptor that is required for the development of green cone photoreceptors. Nat Genet, 27, 94-8.
NISHIDA, A., FURUKAWA, A., KOIKE, C., TANO, Y., AIZAWA, S., MATSUO, I. & FURUKAWA, T. 2003. Otx2 homeobox gene controls retinal photoreceptor cell fate and pineal gland development. Nat Neurosci, 6, 1255-63.
NUGENT, T. & JONES, D. T. 2009. Transmembrane protein topology prediction using support vector machines. BMC Bioinformatics, 10, 159.
O'BRIEN, K. M., SCHULTE, D. & HENDRICKSON, A. E. 2003. Expression of photoreceptor-associated molecules during human fetal eye development. Mol Vis, 9, 401-9.

270
OH, E. C., KHAN, N., NOVELLI, E., KHANNA, H., STRETTOI, E. & SWAROOP, A. 2007. Transformation of cone precursors to functional rod photoreceptors by bZIP transcription factor NRL. Proc Natl Acad Sci U S A, 104, 1679-84.
OHTSUKA, T., ISHIBASHI, M., GRADWOHL, G., NAKANISHI, S., GUILLEMOT, F. & KAGEYAMA, R. 1999. Hes1 and Hes5 as notch effectors in mammalian neuronal differentiation. EMBO J, 18, 2196-207.
ONISHI, A., PENG, G. H., CHEN, S. & BLACKSHAW, S. 2010. Pias3-dependent SUMOylation controls mammalian cone photoreceptor differentiation. Nat Neurosci, 13, 1059-65.
OSAKADA, F., IKEDA, H., MANDAI, M., WATAYA, T., WATANABE, K., YOSHIMURA, N., AKAIKE, A., SASAI, Y. & TAKAHASHI, M. 2008. Toward the generation of rod and cone photoreceptors from mouse, monkey and human embryonic stem cells. Nat Biotechnol, 26, 215-24.
PANG, J. J., LAURAMORE, A., DENG, W. T., LI, Q., DOYLE, T. J., CHIODO, V., LI, J. & HAUSWIRTH, W. W. 2008. Comparative analysis of in vivo and in vitro AAV vector transduction in the neonatal mouse retina: effects of serotype and site of administration. Vision Res, 48, 377-85.
PARFITT, D. A., LANE, A., RAMSDEN, C. M., CARR, A. J. F., MUNRO, P. M., JOVANOVIC, K., SCHWARZ, N., KANUGA, N., MUTHIAH, M. N., HULL, S., GALLO, J. M., DA CRUZ, L., MOORE, A. T., HARDCASTLE, A. J., COFFEY, P. J. & CHEETHAM, M. E. 2016. Identification and Correction of Mechanisms Underlying Inherited Blindness in Human iPSC-Derived Optic Cups. Cell Stem Cell, 18, 769-781.
PEARSON, R. A., BARBER, A. C., RIZZI, M., HIPPERT, C., XUE, T., WEST, E. L., DURAN, Y., SMITH, A. J., CHUANG, J. Z., AZAM, S. A., LUHMANN, U. F., BENUCCI, A., SUNG, C. H., BAINBRIDGE, J. W., CARANDINI, M., YAU, K. W., SOWDEN, J. C. & ALI, R. R. 2012. Restoration of vision after transplantation of photoreceptors. Nature, 485, 99-103.
PEARSON, R. A., BARBER, A. C., WEST, E. L., MACLAREN, R. E., DURAN, Y., BAINBRIDGE, J. W., SOWDEN, J. C. & ALI, R. R. 2010. Targeted disruption of outer limiting membrane junctional proteins (Crb1 and ZO-1) increases integration of transplanted photoreceptor precursors into the adult wild-type and degenerating retina. Cell Transplant, 19, 487-503.
PEARSON, R. A., GONZALEZ-CORDERO, A., WEST, E. L., RIBEIRO, J. R., AGHAIZU, N., GOH, D., SAMPSON, R. D., GEORGIADIS, A., WALDRON, P. V., DURAN, Y., NAEEM, A., KLOC, M., CRISTANTE, E., KRUCZEK, K., WARRE-CORNISH, K., SOWDEN, J. C., SMITH, A. J. & ALI, R. R. 2016. Donor and host photoreceptors engage in material transfer following transplantation of post-mitotic photoreceptor precursors. Nat Commun, 7, 13029.
PFISTER, A. S., TANNEBERGER, K., SCHAMBONY, A. & BEHRENS, J. 2012. Amer2 protein is a novel negative regulator of Wnt/beta-catenin signaling involved in neuroectodermal patterning. J Biol Chem, 287, 1734-41.
PHILLIPS, M. J., WALLACE, K. A., DICKERSON, S. J., MILLER, M. J., VERHOEVEN, A. D., MARTIN, J. M., WRIGHT, L. S., SHEN, W., CAPOWSKI, E. E., PERCIN, E. F., PEREZ, E. T., ZHONG, X., CANTO-SOLER, M. V. & GAMM, D. M. 2012. Blood-derived human iPS cells generate optic vesicle-like structures with the capacity to form retinal laminae and develop synapses. Invest Ophthalmol Vis Sci, 53, 2007-19.
PIERLEONI, A., MARTELLI, P. L. & CASADIO, R. 2008. PredGPI: a GPI-anchor predictor. BMC Bioinformatics, 9, 392.
POTZNER, M. R., TSAROVINA, K., BINDER, E., PENZO-MENDEZ, A., LEFEBVRE, V., ROHRER, H., WEGNER, M. & SOCK, E. 2010. Sequential requirement of Sox4 and Sox11

271
during development of the sympathetic nervous system. Development, 137, 775-84.
PURVES D, A. G., FITZPATRICK D, ET AL 2001. Anatomical Distribution of Rods and Cones, Neuroscience, Sinauer Associates.
RADTKE, N. D., ARAMANT, R. B., PETRY, H. M., GREEN, P. T., PIDWELL, D. J. & SEILER, M. J. 2008. Vision improvement in retinal degeneration patients by implantation of retina together with retinal pigment epithelium. Am J Ophthalmol, 146, 172-182.
RAN, F. A., HSU, P. D., WRIGHT, J., AGARWALA, V., SCOTT, D. A. & ZHANG, F. 2013. Genome engineering using the CRISPR-Cas9 system. Nat Protoc, 8, 2281-308.
RAO, M. & SOCKANATHAN, S. 2005. Transmembrane protein GDE2 induces motor neuron differentiation in vivo. Science, 309, 2212-5.
RATTNER, A., SUN, H. & NATHANS, J. 1999. Molecular genetics of human retinal disease. Annu Rev Genet, 33, 89-131.
REICHMAN, S., SLEMBROUCK, A., GAGLIARDI, G., CHAFFIOL, A., TERRAY, A., NANTEAU, C., POTEY, A., BELLE, M., RABESANDRATANA, O., DUEBEL, J., ORIEUX, G., NANDROT, E. F., SAHEL, J. A. & GOUREAU, O. 2017. Generation of Storable Retinal Organoids and Retinal Pigmented Epithelium from Adherent Human iPS Cells in Xeno-Free and Feeder-Free Conditions. Stem Cells, 35, 1176-1188.
REICHMAN, S., TERRAY, A., SLEMBROUCK, A., NANTEAU, C., ORIEUX, G., HABELER, W., NANDROT, E. F., SAHEL, J. A., MONVILLE, C. & GOUREAU, O. 2014. From confluent human iPS cells to self-forming neural retina and retinal pigmented epithelium. Proc Natl Acad Sci U S A, 111, 8518-23.
RESENDE, R. R. & ADHIKARI, A. 2009. Cholinergic receptor pathways involved in apoptosis, cell proliferation and neuronal differentiation. Cell Commun Signal, 7, 20.
RITCHIE, M. E., PHIPSON, B., WU, D., HU, Y., LAW, C. W., SHI, W. & SMYTH, G. K. 2015. limma powers differential expression analyses for RNA-sequencing and microarray studies. Nucleic Acids Res, 43, e47.
ROBERTS, M. R., HENDRICKSON, A., MCGUIRE, C. R. & REH, T. A. 2005. Retinoid X receptor (gamma) is necessary to establish the S-opsin gradient in cone photoreceptors of the developing mouse retina. Invest Ophthalmol Vis Sci, 46, 2897-904.
ROGERS, C. D., MOODY, S. A. & CASEY, E. S. 2009. Neural induction and factors that stabilize a neural fate. Birth Defects Res C Embryo Today, 87, 249-62.
ROORDA, A., METHA, A. B., LENNIE, P. & WILLIAMS, D. R. 2001. Packing arrangement of the three cone classes in primate retina. Vision Res, 41, 1291-306.
ROORDA, A. & WILLIAMS, D. R. 1999. The arrangement of the three cone classes in the living human eye. Nature, 397, 520-2.
RUBERTE, E., FRIEDERICH, V., MORRISS-KAY, G. & CHAMBON, P. 1992. Differential distribution patterns of CRABP I and CRABP II transcripts during mouse embryogenesis. Development, 115, 973-87.
SAFER, D., ELZINGA, M. & NACHMIAS, V. T. 1991. Thymosin beta 4 and Fx, an actin-sequestering peptide, are indistinguishable. J Biol Chem, 266, 4029-32.
SAKUMA, H., MURAKAMI, A., FUJIMAKI, T. & INANA, G. 1998. Isolation and characterization of the human X-arrestin gene. Gene, 224, 87-95.
SALCHOW, D. J., TROKEL, S. L., KJELDBYE, H., DUDLEY, T. & GOURAS, P. 2001. Isolation of human fetal cones. Curr Eye Res, 22, 85-9.
272
SANTOS-FERREIRA, T., LLONCH, S., BORSCH, O., POSTEL, K., HAAS, J. & ADER, M. 2016a. Retinal transplantation of photoreceptors results in donor-host cytoplasmic exchange. Nat Commun, 7, 13028.
SANTOS-FERREIRA, T., POSTEL, K., STUTZKI, H., KURTH, T., ZECK, G. & ADER, M. 2015. Daylight vision repair by cell transplantation. Stem Cells, 33, 79-90.
SANTOS-FERREIRA, T., VOLKNER, M., BORSCH, O., HAAS, J., CIMALLA, P., VASUDEVAN, P., CARMELIET, P., CORBEIL, D., MICHALAKIS, S., KOCH, E., KARL, M. O. & ADER, M. 2016b. Stem Cell-Derived Photoreceptor Transplants Differentially Integrate Into Mouse Models of Cone-Rod Dystrophy. Invest Ophthalmol Vis Sci, 57, 3509-20.
SCHLAEGER, T. M., DAHERON, L., BRICKLER, T. R., ENTWISLE, S., CHAN, K., CIANCI, A., DEVINE, A., ETTENGER, A., FITZGERALD, K., GODFREY, M., GUPTA, D., MCPHERSON, J., MALWADKAR, P., GUPTA, M., BELL, B., DOI, A., JUNG, N., LI, X., LYNES, M. S., BROOKES, E., CHERRY, A. B., DEMIRBAS, D., TSANKOV, A. M., ZON, L. I., RUBIN, L. L., FEINBERG, A. P., MEISSNER, A., COWAN, C. A. & DALEY, G. Q. 2015. A comparison of non-integrating reprogramming methods. Nat Biotechnol, 33, 58-63.
SCHWARTZ, S. D., HUBSCHMAN, J. P., HEILWELL, G., FRANCO-CARDENAS, V., PAN, C. K., OSTRICK, R. M., MICKUNAS, E., GAY, R., KLIMANSKAYA, I. & LANZA, R. 2012. Embryonic stem cell trials for macular degeneration: a preliminary report. Lancet, 379, 713-20.
SCHWARTZ, S. D., REGILLO, C. D., LAM, B. L., ELIOTT, D., ROSENFELD, P. J., GREGORI, N. Z., HUBSCHMAN, J. P., DAVIS, J. L., HEILWELL, G., SPIRN, M., MAGUIRE, J., GAY, R., BATEMAN, J., OSTRICK, R. M., MORRIS, D., VINCENT, M., ANGLADE, E., DEL PRIORE, L. V. & LANZA, R. 2015. Human embryonic stem cell-derived retinal pigment epithelium in patients with age-related macular degeneration and Stargardt's macular dystrophy: follow-up of two open-label phase 1/2 studies. Lancet, 385, 509-16.
SCHWARZ, N., CARR, A. J., LANE, A., MOELLER, F., CHEN, L. L., AGUILA, M., NOMMISTE, B., MUTHIAH, M. N., KANUGA, N., WOLFRUM, U., NAGEL-WOLFRUM, K., DA CRUZ, L., COFFEY, P. J., CHEETHAM, M. E. & HARDCASTLE, A. J. 2015. Translational read-through of the RP2 Arg120stop mutation in patient iPSC-derived retinal pigment epithelium cells. Hum Mol Genet, 24, 972-86.
SHAABAN, S. A. & DEEB, S. S. 1998. Functional analysis of the promoters of the human red and green visual pigment genes. Invest Ophthalmol Vis Sci, 39, 885-96.
SHARON, D., BLACKSHAW, S., CEPKO, C. L. & DRYJA, T. P. 2002. Profile of the genes expressed in the human peripheral retina, macula, and retinal pigment epithelium determined through serial analysis of gene expression (SAGE). Proc Natl Acad Sci U S A, 99, 315-20.
SHELLEY, E. J., MADIGAN, M. C., NATOLI, R., PENFOLD, P. L. & PROVIS, J. M. 2009. Cone degeneration in aging and age-related macular degeneration. Arch Ophthalmol, 127, 483-92.
SHIRAI, H., MANDAI, M., MATSUSHITA, K., KUWAHARA, A., YONEMURA, S., NAKANO, T., ASSAWACHANANONT, J., KIMURA, T., SAITO, K., TERASAKI, H., EIRAKU, M., SASAI, Y. & TAKAHASHI, M. 2016. Transplantation of human embryonic stem cell-derived retinal tissue in two primate models of retinal degeneration. Proc Natl Acad Sci U S A, 113, E81-90.
SHUFARO, Y. & REUBINOFF, B. E. 2004. Therapeutic applications of embryonic stem cells. Best Pract Res Clin Obstet Gynaecol, 18, 909-27.
SIDMAN, R. L. 1961. Histogenesis of mouse retina studied with thymidine-H3, New York, Academic Press.

273
SIEGERT, S., CABUY, E., SCHERF, B. G., KOHLER, H., PANDA, S., LE, Y. Z., FEHLING, H. J., GAIDATZIS, D., STADLER, M. B. & ROSKA, B. 2012. Transcriptional code and disease map for adult retinal cell types. Nat Neurosci, 15, 487-95, S1-2.
SIEGERT, S., SCHERF, B. G., DEL PUNTA, K., DIDKOVSKY, N., HEINTZ, N. & ROSKA, B. 2009. Genetic address book for retinal cell types. Nat Neurosci, 12, 1197-204.
SINGH, M. S., BALMER, J., BARNARD, A. R., ASLAM, S. A., MORALLI, D., GREEN, C. M., BARNEA-CRAMER, A., DUNCAN, I. & MACLAREN, R. E. 2016. Transplanted photoreceptor precursors transfer proteins to host photoreceptors by a mechanism of cytoplasmic fusion. Nat Commun, 7, 13537.
SINGH, M. S., CHARBEL ISSA, P., BUTLER, R., MARTIN, C., LIPINSKI, D. M., SEKARAN, S., BARNARD, A. R. & MACLAREN, R. E. 2013. Reversal of end-stage retinal degeneration and restoration of visual function by photoreceptor transplantation. Proc Natl Acad Sci U S A, 110, 1101-6.
SJOBERG, M., VENNSTROM, B. & FORREST, D. 1992. Thyroid hormone receptors in chick retinal development: differential expression of mRNAs for alpha and N-terminal variant beta receptors. Development, 114, 39-47.
SKAPER, S. D. 2012. Isolation and culture of rat cone photoreceptor cells. Methods Mol Biol, 846, 147-58.
SRINIVAS, M., NG, L., LIU, H., JIA, L. & FORREST, D. 2006. Activation of the blue opsin gene in cone photoreceptor development by retinoid-related orphan receptor beta. Mol Endocrinol, 20, 1728-41.
STENINA, O. I., DESAI, S. Y., KRUKOVETS, I., KIGHT, K., JANIGRO, D., TOPOL, E. J. & PLOW, E. F. 2003. Thrombospondin-4 and its variants: expression and differential effects on endothelial cells. Circulation, 108, 1514-9.
STINGL, K., BARTZ-SCHMIDT, K. U., BESCH, D., BRAUN, A., BRUCKMANN, A., GEKELER, F., GREPPMAIER, U., HIPP, S., HORTDORFER, G., KERNSTOCK, C., KOITSCHEV, A., KUSNYERIK, A., SACHS, H., SCHATZ, A., STINGL, K. T., PETERS, T., WILHELM, B. & ZRENNER, E. 2013. Artificial vision with wirelessly powered subretinal electronic implant alpha-IMS. Proc Biol Sci, 280, 20130077.
STREIT, A. 2007. The preplacodal region: an ectodermal domain with multipotential progenitors that contribute to sense organs and cranial sensory ganglia. Int J Dev Biol, 51, 447-61.
SULLIVAN, L. S., HECKENLIVELY, J. R., BOWNE, S. J., ZUO, J., HIDE, W. A., GAL, A., DENTON, M., INGLEHEARN, C. F., BLANTON, S. H. & DAIGER, S. P. 1999. Mutations in a novel retina-specific gene cause autosomal dominant retinitis pigmentosa. Nat Genet, 22, 255-9.
SUNDARAM, V., MOORE, A. T., ALI, R. R. & BAINBRIDGE, J. W. 2012. Retinal dystrophies and gene therapy. Eur J Pediatr, 171, 757-65.
SUPEK, F., BOSNJAK, M., SKUNCA, N. & SMUC, T. 2011. REVIGO summarizes and visualizes long lists of gene ontology terms. PLoS One, 6, e21800.
SUZUKI, S. C., BLECKERT, A., WILLIAMS, P. R., TAKECHI, M., KAWAMURA, S. & WONG, R. O. 2013. Cone photoreceptor types in zebrafish are generated by symmetric terminal divisions of dedicated precursors. Proc Natl Acad Sci U S A, 110, 15109-14.
SWAROOP, A., KIM, D. & FORREST, D. 2010. Transcriptional regulation of photoreceptor development and homeostasis in the mammalian retina. Nat Rev Neurosci, 11, 563-76.
SWARTZ, M., EBERHART, J., MASTICK, G. S. & KRULL, C. E. 2001. Sparking new frontiers: using in vivo electroporation for genetic manipulations. Dev Biol, 233, 13-21.

274
TAKAHASHI, K., TANABE, K., OHNUKI, M., NARITA, M., ICHISAKA, T., TOMODA, K. & YAMANAKA, S. 2007. Induction of pluripotent stem cells from adult human fibroblasts by defined factors. Cell, 131, 861-72.
TAKAHASHI, K. & YAMANAKA, S. 2006. Induction of pluripotent stem cells from mouse embryonic and adult fibroblast cultures by defined factors. Cell, 126, 663-76.
TAKAISHI, S., OKUMURA, T., TU, S., WANG, S. S., SHIBATA, W., VIGNESHWARAN, R., GORDON, S. A., SHIMADA, Y. & WANG, T. C. 2009. Identification of gastric cancer stem cells using the cell surface marker CD44. Stem Cells, 27, 1006-20.
TALLILA, J., JAKKULA, E., PELTONEN, L., SALONEN, R. & KESTILA, M. 2008. Identification of CC2D2A as a Meckel syndrome gene adds an important piece to the ciliopathy puzzle. Am J Hum Genet, 82, 1361-7.
THOMPSON, D. A., ALI, R. R., BANIN, E., BRANHAM, K. E., FLANNERY, J. G., GAMM, D. M., HAUSWIRTH, W. W., HECKENLIVELY, J. R., IANNACCONE, A., JAYASUNDERA, K. T., KHAN, N. W., MOLDAY, R. S., PENNESI, M. E., REH, T. A., WELEBER, R. G. & ZACKS, D. N. 2015. Advancing therapeutic strategies for inherited retinal degeneration: recommendations from the Monaciano Symposium. Invest Ophthalmol Vis Sci, 56, 918-31.
TOMITA, K., ISHIBASHI, M., NAKAHARA, K., ANG, S. L., NAKANISHI, S., GUILLEMOT, F. & KAGEYAMA, R. 1996. Mammalian hairy and Enhancer of split homolog 1 regulates differentiation of retinal neurons and is essential for eye morphogenesis. Neuron, 16, 723-34.
TOMITA, M., LAVIK, E., KLASSEN, H., ZAHIR, T., LANGER, R. & YOUNG, M. J. 2005. Biodegradable polymer composite grafts promote the survival and differentiation of retinal progenitor cells. Stem Cells, 23, 1579-88.
TRIMARCHI, J. M., STADLER, M. B. & CEPKO, C. L. 2008. Individual retinal progenitor cells display extensive heterogeneity of gene expression. PLoS One, 3, e1588.
TROPEPE, V., COLES, B. L., CHIASSON, B. J., HORSFORD, D. J., ELIA, A. J., MCINNES, R. R. & VAN DER KOOY, D. 2000. Retinal stem cells in the adult mammalian eye. Science, 287, 2032-6.
TUCKER, B. A., PARK, I. H., QI, S. D., KLASSEN, H. J., JIANG, C., YAO, J., REDENTI, S., DALEY, G. Q. & YOUNG, M. J. 2011. Transplantation of adult mouse iPS cell-derived photoreceptor precursors restores retinal structure and function in degenerative mice. PLoS One, 6, e18992.
TUCKER, B. A., REDENTI, S. M., JIANG, C. H., SWIFT, J. S., KLASSEN, H. J., SMITH, M. E., WNEK, G. E. & YOUNG, M. J. 2010. The use of progenitor cell/biodegradable MMP2-PLGA polymer constructs to enhance cellular integration and retinal repopulation. Biomaterials, 31, 9-19.
TUCKER, P., LAEMLE, L., MUNSON, A., KANEKAR, S., OLIVER, E. R., BROWN, N., SCHLECHT, H., VETTER, M. & GLASER, T. 2001. The eyeless mouse mutation (ey1) removes an alternative start codon from the Rx/rax homeobox gene. Genesis, 31, 43-53.
TURAC, G., HINDLEY, C. J., THOMAS, R., DAVIS, J. A., DELEIDI, M., GASSER, T., KARAOZ, E. & PRUSZAK, J. 2013. Combined flow cytometric analysis of surface and intracellular antigens reveals surface molecule markers of human neuropoiesis. PLoS One, 8, e68519.
UNGER, C., SKOTTMAN, H., BLOMBERG, P., DILBER, M. S. & HOVATTA, O. 2008. Good manufacturing practice and clinical-grade human embryonic stem cell lines. Hum Mol Genet, 17, R48-53.
VAN SCHIL, K., KARLSTETTER, M., ASLANIDIS, A., DANNHAUSEN, K., AZAM, M., QAMAR, R., LEROY, B. P., DEPASSE, F., LANGMANN, T. & DE BAERE, E. 2016. Autosomal

275
recessive retinitis pigmentosa with homozygous rhodopsin mutation E150K and non-coding cis-regulatory variants in CRX-binding regions of SAMD7. Sci Rep, 6, 21307.
VAN ZEEBURG, E. J., MAAIJWEE, K. J., MISSOTTEN, T. O., HEIMANN, H. & VAN MEURS, J. C. 2012. A free retinal pigment epithelium-choroid graft in patients with exudative age-related macular degeneration: results up to 7 years. Am J Ophthalmol, 153, 120-7 e2.
VENKATESH, A., MA, S., LANGELLOTTO, F., GAO, G. & PUNZO, C. 2013. Retinal gene delivery by rAAV and DNA electroporation. Curr Protoc Microbiol, Chapter 14, Unit 14D 4.
VICZIAN, A. S., ZUBER, M.E. 2015. Principles of Developmental Genetics: Chapter 17- Retinal Development. Second ed.: Academic Press.
VLACHANTONI, D., BRAMALL, A. N., MURPHY, M. P., TAYLOR, R. W., SHU, X., TULLOCH, B., VAN VEEN, T., TURNBULL, D. M., MCINNES, R. R. & WRIGHT, A. F. 2011. Evidence of severe mitochondrial oxidative stress and a protective effect of low oxygen in mouse models of inherited photoreceptor degeneration. Hum Mol Genet, 20, 322-35.
VOLLRATH, D., NATHANS, J. & DAVIS, R. W. 1988. Tandem array of human visual pigment genes at Xq28. Science, 240, 1669-72.
WACHS, F. P., COUILLARD-DESPRES, S., ENGELHARDT, M., WILHELM, D., PLOETZ, S., VROEMEN, M., KAESBAUER, J., UYANIK, G., KLUCKEN, J., KARL, C., TEBBING, J., SVENDSEN, C., WEIDNER, N., KUHN, H. G., WINKLER, J. & AIGNER, L. 2003. High efficacy of clonal growth and expansion of adult neural stem cells. Lab Invest, 83, 949-62.
WAHLIN, K. J., MARUOTTI, J. A., SRIPATHI, S. R., BALL, J., ANGUEYRA, J. M., KIM, C., GREBE, R., LI, W., JONES, B. W. & ZACK, D. J. 2017. Photoreceptor Outer Segment-like Structures in Long-Term 3D Retinas from Human Pluripotent Stem Cells. Sci Rep, 7, 766.
WALSH, D. W., GODSON, C., BRAZIL, D. P. & MARTIN, F. 2010. Extracellular BMP-antagonist regulation in development and disease: tied up in knots. Trends Cell Biol, 20, 244-56.
WANG, E. 2005. RNA amplification for successful gene profiling analysis. J Transl Med, 3, 28.
WANG, L. H. & STRITTMATTER, S. M. 1996. A family of rat CRMP genes is differentially expressed in the nervous system. J Neurosci, 16, 6197-207.
WANG, S., SENGEL, C., EMERSON, M. M. & CEPKO, C. L. 2014. A gene regulatory network controls the binary fate decision of rod and bipolar cells in the vertebrate retina. Dev Cell, 30, 513-27.
WANG, Y., CHEN, J., HU, J. L., WEI, X. X., QIN, D., GAO, J., ZHANG, L., JIANG, J., LI, J. S., LIU, J., LAI, K. Y., KUANG, X., ZHANG, J., PEI, D. & XU, G. L. 2011. Reprogramming of mouse and human somatic cells by high-performance engineered factors. EMBO Rep, 12, 373-8.
WANG, Y., MACKE, J. P., MERBS, S. L., ZACK, D. J., KLAUNBERG, B., BENNETT, J., GEARHART, J. & NATHANS, J. 1992. A locus control region adjacent to the human red and green visual pigment genes. Neuron, 9, 429-40.
WARD, J. J., SODHI, J. S., MCGUFFIN, L. J., BUXTON, B. F. & JONES, D. T. 2004. Prediction and functional analysis of native disorder in proteins from the three kingdoms of life. J Mol Biol, 337, 635-45.
WARREN, L., NI, Y., WANG, J. & GUO, X. 2012. Feeder-free derivation of human induced pluripotent stem cells with messenger RNA. Sci Rep, 2, 657.

276
WATANABE, K., KAMIYA, D., NISHIYAMA, A., KATAYAMA, T., NOZAKI, S., KAWASAKI, H., WATANABE, Y., MIZUSEKI, K. & SASAI, Y. 2005. Directed differentiation of telencephalic precursors from embryonic stem cells. Nat Neurosci, 8, 288-96.
WATANABE, S., SANUKI, R., UENO, S., KOYASU, T., HASEGAWA, T. & FURUKAWA, T. 2013. Tropisms of AAV for subretinal delivery to the neonatal mouse retina and its application for in vivo rescue of developmental photoreceptor disorders. PLoS One, 8, e54146.
WEN, R., SONG, Y., KJELLSTROM, S., TANIKAWA, A., LIU, Y., LI, Y., ZHAO, L., BUSH, R. A., LATIES, A. M. & SIEVING, P. A. 2006. Regulation of rod phototransduction machinery by ciliary neurotrophic factor. J Neurosci, 26, 13523-30.
WEST, E. L., GONZALEZ-CORDERO, A., HIPPERT, C., OSAKADA, F., MARTINEZ-BARBERA, J. P., PEARSON, R. A., SOWDEN, J. C., TAKAHASHI, M. & ALI, R. R. 2012. Defining the integration capacity of embryonic stem cell-derived photoreceptor precursors. Stem Cells, 30, 1424-35.
WEST, E. L., PEARSON, R. A., TSCHERNUTTER, M., SOWDEN, J. C., MACLAREN, R. E. & ALI, R. R. 2008. Pharmacological disruption of the outer limiting membrane leads to increased retinal integration of transplanted photoreceptor precursors. Exp Eye Res, 86, 601-11.
WHITMORE, S. S., WAGNER, A. H., DELUCA, A. P., DRACK, A. V., STONE, E. M., TUCKER, B. A., ZENG, S., BRAUN, T. A., MULLINS, R. F. & SCHEETZ, T. E. 2014. Transcriptomic analysis across nasal, temporal, and macular regions of human neural retina and RPE/choroid by RNA-Seq. Exp Eye Res, 129, 93-106.
WIECHMANN, A. & HOWARD, E. 2003. Functional analysis of the human recoverin gene promoter. Curr Eye Res, 26, 25-32.
WIECHMANN, A. F. & HAMMARBACK, J. A. 1993. Expression of recoverin mRNA in the human retina: localization by in situ hybridization. Exp Eye Res, 57, 763-9.
WILEY, L. A., BURNIGHT, E. R., DELUCA, A. P., ANFINSON, K. R., CRANSTON, C. M., KAALBERG, E. E., PENTICOFF, J. A., AFFATIGATO, L. M., MULLINS, R. F., STONE, E. M. & TUCKER, B. A. 2016. cGMP production of patient-specific iPSCs and photoreceptor precursor cells to treat retinal degenerative blindness. Sci Rep, 6, 30742.
WILLIAMS, D. R., MACLEOD, D. I. & HAYHOE, M. M. 1981. Foveal tritanopia. Vision Res, 21, 1341-56.
WILSON, S. W. & HOUART, C. 2004. Early steps in the development of the forebrain. Dev Cell, 6, 167-81.
WINDERICKX, J., BATTISTI, L., MOTULSKY, A. G. & DEEB, S. S. 1992. Selective expression of human X chromosome-linked green opsin genes. Proc Natl Acad Sci U S A, 89, 9710-4.
WOODWARD, W. A. & SULMAN, E. P. 2008. Cancer stem cells: markers or biomarkers? Cancer Metastasis Rev, 27, 459-70.
WRIGHT, A. F., CHAKAROVA, C. F., ABD EL-AZIZ, M. M. & BHATTACHARYA, S. S. 2010. Photoreceptor degeneration: genetic and mechanistic dissection of a complex trait. Nat Rev Genet, 11, 273-84.
WU, F., LI, R., UMINO, Y., KACZYNSKI, T. J., SAPKOTA, D., LI, S., XIANG, M., FLIESLER, S. J., SHERRY, D. M., GANNON, M., SOLESSIO, E. & MU, X. 2013. Onecut1 is essential for horizontal cell genesis and retinal integrity. J Neurosci, 33, 13053-65, 13065a.
XIAO, M. & HENDRICKSON, A. 2000. Spatial and temporal expression of short, long/medium, or both opsins in human fetal cones. J Comp Neurol, 425, 545-59.
YAN, X. X. & WIECHMANN, A. F. 1997. Early expression of recoverin in a unique population of neurons in the human retina. Anat Embryol (Berl), 195, 51-63.

277
YANAI, A., LAVER, C. R., GREGORY-EVANS, C. Y., LIU, R. R. & GREGORY-EVANS, K. 2015. Enhanced functional integration of human photoreceptor precursors into human and rodent retina in an ex vivo retinal explant model system. Tissue Eng Part A, 21, 1763-71.
YE, G. J., BUDZYNSKI, E., SONNENTAG, P., NORK, T. M., SHEIBANI, N., GUREL, Z., BOYE, S. L., PETERSON, J. J., BOYE, S. E., HAUSWIRTH, W. W. & CHULAY, J. D. 2016. Cone-Specific Promoters for Gene Therapy of Achromatopsia and Other Retinal Diseases. Hum Gene Ther, 27, 72-82.
YOKOYAMA, S. & YOKOYAMA, R. 1989. Molecular evolution of human visual pigment genes. Mol Biol Evol, 6, 186-97.
YOSHIDA, S., MEARS, A. J., FRIEDMAN, J. S., CARTER, T., HE, S., OH, E., JING, Y., FARJO, R., FLEURY, G., BARLOW, C., HERO, A. O. & SWAROOP, A. 2004. Expression profiling of the developing and mature Nrl-/- mouse retina: identification of retinal disease candidates and transcriptional regulatory targets of Nrl. Hum Mol Genet, 13, 1487-503.
YOSHIDA, S., YASHAR, B. M., HIRIYANNA, S. & SWAROOP, A. 2002. Microarray analysis of gene expression in the aging human retina. Invest Ophthalmol Vis Sci, 43, 2554-60.
YOUNG, R. W. 1985. Cell differentiation in the retina of the mouse. Anat Rec, 212, 199-205.
YOUNG, T. L., HAWTHORNE, F., FENG, S., LUO, X., ST GERMAIN, E., WANG, M. & METLAPALLY, R. 2013. Whole genome expression profiling of normal human fetal and adult ocular tissues. Exp Eye Res, 116, 265-78.
YU, J., HE, S., FRIEDMAN, J. S., AKIMOTO, M., GHOSH, D., MEARS, A. J., HICKS, D. & SWAROOP, A. 2004. Altered expression of genes of the Bmp/Smad and Wnt/calcium signaling pathways in the cone-only Nrl-/- mouse retina, revealed by gene profiling using custom cDNA microarrays. J Biol Chem, 279, 42211-20.
YU, J., VODYANIK, M. A., SMUGA-OTTO, K., ANTOSIEWICZ-BOURGET, J., FRANE, J. L., TIAN, S., NIE, J., JONSDOTTIR, G. A., RUOTTI, V., STEWART, R., SLUKVIN, II & THOMSON, J. A. 2007. Induced pluripotent stem cell lines derived from human somatic cells. Science, 318, 1917-20.
YUAN, S. H., MARTIN, J., ELIA, J., FLIPPIN, J., PARAMBAN, R. I., HEFFERAN, M. P., VIDAL, J. G., MU, Y., KILLIAN, R. L., ISRAEL, M. A., EMRE, N., MARSALA, S., MARSALA, M., GAGE, F. H., GOLDSTEIN, L. S. & CARSON, C. T. 2011. Cell-surface marker signatures for the isolation of neural stem cells, glia and neurons derived from human pluripotent stem cells. PLoS One, 6, e17540.
YUN, S., SAIJOH, Y., HIROKAWA, K. E., KOPINKE, D., MURTAUGH, L. C., MONUKI, E. S. & LEVINE, E. M. 2009. Lhx2 links the intrinsic and extrinsic factors that control optic cup formation. Development, 136, 3895-906.
ZHAO, L., SAITSU, H., SUN, X., SHIOTA, K. & ISHIBASHI, M. 2010. Sonic hedgehog is involved in formation of the ventral optic cup by limiting Bmp4 expression to the dorsal domain. Mech Dev, 127, 62-72.
ZHAO, X., LIU, J. & AHMAD, I. 2002. Differentiation of embryonic stem cells into retinal neurons. Biochem Biophys Res Commun, 297, 177-84.
ZHONG, H., CHEN, Y., LI, Y., CHEN, R. & MARDON, G. 2015. CRISPR-engineered mosaicism rapidly reveals that loss of Kcnj13 function in mice mimics human disease phenotypes. Sci Rep, 5, 8366.
ZHONG, X., GUTIERREZ, C., XUE, T., HAMPTON, C., VERGARA, M. N., CAO, L. H., PETERS, A., PARK, T. S., ZAMBIDIS, E. T., MEYER, J. S., GAMM, D. M., YAU, K. W. &

278
CANTO-SOLER, M. V. 2014. Generation of three-dimensional retinal tissue with functional photoreceptors from human iPSCs. Nat Commun, 5, 4047.
ZHOU, H., WU, S., JOO, J. Y., ZHU, S., HAN, D. W., LIN, T., TRAUGER, S., BIEN, G., YAO, S., ZHU, Y., SIUZDAK, G., SCHOLER, H. R., DUAN, L. & DING, S. 2009. Generation of induced pluripotent stem cells using recombinant proteins. Cell Stem Cell, 4, 381-4.
ZHOU, S., FLAMIER, A., ABDOUH, M., TETREAULT, N., BARABINO, A., WADHWA, S. & BERNIER, G. 2015. Differentiation of human embryonic stem cells into cone photoreceptors through simultaneous inhibition of BMP, TGFbeta and Wnt signaling. Development, 142, 3294-306.
ZHU, J., CIFUENTES, H., REYNOLDS, J. & LAMBA, D. A. 2016. Immunosuppression via Loss of IL2rgamma Enhances Long-Term Functional Integration of hESC-Derived Photoreceptors in the Mouse Retina. Cell Stem Cell.
ZUBER, M. E. 2010. Eye field specification in Xenopus laevis. Curr Top Dev Biol, 93, 29-60. ZUBER, M. E., PERRON, M., PHILPOTT, A., BANG, A. & HARRIS, W. A. 1999. Giant eyes in
Xenopus laevis by overexpression of XOptx2. Cell, 98, 341-52.
279
Publications Published material:
LAKOWSKI, J., GONZALEZ-CORDERO, A., WEST, E. L., HAN, Y. T., WELBY, E., NAEEM, A., BLACKFORD, S. J., BAINBRIDGE, J. W., PEARSON, R. A., ALI, R. R. & SOWDEN, J. C. 2015. Transplantation of Photoreceptor Precursors Isolated via a Cell Surface Biomarker Panel From Embryonic Stem Cell-Derived Self-Forming Retina. Stem Cells, 33, 2469-82.
Submitted manuscripts:
WELBY, E., LAKOWSKI, J., DI FOGGIA, V., BUNDINGER, D., GONZALEZ-CORDERO, A., LUN, A.T.L., EPSTEIN, M., PATEL, A., KRUCZEK, K., NAEEM, A., MINNECI, F., HUBANK, M., JONES, D.T., MARIONI, J.C., ALI, R.R., SOWDEN, J.C. 2017. Isolation and comparative transcriptome analysis of human foetal and iPSC-derived cone photoreceptor cells. Stem Cell Reports. Minor revisions required.
LAKOWSKI, J., WELBY, E., BUDINGER, D., DI MARCO, F., DI FOGGIA, V., BAINBRIDGE, J.W.B., WALLACE, K., GAMM, D.M., ALI, R.R., SOWDEN, J.C. 2017. Isolation of human photoreceptor precursors via a cell surface marker panel from stem cell-derived retinal organoids and fetal retinae. STEM CELLS. Under review.