A System for Suspending and Vibration-Isolating a Large ...
14
A System for Suspending and Vibration-Isolating a Large Spacecraft for Testing in Vacuum David A. Kienholz*1 Abstract A system is described for suspending from above a 15,900-kg (35,000-lb) payload for ground testing in a vacuum chamber. The system provides very low suspension frequencies to isolate the payload from ambient vibration. It also includes active capability to maintain a very stable ride-height and attitude of the payload. Passive magnetic dampers are included to suppress pendulum-mode lateral oscillations. Designated as the Large Suspension / Isolation System (LSIS) the system is described in terms of its design, analysis, fabrication, and component-level testing. Introduction Spacecraft are often required to maintain a very accurate line-of-sight for a beam-pointing instrument. Doing so requires knowledge of the on-board disturbances, any external disturbances, and the dynamics of the spacecraft as they relate to the line-of-sight. Verifying the first and last of these in ground testing can be quite difficult because of the need to isolate the spacecraft from any external disturbances that would be only artifacts of the ground test environment. The present case was particularly challenging because of the shear size of the test article and the fact that the ground testing had to be done in vacuum. In response to this challenge, a unique vibration isolation system was developed. The system design was derived from smaller versions developed originally under NASA sponsorship for simulating the free-floating boundary conditions of space in ground dynamic testing, such as modal surveys of very flexible spacecraft [1]. While a number of such systems have been built, including even one designed for operation in vacuum [2], none approached the capacity needed for the present application. The primary accomplishment of this development was demonstrating that the design was scalable to much larger sizes than built previously. In fact, experience reported here indicates that it can be scaled to even larger sizes. Requirements and System Architecture Figure 1 shows a simple schematic of the test articles and the suspension system. There are actually two separate test articles that must be held in accurate registration to each other during the test. The larger, designated Body C in the figure, was essentially two relatively rigid bodies connected by a trusswork. The smaller, called Body A/B, was initially separate but was, in some tests, connected by trusswork to Body A/B. The entire apparatus, payload and suspension devices, is inside a large vacuum chamber with the suspension devices mounted to a framework near the top of the chamber. The defining characteristics of the development were (1) the schedule was very aggressive, and (2) very little information about the payload was available to the suspension system designers. No hard requirement was ever set for the vertical suspension frequency, usually a defining requirement. Early simulations indicated that a value of 0.50 Hz or lower would be adequate so this was taken as the allowable maximum. The ride height and orientation of the payloads had to be highly stable once they were “floated” on the suspension and the test began. Again, no hard quantitative requirements were set but predicted values of uplift force resolution given later and the resulting position resolution were accepted as adequate. * CSA Engineering, Inc, Mountain View, CA Proceedings of the 39 th Aerospace Mechanisms Symposium, NASA Marshall Space Flight Center, May 7-9, 2008 317
-
Upload
khangminh22 -
Category
Documents
-
view
1 -
download
0
Transcript of A System for Suspending and Vibration-Isolating a Large ...

A System for Suspending and Vibration-Isolating a Large Spacecraft for Testing in Vacuum
David A. Kienholz*1
Abstract
A system is described for suspending from above a 15,900-kg (35,000-lb) payload for ground testing in a vacuum chamber. The system provides very low suspension frequencies to isolate the payload from ambient vibration. It also includes active capability to maintain a very stable ride-height and attitude of the payload. Passive magnetic dampers are included to suppress pendulum-mode lateral oscillations. Designated as the Large Suspension / Isolation System (LSIS) the system is described in terms of its design, analysis, fabrication, and component-level testing.
Introduction
Spacecraft are often required to maintain a very accurate line-of-sight for a beam-pointing instrument. Doing so requires knowledge of the on-board disturbances, any external disturbances, and the dynamics of the spacecraft as they relate to the line-of-sight. Verifying the first and last of these in ground testing can be quite difficult because of the need to isolate the spacecraft from any external disturbances that would be only artifacts of the ground test environment. The present case was particularly challenging because of the shear size of the test article and the fact that the ground testing had to be done in vacuum. In response to this challenge, a unique vibration isolation system was developed.
The system design was derived from smaller versions developed originally under NASA sponsorship for simulating the free-floating boundary conditions of space in ground dynamic testing, such as modal surveys of very flexible spacecraft [1]. While a number of such systems have been built, including even one designed for operation in vacuum [2], none approached the capacity needed for the present application. The primary accomplishment of this development was demonstrating that the design was scalable to much larger sizes than built previously. In fact, experience reported here indicates that it can be scaled to even larger sizes.
Requirements and System Architecture
Figure 1 shows a simple schematic of the test articles and the suspension system. There are actually two separate test articles that must be held in accurate registration to each other during the test. The larger, designated Body C in the figure, was essentially two relatively rigid bodies connected by a trusswork. The smaller, called Body A/B, was initially separate but was, in some tests, connected by trusswork to Body A/B. The entire apparatus, payload and suspension devices, is inside a large vacuum chamber with the suspension devices mounted to a framework near the top of the chamber.
The defining characteristics of the development were (1) the schedule was very aggressive, and (2) very little information about the payload was available to the suspension system designers. No hard requirement was ever set for the vertical suspension frequency, usually a defining requirement. Early simulations indicated that a value of 0.50 Hz or lower would be adequate so this was taken as the allowable maximum. The ride height and orientation of the payloads had to be highly stable once they were “floated” on the suspension and the test began. Again, no hard quantitative requirements were set but predicted values of uplift force resolution given later and the resulting position resolution were accepted as adequate.
* CSA Engineering, Inc, Mountain View, CA
Proceedings of the 39th Aerospace Mechanisms Symposium, NASA Marshall Space Flight Center, May 7-9, 2008
317

Figure 1 shows the payloads supported from above by a total of 14 suspension devices. The red objects are called active/passive (Type A) devices since they have the facility for real-time adjustment of their uplift force to maintain the payload ride height and attitude. The blue symbols are passive-only (Type P) devices, which have greater lifting capacity but have no real-time trim capability. The green symbols are passive dashpots, which damp the pendulum modes of the payload. The next two sections explain the design and fabrication of these hardware elements.
Figure 1 Schematic of the isolation system and payload.
Operating Principles
Figure 2 shows the operating principle of a Type A suspension device. The uplift force on the payload is provided by a special type of air spring composed of a frictionless piston moving inside a cylinder with the pressurized volume under the piston ported to a much larger external volume. The piston rod shown extending through the lower end of the cylinder is only for illustration. The real configuration is explained in the next section. Pressure in the external volume (and thus in the cylinder) is controlled by a precision mechanical regulator, which also provides make-up air.
In Type A devices, a voice coil actuator (actually several in parallel) act in parallel with the air spring to provide real-time fine trim of the uplift force. The primary feedback sensor is a high-resolution pressure transducer. It senses the very small, slow, random pressure variations that occur in the air spring. A central controller receives this information from all 14 devices. It then calculates the trim force required from the voice coils of each of the eight Type A devices in order to maintain the initial ride height and attitude. The controller then calculates the required actuator currents and sends digital commands to
Payload
Controller
Power amp
Voice-coil actuator
External
TankAir in
Cable
Frictionless Piston
Load, pressure, &position sensors
Active electro- magnetic system
Passive pneumatic system
Precision
Regulator
Figure 2 Operating principle of passive plus active suspension device.
318
the power amplifiers driving the actuators. The update rate is slow enough that the controller is of the look-shoot-look-shoot type and is thus inherently stable.
0.00
0.10
0.20
0.30
0.40
0.50
0.60
0.70
0.80
0.90
1.00
0 10 20 30 40 50 60 70 80 90 100 110 120 130 140 150 160
Piston absolute pressure, psia
Vertical
suspensionfrequency
(Hz)
In atmosphere
In vacuum
Payload
(lbs)
0.0
1000.
2000.
3000.
4000.
5000.
Figure 3 Calculated vertical suspension frequency and payload.
The air spring using a frictionless piston behaves essentially as an ideal regulated air spring. Its stiffness is purely a function of the gas properties of air, the piston area, and the total pressurized volume. The relationship, derived from basic thermodynamics assuming linearity and isentropic compression and
expansion, is k = ) A2 po/Vo where k is the stiffness, ) is the specific heat ratio of the gas (1.40 for air), A
is the piston area, po is the mean absolute pressure and Vo is the mean volume. The dependence of stiffness on pressure means that the suspension frequency is essentially independent of payload mass
2.
Further, it means that an air spring can always be brought back to a zero sag condition under weight load by adjusting the mass of air in the cylinder. Implementation via a frictionless piston rather than a flexible air bag has the advantage that an air bag adds significant stiffness, which sets a lower limit to the suspension frequency. The suspension frequency of a piston air spring can be reduced without limit by increasing the external volume.
Figure 3 shows the calculated suspension frequency and payload for a payload suspended by a Type A device with 227-l (60-gallon) accumulators. There is some loss of payload capacity and increase in suspension frequency because of the vacuum itself. As will be shown, the moving element of the suspension devices is subject to vacuum force, which slightly decreases the payload capacity and increases the suspension frequency. The increase in frequency is also caused by flexible metal bellows seals needed for vacuum compatibility.
Design of Suspension Devices
Figure 4 shows two views of a simplified solid model of a Type A suspension device. Missing from the model is the “bell jar” vacuum housing that encloses the part of the mechanism above the baseplate. The housing recaptures all the exhaust air from the air bearings and pistons such that it can be routed via a tube out through the wall of the vacuum chamber. This and the bellows seals around the carriage rails that extend downwards through the baseplate are the essential features that make the devices operable in vacuum.
2 This independence requires that the absolute pressure be at least several times the ambient pressure acting on the
top of the piston.
319
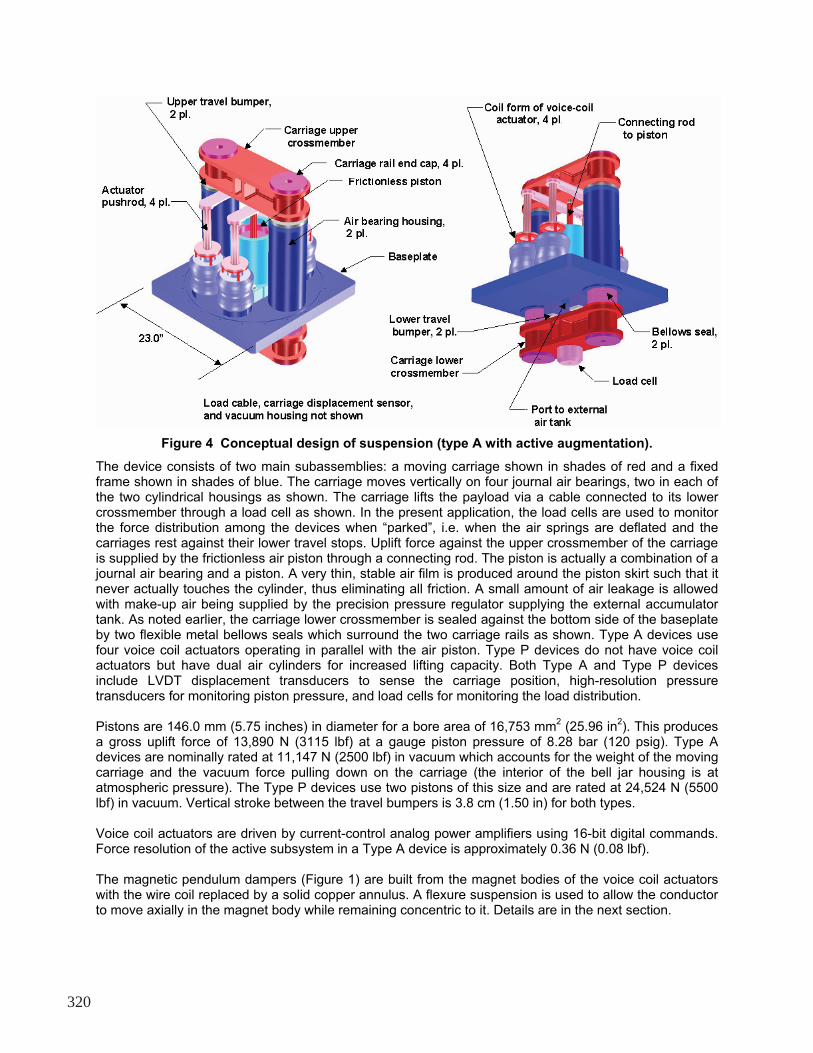
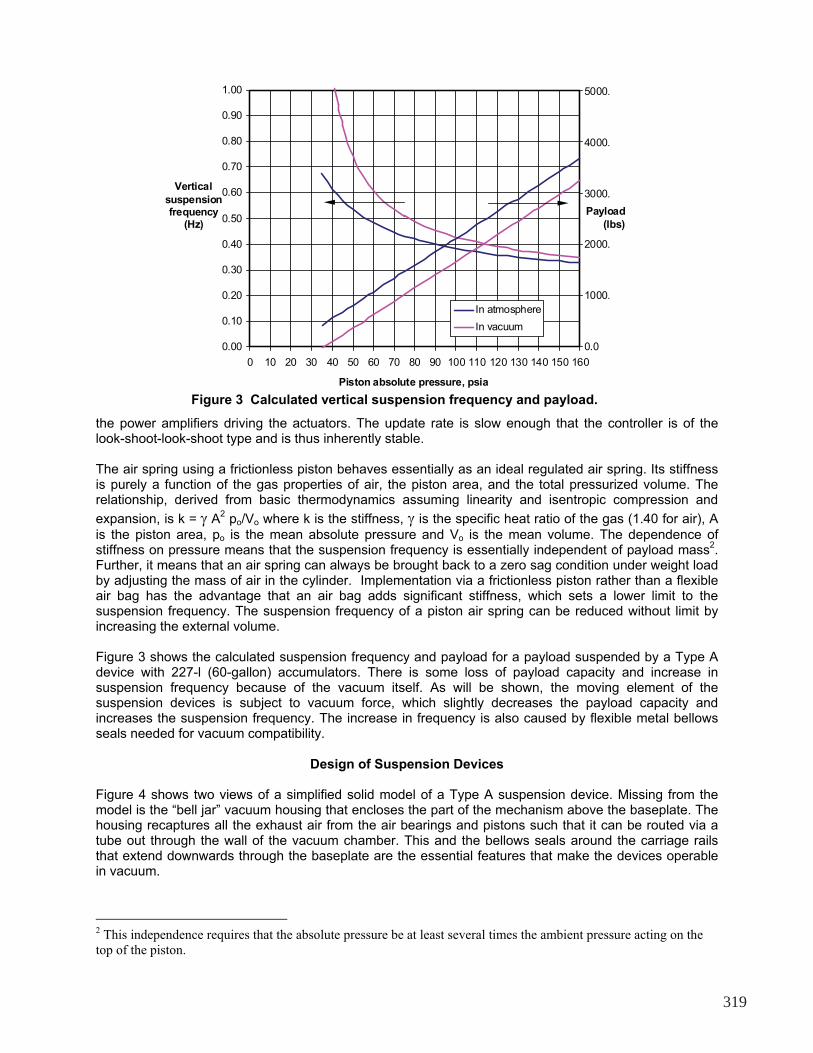
Figure 4 Conceptual design of suspension (type A with active augmentation).
The device consists of two main subassemblies: a moving carriage shown in shades of red and a fixed frame shown in shades of blue. The carriage moves vertically on four journal air bearings, two in each of the two cylindrical housings as shown. The carriage lifts the payload via a cable connected to its lower crossmember through a load cell as shown. In the present application, the load cells are used to monitor the force distribution among the devices when “parked”, i.e. when the air springs are deflated and the carriages rest against their lower travel stops. Uplift force against the upper crossmember of the carriage is supplied by the frictionless air piston through a connecting rod. The piston is actually a combination of a journal air bearing and a piston. A very thin, stable air film is produced around the piston skirt such that it never actually touches the cylinder, thus eliminating all friction. A small amount of air leakage is allowed with make-up air being supplied by the precision pressure regulator supplying the external accumulator tank. As noted earlier, the carriage lower crossmember is sealed against the bottom side of the baseplate by two flexible metal bellows seals which surround the two carriage rails as shown. Type A devices use four voice coil actuators operating in parallel with the air piston. Type P devices do not have voice coil actuators but have dual air cylinders for increased lifting capacity. Both Type A and Type P devices include LVDT displacement transducers to sense the carriage position, high-resolution pressure transducers for monitoring piston pressure, and load cells for monitoring the load distribution.
Pistons are 146.0 mm (5.75 inches) in diameter for a bore area of 16,753 mm2 (25.96 in
2). This produces
a gross uplift force of 13,890 N (3115 lbf) at a gauge piston pressure of 8.28 bar (120 psig). Type A devices are nominally rated at 11,147 N (2500 lbf) in vacuum which accounts for the weight of the moving carriage and the vacuum force pulling down on the carriage (the interior of the bell jar housing is at atmospheric pressure). The Type P devices use two pistons of this size and are rated at 24,524 N (5500 lbf) in vacuum. Vertical stroke between the travel bumpers is 3.8 cm (1.50 in) for both types.
Voice coil actuators are driven by current-control analog power amplifiers using 16-bit digital commands. Force resolution of the active subsystem in a Type A device is approximately 0.36 N (0.08 lbf).
The magnetic pendulum dampers (Figure 1) are built from the magnet bodies of the voice coil actuators with the wire coil replaced by a solid copper annulus. A flexure suspension is used to allow the conductor to move axially in the magnet body while remaining concentric to it. Details are in the next section.
320
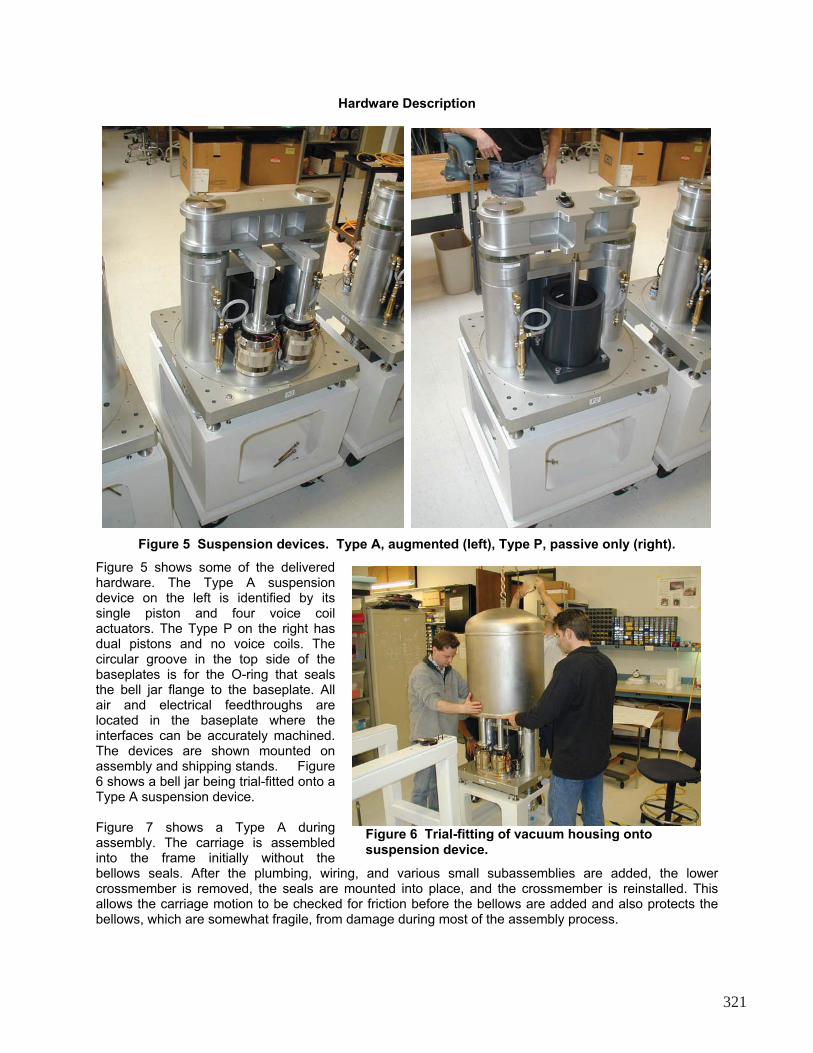
Hardware Description
Figure 5 Suspension devices. Type A, augmented (left), Type P, passive only (right).
Figure 5 shows some of the delivered hardware. The Type A suspension device on the left is identified by its single piston and four voice coil actuators. The Type P on the right has dual pistons and no voice coils. The circular groove in the top side of the baseplates is for the O-ring that seals the bell jar flange to the baseplate. All air and electrical feedthroughs are located in the baseplate where the interfaces can be accurately machined. The devices are shown mounted on assembly and shipping stands. Figure 6 shows a bell jar being trial-fitted onto a Type A suspension device.
Figure 7 shows a Type A during assembly. The carriage is assembled into the frame initially without the bellows seals. After the plumbing, wiring, and various small subassemblies are added, the lower crossmember is removed, the seals are mounted into place, and the crossmember is reinstalled. This allows the carriage motion to be checked for friction before the bellows are added and also protects the bellows, which are somewhat fragile, from damage during most of the assembly process.
Figure 6 Trial-fitting of vacuum housing onto suspension device.
321

An example of the bellows seal is shown in Figure 8. It is formed bellows rather than edge-welded. While the latter type would have had the advantage of lower added stiffness, it would have been much more costly and would have had an unacceptably long delivery time. Since analysis had shown that the target suspension frequency could be met with formed bellows, that was the type used. The end flanges are machined with standard O-ring grooves as shown and then tungsten-inert gas welded to the formed bellows. The bellows are fabricated from 321 stainless steel because of its high ductility. The flanges are made from the same material for welding compatibility. Inside diameter of the bellows is 93.7 mm (3.69 in) and flange-to-flange length in the unstrained condition is 107.4 mm (4.23 in). Stiffness added by the bellows is about 2.90 N/mm (16.5 lbf/inch) per bellows.
Figure 7 Partially assembled Type A device showing the carriage rails and lower crossmember. Bellows seals are installed later.
An important consideration for internally pressurized, formed bellows is lateral (inchworm) buckling. Because the critical buckling pressure is always proportional to axial stiffness divided by length, there is a certain stiffness that must be tolerated. As usual, this controlled the design since the critical pressure had to be at least 1 atm. Measured buckling pressure was found to be in good agreement with theoretical predictions.
Figure 9 shows two views of the passive magnetic pendulum dampers. The body of each damper was mounted to a temporary stanchion fixed to the floor of the vacuum chamber. The moving element of the damper was then connected to the payload by a “stinger” having a flex joint at either end. The resemblance of the magnet bodies of the dampers to those of the voice coil actuator (Figure 5) is clear. While damping performance could have been improved by a custom design, the ad-hoc design based on the actuators was adequate so the ever-present schedule pressure dictated its use. Working stroke of the dampers was about 12.7 mm (0.5 inch). Overall length of the assembly as shown is 248.7 mm (9.79 in) and the envelope diameter is 279.4 mm (11.00 in). Weight is approximately 11.4 kg (25 lb) per damper.
Figure 8 Flexible metal bellows seal.
Experience in modal testing has shown that pendulum modes have practically zero inherent damping. The basic reason is that the potential energy is stored in geometric stiffness rather than elastic stiffness of a material. Hence, there is no material loss factor to dissipate energy. While relatively simple compared to the suspension devices, the passive pendulum dampers were essential to the overall success of the suspension system.
322

Figure 9 Passive magnetic dampers for payload pendulum modes
Testing
The aggressive development schedule for LSIS left time for only the most essential tests prior to shipping the hardware. These were friction and proof load tests of the suspension devices and leak rate tests of the devices and their accumulator tanks. Dynamic tests were performed after the fact on a spare damper for engineering purposes. This section reports methods and results for these tests.
Friction tests of suspension devices.Figure 11 shows the setup for friction tests. A custom test stand (the white structure in the figure) was designed and built for the purpose. It provided a mounting location for the device under test and a means of moving the carriage up and down through a small stroke while the air spring and accumulator tank were fully pressurized to their maximum expected operating pressure. Force applied to the carriage to produce the motion and resulting displacement were transduced and recorded. If friction was present, it would show up as a step in the force at the instant the carriage motion reversed direction. The amplitude of the step would be twice the friction force.
Figure 10 shows a detail of the actuation device for moving the carriage. Initially a variable speed, DC electric motor was to be used to turn a crankshaft with a small, 1.27-
Figure 10 Actuation mechanism for friction tests of suspension devices.
323
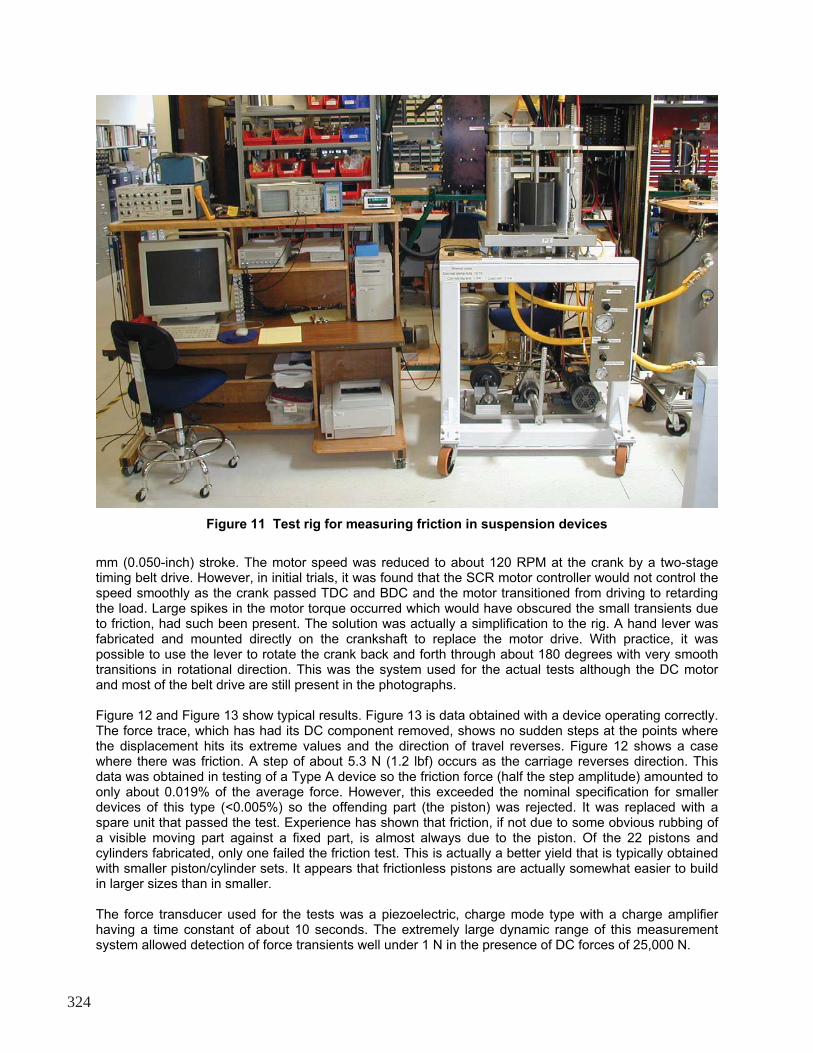
Figure 11 Test rig for measuring friction in suspension devices
mm (0.050-inch) stroke. The motor speed was reduced to about 120 RPM at the crank by a two-stage timing belt drive. However, in initial trials, it was found that the SCR motor controller would not control the speed smoothly as the crank passed TDC and BDC and the motor transitioned from driving to retarding the load. Large spikes in the motor torque occurred which would have obscured the small transients due to friction, had such been present. The solution was actually a simplification to the rig. A hand lever was fabricated and mounted directly on the crankshaft to replace the motor drive. With practice, it was possible to use the lever to rotate the crank back and forth through about 180 degrees with very smooth transitions in rotational direction. This was the system used for the actual tests although the DC motor and most of the belt drive are still present in the photographs.
Figure 12 and Figure 13 show typical results. Figure 13 is data obtained with a device operating correctly. The force trace, which has had its DC component removed, shows no sudden steps at the points where the displacement hits its extreme values and the direction of travel reverses. Figure 12 shows a case where there was friction. A step of about 5.3 N (1.2 lbf) occurs as the carriage reverses direction. This data was obtained in testing of a Type A device so the friction force (half the step amplitude) amounted to only about 0.019% of the average force. However, this exceeded the nominal specification for smaller devices of this type (<0.005%) so the offending part (the piston) was rejected. It was replaced with a spare unit that passed the test. Experience has shown that friction, if not due to some obvious rubbing of a visible moving part against a fixed part, is almost always due to the piston. Of the 22 pistons and cylinders fabricated, only one failed the friction test. This is actually a better yield that is typically obtained with smaller piston/cylinder sets. It appears that frictionless pistons are actually somewhat easier to build in larger sizes than in smaller.
The force transducer used for the tests was a piezoelectric, charge mode type with a charge amplifier having a time constant of about 10 seconds. The extremely large dynamic range of this measurement system allowed detection of force transients well under 1 N in the presence of DC forces of 25,000 N.
324

Figure 12 Test result for suspension device showing friction between piston and cylinder.
Figure 13 Typical test result for suspension device without friction
325
Leak rate testsBecause both the suspension devices and their accumulator tanks were to be used in a vacuum chamber, their leak rate was obviously of concern. The usual method of leak testing, developed for vacuum chambers, involves helium bagging the device, pumping the interior down to vacuum, and analyzing the gases pumped out to see how much helium is present. Because the suspension devices contain air at several different pressures with vacuum outside the device, this standard method would not have been representative of operating conditions.
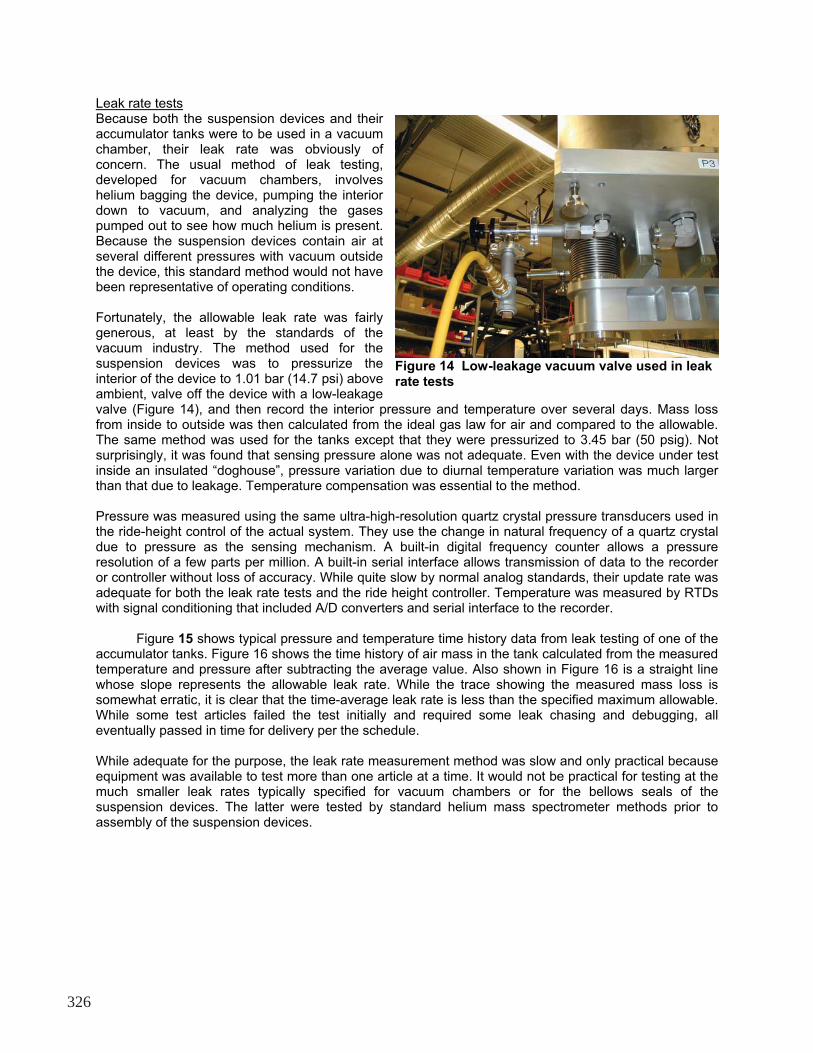
Fortunately, the allowable leak rate was fairly generous, at least by the standards of the vacuum industry. The method used for the suspension devices was to pressurize the interior of the device to 1.01 bar (14.7 psi) above ambient, valve off the device with a low-leakage valve (Figure 14), and then record the interior pressure and temperature over several days. Mass loss from inside to outside was then calculated from the ideal gas law for air and compared to the allowable. The same method was used for the tanks except that they were pressurized to 3.45 bar (50 psig). Not surprisingly, it was found that sensing pressure alone was not adequate. Even with the device under test inside an insulated “doghouse”, pressure variation due to diurnal temperature variation was much larger than that due to leakage. Temperature compensation was essential to the method.
Figure 14 Low-leakage vacuum valve used in leak rate tests
Pressure was measured using the same ultra-high-resolution quartz crystal pressure transducers used in the ride-height control of the actual system. They use the change in natural frequency of a quartz crystal due to pressure as the sensing mechanism. A built-in digital frequency counter allows a pressure resolution of a few parts per million. A built-in serial interface allows transmission of data to the recorder or controller without loss of accuracy. While quite slow by normal analog standards, their update rate was adequate for both the leak rate tests and the ride height controller. Temperature was measured by RTDs with signal conditioning that included A/D converters and serial interface to the recorder.
Figure 15 shows typical pressure and temperature time history data from leak testing of one of the accumulator tanks. Figure 16 shows the time history of air mass in the tank calculated from the measured temperature and pressure after subtracting the average value. Also shown in Figure 16 is a straight line whose slope represents the allowable leak rate. While the trace showing the measured mass loss is somewhat erratic, it is clear that the time-average leak rate is less than the specified maximum allowable. While some test articles failed the test initially and required some leak chasing and debugging, all eventually passed in time for delivery per the schedule.
While adequate for the purpose, the leak rate measurement method was slow and only practical because equipment was available to test more than one article at a time. It would not be practical for testing at the much smaller leak rates typically specified for vacuum chambers or for the bellows seals of the suspension devices. The latter were tested by standard helium mass spectrometer methods prior to assembly of the suspension devices.
326
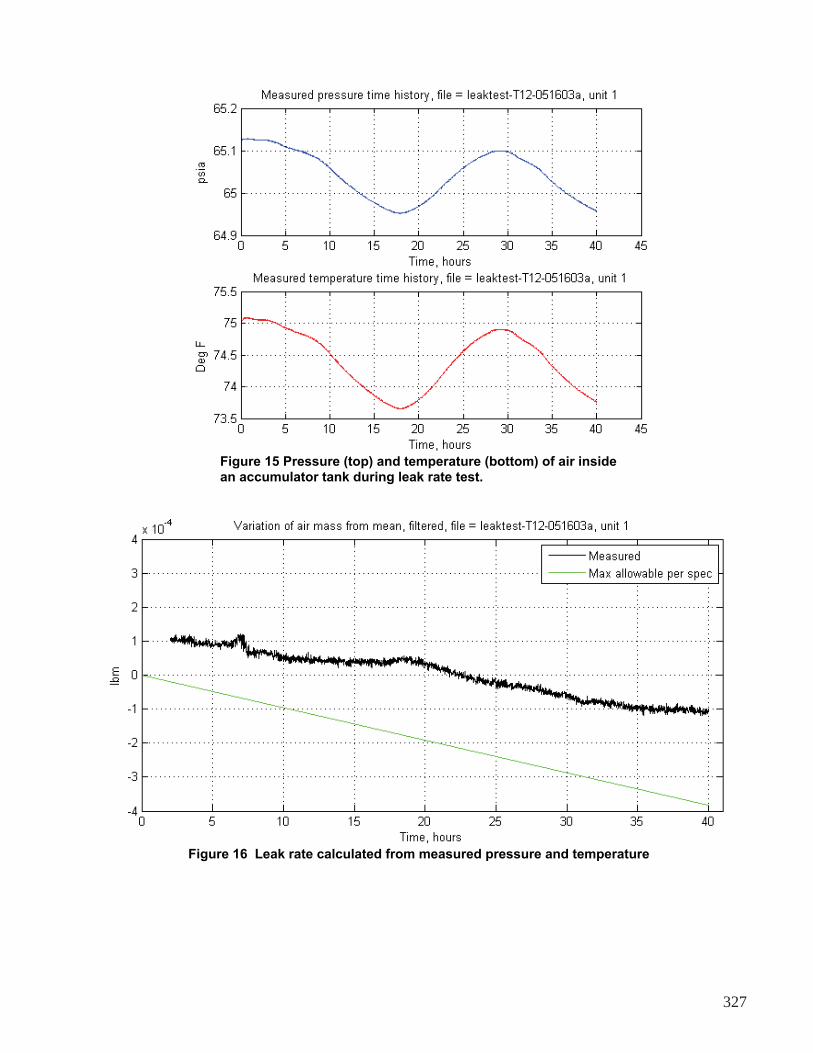
Figure 15 Pressure (top) and temperature (bottom) of air inside an accumulator tank during leak rate test.
Figure 16 Leak rate calculated from measured pressure and temperature
327
Proof load tests of suspension devicesEach of the 14 devices was proof tested to twice its rated load capacity. A modified version of the friction test rig was used for this purpose. Shown in Figure 17, it substituted a hydraulic cylinder for the crankshaft mechanism of the friction tester. Force was determined from the hydraulic pressure applied by a hand pump. The proof loads produced severe deflection of the elastomeric travel stops built into the suspension devices (Figure 4) but they all survived and returned to normal after the load was removed. No failures occurred during proof load tests.
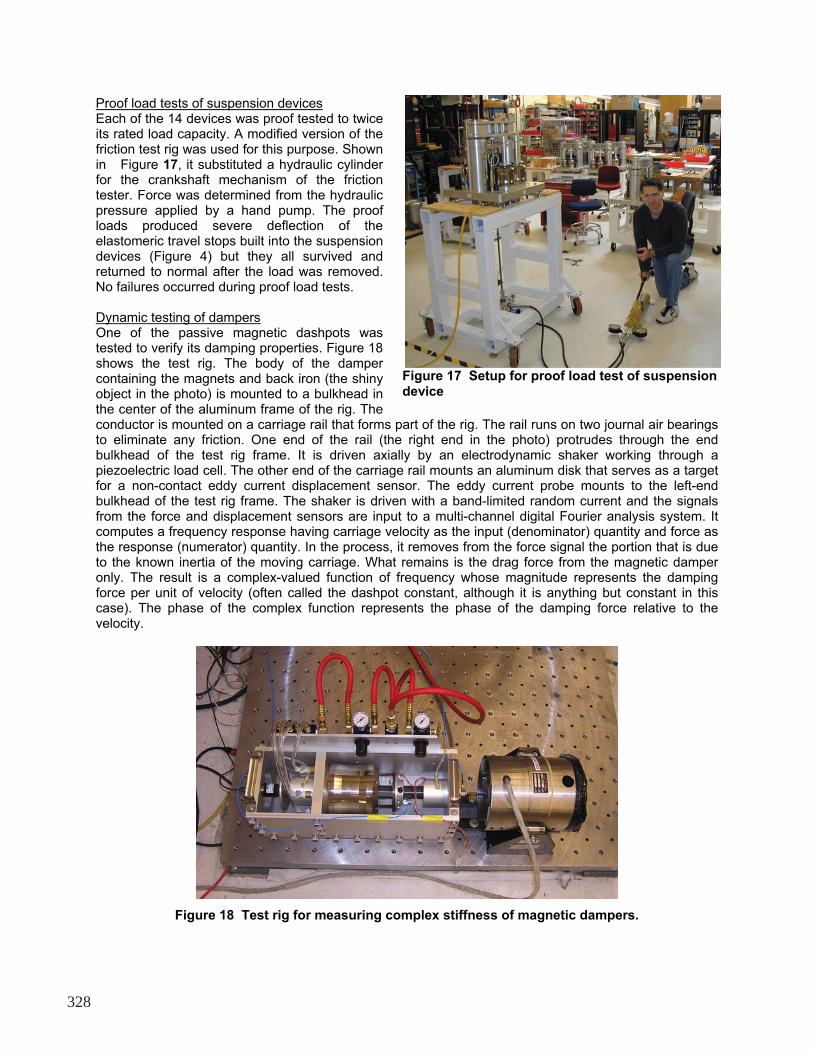
Dynamic testing of dampersOne of the passive magnetic dashpots was tested to verify its damping properties. Figure 18 shows the test rig. The body of the damper containing the magnets and back iron (the shiny object in the photo) is mounted to a bulkhead in the center of the aluminum frame of the rig. The conductor is mounted on a carriage rail that forms part of the rig. The rail runs on two journal air bearings to eliminate any friction. One end of the rail (the right end in the photo) protrudes through the end bulkhead of the test rig frame. It is driven axially by an electrodynamic shaker working through a piezoelectric load cell. The other end of the carriage rail mounts an aluminum disk that serves as a target for a non-contact eddy current displacement sensor. The eddy current probe mounts to the left-end bulkhead of the test rig frame. The shaker is driven with a band-limited random current and the signals from the force and displacement sensors are input to a multi-channel digital Fourier analysis system. It computes a frequency response having carriage velocity as the input (denominator) quantity and force as the response (numerator) quantity. In the process, it removes from the force signal the portion that is due to the known inertia of the moving carriage. What remains is the drag force from the magnetic damper only. The result is a complex-valued function of frequency whose magnitude represents the damping force per unit of velocity (often called the dashpot constant, although it is anything but constant in this case). The phase of the complex function represents the phase of the damping force relative to the velocity.
Figure 17 Setup for proof load test of suspension device
Figure 18 Test rig for measuring complex stiffness of magnetic dampers.
328

Figure 19 Measured force/velocity ratio for the magnetic damper
Figure 19 shows the magnitude of the measured frequency response function for three configurations of the conductor of the damper. The uppermost (red) curve is for the dampers as delivered and installed with the suspension system. These used a single, solid-copper annulus (also called a single shorted turn) as the conductor. The middle (green) curve is for a conductor formed from the same wire-wound coil used in the voice-coil actuators but with the wire ends shorted together. The blue curve is for the aluminum coil form (also called the bobbin) used in the voice-coil actuators but with no wire windings. Not surprisingly, the force/velocity ratio increases as the resistance in the induced current path is decreased, just as theory predicts.
The back iron assembly of the voice-coil actuator (identical to that of the damper) was of a design that produced relatively high inductance in the coil. For the actuator, this was not important since it is used essentially only at zero frequency. For the damper, it was expected that this would cause the induced currents in the damper conductor (which cause the damping force) to drop off with increasing frequency. This would be valuable for the present application since it would allow the magnetic dashpots to damp the very low frequency pendulum mode (less than 1 Hz) but then disappear at higher frequency so as not to transmit disturbing forces into the payload at higher frequencies. The red curve of Figure 19 shows that the design was quite successful. At frequencies over about 50 Hz where the resonances of the payload begin, the force/velocity ratio is reduced by about an order of magnitude from its DC value.
Conclusion
Figure 20 shows eight of the fourteen suspension devices mounted in a framework, ready to be suspended from the roof of the vacuum chamber. These are the eight that support the Body C of Figure 1. While schedule constraints did not allow systematic tests, informal measurements of the vertical frequency by the end user indicated that it was, in fact, 0.50 Hz as designed. Most important, the degree of vibration isolation provided was sufficient to allow the functional tests of the spacecraft to be performed without limitations from ambient disturbances. The LSIS did its job.
329
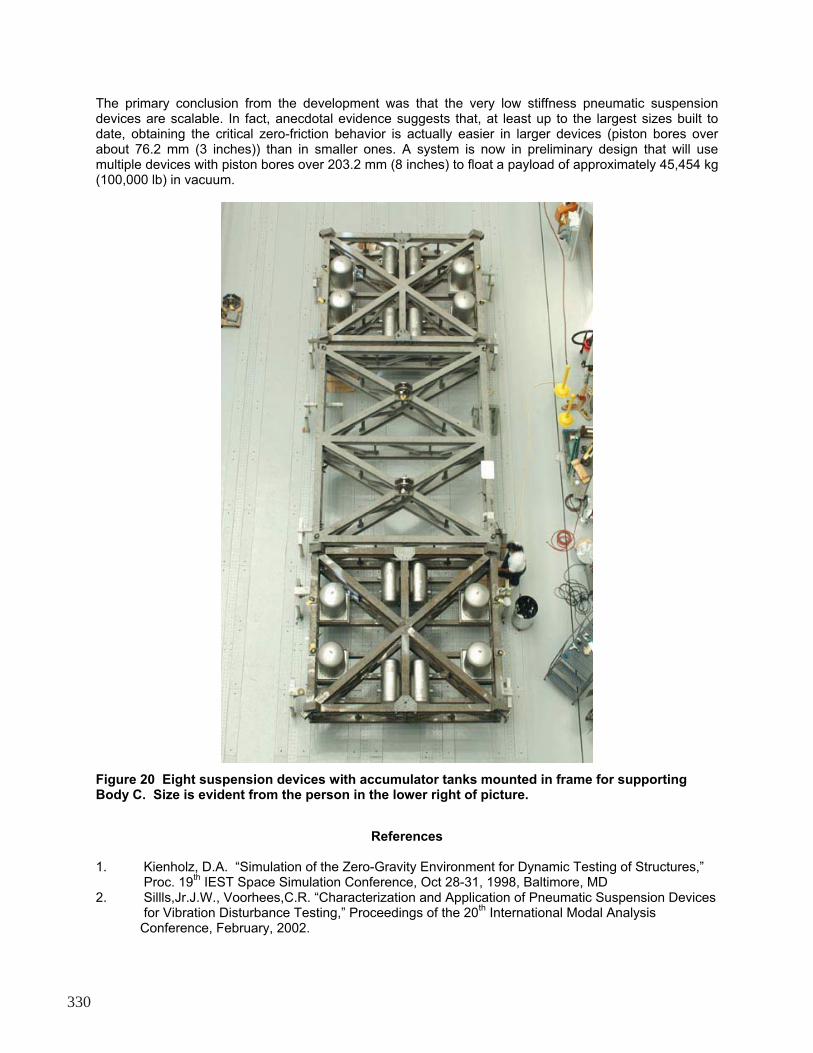
The primary conclusion from the development was that the very low stiffness pneumatic suspension devices are scalable. In fact, anecdotal evidence suggests that, at least up to the largest sizes built to date, obtaining the critical zero-friction behavior is actually easier in larger devices (piston bores over about 76.2 mm (3 inches)) than in smaller ones. A system is now in preliminary design that will use multiple devices with piston bores over 203.2 mm (8 inches) to float a payload of approximately 45,454 kg (100,000 lb) in vacuum.
Figure 20 Eight suspension devices with accumulator tanks mounted in frame for supporting Body C. Size is evident from the person in the lower right of picture.
References
1. Kienholz, D.A. “Simulation of the Zero-Gravity Environment for Dynamic Testing of Structures,” Proc. 19
th IEST Space Simulation Conference, Oct 28-31, 1998, Baltimore, MD
2. Sillls,Jr.J.W., Voorhees,C.R. “Characterization and Application of Pneumatic Suspension Devices for Vibration Disturbance Testing,” Proceedings of the 20
th International Modal Analysis
Conference, February, 2002.
330