Vibration Theory, Vol. 1B linear vibration theory, MATLAB ...
Upload
khangminh22Category
view
1download
0
Vibration Serviceability of Building Floors: Performance Evaluation of1
Contemporary Design Guidelines2
Zandy O Muhammad1 and Paul Reynolds23
1PhD Student, College of Engineering, Mathematics and Physical Sciences, Vibration4
Engineering Section, University of Exeter, UK. Email: [email protected]
2Professor of Structural Dynamics and Control, College of Engineering, Mathematics and6
Physical Sciences, Vibration Engineering Section, University of Exeter, UK. Email:7
ABSTRACT9
The drive towards innovative design of structural systems assisted by more efficient materials10
has resulted in ever more slender spans and lighter weight constructions. This has also been11
accompanied by the growing trend of open-plan floor developments with fewer internal partitions.12
As a consequence, concerns are increasingly expressed over excessive human-induced vibrations13
under normal in-service conditions. These floors might be considered to fail to meet the vibration14
serviceability criterion, even though in some cases they may satisfy the requirements of existing15
vibration design guidelines and tolerance limits. Thus, this paper outlines a thorough back analysis16
of three tested full-scale floors with respective finite element modeling to evaluate the reliability17
of contemporary guidelines. It is demonstrated that current forms of design guidance may require18
significant improvements in the key aspects of walking load models, response prediction and19
threshold tolerance in order tomore reliably predict the actual vibration response and corresponding20
vibration assessment.21
INTRODUCTION22
Excessive vibrations induced by pedestrians are frequently surfacing in contemporary civil23
engineering structures, such as footbridges (Zivanović et al. 2007) and floors (Nguyen 2013; Hudson24
1 Muhammad, October 15, 2018

and Reynolds 2014). These are often a result of advancements in the construction sector resulting25
in innovative structural designs, allowing design engineers to roll out ever more slender, lightweight26
and more flexible systems. Floors, as an integral element of any building, not only characterized by27
larger spans, lighter weight and relatively less damping due to the growing drive towards open-plan28
layouts with fewer partition walls, but also possess particular dynamic features, such as closely-29
spaced mode shapes (Pavic et al. 2008), higher uncertainties in modal parameters (Reynolds and30
Pavic 2003) and subjective judgements on vibration magnitude by different occupants (Setareh31
2009). The potential for annoying vibrations remains high under human-induced loadings. As a32
consequence, vibration serviceability design is a major challenge in modern floor design whereby33
the prediction of vibration responses under human-induced footfall remains a difficult task.34
Several design guidelines, as listed below, are available at the design stage to predict the35
vibration responses and provide methodologies for assessment of vibration serviceability of floors36
under pedestrian-induced vibrations.37
• American Institute of Steel Construction Design Guide 11 (AISC DG11) (Murray et al.38
2016)39
• Design Guide for Vibrations of Reinforced Concrete Floor Systems, Concrete Reinforcing40
Steel Institute (CRSI) (Fanella and Mota 2014)41
• Steel Construction Institute publication 354 (SCI P354) (Smith et al. 2009)42
• European guideline, Human Induced Vibration of Steel Structures 2007 (HiVoSS) (RFCS43
2007a; RFCS 2007b)44
• Concrete Centre Industry Publication 016 (CCIP-016) (Willford and Young 2006)45
• Concrete Society Technical Report 43 Appendix G (CSTR43 App G) (Pavic and Willford46
2005)47
The application of current guidelines is generally for a single pedestrian at the design stage,48
where a deterministic walking load model is utilized to represent actual walking. Even though49
numerous studies (Brownjohn et al. 2004; Zivanović et al. 2007) have shown that such an approach is50
2 Muhammad, October 15, 2018

unable to reliably describe walking and its innate variabilities, nevertheless contemporary guidance51
documents display significant dependence on that force model. Thus, the provided design methods52
often result in inaccurate vibration responses (Hassan and Girhammar 2013; Brownjohn et al.53
2016). The main shortcomings can be summarized as follows (Feldmann et al. 2009):54
• Lack of a pedestrian load model with sufficient reliability as the excitation source; thus a55
probabilistic approach is needed (Zivanović 2006; Nguyen 2013).56
• Incorrect characterization of floor properties in terms of their modal parameters (modal57
mass, natural frequency and damping ratio), in particular modal masses (Middleton 2009).58
• Uncorroborated simplifying assumptions, such as considering partition walls as damping59
elements and ignoring their mass and stiffness contribution.60
• Imprecise assessment of floor response according to relevant vibration descriptors (Setareh61
2009) and tolerance thresholds. In some cases, different tolerance limits are given in different62
guidelines for the same vibration metric (e.g. Response factor (R factor)) (Muhammad et al.63
2017).64
The main objective of this paper is to appraise a number of widely used vibration guidelines65
(AISC DG11, SCI P354, HiVoSS, CCIP-016 and CSTR43 App G) and evaluate the methodologies66
applied in the analysis and design of floors whose vibration responses are of concern. The67
procedures given in each guideline are based on certain assumptions and simplifications, but a68
systematic assessment of the actual efficacy is required to reflect current design practice with69
respect to the full-scale floors under normal in-service conditions. The efficacy and assessment of70
the design guidance are carried out through three tested full-scale floors involving their respective71
finite element (FE) modeling. Both simplified and FE approaches recommended by the guidance72
documents are used to predict the vibration response. To facilitate reliable evaluations, the predicted73
response metrics are compared with those from measurements.74
CONTEMPORARY GUIDELINES AND CODES OF PRACTICE75
The following section gives a brief overview of vibration design methodologies of the current76
3 Muhammad, October 15, 2018

guidelines. The design methods will be describing methodologies pertinent to low-frequency floors77
(LFF); those that exhibit primarily resonant response. For high-frequency floors (HFF) the reader78
is referred to (Middleton 2009; Liu and Davis 2015).79
AISC DG1180
AISC DG11 (Murray et al. 2016) deals with the vibration serviceability of steel framed struc-81
tures. This guidance’s response methodology used in this paper is summarized in Fig.1. The82
vibration response is computed based on the frequency threshold; if the fundamental frequency83
is below 9 Hz, the response under walking is predominantly resonant and can be described by a84
sinusoidal peak acceleration (equivalent R factor=sinusoidal peak acceleration x 0.707 divided by85
the reference value of 0.005 m/s2 (ISO10137 2007)). In the case of floors whose fundamental86
frequency is above this limit, a transient response to a single impulse footstep is deemed more87
appropriate.88
Frequency Response Functions (FRFs) are used to determine the dominant mode shapes and89
frequencies. The FRF magnitudes are computed via harmonic or steady-state analysis for a unit90
load at the walking load location (i.e a stationary location) and the response location along the91
walking path in close proximity to the peak mode amplitude (Murray et al. 2016). A resonant92
build-up factor is considered to account for the walking path.93
SCI P35494
SCI P354 (Smith et al. 2009) gives guidance to assess the vibration serviceability of composite95
steel-concrete floors. SCI P354 response calculation used in this paper is demonstrated in Fig.2.96
Mode superposition is suggested to obtain the total vibration response under stationary walking at97
locations of maximum likely response, with mode amplitudes of multiple modes being extracted98
from the FE model to predict response.99
The cut-off frequency between LFF and HFF is 10 Hz; above this limit the floor is assumed to100
undergo transient response under impulsive footfall loading. For LFFs, the vibration response is101
determined from contribution of modes up to 12 Hz and is assessed based on a single peak value,102
which is defined in terms of a R factor. The R factor is the peak of the running root-mean-square103
4 Muhammad, October 15, 2018
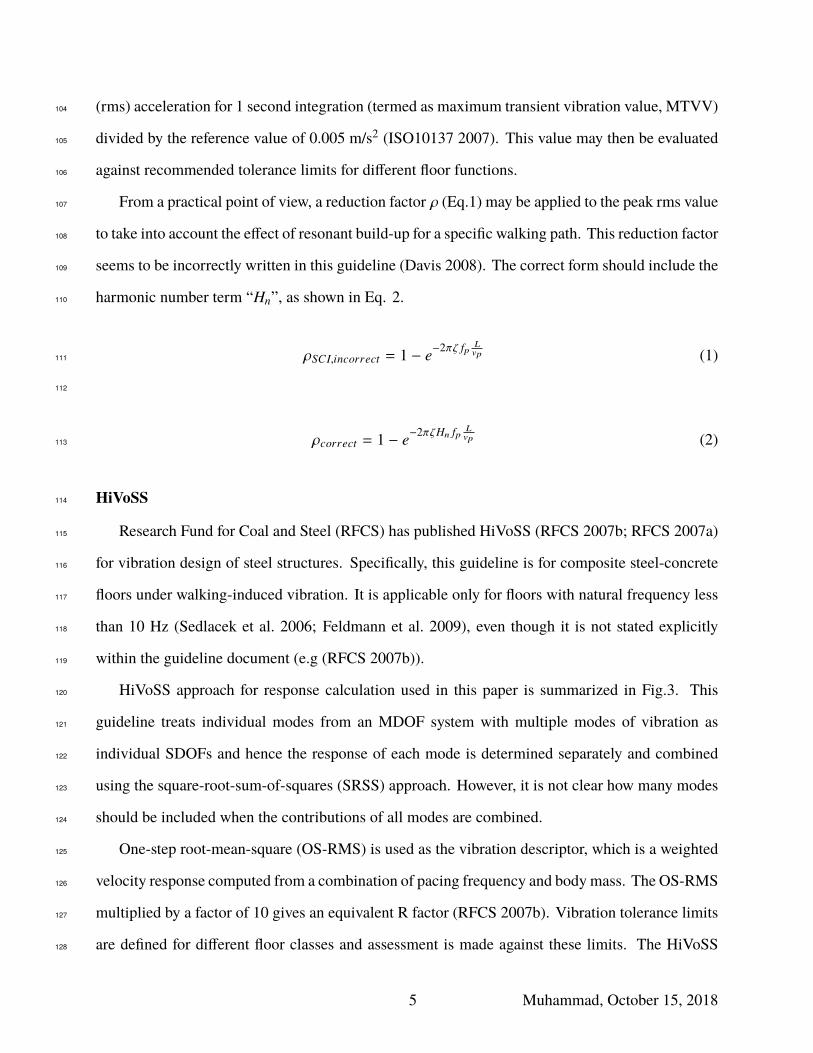
(rms) acceleration for 1 second integration (termed as maximum transient vibration value, MTVV)104
divided by the reference value of 0.005 m/s2 (ISO10137 2007). This value may then be evaluated105
against recommended tolerance limits for different floor functions.106
From a practical point of view, a reduction factor ρ (Eq.1) may be applied to the peak rms value107
to take into account the effect of resonant build-up for a specific walking path. This reduction factor108
seems to be incorrectly written in this guideline (Davis 2008). The correct form should include the109
harmonic number term “Hn”, as shown in Eq. 2.110
ρSCI,incorrect = 1 − e−2πζ fp Lvp (1)111
112
ρcorrect = 1 − e−2πζHn fp Lvp (2)113
HiVoSS114
Research Fund for Coal and Steel (RFCS) has published HiVoSS (RFCS 2007b; RFCS 2007a)115
for vibration design of steel structures. Specifically, this guideline is for composite steel-concrete116
floors under walking-induced vibration. It is applicable only for floors with natural frequency less117
than 10 Hz (Sedlacek et al. 2006; Feldmann et al. 2009), even though it is not stated explicitly118
within the guideline document (e.g (RFCS 2007b)).119
HiVoSS approach for response calculation used in this paper is summarized in Fig.3. This120
guideline treats individual modes from an MDOF system with multiple modes of vibration as121
individual SDOFs and hence the response of each mode is determined separately and combined122
using the square-root-sum-of-squares (SRSS) approach. However, it is not clear how many modes123
should be included when the contributions of all modes are combined.124
One-step root-mean-square (OS-RMS) is used as the vibration descriptor, which is a weighted125
velocity response computed from a combination of pacing frequency and body mass. The OS-RMS126
multiplied by a factor of 10 gives an equivalent R factor (RFCS 2007b). Vibration tolerance limits127
are defined for different floor classes and assessment is made against these limits. The HiVoSS128
5 Muhammad, October 15, 2018

document states that limits specified in ISO10137 (ISO10137 2007), which are used as a basis for129
limits in SCI P354, CCIP-016 and CSTR43 App G, are “unnecessarily harsh” and proposes limits130
that are much higher, for example OS-RMS upper limit of 3.2 for offices (equivalent to R=32).131
CCIP-016132
CCIP-016 (Willford and Young 2006) is applicable for all types of floors and footbridges. This133
guidance’s approach for response calculation implemented in this paper is summarized in Fig.4.134
Response calculations, similar to other guidelines, are separated into resonant response, for LFFs135
whose natural frequency is less than 10 Hz, and impulsive response for HFFs above 10.5 Hz.136
However, it is stated that if the structure is “potentially susceptible to both resonance and impulsive137
response”, both calculation methods should be used and the highest response should be selected138
for assessment.139
The vibration response is determined from contribution of all modes up to 15 Hz and is140
expressed as a maximum value of rms acceleration with integration time of 1/ fp. Then, the R141
factor is computed from the peak rms acceleration, as mentioned before. Similar to SCI P354, a142
reduction factor is introduced to take into account the resonant build-up of vibration. The R factor143
is then compared against tolerance limits for various types of floor usage.144
CSTR43 App G145
CSTR43 App G (Pavic and Willford 2005), similar to CCIP-016, is versatile in its use in terms146
of construction materials for floors. The response calculation is separated based on the fundamental147
natural frequency. The threshold frequency is 10 Hz between LFFs and HFFs, which corresponds148
with resonant and transient response, respectively.149
CSTR43 App G approach for response calculation implemented in this paper is summarized150
in Fig.4. The vibration response is computed, similar to SCI P354, from all modes up to 12 Hz151
and the resonant reduction factor is applied similar to the aforementioned procedure. Thus, the152
evaluation is based on a single peak value of R-factor with corresponding recommended limits.153
6 Muhammad, October 15, 2018
Nature of Forcing Functions Used in Design Guides154
The aforementioned design guidelines use deterministic forcing functions based on either155
Fourier series or polynomial expressions. These are compared in Fig. 5, which shows the forcing156
functions of each guideline overlaid and normalised by the human body weight. It can be seen that,157
with the exception of HiVoSS, the various guidelines result in quite similar forcing functions. The158
HiVoSS forcing function is something of an outlier, with peak force amplitude much larger than159
those from the other guidelines. None of the guidelines has forcing functions that incorporate the160
random variability of walking that is observed in real human pedestrians (Brownjohn et al. 2004)161
due to the “narrow band random process” of walking which has energy at all frequencies (Feldmann162
et al. 2009).163
Most of the above guidelines make a distinction between LFFs, which exhibit primarily resonant164
response tomultiple footfalls at a pacing frequency fp, andHFFs, which exhibit primarily a transient165
response to individual footfalls. However, when carrying out a detailed analysis of the performance166
of theCSTR43AppGguidelines, Zivanović andPavic (2009) highlighted that there is a ‘grey region’167
between the LFF and HFF thresholds, where both resonant and transient responses contribute to168
the overall response. This implies that the cut-off frequency and separation of floors based on their169
fundamental natural frequency may be an unwarranted assumption and a universal forcing function170
might be a better approach. This was also examined in detail by (Brownjohn et al. 2016), who171
proposed a response spectrum approach valid for both LFFs and HFFs.172
EXPERIMENTAL FLOORS AND FE ANALYSIS173
This section presents the experimental data and analytical modeling of three full-scale floors.174
All of these exhibited a perceptible level of vibration in service and one of these had also provoked175
adverse comments from occupants over the excessive vibration magnitude. For each tested floor,176
a detailed FE model was developed to facilitate response prediction using methodologies from177
each of the aforementioned design guidelines. Experimental modal analysis (EMA) was also178
performed on each floor to provide experimental modal parameters, which were used to update179
the FE model. The reason to tune the analytical modal properties to the measured ones was to180
7 Muhammad, October 15, 2018

eliminate inaccurate FE modelling as a source of error in the evaluation of vibration serviceability;181
therefore, the analysed floors were verified against measurement data. In addition, walking response182
measurements were carried out during the experimental campaign to determine the actual vibration183
response for comparison with the numerical response predictions.184
Floor Structure 1 (FS1)185
Description of the Floor186
FS1 is a floor structure within a recently constructed multi-storey office building, which has an187
open-plan layout. The details of this floor were presented in detail by (Hudson and Reynolds 2014)188
and are summarised here for completeness. The floors are of steel-concrete composite construction,189
within a steel building frame of irregular geometry. Primary beams (girders) have spans of up to190
10 m, secondary beams (beams) are at 3 m spacing with spans up to 13 m and steel columns lie191
roughly on a typical grid of 13 m × 9 m, as shown in Fig. 6.192
Construction drawings were used to determine the size of structural members. A 130 mm thick193
light weight concrete is poured upon a 60 mm trapezoidal steel profile decking to form the floor194
slab, which acts compositely with the secondary beams. Details of the structural elements vary195
due to the irregular geometry, but in a typical bay secondary beams are cellular with asymmetric196
form. The section sizes are lower tee 610×229×113 UB and upper tee 457×191×89 UB, with hole197
diameter of 500 mm at 750 mm centres. Primary beams are 792×191/229×101 ACB sections and198
column members are 254×254×73 UC. There are three reinforced concrete core walls to provide199
lateral resistance to the whole structure; these have been included in the FE model due to their200
significant effect on the structural modes.201
Experimental Modal Analysis (EMA)202
Experimental modal properties of the floor were determined from in-situ modal testing using203
multi-reference uncorrelated random excitation from four APS Dynamics shakers (2×APS113 and204
2× APS400) and a test grid of roving accelerometers (Honeywell QA750), as shown in Fig. 7.205
Frequency response functions (FRFs) were acquired using a Data Physics Mobilyzer DP730 digital206
spectrum analyser, and polyreference FRF curve fitting was utilized to determine the experimental207
8 Muhammad, October 15, 2018

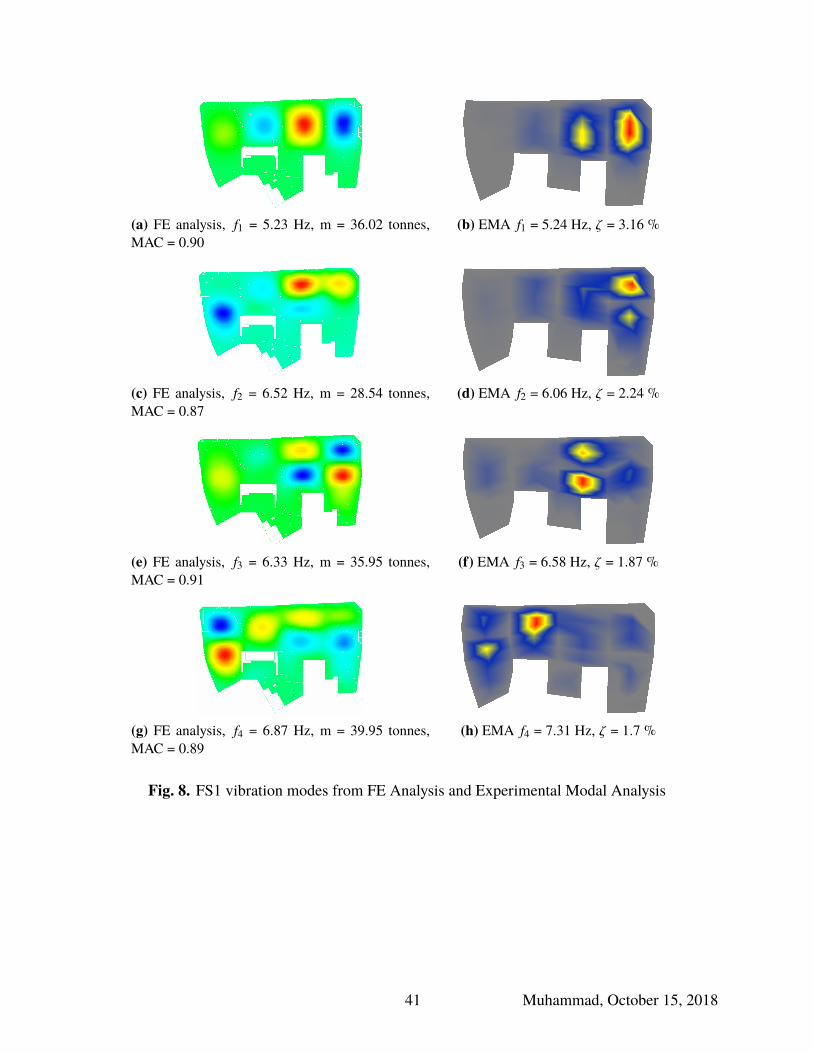
modal properties. The ME’scope suite of modal parameter estimation software was used to extract208
modal properties using a multi-polynomial method to provide reliable estimates of mode frequency,209
damping and shape. The final mode shape results are shown in Fig. 8.210
Development of FE model and Analysis211
The structural members were modeled in ANSYS. The composite steel-concrete floor was212
modeled using SHELL181 elements and orthotropic properties were assumed (flexural stiffness213
in the direction of the ribs is higher than the perpendicular direction). Beams and columns were214
modeled using BEAM188 elements. The composite action between the beams and slabs was215
modeled through a vertical offset of the shell element as recommended in the design guidelines216
(Willford and Young 2006; Smith et al. 2009). The modulus of elasticity (E) of 22 GPa for217
lightweight concrete and density of 1800 kg/m3 were assumed (Pavic and Willford 2005). A218
modal analysis was carried out to obtain modal frequencies, mode shapes and modal masses.219
Updating the FEmodel usingmanual tuningwas conducted by introducing a full height partition220
wall modeled using SHELL181 elements with assumed E of 5 GPa and density of 2500 kg/m3221
between gridline 5D-5E. Also, sensitivity analysis was conducted to obtain the most appropriate222
parameters of E and density of both concrete and steel. After modal updating, the final values that223
gave a close match to the measured modes were 24 GPa and 210 GPa for E of concrete and steel,224
respectively. Material density of steel was 7830 kg/m3 and concrete 1800 kg/m3, as determined225
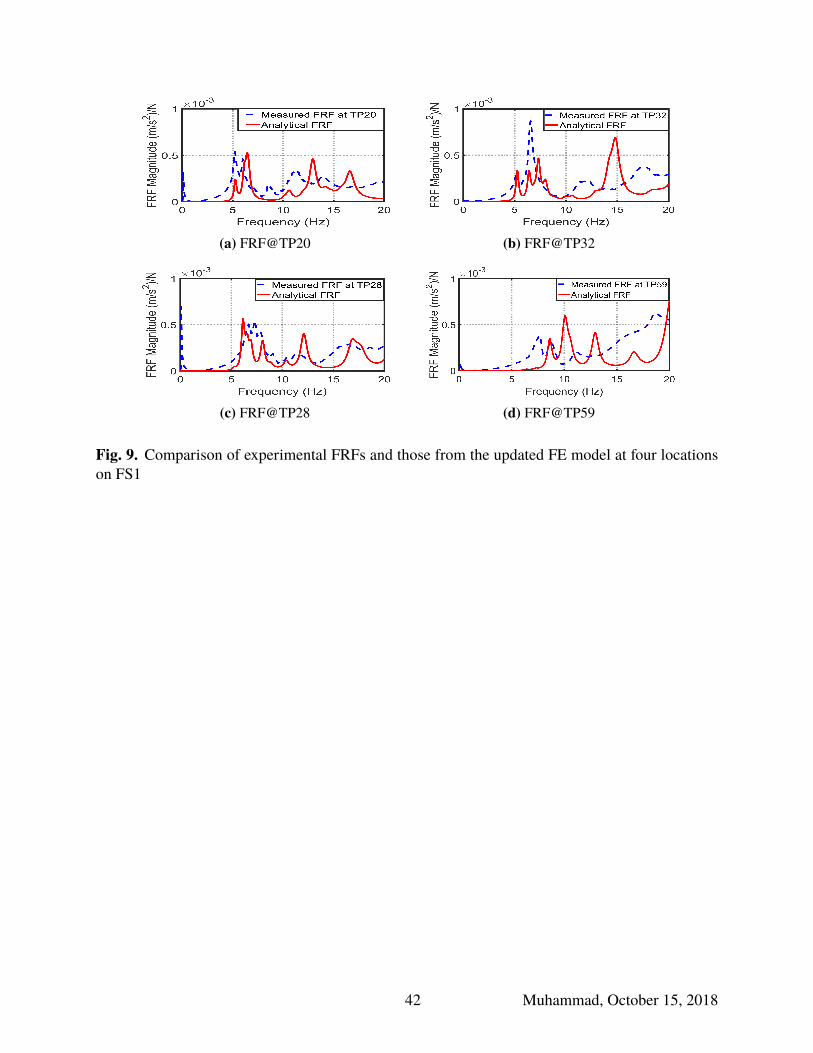
from the literature. Analytical FRF plots were also produced to compare and reconcile with those226
from the measured data, as demonstrated in Fig.9. To generate these FRF plots, a level of damping227
ratio had to be assumed from guidelines suggestion. The value chosen for this floor was 3% based228
upon guideline recommendations for all modes. It is apparent that, despite matching the mode229
shapes quite well, the FE FRF does not match very well with themeasured FRF. However, the modal230
assurance criterion (MAC), shown in Fig.8 and Table 1, exhibits a good consistency. This might231
be associated with some of the difficulties related to modeling civil engineering floor structures,232
where uncertainty in modeling parameters may affect the accuracy of the FE model.233
9 Muhammad, October 15, 2018

Floor Structure 2 (FS2)234
Description of the Floor235
This is the second case-study floor, which has the longest span of all three cases. This floor236
was tested at its bare stage (construction stage). It is a steel-concrete composite floor with normal237
weight concrete poured into a 130 mm deep slab. Secondary beams span 15 m at a spacing of238
3.125 m. The primary beams have a span of 6.25 m. The columns are situated at the intersection239
of beams, with typical bay sizes of 15 m × 6.25 m, as shown in Fig. 10. Details of the structural240
elements in a typical bay are; secondary beams are cellular section sizes 720.5×152/229×81 UB,241
with hole diameter of 500 mm at 750 mm centres. Primary beams are 762×267×134 UB and242
column members are 305×305×158 UC. There are two reinforced concrete walls with 300 mm243
thickness for lateral resistance.244
Experimental Modal Analysis (EMA)245
A modal test was performed using two APS Dynamics Model 400 electrodynamic shakers as246
excitation sources. The structural response was measured using Honeywell accelerometers (model247
QA750). Digital data acquisition was performed using a portal spectrum analyzer model Data248
Physics DP730, similar to FS1. The analyzer provides immediate calculation of the FRFs so that249
the quality of measurement data can be checked during the test. The measurements were acquired250
over a test grid of 93 test points, as shown in Fig. 11. These test points were utilized to acquire the251
modal properties between gridelines F and O.252
Similar to FS1, the ME’scope suite of modal parameter estimation software was used to extract253
the modal properties shown in Fig. 12.254
FE Analysis255
TheANSYSFE softwarewas utilized tomodel all components of the floor structure. Orthotropic256
properties were applied to the SHELL181 elements to model the floor slab with vertical offset to257
incorporate composite action. All beams and columns were modeled as BEAM188 with both their258
ends assumed to have rigid connections (Smith et al. 2009). Due to the construction stage and259
uncompleted top floor (there was only steel deck and partial beam members with no concrete),260
10 Muhammad, October 15, 2018

COMBIN40 was used to model the vertical constraint of “discontinuous columns” in Fig.10.261
COMBIN40 is a single degree of freedom (SDOF) mass/spring element in ANSYS, which mass262
(M) and stiffness (K) were assigned. Since there was no concrete at that floor, COMBIN40 tends263
to behave as a connection for top columns during modal analysis.264
The initial model required a number of updating iterations to reconcile with the measured modal265
analysis and hence manual model updating was conducted for global parameters. The parameters266
updated were E and density of concrete and steel, COMBIN40 properties, lateral bracing members267
and partition wall installed beneath the exterior frame. After modal updating, the final values that268
gave a good reconciliation with measured modes were 37 GPa and 210 GPa for E of concrete and269
steel, respectively. The material density of steel was 7830 kg/m3 and that of concrete was 2300270
kg/m3. Concrete block masonry of 150 mm thick with E of 22 GPa and density of 2000 kg/m3271
were assumed. COMBIN40 parameters were K=12500 N/m and M=15000 kg. It is worth noting272
that partition walls beneath the exterior frame had a significant effect on the mode sequences and273
family of modes; therefore, their modeling improved significantly the FE model. These values274
provided good matching with measured results and thus it can be considered as reliable. Predicted275
modal frequencies and mode shapes are illustrated in Fig. 12. A damping ratio of 1% was assumed276
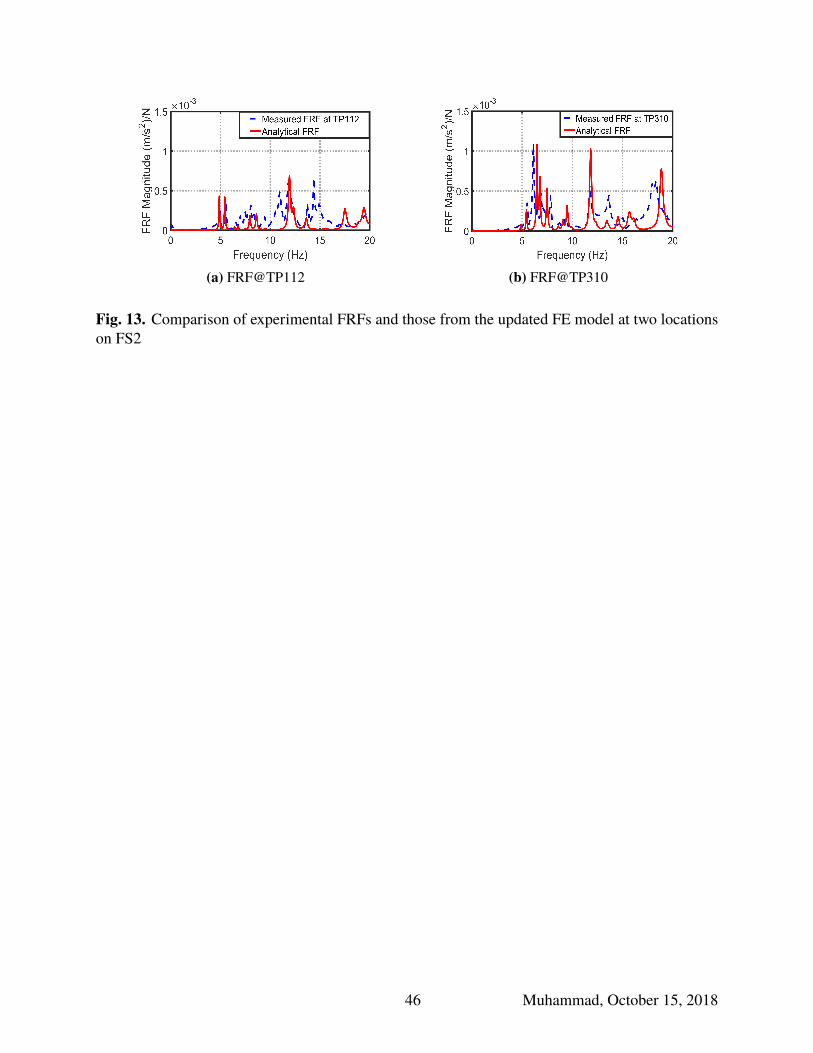
for FRF generation based on the recommendations for bare floors. Analytical and experimental277
FRFs are shown in Fig. 13. It is obvious that there is a good matching between the two FRFs,278
albeit with some inconsistencies. Also, the modal assurance criterion (MAC), presented in Table279
2, exhibits a good consistency; this indicates the FE model is comparably reconciled with the280
experimental data.281
11 Muhammad, October 15, 2018
Floor Structure 3 (FS3)282
Description of the Floor283
This test structure is the second floor in a four-storeymulti-purpose building. It is fully furnished284
composite steel and concrete floor spanning 9.754 m between gridlines H to C and 6.09 m between285
gridlines 24 to 30 (Fig. 14). Steel decking supports the in-situ cast normal weight concrete slab,286
which spans in the direction orthogonal to the secondary beams. At the time of testing, mechanical287
services and raised flooring were mounted beneath and on top the floor. The slab thickness varied288
from 150 mm to 200 mm due to refurbishments. The shaded area in Fig.14 indicates an area which289
was originally intended to be a swimming pool, but was never used for this purpose. In this area290
the slab thickness is 200 mm and there is additional mass loading from demolished partition walls291
that were used bring the floor surface up to the same level as the rest of the floor.292
Secondary beams in a typical bay are 457×152×60UB,whereas primary beams are 533×210×92UB.293
Columnmembers are 254×254×89UC and bracingmembers are 193.7×12.5 CHS. Lateral stiffness294
is provided by the bracing members along the edges of the structure.295
Experimental Modal Analysis (EMA)296
Natural modes were estimated for this floor using EMA with four electrodynamic shakers and297
an array of response accelerometers in the same was as described for FS1. FRF measurements298
were made over a test grid of 81 points, as shown in Fig. 15, using a portable spectrum analyzer.299
To estimate modal properties curve fitting of the FRF data was carried out using the ME’scope300
parameter estimation software. In-service monitoring was carried out on this floor for a duration301
of 12 hours under normal operation, which provided the actual vibration performance of the floor.302
FE Analysis303
Model of the structure was developed in the ANSYS FE software. Floors were modeled using304
SHELL181 elements, whereas beams and columns were modeled using BEAM188 elements.305
Orthotropic properties were assumed for the floors. The shaded area in Fig. 14 was modeled using306
SOLID165 elements, which is an element to model volumes and it is used for the volume of the307
additional mass of the intended swimming pool.308
12 Muhammad, October 15, 2018
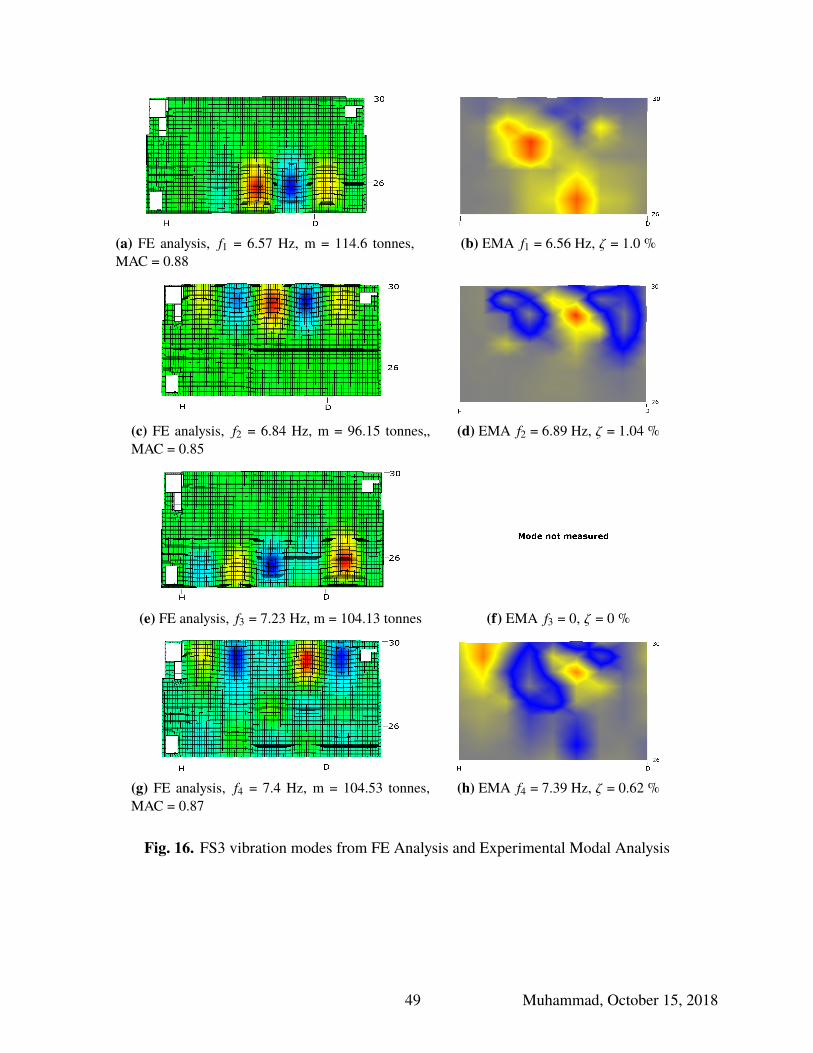
Initial modeling did not result in good matching and as such the top floor together with some309
substantial full height partition walls, were added to the model. This led to a better matching of310
mode shapes in terms of frequency and mode sequences, as shown in Fig. 16. Similar to the two311
previous case-study floors, manual updatingwas used to update the FEmodel. The updating process312
progressed by altering floor material properties such as density and E , as well as properties related313
to the partition walls. The model resulted in closely-spaced modes due to repetitive geometry and314
orthotropic properties, which is expected in floors (Pavic et al. 2008). Modal frequencies and mode315
shapes are shown in Fig. 16. The FE mode shapes shown are for the considered floor and top316
level floor is excluded, for illustration purposes. FRF plots were generated from FE modeling to317
display the matching trend with experimental data at shaker points. Fig. 17 shows the analytical318
and experimental FRFs at four shaker locations. Damping ratio of 3% was assumed based on the319
guideline suggestions for office floors. The MAC values in Fig.16 and Table 3 show to an extend320
a good match and the analytical FRF plots seem to correlate with those of measurements and thus321
the FE model appears to be realistic. This is a clear indication of the need to include partition walls322
and top floors in the model when carrying out evaluation of vibration responses.323
EVALUATION OF RESPONSE PREDICTION USING GUIDELINES324
Pre-construction: Design Stage325
This sections presents the evaluation of response using each of the guidelines to calculate modal326
properties, vibration responses and applying the recommended evaluation procedures.327
Modal Properties Estimation328
• FS1: FS1 has an irregular plan configuration except for a few bays, to which the simplified329
formulae of the guidance are somewhat applicable. Hence, modal properties are determined330
for floor bay C2-D3 (see Fig. 6). Methodologies and simplified equations or recommended331
values provided by each guideline are utilized to estimate the dynamic properties shown in332
Table 4. CSTR43 App G does not provide any simplified techniques and as such formulae333
given in structural dynamics textbooks (e.g. (Smith 1988) or (Blevins 1979)) have been334
13 Muhammad, October 15, 2018
used. Similar formulae are also applicable to the other case study floors.335
• FS2: Modal properties are determined for a typical floor bay L1-M5 (see Fig. 10), since336
the floor is regular and the dimensions of most bays are the same. Simplified equations337
and recommended values provided by each guideline are utilized to estimate the dynamic338
properties, shown in Table 5.339
• FS3: Modal properties are determined for a typical floor bay F29-E28 (see Fig. 14), due to340
regular plan of the floor. Simplified equations and recommended values provided by each341
guideline are utilized to estimate the dynamic properties, shown in Table 6.342
Response Prediction343
Prediction of vibration responses in this paper using both FE analysis and hand calculations344
is based on the methodology of each guideline as illustrated in Figs.1,2,3 and 4. When using FE345
analysis, mode coordinates are extracted for excitation and response points. Contribution of more346
than one mode is then combined through a mode superposition approach. The guidelines that347
utilize such method are SCI P354, CCIP-016 and CSTR43 App G.348
AISC DG11 suggests using harmonic analysis; a typical FRF plot from this analysis is shown349
in Fig.18 for FS1. HiVoSS assumes each vibration mode from FE analysis as a SDOF and as such350
the response is calculated from each mode and superimposed using SRSS. In addition, HiVoSS351
provides charts of vibration response, where the response can be read off from a known modal352
properties. It is worth mentioning that none of the guidelines defines walking routes, nor do they353
pay attention to non-stationary nature of pedestrians. However, it is speculated to take into account354
the line of strongest response (maximum modal ordinates) or mode amplitudes close to, where355
possible, a predefined “walking path”. Such method may yield an assumption of exciting the356
highest mode amplitudes in order to obtain conservatively the uppermost response. It is indicated357
(Zivanović et al. 2012) that significant inaccuracies occur due to the presence of variations in358
walking loads and uncorroborated assumptions in response estimation.359
As far as manual calculations are concerned, the guidelines follow simple techniques to predict360
the vibration response. This typically includes estimating modal properties of the fundamental361
14 Muhammad, October 15, 2018

mode, assuming a harmonic walking load and thus predicting the response. It is worth noting362
that the simplified techniques can estimate accurately the modal frequency, yet an incorrect modal363
mass is often obtained. The vibration response can be significantly affected by such inaccuracies364
in modal properties and more importantly the estimation of the modal damping.365
Here, the vibration responses are calculated based on the above procedure from both the FE366
analysis and manual calculations for the case study floors, as shown below.367
• FS1: This is a relatively new office floor, where pedestrians use various paths during368
normal operations. Although floor occupants had not reported any adverse comments,369
perceptible vibration was obvious and thus the floor can be considered as a “borderline”370
case. The predicted vibration responses following procedures in each guideline are shown371
in Fig.19. It can be seen that the predicted responses vary significantly and hence the372
vibration serviceability assessment can be inconclusive. In particular, use of the simplified373
procedures for modal parameter estimation seem to be inaccurate for estimation of floor374
performance. Also, the assumption of steady state vibration response for serviceability375
assessment is another potential source of inaccuracy, although the measured responses can376
vary due to the variations in subjects’ excitation and modal properties. Reynolds and Pavic377
(2015) remark that use of peak responses is potentially overconservative, whereas using378
vibration dose values or cumulative distribution of response might provide more reliable379
assessment.380
• FS2: This floor is a multi-purpose floor, used as a wedding venue, for meetings and as a381
leisure center. During construction the floors had been reported to be highly responsive,382
which raised concerns of the construction contractor. The predicted vibration response383
compared with the measured response is shown in Fig.20. A good prediction is obtained384
via AISC DG11 methodology in terms of equivalent R-factor, whereas the rest of the guide-385
lines are dissimilar and diverse. Due to the relatively regular plan configuration, both the386
simplified formula and FEmethodology seem to work well per AISCDG11. There are large387
overestimations by most guidelines, which dictate neither satisfactory or unsatisfactory con-388
15 Muhammad, October 15, 2018

dition. Such discrepancies indicate the necessity for significant improvements in response389
prediction and tolerance limits to facilitate reliable and realistic ratings at the design stage.390
• FS3: This floor is also an office floor, which is mostly used as a library and study area. The391
floors had been reported to exhibit large vibration responses during in-service operation,392
due to the gymnasium operating on the floor above, and thus the floor occupants expressed393
annoyance over the magnitude of vibration. The predicted response and its measured394
counterpart are shown in Fig.21. The significant underestimation of response observed for395
all guidelines is due to the difference between the loading condition assumed (i.e. single396
person walking) and the actual loading condition (one or more people exercising in the397
gymnasium above) and hence cannot be attributed to lack of performance of the guidelines.398
Nevertheless, this case does demonstrate an alternative loading mechanism that should be399
considered in buildings with multiple types of occupation.400
Assessment Criteria401
• FS1: As indicated in Fig.19, this office floor has unacceptable performance according to402
CSTR43 App G and CCIP-016, but it is deemed satisfactory and within allowable limits403
(recommended floor classes inHiVoSS)with respect to AISCDG11, SCI P354 andHiVoSS.404
As a consequence, the assessment of the floor under walking is not clearly predicted.405
• FS2: Due to the multi-functional purpose of this structure, its performance might be406
evaluated against a range of assessment criteria. However, in this case it is evaluated against407
the assessment criteria for an office floor, which is also reasonable for a meeting venue.408
Fig.20 shows the response assessed against the relevant threshold limits. It is apparent409
that the floor is unacceptable according to four of the guidelines, whereas it satisfies the410
requirements of HiVoSS for such structures.411
• FS3: Similar to FS1, this floor is assessed under office floor requirements. It is shown in412
Fig.21 that it performs well for all guidelines. Whilst the problem with this floor was due413
to high levels of rhythmic excitation coming from the floor above, it can be seen that for414
normal office walking the floor would have been expected to perform satisfactorily. This415
16 Muhammad, October 15, 2018

correlated with subjective assessment made during the testing.416
Post-construction: In-service Condition417
• FS1: The actual response presented in Fig.19 is measured under a single person walking418
via the walking path (WP) in Fig.6. It is clear that this floor has a satisfactory level of419
vibration, despite being perceptible. In addition, field monitoring indicated that the level420
of vibration did not reach the level of human discomfort. The actual vibration response421
(red line) corresponds to an R-factor of 5.3 for which floor occupants had a perceptible422
vibration without complaining. Hence, from standpoint of normal operation this floor can423
be considered as acceptable.424
• FS2: The actual vibration response under a single person walking resulted in an R-factor425
of 8.2, as shown in Fig.20. Although it is predicted to be unacceptable, the actual response426
was measured along the walking path (WP) shown in Fig.10. It is clear that the predicted427
responses are scattered around the measured R-factor. As mentioned in previous section,428
AISC DG 11 seems to be in close proximity to the actual response. However, it is difficult429
to carry out a reliable assessment due to the diverse predictions of the various guidelines.430
• FS3: It is shown in Fig.21 that this floor had very high level of in-service response, which431
resulted in complaints from floor occupants about the vibration. The measured R-factor in432
service reached 15.1 under excitation from the gymnasium above. Whilst it is not possible433
to draw any conclusions about the performance of the guidelines in terms of predicting the434
response, it is possible to assess whether the response criteria are appropriate. Examining435
Fig.21, it can be seen that the tolerance limit of the HiVoSS guideline was more than double436
the measured R-factor, and hence it would be predicted to be acceptable. This clearly was437
not the case since significant complaints had been received from the building occupants.438
The rest of the guidelines produced an assessment that the floor is unacceptable, which439
correlates with the subjective assessment.440
RESULTS AND DISCUSSION441
17 Muhammad, October 15, 2018
From the analyses presented in this paper, it is clear that the various available design guidelines442
do not give a consistent prediction of the vibration serviceability performance of the floor structures443
considered.444
The results of the maximum predicted R factor for all three case-studies show that the guidelines445
predict quite different values of R-factor or equivalent. There are contradictory response predictions446
between CCIP-016, CSTR43 App G and SCI P354 when comparing the same vibration metric.447
AISC DG11 performs relatively well in terms of both response prediction and assessment for FS1448
and FS2 and also gave a clear assessment of FS3 as being highly unsatisfactory, as expected.449
HiVoSS, however, appears to be an outlier and highly inaccurate.450
None of the guidelines was able to give any insight into the frequency of event occurrence.451
A single peak value compared against the available tolerance limits may not be representative452
of the actual in-service condition, if this condition occurs only very rarely. This may lead to453
inconsistencies between the design stage assessment and actual performance in service. Such a454
wide discrepancy can cause confusion for design engineers as to whether the vibration performance455
is satisfactory or not. Another matter that could arise is the question of what is the probability of456
occurrence of the above predictions? In some cases, these guidelines can produce responses close457
to those measured on the actual structure, but it is not clear for any particular structure at the design458
stage whether there might be over- or under-estimation.459
Simplified techniques for estimation of modal parameters giving results previously shown460
produce large differences in modal mass values, whereas modal frequency seems to be relatively461
well predicted. All guidelines tend to consider modal mass differently. As such, even larger462
inaccuracies appear to occur in obtaining the modal mass, which lead to potentially inaccurate463
estimations of vibration response. Such discrepancies in modal mass highlights that the simply-464
supported plate theory and empirically adjusting for a bay geometry (i.e span and width) can465
produce misleading values, even for regular floor configurations. This has also been observed in466
(Middleton 2009). It is worth noting that the recommended damping ratios for the case-study floors467
seem to be somewhat in line with the measurements.468
18 Muhammad, October 15, 2018
These case-study floors have illustrated a number of major drawbacks in contemporary guide-469
lines in computing vibration response to pedestrian excitation. These are the simplified formulae470
which inaccurately estimate the modal properties and hence produce inaccurate estimates of re-471
sponse. The lack of a realistic vibration response descriptor with respective tolerance limits may472
also be a major downside in these guidelines; a single peak value of vibration response appears473
to be unrepresentative. Therefore, significant improvements are needed with respect to dynamic474
properties, expected loading scenarios and the corresponding walking-induced forces. This would475
result in a more reliable vibration response, which might be in the form of probability of exceedence476
with a realistic predefined set of values for serviceability assessment. This approach would not477
only give design engineers a reliable tool, but also provide a realistic response estimate for various478
floor usage scenarios; thus, leading to more reliable vibration serviceability assessment of floor479
structures.480
CONCLUSION481
This paper has presented a back analysis of contemporary design guidelines using three floors482
that were also physically tested. The merits and demerits of the guidances have been illustrated483
and examined. Vibration serviceability assessment has been performed based on the tuned FE484
model for all floors as well as the respective simplified formula has been used. Vibration responses485
were calculated for a range of the floor frequencies to obtain the peak vibration response in terms486
of equivalent R-factor (for peak acceleration and OS-RMS90) for the guidelines due to ease of487
comparison.488
Walking load models are represented either by Fourier series or a polynomial function. These489
are periodic modeling of a single person without considering the innate variabilities of actual490
walking and as such a probabilistic walking load model remains absent. The frequency threshold491
between LFFs and HFFs is the key factor to determine vibration responses (resonant response to492
multiple footfalls or transient response to individual footfalls) that govern the design procedure.493
The methodologies presented in each guidelines predict a vibration response that may or may not494
match well with actual measurements. A significant over- and under-estimation can be seen in all495
19 Muhammad, October 15, 2018

guidelines, which can be attributedmainly to inaccurate estimation of modal properties, particularly496
for the simplified procedures.497
A steady state response value appears to be misleading and unrepresentative for vibration498
serviceability assessment. Identifying an appropriate vibration descriptor (including tolerance499
limits) coupled with a probabilistic framework might be a key factor for more reliable serviceability500
assessment. In addition, conservative design with an accept-reject method neither results in a501
reliable assessment, nor describes the rare vibration events that may happen. Therefore, significant502
improvements and rigorous approaches are required to introduce probability of exceedence with503
realistic predefined set of values. The vibration ratings and tolerance limits should also reflect such504
a statistical manner. This approach would not only give design engineers a reliable tool, but may505
also lead to more reliable vibration serviceability assessment of floor structures.506
ACKNOWLEDGEMENTS507
The financial support for this research was provided by Qatar National Research Fund (QNRF;508
a member of the Qatar Foundation) via the National Priorities Research Program (NPRP), Project509
Number NPRP8-836-2-353 . The statements made herein are solely the responsibility of the510
authors.511
REFERENCES512
Blevins, R. (1979). Formulas for natural frequency and mode shape. Litton Educational Publ., Inc,513
New York.514
Brownjohn, J., Pavic, A., and Omenzetter, P. (2004). “A spectral density approach for modelling515
continuous vertical forces on pedestrian structures due to walking.” Can. J. Civ. Eng., 31(1),516
65–77.517
Brownjohn, J., Racic, V., and Chen, J. (2016). “Universal response spectrum procedure for predict-518
ing walking-induced floor vibration.” Mech. Syst. & Signal Process., 71(1), 741–755.519
Davis, D. B. (2008). “Finite element modeling for prediction of low frequency floor vibrations due520
to walking.” Ph.D. thesis, The Virginia Polytechnic Institute and State University, Blacksburg,521
Virginia, USA.522
20 Muhammad, October 15, 2018
Fanella, D. A. and Mota, M. (2014). Design guide for vibrations of reinforced concrete floor523
systems. Concrete Reinforcing Steel Institute (CRSI), Schaumburg, IL.524
Feldmann, M., Heinemeyer, C., Butz, C., Caetano, E., Cunha, A., Galanti, F., Goldack, A.,525
Helcher, O., Keil, A., Obiala, R., Schlaich, M., Sedlacek, G., Smith, A., and Waarts, P. (2009).526
“Design of floor structures for human induced vibrations.” Joint Rep EUR 24084 EN, European527
Commission-JRC, Luxembourg.528
Hassan, O. A. B. and Girhammar, U. A. (2013). “Assessment of footfall-induced vibrations in529
timber and lightweight composite floors.” Int. J. of Struct. Stability & Dyn., 13(2), 1–26.530
Hudson, E. J. and Reynolds, P. (2014). “Implications of structural design on the effectiveness of531
active vibration control of floor structures.” Struct. Control & Health Monit., 21(5), 685–704.532
ISO10137 (2007). Bases for tesing o f structures- serviceability of buildings and walkways against533
vibrations. Geneva, Switzerland.534
Liu, D. and Davis, B. (2015). “Walking vibration response of high-frequency floors supporting535
sensitive equipment.” J. of Struct Eng, 141(8), 1–10.536
Middleton, C. J. (2009). “Dynamic performance of high frequency floors.” Ph.D. thesis, The537
University of Sheffield, Sheffield, UK.538
Muhammad, Z., Reynolds, P., and Hudson, E. (2017). “Evaluation of contemporary guidelines for539
floor vibration serviceability assessment.” Dyn. of Civ. Struct., Vol. 2 : Proc. of the 35th IMAC,540
A Conf. and Expos. on Struct. Dyn. 2017, Springer Int. Publ., 339–346.541
Murray, T. M., Allen, D. E., Ungar, E. E., and Davis, D. B. (2016). Vibrations of steel-framed542
structural systems due to human activity. American Institute of Steel Construction (AISC), USA.543
Nguyen, H. A. U. (2013). “Walking induced floor vibration design and control.” Ph.D. thesis,544
Swinburne University of Technology, Australia.545
Pavic, A., Miskovic, Z., and Z̆ivanović, S. (2008). “Modal properties of beam-and-block pre-cast546
floors.” The IES J. Part A: Civ. & Struct. Eng., 1(3), 171–185.547
Pavic, A. and Willford, M. (2005). Vibration serviceability of post- tensioned concrete floors.548
Concrete Society, Slough, UK, 2nd edition.549
21 Muhammad, October 15, 2018

Reynolds, P. and Pavic, A. (2003). “Effects of false floors on vibration serviceability of building550
floors. i: Modal properties.” J. of Perform. of Constr. Facil., 17(2), 75–86.551
Reynolds, P. and Pavic, A. (2015). “Reliability of assessment criteria for office floor vibrations.”552
50th U.K. Conf. on Hum. Responses to Vib., Southampton, UK.553
RFCS (2007a). Human induced vibrations of steel structures (HiVoSS) -vibration design of floors:554
background documnet. European Comission-RFCS, Brussels, Belgium.555
RFCS (2007b). Human induced vibrations of steel structures (HiVoSS) -vibration design of floors:556
guideline. European Comission-RFCS, Brussels, Belgium.557
Sedlacek, G., Heinemeyer, C., Butz, C., Volling, B., Waarts, P., Van Duin, F., Hicks, S., Devine,558
P., and Demarco, T. (2006). “Generalisation of criteria for floor vibrations for industrial, of-559
fice, residential and public building and gymnastic halls.” Tech.Rep Eur 21972 EN, European560
Commission-JRC, Luxembourg.561
Setareh, M. (2009). “Vibration serviceability of a building floor structure. ii: Vibration evaluation562
and assessment.” J. of Perform. of Constr. Facil., 24(6), 508–518.563
Smith, A., Hicks, S., and Devine, P. (2009). Design of floors for vibration: A new approach. Steel564
Construction Institute (SCI), Berkshire, UK, 2nd edition.565
Smith, J. (1988). Vibration of structures. Application in civil engineering desing. Chapman & Hall,566
London, England.567
Willford, M. and Young, P. (2006). A Design guide for footfall induced vibration of structures.568
Concrete Centre(CC), Surry, UK.569
Zivanović, S. (2006). “Probability-based estimation of vibration for pedestrian structures due to570
walking.” Ph.D. thesis, The University of Sheffield, Sheffield, UK.571
Zivanović, S. and Pavic, A. (2009). “Probabilistic modeling of walking excitation for building572
floors.” J. of Perform. of Constr. Facil., 23(3), 132–143.573
Zivanović, S., Pavic, A., and Racic, V. (2012). “Towards modelling in-service pedestrian loading574
of floor structures.” Dyn. of Civ. Struct., Vol. 1 : Proc. of the 30th IMAC, A Conf. and Expos. on575
Struct. Dyn. 2012, Springer Int. Publ., New York, NY, 85–94.576
22 Muhammad, October 15, 2018

Zivanović, S., Pavic, A., and Reynolds, P. (2007). “Probability-based prediction of multi-mode577
vibration response to walking excitation.” Eng. Struc., 29(6), 942–954.578
23 Muhammad, October 15, 2018

List of Tables579
1 MAC values FS1 . . . . . . . . . . . . . . . . . . . . . . . . . . . . . . . . . . . 25580
2 MAC values FS2 . . . . . . . . . . . . . . . . . . . . . . . . . . . . . . . . . . . 26581
3 MAC values FS3 . . . . . . . . . . . . . . . . . . . . . . . . . . . . . . . . . . . 27582
4 Modal properties of FS1 from design guidance simplified formulae . . . . . . . . . 28583
5 Modal properties of FS2 from design guidance simplified formulae . . . . . . . . . 29584
6 Modal properties of FS3 from design guidance simplified formula . . . . . . . . . 30585
24 Muhammad, October 15, 2018

TABLE 1. MAC values FS1
AnalyticalMode No. 1 2 3 4
Mea
sure
d 1 0.9013 0.1214 0.0245 0.11672 0.2162 0.8721 0.027 0.10883 0.026 0.191 0.912 0.164 0.2383 0.1071 0.132 0.8899
25 Muhammad, October 15, 2018

TABLE 2. MAC values FS2
AnalyticalMode No. 1 2 3 4
Mea
sure
d 1 0.989 0.0752 0.0912 0.05992 0.0313 0.942 0.0951 0.0993 0.0959 0.0868 0.939 0.1424 0.0677 0.107 0.129 0.9125
26 Muhammad, October 15, 2018

TABLE 3. MAC values FS3
AnalyticalMode No. 1 2 3 4
Mea
sure
d 1 0.88 0.117 0 0.1292 0.195 0.851 0.2823 0 0 0 04 0.142 0.228 0 0.879
27 Muhammad, October 15, 2018

TABLE 4. Modal properties of FS1 from design guidance simplified formulae
Guidance Natural frequency Modal mass Damping ratio(Hz) (t) (ζ)
Measured 5.24 36.98 3.16%AISC DG11 4.99 51 3%SCI P354 5.23 17.47 3%HiVoSS 5.18 15.9 3%CCIP-016 2.89 7.95 3%
CSTR43 App G 4.52 7.95 3%
28 Muhammad, October 15, 2018

TABLE 5. Modal properties of FS2 from design guidance simplified formulae
Guidance Natural frequency Modal mass Damping ratio(Hz) (t) (ζ)
Measured 4.92 102.03 0.66%AISC DG11 4.48 83.6 1%SCI P354 4.99 17.26 1.1%HiVoSS 4.78 14.77 1%CCIP-016 4.1 7.4 1.15%
CSTR43 App G 6.5 7.4 1%
29 Muhammad, October 15, 2018
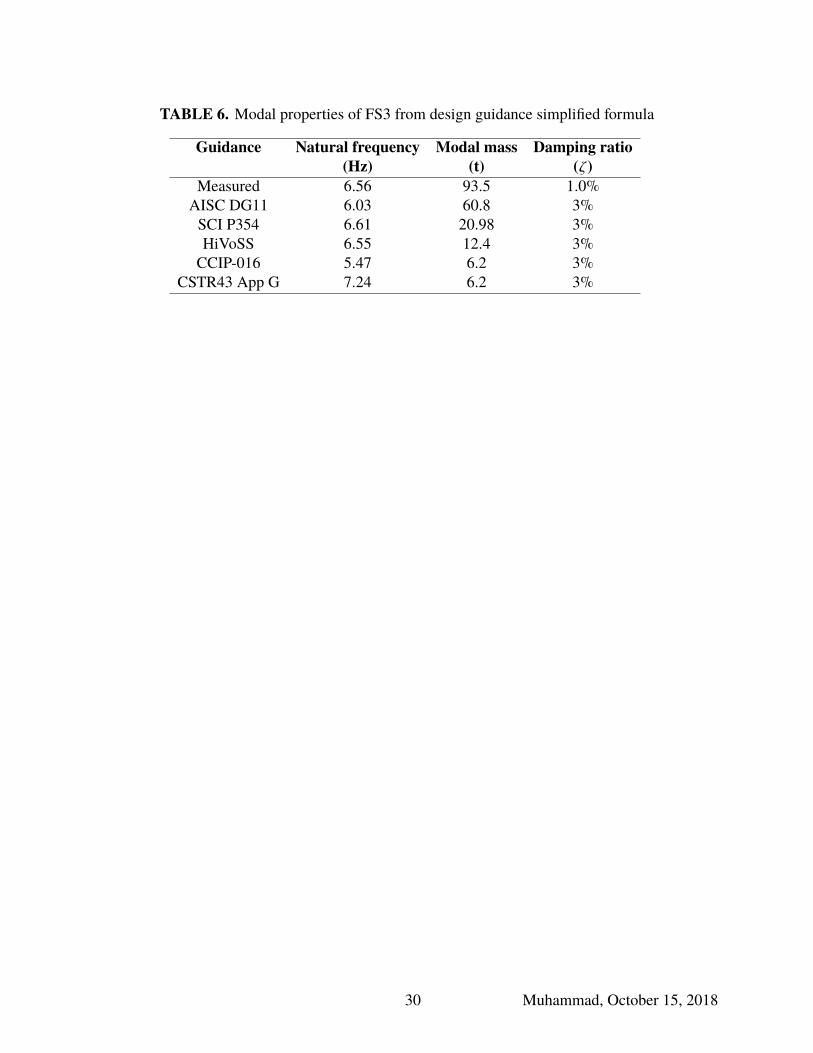
TABLE 6. Modal properties of FS3 from design guidance simplified formula
Guidance Natural frequency Modal mass Damping ratio(Hz) (t) (ζ)
Measured 6.56 93.5 1.0%AISC DG11 6.03 60.8 3%SCI P354 6.61 20.98 3%HiVoSS 6.55 12.4 3%CCIP-016 5.47 6.2 3%
CSTR43 App G 7.24 6.2 3%
30 Muhammad, October 15, 2018

List of Figures586
1 AISC DG11 vibration analysis procedure and chapter designation. . . . . . . . . . 34587
2 SCI P354 vibration analysis procedure and chapter designation. . . . . . . . . . . . 35588
3 HiVoSS vibration analysis procedure and chapter designation. . . . . . . . . . . . 36589
4 CCIP-016 and CSTR43 App G vibration analysis procedure. . . . . . . . . . . . . 37590
5 Comparison between pedestrian forcing functions. . . . . . . . . . . . . . . . . . . 38591
6 Plan layout of FS1 . . . . . . . . . . . . . . . . . . . . . . . . . . . . . . . . . . . 39592
7 Test point locations on FS1. Excitation locations are shown by letter “S”. . . . . . 40593
8 FS1 vibration modes from FE Analysis and Experimental Modal Analysis . . . . . 41594
a FE analysis, f1 = 5.23 Hz, m = 36.02 tonnes, MAC = 0.90 . . . . . . . . . 41595
b EMA f1 = 5.24 Hz, ζ = 3.16 % . . . . . . . . . . . . . . . . . . . . . . . . 41596
c FE analysis, f2 = 6.52 Hz, m = 28.54 tonnes, MAC = 0.87 . . . . . . . . . 41597
d EMA f2 = 6.06 Hz, ζ = 2.24 % . . . . . . . . . . . . . . . . . . . . . . . . 41598
e FE analysis, f3 = 6.33 Hz, m = 35.95 tonnes, MAC = 0.91 . . . . . . . . . 41599
f EMA f3 = 6.58 Hz, ζ = 1.87 % . . . . . . . . . . . . . . . . . . . . . . . . 41600
g FE analysis, f4 = 6.87 Hz, m = 39.95 tonnes, MAC = 0.89 . . . . . . . . . 41601
h EMA f4 = 7.31 Hz, ζ = 1.7 % . . . . . . . . . . . . . . . . . . . . . . . . 41602
9 Comparison of experimental FRFs and those from the updated FE model at four603
locations on FS1 . . . . . . . . . . . . . . . . . . . . . . . . . . . . . . . . . . . 42604
a FRF@TP20 . . . . . . . . . . . . . . . . . . . . . . . . . . . . . . . . . . 42605
b FRF@TP32 . . . . . . . . . . . . . . . . . . . . . . . . . . . . . . . . . . 42606
c FRF@TP28 . . . . . . . . . . . . . . . . . . . . . . . . . . . . . . . . . . 42607
d FRF@TP59 . . . . . . . . . . . . . . . . . . . . . . . . . . . . . . . . . . 42608
10 Plan layout of FS2 . . . . . . . . . . . . . . . . . . . . . . . . . . . . . . . . . . . 43609
11 Test point locations on FS2. Excitation locations are shown by letter “S”. . . . . . 44610
12 FS2 vibration modes from FE Analysis and Experimental Modal Analysis . . . . . 45611
a FE analysis, f1 = 4.88 Hz, m = 85.15 tonnes, MAC = 0.98 . . . . . . . . . 45612
31 Muhammad, October 15, 2018
b EMA f1 = 4.92 Hz, ζ = 0.66 % . . . . . . . . . . . . . . . . . . . . . . . . 45613
c FE analysis, f2 = 5.43 Hz, m = 92.89 tonnes, MAC = 0.94 . . . . . . . . . 45614
d EMA f2 = 5.51 Hz, ζ = 0.74 % . . . . . . . . . . . . . . . . . . . . . . . . 45615
e FE analysis, f3 = 6.41 Hz, m = 32.02 tonnes, MAC = 0.93 . . . . . . . . . 45616
f EMA f3 = 6.12 Hz, ζ = 0.32 % . . . . . . . . . . . . . . . . . . . . . . . . 45617
g FE analysis, f4 = 6.48 Hz, m = 33 tonnes, MAC = 0.91 . . . . . . . . . . . 45618
h EMA f4 = 6.55 Hz, ζ = 0.32 % . . . . . . . . . . . . . . . . . . . . . . . . 45619
13 Comparison of experimental FRFs and those from the updated FE model at two620
locations on FS2 . . . . . . . . . . . . . . . . . . . . . . . . . . . . . . . . . . . 46621
a FRF@TP112 . . . . . . . . . . . . . . . . . . . . . . . . . . . . . . . . . 46622
b FRF@TP310 . . . . . . . . . . . . . . . . . . . . . . . . . . . . . . . . . 46623
14 Plan layout of FS3 . . . . . . . . . . . . . . . . . . . . . . . . . . . . . . . . . . . 47624
15 Test point locations on FS3. Excitation locations are shown by the letter “S”. . . . . 48625
16 FS3 vibration modes from FE Analysis and Experimental Modal Analysis . . . . . 49626
a FE analysis, f1 = 6.57 Hz, m = 114.6 tonnes, MAC = 0.88 . . . . . . . . . 49627
b EMA f1 = 6.56 Hz, ζ = 1.0 % . . . . . . . . . . . . . . . . . . . . . . . . 49628
c FE analysis, f2 = 6.84 Hz, m = 96.15 tonnes„ MAC = 0.85 . . . . . . . . . 49629
d EMA f2 = 6.89 Hz, ζ = 1.04 % . . . . . . . . . . . . . . . . . . . . . . . . 49630
e FE analysis, f3 = 7.23 Hz, m = 104.13 tonnes . . . . . . . . . . . . . . . . 49631
f EMA f3 = 0, ζ = 0 % . . . . . . . . . . . . . . . . . . . . . . . . . . . . . 49632
g FE analysis, f4 = 7.4 Hz, m = 104.53 tonnes, MAC = 0.87 . . . . . . . . . 49633
h EMA f4 = 7.39 Hz, ζ = 0.62 % . . . . . . . . . . . . . . . . . . . . . . . . 49634
17 Comparison of experimental FRFs and those from the updated FE model at four635
locations on FS3 . . . . . . . . . . . . . . . . . . . . . . . . . . . . . . . . . . . 50636
a FRF@TP29 . . . . . . . . . . . . . . . . . . . . . . . . . . . . . . . . . . 50637
b FRF@TP33 . . . . . . . . . . . . . . . . . . . . . . . . . . . . . . . . . . 50638
c FRF@TP49 . . . . . . . . . . . . . . . . . . . . . . . . . . . . . . . . . . 50639
32 Muhammad, October 15, 2018

d FRF@TP53 . . . . . . . . . . . . . . . . . . . . . . . . . . . . . . . . . . 50640
18 Peak FRF magnitude from FE harmonic analysis between grid line B-1 & C-2 . . . 51641
19 FS1 Response prediction of guidelines against actual measured response . . . . . . 52642
20 FS2 Response prediction of guidelines against actual response . . . . . . . . . . . 53643
21 FS3 Response prediction of guidelines against actual response . . . . . . . . . . . 54644
33 Muhammad, October 15, 2018

Fig. 1. AISC DG11 vibration analysis procedure and chapter designation.
34 Muhammad, October 15, 2018
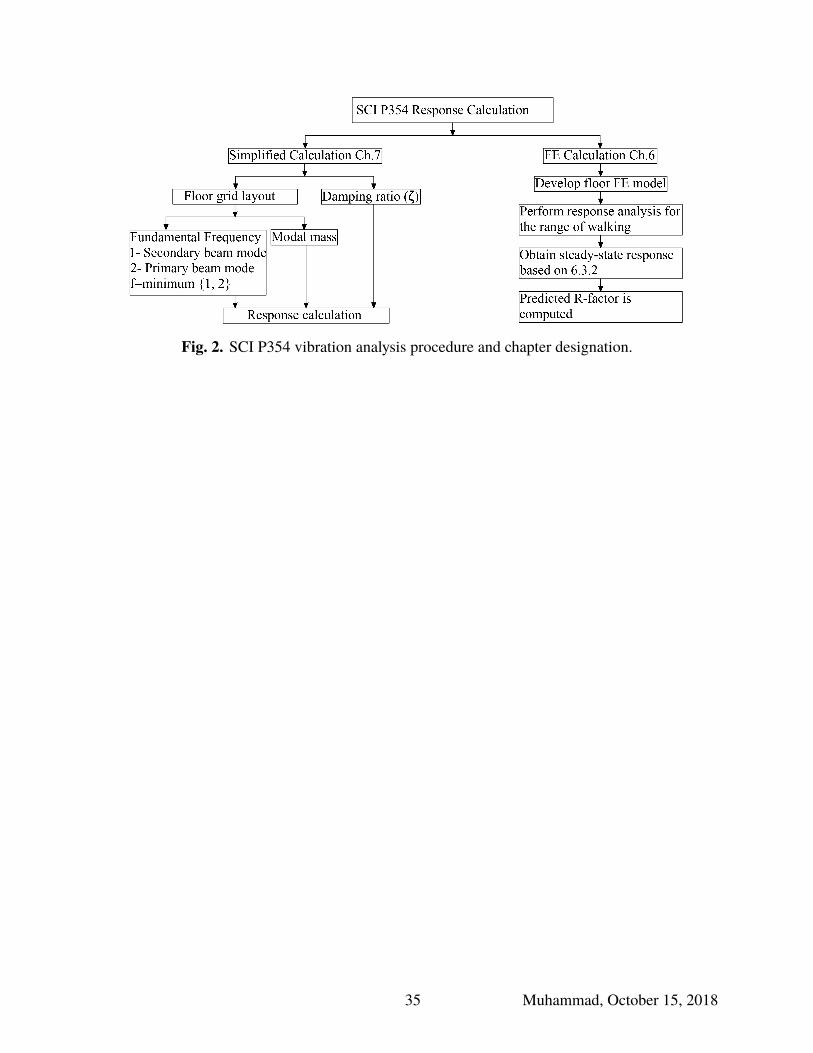
Fig. 2. SCI P354 vibration analysis procedure and chapter designation.
35 Muhammad, October 15, 2018
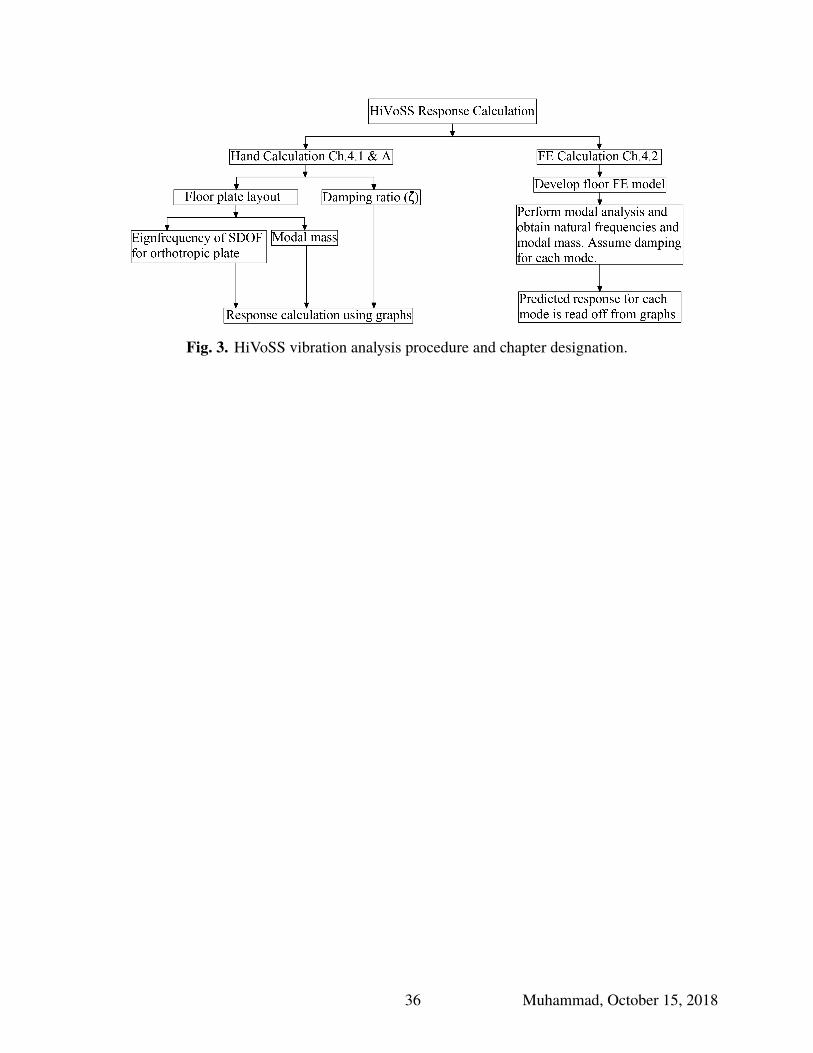
Fig. 3. HiVoSS vibration analysis procedure and chapter designation.
36 Muhammad, October 15, 2018

Fig. 4. CCIP-016 and CSTR43 App G vibration analysis procedure.
37 Muhammad, October 15, 2018

Fig. 5. Comparison between pedestrian forcing functions.
38 Muhammad, October 15, 2018
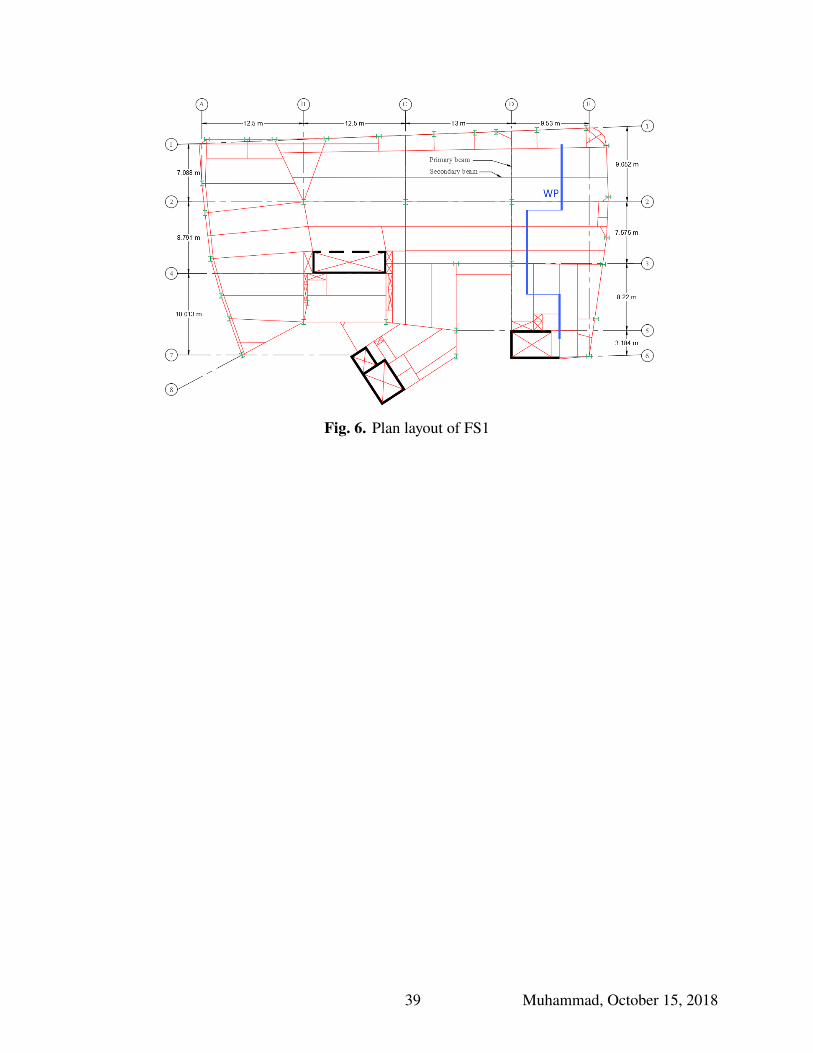
Fig. 6. Plan layout of FS1
39 Muhammad, October 15, 2018
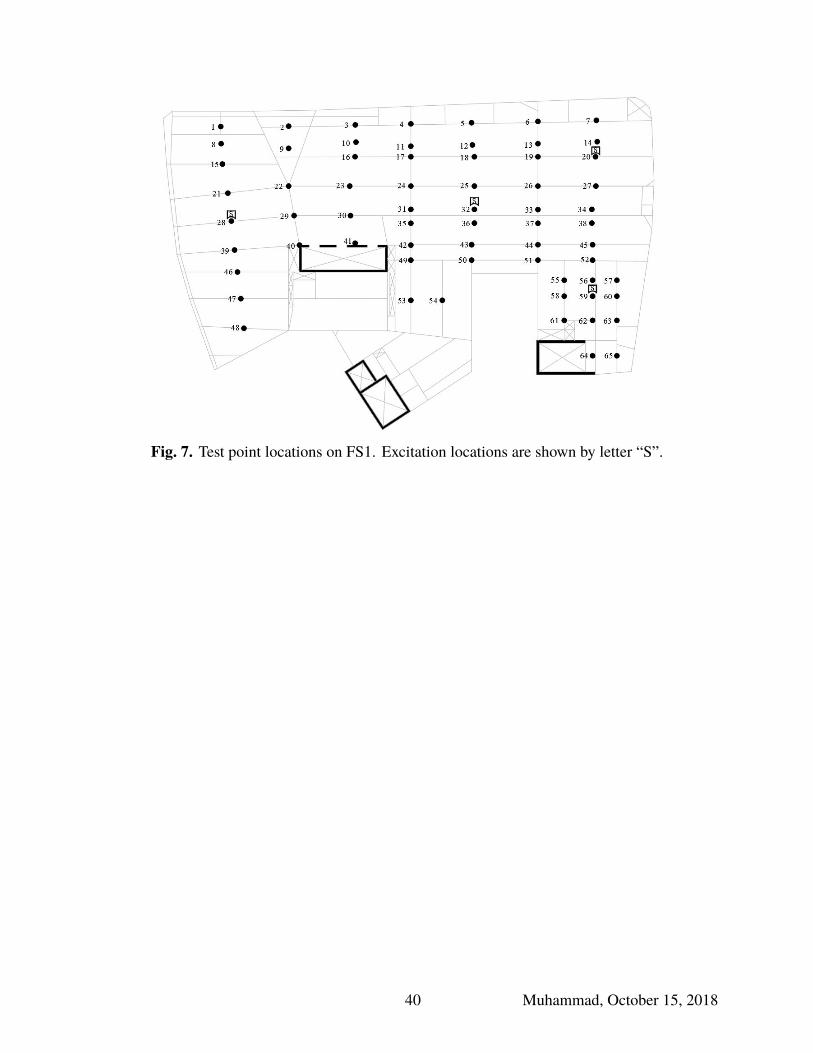
Fig. 7. Test point locations on FS1. Excitation locations are shown by letter “S”.
40 Muhammad, October 15, 2018
(a) FE analysis, f1 = 5.23 Hz, m = 36.02 tonnes,MAC = 0.90
(b) EMA f1 = 5.24 Hz, ζ = 3.16 %
(c) FE analysis, f2 = 6.52 Hz, m = 28.54 tonnes,MAC = 0.87
(d) EMA f2 = 6.06 Hz, ζ = 2.24 %
(e) FE analysis, f3 = 6.33 Hz, m = 35.95 tonnes,MAC = 0.91
(f) EMA f3 = 6.58 Hz, ζ = 1.87 %
(g) FE analysis, f4 = 6.87 Hz, m = 39.95 tonnes,MAC = 0.89
(h) EMA f4 = 7.31 Hz, ζ = 1.7 %
Fig. 8. FS1 vibration modes from FE Analysis and Experimental Modal Analysis
41 Muhammad, October 15, 2018
(a) FRF@TP20 (b) FRF@TP32
(c) FRF@TP28 (d) FRF@TP59
Fig. 9. Comparison of experimental FRFs and those from the updated FE model at four locationson FS1
42 Muhammad, October 15, 2018

Fig. 10. Plan layout of FS2
43 Muhammad, October 15, 2018

Fig. 11. Test point locations on FS2. Excitation locations are shown by letter “S”.
44 Muhammad, October 15, 2018
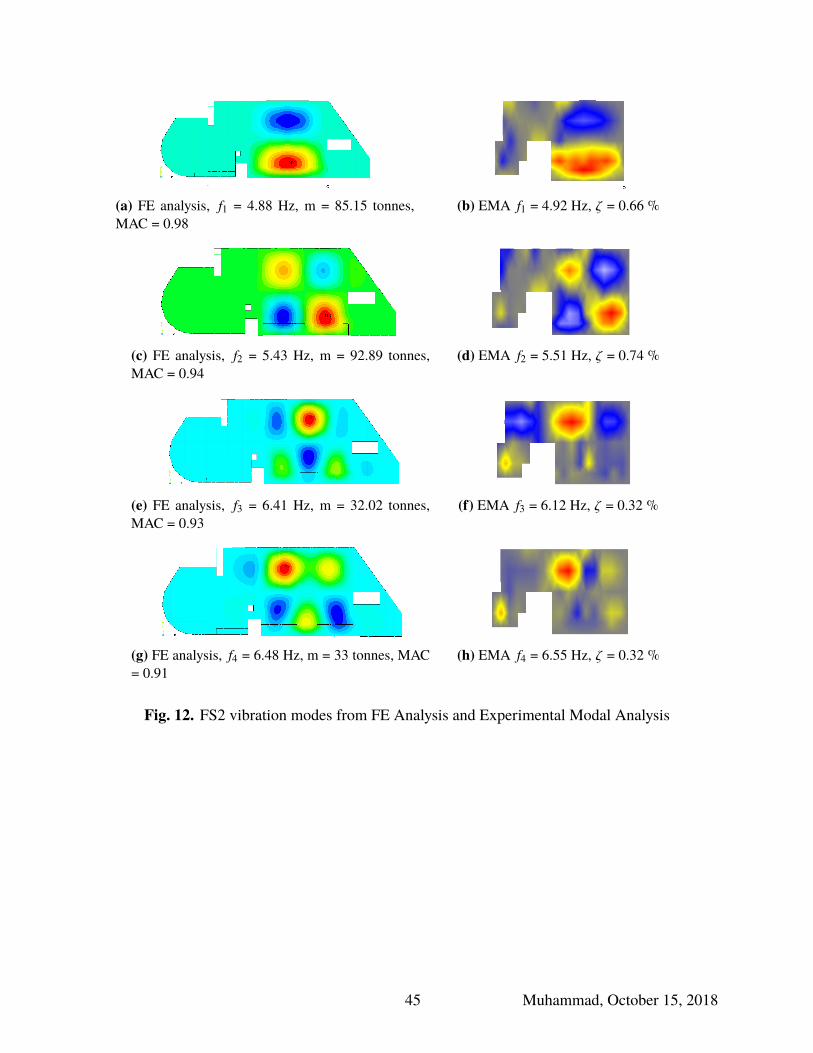
(a) FE analysis, f1 = 4.88 Hz, m = 85.15 tonnes,MAC = 0.98
(b) EMA f1 = 4.92 Hz, ζ = 0.66 %
(c) FE analysis, f2 = 5.43 Hz, m = 92.89 tonnes,MAC = 0.94
(d) EMA f2 = 5.51 Hz, ζ = 0.74 %
(e) FE analysis, f3 = 6.41 Hz, m = 32.02 tonnes,MAC = 0.93
(f) EMA f3 = 6.12 Hz, ζ = 0.32 %
(g) FE analysis, f4 = 6.48 Hz, m = 33 tonnes, MAC= 0.91
(h) EMA f4 = 6.55 Hz, ζ = 0.32 %
Fig. 12. FS2 vibration modes from FE Analysis and Experimental Modal Analysis
45 Muhammad, October 15, 2018
(a) FRF@TP112 (b) FRF@TP310
Fig. 13. Comparison of experimental FRFs and those from the updated FE model at two locationson FS2
46 Muhammad, October 15, 2018
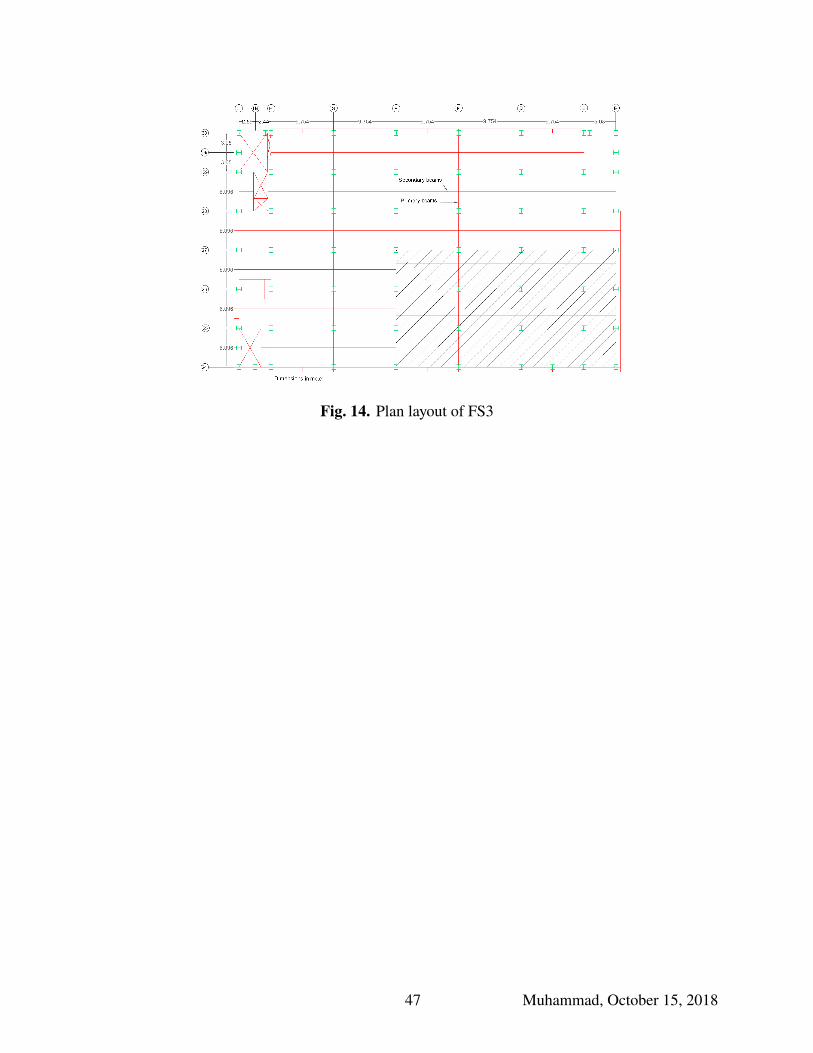
Fig. 14. Plan layout of FS3
47 Muhammad, October 15, 2018

Fig. 15. Test point locations on FS3. Excitation locations are shown by the letter “S”.
48 Muhammad, October 15, 2018
(a) FE analysis, f1 = 6.57 Hz, m = 114.6 tonnes,MAC = 0.88
(b) EMA f1 = 6.56 Hz, ζ = 1.0 %
(c) FE analysis, f2 = 6.84 Hz, m = 96.15 tonnes„MAC = 0.85
(d) EMA f2 = 6.89 Hz, ζ = 1.04 %
(e) FE analysis, f3 = 7.23 Hz, m = 104.13 tonnes (f) EMA f3 = 0, ζ = 0 %
(g) FE analysis, f4 = 7.4 Hz, m = 104.53 tonnes,MAC = 0.87
(h) EMA f4 = 7.39 Hz, ζ = 0.62 %
Fig. 16. FS3 vibration modes from FE Analysis and Experimental Modal Analysis
49 Muhammad, October 15, 2018

(a) FRF@TP29 (b) FRF@TP33
(c) FRF@TP49 (d) FRF@TP53
Fig. 17. Comparison of experimental FRFs and those from the updated FE model at four locationson FS3
50 Muhammad, October 15, 2018

Fig. 18. Peak FRF magnitude from FE harmonic analysis between grid line B-1 & C-2
51 Muhammad, October 15, 2018

Fig. 19. FS1 Response prediction of guidelines against actual measured response
52 Muhammad, October 15, 2018

Fig. 20. FS2 Response prediction of guidelines against actual response
53 Muhammad, October 15, 2018

Fig. 21. FS3 Response prediction of guidelines against actual response
54 Muhammad, October 15, 2018
Copyright © 2022 FDOKUMEN