Nondestructive Techniques for Measuring the Longitudinal ...
Upload
independentCategory
view
5download
0
Electronic Journal of Structural Engineering, 2 (2002) http://www.ejse.org/
2002 EJSE International. All rights reserved.
59eeJJSSEE International
Nondestructive damage detection in large structures via vibration monitoring
Sooyong Park and Yeon-Bok Kim
Civil Engineering Division, Korea Institute of Construction Technology Koyang, Kyonggi-do 411-712, Korea
Email: [email protected]
Norris Stubbs Mechanics and Materials Center, Department of Civil Engineering, Texas A&M University
College Station, TX 77843, USA
ABSTRACT In this paper Nondestructive Damage Detection (NDD) in large/complex structures is investigated via vibration monitoring of such structures. The theory of NDD for truss type structures is formulated. To examine the feasibility of the theory, a finite element model of a 3-D truss structure, which consists of sixteen bays and includes 246 elements, is developed to simulate damage. Four damage cases are simulated numerically. The cases range from the structure being damaged in one location to the structure being damaged in three locations. Next, the theory is applied to the experimental results of a 1:6 scale model of a typical hexagonal truss. These tests consist of 17 damage scenarios subjected to three different types of damage. The performance of the method on simulating experimental data is evaluated and discussed. KEYWORDS Nondestructive damage detection, large structures, vibrational modes, mode shapes.
1. Introduction The seriously deteriorating condition of the civil engineering infrastructure, especially the bridge sector, has stimulated the structural monitoring of integrity of such structural systems. Knowledge of the structural integrity of a system in real time is a critical issue, since the event of failure could be catastrophic. Following the occurrence of a hazardous event like a strong-motion earthquake, structural integrity is a major concern to authorities as well as to users. Consequently, the physical condition of the structure should be assessed immediately. In addition, with respect to the maintenance of structural systems, monitoring the structural health condition at regular intervals could have such beneficial consequences as increase in the productivity of operations, reduction of maintenance costs, and prolongment of the useful service life span. Also, periodic health monitoring could help structural and bridge engineers to improve the efficacy and efficiency of maintenance operations, rehabilitation projects, and replacement decisions. Structural health monitoring is an emerging discipline that combines recent advances in sensing technology with techniques and theories from the field of global nondestructive damage evaluation (NDE). The ultimate objective of the field is to continuously monitor the safety of structures in real time while the structures are in service [1]. An ideal structural health monitoring system should be capable of (1) detecting the existence of damage, (2) locating the damage, (3) sizing the damage, and (4) determining the impact of the damage on the performance of the structure. Such a system has also been referred as a Level IV NDE methodology [2]. During the past decade, a great deal of research has been conducted in the area of nondestructive damage evaluation of structural systems via changes in their vibration characteristics [3-9]. In many studies, the resonant frequencies were used to identify damage

Electronic Journal of Structural Engineering, 2 (2002) http://www.ejse.org/
2002 EJSE International. All rights reserved.
60eeJJSSEE International
and estimate the amount of damage [3,4]. The shifts of frequencies, however, are very difficult to measure when a small amount of damage is introduced to a relatively large/massive structure. However, the changes of mode shapes are more sensitive to damage than those of frequencies.
The objective of this study is to examine the feasibility of NDD theory in large/complex structures through systematic diagnosis. In this paper, to explore the systematic use of modal parameters (i.e., mode shapes) in nondestructive damage evaluation of such a large/complex structure, especially on a 3-D truss type bridge, the following tasks are performed: first, the nondestructive damage detection theory is formulated; second, a finite element model of a truss bridge for damage detection is developed; and third, the feasibility of the damage detection method via numerical simulation is investigated. 2. Nondestructive Damage Detection Theory Let the fraction of the strain energy, Fij, for a typical element j and mode i of a truss structure be given by
∑=
∆
∆= NE
1j
2ijj
2ijj
ij
)(k
)(kF (1)
where kj represents the stiffness of jth element, ∆ij represents the deformation of jth element in ith mode, and NE is the number of elements. Let the corresponding parameter of a damaged structure be characterized by asterisk, then Equation (1) becomes
∑=
∗∗
∗∗∗
∆
∆= NE
1j
2ijj
2ijj
ij
)(k
)(kF (2)
where Fij* and Fij are related by
ijijij dFFF +=∗ (3)
If we set 2ij
j
jj2ijj )(
LEA
)(kA ∆=∆= and ∑∑==
∆=∆=NE
1j
2ij
j
jjNE
1j
2ijj )(
LEA
)(kB , and assume that
the structure is damaged in only a single location, then from Equation (1)
BdA
BdB
AdA
BA
BAdB
BdAdF 2ij ≅
−=−= (4)
Since dBdA = and B >> A, the second term B
dB can be neglected.
If we set jkX = , 2ij )(Y ∆= , and jdkdK = , then Equation (4) can be rewritten as
∂∂
∂∂+
∂∂
∂∂= dK
KY
YAdK
KX
XA
B1dFij (5)
where 2ij )(
XA ∆=
∂∂ , 1
KX =
∂∂ , jk
YA =
∂∂ , and
( )j
2ij
22
ij
k)(2
K
)KP(
K)(
KY ∆−
=∂
∂
=∂∆∂
=∂∂
in which the force )(K)(kP ijijj ∆=∆= .
On substituting YA,
KX,
XA,B
∂∂
∂∂
∂∂ , and
KY
∂∂ into Equation (5), we obtain
Electronic Journal of Structural Engineering, 2 (2002) http://www.ejse.org/
2002 EJSE International. All rights reserved.
61eeJJSSEE International
jijij k
dKFdF −= (6)
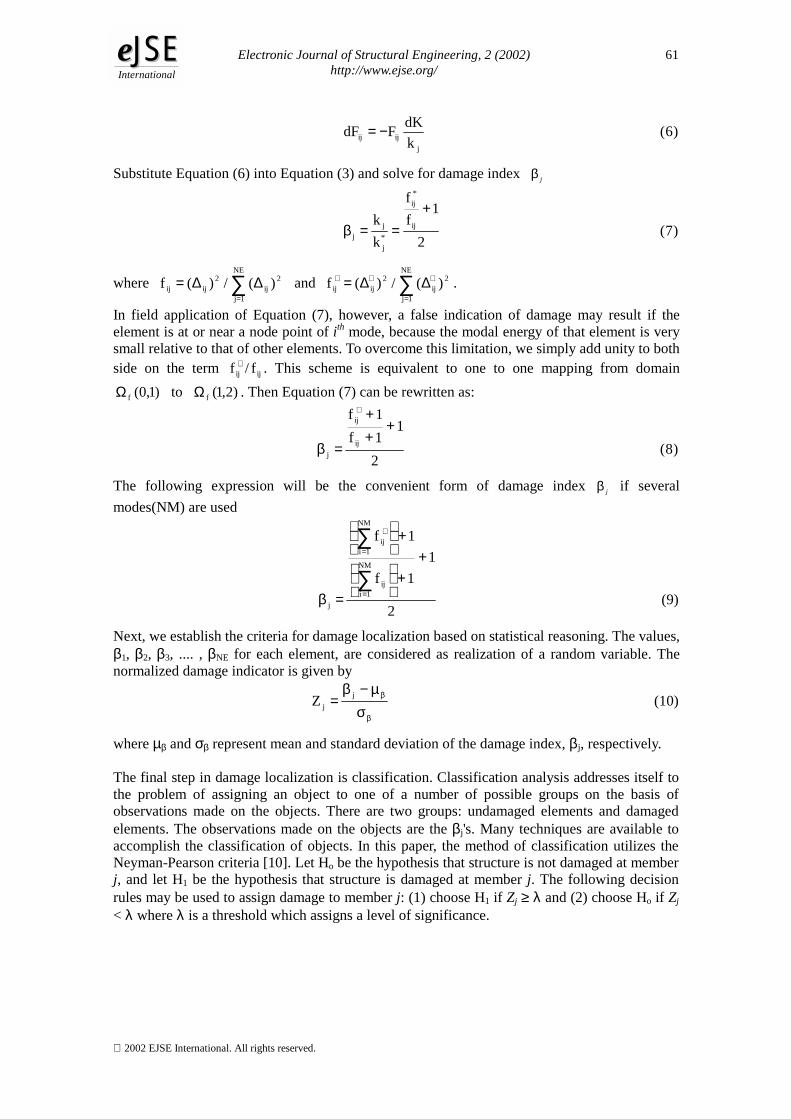
Substitute Equation (6) into Equation (3) and solve for damage index β j
2
1ff
kk ij
*ij
*j
jj
+==β (7)
where ∑=
∆∆=NE
1j
2ij
2ijij )(/)(f and ∑
=
∗∗∗ ∆∆=NE
1j
2ij
2ijij )(/)(f .
In field application of Equation (7), however, a false indication of damage may result if the element is at or near a node point of ith mode, because the modal energy of that element is very small relative to that of other elements. To overcome this limitation, we simply add unity to both side on the term ijij f/f ∗ . This scheme is equivalent to one to one mapping from domain
)1,0(fΩ to )2,1(fΩ . Then Equation (7) can be rewritten as:
2
11f1f
ij
ij
j
+++
=β
∗
(8)
The following expression will be the convenient form of damage index β j if several modes(NM) are used
2
11f
1f
NM
1iij
NM
1iij
j
++
+
=β∑
∑
=
=
∗
(9)
Next, we establish the criteria for damage localization based on statistical reasoning. The values, β1, β2, β3, .... , βNE for each element, are considered as realization of a random variable. The normalized damage indicator is given by
β
β
σµ−β
= jjZ (10)
where µβ and σβ represent mean and standard deviation of the damage index, βj, respectively. The final step in damage localization is classification. Classification analysis addresses itself to the problem of assigning an object to one of a number of possible groups on the basis of observations made on the objects. There are two groups: undamaged elements and damaged elements. The observations made on the objects are the βj's. Many techniques are available to accomplish the classification of objects. In this paper, the method of classification utilizes the Neyman-Pearson criteria [10]. Let Ho be the hypothesis that structure is not damaged at member j, and let H1 be the hypothesis that structure is damaged at member j. The following decision rules may be used to assign damage to member j: (1) choose H1 if Zj ≥ λ and (2) choose Ho if Zj < λ where λ is a threshold which assigns a level of significance.

Electronic Journal of Structural Engineering, 2 (2002) http://www.ejse.org/
2002 EJSE International. All rights reserved.
62eeJJSSEE International
3. Verification of Theory using Simulated Data The damage detection scheme proposed here is accomplished in four steps: first, a finite model of a truss bridge is developed; second, modal parameters for pre-damage and post-damage structures are generated; third, damage index, βj, for each member is calculated; and fourth, the location is classified as damaged or not damaged. Development of finite element model A finite element model of a span of an actual truss bridge is shown in Fig. 1. The test structure selected here is the 161 meter truss span which contains sixteen bays. As shown in Fig. 1, the model is a 3-D truss structure which is assumed to be continuous and to be supported by piers at both ends. The structural system of the model has 246 members which consist of upper & lower chords, strut members, lateral members, vertical members, diagonal members, and bracing. To model the remaining structure, eight linear springs are connected to upper chords at both ends in Y, and Z directions and twelve linear springs are connected to bottom chords at both ends in X, Y, and Z directions. The purpose of four springs in X direction is to model the vertical flexibility of piers. The material properties of truss members are assigned as listed in Table 1. A dynamic analysis is performed on the structure to measure the modal parameters using the commercial FORTRAN code (ABAQUS) [11]. Modal amplitudes are measured in X, Y, and Z directions at 68 pseudo sensors which are attached to every joints of truss. Fig. 2 shows the four mode shapes (first bending, first torsion, second bending, and second torsion) used in this study. Simulation of damage The finite element model developed in the latter section is selected as a baseline model. To aid in the damage detection process, each member is assigned a number. Four damage cases are considered. The cases range from the structure being damaged in one location to the structure being damaged in three locations as follows.
Damage Case 1: reduce stiffness in member 193 by two percent Damage Case 2: reduce stiffness in member 46 by five percent Damage Case 3: reduce stiffness in members 105 and 106 by thirty percent Damage Case 4: reduce stiffness in members 28, 53, and 76 by thirty percent
Pictorial representations of the four damage cases are presented in Fig. 3. Modal parameters are generated for each damage case. The corresponding frequencies for baseline and post-damaged structures are provided in Table 2. Note that changes in frequencies are negligible when small amounts of damage are introduced.
Damage localization results The damage localization scheme is applied to the simulated damage cases. The results for the localization are presented in Figs. 4 to 7. Note that the data are used in two ways. First, damage is localized using a single mode at a time. Second, damage is localized using all four modes simultaneously. For a single mode, Equation (8) is used for calculation of the damage index βj for each member of truss, and then this one set of data is applied to decision rule to localize the damaged members. Equation (9) is used when all four modes are used. In this study, damage threshold value is chosen to be λ = 3 which assigns a 99% significance level. The predicted members for each damage case are shown in Table 3.

Electronic Journal of Structural Engineering, 2 (2002) http://www.ejse.org/
2002 EJSE International. All rights reserve
63eeJJSSEE International
Fig. 1 – Schematic of finite element model
Fig. 2 – First four mode shapes of the truss
Fig. 3 – Identification
First Bending Mode First Torsional Mode
Second Bending Mode Second Torsional Mode
53
06
Damage Case 1 : MemDamage Case 2 : MemDamage Case 3 : MemDamage Case 4 : Mem
10
51
d.
of members to be damaged in fou
46 28 76
ber 193 (diagonal) ber 46 (upper chord) bers 105, 106 (bracing) bers 28, 53, 76 (lower chord, upper c
19
r damage cases
3
hord, vertical)

Electronic Journal of Structural Engineering, 2 (2002) http://www.ejse.org/
2002 EJSE International. All rights reserved.
64eeJJSSEE International
-4
0
4
8
12
1 101 201
-4
0
4
8
12
1 101 201
-4
0
4
8
12
1 101 201
-4
0
4
8
12
1 101 201
-4
0
4
8
12
1 101 201
Fig. 4 – Damage localization results for Damage Case 1 (Damage was inflicted on Member 193)
Member Number In
dica
tor Z
First bending mode
193
Member Number
Indi
cato
r Z
First torsional mode
193
Member Number
Indi
cato
r Z
Second bending mode
193
Member Number
Indi
cato
r Z
Second torsional mode
193
Member Number
Indi
cato
r Z
All four modes
193

Electronic Journal of Structural Engineering, 2 (2002) http://www.ejse.org/
2002 EJSE International. All rights reserved.
65eeJJSSEE International
-4
0
4
8
12
1 101 201
-4
0
4
8
12
1 101 201
-4
0
4
8
12
1 101 201
-4
0
4
8
12
1 101 201
-4
0
4
8
12
1 101 201
Fig. 5 – Damage localization results for Damage Case 2 (Damage was inflicted on Member 46)
Member Number
Indi
cato
r Z
First bending mode
184
Member Number
Indi
cato
r Z
First torsional mode
Member Number
Indi
cato
r Z
Second bending mode
46
Member Number
Indi
cato
r Z
Second torsional mode
Member Number
Indi
cato
r Z
All four modes
46
121 46 154
46
46

Electronic Journal of Structural Engineering, 2 (2002) http://www.ejse.org/
2002 EJSE International. All rights reserved.
66eeJJSSEE International
-4
0
4
8
12
1 101 201
-4
0
4
8
12
1 101 201
-4
0
4
8
12
1 101 201
-4
0
4
8
12
1 101 201
-4
0
4
8
12
1 101 201
Fig. 6 – Damage localization results for Damage Case 3 (Damage was inflicted on Members 105, 106)
Member Number
Indi
cato
r Z
First bending mode
184
Member Number
Indi
cato
r Z
First torsional mode
Member Number
Indi
cato
r Z
Second bending mode
Member Number
Indi
cato
r Z
Second torsional mode
Member Number
Indi
cato
r Z
All four modes
105 106
200
105 106
105 106
105 106
105 106

Electronic Journal of Structural Engineering, 2 (2002) http://www.ejse.org/
2002 EJSE International. All rights reserved.
67eeJJSSEE International
-4
0
4
8
12
1 101 201
-4
0
4
8
12
1 101 201
-4
0
4
8
12
1 101 201
-4
0
4
8
12
1 101 201
-4
0
4
8
12
1 101 201
Fig. 7 – Damage localization results for Damage Case 4 (Damage was inflicted on Members 28, 53, 76)
Member Number
Indi
cato
r Z
First bending mode
Member Number
Indi
cato
r Z
First torsional mode
Member Number
Indi
cato
r Z
Second bending mode
Member Number
Indi
cato
r Z
Second torsional mode
Member Number
Indi
cato
r Z
All four modes
28
53 76
53
28
53
76
164
171
28 53
76

Electronic Journal of Structural Engineering, 2 (2002) http://www.ejse.org/
2002 EJSE International. All rights reserved.
68eeJJSSEE International
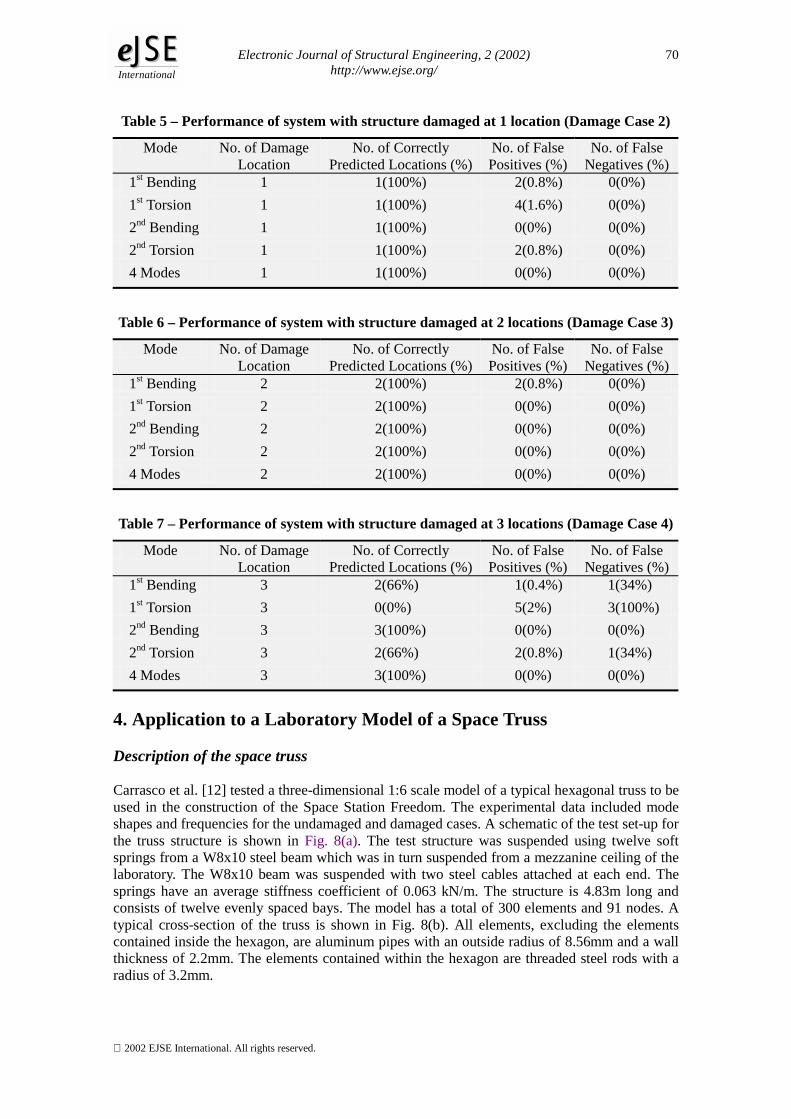
The evaluation of the results for the four damage cases is summarized in Tables 4 to 7. The performance of the method is a function of the number of modes used and the number of damaged locations. Here three indicators are utilized to evaluate the performance of this method. These include (1) the probability of localization, (2) the false positive error rate, and (3) the false negative error rate. The probability of localization is the rate of correct localization of at which we correctly localize a damaged member. The false positive error rate can be defined as the ratio of the number of locations that we incorrectly designate as being damaged to the total number of locations that are indeed not damaged. The false negative error rate can be defined as the ratio of damaged locations that are missed to the total number of damaged locations. In an ideal situation, the probability of localization should be unity, and the false positive and the false negative rates should be zero. In the present application, the consequence of a false negative is much greater than that of a false positive. For a single mode, the probability of localization is perfect for Damage Cases, 1, 2, and 3 in which the number of damage location is one or two. For Damage Case 4, the probability of localization varies from zero to one. For the case of all four modes being used, the probability of localization is one for all damage cases, which means that damage locations are perfectly detected. The false positive error ranges from zero to two percent when a single mode used for damage detection and zero for all four modes used. The false negative error is related to the probability of localization. The false negative error occurs only in Damage Case 4 when an individual mode is utilized for damage localization. Note that Damage Case 4 has three locations of damage and the fundamental assumption of the method is a single location of damage. However, even though this assumption is holding, the false negative error goes to zero when all four modes are used simultaneously for damage detection.
Table 1 - Material properties of truss members
Member Elastic Modulus (kPa)
Poisson’s Ratio
Mass Density (kg/m3)
Upper and Lower Chords 212 x 106 0.3 7850 Diagonal and Support
Springs 175 x 106 0.3 7850
Others 166 x 106 0.3 7850
Table 2 - Frequencies of baseline and post-damaged structures
Frequency (Hz) Damage Case First Bending First Torsion Second Bending Second Torsion
Baseline 0.9798 1.6557 2.1455 3.2315 Case 1 0.9796 1.6554 2.1453 3.2314 Case 2 0.9797 1.6555 2.1451 3.2311 Case 3 0.9797 1.6487 2.1455 3.2283 Case 4 0.9785 1.6546 2.1326 3.2247

Electronic Journal of Structural Engineering, 2 (2002) http://www.ejse.org/
2002 EJSE International. All rights reserved.
69eeJJSSEE International
Table 3 – Estimation of damage severity
Simulated Damage Predicted Damage Damage Case Member(Magnitude) Member(Magnitude)
Case 1 1st Bending 193 193 1st Torsion 193 193, 121 2nd Bending 193 193 2nd Torsion 193 193, 177 All four modes 193 193
Case 2 1st Bending 46 46, 184, 208 1st Torsion 46 46, 119, 121, 122, 154 2nd Bending 46 46 2nd Torsion 46 46, 145, 171 All four modes 46 46
Case 3 1st Bending 105, 106 105, 106, 184, 200 1st Torsion 105, 106 105, 106 2nd Bending 105, 106 105, 106 2nd Torsion 105, 106 105, 106 All four modes 105, 106 105, 106
Case 4 1st Bending 28, 53, 76 28, 30, 53 1st Torsion 28, 53, 76 96, 97, 98, 99, 100 2nd Bending 28, 53, 76 28, 53, 76 2nd Torsion 28, 53, 76 53, 76, 164, 171 All four modes 28, 53, 76 28, 53, 76
Table 4 – Performance of system with structure damaged at 1 location (Damage Case 1)
Mode No. of Damage Location
No. of Correctly Predicted Locations (%)
No. of False Positives (%)
No. of False Negatives (%)
1st Bending 1 1(100%) 0(0%) 0(0%) 1st Torsion 1 1(100%) 1(0.4%) 0(0%) 2nd Bending 1 1(100%) 0(0%) 0(0%) 2nd Torsion 1 1(100%) 1(0.4%) 0(0%) 4 Modes 1 1(100%) 0(0%) 0(0%)
Electronic Journal of Structural Engineering, 2 (2002) http://www.ejse.org/
2002 EJSE International. All rights reserved.
70eeJJSSEE International
Table 5 – Performance of system with structure damaged at 1 location (Damage Case 2)
Mode No. of Damage Location
No. of Correctly Predicted Locations (%)
No. of False Positives (%)
No. of False Negatives (%)
1st Bending 1 1(100%) 2(0.8%) 0(0%) 1st Torsion 1 1(100%) 4(1.6%) 0(0%) 2nd Bending 1 1(100%) 0(0%) 0(0%) 2nd Torsion 1 1(100%) 2(0.8%) 0(0%) 4 Modes 1 1(100%) 0(0%) 0(0%)
Table 6 – Performance of system with structure damaged at 2 locations (Damage Case 3)
Mode No. of Damage Location
No. of Correctly Predicted Locations (%)
No. of False Positives (%)
No. of False Negatives (%)
1st Bending 2 2(100%) 2(0.8%) 0(0%) 1st Torsion 2 2(100%) 0(0%) 0(0%) 2nd Bending 2 2(100%) 0(0%) 0(0%) 2nd Torsion 2 2(100%) 0(0%) 0(0%) 4 Modes 2 2(100%) 0(0%) 0(0%)
Table 7 – Performance of system with structure damaged at 3 locations (Damage Case 4)
Mode No. of Damage Location
No. of Correctly Predicted Locations (%)
No. of False Positives (%)
No. of False Negatives (%)
1st Bending 3 2(66%) 1(0.4%) 1(34%) 1st Torsion 3 0(0%) 5(2%) 3(100%) 2nd Bending 3 3(100%) 0(0%) 0(0%) 2nd Torsion 3 2(66%) 2(0.8%) 1(34%) 4 Modes 3 3(100%) 0(0%) 0(0%)
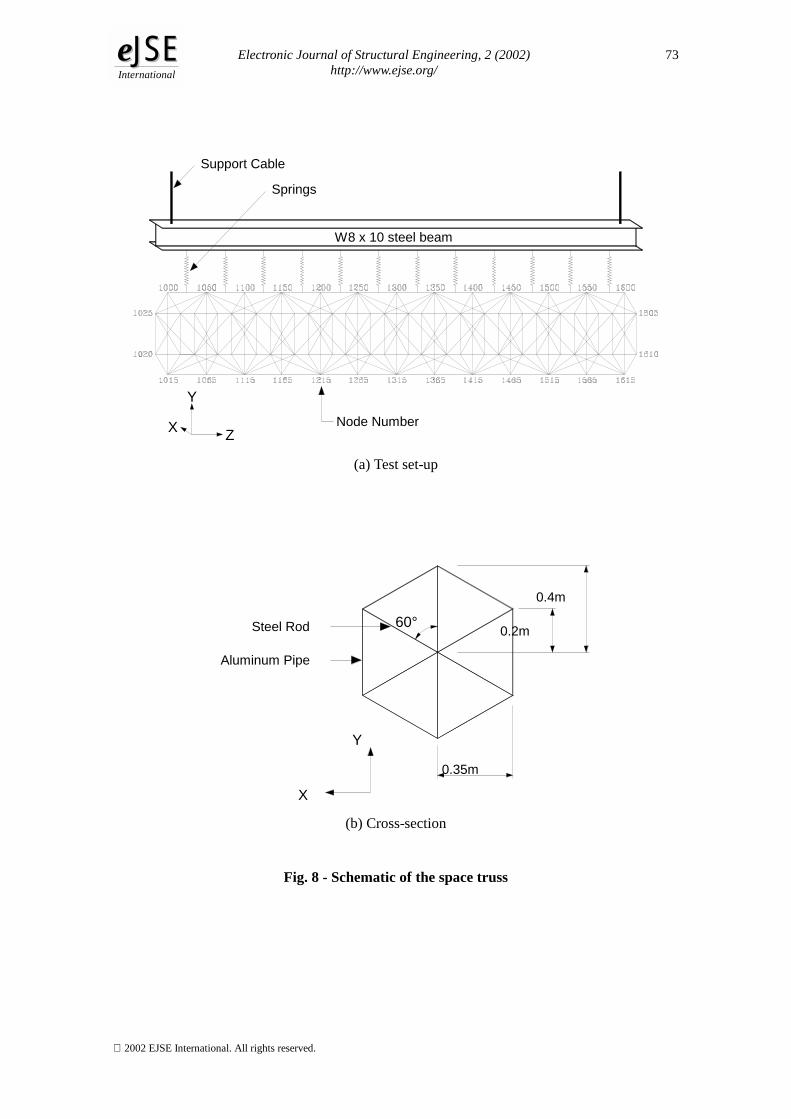
4. Application to a Laboratory Model of a Space Truss Description of the space truss Carrasco et al. [12] tested a three-dimensional 1:6 scale model of a typical hexagonal truss to be used in the construction of the Space Station Freedom. The experimental data included mode shapes and frequencies for the undamaged and damaged cases. A schematic of the test set-up for the truss structure is shown in Fig. 8(a). The test structure was suspended using twelve soft springs from a W8x10 steel beam which was in turn suspended from a mezzanine ceiling of the laboratory. The W8x10 beam was suspended with two steel cables attached at each end. The springs have an average stiffness coefficient of 0.063 kN/m. The structure is 4.83m long and consists of twelve evenly spaced bays. The model has a total of 300 elements and 91 nodes. A typical cross-section of the truss is shown in Fig. 8(b). All elements, excluding the elements contained inside the hexagon, are aluminum pipes with an outside radius of 8.56mm and a wall thickness of 2.2mm. The elements contained within the hexagon are threaded steel rods with a radius of 3.2mm.

Electronic Journal of Structural Engineering, 2 (2002) http://www.ejse.org/
2002 EJSE International. All rights reserved.
71eeJJSSEE International
Summary of the test The tests consisted of 17 damage scenarios and the structure was subjected to three different types of damages (see Table 8). Type I damage corresponded to a 180° x 1.6mm wide cut located at the center of the element. Type II damage corresponded to the removal of 1/3 of the top half of the element. The removed section was located at the center of the damaged element. Type III damage corresponded to a complete cut through the center of the element. Fig. 9 shows a collection of all elements that were damaged. Mode shapes from the 17 damage scenarios and 5 undamaged baselines were measured. In each case, it was determined that there were five fundamental vibration modes for the truss structure that could be used for the purpose of damage detection. The selected modes can be described as follows: (1) the first bending in the X-direction; (2) the first bending in the Y-direction; (3) the first torsion; (4) the second bending in the X-direction; and (5) the second bending in the Y-direction. A visualization of these modes is provided in Fig. 10. The apparatus, test set-up, data collection, and analysis of the measured data are described in great detail by Carrasco et al. [12] Damage detection The location of potential damage in a given structure is implemented in a following manner. First, the damage index for each element j is calculated using Equation (9). Note that in this example all five modes are simultaneously used for the damage localization. Next, the normalized damage indicator, Zj, is calculated using Equation (10). Finally, pre-assigned decision rules are applied if the structure is damaged or not damaged at element j: (a) the element is damaged if Zj ≥ 3; (b) the element is not damage if Zj < 3. Table 9 summarizes results of the predicted damage locations for the 17 damage cases. The performance of the method is summarized in Table 10 according to the type of damage. The probability of localization varies from zero to one. For the type I damage (Damage Cases 1 to 4), which corresponded to a 180° x 1.6mm wide cut located at the center of the element, the proposed method fails to detect the correct locations of damage. Note that type I damage was inflicted at Members 87, 89, 141, and 215. These locations of damage were repeated in type III damage (completely cut at the center of the element) where perfectly detected (see Table 9). The poor performance on smaller damage cases (type I damage) might be attributed to the noise contained in the mode shapes. In other words, the noise level of the measurement system exceeds the level of damage. For the type II damage (Damage Cases 16 and 17), the proposed method correctly finds all damage locations. For the type III damage (Damage Cases 5 to 15), there are two locations of false negative error at Member 37 (Damage Cases 11 and 15). Note that Member 37 is one of the hexagonal member in the middle of the structure. This location has very low strain energy and the sensitivity calculated by Equation (1) is negligible. In overall, 16 locations are correctly detected for the 22 inflicted locations.
Table 8 – Inflicted damage
Damage Case Baseline Damaged element(s) Type of damage 1 89 Type I 2 87 Type I 3 215 Type I 4
1
141 Type I 5 2 89 Type III 6 87 Type III 7 180 Type III 8
3
215 Type III

Electronic Journal of Structural Engineering, 2 (2002) http://www.ejse.org/
2002 EJSE International. All rights reserved.
72eeJJSSEE International
9 141 Type III 10 144 Type III 11 37 Type III 12
4
87, 89 Type III 13 87, 215 Type III 14 89, 144 Type III 15 37, 180 Type III 16 177 Type II 17
5
99, 177 Type II
Table 9 – Damage location for laboratory experiment
Damage scenario Damage location(s) Case Damage type Inflicted Predicted
1 I 89 100, 294, 296, 299 2 I 87 57, 58, 72 3 I 215 137, 294, 296 4 I 141 1, 103, 225, 227, 228 5 III 89 57, 58, 89, 259 6 III 87 87 7 III 180 180, 295, 296, 298, 299 8 III 215 215, 286 9 III 141 57, 58, 141, 255, 256, 257
10 III 144 144 11 III 37 - 12 III 87, 89 87, 89 13 III 87, 215 87, 215 14 III 89, 144 89, 144 15 III 37, 180 26, 180, 295, 296, 298, 299 16 II 177 177, 289, 292 17 II 99, 177 99, 177, 296
Table 10 – Performance of method for the laboratory experiment
Damage Type
No. of Damage Location
No. of Correctly Predicted Locations (%)
No. of False Positives (%)
No. of False Negatives (%)
I 4 0(0%) 15(1.3%) 4(100%) II 3 3(100%) 3(0.5%) 0(0%) III 15 13(87%) 18(0.5%) 2(13%)
Total 22 16(73%) 36(0.7%) 6(27%)
Electronic Journal of Structural Engineering, 2 (2002) http://www.ejse.org/
2002 EJSE International. All rights reserved.
73eeJJSSEE International
(a) Test set-up
(b) Cross-section
Fig. 8 - Schematic of the space truss
Z
Y
X Node Number
Springs
Support Cable
W8 x 10 steel beam
Steel Rod
Aluminum Pipe
0.4m
0.2m
0.35m
60°
Y
X

Electronic Journal of Structural Engineering, 2 (2002) http://www.ejse.org/
2002 EJSE International. All rights reserved.
74eeJJSSEE International
Z
Y141 144
180
215
177
89 87
37
99
Fig. 9 – Inflicted damage locations for damage scenarios 1-17
Fig. 10 - Measured mode shapes for baseline structure
First bending in X-dir.
First bending in Y-dir.
First torsion
Second bending in X-dir.
Second bending in Y-dir.

Electronic Journal of Structural Engineering, 2 (2002) http://www.ejse.org/
2002 EJSE International. All rights reserved.
75eeJJSSEE International
5. Summary and Conclusions
The objective of this study was to examine the feasibility of the nondestructive damage detection theory in large/complex structures via systematic use of modal parameters (i.e., mode shapes). The theory was formulated to localize the damage in 3-D truss type structures. A finite element model representing a span of an actual truss bridge was developed to simulate four damage cases which ranged from the structure being damaged in one location to the structure being damaged in three locations. Next, the theory was applied to the experimental results of a 1:6 scale model of a typical hexagonal truss which subjected to three different types of damage.
From the results obtained, the following conclusions are drawn: (1) the nondestructive damage detection scheme proposed in this study can be applied successfully to large and complex structures; (2) damage detection results might be better if several modes are used simultaneously; and (3) the experimental study shows that the performance of proposed method might be significantly impacted by the noise in the measurement data, especially when small amount of damage is introduced. REFERENCES 1. Chang, F.-K. Structural health monitoring: A summary report on the first international
workshop on structural health monitoring. September 18-20, 1997. Proceedings of the 2nd International Workshop on Structural Health Monitoring. Stanford University, Stanford, California, 1999, pp. xix-xxix.
2. Rytter, A., Vibrational Based Inspection of Civil Engineering Structures. Ph.D. Dissertation, University of Aalborg, Aalborg, Denmark, 1993.
3. Gudmunson, P. Eigenfrequency Changes of Structures Due to Cracks, Notches or Other Geometrical Changes. J. Mech. Phys. Solids, V. 30, No. 5, 1982, pp. 339-353.
4. Stubbs, N., and Osegueda, R. Global Damage Detection in Solids-Experimental Verification. Int. J. Anal. Exp. Modal Analysis, V. 5, No. 2, 1990, pp. 81-97.
5. Biswas, M., Pandey, A.K. and Samman, M.M. Diagnostic Experimental Spectra/Modal Analysis of a Highway Bridge. Int. Journal of Analytical and Experimental Modal Analysis, V. 5, No. 1, 1990, pp. 33-42.
6. Crohas, H. and Lepert, P. Damage Detection Monitoring Method for Offshore Platforms Is Field Tested. Oil and Gas Journal, V. 80, No. 8, 1982, pp. 94-103.
7. Mazurek, D.F. and DeWolf, J.T. Experimental Study of Bridge Monitoring Technique. Journal of Structural Engineering, ASCE, V. 116, No. 9, 1990, pp. 2532-2549.
8. Pandey, A.K. and Biswas, M. Damage Detection in Structures Using Changes in Flexibility. Journal of Sound and Vibration, V. 169, No. 1, 1994, pp. 3-17.
9. Toksoy, T. and Aktan, A.E. Bridge-condition Assessment by Modal Flexibility. Experimental Mechanics, V. 34, No. 3, 1994, pp. 271-278.
10. Gibson, J.D. and Melsa, J.L. Introduction to Nonparametric Detection with Applications. Academic Press, New York, 1975.
11. ABAQUS Version 5.4 User Manual. Hibbitt, Karlsson & Sorensen, Inc., Providence, Rhode Island, 1994.
12. Carrasco, C.J., Osegueda, R.A., and Ferregut, C.M. Modal Tests of a Space Truss Model and Damage Localization Using Modal Strain Energy. Report No. Fast 96-01, University of Texas at El Paso, El Paso, Texas, 1996.
Copyright © 2022 FDOKUMEN