Spectral optical coherence tomography for nondestructive examinations
11
Optica Applicata, Vol. XXXVI, No. 4, 2006 Spectral optical coherence tomography for nondestructive examinations PIOTR TARGOWSKI 1 , TOMASZ BAJRASZEWSKI 1 , IWONA GORCZYŃSKA 1 , MICHALINA GÓRA 1 , ANNA SZKULMOWSKA 1 , MACIEJ SZKULMOWSKI 1 , MACIEJ WOJTKOWSKI 1 , JAKUB J. KALUZNY 2 , BARTLOMIEJ J. KALUZNY 2 , ANDRZEJ KOWALCZYK 1 1 Institute of Physics, Nicolaus Copernicus University, Grudziądzka 5, 87-100 Toruń, Poland 2 Department of Ophthalmology, Collegium Medicum, Nicolaus Copernicus University, M. Skłodowskiej-Curie 9, 85-094 Bydgoszcz, Poland An overview of the spectral optical coherence tomography which is the alternative to the traditional Time domain version is given. Examples of applications in ophthalmology as well as in art preservation are presented. Keywords: spectral optical coherence tomography, ophthalmic imaging, nondestructive testing. 1. Introduction Spectral optical coherence tomography (SOCT) [1] compared to the classical time domain optical coherence tomography (TdOCT) [2] offers a better signal-to-noise ratio [3–5]. Additionally, this method permits one line of an image (an A-scan) to be collected at a time as short as 30 microseconds, thus 100 times faster than in TdOCT. The short data collection time dramatically reduces motion artifacts and leads to improvement of the image quality by increasing the line density. Furthermore, it opens space for new applications such as in vivo 3D imaging [6–10], tomographic movies [9] for investigation of microstructure dynamics of tissues and surfaces of oil paintings. It also expands the scale of measured phase differences, and consequently, increases the measurement range of velocities (e.g., of blood flow in vessels [11, 12]) varying from 0.1 to 5 mm/s. Direct access to spectral data facilitates numerical dispersion correction and absorption measurements. This contribution reviews the physical foundations of SOCT and its implementation. The paper presents examples of nondestructive examinations in ophthalmology as well as in the art conservation. 2. The method In SOCT, the information on locations of structural elements (interfaces) within the object is encoded in the recorded spectrum and must be extracted with the aid of Fourier
-
Upload
independent -
Category
Documents
-
view
0 -
download
0
Transcript of Spectral optical coherence tomography for nondestructive examinations

Optica Applicata, Vol. XXXVI, No. 4, 2006
Spectral optical coherence tomography for nondestructive examinations PIOTR TARGOWSKI1, TOMASZ BAJRASZEWSKI1, IWONA GORCZYŃSKA1, MICHALINA GÓRA1, ANNA SZKULMOWSKA1, MACIEJ SZKULMOWSKI1, MACIEJ WOJTKOWSKI1, JAKUB J. KALUZNY2, BARTLOMIEJ J. KALUZNY2, ANDRZEJ KOWALCZYK1
1Institute of Physics, Nicolaus Copernicus University, Grudziądzka 5, 87-100 Toruń, Poland
2Department of Ophthalmology, Collegium Medicum, Nicolaus Copernicus University, M. Skłodowskiej-Curie 9, 85-094 Bydgoszcz, Poland
An overview of the spectral optical coherence tomography which is the alternative to the traditionalTime domain version is given. Examples of applications in ophthalmology as well as in artpreservation are presented.
Keywords: spectral optical coherence tomography, ophthalmic imaging, nondestructive testing.
1. Introduction
Spectral optical coherence tomography (SOCT) [1] compared to the classical timedomain optical coherence tomography (TdOCT) [2] offers a better signal-to-noise ratio[3–5]. Additionally, this method permits one line of an image (an A-scan) to becollected at a time as short as 30 microseconds, thus 100 times faster than in TdOCT.The short data collection time dramatically reduces motion artifacts and leads toimprovement of the image quality by increasing the line density. Furthermore, it opensspace for new applications such as in vivo 3D imaging [6–10], tomographic movies[9] for investigation of microstructure dynamics of tissues and surfaces of oil paintings.It also expands the scale of measured phase differences, and consequently, increasesthe measurement range of velocities (e.g., of blood flow in vessels [11, 12]) varyingfrom 0.1 to 5 mm/s. Direct access to spectral data facilitates numerical dispersioncorrection and absorption measurements.
This contribution reviews the physical foundations of SOCT and itsimplementation. The paper presents examples of nondestructive examinations inophthalmology as well as in the art conservation.
2. The method
In SOCT, the information on locations of structural elements (interfaces) within theobject is encoded in the recorded spectrum and must be extracted with the aid of Fourier
610 P. TARGOWSKI et al.
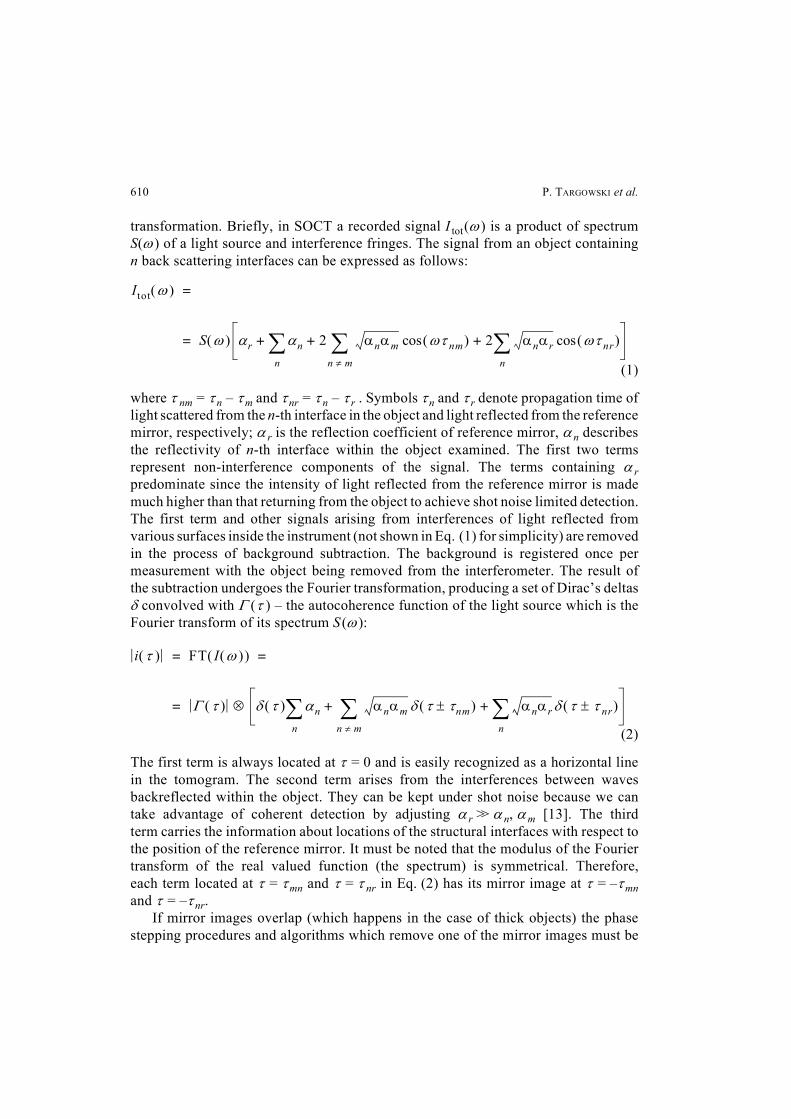
transformation. Briefly, in SOCT a recorded signal I tot(ω ) is a product of spectrumS(ω ) of a light source and interference fringes. The signal from an object containingn back scattering interfaces can be expressed as follows:
(1)
where τ nm = τ n – τ m and τnr = τ n – τ r . Symbols τn and τ r denote propagation time oflight scattered from the n-th interface in the object and light reflected from the referencemirror, respectively; α r is the reflection coefficient of reference mirror, αn describesthe reflectivity of n-th interface within the object examined. The first two termsrepresent non-interference components of the signal. The terms containing α rpredominate since the intensity of light reflected from the reference mirror is mademuch higher than that returning from the object to achieve shot noise limited detection.The first term and other signals arising from interferences of light reflected fromvarious surfaces inside the instrument (not shown in Eq. (1) for simplicity) are removedin the process of background subtraction. The background is registered once permeasurement with the object being removed from the interferometer. The result ofthe subtraction undergoes the Fourier transformation, producing a set of Dirac’s deltasδ convolved with Γ (τ ) – the autocoherence function of the light source which is theFourier transform of its spectrum S (ω ):
(2)
The first term is always located at τ = 0 and is easily recognized as a horizontal linein the tomogram. The second term arises from the interferences between wavesbackreflected within the object. They can be kept under shot noise because we cantake advantage of coherent detection by adjusting α r >> αn, αm [13]. The thirdterm carries the information about locations of the structural interfaces with respect tothe position of the reference mirror. It must be noted that the modulus of the Fouriertransform of the real valued function (the spectrum) is symmetrical. Therefore,each term located at τ = τmn and τ = τ nr in Eq. (2) has its mirror image at τ = –τmnand τ = –τ nr.
If mirror images overlap (which happens in the case of thick objects) the phasestepping procedures and algorithms which remove one of the mirror images must be
Itot ω( )
S ω( ) αr αn 2 αnαm ωτ nm( ) 2 αnαr ωτ nr( )cosn∑+cos
n m≠∑+
n∑+
=
=
i τ( ) FT I ω( )( )
Γ τ( ) δ τ( ) αn αnαm δ τ τnm±( ) αnαr δ τ τ nr±( )n∑+
n m≠∑+
n∑⊗
= =
=
Spectral optical coherence tomography for nondestructive examinations 611
adapted [14–17]. This is done at the cost of extending the measurement time by twoto four times.
The major advantage of SOCT lies in the high acquisition speed, which is due notonly to the lack of moving parts in the reference arm, but also to the high signal-to-noiseratio. The latter permits a short exposition time of the CCD, even for low irradiationof the object (the eye, a painting). It is possible to obtain high quality tomograms witha speed of 30000 A-scans per second even with irradiation level of 200 µW, which isespecially important in the case of eye imaging [18].
It can be roughly estimated that SOCT systems are a hundred times faster thanTdOCT. This advantage of speed is usually used to get A-scans of high density,with transversal scanner step much smaller than the lateral resolution (Fig. 2). Suchover-sampled tomograms show increase in the sensitivity and quality [18, 19]. Asa rule of thumb, collection of about 1000 A-scans per one millimeter of an image maybe recommended. This procedure also increases the number of details visible byreducing the effective speckle size and improves the delineation of internal structure.
Another significant advantage of SOCT lies in dispersion correction. If a verybroadband light source is used in OCT instrument to achieve high axial resolution, thequality of resulting tomograms is disappointingly spoiled by a dispersion broadening.This effect can be limited by a careful balance of dispersion in both arms of theinterferometer, but usually cannot be completely eliminated, mostly due to the refractionin the object examined (vitreous in the eye, varnish and paint layer in the painting). Incontrast to time domain, the SOCT offers additional ability of numerical correctionduring the post-processing of the image. This numerically effective and simple methodis possible due to the availability of spectral information of interfering light [10].
3. The instrument
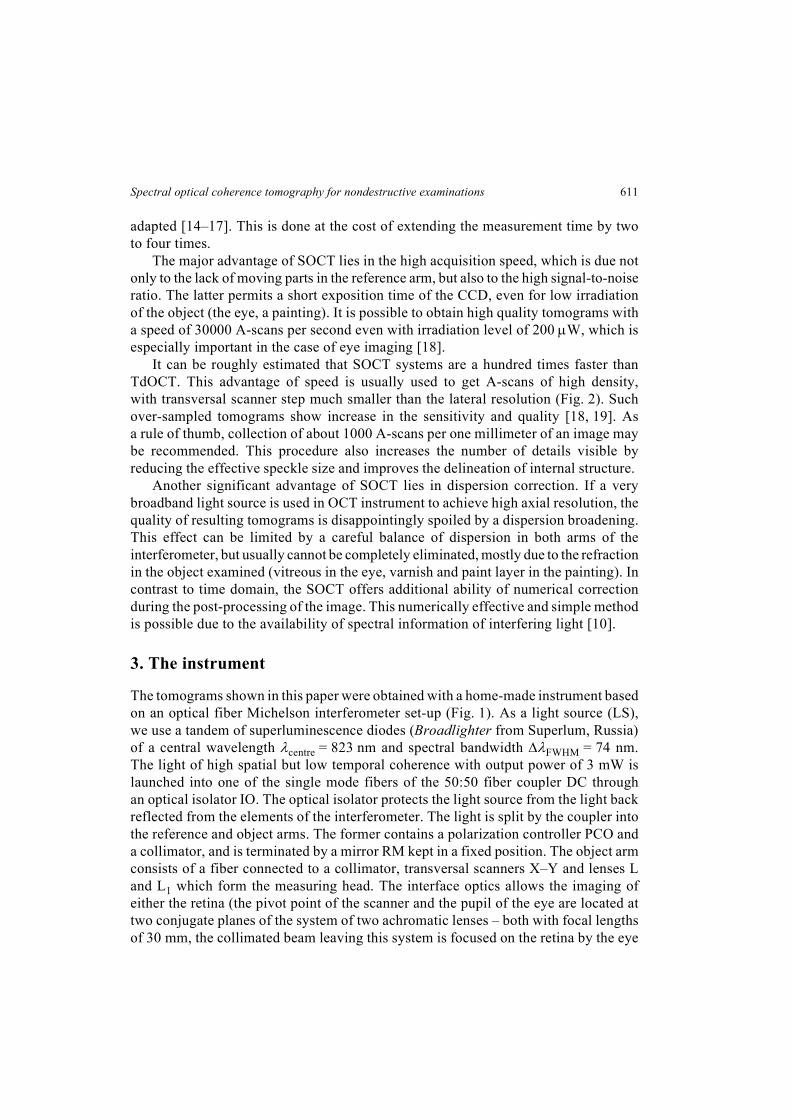
The tomograms shown in this paper were obtained with a home-made instrument basedon an optical fiber Michelson interferometer set-up (Fig. 1). As a light source (LS),we use a tandem of superluminescence diodes (Broadlighter from Superlum, Russia)of a central wavelength λcentre = 823 nm and spectral bandwidth ∆λFWHM = 74 nm.The light of high spatial but low temporal coherence with output power of 3 mW islaunched into one of the single mode fibers of the 50:50 fiber coupler DC throughan optical isolator IO. The optical isolator protects the light source from the light backreflected from the elements of the interferometer. The light is split by the coupler intothe reference and object arms. The former contains a polarization controller PCO anda collimator, and is terminated by a mirror RM kept in a fixed position. The object armconsists of a fiber connected to a collimator, transversal scanners X–Y and lenses Land L1 which form the measuring head. The interface optics allows the imaging ofeither the retina (the pivot point of the scanner and the pupil of the eye are located attwo conjugate planes of the system of two achromatic lenses – both with focal lengthsof 30 mm, the collimated beam leaving this system is focused on the retina by the eye
612 P. TARGOWSKI et al.
lens) or the anterior part of the eye (additional achromatic lens with f = 25.4 mm isplaced after the two achromatic doublets that focus the beam on a desired structure).The former arrangement is used to investigations of the art items. The narrow beamof light penetrates the object, scatters from the elements of its structure, then iscollected by the same optics L and L1 back to the coupler DC. Then it interferes withthe light returning from the reference arm and the interference signal is analysed andregistered by a spectrometer. It consists of a volume phase holographic grating DGwith 1200 lines/mm and achromatic lens SL ( f = 150 mm) which focuses the spectrumon a 12-bit line scan CCD camera. The spectral fringe patterns registered by thisdetector are then transferred to a personal computer COMP. The resulting signal isFourier transformed into an A-scan.
The system operates in the shot noise limited detection mode (the intensity of lightin the reference arm of interferometer is controlled by neutral density filter NDF) withsensitivity of 90 dB. The exposure time per A-scan is usually equal to 42 µs.
The axial resolution of the system (equals to the coherence length of the light) is4 µm in the medium with a refractive index ranging from 1.3 to 1.5. The transversalresolution is determined by the dimension of a light spot and depends on the apertureand aberration of the beam forming objective. In the case of the retina examination theoptical system of the eye forms a light spot amounting to approximately 20 micrometers.In the case of corneal and art conservation imaging the transversal resolution is below10 µm. In order to obtain either 2D slice (B-scan) or 3D volume tomogram the beamis scanned transversally by galvanometric scanners X–Y.
The signal is visualized in real time as a cross-sectional view and stored forpost-processing. The numerical processing of the data, despite of the fast Fouriertransformation, essential to the SOCT method, includes: subtraction of non-interference
Fig. 1. Diagram of the instrument: LS – superluminescent light source, IO – fiber isolator, DC – directionalfiber coupler, PCO – polarization controller, NDF – neutral density filter, RM – reference arm mirror,X–Y – galvoscanner, L1, L – lenses, DG – diffraction grating, SL – spectrometer lens, CCD – line scancamera, COMP – personal computer.

Spectral optical coherence tomography for nondestructive examinations 613
background, spectral shaping [20] and numerical dispersion correction [10]. If necessary,in the case of 3D imaging, individual B-scans are automatically aligned to compensatefor involuntary movements of the eye.
The eye examinations were performed at the eye clinic of the University Hospitalfollowing permission from the Ethic Committee. The optical power at the eye was keptat the level of about 700 µW, below the ANSI safety standard [21].
4. Results
4.1. Retinal imagingIn Figure 2, cross-sectional images of the same human retina, obtained with differentlateral scanning density, but with the same axial resolution, are presented. In panel a,the scanning step is equal to the lateral resolution. In panel b, the same retina is scannedwith oversampling. Increasing the density of scanning significantly improves theimage quality and thus its diagnostic applicability. The examination time (0.3 s) is stillshort enough to eliminate artifacts caused by involuntary movements of the eye.
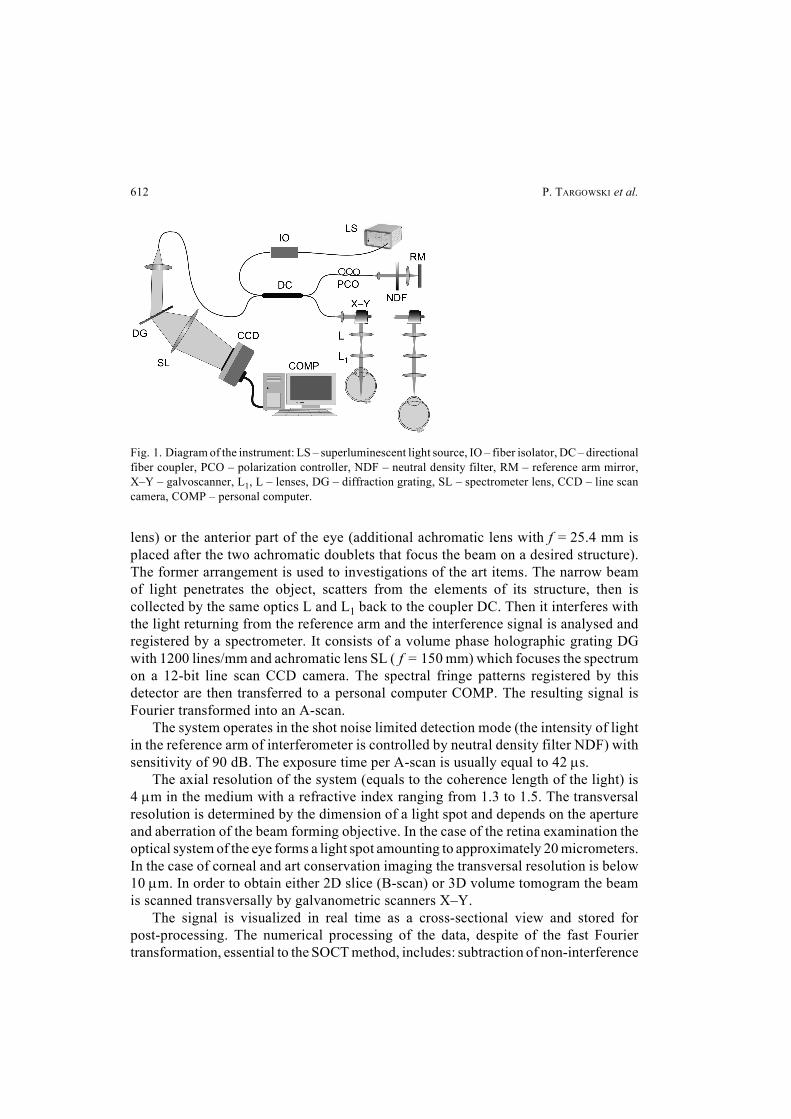
High speed of SOCT allows real time imaging or recording of tomographic moviesshowing functional properties of the tissue examined such as blood vessel pulsations[9]. It also permits a 3D imaging (Fig. 3) in examination time acceptable for a patient.In this case both transversal scanners X–Y (Fig. 1) are utilized: one of the scannersmoves slowly to collect a set of B-scans; each of these is obtained by fast sweep ofthe second scanner. As a result a “flow trough” tomographic movies can be generatedas a new aid for medical diagnosis. If the 3D data set is recorded with sufficientdensity of B-scans, other cross-sections in directions different from those originallyrecorded may be generated. Moreover, by simply adding all intensities over wholeA-scans, the fundus camera-like image can be generated:
(3)I eimag i τ( )τ
∑=
Fig. 2. Cross-sectional images of a human retina obtained with SOCT instrument. The bars indicate200 µm in both directions: an image obtained with the scanner step equal to 15 µm, examination timeequal to 0.02 s (a); the same retina scanned with the step of 1 µm, examination time equal to 0.3 s (b).Only in panel b posterior face of vitreous body indicating its partial detachment is visible.
a b
614 P. TARGOWSKI et al.
The image (Fig. 3a) obtained with the aid of Eq. (3) permits the OCT tomogramto be precisely correlated with a fundus view, which ophthalmologists are used toexamine.
The fast 3D imaging offers the possibility to create thickness maps of certain retinallayers and topographic visualization of chosen surfaces.
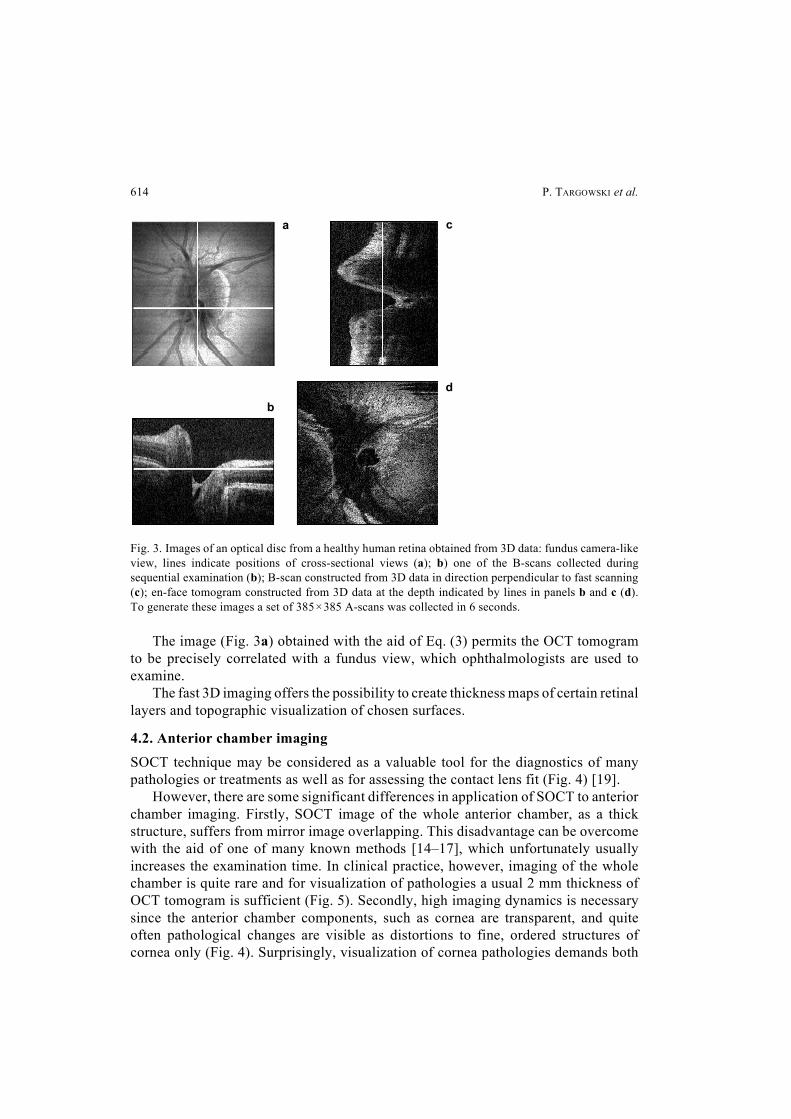
4.2. Anterior chamber imagingSOCT technique may be considered as a valuable tool for the diagnostics of manypathologies or treatments as well as for assessing the contact lens fit (Fig. 4) [19].
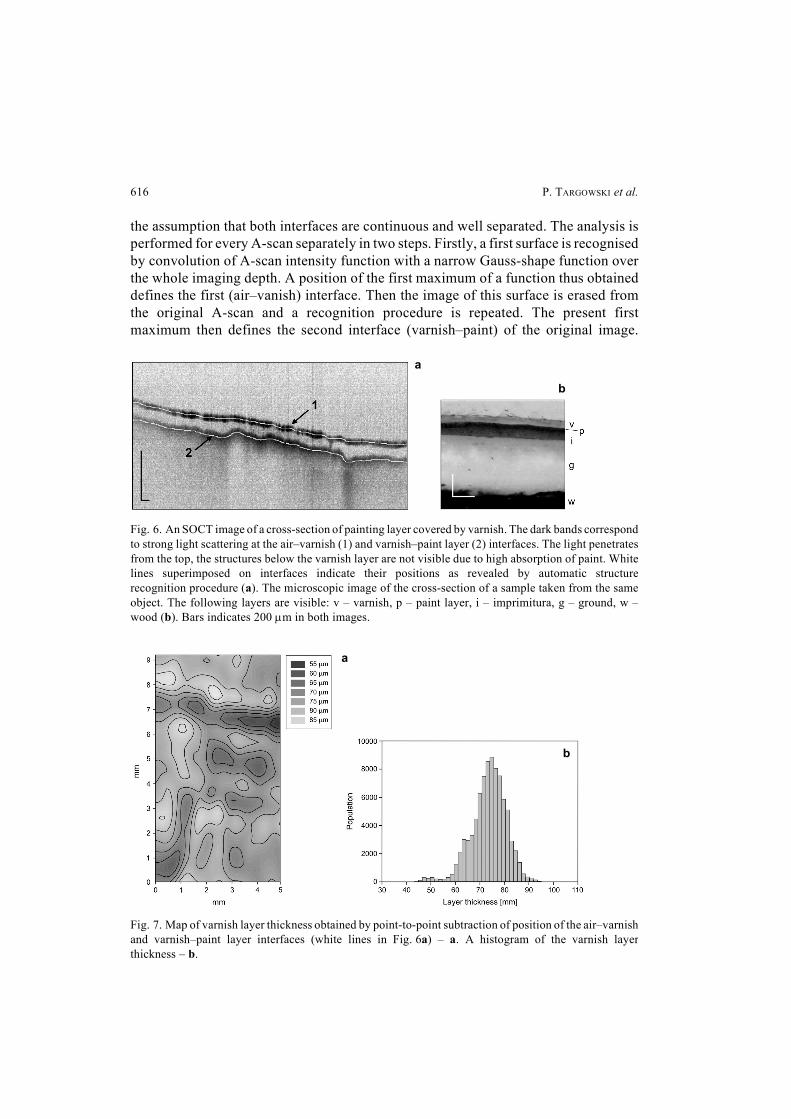
However, there are some significant differences in application of SOCT to anteriorchamber imaging. Firstly, SOCT image of the whole anterior chamber, as a thickstructure, suffers from mirror image overlapping. This disadvantage can be overcomewith the aid of one of many known methods [14–17], which unfortunately usuallyincreases the examination time. In clinical practice, however, imaging of the wholechamber is quite rare and for visualization of pathologies a usual 2 mm thickness ofOCT tomogram is sufficient (Fig. 5). Secondly, high imaging dynamics is necessarysince the anterior chamber components, such as cornea are transparent, and quiteoften pathological changes are visible as distortions to fine, ordered structures ofcornea only (Fig. 4). Surprisingly, visualization of cornea pathologies demands both
Fig. 3. Images of an optical disc from a healthy human retina obtained from 3D data: fundus camera-likeview, lines indicate positions of cross-sectional views (a); b) one of the B-scans collected duringsequential examination (b); B-scan constructed from 3D data in direction perpendicular to fast scanning(c); en-face tomogram constructed from 3D data at the depth indicated by lines in panels b and c (d).To generate these images a set of 385×385 A-scans was collected in 6 seconds.
a
b
c
d
Spectral optical coherence tomography for nondestructive examinations 615
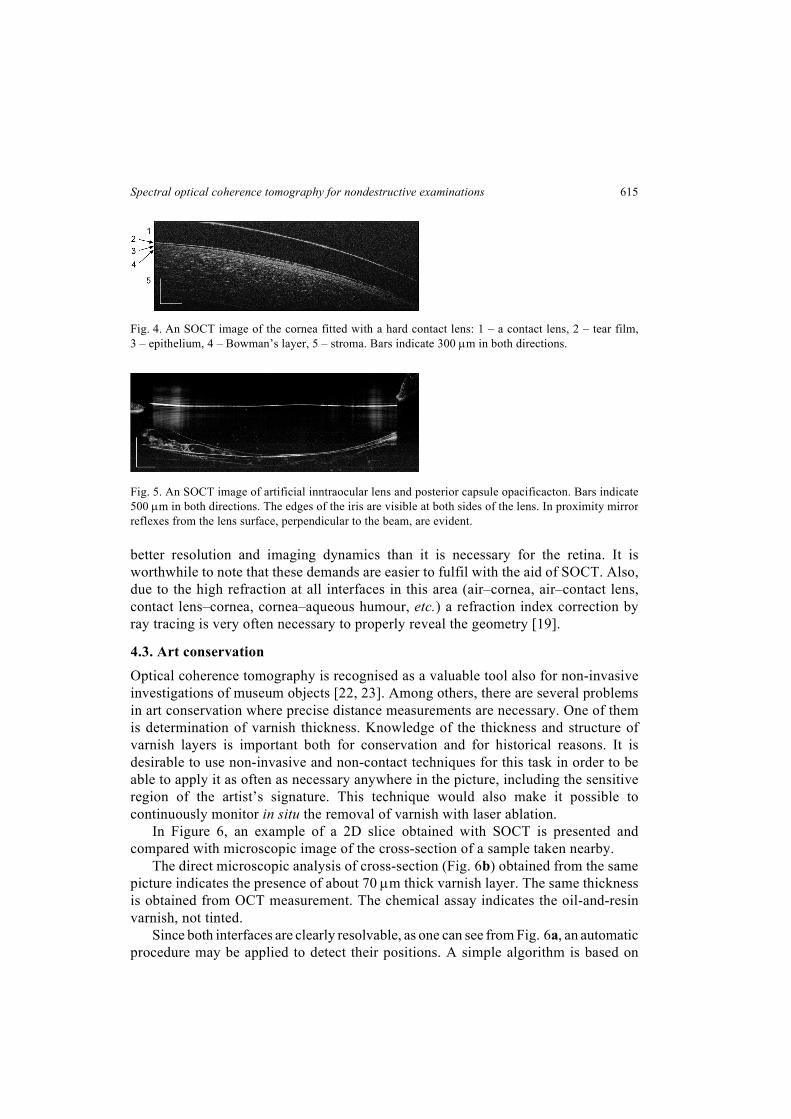
better resolution and imaging dynamics than it is necessary for the retina. It isworthwhile to note that these demands are easier to fulfil with the aid of SOCT. Also,due to the high refraction at all interfaces in this area (air–cornea, air–contact lens,contact lens–cornea, cornea–aqueous humour, etc.) a refraction index correction byray tracing is very often necessary to properly reveal the geometry [19].
4.3. Art conservationOptical coherence tomography is recognised as a valuable tool also for non-invasiveinvestigations of museum objects [22, 23]. Among others, there are several problemsin art conservation where precise distance measurements are necessary. One of themis determination of varnish thickness. Knowledge of the thickness and structure ofvarnish layers is important both for conservation and for historical reasons. It isdesirable to use non-invasive and non-contact techniques for this task in order to beable to apply it as often as necessary anywhere in the picture, including the sensitiveregion of the artist’s signature. This technique would also make it possible tocontinuously monitor in situ the removal of varnish with laser ablation.
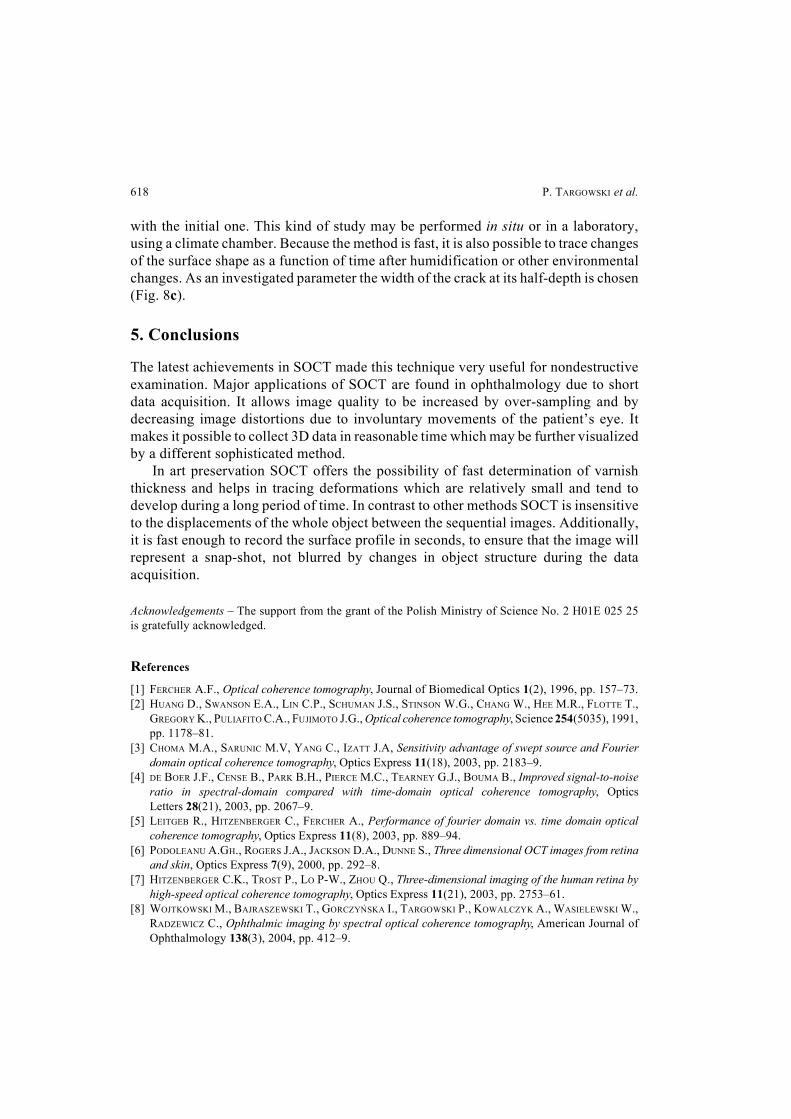
In Figure 6, an example of a 2D slice obtained with SOCT is presented andcompared with microscopic image of the cross-section of a sample taken nearby.
The direct microscopic analysis of cross-section (Fig. 6b) obtained from the samepicture indicates the presence of about 70 µm thick varnish layer. The same thicknessis obtained from OCT measurement. The chemical assay indicates the oil-and-resinvarnish, not tinted.
Since both interfaces are clearly resolvable, as one can see from Fig. 6a, an automaticprocedure may be applied to detect their positions. A simple algorithm is based on
Fig. 5. An SOCT image of artificial inntraocular lens and posterior capsule opacificacton. Bars indicate500 µm in both directions. The edges of the iris are visible at both sides of the lens. In proximity mirrorreflexes from the lens surface, perpendicular to the beam, are evident.
Fig. 4. An SOCT image of the cornea fitted with a hard contact lens: 1 – a contact lens, 2 – tear film,3 – epithelium, 4 – Bowman’s layer, 5 – stroma. Bars indicate 300 µm in both directions.
616 P. TARGOWSKI et al.
the assumption that both interfaces are continuous and well separated. The analysis isperformed for every A-scan separately in two steps. Firstly, a first surface is recognisedby convolution of A-scan intensity function with a narrow Gauss-shape function overthe whole imaging depth. A position of the first maximum of a function thus obtaineddefines the first (air–vanish) interface. Then the image of this surface is erased fromthe original A-scan and a recognition procedure is repeated. The present firstmaximum then defines the second interface (varnish–paint) of the original image.
Fig. 6. An SOCT image of a cross-section of painting layer covered by varnish. The dark bands correspondto strong light scattering at the air–varnish (1) and varnish–paint layer (2) interfaces. The light penetratesfrom the top, the structures below the varnish layer are not visible due to high absorption of paint. Whitelines superimposed on interfaces indicate their positions as revealed by automatic structurerecognition procedure (a). The microscopic image of the cross-section of a sample taken from the sameobject. The following layers are visible: v – varnish, p – paint layer, i – imprimitura, g – ground, w –wood (b). Bars indicates 200 µm in both images.
a
b
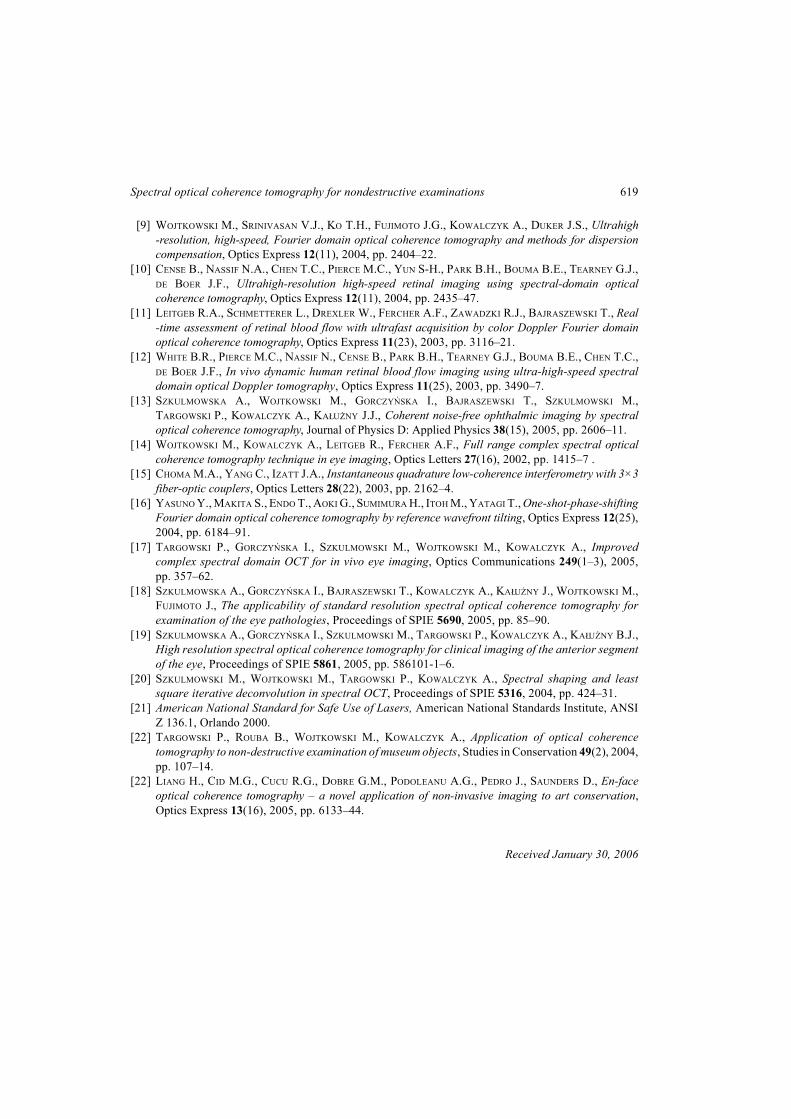
Fig. 7. Map of varnish layer thickness obtained by point-to-point subtraction of position of the air–varnishand varnish–paint layer interfaces (white lines in Fig. 6a) – a. A histogram of the varnish layerthickness – b.
a
b

Spectral optical coherence tomography for nondestructive examinations 617
Finally, the interfaces obtained are smoothed with a median filter. An exemplary resultis shown in Fig. 6a as white lines superimposed on the OCT image.
The above procedure may be applied to a set of parallel B-scans and surfacetopography may thus be obtained. A point-to-point subtraction of both interfacepositions gives a varnish layer thickness map (Fig. 7a). This kind of data may be usefulin planning varnish layer removal, for instance, by laser ablation.
Another problem is investigation of surface deformations of oil paintings on canvasduring exposure to periodic changes of temperature and air humidity. Thesedeformations of canvas support may lead to progressive destruction of the paintlayer. The knowledge of the range and dynamics of these processes is importantfor preservation of artworks. Therefore, there is a need for precise profilometry ofthe painting surface.
In Figure 8a, a perspective view of surface profile (near the crack) of the sampleof oil painting on linen canvas is presented. The surface profile recovering algorithmis similar to that used for the data shown in Fig. 7, but only the first air–paint interfaceis taken into account. Since the profile is given in digital form, a cross-section in anyarbitrary plane may also be extracted (Fig. 8b). Similar data may be obtained in alteredenvironmental conditions, for example, after a humidity jump and directly compared
Fig. 8. A cracked paint surface reconstructed from the OCT data where the plane where the cross-sectionis extracted is also shown (a); a profile of the crack obtained in the cross-section plane (b); changes ofthe crack width caused by a surrounding humidity jump to 100 RH (c).
a
b
c
618 P. TARGOWSKI et al.
with the initial one. This kind of study may be performed in situ or in a laboratory,using a climate chamber. Because the method is fast, it is also possible to trace changesof the surface shape as a function of time after humidification or other environmentalchanges. As an investigated parameter the width of the crack at its half-depth is chosen(Fig. 8c).
5. Conclusions
The latest achievements in SOCT made this technique very useful for nondestructiveexamination. Major applications of SOCT are found in ophthalmology due to shortdata acquisition. It allows image quality to be increased by over-sampling and bydecreasing image distortions due to involuntary movements of the patient’s eye. Itmakes it possible to collect 3D data in reasonable time which may be further visualizedby a different sophisticated method.
In art preservation SOCT offers the possibility of fast determination of varnishthickness and helps in tracing deformations which are relatively small and tend todevelop during a long period of time. In contrast to other methods SOCT is insensitiveto the displacements of the whole object between the sequential images. Additionally,it is fast enough to record the surface profile in seconds, to ensure that the image willrepresent a snap-shot, not blurred by changes in object structure during the dataacquisition.
Acknowledgements – The support from the grant of the Polish Ministry of Science No. 2 H01E 025 25is gratefully acknowledged.
References
[1] FERCHER A.F., Optical coherence tomography, Journal of Biomedical Optics 1(2), 1996, pp. 157–73.[2] HUANG D., SWANSON E.A., LIN C.P., SCHUMAN J.S., STINSON W.G., CHANG W., HEE M.R., FLOTTE T.,
GREGORY K., PULIAFITO C.A., FUJIMOTO J.G., Optical coherence tomography, Science 254(5035), 1991,pp. 1178–81.
[3] CHOMA M.A., SARUNIC M.V, YANG C., IZATT J.A, Sensitivity advantage of swept source and Fourierdomain optical coherence tomography, Optics Express 11(18), 2003, pp. 2183–9.
[4] DE BOER J.F., CENSE B., PARK B.H., PIERCE M.C., TEARNEY G.J., BOUMA B., Improved signal-to-noiseratio in spectral-domain compared with time-domain optical coherence tomography, OpticsLetters 28(21), 2003, pp. 2067–9.
[5] LEITGEB R., HITZENBERGER C., FERCHER A., Performance of fourier domain vs. time domain opticalcoherence tomography, Optics Express 11(8), 2003, pp. 889–94.
[6] PODOLEANU A.GH., ROGERS J.A., JACKSON D.A., DUNNE S., Three dimensional OCT images from retinaand skin, Optics Express 7(9), 2000, pp. 292–8.
[7] HITZENBERGER C.K., TROST P., LO P-W., ZHOU Q., Three-dimensional imaging of the human retina byhigh-speed optical coherence tomography, Optics Express 11(21), 2003, pp. 2753–61.
[8] WOJTKOWSKI M., BAJRASZEWSKI T., GORCZYŃSKA I., TARGOWSKI P., KOWALCZYK A., WASIELEWSKI W.,RADZEWICZ C., Ophthalmic imaging by spectral optical coherence tomography, American Journal ofOphthalmology 138(3), 2004, pp. 412–9.
Spectral optical coherence tomography for nondestructive examinations 619
[9] WOJTKOWSKI M., SRINIVASAN V.J., KO T.H., FUJIMOTO J.G., KOWALCZYK A., DUKER J.S., Ultrahigh-resolution, high-speed, Fourier domain optical coherence tomography and methods for dispersioncompensation, Optics Express 12(11), 2004, pp. 2404–22.
[10] CENSE B., NASSIF N.A., CHEN T.C., PIERCE M.C., YUN S-H., PARK B.H., BOUMA B.E., TEARNEY G.J.,DE BOER J.F., Ultrahigh-resolution high-speed retinal imaging using spectral-domain opticalcoherence tomography, Optics Express 12(11), 2004, pp. 2435–47.
[11] LEITGEB R.A., SCHMETTERER L., DREXLER W., FERCHER A.F., ZAWADZKI R.J., BAJRASZEWSKI T., Real-time assessment of retinal blood flow with ultrafast acquisition by color Doppler Fourier domainoptical coherence tomography, Optics Express 11(23), 2003, pp. 3116–21.
[12] WHITE B.R., PIERCE M.C., NASSIF N., CENSE B., PARK B.H., TEARNEY G.J., BOUMA B.E., CHEN T.C.,DE BOER J.F., In vivo dynamic human retinal blood flow imaging using ultra-high-speed spectraldomain optical Doppler tomography, Optics Express 11(25), 2003, pp. 3490–7.
[13] SZKULMOWSKA A., WOJTKOWSKI M., GORCZYŃSKA I., BAJRASZEWSKI T., SZKULMOWSKI M.,TARGOWSKI P., KOWALCZYK A., KAŁUŻNY J.J., Coherent noise-free ophthalmic imaging by spectraloptical coherence tomography, Journal of Physics D: Applied Physics 38(15), 2005, pp. 2606–11.
[14] WOJTKOWSKI M., KOWALCZYK A., LEITGEB R., FERCHER A.F., Full range complex spectral opticalcoherence tomography technique in eye imaging, Optics Letters 27(16), 2002, pp. 1415–7 .
[15] CHOMA M.A., YANG C., IZATT J.A., Instantaneous quadrature low-coherence interferometry with 3×3fiber-optic couplers, Optics Letters 28(22), 2003, pp. 2162–4.
[16] YASUNO Y., MAKITA S., ENDO T., AOKI G., SUMIMURA H., ITOH M., YATAGI T., One-shot-phase-shiftingFourier domain optical coherence tomography by reference wavefront tilting, Optics Express 12(25),2004, pp. 6184–91.
[17] TARGOWSKI P., GORCZYŃSKA I., SZKULMOWSKI M., WOJTKOWSKI M., KOWALCZYK A., Improvedcomplex spectral domain OCT for in vivo eye imaging, Optics Communications 249(1–3), 2005,pp. 357–62.
[18] SZKULMOWSKA A., GORCZYŃSKA I., BAJRASZEWSKI T., KOWALCZYK A., KAŁUŻNY J., WOJTKOWSKI M.,FUJIMOTO J., The applicability of standard resolution spectral optical coherence tomography forexamination of the eye pathologies, Proceedings of SPIE 5690, 2005, pp. 85–90.
[19] SZKULMOWSKA A., GORCZYŃSKA I., SZKULMOWSKI M., TARGOWSKI P., KOWALCZYK A., KAŁUŻNY B.J.,High resolution spectral optical coherence tomography for clinical imaging of the anterior segmentof the eye, Proceedings of SPIE 5861, 2005, pp. 586101-1–6.
[20] SZKULMOWSKI M., WOJTKOWSKI M., TARGOWSKI P., KOWALCZYK A., Spectral shaping and leastsquare iterative deconvolution in spectral OCT, Proceedings of SPIE 5316, 2004, pp. 424–31.
[21] American National Standard for Safe Use of Lasers, American National Standards Institute, ANSIZ 136.1, Orlando 2000.
[22] TARGOWSKI P., ROUBA B., WOJTKOWSKI M., KOWALCZYK A., Application of optical coherencetomography to non-destructive examination of museum objects, Studies in Conservation 49(2), 2004,pp. 107–14.
[22] LIANG H., CID M.G., CUCU R.G., DOBRE G.M., PODOLEANU A.G., PEDRO J., SAUNDERS D., En-faceoptical coherence tomography – a novel application of non-invasive imaging to art conservation,Optics Express 13(16), 2005, pp. 6133–44.
Received January 30, 2006