Dose calculation using megavoltage cone-beam CT
10
doi:10.1016/j.ijrobp.2006.10.048 PHYSICS CONTRIBUTION DOSE CALCULATION USING MEGAVOLTAGE CONE-BEAM CT OLIVIER MORIN, B.SC.,* † JOSEPHINE CHEN,PH.D.,* MICHÈLE AUBIN, M.S.E.E.,* AMY GILLIS, M.D.,* JEAN-FRANÇOIS AUBRY, M.SC.,* SUPRATIK BOSE,PH.D., ‡ HONG CHEN,PH.D.,* MARTINA DESCOVICH,PH.D.,* PING XIA,PH.D.,* † AND JEAN POULIOT,PH.D.* † *Comprehensive Cancer Center, Department of Radiation Oncology, University of California, San Francisco, San Francisco, CA; † University of California San Francisco and Berkeley, Joint Graduate Group in Bioengineering, San Francisco, CA; ‡ Siemens Medical Solutions, Oncology Care Systems Group, Concord, CA Purpose: To demonstrate the feasibility of performing dose calculation on megavoltage cone-beam CT (MVCBCT) of head-and-neck patients in order to track the dosimetric errors produced by anatomic changes. Methods and Materials: A simple geometric model was developed using a head-size water cylinder to correct an observed cupping artifact occurring with MVCBCT. The uniformity-corrected MVCBCT was calibrated for physical density. Beam arrangements and weights from the initial treatment plans defined using the conventional CT were applied to the MVCBCT image, and the dose distribution was recalculated. The dosimetric inaccuracies caused by the cupping artifact were evaluated on the water phantom images. An ideal test patient with no observable anatomic changes and a patient imaged with both CT and MVCBCT before and after considerable weight loss were used to clinically validate MVCBCT for dose calculation and to determine the dosimetric impact of large anatomic changes. Results: The nonuniformity of a head-size water phantom (30%) causes a dosimetric error of less than 5%. The uniformity correction method developed greatly reduces the cupping artifact, resulting in dosimetric inaccuracies of less than 1%. For the clinical cases, the agreement between the dose distributions calculated using MVCBCT and CT was better than 3% and 3 mm where all tissue was encompassed within the MVCBCT. Dose–volume histograms from the dose calculations on CT and MVCBCT were in excellent agreement. Conclusion: MVCBCT can be used to estimate the dosimetric impact of changing anatomy on several structures in the head-and-neck region. © 2007 Elsevier Inc. Dose calculation, Cone-beam CT, Planning with megavoltage cone-beam CT, Anatomic changes, Weight loss. INTRODUCTION Image-based treatment planning has become the gold stan- dard in radiotherapy (RT). In current practice, a kilovoltage CT (kVCT) scanner is used to acquire a three-dimensional (3D) snapshot of the patient anatomy before the beginning of therapy. This 3D image is imported, as a reference, to a treatment planning system to define the treatment isocenter, contour anatomic structures (target and organs at risk), and choose a beam arrangement to deliver a dose distribution that conforms to the given dose prescriptions and limita- tions. Ideally, the dose delivered upon completion of RT would be identical to the planned dose. In reality, sources of error exist related to patient positioning, anatomic variations over time, the dose calculation engine, and the treatment machine output that will make the dose delivered differ from what was intended. These variables may potentially reduce the probability of tumor control and increase the severity of any side effects. Numerous investigators have reported that organs may shift in size, shape, and position from day to day and week to week because of normal anatomic variability, as well as clinical changes over time, such as tumor shrinkage, edema, or weight loss (1–3). It is fairly common (33%) for head-and-neck cancer patients to have severe weight loss of up to 58% of their pretreat- Reprint requests to: Olivier Morin, B.Sc., Comprehensive Can- cer Center, Department of Radiation Oncology, University of California San Francisco, 1600 Divisadero St., Suite H1031, San Francisco, CA 94143. Tel: (415) 353-7167; Fax: (415) 353-9883; E-mail: [email protected] Presented in part at the 47th Annual Meeting of the American Society for Therapeutic Radiology and Oncology (ASTRO), Den- ver, CO, October 16 –20, 2005. This research was partly funded by Siemens Oncology Care Systems. O. Morin and J.-F. Aubry received a scholarship from the National Sciences and Engineering Research Council of Canada (NSERC). Conflict of interest: none. Acknowledgments—The authors acknowledge the following per- sons for their valuable contributions: at UCSF, Chris Malfatti for the acquisition of phantom images as well as Jeff Bellerose and Clayton Akazawa for planning and contouring on CT and MVCBCT images. At Siemens Oncology Care Systems (OCS), Ali Bani-Hashemi and his team. Received May 25, 2006, and in revised form Sept 22, 2006. Accepted for publication Oct 20, 2006. Int. J. Radiation Oncology Biol. Phys., Vol. xx, No. x, pp. xxx, 2007 Copyright © 2007 Elsevier Inc. Printed in the USA. All rights reserved 0360-3016/07/$–see front matter 1
-
Upload
independent -
Category
Documents
-
view
2 -
download
0
Transcript of Dose calculation using megavoltage cone-beam CT

doi:10.1016/j.ijrobp.2006.10.048
PHYSICS CONTRIBUTION
DOSE CALCULATION USING MEGAVOLTAGE CONE-BEAM CT
OLIVIER MORIN, B.SC.,*† JOSEPHINE CHEN, PH.D.,* MICHÈLE AUBIN, M.S.E.E.,* AMY GILLIS, M.D.,*JEAN-FRANÇOIS AUBRY, M.SC.,* SUPRATIK BOSE, PH.D.,‡ HONG CHEN, PH.D.,*MARTINA DESCOVICH, PH.D.,* PING XIA, PH.D.,*† AND JEAN POULIOT, PH.D.*†
*Comprehensive Cancer Center, Department of Radiation Oncology, University of California, San Francisco, San Francisco, CA;†University of California San Francisco and Berkeley, Joint Graduate Group in Bioengineering, San Francisco, CA; ‡Siemens
Medical Solutions, Oncology Care Systems Group, Concord, CA
Purpose: To demonstrate the feasibility of performing dose calculation on megavoltage cone-beam CT(MVCBCT) of head-and-neck patients in order to track the dosimetric errors produced by anatomic changes.Methods and Materials: A simple geometric model was developed using a head-size water cylinder to correct anobserved cupping artifact occurring with MVCBCT. The uniformity-corrected MVCBCT was calibrated forphysical density. Beam arrangements and weights from the initial treatment plans defined using the conventionalCT were applied to the MVCBCT image, and the dose distribution was recalculated. The dosimetric inaccuraciescaused by the cupping artifact were evaluated on the water phantom images. An ideal test patient with noobservable anatomic changes and a patient imaged with both CT and MVCBCT before and after considerableweight loss were used to clinically validate MVCBCT for dose calculation and to determine the dosimetric impactof large anatomic changes.Results: The nonuniformity of a head-size water phantom (!30%) causes a dosimetric error of less than 5%. Theuniformity correction method developed greatly reduces the cupping artifact, resulting in dosimetric inaccuraciesof less than 1%. For the clinical cases, the agreement between the dose distributions calculated using MVCBCTand CT was better than 3% and 3 mm where all tissue was encompassed within the MVCBCT. Dose–volumehistograms from the dose calculations on CT and MVCBCT were in excellent agreement.Conclusion: MVCBCT can be used to estimate the dosimetric impact of changing anatomy on several structuresin the head-and-neck region. © 2007 Elsevier Inc.
Dose calculation, Cone-beam CT, Planning with megavoltage cone-beam CT, Anatomic changes, Weight loss.
INTRODUCTION
Image-based treatment planning has become the gold stan-dard in radiotherapy (RT). In current practice, a kilovoltageCT (kVCT) scanner is used to acquire a three-dimensional(3D) snapshot of the patient anatomy before the beginningof therapy. This 3D image is imported, as a reference, to atreatment planning system to define the treatment isocenter,contour anatomic structures (target and organs at risk), andchoose a beam arrangement to deliver a dose distributionthat conforms to the given dose prescriptions and limita-tions. Ideally, the dose delivered upon completion of RTwould be identical to the planned dose. In reality, sources of
error exist related to patient positioning, anatomic variationsover time, the dose calculation engine, and the treatmentmachine output that will make the dose delivered differfrom what was intended. These variables may potentiallyreduce the probability of tumor control and increase theseverity of any side effects. Numerous investigators havereported that organs may shift in size, shape, and positionfrom day to day and week to week because of normalanatomic variability, as well as clinical changes over time,such as tumor shrinkage, edema, or weight loss (1–3). It isfairly common (!33%) for head-and-neck cancer patientsto have severe weight loss of up to 58% of their pretreat-
Reprint requests to: Olivier Morin, B.Sc., Comprehensive Can-cer Center, Department of Radiation Oncology, University ofCalifornia San Francisco, 1600 Divisadero St., Suite H1031, SanFrancisco, CA 94143. Tel: (415) 353-7167; Fax: (415) 353-9883;E-mail: [email protected]
Presented in part at the 47th Annual Meeting of the AmericanSociety for Therapeutic Radiology and Oncology (ASTRO), Den-ver, CO, October 16–20, 2005.
This research was partly funded by Siemens Oncology CareSystems.
O. Morin and J.-F. Aubry received a scholarship from the
National Sciences and Engineering Research Council of Canada(NSERC).
Conflict of interest: none.Acknowledgments—The authors acknowledge the following per-sons for their valuable contributions: at UCSF, Chris Malfatti forthe acquisition of phantom images as well as Jeff Bellerose andClayton Akazawa for planning and contouring on CT andMVCBCT images. At Siemens Oncology Care Systems (OCS),Ali Bani-Hashemi and his team.
Received May 25, 2006, and in revised form Sept 22, 2006.Accepted for publication Oct 20, 2006.
Int. J. Radiation Oncology Biol. Phys., Vol. xx, No. x, pp. xxx, 2007Copyright © 2007 Elsevier Inc.
Printed in the USA. All rights reserved0360-3016/07/$–see front matter
1

ment body weight (4). Such variations in target volumeduring the treatment course have dosimetric consequencesthat require repeat treatment planning. At what point duringtreatment a patient needs to undergo repeat planning isdifficult to determine. Commonly, treatment plans are re-vised only when the setup is no longer reproducible, themask used to position the patient no longer fits, or signifi-cant weight loss has been noted. Weekly physical examina-tions and total body weight measurements are performedbut are unable to quantify changes that occur locally at thetarget or along the treatment beams. Most importantly, thesemethods do not quantify the dosimetric impact of the chang-ing anatomy or patient positioning inaccuracies.
Several in-room CT systems have recently been devel-oped, including (1) “CT on rails” (5), (2) a kilovoltagecone-beam CT system (6), (3) a mobile C-arm kilovoltageimager (7), (4) a megavoltage (MV) cone-beam (CB) CT(MVCBCT) system (8), and (5) a tomotherapy system (9).This study used a MVCBCT image, which utilizes thetreatment beam from a conventional linear accelerator andan electronic portal imager to obtain an accurate 3D repre-sentation of the patient in the treatment position. Althoughthis new imaging technology was primarily developed toprovide accurate 3D positioning of the patient momentsbefore dose delivery, the images obtained could also be usedto perform dose calculations. This would open the possibil-ity to monitor the dosimetric affect of changes in anatomyor position compared with the reference CT by applying theinitial treatment plan to the MVCBCT images.
Dose calculation requirementsA 3D image data set must fulfill two requirements before
being used for dose calculation. First, the image volumemust include all the patient tissue along the treatmentbeams. Second, the treatment planning system requires theimage to be calibrated for electron density, a radiologicparameter related to dose deposition in RT. Before imagecalibration, any artifact inherent to the imaging modalitymust be minimized. The calibration of CT images for elec-tron density has been robustly demonstrated on kV and MVCT systems using fan-beam geometry (10, 11). Only re-cently have groups begun investigating the possibility ofcalibrating cone-beam images.
Using a large, open field for CBCT acquisition is anefficient way to obtain a 3D image without the need formultiple gantry rotations and couch movements. However,it exposes the detector to scattered radiation. In transmissionimaging, the unscattered (primary) photons produce theimage, and the scattered (secondary) photons introducenoise and image artifacts. Consequently, quantitative inac-curacies can be present in the reconstructed CT numbers.Although the problem caused by scatter to CBCT images isnot new (12–14), the method to correct its effect is still anactive area of research. Several authors have studied cor-recting kVCBCT images for scatter (15–17). The methodsof reducing the artifacts include changing the acquisitionparameters (e.g., dose, field-of-view, voxel size), using an
anti-scatter grid and performing preprocessing of the two-dimensional projection images. All these methods haveshown promising results for specific cases. Compared withkV photon beams, MV scattered photons are much lessabundant and have more predictable behavior (12). To a firstapproximation, the scatter contribution to a MV projectionimage will be a smooth dome-shaped signal roughly cen-tered on the imager (18, 19). Conventional detector gaincorrection procedures also tend to boost the signal in thecenter of the detector to try to compensate for a lowerdetector response measured when no object is present in thebeam (20). This becomes an overcorrection once the patienthas been placed in the beam, changing the beam’s energyspectrum. The end result of the amplified signal in the centerof the projection images is a cupping artifact, an underes-timation of the CT values in the center of the reconstructedMVCBCT image. The magnitude of the cupping artifactincreases with object size, and the location of the cupping isalso dependent on the object’s position relative to the iso-center. Before electron density calibration and dose calcu-lation, MVCBCT images need to be corrected for thisnonuniformity.
The objective of this research was to demonstrate thefeasibility of performing dose calculations using MVCBCT.Because of the current limitations in the MVCBCT imagingvolume, we focused this study on the dose calculationsperformed in the head-and-neck region. First, we performedphantom experiments to investigate the effect of MVCBCTcupping artifacts on dose calculation accuracy and to de-velop a method to reduce this effect. We then calibrated thecorrected MVCBCT images for electron density and enteredthe calibration data into a commercial planning system. Totest the dosimetric accuracy of using MVCBCT for a clin-ical case, we compared the doses calculated usingMVCBCT and using a conventional CT for a patient whoexhibited minimal anatomic changes between the two imageacquisitions. Finally, we used two sets of CT and MVCBCTimages to track the changes in the delivered dose distribu-tions for a patient who had lost considerable weight duringthe course of intensity-modulated RT (IMRT).
METHODS AND MATERIALS
Imaging and planning equipmentOur clinic has two in-room MV imaging systems capable of
CBCT (MVison, Siemens Medical Solutions, Concord, CA). Bothsystems consist of a standard medical linear accelerator equippedwith an amorphous silicon flat panel detector adapted for MVphotons. Details on the imaging system have been described pre-viously (21). The relatively small contribution of scatter in themega-electron volt energy range, compared with the kiloelectronvolt range, allows the full use of the detector longitudinally (su-perior to inferior) without significant reductions in image quality.Therefore, with the current size of the detector (41 " 41 cm2), avolume of approximately 27 " 27 " 27 cm3 can be imaged. TheMVCBCT acquisition is similar to an arc treatment. The linearaccelerator gantry rotates in a continuous 200° arc (270° to 110°,clockwise) acquiring one portal image for each angle. This acqui-
2 I. J. Radiation Oncology ! Biology ! Physics Volume xx, Number x, 2007
sition procedure lasts 45 s. The image reconstruction starts imme-diately after the acquisition of the first portal image and is com-pleted in 110 s. All the MVCBCT acquisitions presented in thisreport were performed using a total exposure of 7.2 monitor units.
For treatment planning purposes, patients undergoing externalbeam RT at our hospital are imaged using a CT SOMATONEmotion scanner (Siemens Medical Solutions, Malvern, PA). Pre-defined imaging protocols are used to tune the X-ray beam char-acteristics for the best image quality for specific body regions.Quality assurance tests are done to ensure accurate calibration ofthe reconstructed CT numbers for electron density. The obtainedcalibration look-up table is entered in Pinnacle version 7.6 (Phil-lips Medical Solutions, Bothell, WA), the treatment planning sys-tem used by the department.
Uniformity correctionThe predictability of scatter in the MV range allows for the use
of a simple postprocessing method to improve the uniformity ofMVCBCT. For this study, we first imaged a head-size watercylinder to characterize and correct the artifact produced during atypical head-and-neck MVCBCT acquisition. The cylinder diam-eter and length was 16 cm and 24 cm, respectively. The averageCT number of the whole cylinder was used as the CT value desiredafter correction. A geometric model of correction factors wasdefined to characterize the cupping artifact. A basic ellipsoid shape(semiaxes; rx, ry, rz) centered on the cylinder (xc, yc, zc) wasdefined. As described in Eq. 1, each voxel of the water cylinderMVCBCT (x,y,z) falls onto the surface of an ellipsoid !. Using thewater cylinder images, correction factors (CF!) were determinedfor eight values of !. Linear interpolation or extrapolation wasused to determine the correction factors for values of ! that liebetween, or beyond, the tabulated values.
!x " xc
rx"2
# !y " yc
ry"2
# !z " zc
rz"2
$ !2 ! CF! (1)
Electron density calibrationTissue inhomogeneity is derived by converting the CT value in
each voxel of the reconstruction into relative electron density orphysical density, depending on the treatment planning system.This is usually done empirically by scanning a tissue equivalentphantom (CIRS model 062, Norfolk, VA) with inserts of knownelectron density. For the calibration of MVCBCT, however, thissmall phantom could not be used as is, because it did not reproducethe scatter environment of the water cylinder used to define theuniformity correction factors. Instead, electron density inserts (i.e.,air, lung inhale, lung exhale, adipose, water, trabecular bone, anddense bone) were placed in the same water cylinder used to definethe uniformity correction factors. The water cylinder with insertswas imaged using both conventional CT and MVCBCT. TheMVCBCT nonuniformity was reduced using the ellipsoid model ofcorrection factors described. Regions of interest were drawn on theinserts of both CT scans to extract the mean intensities.
Estimating the dosimetric inaccuracies producedby MVCBCT nonuniformity
The water cylinder phantom was used to investigate the impactof the MVCBCT cupping artifact on the accuracy of dose calcu-lation. The water cylinder was first imaged with the conventionalCT scanner. The phantom alignment in the CT room was marked
with three small fiducials. A MVCBCT of the cylinder was ac-quired in the treatment room using the fiducials for alignment. ThekVCT, MVCBCT with cupping artifact, and MVCBCT correctedfor nonuniformity were all imported into the treatment planningsystem. The CT voxel intensities of each scan were converted torelative electron density to water using the calibration curves. Aplan with a single anterior-posterior 10 " 10-cm2 square beam wasapplied on all three image sets. The three dose distributions wereobtained using identical dose grid positions and a resolution of 2mm. Finally, the dose distributions obtained using the twoMVCBCT scans (with and without uniformity correction) werecompared with the reference dose distribution calculated using theconventional CT. To obtain a complete quantitative evaluation ofdose distributions in the low- and high-dose gradient regions, wecomputed dose percentage differences and a % index (22). We usedtypical acceptance criteria of 3% in dose and 3 mm in the distance-to-agreement for the % index.
Clinical test case for validationTo assess the dose calculation accuracy achieved with
MVCBCT on a patient, a head-and-neck patient treated with IMRTfor recurrent nasopharyngeal carcinoma was selected. This patientwas imaged in the first week of therapy and no major change ordeformation in the anatomy from the time of the reference CT wasseen. This observation was also verified with 3D registration of theMVCBCT image with the CT. Manual registration was performeduntil the best match was achieved by visual comparison. TheMVCBCT was corrected for nonuniformity using the ellipsoidcorrection factors previously described. The IMRT plan (isocenter,beams, and contours) defined on the kVCT image was applied tothe MVCBCT image. None of the beam passed through the pa-tient’s shoulders, parts of which extended beyond the MVCBCTfield of view. The dose distributions calculated with the conven-tional CT and MVCBCT were compared using the dose percentagedifferences and % index distributions. Because the anatomy andposition of the patient was nearly identical on both images after 3Dregistration, contours drawn on the conventional CT (e.g., spinalcord, left parotid, right eye, brainstem, and gross tumor volume)were directly copied onto the MVCBCT. The dose–volume histo-grams (DVH) of the structures were compared.
Testing the ability of MVCBCT to determine dosimetricchanges caused by weight loss
One patient treated with IMRT for a base of tongue carcinomawas selected to evaluate the capability of MVCBCT to monitor thedosimetric affect of weight loss. The patient was first imaged withconventional CT (CT1) for planning. The treatment plan createdfor this patient contained beams passing partly through the pa-tient’s shoulders to cover the cervical lymph nodes. Parts of thesebeams extended beyond the MVCBCT field of view. A MVCBCT(MVCBCT1) was acquired during the first week of therapy, 12days after CT1. Additional CT (CT2) and MVCBCT (MVCBCT2)images were acquired on Week 3 (22 days after MVCBCT1) oftreatment. The patient was displaced by 2 cm in the verticaldirection for MVCBCT imaging to obtain better uniformity cor-rection from the method presented in this report. MVCBCTs werecorrected for nonuniformity and transferred to the treatment plan-ning system. As with the previous test case, the MVCBCTs werealigned precisely with their corresponding reference CT(MVCBCT1 with CT1 and MVCBCT2 with CT2) using 3D reg-istration. A dosimetrist and physician contoured the target and
3Dose calculation using MVCBCT ! O. MORIN et al.
critical structures on CT1 and CT2. These contours were copiedonto the corresponding MVCBCTs. For comparison, critical struc-tures (i.e., parotid glands, spinal cord, brainstem, larynx, and righttemporomandibular joint) were also drawn directly on MVCBCT2by the dosimetrist. CT1, but not CT2, was used as a visualreference to guide the contouring on MVCBCT2. To compensatefor parts of the patient’s shoulders and chest that extended outsidethe MVCBCT field of view, tissue and lung contours were drawn
on CT1 and copied onto MVCBCT1 and MVCBCT2 after 3Dregistration. The missing tissue and lungs were assigned a densityrelative to water of 1 and 0.4, respectively. Dose distributions werethen obtained by applying the initial treatment plan onto CT1,MVCBCT1, CT2, and MVCBCT2. The four dose distributionswere produced using identical dose grid positions and a resolutionof 3 mm. The dose percentage differences and % index distribu-tions were computed for different combinations of dose distribu-tions (CT1-MVCBCT1, CT2-MVCBCT2, CT1-CT2, MVCBCT1-MVCBCT2, and CT1-MVCBCT2). Dose–volume histogramswere obtained for several structures (i.e., left temporomandibularjoint, parotid glands, spinal cord, larynx, clinical target volume,and gross tumor volume).
RESULTS
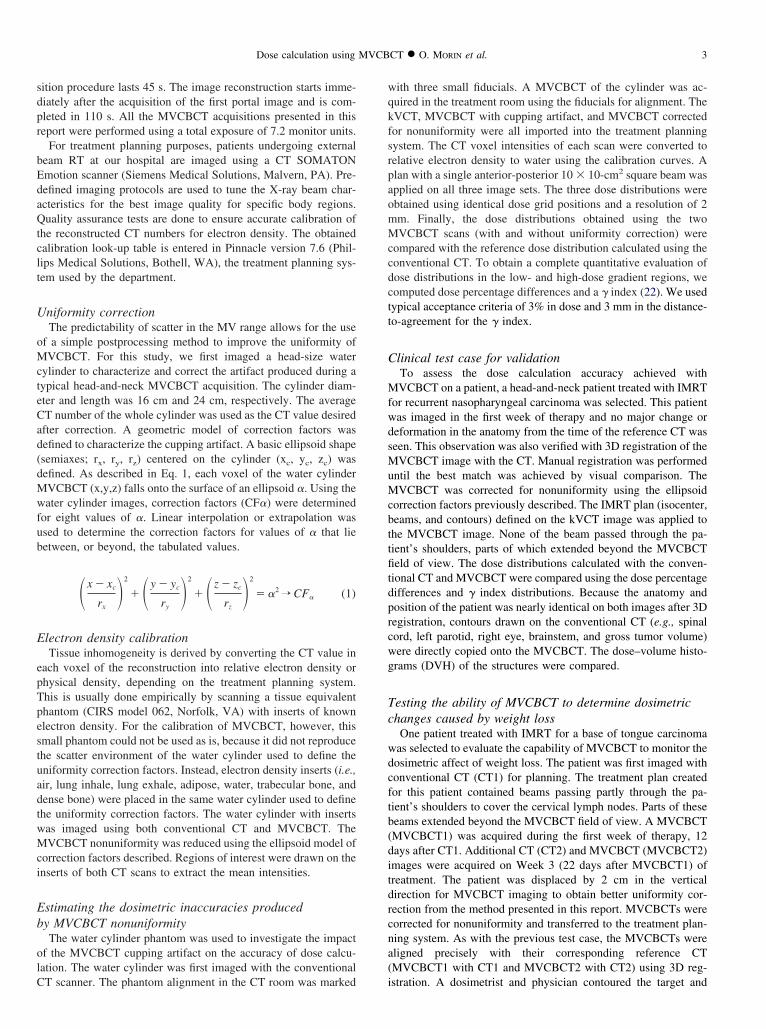
Uniformity correctionFigure 1a shows the uncorrected MVCBCT images in the
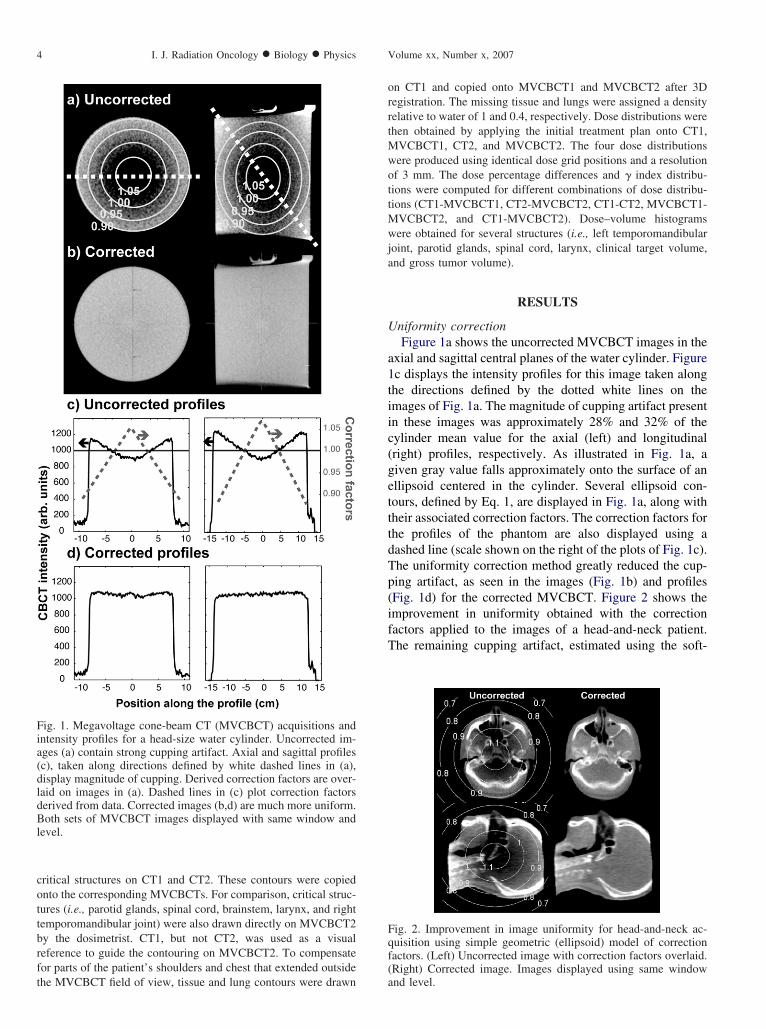
axial and sagittal central planes of the water cylinder. Figure1c displays the intensity profiles for this image taken alongthe directions defined by the dotted white lines on theimages of Fig. 1a. The magnitude of cupping artifact presentin these images was approximately 28% and 32% of thecylinder mean value for the axial (left) and longitudinal(right) profiles, respectively. As illustrated in Fig. 1a, agiven gray value falls approximately onto the surface of anellipsoid centered in the cylinder. Several ellipsoid con-tours, defined by Eq. 1, are displayed in Fig. 1a, along withtheir associated correction factors. The correction factors forthe profiles of the phantom are also displayed using adashed line (scale shown on the right of the plots of Fig. 1c).The uniformity correction method greatly reduced the cup-ping artifact, as seen in the images (Fig. 1b) and profiles(Fig. 1d) for the corrected MVCBCT. Figure 2 shows theimprovement in uniformity obtained with the correctionfactors applied to the images of a head-and-neck patient.The remaining cupping artifact, estimated using the soft-
Fig. 1. Megavoltage cone-beam CT (MVCBCT) acquisitions andintensity profiles for a head-size water cylinder. Uncorrected im-ages (a) contain strong cupping artifact. Axial and sagittal profiles(c), taken along directions defined by white dashed lines in (a),display magnitude of cupping. Derived correction factors are over-laid on images in (a). Dashed lines in (c) plot correction factorsderived from data. Corrected images (b,d) are much more uniform.Both sets of MVCBCT images displayed with same window andlevel.
Fig. 2. Improvement in image uniformity for head-and-neck ac-quisition using simple geometric (ellipsoid) model of correctionfactors. (Left) Uncorrected image with correction factors overlaid.(Right) Corrected image. Images displayed using same windowand level.
4 I. J. Radiation Oncology ! Biology ! Physics Volume xx, Number x, 2007

tissue intensity along selected profiles, was #5% in anydirection.
Image calibrationFigure 3 shows the physical density calibration of the
conventional CT and MVCBCT. These two calibrationcurves were entered in the treatment planning system. Thecurves were used with their respective image data set for allthe dose calculations performed in this study.
Dosimetric inaccuracies produced byMVCBCT nonuniformity
Figure 4 presents a quantitative analysis of the effect ofthe cupping artifact on the dose calculation accuracy for acylindrical water phantom. As seen in Fig. 4 (top), the dosepercentage differences between the doses calculated on theCT and on the uncorrected MVCBCT (Fig. 4, left) showeda systematic deviation, which increased with depth. Thenonuniformity caused the dose calculated in the in-fieldregion (field edge reduced by 4 mm) to be less, on average,by 0.95% and by a maximum of 4.5%. Differences largerthan $10% were observed at the field penumbra and alongthe phantom edge. These differences were likely to be dueto a slight error in the setup (#2 mm) of the phantom orin the placement of the treatment isocenter in the treatmentplanning system. The calculation of the % index on theuncorrected water cylinder (Fig. 4, bottom) showed thatdespite the large cupping artifact only 1% of the whole dosedistribution did not meet the acceptance criteria of 3% and3 mm. When the water cylinder was corrected for nonuni-formity, 98% of the in-field region was within 1% differ-ence in dose, and 92% of the entire dose distribution,including phantom edges and penumbra, was within 2% indose and 2 mm in distance-to-agreement.
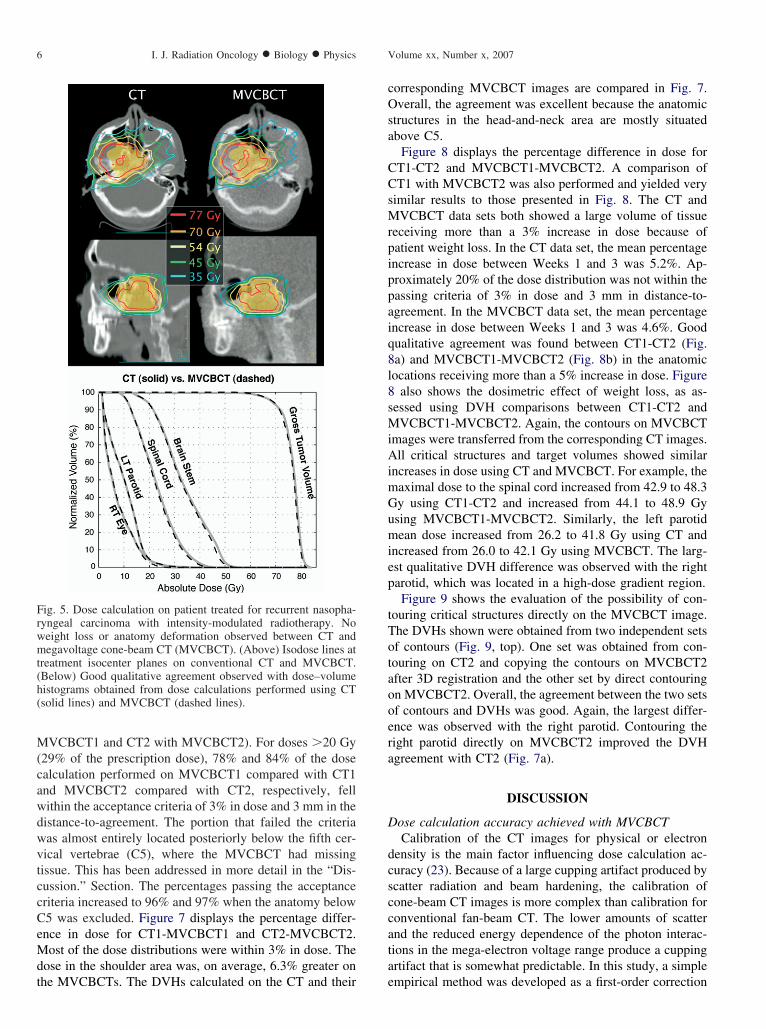
Clinical test caseFigure 5 displays the isodose lines produced using the
conventional CT and MVCBCT for the first test patient.Good qualitative agreement was found between the twodose distributions. For doses %10 Gy (14% of the prescrip-tion dose), the maximal percentage difference in the dosewas 8%. More than 90% of the volume had a percentagedifference of &5%. Percentage differences of 5–8% wereobserved in the left air cavity and are believed to be due toslight misalignments or local anatomic variations. Review-ing the % index, 98% of the complete volume was within 3%and 3 mm and 88% of the volume was within 2% and 2 mm.Overall, as seen in Fig. 5, the DVHs calculated on theconventional CT and on the MVCBCT were also in excel-lent agreement.
Estimating the dosimetric effect of weight loss usingMVCBCT
For the second patient, the weight loss between Weeks 1and 3 of therapy can be easily seen on the axial images ofFig. 6. The patient lost up to 4 cm of soft tissue on bothsides of the neck between CT1 and CT2. First, we comparedthe dose calculation on the MVCBCTs with their respectiveCTs. Minor anatomic changes were observed in the poste-rior aspect of the neck between CT1 and MVCBCT1 (Fig.6, axial images). No observable anatomic changes wereobserved between CT2 and MVCBCT2. Isodose lines dis-played on the axial and sagittal central planes of the con-ventional CT and MVCBCT scans (Fig. 6) showed goodqualitative agreement between the dose distributions ob-tained from images acquired closely in time (CT1 with
Fig. 4. (Top) Dose percentage differences (CT-megavoltage cone-beam CT [MVCBCT]) and (Bottom) % indexes for head-size watercylinder (Left) uncorrected and (Right) corrected for uniformity.
Fig. 3. Physical density calibration of conventional CT (solid line)and megavoltage cone-beam CT (MVCBCT) (dashed line). Rep-resentative cross-sectional images of phantom used for calibrationshown for each modality.
5Dose calculation using MVCBCT ! O. MORIN et al.
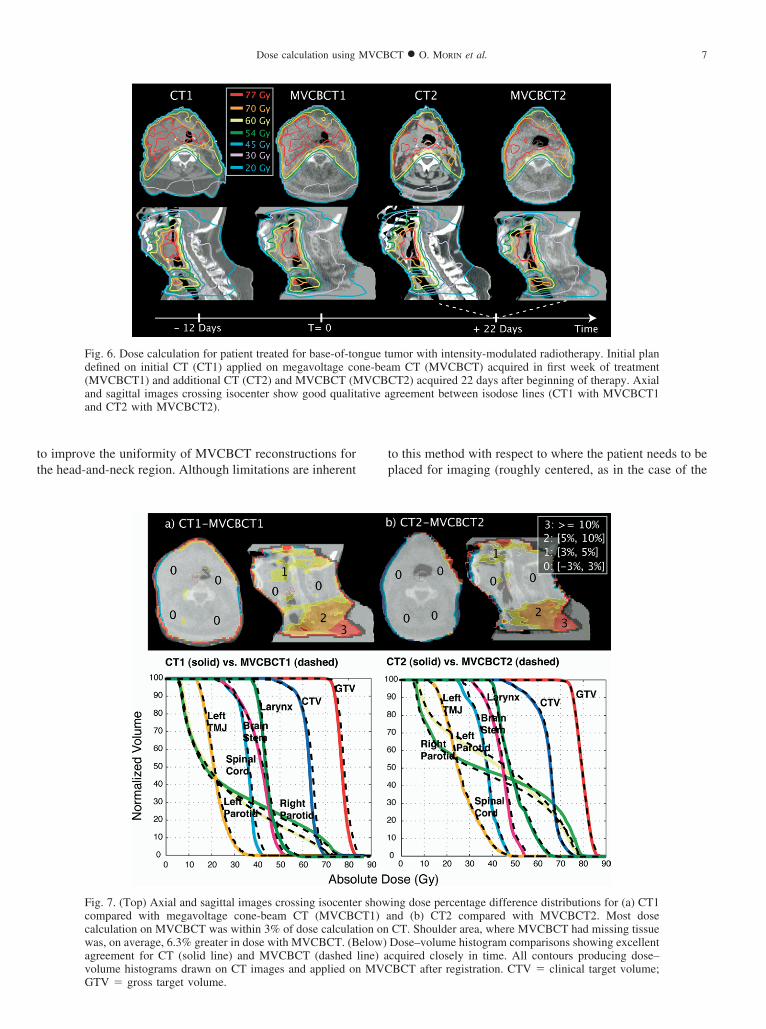
MVCBCT1 and CT2 with MVCBCT2). For doses %20 Gy(29% of the prescription dose), 78% and 84% of the dosecalculation performed on MVCBCT1 compared with CT1and MVCBCT2 compared with CT2, respectively, fellwithin the acceptance criteria of 3% in dose and 3 mm in thedistance-to-agreement. The portion that failed the criteriawas almost entirely located posteriorly below the fifth cer-vical vertebrae (C5), where the MVCBCT had missingtissue. This has been addressed in more detail in the “Dis-cussion.” Section. The percentages passing the acceptancecriteria increased to 96% and 97% when the anatomy belowC5 was excluded. Figure 7 displays the percentage differ-ence in dose for CT1-MVCBCT1 and CT2-MVCBCT2.Most of the dose distributions were within 3% in dose. Thedose in the shoulder area was, on average, 6.3% greater onthe MVCBCTs. The DVHs calculated on the CT and their
corresponding MVCBCT images are compared in Fig. 7.Overall, the agreement was excellent because the anatomicstructures in the head-and-neck area are mostly situatedabove C5.
Figure 8 displays the percentage difference in dose forCT1-CT2 and MVCBCT1-MVCBCT2. A comparison ofCT1 with MVCBCT2 was also performed and yielded verysimilar results to those presented in Fig. 8. The CT andMVCBCT data sets both showed a large volume of tissuereceiving more than a 3% increase in dose because ofpatient weight loss. In the CT data set, the mean percentageincrease in dose between Weeks 1 and 3 was 5.2%. Ap-proximately 20% of the dose distribution was not within thepassing criteria of 3% in dose and 3 mm in distance-to-agreement. In the MVCBCT data set, the mean percentageincrease in dose between Weeks 1 and 3 was 4.6%. Goodqualitative agreement was found between CT1-CT2 (Fig.8a) and MVCBCT1-MVCBCT2 (Fig. 8b) in the anatomiclocations receiving more than a 5% increase in dose. Figure8 also shows the dosimetric effect of weight loss, as as-sessed using DVH comparisons between CT1-CT2 andMVCBCT1-MVCBCT2. Again, the contours on MVCBCTimages were transferred from the corresponding CT images.All critical structures and target volumes showed similarincreases in dose using CT and MVCBCT. For example, themaximal dose to the spinal cord increased from 42.9 to 48.3Gy using CT1-CT2 and increased from 44.1 to 48.9 Gyusing MVCBCT1-MVCBCT2. Similarly, the left parotidmean dose increased from 26.2 to 41.8 Gy using CT andincreased from 26.0 to 42.1 Gy using MVCBCT. The larg-est qualitative DVH difference was observed with the rightparotid, which was located in a high-dose gradient region.
Figure 9 shows the evaluation of the possibility of con-touring critical structures directly on the MVCBCT image.The DVHs shown were obtained from two independent setsof contours (Fig. 9, top). One set was obtained from con-touring on CT2 and copying the contours on MVCBCT2after 3D registration and the other set by direct contouringon MVCBCT2. Overall, the agreement between the two setsof contours and DVHs was good. Again, the largest differ-ence was observed with the right parotid. Contouring theright parotid directly on MVCBCT2 improved the DVHagreement with CT2 (Fig. 7a).
DISCUSSION
Dose calculation accuracy achieved with MVCBCTCalibration of the CT images for physical or electron
density is the main factor influencing dose calculation ac-curacy (23). Because of a large cupping artifact produced byscatter radiation and beam hardening, the calibration ofcone-beam CT images is more complex than calibration forconventional fan-beam CT. The lower amounts of scatterand the reduced energy dependence of the photon interac-tions in the mega-electron voltage range produce a cuppingartifact that is somewhat predictable. In this study, a simpleempirical method was developed as a first-order correction
Fig. 5. Dose calculation on patient treated for recurrent nasopha-ryngeal carcinoma with intensity-modulated radiotherapy. Noweight loss or anatomy deformation observed between CT andmegavoltage cone-beam CT (MVCBCT). (Above) Isodose lines attreatment isocenter planes on conventional CT and MVCBCT.(Below) Good qualitative agreement observed with dose–volumehistograms obtained from dose calculations performed using CT(solid lines) and MVCBCT (dashed lines).
6 I. J. Radiation Oncology ! Biology ! Physics Volume xx, Number x, 2007
to improve the uniformity of MVCBCT reconstructions forthe head-and-neck region. Although limitations are inherent
to this method with respect to where the patient needs to beplaced for imaging (roughly centered, as in the case of the
Fig. 6. Dose calculation for patient treated for base-of-tongue tumor with intensity-modulated radiotherapy. Initial plandefined on initial CT (CT1) applied on megavoltage cone-beam CT (MVCBCT) acquired in first week of treatment(MVCBCT1) and additional CT (CT2) and MVCBCT (MVCBCT2) acquired 22 days after beginning of therapy. Axialand sagittal images crossing isocenter show good qualitative agreement between isodose lines (CT1 with MVCBCT1and CT2 with MVCBCT2).
Fig. 7. (Top) Axial and sagittal images crossing isocenter showing dose percentage difference distributions for (a) CT1compared with megavoltage cone-beam CT (MVCBCT1) and (b) CT2 compared with MVCBCT2. Most dosecalculation on MVCBCT was within 3% of dose calculation on CT. Shoulder area, where MVCBCT had missing tissuewas, on average, 6.3% greater in dose with MVCBCT. (Below) Dose–volume histogram comparisons showing excellentagreement for CT (solid line) and MVCBCT (dashed line) acquired closely in time. All contours producing dose–volume histograms drawn on CT images and applied on MVCBCT after registration. CTV & clinical target volume;GTV & gross target volume.
7Dose calculation using MVCBCT ! O. MORIN et al.

water cylinders), this simple correction greatly reduces thenonuniformity in the CBCT images. Other more robustpreprocessing methods to correct projection images for scat-ter have also been proposed (18, 19). These methods wouldlikely further reduce the cupping artifact. However, theresults of this study have suggested that a first-order cor-rection of the MVCBCT cupping artifact may already besufficient for clinically useful dosimetric accuracy. Thesimulations performed with the head-size water cylinderdemonstrated that the dosimetric error caused by theMVCBCT cupping artifact was much less than the cuppingartifact itself. This trend has also been observed using apelvis-size water cylinder (24). For multiple beam config-urations, dosimetric errors would be further reduced be-cause of averaging over different beam angles. With theuniformity-correction method presented in this report, adose calculation accuracy better than 3% in dose and 3 mmin distance-to-agreement was demonstrated for a head-and-neck patient treated with IMRT.
Expanding dose calculation to more clinical sitesThe other factor that determines dosimetric accuracy is
the field of view of the MVCBCT images. Using the currentMVCBCT system, only the head-and-neck region can befully imaged. One option to compensate for the limited fieldof view of MVCBCT is to merge the images from the kVCTand MVCBCT (10) to supplement the truncated image data.In this study, tissue contours from the kVCT were used to
compensate for using missing tissue in the MVCBCT im-ages of the second patient. However, a 5–10% dosimetricoverestimation still occurred related to missing data artifact,the assumption of rigid body deformation, and the lack ofheterogeneity correction in the missing data region. Despitethis problem, the fact that most critical structures in thehead-and-neck area are situated above the shoulders al-lowed the use of MVCBCT to accurately monitor the dosi-metric effect of weight loss on clinically important struc-tures. A dosimetric accuracy better than 3% in dose and 3mm in distance-to-agreement was demonstrated above theshoulders. As larger detectors are manufactured or newimage acquisition schemes are developed, CBCT shouldbecome capable of completely imaging the anatomy alongthe beams. Simply allowing a lateral shift of the detector foracquisition would increase the field of view to image theshoulders or an average size pelvis (25). The good imagingperformance and calibration possibility of MVCBCT in thepresence of metallic objects could also be used to obtain betterdose calculations in areas near a hip prosthesis or tooth fillings(26).
MVCBCT to monitor dosimetric effect of weight lossDuring the course of external beam RT, many head-and-
neck patients develop significant anatomic changes that maybe related to multiple factors, including shrinkage of thetumor and/or nodal masses, weight loss, and resolution ofpostoperative changes (1). For these cases, it has been
Fig. 8. (Top) Axial and sagittal images crossing isocenter showing dose percentage difference distributions for (a) CT1compared with CT2 and (b) MVCBCT1 compared with MVCBCT2. Large anatomic areas had the dose increased by '5%.These areas’ locations were in good agreement between (Left) CT and (Right) MVCBCT. (Below) Dose–volume histogram(DVH) comparisons. All contours producing DVHs were drawn on CT images and applied to MVCBCT images afterregistration. Effect of weight loss on DVHs was very similar when calculated on either CT or MVCBCT.
8 I. J. Radiation Oncology ! Biology ! Physics Volume xx, Number x, 2007

demonstrated that repeat CT imaging and repeat planning isessential to ensure adequate doses to the target volumes andsafe doses to critical normal tissues (3). One goal of thisstudy was to determine whether MVCBCT imaging couldbe used to detect when repeat planning becomes necessary.With MVCBCT already in use for patient setup, the userperforming the CT-MVCBCT alignment may more readilynotice when a change in anatomy has become potentiallyclinically significant. As the results of this study have dem-onstrated, dose recalculation on MVCBCT is also possibleand can be used to estimate the percentage dose differencesin the target volume or normal tissues. Structures such asspinal cord, brainstem, larynx, and all the bony structurescan be contoured directly on MVCBCT. Although soft-tissue contouring is more difficult, it was feasible even in
structures such as the parotids. Using the initial referenceCT (CT1) as a guide, the dosimetrist was able to contour theparotids in the MVCBCT with reasonable confidence. Us-ing these contours, it was possible to estimate a mean doseincrease from 26 to 42 Gy in the left parotid of the secondpatient. Although weight loss occurred throughout treat-ment, if the anatomy from Week 3 was assumed to representthe anatomy for the remaining treatment fractions (18 of 33fractions), the right and left parotid mean doses would beincreased by 7 and 9 Gy, respectively. These estimatesmatch well the mean dose increase calculated using theconventional CT images. Although weight loss may beexpected in these patients (4), many continue to be treatedwith the original treatment plan because the dosimetricaffect of the weight loss is rarely assessed.
Several head-and-neck patients now undergo imagingweekly with CT and MVCBCT to monitor the dose tocritical structures and further study the dose calculationaccuracy achieved with MVCBCT. Even though dose cal-culation can be performed on MVCBCT, repeating thekVCT is still required for repeat planning. Currently,MVCBCT can provide some soft-tissue information, butconventional CT is preferred for recontouring the targetvolumes (gross tumor volume and clinical target volume).Precise soft-tissue contouring on MVCBCT should becomefeasible as the image quality continues to improve (27) and,combined with a larger reconstructed volume, may elimi-nate the need for repeat kVCT.
CONCLUSION
In this study, we have demonstrated the clinically appli-cable dosimetric accuracy of MVCBCT using a simplecalibration technique. With the current reconstruction vol-ume, it is possible to obtain accurate dose calculation onMVCBCT acquisitions of head-and-neck patients, providedno anatomy is missing along the treatment beams. A dosi-metric accuracy better than 3% in dose and 3 mm indistance-to-agreement was demonstrated above theshoulders. Using MVCBCT, it is now possible to monitorthe dosimetric effect of anatomic variations, includingweight loss and tumor shrinkage for head-and-neck pa-tients. This is a critical step in adapting RT to anatomicchanges during treatment. Several head-and-neck pa-tients have now been selected for a study aimed atmonitoring the dose to critical structures and furtherdefining the dose calculation accuracy achieved withMVCBCT. The future availability of a larger MVCBCTfield of view will allow MVCBCT to be used for dosecalculations on other body sites.
REFERENCES
1. Barker JL Jr, Garden AS, Ang KK, et al. Quantification ofvolumetric and geometric changes occurring during fraction-ated radiotherapy for head-and-neck cancer using an inte-grated CT/linear accelerator system. Int J Radiat Oncol BiolPhys 2004;59:960–970.
2. de Crevoisier R, Tucker SL, Dong L, et al. Increased risk ofbiochemical and local failure in patients with distended rectumon the planning CT for prostate cancer radiotherapy. Int JRadiat Oncol Biol Phys 2005;62:965–973.
3. Hansen EK, Bucci MK, Quivey JM, et al. Repeat CT imaging
Fig. 9. Evaluating the feasibility of contouring critical structureson MVCBCT. (Top) One set of dose–volume histograms (DVHs)obtained from contours drawn on CT2 and copied to MVCBCT2(blue contours); other set obtained by direct contouring onMVCBCT2 (white contours). (Below) Largest DVH differenceobserved within right parotid, located in high-dose gradient region.Contouring directly on MVCBCT improved DVH qualitativeagreement compared with right parotid on CT2 (Fig. 8). Overallgood agreement in DVHs demonstrated contouring capability ofmany head-and-neck structures on MVCBCT.
9Dose calculation using MVCBCT ! O. MORIN et al.

and replanning during the course of IMRT for head-and-neckcancer. Int J Radiat Oncol Biol Phys 2006;64:355–362.
4. Beaver MES, Matheny KE, Roberts DB, et al. Predictors ofweight loss during radiation therapy. Otolaryngol Head NeckSurg 2001;125:645–648.
5. Wong JR, Cheng CW, Grimm L, et al. Clinical implementa-tion of the world’s first Primatom, a combination of CTscanner and linear accelerator, for precise tumor targeting andtreatment. In: Physica M, editor. Istituti Editoriali e Poli-grafici Internazionali. Vol. 17. Italy: Medica Physica 2001. p.271–276.
6. Jaffray DA, Siewerdsen JH, Wong JW, et al. Flat-panel cone-beam computed tomography for image-guided radiation ther-apy. Int J Radiat Oncol Biol Phys 2002;53:1337–1349.
7. Sorensen SP, Chow E, Kriminski S, et al. Image guidedradiotherapy using a mobile kilovoltage x-ray device. MedDosim 2006;31:40–50.
8. Pouliot J, Bani-Hashemi A, Chen J, et al. Low-dose mega-voltage cone-beam CT for radiation therapy. Int J RadiatOncol Biol Phys 2005;61:552–560.
9. Mackie TR, Kapatoes J, Ruchala K, et al. Image guidance forprecise conformal radiotherapy. Int J Radiat Oncol Biol Phys2003;56:89–105.
10. Langen KM, Meeks SL, Poole DO, et al. The use of mega-voltage CT (MVCT) images for dose recomputations. PhysMed Biol 2005;50:4259–4276.
11. Thomas SJ. Relative electron density calibration of CT scan-ners for radiotherapy treatment planning. Br J Radiol 1999;72:781–786.
12. Jaffray DA, Battista JJ, Fenster A, et al. X-ray scatter inmegavoltage transmission radiography: Physical characteris-tics and influence on image quality. Med Phys 1994;21:45–60.
13. Kanamori H, Nakamori N, Inoue K, et al. Effects of scatteredX-rays on CT images. Phys Med Biol 1985;30:239–249.
14. Siewerdsen JH, Jaffray DA. Cone-beam computed tomogra-phy with a flat-panel imager: Magnitude and effects of X-rayscatter. Med Phys 2001;28:220–231.
15. Ruola N, Xiangyang T, Conover D. X-ray scatter correctionalgorithm for cone beam CT imaging. Med Phys 2004;31:1195–1202.
16. Siewerdsen JH, Daly MJ, Bakhtiar B, et al. A simple, directmethod for x-ray scatter estimation and correction in digitalradiography and cone-beam CT. Med Phys 2006;33:187–197.
17. Siewerdsen JH, Moseley DJ, Bakhtiar B, et al. The influenceof antiscatter grids on soft-tissue detectability in cone-beamcomputed tomography with flat-panel detectors. Med Phys2004;31:3506–3520.
18. Spies L, Ebert M, Groh BA, et al. Correction of scatter inmegavoltage cone-beam CT. Phys Med Biol 2001;46:821–833.
19. van Elmpt WJC, Nijsten S, Mijnheer BJ, et al. Experimentalverification of a portal dose prediction model. Med Phys2005;32:2805–2818.
20. Maltz J, Gangadharan B, Hristov D, et al. Su-FF-I-11: Site-specific image-gain calibration for MV CBCT [Abstract]. MedPhys 2006;33:1999.
21. Morin O, Gillis A, Chen J, et al. Megavoltage cone-beam CT:System description and clinical applications. Med Dosim2006;31:51–61.
22. Low DA, Harms WB, Mutic S, et al. A technique for thequantitative evaluation of dose distributions. Med Phys 1998;25:656–661.
23. Seco J, Evans PM. Assessing the effect of electron density inphoton dose calculations. Med Phys 2006;33:540–552.
24. Chen J, Morin O, Chen H, et al. Su-FF-J-72:The effect of MVcone-beam CT cupping artifacts on dose calculation accuracy[Abstract]. Med Phys 2005;32:1936.
25. Smitsmans MHP, De Bois J, Sonke J-J, et al. Automaticprostate localization on cone-beam CT scans for high preci-sion image-guided radiotherapy. Int J Radiat Oncol Biol Phys2005;63:975–984.
26. Aubin M, Morin O, Chen J, et al. The use of megavoltagecone-beam CT to complement CT for target definition inpelvic radiotherapy in presence of hip replacement. Br JRadiol 2006;79:918–921.
27. Faddegon B, Ghelmansarai F, Bani-Hashemi A. Su-FF-J-07:A low-Z target with no flattener and reduced energy forimproved contrast in megavoltage cone-beam CT [Abstract].Med Phys 2006;33:2021.
10 I. J. Radiation Oncology ! Biology ! Physics Volume xx, Number x, 2007