Respiration-Averaged CT for Attenuation Correction in Canine Cardiac PET/CT
9
Respiration-Averaged CT for Attenuation Correction in Canine Cardiac PET/CT Russell A.H. Cook 1,2 , Greg Carnes 1,3 , Ting-Yim Lee 1–4 , and R. Glenn Wells 1,2,4 1 Department of Medical Biophysics, University of Western Ontario, London, Ontario, Canada; 2 Imaging Program, Lawson Health Research Institute, London, Ontario, Canada; 3 Imaging Research Laboratories, Robarts Research Institute, London, Ontario, Canada; and 4 Nuclear Medicine, St. Joseph’s Health Care London, London, Ontario, Canada Heart disease is a leading cause of death in North America. With the increased availability of PET/CT scanners, CT is now com- monly used as a transmission source for attenuation correction. Because of the differences in scan duration between PET and CT, respiration-induced motion can create inconsistencies be- tween the PET and CT data and lead to incorrect attenuation correction and, thus, artifacts in the final reconstructed PET images. This study compared respiration-averaged CT and 4-dimensional (4D) CT for attenuation correction of cardiac PET in an in vivo canine model as a means of removing these in- consistencies. Methods: Five dogs underwent respiration-gated cardiac 18 F-FDG PET and 4D CT. The PET data were recon- structed with 3 methods of attenuation correction that differed only in the CT data used: The first method was single-phase CT at either end-expiration, end-inspiration, or the middle of a breathing cycle; the second was respiration-averaged CT, which is CT temporally averaged over the entire respiratory cycle; and the third was phase-matched CT, in which each PET phase is corrected with the matched phase from 4D CT. After reconstruc- tion, the gated PET images were summed to produce an ungated image. Polar plots of the PET heart images were generated, and percentage differences were calculated with respect to the phase-matched correction for each dog. The difference maps were then averaged over the 5 dogs. Results: For single-phase CT correction at end-expiration, end-inspiration, and mid cycle, the maximum percentage differences were 11% 6 4%, 7% 6 3%, and 5% 6 2%, respectively. Conversely, the maximum difference for attenuation correction with respiration-averaged CT data was only 1.6% 6 0.7%. Conclusion: Respiration- averaged CT correction produced a maximum percentage difference 7 times smaller than that obtained with end-expiration single-phase correction. This finding indicates that using respiration-averaged CT may accurately correct for attenuation on respiration-ungated cardiac PET. Key Words: PET; 4D CT; attenuation correction; respiration- induced motion; cardiac imaging J Nucl Med 2007; 48:811–818 DOI: 10.2967/jnumed.106.034199 Cardiovascular disease causes 1 in 3 deaths in Canada (1) and worldwide (2) every year. The largest component of cardiovascular disease is heart disease. Proper patient management after a heart attack is crucial to maximize recovery. Cardiac imaging of 18 F-FDG uptake with PET, currently the gold standard for determining the viability of heart tissue, allows the clinician to determine whether the tissue is ischemic or necrotic (3). This distinction is a clin- ical factor guiding the clinician toward treating the patient medically, with bypass surgery, or with heart transplanta- tion (4). Accurate PET images require attenuation correction for signal loss via photon absorption in patient tissues (5). This correction is done through the use of a transmission scan. In the past, the transmission image, or map, has generally been acquired through the use of a radioisotope source such as 68 Ge. However, the low 511-keV photon flux generated by such radioisotopes requires lengthy transmission scans. Because the length of a radioisotope transmission scan is similar to that of a PET emission scan, the 2 data sets are consistent and the problem of respiratory motion is re- duced, leading it to have received minimal attention (6) despite having been recognized for some time (7). With the advent of hybrid PET/CT scanners, the use of CT for attenuation correction has become common (8), and in some of these hybrid scanners, radioisotope attenuation correction is no longer available. Some advantages of using CT as a transmission source for attenuation correction in- clude its speed, nearly noise-free images, and high spatial resolution. These advantages increase patient throughput, im- prove the signal-to-noise ratio of the attenuation-corrected PET images, and accurately localize tracer uptake anatom- ically. However, the speed of the CT scan is also a potential source of problems. The typical temporal resolution of a CT image is less than 1 s, significantly shorter than the 4-s resting breathing period of a person (9). CT therefore acquires a snapshot image of the patient at a single phase of the respiratory cycle. A cardiac PET scan requires 15–30 min per acquisition and gives an image that is temporally averaged over many respiratory cycles. Inconsistencies between a CT attenuation correction map from a single Received Jul. 3, 2006; revision accepted Oct. 31, 2006. For correspondence or reprints contact: R. Glenn Wells, PhD, Lawson Health Research Institute, Nuclear Medicine Department, Room C531, St. Joseph’s Hospital, 268 Grosvenor St., London, Ontario, Canada, N6A 4V2. E-mail: [email protected] COPYRIGHT ª 2007 by the Society of Nuclear Medicine, Inc. A VERAGE CT CORRECTION OF CARDIAC PET • Cook et al. 811 by on June 16, 2015. For personal use only. jnm.snmjournals.org Downloaded from
Transcript of Respiration-Averaged CT for Attenuation Correction in Canine Cardiac PET/CT

Respiration-Averaged CT for AttenuationCorrection in Canine Cardiac PET/CT
Russell A.H. Cook1,2, Greg Carnes1,3, Ting-Yim Lee1–4, and R. Glenn Wells1,2,4
1Department of Medical Biophysics, University of Western Ontario, London, Ontario, Canada; 2Imaging Program, Lawson HealthResearch Institute, London, Ontario, Canada; 3Imaging Research Laboratories, Robarts Research Institute, London, Ontario, Canada;and 4Nuclear Medicine, St. Joseph’s Health Care London, London, Ontario, Canada
Heart disease is a leading cause of death in North America. Withthe increased availability of PET/CT scanners, CT is now com-monly used as a transmission source for attenuation correction.Because of the differences in scan duration between PET andCT, respiration-induced motion can create inconsistencies be-tween the PET and CT data and lead to incorrect attenuationcorrection and, thus, artifacts in the final reconstructed PETimages. This study compared respiration-averaged CT and4-dimensional (4D) CT for attenuation correction of cardiacPET in an in vivo canine model as a means of removing these in-consistencies. Methods: Five dogs underwent respiration-gatedcardiac 18F-FDG PET and 4D CT. The PET data were recon-structed with 3 methods of attenuation correction that differedonly in the CT data used: The first method was single-phaseCT at either end-expiration, end-inspiration, or the middle of abreathing cycle; the second was respiration-averaged CT, whichis CT temporally averaged over the entire respiratory cycle; andthe third was phase-matched CT, in which each PET phase iscorrected with the matched phase from 4D CT. After reconstruc-tion, the gated PET images were summed to produce an ungatedimage. Polar plots of the PET heart images were generated, andpercentage differences were calculated with respect to thephase-matched correction for each dog. The difference mapswere then averaged over the 5 dogs. Results: For single-phaseCT correction at end-expiration, end-inspiration, and mid cycle,the maximum percentage differences were 11% 6 4%, 7% 6
3%, and 5% 6 2%, respectively. Conversely, the maximumdifference for attenuation correction with respiration-averagedCT data was only 1.6% 6 0.7%. Conclusion: Respiration-averaged CT correction produced a maximum percentagedifference 7 times smaller than that obtained with end-expirationsingle-phase correction. This finding indicates that usingrespiration-averaged CT may accurately correct for attenuationon respiration-ungated cardiac PET.
Key Words: PET; 4D CT; attenuation correction; respiration-induced motion; cardiac imaging
J Nucl Med 2007; 48:811–818DOI: 10.2967/jnumed.106.034199
Cardiovascular disease causes 1 in 3 deaths in Canada(1) and worldwide (2) every year. The largest componentof cardiovascular disease is heart disease. Proper patientmanagement after a heart attack is crucial to maximizerecovery. Cardiac imaging of 18F-FDG uptake with PET,currently the gold standard for determining the viability ofheart tissue, allows the clinician to determine whether thetissue is ischemic or necrotic (3). This distinction is a clin-ical factor guiding the clinician toward treating the patientmedically, with bypass surgery, or with heart transplanta-tion (4).
Accurate PET images require attenuation correction forsignal loss via photon absorption in patient tissues (5). Thiscorrection is done through the use of a transmission scan. Inthe past, the transmission image, or map, has generallybeen acquired through the use of a radioisotope source suchas 68Ge. However, the low 511-keV photon flux generatedby such radioisotopes requires lengthy transmission scans.Because the length of a radioisotope transmission scan issimilar to that of a PET emission scan, the 2 data sets areconsistent and the problem of respiratory motion is re-duced, leading it to have received minimal attention (6)despite having been recognized for some time (7).
With the advent of hybrid PET/CT scanners, the use ofCT for attenuation correction has become common (8), andin some of these hybrid scanners, radioisotope attenuationcorrection is no longer available. Some advantages of usingCT as a transmission source for attenuation correction in-clude its speed, nearly noise-free images, and high spatialresolution. These advantages increase patient throughput, im-prove the signal-to-noise ratio of the attenuation-correctedPET images, and accurately localize tracer uptake anatom-ically. However, the speed of the CT scan is also a potentialsource of problems. The typical temporal resolution of aCT image is less than 1 s, significantly shorter than the 4-sresting breathing period of a person (9). CT thereforeacquires a snapshot image of the patient at a single phaseof the respiratory cycle. A cardiac PET scan requires 15–30min per acquisition and gives an image that is temporallyaveraged over many respiratory cycles. Inconsistenciesbetween a CT attenuation correction map from a single
Received Jul. 3, 2006; revision accepted Oct. 31, 2006.For correspondence or reprints contact: R. Glenn Wells, PhD, Lawson
Health Research Institute, Nuclear Medicine Department, Room C531, St.Joseph’s Hospital, 268 Grosvenor St., London, Ontario, Canada, N6A 4V2.
E-mail: [email protected] ª 2007 by the Society of Nuclear Medicine, Inc.
AVERAGE CT CORRECTION OF CARDIAC PET • Cook et al. 811
by on June 16, 2015. For personal use only. jnm.snmjournals.org Downloaded from

respiratory phase and a temporally averaged PET studyimaged over many breathing periods may lead to errors inthe final attenuation-corrected image (10). This respiration-induced misregistration between the PET and CT scans hasbrought about increased interest in methods to correct forartifacts from respiratory motion (6,10–16).
Respiration causes the heart to move by up to 1.6 cm,which is about the thickness of the heart wall (13). In otherwords, the entire heart wall can move into the adjacent lungregion, and that part of the heart will consequently beundercorrected. Errors resulting from the PET/CT data mis-match can seriously affect the count levels in the recon-structed heart image (14). Studies of simulations (10), canines(14), and humans (15) have shown that attenuation correctionbased on CT scans acquired at a single phase of the respira-tory cycle, such as at end-expiration or end-inspiration, leadsto incorrect calculated levels of heart activity. Additionally,these errors are also seen clinically in 18F-FDG PET studiescorrected with a standard helical CT scan (16,17), possiblyleading to a change in diagnosis or treatment of the patient(18).
One solution to this temporal mismatch is to reduce theinfluence of respiration-induced motion on the data throughgating of the PET acquisition, wherein the PET data areseparated into multiple temporal bins based on the phase ofthe respiratory cycle (19). Each bin (gate) contains only asmall portion of the respiratory cycle and correspondinglyreduces the motion present in that gate. The CT informa-tion can be organized in a similar fashion by obtaining a4-dimensional (4D) CT dataset (9). The reconstructed CTimages are retrospectively reordered to produce CT volumesdistributed throughout the respiratory cycle, with each phasehaving approximately the same temporal duration as thePET gates. Each individual PET gate and the reordered 4DCT can be matched for respiratory phase, allowing consis-tent attenuation correction of all PET gates throughout therespiratory cycle. The problem with this phase-matchedapproach is that it is both computationally and procedurallycomplex, because the 4D CT images have to be separatelyreconstructed for each individual respiratory phase and thenmatched to the gated PET data for image reconstruction withattenuation correction. This approach is potentially difficultto implement clinically. Furthermore, routine clinical cardiacstudies are not respiration-gated.
A simpler solution to the temporal misregistration problemis to obtain a CT volume temporally averaged over therespiratory cycle of the patient, or a respiration-averaged CTvolume. Such a CT volume has the same temporal propertiesas the respiration-ungated PET data, and the approach hasshown promise in oncology (17). This solution is more easilyimplemented than the phase-matched technique, becausematching of the PET and CT phases is not required, nor istriggering of either acquisition at a particular phase of therespiratory cycle.
In this study, we examined the effects of respiration in acanine model of cardiac 18F-FDG PET. The objective of our
study was to compare the accuracy of respiration-averagedCT with phase-matched CT for attenuation correction ofrespiration-ungated PET images.
MATERIALS AND METHODS
Five dogs, weighing approximately 22 kg each, were anesthe-tized with a 15- to 20-mL dose of 1% propofol and maintainedwith 1.5%–2% isoflurane gas. This study was approved by theAnimal Use Subcommittee of the Canadian Council on AnimalCare at the University of Western Ontario (ethics approval 2005-002-02). The dogs were intubated and ventilated for the durationof the study, with the ventilation rate set at 8 breaths per minuteand a peak inspiratory pressure of 16 cm of H2O. The resultantrespiratory cycle of the dogs was asymmetric, with inspirationtaking place over the first third of the cycle and expirationencompassing the remaining two thirds. The heart rate wasmonitored throughout and had a mean value of 103.6 beats perminute for the 5 animals, with a range of 91–115. The dogs werelaid supine, to mimic human positioning during clinical exami-nations, and injected with 260 MBq of 18F-FDG.
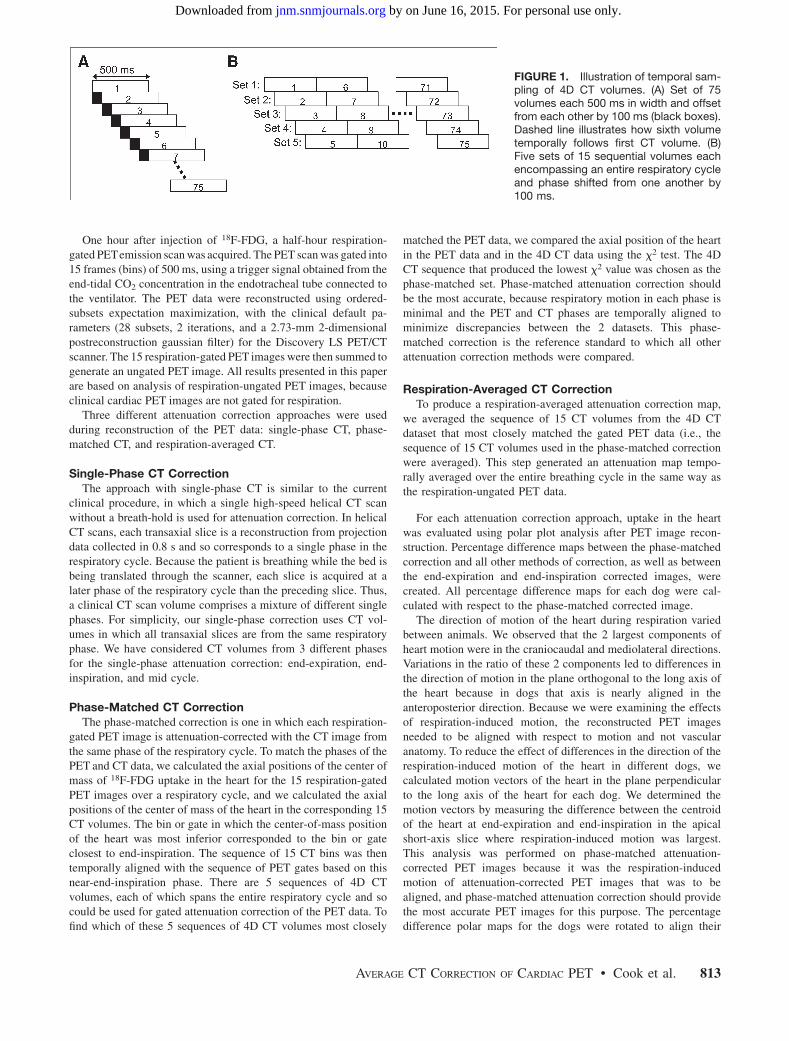
Immediately after tracer injection, a 4D CT cine transmissionscan was acquired with CT parameters set to the default values fora clinical PET/CT examination (80 mA; 120 kV). All scans wereacquired on a 4-slice Discovery LS PET/CT scanner (GE Health-care) at St. Joseph’s Health Care London. The total axial field ofview was 15 cm (1 PET bed position), centered on the heart. The4D CT data were acquired in a shoot (cine)-and-step format, witha scan time of 8.2 s (1-cm field of view) to ensure that a completedataset for an entire breath cycle (7.5 s) was acquired at each bedposition before moving to the next. However, because no trigger-ing is used during cine CT acquisitions, the initial phase of therespiratory cycle that was captured was different at each bedposition. Therefore, to ensure a consistent dataset within each CTvolume, we temporally aligned the constituent slices from suc-cessive CT bed positions using software that compared theposition of the chest wall in abutting transaxial CT images. Thisapproach is similar to that of Pan et al. (9), who use internalmeasurements and do not require a respiratory triggering device toalign successive CT bed positions. The rotation speed of the CTgantry was 500 ms per revolution, and projection data from a full360� were used for image reconstruction. In other words, eachreconstructed image corresponded to a temporal width of 500 msof the respiratory cycle and was equivalent to a bin in therespiration-gated PET acquisition as described below. From an8.2-s cine scan at each bed position, 78 images were reconstructedby offsetting the 500-ms temporal width of each successive imageby 100 ms. From these 78 images, 75 images corresponding to1 breath cycle, for each bed position, were aligned in respiratoryphase with respect to one another. Therefore, 75 3-dimensional CTvolumes were produced, offset from one another by 100 ms(Figure 1A). The 75 CT volumes were then reordered into 5 setsof 15 sequential volumes (Fig. 1B). Within each set of 15 se-quential volumes, each volume covered 0.5 s of the respiratorycycle such that the entire cycle was covered. Each of the 5 sets of15 volumes was phase-shifted from the other sets by 100 ms. TheCT acquisition produced 2.5-mm-thick contiguous slices. The CTvolumes were then interpolated to 4.25-mm-thick contiguousslices to match the PET slice thickness before conversion of theCT image to an attenuation map.
812 THE JOURNAL OF NUCLEAR MEDICINE • Vol. 48 • No. 5 • May 2007
by on June 16, 2015. For personal use only. jnm.snmjournals.org Downloaded from
One hour after injection of 18F-FDG, a half-hour respiration-gated PETemission scan was acquired. The PET scan was gated into15 frames (bins) of 500 ms, using a trigger signal obtained from theend-tidal CO2 concentration in the endotracheal tube connected tothe ventilator. The PET data were reconstructed using ordered-subsets expectation maximization, with the clinical default pa-rameters (28 subsets, 2 iterations, and a 2.73-mm 2-dimensionalpostreconstruction gaussian filter) for the Discovery LS PET/CTscanner. The 15 respiration-gated PET images were then summed togenerate an ungated PET image. All results presented in this paperare based on analysis of respiration-ungated PET images, becauseclinical cardiac PET images are not gated for respiration.
Three different attenuation correction approaches were usedduring reconstruction of the PET data: single-phase CT, phase-matched CT, and respiration-averaged CT.
Single-Phase CT CorrectionThe approach with single-phase CT is similar to the current
clinical procedure, in which a single high-speed helical CT scanwithout a breath-hold is used for attenuation correction. In helicalCT scans, each transaxial slice is a reconstruction from projectiondata collected in 0.8 s and so corresponds to a single phase in therespiratory cycle. Because the patient is breathing while the bed isbeing translated through the scanner, each slice is acquired at alater phase of the respiratory cycle than the preceding slice. Thus,a clinical CT scan volume comprises a mixture of different singlephases. For simplicity, our single-phase correction uses CT vol-umes in which all transaxial slices are from the same respiratoryphase. We have considered CT volumes from 3 different phasesfor the single-phase attenuation correction: end-expiration, end-inspiration, and mid cycle.
Phase-Matched CT CorrectionThe phase-matched correction is one in which each respiration-
gated PET image is attenuation-corrected with the CT image fromthe same phase of the respiratory cycle. To match the phases of thePET and CT data, we calculated the axial positions of the center ofmass of 18F-FDG uptake in the heart for the 15 respiration-gatedPET images over a respiratory cycle, and we calculated the axialpositions of the center of mass of the heart in the corresponding 15CT volumes. The bin or gate in which the center-of-mass positionof the heart was most inferior corresponded to the bin or gateclosest to end-inspiration. The sequence of 15 CT bins was thentemporally aligned with the sequence of PET gates based on thisnear-end-inspiration phase. There are 5 sequences of 4D CTvolumes, each of which spans the entire respiratory cycle and socould be used for gated attenuation correction of the PET data. Tofind which of these 5 sequences of 4D CT volumes most closely
matched the PET data, we compared the axial position of the heartin the PET data and in the 4D CT data using the x2 test. The 4DCT sequence that produced the lowest x2 value was chosen as thephase-matched set. Phase-matched attenuation correction shouldbe the most accurate, because respiratory motion in each phase isminimal and the PET and CT phases are temporally aligned tominimize discrepancies between the 2 datasets. This phase-matched correction is the reference standard to which all otherattenuation correction methods were compared.
Respiration-Averaged CT CorrectionTo produce a respiration-averaged attenuation correction map,
we averaged the sequence of 15 CT volumes from the 4D CTdataset that most closely matched the gated PET data (i.e., thesequence of 15 CT volumes used in the phase-matched correctionwere averaged). This step generated an attenuation map tempo-rally averaged over the entire breathing cycle in the same way asthe respiration-ungated PET data.
For each attenuation correction approach, uptake in the heartwas evaluated using polar plot analysis after PET image recon-struction. Percentage difference maps between the phase-matchedcorrection and all other methods of correction, as well as betweenthe end-expiration and end-inspiration corrected images, werecreated. All percentage difference maps for each dog were cal-culated with respect to the phase-matched corrected image.
The direction of motion of the heart during respiration variedbetween animals. We observed that the 2 largest components ofheart motion were in the craniocaudal and mediolateral directions.Variations in the ratio of these 2 components led to differences inthe direction of motion in the plane orthogonal to the long axis ofthe heart because in dogs that axis is nearly aligned in theanteroposterior direction. Because we were examining the effectsof respiration-induced motion, the reconstructed PET imagesneeded to be aligned with respect to motion and not vascularanatomy. To reduce the effect of differences in the direction of therespiration-induced motion of the heart in different dogs, wecalculated motion vectors of the heart in the plane perpendicularto the long axis of the heart for each dog. We determined themotion vectors by measuring the difference between the centroidof the heart at end-expiration and end-inspiration in the apicalshort-axis slice where respiration-induced motion was largest.This analysis was performed on phase-matched attenuation-corrected PET images because it was the respiration-inducedmotion of attenuation-corrected PET images that was to bealigned, and phase-matched attenuation correction should providethe most accurate PET images for this purpose. The percentagedifference polar maps for the dogs were rotated to align their
FIGURE 1. Illustration of temporal sam-pling of 4D CT volumes. (A) Set of 75volumes each 500 ms in width and offsetfrom each other by 100 ms (black boxes).Dashed line illustrates how sixth volumetemporally follows first CT volume. (B)Five sets of 15 sequential volumes eachencompassing an entire respiratory cycleand phase shifted from one another by100 ms.
AVERAGE CT CORRECTION OF CARDIAC PET • Cook et al. 813
by on June 16, 2015. For personal use only. jnm.snmjournals.org Downloaded from

motion vectors to the 1 dog that had a motion vector close to theaverage of the 5 dogs (Fig. 2). After alignment of the motionvectors, the polar percentage difference maps between the atten-uation correction techniques were averaged over the 5 dogs.
Two additional considerations exist with the respiration-averaged CTapproach: errors in phase and period matching betweenthe PET and CT data. First, the respiration-averaged CT image wasobtained from the sequence of 4D CT volumes phase-matched to thePET data. However, because errors might occur in the matching ofphases, the sensitivity of the respiration-averaged CT to possiblephase shifts between the PET and CT datasets must be determined.To determine this sensitivity, we averaged the remaining 4 se-quences of 15 CT volumes (offset from the matched set by 100, 200,300, and 400 ms) and used them for attenuation correction. Theresulting respiration-averaged attenuation correction maps corre-sponded to 4 phase shifts separated by 100 ms. Because ourrespiratory bins were 500 ms, respiration-averaged CT maps fromimages phase-shifted by 500 ms or more were equivalent to 1 of the 5respiration-averaged CT maps already considered.
Second, a respiration-averaged CT volume obtained overexactly 1 respiratory cycle might not always be obtainable witha 4D CT acquisition in patients, because the axial coverage of theCT scanner is only 2 cm at most, and scanning at multiple bedpositions is needed to cover the entire heart. Therefore, if thepatient’s breathing period were to change over the course of the4D CT acquisition, transaxial slices acquired at different bedpositions could encompass either more or less than 1 respiratoryperiod and lead to discrepancies in the length of respiration usedto generate different portions of the respiration-averaged CTvolume. Because the dogs in our study were ventilated, therespiratory period was fixed from one bed position to another,and these discrepancies were not present in our data. We examinedthese errors by creating incorrectly respiration-averaged CT vol-umes that contained both 120% and 220% of the respiratorycycle. Clinically, these errors would be present only in smallsections of the 4D CT volume, when the respiratory periodfluctuates between bed positions, and would not be present acrossthe entire 4D CT volume. However, our model looked at theworst-case scenario, in which the 4D CT acquisition time at eachbed position does not equal the respiratory period, and erred in thesame way by either missing or duplicating the same portion of therespiratory cycle. These incorrectly respiration-averaged CT im-ages were achieved by taking 3 consecutive phases including end-expiration, or 3 consecutive phases including end-inspiration, andeither doubling or removing their contribution to the respiration-averaged CT. These incorrect respiration-averaged CT volumeswere then used for attenuation correction and compared with theimages acquired with phase-matched CT attenuation correction. Ifthese incorrectly respiration-averaged CT volumes did not pro-duce large errors in the PET images when used for attenuation
correction, then it is unlikely that the random (uncorrelated)fluctuations in 4D CT acquisitions that may occur clinically willhave a large effect.
RESULTS
The polar plot of 18F-FDG uptake in the myocardium,corrected using phase-matched CT and averaged over all5 subjects, is shown in Figure 3. Also shown in Figure 3are the averaged difference polar plots for the othermethods of attenuation correction. The maximum percent-age differences between phase-matched CT attenuationcorrection and respiration-averaged, end-expiration, end-inspiration, and mid cycle CT attenuation corrections were1.6% 6 0.7%, 11% 6 4%, 7% 6 3%, and 5% 6 2%,respectively. Finally, the maximum percentage differencebetween end-expiration and end-inspiration was 17% 6 7%and represents the maximum possible variation in 18F-FDGuptake produced by the use of different phases of therespiratory cycle for attenuation correction.
In individual cases, the errors were larger than thoseshown in Figure 3, but the spatial distributions of the dif-ferences were similar in all cases and so only the averageimages are presented in this paper. However, the maximumabsolute percentage differences from the phase-matchedmethod are shown in a scatter plot in Figure 4 for each in-dividual dog and for each method of CT attenuation cor-rection. Use of a Sidak-corrected paired t test showed thatthe mean maximum absolute percentage error for respira-tion-averaged CT attenuation correction with respect to thephase-matched method was significantly (P , 0.05) lessthan those for all other methods of CT attenuation correction.
The results for the 4 phase-shifted respiration-averagedCT attenuation corrections did not visually differ fromthose for the correct respiration-averaged CT attenuationcorrections (Fig. 3B) and are, therefore, not shown. Whencompared with the correct phase-matched CT attenuationcorrection image, the maximum percentage differences in18F-FDG uptake were 1.6% 6 0.7% for the 100-, 300-, and400-ms phase shifts and 1.7% 6 0.7% for the 200-ms phaseshift. Figure 5 compares phase-matched and incorrectlyrespiration-averaged corrections. When the final 3 phasesof the cycle, including end-expiration, were included twicein the averaging, the maximum difference was 3% 6 1%.When the 3 consecutive phases, including end-inspiration,were included twice in the averaging, the maximum dif-ference was 1.6% 6 0.6%. When the last 3 phases,
FIGURE 2. Illustration of rotation ofpolar plots to align respiration-inducedmotion vectors. (A) Polar plot withrespiration-induced motion depicted byarrow. (B) Polar plot with respiration-induced motion depicted by arrow in dif-ferent direction with respect to A. (C) Polarplot in B rotated such that respiration-induced motion is aligned with that of A.
814 THE JOURNAL OF NUCLEAR MEDICINE • Vol. 48 • No. 5 • May 2007
by on June 16, 2015. For personal use only. jnm.snmjournals.org Downloaded from

including end-expiration, were omitted from the averaging,the maximum difference was 1.2% 6 0.5%. When 3 con-secutive phases, including end-inspiration, were not in-cluded in the averaging, the maximum difference was 1.9%6 0.7%. All percentage difference maps were calculatedwith respect to phase-matched CT attenuation correction.
Figures 6 and 7 examine the cause of the differences be-tween the phase-matched, end-expiration, and end-inspirationCT attenuation corrections. Figure 6 shows the CT image atend-expiration, with the phase-matched-CT–corrected PETimage at end-inspiration superimposed in color. A thresholdof 50% of the maximum was applied to the PET data, and theresultant image was superimposed onto the CT image. Con-versely, Figure 7 shows the phase-matched-CT–correctedPET image at end-expiration superimposed on the end-
inspiration CT image. Figure 6C clearly demonstrates thatthe PET image of the heart at end-inspiration extends into theliver region of the end-expiration CT image. Figures 7A and7B demonstrate that the PET image of the heart at end-expiration is partly in the lung region of the end-inspirationCT image.
DISCUSSION
Only the average data of 5 dogs were presented in this pa-per; however, the results from each individual dog showed
FIGURE 3. Polar plots of 18F-FDG up-take in heart and percentage difference inuptake between phase-matched CT at-tenuation correction and different single-phase attenuation corrections averagedover 5 dogs. (A) Average polar plot withphase-matched CT attenuation correc-tion, with arrow indicating direction ofrespiration-induced motion to which allpolar plots from individual dogs werealigned. (B–E) Polar plots of percentagedifferences in uptake between phase-matched CT attenuation correction andaverage (B), end-expiration (C), end-inspiration (D), and mid cycle (E) CTattenuation corrections. (F) Average polarplot of percentage difference betweenend-expiration and end-inspiration CTattenuation corrections. All percentage
differences were calculated point by point with respect to phase-matched CT attenuation correction of each dog beforeaveraging.
FIGURE 4. Scatter plot showing distribution of maximumabsolute errors for all 5 dogs and each method of CT attenuationcorrection. Errors are expressed as percentage difference fromphase-matched CT attenuation correction polar map.
FIGURE 5. Results of attenuation correction with incorrectlyrespiration-averaged CT. Average, over 5 dogs, of polar plots ofpercentage differences between phase-matched CT attenua-tion correction and incorrectly respiration-averaged CT atten-uation corrections with final 3 phases of expiration includedtwice (A), with 3 consecutive phases including end-inspirationincluded twice (B), with final 3 phases of expiration omitted (C),and with 3 consecutive phases including end-inspiration omit-ted (D).
AVERAGE CT CORRECTION OF CARDIAC PET • Cook et al. 815
by on June 16, 2015. For personal use only. jnm.snmjournals.org Downloaded from

similar relationships between the different methods of at-tenuation correction. For example, in the dog for which thedifferences were greatest, the maximum percentage differ-ence between phase-matched correction and end-expirationcorrection was 20%. For this same dog, the maximum dif-ference between phase-matched and respiration-averagedcorrections was 4%, a 5-fold reduction from the previoussingle-phase case. This result is similar to what we sawwith the average data, because the maximum difference be-tween phase-matched and end-expiration corrections was11% 6 4%. This difference also dropped by a factor of 7, to1.6% 6 0.7%, when phase-matched correction was com-pared with respiration-averaged correction.
Reorientation of the percentage difference polar plots toalign the respiration-induced motion vectors leads to aver-aging over different anatomic regions of the hearts of the 5dogs. The fact that the hearts of the 5 dogs were undamagedreduces the heterogeneity of 18F-FGD uptake in the heart.Some heterogeneity will remain even in normal hearts, butthe effect of these heterogeneities on the average of the dif-ference maps should be minimal, because each differencemap is first normalized with respect to its own phase-matched-CT–corrected image. However, this approach pre-cludes statements on which anatomic regions of the heartwould most likely be affected by respiratory motion. In-stead, the effects are tied to the direction of the respiration-induced motion of the heart, with attenuation correctionartifacts positioned along this direction of motion.
The percentage differences between phase-matched andend-expiration corrections were larger than those with end-inspiration correction. Because of the asymmetry of therespiratory cycle, with expiration encompassing two thirdsof the cycle, it was expected that the end-expiration CTimage would be closer to a respiration-averaged CT imagethan would the end-inspiration CT image, thus generatingless error. However, this was not the case. The cause of thisdisparity is seen in Figures 6 and 7, which show the PETheart position with respect to the CT image for an exampledog. When the PET heart image was at end-inspiration andwas corrected with its phase-matched CT image, the heart
appeared in the liver on the end-expiration CT image.Because of the large volume of lung being ‘‘replaced’’ bythe liver at that transaxial level of the heart, this effect willgreatly overcorrect that region of the heart when end-expiration CT attenuation correction is applied. In otherwords, a horizontal line, drawn through the region of thePET heart but incorrectly placed in the CT liver, containsmore attenuating material than is actually experienced byphotons exiting that region of the heart. Conversely, whenthe PET data at end-expiration are superimposed on theend-inspiration CT image, a small portion of the heart isplaced in the lung region of the CT image. This region ofthe heart is, therefore, undercorrected when end-inspirationCT attenuation correction is applied, because a section ofthe heart will be attenuation-corrected as though it werelung at that sagittal level of the heart. In other words, avertical line, drawn through the region of the PET heart butincorrectly placed in CT lung, contains less attenuatingmaterial than is actually experienced by that region of theheart. On examining these 2 figures, one can see that theregion in the liver with end-expiration CT appears largerthan the region in the lung with end-inspiration CT. This,combined with differences in the attenuation correctionfactor between the regions, leads to larger errors when end-expiration CT is used for attenuation correction than whenend-inspiration CT is used.
Our experimental condition was idealized, because thedogs were sedated and ventilated. Both measures resultedin a regular, consistent breathing pattern, which may notoccur clinically. Having a fixed respiratory period greatlysimplified the acquisition of respiration-averaged CT be-cause inconsistencies would otherwise arise between CTslices. Thus, the question is raised of what happens if therespiration-averaged CT is obtained incorrectly (i.e., notobtained over exactly 1 respiratory cycle), such as mightoccur if a patient’s breathing rate changed during 4D CTacquisition. This question was examined in Figure 5, whichcompares the phase-matched-CT–corrected image with im-ages obtained with incorrect respiration-averaged CT. Thelargest maximum percentage difference was only 3% 6 1%.
FIGURE 7. Fusion of phase-matchedCT attenuation-corrected PET image atend-expiration with CT image at end-inspiration: transaxial slice (A), coronalslice (B), and sagittal slice (C).
FIGURE 6. Fusion of phase-matchedCT attenuation-corrected PET image atend-inspiration with CT image at end-expiration: transaxial slice (A), coronalslice (B), and sagittal slice (C).
816 THE JOURNAL OF NUCLEAR MEDICINE • Vol. 48 • No. 5 • May 2007
by on June 16, 2015. For personal use only. jnm.snmjournals.org Downloaded from

This value is twice the maximum difference of 1.6% 6
0.7% that was seen when the correct respiration-averagedCT image was used for attenuation correction but stillrepresents a large reduction over the error seen with single-phase CT corrections. This respiration-averaged CT atten-uation correction is therefore quite robust with respect tosmall errors in the length of the respiratory cycle used inthe averaging. Additionally, when the other 4 phase-shiftedCT volumes were averaged and compared with the averageof CT volumes used in the phase-matched correction ofPET images, respiration-averaged CT was independent ofphase shifts in the CT data, because all 4 phase-shiftedcorrections generated nearly indistinguishable results fromthe result seen in Figure 3B. This finding, by indicating thatthe specific phase of the cycle and duration of the scan donot greatly influence the accuracy of the correction, sim-plifies acquisition of respiration-averaged CT. Cine acqui-sitions of the patient can be obtained without the need forrespiratory monitoring of the phase of acquisition.
Although the canine model is similar to humans, differ-ences remain between the two, such as the magnitude of theattenuation correction factors and the breathing rate. Theattenuation correction factor in humans can be 2 or 3 timeslarger than that in the dogs used in this experiment, andsubsequently some of the differences in our data couldpotentially be even larger in humans. Also, the averagebreathing rate for humans is approximately 12–18 breathsper minute, producing a respiratory period of about 4 s,compared with the 7.5 s used for the dogs in this study. Thelonger period was selected to minimize motion within eachimage of the 4D CT acquisition. Having a shorter respira-tory period would increase the motion in each individualCT volume of the 4D CT acquisition. However, this effectshould be small, because a cine mode acquisition using a0.5-s rotation speed is still fast enough to capture multiplephases of a 4-s respiratory cycle without producing signif-icant respiration-induced image artifacts from inconsis-tencies in the projection data.
Another approach to obtaining a respiration-averaged CTscan of the patient is the use of slow-rotation CT (e.g., up toa 4-s rotation speed is available on our PET/CT scanner).This approach would not require gating, because the rota-tion speed and respiratory period would be similar. How-ever, such an acquisition results in inconsistencies in theprojection data because, during the course of the acquisi-tion, projections are obtained from different phases of therespiratory cycle, leading to artifacts in the reconstructedimages. Such drawbacks to slow-rotation CT have beenshown in oncology studies (20).
One concern is the dose received by the patient duringthe multiple respiratory cycles required for 4D CT. How-ever, accurate CT images can be obtained by reducing thex-ray tube current from 80 mA (used in this study) to 10mA, and the dose to the patient would be reduced corre-spondingly (21). This approach would acquire an accuraterespiration-averaged CT scan through 4D CT protocols,
with only a small increase in dose relative to routine non–breath-hold helical CT.
CONCLUSION
In respiration-ungated cardiac PET images from a livecanine model, we compared 3 types of CT attenuation correc-tion: CTof a single respiratory phase (either at end-inspiration,mid-cycle, or end-expiration), respiration-averaged CT, andphase-matched CT. Single-phase correction led to a maximumerror of 11% 6 4%, when compared with phase-matchedcorrection. This error was greatly reduced to 1.6% 6 0.7%through the use of CT averaged over an entire respiratorycycle, as can be obtained with the 4D CTacquisition describedby Pan et al. (9).
ACKNOWLEDGMENTS
We thank Jane Sykes, Lela Dorrington, Jennifer Hadway,Dominique Ouimet, Lynn Keenliside, and Benoit Lewdenfor their invaluable technical assistance with this research.This work was supported by the Heart and Stroke Founda-tion of Ontario (grant NA 5292 and a Masters award), theUniversity of Western Ontario, the Ontario Research andDevelopment Challenge Fund, the Lawson Health ResearchInstitute, and GE Healthcare.
REFERENCES
1. Causes of Death 2002 (report 84-208-XIE). Ottawa, ON, Canada: Statistics
Canada, Vital and Cancer Statistics Section; 2004.
2. Beaglehole R, Irwin A, Prentice T. The World Health Report 2004: Changing
History. Geneva, Switzerland: World Health Organization; 2004.
3. Segall G. Assessment of myocardial viability by positron emission tomography.
Nucl Med Commun. 2002;23:323–330.
4. Saab G, deKemp RA, Ukkonen H, et al. Gated fluorine 18 fluorodeoxyglucose
positron emission tomography: determination of global and regional left ventricular
function and myocardial tissue characterization. J Nucl Cardiol. 2003;10:297–303.
5. Zaidi H, Hasegawa B. Determination of the attenuation map in emission
tomography. J Nucl Med. 2003;44:291–315.
6. Livieratos L, Stegger L, Bloomfield PM, Schafers K, Bailey DL, Camici PG.
Rigid-body transformation of list-mode projection data for respiratory motion
correction in cardiac PET. Phys Med Biol. 2005;50:3313–3322.
7. Ter-Pogossian MM, Bergmann SR, Sobel BE. Influence of cardiac and
respiratory motion on tomographic reconstructions of the heart: implications
for quantitative nuclear cardiology. J Comput Assist Tomogr. 1982;6:1148–1155.
8. Kinahan P, Hasegawa B, Beyer T. X-ray based attenuation correction for positron
emission tomography/computed tomography scanners. Semin Nucl Med. 2003;
33:166–179.
9. Pan T, Lee T, Rietzel E, Chen G. 4D-CT imaging of a volume influenced by
respiratory motion on multi-slice CT. Med Phys. 2004;31:333–340.
10. Fitzpatrick GM, Wells RG. Simulation study of respiratory-induced errors in
cardiac position emission tomography/computed tomography. Med Phys.
2006;33:2888–2895.
11. Goerres GW, Burger C, Kamel E, et al. Respiration-induced attenuation artifact
at PET/CT: technical considerations. Radiology. 2003;226:906–910.
12. Nehmeh SA, Erdi YE, Pan T, et al. Four-dimensional (4D) PET/CT imaging of
the thorax. Med Phys. 2004;31:3179–3186.
13. Livieratos L, Rajappan K, Stegger L, Schafers K, Bailey DL, Camici PG.
Respiratory gating of cardiac PET data in list-mode acquisition. Eur J Nucl Med
Mol Imaging. 2006;33:584–588.
14. Chin B, Nakamoto Y, Kraitchman D, et al. PET-CT evaluation of 2-deoxy-2-
[18F]fluoro-D-glucose myocardial uptake: effect of respiratory motion. Mol
Imaging Biol. 2003;5:57–64.
AVERAGE CT CORRECTION OF CARDIAC PET • Cook et al. 817
by on June 16, 2015. For personal use only. jnm.snmjournals.org Downloaded from

15. Le Meunier L, Maarss-Moreno R, Carrasquillo J, et al. PET/CT imaging: effect
of respiratory motion on 18FDG myocardial uptake [abstract]. J Nucl Med.
2005;46(suppl):163P.
16. Wassenaar R, Wells RG, deKemp R. Clinical evaluation of CT versus Ge-68 atten-
uation correction in cardiac PET imaging [abstract]. J Nucl Med. 2004;45(suppl):118P.
17. Pan T, Mawlawi O, Nehmeh SA, et al. Attenuation correction of PET images with
respiration-averaged CT images in PET/CT. J Nucl Med. 2005;46:1481–1487.
18. Loghin C, Sdringola S, Gould KL. Common artifacts in PET myocardial perfu-
sion images due to attenuation-emission misregistration: clinical significance,
causes, and solutions. J Nucl Med. 2004;45:1029–1039.
19. Klein GJ, Reutter BW, Ho MH, Reed JH, Huesman RH. Real-time system for
respiratory-cardiac gating in positron tomography. IEEE Trans Nucl Sci. 1998;45:
2139–2143.
20. Mori S, Kanematsu N, Mizuno H, Sunaoka M, Endo M. Physical evaluation of
CT scan methods for radiation therapy planning: comparison of fast, slow and
gating scan using the 256-detector row CT scanner. Phys Med Biol. 2006;51:
587–600.
21. Koepfli P, Hany TF, Wyss CA, et al. CT attenuation correction of myocardial
perfusion quantification using PET/CT hybrid scanner. J Nucl Med. 2004;45:
537–542.
818 THE JOURNAL OF NUCLEAR MEDICINE • Vol. 48 • No. 5 • May 2007
by on June 16, 2015. For personal use only. jnm.snmjournals.org Downloaded from

Doi: 10.2967/jnumed.106.034199Published online: April 27, 2007.
2007;48:811-818.J Nucl Med. Russell A.H. Cook, Greg Carnes, Ting-Yim Lee and R. Glenn Wells Respiration-Averaged CT for Attenuation Correction in Canine Cardiac PET/CT
http://jnm.snmjournals.org/content/48/5/811This article and updated information are available at:
http://jnm.snmjournals.org/site/subscriptions/online.xhtml
Information about subscriptions to JNM can be found at:
http://jnm.snmjournals.org/site/misc/permission.xhtmlInformation about reproducing figures, tables, or other portions of this article can be found online at:
(Print ISSN: 0161-5505, Online ISSN: 2159-662X)1850 Samuel Morse Drive, Reston, VA 20190.SNMMI | Society of Nuclear Medicine and Molecular Imaging
is published monthly.The Journal of Nuclear Medicine
© Copyright 2007 SNMMI; all rights reserved.
by on June 16, 2015. For personal use only. jnm.snmjournals.org Downloaded from