Monte Carlo simulation and patient dosimetry for a kilovoltage cone-beam CT unit
12
Monte Carlo simulation and patient dosimetry for a kilovoltage cone-beam CT unit P. Downes Department of Medical Physics, Velindre Cancer Centre, Velindre Road, Cardiff CF14 2TL, United Kingdom and Cardiff School of Computer Science, Cardiff University, Cardiff CF24 3AA, United Kingdom R. Jarvis and E. Radu Department of Medical Physics, Velindre Cancer Centre, Velindre Road, Cardiff CF14 2TL, United Kingdom I. Kawrakow Ionizing Radiation Standards, National Research Council of Canada, Ottawa, Ontario, K1A 0R6 Canada E. Spezi a Department of Medical Physics, Velindre Cancer Centre, Velindre Road, Cardiff CF14 2TL, United Kingdom and Institute of Medical Engineering and Medical Physics, School of Engineering, Cardiff University, Cardiff CF24 3AA, United Kingdom Received 18 March 2009; revised 14 July 2009; accepted for publication 14 July 2009; published 12 August 2009 Purpose: The purpose of this work is to characterize the x-ray volume imager XVI, the cone- beam computed tomography CBCT unit mounted on the Elekta Synergy linac, with F1 bowtie filter and to calculate the three-dimensional dose delivered to patients using volumetric acquisition. Methods: The XVI is modeled in detail using a new Monte Carlo MC code, BEAMPP, under development at the National Research Council Canada. In this investigation, a new component module is developed to accurately model the unit’s bowtie filter used in conjunction with the available beam collimators at the clinical energy of 120 kV. The modeling is compared against percentage depth dose PDD and profile measurements. Kilovoltage radiation beams’ phase space files are also analyzed. The authors also describe a method for the absolute dose calibration of the MC model of the CBCT unit when used in a clinical volumetric acquisition mode. Finally, they calculate three-dimensional patient dose from CBCT image acquisition in three clinical cases of interest: Pelvis, lung, and head and neck. Results: The agreement between measurement and MC is shown to be very good: Within 2% for the PDD and within 3.5% inside the radiation field for all the collimators with the F1 bowtie filter. A full account of the absolute calibration method is given and dose calculation is validated against ion chamber measurements in different locations of a plastic phantom. Calculations and experiments agree within 2% or better in both at the center and the periphery of the phantom, with worst agreement of 4.5% at the surface of the phantom and for one specific combination of collimator and filter. Patient dose from CBCT scan reveals that dose to tissue is between 2 and 2.5 cGy for a pelvis or a lung full acquisition. For H&N dose to tissue is 5 cGy, with the unit presets used in this work. Dose to bony structures can be two to three times higher than dose to tissue. Conclusions: The XVI CBCT unit has been fully modeled including the F1 bowtie filter. Absolute dose distribution from the unit has been successfully validated. Full MC patient dose calculation has shown that the three-dimensional dose distribution from CBCT is complex. Patient dose from CBCT exposure cannot be completely accounted for by using a numerical factor as an estimate of the dose at the center of the body. Furthermore, additional dose to bone should be taken into account when adopting any IGRT strategy and weighed vs the unquestionable benefits of the technique in order to optimize treatment. Full three-dimensional dose calculation is recommended if patient dose from CBCT is to be integrated in any adaptive planning strategy. © 2009 American Association of Physicists in Medicine. DOI: 10.1118/1.3196182 Key words: dosimetry, radiation therapy, computerised tomography, phantoms, Monte Carlo methods, patient treatment 4156 4156 Med. Phys. 36 „9…, September 2009 0094-2405/2009/36„9…/4156/12/$25.00 © 2009 Am. Assoc. Phys. Med.
-
Upload
independent -
Category
Documents
-
view
1 -
download
0
Transcript of Monte Carlo simulation and patient dosimetry for a kilovoltage cone-beam CT unit

Monte Carlo simulation and patient dosimetry for a kilovoltage cone-beamCT unit
P. DownesDepartment of Medical Physics, Velindre Cancer Centre, Velindre Road, Cardiff CF14 2TL,United Kingdom and Cardiff School of Computer Science, Cardiff University, Cardiff CF24 3AA,United Kingdom
R. Jarvis and E. RaduDepartment of Medical Physics, Velindre Cancer Centre, Velindre Road, Cardiff CF14 2TL,United Kingdom
I. KawrakowIonizing Radiation Standards, National Research Council of Canada, Ottawa, Ontario, K1A 0R6 Canada
E. Spezia�
Department of Medical Physics, Velindre Cancer Centre, Velindre Road, Cardiff CF14 2TL,United Kingdom and Institute of Medical Engineering and Medical Physics, School of Engineering,Cardiff University, Cardiff CF24 3AA, United Kingdom
�Received 18 March 2009; revised 14 July 2009; accepted for publication 14 July 2009;published 12 August 2009�
Purpose: The purpose of this work is to characterize the x-ray volume imager �XVI�, the cone-beam computed tomography �CBCT� unit mounted on the Elekta Synergy linac, with F1 bowtiefilter and to calculate the three-dimensional dose delivered to patients using volumetric acquisition.Methods: The XVI is modeled in detail using a new Monte Carlo �MC� code, BEAMPP, underdevelopment at the National Research Council Canada. In this investigation, a new componentmodule is developed to accurately model the unit’s bowtie filter used in conjunction with theavailable beam collimators at the clinical energy of 120 kV. The modeling is compared againstpercentage depth dose �PDD� and profile measurements. Kilovoltage radiation beams’ phase spacefiles are also analyzed. The authors also describe a method for the absolute dose calibration of theMC model of the CBCT unit when used in a clinical volumetric acquisition mode. Finally, theycalculate three-dimensional patient dose from CBCT image acquisition in three clinical cases ofinterest: Pelvis, lung, and head and neck.Results: The agreement between measurement and MC is shown to be very good: Within �2% forthe PDD and within �3.5% inside the radiation field for all the collimators with the F1 bowtiefilter. A full account of the absolute calibration method is given and dose calculation is validatedagainst ion chamber measurements in different locations of a plastic phantom. Calculations andexperiments agree within �2% or better in both at the center and the periphery of the phantom,with worst agreement of 4.5% at the surface of the phantom and for one specific combination ofcollimator and filter. Patient dose from CBCT scan reveals that dose to tissue is between 2 and2.5 cGy for a pelvis or a lung full acquisition. For H&N dose to tissue is 5 cGy, with the unitpresets used in this work. Dose to bony structures can be two to three times higher than dose totissue.Conclusions: The XVI CBCT unit has been fully modeled including the F1 bowtie filter. Absolutedose distribution from the unit has been successfully validated. Full MC patient dose calculationhas shown that the three-dimensional dose distribution from CBCT is complex. Patient dose fromCBCT exposure cannot be completely accounted for by using a numerical factor as an estimate ofthe dose at the center of the body. Furthermore, additional dose to bone should be taken intoaccount when adopting any IGRT strategy and weighed vs the unquestionable benefits of thetechnique in order to optimize treatment. Full three-dimensional dose calculation is recommendedif patient dose from CBCT is to be integrated in any adaptive planning strategy. © 2009 AmericanAssociation of Physicists in Medicine. �DOI: 10.1118/1.3196182�
Key words: dosimetry, radiation therapy, computerised tomography, phantoms, Monte Carlo
methods, patient treatment4156 4156Med. Phys. 36 „9…, September 2009 0094-2405/2009/36„9…/4156/12/$25.00 © 2009 Am. Assoc. Phys. Med.

4157 Downes et al.: MC patient dosimetry for a kV CBCT unit 4157
I. INTRODUCTION
Image guided radiotherapy �IGRT� techniques are being in-creasingly used in the clinical environment. Cone-beamcomputed tomography �CBCT� is one such technique and itoffers many benefits through being able to image the targetvolume and organs at risk at treatment time. This imaginggives the possibility to correct for patient positioning errorsprior to treatment.1,2
An issue with such increased use of CBCT, whether apatient is scanned every fraction or only for a few fractions,lies in the potentially amplified risk of the patients develop-ing a secondary cancer due to a greater dose delivered tonormal tissue.3–5 Consequently, being able to carry out accu-rate dosimetric characterization of CBCT imaging is clini-cally very important. A better understanding of the dose fromimage guidance will allow practitioners to make more in-formed decisions about treatment to be given to a patient andto undertake possible corrective actions.
FIG. 1. Elekta XVI F1 bowtie collimator. A picture of the F1 bowtie filter isshown in �a�. A schematic drawing of the bowtie filter is also reported in �b�with the axial and sagittal cross sections of the filter taken at the midpoints.Drawings are not to scale. All dimensions are in centimeters. Panel �c�
shows the modeled representation of the bowtie filter.Medical Physics, Vol. 36, No. 9, September 2009
Monte Carlo �MC� is the most accurate method for dosi-metric calculations and is therefore the ideal tool to evaluatethe amount of radiation delivered by a CBCT unit. MC meth-ods have previously been used to simulate diagnostic x-rayunits6,7 and CT scanners.8–10 More recently, MC codes havebeen validated in the kV energy range11,12 and more efficienttechniques for the simulation of x-ray sources have beendeveloped.13,14
There has been recent work carried out by Ding et al.15
using MC to characterize the onboard imaging CBCT unit ofthe Varian Trilogy linear accelerator and the patient dosedistributions from the unit were assessed.16 Chow et al.17
carried out limited MC modeling of the x-ray volume imag-ing �XVI� CBCT unit on the Elekta Synergy linear accelera-tor, but this work does not investigate the use of differentcollimators or filter inserts. Spezi et al.18 recently reported adetailed MC simulation of the XVI unit including the radia-tion source, S, M, and L �small, medium, and large� retract-able collimator cassettes with the F0 neutral filter.
The bowtie filter in the XVI unit has been reported toimprove image quality including image uniformity, CT num-ber accuracy, contrast-to-noise ratio, and skinlinereconstruction.19 In this work, we present a model of theElekta XVI system with F1 bowtie filter on the Elekta Syn-ergy linear accelerator. The model of the F1 bowtie filter wasdeveloped using BEAMPP, a code under development at theNational Research Council Canada. The new MC model isvalidated against an extensive set of experimental measure-ments taken in water. Furthermore, MC calculations are cali-brated for absolute dose. Experimental validation is carriedout through an extensive set of measurements in plasticphantoms. Furthermore, we use the developed techniques tocalculate the three-dimensional patient dose from CBCT im-age acquisition in three clinical cases of interest: Pelvis,lung, and head and neck �H&N�.
II. MATERIALS AND METHODS
II.A. The XVI unit and the Elekta F1 bowtie filter
The CBCT unit studied in this work is the XVI unit,which is mounted on the Elekta Synergy linear accelerator�Elekta, Crawley, UK�. A detailed description of the unit,including tube housing and beamline, can be foundelsewhere.18
Nevertheless, we give a brief account of the unit maincomponents. The XVI unit is mounted 90° to the linac andisocentric at 100 cm. The beamline contains a collimator slotand a filter slot. There are three types of collimator cassettes:S, M, and L. Each type produces a small, medium, and largefield of view �FOV�, respectively, where the different FOVsare defined by the panel offset from the kV central axis. Thedetector panel shifts to match the selected FOV beam offsetwith the larger fields being defined by larger offsets. Thereare three nominal field lengths labeled as 2, 10, and 20 forthe M and L type collimators. There is also an MV 15�15collimator that is used in the MotionView acquisition mode
2
and defines a nominal 15�15 cm field.
4158 Downes et al.: MC patient dosimetry for a kV CBCT unit 4158
There are two filter cassettes available for the unit: The F0neutral filter and the F1 bowtie filter. All the cassettes havethin plastic windows at the top and at the bottom. The F1bowtie filter, depicted in Fig. 1�a�, is made of an aluminumalloy. The shape of the bowtie is doubly concave in thecrossline direction and is flat about the central beam axis inthe inline direction. This is shown in Fig. 1�b�. The filtercassette is 13.55 cm in length and 11.5 cm in width. Thefilter itself is 3.0 cm thick at the edge of the cassette andnarrows to 0.2 cm thick at its center. The radius of curvatureof the upper and lower faces of the filter is the same at12.9 cm.
II.B. Experimental measurements
II.B.1. F1 bowtie and XVI unit measurements
The XVI unit with the F1 bowtie filter was characterizedusing a large set of measurements. A cylindrical ionizationchamber, CC13-S �IBA Dosimetry GmbH, Germany�, withan active volume of 0.13 cm3, was used in these measure-ments connected to a NE2620A electrometer. The chamberwas placed in a computer-controlled water phantom �RFA-300, IBA Dosimetry GmbH, Germany�. A RIO 3G diode�IBA Dosimetry GmbH, Germany� was used as a referencedetector in all measurements. Percentage depth dose �PDD�and planar profiles in the inline and crossline directions at1 cm deep were acquired using the OMNIPRO ACCEPT soft-ware �version 6.3� �Scanditronix Wellhofer AB, Germany�with ten samples per point. The estimated uncertainty in allmeasurements is �3% due to beam stability and beam re-producibility.
The measurements were made using the nominal 120 kVbeam as this is the beam used in our local clinical practice.The kV beam was delivered for 300 frames at 40 mA/frameand with 40 ms/frame. The source-to-surface distance �SSD�was set to 70 cm so that the measurements for all insertscould be taken without the need to reposition the water phan-tom with larger projected fields being offset at the isocenterby exact distances. When taking inline profiles �target-gantrydirection denoted with Y�, the chamber was offset in thecrossline direction �denoted with X� 8.7 and 5.2 cm for the Land M series of inserts, respectively. The profiles were mea-sured at 1 cm deep. The other collimators require no shift asthey produce symmetric fields with respect to the centralbeam axis. Measurements were taken for the S20, MV 15�15, L20, L10, M20, and M10 inserts.
II.B.2. Absolute dose calibration and validation
Absolute dose measurements were carried out with theNE2571 Farmer chamber calibrated for absolute dose.
The intercomparison between the secondary standard andthe NE2571 Farmer chamber was made according to IPEMBcode of practice.20 The field chamber was calibrated againsta secondary standard NE2561 chamber by intercomparing inwater at 2 cm depth to obtain an air kerma free in air cali-
bration factor. This intercomparison was done at 100 cmMedical Physics, Vol. 36, No. 9, September 2009
SSD. The MV 15�15 collimator and F0 neutral filter wereused in the beamline. The beam was delivered using theXVI’s planar acquisition mode.
The dose to water at 2 cm was then measured using thefollowing equation:20
Dw,z=2 = MNkkch�� �̄en
��
w/air�
z=2,�, �1�
where Dw,z=2 is the dose to water at the position of the cham-ber at 2 cm deep and field diameter �, M is the instrumentreading corrected for air density, Nk is the chamber air kermacalibration factor, kch is a factor to account for the differencebetween calibrating in air and measuring in a phantom, and���̄en /��w/air�z=2,� is the mass-energy absorption coefficientratio water to air averaged over the photon spectrum at 2 cmdeep for that field size. The chamber specific factors Nk andkch for the NE2571 used in this work were 0.901 and 1.023,respectively.
Once the chamber was calibrated, outputs for each insertwith the F0 neutral filter and the F1 bowtie filter were mea-sured at the isocenter using the homogeneous Quasar multi-purpose body phantom �Modus Medical Devices, Inc.,Canada�. This phantom is oval shaped and is made of acrylic.There are a number of arrangements possible with a varietyof inserts available; this makes it possible to perform bothhomogeneous and heterogeneous measurements. A custominsert was made in-house from acrylic to allow the NE2571ion chamber to be placed inside the Quasar phantom.
The volumetric acquisition mode was used as this is themode used clinically in our center, where the XVI wasstarted at −180° and rotated 360° clockwise, as shown in Fig.2. This is equivalent to −90° in the linac coordinate systemas the XVI unit is mounted orthogonally to the megavoltagebeam direction. Beam energy and parameters were identicalto the ones used in the previous section. The body phantomwas positioned on the iBEAM evo couchtop �Medical Intel-ligence GmbH, Germany� with its geometric center at theisocenter of the XVI rotation and irradiated. The number of
FIG. 2. A diagram of the Quasar multipurpose body phantom with the initialposition and rotation used in the volumetric acquisition mode. The locations,P0–P3, are positions at which chamber measurements were taken.
frames acquired varies per acquisition and depends on the
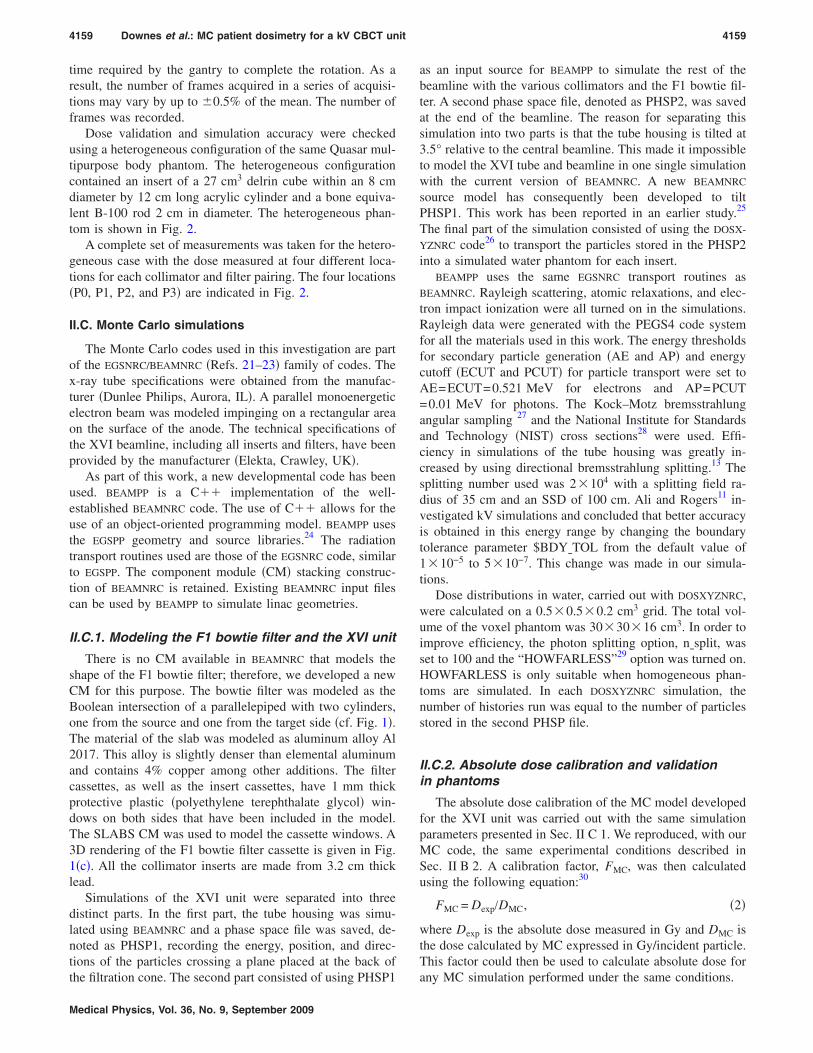
4159 Downes et al.: MC patient dosimetry for a kV CBCT unit 4159
time required by the gantry to complete the rotation. As aresult, the number of frames acquired in a series of acquisi-tions may vary by up to �0.5% of the mean. The number offrames was recorded.
Dose validation and simulation accuracy were checkedusing a heterogeneous configuration of the same Quasar mul-tipurpose body phantom. The heterogeneous configurationcontained an insert of a 27 cm3 delrin cube within an 8 cmdiameter by 12 cm long acrylic cylinder and a bone equiva-lent B-100 rod 2 cm in diameter. The heterogeneous phan-tom is shown in Fig. 2.
A complete set of measurements was taken for the hetero-geneous case with the dose measured at four different loca-tions for each collimator and filter pairing. The four locations�P0, P1, P2, and P3� are indicated in Fig. 2.
II.C. Monte Carlo simulations
The Monte Carlo codes used in this investigation are partof the EGSNRC/BEAMNRC �Refs. 21–23� family of codes. Thex-ray tube specifications were obtained from the manufac-turer �Dunlee Philips, Aurora, IL�. A parallel monoenergeticelectron beam was modeled impinging on a rectangular areaon the surface of the anode. The technical specifications ofthe XVI beamline, including all inserts and filters, have beenprovided by the manufacturer �Elekta, Crawley, UK�.
As part of this work, a new developmental code has beenused. BEAMPP is a C�� implementation of the well-established BEAMNRC code. The use of C�� allows for theuse of an object-oriented programming model. BEAMPP usesthe EGSPP geometry and source libraries.24 The radiationtransport routines used are those of the EGSNRC code, similarto EGSPP. The component module �CM� stacking construc-tion of BEAMNRC is retained. Existing BEAMNRC input filescan be used by BEAMPP to simulate linac geometries.
II.C.1. Modeling the F1 bowtie filter and the XVI unit
There is no CM available in BEAMNRC that models theshape of the F1 bowtie filter; therefore, we developed a newCM for this purpose. The bowtie filter was modeled as theBoolean intersection of a parallelepiped with two cylinders,one from the source and one from the target side �cf. Fig. 1�.The material of the slab was modeled as aluminum alloy Al2017. This alloy is slightly denser than elemental aluminumand contains 4% copper among other additions. The filtercassettes, as well as the insert cassettes, have 1 mm thickprotective plastic �polyethylene terephthalate glycol� win-dows on both sides that have been included in the model.The SLABS CM was used to model the cassette windows. A3D rendering of the F1 bowtie filter cassette is given in Fig.1�c�. All the collimator inserts are made from 3.2 cm thicklead.
Simulations of the XVI unit were separated into threedistinct parts. In the first part, the tube housing was simu-lated using BEAMNRC and a phase space file was saved, de-noted as PHSP1, recording the energy, position, and direc-tions of the particles crossing a plane placed at the back of
the filtration cone. The second part consisted of using PHSP1Medical Physics, Vol. 36, No. 9, September 2009
as an input source for BEAMPP to simulate the rest of thebeamline with the various collimators and the F1 bowtie fil-ter. A second phase space file, denoted as PHSP2, was savedat the end of the beamline. The reason for separating thissimulation into two parts is that the tube housing is tilted at3.5° relative to the central beamline. This made it impossibleto model the XVI tube and beamline in one single simulationwith the current version of BEAMNRC. A new BEAMNRC
source model has consequently been developed to tiltPHSP1. This work has been reported in an earlier study.25
The final part of the simulation consisted of using the DOSX-
YZNRC code26 to transport the particles stored in the PHSP2into a simulated water phantom for each insert.
BEAMPP uses the same EGSNRC transport routines asBEAMNRC. Rayleigh scattering, atomic relaxations, and elec-tron impact ionization were all turned on in the simulations.Rayleigh data were generated with the PEGS4 code systemfor all the materials used in this work. The energy thresholdsfor secondary particle generation �AE and AP� and energycutoff �ECUT and PCUT� for particle transport were set toAE=ECUT=0.521 MeV for electrons and AP=PCUT=0.01 MeV for photons. The Kock–Motz bremsstrahlungangular sampling 27 and the National Institute for Standardsand Technology �NIST� cross sections28 were used. Effi-ciency in simulations of the tube housing was greatly in-creased by using directional bremsstrahlung splitting.13 Thesplitting number used was 2�104 with a splitting field ra-dius of 35 cm and an SSD of 100 cm. Ali and Rogers11 in-vestigated kV simulations and concluded that better accuracyis obtained in this energy range by changing the boundarytolerance parameter $BDY�TOL from the default value of1�10−5 to 5�10−7. This change was made in our simula-tions.
Dose distributions in water, carried out with DOSXYZNRC,were calculated on a 0.5�0.5�0.2 cm3 grid. The total vol-ume of the voxel phantom was 30�30�16 cm3. In order toimprove efficiency, the photon splitting option, n�split, wasset to 100 and the “HOWFARLESS”29 option was turned on.HOWFARLESS is only suitable when homogeneous phan-toms are simulated. In each DOSXYZNRC simulation, thenumber of histories run was equal to the number of particlesstored in the second PHSP file.
II.C.2. Absolute dose calibration and validationin phantoms
The absolute dose calibration of the MC model developedfor the XVI unit was carried out with the same simulationparameters presented in Sec. II C 1. We reproduced, with ourMC code, the same experimental conditions described inSec. II B 2. A calibration factor, FMC, was then calculatedusing the following equation:30
FMC = Dexp/DMC, �2�
where Dexp is the absolute dose measured in Gy and DMC isthe dose calculated by MC expressed in Gy/incident particle.This factor could then be used to calculate absolute dose for
any MC simulation performed under the same conditions.
4160 Downes et al.: MC patient dosimetry for a kV CBCT unit 4160
To simulate the Quasar body phantom, a CT scan of thehomogeneous phantom was made using a Somatom Sensa-tion scanner �Siemens Medical Solutions, Erlangen, Ger-many�. The resulting set of DICOM images were loaded intothe MATLAB software �The MathWorks, Inc., Natick, USA�using the DICOM-RT toolbox30 and a voxel phantom wascreated in the form of an egsphant file that could be read byDOSXYZNRC. To simulate the Quasar body phantom in theheterogeneous configuration, we used a CT scan of the phan-tom with the B-100 cylindrical bone insert and delrin cubeinsert.
The presence of the iBEAM evo carbon fiber table wastaken into account in the simulations. The iBEAM evocouchtop was scanned with identical CT scanner settings asthe Quasar phantom scan. The original CT scanner tablepresent in the Quasar phantom CT scan was replaced withthe CT data from the iBEAM scan, following a procedurereported elsewhere.31
The simulation of the gantry rotation was modeled usingthe DOSXYZNRC input source, ISOURCE, No. 8. ISOURCE 8makes it possible to simulate a phase space source from mul-tiple directions with multiple pairs of polar and azimuthalangle pairs being used to define the different directions. Thephase space file, PHSP2, was used as a particle source withthe initial direction set to −180°; it was rotated clockwise360° in 1° increments to +269°. Simulations were carried outfor all collimator and filter combinations. The MC absolutedose was calculated at the isocenter.
Validation was carried out by comparing simulations ofthe heterogeneous Quasar phantom against experimentalmeasurement at four different locations in the phantom �cf.Fig. 2� using the calculated calibration factor.
II.C.3. Absolute dose calculation in patientgeometry
The assessment of the dose delivered to patients undergo-ing CBCT scan was performed using volumetric dataset al-ready acquired in our center for radiotherapy treatment pur-poses. The absolute CBCT dose in the patient geometry wasretrospectively calculated for three clinical cases representa-tive of the following treatment sites: Pelvis, Chest, andH&N. The effect of the tabletop attenuation was taken intoaccount in the dose calculation.
For the pelvis case, an M10 collimator cassette was used.The H&N case and the lung cases were simulated with theS20 and the M20 collimators, respectively. In all cases, theF1 bowtie filter was used. The isocenter of the CBCT coin-cided with isocenter of the radiotherapy treatment.
III. RESULTS AND DISCUSSION
III.A. Monte Carlo simulations
III.A.1. F1 bowtie filter modeling
The number of primary electrons started in the tube hous-ing simulation was 250�106. The number of particlesscored as output from this simulation at the bottom of the
6
tube housing �PHSP1� was 57�10 particles. PHSP1 wasMedical Physics, Vol. 36, No. 9, September 2009
used as source for all subsequent simulations and each par-ticle was recycled four times. The simulations of the F1bowtie filter with different collimators yielded varying sizeoutput PHSP files �PHSP2�, with each file having a particledensity ranging between 5�105 and 6�105 particles /cm2.
TABLE I. Mean energy of the particles of a nominal 120 kVp beam from theXVI unit for F1 bowtie filter insert for all of the collimator inserts. Themean energy of the F0 neutral filter is shown for comparison.
Energy�keV�
F0 F1
S20 62.08 64.94MV15�15 62.15 64.86M20 62.16 66.50M10 62.29 66.55M20 62.36 66.74L20 62.29 68.77L10 62.34 68.80L2 62.29 69.05
!" # " # !"
$ &'()
"
*+#, "-
#, "-
-+#, "-
!, ".
!+*#, ".
,/,0
1234
5,/
',67
/'7
8,/
9:;0
97'4
,&<
,='(
*)
>! ?*"
>! <*"
>! @*"
>" ?*"
>" <*"
>" @*"
"+"A "+". "+"B "+!*
C/,012 &<,=)
"+",D""
!+", "E
*+", "E
A+", "E
E+", "E
#+", "E
.+", "E
-+", "E
345,/
',6<
,=67
/'7
8,/
9:;0
97'4
,&'
( *
<,=
!)
>! ?*"
>! <*"
>! @*"
>" ?*"
>" <*"
>" @*"
%&
'&
FIG. 3. �a� Energy fluence profiles and �b� energy spectra profiles of selectedcollimator inserts for the F1 bowtie filter. The F0 neutral filter profiles are
shown for comparison.
ely. T
4161 Downes et al.: MC patient dosimetry for a kV CBCT unit 4161
An analysis of the PHSP2 files created after completion ofthe simulation of the beamline was carried out. Table I re-ports the mean energy of the particles in PHSP2 for eachcollimator using the F1 bowtie filter. The mean energies arealso reported for the F0 neutral filter cases. The mean energyof the kV photon beam increases when the F1 bowtie filter isused. This is expected as the filter is designed to improveimage quality by selectively attenuating and removing pho-tons at the periphery of the exposed FOV to compensate forthe patient profile.19 The lowest mean energy for the bowtiefiltered fields is observed for the centered collimators �S20and MV 15�15� with 64.94 keV for the S20. There is anevident increase in the M series mean energy at 66.74 keVand an even larger increase for the L series to 69.05 keV.The change in the mean energy of the collimated fields fol-lows a similar trend for both F1 bowtie and F0 neutral filter,with the mean energy increasing as the reconstructed volumeof the collimator series increases. The change, however, ismuch more noticeable in the case of the F1 filter. In this case,there is an average of 2.6% increase in the mean energybetween the M series collimators and the S20 collimatorcompared to only a 0.2% increase when the F0 filter is used.There is an average of 6.1% increase in the mean energywhen using an L series collimator with the F1 bowtie filtercompared to the S20 collimator. The collimators define the
!"
" ! # $ % &" &!"
!'
'"
('
&""
)+,-.
" ! # $ % &" &!/#/!"!#
)+011.2.34.
+.567 849: ;:<&"
" ! # $ % &" &!"
!'
'"
('
&""
)+,-.
" ! # $ % &" &!/#/!"!#
)+011.2.34.
+.567 849: 4:
FIG. 4. Selected measured and calculated PDDs for the Elekta Synergy XVIM20, M10, and L10 collimators are show in �a�, �b�, �c�, and �d�, respectiv
FOV for the XVI with the FOV increasing from the S series
Medical Physics, Vol. 36, No. 9, September 2009
collimators through the M series to the L series. For largerreconstructed FOV, the radiation field extends further intothe thicker part of the bowtie filter. This leads to more lowenergy particles being attenuated and removed.
Figure 3�a� shows energy fluence of a selected number ofcollimators paired with the F1 bowtie filter. The energy flu-ence when using the F0 neutral filter is also depicted forcomparison. It is evident that the F1 filter determines a sig-nificant decrease in the beam energy fluence. In the S20 case,the energy fluence at the center of the field �X=0 cm� dropsby 15.7% with the F1 filter. The energy fluence decreasesprogressively as we move away from the central beam axis.This again is due to the filter’s shape which is thinnest at itscenter and becomes increasingly thick as we move awayfrom the central beam axis. Energy spectra for selected col-limators are shown in Fig. 3�b�. There is an evident increasein beam hardening across the S, M, and L collimators for theF1 bowtie filter case. This is denoted by a smaller amount oflow energy particles being in the L20 spectrum than in theM20 spectrum, which, in turn, is less than in the S20 spec-trum. As already noted, this is due to the increasing numberof lower energy particles being removed due to the increas-ing target thickness traversed.18 The F1 bowtie filter spectrashow beam hardening when compared to their equivalent F0
<!"
" ! # $ % &" &!"
!'
'"
('
&""
)+,-.
" ! # $ % &" &!/#/!"!#
)+011.2.34.
+.567 849: =:>&"
" ! # $ % &" &!"
!'
'"
('
&""
)+,-.
" ! # $ % &" &!/#/!"!#
)+011.2.34.
+.567 849: ?:
ith the F1 bowtie filter. Monte Carlo ��� and experiments ��� for the S20,he percentage dose difference is also shown.
unit w
spectra.

4162 Downes et al.: MC patient dosimetry for a kV CBCT unit 4162
A comparison between MC simulated results of the F1bowtie filter and measured PDDs for selected collimators ispresented in Fig. 4. The final MC uncertainty for all simula-tions was less than 2%. Both sets of data were normalized to1 cm deep for both MC and measurements. The MC nor-malisation value is the average dose in a ring of 2 mmaround the normalization point at the depth of 1 cm. Thelower panel shows the percentage dose difference to maxi-mum dose. At larger depths, an increased gap between MCand measurements is noticeable. This difference may be at-tributed to the uncertainty associated with the single pointnormalization method used for measurements. Nevertheless,the largest percentage difference observed in the PDDs isless than 2.5% at 12 cm deep. Results of the comparisonbetween MC and measured profiles for the XVI unit usingthe F1 bowtie filter in the inline and crossline directions areshown for selected collimators in Figs. 5 and 6, respectively.For the inline and crossline plots, the largest dose differencesbetween measurement and MC are observed at the fieldedges with a maximum of 8% being found in the worst case.This is not of concern because it occurs in a region of highdose gradient.
III.A.2. Absolute dose calibration and validationin phantoms
The absolute dose calibration was successfully carried out
!"
/&" /' " ' &""
!'
'"
('
&""
)+,-.
/&" /' " ' &"/&"/'"'&"
-/;/0- 849:)+011.2.34.
;:<&"
/% /$ /# /! " ! # $ %"
!'
'"
('
&""
)+,-.
/% /$ /# /! " ! # $ %/&"/'"'&"
-/;/0- 849:)+011.2.34.
4:
FIG. 5. Selected measured and calculated lateral profiles in the inline directioCarlo ��� and experiments ��� for the S20, M20, M10, and L10 collimatois also shown.
using the homogeneous Quasar phantom. The MC dose,
Medical Physics, Vol. 36, No. 9, September 2009
DMC, was calculated by volume averaging the active volumeof the chamber at the isocenter �P0 in Fig. 2� and comparedagainst measurement. A MC factor, FMC, calculated usingEq. �2�, was calculated for each collimator and filter pairing.All the MC factors were within 1.9% of the mean and it wasfound that one MC factor was sufficient to describe all col-limator and filter pairings and this was calculated to be1.47�1017 ��0.01�1017� per particle. Since each volumet-ric acquisition with the XVI unit can acquire a different num-ber of frames, the factor FMC was also calculated “perframe,” The new factor was denoted FMC,fr and is found to be2.39�1014 ��0.01�1014� per particle per frame.
In the homogeneous phantom, the largest dose is observedfor the centered S20 collimator in both F0 neutral filter andthe F1 bowtie filter cases. The doses measured at the iso-center were 2.83 and 2.13 cGy, respectively. With MC, thesewere calculated as 2.84 and 2.14 cGy, respectively. Thesmallest measured dose is seen for the nominal 2 cm fieldcollimator at the largest offset, L2, where 1.03 and 0.76 cGyare measured in the F0 and F1 cases, respectively. Similarly,these were found to be 1.05 and 0.78 cGy when calculatedusing MC. There is an average of 23.9% ��1.1% � decreasein the amount of dose measured at the isocenter when usingthe F1 bowtie filter compared to the F0 neutral filter in volu-metric acquisition mode across all inserts. The MC agreeswith measurement with a calculated average decrease of
<!"
/&" /' " ' &""
!'
'"
('
&""
)+,-.
/&" /' " ' &"/&"/'"'&"
-/;/0- 849:)+011.2.34.
=:>&"
/% /$ /# /! " ! # $ %"
!'
'"
('
&""
)+,-.
/% /$ /# /! " ! # $ %/&"/'"'&"
-/;/0- 849:)+011.2.34.
?:
1 cm deep for the Elekta Synergy XVI unit with the F1 bowtie filter. Monteshow in �a�, �b�, �c�, and �d�, respectively. The percentage dose difference
n atrs are
22.2% ��1.8% �.

4163 Downes et al.: MC patient dosimetry for a kV CBCT unit 4163
Figure 7 shows a dose distribution from a simulation ofthe volumetric acquisition mode for the L20 collimator cas-sette with the F1 bowtie filter �Figs. 7�a� and 7�b�� and withthe F0 neutral filter �Figs. 7�c� and 7�d��. The dose is given in
!"
/&" /' " ' &""
!'
'"
('
&""
)+,-.
/&" /' " ' &"/&"/'"'&"
-/;/0- 849:)+011.2.34.
;:<&"
/&' /&" /' " '"
!'
'"
('
&""
&!'
)+,-.
/&' /&" /' " '/&"/'"'&"
-/;/0- 849:)+011.2.34.
4:FIG. 6. Selected measured and calculated lateral profiles in the crossline diMonte Carlo ��� and experiments ��� for the S20, M20, M10, and L10difference is also shown.
FIG. 7. Transverse and coronal views of a volumetric representation of thehomogeneous Quasar phantom with overlaid MC dose distribution. Thedose is calculated for the volumetric acquisition mode with the L20 colli-mator with the ��a� and �b�� F1 bowtie filter and with the ��c� and �d�� F0
neutral filter.Medical Physics, Vol. 36, No. 9, September 2009
cGy and dose contours are plotted in both the transverse andcoronal planes. It is interesting to see that although the rota-tion of the gantry around the phantom is symmetric, the dosedistribution is asymmetric in the transverse plane. This is dueto the nonrotational symmetry of the phantom along the Zaxis and to the irradiation field being offset from the centralbeam axis for the L series. The same effect is observed whenthe M series collimator cassettes are used, although this is
<!"
/&' /&" /' " '"
!'
'"
('
&""
&!'
)+,-.
/&' /&" /' " '/&"/'"'&"
-/;/0- 849:)+011.2.34.
=:>&"
/!" /&' /&" /' ""
!'
'"
('
&""
&!'
&'"
&('
!""
)+,-.
/!" /&' /&" /' "/&"/'"'&"
-/;/0- 849:)+011.2.34.
?:n at 1 cm deep for the Elekta Synergy XVI unit with the F1 bowtie filter.ators are show in �a�, �b�, �c�, and �d�, respectively. The percentage dose
!
!"
#!
#!"
$!
$!"
%!
%!"
&!
' '# '$ '%
!"#%&'()
*+,-.#/ 0!"121!3
()*+,-).)/0 2
(3 2
()*+,-).)/0 2#
(3 2#
FIG. 8. Quasar phantom absolute dose comparisons for M20 collimator cas-sette with both F0 and F1 filters for all locations P0, P1, P2, and P3 �cf.
rectiocollim
Fig. 2�.

4164 Downes et al.: MC patient dosimetry for a kV CBCT unit 4164
not reported in this document. For the S series collimatorcassettes, the dose distribution is instead symmetric in thetransverse plane. As shown in Fig. 7, the use of the bowtiefilter produces a decrease in the dose delivered to the phan-tom between 30% and 50%. This is in agreement with theexperimental data reported in literature for the M20 collima-tor cassette.19 The coronal view reveals in both cases ahigher dose delivered to the external part of the phantom�Figs. 7�b� and 7�d��.
Figure 8 shows a comparison between simulation andmeasurement at the four separate locations measured �P0–P3in Fig. 2� for the M20 collimator for both F0 and F1 filters.The dose change with position for the M20 collimator isrepresentative of the trend seen for all of the collimator in-serts, and therefore, only the results for this insert are shown.The agreement between MC and measurement is very goodwith the maximum difference at any position, with or with-out bowtie, being 4.5% for F1 bowtie insert at location P2.
It is interesting to note that the dose is found to be higherat positions closer to the edge of the phantom, i.e., doses forpositions P1, P2, and P3 are higher than doses measured atP0 �isocenter� for all the collimators. Dose differences be-tween the center and the periphery of phantoms depend onseveral factors such as phantom size, source to phantom dis-tance, and finally attenuation characteristics of the kV beam.These data compare well to the experimental measurements
!
!"
#!
#!"
$!
$!"
%!
&$ '$ '# ($ (# ()#"*#"
!"#%&'()
*!++,-./!0
()*+,-).)/0 2
(3 2
()*+,-).)/0 2#
(3 2#
$%
!
#!
$!
%!
&!
"!
7!
&$ '$ '# ($ (# ()#"*#"
!"#%&'()
*!++,-./!0
()*+,-).)/0 2
(3 2
()*+,-).)/0 2#
(3 2#
&%
FIG. 9. Quasar phantom absolute dose comparisons for the F0 and F1 filtersfor locations �a� P0 and �b� P2.
already reported in literature for a similar phantom
Medical Physics, Vol. 36, No. 9, September 2009
diameter.32 The difference between dose to periphery andcenter of the phantom is expected to decrease with the de-crease of the phantom diameter.
Figure 9�a� shows a comparison between the dose mea-sured and the calculated MC dose from simulations with thechamber position at position P0 for both the F0 neutral andF1 bowtie filters for a number of inserts. Figure 9�b� showsthe same comparison at position P2 on the edge of the Qua-sar phantom. A clear pattern can be noticed: The dose mea-sured decreases for smaller fields and as the FOV increases.The maximum dose measured at the isocenter �P0� is2.73 cGy and is delivered with the S20 collimator and the F0neutral filter. A dose of 2.06 cGy is recorded when the volu-metric irradiation is carried out with the F1 bowtie filter.These are in good agreement with MC, where 2.72 cGy wascalculated with the F0 neutral filter and 2.07 cGy with F1bowtie filter.
III.A.3. Absolute dose calculation in patientgeometry
Figure 10 depicts the Monte Carlo calculated dose for apatient treated for bladder cancer. The calculation matrix was0.2�0.2�0.3 cm3. The isodose lines show absolute dose towater. Dose to medium to dose to water conversion was car-ried out using a method outlined elsewhere.33 DOSXYZnrcdose files were imported and analyzed within the CERR�Ref. 34� environment for MATLAB. With the M10 collimatorcassette, the projected reconstructed volume is a cylinderwith a diameter of 41.7 cm and a length of 10.7 cm. Theirradiation field as delimited by the collimator is clearly vis-ible in the sagittal view and coronal views �Figs. 10�b� and10�c��. The maximum dose in the volume is 13 cGy. Thedose to bony structures is two to three times higher than thedose to tissue. This is shown in Fig. 10�d� where the doseprofiles in the transverse and sagittal planes are depicted. Asnoted in the previous section, the dose distribution is notsymmetric because the collimator is offset with respect to theunit central axis.
Figure 11 reports the CBCT dose calculated for a patienttreated for lung cancer. With the M20 collimator cassette, theprojected reconstructed volume is a cylinder with a diameterof 41.7 cm and a length of 21.9 cm. In this case the irradi-ated field extends to all the CT volume in the sup-inf direc-tion. The maximum dose in the volume is 19.7 cGy. In thiscase dose to bone is three to four times higher than dose totissue, and peak doses of 10 cGy are visible in all the sec-tions. The asymmetry of the dose distribution is particularlyevident in the transverse �Fig. 11�a�� and coronal �Fig. 11�c��isodose maps and in the dose profile in Fig. 11�d�.
Figure 12 shows the CBCT dose calculated for a patienttreated for a H&N cancer. With the S20 collimator cassette,the projected reconstructed volume is a cylinder with a di-ameter of 27.4 cm and a length of 23.9 cm. The field edgesare clearly visible in the sagittal and coronal views �Figs.12�b� and 12�c�, respectively�. In this case, the dose distribu-tion is more uniform as shown in the transverse isodose map
�Fig. 12�a��. There is basically no difference between dose to
4165 Downes et al.: MC patient dosimetry for a kV CBCT unit 4165
FIG. 10. Patient dose from XVI CBCT pelvis scan simulated using the M10 collimator and F1 bowtie filter. �a� Transverse, �b� sagittal, and �c� coronal dosecontours are shown. Absolute dose profiles in the transverse and sagittal plane are shown in �d�.
FIG. 11. Patient dose from XVI CBCT lung scan simulated using the M20 collimator and the F1 bowtie filter. �a� Transverse, �b� sagittal, and �c� coronal dose
contours are shown. Absolute dose profiles in the transverse and sagittal plane are shown in �d�.Medical Physics, Vol. 36, No. 9, September 2009

4166 Downes et al.: MC patient dosimetry for a kV CBCT unit 4166
the periphery and center of the body as shown in the doseprofiles in Fig. 12�d�. This was not the case for the pelvisirradiation where the diameter of the body was bigger �cf.Fig. 10�d��. The average dose to tissue �5 cGy� is alsohigher than for the pelvic and the lung cases. The maximumdose in the volume is 28.2 cGy. In the isodose maps pro-vided and in the dose profiles of Fig. 12�d� peaks of 20 cGyand large areas of dose between 10 and 15 cGy are visible.
IV. CONCLUSIONS
In this work we have successfully used MC to model theElekta x-ray volume imaging unit and provided a detailedsimulation of the F1 bowtie filter. This novel characterizationwork was carried out using the combinatorial geometry fea-tures of the MC code BEAMPP. The modeling of the F1bowtie filter has been shown to be in excellent agreementwith an extended set of measurements in a water phantom.To our knowledge, this is the first time that the Elekta F1bowtie filter has been modeled with MC technology. In thisinvestigation, we have also presented detailed information onspectra, mean energy, and photon energy fluence for thesimulated collimator cassettes and filter. The availability ofMC generated beam spectra for both the neutral and bowtiefilters can be a very valuable input for the development ofdose and image quality optimization techniques. This part ofthe current investigation completes the information providedin an earlier work by the same authors.18
In addition to this, we described a method for the absolutedose calibration of our MC model of the CBCT unit whenused in a clinical volumetric acquisition mode. A single
FIG. 12. Patient dose from XVI CBCT H&N scan simulated using the S20 cocontours are shown. Absolute dose profiles in the transverse and sagittal pla
frame-independent calibration factor was derived for all of
Medical Physics, Vol. 36, No. 9, September 2009
the XVI collimator inserts and filters and validated with ionchamber measurements in a plastic phantom. We finally cal-culated the absolute dose distributions from typical CBCTvolumetric scans in real patient anatomies.
Our work showed that the additional dose delivered topatients from CBCT is not homogeneous and may not besymmetric, depending on the beam collimation system, cen-ter of rotation, and patient anatomy. Full MC patient dosecalculation have shown that the three-dimensional dose dis-tribution from CBCT is complex, with differences betweendose at the center and dose at the periphery of the body,which depends on body diameter, composition, and kV beamattenuation characteristics. We have also shown that the doseto bony structures is significantly higher than dose to tissue,and we have quantified this difference in three clinical casesof interest. Additional dose to bone should be taken intoaccount when adopting any IGRT strategy and weighed vsthe indubitable benefits of the technique in order to optimizetreatment. Patient dose from CBCT exposure cannot be com-pletely accounted for by using a numerical factor as an esti-mate of the dose at the center of the body. Full three-dimensional dose calculation is recommended if patient dosefrom CBCT is to be integrated in any adaptive planningstrategy.
ACKNOWLEDGMENTS
The authors wish to thank Dr. Giulia Thomson, Mrs. JanetRichard, and Mr. Andy Little �Elekta, Crawley, UK� for pro-viding geometry details of the Elekta Synergy CBCT kV
tor and the F1 bowtie filter. �a� Transverse, �b� sagittal, and �c� coronal dosee shown in �d�.
llimane ar
unit. This work was partially funded by Cancer Research

4167 Downes et al.: MC patient dosimetry for a kV CBCT unit 4167
Wales Grant No. 7019 and Engineering and Physical Sci-ences Research Council Grant No. EP/C538641/1.
a�Author to whom correspondence should be addressed. Electronic mail:[email protected]
1D. A. Jaffray and J. H. Siewedersen, “Cone-beam computed tomographywith a flat panel imager: Initial performance characterization,” Med.Phys. 27, 1311–1323 �2000�.
2G. X. Ding, D. M. Duggan, C. W. Coffey, M. Deeley, D. E. Hallahan, A.Cmelak, and A. Malcolm, “Study on adaptive IMRT treatment planningusing kV cone beam CT,” Radiother. Oncol. 85, 116–125 �2007�.
3E. G. A. Aird, “Second cancer risk, concomitant exposures, and IRMER�2000�,” Br. J. Radiol. 77, 983–985 �2004�.
4S. P. Waddington and A. L. McKenzie, “Assessment of effective dosefrom concomitant exposure required in verification of the target volumein radiotherapy,” Br. J. Radiol. 77, 557–561 �2004�.
5D. Brenner, “Induced cancers after prostate-cancer radiotherapy: Nocause for concern?,” Int. J. Radiat. Oncol., Biol., Phys. 65, 637–639�2006�.
6F. Verhaegen, A. E. Nahum, S. Van de Putte, and Y. Namito, “MonteCarlo modeling of radiotherapy kV x-ray units,” Phys. Med. Biol. 44,1767–1789 �1999�.
7F. Monti di Sopra, P. Keall, and W. Beckham, “An analytical model of akilovoltage beam phase space,” Med. Phys. 26, 2000–2006 �1999�.
8M. R. Ay and H. Zaidi, “Development and validation of MCNP4C-basedMonte Carlo simulator for fan-and cone-beam x-ray CT,” Phys. Med.Biol. 50, 4863–4885 �2005�.
9M. Bazalova and F. Verhaegen, “Monte Carlo simulation of a computedtomography x-ray tube,” Phys. Med. Biol. 52, 5945–5955 �2007�.
10G. Jarry, J. J. De Marco, U. Beifuss, C. H. Cagnon, and M. F. McNitt-Gray, “A Monte Carlo-based method to estimate radiation dose fromspiral CT: From phantom testing to patient-specific models,” Phys. Med.Biol. 48�16�, 2645–2663 �2003�.
11E. S. M. Ali and D. W. O. Rogers, “Benchmarking EGSnrc in the kilo-voltage energy range against experimental measurements of charged par-ticle backscatter coefficients,” Phys. Med. Biol. 53, 1527–1543 �2008�.
12X. Llovet, L. Sorbier, C. S. Campos, E. Acosta, and F. Salvat, “MonteCarlo simulation of x-ray spectra generated by kilo-electron-volt elec-trons,” J. Appl. Phys. 93�7�, 3844–3851 �2003�.
13I. Kawrakow, D. W. O. Rogers, and B. R. Walters, “Large efficiencyimprovements in BEAMnrc using directional bremsstrahlung splitting,”Med. Phys. 31�10�, 2883–2898 �2004�.
14E. Mainegra-Hing and I. Kawrakow, “Efficient x-ray tube simulations,”Med. Phys. 33, 2683–2690 �2006�.
15G. X. Ding, D. M. Duggan, and C. W. Coffey, “Characteristics of kilo-voltage x-ray beams used for cone-beam computed tomography in radia-tion therapy,” Phys. Med. Biol. 52, 1595–1615 �2007�.
16G. X. Ding, D. M. Duggan, and C. W. Coffey, “Accurate patient dosim-etry of kilovoltage cone-beam CT in radiation therapy,” Med. Phys. 35,1135–1144 �2008�.
17J. C. Chow, M. K. Leung, M. K. Islam, B. D. Norrlinger, and D. A.Jaffray, “Evaluation of the effect of patient dose from cone beam com-puted tomography on prostate IMRT using Monte Carlo simulation,”Med. Phys. 35, 52–60 �2008�.
Medical Physics, Vol. 36, No. 9, September 2009
18E. Spezi, P. Downes, E. Radu, and R. Jarvis, “Monte Carlo simulation ofan x-ray volume imaging cone beam CT unit,” Med. Phys. 36, 127–136�2009�.
19N. Mail, D. J. Moseley, J. H. Siewedersen, and D. A. Jaffray, “The in-fluence of bowtie filtration on cone-beam CT image quality,” Med. Phys.36, 22–32 �2009�.
20S. C. Klevenhagen, R. J. Aukett, R. M. Harrison, C. Moretti, A. E.Nahum, and K. E. Rosser, “The IPEMB code of practice for the determi-nation of absorbed dose for x-rays below 300 kV generating potential�0.035 mm Al- 4 mm Cu HVL; 10–300 kV generating potential�,” Phys.Med. Biol. 41, 2605–2625 �1996�.
21W. R. Nelson, H. Hirayama, and D. W. O. Rogers, “The EGS4 codesystem,” Stanford Linear Accelerator Center, Report No. SLAC-265,1985 �unpublished� �available online at http://www.fnal.gov/docs/products/egs4/pegs4.html�.
22I. Kawrakow and D. W. O. Rogers, “The EGSnrc code system: MonteCarlo simulation of electron and photon transport National ResearchCouncil of Canada,” Report No. PIRS-701, 2002 �unpublished�.
23D. W. O. Rogers, B. A. Faddegon, G. X. Ding, C. M. Ma, J. We, and T.R. Mackie, “BEAM: A Monte Carlo code to simulate radiotherapy treat-ment units,” Med. Phys. 22, 503–524 �1995�.
24I. Kawrakow, “EGSnrc C�� class library,” NRCC Report No. PIRS-898, 2005 �unpublished�.
25P. Downes and E. Spezi, “Simulating oblique incident irradiation usingthe BEAMnrc Monte Carlo code,” Phys. Med. Biol. 54, N93–N100�2009�.
26B. Walters, I. Kawrakow, and D. W. O. Rogers, “DOSXYZnrc UsersManual,” NRCC Report No. PIRS-794revB, 2006 �unpublished�.
27H. W. Koch and J. W. Motz, “Bremsstrahlung cross-section formulas andrelated data,” Rev. Mod. Phys. 31, 920–955 �1959�.
28J. H. Hubbell and S. M. Seltzer, “Tables of X-Ray Mass AttenuationCoefficients and Mass Energy-Absorption Coefficients 1 keV to 20 MeVfor Elements Z=1 to 92 and 48 Additional Substances of DosimetricInterest,” NISTIR No. 5632 �1995�.
29B. R. Walters and I. Kawrakow, “A HOWFARLESS option to increaseefficiency of homogeneous phantom calculations with DOSXYZnrc,”Med. Phys. 34�10�, 3794–3807 �2007�.
30E. Spezi, D. G. Lewis, and C. W. Smith, “A DICOM-RT-based toolboxfor the evaluation and verification of radiotherapy plans,” Phys. Med.Biol. 47, 4223–4232 �2002�.
31E. Spezi, R. L. Angelini, F. Romani, A. Guido, F. Bunkheila, M. Ntreta,and A. Ferri, “Evaluating the influence of the Siemens IGRT carbon fibretabletop in head and neck IMRT,” Radiother. Oncol. 89, 114–122 �2008�.
32M. K. Islam, T. G. Purdie, B. D. Norrlinger, H. Alasti, D. J. Moseley, M.B. Sharpe, J. H. Siewerdsen, and D. A. Jaffray, “Patient dose from kilo-voltage cone beam computed tomography imaging in radiation therapy,”Med. Phys. 33, 1573–1582 �2006�.
33J. V. Siebers, P. J. Keall, A. E. Nahum, and R. Mohan, “Convertingabsorbed dose to medium to absorbed dose to water for Monte Carlobased photon beam dose calculations,” Phys. Med. Biol. 45, 983–995�2000�.
34J. O. Deasy, A. I. Blanco, and V. H. Clark, “CERR: A computationalenvironment for radiotherapy research,” Med. Phys. 30, 979–985 �2003�.