Increased susceptibility to amyloid toxicity in familial Alzheimer's fibroblasts
Upload
khangminh22Category
view
1download
0
Familial Cortical Myoclonus Caused by Mutation in NOL3
by
Jonathan Foster Rnsseil
DISSERTATION
Submitted in partial satisfaction of the requirements for the degree of
DOCTOR OF PHILOSOPHY
in
Biomedical Sciences
in the

Copyright 2013
by
Jonathan Foster Russell
ii

I dedicate this dissertation to Mom and Dad, for their adamantine love and support
iii

No man has earned the right to intellectual ambition until he has learned to lay his course by a star which he has never seen—to dig by the divining rod for springs which he may never reach. In saying this, I point to that which will make your study heroic. For I say
to you in all sadness of conviction, that to think great thoughts you must be heroes as well as idealists. Only when you have worked alone – when you have felt around you a black gulf of solitude more isolating than that which surrounds the dying man, and in hope and
in despair have trusted to your own unshaken will – then only will you have achieved. Thus only can you gain the secret isolated joy of the thinker, who knows that, a hundred years after he is dead and forgotten, men who never heard of him will be moving to the
measure of his thought—the subtile rapture of a postponed power, which the world knows not because it has no external trappings, but which to his prophetic vision is more
real than that which commands an army.
-Oliver Wendell Holmes, Jr.
iv
ACKNOWLEDGMENTS I am humbled by the efforts of many, many others who were essential for this
work. To be provided the privilege of pursuing truth as a profession requires the stars to
align. For me, they have.
I wish to thank my thesis advisor, Louis J. Ptáček, M.D., for his mentorship.
During the course of my interviews with about 50 MSTP faculty members across the
country, the most challenging interview I had was with Louis! It didn’t scare me off,
though: I appreciated the intensity of his questions and the direction of the science, and I
was eager to join the lab. Louis took me under his wing as a neophyte first-year medical
student, and he has provided me with priceless advice and encouragement over the last
four years.
I have benefitted immensely from the help of many members of the laboratory,
viz.: S.Y. (Christin) Chong, Ph.D., Mary Heng, Ph.D., Lorna Kategaya, Ph.D., Sehoon
Keum, Ph.D., Mary Lange, Hsien-Yang Lee, Ph.D., Emily Quinn, Jenise C. Wong, M.D.,
Ph.D., Linda Zhang, and Ying Zhang. Zachery Kornberg aided me with the linkage and
Sanger sequencing. I could not have performed the FACS experiments without Philip
Kurien, M.D. The biochemistry expertise of William (Casey) Hallows, Ph.D., was crit-
ical. Perhaps more importantly, he was a fun guy to eat lunch with daily. I am especially
indebted to Shen-Yi (Bruce) Howng, Ph.D., for serving as my scientific sounding board,
and for his friendship. Over the past few years I spent many (most?) of my waking hours
working alongside Bruce. There may never again be a time in my life when I have the
freedom and environs for such frequent, deep, freewheeling discussions. I will always
cherish them.
v

I am grateful to the many UCSF faculty members who took time out of their
incredibly busy lives to generously offer their mentorship. I thank Daniel H. Lowenstein,
M.D., Scott A. Oakes, M.D., and Anthony Wynshaw-Boris, M.D., Ph.D., for their service
and helpful advice during my qualifying exam. Kevin M. Shannon, M.D., directed the
MSTP and provided invaluable experimental suggestions and career advice during my
dissertation committee meetings. Kevin also repeatedly demonstrated that he could beat
me in golf. Finally, Robert L. Nussbaum, M.D., has guided my development for five
years: first as my MSTP advisor, then as my BMS advisor, then as chair of my qualifying
exam committee, and ultimately as chair of my dissertation committee. His scientific in-
sight, ethical standards, and moral support were all far beyond the call of duty. I am
willing to bet that faculty advisors underestimate the influence of a meeting that takes
place each quarter and may only last an hour. More than once I entered Bob’s office
deep in the throes of graduate school despondency, and yet he found a way to buoy my
spirits. This was, as they say, nontrivial. His creed – to never lose sight of our patients,
for they are the reason we do science – has become mine.
Many others at UCSF were critical to this work, including Jana Toutolmin and
Catherine Norton in the MSTP office, and Lisa Magargal et al. in the BMS office.
MacKenzie A. Howard, Ph.D. and Scott C. Baraban, Ph.D., helped with electro-
physiological characterization of NOL3 knockout mice. Jonathan Trinidad, Ph.D., as-
sisted with mass spectrometry experiments.
I was lucky to benefit from numerous collaborations outside of UCSF. Jamie L.
Steckley, M.D., Angelika F.G. Hahn, M.D., and their colleagues at London Health
Science University and other universities in Canada phenotyped the patients and col-
vi

lected DNA samples. Giovanni Coppola, M.D., Daniel H. Geschwind, M.D., Ph.D., and
others at UCLA performed targeted sequencing. Joe Quadrilatero, Ph.D., of the
University of Waterloo generously shared Nol3 knockout mice. Peter Kuffa and Gabriel
Nunez, Ph.D., of the University of Michigan shared human NOL3 cDNA constructs.
Kinya Ishikawa, M.D., Ph.D., of Tokyo Medical and Dental University dug through his
freezers and transcribed the sequences of many primer sequences for the BEAN, tk2, and
FLJ27243 genes. The Nol3 knockin mouse was generated through collaborations with
inGenious Targeting Laboratory, Inc., and with Caiying Guo, Ph.D., of the Howard
Hughes Medical Institute Janelia Farm Research Campus. The proteomic screen was
done in collaboration with Applied Biomics. It goes without saying that we are forever
indebted to the patients and their families for their participation.
Graduate school is just one stop of many on my educational journey, and I would
be remiss to omit important teachers and mentors at prior junctions. They have
influenced me greatly. They include Tas Anthony, Margaret Shullaw, and James
Ruebush at Iowa City West High School; Alejandro Aballay, Ph.D., David Brady, Ph.D.,
Kevin DeLapp, Ph.D., Kylie A. Haskins, Ph.D., V. Louise Roth, Ph.D., and Thomas P.
Witelski, Ph.D., at Duke University; and Louise Aronson, M.D., and Don Ganem, M.D.,
at UCSF School of Medicine.
Personal financial support was provided by the UCSF MSTP (funded by NIH
NIGMS grant T32GM07618 and the UCSF School of Medicine), and later by NIH
NINDS grant F31NS077533. The research itself was funded by NIH grants NS044379
and U54 RR19481, by the Sandler Fund for Neurogenetics, and by the Howard Hughes
Medical Institute. In the stress generated by interminable grant applications, we often
vii

lose sight of the fact that, historically, it is a very recent phenomenon for anyone other
than a select group of aristocrats to have the wherewithal to conduct meaningful scientific
research. I am grateful to be born in this age and for the resources that modern society
chooses to allocate for research. That they go towards science rather than guns or butter
underscores our responsibility to conduct our research nobly.
Lastly, I wish to express my heartfelt dependence upon my friends and especially
my family. My fiancée has offered unyielding support throughout the ecstasy and agony
of graduate school. Her love, loyalty, good cheer, and unconditional kindness made it
less agony, mostly ecstasy. My grandparents have loved and provided for me in in-
numerable ways. My brother, sister, sister-in-law, nephews, and niece were all constant
sources of joy and encouragement. Most importantly, I have always been able to count
on my parents. I can be a trying child, yet they are a wellspring of emotional, financial,
and moral ballast. They instilled in us a thirst for knowledge that cannot be slaked,
ethical standards requiring constant vigilance, and a love for man that necessitates im-
proving his lot. These principles have impelled this work. For these reasons, I dedicate
this dissertation to them.
viii

ABSTRACT
Familial Cortical Myoclonus Caused by Mutation in NOL3
Jonathan Foster Russell Many neurologic diseases cause discrete episodic impairment. Study of the genes and
mechanisms underlying these diseases has informed our understanding of the nervous
system. Here we describe a novel episodic neurologic disorder, which we term familial
cortical myoclonus (FCM). FCM is characterized by adult onset, slowly progressive,
multifocal, cortical myoclonus, inherited as an autosomal dominant trait. On the basis of
clinical, electrophysiological, and genetic data, FCM is nosologically distinct. We uti-
lized genome-wide single nucleotide polymorphism genotyping, microsatellite linkage,
and massively parallel sequencing to identify a mutation in the gene nucleolar protein 3
(NOL3) that likely causes FCM. NOL3 is thought to bind to pro-apoptotic proteins and
thereby repress apoptosis, but our extensive experimentation did not replicate these
claims. In vitro, the NOL3 mutation leads to post-translational modification of NOL3
protein. We could not pinpoint the identity of the modification, but did find that this
process is regulated by phosphorylation at residue T114. Finally, a proteomic screen for
novel binding partners identified two candidates that modulate neuronal/astroglial differ-
entiation. We hypothesize that the NOL3 mutation abrogates these interactions to cause
FCM. This hypothesis will be tested with Nol3 mutant mice that we generated. In total,
this work defines a novel episodic neurologic phenotype and the associated mutation,
calls into question some of the published functions of NOL3, and presents an alternative
mechanism that may explain the pathophysiology of FCM.
ix

TABLE OF CONTENTS Chapter I An Overview of Episodic Neurologic Disorders………………….……….. 1 Chapter II Familial Cortical Myoclonus, a Novel Movement Disorder……….……… 57 Chapter III Identification of a Mutation in NOL3…………………………………….... 86 Chapter IV Functional Characterization of the NOL3 Mutation……………….………. 127 Chapter V Conclusion………………………………………………………….…….... 212
x

LIST OF TABLES Chapter I Table 1. Diagnosis of complex episodic disorders……………….……….. 9 Chapter II Table 1. Clinical characteristics in 11 affected family members………….. 72 Chapter III Table 1. Genome-wide SNP array……………….……………….……….. 103 Table 2. Three putative shared regions identified by SNP IBD analysis….. 104 Table 3. Critical region pairwise LOD analysis……………….…………... 108 Table 4. Targeted DNA capture and massively parallel sequencing reads (A) and variants (B)…………….……………….………….... 110 Table 5. Novel non-synonymous coding variants in critical region identified by targeted DNA capture and massively parallel sequencing……………….……………….……………….………...113 Chapter IV Table 1. Primers used for cloning mutant NOL3 constructs………………. 141 Table 2. Novel NOL3 binding partners identified by co-
immunoprecipitation and differential two-dimensional gel electrophoresis……………………………………………………... 185
Appendices Appendix 1. Microsatellite markers and primers for linkage analysis……. 220 Appendix 2. Critical region contains 113 known or predicted genes……... 222 Appendix 3. Primers for Sanger sequencing select candidate genes in critical region……………….……………….……………….….. 226 Appendix 4. NOL3 primers……………….……………….………………. 231 Appendix 5. Detailed characterization of knockin mouse generation…….. 232
xi

LIST OF FIGURES Chapter I Figure 1. The landscape of episodic neurologic disorders……………….… 4 Figure 2. Channelopathy mechanisms……………….……………….…… 11 Figure 3. Beyond the channelopathy paradigm: mechanisms of synaptopathy and circuitopathy……………….……………….……21 Chapter II Figure 1. Extended family pedigree……………….……………….……… 69 Figure 2. Somatosensory evoked potentials in the familial cortical myoclonus family……………….……………….…………………. 74 Figure 3. Functional magnetic resonance imaging in the familial cortical myoclonus family……………….……………….………… 74 Figure 4. Additional patients with a history of cortical myoclonus that may be familial……………….……………….………………. 76 Chapter III Figure 1. Microsatellite linkage genotyping methodology………………... 95 Figure 2. Genome-wide SNP mapping identified 3 candidate linkage regions…………………………………………………………….... 104 Figure 3. Genetic and physical map positions of microsatellite markers…. 105 Figure 4. Pedigree with chromosome 16q21-22.1 haplotypes…………….. 106 Figure 5. Fine mapping of critical region…………………………………. 107 Figure 6. Coverage (post-duplicate removal) by massively parallel sequencing over the entire region on chromosome 16 (top)
and by coding sequence of each gene (bottom)……………………. 111 Figure 7. Alignment of short sequence reads (post-duplicate removal) over the NOL3 E21Q sequence variant……………………………. 112 Figure 8. Sanger sequencing chromatographs (electropherograms) confirmed cosegregation of the NM_001185058.1:c.61G>C variant, predicted to cause an E21Q mutation in NOL3…………… 113 Chapter IV
Figure 1. Overview of published functions of NOL3……………………... 129 Figure 2. NOL3 protein contains a C-terminal proline(P)/
glutamate(E) domain, and an N-terminal caspase activation recruitment domain (CARD)………………………………………. 131
xii

xiii
Figure 3. NOL3 amino acid sequence is highly conserved across species... 154 Figure 4. Alignment of amino acid sequences of human genes containing CARDs…………………………………………………. 156 Figure 5. NOL3 protein secondary structure predictions………………….. 157 Figure 6. In silico homology modelling of WT and E21Q NOL3
protein structure predicts that E21Q alters the electrostatic surface potential of NOL3…………………………………………. 158
Figure 7. Expression of Nol3 RNA in the murine brain…………………... 159 Figure 8. Nol3 may be more highly expressed in oligodendrocytes
than astrocytes……………………………………………………… 160 Figure 9. Expression of Nol3 in various murine brain cell types………….. 161 Figure 10. NOL3 RNA expression during development in humans………. 162 Figure 11. NOL3 RNA is expressed at comparable levels in various
human brain regions………………………………………………... 163 Figure 12. The E21Q mutation does not affect cytoplasmic expression
of NOL3-FLAG in SK-N-SH cells, a cell line of neuronal origin…. 165 Figure 13. Neither WT nor E21Q NOL3-FLAG localize to
mitochondria in HEK293 cells……………………………………... 166 Figure 14. NOL3E21Q-FLAG exhibits altered post-translational
modification in HEK293 cells……………………………………... 167 Figure 15. NOL3-FLAG protein is present at equal levels in WT and
E21Q stable cell lines………………………………………………. 168 Figure 16. In vitro phosphatase treatment does not remove mutant-
enriched upper band………………………………………………... 169 Figure 17. T114A mutation abrogates formation of upper band in
mutant (E21Q) background………………………………………… 171 Figure 18. Coomassie staining demonstrates robust purification of
NOL3-FLAG prior to mass spectrometry analysis………………… 173 Figure 19. T114 is hyper-phosphorylated in both mutant upper and
lower bands, relative to WT………………………………………... 173 Figure 20. FACS double stain approach for apoptosis analysis…………... 178 Figure 21. Expression of either WT or E21Q NOL3 predisposes
HEK293 cells to apoptosis at baseline……………………………... 180 Figure 22. Quantification of FACS data confirms that NOL3
expression predisposes to apoptosis at baseline…………………….181 Figure 23. Putative pro-apoptotic binding partners do not interact
with NOL3…………………………………………………………. 182 Figure 24. Two-dimensional gel electrophoresis of co-
immunoprecipitates obtained from Vehicle or WT NOL3 HEK293 cells………………………………………………………. 184
Figure 25. Somatosensory evoked potentials in aged Nol3-/- (KO) and Nol3+/+ (WT) littermate control mice…………………………. 187
Figure 26. Generation of mice with knockin allele or conditional knockout allele at the Nol3 locus…………………………………... 189

CHAPTER I
An Overview of Episodic Neurologic Disorders
1

SUMMARY Many neurologic diseases cause discrete episodic impairment in contrast with progressive
deterioration. The symptoms of these episodic disorders exhibit striking variety. Herein
we review what is known of the phenotypes, genetics, and pathophysiology of episodic
neurologic disorders. Of these, most are genetically complex, with unknown or poly-
genic inheritance. Four are very common: transient ischemic attack, syncope, epilepsy,
and migraine. Many other symptomatically similar disorders are complex and rare, as
exemplified by episodic disorders with autoimmune etiology. In contrast, a fascinating
panoply of episodic disorders exhibit Mendelian inheritance. We classify episodic Men-
delian disorders according to the primary neuroanatomical location affected: skeletal
muscle, cardiac muscle, neuromuscular junction, peripheral nerve, or central nervous
system (CNS). Most known Mendelian mutations alter genes that encode membrane-
bound ion channels. These mutations cause ion channel dysfunction, which ultimately
leads to altered membrane excitability as manifested by episodic disease. Other Men-
delian disease genes encode proteins essential for ion channel trafficking or stability. In
fact, autoimmune episodic disorders share the pathophysiological endpoint of ion channel
dysfunction. These observations have cemented the “channelopathy” paradigm, in which
episodic disorders are conceptualized as disorders of ion channels. However, we expand
upon this paradigm to propose that dysfunction at the synaptic and neuronal circuit levels
may underlie some episodic neurologic entities.
2

INTRODUCTION Whereas many diseases of the nervous system cause progressive deterioration, a
sizable fraction of them are predominantly episodic in nature. In this subset of disorders,
a patient’s neurologic function is impaired during an episode (also known as an attack).
Although some patients may suffer from superimposed, chronic neurologic dysfunction,
between attacks patients are usually completely normal. Episodes are often triggered by
mundane stimuli, such as hunger, fatigue, emotions, stress, exercise, diet, temperature, or
hormones. Why these commonplace stimuli trigger episodes of neurologic impairment in
some patients but not others is poorly understood.
Many episodic neurologic disorders exist, encompassing a protean range of
symptoms. These may include weakness, stiffness, paralysis, arrhythmia, pain, ataxia,
migraine, involuntary movements, and seizures. The vast majority of episodic neurologic
disorders exhibit complex inheritance—that is, disease seems to develop primarily owing
to environmental influences rather than genetic ones. In this review, we briefly address
the complex disorders that are commonly encountered in clinical practice: transient is-
chemic attack, syncope, epilepsy, and migraine (Figure 1). Aside from these four dis-
eases, which are complex and common, there exist a myriad of symptomatically similar
diseases that are complex but rare. Of these, many are in fact progressive neurologic
disorders that happen to feature episodic symptoms but are not primarily episodic in
nature. However, others are indeed primarily episodic. In this chapter, we focus on those
complex, rare disorders with autoimmune etiology because they have provided
substantial pathophysiological insight. [CONTINUED, p. 5]
3

Figure 1. The landscape of episodic neurologic disorders. There are many episodic neurologic disorders, with a vast range in genetic contribution and prevalence. Prevalence is depicted in crude approximation by the size of each ellipse. This fascinating group includes four common complex disorders (left), many rare complex disorders including autoimmune (lower left), and many rare Mendelian forms (right). Some Mendelian phenotypes exhibit profound similarity to particular complex disorders, as depicted by identical coloration (e.g., light green for idiopathic epilepsy and for Mendelian epilepsy syndromes). Often, Mendelian phenotypes share phenotypic and/or genetic characteristics, as depicted by overlap and/or similar coloration of each corresponding ellipse. Some complex disorders seem to have a substantial genetic con-tribution, particularly epilepsy, but most of the complex inheritance remains unexplained (middle). Abbreviations: ADPEAF, autosomal dominant partial epilepsy with auditory features; AF, atrial fibrillation; ATS, Andersen-Tawil syndrome; AHC, alternating hemi-plegia of childhood; CIP, congenital insensitivity to pain; CMS, congenital myasthenic syndromes; CPVT, catecholaminergic polymorphic ventricular tachycardia; EA, epi-
4

sodic ataxia; ES, Escobar syndrome; FADS, fetal akinesia deformation sequence; FCM, familial cortical myoclonus; FHM, familial hemiplegic migraine; GEFS+, generalized epilepsy with febrile seizures plus; HH, hereditary hyperekplexia; HyperKPP, hyper-kalemic periodic paralysis; HypoKPP, hypokalemic periodic paralysis; IEM, inherited erythromelalgia; JME, juvenile myoclonic epilepsy; LE, Lambert-Eaton myasthenic syndrome; LQTS, long QT syndrome; MC, myotonia congenita; MDS, myoclonus dys-tonia syndrome; MG, myasthenia gravis; PAM, potassium-aggravated myotonia; PED, paroxysmal exercise-induced dyskinesia; PEPD, paroxysmal extreme pain disorder; PKD, paroxysmal kinesigenic dyskinesia; PMC, paramyotonia congenita; PME, pro-gressive myoclonic epilepsy; PNKD, paroxysmal non-kinesigenic dyskinesia; SeSAME, seizures, sensorineural deafness, ataxia, mental retardation, and electrolyte imbalance; SQTS, short QT syndrome; TIA, transient ischemic attack; TPP, thyrotoxic periodic paralysis.
For the same reason, the remaining bulk of this chapter focuses on episodic
neurologic disorders that are Mendelian (Figure 1). Each is rare. For these disorders,
single gene mutations are sufficient to cause disease. However, even in these genetic
diseases, environmental factors can still be important in triggering attacks. Over the past
two decades, medical geneticists have extensively clarified the known phenotypes, iden-
tified many novel phenotypes, and pinpointed scores of disease genes. In many cases,
disease gene discovery has directly led to pathophysiological insight and, in a few cases,
even novel treatments. We organize these diverse disorders on the basis of the primary
neuroanatomical location affected: skeletal muscle, cardiac muscle, neuromuscular junc-
tion (NMJ), peripheral nerve, or CNS. As much as is possible given practical constraints,
for each disorder we review the clinical presentation, genetics, and pathophysiology, with
particular emphasis on new discoveries and unanswered questions. Finally, in the con-
cluding section we present our view of the field’s urgent challenges.
5

COMPLEX DISORDERS Complex episodic neurologic disorders develop primarily due to environmental
factors, although in most disorders some evidence indicates polygenic inheritance, which
remains largely undeciphered (Poduri & Lowenstein 2011, Shyti et al. 2011, Della-Morte
et al. 2012). Complex episodic disorders are very common in aggregate. This group
includes a legion of causes that are each individually rare, such as autoimmune episodic
disorders (see below). Also, four complex disorders are commonly encountered in clin-
ical practice: transient ischemic attack, syncope, epilepsy, and migraine (Figure 1).
Four Common Complex Disorders
A transient ischemic attack (TIA) results from diminished cerebral perfusion that
causes abrupt, focal neurological symptoms in a pattern corresponding to the com-
promised vascular distribution (Della-Morte et al. 2012). Cerebral hypoperfusion usually
arises from platelet emboli or thrombi that transiently lodge in a cerebral artery but are
dislodged before permanent neurologic injury develops; by definition, TIA symptoms
resolve within 24 hours. Despite prompt resolution, TIAs typically recur over the course
of days to weeks with a stereotypic symptom cluster. These patients should be promptly
evaluated and treated, usually by addressing the source of emboli or by anticoagulation,
to decrease the risk of progression to ischemic stroke (Della-Morte et al. 2012).
Transient cerebral hypoperfusion also results in syncope (i.e., fainting; Gauer
2011). Causes of hypoperfusion include orthostatic hypotension, neurovascular disease,
decreased cardiac output (usually from arrhythmia), and neural reflexes. For example, a
classic scenario is an unpleasant stimulus, such as a noisome odor, triggering a vasovagal
6

reflex of bradycardia and hypotension that leads to syncope. The clinical history and
premonitory symptoms – fading vision, nausea, pallor, sweating, etc. – are typically diag-
nostic. Syncopal patients occasionally exhibit brief, mild myoclonic limb jerks or incon-
tinence but are fully oriented upon awakening, distinguishing syncope from the postictal
confusion of a true seizure.
Epilepsy is defined as recurrent seizures, which result from episodic cortical
hyperexcitability. Generalized hyperexcitability manifests as unconsciousness, tonic-
clonic convulsions, cyanosis, reactive hyperventilation, excessive salivation, and postictal
confusion. In comparison, when hyperexcitability involves a focal neurologic region,
the symptoms reflect the affected cortical region and vary widely depending on the par-
ticular epilepsy syndrome (Berg et al. 2010, Berg & Scheffer 2011). Epilepsy has mani-
fold pathophysiologies, primarily structural, metabolic, neurodegenerative, idiopathic,
and genetic (including some Mendelian forms; see below and Figure 1). Interestingly,
seizures can be triggered by stressors such as infection, psychosomatic trauma, or men-
ses.
The final common complex disorder is migraine. Migraine is characterized by
episodic severe headache accompanied by nausea, photophobia, and phonophobia. Many
patients experience prodromal symptoms hours to days before headache, which vary
widely, and about one-quarter of patients experience aura, commonly visual, which
immediately precedes the headache. The pathophysiology of migraine remains hotly dis-
puted but probably involves both alterations in cortical excitability (i.e., cortical spread-
ing depression) as well as transient vasoconstriction followed by vasodilatation of cere-
7

bral and meningeal vessels (Dodick 2008). Like epilepsy, migraine is commonly trig-
gered by stressors (Haut et al. 2006).
A Myriad of Rare Complex Disorders
Episodic neurologic symptoms also occur in a wide range of complex disorders,
each of which is individually rare (Figure 1). Many are diseases of progressive
deterioration that happen to feature episodic symptoms, whereas others are primarily
episodic in nature, after which the patient returns to normal baseline. For a given clinical
finding, the differential diagnosis is typically extensive (Table 1). For example,
myoclonus is a component of more than 200 disorders that span the spectrum of
neurologic disease: structural malformations, infections, storage disorders, spinocere-
bellar degenerations, dementias, metabolic derangements, toxin/drug exposures, post-
hypoxia, malabsorption (Celiac’s disease), various epilepsy syndromes, and many more
(Caviness & Brown 2004). The differential diagnosis can be just as broad for other
episodic presentations (Table 1). Usually the diagnosis is suggested by the entire clinical
history and examination rather than by episodic symptoms per se. If a diagnosis remains
elusive, there is an increased probability of an autoimmune or Mendelian cause.
8

Table 1. Diagnosis of complex episodic disorders. Episodic neurologic symptoms occur in a variety of complex disorders. The differential diagnosis for a given finding can be very broad. Select episodic presentations are pro-vided along with references containing diagnostic approaches. We have omitted other presentations, such as arrhythmia, ataxia, hemiplegia, pain, paralysis, stiffness, and weak-ness. Presentation Reference(s) with diagnostic approach Dyskinesia Fahn et al. 2011 Exaggerated startle Dreissen et al. 2012 Migraine Haut et al. 2006 Myoclonus Caviness & Brown 2004 Ophthalmic disorder Sheffield & Stone 2011 Seizures Berg et al. 2010, Berg et al. 2011 Sleep disorder Sehgal & Mignot 2011 Syncope Gauer 2011 TIA Della-Morte et al. 2012
Rare complex disorders with autoimmune etiologies have provided especial
insight into pathophysiology (Vincent et al. 2006, Kleopa 2011). Classically, these
autoimmune episodic disorders are caused by autoantibodies against ion channels
(Figure 2A). For example, ion channels at the NMJ are the targets of autoantibodies that
cause muscle weakness in Lambert-Eaton myasthenic syndrome (LEMS) and myasthenia
gravis (MG) (Vincent et al. 2006). Clinically, LEMS is characterized by proximal mus-
cle weakness and autonomic dysfunction, whereas MG patients exhibit striking fati-
gability, particularly of ocular muscles. Both LEMS and MG must be distinguished from
congenital myasthenic syndromes (see below), which also present with weakness but are
juvenile onset and Mendelian rather than autoimmune in etiology. LEMS is caused by
autoantibodies against presynaptic voltage-gated calcium channels, whereas MG is usu-
ally caused by autoantibodies against the nicotinic acetylcholine receptor (AChR) on the
motor end plate. Recent work has tied AChR-seronegative MG to autoantibodies against
9

muscle-specific tyrosine kinase (MuSK) (Hoch et al. 2001) or low-density lipoprotein
receptor-related protein 4 (Lpr4) (Higuchi et al. 2011, Pevzner et al. 2012). Neither of
these targets are ion channels; instead, they function to promote postsynaptic clustering
of the AChR channel (Figure 2C).
A compelling, recently elucidated example of autoantibodies interfering with
targets other than ion channels to cause episodic disease is stiff-man syndrome (SMS).
SMS is characterized by extreme muscle cramps superimposed upon progressive, fluc-
tuating muscle rigidity and stiffness. Tragically, these symptoms are so severe that they
often cause joint deformities, skeletal fractures, and even muscle rupture. Cramp attacks
are triggered by movement, unanticipated somatosensory stimuli, stress, and strong emo-
tions. Solimena et al. (1988) showed that 80% of patients develop auto-antibodies
against glutamic acid decarboxylase (GAD) autoantibodies, but anti-GAD antibody
infusion into model animals does not passively transfer SMS symptoms. Recently, Geis
et al. (2010) achieved passive transfer in rats by infusing anti-amphiphysin antibodies
collected from human SMS patients. Furthermore, anti-amphiphysin antibodies were
internalized into CNS GABAergic neurons where they inhibited GABA (gamma-amino-
butyric acid) release. This work demonstrates that SMS is caused by autoantibodies di-
rected not against ion channels but rather against intracellular, pre-synaptic targets
(Figure 2C). It seems likely that other autoimmune or “idiopathic” disorders may be
caused by autoantibodies targeting intracellular, synaptic, or even non-neuronal targets
(Lennon et al. 2005). [CONTINUED, p. 12]
10

Figure 2. Channelopathy mechanisms. (A) Normally, ion channels are trafficked from the endoplasmic reticulum (ER) via secretory vesicles to the cell membrane, where they conduct ions across the membrane to control cellular membrane potential and hence excitability. (B) Many autoimmune episodic neurologic disorders are caused by autoantibodies binding to ion channels, which causes defective channel function, such as decreased ion permeability (shown here). (C) Investigators have recently associated numerous autoimmune episodic disorders with autoantibodies against targets other than channels. These autoantibodies bind to channel-associated regulatory proteins, thereby indirectly causing defective channel function. Shown here are autoantibodies against a regulatory protein that stabilizes the channel at the membrane. Inhibition of this regulatory protein by autoantibody binding results in decreased channel stability, so more channels are degraded and overall current is decreased. (D-E) Most episodic neurologic disorders that exhibit Mendelian inheritance are caused by mutations in ion channel genes. There are many different possible effects of mu-tations, including absent or decreased expression (D), defective trafficking or stability leading to premature degradation, decreased ion permeability (E), increased ion permeability, and altered channel kinetics (e.g., delayed inactivation). (F) Aside from mutations in ion channels themselves, recent work has identified mutations in genes that do not encode channels. Like the targets of some autoantibodies (C), these genes encode regulatory proteins that bind to channels and are critical for channel stability and localization. When mutated, defective regulatory proteins result in aberrant channel trafficking or stability, premature channel degradation, and hence de-creased current. For panels B-F, see text for examples.
11

Another example of an autoimmune episodic disorder is Isaac’s syndrome
(neuromyotonia). Isaac’s syndrome is a disorder of motor nerve hyperexcitability that
can present with hyperhidrosis and a range of muscle symptoms including fasciculations,
cramps, stiffness, myokymia (quivering), and pseudomyotonia (slow relaxation). For
many years, Isaac’s syndrome and two related disorders, Morvan’s syndrome and limbic
encephalitis, were thought to result from autoantibodies against voltage-gated potassium
channels (Vincent et al. 2006). However, the data were mixed. Dalmau and colleagues
recently presented strong evidence that these disorders are instead caused by autoanti-
bodies against the Caspr2-Lgi1 complex, which associates with voltage-gated potassium
channels on the motor nerve (Lai et al. 2010, Lancaster et al. 2011, Irani et al. 2012,
Loukaides et al. 2012). These findings further illustrate an emerging understanding that
in addition to targeting channels directly (Figure 2B), autoantibodies may target channel-
associated regulatory proteins to cause channel dysfunction indirectly (Figure 2C).
12

MENDELIAN DISORDERS
General Characteristics
Although each is individually rare, many distinct episodic disorders exhibit Men-
delian inheritance. Despite very strong genetic contributions, these diseases share strik-
ing similarity with the complex disorders discussed above in that patients are often com-
pletely normal between attacks, and attacks are often triggered by commonplace envi-
ronmental stimuli.
We have organized the Mendelian episodic disorders on the basis of the focus of
pathology within the nervous system: skeletal muscle, cardiac muscle, NMJ, peripheral
nerve, or CNS (Figure 1). Most are juvenile onset and autosomal dominant. The vast
majority of known disease genes encode ion channels, which has led to use of the term
“channelopathies” to describe this group of disorders (Figure 2; Kullmann 2010, Ryan &
Ptáček 2010). However, this usage is a misnomer for two reasons. First, complex epi-
sodic disorders can also result from channel dysfunction, as exemplified by the auto-
immune diseases discussed above. Second, some non-neurologic Mendelian diseases are
caused by mutations in ion channels (Benoit et al. 2010). Thus, the term “channel-
opathy” should be reserved for any disorder, complex or Mendelian, neurologic or non-
neurologic, caused by channel dysfunction.
Most Mendelian channelopathies affect primarily a single organ system, presum-
ably because a typical ion channel is expressed in one cell type or a limited number of
cell types. The exact pathophysiology depends on the mutation severity (e.g., missense
or nonsense) and on the type of channel that is mutated (Kullman 2010, Ryan & Ptáček
2010). Missense mutations are often gain-of-function, causing increased ion flux. How-
13

ever, missense mutations can certainly cause loss-of-function (Figure 2E), and dominant-
negative mechanisms are also common because some channels are composed of subunits
encoded by separate genes that homo- or hetero-multimerize into a functional channel.
Nonsense (truncation) mutations are almost always loss-of-function or dominant-negative
(Figure 2D). Although exceptions abound, generally mutations in sodium channel genes
cause gain-of-function, whereas potassium and chloride channel mutations cause loss-of-
function. Sodium, potassium, and chloride channels usually cause myocyte or neuronal
dysfunction. In contrast, AChR, GABAA receptor, glycine receptor, and calcium channel
mutations typically disrupt synaptic transmission. In any case, in the peripheral nervous
system (PNS) the ultimate pathophysiology rests on whether the mutation renders the
affected cell hypoexcitable or hyperexcitable. In the CNS, pathophysiology rests on
whether inhibitory or excitatory neurons are preferentially affected, thereby resulting in a
net hypoexcitable or hyperexcitable network (Figure 3B).
Skeletal Muscle
Primary skeletal muscle disorders were the first episodic disorders for which
causative mutations were identified (Ptáček et al. 1991, Rojas et al. 1991, McClatchey et
al. 1992, Ptáček et al. 1992). These entities were central to establishing the “channel-
opathy” paradigm, as all known disease genes encode ion channels. The molecular and
cellular pathophysiology has been thoroughly elucidated, and in some cases this insight
has led to clinical trials and successful treatments (Tawil et al. 2000). Each disorder falls
on a spectrum ranging from muscle hyperexcitability to hypoexcitability. Hyperexcit-
14

able muscle presents clinically as myotonia: after contraction, the muscle is slow to relax.
In contrast, hypoexcitable muscle presents clinically as weakness or paralysis.
Myotonia congenita (MC) constitutes the far hyperexcitable end of the spectrum.
Patients suffer stiffness, particularly after prolonged inactivity, which is relieved by
repetitive muscle activity (Lossin & George 2008). Mutations in CLCN1, the skeletal
muscle chloride channel, cause MC in either autosomal dominant (Thomsen disease) or
autosomal recessive (Becker disease) forms (Koch et al. 1992). Myotonia in Becker dis-
ease tends to be more severe and can even be accompanied by episodic weakness.
Like Becker disease, paramyotonia congenita (PMC) is characterized by both
myotonia and weakness (Jurkat-Rott et al. 2010). PMC can be distinguished from MC
because PMC patients exhibit “paradoxical myotonia”, in which myotonia is exacerbated
by exercise and can transition to weakness (whereas myotonia in MC is relieved by
exercise). Also, PMC attacks are prominently triggered by cold and mostly affect the
upper extremities and face. PMC is caused by mutations in SCN4A, a skeletal muscle
voltage-gated sodium channel (Ptáček et al. 1992). Different SCN4A mutations cause
potassium-aggravated myotonia (PAM) (Ptáček et al. 1994b), in which myotonia is
instead triggered by potassium. However, in PAM the myotonia never transitions to
weakness (Jurkat-Rott et al. 2010).
On the opposite, hypoexcitable end of the spectrum are hyperkalemic periodic
paralysis (HyperKPP) and hypokalemic periodic paralysis (HypoKPP) (Jurkat-Rott et al.
2010). Patients suffer from episodes of weakness or paralysis, triggered by exercise or
stress. During attacks, HypoKPP patients are always hypokalemic, whereas HyperKPP
patients are often normokalemic. However, for purposes of diagnosis HyperKPP attacks
15

can be induced by a potassium load. Aside from serum potassium levels, the periodic
paralyses are clinically distinguishable because HypoKPP never causes myotonia,
whereas HyperKPP causes myotonia early in an attack before evolving to weak-
ness/paralysis. Both HyperKPP and HypoKPP patients can develop progressive fixed
weakness in those muscles prone to paralytic attacks. Like PMC and PAM, HyperKPP
and HypoKPP are caused by mutations in SCN4A (Ptáček et al. 1991, Bulman et al.
1999), which highlights the relatedness of these disorders. Other cases of HypoKPP are
caused by mutations in CACNA1S, which encodes a skeletal muscle voltage-gated cal-
cium channel (Ptáček et al. 1994a). Genotype-phenotype correlations and pathophys-
iological mechanisms are reviewed elsewhere (Raja Rayan & Hanna 2010).
A variant of HypoKPP is thyrotoxic periodic paralysis (TPP) (Jurkat-Rott et al.
2010). TPP patients suffer weakness/paralysis in attacks triggered by thyrotoxicosis.
TPP usually afflicts young adult males of Asian ancestry. Ryan et al. (2010) recently
demonstrated that some TPP cases are caused by mutations in KCNJ18, encoding a skel-
etal muscle potassium channel. KCNJ18 mutations have since been discovered in a few
patients with non-familial HypoKPP but normal thyroid function, called “sporadic peri-
odic paralysis” (Cheng et al. 2011). However, KCNJ18 mutations account for only one-
fourth to one-third of TPP cases. We have sequenced many known ion channels in
KCNJ18-mutation negative TPP patients but found no mutations (L.J. Ptáček, unpublish-
ed observations), and the genetic basis underlying these cases remains to be elucidated.
Finally, periodic paralysis (either HypoKPP or HyperKPP) is observed in
Andersen-Tawil syndrome (ATS) (Tristani-Firouzi & Etheridge 2010). ATS is a
pleiotropic disorder: periodic paralysis may be accompanied by neurocognitive deficits,
16

skeletal dysmorphisms, and, of paramount clinical importance, long QT syndrome (see
below). ATS is caused by mutations in KCNJ2, another potassium channel (Plaster et al.
2001). KCNJ2 mutations are found in only 60% of ATS families, suggesting the exist-
ence of at least one additional disease gene.
Cardiac Muscle
Numerous Mendelian diseases feature episodic dysfunction of cardiac muscle.
These include atrial fibrillation and four ventricular arrhythmias: long QT syndrome,
short QT syndrome, Brugada syndrome, and catecholaminergic polymorphic ventricular
tachycardia. Most of the disease genes encode ion channels, but some do not. For ex-
ample, atrial fibrillation (AF) can be caused by autosomal dominant mutations in five
potassium channel genes (KCNA5, KCNE2, KCNE5, KCNJ2, KCNQ1) and three sodium
channel genes (SCN1B, SCN2B, SCN5A) (Mahida et al. 2011). However, monogenic AF
can also be caused by mutations in GJA5, NPPA, or NUP155, which encode a gap
junction protein, atrial natriuretic peptide, and a nucleoporin, respectively. Pathophysio-
logical mechanisms for these non-ion channel genes are not known (Mahida et al. 2011).
A well-known ventricular arrhythmia, long QT syndrome (LQTS) is defined by
an elongated QT interval per EKG. This electrical abnormality reflects delayed cardio-
myocyte repolarization, which predisposes to torsades de pointes arrhythmia that mani-
fests clinically as palpitations, syncope, or sudden cardiac death. LQTS presents in four
clinical subtypes: Andersen-Tawil syndrome (see above), Romano-Ward syndrome (most
common), Jervell and Lange-Nielsen syndrome (includes congenital deafness), and
Timothy syndrome (includes cardiac malformations, syndactyly, and autism spectrum
17

disorders) (McBride & Garg 2010). Like AF, LQTS is genetically heterogeneous, with
13 known genes, including six potassium channel genes (KCNE1, KCNE2, KCNH2,
KCNJ2, KCNJ5, KCNQ1), two sodium channel genes (SCN4B, SCN5A), one calcium
channel gene (CACNA1C), and four genes not encoding channels: AKAP9, ANK2, CAV3,
and SNTA1. Mutations in the four non-channel genes seem to disrupt trafficking or
stability of cardiomyocyte ion channels (Figure 2F; Mohler et al. 2003, Vatta et al. 2006,
Chen et al. 2007, Ueda et al. 2008).
Patients with short QT syndrome (SQTS) suffer from a shortened QT interval
that, like LQTS, predisposes to ventricular arrhythmia and sudden cardiac death. SQTS
is caused by autosomal dominant mutations in three potassium channel genes (KCNH2,
KCNJ2, KCNQ1), two of which are also LQTS genes (McBride & Garg 2010). Thus,
SQTS and LQTS constitute a spectrum ranging from prolonged to delayed cardiomyo-
cyte repolarization. SQTS can also present in concert with Brugada syndrome (BS) –
defined by elevation of the ST segment in select EKG leads – in patients with mutations
in CACNA1C and CACNB2, which encode calcium channel subunits. Alternatively,
isolated BS results from mutations in three sodium channel genes (SCN1B, SCN3B,
SCN5A), one potassium channel gene (KCNE3), and GPD1L, which encodes a protein
that regulates SCN5A phosphorylation and thereby modulates sodium current density
(Figure 2F; Valdivia et al. 2009, McBride & Garg 2010).
Finally, another important cause of sudden cardiac death in children is catechol-
aminergic polymorphic ventricular tachycardia (CPVT). In CPVT, the catecholaminergic
surge associated with strong emotions or exercise can trigger ventricular tachycardia.
The four disease genes, RYR2, CASQ2, TRDN, and CALM1, encode essential components
18

of cardiomyocyte calcium signaling (McBride & Garg 2010, Nyegaard et al. 2012, Roux-
Buisson et al. 2012). Recently, Watanabe et al. (2009) elegantly identified flecainide as a
potent inhibitor of arrhythmias in a CPVT mouse model. This work was validated in hu-
man trials (van der Werf et al. 2011), suggesting an effective treatment for this otherwise
lethal disease.
Neuromuscular Junction
Mendelian disorders of the neuromuscular junction (NMJ) are known as congen-
ital myasthenic syndromes (CMS). CMS are distinguished from the complex, autoim-
mune NMJ disorders LEMS and MG (see above), because CMS cannot be treated by
immunosuppression. Although CMS subtypes are clinically and genetically heterogene-
ous, they are usually characterized by episodic ocular and respiratory weakness (Barisic
et al. 2011). Weakness results from impaired neuromuscular transmission.
Most CMS subtypes are autosomal recessive, caused by mutations in 1 of 14
known genes. The subtypes/genes are classified by the NMJ component that is primarily
affected: pre-synaptic, synaptic, or post-synaptic (Figure 3A; Barisic et al. 2011). Pre-
synaptic CMS features prominent episodic apnea, and is caused by mutations in CHAT,
encoding an enzyme critical for acetylcholine synthesis (Figure 3A, part ii). Synaptic
CMS can be caused by mutations in COLQ (Mihaylova et al. 2008) and LAMB2 (Maselli
et al. 2009), which encode proteins that anchor acetylcholinesterase to the basal lamina
(Figure 3A, part iii). The most common type of CMS, by far, is post-synaptic CMS,
usually caused by defects in acetylcholine receptor (AChR) subunit genes CHRNA1,
CHRNB1, CHRND, and CHRNE (Figure 3A, part iv). Mutations in another AChR
19

subunit gene, CHRNG, cause Escobar syndrome (ES), characterized by joint contractures,
pterygia (webbing), and in utero CMS-like respiratory distress that resolves by birth
(Hoffmann et al. 2006). Finally, rare cases of post-synaptic CMS are caused by mu-
tations in non-AChR genes, namely AGRN, DOK7, GFPT1, MUSK, and RAPSN. These
genes constitute a molecular pathway essential for AChR aggregation and positioning on
the post-synaptic membrane (Figure 3A, part v; Barisic et al. 2011). Mutations in some
of these genes (CHRNA1, CHRNB1, CHRND, DOK7, and RASPN) cause fetal akinesia
deformation sequence (FADS), a perinatal lethal syndrome characterized by develop-
mental anomalies like pterygia, as well as fetal akinesia. Given the clinical and genetic
overlap, FADS is considered an extreme phenotype on a continuum that includes ES and
CMS. Identifying which gene is mutated in a CMS patient is critical because certain
genetic subtypes respond robustly to otherwise toxic medications (Barisic et al. 2011).
About half of CMS cases await genetic diagnosis, suggesting a fruitful area for human
genetics to provide further insights into synaptic physiology.
20

Figure 3. Beyond the channelopathy paradigm: mechanisms of synaptopathy and circuitopathy. (A) A compelling area for future study is the role of disease genes controlling excitability at the synaptic level, i.e., “synaptopathy”. In a normal synapse (i), a neurotransmitter (NT) is enzymatically synthesized in the pre-synaptic (Pre) cell and then released into the
21

synaptic cleft, where it activates post-synaptic (Post) NT receptors that then pass current. Regulatory proteins modulate NT receptor stability and localization. NT is metabolized in the synaptic cleft by enzymes that can be anchored to the pre-synaptic cell, the post-synaptic cell, or the basal lamina (depicted). Defects in these processes can alter synaptic transmission and excitability, as exemplified by defective neuromuscular junction (NMJ) synaptic transmission in the congenital myasthenic syndromes (CMS). CMS can be caused by mutations in a NT synthesis enzyme (ii), mutations in proteins that anchor a NT metabolism enzyme to the basal lamina (iii), mutations in the NT receptor itself (iv), and mutations in proteins that regulate NT receptor stability/localization (v). Although this pathophysiology has been heretofore demonstrated only for one type of synapse – the NMJ in CMS – other episodic disorders of the CNS are likely caused by dysfunction of higher-order synapses. Additional mechanisms of synaptopathy are conceivable, such as defects in synaptic vesicle release. (B) Another potential mechanism of episodic disease is defective regulation at the circuit level, i.e., “circuitopathy”. For example, one type of defective circuit is exemplified by GEFS+ (generalized epilepsy with febrile seizures plus), which is caused by SCN1A mutations that result in decreased GABAergic inhibition by interneurons. Certainly many other types of defective circuits are possible, but whether they can cause episodic neurologic disease is not yet known.
Peripheral Nerve
Recent studies have shown that mutations in SCN9A cause an intriguing trio of
pain perception disorders. SCN9A encodes a sodium channel that is specifically ex-
pressed in those peripheral sensory neurons that function as nociceptors. Mutations lead
to aberrant excitability of nociceptive nerves and thus alter the patient’s sensitivity to
painful stimuli. Autosomal dominant, gain-of-function mutations cause hypersensitivity
to pain in two disorders: inherited erythromelalgia (IEM) and paroxysmal extreme pain
disorder (PEPD) (Yang et al. 2004, Fertleman et al. 2006). Burning pain occurs in dis-
crete episodes, accompanied by erythema and swelling. IEM affects the extremities and
is commonly triggered by exercise, heat, or dietary components, whereas PEPD affects
submandibular, ocular, and rectal areas and is triggered by perianal stimulation (e.g.,
bowel movements).
22

Autosomal recessive, loss-of-function SCN9A mutations cause the opposite phe-
notype: congenital insensitivity to pain (CIP), characterized by complete absence of pain
sensation (Cox et al. 2006). Although ostensibly appealing, patients with CIP suffer
substantial injuries and early deaths because of inadvertent trauma. Early studies sug-
gested that CIP patients are otherwise normal, but Weiss et al. (2011) recently demon-
strated that the patients cannot smell; moreover, mice with olfactory sensory neuron-spe-
cific SCN9A knockout also exhibit anosmia (Weiss et al. 2011). Nevertheless, the specif-
icity and degree of pain relief achieved by genetic inactivation of this channel make it a
promising target for developing drugs to treat pain (Clare 2010).
Central Nervous System
A smorgasbord of Mendelian episodic disorders afflict the CNS, with diverse
symptoms depending on which region of the CNS is affected. For example, the cere-
bellum is the focus of pathology in episodic ataxia (EA). EA is distinguished by attacks
of ataxia (imbalance and incoordination) without impaired consciousness (Jen et al. 2007,
Jen 2008). Sometimes, attacks include weakness or are superimposed on progressive
ataxia. Seven subtypes (EA1-EA7) vary in associated symptoms, such as myokymia,
nystagmus, tinnitus, vertigo, and hemiplegic migraine. Most subtypes share exertion,
emotions, and startle as triggers. Each is autosomal dominant, with mutations in KCNA1
(EA1), CACNA1A (EA2), CACNB4 (EA5), and SLC1A3 (EA6). Despite demonstrated
linkage, the genes for EA3, EA4, and EA7 have proven elusive. KCNA1 and
CACNA1A/CACNB4 encode subunits of potassium and calcium channels, respectively,
that are highly expressed in Purkinje cells of the cerebellum (Tomlinson et al. 2009), and
23

indeed, mice expressing mutant channels exhibit aberrant Purkinje cell activity (Jen et al.
2007). The EA6 gene, SLC1A3, encodes a glutamate reuptake transporter expressed in
cerebellar astrocytes (Jen et al. 2005), but how mutant SLC1A3 alters cerebellar output
remains unknown.
EA2 features migraine, so it is also termed familial hemiplegic migraine (FHM)
type 1. FHM patients suffer from attacks of headache with hemiplegia during aura.
Whereas FHM1 is associated with ataxia, two other subtypes, FHM2 and FHM3, are not.
For all subtypes, inheritance is autosomal dominant. FHM2 is caused by mutations in
ATP1A2 (De Fusco et al. 2003), which encodes a sodium-potassium ATPase. FHM3
patients carry mutations in the sodium channel SCN1A (Dichgans et al. 2005). Knockin
mouse models for both FHM1 and FHM2 have increased susceptibility to cortical spread-
ing depression (CSD) (Tottene et al. 2009, Leo et al. 2011), in keeping with the theory
that aberrant cortical excitability is at least partially responsible for migraine patho-
physiology (see above).
A related disorder is alternating hemiplegia of childhood (AHC), characterized by
recurrent attacks of hemiplegia (Neville & Ninan 2007). AHC often presents with con-
comitant epilepsy and developmental delay. As a very rare, sporadic disorder, the eti-
ology of AHC has long remained a mystery, but Heinzen et al. (2012) recently showed
that AHC is caused by de novo mutations in ATP1A3, another sodium-potassium ATPase
gene. The mechanism linking sodium-potassium ATPases and hemiplegia in FHM2 and
AHC is not clear. Distinct ATP1A3 mutations cause a quite dissimilar phenotype, auto-
somal dominant rapid-onset dystonia-parkinsonism (de Carvalho Aguiar et al. 2004).
24

Some families exhibit autosomal dominant migraine without hemiplegia. So far
two genes have been proposed. The first, KCNK18, a potassium channel, was mutated in
a single large family and tracked with the phenotype in nine affected individuals
(Lafreniere et al. 2010). Moreover, the mutant subunit suppressed wild-type channel
function in vitro through a dominant negative effect (Lafreniere et al. 2010). However,
the same group (Andres-Enguix et al. 2012) later discovered KCNK18 variants in
unaffected controls, variants that also completely abrogate wild-type channel function.
How to reconcile these data? One possibility is that KCNK18 mutation alone is not
sufficiently causative and that the single affected family carries additional migraine
susceptibility variants. However, it is extremely unlikely that another locus would
cosegregate with the phenotype in the large family (nine affected individuals), which
suggests that either the KCNK18 linkage region itself contains additional susceptibility
variants or that KCNK18 is not causally related to the phenotype. On balance, it is our
view that KCNK18 mutations are likely not causative, although we would happily recant
upon identification of additional affected families with KCNK18 mutations. A stronger
case can be made for the second candidate gene, CSNK1D, which encodes a kinase,
because two independent families carry distinct mutations (Brennan et al. 2013). These
mutations alter nearby residues that reside in the highly conserved kinase domain, and
were shown in vitro to disrupt kinase activity (Xu et al. 2005, Brennan et al. 2013).
Furthermore, a mutant mouse model exhibits increased peripheral allodynia, cortical
spreading depression, and arterial dilation, all physiological markers of migraine
(Brennan et al. 2013). In any case, the overlapping, well-characterized phenotypes of
these three families strongly argue for the existence of Mendelian migraine that is distinct
25

from FHM and distinct from migraine with complex inheritance (Eriksen et al. 2004).
Heretofore unnamed, we propose the term autosomal dominant migraine (ADM) for this
disorder.
Hereditary hyperekplexia (HH) is a disorder of the brain stem, featuring an
exaggerated startle reaction (Dreissen et al. 2012). Most patients exhibit stiffness at birth
that lasts through infancy. Stiffness is exacerbated by handling and is so pronounced that
the baby can be held vertically or horizontally without a change in posture. Con-
sciousness is always preserved. Although prolonged stiffness resolves after infancy,
throughout the rest of their lives patients suffer from stiffness for a few seconds after an
exaggerated startle reaction to unexpected stimuli. HH inheritance can be autosomal
dominant, autosomal recessive or sporadic, and is usually caused by mutations in GLRA1
(Shiang et al. 1993). GLRA1 encodes a subunit of the glycine receptor located in the
postsynaptic membrane of glycinergic neurons (Figure 3A, part iv; Dreissen et al.
2012). Less commonly, patients carry mutations in SCL6A5 (which encodes a
presynaptic glycine transporter) (Rees et al. 2006), or, very rarely, mutations in GLRB,
GPHN, or ARHGEF9 (all encode postsynaptic glycinergic proteins). These mutations
decrease the inhibition exerted by glycinergic neurons in the spinal cord and brainstem,
resulting in excessive excitation as reflected by stiffness and exaggerated startle
(Dreissen et al. 2012).
Another fascinating group of episodic disorders are the paroxysmal dyskinesias.
In these diseases, excessive excitation manifests as attacks of involuntary movements that
can include dystonia (sustained contractions), athetosis (writhing), and chorea (small
dance-like movements) (Bhatia 2011). There are three Mendelian paroxysmal dys-
26

kinesias: paroxysmal exercise-induced dyskinesia (PED), paroxysmal non-kinesigenic
dyskinesia (PNKD), and paroxysmal kinesigenic dyskinesia (PKD). All three are auto-
somal dominant with juvenile onset.
PED is usually triggered by exercise and causes dystonia in the heavily exercised
muscles. The PED gene, SLC2A1, encodes the main glucose transporter in the brain
(Suls et al. 2008, Weber et al. 2008). Mutations impair glucose import into the brain such
that the increased energy demand after exercise renders the basal ganglia hypoglycemic.
However, this defect must not be specific to the basal ganglia seeing as PED often
presents with concomitant neurologic illness that may include hemiplegic migraine,
developmental delay, and especially epilepsy. Indeed, De Vivo disease, which is also
caused by SLC2A1 mutations, features severe, global developmental delay and epilepsy;
PED may not be appreciable (De Vivo et al. 1991, Seidner et al. 1998). Diagnosis of any
phenotype along this PED-De Vivo spectrum is critical because the ketogenic diet is a
highly effective treatment (Leen et al. 2010). Ketone bodies use a different transporter to
enter the CNS and thereby provide an alternative energy source.
In contrast with PED, PKD attacks are often triggered by startle or sudden
movements (hence “kinesigenic”) (Bhatia 2011). PNKD attacks are, by definition, not
triggered by movement. Instead, PNKD is induced by ethanol, caffeine, or stress. In
both PKD and PNKD, hormones play a role: PKD attacks peak in puberty but decrease in
pregnancy, and PNKD attacks increase with menses. However, the exact role of hor-
mones in the genesis of attacks is unclear. PNKD is caused by mutations in the gene
PNKD, which encodes an enzyme that seems to modulate dopamine release in the stri-
atum in response to ethanol, caffeine, and redox status (Lee et al. 2004, Rainier et al.
27

2004, Lee et al. 2012b). One hypothesis is that PNKD mutations, which alter protein
stability and cleavage (Ghezzi et al. 2009, Shen et al. 2011), are gain-of-function, ren-
dering a patient more susceptible to stimuli that trigger dopamine dysregulation in the
basal ganglia (Lee et al. 2012b).
Numerous groups recently identified the PKD disease gene, PRRT2 (Chen et al.
2011, Wang et al. 2011, Heron et al. 2012, Lee et al. 2012a, Li et al. 2012). Within
affected families, there is remarkable pleiotropy; some patients suffer from episodic
ataxia or hemiplegic migraine (Cloarec et al. 2012, Gardiner et al. 2012, Marini et al.
2012), and others from benign, afebrile infantile epilepsy prior to PKD onset [termed
infantile convulsions with choreoathetosis (ICCA)] (Cloarec et al. 2012, Heron et al.
2012, Lee et al. 2012a). In fact, some patients suffer from benign familial infantile
epilepsy (BFIE) that resolves in infancy and is never succeeded by PKD (Heron et al.
2012). Given the phenotypic and genetic overlap of these disorders, we have proposed
the term PKD/infantile convulsions (PKD/IC) for the diagnosis of any PRRT2 mutation-
positive patient with BFIE, PKD, or both (ICCA) (Cloarec et al. 2012, Lee et al. 2012a).
PRRT2 encodes a transmembrane protein that lacks characteristic ion channel motifs, and
its function is not known. Lee et al. (2012a) found that mutations disrupt in vitro binding
of PRRT2 to SNAP-25, a synaptic protein integral for neurotransmitter release.
However, PRRT2 predominantly localizes to axons rather than to dendritic processes
(Lee et al. 2012a), and it is a widespread misconception that individual protein-protein
interactions are critical to physiological function (Gillis & Pavlidis 2012). Nevertheless,
one possible unifying hypothesis is that PKD and PNKD are both disorders of synaptic
regulation (Figure 3A), although this certainly remains unproven.
28

Another Mendelian movement disorder is marked by the primary symptom of
myoclonus. Myoclonus is defined as sudden, brief, involuntary movements, i.e., twitch-
es. Myoclonus is commonly a component of epilepsy, but in this disorder seizures do not
occur. The disorder, myoclonus dystonia syndrome (MDS), is characterized by juvenile
onset myoclonus and/or dystonia (Nardocci et al. 2008, Roze et al. 2008). MDS patients
suffer severe psychiatric comorbidity, especially depression, although MDS symptoms
are clearly ameliorated by ethanol, so depression may simply be a by-product of self-
medication by intoxication. MDS is caused by autosomal dominant mutations in SGCE
(Zimprich et al. 2001), which, like PRRT2, encodes a non-ion channel transmembrane
protein. Although SGCE was cloned in 2001, there has been almost no mechanistic in-
sight since, and its function continues to be obscure.
The broadest category of inherited episodic CNS disorders is composed of the
Mendelian epilepsy syndromes (Poduri & Lowenstein 2011). An illustrative example is
generalized epilepsy with febrile seizures plus (GEFS+). Whereas febrile seizures are
common and typically benign in young children, their persistence after age six defines
GEFS+. Most GEFS+ cases are genetically complex, but about 10% are autosomal dom-
inant. So far, all known disease genes encode ion channels, including three voltage-gated
sodium channel genes (SCN1A, SCN1B, SCN2A) and two GABAA receptor (GABAAR)
subunit genes: GABRG2 and GABRD (Wallace et al. 1998, Escayg et al. 2000, Baulac et
al. 2001, Sugawara et al. 2001, Dibbens et al. 2004). Thirteen additional loci have been
linked to GEFS+ and await gene identification (Morar et al. 2011, Poduri & Lowenstein
2011). Mutations in SCN1A are most common. In fact, other SCN1A mutations cause
more severe phenotypes along the GEFS+ continuum: severe myoclonic epilepsy of
29

infancy (SMEI, also known as Dravet syndrome), borderline SMEI, and intractable
epilepsy of childhood (IEC) (Stafstrom 2009). SCN1A knockout and knockin mice die
young from epilepsy, and their hippocampal GABAergic interneurons are hypoexcitable,
leading to a net hyperexcitable state (Figure 3B; Yu et al. 2006, Martin et al. 2010).
Given that GEFS+ can also be caused by mutations in GABAAR subunits, interneuron
dysfunction is likely a common mechanism underlying the entire GEFS+ continuum,
although to our knowledge this hypothesis remains to be tested in GABRG2 and GABRD
knockout mice.
Predictably, many other Mendelian epilepsy syndromes are caused by mutations
in ion channels. These phenotypes and the associated genes are extensively reviewed
elsewhere (Helbig et al. 2008, Mantegazza et al. 2010, Nicita et al. 2012). The known
genes include two GABAAR subunits, two AChR subunits, the brain glucose transporter,
a sodium-potassium ATPase, four potassium channels, one calcium channel subunit, one
chloride channel, and one sodium channel. Two other sodium channel genes, SCN3A and
SCN8A, have been associated with childhood epilepsy (Holland et al. 2008, Estacion et
al. 2010, Veeramah et al. 2012), but mutations were each detected in only a single pa-
tient; therefore, definitive assignment of these genes will require the discovery of distinct
mutations in additional patients.
Recent work has demonstrated that mutations in non-channel genes can cause
Mendelian epilepsy. For example, patients with a phenotype along the GEFS+ spectrum
who lack an SCN1A mutation and are female sometimes harbor PCDH19 mutations
(Depienne et al. 2009, Depienne et al. 2011). PCDH19 encodes a calcium-dependent cell
adhesion protein (Morishita & Yagi 2007). Two fascinating unanswered questions are,
30
how do mutations in a cell adhesion protein cause epilepsy, and why do these mutations
cause disease only in females?
Another well-characterized epilepsy syndrome caused by mutations in a non-
channel gene is autosomal dominant partial epilepsy with auditory features (ADPEAF).
The disease gene is LGI1 (Kalachikov et al. 2002). Interestingly, Lgi1 associates with
voltage-gated potassium channels, and autoantibodies to the Lgi1-Caspr2 complex are as-
sociated with the autoimmune, peripheral nerve disorder known as Isaac’s syndrome (see
above). How LGI1 mutations cause temporal lobe epilepsy without any peripheral nerve
hyperexcitability is not clear, and in fact Lgi1 function is essentially unknown. Recent
work suggests that Lgi1 inhibits seizure-induced trafficking of potassium channels in
thalamocortical neurons (Figure 2C; Smith et al. 2012), but it also seems to function in
remodeling of synapses and sensory axons (Zhou et al. 2009, Zhou et al. 2012), and it is
unclear how these findings can be reconciled into a unifying hypothesis.
Yet another non-channel epilepsy gene, EFHC1, is mutated in one subset of
juvenile myoclonic epilepsy (JME) (Suzuki et al. 2004). EFHC1 encodes a microtubule-
associated protein that regulates cell division and neuronal migration during cortical
development (de Nijs et al. 2009). In fact, a cornucopia of genes that function in neu-
ronal migration are mutated in Mendelian syndromes that feature epilepsy as one symp-
tom along with dramatic, radiologically evident malformations of cortical development
(Andrade 2009, Barkovich et al. 2012). For example, severe mutations in a gene essen-
tial for interneuron migration, ARX, cause gross cortical malformations, but milder mu-
tations result in less severe phenotypes such as early infantile epileptic encephalopathy or
even isolated mental retardation (Kitamura et al. 2002, Stromme et al. 2002, Shoubridge
31

et al. 2010). Likewise, severe infantile epilepsy phenotypes are caused by mutations in
CDKL5, STXBP1, and TBC1D24, which are non-channel genes that are clearly essential
for normal brain development, although their exact function remains unknown (Weaving
et al. 2004, Saitsu et al. 2008, Corbett et al. 2010, Falace et al. 2010). On the basis of
these data, it seems likely that many complex cases of epilepsy – which have a substantial
genetic contribution (Figure 1) – may result from a constellation of more subtle, genet-
ically influenced defects in cortical development.
One last class of Mendelian epilepsies is progressive myoclonic epilepsy (PME):
juvenile onset, myoclonic epilepsy in association with neurodegeneration, dementia, and
early death (Ramachandran et al. 2009). There are many PME subtypes and causative
genes, mostly encoding lysosomal proteins (Ramachandran et al. 2009). Some clinical
variants also feature substantial pathology outside the CNS, such as action myoclonus-
renal failure (AMRF) syndrome (Badhwar et al. 2004). A similar disorder, deemed
SeSAME syndrome (Seizures, Sensorineural deafness, Ataxia, Mental retardation, and
Electrolyte imbalance), is caused by mutations in the potassium channel KCNJ10
(Bockenhauer et al. 2009, Scholl et al. 2009). Epilepsy in SeSAME syndrome is less
severe, does not progress, and is not accompanied by neurodegeneration, so it does not
qualify as a PME subtype. We highlight it here to emphasize a somewhat unusual case in
which ion channel mutations cause dramatic pleiotropy in diverse organ systems.
Finally, primary episodic sleep disorders, a few of which are Mendelian, are re-
viewed elsewhere (Sehgal & Mignot 2011, Zhang et al. 2011). Mendelian ophthalmic
disorders are extraordinarily diverse and have been very well characterized; however,
32

they are usually progressive rather than episodic, as reviewed by Sheffield & Stone
(2011).
33

BEYOND THE CHANNELOPATHY PARADIGM
We have highlighted the immense progress made in characterizing the pheno-
types, genetics, and pathophysiology of episodic neurologic disorders. In our view, four
main objectives should be the focus of future work.
The first two objectives are broadly applicable to human genetics. First, we
should identify all Mendelian phenotypes and disease genes. This goal is realistic given
the advent of inexpensive, high-throughput sequencing (Gonzaga-Jauregui et al. 2012).
Many sporadic or seemingly idiopathic cases of severe, stereotyped disorders are likely
the result of mutations that are remarkably straightforward to detect via exome sequenc-
ing (Choi et al. 2009, Bamshad et al. 2011). On the other hand, many of the disorders
described above were characterized in large families with highly significant linkage, and
yet, cloning of the disease genes at linked loci remained elusive for years, often because
of the sheer number of candidate genes within the critical regions. This problem is now
easily circumvented by high-throughput sequencing (e.g., Lee et al. 2012a).
However, there will be challenges. Foremost among them is evaluating whether a
rare variant is truly causative. Numerous “disease genes” have been assigned on the ba-
sis of a single affected patient carrying a variant (Holland et al. 2008, Veeramah et al.
2012). Although this data certainly represents grounds for functional investigation, the
gold standard should continue to be allelic heterogeneity. In fact, every human carries
hundreds of rare, novel variants (Tennessen et al. 2012), so even using the identification
of two rare variants in the same gene from a large collection of patients to claim causality
may be unwarranted (O’Roak et al. 2012, Sanders et al. 2012). Instead, large families
with the statistical power to detect linkage will remain valuable because linkage con-
34

strains the pool of rare variants that must be considered for causality. Even when the
evidence includes a highly penetrant phenotype, large families, linkage, and allelic
heterogeneity, some mutations are not sufficient to cause disease in unrelated patients
(Klassen et al. 2011). The sobering reality is that determining the causal relationships
between mutations and Mendelian diseases may take many years to unravel.
The second main objective is to identify genetic risk factors for related,
genetically complex disorders (Figure 1). It was hoped that genome-wide association
studies (GWAS) would provide an unbiased method for doing so; however, except for a
few remarkable early findings (Hageman et al. 2005, Duerr et al. 2006), despite extensive
patient collections the calculated effect sizes have been very small. Consequently, the
overwhelming majority of GWAS associations have been insufficient to induce research-
ers to pursue functional biological investigation, or when investigated are found to have
no functional effect. It remains an open question whether high-throughput sequencing
will prove fruitful where GWAS was not, although we remain hopeful. In our view, one
possibility merits serious consideration: the null hypothesis. Perhaps the “missing herit-
ability” (Eichler et al. 2010) is not missing after all but has instead been grossly over-
estimated by inherently biased measures of heritability. Only time will tell. Given this
history, we are puzzled as to why more resources are not directed toward the tried-and-
true approach of applying our comprehension of rare Mendelian disorders to understand
pathophysiology of related complex diseases, as exemplified by Goldstein & Brown’s
(2009) elucidation of familial hypercholesterolemia, which sparked development of the
blockbuster statin drugs. This approach has seemingly fallen out of favor. In this regard,
episodic neurologic disorders are particularly tantalizing because Mendelian forms exhib-
35

it very specific symptoms and symptom clusters (e.g., congenital insensitivity to pain)
that may allow for pharmacological treatments with minimal side effects.
A third goal is to understand why these disorders are episodic in nature. Typical-
ly, patients appear to be normal between attacks and yet suffer extreme dysfunction
during an attack. Moreover, attacks are triggered by precipitants that are routinely en-
countered by affected patients and unaffected patients alike, and even in affected patients
these precipitants do not always trigger an attack. The link between the precipitant and
an attack is clear for some disorders, such as the primary skeletal muscle disorders in
which altered extracellular ion concentrations affect myocyte excitability. Another well-
characterized example is PED, in which exercise depletes blood glucose to cause CNS
hypoglycemia and hence dyskinesia. However, other triggers remain baffling. For ex-
ample, strong emotion is a common trigger, but how do psychological factors trigger neu-
rological dysfunction? No one knows.
Finally, the fourth objective is to expand on the channelopathy paradigm (Figure
3). Although more mutations in ion channels will likely be found, it has become evident
that many genes that do not encode channels can be mutated to cause episodic disorders.
For some, the effect of gene mutation is easily tied to changes in excitability, such as
when the genes encode proteins essential for ion channel trafficking, stability, or function
(Figure 2F). However, as we have repeatedly noted, for many genes the link to cellular
excitability remains poorly understood. We propose that rather than disease genes affect-
ing excitability in a cell-intrinsic way (e.g., ion channel expression or localization on the
cell membrane), a compelling area for future study is the role of disease genes in mod-
ulating excitability at the synaptic level. This concept of a “synaptopathy” is certainly
36

not new, since the congenital myasthenic syndromes have long been known to be dis-
orders of synaptic regulation (Figure 3A). However, the concept of synaptopathy has, to
date, been restricted to the NMJ (Figure 3A), and it seems probable that higher synapses
may be dysfunctional in episodic disorders of the CNS. We cannot help but speculate
that the lessons learned by investigating synaptic function in Mendelian episodic dis-
orders may apply to various complex disorders such as autism that are known syn-
aptopathies (Grabrucker et al. 2011).
Likewise, disordered regulation of excitability at the circuit level (“circuit-
opathy”) likely contributes to episodic disorders of the CNS (Figure 3B). For example,
SCN1A mutations in GEFS+, in which sodium channel dysfunction results in aberrant
interneurons, can be conceptualized as a channelopathy or a circuitopathy because ion
channels and also neuronal circuits are defective. Many other types of aberrant circuits
are possible, and we anticipate that some non-channel genes, especially those implicated
in brain development and/or mutated in Mendelian epilepsy syndromes, cause disease by
altering circuit wiring.
In summary, the past two decades have borne witness to the description of many
novel episodic neurologic phenotypes, the identification of causative mutations, and the
elucidation of underlying pathophysiology. On all three fronts – syndromes, genes, and
mechanisms – much work remains. With the widespread application of high-throughput
genomic technology, we expect progress to continue apace. In time, we expect that these
fronts will be conquered and the spoils will redound in the form of novel treatments for
these tragic diseases. We owe as much to our patients.
37

REFERENCES
Andrade DM. 2009. Genetic basis in epilepsies caused by malformations of cortical
development and in those with structurally normal brain. Hum Genet 126:173-93
Andres-Enguix I, Shang L, Stansfeld PJ, Morahan JM, Sansom MSP, et al. 2012.
Functional analysis of missense variants in the TRESK (KCNK18) K+ channel.
Sci Rep 2:237
Badhwar A, Berkovic S, Dowling JP, Gonzales M, Narayanan S, et al. 2004. Action
myoclonus-renal failure syndrome: characterisation of a unique cerebro-renal
disorder. Brain 127:2173-82
Bamshad MJ, Ng SB, Bigham AW, Tabor HK, Emond MJ, et al. 2011. Exome
sequencing as a tool for Mendelian disease gene discovery. Nat Rev Genet
12:745-55
Barisic N, Chaouch A, Muller JS, Lochmuller H. 2011. Genetic heterogeneity and
pathophysiological mechanisms in congenital myasthenic syndromes. Eur J
Paediatr Neurol 15:189-96
Barkovich AJ, Guerrini R, Kuzniecky RI, Jackson GD, Dobyns WB. 2012. A
developmental and genetic classification for malformations of cortical
development: update 2012. Brain 135:1348-69
Baulac S, Huberfeld G, Gourfinkel-An I, Mitropoulou G, Beranger A, et al. 2001. First
genetic evidence of GABA(A) receptor dysfunction in epilepsy: a mutation in the
gamma2-subunit gene. Nat Genet 28:46-48
38

Benoit G, Machuca E, Heidet L, Antignac C. 2010. Hereditary kidney diseases:
highlighting the importance of classical Mendelian phenotypes. Ann N Y Acad
Sci 1214:83-93
Berg AT, Berkovic SF, Brodie MJ, Buchhalter J, Cross JH, et al. 2010. Revised
terminology and concepts for organization of seizures and epilepsies: Report of
the ILAE Commission on Classification and Terminology, 2005-2009. Epilepsia
51: 676-85
Berg AT, Scheffer IE. 2011. New concepts in classification of the epilepsies: entering
the 21st century. Epilepsia 52:1058-62
Bhatia KP. 2011. Paroxysmal dyskinesias. Mov Disord 26:1157-65
Bockenhauer D, Feather S, Stanescu HC, Bandulik S, Zdebik AA, et al. 2009. Epilepsy,
ataxia, sensorineural deafness, tubulopathy, and KCNJ10 mutations. N Engl J
Med 360:1960-70
Brennan KC, Bates EA, Shapiro RE, Zyuzin J, Hallows WC, et al. 2013. Casein kinase
Iδ mutations in familial migraine and advanced phase sleep syndrome.
Manuscript submitted.
Bulman DE, Scoggan KA, van Oene MD, Nicolle MW, Hahn AF, et al. 1999. A novel
sodium channel mutation in a family with hypokalemic periodic paralysis.
Neurology 53:1932-36
Caviness J, Brown P. 2004. Myoclonus: current concepts and recent advances. Lancet
Neurol 3:598-607
39

Chen L, Marquardt ML, Tester DJ, Sampson KJ, Ackerman MJ, et al. 2007.
Mutation of an A-kinase-anchoring protein causes long-QT syndrome. Proc Natl
Acad Sci U S A 104:20990-95
Chen WJ, Lin Y, Xiong ZQ, Wei W, Ni W, et al. 2011. Exome sequencing identifies
truncating mutations in PRRT2 that cause paroxysmal kinesigenic dyskinesia.
Nat Genet 43:1252-55
Cheng CJ, Lin SH, Lo YF, Yang SS, Hsu YJ, et al. 2011. Identification and functional
characterization of Kir2.6 mutations associated with non-familial hypokalemic
periodic paralysis. J Biol Chem 286:27425-35
Choi M, Scholl UI, Ji W, Liu T, Tikhonova IR, et al. 2009. Genetic diagnosis by whole
exome capture and massively parallel DNA sequencing. Proc Natl Acad Sci U S
A 106:19096-101
Clare JJ. 2010. Targeting voltage-gated sodium channels for pain therapy. Expert Opin
Investig Drugs 19:45-62
Cloarec R, Bruneau N, Rudolf G, Massacrier A, Salmi M, et al. 2012. PRRT2 links
infantile convulsions and paroxysmal dyskinesia with migraine. Neurology
79:2097-2103
Corbett MA, Bahlo M, Jolly L, Afawi Z, Gardner AE, et al. 2010. A focal epilepsy and
intellectual disability syndrome is due to a mutation in TBC1D24. Am J Hum
Genet 87:371-75
Cox JJ, Reimann F, Nicholas AK, Thornton G, Roberts E, et al. 2006. An SCN9A
channelopathy causes congenital inability to experience pain. Nature 444:894-98
40

de Carvalho Aguiar P, Sweadner KJ, Penniston JT, Zaremba J, Liu L, et al. 2004.
Mutations in the Na+/K+-ATPase alpha3 gene ATP1A3 are associated with
rapid-onset dystonia parkinsonism. Neuron 43:169-75
De Fusco M, Marconi R, Silvestri L, Atorino L, Rampoldi L, et al. 2003.
Haploinsufficiency of ATP1A2 encoding the Na+/K+ pump alpha2 subunit
associated with familial hemiplegic migraine type 2. Nat Genet 33:192-96
de Nijs L, Leon C, Nguyen L, Loturco JJ, Delgado-Escueta AV, et al. 2009. EFHC1
interacts with microtubules to regulate cell division and cortical development.
Nat Neurosci 12:1266-74
De Vivo DC, Trifiletti RR, Jacobson RI, Ronen GM, Behmand RA, et al. 1991.
Defective glucose transport across the blood-brain barrier as a cause of persistent
hypoglycorrhachia, seizures, and developmental delay. N Engl J Med 325:703-9
Della-Morte D, Guadagni F, Palmirotta R, Testa G, Caso V, et al. 2012. Genetics of
ischemic stroke, stroke-related risk factors, stroke precursors and treatments.
Pharmacogenomics 13:595-613
Depienne C, Bouteiller D, Keren B, Cheuret E, Poirier K, et al. 2009. Sporadic infantile
epileptic encephalopathy caused by mutations in PCDH19 resembles Dravet
syndrome but mainly affects females. PLoS Genet 5:e1000381
Depienne C, Trouillard O, Bouteiller D, Gourfinkel-An I, Poirier K, et al. 2011.
Mutations and deletions in PCDH19 account for various familial or isolated
epilepsies in females. Hum Mutat 32:E1959-75
41

Dibbens LM, Feng HJ, Richards MC, Harkin LA, Hodgson BL, et al. 2004. GABRD
encoding a protein for extra- or peri-synaptic GABAA receptors is a susceptibility
locus for generalized epilepsies. Hum Mol Genet 13:1315-19
Dichgans M, Freilinger T, Eckstein G, Babini E, Lorenz-Depiereux B, et al. 2005.
Mutation in the neuronal voltage-gated sodium channel SCN1A in familial
hemiplegic migraine. Lancet 366:371-77
Dodick DW. 2008. Examining the essence of migraine—is it the blood vessel or the
brain? A debate. Headache 48:661-67
Dreissen YEM, Bakker MJ, Koelman JHTM, Tijssen MAJ. 2012. Exaggerated startle
reactions. Clin Neurophysiol 123:34-44
Duerr RH, Taylor KD, Brant SR, Rioux JD, Silverberg MS, et al. 2006. A genome-wide
association study identifies IL23R as an inflammatory bowel disease gene.
Science 314:1461-63
Eichler EE, Flint J, Gibson G, Kong A, Leal SM, et al. 2010. Missing heritability and
strategies for finding the underlying causes of complex disease. Nat Rev Genet
11:446-50
Eriksen MK, Thomsen LL, Andersen I, Nazim F, Olesen J. 2004. Clinical
characteristics of 362 patients with familial migraine with aura. Cephalalgia
24:564-75
Escayg A, MacDonald BT, Meisler MH, Baulac S, Huberfeld G, et al. 2000. Mutations
of SCN1A, encoding a neuronal sodium channel, in two families with GEFS+.
Nat Genet 24:343-45
42

Estacion M, Gasser A, Dib-Hajj SD, Waxman SG. 2010. A sodium channel mutation
linked to epilepsy increases ramp and persistent current of Nav1.3 and induces
hyperexcitability in hippocampal neurons. Exp Neurol 224:362-68
Fahn S. 2011. Classification of movement disorders. Mov Disord 26:947-57
Falace A, Filipello F, La Padula V, Vanni N, Madia F, et al. 2010. TBC1D24, an ARF6-
interacting protein, is mutated in familial infantile myoclonic epilepsy. Am J Hum
Genet 87:365-70
Fertleman CR, Baker MD, Parker KA, Moffatt S, Elmslie FV, et al. 2006. SCN9A
mutations in paroxysmal extreme pain disorder: allelic variants underlie distinct
channel defects and phenotypes. Neuron 52:767-74
Gardiner AR, Bhatia KP, Stamelou M, Dale RC, Kurian MA, et al. 2012. PRRT2 gene
mutations: from paroxysmal dyskinesia to episodic ataxia and hemiplegic
migraine. Neurology 79:2115-21
Gauer RL. 2011. Evaluation of syncope. Am Fam Physician 84:640-50
Geis C, Weishaupt A, Hallermann S, Grunewald B, Wessig C, et al. 2010. Stiff person
syndrome-associated autoantibodies to amphiphysin mediate reduced GABAergic
inhibition. Brain 133:3166-80
Ghezzi D, Viscomi C, Ferlini A, Gualandi F, Mereghetti P, et al. 2009. Paroxysmal non-
kinesigenic dyskinesia is caused by mutations of the MR-1 mitochondrial
targeting sequence. Hum Mol Genet 18:1058-64
Gillis J, Pavlidis P. 2012. “Guilt by association” is the exception rather than the rule in
gene networks. PLoS Comput Biol 8:e1002444
43

Goldstein JL, Brown MS. 2009. The LDL receptor. Arterioscler Thromb Vasc Biol
29:431-38
Gonzaga-Jauregui C, Lupski JR, Gibbs RA. 2012. Human genome sequencing in health
and disease. Annu Rev Med 63:35-61
Grabrucker AM, Schmeisser MJ, Schoen M, Boeckers TM. 2011. Postsynaptic
ProSAP/Shank scaffolds in the cross-hair of synaptopathies. Trends Cell Biol
21:594-603
Hageman GS, Anderson DH, Johnson LV, Hancox LS, Taiber AJ, et al. 2005. A
common haplotype in the complement regulatory gene factor H (HF1/CFH)
predisposes individuals to age-related macular degeneration. Proc Natl Acad Sci
U S A 102:7227-32
Haut SR, Bigal ME, Lipton RB. 2006. Chronic disorders with episodic manifestations:
focus on epilepsy and migraine. Lancet Neurol 5:148-57
Heinzen EL, Swoboda KJ, Hitomi Y, Gurrieri F, Nicole S, et al. 2012. De novo
mutations in ATP1A3 cause alternating hemiplegia of childhood. Nature Genet
44:1030-4
Helbig I, Scheffer IE, Mulley JC, Berkovic SF. 2008. Navigating the channels and
beyond: unraveling the genetics of the epilepsies. Lancet Neurol 7:231-45
Heron SE, Grinton BE, Kivity S, Afawi Z, Zuberi SM, et al. 2012. PRRT2 mutations
cause benign familial infantile epilepsy and infantile convulsions with
choreoathetosis syndrome. Am J Hum Genet 90:152-60
44

Higuchi O, Hamuro J, Motomura M, Yamanashi Y. 2011. Autoantibodies to low-
density lipoprotein receptor-related protein 4 in myasthenia gravis. Ann Neurol
69:418-22
Hoch W, McConville J, Helms S, Newson-Davis J, Melms A, et al. 2001. Auto-
antibodies to the receptor tyrosine kinase MuSK in patients with myasthenia
gravis without acetylcholine receptor antibodies. Nat Med 7:365-68
Hoffmann K, Muller JS, Stricker S, Megarbane A, Rajab A, et al. 2006. Escobar
syndrome is a prenatal myasthenia caused by disruption of the acetylcholine
receptor fetal gamma subunit. Am J Hum Genet 79:303-12
Holland KD, Kearney JA, Glauser TA, Buck G, Keddache M, et al. 2008. Mutation of
sodium channel SCN3A in a patient with cryptogenic pediatric partial epilepsy.
Neurosci Lett 433:65-70
Irani SR, Pettingill P, Kleopa KA, Schiza N, Waters P, et al. 2012. Morvan syndrome:
clinical and serological observations in 29 cases. Ann Neurol 72:241-55
Jen JC, Wan J, Palos TP, Howard BD, Baloh RW. 2005. Mutation in the glutamate
transporter EAAT1 causes episodic ataxia, hemiplegia, and seizures. Neurology
65:529-34
Jen JC, Graves TD, Hess EJ, Hanna MG, Griggs RC, et al. 2007. Primary episodic
ataxias: diagnosis, pathogenesis and treatment. Brain 130:2484-93
Jen JC. 2008. Hereditary episodic ataxias. Ann N Y Acad Sci 1142:250-53
Jurkat-Rott K, Lerche H, Weber Y, Lehmann-Horn F. 2010. Hereditary channelopathies
in neurology. Adv Exp Med Biol 686:305-34
45

Kalachikov S, Evgrafov O, Ross B, Winawer M, Barker-Cummings C, et al. 2002.
Mutations in LGI1 cause autosomal-dominant partial epilepsy with auditory
features. Nat Genet 30:335-41
Kitamura K, Yanazawa M, Sugiyama N, Miura H, Iizuka-Kogo A, et al. 2002. Mutation
of ARX causes abnormal development of forebrain and tests in mice and X-linked
lissencephaly with abnormal genitalia in humans. Nat Genet 32:359-69
Klassen T, Davis C, Goldman A, Burgess D, Chen T, et al. 2011. Exome sequencing of
ion channel genes reveals complex profiles confounding personal risk assessment
in epilepsy. Cell 145:1036-48
Kleopa KA. 2011. Autoimmune channelopathies of the nervous system. Curr
Neuropharmacol 9:458-67
Koch MC, Steinmeyer K, Lorenz C, Ricker K, Wolf F, et al. 1992. The skeletal muscle
chloride channel in dominant and recessive human myotonia. Science 257:797-
800
Kullman DM. 2010. Neurological channelopathies. Annu Rev Neurosci 33:151-72
Lafreniere RG, Zameel Cader M, Poulin J-F, Andres-Enguix I, Simoneau M, et al. 2010.
A dominant-negative mutation in the TRESK potassium channel is linked to
familial migraine with aura. Nat Med 16:1157-60
Lai M, Huijbers MG, Lancaster E, Graus F, Bataller L, et al. 2010. Investigation of
LGI1 as the antigen in limbic encephalitis previously attributed to potassium
channels: a case series. Lancet Neurol 9:776-85
Lancaster E, Huijbers MG, Bar V, Boronat A, Wong A, et al. 2011. Investigations of
caspr2, an autoantigen of encephalitis and neuromyotonia. Ann Neurol 69:303-11
46

Lee HY, Huang Y, Bruneau N, Roll P, Roberson ED, et al. 2012a. Mutations in the gene
PRRT2 cause paroxysmal kinesigenic dyskinesia with infantile convulsions. Cell
Rep 1:2-12
Lee HY, Nakayama J, Xu Y, Fan X, Karouani M, et al. 2012b. Dopamine dysregulation
in a mouse model of paroxysmal nonkinesigenic dyskinesia. J Clin Invest
122:507-18
Lee HY, Xu Y, Huang Y, Ahn AH, Auburger GW, et al. 2004. The gene for paroxysmal
non-kinesigenic dyskinesia encodes an enzyme in a stress response pathway.
Hum Mol Genet 13:3161-70
Leen WG, Klepper J, Verbeek MM, Leferink M, Hofste T, et al. 2010. Glucose
transporter-1 deficiency syndrome: the expanding clinical and genetic spectrum of
a treatable disorder. Brain 133:655-70
Lennon VA, Kryzer TJ, Pittock SJ, Verkman AS, Hinson SR. 2005. IgG marker of
optic-spinal multiple sclerosis binds to the aquaporin-4 water channel. J Exp Med
202:473-77
Leo L, Gherardini L, Barone V, De Fusco M, Pietrobon D, et al. 2011. Increased
susceptibility to cortical spreading depression in the mouse model of familial
hemiplegic migraine type 2. PLoS Genet 7:e1002129
Li J, Zhu X, Wang X, Sun W, Feng B, et al. 2012. Targeted genomic sequencing
identifies PRRT2 mutations as a cause of paroxysmal kinesigenic choreoathetosis.
J Med Genet 49:76-78
Lossin C, George AL Jr. 2008. Myotonia congenita. Adv Genet 63:25-55
47

Loukaides P, Schiza N, Pettingill P, Palazis L, Vounou E, et al. 2012. Morvan’s
syndrome associated with antibodies to multiple components of the voltage-gated
potassium channel complex. J Neurol Sci 312:52-56
Mahida S, Lubitz SA, Rienstra M, Milan DJ, Ellinor PT. 2011. Monogenic atrial
fibrillation as pathophysiological paradigms. Cardiovasc Res 89:692-700
Mantegazza M, Rusconi R, Scalmani P, Avanzini G, Franceschetti S. 2010.
Epileptogenic ion channel mutations: from bedside to bench and, hopefully, back
again. Epilepsy Res 92:1-29
Marini C, Conti V, Mei D, Battaglia D, Lettori D, et al. 2012. PRRT2 mutations in
familial infantile seizures, paroxysmal dyskinesia, and hemiplegic migraine.
Neurology 79:2109-14
Martin MS, Dutt K, Papale LA, Dube CM, Dutton SB, et al. 2010. Altered function of
the SCN1A voltage-gated sodium channel leads to gamma-aminobutyric acidergic
(GABAergic) interneuron abnormalities. J Biol Chem 285:9823-34
Maselli RA, Ng JJ, Anderson JA, Cagney O, Arredondo J, et al. 2009. Mutations in
LAMB2 causing a severe form of synaptic congenital myasthenic syndrome. J
Med Genet 46:203-8
McBride KL, Garg V. 2010. Impact of Mendelian inheritance in cardiovascular
disease. Ann N Y Acad Sci 1214:122-37
McClatchey AI, McKenna-Yasek D, Cros D, Worthen HG, Kuncl RW, et al. 1992.
Novel mutations in families with unusual and variable disorders of the skeletal
muscle sodium channel. Nat Genet 2:148-52
Mihaylova V, Muller JS, Vilchez JJ, Salih MA, Kabiraj MM, et al. 2008. Clinical and
48

molecular genetic findings in COLQ-mutant congenital myasthenic syndromes.
Brain 131:747-59
Mohler PJ, Schott JJ, Gramolini AO, Dilly KW, Guatimosim S, et al. 2003. Ankyrin-B
mutation causes type 4 long-QT cardiac arrhythmia and sudden cardiac death.
Nature 421:634-39
Morar B, Zhelyazkova S, Azmanov DN, Radionova M, Angelicheva D, et al. 2011. A
novel GEFS+ locus on 12p13.33 in a large Roma family. Epilepsy Res 97:198-
207
Morishita H, Yagi T. 2007. Protocadherin family: diversity, structure, and function.
Curr Opin Cell Biol 19:584-92
Nardocci N, Zorzi G, Barzaghi C, Zibordi F, Ciano C, et al. 2008. Myoclonus-dystonia
syndrome: clinical presentation, disease course, and genetic features in 11
families. Mov Disord 23:28-34
Neville BG, Ninan M. 2007. The treatment and management of alternating hemiplegia
of childhood. Dev Med Child Neurol 49:777-80
Nicita F, De Liso P, Danti FR, Papetti L, Ursitti F, et al. 2012. The genetics of
monogenic idiopathic epilepsies and epileptic encephalopathies. Seizure 21:3-11
Nyegaard M, Overgaard MT, Sondergaard MT, Vranas M, Behr ER, et al. 2012.
Mutations in calmodulin cause ventricular tachycardia and sudden cardiac death.
Am J Hum Genet 91:703-12
O’Roak BJ, Vives L, Girirajan S, Karakoc E, Krumm N, et al. 2012. Sporadic autism
exomes reveal a highly interconnected protein network of de novo mutations.
Nature 485:246-50
49

Pevzner A, Schoser B, Peters K, Cosma NC, Karakatsani A, et al. 2012. Anti-LRP4
autoantibodies in AchR- and MuSK-antibody-negative myasthenia gravis. J
Neurol 259:427-35
Plaster NM, Tawil R, Tristani-Firouzi M, Canun S, Bendahhou S, et al. 2001. Mutations
in Kir2.1 cause the developmental and episodic electrical phenotypes of
Andersen’s syndrome. Cell 105:511-19
Poduri A, Lowenstein D. 2011. Epilepsy genetics – past, present, and future. Curr Opin
Genet Dev 21:325-32
Ptáček LJ, George AL Jr, Barchi RL, Griggs RC, Riggs JE, et al. 1992. Mutations in an
S4 segment of the adult skeletal muscle sodium channel cause paramyotonia
congenita. Neuron 8:891-97
Ptáček LJ, George AL Jr, Griggs RC, Tawil R, Kallen RG, et al. 1991. Identification of
a mutation in the gene causing hyperkalemic periodic paralysis. Cell 67:1021-27
Ptáček LJ, Tawil R, Griggs RC, Engel AG, Layzer RB, et al. 1994a. Dihydropyridine
receptor mutations cause hypokalemic periodic paralysis. Cell 77:863-68
Ptáček LJ, Tawil R, Griggs RC, Meola G, McManis P, et al. 1994b. Sodium channel
mutations in acetazolamide-responsive myotonia congenita, paramyotonia
congenita, and hyperkalemic periodic paralysis. Neurology 44:1500-3
Rainier S, Thomas D, Tokarz D, Ming L, Bui M, et al. 2004. Myofibrillogenesis
regulator 1 gene mutations cause paroxysmal dystonic choreoathetosis. Arch
Neurol 61:1025-29
Raja Rayan DL, Hanna MG. 2010. Skeletal muscle channelopathies: nondystrophic
myotonias and periodic paralysis. Curr Opin Neurol 23:466-76
50

Ramachandran N, Girard JM, Turnbull J, Minassian BA. 2009. The autosomal
recessively inherited progressive myoclonus epilepsies and their genes. Epilepsia
50(Suppl 5):29-36
Rees MI, Harvey K, Pearce BR, Chung SK, Duguid IC, et al. 2006. Mutations in the
gene encoding GlyT2 (SLC6A5) define a presynaptic component of human startle
disease. Nat Genet 38:801-6
Rojas CV, Wang JZ, Schwartz LS, Hoffman EP, Powell BR, et al. 1991. A Met-to-Val
mutation in the skeletal muscle Na+ channel alpha-subunit in hyperkalaemic
periodic paralysis. Nature 354:387-89
Roux-Buisson N, Cacheux M, Fourest-Lieuvin A, Fauconnier J, Brocard J, et al. 2012.
Absence of triadin, a protein of the calcium release complex, is responsible for
cardiac arrhythmia with sudden death in humans. Hum Mol Genet 21:2759-67
Roze E, Apartis E, Clot F, Dorison N, Thobois S, et al. 2008. Myoclonus-dystonia:
clinical and electrophysiologic pattern related to SGCE mutations. Neurology
70:1010-16
Ryan DP, da Silva MR, Soong TW, Fontaine B, Donaldson MR, et al. 2010. Mutations
in potassium channel Kir2.6 cause susceptibility to thyrotoxic hypokalemic
periodic paralysis. Cell 140:88-98
Ryan DP, Ptáček LJ. 2010. Episodic neurological channelopathies. Neuron 68:282-92
Saitsu H, Kato M, Mizuguchi T, Hamada K, Osaka H, et al. 2008. De novo mutations in
the gene encoding STXBP1 (MUNC18-1) cause early infantile epileptic
encephalopathy. Nat Genet 40:782-88
51

Sanders J, Murtha MT, Gupta AR, Murdoch JD, Raubeson MJ, et al. 2012. De novo
mutations revealed by whole-exome sequencing are strongly associated with
autism. Nature 485:237-41
Scholl UI, Choi M, Liu T, Ramaekers VT, Hausler MG, et al. 2009. Seizures,
sensorineural deafness, ataxia, mental retardation, and electrolyte imbalance
(SeSAME syndrome) caused by mutations in KCNJ10. Proc Natl Acad Sci U S A
106:5842-47
Sehgal A, Mignot E. 2011. Genetics of sleep and sleep disorders. Cell 146:194-207
Seidner G, Alvarez MG, Yeh JI, O’Driscoll KR, Klepper J, et al. 1998. GLUT-1
deficiency syndrome caused by haploinsufficiency of the blood-brain barrier
hexose carrier. Nat Genet 18:188-91
Sheffield VC, Stone EM. 2011. Genomics and the eye. N Engl J Med 364: 1932-42
Shen Y, Lee HY, Rawson J, Ojha S, Babbitt P, et al. 2011. Mutations in PNKD causing
paroxysmal dyskinesia alters protein cleavage and stability. Hum Mol Genet
20:2322-32
Shiang R, Ryan SG, Zhu YZ, Hahn AF, O’Connell P, et al. 1993. Mutations in the
alpha 1 subunit of the inhibitory glycine receptor cause the dominant neurologic
disorder, hyperekplexia. Nat Genet 5:351-58
Shoubridge C, Fullston T, Gecz J. 2010. ARX spectrum disorders: making inroads into
the molecular pathology. Hum Mutat 31:889-900
Shyti R, de Vries B, van den Maagdenberg A. 2011. Migraine genes and the relation to
gender. Headache 51:880-90
52

Smith SE, Xu L, Kasten MR, Anderson MP. 2012. Mutant LGI1 inhibits seizure-
induced trafficking of Kv4.2 potassium channels. J Neurochem 120:611-21
Solimena M, Folli F, Denis-Donini S, Comi GC, Pozza G, et al. 1988. Autoantibodies to
glutamic acid decarboxylase in a patient with stiff-man syndrome, epilepsy, and
type I diabetes mellitus. N Engl J Med 318:1012-20
Stafstrom CE. 2009. Severe epilepsy syndromes of early childhood: the link between
genetics and pathophysiology with a focus on SCN1A mutations. J Child Neurol
24:S15-23
Strømme P, Mangelsdorf ME, Shaw MA, Lower KM, Lewis SM, et al. 2002. Mutations
in the human ortholog of Aristaless cause X-linked mental retardation and
epilepsy. Nat Genet 30:441-45
Sugawara T, Tsurubuchi Y, Agarwala KL, Ito M, Fukuma G, et al. 2001. A missense
mutation of the Na+ channel alpha II subunit gene Na(v)1.2 in a patient with
febrile and afebrile seizures causes channel dysfunction. Proc Natl Acad Sci U S
A 98:6384-89
Suls A, Dedeken P, Goffin K, Van Esch H, Dupont P, et al. 2008. Paroxysmal exercise-
induced dyskinesia and epilepsy is due to mutations in SLC2A1, encoding the
glucose transporter GLUT1. Brain 131:1831-44
Suzuki T, Delgado-Escueta AV, Aguan K, Alonso ME, Shi J, et al. 2004. Mutations in
EFHC1 cause juvenile myoclonic epilepsy. Nat Genet 36:842-49
Tawil R, McDermott MP, Brown R Jr, Shapiro BC, Ptáček LJ, et al. 2000. Randomized
trials of dichlorphenamide in the periodic paralyses. Working Group on Periodic
Paralysis. Ann Neurol 47:46-53
53

Tennessen JA, Bigham AW, O’Connor TD, Fu W, Kenny EE, et al. 2012. Evolution
and functional impact of rare coding variation from deep sequencing of human
exomes. Science 337:64-69
Tomlinson SE, Hanna MG, Kullmann DM, Tan SV, Burke D. 2009. Clinical
neurophysiology of the episodic ataxias: insights into ion channel dysfunction in
vivo. Clin Neurophysiol 120:1768-76
Tottene A, Conti R, Fabbro A, Vecchia D, Shapovalova M, et al. 2009. Enhanced
excitatory transmission at cortical synapses as the basis for facilitated spreading
depression in Ca(v)2.1 knockin migraine mice. Neuron 61:762-73
Tristani-Firouzi M, Etheridge SP. 2010. Kir 2.1 channelopathies: the Andersen-Tawil
syndrome. Pflugers Arch 460:289-94
Ueda K, Valdivia C, Medeiros-Domingo A, Tester DJ, Vatta M, et al. 2008. Syntrophin
mutation associated with long QT syndrome through activation of the nNOS-
SCN5A macromolecular complex. Proc Natl Acad Sci U S A 105:9355-60
Valdivia CR, Ueda K, Ackerman MJ, Makielski JC. 2009. GPD1L links redox state to
cardiac excitability by PKC-dependent phosphorylation of the sodium channel
SCN5A. Am J Physiol Heart Circ Physiol 297:H1446-52
van der Werf C, Kannankeril PJ, Sacher F, Krahn AD, Viskin S, et al. 2011. Flecainide
therapy reduces exercise-induced ventricular arrhythmias in patients with
catecholaminergic polymorphic ventricular tachycardia. J Am Coll Cardiol
57:2244-54
54

Vatta M, Ackerman MJ, Ye B, Makielski JC, Ughanze EE, et al. 2006. Mutant caveolin-
3 induces persistent late sodium current and is associated with long-QT syndrome.
Circulation 114:2104-12
Veeramah KR, O’Brien JE, Meisler MH, Cheng X, Dib-Hajj SD, et al. 2012. De novo
pathogenic SCN8A mutation identified by whole-genome sequencing of a family
quartet affected by infantile epileptic encephalopathy and SUDEP. Am J Hum
Genet 90:502-10
Vincent A, Lang B, Kleopa KA. 2006. Autoimmune channelopathies and related
neurological disorders. Neuron 52:123-38
Wallace RH, Wang DW, Singh R, Scheffer IE, George AL Jr, et al. 1998. Febrile
seizures and generalized epilepsy associated with a mutation in the Na+-channel
beta1 subunit gene SCN1B. Nat Genet 19:366-70
Wang JL, Cao L, Li XH, Hu ZM, Li JD, et al. 2011. Identification of PRRT2 as the
causative gene of paroxysmal kinesigenic dyskinesias. Brain 134:3493-3501
Watanabe H, Chopra N, Laver D, Hwang HS, Davies SS, et al. 2009. Flecainide
prevents catecholaminergic polymorphic ventricular tachycardia in mice and
humans. Nat Med 15:380-3
Weaving LS, Christodoulou J, Williamson SL, Friend KL, McKenzie OL, et al. 2004.
Mutations of CDKL5 cause a severe neurodevelopmental disorder with infantile
spasms and mental retardation. Am J Hum Genet 75:1079-93
Weber YG, Storch A, Wuttke TV, Brockmann K, Kempfle J, et al. 2008. GLUT1
mutations are a cause of paroxysmal exertion-induced dyskinesias and induce
hemolytic anemia by a cation leak. J Clin Invest 118:2157-68
55

Weiss J, Pyrski M, Jacobi E, Bufe B, Willnecker V, et al. 2011. Loss-of-function
mutations in sodium channel Nav1.7 cause anosmia. Nature 472:186-90
Xu Y, Padiath QS, Shapiro RE, Jones CR, Wu SC, et al. 2005. Functional consequences
of a CK1delta mutation causing familial advanced sleep phase syndrome. Nature
434:640-44
Yang Y, Wang Y, Li S, Xu Z, Li H, et al. 2004. Mutations in SCN9A, encoding a
sodium channel alpha subunit, in patients with primary erythermalgia. J Med
Genet 41:171-74
Yu FH, Mantegazza M, Westenbroek RE, Robbins CA, Kalume F, et al. 2006. Reduced
sodium current in GABAergic interneurons in a mouse model of severe
myoclonic epilepsy in infancy. Nat Neurosci 9:1142-49
Zhang L, Jones CR, Ptáček LJ, Fu YH. 2011. The genetics of the human circadian
clock. Adv Genet 74: 231-47
Zhou YD, Lee S, Jin Z, Wright M, Smith SE, Anderson MP. 2009. Arrested maturation
of excitatory synapses in autosomal dominant lateral temporal lobe epilepsy. Nat
Med 15:1208-14
Zhou YD, Zhang D, Ozkaynak E, Wang X, Kasper EM, et al. 2012. Epilepsy gene LGI1
regulates postnatal developmental remodeling of retinogeniculate synapses. J
Neurosci 32:903-10
Zimprich A, Grabowski M, Asmus F, Naumann M, Berg D, et al. 2001. Mutations in the
gene encoding epsilon-sarcoglycan cause myoclonus-dystonia syndrome. Nat
Genet 29:66-69
56

CHAPTER II
Familial Cortical Myoclonus, a Novel Movement Disorder
57

SUMMARY Myoclonus is characterized by sudden, brief involuntary movements, and its presence is
debilitating. The differential diagnosis of myoclonus is extensive, but in only two auto-
somal dominant disorders, familial adult myoclonic epilepsy (FAME) and myoclonus
dystonia syndrome (MDS), does myoclonus predominate. We identified 11 members of
a large, Canadian Mennonite family suffering from adult onset, slowly progressive, dis-
abling, multifocal myoclonus. Somatosensory evoked potentials indicated a cortical ori-
gin of the myoclonus. There were no associated seizures. In total, this family’s pheno-
type is not consistent with any previously described syndrome, including FAME or MDS.
We propose that familial cortical myoclonus (FCM) is a novel movement disorder. We
also identified seven patients from five kindreds who suffered from cortical myoclonus
that may be familial; however, their inheritance was not clear, and the phenotypes were
not consistent with the index family, so we concluded that none of these patients have
FCM. We anticipate that this work will enhance diagnosis in patients with myoclonus.
Furthermore, genetic analysis of the FCM family to identify the underlying mutation may
provide insight into the pathophysiology of this peculiar disorder.
58

INTRODUCTION Myoclonus is characterized by sudden, brief, shock-like involuntary movements
(Caviness & Brown 2004, Kojovic et al. 2011). These movements can result from invol-
untary muscle contractions (“positive myoclonus”) or from involuntary muscle relax-
ations (“negative myoclonus”). Myoclonic movements are simple, in contrast with cho-
rea (movements that are complex and brief) or dystonia (movements that are complex
and sustained). Unlike a tic, myoclonus cannot be voluntarily suppressed. On gross ex-
amination it may be difficult to differentiate high-frequency myoclonus from tremor or a
clonic seizure, both of which involve rhythmic alternating contraction of agonist and
antagonist muscles. In contrast, myoclonic jerks are arrhythmic or solitary and do not
alternately afflict muscle pairs. (However, myoclonus may be one component of a
seizure, as noted below.) Myoclonic movements can differ substantially between patients
in their distribution (focal, segmental, multifocal, hemi, or generalized), temporal pattern
(continuous or intermittent), and activation (“spontaneous myoclonus” occurs at rest,
whereas “stimulus-sensitive myoclonus” occurs in response to various stimuli; e.g.,
action myoclonus is triggered by voluntary movement). Depending on which muscles
are affected and the frequency of attacks, myoclonus can be severely debilitating.
In Chapter I we introduced the differential diagnosis for myoclonus. It is ex-
tremely broad, spanning the spectrum of neurologic disease: structural malformations, in-
fections, storage disorders, spinocerebellar degenerations, dementias, metabolic derange-
ments, toxin/drug exposures, post-hypoxia, malabsorption (Celiac’s disease), various epi-
lepsy syndromes, and many more (Caviness & Brown 2004, Kojovic et al. 2011, Lozsadi
2012). Organizing such a heterogeneous collection of disorders is challenging.
59

One approach is to classify the myoclonus into four categories: physiologic,
symptomatic, epileptic, or essential. Physiologic myoclonus, such as hiccups or hypna-
gogic jerks, is widespread and benign. The second type, symptomatic myoclonus, can
occur secondary to a multifarious array of neurologic illnesses (see list in preceding para-
graph). The third type is epileptic myoclonus, in which myoclonus occurs as just one
component of a chronic seizure disorder, although very rarely, myoclonus can be the sole
outward manifestation of epilepsy (discussed below). Finally, in essential myoclonus the
myoclonus is the predominant or only clinical finding.
Another scheme groups myoclonus by the level of the nervous system from which
it is thought to originate. The terminal step in myoclonus is inappropriate contraction of
skeletal muscle. This inappropriate contraction arises from hyperexcitability of the nerv-
ous system at any point along the normal pathway for propagation of motor output – from
the cerebral cortex, to the subcortex, to the spine, to the peripheral nervous system. The
focus of hyperexcitability is called the “myoclonus generator”. In identifying the gener-
ator, clinical details are helpful (Kojovic et al. 2011, Lozsadi 2012) but electrophys-
iological examination is the standard of care (Shibasaki & Hallett 2005, Cassim &
Houdayer 2006). If electromyelography (EMG) demonstrates shorter bursts, it reflects a
higher-level generator (e.g., cortical myoclonus has bursts of <50ms). In contrast, longer
bursts indicate a lower-level generator (e.g., a spinal or peripheral origin of the myo-
clonus).
Relative to cortical myoclonic jerks, subcortical jerks are typically more sustained
(around 500ms), but this may not always be the case. To distinguish between the two,
EMG is paired with electroencephalography (EEG). EMG-EEG is measured over time in
60

response to sensory stimulation by way of electrical shocks at the median nerve. After
around 100 jerks are detected by EMG, the EEG traces corresponding to one second
before and one second after those jerks are averaged into a composite trace. This
technique is known as jerk-locked back averaging (JLBA), and the cortical responses are
known as somatosensory evoked potentials (SSEPs) (Shibasaki & Hallett 2005, Cassim
& Houdayer 2006). In cortical myoclonus, the SSEPs over the parietal P25-N33 com-
plex, corresponding to the somatosensory cortex, exhibit amplitude of at least 10 times
greater than normal. Typically, the cutoff for labeling such traces as “giant SSEPs” is
8.6μV (Shibasaki & Hallett 2005). This test very effectively distinguishes cortical myo-
clonus (giant SSEPs) from subcortical myoclonus and also spinal or peripheral myo-
clonus, which all are associated with normal SSEPs. Giant SSEPs reflect a hyperex-
citable somatosensory cortex, corresponding to the enhanced stimulus-sensitivity in
cortical myoclonus. Various sensory stimuli, such as action, posture, touch, or emotion,
can serve as triggers. Hyperexcitability of the somatosensory cortex can be corroborated
by functional MRI (fMRI): the primary somatic sensory cortex (SI) contralateral to the
myoclonic muscle(s) is found to have increased blood flow thought to correspond to
neuronal activity (Shibasaki & Hallett 2005, Cassim & Houdayer 2006).
Typically, electrophysiological examination is not required for diagnosing myo-
clonus because symptomatic myoclonus predominates and a diagnosis is suggested by the
holistic clinical picture (Caviness & Brown 2004, Borg 2006, Kojovic et al. 2011). The
same is true for epileptic myoclonus. Essential myoclonus, in which myoclonus is the
major or lone clinical finding, has a more limited differential diagnosis. Sporadic cases
in the elderly may be primary progressive myoclonus of aging (Alvarez & Caviness
61

2008, Katschnig et al. 2011). In neonates one should consider benign neonatal sleep
myoclonus (Maurer et al. 2010), which was thought to be sporadic but in fact may be
hereditary (Afawi et al. 2012). A family history of myoclonus can be instructive, as two
hereditary disorders constitute the vast majority of essential myoclonus: familial adult
myoclonic epilepsy, and myoclonus dystonia syndrome.
Familial adult myoclonic epilepsy (FAME) is also known as benign adult familial
myoclonic epilepsy (BAFME) or familial cortical myoclonic tremor with epilepsy
(FCMTE), among other monikers. FAME is technically epileptic myoclonus rather than
essential myoclonus, but it may be considered to be essential myoclonus because the
myoclonus is sometimes the only detectable symptom (Striano et al. 2005). Classically,
FAME is an adult onset disorder, but at least two very large families exhibit juvenile
onset (Gardella et al. 2006, Crompton et al. 2012). Symptoms range from finger tremor-
like myoclonus to postural limb tremor-like myoclonus to generalized tonic-clonic
seizures (Crompton et al. 2012). Likely, many mild cases of FAME are misdiagnosed as
essential tremor (Louis 2001, Bain 2007, Louis et al. 2008). Classic FAME does not
include dementia, although it may include decreased cognition (Van Rootselaar et al.
2005). One severe variant, called FAME3, is distinguished by dementia along with
prominent ataxia, cerebellar atrophy, early disability, and death (Carr et al. 2007). The
myoclonus in FAME is provoked by stress, emotion, fatigue, and touch (Van Rootselaar
et al. 2005), reflecting cortical myoclonus. Giant SSEPs are observed. FAME inher-
itance is autosomal dominant, with linkage to chromosomes 8q23.3-q24.11 (Mikami et
al. 1999, Plaster et al. 1999, Mori et al. 2011), 2p11.1-p12.2 (Guerrini et al. 2001,
Crompton et al. 2012), 5p15.31-p15 (Depienne et al. 2010), and 3q26.32-q28 (Yeetong et
62

al. 2012). Despite over ten years of extensive study, the disease genes residing in the
FAME critical regions have not been identified.
The second hereditary essential myoclonus disorder is myoclonus dystonia syn-
drome (MDS). MDS is typically characterized by myoclonic jerks of the arms and axial
musculature, along with mild dystonia (often cervical dystonia or writer’s cramp)
(Nardocci et al. 2008, Kinugawa et al. 2009, Muller 2009). Symptoms are clearly amel-
iorated with alcohol and exacerbated by muscle activation, posture, or psychological
stress. However, MDS is not considered stimulus-sensitive, and SSEPs are normal, indi-
cating a subcortical origin (Shibasaki & Hallett 2005, Cassim & Houdayer 2006). Cogni-
tion is normal. There is pronounced psychiatric comorbidity, including depression, anx-
iety, and obsessive-compulsive disorder (Saunders-Pullman et al. 2002), but the prev-
alence of these conditions may relate to frequent self-medication by intoxication. Onset
occurs in childhood or adolescence, and the course is variable, from progression to
spontaneous remission. MDS is inherited in an autosomal dominant fashion, with re-
duced penetrance and variable expressivity. Most cases are caused by mutations in the
epsilon sarcoglycan (SGCE) gene on chromosome 7q21.3 (Zimprich et al. 2001,
Nardocci et al. 2008, Roze et al. 2008). Some cases are caused by microdeletions
spanning the SGCE gene (Han et al. 2008). There is also strong evidence for a second
locus, chromosome 18p11 (Grimes et al. 2002; Han et al. 2007), as well as for additional
locus heterogeneity (Valente et al. 2003, Schule et al. 2004, Orth et al. 2007, Groen et al.
2011). A few exceptional cases of MDS include one SGCE mutation-positive family
with onset in middle age (Wong et al. 2010); myoclonus dystonia plus syndrome,
characterized by MDS and short stature, microcephaly, and mental retardation, caused by
63
a 7q21 microdeletion encompassing the SGCE gene and others nearby (Saugier-Veber et
al. 2010); and MDS-like symptoms observed in concert with cerebrotendinous xantho-
matosis (Lagarde et al. 2012), ataxia-telangiectasia (Saunders-Pullman et al. 2012), and
tyrosine hydroxylase deficiency (Stamelou et al. 2012). Importantly, studies have dem-
onstrated via normal SSEPs that the myoclonus is subcortical in all known SGCE mu-
tation-positive and mutation-negative cases of MDS (Li et al. 2008, Marelli et al. 2008).
SGCE encodes a membrane protein thought to function in the dystrophin-
glycoprotein complex (DGC), but there is little data to support the hypothesis that SGCE
functions in a DGC-like complex in the brain (Waite et al. 2012). The other sarco-
glycans, sarcoglycan alpha, beta, gamma, and delta, are mutated in limb girdle muscular
dystrophy (LGMD) (Ozawa et al. 2005), but patients with MDS and mutations in SGCE
do not have LGMD, and patients with LGMD do not have MDS, as would be expected if
SGCE were functioning together with the other sarcoglycans. Since MDS pathology is
specific to the brain, one possibility is that SGCE has a different function in the CNS.
Ritz et al. (2010) identified a SGCE isoform expressed exclusively in brain, but it is
unclear whether this isoform differs functionally from other SGCE isoforms. Inves-
tigations of the SGCE knockout mouse, which recapitulates some aspects of the MDS
phenotype, have been largely uninformative at the molecular and cellular level (Yokoi et
al. 2006, 2010, 2011). It has been twelve years since SGCE was pinpointed, yet the
pathophysiology of MDS is entirely unknown.
We have identified a family with a phenotype that is clinically and electro-
physiologically distinct from other familial disorders in which myoclonus is prominent,
including FAME and MDS. Affected members of the large family suffer from autosomal
64

dominant, slowly progressive, multifocal, cortical myoclonus evoked by somatosensory
stimuli. Their myoclonus is not associated with seizures or other neurological deficits
aside from mild cerebellar ataxia late in the course of the illness. Here we present the
family’s phenotype as assessed by history, neurological examination, electrophysiology,
and imaging. Familial cortical myoclonus without epilepsy or other neurological deficits
has not been described. Thus, we propose that this family exhibits a novel movement
disorder, which we have termed familial cortical myoclonus (FCM).
65

METHODS This study was approved by the University of Western Ontario Health Sciences
Research Ethics Board, and by the University of California, San Francisco Institutional
Review Board. All family members provided written informed consent. Thirty-five fam-
ily members underwent personal interview and complete neurological examination. An
individual was identified as affected with myoclonus if the patient reported symptoms of
recurrent sudden, involuntary rapid movements of the face, extremities, or body; or if
myoclonus was observed upon examination.
Nine of 11 affected individuals, and 12 unaffected relatives (Figure 1), underwent
SSEP studies. SSEPs were performed by stimulating the median nerve at the wrist with
electric shocks delivered at a rate of 5.1Hz as a square wave pulse of 0.2ms duration. An
SSEP was determined to be “giant” if the P25-N33 amplitude difference was greater than
8.6V, as defined by Shibasaki & Hallett (2005). Jerk-locked back averaging was not
performed as this technique was not available to us and family members were residing in
multiple locations across Canada. Instead, multiple representative traces for each patient
were averaged to arrive at the values in Table 1.
Several family members were investigated with multiple EEGs and computed
tomography (CT) or magnetic resonance imaging (MRI) of the brain. Also, the proband
(both on and off clonazepam treatment) and her unaffected son underwent fMRI.
Ten affected patients and 25 unaffected relatives donated DNA for genetic
studies. DNA was extracted from whole blood according to standard protocols. The
quantity and quality of DNA was determined on a NanoDrop ND-1000 UV-Vis Spectro-
photometer (Nanodrop Technologies, Wilmington, DE). DNA stocks were stored in a
66

locked refrigerator at 4ºC, and DNA aliquots were stored at -20ºC. Analysis of the DNA
samples is presented in Chapter III.
We searched for additional families or individuals with similar symptoms to the
index family. Clinical data and DNA samples from these patients – 7 individuals from 5
kindreds – were provided by the following collaborators: Steven Frucht, M.D., of Mount
Sinai School of Medicine; Leon Dure, M.D., of the University of Alabama at Bir-
mingham School of Medicine; and Kailash Bhatia, M.D., of University College London
Institute of Neurology.
67

68
RESULTS Family Heritage The family (Figure 1) is of Mennonite heritage having emigrated from Ukraine
through Holland to western Canada (Puffenberger 2003).
Case Reports
The proband (arrow in Figure 1) was a 64 year old female who had suffered
sudden, involuntary jerking movements in her hands since her teens. The jerks were
elicited by action or inadvertent touch. She tended to stumble when walking over uneven
ground. At the age of 16 she developed sudden, unexplained falls with preserved con-
sciousness. Falls were also triggered by sudden movement, for example when she rushed
to answer the phone. At age 48 she had sustained a fall and head injury triggered by a
sudden turning of her head. Over time the jerks became more frequent and widespread,
so that she opted for treatment with clonazepam which ameliorated her symptoms. She
reported no cognitive symptoms, ataxia, or seizures, and, apart from myoclonus, the
neurologic examination was normal. Multifocal myoclonus occurred at rest and with
activity in her face and upper extremities when examined off clonazepam. EEG and MRI
of the head were unremarkable on several occasions. Median nerve SSEP studies showed
giant amplitude P25-N33 cortical response at age 48 (20.3µV) and age 60 (11.3µV).
Brain fMRI demonstrated hyperactivation in the contralateral SI cortex with hand rub-
bing compared to the study of her unaffected son (Figure 3), further supporting the
concept of a cortical origin of the myoclonus. Motor and visual activation maps did not
differ from controls. [CONTINUED, p. 70]

III-
8II
I-9
I-1
I-2
34
29
23
32
II-1
II-2
II-3
II-4
II-5
II-6
II-7
II-8
II-9
II-1
0II
-11
II-1
2II
-13
II-1
4II
-15
II-1
6II
-17
III-
1II
I-2
III-
3II
I-4
III-
5II
I-6
III-
7II
I-10
III-
11II
I-12
III-
13II
I-14
III-
15II
I-16
III-
17II
I-18
III-
19II
I-20
III-
21II
I-22
III-
23
IV-1
IV-2
IV-3
IV-4
IV-5
IV-6
IV-7
*
**
**
**
**
*
*s
ss
ss
s
ss
s
ss
(1 o
f 3)s
s
ss
s
ss
ss
(1 o
f 9)
69
Fig
ure
1.
Ext
end
ed f
amil
y p
edig
ree.
D
ots
deno
te p
atie
nts
wit
h un
know
n ph
enot
ype.
D
iam
onds
ind
icat
e un
affe
cted
pro
geny
wit
h ge
nder
mas
ked
to p
rese
rve
anon
ymit
y;
the
num
ber
insi
de d
iam
ond
deno
tes
mul
tipl
e un
affe
cted
pro
geny
. A
ster
isks
mar
k pa
tien
ts t
hat
carr
y th
e N
OL
3 m
utat
ion.
S
ind
icat
es
that
SS
EP
was
per
form
ed o
n th
at p
atie
nt.
One
ast
eris
k ha
s be
en o
mit
ted
from
a c
arri
er t
o pr
eser
ve a
nony
mit
y, a
nd s
ome
addi
tion
al
fam
ily
mem
bers
(in
clud
ing
one
unaf
fect
ed p
atie
nt w
ho w
as a
naly
zed
by S
SE
P)
wer
e om
itte
d al
toge
ther
.
1

The excessive cortical activation in the proband was markedly suppressed by the pre-
scription of clonazepam which had successively alleviated the myoclonus.
The father of the proband (II-3 in Figure 1) began to have sudden falls with pre-
served consciousness at age 50. Triggers included walking over uneven ground or sud-
den head movements. He also described sudden jerky movements in his limbs. Symp-
toms were most prominent in the morning and improved after eating lunch. He devel-
oped jerking in the extremities in response to exertion, emotional stress, fatigue or sleep
deprivation. There was no history of seizures or dystonia. Examination at age 77 re-
vealed intermittent myoclonus in all four limbs, occurring spontaneously or with touch.
Myoclonus was prominent upon testing of deep tendon reflexes. There was mild dif-
ficulty with heel-shin testing and a slightly wide-based gait. Treatment with clonazepam
thrice daily at a dose of 0.5mg significantly reduced myoclonus. However, falls prog-
ressed and by age 85 he was confined to a wheelchair, unable to care for himself, and
resided in a nursing home. EEG was normal, whereas SSEP studies demonstrated giant
cortical responses at 69.4µV.
A third affected patient, the proband’s youngest brother (III-8 in Figure 1), was a
52 year old male who first became aware of sudden jerking movements in his arms while
playing baseball in his mid-twenties. He would experience sudden jerking movements of
the arms when he reached out to catch the ball. He developed sudden falls if he was
touched inadvertently, and would be unable to protect himself with his hands. He also
tended to fall if he was walking on uneven ground and had to make a sudden corrective
movement. Symptoms were increased with fatigue, exertion, stress, or emotional ex-
tremes. Myoclonus was more prominent early in the morning prior to eating breakfast.
70

71
He thought drinking caffeine or alcohol worsened his symptoms. Treatment with val-
proate at 250mg two or three times daily provided excellent symptom control. His neu-
rologic examination showed intermittent diffuse multifocal myoclonus which was worse
with action. Finger-nose and heel-shin testing were normal, but he had difficulty with
tandem gait. Stance and gait were wide-based. Median nerve SSEPs showed giant
amplitude cortical responses (42.9µV).
Summary of Clinical Findings
We identified a large Canadian Mennonite family with a history of myoclonus. In
total, 11 family members (7 male, 4 female) exhibited stimulus-evoked, multifocal myo-
clonus throughout the face, arms and legs (Table 1). Onset ranged from the second to the
seventh decade. Inheritance was autosomal dominant. Myoclonus was the most prom-
inent and disabling clinical feature in all patients. Myoclonus was triggered by action,
sudden movements, and/or by inadvertent somatosensory stimuli, but not by light, noise,
or startle. Symptoms reportedly were aggravated by fatigue, exertion, sleep deprivation,
emotion, and hunger. Five individuals observed that their symptoms were alleviated by a
diet of frequent small meals taken throughout the day. Alcohol reportedly had no effect
except in one individual in whom myoclonus was ameliorated and in another in whom
myoclonus was exacerbated by alcohol. Most (8 of 11) individuals had sustained mul-
tiple sudden falls without loss of consciousness that were provoked either by sudden
movements or by walking on uneven ground. Patients could not prevent these falls, nor
could they protect themselves, and thus they often sustained severe injuries. Generally,
they could get up immediately after and [CONTINUED, p. 73]

Tab
le 1
. C
lin
ical
ch
arac
teri
stic
s in
11
affe
cted
fam
ily
mem
ber
s.
Abb
revi
atio
ns a
re:
+,
pres
ence
, -,
abs
ence
; F
, fa
ce;
FN
T,
fing
er n
ose
test
; L
E,
low
er e
xtre
mit
y; U
E,
uppe
r ex
trem
ity.
ID
s re
fer
to
Fig
ure
1.
ID
Age
of
O
nset
M
yocl
onus
F
alls
S
peec
h di
stur
banc
e O
ther
E
ffec
tive
tr
eatm
ent
Med
ian
SS
EP
s
acti
on
touc
h m
otio
ns
inso
mni
a fa
tigu
e,
exer
tion
la
ck o
f fo
od
Loc
atio
n A
lcoh
ol
effe
ct
P25
-N33
(µ
V)
II-3
50
+
+
+
+
+
+
U
E, L
E
none
+
-
mil
d at
axia
cl
onaz
epam
69
.4
II-1
1 50
s +
+
+
F,U
E,L
E
none
+
-
mul
ti-i
nfar
ct
dem
enti
a va
lpro
ate
not d
one
II-1
4 60
s +
UE
,LE
no
ne
+
- ac
tion
trem
or
79
.1
III-
1 la
te
teen
s +
+
+
+
F
,UE
,LE
no
ne
+
+
cl
onaz
epam
20
.3
III-
3 30
s +
+
+
+
+
UE
,LE
de
crea
sed
+
- m
ild
atax
ia
clon
azep
am,
valp
roat
e 39
.4
III-
7 40
s +
+
+
+
F
,UE
no
ne
- -
55.0
III-
8 18
+
+
+
+
+
+
U
E,L
E
incr
ease
d +
-
mil
d at
axia
va
lpro
ate
42.9
III-
16
40
+
+
UE
,LE
no
ne
+
- m
ild
atax
ia
re
fuse
d
III-
18
40
+
+
+
U
E
none
-
-
21
.8
IV-2
20
+
+
+
+
+
+
F
,UE
,LE
no
ne
+
+
gian
t, da
ta
unav
aila
ble
IV-4
la
te
20s
+
+
+
+
+
U
E,L
E
none
-
+
21.2
72
82

function with normal strength.
Myoclonus became progressively more frequent and widespread over decades and
thereby interfered with activities of daily living. Older patients became wheelchair-
dependent. Four showed signs of mild cerebellar limb and gait ataxia late in the course
of their illness. There were no signs of cognitive decline, spasticity, or dystonia apart
from one individual who had several strokes and developed multi-infarct dementia, likely
independent of the myoclonus, which had been present for many years. Moreover, overt
seizures were not observed, nor was there a history of psychiatric illness or treatment
with psychotropic medication. Myoclonus was effectively suppressed in five patients by
treating with either clonazepam or valproic acid (Table 1).
SSEP studies, using median nerve electrical depolarization as the stimulus, and
recording electrodes to measure ensuing brain electrical activity (see Introduction), were
performed. SSEPs in 9 of 9 affected patients showed giant cortical responses (Figure
2A). All 12 unaffected relatives who were tested with SSEPs had normal cortical evoked
responses of low amplitude (Figure 2B). As noted above, fMRI of the brain revealed
excessive activation of the contralateral SI cortex in the proband, as compared to her un-
affected son (Figure 3). Finally, repeated EEG recordings in several affected family
members were always normal, with no epileptiform activity; thus, the infrequent falls
were unlikely to be caused by seizures. [CONTINUED, p. 75]
73

Figure 2. Somatosensory evoked potentials in the familial cortical myoclonus family. Somatosensory evoked potential waveforms were measured following electrical stimu-lation of the median nerve at the wrist in a representative (A) affected (II-3 in Figure 1; 69.4μV) and (B) unaffected (1.1μV) family member.
A B
Figure 3. Functional magnetic resonance imaging in the familial cortical myoclonus family. Brain imaging demonstrated unusually high activation of the contralateral somatosensory cortex in response to hand rubbing in the affected proband (A; III-1 in Figure 1) as compared to her unaffected son (B; IV-1).
74

Search for Additional Patients and Kindreds with Familial Cortical Myoclonus
We canvassed movement disorder specialists and neurogeneticists around the
globe in an effort to identify additional individuals and kindreds with the same or a
similar phenotype. We identified 7 subjects from 5 kindreds suffering from cortical myo-
clonus that may be familial (Figure 4).
Patient 45141 was a Puerto Rican man with myoclonus, ET-like tremor, and
orthostatic tremor. The myoclonus responded to valproate and levetiracetam. Cognition
was normal. Inheritance was reportedly autosomal dominant, but we were unable to
obtain clinical information or DNA from his affected brother.
Kindred K50197 was an African American family with prominent myoclonus.
The myoclonus was somewhat stimulus-sensitive. Again, cognition was normal and in-
heritance was reported to be autosomal dominant. No additional information or DNA
samples were available.
Patient 101287 was a 9 year old female with a six year history of myoclonus.
Myoclonus was triggered by action. For example, she had trouble drinking or holding
plates. On exam, she had a pattern of irregularly irregular myoclonic jerks, primarily
affecting the upper extremities. Myoclonus resolved in sleep but then persisted through-
out the daytime and worsened when she was distracted. EEG and MRI were normal. She
had resulted from a birth complicated by placenta previa but subsequently attained nor-
mal developmental milestones. She was otherwise healthy and intelligent. Attempts to
treat her myoclonus with phenobarbital, levetiracetam, valproate, and lamotrigine were
ineffective. Her family history was negative for movement disorders.
75

For the remaining three patients, apart from a history of cortical myoclonus that
may be familial and had resisted diagnosis, clinical data were not available.
K7398
45141
K50190
101267
K50197
101280 101281
K50200
101287
K50202
101290 101291 101292 Figure 4. Additional patients with a history of cortical myoclonus that may be familial. Dot denotes patient with unknown phenotype. Anonymized patient numbers indicate those patients for whom DNA was obtained and analyzed (see Chapter III). The rela-tionship of patient 101292 to the remainder of kindred K50202 is not known.
76

DISCUSSION We have described a large family suffering from autosomal dominant, adult onset,
slowly progressive, multifocal myoclonus. All affected patients exhibited giant SSEPs
(Figure 2), which are the sine qua non of cortical myoclonus (Caviness & Brown 2004,
Shibasaki & Hallett 2005, Kojovic et al. 2011). A cortical origin of the myoclonus is
corroborated by the fMRI measurement of excessive activation in the contralateral
somatosensory cortex (Figure 3; see Introduction). The myoclonus was well controlled
in many affected family members by clonazepam or valproate (Table 1), but nevertheless
became progressively more frequent and ultimately debilitating. There were no other
neurological symptoms or signs apart from mild ataxia late in the course of the illness. In
our view, the ataxia is likely unrelated to the myoclonus because many years had elapsed
prior to ataxia onset, and it was restricted to patients of advanced age, for whom ataxia is
a common finding.
This family’s illness went undiagnosed for more than a decade after coming to
clinical attention. Many diagnoses were entertained. Cortical myoclonus is dominantly
inherited in epileptic disorders such as FAME (see Introduction). However, the clinical
presentation of FAME is distinct from that observed in our family, where myoclonus was
slowly progressive and became disabling late in the course of the illness, and overt sei-
zures were not observed. The presentation in this family is also not consistent with a
progressive myoclonic epilepsy syndrome (see Chapter I), because there were neither
seizures nor progressive dementia. The phenotype would be more consistent with the
syndrome of progressive myoclonic ataxia defined by infrequent seizures and little or no
cognitive dysfunction (Marseilles Consensus Group 1990), although ataxia was mild and
77

occurred late in the illness, and we could not detect even infrequent seizures. Another
possible diagnosis is hereditary hyperekplexia, an autosomal dominant disorder char-
acterized by an excessive startle reaction (see Chapter I). However, hereditary hyper-
ekplexia is clinically distinct and neurophysiologically marked by hyperexcitability of
brain stem origin; giant SSEP cortical responses are not observed (Dreissen et al. 2012).
The presentation in this family also differs from MDS (see Introduction), which
is, to our knowledge, the sole hereditary essential myoclonus syndrome hitherto de-
scribed. MDS is characterized by juvenile onset essential myoclonus, dystonia, and
psychiatric comorbidity (Nardocci et al. 2008, Roze et al. 2008), whereas in this family
myoclonus was adult onset and not accompanied by dystonia or psychiatric comorbidity.
Furthermore, in MDS the symptoms are clearly ameliorated by alcohol, which was not
the case in this family. Finally, in MDS the myoclonus is of subcortical origin and is not
stimulus-sensitive; giant SSEPs are never observed (Li et al. 2008, Marelli et al. 2008).
Hence, by exclusion we conclude that this family represents the first report of a
nosologically distinct disorder. This syndrome consists of autosomal dominant, adult
onset, slowly progressive, multifocal, cortical myoclonus, without associated dystonia or
seizures. We propose for this disorder the term familial cortical myoclonus (FCM).
Identifying additional patients and families with the same or a similar phenotype
would bolster the claim that FCM constitutes a novel phenotype. To this end, we found 7
subjects from 5 kindreds suffering from cortical myoclonus that may be familial (Figure
4). However, the clinical phenotypes of the 7 subjects were not identical to the FCM
family, and none of the 5 kindreds exhibited parent-to-child transmission characteristic of
78

dominant inheritance. We made further attempts to identify additional FCM patients,
which are described in Chapter III.
We anticipate that the characterization of FCM will enhance diagnosis in patients
with myoclonus. Furthermore, as has been true for many other Mendelian diseases
(Chapter I), description of this phenotype provides the opportunity to identify the caus-
ative mutation (Chapter III) and to elucidate pathophysiology (Chapter IV) that may be
more broadly applicable to other types of myoclonus or even related diseases of neuronal
hyperexcitability.
79

REFERENCES Afawi Z, Bassan H, Heron S, Oliver K, Straussberg R, et al. 2012. Benign neonatal
sleep myoclonus: an autosomal dominant form not allelic to KCNQ2 or KCNQ3.
J Child Neurol 27:1260-63
Alvarez M, Caviness JN. 2008. Primary progressive myoclonus of aging. Mov Disord
23:1658-64
Bain PG. 2007. Tremor. Parkinsonism Relat Disord 13(Suppl 3):S369-74
Borg M. 2006. Symptomatic myoclonus. Neurophysiol Clin 36:309-18
Carr JA, van der Walt PE, Nakayama J, Fu YH, Corfield V, et al. 2007. FAME 3: a
novel form of progressive myoclonus and epilepsy. Neurology 68:1382-89
Cassim F, Houdayer E. 2006. Neurophysiology of myoclonus. Neurophysiol Clin
36:281-91
Caviness J, Brown P. 2004. Myoclonus: current concepts and recent advances. Lancet
Neurol 3:598-607
Crompton DE, Sadleir LG, Bromhead CJ, Bahlo M, Bellows ST, et al. 2012. Familial
adult myoclonic epilepsy: recognition of mild phenotypes and refinement of the
2q locus. Arch Neurol 69:474-81
Depienne C, Magnin E, Bouteiller D, Stevanin G, Saint-Martin C, et al. 2010. Familial
cortical myoclonic tremor with epilepsy: the third locus (FCMTE3) maps to 5p.
Neurology 74:2000-3
Dreissen YEM, Bakker MJ, Koelman JHTM, Tijssen MAJ. 2012. Exaggerated startle
reactions. Clin Neurophysiol 123:34-44
Gardella E, Tinuper P, Marini C, Guerrini R, Parrini E, et al. 2006. Autosomal dominant
80

early-onset cortical myoclonus, photic-induced myoclonus, and epilepsy in a large
pedigree. Epilepsia 47:1643-49
Grimes DA, Han F, Lang AE, St George-Hyssop P, Racacho L, et al. 2002. A novel
locus for inherited myoclonus-dystonia on 18p11. Neurology 59:1183-86
Groen J, van Rootselaar AF, van der Salm SM, Bloem BR, Tijssen M. 2011. A new
familial syndrome with dystonia and lower limb action myoclonus. Mov Disord
26:896-900
Guerrini R, Bonanni P, Patrignani A, Brown P, Parmeggiani L, et al. 2001. Autosomal
dominant cortical myoclonus and epilepsy (ADCME) with complex partial and
generalized seizures: A newly recognized epilepsy syndrome with linkage to
chromosome 2p11.1-q12.2. Brain 124:2459-75
Han F, Racacho L, Lang AE, Bulman DE, Grimes DA. 2007. Refinement of the DYT15
locus in myoclonus-dystonia. Mov Disord 22:888-92
Han F, Racacho L, Yang H, Read T, Suchowersky O, et al. 2008. Large deletions
account for an increasing number of mutations in SGCE. Mov Disord 23:456-60
Katschnig P, Massano J, Edwards MJ, Schwingenschuh P, Cordivari C, et al. 2011.
Late-onset asymmetric myoclonus: an emerging syndrome. Mov Disord 26:1744-
48
Kinugawa K, Vidailhet M, Clot F, Apartis E, Grabli D, et al. 2009. Myoclonus-dystonia:
an update. Mov Disord 24:479-89
Kojovic M, Cordivari C, Bhatia K. 2011. Myoclonic disorders: a practical approach for
diagnosis and treatment. Ther Adv Neurol Disord 4:47-62
Lagarde J, Roze E, Apartis E, Pothalil D, Sedel F, et al. 2012. Myoclonus and dystonia
81

in cerebrotendinous xanthomatosis. Mov Disord 27:1805-10
Li J, Cunic D, Paradiso G, Gunraj C, Pal PK, et al. 2008. Electrophysiological features
of myoclonus-dystonia. Mov Disord 23:2055-61
Louis ED. 2001. Clinical practice. Essential tremor. N Engl J Med 345:887-91
Louis ED, Vonsattel JP. 2008. The emerging neuropathology of essential tremor. Mov
Disord 23:174-82
Lozsadi D. 2012. Myoclonus: a pragmatic approach. Pract Neurol 12:215-24
Marelli C, Canafoglia L, Zibordi F, Ciano C, Visani E, et al. 2008. A
neurophysiological study of myoclonus in patients with DYT11 myoclonus-
dystonia syndrome. Mov Disord 23:2041-48
Marseilles Consensus Group. 1990. Classification of progressive myoclonic epilepsies
and related disorders. Ann Neurol 28:113-16
Maurer VO, Rizzi M, Bianchetti MG, Ramelli GP. 2010. Benign neonatal sleep
myoclonus: a review of the literature. Pediatrics 125:e919-24
Mikami M, Yasuda T, Terao A, Nakamura M, Ueno S, et al. 1999. Localization of a
gene for benign adult familial myoclonic epilepsy to chromosome 8q23.3-q24.1.
Am J Hum Genet 65:745-51
Mori S, Nakamura M, Yasuda T, Ueno S, Kaneko S, et al. 2011. Remapping and
mutation analysis of benign adult familial myoclonic epilepsy in a Japanese
pedigree. J Hum Genet 56:742-47
Muller U. 2009. The monogenic primary dystonias. Brain 132:2005-25
Nardocci N, Zorzi G, Barzaghi C, Zibordi F, Ciano C, et al. 2008. Myoclonus-dystonia
82

syndrome: clinical presentation, disease course, and genetic features in 11
families. Mov Disord 23:28-34
Orth M, Djarmati A, Baumer T, Winkler S, Grunewald A, et al. 2007. Autosomal
dominant myoclonus-dystonia and Tourette syndrome in a family without linkage
to the SGCE gene. Mov Disord 22:2090-96
Ozawa E, Mizuno Y, Hagiwara Y, Sasaoka T, Yoshida M. 2005. Molecular and cell
biology of the sarcoglycan complex. Muscle Nerve 32:563-76
Plaster NM, Uyama E, Uchino M, Ikeda T, Flanigan KM, et al. 1999. Genetic
localization of the familial adult myoclonic epilepsy (FAME) gene to
chromosome 8q24. Neurology 53:1180-83
Puffenberger EG. 2003. Genetic heritage of the Old Order Mennonites of southeastern
Pennsylvania. Am J Med Genet C Semin Med Genet 121C:18-31
Ritz K, van Schaik BD, Jakobs ME, van Kampen AH, Aronica E, et al. 2011. SGCE
isoform characterization and expression in human brain: implications for
myoclonus-dystonia pathogenesis? Eur J Hum Genet 19:438-44
Roze E, Apartis E, Clot F, Dorison N, Thobois S, et al. 2008. Myoclonus-dystonia:
clinical and electrophysiological pattern related to SGCE mutations. Neurology
70:1010-16
Saugier-Veber P, Doummar D, Barthez MA, Czernecki V, Drouot N, et al. 2010.
Myoclonus dystonia plus syndrome due to a novel 7q21 microdeletion. Am J Med
Genet A 152A:1244-49
Saunders-Pullman R, Raymond D, Stoessl AJ, Hobson D, Nakamura K, et al. 2012.
83

Variant ataxia-telangiectasia presenting as primary-appearing dystonia in
Canadian Mennonites. Neurology 78:649-57
Saunders-Pullman R, Shriberg J, Heiman G, Raymond D, Wendt K, et al. 2002.
Myoclonus dystonia: possible association with obsessive-compulsive disorder and
alcohol dependence. Neurology 58:242-45
Schule B, Kock N, Svetel M, Dragasevic N, Hedrich K, et al. 2004. Genetic
heterogeneity in ten families with myoclonus-dystonia. J Neurol Neurosurg
Psychiatry 75:1181-85
Shibasaki H, Hallett M. 2005. Electrophysiological studies of myoclonus. Muscle
Nerve 31:157-74
Stamelou M, Mencacci NE, Cordivari C, Batla A, Wood NW, et al. 2012. Myoclonus-
dystonia syndrome due to tyrosine hydroxylase deficiency. Neurology 79:435-41
Striano P, Zara F, Striano S. 2005. Autosomal dominant cortical tremor, myoclonus and
epilepsy: many syndromes, one phenotype. Acta Neurol Scand 111:211-17
Valente EM, Misbahuddin A, Brancati F, Placzek MR, Garavaglia B, et al. 2003.
Analysis of the epsilon-sarcoglycan gene in familial and sporadic myoclonus-
dystonia: evidence for genetic heterogeneity. Mov Disord 18:1047-51
Van Rootselaar AF, van Schaik IN, van den Maagdenberg AM, Koelman JH, Callenbach
PM, et al. 2005. Familial cortical myoclonic tremor with epilepsy: a single
syndromic classification for a group of pedigrees bearing common features. Mov
Disord 20:665-73
Waite A, Brown SC, Blake DJ. 2012. The dystrophin-glycoprotein complex in brain
development and disease. Trends Neurosci 35:487-96
84

Wong SH, Steiger MJ, Larner AJ, Fletcher NA. 2010. Hereditary myoclonus dystonia
(DYT11): a novel SGCE gene mutation with intrafamilial phenotypic
heterogeneity. Mov Disord 25:956-57
Yeetong P, Ausavarat S, Bhidayasiri R, Piravej K, Pasutharnchat N, et al. 2012. A
newly identified locus for benign adult familial myoclonic epilepsy on
chromosome 3q26.32-3q28. Eur J Hum Genet epub doi: 10.1038/ejhg.2012.133
Yokoi F, Dang MT, Li J, Li Y. 2006. Myoclonus, motor deficits, alterations in
emotional responses and monoamine metabolism in epsilon-sarcoglycan deficient
mice. J Biochem 140:141-46
Yokoi F, Dang MT, Zhou T, Li Y. 2012. Abnormal nuclear envelopes in the striatum
and motor deficits in DYT11 myoclonus-dystonia mouse models. Hum Mol
Genet 21:916-25.
Yokoi F, Yang G, Li J, DeAndrade MP, Zhou T, et al. 2010. Earlier onset of motor
deficits in mice with double mutations in Dyt1 and Sgce. J Biochem 148:459-66
Zimprich A, Grabowski M, Asmus F, Naumann M, Berg D, et al. 2001. Mutations in the
gene encoding epsilon-sarcoglycan cause myoclonus-dystonia syndrome. Nat
Genet 29:66-69
85

CHAPTER III
Identification of a Mutation in NOL3
86

SUMMARY We analyzed DNA from 35 members of a family suffering from familial cortical myo-
clonus (FCM). We used unbiased, genome-wide SNP genotyping to pinpoint three puta-
tive linkage regions. Two were excluded by classic microsatellite linkage analysis, and
the third, chromosome 16q21-22.1, was linked. This critical region was subjected to tar-
geted DNA capture followed by massively parallel sequencing. In combination with
Sanger sequencing, we sequenced all known or predicted coding sequence. This analysis
revealed only a single cosegregating, novel, non-synonymous mutation, which resides in
the gene nucleolar protein 3 (NOL3). To date we have been unable to identify additional
NOL3 mutations. Nevertheless, substantial evidence indicates that NOL3 is the FCM
disease gene.
87

INTRODUCTION In Chapter II we presented clinical and electrophysiological data that familial
cortical myoclonus (FCM) is a nosologically distinct movement disorder. Since FCM
inheritance is autosomal dominant, we sought to identify the causative mutation. We
utilized multiple overlapping methodologies: genome-wide single nucleotide polymor-
phism (SNP) mapping, microsatellite linkage analysis, massively parallel sequencing
(MPS), and Sanger sequencing. Microsatellite linkage and Sanger sequencing have been
mainstays of human genetics for many years (Strachan & Read 2010). In comparison,
SNP mapping and MPS are relatively new techniques. As such, they each merit an
introduction.
Linkage analysis is the first step in dissecting the genomic transmission of a
Mendelian trait. The concept of linkage analysis is to search for identical-by-descent
(IBD) regions within affected members of a family. It has been quite successful in
identifying the mutations underlying many Mendelian disorders (Strachan & Read 2010).
Until recently, microsatellite markers were used for linkage analysis because they are
abundant, highly polymorphic, and relatively easy to genotype. However, one often runs
against the power limit because of insufficient number of samples, ambiguity of genomic
information, and/or phenotypic heterogeneity. To overcome these limitations and to ex-
ploit the rapid genotyping capability of SNP arrays, Giovanni Coppola et al., our col-
laborators at UCLA, have developed a mapping algorithm that identifies IBD regions
using high density SNP data. Similar methods have been reported in the literature, most-
ly addressing families with autosomal recessive inheritance (Lencz et al. 2007, Shojaee et
al. 2008). This approach is logically similar to genomic mismatch scanning (Nelson et al.
88

1993, Cheung & Nelson 1998). The analytical principle is based on the fact that in
regions where subjects share a DNA fragment by descent, they must always share an
allele at SNPs therein. Conversely, in regions where they do not share a fragment, there
will be frequent occurrences of SNPs for which they do not share an allele, i.e., one sam-
ple is AA genotype and the other is BB genotype. By scanning for these counter-evi-
dence AA versus BB SNPs, we delineate the boundaries of possible IBD fragments. The
resulting blocks are compatible with an underlying IBD fragment, and if they are
substantially larger (measured in centimorgan size) than the genomic background level of
block sizes that represent population-level IBD, it becomes more likely that such a block
represents true IBD, and thus it becomes a candidate linkage region for the disease in
question. With a pedigree relating the individuals it is possible to assign an odds ratio
comparable to the LOD score of traditional linkage analysis.
Whereas SNP genotyping has supplanted classic microsatellite linkage as the
initial genome-wide scan to localize a mutation, identifying the mutation within that lo-
cus can still be challenging. Before thorough genomic maps, geneticists relied upon a
grabbag of laborious tricks for gene identification (Strachan & Read 2010). After com-
pletion of the Human Genome Project (Lander et al. 2001) but prior to 2009, the can-
didate gene approach reigned supreme. A researcher attempting to identify a mutation
would use the genome map to list the genes within the linked locus. He would then rank
these candidate genes on the basis of known association with disease, sequence homol-
ogy, expression patterns, and so on. Then, for each coding exon he would design prim-
ers, perform polymerase chain reaction (PCR), Sanger sequence the resulting amplicons,
and compare the patient’s sequence to the reference sequence (or an unaffected relative).
89

This process was repeated iteratively until a novel variant was identified. The next step
was to confirm that the variant cosegregated with the phenotype in the family and that it
was not present in a large cohort of controls. Finally, the researcher would sequence that
same gene in other families with the same or similar phenotypes, in hopes of identifying
additional alleles. This “allelic heterogeneity” is the gold standard of genetics, for if
independent mutational events lead to the same phenotype, the most parsimonious
explanation is that mutations in that gene cause the phenotype. Needless to say, iden-
tifying mutations using this approach – particularly if a priori the disease gene was not
ranked highly on the candidate gene list – often required herculean effort. In some in-
stances it was truly a Sisyphean task, as evidenced by the many loci with strong evidence
of linkage that have resisted gene identification. For example, our laboratory has spent
fourteen years searching for the causative mutation within a locus for familial adult myo-
clonic epilepsy (Plaster et al. 1999), to no avail. Another group has replicated the same
locus (Mikami et al. 1999) and also failed to identify the disease gene (Mori et al. 2011).
This all changed in 2009 with the application of massively parallel sequencing
(MPS) to disease gene discovery (Choi et al. 2009, Ng et al. 2010). (MPS is often
referred to as next-generation sequencing [NGS], a term which we eschew because of its
imprecision.) MPS enables the sequencing and analysis of billions and even trillions of
base pairs in a rapid, accurate manner. For a geneticist attempting to identify a novel
disease gene, this technology can substantially hasten the process. Since 2009 it has been
widely adopted and repeatedly demonstrated its worth (Gonzaga-Jauregui et al. 2012).
There exist a number of ingenious methods for MPS, too many to present here
(Metzker 2010). Briefly, we will describe the method we used. A patient’s genomic
90

DNA is sheared and adaptors are ligated to the resulting fragments. The ligated frag-
ments are then electrophoresed to select fragments of a desired size (in our case, 200-300
base pairs). Purified fragments are then amplified by adaptor-mediated PCR. The next
step is critical. All 200-300bp fragments can be sequenced, but often the experimental
question dictates that the sequencing is done in a targeted manner—there is no use
sequencing regions of the genome that cannot contain the mutation. For example, more
than 90% of Mendelian mutations occur in protein-coding sequence, so it is logical to
first focus on sequencing all coding sequence (the “exome”). On the other hand, suppose
that linkage information pinpointed a particular locus (the “critical region”). In that case,
there is no sense in sequencing any genomic regions other than the coding sequence
within the critical region. Targeting the exome requires an array consisting of oligo-
nucleotides tiled over the exome that have been prefabricated on a glass slide; targeting a
critical region requires a custom array containing a subset of the exome array. The 200-
300bp fragments are washed over the array, and those fragments that hybridize to the
array are “captured” whereas other fragments are eluted. The captured fragments are
purified and then sequenced simultaneously using the Illumina methodology (Metzker
2010). This entire process is known as targeted DNA capture and MPS, or, in the case of
sequencing the exome, whole exome sequencing.
What of whole genome sequencing (WGS)? In our opinion, WGS, although rap-
idly becoming commonplace, is largely a waste of money. Each base-pair sequenced car-
ries with it a finite cost, and the functional significance – or lack thereof, the ENCODE
project (ENCODE Project Consortium et al. 2012) notwithstanding – of the vast majority
of the genome is currently not known. Since coverage (both breadth and depth) of
91

sequence is critical for mutation discovery, rather than probe regions of the genome
where the mutation cannot possibly reside it seems more prudent to ensure adequate
coverage of the exome (or critical region). As always, there are caveats, such as the
search for mutations in noncoding or unannotated sequence, or if adequate coverage of
the exome can be achieved using the money saved by omitting array hybridization.
Certainly in time the cost of WGS will be outstripped by the resources required for
designing a custom array and performing targeted capture. However, that day has not yet
arrived, and thus we opted for targeted capture of the critical region followed by MPS.
92

METHODS All nucleotide positions are in reference to NCBI Homo sapiens genome build
37.1 (www.ncbi.nlm.nih.gov/genome/guide/human).
Determination of IBD Segments by SNP Mapping
We utilized the GeneChip Human Mapping 250K Nsp array (Affymetrix, Santa
Clara, CA). This array covers ~250,000 SNPs across the genome, per subject. The
genotyping accuracy of the Affymetrix 250K chip reported by the manufacturer is es-
timated to be 99.5%. In order to account for the estimated error rate, we adopted a
window-cleaning function to remove isolated breaks. This algorithm identifies breaks
within a pairwise comparison and removes isolated, singular breaks that are otherwise
consistent with IBD in a surrounding specified number of SNP calls.
In regions where two affected individuals share an interval of DNA from a
common ancestor, the two individuals will have long contiguous intervals of genotypes
that are compatible with one allele being shared. Identifying these shared intervals
became technically possible with the development of high density SNP genotyping
technology. Genotyping large number of SNPs across the genome is now easy and cost
effective, and it provides us with polymorphism data at a very high resolution. When
using a 250K SNP panel, the practical mean resolution of IBD block detection comes
down to 1-2cM even after factoring in the linkage disequilibrium between SNPs. Given
this resolution, the IBD blocks inherited by distantly related individuals are likely to be
significantly larger and readily detectable even after 10 generations (Chapman &
Thompson 2003).
93
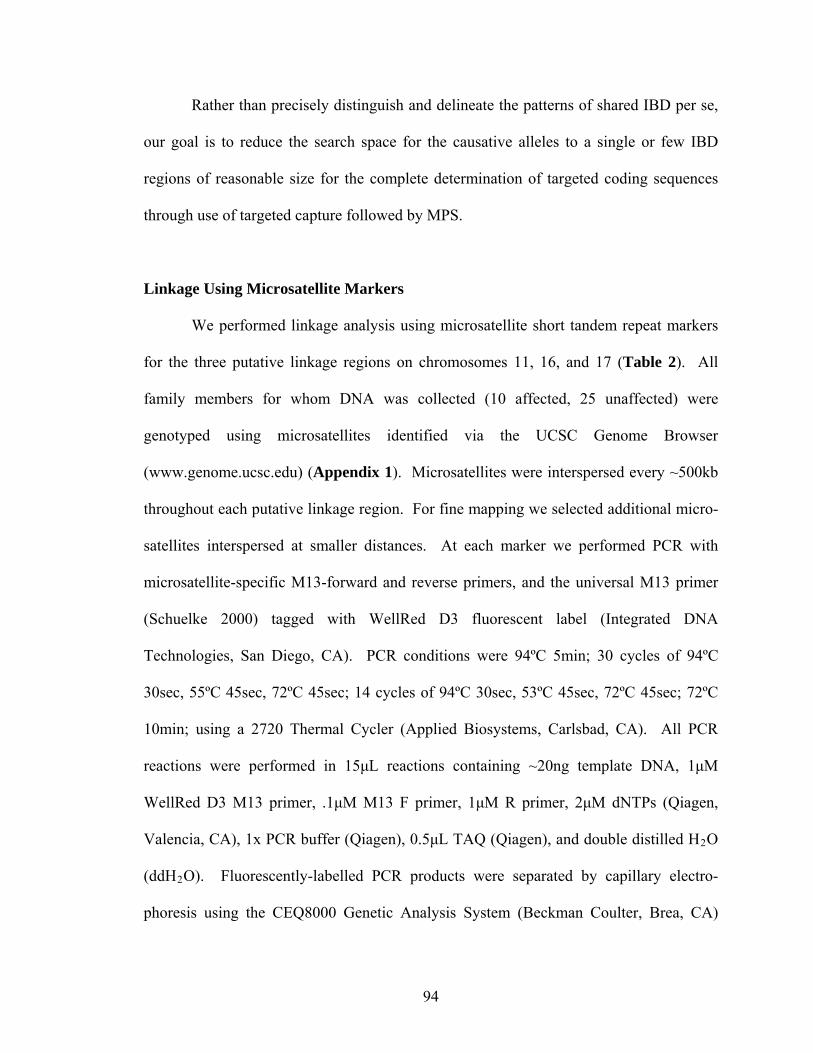
Rather than precisely distinguish and delineate the patterns of shared IBD per se,
our goal is to reduce the search space for the causative alleles to a single or few IBD
regions of reasonable size for the complete determination of targeted coding sequences
through use of targeted capture followed by MPS.
Linkage Using Microsatellite Markers
We performed linkage analysis using microsatellite short tandem repeat markers
for the three putative linkage regions on chromosomes 11, 16, and 17 (Table 2). All
family members for whom DNA was collected (10 affected, 25 unaffected) were
genotyped using microsatellites identified via the UCSC Genome Browser
(www.genome.ucsc.edu) (Appendix 1). Microsatellites were interspersed every ~500kb
throughout each putative linkage region. For fine mapping we selected additional micro-
satellites interspersed at smaller distances. At each marker we performed PCR with
microsatellite-specific M13-forward and reverse primers, and the universal M13 primer
(Schuelke 2000) tagged with WellRed D3 fluorescent label (Integrated DNA
Technologies, San Diego, CA). PCR conditions were 94ºC 5min; 30 cycles of 94ºC
30sec, 55ºC 45sec, 72ºC 45sec; 14 cycles of 94ºC 30sec, 53ºC 45sec, 72ºC 45sec; 72ºC
10min; using a 2720 Thermal Cycler (Applied Biosystems, Carlsbad, CA). All PCR
reactions were performed in 15μL reactions containing ~20ng template DNA, 1μM
WellRed D3 M13 primer, .1μM M13 F primer, 1μM R primer, 2μM dNTPs (Qiagen,
Valencia, CA), 1x PCR buffer (Qiagen), 0.5μL TAQ (Qiagen), and double distilled H2O
(ddH2O). Fluorescently-labelled PCR products were separated by capillary electro-
phoresis using the CEQ8000 Genetic Analysis System (Beckman Coulter, Brea, CA)
94

(Figure 1). Genotypes for each family member at each marker were manually compiled
and analyzed for evidence of linkage.
201/203 201/201
203/201
Figure 1. Microsatellite linkage genotyping methodology. Shown is an example of a pedigree and the CEQ8000 Genome Analyzer traces obtained for each subject. Each subject’s genomic DNA was PCRed using microsatellite-specific M13-forward and reverse primers, as well as the universal M13 primer tagged with a fluorescent label. PCR amplicons were electrophoresed and the base pair (bp) length was measured by the Genome Analyzer (denoted by the numbers above peaks). A hetero-zygous subject (201/203) has two large peaks, whereas a homozygous subject (201/201) has a single large peak. A difference of two bp, or multiples thereof, corresponds to microsatellite alleles of different length. Smaller peaks that occur prior to a large one are background (presumably due to polymerase slippage).
To confirm the statistical significance of linkage, pairwise LOD scores were cal-
culated using Superlink (Fishelson & Geiger 2002, Silberstein et al. 2006). Assumptions
were an autosomal dominant mode of inheritance with 90% penetrance and 0% pheno-
copy rate; disease mutant gene frequency of 0.0001; and uniform distribution of allele
frequencies. Non-Mendelian inheritance of markers (see Figure 4) were not compatible
95

with the Superlink algorithm and were therefore replaced with null values. To ensure
robustness, LOD scores were found to be stable across order-of-magnitude variations in
the calculation parameters (Table 3).
Targeted DNA Capture and Massively Parallel Sequencing
Based on our initial IBD analysis and the linkage mapping, for reasons enumer-
ated in the Introduction we focused on the critical region on chromosome 16. We de-
signed a capture library to target the coding sequence of every RefSeq gene contained
within the region from chr16:66,648,792 – 72,221,807 on the UCSC hg19 reference
build. (Only one predicted gene resides between the southern border of the critical region
at 65,206,293 and the southern border [66,648,792] of the sequence assayed by targeted
capture. This gene, LOC283867, was bidirectionally Sanger sequenced to rule out
presence of a variant; see below.) The coding exons from all aligned RefSeq transcripts
in the region were merged into single, non-overlapping intervals before excluding repeat-
masked regions (RepeatMasker 3.2.7; www.repeatmasker.org), and were expanded by up
to 300bp on either side to ensure coverage of all coding sequence and splice junctions.
These regions were submitted to Agilent's eArray (http://earray.chem.agilent.com),
generating a final capture library design that consisted of 25,710 120-mer probes
targeting a total of 875,805bp amongst 1,150 distinct regions of the reference genome,
with an average tiling density of 4x.
Library construction and hybrid-selection was performed according to manufac-
turers' protocols. Briefly, a total of 1.5μg of DNA was diluted in 100μL of TE buffer and
sonicated to a median fragment size of 200bp using an S2 instrument (Covaris, Woburn,
96

MA). The fragmented DNA was filled, end-polished, and A-tailed, followed by ligation
of adapters. After several rounds of amplification, the library was size-selected by
excision of 200-300bp fragments visualized with DNA Star on a 4% Nu Sieve Gel
(Lonza, Rockland, ME). All adapter and amplification oligos were purchased from IDT
(Coralville, IA) with additional modifications as specified in Bentley et al. (2008).
Quality and fragment distribution was assessed using a BioAnalyzer DNA 1000
Chip (Agilent Technologies, Santa Clara, CA). The samples were then hybridized to the
SureSelect capture library for 24hrs. The captured sample library was purified and pre-
pared for sequencing exactly as described in the Agilent SureSelect PE Protocol.
Single-end library sequencing was performed using a Genome Analyzer IIx
(Illumina, San Diego, CA), yielding over 15,000,000 76bp reads on target (Table 4A).
Alignment to the human genome was done using Burrows-Wheeler aligner with default
settings (Li & Durbin 2009), and variants were called using the Genome Analysis Tool
Kit (McKenna et al. 2010), and annotated using ANNOVAR (http://www.openbioinfor
matics.org/annovar). Capture efficiency was ~75% as defined by reads falling within
100bp of targeted sequence (Table 4A). Mean per-base coverage (including duplicate
reads) was 634x, covering 98.9% of the target region (Table 4A). After duplicate read
removal, average per-base coverage was 15x (Table 4A). Variant call sites exhibited sig-
nificant overlap with DBSNP 132, at 95.23%, and are summarized in Table 4B.
We identified 7 novel non-synonymous variants for further follow up. Although
upon first inspection there appears to be a high false positive rate of variants identified by
MPS (4 of 7, Table 5), in our experience this false positive rate is substantially inflated
because it represents called variants of a novel subset which are not representative of the
97

callset in general. Although insertion-deletion (indel) variants are more difficult to detect
by single-end sequencing vis-à-vis paired-end sequencing, we nonetheless detected a rich
library of indel variants dispersed throughout the target region. However, none of the
detected indels resided in coding sequence (data not shown).
Sanger Sequencing of Additional Coding Sequences Not Assayed by MPS
We sequenced all known or predicted exons that were covered by MPS at less
than 10x coverage post-duplicate removal; however, even at less than 10x coverage post-
duplicate removal, the chance of not detecting a heterozygous variant given our average
per-base coverage of 634x is slight (Choi et al. 2009). Nevertheless, for each locus we
Sanger sequenced PCR amplicons obtained from two affected and one unaffected family
member. All primers (Appendix 3) were designed to span the exons and splice junctions
of candidate genes using the Primer3 program (www.frodo.wi.mit.edu), with genomic
sequence obtained from the UCSC Genome Browser.
Also, because a penta-nucleotide repeat insertion in non-coding sequence was
previously reported by Sato et al. (2009) in association with spinocerebellar ataxia type
31, to rule out this locus we utilized primers (primers 12-23, Appendix 3) that were tiled
over the entire region from 66,514,116 – 66,520,026 which harbors the penta-nucleotide
repeat insertion.
Except for those primers noted below, the following conditions were used: 94ºC
3min; 10 cycles of 94ºC 20sec, 62ºC 30sec (touchdown step with 0.5ºC decrease in
annealing temperature each cycle), 72ºC 1min; 38 cycles of 94ºC 20sec, 58ºC 30sec,
72ºC 1min; 72ºC 10min; using a 2720 Thermal Cycler. All PCR reactions were
98

performed in 15μL reactions containing ~20ng template DNA, 1μM F primer, 1μM R
primer, 2μM dNTPs (Qiagen), 1x PCR buffer (Qiagen), 0.5μL TAQ (Qiagen), and
ddH2O. Amplicons were separated by gel electrophoresis to confirm amplification and
proper size, purified using the QIAquick PCR Purification Kit (Qiagen), then bidirec-
tionally sequenced using the F or R primer in turn. Sequencing was performed by Quin-
tara Biosciences (Albany, CA) and analyzed with Sequencher software v4.8 (Gene Codes
Corp., Ann Arbor, MI).
Many of these genes were excluded from targeted DNA capture because they are
highly repetitive or GC-rich, so select loci required extensive PCR optimization. The
following primer pairs (Appendix 3) required gel-purification using QIAquick Gel Ex-
traction Kit (Qiagen) due to nonspecific amplification: 2, 6, 11, 13, 21, 22, 25, 28, 32, 37,
45, 46, 51, 55, 61, 68, 70. For primers 6-39, PCR reactions were performed in 50μL
reactions containing ~20ng template DNA, 0.2μM F primer, 0.2μM R primer, 1x TaKaRa
buffer, 1 unit TaKaRa Taq, 0.2mM TaKaRa dNTP mixture, and ddH2O (TaKaRa
reagents from TaKaRa Bio, Otsu, Shiga, Japan); conditions were 94ºC 5min; 40 cycles of
94ºC 30sec, 56ºC 30sec, 72ºC 90sec; 72ºC 10min. Primers 6 and 48 required the same
conditions except that instead of 1x TaKaRa buffer, 1x GC buffer II and 1x GC buffer I
(TaKaRa Bio Inc.), respectively, were substituted. Primer 45 required conditions of 94ºC
3min; 10 cycles of 94ºC 20sec, 62ºC 30sec (touchdown step), 72ºC 1min; 45 cycles of
94ºC 20sec, 58ºC 30sec, 72ºC 1min; 72ºC 10min. Primer 46 required conditions of 94ºC
3min; 45 cycles of 94ºC 20sec, 61ºC 30sec, 72ºC 1min; 72ºC 10min. Primer 61 required
a 2min extension time with the standard cycling conditions.
99

Sanger Sequencing of NOL3 in Cases and Controls
To detect the E21Q variant we performed bidirectional Sanger sequencing of
exon 2 of NOL3 in all affected and unaffected family members for whom DNA was
collected (10 affected, 25 unaffected). This analysis (Figure 8) confirmed that the E21Q
variant cosegregates with the affected status and the linked haplotype. To rule out E21Q
as simply a rare variant, we sequenced an in-house collection of 252 Caucasian control
subjects. We detected no variants at this locus in any of the 504 control chromosomes.
In collaboration with a number of movement disorder specialists and neuro-
geneticists around the globe, we identified 7 patients from 5 kindreds suffering from
cortical myoclonus that may be familial (see Chapter II). We bidirectionally Sanger se-
quenced the 5’UTR, coding, splice junction, and 3’UTR sequence of NOL3 in all of these
patients and their unaffected relatives for whom we obtained DNA. This analysis iden-
tified no novel variants.
We undertook further efforts to identify additional NOL3 alleles. We collab-
orated with Samuel Berkovic, M.D., of the University of Melbourne. His group se-
quenced all NOL3 coding sequence, splice junctions, and UTRs in their collection of pa-
tients with FAME, benign neonatal sleep myoclonus (Maurer et al. 2010, Afawi et al.
2012), and undiagnosed myoclonus. Additionally, we presented this work at the Amer-
ican Society for Human Genetics annual meeting (San Francisco, 2012), where Mark
LeDoux, M.D., of the University of Tennessee explained that he may know of a family
with FCM (see Results).
For these experiments, NOL3 genomic and mRNA sequence was obtained from
NCBI Genome Build 37.1 and primers were designed using Primer3 (Appendix 4). All
100

PCR reactions were performed in 15μL reactions containing ~20ng template DNA, 1μM
F primer, 1μM R primer, 2μM dNTPs (Qiagen), 1x PCR buffer (Qiagen), 0.5μL TAQ
(Qiagen), and ddH2O. Amplicons were electrophoresed, purified, and sequenced with
either F or R primer, as described above.
Database Analyses for NOL3 E21Q Variant
To ensure that the E21Q variant was not simply a rare variant, we combed
genomic databases for the presence of NOL3 variants in healthy controls. The E21Q
variant was not present in dbSNP (www.ncbi.nlm.nih.gov/projects/SNP) or in 1,094 ge-
nomes from multiple ethnicities studied in the 1000 Genomes Project
(www.browser.1000genomes.org). Review of the Database of Genomic Variants
(http://projects.tcag.ca/variation) for copy number variants revealed a 3.5kb duplication
spanning NOL3 in Yoruban controls (Matsuzaki et al. 2009) and a 155kb deletion
spanning NOL3 and 15 adjacent genes in an Asian control (Park et al. 2010).
Large-scale Screen for NOL3 E21Q Variant
To assess the prevalence of the NOL3 E21Q mutation in the general population,
we screened a large series of controls obtained from NIMH using MassArray (Sequenom,
San Diego, CA). Control subjects from the National Institute of Mental Health Schizo-
phrenia Genetics Initiative (NIMH-GI), data and biomaterials are being collected by the
“Molecular Genetics of Schizophrenia II” (MGS-2) collaboration. The investigators and
co-investigators are: ENH/Northwestern University, Evanston, IL, MH059571, Pablo V.
Gejman, M.D. (Collaboration Coordinator; PI), Alan R. Sanders, M.D.; Emory
101

University School of Medicine, Atlanta, GA, MH59587, Farooq Amin, M.D. (PI);
Louisiana State University Health Sciences Center, New Orleans, LA, MH067257,
Nancy Buccola (PI); University of California-Irvine, Irvine, CA, MH60870, William
Byerley, M.D. (PI); Washington University, St. Louis, MO, MH060879, C. Robert
Cloninger, M.D. (PI); University of Iowa, Iowa City, IA, MH59566, Raymond Crowe,
M.D. (PI), Donald Black, M.D.; University of Colorado, Denver, CO, MH059565,
Robert Freedman, M.D. (PI); University of Pennsylvania, Philadelphia, PA, MH061675,
Douglas Levinson, M.D. (PI); University of Queensland, Queensland, Australia,
MH059588, Bryan Mowry, M.D. (PI); Mt. Sinai School of Medicine, New York, NY,
MH59586, Jeremy Silverman, Ph.D. (PI).
A SNP Genotyping Assay using Sequenom iPLEX Gold Technology (Sequenom,
San Diego, CA, USA) was executed according to manufacturer’s instructions. Spectro
chip arrays were spotted with a nanodispenser, and a Sequenom MALDI-TOF spectro-
photometer was used to read the array. The SpectroAquire and MassARRAY Typer
Software packages (Sequenom) were used for interpretation and Typer analyzer v.3.4.0.1
8 was used to review and analyze all data. Only high-level calls (Conservative and Mod-
erate, according to the Sequenom software) were considered for further analyses.
We screened a total of 4,246 samples from the NIMH reference control set. We
confirmed the presence of the mutation in all of the affected family members from the
FCM index family, consistent with their inclusion as positive controls. We did not detect
the NOL3 E21Q sequence variant in any of the 4,246 controls.
102

RESULTS To identify the mutation underlying FCM, ten affected and two unaffected family
members (marked by asterisks in Figure 4) were genotyped by genome-wide SNP
mapping. Mapping using identity-by-descent analysis, a statistical technique for ana-
lyzing SNP data to identify chromosomal regions of shared haplotypes, was conducted as
described above (Table 1). We assumed that the two unaffected individuals were not
carriers of the disease allele based on rigorous clinical evaluation, their advanced age at
examination, and because they had unaffected progeny. Our original ten-way compar-
ison including only affecteds yielded four primary regions of interest. We then used
genotyping information from the two unaffecteds in order to exclude one region. This
left three candidate regions on chromosomes 11, 16, and 17 (Table 2, Figure 2).
Table 1. Genome-wide SNP array. Abbreviations are: F, female; M, male; MCR, mean call rate; MDR, mean detection rate. The pedigree IDs correspond to Figure 4.
Pedigree ID
Gender SNP Call AA Call AB Call BB Call MCR MDR
II-3 M 97.68% 38.62% 24.17% 37.22% 96.40% 99.32%II-4 F 96.23% 38.84% 23.70% 37.46% 92.71% 98.59%II-7 M 96.84% 38.44% 24.65% 36.92% 95.92% 99.18%II-9 F 97.40% 38.28% 24.71% 37.01% 96.53% 99.11%III-2 F 95.26% 38.58% 24.49% 36.93% 92.68% 98.38%III-3 M 96.55% 38.33% 24.80% 36.87% 94.43% 98.98%III-6 M 96.18% 38.22% 25.07% 36.71% 94.73% 99.26%III-7 M 96.09% 38.67% 23.96% 37.37% 93.37% 98.74%III-11 M 96.05% 38.37% 24.83% 36.80% 93.98% 98.78%III-12 F 96.60% 37.52% 26.44% 36.04% 95.01% 98.79%IV-2 M 97.27% 38.07% 25.29% 36.65% 96.05% 99.32%IV-3 F 95.02% 38.43% 24.97% 36.60% 91.71% 98.35%
103

Figure 2. Genome-wide SNP mapping identified 3 candidate linkage regions. Identity-by-descent block size (cM) is plotted against genomic position. Blocks that were not identical-by-descent have been omitted. IBD blocks are in green. cM denotes centi-morgan.
Table 2. Three putative shared regions identified by SNP IBD analysis. All positions refer to NCBI Build 37.1. Abbreviations: Chr, chromosome; cM, centi-morgan; Mb, megabase.
Position (SNP) Size Likelihood Chr start end Mb cM SNPs
1 16 65,306,450 (rs9302570)
73,346,034 (rs6564635)
8.04 5.62 449
2 17 34,461,903 (rs2376468)
36,194,230 (rs6607302)
1.73 4.92 93
3 11 63,874,943 (rs683996)
65,917,084 (rs801741)
2.04 1.12 60
We then sought to confirm these putative linkage regions using microsatellite
linkage analysis. For the candidate regions on chromosomes 11 and 17, none of the
microsatellite markers cosegregated with the disease phenotype, and setting phase en-
abled us to rule out linkage to these regions (data not shown). In contrast, ten micro-
satellite markers on chromosome 16q21-16q22.1 cosegregated with the disease pheno-
type (Figures 3-5). We performed fine mapping by selecting and genotyping additional
104

microsatellites (Figure 5). Fine mapping ceased when we found that no additional anno-
tated genes resided between marker 16.16 (65,206,293) and marker 16.3 (65,285,223),
and when we had exhausted all informative microsatellites between marker 16.19
(70,564,103) and marker 16.21 (70,779,308).
Of note, patient IV-5 carried the mutant haplotype but was asymptomatic when
examined at age 26. SSEP was not performed, but given the late onset of the phenotype
and IV-5’s inheritance of what was otherwise a 100% penetrant haplotype, we assumed
IV-5 was a carrier. [CONTINUED, p. 107]
16.16 65,206,74816.3 65,285,223
D16S3019 66,129,156D16S3107 67,657,92216.4 68,948,712
16.19 70,563,88716.21 70,779,308
D16S3043 65,492,263
cM Microsatellite nt position
83
84
85
86
87
88
89
90
91
16.6 64,999,636D16S3050 65,067,048
D16S3095 69,946,150
D16S3106 72,187,732
D16S512 74,067,713
16.13 74,775,616
Figure 3. Genetic and physical map positions of microsatellite markers. All distances are based on the deCODE map and NCBI 37.1. The bar represents the critical region.
105

P M5 52 21 15 52 62 55 74 14 51 44 43 23 20 1
P M5 72 31 62 21 75 43 32 14 21 31 14 41 17 7
P M5 72 31 62 21 35 53 72 34 31 31 34 31 37 9
P M5 52 21 14 53 63 53 71 12 53 43 13 43 10 7
P M7 53 26 12 21 15 58 32 24 41 11 14 42 14 7
P M7 73 35 22 21 55 23 42 44 21 31 44 41 17 2
P M7 73 35 22 21 55 23 42 44 21 31 44 41 17 2
P M5 92 21 12 61 65 53 72 14 51 41 44 21 27 1
P M5 92 21 12 61 35 53 42 44 21 31 34 41 37 1
P M5 52 21 12 51 65 53 72 14 51 41 44 21 27 1
P M5 52 21 12 51 65 53 72 14 51 41 44 21 27 1
5 52 21 15 22 15 55 34 24 41 14 13 42 15 7
7 53 25 12 51 25 23 72 44 41 31 44 51 27 5
5 52 21 15 22 12 55 34 24 41 14 13 43 10 7
5 92 21 15 66 35 57 41 45 24 34 32 42 31 1
7 53 25 15 56 27 21 71 42 43 34 42 51 28 5
7 53 25 15 56 27 21 71 42 43 34 42 51 28 5
7 53 25 15 56 27 21 71 42 43 34 42 51 28 5
7 93 22 22 25 12 54 94 12 23 34 54 21 22 3
7 53 25 15 56 27 51 51 42 43 14 42 31 38 0
7 53 26 12 41 35 38 32 14 21 31 34 32 34 0
8 71 33 67 23 31 56 74 31 31 45 31 31 39 9
P M5 52 21 15 52 62 55 74 14 51 44 43 23 20 1
P M5 52 21 45 52 42 57 54 14 43 44 55 32 25 5
P M5 92 21 25 22 12 57 94 44 23 34 55 22 25 3
P M7 53 26 12 51 65 58 72 14 51 41 44 22 24 1
I-1 I-2
II-1 II-2 II-3 II-4 II-5 II-6 II-7 II-8 II-9 II-10
III-1 III-2 III-3 III-4 III-5 III-6 III-7 III-8 III-9 III-10 III-11 III-12 III-13
IV-1 IV-2 IV-3 IV-4 IV-5
16.6D16S3050
16.1616.3
D16S3043D16S3019D16S3107
16.4D16S3095
16.1916.21
D16S3106D16S512
16.13
SN
P id
enti
ty-b
y-d
esc
ent
inte
rval
* * * *
* * * * * *
* *
Figure 4. Pedigree with chromosome 16q21-22.1 haplotypes. Each microsatellite allele for a given marker is denoted by a different integer value. Red boxes enclose the mutant haplotype. Yellow highlighting indicates the critical region of the mutant haplotype. Blue arrows denote recombination events. Alleles are highlighted in green if they differ from the remainder of that haplotype, because of either a recombination or non-Mendelian inheritance (II-1 and progeny, III-13, IV-4; likely due to spontaneous repeat contraction/expansion). II-1 and II-7 are now deceased but were examined prior to death. IV-3 was an asymptomatic adult with normal somatosensory evoked potentials (SSEP). The dot (III-13) denotes unknown phenotype; he refused SSEP. IV-5 was an asymptomatic 26 year old at examination (refused SSEP), and is predicted to be a carrier, although incomplete penetrance is possible. Forty-two relatives were omitted to preserve anonymity. Asterisks denote subjects who were genotyped for genome-wide SNP identity-by-descent mapping.
106

74,775,84674,775,61616.13
74,530,67474,530,429D16S3115
74,067,91574,067,713D16S512
73,330,06373,329,816D16S3066
72,711,82172,711,582D16S3139
72,188,02172,187,732D16S3106
71,335,35471,335,127D16S752
70,860,74570,860,57816.5
70,779,50770,779,30816.21
70,564,10370,563,88716.19
70,306,96970,306,72516.1
69,946,41169,946,150D16S3095
69,106,12069,105,838D16S3141
68,948,92768,948,71216.4
67,658,22167,657,922D16S3107
66,936,08166,935,898D16S3086
66,129,45566,129,156D16S3019
65,492,55965,492,263D16S3043
65,285,46265,285,22316.3
65,206,29365,206,74816.16
65,067,20765,067,048D16S3050
64,999,78564,999,63616.6
StopStartMarker
The mutant haplotype at these markers was absent in II-7 and his progeny.
The mutant haplotype at these markers was present in all affected individuals, and absent in all unaffected individuals (except IV-5).
The mutant haplotype at these markers was present in IV-3, who was asymptomatic and had normal SSEP.
Recombination event
Recombination event
Figure 5. Fine mapping of critical region. Positions are via NCBI 37.1
We were able to delineate the northern (centromeric) border of the critical region
because three markers (16.6, D16S3050, 16.16) exhibited cosegregation with the disease
phenotype in all family members except for patient II-7 and his progeny, reflecting an
obligate recombination event between 16.16 (65,206,293) and 16.3 (65,285,223) (Fig-
ures 4, 5). We delineated the southern (telomeric) border of the critical region because 9
microsatellite markers (16.21, 16.5,…, D16S3115, 16.13), while shared by all affected
individuals, were also present in patient IV-3 (Figures 4, 5). IV-3 had an asymptomatic
history like IV-5, but IV-3 also underwent SSEP which was normal. While we could not
107

definitively rule out incomplete penetrance or delayed onset, we deemed IV-3 to be un-
affected and thereafter focused our efforts on the 5.57Mb region between markers 16.16
and 16.21 on chromosome 16q21-22.1 (Figures 4, 5). The SNP IBD analysis had
suggested that the southern border was 73,346,034 (Table 2); however, that analysis only
compared sequence similarity among ten affected patients and did not utilize unaffected
patient genotypes to rule out the region from 70,779,308 – 73,346,034 that, shared among
both affected patients and unaffected IV-3, must therefore not contain the disease gene.
Thus, conservatively including the spaces between informative markers, we concluded
that the disease gene must reside in a 5.57Mb region on chromosome 16q21-22.1
(65,206,293 – 70,779,308). The peak pairwise LOD score was 4.54 (Table 3). A LOD
score above 3.0 is the cutoff for strong statistical significance (Strachan & Read 2010).
A LOD of 4.54 reflects the probability that this degree of linkage would occur by chance
is about one in 35,000.
Table 3. Critical region pairwise LOD analysis. Recombination Fraction
Marker 0 0.01 0.05 0.1 0.2 0.3 0.4
16.6 -4.4841 -0.8611 -0.1713 0.0744 0.179 0.1013 -0.0016 D16S3050 -3.7385 -0.1594 0.4065 0.535 0.4714 0.2731 0.076
16.16 -3.7918 -0.156 0.4098 0.538 0.4736 0.2741 0.076
16.3 4.0454 4.0032 3.801 3.4917 2.734 1.8139 0.7571
D16S3043 4.0641 4.0221 3.8203 3.5114 2.7539 1.8324 0.7694
D16S3019 3.0811 3.027 2.8051 2.5146 1.8838 1.1746 0.4097
D16S3107 4.0641 4.0221 3.8204 3.5114 2.7539 1.8324 0.7697
16.4 4.5448 4.4691 4.1588 3.7526 2.8708 1.8783 0.7787
D16S3095 1.7068 1.6997 1.6419 1.523 1.1889 0.7741 0.3384
16.19 1.78 1.7715 1.7068 1.5779 1.2171 0.7657 0.2987
16.21 3.0451 3.0443 2.9821 2.8111 2.2671 1.5186 0.6135
D16S3106 3.0641 3.0635 3.0017 2.8311 2.2873 1.5373 0.6263
D16S512 1.4037 1.4315 1.4866 1.4696 1.261 0.8894 0.3905
16.13 3.0641 3.0634 3.0017 2.8311 2.2873 1.5373 0.6249
108

The 5.57Mb critical region contained 113 known or predicted candidate genes
(Appendix 2). We considered all predicted open reading frames to be candidate genes.
Of particular a priori interest were 7 solute carrier genes; neuritin 1-like (NRN1L), similar
to neuritin, a gene that promotes motor neuron axon arborization; and syntrophin beta 2
(SNTB2), which encodes a component of the dystrophin glycoprotein complex implicated
in myoclonus dystonia syndrome (see Chapter II).
To identify putative disease-causing variants, we performed targeted capture of
the critical region in one affected patient (the proband) followed by MPS (see
Introduction; Gnirke et al. 2009). Mean coverage over 98.9% of targeted base-pairs was
634x (Table 4). A number of GC-rich or highly repetitive exons were absent from the
arrays used for targeted DNA capture, or were present on the arrays but sequenced at less
than 10x coverage (post-duplicate removal), so we individually Sanger sequenced all of
these exons (Appendix 3). Thus, all known or predicted coding sequences (including
splice junctions) in the critical region were either bidirectionally Sanger sequenced or
sequenced at mean per-base coverage of 634x (Table 4). The sensitivity to detect hetero-
zygous variants via MPS approaches 100% at per-base coverage of 20x or greater (Choi
et al. 2009), so our complementary sequencing approaches are very likely to have iden-
tified all coding variants in the critical region. [CONTINUED, p. 112]
109

110
Table 4. Targeted DNA capture and massively parallel sequencing reads (A) and variants (B). (A)
Probed bases 2,032,106bp
Targeted bases 873,213bp
Total number of aligned reads 22,421,614
Reads with single alignment 19,563,230 87.30%
Singular alignments within target region (+/- 100bp) 16,717,268 74.60%
Reads on target region 15,621,205 69.70%
Average target sequence enrichment (absolute) 118.7 Mb 634x
Average target enrichment (duplicates removed) 29.7 Mb 15x
Proportion of exons covered 98.9%
Target covered (non-duplicate reads) Depth Proportion of target regions
20x 36.24%
5x 69.60%
1x 98.90%
(B)
Variants 672
Heterozygous 468 (70%) Intergenic 386 Synonymous 77
Homozygous 204 (30%) Intronic 146 Non-synonymous 68
dbSNP132 640 (95%) Exonic 140 UTR 80
Total 672 672

Fig
ure
6.
Cov
erag
e (p
ost-
du
pli
cate
rem
oval
) b
y m
assi
vely
par
alle
l se
qu
enci
ng
over
th
e en
tire
reg
ion
on
ch
rom
osom
e 16
(to
p)
and
by
cod
ing
seq
uen
ce o
f ea
ch g
ene
(bot
tom
).
111
111

Figure 7. Alignment of short sequence reads (post-duplicate removal) over the NOL3 E21Q sequence variant.
Seven variants met our quality criteria as putative disease-causing variants (Table
5), but only one variant cosegregated with affected status, was not present in any genome
database or controls, and was predicted to cause an amino acid change. This variant was
NM_001185058.1:c.61G>C in the gene nucleolar protein 3 (NOL3), predicted to cause
an E21Q missense mutation (Figures 7, 8). This variant is not present in any SNP data-
base or in 1,094 genomes from multiple ethnicities studied in the 1000 Genomes Project.
Furthermore, we did not detect this variant upon Sanger sequencing 252 unrelated
112

Caucasian control subjects, and it was absent from an additional 4,246 normal controls
analyzed by Sequenom MassArray (Gabriel et al. 2009). Thus, having exhaustively se-
quenced all coding sequences in the critical region and identified only a single novel,
non-synonymous coding variant, E21Q, which is extremely rare (absent from more than
10,000 control chromosomes), we conclude that the NOL3 mutation is likely causative of
this family’s clinical presentation.
Table 5. Novel non-synonymous coding variants in critical region identified by targeted DNA capture and massively parallel sequencing. Positions are via NCBI 37.1. Although at first inspection there appears to be a high false positive rate, in our experience this is substantially inflated because it represents called variants of a novel subset which are not representative of the callset in general.
Gene Position Base
Change AA
Change Follow up
NOL3 67,208,133 G→C E21Q cosegregates, and absent in 0 of 252 unrelated
controls
EXOC3L 67,218,411 C→T R716H absent from all databases and 0 of 180 control
exomes, but present in 3 of 140 unrelated controls
PLEKHG4 67,316,179 C→A Q394K false positive
DPEP3 68,009,705 C→G A502G false positive
PRMT7 68,349,938 A→G E19G false positive
TMCO7 69,117,433 G→A V1052I did not cosegregate
TMED6 69,385,563 C→G D32H false positive
G AC G C GA
Unaffected AffectedEV
T
E/QT TV
G GCG C A G A C GT
Figure 8. Sanger sequencing chromatographs (electropherograms) confirmed cosegregation of the NM_001185058.1:c.61G>C variant, predicted to cause an E21Q mutation in NOL3.
113

Identifying additional NOL3 alleles that are associated with FCM or FCM-like
phenotypes (i.e., allelic heterogeneity) would support the conclusion that NOL3 mutation
causes FCM. As described in Chapter II, we identified 7 subjects from 5 kindreds suf-
fering from cortical myoclonus that may be familial. We Sanger sequenced all coding se-
quence, splice junctions, and UTRs of NOL3 in these patients, but did not observe any
NOL3 variants. However, none of these 7 patients had phenotypes that were identical to
the FCM family, and none of the 5 kindreds exhibited parent-to-child transmission
characteristic of dominant inheritance. We further sequenced NOL3 in a collection of
patients with FAME, undiagnosed myoclonus, or benign neonatal sleep myoclonus,
which may be autosomal dominant (Maurer et al. 2010, Afawi et al. 2012). None of
these patients had NOL3 mutations. In a promising development, we recently became
aware that Mark LeDoux of the University of Tennessee, a dystonia geneticist and
movement disorder specialist, has phenotyped (but never published) a large family from
Mississippi with adult onset, autosomal dominant, highly penetrant myoclonus, including
with giant SSEPs. His group is currently taking DNA samples to sequence NOL3 in the
Mississippi family.
114

DISCUSSION We used SNP mapping, linkage, and targeted MPS to identify a mutation in
NOL3. Although to date we have been unable to identify additional FCM kindreds with
mutations in NOL3, we have presented substantial evidence that NOL3 is the disease gene
underlying FCM. We sequenced all known or predicted splice junctions and coding
sequences within the critical region at 634x average coverage and detected only a single
novel variant, the E21Q mutation in NOL3, which cosegregated with the phenotype. This
mutation was absent in more than 10,000 control chromosomes. Given the deluge of se-
quencing data recently deposited in public databases, the absence of the E21Q mutation
in these databases constitutes additional evidence that it is extremely rare and therefore
likely causative of this family’s phenotype.
Nevertheless, we do concede the possibility that E21Q is a private variant that is
linked to the actual disease mutation but is not itself causative. There are numerous
plausible explanations. For example, the causative mutation could reside in coding se-
quence within the critical region that is currently not annotated, or in noncoding sequence
within the critical region, such as an untranslated region, promoter, or intronic branch site
(see Chapter IV). Alternatively, the causative mutation may not have been detected due
to systematic sequencing error. We sought to mitigate this shortcoming by identifying
coding sequences that were not sequenced adequately by MPS and then carefully Sanger
sequencing them, but one can never be sure that mistakes were not made. Another pos-
sibility is that FCM is caused by a synonymous variant that, instead of modifying the
amino acid sequence, alters mRNA stability or expression; to our knowledge, causative
synonymous variants are always identified by sequencing an disease gene that has alread-
115

y been established—pinpointing a disease gene by way of a synonymous index mutation
would be very difficult. Finally, we cannot exclude the possibility of a copy number var-
iant (CNV) causing FCM, although we did not detect any CNVs by massively parallel se-
quencing, and prior studies have detected both heterozygous duplications and deletions
spanning NOL3 in normal subjects (see Methods), which strongly argues against this
scenario.
However remote these possibilities, there are two parallel lines of investigation to
definitively demonstrate that NOL3 is the FCM disease gene. The first is characterization
of a knockin mouse model harboring an E21Q mutation (see Chapter IV). The second is
identification of independent NOL3 alleles that cause FCM or FCM-like phenotypes such
as familial adult myoclonic epilepsy (FAME), SGCE mutation-negative myoclonus
dystonia syndrome (MDS), or perhaps even idiopathic generalized epilepsy. Unfortu-
nately, our efforts to date – sequencing patients with undiagnosed myoclonus, FAME, or
benign neonatal sleep myoclonus – have been fruitless. We are heartened by the recent
news that the LeDoux group has phenotyped a large family from Mississippi with adult
onset, autosomal dominant, highly penetrant myoclonus, including with giant SSEPs, an
electrophysiological characteristic that distinguishes FCM from two very similar auto-
somal dominant conditions (see Chapter II). To our knowledge, this family is the first
dead ringer for the FCM phenotype, so we anticipate that they will carry an independent
NOL3 mutation. It may instead be the case that the Mississippi family is distantly related
to the FCM index family. If so, we expect that they will carry the same critical region
haplotype and E21Q mutation; this would raise the LOD score but would not establish
allelic heterogeneity.
116

On a somewhat tangential note, one approach we considered to attain allelic
heterogeneity was searching for NOL3 mutations in natural animal models of inherited
myoclonus. Inherited myoclonus has been described in dogs (Fox et al. 1984), horses
(Gundlach et al. 1993), lambs (Blignaut et al. 2011), and, most prominently, Hereford
calves (Harper et al. 1986). It is thought that the myoclonus in these species results from
mutations in Glra1, which encodes a glycine receptor subunit, though this has only been
demonstrated for calves (Pierce et al. 2001). This mechanism is analogous to that of
hereditary hyperekplexia in humans (see Chapters I, II). Indeed, the myoclonus in these
species more closely resembles hereditary hyperekplexia than FCM: it is juvenile onset,
autosomal recessive, and lower motor neuron in pathology. It would be worthwhile to
sequence NOL3 in those species without evident glycine receptor abnormalities, but we
were unable to obtain their DNA.
The genetic analysis presented in this chapter strengthens the conclusion that
FCM constitutes a novel phenotype. This conclusion was put forth in Chapter II on the
basis of clinical data. As detailed therein, the autosomal dominant myoclonus observed
in the index family could conceivably be misdiagnosed as FAME or MDS. However, our
linkage data ruled out all known FAME loci (Mikami et al. 1999, Plaster et al. 1999,
Guerrini et al. 2001, Depienne et al. 2010, Crompton et al. 2012, Yeetong et al. 2012).
Moreover, we excluded linkage to known MDS chromosomal regions (Zimprich et al.
2001, Grimes et al. 2002, Han et al. 2007), and we sequenced but found no mutations in
the SGCE gene. In concert with the clinical dissimilarity (see Chapter II), the evidence
for a novel locus in this family bolsters the contention that FCM is a novel phenotype.
117

A substantial strength of this work is that exons which were not covered to at least
10x depth by MPS were subsequently Sanger sequenced. Given the GC-rich and/or
highly repetitive nature of many of these exons, which likely explains why they were not
amenable to MPS, the manual PCR and sequencing of these exons proved tedious. Had
we been lucky enough to quickly identify independent NOL3 alleles, this step would not
have been necessary. However, another NOL3 allele did not readily present itself, and
this step was most certainly necessary. In the absence of allelic heterogeneity, if an exon
is not sequenced it simply cannot be excluded, and any assignment of a disease gene
should be considered preliminary. We stress it here because many groups fail to do like-
wise (e.g., Veeramah et al. 2012). In our view, the failure to do so is a misapplication of
a powerful technology.
In fact, even if MPS is properly applied and two or more mutations are identified
in a gene, that gene may still not be the disease gene! Every human carries hundreds of
rare, novel variants (Tennessen et al. 2012, Fu et al. 2013), so if the exome is sequenced
in a large cohort, just by chance one may observe multiple mutations in the same gene
that are not truly causative. If that large cohort consists of patients with a particular dis-
order, one could erroneously conclude that the implicated gene affects the pathology of
that disorder. We expect this fallacy to be rife in the next few years in the field of com-
plex genetics, as larger and larger samples of patients are sequenced for causative rare
variants (O’Roak et al. 2012, Sanders et al. 2012). For Mendelian traits, large families
will remain valuable because they enable the statistical power of linkage to dictate the
subset of the rare variants identified by MPS that can be considered for causality. Even
when linkage from a large family with a stereotyped, highly penetrant phenotype is used
118

to identify a mutation, and the causality has been validated by allelic heterogeneity and
functional experiments, some unrelated persons may carry the exact same mutation and
be unaffected (Klassen et al. 2011). Even Mendelian mutations are not deterministic.
Some complex geneticists are attempting to do something similar, by using MPS
to search for rare variants in loci suggested by genome-wide association studies (GWAS).
Setting aside our fundamental objections to GWAS (see Chapter I), this approach is
nonetheless logically inconsistent. GWAS are not designed nor powered to detect loci
harboring rare variants. GWAS is based on the hypothesis that common diseases result
from common variants, whereas MPS is based on the hypothesis that common diseases
result from rare variants. To utilize GWAS loci to constrain the MPS-identified variants
that are considered for causality is to conflate two diametrically opposed hypotheses. It
may well be true that certain loci are home to both causative common variants and
causative rare variants, but is this substantially more likely than the alternative scenario in
which the causative variants, common and rare, are interspersed throughout the genome?
In effect, this approach simply provides tenuous cover to discard the vast majority of the
variants identified by MPS, because right now we have no idea what to make of them.
Hence, although MPS provides a powerful way to rapidly sequence much of the
exome or genome, it is not foolproof. Methods of localizing a mutation, such as genome-
wide SNP array genotyping and microsatellite linkage, remain powerful. It should be
noted that methods are being developed for SNP and microsatellite linkage using whole-
genome sequencing data (Nielsen et al. 2011). In time, this application will enable both
linkage and candidate mutation identification to be done in one fell swoop, providing a
justification for the establishment of whole genome sequencing as the standard (see
119

Introduction). For the time being, however, MPS retains the following weaknesses:
regions of low or no coverage; sequencing or data annotation methodologies that may
systematically miss particular mutations, such as indels (e.g., Lee et al. 2012a); difficulty
prioritizing noncoding variants that may be functionally relevant but are incredibly plen-
tiful; inability to prioritize coding sequences that are included in genome databases but
are not currently annotated as part of the exome; and inability to assess sequences in gaps
in the human genome map, of which there are almost 300 (Garber et al. 2009). While
MPS is no doubt a revolutionary technology, we believe that the field has been subject to
a certain degree of hype. There are considerable limitations to MPS that should be
weighed carefully when designing experiments and interpreting results, and even seem-
ingly airtight genetic cases should be functionally validated in vitro and in vivo.
Notwithstanding these limitations, we utilized MPS to identify a NOL3 mutation
that likely causes FCM. This was guided by unbiased genome-wide SNP array geno-
typing and confirmatory microsatellite linkage to chromosome 16q21-22.1. Thus far we
have been unable to identify additional NOL3 alleles. In total, this work bolsters the as-
sertion in Chapter II that FCM constitutes a novel movement disorder. Furthermore,
knowledge of the mutation in NOL3 raises hope that functional investigation of NOL3
(Chapter IV) may shed light on neuronal membrane hyperexcitability and the patho-
physiology of myoclonus and related disorders.
120

REFERENCES Afawi Z, Bassan H, Heron S, Oliver K, Straussberg R, et al. 2012. Benign neonatal
sleep myoclonus: an autosomal dominant form not allelic to KCNQ2 or KCNQ3.
J Child Neurol 27:1260-63
Bentley D, Balasubramanian S, Swerdlow H, Smith GP, Milton J, et al. 2008. Accurate
whole human genome sequencing using reversible terminator chemistry. Nature
456:53-59
Blignaut DJ, Holm DE, Leask R, Stander N, Steyl JC. 2011. Congenital reflex
myoclonus in two Merino cross lambs in South Africa. Vet Rec 169:684
Chapman NH, Thompson EA. 2003. A model for the length of tracts of identity by
descent in finite random mating populations. Theoretical Population Biol
64:141-150
Cheung VG, Nelson SF. 1998. Genomic mismatch scanning identifies human genomic
DNA shared identical by descent. Genomics 47:1-6
Choi M, Scholl UI, Ji W, Liu T, Tikhonova IR, et al. 2009. Genetic diagnosis by whole
exome capture and massively parallel DNA sequencing. Proc Natl Acad Sci U S
A 106:19096-101
Crompton DE, Sadleir LG, Bromhead CJ, Bahlo M, Bellows ST, et al. 2012. Familial
adult myoclonic epilepsy: recognition of mild phenotypes and refinement of the
2q locus. Arch Neurol 69:474-81
Depienne C, Magnin E, Bouteiller D, Stevanin G, Saint-Martin C, et al. 2010. Familial
cortical myoclonic tremor with epilepsy: the third locus (FCMTE3) maps to 5p.
Neurology 74:2000-3
121

ENCODE Project Consortium, Dunham I, Kundaje A, Aldred SF, Collins PJ, et al. 2012.
An integrated encyclopedia of DNA elements in the human genome. Nature
489:57-74
Fishelson M, Geiger D. 2002. Exact genetic linkage computations for general pedigrees.
Bioinformatics 18(Suppl 1):S189-198
Fox JG, Averill DR, Hallett M, Schunk K. 1984. Familial reflex myoclonus in Labrador
Retrievers. Am J Vet Res 45:2367-70
Fu W, O’Connor TD, Jun G, Kang HM, Abecasis G, et al. 2013. Analysis of 6,516
exomes reveals the recent origin of most human protein-coding variants. Nature
493:216-20
Gabriel S, Ziaugra L, Tabbaa D. 2009. SNP genotyping using the Sequenom
MassARRAY iPLEX platform. Curr Protoc Hum Genet 60:2.12.1-2.12.18
Garber M, Zody MC, Arachchi HM, Berlin A, Gnerre S, et al. 2009. Closing gaps in the
human genome using sequencing by synthesis. Genome Biol 10:R60
Gnirke A, Melkinov A, Maguire J, Rogov P, LeProust EM, et al. 2009. Solution hybrid
selection with ultra-long oligonucleotides for massively parallel targeted
sequencing. Nat Biotechnol 27:182-89
Gonzaga-Jauregui C, Lupski JR, Gibbs RA. 2012. Human genome sequencing in health
and disease. Annu Rev Med 63:35-61
Grimes DA, Han F, Lang AE, St George-Hyssop P, Racacho L, et al. 2002. A novel
locus for inherited myoclonus-dystonia on 18p11. Neurology 59:1183-86
Guerrini R, Bonanni P, Patrignani A, Brown P, Parmeggiani L, et al. 2001. Autosomal
122

dominant cortical myoclonus and epilepsy (ADCME) with complex partial and
generalized seizures: A newly recognized epilepsy syndrome with linkage to
chromosome 2p11.1-q12.2. Brain 124:2459-75
Gundlach AL, Kortz G, Burazin TC, Madigan J, Higgins RJ. 1993. Deficit of inhibitor
glycine receptors in spinal cord from Peruvian Pasos: evidence for an equine form
of inherited myoclonus. Brain Res 628:263-70
Han F, Racacho L, Lang AE, Bulman DE, Grimes DA. 2007. Refinement of the DYT15
locus in myoclonus-dystonia. Mov Disord 22:888-92
Harper PA, Healy PJ, Dennis JA. 1986. Inherited congenital myoclonus of polled
Hereford calves (so-called neuraxial oedema): a clinical, pathological and
biochemical study. Vet Rec 119:59-62
Klassen T, Davis C, Goldman A, Burgess D, Chen T, et al. 2011. Exome sequencing of
ion channel genes reveals complex profiles confounding personal risk assessment
in epilepsy. Cell 145:1036-48
Lander ES, Linton LM, Birren B, Nusbaum C, Zody MC, et al. 2001. Initial sequencing
and analysis of the human genome. Nature 409:860-921
Lee HY, Huang Y, Bruneau N, Roll P, Roberson ED, et al. 2012. Mutations in the gene
PRRT2 cause paroxysmal kinesigenic dyskinesia with infantile convulsions. Cell
Rep 1:2-12
Lencz T, Lambert C, Derosse P, Burdick KE, Morgan TV, et al. 2007. Runs of
homozygosity reveal highly penetrant recessive loci in schizophrenia. Proc Natl
Acad Sci USA 104:19942-19947
123

Li H, Durbin R. 2009. Fast and accurate short read alignment with Burrows-Wheeler
transform. Bioinformatics 25:1754-1760
Matsuzaki H, Wang PH, Hu J, Rava R, Fu GK. 2009. High resolution discovery and
confirmation of copy number variants in 90 Yoruba Nigerians. Genome Biol
10:R125
Maurer VO, Rizzi M, Bianchetti MG, Ramelli GP. 2010. Benign neonatal sleep
myoclonus: a review of the literature. Pediatrics 125:e919-24
McKenna A, Hanna M, Banks E, Sivachenko A, Cibukskis K, et al. 2010. The Genome
Analysis Toolkit: A MapReduce framework for analyzing next-generation DNA
sequencing data. Genome Res 20:1297-1303
Metzker ML. 2010. Sequencing technologies – the next generation. Nat Rev Genet
11:31-46
Mikami M, Yasuda T, Terao A, Nakamura M, Ueno S, et al. 1999. Localization of a
gene for benign adult familial myoclonic epilepsy to chromosome 8q23.3-q24.1.
Am J Hum Genet 65:745-51
Mori S, Nakamura M, Yasuda T, Ueno S, Kaneko S, et al. 2011. Remapping and
mutation analysis of benign adult familial myoclonic epilepsy in a Japanese
pedigree. J Hum Genet 56:742-47
Nelson SF, McCusker JH, Sander MA, Kee Y, Modrich P, et al. 1993. Genomic
mismatch scanning: a new approach to genetic linkage mapping. Nat Genet 4:11-
18
Nielsen R, Paul JS, Albrechtsen A, Song YS. 2011. Genotype and SNP calling from
next-generation sequencing data. Nat Rev Genet 12:443-51
124

Ng SB, Buckinham KJ, Lee C, Bigham AW, Tabor HK, et al. 2010. Exome sequencing
identifies the cause of a Mendelian disorder. Nat Genet 42:30-35
O’Roak BJ, Vives L, Girirajan S, Karakoc E, Krumm N, et al. 2012. Sporadic autism
exomes reveal a highly interconnected protein network of de novo mutations.
Nature 485:246-50
Park H, Kim JI, Ju YS, Gokcumen O, Mills RE, et al. 2010. Discovery of common
Asian copy number variants using integrated high-resolution array CGH and
massively parallel DNA sequencing. Nat Genet 42:400-405
Pierce KD, Handford CA, Morris R, Vafa B, Dennis JA, et al. 2001. A nonsense
mutation in the alpha1 subunit of the inhibitory glycine receptor associated with
bovine myoclonus. Mol Cell Neurosci 17:354-63
Plaster NM, Uyama E, Uchino M, Ikeda T, Flanigan KM, et al. 1999. Genetic
localization of the familial adult myoclonic epilepsy (FAME) gene to
chromosome 8q24. Neurology 53:1180-83
Sanders J, Murtha MT, Gupta AR, Murdoch JD, Raubeson MJ, et al. 2012. De novo
mutations revealed by whole-exome sequencing are strongly associated with
autism. Nature 485:237-41
Sato N, Amino T, Kobayashi K, Asakawa S, Ishiguro T, et al. 2009. Spinocerebellar
ataxia type 31 is associated with "inserted" penta-nucleotide repeats containing
(TGGAA)n. Am J Hum Genet 85:544-557
Schuelke M. 2000. An economic method for the fluorescent labeling of PCR fragments.
Nat Biotechnol 18:233-234
125

Shojaee S, Sina F, Banihosseini SS, Kazemi MH, Kalhor R, et al. 2008. Genome-wide
linkage analysis of a Parkinsonian-pyramidal syndrome pedigree by 500K SNP
arrays. Am J Hum Genet 82:1375-1384
Silberstein M, Tzemach A, Dovgolevsky N, Fishelson M, Schuster A, et al. 2006.
Online system for faster multipoint linkage analysis via parallel execution on
thousands of personal computers. Am J Hum Genet 78:922-935
Strachan T, Read AP. 2010. Human molecular genetics, 4th edition. New York: Garland
Science
Tennessen JA, Bigham AW, O’Connor TD, Fu W, Kenny EE, et al. 2012. Evolution
and functional impact of rare coding variation from deep sequencing of human
exomes. Science 337:64-69
Veeramah KR, O’Brien JE, Meisler MH, Cheng X, Dib-Hajj SD, et al. 2012. De novo
pathogenic SCN8A mutation identified by whole-genome sequencing of a family
quartet affected by infantile epileptic encephalopathy and SUDEP. Am J Hum
Genet 90:502-10
Yeetong P, Ausavarat S, Bhidayasiri R, Piravej K, Pasutharnchat N, et al. 2012. A
newly identified locus for benign adult familial myoclonic epilepsy on
chromosome 3q26.32-3q28. Eur J Hum Genet epub doi: 10.1038/ejhg.2012.133
Zimprich A, Grabowski M, Asmus F, Naumann M, Berg D, et al. 2001. Mutations in the
gene encoding epsilon-sarcoglycan cause myoclonus-dystonia syndrome. Nat
Genet 29:66-69
126

CHAPTER IV
Functional Characterization of the NOL3 Mutation
127

SUMMARY Previously we identified a mutation in the gene nucleolar protein 3 (NOL3) that likely
causes familial cortical myoclonus (FCM). Here we first review the NOL3 literature, and
then describe our experiments to functionally characterize the NOL3 mutation. NOL3
encodes a protein-protein interaction motif that facilitates binding to five pro-apoptotic
binding partners. Consequently, NOL3 functions to repress apoptosis. Most groups have
focused on NOL3 in cardiomyocytes because its expression appears to minimize ischemic
cardiac injury. In contrast, the role of NOL3 in the CNS is essentially unknown. We
found that NOL3 is broadly expressed in the murine and human brain. Despite extensive
testing, we could not replicate the published NOL3 binding partners. Moreover, we
found that NOL3 expression actually enhanced basal apoptosis. We sought to elucidate
the effects of the NOL3 mutation that was identified in FCM patients. We observed that
the mutation alters post-translational modification (PTM) of NOL3. The exact identity of
the PTM eluded us, but we did find that generation of this PTM is regulated by phos-
phorylation at T114 on NOL3. We also studied previously-generated Nol3 knockout
mice but did not detect a neurologic phenotype. Finally, we screened the proteome for
novel binding partners of WT or mutant NOL3. We identified two candidates, HNRNPD
and PRPF19, which are important for CNS development. These interactions were abro-
gated by the mutation, suggesting a hypothesis that will be tested using mutant knockin
mice that we generated. In total, this work calls into question some of the published
functions of NOL3 and presents an alternative mechanism by which NOL3 mutation may
potentially cause FCM.
128

INTRODUCTION In Chapter II we described a novel Mendelian phenotype, familial cortical myo-
clonus (FCM), and in Chapter III we identified a mutation in the gene nucleolar protein 3
(NOL3) that likely causes FCM. We sought to investigate the molecular pathophysiology
of NOL3 mutation in FCM, not only in hopes of bolstering the claim that NOL3 mutation
causes FCM but also with the expectation that it may provide broader insight into NOL3
function. We first review the published functions of NOL3, which are summarized in
Figure 1.
reperfusionOx. stress hypoxia
INTRINSICAPOPTOTICPATHWAY
EXTRINSICAPOPTOTICPATHWAY
FASL FAS
FADD
CASP-8
CASP-2
Bax
Smac/DIABLO release from mitoch.
CASP-9
N-term. (CARD)
DifferentC-term.
“Nop30”-nuclear-alternative splicing-homomultimers via CARD
vs. “ARC”-cytoplasmic(controversial)
PROTEASOMAL DEGRADATIONRAS
binds
binds
bind
sbi
nds
bind
s
p53
repress transx
N-term. (CARD)
C-term. (P/E)
transx
poly
-Ub
sequesters free cytoplasmic Calcium
protects neuronal ischemic death
T-149
CK2 calcineurin
P de-P
pARC translocates from cytopl. to mitoch. binds pro-CASP8 in mitoch.
C-term. (P/E) Cardiomyocyte
apoptosis
Ventricular
remodeling
Ischemia-reperfusion
pressure overload
↓K efflux?
Figure 1. Overview of published functions of NOL3. See text for details. Abbreviations: C-term., C-terminus; CARD, caspase activation recruitment domain; CASP, caspase; CK2, casein kinase 2; cytopl., cytoplasm; de-P, de-phosphorylation; K, potassium; mitoch., mitochondria; N-term., N-terminus; ox. stress, oxidative stress; P, phosphorylation; P/E, proline/glutamate-rich domain; poly-Ub, poly-ubiquitylation.
129

NOL3 was first identified in 1998 on the basis of sequence homology to a motif
called a caspase activation recruitment domain (CARD) (Koseki et al. 1998). CARDs are
one of six types of conserved protein motifs that are critical to apoptotic signalling (Reed
et al. 2004). CARDs facilitate protein-protein interactions: a CARD on each of two
interacting proteins bind to one another via complementary electrostatic surfaces (Chou
et al. 1998). This protein binding regulates the activity of apoptotic proteins. For ex-
ample, the namesakes of the CARD, caspases, are proteases that initiate or execute
proteolytic cleavage cascades. Widespread proteolysis ravages the cellular machinery,
causing cell death (Reed et al. 2004). Caspase activity is altered when the caspase CARD
is bound to the CARD of another protein (Reed et al. 2004). The name of the domain,
caspase activation recruitment, is a misnomer. Some proteins with CARDs inhibit cas-
pases, and other CARDs activate apoptotic signaling proteins that are not caspases.
Five human proteins with CARDs have been crystallized (Chou et al. 1998,
Vaughn et al. 1999, Zhou et al. 1999, Renatus et al. 2001, Hiller et al. 2003, Manon et al.
2007, Srimathi et al. 2008, de Alba 2009). Each CARD contains a bundle of 6 alpha-
helices (Reed et al. 2004). Many CARDs can homodimerize, and, as noted above, all are
thought to heterodimerize via complementary electrostatic interactions. Each CARD
consists of a hydrophobic core surrounded by acidic (negatively charged) or basic (pos-
itively charged) residues (Chou et al. 1998). The positive residues of one CARD interact
with the negative residues of the other CARD, and vice versa. These interactions are
highly specific depending on the particular CARD-CARD interaction (Chou et al. 1998,
Zhou et al. 1999).
130

NOL3 encodes a 206 amino acid protein containing an N-terminal CARD. The
C-terminus consists of a proline(P)/glutamate(E)-rich domain (Koseki et al. 1998)
(Figure 2). Little is known about the function of the P/E domain. On the other hand,
based on the presence of the CARD, a logical hypothesis was that NOL3 regulates
apoptosis. Indeed, Koseki et al. (1998) found that NOL3 binds Caspase-2 and Caspase-8.
NOL3 did not bind Caspase-1, -3, or -9, in keeping with the specificity of CARD-CARD
heterodimerization interactions. The authors further showed that NOL3 overexpression
in cell culture blocks apoptosis. They concluded that NOL3 protein-protein interactions
function to repress apoptosis. For this reason, NOL3 is often referred to as apoptosis
repressor with CARD domain (ARC).
NH2 COOHCARD P/E domain
Figure 2. NOL3 protein contains a C-terminal proline(P)/glutamate(E) domain, and an N-terminal caspase activation recruitment domain (CARD). CARDs mediate protein-protein binding via electrostatic interactions. The E21Q mutation, identified in patients with FCM, is denoted by the black arrow. Known phosphoresidues are denoted by red diamondhead arrows; T149 is a well-characterized phosphoresidue (blue diamondhead arrow). The seminal observation that NOL3 inhibits apoptosis has been reinforced many
times by multiple groups in the succeeding years. For example, Neuss et al. (2001)
showed that oxidative stress leads to a decrease in NOL3 expression, and oxidative stress-
induced cell death could be suppressed by ectopic NOL3 expression. Apart from the
binding partners first identified, Caspase-2 and Caspase-8, both Gustafsson et al. (2004)
and Nam et al. (2004) found that NOL3 binds Bax. NOL3 binding to Bax inhibited Bax
131

activation and translocation to mitochondria, which would ordinarily trigger apoptosis.
Nam et al. (2004) also found that NOL3 binds Fas and FADD to interfere with the
normal pro-apoptotic Fas-FADD interaction. The NOL3 CARD is both necessary and
sufficient for these protein-protein interactions (Figure 1; Nam et al. 2004).
NOL3 is expressed in the heart, skeletal muscle, and brain (Koseki et al. 1998,
Engidawork et al. 2001, Gulesserian et al. 2001, Shelke & Leeuwenburgh 2003), as well
as smooth muscle in the pulmonary vasculature (Quadrilatero et al. 2010, Zaiman et al.
2012). In the brain, it is not known which regions or cell types express NOL3. An early
paper suggested that in cultured hippocampal neurons the GFP-tagged CARD domain of
NOL3 localizes to the cell body, whereas the C-terminal domain localizes to dendrites
(Hong et al. 2003).
Early observations that NOL3 is expressed in the heart and in skeletal muscle
raised the exciting possibility that apoptotic repression by NOL3 could be exploited to
ameliorate cardiac or skeletal disorders characterized by inappropriate apoptosis. One
such disorder is muscular dystrophy. Although it is not entirely clear whether the in-
creased cell death of dystrophic pathology results from necrosis or apoptosis, it was
certainly reasonable to hypothesize that overexpression of NOL3 would alleviate dys-
trophic pathology (Abmayr et al. 2004). However, transgenic NOL3 expression in mice
had no effect.
Investigators have been more successful in cardiomyocytes. In contrast to dys-
trophic myocytes, it is much better established that cardiomyocytes undergo apoptosis
due to ischemia in acute coronary syndromes. Apoptotic cardiomyocytes are then re-
placed by fibrotic tissue, which impairs cardiac function. Therefore, a suppressor of
132

cardiomyocyte apoptosis would make an attractive therapeutic target. Ekhterae et al.
(2003) found that in cultured cardiomyocytes NOL3 represses apoptosis, possibly by
blocking voltage-gated potassium channels (Figure 1). Gustafsson et al. (2004) sug-
gested instead that NOL3 represses cardiomyocyte apoptosis by binding to Bax and
preventing its activation. Still another group proposed that NOL3 interferes with cyto-
chrome c release and Caspase-3 activation (Li et al. 2007). A separate group implicated
spironolactone, a mineralocorticoid receptor antagonist, in blocking NOL3 degradation in
cardiomyocytes, which would presumably protect against infarction (Loan Le et al.
2012). Finally, one laboratory has argued that phosphorylation of NOL3 enables re-
pression of cardiomyocyte apoptosis. Li et al. (2002) produced evidence that NOL3 is
phosphorylated at its threonine 149 (T149) residue (Figure 2). The paper stated that
T149 phosphorylation was essential for NOL3 translocation from the cytoplasm to the
mitochondria. Furthermore, it claimed that only the phosphorylated form of NOL3 could
bind to Caspase-8 and thereby repress apoptosis. The same group later showed that the
non-phosphorylatable version of NOL3 cannot bind Caspase-8 or FADD (Murtaza et al.
2008).
These observations were extended with in vivo models. Gustafsson et al. (2004)
suffused rat hearts with either recombinant wild-type (WT) NOL3 or NOL3 with a point
mutation in the CARD. To model an acute coronary syndrome, this study and others
used ischemia-reperfusion, in which the heart is rendered ischemic (e.g., through aortic
clamp) and then reperfused. Infarct size is then assessed. Gustafsson et al. (2004) found
that WT NOL3 suppressed infarct size, but mutant NOL3 did not. Donath et al. (2006)
took a genetic approach, performing ischemia-reperfusion experiments on Nol3 knockout
133

mice. These mice had no gross behavioral or morphological deficits and no cardiac
phenotype at baseline. However, after ischemia-reperfusion, knockout mice had larger
infarcts and cardiomyopathy. Pyo et al. (2008) showed the converse by generating
transgenic cardiac-specific Nol3 overexpressing mice. These mice were resistant to
ischemia-reperfusion injury. Curiously, Pyo et al. found that when cardiomyocytes from
these mice were cultured, the C-terminal P/E domain of NOL3 was sufficient for apop-
totic repression. A second Nol3 knockout mouse line was created by Zaiman et al.
(2012). They observed that under conditions of chronic hypoxia, Nol3 expression was
upregulated and Nol3-deficient mice had increased cell death, decreased proliferation,
and decreased vascular remodeling. Thus, Nol3 inhibition of apoptosis acts to limit the
damage of hypoxia-induced pulmonary hypertension.
There have been attempts to validate these mouse experiments in higher organ-
isms such as rabbits (Bouma et al. 2010) and even sheep (Ekhterae et al. 2011). How-
ever, the data are weak. Similarly, Donath et al. (2006) claimed that NOL3 protein is less
abundant in hearts from human patients with end-stage congestive heart failure, and
Zaiman et al. (2012) showed increased NOL3 expression in biopsies from patients with
pulmonary hypertension. In our view, their data is wholly unconvincing.
Another line of investigation has focused on NOL3 in cancer. NOL3 is clearly
upregulated in cancer cell lines (Wang et al. 2005, Heikaus et al. 2008, Mercier et al.
2008, Rajandram et al. 2009). In cancer cells NOL3 function seems to differ from its or-
dinary apoptotic function: in the nucleus of cancer cells, NOL3 binds p53, preventing p53
tetramerization and triggering p53 export to the cytoplasm (Figure 1). This blocks p53
induction of apoptosis (Foo et al. 2007), allowing cancer cell growth to proceed un-
134

checked. NOL3 is able to evade degradation in cancer cells due to RAS, which simul-
taneously activates NOL3 transcription and prevents NOL3 protein poly-ubiquitylation
(Wu et al. 2010). In other cancer work, two groups suggested the involvement of NOL3
in doxorubicin chemotherapy resistance (An et al. 2009, Wang et al. 2009), and Carter et
al. (2011) found that NOL3 expression has prognostic value for acute myeloid leukemia.
If NOL3 inhibits cardiomyocyte apoptosis, it would be logical to hypothesize that
it does the same in the CNS. This supposition is supported by a modicum of evidence.
NOL3 expression has been detected in the brains of rats, mice, and humans (Koseki et al.
1998, Engidawork et al. 2001, Gulesserian et al. 2001, Shelke & Leeuwenburgh 2003).
In the mouse cortex, Nol3 expression declines with age (Shelke & Leeuwenburgh 2003).
Nol3 expression also declines in cerebellar tissue after chronic alcohol intake (Ren et al.
2009). In ischemic primary cortical neuronal cultures, Nol3 is upregulated, further sug-
gesting a role in neuroprotection (Prasad et al. 2010). Hong et al. (2003) found that rat
hippocampal neurons that are ischemic have decreased Nol3 expression, but Nol3 over-
expression prevented ischemic neuronal death. Hong et al.’s is the lone experiment to
show a functional consequence other than gene expression changes. Given the incon-
sistencies between Hong et al. and Prasad et al., with one observing Nol3 upregulation
and the other downregulation in response to ischemia, and both papers being plagued by
technical weaknesses, the function of NOL3 in the CNS remains essentially unknown.
One early paper used a human cDNA library expressed in yeast to identify an
alternatively spliced NOL3 isoform, termed Nop30 (nucleolar protein of 30 kDa) (Figure
1; Stoss et al. 1999). Nop30 and NOL3 both contain an N-terminal CARD but differ in
their C-terminus. Stoss et al. demonstrated that Nop30 can homodimerize and also can
135

heterodimerize with NOL3. Moreover, the authors stated that Nop30 heterodimerizes
with the splicing factor SRp30c, and the overexpression of Nop30 affects RNA splicing.
We doubt the biological relevance of these findings. They have never been replicated
and the same group has never published again on Nop30. More damningly, the Nop30
transcript has never been detected in vivo. However, although it seems likely that Nop30
was a spurious finding, we cannot rule out a role for Nop30 and/or NOL3 in RNA proc-
essing.
Our hypothesis that FCM is caused by mutation in NOL3, a repressor of apop-
tosis, is strengthened by the known pathophysiology of Unverricht-Lundborg disease
(ULD) (Kalviainen et al. 2008). Although ULD patients suffer extensive neurodegen-
eration, ULD is in some ways similar to FCM: ULD is a Mendelian disorder character-
ized by progressive myoclonic epilepsy with stimulus-sensitive myoclonus of the proxi-
mal extremities (Kalviainen et al. 2008). However, ULD differs from FCM in that ULD
myoclonus is subcortical in origin (Kalviainen et al. 2008). Interestingly, ULD is caused
by mutations in cystatin-B (CSTB), a gene which encodes an inhibitor of apoptosis
(Joensuu et al. 2008). CSTB knockout mice have increased cerebellar apoptosis and
hyperexcitable hippocampal slices, and suffer from myoclonic seizures as measured by
gross observation and electrophysiologic monitoring (Lehtinen et al. 2009). Thus, there
is precedent for mutation in an apoptosis repressor leading to neuronal hyperexcitability
as manifested clinically by myoclonus.
In addition to the CSTB mouse, there is strong justification for studying myo-
clonus in mouse models. Espinosa et al. (2001) demonstrated that mice with potassium
channel mutations exhibited myoclonus that was easily phenotyped by visual observa-
136

tion. Similarly, Suzuki et al. (2009) studied mice with null alleles in Efhc1, a gene that is
mutated in humans with juvenile myoclonic epilepsy (see Chapter I). In Efhc1 knockout
mice they observed seizures and frequent spontaneous myoclonus.
We sought to elucidate the molecular pathophysiology by which NOL3 mutation
causes FCM. Since the mutation resides in a protein-protein interaction motif that, as
detailed above, is known to be important for protein binding, we hypothesized that the
mutation alters NOL3 protein-protein interactions. In this chapter we present the exper-
iments we undertook to test this hypothesis, along with other experiments that provide a
basic characterization of NOL3 in the brain.
137

METHODS
Amino Acid Alignment
Evolutionary conservation was investigated using NOL3 amino acid sequences
from different organisms. Sequences were aligned with the ClustalW2 program
(www.ebi.ac.uk/Tools/clustalw2/index.html). Identity and similarity between species
was determined with BLASTp, using sequences obtained from NCBI Protein
(http://www.ncbi.nlm.nih.gov/protein), including Human (Homo sapiens;
NP_001171987.1), canine (Canis lupus familiaris; XP_853983.1), cattle (Bos taurus;
NP_001077157.1), mouse (Mus musculus; NP_084428.1), and rat (Rattus norvegicus;
NP_445968.2). NOL3 homologs from other species were identified by BLASTp
(http://blast.ncbi.nlm.nih.gov) but were omitted from amino acid alignment (for example,
Pan troglodytes NOL3 is 100% identical to human NOL3).
Interestingly, we were unable to identify homologs in Caenorhabditis elegans,
Drosophila melanogaster, or Danio rerio. We also searched for NOL3 homologs in 9
additional species encompassing 4 reptile/bird genomes (Anolis carolinesis, i.e., green
anole lizard; Gallus gallus, i.e., chicken; Meleagris gallopavo, i.e., turkey; Taeniopygia
guttata, i.e., zebra finch), 1 amphibian (Xenopus tropicalis, i.e., frog), and 4 bony fish in
addition to zebrafish (Gadus morhua, i.e., Atlantic cod; Gasterosteus aculeatus, i.e.,
stickleback; Latimeria chalumnae, i.e., West Indian Ocean coelacanth; Takifugu rubripes,
i.e., Puffer fish). To ensure that negative results were not a consequence of ultra-strin-
gent search parameters, we individually varied the following parameters: Expect Thresh-
old from the standard value (10) to up to three orders of magnitude (100, 1,000, or
10,000); Matrix from the standard (BLOSUM62) to all other available matrices (PAM30,
138

PAM70, BLOSUM80, BLOSUM45); Gap Costs from the standard (Existence 11,
Extension 1) to all other available conditions (Existence 9, Extension 2; Existence 8,
Extension 2; Existence 7, Extension 2; Existence 12, Extension 1; Existence 10,
Extension 1); and Compositional Adjustments from the standard value (Conditional
compositional score matrix adjustment) to either Composition-based statistics or Univer-
sal compositional score matrix adjustment (the condition No adjustment was omitted
because it revealed thousands of homology matches due to low stringency). The defini-
tion for homology was >50 alignment score, or e-value <1e-10; for comparison, under
standard search parameters, a homology match to Mus musculus, a positive control,
yielded >200 alignment score and an e-value of 2e-82.
In Silico Homology Modelling
The crystal structure of NOL3 protein is not known, so to analyze the 3-dimen-
sional structure we performed in silico homology modelling. We used the structure of
the Nod1 CARD domain (PDB structure 2DBD) (Manon et al. 2007) as the template.
Since the C-terminus of NOL3 is not homologous to any published structures, only the
N-terminal CARD was modelled, viz. amino acids 10-83. We performed homology
modelling using SWISS-MODEL (http://swissmodel.expasy.org), and analyzed resultant
structures with UCSF Chimera software (www.cgl.ucsf.edu/chimera). We repeated the
analysis with a different structure of the Nod1 CARD domain (PDB structure 2NZ7)
(Srimathi et al. 2008) and obtained similar results (data not shown).
139

Other Bioinformatic Analyses
We predicted NOL3 protein secondary structure using Jpred
(www.compbio.dundee.ac.uk/www-jpred), I-TASSER (www.zhanglab.ccmb.med.umich.
edu/I-TASSER), and PSIPRED (www.bioinf.cs.ucl.ac.uk/psipred). Potential splicing
enhancers, splice branch points, and nuclear export sequences were predicted with
RESCUE-ESE (www.genes.mit.edu/burgelab/rescue-ese), Human Splicing Finder
(www.umd.be/HSF), and NetNES 1.1 (www.cbs.dtu.duk/services/netNES), respectively.
We also used PolyPhen-2 (www.genetics.bwh.harvard.edu/pph2) to predict whether
E21Q is a deleterious variant.
NOL3 Constructs
A pcDNA3.1 vector containing human NOL3 cDNA sequence with a C-terminal
FLAG-tag (the E21Q mutation is near the N-terminus) was kindly provided by Gabriel
Nunez, Ph.D., and Peter Kuffa (University of Michigan) (Koseki et al. 1998). Site-
directed mutagenesis to introduce the E21Q mutation was performed with the
QuikChange II XL Mutagenesis kit (Agilent) using HPLC-purified primer 5’-GAAACG
CCTGGTCCAGACGCTGCAGGC-3’ and its antisense primer 5’-GCCTGCAGCGTCT
GGACCAGGCGTTTC-3’. The manufacturer’s instructions were followed, with the
following refinements: for PCR, a 7min extension step was used to amplify the ~6kb
pcDNA3.1; DpnI digestion was performed for 2h at 37ºC; before transformation, PCR
products were purified with QIAquick PCR Purification Kit (Qiagen). Colonies were
cultured, and plasmid was isolated by QIAprep Plasmid Miniprep Kit (Qiagen) and then
sequenced with the following primers: 5’-GGCGGTAGGCGTGTA-3’, 5’-CGTCGCCG
140

TCCAGCTC-3’, 5’-AGCACCCAGTCCGCCCTGAGC-3’. Mutation-positive clones
were transformed and cultured, and ample plasmid was purified using QIAfilter Plasmid
Maxi Kit (Qiagen). Purified plasmid was again Sanger sequenced to ensure correct
sequence. Other NOL3 mutant constructs were constructed using the same approach.
The site-directed mu-tagenesis primers used are listed in Table 1.
Table 1. Primers used for cloning mutant NOL3 constructs.
Mutation Primers
S104A 5’-GCTACCGGGACCGCGCCTATGACCCTCCAT-3’
ATGGAGGGTCATAGGCGCGGTCCCGGTAGC
T114A CAGGCCACTGGGCGCCGGAGGCA TGCCTCCGGCGCCCAGTGGCCTG
T122A CCGGCTCGGGGGCCACATGCCCC GGGGCATGTGGCCCCCGAGCCGG
T123A GCTCGGGGACCGCATGCCCCGGG CCCGGGGCATGCGGTCCCCGAGC
T149A GTGCAATCCGGGGCCCCGGAGGAGC GCTCCTCCGGGGCCCCGGATTGCAC
T114D GCCCAGGCCACTGGGATCCGGAGGCACCCGG CCGGGTGCCTCCGGATCCCAGTGGCCTGGGC
C79A GGAGCTGCTACGCGCTGCCCAGCGTACC GGTACGCTGGGCAGCGCGTAGCAGCTCC
K17R CCGCGAGCGGAGACGCCTGGTCG CGACCAGGCGTCTCCGCTCGCGG
K68R GGTGCAGGGCAGGGGCGAGGCCCG CGGGCCTCGCCCCTGCCCTGCACC
K163R GCTGAGGCCTCTAGAGAGGCTGAACC GGTTCAGCCTCTCTAGAGGCCTCAGC
NOL3 Expression in the CNS
To determine the expression pattern of NOL3 in the CNS, we utilized the mouse
and human versions of the Allen Brain Atlas (Lein et al. 2007, Hawrylycz et al. 2012).
For further analysis, including differential expression of Nol3 by CNS cell type, we uti-
lized BacTRAP (www.bactrap.org; Heiman et al. 2008), and supplementary data from
141

Sugino et al. (2006) and Cahoy et al. (2008). Data were analyzed and plotted with
Microsoft Excel.
To assay expression of NOL3 in human brain regions, we performed reverse tran-
scriptase PCR on a RapidScan cDNA panel containing first-strand cDNA prepared from
12 human brain parts (AMSBio, Lake Forest, CA). NOL3 was amplified using the
following primers: 5’-GCCAGAGTACGAGGCATTGGATGC-3’, 5’-CGGACTCGTCC
CTTTCCTCGAAG-3’. This PCR yields a 647bp product from genomic DNA and a
491bp product from cDNA. We confirmed that each lane contained comparable amounts
of cDNA by PCRing beta-actin (ACTB) with the following primers: 5’-CATGTACGTT
GCTATCCAGGC-3’, 5’-CTCCTTAATGTCACGCACGAT-3’.
We also used reverse transcriptase PCR to assay expression of Nol3 in cultured
primary oligodendrocytes and astrocytes from WT mice. We used the following primers
for Nol3: 5’-CTCCGGCTCTTGTTCTGGAT-3’, 5’-GCGGAGTTCGAAGAAATG-3’,
yielding an RNA-specific product of 549bp. For a loading control, we PCRed beta-actin
with the following primers: 5’-GGCTGTATTCCCCTCCATCG-3’, 5’-CCAGTTGGTA
ACAATGCCATGT-3’ (product size of 154bp).
Generation of Stable Cell Lines and Transiently Transfected Cell Lines
Human embryonic kidney (HEK) 293 cells were obtained from American Type
Culture Collection (catalog number CRL-1573, ATCC, Manassas, VA) and cultured in
DMEM supplemented with 10% fetal bovine serum (FBS) in a 37ºC incubator with 5%
CO2. Cells were transiently transfected with either FuGENE (Roche, Indianapolis, IN)
or Lipofectamine 2000 reagent (Invitrogen, Carlsbad, CA) according to manufacturers’
142

in-structions. Multiple, independent stable cell lines were generated by transfecting a
50% confluent culture, which was grown to confluency, split to a 15cm plate, and
selected with G418 (Invitrogen) antibiotic at 400μg/mL. Each independent stable line
was poly-clonal. Stable lines were maintained in DMEM containing 10% FBS and
200μg/mL G418. Lines expressing NOL3 protein at similar levels were identified by the
following method: cells were washed with ice-cold PBS, scraped with a cold scraper,
isolated by centrifugation, lysed with RIPA buffer (50mM Tris HCl pH 7.4, 150mM
NaCl, 1mM EDTA, 1% Triton X-100, 1% Sodium deoxycholate, 0.1% SDS, 1 cOmplete
protease inhibitor cocktail tablet (Roche) per 10 mL), sonicated, harvested for protein by
4ºC centrifugation, and analyzed by Western blotting. Cell stocks were stored in liquid
nitrogen and cell lysates at -20ºC or -80ºC.
The other cell lines used were HeLa (CCL-2) and COS7 (CRL-1651) courtesy of
ATCC, and SK-N-SH (MA6210) from ATCC by way of the UCSF Cell Culture Facility.
Western Blots
SDS-PAGE (sodium dodecyl sulfate-polyacrylamide gel electrophoresis) was per-
formed under standard conditions. Briefly, 4X SDS buffer (50mM Tris HCl pH 6.8, 2%
SDS, 10% glycerol, 1% β-mercaptoethanol, 12.5mM EDTA, 0.02% bromophenol blue)
was added 1:3 to each sample, and samples were then denatured by boiling for 5min at
95ºC. Equal amounts of sample were loaded into a 12% Bis-Tris NUPAGE Gel
(Invitrogen); electrophoresed using NUPAGE MOPS buffer (50mM MOPS, 50mM Tris
Base, 0.1% SDS, 1mM EDTA, pH 7.7; Invitrogen) at 50mA for ~1hr; and transferred to a
nitrocellulose membrane in transfer buffer (25mM Tris Base, 192mM glycine, 10%
143
methanol) at 100mA for ~1hr at 4ºC. Membranes were blocked in Odyssey Blocking
Buffer (LI-COR Biosciences, Lincoln, NE) for 5min at room temperature (RT), incubated
with primary antibody/antibodies for 1hr at RT, washed thrice for 5min each with TBS-T
(50mM Tris Base, 150mM NaCl, 0.05% Tween 20, pH 7.6), incubated with secondary
antibody/antibodies for 1hr at RT, then again washed thrice for 5min each with TBS-T.
The following antibodies were diluted in Odyssey Blocking Buffer: rabbit anti-FLAG
clone F7425 (Sigma-Aldrich, St. Louis, MO) at 1:500; mouse anti-GAPDH clone
MAB374 (Millipore, Billerica, MA) at 1:500; rabbit anti-NOL3 clone 160737 (Cayman
Chemical, Ann Arbor, MI) at 1:500; and various IR-Dye Secondary Antibodies (LI-
COR) at 1:10,000. Membranes were scanned and densitometry analyses were performed
with the Odyssey Infrared Imaging System and accompanying software (LI-COR).
Molecular weight was determined by co-loading Precision Plus Dual Color Standards
(Bio-Rad, Hercules, CA). GAPDH served as loading control, and quantity of the lower
molecular weight FLAG band served as an additional, internal loading control; also, total
FLAG:GAPDH levels were ~1 (Figure 15). All experiments were performed at least
thrice. Statistical analysis was a paired two-tailed t-test, using Microsoft Excel.
Investigations to Identify the Upper Band
Western blots were performed in the manner described above and were probed
using the following antibodies: anti-phosphothreonine mAb clone 14B3 (Calbiochem,
Darmstadt, Germany); anti-ubiquitin clone 6C1.17 (BD Pharmingen, San Jose, CA); and
anti-ubiquitin clone P4D1 (Santa Cruz Biotechnology, Santa Cruz, CA). Phosphatase
treatment was performed using calf intestinal alkaline phosphatase (New England
144

BioLabs, Ipswich, MA), protein phosphatase 1 (New England BioLabs), and potato acid
phosphatase (Sigma Aldrich), all according to manufacturers’ protocols. We also tin-
kered with the protocols by adding up to 10-fold additional phosphatase, and by incu-
bating for variable intervals (1, 5, 10, 30, 60, and 120min). For in vivo phosphatase
experiments, we treated HEK293 cells with 100μM, 1mM, or 10mM sodium fluoride or
sodium orthovanadate (both from New England BioLabs), waited 20min, then harvested
cell lysates and immunoblotted.
To test the hypothesis of palmitoylation, 100μL of protein lysate (1mg/mL) or of
immunoprecipitated NOL3 was incubated with 5μL of 200mM TCEP(tris-2-carboxy-
ethyl-phosphine)-HCl solution (Thermo Scientific, Rockford, IL) at 55ºC for 1h. Then,
5μL from a 1M iodoacetamide solution (Sigma-Aldrich) was added and tubes were kept
at RT for 1h in the dark. Samples were then processed for SDS-PAGE as described
above.
For mass spectrometry experiments, we took care to avoid contamination. Lysate
and IP samples were run by SDS-PAGE, and the gels were then stained with Coomassie
blue dye for 1h at RT and destained with double distilled H2O (ddH2O) overnight at RT.
The next day, we excised bands of interest. Samples were prepared and digested with
trypsin as previously described (Trinidad et al. 2008). For some experiments,
phosphorylated peptides were enriched using titanium dioxide as previously described
(Trinidad et al. 2008). Tandem mass spectrometry (MS/MS) was carried out with an
Orbitrap liquid chromatography/mass spectrometer (Thermo) at the UCSF Mass Spec-
trometry Facility. The data were analyzed using Protein Prospector as previously
145

described (Trinidad et al. 2008). For this work we relied heavily upon a collaboration
with Jonathan Trinidad, Ph.D., of the Facility.
Co-immunoprecipitations
For our attempts at co-immunoprecipitations (co-IPs) of proteins that interact with
NOL3 in the mouse brain, WT and Nol3 knockout littermates were aged to one year.
Mice were anesthetized with isoflurane and euthanized by cervical dislocation. Whole
brain was dissected and stored overnight at -80ºC. The next day, samples were thawed
for 2min, upon which 3mL of tissue lysis buffer (5mM Tris-HCl pH 7.4, 1mM EDTA,
1% NP40, Roche cOmplete protease inhibitor, Roche PHOSStop phosphatase inhibitor)
was added to a Dounce homogenizer along with the sample. Each sample was Dounce
homogenized about 25 times until the solution was homogeneous by inspection. Solu-
tions were transferred to 1.5mL eppendorf tubes, sonicated briefly, then centrifuged at
14,000rpm for 10min at 4ºC. The supernatant was used for further co-IPs, IPs, and
Western blots.
For co-IPs in HEK293 cells, dishes were grown to confluency, then placed on ice,
rinsed twice gently with ice-cold PBS, and lysed using various buffers including RIPA
(see above), NP40 (50mM Tris-HCl pH 7.4, 150mM NaCl, 1% NP-40, protease and
phosphatase inhibitors), or gentler lysis buffer (50mM Tris-HCl pH 7.4, 150mM NaCl,
1mM EDTA, 1% Triton, protease and phosphatase inhibitors). The buffer and detached
cells were placed into a 15mL conical and centrifuged at 1100rpm for 5min at 4ºC. The
supernatant at this step was the “input”—some was saved for later analysis. When using
antibodies with lower affinity, samples were precleared by adding 50µL of protein A-
146
agarose (for rabbit monoclonal antibodies) or protein G-agarose (for mouse monoclonal
antibodies) for every 1mL of lysate, rotated at 4ºC for 1h, then centrifuged at 14,000rpm
for 5min at 4ºC. Samples were then centrifuged at 14,000rpm for 10min at 4ºC, upon
which the supernatant was removed. Primary antibody was added, typically 1-5µg of
antibody per 1mg of 1mg/mL lysate, and incubated for variable intervals (from 1h to two
days) on a circular rotator at 4ºC. Samples were then centrifuged at 3000rpm for 1min at
4ºC, thrice washed with ice-cold PBS, and centrifuged at 3000rpm for 1min at 4ºC.
Samples thus prepared were used for further treatments to study the upper band, such as
in vitro phosphatase assays (see above). Otherwise, for co-IPs the pellets (along with the
input samples, see above) were resuspended in 40µL of SDS sample buffer and run by
SDS-PAGE as explicated above. For anti-FLAG IPs and co-IPs, we used EZView Red
Anti-FLAG M2 affinity beads (Sigma-Aldrich). For immunoblotting of putative inter-
acting proteins, we used the following primary antibodies: anti-Bax clone 2772 (Cell
Signaling, Beverly, MA); anti-Bax clone 6A7 (Sigma-Aldrich); anti-Caspase-2 clone
3507 (Millipore); anti-Caspase-8 clone 12F5 (Enzo Life Sciences, Villeurbanne, France);
anti-FADD clone 1F7 (Millipore); anti-Fas clone CH11 (Millipore); anti-MDM2 clone
SMP14 (Santa Cruz Biotechnology); anti-PACSIN3 clone ab86077 (Abcam, Cambridge,
MA); and anti-PNKP (Sigma-Aldrich). Primary antibodies were typically diluted at
1:1000, but for optimization purposes we performed serial dilutions and immunoblotted
with antibody solutions as concentrated as 1:100.
For identification of novel binding partners, co-IPs corresponding to vector,
NOL3WT, or NOL3E21Q cell lines were each labeled with a different fluorescent dye and
simultaneously run on a 2-dimensional SDS-PAGE gel. DeCyder software was used to
147

identify and quantify gel spots with differential protein levels. Those spots which were
more highly expressed in NOL3WT or NOL3E21Q cells than vector were excised and
identified by standard tandem mass spectrometry. This work was done in collaboration
with Applied Biomics (Hayward, CA).
Apoptosis Cell Imaging and FACS
For apoptosis imaging experiments we used either transiently transfected or stable
HEK293 cell lines. Glass slides were coated with polylysine and washed thrice with dis-
tilled water, then seeded with cells. When appropriate, cells were transfected at least 5h
later. The next day, or when cells reached 90% confluency, we added one of a variety of
stimuli that induce apoptosis. These stimuli included anti-Fas agonist clone CH11
(Millipore), brefeldin A, and etoposide (both courtesy of Scott A. Oakes, M.D.). How-
ever, the majority of our experiments utilized staurosporine (STS, Sigma-Aldrich), a
broad-spectrum kinase inhibitor, because many of the published experiments demon-
strating a role for NOL3 in repressing apoptosis utilized STS (e.g., Ekhterae et al. 2003).
We experimented with a wide variety of STS concentrations (on a log scale) and
incubation times (from 1h to 48h). After STS incubation, cells were washed thrice with
PBS and fixed using 4% paraformaldehyde. Cells were again washed thrice with PBS,
permeabilized with 0.2% Triton, and washed with PBS. We then executed various proto-
cols to measure apoptosis. These included measurement of mitochondrial membrane
permeability, nuclear fragmentation (Trypan Blue exclusion or Hoechst 33342), and
especially chromosomal fragmentation using terminal deoxynucleotidyl transferase dUTP
nick end labeling (TUNEL). For TUNEL assays, we used the DEADEnd Fluorometric
148

TUNEL System (Promega, Madison, WI) and included DNase treatment as a positive
control. After TUNEL staining, cells were prepared for fluorescence microscopy as
explicated below.
For fluorescence activated cell sorting (FACS) analysis of apoptosis, cells grown
to 90% confluency were treated with 1µM STS for 5h at 37ºC. We also tested a variety
of confluencies (data not shown). After STS incubation, media was removed and cells
were washed with PBS, upon which warm PBS containing 3% FBS and 1mM EDTA
(PBS-FBS-EDTA) was added and pipetted up and down to gently detach cells from the
plate. Cells in solution were added to a 15mL conical and kept on ice for the remainder
of the protocol. The cells were centrifuged at 1000rpm for 3min at 4ºC, the supernatant
was removed, and 5mL of ice-cold PBS-FBS-EDTA was added to the cell pellet. The
solution was passed through a 40µm filter and again 5mL of ice-cold PBS-FBS-EDTA
was added. The solution was then transferred to a 15mL conical and centrifuged at
1000rpm for 3min at 4ºC. The supernatant was removed, and cells were resuspended in
2mL of PBS-FBS. One-quarter of each sample was added to one of four 5mL
polystyrene tubes, then stained with fluorescent markers. The markers used were 4’,6-
diamidino-2-phenylindole (DAPI; Invitrogen) at a 1:10,000 dilution, propidium iodide
(PI; Invitrogen) at a 1:50 dilution, and annexin V-fluorescein isothiocyanate (annexin V-
FITC; BD Pharmingen) at a 1:100 dilution, all according to manufacturers’ protocols.
For each sample, one tube was left unstained, one tube was stained with DAPI (or, as it
happened, PI), one tube was stained with annexin V, and one tube was stained with both
PI and annexin V. We performed FACS with a UCSF Laboratory for Cell Analysis
FACSCanto II flow cytometer (BD Biosciences, San Jose, CA). The settings were the
149

405nm laser and 450/50 filter for DAPI, and the 488nm laser with 670LP-655LP (PI) or
530/30-502LP (FITC) filters. Data was gathered using FACSDiva software (BD Bio-
sciences) and subsequently analyzed with FlowJo v.10.0.5 (Tree Star, Portland, OR).
The FACS plots in Figure 21 depict data for 100,000 cells per condition.
Immunohistochemistry and Cell Imaging
For immunohistochemistry, cells were cultured in chamber slides or on poly-
lysine-coated cover slips within 6-well dishes. To stain mitochondria, the cells were
incubated with 300nM Mitotracker (Invitrogen) for 30min at 37ºC. Cells were then
washed thrice for 2min each in PBS, fixed with 4% paraformaldehyde for 15min at 37ºC,
washed thrice with PBS, permeabilized with 0.2% Triton, and washed with PBS. Slides
were prepared using VECTASHIELD Hard-set mounting medium with DAPI (Vector
Laboratories, Burlingame, CA). For immunohistochemistry sans Mitotracker, cells were
simply washed with PBS, fixed, and permeabilized. For all immunohistochemistry, cells
were blocked with 5% normal goat serum (NGS) in PBS for 1h at RT, then incubated
with primary antibody (diluted 1:500 in 5% NGS blocking buffer) overnight at 4ºC in a
humidified chamber. The next day they were washed thrice for 5min with PBS, upon
which secondary antibody (diluted 1:500 in blocking buffer) was added for 1.5h at RT in
a humidified chamber. They were then washed thrice with PBS and slides were prepared
using VECTASHIELD. The primary antibodies used were anti-FLAG clone M2 (Sigma-
Aldrich) and anti-NOL3 (see above).
We imaged cells by fluorescence microscopy using a DM6000 FS (Leica,
Wetzlar, Germany). Images were obtained with Image-Pro Plus software (Media-
150

Cybernetics, Rockville, MD). For confocal microscopy, we used the CSU22 spinning
disk confocal microscope (Yokogawa, Tokyo, Japan) at the UCSF Nikon Imaging Cen-
ter. With both microscopes we used the following lasers: 405nm for DAPI, 491nm for
FITC, and 561nm for rhodamine (Mitotracker). Confocal images were taken using in-
house software. All images were analyzed with ImageJ (www.rsbweb.nih.gov/ij).
SSEP Studies in Mice
All mice were housed in the UCSF Laboratory Animal Resource Center (LARC)
with approval of the Institutional Animal Care and Use Committee. All procedures
throughout the study, including euthanasia, were performed in accordance with insti-
tutional, state, and federal regulations for the humane handling of animals. Nol3
knockout (KO) mice were previously generated by Donath et al. (2006) and were a kind
gift of Joe Quadrilatero, Ph.D., of the University of Waterloo. Mice were genotyped
using the following primers: WT (5’-GATACCAGGAGATCTCTCAAAATT-3’, 5’-
CAGCGCATCCAAGGCTTCGTACTC-3’), KO (5’-GATACCAGGAGATCTCTCAAA
ATT-3’, 5’-GATTGGGAAGACAATAGCAGGCATGC-3’). We used standard PCR re-
agents, except that unlike some genotyping protocols, the WT and KO PCR reactions
were not combined into a single reaction. PCR was performed as follows: 93ºC 2min;
55ºC 1min; 65ºC 3min; 29 cycles of 93ºC 30sec, 55ºC 30sec, 65ºC 3min; 65ºC 7min.
The WT and KO bands were ~760bp and ~450bp, respectively.
Proof of principle for performing somatosensory evoked potentials (SSEPs) in
mice was provided by Iuliano et al. (1994). Gross behavioral phenotyping to rule out
myoclonus was performed similar to the protocol of Espinosa et al. (2001). For SSEPs,
151

Nol3 knockout (Nol3-/-) and WT (Nol3+/+) littermates were anesthetized with a mixture of
ketamine and xylazine. A small incision was made in the scalp and the fascia cleaned
away from the skull. A prefabricated electroencephalography (EEG) headmount
(Pinnacle Technology, Lawrence, KS) was attached to the skull by four screws that
penetrated through the skull to the dura. These screws were placed such that a pair
straddled the somatosensory cortex of each hemisphere, and the screws served as cortical
surface electrodes to monitor EEG activity in each hemisphere. The headmount included
a pair of silver wire electrodes that were inserted subcutaneously over the trapezius
muscles to record electromyographic (EMG) activity to detect movement and stimulus
artifacts. The headmount was then linked to an amplifier (Pinnacle Technology) and
EEG data was sampled at a rate of 400Hz.
SSEPs were evoked in anesthetized mice by stimulating the gastrocnemius muscle
with a 2msec square current pulse delivered through a needle electrode. Suprathreshold
stimuli evoked SSEPs that could be detected in the EEG of both hemispheres. SSEP
threshold was roughly measured and stimulus strength was set to approximately 125% of
threshold, which evoked a response to each stimulus. SSEP threshold was similar be-
tween genotypes (18-25mA). Fifteen to twenty SSEP sweeps were then recorded in
response to the suprathreshold stimulus, averaged and normalized to peak amplitude.
Mean SSEP time to peak, measured from the EMG stimulus artifact, and 10-90% rise
time were calculated for each mouse.
152

Generation of E21Q Knockin Mutant Mice Mice with a Nol3 allele containing the E21Q mutation and three LoxP sites were
generated as described in Appendix 5. In deciding where to place the third LoxP site, we
utilized the following three splice acceptor prediction programs: Human Splicing Finder
(URL above), Softberry (www.linux1.softberry.com/berry.phtml) and Fruitfly
(www.fruitfly.org). The targeting vector was constructed in collaboration with ingenious
Targeting Laboratory (Ronkonkoma, New York). Embryonic stem cell work was
completed by the Howard Hughes Medical Institute Janelia Farm Research Campus core
facility.
153

RESULTS Evolutionary Conservation and Other Bioinformatic Analyses
First, we assessed NOL3 evolutionary conservation. When we compared NOL3
amino acid sequence across humans, dogs, cattle, mice, and rats, we observed extremely
high conservation (Figure 3). For example, between humans and mice 88.4% of residues
are identical and 93.2% are similar. Conservation is particularly pronounced for the
CARD, including the region around E21, the residue mutated in FCM (Figure 3). De-
spite extensive searching, we were unable to identify homologs in Drosophila, C.
elegans, or even “lower” vertebrate species such as D. rerio (zebrafish). However, as a
positive control we did identify NOL3 homologs in newly-sequenced vertebrate mammal
human M A P I LV L A LLL ALLA VL P AL ALP A VM P I LV L A LLL ALLA VLA P AL ALP A VM P I LV L A LLL ALLA VL P AL ALP A VM V P I LV L A LLL ALVA VL P AL ALP A VM M P I LV L A LLL ALVA VL P AL ALP A V
GN Q S T T Q SG G TG YGNSQ S T T Q SG G G YGNTQ S T H T Q SG G TG YGN Q S T T Q SG G TG YGN Q S T T Q SG G TG Y
ER E DRERKR E D D R E E D D ERR RR 60 canine ER E DRERKR E D D R E E D D ERR RR 60 cattle ER E D ERKR E D D R E E D D ERR RR 60 mouse ER E DRERKR E D D R E E D D ERR RR 60 rat ER E DRERKR E D D R E E D D ERR RR 60 *** *********:********************:*****:******************* human K E E R R D D RDR D E 20 canine K E E R R D D RER D E 20 cattle K E E R R D D RER D D 20 mouse K E E R R D D R R D E 20 rat K E E R D D RDR D E 120 ******.********** ***:*. ***:*******.***:**:*..*.***** *..* human R D DE E E EE -------E E E E KE-- E E 168 canine E R D E E EE -------D E E -- E E 164 cattle R E DE R ED E EE -------E E E E E E E 168 mouse E R E EE E E R EE E E E E DE D E E E E E E 180 rat R EEEE ED E R EE E E E K DE D E E E E-- E E 178 .**** ****.: * .* .*** *. : **. :*:** .* * human E E E E E E E E E E E D E E D EERDE ED - 208 canine E D E E E E E E ERE E E E D E DE ED - 204 cattle D D E E E E E E E E E E D E DE ED - 206 mouse E E E E E E E E E E E E E E D EEDE ED 20 rat E E E E E E E E E E E E ERE D E DE E E 221 :*: : ***.*.***** * **:* ***:: ****..
LLLLV AA LL A A AP PAW W V P PP P W P APLLLLV AA LLL A A AP PAW W V W AA A W P APLLLLV AA LL A V AP P W W V PP P W P AALLLLV AA LL A V MP PAW W V P P P W P APLLLLV AA LL A V MP PAW W V P PP P W P AP
P LP A P A P AV P P--- P L A A A PP LP AA P AP AA L P--- P L A A LPWLP AP A P AA L A--- P L A A PP LP A V P AL P P P L A A P L M P P PP LP A I P AV P P P L A A P L M P P P
P P P L P A A P P L P P P P P FP M L P P A P P L P P P P L A
L P M P P P A P P A P P P-- P F AP P P P P P P P P P P P P P P FV P P P P P P P P P P P P P F
QG G CQ C Q T G QH G GY SY C GH T GS 1QS G CQ C Q T QH GTGY S C GH T GS 1QS G CQ SC Q T T QH GTGY SY C GH T G S 1QS G CQ C QQT QH G GY N SY SC GH T SS 1QS G CQ C QQT S QH G GY SY C GH T SS
GTTC G S GG GS QSGT SSTTC CG G GGS QSGS G----GTTC S G S QSGT TS G--GTTC S Q GG GS Q T T G Q N QGTTC G S GG S Q T T G Q
S S--S Q G S S--
Q G S S--Q S S--- 2Q G S GC NT
acidic residueCARD domainalpha-helix
Id. (%) Sim. (%)canine 83.3 88.1
cattle 91.1 93.8
mouse 88.4 93.2
rat 81.7 85.6
Figure 3. NOL3 amino acid sequence is highly conserved across species.
154

genomes, including the giant panda (Ailuropoda melanoleuca), marmoset (Callithrix
jacchus), and many other vertebrate mammals. For example, chimpanzee NOL3 is 100%
identical to human NOL3. We concluded that the NOL3 gene is highly conserved but is
restricted to higher vertebrates. The high degree of conservation suggests positive selec-
tion for NOL3 function ever since its emergence in higher vertebrates. This is further
supported by the observation that databases cataloguing variants from tens of thousands
of human genomes contain only a handful of non-synonymous SNPs in NOL3 coding
sequence—presumably, NOL3 mutations are likely to be deleterious to the organism and
have been selected against.
We next attempted to identify NOL3 homologs in the human proteome. Homol-
ogy searching suggested three potential homologs (testis anion transporter 1 isoform a,
SLC family 26 member 8, and anion transporter/exchange-8), but these genes were only
modestly homologous to the NOL3 P/E domain. There was no evident homology to the
CARD. We were flummoxed that this approach failed to point to other proteins with
CARDs. Six caspases contain CARDs, and CARDs are found in at least 22 other human
genes (Reed et al. 2004). We performed peptide sequence alignment amongst human
genes containing CARDs and were startled to observe strikingly low conservation
(Figure 4). While NOL3 may be more highly related to CARD genes than to randomly
selected genes, the conservation is underwhelming, except for between NOL3 and
CARD6 (Figure 4). Given the dissimilarity in amino acid sequence, we asked whether
the NOL3 CARD has the 6 or 7 antiparallel alpha-helices characteristic of the CARD
motif (Reed et al. 2004). We used three separate secondary structure prediction pro-
grams, but none predicted more than 5 alpha-helices within the CARD, and one predicted
155

4 (Figure 5). Repeating the analysis with the E21Q mutation returned similar results
(data not shown).
CASP-2 -----------MHPDHQETLKKNRVVLAKQLLLSELLEHLLEK--DIIT-LEMRELIQAK 77 CASP-9 -----------MDEADRRLLRRCRLRLVEELQVDQLWDALLSR--ELFR-PHMIEDIQRA 46 CARD16 ---------------EKRKLFIHSMGEG---TINGLLDELLQT--RVLN-QEEMEKVKRE 46 CARD17 ---------------EKRKQFIRSVGEG---TINGLLGELLET--RVLS-QEEIEIVKCE 46 CARD18 ---------------KKRRIFIHSVGAG---TINALLDCLLED--EVIS-QEDMNKVRDE 46 CASP-1 ---------------AKRKQFINSVSIG---TINGLLDELLEK--RVLN-QEEMDKIKLA 46 CASP-4 ------------KHPDKPLKVLEQLGKE---VLTEYLEKLVQS--NVLK-LKEEDKQKFN 46 CASP-5 NTDQKSTSVKKDNHKKKTVKMLEYLGKD---VLHGVFNYLAKH--DVLT-LKEEEKKKYY 104 CASP-12 ------------PSNGVLVHMVKLLIKT---FLDGIFDDLMEN--NVLN-TDEIHLIGKC 47 NOD1 ----SESHPHIQLLKSNRELLVTHIRN-----TQCLVDNLLKN--DYFS-AEDAEIVCAC 61 NOD2 ----GCEMCSQEAFQAQRSQLVELLVSGSLEGFESVLDWLLSW--EVLS-WEDYEGFHLL 77 CARD11 -----------EEDALWENVECNRHMLSRYINPAKLTPYLRQC--KVIDEQDEDEVLNAP 64 CARD10 -----------EEDALWERIEGVRHRLARALNPAKLTPYLRQC--RVIDEQDEEEVLSTY 69 ASC ------------------------------------------------------------ PYCARD ------------------------------------------------------------ CARD8 SHYCSVLFLSVNYLGGTFPGDICSEENQ---------IVSSYA--SKVCFEIEEDYKNRQ 55 NALP1 ASHVAQANLKLLDVSKIFPIAEIAEESSPEVVPVELLCVPSPA--SQGDLHTKPLGTDDD 1078 BIRC2 TEEARFLTYHMWPLTFLSPSELARAGFYYIGPGDRVACFACGG--KLSNWEPKDDAMSEH 240 BIRC3 NENARLLTFQTWPLTFLSPTDLAKAGFYYIGPGDRVACFACGG--KLSNWEPKDNAMSEH 225 CRADD ------------------------------------------------------------ RAIDD-2 ------------------------------------------------------------ CARD14 ---------ALDEETLWEMMESHRHRIVRCICPSRLTPYLRQA--KVLCQLDEEEVLHSP 61 NLRC3 -------------QGHGTGSPAEQVKALMDLLAGKGSQGSQAP--QALDRTPDAPLGPCS 58 DLG5 GFDMAEGVNEPCFPGDCGIFVTKVDKGSIADGRLRVNDWLLRI--NDVDLINKDKKQAIK 693 BCL10 ------------MEPTAPSLTEEDLTEVKKDALENLRVYLCEK--IIAERHFDHLRAKKI 46 NLRC4 NREEVNIICCEKVEQDAARGIIHMILKKGSESCNLFLKSLKEWNYPLFQDLNGQSLFHQT 93 APAF-1 AGCGKSVLAAEAVRDHSLLEGCFPGGVHWVSVGKQDKSGLLMKLQNLCTRLDQDESFSQR 215 NOL3 -----------MGNAQERPSETIDRERKRLVETLQADSGLLLDALLARGVLTGPEYEALD 49 CARD6 ------------MATESTPSEIIERERKKLLEILQHDPDSILDTLTSRRLISEEEYETLE 48 DDX58 -----------MTTEQRRSLQAFQDYIRKTLDPTYILSYMAPWFREEEVQYIQAEKNNKG 49 IFIH1 ----VLDYLTFLPAEVKEQIQRTVATSGNMQAVELLLSTLEKGVWHLGWTREFVEALRRT 86 MAVS --------------MPFAEDKTYKYICRNFSNFCNVDVVEILPYLPCLTARDQDRLRATC 46 QRICH1 ---------MNNSLENTISFEEYIRVKARSVPQHRMKEFLDSLASKGPEALQEFQQTATT 51 RIPK2 -------MNGEAICSALPTIPYHKLADLRYLSRGASGTVSSARHADWRVQVAVKHLHIHT 53
Figure 4. Alignment of amino acid sequences of human genes containing CARDs. NOL3 sequence is highlighted in red. The E21 residue is highlighted in green.
Secondary structure is less relevant than tertiary structure because CARDs bind
via surface electrostatic interactions. The E21Q mutation changes an acidic glutamate to
a neutral glutamine residue, so a priori it seemed likely that the mutation alters the
electrostatic surface potential of NOL3. The 3-dimensional protein structure of NOL3
has not been determined. In the absence of a known structure, the best way to approx-
imate the structural effects of a mutation is via in silico homology modelling. This
156
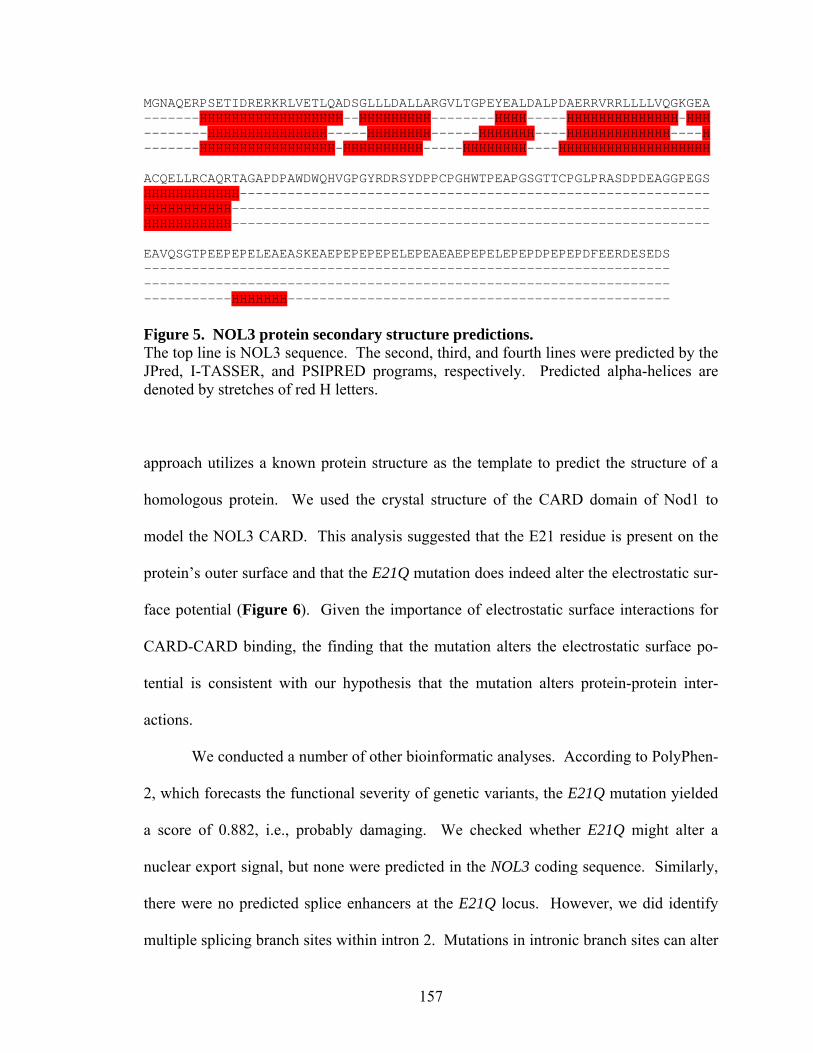
MGNAQERPSETIDRERKRLVETLQADSGLLLDALLARGVLTGPEYEALDALPDAERRVRRLLLLVQGKGEA -------HHHHHHHHHHHHHHHHHH--HHHHHHHHH--------HHHH-----HHHHHHHHHHHHHH-HHH --------HHHHHHHHHHHHHHH-----HHHHHHHH------HHHHHHH----HHHHHHHHHHHHH----H -------HHHHHHHHHHHHHHHHH-HHHHHHHHHH-----HHHHHHHH----HHHHHHHHHHHHHHHHHHH ACQELLRCAQRTAGAPDPAWDWQHVGPGYRDRSYDPPCPGHWTPEAPGSGTTCPGLPRASDPDEAGGPEGS HHHHHHHHHHHH----------------------------------------------------------- HHHHHHHHHHH------------------------------------------------------------ HHHHHHHHHHH------------------------------------------------------------ EAVQSGTPEEPEPELEAEASKEAEPEPEPEPELEPEAEAEPEPELEPEPDPEPEPDFEERDESEDS ------------------------------------------------------------------ ------------------------------------------------------------------ -----------HHHHHHH------------------------------------------------ Figure 5. NOL3 protein secondary structure predictions. The top line is NOL3 sequence. The second, third, and fourth lines were predicted by the JPred, I-TASSER, and PSIPRED programs, respectively. Predicted alpha-helices are denoted by stretches of red H letters.
approach utilizes a known protein structure as the template to predict the structure of a
homologous protein. We used the crystal structure of the CARD domain of Nod1 to
model the NOL3 CARD. This analysis suggested that the E21 residue is present on the
protein’s outer surface and that the E21Q mutation does indeed alter the electrostatic sur-
face potential (Figure 6). Given the importance of electrostatic surface interactions for
CARD-CARD binding, the finding that the mutation alters the electrostatic surface po-
tential is consistent with our hypothesis that the mutation alters protein-protein inter-
actions.
We conducted a number of other bioinformatic analyses. According to PolyPhen-
2, which forecasts the functional severity of genetic variants, the E21Q mutation yielded
a score of 0.882, i.e., probably damaging. We checked whether E21Q might alter a
nuclear export signal, but none were predicted in the NOL3 coding sequence. Similarly,
there were no predicted splice enhancers at the E21Q locus. However, we did identify
multiple splicing branch sites within intron 2. Mutations in intronic branch sites can alter
157

splicing and cause disease (Burrows et al. 1998). We sequenced all FCM patients and
putative FCM patients (see Chapter III), but they were all WT at these putative branch
sites.
WT (E21) Mutant (E21Q)
Figure 6. In silico homology modelling of WT and E21Q NOL3 protein structure predicts that E21Q alters the electrostatic surface potential of NOL3. WT denotes wild-type; asterisk denotes amino acid 21; red denotes negative charge; blue denotes positive charge. The NOL3 CARD sequence was modelled based on homology to the structure of the CARD domain of Nod1. Structures were visualized with UCSF Chimera software.
NOL3 Expression
As noted above, the literature makes clear that NOL3 is expressed in the brain
(Koseki et al. 1998, Engidawork et al. 2001, Gulesserian et al. 2001, Shelke & Leeuwen-
burgh 2003, Abmayr et al. 2004). However, nothing is known about which particular
brain regions or cell types express NOL3. This knowledge can be helpful in under-
standing pathophysiology (e.g., Lee et al. 2004). We examined expression in both mice
and humans. For mice, we first utilized data that had been generated from high-through-
158

put projects. The Allen Brain Atlas data (Lein et al. 2007), generated by in situ hybrid-
ization, suggested diffuse moderate expression (Figure 7). Nol3 was expressed at higher
levels in the olfactory bulb, hippocampus, and hypothalamus (Figure 7). Our immuno-
histochemistry of Nol3 protein in WT mouse brain agreed with these results (data not
shown; see Discussion).
Figure 7. Expression of Nol3 RNA in the murine brain. Image generated by the murine Allen Brain Atlas (Lein et al. 2007). Red, yellow, and green denote high, intermediate, and low gene expression, respectively. What about CNS cell type? Sugino et al. (2006) developed an elegant approach
of labelling different neuronal populations with combinations of fluorescent proteins,
enabling isolation and transcriptome profiling of each neuronal type. Their data did not
indicate differential expression of Nol3 by brain region, nor was Nol3 enriched in gluta-
matergic or GABAergic neurons. However, their approach was restricted to neurons.
Glia make up the vast majority of cells in the CNS, and it is becoming clear that they
159

serve many important roles (Molofsky et al. 2012). Cahoy et al. (2008) profiled expres-
sion in neurons, astrocytes, oligodendrocyte progenitor cells (OPCs), and oligodendro-
cytes. Again, Nol3 expression was diffuse and relatively modest, albeit detectable. Nol3
was ~3-fold enriched in oligodendrocytes and ~3-fold enriched in neurons, relative to
astrocytes. In a separate experiment, we performed reverse transcriptase PCR of RNA
from cultured oligodendrocytes or astrocytes, and observed Nol3 enrichment in oligo-
dendrocytes (Figure 8). This finding is preliminary because the RNA came from
cultures generated with different WT mice, and the experiment was only performed once.
Figure 8. Nol3 may be more highly expressed in oligodendrocytes than astrocytes. Reverse transcriptase PCR was performed on RNA from WT mouse primary cultured oligodendrocytes or astrocytes. We never attempted to repeat this admittedly crude experiment, so it is not definitive. ACTB denotes beta-actin (loading control); OL denotes oligodendrocyte.
Heiman et al. (2008) developed an ingenious method for transcriptional profiling
in which various mouse lines each carry a different transgenic driver that promotes ex-
pression of a tagged ribosome. The tagged ribosome is then affinity purified and the
associated RNAs are identified by microarray. For Nol3, they found increased expression
in cholinergic neurons of the forebrain and basal ganglia, and in motoneurons of the brain
160

stem (Figure 9). Their data did not concord with Cahoy et al. or Figure 8, as Heiman et
al. detected robust expression in cerebellar and cortical astrocytes (Figure 9).
0
20
40
60
80
100
120
140
160
astro
cyte
s
Bergm
ann g
lia
Golgi c
ells
Granule
cel
ls
mat
ure O
Ls
mat
ure O
Ls & O
PCs
Purkin
je ce
lls
stell
ate
& bask
et c
ells
astro
cyte
s
CS, CP n
euro
ns
CS neu
rons
CT neu
rons
CCK neu
rons
inte
rneu
rons (C
ort)
inte
rneu
rons (P
noc)
mat
ure O
Ls
mat
ure O
Ls & O
PCs
Ch-erg
ic n
eurons
Ch-erg
ic n
eurons
Drd1 M
SNs
Drd2 M
SNs
moto
neuro
ns
moto
neuro
ns
region
no
rma
lize
d e
xp
res
sio
n
cerebellum cortex fb basal ganglia bs sc
Figure 9. Expression of Nol3 in various murine brain cell types. These data were generated by Heiman et al. 2008. Of course, FCM is a disease of humans, so we studied NOL3 expression in the
human brain. According to the Human Protein Atlas (Uhlen et al. 2010), NOL3 protein
levels are high in cerebral cortical neurons and Purkinje cells, and moderate in hippo-
campal neurons, cortical and hippocampal glia, and cells in the granular and molecular
layers of the cerebellum. This data is consistent with the human Allen Brain Atlas (Haw-
rylycz et al. 2012), which showed high expression in the locus cereleus, hypothalamus,
globus pallidus, and cerebral cortical layers. The Atlas also indicated that NOL3 expres-
sion is low during development and rises through childhood, leveling off at around age
30 (Figure 10). This finding could potentially explain the adult onset nature of the
161

disease—perhaps NOL3 becomes more abundant and hence more functionally relevant as
humans age. To move beyond high-throughput databases, we obtained a panel of human
cDNA from ten regions of the brain and assayed NOL3 expression by reverse-tran-
scriptase PCR. This experiment is less sensitive than the techniques employed by the
high-throughput projects, but more specific. It suggested that NOL3 is expressed at
roughly equal levels in various regions (Figure 11). In sum, in both mice and humans
there is moderate expression of NOL3 throughout the brain.
Figure 10. NOL3 RNA expression during development in humans. These data were generated by the human Allen Brain Atlas (Hawrylycz et al. 2012).
162

NOL3
ACTB250
491647
Fron
tal l
obe
Tem
pora
l lob
eC
ereb
ellu
mH
ippo
cam
pus
Subs
tant
iani
gra
Cau
date
nuc
leus
Am
ygda
la
No
DN
A
Spin
al c
ord
Pons
Med
ulla
Gen
omic
DN
A
Hyp
otha
lam
us
Thal
amus
Figure 11. NOL3 RNA is expressed at comparable levels in various human brain regions. ACTB denotes beta-actin gene (loading control).
NOL3 Subcellular Localization
One common mechanism by which point mutations cause disease is by disrupting
protein trafficking rather than protein function per se. Protein trafficking is assessed by
examining subcellular localization. For WT NOL3, the literature conflicts. Some groups
claim it has nuclear localization, which would be in keeping with the nomenclature nucle-
olar protein 3 (Wang et al. 2005, Heikaus et al. 2008). Other groups state that NOL3 is
cytoplasmic (Stoss et al. 1999, Wang et al. 2005, Heikaus et al. 2008). Some evidence
supports the idea that NOL3 can be nuclear or cytoplasmic depending on the cell line,
e.g., nuclear in most cancer cells and cytoplasmic in primary cultured rat neurons (Wang
et al. 2005). Li et al. (2002) argued that NOL3 ordinarily trafficks from the cytoplasm to
mitochondria, and that a point mutation in the T149 residue prevented the mutant protein
from entering the mitochondria. However, their images were low-resolution, scant, and
not quantified.
In any case, because it is generally accepted that point mutations can disrupt
trafficking, and there was some evidence, albeit controversial, that NOL3 point mutations
163
disrupt trafficking, we hypothesized that the E21Q mutation might do likewise. We ex-
amined subcellular localization in HEK293 cells via fluorescence microscopy. Initially
we transfected GFP-tagged NOL3 (Wang et al. 2005), but we observed punctae character-
istic of GFP tetramerization (data not shown), which is a well-described phenomenon that
confounds any determination of subcellular localization (Rizzo et al. 2010). Though it
may be ingrateful, we must note that since we used a construct kindly provided by Wang
et al. (2005), their findings should be interpreted with caution.
To circumvent this problem, we expressed WT or E21Q NOL3 with a FLAG
epitope tag and performed immunohistochemistry against either the FLAG epitope or
NOL3 itself. We also co-stained with the mitochondrial dye Mitotracker, to test the
claims of Li et al. (2002). Initial experiments did not reveal any appreciable differences
between WT and E21Q (data not shown). The same was true in the cell line SK-N-SH,
which is neuronal in origin (Figure 12). We confirmed this in HEK cells by high-res-
olution confocal microscopy. Confocal imaging demonstrated punctate staining of NOL3
that did not overlap with mitochondria (Figure 13). We propose that the diffuse cyto-
plasmic expression observed by ordinary fluorescence microscopy in HEK and SK-N-SH
(Figure 12) cells does not account for variation in NOL3 localization in the z plane.
When this was controlled for by confocal microscopy (which constrains fluorescence to
one particular z plane at a time), the fluorescence was punctate. At this time we do not
know whether these punctae reside in the cytoplasm or in non-mitochondrial, membrane-
bound organelles. We abandoned this line of investigation because we are more inter-
ested in the pathophysiology of FCM – as reflected in differences between WT and
164

mutant NOL3 – rather than the subcellular localization per se. We concluded that the
E21Q mutation does not affect protein trafficking. [CONTINUED, p. 166]
WTWT
E21Q E21Q
Figure 12. The E21Q mutation does not affect cytoplasmic expression of NOL3-FLAG in SK-N-SH cells, a cell line of neuronal origin. Cells were transiently transfected and visualized with ordinary fluorescence microscopy. DAPI, FLAG, and Mitotracker are stained blue, green, and red, respectively. Shown are results using an antibody to FLAG; comparable results were obtained for NOL3 antibody. Comparable results were obtained in HEK cells. There was no green signal visible in cells transfected with empty vector (note that some adjacent cells not expressing the transgene have no green visible).
165

WT WT
E21Q E21Q
Figure 13. Neither WT nor E21Q NOL3-FLAG localize to mitochondria in HEK293 cells. Cells were transiently transfected and visualized with confocal microscopy. DAPI, FLAG, and Mitotracker are stained blue, green, and red, respectively. Shown are results using an antibody to NOL3 protein itself; comparable results were obtained for FLAG antibody. There was no green signal visible in cells transfected with empty vector (note that some adjacent cells not expressing the transgene have no green visible). The E21Q Mutation Alters Post-translational Modification of NOL3 Protein
Our next approach to investigating the functional consequences of the E21Q
mutation was to generate HEK293 cell lines with stably-incorporated cDNA transgenes
encoding FLAG-tagged WT or E21Q NOL3. To ensure that the lines were expressing
166

comparable amounts of transgene, we harvested protein and immunoblotted. We were
immediately struck by the presence of two distinct bands in NOL3E21Q cells but only a
very faint second band in NOL3WT cells (Figure 14A). By densitometry, the higher mol-
ecular weight species (henceforth referred to as the upper band) was ~10-fold enriched in
NOL3E21Q cells (Figure 14B). However, the total amount of NOL3 did not differ
between WT and E21Q cell lines (Figure 15). This phenomenon held true for multiple
independent HEK stable cell lines (Figure 14A), for transiently transfected HEK cells
(data not shown), and for the COS7 cell line (data not shown). It was also observed when
immunoblots were probed with either anti-FLAG (Figure 14A) or anti-NOL3 antibody
(data not shown). The transgene encoded a cDNA, so the upper band could not have re-
sulted from alternative splicing. It is unlikely that the upper band was a nonspecific stain
because there was very little background staining, and we observed the upper band in a
number of different cell lines and when staining with antibody to either the endogenous
protein or the tag. Thus, we concluded that the E21Q mutation alters post-translational
modification of NOL3 protein in cells.
NOL3WT NOL3WTNOL3E21Q NOL3E21Q
line 1 line A line 2 line B
A
GAPDH
NOL3-FLAG
37
25
kD
0
0.1
0.2
0.3
0.4
0.5
0.6
WT E21Q
up
pe
r:lo
we
r b
an
d r
ati
o
B **
Figure 14. NOL3E21Q-FLAG exhibits altered post-translational modification in HEK293 cells. (A) Shown is representative experiment from four independently generated stable cell lines probed with anti-FLAG antibody. Glyceraldehyde-3-phosphate dehydrogenase (GAPDH) is loading control.
167

(B) Quantification of upper:lower ratio of FLAG bands in NOL3WT-FLAG versus NOL3E21Q-FLAG stable cell lines. Shown is the mean of 3 biological replicates; error bars denote standard deviation. **Paired 2-tailed t-test P-value was 0.0078.
0
0.2
0.4
0.6
0.8
1
1.2
1.4
1.6
1.8
2
WT E21Q
tota
l FL
AG
:GA
PD
H r
ati
o
Figure 15. NOL3-FLAG protein is present at equal levels in WT and E21Q stable cell lines. The E21Q FLAG:GAPDH ratio for each experiment was normalized relative to WT. Data represent three independent biological replicates. The paired two-tailed t-test P-value was 0.818.
Seeing as the upper, mutant-specific band was our only biochemical lead, it be-
came a priority to identify it. The gel shift is ~2kD, NOL3 is known to be phospho-
rylated at 7 residues (Figure 2; Olsen et al. 2010), and phosphorylation at one of these
residues, T149, is functionally important for NOL3 protein-protein interactions and con-
sequent repression of apoptosis (see above; Li et al. 2002). Thus, our working hypothesis
was that the upper band corresponds to a phosphorylated form of NOL3. We tested this
hypothesis in multiple ways.
Presumably the two bands represent species in equilibrium, so any decrease in the
upper band should commensurately enhance the lower band, and vice versa. If the upper
band represents a phosphorylated form, then de-phosphorylation would be expected to
168

abrogate the upper band. Conversely, it is also possible that the upper band is a non-
phosphorylated form and that the lower band instead corresponds to a phosphorylated
form (proteins do not always run true to their molecular weight); in this case, de-phos-
phorylation would be expected to abrogate the lower band. We investigated these pos-
sibilities with in vitro phosphatase treatment, in which protein lysates from WT or E21Q
cells were incubated with phosphatase and then immunoblotted. We experimented with
different phosphatases (calf intestinal alkaline phosphatase, protein phosphatase 1, potato
acid phosphatase), different amounts of each phosphatase, and various incubation times.
We were cognizant that since a lysate contains the entire repertoire of phosphorylated
proteins from a cell, the phosphatase enzyme may be so flooded with substrate as to con-
sume its activity. Therefore, it is very unlikely that even large quantities of phosphatase
would cause detectable changes in phospho-NOL3. To minimize interactions between
phosphatase and nonspecific phosphorylated substrates, we repeated in vitro phosphatase
experiments with immunoprecipitated NOL3-FLAG. Immunoprecipitation did not alter
the banding patterns of WT or E21Q samples (Figure 14A). In all of these experiments,
with lysate or immunoprecipitate, phosphatase treatment did not affect the banding pat-
tern (Figure 16).
Figure 16. In vitro phosphatase treatment does not remove mutant-enriched upper band.
empty WT E21Q
no treatment CIP PP1
The same results were observed for a range of phosphatase doses and incubation times. CIP denotes calf intestinal alkaline phosphatase; PP1 denotes protein phosphatase 1.
169

However, it is possible that the in vitro phosphatase treatment was simply not
sufficient to de-phosphorylate phospho-NOL3. For example, perhaps the enzyme was in-
active, or phospho-NOL3 is refractory to de-phosphorylation except when catalyzed by
one specific phosphatase. These possibilities are exceedingly unlikely, but, to our
knowledge, cannot be disproved. In fact, it is impossible to dream up a positive control.
When the experiment is performed on lysate, there is such a plethora of phosphorylated
proteins present that no single phospho-protein can serve as positive control, since the
probability is that the phosphatase will be overwhelmed with substrate before the positive
control protein is appreciably de-phosphorylated. The melange of nonspecific phospho-
rylated proteins is removed by immunoprecipitation, but then there is no positive control
protein that is co-immunoprecipitated. Conceivably, one could use as a positive control a
phospho-protein that was separately immunoprecipitated, but that demolishes internal
validity. Thus, despite using three different phosphatases, and many different phospha-
tase doses, and a range of incubation times, we cannot say for certain that the upper band
is refractory to in vitro de-phosphorylation.
Next, we approached the hypothesis from a different angle: in vivo treatment with
a phosphatase inhibitor. We reasoned that treatment with phosphatase inhibitor should
drive the equilibrium towards the phosphorylated form. This in turn should be readily
discernible by abrogation of the lower band (if the upper band represents phospho-
NOL3), or abrogation of the upper band (if the lower band represents phospho-NOL3).
Ellis et al. (2001) provided proof of principle. We utilized two phosphatase inhibitors,
orthovanadate and fluoride, and incubated WT or E21Q cells for various time points (see
Methods), then harvested protein and immunoblotted. The treatment did not alter the
170

banding pattern (data not shown). We considered extending this approach by treating
cells with kinase inhibitors, or transfecting with phosphatase or kinase genes, but opted to
not do so.
Instead, we created mutants of five of the seven published NOL3 phosphorylation
sites (Figure 2; Olsen et al. 2010, Li et al. 2002). We individually mutated these residues
to alanines, which are sterically neutral and cannot be phosphorylated. Four of the five
alanine mutations had no effect, but one, T114A, abrogated the upper band (Figure 17).
While this mutation did dramatically decrease the amount of upper band, it did not appear
to completely abolish it (Figure 17). This suggested that T114 is critical to generation of
the upper band but phospho-T114 does not constitute the upper band per se.
untransfe
cted
empty vecto
r
E21Q stable
E21Q transient
S104A
T114
A
T122
A
T123
A
T149
A
E21Q Figure 17. T114A mutation abrogates formation of upper band in mutant (E21Q) background. The experiment was repeated at least five times. A representative image is shown. To ensure that the upper band did not correspond to phospho-T114 – and if not, to
identify the upper band once and for all – we pursued semi-quantitative mass spectrom-
etry. We immunoprecipitated NOL3-FLAG from WT and E21Q protein lysates, then
stained with Coomassie dye and excised the upper and lower bands (Figure 18). Purifi-
171

cation was robust. These samples were extensively analyzed by generic tandem mass
spectrometry (MS/MS) as well as phospho-enrichment MS/MS. We observed dramat-
ically increased T114 phosphorylation in both the E21Q upper band and the E21Q lower
band, relative to the WT lower band (Figure 19). The measurement of increased phos-
pho-T114 in the mutant lower band, along with low but detectable levels of phospho-
T114 in the WT lower band, was not consistent with the hypothesis that the upper band
corresponds to phospho-T114. To further rule out this possibility, we mutated T114 to an
aspartate, a residue that can mimic constitutive phosphorylation. In theory, if phospho-
T114 is the upper band, then the T114D mutation should eliminate the equilibrium be-
tween non-phospho-NOL3 and phospho-NOL3—instead, all species should resemble
phospho-NOL3 on Western blot. However, the banding patterns in WT;T114D and
E21Q;T114D double mutants were unchanged from that of WT and E21Q, respectively
(data not shown). Thus, we concluded that the upper band does not correspond to phos-
pho-T114 per se. Rather, we propose that phosphorylation at T114 regulates the for-
mation of the upper band, either by promoting the transformation from the lower to the
upper band, or by inhibiting the transformation from the upper to the lower band.
One interesting question is whether T114 may be the “gatekeeper residue” for a
kinase that phosphorylates NOL3 at multiple residues. Alternatively, one could posit that
the E21Q mutation permits indiscriminate phosphorylation of NOL3. However, repeated
MS/MS experiments, including phospho-enrichment, did not reveal any residues other
than T114 that were phosphorylated (data not shown). [CONTINUED, p. 174]
172

WT E21Q
L = Lysate
IP = anti-FLAG IP
S = IP supernatant
L IP S L IP S
25
37
50
20
75100
150250
IgH
IgL
NOL3-FLAG
Figure 18. Coomassie staining demonstrates robust purification of NOL3-FLAG prior to mass spectrometry analysis.
0.0
5.0
10.0
15.0
20.0
25.0
30.0
35.0
40.0
1 2 3
experiment
rela
tive
T11
4 p
ho
sph
ory
lati
on
WT low er band
E21Q low er band
E21Q upper band
Figure 19. T114 is hyper-phosphorylated in both mutant upper and lower bands, relative to WT.
173

Having ruled out phosphorylation, we tested alternative identities for the mutant-
enriched upper band. A reasonable guess was a ubiquitylated species because it was
previously published that apoptotic stimuli trigger NOL3 ubiquitylation (Nam et al.
2007). Ubiquitylation occurs on lysine residues, which also happen to be the cleavage
sites for trypsin. Ubiquitylation interrupts trypsin digestion and is thus easily detected by
MS/MS. Indeed, semi-quantitative MS/MS suggested that peptides corresponding to
tryptic cleavage at lysine residues were reduced in the mutant lower and upper bands.
These peptides were enriched ~10-fold in the mutant upper band relative to the mutant
lower band, and enriched ~50-fold in the mutant upper band relative to the WT lower
band (data not shown). Furthermore, there was ~10-fold more ubiquitin per molecule of
NOL3 in the mutant upper band versus the mutant lower band (data not shown). These
measurements could be consistent with the upper band corresponding to a ubiquitylated
NOL3 species, since there will inevitably be some contamination of the upper band
species in the lower band samples. However, this hypothesis was contradicted by our
repeated attempts at immunoblotting with anti-ubiquitin antibodies (see Methods), which
did not stain either the upper or the lower band (data not shown). In parallel, we ex-
pressed tagged ubiquitin motifs to facilitate ubiquitin immunoblotting, but still did not
detect any staining that colocalized with either NOL3 band (data not shown). Moreover,
we mutated the three lysine residues on NOL3 to alanines, but there was no effect on the
upper band (data not shown). If all lysines have been mutated to alanines, ubiquitylation
cannot take place, so the persistence of the upper band indicated that it is not a ubiq-
uitylated NOL3 species.
174

We entertained a number of other hypotheses regarding the upper band’s identity.
N-terminal cleavage is common in apoptotic signaling pathways, as is N-terminal
acetylation (Yi et al. 2011). However, when we cloned a construct with distinct epitope
tags at the N-terminus and the C-terminus, the banding pattern was identical upon
immunoblotting with an antibody to either the N-terminal tag or C-terminal tag (data not
shown). A species with N-terminal acetylation was detected by MS/MS, but the acety-
lated peptide was equally abundant in WT and E21Q samples (data not shown). Another
species with N-terminal myristoylation was identified but again did not differ between
WT and E21Q (data not shown). We also considered palmitoylation at residue C79
because MS/MS never detected a peptide containing this residue (data not shown).
However, treatment with the reducing agent beta-mercaptoethanol, which should remove
palmitoylation on cysteine residues (Valdez-Taubas & Pelham 2005), did not affect the
upper band (data not shown). Furthermore, mutating C79 to alanine in a mutant back-
ground did not abolish the upper band, nor did it enhance the upper band in a WT
background (data not shown). Another hypothesis was suggested to us by way of a very
interesting paper in which a protein of the Bcl apoptotic family exhibited a ~2kD gel shift
upon apoptotic stimulation, a gel shift that conferred the function of repressing apoptosis
(Deverman et al. 2002). Deverman et al. ascribed these gel shifts to deamidation of two
asparagine residues. Asparagine residues are most likely to be deamidated when fol-
lowed by a glycine residue in an unstructured portion of the protein. In NOL3 (a 206 aa
peptide) there is only a single asparagine residue, and it is not followed by a glycine.
This alone would not be conclusive; however, the absence of a deamidated species by
175

MS/MS, and the presence of peptide fragments containing normal asparagine residues in
the upper band, did rule out deamidation (data not shown).
There were yet more possibilities. Perhaps the mutation causes a failure to ter-
minate translation, a phenomenon that is occasionally observed in expressed proteins.
However, when we searched the MS/MS data for peptides containing the stretch of
residues after the FLAG tag that would be translated if termination did not occur, none
had been detected (data not shown). A second idea was that the upper band might cor-
respond to a version of NOL3 that was not being fully denatured. We tested this hypoth-
esis by using more concentrated SDS sample buffer and boiling for longer periods of
times to ensure denaturation. We also tried adding TCEP, a reducing agent that breaks
disulfide bonds. Neither treatment had any effect (data not shown). Our final approach
was to digest with proteases other than trypsin. Again, there were no unassigned peptides
with molecular weight of ~2kD different than the corresponding WT species (data not
shown).
All of our attempts to identify the upper band by MS/MS or to alter the upper
band with biochemical treatments were ineffectual. Out of ideas, we discontinued this
line of investigation. We concluded that the E21Q mutation alters post-translational
modification of NOL3, and that this process is regulated by the T114 residue. However,
the identity of the modified species remains unknown, and in fact, we do not know for
sure that the upper band represents a bona fide biochemical lead into FCM patho-
physiology (see Discussion).
176

Apoptosis and Putative Pro-apoptotic Binding Partners
NOL3 binds five pro-apoptotic binding partners: Caspase-2, Caspase-8, Fas,
FADD, and Bax (see Introduction). These interactions are necessary for NOL3 to
repress apoptosis. The E21Q mutation resides in the protein-protein interaction motif
that is crucial for binding. Previously, point mutations in NOL3 have been shown to
abolish NOL3 binding to one of its pro-apoptotic binding partners (Li et al. 2002), and
hence diminish NOL3 inhibition of apoptosis (Li et al. 2002, Gustaffson et al. 2004).
Thus, we sought to assess whether the E21Q mutation alters the known binding inter-
actions, and/or whether it affects NOL3 apoptotic function.
We began with apoptosis. The published experiments, which demonstrated that
NOL3 blocks apoptosis, employed microscopy to measure cellular viability. Cells are
incubated with an inducer of apoptosis and then stained for markers of apoptosis, such as
nuclear condensation, loss of mitochondrial membrane integrity, or chromatin fragmen-
tation. We expended considerable effort attempting to replicate these experiments. Al-
though some of our data did suggest that NOL3 expression represses apoptosis, the data
were inconsistent (data not shown). With practice, we ascertained what we feel is a fatal
flaw of these experiments: cells which have already died will detach from the plate and
are lost in the washes and incubations required to assess viability via imaging. The in-
ability to include already-dead cells confounds the analysis.
To circumvent this shortcoming, we undertook fluorescence activated cell sorting
(FACS) using a nuclear stain (PI, propidium iodide) and a phosphatidylserine stain
(annexin V). The double stain approach (Figure 20) discriminates amongst the stages of
apoptosis. An early apoptotic cell is annexin V-positive (since phosphatidylserine is
177
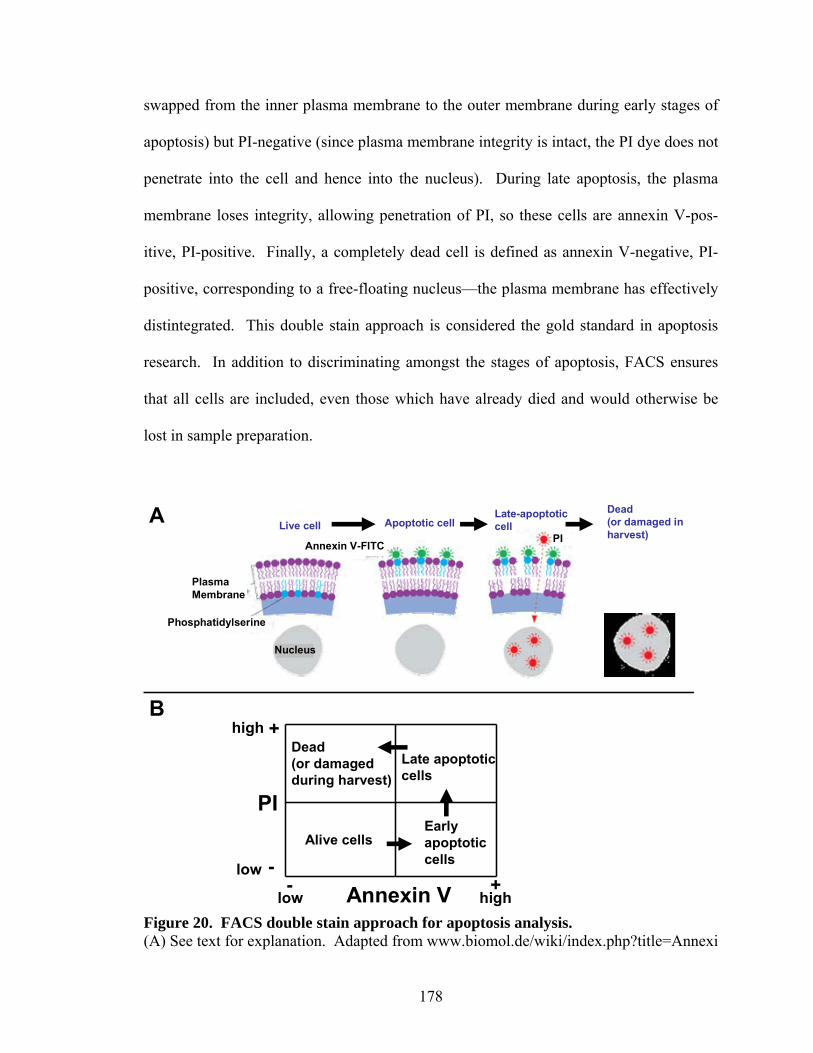
swapped from the inner plasma membrane to the outer membrane during early stages of
apoptosis) but PI-negative (since plasma membrane integrity is intact, the PI dye does not
penetrate into the cell and hence into the nucleus). During late apoptosis, the plasma
membrane loses integrity, allowing penetration of PI, so these cells are annexin V-pos-
itive, PI-positive. Finally, a completely dead cell is defined as annexin V-negative, PI-
positive, corresponding to a free-floating nucleus—the plasma membrane has effectively
distintegrated. This double stain approach is considered the gold standard in apoptosis
research. In addition to discriminating amongst the stages of apoptosis, FACS ensures
that all cells are included, even those which have already died and would otherwise be
lost in sample preparation.
B
Phosphatidylserine
PlasmaMembrane
PI
Nucleus
Live cell Apoptotic cellLate-apoptotic cell
Dead (or damaged in harvest)
Annexin V-FITC
Annexin V
PI
low
low
high
high
Alive cellsEarly apoptoticcells
Late apoptoticcells
Dead(or damaged during harvest)
- +-
+
A
Figure 20. FACS double stain approach for apoptosis analysis. (A) See text for explanation. Adapted from www.biomol.de/wiki/index.php?title=Annexi
178

n_V_Apoptosis_Detection_Kit. (B) Schematic of cell viability as assayed by relative amounts of annexin V and PI. PI denotes propidium iodide. These experiments revealed greater cell death at baseline (before treatment with
apoptotic inducer) in cells expressing either WT or E21Q NOL3 relative to vector
(Figures 21, 22). After treatment, there were comparable levels of cell death between
vector and the NOL3 conditions (Figures 21, 22). Since there was increased apoptosis in
NOL3 cells at baseline, the relative increase in apoptosis upon treatment was smaller.
The populations on FACS were less distinct than expected, but the placement of the
FACS gates distinguished positively- or negatively-stained cells quite well, as is evident
by comparing the unstained control to the PI-stained or annexin V-stained control
(Figure 21). Moreover, there was clear progression in cell death after treatment (Figures
21, 22). On the basis of these data, we concluded that NOL3 expression enhances
apoptosis at baseline. This directly contradicts published findings (see Discussion). In
any case, it is less important whether NOL3 represses or enhances apoptosis. The more
pertinent question, given our interest in FCM pathophysiology, is whether the E21Q
mutation has any effect on this process. Upon close inspection with the double stain
FACS analysis, the answer seems to be no. [CONTINUED, p. 181]
179

Figure 21. Expression of either WT or E21Q NOL3 predisposes HEK293 cells to apoptosis at baseline. PI denotes propidium iodide; Tx denotes treatment with staurosporine. See Figure 20 for a schematic on interpreting these plots.
180

0
10
20
30
40
50
60
70
80
90100
VEC no Tx VEC Tx WT no Tx WT Tx E21Q no Tx E21Q Tx
% c
ells
very dead via apopt
late apopt or necrosis
early apopt
intact
Figure 22. Quantification of FACS data confirms that NOL3 expression predisposes to apoptosis at baseline. Tx denotes treatment with an inducer of apoptosis; VEC denotes vector. Error bars are not shown because this data depicts a representative experiment. What about the published claims of NOL3 binding to pro-apoptotic proteins?
Presumably, if NOL3 expression predisposes to a higher basal rate of apoptosis, this
mechanism may still be at play. Virtually all of the literature data comes from in vitro
systems in which both the bait and the putative prey were highly overexpressed (e.g.,
driven by a cytomegalovirus [CMV] promoter). Since co-immunoprecipitations (co-IPs)
are notoriously dependent upon protein overexpression and/or wash conditions, we
sought to validate these interactions in more biologically relevant systems. First, we tried
co-IPs with WT mice (Nol3 knockout mice serving as a negative control). Unfortunately,
the endogenous NOL3 antibody worked very poorly for these IPs (data not shown). (We
are currently generating a new endogenous NOL3 antibody via the UC Davis/NIH
NeuroMab project.) As a compromise, we used HEK293 cells to overexpress NOL3 in
the context of endogenous expression of putative prey proteins. We then co-IPed against
the NOL3 FLAG tag and probed for the prey using endogenous antibodies. We exper-
181

imented with many different antibodies, antibody concentrations, and wash conditions
(see Methods). For two putative prey proteins, Caspase-2 and Bax, we were able to de-
monstrate via Western blot the lack of interaction between NOL3 and prey (Figure 23).
Given these results, it is reasonable to conclude that the published protein-protein inter-
actions either represent nonspecific phenomena implicit in double overexpression in vitro
systems, or that these phenomena are not applicable to our more biologically rel-evant
single overexpression in vitro system, and by extension, are unlikely to be bio-logically
relevant in vivo.
Caspase-2
Bax
VEC WT mutant empty
IP input IP input IP input N/A
FLAG (NOL3)
Figure 23. Putative pro-apoptotic binding partners do not interact with NOL3. Shown are Western blots performed with antibodies to endogenous Caspase-2 or Bax. Enrichment of NOL3 via immunoprecipitation (IP) serves as a positive control. We tried many different antibodies and wash conditions of varying stringency, to no avail. All other putative pro-apoptotic binding partners could never be satisfactorily stained with endogenous Ab. VEC denotes vector. A high-throughput protein-protein “interactome” project had previously used co-
IP and MS/MS to identify two putative binding partners of NOL3, PACSIN3 and PNKP
(Ewing et al. 2007). The study stated that these were high-confidence interactions. This
hypothesis was attractive because PACSIN3 is involved in synaptic vesicle membrane
182

trafficking and endocytosis, and it also binds TRPV4 (Cuajungco et al. 2006), a calcium
channel that tunes neuronal excitability in response to sensory stimuli (D’hoedt et al.
2008). TRPV4 mutations in humans can cause neuropathy (Auer-Grumbach et al. 2010,
Deng et al. 2010, Landoure et al. 2010), spinal muscular atrophy (Auer-Grumbach et al.
2010), and skeletal dysplasias (Rock et al. 2008, Krakow et al. 2009). The other putative
binding partner, PNKP, is a DNA repair enzyme. PNKP is mutated in a microcephaly
syndrome that includes severe seizures (Shen et al. 2010). Alas, repeated attempts to
validate the interactions between NOL3 and PNKP or PACSIN3 through co-IPs were
negative (data not shown).
Screen for Novel Binding Partners
Though we had ruled out the published binding partners, we nevertheless felt that
since the E21Q mutation resides in the CARD domain, a known protein-protein inter-
action motif, it was still reasonable to hypothesize that FCM pathophysiology results
from altered protein binding. For example, the E21Q mutation could cause loss-of-
function in NOL3WT binding interactions. Alternatively, the mutation could cause gain-
of-function in NOL3E21Q-specific binding partners. To identify novel NOL3WT and
NOL3E21Q binding partners, we performed co-IP followed by MS/MS.
We aged WT and Nol3 knockout littermate mice to one year, isolated brain, and
performed co-IPs. Unfortunately, as mentioned above, the endogenous antibody was not
effective, and we were unable to obtain sufficient protein for the screen (data not shown).
Instead, we used HEK293 cells expressing either vehicle (vector), NOL3WT-FLAG, or
NOL3E21Q-FLAG, and co-IPed against the FLAG tag. The bound proteins were eluted,
183

fluorescently labeled, run on a 2D SDS-PAGE gel, and identified by MS/MS (Figure
24). We focused on those proteins that were enriched relative to vehicle in the WT
sample, the E21Q sample, or both. In both NOL3 conditions, the positive control, NOL3,
was very highly enriched. (None of the published interactors, discussed above, were
identified by this method, which is further evidence against their biological relevance.)
After removing hits that were likely nonspecific (actin, HSP70, Ig light chain), there were
three candidates (Table 2).
VehicleWT
6
7
18
21
32
22
23
31
33
34 10
Figure 24. Two-dimensional gel electrophoresis of co-immunoprecipitates obtained from Vehicle or WT NOL3 HEK293 cells. The E21Q gel is omitted because no NOL3E21Q-specific binding partners were identified. Spot numbers correspond to Table 2.
184

Table 2. Novel NOL3 binding partners identified by co-immunoprecipitation and differential two-dimensional gel electrophoresis. The listed values represent relative spot intensity. The NOL3 lower and upper bands served as positive controls (since virtually no NOL3 was observed on the vehicle gel, the ratios were so high as to be meaningless). NOL3 upper band (spot 22) was much less abundant than the lower band in NOL3WT (see Figure 24), in keeping with low but detectable levels observed by Western blot (Figure 14A). Spot numbers correspond to Figure 24.
Spot # Gene WT/Vehicle Mutant/Vehicle Other 23 NOL3 very high very high positive control 22 NOL3 very high very high positive control 18 ACTIN 4.08 no change likely nonspecific 10 PRPF19 2.36 no change presumably PRPF19α 31 IG light 2.05 no change low quality MS/MS 6 HSP70 2.00 1.40 likely nonspecific 34 PRPF19 1.63 2.28 presumably PRPF19β 7 ESRRA 1.63 1.67 low quality MS/MS 33 HSP70 1.30 1.64 21 HNRNPD 1.26 no change likely nonspecific
The first candidate, ESRRA, is similar to estrogen receptor (ER)-alpha, but has no
known endogenous ligand (Sladek et al. 1997). Little is known about its function, but it
presumably modulates a bevy of transcriptional targets a la ER-alpha. The MS/MS data
for ESRRA was relatively low quality (Table 2), so it was not identified with certainty
and is less compelling than the other two candidates. The second hit was HNRNPD.
Interestingly, HNRNPD functions in regulating expression of the peptide neurotrans-
mitter enkephalin (Dobi et al. 2006), and in the proliferation and differentiation of
cortical and cerebellar neural progenitors (Hambardzumyan et al. 2009, Lee et al. 2008).
The third hit, PRPF19, modulates neural differentiation and neuronal/astroglial cell fate
decisions (Urano et al. 2006).
PRPF19 is the most promising candidate for two reasons. First, the PRPF19 fold
changes were highest of all the candidates, and second, two independent PRPF19 iso-
185

forms were enriched (Table 2). It is very unlikely that nonspecific binding would have
led to enrichment of two distinct isoforms of the same gene. (The same argument could
be made for HSP70, but HSP70 is known to function in protein folding and was probably
enriched because of the CMV-mediated overexpression; this is corroborated by its
enrichment in both WT and E21Q.) Interestingly, a previous paper identified two
PRPF19 isoforms, PRPF19α and PRPF19β, one of which drives differentiation into
neurons, and the other into astroglia (Urano et al. 2006). The MS/MS data did not enable
determination of which gel spot corresponded to which isoform. Since PRPF19α is
504aa and PRPF19β is 523aa (Urano et al. 2006), we presume that spot 10, which ran at a
smaller molecular weight, corresponds to PRPF19α. Conversely, spot 34 likely repre-
sents PRPF19β. The screen suggested that both NOL3WT and NOL3E21Q interact with
PRPF19β, but that NOL3E21Q does not interact with PRPF19α (Table 2). NOL3E21Q loss-
of-function in binding to PRPF19α was accompanied by enhanced binding to PRPF19β
(Table 2), supporting the idea that there is an equilibrium in NOL3 binding that main-
tains the balance of PRPF19α/β (see Discussion). NOL3E21Q also did not interact with
HNRNPD. Thus, we hypothesize that the E21Q mutation causes loss-of-function in
binding to HNRNPD and PRPF19α, and that these alterations ultimately affect CNS
development (see Discussion).
Absence of Neuronal Hyperexcitability in Nol3 Knockout Mice
Since the NOL3 mutation causes a human disorder of neuronal hyperexcitability,
we investigated the phenotype of a previously-generated Nol3 knockout (Nol3-/-) mouse
line (Donath et al. 2006). On inspection, Nol3-/- mice did not exhibit any overt motor
186

phenotype, including myoclonus (data not shown). To assess cortical excitability, we
measured SSEPs in aged (5 months old) Nol3-/- mice and littermate WT (Nol3+/+)
controls. SSEPs were recorded with cortical surface electrodes in response to stimulation
with brief current pulses delivered via a needle electrode to the hindlimb. Mean SSEP
time to peak (WT: 59.4±0.4msec [n=4]; KO: 58.3±0.1msec [n=3]; p=0.67 by t-test) and
10-90% rise time (WT: 41.8±0.1msec [n=4]; KO: 44.2±0.3msec [n=3]; p=0.21 by t-test)
were statistically equivalent between genotypes (Figure 25). These data indicate normal
conduction velocity of signals from the periphery to the cortex, and normal population
responses of the somatosensory cortex to peripheral stimulation.
-0.6
-0.4
-0.2
0
0.2
0.4
0.6
0.8
1
1.2
0 0.5 1 1.5
Time (sec)
Av
era
ge
d,
No
rma
lize
d P
ote
nti
al
WT1WT2WT3WT4KO1KO2KO3
Figure 25. Somatosensory evoked potentials in aged Nol3-/- (KO) and Nol3+/+ (WT) littermate control mice.
187

Generation of E21Q Mice
Since Nol3 knockout mice do not recapitulate the human FCM phenotype (see
above), we sought to test whether mice carrying the E21Q point mutation in Nol3 would
be a more faithful disease model. The Nol3 gene contains 4 exons. Exons 2 and 3
encode the vast majority of the protein, with a few terminal amino acids encoded by exon
4. A targeting vector was constructed that matched the WT allele except for the addition
of two FRT sites, three LoxP sites, a Neo cassette, and the E21Q point mutation (Figure
26). Placing the third LoxP site in the intronic region between exons 3 and 4 was a
calculated gamble: placement in the intron could interfere with mRNA splicing, whereas
insertion distal to that intron, in the 3’UTR, could interfere with mRNA stability.
However, a location distal to the 3’UTR would have precluded efficient recombination,
and bioinformatic analyses suggested that placement in the intron would not disrupt or
create a splice acceptor site. Southern blot and PCR data to confirm successful construc-
tion of the targeting vector are presented in Appendix 5.
Upon electroporation of the targeting vector into embryonic stem (ES) cells, the
5’ and 3’ homology arms underwent recombination (Figure 26). After neomycin
screening, ES cells were inserted into blastocysts, which were subsequently implanted
into pseudopregnant females to generate chimeric mice. Chimeric mice will be bred to
homozygosity, and then crossed to Flp mice to generate Nol3E21Q knockin mice. It will
then be possible to generate mice carrying a conditional knockout allele by crossing the
Nol3E21Q knockin allele to various Cre lines. The diversity of tissue-specific and
temporal-specific Cre lines should allow us to interrogate the cell types and develop-
mental stages that contribute to the phenotype of Nol3E21Q mice.
188

Figure 26. Generation of mice with knockin allele or conditional knockout allele at the Nol3 locus. The depicted segments are the following lengths: 3’ homology arm, 5809bp; 5’ homology arm, 1798bp; E21Q point mutation, 1bp; FRT, 34bp; LoxP, 50bp; middle homology arm, 793bp; Neo cassette, 1712bp. See text and Appendix 5 for more detail.
189

DISCUSSION We have described our attempts to elucidate the mechanism by which NOL3 mu-
tation causes familial cortical myoclonus (FCM). We found that NOL3 is broadly ex-
pressed in the CNS and that the NOL3 mutation alters post-translational modification of
NOL3. This modification is regulated by phosphorylation at the T114 residue, but its
identity is still a mystery. We were unable to replicate the published claims that NOL3
interacts with several pro-apoptotic binding partners, and, in further contrast to the liter-
ature, NOL3 expression predisposed to apoptosis at baseline. In other work, a proteomic
screen for novel binding partners suggested two tantalizing candidates: HNRNPD and
PRPF19. Finally, we phenotyped Nol3 knockout mice, and, since they did not have a
phenotype akin to FCM, we generated Nol3 knockin mutant mice. These experiments
have a number of limitations and implications that are discussed in turn in the succeeding
sections.
NOL3 is Broadly Expressed in the Murine and Human Brain
We demonstrated through various approaches that NOL3 is expressed in many
brain regions in both mice and humans (Figures 7, 11). Prior studies have demonstrated
Nol3 expression in the CNS of mice (see above), but our studies provide the first detailed
characterization. We had hoped to detect expression in more limited subsets of the brain
so as to aid in understanding FCM. Instead, Nol3 is broadly expressed at low to moderate
levels. The functional significance of this is not clear.
We had further hoped to glean some insight into pathophysiology if Nol3 expres-
sion were restricted to particular CNS cell types. This was not the case: Nol3 was
190

expressed in most or all cell types, at least in the mouse brain (Figure 9). We believe
that Figure 8 should be interpreted with circumspection—this experiment was a one-off.
More stock can be placed in Figure 9. A major caveat is that all of these studies meas-
ured Nol3 RNA. In point of fact, this is a shortcoming of nearly all contemporary gene
expression studies. Since RNA is easy to measure, it is the only thing measured. How-
ever, with some notable exceptions (e.g., microRNAs), the primary matter of functional
importance for the cell is the quantity of corresponding protein. Thus, we corroborated
the RNA data by immunohistochemistry of NOL3 protein in WT mouse brain slices.
This showed diffuse, low-level expression, with particular enrichment in the cell bodies
of cortical pyramidal neurons and cerebellar Purkinje cells (data not shown). Given the
relatively poor quality of the endogenous antibody, these findings are not definitive and
have been omitted.
In Silico Homology Modelling and Bioinformatic Analyses
NOL3 is highly evolutionarily conserved, particularly around the mutated residue
(Figure 1). Interestingly, we were unable to identify NOL3 homologs in lower vertebrate
species. It is tempting to speculate that the restriction of NOL3 to higher vertebrates may
somehow relate to the increasing complexity of their CNS. But correlation does not
causation make, and for the time being this supposition remains just that—speculative.
To understand the structural ramifications of the E21Q mutation, in silico homol-
ogy modelling was the only realistic option. Homology modelling is prone to error, and
these analyses should be interpreted with due caution. This is particularly concerning
because the CARD domain of Nod1, which served as the scaffold, is not especially ho-
191

mologous to the NOL3 CARD (Figure 4). If we were to select a scaffold based upon
amino acid sequence homology, CARD6 would have been a much better choice (Figure
4), but its structure was not available. Figure 4, the alignment of all human CARD pro-
teins, was illuminating—we were struck by their dissimilarity. When considered in con-
cert with the fact that NOL3 lacks the 6 or 7 alpha-helices stereotypical of a CARD
(Figure 5), it would not be unreasonable to conclude that NOL3 may not even be a
CARD after all. However, this assertion is contradicted by the substantial homology be-
tween NOL3 and CARD6. Nevertheless, we marvel at the influence that bioinfor-
maticians can wield when assigning gene nomenclature to predicted coding sequences.
We fear that nomenclature itself often biases investigation towards a functional direction
that may be based solely on underwhelming sequence homology. Still, it cannot be dis-
puted that the E21Q mutation changes a glutamate to a glutamine residue. If the homol-
ogy modelling can be believed, then the E21 residue is positioned on the outer surface of
the protein, and even if the modelling cannot be believed, having a polar side-chain the
glutamate is unlikely to be positioned in the protein’s hydrophobic core. As an exposed
residue, a change from a glutamate (acidic) to a glutamine (neutral) residue will change
the electrostatic surface potential. On balance, these analyses, in combination with the
literature, support the hypothesis that the E21Q mutation alters protein-protein inter-
actions (see below).
The Elusive Upper Band
When we first performed Western blots from cells expressing NOL3WT or
NOL3E21Q, we were puzzled by the doublet banding pattern in E21Q samples. However,
192

this finding was robust and for a very long time was our only biochemical lead. We thus
expended considerable time and effort attempting to identify it. In the end, we failed to
identify it but did gain insight into the underlying biochemistry. We learned that mu-
tating the T114 residue to an alanine (which prevents phosphorylation) abrogated the
upper band (Figure 17). This was not true for the other phospho-site mutants that we
tested (Figure 17). It should be noted that we only tested five of the seven known phos-
pho-sites, but it would have been prohibitive to mutate all candidate phospho-sites (there
are 17 serine, threonine, or tyrosine residues that we did not check), and by MS/MS we
did not detect phosphorylation at any NOL3 residue other than T114. Despite the T114A
mutation abrogating the upper band, we do not believe that the upper band corresponds to
phospho-T114, for the following three reasons: phospho-T114 peptide was enriched in
both the upper and lower bands from E21Q cells (Figure 19); a small amount of upper
band was observed despite the T114A mutation (Figure 17); and repeated phosphatase
manipulations – which should have modified the relative amounts of non-phospho-T114
and phospho-T114 – were ineffectual (Figure 16).
To reconcile these findings, we propose that phosphorylation at T114 regulates
formation of the upper band, either by promoting the post-translational modification that
converts the lower band to the upper band, or by inhibiting the modification that converts
the upper band to the lower band. We cannot explain why the phospho-mimic T114D
mutation and phosphatase manipulations, both of which would be expected to alter these
processes, had no overt effect. It is even possible that the T114A mutation abrogates for-
mation of the upper band by precluding some T114 modification other than phospho-
rylation. This would not, prima facie, accord with the mutant-specific MS/MS enrich-
193

ment of phospho-T114, but is nevertheless possible. We also do not know the exact iden-
tity of the upper band. As described in excruciating detail above, we considered many
explanations for its identity and tested each using in vitro chemical treatments, muta-
genesis, and MS/MS. Ultimately, it all proved fruitless.
The upper band’s recalcitrance prompted us to doubt its biological relevance.
These reservations are not intrinsic to its truculent nature—rather, it simply remains un-
clear whether the mutant-specific upper band represents a bona fide biochemical lead to
understanding FCM pathophysiology or whether it is a red herring, a breadcrumb left by
Mother Nature to induce us into a hopeless line of experimentation. If the latter, we fell
for it hook, line, and sinker. On the other hand, the former would be supported by detec-
tion of the upper band in vivo. The upper band was not discernible by Western blot in
samples from WT mice (Donath et al. 2006, and data not shown). Detection of the upper
band would not necessarily be expected in vivo given that in WT cell lines the upper band
is sometimes faint enough to be invisible (Figure 14A). Considering the low quality of
the endogenous NOL3 antibody, it may well be the case that the upper band is present in
brain lysates but dilute enough to be below the limit of detection. Whether the upper
band exists in vivo can be settled once and for all with the E21Q knockin mice. A
complementary way to bolster the upper band’s biological relevance would be if addi-
tional FCM-causative NOL3 alleles are associated with a doublet banding pattern in vitro.
Until either and preferably both of these developments come to pass, we refrain from
passing judgment on the upper band’s functional importance. We failed to identify it,
and we failed to demonstrate its significance to FCM pathophysiology. The upper band
was a fickle mistress indeed.
194

NOL3 in Apoptosis
When we had accumulated sufficient genetic evidence that NOL3 is the FCM
gene (Chapter III) and were ready to begin functional investigation, we were gratified to
learn that NOL3 was a relatively well-characterized gene (see Introduction). In retro-
spect, this was less of a blessing than a curse, for we were pigeonholed by the published
claims that NOL3 functions in apoptosis. Our data do support a role for NOL3 in apop-
tosis, but that role is to enhance apoptosis at baseline. This conclusion is antithetical to
the literature, which states that NOL3 represses apoptosis. Using our data, one could, in
theory, argue that NOL3 represses apoptosis, but only if one calculates the relative cell
death as a fold change, comparing pre-treatment to post-treatment values (Figures 21,
22). Any such calculation is confounded by the greater cell death at baseline (pre-treat-
ment) in cells expressing NOL3 (either WT or E21Q). Post-treatment, there are compa-
rable levels of cell death in vehicle, WT, and E21Q (Figures 21, 22). In our view, to
argue from these data that NOL3 represses apoptosis is disingenuous. If a cell starts dead
it is less likely that treatment will kill it, but that does not imply that starting dead
represses apoptosis! As far as we can tell, the most accurate conclusion is that NOL3 en-
hances basal apoptosis. Why an increase in apoptosis at baseline is not accompanied by a
commensurate increase in apoptosis upon apoptotic induction is unclear. In any case, it is
actually less important whether NOL3 represses or enhances apoptosis, for our ultimate
goal is to understand FCM pathophysiology, however that may come about. The more
important question then becomes whether the E21Q mutation has any effect on this proc-
ess. According to our double stain FACS analysis, the answer is no.
195

One does not blithely conclude that a stack of published papers are erroneous.
And yet, it is impossible to adopt the party line when our data directly contradict it. We
concede that our experiments are not definitive. One obvious limitation – among many –
is that vehicle cells, while expressing an empty vector, did not overexpress protein via a
CMV promoter, a la WT or E21Q cells. The robust NOL3-FLAG overexpression may
have altered various cellular processes, including apoptosis. This limitation is not sol-
uble, as overexpression of any other protein would confound the data. In that sense, uti-
lizing both a WT and mutant NOL3 construct serves as an internal control. In the end, we
cannot say for sure that NOL3 enhances apoptosis – though all evidence points in that
direction – but it seems safer to conclude that the E21Q mutation has no effect on the role
of NOL3 in apoptosis, whatever that role may be (if any). Considered in isolation, this
objection may be compelling. However, we must stress that the same shortcoming ap-
plies to the published experiments, experiments that we were unable to replicate despite
using the exact same constructs, cell lines, apoptotic induction/measurement reagents,
and methods. In retrospect, then, it is troubling that the published NOL3 papers did not
utilize the double stain FACS approach for assaying apoptosis. This assay is the gold
standard method and has been established for well over a decade—for example, it was
detailed in Current Protocols in 2001 (Zhivotovsky et al. 2001). Therefore, its omission
as a validation step may be an indication that the data in those papers was, as is sadly all
too common, massaged in order to generate conclusions that were expedient at the time
but in the long view simply do not stand. At the very least, one could surmise that those
groups performed FACS double staining and observed incompatible results.
196

Similarly, we were dismayed to find that we could not replicate the published
NOL3 interactions with pro-apoptotic binding partners (Figure 23). Again, we are cog-
nizant of the hubris in concluding that since we could not replicate the finding, the find-
ing must be wrong. We may be wrong. All we can say for certain is that our laborious
attempts to replicate the literature using the exact published methods were futile. Neither
were we able to replicate the mitochondrial subcellular localization of NOL3 (Figures
12, 13) that was published in one paper (Li et al. 2002). We were also appalled to hear
from a separate principal investigator that they had not used “yeast two-hybrid screening
to identify interacting proteins with full-length [NOL3] as bait”, as was published in Nam
et al. (2004). Instead, they “actually used an antibody array screen” (personal commu-
nication) to identify the putative NOL3 binding partners. Repeated requests to obtain
pertinent reagents and primary data from both groups went unanswered. While we can
never rule out confounding factors, we believe that if considerable effort is not sufficient
to replicate what should be a straightforward finding, that finding must be called into
question. At the minimum, the inability to replicate these interactions under slightly
more biologically relevant conditions should raise doubts as to their importance in vivo.
PNKP19 and HNRNPD: a Potential Mechanism for FCM Pathophysiology?
Before expounding on the proteomics screen, we wish to touch on its disad-
vantages. (These partially apply to the apoptosis assays and co-IPs discussed above.) It
is possible that the FLAG tag affects the binding properties of NOL3. We believe that
this scenario is unlikely because the FLAG tag is a small epitope and is located at the C-
terminus, whereas the protein-protein interaction motif is N-terminal; furthermore, since
197

the E21Q mutation is near the N-terminus, any alterations in NOL3 binding due to the
FLAG tag will, presumably, equally affect both WT and mutant NOL3. Of greater con-
cern is the choice of cell line. HEK293 cells, although they have been used extensively
to characterize NOL3 (e.g., Koseki et al. 1998, Hong et al. 2003, Nam et al. 2004),
obviously differ substantially from in vivo CNS cells. These differences could affect
NOL3 function and could distort the pool of candidate binding partners. In other words,
the screen may have been limited in detecting biologically relevant interactions. After
all, if you fish all day long in a pool filled with minnows that bite at the lure, you may
feel that the lure is attractive only to minnows, but you cannot know until you cast into
the ocean—if the big fish bite, you were wrong all along. For technical reasons, we
could not avoid this shortcoming. Nevertheless, the candidate binding partners identified
by the screen present a legitimate starting point if they can be validated in vivo.
If they hold up, the HNRNPD and PRPF19 interactions intimate a seductive
hypothesis. The hypothesis is as follows. NOL3WT ordinarily interacts with HNRNPD,
PRPF19α, and PRPF19β (Table 2). The E21Q mutation abolishes the interactions with
HNRNPD and PRPF19α (Table 2). Since PRPF19α drives neuronal differentiation,
whereas PRPF19β promotes astroglial differentiation (Urano et al. 2006), the cessation of
the PRPF19α interaction should alter the balance of neuronal/astroglial differentiation.
For now, we do not know whether NOL3’s interactions with PRPF19α/β serve to activate
or inhibit, so it is impossible to predict the precise effects on differentiation. Similarly,
we do not know whether this mechanism alters differentiation of excitatory versus inhib-
itory neurons. The same goes for differentiation of astroglia, which are becoming appre-
ciated as critical modulators of CNS output in their own right (Coulter & Eid 2012,
198

Molofsky et al. 2012). At any rate, we predict that the ultimate effect of these abrogated
interactions is cortical hyperexcitability, as manifested in stimulus-sensitive myoclonus
(i.e., FCM). This hypothesis is testable (see Chapter V). In passing, we cannot help but
remark that the data in the PRPF19 paper are, in our view, modest (Urano et al. 2006).
Whether the findings can be replicated is an open question.
This hypothesis posits a loss-of-function, which, at first glance, does not seem to
agree with the apparent absence of a phenotype in Nol3 knockout mice (Figure 26), nor
with the observation that one neurologically normal human has a heterozygous chromo-
somal deletion spanning NOL3 (Park et al. 2010). However, these data need not contra-
dict the HNRNPD/PRPF19 hypothesis, for the situation may be more complex than sim-
ple loss-of-function. For example, suppose that NOL3 binding to both PRPF19α and
PRPF19β maintains a balance of differentiation that ensures proper CNS development.
When NOL3 is mutated such that it can only bind PRPF19β and not PRPF19α, PRPF19β
is hyperactive and drives differentiation towards a mutant phenotype. Now, suppose that
NOL3 is absent altogether (e.g., in Nol3 knockout mice). In this scenario, it is plausible
that PRPF19α and PRPF19β remain in balance. That is to say, NOL3 is not essential to
maintain the balance—it is only when NOL3 function is selectively disrupted that pathol-
ogy ensues. Of course, the actual mechanism may be dramatically more complex than
that. In any event, the presence or absence of an excitability phenotype in E21Q knockin
mice should help to resolve at least some of these issues (see Chapter V).
In sum, we have shown that NOL3 is highly conserved and broadly expressed in
the brain. The E21Q mutation, which causes familial cortical myoclonus (FCM) in hu-
mans, alters post-translational modification of NOL3 protein in vitro, although the iden-
199

tity and biological relevance of this change is not clear. In contrast to the literature, we
did not observe NOL3 binding to pro-apoptotic proteins, nor did NOL3 repress apoptosis.
Be that as it may, we identified novel NOL3 binding interactions that are disrupted by the
E21Q mutation and thus may explain FCM pathophysiology. This putative mechanism,
some experiments required to test it, and the implications are more fully explored in
Chapter V.
200

REFERENCES Abmayr S, Crawford RW, Chamberlain JS. 2004. Characterization of ARC, apoptosis
repressor interacting with CARD, in normal and dystrophin-deficient skeletal
muscle. Hum Mol Genet 13:213-21
An J, Li P, Li J, Dietz R, Donath S. 2009. ARC is a critical cardiomyocyte survival
switch in doxorubicin cardiotoxicity. J Mol Med 87:401-10
Auer-Grumbach M, Olschewski A, Papic L, Kremer H, McEntagart ME, et al. 2010.
Alterations in the ankyrin domain of TRPV4 cause congenital distal SMA,
scapuloperoneal SMA and HMSN2C. Nat Genet 42:160-64
Bouma W, Noma M, Kanemoto S, Matsubara M, Leshnower BG, et al. 2010. Sex-
related resistance to myocardial ischemia-reperfusion injury is associated with
high constitutive ARC expression. Am J Physiol Heart Circ Physiol 298:H1510-
17
Burrows NP, Nicholls AC, Richards AJ, Luccarini C, Harrison JB, et al. 1998. A point
mutation in an intronic branch site results in aberrant splicing of COL5A1 and in
Ehler-Danlos syndrome type II in two British families. Am J Hum Genet 63:390-
98
Cahoy JD, Emery B, Kaushal A, Foo LC, Zamanian JL, et al. 2008. A transcriptome
database for astrocytes, neurons, and oligodendrocytes: a new resource for
understanding brain development and function. J Neurosci 28:264-78
Carter BZ, Qiu YH, Zhang N, Coombes KR, Mak DH, et al. 2011. Expression of ARC
(apoptosis repressor with caspase recruitment domain), an antiapoptotic protein, is
strongly prognostic in AML. Blood 117:780-87
201

Chou JJ, Matsuo H, Duan H, Wagner G. 1998. Solution structure of the RAIDD CARD
and model for CARD/CARD interaction in caspase-2 and caspase-9 recruitment.
Cell 94:171-80
Coulter DA, Eid T. 2012. Astrocytic regulation of glutamate homeostasis in epilepsy.
Glia 60:1215-26
Cuajungco MP, Grimm C, Oshima K, D’hoedt D, Nilius B, et al. 2006. PACSINs bind
to the TRPV4 cation channel. J Biol Chem 281:18753-62
D’hoedt D, Owsianik G, Prenen J, Cuajungco MP, Grimm C, et al. 2008. Stimulus-
specific modulation of the cation channel TRPV4 by PACSIN3. J Biol Chem
283:6272-80
de Alba E. 2009. Structure and interdomain dynamics of apoptosis-associated speck-like
protein containing a CARD (ASC). J Biol Chem 284:32932-41
Deng HX, Klein CJ, Yan J, Shi Y, Wu Y, et al. 2010. Scapuloperoneal spinal muscular
atrophy and CMT2C are allelic disorders caused by alterations in TRPV4. Nat
Genet 42:165-69
Deverman BE, Cook BL, Manson SR, Niederhoff RA, Langer EM, et al. 2002. Bcl-xL
deamidation is a critical switch in the regulation of the response to DNA damage.
Cell 111:51-62
Dobi A, Szemes M, Lee C, Palkovits M, Lim F, et al. 2006. AUF1 is expressed in the
developing brain, binds to AT-rich double-stranded DNA, and regulates
enkephalin gene expression. J Biol Chem 281:28889-900
202

Donath S, Li P, Willenbockel C, Al-Saadi N, Gross V, et al. 2006. Apoptosis repressor
with caspase recruitment domain is required for cardioprotection in response to
biomechanical and ischemic stress. Circulation 113:1203-12
Doyle JP, Dougherty JD, Heiman M, Schmidt EF, Stevens TR, et al. 2008. Application
of a translational profiling approach for the comparative analysis of CNS cell
types. Cell 135:749-62
Ekhterae D, Platoshyn O, Zhang S, Remillard CV, Yuan JXJ. 2003. Apoptosis repressor
with caspase domain inhibits cardiomyocyte apoptosis by reducing K+ currents.
Am J Physiol Cell Physiol 284:C1405-10
Ekhterae D, Hinmon R, Matsuzaki K, Noma M, Zhu W, et al. 2011. Infarction induced
myocardial apoptosis and ARC activation. J Surg Res 166:59-67
Ellis CE, Schwartzberg PL, Grider TL, Fink DW, Nussbaum RL. 2001. α-synuclein is
phosphorylated by members of the Src family of protein-tyrosine kinases. Proc
Natl Acad Sci U S A 276:3879-84
Engidawork E, Gulesserian T, Yoo BC, Cairns N, Lubec G. 2001. Alteration of
caspases and apoptosis-related proteins in brains of patients with Alzheimer’s
disease. Biochem Biophys Res Commun 281:84-93
Espinosa F, McMahon A, Chan E, Wang S, Ho CS, et al. 2001. Alcohol
hypersensitivity, increased locomotion, and spontaneous myoclonus in mice
lacking the potassium channels Kv3.1 and Kv3.3. J Neurosci 21:6657-65
Ewing RM, Chu P, Elisma F, Li H, Taylor P, et al. 2007. Large-scale mapping of human
protein-protein interactions by mass spectrometry. Mol Syst Biol 3:89
Foo RSY, Nam YJ, Ostreicher MJ, Metzl MD, Whelan RS, et al. 2007. Regulation of
203

p53 tetramerization and nuclear export by ARC. Proc Natl Acad Sci U S A
104:20826-31
Gulesserian T, Engidawork E, Yoo BC, Cairns N, Lubec G. 2001. Alteration of
caspases and other apoptosis regulatory proteins in Down syndrome. J Neural
Transm Suppl 61:163-79
Gustafsson AB, Tsai JG, Logue SE, Crow MT, Gottlieb RA. 2004. Apoptosis repressor
with caspase recruitment domain protects against cell death by interfering with
Bax activation. J Biol Chem 279:21233-38
Hambardzumyan D, Sergent-Tanguy S, Thinard R, Bonnamain V, Masip M, et al. 2009.
AUF1 and Hu proteins in the developing rat brain: implication in the proliferation
and differentiation of neural progenitors. J Neurosci Res 87:1296-1309
Hawrylycz MJ, Lein ES, Guillozet-Bongaarts AL, Shen EH, Ng L, et al. 2012. An
anatomically comprehensive atlas of the adult human brain transcriptome. Nature
489:391-99
Heikaus S, Kempf T, Mahotka C, Gabbert HE, Ramp U. 2008. Caspase-8 and its
inhibitors in RCCs in vivo: the prominent role of ARC. Apoptosis 13:938-49
Heiman M, Schaefer A, Gong S, Peterson JD, Day M, et al. 2008. A translational
profiling approach for the molecular characterization of CNS cell types. Cell
135:738-48
Hiller S, Kohl A, Fiorito F, Herrmann T, Wider G, et al. 2003. NMR structure of the
apoptosis- and inflammation-related NALP1 pyrin domain. Structure 11:1199-
205
Hong YM, Jo DG, Lee JY, Chang JW, Nam JH, et al. 2003. Down-regulation of ARC
204

contributes to vulnerability of hippocampal neurons to ischemia/hypoxia. FEBS
Lett 543:170-73
Iuliano BA, Schmelzer JD, Thiemann RL, Low PA, Rodriguez M. 1994. Motor and
somatosensory evoked potentials in mice infected with Theiler’s murine
encephalomyelitis virus. J Neurol Sci 123:186-94
Joensuu T, Lehesjoki AE, Kopra O. 2008. Molecular background of EPM1-Unverricht-
Lundborg disease. Epilepsia 49:557-63
Kalviainen R, Khyuppenen J, Koskenkorva P, Erikkson K, Vanninen R, et al. 2008.
Clinical picture of EPM1-Unverricht-Lundborg disease. Epilepsia 49:549-56
Koseki T, Inohara N, Chen S, Nunez G. 1998. ARC, an inhibitor of apoptosis expressed
in skeletal muscle and heart that interacts selectively with caspases. Proc Natl
Acad Sci U S A 95:5156-60
Krakow D, Vriens J, Camacho N, Luong P, Deixler H, et al. 2009. Mutations in the
gene encoding the calcium-permeable ion channel TRPV4 produce
spondylometaphyseal dysplasia, Kozlowski type and metatropic dysplasia. Am J
Hum Genet 84:307-15
Kuo CT, Zhu S, Younger S, Jan LY, Jan YN. 2006. Identification of E2/E3
ubiquitinating enzymes and caspase activity regulating Drosophila sensory neuron
dendrite pruning. Neuron 51:283-90
Landoure G, Zdebik AA, Martinez TL, Burnett BG, Stanescu HC, et al. 2010. Mutations
in TRPV4 cause Charcot-Marie-Tooth disease type 2C. Nat Genet 42:170-74
Lee C, Gyorgy A, Maric D, Sadri N, Schneider RJ, et al. 2008. Members of the NuRD
205

chromatin remodeling complex interact with AUF1 in developing cortical
neurons. Cereb Cortex 18:2909-19
Lee HY, Xu Y, Huang Y, Ahn AH, Auburger GW, et al. 2004. The gene for paroxysmal
non-kinesigenic dyskinesia encodes an enzyme in a stress response pathway.
Hum Mol Genet 13:3161-70
Lehtinen MK, Tegelberg S, Schipper H, Su H, Zukor H, et al. 2009. Cystatin B
deficiency sensitizes neurons to oxidative stress in progressive myoclonus
epilepsy, EPM1. J Neurosci 29:5910-15
Lein ES, Hawrylycz MJ, Ao N, Ayres M, Bensinger A, et al. 2007. Genome-wide atlas
of gene expression in the adult mouse brain. Nature 445:186-76
Li PF, Li J, Muller EC, Otto A, Dietz R, et al. 2002. Phosphorylation by protein kinase
CK2: a signaling switch for the caspase-inhibiting protein ARC. Mol Cell
10:247-58
Li YZ, Liu XH, Zhu XM, Cai LR. 2007. ARC contributes to the inhibitory effect of
preconditioning on cardiomyocyte apoptosis. Apoptosis 12:1589-95
Li Z, Jo J, Jia JM, Lo SC, Whitcomb DJ, et al. 2010. Caspase-3 activation via
mitochondria is required for long-term depresssion and AMPA receptor
internalization. Cell 141:859-71
Loan Le TY, Mardini M, Howell VM, Funder JW, Ashton AW, et al. 2012. Low-dose
spironolactone prevents apoptosis repressor with caspase recruitment domain
degradation during myocardial infarction. Hypertension 59:1164-69
Manon F, Favier A, Núñez G, Simorre JP, Cusack S. 2007. Solution structure of NOD1
206

CARD and mutational analysis of its interaction with the CARD of downstream
kinase RICK. J Mol Biol 365:160-74
Mercier I, Vuolo M, Jasmin JF, Medina CM, Williams M, et al. 2008. ARC (apoptosis
repressor with caspase recruitment domain) is a novel marker of human colon
cancer. Cell Cycle 7:1640-47
Molofsky AV, Krencik R, Ullian EM, Tsai HH, Deneen B, et al. 2012. Astrocytes and
disease: a neurodevelopmental perspective. Genes Dev 26:891-907
Murtaza I, Wang HX, Feng X, Alenina N, Bader M, et al. 2008. Down-regulation of
catalase and oxidative modification of protein kinase CK2 lead to the failure of
apoptosis repressor with caspase recruitment domain to inhibit cardiomyocyte
hypertrophy. J Biol Chem 283:5996-6004
Nam YJ, Mani K, Ashton AW, Peng CF, Krishnamurthy B, et al. 2004. Inhibition of
both the extrinsic and intrinsic death pathways through nonhomotypic death-fold
interactions. Mol Cell 15:901-12
Nam YJ, Mani K, Wu L, Peng CF, Calvert JW, et al. 2007. The apoptosis inhibitor ARC
undergoes ubiquitin-proteasomal-mediated degradiation in response to death
stimuli: identification of a degradation-resistant mutant. J Biol Chem 282:5522-
28
Neuss M, Monticone R, Lundberg MS, Chesley AT, Fleck E, et al. 2001. The apoptotic
regulatory protein ARC (apoptosis repressor with caspase recruitment domain)
prevents oxidant stress-mediated cell death by preserving mitochondrial function.
J Biol Chem 276:33915-22
Olsen JV, Vermeulen M, Santamaria A, Kumar C, Miller ML, et al. 2010. Quantative
207

phosphoproteomics reveals widespread full phosphorylation site occupancy
during mitosis. Sci Signal 3:ra3
Park H, Kim JI, Ju YS, Gokcumen O, Mills RE, et al. 2010. Discovery of common
Asian copy number variants using integrated high-resolution array CGH and
massively parallel DNA sequencing. Nat Genet 42:400-405
Prasad SS, Russell M, Nowakowska M. 2010. Neuroprotection induced in vitro by
ischemic preconditioning and postconditioning: modulation of apoptosis and
PI3K-Akt pathways. J Mol Neurosci 43:428-42
Pyo JO, Nah J, Kim HJ, Chang JW, Song YW, et al. 2008. Protection of cardiomyocytes
from ischemic/hypoxic cell death via Drbp1 and pMe2GlyDH in cardio-specific
ARC transgenic mice. J Biol Chem 283:30707-14
Quadrilatero J, Bloemberg D. 2010. Apoptosis repressor with caspase recruitment
domain is dramatically reduced in cardiac, skeletal, and vascular smooth muscle
during hypertension. Biochem Biophys Res Commun 391:1437-42
Rajandram R, Pat BK, Li J, Johnson DW, Gobe GC. 2009. Expression of apoptotic
tumour necrosis factor receptor-associated factor, caspase recruitment domain and
cell death-inducing DFF-45 effector genes in therapy-treated renal cell carcinoma.
Nephrology 14:205-12
Reed JC, Doctor KS, Godzik A. 2004. The domains of apoptosis: a genomics
perspective. Sci STKE 239:re9
Ren J, Babcock SA, Li Q, Huff AF, Li SY, et al. 2009. Aldehyde dehydrogenase-2
transgene ameliorates chronic alcohol ingestion-induced apoptosis in cerebral
cortex. Toxicol Lett 187:149-56
208

Renatus M, Stennicke HR, Scott FL, Liddington RC, Salvesen GS. 2001. Dimer
formation drives the activation of the cell death protease caspase 9. Proc Natl
Acad Sci U S A 98:14250-55
Rizzo MA, Davidson MW, Piston DW. 2010. Fluorescent protein tracking and
detection: fluorescent protein structure and color variants. Live Cell Imaging, 2nd
ed. Cold Spring Harbor, NY: CSHL Press
Rock MJ, Prenen J, Funari VA, Funari TL, Merriman B, et al. 2008. Gain-of-function
mutations in TRPV4 cause autosomal dominant brachyolmia. Nat Genet 40:999-
1003
Shelke RR, Leeuwenburgh C. 2003. Lifelong caloric restriction increases expression of
apoptosis repressor with a caspase recruitment domain (ARC) in the brain.
FASEB J 17:494-96
Shen J, Gilmore EC, Marshall CA, Haddadin M, Reynolds JJ, et al. 2010. Mutations in
PNKP cause microcephaly, seizures and defects in DNA repair. Nat Genet
42:245-49
Sladek R, Beatty B, Squire J, Copeland NG, Gilbert DJ, et al. 1997. Chromosomal
mapping of the human and murine orphan receptors ERRalpha (ESRRA) and
ERRbeta (ESRRB) and identification of a novel human ERRalpha-related
pseudogene. Genomics 45:320-26
Srimathi T, Robbins SL, Dubas RL, Hasegawa M, Inohara N, et al. 2008.
Monomer/dimer transition of the caspase-recruitment domain of human Nod1.
Biochemistry 47:1319-25
Stoss O, Schwaiger FW, Cooper TA, Stamm S. 1999. Alternative splicing determines
209

the intracellular localization of the novel nuclear protein Nop30 and its interaction
with the splicing factor SRp30c. J Biol Chem 274:10951-62
Sugino K, Hempel CM, Miller MN, Hattox AM, Shapiro P, et al. 2006. Molecular
taxonomy of major neuronal classes in the adult mouse forebrain. Nat Neurosci
9:99-107
Suzuki T, Miyamoto H, Nakahari T, Inoue I, Suemoto T, et al. 2009. Efhc1 deficiency
causes spontaneous myoclonus and increased seizure susceptibility. Hum Mol
Genet 18:1099-1109
Tan WQ, Wang JX, Lin ZQ, Li YR, Lin Y, et al. 2008. Novel cardiac apoptotic
pathway: the dephosphorylation of apoptosis repressor with caspase recruitment
domain by calcineurin. Circulation 118:2268-76
Trinidad JC, Thalhammer A, Specht CG, Lynn AJ, Baker PR, et al. 2008. Quantitative
analysis of synaptic phosphorylation and protein expression. Mol Cell
Proteomics 7:684-96
Uhlen M, Oksvold P, Fagerberg L, Lundberg E, Jonasson K, et al. 2010. Towards a
knowledge-based human protein atlas. Nat Biotechnol 28:1248-50
Urano Y, Iiduka M, Sugiyama A, Akiyama H, Uzawa K, et al. 2006. Involvement of the
mouse Prp19 gene in neuronal/astroglial cell fate decisions. J Biol Chem
281:7498-7514
Valdez-Taubas J, Pelham H. 2005. Swf1-dependent palmitoylation of the SNARE Tlg1
prevents its ubiquitination and degradation. EMBO J 24:2524-32
Vaughn DE, Rodriguez J, Lazebnik Y, Joshua-Tor L. 1999. Crystal structure of Apaf-1
210

caspase recruitment domain: an alpha-helical Greek key fold for apoptotic
signaling. J Mol Biol 293:439-47
Wang JX, Li Q, Li PF. 2009. Apoptosis repressor with caspase recruitment domain
contributes to chemotherapy resistance by abolishing mitochondrial fission
mediated by dynamin-related protein-1. Cancer Res 69:492-500
Wang M, Qanungo S, Crow MT, Watanabe M, Nieminen AL. 2005. Apoptosis
repressor with caspase recruitment domain (ARC) is expressed in cancer cells and
localizes to nuclei. FEBS Lett 579:2411-15
Wu L, Nam YJ, Kung G, Crow MT, Kitsis RN. 2010. Induction of the apoptosis
inhibitor ARC by Ras in human cancers. J Biol Chem 285:19235-45
Yi CH, Pan H, Seebacher J, Jang IH, Hyberts SG, et al. 2011. Metabolic regulation of
protein N-alpha-acetylation by Bcl-xL promotes cell survival. Cell 146:607-20
Zaiman AL, Damico R, Thoms-Chesley A, Files DC, Kesari P, et al. 2012. A critical
role for the protein apoptosis repressor with caspase recruitment domain in
hypoxia-induced pulmonary hypertension. Circulation 124:2533-42
Zhivotovsky B, Samali A, Orrenius S. 2001. Determination of apoptosis and necrosis.
Curr Protoc Toxicol Chapter 2:Unit2.2
Zhou P, Chou J, Olea RS, Yuan J, Wagner G. 1999. Solution structure of Apaf-1 CARD
and its interaction with caspase-9 CARD: a structural basis for specific
adaptor/caspase interaction. Proc Natl Acad Sci U S A 96:11265-70
211

CHAPTER V
Conclusion
212

We have described the characterization of a novel phenotype, familial cortical
myoclonus (FCM), the identification of a mutation in NOL3, and functional investi-
igations to elucidate the molecular pathophysiology by which NOL3 mutation causes
FCM. In the preceding chapters we presented ample evidence that FCM is a novel
phenotype and that NOL3 is the disease gene. On the other hand, the molecular mech-
anism is still speculative. In Chapter IV we laid out the hypothesis that the mutation
alters the binding of NOL3 to HNRNPD and PRPF19α/β, thereby skewing neuron-
al/astroglial differentiation during development.
Given the panoply of reagents that we have generated, it should be relatively
straightforward to test this hypothesis. First, the HNRNPD and PRPF19 interactions with
NOL3WT must be validated in vitro, then in vivo (in WT mice). Concomitantly, one can
address whether the E21Q mutation alters HNRNPD and PRPF19 interactions both in
vitro and in vivo (in E21Q knockin mice). Nol3 knockout mice can serve as a negative
control. The E21Q mice will, it is hoped, exhibit a myoclonus phenotype behaviorally
and electrophysiologically. The next step would be a careful examination of neuronal
proliferation and differentiation. This can be studied in vivo, using various Cre driver
lines, because the E21Q allele is floxed. Moreover, since Nol3 null mice are WT, we
should be able to exploit the many existing Cre lines to perform tissue- and temporal-
specific rescue of the E21Q myoclonus phenotype. Both HNRNPD and PRPF19 mod-
ulate RNA processing, so transcriptome sequencing (“RNA-seq”) should provide insight
into the broader transcriptional changes. Finally, if the E21Q mice do faithfully reca-
pitulate the FCM phenotype, it may even be possible to apply the knowledge gleaned
from cellular and molecular studies by testing various compounds as possible treatments.
213

We are optimistic, but wish to emphasize in the most strenuous terms that the
HNRNPD/PRPF19 hypothesis is a tentative one. Even if this hypothesis proves to be
wrong, though, we predict that the E21Q knockin mice will confirm the assignment of
NOL3 as the disease gene. Granted, many bona fide human disease genes are not associ-
ated with similar phenotypes in mouse models, and sometimes there is no mouse pheno-
type at all. In that sense, a negative result would be less definitive than a positive one—
that is, the absence of a myoclonus phenotype in the E21Q mice would not discredit
NOL3 as the disease gene. Ultimately, the claim that NOL3 is the FCM gene can be best
settled by the identification of independent NOL3 mutations in patients with the same or a
similar phenotype. As discussed in Chapter III, this long-awaited development may be
nigh.
Were the HNRNPD/PRPF19 hypothesis to prove incorrect, what then is the
mechanistic link between NOL3 and neuronal hyperexcitability? The possibilities are, of
course, legion. Given the published findings that NOL3 inhibits apoptosis, an obvious
possibility is that a mutation in an apoptosis repressor leads to increased apoptosis of
neurons (e.g., inhibitory neurons). In the view of our results outlined in Chapter IV, this
seems unlikely. It is also possible that NOL3 functions in apoptotic signaling but not in
apoptosis per se. Caspases and their inhibitors are expressed in healthy mature neurons
and can regulate CNS functions other than apoptosis. For example, gain-of-function in a
Drosophila apoptosis repressor abrogates caspase activity and dendritic pruning (Kuo et
al. 2006, Rumpf et al. 2011). Caspase-3 activation promotes AMPA receptor internal-
ization and associated long-term depression (Li et al. 2010). Caspase-3 also modulates
glutamatergic synaptic transmission and plasticity (D’Amelio et al. 2010), and other cas-
214

pases control neuroinflammatory microglia (Burguillos et al. 2011) and pruning of axons
(Nikolaev et al. 2009). Caspases are able to modulate these diverse activities without
initiating apoptosis because they are active only in certain subcellular compartments
(Feinstein-Rotkopf & Arama 2009). Returning to the dendritic pruning example, caspase
activity is localized to those dendrites that are degenerating (Williams et al. 2006), there-
by preventing widespread cellular damage. In total, these studies indicate that alterations
in apoptotic pathway signaling may cause neurologic phenotypes by mechanisms other
than apoptosis itself. However, since we observed relatively diffuse subcellular expres-
sion of WT and mutant NOL3, it is unlikely that this mechanism applies to FCM unless
in vivo NOL3 expression is more localized.
In fact, at this point it is still uncertain whether the NOL3 mutation causes a loss-
of-function, a gain-of-function, or a neomorph. The absence of an excitability phenotype
in Nol3 knockout mice, in concert with the observation of a neurologically normal patient
with a heterozygous deletion of NOL3 (Park et al. 2010), strongly argues against a loss-
of-function mechanism. A gain-of-function seems more plausible, especially seeing as
the E21Q mutation enhances NOL3 post-translational modification. Liu et al. (2011)
gives an illustrative example. They found that patients with chronic mucocutaneous can-
didiasis had mutations in STAT1 that were gain-of-function: the mutations enhance phos-
phorylation of STAT1 and thereby dampen IL-17 immunity. For FCM, a neomorphic
mechanism is also possible, but a priori it is impossible to predict what that may be.
Moving beyond the molecular and cellular scale to the anatomical level, the
pathophysiology of myoclonus is, to quote Churchill by way of Carr, “a riddle, wrapped
in a mystery, inside an enigma” (2012). Even the anatomically tidy categories of sub-
215

cortical and cortical myoclonus have been called into question (Carr 2012). It turns out
that cortical myoclonus may involve or derive from subcortical structures (Carr 2012).
Other authors have argued for a cerebellar origin. For example, patients with familial
adult myoclonic epilepsy, a classic disorder of cortical myoclonus, exhibit cerebellar pa-
thology on autopsy and MRI (van Rootselaar et al. 2004, 2007, Striano et al. 2009,
Buijink et al. 2012). Possible explanations include abnormal reciprocal interactions be-
tween the cerebellum and the motor cortex, or decreased cortical inhibition due to a dys-
functional cerebello-thalamo-cortical loop (Striano et al. 2012). Alternatively, the cere-
bellar pathology may be unrelated; under this model, the cortical hyperexcitability results
from enhanced intrinsic rhythmicity in cortical generators (Striano et al. 2012). For now,
we just do not know. For an elementary motor output – myoclonus – we have a very
poor understanding of its etiology even at the broad anatomical level. In this regard,
identifying a molecular culprit, NOL3, may be helpful.
In summary, we have identified a novel Mendelian phenotype characterized by
autosomal dominant cortical myoclonus. We propose for this disorder the term familial
cortical myoclonus (FCM). FCM is likely caused by a mutation in the gene NOL3. The
mutation does not alter the published apoptotic NOL3 functions. Instead, we hypothesize
that the NOL3 mutation disrupts NOL3 interactions with HNRNPD and PRPF19, thus al-
tering cortical development and culminating in neuronal hyperexcitability and disease.
This hypothesis will be tested in the transgenic mice we generated. This work should fa-
cilitate diagnosis and genetic counseling in patients with myoclonus. Furthermore, as has
proved the case for many other Mendelian diseases, we anticipate that further investiga-
tion to understand the role of NOL3 in FCM pathophysiology will provide insight into
216

mechanisms of membrane hyperexcitability relevant to other forms of myoclonus and
even epilepsy.
217

REFERENCES Buijink AW, Caan MW, Tijssen MA, Hoogduin JM, Maurits NM, et al. 2012.
Decreased cerebellar fiber density in cortical myoclonic tremor but not in
essential tremor. Cerebellum epub ahead of print
Burguillos MA, Deierborg T, Kavanagh E, Persson A, Hajji N, et al. 2011. Caspase
signalling controls microglia activation and neurotoxicity. Nature 472:319-24
Carr J. 2012. Classifying myoclonus: a riddle, wrapped in a mystery, inside an enigma.
Parkinsonism Relat Disord 18(Suppl 1):S174-76
D’Amelio M, Cavallucci V, Middei S, Marchetti C, Pacioni S, et al. 2011. Caspase-3
triggers early synaptic dysfunction in a mouse model of Alzheimer’s disease. Nat
Neurosci 14:69-76
Feinstein-Rotkopf Y, Arama E. 2009. Can’t live without them, can live with them: roles
of caspases during vital cellular processes. Apoptosis 14:980-95
Kuo CT, Zhu S, Younger S, Jan LY, Jan YN. 2006. Identification of E2/E3
ubiquitinating enzymes and caspase activity regulating Drosophila sensory
neuron dendrite pruning. Neuron 51:283-90
Li Z, Jo J, Jia JM, Lo SC, Whitcomb DJ, et al. 2010. Caspase-3 activation via
mitochondria is required for long-term depression and AMPA receptor
internalization. Cell 141:859-71
Liu L, Okada S, Kong XF, Kreins AY, Cypowyj S, et al. 2011. Gain-of-function human
STAT1 mutations impair IL-17 immunity and underlie chronic mucocutaneous
candidiasis. J Exp Med 208:1635-48
Nikolaev A, McLaughlin T, O’Leary DDM, Tessier-Lavigne M. 2009. APP binds DR6
218

to trigger axon pruning and neuron death via distinct caspases. Nature 457:981-
89
Park H, Kim JI, Ju YS, Gokcumen O, Mills RE, et al. 2010. Discovery of common
Asian copy number variants using integrated high-resolution array CGH and
massively parallel DNA sequencing. Nat Genet 42:400-405
Rumpf S, Lee SB, Jan LY, Jan YN. 2011. Neuronal remodeling and apoptosis require
VCP-dependent degradation of the apoptosis inhibitor DIAP1. Development
138:1153-60
Striano P, Caranci F, Di Benedetto R, Tortora F, Zara F, et al. 2009. 1H MR
spectroscopy indicates prominent cerebellar dysfunction in benign adult familial
myoclonic epilepsy. Epilepsia 50:1491-97
Striano P, Louis ED, Manto M. 2012. Autosomal dominant cortical tremor, myoclonus,
and epilepsy: is the origin in the cerebellum? Editorial. Cerebellum epub ahead
of print
van Rootselaar AF, Aronica E, Jansen Steur EN, Rozemuller-Kwakkel JM, de Vos RA, et
al. 2004. Familial cortical tremor with epilepsy and cerebellar pathological
findings. Mov Disord 19:213-17
van Rootselaar AF, van der Salm SMA, Bour LJ, Edwards MJ, Brown P, et al. 2007.
Decreased cortical inhibition and yet cerebellar pathology in “familial cortical
myoclonic tremor with epilepsy”. Mov Disord 22:2378-85
Williams DW, Kondo S, Krzyzanowska A, Hiromi Y, Truman JW. 2006. Local caspase
activity directs engulfment of dendrites during pruning. Nat Neurosci 9:1234-36
219

APPENDICES Appendix 1. Microsatellite markers and primers for linkage analysis. All references are to NCBI build 37.1. M13 denotes TGTAAAACGACGGCCAGT.
Marker Start End Primers Size
range
16.6 64,999,636 64,999,785 (M13)GGTCTGCTGCTGTCCAAGAC
TCCTAATTTCTCCCTCTTGTTCC 134-164
D16S3050 65,067,048 65,067,207 (M13)CATCTAATAAGTGATACACCCTGG
CAAACTGGCTTGTGATTTCT 168-186
16.16 65,206,748 65,206,293 (M13)CCAACTTTTCCCCAATGATG
AATTGAATGTGGTGGTGGTG 227-243
16.3 65,285,223 65,285,462 (M13)TCCCCAGACAATGTGTTTCA
TCCCTTGGACTTTGCTGACT 249-267
D16S3043 65,492,263 65,492,559 (M13)AACCATGCCATCATAACTTTG
AGATGCAGAAAGCAGGAGAGG 296-314
D16S3019 66,129,156 66,129,455 (M13)GGGCTGGAGGTCTAGTTCTAAG
TTGAAGGGAGGAAATAACTGATG 308-324
D16S3086 66,935,898 66,936,081 (M13)CCTGCTGGGAAGTGACC
CTAAGGACAAATGTAGATGCTCTGG 200-206
D16S3107 67,657,922 67,658,221 (M13)GGGAATAAGCCAGACAAGAGG
AGCCTGGGCAAGAGAGTG 297-323
16.4 68,948,712 68,948,927 (M13)TTTGGCAGAAAGGCTACTTCA
CGCCCATCCTCCACTATCTA 224-234
D16S3141 69,105,838 69,106,120 (M13)AAACTCTTTGGAAGGGAGTGG
CCTAAAGACTGCCCTTGTCC 314-334
D16S3095 69,946,150 69,946,411 (M13)ACCACTGCACCACTCTAGCC
CTGAGTTCATCCTGGCCTTC 270-282
16.1 70,306,725 70,306,969 (M13)CCCACACTAGGTCCCTGAAA GCTAGGATGCACTGAAGACACA
210-238
16.19 70,563,887 70,564,103 (M13)AATTAGCTGGGTGTGGTGGT
AGCATTGTGAGATCCCCATC 230-242
16.21 70,779,308 70,779,507 (M13)GCAAAGTCCAGCCTACCACT
AAACACAGCCAGCAGAAGGT 208-222
16.5 70,860,578 70,860,745 (M13)GATCTCACACTGCTGGATGC
GCATTTGGAGCTAAGATGTGG 176-192
D16S752 71,335,127 71,335,354 (M13)GGGGTCACTGCATTTCATCT
AGGATCGCCTCTTTCCTTGT 242-262
D16S3106 72,187,732 72,188,021 (M13)TGGACCTTATACCTCTTTGATAACC
AGGAGAGCTTTGCAACATCC 209-219
D16S3139 72,711,582 72,711,821 (M13)AAGACAAGGATACCCACACTTACC
TGACTTCTGAGTATGAACTTTGTATCC 256-258
D16S3066 73,329,816 73,330,063 (M13)TGCCTACATTATTTCCAAACAGAA
AAGCCACCTGTGTCTCTTGC 205-213
D16S512 74,067,713 74,067,915 (M13)TGAGAGCCAAATAAATAAATGG
TCACGTTGTGAATGCAAGT 214-220
D16S3115 74,530,429 74,530,674 (M13)GGAGAATGGCTTTCTTGC
CAACTCTATGATGGGGTTTTATTAC 261-267
16.13 74,775,616 74,775,846 (M13)TCCCAAAGTGCTCGGATTAC
AGGCATTTCCATGTATGATGTG 237-265
11.1 63,967,764 63,968,180 (M13)AAGGTGACGAGACCTGTGG
ACCCACCTTCCAATGTACTGC 331-357
220

221
11.2 64,471,993 64,472,242 (M13)CCTAGCCAGAGTCCACCTACTG
GATGATGCCTGACTGCTGTACT 259-277
11.3 65,211,716 65,211,986 (M13)CCACCTGGTAGTCCTCAGAC
CCCCTCCTGCTAGTGCTAAG 274-292
11.4 65,705,974 65,706,129 (M13)TTCTAGTAGGCAAAACCAGGATG
CAAGACCTGAGCCAGTGTACC 164-182
11.5 65,903,669 65,903,957 (M13)GCTGTTGCTTTCAGTGTTTGG
ATGGTGCTCATCACTCCTAGC 300-308
17.1 34,630,044 34,630,317 (M13)GAATTGAGGGTCCCAATAAAGA
GGTGGTCAGTTTCCCAAAGA 250-260
D17S1867 35,379,394 35,379,489 (M13)AGTTTGACACTGAGGCTTTG
TTTAGACTTGGTAACTGCCG 108-114
D17S1788 36,086,054 36,086,208 (M13)TGCAGATGCCTAAGAACTTTTCAG
GCCATGATCTCCCAAAGCC 171-181

Ap
pen
dix
2. C
riti
cal r
egio
n c
onta
ins
113
kn
own
or
pre
dic
ted
gen
es.
222
Pos
itio
ns a
re v
ia N
CB
I 37
.1. G
enes
are
list
ed in
seq
uenc
e or
der
on c
hrom
osom
e 16
q21-
22.1
.
L
ocat
ion
st
art
end
G
ene
Des
crip
tion
65
,318
,402
65
,610
,203
L
OC
2838
67
hypo
thet
ical
pro
tein
LO
C28
3867
66
,400
,525
66
,438
,686
C
DH
5 ca
dher
in 5
, typ
e 2,
VE
-cad
heri
n (v
ascu
lar
endo
thel
ium
) 66
,460
,816
66
,516
,745
B
EA
N
brai
n ex
pres
sed,
ass
ocia
ted
with
Ned
d4
66,5
03,9
66
66,5
83,8
42
TK
2 th
ymid
ine
kina
se 2
, mito
chon
dria
l 66
,516
,775
66
,519
,747
F
LJ2
7243
F
LJ2
7243
pro
tein
66
,586
,466
66
,603
,693
C
KL
F
chem
okin
e-li
ke f
acto
r 66
,600
,294
66
,613
,040
C
MT
M1
CK
LF
-lik
e M
AR
VE
L tr
ansm
embr
ane
dom
ain
cont
aini
ng 1
66
,613
,351
66
,622
,178
C
MT
M2
CK
LF
-lik
e M
AR
VE
L tr
ansm
embr
ane
dom
ain
cont
aini
ng 2
66
,637
,935
66
,647
,795
C
MT
M3
CK
LF
-lik
e M
AR
VE
L tr
ansm
embr
ane
dom
ain
cont
aini
ng 3
66
,648
,653
66
,730
,610
C
MT
M4
CK
LF
-lik
e M
AR
VE
L tr
ansm
embr
ane
dom
ain
cont
aini
ng 4
66
,754
,796
66
,785
,701
D
YN
C1L
I2
dyne
in, c
ytop
lasm
ic 1
, lig
ht in
term
edia
te c
hain
2
66,7
88,8
79
66,8
35,5
23
CC
DC
79
coile
d-co
il do
mai
n co
ntai
ning
79
66,8
36,7
78
66,8
64,9
00
NA
E1
NE
DD
8 ac
tivat
ing
enzy
me
E1
subu
nit 1
(am
yloi
d be
ta p
recu
rsor
bin
ding
pro
tein
1)
66,8
78,2
80
66,8
88,0
52
CA
7 ca
rbon
ic a
nhyd
rase
VII
66
,914
,436
66
,921
,855
P
DP
2 py
ruva
te d
ehyd
roge
nase
pho
spha
tase
isoe
nzym
e 2
66,9
42,0
25
66,9
52,8
60
CD
H16
ca
dher
in 1
6, K
SP
-cad
heri
n 66
,955
,582
66
,959
,547
R
RA
D
Ras
-rel
ated
ass
ocia
ted
wit
h di
abet
es
66,9
58,7
81
66,9
59,4
38
LO
C10
0287
719
hypo
thet
ical
pro
tein
LO
C10
0287
719
66,9
65,9
59
66,9
68,3
20
FA
M96
B
fam
ily
wit
h se
quen
ce s
imil
arit
y 96
, mem
ber
B
66,9
68,3
47
66,9
78,9
99
CE
S2
carb
oxyl
este
rase
2 (
inte
stin
e, li
ver)
66
,995
,138
67
,008
,999
C
ES3
ca
rbox
yles
tera
se 3
(br
ain)
67
,022
,633
67
,043
,661
C
ES8
ca
rbox
yles
tera
se 8
(pu
tativ
e)
67,0
63,0
50
67,1
34,9
61
CB
FB
co
re-b
indi
ng f
acto
r, b
eta
subu
nit
67,1
43,9
15
67,1
82,4
42
C16
orf7
0 ch
rom
osom
e 16
ope
n re
adin
g fr
ame
70
67,1
83,1
80
67,1
84,3
88
B3G
NT
9 U
DP
-Glc
NA
c:be
taG
al b
eta-
1,3-
N-a
cety
lglu
cosa
min
yltr
ansf
eras
e 9
67,1
88,0
83
67,1
93,8
12
TR
AD
D
TN
FR
SF1A
-ass
ocia
ted
via
deat
h do
mai
n 67
,193
,864
67
,198
,077
F
BX
L8
F-b
ox a
nd le
ucin
e-ri
ch r
epea
t pro
tein
8

67,1
97,2
88
67,2
03,8
48
HSF
4 he
at s
hock
tran
scri
ptio
n fa
ctor
4
67,2
07,7
72
6720
9624
N
OL
3 nu
cleo
lar
prot
ein
3 (a
popt
osis
rep
ress
or w
ith C
AR
D d
omai
n)
67,2
09,5
07
67,2
17,8
83
KIA
A08
95L
K
IAA
0895
-lik
e 67
,218
,282
67
,224
,107
E
XO
C3L
ex
ocys
t com
plex
com
pone
nt 3
-lik
e 67
,226
,068
67
,232
,821
E
2F4
E2F
tran
scri
ptio
n fa
ctor
4, p
107/
p130
-bin
ding
67
,233
,014
67
,237
,932
E
LM
O3
engu
lfm
ent a
nd c
ell m
otili
ty 3
67
,241
,042
67
,260
,951
L
RR
C29
le
ucin
e ri
ch r
epea
t con
tain
ing
29
67,2
61,0
16
67,2
63,1
82
TM
EM
208
tran
smem
bran
e pr
otei
n 20
8 67
,263
,292
67
,281
,561
F
HO
D1
form
in h
omol
ogy
2 do
mai
n co
ntai
ning
1
67,2
82,8
53
67,3
06,0
93
SLC
9A5
solu
te c
arri
er f
amil
y 9
(sod
ium
/hyd
roge
n ex
chan
ger)
, mem
ber
5 67
,289
,522
67
,290
,572
L
OC
1002
8926
2 hy
poth
etic
al p
rote
in L
OC
1002
8926
2 67
,311
,413
67
,323
,402
P
LE
KH
G4
plec
kstr
in h
omol
ogy
dom
ain
cont
aini
ng, f
amil
y G
(w
ith R
hoG
ef d
omai
n) m
embe
r 4
67,3
23,3
93
67,3
60,6
61
KC
TD
19
pota
ssiu
m c
hann
el te
tram
eris
atio
n do
mai
n co
ntai
ning
19
67,3
60,7
47
67,4
19,1
03
LR
RC
36
leuc
ine
rich
rep
eat c
onta
inin
g 36
67
,423
,631
67
,424
,540
L
OC
1002
8774
6 hy
poth
etic
al p
rote
in L
OC
1002
8774
6 67
,423
,712
67
,427
,438
T
PP
P3
tubu
lin p
olym
eriz
atio
n-pr
omot
ing
prot
ein
fam
ily
mem
ber
3 67
,428
,322
67
,450
,377
Z
DH
HC
1 zi
nc f
inge
r, D
HH
C-t
ype
cont
aini
ng 1
67
,465
,041
67
,471
,456
H
SD11
B2
hydr
oxys
tero
id (
11-b
eta)
deh
ydro
gena
se 2
67
,471
,922
67
,515
,140
A
TP
6V0D
1 A
TP
ase,
H+
tran
spor
ting,
lyso
som
al 3
8kD
a, V
0 su
buni
t d1
67,5
16,4
74
67,5
17,7
16
AG
RP
ag
outi
rela
ted
prot
ein
hom
olog
(m
ouse
) 67
,562
,720
67
,580
,689
F
AM
65A
fa
mil
y w
ith
sequ
ence
sim
ilar
ity
65, m
embe
r A
67
,596
,310
67
,673
,086
C
TC
F
CC
CT
C-b
indi
ng f
acto
r (z
inc
fing
er p
rote
in)
67,6
79,0
30
67,6
91,4
56
RL
TP
R
RG
D, l
euci
ne-r
ich
repe
at, t
ropo
mod
ulin
and
pro
line-
rich
con
tain
ing
prot
ein
67,6
91,4
33
67,6
94,7
18
AC
D
adre
noco
rtic
al d
yspl
asia
hom
olog
(m
ouse
) 67
,694
,851
67
,696
,680
P
AR
D6A
pa
r-6
part
ition
ing
defe
ctiv
e 6
hom
olog
alp
ha (
C. e
lega
ns)
67,6
96,8
48
67,7
00,6
67
C16
orf4
8 ch
rom
osom
e 16
ope
n re
adin
g fr
ame
48
67,7
00,7
19
67,7
02,6
60
C16
orf8
6 ch
rom
osom
e 16
ope
n re
adin
g fr
ame
86
67,7
08,4
36
67,7
53,3
24
GF
OD
2 gl
ucos
e-fr
ucto
se o
xido
redu
ctas
e do
mai
n co
ntai
ning
2
67,7
57,0
05
67,8
40,5
55
RA
NB
P10
R
AN
bin
ding
pro
tein
10
67,8
40,7
81
67,8
61,9
71
TSN
AX
IP1
tran
slin
-ass
ocia
ted
fact
or X
inte
ract
ing
prot
ein
1 67
,862
,064
67
,869
,241
C
EN
PT
ce
ntro
mer
e pr
otei
n T
67
,876
,213
67
,878
,097
T
HA
P11
T
HA
P d
omai
n co
ntai
ning
11
67,8
80,6
35
67,9
06,4
70
NU
TF
2 nu
clea
r tr
ansp
ort f
acto
r 2
223
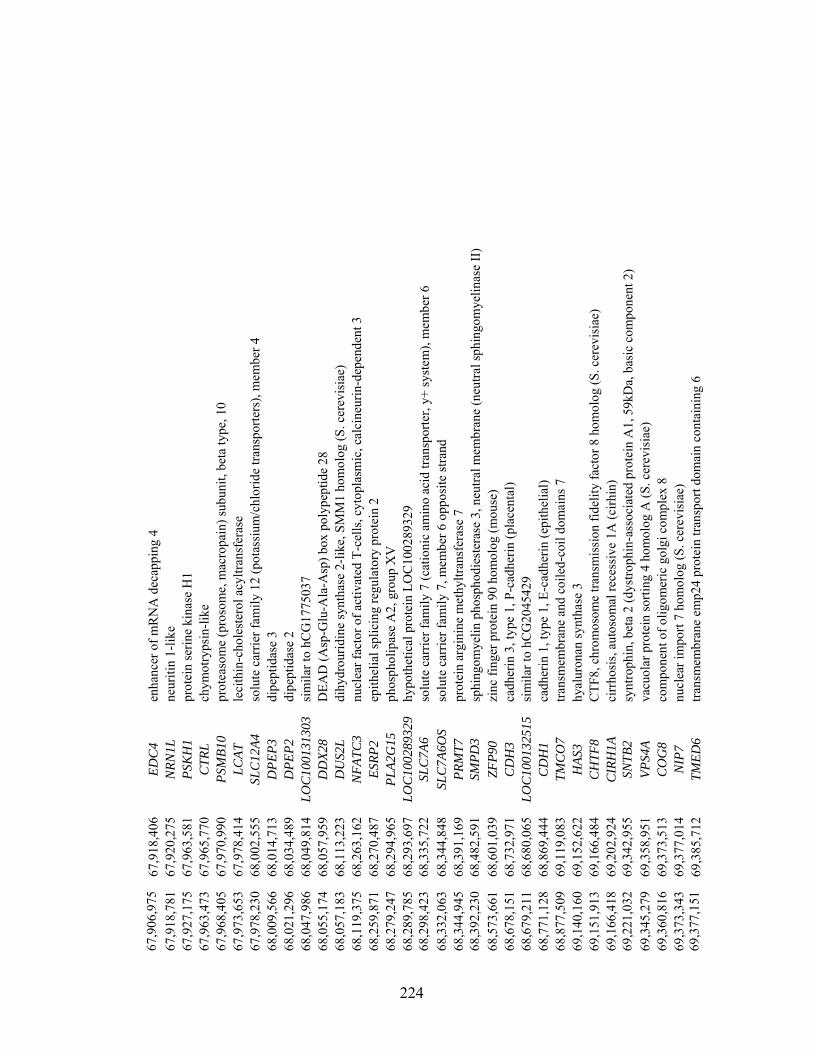
67,9
06,9
75
67,9
18,4
06
ED
C4
enha
ncer
of
mR
NA
dec
appi
ng 4
67
,918
,781
67
,920
,275
N
RN
1L
neur
itin
1-lik
e 67
,927
,175
67
,963
,581
P
SKH
1 pr
otei
n se
rine
kin
ase
H1
67,9
63,4
73
67,9
65,7
70
CT
RL
ch
ymot
ryps
in-l
ike
67,9
68,4
05
67,9
70,9
90
PSM
B10
pr
otea
som
e (p
roso
me,
mac
ropa
in)
subu
nit,
beta
type
, 10
67,9
73,6
53
67,9
78,4
14
LC
AT
le
cith
in-c
hole
ster
ol a
cylt
rans
fera
se
67,9
78,2
30
68,0
02,5
55
SLC
12A
4 so
lute
car
rier
fam
ily
12 (
pota
ssiu
m/c
hlor
ide
tran
spor
ters
), m
embe
r 4
68,0
09,5
66
68,0
14,7
13
DP
EP
3 di
pept
idas
e 3
68,0
21,2
96
68,0
34,4
89
DP
EP
2 di
pept
idas
e 2
68,0
47,9
86
68,0
49,8
14
LO
C10
0131
303
sim
ilar
to h
CG
1775
037
68,0
55,1
74
68,0
57,9
59
DD
X28
D
EA
D (
Asp
-Glu
-Ala
-Asp
) bo
x po
lype
ptid
e 28
68
,057
,183
68
,113
,223
D
US2
L
dihy
drou
ridi
ne s
ynth
ase
2-lik
e, S
MM
1 ho
mol
og (
S. c
erev
isia
e)
68,1
19,3
75
68,2
63,1
62
NF
AT
C3
nucl
ear
fact
or o
f ac
tiva
ted
T-c
ells
, cyt
opla
smic
, cal
cine
urin
-dep
ende
nt 3
68
,259
,871
68
,270
,487
E
SRP
2 ep
ithel
ial s
plic
ing
regu
lato
ry p
rote
in 2
68
,279
,247
68
,294
,965
P
LA
2G15
ph
osph
olip
ase
A2,
gro
up X
V
68,2
89,7
85
68,2
93,6
97
LO
C10
0289
329
hypo
thet
ical
pro
tein
LO
C10
0289
329
68,2
98,4
23
68,3
35,7
22
SLC
7A6
solu
te c
arri
er f
amil
y 7
(cat
ioni
c am
ino
acid
tran
spor
ter,
y+
sys
tem
), m
embe
r 6
68,3
32,0
63
68,3
44,8
48
SLC
7A6O
S so
lute
car
rier
fam
ily
7, m
embe
r 6
oppo
site
str
and
68,3
44,9
45
68,3
91,1
69
PR
MT7
pr
otei
n ar
gini
ne m
ethy
ltran
sfer
ase
7 68
,392
,230
68
,482
,591
SM
PD
3 sp
hing
omye
lin p
hosp
hodi
este
rase
3, n
eutr
al m
embr
ane
(neu
tral
sph
ingo
mye
linas
e II
) 68
,573
,661
68
,601
,039
Z
FP
90
zinc
fin
ger
prot
ein
90 h
omol
og (
mou
se)
68,6
78,1
51
68,7
32,9
71
CD
H3
cadh
erin
3, t
ype
1, P
-cad
heri
n (p
lace
ntal
) 68
,679
,211
68
,680
,065
L
OC
1001
3251
5 si
mila
r to
hC
G20
4542
9 68
,771
,128
68
,869
,444
C
DH
1 ca
dher
in 1
, typ
e 1,
E-c
adhe
rin
(epi
thel
ial)
68
,877
,509
69
,119
,083
T
MC
O7
tran
smem
bran
e an
d co
iled-
coil
dom
ains
7
69,1
40,1
60
69,1
52,6
22
HA
S3
hyal
uron
an s
ynth
ase
3 69
,151
,913
69
,166
,484
C
HT
F8
CT
F8,
chr
omos
ome
tran
smis
sion
fid
elity
fac
tor
8 ho
mol
og (
S. c
erev
isia
e)
69,1
66,4
18
69,2
02,9
24
CIR
H1A
ci
rrho
sis,
aut
osom
al r
eces
sive
1A
(ci
rhin
) 69
,221
,032
69
,342
,955
SN
TB
2 sy
ntro
phin
, bet
a 2
(dys
trop
hin-
asso
ciat
ed p
rote
in A
1, 5
9kD
a, b
asic
com
pone
nt 2
) 69
,345
,279
69
,358
,951
V
PS4
A
vacu
olar
pro
tein
sor
ting
4 ho
mol
og A
(S.
cer
evis
iae)
69
,360
,816
69
,373
,513
C
OG
8 co
mpo
nent
of
olig
omer
ic g
olgi
com
plex
8
69,3
73,3
43
69,3
77,0
14
NIP
7 nu
clea
r im
port
7 h
omol
og (
S. c
erev
isia
e)
69,3
77,1
51
69,3
85,7
12
TM
ED
6 tr
ansm
embr
ane
emp2
4 pr
otei
n tr
ansp
ort d
omai
n co
ntai
ning
6
224

69,3
89,4
64
69,4
19,8
59
TE
RF
2 te
lom
eric
rep
eat b
indi
ng f
acto
r 2
69,4
58,4
28
69,5
00,1
69
CY
B5B
cy
toch
rom
e b5
type
B (
oute
r m
itoch
ondr
ial m
embr
ane)
69
,598
,997
69
,738
,569
N
FA
T5
nucl
ear
fact
or o
f ac
tivat
ed T
-cel
ls 5
, ton
icity
-res
pons
ive
69,7
43,3
04
69,7
60,7
07
NQ
O1
NA
D(P
)H d
ehyd
roge
nase
, qui
none
1
69,7
75,7
70
69,7
88,8
29
NO
B1
NIN
1/R
PN12
bin
ding
pro
tein
1 h
omol
og (
S. c
erev
isia
e)
69,7
96,2
09
69,9
75,6
44
WW
P2
WW
dom
ain
cont
aini
ng E
3 ub
iqui
tin p
rote
in li
gase
2
69,9
84,8
10
69,9
98,1
41
CL
EC
18A
C
-typ
e le
ctin
dom
ain
fam
ily
18, m
embe
r A
70
,147
,529
70
,195
,205
P
DP
R
pyru
vate
deh
ydro
gena
se p
hosp
hata
se r
egul
ator
y su
buni
t 70
,207
,928
70
,220
,796
C
LE
C18
C
C-t
ype
lect
in d
omai
n fa
mily
18,
mem
ber
C
70,2
84,1
34
70,2
85,8
33
EX
OSC
6 ex
osom
e co
mpo
nent
6
70,2
86,2
90
70,3
23,4
09
AA
RS
alan
yl-t
RN
A s
ynth
etas
e 70
,328
,749
70
,369
,186
D
DX
19B
D
EA
D (
Asp
-Glu
-Ala
-As)
box
pol
ypep
tide
19B
70
,380
,732
70
,407
,284
D
DX
19A
D
EA
D (
Asp
-Glu
-Ala
-As)
box
pol
ypep
tide
19A
70
,413
,338
70
,472
,991
ST
3GA
L2
ST
3 be
ta-g
alac
tosi
de a
lpha
-2,3
-sia
lylt
rans
fera
se 2
70
,488
,498
70
,514
,177
F
UK
fu
coki
nase
70
,514
,472
70
,557
,459
C
OG
4 co
mpo
nent
of
olig
omer
ic g
olgi
com
plex
4
70,5
57,6
91
70,6
08,8
20
SF3B
3 sp
licin
g fa
ctor
3b,
sub
unit
3, 1
30kD
a 70
,680
,468
70
,694
,585
IL
34
inte
rleu
kin
34
70,6
95,1
07
70,7
19,9
54
MT
SS1L
m
etas
tasi
s su
ppre
ssor
1-l
ike
70,7
21,3
42
70,8
35,0
71
VA
C14
V
ac14
hom
olog
(S
. cer
evis
iae)
225

Ap
pen
dix
3.
Pri
mer
s fo
r S
ange
r se
qu
enci
ng
sele
ct c
and
idat
e ge
nes
in c
riti
cal r
egio
n.
226
Pos
itio
ns a
re v
ia N
CB
I 37
.1.
Pri
mer
s 12
-23
over
lap
and
in t
otal
cov
er F
LJ2
7243
, B
EA
N e
xons
5 a
nd 6
, tk
2 ex
on 1
1, a
nd t
he p
enta
-nu
cleo
tide
rep
eat i
nser
tion
. P
rim
ers
25-3
0 ov
erla
p an
d in
tota
l cov
er tk
2 ex
on 1
0.
Pri
mer
L
ocu
s P
rim
ers
Siz
e S
tart
E
nd
1 L
OC
2838
67 e
x 9
5’-G
GG
GG
AT
AG
AG
GG
TG
AG
G-3
’ 5’
-GA
GG
GA
GG
GG
TG
AG
GT
GT
AG
-3’
192
bp
65,3
19,2
30
65,3
19,4
21
2 L
OC
2838
67 e
x 8
GC
CT
CC
TG
AG
AA
AG
CA
CA
GT
G
GG
AT
AT
CG
CC
CT
TT
GT
GA
T
355
65,3
45,2
04
65,3
45,5
58
3 L
OC
2838
67 e
x 7
AG
GT
GG
CT
GA
AC
AT
GA
GC
TT
T
GA
TA
CC
CA
TC
TT
CC
AC
AT
TG
A
234
65,3
88,0
72
65,3
88,3
05
4 L
OC
2838
67 e
x 6
CA
TG
AA
TG
AA
AC
TA
TG
AG
GC
AA
A
TT
AG
GG
AG
GG
CA
AT
AT
GC
TT
T
246
65,3
90,2
46
65,3
90,4
91
5 L
OC
2838
67 e
x 5
GC
TT
CT
CT
CC
AT
TA
CA
GA
GT
AT
GT
G
GG
GA
CA
TT
TT
GC
TT
GT
CA
GC
30
0 65
,397
,003
65
,397
,302
6 B
EA
N e
x 1
CC
GC
AT
CT
CG
GA
GT
GA
CC
T
CG
AG
TC
AG
GC
AG
AA
AA
CC
T
752
66,4
60,8
97
66,4
61,6
48
7 B
EA
N e
x 2
CT
AG
GT
GT
CA
AT
GA
AC
AC
CC
TT
C
AC
TT
CG
GG
AA
GG
GC
TG
AT
AC
AG
80
7 66
,471
,041
66
,471
,847
8 B
EA
N e
x 3,
tk2
ex 1
4 G
TG
AG
GT
GC
TG
CT
CT
CC
TT
C
CC
CA
TC
CA
TT
CC
TC
TC
TT
CA
83
8 66
,503
,331
66
,504
,168
9 tk
2 ex
13
GA
TG
CT
CC
CC
TC
TG
GG
AA
GT
C
GA
GA
CG
GA
GT
CT
CT
CA
CT
GT
CG
79
5 66
,509
,219
66
,510
,013
10
BE
AN
ex
4 A
CT
GC
CT
AG
TG
CC
AG
GT
TA
TC
C
CC
AC
GG
AA
AT
AG
CC
AG
AT
AC
TC
C
821
66,5
11,1
82
66,5
12,0
02
11
tk2
ex 1
2 C
AA
CT
CC
AT
CA
TG
GG
AA
AG
AG
T
GA
AG
TC
TC
AC
TC
TG
TC
GC
TA
AG
G
825
66,5
11,6
76
66,5
12,5
00
12
see
lege
nd
G
AG
AC
CA
GG
GT
GT
CT
GG
TA
GC
G
TG
TT
AT
GA
GT
CA
CG
TG
TG
CA
TC
82
1 66
,514
,116
66
,514
,936
13
see
lege
nd
G
GC
AC
CT
CC
GA
CT
CA
GG
CA
G
CC
TG
GA
AT
CG
AG
AG
AT
AG
GC
AC
80
3 66
,514
,587
66
,515
,391
14
see
lege
nd
T
TT
CA
CG
GA
AC
GT
GG
AG
CT
CT
C
TG
TC
TC
TG
CA
AA
CA
CC
CA
CG
TG
80
9 66
,515
,077
66
,515
,885
15
see
lege
nd
G
CT
AT
CT
CT
GA
CG
CT
GC
AG
GC
G
CT
GC
AC
GC
AG
GA
TG
CT
AC
AG
84
3 66
,515
,540
66
,516
,382
16
see
lege
nd
G
TA
AC
AG
AG
GT
GA
TT
CC
TG
AA
GA
69
9 66
,516
,067
66
,516
,755

GG
AA
CC
TT
AT
GC
AC
TC
TC
TG
AA
AG
17
see
lege
nd
A
AG
CA
GT
TC
TG
AC
CA
CC
TT
AG
T
GC
TT
CA
AT
GG
TG
CT
TA
AT
CT
TG
AG
72
6 66
,516
,426
66
,517
,151
18
see
lege
nd
G
TA
TG
AA
CA
TA
GC
TC
AC
TG
TA
G
GC
AT
CT
AG
GA
CT
AT
GT
TA
GT
GG
G
762
66,5
16,8
20
66,5
17,5
81
19
see
lege
nd
C
AA
CT
TC
AG
GA
CC
TG
AC
TC
TA
G
CC
AT
GC
CT
AG
TG
AT
GT
TC
AG
AA
C
839
66,5
17,2
88
66,5
18,1
26
20
see
lege
nd
T
GG
CT
CT
GC
TG
CG
CC
TA
TC
AC
C
TC
AC
TC
CA
TC
TG
GT
AC
TC
CT
G
821
66,5
17,7
65
66,5
18,5
85
21
see
lege
nd
G
AT
GG
TG
TC
CA
GC
CA
TG
TG
CT
G
AG
CC
TT
AC
TC
TG
TA
TC
AA
CC
CT
C
838
66,5
18,1
92
66,5
19,0
29
22
see
lege
nd
C
CA
AG
CA
GG
TC
AC
CA
CT
GC
AG
A
CC
GC
TC
AT
GC
CA
AG
AG
CC
TG
71
6 66
,518
,626
66
,519
,341
23
see
lege
nd
, BE
AN
ex
7 A
CA
TG
CA
CA
TA
CA
CA
CA
CT
GG
A
GA
GG
AT
CT
CT
TT
GT
TT
TG
GA
TT
95
0 66
,519
,077
66
,520
,026
24
BE
AN
ex
8 T
GT
CT
TT
GA
GC
CT
CA
GT
GT
AC
C
AG
GA
AC
TG
CA
TC
CG
AG
AC
C
897
66,5
26,6
73
66,5
27,5
74
25
see
lege
nd
A
TG
CC
AA
CC
GT
GC
CC
AG
AG
C
CC
TA
AC
GT
GG
AG
TG
TA
TG
GG
TC
80
9 66
,543
,114
66
,543
,922
26
see
lege
nd
C
AC
CA
GC
TC
TG
CC
TG
CC
GC
A
AG
AA
AC
AG
GC
CA
CA
GC
CT
CT
C
828
66,5
43,7
34
66,5
44,5
61
27
see
lege
nd
A
AG
AT
TC
CT
GG
TA
GC
AA
AG
GT
T
AG
GT
CC
TG
CT
TG
AA
CT
GC
TG
C
833
66,5
44,2
36
66,5
45,0
68
28
see
lege
nd
G
CA
GC
CT
CG
CC
TT
CA
AT
GC
AG
C
CT
GA
CA
CC
AC
GC
TG
GA
GC
T
817
66,5
44,7
44
66,5
45,5
60
29
see
lege
nd
G
AC
TG
TC
CT
TG
GG
AA
CT
GC
TC
G
TC
TC
CA
GC
TG
TG
AA
AG
GA
GG
A
810
66,5
45,2
31
66,5
46,0
40
30
see
lege
nd
G
TC
CC
GT
TT
GT
CA
TT
TA
CC
CA
C
TT
GC
CA
CG
TT
GG
CC
AA
GC
TG
G
829
66,5
45,6
79
66,5
46,5
08
31
tk2
ex 9
A
GC
AA
GA
GA
AA
GG
AG
GA
TT
AC
T
CA
GT
GT
TT
GT
GC
CC
AC
GA
AC
C
864
66,5
47,1
08
66,5
47,9
72
32
tk2
ex 8
A
AC
AC
CA
CT
AA
GC
AT
GA
GC
AC
C
CC
AA
AT
CC
AC
TG
TG
AT
CT
GA
TG
G
869
66,5
50,5
81
66,5
51,4
50
33
tk2
ex 7
G
CA
AG
TG
CC
TC
AC
CC
AC
TG
C
GC
AG
TG
GC
AT
GA
TC
AT
GA
CC
C
810
66,5
51,5
88
66,5
52,3
98
34
tk2
ex 6
G
AA
GT
GG
AC
AC
CT
GG
GC
TG
G
CT
CA
CC
CT
AT
TT
AG
GT
CC
GT
GG
83
5 66
,562
,535
66
,563
,370
227

35
tk2
ex 5
G
GG
CA
CT
AG
AG
GC
AG
GT
CA
G
GG
AT
CC
CA
TC
AC
CT
AG
GT
AC
TG
84
1 66
,565
,101
66
,565
,941
36
tk2
ex 4
C
CA
CT
GG
GA
AT
AG
TA
TG
GG
AT
A
GT
GA
GA
CA
GG
GA
GC
GT
AC
TA
AA
G
814
66,5
70,6
21
66,5
71,4
34
37
tk2
ex 3
G
CA
AT
GC
AA
TG
GC
GT
GA
TC
TC
A
GC
TC
TC
GT
TA
AG
GA
GG
CA
GG
AC
83
5 66
,575
,378
66
,576
,212
38
tk2
ex 2
G
CC
CA
AA
TC
TA
CC
TG
AA
GG
AT
A
TG
CT
CA
CA
CT
CT
GG
TG
CC
AG
C
859
66,5
82,6
35
66,5
83,4
93
39
tk2
ex 1
G
GG
GA
AA
GA
GT
AG
AG
CA
AG
GA
T
CT
CC
AT
CC
CA
GA
AC
CA
AA
G
816
66,5
83,6
25
66,5
84,4
40
40
CM
TM
4 ex
4
AG
GG
GG
AA
GA
GA
TC
AA
GG
AA
T
GG
AA
AT
CT
GA
CA
GG
AC
AA
GG
39
5 66
,655
,879
66
,656
,273
41
CM
TM
4 ex
3
AG
GT
TG
GG
TA
TC
GT
GG
GT
CT
A
GG
GG
GA
GC
AG
GA
CA
CA
T
288
66,6
57,2
20
66,6
57,5
07
42
DY
NC
1LI2
ex
1 C
AT
CG
CA
GA
CC
TA
GA
GG
AC
A
GA
CA
AT
GG
CA
AG
AG
TG
GT
CA
39
9 66
,785
,258
66
,785
,656
43
NA
E1
ex 2
0 A
AT
GC
AG
CA
GT
AG
GG
TG
TC
C
TG
AC
AA
GT
AA
CT
TT
GA
AA
TA
GC
AA
GC
63
0 66
,836
,663
66
,837
,292
44
LO
C10
0287
719
CA
GC
AG
CA
GC
AC
CT
TG
TA
AA
A
GT
GC
GT
GG
CC
TC
CT
AA
TC
57
5 66
,958
,793
66
,959
,367
45
CE
S3
ex 5
C
TT
GG
GT
CC
CT
TC
CA
GG
T
GA
CT
CT
GC
CA
CC
AC
TT
GA
AG
A
500
67,0
06,5
11
67,0
07,0
10
46
CB
FB
ex
5 G
AT
TA
CA
GG
CG
TG
AG
CC
AC
T
CA
CA
AA
GC
CA
GA
GA
GT
AC
AA
CT
TT
36
4 67
,115
,993
67
,116
,356
47
LO
C10
0289
329
CC
AT
CC
AG
TG
TC
CC
TT
GA
GT
G
CA
GC
GA
GC
AC
AT
CG
AG
A
293
68,2
93,4
88
68,2
93,7
80
48
ZF
P90
ex
1 T
CC
CC
TG
GA
GA
TG
TG
GT
TT
A
GA
CT
GC
TC
CA
AA
CA
CC
CT
TG
24
4 68
,573
,563
68
,573
,806
49
ZF
P90
ex
2 T
GA
TA
GC
TC
CT
GC
AG
TA
TG
TT
CC
A
CC
TA
AG
CT
CT
GG
GC
AC
CA
C
297
68,5
91,8
17
68,5
92,1
13
50
ZF
P90
ex
3 A
GG
GT
TC
TT
TG
TC
CA
CT
TG
C
CA
GC
TG
CT
GG
AG
GG
TA
TC
TC
23
5 68
,592
,320
68
,592
,554
51
ZF
P90
ex
4 T
GT
CT
TT
CT
TC
AT
TC
CT
AC
TC
TA
GC
C
AT
GG
TG
TT
TC
TT
TC
CA
GG
AT
58
6 68
,596
,869
68
,597
,454
52
ZF
P90
ex
4 G
CA
AT
TT
GG
GA
CA
TA
AT
GC
AG
T
CG
AC
TA
AA
GG
CT
TT
CC
CA
C
563
68,5
97,2
60
68,5
97,8
22
53
ZF
P90
ex
4 G
GT
CC
TT
TA
GG
CA
TG
GC
AC
52
9 68
,597
,725
68
,598
,253
228

CC
AG
TA
TG
AA
TT
CT
GT
GA
TG
CT
C
54
ZF
P90
ex
4 C
CC
CT
AT
GA
TT
GT
GA
GC
AG
G
GA
TC
CT
GA
AT
CA
GA
AC
AT
TT
TA
GC
54
3 68
,598
,119
68
,598
,661
55
LO
C10
0132
515
ex 2
G
TC
CA
CA
CC
AA
AA
TG
GT
CA
C
GA
CC
AA
TC
AG
CA
CC
CA
CC
T
567
68,6
79,1
48
68,6
79,7
14
56
LO
C10
0132
515
ex 1
C
TC
AA
CC
GC
AC
CC
AC
AT
C
CT
CC
CC
GG
GA
AC
TG
AG
GT
68
3 68
,679
,093
68
,679
,775
57
CD
H1
ex 1
G
AA
CT
GC
AA
AG
CA
CC
TG
TG
A
GT
GA
CG
AC
GG
GA
GA
GG
AA
G
250
68,7
71,2
06
68,7
71,4
45
58
CD
H1
ex 4
G
GC
TA
GG
TT
GG
AC
TG
TT
AG
AC
C
CA
CT
GG
GT
CT
TT
TC
CC
TT
TC
29
9 68
,842
,252
68
,842
,550
59
CD
H1
ex 1
5 A
AC
TG
AA
CA
TA
GC
CC
TG
TG
TG
TA
T
TT
TT
CT
CA
TT
TT
TG
AC
AC
AA
CT
CC
29
3 68
,863
,484
68
,863
,776
60
CD
H1
ex 1
6 A
GA
CT
TC
TT
GC
CC
CA
GA
TG
A
AA
GG
GA
AG
GG
AG
CT
GA
AA
AA
36
6 68
,867
,123
68
,867
,488
61
SN
TB
2 ex
1
TC
AC
CG
TC
CG
TT
GT
TA
CC
TC
C
GC
CT
GT
GA
GT
GG
TA
GG
AA
G
1863
69
,220
,461
69
,222
,323
62
SN
TB
2 ex
2
TC
CC
AA
AG
TG
CT
GG
GA
TT
AC
C
CC
CA
AA
AA
TG
CA
TC
TC
TC
A
499
69,2
79,3
55
69,2
79,8
53
63
TE
RF
2 ex
4
GC
GC
CT
GG
CT
TT
AT
AA
TT
GT
T
CC
TT
TC
CC
TA
TT
TC
CC
CA
CA
29
4 69
,406
,101
69
,406
,394
64
TE
RF
2 ex
1
GC
TC
GG
AA
CG
CT
GT
TT
CT
AT
G
AC
AA
GC
AA
AG
CT
GG
GA
GA
G
517
69,4
19,3
80
69,4
19,8
96
65
CY
B5B
ex
1 C
TC
AG
TT
AG
CG
GT
GG
AG
AG
G
TC
CC
TT
CC
TT
CC
CA
CA
TA
CA
28
3 69
,458
,564
69
,458
,846
66
CY
B5B
ex
2 T
TC
TT
CC
CA
TT
GC
AT
CC
TG
T
AC
TG
GG
AT
GA
CA
GG
TG
TG
AG
39
7 69
,480
,902
69
,481
,298
67
CY
B5B
ex
3 C
AA
GG
GA
CT
CT
GA
TA
TG
CT
CA
A
AC
CA
CA
CA
GG
GC
AT
AG
CT
T
466
69,4
81,8
46
69,4
82,3
11
68
CY
B5B
ex
4 T
TC
CC
AG
TC
TA
TC
CA
TT
GC
TT
G
CT
AC
CT
GT
CC
AT
GC
AT
CC
T
491
69,4
92,8
25
69,4
93,3
15
69
CY
B5B
ex
5 C
CC
CA
AC
TA
CT
TT
GT
GA
TA
AA
AG
C
GA
TG
TC
TG
GC
CA
AT
CG
TC
TT
37
8 69
,496
,188
69
,496
,565
70
NF
AT
5 ex
10
TC
TG
GT
AA
GT
AC
GC
AT
AT
TT
GT
GG
G
GT
GG
TC
AT
GT
TT
AC
CA
TT
AG
GA
3 7
0 69
,704
,012
69
,704
,381
71
NF
AT
5 ex
12
CC
CA
CT
TG
GA
GA
TT
GG
AG
AA
C
AA
TA
TG
AA
GA
TA
CC
CT
GC
AA
AG
37
7 69
,718
,619
69
,718
,995
229

72
EX
OS
C6
ex 1
.1
GT
CA
GG
GA
GG
AC
TT
GG
GT
TC
C
AC
AT
GT
CA
GC
CA
CC
AG
AG
A
700
70,2
84,8
22
70,2
85,5
21
73
EX
OS
C6
ex 1
.2
CA
GC
TG
CT
CA
GA
CA
CA
GG
AT
A
AC
CA
GG
GC
CT
GA
CT
GA
CT
A
617
70,2
85,2
64
70,2
85,8
80
230

Appendix 4. NOL3 primers. Positions are via NCBI 37.1
Primer Regions
amplified Start End Primers Size
exon 1 5'UTR 67,207,688 67,208,005 5’-TGGATAAACGGGGTCTGAAC-3’ 5’-TCTGACCACTCCCTCAATGC-3’
318 bp
exon 2 coding 67,207,986 67,208,427 GCATTGAGGGAGTGGTCAG
CCTTTTGTCTGCCCCAGC 442
exon 3 coding 67,208,468 67,208,931 GAGTGTGAAACCGCACAGG TGGTCAAAGAGGTGGGGTC
464
exon 4.1
8bp coding, 3'UTR
67,208,851 67,209,382 GTGAGTCCGCCCAAACC
GTTCAGCTCAGGAACTTGCG 532
exon 4.2
3'UTR 67,209,222 67,209,684 CCTTAGGAGTCCAGGCTGC CCTTTGGCCTTAGTTTTCCC
463
231

Appendix 5. Detailed characterization of knockin mouse generation. A C57BL/6 BAC clone (RP23:80P23) was used to subclone an 8.94kb region into a 2.4kb backbone vector (pSP72, Promega) containing an ampicillin selection cassette. The construct was designed so that the 3’ homology arm extended 5.81kb 3’ to the 3’ LoxP site. The 5’ homology arm attaches to the 5’ end of the Neo cassette flanked by LoxP-FRT sites. The 5’ homology arm is 1.80kb. The Neo cassette was inserted 536bp upstream of the GC point mutation in exon 2 of Nol3. The 3’ LoxP site, which is located between exons 3 and 4, was engineered to contain Mfe I, BamHI, and BclI sites for Southern blot analysis; it is located 52bp downstream of exon 3. The targeting vector was confirmed by restriction analysis after each modification step. P6 and T73 primers were used for sequencing the 5’ and 3’ ends of the BAC sub-clone, respectively. The N1 and N2 primers anneal within the Neo cassette and sequenced the 5’ end of the target region and the 3’ end of the short homology arm, respectively. The Lox1 and SQ1 primers ensured successful introduction of the GC point mutation (see below) and ruled out the introduction of additional mutations by PCR. Primer Sequence P6 5’-GAGTGCACCATATGGACATATTGTC-3’ T73 TAATGCAGGTTAACCTGGCTTATCG N1 TGCGAGGCCAGAGGCCACTTGTGTAGC N2 TTCCTCGTGCTTTACGGTATCG Lox1 GGCAGTAGGTGTCTCGGTGC SQ1 CTCCTGGTCAGCGTAGAGTAACGC As shown below, Southern blots confirmed proper construction of the targeting vector. Moreover, successful introduction of the E21Q mutation was confirmed by Sanger sequencing of the G to C mutation (see below).
232

Long Arm External Probe
Restriction Enzyme
Enzyme Location WT KO
Neo Deletion (via FLP)
Cre Deletion of Target Region
Apa LI Neo cassette 14.55 13.12 11.59 10.15
Bcl I Single LoxP 12.3 6.61 6.61 11.09
EcoRI Neo cassette 10.99 7.7 7.7 9.79
Mfe I Single LoxP 21.22 14.34 14.34 14.34
Xba I Neo cassette 10.88 7.79 7.79 6.35
Short Arm Internal Probe
Restriction Enzyme
Enzyme Location WT KO
Neo Deletion (via FLP)
Cre Deletion of Target Region
Mfe I Single LoxP 21.22 8.64 7.1 5.67
Bcl I Single LoxP 12.3 7.46 5.92 11.09
Acc65I Neo cassette 4.98 3.47 1.94 3.78
Stu I Neo cassette 6.34 3.18 6.57 5.13
ApaLI Neo cassette 14.55 3.19 3.19 3.19
Bsr
GI
Avr
II
Hin
dII
I
Mfe
I +
E
ocR
I
Eco
RV
1 K
B
Lad
der
Expected Restriction PatternsAvr II: 2124 1202 9710BsrG I: 5580 513 2331 4612EcoR V: 8802 4234Hind III: 2149 10887Mfe I +EcoRI: 1434 11602
Reference
233

234

Copyright © 2022 FDOKUMEN