An Analysis of McLean County, Illinois Farmers' Perceptions of Genetically Modified Crops
Upload
khangminh22Category
view
1download
0
Farmers’ Risk Perceptions, Attitudes and Management Strategies,
and Willingness to Pay for Crop Insurance in Nepal
Bibek Sapkota
Master of Science (Agricultural Economics) Tribhuvan University, Nepal
Bachelor of Science (Agriculture), Tribhuvan University, Nepal
This thesis is presented for the degree of
Doctor of Philosophy (Agricultural Economics)
The University of Western Australia
UWA School of Agriculture and Environment
November 2021

i
Declaration
I, Bibek Sapkota, declare that the work contained in this thesis has been substantially accomplished
during the enrolment in this degree.
This thesis does not contain material that has been submitted for the award of any other degree or
diploma in my name, in any university or other tertiary institution.
In the future, no part of this thesis will be used in a submission in my name for any other degree or
diploma in any university or other tertiary institution without the prior approval of The University of
Western Australia and, where applicable, any partner institution responsible for the joint award of this
degree.
This thesis does not contain any material previously published or written by another person, except
where due reference has been made in the text and, where relevant, in the Authorship Declaration that
follows.
This thesis does not violate or infringe any copyright, trademark, patent or other rights whatsoever of
any person.
The research involving human data reported in this thesis was assessed and approved by The
University of Western Australia Human Ethics Committee (Human Ethics Ref: RA/4/20/4795, UWA).
This thesis contains work prepared for publication, some of which have been co-authored.
I certify that help received in preparing this thesis and all sources used have been duly acknowledged.
I have attempted to use inclusive language throughout the thesis.
Bibek Sapkota
November 2021

ii
Abstract
Weather-related risks coupled with rainfed farming conditions and inadequate risk management
options are some of the major impediments to the growth of the Nepalese agricultural economy.
Increased frequency and intensity of extreme weather events in recent years indicate Nepal’s high
vulnerability to these risks. Unmanaged farming risks have negative impacts on the well-being of
farming communities and the overall economy. Given that most farmers are subsistence smallholders,
they have a low capacity to manage risks without external support. To assist farmers in managing
risks, the Government of Nepal initiated an agricultural insurance program in 2013 using a public–
private partnership model. However, farmers’ participation in the agricultural insurance program is
low, despite a 75% premium subsidy. Farmers’ needs, preferences and willingness to pay are
important factors determining their demand for insurance products. The agricultural insurance
products currently available in the market were based on a feasibility study that only addressed
supply-side issues and implementation mechanisms of the insurance program. Information on farmers’
risk perceptions, risk attitudes and risk management strategies are lacking, which are important
indicators of the demand for risk management products and policy interventions. This study analyses
the demand–supply incongruity in the Nepalese agricultural insurance market, focusing on farmers’
risk perceptions, risk attitudes, existing risk management strategies and willingness to pay for crop
insurance.
The study follows a sequential mixed-methods research design using cross-sectional data collected
from the decision-makers of randomly selected farming households from the Terai region of Nepal.
The qualitative study employs in-depth interviews with 45 farmers followed by content analysis and
cognitive mapping techniques to present the relationships between various constructs related to
farming risk. The subsequent quantitative study employs a semi-structured questionnaire survey with
420 farmers. The survey included psychometric scaling questions to elicit farmers’ perceptions of risk
and uncertainties, a monetary lottery-choice experiment to measure their risk attitudes, and a discrete
choice experiment to measure their willingness to pay for crop insurance.
The qualitative study established a broad context of farming risk in Nepal, identifying major concerns
for farmers, such as uncertainties in labour supply, technical knowledge on modern farming
technologies, and supply of farm inputs (seeds, fertilisers and agrochemicals). Climatic risk factors
such as erratic rainfall patterns and increased temperature were major sources of production risks.
Farmers’ low bargaining power, unstable policies and increased market competition were major
sources of market risks. The study also found that male and female farmers have different concerns in
farming, which can be linked to the gender-specific division of roles. Despite their willingness to buy
crop insurance to supplement traditional risk management, many farmers were unaware of the
iii
availability of such products in the market. Therefore, awareness campaigns and training programs
could improve the adoption of crop insurance. Moreover, the qualitative study validated the
applicability of the cognitive mapping approach to study risk in the farming context. Future
researchers and industries can apply such a qualitative method to complement the psychometric
method to understand risk perceptions more comprehensively and communicate the findings.
Consistent with the qualitative study’s findings, psychometric analysis of farmers’ risk perceptions
revealed that the risks associated with labour supply are the most important concerns in farming.
Similarly, farmers’ low bargaining power is the major source of market risk. Farmers’ risk perception
is highly correlated with their past risk exposure. Farmers’ perception of drought risk is associated
with drought experience, age, family size, migration status, access to infrastructure and services, and
rice productivity, whereas the perception of flood risk is associated with flood experience, farm size,
migration status, rice productivity and joint family system. We also found spatial variation in farmers’
perceptions of both risks. These relationships reinforce the findings of earlier studies that risk
perception is a combined function of objective risk factors and the perceiver’s characteristics. Farmers
rated on-farm self-insurance options such as farm diversification more important than market-based
risk management options such as insurance.
On average, farmers showed a risk-averse attitude to the lottery-choice gamble used in the experiment.
We found that farmers’ risk attitude is associated with their gender, age, family size, farm size,
numeracy skill, geographical location and flood risk perception. Similarly, their risk attitude is
correlated to various farming decisions, such as farm mechanisation, monetary saving, involvement in
groups and cooperatives, production diversification, crop varietal diversification, use of stress-tolerant
crop varieties, and crop insurance adoption. However, the perceptions of drought and flood risks do
not significantly influence farmers’ decision-making, except for the positive association of drought
risk perception with loan use in farming. These findings suggest that farmers’ decision-making is
influenced more by risk attitude than risk perception.
The discrete choice experiment reveals that the utility of crop insurance has a positive association with
risk coverage level, while the same has negative associations with insurance premium and deductible.
Moreover, farmers’ risk aversion increases their willingness to pay for crop insurance. Among the
attributes used in the experiment, the sum insured had the dominant effect on the utility of insurance.
However, such utility is unaffected by insurance type, indicating that farmers are indifferent about
loss-based insurance and rainfall-index insurance. The results also suggest considerable preference
heterogeneity among farmers for crop insurance attributes, indicating a potential for diversifying crop
insurance products. Farmers’ willingness to pay for the existing crop insurance product is less than the
current premium, partly explaining the demand–supply mismatch in the insurance market.

iv
The research contributes to academic literature examining the theories to explain interrelationships
between risk perception, risk attitude and decision-making in the context of small-scale subsistence
farming, such as that of Nepal. Moreover, the findings have practical implications for improving risk
management products and policies. Policy suggestions emerging from this study include: 1) Given that
considerable heterogeneity exists in farmers’ risk perception, attitude and willingness to pay for crop
insurance, identifying target groups in terms of income status, geography, crops, farm size, etc. and
customizing risk management products according to their specific needs and preference may improve
insurance uptake; 2) Increasing risk coverage level is likely to increase the adoption of crop insurance
by farmers because they prefer insurance products that protect potential income to the existing
insurance product that only covers production cost; 3) Educating farmers about the concept and
benefits of insurance is essential to help them make informed decisions and choose the optimum risk
management strategy that suits their circumstances; 4) A holistic approach is needed for the
management of farming risks, as agricultural insurance is suitable for managing only weather-related
risks; 5) This study focusses on the management of weather-related risks using crop insurance. Further
research is necessary to identify appropriate strategies to mitigate market risks.

v
Authorship Declaration
This thesis contains co-authored papers prepared for publication.
Details of the papers:
1. Sapkota, B., Rola-Rubzen, M.F., and Murray-Prior, R. (2021). Cognitive Mapping of
Nepalese Farmers’ Risk Perceptions (currently being revised for submission to Agricultural
Systems).
Location in thesis: Chapter 4
2. Sapkota, B., Burton, M., Rola-Rubzen, M.F., and Murray-Prior, R. (2021). A Psychometric
Analysis of Farmers’ Perceptions of Risks, Uncertainties and Management Strategies in Nepal
(currently being revised for submission to the Australian Journal of Agricultural Economics).
Location in thesis: Chapter 5
3. Sapkota, B., Burton, M., Rola-Rubzen, M.F., and Murray-Prior, R. (2021). Linkages Between
Farmers’ Risk Attitudes, Sociodemographic Factors and the Choice of Risk Management
Strategies (currently being revised for submission to the Journal of Risk Research).
Location in thesis: Chapter 6
4. Sapkota, B., Burton, M., Rola-Rubzen, M.F., and Murray-Prior, R. (2021). Farmers’
Willingness to Pay for Crop Insurance in Nepal (currently being revised for submission to the
Journal Agricultural Economics).
Location in thesis: Chapter 7
The student’s contribution to each manuscript is approximately 80%, while co-authors share the
remaining 20%. I have permission from the co-authors, undersigned, to include these papers in my
thesis.
Bibek Sapkota Maria Fay Rola-Rubzen Michael Burton Roy Murray-Prior
November 2021

vi
Presentations Resulting from this Research
1 Sapkota, B., Rola-Rubzen, M.F., Burton, M., and Murray-Prior, R. (2021). Linkages Between
Farmers’ Risk Attitudes, Sociodemographic Factors and the Choice of Risk Management
Strategies. West Australian Agricultural and Resource Economics Society Conference, 18
October 2018, UWA, Perth.
2 Sapkota, B., Rola-Rubzen, M.F., Burton, M., and Murray-Prior, R. (2021). Farmers’
Willingness to Pay for Crop Insurance in Nepal. Australian Agricultural and Resource
Economics Society Conference, 10-14 February 2020, UWA, Perth.
3 Sapkota, B., Rola-Rubzen, M.F., Burton, M., and Murray-Prior, R. (2021). A Psychometric
Analysis of Farmers’ Perceptions of Risks, Uncertainties and Management Strategies. UWA
School of Agriculture and Environment, Agricultural and Resource Economics (ARE)
Seminar Series, 12 March 2021, UWA, Perth.

vii
Abbreviations and Acronyms
ACIAR Australian Centre for International Agricultural Research
ADS Agriculture Development Strategy 2015–2035
AFP Actuarially Fair Premium
AGDP Agricultural Gross Domestic Product
AISI Access to Infrastructure and Service Index
ANOVA Analysis of Variance
BE Behavioural Economics
C Certain Amount
CA Conjoint Analysis
CC Climate Change
CE Certainty Equivalent
CL Conditional Logit
CM Cognitive Mapping
CRRA Constant Relative Risk Aversion
CT Cultural Theory
CVDI Crop Varietal Diversity Index
CVM Contingent Valuation Method
DADO District Agriculture Development Office
DCE Discrete Choice Experiment
DM Decision-Maker
DV Dependent Variable
ETR Eastern Terai Region
EU Expected Utility
EUT Expected Utility Theory
FAO Food and Agriculture Organization
FMI Farm Mechanisation Index
GDP Gross Domestic Product
GEI Gender Equality Index
GoN Government of Nepal
Ha Hectare
HH Household
IID Independent and Identically Distributed
ILO International Labour Organization
IPCC Intergovernmental Panel on Climate Change

viii
IV Independent Variable
L Lottery
LBI Loss-Based Insurance
LCE Lottery-Choice Experiment
Max WTP Maximum Willingness to Pay
mm Millimetre
ML Mixed Logit
MoALD Ministry of Agriculture and Livestock Development
MPCI Multi-Peril Crop Insurance
MPL Multiple Price List
Mt Metric tonnes
MTR Mid-Terai Region
NAPA National Adaptation Program of Action
NARC Nepal Agriculture Research Council
NPCI Named-Peril Crop Insurance
NPR Nepalese Rupee (120 NPR ≈ 1 USD, as of 9 April 2021)
OECD Organization for Economic Co-operation and Development
OLS Ordinary Least Square
P Probability Value
PDI Production Diversity Index
PPP Public–Private Partnership
PT Psychometric Theory
QUAL Qualitative
QUANT Quantitative
r Pearson Correlation Coefficient
RCT Rational Choice Theory
RII Rainfall-Index Insurance
RP Revealed Preference
RPL Random Parameter Logit
RUT Random Utility Theory
SD Standard Deviation
SDGs Sustainable Development Goals
SDI Sale Diversity Index
SE Standard Error
SEU Subjective Expected Utility
SP Stated Preference

ix
SQ Status-Quo
STRV Stress-Tolerant Rice Variety
TEPC Trade and Export Promotion Centre
UN United Nations
USD United States Dollar
VNM von Neumann & Morgenstern
UWA The University of Western Australia
VIF Variance Inflation Factor
WII Weather-Index Insurance
WTP Willingness to Pay
WTR Western Terai Region

x
Acknowledgments
This thesis is an outcome of the collaborative efforts of many individuals and institutions. I would like
to acknowledge their contributions in helping me shape my thesis.
First of all, I would like to express my sincere gratitude to my supervisors, Associate Professor Dr Fay
Rola-Rubzen, Associate Professor Dr Michael Burton, and Dr Roy Murray-Prior, for their unremitting
guidance and support to accomplish this study. Thanks are equally due to the Graduate Research
Coordinator, Associate Professor Dr Ram Pandit, for his academic and administrative support. I would
also like to thank Emeritus Professor Brian Hardaker from the University of New England for
reviewing the qualitative paper and providing valuable suggestions.
My sincere thanks to the Australian Centre for International Agricultural Research (ACIAR) for
granting me an Australia Awards – John Allwright Fellowship (AA-JAF) to pursue this study. I started
my PhD at Curtin University and transferred to The University of Western Australia (UWA) after two
years. I thank both universities for envisioning a doctoral degree within me and providing me the
state-of-the-art academic platforms, library facilities and IT support. I am grateful to the academic and
administrative personnel of the School of Agriculture and Environment, Graduate Research School
and Australia Awards support unit of UWA. Special thanks to my home institution, Nepal Agricultural
Research Council (NARC), for granting me study leave. The National Agricultural Policy Research
Centre of NARC also deserves thanks for providing me with android tablets to carry out the survey.
This study involved lengthy interviews with farmers and painstaking numerical exercises. I would like
to extend my special gratitude to the farmers for their participation and the enumerators for helping me
carry out the survey.
Life in Perth was not always wonderful. Focusing on the work amid growing uncertainties about
COVID-19 and finding a new normal in the changing working environment were challenging. Faring
through such ups and downs would not have been possible without the technical, moral and social
support of many friends. I appreciate all my friends within and outside the university who supported
me directly and indirectly during my PhD journey. I am equally indebted to the Nepalese community
in Western Australia for their social support during challenging times.
Last but not least, I would like to express my appreciation to my wife Sujata and son Intel for
providing me with an excellent working environment, emotional support and a lovely home for
respite. My parents, other family members, relatives and friends who live in Nepal also deserve equal
appreciation for their love and encouragement.

xi
Contents
Declaration ............................................................................................................................................. i
Abstract ............................................................................................................................................ ii
Authorship Declaration ........................................................................................................................ v
Presentations Resulting from this Research ...................................................................................... vi
Abbreviations and Acronyms ............................................................................................................. vii
Acknowledgments .................................................................................................................................. x
List of Tables ........................................................................................................................................ xv
List of Figures ..................................................................................................................................... xvi
Chapter 1: Introduction ........................................................................................................................ 1
1.1 Overview of Nepalese agriculture ................................................................................................. 1
1.2 Risks in Nepalese farming ............................................................................................................. 2
1.3 Importance of risk management .................................................................................................... 4
1.4 Status of agricultural insurance in Nepal....................................................................................... 4
1.5 Research on farming risk in Nepal ................................................................................................ 5
1.6 Research problem .......................................................................................................................... 7
1.7 Aim and objectives ........................................................................................................................ 8
1.8 Definition of key terms .................................................................................................................. 9
1.9 Thesis organisation ...................................................................................................................... 10
1.10 References ................................................................................................................................. 12
Chapter 2: Literature Review ............................................................................................................ 17
2.1 Decision theories ......................................................................................................................... 17
2.2 Factors affecting risk perception ................................................................................................. 18
2.3 Determinants of individuals’ risk attitudes .................................................................................. 20
2.3.1 Individual characteristics ...................................................................................................... 20
2.3.2 Socio-economic factors ........................................................................................................ 21
2.4 Relationship between risk experience, risk perception and risk attitude ..................................... 22
2.5 Relationship between risk attitude and risk management ........................................................... 22
2.6 Flood risk in farming ................................................................................................................... 23
2.7 Drought risk in farming ............................................................................................................... 24
2.8 Risk management ........................................................................................................................ 25
2.8.1 Classification of risk management strategies ....................................................................... 25
2.8.2 Evolution of agricultural insurance ...................................................................................... 27
2.8.3 Agricultural insurance products ........................................................................................... 28
2.8.4 Limitations in the agricultural insurance market .................................................................. 30
2.8.5 Government’s role in the agricultural insurance market ...................................................... 31

xii
2.9 Summary and conclusion ............................................................................................................ 32
2.10 References ................................................................................................................................. 34
Chapter 3: Research Methodology .................................................................................................... 49
3.1 Research design ........................................................................................................................... 49
3.2 Conceptual framework ................................................................................................................ 50
3.3 Study area .................................................................................................................................... 51
3.4 Sampling design .......................................................................................................................... 52
3.5 Fieldwork and data collection ..................................................................................................... 54
3.6 Ethical consideration ................................................................................................................... 55
3.7 Basic socio-demographic information ......................................................................................... 55
3.8 References ................................................................................................................................... 57
Chapter 4: Cognitive Mapping of Nepalese Farmers’ Risk Perceptions and Management
Strategies (Paper 1) ......................................................................................................... 59
4.1 Abstract ....................................................................................................................................... 59
4.2 Introduction ................................................................................................................................. 59
4.2.1 Definition of key terms related to risk .................................................................................. 61
4.2.2 The need for studying farmers’ risk perception ................................................................... 62
4.2.3 Qualitative methods in risk perception research .................................................................. 62
4.2.4 Cognitive mapping approach ................................................................................................ 63
4.3 Methodology ............................................................................................................................... 65
4.3.1 Sampling ............................................................................................................................... 65
4.3.2 Data analysis ........................................................................................................................ 65
4.3.3 Construction of cognitive maps ............................................................................................ 66
4.3.4 Analytical framework ........................................................................................................... 67
4.4 Findings and discussion............................................................................................................... 70
4.4.1 Graph theory indicators ........................................................................................................ 70
4.4.2 Domain analysis ................................................................................................................... 72
4.4.3 Centrality analysis ................................................................................................................ 74
4.4.4 Most mentioned constructs ................................................................................................... 75
4.4.5 Reflection on the cognitive mapping approach .................................................................... 79
4.5 Conclusion ................................................................................................................................... 79
4.6 References ................................................................................................................................... 81
Chapter 5: A Psychometric Analysis of Farmers’ Perceptions of Risks, Uncertainties and
Management Strategies in Nepal (Paper 2) .................................................................. 87
5.1 Abstract ....................................................................................................................................... 87
5.2 Introduction ................................................................................................................................. 88
5.2.1 Risk ....................................................................................................................................... 89

xiii
5.2.2 Risk perception ..................................................................................................................... 89
5.2.3 Factors affecting risk perception .......................................................................................... 90
5.2.4 Risk management strategies ................................................................................................. 91
5.3 Methodology ............................................................................................................................... 92
5.3.1 Psychometric methods .......................................................................................................... 93
5.3.2 Description of the study tools and data analysis techniques ................................................ 93
5.3.3 Tobit Model specification .................................................................................................... 94
5.3.4 Sampling and data collection................................................................................................ 95
5.4 Findings and discussion............................................................................................................... 95
5.4.1 Sample characteristics .......................................................................................................... 95
5.4.2 Risk mapping ........................................................................................................................ 96
5.4.3 Factors associated with risk perceptions ............................................................................ 103
5.4.4 Risk management strategies ............................................................................................... 107
5.5 Conclusion ................................................................................................................................. 109
5.6 References ................................................................................................................................. 111
Chapter 6: Linkages Between Farmers’ Risk Attitudes, Sociodemographic Factors and the
Choice of Risk Management Strategies in Nepal (Paper 3) ...................................... 116
6.1 Abstract ..................................................................................................................................... 116
6.2 Introduction ............................................................................................................................... 116
6.3 Methodology ............................................................................................................................. 119
6.3.1 Measuring risk attitudes ..................................................................................................... 119
6.3.2 Lottery–choice experiment instrument ............................................................................... 120
6.3.3 Measures of risk aversion ................................................................................................... 121
6.3.4 Validity and reliability of the LCE instrument ................................................................... 124
6.3.5 Experiment implementation ............................................................................................... 125
6.3.6 Econometric models ........................................................................................................... 127
6.4 Findings and discussion............................................................................................................. 129
6.4.1 Summary statistics .............................................................................................................. 129
6.4.2 Risk attitude analysis .......................................................................................................... 131
6.4.3 Factors associated with risk attitude ................................................................................... 134
6.4.4 Association of risk attitude and risk perceptions with risk management decisions............ 136
6.5 Conclusion ................................................................................................................................. 140
6.6 References ................................................................................................................................. 142
Chapter 7: Farmers’ Willingness to Pay for Crop Insurance in Nepal (Paper 4) ....................... 150
7.1 Abstract ..................................................................................................................................... 150
7.2 Introduction ............................................................................................................................... 150
7.2.1 Attributes of crop insurance ............................................................................................... 154
xiv
7.2.2 Risk aversion and demand for insurance ............................................................................ 154
7.3 Methodology ............................................................................................................................. 155
7.3.1 Analytical approach ............................................................................................................ 156
7.3.2 Choice models .................................................................................................................... 157
7.3.3 Experimental design ........................................................................................................... 158
7.3.4 Survey implementation ....................................................................................................... 159
7.4 Findings and discussion............................................................................................................. 160
7.4.1 Sample description ............................................................................................................. 160
7.4.2 Choice modelling ............................................................................................................... 161
7.5 Conclusion ................................................................................................................................. 169
7.6 References ................................................................................................................................. 171
Chapter 8: Summary and Conclusion ............................................................................................. 178
8.1 Research overview .................................................................................................................... 178
8.2 Key findings .............................................................................................................................. 179
8.3 Significance of the study and policy implications ..................................................................... 181
8.4 Limitations of the study and future research directions ............................................................ 183
Chapter 9: Appendices ...................................................................................................................... 185

xv
List of Tables
Table 3.1 Sample size calculation ......................................................................................................... 53
Table 3.2 Details of the multi-stage random sampling .......................................................................... 54
Table 4.1 Characteristics of the sample selected for cognitive mapping .............................................. 66
Table 4.2 Graph theory indicators from the cognitive maps ................................................................. 71
Table 4.3 Dominant constructs in the cognitive maps .......................................................................... 73
Table 4.4 Central constructs in the cognitive maps ............................................................................... 75
Table 4.5 Most mentioned constructs in the cognitive maps ................................................................ 78
Table 5.1 Descriptive statistics .............................................................................................................. 96
Table 5.2 Sources of uncertainty/risk factors in farming ...................................................................... 98
Table 5.3 Vulnerabilities to drought and flood risk .............................................................................. 99
Table 5.4 Correlation between farmers’ perceptions of drought and flood risk .................................. 102
Table 5.5 Factors associated with farmers’ risk perceptions ............................................................... 105
Table 6.1 Lottery–choice instrument used in the study ....................................................................... 121
Table 6.2 CRRA calculation and risk attitude classification ............................................................... 124
Table 6.3 Summary statistics by region .............................................................................................. 130
Table 6.4 Logistic regression of ‘certain–choice’ on the certain LCE amount ................................... 132
Table 6.5 Description of risk attitude measures .................................................................................. 133
Table 6.6 Distribution of respondents by risk attitude class ............................................................... 133
Table 6.7 Estimates of OLS regression model of farmers’ risk attitude ............................................. 136
Table 6.8 Estimates of Multivariate Probit models of farmers’ risk management strategies .............. 137
Table 6.9 Correlation between the adoption of risk management strategies (multivariate probit) ..... 138
Table 6.10 Estimates of OLS models of farmers’ risk management strategies ................................... 139
Table 7.1 Summary of attributes and levels included in the DCE ...................................................... 159
Table 7.2 Basic characteristics of the samples .................................................................................... 161
Table 7.3 Estimates of the Correlated ML and CL models of farmers’ choice ................................... 163
Table 7.4 Summary of WTP estimates for crop insurance attributes .................................................. 165
Table 7.5 Dominance analysis using conditional logistic regression .................................................. 166
Table 7.6 WTP estimates for various insurance policy combinations ................................................ 167
Table 7.7 Reasons for not buying crop insurance ............................................................................... 168

xvi
List of Figures
Figure 1.1 GDP and AGDP trends .......................................................................................................... 1
Figure 1.2 Area, production and productivity of Rice, Maize and Wheat in the last 20 years ................ 2
Figure 1.3 Adoption of agricultural insurance in Nepal .......................................................................... 5
Figure 2.1 Risk assessment matrix used for evaluating insurability of farming risk ............................ 26
Figure 3.1 Exploratory mixed-methods (qual=>QUAN) research design. ........................................... 50
Figure 3.2 Conceptual framework of the study ..................................................................................... 51
Figure 3.3 Map of Nepal showing study clusters and districts .............................................................. 52
Figure 3.4 Basic socio-demographic characteristics of respondents and households ........................... 56
Figure 4.1 Cognitive map of female-1 .................................................................................................. 69
Figure 4.2 Cognitive map of male-1 ..................................................................................................... 70
Figure 5.1 Hypothesized relationships between various factors and risk perception ............................ 91
Figure 5.2 Farmers’ experience and perception of risks ..................................................................... 101
Figure 5.3 Farmers’ perceptions of probabilities and losses of drought and flood risks ..................... 103
Figure 5.4 Insurability of drought and flood risk ................................................................................ 103
Figure 5.5 Importance of risk management options ............................................................................ 108
Figure 6.1 Risk attitude analysis using a lottery–choice experiment .................................................. 132
Figure 7.1 An example of the choice cards used in the DCE .............................................................. 159
Figure 7.2 Distribution of random parameter estimates in the correlated ML model ......................... 164
Figure 7.3 Distribution of WTP estimates for crop insurance attributes ............................................. 165
Figure 7.4 Market share of different crop insurance policy combinations .......................................... 168
1
Chapter 1: Introduction
This chapter provides background to the research, presenting a brief overview of Nepalese agriculture,
risks in farming, previous research on farming risks, research problems and study objectives. It
includes a glossary of key terms relevant to this study. The chapter concludes by describing how the
research outcomes are organised in this thesis.
1.1 Overview of Nepalese agriculture
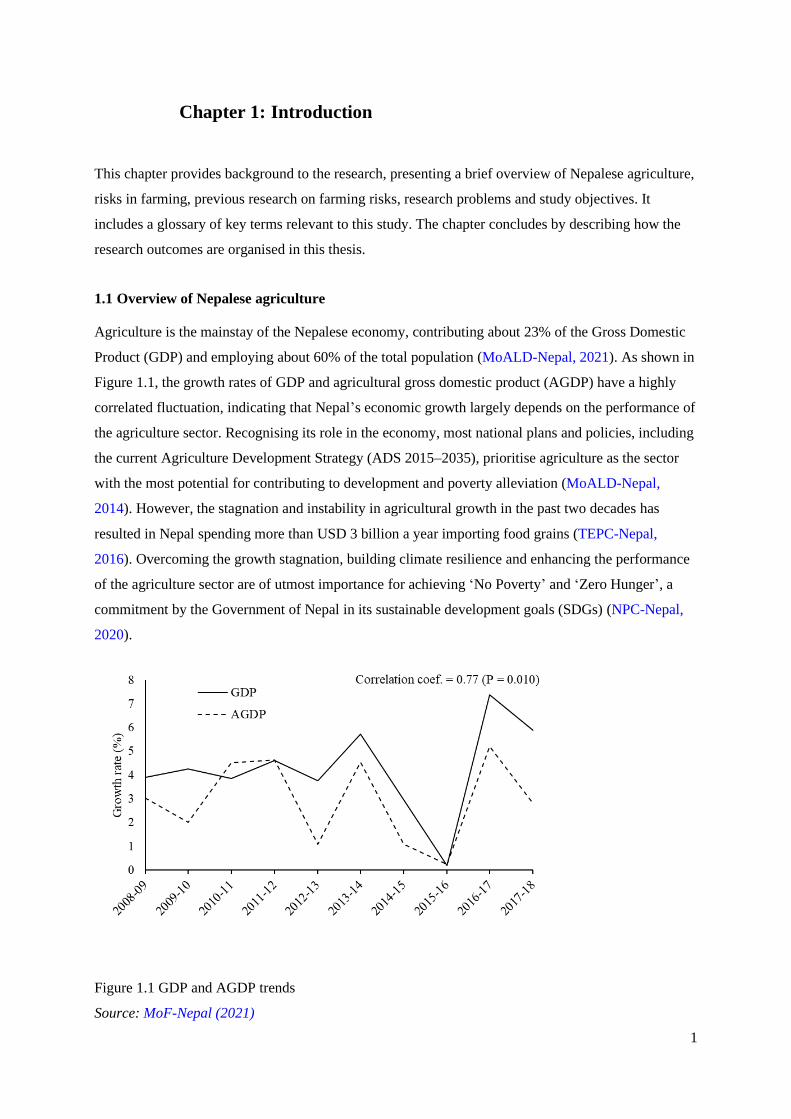
Agriculture is the mainstay of the Nepalese economy, contributing about 23% of the Gross Domestic
Product (GDP) and employing about 60% of the total population (MoALD-Nepal, 2021). As shown in
Figure 1.1, the growth rates of GDP and agricultural gross domestic product (AGDP) have a highly
correlated fluctuation, indicating that Nepal’s economic growth largely depends on the performance of
the agriculture sector. Recognising its role in the economy, most national plans and policies, including
the current Agriculture Development Strategy (ADS 2015–2035), prioritise agriculture as the sector
with the most potential for contributing to development and poverty alleviation (MoALD-Nepal,
2014). However, the stagnation and instability in agricultural growth in the past two decades has
resulted in Nepal spending more than USD 3 billion a year importing food grains (TEPC-Nepal,
2016). Overcoming the growth stagnation, building climate resilience and enhancing the performance
of the agriculture sector are of utmost importance for achieving ‘No Poverty’ and ‘Zero Hunger’, a
commitment by the Government of Nepal in its sustainable development goals (SDGs) (NPC-Nepal,
2020).
Figure 1.1 GDP and AGDP trends
Source: MoF-Nepal (2021)

Chapter 1. Introduction 2
Rice, maize and wheat are major cereal crops grown in Nepal. These crops contribute about 31% to
the total AGDP altogether, with rice alone contributing about 15% (MoALD-Nepal, 2021). Figure 1.2
shows the area, production and productivity of rice, maize and wheat in the last 20 years. The area of
these crops remained almost constant over this period, while the production and productivity have
slightly increased. Among these crops, rice ranks highest in terms of area, production and productivity.
The average growth rate of rice productivity over the last 50 years has been around 1.6%, which is far
below the population growth rate (IRRI, 2021). In 2020, 5.55 million mt of rice was produced from
1.46 million ha of land, with average productivity of 3.80 mt/ha (MoALD-Nepal, 2021). The
government of Nepal has recommended 114 improved rice varieties (70 open-pollinated and 44 hybrid
varieties) for farmer cultivation (NARC, 2018).
Figure 1.2 Area, production and productivity of Rice, Maize and Wheat in the last 20 years
Source: (MoALD-Nepal, 2020b)
1.2 Risks in Nepalese farming
The stagnation and high variability in agricultural growth can be attributed to some inherent features
of agriculture in general and specific characteristics of Nepalese farming systems that lead to various
risks, coupled with inadequate arrangements for risk management. Agriculture is exposed to numerous
risks stemming from various sources because it is mainly undertaken in open environments and

Chapter 1. Introduction 3
involves managing inherently variable living things (Hardaker et al., 2015). Farming risks arise from
the uncertain and uncontrollable variability of several factors that determine farm production and
income (OECD, 2009), particularly. Among such factors, climatic variables and market forces are the
most important ones, which are becoming increasingly unpredictable due to climate change and
increased market liberalization (Iturrioz, 2009). Further, production risks have more severe
consequences than market risks for the livelihoods of subsistence farmers, such as those in Nepal,
because much of what they produce is consumed at home.
Although climate change remains an issue of widespread political debate, the scientific literature
agrees that it is a natural phenomenon aggravated by human factors, with primarily negative impacts
on agriculture. For instance, the fifth assessment report of the Intergovernmental Panel on Climate
Change (IPCC, 2014) warns that, by the mid-21st century, climate change coupled with increasing
food demand will pose considerable risk to global food security and poverty reduction efforts and
negatively impact agricultural production systems if appropriate adaptation measures are not
implemented in time. The report also predicts that poverty traps and hunger hotspots will be intensive
in developing countries like Nepal. Based on the global climate risk index, Nepal was ranked fourth
most affected country by climatic hazards in 2017 and 11th for the last two decades (Eckstein et al.,
2019). Moreover, numerous studies have shown evidence of climate change in Nepal, such as
increased incidence of extreme weather events, increased overall temperature, more erratic rainfall
pattern and adverse effects on agricultural production (see Acharya, 2018; Chhetri & Easterling, 2010;
Devkota & Gyawali, 2015; Karn, 2014; Khadka et al., 2014; Khanal et al., 2018; Malla, 2008;
Palazzoli et al., 2015; Shrestha & Nepal, 2016; Shrestha et al., 2019; Sujakhu et al., 2016).
Rainfed lowland is the dominant agricultural ecosystem of Nepal, with only one-third of the total crop
area having reliable irrigation facilities (Bagazonzya et al., 2009). Due to the high dependency on
precipitation, Nepalese agriculture is highly vulnerable to weather-related risks such as drought and
flood resulting from erratic rainfall distribution. For instance, about 90% of crop losses in Nepal are
caused by hydro-meteorological hazards, of which drought and flood account for 38.9% and 23.2%,
respectively (FAO, 2014). The value of crop losses from 1983 to 2005 due to such hazards was more
than 288 million USD (FAO, 2010). Rice accounts for 78% of the total crop loss due to drought and
flood (Ghimire, 2017). While about two-thirds of the rice area is rainfed and prone to both drought and
flood at any stage of crop growth, the average area affected by drought and flood is 30% and 15%,
respectively (Yadaw et al., 2017). Even more alarming is that weather-related disasters have escalated
since the 1990s and will be more frequent and intensive in the future (FAO, 2010, 2014). While initial
temperature increases (up to 2.5C increase) will slightly increase agricultural production up to 2050
due to the carbon fertilisation effect, further increases will reduce production by 4.8% by 2080 and
17.3% thereafter (see Cline, 2007). Since these predictions do not account for the production losses

Chapter 1. Introduction 4
due to natural disasters, which are likely to increase during that period, the impact of climate change
on Nepalese agriculture will be more substantial than these figures (FAO, 2010).
1.3 Importance of risk management
Managing farming risk is critical as agriculture is a major contributor to anthropogenic greenhouse gas
emissions, and climate change has primarily negative effects on agriculture (see IPCC, 2014).
Unmanaged farming risks negatively affect the well-being of farming households and weaken the
overall economy. According to Cervantes-Godoy et al. (2013), agricultural shocks result in depletion
of assets and decreased disposable income of the smallholders leading them into a poverty trap. They
note that a credit constraint is the main feature of such a poverty trap attributed to moneylenders'
unwillingness to finance the smallholder farmers. Consequently, risk-affected farmers are forced to
invest in less productive technologies, use insufficient inputs and resort to low-risk/low-return options.
The inability to cope with the consequences of risks can force poor households into a long-term debt
trap and bonded labour contract (Fafchamps, 2004). Unfortunately, in the pursuit of avoiding further
risk, smallholders often miss opportunities that might help them escape the poverty trap (Cervantes-
Godoy et al., 2013). A crisis resulting from several adverse consequences of unmanaged farming risks
was the leading cause of the increasing spate of farmer suicide in India (Vasavi, 2009). Adverse
production outcomes can also increase gender disparity because the burden of hardships is often
disproportionally shared among family members, with female members sharing the most (Dercon &
Krishnan, 2000).
The lack of risk management also challenges the sustainability of the farming profession because it
can deteriorate farm conditions, making it unworthy to hand over to the next generation (Hardaker et
al., 2015). In contrast, appropriate arrangements for risk management stabilise farm income and
improve farmers’ creditworthiness, consequently motivating them to adopt high-risk/high-return
innovations (Singla & Sagar, 2012). Risk management also increases farm productivity (Lien et al.,
2016), improves the well-being of the farming community, and ensures the survival of the agribusiness
sector (Hardaker et al., 2015). Hence, risk management mechanisms are needed to create an
environment that promises a predictable return on investment and enhances the economic viability of
the farming business. However, more than two-thirds of farmers in Nepal are smallholders who
cultivate less than one ha of land (CBS-Nepal, 2013), with a low capacity to deal with risks without
external support. Realising the need to assist smallholder farmers, the Government of Nepal initiated a
subsidised agricultural insurance program in 2013.
1.4 Status of agricultural insurance in Nepal
The current agricultural insurance program in Nepal is implemented through a public-private
partnership model. The government designated 20 non-life insurance companies to provide insurance
Chapter 1. Introduction 5
products to farmers throughout the country. The local stations of the Department of Agriculture
facilitate the linkage between farmers and companies. The existing crop insurance product is yield-
loss-based, multi-peril crop insurance. A farmer who owns at least 0.03 ha of land is eligible for crop
insurance. The level of insurance coverage is equivalent to the cost of cultivation for the given crop,
which is determined by the local representatives of the Department of Agriculture. The insurance
premium rate is equal to 5% of the sum insured before the subsidy. The Ministry of Agriculture and
Livestock Development provided a 50% subsidy for the insurance premium until the second year,
which was later increased to 75%. In the case of loss, the indemnity to be paid out is based on a joint
evaluation of technicians and insurance companies as agreed when underwriting the policy (MoALD-
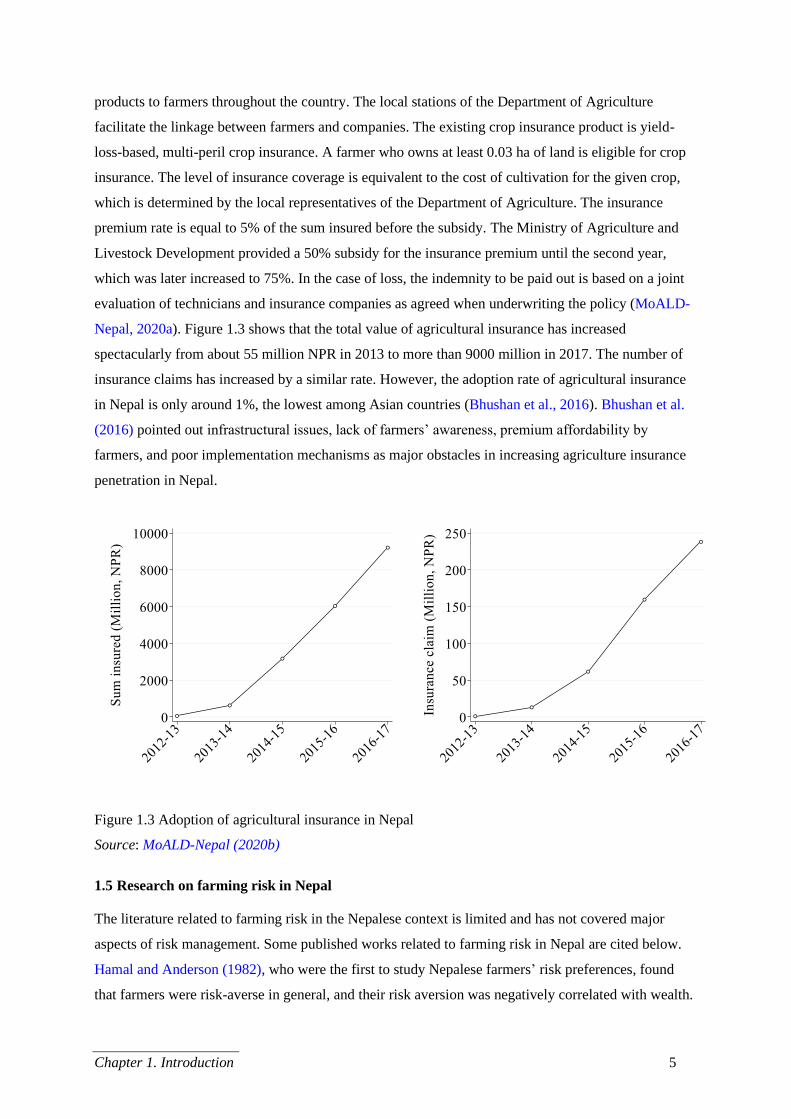
Nepal, 2020a). Figure 1.3 shows that the total value of agricultural insurance has increased
spectacularly from about 55 million NPR in 2013 to more than 9000 million in 2017. The number of
insurance claims has increased by a similar rate. However, the adoption rate of agricultural insurance
in Nepal is only around 1%, the lowest among Asian countries (Bhushan et al., 2016). Bhushan et al.
(2016) pointed out infrastructural issues, lack of farmers’ awareness, premium affordability by
farmers, and poor implementation mechanisms as major obstacles in increasing agriculture insurance
penetration in Nepal.
Figure 1.3 Adoption of agricultural insurance in Nepal
Source: MoALD-Nepal (2020b)
1.5 Research on farming risk in Nepal
The literature related to farming risk in the Nepalese context is limited and has not covered major
aspects of risk management. Some published works related to farming risk in Nepal are cited below.
Hamal and Anderson (1982), who were the first to study Nepalese farmers’ risk preferences, found
that farmers were risk-averse in general, and their risk aversion was negatively correlated with wealth.

Chapter 1. Introduction 6
They also found that farmers’ risk aversion limited their adoption of modern farming technologies.
However, the study only involved 60 households from two Central Terai districts. Recently, Sharma
(2016) elicited the risk attitude of coffee producers in two districts, namely Lalitpur and Gulmi, using
contextualised lottery-choice experiments and found that smallholder farmers were risk-averse with
total household income negatively affecting risk aversion. They also found that risk aversion did not
affect land allocation but did affect labour allocation for coffee farming. This study addressed a few
important questions about the implications of risk attitude on some variables related to coffee farming,
which is an important export commodity for Nepal. However, the findings may not generalise to other
contexts with different geographic conditions, socio-economic settings, crops and risk profiles.
With the main aim of assisting the Government of Nepal to develop an overall framework for crop
insurance programs, The World Bank conducted a feasibility study of crop insurance in Nepal
(Bagazonzya et al., 2009). They conducted risk assessments in crop and livestock sectors using time-
series district-level production and yield data. They also found crop insurance products, including
weather-index insurance, as feasible in the Nepalese context and recommended a public-private
partnership model to implement the insurance program. However, they admitted that their report drew
heavily on international experience and suggested a comprehensive demand assessment for
agricultural insurance products in Nepal. Ghimire et al. (2016b) identified key issues related to
implementing the insurance program in the banana sector and suggested refinement of insurance
products based on farmer preferences. Similarly, Malla (2008) presented evidence of the negative
impacts of climate change on Nepalese agriculture and recommended crop insurance as an appropriate
risk management strategy. Budhathoki et al. (2019) is the only study that looked at farmers’ general
interest in index-based insurance schemes, their willingness to pay (WTP) for rice and wheat crop
insurance, and factors affecting the adoption of crop insurance. However, they only covered a small
geographic area and used a contingent valuation method (CVM) which does not offer insight into
farmer preferences and trade-off behaviours among crop insurance attributes.
Other than the studies discussed above, which looked at farmers’ risk attitude and risk management
strategies, most studies have limited their focus to issues related to climate change (see Acharya, 2018;
Chhetri & Easterling, 2010; Haefele et al., 2014; Karn, 2014; Khanal, 2018; Palazzoli et al., 2015;
Shrestha & Nepal, 2016; Sujakhu et al., 2016). Although these studies have made important
contributions to understanding the prevalence of weather-related risks and identifying or developing
risk management strategies, there remains a lack of systematic studies in Nepal on farmers’
perceptions of risks, attitudes towards risk and decision-making in the presence of risk.

Chapter 1. Introduction 7
1.6 Research problem
Substantial resources are being invested in developing countries to implement research and
development (R&D) projects to uplift smallholder farmers’ livelihoods through the development and
dissemination of improved farming technologies (see Beintema et al., 2020). The theory of change and
impact pathways envisaged by these projects are underpinned by the assumption that farmers, being
rational agents, adopt the technologies they perceive are superior to existing technologies. However, a
common issue faced by most of these R&D projects is that farmers vary in their adoption behaviours.
Most farmers often dis-adopt the technologies promoted by such projects as soon as the projects end.
Research has shown that modern farming technologies have a long adoption lag in smallholder
farming. For instance, a farm-level survey conducted in Nepal by Gautam et al. (2013) (cited in
Gauchan, 2017, p. 642) found that a new rice variety takes 12 years to reach a peak adoption level;
once adopted, farmers do not replace it for the next 18 years. Kumar et al. (2020) also noted that the
adoption rates of improved crop varieties and fertilisers are lower in Nepal compared to other South
Asian countries. These findings imply that both the adoption and replacement rates of farming
technology are low in Nepal. Despite well-known theories of the innovation-decision process (e.g.,
Rogers, 2003), why farmers respond differently to an intervention that offers obvious benefits
compared to their existing practices is a persistent research question.
Adopting new technology is a risky decision because the farmers must choose among competing
alternatives whose potential returns and associated probabilities are not precisely known beforehand
(Greiner et al., 2009). High-yielding technologies often entail higher risk in terms of yield variability
and market acceptance. For example, the high-yielding rice and wheat varieties developed during the
"green revolution" period were more profitable but riskier than the traditional varieties (Andrew &
Mark, 1995). Research has shown that farmers' decision-making involves evaluating not only the
potential outcomes but also the variability of outcomes (Chavas & Nauges, 2020). Risk, uncertainty,
and learning play many important roles in the process of farmers' adoption decisions (Marra &
Carlson, 1990). Therefore, understanding the dynamics of farmers' decision-making, which is an
ongoing interest of both researchers and policymakers, is incomplete without the knowledge of
farmers' risk perceptions and risk attitudes.
The science of farming risk management in Nepal is in its initial stage, lacking vital information and
evidence-based policies. A few studies have found that farmers are risk-averse in general; their risk
aversion influences decision-making (see Budhathoki et al., 2019; Hamal & Anderson, 1982; Sharma,
2016), and they are willing to pay three times more than the existing premium for the current crop
insurance product (see Budhathoki et al., 2019). However, these studies involved small sample sizes
representing small geographic domains, limiting the generalizability of their findings. These findings
may not generalise to other contexts that involve different geographic locations, socio-economic

Chapter 1. Introduction 8
settings, crops and risk profiles. The contribution of most other studies on this topic is limited to
identifying climate change as the major risk factor and discussing adaptation measures. More
importantly, none of these studies could influence policy change except for the feasibility study
conducted by the World Bank (Bagazonzya et al., 2009), which was undertaken to inform the
development of the agricultural insurance program. However, the scope of their study was limited to
reviewing international experiences, mapping objective risks and addressing institutional challenges
for the implementation of the insurance program. They did not look at many important demand-side
issues, such as farmers’ risk perceptions, risk attitudes, existing risk management strategies and
willingness to pay for modern risk management tools such as insurance. These are the variables of
utmost importance for both the risk market and policy space to predict farmer demand for risk
management products and potential response to policy interventions.
In the absence of an efficient risk market that supplies modern risk management products, farmers rely
on traditional self-insurance strategies or government disaster relief payments in the case of adverse
production outcomes in agriculture (Mahul & Stutley, 2010). Despite 75–90% subsidies in premiums,
farmer participation in the crop insurance program has been negligible thus far (Ghimire et al., 2016a).
Although Figure 2 shows a rapidly increasing trend of the sum insured and insurance claims, the
adoption rate remains the lowest among Asian countries (Bhushan et al., 2016). A case study on
banana insurance conducted by Ghimire et al. (2016b) identified the insurance product design as the
major factor responsible for demand-supply mismatch and suggested refinement and diversification of
insurance products based on farmer preferences. Bagazonzya et al. (2009) also suggested further
research to understand farmer preferences about crop insurance products. Knowing how farmers value
and trade off the attributes of crop insurance products is necessary to diversify the agricultural risk
market. Knowledge of existing risk management practices is also important to predict farmer demand
for crop insurance products. Therefore, a comprehensive understanding of how farmers perceive risk,
how tolerant they are to risk, and how they deal with risk is necessary to inform future risk
management efforts.
This study aims to overcome the information gap in farming risk management in Nepal, focusing on
prevailing risks and risk factors from the farmer perspective, their attitude towards risk, existing risk
management practices and their willingness to buy formal risk management products. Such
information can help the government and insurance companies refine policies and risk management
products and help farmers improve their decision making.
1.7 Aim and objectives
The overarching aim of this study is to stimulate policy change related to farming risk management
and crop insurance program in Nepal, embracing a holistic approach that is responsive to the needs

Chapter 1. Introduction 9
and preferences of farming communities. This aim will be accomplished with the following specific
objectives:
1 Examine the applicability of the cognitive mapping approach for studying risk perceptions.
2 Evaluate farmers' risk perceptions and identify the factors influencing drought and flood risk
perceptions.
3 Estimate farmers' risk attitudes and identify factors associated with risk attitude.
4 Compare farmers' risk management strategies in terms of applicability and efficacy.
5 Estimate farmers' willingness to pay for crop insurance.
1.8 Definition of key terms
This thesis applies qualitative and quantitative research methods to analyse risk, risk perception and
risk attitude. Accordingly, the key variables and concepts have methodology specific definitions. A
more detailed explanation of various terms and concepts has been made in the chapters they appear.
Below is a brief glossary of key variables and concepts in general terms.
Risk: refers to a situation with the uncertain possibility of undesirable outcomes, but the probability
distribution of such outcomes can be estimated with some accuracy. Risk has two major elements:
probability and impact. Probability refers to how often the given outcome is likely to occur, and
impact refers to the size of the potential loss. The product of probability and impact is the measure of
objective risk. Subjective risk refers to the risk perceived by individuals. The literature has also
distinguished between upside and downside risks, the former is the uncertain possibility of gain, and
the latter is the uncertain possibility of loss. This thesis focuses on downside risks.
Uncertainty is the felt possibility of an undesirable outcome but with no estimates of probability or
potential impact. Uncertainty also refers to the risk factor or source of risk.
Ambiguity is a situation that can be perceived in more than one way. We use uncertainty and
ambiguity synonymously to refer to situations where the probability distribution of outcomes is
unknown.
Risk perception is a latent construct indicating the subjective evaluation of risk in terms of
probability and impact of outcomes. We calculate risk perception as the product of subjective
probability and the size of the potential loss. Risk perception also refers to the expectation of loss by
individuals.

Chapter 1. Introduction 10
Expected value is the sum-product of all possible outcomes and their probabilities.
Risk attitude is a personal characteristic, indicating how individuals evaluate risk in terms of a certain
outcome. It is also a measure of their risk acceptance or tolerance. The certain amount that provides
equal utility as the risk is called the certainty equivalent of the risk. By eliciting the certainty
equivalents of a given risk, we can derive individual utility curves and categorise them as risk-neutral,
risk-averse or risk-preferring individuals. The certainty equivalent equal to the expected value of the
risk indicates risk neutrality, while higher and lower certainty equivalents than the expected value
indicate risk preference and risk aversion, respectively.
Risk management is taking action (or sometimes not taking action) to reduce the probability or
impact of an undesirable outcome.
Willingness to pay is the maximum value that a consumer is willing to pay for an economic good or
service.
1.9 Thesis organisation
This thesis comprises four research papers arranged into four separate chapters along with
Introduction, Research Methodology, Literature Review, and Summary and Conclusion chapters.
Thus, it has eight chapters.
Chapter 1 (Introduction) establishes the research context, discusses research problems and formulates
research objectives. Chapter 2 (Literature Review) presents the review of concepts, theories, methods
and findings of previous works relevant to this thesis. Chapter 3 (Research Methodology) discusses
the overall methodology applied to achieve the research objectives. The common elements across the
individual papers are covered in Chapters 1 to 3 to minimise redundancy. However, some elements,
such as sampling design, may reappear in the individual papers to improve the coherence of the
content for reading them as stand-alone papers. Each chapter contains a separate reference section.
The appendices are presented as a combined section at the end.
Chapter 4 (Paper 1) is based on the qualitative study, which looks at farmers’ perceptions of risk,
sources of uncertainty, existing management strategies, risk attitude and their willingness to adopt
crop insurance. The study uses cognitive mapping techniques to analyse data and present findings.
There are two main contributions of this paper. First, it establishes a broad context of farming risk in
Nepal, explores farmers’ risk perception and attitudes, and prioritises the risks, sources of risk and
management strategies from the farmer perspective. Second, the paper validates the applicability of
the cognitive mapping approach in the farming context to elicit and analyse attitudinal variables, such
as risk perception and attitude, and present the findings concisely. Moreover, the qualitative study’s

Chapter 1. Introduction 11
findings were used to develop research concepts and survey instruments for the following quantitative
study.
Chapter 5 (Paper 2) is the outcome of the quantitative study, which looks at farmers' perceptions of
risks, uncertainties and management strategies. It assesses prevailing risks and uncertainties in farming
and ranks risk management strategies using psychometric scaling methods. It also identifies the factors
affecting farmers' perceptions of drought and flood risks estimating Tobit regression models.
Chapter 6 (Paper 3) is mainly the outcome of the lottery-choice experiment (LCE). The paper begins
with the derivation of the constant relative risk aversion (CRRA) coefficient for each respondent,
analysing the choices they made between an equally likely monetary lottery against a series of certain
amounts. The paper identifies socio-demographic and individual variables affecting the CRRA and
examines the relationship between CRRA and the choice of risk management strategies estimating
Multivariate Linear and Probit models.
Chapter 7 (Paper 4) presents the outcome of the discrete choice experiment (DCE) for crop insurance
products. The choice alternatives are defined by crop insurance type (loss-based crop insurance and
rainfall-index crop insurance), deductible (15%, 20%, and 25%), insurance sum (NPR 60000 and
90000 per ha), and premium price (six levels: NPR 250 to 15000). The DCE followed a block design
with six blocks, each having four choice scenarios. A Mixed Logit model with a random distribution
of parameters was estimated to analyse the effect of the attributes on the utility of choice alternatives
and derive farmers’ WTP for crop insurance. The model also includes CRRA values from Paper 3 to
examine the effect of risk attitude on farmers’ WTP for crop insurance.
Chapter 8 synthesises the conclusions from the four papers and discusses future research directions.

Chapter 1. Introduction 12
1.10 References
Acharya, R. (2018). The Effects of Changing Climate and Market Conditions on Crop Yield and
Acreage Allocation in Nepal. Climate, 6(2). https://doi.org/https://doi.org/10.3390/cli6020032
Andrew, D. F., & Mark, R. R. (1995). Learning by Doing and Learning from Others: Human Capital
and Technical Change in Agriculture. The Journal of political economy, 103(6), 1176-1209.
https://doi.org/https://doi.org/10.1086/601447
Bagazonzya, H. K., Devkota, K., Mahul, O., & Stutley, C. (2009). Agricultural Insurance Feasibility
Study for Nepal (46521-NP). W. Bank.
https://documents.worldbank.org/curated/en/246101468052838449/Nepal-Agricultural-
insurance-feasibility-study
Beintema, N., Pratt, A. N., & Stads, G.-J. (2020). Key Trends in Global Agricultural Research
Investment (Agricultural Science & Technology Indicators (ASTI) Program Note, Issue.
https://www.asti.cgiar.org/sites/default/files/pdf/Global-update-ASTI-note.pdf
Bhushan, C., Singh, G., Rattani, V., & Kumar, V. (2016). Insuring Agriculture in Times of Climate
Change. https://www.cseindia.org/insuring-agriculture-in-times-of-climate-change-8020
Budhathoki, N. K., Lassa, J. A., Pun, S., & Zander, K. K. (2019). Farmers’ Interest and Willingness-
to-Pay for Index-Based Crop Insurance in the Lowlands of Nepal. Land use policy, 85, 1-10.
https://doi.org/https://doi.org/10.1016/j.landusepol.2019.03.029
CBS-Nepal. (2013). National Sample Census of Nepalese Agriculture, 2011/12.
https://nada.cbs.gov.np/index.php/catalog/53/study-description
Cervantes-Godoy, D., Kimura, S., & Antón, J. (2013). Smallholder Risk Management in Developing
Countries. In OECD Food, Agriculture and Fisheries Papers, No. 61 (pp. 57). Paris: OECD
Publishing.
Chavas, J. P., & Nauges, C. (2020). Uncertainty, Learning, and Technology Adoption in Agriculture.
Applied Economic Perspectives and Policy, 42(1), 42-53.
https://doi.org/https://doi.org/10.1002/aepp.13003
Chhetri, N. B., & Easterling, W. E. (2010). Adapting to Climate Change: Retrospective Analysis of
Climate Technology Interaction in the Rice-Based Farming System of Nepal. Annals of the
Association of American Geographers, 100(5), 1156-1176.
https://doi.org/https://doi.org/10.1080/00045608.2010.518035
Cline, W. R. (2007). Global Warming and Agriculture: Impact Estimates by Country. Center for
Global Development, Peterson Institute for International Economics.
Dercon, S., & Krishnan, P. (2000). In Sickness and in Health: Risk Sharing within Households in
Rural Ethiopia. Journal of Political Economy, 108(4), 688-727.
https://doi.org/https://doi.org/10.1086/316098

Chapter 1. Introduction 13
Devkota, L. P., & Gyawali, D. R. (2015). Impacts of Climate Change on Hydrological Regime and
Water Resources Management of the Koshi River Basin, Nepal. Journal of Hydrology:
Regional Studies, 4, 502-515. https://doi.org/https://doi.org/10.1016/j.ejrh.2015.06.023
Eckstein, D., Hutfils, M. L., & Winges, M. (2019). Global Climate Risk Index 2019. Germanwatch.
https://www.germanwatch.org/en/16046
Fafchamps, M. (2004). Rural Poverty, Risk and Development. Edward Elgar Pub.
FAO. (2010). Implications of Climate Change for Agriculture and Food Security and Adaptation
Priorities in Nepal. In. Rome, Italy: Food and Agriculture Organization of the United Nations.
FAO. (2014). Managing Climate Risks and Adapting to Climate Change in the Agriculture Sector in
Nepal. F. a. A. O. o. t. U. Nations. https://www.fao.org/3/a-i3577e.pdf
Gauchan, D. (2017). Pattern of Adoption and Farm Level Diffusion of Modern Rice Varieties in
Nepal. In M. N. Paudel, D. R. Bhandari, M. P. Khanal, B. K. Joshi, P. Acharya, & K. H.
Ghimire (Eds.), Rice Science and Technology in Nepal: A Historical, Socio-Cultural and
Technical Compendium (pp. 639-645). Crop Development Directorate and Agronomy Society
of Nepal.
Ghimire, S. R. (2017). Climate Change, Disaster and Their Effects on Rice Farming in Nepal. In M.
N. Paudel, D. R. Bhandari, M. P. Khanal, B. K. Joshi, P. Acharya, & K. H. Ghimire (Eds.),
Rice Science and Technology in Nepal: A Historical, Socio-Cultural and Technical
Compendium (pp. 530-535). Crop Development Directorate and Agronomy Society of Nepal.
https://www.doacrop.gov.np/downloadfile/Rice_science_and_technology_1512106674.pdf
Ghimire, Y. N., Timsina, K. P., & Gauchan, D. (2016a). Risk Management in Agriculture: Global
Experiences and Lessons for Nepal (00273-087/2015/016).
https://doi.org/10.13140/RG.2.1.2670.4882
Ghimire, Y. N., Timsina, K. P., Kandel, G., Devkota, D., Thapamagar, D. B., Gautam, S., & Sharma,
B. (2016b). Agricultural Insurance Issues and Factors Affecting Its Adoption: A Case of
Banana Insurance in Nepal. Nepalese Horticulture, 11(1), 74-82.
Greiner, R., Patterson, L., & Miller, O. (2009). Motivations, Risk Perceptions and Adoption of
Conservation Practices by Farmers. Agricultural Systems, 99(2-3), 86-104.
https://doi.org/https://doi.org/10.1016/j.agsy.2008.10.003
Haefele, S. M., Bhattachan, B. K., Adhikari, B. B., Jr, C. C. A., & Shresta, S. M. (2014). Spatial
Variability of Fertilizer Management and Response in Rainfed Rice of Nepal. Agriculture,
Ecosystems & Environment, 189, 190-198.
https://doi.org/https://doi.org/10.1016/j.agee.2014.03.041
Hamal, K. B., & Anderson, J. R. (1982). A Note on Decreasing Absolute Risk Aversion among
Farmers in Nepal. Australian Journal of Agricultural Economics, 26(3), 220-225.
https://doi.org/https://doi.org/10.1111/j.1467-8489.1982.tb00414.x
Chapter 1. Introduction 14
Hardaker, J. B., Lien, G., Anderson, J. R., & Huirne, R. B. M. (2015). Coping with Risk in
Agriculture: Applied Decision Analysis (3rd ed.). CABI.
https://ebookcentral.proquest.com:80/lib/CURTIN/docDetail.action?docID=2066663
IPCC. (2014). Climate Change 2014: Synthesis Report. Contribution of Working Groups 1, 2 and 3 to
the Fifth Assessment Report of the Intergovernmental Panel on Climate Change.
https://www.ipcc.ch/report/ar5/syr/
IRRI. (2021). Nepal and Irri. Retrieved 29/10/2021 from https://www.irri.org/where-we-
work/countries/nepal
Iturrioz, R. (2009). Agricultural Insurance.
https://documents.worldbank.org/curated/en/985551468150558970/Agricultural-insurance
Karn, P. K. (2014). The Impact of Climate Change on Rice Production in Nepal (Working Paper No.
85–14). (Working Paper, No 85–14, Issue. SANDEE.
https://www.sandeeonline.org/uploads/documents/publication/1032_PUB_Working_Paper_85
_Prakash.pdf
Khadka, D., Babel, M. S., Shrestha, S., & Tripathi, N. K. (2014). Climate Change Impact on Glacier
and Snow Melt and Runoff in Tamakoshi Basin in the Hindu Kush Himalayan (Hkh) Region.
Journal of Hydrology, 511, 49-60.
https://doi.org/https://doi.org/10.1016/j.jhydrol.2014.01.005
Khanal, U. (2018). Farmers' Perspectives on Autonomous and Planned Climate Change Adaptations:
A Nepalese Case Study [Thesis, Queensland University of Technology]. Queensland.
https://eprints.qut.edu.au/120363/1/Uttam_Khanal_Thesis.pdf
Khanal, U., Wilson, C., Hoang, V.-N., & Lee, B. (2018). Farmers' Adaptation to Climate Change, Its
Determinants and Impacts on Rice Yield in Nepal. Ecological Economics, 144, 139-147.
https://doi.org/https://doi.org/10.1016/j.ecolecon.2017.08.006
Kumar, A., Takeshima, H., Thapa, G., Adhikari, N., Saroj, S., Karkee, M., & Joshi, P. K. (2020).
Adoption and Diffusion of Improved Technologies and Production Practices in Agriculture:
Insights from a Donor-Led Intervention in Nepal. Land use policy, 95, 104621.
https://doi.org/https://doi.org/10.1016/j.landusepol.2020.104621
Lien, G., Kumbhakar, S. C., & Hardaker, J. B. (2016). Accounting for Risk in Productivity Analysis:
An Application to Norwegian Dairy Farming. Journal of Productivity Analysis, 47(3), 247-
257. https://doi.org/https://doi.org/10.1007/s11123-016-0482-2
Mahul, O., & Stutley, C. J. (2010). Government Support to Agricultural Insurance: Challenges and
Options for Developing Countries. World Bank. https://doi.org/https://doi.org/10.1596/978-0-
8213-8217-2
Malla, G. (2008). Climate Change and Its Impact on Nepalese Agriculture. The Journal of Agriculture
and Environment, 9, 62-71. https://dx.doi.org/10.3126/aej.v9i0.2119

Chapter 1. Introduction 15
Marra, M. C., & Carlson, G. A. (1990). The Decision to Double Crop: An Application of Expected
Utility Theory Using Stein's Theorem. American Journal of Agricultural Economics, 72(2),
337-345. https://doi.org/https://doi.org/10.2307/1242337
MoALD-Nepal. (2014). Agriculture Development Strategy 2015 - 2035.
https://www.doanepal.gov.np/downloadfile/ADS_-FINAL_1542883806.pdf
MoALD-Nepal. (2020a). Agriculture Management Information System. Ministry of Agriculture and
Livestock Development. Retrieved 03/05/2021 from https://namis.gov.np/pages/insurance
MoALD-Nepal. (2020b). Statistical Information on Nepalese Agriculture for 2018/19.
https://www.moald.gov.np/publication/Agriculture%20Statistics
MoALD-Nepal. (2021). Selected Indicators of Nepalese Agriculture.
https://www.moald.gov.np/publication/Agriculture%20Statistics
MoF-Nepal. (2021). Macroeconomic Indicators. Government of Nepal, Ministry of Finance.
Retrieved 03/05/2021 from https://data.mof.gov.np/macroeconomicChart.aspx
NARC. (2018). Released and Registered Crop Varieties in Nepal 2075. http://narc.gov.np/wp-
content/uploads/2019/07/Release-Veraiety-booklet-final-document-2.pdf
NPC-Nepal. (2020). National Review of Sustainable Development Goals: Nepal. T. G. o. Nepal.
https://sustainabledevelopment.un.org/content/documents/26541VNR_2020_Nepal_Report.pd
f
OECD. (2009). Managing Risk in Agriculture: A Holistic Framework. The Organization for Economic
Co-operation and Development. https://doi.org/https://doi.org/10.1787/9789264075313-en
Palazzoli, I., Maskey, S., Uhlenbrook, S., Nana, E., & Bocchiola, D. (2015). Impact of Prospective
Climate Change on Water Resources and Crop Yields in the Indrawati Basin, Nepal.
Agricultural Systems, 133, 143-157. https://doi.org/https://doi.org/10.1016/j.agsy.2014.10.016
Rogers, E. M. (2003). Diffusion of Innovations (5th ed.). Free Press of Glencoe.
Sharma, G. P. (2016). Household Welfare, Resource Allocations and Risk Attitudes of Smallholder
Coffee Producers in Nepal [Thesis, The University of Western Australia]. Perth.
https://research-repository.uwa.edu.au/en/publications/household-welfare-resource-
allocations-and-risk-attitudes-of-smal
Shrestha, R. P., & Nepal, N. (2016). An Assessment by Subsistence Farmers of the Risks to Food
Security Attributable to Climate Change in Makwanpur, Nepal. Food Security, 8(2), 415-425.
https://doi.org/https://doi.org/10.1007/s12571-016-0554-1
Shrestha, U. B., Shrestha, A. M., Aryal, S., Shrestha, S., Gautam, M. S., & Ojha, H. (2019). Climate
Change in Nepal: A Comprehensive Analysis of Instrumental Data and People’s Perceptions.
Climatic Change. https://doi.org/https://doi.org/10.1007/s10584-019-02418-5
Singla, S., & Sagar, M. (2012). Integrated Risk Management in Agriculture: An Inductive Research.
The Journal of Risk Finance, 13(3), 199-214.
https://doi.org/https://doi.org/10.1108/15265941211229235

Chapter 1. Introduction 16
Sujakhu, N. M., Ranjitkar, S., Niraula, R. R., Pokharel, B. K., Schmidt-Vogt, D., & Xu, J. (2016).
Farmers' Perceptions of and Adaptations to Changing Climate in the Melamchi Valley of
Nepal. Mountain Research and Development, 36(1), 15-30.
https://doi.org/https://doi.org/10.1659/mrd-journal-d-15-00032.1
TEPC-Nepal. (2016). Import of Cereals into Nepal in 2015. Ministry of Commerce and Supplies, The
Government of Nepal. Retrieved 27 October 2016 from
https://nepaltradeportal.gov.np/web/guest/data-visualization
Vasavi, A. R. (2009). Suicides and the Making of India's Agrarian Distress. South African Review of
Sociology, 40(1), 94-108. https://doi.org/https://doi.org/10.1080/21528586.2009.10425102
Yadaw, R. B., Haba, A. K., & Tripathi, B. P. (2017). Drought and Submergence Tolerant Rice Variety
for the Rainfed Loland Ecosystem of Nepal. In M. N. Paudel, D. R. Bhandari, M. P. Khanal,
B. K. Joshi, P. Acharya, & K. H. Ghimire (Eds.), Rice Science and Technology in Nepal: A
Historical, Socio-Cultural and Technical Compendium (pp. 536-540). Crop Development
Directorate and Agronomy Society of Nepal.
https://www.doacrop.gov.np/downloadfile/Rice_science_and_technology_1512106674.pdf

17
Chapter 2: Literature Review
The Introduction chapter and individual papers include literature reviews that identify research gaps
leading to the formulation of research objectives. This chapter aims to develop a broad understanding
of the theories, methodology, concepts, and findings of previous works relevant to this thesis. First, we
discuss the theories of human decision-making followed by a review of the relationships between
various socio-economic factors, risk perception and risk attitude. Then, we present the importance of
managing drought risk in farming. Next, we discuss risk management strategies focusing on crop
insurance, the evolution of agricultural insurance, issues in the insurance market, and the
government’s role in the insurance market. Finally, we present a chapter summary and conclusion.
2.1 Decision theories
There are two contrasting schools of theories describing human decision-making in the presence of
risk and uncertainty. The neo-classical economic theories portray humans as ‘homo economicus’
(perfectly rational agents) who have a stable preference for the optimal ends based on their subjective
evaluation of the attractiveness of competing alternatives (see Becker, 1976). The behavioural
economic theories assume that human decisions incorporate systematic errors because rationality is
often bounded by heuristics, cognitive biases, and framing effects (see Fox, 2015). Behavioural
economics believes that human decisions result from a less deliberate, non-linear, and less controlled
process than we assume (Samson, 2014). The landmark contributions in the development of
behavioural economics are Simon (1955)’s idea of bounded rationality, Gigerenzer and Goldstein
(1996)’s concept of ecological rationality, Kahneman and Tversky (1979)’s prospect theory, and
Thaler (1999)’s concept of mental accounting. This thesis aligns with rational choice theories, which
are discussed below.
The development of the modern probability theory of human decision-making began in the 17th
Century, mainly to solve elite people’s gambling problems. Early decision theories (e.g., Blaise Pascal
and Pierre de Fermat) assumed that a gamble offering the payoffs x1, …,xn with probabilities p1, …pn
is worth its expected value �� = ∑ 𝑥𝑖𝑝𝑖 (Machina, 1987). However, theorists were not satisfied with the
idea of probabilistic expectations because they observed that people consider more than just the
expected value in gambling. One of the major contests to the expected value maximization theory is
the famous ‘St. Petersburg Paradox’ presented by Nicolas Bernoulli in 1728, who showed how a
gamble worth only a trivial amount can have an infinite expected value (Machina, 1987). Bernoulli
(1738) explained this phenomenon with a logarithmic utility function that showed the diminishing
marginal utility of wealth. He illustrated that it is not the expected value but the logarithm of expected
value (expected utility) that people tend to maximize while gambling. However, Bernoulli (1738) did

Chapter 2: Literature review 18
not suggest any method to measure utility. Much later, von Neumann and Morgenstern (1944)
developed four axioms: completeness, transitivity, continuity, and independence, which provided
necessary and sufficient conditions for Bernoulli (1738)’s hypothesis. Furthermore, Savage (1954)
introduced the concept of personal probability to von Neumann and Morgenstern (1944)’s Expected
Utility (EU) model, which is known as the subjective expected utility (SEU) theory. According to the
SEU hypothesis, a single value index that combines the decision-maker’s VNM utility function and
subjective probability distribution, can be used to order the attractiveness of risky alternatives.
Hardaker et al. (2015) suggest that the decision theory based on SEU maximization is equally
applicable for both descriptive analysis (explaining how people behave) and prescriptive analysis
(advising how people ought to make choices). However, they suspect that the SEU theory may not
reliably predict human behaviour in all cases. Other experiments have shown that individuals do not
always adhere to Savage axioms. For instance, the ‘Allais Paradox’ (Allais, 1953) and ‘Ellsberg
Paradox’ (Ellsberg, 1961) are the two most prominent criticisms that challenged the Savage axioms.
Popular alternatives to the SEU theory include Kahneman and Tversky (1979)’s ‘prospect theory’ and
Quiggin (1993)’s ‘generalised expected utility theory,’ which are more helpful in describing behaviour
rather than prescribing good choices under risk (Hardaker et al., 2015). Therefore, despite many
criticisms, SEU maximization remains the best normative model of human decision-making in the
presence of risk.
Based on the SEU theory, researchers developed several methods to measure individual risk
perception and risk attitude. These methods are discussed in the relevant papers. In what follows, we
discuss earlier findings on the factors determining farmers’ risk perception, risk attitude and the effect
of these constructs on their decision-making.
2.2 Factors affecting risk perception
The literature has extensively covered the factors underpinning individual variation in risk perception.
However, the findings vary across decision domains and study regions, as cited below. While various
authors (e.g., Fonta et al., 2015; Gebrehiwot & van der Veen, 2015; van Winsen et al., 2016) reported
a negative correlation between age and risk perception, others (e.g., Cohn et al., 1995; Okoffo et al.,
2016; Otani et al., 1992) reported the opposite relationship. Similarly, Legesse and Drake (2005)
reported a domain-specific relationship between age and risk perception. They found a negative
correlation between age and the perception of wind risk and a positive correlation between age and the
perception of price risk, while the relationship was non-significant for the perception of other risks.
Likewise, Ahsan (2011) and Meuwissen et al. (2001) reported a significant relationship between age
and risk perception.

Chapter 2: Literature review 19
Gender and education are other important variables that have varied associations with risk perception.
For instance, while researchers (e.g., Boholm, 1998; Finucane et al., 2000; Karpowicz‐Lazreg &
Mullet, 1993; Wieland & Sarin, 2012) reported women to have higher risk perception than men,
Legesse and Drake (2005) did not find any relationship between gender and risk perception except for
the impact of flood and likelihood of disease and pest. Likewise, while Pidgeon (1998) reported a
positive correlation between women and risk perception, they argued that sex differences in risk
perception might disappear in deprived communities. We are aware of only one study (i.e., Tucker et
al., 2013) that found women’s risk perception rating lower than men’s. Tucker et al. (2013) argued that
such sex differences in risk perception might be due to the gendered division of work in farming, with
women practising low-risk activities. Similarly, the relationship between education and risk perception
has been reported as positive (see Fonta et al., 2015; Gebrehiwot & van der Veen, 2015; Okoffo et al.,
2016; Wang et al., 2016), negative (see Legesse & Drake, 2005; Savage, 1993; van Winsen et al.,
2016), and non-significant (see Ginder et al., 2009; van Winsen et al., 2016). Ahsan (2011) also
reported a significant but varied correlation between education and the perceptions of various risks.
Variables that represent the wealth of the decision-maker also have varied relationships with risk
perception. For instance, while many researchers found a negative correlation (e.g., Ginder et al.,
2009; Lefebvre et al., 2014; Okoffo et al., 2016; Santeramo et al., 2016) and Lucas and Pabuayon
(2011) found a positive correlation between farm size and risk perception, van Winsen et al. (2016)
found a non-significant result. Three authors (Gebreegziabher & Tadesse, 2013; Gebrehiwot & van
der Veen, 2015; Ullah et al., 2015) reported a positive correlation between the scale of farming and
risk perception, while Legesse and Drake (2005) reported a negative relationship between the number
of plots and the perception of drought and disease risk. Similarly, Legesse and Drake (2005) found
asset level positively associated with the perceptions of institutional, market, land scarcity, flood,
weed, and human risks, while asset level was negatively associated with the perceptions of drought
risk and disease/pest risks. Patt and Schroter (2008) also suggested an endowment effect on risk
perception, implying that we fear losing things we own more than we do not.
Similarly, Legesse and Drake (2005) found a positive association of risk perception with access to
information and infrastructure. They argued that such access makes them dependent on these facilities,
leading to higher risk perceptions related to the facilities. Other variables that have positive
associations with risk perceptions include land ownership (see Ahsan, 2011), full-time involvement in
farming (see Ahsan, 2011), promotional campaigns about risk management (see Ginder et al., 2009;
van Winsen et al., 2016; Wang et al., 2016), perception of climate change (see Falco et al., 2014;
Fonta et al., 2015) and proximity to the sources of risk (Brody et al., 2008). Likewise, other variables
that negatively influence risk perception include family size (see Fonta et al., 2015; Legesse & Drake,
Chapter 2: Literature review 20
2005; Okoffo et al., 2016), distance to market (see Lefebvre et al., 2014), and geographic location (see
Legesse & Drake, 2005).
2.3 Determinants of individuals’ risk attitudes
While studies have extensively explored the factors that explain the variation in individuals’ risk
attitudes, the results are not consistent across studies or regions. These factors are discussed below in
two broad categories: individual characteristics and socio-economic factors.
2.3.1 Individual characteristics
Individual characteristics include the variables related to intrinsic attributes such as gender, age and
education. Among these, gender is the most widely studied variable for its potential association with
risk attitude. For instance, in a meta-analysis of 150 studies conducted from 1967 to 1997, Byrnes et
al. (1999) concluded that women are more risk-averse than men. While many studies reported females
as more risk-averse than males (e.g., Brick et al., 2012; Croson & Gneezy, 2009; Eckel & Grossman,
2002, 2008; Hermann & Mußhoff, 2017; Nielsen et al., 2013; Weber et al., 2002; Ye & Wang, 2013),
others reported a non-significant correlation between gender and risk attitude (e.g., Harrison et al.,
2007; Schubert et al., 1999). In Holt and Laury (2002)’s experiment, females showed higher risk
aversion than males at low payoff lotteries, but the gender difference disappeared at high payoff
levels.
Similarly, the variables that represent decision-makers’ age have varied associations with their risk
attitudes. While several authors reported a positive association between age and risk aversion (e.g.,
Hallahan et al., 2004; Nielsen et al., 2013; Tanaka et al., 2010; van Winsen et al., 2016; Vroom &
Pahl, 1971) and Ullah et al. (2015) reported the opposite result, many authors found risk attitude and
age uncorrelated (e.g., Holt & Laury, 2002; Picazo‐Tadeo & Wall, 2011; Ye & Wang, 2013). Some
researchers have examined the association of farming experience with risk attitude. For instance, three
studies found a positive correlation between farming experience and risk aversion (Iqbal et al., 2016;
Ullah et al., 2015), whereas Ye and Wang (2013) reported mixed results across study groups.
Education is another important attribute of individuals that influences their risk attitude. For instance,
while many authors found individuals’ risk aversion increased with increasing education level (e.g.,
Bar-Shira et al., 1997; Harrison et al., 2007; Tanaka et al., 2010; Ullah et al., 2015), others found the
opposite result (e.g., Hartog et al., 2002; Iqbal et al., 2016; Moscardi & De Janvry, 1977; Nielsen et
al., 2013; Shapiro & Brorsen, 1988; Ullah et al., 2015; Velandia et al., 2009). Anderson and Mellor
(2009) and Nielsen et al. (2013) found risk attitude unaffected by education. Ye and Wang (2013) also
reported a non-significant correlation between education and risk attitude, while such a relationship
was positive for freelancers. In addition to measuring the education variable, researchers have

Chapter 2: Literature review 21
examined the correlation between respondents’ numeracy skills or cognitive abilities with their risk
attitudes. For instance, three authors reported a negative correlation between cognitive ability and risk
aversion (e.g., Benjamin et al., 2013; Dohmen et al., 2010; Frederick, 2005), whereas Sherman (1974)
found a similar result for ambiguity aversion. Likewise, Dohmen et al. (2010) reported that farmers’
risk aversion decreases with increasing intelligence.
2.3.2 Socio-economic factors
Socio-economic factors include variables that characterise the decision-makers’ wealth or income
status, family structure and social capital. Among these variables, wealth is the most widely discussed
variable influencing risk attitude. The classical theories of absolute risk aversion (ARA) and relative
risk aversion (RRA) derive risk aversion coefficients as a ratio of derivatives of the utility function
with respect to wealth (Arrow, 1965; Pratt, 1964). Consistent with the theory of decreasing ARA,
many studies reported that individuals’ risk aversion decreased with increasing wealth (e.g.,
Binswanger, 1980; Hamal & Anderson, 1982; Holt & Laury, 2002; Tanaka et al., 2010; Wik et al.,
2004; Ye & Wang, 2013; Yesuf & Bluffstone, 2009). However, the findings of Cohen and Einav
(2007) and Dohmen et al. (2011) contradict the theory. Nielsen et al. (2013) also found that
individuals from the middle-wealth group were risk-preferring, while those from the poorest and
wealthiest groups were risk-averse to the lottery used in the experiment. Two studies (Brick et al.,
2012; Mosley & Verschoor, 2005), along with Binswanger (1980) at high payoff levels, also reported
that individuals’ risk attitudes were not associated with their wealth.
Researchers have also used farm size, income and social capital as proxies for wealth because
measuring household wealth is not straightforward. Nevertheless, the association between these
variables and risk attitude is ambiguous. For instance, while three studies found a positive correlation
between landholding size and risk aversion (Iqbal et al., 2016; Lucas & Pabuayon, 2011; Ullah et al.,
2015), Feder (1980) and Velandia et al. (2009) reported the opposite results. Similarly, the correlation
between income and risk aversion was positive (see Cohen & Einav, 2007; Iqbal et al., 2016), negative
(see Ullah et al., 2015), and non-significant (see Tanaka et al., 2010). Likewise, Hellerstein et al.
(2013) found that farmers’ risk aversion increased with increasing share of farm income in total
income. In contrast, social capital (Steer & Sen, 2010), including linkage with authority and
involvement in social organisations (Nielsen et al., 2013), was negatively associated with risk
aversion. Other socio-economic factors, such as family size and dependency ratio, have varied
associations with individuals’ risk attitudes. For instance, three studies reported a positive correlation
between risk aversion and family size (Lucas & Pabuayon, 2011; Ullah et al., 2015; Ye & Wang,
2013), while others reported limited relationship between the same (e.g., Binswanger, 1980; Ye &
Wang, 2013; Yesuf & Bluffstone, 2009). Likewise, while Hallahan et al. (2004) and Dohmen et al.

Chapter 2: Literature review 22
(2011) found that an individual’s risk aversion increased with increasing number of dependents,
Picazo‐Tadeo and Wall (2011) found a non-significant relationship between the same variables.
2.4 Relationship between risk experience, risk perception and risk attitude
The literature does not have a consensus on the correlation between past exposure to risk and risk
perception. For example, van Winsen et al. (2016) and Menapace et al. (2016) found a positive
correlation between past risk exposure and risk perception, while Slovic (1987) argued that familiarity
with risk decreases risk perception because people feel that they have more control over the risks when
they are more familiar with it. More importantly, the correlation between risk perception and risk
aversion is ambiguous. For instance, while several authors reported a positive correlation between risk
perception and risk aversion (e.g., Cho & Lee, 2006; Keil et al., 2000; Nielsen et al., 2013; Sitkin &
Pablo, 1992), Weber and Hsee (1998) reported a negative relationship and van Winsen et al. (2016)
found risk perception and risk aversion uncorrelated.
2.5 Relationship between risk attitude and risk management
A large body of literature has shown that farmers’ attitude determines real-life behaviours, such as
farm diversification, income diversification, technology adoption, investment, loan taking and
insurance purchase, but to varying degrees. For instance, Marra and Carlson (1990) reported that land
allocation for double cropping (wheat/soybean) compared to single cropping (wheat) increased with
increasing risk aversion. Chavas and Holt (1996) also found a positive association of risk aversion
with mixed cropping practices. Likewise, Nielsen et al. (2013) found that cropping pattern was
significantly associated with farmers’ risk attitude. In contrast, Engle Warnick et al. (2011) reported a
negative correlation between risk aversion and crop varietal diversification in Peru, while such
diversification was not associated with ambiguity aversion. A study conducted by Hellerstein et al.
(2013) is also noteworthy in this context. They used the number of risky choices and coefficient of
constant relative risk aversion as measures of risk aversion, but these measures could not predict
farming decisions. Then, they constructed a coarser dummy measure of risk aversion that predicted
many farming decisions but mostly in unexpected directions. Similarly, while three studies reported
the proportion of off-farm income increased with an increase in farmers’ risk aversion (Kyle, 1993;
van Winsen et al., 2016; Ye & Wang, 2013), Goodwin and Mishra (2004) found off-farm labour
supply uncorrelated with farmers’ risk attitude.
Farmers’ risk attitude has also been linked to the adoption of modern farming technologies (Marra et
al., 2003), including the adoption of high-yielding varieties (Smale et al., 1994) and choice of farm
inputs (Gong et al., 2016). Various authors (e.g., Feder & Umali, 1993; Knight et al., 2003; Leathers &
Smale, 1991; Lindner et al., 1982; Tsur et al., 1990) reported that technology adoption decreased with
increasing farmers’ risk aversion (see also Marra et al., 2003 for a more detailed review). Similarly,

Chapter 2: Literature review 23
Liu (2013) reported that the adoption of BT cotton was negatively associated with both risk aversion
and loss aversion of Chinese farmers. In contrast, Engle Warnick et al. (2011) found such adoption
uncorrelated with Peruvian farmers’ risk attitude. Similarly, while risk aversion had a positive
association with pesticide use on cotton in China, ambiguity aversion had a negative association (Liu
& Huang, 2013). Likewise, although the association of Nepali farmers’ risk aversion was negative
with technology adoption at the low-income level, such an association disappeared as farmer wealth
increased (Hamal & Anderson, 1982). Another unusual finding (as noted by the authors) in this
context is that of Barham et al. (2014), who used the experimental measures of risk aversion and
ambiguity aversion to explain the adoption lag for genetically modified (GM) corn and soybean in the
USA. They reported a strong positive correlation between ambiguity aversion and the timing of GM
corn adoption, while the same was not correlated with the adoption lag for GM soybean. Similarly,
risk aversion had a weak positive association with the adoption timing of GM soybean, but the same
had no correlation with the adoption lag for GM corn.
Risk aversion intuitively refers to the willingness to manage risk. This intuition is supported by
numerous studies that found a positive correlation between risk aversion and the adoption of risk
management tools. However, several counterintuitive findings also exist in the literature. For example,
risk aversion was negatively correlated with the adoption of risk-reducing behaviours (Holden &
Quiggin, 2017), uptake of insurance (Hellerstein et al., 2013; Just et al., 1999; Menapace et al., 2016),
willingness to pay for insurance (Ye & Wang, 2013) and adoption of market-based risk management
products (Flaten et al., 2005; Hellerstein et al., 2013; Menapace et al., 2016). Farmers’ risk attitude
also influences their decisions related to market risk management. For example, farmers’ risk aversion
had a positive association with the use of futures contracts (Pennings & Garcia, 2001) and the
acquisition of loans from informal sources (Jacobson & Petrie, 2009). However, Pennings and Garcia
(2001) reported that applying other financial mechanisms to reduce market risks was not associated
with farmers’ risk aversion. Binswanger (1980) also found farmers’ investment behaviour uncorrelated
with their risk attitude but negatively associated with constraints in credit, marketing and extension
facilities.
2.6 Flood risk in farming
The online Glossary of Meteorology published by the American Meteorological Society (2019)
defines drought as “overflowing of the normal confines of a stream or other body of water, or the
accumulation of water over areas that are not normally submerged”. Flooding is one of the major
abiotic constraints to crop production worldwide, resulting in substantial economic loss. About 14% of
the global rice area (approximately 22 million ha) is unfavourably submerged annually, affecting the
livelihood of more than 100 million people (Singh et al., 2016). About 10% rice area in Nepal is prone
to flood during the early and middle stages of crop growth (Yadaw et al., 2017). Although rice plants
Chapter 2: Literature review 24
require a large amount of water, flooding results in an anaerobic environment leading to severe crop
loss (Debabrata & Jijnasa, 2021). The effect of flooding is more detrimental in improved rice varieties
because most of them are susceptible to submergence stress (Afrin et al., 2018). The frequency and
intensity of floods have increased in recent years as a consequence of climate change and
anthropogenic activities.
2.7 Drought risk in farming
The American Meteorological Society (2019) defines drought as “A period of abnormally dry weather
sufficiently long enough to cause a serious hydrological imbalance”. In the context of agriculture, it
defines drought as “the conditions that result in adverse crop responses, usually because plants
cannot meet potential transpiration as a result of high atmospheric demand and/or limited soil
moisture”. Drought occurs mainly when the rainfall frequency or amount falls significantly below an
average level (Dai, 2011). World Bank (2015) points out five conditions that indicate drought: delayed
onset of the rainy season, early termination of the rainy season, prolonged periods without rainfall or
erratic rainfall distribution, deficit in cumulative rainfall over the cropping season, and soil moisture
deficit during critical stages of crop growth. As compared to other climatic hazards, drought often has
a slower and quieter onset, develops more steadily, covers a broader geographical area, and may linger
for longer (Dahal et al., 2016; Di Lena et al., 2014; Mishra & Singh, 2010; Rossi et al., 1992).
Among weather-related risks, drought is considered the most critical because of its high prevalence
and detrimental effects on crop production, which challenges the macroeconomic objectives of global
food security, poverty reduction, and environmental protection (Dar et al., 2020; Hill et al., 2019; Kyle
et al., 2016; Pandey et al., 2007; Ward et al., 2020). Many historical crop production disasters in
different parts of the world have been attributed to low rainfall leading to droughts (see Dahal et al.,
2016; Friend et al., 2005; Funk, 2011; Krishna Kumar et al., 2004; Lobell & Burke, 2008; Sivakumar
et al., 2005; Wong et al., 2010). Globally, the drought-prone area under major food crops, including
rice, maize, wheat, soybean and barley, has increased from 5–10% to 15–25% since 1960 (Jemma et
al., 2010).
Drought has more detrimental effects on rice than other crops because it is a semi-aquatic plant (Fukao
et al., 2011). Moisture deficit can cause severe damage at any stage of crop growth leading to partial
or complete yield loss (Yugi et al., 2014). Only about half of the rice area in Asia is irrigated (Bailey-
Serres et al., 2010; Huke & Huke, 1997), which implies that the remaining half is vulnerable to
drought risk at some stage of crop growth. Similarly, more than two-thirds of the rice area in Nepal is
rainfed (Bagazonzya et al., 2009), which indicates a high vulnerability to drought. A more alarming
concern about drought is that it will intensify in the 21st Century in most parts of the world (IPCC,
2014). This thesis considers crop insurance, particularly rainfall-index insurance, as an option for
Chapter 2: Literature review 25
mitigating drought risk in rice farming and examines its relevancy in terms of farmers’ willingness to
pay for it (Chapter 7).
2.8 Risk management
OECD (2009) defines risk management as a broader risk governance framework comprising three
major steps: risk assessment and evaluation, risk management and risk communication. Risk
assessment involves quantifying risks in terms of the product of frequency and likely impacts of a
given risk, whereas risk evaluation involves prioritising risks based on the risk assessment and societal
risk attitude or risk tolerance level. The study of farmers’ risk perception and attitude is of utmost
importance to accomplish the first stage of the broad risk management framework. Risk management
is the application of appropriate measures by farmers and other relevant institutions to reduce, control
or regulate risks. The selection of a proper risk management strategy is based on the economic
analysis of potential risk management options compared to self-insurance. A farmer’s decision to
select an appropriate strategy depends on their risk exposure and risk attitude. Similarly, risk
communication is the sharing of experience and information about risk and management between
farmers, policymakers and other relevant stakeholders. Selection of an appropriate risk management
strategy is important and the most complex decision that farmers have to make, which determines the
viability and sustainability of farm business (Coble et al., 2000; Ke & Wang, 2002).
2.8.1 Classification of risk management strategies
Risk management involves two main strategies: reducing loss exposure or handling the consequences
of adverse outcomes once they occur. A third strategy is not taking any action or taking risk (Hoag,
2010). Nevertheless, risk management strategies have been classified on several bases, as discussed
below.
Jafee et al. (2010) classify risk management strategies into ex-ante and ex-post strategies based on
when the actions are taken. Ex-ante strategies include the measures applied beforehand to reduce the
chances of adverse outcomes and advance arrangements for coping with potential adverse outcomes
(e.g., using pest-resistant crop varieties, crop insurance and monetary saving). In contrast, ex-post
strategies include the actions undertaken to cope with adverse outcomes after they occur (e.g., selling
assets, seeking temporary employment and migration).
Similarly, OECD (2009) classifies risk management strategies into policies and programs
implemented by the government, solutions or products supplied by the market, and farm-level actions
taken by farmers. Likewise, FAO (2014) classifies risk management strategies into formal and
informal strategies. Informal strategies include actions taken by farming households or communities,
whereas formal strategies include market-based options or public interventions. Many rural farming

Chapter 2: Literature review 26
households in the Asia-Pacific region practice informal risk management strategies mainly because
market-based risk management solutions do not exist (FAO, 2014). Such informal strategies may not
provide complete protection against high-impact weather-related risks such as floods and drought.
Farm diversification is an example of an informal risk management strategy practised by farmers.
However, diversifying investment into several activities to reduce risk often results in low returns
(ILO, 2006). Another popular informal strategy to avoid drought risk is the use of local varieties,
which are usually resistant to multiple stresses, but the production potential of most of these varieties
is low (FAO, 2014).
Based on the objectives, Holzmann and Jorgensen (2001) categorise risk management strategies into
risk-reducing, mitigating and coping strategies. Risk-reducing strategies, such as seed treatment to
prevent seed-borne diseases in rice crops, involve preventive measures to reduce the probability of risk
exposure or magnitude of loss. Risk mitigating strategies include measures such as insurance, which
help reduce the potential consequence of risk. Risk coping strategies, such as disaster relief payment,
help deal with the consequences once the adverse event has occurred. Prevention and mitigation of
risks smoothen income, whereas coping with risks involves consumption smoothening (OECD, 2009).
Among the classifications of risk management strategies available in the literature, we found Rejda
and McNamara (2014)’s classification (Figure 2.1) applicable to our analysis of farmers’ risk
perceptions because we also measured risk perceptions in terms of the probability and severity of the
loss. In Chapter 5, we use their risk assessment matrix to examine the applicability of crop insurance
against drought and flood based on farmers’ perceptions of probability and potential loss associated
with these risks.
Figure 2.1 Risk assessment matrix used for evaluating insurability of farming risk
Note: Adapted from Rejda and McNamara (2014)

Chapter 2: Literature review 27
2.8.2 Evolution of agricultural insurance
Although crop-hail insurance started in Germany as early as the late 1700s through small mutual
companies (Smith & Glauber, 2012), public involvement in the agricultural insurance industry began
in 1938 when the American Congress approved the ‘Federal Crop Insurance Program’ under the
‘Agricultural Adjustment Act’(Joseph, 2013). The value of global agricultural insurance premium
tripled from USD 10.2 billion in 2006 to 30.7 billion in 2017, indicating a rapid growth of the
agricultural insurance market (see Hohl, 2019). More than half of the countries worldwide had some
form of agricultural insurance in 2010 (Mahul & Stutley, 2010). According to FAO (2011), the main
reasons for the rapid growth of the agricultural insurance market, especially in developing countries,
are increasing global food demand and price, increasing production risks due to climate change, and
government preferences for insurance over disaster relief payment. The change from public-funded
programs to public-private partnership programs and the emergence of innovative insurance products,
such as index-based insurance, especially targeting smallholder farmers, are major transformations
that the agricultural insurance industry have experienced in the past three decades (Hohl, 2019).
Nepal’s history of insurance services dates to 1937, when the government of Nepal established Nepal
Bank Limited, the first bank of Nepal (Investopaper, 2020). The insurance services were mainly
started to safeguard the loans provided by the bank. Indian insurance companies used to provide non-
life insurance services in Nepal before the establishment of the first Nepalese insurance company in
1947 called Nepal Malchalani Tatha Beema Company, later named as Nepal Insurance Company
Limited. Life insurance services started in 1968 when the Government of Nepal established the first
Nepalese insurance company called “Rastriya Beema Sansthan” (Investopaper, 2020). After the
restoration of democracy in 1990, the government adopted a liberal economic policy allowing several
life and non-life insurance companies to be established. Currently, there are 19 life insurance and 20
non-life insurance companies in the Nepalese insurance market (Singh, 2021). In 2020, insurance
companies collected 152 billion NPR premiums altogether, with the life insurance sector sharing about
80% of the total premium (Investopaper, 2021).
The chronology of the development of agricultural insurance in Nepal was comprehensively reviewed
by Bagazonzya et al. (2009) and Bhushan et al. (2016). According to these reviews, the history of non-
regulated livestock insurance in Nepal dates to 1987 when the Central Bank of Nepal and Deposit
Insurance and Credit Guarantee Corporation jointly implemented all-risk livestock insurance schemes,
particularly to protect commercial banks’ lending to small farmers to purchase livestock.
Simultaneously, Small Farmer Cooperative Limited, Community Livestock Development Program
and Centre for Self-Help Development started separate livestock insurance programs. Similarly, crop
insurance was introduced in 2007 as pilot programs in selected areas through farmers’ multi-purpose
cooperatives in collaboration with the Department of Agriculture. Amid many challenges, these early
Chapter 2: Literature review 28
initiatives indicated significant demand for both livestock and crop insurance. Therefore, upon a joint
request from the Ministry of Finance, Ministry of Agriculture and Livestock Development (the then
Ministry of Agriculture and Cooperatives), and Insurance Board, the World Bank conducted a
feasibility study on agricultural insurance in 2009. Mainly based on the recommendations of their
study, the Government of Nepal enacted Agriculture Insurance Directives in 2013, which facilitated
the development of livestock and crop insurance products.
2.8.3 Agricultural insurance products
The insurance market offers a range of agricultural insurance products. We focus on two major crop
insurance products: loss-based insurance (LBI) and weather-index insurance (WII). Some forms of LBI
are already available in Nepal, and the government has shown interest in introducing WII.
2.8.3.1 Loss-based insurance
LBI is a traditional form of insurance in which the insurer pays a specified indemnity to the insured
party according to the assessment of actual yield loss (Diersen et al., 2015). Multi-peril crop insurance
(MPCI) and named-peril crop insurance (NPCI) are the two most popular LBI products in the Asia-
Pacific region (FAO, 2011). MPCI is popular because it provides loss protection against all perils,
including climatic, natural and biological adverse events. NPCI is a demand-based insurance product
covering losses due to a specific adverse event, named when underwriting the contract. NPCI is
suitable in areas where farmers have a higher perception of a particular risk. Despite being the most
straightforward and easy-to-implement instrument, the uptake of LBI is low worldwide (FAO, 2011).
Moral hazards and adverse selection are two major issues in the LBI market (Diersen et al., 2015).
Similarly, the systemic nature of weather-related risks and high-premium rates are major constraints to
the economic feasibility of LBI (FAO, 2011). Because it requires individual loss verification, the
operational cost of LBI is so high that only a small part of the premium is left for indemnity payment
(Carter et al., 2015). These facts indicate that LBI is not an ideal solution for smallholder farmers.
2.8.3.2 Weather-index insurance
Recently, WII has received the growing attention of donors, policymakers, and insurance companies
as a more convenient option than LBI to mitigate weather-related farming risks in developing
countries (Alan & Hendrik, 2011; Hill et al., 2019; Odening & Shen, 2014). WII involves an index
derived using one or more weather variables to indicate indemnification or production loss (Barnett &
Mahul, 2007). The variables used to construct the index should be highly correlated with crop yield
(Diersen et al., 2015). A pre-defined yield or loss distribution model, with the index as the explanatory
variable, is used to decide whether indemnification is made (Barnett & Mahul, 2007). A long-term
average of the weather variable is used as the reference value, and the deficit or excess on the
reference value recorded over a specified period is used to determine the indemnification (Barnett &

Chapter 2: Literature review 29
Mahul, 2007). A threshold level of the deficit or excess on the index value is set as a trigger point for
policy activation, and the indemnification per unit index value increases as the deficit or excess
increases (Barnett & Mahul, 2007; FAO, 2011). Rainfall-index insurance (RII) is the most popular
WII, which is more suitable for drought than other risks (FAO, 2011).
WII offers the following major advantages over LBI (Barnett & Mahul, 2007; Carter et al., 2015;
FAO, 2011; Odening & Shen, 2014):
• Insurance contract is simple, and operational cost is low
• Indemnification is fast because loss verification is not required
• Indemnification is based on a measured value of the index, saving the cost for loss estimation
• Information asymmetry is not an issue, eliminating the scope for adverse selection
• No issue of moral hazard because insured agents do not have any control over the index
• Unlike traditional insurance products, insurance companies need not hire agricultural experts
because crop monitoring and loss assessment are not required.
Moreover, FAO (2011) suggested three potential contributions of WII in the process of climate change
adaptation in developing countries: (1) can be a major risk transfer component of the comprehensive
climate change adaptation strategy; (2) can help build a more resilient farming system, increasing
farmers’ financial capacity, enabling them to invest in resilient crop production technologies and
productive inputs; (3) can be bundled with climate-resilient technology, keeping a mandatory
condition that the insurance beneficiaries use recommended farming practices or technologies, such as
drought-resistant crop varieties, to accelerate the climate change adaptation process.
Demerits of weather-index insurance
The advantages of WII come at the cost of ‘basis risks’ that arise from the imperfect correlation
between crop loss distribution and the index (Adeyinka et al., 2016; Alan & Hendrik, 2011; Odening
& Shen, 2014; OECD, 2009; Woodard & Garcia, 2008). The greatest strength of index insurance, i.e.,
using an index for indemnification, can also be its greatest weakness if the index is weakly correlated
with loss distribution at the farm level (Hill et al., 2016). Basis risk is the difference between the
indemnity payoff suggested by the index model and actual yield loss at the farm level (Mario & Katie,
2012; Woodard & Garcia, 2008). There are two types of basis risk associated with WII (Barnett &
Mahul, 2007; Muneepeerakul et al., 2017). First, production basis risk (also called technical or local
basis risk) indicates imperfect correlations between weather index and crop yield. Apart from the

Chapter 2: Literature review 30
climatic factor on which the index is based, crop yield depends on several non-climatic factors such as
insect or disease infestation, weed infestation, varietal performance, input use, and other management
practices (Barnett & Mahul, 2007). For instance, Odening et al. (2007) showed that cumulative rainfall
predicted less than 25% of the variation in wheat yield in Germany. Second, geographical or spatial
basis risk arising from the imperfect covariance between the conditions at the reference station and the
crop field (Barnett & Mahul, 2007; Muneepeerakul et al., 2017; Odening & Shen, 2014).
Researchers have suggested several ways to deal with basis risk. Some spatial basis risk can be
mitigated by designing the index more carefully and increasing the density of weather stations
(Odening & Shen, 2014). Using an insurance portfolio comprising different contracts for different
locations is an alternative method for dealing with spatial basis risk (Berg & Schmitz, 2008; Woodard
& Garcia, 2008). For instance, a case study in Germany showed a 20–40% reduction in spatial basis
risk when the portfolio insurance-based multi-site rainfall model was compared with a single-site
model (Ritter et al., 2012). WII works well in areas where the dominant cause of crop loss is a specific
weather variable (Barnett & Mahul, 2007). Therefore, identifying appropriate target areas for a given
WII is an important consideration for its success.
2.8.4 Limitations in the agricultural insurance market
The systemic nature of weather risk is the leading cause for crop insurance market failure unless
appropriate arrangements for transferring such risks, such as re-insurance, are put in place (Duncan &
Myers, 2000; Mario & Joseph, 1997). Weather risks often violate the requirements for insurability
because most weather risks are systemic; estimating actuarially fair premiums is difficult due to
volatile weather variables leading to non-stationary yield distributions and lack of sufficient data on
yield and weather hindering estimation of reliable loss distributions (Odening & Shen, 2014).
Moreover, crop insurance markets in developing countries are constrained by small farm size, limited
farm record keeping, substantial loss estimation costs, and considerable scope for moral hazard and
adverse selection (Hazell et al., 1986). The success of crop insurance in the context of the subsistence
farming system is also constrained by low levels of resource-poor farmer knowledge and awareness of
risk and insurance, low affordability, and the need to develop a widespread supply channel in the face
of low demand (FAO, 2011). Furthermore, insurance is not a panacea that can overcome all risks in
farming. It only addresses production risks until the crop is harvested and does not extend to
downstream sources of risks such as post-harvest risks, including storage loss and market risks (FAO,
2014). Therefore, agricultural insurance cannot replace sound risk management and should be
promoted only by providing essential services such as training and extension, timely input supply, and
appropriate arrangement for output marketing (Mahul & Stutley, 2010).
Chapter 2: Literature review 31
Adverse selection and moral hazard
Underwriting insurance contracts involves specifying the premium rate and all terms and conditions
related to the loss estimation process—a threshold level of loss that triggers the insurance policy—and
the indemnification process. Information sharing plays a vital role in the insurance market because
information asymmetry between farmers and insurers results in adverse selection (He et al., 2019;
Knight & Coble, 1997; Quiggin et al., 1993). Due to insurers’ lack of information on the actual risk of
insuring individuals, the insurance market relies on a generalised measure of risk, selling its crop
insurance products at an average premium price. Low-risk individuals will gradually discontinue their
contracts when they realise that they are paying more than they should. Consequently, the insurance
market is left with high-risk individuals who pay less but are likely to claim more. Such a situation is
known as adverse selection (Shiva & Agapi, 2001).
Moral hazard is the lack of incentives for insured agents to prevent loss once the loss has been insured
(Diersen et al., 2015). It is more pronounced when several production factors are within the farmer’s
control, and the losses depend on how well the farm is managed (Alizadeh-Masoodian & Nomikos,
2005). In the Philippines, He et al. (2019) reported that farmers with the cost-of-production insurance
invested more on inputs that increase production costs or indemnity amounts and less on inputs that
increase productivity but are not entered into the indemnification formula, thus signifying the
prevalence of moral hazard. Another study conducted by Quiggin et al. (1993) in the USA found that
insured farmers used fewer inputs and had lower yields than uninsured farmers.
Implementing actuarial insurance pricing mechanisms, such as ‘bonus-malus incentives’ and risk-
sharing between the insurer and insured party through ‘deductible’, are some of the strategies for
dealing with adverse selection and moral hazard in the insurance market. Rejesus et al. (2006)
suggested that a performance-based premium discounting system could address both issues, improving
the actuarial soundness of the crop insurance market. They noted that the existing low-risk
participants, who are likely to leave the market when they realise that they are being overcharged,
would continue if they receive a premium discount for low loss exposure. Likewise, non-participating
low-risk farmers would be motivated to enter the market due to the possibility of a premium discount
for their better-than-average performance potential. They further noted that long-term incentives for
maintaining a good production record could outweigh short-term incentives for moral hazard.
2.8.5 Government’s role in the agricultural insurance market
A high vulnerability of agriculture to weather-related risks indicates the general demand for risk
management products, such as insurance. However, the agricultural insurance market is a quasi-
market that does not function well without government support (OECD, 2009). Crop insurance does
not work effectively in isolation and is not a promising solution for subsistence farmers unless the

Chapter 2: Literature review 32
premium is heavily subsidised (FAO, 2011). The adoption of unsubsidised crop insurance is low even
in developed countries. For example, less than 1% of German farmers buy unsubsidised crop
insurance despite high-risk perceptions, while farmer participation in the USA, Canada, and some EU
countries is high because of massive subsidies of insurance premiums (Odening & Shen, 2014).
Agricultural insurance schemes in most countries are government programs, except in countries such
as Australia and New Zealand, where the government’s role is minimal (FAO, 2011). Premium
subsidies are the most common feature of crop insurance markets across the world.
Information asymmetry and difficulty monitoring farmer behaviours lead to adverse selection and
moral hazard in the insurance market (Mahul & Stutley, 2010). The government can facilitate
information generation on weather patterns, insects, or disease prevalence through research (OECD,
2009). The government can also facilitate sharing information between farmers and insurers, which
overcomes information asymmetry (OECD, 2009). The government’s extension network can provide
technical assistance to farmers and monitor their behaviours, which helps reduce the moral hazard
(Mahul & Stutley, 2010).
Insurance companies in developing countries have limited access to international re-insurance
markets. Moreover, such international re-insurance companies are less interested in engaging with
insurance companies in developing countries that often provide insurance to small businesses. The
government can play an important role in assisting insurance companies in accessing the international
re-insurance market (Mahul & Stutley, 2010). Moreover, overcoming market and regulatory
impediments is necessary to attract insurance and re-insurance companies into the agricultural
insurance market.
The need for high-quality weather data and sophisticated infrastructure are major challenges for
developing and implementing WII in developing countries (FAO, 2011). Governments, donors and
international agencies can facilitate the development of the WII system by establishing a regulatory
framework, assessing demand, generating and managing required data, training insurance providers,
educating farmers, funding piloting of the insurance products, and providing a level of re-insurance
support (Barnett & Mahul, 2007). The government can also help raise farmers’ risk awareness and
educate them about the concept and benefits of farm insurance, which will increase demand (Mahul &
Stutley, 2010).
2.9 Summary and conclusion
Understanding farmers’ risk perceptions, attitudes towards risk and decision-making is an ongoing
research topic in agricultural economics. There are two contrasting theories to explain human
decision-making in the presence of risk. The first is the rational choice theory, which assumes humans
are expected utility-maximising agents. The second is behavioural economic theory, which assumes

Chapter 2: Literature review 33
that human decisions incorporate systematic errors due to bounded rationality, cognitive heuristics and
framing effects. While the behavioural economic theory helps describe human behaviour, the rational
choice theory is equally helpful in understanding human choices and advising how they ought to make
choices. Therefore, rational choice theory dominates the decision analysis in various fields. Based on
the expected utility maximisation theory, an extensive body of literature has analysed farmers’ risk
perceptions, risk attitudes and management decisions. However, the relationships between these
variables are not consistent across regions, studies and decision domains. This inconsistency indicates
the need for a separate analysis of these variables to understand farmer behaviour in each context.
The literature review revealed that drought is the most critical weather-related risk, in global and
Nepalese contexts, due to its detrimental effects on crop production and the national economy. A more
alarming concern is that the prevalence and intensity of drought are predicted to increase due to
climate change. Therefore, managing drought risk is of utmost importance not only for the income
stability of farming communities but also for the sustainable growth of Nepal’s rural and national
economies. Crop insurance can be an important tool for mitigating drought risk in farming and
supporting climate change adaptation initiatives.
The agricultural insurance market has many limitations. Due to information asymmetry between
farmers and insurance companies, the traditional LBI products suffer moral hazard and adverse
selection issues. Likewise, lack of data and insufficient infrastructure result in a poor weather index,
which leads to high basis risk in the case of WII. Moreover, systemic weather risks often violate the
requirements for insurability criteria. The systemic nature of weather risks also justifies the need for
public support in the insurance market. The government can play a crucial role in establishing a
thriving crop insurance market by providing premium subsidies and re-insurance support, facilitating
information generation and sharing, removing policy hurdles for attracting insurance and re-insurance
companies into the market, and educating farmers on the benefits of insurance to increase demand.
Chapter 2: Literature review 34
2.10 References
Adeyinka, A. A., Krishnamurti, C., Maraseni, T. N., & Chantarat, S. (2016). The Viability of Weather-
Index Insurance in Managing Drought Risk in Rural Australia. International Journal of Rural
Management, 12(2), 125-142. https://doi.org/https://doi.org/10.1177/0973005216660897
Afrin, W., Nafis, M. H., Hossain, M. A., Islam, M. M., & Hossain, M. A. (2018). Responses of Rice
(Oryza Sativa L.) Genotypes to Different Levels of Submergence. Comptes rendus. Biologies,
341(2), 85-96. https://doi.org/https://doi.org/10.1016/j.crvi.2018.01.001
Ahsan, D. A. (2011). Farmers’ Motivations, Risk Perceptions and Risk Management Strategies in a
Developing Economy: Bangladesh Experience. Journal of Risk Research, 14(3), 325-349.
https://doi.org/https://doi.org/10.1080/13669877.2010.541558
Alan, F., & Hendrik, W. (2011). Concept and Unintended Consequences of Weather Index Insurance:
The Case of Mexico. American Journal of Agricultural Economics, 93(2), 505-511.
https://doi.org/https://doi.org/10.1093/ajae/aaq137
Alizadeh-Masoodian, A., & Nomikos, N. (2005). Agricultural Reforms and Use of Market
Mechanisms for Risk Management. https://openaccess.city.ac.uk/id/eprint/16261/
Allais, M. (1953). Le Comportement De L'homme Rationnel Devant Le Risque: Critique Des
Postulats Et Axiomes De L'ecole Americaine. Econometrica, 21(4), 503-546.
https://doi.org/https://doi.org/10.2307/1907921
American Meteorological Society. (2019). Glossary of Meteorology. American Meteorological
Society. https://glossary.ametsoc.org/wiki/Drought
Anderson, L., & Mellor, J. (2009). Are Risk Preferences Stable? Comparing an Experimental Measure
with a Validated Survey-Based Measure. Journal of Risk and Uncertainty, 39(2), 137-160.
https://doi.org/https://doi.org/10.1007/s11166-009-9075-z
Arrow, K. J. (1965). Aspects of the Theory of Risk Bearing. Yrjö Jahnssonin Säätiö, Academic
Bookstore.
Bagazonzya, H. K., Devkota, K., Mahul, O., & Stutley, C. (2009). Agricultural Insurance Feasibility
Study for Nepal (46521-NP). W. Bank.
https://documents.worldbank.org/curated/en/246101468052838449/Nepal-Agricultural-
insurance-feasibility-study
Bailey-Serres, J., Fukao, T., Ronald, P., Ismail, A., Heuer, S., & Mackill, D. (2010). Submergence
Tolerant Rice: Sub1’s Journey from Landrace to Modern Cultivar. Rice, 3(2), 138-147.
https://doi.org/https://doi.org/10.1007/s12284-010-9048-5
Bar-Shira, Z., Just, R. E., & Zilberman, D. (1997). Estimation of Farmers' Risk Attitude: An
Econometric Approach. Agricultural Economics, 17(2), 211-222.
https://doi.org/https://doi.org/10.1016/S0169-5150(97)00021-2

Chapter 2: Literature review 35
Barham, B. L., Chavas, J.-P., Fitz, D., Salas, V. R., & Schechter, L. (2014). The Roles of Risk and
Ambiguity in Technology Adoption. Journal of Economic Behavior & Organization, 97, 204-
218. https://doi.org/https://doi.org/10.1016/j.jebo.2013.06.014
Barnett, B., & Mahul, O. (2007). Weather Index Insurance for Agriculture and Rural Areas in Lower-
Income Countries. American Journal of Agricultural Economics, 89(5), 1241-1247.
https://doi.org/https://doi.org/10.1111/j.1467-8276.2007.01091.x
Becker, G. S. (1976). The Economic Approach to Human Behavior. The University of Chicago Press.
Benjamin, D. J., Brown, S. A., & Shapiro, J. M. (2013). Who Is 'Behavioural'? Cognitive Ability and
Anomalous Preferences. Journal of the European Economic Association, 11(6), 1231-1255.
https://doi.org/https://doi.org/10.1111/jeea.12055
Berg, E., & Schmitz, B. (2008). Weather-Based Instruments in the Context of Whole-Farm Risk
Management. Agricultural Finance Review, 68(1), 119-133.
https://doi.org/https://doi.org/10.1108/00214660880001222
Bernoulli, D. (1738). Specimen Theoriae Novae De Mensvra Sortis [Exposition of a new theory on the
measurement of risk]. Commentarii Academiae Scientiarum Imperialis Petropolitanae, 5,
175-192. https://doi.org/https://doi.org/10.2307/1909829 (Exposition of a new theory on the
measurement of risk) (Specimen Theoriae Novae De Mensvra Sortis)
Bhushan, C., Singh, G., Rattani, V., & Kumar, V. (2016). Insuring Agriculture in Times of Climate
Change. https://www.cseindia.org/insuring-agriculture-in-times-of-climate-change-8020
Binswanger, H. P. (1980). Attitudes toward Risk: Experimental Measurement in Rural India.
American Journal of Agricultural Economics, 62(3), 395-407.
https://doi.org/https://doi.org/10.2307/1240194
Boholm, A. (1998). Comparative Studies of Risk Perception: A Review of Twenty Years of Research.
Journal of Risk Research, 1(2), 135-163.
https://doi.org/https://doi.org/10.1080/136698798377231
Brick, K., Visser, M., & Burns, J. (2012). Risk Aversion: Experimental Evidence from South African
Fishing Communities. American Journal of Agricultural Economics, 94(1), 133-152.
https://doi.org/https://doi.org/10.1093/ajae/aar120
Brody, S. D., Zahran, S., Vedlitz, A., & Grover, H. (2008). Examining the Relationship between
Physical Vulnerability and Public Perceptions of Global Climate Change in the United States.
Environment and Behavior, 40(1), 72-95.
https://doi.org/https://doi.org/10.1177/0013916506298800
Byrnes, J. P., Miller, D. C., & Schafer, W. D. (1999). Gender Differences in Risk Taking: A Meta-
Analysis. Psychological Bulletin, 125(3), 367-383.
https://doi.org/https://doi.org/10.1037/0033-2909.125.3.367
Chapter 2: Literature review 36
Carter, M., Elabed, G., & Serfilippi, E. (2015). Behavioral Economic Insights on Index Insurance
Design. Agricultural Finance Review, 75(1), 8-18.
https://doi.org/https://doi.org/10.1108/AFR-03-2015-0013
Chavas, J.-P., & Holt, M. (1996). Economic Behavior under Uncertainty: A Joint Analysis of Risk
Preferences and Technology. The Review of Economics and Statistics, 78(2), 329-335.
https://doi.org/https://doi.org/10.2307/2109935
Cho, J., & Lee, J. (2006). An Integrated Model of Risk and Risk-Reducing Strategies. Journal of
Business Research, 59(1), 112-120.
https://doi.org/https://doi.org/10.1016/j.jbusres.2005.03.006 (Journal of Business Research)
Coble, K. H., Heifner, R. G., & Zuniga, M. (2000). Implications of Crop Yield and Revenue Insurance
for Producer Hedging. Journal of Agricultural and Resource Economics, 25(2), 432-452.
https://doi.org/https://doi.org/10.2307/40987069
Cohen, A., & Einav, L. (2007). Estimating Risk Preferences from Deductible Choice. American
Economic Review, 97(3), 745-788. https://doi.org/https://doi.org/10.1257/aer.97.3.745
Cohn, L. D., Macfarlane, S., Yanez, C., & Imai, W. K. (1995). Risk-Perception: Differences between
Adolescents and Adults. Health Psychology, 14(3), 217-222.
https://doi.org/https://doi.org/10.1037/0278-6133.14.3.217
Croson, R., & Gneezy, U. (2009). Gender Differences in Preferences. Journal of Economic Literature,
47(2), 448-474. https://doi.org/https://doi.org/10.1257/jel.47.2.448
Dahal, P., Dahal, P., Shrestha, N. S., Shrestha, N. S., Shrestha, M. L., Shrestha, M. L., Krakauer, N.
Y., Krakauer, N. Y., Panthi, J., Panthi, J., Pradhanang, S. M., Pradhanang, S. M., Jha, A., Jha,
A., Lakhankar, T., & Lakhankar, T. (2016). Drought Risk Assessment in Central Nepal:
Temporal and Spatial Analysis. Natural Hazards, 80(3), 1913-1932.
https://doi.org/https://doi.org/10.1007/s11069-015-2055-5
Dai, A. (2011). Drought under Global Warming: A Review. Wiley interdisciplinary reviews. Climate
change, 2(1), 45-65. https://doi.org/https://doi.org/10.1002/wcc.81
Dar, M. H., Waza, S. A., Shukla, S., Zaidi, N. W., Nayak, S., Hossain, M., Kumar, A., Ismail, A. M.,
& Singh, U. S. (2020). Drought Tolerant Rice for Ensuring Food Security in Eastern India.
Sustainability, 12(6), 2214. https://doi.org/https://doi.org/10.3390/su12062214
Debabrata, P., & Jijnasa, B. (2021). Flooding Tolerance in Rice: Focus on Mechanisms and
Approaches. Rice science, 28(1), 43-57.
https://doi.org/https://doi.org/10.1016/j.rsci.2020.11.006
Di Lena, B., Di Lena, B., Vergni, L., Vergni, L., Antenucci, F., Antenucci, F., Todisco, F., Todisco,
F., Mannocchi, F., & Mannocchi, F. (2014). Analysis of Drought in the Region of Abruzzo
(Central Italy) by the Standardized Precipitation Index. Theoretical and applied climatology,
115(1), 41-52. https://doi.org/https://doi.org/10.1007/s00704-013-0876-2

Chapter 2: Literature review 37
Diersen, M., Gurung, P., & Fausti, S. (2015, January 31-February 3, 2015). Optimal Allocation of
Index Insurance Intervals for Commodities Southern Agricultural Economics Association
(SAEA) Annual Meeting, Atlanta, Georgia, January 31-February 3, 2015.
Dohmen, T., Falk, A., Huffman, D., & Sunde, U. (2010). Are Risk Aversion and Impatience Related
to Cognitive Ability? American Economic Review, 100(3), 1238-1260.
https://doi.org/https://doi.org/10.1257/aer.100.3.1238
Dohmen, T., Falk, A., Huffman, D., Sunde, U., Schupp, J., & Wagner, G. (2011). Individual Risk
Attitudes: Measurement, Determinants, and Behavioral Consequences. Journal of the
European Economic Association, 9(3), 522-550. https://doi.org/https://doi.org/10.1111/j.1542-
4774.2011.01015.x
Duncan, J., & Myers, R. J. (2000). Crop Insurance under Catastrophic Risk. American Journal of
Agricultural Economics, 82(4), 842-855. https://doi.org/https://doi.org/10.1111/0002-
9092.00085
Eckel, C. C., & Grossman, P. J. (2002). Sex Differences and Statistical Stereotyping in Attitudes
toward Financial Risk. Evolution and Human Behavior, 23(4), 281-295.
https://doi.org/https://doi.org/10.1016/S1090-5138(02)00097-1
Eckel, C. C., & Grossman, P. J. (2008). Forecasting Risk Attitudes: An Experimental Study Using
Actual and Forecast Gamble Choices. Journal of Economic Behavior & Organization, 68(1),
1-17. https://doi.org/https://doi.org/10.1016/j.jebo.2008.04.006
Ellsberg, D. (1961). Risk, Ambiguity, and the Savage Axioms. The Quarterly Journal of Economics,
75(4), 643-669. https://doi.org/https://doi.org/10.2307/1884324
Engle Warnick, J. C., Escobal, J., & Laszlo, S. C. (2011). Ambiguity Aversion and Portfolio Choice in
Small-Scale Peruvian Farming. The B.E. Journal of Economic Analysis & Policy, 11(1), 1-56.
https://doi.org/https://doi.org/10.2202/1935-1682.2331
Falco, S. D., Adinolfi, F., Bozzola, M., & Capitanio, F. (2014). Crop Insurance as a Strategy for
Adapting to Climate Change. Journal of Agricultural Economics, 65(2), 485-504.
https://doi.org/https://doi.org/10.1111/1477-9552.12053
FAO. (2011). Agricultural Insurance in Asia and the Pacific Region.
https://www.fao.org/3/i2344e/i2344e00.pdf
FAO. (2014). Managing Climate Risks and Adapting to Climate Change in the Agriculture Sector in
Nepal. F. a. A. O. o. t. U. Nations. https://www.fao.org/3/a-i3577e.pdf
Feder, G. (1980). Farm Size, Risk Aversion and the Adoption of New Technology under Uncertainty.
Oxford Economic Papers, 32(2), 263-283.
https://doi.org/https://doi.org/10.1093/oxfordjournals.oep.a041479
Feder, G., & Umali, D. L. (1993). The Adoption of Agricultural Innovations: A Review.
Technological Forecasting & Social Change, 43(3), 215-239.
https://doi.org/https://doi.org/10.1016/0040-1625(93)90053-A

Chapter 2: Literature review 38
Finucane, M. L., Slovic, P., Mertz, C. K., Flynn, J., & Satterfield, T. A. (2000). Gender, Race, and
Perceived Risk: The 'White Male' Effect. Health, risk & society, 2(2), 159-172.
https://doi.org/https://doi.org/10.1080/713670162
Flaten, O., Lien, G., Koesling, M., Valle, P. S., & Ebbesvik, M. (2005). Comparing Risk Perceptions
and Risk Management in Organic and Conventional Dairy Farming: Empirical Results from
Norway. Livestock Production Science, 95(1-2), 11-25.
https://doi.org/https://doi.org/10.1016/j.livprodsci.2004.10.014
Fonta, W. M., Sanfo, S., Ibrahim, B., & Barry, B. (2015). Farmers Awareness, Perception of Climate
Hazards and Their Willingness to Participate in Crop Insurance Schemes in Southwestern
Burkina Faso. Procedia Environmental Sciences, 29, 7-8.
https://doi.org/https://doi.org/10.1016/j.proenv.2015.07.127
Fox, J. (2015). From "Economic Man" to Behavioral Economics. Harvard Business Review, 93(5), 78-
85.
Frederick, S. (2005). Cognitive Reflection and Decision Making. Journal of Economic Perspectives,
19(4), 25-42. https://doi.org/https://doi.org/10.1257/089533005775196732
Friend, A. D., Valentini, R., Aubinet, M., Matteucci, G., Heinesch, B., Ciais, P., Allard, V., Soussana,
J. F., Manca, G., Schulze, E. D., Viovy, N., Loustau, D., Ourcival, J. M., Papale, D.,
Bernhofer, C., Knohl, A., Buchmann, N., Grünwald, T., Krinner, G., Granier, A., Seufert, G.,
Ogée, J., Carrara, A., Miglietta, F., Chevallier, F., Friedlingstein, P., Reichstein, M., Keronen,
P., De Noblet, N., Rambal, S., Pilegaard, K., Vesala, T., & Sanz, M. J. (2005). Europe-Wide
Reduction in Primary Productivity Caused by the Heat and Drought in 2003. Nature,
437(7058), 529-533. https://doi.org/https://doi.org/10.1038/nature03972
Fukao, T., Yeung, E., & Bailey-Serres, J. (2011). The Submergence Tolerance Regulator Sub1a
Mediates Crosstalk between Submergence and Drought Tolerance in Rice. The Plant Cell,
23(1), 412-427. https://doi.org/https://doi.org/10.1105/tpc.110.080325
Funk, C. (2011). We Thought Trouble Was Coming. Nature (London), 476(7358), 7-7.
https://doi.org/https://doi.org/10.1038/476007a
Gebreegziabher, K., & Tadesse, T. (2013). Risk Perception and Management in Smallholder Dairy
Farming in Tigray, Northern Ethiopia. Journal of Risk Research, 17(3), 367-381.
https://doi.org/https://doi.org/10.1080/13669877.2013.815648
Gebrehiwot, T., & van der Veen, A. (2015). Farmers Prone to Drought Risk: Why Some Farmers
Undertake Farm-Level Risk-Reduction Measures While Others Not? Environmental
Management, 55(3), 588-602. https://doi.org/https://doi.org/10.1007/s00267-014-0415-7
Gigerenzer, G., & Goldstein, D. G. (1996). Reasoning the Fast and Frugal Way: Models of Bounded
Rationality. Psychological Review, 103(4), 650-669.
https://doi.org/https://doi.org/10.1037/0033-295X.103.4.650

Chapter 2: Literature review 39
Ginder, M., Spaulding, A. D., Tudor, K. W., & Randy Winter, J. (2009). Factors Affecting Crop
Insurance Purchase Decisions by Farmers in Northern Illinois. Agricultural Finance Review,
69(1), 113-125. https://doi.org/https://doi.org/10.1108/00021460910960507
Gong, Y., Baylis, K., Kozak, R., & Bull, G. (2016). Farmers’ Risk Preferences and Pesticide Use
Decisions: Evidence from Field Experiments in China. Agricultural Economics, 47(4), 411-
421. https://doi.org/https://doi.org/10.1111/agec.12240
Goodwin, B., & Mishra, A. (2004). Farming Efficiency and the Determinants of Multiple Job Holding
by Farm Operators. American Journal of Agricultural Economics, 86(3), 722-729.
https://doi.org/https://doi.org/10.1111/j.0002-9092.2004.00614.x
Hallahan, T. A., Faff, R. W., & McKenzie, M. D. (2004). An Empirical Investigation of Personal
Financial Risk Tolerance. Financial Services Review, 13(1), 57-78.
Hamal, K. B., & Anderson, J. R. (1982). A Note on Decreasing Absolute Risk Aversion among
Farmers in Nepal. Australian Journal of Agricultural Economics, 26(3), 220-225.
https://doi.org/https://doi.org/10.1111/j.1467-8489.1982.tb00414.x
Hardaker, J. B., Lien, G., Anderson, J. R., & Huirne, R. B. M. (2015). Coping with Risk in
Agriculture: Applied Decision Analysis (3rd ed.). CABI.
https://ebookcentral.proquest.com:80/lib/CURTIN/docDetail.action?docID=2066663
Harrison, G. W., Lau, M. I., & Rutström, E. E. (2007). Estimating Risk Attitudes in Denmark: A Field
Experiment*. Scandinavian Journal of Economics, 109(2), 341-368.
https://doi.org/https://doi.org/10.1111/j.1467-9442.2007.00496.x
Hartog, J., Ferrer‐I‐Carbonell, A., & Jonker, N. (2002). Linking Measured Risk Aversion to Individual
Characteristics. Kyklos, 55(1), 3-26. https://doi.org/https://doi.org/10.1111/1467-6435.00175
Hazell, P. B. R., Pomareda, C., & Valdes, A. (1986). Crop Insurance for Agricultural Development :
Issues and Experience. Published for the International Food Policy Research Institute by the
Johns Hopkins University Press.
He, J., Zheng, X., Rejesus, R. M., & Yorobe, J. M. (2019). Moral Hazard and Adverse Selection
Effects of Cost‐of‐Production Crop Insurance: Evidence from the Philippines. The Australian
journal of agricultural and resource economics, 63(1), 166-197. https://doi.org/10.1111/1467-
8489.12290
Hellerstein, D., Higgins, N., & Horowitz, J. (2013). The Predictive Power of Risk Preference
Measures for Farming Decisions. European Review of Agricultural Economics, 40(5), 807-
833. https://doi.org/https://doi.org/10.1093/erae/jbs043
Hermann, D., & Mußhoff, O. (2017). Displaying Expected Values in Risk Elicitation Tasks: The
Effect of Information in Experimental Risk Research. Journal of Risk Research, 1-11.
https://doi.org/https://doi.org/10.1080/13669877.2017.1378246
Hill, R. V., Kumar, N., Magnan, N., Makhija, S., de Nicola, F., Spielman, D. J., & Ward, P. S. (2019).
Ex Ante and Ex Post Effects of Hybrid Index Insurance in Bangladesh. Journal of

Chapter 2: Literature review 40
Development Economics, 136, 1-17.
https://doi.org/https://doi.org/10.1016/j.jdeveco.2018.09.003
Hill, R. V., Robles, M., & Ceballos, F. (2016). Demand for a Simple Weather Insurance Product in
India: Theory and Evidence. American Journal of Agricultural Economics, 98(4), 1250-1270.
https://doi.org/https://doi.org/10.1093/ajae/aaw031
Hoag, D. L. (2010). Managing Risk and Risky Decisions. In D. L. Hoag (Ed.), Applied Risk
Management in Agriculture (pp. 9-18). CRC Press.
Hohl, R. (2019). Agricultural Risk Transfer: From Insurance to Re-Insurance to Capital Markets.
John Wiley & Sons Ltd.
Holden, S. T., & Quiggin, J. (2017). Climate Risk and State-Contingent Technology Adoption:
Shocks, Drought Tolerance, and Preferences. European Review of Agricultural Economics,
44(2), 285-308. https://doi.org/https://doi.org/10.1093/erae/jbw016
Holt, C. A., & Laury, S. K. (2002). Risk Aversion and Incentive Effects. American Economic Review,
92(5), 1644-1655. https://doi.org/https://doi.org/10.1257/000282802762024700
Holzmann, R., & Jorgensen, S. (2001). Social Risk Management: A New Conceptual Framework for
Social Protection, and Beyond. International Tax and Public Finance, 8, 529-556.
Huke, R. E., & Huke, E. H. (1997). Rice Area by Type of Culture: South, Southeast, and East Asia. A
Revised and Updated Database. International Rice Research Institute.
ILO. (2006). Protecting the Poor: A Microinsurance Compendium. International Labour Organization.
Investopaper. (2020). History of Insurnace in Nepal: From 1947 to 2020. Retrieved 29/10/2021 from
https://www.investopaper.com/news/history-of-insurance-in-
nepal/#:~:text=%20History%20Of%20Insurance%20In%20Nepal%3A%20From%202004,the
%20political%20change%20of%202046%20BS%2C...%20More%20
Investopaper. (2021). Current Status of Insurance Business in Nepal. Retrieved 28/10/2021 from
https://www.investopaper.com/news/current-status-of-insurance-business-in-nepal/
IPCC. (2014). Climate Change 2014: Synthesis Report. Contribution of Working Groups 1, 2 and 3 to
the Fifth Assessment Report of the Intergovernmental Panel on Climate Change.
https://www.ipcc.ch/report/ar5/syr/
Iqbal, M. A., Ping, Q., Abid, M., Muhammad Muslim Kazmi, S., & Rizwan, M. (2016). Assessing
Risk Perceptions and Attitude among Cotton Farmers: A Case of Punjab Province, Pakistan.
International Journal of Disaster Risk Reduction, 16, 68-74.
https://doi.org/https://doi.org/10.1016/j.ijdrr.2016.01.009
Jacobson, S., & Petrie, R. (2009). Learning from Mistakes: What Do Inconsistent Choices over Risk
Tell Us? Journal of Risk and Uncertainty, 38(2), 143-158.
https://doi.org/https://doi.org/10.1007/s11166-009-9063-3
Jafee, S., Siegel, P., & Andrews, C. (2010). Rapid Agricultural Supply Chain Risk Assessment: A
Conceptual Framework (Agriculture and Rural Development Discussion Paper 47, Issue.

Chapter 2: Literature review 41
https://documents1.worldbank.org/curated/en/657211468157529181/pdf/565900NWP0ARD0
1pApRisk1combined1web.pdf
Jemma, G., Richard, B., Eleanor, B., Robin, C., Joanne, C., Kate, W., & Andrew, W. (2010).
Implications of Climate Change for Agricultural Productivity in the Early Twenty-First
Century. Philosophical Transactions. Biological Sciences, 365(1554), 2973-2989.
https://doi.org/https://doi.org/10.1098/rstb.2010.0158
Joseph, W. G. (2013). The Growth of the Federal Crop Insurance Program, 1990—2011. American
Journal of Agricultural Economics, 95(2), 482-488.
https://doi.org/https://doi.org/10.1093/ajae/aas091
Just, R. E., Calvin, L., & Quiggin, J. (1999). Adverse Selection in Crop Insurance: Actuarial and
Asymmetric Information Incentives. American Journal of Agricultural Economics, 81(4), 834-
849. https://doi.org/https://doi.org/10.2307/1244328
Kahneman, D., & Tversky, A. (1979). Prospect Theory: An Analysis of Decision under Risk.
Econometrica, 47(2), 263-291. https://doi.org/https://doi.org/10.2307/1914185
Karpowicz‐Lazreg, C., & Mullet, E. (1993). Societal Risk as Seen by the French Public. Risk Analysis,
13(3), 253-258. https://doi.org/https://doi.org/10.1111/j.1539-6924.1993.tb01076.x
Ke, B., & Wang, H. (2002). An Assessment of Risk Management Strategies for Grain Growers in the
Pacific Northwest. Agricultural Finance Review, 62(2), 117-133.
https://doi.org/https://doi.org/10.1108/00214920280001133
Keil, M., Wallace, L., Turk, D., Dixon-Randall, G., & Nulden, U. (2000). An Investigation of Risk
Perception and Risk Propensity on the Decision to Continue a Software Development Project.
The Journal of systems and software, 53(2), 145-157.
https://doi.org/https://doi.org/10.1016/S0164-1212(00)00010-8
Knight, J., Weir, S., & Woldehanna, T. (2003). The Role of Education in Facilitating Risk-Taking and
Innovation in Agriculture. The Journal of Development Studies, 39(6), 1-22.
https://doi.org/https://doi.org/10.1080/00220380312331293567
Knight, T. O., & Coble, K. H. (1997). Survey of U.S. Multiple Peril Crop Insurance Literature since
1980. Review of Agricultural Economics, 19(1), 128-156.
https://doi.org/https://doi.org/10.2307/1349683
Krishna Kumar, K., Rupa Kumar, K., Ashrit, R. G., Deshpande, N. R., & Hansen, J. W. (2004).
Climate Impacts on Indian Agriculture. International journal of climatology, 24(11), 1375-
1393. https://doi.org/https://doi.org/10.1002/joc.1081
Kyle, E., Alain de, J., Elisabeth, S., & Manzoor, H. D. (2016). Technological Innovations, Downside
Risk, and the Modernization of Agriculture. The American economic review, 106(6), 1537-
1561. https://doi.org/https://doi.org/10.1257/aer.20150474

Chapter 2: Literature review 42
Kyle, S. C. (1993). The Relation between Farm Production Risk and Off-Farm Income. Agricultural
and Resource Economics Review, 22(2), 179-188.
https://doi.org/https://doi.org/10.1017/S1068280500004779
Leathers, H. D., & Smale, M. (1991). A Bayesian Approach to Explaining Sequential Adoption of
Components of a Technological Package. American Journal of Agricultural Economics, 73(3),
734-742. https://doi.org/https://doi.org/10.2307/1242825
Lefebvre, M., Nikolov, D., Gomez-y-Paloma, S., & Chopeva, M. (2014). Determinants of Insurance
Adoption among Bulgarian Farmers. Agricultural Finance Review, 74(3), 326-347.
https://doi.org/https://doi.org/10.1108/afr-05-2013-0022
Legesse, B., & Drake, L. (2005). Determinants of Smallholder Farmers' Perceptions of Risk in the
Eastern Highlands of Ethiopia. Journal of Risk Research, 8(5), 383-416.
https://doi.org/https://doi.org/10.1080/1366987042000192426
Lindner, R. K., Pardey, P. G., & Jarrett, F. G. (1982). Distance to Information Source and the Time
Lag to Early Adoption of Trace Element Fertilizers. Australian Journal of Agricultural
Economics, 26(2), 98–113. https://doi.org/https://doi.org/10.1111/j.1467-8489.1982.tb00618.x
Liu, E. M. (2013). Time to Change What to Sow: Risk Preferences and Technology Adoption
Decisions of Cotton Farmers in China. Review of Economics and Statistics, 95(4), 1386-1403.
https://doi.org/https://doi.org/10.1162/REST_a_00295
Liu, E. M., & Huang, J. (2013). Risk Preferences and Pesticide Use by Cotton Farmers in China.
Journal of Development Economics, 103(C), 202-215.
https://doi.org/https://doi.org/10.1016/j.jdeveco.2012.12.005
Lobell, D. B., & Burke, M. B. (2008). Why Are Agricultural Impacts of Climate Change So
Uncertain? The Importance of Temperature Relative to Precipitation. Environmental research
letters, 3(3), 034007. https://doi.org/https://doi.org/10.1088/1748-9326/3/3/034007
Lucas, M. P., & Pabuayon, I. M. (2011). Risk Perceptions, Attitudes, and Influential Factors of
Rainfed Lowland Rice Farmers in Ilocos Norte, Philippines. Asian Journal of Agriculture and
Development, 8(2), 61-77. https://doi.org/https://doi.org/10.22004/ag.econ.199327
Machina, M. J. (1987). Choice under Uncertainty: Problems Solved and Unsolved. Journal of
Economic Perspectives, 1(1), 121-154.
Mahul, O., & Stutley, C. J. (2010). Government Support to Agricultural Insurance: Challenges and
Options for Developing Countries. World Bank. https://doi.org/https://doi.org/10.1596/978-0-
8213-8217-2
Mario, J. M., & Joseph, W. G. (1997). Systemic Risk, Reinsurance, and the Failure of Crop Insurance
Markets. American Journal of Agricultural Economics, 79(1), 206-215.
https://doi.org/https://doi.org/10.2307/1243954
Mario, J. M., & Katie, F. (2012). Index Insurance for Developing Countries. Applied economic
perspectives and policy, 34(3), 391-427. https://doi.org/https://doi.org/10.1093/aepp/pps031

Chapter 2: Literature review 43
Marra, M., Pannell, D. J., & Ghadim, A. A. (2003). The Economics of Risk, Uncertainty and Learning
in the Adoption of New Agricultural Technologies: Where Are We on the Learning Curve?
Agricultural Systems, 75, 215-234. https://doi.org/https://doi.org/10.1016/S0308-
521X(02)00066-5
Marra, M. C., & Carlson, G. A. (1990). The Decision to Double Crop: An Application of Expected
Utility Theory Using Stein's Theorem. American Journal of Agricultural Economics, 72(2),
337-345. https://doi.org/https://doi.org/10.2307/1242337
Menapace, L., Colson, G., & Raffaelli, R. (2016). A Comparison of Hypothetical Risk Attitude
Elicitation Instruments for Explaining Farmer Crop Insurance Purchases. European Review of
Agricultural Economics, 43(1), 113-135. https://doi.org/https://doi.org/10.1093/erae/jbv013
Meuwissen, M. P. M., Huirne, R. B. M., & Hardaker, J. B. (2001). Risk and Risk Management: An
Empirical Analysis of Dutch Livestock Farmers. Livestock Production Science, 69(1), 43-53.
https://doi.org/https://doi.org/10.1016/S0301-6226(00)00247-5
Mishra, A. K., & Singh, V. P. (2010). A Review of Drought Concepts. Journal of hydrology, 391(1),
202-216. https://doi.org/https://doi.org/10.1016/j.jhydrol.2010.07.012
Moscardi, E., & De Janvry, A. (1977). Attitudes toward Risk among Peasants: An Econometric
Approach. American Journal of Agricultural Economics, 59(4), 710-716.
https://doi.org/https://doi.org/10.2307/1239398
Mosley, P., & Verschoor, A. (2005). Risk Attitudes and the ‘Vicious Circle of Poverty’. The European
Journal of Development Research, 17(1), 59.
https://doi.org/https://doi.org/10.1080/09578810500066548
Muneepeerakul, C. P., Muneepeerakul, R., & Huffaker, R. G. (2017). Rainfall Intensity and Frequency
Explain Production Basis Risk in Cumulative Rain Index Insurance. Earth's future, 5(12),
1267-1277. https://doi.org/https://doi.org/10.1002/2017EF000661
Nielsen, T., Keil, A., & Zeller, M. (2013). Assessing Farmers’ Risk Preferences and Their
Determinants in a Marginal Upland Area of Vietnam: A Comparison of Multiple Elicitation
Techniques. Agricultural Economics, 44(3), 255-273.
https://doi.org/https://doi.org/10.1111/agec.12009
Odening, M., Musshoff, O., & Xu, W. (2007). Analysis of Rainfall Derivatives Using Daily
Precipitation Models: Opportunities and Pitfalls. Agricultural Finance Review, 67(1), 135-
156. https://doi.org/https://doi.org/10.1108/00214660780001202
Odening, M., & Shen, Z. (2014). Challenges of Insuring Weather Risk in Agriculture. Agricultural
Finance Review, 74(2), 188-199. https://doi.org/https://doi.org/10.1108/afr-11-2013-0039
OECD. (2009). Managing Risk in Agriculture: A Holistic Framework. The Organization for Economic
Co-operation and Development. https://doi.org/https://doi.org/10.1787/9789264075313-en

Chapter 2: Literature review 44
Okoffo, E. D., Denkyirah, E. K., Adu, D. T., & Fosu-Mensah, B. Y. (2016). A Double-Hurdle Model
Estimation of Cocoa Farmers' Willingness to Pay for Crop Insurance in Ghana. SpringerPlus,
5(1), 1-19. https://doi.org/https://doi.org/10.1186/s40064-016-2561-2
Otani, H., Leonard, S. D., Ashford, V. L., Bushroe, M., & Reeder, G. (1992). Age Differences in
Perception of Risk. Perceptual and Motor Skills, 74(2), 587-594.
https://doi.org/https://doi.org/10.2466/PMS.74.2.587-594
Pandey, S., Bhandari, H., Ding, S., Prapertchob, P., Sharan, R., Naik, D., Taunk, S. K., & Sastri, A.
(2007). Coping with Drought in Rice Farming in Asia: Insights from a Cross-Country
Comparative Study: Coping with Drought in Rice Farming in Asia. Agricultural Economics,
37, 213-224. https://doi.org/https://doi.org/10.1111/j.1574-0862.2007.00246.x
Patt, A., & Schroter, D. (2008). Perceptions of Climate Risk in Mozambique: Implications for the
Success of Adaptation Strategies. Global Environmental Change, 18(3), 458-467.
https://doi.org/https://doi.org/10.1016/j.gloenvcha.2008.04.002
Pennings, J. M. E., & Garcia, P. (2001). Measuring Producers’ Risk Preferences: A Global Risk‐
Attitude Construct. American Journal of Agricultural Economics, 83(4), 993-1009.
https://doi.org/https://doi.org/10.1111/0002-9092.00225
Picazo‐Tadeo, A. J., & Wall, A. (2011). Production Risk, Risk Aversion and the Determination of
Risk Attitudes among Spanish Rice Producers. Agricultural Economics, 42(4), 451-464.
https://doi.org/https://doi.org/10.1111/j.1574-0862.2011.00537.x
Pidgeon, N. (1998). Risk Assessment, Risk Values and the Social Science Programme: Why We Do
Need Risk Perception Research. Reliability engineering & system safety, 59(1), 5-15.
https://doi.org/https://doi.org/10.1016/S0951-8320(97)00114-2
Pratt, J. (1964). Risk Aversion in the Small and in the Large. Econometrica, 32(1/2), 122-136.
https://doi.org/https://doi.org/10.2307/1913738
Quiggin, J. (1993). Generalized Expected Utility Theory: The Rank-Dependent Model. Kluwer
Academic Publishers.
Quiggin, J. C., Karagiannis, G., & Stanton, J. (1993). Crop Insurance and Crop Production: An
Empirical Study of Moral Hazard and Adverse Selection.
https://doi.org/https://doi.org/10.1111/j.1467-8489.1993.tb00531.x
Rejda, G. E., & McNamara, M. J. (2014). Principles of Risk Management and Insurance (12th ed.).
Pearson.
Rejesus, R. M., Coble, K. H., Knight, T. O., & Jin, Y. (2006). Developing Experience-Based Premium
Rate Discounts in Crop Insurance. American Journal of Agricultural Economics, 88(2), 409-
419. https://doi.org/10.1111/j.1467-8276.2006.00867.x
Ritter, M., Musshoff, O., & Odening, M. (2012). Minimizing Geographical Basis Risk of Weather
Derivatives Using a Multi-Site Rainfall Model 123rd EAAE Seminar, February 23-24, 2012,
Dublin, Ireland, https://purl.umn.edu/122527

Chapter 2: Literature review 45
Rossi, G., Benedini, M., Tsakiris, G., & Giakoumakis, S. (1992). On Regional Drought Estimation and
Analysis. Water resources management, 6(4), 249-277.
https://doi.org/https://doi.org/10.1007/BF00872280
Samson, A. (2014). An Introduction to Behavioral Economics. In A. Samson (Ed.), The Behavioral
Economics Guide 2014 (with a Foreword by George Loewenstein and Rory Sutherland) (1st
ed., pp. 131). https://www.behavioraleconomics.com
Santeramo, F. G., Goodwin, B. K., Adinolfi, F., & Capitanio, F. (2016). Farmer Participation, Entry
and Exit Decisions in the Italian Crop Insurance Programme. Journal of Agricultural
Economics, 67(3), 639-657. https://doi.org/https://doi.org/10.1111/1477-9552.12155
Savage, I. (1993). Demographic Influences on Risk Perceptions. Risk Analysis, 13(4), 413-420.
https://doi.org/https://doi.org/10.1111/j.1539-6924.1993.tb00741.x
Savage, L. J. (1954). The Foundations of Statistics. Wiley.
Schubert, R., Brown, M., Gysler, M., & Brachinger, H. W. (1999). Financial Decision-Making: Are
Women Really More Risk Averse? American Economic Review, 89(2), 381-385.
https://doi.org/https://doi.org/10.1257/aer.89.2.381
Shapiro, B. I., & Brorsen, B. W. (1988). Factors Affecting Farmers' Hedging Decisions. Applied
Economic Perspectives and Policy, 10(2), 145-153.
https://doi.org/https://doi.org/10.1093/aepp/10.2.145
Sherman, R. (1974). The Psychological Difference between Ambiguity and Risk. The Quarterly
Journal of Economics, 88(1), 166-169. https://doi.org/:https://doi.org/10.2307/1881806
Shiva, S. M., & Agapi, S. (2001). Evidence of Adverse Selection in Crop Insurance Markets. The
Journal of risk and insurance, 68(4), 685-708. https://doi.org/https://doi.org/10.2307/2691544
Simon, H. A. (1955). A Behavioral Model of Rational Choice. The Quarterly Journal of Economics,
69(1), 99-118. https://doi.org/https://doi.org/10.2307/1884852
Singh, R. (2021). The Full List of the Insurance Companies in Nepal. Retrieved 28/10/2021 from
https://www.gulftips.com/list-of-the-insurance-companies-in-nepal/
Singh, R., Singh, Y., Xalaxo, S., Verulkar, S., Yadav, N., Singh, S., Singh, N., Prasad, K. S. N.,
Kondayya, K., Rao, P. V. R., Rani, M. G., Anuradha, T., Suraynarayana, Y., Sharma, P. C.,
Krishnamurthy, S. L., Sharma, S. K., Dwivedi, J. L., Singh, A. K., Singh, P. K., Nilanjay,
Singh, N. K., Kumar, R., Chetia, S. K., Ahmad, T., Rai, M., Perraju, P., Pande, A., Singh, D.
N., Mandal, N. P., Reddy, J. N., Singh, O. N., Katara, J. L., Marandi, B., Swain, P., Sarkar, R.
K., Singh, D. P., Mohapatra, T., Padmawathi, G., Ram, T., Kathiresan, R. M., Paramsivam,
K., Nadarajan, S., Thirumeni, S., Nagarajan, M., Singh, A. K., Vikram, P., Kumar, A.,
Septiningshih, E., Singh, U. S., Ismail, A. M., Mackill, D., & Singh, N. K. (2016). From Qtl to
Variety-Harnessing the Benefits of Qtls for Drought, Flood and Salt Tolerance in Mega Rice
Varieties of India through a Multi-Institutional Network. Plant Science, 242, 278-287.
https://doi.org/https://doi.org/10.1016/j.plantsci.2015.08.008
Chapter 2: Literature review 46
Sitkin, S., & Pablo, A. (1992). Reconceptualizing the Determinants of Risk Behavior. The Academy of
Management Review, 17(1), 9. https://doi.org/https://doi.org/10.2307/258646
Sivakumar, M. V. K., Das, H. P., & Brunini, O. (2005). Impacts of Present and Future Climate
Variability and Change on Agriculture and Forestry in the Arid and Semi-Arid Tropics.
Climatic change, 70(1), 31-72. https://doi.org/https://doi.org/10.1007/s10584-005-5937-9
Slovic, P. (1987). Perception of Risk. Science, 236(4799), 280-285.
https://doi.org/https://doi.org/10.1126/science.3563507
Smale, M., Just, R., & Leathers, H. (1994). Land Allocation in Hyv Adoption Models: An
Investigation of Alternative Explanations. American Journal of Agricultural Economics,
76(3), 535. https://doi.org/https://doi.org//10.2307/1243664
Smith, V. H., & Glauber, J., W. (2012). Agricultural Insurance in Developed Countries: Where Have
We Been and Where Are We Going? Applied Economic Perspectives and Policy, 34(3), 363-
390. https://doi.org/https://doi.org/10.1093/aepp/pps029
Steer, L., & Sen, K. (2010). Formal and Informal Institutions in a Transition Economy: The Case of
Vietnam. World Development, 38(11), 1603-1615.
https://doi.org/https://doi.org/10.1016/j.worlddev.2010.03.006
Tanaka, T., Camerer, C. F., & Nguyen, Q. (2010). Risk and Time Preferences: Linking Experimental
and Household Survey Data from Vietnam. American Economic Review, 100(1), 557-571.
https://doi.org/https://doi.org/10.1257/aer.100.1.557
Thaler, R. H. (1999). Mental Accounting Matters. Journal of Behavioral Decision Making, 12(3), 183-
206. https://doi.org/https://doi.org/10.1002/(SICI)1099-0771(199909)12:3<183::AID-
BDM318>3.0.CO;2-F
Tsur, Y., Sternberg, M., & Hochman, E. (1990). Dynamic Modelling of Innovation Process Adoption
with Risk Aversion and Learning. Oxford Economic Papers-New Series, 42(2), 336-355.
https://doi.org/https://doi.org/10.1093/oxfordjournals.oep.a041950
Tucker, B., Tombo, J., Tsiazonera, Hajasoa, P., Nagnisaha, C., Lahitoka, V. R., & Zahatsy, C. (2013).
Beyond Mean and Variance: Economic Risk Versus Perceived Risk of Farming, Foraging, and
Fishing Activities in Southwestern Madagascar. Human Ecology, 41(3), 393-407.
https://doi.org/https://doi.org/10.1007/s10745-013-9563-2
Ullah, R., Shivakoti, G. P., & Ali, G. (2015). Factors Affecting Farmers’ Risk Attitude and Risk
Perceptions: The Case of Khyber Pakhtunkhwa, Pakistan. International Journal of Disaster
Risk Reduction, 13, 151-157. https://doi.org/https://doi.org/10.1016/j.ijdrr.2015.05.005
van Winsen, F., de Mey, Y., Lauwers, L., Van Passel, S., Vancauteren, M., & Wauters, E. (2016).
Determinants of Risk Behaviour: Effects of Perceived Risks and Risk Attitude on Farmer’s
Adoption of Risk Management Strategies. Journal of Risk Research, 19(1), 56-78.
https://doi.org/https://doi.org/10.1080/13669877.2014.940597

Chapter 2: Literature review 47
Velandia, M., Rejesus, R. M., Knight, T. O., & Sherrick, B. J. (2009). Factors Affecting Farmers'
Utilization of Agricultural Risk Management Tools: The Case of Crop Insurance, Forward
Contracting, and Spreading Sales. Journal of Agricultural and Applied Economics, 41(1), 107-
123. https://doi.org/https://doi.org/10.1017/S1074070800002583
von Neumann, J., & Morgenstern, O. (1944). Theory of Games and Economic Behavior. Princeton
University Press.
Vroom, V. H., & Pahl, B. (1971). Relationship between Age and Risk Taking among Managers.
Journal of Applied Psychology, 55(5), 399-405.
https://doi.org/https://doi.org10.1037/h0031776
Wang, M., Ye, T., & Shi, P. (2016). Factors Affecting Farmers’ Crop Insurance Participation in China.
Canadian Journal of Agricultural Economics/Revue Canadienne D'agroeconomie, 64(3), 479-
492. https://doi.org/https://doi.org/10.1111/cjag.12088
Ward, P. S., Makhija, S., & Spielman, D. J. (2020). Drought-Tolerant Rice, Weather Index Insurance,
and Comprehensive Risk Management for Smallholders: Evidence from a Multi-Year Field
Experiment in India. Aust J Agric Resour Econ, 64(2), 421-454.
https://doi.org/https://doi.org/10.1111/1467-8489.12342
Weber, E. U., Blais, A. R., & Betz, N. E. (2002). A Domain‐Specific Risk‐Attitude Scale: Measuring
Risk Perceptions and Risk Behaviors. Journal of Behavioral Decision Making, 15(4), 263-
290. https://doi.org/https://doi.org/10.1002/bdm.414
Weber, E. U., & Hsee, C. (1998). Cross-Cultural Differences in Risk Perception, but Cross-Cultural
Similarities in Attitudes Towards Perceived Risk. Management science, 44(9), 1205-1217.
https://doi.org/https://doi.org/10.1287/mnsc.44.9.1205 (Management Science)
Wieland, A., & Sarin, R. (2012). Domain Specificity of Sex Differences in Competition. Journal of
economic behavior & organization, 83(1), 151-157.
https://doi.org/https://doi.org/10.1016/j.jebo.2011.06.019
Wik, M., Aragie Kebede, T., Bergland, O., & Holden, S. T. (2004). On the Measurement of Risk
Aversion from Experimental Data. Applied Economics, 36(21), 2443-2451.
https://doi.org/https://doi.org/10.1080/0003684042000280580
Wong, G., Lambert, M. F., Leonard, M., & Metcalfe, A. V. (2010). Drought Analysis Using Trivariate
Copulas Conditional on Climatic States. Journal of hydrologic engineering, 15(2), 129-141.
https://doi.org/https://doi.org/10.1061/(ASCE)HE.1943-5584.0000169
Woodard, J. D., & Garcia, P. (2008). Basis Risk and Weather Hedging Effectiveness. Agricultural
Finance Review, 68(1), 99-117. https://doi.org/https://doi.org/10.1108/00214660880001221
World Bank. (2015). Agricultural Risk Management in the Face of Climate Change (World Bank
Group Report Number AUS5773). (Agriculture Global Practice Discussion Paper, The World
Bank Group Report Number AUS5773, Issue.
https://openknowledge.worldbank.org/handle/10986/22897
Chapter 2: Literature review 48
Yadaw, R. B., Haba, A. K., & Tripathi, B. P. (2017). Drought and Submergence Tolerant Rice Variety
for the Rainfed Loland Ecosystem of Nepal. In M. N. Paudel, D. R. Bhandari, M. P. Khanal,
B. K. Joshi, P. Acharya, & K. H. Ghimire (Eds.), Rice Science and Technology in Nepal: A
Historical, Socio-Cultural and Technical Compendium (pp. 536-540). Crop Development
Directorate and Agronomy Society of Nepal.
https://www.doacrop.gov.np/downloadfile/Rice_science_and_technology_1512106674.pdf
Ye, T., & Wang, M. (2013). Exploring Risk Attitude by a Comparative Experimental Approach and
Its Implication to Disaster Insurance Practice in China. Journal of Risk Research, 16(7), 861-
878. https://doi.org/https://doi.org/10.1080/13669877.2012.743159
Yesuf, M., & Bluffstone, R. A. (2009). Poverty, Risk Aversion, and Path Dependence in Low-Income
Countries: Experimental Evidence from Ethiopia. American Journal of Agricultural
Economics, 91(4), 1022-1037. https://doi.org/https://doi.org/10.1111/j.1467-
8276.2009.01307.x
Yugi, R. A., Ponendi, H., & Untung, S. (2014). Drought Tolerance, Phosphorus Efficiency and Yield
Characters of Upland Rice Lines. Emirates Journal of Food and Agriculture, 26(1), 25-34.
https://doi.org/https://doi.org/10.9755/ejfa.v26i1.14417

49
Chapter 3: Research Methodology
This chapter presents the overall methodology used to achieve the research objectives, with specific
methods detailed in the individual papers.
3.1 Research design
This study aligns with pragmatism from ontological and epistemological perspectives and follows the
abductive research approach using a mixed-methods research design comprising qualitative and
quantitative phases in a sequence (Saunders, 2012). The qual=>QUAN design (uppercase letters
indicate higher priority and arrow indicates the method sequence) is also called exploratory sequential
design, where the qualitative study identifies the themes describing the situational contexts of the issue
under study and the follow-up quantitative study tests or confirms the qualitative results (Plano Clark
& Ivankova, 2016). The exploratory mixed-methods research design is suitable for studying farming
risk in Nepal because it is a relatively less studied topic and relevant variables are not well-known.
Such a design is useful for exploring a broad background of the issue using qualitative methods and
examining the generalizability of emerging hypotheses to the population using quantitative methods
(see Creswell & Plano Clark, 2011). The qualitative results also inform the development and
implementation of quantitative methods and survey instruments (Plano Clark & Ivankova, 2016).
The study used primary cross-sectional data collected through interviews and experiments. The
qualitative part involved open-ended and in-depth conversational interviews for data collection and
cognitive mapping techniques for analysis. The quantitative survey was conducted from October 2018
to January 2019 using a pre-tested questionnaire comprising semi-structured questions to measure
socio-demographic variables, psychometric scaling questions to measure perceptions of risk and
uncertainties, lottery-choice experiment to measure risk attitude, and discrete choice experiment to
measure willingness to pay for crop insurance. The quantitative data were analysed using a descriptive
approach, risk mapping and regression analyses. The first paper is the outcome of the qualitative
study, which directly contributes to objectives 1, 2 and 4 and indirectly to 3 and 5 as well. Three
quantitative papers contribute to one or more objectives, as shown in Figure 3.1.

Chapter 3: Research Methodology 50
Figure 3.1 Exploratory mixed-methods (qual=>QUAN) research design.
Note: Solid and dotted arrows indicate primary and secondary linkages, respectively, between the
elements in the diagram.
3.2 Conceptual framework
The theoretical foundation of this study is underpinned by two major theories from neoclassical
economics: psychometric theory (PT) and expected utility theory (EUT). The measurement and
analysis of risk perception are based on PT, which assumes that individual perception of risk is
subjective and can be explained by psychological or cognitive factors (Sjöberg et al., 2004). Similarly,
the measurement and analysis of risk attitude are based on EUT first posited by Bernoulli (1738),
which describes the rational human decisions in the presence of risk as the outcomes of their utility-
maximising behaviour. Building on this theoretical foundation, we developed a conceptual framework
(Figure 3.2) to guide the identification, measurement and analysis of the variables relevant to the
research problems. Meraner and Finger (2017) adopted a similar conceptual framework that explains
farmers’ risk management decisions as a combined function of farmer characteristics (risk perception
and risk attitude), farm characteristics and household characteristics.
The research involves measuring three groups of variables and analysing their relationships, as shown
in Figure 3.2. The first group includes the variables related to individual characteristics, farm
characteristics, objective risk factors, other socio-demographic variables and attributes of crop
insurance products. The second group comprises attitudinal variables such as risk perception, risk
attitude, risk experience and willingness to pay for crop insurance. The third group includes decision-
making variables, such as the choice of risk management strategy, selection of crop varieties and farm
mechanisation. The risk management strategies include on-farm strategies such as farm diversification
and off-farm strategies such as crop insurance. As discussed in the Literature Review, the relationships
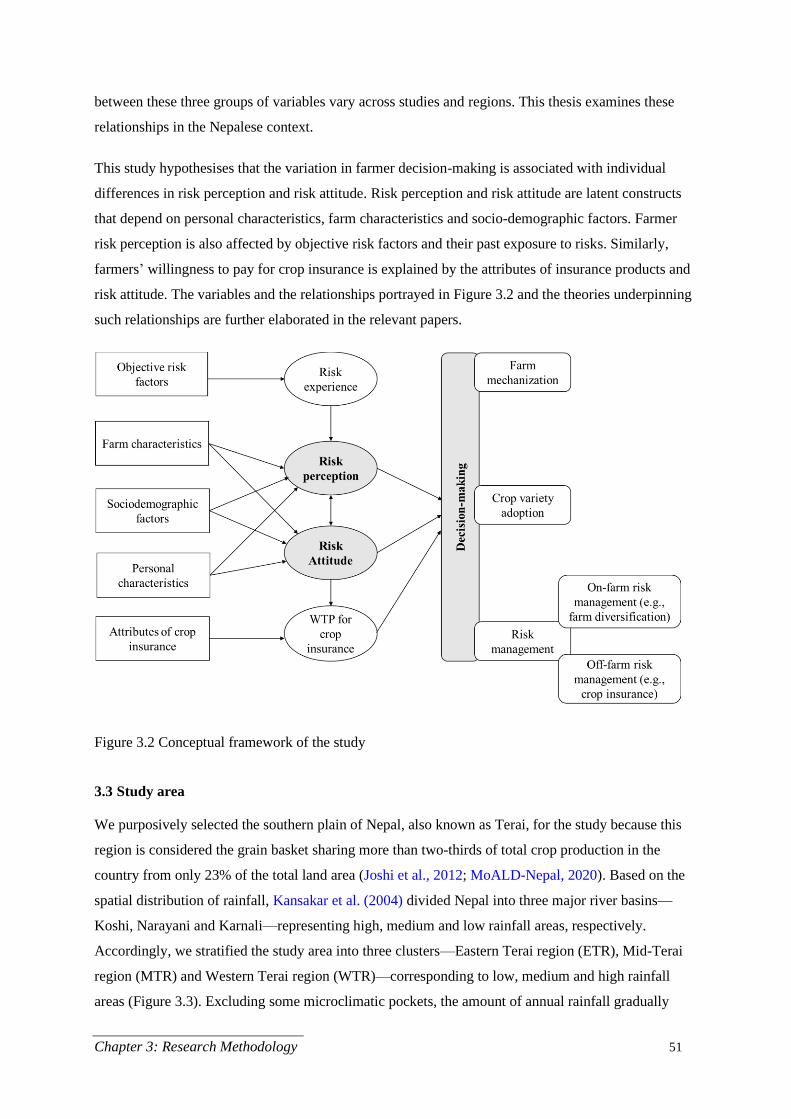
Chapter 3: Research Methodology 51
between these three groups of variables vary across studies and regions. This thesis examines these
relationships in the Nepalese context.
This study hypothesises that the variation in farmer decision-making is associated with individual
differences in risk perception and risk attitude. Risk perception and risk attitude are latent constructs
that depend on personal characteristics, farm characteristics and socio-demographic factors. Farmer
risk perception is also affected by objective risk factors and their past exposure to risks. Similarly,
farmers’ willingness to pay for crop insurance is explained by the attributes of insurance products and
risk attitude. The variables and the relationships portrayed in Figure 3.2 and the theories underpinning
such relationships are further elaborated in the relevant papers.
Figure 3.2 Conceptual framework of the study
3.3 Study area
We purposively selected the southern plain of Nepal, also known as Terai, for the study because this
region is considered the grain basket sharing more than two-thirds of total crop production in the
country from only 23% of the total land area (Joshi et al., 2012; MoALD-Nepal, 2020). Based on the
spatial distribution of rainfall, Kansakar et al. (2004) divided Nepal into three major river basins—
Koshi, Narayani and Karnali—representing high, medium and low rainfall areas, respectively.
Accordingly, we stratified the study area into three clusters—Eastern Terai region (ETR), Mid-Terai
region (MTR) and Western Terai region (WTR)—corresponding to low, medium and high rainfall
areas (Figure 3.3). Excluding some microclimatic pockets, the amount of annual rainfall gradually

Chapter 3: Research Methodology 52
decreases from East to West. Accordingly, ETR, MTR and WTR can be considered as high, medium
and low vulnerable clusters to flooding risk, respectively, with the opposite gradient for drought risk
vulnerability.
Figure 3.3 Map of Nepal showing study clusters and districts
Note: n indicates sample sizes within districts.
3.4 Sampling design
The study population comprises farmers from the Terai region of Nepal that are mainly involved in
rice cultivation. Rice crop is mainly grown during June -October, which coincides with the monsoon
in Nepal. Rice is the most crucial crop in Nepal, accounting for more than 50% of the total agricultural
area and production (Joshi et al., 2011). It contributes about one-fifth of the total AGDP and provides
about one-third of the Nepalese people’s total calorie requirements (Tripathi et al., 2019). Despite its
importance, rice productivity is threatened by the changing climate and extreme weather events
(Rayamajhee et al., 2020).
Farming households and adult members of the selected households actively involved in agricultural-
related decision-making and farming activities are the fundamental units of analysis in this study. In

Chapter 3: Research Methodology 53
the qualitative study, we selected 45 farmers applying the maximum variation sampling technique and
the concept of theoretical saturation (see Mark, 2010; Patton, 1990). The sampling design of the
qualitative study is discussed in the corresponding paper. Here, we discuss the sampling design of the
quantitative study, which is common to the three quantitative papers.
We first calculated the minimum sample size, considering a 95% confidence interval and 5% margin
of error (see Moore & McCabe, 2000), to represent the total farming households in the study area. We
determined the number of sub-samples within the strata proportionate to the number of farming
households (Table 3.1).
Table 3.1 Sample size calculation
Strata Number of households (CBS-Nepal, 2013) Targeted sample size
Eastern Terai Region 701 081 182
Mid Terai Region 482 394 125
Western Terai Region 296 035 77
Terai Region 1 479 510 384
We applied the multi-stage stratified random sampling technique to select districts, local units and
villages. Considering the sub-sample sizes, we selected two districts from MTR and WTR and three
districts from ETR. We selected two local units within each district and one village from each local
unit, resulting in 14 villages as final study sites. The choice scenarios in the discrete choice experiment
were grouped into six blocks. To ensure at least five participants in each block, we randomly selected
30 respondents in each village. The final sample size for the quantitative study was 420, although the
targeted sample size was only 384 (Table 3.2).

Chapter 3: Research Methodology 54
Table 3.2 Details of the multi-stage random sampling
Strata1 # Districts Selected
districts
# Local
units
Selected
local units
#
Wards
Selected
wards
Selected
households
ETR 9 Sunsari 12 Gadhi 6 3 30
Ramdhuni 9 3 & 4 30
Siraha 17 Bariyapatti 5 4 30
Dhangadhimai 14 3 30
Dhanusha 18 Laxminiya 7 1 30
Mithila 11 9 30
Sub-total of ETR 180
MTR 7 Parasi 7 Ramgram 18 16 30
Sunwal 13 12 30
Kapilbastu 9 Shibraj 11 10 30
Suddodan 6 3 30
Sub-total of MTR 120
WTR 5 Bardiya 8 Badhaiyatal 9 2 30
Gulariya 12 8 30
Kanchanpur 9 Bedkot 10 8 30
Shuklaphanta 12 4 30
Sub-total of WTR 120
Total 420
3.5 Fieldwork and data collection
The fieldwork was conducted in two phases. The qualitative interviews were undertaken by the
researcher from October through December 2017 using an interview guide. The quantitative survey
was undertaken from October 2018 through January 2019 using a pre-tested semi-structured
questionnaire (Appendix C). We employed and trained six enumerators, who are researchers working
at the field stations of the Nepal Agricultural Research Council. We used the Qualtrics application to
carry out the quantitative interviews. In cases where the use of tablets was not feasible, paper-based
1 According to the constitution of Federal Democratic Republic of Nepal promulgated in 2015, the country is
divided in to 77 districts grouped into seven provinces. This study area consists of 20 districts situated in the
southern plain of Nepal, also known as Terai Region. The districts have various number of local units called
municipalities and rural municipalities. The local units have varied number of wards. A ward may consist of one
or more villages/settlements.

Chapter 3: Research Methodology 55
questionnaires were used. The information of paper-based interviews was entered into the Qualtrics
software. The qualitative data were analysed using NVivo 12 and Banxia Decision Explorer software,
while the quantitative data were analysed using Stata 16.1 and Microsoft Excel.
The questionnaire was first developed in English and then translated into Nepali. We also employed
another researcher from NARC, who did not see the original questionnaire, to back-translate the
Nepali questionnaire into English to examine and ensure the linguistic equivalence in translation (see
Pena, 2007). Pre-testing of the questionnaire was carried out with five farmers (three men and two
women) in the Morang district (non-sample district) to check whether the questions worked as
intended and were understood by the targeted respondents. Farmers from Morang have similar socio-
economic characteristics to farmers from sample districts. A pilot study of the discrete choice
experiment was conducted with the first 50 respondents, which is discussed in Chapter 6.
3.6 Ethical consideration
The study was approved as low-risk research by the UWA human ethics committee following the
ethical requirements of the Australian National Statement on Ethical Conduct in Human Research
(National Statement) and the policies and procedures of the UWA. There is no formal ethics approval
system in Nepal for conducting research of this kind. However, we obtained written consent from all
respondents using the project information sheet and participant consent form. All forms of physical
and soft copies of information are securely stored at the UWA facilities.
3.7 Basic socio-demographic information
Figure 3.4 presents some of the basic socio-demographic characteristics of the respondents and
households. A more detailed description of the respondents and summary statistics of the variables
related to the specific topics are presented in the corresponding papers.

Chapter 3: Research Methodology 56
Figure 3.4 Basic socio-demographic characteristics of respondents and households
About 42% of survey respondents were female farmers. The respondents’ age ranged from 24–77,
with an average age of about 50 years. The 60 and over age category had the most respondents, and
the youngest category (20–29 years) the fewest. The respondents had 5.71 years of formal schooling
on average, with only a few having university degrees, while the number of respondents with no
formal education was highest in all categories. The respondents’ educational attainment was lower
than those in previous studies involving experimental methods (see Meraner & Finger, 2017; Nielsen
et al., 2013; Tanaka et al., 2010). The amount of cultivated land per household was 1.21 ha, with the
0.5 to 0.9 ha category having the highest proportion of households. In all clusters, the farm sizes were
larger than the national average (0.66 ha) reported for 2011 (CBS-Nepal, 2017). This inconsistency is
mainly because our study population comprises rice farmers from the Terai region, who generally
have larger farms than average Nepalese farmers. On average, only one-third of farmland had assured
sources of irrigation, which implies that about two-thirds of rice farming in the Terai region of Nepal
depends on monsoonal rainfall.
The following four chapters are written as journal papers addressing five research objectives, as shown
in Figure 3.1. Although the research objectives are interlinked and the elements of one chapter may be
referenced in other chapters, each chapter can be read as a stand-alone paper.
Chapter 3: Research Methodology 57
3.8 References
Bernoulli, D. (1738). Specimen Theoriae Novae De Mensvra Sortis [Exposition of a new theory on the
measurement of risk]. Commentarii Academiae Scientiarum Imperialis Petropolitanae, 5,
175-192. https://doi.org/https://doi.org/10.2307/1909829 (Exposition of a new theory on the
measurement of risk) (Specimen Theoriae Novae De Mensvra Sortis)
CBS-Nepal. (2013). National Sample Census of Nepalese Agriculture, 2011/12.
https://nada.cbs.gov.np/index.php/catalog/53/study-description
CBS-Nepal. (2017). Statistical Year Book of Nepal - 2017. https://cbs.gov.np/statistical-year-book-
2017/
Creswell, J. W., & Plano Clark, V. L. (2011). Choosing a Mixed Methods Design. In J. W. Creswell &
V. L. Plano Clark (Eds.), Designing and Conducting Mixed Methods Research (2nd ed., pp.
53-68). Sage.
Joshi, K. D., Conroy, C., & Witcombe, J. R. (2012). Agriculture, Seed and Innovation in Nepal:
Industry and Policy Issues for the Future (International Food Policy Research Institure Project
Paper, Issue. https://agriknowledge.org/downloads/rx913p94m
Joshi, N. p., Maharjan, K. L., & Piya, L. (2011). Production Economics of Rice in Different
Development Regions of Nepal. Journal of International Development and Cooperation,
17(1), 103-112. https://doi.org/ https://doi.org/10.15027/31344
Kansakar, S. R., Hannah, D. M., Gerrard, J., & Rees, G. (2004). Spatial Pattern in the Precipitation
Regime of Nepal. International Journal of Climatology, 24(13), 1645-1659.
https://doi.org/https://doi.org/10.1002/joc.1098
Mark, M. (2010). Sample Size and Saturation in Ph.D. Studies Using Qualitative Interviews. Forum:
Qualitative Social Research, 11(3), 1-19. https://doi.org/https://doi.org/10.17169/fqs-
11.3.1428
Meraner, M., & Finger, R. (2017). Risk Perceptions, Preferences and Management Strategies:
Evidence from a Case Study Using German Livestock Farmers. Journal of Risk Research, 1-
26. https://doi.org/https://doi.org/10.1080/13669877.2017.1351476
MoALD-Nepal. (2020). Statistical Information on Nepalese Agriculture for 2018/19.
https://www.moald.gov.np/publication/Agriculture%20Statistics
Moore, D. S., & McCabe, G. P. (2000). Introduction to the Practice of Statistics (3rd ed.). W. H.
Freeman and Company.
Nielsen, T., Keil, A., & Zeller, M. (2013). Assessing Farmers’ Risk Preferences and Their
Determinants in a Marginal Upland Area of Vietnam: A Comparison of Multiple Elicitation
Techniques. Agricultural Economics, 44(3), 255-273.
https://doi.org/https://doi.org/10.1111/agec.12009
Patton, M. Q. (1990). Designing Qualitative Studies. SAGE Publications.

Chapter 3: Research Methodology 58
Pena, E. D. (2007). Lost in Translation: Methodological Considerations in Cross-Cultural Research.
Child Development, 78(4), 1255-1264. https://doi.org/https://doi.org/10.1111/j.1467-
8624.2007.01064.x
Plano Clark, V. L., & Ivankova, N. V. (2016). How to Use Mixed Methods Research?: Understanding
the Basic Mixed Methods Designs. In V. L. Plano Clark & N. V. Ivankova (Eds.), Mixed
Methods Research: A Guide to the Field (pp. 105). SAGE Publications, Inc.
https://doi.org/https://doi.org.10.4135/9781483398341.n8
Rayamajhee, V., Guo, W., & Bohara, A. K. (2020). The Impact of Climate Change on Rice Production
in Nepal. Economics of Disasters and Climate Change.
https://doi.org/https://doi.org/10.1007/s41885-020-00079-8
Saunders, M. (2012). Research Methods for Business Students (6th ed.). Pearson.
Sjöberg, L., Moen, B.-E., & Rundmo, T. (2004). Explaining Risk Perception: An Evaluation of the
Psychometric Paradigm in Risk. R. publikasjoner.
https://www.forskningsradet.no/csstorage/vedlegg/Psychometric_paradigm.pdf
Tanaka, T., Camerer, C. F., & Nguyen, Q. (2010). Risk and Time Preferences: Linking Experimental
and Household Survey Data from Vietnam. American Economic Review, 100(1), 557-571.
https://doi.org/https://doi.org/10.1257/aer.100.1.557
Tripathi, B. P., Bhandari, H. N., & Ladha, J. K. (2019). Rice Strategy for Nepal. Acta Scientific
Agriculture, 3(2), 171-180.
59
Chapter 4: Cognitive Mapping of Nepalese Farmers’ Risk
Perceptions and Management Strategies (Paper 1)
4.1 Abstract
This paper validates the applicability of the cognitive mapping approach for studying risk perception
and management strategies in the context of smallholder subsistence farming. We conducted in-depth
interviews with 45 farmers from the Terai region of Nepal and used the content analysis method to
convert the interview transcripts into individual cognitive maps. Then, we applied centrality analysis,
domain analysis and most mentioned constructs techniques to identify the relative importance of
various constructs related to farming risks and management strategies. We found that farmer
perception of risk is a complex network of interdependencies between sources of uncertainty, risks and
management strategies. The quantitative risk mapping approach that requires farmers to disentangle
such complexity and assign numerical values to the risks may not elucidate a complete picture of
farmers’ risk perceptions. Cognitive mapping can complement the quantitative approach in broadening
the understanding of risk and communicating the key message to the relevant stakeholders. The results
revealed that most of the risks perceived by Nepalese farmers are related to production risk. This
finding is consistent with the fact that subsistence smallholders are more exposed to production risks
than market risks. Likewise, the farmers’ feeling of insufficiency in technical knowledge about
modern farming technologies was the main factor leading to their perceptions of risk in adopting such
technologies. We also found women farmers were mainly worried about the uncertainty in the supply
of basic inputs such as seeds and fertilisers, while males were mainly concerned about access to more
advanced elements of farming such as mechanisation services. Apart from this difference, perceptions
of climatic risk factors such as the unpredictable onset of monsoon, heavy rainfall and increased
temperature were similar between men and women. Similarly, the farmers’ low bargaining power, lack
of government support and competition with imported goods were major factors leading to market
risks. Along with managing risks through on-farm diversification strategies, farmers were willing to
buy market-based risk management tools, such as crop insurance. However, most farmers were not
aware that crop insurance products were available in the market. Therefore, educating farmers about
the concept and benefits of crop insurance is likely to improve its adoption.
Keywords: cognitive mapping, farming risk, Nepal, risk perception, risk management, risk preference
4.2 Introduction
This paper validates the applicability of the cognitive mapping approach for studying risk perceptions
and management strategies in the context of smallholder subsistence farming, while the mainstream
approach to risk is quantitative. The quantitative methods are based on the psychometric theory (Aven,

Chapter 4: Cognitive Mapping of Farming Risks 60
2010), which assumes that individual risk perceptions can be measured in terms of various
characteristics of risk (Sjöberg et al., 2004; Slovic, 1992; van Winsen et al., 2013). These methods ask
respondents to rate their perceptions of various risk characteristics on a scale and derive numerical
scores that represent their risk perceptions (Sjöberg, 2000). Although the psychometric theory is
compatible with several quantitative methods for carrying out studies and testing the theory, it is not
free from criticism. The psychometric theory considers qualitative attributes of risks as intrinsic
characteristics of hazards, but researchers argue that risk is a cognitive construct that exists in the
perceivers’ heads (e.g., Rayner, 1992; Turner & Waynne, 1992). Moreover, psychometric methods
involve data aggregation to develop personal risk profiles (Slovic, 1992), but the aggregated score is
only part of the risk perception, which may not ideally represent individual stories (Vlek & Stallen,
1981). Realising the limitations of quantitative methods in fully explaining such a pervasive but
nuanced aspect of human existence, Smithson (1988) called for alternative approaches to risk that
move beyond the reliance on probability theory. Exploring such approaches is one of the major
objectives of this paper.
Three other reasons further reinforce our motivation for using a qualitative method. Firstly, alternative
methods are required to complement quantitative methods or reach beyond the limits of quantitative
representation to enhance the understanding of risk and effectiveness of risk communication. van
Winsen et al. (2013) also suggested that qualitative approaches are necessary to address the
complexity of the probabilistic quantification of risk, the interconnectedness of seemingly discrete
risks, and individual differences in risk perception. Similarly, Sjöberg (2000) suggested that
unstructured and soft approaches, such as in-depth interviews, allow follow-up investigation so that
respondents can further explain their opinions about risk, which is often ignored in questionnaire
methods.
Secondly, qualitative methods are needed due to the qualitative dimensions of risk. Studies have
shown that risk perception is largely affected by qualitative factors (e.g., Otway & Winterfeldt, 1982;
Vlek & Stallen, 1980, 1981), which are more appropriately investigated through qualitative
approaches than statistical computation. According to Slovic (1987), people evaluate risks in terms of
qualitative attributes such as voluntary versus involuntary, chronic versus catastrophic, usual versus
unusual and known versus unknown. Questions such as how familiar people are with a hazard, how
early the undesirable effects of the hazard are realised, and what management options are available to
manage the effects are better answered in qualitative terms (Lowrance, 1976; Winterfeldt & Edwards,
1984).
Thirdly, because risk perception is often a socially shared experience of individuals in a community
(Rohrmann & Renn, 2000), qualitative approaches are necessary that allow people to verbally explain
their opinion on risk (Henrich & McElreath, 2002; Kuznar, 2001; Tucker, 2012). Zinn (2017) also

Chapter 4: Cognitive Mapping of Farming Risks 61
urged the need for qualitative attribution of risk perception to answer how risk-taking is rooted in
social institutions and practices and how people question, compromise or deal with social and cultural
structures in their daily lives.
Furthermore, several researchers have recommended a combination of quantitative and qualitative
approaches to capture a comprehensive picture of risk perceptions (e. g., Sjöberg, 2000; Wright,
2016). Qualitative research helps explore an issue in detail and identify new dimensions, whereas
quantitative studies help simplify the picture and identify the important aspects to focus on (Sjöberg,
2000). From this perspective, qualitative approaches are necessary to explore major themes related to
farming risks and identify the variables for further investigation, while quantitative approaches are
necessary to identify the important aspects of risk and prioritise management actions. A mixed-
methods approach is more pertinent than the single method approach for studying farming risks in the
context of Nepal, where no systematic research has been done on this topic. Therefore, we used a
mixed-methods design to accomplish the research objectives as outlined in the Introduction. The
qualitative study established a broad context of the farming risk and identified relevant variables, and
the quantitative study identified important aspects of risk for prioritising risk management actions.
This paper presents the findings of the qualitative study. The remainder of this paper is organized as
follows. First, we clarify the key terms relevant to this paper, followed by a brief discussion on the
importance of risk perception studies. Next, we briefly review the qualitative methods used in risk
perception studies, with a special focus on the cognitive mapping approach. The methodology section
clarifies the sampling approach, interview methods and data analysis techniques. Then, we present the
findings and discussion, and conclusion of the study.
4.2.1 Definition of key terms related to risk
The understanding and definition of risk and related terms vary across individuals and decision
contexts. Therefore, it is essential to clarify the key terms and constructs relevant to this paper.
Although the quantitative measure of risk perception combines the probability of loss exposure and the
size of likely loss (Agrawal, 2009), this paper adopts the following qualitative definitions of risk and
risk perception. We define risks as undesirable outcomes that farmers foresee in various aspects of
their farming. We examine farmers’ perceptions of a risk looking at how often they talk about it in the
interviews and how connected the risk is with other constructs and management actions in the
cognitive maps. We define intrinsic factors as the sources of uncertainty related to the perceiver’s
characteristics, such as knowledge, attitude, expectation, willingness and behaviour. Likewise,
extrinsic factors are sources of uncertainty that originate outside the perceiver, such as climatic factors,
farm characteristics and institutional factors. Similarly, risk management refers to the actions taken by
farmers ex-ante to reduce the chances of undesirable situations happening or manage the consequences
of such outcomes once they occur. We follow Hardaker et al. (2015)’s categorisation of risk into two

Chapter 4: Cognitive Mapping of Farming Risks 62
broad categories: business risk and financial risk. Business risk includes the combined effect of
production, market, institutional and personal risk, whereas financial risk includes the risks arising
from the methods of financing the business.
4.2.2 The need for studying farmers’ risk perception
The importance of studying farmers’ risk perception is well recognised in the literature. Information
on farmers’ risk perception and responses to risk are necessary to understand and predict their
behaviour. Risk perception indicates how concerned people are about the uncertainty and likely
undesirable outcomes (Slovic, 2000). It also indicates their potential decisions on adopting risk
management strategies (Gebrehiwot & van der Veen, 2015). When faced with risk, people often place
greater weight on potential negative outcomes than positive outcomes and are willing to avoid the
risks (Ghadim & Pannell, 2003; Marra et al., 2003). A high perception of risk results in conservative
and prudent behaviour, while a low perception of risk results in less conservative behaviour (Rejda &
McNamara, 2014). Farmers’ risk perception is also an important indicator of their demand for crop
insurance (Gebrehiwot & van der Veen, 2015; Marra et al., 2003).
Farmers’ risk perception is not only an indicator of their risk management decisions but also
associated with investment, innovation and farm productivity (Ullah et al., 2015). Knowing individual
perceptions of risk is essential for understanding their saving and investment behaviour (Weerdt,
2005). Analysis of sources and nature of risks helps farmers choose the best available option (Lomott
& Lyskawa, 2014). People tend to invest more in financial opportunities they perceive as less risky
(Weber & Hsee, 1998). The question of why large sections of farmers in developing countries do not
adopt the most profitable livelihood options available to them persists despite long-running efforts to
increase the adoption of modern crop varieties, technologies and farm mechanisation. A study
conducted by Liu and Huang (2013) in China found that the perceived uncertainty associated with new
technology was the primary factor determining farmer adoption decisions.
Despite the need to study farmers’ risk perception, as highlighted above, research is still lacking in the
Nepalese context. A comprehensive understanding of how farmers perceive risk and how they deal
with risk is necessary to inform future risk management efforts. Hence, this study attempts to
overcome the information gap in farming risk management in Nepal, focusing on prevailing risks,
sources of risk and risk management practices from farmers’ perspectives. Such information will help
the government and insurance companies refine policies and risk management products.
4.2.3 Qualitative methods in risk perception research
Researchers have emphasised the need for integrating qualitative approaches into the risk research
methodology, as discussed above, but little research has used such an approach thus far. The few
Chapter 4: Cognitive Mapping of Farming Risks 63
studies that have applied qualitative methods to study risk in part or fully are cited below. Even the
early psychometric studies included qualitative variables to characterise risk, but their methods were
still quantitative (e.g., Fischhoff et al., 1978; Slovic et al., 1980). While Ellis (1998) applied an in-
depth, open-ended interview method and constructed influence diagrams or mental models to
represent individual risk perception, Lupton and Tulloch (2002) applied the same to examine the role
of risk epistemologies and perceptions in people’s lives. Similarly, McCarthy (2007) and Meuwissen
et al. (2001) conducted in-depth interviews to identify sources of risk. While Ellis (2000) applied the
questioning method to develop cognitive models of experts and laypeople about chemical risks on
human health, van Winsen et al. (2013) used the Grounded Theory approach to develop cognitive
maps of Dutch dairy farmers’ risk perception. Likewise, Legesse and Drake (2005) conducted a
participatory rural appraisal method to supplement the findings of a quantitative survey. Murray-Prior
(1998) also used a qualitative decision model based on Kelly (1955)’s personal construct theory to
analyse farmer behaviour. Among these studies, van Winsen et al. (2013) used the qualitative method
exclusively to study farmers’ risk perception. The scarcity of qualitative methods in risk perception
research also motivated us to validate a new method while answering the research questions.
Therefore, we used the cognitive mapping approach, which is discussed below.
4.2.4 Cognitive mapping approach
Graphical representation of knowledge, attitude, perceptions, or other information as a set of
constructs and interrelationships between the constructs is called cognitive mapping (CM) (Alberto et
al., 2017; Novak & Musonda, 1991). CM is qualitative modelling of the functioning of a complex
system that represents relevant variables and causal interconnections among these variables (Özesmi
& Özesmi, 2004). CM is rooted in Kelly (1955)’s personal construct theory, which suggests that
human beings disaggregate the functioning of the world into mental constructs to represent their
experiences and understanding of their surroundings. An important postulate of Kelly (1955)’s
personal construct theory is that every construct is bipolar in nature. Constructs or concepts and
pathways are the major constituents of cognitive maps (Huff & Fletcher, 1990), where the constructs
relate to issues, events, various factors and outcomes, and the pathways represent the relationships
between the constructs (Goodier & Soetanto, 2013). The constructs bear context-specific meaning
depending on the relationship between one another as indicated by the direction of arrows (Farsari et
al., 2011). According to van Winsen et al. (2013), there are four essential aspects of the relationship:
(1) Meaning: relationship is itself a construct which defines the connection between constructs; (2)
Direction: uni-directional or bi-directional; (3) Sign: positive or negative relationship; (4) Strength: the
map that depicts the strength of relationships is known as ‘fuzzy cognitive map’. However, they
suggested that the fourth aspect can be omitted in a pure qualitative cognitive model.
Chapter 4: Cognitive Mapping of Farming Risks 64
Human perceptions of almost every issue or system can be represented by cognitive maps (Özesmi &
Özesmi, 2004). According to Özesmi and Özesmi (2004), CM can be done using physical variables
such as rainfall amount or distance to market and abstract concepts such as perceptions or attitudes.
Likewise, Wood et al. (2012) suggested CM as an appropriate approach to understand and
communicate any complex system. Similarly, while van Winsen et al. (2013) recommended CM as a
useful tool for modelling the decision-making process, Eden and Ackermann (2004) recommended it
as a decision-making tool in a complex setting. van Winsen et al. (2013) also suggested CM as a bi-
directional learning tool between farmers, researchers and policymakers. It can also be used as a
participatory policy development tool that enables a deeper understanding of the system (Özesmi,
1999). These suggestions imply that CM can simplify a complex issue into information that is easy to
understand.
Several studies in various fields have applied the CM approach for different purposes. For example,
while Goodier and Soetanto (2013) constructed cognitive maps to design future scenarios of the UK
construction sector, Soetanto et al. (2011) applied CM to identify the skills required by construction
industries in the UK. Similarly, while Fernandes et al. (2018) used CM to rank the factors affecting
sustainable development in Portuguese urban areas, Farsari et al. (2011) studied mental models of
policymakers applying the CM method. Other works that applied CM methods include the
improvement of auditing task planning in public organisations (Ackermann & Eden, 2001),
empowerment of management team to analyse and manage complexities in the UK Home Office
Prison Department (Eden & Ackermann, 2004), exploration of decision-making process in a public
sector performance appraisal system (Ahmad & Ali, 2004) and enhancement of citizens’ participation
in strategic forest management planning process (Hjortsø, 2004).
Although the application of the CM approach seems diversified, the literature related to the application
of CM in agricultural studies is relatively scarce. A few studies that have applied CM approaches in
the natural resource management sector include: designing ecological management plan (Özesmi &
Özesmi, 2004), comparing perceptions of different stakeholders about environmental conflict
(Özesmi, 1999); studying Dutch dairy farmers’ risk perceptions (van Winsen et al., 2013) and studying
local knowledge in agroforestry management (Isaac et al., 2009). According to van Winsen et al.
(2013), the advantages of CM are that it allows in-depth investigation of complex issues, it emphasises
interdependencies among constructs, it is applicable at the farm level, the results are farmer-driven
rather than researcher-driven, and it can depict multiple meanings of risk. Such diversified
applicability but scarce adoption of the CM approach in agriculture indicates scope for validating an
alternative research method for addressing the complexities in farming risk.

Chapter 4: Cognitive Mapping of Farming Risks 65
4.3 Methodology
Aligned to the interpretive research philosophy, we followed an inductive approach allowing
constructs and the relationships among the constructs to emerge from the data without proposing any a
priori hypotheses. We collected data using an open-ended conversational interview method without a
structured interview guide. However, we applied an outline guide to confine the conversations within
the scope of the study. We phrased main thematic questions, follow-up questions and probes during
the interview.
4.3.1 Sampling
We purposively selected the Terai region of Nepal for the study as it has the highest share of total
agricultural production in the country (see MoALD-Nepal, 2018). We applied the maximum variation
sampling technique so that the interviewees sufficiently represented the existing heterogeneity of the
population in terms of age, gender, education, economic status, and geographical region (see Patton,
1990). We determined the sample size based on the concept of theoretical saturation (see Mark, 2010).
Researchers have suggested varying sample sizes for achieving theoretical saturation in qualitative
studies. While Guest et al. (2006) suggested six samples for code saturation and 12 samples for
meaning saturation, Hennink et al. (2017) suggested nine interviews for thematic saturation and 16–24
interviews for meaning saturation. In our case, we did not find additional constructs after the 11th
interview. However, we continued until the 45th interview to fully understand the meaning of the
constructs and the relationships between them. We identified appropriate samples in consultation with
the District Agriculture Development Offices and Agricultural Research Stations in the study area. We
first contacted the identified samples by phone to get preliminary consent, scheduled the interview and
then conducted actual interviews in person to visit their homes from October through December 2017.
We audio-recorded the interviews and de-identified the interviewees with pseudonyms wherever they
appear.
4.3.2 Data analysis
The preliminary data analysis started with the first interview to examine data saturation and refine the
technique for the following interviews. Although actual coding was done later, interviews were
transcribed on the same or following day. We transcribed the interviews in the Nepali language and
translated them into English for further analysis. We also back-translated the transcripts into Nepali to
verify meaning equivalency in translation (see Chen & Boore, 2010). Then, we coded the transcript
contents into various themes and sub-themes related to farming risk using NVivo Pro 11. Although we
analysed 45 interviews to identify nodes and interpret the relationships among nodes, we purposively
selected six interviews for constructing cognitive maps and further analysis. The selection of samples
for cognitive mapping was also based on the maximum variation sampling technique, ensuring that the

Chapter 4: Cognitive Mapping of Farming Risks 66
minimum samples represent maximum heterogeneity in terms of socio-economic characteristics (see
Table 4.1 and Appendix A). van Winsen et al. (2013) used a similar strategy for constructing cognitive
maps. They conducted in-depth interviews with 19 farmers and selected four interviews for
constructing cognitive maps to represent the sample. Other researchers have constructed a varied
number of cognitive maps, ranging from one to 116, to study different issues (see Özesmi & Özesmi,
2004, p. 58). We have presented only two cognitive maps in the discussion section (Figures 4.1 and
4.2). All six cognitive maps and their explanation are presented in Appendix B1 to B6.
Table 4.1 Characteristics of the sample selected for cognitive mapping
SN Name Geographic cluster Education Age Family size Landholding (ha)
1 Female-1 Eastern Terai region Secondary 42 6 2.66
2 Female-2 Central Terai region Illiterate 70 5 3.33
3 Female-3 Western Terai region Lower secondary 42 4 0.33
4 Male-1 Western Terai region Adult literacy 47 19 7.50
5 Male-2 Eastern Terai region Tertiary 53 4 1.00
6 Male-3 Eastern Terai region Higher secondary 28 6 1.50
4.3.3 Construction of cognitive maps
According to Özesmi and Özesmi (2004), cognitive maps can be constructed in four ways: (1) eliciting
information using a questionnaire, (2) analysing written texts, (3) using available data having causal
relationships, and (4) conducting interviews with people and asking them to draw maps directly. The
questionnaire method involves identifying variables, selecting important ones to include in the map,
and defining the relationships among the chosen variables (Roberts, 1976). Text analysis or content
analysis involves identifying the concepts, constructs, variables, or factors and relationships between
these using the interview transcripts (Özesmi & Özesmi, 2004; Wrightson, 1976). Coding involves
identifying causes, effects, constructs, and linkages that may or may not be explicitly mentioned in the
text (Özesmi & Özesmi, 2004). The third and fourth methods are applicable in specific conditions. Of
these four methods, content analysis is most suitable for the analysis of in-depth interview transcripts.
Researchers have applied different structures for constructing mental models in various fields with
somewhat varying objectives and foci. For instance, while Brightman (2003) constructed a mind map
focusing on a single construct, the cognitive map of Wood et al. (2012) and causal map of Montibeller
and Belton (2006) did not focus on a single construct. Likewise, while Brightman (2003) followed a
hierarchical structure to construct a dialogue map, Bostrom et al. (1992) and Carriger and Newman
(2012) did not follow an ordered structure in their influence diagrams and concept maps. Similarly,
while Brightman (2003) focused on complex relationships to construct a concept map, Montibeller and
Belton (2006) and Zhu and Timmermans (2010) focused on causal relationships to construct a causal
map and a cognitive map. Also, while Wood et al. (2012) and Zhu and Timmermans (2010) allowed
Chapter 4: Cognitive Mapping of Farming Risks 67
bi-directional relationships and feedback loops in CM, Howard and Matheson (2005) used only uni-
directional relationships, not allowing feedback loops in the influence diagram. A bi-directional
relationship is the reciprocal causal relationship between constructs, and a loop is the sequential
relationship between more than two constructs forming a cycle (van Winsen et al., 2013). Such
variation in structures of cognitive models provides the flexibility to apply an appropriate construction
method that best suits our context. Accordingly, our approach does not limit the focus to a single
construct or follow a hierarchical structure; it focuses on causal relationships and allows bi-directional
relationships and feedback loops.
Many software packages are available for CM, including Banxia Decision Explorer (DE), Coogle,
Mind Manager, Mind Mapper, and Free Mind. Among them, DE is the most appropriate tool for
constructing cognitive maps because it allows better visualisation of several concepts and linkages to
collect feedback from the participants and carry out further analysis (Goodier & Soetanto, 2013;
Tegarden & Sheetz, 2003). Goodier and Soetanto (2013) also suggest that DE helps depict different
types of relationships, such as causal, cognitive, temporal or researcher defined, between various
concepts constructed as short phrases. DE contains several tools for analysing the cognitive model,
allowing a better understanding of individuals’ cognition of the issue under study. Accordingly, we
chose DE for this study.
4.3.4 Analytical framework
Graph theory indicators
We compared the cognitive maps based on various graph theory indicators such as number of
constructs (N), number of linkages (L), linkage/construct (L/N) ratio, and map density (D). Hage and
Harary (1983) defined map density as the ratio of existing connections (L) to maximum possible
connections between the constructs. If a construct can have a causal relationship with itself, the
maximum possible links is equal to the square of the total number of constructs (N2). Map density tells
us how sparse or connected the map is (Özesmi & Özesmi, 2004). The higher the value of D, the
larger the number of causal relationships among variables. High D values also indicate that individuals
have more flexibility to adapt to changes (Hage & Harary, 1983). Alternatively, van Winsen et al.
(2013) used a slightly different formula, calculating map density as linkage to construct ratio halved
(L/2N). We calculated map density using Hage and Harary (1983)’s formula and the L/N ratio,
representing a similar characteristic to van Winsen et al. (2013)’s formula.
Domain and centrality analysis
Although DE allows several tools to analyse cognitive maps, domain and centrality analyses are
considered more important, revealing the importance of the constructs in terms of the number of

Chapter 4: Cognitive Mapping of Farming Risks 68
linkages (Farsari et al., 2011). According to Eden et al. (1992), the domain score (D) of a construct is
calculated as a summation of total in-arrows and out-arrows around the construct. The value of D
indicates how connected a construct is to other constructs and the overall strength of all connections
(Özesmi & Özesmi, 2004). However, Eden et al. (1992) suggested that domain analysis ignores the
wider context of the construct, accounting only for local complexity. They noted that centrality
analysis overcomes this shortcoming by extending the same principle to account for the relevant
interconnections beyond the immediate domain of the construct. While domain analysis accounts only
for immediate linkages, centrality analysis goes beyond immediate linkages, considering all
secondary, tertiary and even further connections. According to Eden (2004), the centrality score is
calculated as follows:
𝐶 = ∑𝐿𝑖
𝑁𝑖
𝑛
1
where C = centrality score, 𝐿𝑖 = number of linkages in the ith layer, 𝑁𝑖 = level of the ith layer.
The individual cognitive maps can be compared based on D and C values. For instance, Soetanto et al.
(2011) ranked the constructs according to the D and C scores. They found eight of the top ten
constructs common across domain and centrality analyses, which they considered for further detailed
analysis.
Other analyses
Following Özesmi and Özesmi (2004), we compared the cognitive maps based on the most mentioned
constructs and construct types. We ranked the constructs based on the frequency of their appearance in
the maps. Such ranking indicates the importance of a construct and assumes that people tend to talk
more about the aspects they consider more important. We can also classify the constructs into major
types such as transmitter/receiver/ordinary or cause/effects and rank them by domain or centrality
score (Özesmi & Özesmi, 2004). For instance, van Winsen et al. (2013) classified the constructs into
four categories: ‘causes’, ‘effects’, ‘values at stake’, and ‘risk management’. Accordingly, we reduced
the interview transcripts to various constructs and established the relationships between them through
textual analysis using NVivo. Then, we classified the constructs into four categories, namely ‘intrinsic
factors’, ‘extrinsic factors’, ‘perceived risk’, and ‘risk management’. Intrinsic factors relate to farmers’
inherent characteristics such as education, farming motivation and knowledge, whereas extrinsic
factors relate to farm characteristics such as irrigation availability, input availability, policies and
market access. Perceived risks are the constructs related to the consequences of uncertainty caused by
various factors. Both intrinsic and extrinsic factors are the causes or sources that lead to risks. Risk
management constructs are the options that farmers have in place to act upon various factors and

Chapter 4: Cognitive Mapping of Farming Risks 69
perceived risks. We differentiated four types of constructs in terms of colour and font style (see
Figures 4.1 and 4.2).
Figure 4.1 Cognitive map of female-1
(Legend: Extrinsic factor = regular; intrinsic factor = underlined, perceived risk = bold red and risk
management = italicised bold blue)

Chapter 4: Cognitive Mapping of Farming Risks 70
Figure 4.2 Cognitive map of male-1
(Legend: Extrinsic factor = regular; intrinsic factor = underlined, perceived risk = bold red and risk
management = italicised bold blue)
4.4 Findings and discussion
4.4.1 Graph theory indicators
Considering the whole map, the number of constructs (N) ranged from 34 to 48 across individual
cognitive maps, with a mean of 42 and 12% coefficient of variation (Table 4.2). Such low variation in
N across maps indicates similar perceptions of the complexity of farming risks among farmers. van
Winsen et al. (2013) also interpreted N ranging from 25 to 37 to indicate a similar understanding of
the complexity of farming risks. Other studies have reported N ranging from 14 to 59 (see Özesmi &
Özesmi, 2004, p. 58). Similarly, considering all four categories of constructs, the extrinsic factor, risk
management, and perceived risk categories had similar N while the intrinsic factor category had the
smallest N (Table 4.2). This finding suggests that farmers’ focus is more strongly on extrinsic
circumstances than intrinsic factors as the sources of risk. Similarly, they give similar emphasis on risk
and risk management. In van Winsen et al. (2013)’s case, farmers showed the strongest emphasis on
the causes of risks. Our interpretation of N is based on the idea that people are likely to talk more
about the issue they consider more complex (Eden, 2004), which results in a higher N on a map.
Similarly, among various aspects of an issue, people tend to talk more about the aspects they think are
more important (Soetanto et al., 2011). From this perspective, the size of a map indicates the

Chapter 4: Cognitive Mapping of Farming Risks 71
perception of the overall complexity of an issue, while the partitioning of such complexity into various
aspects helps to identify the focus of the perceiver.
In the above discussion, we only considered the number of constructs to understand perceived
complexity in farming risks. The map density (D) and link/concept ratio (L/N) help extend our
understanding of the issue by considering relationships between the constructs. D ranged from 0.029
to 0.035 with a mean of 0.032 and 6% coefficient of variation (Table 4.2). Researchers have reported
varied map densities (see Özesmi & Özesmi, 2004, pp. 60, 61). According to Isaac et al. (2009), a
small variation in map density indicates similar perceptions regarding the issue’s complexity.
Likewise, the average ratio of links to the constructs was 1.33, and higher than one in each case (Table
4.2). According to Georgiou (2009), the L/N ratio should be ideally around 1.2. They argued that the
inexperience of the mapper results in a higher L/N ratio. However, various researchers reported L/C
values ranging from 1.20 to 2.07 (see Özesmi & Özesmi, 2004, p. 60). More than one link per
construct simply implies that one outcome is the consequence of more than one cause, or one cause is
leading to more than one consequence. According to van Winsen et al. (2013), a higher value for the
L/C ratio indicates that farmers perceive more than one cause of the risk and aim to achieve more than
one goal with a single intervention. Such complexity suggests that isolating and assigning the
probability to a particular risk and quantifying the consequences, as required in the conventional risk
mapping exercise, is not easy for farmers. Moreover, low variation in these graph theory indicators
across samples also indicates that the diversity in the sample characteristics in terms of geographical
region, age, education, family size and landholding size did not produce an observable difference on
the complexity of the cognitive maps related to farmers’ risk perception.
Table 4.2 Graph theory indicators from the cognitive maps
Sample Constructs (#) Links
(L)
Density
(D=L/N2)
L/N
Extrinsic
factor
Intrinsic
factor
Perceived
risk
Risk
management
Total
(N)
Female-1 15 4 14 15 48 71 0.031 1.48
Female-2 12 6 10 9 37 43 0.031 1.16
Female-3 11 6 6 11 34 41 0.035 1.21
Male-1 10 6 16 10 42 57 0.032 1.36
Male-2 14 4 13 15 46 69 0.033 1.50
Male-3 13 5 12 14 44 57 0.029 1.30
Mean 12.50 5.17 11.83 12.33 41.83 56.33 0.03 1.33
CV 13.66 17.37 26.91 19.68 11.74 20.36 5.81 9.52
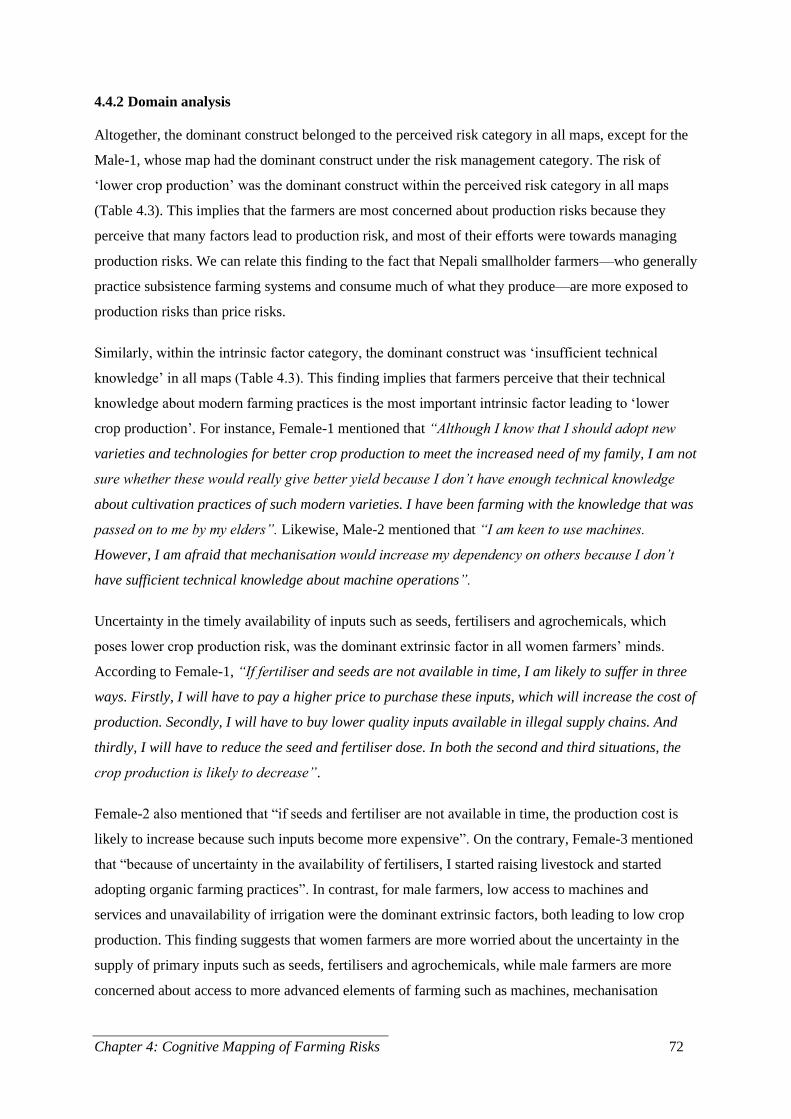
Chapter 4: Cognitive Mapping of Farming Risks 72
4.4.2 Domain analysis
Altogether, the dominant construct belonged to the perceived risk category in all maps, except for the
Male-1, whose map had the dominant construct under the risk management category. The risk of
‘lower crop production’ was the dominant construct within the perceived risk category in all maps
(Table 4.3). This implies that the farmers are most concerned about production risks because they
perceive that many factors lead to production risk, and most of their efforts were towards managing
production risks. We can relate this finding to the fact that Nepali smallholder farmers—who generally
practice subsistence farming systems and consume much of what they produce—are more exposed to
production risks than price risks.
Similarly, within the intrinsic factor category, the dominant construct was ‘insufficient technical
knowledge’ in all maps (Table 4.3). This finding implies that farmers perceive that their technical
knowledge about modern farming practices is the most important intrinsic factor leading to ‘lower
crop production’. For instance, Female-1 mentioned that “Although I know that I should adopt new
varieties and technologies for better crop production to meet the increased need of my family, I am not
sure whether these would really give better yield because I don’t have enough technical knowledge
about cultivation practices of such modern varieties. I have been farming with the knowledge that was
passed on to me by my elders”. Likewise, Male-2 mentioned that “I am keen to use machines.
However, I am afraid that mechanisation would increase my dependency on others because I don’t
have sufficient technical knowledge about machine operations”.
Uncertainty in the timely availability of inputs such as seeds, fertilisers and agrochemicals, which
poses lower crop production risk, was the dominant extrinsic factor in all women farmers’ minds.
According to Female-1, “If fertiliser and seeds are not available in time, I am likely to suffer in three
ways. Firstly, I will have to pay a higher price to purchase these inputs, which will increase the cost of
production. Secondly, I will have to buy lower quality inputs available in illegal supply chains. And
thirdly, I will have to reduce the seed and fertiliser dose. In both the second and third situations, the
crop production is likely to decrease”.
Female-2 also mentioned that “if seeds and fertiliser are not available in time, the production cost is
likely to increase because such inputs become more expensive”. On the contrary, Female-3 mentioned
that “because of uncertainty in the availability of fertilisers, I started raising livestock and started
adopting organic farming practices”. In contrast, for male farmers, low access to machines and
services and unavailability of irrigation were the dominant extrinsic factors, both leading to low crop
production. This finding suggests that women farmers are more worried about the uncertainty in the
supply of primary inputs such as seeds, fertilisers and agrochemicals, while male farmers are more
concerned about access to more advanced elements of farming such as machines, mechanisation
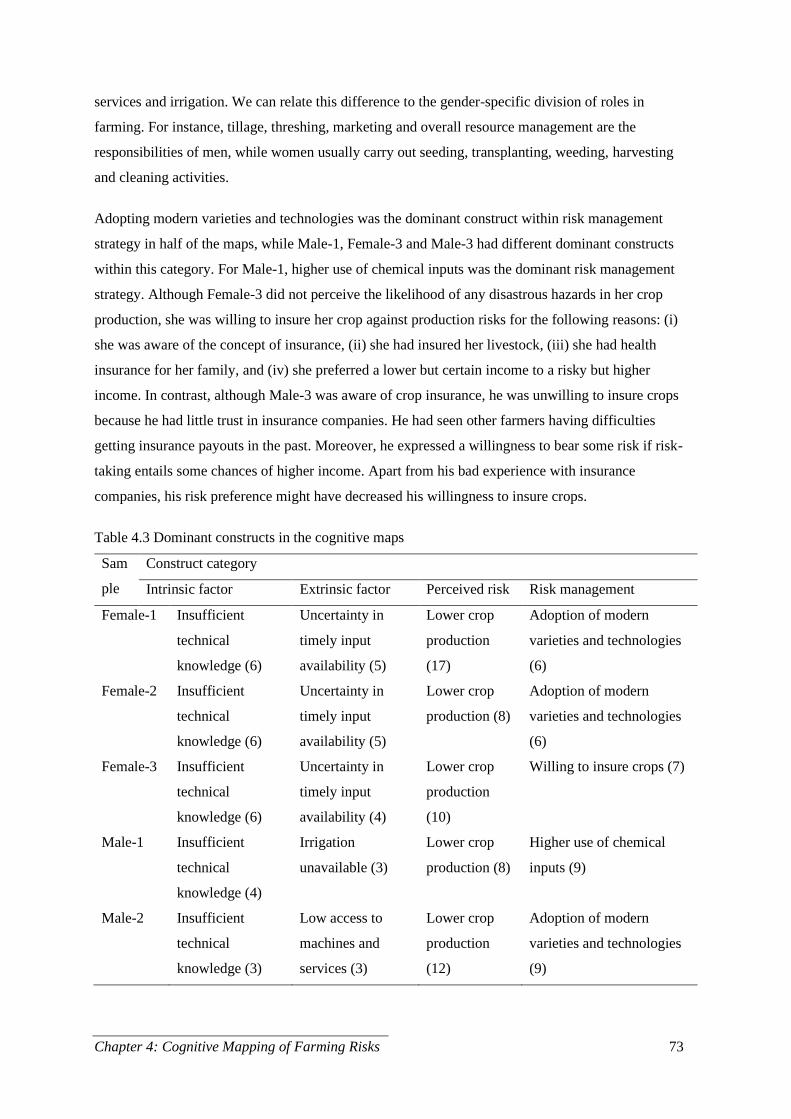
Chapter 4: Cognitive Mapping of Farming Risks 73
services and irrigation. We can relate this difference to the gender-specific division of roles in
farming. For instance, tillage, threshing, marketing and overall resource management are the
responsibilities of men, while women usually carry out seeding, transplanting, weeding, harvesting
and cleaning activities.
Adopting modern varieties and technologies was the dominant construct within risk management
strategy in half of the maps, while Male-1, Female-3 and Male-3 had different dominant constructs
within this category. For Male-1, higher use of chemical inputs was the dominant risk management
strategy. Although Female-3 did not perceive the likelihood of any disastrous hazards in her crop
production, she was willing to insure her crop against production risks for the following reasons: (i)
she was aware of the concept of insurance, (ii) she had insured her livestock, (iii) she had health
insurance for her family, and (iv) she preferred a lower but certain income to a risky but higher
income. In contrast, although Male-3 was aware of crop insurance, he was unwilling to insure crops
because he had little trust in insurance companies. He had seen other farmers having difficulties
getting insurance payouts in the past. Moreover, he expressed a willingness to bear some risk if risk-
taking entails some chances of higher income. Apart from his bad experience with insurance
companies, his risk preference might have decreased his willingness to insure crops.
Table 4.3 Dominant constructs in the cognitive maps
Sam
ple
Construct category
Intrinsic factor Extrinsic factor Perceived risk Risk management
Female-1 Insufficient
technical
knowledge (6)
Uncertainty in
timely input
availability (5)
Lower crop
production
(17)
Adoption of modern
varieties and technologies
(6)
Female-2 Insufficient
technical
knowledge (6)
Uncertainty in
timely input
availability (5)
Lower crop
production (8)
Adoption of modern
varieties and technologies
(6)
Female-3 Insufficient
technical
knowledge (6)
Uncertainty in
timely input
availability (4)
Lower crop
production
(10)
Willing to insure crops (7)
Male-1 Insufficient
technical
knowledge (4)
Irrigation
unavailable (3)
Lower crop
production (8)
Higher use of chemical
inputs (9)
Male-2 Insufficient
technical
knowledge (3)
Low access to
machines and
services (3)
Lower crop
production
(12)
Adoption of modern
varieties and technologies
(9)

Chapter 4: Cognitive Mapping of Farming Risks 74
Male-3 Insufficient
technical
knowledge (5)
Low access to
machines and
services (3)
Lower crop
production
(11)
Not willing to insure crops
(9)
Note: Figures in parentheses indicate domain scores
4.4.3 Centrality analysis
The centrality analysis of the cognitive maps produced slightly different results from the domain
analysis. Considering all four categories of constructs, the most central construct in each map
belonged to the perceived risk category (Table 4.4). The risk of lower crop production was the most
central construct in each map except for Male-1’s map, where the most central construct was the
higher incidences of insects and diseases leading to the risk of lower crop production. Although the
perception of the most central intrinsic factor leading to farming risks was insufficient technical
knowledge in each case, the perception of extrinsic factors varied greatly. Female-1, Female-3 and
Male-2 perceived uncertainty in timely availability of inputs as the most central extrinsic source
farming risk, whereas Female-2 and Male-3 perceived low access to machines and services as the most
central source of farming risks. Similarly, Male-1 perceived increased temperature as the most central
extrinsic source of farming risk.
The most important risk management strategy also varied greatly. Female-1 perceived that group
involvement had helped her manage farming risks, while Female-2 and Male-1 thought that higher use
of chemical inputs helped them reduce the risk of product failure due to insects and diseases.
Similarly, while Female-3 was willing to insure crops as the most useful risk management strategy,
Male-3 was unwilling to insure crops because he did not trust insurance companies. For Male-2, the
adoption of modern varieties and technologies was the most central risk management strategy against
farming risks. Although the above analysis showed varied results, we could not establish any pattern
in these results corresponding to the variation in sample characteristics. Based on this finding, we
could not find any association of farmers’ geographical location, age, education, family size or
landholding size with their perceptions of risk, risk factors or choice of management option.

Chapter 4: Cognitive Mapping of Farming Risks 75
Table 4.4 Central constructs in the cognitive maps
Name Construct category
Intrinsic factor Extrinsic factor Perceived risk Risk management
Female-1 Insufficient
technical
knowledge (21
from 42 c)
Uncertainty in
timely input
availability (20
from 44 c)
Lower crop
production (29
from 45 c)
Group involvement
(22 from 44 c)
Female-2 Farming as family
legacy (7 from 16
c)
Low access to
machines and
services (8 from 18
c)
Lower crop
production (13
from 20 c)
Higher use of
chemical inputs (12
from 27 c)
Female-3 Insufficient
technical
knowledge (15
from 29 c)
Uncertainty in
timely input
availability (14
from 30 c)
Lower crop
production (15
from 23 c)
Willing to insure
crops (14 from 25
c)
Male-1 Insufficient
technical
knowledge (10
from 20 c)
Increased
temperature (8
from 21 c)
Higher incidences
and insects and
diseases (18 from
33 c)
Higher use of
chemical inputs (17
from 33 c)
Male-2 Insufficient
technical
knowledge (19
from 41 c)
Uncertainty in
timely input
availability (18
from 41 c)
Lower crop
production (24
from 41 c)
Adoption of
modern varieties
and technologies
(22 from 41 c)
Male-3 Insufficient
technical
knowledge (16
from 34 c)
Low access to
machines and
services (12 from
28 c)
Lower crop
production (23
from 38 c)
Not willing to
insure crops (20
from 39 c)
Note: Figures in parentheses indicate centrality scores from the number of constructs.
4.4.4 Most mentioned constructs
We calculated the repeat index for each construct by dividing the number of farmers mentioning it by
the total number of farmers—six in our case. We used this index to rank the importance of the
constructs, assuming that the more people agree on an idea, the more important the idea is. van
Winsen et al. (2013) also used the number of farmers mentioning a construct to rate its importance.
The constructs with a repeat index ≥0.5, meaning at least half of the farmers mentioned it, are
discussed below. Like other results discussed earlier, we could not attribute the variation in most
mentioned constructs to differences in sample characteristics. This finding gives us more strength to

Chapter 4: Cognitive Mapping of Farming Risks 76
conclude that age, education, gender, family size, landholding size and decision-maker’s geographical
location do not affect their perception of risk, risk factors or management decisions.
As shown in Table 4.5, insufficient technical knowledge is the most important intrinsic risk factor
because all farmers mentioned it. Similarly, most farmers were involved in the farming occupation
only to continue the family legacy, which means they were less motivated by its economic prospect.
Such motivation might have negative implications not only in dealing with risk but also in overall
farm efficiency.
Within the extrinsic risk category, all farmers perceived that uncertainty in the timely availability of
farm inputs (e.g., fertilisers, chemicals, and labour) is the primary factor leading to farming risks. Low
access to farm machines and farm mechanisation services were also perceived as important factors
leading to farming risks. Low access to mechanisation services was mainly due to the high initial cost
of farm machines and unavailability of custom hiring services. Similarly, the uncertain onset of
monsoon, often late, is an important source of drought risk. Such risk perception is magnified by the
unavailability of canal irrigation systems and the high cost of pumping groundwater to irrigate crops.
Other important sources of climatic risk include heavy rainfall and increased temperature. Apart from
the factors that impart uncertainty in farm production, farmers also face many factors that lead to
unpredictability in the market. Farmers possess less bargaining power in the market because they sell
their produce to meet their cash needs, and they think that the government does not intervene in the
market in their favour. In such situations, farmers are left with no option other than accepting whatever
price the contractors offer for their produce. All farmers perceived such a price determination system
as the major source of price risk in the farm business. Moreover, farmers often need to compete with
the unregulated import of cheaper products, a major source of market risk in the Terai region.
Drought, higher incidence of insects and diseases, higher production cost, lower crop production and
lower output price were the major risks perceived by all farmers. Similarly, while most farmers
perceived flood, higher input costs, delayed rice planting and soil fertility degradation as major
farming risks, half of them perceived human health and environmental degradation and storage loss as
the major risks. From their ranking of risks, it is again clear that farmers are more concerned about
production risks.
For instance, Female-1 mentioned that “To address the issue of food and income insufficiency, I
adopted modern crop varieties and technologies. Since I didn’t have enough technical knowledge of
such technologies, I knew that I could have no production at all. However, I was fortunate not to have
seen so happening, but, at the same time, I found modern crop varieties more susceptible to insects and
diseases. I used more fertilisers, pesticides, and fungicides to manage insects and diseases even if I
knew that such chemicals are harmful to health and the environment. The use of chemicals also

Chapter 4: Cognitive Mapping of Farming Risks 77
increased my cost of production. As I continued using a higher dose of chemicals and fertilisers, I
found my soil less productive year after year”.
In the above example, Female-1 adopted modern crop varieties and technologies to reduce the risk of
food and income insufficiency. However, it triggered an intrinsic factor, i.e., insufficient technical
knowledge, which might lead to production risk, consequently affecting her objective of fighting food
and income insufficiency. The adoption of modern crop varieties also increased the risk of insects and
diseases, leading to production risk. Moreover, the higher use of chemical inputs to overcome
production risk due to insects and diseases triggered her perception of human health and
environmental risk and higher production costs. Furthermore, she also perceived that the chemicals
negatively affect soil fertility, ultimately leading to production risk. This example shows that farmers
do not perceive farming risks as independent items but as a network of causes and effects having
multi-faceted relationships. Such a complex network implies that, sometimes, a cause may induce
other causes, an effect may trigger other causes, or an effect leads to other effects. It also shows how
farmers trade-off between risks and benefits attached to their decisions.
Farm diversification and mechanisation were the most important risk management strategies followed
by all farmers. Likewise, most farmers perceived the increasing use of chemical inputs and
groundwater as major risk management strategies. Similarly, farmers said they manage risks by
accessing credit facilities, adopting modern varieties and technologies, getting involved in a group,
selling farm produce in lean seasons, and diversifying crop varieties. As part of the interview, we
asked the farmers to choose between a certain amount and a lottery resulting in the expected value
slightly higher than a certain amount. Of the four farmers who chose a certain amount, implying risk
aversion, three were willing to buy crop insurance. This finding suggests that farmers’ risk aversion
translates into their willingness to insure crops. However, only one farmer had already purchased crop
insurance, and only half of the farmers were aware of it. Such a low level of awareness partly explains
the low adoption of crop insurance. Moreover, farmers’ risk preference (Male-3) and their choice for
other management options such as group involvement (Male-3) and expectation for government
support in case of hazards (Male-1) were also important factors leading to the reluctance of farmers to
adopt crop insurance. This result suggests that farmers’ willingness to insure crops is affected by their
risk attitude and availability of other management options.

Chapter 4: Cognitive Mapping of Farming Risks 78
Table 4.5 Most mentioned constructs in the cognitive maps
Category Constructs Repeat index
Intrinsic factor
Insufficient technical knowledge 1.00
Farming as a family legacy 0.83
Preference for a certain lower income to risky higher income 0.67
Aware of crop insurance 0.50
Extrinsic factor
Uncertainty in timely availability of inputs 1.00
Uncertainty in labour availability 1.00
Price determination by contractors 1.00
Late monsoon 0.83
Uncertainty in irrigation availability 0.67
Low access to machines and services 0.67
Heavy rainfall 0.50
Increased temperature 0.50
Unregulated import of cheaper products 0.50
Perceived risk
Drought 1.00
Higher incidence of insects and diseases 1.00
Higher production cost 1.00
Lower crop production 1.00
Lower output price 1.00
Flood 0.67
Higher input cost 0.67
Delayed rice planting 0.67
Soil fertility degradation 0.67
Human health and environmental degradation 0.50
Storage loss 0.50
Risk management
Farm diversification 1.00
Mechanisation 1.00
Higher use of chemical inputs 0.83
Use groundwater 0.83
Accessing credit facilities 0.67
Adoption of modern varieties and technologies 0.67
Group involvement 0.67
Selling in lean seasons 0.67
Varietal diversification 0.67
Willing to insure crops 0.50
Chapter 4: Cognitive Mapping of Farming Risks 79
4.4.5 Reflection on the cognitive mapping approach
CM helped us reduce a complex topic such as farming risk—implicit in the long open-ended
conversational interviews—into explicit networks of constructs. We could replace thousands of words
with a simple picture to explain the story succinctly. It allowed us to explain farmers’ understanding of
risk and management decisions using various map dimensions, offering semi-quantitative flavours in
qualitative research. It also helped us analyse the effect of individual heterogeneity on the perceptions
of risk and management decisions. Moreover, CM is a flexible tool that can be adapted to a variety of
contexts. In addition to its applicability as a research method, it can also serve as a communication
tool because of its power in presenting a complex topic using a simple picture that is easy to
understand for a wide range of audiences. Because there is no specific start or end point to read the
map, readers can choose their construct of interest and follow relevant links to interpret the idea.
Furthermore, the CM approach can be an appropriate tool for recording, analysing, and reporting focus
group discussions, presentations and dialogues. We also see the opportunity for further exploring the
potential of the CM approach. In our study, the interviewees were not essentially aware of the
approach. Future research may consider a participatory approach for map construction. Alternatively,
such mapping exercises can be tested in a group setting.
4.5 Conclusion
This study has shown that farmers do not perceive various risks as discrete elements. Farmers do not
even consider it worthwhile to differentiate the various notions of risk such as risk factors, uncertainty
and risk. They often understand these constructs as synonyms of threats or challenges to their farming
occupation. Their cognition of risk is a complex network of bi-directional causal relationships between
sources of uncertainty, risks and management strategies. The multiple linkages between the constructs
indicate that farmers perceive more than one cause of a risk, and they aim to meet more than one goal
while responding to the risks. This tendency informs us that risk management products, such as multi-
peril crop insurance that target multiple risks, will create more demand than those targeting a single
risk. Such complexity also indicates that conventional risk mapping is challenging because it is
difficult for farmers to quantify the probability and consequences of one element out of such
entanglement. We found that cognitive mapping can complement the quantitative methods to dissect
such complexity into tangible parts and communicate the key message to a wide range of audiences.
Among the various risks perceived by farmers, the majority belonged to the production risk category.
This finding is consistent with the fact that smallholder subsistence farmers, who consume much of
what they produce, are more exposed to production risks than market risks. Similarly, farmer
perception of a gap between their existing knowledge and the knowledge required to adopt new crop
varieties or technologies was the primary factor determining their perception of production uncertainty
Chapter 4: Cognitive Mapping of Farming Risks 80
associated with adopting such varieties or technologies. Such risk factors may explain the low rate of
varietal and technological adoption. The results also showed that men and women had different
perceptions of extrinsic sources of farming risks. For instance, while women farmers were worried
about the uncertainty in the supply of basic inputs, males were worried about access to more advanced
elements of farming. We can relate such differences to gender-differentiated roles in farming.
However, the perceptions of other climatic risk factors such as the uncertain onset of monsoon leading
to drought, heavy rainfall leading to flooding, and increased temperature leading to low crop
production were common to all samples.
Apart from the factors that lead to production risks, traders’ monopolistic role in determining the price
of farm produce, lack of government support in the market, and unregulated import of cheaper goods
were the primary sources of market risk perceived by farmers. The government’s role seems pivotal in
protecting farmers against such risks. Announcing minimum support prices for major commodities
before the start of the growing season could help farmers maximise expected returns considering all
potential investment options. Similarly, policy adjustment aimed at regulating imports also falls within
the scope of the government’s responsibility. Moreover, the promotion of cooperative marketing
systems may increase farmers’ bargaining power in the market.
Farm diversification, mechanisation, adoption of modern varieties and technologies, application of
more chemical inputs, and groundwater use were the major strategies targeted against production
risks. Likewise, participating in farmer groups, accessing credit facilities and income diversification
were the farmers’ major strategies for dealing with financial risk. Similarly, although selling farm
produce in lean seasons was the major strategy against price risk, it was constrained by two main
factors. Firstly, smallholders need cash immediately to purchase inputs for the next crop. Secondly, it
exposes them to further risks such as storage loss and price risk in the lean seasons. In addition to
these informal strategies, farmers were willing to buy formal risk management products such as crop
insurance. Moreover, farmer awareness of potential risk management options and their risk attitude are
linked to their willingness to purchase crop insurance. However, because risk aversion is an intrinsic
characteristic of farmers, educating them about the concept and benefits of crop insurance is likely to
create more demand for it. Furthermore, understanding the complexity of farming risks was similar
irrespective of wealth, age, education, family size and geographical location of the decision-maker.
Such homogeneous perception of risk suggests that a risk management intervention or product may
have wide acceptability.

Chapter 4: Cognitive Mapping of Farming Risks 81
4.6 References
Ackermann, F., & Eden, C. (2001). Soda–Journey Making and Mapping in Practice. In J. Rosenhead
& J. Mingers (Eds.), Rational Analysis for a Problematic World Revisited: Problem
Structuring Methods for Complexity, Uncertainty and Conflict (2nd ed., pp. 43-60). Wiley.
Agrawal, R. C. (2009). Risk Management. ABD Publishers.
Ahmad, R., & Ali, N. A. (2004). Performance Appraisal Decision in Malaysian Public Service.
International Journal of Public Sector Management, 17(1), 48-64.
https://doi.org/https://doi.org/10.1108/09513550410515565
Alberto, J. C., Priit, R., & Aet, M. (2017). Developing Higher-Order Thinking Skills with Concept
Mapping: A Case of Pedagogic Frailty. Knowledge Management & E-Learning: An
International Journal, 9(3), 348-365.
https://doi.org/https://doi.org/10.34105/j.kmel.2017.09.021
Aven, T. (2010). On How to Define, Understand and Describe Risk. Reliability Engineering & System
Safety, 95(6), 623-631. https://doi.org/https://doi.org/10.1016/j.ress.2010.01.011
Bostrom, A., Fischhoff, B., & Morgan, M. G. (1992). Characterizing Mental Models of Hazardous
Processes: A Methodology and an Application to Radon. Journal of Social Issues, 48(4), 85-
100. https://doi.org/https://doi.org/10.1111/j.1540-4560.1992.tb01946.x
Brightman, J. (2003, 8–9 May). Mapping Methods for Qualitative Data Structuring (Qds) Strategies in
qualitative research: methodological Issues and practices using QSR NVivo and NUD*IST,
London. https://banxia.com/pdf/de/Map_for_qual_data_struct.pdf
Carriger, J. F., & Newman, M. C. (2012). Influence Diagrams as Decision‐Making Tools for Pesticide
Risk Management. Integrated Environmental Assessment and Management, 8(2), 339-350.
https://doi.org/https://doi.org/10.1002/ieam.268
Chen, H. Y., & Boore, J. R. (2010). Translation and Back-Translation in Qualitative Nursing
Research: Methodological Review. Journal of Clinical Nursing, 19(1-2), 234.
https://doi.org/https://doi.org/10.1111/j.1365-2702.2009.02896.x
Eden, C. (2004). Analyzing Cognitive Maps to Help Structure Issues or Problems. European Journal
of Operational Research, 159(3), 673-686. https://doi.org/https://doi.org/10.1016/S0377-
2217(03)00431-4
Eden, C., & Ackermann, F. (2004). Cognitive Mapping Expert Views for Policy Analysis in the Public
Sector. European Journal of Operational Research, 152(3), 615-630.
https://doi.org/https://doi.org/10.1016/S0377-2217(03)00061-4
Eden, C., Ackermann, F., & Cropper, S. (1992). The Analysis of Cause Maps. Journal of Management
Studies, 29(3), 309-324. https://doi.org/https://doi.org/10.1111/j.1467-6486.1992.tb00667.x
Ellis, F. (1998). Household Strategies and Rural Livelihood Diversification. Journal of Development
Studies, 35(1), 1-38. https://doi.org/https://doi.org/10.1080/00220389808422553

Chapter 4: Cognitive Mapping of Farming Risks 82
Ellis, F. (2000). The Determinants of Rural Livelihood Diversification in Developing Countries.
Journal of Agricultural Economics, 51(2), 289-302.
https://doi.org/https://doi.org/10.1111/j.1477-9552.2000.tb01229.x
Farsari, I., Butler, R. W., & Szivas, E. (2011). Complexity in Tourism Policies. Annals of Tourism
Research, 38(3), 1110-1134. https://doi.org/https://doi.org/10.1016/j.annals.2011.03.007
Fernandes, I. D. S., Ferreira, F. A. F., Bento, P., Jalali, M. S., & António, N. J. S. (2018). Assessing
Sustainable Development in Urban Areas Using Cognitive Mapping and Mcda. International
Journal of Sustainable Development & World Ecology, 25(3), 216-226.
https://doi.org/https://doi.org/10.1080/13504509.2017.1358221
Fischhoff, B., Slovic, P., Lichtenstein, S., Read, S., & Combs, B. (1978). How Safe Is Safe Enough? A
Psychometric Study of Attitudes Towards Technological Risks and Benefits. Policy Sciences,
9(2), 127-152. https://doi.org/https://doi.org/10.1007/BF00143739
Gebrehiwot, T., & van der Veen, A. (2015). Farmers Prone to Drought Risk: Why Some Farmers
Undertake Farm-Level Risk-Reduction Measures While Others Not? Environmental
Management, 55(3), 588-602. https://doi.org/https://doi.org/10.1007/s00267-014-0415-7
Georgiou, I. (2009). A Graph-Theoretic Perspective on the Links-to-Concepts Ratio Expected in
Cognitive Maps. European Journal of Operational Research, 197(2), 834-836.
https://doi.org/https://doi.org/10.1016/j.ejor.2008.07.030
Ghadim, A. K. A., & Pannell, D. J. (2003). Risk Attitudes and Risk Perceptions of Crop Producers in
Western Australia. In B. A. Babcock, R. W. Fraser, & J. N. Lekakis (Eds.), Risk Management
and the Environment: Agriculture in Perspective (pp. 113-133). Springer Netherlands.
https://doi.org/https://doi.org/10.1007/978-94-017-2915-4_8
Goodier, C. I., & Soetanto, R. (2013). Building Future Scenarios Using Cognitive Mapping. Journal of
Maps, 9(2), 203-217. https://doi.org/https://doi.org/10.1080/17445647.2013.770997
Guest, G., Bunce, A., & Johnson, L. (2006). How Many Interviews Are Enough?: An Experiment with
Data Saturation and Variability. Field Methods, 18(1), 59-82.
https://doi.org/https://doi.org/10.1177/1525822X05279903
Hage, P., & Harary, F. (1983). Structural Models in Anthropology. Oxford University Press.
Hardaker, J. B., Lien, G., Anderson, J. R., & Huirne, R. B. M. (2015). Coping with Risk in
Agriculture: Applied Decision Analysis (3rd ed.). CABI.
https://ebookcentral.proquest.com:80/lib/CURTIN/docDetail.action?docID=2066663
Hennink, M. M., Kaiser, B. N., & Marconi, V. C. (2017). Code Saturation Versus Meaning Saturation:
How Many Interviews Are Enough? Qualitative Health Research, 27(4), 591-608.
https://doi.org/https://doi.org/10.1177/1049732316665344
Henrich, J., & McElreath, R. (2002). Are Peasants Risk‐Averse Decision Makers? 1. Current
Anthropology, 43(1), 172-181. https://doi.org/https://doi.org/10.1086/338291
Chapter 4: Cognitive Mapping of Farming Risks 83
Hjortsø, C. N. (2004). Enhancing Public Participation in Natural Resource Management Using Soft
or––an Application of Strategic Option Development and Analysis in Tactical Forest
Planning. European Journal of Operational Research, 152(3), 667-683.
https://doi.org/https://doi.org/10.1016/S0377-2217(03)00065-1
Howard, R. A., & Matheson, J. E. (2005). Influence Diagrams. Decision Analysis, 2(3), 127-143.
https://doi.org/https://doi.org/10.1287/deca.1050.0020
Huff, A. S., & Fletcher, K. E. (1990). Conclusion: Key Mapping Decisions. In A. S. Huff (Ed.),
Mapping Strategic Thought (pp. 403-412). Wiley.
Isaac, M. E., Dawoe, E., & Sieciechowicz, K. (2009). Assessing Local Knowledge Use in
Agroforestry Management with Cognitive Maps. Environmental Management, 43(6), 1321-
1329. https://doi.org/https://doi.org/10.1007/s00267-008-9201-8
Kelly, G. A. (1955). The Psychology of Personal Constructs (Vol. 1 & 2). W. W. Norton & Co.
Kuznar, L. (2001). Risk Sensitivity and Value among Andean Pastoralists: Measures, Models, and
Empirical Tests 1. Current Anthropology, 42(3), 432-440.
https://doi.org/https://doi.org/10.1086/320483
Legesse, B., & Drake, L. (2005). Determinants of Smallholder Farmers' Perceptions of Risk in the
Eastern Highlands of Ethiopia. Journal of Risk Research, 8(5), 383-416.
https://doi.org/https://doi.org/10.1080/1366987042000192426
Liu, E. M., & Huang, J. (2013). Risk Preferences and Pesticide Use by Cotton Farmers in China.
Journal of Development Economics, 103(C), 202-215.
https://doi.org/https://doi.org/10.1016/j.jdeveco.2012.12.005
Lomott, M. J., & Lyskawa, K. (2014). The New Instruments of Risk Management in Agriculture in the
European Union. Procedia Economics and Finance, 9, 321-330.
Lowrance, W. W. (1976). Of Acceptable Risk: Science and the Determination of Safety. Kaufmann,
William, Incorporated.
Lupton, D., & Tulloch, J. (2002). 'Life Would Be Pretty Dull without Risk': Voluntary Risk-Taking
and Its Pleasures. Health, Risk & Society, 4(2), 113-124.
https://doi.org/https://doi.org/10.1080/13698570220137015
Mark, M. (2010). Sample Size and Saturation in Ph.D. Studies Using Qualitative Interviews. Forum:
Qualitative Social Research, 11(3), 1-19. https://doi.org/https://doi.org/10.17169/fqs-
11.3.1428
Marra, M., Pannell, D. J., & Ghadim, A. A. (2003). The Economics of Risk, Uncertainty and Learning
in the Adoption of New Agricultural Technologies: Where Are We on the Learning Curve?
Agricultural Systems, 75, 215-234. https://doi.org/https://doi.org/10.1016/S0308-
521X(02)00066-5
McCarthy, M. (2007). Risk Management and Farming Families: Perceptions & Practices. A Report
for the Rural Industries Research and Development Corporation. RIRDC.

Chapter 4: Cognitive Mapping of Farming Risks 84
Meuwissen, M. P. M., Huirne, R. B. M., & Hardaker, J. B. (2001). Risk and Risk Management: An
Empirical Analysis of Dutch Livestock Farmers. Livestock Production Science, 69(1), 43-53.
https://doi.org/https://doi.org/10.1016/S0301-6226(00)00247-5
MoALD-Nepal. (2018). Statistical Information on Nepalese Agriculture for 2016/17.
https://moad.gov.np/public/uploads/500030983-
Statistical%20Information%20on%20Nepalese%20Agriculture%202073,%2074%20(2).pdf
Montibeller, G., & Belton, V. (2006). Causal Maps and the Evaluation of Decision Options—a
Review. Journal of the Operational Research Society, 57(7), 779.
https://doi.org/https://doi.org/10.1057/palgrave.jors.2602214
Murray-Prior, R. (1998). Modelling Farmer Behaviour: A Personal Construct Theory Interpretation of
Hierarchical Decision Models. Agricultural systems, 57(4), 541-556.
https://doi.org/https://doi.org/10.1016/S0308-521X(98)00008-0 (Agricultural Systems)
Novak, J. D., & Musonda, D. (1991). A Twelve-Year Longitudinal Study of Science Concept
Learning. American Educational Research Journal, 28(1), 117-153.
https://doi.org/https://doi.org/10.3102/00028312028001117
Otway, H., & Winterfeldt, D. (1982). Beyond Acceptable Risk: On the Social Acceptability of
Technologies. Policy Sciences, 14(3), 247-256.
https://doi.org/https://doi.org/10.1007/BF00136399
Özesmi, U. (1999). Modeling Ecosystems from Local Perspectives: Fuzzy Cognitive Maps of the
Kizilirmak Delta Wetlands in Turkey. World Conference on Natural Resource Modelling,
Halifax, NS, Canada, 23–25 June 1999.
Özesmi, U., & Özesmi, S. L. (2004). Ecological Models Based on People’s Knowledge: A Multi-Step
Fuzzy Cognitive Mapping Approach. Ecological Modelling, 176(1-2), 43-64.
https://doi.org/https://doi.org/10.1016/j.ecolmodel.2003.10.027
Patton, M. Q. (1990). Designing Qualitative Studies. SAGE Publications.
Rayner, S. (1992). Cultural Theory and Risk Analysis. In S. Krimsky & D. Golding (Eds.), Social
Theories of Risk (pp. 83-115). Praeger.
Rejda, G. E., & McNamara, M. J. (2014). Principles of Risk Management and Insurance (12th ed.).
Pearson.
Roberts, F. S. (1976). The Questionnaire Method. In R. Axelrod (Ed.), Structure of Decision: The
Cognitive Maps of Political Elites (pp. 333-342). Princeton University Press.
Rohrmann, R., & Renn, O. (2000). Risk Perception Research. In O. Renn & R. Rohrmann (Eds.),
Cross-Cultural Risk Perception: A Survey of Empirical Studies (pp. 13-53). Kluwer Academic
Publishers.
Sjöberg, L. (2000). The Methodology of Risk Perception Research. Quality and Quantity, 34(4), 407-
418. https://doi.org/https://doi.org/10.1023/A:1004838806793
Chapter 4: Cognitive Mapping of Farming Risks 85
Sjöberg, L., Moen, B.-E., & Rundmo, T. (2004). Explaining Risk Perception: An Evaluation of the
Psychometric Paradigm in Risk. R. publikasjoner.
https://www.forskningsradet.no/csstorage/vedlegg/Psychometric_paradigm.pdf
Slovic, P. (1987). Perception of Risk. Science, 236(4799), 280-285.
https://doi.org/https://doi.org/10.1126/science.3563507
Slovic, P. (1992). Perception of Risk: Reflections on the Psychometric Paradigm. In S. Krimsky & D.
Golding (Eds.), Social Theories of Risk (pp. 117-152). Praeger.
Slovic, P. (2000). The Perception of Risk. Earthscan Publication.
Slovic, P., Fischhoff, B., & Lichtenstein, S. (1980). Facts and Fears: Understanding Perceived Risk. In
R. C. Schwing & W. A. Alberts Jr. (Eds.), Societal Risk Assessment: How Safe Is Safe
Enough? (pp. 181-216). New York: Plenum Press.
Smithson, M. (1988). Ignorance and Uncertainty: Emerging Paradigms. Springer-Verlag.
Soetanto, R., Dainty, A. R. J., Goodier, C. I., & Austin, S. A. (2011). Unravelling the Complexity of
Collective Mental Models: A Method for Developing and Analysing Scenarios in Multi-
Organisational Contexts. Futures, 43(8), 890-907.
https://doi.org/https://doi.org/10.1016/j.futures.2011.06.013
Tegarden, D. P., & Sheetz, S. D. (2003). Group Cognitive Mapping: A Methodology and System for
Capturing and Evaluating Managerial and Organizational Cognition. Omega, 31(2), 113-125.
https://doi.org/https://doi.org/10.1016/S0305-0483(03)00018-5
Tucker, B. (2012). Do Risk and Time Experimental Choices Represent Individual Strategies for
Coping with Poverty or Conformity to Social Norms? Current Anthropology, 53(2), 149-180.
https://doi.org/https://doi.org/10.1086/664569
Turner, G., & Waynne, B. (1992). Risk Communication. In J. Durant (Ed.), Biotechnology in Public:
A Review of Recent Research (pp. 109-141). Science Museum.
Ullah, R., Shivakoti, G. P., & Ali, G. (2015). Factors Affecting Farmers’ Risk Attitude and Risk
Perceptions: The Case of Khyber Pakhtunkhwa, Pakistan. International Journal of Disaster
Risk Reduction, 13, 151-157. https://doi.org/https://doi.org/10.1016/j.ijdrr.2015.05.005
van Winsen, F., de Mey, Y., Lauwers, L., Van Passel, S., Vancauteren, M., & Wauters, E. (2013).
Cognitive Mapping: A Method to Elucidate and Present Farmers’ Risk Perception.
Agricultural Systems, 122, 42-52. https://doi.org/https://doi.org/10.1016/j.agsy.2013.08.003
Vlek, C., & Stallen, P.-J. (1980). Rational and Personal Aspects of Risk. Acta Psychologica, 45(1),
273-300. https://doi.org/https://doi.org/10.1016/0001-6918(80)90038-4
Vlek, C., & Stallen, P.-J. (1981). Judging Risks and Benefits in the Small and in the Large.
Organizational Behavior and Human Performance, 28(2), 235-271.
https://doi.org/https://doi.org/10.1016/0030-5073(81)90024-6

Chapter 4: Cognitive Mapping of Farming Risks 86
Weber, E. U., & Hsee, C. (1998). Cross-Cultural Differences in Risk Perception, but Cross-Cultural
Similarities in Attitudes Towards Perceived Risk. Management science, 44(9), 1205-1217.
https://doi.org/https://doi.org/10.1287/mnsc.44.9.1205 (Management Science)
Weerdt, J. D. (2005). Measuring Risk Perceptions: Why and How (SP Discussion Paper No. 0533).
(SP Discussion Paper No. 0533, Issue.
https://documents1.worldbank.org/curated/en/740851468137091575/pdf/351450Measuring0ri
sk0SP0533.pdf
Winterfeldt, v. D., & Edwards, W. (1984). Patterns of Conflict About Risky Technologies. Risk
Analysis, 4(1), 55-68. https://doi.org/https://doi.org/10.1111/j.1539-6924.1984.tb00131.x
Wood, M. D., Bostrom, A., Bridges, T., & Linkov, I. (2012). Cognitive Mapping Tools: Review and
Risk Management Needs. Risk Analysis, 32(8), 1333-1348.
https://doi.org/https://doi.org/10.1111/j.1539-6924.2011.01767.x
Wright, J. F. (2016). Risk Management; a Behavioural Perspective. Journal of Risk Research, 21(6),
710-724. https://doi.org/https://doi.org/10.1080/13669877.2016.1235605
Wrightson, M. T. (1976). The Documentary Coding Method. In R. Axelrod (Ed.), Structure of
Decision: The Cognitive Maps of Political Elites (pp. 291-332). Princeton University Press.
Zhu, W., & Timmermans, H. (2010). Cognitive Process Model of Individual Choice Behaviour
Incorporating Principles of Bounded Rationality and Heterogeneous Decision Heuristics.
Environment and Planning B: Planning and Design, 37(1), 59-74.
https://doi.org/https://doi.org/10.1068/b35039
Zinn, J. O. (2017). The Meaning of Risk-Taking – Key Concepts and Dimensions. Journal of Risk
Research, 1-15. https://doi.org/https://doi.org/10.1080/13669877.2017.1351465

87
Chapter 5: A Psychometric Analysis of Farmers’ Perceptions of
Risks, Uncertainties and Management Strategies in
Nepal (Paper 2)
5.1 Abstract
Risk perceptions indicate how worried people are about risks and affect their decisions to manage
potential adverse outcomes. We conducted a psychometric analysis of farmers’ perceptions of risks,
uncertainties and management strategies using a questionnaire survey with 420 randomly selected
farmers from Nepal’s Terai region. The results showed that farmers were most concerned about the
risks associated with labour supply, followed by the price of farm outputs and drought. Traders’
dominant role in price determination of farm outputs was the primary source of market risks. The
Farmers’ drought risk perception was associated with drought experience, family size, rice
productivity, migrant family, age and access to infrastructure and services. Likewise, their flood risk
perception was correlated to flood experience, rice productivity, farm size, migrant family, and joint
family system. We also found significant spatial variation in farmers’ risk perceptions. These
relationships suggest that farmers’ risk perception is a combined function of objective risk factors,
personal characteristics and farm characteristics. Although farmers considered drought risk more
severe than flood risk, their perceptions of the two risks were uncorrelated. This finding suggests that
risk management support programs that consider drought and flood as mutually exclusive risks are not
likely to meet a proportion of farmers’ needs. We also found that drought and flood were not ideally
insurable risks, which implies a wide gap between an actuarially fair premium and the farmers’
willingness to pay. In such a case, the government may need to provide a high subsidy to improve the
adoption of crop insurance. Although crop insurance adoption has recently gained momentum, farmers
rated the applicability and effectiveness of on-farm diversification strategies higher than those of crop
insurance. Therefore, a holistic risk management approach should be applied involving the right
combination of on-farm tools and market-based tools. Improving farmers’ access to modern farming
technologies such as climate-smart crop varieties and training them on the use of such technologies
can increase the effectiveness of on-farm diversification strategies. In addition, establishing a weather
forecasting service, irrigation development and promoting drought-tolerant crop varieties may be
effective strategies to mitigate drought risk.
Keywords: agriculture, Nepal, psychometric paradigm, risk perception, uncertainties
Chapter 5. Psychometric Study of Risk Perceptions 88
5.2 Introduction
Understanding how farming communities perceive risk is a common interest of researchers,
policymakers and risk management actors. Knowing how worried the farmers are about risks helps
predict their potential response to policy interventions and willingness to adopt the risk mitigation
measures. The effectiveness of agricultural development programs will be improved if farmers’ risk
perceptions and the factors causing variation in the individual judgement of risk are accounted for
(Legesse & Drake, 2005). The success of climate change adaptation policies relies on a shared
understanding of the causes of climate change and associated risks between policymakers and farmers
(Patt & Schroter, 2008). Farmers are unlikely to support climate change adaptation initiatives that
require them to take individual action unless they perceive that it poses considerable risks to their
farming and livelihoods (Ahsan & Brandt, 2014).
Several studies have analysed farmers’ risk perceptions and decision-making to deal with these risks.
However, the causal relationships between risk perception, risk attitude and risk responses are
inconsistent across studies. For example, Weber et al. (2002) reported that the variation in risk
responses was due to the difference in risk perceptions. Similarly, Sitkin and Pablo (1992) found the
effect of various factors on risk response to be mediated by risk perception and risk attitude. Petrolia
(2016) also found that the nature of risk perception confounded the effect of risk attitude on choice
behaviour. In contrast, van Winsen et al. (2016) found that risk responses were not affected by risk
perception but by risk attitude.
Authors also have contrasting views on the effect of risk perception on willingness to reduce risk. For
instance, while Lin et al. (2008) found higher risk perception associated with higher willingness to
invest in mitigating risk in Taiwan, Sjöberg (2000) argued that it is simplistic to assume that higher
risk perception indicates higher demand for risk mitigation. Moreover, human behaviour is so diverse
and inconsistent that no single model can accurately predict all outcomes (Hardaker & Lien, 2010).
Individuals differ in their perceptions even for a well-known risk (van Winsen et al., 2016) because the
judgement of the probability and impact of an unfavourable event is highly individualised
(Gebreegziabher & Tadesse, 2013). Furthermore, perceived and objective risks are often incongruent,
indicating that the nature of risk affects individual perceptions and reactions to the risks variably
(Linda & Nicole, 2004). These facts signify that a context-specific understanding of how farmers
perceive and deal with risk seems pivotal for informing policymaking related to farm risk
management. This paper comprehensively answers what farming risks the Nepalese farmers are most
concerned about, what sources of uncertainty they perceive in farming, what factors influence their
risk perceptions and what risk management strategies they consider are important.

Chapter 5. Psychometric Study of Risk Perceptions 89
5.2.1 Risk
Risk is a pervasive feature of human existence as the future is inherently uncertain, yet there is no
single universal definition of risk. Variability of outcomes and the possibility of loss are two common
elements across all definitions of risk. For a risk to exist, there must always be at least two possible
outcomes, and we do not know for sure how often such outcomes will occur (Vaughan & Vaughan,
2008). An additional commonality across all notions of risk is that uncertainty always relates to a
future state of the world (see Sjöberg, 2000). Although risk, uncertainty and ambiguity are often used
interchangeably in day-to-day life, academia defines these as distinct notions. Risk is defined as a
situation where the probabilities of outcomes can be estimated with some accuracy, while uncertainty
refers to a situation where such probabilities are unknown (Hardaker et al., 2015; Rejda & McNamara,
2014). In contrast, Barham et al. (2014) used uncertainty as a broad term that includes both risk and
ambiguity. They referred to risk when the probability distribution of random outcomes was known and
ambiguity when such distribution was unknown. Furthermore, when risk is measured in terms of
variance of outcomes, it can be divided into downside risk and upside potential. The downside risk
measures the distribution of outcomes below the mean or expected level, while upside potential, also
called upside risk, refers to the right-hand side variability of the outcomes (see Grootveld &
Hallerbach, 1999). In this paper, risk refers to undesirable outcomes in farming when farmers have
personal estimates of probability and potential loss associated with it, and uncertainty as the situation
where they have a vague idea of unfavourable outcomes with no estimate of probability or likely loss.
5.2.2 Risk perception
Risk perception is an individual’s judgement on the characteristics of risk (Agrawal, 2009). Perceiving
a risk involves estimating the probabilities and undesirable consequences (Sjoberg et al., 2004). In
mathematical terms, risk perception is the product of subjective probability and magnitude of negative
impacts of an outcome (MacCrimmon & Wehrung, 1986; Patt & Schroter, 2008). Risk perception is a
more reliable indicator of human behaviour than objective risk because decision-making is influenced
more by what they think will happen than by what really happens (Howarth, 1988). Farmers’ decision-
making depends on their intuitive estimates of risk, and they can express it when asked (Sherrick et al.,
2004).
There are two approaches to probability estimation: frequentism and subjectivism (Hardaker & Lien,
2010). The frequentists consider probability as the limit of a relative frequency estimated based on an
infinite number of observations, called objective probability. In contrast, the subjectivists view
probability as a degree of belief by rational agents, also called personal probability. In line with the
approaches to probability estimation, risk is also viewed from two perspectives. Objective risk, also
called the degree of risk, refers to the relative variation of actual loss from expected loss. Subjective
risk, also called perceived risk, refers to the personal expectation of loss (Rejda & McNamara, 2014).
Chapter 5. Psychometric Study of Risk Perceptions 90
The idea of objective risk is relevant to corporate and institutional decision-making contexts.
However, in personal decision-making spaces, such as farming, individual perception of risk is more
important than objective risk—this paper analyses subjective risks in farming from the farmer
perspective.
5.2.3 Factors affecting risk perception
Extensive efforts have been made to relate farmers’ risk perception with their age (Fonta et al., 2015;
van Winsen et al., 2016), gender (Boholm, 1998; Lupton & Tulloch, 2002), education (Gebrehiwot &
van der Veen, 2015; Ginder et al., 2009), wealth (Ginder et al., 2009; Lefebvre et al., 2014), farm size
(Lucas & Pabuayon, 2011; van Winsen et al., 2016), access to infrastructure (Legesse & Drake, 2005)
and family size (Fonta et al., 2015; Lefebvre et al., 2014). However, the relationships between risk
perception and these variables are not consistent across studies. Consequently, the literature lacks
explicit theoretical models that explain the heterogeneity in individuals’ risk perceptions. Researchers
also disagree on the relationship between risk experience and risk perception. For instance, while van
Winsen et al. (2016) found a positive effect of past risk exposure on risk perception, Slovic (1987)
argued that familiarity with risk decreases risk perception because people feel they have more control
over the risks when they become more familiar with them.
The diverging findings of the studies conducted in other regions suggest that the relationship between
the same factors and risk perceptions may vary across geography and socio-demographic conditions.
Therefore, one of the objectives of this study is to test the findings of earlier studies in the Nepalese
context. Moreover, Nepalese agriculture has some unique features that have not been linked with
farmers’ risk perceptions in other regions. For instance, land tenancy is an important aspect of
Nepalese agriculture because many farmers are part-tenants (MoALD-Nepal, 2014), and landlords
usually make the key farming decisions. Therefore, tenant farmers may have different risk perceptions
than owner-cultivators. Likewise, the Government of Nepal has promoted two flood-tolerant and six
drought-tolerant rice varieties (SQCC-Nepal, 2019) to reduce production risks due to floods and
droughts. Farmer awareness and access to these climate-resilient crop varieties affect their risk
perception. Similarly, both governmental and non-governmental agricultural extension programs are
implemented through farmer groups. Farmer involvement in groups might affect their risk perception
because such groups can create risk awareness while also being a risk management agency. Further,
we examined the association of rice productivity and households’ migration status with their risk
perception. Figure 5.1 shows 16 hypotheses tested in this study. The dependent variables include the
measures of farmers’ drought and flood risk perceptions. Similarly, the explanatory variables include
those reported to have varied effects on risk perception by earlier studies and those not studied
elsewhere before (indicated by shaded boxes).

Chapter 5. Psychometric Study of Risk Perceptions 91
Figure 5.1 Hypothesized relationships between various factors and risk perception
Note: Shaded boxes include the variables not studied before elsewhere.
5.2.4 Risk management strategies
Risk management involves identifying potential loss exposures of a firm and applying the most
appropriate strategy to deal with such exposures (Rejda & McNamara, 2014). It also involves deciding
to take (or not to take) action (Hoag, 2009). Moreover, risk management itself is a risky undertaking
because whether the loss will happen or not is uncertain. In farming, the sources of uncertainty, risk,
and risk management action form a complicated network of relationships that a risk management
strategy may become a risk factor itself (van Winsen et al., 2013). For instance, farmers may decide to
grow a drought-tolerant rice variety to reduce the risk of yield loss due to drought. However, this
decision involves a risk of forfeiting higher yields that a regular water-intensive variety could yield if
rainfall occurs normally. Furthermore, risk management always involves a cost, either as a direct cost
such as the insurance premium or indirect cost such as giving up the potential gain (Hoag, 2009).
Therefore, a good risk management strategy seeks a balance between accepting risk or acting against
it.
Although the strategies to deal with risk are as diverse as the risks in farming (Hoag, 2009), the
common purpose of all strategies is to stabilise income and maintain sustainable growth of the farming
sector (Lomott & Lyskawa, 2014). Depending on availability, applicability and affordability, farmers
can use one or more tools to manage risk (Gurenko & Mahul, 2004; Mahul & Stutley, 2010). In
developing countries like Nepal, where the agricultural insurance market is underdeveloped, farmers
generally depend on self-insurance and disaster relief payments to deal with farming risks (Mahul &
Stutley, 2010). Self-insurance is a set of individual actions practised by farmers to reduce their risk
exposure (OECD, 2009). Farm diversification, development of irrigation facilities, engaging in off-

Chapter 5. Psychometric Study of Risk Perceptions 92
farm income opportunities, and monetary savings are some of the traditional strategies practised by
farmers to mitigate the potential negative consequences of risk (Alan & Hendrik, 2011). However,
traditional strategies do not absorb a large share of weather risks, leading to humanitarian calamities in
the case of major production shocks (Barnett & Mahul, 2007). Recently, low-premium agricultural
insurance has become a popular tool for protecting poor farmers against the negative consequences of
weather-related risks in developing countries (FAO, 2014). A sound risk management policy should
ensure coherence between farmers’ traditional strategies and market solutions, avoiding the potential
conflict of interests between farmers, government, and private insurance companies in the risk market
(OECD, 2009). Such policymaking requires a good understanding of farmers’ perceptions of the
applicability and efficacy of the potential risk management alternatives. This paper also assesses the
diversity in farmers’ risk management strategies and ranks them by their importance from the farmers’
perspectives.
5.3 Methodology
The psychometric theory is the dominant theory in risk perception research, which assumes that
individuals perceive risks subjectively, and their perception is affected by cognitive or psychological
factors (Sjöberg et al., 2004). The theories, methods, and findings of risk perception studies based on
psychometric theory have been so popular that they constitute what is known as the ‘psychometric
paradigm’ (Slovic, 1993). Moreover, the early study that used the psychometric method (Fischhoff et
al., 1978) has been replicated many times in diverse contexts; most of which have confirmed the
original two-factor model—dread and novelty—to account for risk perception (Sjöberg et al., 2004).
Therefore, psychometric methods are considered highly robust in measuring risk perception.
The psychometric theory assumes that the semantical classification of hazards, mental representation
of information, and probability estimation are done through interdependent cognitive activities
(Boholm, 1998). More specifically, the psychometric theory is built on the following major
assumptions:
• Individual perception of risk is subjective and can be measured in terms of various
characteristics of risk (Sjöberg et al., 2004; Slovic, 1992; van Winsen et al., 2013).
• Risks can be classified; individuals understand risk well and can discretely quantify and
compare them (van Winsen et al., 2013).
• Risk perception is influenced by psychological, social, cultural, and institutional factors, and
properly designed studies can estimate such influences to explain individual variation in risk
perception (Slovic, 1992).

Chapter 5. Psychometric Study of Risk Perceptions 93
5.3.1 Psychometric methods
Psychometric methods involve psychological scaling of various risk characteristics and multivariate
analysis techniques to represent risk perception in quantitative terms (Slovic, 1987). Risk perception is
assessed by asking respondents to rate the probability and potential loss associated with the risk on a
given scale (Baird et al., 2009; Goszczynska et al., 1991; Mary et al., 2003; Sjöberg et al., 2000;
Slovic, 1987; Smith et al., 2000; Stoffle et al., 1991). Ranking different risks based on a composite
index that constitutes individuals’ subjective probability and magnitude of impact is also known as
‘risk mapping’ (van Winsen et al., 2013). According to Sjöberg et al. (2004), adopting a psychometric
method to a specific domain involves:
• Listing various sources of risk
• Developing scaling questions that characterise the risk in terms of probability and impact
• Surveying respondents to elicit their responses to the questions
• Carrying out descriptive and multivariate analysis of the data to calculate risk perceptions and
identifying the factors that explain the variation in respondents’ judgement and perception.
We adapted the methods to elicit farmers’ risk perceptions from three studies, i.e., van Winsen et al.
(2016), Greiner et al. (2009), and Meraner and Finger (2017). Both van Winsen et al. (2016) and
Meraner and Finger (2017) used five-point Likert scale questions to elicit the probability and impact
of different risks and descriptive approaches to analyse the data. Although Greiner et al. (2009) used a
slightly different risk assessment matrix to elicit risk perception, their analytical approach is similar to
the other two studies. The number of response categories is an important consideration in designing
Likert-scaling questions to reduce cognitive burden and response bias. Sjöberg (2000) suggested that
five or seven categories are generally preferable in categorical scales. Accordingly, we used five-point
scales to elicit farmers’ responses to the psychometric questions. The questionnaire used in the survey
is presented in Appendix C.
5.3.2 Description of the study tools and data analysis techniques
We asked the farmers to rate their agreement on various statements representing the sources of
uncertainty or risk factors in their farming on a five-category scale (0 meaning strongly disagree to 1
meaning strongly agree). We ranked these sources of uncertainty based on the average scores across
samples. Likewise, we developed a list of unfavourable outcomes related to farming and asked the
farmers how likely they think the given outcomes would happen next year (0 meaning not likely at all
to 1 meaning certain). We also asked them how much loss they think they would suffer if the
outcomes occurred (0 meaning not at all to 1 meaning complete loss). We calculated the risk
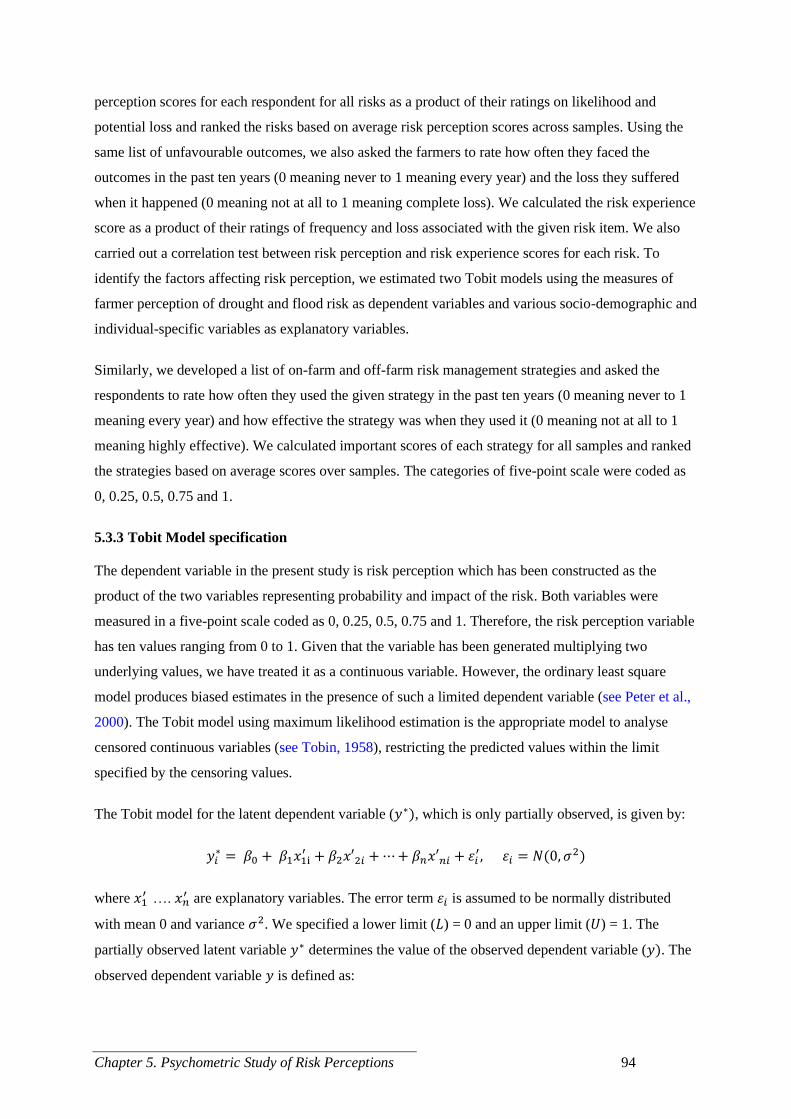
Chapter 5. Psychometric Study of Risk Perceptions 94
perception scores for each respondent for all risks as a product of their ratings on likelihood and
potential loss and ranked the risks based on average risk perception scores across samples. Using the
same list of unfavourable outcomes, we also asked the farmers to rate how often they faced the
outcomes in the past ten years (0 meaning never to 1 meaning every year) and the loss they suffered
when it happened (0 meaning not at all to 1 meaning complete loss). We calculated the risk experience
score as a product of their ratings of frequency and loss associated with the given risk item. We also
carried out a correlation test between risk perception and risk experience scores for each risk. To
identify the factors affecting risk perception, we estimated two Tobit models using the measures of
farmer perception of drought and flood risk as dependent variables and various socio-demographic and
individual-specific variables as explanatory variables.
Similarly, we developed a list of on-farm and off-farm risk management strategies and asked the
respondents to rate how often they used the given strategy in the past ten years (0 meaning never to 1
meaning every year) and how effective the strategy was when they used it (0 meaning not at all to 1
meaning highly effective). We calculated important scores of each strategy for all samples and ranked
the strategies based on average scores over samples. The categories of five-point scale were coded as
0, 0.25, 0.5, 0.75 and 1.
5.3.3 Tobit Model specification
The dependent variable in the present study is risk perception which has been constructed as the
product of the two variables representing probability and impact of the risk. Both variables were
measured in a five-point scale coded as 0, 0.25, 0.5, 0.75 and 1. Therefore, the risk perception variable
has ten values ranging from 0 to 1. Given that the variable has been generated multiplying two
underlying values, we have treated it as a continuous variable. However, the ordinary least square
model produces biased estimates in the presence of such a limited dependent variable (see Peter et al.,
2000). The Tobit model using maximum likelihood estimation is the appropriate model to analyse
censored continuous variables (see Tobin, 1958), restricting the predicted values within the limit
specified by the censoring values.
The Tobit model for the latent dependent variable (𝑦∗), which is only partially observed, is given by:
𝑦𝑖∗ = 𝛽0 + 𝛽1𝑥1i
′ + 𝛽2𝑥′2𝑖 + ⋯ + 𝛽𝑛𝑥′𝑛𝑖
+ 𝜀𝑖′, 𝜀𝑖 = 𝑁(0, 𝜎2)
where 𝑥1′ …. 𝑥𝑛
′ are explanatory variables. The error term 𝜀𝑖 is assumed to be normally distributed
with mean 0 and variance 𝜎2. We specified a lower limit (𝐿) = 0 and an upper limit (𝑈) = 1. The
partially observed latent variable 𝑦∗ determines the value of the observed dependent variable (𝑦). The
observed dependent variable 𝑦 is defined as:

Chapter 5. Psychometric Study of Risk Perceptions 95
𝑦 = {
𝐿 𝑖𝑓 𝑦∗ < 𝐿𝑈 𝑖𝑓 𝑦∗ > 𝑈
𝑦∗𝑖𝑓 L < 𝑦∗ < U
or
𝑦 = max(𝑦∗, 𝐿) 𝑎𝑛𝑑 min (𝑦∗, 𝑈)
The estimated parameters represent the marginal effects of 𝑥 variables on 𝑦∗ which will be attenuated
when the point of evaluation lies close to the limits. The marginal effects of 𝑥 variables on the
expected value of 𝑦 are complicated by the censoring at the lower and upper limits. In the results that
follow Tobit estimation, we have reported the marginal effects of 𝑥 variables on y*. The 𝑥 variables
include those shown in Figure 5.1.
5.3.4 Sampling and data collection
The study involves 420 randomly selected farmers from the Terai region of Nepal. The study area is
divided into three regions—Eastern Terai region (ETR), Mid-Terai region (MTR), and Western Terai
region (WTR)—based on the amount of annual precipitation. We used a face-to-face survey using a
pre-tested semi-structured questionnaire. The details of sampling design and survey implementation
are presented in Chapter 3 (Methodology).
5.4 Findings and discussion
5.4.1 Sample characteristics
Table 5.1 presents the summary statistics of the socio-demographic variables relevant to the
subsequent analyses of farmers’ risk perceptions. We also examined the association of these socio-
demographic variables with the geographical location using Pearson’s chi-square test (for categorical
variables) and simple linear regression for continuous variables. The tests were significant for
migration status, family type, family size, cultivated area, tenancy, income sources, off-farm
employment, overseas employment, rice productivity and group involvement. We will examine the
influence of such regional variation in explanatory variables on farmers’ risk perceptions later.
The study region has a mixed population of endogenous communities that migrated from hilly areas.
About one-third of the respondents represented migrant households. More than two-thirds of the
sample households had a joint family system. Major typologies of Nepali farmers include owner-
cultivator, who cultivate own land; part-tenant, who cultivate rented land in addition to their own; and
landless-tenant, who cultivate only rented land (Sugden & Gurung, 2012). Most of the respondents
were owner-cultivators, with about one-fifth representing part-tenant farmers. About 54% of sample
households had at least one family member in off-farm employment, with 29% of households having
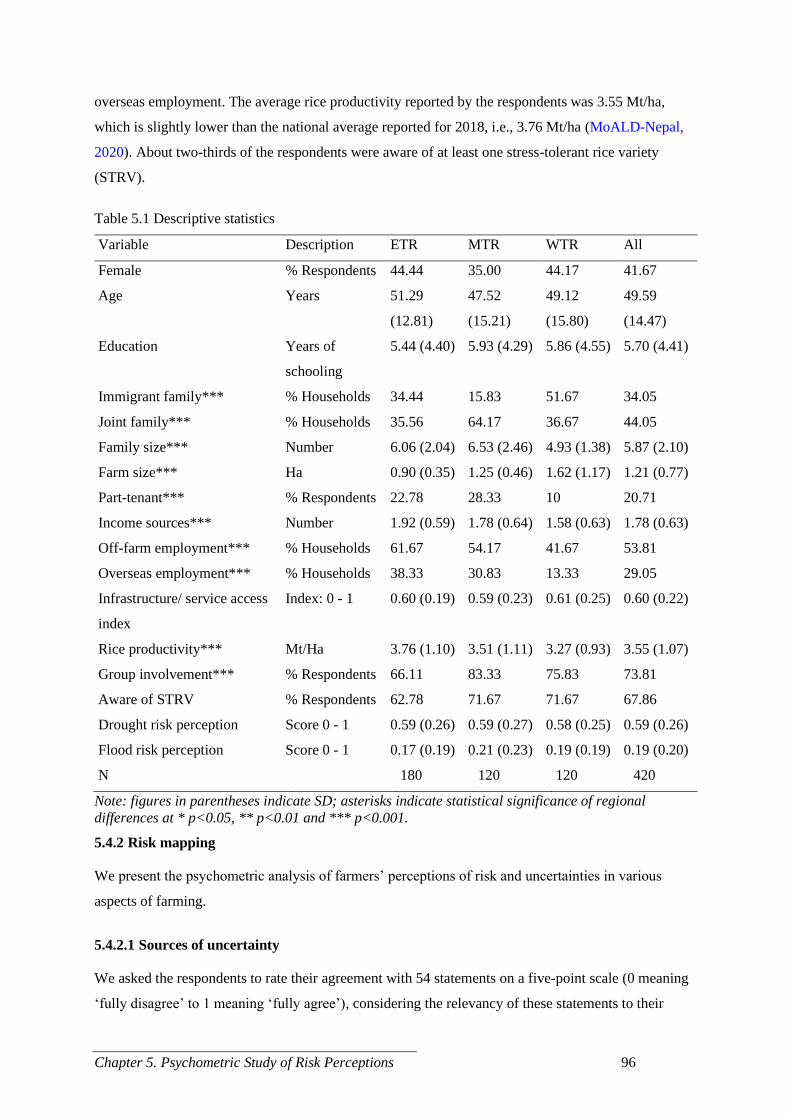
Chapter 5. Psychometric Study of Risk Perceptions 96
overseas employment. The average rice productivity reported by the respondents was 3.55 Mt/ha,
which is slightly lower than the national average reported for 2018, i.e., 3.76 Mt/ha (MoALD-Nepal,
2020). About two-thirds of the respondents were aware of at least one stress-tolerant rice variety
(STRV).
Table 5.1 Descriptive statistics
Variable Description ETR MTR WTR All
Female % Respondents 44.44 35.00 44.17 41.67
Age Years 51.29
(12.81)
47.52
(15.21)
49.12
(15.80)
49.59
(14.47)
Education Years of
schooling
5.44 (4.40) 5.93 (4.29) 5.86 (4.55) 5.70 (4.41)
Immigrant family*** % Households 34.44 15.83 51.67 34.05
Joint family*** % Households 35.56 64.17 36.67 44.05
Family size*** Number 6.06 (2.04) 6.53 (2.46) 4.93 (1.38) 5.87 (2.10)
Farm size*** Ha 0.90 (0.35) 1.25 (0.46) 1.62 (1.17) 1.21 (0.77)
Part-tenant*** % Respondents 22.78 28.33 10 20.71
Income sources*** Number 1.92 (0.59) 1.78 (0.64) 1.58 (0.63) 1.78 (0.63)
Off-farm employment*** % Households 61.67 54.17 41.67 53.81
Overseas employment*** % Households 38.33 30.83 13.33 29.05
Infrastructure/ service access
index
Index: 0 - 1 0.60 (0.19) 0.59 (0.23) 0.61 (0.25) 0.60 (0.22)
Rice productivity*** Mt/Ha 3.76 (1.10) 3.51 (1.11) 3.27 (0.93) 3.55 (1.07)
Group involvement*** % Respondents 66.11 83.33 75.83 73.81
Aware of STRV % Respondents 62.78 71.67 71.67 67.86
Drought risk perception Score 0 - 1 0.59 (0.26) 0.59 (0.27) 0.58 (0.25) 0.59 (0.26)
Flood risk perception Score 0 - 1 0.17 (0.19) 0.21 (0.23) 0.19 (0.19) 0.19 (0.20)
N
180 120 120 420
Note: figures in parentheses indicate SD; asterisks indicate statistical significance of regional
differences at * p<0.05, ** p<0.01 and *** p<0.001.
5.4.2 Risk mapping
We present the psychometric analysis of farmers’ perceptions of risk and uncertainties in various
aspects of farming.
5.4.2.1 Sources of uncertainty
We asked the respondents to rate their agreement with 54 statements on a five-point scale (0 meaning
‘fully disagree’ to 1 meaning ‘fully agree’), considering the relevancy of these statements to their
Chapter 5. Psychometric Study of Risk Perceptions 97
farming conditions. These statements represent the sources of uncertainty or risk factors. Table 5.2
presents the ordered list of the top ten risk factors based on average scaling scores over samples (see
Appendix H for the complete list). The median values of more than half of the risk factors were
greater than or equal to 0.75. This result implies that farmers have high perceptions of uncertainties in
farming, in general.
Farmers perceived the traders’ dominant role in determining the price of farm outputs as the most
important source of uncertainty leading to market risks. Mainly during the crop harvesting months,
there are many farmers who want to sell their produce and few traders who want to buy them.
Consequently, farmers have low bargaining power and are less likely to fetch a reasonable price for
their produce. Similarly, they perceived the increase in the number of drought days as the second most
important source of risk. The uncertainty about the incidence of drought in the forthcoming crop
season affects farmers’ decision-making related to crop selection, variety selection and planting time.
For instance, a farmer may be uncertain whether to grow a drought-tolerant crop variety with low
potential yield or a water-intensive variety with higher yield potential in the absence of a clear idea
about the likelihood of drought. In addition to posing a threat of production losses, sometimes
complete losses, drought may also increase production costs if farmers need to pay for irrigation. The
top ten risk factors also include unavailability of labour in peak seasons, insufficient government
support in the market, increased overseas migration of male youth, increased insect and disease
infestation, lack of access to irrigation, and unstable government support and subsidy. When labour
demand exceeds supply, the wage rate is likely to increase, leading to the risk of increased production
costs. Insufficient external support in the market—for infrastructure development, policy intervention
or price support—may increase uncertainties about farmer access to markets and potential price. In
addition to causing labour shortages, increased outmigration of male youth has resulted in the
feminisation of agriculture, creating challenges and opportunities for the Nepali farming sector (see
Bhawana & Race, 2020; Gartaula et al., 2010; Spangler & Christie, 2019). Increased insect and
disease infestation may affect farmers’ decision-making related to the selection of crop variety,
planting time and input use. The lack of irrigation access also affects farmers’ decisions on crop
variety selection and planting time in the context of uncertain rainfall. If farmers are uncertain about
the continuity of government support and subsidies in the coming seasons, their financial plan will
likely be affected.
We implemented factor analysis to examine the possibility of reducing 54 risk factors into fewer latent
constructs. However, the analysis suggested a 21-factor model (eigenvalue > 1), which only explained
60% of the variation in the farmer ratings of the risk factors, with no meaningful factor loadings.
Therefore, we thematically ascribed the factors into one or more of five categories of farming risks
(production, market, institutional, personal and financial) suggested by Hardaker et al. (2015) and

Chapter 5. Psychometric Study of Risk Perceptions 98
Komarek et al. (2020). Greiner et al. (2009) also followed a similar strategy to attribute risk factors
into risk categories after failing to achieve reliable results through factor analysis. We also indicated
drought or flood to the relevant statements ascribed in the production risk category, considering these
statements as the factors leading to drought or flood risks. We constructed separate indices to represent
farmer vulnerability to drought and flood risks using these statements, which we discuss in the next
paragraph.
Table 5.2 Sources of uncertainty/risk factors in farming
Rank Risk factors Risk category Scale rating
Mean SD P50
1 Traders determine price of output Market 0.86 0.18 1.00
2 Number of drought days has increased Production (drought) 0.85 0.18 1.00
3 Rainfall has been more erratic than
before
Production (drought,
flood)
0.85 0.20 1.00
4 Labour is not sufficiently available
when needed
Production, market 0.85 0.19 0.75
5 Government support in the market is
not sufficient
Market, institutional 0.84 0.19 0.75
6 Outmigration of male youth has
increased
Production, market 0.84 0.20 0.75
7 Onset of monsoon has delayed Production (drought) 0.84 0.18 0.75
8 Insect and disease infestations has
increased
Production 0.83 0.19 0.75
9 I do not have access to reliable
irrigation
Production (drought) 0.81 0.22 0.75
10 Government support and subsidies are
not stable
Institutional, financial 0.77 0.22 0.75
Note: Figures in parentheses indicate SD.
5.4.2.2 Vulnerabilities to drought and flood risks
From the list of risk factors discussed earlier (see Appendix H), we extracted seven statements related
to drought risk, five statements related to flood risk, and one statement related to both. We calculated
the drought vulnerability index (DVI) and flood vulnerability index (FVI), averaging the scale scores
of the respective statements (Table 5.3). We used these indices as explanatory variables in the models
of farmers’ risk perceptions. The paired t-test suggests that farmer vulnerability to drought is higher
than for flood (H0: DVI = FVI; P= 0.000). We also conducted a one-way ANOVA test to examine
whether the vulnerabilities to drought and flood risk were associated with geographical location. The

Chapter 5. Psychometric Study of Risk Perceptions 99
test produced non-significant results for both indices, suggesting that the farmers’ perceptions of
objective factors leading to drought and flood risks are similar across study regions.
Table 5.3 Vulnerabilities to drought and flood risk
Rank Statements Scale rating
Mean SD
1 The number of drought days has increased 0.85 0.18
2 Rainfall has become more erratic than before 0.85 0.20
3 The onset of monsoon has delayed 0.84 0.18
4 I do not have access to reliable irrigation 0.81 0.22
5 The groundwater table is deepening 0.73 0.24
6 Natural water sources have dried up 0.72 0.23
7 I am at the tail-end of the irrigation system 0.39 0.28
8 Most of my farmlands are upland 0.35 0.28
DVI 0.69 0.10
1 Rainfall has become more erratic than before 0.85 0.20
2 Rainfall intensity has increased 0.68 0.25
3 Total rainfall has increased 0.48 0.24
4 Most of my farmlands are low lying 0.40 0.29
5 Unplanned physical development has blocked natural drainage channels 0.40 0.29
6 My farmlands are close to a river 0.27 0.24
FVI 0.51 0.11
5.4.2.3 Risk experience and perceptions
We presented the farmers with 34 risks items and asked them to rate how often they had experienced
these risks in the past ten years (0 meaning ‘never’ to 1 meaning ‘each year’) and the magnitude of the
negative impact on their income due to these risks when it occurred (0 meaning ‘not at all’ to 1
meaning ‘complete loss’). Similarly, we asked them to rate the likelihood of the same risks next year
(0 meaning ‘not at all likely’ to 1 meaning ‘certain’) and the potential impact on their income due to
the risks (0 meaning ‘not at all’ to 1 meaning ‘complete loss’). The scales used in all cases had five
categories coded as 0, 0.25, 0.5, 0.75 and 1. We calculated experience scores as the product of
frequency and impact ratings and perception scores as the product of likelihood and potential impact
ratings for all risk items. Figure 5.1 presents the average risk experience and perception scores of each
risk over samples sorted in ascending order by risk perception score.
The risk associated with the shortage of farm labour was ranked highest, followed by the risk of lower
prices for farm produce and drought. The risks associated with increased production cost, insect

Chapter 5. Psychometric Study of Risk Perceptions 100
infestation, high input price, subsidy cut, disease and delay in rice planting were among the top ten
risks. Drought was perceived as the third most important risk, while the flood was much lower in the
risk perception ranking. This disparity is consistent with differences in vulnerabilities to drought and
flood risk, as discussed earlier. The numbers within brackets adjacent to each risk item indicate the
correlation coefficients between risk experience and perception, and the asterisks indicate the
significance of the correlation. The correlations were significant, and the coefficients were more than
0.5 for each pair. This finding has important methodological implications. The self-reported scaling
method is prone to various response biases. Speculating about the future state of the world is
cognitively more demanding for farmers and likely to incorporate more response biases than reporting
what they experienced in the past. Therefore, researchers should consider using the measure of risk
experience as a proxy of risk perception, especially when the respondents have low education status
and less informed risk perceptions.

Chapter 5. Psychometric Study of Risk Perceptions 101
Figure 5.2 Farmers’ experience and perception of risks
Note: Risks are sorted by mean rating score; error bars show SD; figures within the bars indicate
median rating score; figures within the parentheses indicate the correlation coefficient between risk
experience and perception; asterisks indicate statistical significance at * p<0.05, ** p<0.01 and ***
p<0.001.

Chapter 5. Psychometric Study of Risk Perceptions 102
5.4.2.4 Relationship between farmers’ perceptions of drought and flood risk
In Nepal, rice is mainly transplanted in June-July and harvested in October-November. The rice-
growing season coincides with the Monsoon, which receives more than 80% of the annual rainfall
(Dahal et al., 2016). Although drought and flood do not occur simultaneously because the objective
factors leading to these hazards are counteractive, a rice crop may face both drought and flood at
different stages of growth. We analysed the correlation between farmers’ perceptions and experiences
of drought and flood risks. As shown in Table 5.4, farmers’ risk perceptions are highly correlated with
their risk experience for both drought and flood. Their experiences of the two risks are also slightly
negatively correlated. However, their perceptions of the two risks are uncorrelated. Since farmer
behaviour depends on what they perceive will happen more than what they experienced (Howarth,
1988), these findings imply that a risk management support program assuming flood and drought as
mutually exclusive risks will not likely meet the needs of a proportion of farmers. Therefore, farmers’
risk perceptions need to be assessed within each context to improve the effectiveness of risk
management interventions.
Table 5.4 Correlation between farmers’ perceptions of drought and flood risk
Drought perception Drought experience Flood perception
Drought experience 0.52***
Flood perception –0.08 –0.08
Flood experience –0.11 –0.11* 0.70***
Note: Asterisks indicate statistical significance at * p<0.05, ** p<0.01 and *** p<0.001.
5.4.2.5 Insurability of drought and flood risks
The insurability of rice crops against drought and flood depends on the nature of crop losses due to
these hazards. Floods cause immediate physical damage, while losses due to droughts are realized
slowly over time. Horizontal risk transfer, such as insurance, is an ideal strategy for mitigating low-
frequency high-impact risk (Rejda & McNamara, 2014). We examined the insurability of drought and
flood risks by analysing farmers’ perceptions of the probabilities and impacts of these risks in relation
to the rice crop. The farmers considered drought more severe than flood, both in terms of probability
and potential loss (Figures 5.2 and 5.3). This finding has important implications for the insurance
market. As shown in Figure 5.3, both drought and flood are not ideally suitable for risk transfer
strategy. Farmer willingness to pay for flood risk may be much lower than an economical rate for
insurance providers. Similarly, the premium for drought insurance may be high given that farmers
have high perceptions of the likelihood and impact of the risk. In such cases, the government may
need to substantially subsidise the premium to increase the adoption of crop insurance.

Chapter 5. Psychometric Study of Risk Perceptions 103
Figure 5.3 Farmers’ perceptions of probabilities and losses of drought and flood risks
Figure 5.4 Insurability of drought and flood risk
5.4.3 Factors associated with risk perceptions
Of the various risks presented in Figure 5.1, we modelled farmers’ perceptions of drought and flood
risk because they are major weather-related risks in farming (see section 1.2). We estimated the Tobit

Chapter 5. Psychometric Study of Risk Perceptions 104
model to identify the factors associated with farmers’ risk perceptions. To account for the spatial
correlation in the observations, we have reported robust standard errors clustered by study regions. We
also estimated Ordered Logit and Fractional Probit models to check the robustness of Tobit estimates.
Table 5.5 shows the estimates of Tobit, Ordered Logit and Fractional Probit models of farmers’
perceptions of drought and flood risks. The consistent results across different models indicate that
Tobit estimates are robust. In addition, the highest Log-Likelihood and Pseudo-R2 values for the Tobit
model suggest that it is a preferable model among the three. The following discussion is based on the
Tobit model estimates.
The perception of drought risk is positively associated with drought experience, family size, rice
productivity and migrant family, while the same is negatively associated with age and access to
infrastructure and services. Similarly, the perception of flood risk is positively correlated to flood
experience, rice productivity, farm size, and migrant family, while it is negatively correlated to the
joint family system. Mid-Terai and Western-Terai farmers have lower perceptions of drought risk and
higher perceptions of flood risk than Eastern-Terai farmers.
The risk experience variable was generated by multiplying the frequency and impact of an
unfavourable event in the last ten years as assessed by the farmers. Due to the unavailability of
information on the prevalence of drought and flood events in the study region, we assumed the risk
experience measure as a proxy for objective risk. The strong positive correlation between risk
perception and experience for both risks indicates that the risk perception is shaped by objective risk,
to a great extent. Che et al. (2020) also found a positive recency effect on risk perception, which
implies that a recent experience of a bad outcome increases the perceived threat of the same outcome
happening in the future.
The Terai region of Nepal has a mixed population of indigenous communities and migrant
communities from hilly areas. The migrant communities often live in more marginal areas than the
indigenous communities. We can link this to the positive correlation between risk perception and
migrant household dummy. Contrary to the hypothesized relationship, the models show a positive
correlation between rice productivity and perceptions of both risks, which requires further exploration.
One reason underlying this relationship may be that the farmers with higher efficiency consider
farming as the primary income source and are more concerned about the potential threats to their
business than less efficient farmers who resort to off-farm opportunities for livelihood and are less
worried about farming.
The respondents with a joint family system have higher flood risk perceptions than those belonging to
the nuclear family. Similarly, the farmers cultivating larger areas are likely to have higher flood risk
perceptions than the smaller farmers. The farmers who cultivate larger areas have a higher physical

Chapter 5. Psychometric Study of Risk Perceptions 105
vulnerability to loss exposure compared to those cultivating smaller areas. Moreover, the increased
dependency of the larger farmers on farming might have resulted in higher risk perceptions than the
smaller farmers. Gebrehiwot and van der Veen (2015) also reported a positive effect of the scale of
farming on risk perception (cf. Santeramo et al., 2016).
A farmer’s drought risk perception increases with the increase in family size (cf. Legesse & Drake,
2005). Since farming is the primary source of income for most respondents, increased family size
increases their responsibility of producing more food. Such a burden may amplify their perception of
drought, which is a major risk for their farming. In contrast, the feeling of better control over a risk
due to experience in handling it may be why older farmers have a lower perception of drought risk
than younger farmers. This result supports the findings of earlier studies (e.g., Fonta et al., 2015;
Gebrehiwot & van der Veen, 2015; van Winsen et al., 2016) that reported a positive association of age
with risk perception (cf. Cohn et al., 1995).
Similarly, farmers’ access to infrastructures and services, such as all-weather roads, post-harvest
storage and processing facilities, input and output markets, agricultural research and extension
agencies, credit providers and insurance companies, is likely to decrease their perceptions of drought
risk. Increased access to such facilities may increase farmers’ feeling of control over the risks,
consequently decreasing their risk perception. However, this result contradicts Legesse and Drake
(2005), who reported a positive association of risk perception with access to information and
infrastructure.
Farmers’ risk perceptions are not associated with other variables, such as gender, education, tenancy
status, income sources, overseas employment, group involvement STRV awareness, and indices
representing vulnerabilities to drought and flood. As discussed earlier (Chapter 2), studies conducted
in other regions have reported varied effects of these variables on farmers’ risk perceptions. These
findings can aid in identifying specific target groups and designing appropriate agricultural
development and risk management programs to help them uplift their living livelihoods.
Table 5.5 Factors associated with farmers’ risk perceptions
Explanatory variables Drought risk perception Flood risk perception
Tobit Ordered
Logit
Frac.
Probit
Tobit Ordered
Logit
Frac.
Probit
Region MTR (vs ETR) –0.03*
(0.01)
–0.26***
(0.04)
–0.09***
(0.03)
0.04***
(0.01)
0.33***
(0.09)
0.15***
(0.03)
WTR (vs ETR) –0.05*
(0.02)
–0.27**
(0.10)
–0.10**
(0.04)
0.02*
(0.01)
0.10
(0.08)
0.09*
(0.04)

Chapter 5. Psychometric Study of Risk Perceptions 106
Age (years) –0.00*
(0.00)
–0.02***
(0.00)
–0.00**
(0.00)
0.00
(0.00)
–0.00
(0.01)
0.00
(0.00)
Drought experience 0.68***
(0.06)
5.46***
(0.56)
1.62***
(0.14)
Flood experience
0.99***
(0.05)
9.76***
(0.89)
2.88***
(0.07)
Family size 0.02**
(0.01)
0.19**
(0.06)
0.06**
(0.02)
–0.01
(0.01)
–0.13
(0.07)
–0.02
(0.03)
Rice productivity (mt/ha) 0.02***
(0.00)
0.11***
(0.03)
0.04**
(0.01)
0.02***
(0.01)
0.27***
(0.05)
0.07**
(0.02)
Migrant family (vs
indigenous)
0.05**
(0.02)
0.48***
(0.09)
0.14***
(0.03)
0.02*
(0.01)
0.26**
(0.09)
0.05*
(0.03)
Joint family (vs nuclear) –0.05
(0.04)
–0.32
(0.19)
–0.09
(0.09)
–0.03***
(0.01)
–0.27***
(0.04)
–0.07
(0.05)
Infrastructure & service
index
–0.16*
(0.08)
–1.13***
(0.22)
–0.38**
(0.15)
–0.01
(0.03)
–0.28
(0.30)
–0.09
(0.10)
Farm size (ha) 0.01
(0.03)
0.01
(0.20)
0.02
(0.06)
0.04***
(0.01)
0.47***
(0.08)
0.09**
(0.03)
Education (years) –0.00
(0.00)
–0.04***
(0.01)
–0.01
(0.01)
0.00
(0.00)
–0.01
(0.03)
0.01
(0.01)
Female –0.05
(0.04)
–0.33
(0.31)
–0.14
(0.10)
0.01
(0.02)
0.15
(0.30)
0.04
(0.04)
Part–tenant farmer
(vs owner cultivator)
–0.00
(0.01)
0.09
(0.06)
0.01
(0.01)
0.02
(0.04)
–0.07
(0.27)
0.07
(0.11)
STRV awareness 0.00
(0.04)
0.00
(0.26)
0.01
(0.11)
0.06
(0.03)
0.53
(0.35)
0.22*
(0.10)
Income sources –0.00
(0.03)
–0.07
(0.22)
0.00
(0.08)
0.02
(0.02)
0.25
(0.21)
0.05
(0.05)
Overseas employment 0.00
(0.03)
0.08
(0.14)
–0.01
(0.07)
0.04
(0.03)
0.36
(0.33)
0.14
(0.09)
Group involvement –0.01
(0.09)
0.02
(0.57)
–0.03
(0.20)
0.00
(0.03)
0.12
(0.40)
0.03
(0.10)
Drought vulnerability
index
–0.06
(0.11)
–0.36
(0.77)
–0.20
(0.24)
Flood vulnerability index
0.03
(0.12)
0.44
(1.28)
0.13
(0.36)

Chapter 5. Psychometric Study of Risk Perceptions 107
Constant 0.24
(0.20)
–0.62
(0.40)
–0.24*
(0.11)
–2.20***
(0.27)
Observations 420 420 420 420 420 420
Pseudo R2 0.44 0.11 0.07 0.93 0.16 0.13
LL (Null model) –172.18 –789.15 –284.46 –144.37 –838.72 –201.76
LL (Full model) –97.21 –699.25 –265.52 –10.08 –701.49 –175.16
Note: Figures in parentheses indicate robust SE clustered by study regions; asterisks indicate
statistical significance at * p<0.05, ** p<0.01 and *** p<0.00.
5.4.4 Risk management strategies
We assessed the importance of a diverse range of risk management options from farmers’
perspectives. We asked farmers to rate the applicability and efficacy of the options and calculated
importance scores as a product of their ratings on these two constructs. The applicability component
represents how often farmers applied the given option in the past (0 meaning ‘never applied’ to 1
meaning ‘always applied’), and the efficacy component represents the effectiveness of the option in
overcoming crop or income loss (0 meaning ‘not effective at all’ to 1 meaning ‘extremely effective’).
Figure 5.4 presents the ordered bar chart of the risk management options by importance score.
Crop diversification, crop varietal diversification and integrated farming were the top–ranked risk
management strategies. Farmers also considered participating in farmer groups as an important risk
management strategy. Such self–help groups function as an avenue for technological capacity
building, input supply, risk awareness, saving and microcredit, and marketing. Other strategies such as
testing new technology or crop variety in a smaller area and take upscaling decisions based on the
results, observing the performance of new technology in fellow farmers’ farms first, growing modern
crop varieties and technologies, consulting fellow farmers for advice, maintaining cash saving and
diversifying income sources were among the list of top 10 risk management options. Most options that
ranked higher belong to on–farm risk management strategies, while modern market–based tools such
as crop insurance and forward contracts were considered less important. Farmer awareness and access
to such market–based options are crucial factors to consider before prioritising risk management
strategies. The responses to follow–up questions revealed that 27% of respondents were not aware of
any form of insurance, only 50% said they had access to at least one of the six insurances (crop,
livestock, life, health, vehicle, and house), 40% had purchased at least one of these insurances, 18%
had purchased livestock insurance, and 10% had purchased crop insurance. These figures suggest that
farmers do not have adequate awareness and access to farm insurance products.

Chapter 5. Psychometric Study of Risk Perceptions 108
Figure 5.5 Importance of risk management options
Note: Options are sorted by mean importance scores; error bars show SD; figures within the bars
indicate median rating scores.
Chapter 5. Psychometric Study of Risk Perceptions 109
5.5 Conclusion
Information on farmers’ risk perception is essential for understanding and predicting their behaviour in
the face of risk and uncertainty. Farmers’ risk perception indicates their risk management decisions
and is associated with their investment, innovation, and farm productivity. Therefore, knowing the
sources of risk and drivers of farmers’ risk perception is imperative in designing effective risk
management products and support programs. Risk perception is a latent construct that constitutes an
individual’s estimation of the probability and severity of unfavourable outcomes. Because of the
subjective nature of such estimates, risk perception is a highly individual–specific variable. While this
topic has been studied for a long time, whether the variation in risk perception is due to individual
characteristics or objective risk factors persists because the literature reports contrasting findings
across regions. We conducted a psychometric study of farmers’ perception of risk and uncertainties
and the factors affecting risk perception using a questionnaire survey with the key decision-makers
from 420 randomly selected households in Nepal's Terai region.
The results showed that farmers generally have high perceptions of risk in farming. The farmers
perceived traders’ dominant role in determining the price of farm outputs as the most important source
of price risk. This result is consistent with the finding of our earlier qualitative study (see Chapter 4).
However, while the qualitative study suggested farmers’ insufficient technical knowledge as the most
important source of production risk, the psychometric analysis suggested increased number of drought
days as the most important source of production risk. In the absence of information on the incidence of
drought in the coming season, farmers face crop selection, variety selection, and planting time
uncertainties. Drought also increases the irrigation requirement, which increases production costs.
Farmers perceived the risk associated with the shortage of farm labour as the most important risk,
followed by the risk of lower prices for farm produce and drought. Farmer vulnerability to and
perception of drought risk were considerably higher than that of flood risk throughout the study area.
The earlier qualitative study also suggested that the farmers were more concerned about drought than
flood. Farmers perceived drought as a higher likelihood, higher–impact risk than flood risk. Insurance
providers may charge higher premiums for insuring such risks, and the government may need to
increase subsidies to improve the adoption of such products by poor farmers.
Moreover, farmer perceptions of drought and flood risk were not correlated, and some respondents had
high perceptions of both risks. This finding implies that flood and drought are not mutually exclusive
risks. Therefore, farmers’ risk perceptions should be considered when designing risk management
products and support programs. Moreover, farmers’ risk experience and perceptions were positively
correlated. Researchers may consider using risk experience as a proxy for risk perception to minimise
response biases if the respondents have low education and less informed risk perception.
Chapter 5. Psychometric Study of Risk Perceptions 110
The Tobit regression suggested that farmer perception of drought risk is associated with their age,
family size, migration status, access to infrastructure and services, and rice productivity. Similarly, the
farmer perception of flood risk correlates to farm size, migration status, rice productivity and joint
family system. Risk experience and risk perception are strongly correlated, implying that risk
perception is significantly shaped by objective risk factors. Non-significant correlation between gender
and risk perception supports the findings of our earlier qualitative study that found similar perceptions
of climatic risks between men and women (see Chapter 4). We also found a significant regional
variation in farmers’ risk perceptions, which has practical implications in identifying targets groups for
agricultural development programs. If farmers’ perceptions of risk and uncertainty and the associated
factors are accounted for, the effectiveness of agriculture extension programs and risk management
interventions will be improved.
Crop diversification, crop varietal diversification and integrated farming were the most important risk
management strategies from farmers’ perspectives. The earlier qualitative study also suggested crop
varietal diversification, including modern crop varieties, as the most important strategy to manage
production risk. Improving farmers’ access to modern farming technologies, developing and
promoting climate-smart crop varieties and training them on the use of such technologies can help
improve the effectiveness of on-farm diversification strategies in managing production risks. Weather
forecasting service, irrigation development and promotion of drought-tolerant crop varieties may be
effective strategies to mitigate drought risk. Improving farmers’ skills for on-farm and off-farm jobs
may help them diversify income opportunities and better manage livelihood risks.
Farmers considered on-farm risk management strategies more important than the modern market–
based tools, such as crop insurance. Their preference for on-farm risk management options was mainly
due to inadequate awareness of and access to farm insurance products. Therefore, in addition to
improving farmers’ capacity for on-farm risk management, agriculture extension program and
insurance companies should consider educating farmers about the concept and benefits of insurance.
Since there is no one–size–fits–all strategy for managing farming risks, a holistic risk management
approach should be applied involving a wise combination of on-farm tools and market–based tools.

Chapter 5. Psychometric Study of Risk Perceptions 111
5.6 References
Agrawal, R. C. (2009). Risk Management. ABD Publishers.
Ahsan, D., & Brandt, U. S. (2014). Climate Change and Coastal Aquaculture Farmers’ Risk
Perceptions: Experiences from Bangladesh and Denmark. Journal of Environmental Planning
and Management, 58(9), 1649-1665.
https://doi.org/https://doi.org/10.1080/09640568.2014.942414
Alan, F., & Hendrik, W. (2011). Concept and Unintended Consequences of Weather Index Insurance:
The Case of Mexico. American Journal of Agricultural Economics, 93(2), 505-511.
https://doi.org/https://doi.org/10.1093/ajae/aaq137
Baird, T., Leslie, P., & McCabe, J. (2009). The Effect of Wildlife Conservation on Local Perceptions
of Risk and Behavioral Response. An Interdisciplinary Journal, 37(4), 463-474.
https://doi.org/https://doi.org/10.1007/s10745-009-9264-z
Barham, B. L., Chavas, J.-P., Fitz, D., Salas, V. R., & Schechter, L. (2014). The Roles of Risk and
Ambiguity in Technology Adoption. Journal of Economic Behavior & Organization, 97, 204-
218. https://doi.org/https://doi.org/10.1016/j.jebo.2013.06.014
Barnett, B., & Mahul, O. (2007). Weather Index Insurance for Agriculture and Rural Areas in Lower-
Income Countries. American Journal of Agricultural Economics, 89(5), 1241-1247.
https://doi.org/https://doi.org/10.1111/j.1467-8276.2007.01091.x
Bhawana, K. C., & Race, D. (2020). Women’s Approach to Farming in the Context of Feminization of
Agriculture: A Case Study from the Middle Hills of Nepal. World Development Perspectives,
20, 100260. https://doi.org/https://doi.org/10.1016/j.wdp.2020.100260
Boholm, A. (1998). Comparative Studies of Risk Perception: A Review of Twenty Years of Research.
Journal of Risk Research, 1(2), 135-163.
https://doi.org/https://doi.org/10.1080/136698798377231
Che, Y., Feng, H., & Hennessy, D. A. (2020). Recency Effects and Participation at the Extensive and
Intensive Margins in the Us Federal Crop Insurance Program. Geneva papers on risk and
insurance. Issues and practice, 45(1), 52-85. https://doi.org/https://doi.org/10.1057/s41288-
019-00147-5
Cohn, L. D., Macfarlane, S., Yanez, C., & Imai, W. K. (1995). Risk-Perception: Differences between
Adolescents and Adults. Health Psychology, 14(3), 217-222.
https://doi.org/https://doi.org/10.1037/0278-6133.14.3.217
Dahal, P., Dahal, P., Shrestha, N. S., Shrestha, N. S., Shrestha, M. L., Shrestha, M. L., Krakauer, N.
Y., Krakauer, N. Y., Panthi, J., Panthi, J., Pradhanang, S. M., Pradhanang, S. M., Jha, A., Jha,
A., Lakhankar, T., & Lakhankar, T. (2016). Drought Risk Assessment in Central Nepal:
Temporal and Spatial Analysis. Natural Hazards, 80(3), 1913-1932.
https://doi.org/https://doi.org/10.1007/s11069-015-2055-5

Chapter 5. Psychometric Study of Risk Perceptions 112
FAO. (2014). Managing Climate Risks and Adapting to Climate Change in the Agriculture Sector in
Nepal. F. a. A. O. o. t. U. Nations. https://www.fao.org/3/a-i3577e.pdf
Fischhoff, B., Slovic, P., Lichtenstein, S., Read, S., & Combs, B. (1978). How Safe Is Safe Enough? A
Psychometric Study of Attitudes Towards Technological Risks and Benefits. Policy Sciences,
9(2), 127-152. https://doi.org/https://doi.org/10.1007/BF00143739
Fonta, W. M., Sanfo, S., Ibrahim, B., & Barry, B. (2015). Farmers Awareness, Perception of Climate
Hazards and Their Willingness to Participate in Crop Insurance Schemes in Southwestern
Burkina Faso. Procedia Environmental Sciences, 29, 7-8.
https://doi.org/https://doi.org/10.1016/j.proenv.2015.07.127
Gartaula, H. N., Niehof, A., & Visser, L. (2010). Feminisation of Agriculture as an Effect of Male out-
Migration: Unexpected Outcomes from Jhapa District, Eastern Nepal. International Journal of
Interdisciplinary Social Sciences, 5(2), 565-578. https://doi.org/https://doi.org/10.18848/1833-
1882/CGP/v05i02/51588
Gebreegziabher, K., & Tadesse, T. (2013). Risk Perception and Management in Smallholder Dairy
Farming in Tigray, Northern Ethiopia. Journal of Risk Research, 17(3), 367-381.
https://doi.org/https://doi.org/10.1080/13669877.2013.815648
Gebrehiwot, T., & van der Veen, A. (2015). Farmers Prone to Drought Risk: Why Some Farmers
Undertake Farm-Level Risk-Reduction Measures While Others Not? Environmental
Management, 55(3), 588-602. https://doi.org/https://doi.org/10.1007/s00267-014-0415-7
Ginder, M., Spaulding, A. D., Tudor, K. W., & Randy Winter, J. (2009). Factors Affecting Crop
Insurance Purchase Decisions by Farmers in Northern Illinois. Agricultural Finance Review,
69(1), 113-125. https://doi.org/https://doi.org/10.1108/00021460910960507
Goszczynska, M., Tyszka, T., & Slovlc, P. (1991). Risk Perception in Poland: A Comparison with
Three Other Countries. Journal of Behavioral Decision Making, 4(3), 179-193.
https://doi.org/https://doi.org/10.1002/bdm.3960040305
Greiner, R., Patterson, L., & Miller, O. (2009). Motivations, Risk Perceptions and Adoption of
Conservation Practices by Farmers. Agricultural Systems, 99(2-3), 86-104.
https://doi.org/https://doi.org/10.1016/j.agsy.2008.10.003
Grootveld, H., & Hallerbach, W. (1999). Variance Vs Downside Risk: Is There Really That Much
Difference? European journal of operational research, 114(2), 304-319.
https://doi.org/https://doi.org/10.1016/S0377-2217(98)00258-6 (European Journal of
Operational Research)
Gurenko, E., & Mahul, O. (2004). Enabling Productive but Asset-Poor Farmers to Succeed: A Risk
Financing Framework. World Bank Policy Research Working Paper 3211, Washington, DC.
Hardaker, J. B., & Lien, G. (2010). Probabilities for Decision Analysis in Agriculture and Rural
Resource Economics: The Need for a Paradigm Change. Agricultural Systems, 103(6), 345-
350. https://doi.org/https://doi.org/10.1016/j.agsy.2010.01.001

Chapter 5. Psychometric Study of Risk Perceptions 113
Hardaker, J. B., Lien, G., Anderson, J. R., & Huirne, R. B. M. (2015). Coping with Risk in
Agriculture: Applied Decision Analysis (3rd ed.). CABI.
https://ebookcentral.proquest.com:80/lib/CURTIN/docDetail.action?docID=2066663
Hoag, D. L. (2009). Introduction. In D. L. Hoag (Ed.), Applied Risk Management in Agriculture (pp.
403). CRC Press, Taylor & Francis Group.
https://www.crcnetbase.com.dbgw.lis.curtin.edu.au/doi/pdfplus/10.1201/b15855-3
Howarth, C. I. (1988). The Relationship between Objective Risk, Subjective Risk and Behaviour.
Ergonomics, 31(4), 527-535. https://doi.org/https://doi.org/10.1080/00140138808966697
Komarek, A. M., De Pinto, A., & Smith, V. H. (2020). A Review of Types of Risks in Agriculture:
What We Know and What We Need to Know. Agricultural systems, 178, 102738.
https://doi.org/https://doi/org/10.1016/j.agsy.2019.102738
Lefebvre, M., Nikolov, D., Gomez-y-Paloma, S., & Chopeva, M. (2014). Determinants of Insurance
Adoption among Bulgarian Farmers. Agricultural Finance Review, 74(3), 326-347.
https://doi.org/https://doi.org/10.1108/afr-05-2013-0022
Legesse, B., & Drake, L. (2005). Determinants of Smallholder Farmers' Perceptions of Risk in the
Eastern Highlands of Ethiopia. Journal of Risk Research, 8(5), 383-416.
https://doi.org/https://doi.org/10.1080/1366987042000192426
Lin, S., Lin, S., Shaw, D., Shaw, D., Ho, M.-C., & Ho, M.-C. (2008). Why Are Flood and Landslide
Victims Less Willing to Take Mitigation Measures Than the Public? Natural Hazards, 44(2),
305-314. https://doi.org/https://doi.org/10.1007/s11069-007-9136-z
Linda, B., & Nicole, M. (2004). Risk and Risk Perception: A Literature Review. R. I. R. a. D.
Corporation. www.rirdc.gov.au/fullreports/index.htm
Lomott, M. J., & Lyskawa, K. (2014). The New Instruments of Risk Management in Agriculture in the
European Union. Procedia Economics and Finance, 9, 321-330.
Lucas, M. P., & Pabuayon, I. M. (2011). Risk Perceptions, Attitudes, and Influential Factors of
Rainfed Lowland Rice Farmers in Ilocos Norte, Philippines. Asian Journal of Agriculture and
Development, 8(2), 61-77. https://doi.org/https://doi.org/10.22004/ag.econ.199327
Lupton, D., & Tulloch, J. (2002). 'Life Would Be Pretty Dull without Risk': Voluntary Risk-Taking
and Its Pleasures. Health, Risk & Society, 4(2), 113-124.
https://doi.org/https://doi.org/10.1080/13698570220137015
MacCrimmon, K. R., & Wehrung, D. A. (1986). Taking Risks: The Management of Uncertainty. The
Free Press.
Mahul, O., & Stutley, C. J. (2010). Government Support to Agricultural Insurance: Challenges and
Options for Developing Countries. World Bank. https://doi.org/https://doi.org/10.1596/978-0-
8213-8217-2
Chapter 5. Psychometric Study of Risk Perceptions 114
Mary, E. T., Dilek, Ö., & Gülbanu, G. (2003). A Cognitive Portrayal of Risk Perception in Turkey:
Some Cross-National Comparisons. Risk Management, 5(4), 25-35.
https://doi.org/https://doi.org/10.1057/palgrave.rm.8240162
Meraner, M., & Finger, R. (2017). Risk Perceptions, Preferences and Management Strategies:
Evidence from a Case Study Using German Livestock Farmers. Journal of Risk Research, 1-
26. https://doi.org/https://doi.org/10.1080/13669877.2017.1351476
MoALD-Nepal. (2014). Statistical Information on Nepalese Agriculture. https://goo.gl/n0c2BL
MoALD-Nepal. (2020). Statistical Information on Nepalese Agriculture for 2018/19.
https://www.moald.gov.np/publication/Agriculture%20Statistics
OECD. (2009). Managing Risk in Agriculture: A Holistic Framework. The Organization for Economic
Co-operation and Development. https://doi.org/https://doi.org/10.1787/9789264075313-en
Patt, A., & Schroter, D. (2008). Perceptions of Climate Risk in Mozambique: Implications for the
Success of Adaptation Strategies. Global Environmental Change, 18(3), 458-467.
https://doi.org/https://doi.org/10.1016/j.gloenvcha.2008.04.002
Peter, C. A., Michael, E., & Jacek, A. K. (2000). The Use of the Tobit Model for Analyzing Measures
of Health Status. Quality of Life Research, 9(8), 901-910.
https://doi.org/https://doi.org/10.1023/A:1008938326604
Petrolia, D. R. (2016). Risk Preferences, Risk Perceptions, and Risky Food. Food Policy, 64, 37-48.
https://doi.org/https://doi.org/10.1016/j.foodpol.2016.09.006
Rejda, G. E., & McNamara, M. J. (2014). Principles of Risk Management and Insurance (12th ed.).
Pearson.
Santeramo, F. G., Goodwin, B. K., Adinolfi, F., & Capitanio, F. (2016). Farmer Participation, Entry
and Exit Decisions in the Italian Crop Insurance Programme. Journal of Agricultural
Economics, 67(3), 639-657. https://doi.org/https://doi.org/10.1111/1477-9552.12155
Sherrick, B. J., Barry, P. J., Ellinger, P. N., & Schnitkey, G. D. (2004). Factors Influencing Farmers
Crop Insurance Decisions. American Journal of Agricultural Economics, 86(1), 103-114.
https://doi.org/https://doi.org/10.1111/j.0092-5853.2004.00565.x
Sitkin, S., & Pablo, A. (1992). Reconceptualizing the Determinants of Risk Behavior. The Academy of
Management Review, 17(1), 9. https://doi.org/https://doi.org/10.2307/258646
Sjöberg, L. (2000). The Methodology of Risk Perception Research. Quality and Quantity, 34(4), 407-
418. https://doi.org/https://doi.org/10.1023/A:1004838806793
Sjöberg, L., Kolarova, D., Rucai, A. A., & Bernström, M. L. (2000). Risk Perception in Bulgaria and
Romania. In O. Ren & R. Rohrmann (Eds.), Cross-Cultural Risk Perception: A Survey of
Empirical Studies (pp. 147–183). Kluwer Academic Publishers.
Sjoberg, L., Moen, B.-E., & Rundmo, T. (2004). Explaining Risk Perception: An Evaluation of the
Psychometric Paradigm in Risk Perception Research. C Rotunde Publikasjoner, Norwegian
University of Science and Technology. https://goo.gl/0254bI

Chapter 5. Psychometric Study of Risk Perceptions 115
Sjöberg, L., Moen, B.-E., & Rundmo, T. (2004). Explaining Risk Perception: An Evaluation of the
Psychometric Paradigm in Risk. R. publikasjoner.
https://www.forskningsradet.no/csstorage/vedlegg/Psychometric_paradigm.pdf
Slovic, P. (1987). Perception of Risk. Science, 236(4799), 280-285.
https://doi.org/https://doi.org/10.1126/science.3563507
Slovic, P. (1992). Perception of Risk: Reflections on the Psychometric Paradigm. In S. Krimsky & D.
Golding (Eds.), Social Theories of Risk (pp. 117-152). Praeger.
Slovic, P. (1993). Perceived Risk, Trust, and Democracy. Risk Analysis, 13(6), 675-682.
https://doi.org/https://doi.org/10.1111/j.1539-6924.1993.tb01329.x
Smith, K., Barrett, C. B., & Box, P. W. (2000). Participatory Risk Mapping for Targeting Research
and Assistance: With an Example from East African Pastoralists. World Development, 28(11),
1945-1959. https://doi.org/https://doi.org/10.1016/S0305-750X(00)00053-X
Spangler, K., & Christie, M. E. (2019). Renegotiating Gender Roles and Cultivation Practices in the
Nepali Mid-Hills: Unpacking the Feminization of Agriculture. Agriculture and Human
Values, 37(2), 415-432. https://doi.org/https://doi.org/10.1007/s10460-019-09997-0
SQCC-Nepal. (2019). Notified Crop Varieties from National Seed Board-2075.
https://sqcc.gov.np/en/category/publications
Stoffle, R. W., Traugott, M. W., Stone, J. V., McIntyre, P. D., Jensen, F. V., & Davidson, C. C.
(1991). Risk Perception Mapping: Using Ethnography to Define the Locally Affected
Population for a Low‐Level Radioactive Waste Storage Facility in Michigan. American
Anthropologist, 93(3), 611-635. https://doi.org/https://doi.org/10.1525/aa.1991.93.3.02a00050
Sugden, F., & Gurung, G. (2012). Absentee Landlordism and Agrarian Stagnation in Nepal: A Case
from the Eastern Tarai (Vol. Kathmandu). NepalInstitute of Development Studies.
Tobin, J. (1958). Estimation of Relationships for Limited Dependent Variables. Econometrica, 26(1),
24-36. https://doi.org/https://doi.org/10.2307/1907382
van Winsen, F., de Mey, Y., Lauwers, L., Van Passel, S., Vancauteren, M., & Wauters, E. (2013).
Cognitive Mapping: A Method to Elucidate and Present Farmers’ Risk Perception.
Agricultural Systems, 122, 42-52. https://doi.org/https://doi.org/10.1016/j.agsy.2013.08.003
van Winsen, F., de Mey, Y., Lauwers, L., Van Passel, S., Vancauteren, M., & Wauters, E. (2016).
Determinants of Risk Behaviour: Effects of Perceived Risks and Risk Attitude on Farmer’s
Adoption of Risk Management Strategies. Journal of Risk Research, 19(1), 56-78.
https://doi.org/https://doi.org/10.1080/13669877.2014.940597
Vaughan, E. J., & Vaughan, T. M. (2008). Fundamentals of Risk and Insurance (10th ed.). John Wiley
& Sons, Inc.
Weber, E. U., Blais, A. R., & Betz, N. E. (2002). A Domain‐Specific Risk‐Attitude Scale: Measuring
Risk Perceptions and Risk Behaviors. Journal of Behavioral Decision Making, 15(4), 263-
290. https://doi.org/https://doi.org/10.1002/bdm.414

116
Chapter 6: Linkages Between Farmers’ Risk Attitudes,
Sociodemographic Factors and the Choice of Risk
Management Strategies in Nepal (Paper 3)
6.1 Abstract
Risk attitude indicates an individual’s willingness to trade–off potential income for certainty. Farmers’
risk attitude is an important indicator of their demand for risk management products. We elicited the
risk attitudes of 409 randomly selected farmers from the Terai region of Nepal using an incentivised
monetary lottery–choice experiment. We then examined the relationships between various
sociodemographic variables, farmers’ risk attitudes and their risk management decisions. We found
that farmers were risk-averse in general, but to varying degrees. Farmers’ risk aversion increased as
we moved from East to West, the direction in which the duration and amount of monsoonal rainfall
decrease. Similarly, farmers’ numeracy skills and landholding size had a positive association with
their risk aversion. Contrary to the prevalent stereotyping that women are more risk-averse than males,
we found the opposite result. We also found that farmers’ decisions on farm mechanisation, monetary
saving, involvement in groups and cooperatives, production diversification, use of stress-tolerant rice
varieties, and adopting insurance products were associated with their risk attitudes. Information on
farmers’ risk attitudes, factors explaining the heterogeneity in their risk attitudes, and how this
heterogeneity reflects in their decision–making can aid the development of policy interventions,
agriculture extension programs and risk management products.
Keywords: agriculture, lottery–choice experiment, Nepal, risk attitude, risk aversion, risk
management
6.2 Introduction
Analysing farmers’ risk attitudes is an ongoing research agenda in agricultural economics. This paper
measures farmers’ risk attitudes using a monetary lottery choice experiment and analyses the
association of such a measure of risk attitude with farm characteristics, sociodemographic
characteristics and farmers’ risk management decisions. The motivation underlying this work is the
potential role of risk attitude on farmers’ choice of risk management strategies, including crop
insurance. The theory of absolute risk aversion suggests that people are risk-averse, and their aversion
is negatively correlated with wealth or income (Pratt, 1964). The theoretical model of farm innovation
and technology adoption includes risk attitude as a key variable (Feder, 1980; Feder et al., 1985). The
decreasing marginal utility of wealth (Pratt, 1964) generally implies that poorer farmers are more risk-
averse and less likely to adopt new farming technologies that increase risk. However, documentary

Chapter 6. Risk Attitudes: Lottery-Choice Experiment 117
evidence suggests that the degree of risk aversion and its effect on decision–making vary across
individuals and decision contexts despite these well-known theories. Therefore, context-specific
analysis of farmers’ risk attitudes is essential for informing policy development related to farming risk
management.
Risk aversion is not merely an emotional attribute representing people’s dislike of risk but also an
indicator of their willingness to sacrifice some income to eliminate risk (Ert & Haruvy, 2017;
Hardaker et al., 2015; Ye & Wang, 2013). Risk attitude reflects what level of hazard, threat, or
monetary loss individuals are willing to accept (Ye & Wang, 2013). According to Hardaker et al.
(2015), risk management should be viewed as an integral part of the overall decision–making process,
which involves balancing risks against potential benefits. Risk attitude is a crucial factor determining
how farmers attain such balance (Saqib et al., 2016). For instance, a risk–the averse farmer is more
inclined to reduce income variation than maximise profit (Binici et al., 2003). More specifically,
farmers’ risk aversion implies their tendency to compromise higher returns for certainty.
The importance of studying farmers’ risk attitudes has been well established within the literature (see
Lusk & Coble, 2005; Pennings & Garcia, 2001; Petrolia, 2016). Knowing farmers’ risk attitudes, the
factors that explain the heterogeneity in their risk attitudes, and how such heterogeneity reflects in
their decision–making is essential for developing policy interventions, agriculture extension programs
and risk management products. Such studies are even more important for developing countries where
farmers are mostly poor, vulnerable to the negative consequences of farming risks, and less resilient to
shocks without external support (Ye & Wang, 2013). Accounting for the needs, preferences, and risk-
taking behaviours of the potential target group is necessary when designing risk management support
interventions to improve their acceptability (Flaten et al., 2005; Santeramo et al., 2016).
Moreover, the agriculture sector offers a unique case study of risk attitudes for many reasons. First, the
sources of uncertainty in farming are numerous, including production (weather, disease), market
(price, input, output), finance (interest), personal (death, sickness), and institutional (policy) factors
(Bard & Barry, 2001). Second, the sources of uncertainty are continuously growing due to the
changing climate and increasing market competition (Sulewski & Kłoczko-Gajewska, 2014). Third,
the portfolio of farming risk management strategies is large and growing (Meraner & Finger, 2017).
For instance, income diversification, cutting expenditure, selling assets, and migration are some of the
strategies practised by farmers to cope with the consequences of risk (Ashraf & Routray, 2013).
Similarly, production diversification, storing produce for future sale, adopting less risky farming
practices, engaging in off-farm employment, saving cash instead of investing for capital gain, and
purchasing insurance are some of the managerial tendencies consistent with risk aversion (Binici et al.,
2003). Fourth, many risks in farming are covariate, meaning a risk affects many households in a
community at a time, and such risks cannot be managed through local insurance or credit

Chapter 6. Risk Attitudes: Lottery-Choice Experiment 118
arrangements (Barrett, 2011). Lastly, the effects of such covariate risk are systemic, which may extend
beyond farming households, affecting all other actors in the agricultural value chains, including
consumers.
The literature has extensively covered the relationships between various personal and socio-economic
factors, risk attitudes, and risk management behaviours, but the findings are not consistent across
regions. For instance, researchers have reported varied relationships between farmers’ risk attitudes
and factors, such as age (Nielsen et al., 2013; Ullah et al., 2015; van Winsen et al., 2016), gender
(Brick et al., 2012; Harrison et al., 2007; Holt & Laury, 2002), wealth (Binswanger, 1980; Cohen &
Einav, 2007; Dohmen et al., 2011), farm size (Lucas & Pabuayon, 2011; Velandia et al., 2009), and
family size (Binswanger, 1980; Lucas & Pabuayon, 2011). Similarly, researchers have reported varied
relationships between measures of farmers’ risk aversion and risk management decisions, such as farm
diversification (Chavas & Holt, 1996; Engle Warnick et al., 2011), adoption of modern technologies
(Engle Warnick et al., 2011; Marra et al., 2003), and uptake of insurance (Hellerstein et al., 2013).
These contrasting findings suggest that the effect of different factors on farmer risk attitude may vary
across geographical locations and socio-demographic settings. Moreover, farmers’ decision–making
process when choosing a risk management strategy is dynamic (Meraner & Finger, 2017),
necessitating more research. Therefore, a region-specific study of farmers’ risk attitudes is necessary
to understand and predict their behaviours.
Information on farmers’ risk attitudes and the role of risk attitude in decision making is limited in
Nepalese agriculture. A literature search related to this topic revealed only five published works in
Nepal, which are cited below. First, Hamal and Anderson (1982) analysed the risk attitudes of rice
farmers from two Terai districts. They found that farmers were risk-averse in general, and their risk
aversion was negatively correlated with wealth. They also identified farmers’ risk aversion as a
limiting factor in the adoption of modern farming technologies. Second, Sharma (2016) elicited the
risk attitudes of coffee producers from two mid-hill districts using a lottery–choice experiment and
reported similar results to Hamal and Anderson (1982). Moreover, Sharma (2016) found that farmers’
risk aversion affected labour allocation but did not affect land allocation for coffee farming. Third,
Mishra et al. (2020) used the Bayesian method to investigate the effect of contact farming on
production risk, technical efficiency and risk attitude of tomato, ginger, lentil and paddy farmers. They
found contract farming an effective method to reduce production risk, increase technical efficiency
and support the modernization of agriculture. They also found contract farmers more risk-averse than
independent farmers. Fourth, Mohan (2020) studied the effect of risk aversion on tea certification to an
agricultural standard. They used a lottery game adapted from Binswanger (1980) and Eckel and
Grossman (2008) to elicit farmers’ risk attitudes. They reported a positive correlation between risk
aversion and farmers’ propensity to get their tea certified. Fifth, Begho (2021) investigated the effect

Chapter 6. Risk Attitudes: Lottery-Choice Experiment 119
of risk attitude on the adoption of rice varieties. They used a single choice list procedure to measure
farmers’ risk attitudes, which is similar to Mohan (2020)’s lottery game. Begho (2021) found a
negative correlation between risk aversion and the propensity to adopt new rice varieties.
Although the abovementioned studies answered some important questions about farmers’ risk
attitudes, none of them investigated the relationships between risk aversion and the choice of risk
management strategy. Moreover, their findings represent small geographical areas and specific
samples. This paper examines Nepali farmers’ risk attitudes more comprehensively, involving a larger
sample size and representing a wider geographic area than the earlier studies. Further, this paper
investigates the association of risk attitude with sociodemographic factors and risk management
decisions, such as crop insurance purchase.
6.3 Methodology
Risk attitude is studied within the framework of the expected utility theory (EUT), originally proposed
by Bernoulli (1738). The EUT assumes that humans are homo–economicus, and their decisions
conform with von Neumann and Morgenstern (1944)’s expected utility axioms and are stable over
space and time (Becker, 1976). Assuming that farmers are rational decision–making agents, who
maximise expected utility while choosing between available alternatives, we adapted a lottery–choice
instrument to measure their risk attitudes. Moreover, we adapted a conceptual model similar to that of
Meraner and Finger (2017), which hypothesises that farmers’ decision–making is a function of their
risk attitudes, while their risk attitude depends on various individual, farm and socio–economic
characteristics. Our model of farmers’ risk management decisions also includes farmers’ risk
perceptions measured using a psychometric scaling method (see Chapter 5 for details). The study
involves measuring three distinct groups of variables: (1) farmers’ risk attitudes; (2) individual, socio–
economic, and demographic attributes of farmers and households; (3) measures of risk management
strategies. Here, we discuss the methods for measuring the variables included in the conceptual model
and analysing the relationships between them.
6.3.1 Measuring risk attitudes
Researchers have developed several methods to elicit individual risk attitudes. Field and lab
experiments are the most prevalent risk attitude elicitation methods, involving hypothetical (e.g.,
Asravor, 2019; Kahneman & Tversky, 1979; Menapace et al., 2016), real monetary payoff (e.g., Brick
et al., 2012; Dohmen et al., 2011; Hellerstein et al., 2013; Hermann & Mußhoff, 2017; Meraner &
Finger, 2017) or a combination of both (e.g., Binswanger, 1980; Holt & Laury, 2002; Morgenstern et
al., 2014; Nielsen et al., 2013) choice scenarios. Such methods are also called lottery–choice
experiment (LCE) or multiple price list (MPL) methods because they ask respondents to choose
between a series of options that vary in payoff and risk level (Charness et al., 2013). Such a design
Chapter 6. Risk Attitudes: Lottery-Choice Experiment 120
produces sufficient data points to fit a smoother utility curve and estimates parameters with more
precision. An important assumption across these methods is that an individual has a constant relative
risk aversion coefficient, which is indicated by the shape of the utility curve (Pennings & Garcia,
2001). MPL methods have the advantage of reflecting participant’s inherent choice (Hermann &
Mußhoff, 2017), allowing calculation of utility function parameters such as the risk aversion
coefficient (Charness et al., 2013), and providing incentive-compatible designs (Charness et al., 2013;
Hermann & Mußhoff, 2017).
Although Binswanger (1980), who was the first to use MPL, conducted an incentivised money lottery–
choice experiment to elicit risk preference in a rural Indian farming context (Charness et al., 2013),
variants of the MPL method proliferated after Holt and Laury (2002) published their seminal work.
According to Anderson and Mellor (2009), Holt and Laury (2002)’s instrument is the ‘Gold Standard’
in risk attitude elicitation research. Different MPL instruments are developed mainly by allowing the
payoff amount, probabilities, or both to vary across choice scenarios (e.g., Brick et al., 2012; Eckel &
Grossman, 2008; Hellerstein et al., 2013; Holt & Laury, 2002; Jacobson & Petrie, 2009). Usually,
participants in such experimental studies are university students who have higher numeracy skills and
cognitive ability. Since Nepalese farmers have a low level of education and are less familiar with such
experimental procedures, we searched for the simplest experimental instrument, which is easy for less-
educated respondents to understand and make an informed choice.
6.3.2 Lottery–choice experiment instrument
Table 6.1 presents the LCE instrument adapted from Brick et al. (2012), which was also used by
Jianjun et al. (2015) and Jin et al. (2017). This is the simplest experimental instrument available within
the literature that allows estimation of the utility function parameters. Brick et al. (2012)’s instrument
had eight decision rows, had less–linearly decreasing certain amounts, and did not include a certain
zero amount against the lottery, restricting the respondents from making extremely risk-averse
choices. Therefore, we added three decision rows, including a Zero value in the certain amount
column to cover the full range of possible choices and made the decline in certain amount perfectly
linear. In this way, the experiment involved 11 choice scenarios, each asking the respondents to
choose between a coin–toss lottery and a certain amount. We scaled up the monetary values of Brick
et al. (2012)’s instrument by 10 to maintain the attractiveness of the choice options in terms of Nepali
Rupees (NPR). The expected value of the lottery was NPR 100, with NPR 200 and zero as two equally
likely outcomes. The lottery was constant throughout 11 scenarios, while the certain amounts
gradually decreased from NPR 200 to zero.

Chapter 6. Risk Attitudes: Lottery-Choice Experiment 121
Table 6.1 Lottery–choice instrument used in the study
Choice
scenarios
Certain amount (C) Lottery amount (L)
Head (L1) Tail (L2)
1 200 200 0
2 180 200 0
3 160 200 0
4 140 200 0
5 120 200 0
6 100 200 0
7 80 200 0
8 60 200 0
9 40 200 0
10 20 200 0
11 0 200 0
Note: Amounts in NPR; instrument adapted from Brick et al. (2012)
Payoff scale
The respondents’ motivation to state true preference in the experiment is affected by the payoff size of
the lottery (Holt & Laury, 2002) and whether the experiment is hypothetical or involves an actual
payment (Tanaka et al., 2010; Wik et al., 2004; Yesuf & Bluffstone, 2009). Risk aversion parameters
are underestimated when the experiment is hypothetical or involves low payoff scales (Holt & Laury,
2002). If an experiment involves actual payment lotteries and attractive payoff scales, then
inconsistent responses will decrease, and respondents are more likely to participate (Camerer, 2003;
Camerer & Hogarth, 1999). Accordingly, the present research involved real monetary payments with
100 NPR as the expected payoff (200 NPR as the favourable payoff) of the lottery, which is slightly
above the hourly wage rate in the locality. The payoff scales in the experiments of Holt and Laury
(2002) and Nielsen et al. (2013) were also equivalent to the respondents’ opportunity cost. In addition
to the money the respondents won in the experiment, we paid NPR 100 to all respondents for
participating in the experiment.
6.3.3 Measures of risk aversion
The Arrow–Pratt measures of absolute risk aversion (ARA) and relative risk aversion (RRA) are the
most popular measures of risk aversion, introduced by Pratt (1964) and Arrow (1965). Depending on
how the risk aversion function changes for increasing wealth, these measures can be categorised into
increasing, decreasing, and constant absolute or relative risk aversion (Hardaker et al., 2015). Several
studies (e.g., Brick et al., 2012; Eckel & Grossman, 2008; Hermann & Mußhoff, 2017; Meraner &
Finger, 2017; Nielsen et al., 2013) considered constant relative risk aversion (CRRA), which implies

Chapter 6. Risk Attitudes: Lottery-Choice Experiment 122
that relative utilities of risky options are unaffected if all payoffs are scaled by a positive constant
(Hardaker et al., 2015). The CRRA also means decreasing ARA. We derived a formula for calculating
the CRRA coefficient (CRRA indicates the coefficient hereafter) using the following utility function:
𝑢(𝑥) = 𝑥1−𝑟
1 − 𝑟… … … 𝐸𝑞𝑢𝑎𝑡𝑖𝑜𝑛 6.1
where x is monetary value, and 𝑟 is CRRA. According to Hardaker et al. (2015), this utility function is
preferred over other functions because it is consistent with CRRA.
For a respondent to be indifferent between the lottery and a certain amount, expected utilities of both
should be equal, i.e.,
𝑈(𝐶) = 𝑈(𝐿)
or
𝐶1−𝑟
1 − 𝑟=
𝐿11−𝑟
1 − 𝑟 × 𝑝 +
𝐿21−𝑟
1 − 𝑟 × (1 − 𝑝)
here C is a certain amount, and L1 and L2 are the lottery outcomes with probabilities p and 1–p,
respectively. In our case, L2 is 0, and p and 1–p are equal. Therefore, the above equation reduces to:
𝐶1−𝑟
1 − 𝑟=
𝐿11−𝑟
1 − 𝑟 × 𝑝
or
𝐶1−𝑟 = 𝐿11−𝑟 × 𝑝
Taking logs of both sides,
(1 − 𝑟) ln 𝐶 = (1 − 𝑟) ln 𝐿1 + ln 𝑝
or
(1 − 𝑟) ln 𝐶 − (1 − 𝑟) ln 𝐿1 = ln 𝑝
or
(1 − 𝑟) (ln 𝐶 − ln 𝐿1) = ln 𝑝

Chapter 6. Risk Attitudes: Lottery-Choice Experiment 123
or
(1 − 𝑟) = ln 𝑝
(ln 𝐶 − ln 𝐿1)
or
𝑟 = 1 − ln 𝑝
(ln 𝐶 − ln 𝐿1)… … … 𝐸𝑞𝑢𝑎𝑡𝑖𝑜𝑛 6.2
Table 6.2 details the CRRA calculation and classification of respondents into risk attitude classes. If
one can identify the values of L1 and C to which a respondent is indifferent, one can infer the implied
value of CRRA. The C value that makes a respondent indifferent to C and L is called the certainty
equivalent (CE) of L. The primary purpose of the experiment is to ascertain the CE of the given L for
each respondent and assign them the corresponding CRRA. However, asking respondents to choose
the row on which they are indifferent to C and L is less practical than asking their preference between
C and L for each row. Therefore, we asked respondents to choose between C and L in each row and
identify the row on which they switched from C to L. For example, if a respondent chooses C up to the
fourth row and switches to L in the fifth, the indifference point must have occurred anywhere between
the fourth and fifth rows (C = 139 to 121). We considered the midpoint of the C values of the
switching row and the previous row as CE for simplicity. We calculated CRRA values for each row
using the values of CE and L in Equation 6.2. A zero value of CRRA means risk neutrality, while
negative and positive values mean risk preference and risk aversion, respectively. Eleven choices may
lead to 12 switching behaviours, including a never switching decision. Accordingly, we classified
respondents into 12 risk attitude classes based on the CRRA values. However, choosing L even when
C is equal to the highest possible gain from L and not choosing L even when C is equal to zero are
behaviours inconsistent with the expected utility theory. Therefore, we excluded respondents in the 1st
and 12th rows from the analysis.

Chapter 6. Risk Attitudes: Lottery-Choice Experiment 124
Table 6.2 CRRA calculation and risk attitude classification
Card
no.
Certain
amount
(C)
Lottery amount
(L)
CE of L if
switched to
L on this
row
CRRA if
switched to
L on this
row
Risk attitude class
Head
(L1)
Tail
(L2)
1 200 200 0 –∞ Infinitely risk–preferring
2 180 200 0 190 –12.51 Extremely risk–preferring
3 160 200 0 170 –3.27 Highly risk–preferring
4 140 200 0 150 –1.41 Moderately risk–preferring
5 120 200 0 130 –0.61 Slightly risk–preferring
6 100 200 0 110 –0.16 Risk–preferring to neutral
7 80 200 0 90 0.13 Risk–neutral to averse
8 60 200 0 70 0.34 Moderately risk–averse
9 40 200 0 50 0.50 Highly risk–averse
10 20 200 0 30 0.63 Extremely risk–averse
11 0 200 0 10 0.77 Extremely to infinitely risk–averse
# Those who never switched to L ∞ Infinitely risk–averse
Note: Amounts in NPR
6.3.4 Validity and reliability of the LCE instrument
Framing and presenting choice problems are crucial considerations in choice experiments. If the
respondents do not clearly understand the choice task, they may exhibit noisy preferences (Charness et
al., 2013). The preferences are inconsistent with the EUT axioms when the respondents do not choose
strictly dominated options (Barham et al., 2014) or make more than one switching point (Barham et
al., 2014; Jacobson & Petrie, 2009). According to Andersen et al. (2006), the standard MPL format is
likely to tempt respondents towards the middle of the list. Dave et al. (2010) analysed noise–reliability
trade-offs between MPL instruments with different degrees of complexity and concluded in favour of
the simpler instrument, especially when the respondents have low numeracy skills.
Overcoming hypothetical bias and improving the external validity of the experimental measures of
risk attitude are ongoing concerns of researchers. Some of the techniques that have been found
effective in motivating the subjects to state true preferences include displaying outcome probabilities
graphically (see Meraner & Finger, 2017; Wakker et al., 1994), using real–payment lottery games,
increasing the potential incentives from the lottery games (see Holt & Laury, 2002), framing the
choice problems in real-life decision contexts (see Hellerstein et al., 2013; Kimball et al., 2008;
Menapace et al., 2016; Meuwissen et al., 2001) and using virtual reality to mimic real-life settings (see
Fiore et al., 2009). However, some researchers have reported contrasting effects of these techniques on
the external validity of the risk attitude measures. For example, while Harrison and List (2004) found

Chapter 6. Risk Attitudes: Lottery-Choice Experiment 125
contextualized framing of choice tasks improved task comprehension by the subjects, Rommel et al.
(2016) reported that framing choice questions in familiar contexts negatively affected the task
comprehension by the subjects. Meraner and Finger (2017) also reported that a standard monetary
MPL is as efficient as a contextualized choice experiment in measuring risk attitude. In what follows,
we discuss the strategies that we adopted to address these issues.
We presented graphic choice cards reflecting the choice scenarios so that farmers better understand
decision problems (see Appendix G). Like the ordered MPL design followed by various researchers
(e.g., Binswanger, 1980; Eckel & Grossman, 2002, 2008; such as Holt & Laury, 2002), we sorted
choice scenarios by descending value of a certain amount. As Jacobson and Petrie (2009) did, we
presented the choice cards one–by–one in the sequence of first to eleventh. This strategy helped
minimise middle response bias, ensuring that the respondents did not have an exact reference for
previous or subsequent choice scenarios while making decisions. Following various studies (e.g.,
Hellerstein et al., 2013; Liu, 2013; Tanaka et al., 2010), we informed the respondents beforehand that,
upon completing the task, they would be asked to randomly draw one ball from a bag containing 11
numbered balls and the matching choice card would be chosen for actual payment based on the
decision they had already made on that card. Charness et al. (2013) suggested that if the respondents
know that all choices are equally likely to be selected for actual payment, they will be motivated to
maximise the expected utility from each decision. Following Nielsen et al. (2013), we allowed the
respondents to revisit their choices when they finished the choice tasks. As a result of these strategies,
only 11 (2.61%) respondents made inconsistent choices in our experiment.
6.3.5 Experiment implementation
The experiment involved 420 randomly selected farmers from the Terai region of Nepal, divided into
three regions (see Chapter 3 for details of sampling design). Excluding 11 respondents whose choice
behaviours were inconsistent with EUT, the final sample size for risk attitude analysis was 409. The
LCE was combined with a questionnaire survey to measure factors that might affect farmers’ risk
attitudes and adoption of various risk management practices. Along with the variables that had
ambiguous effects on risk attitudes in other regions, as reviewed earlier, we included additional
variables that are important in the Nepali context. Here, we briefly define the variables included in the
questionnaire and various indices derived for the analysis.
6.3.5.1 Factors that might affect risk attitude
We categorised the factors that might affect farmers’ risk attitude into farmers’ characteristics and
socio-economic factors. Farmers’ characteristics included variables related to their inherent attributes
such as age, education, gender and their perceptions of flood and drought risk in farming. In addition
to farmers’ education, we included a numeracy score in the model (see Appendix C for a description

Chapter 6. Risk Attitudes: Lottery-Choice Experiment 126
of the numeracy test used in the survey). Education is expected to correlate with farmers’ risk literacy
and ability to evaluate expected payoffs from the risky prospects. In addition to the respondent’s
gender, we used the gender equality index of respondent households in the analysis. We assessed
gender participation in five household decisions, eight farming activities, and six farming decisions in
terms of male–only (0), female–only (0), or both (1). We calculated the gender equality index
averaging the responses to these 19 items. A GEI value close to one means equal gender participation
in farming activities and decision–making, whereas lower values indicate gender disparity. Moreover,
we assessed farmer perception of drought and flood risk in farming using the psychometric method, as
discussed in Chapter 5. Although the Nepali farming system is vulnerable to many risks, drought and
flood are the most prominent climatic risks.
Socio–economic factors included family type, family size, dependency ratio, migration status, income
sufficiency, sources of income, whether agriculture was the primary source of income, and whether
agriculture was the only source of income. The terai region of Nepal has a mixed population of
indigenous communities and migrated communities from hilly areas. Therefore, we included whether
the household had migrated or was indigenous to examine the effect of migration status on risk
attitude. Similarly, we used farm size (area cultivated by the farmer in the previous year) as a proxy
for their wealth. We also included the proportion of irrigated land to farm size to see the effect of
irrigation availability on risk attitude. The model also included the access to infrastructure and services
index. We asked farmers whether they have access to nine infrastructures and services and created
nine dummy variables to represent their responses. We calculated the access to infrastructure and
service index as an average of the nine dummy variables. Additionally, we used rice productivity
reported by the farmers as a proxy for farm technical efficiency.
6.3.5.2 Numeracy test
The reliability of the experimental measure of risk attitude depends on how well the respondents
understand the choice task. Rommel et al. (2016) reported a positive correlation between respondents’
numeracy skills and task comprehension. Results from studies that do not consider respondents’
cognitive ability are biased because such ability is associated with risk attitude (Barham et al., 2014).
For instance, while three authors found a negative relationship between cognitive ability and risk
aversion (Benjamin et al., 2013; Dohmen et al., 2010; Frederick, 2005), Sherman (1974) reported
similar results for ambiguity aversion. To account for the respondents’ cognitive ability, various
authors embedded a probability-based numeracy skill test with the experiment (e.g., Hermann &
Mußhoff, 2017; Meraner & Finger, 2017). We also assessed farmers’ numeracy skills using a
numeracy test adapted from BBC’s probability quiz level A intended for adults (see Appendix C for
test questions). Moreover, we asked respondents to self–assess their comprehension of the choice task
on a five-point scale and used it in the model of their risk attitude.

Chapter 6. Risk Attitudes: Lottery-Choice Experiment 127
6.3.5.3 Risk management strategies that might be affected by risk attitude
We categorised farmers’ risk management strategies into non–farm and on-farm strategies. Non–farm
risk management strategies included income diversification, loan use in farming, monetary saving,
group involvement and adoption of crop insurance. On-farm risk management strategies included farm
mechanisation, production diversification, sale diversification, crop varietal diversification, and
adoption of stress-tolerant rice varieties (STRVs). The selection of variables to represent farmers’ risk
management strategies was informed by our earlier qualitative study (Chapter 4) and psychometric
scaling of risk management strategies (Chapter 5).
We created separate dummies to represent loan use in farming, monetary saving, group involvement
and crop insurance purchase. According to SQCC-Nepal (2019), six drought–tolerant (Sukhadhan 1 to
6), three submergence–tolerant (Swarna Sub–1, Shamba Mahasuri Sub–1 and Cheharang Sub–1), and
two multi-stress-tolerant (Bahuguni 1 & 2) rice varieties have been released for cultivation. We
created a dummy variable to represent whether the respondent used any of these STRVs.
We constructed separate indices to represent some risk management strategies as continuous variables.
We asked the respondents whether they used 16 farm machines and mechanised nine farming
activities. The list of farming activities and machines was developed in consultation with local
researchers and farmers. Then, we calculated the farm mechanisation index averaging the 25 binary
responses (1 = yes and 0 = no). Similarly, we asked the respondents whether they grow/raise 13
crop/livestock commodities. We calculated the production diversity index as the sum of these 13
binary responses divided by land area cultivated by the respondents in the previous season. We also
calculated the sale diversity index, similar to the production diversity index. Likewise, we constructed
the rice varietal diversity index as a ratio of rice varieties grown to the total area cultivated (ha) by
respondents in the previous season. We also calculated the income diversity index, dividing the
income sources by the highest value of income sources within the sample.
6.3.6 Econometric models
6.3.6.1 Factors affecting risk attitude
The effects of various factors on risk attitude were examined by estimating the OLS model as follows:
𝑦𝑖 = 𝛽0 + 𝛽1𝑥𝑖1 + 𝛽2𝑥𝑖2 + ⋯ + 𝛽𝑘𝑥𝑖𝑘 + 𝜀𝑖 … … … 𝐸𝑞𝑢𝑎𝑡𝑖𝑜𝑛 6.3
where 𝑦𝑖 is CRRA for the ith respondent (i=1, …, n), n is sample size, 𝑥 represents independent
variables that might affect risk attitude as discussed earlier, 𝑘 represents the number of 𝑥 variables, 𝛽0
is the intercept, 𝛽1, … , 𝛽𝑘 are parameters to be estimated, and 𝜀𝑖 is the error term.

Chapter 6. Risk Attitudes: Lottery-Choice Experiment 128
6.3.6.2 Relationships between risk attitude and the application of risk management strategies
Farmers may need to apply more than one risk management strategy simultaneously to deal with
farming risks. Considering that many risk management strategies are not mutually exclusive, the
decision to apply one strategy may affect the decision to apply other strategies. Univariate models of
such decisions exclude useful economic information on the interdependence of simultaneous adoption
decisions (Kassie, 2013). Models that do not account for the synergies and trade-offs between different
alternatives produce biased estimates (Greene, 2012). Multivariate models account for potential
complementarities (positive correlations) and substitutability (negative correlations) among choice
options, allowing for correlation in error terms across dependent variables (Mittal & Mehar, 2016).
Moreover, the Multivariate Probit model offers a higher estimation efficiency compared to the
Multinomial Logit when there is simultaneity in decision–making (see Gillespie et al., 2004).
Therefore, we estimated a Multivariate Probit model using the simulated maximum likelihood method
to examine the effect of farmers’ risk attitude (CRRA), drought risk perception (Drought RP), and
flood risk perception (Flood RP) on the adoption of risk management strategies measured as binary
variables. The following J–equation Multivariate Probit model adapted from Mittal and Mehar (2016)
and Cappellari and Jenkins (2003) was used to examine the effect of explanatory variables on the
dependent variables:
𝑌𝑖𝑗∗ = 𝑋𝑖𝑗
′ 𝛽𝑗 + 𝜀𝑖𝑗 … … … 𝐸𝑞𝑢𝑎𝑡𝑖𝑜𝑛 6.4
𝑦𝑖𝑗 = 1 𝑖𝑓 𝑦𝑖𝑗∗ > 0 𝑎𝑛𝑑 0 𝑜𝑡ℎ𝑒𝑟𝑤𝑖𝑠𝑒
Where 𝑌𝑖𝑗∗ (𝑗 = 1, … , 6) represent six risk management strategies available to the ith farmer (i=1, …,n),
𝑛 is sample size, 𝑋𝑖𝑗′ is a k×1 vector of observed variables that affect the adoption of risk management
strategies, 𝛽𝑗 is a k ×1 vector of parameters to be estimated, and 𝜀𝑖𝑗 is the unobserved error term
which may be correlated across 𝑗. The 𝑦𝑖𝑗 represents outcomes for 𝐽 different adoption decisions
happening simultaneously. The dependent variables include loan use in farming, monetary saving,
STRV use, crop insurance, off-farm employment and group involvement. Similarly, the independent
variables include CRRA, drought risk perception and flood risk perception. We also estimated
individual logit models of all risk management decisions as robustness checks.
We also estimated six OLS models to examine the association of farmers’ risk attitude, drought risk
perception and flood risk perception with the risk management strategies that were measured as
continuous variables. The functional form of the OLS model has been already presented in Equation
6.3. The dependent variables, in this case, include farm mechanization, number of groups involved,
production diversity index, rice varietal diversity index, sale diversification index and income
Chapter 6. Risk Attitudes: Lottery-Choice Experiment 129
diversification index (these indices have been described in Chapter 5). To account for the potential
heteroscedasticity, we have reported robust standard errors.
6.4 Findings and discussion
6.4.1 Summary statistics
This section presents the summary statistics of the variables included in the analyses of farmers’ risk
attitudes. Some of these variables are described in Chapters 3 and 4. Therefore, we only discuss the
variables not discussed elsewhere. We also examined whether these variables are associated with the
study regions using the chi-square test for categorical variables and linear regression for continuous
variables. As indicated by the asterisks, many variables vary across regions.
The sample households have a high dependency on agriculture for their livelihoods. As shown in
Table 6.3, agriculture is the first income source of more than two–thirds of households and the only
income source of about one–third of households. The dependency on agriculture increases from East
to West. The average irrigated area is only one–third of total farmland, and the irrigated area decreases
from East to West, consistent with the categorisation of the study area to represent low, medium and
high vulnerability to drought risk based on rainfall amount. In addition to education, we also used a
measure of farmers’ numeracy skills and self–assessed comprehension of the experimental task in the
model of their risk attitude.
The overall mean of CRRA was slightly negative, indicating risk-neutral to risk–preferring attitudes
towards the lottery. The mean CRRA for ETR, MTR, and WTR were negative (risk preference),
nearly zero (risk neutrality), and positive (risk aversion), respectively. However, positive median
values of CRRA for all regions indicate that farmers were generally risk-averse. The pattern of
regional variation in CRRA indicates that farmers’ risk aversion increases from East to West.
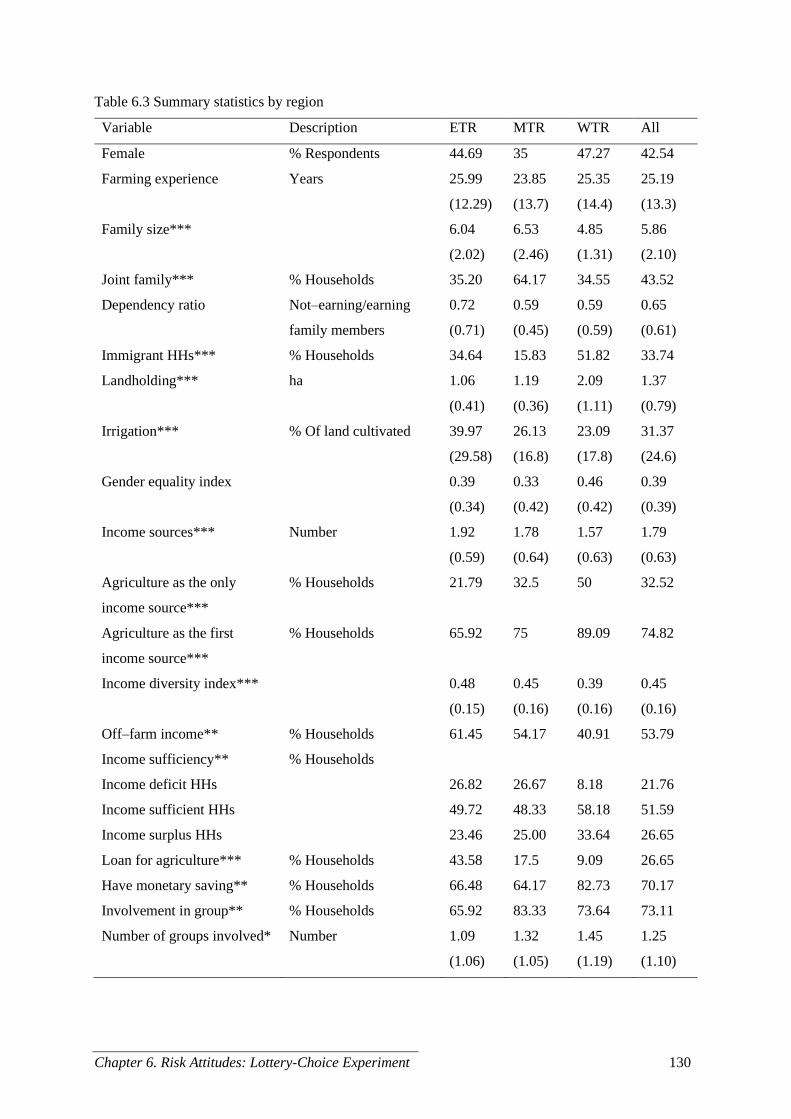
Chapter 6. Risk Attitudes: Lottery-Choice Experiment 130
Table 6.3 Summary statistics by region
Variable Description ETR MTR WTR All
Female % Respondents 44.69 35 47.27 42.54
Farming experience Years 25.99
(12.29)
23.85
(13.7)
25.35
(14.4)
25.19
(13.3)
Family size***
6.04
(2.02)
6.53
(2.46)
4.85
(1.31)
5.86
(2.10)
Joint family*** % Households 35.20 64.17 34.55 43.52
Dependency ratio Not–earning/earning
family members
0.72
(0.71)
0.59
(0.45)
0.59
(0.59)
0.65
(0.61)
Immigrant HHs*** % Households 34.64 15.83 51.82 33.74
Landholding*** ha 1.06
(0.41)
1.19
(0.36)
2.09
(1.11)
1.37
(0.79)
Irrigation*** % Of land cultivated 39.97
(29.58)
26.13
(16.8)
23.09
(17.8)
31.37
(24.6)
Gender equality index
0.39
(0.34)
0.33
(0.42)
0.46
(0.42)
0.39
(0.39)
Income sources*** Number 1.92
(0.59)
1.78
(0.64)
1.57
(0.63)
1.79
(0.63)
Agriculture as the only
income source***
% Households 21.79 32.5 50 32.52
Agriculture as the first
income source***
% Households 65.92 75 89.09 74.82
Income diversity index***
0.48
(0.15)
0.45
(0.16)
0.39
(0.16)
0.45
(0.16)
Off–farm income** % Households 61.45 54.17 40.91 53.79
Income sufficiency** % Households
Income deficit HHs
26.82 26.67 8.18 21.76
Income sufficient HHs 49.72 48.33 58.18 51.59
Income surplus HHs
23.46 25.00 33.64 26.65
Loan for agriculture*** % Households 43.58 17.5 9.09 26.65
Have monetary saving** % Households 66.48 64.17 82.73 70.17
Involvement in group** % Households 65.92 83.33 73.64 73.11
Number of groups involved* Number 1.09
(1.06)
1.32
(1.05)
1.45
(1.19)
1.25
(1.10)

Chapter 6. Risk Attitudes: Lottery-Choice Experiment 131
Infrastructure/ services
access index
0.24
(0.11)
0.20
(0.11)
0.22
(0.13)
0.22
(0.12)
Farm mechanisation
index***
0.30
(0.10)
0.37
(0.12)
0.35
(0.14)
0.33
(0.12)
Rice productivity*** Mt/ha 3.76
(1.10)
3.51
(1.11)
3.26
(0.95)
3.56
(1.08)
Production diversity
index***
9.34
(4.93)
5.98
(2.57)
5.70
(3.05)
7.38
(4.25)
Sale diversity index***
4.94
(3.48)
3.43
(2.08)
3.23
(2.15)
4.04
(2.90)
Rice varietal diversity
index***
4.11
(1.78)
3.37
(0.92)
3.08
(1.15)
3.61
(1.48)
Used STRVs % Respondents 31.28 43.33 31.82 34.96
Crop insurance adoption % Respondents 8.38 10 8.18 8.8
Drought risk perception 0–1 0.59
(0.26)
0.59
(0.27)
0.58
(0.25)
0.59
(0.26)
Flood risk perception 0–1 0.17
(0.19)
0.21
(0.23)
0.19
(0.18)
0.18
(0.20)
Numeracy score 0–5 2.89
(1.56)
2.57
(1.39)
2.60
(1.46)
2.72
(1.49)
Experiment comprehension 0–1 3.77
(0.98)
3.69
(1.07)
3.75
(1.10)
3.74
(1.04)
CRRA*** Mean –0.29
(0.93)
0.03
(0.70)
0.19
(0.53)
–0.06
(0.80)
Median –0.16 0.34 0.34 0.13
N
179 120 110 409
Note: Figures in parentheses indicate SD; asterisks indicate significance of regional differences at *
p<0.05, ** p<0.01 and *** p<0.001.
6.4.2 Risk attitude analysis
In the LCE, a respondent made 11 decisions whether to play the lottery (L) or accept a certain amount
(C). We expanded the dataset into 11 rows for each respondent keeping 11 values of C (0 to 200), and
created a dummy variable called ‘certain–choice’ (1 if C was chosen or 0 otherwise). This expansion
resulted in 4499 observations, or 11 times the sample size (409). Then we estimated logistic regression
using ‘certain–choice’ as the dependent variable and C as the independent variable. As expected, the
probability of choosing C over L increases as the value of C increases (Table 6.4).

Chapter 6. Risk Attitudes: Lottery-Choice Experiment 132
Table 6.4 Logistic regression of ‘certain–choice’ on the certain LCE amount
Independent variable Odds ratio SE
Certain amount 1.04*** 0.00
Constant 0.01*** 0.00
Log–likelihood –1363.07
LR chi2(1) 3455.33***
Pseudo R2 0.56
Observations 4499
Note: Asterisks indicate statistical significance at * p<0.05, ** p<0.01 and *** p<0.001.
We predicted the probabilities of choosing C over L in the experiment using logistic regression
estimates. We also separated these probabilities by study region. Figure 6.1 shows the overall and
region-wise probabilities of choosing different values of C over L. The dotted line shows the
theoretical probabilities of choosing C over L by a risk-neutral decision-maker (DM), which is a
reference line for evaluating predicted probabilities. A risk-neutral DM is an expected value
maximiser who is indifferent between C and L when C is equal to the expected value of L. The value
of C corresponding to 0.5 provability of choosing C over L is the certainty equivalent (CE) of L. The
CE for the risk-neutral DM is 100 NPR in our case, and the average CE for the respondents is about
87.79 NPR. This finding suggests that the farmers were risk-averse in general. We also observed
regional variation in farmers’ risk attitudes. Although the CE for ETR respondents indicates a risk-
neutral attitude, the same for MTR and WTR indicate risk aversion. Moreover, the graph shows that
farmers’ risk aversion increased from East to West.
Figure 6.1 Risk attitude analysis using a lottery–choice experiment
Note: Arrows indicate CE.

Chapter 6. Risk Attitudes: Lottery-Choice Experiment 133
6.4.2.1 Constant relative risk aversion coefficient (CRRA)
Table 6.5 presents the summary statistics of CRRA derived from the utility function elicited through
LCE. We also examined whether CRRA is associated with study regions using regression analysis
considering robust standard errors2. A highly significant result implies that farmers’ risk attitudes
varied across study regions.
Table 6.5 Description of risk attitude measures
Variables ETR MTR WTR All
CRRA*** Mean –0.29 (0.93) 0.03 (0.70) 0.19 (0.53) –0.06 (0.80)
Median –0.16 0.34 0.34 0.13
Note: Figures in parentheses indicate SD; asterisks indicate the significance of the regional difference
at * p<0.05, ** p<0.01 and *** p<0.001.
6.4.2.2 Classification of respondents by risk attitude
Table 6.6 shows the region-wise distribution of respondents into various risk attitude classes based on
CRRA values, as discussed in the Methodology section. About half of the respondents belonged to the
three classes grouped in the risk-averse category. Similarly, while 29% of respondents belonged to two
classes grouped as the risk-neutral category, the remainder (22%) belonged to three classes grouped as
the risk–preferring category. The proportion of respondents in risk aversion classes was highest in
WTR (74%), followed by MTR (56%) and ETR (35%).
Table 6.6 Distribution of respondents by risk attitude class
Risk attitude class ETR MTR WTR All
Highly risk–preferring 10 (5.59) 2 (1.67) 0 (0.00) 12 (2.93)
Moderately risk–preferring 20 (11.10) 9 (7.50) 7 (6.36) 36 (8.80)
Slightly risk–preferring 23 (12.85) 10(8.33) 7 (6.36) 40 (9.78)
Sub–total of risk–preferring category 53 (29.61) 21 (17.50) 14 (12.72) 88 (21.51)
Risk–preferring to neutral 37 (20.67) 19 (15.83) 9 (8.18) 65 (15.89)
Risk–neutral to averse 27 (15.08) 13 (10.83) 13 (11.82) 53 (12.96)
Sub–total of risk–neutral category 64 (35.75) 32 (26.66) 22 (20.00) 118 (28.85)
Moderately risk–averse 33 (18.44) 31 (25.83) 24 (21.82) 88 (21.52)
Highly risk–averse 27 (15.08) 25 (20.83) 35 (31.82) 87 (21.27)
Extremely risk–averse 2 (1.12) 11 (9.17) 15 (13.64) 28 (6.85)
Sub–total of risk–averse category 62 (34.64) 67 (55.83) 74 (67.28) 203 (49.64)
2 One-way ANOVA and Kruskal-Wallis H test produced similar results, indicating that the regression analysis
results are robust.

Chapter 6. Risk Attitudes: Lottery-Choice Experiment 134
Total 179 120 110 409
Note: Figures in parentheses indicate column percentage.
The CRRA discussed in this paper is a measure of farmers’ risk attitudes when evaluating the
monetary lottery used in the experiment. An important assumption of this study is that the measure of
risk attitude derived from an incentivised LCE is sufficiently correlated with risk attitude when
evaluating real-life risks, such as those in farming. The reliability of the experimental instrument is a
critical factor for determining this correlation. If a lottery involves the risk of losing life with some
possibilities, every individual will have a risk-averse attitude. Similarly, if the risk is trivial with some
possibility of gain, most individuals will prefer to take the risk. However, such instruments do not
yield variable data so that individuals can be compared based on their risk attitudes. The heterogeneity
in respondents’ choice behaviours suggests that the experimental instrument and payoff scale used in
our study were appropriate to produce a reliable measure of risk attitude.
6.4.3 Factors associated with risk attitude
Table 6.7 presents the results of the OLS estimation using CRRA as a dependent variable. Although
the initial model included many independent variables, we eliminated variables with a variance
inflation factor (VIF) greater than or equal to 10 to overcome the multicollinearity issue. The mean
VIF of the final model was 1.78, with none of the variables with a VIF greater than four. We have
reported robust standard errors to account for the heteroscedasticity, as suggested by the Breusch–
Pagan/Cook–Weisberg tests. Further, we have adjusted the standard errors by clustering to account for
potential correlation in observations within study districts (see Wooldridge et al., 2017).
The regression results show that farmers’ risk aversion is correlated with geographical location.
Among the three regions, the farmers from WTR were most risk-averse, followed by those from MTR.
As shown in Table 6.3, the proportion of households with agriculture as the only source of income and
agriculture as the first source of income increased from east to west. Likewise, the proportion of
irrigated land and the amount of annual rainfall decreased in the same direction. These results lead us
to conclude that the households’ dependency on agriculture for livelihoods increases the farmers’
preference for certainty. Moreover, the overall physical and human development indicators decreased
from East to West. The increase in farmers’ risk aversion with decreasing physical and human
development and rainfall implies that less resourceful or underdeveloped contexts make farmers more
risk-averse.
Our finding on the relationship between gender and risk attitude is unusual because most previous
studies reported either positive (e.g., Brick et al., 2012; Croson & Gneezy, 2009; Eckel & Grossman,
2002, 2008; Hermann & Mußhoff, 2017; Nielsen et al., 2013; Weber et al., 2002; Ye & Wang, 2013)
or non–significant (e.g., Harrison et al., 2007; Schubert et al., 1999) effects of being female on the
Chapter 6. Risk Attitudes: Lottery-Choice Experiment 135
level of risk aversion. Generally, males are the decision-makers in Nepalese households. A female
acquires a decision–making role only if a family does not have an adult male. The female respondents
in the study were active decision-makers in their families. Such an acquired status for decision–
making might have made them less risk-averse than they would have been otherwise. Further research
involving non–decision–making women is needed to ascertain whether Nepali women are more risk-
taking than men. Nevertheless, farmers’ risk attitudes were unaffected by the levels of gender equality
in household decision–making and farming activities.
The farming experiences of the respondents, a linear function of their age, had a negative association
with their risk aversion. With more experience in farming and dealing with risks, farmers might have
developed better ideas to maximise expected benefits by taking some risks. However, this finding
contradicts those of Iqbal et al. (2016) and Ullah et al. (2015), who reported positive correlations
between farming experiences and risk aversion. Considering the land as a proxy for wealth, the
positive correlation between farm size and risk aversion is consistent with the classical theory of ARA
and findings of others (e.g., Iqbal et al., 2016; Lucas & Pabuayon, 2011; Ullah et al., 2015). However,
some studies reported a negative relationship between farm size and risk aversion (e.g., Feder, 1980;
Velandia et al., 2009). The positive correlation between risk aversion and numeracy (numeracy and
education were positively correlated) suggests that individuals tend to avoid risk as they become more
able to calculate risks. However, earlier studies reported negative relationships between numeracy and
risk aversion (e.g., Benjamin et al., 2013; Dohmen et al., 2010; Frederick, 2005) while the correlation
between education and risk aversion varied across studies (see Harrison et al., 2007; Hartog et al.,
2002; Nielsen et al., 2013; Tanaka et al., 2010).
Although farmers had higher perceptions of drought risk than flood risk (see Table 6.3), their risk
attitudes were correlated only with their flood risk perception. The differential associations of flood
and drought risk perceptions with risk attitude are not surprising because these risks affect farm
production in different ways. Most flood-related hazards are catastrophic, while the drought effects are
not realised as immediately as flood effects. The experience of immediate loss of property and crops
due to floods might have influenced farmers with higher flood risk perceptions to become more risk-
averse. Earlier studies reported ambiguous relationships between farmers’ risk perceptions and risk
attitudes. For instance, Ullah et al. (2015) reported a positive correlation between risk perception and
risk aversion, while van Winsen et al. (2016) found these variables uncorrelated. Moreover, the other
variables included in the model had non–significant association with risk attitude, which is also
noteworthy because other studies reported varying results for most of these variables.

Chapter 6. Risk Attitudes: Lottery-Choice Experiment 136
Table 6.7 Estimates of OLS regression model of farmers’ risk attitude
Dependent variable: CRRA
Coef. Robust SE
Region (Base ETR) MTR 0.19* 0.05
WTR 0.23** 0.05
Female
−0.36* 0.10
Age (Years)
−0.02* 0.01
Family size
−0.02 0.02
Farm size (Ha)
0.23* 0.06
Numeracy score (0−5)
0.07* 0.03
Flood risk perception
0.28* 0.09
Joint family
0.12 0.08
Dependency ratio (Earning/ non–earning members)
0.03 0.08
Migrant household (Base: indigenous)
−0.03 0.14
Irrigation (% of farm size)
0.00 0.00
Agriculture as first income source
0.03 0.10
Agriculture as only income source
−0.05 0.10
Income sufficiency (Base deficit) Sufficient 0.03 0.13
Surplus −0.01 0.08
Gender equality index
0.11 0.17
Infrastructure/ service access index
−0.34 0.39
Rice productivity (Mt/Ha)
−0.02 0.03
Choice task comprehension
0.03 0.18
Drought risk perception
−0.03 0.10
Constant
0.44 0.48
R2
0.30
N
409
Note: Asterisks indicate statistical significance at * p<0.05, ** p<0.01 and *** p<0.001; SEs are
adjusted for seven clusters in study districts to account for potential spatial correlation in
observations.
6.4.4 Association of risk attitude and risk perceptions with risk management decisions
As shown in Table 6.8, both Drought RP and Flood RP were not related to the adoption of risk
management strategies except for the positive correlation between Drought RP and loan use in
farming. But CRRA was positively associated with monetary saving, STRV use, adoption of crop
insurance and group involvement, but non–significant for loan use in farming and off-farm
employment. Earlier studies that reported varied effects of risk aversion and risk perception on risk
management decisions are noteworthy in this context. For instance, while Sherrick et al. (2003)
reported a higher likelihood of crop insurance use for a higher perception of yield risk, van Winsen et

Chapter 6. Risk Attitudes: Lottery-Choice Experiment 137
al. (2016) concluded that the propensity to implement risk management strategy is not affected by risk
perception but by risk attitude. Likewise, while Meraner and Finger (2017) found a positive effect of
risk aversion on the adoption of risk management strategies, several studies (e.g., Hellerstein et al.,
2013; Just et al., 1999; Menapace et al., 2016) reported a negative effect of risk aversion on insurance
uptake.
Drought is the most important weather-related risk in the study area. Farmers who are more worried
about drought might take a loan to cope with the associated negative consequences. The positive
association between risk aversion and monetary saving might be because farmers who dislike risk
prefer more financial liquidity to manage the likely undesirable outcomes. The adoption of flood and
drought-tolerant rice varieties is gaining momentum in Nepal. Risk-averse farmers might consider
such varieties as appropriate options for minimising production uncertainty. The positive association
of risk aversion with the adoption of crop insurance was consistent with the general expectation.
Farmers with a high dislike of risk are expected to be more willing to pay for certainty. Similarly,
involvement in farmer groups is an important risk management strategy. Farmer groups can be
important platforms for local innovations and information exchange, helping farmers better manage
their farms. Such groups and cooperatives can also help farmers manage credit risks by providing
microcredit facilities and price risk by increasing their bargaining power in the market. Increased
awareness about the availability and benefits of formal risk management strategies (e.g., crop
insurance) through information sharing also increases the demand for such strategies.
We also examined the robustness of multivariate probit results estimating individual logit models of
all risk management strategies using the same independent variables. The estimates are almost
identical to those of the Multivariate Probit model except for the significant positive association
between Flood RP and STRV use in the individual logit model (see Appendix I). The consistency in
the results across the two models confirms that the estimates of the multivariate probit model are
robust and unbiased.
Table 6.8 Estimates of Multivariate Probit models of farmers’ risk management strategies
Model Loan use
in farming
Monetary
saving
STRV
use
Crop
insurance
Off-farm
employment
Group
involvement
CRRA –0.06
(0.08)
0.21**
(0.08)
0.24**
(0.09)
0.93**
(0.28)
–0.01
(0.08)
0.45***
(0.08)
Drought RP 0.53*
(0.26)
–0.28
(0.26)
0.23
(0.25)
–0.27
(0.34)
–0.22
(0.25)
–0.20
(0.27)
Flood RP –0.56
(0.35)
–0.02
(0.33)
0.60
(0.32)
–0.08
(0.46)
0.03
(0.32)
0.43
(0.36)

Chapter 6. Risk Attitudes: Lottery-Choice Experiment 138
Constant –0.85***
(0.19)
0.72***
(0.18)
–0.62***
(0.17)
–1.36***
(0.24)
0.22
(0.17)
0.72***
(0.19)
Log–
likelihood
–1299.56
Wald chi2(18) 72.41**
Draws 500
Observations 409
Note: Figures in parentheses indicate SE; LR test of rho21 = rho31 =…= rho65 = 0: chi2(15) =
99.01***; asterisks indicate statistical significance at * p<0.05, ** p<0.01, and *** p<0.001; the
bold figures indicate that the coefficients are also significant in individual logit models.
Pairwise correlation coefficients between the residuals of most of the risk management strategies in
the Multivariate Probit model are significant (Table 6.9). This result implies that the error terms in the
risk management decision equations are correlated and justifies the use of the Multivariate Probit
model instead of independent binary models (Mittal & Mehar, 2016). The positive correlation
indicates a complementarity, and the negative correlation indicates substitutability between the risk
management strategies. We expected a negative correlation between crop insurance purchase and
STRV use because STRVs minimize production loss due to climatic stresses, decreasing farmers’
demand for crop insurance. However, the model suggests that crop insurance purchase and STRV use
are the most significant complementary strategies. The positive correlation between these variables
might be because the insurance companies and extension agencies encourage farmers to grow STRVs
to minimize the insurance claim and subsidy burden. Moreover, farmers’ awareness of such
technologies might be associated with their awareness of crop insurance programs resulting in higher
adoption of both. Further, the model suggests that off-farm employment and monetary saving are
substitutable strategies to some degree. Farmers who have off-farm employment might have
considered maintaining monetary reserves less important as a risk management strategy.
Table 6.9 Correlation between the adoption of risk management strategies (multivariate probit)
Loan use in
farming
Monetary
saving
STRV
use
Crop
insurance
Off-farm
employment
Monetary saving –0.11
(0.09)
STRV use 0.18*
(0.08)
0.23**
(0.08)
Crop insurance 0.34**
(0.11)
0.39**
(0.13)
0.56***
(0.09)
Off-farm
employment
0.29***
(0.08)
–0.21**
(0.08)
–0.12
(0.08)
0.00
(0.11)

Chapter 6. Risk Attitudes: Lottery-Choice Experiment 139
Group
involvement
0.34***
(0.09)
–0.04
(0.09)
0.31***
(0.08)
0.10
(0.14)
0.15
(0.08)
Note: Figures in parentheses indicate SE; asterisks indicate statistical significance at * p<0.05, **
p<0.01 and *** p<0.001.
As shown in Table 6.10, none of the risk management measures was associated with farmers’ risk
perceptions. However, CRRA was positively associated with farm mechanisation and the number of
groups involved. This association was negative for production diversification and rice varietal
diversification. Sale diversification and income diversification were not associated with any
explanatory variables included in the model.
Table 6.10 Estimates of OLS models of farmers’ risk management strategies
Model Farm
Mechanisation
index
Number
of groups
involved
Production
diversity
index
Rice varietal
diversity
index
Sale diversity
index
Income
diversity
index
CRRA 0.02**
(0.01)
0.48***
(0.07)
–1.40***
(0.31)
–0.33***
(0.09)
–0.35
(0.22)
–0.02
(0.01)
Drought RP –0.02
(0.02)
–0.25
(0.21)
0.29
(0.73)
–0.18
(0.25)
0.14
(0.61)
0.00
(0.03)
Flood RP 0.01
(0.03)
0.23
(0.27)
0.52
(0.89)
–0.18
(0.29)
0.80
(0.64)
0.02
(0.04)
Constant 0.34***
(0.02)
1.39***
(0.14)
7.02***
(0.48)
3.73***
(0.16)
3.79***
(0.41)
0.44***
(0.02)
F 4.76 19.10 7.05 4.53 1.23 1.16
R2 0.03 0.13 0.07 0.03 0.01 0.01
Observations 409 409 409 409 409 409
Note: Figures in parentheses indicate Robust SE; asterisks indicate statistical significance at *
p<0.05, ** p<0.01 and *** p<0.001.
As discussed earlier, the Multivariate Probit model suggested a positive association between risk
aversion and farmers’ involvement in the group. The OLS models reinforce this finding, suggesting
that the increase in farmers’ risk aversion increases their tendency to be involved in more groups.
Similarly, mechanisation of farm activities is a major risk management strategy adopted by farmers.
Due to increasing youth outmigration and the higher opportunity cost of labour in industrial sectors,
agriculture is facing increasing uncertainty in labour supply, especially during peak seasons. Changing
climatic patterns have been limiting farmers to follow the usual crop calendars. For instance,
uncertainty in the onset of monsoon is a major manifestation of climate change in Nepal, which
interferes with farmers’ timing for rice seeding and transplantation. Grain quality risk associated with
unexpected rainfall during crop harvest is an emerging weather risk in farming. Provided that access to
Chapter 6. Risk Attitudes: Lottery-Choice Experiment 140
machines and mechanisation services are not constraints, increased risk aversion was associated with
increasing machine use for farming activities to overcome these risks. Moreover, the use of machines
for cleaning, grading and packaging operations also subsides market risks adding value to farm
produce.
The negative association of risk aversion with the production and rice varietal diversification is
counterintuitive because a risk-averse farmer is expected to adopt a more diversified production
system. Engle Warnick et al. (2011) also reported a negative correlation between risk aversion and
crop varietal diversification. However, the number of commodities or crop varieties a farmer grows
depends on farm size and irrigation facilities. To account for the effect of farm size on production
diversification, we constructed an index dividing the number of crops grown by farm size. The
availability of irrigation and production diversity index decrease from the East towards the West (see
Table 3), while farmers’ risk aversion increases in the opposite direction (see Table 4). This
discrepancy explains the negative relationship of risk–aversion with production diversification and
rice varietal diversification.
6.5 Conclusion
This study used an incentivized monetary-lottery choice experiment to elicit farmers’ utility function.
Using the risk aversion coefficient derived from the utility function as a measure of risk attitude, this
study reinforces some existing theories while establishing new relationships between various personal
and socio-economic factors, farmers’ risk attitudes and their choice of risk management strategies in
the Nepali context. In general, farmers showed a risk-averse attitude to the lottery game, and their risk
aversion increased from East to West. Although the current rate of crop insurance adoption is low, the
findings that farmers were risk-averse and risk aversion was positively correlated with insurance
adoption indicate the potential for expansion of the existing agricultural insurance market. Information
on spatial variation in farmers’ risk attitudes can be useful for insurance companies to identify target
groups, assess region-specific demand, diversify insurance products, set appropriate premium prices to
minimise adverse selection, and design promotional programs.
The negative correlation between female and risk aversion does not support the prevalent stereotyping
about gender that females are more risk–averse than males. We suspect that the acquired decision–
making status of female respondents could make them less risk–averse than males, who are the default
decision–makers in Nepali households. Although further research is required to clarify such a
surprising finding, it suggests that policies and programs should not assume that women are more
risk–averse than men. Similarly, policies and programs that aim at improving farmers’ adoption of
modern farming technologies and risk management products may consider the findings that larger

Chapter 6. Risk Attitudes: Lottery-Choice Experiment 141
farmers are more risk–averse than smaller ones, and risk aversion decreases with increasing farming
experience.
Similarly, increased risk aversion with increasing numeracy skills may be due to individuals’ better
ability to calculate risk. Since increasing the formal education level of farmers is not practical in a
short timeframe, insurance companies are likely to benefit if they invest in training farmers on
probability calculations and risk management through insurance. Such skills may increase farmers’
willingness to adopt insurance products through increased risk aversion. However, further research is
needed to compare the effectiveness of numeracy training and conventional awareness campaign or
advertisement in creating demand for risk management products. We also found that farmers’ risk
aversion was positively associated with monetary saving, STRV use, adoption of crop insurance and
group involvement. These findings can aid both insurance companies and extension agencies in
designing risk management products and support programs.
Further, while answering specific questions related to farmers’ risk attitudes and farming risk
management in Nepal, we have developed a simplified MPL, which is less cognitively demanding
than the existing instruments and suitable for eliciting risk attitudes even when the respondents have
low levels of formal education. A small number of inconsistent responses and the significant
correlation between CRRA and the adoption of risk management strategies suggest that the instrument
used in the experiment was reliable. Future research may adapt our instrument to elicit the risk
attitudes of individuals in various sectors.
Chapter 6. Risk Attitudes: Lottery-Choice Experiment 142
6.6 References
Andersen, S., Harrison, G. W., Lau, M. I., & Rutström, E. E. (2006). Elicitation Using Multiple Price
List Formats. Experimental Economics, 9(4), 383-405.
https://doi.org/https://doi.org/10.1007/s10683-006-7055-6
Anderson, L., & Mellor, J. (2009). Are Risk Preferences Stable? Comparing an Experimental Measure
with a Validated Survey-Based Measure. Journal of Risk and Uncertainty, 39(2), 137-160.
https://doi.org/https://doi.org/10.1007/s11166-009-9075-z
Arrow, K. J. (1965). Aspects of the Theory of Risk Bearing. Yrjö Jahnssonin Säätiö, Academic
Bookstore.
Ashraf, M., & Routray, J. K. (2013). Perception and Understanding of Drought and Coping Strategies
of Farming Households in North-West Balochistan. International Journal of Disaster Risk
Reduction, 5, 49-60. https://doi.org/https://doi.org/10.1016/j.ijdrr.2013.05.002
Asravor, R. K. (2019). Farmers' Risk Preference and the Adoption of Risk Management Strategies in
Northern Ghana. Journal of Environmental Planning and Management, 62(5), 881-900.
https://doi.org/https://doi.org/10.1080/09640568.2018.1452724
Bard, S. K., & Barry, P. J. (2001). Assessing Farmers' Attitudes toward Risk Using the "Closing-in"
Method. Journal of Agricultural and Resource Economics, 26(1), 248-260.
https://doi.org/https://doi.org/10.2307/40987106
Barham, B. L., Chavas, J.-P., Fitz, D., Salas, V. R., & Schechter, L. (2014). The Roles of Risk and
Ambiguity in Technology Adoption. Journal of Economic Behavior & Organization, 97, 204-
218. https://doi.org/https://doi.org/10.1016/j.jebo.2013.06.014
Barrett, C. B. (2011). Covariate Catastrophic Risk Management in the Developing World: Discussion.
American Journal of Agricultural Economics, 93(2), 512-513.
https://doi.org/https://doi.org/10.1093/ajae/aaq134
Becker, G. S. (1976). The Economic Approach to Human Behavior. The University of Chicago Press.
Begho, T. (2021). Using Farmers’ Risk Tolerance to Explain Variations in Adoption of Improved Rice
Varieties in Nepal. Journal of South Asian development, 16(2), 171-193.
https://doi.org/https://doi.org/10.1177/09731741211023636
Benjamin, D. J., Brown, S. A., & Shapiro, J. M. (2013). Who Is 'Behavioural'? Cognitive Ability and
Anomalous Preferences. Journal of the European Economic Association, 11(6), 1231-1255.
https://doi.org/https://doi.org/10.1111/jeea.12055
Bernoulli, D. (1738). Specimen Theoriae Novae De Mensvra Sortis [Exposition of a new theory on the
measurement of risk]. Commentarii Academiae Scientiarum Imperialis Petropolitanae, 5,
175-192. https://doi.org/https://doi.org/10.2307/1909829 (Exposition of a new theory on the
measurement of risk) (Specimen Theoriae Novae De Mensvra Sortis)

Chapter 6. Risk Attitudes: Lottery-Choice Experiment 143
Binici, T., Koc, A. A., Zulauf, C. R., & Bayaner, A. (2003). Risk Attitudes of Farmers in Terms of
Risk Aversion: A Case Study of Lower Seyhan Plain Farmers in Adana Province, Turkey.
Turkish Journal of Agriculture and Forestry, 27(5), 305–312.
https://doi.org/https://doi.org/10.3906/tar-0303-5
Binswanger, H. P. (1980). Attitudes toward Risk: Experimental Measurement in Rural India.
American Journal of Agricultural Economics, 62(3), 395-407.
https://doi.org/https://doi.org/10.2307/1240194
Brick, K., Visser, M., & Burns, J. (2012). Risk Aversion: Experimental Evidence from South African
Fishing Communities. American Journal of Agricultural Economics, 94(1), 133-152.
https://doi.org/https://doi.org/10.1093/ajae/aar120
Camerer, C. (2003). Behavioral Game Theory: Experiments in Strategic Interaction. Princeton
University Press.
Camerer, C., & Hogarth, R. (1999). The Effects of Financial Incentives in Experiments: A Review and
Capital-Labor-Production Framework. Journal of Risk and Uncertainty, 19(1), 7-42.
https://doi.org/https://doi.org/10.1023/A:1007850605129
Cappellari, L., & Jenkins, S. P. (2003). Multivariate Probit Regression Using Simulated Maximum
Likelihood. The Stata journal, 3(3), 278-294.
https://doi.org/https://doi.org/10.1177/1536867X0300300305
Charness, G., Gneezy, U., & Imas, A. (2013). Experimental Methods: Eliciting Risk Preferences.
Journal of Economic Behavior & Organization, 87, 43-51.
https://doi.org/https://doi.org/10.1016/j.jebo.2012.12.023
Chavas, J.-P., & Holt, M. (1996). Economic Behavior under Uncertainty: A Joint Analysis of Risk
Preferences and Technology. The Review of Economics and Statistics, 78(2), 329-335.
https://doi.org/https://doi.org/10.2307/2109935
Cohen, A., & Einav, L. (2007). Estimating Risk Preferences from Deductible Choice. American
Economic Review, 97(3), 745-788. https://doi.org/https://doi.org/10.1257/aer.97.3.745
Croson, R., & Gneezy, U. (2009). Gender Differences in Preferences. Journal of Economic Literature,
47(2), 448-474. https://doi.org/https://doi.org/10.1257/jel.47.2.448
Dave, C., Eckel, C., Johnson, C., & Rojas, C. (2010). Eliciting Risk Preferences: When Is Simple
Better? Journal of Risk and Uncertainty, 41(3), 219-243.
https://doi.org/https://doi.org/10.1007/s11166-010-9103-z
Dohmen, T., Falk, A., Huffman, D., & Sunde, U. (2010). Are Risk Aversion and Impatience Related
to Cognitive Ability? American Economic Review, 100(3), 1238-1260.
https://doi.org/https://doi.org/10.1257/aer.100.3.1238
Dohmen, T., Falk, A., Huffman, D., Sunde, U., Schupp, J., & Wagner, G. (2011). Individual Risk
Attitudes: Measurement, Determinants, and Behavioral Consequences. Journal of the

Chapter 6. Risk Attitudes: Lottery-Choice Experiment 144
European Economic Association, 9(3), 522-550. https://doi.org/https://doi.org/10.1111/j.1542-
4774.2011.01015.x
Eckel, C. C., & Grossman, P. J. (2002). Sex Differences and Statistical Stereotyping in Attitudes
toward Financial Risk. Evolution and Human Behavior, 23(4), 281-295.
https://doi.org/https://doi.org/10.1016/S1090-5138(02)00097-1
Eckel, C. C., & Grossman, P. J. (2008). Forecasting Risk Attitudes: An Experimental Study Using
Actual and Forecast Gamble Choices. Journal of Economic Behavior & Organization, 68(1),
1-17. https://doi.org/https://doi.org/10.1016/j.jebo.2008.04.006
Engle Warnick, J. C., Escobal, J., & Laszlo, S. C. (2011). Ambiguity Aversion and Portfolio Choice in
Small-Scale Peruvian Farming. The B.E. Journal of Economic Analysis & Policy, 11(1), 1-56.
https://doi.org/https://doi.org/10.2202/1935-1682.2331
Ert, E., & Haruvy, E. (2017). Revisiting Risk Aversion: Can Risk Preferences Change with
Experience? Economics Letters, 151, 91-95.
https://doi.org/https://doi.org/10.1016/j.econlet.2016.12.008
Feder, G. (1980). Farm Size, Risk Aversion and the Adoption of New Technology under Uncertainty.
Oxford Economic Papers, 32(2), 263-283.
https://doi.org/https://doi.org/10.1093/oxfordjournals.oep.a041479
Feder, G., Just, R. E., & Zilberman, D. (1985). Adoption of Agricultural Innovations in Developing
Countries: A Survey. Economic Development and Cultural Change, 33(2), 255-298.
https://doi.org/https://doi.org/10.1086/451461
Fiore, S. M., Harrison, G. W., Hughes, C. E., & Rutström, E. E. (2009). Virtual Experiments and
Environmental Policy. Journal of environmental economics and management, 57(1), 65-86.
https://doi.org/https://doi.org/10.1016/j.jeem.2008.08.002
Flaten, O., Lien, G., Koesling, M., Valle, P. S., & Ebbesvik, M. (2005). Comparing Risk Perceptions
and Risk Management in Organic and Conventional Dairy Farming: Empirical Results from
Norway. Livestock Production Science, 95(1-2), 11-25.
https://doi.org/https://doi.org/10.1016/j.livprodsci.2004.10.014
Frederick, S. (2005). Cognitive Reflection and Decision Making. Journal of Economic Perspectives,
19(4), 25-42. https://doi.org/https://doi.org/10.1257/089533005775196732
Gillespie, J. M., Davis, C. G., & Rahelizatovo, N. C. (2004). Factors Influencing the Adoption of
Breeding Technologies in U.S. Hog Production. Journal of Agricultural and Applied
Economics, 36(1), 35-47. https://doi.org/https://doi.org/10.22004/ag.econ.42898
Greene, W. H. (2012). Econometric Analysis (7th ed. ed.). Prentice-Hall.
Hamal, K. B., & Anderson, J. R. (1982). A Note on Decreasing Absolute Risk Aversion among
Farmers in Nepal. Australian Journal of Agricultural Economics, 26(3), 220-225.
https://doi.org/https://doi.org/10.1111/j.1467-8489.1982.tb00414.x
Chapter 6. Risk Attitudes: Lottery-Choice Experiment 145
Hardaker, J. B., Lien, G., Anderson, J. R., & Huirne, R. B. M. (2015). Coping with Risk in
Agriculture: Applied Decision Analysis (3rd ed.). CABI.
https://ebookcentral.proquest.com:80/lib/CURTIN/docDetail.action?docID=2066663
Harrison, G. W., Lau, M. I., & Rutström, E. E. (2007). Estimating Risk Attitudes in Denmark: A Field
Experiment*. Scandinavian Journal of Economics, 109(2), 341-368.
https://doi.org/https://doi.org/10.1111/j.1467-9442.2007.00496.x
Harrison, G. W., & List, J. A. (2004). Field Experiments. Journal of Economic Literature, 42(4),
1009-1055. https://doi.org/https://doi.org/10.1257/0022051043004577
Hartog, J., Ferrer‐I‐Carbonell, A., & Jonker, N. (2002). Linking Measured Risk Aversion to Individual
Characteristics. Kyklos, 55(1), 3-26. https://doi.org/https://doi.org/10.1111/1467-6435.00175
Hellerstein, D., Higgins, N., & Horowitz, J. (2013). The Predictive Power of Risk Preference
Measures for Farming Decisions. European Review of Agricultural Economics, 40(5), 807-
833. https://doi.org/https://doi.org/10.1093/erae/jbs043
Hermann, D., & Mußhoff, O. (2017). Displaying Expected Values in Risk Elicitation Tasks: The
Effect of Information in Experimental Risk Research. Journal of Risk Research, 1-11.
https://doi.org/https://doi.org/10.1080/13669877.2017.1378246
Holt, C. A., & Laury, S. K. (2002). Risk Aversion and Incentive Effects. American Economic Review,
92(5), 1644-1655. https://doi.org/https://doi.org/10.1257/000282802762024700
Iqbal, M. A., Ping, Q., Abid, M., Muhammad Muslim Kazmi, S., & Rizwan, M. (2016). Assessing
Risk Perceptions and Attitude among Cotton Farmers: A Case of Punjab Province, Pakistan.
International Journal of Disaster Risk Reduction, 16, 68-74.
https://doi.org/https://doi.org/10.1016/j.ijdrr.2016.01.009
Jacobson, S., & Petrie, R. (2009). Learning from Mistakes: What Do Inconsistent Choices over Risk
Tell Us? Journal of Risk and Uncertainty, 38(2), 143-158.
https://doi.org/https://doi.org/10.1007/s11166-009-9063-3
Jianjun, J., Yiwei, G., Xiaomin, W., & Nam, P. K. (2015). Farmers’ Risk Preferences and Their
Climate Change Adaptation Strategies in the Yongqiao District, China. Land Use Policy, 47,
365-372. https://doi.org/https://doi.org/10.1016/j.landusepol.2015.04.028
Jin, J., He, R., Gong, H., Xu, X., & He, C. (2017). Farmers' Risk Preferences in Rural China:
Measurements and Determinants. International Journal of Environmental Research and
Public Health, 14(7), 1-11. https://doi.org/https://doi.org/10.3390/ijerph14070713
Just, R. E., Calvin, L., & Quiggin, J. (1999). Adverse Selection in Crop Insurance: Actuarial and
Asymmetric Information Incentives. American Journal of Agricultural Economics, 81(4), 834-
849. https://doi.org/https://doi.org/10.2307/1244328
Kahneman, D., & Tversky, A. (1979). Prospect Theory: An Analysis of Decision under Risk.
Econometrica, 47(2), 263-291. https://doi.org/https://doi.org/10.2307/1914185

Chapter 6. Risk Attitudes: Lottery-Choice Experiment 146
Kassie, M. (2013). Adoption of Interrelated Sustainable Agricultural Practices in Smallholder
Systems: Evidence from Rural Tanzania. Technological Forecasting & Social Change, 80(3),
525-540. https://doi.org/https://doi.org/10.1016/j.techfore.2012.08.007
Kimball, M. S., Sahm, C. R., & Shapiro, M. (2008). Imputing Risk Tolerance from Survey Responses.
Journal of the Americal Statistical Association, 103(483), 1028-1038.
https://doi.org/https://doi.org/10.1198/016214508000000139
Liu, E. M. (2013). Time to Change What to Sow: Risk Preferences and Technology Adoption
Decisions of Cotton Farmers in China. Review of Economics and Statistics, 95(4), 1386-1403.
https://doi.org/https://doi.org/10.1162/REST_a_00295
Lucas, M. P., & Pabuayon, I. M. (2011). Risk Perceptions, Attitudes, and Influential Factors of
Rainfed Lowland Rice Farmers in Ilocos Norte, Philippines. Asian Journal of Agriculture and
Development, 8(2), 61-77. https://doi.org/https://doi.org/10.22004/ag.econ.199327
Lusk, J. L., & Coble, K. H. (2005). Risk Perceptions, Risk Preference, and Acceptance of Risky Food.
American Journal of Agricultural Economics, 87(2), 393-405.
https://doi.org/https://doi.org/10.1111/j.1467-8276.2005.00730.x
Marra, M., Pannell, D. J., & Ghadim, A. A. (2003). The Economics of Risk, Uncertainty and Learning
in the Adoption of New Agricultural Technologies: Where Are We on the Learning Curve?
Agricultural Systems, 75, 215-234. https://doi.org/https://doi.org/10.1016/S0308-
521X(02)00066-5
Menapace, L., Colson, G., & Raffaelli, R. (2016). A Comparison of Hypothetical Risk Attitude
Elicitation Instruments for Explaining Farmer Crop Insurance Purchases. European Review of
Agricultural Economics, 43(1), 113-135. https://doi.org/https://doi.org/10.1093/erae/jbv013
Meraner, M., & Finger, R. (2017). Risk Perceptions, Preferences and Management Strategies:
Evidence from a Case Study Using German Livestock Farmers. Journal of Risk Research, 1-
26. https://doi.org/https://doi.org/10.1080/13669877.2017.1351476
Meuwissen, M. P. M., Huirne, R. B. M., & Hardaker, J. B. (2001). Risk and Risk Management: An
Empirical Analysis of Dutch Livestock Farmers. Livestock Production Science, 69(1), 43-53.
https://doi.org/https://doi.org/10.1016/S0301-6226(00)00247-5
Mishra, A. K., Rezitis, A. N., & Tsionas, M. G. (2020). Production under Input Endogeneity and
Farm-Specific Risk Aversion: Evidence from Contract Farming and Bayesian Method.
European Review of Agricultural Economics, 47(2), 591-618.
https://doi.org/https://doi.org/10.1093/erae/jbz027
Mittal, S., & Mehar, M. (2016). Socio-Economic Factors Affecting Adoption of Modern Information
and Communication Technology by Farmers in India: Analysis Using Multivariate Probit
Model. The journal of agricultural education and extension, 22(2), 199-212.
https://doi.org/https://doi.org/10.1080/1389224X.2014.997255

Chapter 6. Risk Attitudes: Lottery-Choice Experiment 147
Mohan, S. (2020). Risk Aversion and Certification: Evidence from the Nepali Tea Fields. World
Development, 129, 104903. https://doi.org/https://doi.org/10.1016/j.worlddev.2020.104903
Morgenstern, R., Heldmann, M., & Vogt, B. (2014). Differences in Cognitive Control between Real
and Hypothetical Payoffs. Theory and Decision, 77(4), 557-582.
https://doi.org/https://doi.org/10.1007/s11238-013-9408-x
Nielsen, T., Keil, A., & Zeller, M. (2013). Assessing Farmers’ Risk Preferences and Their
Determinants in a Marginal Upland Area of Vietnam: A Comparison of Multiple Elicitation
Techniques. Agricultural Economics, 44(3), 255-273.
https://doi.org/https://doi.org/10.1111/agec.12009
Pennings, J. M. E., & Garcia, P. (2001). Measuring Producers’ Risk Preferences: A Global Risk‐
Attitude Construct. American Journal of Agricultural Economics, 83(4), 993-1009.
https://doi.org/https://doi.org/10.1111/0002-9092.00225
Petrolia, D. R. (2016). Risk Preferences, Risk Perceptions, and Risky Food. Food Policy, 64, 37-48.
https://doi.org/https://doi.org/10.1016/j.foodpol.2016.09.006
Pratt, J. (1964). Risk Aversion in the Small and in the Large. Econometrica, 32(1/2), 122-136.
https://doi.org/https://doi.org/10.2307/1913738
Rommel, J., Hermann, D., Müller, M., & Mußhoff, O. (2016). Comprehension in Risk Elicitation
Experiments. Applied Economics Letters, 24(9), 627-634.
https://doi.org/https://doi.org/10.1080/13504851.2016.1217302
Santeramo, F. G., Goodwin, B. K., Adinolfi, F., & Capitanio, F. (2016). Farmer Participation, Entry
and Exit Decisions in the Italian Crop Insurance Programme. Journal of Agricultural
Economics, 67(3), 639-657. https://doi.org/https://doi.org/10.1111/1477-9552.12155
Saqib, S. E., Ahmad, M. M., Panezai, S., & Rana, I. A. (2016). An Empirical Assessment of Farmers'
Risk Attitudes in Flood-Prone Areas of Pakistan. International Journal of Disaster Risk
Reduction, 18, 107-114. https://doi.org/https://doi.org/10.1016/j.ijdrr.2016.06.007
Schubert, R., Brown, M., Gysler, M., & Brachinger, H. W. (1999). Financial Decision-Making: Are
Women Really More Risk Averse? American Economic Review, 89(2), 381-385.
https://doi.org/https://doi.org/10.1257/aer.89.2.381
Sharma, G. P. (2016). Household Welfare, Resource Allocations and Risk Attitudes of Smallholder
Coffee Producers in Nepal [Thesis, The University of Western Australia]. Perth.
https://research-repository.uwa.edu.au/en/publications/household-welfare-resource-
allocations-and-risk-attitudes-of-smal
Sherman, R. (1974). The Psychological Difference between Ambiguity and Risk. The Quarterly
Journal of Economics, 88(1), 166-169. https://doi.org/:https://doi.org/10.2307/1881806
Sherrick, B. J., Schnitkey, G. D., Ellinger, P. N., Barry, P. J., & Wansink, B. (2003). Farmers'
Preferences for Crop Insurance Attributes. Review of Agricultural Economics, 25(2), 415-429.
https://doi.org/https://doi.org/10.1111/1467-9353.00147

Chapter 6. Risk Attitudes: Lottery-Choice Experiment 148
SQCC-Nepal. (2019). Notified Crop Varieties from National Seed Board-2075.
https://sqcc.gov.np/en/category/publications
Sulewski, P., & Kłoczko-Gajewska, A. (2014). Farmers’ Risk Perception, Risk Aversion and
Strategies to Cope with Production Risk: An Empirical Study from Poland. Studies in
Agricultural Economics, 116(3), 140-147. https://doi.org/https://doi.org/10.7896/j.1414
Tanaka, T., Camerer, C. F., & Nguyen, Q. (2010). Risk and Time Preferences: Linking Experimental
and Household Survey Data from Vietnam. American Economic Review, 100(1), 557-571.
https://doi.org/https://doi.org/10.1257/aer.100.1.557
Ullah, R., Shivakoti, G. P., & Ali, G. (2015). Factors Affecting Farmers’ Risk Attitude and Risk
Perceptions: The Case of Khyber Pakhtunkhwa, Pakistan. International Journal of Disaster
Risk Reduction, 13, 151-157. https://doi.org/https://doi.org/10.1016/j.ijdrr.2015.05.005
van Winsen, F., de Mey, Y., Lauwers, L., Van Passel, S., Vancauteren, M., & Wauters, E. (2016).
Determinants of Risk Behaviour: Effects of Perceived Risks and Risk Attitude on Farmer’s
Adoption of Risk Management Strategies. Journal of Risk Research, 19(1), 56-78.
https://doi.org/https://doi.org/10.1080/13669877.2014.940597
Velandia, M., Rejesus, R. M., Knight, T. O., & Sherrick, B. J. (2009). Factors Affecting Farmers'
Utilization of Agricultural Risk Management Tools: The Case of Crop Insurance, Forward
Contracting, and Spreading Sales. Journal of Agricultural and Applied Economics, 41(1), 107-
123. https://doi.org/https://doi.org/10.1017/S1074070800002583
von Neumann, J., & Morgenstern, O. (1944). Theory of Games and Economic Behavior. Princeton
University Press.
Wakker, P., Erev, I., & Weber, E. (1994). Comonotonic Independence: The Critical Test between
Classical and Rank-Dependent Utility Theories. Journal of Risk and Uncertainty, 9(3), 195-
230. https://doi.org/https://doi.org/10.1007/BF01064200
Weber, E. U., Blais, A. R., & Betz, N. E. (2002). A Domain‐Specific Risk‐Attitude Scale: Measuring
Risk Perceptions and Risk Behaviors. Journal of Behavioral Decision Making, 15(4), 263-
290. https://doi.org/https://doi.org/10.1002/bdm.414
Wik, M., Aragie Kebede, T., Bergland, O., & Holden, S. T. (2004). On the Measurement of Risk
Aversion from Experimental Data. Applied Economics, 36(21), 2443-2451.
https://doi.org/https://doi.org/10.1080/0003684042000280580
Wooldridge, J., Abadie, A., Imbens, G., & Athey, S. (2017). When Should You Adjust Standard
Errors for Clustering? NBER Working Paper Series.
https://doi.org/https://doi.org/10.3386/w24003
Ye, T., & Wang, M. (2013). Exploring Risk Attitude by a Comparative Experimental Approach and
Its Implication to Disaster Insurance Practice in China. Journal of Risk Research, 16(7), 861-
878. https://doi.org/https://doi.org/10.1080/13669877.2012.743159
Chapter 6. Risk Attitudes: Lottery-Choice Experiment 149
Yesuf, M., & Bluffstone, R. A. (2009). Poverty, Risk Aversion, and Path Dependence in Low-Income
Countries: Experimental Evidence from Ethiopia. American Journal of Agricultural
Economics, 91(4), 1022-1037. https://doi.org/https://doi.org/10.1111/j.1467-
8276.2009.01307.x

150
Chapter 7: Farmers’ Willingness to Pay for Crop Insurance in
Nepal (Paper 4)
7.1 Abstract
The Government of Nepal started crop and livestock insurance programs in 2013, employing a public-
private partnership model. Despite a 75% subsidy for the premium, farmers’ participation in the crop
insurance program has been negligible thus far. The available crop insurance product mainly draws on
a feasibility study that only looked at supply-side issues. Information on farmers’ risk attitudes,
preferences, and willingness to pay (WTP) for crop insurance is lacking for Nepal. We estimated
farmers’ WTP for crop insurance using a discrete choice experiment (DCE) with 420 randomly
selected farmers. The DCE involved hypothetical insurance products defined by various levels of risk
coverage, deductible, premium price and insurance type. The study also involved an incentivised
monetary lottery–choice experiment (LCE) for eliciting farmers’ risk attitudes, together with a socio-
demographic survey. We estimated a Mixed Logit model with correlated random parameters to
analyse farmers’ choices in the experiment. The results showed that premium price and deductible had
negative effects on the utility of crop insurance, while sum insured had a positive effect. Similarly,
farmers’ risk aversion had a negative effect on the utility of the status–quo, implying that more risk-
averse farmers were more willing to pay for insurance. While the mean coefficient for insurance type
suggested that farmers were indifferent between loss-based insurance and rainfall–index insurance,
significant standard deviations for all coefficients suggested considerable preference heterogeneity
among farmers for crop insurance attributes, indicating a potential for diversifying crop insurance
products. Among the attributes considered in the experiment, the sum insured had the dominant effect
on the utility of insurance. Farmers’ WTP for the existing crop insurance product is almost equal to the
current subsidised premium, which indicates that the low uptake of crop insurance in Nepal is not
related to price.
Keywords: crop insurance, discrete choice experiment, Nepal, rice farmers, risk attitude, rainfall–index
insurance, willingness to pay
7.2 Introduction
This paper analyses farmers’ preferences for various characteristics of crop insurance, which has
emerged as a popular ex-ante risk management tool in farming, especially for weather-related risks.
The tripling of global premium turnover from USD 10.2 billion in 2006 to 30.7 billion in 2017 implies
that the agricultural insurance market is growing rapidly (see Hohl, 2019). A study conducted by
Mahul and Stutley (2010) found that more than 108 (50%) countries across the world had some form
of agricultural insurance program at the time of the study. Crop insurance is the largest component of

Chapter 7: Discrete Choice Experiment of Crop Insurance 151
the agricultural insurance industry, contributing about 90% of the total agricultural insurance premium
in 2017 (Hohl, 2019). Increasing global food demand and price, increasing production risks due to
climate change, and governments’ preferences for insurance over disaster loss payments are the
reasons for the rapid growth of the agricultural insurance market, especially in developing countries
(FAO, 2011).
The main purpose of agricultural insurance is to pool farming risks and protect farmers against
production losses, thereby stabilising their income. The major benefits of agricultural insurance
include increased production, increased income, smoothened consumption, and reduction in loss
disparity (Zhao et al., 2016). Crop insurance encourages farmers to expand crop areas and pursue
high–risk, high–return farming options, which may require investing in advanced technologies and
productive inputs (FAO, 2014). A properly designed insurance program stimulates economic growth
and protects farmers from falling into the poverty trap by addressing credit constraints, the major
reason for the chronic underinvestment problem in developing countries (Barnett et al., 2008). Credit
institutions are more willing to fund insured farmers as they are less likely to default on the loans
(FAO, 2014). Agricultural insurance can also be an important tool for assisting the process of climate
change adaptation (Falco et al., 2014; Garrido & Zilberman, 2008).
Despite a large body of literature showing the significant benefits of crop insurance (see Carter et al.,
2015; Elabed & Carter, 2015; Karlan et al., 2014), the viability of agricultural insurance markets is
often limited by the low demand for it (FAO, 2011). Unlike other goods, for which the demand is
shaped by the present utility of goods against the price paid, insurance provides an uncertain or
stochastic utility that accrues only in the future states of the world (Carter et al., 2015). Poor farmers
are often doubtful of insurance, which requires advanced payment for managing a risk that may or
may not happen (Dercon & Kirchberger, 2008). Perceived demand for agricultural insurance can be
overestimated if it does not account for other risk management options practised by farmers (Mahul &
Stutley, 2010). A systematic study is needed to know whether agricultural insurance is an appropriate
or cost-effective risk management tool in a given context because it is not a ‘silver bullet’ for risk
management and climate adaptation (FAO, 2011).
A large public intervention in the form of premium subsidies is the most common feature of
agricultural insurance markets worldwide (Mahul & Stutley, 2010). Since the demand for agricultural
insurance is relatively price–inelastic, such subsidies are required to increase farmer participation
(Keith & Barry, 2013). The transformation of public-funded insurance programs into public-private
partnership (PPP) programs and the emergence of index-based insurance products, especially targeting
smallholder farmers, are some of the major developments in the agricultural insurance industry in
recent years (Hohl, 2019). The PPP model of the agricultural insurance market features the farmers as
buyers, private companies as suppliers, and the government as the premium subsidy and reinsurance

Chapter 7: Discrete Choice Experiment of Crop Insurance 152
protection provider (FAO, 2011). Knowing buyers’ preferences and willingness to pay (WTP) for
insurance products is fundamental for insurance companies and the government in such a multi-
stakeholder market.
Setting appropriate premium rates and subsidy level is the primary problem in establishing a viable
agricultural insurance market. Premium rates set without information on farmers’ WTP result in
‘adverse selection’ and ‘moral hazards’ (Liesivaara & Myyrä, 2014), leading to market failure (Arias
& Covarrubias, 2006; Quiggin et al., 1993). Estimates of WTP can be used to project the change in
demand and profitability of a product or service in response to the price change (Breidert et al., 2006).
Companies can maximise their profit by adopting a harmonised pricing mechanism that acknowledges
the consumers’ WTP (Beredugo & Etuk, 2014). Therefore, companies need to make pricing decisions
with an understanding of the likely response of potential consumers.
Although some form of farm insurance program existed in Nepal as early as 1987 (see Bagazonzya et
al., 2009; Bhushan et al., 2016), the Government of Nepal formally initiated crop and livestock
insurance programs in 2013 employing a PPP model. The Ministry of Agriculture and Livestock
Development provided a 50% subsidy in the insurance premium until the second year, which was
increased to 75% afterward. Although the value of sum insured increased from 55 million NPR in
2013 to 9000 million in 2017 (MoALD-Nepal, 2020a), the adoption of agricultural insurance in Nepal
remains the lowest among Asian countries (Bhushan et al., 2016). Bhushan et al. (2016) pointed out
that farmers’ ability to pay is a major constraint to the adoption of crop insurance in Nepal. In addition
to affordability, the uptake of crop insurance products largely depends on farmers’ WTP (Santeramo et
al., 2016). This paper analyses the demand-supply incongruency in the insurance market in light of
farmers’ risk attitudes and WTP for various insurance product attributes.
The Nepali agricultural insurance market is in its infancy, requiring evidence-based product
improvement and implementation mechanisms to increase uptake by farmers. The existing crop
insurance program was mainly based on a feasibility study conducted by Bagazonzya et al. (2009).
The scope of their study was limited to reviewing international practices, assessing farming risks and
identifying operational and institutional mechanisms to implement the insurance program. Little is
known about demand-side issues, such as farmers’ preference and WTP for crop insurance. Few
studies conducted in Nepal related to crop insurance are cited below. Poudel et al. (2016) estimated
actuarially fair premium rates of rainfall-index insurance in Nepal using production and rainfall data,
Budhathoki et al. (2020) analysed farmers’ perceptions of heat, cold and flood risks and identified
crop insurance as one of the intended risk management strategies. However, both of these studies did
not account for farmers’ willingness to pay for crop insurance. Although Budhathoki et al. (2019)
looked at farmers’ WTP for insuring rice and wheat crops, they only covered a small geographic area
and used a contingent valuation method (CVM), which does not offer insight into farmers’ preferences

Chapter 7: Discrete Choice Experiment of Crop Insurance 153
and trade-off behaviours across crop insurance attributes. The present research evaluates farmers’ risk
attitudes, estimates their WTP for crop insurance, compares the importance of various characteristics
of crop insurance products, and examines the effect of risk aversion on WTP.
This research investigates the relevance of crop insurance against drought risk in rice farming. Among
weather-related risks, drought has received the most attention from farmers, policymakers and
researchers. The growing emphasis on drought risk and its management is underpinned by an
increasing incidence and severity of drought due to climate change (IPCC, 2014). Drought has
detrimental effects on ecosystems and agricultural production, results in socio-economic costs for
farming households, and jeopardises the macroeconomic objectives of food security, poverty
reduction, and environmental protection (Dar et al., 2020; Hill et al., 2019; Kyle et al., 2016; Pandey et
al., 2007; Ward et al., 2020a). The effect of drought is more detrimental on rice crops than other crops,
which is the staple food for more than half of the global population (Dar et al., 2020) and most of the
Nepali population. About two–thirds of the total rice area in Nepal has some form of irrigation facility
(MoALD-Nepal, 2020b); the remaining rice crop area depends on monsoonal rainfall and is therefore
prone to severe drought. The high dependency on rainfall indicates a high vulnerability of rice crops to
drought. Our earlier findings (Chapters 4 and 5)—that farmers’ perceptions of drought risk were
highest among weather-related risks—also reinforced our motivation to explore more effective options
to deal with drought risk in farming.
This study considers two major types of crop insurance—loss-based insurance (LBI) and rainfall-
index insurance (RII)—as potential alternatives to mitigate weather-related risks in rice farming. LBI
is traditional yield insurance that involves the insurance company paying a specified indemnity
amount to the insured party if the yield loss exceeds an agreed threshold level (Diersen et al., 2015).
Despite being an easy risk management instrument, the uptake of LBI is low worldwide, with just a
few exceptions where governments have massively subsidised the insurance premium (FAO, 2011).
High chances of moral hazard and adverse selection are two major disadvantages of LBI products
(Diersen et al., 2015). Moreover, most weather-related risks are systemic, or loss exposures of
individual farms are correlated, limiting the insurability of such risks (Adeyinka et al., 2016).
Weather–index insurance (WII) products have emerged as more effective and equitable insurance
tools than LBI in managing such risks (Jesús & Shingo, 2011). WII involves an index constructed
using one or more weather variables as an indicator of production loss. A reference value is derived
based on the historical average of the weather parameter, and a deficit or excess on the reference value
recorded during a specified period is used to determine indemnification (Barnett et al., 2008). RII is
the most popular WII for use against rainfall deficit or drought (FAO, 2011).
WII was first introduced into India in 2003 (FAO, 2011). Since then, it has received attention in the
South Asia region as an innovative solution to deal with farming risks. Many pilot projects of WII are

Chapter 7: Discrete Choice Experiment of Crop Insurance 154
being carried out in the region targeting smallholder farmers (Hill et al., 2019). A rainfall–based WII
was initiated for apple crops in the Jumla district of Nepal by the Sakchyam project and Shikhar
Insurance company in 2016 (Sakchyam, 2016). The Ministry of Agriculture and Livestock
Development (MoALD), donors (e.g., World Bank), and private insurance companies have shown
interest in introducing similar insurances for other crops. Recent studies conducted in India (e.g., Ward
& Makhija, 2018; Ward et al., 2020a) and Bangladesh (e.g., Ward et al., 2020b) have shown higher
demand for WII than other types of risk management products. In contrast, another study conducted
by Akter et al. (2017) in Bangladesh found most farmers insurance averse, while those who were
willing to buy insurance preferred standard insurance over WII. The present research answers whether
Nepali farmers prefer WII over LBI.
7.2.1 Attributes of crop insurance
The premium price is the most important attribute of an insurance product, which is supposed to
negatively affect its demand. However, the relationship between premium price and demand for crop
insurance is not univocal. For example, while Ginder et al. (2009) identified premium price as the
most important determinant of farmers’ insurance product choice, Serra et al. (2003) found a price–
inelastic demand for crop insurance. Serra et al. (2003) concluded that premium subsidy alone could
not increase farmers’ participation in a crop insurance program. In contrast, Garrido and Zilberman
(2008) found a positive correlation between premium subsidy and insurance adoption. These
contrasting results suggest that other factors confound the relationship between price and demand for
crop insurance. Moreover, the demand for crop insurance is affected by risk level, expected risk
coverage, availability of alternative risk management tools, and characteristics of the insurance
contract (Ginder et al., 2009). For instance, Babcock and Hart (2005) concluded that increasing risk
coverage increases the demand for crop insurance. Likewise, Ramsey (2020) found a positive
correlation between expected return to insurance and adoption rate. In general, increasing the level of
risk coverage implies a higher premium. Furthermore, deductible is another essential feature of a co-
insurance contract that directly affects the premium price. In the case of crop insurance, deductible
serves as a trigger for indemnification. The present research considers premium price, deductible, risk
coverage level and insurance product type as major characteristics of crop insurance products that
determine farmers’ demand. The discrete choice model examines the hull hypothesis that these
attributes do not affect the utility of crop insurance.
7.2.2 Risk aversion and demand for insurance
Risk aversion implies a preference for certainty over uncertainty, even when the uncertain outcome
offers a higher expected value. Although most economic theories assume humans as risk-averse
agents, individuals have varying degrees of risk aversion to the same risk (Binswanger, 1980; Edgardo
& Alain de, 1977). Nevertheless, a rational agent, who maximises the expected utility, is willing to
Chapter 7: Discrete Choice Experiment of Crop Insurance 155
pay for insurance if the premium is actuarially fair (Elabed & Carter, 2015). However, Daniel (2016)
found a negative effect of risk aversion on demand for insurance at higher risk aversion levels but a
positive effect at lower risk aversion levels. They argued that the counterintuitive relationship between
risk aversion and demand for insurance might be due to the imperfect risk coverage provided by the
insurance. This finding implies that the effect of risk aversion on WTP is confounded by the
characteristics of the insurance. In an earlier study (Chapter 6), we derived a constant relative risk
aversion coefficient (CRRA) for each respondent using an incentivised monetary lottery–choice
experiment. The discrete choice model also examines another null hypothesis that the CRRA does not
affect the utility of crop insurance.
7.3 Methodology
The methods for evaluating WTP are classified into two major categories: revealed preference (RP)
and stated preference (SP) (Abbeam et al., 2014; Baker & Ruting, 2014; Breidert et al., 2006). RP
methods are used to analyse actual purchase data, whereas SP methods analyse consumers’ intention
to purchase (Breidert et al., 2006; Louviere et al., 2010). While RP methods more accurately estimate
consumers’ WTPs, SP methods are suitable for products or services that are not already available in
the market (Lancsar & Louviere, 2008; Liesivaara & Myyrä, 2014). In the Nepalese farming sector,
insurance products are not diversified, and the level of adoption is very low, so we used an SP method
involving hypothetical insurance products.
The contingent valuation method (CVM) and choice modelling are two SP methods widely used in
evaluating farmers’ WTP for crop insurance (e.g., Abbeam et al., 2014; Okoffo et al., 2016; Taneja et
al., 2014). CVM directly asks respondents to state their WTP for a given good or service (Carson,
2012). CVM is a linear approach that ignores trade-offs between mutually competitive attributes of the
good or service being valued (Venkatram, 2004). Rather than the consumers stating a price that they
are willing to pay for a good or service, it is easier for them to answer if a given price is acceptable or
not (Brown et al., 1996). In indirect surveys, consumers are presented with various products with
systematically varied prices and asked if they would purchase the products at a given price or not
(Marbeau, 1987). Breidert et al. (2006) also argued that when consumers are presented with product
alternatives and respective prices, it is cognitively easier for them to rank the alternatives based on
their preferences. In such surveys, the consumers are free to choose between different scenarios
according to the weightage they attach to price or other attributes (Cameron & James, 1987). Discrete
choice experiment (DCE), which uses an indirect survey to measure consumers’ WTP, is the most
popular choice modelling method. DCEs help simulate real market situations and estimate more
accurate WTPs than other methods (Breidert et al., 2006). Therefore, we used DCE to measure
farmers’ WTP for crop insurance.
Chapter 7: Discrete Choice Experiment of Crop Insurance 156
7.3.1 Analytical approach
The theoretical framework of DCE comprises three important theories from classical economics that
explain consumer behaviour. The first is expected utility maximisation, or rational choice theory
(RCT), which has its major roots in Bernoulli (1738)’s logarithmic utility function and von Neumann
and Morgenstern (1944)’s four axioms of perfect rationality. The RCT assumes that consumers can
assign utilities to each of the available alternatives and have a stable preference for the one that
provides the highest utility, subject to their affordability (Amaya-Amaya et al., 2008). The second is
Lancaster (1966)’s characteristics demand theory, which states that consumers buy a good not for the
good itself but for its attributes. In the experiment, respondents face choice problems between
alternatives defined by varying levels of attributes, allowing researchers to model the impact of change
in levels of the attribute on the demand for a good (Hauber et al., 2016). Changing the levels of
attributes affects the total utility of the options, which can result in a discrete switch between the
alternatives based on the most beneficial combination of attributes (Amaya-Amaya et al., 2008). The
third is McFadden (2001)’s random utility theory (RUT), originally proposed by Thurstone (1994) in
psychology and introduced into economics by Marschak (1960). Among these theories, RUT provides
a major analytical basis to the DCE, which we discuss below.
RUT assumes that individual choice behaviour has a stochastic or random component. People can
discriminate between choice alternatives by their cognitive judgement of the indirect utilities.
However, because such cognitive utilities are hidden inside decision–makers’ heads and cannot be
measured directly, the analyst can separate the utilities into two additive parts: a deterministic
component (observable) and a random component (unobservable) (Amaya-Amaya et al., 2008). In
mathematical terms, the latent utility (𝑈𝑛𝑗) obtained by an individual (n) from choosing j alternative (j
= 1, …, J) can be represented by the sum of observable component (𝑉𝑛𝑗) and the unobservable
component (𝜀𝑛𝑗 ).
𝑈𝑛𝑗 = 𝑉𝑛𝑗 + 𝜀𝑛𝑗 … … … … … … 𝐸𝑞𝑢𝑎𝑡𝑖𝑜𝑛 7.1
The deterministic component (𝑉𝑛𝑗), also called representative utility, can be modelled as a linear
function of observed attributes of alternative (𝑥′𝑛𝑗) and decision–maker’s characteristics (𝑧′𝑛).
𝑉𝑛𝑗 = 𝛽𝑥′𝑛𝑗 + γiz′n … … … … … … 𝐸𝑞𝑢𝑎𝑡𝑖𝑜𝑛 7.2
Where 𝛽 and γ represent parameter vectors of 𝑋 and 𝑍, respectively.
The random component represents unmeasured variation in preferences, which can be due to
unobserved variables affecting choice, individual taste variation, and measurement errors (Manski,
Chapter 7: Discrete Choice Experiment of Crop Insurance 157
1977). Different assumptions about the distribution of unobserved 𝜀𝑛𝑗 results in different discrete
choice models (Hole, 2007).
7.3.2 Choice models
Multinomial Logit (MNL) and Conditional Logit (CL) are two popular models for analysing discrete
choice. MNL is used to model choice as the function of decision–makers’ characteristics, while CL
explains choice as the function of alternative–specific characteristics (Saul & Greg, 1988). If we
assume that random terms are independently and identically distributed (IID) type I extreme value, the
choice probability that a respondent (n) choses jth alternative is given by the Conditional Logit model
(Equation 7.3).
𝑃𝑛𝑗 =exp (𝜎𝑛𝑉𝑛𝑗)
∑ exp (𝜎𝑛𝑉𝑛𝑗)𝐽𝑗=1
… … … … … … 𝐸𝑞𝑢𝑎𝑡𝑖𝑜𝑛 7.3
Both MNL and CL are valid only when random component of the utility is IID across alternatives,
which is often unlikely. Moreover, both models do not account for individual preference
heterogeneity, assuming constant coefficients of the explanatory variables across decision-makers.
Alternatively, Mixed Logit (ML), also called Random Parameters Logit (RPL), allows the coefficients
of alternative–specific variables to vary across decision-makers and estimates means and standard
deviations of the coefficients. Means of the coefficients are average marginal utilities of the variables,
while standard deviations provide insight into the distribution of such utilities across individuals or
individual taste variation. Moreover, the random parameters of different attributes are likely to be
correlated, so ML with correlated normal distribution of random coefficients (‘correlated ML’
hereafter) can be used to account for such correlations.
𝑃𝑛𝑗(𝛽𝑛) = ∫exp (𝛽𝑛
′ 𝑋𝑛𝑗)
∑ exp (𝛽𝑛′ 𝑋𝑛𝑘)𝐾
𝑘=1
𝑓(𝛽/𝜃)𝑑𝛽 … … … … … … 𝐸𝑞𝑢𝑎𝑡𝑖𝑜𝑛 7.4
Where 𝛽′ representants individual-specific parameter with 𝑓(𝛽/𝜃)𝑑𝛽 density function.
7.3.2.1 Willingness to pay (WTP)
We estimated WTPs for attributes and different bundles of attributes representing insurance policies
using Equations 7.5 and 7.6, respectively. WTP for an attribute is simply the ratio of the attribute–
specific coefficient to the coefficient for premium, with the sign reversed. Similarly, WTP for an
insurance policy is the ratio of the sum of products of values and coefficients for all variables included
in the utility model excluding premium to the coefficient for premium, again with the sign reversed.
𝑊𝑇𝑃𝑎𝑡𝑡𝑟𝑖𝑏𝑢𝑡𝑒 = −𝛽′
𝑎𝑡𝑡𝑟𝑖𝑏𝑢𝑡𝑒
𝛽′𝑝𝑟𝑒𝑚𝑖𝑢𝑚
… … … … … … 𝐸𝑞𝑢𝑎𝑡𝑖𝑜𝑛 7.5

Chapter 7: Discrete Choice Experiment of Crop Insurance 158
𝑊𝑇𝑃𝑃𝑜𝑙𝑖𝑐𝑦 = −∑ 𝛽′ ∗ 𝑎𝑡𝑡𝑟𝑖𝑏𝑢𝑡𝑒
𝛽′𝑝𝑟𝑒𝑚𝑖𝑢𝑚
… … … … … … 𝐸𝑞𝑢𝑎𝑡𝑖𝑜𝑛 7.6
7.3.2.2 Market share
In the correlated ML model, we defined the status–quo option as having zero utility. The alternative–
specific constant (ASC) was defined as 0 for the status–quo option and 1 for the insurance policy.
Considering these, we calculated market shares of various policies with different combinations of the
attributes using Equation 7.7. The market share shows how the insurance policies would perform in
the market if they existed. If a policy is priced exactly at WTP, the market share would be 0.5 or 50%
of farmers would buy it.
Market share =e∑ β′x
1 + e∑ β′x… … … … … … 𝐸𝑞𝑢𝑎𝑡𝑖𝑜𝑛 7.7
7.3.3 Experimental design
The DCE involved different crop insurance contracts as choice alternatives (Table 7.1). The crop
insurance contract covers production risk in rice crop for one season. The rice crop is grown during
June – October in Nepal. Both drought and flood may occur at any stage of crop growth depending on
the distribution of monsoon during the crop period.
The choice alternatives are defined by insurance product types, sum insured, deductible and premium
price. We used two types of crop insurance products, namely loss-based insurance (LBI) and rainfall-
index insurance (RII). LBI covers production loss due to various reasons, including floods, drought,
insects and diseases. LBI requires field assessment of production loss for determining indemnification.
In contrast, the RII indemnifies the insurers irrespective of production loss based on the rainfall
recorded during a specified period. A rainfall record of 1000 mm during June – September has been
set as the normal rainfall. The deficit amount below the normal level will indicate the indemnification
amount. The RII also involves a trigger (15% rainfall deficit in this study) for policy activation. The
15% trigger implies that the indemnification is not activated above 850 mm rainfall during the crop
period. The details of payment schedule have been presented in Appendix D and E.
Insurance contracts were also differentiated by two levels of the sum insured: NPR 60000 NPR and
90000 NPR per hectare, which are equivalent to potential income and cost of cultivation from one
hectare of land, respectively. Further, the choice alternatives were also defined by three levels of
deductibles (15%, 20% and 25%) and five levels of premium price (NPR 250, 500, 750, 1000, 1250
and 1500 per hectare.

Chapter 7: Discrete Choice Experiment of Crop Insurance 159
Table 7.1 Summary of attributes and levels included in the DCE
SN Attributes Unit Levels
A1 Insurance type Loss–based insurance Rainfall–index insurance
A2 Premium NPR/ha 250 500 750 1000 1250 1500
A3 Sum insured NPR/ha 60000 90000
A4 Deductible % of sum insured 15 20 25
We used Ngene software to generate a D–efficient design with 24 choice scenarios (Appendix F). We
blocked the choice scenarios into six groups, each with four choice scenarios. That is, each farmer
faced four choice scenarios in the experiment. The choice card also involved a status–quo option.
Respondents were asked to choose the best and worst options from three, which allowed a full profile
ranking of the options. We developed graphic choice cards representing the choice scenarios and
presented the cards to the respondents randomly to eliminate potential ordering bias (Figure 7.1).
Figure 7.1 An example of the choice cards used in the DCE
7.3.4 Survey implementation
This paper considers crop insurance, particularly rainfall–index insurance, as an option for mitigating
drought risk in rice farming and estimates farmers’ willingness to pay for it. More than two–thirds of
the rice area in Nepal is rainfed (Bagazonzya et al., 2009), which makes them vulnerable to drought.
We conducted the DCE with the decision-makers from 420 randomly selected rice farming households
in the Terai region of Nepal from October 2018 through February 2019. The study area was divided
into three geographic regions—Eastern Terai region (ETR), Mid–Terai region (MTR), and Western
Terai region (WTR)—representing high, medium and low rainfall areas, respectively. From 2001 to

Chapter 7: Discrete Choice Experiment of Crop Insurance 160
2012, the average annual rainfall records for ETR, MTR and WTR were 1926 mm, 1819 mm and 1642
mm, respectively (CBS-Nepal, 2014). We used a multi-stage random sampling technique to select up
to 14 villages from seven districts and randomly selected 30 farmers from each village, ensuring five
respondents in each of six experimental blocks for a total sample size of 420. See Chapter 3
(Methodology) for a more detailed description of the sampling design.
Supplementary data were collected through a questionnaire survey that included an incentivised
monetary lottery–choice experiment (LCE) to elicit the respondents’ risk attitudes. We conducted
face–to–face interviews and experiments with the respondents visiting their homes. The purpose of the
study and the concepts related to crop insurance and experiments were thoroughly explained to the
respondents. A clear explanation of attributes, levels, and payout structures (see Appendix D, E and I)
was provided to the participants before presenting the choice cards, and they could ask questions when
needed. The principal researcher trained the enumerators to minimise interviewer bias. Similarly, to
minimise hypothetical bias, the respondents were reminded repeatedly about the general tendency to
overstate WTP and urged to make honest decisions. We also assured the respondents that the
information would remain anonymous to minimise social desirability bias. In addition to the
opportunity of winning up to NPR 200 the LCE, we provided the respondents with NPR 100 for their
participation in the study. We conducted a pre-testing survey with five farmers to examine whether the
questionnaire and DCE tools elicited the information we needed and the respondents could complete
the tasks. We also conducted a pilot survey with 60 respondents and checked the consistency of the
data with the analytical models. We completed the main survey using the same experimental design as
the pilot survey did not suggest any change.
7.4 Findings and discussion
7.4.1 Sample description
Table 7.2 presents some socio-economic and attitudinal characteristics of the respondents by clusters
relevant to the context of risk management decisions. Although we conducted the experiment with 420
respondents, we eliminated 11 (2.61%) who made inconsistent choices in the lottery–choice
experiment. The inconsistent choices refer to decisions that are not consistent with the expected utility
axioms, i.e., not choosing a strictly dominating option and switching across risky and certain options
more than once. Moreover, 39 (9.48%) of the remaining respondents chose the status–quo option in all
four choice cards. Among these respondents, 24 mentioned that the insurance premiums were higher
than their WTP, 13 mentioned that they did not want any insurance at all, and two mentioned that the
sums insured were not attractive for them. We kept the respondents mentioning the first and third
reasons because such information still has economic meaning. We considered the respondents who did
not want any insurance at all as protesters (see Jourdain & Vivithkeyoonvong, 2017) and excluded
them from the analysis, reducing our effective sample size to 396.

Chapter 7: Discrete Choice Experiment of Crop Insurance 161
The participants' education level is an important indicator of the reliability of the information collected
through complex experimental studies, such as DCEs. The respondents had nearly six years of formal
education, which is lower than the participants' educational attainment in DCEs conducted in other
regions. In addition to formal education, farmers also develop numeracy skills through informal and
non–formal education. To test such skills, we included five probability-based quizzes in the survey
(Appendix C). The average score in the quizzes was 2.75, indicating that the farmers answered more
than half the questions correctly. Moreover, we asked the respondents to self–assess their
comprehension of the experimental tasks on a five-point scale. The average task comprehension score
across samples was 0.69, indicating that the participants understood the experimental tasks and made
informed decisions in the experiment.
Table 7.2 Basic characteristics of the samples
Variable Description ETR MTR WTR All
Sample size
172 117 107 396
Female % Respondents 43.02 33.33 46.73 41.16
Formal education Years 5.60 (4.36) 6.09 (4.22) 5.56 (4.43) 5.73 (4.35)
Numeracy score 0–5 2.95 (1.54) 2.56 (1.40) 2.63 (1.45) 2.75 (1.49)
Experiment comprehension 0–1 (scale) 0.70 (0.24) 0.67 (0.27) 0.68 (0.28) 0.69 (0.26)
Flood risk perception 0–1 (score) 0.17 (0.19) 0.21 (0.23) 0.19 (0.18) 0.19 (0.20)
Drought risk perception 0–1 (score) 0.59 (0.26) 0.59 (0.27) 0.58 (0.25) 0.59 (0.26)
CRRA –0.32 (1.02) 0.03 (0.74) 0.21 (0.51) –0.07 (0.86)
Group involvement % Households 67.44 85.47 74.77 74.75
STRVs use % Households 30.81 43.59 32.71 35.1
Insurance adoption (Any) % Households 38.95 42.74 39.25 40.15
Crop insurance adoption % Households 8.72 10.26 8.41 9.09
Note: Figures in parentheses indicate SD. Insurance adoption shows the percentage of respondent
households who had purchased any of six insurance products, namely crop, livestock, health,
life, vehicle and house.
7.4.2 Choice modelling
We started our analysis by estimating CL and checked for any inconsistencies in the data. Then, we
estimated ML followed by correlated ML. The sign and significance of the coefficients of explanatory
variables are consistent across these models, indicating the robustness of the findings (see Table 7.3).
We calculated WTP and market shares using the correlated ML estimates, which allows for examining
individual preference heterogeneity. Another important benefit of using correlated ML is that it
accounts for all sources of correlation, including those arising from factors not included in the model,
which is called scale heterogeneity (Hess & Train, 2017). We used CL estimates to carry out
Chapter 7: Discrete Choice Experiment of Crop Insurance 162
dominance analysis for examining the relative importance of crop insurance attributes because the
algorithm is not compatible with ML specifications.
7.4.2.1 Correlated Mixed Logit estimation
Following Hole (2007), we implemented the maximum simulated likelihood algorithm to estimate the
correlated ML model in Stata 16. We first estimated uncorrelated ML and used those estimates as
starting values for the correlated ML estimation. The model included premium, sum insured,
deductible and rainfall–index dummy as the independent variables. Similarly, we included a no status–
quo dummy variable (NoSQ) to represent whether the choice corresponds to either insurance type. We
also included the interaction term of NoSQ dummy and CRRA (NoSQ*CRRA) to examine the effect
of risk aversion on choice. NoSQ*CRRA was specified as a fixed parameter variable, where the
remaining variables were specified as random parameter variables. Table 7.3 shows the results of both
CL and ML estimations. In what follows, we only discuss ML estimates.
As expected, the mean coefficients for premium and deductible were negative, while that of sum
insured was positive. The mean coefficient of the rainfall–index dummy was non–significant,
indicating farmers’ indifference between insurance types for the same level of risk coverage.
Similarly, the positive coefficient of CRRA*NoSQ implies that the utility of crop insurance increases
with increasing risk aversion. The non–significant coefficient of NoSQ dummy suggests that the
farmers do not derive higher utility just by changing from the status–quo to having an insurance.
However, the significant standard deviations of NoSQ and rainfall–index dummy together imply that
some farmers derive higher utility by changing from status–quo to having an insurance irrespective of
insurance type, while some farmers do so only when the product type is rainfall–index insurance.
A likelihood–ratio test rejected the null hypothesis that all standard deviations are jointly equal to zero,
which implies that the respondents have a heterogeneous preference for crop insurance attributes.
Since the coefficients of the standard deviation are significant for all variables, preference
heterogeneity exists for all attributes. These tests justify the use of the correlated ML to model
farmers’ choices.

Chapter 7: Discrete Choice Experiment of Crop Insurance 163
Table 7.3 Estimates of the Correlated ML and CL models of farmers’ choice
Attributes Correlated ML CL
Mean Coef. SE Coef. Robust SE
CRRA*NoSQ 3.432*** 0.517 1.766*** 0.204
Premium (NPR) –0.011*** 0.002 –0.004*** 0.000
Deductible (%) –0.228*** 0.059 –0.072*** 0.017
Sum insured (’000, NPR/ha) 0.239*** 0.040 0.100*** 0.005
Rainfall–index dummy 0.253 0.370 0.256 0.125
NoSQ dummy –3.678 2.120 –2.500*** 0.547
SD
Premium (NPR) 0.006*** 0.001
Deductible (%) 0.185** 0.074
Sum insured (’000, NPR/ha) 0.133*** 0.026
Rainfall–index dummy 1.242* 0.513
NoSQ dummy 10.397*** 3.204
Log–likelihood –688.669 Log pseudo–likelihood –817.825
Observations 4752 Observations 4752
LR chi2(15) 258.310*** Wald chi2(6) 631.440***
Pseudo R2 0.530
Note: Asterisks indicate statistical significance at * p<0.05, ** p<0.01 and *** p<0.001. We have
reported three decimal places because some estimates are too small.
7.4.2.2 Individual preference heterogeneity
Figure 7.2 shows the distribution of the random parameters estimated by correlated ML, indicating
individual preference heterogeneity or taste variation. Almost all respondents had positive coefficients
for sum insured and negative coefficients for deductible and premium, indicating that farmers dislike
premium price and deducible and like insurance coverage. About 31% of respondents had positive
coefficients for the NoSQ dummy, implying that about one–third of farmers prefer crop insurance to
status–quo irrespective of product type. Similarly, 52% of respondents had positive coefficients for
rainfall–index dummy, indicating that more than half of farmers prefer rainfall–index insurance to
loss-based insurance. The heterogeneous preferences of the farmers for the attributes of crop insurance
suggest scope for diversifying crop insurance products.

Chapter 7: Discrete Choice Experiment of Crop Insurance 164
Figure 7.2 Distribution of random parameter estimates in the correlated ML model
7.4.2.3 WTP for attributes
We calculated farmers’ WTP for various attributes that define the choice alternatives using random
parameter estimates of correlated ML model for individuals. The WTP for an attribute is the ratio of
its coefficient to the coefficient of the premium. Table 7.4 shows the summary statistics of the WTP
estimates for various attributes used in the experiment, while the kernel density plots in Figure 7.3
show their distribution across individuals. The distribution of WTP estimates corresponds to the
distribution of random parameter estimates in the correlated ML model. The WTP estimates for
deductible were mostly negative, and sum insured and CRRA*NoSQ were mostly positive. This
finding indicates that farmers prefer higher insurance coverage and lower deductible, and their WTP
for crop insurance increases as their risk aversion increases. The WTP estimates for rainfall–index
insurance and NoSQ dummies were positive for 52% and 31% of respondents, respectively. Based on
these figures, we can conclude that about one–third of farmers are willing to pay to change from
status–quo to either insurance type, while about half of the farmers are willing to pay only for rainfall–
index insurance. These results are somewhat consistent with the findings of previous studies. For
instance, Zhao et al. (2016) found that increasing the risk coverage up to a level equivalent to potential
income encouraged farmers to adopt crop insurance even when they had to pay higher premiums.

Chapter 7: Discrete Choice Experiment of Crop Insurance 165
Similarly, the Rain and Hail Society ( 2013), cited in Zhao et al. (2016), reported high participation of
farmers in high–premium insurance programs in the USA, indicating the effectiveness of high–
premium, high–indemnity insurance in managing farming risks.
Figure 7.3 Distribution of WTP estimates for crop insurance attributes
Table 7.4 Summary of WTP estimates for crop insurance attributes
Variable Observations Mean SD Min Max
Deductible 396 –21 23 –227 210
Sum insured 396 25 18 –69 139
Rainfall–index dummy 396 24 223 –3555 1486
NoSQ 396 –562 805 –3874 2955
CRRA*NoSQ 396 332 363 –5147 3528
7.4.2.4 Relative importance of crop insurance attributes
Knowing the relative importance of the insurance attributes allows predicting market shares of
competing insurance products and provides guidance for configuring new products targeting specific
producer groups (Sherrick et al., 2004). We carried out dominance analysis using the CL estimates to
examine the relative importance of the crop insurance attributes. The dominance analysis partitions the
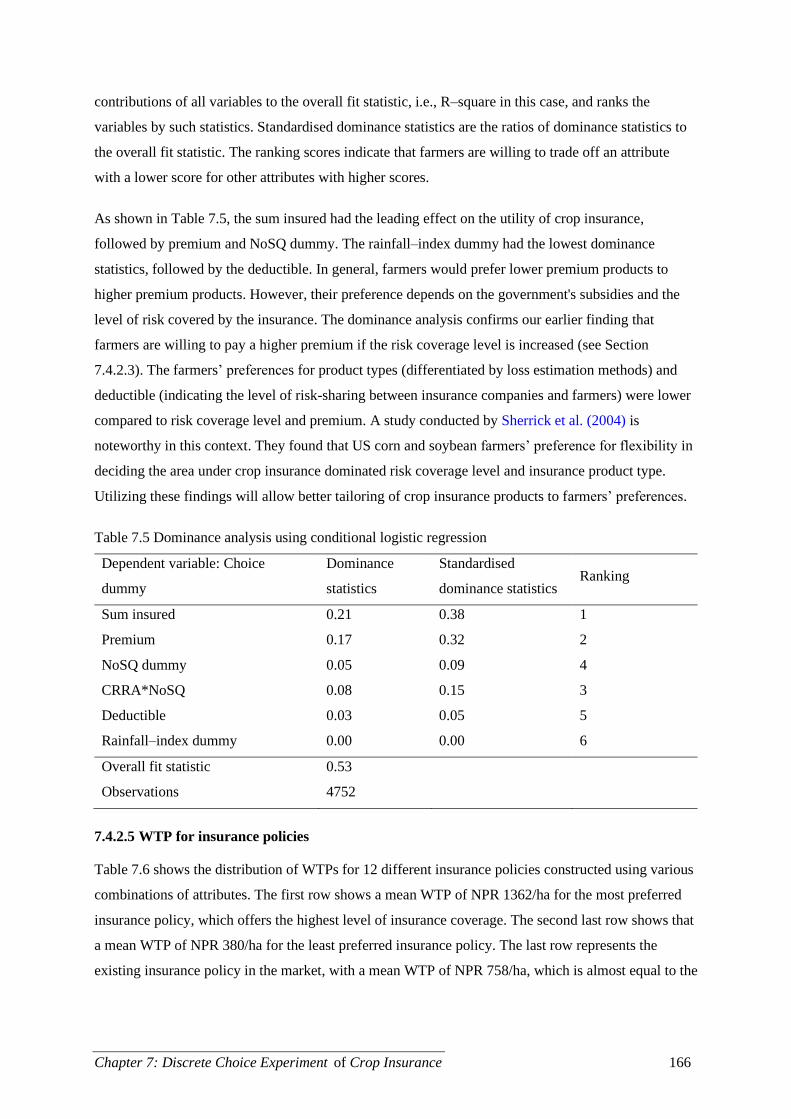
Chapter 7: Discrete Choice Experiment of Crop Insurance 166
contributions of all variables to the overall fit statistic, i.e., R–square in this case, and ranks the
variables by such statistics. Standardised dominance statistics are the ratios of dominance statistics to
the overall fit statistic. The ranking scores indicate that farmers are willing to trade off an attribute
with a lower score for other attributes with higher scores.
As shown in Table 7.5, the sum insured had the leading effect on the utility of crop insurance,
followed by premium and NoSQ dummy. The rainfall–index dummy had the lowest dominance
statistics, followed by the deductible. In general, farmers would prefer lower premium products to
higher premium products. However, their preference depends on the government's subsidies and the
level of risk covered by the insurance. The dominance analysis confirms our earlier finding that
farmers are willing to pay a higher premium if the risk coverage level is increased (see Section
7.4.2.3). The farmers’ preferences for product types (differentiated by loss estimation methods) and
deductible (indicating the level of risk-sharing between insurance companies and farmers) were lower
compared to risk coverage level and premium. A study conducted by Sherrick et al. (2004) is
noteworthy in this context. They found that US corn and soybean farmers’ preference for flexibility in
deciding the area under crop insurance dominated risk coverage level and insurance product type.
Utilizing these findings will allow better tailoring of crop insurance products to farmers’ preferences.
Table 7.5 Dominance analysis using conditional logistic regression
Dependent variable: Choice
dummy
Dominance
statistics
Standardised
dominance statistics Ranking
Sum insured 0.21 0.38 1
Premium 0.17 0.32 2
NoSQ dummy 0.05 0.09 4
CRRA*NoSQ 0.08 0.15 3
Deductible 0.03 0.05 5
Rainfall–index dummy 0.00 0.00 6
Overall fit statistic 0.53
Observations 4752
7.4.2.5 WTP for insurance policies
Table 7.6 shows the distribution of WTPs for 12 different insurance policies constructed using various
combinations of attributes. The first row shows a mean WTP of NPR 1362/ha for the most preferred
insurance policy, which offers the highest level of insurance coverage. The second last row shows that
a mean WTP of NPR 380/ha for the least preferred insurance policy. The last row represents the
existing insurance policy in the market, with a mean WTP of NPR 758/ha, which is almost equal to the

Chapter 7: Discrete Choice Experiment of Crop Insurance 167
current premium price after subsidy (NPR 750/ha). This finding supports the conclusion of
Budhathoki et al. (2019) that the low adoption of crop insurance in Nepal is not related to price.
Table 7.6 WTP estimates for various insurance policy combinations
Policy WTP (NPR/ha)
Sum insured
(NPR/ha)
Deductible
(%) Insurance type Observations Mean SD Min Max
90000
15 Rainfall–index 396 1362 995 –9632 7905
Loss–based 396 1338 812 –6076 6419
20 Rainfall–index 396 1254 885 –8583 6768
Loss–based 396 1231 706 –5028 5281
25 Rainfall–index 396 1147 778 –7535 5630
Loss–based 396 396 1123 603 –3979
60000
15 Rainfall–index 396 619 620 –7969 3730
Loss–based 396 595 465 –4414 2243
20 Rainfall–index 396 511 536 –6921 2592
Loss–based 396 487 403 –3365 1356
25 Rainfall–index 396 404 465 –5872 1455
Loss–based 396 380 370 –2317 1224
60000
(existing) 10 Loss–based 396 758 547 –775 5796
7.4.2.6 Market share
We calculated the potential market share of various insurance product combinations using correlated
ML estimates. Figure 7.4 shows the market share of the insurance product combinations mentioned in
Table 7.6 at various premium levels (12 insurance products). The existing insurance product features
loss-based insurance with NPR 60000/ha sum insured and 10% deductible, priced at NPR 750 (after
75% subsidy). Market share was highest for the rainfall-index insurance product with NPR 90000/ha
sum insured and 15% deductible, and lowest for the loss-based insurance product with NPR 60000/ha
sum insured and 20% deductible, at all premium rates. The predicted market share of the existing
product at the existing premium price was 53%, which is inconsistent with the existing crop adoption
within the sample (9%). Therefore, the market share predicted by the model is inconsistent with the
existing adoption of crop insurance in the market.

Chapter 7: Discrete Choice Experiment of Crop Insurance 168
Figure 7.4 Market share of different crop insurance policy combinations
To explain the potential overestimation of WTP, we asked open-ended follow–up questions to the
respondents who stated their WTP in at least one choice scenario but had not yet bought a crop
insurance product. Of 281 such respondents, 36% said they did not know about the availability of
insurance (Table 7.7). Such lack of awareness of the insurance explains the overestimation of WTPs as
indicated by the market shares. All the other reasons mentioned by the farmers were not related to the
premium rate either. Moreover, the crop insurance adoption rate within the sample is the current
adoption, which does not indicate their future intention to adopt. A recent study conducted by
Budhathoki et al. (2019) in the same population found that 84% of farmers were interested in buying
area-based crop insurance and willing to pay USD 42.42/ha/season, which is three times more than the
current premium price. These facts lead us to conclude that the market share predicted by the choice
model was not overestimated.
Table 7.7 Reasons for not buying crop insurance
Reasons Frequency Per cent
Companies are unreliable 21 7.47
I didn't like just cost compensation 25 8.90
I didn't understand its concept well before 14 4.98
Existing product is too complex 12 4.27
No facilitation 42 14.95
Others haven't done it 36 12.81
Process is cumbersome 29 10.32
Chapter 7: Discrete Choice Experiment of Crop Insurance 169
I was unaware about insurance 102 36.30
Total 281 100
7.5 Conclusion
This study offers a broad perspective on the scope of crop insurance products relative to other
available options for mitigating drought risk in rice farming. Nepali farmers are willing to pay for crop
insurance if the products are tailored to what they value. The results of the choice models suggest that
the demand for crop insurance depends on premium, deductible and risk coverage levels. Some
farmers also prefer rainfall–index insurance, which overcomes the issue of loss estimation. Moreover,
farmers’ WTP for crop insurance increases as they become more risk-averse. The dominance analysis
showed that the risk coverage level is the most preferred, and the insurance product type (based on the
loss estimation method) is the least preferred attribute of crop insurance products. The findings on the
relative importance of the insurance attributes will be useful in predicting market shares of competing
insurance products and customising new products to farmers’ preferences. Another important finding
of the study is that farmers have heterogeneous preferences for crop insurance attributes, indicating the
scope for diversifying the products according to their tastes. The main reason for the low adoption of
crop insurance is not due to high premiums but due to the lack of awareness of its availability in the
market. Therefore, in addition to designing insurance products according to farmers’ preferences,
creating awareness of crop insurance availability and benefits is crucial for improving its adoption.
The weather conditions vary significantly across study sites, resulting in heterogeneous rainfall–yield
models. However, due to practical reasons, we used a single hypothetical rainfall index that might
have incorporated a large basis risk. Supplying such a single-index insurance product with a large
basis risk throughout the country may lead to market failure. Crop varietal diversity, specifically the
adoption of drought-tolerant rice varieties, may also significantly affect rainfall–yield models.
Therefore, developing reliable indices by considering the rainfall-yield models based on location-
specific data is essential for minimizing the basis risk associated with rainfall–index insurance. Loss–
based insurance products should also be customized based on site-specific information on farmers’
needs, preferences and WTP to minimize adverse selection and moral hazard in the insurance market.
Farmers’ needs and preferences indicate that crop insurance can be an important aid for accelerating
the process of agricultural modernization in Nepal. However, it should not be considered a panacea
that can overcome all risks in farming. Moreover, as Mahul and Stutley (2010) suggested, crop
insurance does not operate in isolation and should not replace essential agricultural supports, such as
timely input supply, extension services and output marketing facilities. OECD (2009) also
recommended adopting a holistic approach for managing farm risks, with insurance as a component of

Chapter 7: Discrete Choice Experiment of Crop Insurance 170
the comprehensive risk management framework. We support these suggestions and recommend
improving risk management policy and products according to farmers’ needs and preferences.
We evaluated the crop insurance policies based on single-season risk coverage. However, several
authors have suggested temporal diversification of insurance contracts, such as offering multi-year
insurance, as a potential measure for addressing systemic risks in farming. Such multi-year contracts
can be diversified by adopting different pricing mechanisms, e.g., static (constant premium rate) or
dynamic (premium rate adjusted based on claims), and indemnification schemes (based on annual loss
or losses during a specified period). Calum and Megan (2012) suggested that non–weather indices,
such as the normalised difference vegetation index, can be used to predict yield loss more accurately
than the weather index. Farmers’ might also be interested in risk management products other than
yield insurance, such as revenue insurance. Future research could evaluate farmers’ WTP for these
alternatives.

Chapter 7: Discrete Choice Experiment of Crop Insurance 171
7.6 References
Abbeam, G. D., Addai, K. N., & Ehiakpor, D. (2014). Willingness to Pay for Farm Insurance by
Smallholder Cocoa Farmers in Ghana. Journal of Social Science for Policy Implication, 2(1),
163-183.
Adeyinka, A. A., Krishnamurti, C., Maraseni, T. N., & Chantarat, S. (2016). The Viability of Weather-
Index Insurance in Managing Drought Risk in Rural Australia. International Journal of Rural
Management, 12(2), 125-142. https://doi.org/https://doi.org/10.1177/0973005216660897
Akter, S., Krupnik, T. J., & Khanam, F. (2017). Climate Change Skepticism and Index Versus
Standard Crop Insurance Demand in Coastal Bangladesh. Regional environmental change,
17(8), 2455-2466. https://doi.org/https://doi.org/10.1007/s10113-017-1174-9
Amaya-Amaya, M., Gerard, K., & Ryan, M. (2008). Discrete Choice Experiments in a Nutshell. In M.
Ryan, K. Gerard, & M. Amaya-Amaya (Eds.), Using Discrete Choice Experiments to Value
Health and Health Care (Vol. 11, pp. 13-46). Springer.
https://doi.org/https://doi.org/10.1007/978-1-4020-5753-3_1
Arias, D., & Covarrubias, K. (2006). Agricultural Insurance in Mesoamerica: An Opportunity to
Deepen Rural Financial Markets (Economic and Sector Study Series, Issue.
https://publications.iadb.org/en/publication/agricultural-insurance-mesoamerica-opportunity-
deepen-rural-financial-markets
Babcock, B. A., & Hart, C. E. (2005). Influence of the Premium Subsidy on Farmers' Crop Insurance
Coverage Decisions. CARD Working Paper 05-WP 393, Iowa State University, Ames, IA.
(CARD Working Paper 05-WP 393)
Bagazonzya, H. K., Devkota, K., Mahul, O., & Stutley, C. (2009). Agricultural Insurance Feasibility
Study for Nepal (46521-NP). W. Bank.
https://documents.worldbank.org/curated/en/246101468052838449/Nepal-Agricultural-
insurance-feasibility-study
Baker, R., & Ruting, B. (2014). Environmental Policy Analysis: A Guide to Non-Market Valuation.
Productivity Commission Staff Working Paper. Canberra: Australian Government.
Barnett, B. J., Barrett, C. B., & Skees, J. R. (2008). Poverty Traps and Index-Based Risk Transfer
Products. World Development, 36(10), 1766-1785.
https://doi.org/https://doi.org/10.1016/j.worlddev.2007.10.016 (World Development)
Beredugo, S. B., & Etuk, A. J. (2014). The Effect of Price Harmonization on Profitability of Selected
Banks in Cross River State, Nigeria. European Journal of Accounting Auditing and Finance
Research, 2(4), 23-32.
Bernoulli, D. (1738). Specimen Theoriae Novae De Mensvra Sortis [Exposition of a new theory on the
measurement of risk]. Commentarii Academiae Scientiarum Imperialis Petropolitanae, 5,

Chapter 7: Discrete Choice Experiment of Crop Insurance 172
175-192. https://doi.org/https://doi.org/10.2307/1909829 (Exposition of a new theory on the
measurement of risk) (Specimen Theoriae Novae De Mensvra Sortis)
Bhushan, C., Singh, G., Rattani, V., & Kumar, V. (2016). Insuring Agriculture in Times of Climate
Change. https://www.cseindia.org/insuring-agriculture-in-times-of-climate-change-8020
Binswanger, H. P. (1980). Attitudes toward Risk: Experimental Measurement in Rural India.
American Journal of Agricultural Economics, 62(3), 395-407.
https://doi.org/https://doi.org/10.2307/1240194
Breidert, C., Hahsler, M., & Reutterer, T. (2006). A Review of Methods for Measuring Willingness-
to-Pay. Innovative Marketing, 2(4), 8-32.
Brown, T. C., Champ, P. A., & Bishop, R. C. (1996). Which Response Format Reveals the Truth
About Donations to a Public Good? Land Economics, 72(2), 152-166.
https://doi.org/https://doi.org/10.2307/3146963
Budhathoki, N. K., Lassa, J. A., Pun, S., & Zander, K. K. (2019). Farmers’ Interest and Willingness-
to-Pay for Index-Based Crop Insurance in the Lowlands of Nepal. Land use policy, 85, 1-10.
https://doi.org/https://doi.org/10.1016/j.landusepol.2019.03.029
Budhathoki, N. K., Paton, D., Lassa, J. A., Bhatta, G. D., & Zander, K. K. (2020). Heat, Cold, and
Floods: Exploring Farmers' Motivations to Adapt to Extreme Weather Events in the Terai
Region of Nepal. Natural hazards (Dordrecht), 103(3), 3213-3237.
https://doi.org/https://doi.org/10.1007/s11069-020-04127-0
Calum, G. T., & Megan, K. M. (2012). Applicability of the Normalized Difference Vegetation Index
in Index-Based Crop Insurance Design. Weather, climate, and society, 4(4), 271-284.
https://doi.org/https://doi.org/10.1175/WCAS-D-11-00059.1
Cameron, T. A., & James, M. D. (1987). Estimating Willingness to Pay from Survey Data: An
Alternative Pre-Test-Market Evaluation Procedure. Journal of Marketing Research, 24(4),
389-395. https://doi.org/https://doi.org/10.1177/002224378702400406
Carson, R. T. (2012). Contingent Valuation: A Practical Alternative When Prices Aren't Available.
Journal of Economic Perspectives, 26(4), 27-42.
https://doi.org/https://doi.org/10.1257/jep.26.4.27
Carter, M., Elabed, G., & Serfilippi, E. (2015). Behavioral Economic Insights on Index Insurance
Design. Agricultural Finance Review, 75(1), 8-18.
https://doi.org/https://doi.org/10.1108/AFR-03-2015-0013
CBS-Nepal. (2014). Environment Statistics of Nepal, 2013.
https://www.unep.org/resources/report/environment-statistics-nepal-2013
Daniel, J. C. (2016). A Theory of Rational Demand for Index Insurance. American economic journal.
Microeconomics, 8(1), 283-306. https://doi.org/https://doi.org/10.1257/mic.20140103

Chapter 7: Discrete Choice Experiment of Crop Insurance 173
Dar, M. H., Waza, S. A., Shukla, S., Zaidi, N. W., Nayak, S., Hossain, M., Kumar, A., Ismail, A. M.,
& Singh, U. S. (2020). Drought Tolerant Rice for Ensuring Food Security in Eastern India.
Sustainability, 12(6), 2214. https://doi.org/https://doi.org/10.3390/su12062214
Dercon, S., & Kirchberger, M. (2008). Literature Review on Microinsurance (Microinsurance
Research Paper No 1, International Labor Office, Issue.
https://www.ilo.org/wcmsp5/groups/public/---
ed_emp/documents/publication/wcms_124449.pdf
Diersen, M., Gurung, P., & Fausti, S. (2015, January 31-February 3, 2015). Optimal Allocation of
Index Insurance Intervals for Commodities Southern Agricultural Economics Association
(SAEA) Annual Meeting, Atlanta, Georgia, January 31-February 3, 2015.
Edgardo, M., & Alain de, J. (1977). Attitudes toward Risk among Peasants: An Econometric
Approach. American Journal of Agricultural Economics, 59(4), 710-716.
https://doi.org/https://doi.org/10.2307/1239398
Elabed, G., & Carter, M. R. (2015). Compound-Risk Aversion, Ambiguity and the Willingness to Pay
for Microinsurance. Journal of economic behavior & organization, 118, 150-166.
https://doi.org/https://doi.org/10.1016/j.jebo.2015.03.002
Falco, S. D., Adinolfi, F., Bozzola, M., & Capitanio, F. (2014). Crop Insurance as a Strategy for
Adapting to Climate Change. Journal of Agricultural Economics, 65(2), 485-504.
https://doi.org/https://doi.org/10.1111/1477-9552.12053
FAO. (2011). Agricultural Insurance in Asia and the Pacific Region.
https://www.fao.org/3/i2344e/i2344e00.pdf
FAO. (2014). Managing Climate Risks and Adapting to Climate Change in the Agriculture Sector in
Nepal. F. a. A. O. o. t. U. Nations. https://www.fao.org/3/a-i3577e.pdf
Garrido, A., & Zilberman, D. (2008). Revisiting the Demand for Agricultural Insurance: The Case of
Spain. Agricultural Finance Review, 68(1), 43-66.
https://doi.org/https://doi.org/10.1108/00214660880001218
Ginder, M., Spaulding, A. D., Tudor, K. W., & Randy Winter, J. (2009). Factors Affecting Crop
Insurance Purchase Decisions by Farmers in Northern Illinois. Agricultural Finance Review,
69(1), 113-125. https://doi.org/https://doi.org/10.1108/00021460910960507
Hauber, A. B., Gonzalez, J. M., Groothuis-Oudshoorn, C. G., Prior, T., Marshall, D. A., Cunningham,
C., MJ, I. J., & Bridges, J. F. (2016). Statistical Methods for the Analysis of Discrete Choice
Experiments: A Report of the Ispor Conjoint Analysis Good Research Practices Task Force.
Value in Health, 19(4), 300-315. https://doi.org/https://doi.org/10.1016/j.jval.2016.04.004
Hess, S., & Train, K. (2017). Correlation and Scale in Mixed Logit Models. Journal of choice
modelling, 23, 1-8. https://doi.org/https://doi.org/10.1016/j.jocm.2017.03.001
Hill, R. V., Kumar, N., Magnan, N., Makhija, S., de Nicola, F., Spielman, D. J., & Ward, P. S. (2019).
Ex Ante and Ex Post Effects of Hybrid Index Insurance in Bangladesh. Journal of

Chapter 7: Discrete Choice Experiment of Crop Insurance 174
Development Economics, 136, 1-17.
https://doi.org/https://doi.org/10.1016/j.jdeveco.2018.09.003
Hohl, R. (2019). Agricultural Risk Transfer: From Insurance to Re-Insurance to Capital Markets.
John Wiley & Sons Ltd.
Hole, A. R. (2007). Fitting Mixed Logit Models by Using Maximum Simulated Likelihood. The Stata
journal, 7(3), 388-401. https://doi.org/https://doi.org/10.1177/1536867X0700700306
IPCC. (2014). Climate Change 2014: Synthesis Report. Contribution of Working Groups 1, 2 and 3 to
the Fifth Assessment Report of the Intergovernmental Panel on Climate Change.
https://www.ipcc.ch/report/ar5/syr/
Jesús, A., & Shingo, K. (2011). Risk Management in Agriculture in Australia. OECD Food,
Agriculture and Fisheries, Working Papers No. 39.
https://doi.org/https://doi.org/10.1787/5kgj0d8bj3d1-en (OECD Food, Agriculture and
Fisheries Papers)
Jourdain, D., & Vivithkeyoonvong, S. (2017). Valuation of Ecosystem Services Provided by Irrigated
Rice Agriculture in Thailand: A Choice Experiment Considering Attribute Nonattendance.
Agricultural Economics, 48(5), 655-667. https://doi.org/https://doi/org/10.1111/agec.12364
Karlan, D., Osei, R., Osei-Akoto, I., & Udry, C. (2014). Agricultural Decisions after Relaxing Credit
and Risk Constraints. The Quarterly journal of economics, 129(2), 597-652.
https://doi.org/https://doi.org/10.1093/qje/qju002
Keith, H. C., & Barry, J. B. (2013). Why Do We Subsidize Crop Insurance? American Journal of
Agricultural Economics, 95(2), 498-504. https://doi.org/https://doi.org/10.1093/ajae/aas093
Kyle, E., Alain de, J., Elisabeth, S., & Manzoor, H. D. (2016). Technological Innovations, Downside
Risk, and the Modernization of Agriculture. The American economic review, 106(6), 1537-
1561. https://doi.org/https://doi.org/10.1257/aer.20150474
Lancaster, K. J. (1966). A New Approach to Consumer Theory. Journal of Political Economy, 74(2),
132-157. https://doi.org/https://doi.org/10.1086/259131
Lancsar, E., & Louviere, J. (2008). Conducting Discrete Choice Experiments to Inform Healthcare
Decision Making: A User's Guide. Pharmacoeconomics, 26(8), 661-677.
https://doi.org/https://doi.org/10.2165/00019053-200826080-00004
Liesivaara, P., & Myyrä, S. (2014). Willingness to Pay for Agricultural Crop Insurance in the
Northern Eu. Agricultural Finance Review, 74(4), 539-554.
https://doi.org/https://doi.org/10.1108/afr-06-2014-0018
Louviere, J. J., Flynn, T. N., & Carson, R. T. (2010). Discrete Choice Experiments Are Not Conjoint
Analysis. Journal of Choice Modelling, 3(3), 57-72.
https://doi.org/https://doi.org/10.1016/S1755-5345(13)70014-9
Chapter 7: Discrete Choice Experiment of Crop Insurance 175
Mahul, O., & Stutley, C. J. (2010). Government Support to Agricultural Insurance: Challenges and
Options for Developing Countries. World Bank. https://doi.org/https://doi.org/10.1596/978-0-
8213-8217-2
Manski, C. F. (1977). The Structure of Random Utility Models. Theory and Decision, 8(3), 229-254.
https://doi.org/https://doi.org/10.1007/BF00133443
Marbeau, Y. (1987). What Value Pricing Research Today? Journal of Market Research Society, 29(2),
153-182.
Marschak, J. (1960). Binary Choice Constraints on Random Utility Indicators. In K. Arrow (Ed.),
Stanford Symposium on Mathematical Methods in the Social Sciences. Stanford University
Press. https://EconPapers.repec.org/RePEc:cwl:cwldpp:74
McFadden, D. (2001). Economic Choices. The American Economic Review, 91(3), 351-378.
https://doi.org/https://doi.org/10.1257/aer.91.3.351
MoALD-Nepal. (2020a). Agriculture Management Information System. Ministry of Agriculture and
Livestock Development. Retrieved 03/05/2021 from https://namis.gov.np/pages/insurance
MoALD-Nepal. (2020b). Statistical Information on Nepalese Agriculture for 2018/19.
https://www.moald.gov.np/publication/Agriculture%20Statistics
OECD. (2009). Managing Risk in Agriculture: A Holistic Framework. The Organization for Economic
Co-operation and Development. https://doi.org/https://doi.org/10.1787/9789264075313-en
Okoffo, E. D., Denkyirah, E. K., Adu, D. T., & Fosu-Mensah, B. Y. (2016). A Double-Hurdle Model
Estimation of Cocoa Farmers' Willingness to Pay for Crop Insurance in Ghana. SpringerPlus,
5(1), 1-19. https://doi.org/https://doi.org/10.1186/s40064-016-2561-2
Pandey, S., Bhandari, H., Ding, S., Prapertchob, P., Sharan, R., Naik, D., Taunk, S. K., & Sastri, A.
(2007). Coping with Drought in Rice Farming in Asia: Insights from a Cross-Country
Comparative Study: Coping with Drought in Rice Farming in Asia. Agricultural Economics,
37, 213-224. https://doi.org/https://doi.org/10.1111/j.1574-0862.2007.00246.x
Poudel, M. P., Chen, S. E., & Huangg, W. C. (2016). Pricing of Rainfall Index Insurance for Rice and
Wheat in Nepal. Journal of Agricultural Science and Technology, 18(2), 291-302.
Quiggin, J. C., Karagiannis, G., & Stanton, J. (1993). Crop Insurance and Crop Production: An
Empirical Study of Moral Hazard and Adverse Selection. Australian Journal of Agricultural
Economics, 37(2), 95-113. https://doi.org/https://doi.org/10.1111/j.1467-8489.1993.tb00531.x
Ramsey, A. F. (2020). Probability Distributions of Crop Yields: A Bayesian Spatial Quantile
Regression Approach. American Journal of Agricultural Economics, 102(1), 220-239.
https://doi.org/https://doi.org/10.1093/ajae/aaz029
Sakchyam. (2016). First Weather Index Insurance Product Launched in Nepal for Apple Farmers of
Jumla. Sakchyam- Access to Finance Programme. Retrieved 01/06/2020 from
https://sakchyam.com.np/first-weather-index-insurance-product-launched-in-nepal-for-apple-
farmers-of-jumla

Chapter 7: Discrete Choice Experiment of Crop Insurance 176
Santeramo, F. G., Goodwin, B. K., Adinolfi, F., & Capitanio, F. (2016). Farmer Participation, Entry
and Exit Decisions in the Italian Crop Insurance Programme. Journal of Agricultural
Economics, 67(3), 639-657. https://doi.org/https://doi.org/10.1111/1477-9552.12155
Saul, D. H., & Greg, J. D. (1988). Multinomial and Conditional Logit Discrete-Choice Models in
Demography. Demography, 25(3), 415-427. https://doi.org/https://doi.org/10.2307/2061541
Serra, T., Goodwin, B. K., & Featherstone, A. M. (2003). Modeling Changes in the Us Demand for
Crop Insurance During the 1990s. Paper presented at the American Agricultural Economics
Association Annual Meetings, July 27-30, 2003, Montreal, Canada.
https://doi.org/https://core.ac.uk/download/pdf/7062249.pdf
Sherrick, B. J., Barry, P. J., Ellinger, P. N., & Schnitkey, G. D. (2004). Factors Influencing Farmers
Crop Insurance Decisions. American Journal of Agricultural Economics, 86(1), 103-114.
https://doi.org/https://doi.org/10.1111/j.0092-5853.2004.00565.x
Taneja, G., Pal, B. D., Joshi, P. K., Agrawal, P., K., & Tyagi, N. K. (2014). Farmers' Preference for
Climate-Smart Agriculture: An Assessment in the Indo-Gangetic Plain (IFPRI Dicussion
Paper, Issue.
https://ebrary.ifpri.org/utils/getfile/collection/p15738coll2/id/128116/filename/128327.pdf
Thurstone, L. L. (1994). A Law of Comparative Judgment. Psychological Review, 101(2), 266-270.
https://doi.org/https://doi.org/10.1037/0033-295X.101.2.266 (The Centennial Issue of the
Psychological Review)
Venkatram, R. (2004). The Contingent Valuation Method: A Review. Environmental Impact
Assessment Review, 24(1), 89-102. https://doi.org/https://doi.org/10.1016/S0195-
9255(03)00138-0
von Neumann, J., & Morgenstern, O. (1944). Theory of Games and Economic Behavior. Princeton
University Press.
Ward, P. S., & Makhija, S. (2018). New Modalities for Managing Drought Risk in Rainfed
Agriculture: Evidence from a Discrete Choice Experiment in Odisha, India. World Dev, 107,
163-175. https://doi.org/https://doi.org/10.1016/j.worlddev.2018.03.002
Ward, P. S., Makhija, S., & Spielman, D. J. (2020a). Drought-Tolerant Rice, Weather Index Insurance,
and Comprehensive Risk Management for Smallholders: Evidence from a Multi-Year Field
Experiment in India. Aust J Agric Resour Econ, 64(2), 421-454.
https://doi.org/https://doi.org/10.1111/1467-8489.12342
Ward, P. S., Ortega, D. L., Spielman, D. J., Kumar, N., & Minocha, S. (2020b). Demand for
Complementary Financial and Technological Tools for Managing Drought Risk. Economic
Development and Cultural Change, 68(2), 607-653.
https://doi.org/https://doi.org/10.1086/700632
Zhao, Y., Chai, Z., Delgado, M. S., & Preckel, P. V. (2016). An Empirical Analysis of the Effect of
Crop Insurance on Farmers’ Income: Results from Inner Mongolia in China. China

Chapter 7: Discrete Choice Experiment of Crop Insurance 177
agricultural economic review, 8(2), 299-313. https://doi.org/https://doi.org/10.1108/CAER-
05-2014-0045

178
Chapter 8: Summary and Conclusion
This chapter concludes the thesis by presenting a summary of the research, key findings, significance
of the study, policy recommendations, limitations of the study and suggestions for future research.
8.1 Research overview
Understanding the dynamics of farmers’ decision–making in the face of risk and uncertainty is an
ongoing research agenda for behavioural scientists and policymakers. Risk perception and risk attitude
are the key variables of farmers’ decision–making models that align with the theory of expected utility
maximisation. These variables are indicators of farmers’ risk management decisions and are associated
with investment, innovation, and overall performance of the farming sector. Knowing what risks
concern farmers the most, their risk profile, and their strategies for dealing with risk are essential for
designing effective risk management policies and products. While the body of literature on risk and
decision–making is quite extensive, no universal theory explains the relationships between individual
characteristics, socio-demographic factors, risk perception, risk attitude and response to risk. Studies
conducted in other parts of the world have reported contrasting relationships between these variables.
To address the paucity of significant studies investigating these variables in the Nepalese context, we
analysed the relationships between farmers’ risk perceptions, risk attitudes and risk management
decisions. More specifically, the study assessed farmers’ risk perceptions, estimated their risk
attitudes, assessed existing risk management strategies, and estimated their willingness to pay for crop
insurance.
We used a sequential mixed–methods (qual=>QUAN) research design within the framework of the
rational decision–making model, which assumes that individuals can evaluate their economic options
and choose the one that maximises the present value of expected earnings. The qualitative study
involved in-depth interviews with 45 farmers from the Terai region of Nepal and content analysis of
interview transcripts, followed by cognitive mapping of the relationships between various themes and
sub-themes emerging from the data. The qualitative study established a broad context of farming risk
in Nepal, particularly assessing perceived risks, risk factors, risk attitudes and risk management
strategies. It helped us identify variables and develop survey instruments for the subsequent
quantitative studies involving a questionnaire survey of 420 randomly selected farmers from the same
region. The survey contained psychometric scaling questions to elicit farmers’ perceptions of risk and
management strategies, incentivised lottery–choice experiments to elicit their risk attitudes, and
discrete choice experiments to measure their willingness to pay for crop insurance.

Chapter 8: Summary and Conclusion 179
8.2 Key findings
This section summarises key findings of the study, addressing five research objectives as below.
Objective 1: Examine the applicability of the cognitive mapping approach for studying risk
perceptions
Analysis of the cognitive maps indicated that farmers’ risk perception is a complex network of
reciprocal relationships between sources of uncertainty, risks and management strategies. The multiple
linkages between the constructs indicate that farmers perceive more than one cause of risk and aim to
meet more than one goal while responding to the risks. Such complexity indicates that the
psychometric risk mapping, which requires farmers to quantify the probability and consequences of
one element out of the entanglement, may not elucidate a complete picture of farmers’ risk
perceptions. We found cognitive mapping as an appropriate tool to reduce long open-ended
conversational interviews into explicit networks of constructs. Domain analysis, centrality analysis
and the most mentioned constructs techniques allowed us to explain farmers’ understanding of risk
and management decisions, offering semi-quantitative flavours in qualitative research. In addition to
its applicability as a research method, cognitive mapping can also serve as a communication tool
because of its power in presenting a complex topic using a simple diagram. Furthermore, cognitive
mapping can be an appropriate tool for recording, analysing, and reporting focus group discussions,
presentations and dialogues.
Objective 2: Evaluate farmers' risk perceptions and identify the factors influencing drought and
flood risk perceptions
The findings of the qualitative and quantitative studies mostly converge for prevalent risks, farmers’
risk perceptions, risk attitudes and management strategies. Both methods revealed that farmers were
more concerned about production risks than market risks. The study showed that farmers’ insufficient
technical knowledge and uncertain labour supply were the primary sources of production risk, while
farmers’ low bargaining power was the most important source of market risks. The study also revealed
that men and women farmers had similar perceptions of climatic risk factors, with drought being the
most critical weather risk, followed by flood. However, perceptions of uncertainties about input supply
varied across genders. For example, women farmers were most concerned about the uncertainty in the
availability of basic inputs, such as seeds and fertiliser, while male farmers were most worried about
the uncertainty in their access to farm machines and irrigation. We can relate the different risk
perceptions of men and women to gender-differentiated roles in farming. Further, the Tobit model
estimates suggested that farmers’ perception of drought risk was associated with their age, family size,
migration status, access to infrastructure and services, and rice productivity. Similarly, their perception

Chapter 8: Summary and Conclusion 180
of flood risk was associated with farm size, migration status, rice productivity and joint family system.
We also found significant spatial variation in farmers’ perceptions of both risks. Moreover, their risk
perception and past exposure to risk were highly correlated. These findings suggest that the variation
in farmers’ risk perception is linked to differences in objective risk factors, socio-demographic factors,
and farm characteristics.
Objective 3: Estimate farmers' risk attitudes and identify factors associated with risk attitude
In the qualitative study, most farmers preferred a certain low–income option to a risky high–income
option. The results of the lottery–choice experiment also revealed that farmers are risk-averse in
general, and their risk aversion is associated with their gender, farm size, farming experience,
numeracy skills and flood risk perception. The results also showed that farmers’ risk aversion
increases from East to West, the direction in which the amount of rainfall decreases. Likewise,
farmers’ risk aversion is linked to various farming and risk management decisions, such as farm
mechanisation, farm diversification, crop varietal diversification, group involvement, monetary saving,
use of stress-tolerant rice varieties, and purchase of crop insurance. However, these decisions are not
associated with farmers’ risk perception. These findings lead us to conclude that risk attitude has a
more significant influence on farmers’ decision–making than risk perception.
Objective 4: Compare farmers' risk management strategies in terms of applicability and efficacy
Farmers considered diversification, such as crop diversification, crop varietal diversification and
integrated farming, as the most important strategy for managing production risks in their farming.
From farmers’ perspectives, on-farm risk management strategies are more important than market-
based risk management strategies such as crop insurance. About one–third of respondents were not
aware of the availability of crop insurance in the market, and more than two–thirds of respondents
were not aware of the concepts and benefits of crop insurance. Their lack of knowledge might be why
they preferred on-farm risk management strategies over crop insurance.
Objective 5: Estimate farmers' willingness to pay for crop insurance
The discrete choice experiment of hypothetical crop insurance products revealed that farmers are
willing to buy crop insurance if the insurance products are tailored to their needs and preferences.
Premium, deductible and risk coverage levels are major determinants of farmer demand for crop
insurance. Almost half of the respondents stated a higher willingness to pay for rainfall–index
insurance than loss-based insurance, presumably because the index eliminates the tedious loss
estimation process for determining indemnification, a major drawback of loss–based insurance. The
dominance analysis showed that sum insured is the most preferred attribute of crop insurance, which

Chapter 8: Summary and Conclusion 181
implies that farmers are willing to pay higher if the risk coverage level is increased. We also found
that farmer willingness to pay for crop insurance increases as their risk aversion increases. These
findings suggest that there is scope to expand the crop insurance market in Nepal.
8.3 Significance of the study and policy implications
This thesis contributes to the growing body of literature on the relationships between socio-
demographic factors, risk perception, risk attitude and decision–making in the Nepalese farming
context. The study makes two significant methodological contributions. First, it has validated the
cognitive mapping technique as an effective tool for studying farmers' risk perception, which can be a
complementary method to the conventional psychometric scaling method for enhancing the
understanding of farming risks. Second, we have adapted a simple and easy–to–implement
experimental tool (multiple price list) for measuring risk attitudes in the farming context of developing
countries where respondents often have low formal education. Moreover, the study answered some
important questions about the prevalent farming risks in Nepal, sources of uncertainty, farmers’ risk
perceptions and attitudes, and risk management strategies, which have practical implications for policy
development and risk management product design. Potential beneficiaries of this study include
farmers, agricultural researchers, extension workers, students, insurance providers and policymakers.
Key recommendations emerging from this study are summarized as follows.
• The study showed considerable heterogeneity in farmers’ risk vulnerabilities, risk perceptions,
risk attitudes, choice of risk management strategy, and WTP for crop insurance. Such
heterogeneity implies that a one–size–fits–all agricultural insurance product is likely to suffer
from moral hazards and adverse selection arising from information asymmetry between
farmers and insurance providers. Proper identification of target groups and customising
insurance products according to potential clients’ risk perceptions, risk tolerances and WTP
may help minimise such issues in the market.
• Sources of uncertainty in farming are so diverse that insurance alone cannot address all risks.
For example, the risk associated with labour shortage is not insurable, despite being the most
important risk identified in the farmers’ risk perception study. In addition to expressing their
willingness to pay for crop insurance, the farmers also emphasised the need for applying on-
farm risk management strategies. Therefore, the government should formulate a holistic risk
management policy that fosters the balanced use of on-farm risk management strategies and
market–based alternatives. Along with subsidising the premium price to overcome the
potential gap between farmers’ WTP and profitable premium rates for insurance providers, the
government should focus on capacity–building interventions to improve farmer resilience to

Chapter 8: Summary and Conclusion 182
risk and self–insurance capacity. Moreover, agricultural insurance should be implemented
with adequate extension support, input supply and output marketing arrangements.
• Improving farmers’ access to modern farming technologies, developing and promoting
climate-smart crop varieties and training farmers on the use of such technologies can be
helpful in increasing the effectiveness of on-farm diversification strategies in managing
production risks. Weather forecasting service, irrigation development and promotion of
drought-tolerant crop varieties may be some of the effective strategies to mitigate drought risk.
Improving farmers’ skills for on-farm and off-farm jobs may help them diversify income
opportunities and better manage livelihood risks.
• The low adoption of crop insurance is mainly due to two reasons not related to insurance costs
or subsidy deficits.
› First, most farmers were unaware of the availability of such risk management tools in
the market. They did not know about the concepts and benefits of insurance.
Therefore, facilitating a linkage between farmers and insurance companies is needed
to increase farmer awareness of the crop insurance program. Employing insurance
agents in rural areas may increase farmer awareness and access to insurance products.
Agricultural extension programs also need to increase farmer training programs to
educate them about the concepts and benefits of crop insurance.
› Second, the insurance market is not diversified, and the existing insurance product
does not meet farmers’ needs and preferences. Farmers are willing to pay more than
the existing premium for insurance if the risk coverage level increases. Moreover,
considerable preference heterogeneity exists among farmers regarding crop insurance
attributes. Therefore, offering diversified insurance products with varying risk
coverage levels and product types allows farmers to select the best product based on
their needs and preferences.
• The qualitative study showed that farmers perceive risk as complex networks of multiple
connections between sources of risks, their tendency to avoid risks, and decisions made to deal
with them. In-depth interviews and cognitive mapping can be useful for disentangling such
complexity and gaining comprehensive insight into the numerical measures of risk perception.
• This study considered the case of the Nepalese farming context, which is characterized by the
prevalence of smallholder subsistence farmers, inadequate infrastructure and facilities, and

Chapter 8: Summary and Conclusion 183
high vulnerability to climate change. Researchers, policymakers, and insurance providers from
other developing countries with similar farming contexts may benefit from the findings and
methodological approaches adopted in this study.
8.4 Limitations of the study and future research directions
This research suffered several practical constraints that limited the generalizability of the outputs to a
wider context. The following points highlight the limitations of this study and offer suggestions for
future research.
• We divided the study area into three broad regions based on the average amount of annual rainfall.
However, considerable microclimatic diversity exists across and within the regions. Aggregated
risk perception scores may not represent the variability in farmers’ risk vulnerability and
perception due to climatic variability. The development of risk management products and support
programs based on site-specific assessments of farmers’ risk perceptions is likely to improve the
acceptability of such interventions.
• The expected payoff level in the lottery-choice experiment was equivalent to the average
opportunity cost of the farmers for one hour. The risk could have been too small to stimulate the
actual risk attitudes of some farmers. Therefore, the coefficient of risk aversion derived from the
experiment has limited generalizability to other risky prospects with higher values at stake. Future
researchers could increase the payoff scale or use various payoff scales to elicit more accurate
measures of risk attitude.
• The discrete choice experiment used a single rainfall–index for the whole study area due to
practical reasons. Such a single index might entail a higher basis risk, given the microclimatic
diversity in the study area. If companies want to develop rainfall–index insurance products, they
should develop site-specific indices based on local rainfall–yield models to minimise the basis
risk.
• The study used cross-sectional data to analyse farmers’ risk perceptions and risk attitudes.
However, these variables may vary for an individual over time. Future researchers may consider
applying a longitudinal approach to study such variables.
• Due to the unavailability of historical data on the frequency and severity of drought and flood in
the study sites, we used the measure of farmers’ risk experience as a proxy of objective risk. The
risk experience variable was constructed by multiplying farmers’ ratings of the frequency and

Chapter 8: Summary and Conclusion 184
average crop loss associated with a risk in the past ten years. Future research may estimate
objective risks and compare the objective risks with farmers’ risk perceptions.
• In general, crop insurance contracts are made for a single season, which only allows for the spatial
transfer of risk. Offering multi-year insurance contracts that allow for the spatiotemporal transfer
of risk could be one measure for addressing the catastrophic nature of weather-related risks. Future
researchers may evaluate farmers’ WTP for such insurance contracts.
• Researchers have suggested innovative solutions, such as a bonus-malus system or premium
discounting system based on loss experience, to improve the actuarial soundness of the crop
insurance market. Future research could consider investigating the feasibility of integrating such
innovations into the Nepalese crop insurance program.
• This study focussed on crop insurance as a major strategy to mitigate the weather–related risks in
rice farming in the Terai region of Nepal. Future research may analyse farming risks and
applicability of insurance by geographical regions (Mountain, Hills and Terai), crop, livestock
types and income groups.
• This thesis has comprehensively mapped prevalent risks in the Nepalese farming sector. However,
due to resource and time constraints, the risk management component of the thesis
disproportionately focuses on weather-related risks in rice farming, especially drought. Further
research is necessary covering other crops and risks to support the development of a holistic
agricultural risk management framework.
• This study used insurance adoption as a dichotomous variable to account for whether respondents
had an ongoing insurance contract at the time of the survey. However, adoption has various levels,
including continuous adoption, intermittent adoption, dis–adoption and non–adoption. Future
researchers may consider measuring adoption as a continuous or ordinal variable.
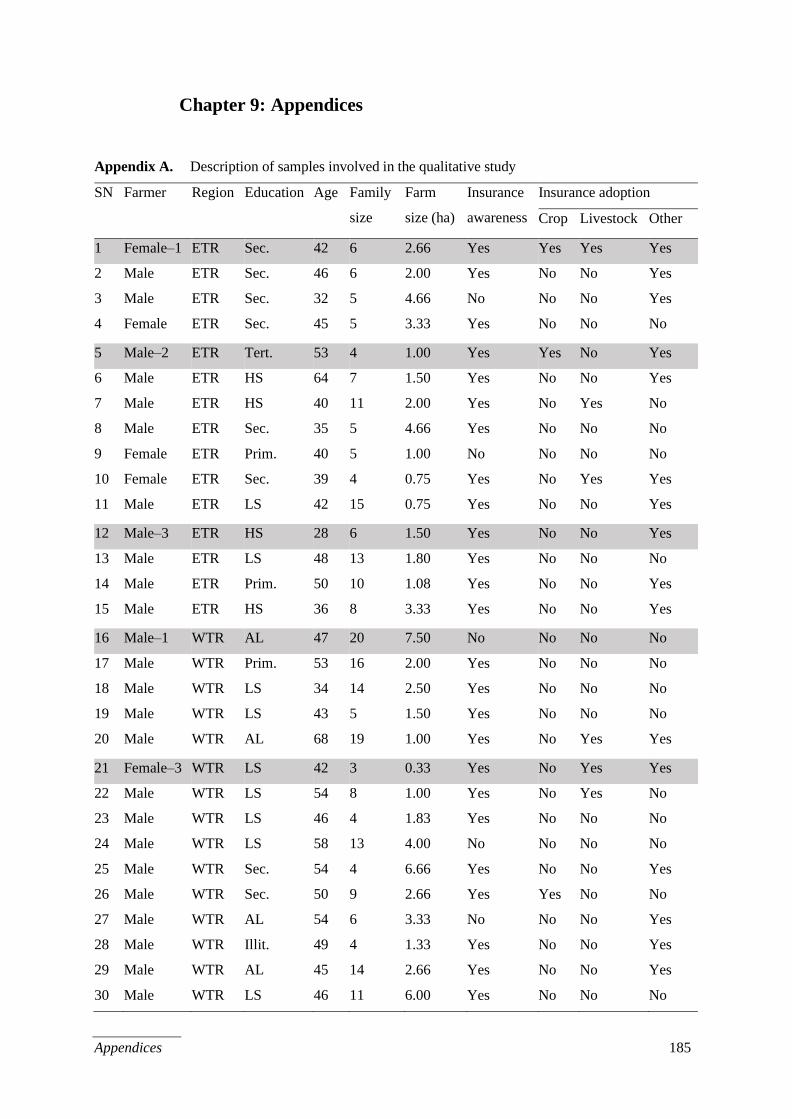
Appendices 185
Chapter 9: Appendices
Appendix A. Description of samples involved in the qualitative study
SN Farmer Region Education Age Family
size
Farm
size (ha)
Insurance
awareness
Insurance adoption
Crop Livestock Other
1 Female–1 ETR Sec. 42 6 2.66 Yes Yes Yes Yes
2 Male ETR Sec. 46 6 2.00 Yes No No Yes
3 Male ETR Sec. 32 5 4.66 No No No Yes
4 Female ETR Sec. 45 5 3.33 Yes No No No
5 Male–2 ETR Tert. 53 4 1.00 Yes Yes No Yes
6 Male ETR HS 64 7 1.50 Yes No No Yes
7 Male ETR HS 40 11 2.00 Yes No Yes No
8 Male ETR Sec. 35 5 4.66 Yes No No No
9 Female ETR Prim. 40 5 1.00 No No No No
10 Female ETR Sec. 39 4 0.75 Yes No Yes Yes
11 Male ETR LS 42 15 0.75 Yes No No Yes
12 Male–3 ETR HS 28 6 1.50 Yes No No Yes
13 Male ETR LS 48 13 1.80 Yes No No No
14 Male ETR Prim. 50 10 1.08 Yes No No Yes
15 Male ETR HS 36 8 3.33 Yes No No Yes
16 Male–1 WTR AL 47 20 7.50 No No No No
17 Male WTR Prim. 53 16 2.00 Yes No No No
18 Male WTR LS 34 14 2.50 Yes No No No
19 Male WTR LS 43 5 1.50 Yes No No No
20 Male WTR AL 68 19 1.00 Yes No Yes Yes
21 Female–3 WTR LS 42 3 0.33 Yes No Yes Yes
22 Male WTR LS 54 8 1.00 Yes No Yes No
23 Male WTR LS 46 4 1.83 Yes No No No
24 Male WTR LS 58 13 4.00 No No No No
25 Male WTR Sec. 54 4 6.66 Yes No No Yes
26 Male WTR Sec. 50 9 2.66 Yes Yes No No
27 Male WTR AL 54 6 3.33 No No No Yes
28 Male WTR Illit. 49 4 1.33 Yes No No Yes
29 Male WTR AL 45 14 2.66 Yes No No Yes
30 Male WTR LS 46 11 6.00 Yes No No No
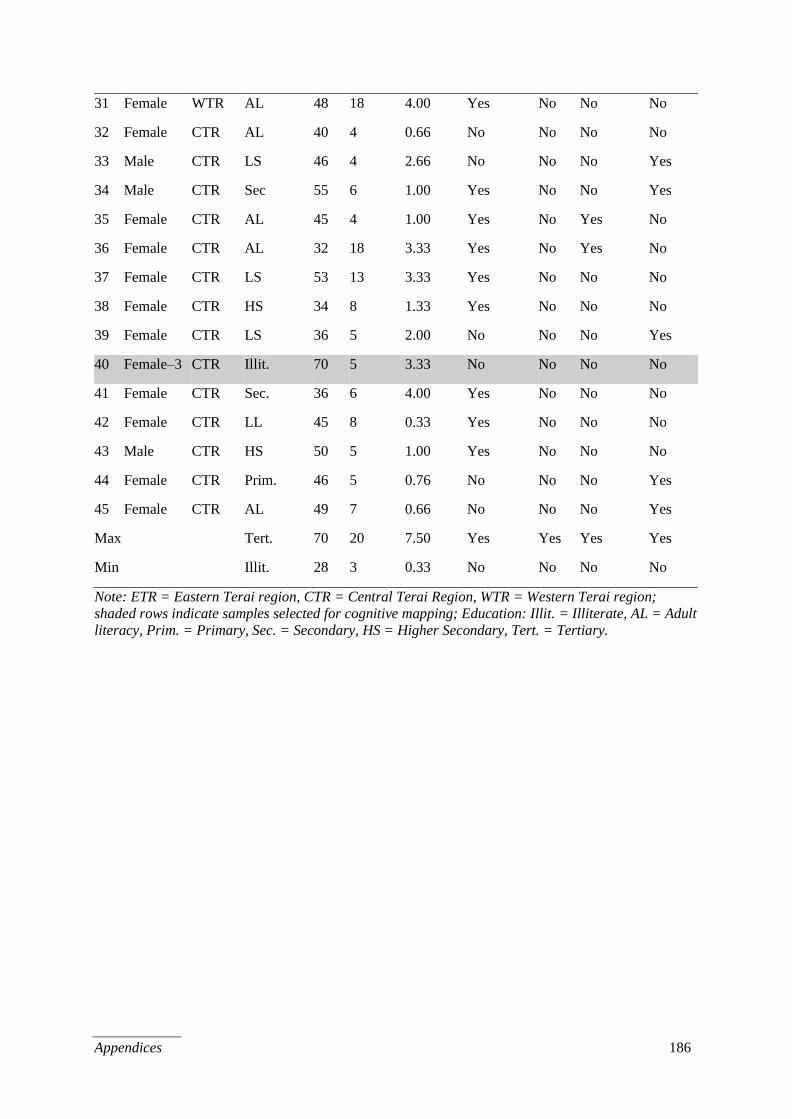
Appendices 186
31 Female WTR AL 48 18 4.00 Yes No No No
32 Female CTR AL 40 4 0.66 No No No No
33 Male CTR LS 46 4 2.66 No No No Yes
34 Male CTR Sec 55 6 1.00 Yes No No Yes
35 Female CTR AL 45 4 1.00 Yes No Yes No
36 Female CTR AL 32 18 3.33 Yes No Yes No
37 Female CTR LS 53 13 3.33 Yes No No No
38 Female CTR HS 34 8 1.33 Yes No No No
39 Female CTR LS 36 5 2.00 No No No Yes
40 Female–3 CTR Illit. 70 5 3.33 No No No No
41 Female CTR Sec. 36 6 4.00 Yes No No No
42 Female CTR LL 45 8 0.33 Yes No No No
43 Male CTR HS 50 5 1.00 Yes No No No
44 Female CTR Prim. 46 5 0.76 No No No Yes
45 Female CTR AL 49 7 0.66 No No No Yes
Max Tert. 70 20 7.50 Yes Yes Yes Yes
Min Illit. 28 3 0.33 No No No No
Note: ETR = Eastern Terai region, CTR = Central Terai Region, WTR = Western Terai region;
shaded rows indicate samples selected for cognitive mapping; Education: Illit. = Illiterate, AL = Adult
literacy, Prim. = Primary, Sec. = Secondary, HS = Higher Secondary, Tert. = Tertiary.

Appendices 187
Appendix B. Cognitive maps of the samples analysed in the qualitative study with explanation
Appendix B.1 Cognitive map of Female–1
(Legend: regular, intrinsic factor: underlined, perceived risk: bold red and risk management:
italicised bold blue)
Female–1 is a 42–year–old farmer from the Sunsari district of the Eastern Terai region. She completed
high school level education. She heads a six–membered family that solely depends on farming from
2.66 ha of land for their livelihood.
She got into farming as a family legacy because she never came across any other employment option.
She learned basic farming practices seeing her elders do it. As the family grew up, production from the
same piece of land did not meet the family's food, fibre, and other requirements. To cope with this
insufficiency, she looked for opportunities to increase farm production. She adopted modern, short–
duration and high–yielding crop varieties and farming technologies to produce more from the same
piece of land. She found these modern crop varieties and technologies riskier than local crop varieties
and conventional practices because they needed to increase their technical knowledge. She sought
assistance from the agricultural research station and District Agriculture Development Office to deal
with this risk. She also found modern crop varieties more susceptible to insects and diseases than local
varieties. She applies more pesticides, fertilisers and other chemicals to increase production from the
high–yielding varieties, which she knows are harmful to humans and the environment. Moreover, the
increased use of chemical inputs increased the costs of production.

Appendices 188
Compared to ten years before, the climatic patterns have changed considerably and hampered farming
practices. In particular, variation in rainfall pattern in terms of timing of monsoonal onset and seasonal
rainfall distribution has made it more difficult for her to synchronise the farming calendar with
rainfall, as her farming system is rainfed. The most prominent risk posed by erratic rainfall is flooding.
High–intensity rainfall can inundate her newly planted rice fields for more than a week, washing the
rice plants away, reducing rice production. This year was a high–flooded year, and she lost half of her
rice plants to flooding. She assumes that floods come twice in five years and reduce her rice
production by half. The negative effect of the flood is not limited to one season but also affects soil
fertility as it silts the cropland and makes it less fertile, affecting crop productivity in following
seasons. To overcome some of the flood risks, she plans to grow the flood–tolerant rice varieties that
she tested this year on a small piece of land.
Her farming depends on monsoonal rainfall. If the monsoon does not occur as expected in terms of
onset timing and seasonal distribution, the rice faces drought, which is another major risk to rice
production. If the onset of monsoon is delayed, rice transplantation is delayed, reducing crop
production. Similarly, if the monsoon is not evenly distributed between June and August, the rice crop
will face flood and drought intermittently. Despite the nearby irrigation canal, the water supply is
unreliable. She said that the canal does not supply water when she needs it most. To cope with
drought, she relies on pumped groundwater, which she thinks is not as good as rainfall in terms of
quality and increases production costs. Early monsoon is one of the features of erratic rainfall, which
she thinks is a good thing for both spring and main season rice production. However, early monsoon
usually coincides with the winter crop harvest, significantly reducing the quality of produce. She
considers drought as the major climatic risk to her rice production, followed by flood.
She thinks that winters have increasingly shortened compared to ten years ago. The early blow of
western air terminates the winter season early, forcing the wheat crop to start flowering. The forced
flowering reduces the vegetative growth period of wheat and other winter crops, significantly reducing
production.
She thinks that uncertainty related to the timely availability of inputs such as seeds, fertilisers,
herbicides, and other agrochemicals poses two risks in her farming: (1) increases the chance of
reduced crop production, and (2) a short supply of inputs, increases input prices, which increases
production costs. She thinks that even if the inputs are available, their quality is uncertain as she has
received contaminated inputs in the past. Moreover, she does not have enough knowledge to check
input quality, which negatively affects crop production.
Due to the increase in overseas youth migration for employment and higher opportunity cost of
labourers in the off–farm sector, labour availability has declined. In addition to posing uncertainty for

Appendices 189
the crop acreage decisions, this labour shortage has increased production costs. To deal with the risk of
higher production costs and labour unavailability, she uses machines to carry out various farming
activities, such as land preparation, planting, harvesting and threshing. However, mechanisation is not
a risk–free panacea. The most limiting factor for farm mechanisation is that she does not have enough
capital to purchase machines. While mechanisation services are available in villages through the
custom hiring service provision model, demand for these services increase during peak seasons. She is
associated with an agriculture production cooperative, which has bought farm machinery and provided
services to other members. She owns a zero–tilled seed drill, which she purchased using a loan from a
farmer group. As a novice user of farm machinery, she often questions the production success from
machinery and her technical knowledge associated with machinery operations. She is also uncertain
about the economics of farm mechanisation because she suspects that her land is not suitable for
mechanisation as it is fragmented into small pieces and scattered in many locations.
The increasing population has increased market access tremendously in the past ten years; the risk of
not selling produce at the market is minimal. However, increasing production and competition in the
market have led to price stagnation over the same period because the price determination system does
not allow for farmers to bargain their prices; price determination is the sole power of a small number
of contractors. Moreover, consumers have become more conscious about produce quality. If farmers
do not maintain the quality of their produce, they must accept a lower price. In years with low crop
yield, the price increases slightly; hence, she prefers selling rice in the lean seasons. However, there is
a risk of loss due to insects and rodents in storage.
Uncertainty of crop yield is the major risk to her farming. She does not have any other options to meet
the family’s requirements if farm production fails. To cope with the possible failure of a component
commodity, she has adopted an integrated farming system that incorporates both horizontal diversity
(several crops in a season) and spatial diversity (crop rotation). She also grows several varieties within
a single crop according to land type and maturity duration that fits into the crop rotation plan. She
thinks that varietal diversification minimises the risk of full crop failure, even if one variety fails for
some reason. Moreover, her farming system integrates several livestock components, including goats,
pigs and poultry, to minimise the risks associated with fertiliser unavailability. Nevertheless, she
struggled for a few years to convince the elders when she wanted to add pigs into her farming system,
as they did not allow her to raise pigs due to cultural restrictions.
She heard about crop insurance for safeguarding against production risks and bought it for her rice
crop. She also insured eight pigs for NPR 20000 each, paying only NPR 250 for the insurance
premium. She also has family health insurance, paying NPR 500 per year for health benefits up to
NPR 25000 per year. She has a reasonable understanding of the concepts of risk, insurance and
premium. She thinks that the insurance premiums for the pig and health insurance programs are

Appendices 190
negligible compared to risks. She feels that the premium for crop insurance is not too high, and she is
ready to insure her rice production against failures due to flood, drought, insects and diseases. When
she was asked to choose between a certain NPR 2000 and a lottery with the chance of winning 5000
NPR or nothing with equal probabilities, she preferred the certain outcome, although the lottery had a
higher expected value. She added that she is happier with lower but guaranteed income than higher
risky income. This attitude confirms that she is risk–averse, which is consistent with her willingness to
insure her rice crops.

Appendices 191
Appendix B.2 Cognitive map of the oldest and least educated sample (Female–2)
(Legend: regular, intrinsic factor: underlined, perceived risk: bold red and risk management:
italicised bold blue)
Female–2 is a 70–year–old farmer from the Parasi district of the Central Terai region. She is illiterate
and heads a five–membered family that depends on farming from 3.33 ha of land for their livelihood.
Being illiterate and having no other job opportunities, she got into farming as the only option for her
livelihood. She used to practice a traditional way of farming which had low crop production.
Compared to the past, she thinks that the temperature has risen. She thinks that rainfall has become
more erratic, creating drought, but she has not experienced any serious flood events of note. As she
does not have access to irrigation facilities, drought hampers her crop production almost every year. If
crop production is low, her family must go through food insufficiency, as she does not have any other
source of income. To cope with food insufficiency, she has adopted modern crop varieties and
technologies, expecting better yields. However, modern varieties and technologies are not free from
risk. She thinks that modern crop varieties require higher applications of fertiliser, which increase
production costs. She feels that adopting modern crop varieties has extinguished the local crop
varieties that can tolerate insects and diseases. Modern varieties are more susceptible to insects and
diseases, increasing the risk of lower crop production. The cultivation of modern crop varieties and
technologies requires new knowledge to increase yields. She thinks if she does not acquire appropriate
knowledge, even the modern varieties will not produce higher yields. As she does not have any
linkage with agencies that provide technical training, she relies solely on fellow farmers to learn. In
addition to adopting modern crop varieties and technologies, she has diversified her farm in terms of
the number of crops and the number of varieties within a crop to cope with crop production risk. She

Appendices 192
thinks that if one crop fails to produce for some reason, the same reason might not apply to other
crops. Similarly, if one variety of rice fails because of some reason, other varieties might do well.
She thinks that labour unavailability and higher input costs, such as seed, fertilisers, and chemicals, are
the major challenges to her farming. She feels that increasing overseas migration and higher wage
rates in off–farm sectors are the major reasons for labour unavailability. She thinks that farm
mechanisation would be the most appropriate tool for coping with the risk of higher production costs
due to higher input costs and labour unavailability. However, she has little access to farm machines
and services because she cannot afford them. She does not have access to formal credit institutions and
relies on neighbours for credit for farm mechanisation. In addition to the economic aspects of farm
mechanisation, she thinks that machine operations degrade soil fertility. She feels that traditional
tillage practices would make the soil more fertile.
In her early days, there was no tradition of selling agricultural produce. There was no market, but
nowadays, she can sell whatever and whenever she likes. In addition to the risk of low crop
production, the chance of not getting a reasonable price for farm produce is always there. The traders
determine the price of the farm produce, and there is always a risk that they might not offer a
reasonable price. The government does not support price determination or guarantee profitable prices
for farm produce. Selling farm produce in lean seasons is one option for minimising low output price
risk. However, as she does not have any other income source, she must sell the produce immediately
after harvest as she needs cash to meet household needs and purchase inputs for next season’s crops.
She is not willing to insure crops, as she is unaware that it exists or any other insurance for that matter.
She believes that crop insurance is not necessary because fellow farmers would have done it already.
This attitude shows her dependency on fellow farmers for important farming decisions. Her
unwillingness for crop insurance might also be due to her reliance on on–farm diversification and
varietal diversification to minimise crop production risk.

Appendices 193
Appendix B.3 Cognitive map of smallest holding sample, also representative of nuclear family
samples (Female–3)
(Legend: regular, intrinsic factor: underlined, perceived risk: bold red and risk management:
italicised bold blue)
Female–3, 42, is the smallest landholding sample from the Bardiya district of Western Terai region
and represents nuclear families. She owns 0.33 ha of land to sustain a three–membered family.
Having no other options for livelihood, she adopted farming as a family legacy. As she is farming
from her own experience and knowledge inherited from elders, she thinks that her farming knowledge
is insufficient to adopt modern farming technologies. For this reason, she fears adopting new farming
technologies. She also feels that she has low access to government subsidies and support programs,
which would have increased her technical know–how. Neighbours are the major source of information
regarding farming practices. She adopts only the technologies that she observes doing better in fellow
farmers’ fields. Moreover, she is associated with a farmer group, which has increased her access to
new technical knowledge and support services. With this much farming knowledge and status of
technology adoption, she often fears whether crop production from her little piece of land would be
sufficient to sustain her small family.
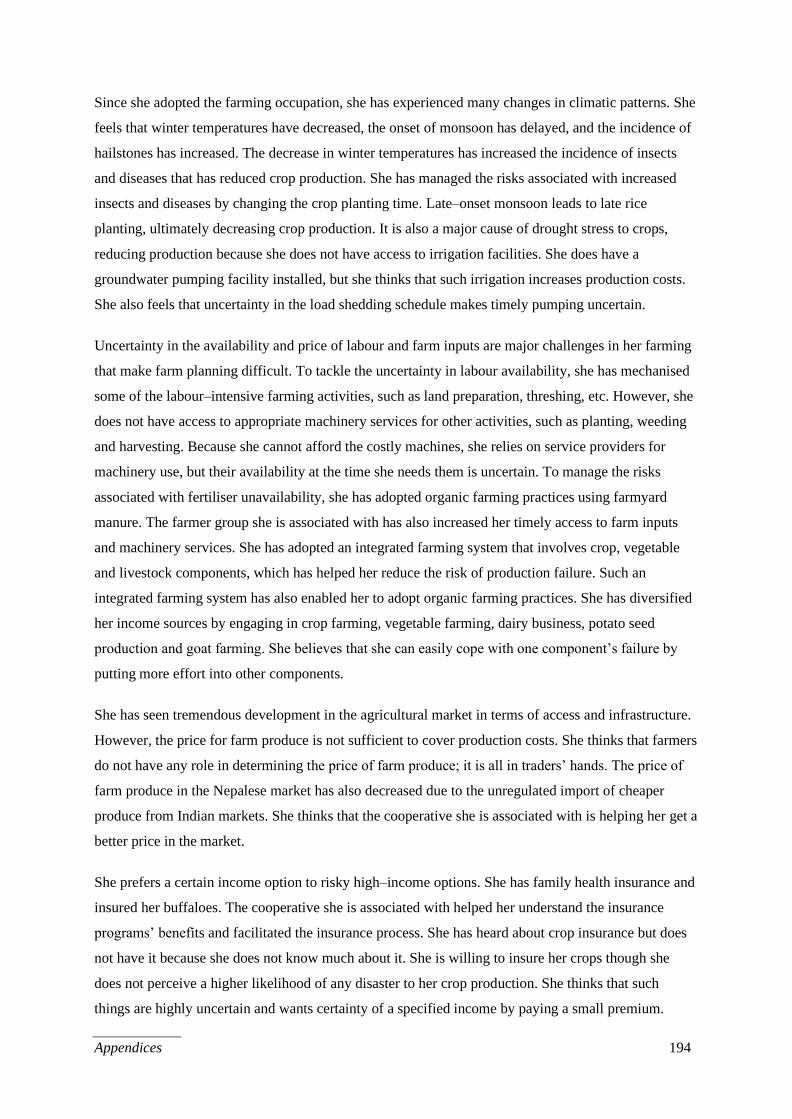
Appendices 194
Since she adopted the farming occupation, she has experienced many changes in climatic patterns. She
feels that winter temperatures have decreased, the onset of monsoon has delayed, and the incidence of
hailstones has increased. The decrease in winter temperatures has increased the incidence of insects
and diseases that has reduced crop production. She has managed the risks associated with increased
insects and diseases by changing the crop planting time. Late–onset monsoon leads to late rice
planting, ultimately decreasing crop production. It is also a major cause of drought stress to crops,
reducing production because she does not have access to irrigation facilities. She does have a
groundwater pumping facility installed, but she thinks that such irrigation increases production costs.
She also feels that uncertainty in the load shedding schedule makes timely pumping uncertain.
Uncertainty in the availability and price of labour and farm inputs are major challenges in her farming
that make farm planning difficult. To tackle the uncertainty in labour availability, she has mechanised
some of the labour–intensive farming activities, such as land preparation, threshing, etc. However, she
does not have access to appropriate machinery services for other activities, such as planting, weeding
and harvesting. Because she cannot afford the costly machines, she relies on service providers for
machinery use, but their availability at the time she needs them is uncertain. To manage the risks
associated with fertiliser unavailability, she has adopted organic farming practices using farmyard
manure. The farmer group she is associated with has also increased her timely access to farm inputs
and machinery services. She has adopted an integrated farming system that involves crop, vegetable
and livestock components, which has helped her reduce the risk of production failure. Such an
integrated farming system has also enabled her to adopt organic farming practices. She has diversified
her income sources by engaging in crop farming, vegetable farming, dairy business, potato seed
production and goat farming. She believes that she can easily cope with one component’s failure by
putting more effort into other components.
She has seen tremendous development in the agricultural market in terms of access and infrastructure.
However, the price for farm produce is not sufficient to cover production costs. She thinks that farmers
do not have any role in determining the price of farm produce; it is all in traders’ hands. The price of
farm produce in the Nepalese market has also decreased due to the unregulated import of cheaper
produce from Indian markets. She thinks that the cooperative she is associated with is helping her get a
better price in the market.
She prefers a certain income option to risky high–income options. She has family health insurance and
insured her buffaloes. The cooperative she is associated with helped her understand the insurance
programs’ benefits and facilitated the insurance process. She has heard about crop insurance but does
not have it because she does not know much about it. She is willing to insure her crops though she
does not perceive a higher likelihood of any disaster to her crop production. She thinks that such
things are highly uncertain and wants certainty of a specified income by paying a small premium.

Appendices 195
Appendix B.4 Cognitive map of the sample with the largest landholding and joint family system
(Male–1)
(Legend: regular, intrinsic factor: underlined, perceived risk: bold red and risk management:
italicised bold blue)
Male–1, 47, from the Bardiya district of the Western Terai region, is the largest landholder among the
samples. He heads 20 members of joint families earning bread and butter from 7.5 ha of land.
Having no other employment options to follow, he got into farming as a family legacy using the
knowledge his father passed onto him. For this reason, he thinks that his farming knowledge is low
and the major reason for low crop production. To overcome the risk of low crop production, he is keen
to adopt modern crop varieties and farming technologies. He suspects that modern varieties and
technologies would not produce more than he currently does with his current knowledge level. Before
he adopts a new crop variety or technology, he minimises the risk of production failure by testing it in
a small area in the first year. He also thinks that modern varieties and technologies require more
chemical inputs, resulting in higher production costs. The higher use of chemical inputs is also due to
the higher susceptibility of modern varieties and technologies to insects and diseases. He thinks that
higher use of chemical inputs degrades soil fertility, leading to higher use of chemical inputs, creating
a vicious circle of low fertility–chemical input use and increased insect resistance against chemicals,
leading to further chemical use in the future. Similarly, higher use of chemical inputs is associated
with lower produce quality, fetching lower prices in the market. Lower produce quality is also
correlated with poorer family health.

Appendices 196
Since his childhood, he has seen many changes in climatic patterns. Rainfall has become more erratic.
Sometimes, it rains heavily, creating floods. However, the amount of precipitation has decreased in
general, making drought the most critical challenge for farming, particularly as he does not have
access to irrigation facilities. The use of pumped water requires high initial capital investment and
higher operational costs, resulting in higher production costs. Late–onset monsoon has become usual
in recent years, delaying rice planting. He thinks that a higher incidence of insects and diseases is the
major risk associated with the late planting of rice. He feels that all other climatic hazards, such as
drought, floods, and high temperature, increase insect and disease incidence. Additionally, flood
hazards are associated with direct crop losses, decreasing crop production and increasing land
degradation. He thinks that land degradation and physical vulnerability to climatic hazards are
associated with the price risk of land and property.
Unavailability of quality inputs in time and labour shortage are other major challenges in farming. If
labourers and inputs are not easily available when needed, they must pay more to secure them,
resulting in higher total production costs. To overcome the labour shortage challenge, he thinks that
mechanisation is the most appropriate solution. He owns some farm machinery. However, machinery
support services and spare parts are not available in local markets, so the proper and uninterrupted
functioning of such machinery is uncertain. He also thinks that increasing farm mechanisation has
decreased the soil animal population, negatively affecting soil fertility and environmental balance.
On top of many challenges that threaten farm production, he has seen that farmers are always
uncertain about how much their farm produce will fetch in the market. He is not satisfied with the
price of farm produce he received in the past few years, always being very low and not sufficient to
cover production costs. Farmers do not have any hand in price determination and must accept the price
the contractors offer. The government does not support farmers by guaranteeing a minimum support
price for farm produce. Lower prices in nearby Indian markets negatively impact the prices in
Nepalese markets. The government has not protected Nepali farmers from the illegal import of cheap
farm produce from India.
He is willing to take a risk if he can expect higher income at some level. However, if the value at stake
is high, he prefers safer but lower income to risky higher income. He is not aware of the concept of
insurance. He is not willing to pay a premium price to insure his crops. He expects the government to
compensate farmers in the case of disaster in their farm production. He also expects the government to
construct a flood barrage instead of spending money on crop insurance programs. Though he sees
many challenges in his farming, he does not think that crop insurance is worth it. To manage
production risks, he prefers to diversify his farm, adopt a varietal diversification strategy, and adopt an
integrated farming system that includes livestock components.

Appendices 197
Appendix B.5 Cognitive map of the most educated sample (Male–2)
(Legend: regular, intrinsic factor: underlined, perceived risk: bold red and risk management:
italicised bold blue)
Male–2, 53, is the most educated sample from the Sunsari district of the Eastern Terai region, having
completed a master’s degree. In addition to running a cooperative, he cultivates 1 ha of land to sustain
a four–member family.
When he completed his master’s degree, he analysed available employment options and decided to get
into farming. He was aware that agriculture is not free from risk, and it is risky if he did not do it
differently from the other farmers. He is always keen to learn about new farming technologies and
modern crop varieties. He formed an agricultural cooperative organising fellow farmers, which
collectively produces and sells crop seeds.
Since he can remember, he has witnessed many changes in the environment and climate. He thinks
flood and drought hazards have increased rapidly in the past decade, posing a production risk. He feels
that unscientific urbanisation and ill–planned physical development, which have blocked natural water
channels, are more important for increased flooding than heavy rainfall. In recent years, the onset of
monsoon has been delayed, forcing farmers to plant rice later than usual. As he does not have access to
reliable canal irrigation, delayed monsoon causes drought stress to plants. He has been managing the
risks associated with flood and drought by changing the planting time, growing stress–tolerant rice
Appendices 198
varieties (STRVs), and adopting modern farming technologies. He finds that the STRVs have lower
grain quality, fetching lower prices in the market. He irrigates his crops by pumping groundwater to

Appendices 199
overcome the drought risks, but he thinks that the pumped irrigation increases production costs more
than canal irrigation. He also feels that hailstones and windstorms have increased in recent years.
He thinks that farm diversification, in terms of the number of crops grown, the number of varieties of a
crop grown, and the inclusion of livestock components in the farming system, has helped him manage
the risk of complete production failure. He has adopted modern crop varieties and technologies
because he thinks these have higher productivity than local varieties and conventional practices, but
they are not free from risk. He feels that there is a risk of farmers’ existing knowledge not being
sufficient to apply these modern technologies efficiently. He also thinks that these new varieties were
developed elsewhere and not tested under local conditions, posing a risk of production failure. In
addition, these varieties require more chemical inputs to increase production and minimise insects and
diseases. He thinks that higher chemical input use is directly related to higher production costs.
Moreover, he thinks that the increasing use of chemical inputs poses tremendous threats to human
health and the environment.
The increasing shortage of farm labourers and the unavailability of agricultural inputs, such as seed,
fertilisers, and chemicals, are other major threats to their farming. These result in higher production
costs because the shortage of these inputs results in higher input prices and labour wages. He thinks
that farm mechanisation is the most appropriate arrangement for managing risks associated with a
labour shortage, and he is using machines for many farm operations. However, in their context, farm
mechanisation is constrained by many factors. Smallholding, fragmented land, scattered holdings and
poorly developed land are major hurdles limiting the technical feasibility and economic advantages of
farm mechanisation. Similarly, limited access to machines and machinery services due to the high
initial capital investment to purchase them is a major hurdle for farm mechanisation. In a far corner of
this mind, he feels that environmental pollution and soil fertility degradation are some long–term
negative impacts of farm mechanisation.
He thinks that market opportunities have developed tremendously in the past few years. However, he
is not satisfied with the price he gets for his farm produce. He thinks that farmers do not have a role in
determining the price of their produce, and traders have the sole right. Farmers are obliged to accept
whatever price the contractors offer, and the government does not oversee this or implement any
policies favouring farmers. The government has failed to regulate the illegal import of cheaper farm
produce from India, which is the major reason for the lower prices in Nepalese markets. Selling the
produce in lean seasons is one option for getting better prices, but this decision is subject to the
availability of an appropriate storage facility. There is a risk of loss in storage due to rodents, insects
and diseases, and he does not have access to proper post–harvest processing, storage or other value
addition facilities. He thinks that group involvement and cooperative farming has helped him manage
the many risks associated with input unavailability, credit unavailability, lack of information about

Appendices 200
government subsidy and support programs, low access to machines and services, lower price of farm
produce in the market, lack of technical know–how about farm mechanisation and modern farming
practices, etc. The group has helped him diversify sources of income, which he thinks is important for
managing risks associated with low crop production.
He has life insurance for himself and his family members and understands the concept of insurance.
He prefers certain income options, despite it offering lower income, to the higher risky income
options. For these reasons, he is ready to sacrifice a small amount of his total income to insure his rice
crop. However, he does not like the existing crop insurance program. According to him, the current
insurance program pays only 80% of the production cost for complete failure, and other things related
to the loss assessment are not clear. He thinks that many farmers have not adopted crop insurance
programs because the existing product is not what they want. He thinks that if there were multiple crop
insurance products in the market, farmers would insure to a specified production level rather than for
production costs, even if they have to pay a higher premium than the existing one.
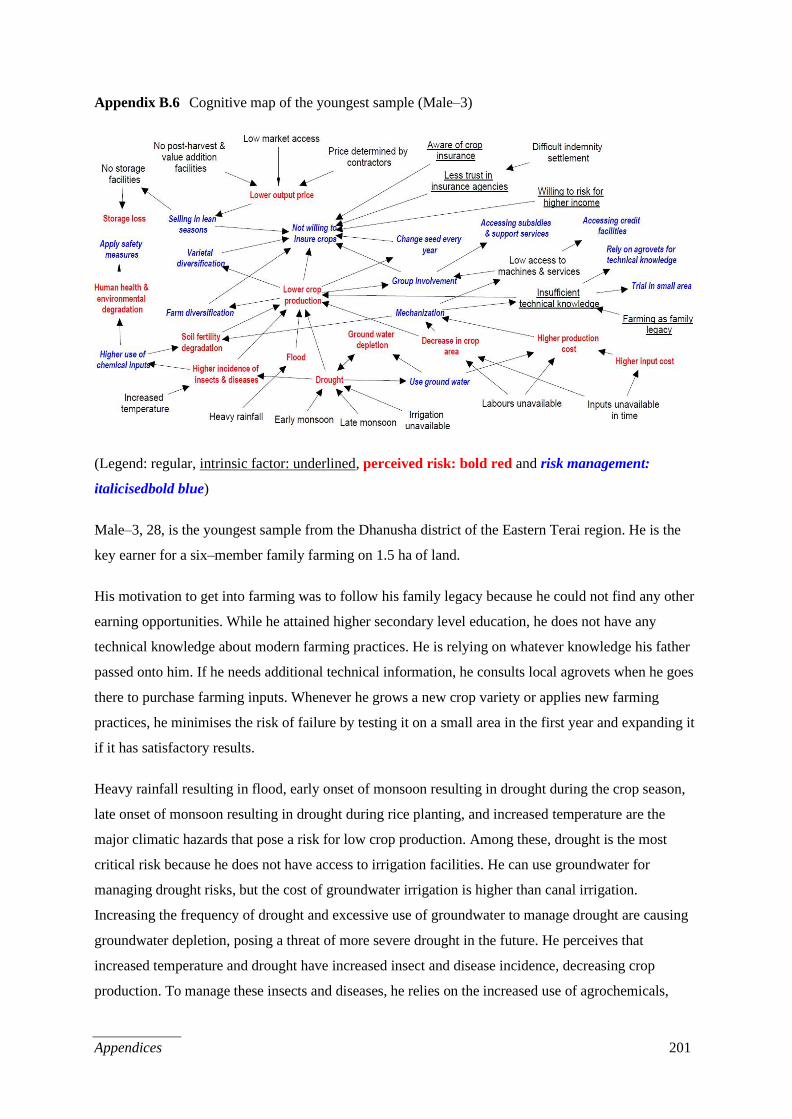
Appendices 201
Appendix B.6 Cognitive map of the youngest sample (Male–3)
(Legend: regular, intrinsic factor: underlined, perceived risk: bold red and risk management:
italicised bold blue)
Male–3, 28, is the youngest sample from the Dhanusha district of the Eastern Terai region. He is the
key earner for a six–member family farming on 1.5 ha of land.
His motivation to get into farming was to follow his family legacy because he could not find any other
earning opportunities. While he attained higher secondary level education, he does not have any
technical knowledge about modern farming practices. He is relying on whatever knowledge his father
passed onto him. If he needs additional technical information, he consults local agrovets when he goes
there to purchase farming inputs. Whenever he grows a new crop variety or applies new farming
practices, he minimises the risk of failure by testing it on a small area in the first year and expanding it
if it has satisfactory results.
Heavy rainfall resulting in flood, early onset of monsoon resulting in drought during the crop season,
late onset of monsoon resulting in drought during rice planting, and increased temperature are the
major climatic hazards that pose a risk for low crop production. Among these, drought is the most
critical risk because he does not have access to irrigation facilities. He can use groundwater for
managing drought risks, but the cost of groundwater irrigation is higher than canal irrigation.
Increasing the frequency of drought and excessive use of groundwater to manage drought are causing
groundwater depletion, posing a threat of more severe drought in the future. He perceives that
increased temperature and drought have increased insect and disease incidence, decreasing crop
production. To manage these insects and diseases, he relies on the increased use of agrochemicals,

Appendices 202
which is degrading soil fertility and reducing crop production. He is also aware that these chemicals
pose several threats to human health and the environment. When applying chemicals, he tries to
minimise health risks by spraying proper doses and using personal safety measures.
In addition to climatic risks, the timely availability of farm labourers and agricultural inputs are major
threats that pose risks in his farming. Firstly, if labours and inputs are not available in sufficient
quantity, he must reduce the crop area to match the availability, ultimately reducing his total crop
production. Secondly, if he wants to cultivate all his land, he has to pay higher costs for labour and
inputs that increases production costs. To manage the risk associated with labour unavailability, he
uses farm machines to some extent. However, mechanisation is not free from risk. Firstly, he lacks
sufficient technical knowledge about machine operations and other farming technologies required for
farm mechanisation. Even the agrovets and machinery service providers lack adequate technical
knowledge about mechanised farming practices. Secondly, low access to machines and services is
another constraint in mechanisation because of higher cash needs. He is managing such cash needs for
farm mechanisation by accessing credit facilities. Moreover, his involvement in the farmer group has
helped him have easier and cheaper access to credit, machinery and services. Moreover, being
involved in the group, he has become aware of subsidies and support services that the government and
other agencies provide to farmers. He agrees that mechanisation is an essential solution for improving
the labour problem. However, in a far corner of his mind, he feels that farm mechanisation degrades
soil fertility more rapidly than conventional farming practices.
Being in a remote rural village, finding markets for farm produce is a big worry for him. Moreover, he
becomes frustrated when he thinks of the usual scenario of low crop production and low prices for
farm output in markets. He thinks that it is unjust that traders determine the price of the produce that
farmers have invested their efforts and money in. Selling the farm produce in lean seasons would help
manage the risk of low output prices in peak seasons, but this is limited by the lack of appropriate
storage facilities and the risk of storage loss. He does not have access to proper storage and post–
harvest value addition facilities to make better money from the farm produce.
He is aware of the farm insurance program being implemented but has not insured his farm against
such risks. He is not willing to insure his farm in the future. He is willing to accept some risk in the
expectation of higher income. Moreover, he does not trust farm insurance companies because one of
his fellow farmers had a tough time settling an indemnity in the past, spending more money than he
was paid in the end. Instead of the cumbersome and risky farm insurance, he tries to manage crop
production risks by growing more crops and crop varieties and raising animals. He thinks that even if
one component completely fails to produce, he can expect better production from other components.
Similarly, he changes crop seeds every year, assuming that purchased seeds are superior in quality and
can withstand biotic and abiotic stresses more than home–saved seeds.

Appendices 203
Appendix C. Household survey questionnaire
Interview date DD / MM / YYYY
Interview start time HH / MM AM PM
Interviewer
Have you understood all the information provided in the participant
information form, were given the opportunity to ask questions, signed the
participant consent form, and were provided with a copy of both forms?
Yes
No
Sample identifiers
i Study region 1. ETR
2. MTR
3. WTR
ii Sample serial no
iii Name of the sample farmer
iv Phone number
v Province
vi District
vii Municipality/ Rural municipality
viii Ward no
ix Name of village
Section A: Personal information of respondent (household head)
A1 Gender Male=1, Female=2, Others=3
A2 Age Years
A3 Age you started farming as a decision–maker
A4 Education 1. Illiterate (cannot read and write)
2. Literate but no formal education
3. Completed primary level
4. Completed secondary level
5. Completed higher secondary level
6. Completed university degree
7. Completed higher degree
A5 Marital
status
1. Married
2. Single, never married

Appendices 204
3. Single, divorced
4. Single widowed
5. Others
Section B: Household information
B1 Family type 1. Nuclear
2. Joint
B2 How many people live in
your household?
1. Adult men (above 18 years)
2. Adult women (above 18 years)
3. Children (below 18 years)
B3 How many men are earning?
B4 How many women are earning?
B5 Are there any persons in
your family working away
from home?
1. Yes → go to B–6
2. No → go to section C
B6 How many persons are
working away?
1. Men in–country
2. Men overseas
3. Women in–country
4. Women overseas
Section C: Economic characteristics
C1 Is your family immigrant or indigenous to this place? 1. Immigrant → go to C2
2. Indigenous→ go to C3
C2 Which year did your family migrate to this place? Years
C3 How much land do you own? Kattha
C4 How much land have you rented in? Kattha
C5 How much land have you rented out? Kattha
C6 How much land did you cultivate last year? Kattha
C7 What percentage of total land cultivated do you
consider is irrigated?
%
C8 How many parcels of land do you have?
C9 How much of your land has road access for
mechanisation?
% of total holding
C10 What is the total annual income of your family? NPR

Appendices 205
C11 What are the sources of
your family income?
i. Farming
ii. Business
iii. Employment (Casual &
permanent)
iv. Labouring
v. Others
Total
% of total
% of total
% of total
% of total
% of total
100 %
C12
What is the share of
different commodities in
farm income?
i. Crops
ii. Vegetables
iii. Fruits
iv. Livestock
v. Fishery
vi. Forestry
vii. Others
Total
% of total
% of total
% of total
% of total
% of total
% of total
% of total
100%
C13 How sufficient was your
own farm production to
meet family food
requirements last year?
1. 0 – 3 months
2. 3 – 6 months
3. 6 – 9 months
4. 9 – 12 months
5. >12 months
C14 How sufficient is your
family's annual income to
meet the family
requirements?
1. Deficit
2. Sufficient
3. Surplus
If the answer is ‘1’, go to C14;
otherwise, go to Section D
C15 How do you manage your
family requirements for
deficit months?
1. Spend from saving
2. Take monetary loan
3. Borrowing food grains
4. Selling assets
5. Decrease consumption
6. Others
If the answer is “6”, please
specify:
––––––––––––––––––

Appendices 206
Section D: Village infrastructure and facilities
SN Infrastructures and facilities
(Consider the nearest one)
i ii iii
Do you have
access to
these
How much is
the distance
to?
(KM)
Considering all aspects of
services or infrastructure, how
satisfied are you with these?
1. Yes
2. No
1. Very satisfied
2. Satisfied
3. Neutral
4. Unsatisfied
5. Very unsatisfied
D1 All–weather road
D2 Agri–inputs market
D3 Agri–outputs market
D4 Agri–technology service centre
D5 Agri–extension service centre
D6 Health facilities
D7 Post–harvest storage
D8 Post–harvest processing
D9 Credit institutions
D10 Insurance companies
D11 Others (specify) ––––––––––––––
Section E: Gender role i ii
Male (%) Female (%)
E1 Who is involved in
following household
decisions?
i. Health
ii. Education
iii. Farming
iv. Finance
v. Social
vi. Others (specify)
E2 Who is involved in the
following farming
activities?
i. Cultivation
ii. Processing
iii. Marketing
iv. Others (specify)

Appendices 207
E3 Who is involved in
following farming
decisions?
i. Crop selection
ii. Area selection
iii. Marketing
iv. Investment
v. Saving
vi. Others (Specify)
-----------------
Section F: Farm mechanisation
Do you use machines for the following operations in given crops?
Yes = 1, No = 0
SN Operations i Rice ii Wheat iii Maize iv Pulses v Potato
F1 Primary tillage
F2 Secondary tillage
F3 Planting
F4 Chemical spray
F5 Irrigation
F6 Weeding
F7 Harvesting
F8 Threshing
F9 Drying
F10 Grading
F11 Others (specify )
Which of the following machines do you use in your farms?
SN Machines i Use ii Ownership iii Operations
(1=Yes; 2=No) (1=Own; 2=Hired) (1=Self; 2=Serviced)
F12 Tractor
F13 Power tiller
F14 Disc plough
F15 Cultivator
F16 Rotavator
F17 Potato planter
F18 Rice transplanter
F19 Zero till seed drill
F20 Combined harvester
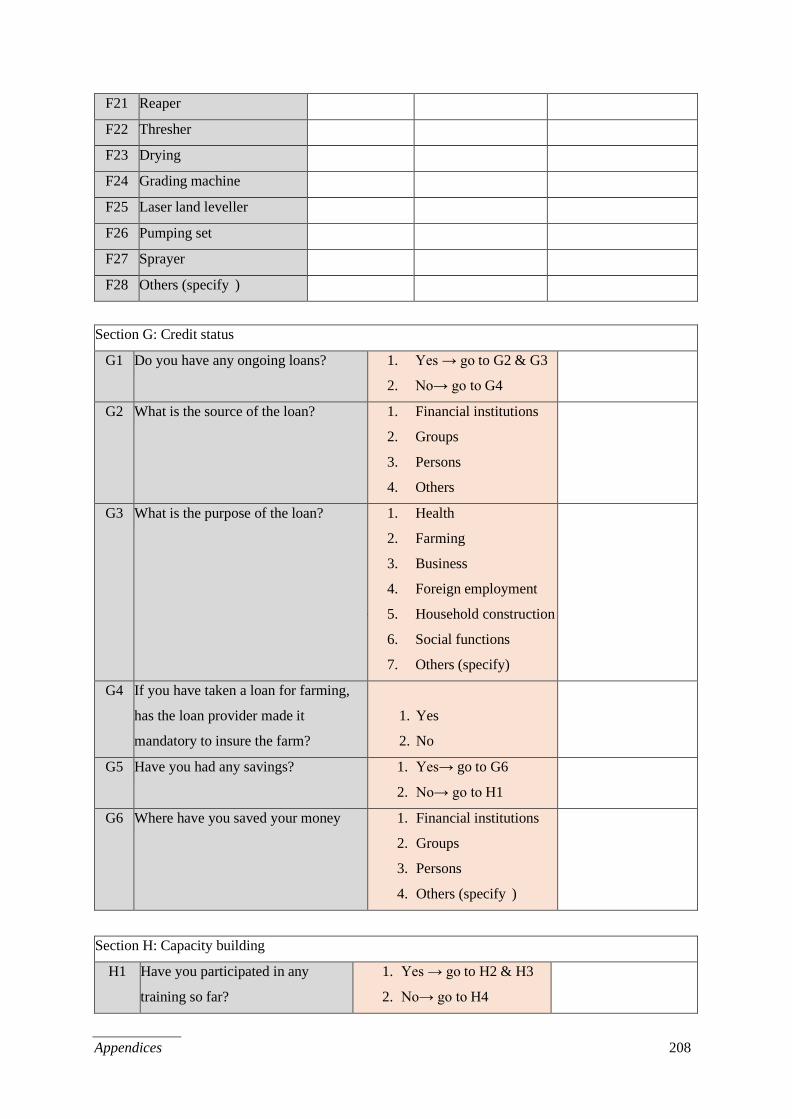
Appendices 208
F21 Reaper
F22 Thresher
F23 Drying
F24 Grading machine
F25 Laser land leveller
F26 Pumping set
F27 Sprayer
F28 Others (specify )
Section G: Credit status
G1 Do you have any ongoing loans? 1. Yes → go to G2 & G3
2. No→ go to G4
G2 What is the source of the loan? 1. Financial institutions
2. Groups
3. Persons
4. Others
G3 What is the purpose of the loan? 1. Health
2. Farming
3. Business
4. Foreign employment
5. Household construction
6. Social functions
7. Others (specify)
G4 If you have taken a loan for farming,
has the loan provider made it
mandatory to insure the farm?
1. Yes
2. No
G5 Have you had any savings? 1. Yes→ go to G6
2. No→ go to H1
G6 Where have you saved your money 1. Financial institutions
2. Groups
3. Persons
4. Others (specify )
Section H: Capacity building
H1 Have you participated in any
training so far?
1. Yes → go to H2 & H3
2. No→ go to H4

Appendices 209
H2 How many times have you participated in such training
H3 What was the training that you
participated in the highest number
of times about?
1. Farming
2. Health and sanitation
3. Group mobilisation
4. Cooperative management
5. Others
H4 Have you participated in any study
tours?
1. Yes→ go to H5 & H6
2. No→ go to I1
H5 How many times have you participated in such study tours?
H6 What was the study tour that you
participated in the highest number
of times about?
1. Farming
2. Health and sanitation
3. Group mobilisation
4. Cooperative management
5. Others
Section I: Social engagement
I1
Is any member of your family involved in any of the following social
groups or cooperatives?
1. Yes
2. No
i Agriculture production–related
ii Agriculture marketing related
iii Post–harvest value addition related
iv Microcredit related
v Income generation related
vi Health and sanitation–related
I2 Which year did your family first join such a group?
I3 How many groups are you in a leadership role?
I4 Is any female member of your family
involved in such groups?
1. Yes
2. No
I5 How helpful do you think these groups are in
related issues?
1. Very helpful
2. Helpful
3. Moderately helpful
4. Unhelpful
5. Very unhelpful
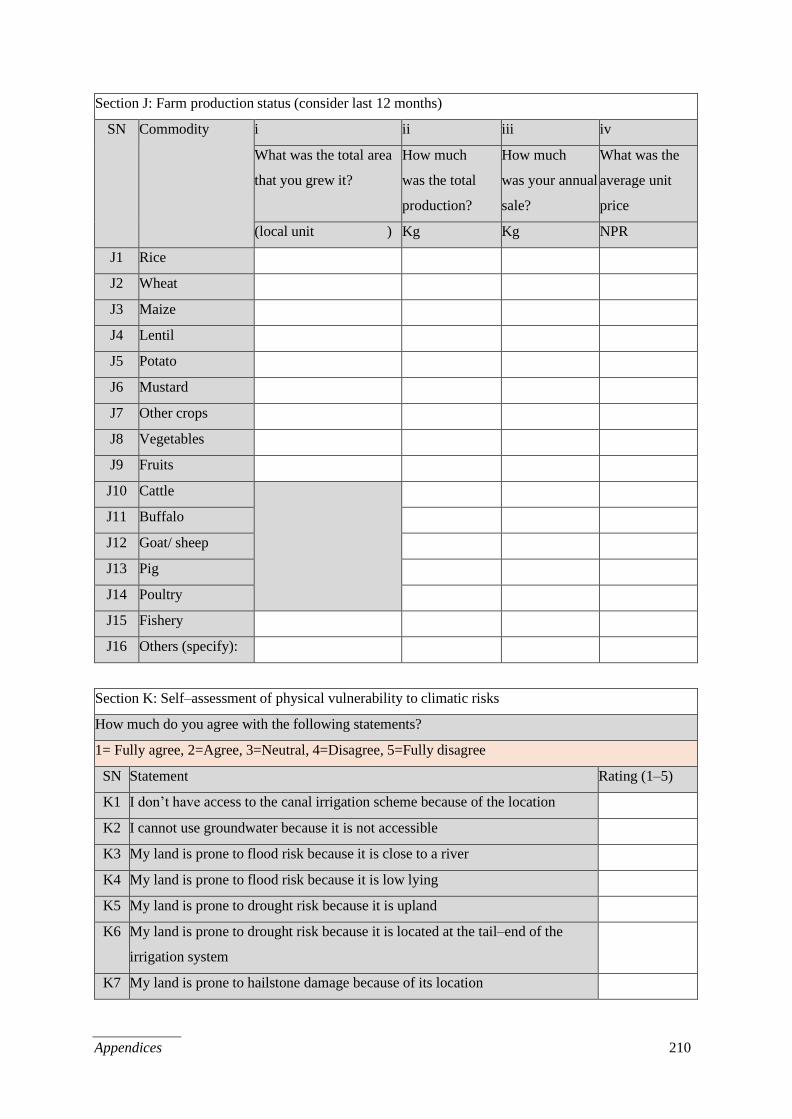
Appendices 210
Section J: Farm production status (consider last 12 months)
SN Commodity i ii iii iv
What was the total area
that you grew it?
How much
was the total
production?
How much
was your annual
sale?
What was the
average unit
price
(local unit ) Kg Kg NPR
J1 Rice
J2 Wheat
J3 Maize
J4 Lentil
J5 Potato
J6 Mustard
J7 Other crops
J8 Vegetables
J9 Fruits
J10 Cattle
J11 Buffalo
J12 Goat/ sheep
J13 Pig
J14 Poultry
J15 Fishery
J16 Others (specify):
Section K: Self–assessment of physical vulnerability to climatic risks
How much do you agree with the following statements?
1= Fully agree, 2=Agree, 3=Neutral, 4=Disagree, 5=Fully disagree
SN Statement Rating (1–5)
K1 I don’t have access to the canal irrigation scheme because of the location
K2 I cannot use groundwater because it is not accessible
K3 My land is prone to flood risk because it is close to a river
K4 My land is prone to flood risk because it is low lying
K5 My land is prone to drought risk because it is upland
K6 My land is prone to drought risk because it is located at the tail–end of the
irrigation system
K7 My land is prone to hailstone damage because of its location
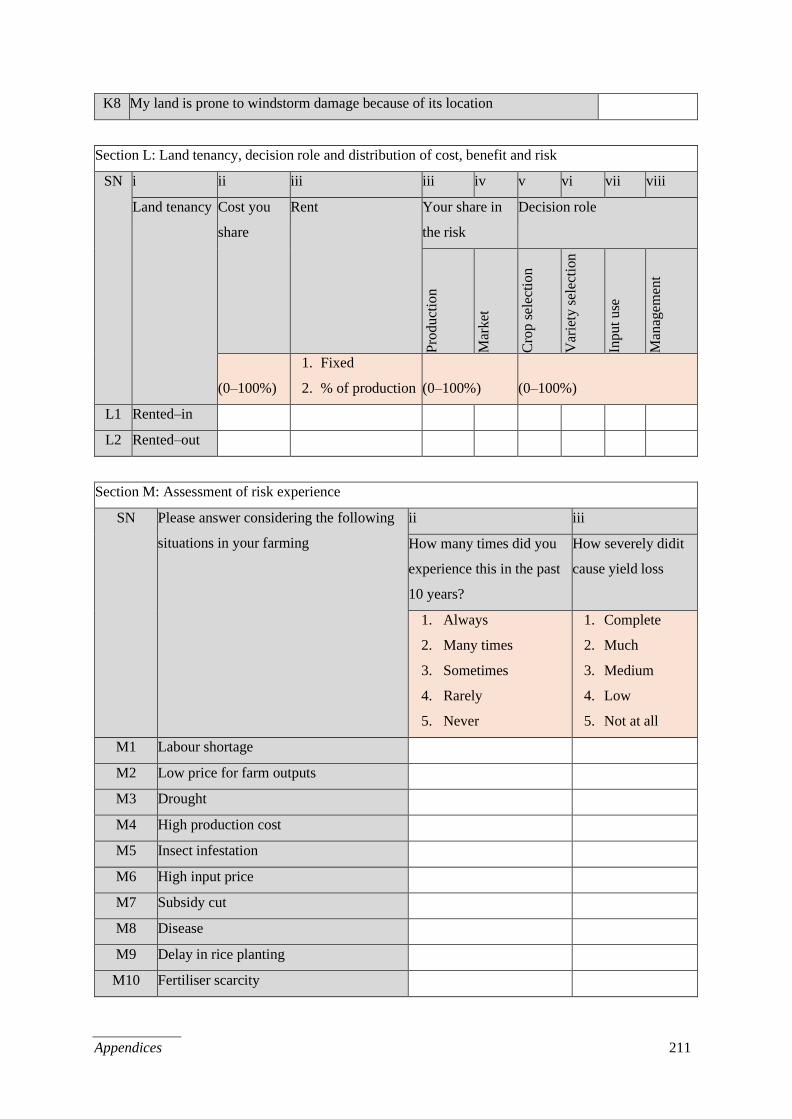
Appendices 211
K8 My land is prone to windstorm damage because of its location
Section L: Land tenancy, decision role and distribution of cost, benefit and risk
SN i ii iii iii iv v vi vii viii
Land tenancy Cost you
share
Rent Your share in
the risk
Decision role
Pro
du
ctio
n
Mar
ket
Cro
p s
elec
tio
n
Var
iety
sel
ecti
on
Inp
ut
use
Man
agem
ent
(0–100%)
1. Fixed
2. % of production
(0–100%)
(0–100%)
L1 Rented–in
L2 Rented–out
Section M: Assessment of risk experience
SN Please answer considering the following
situations in your farming
ii iii
How many times did you
experience this in the past
10 years?
How severely did it
cause yield loss
1. Always
2. Many times
3. Sometimes
4. Rarely
5. Never
1. Complete
2. Much
3. Medium
4. Low
5. Not at all
M1 Labour shortage
M2 Low price for farm outputs
M3 Drought
M4 High production cost
M5 Insect infestation
M6 High input price
M7 Subsidy cut
M8 Disease
M9 Delay in rice planting
M10 Fertiliser scarcity
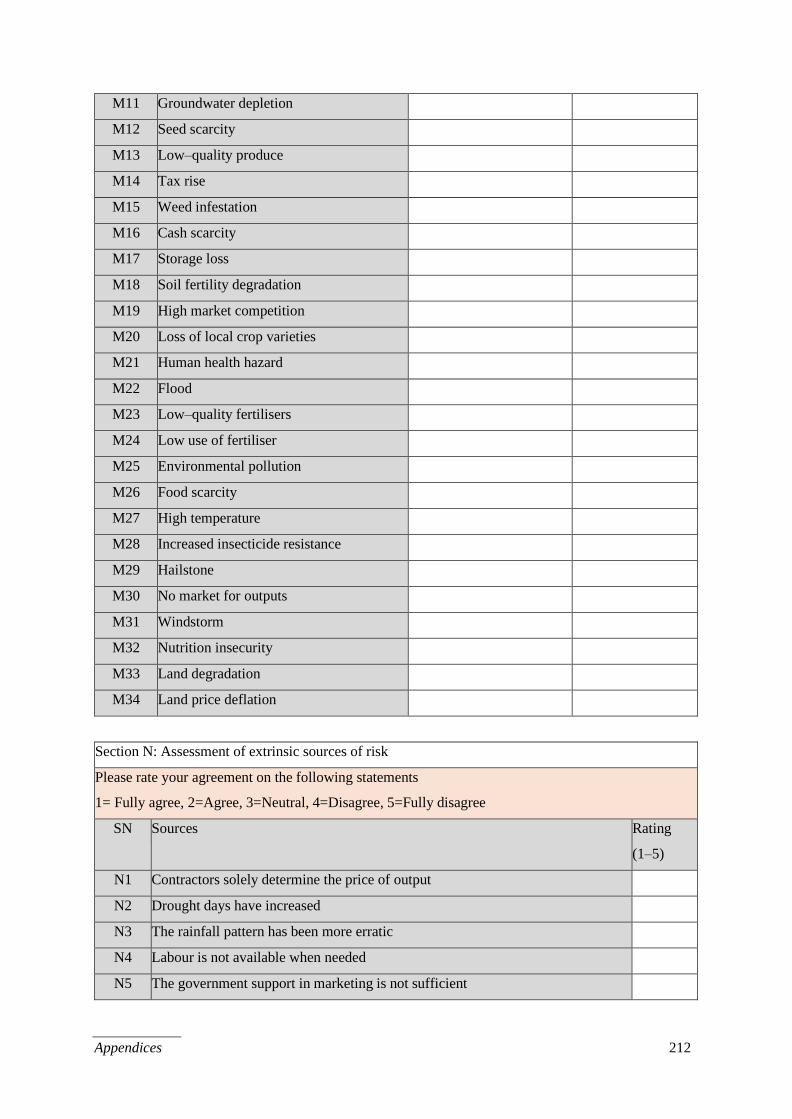
Appendices 212
M11 Groundwater depletion
M12 Seed scarcity
M13 Low–quality produce
M14 Tax rise
M15 Weed infestation
M16 Cash scarcity
M17 Storage loss
M18 Soil fertility degradation
M19 High market competition
M20 Loss of local crop varieties
M21 Human health hazard
M22 Flood
M23 Low–quality fertilisers
M24 Low use of fertiliser
M25 Environmental pollution
M26 Food scarcity
M27 High temperature
M28 Increased insecticide resistance
M29 Hailstone
M30 No market for outputs
M31 Windstorm
M32 Nutrition insecurity
M33 Land degradation
M34 Land price deflation
Section N: Assessment of extrinsic sources of risk
Please rate your agreement on the following statements
1= Fully agree, 2=Agree, 3=Neutral, 4=Disagree, 5=Fully disagree
SN Sources Rating
(1–5)
N1 Contractors solely determine the price of output
N2 Drought days have increased
N3 The rainfall pattern has been more erratic
N4 Labour is not available when needed
N5 The government support in marketing is not sufficient

Appendices 213
N6 Youth overseas migration has increased
N7 The onset of monsoon has delayed
N8 Insects and diseases have increased
N9 Reliable canal irrigation is not available
N10 Governments’ support and subsidies are not consistent
N11 The initial cost of machines is high
N12 Government decision on support price is not timely
N13 The weed problem has increased
N14 Family needs have diversified and increased
N15 I have low access to subsidies & support services
N16 Machines & mechanisation services are not available
N17 I do not have enough money to invest
N18 Off–farm sectors are paying higher wages to labours
N19 Groundwater table has deepened
N20 Water sources have dried
N21 Post–harvest & value addition facilities are not unavailable
N22 Rainfall intensity has increased
N23 The credit facility is not available
N24 Seeds, fertilisers and agrochemicals are not available in time
N25 Machinery support services and spare parts are not available
N26 My lands are fragmented & scattered in many locations
N27 Winter has shortened
N28 Unregulated import of cheaper products creates market distortion
N29 Overall temperature has increased
N30 Modern varieties need more inputs
N31 Storage facilities are not available
N32 The onset of monsoon has hastened
N33 Market competition has increased
N34 Fuel and energy prices have increased
N35 Technologies are not tested in my local conditions
N36 Winter temperature has decreased
N37 Winter temperature has increased
N38 Windstorm frequency has increased
N39 The total amount of rainfall has increased
N40 The electricity supply is irregular

Appendices 214
N41 Crop duration has shortened
N42 Unplanned physical development has blocked natural drainage channels
N43 Consumers' quality awareness has increased, and preference is changing
N44 Insurance companies are not trustworthy
N45 Sociocultural norms have restricted me to explore new opportunities
N46 Hailstone frequency has increased
N47 I have low access to market
Section O: Assessment of intrinsic sources of risks
How much do you agree with the following statements?
1= Fully agree, 2=Agree, 3=Neutral, 4=Disagree, 5=Fully disagree
SN Statements Rating (1–5)
O1 I think farming is not a profitable prospect
O2 I am doing farming because I don’t have money to invest in other sectors
O3 I am not aware that crop insurance products are available
O4 I am not aware of the concept and benefits of insurance
O5 I am doing farming because I don’t have sufficient skills to do other jobs
O6 I prefer production insurance instead of cost return insurance
O7 I do not have sufficient technical knowledge about modern farming practices
O8 My performance in farming is limited because of my education
O9 I am doing farming only to continue the family legacy
O10 I am not aware of other farmers who have done crop insurance
O11 I am afraid to adopt new technologies
O12 I do not trust insurance companies
Section P: Assessment of risk perception
SN Please answer considering the following
situations in your farming
iv v
How likely is this to
happen next year?
How much would be
the loss if it happens?
1. Certain
2. Much likely
3. Moderately likely
4. Unlikely
5. Not at all likely
1. Complete
2. Much
3. Medium
4. Low
5. Not at all
P1 Labour shortage

Appendices 215
P2 Low price for farm outputs
P3 Drought
P4 High production cost
P5 Insect infestation
P6 High input price
P7 Subsidy cut
P8 Disease
P9 Delay in rice planting
P10 Fertiliser scarcity
P11 Groundwater depletion
P12 Seed scarcity
P13 Low–quality produce
P14 Tax rise
P15 Weed infestation
P16 Cash scarcity
P17 Storage loss
P18 Soil fertility degradation
P19 High market competition
P20 Loss of local crop varieties
P21 Human health hazard
P22 Flood
P23 Low–quality fertilisers
P24 Low use of fertiliser
P25 Environmental pollution
P26 Food scarcity
P27 High temperature
P28 Increased insecticide resistance
P29 Hailstone
P30 No market for outputs
P31 Windstorm
P32 Nutrition insecurity
P33 Land degradation
P34 Land price deflation
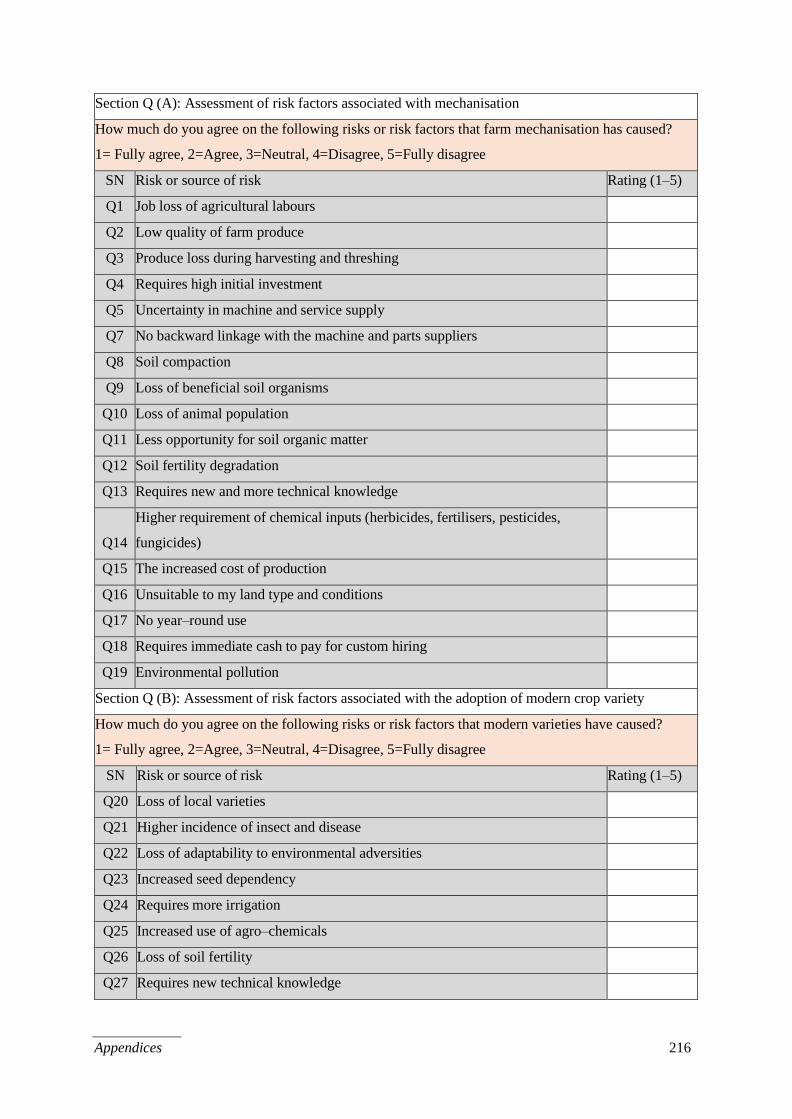
Appendices 216
Section Q (A): Assessment of risk factors associated with mechanisation
How much do you agree on the following risks or risk factors that farm mechanisation has caused?
1= Fully agree, 2=Agree, 3=Neutral, 4=Disagree, 5=Fully disagree
SN Risk or source of risk Rating (1–5)
Q1 Job loss of agricultural labours
Q2 Low quality of farm produce
Q3 Produce loss during harvesting and threshing
Q4 Requires high initial investment
Q5 Uncertainty in machine and service supply
Q7 No backward linkage with the machine and parts suppliers
Q8 Soil compaction
Q9 Loss of beneficial soil organisms
Q10 Loss of animal population
Q11 Less opportunity for soil organic matter
Q12 Soil fertility degradation
Q13 Requires new and more technical knowledge
Q14
Higher requirement of chemical inputs (herbicides, fertilisers, pesticides,
fungicides)
Q15 The increased cost of production
Q16 Unsuitable to my land type and conditions
Q17 No year–round use
Q18 Requires immediate cash to pay for custom hiring
Q19 Environmental pollution
Section Q (B): Assessment of risk factors associated with the adoption of modern crop variety
How much do you agree on the following risks or risk factors that modern varieties have caused?
1= Fully agree, 2=Agree, 3=Neutral, 4=Disagree, 5=Fully disagree
SN Risk or source of risk Rating (1–5)
Q20 Loss of local varieties
Q21 Higher incidence of insect and disease
Q22 Loss of adaptability to environmental adversities
Q23 Increased seed dependency
Q24 Requires more irrigation
Q25 Increased use of agro–chemicals
Q26 Loss of soil fertility
Q27 Requires new technical knowledge

Appendices 217
Q28 The increased cost of production
Q29 Low taste of food
Q30 Low quality of produce
Q31 Human health hazards and environmental pollution
Q32 Increased production uncertainty
Section R: Assessment of risk preference (Relative risk aversion)
How much do you agree with the following statements?
1= Fully agree, 2=Agree, 3=Neutral, 4=Disagree, 5=Fully disagree
SN Statement Rating
(1–5)
R1 I am willing to take more risk than other farmers in relation to adopting new
technologies
R2 I am willing to take more risk than other farmers in relation to financial issues
R3 I am willing to take more risk than other farmers in relation to health issues
R4 I am willing to take more risk than other farmers in relation to selling produces
R5 I prefer higher though risky income to low but certain income option
R6 I am more risk–taker than other farmers in relation to farming
R7 I am willing to take more risk than others in other life issues
Section S: Assessment of risk management strategies
SN Risk management strategies i ii
Applicability
Contribution in
overcoming
farming risk
1. Very irrelevant
2. Irrelevant
3. Neutral
4. Relevant
5. Very relevant
1. Very useless
2. Useless
3. Neutral
4. Useful
5. Very useful
S1 Diversify crops
S2 Diversify crop varieties
S3 Practice integrated farming
S4 Involve in self–help groups
S5 Test in smaller areas first

Appendices 218
S6 Observe in others' fields first
S7 Adopt modern varieties and technologies
S8 Consult with fellow farmers
S9 Maintain cash saving
S10 Diversify income sources
S11 Mechanise farm activities
S12 Seek off–farm employment
S13 Consult with agrovets
S14 Hire mechanisation services
S15 Use groundwater
S16 Diversify cropland locations
S17 Change seed every year
S18 Have cash at home
S19 Take loan
S20 Involve in cooperative farming & marketing
S21 Practice mixed cropping
S22 Keep market information updated
S23 Purchase family health insurance
S24 Shift planting time
S25 Consult with research & extension agencies
S26 Increase insecticide & fungicide doses
S27 Sell produces in off–seasons
S28 Use PPE & safety measures
S29 Purchase life insurance
S30 Access subsidies
S31 Purchase livestock insurance
S32 Diversify output markets
S33 Have a backup rice seedbed
S34 Upscale farm enterprise
S35 Adopt stress–tolerant rice varieties
S36 Double plant rice if needed
S37 Record costs and benefits
S38 Increase fertiliser dose
S39 Purchase farm machines
S40 Purchase crop insurance

Appendices 219
S41 Practice organic farming
S42 Practice high–density planting
S43 Have forward contract
Section T: Awareness about technology and support services
T1 Have you heard of any of the following
stress–tolerant rice varieties?
Awareness Quality awareness
Yes→ go to S1b
No→ go to S4
1. Flood tolerant
2. Drought tolerant
Swarna Sub–1
Shambha Mahasuri Sub–1
Cheharang Sub–1
Sukhadhan 1–6
T2 Have you used any of these varieties? Yes → go to K
No → go to
T3 How useful have you found the stress–
tolerant crop varieties in managing said
risks?
1. Very useful
2. Useful
3. Neutral
4. Less useful
5. Very useless
T4 Are you aware of the fertiliser cost
subsidy?
Yes→ go to S5
No→ go to S6
T5 Have you claimed fertiliser cost subsidy? Yes
No
T6 Are you aware of the insurance premium
subsidy
Yes→ go to S7
No→ go to T1
T7 Have you claimed an insurance premium
subsidy?
Yes
No
Section U: Farm diversification
Crop diversification
SN Season Number of crops grown
U1 Kharif
U2 Rabi
U3 Zaid
Varietal diversification

Appendices 220
SN Crop i ii
Total local varieties Total modern varieties
U4 Rice
U5 Wheat
U6 Maize
U7 Lentil
U8 Potato
U9 Others
(specify)–––––––
Section V: Involvement in insurance
SN Have you purchased the following
insurance products?
i. Use ii. Since which year?
1. Yes
2. No
V1 Crop insurance products
V2 Livestock insurance products
V3 Health insurance products
V4 Life insurance products
V5 Vehicle insurance products
V6 House insurance products
Section W: Numeracy test
Please put a circle on your answer
W1 The probability of tossing a coin and getting 'heads'
is 1 in 2.
True False
W2 How many possible outcomes are there when you roll
a dice?
One Six
W3 The probability of rolling a dice and getting the
number 3 is one–in–three.
True False
W4 What is more likely to happen? Rolling a dice and
getting a 6
Tossing a coin
and getting 'head'
W5
One hundred people were asked to state their favourite
colour. Sixty said blue. This experiment says that the
probability of someone choosing blue
is 60%.
True
False

Appendices 221
Section X: Lottery–Choice Experiment
Note: Explain the details of the experiment and present 11 choice cards one by one.
SN Choice cards Which option would you go for?
(Certain amount–1, Lottery–2)
X1 Choice card 1
X2 Choice card 2
X3 Choice card 3
X4 Choice card 4
X5 Choice card 5
X6 Choice card 6
X7 Choice card 7
X8 Choice card 8
X9 Choice card 9
X10 Choice card 10
X11 Choice card 11
Ask the respondent to pick one of the 1–11 marked balls from the bucket. If the farmer has chosen the
fixed amount on the selected number card, give them the amount. If the farmer has chosen to play the
lottery, play the lottery tossing a coin and pay them according to the result.
X12 What is the number of the ball the respondent picked up?
X13
What is the outcome from the selected card and the coin toss?
1. Had selected the certain amount
2. Respondent won the lottery
3. Respondent lost the lottery
Section Y: Discrete Choice Experiment
Explain the experiment, present six choice cards one–by–one in random orders and ask the question
only after giving them enough time to ask the questions and making sure that they fully understand the
task. Present four cards randomly, one–by–one, allow them to reconsider the choices, if they want and
note their preferences on the following table.
Choose the assigned block for the respondent
Y1 DCE Block
White (1) Yellow (2) Blue (3) Green (4) Red (5) Brown (6)
Y2. Please mention your preference on each of the four cards.
Option A = 1, Option B = 2, Option C = 3

Appendices 222
Block
Card
Which
would you
buy?
Which is
the worst
option?
Card
Which
would you
buy?
Which is
the worst
option?
White (1) Card 4 Card 17
Card 11 Card 19
Yellow (2) Card 5 Card 13
Card 12 Card 23
Blue (3) Card 1 Card 8
Card 3 Card 11
Green (4) Card 2 Card 7
Card 6 Card 20
Red (5) Card 14 Card 18
Card 15 Card 21
Brown (6) Card 9 Card 22
Card 16 Card 24
Y 3: If the respondent has selected the third option (not to buy) in all four cards, ask to explain why?
Y 4: If the respondent has selected the purchase option in any of the cards and has not already bought a
crop insurance product, ask why?
Y 5: In the above two exercises, how easy did you find it to understand the exercises?
Very difficult =1, difficult =2, neutral =3, easy =4, very easy =5
Y 6: Would you like to say anything related to the questions covered in this interview?
Thank you very much for your time, valuable information and contribution to this study.
The interview ended at: – –/– –
mm / hh
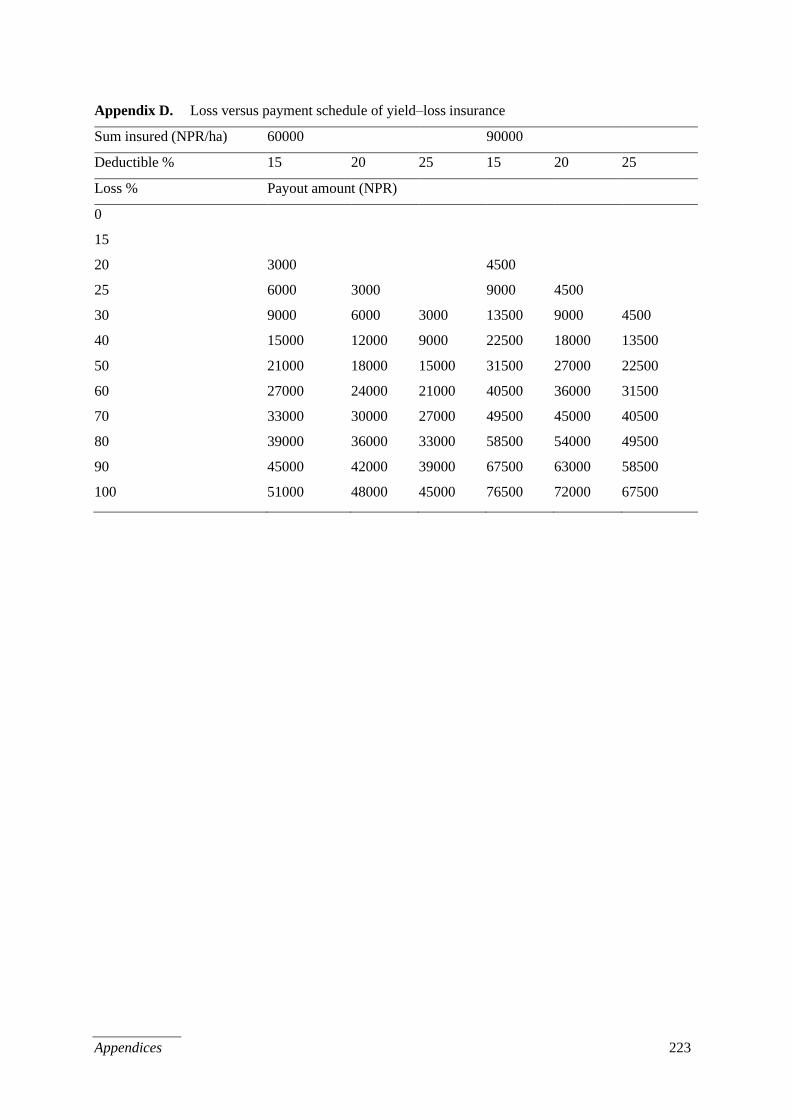
Appendices 223
Appendix D. Loss versus payment schedule of yield–loss insurance
Sum insured (NPR/ha) 60000 90000
Deductible % 15 20 25 15 20 25
Loss % Payout amount (NPR)
0
15
20 3000 4500
25 6000 3000 9000 4500
30 9000 6000 3000 13500 9000 4500
40 15000 12000 9000 22500 18000 13500
50 21000 18000 15000 31500 27000 22500
60 27000 24000 21000 40500 36000 31500
70 33000 30000 27000 49500 45000 40500
80 39000 36000 33000 58500 54000 49500
90 45000 42000 39000 67500 63000 58500
100 51000 48000 45000 76500 72000 67500

Appendices 224
Appendix E. Loss versus payment schedule of rainfall–index insurance
Sum insured (NPR/ha) 60000 90000
Deductible% 15 20 25 15 20 25
Rainfall (mm) Rainfall deficit% Payout amount (NPR)
1000 0
850 15
800 20 3000 4500
750 25 6000 3000 9000 4500
700 30 9000 6000 3000 13 500 9000 4500
600 40 15000 12000 9000 22500 18000 13500
500 50 21000 18000 15000 31500 27000 22500
400 60 27000 24000 21000 40500 36000 31500
300 70 33000 30000 27000 49500 45000 40500
200 80 39000 36000 33000 58500 54000 49500
100 90 45000 42000 39000 67500 63000 58500
0 100 51000 48000 45000 76500 72000 67500

Appendices 225
Appendix F. Choice scenarios (24) defined by various levels of attributes in the discrete choice
experiment
Choice
situation
Alternative 1 Alternative 2 Block
Premium Deductible Sum
insured
Insurance
type
Premium Deductible Sum
insured
Insurance
type
4 750 15 60 0 500 20 90 0 1
11 750 15 60 0 250 25 90 1 1
17 1250 20 90 0 1000 15 60 1 1
19 500 15 60 0 1250 15 90 1 1
5 500 25 90 1 750 20 60 0 2
12 1250 25 60 0 1500 25 90 0 2
13 750 20 90 1 250 25 60 1 2
23 1500 20 90 1 1500 20 60 0 2
1 250 25 90 1 750 20 60 0 3
3 500 15 90 1 250 20 60 1 3
8 1250 25 60 1 1250 25 90 1 3
10 1000 20 60 1 1000 15 90 0 3
2 1250 20 90 0 1500 15 60 0 4
6 250 25 90 1 1250 15 60 0 4
7 1000 20 60 1 500 25 90 0 4
20 250 25 60 0 1250 20 90 1 4
14 250 25 90 0 1000 25 60 1 5
15 250 20 60 0 1000 15 90 0 5
18 1500 20 90 1 1250 20 60 1 5
21 500 15 90 0 750 20 60 1 5
9 750 15 60 1 750 15 90 1 6
16 1000 15 60 0 500 15 90 0 6
22 1000 15 90 0 500 25 60 1 6
24 1500 25 60 1 1000 25 90 0 6
Note: Insurance type 0 = Yield–Loss, 1 = Rainfall–Index
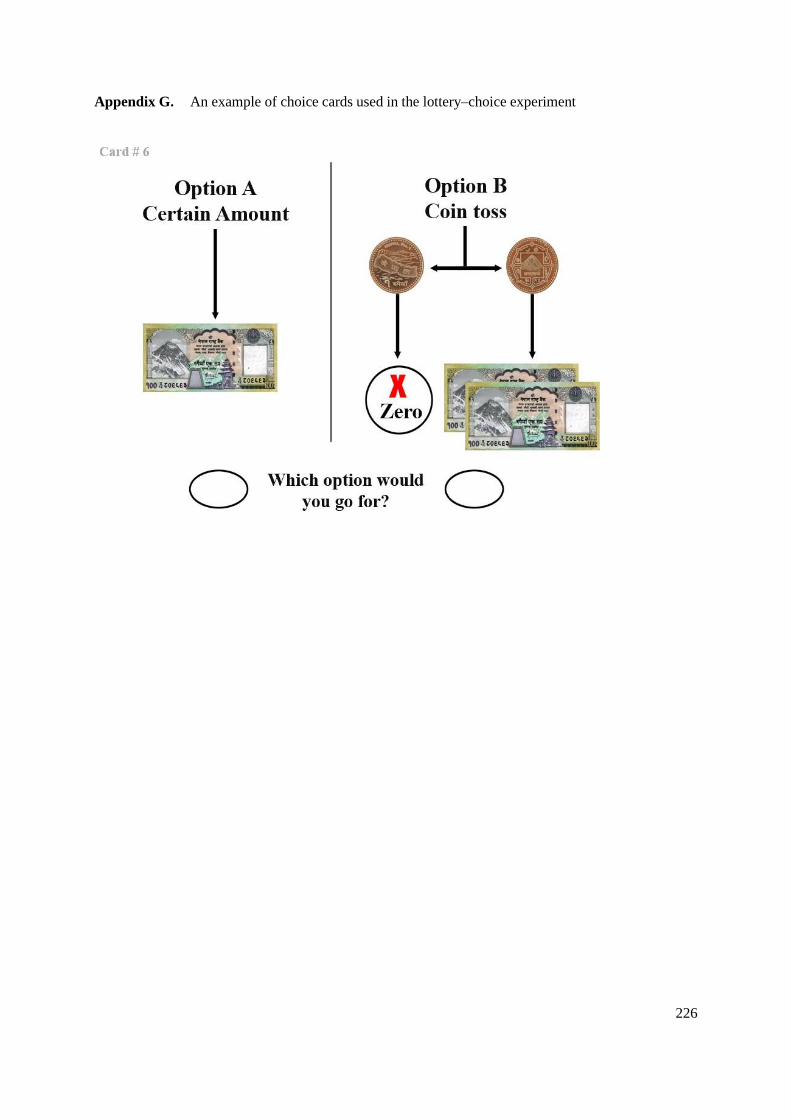
226
Appendix G. An example of choice cards used in the lottery–choice experiment
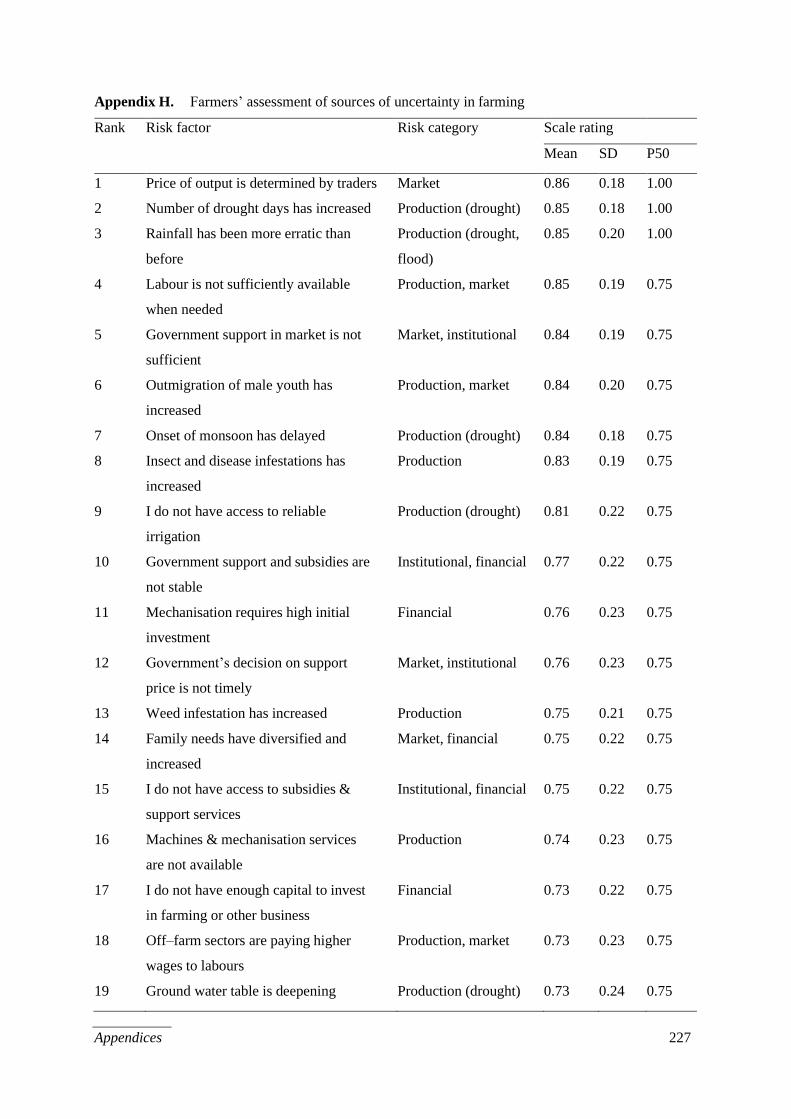
Appendices 227
Appendix H. Farmers’ assessment of sources of uncertainty in farming
Rank Risk factor Risk category Scale rating
Mean SD P50
1 Price of output is determined by traders Market 0.86 0.18 1.00
2 Number of drought days has increased Production (drought) 0.85 0.18 1.00
3 Rainfall has been more erratic than
before
Production (drought,
flood)
0.85 0.20 1.00
4 Labour is not sufficiently available
when needed
Production, market 0.85 0.19 0.75
5 Government support in market is not
sufficient
Market, institutional 0.84 0.19 0.75
6 Outmigration of male youth has
increased
Production, market 0.84 0.20 0.75
7 Onset of monsoon has delayed Production (drought) 0.84 0.18 0.75
8 Insect and disease infestations has
increased
Production 0.83 0.19 0.75
9 I do not have access to reliable
irrigation
Production (drought) 0.81 0.22 0.75
10 Government support and subsidies are
not stable
Institutional, financial 0.77 0.22 0.75
11 Mechanisation requires high initial
investment
Financial 0.76 0.23 0.75
12 Government’s decision on support
price is not timely
Market, institutional 0.76 0.23 0.75
13 Weed infestation has increased Production 0.75 0.21 0.75
14 Family needs have diversified and
increased
Market, financial 0.75 0.22 0.75
15 I do not have access to subsidies &
support services
Institutional, financial 0.75 0.22 0.75
16 Machines & mechanisation services
are not available
Production 0.74 0.23 0.75
17 I do not have enough capital to invest
in farming or other business
Financial 0.73 0.22 0.75
18 Off–farm sectors are paying higher
wages to labours
Production, market 0.73 0.23 0.75
19 Ground water table is deepening Production (drought) 0.73 0.24 0.75

Appendices 228
20 Natural water sources have dried Production (drought) 0.72 0.23 0.75
21 Post–harvest & value addition facilities
are not available
Market 0.71 0.24 0.75
22 Rainfall intensity has increased Production (flood) 0.68 0.25 0.75
23 Credit facility is not available Financial 0.67 0.27 0.75
24 I do not have skills to pursue other
employment
Personal 0.65 0.30 0.75
25 Seeds, fertilisers and agrochemicals are
not available in time
Production 0.64 0.27 0.75
26 Machinery support services and spare
parts are not available
Production, market 0.64 0.27 0.75
27 My farmlands are fragmented &
scattered in many locations
Production 0.63 0.29 0.75
28 Winter has shortened Production 0.61 0.28 0.75
29 Unregulated import of cheaper
products creates market distortion
Market 0.60 0.29 0.50
30 I do not have sufficient technical
knowledge of farming
Production, personal 0.57 0.25 0.50
31 Overall temperature has increased Production 0.56 0.28 0.50
32 I am not performing well in farming
because I have low education
Personal 0.56 0.32 0.50
33 Modern varieties need more inputs Production, market 0.55 0.24 0.50
34 Storage facilities are not available Market 0.55 0.25 0.50
35 I am doing farming just to continue my
family legacy
Personal 0.54 0.24 0.50
36 Market competition has increased Market 0.54 0.24 0.50
37 Fuel and energy prices have increased Market 0.53 0.24 0.50
38 Technologies are not tested in my farm
conditions
Production 0.50 0.26 0.50
39 Winter temperature has decreased Production 0.50 0.21 0.50
40 Windstorm frequency has increased Production 0.49 0.23 0.50
41 Total rainfall has increased Production (flood) 0.48 0.24 0.50
42 Electricity supply is not regular Production 0.43 0.29 0.50
43 Crop duration has shortened Production 0.41 0.30 0.50
44 I fear to try new technologies Personal 0.41 0.28 0.50
45 Most of my farmlands is low lying Production (flood) 0.40 0.29 0.50
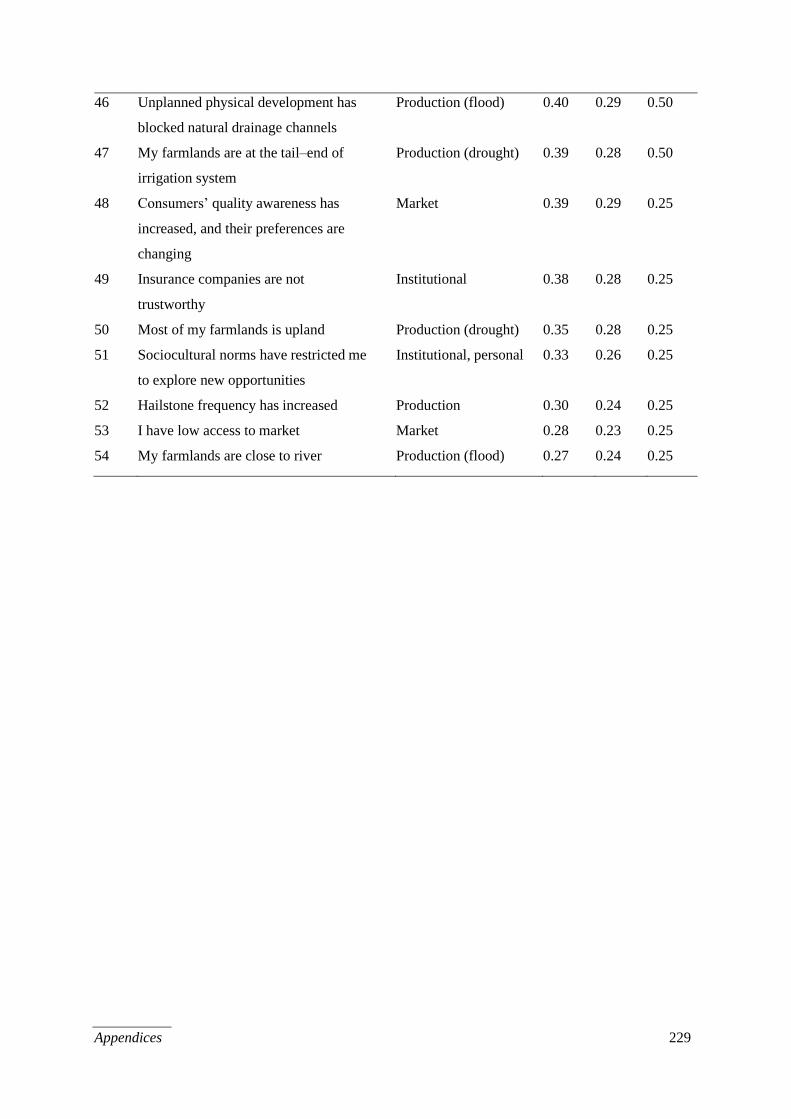
Appendices 229
46 Unplanned physical development has
blocked natural drainage channels
Production (flood) 0.40 0.29 0.50
47 My farmlands are at the tail–end of
irrigation system
Production (drought) 0.39 0.28 0.50
48 Consumers’ quality awareness has
increased, and their preferences are
changing
Market 0.39 0.29 0.25
49 Insurance companies are not
trustworthy
Institutional 0.38 0.28 0.25
50 Most of my farmlands is upland Production (drought) 0.35 0.28 0.25
51 Sociocultural norms have restricted me
to explore new opportunities
Institutional, personal 0.33 0.26 0.25
52 Hailstone frequency has increased Production 0.30 0.24 0.25
53 I have low access to market Market 0.28 0.23 0.25
54 My farmlands are close to river Production (flood) 0.27 0.24 0.25

Appendices 230
Appendix I. Estimates of individual logit models of farmers’ risk management strategies
Model Loan use
in farming
Monetary
saving
STRV
use
Crop
insurance
Off–farm
employment
Group
involvement
CRRA –0.13
(–0.14)
0.32*
(–0.13)
0.45**
(–0.16)
2.36***
(–0.69)
–0.01
(–0.13)
0.77***
(–0.15)
Drought risk
perception
1.00*
(–0.46)
–0.43
(–0.43)
0.31
(–0.41)
–0.51
(–0.66)
–0.35
(–0.39)
–0.27
(–0.46)
Flood risk
perception
–1.01
(–0.62)
–0.05
(–0.56)
1.03*
(–0.52)
0.23
(–0.87)
0.03
(–0.5)
0.66
(–0.62)
Constant –1.45***
(–0.33)
1.15***
(–0.3)
–0.99***
(–0.29)
–2.62***
(–0.53)
0.35
(–0.27)
1.14***
(–0.33)
N 409 409 409 409 409 409
LR Chi2 9.07 7.14 13.65 24.19 0.85 33.53
Pseudo R2 0.02 0.01 0.03 0.10 0.00 0.07
LL (Null model) –237.12 –249.25 –264.71 –121.85 –282.32 –238.12
LL (Full model) –232.58 –245.68 –257.89 –109.76 –281.89 –221.36
Note: Figures in parentheses indicate SE; asterisks indicate statistical significance at * p<0.05, **
p<0.01, and *** p<0.001.

Appendices 231
Appendix J. Explanation of the discrete choice experiment provided to the participants
In the following exercise, I will present you with four cards and ask you to choose one of the three
options shown in the cards. The first two options are defined by different characteristics of crop
insurance products, while the third is the no purchase option. The crop insurance contract covers
production risk in rice crops for one season.
The crop insurance products vary by insurance product types, sum insured, deductible and premium
price. You will see two types of crop insurance products, namely loss-based insurance (LBI) and
rainfall-index insurance (RII). LBI covers production loss due to various reasons, including floods,
drought, insects and diseases. LBI requires field assessment of production loss for determining
indemnification. In contrast, the RII indemnifies the insurers irrespective of production loss based on
the rainfall recorded during a specified period. A rainfall record of 1000 mm during June – September
has been set as the normal rainfall. The deficit amount below the normal level will indicate the
indemnification amount. The RII also involves a trigger (15% rainfall deficit in this study) for policy
activation. The 15% trigger implies that the indemnification is not activated above 850 mm rainfall
during the crop period.
Insurance products are also differentiated by two levels of the sum insured: NPR 60000 NPR and
90000 NPR per hectare, three levels of deductibles (15%, 20% and 25%) and five levels of premium
price (NPR 250, 500, 750, 1000, 1250 and 1500 NPR) per hectare. The sum insured indicates the risk
coverage level or the amount of insurance payout you would receive in case of crop loss. Insurance
payout is calculated based on the crop loss or rainfall deficit percentage. For example, if the crop loss
or rainfall deficit is 100%, you will receive 100% of sum insured as the insurance payout. The
deductible indicates the amount to be deducted from the insurance payout determined based on the
crop loss. For example, if you insure one ha of rice crop for one season specifying the sum insured as
NPR 90000 and deductible as 20%, you will only receive an insurance payout of NPR 72000 for 100%
crop loss or rainfall deficit. You can see the further details of the indemnification schedule in the
following tables (Show them appendices D and E).
Copyright © 2022 FDOKUMEN