Collective Emancipation of Marginal Farmers - Development ...
134
October 2016 by Astad Pastakia and Pratul Ahuja for Development Support Center, Ahmedabad Collective Emancipation of Marginal Farmers The Case of Krushidhan Producer Company Incubated by Development Support Center in Gujarat Impact Assessment Study of Livelihood Enhancement through Participatory Natural Resource Management (LEPNRM) Programme – Phase II Supported by RBS Foundation India
-
Upload
khangminh22 -
Category
Documents
-
view
3 -
download
0
Transcript of Collective Emancipation of Marginal Farmers - Development ...

October 2016
by
Astad Pastakia and Pratul Ahuja
for
Development Support Center,
Ahmedabad
Collective Emancipation of Marginal FarmersThe Case of Krushidhan Producer Company Incubated by Development Support Center in Gujarat
Impact Assessment Study
of Livelihood Enhancement through Participatory
Natural Resource Management (LEPNRM) Programme – Phase II
Supported by RBS Foundation India
i
Table of Contents
Acknowledgements....................................................................................................................................... ii
Executive Summary...................................................................................................................................... iii
1 Introduction .......................................................................................................................................... 1
1.1 Context of Study ........................................................................................................................... 1
1.2 Objectives and Methodology........................................................................................................ 2
2 LEPNRM: Underlying Theory of Change................................................................................................ 8
3 DSC’s Extension System under LEPNRM-II..........................................................................................18
3.1 Coverage .....................................................................................................................................18
3.2 Main Features of the Extension System .....................................................................................19
3.3 New Technology: Extent of Adoption .........................................................................................22
3.4 Role of Kisan Clubs and Producer Groups...................................................................................26
4 Impact on Economics of Farming........................................................................................................28
4.1 Profile of Farmers in Sample.......................................................................................................28
4.2 Effectiveness of agriculture extension services ..........................................................................31
4.3 Study area level impacts .............................................................................................................38
4.4 Project level impact ....................................................................................................................52
5 Impact on Sustainability of Agriculture...............................................................................................58
5.1 Assessment of Soil Health: Sampling Frame...............................................................................58
5.2 Findings of Soil Survey ................................................................................................................59
5.3 Indicators for Monitoring Soil Health .........................................................................................62
6 Krushidhan Producer Company: Key Accomplishments and Strategic Plans .....................................64
6.1 Overview of Achievements .........................................................................................................64
6.2 Governance of Krushidhan .........................................................................................................75
6.3 Strategic Planning for Next Phase...............................................................................................87
7 Conclusions and Recommendations...................................................................................................93
Annexure 1: Questionnaire for Sample Survey
Annexure 2: Brainstorming and Assessment of Business Options: Findings fromWorkshop
Annexure 3: Legal requirements for Production of Bio-pesticides and Bio-fertilizers

ii
Acknowledgements
It has always been a pleasure to take a close look at DSC’s work because of a high degree of
professionalism that it tries to maintain in all its projects. LEPNRM programme has been no exception.
During the period of the study i.e. from April to September 2016, DSC has undergone a transition in
leadership. We are grateful to both Mr. Sachin Oza, the ex-director as well as Mr. Mohan Sharma, the
present director for their patronage and valuable feedback during every stage of the study. Such an
engagement makes it a learning experience for the external team of consultants as much as it is for the
implementation team.
We are thankful to Ms. Dhruvi Shah, Program Director and Mr. Sunil Kumar, Director, RBS Foundation
for engaging us for this exercise and for the free hand given in carrying it out to the satisfaction of all
stakeholders. The long term committment shown by RBS Foundation to a project like this is often found
lacking in most donor agencies who are in a hurry to move on to other areas and target populations. It is
a demonstration of the deep appreciation of what it takes to create people’s institutions from the base
upwards leading ultimately to “value chain development approach” in transforming the lives and
livelihoods of marginal farmers in a sustainable manner.
We would like to place on record the untiring efforts of Mr. Jasvant Chauhan, the present CEO of
Krushidhan Producer Company who accompanied us during all field visits and responded proactively to
all requests for information related to the company. Like wise the entire field staff of DSC was
forthcoming in testing all suggestions and ideas and collating the necessary data in a timebound
manner. We are also thankful to Mr. Bharat Patel for his extremely valuable inputs during the field
surveys and report preparation. Last but not the least, we would like to acknowledge the assistance
received in data handling and field surveys from Sandip Varia, Mushtaqali Sheikh, Mahendra Patel, Fulaji
Thakor, Vikram Makwana, Tejas Makwana, Ketan Malaviya and Mahesh Parmar.
While the authors have relied heavily on the DSC team for collating the project level data, it takes full
responsibiliy for the primary level data collected by it as well as the analysis, conclusions and
recommendations presented in the study. We trust that all direct stakeholders of this project will
benefit from this exercise. We believe that DSC’s experience through this project also has immense
value for other NGOs trying to incubate farmer collectives, in terms of what pitfalls to avoid and what
strategies to deploy during the start-up phase of promoting an FPO. We look forward to continued
engagement with DSC and its various initiatives in the coming years as well.
19 October 2016
Astad Pastakia
Pratul Ahuja

iii
Executive Summary
The Livelihood Enhancement through Participatory Natural Resource Management (LEPNRM) project
was initiated by DSC in 2008 with financial assistance from RBS Foundation India. The project adopted a
holistic approach towards agriculture development and focused on five aspects namely - productivity
enhancement, cost reduction, risk mitigation, value addition and market linkages. In the first phase of
the project (2008-2011), the emphasis was on agriculture extension through development of user
friendly IEC material, capacity building, development of a cadre of para-workers and formation of SHGs
and Farmer Clubs at the village level. The second phase of the project (2012-2016) aimed at promoting a
Farmer Producer Organisation (FPO) so that farmers would be better organised to deal with market
forces, through backward and forward linkages. The current Impact Assessment Study is focused on
Phase II of the LEPNRM project and covers the performance of both the agricultural extension system
brought in place by DSC during Phase I as well as the newly formed FPO.
The twin objectives of the study were addressed by having a two member team of consultants. While
one looked at the performance of the company, the other focused on the impacts of the extension
system as well as the activities of the company on the target population of farmers. In order to assess
the impacts on farmers, a field level survey was carried out covering 200 farmers from 145 villages
across the 4 districts of Mehsana, Sabarkantha, Aravalli and Ahmedabad in Gujarat. The results of soil
samples tested by the Gujarat Agricultural University were taken as the basis for comparison with
benchmark data on soil health, in order to analyse the impact on sustainability of farming in the project
areas.
To understand the working of the company as well as the internal processes established for smooth
functioning, interviews were held with all primary stakeholders and stakeholder groups. The financial
statements for the past three years (since the emergence of the new avatar of the company in 2011)
were analysed to understand the financial health of the company. An effort was made to estimate the
area level impacts on the farming community based on the findings of the field level survey. Using DSC’s
Theory of Change, the study highlights the importance of a value chain approach for promoting and
strengthening farm based livelihoods and provides a conceptual frame to understand the progress made
so far. The framework was further used in a workshop mode with DSC staff to carry out a brainstorming
exercise and prepare the strategic plan needed for the next phase of the intervention.
Farmer level impacts
Before going to the farmer level impacts it is necessary to explain some of the forces at play which have
been affecting both sustainability of farming as well as economic viability of the marginal farmer in the
project area.
The average per farmer cultivated land is lowest in Meghraj at 1 Ha and highest in Himmatnagar at 2.3
Ha. About 80 to 100 per cent of this cultivated land across the five project locations is irrigated either
through bore-wells or canal network or both.

iv
Over the past 3 years, milch animal population has shown a decline in Visnagar, Himmatnagar and
Modasa due to social changes and reduced fodder availability as a result of shift in cropping pattern
towards cash crops. A decline in the number of draught animals like bullock, ox etc. has also been
witnessed, especially in Visnagar and Himmatnagar where increasing mechanization in agriculture is
seen as the primary reason behind this trend.
Increase in menace of wild animals like nilgai and wild pig in agriculture has been reported from across
all project locations. Farmers’ efforts to deal with this menace by adopting a range of different measures
have met with varying levels of success. DSC’s extension system has also responded to this challenge
recently by introducing solar fencing and group fencing on a trial basis. Other adaptations include
changes in cropping pattern towards crops that are not attacked by the ungulates.
The effects of climate change have been felt in the project area during recent years. Some crops like
wheat are more sensitive to climate change. Adaptations are being made intuitively by farmers as well
as through recommendations from the Agricultural Research Centers located in the area (particularly
the Wheat Research Center). Chief among these are the adoption of shorter duration varieties and
varieties more suited to higher temperature. Better soil and water management practices are also
recommended.
The above changes have resulted in an adjusted cropping pattern which was captured as follows: Cotton
and castor are the main Kharif crops in Visnagar, Himmatnagar and Modasa. In Meghraj, cotton and
maize - which is grown in place of castor – are the predominant Kharif crops whereas in Vehlal, paddy
and vegetables are commonly grown. Wheat dominates Rabi season cultivation across all five project
locations while fennel is also grown in Visnagar. In Summer, there is some vegetable cultivation that is
carried out in Vehlal; however, farmers in other locations are not able to take any crops due to lack of
water.
DSC’s extension services have led to a significant reduction in quantity of agriculture inputs like seeds,
chemical pesticides, fertilisers, weedicides, irrigation water and labour as well as an improvement in the
farmer incomes due to higher crop productivity and better price realisation. The change in agriculture
inputs is reflected in the table below:
Percentage change in agriculture inputs after the project
Crop Seed Bio-pesticide
Chemicalpesticides
Chemicalfertilisers
Weedicides No. ofwaterings
Labour &Misc.
Cotton -9 67 3 8 -29 -2 11
Castor 5 0 11 12 -11 1 16
Paddy -42 Initiated -11 -18 -58 -9 -9
Maize -47 Initiated -49 -11 -21 -20 -9
Vegetables -23 Initiated -13 -9 -20 5 -7
Wheat -10 69 8 0 -11 -5 6
Fennel 12 Not used -11 13 4 -9 16
The extent of change in crop productivity and price realisation as a result of the project is summarised in
the table below. Maize and vegetables have witnessed the highest gains in productivity after the project

v
while yield of cotton and castor has suffered. Farmers have also realised better prices, especially in the
case of wheat, vegetables and fennel by undertaking cleaning and grading.
Change in productivity & price realisation after the project
Crop% change inproductivity
Change in pricerealisation (Rs./kg)
Cotton -8 -2
Castor -4 -9
Paddy -2 2
Maize 61 4
Wheat 5 6
Vegetables 28 8
Fennel 4 6
The overall impact of DSC’s extension services and activities has been extremely positive, not just from
an economic but also environmental point of view. The total economic benefit at the project level due
to savings in agriculture input expenses and improved income is nearly Rs. 90 crores (refer Table below)
which translates to more than Rs. 27,000/- per farmer household. Similarly, the increasing substitution
of chemical inputs with bio-inputs and adoption of water-efficient practices and technologies by farmers
has led to improved soil health and water savings, which have begun to reverse some of the harmful
effects of sustained and excessive use of chemicals in agriculture.
Economic impact of project
Expense savings Rs.
Seeds 89,43,491
Chemical pesticide 88,76,135
Bio-pesticide 26,18,050
Chemical fertilisers 86,42,395
Weedicides 1,63,41,103
Irrigation water 1,98,11,424
Labour & misc 75,74,061
Sub-total 7,28,06,658
Increased income
Higher productivity 26,67,70,713
Better price realisation 55,28,57,945
Sub-total 81,96,28,658
Grand Total 89,24,35,316
KPCL plays a central role in the delivery and effectiveness of DSC’s extension efforts, at least in as far as
agriculture input supply in concerned. This is corroborated by the fact that a majority of farmers across
all project locations claim that input supply has improved after formation of KPCL. The availability of

vi
new variety seeds at fair prices from KPCL outlets has been able to bring down seed failure rates,
improve productivity and ensure higher savings for farmers. Sale of genuine chemical pesticides and
weedicides from the company retail outlets has helped reduce crop damage due to disease and pest
attack. Farmers are now able to buy bio-pesticide, vermi-compost and other bio-inputs such as
trichoderma viride, madhyam etc. from these outlets, bringing down their dependence on chemical
inputs and ensuring better soil and plant health. Also, new agriculture tools and equipment such as
chipiyas, cutters and spray pumps sold through KPCL outlets not only reduce time and effort, but also
the drudgery of labour, helping bring down labour costs.
Suggestions to strengthen DSC’s Extension System
Despite the expectation of improved productivity due to adoption of scientific agriculture practices by
farmers as part of the project, yields of cotton, castor and paddy have suffered. This is due to a variety
of factors including adverse weather conditions, disease, pest attack and the growing menace of wild
animals. While little can be done in the case of natural events, dealing with the wild animal menace
needs to be accorded top priority. Although DSC has initiated a few pilots in the form of group fencing
and solar electric fencing, these options will have to be thoroughly evaluated in terms of their scalability
and feasibility in order to come up with an effective long-term solution to this problem.
By and large, the agriculture extension information provided by DSC has been well received, with
farmers in each project location deriving varying levels of satisfaction from the different sources of
information. Going forward however, it is important to bear in mind that in order to be more effective, a
bouquet of different sources of information will have to be offered in each project location, rather than
what has been most useful in a particular location. The challenge though is that with very low levels of
willingness to pay among farmers, DSC might have to look for other sources of funding to support its
agriculture extension information programme.
Some of the key suggestions received from farmers to improve usefulness of the extension services
include direct procurement of farmers’ produce by KPCL and assistance in grading, packing and
marketing of farmers’ produce, especially spices and vegetables. Farmers would also like access to the
services of an agriculture expert, greater interaction and experience sharing, information on improved
seed varieties, latest/low-cost agriculture techniques and available government subsidies and assistance
in carrying out animal husbandry scientifically.
DSC needs to remodel its extension system to meet the changing needs of farmers in different project
locations. While farmers in newer project locations such as Meghraj and Vehlal want extension activities
to continue to focus on agri advisory information dissemination, package of practices and knowledge
transfer, those in DSC’s traditional project locations such as Visnagar, Himmatnagar and Modasa seek a
higher level of engagement. This may include services such as assistance in crop diversification,
infrastructure in the form of godowns, cold storage facilities etc., support for marketing of produce and
promotion of entrepreneurship among farmers. By offering differentiated levels of extension services to
suit different requirements, DSC will be able to retain its appeal and relevance among its farmer
members.

vii
In order to maintain and strengthen the network of grassroots-level institutions that form the base of its
extension efforts, DSC needs to encourage membership of Kisan Clubs, bio-pesticide and vermi-compost
groups. According to the primary survey, one of the main reasons for people not joining these
institutions was the absence - and therefore lack of information about activities - of bio-pesticide/vermi
groups and Kisan Clubs. Greater efforts therefore need to be made to set up more groups/Clubs and
increase visibility of the benefits they offer, so that people are able to see value in becoming a member.
KPCL is currently at a stage of growth where it is well placed to leverage its inherent strengths for
expanding its membership base. It enjoys huge appeal not just among its member-shareholders but also
non-member farmers who prefer KPCL over other market players, primarily due to the assurance of
quality and fair price of agriculture inputs. Considering that a very small proportion of the total project
beneficiary farmers are KPCL members, there exists a huge potential for scaling up. To translate this
potential into membership, a good starting point will be to consider allowing payment of KPCL
membership fee on an installment basis as suggested by some farmers and improve
visibility/information about KPCL’s activities among non-members to generate their interest in
participation.
Impact on sustainability of agriculture
The comparison of soil samples before and after the LEPNRM project on five important chemical
parameters of soil health shows that there has been significant improvement. This augers well for the
sustainability of agriculture in the region.
i. There has been significant improvement in PH of soils across all regions. In the case of Meghraj it has
moved from acidic towards neutral while in all other cases it has moved from alkaline towards
neutral condition. This may be considered a significant gain within a short period of 4 years.
ii. EC levels have been maintained at fairly low levels in all project areas. In the case of Visnagar, EC was
on the higher side at 1.25 mmhos/cm before the project started as compared to other regions, which
has been brought down by 14.4 %.
iii. Both the above changes can be considered positive from the view point of environmental
sustainability and can be attributed to conjunctive use of chemical and bio-fertilizers being promoted
by DSC. However, isolated cases of high EC persist indicating salinity in soil on account of excessive
use of chemicals and/or mismanagement of irrigation water. These farmers must be contacted
directly and counselled for better land use and farming practices.
iv. Among the nutrients, organic carbon has shown a marginal increase across project areas. Promotion
of greater use of bio-fertilizers, incorporation of crop waste into the soil instead of burning, practice
of cover crops and green manuring etc. are some of the time tested methods of increasing organic
carbon, which has a direct impact on soil texture, water holding capacity, microbial activity and
productivity of soils.
v. In the case of the two macro-nutrients, both P and K have seen significant gains in all regions except
Meghraj. In Meghraj, the level of P is almost the same while there has been considerable loss of K.
However even after this loss, the soil has a good buffer of 433 kg/ha which is better than some of the

viii
other regions. Depletions of upto 25-50 % of the nutrient buffer can be attributed to the previous
crop. Some crops extract more potassium than others.
vi. In contrast to organic carbon, the variation seen in P and K buffers is very high. This again is to be
expected because farmers are not in the habit of adjusting dosage based on soil analysis. Some
farmers apply higher doses in the hope of getting higher yields, others apply sub-optimal doses. The
residual fertilizer contributes to the buffer. Proper management of the nutrient buffer is now
consider important for sustainable yields.
Suggestions for better monitoring of soil health
As all studies on soil health indicators have emphasised, soil health is governed by several factors over
and above the chemical conditions. Some of these parameters relate to physical conditions of the soil
such as porosity, water holding capacity, soil structure, soil depth etc. More importantly, soil being a
living eco-system supports a large variety of micro-organisms which interact with the chemical and
physical components in the process modifying them. Hence, soil healh indicators should ideally be
drawn from all three aspects of soil. Needless to say this makes monitoring soils for their health and
sustainabiliy a lot more cumbersome and expensive. However, in order to get a comprehensive idea
about soil health status, the authors recommend that during the third phase of LEPNRM, sufficient funds
be alloted to monitor soil health on all three categories of soil health indicators. Costs can be minimised
by selecting the most important indicators in each category.
Performance of Krushidhan Producer Company
In a recent review paper on performance of FPOs in India, Prof. Tushar Shah identified eight principles
adopted by the high growth milk producer companies promoted 3-4 years ago by NDDB. An assessment
of Krushidhan FPO shows that it has intuitively followed all these principles in letter and spirit.
Krushidhan’s financial statements also indicate that over the past three years it has started making
modest profits while its growth trajectory has been impressive.
A comparative analysis of business turnover to membership ratio showed that Krushidhan was way
below the MPCs. However, it should be noted that there is a qualitative difference between the sales of
Krushidhan and MPCs. Most of its sale has been restricted to inputs rather than outputs. When
Krushidhan gets into collective marketing of outputs, the turnover is bound to increase significantly as
outputs are both bulky and of high value.
This difference has arisen also because Krushidhan works in agriculture with a social mission of making it
environmentally sustainable while ensuring the economic viability of the marginal farmer. This mission
has guided the portfolio of activities in the first three years where creating backward linkages was
considered critical for higher and more sustainable productivity. Also given the diversity of cropping
patterns, Krushidhan has to deal with a diverse portfolio of inputs. The company has therefore been
more in the service sector rather than commodity business, although it did not charge a penny for its
services. The economic benefits derived by farmers due to reduced costs, increased productivity,
reduced risk and increased price realisation are estimated to be nearly Rs. 90 crores. When these as well

ix
as the environmental and social gains are factored in, the performance of Krushidhan looks even better
than that of MPCs.
Suggestions for strengthening Krushidhan FPO
Krushidhan needs to continue its trajectory of growth using a value chain approach while adhering to
the eight principles identified by Dr. Shah. Two factors will enable it to meet its projected targets; a)
increasing its share-holder base and thereby available internal funds for doing business while
simultaneously increasing member allegiance b) getting into building collective marketing of produce
through aggregation, cleaning and grading, storage, market information based selling, value addition
and whatever needs to be done to get the farmer a better price for her/his produce. At the same time
DSC will need to make its extension services more aligned and synchronised with the activities of the
company so that members perceive greater benefits and experience greater loyalty to the company,
which is so crucial for collective action.
Some of the issues related to governance and management of the company as well as possible solutions
/recommendations are discussed in the report.

1
1 Introduction
1.1 Context of Study
Development Support Center (DSC) established in 1994 by late Shri Anil Shah is well known for its
pioneering work in the field of Participatory Irrigation Management (PIM). More recently it has also
established itself as an agency that provides effective solutions for farm and off-farm rural livelihoods
through Participatory Natural Resource Management (PNRM). After more than a decade of successful
work in the area of PIM and watershed development, in 2008, DSC initiated a project aimed at
improving the agriculture based livelihoods of farmers in Gujarat called “Livelihood Enhancement
through Participatory Natural Resource Management” (LEPNRM) in Ahmedabad, Mehsana,
Sabarkantha, Aravali and Amreli districts of Gujarat with financial assistance of RBS Foundation India
(RBSFI). About 40,000 rural families in 160 villages were targeted under the project (Figure 1-1). This
programme adopted a holistic approach towards agriculture development and focused on five aspects
namely - productivity enhancement, cost reduction, risk mitigation, value addition and market linkages.
Figure 1-1: Project Areas identified in Map of Gujarat
Project locations

2
In the first phase (2008-2011), the emphasis was on agriculture extension through development of user
friendly IEC material, capacity building, development of a cadre of para-workers and formation of SHGs
and Farmer Clubs at the village level. The project was successful in demonstrating various package-of-
practices and technologies that included new varieties of seeds, inter-cropping, soil testing, production
and use of vermi-compost and bio-pesticides, drip irrigation etc., with more than 5000 farmers.
The first author had the benefit of conducting the impact assessment study of this phase of LEPNRM.
The study showed that the improved practices were shared and adopted by about 15,000 farmers. They
benefited by increased crop yield in the range of 20%-70% in various crops such as wheat, castor,
mustard, cotton, maize and groundnut. Net income at the farm level was also increased due to better
management practices.
Subsequently in October 2011, a second phase of the project was launched by DSC which aimed at
promoting a Farmer Producer Organisation (FPO) so that farmers would be better organised to deal with
the market forces, through backward and forward linkages. This would result in significant savings in
cost of inputs without compromising on the quality and would simultaneously improve the price realised
for the produce. The project implemented in 151 villages targeting 32,300 households was completed in
March 2016. The districts covered remain the same as in the first phase. It is this project which is the
focus of the present impact study.
Some of the important dimensions of Phase II include:
1. Scaling up of better crop management practices, low cost technologies, organic inputs etc. in
collaboration with government, cooperatives and private agencies.
2. Capacity building of farmers in collaboration with agriculture universities, crop research stations,
private input suppliers, etc.
3. Formation and capacity building of farmers affiliation groups (Kisan Clubs), women enterprise
groups, Self Help Groups etc. for participatory learning and collective action.
4. Developing Krushi Dhan Farmers Producer Company (KPCL) into a three-tier, effective service
company through hand-holding, capacity building and technical support so that it can benefit small
and marginal farmers through cost effective and timely input supply and better price realization on
outputs through collective marketing initiatives.
1.2 Objectives and Methodology
Objectives and Expected Outcomes
The set of objectives given to the study team by DSC is reproduced below:
1. To assess the impact of Phase II: Socio–economic and environmental impacts at the household and
village levels, benefit-cost ratio of extension services provided by DSC and the business conducted
by KPCL.

3
2. To assess the potential of KPCL through a SWOT analysis of KPCL and maybe that of DSC`s
agriculture extension services too.
3. Based on the current and likely scenario of agri-enterprise development and competition from the
private sector in the country, to suggest how KPCL could scale-up its operations and make it a
financially viable, profit making company – which activities? what scale? which market – local?
regional? export?
4. To indicate the likely risks and competitors for each of the suggested activities.
5. To suggest ways and means of mobilising funds for KPCL - accessing credit etc.
6. Since extension and enterprise are closely related, to suggest the role of the support services that
need to be provided by DSC to farmers so that they can overcome some of the challenges indicated
above.
7. To suggest strategies for making the extension services more demand driven and less dependent on
grants.
Apart from providing valuable feedback to various stakeholders of the programme, the study was
expected to:
Suggest a suitable model of agriculture extension services for farmers in 165 villages
Suggest an appropriate business portfolio and strategies for the KPCL, given its ambition to scale up
its turnover and become a profitable venture in the coming five years
Methodology
The methodology included the following:
i) Review of internal reports, project proposal, physical progress reports, case studies etc. and
secondary data provided by the project team.
ii) A representative sample survey to assess the extent of impact on farm productivity and family
income among participating farmers. It was visualised that the sample would include suitable
number of respondents from three sections of the farming community which could be seen as
three concentric circles of influence:
- Farmer shareholders of the producer company (innermost circle)
- Farmers who have accessed services from the company but are not its members (circle
just outside of the core)
- Farmers who are aware of the company and/or DSC by virtue of being located within the
project area but have never been directly involved (outermost circle)
iii) The findings would help in developing strategies to broaden the influence of the company and to
encourage more farmers to progressively move from outer to inner circles. Details of the sampling
frame are given at the end of this section.

4
iv) A scientific soil survey to assess the improvement in the soil parameters over time. This included
testing of organic carbon, PH and nutrient status of soils. Improvement in soil health would serve as
an indicator for sustainability of farming practices adopted under LEPNRM. This was carried out
with the help/guidance of Gujarat Agricultural University as DSC also has its own facility of mobile
van for soil testing.
v) A sample survey among members of the producer company to assess the type and satisfaction of
governance was initially visualised. However, we were informed that such a survey had just been
completed by DSC with the help of students. It was therefore proposed to utilise the findings of this
study as inputs to the larger study of the producer company’s performance. In addition, personal
interviews with board members and FGDs with active members would be used to understand the
governance of the company. The framework provided by Dr. Tushar Shah capturing variables such
as member representation, member allegiance, producer centeredness of processes, professional
management, checks and balances between the board of governance, professional staff and
producer members would be useful for this component of the study.
vi) Individual interviews with professional staff and board members to understand the marketing
strategy deployed and the financial status of the company, as well as future plans.
vii) Individual interviews with selected partners of DSC and KPCL who are associated with extension
and business activities of the company in Visnagar, Mehsana, Himm\ j]a atanagar and Modasa such
as Wheat Research Station, key input suppliers to KPCL etc.
viii) Participatory methods to enable the staff and board of the company to develop the broad contours
of long term plan/strategy for the company were visualised. In practice this was achieved through a
series of planning workshops facilitated jointly by the consultants and DSC.
Sampling Frame
A sample of 200 farmers was selected for the study. They were selected from within 145 project
villages in 5 locations in Gujarat which constitutes the project area. The information on area wise
number of farmers and number of villages targeted through project activities is summarised in Table
1-1. A proportionate sample of villages was selected at random as shown in Table 1-2. From each
village site, a minimum of 5 farmers including 2 KPCL shareholders, 2 Kisan Club members and 1 control
farmer were selected at random from the list of farmers provided by DSC, ensuring representation of
marginal, small, medium/large and women farmers.

5
Table 1-1: Participating villages and farmers in five different clusters of the project area
Name of location Name of block(s) and district No of
villages
No of farmers registered
in the project
No of sample
farmers
Dharoi PIM cluster Visnagar, Unjha, Kheralu, Satlasna,
Vadnagar: Mehsana district
60 25,000 90
Guhai PIM cluster Himmatnagar: Sabarkantha district 30 5500 45
Mazum PIM Cluster Modasa, Dhansura: Aravalli district 15 3000 25
Meghraj watershed
cluster
Meghraj: Aravalli district 20 3500 20
SSNNL Vehlal PIM
Cluster
Daskroi: Ahmedabad district 20 1500 20
Total 145 38,500 200

6
Table 1-2: Sampling frame
Projectlocation
VISNAGAR HIMMATNAGAR MODASA MEGHRAJ VEHLALTotal
Clusters Dharoi Vadnagar Visnagar Lolasan Ilol Polajpur Mazum Bani Navasamera Navagra Itva Kuha Bhavda
No. of villages 6 6 6 3 3 3 2 3 1 2 1 2 2 40
No. of samples 30 30 30 15 15 15 10 15 5 10 5 10 10 200
Name ofvillages
Dedasan Sulipur Thalota Lolasan Dedhrota Vakhatpura Kolikhad Rahiyol Navasamera Bhatkota Itva Kuha Bhavda -
Fudeda Kahipur Pudgam Dolgarh Navanagar Polajpur Dalilpur Bhensawada - Valuna Karoli Dhamatvan -
Kot Malekpur Denap Tejpura Ilol Navalpur - Garudi - - - - - -
Ransipur Kesimpa Kiyadar - - - - - - - - - - -
Javanpura Navapura Kansa - - - - - - - - - - -
Khodamali Sundhiya Vanagala - - - - - - - - - - -
Shareholders 12 12 12 6 6 6 4 6 2 4 2 4 4 80
Kisan Clubmembers butNOTshareholders 12 12 12 6 6 6 4 6 2 4 2 4 4 80
Ordinaryfarmers 6 6 6 3 3 3 2 3 1 2 1 2 2 40

7
Key parameters/ indicators
The purpose of the survey is to assess the change (decrease/increase) in productivity of crops, cost
structure, price realisation, gross and net incomes etc. This would be assessed through recall data of
the performance before and after the intervention and also by comparison between control and
sample farmers.
The indicators used to measure the impact at the household level were as follows:
i. Decrease/ increase in per hectare/ per farmer cost of cultivation of 2 major crops in each kharif,
rabi and summer.
ii. Change in production related risks of major crops (controllable and natural risks)
iii. Increase/ decrease in per hectare yield
iv. Increase / decrease in price realization
v. Increase / decrease in gross income (per hectare/ per farmer) including labour and transaction
costs of 2 major crops in each kharif, rabi and summer.
vi. Increase / decrease in net income (per hectare/ per farmer) including labour and transaction
costs
vii. Number of farmers and cultivated area brought under change in crop practices (better
management practices adopted from sowing to harvesting and post harvesting processes)
viii. Increased area under efficient irrigation techniques like drip/ sprinkler furrow irrigation etc.
ix. Change in per hectare/ per farmer dose of chemical fertilizers and pesticides
x. Increase/ decrease in production and use of organic inputs (per hectare/ per farmer)
xi. Increase/ decrease in cropped area under seed replacement / seed improvement
xii. Change in mindset of farmers towards adopting sustainable agriculture practices right from pre
sowing operations to post harvest processing and marketing i.e. seed selection, balanced use of
chemical fertilizers, production and application of pesticides and organic inputs, cleaning,
grading etc.
xiii. Level of participation of farmers in farmers organisations and collective actions (Kisan Club,
cluster committee, producer enterprise groups and Krushi Dhan Producer Company)
xiv. Change in input supply pattern (accessibility, timeliness, reliability and quality)
xv. Change in the quality and timeliness of information, education and communication services
provided to the farmers from the project in comparison of other Departments/ agencies
xvi. Assessment of financial and institutional strength and SWOT analysis of Krushi Dhan Producer
Company for its sustainability

8
2 LEPNRM: Underlying Theory of Change
While LEPNRM-I built the foundation through its extension system to make agriculture sustainable and
economically attractive at the same time, LEPNRM-II saw the emergence of Krushidhan FPO as a major
force for socio-economic change and empowerment of small and marginal farmers in the project area.
Table 2-1 summarises the two phases of the programme in terms of the main focus, reach and impacts.
Table 2-1: Summary of two Phases of LEPNRM
LEPNRM
Project
Focus Reach Impact
Phase I
(2008-
2011)
Agri Extension through
Kisan Clubs to make
agriculture viable for marginal
farmers and ecologically
sustainable and piloting small
group enterprise
15,000 farmers out of possible
38,500
300 Kisan Clubs (240 male and
60 female groups) formed in
132 villages
20-70% increase in productivity of crops such
as wheat, castor, mustard, cotton, maize and
groundnut
Phase II
(2012-
2016)
Agri extension running parallel
to aggregation of farmers under
Krushidhan FPO
Extension : 32,300 farmers
covering 45,500 hectares from
151 villages
Market linkages: 6000 farmers
Shareholders of FPO: 2035
farmers
Increased use of bio-pesticides and
fertilizers; reduced cost on agri-inputs
especially seeds;
Lower crop loss and higher productivity;
Better condition of soil health; higher prices in
selected crops like groundnut, pulses, spices;
Better economics of seed producers
The underlying theory of change was articulated by DSC at various forums as shown in Figure 2-1. The
figure shows how agriculture which was increasingly becoming unviable for the marginal farmer and
non-sustainable in the long run due to continuous and indiscriminate use of chemical inputs could be
transformed through a series of measures aimed at stabilising cost and production to start with and
improving price realisation through collective marketing and value addition at a later stage. The end
state would be more sustainable agriculture where farming for marginal farmers would once again
become economically viable.
The same figure shows how a pyramid structure of people’s institutions would prove instrumental in
achieving this change. Phase 1 saw the creation of the base of the pyramid which ultimately gave rise to
the FPO in Phase II. More than 300 Kisan Clubs/ Producer Groups were formed in 132 villages including
240 male groups and 60 women groups. Six Taluka/ Block level Associations have been formed and
these are playing a role of intermediator between Kisan Clubs and the Apex level company. These
groups have a total saving of Rs. 40 lakhs and they are linked with KPCL for agricultural input supply and
aggregation of outputs for collective marketing.

9
LEPNRM: The Strategy for Sustainable Agriculture Development
Sustainable
agriculture
livelihoods
Increasing
cost, risks,
info gaps,
yield gaps,
market price
fluctuation
Farmer
producer
company
Cluster level association
Producer’s group/Kisan Clubs
Value addition and
marketing
Productivity
Enhancement
Cost reduction
Risk management
Development Support Centre Ahmedabad-January 27, 2015
Figure 2-1: Theory of Change articulated by DSC
An attempt has been made in this section to elaborate this theory further and to highlight the fact that it
uses a value chain approach for promoting and strengthening farm based livelihoods. This elaborated
framework provides a conceptual frame to understand the progress made so far and strategic plans
being made for the next phase of interventions.
Conceptual Framework
Based on the understanding of LEPNRM I and II as well as work being carried out by FPOs elsewhere in
the country, a simple three-stage conceptual framework can be proposed that underlines a value chain
development approach to livelihood promotion (Figure 2-2) viz.:
(1) Stabilising Cost and Production: This is the first step which involves dealing with production risks,
reducing costs and enhancing productivity through a variety of measures including new technology,
building a sustainable asset base, capacity building of farmers and producer groups. It also involves
creating market orientation as well as a vision for sustainable agriculture. Much of this was
accomplished in LEPNRM I, through DSC’s extension work for which the Kisan Clubs became the

nerve centers. This work has be
programme.
(2) Understanding and Dealing with
of aggregation, market intelligen
linkages for collective procurem
marketing of produce. Considerab
LEPNRM II, while a good beginni
establishment of Krushidhan the
(3) Moving up the Value Chain: This
institutions take up backward an
them to create and capture value
This is the logical step for mov
sector and in supply of organic
LEPNRM III or beyond, Krushidhan
Figure
The framework suggests a logical seq
the particular situation in a sub-secto
tasar silk value chain promoted by PRA
to scale up, backward integration be
forward integrate in ways that poor p
In some sub-sectors it may not be po
reasons such as:
k has been continued and expanded further in the secon
ing with Markets: This involves creating market linkages
igence and negotiation in the market place. It can in
rocurement of quality inputs as well as forward linkage
Considerable progress has been made on creating backward
beginning has been made in establishing forward linkages.
han the FPO has made this possible.
This is the final stage where farmer’s institutions or fa
ward and forward integration of various steps in the supply
ure value, thereby dramatically improving their share in the
for moving beyond backward and forward linkages. Alread
organic inputs, the first step of backward integration has
dhan would aspire to move into this stage.
igure 2-2: Conceptual Framework with VCD Approach
gical sequence of steps through which VCD can take place
sector, some steps may be omitted or by-passed. For
ed by PRADAN and CSB, CSB was the only supplier of seed
ation became essential. Invention of reeling machines mad
at poor producers could benefit.
ot be possible to progress beyond a particular point on acc
10
e second phase of the
through a process
It can include backward
linkages for collective
ackward linkages during
linkages. The successful
ns or farmer supported
e supply chain, enabling
are in the terminal price.
es. Already in the seed
ation has taken place. In
ke place. Depending on
. For example in the
of seed material, hence
ines made it possible to
t on account of various

11
– Severe entry barriers
– Severe competition including indulgence of malpractices by competitors
– Absence of suitable technology
– Consumer preferences – e.g. in poultry broiler market, consumers in many parts of India have
a strong preference for fresh rather than processed/cold storage birds
Sometimes depending on available opportunities backward linkages may happen before forward
linkages and vice-versa.
Criticality of People’s Institutions
To make a VCD intervention succeed, a development agency must invest heavily in the facilitation of
appropriate people’s institutions and governance structures at different stages of aggregation. Typically
the need for institutions is felt as the intervention moves from primary production stage to marketing
and value addition stage. Hence marginal farmers need to come together in the spirit of collaboration to
meet common goals of dealing with the markets and building capacities to absorb new technology and
develop new organizational skills. Producer groups then need to collaborate at a cluster level, which in
turn collaborate to create an area level organization that would be large enough to make a dent in the
local markets. At an even higher level of aggregation, FPOs could collaborate to form an apex state level
company to deal with market opportunities in a pro-active manner.
People’s institutions play an important function of governance and maintaining cohesion within the
members for collaborative action. Table 2-2 provides an illustrative list of PIs for different levels of
aggregation and at different stages in VCD.
Table 2-2: Illustrative List of PIs for Value Chain Development
Stage Village Level Cluster Level Area Level
Stabilising
Production
SHGs for credit;
Producer Groups for
technology absorption
Cluster level Organisation
(CLO) for technology absorption
(if needed)
Federation of SHGs to mobilize credit from
banks (if available)
Market Linkages and
collective marketing
/procurement
SHGs; Producer
groups
CLO for demand aggregation
and collective supply of inputs;
for collective marketing
initiatives
Farmer Producer’s Organisation (FPO) with
membership of PGs and /or SHGs; employing
professionals for marketing; to establish
backward and forward linkages
Backward and
Forward Integration
SHGs; Producer
groups - some of
which may specialise
in quality inputs like
seed material, organic
inputs etc.
CLO for absorption of new
technology, creating new
linkages, continued collective
procurement and marketing
FPO with reliable market linkages; employing
professionals for marketing and processing
technology;
Strategic tie-up with a social entrepreneur or
creation of special marketing organisation with
stakes of FPO in it

Many agencies that are target driven
compound matters there is a dearth o
investment in the chain of people’s in
DSC being a pioneer in the field of p
pitfall and has paid adequate attentio
To contextualize the discussion, a thr
people’s institutions under LEPNRM. T
Stage 1
Fig
As seen in Figure 2-2, Kisan Clubs whi
became the focal point for introducing
- Enhance productivity of lan
- Reduce cost of production
- Mitigate risks
- Enhance quality of output
Investments in hardware (land impr
balanced with investments in softwar
together in the spirit of cooperation
and a vision of sustainable agricultur
(2011) as reproduced in Table 2-3 belo
et driven often fail to invest sufficiently in building these
dearth of professionals willing to work for farmer’s institut
ople’s institutions so necessary for VCD, often leads to failu
field of participatory natural resource management is full
attention to building suitable farmer’s institutions.
on, a three stage diagram is presented that brings out the
PNRM. These are presented in Figure 2-3 to 2.6.
Figure 2-3: Stage 1 – Stabilising Production
Clubs which are producer groups of 8-12 like-minded and int
roducing change through a range of interventions designed
ity of land and water resources
duction
f output and resultant price realization
and improvement, new seeds, technology, equipment etc.
software (capacity building not only to absorb new techno
eration but also to develop input quality orientation, mar
agriculture). This was brought out clearly in the LEPNRM
below.
12
g these institutions. To
institutions. Neglecting
s to failure. Fortunately
nt is fully aware of this
ut the role of various
and interested farmers
esigned to:
ent etc.) were suitably
w technology, and work
ion, market orientation
PNRM – I review report

13
Table 2-3: Framework of assessment used in LEPNRM-I
Slno.
Activity Strategy Elements
CostReduction
ProductivityEnhancement
PriceIncrease
Riskreduction
Socialcapital
Humancapital
1 Participatory extension
system (PES)
2 Seed production andsupply by farmers
() 3 Input supply by
federations (bulkprocurement)
()
4 Supply of organic inputsby farmers/ women’sSHGs
a) Vermi-compostb) bio-pesticide
5 Soil testing - 6 Supply of low cost
agricultural tools andequipment i.e. drip
() ()
7 Rainfall/ weatherinsurance
_ _ _ _
8 Market linkage (cotton) _ _ () ()
9 Contract farming(potato)
_ _ 10 Local processing and
marketing of produce(spices)
_ _
11 Credit through women’sSHGs
() _ _ () – Implies partial impact or impact in some cases
Stage 2
Figure 2-4 shows the emergence of KPCL or Krushidhan FPO as an area level institution to take up the
challenge of dealing effectively with markets through establishment of both backward and forward
linkages.

F
While trying to establish backward an
having an intermediate body that wo
Hence for a cluster of 8-10 villages a
Kisan Clubs. These committees carry
supply of agri-inputs as per the requ
informal committees are likely to assu
own right. In Figure 2-5, the diagram
institutions.
Figure 2-4: Stage 2 – Dealing with Markets
ackward and forward linkages, Krushidhan soon realized the
that would link it with the farmers and bring down its op
illages a “cluster committee” was formed with representati
es carry out the function of organizing demand aggregatio
the requirements of the farmers within their cluster. In du
ly to assume greater significance and may become formal
diagram is suitably modified to include cluster committees
14
alized the importance of
n its operational costs.
resentatives of different
ggregation and physical
er. In due course these
formal entities in their
mittees as intermediate

Figure 2-5: Stag
Figure 2-6 shows the institutional arran
are modified somewhat with the likel
order to reach distant or niche market
Stage 2 - Development of social capital to deal with markets
onal arrangements in Stage 3. In a more advanced stage,
the likelihood of a specialized marketing agency joining th
e markets (Figure 2-7).
15
the arrangements
ining the value chain in

Figure 2-6: Stage 3 - Exploiting Markets
16

FigurFigure 2-7: Stage 3 (advanced) - Exploiting Markets
17

18
3 DSC’s Extension System under LEPNRM-II
3.1 Coverage
Although the project area remained the same, during LEPNRM phase II, the extension system was
expanded very significantly to cover 32,300 farmers from 151 villages. The total area of farming covered
was about 45,500 Ha (Table 3-1). As can be seen from the break-up of coverage across the five project
units, Visnagar takes the lion’s share with neighbouring Himmatnagar coming a distant second. More
significantly, the coverage of Visnagar both in terms of farmers and area covered is greater than all the
other four units put together.
Table 3-1: Coverage of Extension in LEPNRM II
Sl. No. Name of Block No ofVillages
No offarmers
Total area(Ha)
1 Kujad 18 3000 5000
2 Visnagar 69 19500 25000
3 Modasa 18 3000 5000
4 Himmatnagar 28 4500 7000
5 Meghraj 18 2300 3500
Total 151 32300 45500
The coverage of crops under three different seasons viz. Kharif (monsoon), Rabi (winter) and Zaid
(summer) for all five units under the project is summarized in Table 3-2.
It may be noted that wheat, a rabi season crop, occupies the top position with a coverage of 19135 Ha.
The project area has an advantage in as much as a Wheat Research and Extension Center of the ICAR is
located there. The scientists at the center are extremely responsive and the DSC team at Visnagar has
established an excellent rapport with them. In addition, wheat being a thermal sensitive crop has of late
been affected by climate change. An increase in about 1 degree C and delay in monsoon are some of the
aspects of climate change which are affecting crop productivity. The center has identified new varieties
and changes in package of practices that farmers can adopt as an adaptation to climate change. Wheat
being a major food grain is also important for the food security of the farming community.
The second position is occupied by fodder in summer season with coverage of 13615 Ha, thus signifying
the importance of animal husbandry in the farming systems of the region. Fodder is cultivated in all
three seasons but the fodder crops are different in each season. In kharif, crops like jowar are used as
green fodder and paddy straw is used as dry fodder; in rabi season, Lucerne (alfalfa) is a popular green
fodder which continues till mid-summer as the last harvest is done in March-April. Wheat is commonly
used as dry fodder.

19
During the past two years, the Gujarat Agricultural University has introduced new fodder crops such as
makkhan grass which the farmers have taken to very enthusiastically. According to the farmers with
whom the authors interacted, unlike Lucerne it is not susceptible to insect attack. The leaves are very
soft and are much preferred by the animals. The seed costs less than Lucerne seeds. Finally the milk
produced has higher fat content by about 1%. A farmer with three animals can get an increased income
of Rs 400/day. This bodes well for DSC’s thrust to replace chemicals with bio-inputs as a boost in animal
husbandry will mean greater availability of organic manure and bio-pesticides.
Table 3-2: Coverage of Crops under Extension for three seasons (Ha)
The third and fourth positions are occupied by cotton - a cash crop and castor - an oilseed crop. Both
cotton and castor are grown in kharif season but last till the end of winter. Both are cultivated as cash
crops. Cotton has been the highest consumer of pesticides. During the past decade, the introduction of
genetically engineered Bt varieties of cotton had made the crop resistant to attack from bollworms.
However, as the prescribed precautions of maintaining a buffer strip all around the crop has not been
followed in most places, the crop of late has shown signs of becoming susceptible to pink bollworm. As a
result the expenditure on cotton pesticides has increased to some extent.
3.2 Main Features of the Extension System
An agriculture extension system provides both, knowledge inputs as well as material inputs or access to
the same. In this case the knowledge inputs are largely provided by a team of trained workers from DSC
through their field offices. DSC also tries to link up with research institutions and provide farmers with
Crop Kharif Rabi Zaid
Cotton 11390 11390 -
Castor 10390 10390 -
Bajra 2500 - 4000
Maize 1750 - -
Paddy 3070 - -
Groundnut 3450 - 1205
Fennel 2500 4100 -
Fodder 4190 5160 13615
Pulses 4335 - -
Vegetables 1820 1210 1425
Others 315 - -
Wheat - 19135 -
Chana - 805 -
Tobacco - 3200 -
Potato - 1000 -
Total 45465 45500 20245

20
exposure not only through demonstration on farmers’ fields but also through exposure visits to
successful farmers and research stations elsewhere in the state or country. It also organizes training
camps for certain themes, skills or technologies with which farmers may not be familiar. Finally it has
established an SMS based advisory which provides critical information during the season to farmers on
their cell phone.
There is a direct linkage with the work of the extension team and that of Krushidhan Producer Company.
The company makes sure that those seeds of varieties prescribed by the extension team are available in
its retail outlets. Similarly as per the outbreak of pests and diseases, the suggested agri-inputs are made
available in a timely manner and at the lowest possible price. In the case of bio-inputs, the excess
production is purchased from producer groups and sold under the banner of the company. The company
also sells equipment that can greatly reduce the drudgery of women and other labourers while
improving their efficiency and reducing cost of labour. The range of inputs provided by the extension
system and their expected impacts on farming is summarized in Table 3-3.
Table 3-3: Summary of extension work and expected impacts
No. Type of Knowledge input Conjunctive use of
Producer company
Expected Impacts on
marginal farmer
1 Demonstration/ Trial on farmers field for:
- Package of practices for a given crop or
variety
- Introduction of new crop or variety
- New techniques such as SRI in paddy
Timely supply of seed or
planting material
Timely supply of all other
agri-inputs
Increased productivity;
Reduced cost
2 Adjustment in crop variety, date of sowing, method
of sowing etc. to deal with climate change
Timely supply of new variety
seeds
Risk reduction
3 New measures, techniques or technology to deal
with menace of ungulates like wild boar, neelgai
etc.
Linkage with suppliers of
new technology
Risk reduction
4 Introduction of new tools and equipment to reduce
drudgery and cost of labour
Supply of those tools and
equipments through
company outlets
Cost and drudgery reduction
5 Promoting self reliance in seed supply through
backward integration in production of certified and
foundation seed
Company procures seed
produced and supplies to
interested farmers
Better price realisation and
better income
6 Substituting chemical inputs with bio-inputs in
agriculture to the extent possible
Supply of bio-inputs not
available locally;
Procurement of surplus
production of bio-inputs from
producer groups
Improved soil health and
productivity;
Long term sustainability of
agriculture

21
7 Self-reliance in supply of bio-inputs through
producer groups and women’s SHGs
Procurement of surplus
production of bio-inputs from
producer groups
As above;
Also alternative livelihood for
poor women/ farmers
8 Cleaning and grading of produce before selling with
the help of new technology
Supply of new equipment
and after sales services
Better price realisation
9 Cottage industry for producer groups to add value
to local produce before selling in the market
Branding and marketing
through common outlets of
the company
Better price realization;
Alternative livelihood for the
poor
10 Demonstration of drip-irrigation technology and
other water conservation techniques
No role at present as DSC
facilitates direct linkage of
farmers with suppliers
Reduced cost, improved water
use efficiency, better
productivity, better soil health
Of the categories listed in the table above, the most important are demonstration of new crop
technology (1 and 2), self reliance in seed production (5) , substituting chemicals with bio-inputs (6 and
7) and improved water use efficiency (10) as these have been implemented on scale. The rest are mostly
on pilot scale or trial basis, but which are promising and should assume larger proportions in the near
future. We discuss the extent of adoption and the progress made in some of the more important ones in
the following section.
As discussed earlier, DSC uses a combination of methods to reach out to the farmer and build the
capacity of the farmer to adopt new technology that not only improves the economics of farming but
also makes it ecologically sustainable. The appropriate mix of methods depends on the local culture and
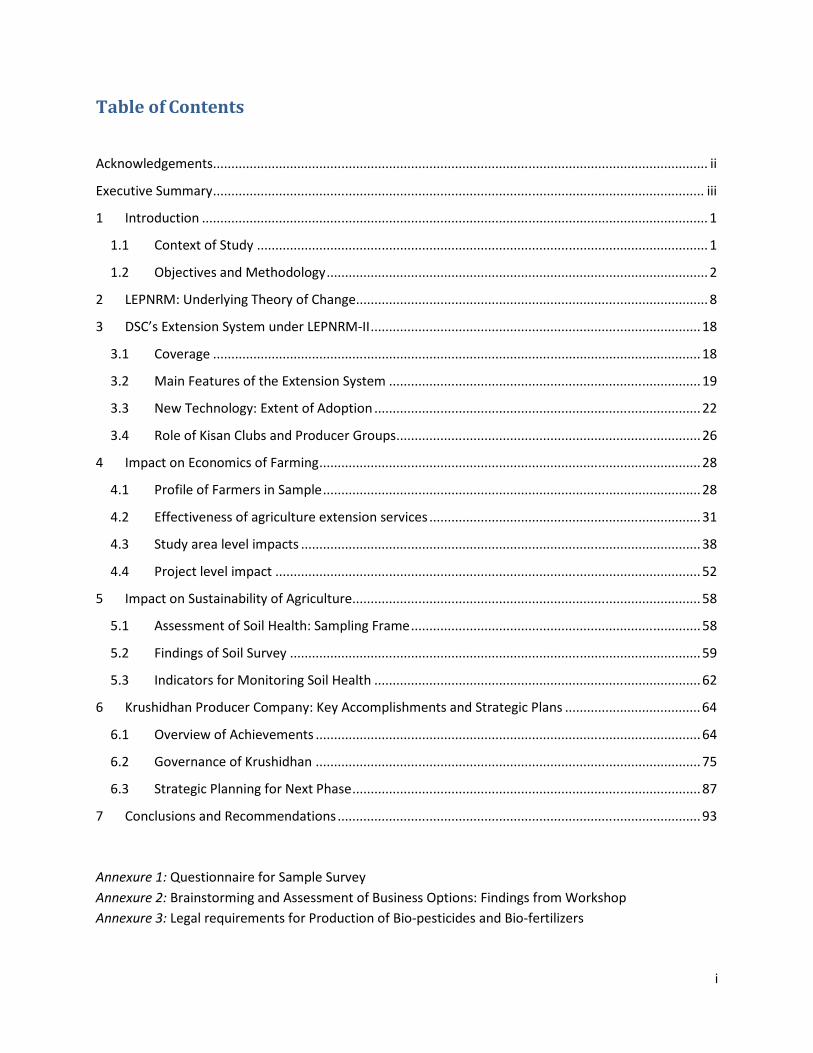
preferences of farmers. Table 3-4 shows the full range of methods used and the extent of participation
of farmers in these extension/capacity building events. As the table shows, over 73,500 individuals
participated in 2891 events during Phase II of the programme. The most important of these from the
point of technology extension were demonstrations, exposure visits, farmer workshops and training (1
to 5). The other events (6 to 9) were more to do with capacity building for people’s institutions including
Kisan clubs at the grassroots level and KPCL as the apex institution.
22
Table 3-4: Range of extension methods used by DSC
Sl .
No.
Type of event No of events organised No of Participants
1 Demonstrations/ trials in farmers’ fields 1308 10,331
2 Exposure visits for farmers 153 1,955
3 Farmer meetings/ workshops 642 12,303
4 Training 215 3,218
5 Night video shows 262 9,998
6 KPCL awareness campaign 106 32,400
7 Cluster level shareholder sammelan 119 2,104
8 Special sammelan for women
shareholders
44 304
9 Inauguration of Kisan Club by NABARD
officials
42 1,198
Total 2891 73,811
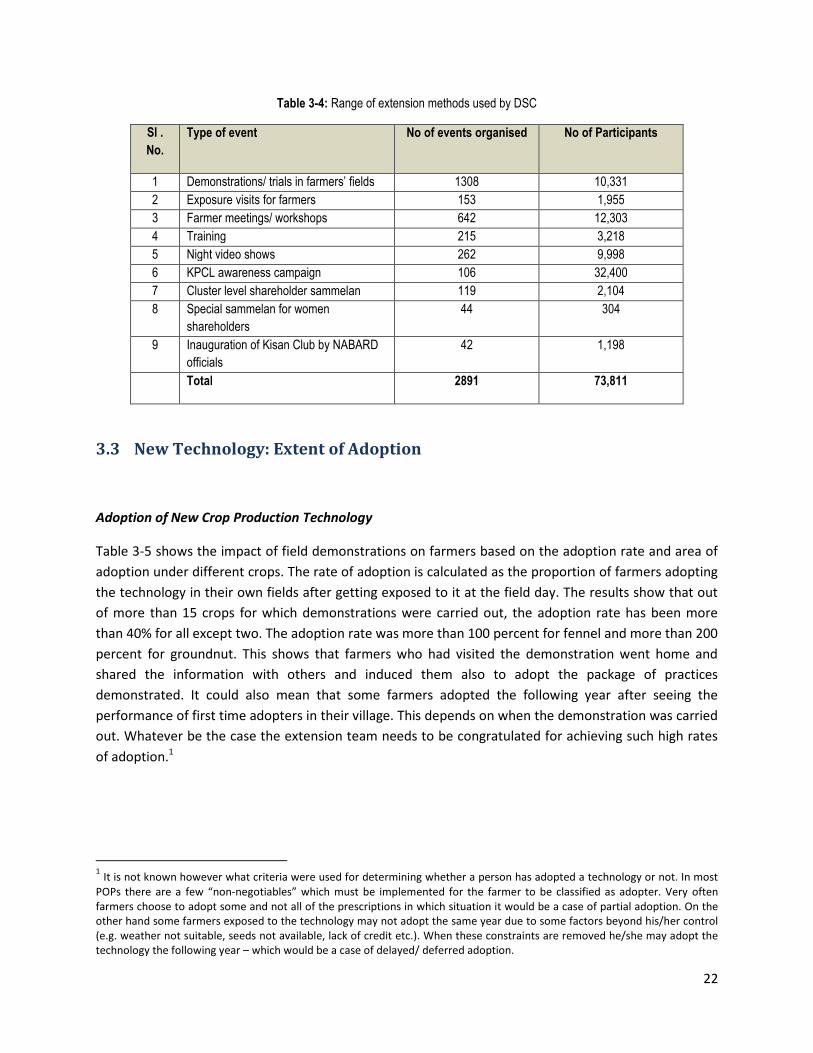
3.3 New Technology: Extent of Adoption
Adoption of New Crop Production Technology
Table 3-5 shows the impact of field demonstrations on farmers based on the adoption rate and area of
adoption under different crops. The rate of adoption is calculated as the proportion of farmers adopting
the technology in their own fields after getting exposed to it at the field day. The results show that out
of more than 15 crops for which demonstrations were carried out, the adoption rate has been more
than 40% for all except two. The adoption rate was more than 100 percent for fennel and more than 200
percent for groundnut. This shows that farmers who had visited the demonstration went home and
shared the information with others and induced them also to adopt the package of practices
demonstrated. It could also mean that some farmers adopted the following year after seeing the
performance of first time adopters in their village. This depends on when the demonstration was carried
out. Whatever be the case the extension team needs to be congratulated for achieving such high rates
of adoption.1
1It is not known however what criteria were used for determining whether a person has adopted a technology or not. In most
POPs there are a few “non-negotiables” which must be implemented for the farmer to be classified as adopter. Very often
farmers choose to adopt some and not all of the prescriptions in which situation it would be a case of partial adoption. On the
other hand some farmers exposed to the technology may not adopt the same year due to some factors beyond his/her control
(e.g. weather not suitable, seeds not available, lack of credit etc.). When these constraints are removed he/she may adopt the
technology the following year – which would be a case of delayed/ deferred adoption.

23
Table 3-5: Extent of adoption resulting from Field Demonstrations
Crop No. of DemosNo. of
field days
No. ofparticipantsin field day
No. of farmersadopted POP
%adoption
Area inHa
Cotton 178 97 2255 1287 57 565
Castor 62 32 680 467 69 225
Wheat 434 72 1633 1066 65 446
Organic wheat 97 45 1287 76 6 47
Maize 19 16 585 453 77 168
Sorghum fodder 15 9 140 58 41 12
Fennel 25 9 181 252 139 60
Groundnut 24 27 471 1080 229 576
Cumin 17 4 96 2 2 0
Chana 63 10 187 123 66 47
Mung 12 5 64 35 55 7
SRI Paddy 38 10 387 186 48 86
Makkhan ghas(new fodder crop) 56 26 734 490 67 35
Madhyam 197 24 556 294 53 280
Other 71 64 1075 498 46 119
Total 1308 450 10331 6367 2674
The table shows that the extent of adoption has been in 2674 Ha of agricultural land by over 6350
marginal farmers. It is to be expected that there would be a multiplier effect as during subsequent years
more farmers would try to emulate the successful first time adopters.
Backward Integration: Seed Production by farmers
The project has seen adoption of seed technology, mainly in wheat crop – first for truthful seed and
more recently for certified and even foundation seed. Although the quantum of seed produced is still
not very big, farmers have gained sufficient confidence during the past three years to be able to take it
up on a bigger scale. This kind of backward integration is very important from the economics point of
view as farmers who produce the seed get more remunerative prices. Farmers who buy that seed from
the producer company also gain by getting timely supply of certified seed at a reasonable price.
Table 3-6 summarises the experience of becoming self-sufficient in seed supply at least in one crop to
begin with. The figures show that while many farmers were involved in production of truthful seed, only
a handful have ventured into certified and foundation seed production. This is because the quality
standards are more stringent in the latter and therefore the risk of the lot getting rejected is higher.
There has been a shift from production to truthful seed to certified seed during the last year. This aspect
and the reasons for the same are discussed later in the section on impacts of extension system.

24
Table 3-6: Adoption of seed production technology in wheat
Type of wheatseed
Productionin tonnes
No. of farmersproducing
seed
Additionalincome to seed
producer(Rs lakhs)
Area to becovered (Ha)
Increase inproduction of
wheat (tonnes)
Additionalincome to
farmers usingthe seed* (Rs.
Lakhs)
Truthful seeds 155.7 151 15.6 1235 1037.7 228
Certified seeds 46.9 11 2.3 372 312.7 63
Foundationseeds
2.8 10 0.43 23 19.0 5
Total205.4 172 18.33 1630 1369.4 296
*Estimated on the basis of additional yields ranging from 10% to 40% realized by using certified/truthful seed material
Shift from Chemical to Bio-Inputs
Given the steady deterioration of soils in the project region due to continuous and indiscriminate use of
chemical fertilizers as well as the harmful impact of pesticides on the local agro-ecology, a need was felt
to gradually steer farmers towards rationalization of the use of chemical inputs. Hence soil-testing based
prescriptions were made for the appropriate dosage of chemical fertilizers. Conjunctive use of vermi-
compost and other bio-fertilizers was promoted. Adoption of bio-pesticides was advocated with
chemical pesticides to be used as a measure of last resort. To achieve this, producer groups and
women’s self help groups were encouraged to produce these inputs at the village level and supply them
to farmers locally. In this way the farmers would be assured of getting good quality of inputs without
incurring additional cost on transport of the material which is bulky in nature. The efforts made in
promoting bio-inputs and the extent of adoption by farmers in the project area is summarized in Table
3-7. The table shows that over 1860 demonstrations led to about 3500 farmers adopting the use of bio-
inputs in approximately 3,250 Ha of land.
Table 3-7: Adoption of Biological Inputs for Sustainable Agriculture
Bio-input adoption No. of demos Demo area(Bighas)
No of farmersAdopting Bio-inputs
Area of Adoption
(Bighas) (Ha)
Vermi application 984 234 1,968 7,872 1,874
Bio-pesticideapplication
880 262 1,554 5,828 1,388
Total1,864 496 3,522 13,699 3,262
Table 3-8 shows how this was produced within the farming community itself, thereby eliminating the
need to import these inputs from other regions. The figures suggest that some farmers have imported
vermi-compost from neighbouring areas as the estimated area with local production is much less that
estimated area of adoption. The reverse is true for bio-pesticide, suggesting that some bio-pesticide
produced may have remained unsold or sold to outsiders. It is also possible that the real adoption may

25
be underestimated by DSC. These discrepancies could also partly be explained by the fact that the rate
of application of bio-inputs vary from farmer to farmer quite a bit depending on a number of factors
including type of crop, planting density, quality of bio-inputs obtained and cash available with the
farmer to procure the input.
Table 3-8: Production of Bio-inputs by Farmers and Producer groups
Bio-input productionNo. of producer
groupsNo. of
members No. of beds ProductionArea covered
(Bighas)
Vermi-compost
Group 19 248 522 745 (tonnes) 1862
Individual - 157 384 1170 (tonnes) 2926
Total 405 1915 (tonnes) 4788
Bio-pesticide
Group 45 780 - 31200 (litres) 7800
Individual 2 30 - 17200 (litres) 4550
Total 12350
Adoption of New Tools and Equipment
In addition, 176 chipiyas2were sold resulting in savings of an estimated 4400 person days of labour,
valued at Rs 8.8 lakhs. Also sold through the outlets of the company were 245 cutters and 15 spray
pumps.
Adoption of Cleaning and Grading of Produce
This initiative has been taken up on pilot scale but should prove very important in the next phase of
LEPNRM when the company moves into aggregation of produce for collective marketing so that farmers
may realize a better price for their produce.
Cleaning and grading machines have been procured and given to a few villages so that farmers may get
their produce cleaned and graded for a small fee before selling in the market. A beginning was made
with wheat where 790 farmers paid to get the services of the machine. Similarly 54 farmers go to
Jagudan to get their fennel cleaned and graded. The details and benefits accrued through this initiative
are summarized in Table 3-9.
2A chipiya is a hand tool used to uproot crop stubble without having to bend or apply much force. This greatly reduces the
drudgery of labour and even women can use the hand-tool to save the cost of hiring labour.

26
Table 3-9: Summary of Cleaning and Grading Activity
Produce No of farmers
adopting
Quantity of produce graded
(tonnes)
Income (Rs. Lakhs)
Wheat 790 533.10 10.66
Jagudan fennel 54 22.26 2.23
3.4 Role of Kisan Clubs and Producer Groups
During LEPNRM Phase I, DSC focused on building small groups of interested farmers. The groups were
called Kisan Clubs where they would meet to discuss issues of common interest in improving their
farming and making it economically viable. New ideas were first seeded in these groups. Later these
groups became more proactive and started influencing other farmers in the village. The groups also took
an active part in distribution of agri-inputs and in organizing aggregation of produce when collective
marketing initiatives were taken. Hence these groups at the grassroots level provided the foundation
not only for the extension work but also became the foundation of the producer company, which has a
pyramid structure with Kisan Clubs at the base, cluster level committees at the cluster level and
Krushidhan as the apex level institution with a representative board of directors.
Aligned to this structure were producer groups and women’s SHGs who also supported the company
and worked with it closely. Table 3-10 provides the break-up of these informal grassroots level
institutions that have played a pivotal role in the success of the intervention as well as producer
company.
Table 3-10: Grassroots level institutions forming the base of the company
Sl No. Type of Institution No. of institutions No. of members
1 Kisan Clubs (Male) 235 4607
2 Women Kisan Clubs cum SHGs 91 1479
Total 326 6086
Special purpose produce groups
1 Spice producer groups (women) 19 102
2 Bio-pesticide producer groups (women) 45 780
3 Vermi-compost producer groups
(women)
19 248
4 Group fencing farmer groups (men) 2 73

27
As the table shows producer groups fall into two broad categories a) Kisan clubs of male farmers and b)
Women Kisan clubs cum SHGs. The total number of such institutions created till date is about 325 with a
membership of over 6000 individuals. Some of these are special purpose producer groups, bio-inputs
being the largest among these. Producer-groups for group fencing are the most recent addition. It is a
response to the growing menace of ungulates destroying valuable crops. If this solution is found
effective the numbers of such groups is likely to grow rapidly in the coming months.

28
4 Impact on Economics of Farming
This section summarises the findings from the sample survey in four broad sections:
1. Profile of farmers in sample
2. Effectiveness of agriculture extension services
3. Study area-level impacts
4. Project-level impacts
4.1 Profile of Farmers in Sample
Farmer and land details
As indicated in Section 2 above, a primary survey of 200 farmers was conducted as part of the impact
assessment study. These farmers consisted of project beneficiary farmers (i.e KPCL shareholders and
Kisan Club members) as well as a control group made up of ordinary farmers. The break-up of the total
sample by category of farmers is shown in Figure 4-1:
a. KPCL shareholders: 80
b. Kisan Club members: 80
c. Control farmers: 40
Figure 4-1: Sample farmers by category
Figure 4-2 shows the total land under cultivation in each project location where it can be seen that the
average land cultivated per farmer is lowest in Meghraj at 1 Ha and highest in Himmatnagar at 2.3 Ha.
Between 80 to 100 per cent of the cultivated land is irrigated, with levels of irrigation ranging from 80%
Visnagar H'nagar Modasa Meghraj Vehlal
KPCL shareholder 36 18 10 8 8
KCmember 36 18 10 8 8
Control farmer 18 9 5 4 4
0
5
10
15
20
25
30
35
40
No.offarm
ers
Sample farmers by category

29
in Meghraj (rain-fed) to 88% in Himmatnagar, 94% in Modasa, 95% in Visnagar and 100% in Vehlal - the
last four locations benefiting from canal irrigation.
Figure 4-2: Land details
Ownership of milch and draught animals
An analysis of ownership of milch animals before and after the project in Figure 4-3 shows that while the
number of milch animals has remained constant in Vehlal and increased by 62% in Meghraj, it has
declined by 16% in Visnagar, 8% in Himmatnagar and 4% in Modasa. The number of draught animals has
remained constant in Modasa and Meghraj but declined by 29% in Visnagar, 68% in Himmatnagar and
28% in Vehlal as can be seen in Figure 4-4. A number of reasons could be attributed to such a trend.
Milch animals require a lot of tending to, and dispersal and social change among the main farming
community of Patels (which has traditionally reared milch animals) over the years has meant that this
occupation is often looked down upon by younger members of the community who prefer to take up
jobs in urban areas instead. Coupled with this, an increasing shift in cropping pattern toward commercial
crops like cotton, castor, fennel etc. especially in North Gujarat, has affected fodder availability, in turn
impacting ownership of milch animals.
Increasing mechanization in agriculture, especially where farmers have access to canal irrigation and are
thus more assured of their crops, along with deficit of labour are seen as the primary reasons for the
decline in number of draught animals.
0.0
0.5
1.0
1.5
2.0
2.5
Visnagar H'nagar Modasa Meghraj Vehlal
LandinHa
Land details
Total land under cultivation Irrigated land

30
Figure 4-3: Ownership of milch animals Figure 4-4: Ownership of draught animals
Wild animal menace
Over the past 3 years, increase in menace from wild animals such as nilgai and wild pig and resultant
damage to crops has been reported by a majority of farmers – ranging from 94% in Visnagar to 84% in
Himmatnagar, 80% in Vehlal, 75% in Modasa and 56% in Meghraj. The survey also discussed the
measures farmers had taken to deal with wild animal menace and the effectiveness of the measures
adopted.
Table 4-1 shows the level of adoption of the top 3 measures in each project location where the darkest
coloured cell represents adoption by the highest proportion of farmers, followed by lighter and lightest
coloured cells representing second and third highest proportion of adoption respectively. Two cells
having the same shade in a project location mean equal levels of adoption. Table 4-2 indicates the
percentage of farmers who found that measure highly or fairly effective. For eg., in the case of Visnagar,
while use of poison has been adopted by the highest proportion of farmers, only 88% of the farmers
have found this measure to be highly or fairly effective. Taking another example – in Meghraj, while the
highest proportion of farmers has registered complaint about wild animal menace to the Forest
Department (as represented by the darkest coloured cell), none of these farmers has found this
measure to be effective (represented by the value ‘0’ in Table 4-2).
To address the challenge of wild animal menace, DSC has recently experimented with group fencing in
its Visnagar and Himmatnagar project locations, the cost-benefits of which are quite encouraging.
Against a total investment of Rs. 15,000/- per acre for permanent group fencing of farmland, crop
savings worth Rs. 3,000/- per season or about Rs. 7,500/- over the entire year have been achieved.
Hence, it is possible to recover the entire investment of Rs. 15,000/- over two years. Besides group
fencing, use of solar alarm fencing is also being piloted and results of its costs and benefits are awaited.
Visnagar H'nagar Modasa Meghraj Vehlal
3 yrs ago 227 139 88 29 42
Now 211 131 84 47 42
0
50
100
150
200
250
T0ta
lno.ofanim
als
Ownership of milch animals
Visnagar H'nagar Modasa Meghraj Vehlal
3 yrs ago 41 56 17 23 18
Now 29 18 18 23 13
0
10
20
30
40
50
60
Tota
lno.ofanim
als
Ownership of draught animals
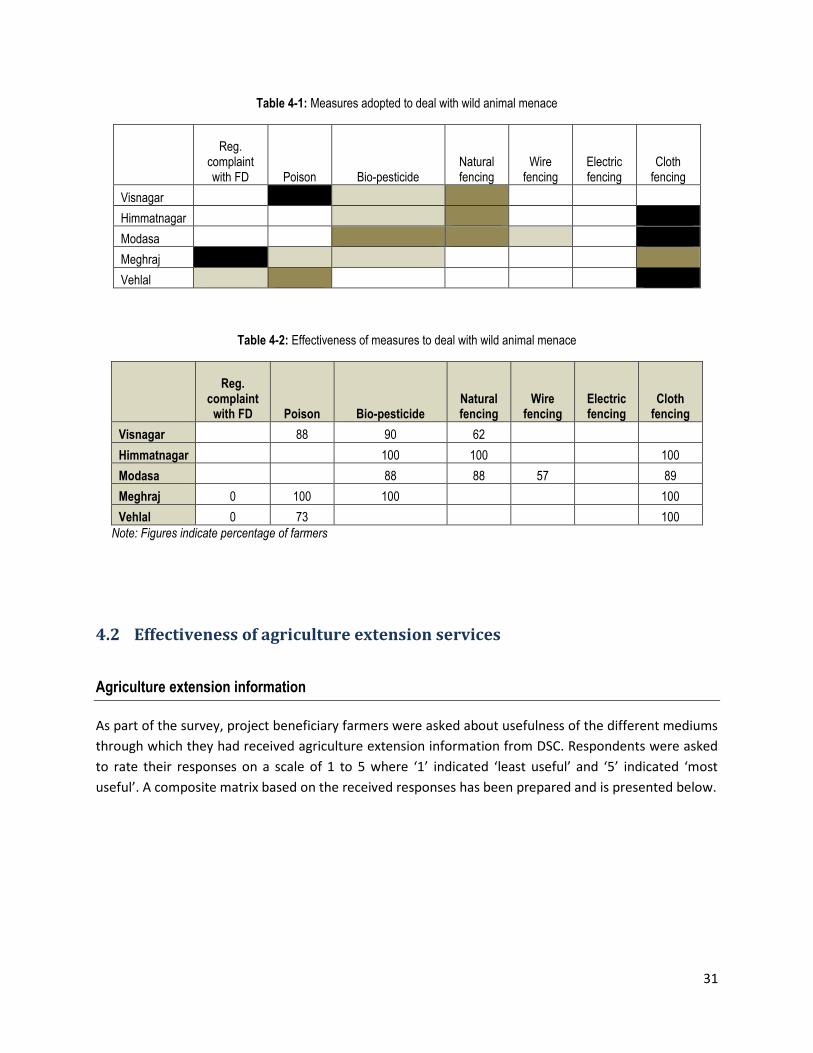
31
Table 4-1: Measures adopted to deal with wild animal menace
Reg.complaintwith FD Poison Bio-pesticide
Naturalfencing
Wirefencing
Electricfencing
Clothfencing
Visnagar
Himmatnagar
Modasa
Meghraj
Vehlal
Table 4-2: Effectiveness of measures to deal with wild animal menace
Reg.complaint
with FD Poison Bio-pesticideNaturalfencing
Wirefencing
Electricfencing
Clothfencing
Visnagar 88 90 62
Himmatnagar 100 100 100
Modasa 88 88 57 89
Meghraj 0 100 100 100
Vehlal 0 73 100
Note: Figures indicate percentage of farmers
4.2 Effectiveness of agriculture extension services
Agriculture extension information
As part of the survey, project beneficiary farmers were asked about usefulness of the different mediums
through which they had received agriculture extension information from DSC. Respondents were asked
to rate their responses on a scale of 1 to 5 where ‘1’ indicated ‘least useful’ and ‘5’ indicated ‘most
useful’. A composite matrix based on the received responses has been prepared and is presented below.

32
Table 4-3: Composite matrix of usefulness of information received from DSC
Projectlocation
MobileSMS
Awarenesscampaign
Farmersmeet/
workshop/training
Paraworkers/DSC staff
Printmaterial
VideoFilms
Fielddays,
exposurevisits
Overall rank
Visnagar 3.3 3.0 3.5 4.5 3.4 3.0 4.1 3.5
Himmatnagar 3.3 4.6 4.3 3.9 3.4 4.1 4.1 4.0
Modasa 2.7 2.2 3.9 3.8 2.0 2.5 2.7 2.8
Meghraj 3.9 3.5 4.4 4.5 4.8 4.1 3.8 4.1
Vehlal 3.0 1.5 3.8 2.4 4.6 4.0 3.9 3.3
Overall rank 3.2 2.9 4.0 3.8 3.7 3.5 3.7
As can be seen from the matrix, mobile SMS services are perceived to be most useful in Meghraj and
least useful in Modasa. This may be due to the information vacuum faced by Meghraj farmers since no
other developmental agency works in this remote, tribal area unlike Modasa which is more centrally
located. Services of DSC staff and para workers are perceived as most useful in Visnagar and Meghraj
but least useful in Vehlal as it has recently faced high turnover of para workers. Usefulness of awareness
campaigns is seen to be highest in Himmatnagar but poor in Vehlal since DSC lacks human resources in
this location which can ensure the effective design and delivery of such campaigns. Farmers’ meets,
workshops and trainings are found to be more beneficial in Meghraj but of least value in Visnagar. The
most likely reason for this could be ‘exposure fatigue’ of farmers considering that Visnagar is DSC’s
earliest PIM location and has already witnessed a large number of such events. Print material consisting
of pamphlets, crop booklets, Divadandi, farmer diary etc. are of high utility in Meghraj but of low utility
in Modasa. Video films on the other hand are most effective in Himmatnagar and Meghraj but least
effective in Modasa. Field days and exposure visits were found to be most useful in Visnagar and
Himmatnagar, where farmers are more progressive and open to new knowledge and information, but
least useful in Modasa.
The overall rank of usefulness of information by medium shows farmer meets/workshops/trainings as
being most useful and campaigns as being the least useful source of information from DSC. Overall
ranking of usefulness by project location shows Meghraj - where farmers have traditionally been
information-deprived - benefitting the most and Modasa - where farmers seek higher order extension
services and support - the least from information provided by DSC.
Willingness to pay for the information is extremely low among farmers across all project locations
except in Himmatnagar where 90% of the farmers said they were willing to pay (Figure 4-5). In Modasa,
none of the surveyed farmers was willing to pay. In terms of the amount they could pay for the
information, Vehlal farmers said they could to pay a maximum of upto Rs. 130/- per month as compared
to Rs. 84/- in Himmatnagar, Rs. 63/- in Visnagar and Rs. 41/- in Meghraj.

33
Figure 4-5: Farmer willingness to pay for information
Suggestions were received from farmers on how DSC could improve usefulness of the extension services
it provides to farmers. While a majority (41%) of respondents said that they were satisfied with DSC’s
services, 21% of the farmers expressed the need for more advice and information, 10% want a specific
set of services from DSC and 27% feel that the organisation should expand its outreach activities as can
be seen from Figure 4-6. The suggestions received can be broadly divided into three categories:
i. Need for more information and advice – Farmers want DSC to provide more information, especially
related to crops like cumin, fennel, castor, fruits etc. They would also like exposure to improved seed
varieties, latest/low-cost agriculture techniques, more experience-sharing by successful farmers as
well as information about available government subsidies. One of the key suggestions received was
that DSC should make farmers more aware about the importance of putting such advice and
information to use.
ii. Need for specific services – Farmers have expressed a need for DSC to provide a bouquet of specific
services which could serve them better in the long-term. While some of these services like grading
facilities for wheat and paddy, supplying good quality certified seeds and pesticides, helping farmers
deal with wild animal menace by setting up fencing etc. are already being undertaken by DSC on a
pilot or mainstream basis, a decision about other suggested services will have to be taken. These
include distribution of fertiliser and assisting in the marketing of farmers’ produce either through
direct buying or facilitating market linkage so that farmers are able to get good prices.
iii. Need to expand outreach – Farmers feel that DSC needs to focus on expanding the outreach of its
services by increasing KPCL’s shareholder strength, setting up more Kisan Clubs and KPCL outlets,
encouraging women’s participation in meetings and organising meetings at times which are more
convenient to farmers. They would also like the interaction with DSC – whether it is through
Visnagar H'nagar Modasa Meghraj Vehlal
No 91 10 100 78 89
Yes 9 90 0 22 11
Max amt/month 63 84 0 41 130
020406080
100120140
%offa
rm
ers
Willingness to pay for information

34
workshops, field days, exposure visits, trainings or video films – to increase and even non-member
farmers to be brought under the fold of DSC’s services.
Figure 4-6 Suggestions for improving DSC’s services
Membership of peoples’ institutions
In order to better understand the effectiveness of project interventions, farmers were asked about their
reasons for not joining a vermi-compost, bio-pesticide production group or a Kisan Club promoted under
the project. These reasons are elaborated below:
Reasons for not becoming vermi-compost group member
Visnagar: Of the 20% farmers who responded, 47% claimed absence of vermi group in the village and
another 47% said that they made their own vermi or bought FYM
Himmatnagar: Of the 74% farmers who responded, 92% said they have no time or space for vermi
activity
Modasa: Of the 67% farmers who responded, 71% claimed absence of vermi group in the village and
21% had no time
Meghraj: Of the 67% farmers who responded, 40% said they do not have information and another 40%
made their own vermi or bought FYM
Vehlal: Only 6% farmers responded, hence results not usable
Reasons for not becoming bio-pesticide group member
Visnagar: Of the 12% farmers who responded, 40% had no time; 30% claimed absence of bio-pesticide
group/non-availability of desi cows in village and another 20% were not interested
Himmatnagar: Of the 11% farmers who responded, all respondents indicated that they were too busy
and had no time for joining bio-pesticide group
Satisfied
Needmore
information &
advice
Need specific
services
Need to expand
outreach
% 41 21 10 27
0
5
10
15
20
25
30
35
40
45
%ofrespondents
Suggestions for improving DSC's services

35
Modasa: Of the 19% farmers who responded, all respondents claimed absence of bio-pesticide group or
desi cows in the village
Meghraj: Of the 79% farmers who responded, 36% said they did not have information about bio-
pesticide group; 36% made their own bio-pesticide or bought from KPCL outlet and another 27% were
not interested
Vehlal: No response received
Reasons for not becoming Kisan Club member
Visnagar: Of the 57% farmers who responded, 50% were not interested and another 50% did not have
information about Kisan Club
Himmatnagar: No response received
Modasa: Of the 43% farmers who responded, 67% had no time and another 33% were not interested
Meghraj: Of the 75% farmers who responded, 67% were already members of Sangam Mandli and
another 33% did not have enough information
Vehlal: No response received
Farmers were asked to provide feedback on which activities of their Kisan Club they found most useful.
According to the farmers, facilitation of agriculture input supply was the most useful activity undertaken
by the Club, followed by savings and internal lending, crop advisory/information and exposure visits in
that order.
Table 4-4 maps the reasons why farmers have not become a Krushi Dhan member. In the case of
Visnagar, 28% of farmers are not interested in joining, another 26% do not have enough information
about KPCL’s activities and 24% are not even members of Kisan Clubs – a pre-requisite for KPCL’s
membership. In Himmatnagar, as high as 81% of the surveyed farmers claim that since they do not have
adequate information about KPCL’s activities, they do not feel inclined to become its member-
shareholders. In Modasa, 78% of the farmers are not interested in becoming members while 22% feel
that the membership fee is too high. The question of affordability becomes more pronounced in the
case of Meghraj - a rain-fed area with poorer agricultural incomes – where 86% of the farmers are
unable to pay KPCL’s membership fee. 57% of farmers in Vehlal claim that the producer company outlet
is too far whereas another 29% are not interested.
65% of the farmers feel that women should have greater participation in Krushi Dhan. However, of these
farmers, only 24% would like to see women becoming a KPCL Governing Board member. 53% would like
them to remain shareholders while 43% feel that women should only be service receivers in KPCL.
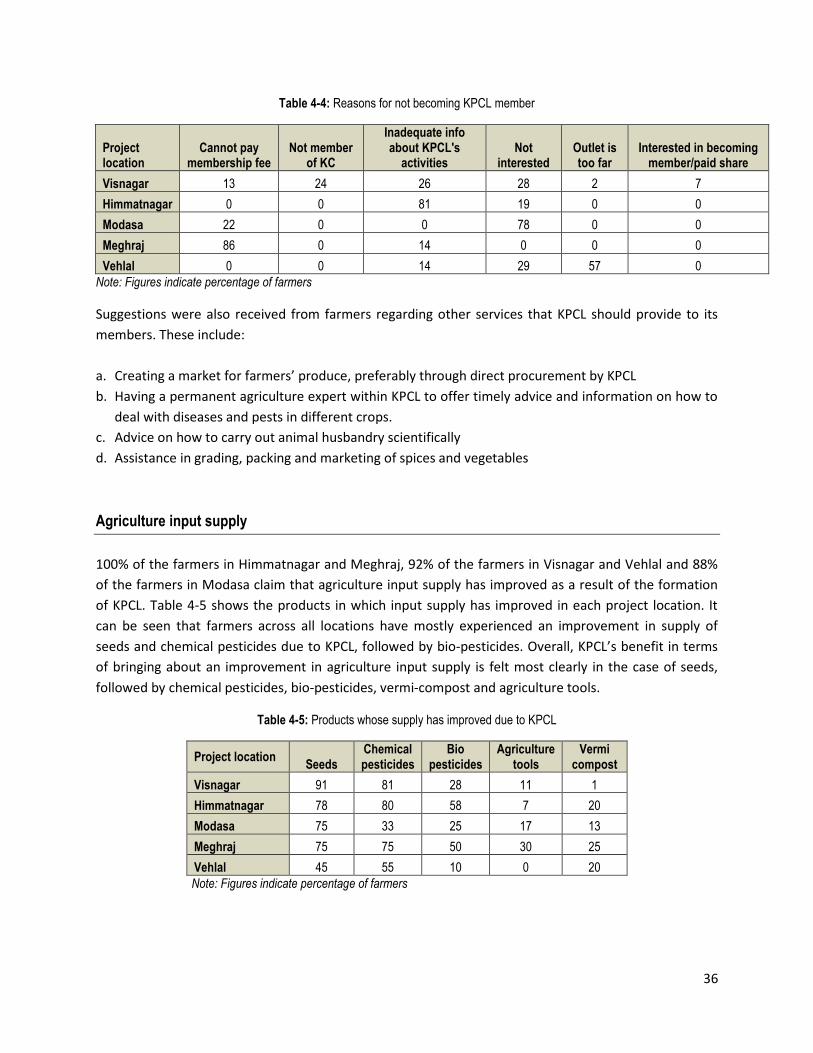
36
Table 4-4: Reasons for not becoming KPCL member
Projectlocation
Cannot paymembership fee
Not memberof KC
Inadequate infoabout KPCL's
activitiesNot
interestedOutlet istoo far
Interested in becomingmember/paid share
Visnagar 13 24 26 28 2 7
Himmatnagar 0 0 81 19 0 0
Modasa 22 0 0 78 0 0
Meghraj 86 0 14 0 0 0
Vehlal 0 0 14 29 57 0
Note: Figures indicate percentage of farmers
Suggestions were also received from farmers regarding other services that KPCL should provide to its
members. These include:
a. Creating a market for farmers’ produce, preferably through direct procurement by KPCL
b. Having a permanent agriculture expert within KPCL to offer timely advice and information on how to
deal with diseases and pests in different crops.
c. Advice on how to carry out animal husbandry scientifically
d. Assistance in grading, packing and marketing of spices and vegetables
Agriculture input supply
100% of the farmers in Himmatnagar and Meghraj, 92% of the farmers in Visnagar and Vehlal and 88%
of the farmers in Modasa claim that agriculture input supply has improved as a result of the formation
of KPCL. Table 4-5 shows the products in which input supply has improved in each project location. It
can be seen that farmers across all locations have mostly experienced an improvement in supply of
seeds and chemical pesticides due to KPCL, followed by bio-pesticides. Overall, KPCL’s benefit in terms
of bringing about an improvement in agriculture input supply is felt most clearly in the case of seeds,
followed by chemical pesticides, bio-pesticides, vermi-compost and agriculture tools.
Table 4-5: Products whose supply has improved due to KPCL
Project locationSeeds
Chemicalpesticides
Biopesticides
Agriculturetools
Vermicompost
Visnagar 91 81 28 11 1
Himmatnagar 78 80 58 7 20
Modasa 75 33 25 17 13
Meghraj 75 75 50 30 25
Vehlal 45 55 10 0 20
Note: Figures indicate percentage of farmers

37
Farmers were also asked about the parameters on which they prefer KPCL over other market players for
purchase of agriculture inputs. As per Table 4-6, fair prices, good quality of input and better after sales
service are the predominant factors for farmers of Visnagar and Himmatnagar to choose KPCL.
Reasonable prices and better accessibility to KPCL’s outlet/s seem to be the key parameters influencing
farmers in Modasa. In Meghraj, 50% of the surveyed farmers buy from KPCL because they feel it is their
own company while fair prices, quality of inputs and good accessibility of outlets seem to be the other
important factors for farmers. Farmers in Vehlal prefer buying from KPCL (Ekta Cooperative) primarily
because of good quality of inputs and better prices than the market.
Table 4-6: Parameters for preference to KPCL
Project locationBetter
accessibility Fair priceGood input
qualityBetter after
salesYour owncompany
Visnagar 52 90 89 76 33
Himmatnagar 13 78 78 73 16
Modasa 46 67 29 4 8
Meghraj 35 55 55 25 50
Vehlal 15 30 55 0 20
Note: Figures indicate percentage of farmers
Figure 4-7 highlights the percentage of farmers who are not members of KPCL but still prefer to buy
agriculture inputs from its outlets. It can be seen from the figure that a large proportion of non-member
farmers in Visnagar, Modasa and Meghraj purchase agriculture inputs from its outlets. This is primarily
due to two reasons – first, farmers feel assured about the quality of seed sold through KPCL and second,
agriculture inputs are available at more reasonable rates from KPCL outlets than the market. 98% of
farmers across the five project locations have not got support for marketing or selling their produce
since this is a service that KPCL does not currently offer.
Figure 4-7: Purchase of agri inputs from KPCL by non-members
Visnagar H'nagar Modasa Meghraj Vehlal
No 23 83 33 11 56
Yes 78 17 67 89 44
0
10
20
30
40
50
60
70
80
90
100
%ofnon-m
emberfarm
ers
Non-member buying from KPCL

38
4.3 Study area level impacts
This section examines the extent to which DSC’s agriculture extension services have had an impact on
the quantity of agriculture inputs used, crop productivity and adoption of sustainable agriculture
practices. The findings present results of a sample survey of 200 project beneficiary and control farmers
and record change in impact parameters over a 3-year period i.e. before and after the implementation
of the second phase of the project using recall method. The analysis is presented crop-wise for the
major crops grown in each cropping season – Kharif (monsoon), Rabi (winter) and Zaid (summer).
At the outset, Table 4-7 below presents details of the cropping pattern across the five project locations.
Table 4-7: Cropping pattern across project locations
Visnagar Himmatnagar Modasa Meghraj Vehlal
Total area under
cultivation (Ha)1.8 2.3 2.0 1.0
1.9
Area
(Ha)
under
% of total
area
under
cultivation
Area
(Ha)
under
% of total
area
under
cultivation
Area
(Ha)
under
% of total
area
under
cultivation
Area
(Ha)
under
% of total
area
under
cultivation
Area
(Ha)
under
% of total
area
under
cultivation
Kharif
Cotton 0.5 31 1.1 46 0.5 23 0.4 40
Castor 0.5 26 0.9 38 0.7 35
Maize 0.4 40
Paddy 1.0 49
Vegetables 0.4 21
Rabi
Wheat 0.3 18 1.2 50 0.7 35 0.4 40 0.7 37
Fennel 0.4 22
Zaid
Vegetables 0.3 17
Note: Figures in table are per farmer

39
Quantity of agriculture inputs
Before impact of extension services on the quantity of agriculture inputs is discussed, it is important to
highlight a few points.
i. Expense on bio-fertiliser - of which Farmer Yard Manure (FYM) constitutes a major part - has not
been considered since farmers rarely buy FYM from the market and instead use what they get from
their own animals. Also, the frequency of application of FYM is not yearly but every 2-4 years.
ii. The total number of waterings refers to both canal and borewell waterings.
iii. Labour costs include the cost incurred by farmers on hiring labour for land preparation, sowing,
spraying of fertilisers, pesticides and weedcides, watering, harvesting etc. while miscellaneous costs
refer to rent for agricultural machinery like tractor, rotavator, thresher etc.
iv. For certain agriculture inputs such as chemical pesticides, fertilisers and weedicides, farmers were
only asked to report their expenses before and after the project. The quantity of each of these
inputs has been derived on the basis of these expenses. For each crop, only the pesticides,
fertilisers and weedicides specific to that crop have been considered.
KHARIF CROPS
Cotton
Cotton is one of the important Kharif crops across Visnagar, Himmatnagar, Modasa and Meghraj where
it covers 31%, 46%, 23% and 40% of total area under cultivation respectively.
As part of better management practices for cotton, farmers were advised to put only one seed per hole
while sowing. As a result, seed use has declined by about 200 gms per Ha after the project as can be
seen in Table 4-8. Also, use of bio-pesticide has increased from 13 lit/Ha before the project to 21 lit/Ha
after the project. Chemical pesticide and fertiliser use has increased by 3% and 8% respectively on
account of higher incidence of pest attack and disease over the past 2-3 years. Weedicide use has come
down by as much as 29%, a major reason for which is adoption of practices such as mulching and use of
decomposed FYM by farmers, which help prevent weed growth. The number of waterings required for
cotton has also reduced owing to adoption of water saving practices such as land leveling before sowing,
preparation of modified bed and furrow, drip irrigation and mulching.

40
Table 4-8: Project impact on cotton
COTTON Before project After project % diff
Seed (kg) 2.3 2.1 -9
Bio-pesticide (lit.) 13 21 67
Chemical pesticides 3
Imidacloprid (ml) 353 363
Regent (ml) 882 908
Acetamiprid (gms) 176 182
Phorate (kg) 10.6 10.9
Monocrotophos (ml) 1764 1817
Acephate (gms) 882 908
Chemical fertilisers 8
Urea (kg) 357 386
DAP (kg) 214 231
Weedicide
Targa Super (ml) 2142 1735 -29
Total no. of waterings 38 37 -2
Labour & Misc. costs (Rs.) 21177 23458 11
Note: All figures are average per farmer per hectare values
Labour and miscellaneous costs account for the highest proportion of input costs and have seen an
increase of more than 11%, largely due to more expensive labour and higher rents for agriculture
machinery like tractor, thresher, rotavator etc.
Castor
Castor is the other prominent Kharif crop in Visnagar, Himmatnagar and Modasa along with cotton and
covers 26%, 38% and 35% of total area under cultivation respectively.
Table 4-9 shows that while seed use has gone up by by 5%, the level of bio-pesticide use has remained
constant before and after the project. Like cotton, castor crop was also more vulnerable to pest and
diseases over the past 2-3 years, which is reflected in an increase in the quantity of chemical pesticides
and fertilisers used before and after the project. Weedicide use has come down by 11% due to greater
FYM decomposition and a gradual shift to vermi-compost. While the number of waterings required for
castor has remained nearly the same, labour and miscellaneous costs have shown an increase of 16%
due to higher labour and rentals for agriculture machinery.

41
Table 4-9: Project impact on castor
CASTOR Before project After project % diff
Seed (kg) 5.7 6.0 5
Bio-pesticide (lit.) 14 14 0
Chemical pesticides 11
Quinalphos (ml) 1491 1655
Acetamiprid (gms) 298 331
Chemical fertilisers 12
Urea (kg) 302 339
DAP (kg) 181 203
Weedicide -11
Targa Super (ml) 1313 1168
Total no. of waterings 70 71 1
Labour & Misc. costs (Rs.) 14189 16508 16
Note: All figures are average per farmer per hectare values
Paddy
In Vehlal, paddy is the predominant Kharif crop and covers 49% of total area under cultivation.
The System of Rice Intensification (SRI) method of paddy cultivation was introduced in Vehlal in 2013 as
one of the initiatives under LEPNRM Phase II. This method focuses on adoption of better agriculture
practices by farmers and aims at improving productivity of irrigated rice while reducing quantity of
inputs. From Table 4-10, it is evident that a greater impact has been witnessed due to SRI in Vehlal as
compared to other crops. The project has led to a 42% drop in seed use by farmers as well as adoption
of bio-pesticide which they were not using previously. The quantity of chemical pesticides, chemical
fertilisers and weedicides used has come down by 11%, 18% and 58% respectively. An important impact
- especially with respect to a water-intensive crop like paddy - is that there are 8 fewer waterings now
required per hectare as compared to before the project. The decrease in inputs has also contributed to a
9% reduction in labour and miscellaneous costs borne by farmers.
Table 4-10: Project impact on paddy
PADDY Before project After project % diff
Seed (kg) 36 21 -42
Bio-pesticide (lit.) 0 17 NA
Chemical pesticides -11
Imidacloprid (ml) 571 508
Phorate (kg) 17 15
Monocrotophos (ml) 1428 1271
Acephate (gms) 571 508
Acetamiprid (gms) 286 254

42
PADDY Before project After project % diff
Chemical fertilisers -18
Urea (kg) 86 70
DAP (kg) 43 35
Weedicide -58
Aniloguard (ml) 1200 504
Total no. of waterings 97 88 -9
Labour & Misc. costs (Rs.) 21979 20065 -9
Note: All figures are average per farmer per hectare values
Maize
In the case of Meghraj, the other important Kharif crop besides cotton is maize which covers 40% of
total area under cultivation.
A look at change in impact parameters for maize before and after the project in Table 4-11 shows that
with the introduction of the high-yielding Advanta-740 variety over the past 2-3 years, seed use has
nearly halved from 40 kg/Ha to 21 kg/Ha. Also, greater adoption of bio-pesticide and vermi-compost by
farmers under the project has made a significant impact on the quantities of chemical pesticides,
chemical fertilisers and weedicides used by them which have come down by 49%, 11% and 21%
respectively. The new variety of maize also requires lesser water which has led to a 20% reduction in the
number of waterings required. The overall decrease in quantity of agriculture input requirement in
maize has reduced farmer expenses on labour and miscellaneous costs by 9%.
Table 4-11: Project impact on maize
MAIZE Before project After project % diff
Seed (kg) 40 21 -47
Bio-pesticide (lit.) 0 17 NA
Chemical pesticides -49
Phorate (kg) 8.7 4.4
Imidacloprid (ml) 290 148
Acetamiprid (gms) 145 74
Chemical fertilisers -11
Urea (kg) 35 31
DAP (kg) 18 16
Weedicide -21
Pendimethalin (ml) 1880 1485
Total no. of waterings 10 8 -20
Labour & Misc. costs (Rs.) 21456 19551 -9
Note: All figures are average per farmer per hectare values

43
Vegetables
Besides paddy, vegetables are also grown in the Kharif season in Vehlal and cover 21% of the total area
under cultivation. The main vegetables grown are lady finger, chowli, brinjal and guvar (cluster beans).
As seen from Table 4-12, the project has been instrumental in reducing overall seed use by 20% due to
adoption of hybrid seed varieties by farmers. Use of bio-pesticide, which was not seen before the
project, has now started, leading to a 19% reduction in the quantity of chemical pesticides required per
hectare. Similarly, use of chemical fertilisers and weedicides has come down by 3% and 15%
respectively. The number of waterings required for vegetables before and after the project has
remained constant whereas labour and miscellaneous costs have come down by 7%.
Table 4-12: Project impact on vegetables
VEGETABLES Before project After project % diff
Seed (kg) 10 8 -20
Bio-pesticide (lit.) 0 34 NA
Chemical pesticides -19
Imidacloprid (ml) 928 752
Monocrotophos (ml) 4641 3759
Acephate (gms) 2321 1880
Acetamiprid (gms) 464 376
Profenofos+cyper methrin (ml) 2321 1880
Chlorpyriphos+cyper methrin (ml) 2321 1880
Chemical fertilisers -3
Urea (kg) 78 76
DAP (kg) 48 44
Weedicide -15
Pendimethalin (ml) 1350 1148
Total no. of waterings 29 29 0
Labour & Misc. costs (Rs.) 16665 15485 -7
Note: All figures are average per farmer per hectare values

44
RABI CROPS
Wheat
Wheat is the most common Rabi crop across all 5 project locations and covers 18%, 50%, 35%, 40% and
37% of total area under cultivation respectively in Visnagar, Himmatnagar, Modasa, Meghraj and Vehlal.
Change in impact parameters for wheat before and after project can be noted in Table 4-13 where
quantity of seed required per hectare has fallen by upto 10% from 173 kg to 156 kgs but is still higher
than the seed rate of 120 kg/Ha recommended by DSC. Use of bio-pesticide has also increased from 16
lit./Ha to 27 lit./Ha. Despite this, a small increase of 8% is seen in case of the quantity of chemical
pesticides used over the 3 year project period. On the other hand, greater use of bio-fertilisers such as
vermi-compost and FYM by farmers has resulted in a plateauing of demand for chemical fertilisers like
urea and DAP. Weedicide use has also shown a decline of 11% along with a reduction of 2 waterings per
hectare before and after the project. On the other hand, labour and miscellaneous costs have shown a
small increase of 6%.
Table 4-13: Project impact on wheat
WHEAT Before project After project % diff
Seed (kg) 173 156 -10
Bio-pesticide (lit.) 16 27 69
Chemical pesticides 8
Chlorpyriphos (ml) 2331 2517
Chemical fertilisers 0
Urea (kg) 66 66
DAP (kg) 42 42
Weedicide -11
Algrip (gms) 20 17
Total no. of waterings 44 42 -5
Labour & Misc. costs (Rs.) 16298 17260 6
Note: All figures are average per farmer per hectare values
Fennel
Fennel is another important Rabi crop besides wheat in Visnagar and covers 22% of total area under
cultivation.
Seed use in the case of fennel has increased by 400 gms per Ha over the 3 year project period (Table
4-14). While no bio-pesticide use has been reported by farmers cultivating fennel, the quantity of
chemical pesticides used has come down by 11%. On the other hand, an increase of 13% and 4% is seen
in the quantity of chemical fertilisers and weedicides respectively. Adoption of water saving practices

45
has resulted in reducing upto 4 waterings per Ha. However, increase in inputs such as seeds and
fertilisers have also pushed up labour and miscellaneous costs by 16%.
Table 4-14: Project impact on fennel
FENNEL Before project After project % diff
Seed (kg) 3.4 3.8 12
Bio-pesticide (lit.) 0 0 0
Chemical pesticides -11
Imidacloprid (ml) 410 365
Acetamiprid (gms) 205 182
Chemical fertilisers 13
Urea (kg) 48 54
DAP (kg) 40 45
Weedicide 4
Goal (ml) 240 249
Total no. of waterings 46 42 -9
Labour & Misc. costs (Rs.) 15374 17831 16
Note: All figures are average per farmer per hectare values
SUMMER CROP
Vegetables
Among the 5 project locations, summer cropping is carried out only in Vehlal where farmers are able to
grow vegetables such as chowli and guvar using canal water. These vegetables however cover only 17%
of the total area under cultivation during the summer season.
As evident from Table 4-15, a 25% reduction in the quantity of seed used can be seen post the project.
As in the case of fennel, use of bio-pesticide has not been reported by farmers who have cultivated
vegetables in this season. While use of chemical pesticides, chemical fertilisers and weedicides has come
down by 7%, 15% and 24% respectively, the number of waterings required for vegetables has shown a
slight increase over the three year project period. Labour and miscellaneous costs which account for the
highest proportion of input costs have shown a decline of nearly Rs. 1,000/- per Ha due to decrease in
inputs.

46
Table 4-15: Project impact on vegetables
VEGETABLES Before project After project % diff
Seed (kg) 16.8 12.6 -25
Bio-pesticide (lit.) 0 0 0
Chemical pesticides -7
Imidacloprid (ml) 554 516
Monocrotophos (ml) 2772 2578
Acephate (gms) 1386 1289
Acetamiprid (gms) 277 258
Profenofos+cyper methrin (ml) 1386 1289
Chlorpyriphos+cyper methrin (ml) 1386 1289
Chemical fertilisers -15
Urea (kg) 53 45
DAP (kg) 38 32
Weedicide -24
Pendimethalin (ml) 720 547
Total no. of waterings 46 50 9
Labour & Misc. costs (Rs.) 15275 14322 -6
Note: All figures are average per farmer per hectare values
Productivity
After discussing changes in the quantity of agriculture inputs for the main crops grown in the project
locations, Table 4-16 examines impact of the project on productivity of these crops by looking at
differences in productivity before and after the project for beneficiary and control farmers. It can be
seen from the table that ‘after project’ productivity figures for all crops are significantly higher for
beneficiary farmers as compared to control farmers. Even though crops such as cotton, castor and
paddy have witnessed a slight decline in productivity over the past three years, a huge increase in
productivity can be seen in case of maize and vegetables. This is largely due to use of new high-yielding
variety seeds, such as the Advanta-740 variety in maize and hybrid variety in lady finger.
Over the past 3-4 years, productivity of cotton and castor has been largely affected by adverse weather
conditions such as irregular, insufficient or excess rainfall as well as incidences of disease (like wilting in
cotton and castor) and pest attack (eg. pink bollworm in cotton). Even so, project beneficiary farmers
seem to have fared much better than control farmers, who have suffered greater yield losses.

47
Table 4-16: Project impact on productivity
Project beneficiaries Control farmers
Productivity (kg/Ha)Beforeproject After project % diff
Beforeproject After project % diff
Cotton 2321 2129 -8 2348 1976 -16
Castor 2826 2721 -4 2882 2574 -11
Paddy 3818 3752 -2 4242 3570 -16
Maize 2205 3551 61 1966 2402 22
Wheat 3078 3221 5 3079 2947 -4
Vegetables 8527 10930 28 5390 8225 53
Fennel 1797 1873 4 1785 1869 5
In the case of wheat, while project beneficiary farmers have recorded a marginal gain in productivity,
control farmers have reported a 4% decline. According to the farmers, wheat production has suffered on
account of unusually warm weather coupled with strong winds which led to wheat stalks falling. Also,
late/less sowing of wheat due to unfavourable weather also affected its production.
Greater adoption of new maize seeds, access to scientific Package of Practices and availability of crop
advisory services has resulted in an impressive productivity gain of upto 61% among project farmers as
compared to a more modest 22% among control farmers. In vegetables, productivity figures for control
farmers seem to be higher than project beneficiaries; however, this is due to the fact that some control
farmers who did not grow vegetables three years back have started doing so now. In the case of fennel,
productivity gains of beneficiary and control farmers before and after the project are similar.
Adoption of sustainable agriculture practices
Impact of DSC’s agriculture extension services on adoption of sustainable agriculture practices has been
measured through a comparison between levels of adoption of project beneficiary farmers (which
include KPCL shareholders and Krushidhan members) and control farmers who have not received any
services from DSC.
Figure 4-8 shows that about 70% of project beneficiary farmers have made efforts to save irrigation
water as compared to only 50% of control farmers. This is being done through measures such as land
leveling, replacing ‘flood’ irrigation with ‘furrow’ irrigation, adopting seeds that require less water, using
vermi-compost and FYM, harvesting rain water etc. What is interesting to note is that the project has
been able to bring about greater awareness about efficient water use among farmers (Figure 4-9) where
51% of project beneficiary farmers (as against 39% of control farmers) are using only as much irrigation
water as they need.
Prevalence of drip and sprinkler systems is seen to be higher among control farmers than beneficiary
farmers (Figure 4-9). This could be attributed to a lack of awareness of low-cost methods of water saving

48
among control farmers. However, other factors such as availability of government subsidy for drip
systems and the mandatory requirement of installation of drip when applying for new electric
connections may also be strong drivers for farmers to take these higher-cost alternatives in absence of
adequate awareness of more cost-effective measures.
Figure 4-8: Efforts to save irrigation water Figure 4-9: Methods adopted to save irrigation water
In addition to low-cost methods of water saving, an increasing number of project farmers are now
installing drip irrigation systems for saving irrigation water as can be seen from Figure 4-10 where the
proportion of project farmers adopting drip irrigation over the past 3 years has increased from 9% to
19% but reduced from 8% to 5% for control farmers. A much larger percentage of beneficiary farmers
has also been able to irrigate additional area using drip as compared to control farmers.
Figure 4-10: Adoption of drip irrigation
The survey also asked farmers about whether they got their soil tested and were aware of how to
produce bio-pesticide, vermi-compost and organic manure. Figure 4-11 shows that 38% of project
beneficiary farmers used to get their soil tested before joining the project as compared to 26% of
0 20 40 60 80
Projectbeneficiaries
Control farmers
% of farmers
Made efforts to save irrigation water
Yes
No
SRI
Use water as
per
requirement
Drip,
sprinkler,
pipeline
Projectbeneficiaries 9 51 40
Control farmers 39 61
010203040506070
%
Methods adopted to save irrigation water
3 yrs ago Now
Addn area
irrigated
using drip
Projectbeneficiaries 9 19 16
Control farmers 8 5 3
05
10152025
%
Adoption of drip irrigation

49
control farmers. Of these 38% farmers, a third used DSC’s services for soil-testing, indicating that even
before the start of the second phase of the project, DSC’s soil testing services had become fairly popular
among the farmer fraternity.
Figure 4-11: Adoption of soil testing
A similar analysis for levels of awareness about producing bio-inputs (Figure 4-12 and Figure 4-13) shows
that only 8% of project beneficiary farmers as against 17% of control farmers were aware about how to
produce bio-pesticide and vermi-compost. The corresponding figures for awareness about producing
organic manure ranged from 7% among project beneficiary farmers and 3% among control farmers.
Figure 4-12: Awareness of bio-pest & vermi production Figure 4-13: Awareness of organic manure production
Although eliminating the use of chemicals in agriculture is not an immediate but a longer term goal
under this project, farmers were asked if they had been successful in producing any crop using zero
chemicals so that any progress towards this goal could be measured. Responses in Figure 4-14Error!
0 20 40 60 80
Projectbeneficiaries
Control farmers
% of farmers
Conduct soil testing
Yes
No
0 20 40 60 80 100
Project beneficiaries
Control farmers
%of farmers
Aware about producing bio-pest & vermicompost
Yes
No
0 20 40 60 80 100 120
Projectbeneficiaries
Control farmers
% of farmers
Aware about producing organic manure
Yes
No

50
Reference source not found. reveal that the concept of cultivating crops without using any chemicals
has still not gained popularity among farmers, which is understandable, given the focus of DSC’s
extension services on reducing chemical inputs. However, the fact that 6% of project beneficiary farmers
have already initiated zero-chemical cultivation in crops like wheat, castor, pearl millet and corn is an
encouraging start.
Figure 4-14: Producing crop without chemicals
Figure 4-15 and Figure 4-16 highlight the status of adoption of trichoderma viride and neem oil. It can be
seen that 28% of project beneficiary farmers have started using trichoderma viride for control of wilting
disease after joining the project as against 21% of control farmers. Similarly, 45% of beneficiary farmers
are using neem oil for biological control of pests after coming under DSC’s fold as compared to only 19%
of control farmers who use this method of pest reduction.
Figure 4-15: Adoption of trichoderma viride Figure 4-16: Adoption of neem oil
Another biological means of pest control involves use of yellow sticky trap, adoption of which is seen to
be at similar levels among both project beneficiary and control farmers (Figure 4-17). A significant
difference is however seen between the two categories of farmers as far as use of micro-nutrients like
0 20 40 60 80 100
Projectbeneficiaries
Control farmers
% of farmers
Produced crop with zero chemicals
Yes
No
0 20 40 60 80 100
Projectbeneficiaries
Control farmers
% of farmers
Using trichoderma viride
Yes
No
0 20 40 60 80 100
Projectbeneficiaries
Control farmers
% of farmers
Using neem oil
Yes
No

51
zinc and sulphur is concerned. 84% of project beneficiary farmers reported initiating use of micro-
nutrients after joining the project as compared to only 47% of control farmers.
Figure 4-17: Adoption of yellow sticky trap Figure 4-18: Use of micro-nutrients
Post project cleaning and grading of produce is being undertaken by 51% of project beneficiaries as
against only 32% of control farmers (Figure 4-19). Some of the crops being cleaned and graded include
wheat, vegetables and fennel where average price premiums of Rs. 2/- per kg in wheat, Rs. 5/- per kg in
vegetables and Rs. 13/- per kg in fennel have been realised by farmers.
Figure 4-19: Cleaning & grading of produce
0 20 40 60 80
Projectbeneficiaries
Control farmers
% of farmers
Using yellow sticky trap
Yes
No
0 20 40 60 80 100
Projectbeneficiaries
Control farmers
%of farmers
Using micro-nutrients
Yes
No
0 20 40 60 80
Projectbeneficiaries
Control farmers
% of farmers
Undertaking cleaning & grading
Yes
No

52
4.4 Project level impact
In this section, an attempt is made to estimate the overall impact of agriculture extension activities on
the entire 32,300 farmer households from the 151 villages spread across the five project locations. This
impact has occurred at two levels – economic and environmental.
Economic impact
Adoption of better agriculture practices under the project has resulted not only in the savings of
farmers’ expenses on various agriculture inputs but also improved incomes due to higher crop
productivity and better price realisation. For calculation of project level impact, figures related to per
unit savings in input expenses or per unit increase in productivity and price are taken from the survey
findings. Also, since adoption may vary across farmers and project locations, the percentage adoption
for each crop calculated on the basis of DSC data (Chapter 3, Table 3-5) has been considered to arrive at
the total quantum of savings in agriculture inputs and increase in farmer income.
Farmer expenses have come down due to reduced input quantities of seeds, increased replacement of
chemical pesticides, fertilisers and weedicides with bio-inputs, lesser demand for irrigation water and
savings in labour and miscellaneous expenses. Savings in expense on seeds are seen in the case of
cotton, paddy, maize, vegetables and wheat. At the project level, the total savings achieved are close to
Rs. 90 lakhs as can be seen from Table 4-17 Error! Reference source not found.. These have been
estimated on the basis of the following assumptions:
a. A packet of 450 gms of BT cotton seed costs Rs. 800/-
b. Wheat seed cost is Rs. 25/- per kg
c. Maize seed (Advanta-740 variety) cost is Rs. 90/- per kg
d. Paddy seed (gujari variety commonly grown in Vehlal) cost is Rs. 25/- per kg
e. Since lady finger, chowli and guvar are the commonly grown vegetables in the project area, an
average value of Rs. 1300/kg has been assumed on the basis of the following seed costs - Rs.
3000/kg (lady finger hybrid variety), Rs. 400/kg (chowli) and Rs. 500/kg (guvar).
Table 4-17: Saving in expense on seeds
CropTotal area undercultivation (Ha) Saving in kg/Ha
Total saving(kg.) % adoption
Savings in expense(Rs.)
Cotton 11390 0.2 2278 0.57 23,09,333
Paddy 3070 15 46050 0.48 5,52,600
Maize 1750 18.9 33075 0.77 6,36,694
Vegetables 4455 3.1 13811 0.46 1,58,821
Wheat 19135 17 325295 0.65 52,86,044
Total 39800 420509 89,43,491

53
Saving in expenses on chemical pesticides is seen in the case of paddy, maize, fennel and vegetables
with per hectare savings ranging from around Rs. 400/- in paddy to nearly Rs. 1100/- in vegetables
(Table 4-18). Even in crops like cotton, castor and wheat where this expense has shown an increase, the
actual consumption of pesticides may not have gone up in the same proportion as expense, considering
that market prices of some of the commonly used chemical pesticides have risen by an average of 45%
over the past 3 years. The total project-level savings on account of reduced use of chemical pesticides by
farmers are Rs. 88.76 lakhs.
Table 4-18: Saving in expense on chemical pesticides
Crop Total area under cultivation (Ha) Savings in Rs./Ha % adoption Total savings (Rs.)
Paddy 3070 408 0.48 6,01,229
Maize 1750 679 0.77 9,14,953
Fennel 6600 559 1.39 51,28,266
Vegetables 4455 1089 0.46 22,31,688
Total 15875 88,76,135
A reduction in expense on chemical pesticides has also been possible due to their increased replacement
with bio-pesticide by farmers. Bio-pesticide is also cheaper than chemical pesticides – with an estimated
expense of Rs. 630/- (@ Rs. 50/- per litre3for 1.5 litre requirement per Ha) as against Rs. 1,428/- for
Imidacloprid, a common pesticide used in cotton (@ Rs. 170/- per 100ml for 840 ml requirement per Ha)
or Rs. 1,050 for Regent, a common pesticide for wheat crop (@ Rs. 300/- per 250ml for a 840 ml
requirement per Ha). Factoring in expense on other commonly used chemical pesticides such as
Quinalphos, Chlorpyriphos and Acetamiprid, a conservative assumption of saving of Rs. 110/- per Ha due
to switch to bio-pesticide has been used for purposes of calculating savings in Table 4-19Error!
Reference source not found..
Table 4-19: Saving due to use of bio-pesticide
Crop Total area under cultivation (Ha) % adoption Total savings (Rs.)
Cotton 11390 0.57 7,14,153
Paddy 3070 0.48 1,62,096
Maize 1750 0.77 1,48,225
Vegetables 4455 0.46 2,25,423
Wheat 19135 0.65 13,68,153
Total 39800 26,18,050
Savings in expense on chemical fertilisers have been realised in the case of paddy, maize, fennel and
vegetables while these expenses have increased for cotton and castor. However, since market prices of
chemical fertilisers have increased by nearly 17% over the past 3 years, only a part of this increase may
3In fact, after getting trained under the project, farmers have also started producing bio-pesticide by themselves, further
bringing down this input expense.

54
be attributed to a real increase in their consumption. At the project level, the savings in chemical
fertiliser expense is worth Rs. 86.42 lakhs (Table 4-20). It is important to note here that unlike bio-
pesticide which can effectively substitute chemical pesticides, vermi-compost or FYM can only be used
as supplementary fertilisers. This is because they contain insufficient quantity of N,P,K needed for
crops, thus necessitating application of chemical fertilisers such as urea and DAP. Also, a large quantity
of vermi-compost or FYM is generally required – for instance, in place of 50kg of urea costing Rs. 320/-,
500kg of vermi-compost may be needed, which costs Rs. 2,500/-. It is for these reasons that chemical
fertilisers prove more difficult to be completely replaced.
Table 4-20: Saving in expense on chemical fertilisers
Crop Total area under cultivation (Ha) Savings in Rs./Ha % adoption Total savings (Rs.)
Paddy 3070 1165 0.48 17,16,744
Maize 1750 540 0.77 7,27,650
Fennel 6600 559 1.39 51,28,266
Vegetables 4455 522 0.46 10,69,735
Total 15875 86,42,395
As in the case of chemical pesticides and fertilisers, expense savings have also been realised by farmers
in weedicides. Preparation of modified bed and furrow, mulching, decomposing the FYM before use etc.
are some of the practices which have helped to naturally reduce the incidence of weeds and bring down
farmers’ dependence on weedicides. This has resulted in a cost reduction of over Rs. 1.63 crores across
nearly all major crops grown in the project area as shown in Error! Reference source not found..
Table 4-21: Saving in expense on weedicides
Crop Total area under cultivation (Ha) Savings in Rs./Ha % adoption Total savings (Rs.)
Cotton 11390 699 0.57 45,38,118
Castor 10390 155 0.69 11,11,211
Paddy 3070 1412 0.48 20,80,723
Maize 1750 719 0.77 9,68,853
Fennel 6600 559 1.39 51,28,266
Vegetables 4455 462 0.46 9,46,777
Wheat 19135 126 0.65 15,67,157
Total 56790 1,63,41,103
Table 4-22 highlights the expense savings achieved by farmers as a result of reduced number of
waterings required for crops post the project. Here, it is important to note that the biggest saving in
irrigation water has been achieved in the case of paddy, a highly water-intensive crop, although savings
are seen in other crops as well and are a result of better water management practices as well as

55
adoption of drip irrigation4by farmers. Although both canal and borewell water is used conjunctively for
irrigation in all project locations except Meghraj, only saving in expense on borewell water has been
taken into account to arrive at estimates of saving since canal water is not available across all three
cropping seasons. Assuming one borewell watering to be of 4 hours duration and hourly rental for diesel
pump to be Rs. 60/-, a saving of Rs. 240/- per watering per Ha has been considered for calculation of
total savings which are estimated to be nearly Rs. 2 crores for the overall project.
Table 4-22: Saving in expense on irrigation water
Crop Total area under cultivation (Ha) Savings in no. of waterings per Ha % adoption Total savings (Rs.)
Cotton 11390 1 0.57 15,58,152
Paddy 3070 8 0.48 28,29,312
Maize 1750 2 0.77 6,46,800
Fennel 6600 4 1.39 88,07,040
Wheat 19135 2 0.65 59,70,120
Total 41945 1,98,11,424
Labour and miscellaneous expenses at the project level are estimated to have come down by more than
Rs. 75 lakhs. This is on account of reduction in quantities of agriculture inputs (as discussed above) as
well as adoption of new agriculture tools, equipment and technology such as chipiyas (see Chapter 3 for
more details) and drip irrigation by farmers, the latter helping save labour costs for watering and
administering fertiliser/pesticide (since these can be done through drip itself).
Table 4-23: Saving in labour and miscellaneous expense
Crop Total area under cultivation (Ha) Savings in Rs./Ha % adoption Total savings (Rs.)
Paddy 3070 1914 0.48 28,20,470
Maize 1750 1905 0.77 25,66,988
Vegetables 4455 1067 0.46 21,86,603
Total 9275 75,74,061
Thus, while agriculture input expenses have reduced on the one hand, farmer incomes have also
improved owing to an increase in crop productivity and better price realisation. Over the past 3 years,
productivity has increased, especially in maize and vegetables by 1350 kg/Ha and 2400 kg/Ha. This alone
has provided more than Rs. 26.67 crores of additional income to farmers at the overall project level
(Table 4-24). Simultaneously, farmers have been able to realise better prices due to improved quality of
produce (for example through SRI paddy in Vehlal and Advanta maize in Meghraj) and cleaning and
grading, especially in the case of fennel, wheat and vegetables (Table 4-25).
4Nearly 20% of project farmers have adopted drip irrigation over the past 3 years

56
Table 4-24: Increase in income due to higher productivity
CropTotal area undercultivation (Ha)
Increase inproductivity
(kg/Ha)
Project levelincrease in
productivity (kg)
Prevailingmarket price
(Rs./kg)%
adoption
Total increasein farmerincome
Maize 1750 1346 2355500 16 0.77 2,90,19,760
Fennel 6600 76 501600 78 1.39 5,43,83,472
Vegetables 4455 2404 10709820 30 0.46 14,77,95,516
Wheat 19135 143 2736305 20 0.65 3,55,71,965
Total 31940 16303225 26,67,70,713
Table 4-25: Difference in crop prices before and after the project
Crop Price before project (Rs./kg) Price after project (Rs./kg) Diff. in price realisation (Rs./kg)
Cotton 46 44 -2
Castor 41 32 -9
Paddy 13 15 2
Maize 12 16 4
Fennel 72 78 6
Vegetables 23 31 8
Wheat 14 20 6
At the project level, the compounded effect of higher productivity and increase in price realisation has
resulted in an additional income of Rs. 55.28 lakhs reaped by farmers as shown in Table 4-26.
Table 4-26: Increase in income due to better price realisation
Crop
Total areaunder
cultivation(Ha)
Productivity(kg/Ha)
Increase in pricerealisation (Rs./kg)
%adoption Total additional income to farmers
Paddy 3070 3752 2 0.48 1,10,57,894
Maize 1750 3551 4 0.77 1,91,39,890
Fennel 6600 1873 6 1.39 10,30,97,412
Vegetables 4455 10930 8 0.46 17,91,90,792
Wheat 19135 3221 6 0.65 24,03,71,957
Total 35010 55,28,57,945
Table 4-27 summarises the combined economic impact of cost reduction in agriculture inputs and
increase in farmer incomes, which is to the tune of almost Rs. 90 crores for the overall project. It can be
seen that increase in farmer income due to higher productivity and price realisation is about 11 times
the savings achieved by them in agriculture input expenses. Distributing the total value of economic
impact equally among all 32,300 project beneficiary farmers, the aggregate value of economic gain to
each farmer household under the project is to the tune of more than Rs. 27,000/-.

57
Table 4-27: Economic impact of project
Expense savings Rs.
Seeds 89,43,491
Chemical pesticide 88,76,135
Bio-pesticide 26,18,050
Chemical fertilisers 86,42,395
Weedicides 1,63,41,103
Irrigation water 1,98,11,424
Labour & misc 75,74,061
Sub-total 7,28,06,658
Increased income
Higher productivity 26,67,70,713
Better price realisation 55,28,57,945
Sub-total 81,96,28,658
Grand Total 89,24,35,316
Environmental impact
Besides the above discussed quantitative economic impacts, the project has also had a number of
qualitative environmental impacts which play a crucial role in ensuring the long-term sustainability of
agriculture.
The first among these is reduction of chemical inputs such as pesticides, fertilisers and weedicides and
their replacement with bio-inputs. This has been possible due to DSC’s extensive farmer training
programmes on production of bio-pesticide and vermi-compost and setting up a distribution network
for these products through KPCL. As a result, a gradual shift towards more organic cultivation has
started. Already, farmers across various project locations are beginning to report loosening up of soil,
better water retention capacity, reduction in salinity and rise in micro-biological activity which can be
seen as definite indicators of an improvement in soil health. A more detailed analysis of the impact of
the project on soil health is presented in the next chapter.
Secondly, adoption of better water management practices and drip irrigation technology – which can
help save upto 80% water and increase productivity by 1.5 times - has resulted in significant water
savings. Further, improved crop productivity due to drip is preventing farmers from resorting to
excessive use of harmful chemical inputs to maximise production from their land.

58
5 Impact on Sustainability of Agriculture
While assessing sustainability of a farming system is an elaborate exercise and beyond the purview of
this study, since the project specifically aims at improving sustainability, an effort was made by DSC to
assess the state of soils before and after the project. Soil health can be taken as a proxy for agricultural
sustainability as soil is the living medium that supports the entire agro-ecosystem of a given region. A
major limitation of this approach is that it does not consider the biodiversity of the agro-system and the
balance of species within this system, which are important indicators of sustainability as well. A
comprehensive assessment of soil health is also an elaborate affair going into several parameters drawn
from physical, chemical and biological domains of soil. However, given the limitations of time and
resources of the project only a few chemical indicators were taken up for assessment. Hence the results
may be considered indicative at best.
5.1 Assessment of Soil Health: Sampling Frame
A soil survey was carried out with a sample of 60 farms selected from 4 project units – 15 from Modasa,
17 from Meghraj, 13 from Visnagar and 15 from Himmatnagar. The soil samples were taken from among
the fields which were part of the benchmark study carried out in 2011-12. The purpose was to compare
the results with the benchmark to see if selected chemical indicators of soil health showed any
significant changes over a period of four years.
Although DSC has been operating a mobile soil testing van under the project, to avoid any scope of bias,
it got the samples tested at the Gujarat Agricultural University. In this section we present the main
findings.
Parameters selected
Although Nitrogen (in available form) is one of the most important macro-nutrients consumed by plants
it has not been included mainly because nitrogen is available in nitrate form which is easily leached and
therefore often not found in the topsoil. Also since it is extracted by the crop plants from the soil it has
to be replenished after crop harvest in any case. In the case of the other two macro-nutrients, viz.
Phosphorous and Potash, there is a build up in the soil if the amount provided externally is more than
the amount extracted by the crops. The soil being a living system is also composed of numerous
varieties of micro-organisms which work on the bio-mass and convert nutrients into forms available to
the plant. The extent of microbial activity also affects the net build-up of nutrients in the soil. Hence an
increase in P and K content can be seen as an improvement in soil nutrient status. In fact recent
research emphasises the need to maintain a certain nutrient buffer in the soils to make agriculture more
sustainable.
Organic carbon is an indicator of the biomass available for decomposition. This would happen if the
conditions are conducive. One of the conditions is PH which is a measure of acidity and alkalinity. While
a neutral PH of around 7 to 7.5 is considered ideal, both extremes are undesirable. A high level of
electrical conductivity indicates excess salts in the soil. This can prove harmful to plant growth in various

59
ways including toxicity and imbalance of available nutrients. Such a situation may arise if the soil has
been subjected to high chemical farming over several years or innundated with saline water. It can be
reversed by reducing chemical inputs and increasing the use of organic fertilizers. Hence both PH and EC
are important indicators of soil health.
5.2 Findings of Soil Survey
Table 5-1 provides an overview of the average results before and after the intervention on five different
parameters of soil health.
Table 5-1: Overview of Soil Health Indicators before and after the project
No. Soil Parameter 2011-12 2015-16 Change (%) over base year
1 PH 7.32 7.30 negligible
2 Electrical Conductivity (mmhos/cm) 0.65 0.66 negligible
3 Organic Carbon (%) 0.05 0.08 60.0
4 Phosphorous (Kg/ha) 58.37 80.61 38.1
5 Potash (Kg/ha) 394.24 421.73 7.0
The table shows that the paramaters of PH and EC have remained largely unchanged. The level of EC is
also very low and the PH is very close to neutral which is good for the normal growth of plants.
Organic carbon levels are rather low but there is a significant improvement. Although the percentage
change is high in absolute terms it is not very big. Hence more emphasis on use of biomass and bio-
inputs needs to continue. There has been a significant increase in Phosphorous content of close to 40%
and a moderate increase in Potash content. Since Indian soils are generally rich in Potash content, it is
never a cause of concern. However, the increase in Phosphorous content may be seen as a significant
development.
Capturing the Variability in Results
It is worth noting that the above table gives only an average picture. Hidden behind these average
pictures could be variations across regions as well as farmer’s fields. Table 5-2 shows the average results
for the four different regions.

60
Table 5-2: Soil Indicators for the four regions
No. Region PH EC Organic C P K
1 Modasa
Before 7.61 0.55 0.06 67.8 379.9
After 7.48 0.57 0.09 99.31 504.2
Change +0.13 -0.03 +0.03 +31.51 +124.3
2 Meghraj
Before 6.76 0.50 0.01 88.55 573.18
After 6.93 0.62 0.04 86.55 433.24
Change +0.13 -0.12 +0.03 -2.00 -139.94
3 Visnagar
Before 7.67 1.25 0.05 31.58 265.7
After 7.58 1.07 0.08 58.85 339.1
Change +0.09 +0.18 +0.03 +27.27 +73.4
4 Himmatnagar
Before 7.35 0.40 0.08 37.94 317.18
After 7.27 0.44 0.11 74.02 397.82
Change +0.08 -0.04 +0.03 +36.08 +80.64
*+ Indicates positive direction of change while – indicates negative movement
The following inferences can be drawn from the table regarding the impact of the project on soils of
different regions participating in the project:
- There has been significant improvement in PH of soils across all regions. In the case of Meghraj it
has moved from acidic towards neutral while in all other cases it has moved from alkaline towards
neutral condition. This may be considered a significant gain within a short period of 4 years.
- EC levels have been maintained at fairly low levels in all project areas. In the case of Visnagar, EC
was on the higher side at 1.25 mmhos/cm before the project started as compared to other regions,
which has been brought down by 14.4 %.
- Both the above changes can be considered positive from the view point of environmental
sustainability and can be attributed to conjunctive use of chemical and bio-fertilizers being
promoted by DSC.
- Among the nutrients, organic carbon has shown a marginal increase across project areas.
Promotion of greater use of bio-fertilizers, incorporation of crop waste into the soil instead of
burning, practice of cover crops and green manuring etc. are some of the time tested methods of
increasing organic carbon, which has a direct impact on soil texture, water holding capacity,
microbial activity and productivity of soils.

61
- In the case of the two macro-nutrients, both P and K have seen significant gains in all regions except
Meghraj. In Meghraj, the level of P is almost the same while there has been considerable loss of K.
However, even after this loss the soil has a good buffer of 433 kg/ha which is better than some of
the other regions. Depletions of upto 25-50 % of the nutrient buffer can be attributed to the
previous crop. Some crops extract more potassium than others.
To check the variation within farmer’s fields, standard deviation is a good measure. However, we have
taken the range as it shows the extreme values from both sides. In the case of PH for instance very low
value (3-4) would indicate high acidity and very high value (9-10) would indicate alkalinity of the soil.
Both the extremes are harmful and such soils need to be treated with suitable amendments to restore
the PH value to neutral levels.
Table 5-3: Extent of Variation in Soil Test Results across Fields
No. Soil Parameter 2011-12 2015-16
Average Range Average Range
1 PH 7.32 6.10-8.80 7.30 6.30-8.50
2 Electrical Conductivity (mmhos/cm) 0.65 0.08-5.25 0.66 0.18-3.25
3 Organic Carbon (%) 0.05 0-0.20 0.08 0.02-0.25
4 Phosphorous (Kg/ha) 58.37 3.11-444.75 80.61 9.33-161.72
5 Potash (Kg/ha) 394.24 67.20-1021.44 421.73 134.40-1048.32
The following inferences may be drawn from Table 5-3 regarding variability across farmers’ fields:
- Although the average PH is at a healthy 7.32, like the average depth of a river it is deceptive. There
are some plots which are clearly alkaline as the reading is close to 9. On the other hand there are
some plots which are some what acidic with PH close to 6.
- PH and EC should be seen in conjunction as both are inter-related. Here again there are some plots
which show an EC of 5.25. Any value higher than 4 is indicative of salinity in the soil. This salinity is
caused due to accumulation of salts in the soil, which in turn could be because of excess use of
chemical fertilizers. Sometimes it could be due to use of brackish water, or due to overirrigation
resulting in salts from lower reaches of soil being brought to the top. This problem can be tackled
by leaching of the salts from the soil with good quality water and proper drainage. When high EC is
combined with high PH (9-11) it is indicative of alkalinity. Here too the problem is of excess salts,
but is more difficult to solve because the salts have altered the chemical composition of soil micells
and are difficult to leach away. The conventional treatment is to add gypsum to the top soil. The
University has not recommended the use of this additive in any of the samples. This impliies that

62
alkalinity is not a problem in this area and the salts can be leached away with proper water
management.
- The variation in organic carbon is within a narrow band. This is to be expected because the farming
practices are almost uniform with only a tiny fraction of the farming population claiming to have
adopted organic farming, and completely doning away with chemicals.
- In contrast to carbon, the variation seen in P and K buffers is very high. This again is to be expected
because farmers are not in the habit of adjusting dosage based on soil analysis. Some farmers apply
higher doses in the hope of getting higher yields, others apply sub-optimal doses. The residual
fertilizer contributes to the buffer. Proper management of the nutrient buffer is now considered
important for sustainable yields.
The soil test reports also provide a set of recommendations depending on what crop the farmer wants
to grow. The recommendations are common for a particular region and particular crop, since the
scientists do not consider the variability significant enough to modify the recommendation unless there
are some extreme values that come to their attention. Hence farmers get to apply doses of fertilizer and
FYM which approximately meet the requirements of the region rather than their specific field. In a
country with scarce resources and poor farmers, this may seem appropriate. It can prove misleading in a
few cases in case of high variability which is often found in soils. Perhaps one way to reduce this risk
would be to identify the different soil types within a region and to take samples from each soil type. In
this way, recommendations could be made separately for different soil types as well as proposed crops.
5.3 Indicators for Monitoring Soil Health
In February 2015, the GoI launched an ambitions scheme of creating Soil Health Cards for over 14
million farmers with a generous budget. However, the so called soil health card is a mis-nomer as it
covers only the five chemical parameters that have been used above. The general practice is to report
only on macro-nutrients and PH, EC. When dealing with large number of samples this is the best that
can be done.
However, it should be made clear that this falls short of measuring soil health in more ways than one.
Firstly, the seven micro-nutrients that are equally important for soil health are not covered. Deficiency
of nutrients like Zn, Fe, Mo, Co etc. can produce disease like symptoms on the plant and stunt their
growth. Micro-nutrient defeciency is common in soils subjected to chemical farming and mono-cropping
for several years without a break as the nutrient buffer in the soil is completely depleted due to
continuous extraction. Testing micro-nutrients is both expensive as well as time consuming. Hence it is
taken up only in cases where plants show defeciency symptoms.
Secondly, as all studies on soil health indicators have emphasised, soil health is governed by several
factors over and above the chemical conditions. Some of these parameters relate to physical conditions
of the soil such as porosity, water holding capacity, soil structure, soil depth etc. More importantly, soil
being a living eco-system supports a large variety of micro-organisms which interact with the chemical

63
and physical components in the process modifying them. Hence ideally soil healh indicators should be
drawn from all three aspects of soil. For a comprehensive coverage of the subject, DSC may refer to
Cardoso et. al. (2013)5which is an open access resource.
Needless to say this makes monitoring soils for their health and sustainabiliy is a lot more cumbersome
and expensive. Understandably, such indicators are used only for academic studies and projects where it
is important to monitor soil health. The authors recommend that during the third phase of LEPNRM,
sufficient funds be alloted to monitor soil health on all three categories of soil health indicators.
5Elke Jurandy Bran Nogueira Cardoso et. al. “Soil health: Looking for suitable indicators.” In Scientia Agricola, Vol. 70, no. 4.
Piracicaba July/Aug. 2013, accessed at www.scielo.br

64
6 Krushidhan Producer Company: Key Accomplishments and Strategic
Plans
6.1 Overview of Achievements
This section provides an overview of the progress made so far by the FPO on various fronts including
coverage, activities undertaken and profitability. The focus is on the economic and financial dimensions
of the company rather than the governance and social dimensions which are covered in the following
section.
i) Coverage
As shown in Error! Reference source not found., the company had a base of over 2035 farmer families
by the end of March 2016 as shareholders. The number of families who actually benefitted from the
services of the company however, was more than twice the membership in 2014-15 and more than
thrice the membership in 2015-16.
The geographical coverage of LEPNRM remained the same, covering 11 blocks in 4 districts of central
and northern Gujarat. The coverage of villages was reduced to 165 last year as some of the villages had
to be dropped on account of lack of response from the farmers there.
Table 6-1: Coverage under LEPNRM - II
Particulars 2014-15 2015-16
No of Districts 4 4
No. of Blocks 11 11
No. of Villages 170 165
No. of Farmers 4000 6000
No. of Shareholders 1560 2035
ii) Financial Performance
The audited report of the year just completed is awaited. However, the unaudited statements reveal
that the company has made a profit of Rs. 8.43 lakhs during the financial year 2015-16. This has helped
KPCL to wipe out the burden of losses worth Rs. 7.34 lakhs which were carried forward from the
previous avatar of the company in 2013. The highlights of financial performance from 2013 till 2016 are
provided in Table 6-2.

65
Table 6-2: Financial Performance of KPCL over the past three years
Particulars 31st March2016
31st March2015
31st March2014
31st March2013
Total Revenue 10,632,654 4,630,623 2,909,874 1,540
Total Expenses 9,789,420 4,462,728 2,529,272 250,998
Profit Before Tax 843,234 167,895 380,602 (249,458)
Profit After Tax 843,234 167,895 380,602 (248,796)
Share Capital 780,000 780,000 538,000 100,000
Reserves and Surplus (139,603) (185,589) (353,484) (734,086)
Long-term Borrowings 303,000 - - -
Revolving Fund 10,00,000 10,00,000 10,00,000 10,00,000
Fixed Assets includinginvestments
74,466 28,480 34,470 35,254
Current Liabilities 2,100,317 1,257,245 974,369 1,057,908
Current Assets 3,773,668 2,637,262 1,959,789 228,332
Some of the highlights of the performance can be summed up as follows:
• The total revenue increased from a miniscule Rs. 1540/- in 2013, to Rs. 100.6 lakhs in 2016.
• The PAT during the past three years of operation ranged from Rs. 1.68 lakhs in 2015 to Rs 8.43 lakhs
in 2016.
• Operations were managed without incurring long term debt so far, which is commendable. In the
absence of such borrowings, the funds required for carrying on business were raised from various
internal sources including share capital, a revolving fund from a donor agency, advances from SHGs,
Kisan Clubs and some individual farmers and accumulated profits. The long term loan of about Rs. 3
lakhs shown during the current year can also be considered an internal source as it represents the
loans taken from different Kisan Clubs.
• Current assets more than cover current liabilities in 2016, which was not the case in 2013. The CL:CA
ratio dropped from 4.6 to a healthy 0.56.
• Share capital increased significantly over past three years by 7.8 times. This needs to continue
growing if the company has to expand at the rate that it desires.

66
• The fixed asset base is very small. The absence of collateral makes it difficult for the company to get
commercial loans. Investment in godowns and processing units would help not only to improve price
realization for the farmers but also to serve as collateral for accessing commercial credit.
iii) Product Portfolio
KPCL has a highly diversified product portfolio as it has to meet the needs of farmers with different
cropping patterns in different agro-ecosystems. As of now the portfolio is dominated by agri-input
products indicating that the work on establishing backward linkages has progressed to a large extent.
The same cannot be said about forward linkages and this would be the next frontier to tackle.
The data on agri-input sales by KPCL over the past three years is shown in Table 6-3. Within input supply
it appears that seeds take the lion’s share with over 70% of the sales coming from it. Again, within
seeds, cotton dominates at Rs 44.86 lakhs with grains a poor second at Rs 11.47 lakhs and castor taking
the third place at Rs 7.88 lakhs.
New fodder seeds that have come into the market recently have bright prospects because of attractive
qualities and high animal husbandry base in the project area. However, this will need to be combined
with support for fencing as the problem of ungulates (neelgai and wild boars) has become acute in many
places, forcing farmers to switch to crops that do not attract such animals to the farm.
The sale of bio-products dipped in 2014-15 but recovered in 2015-16. The reverse trend was observed
for pesticides. The dip may have been due to heavy pest attack which could not be controlled by regular
bio-pesticides forcing farmers to take resort to chemical pesticides. Farm equipment has acquired a
significant position with a share of almost 12 %, coming close to bio-products.
Table 6-3: Product Profile of KPCL (agri-inputs)
Product Line 2013-14 2014-15 2015-16 (unaudited)
Sales (Rs.lakhs)
% Sales (Rs.lakhs)
% Sales (Rs.Lakhs)
%
Seeds 19.92 72.45 40.42 87.56 76.54 71.37
Cotton 9.89 28.29 44.86
Castor 3.41 6.2 7.88
Maize 0.29 0.39 0.09
Grains 1.32 0.36 11.47
Pulses 0.34 0.27 0.85
Fodder 3.56 3.8 6.42
Vegetable 0.48 0.82 1.52
Groundnut - 0 2
Others 0.63 0.29 1.45
Bio Products 4.54 16.54 2.27 4.91 13.47 12.56

67
Product Line 2013-14 2014-15 2015-16 (unaudited)
Sales (Rs.lakhs)
% Sales (Rs.lakhs)
% Sales (Rs.Lakhs)
%
Bio-pesticides 0.96 0.04 4.06
Bio-fertilisers 1.55 0.84 9.41
Bio-culture 2.03 1.39 ?
Pesticides 0.76 2.76 3.32 7.2 4.45 4.15
Farm Equipment 2.23 8.12 0.13 0.28 12.78 11.91
Total 27.45 46.14 107.24
The data on collective marketing of output is summarized in Table 6-4.
Table 6-4: Product Profile of KPCL (Commodities)
Product Line Sales (2013-14) Sales (2014-15) Sales (2015-16)
Quantity Value (Rs.lakhs)
Quantity Value (Rs.lakhs)
Quantity Value (Rs.lakhs)
Groundnut 379 MT 150.00 - - - -
Spices - - 100 Kg 0.04 105 Kg 0.13
Pulses 1150 Kg 0.28 528 Kg 0.34
Total 150.00 0.32 0.57
In February 2014, DSC was faced with a major crisis of farmers in Dhari region not finding remunerative
prices for their groundnut produce. The price of Rs. 30-33/kg was not enough to even cover the basic
cost of production. The crisis got converted into an opportunity when Government of India announced a
minimum support price of Rs. 40/kg for groundnut. The scheme was routed through Small Farmers’
Agribusiness Consortium, of which KPCL was a member. Within a space of 17 days, produce of over 100
farmers was aggregated and sold after ensuring that it met all the quality standards stipulated by the
agency. Produce of 378.44 MT worth over Rs. 150 lakhs was aggregated from 15 villages.
Although the groundnut was sold to the government and not in the open market, the entire experience
provided a wealth of learning, working with different agencies while ensuring that the interest of the
marginal farmer was not compromised. At first the farmers were asked to bring their produce to the
APMC at Dhari. Enforcement of strict quality measures (see Table 6-5) led to high initial rates of
rejection, causing much hardship to the marginal farmer who had to bear the additional cost of loading-
unloading and transportation. In the interest of the farmers, DSC and KPCL prevailed on the partner
agencies to arrange for procurement at the village level. The farmers too learnt to segregate their
produce in order to meet the quality specifications. Thereafter it became a win-win situation for all the
partners involved.

68
Table 6-5: Quality Specifications under MSP scheme for Groundnut
No Parameter Specification
1 Humidity < 8%
2 Net weight of kernel > 65%
3 Mixed with other variety of groundnut < 4%
4 Underdeveloped nuts < 4%
5 Damaged and decayed nuts < 2%
6 Foreign elements < 2%
The entire experience has been well documented by Center for Integrated Development (CfID) which
has written a case study on KPCL. Figure 6-1 taken from the case study shows the role of different
agencies involved and the flow of produce, money and information within the arrangement.
Figure 6-1 Roles of Different Agencies involved in Groundnut MSP Scheme

69
iv) Margin Analysis
To understand the contribution of different products better, it becomes necessary to examine the
margins offered by different product lines. Some products may have high volume but low margin while
others may contribute more to profitability of the company on account of high margins. An attempt was
made to estimate the margins obtained in different product lines over the past three years (see Table
6-6). The main findings are summarized below;
• Seeds:
Except for cotton and maize where margins are going down over time, in all crops the margins are
seeing an upward trend.
Pulses, grain, fodder and vegetables show healthy margins ranging from 20-30% and possibly are the
crops to target in future if seen only from the profitability point of view.
Although cotton has the highest share in sales, the margins are the lowest having gone down from
8.9 % in 2013-14 to about 2 % on 2015-16. The reasons for the severe drop need to be examined and
steps taken to improve bargaining power for realization of better margins.
• Bio-pesticides
Bio-pesticides have a high margin (40-50%) as compared to bio-fertilizers where margin is only about
10%. This may be due to shortage of cow urine and the fact that production of bio-pesticides is more
knowledge intensive while production of bio-fertilizer is more labour intensive. Also, bio-pesticides
compete with chemical pesticides which command a high price.
• Chemical Pesticides provide very low margins (< 4%) while farm equipment margin ranges from 10-
15%
Table 6-6: Margin Analysis of Agri-input Products
Product Line 2013-14 2014-15 2015-16(unaudited)
Seeds
Cotton 8.90 3.18 2.05
Castor 8.50 8.55 11.42
Maize 24.14 10.26 11.11
Grains 15.91 22.22 29.21
Pulses 17.65 14.81 28.24
Fodder 14.33 10.79 18.38
Vegetable 18.75 28.05 12.50
Groundnut - - 4.00

70
Product Line 2013-14 2014-15 2015-16(unaudited)
Others 15.87 3.45 2.76
Bio Products
Bio-pesticides 5.21 50.00 39.90
Bio-fertilizes 9.68 0 11.90
Bio-culture 2.46 10.07 -
Pesticides 3.95 1.81 3.37
Farm Equipment 4.48 15.38 10.80
v) Wheat Seed Production
DSC initiated a pilot for seed production in wheat crop as early as 2013-14. Production of truthful and
certified seed was seen as an attempt to improve the price realization for the seed producer on one
hand and greater control over supply of seed to farmers on the other.
In 2015-16, the project continued to remain on pilot scale with a production of about 45 tonnes of seed
material. However, one major difference was the qualitative difference in the type of seed produced.
The last two years have witnessed a shift from production of truthful seed to certified and foundation
seed (Table 6-7), signifying the growing confidence of farmers in seed production.
Table 6-7: Production of Wheat Seed on Pilot Scale
Year Truthful Seed Certified Seed Foundation Seed
2012-13 30,090 - -
2013-14 88.070 - -
2014-15 92,160 - -
2015-16 - 19,200 1,960
2016-17 - 24,700 900
Total (kg) 130,320 42,900 1,860
Total (tonnes) 170.32 42.90 1.86
Table 6-8 shows the contribution of different project units to wheat seed production over time.
Interestingly, there has been a shift from Vadnagar/Visnagar to Modasa for certified seed, but for
foundation seed the locus has shifted back to Vadnagar. The main reason cited was the average size of
plots. Since certified seed requires larger plots, the base had to shift from Vadnagar to Modasa and

71
Himmatnagar. Also the quality of grain produced in Visnagar is somewhat inferior since the farmers use
canal water there. The grain is bolder and better in Modasa where farmers use water of bore-wells. The
shift back to Vadnagar for production of foundation seed was attributed to the linkages established
between the field unit there and the Vijapur Wheat Research Center because of which it was able to
access breeder seed.
Table 6-8: Contribution of Different Project Units to Seed Production (Kgs)
Block Truthful Seed Certified Seed Foundation Seed Total
Vadnagar/Visnagar
124,200 - 1,960 126,160
Himmatnagar 21,150 7,200 900 29,250
Modasa 24,400 35,700 - 60,100
Meghraj 570 - - 570
Total 170,320 42,900 2,860 216,080
vi) Sales Analysis
There has been an exponential growth in sales over the past three years as seen in Figure 6-2, with total
sales crossing Rs. 80 lakhs in 2015-16. In order to understand the source of growth, further analysis of
sales data was carried out. Break-up and trend of sales was analysed for a) members versus non-
members and b) different project locations (units).
Members vs. Non-members
Krushidhan has a policy of supplying its goods and services to all farmers in the project region
irrespective of their being a share-holder of the company. Hence the actual reach of the company goes
far beyond its 2035 members (share-holders). In order to understand the actual reach of the company
and the trends in expanding reach, data on sales to members versus non-members was compiled for the
past three years. The trend is presented in the graphs in Figure 6-2. As seen in the figure, sales to
members during 2013-14 (year of reconstituting the company) were more, but subsequently non-
member sales has overtaken and shot up far more than sales to members. This can be attributed to the
growing popularity of products supplied by Krushidhan in the project area.
These non-members who have already benefitted from the services of the company can be targeted as
potential future share-holders.

Figure 6
Share of Different Project Locations
The contribution over time of the diff
not found.. Visnagar/Vadnagar area
pattern of Visnagar, Himmatnagar an
this year. The Modasa team leader e
dealers in Modasa town. These com
giving them credit. As the company
credit), they are unable to attract th
distant villages where the need of the
Figure 6
0
1,000,000
2,000,000
3,000,000
4,000,000
5,000,000
6,000,000
7,000,000
8,000,000
9,000,000
2013
0100000020000003000000400000050000006000000700000080000009000000
6-2 Trends in Sales to Members vs. Non-members
ations
f the different project units is shown in Figure 6-3Error! Re
ar area has contributed the most followed by Himmatnag
agar and Meghraj are almost the same. However, Modasa
leader explained that they were facing severe competitio
ese competitors have developed a modus of binding thei
mpany has decided not to go down this route (of provid
attract the customers. His suggestion was to move down fu
d of the company was greater.
6-3 Contribution of Different Regions to Total Sales
2013-14 2014-15 2015-16
Member
Non-membe
Total
2013-14
2014-15
2014-15
72
Error! Reference source
matnagar. The growth
Modasa has fallen back
mpetition from private
ing their customers by
f providing products on
down further to more
member

73
vii) Working Capital Management
Working capital management in Producer companies is critical for its success. This is because most agri-
inputs and outputs are a) bulky, therefore demanding good logistics and storage b) high value therefore
requiring high doses of credit c) perishable nature of commodities vulnerable to market risks.
During the initial stages, the company finds it difficult to access credit from commercial sources which
demand collateral. Commercial loans carry high interest rate burden. Even if the company manages to
get such funds, if it does not have professional management or if the management makes mistakes due
to lack of experience it could end up in erosion of working capital. This would directly affect the balance
sheet leading to a vicious cycle.
It is heartening to note therefore that KPCL has come through the first three years raising working
capital entirely through internal sources and managing it well enough to be able to earn moderate
profits. While the official statement on sources and uses of funds is being compiled, back of the
envelope figures indicate how the working capital was raised:
- Grant from donors (revolving fund) – Rs 10 lakhs
- Share capital money – Rs 9 lakhs
- Previous year’s profits – Rs 5 lakhs
- Advance from SHGs, Kisan Clubs and individual farmers – > Rs 10 lakhs (see Figure 6-4Error!
Reference source not found.)
Figure 6-4 Contribution of SHGs/KCs/Farmers to WC (Rs. lakhs)
Figure 6-4 shows how farmers and their institutions have been contributing to the working capital of the
company. As in all other cases, the contribution of the Vadnagar/Visnagar unit is far greater than those
of the others. Meghraj farmers did not contribute as they did not have SHGs. Their credit needs were
being met through a women’s credit cooperative. The cooperative is doing well and has a total savings
0
1
2
3
4
5
6
2014-15
2015-16
2016-17

74
of Rs 50 lakhs. However, it is by law restricted from taking part in enterprise and is therefore unable to
provide loans to the company.
viii) Issue of high growth with financial sustainability
The company has showed an exponential growth during the first three years of operation. In order to
maintain this growth, it would need to increase its sales turnover to over Rs. 3 crores in the coming
financial year. The challenge is to do it in a manner that is financially sustainable. So far it has done well
by utilising its own funds and managing it well. To continue growing, it will need to increase membership
and resultant share capital. Increase in equity will enable it to get long term debt from financial
institutions. So far it has been difficult to approach the financial institutions to ask for collateral in order
to cover their risk. Although KPCL does not have any significant assets to offer as collateral, it now has a
clean balance sheet and professional team to show, which should provide the necessary assurance to
prospective financial agencies.
Past efforts of KPCL to procure godowns for its commercial activities did not meet with success.
However, looking at the future plans of expansion as well as the need to invest in assets, KPCL will need
to intensify its efforts to procure/ build godowns at central places. DSC may like to explore the support
of donor agencies or government for the purpose. It was felt that centers located at cross-roads which
can be easily accessed by farmers from maximum number of villages in a given region would serve the
purpose. We would add that godowns when not used for storage could double up as training centers
and/or retail outlets for supply of agri-inputs as well as other commodities that the farming
communities need.
Use of financial incentives to members
In a recent scholarly article in Economic and Political Weekly (Feb 20, 2016), eminent researcher Dr.
Tushar Shah built the case for rapid growth of FPOs through clever use of economic incentives to their
members. Drawing upon the experience of five MPCs (Milk Producer Companies) established by NDDB
(touted as the new generation Milk Producer Cooperatives), which have experienced dramatic growth
and achieved scale of operations within a short space of three years, Shah attributes their success to
good design thinking and a compelling business model.
Chief among the drivers of growth are the economic incentives that reward those members who
contribute more to the business of the company. Therefore shareholders are graded into A, B, C classes
according to their economic contribution. Those in A category are given a bigger say in decision making
in the company. While at face value the proposition appears attractive, one must bear in mind that the
FPO also has certain social goals. Its primary objective is to lift the poorest farmers out of poverty and
make marginal farmers viable. Given the heterogenous composition of the company, giving too much
emphasis to economic contribution could in the long run create a culture of decision making where the
needs of the poorest are neglected the most. Hence while economic incentives can boost growth,
judicious use is called for so as to balance economic growth with social equity and justice.

75
6.2 Governance of Krushidhan
A collective enterprise such as Krushidhan FPO faces two types of risks. The first is vertical in nature
which is actually the enterprise risk or risk of doing business in a competitive market. The second is
horizontal risk which is the risk of a large number of members coming together with a common purpose
where good governance becomes the key to success. Failure of governance has often led to breakdown
of collective enterprise institutions leading to their ultimate decline or closure. Therefore it is absolutely
imperative to keep close track of the governance systems in place, which include among other things, a
representative and enlightened leadership, a professional cadre that understands the needs of the
market as well as its members/shareholders, a committed and growing membership base that develops
high member allegiance and shows loyalty to the company in the face of adversity.
To understand the system of governance at Krushidhan, we adopted the following methods:
a) Preliminary analysis of share-holding pattern and membership profile
b) Interaction with the elected board of directors
c) Interaction with the ex-president and key staff from DSC who facilitated the company
during its formative stages
The findings from the above three sources enabled us to assess the level of governance as well as the
emerging issues before the leadership that need to be tackled for greater member satisfication and
social impact.
i) Share-holding Pattern
Understanding the share-holding pattern in a member-based commercial enterprise is important
because this determines the power base and ultimately affects decision-making and governance of the
institution. To start with, an analysis of the share-holding by project locations was done (see Figure 6-5).
As seen in the diagram, Visnagar has the lion’s share followed by Himmatnagar.
Visnagar
Hi,nagar
Modasa
Megharaj

76
Figure 6-5 Share-holding Pattern of KPCL (2015-16)
The growth in share holding across project locations is captured in Error! Reference source not found..
As seen, all regions are growing at the same pace except Modasa. KPCL’s management will need to
verify whether the lack of growth both in sales and membership is because of the reasons cited by the
unit manager, or due to lack of sufficient efforts in reaching out to the farmers of the region.
At the moment the share-holding pattern is in proportion to the contribution of sales. This gives them
greater say in decision making. As of now, decisions are made keeping in view the needs of all five
regions. However, there is no guarantee that in future the dominant region would not try to assert itself
leading to the marginalization of one or more regions. This is an issue that needs to be considered while
expanding share holding pattern in future.
Figure 6-6 Growth pattern in Share-holding across Project Locations
ii) Profile of Share-holders
KPCL aims at creating an inclusive society by serving the needs of small and marginal farmers. An
analysis of member farmers based on size of their land-holding in 2015-16 (Figure 6-7) confirms that
more than 72 percent of the members are small and marginal. Only 10 farmers representing 0.5% are
large farmers.
0
1000
2000
3000
4000
5000
2015-16
2014-15
2013-14
Marginal
Small
Semi-med
medium
Big
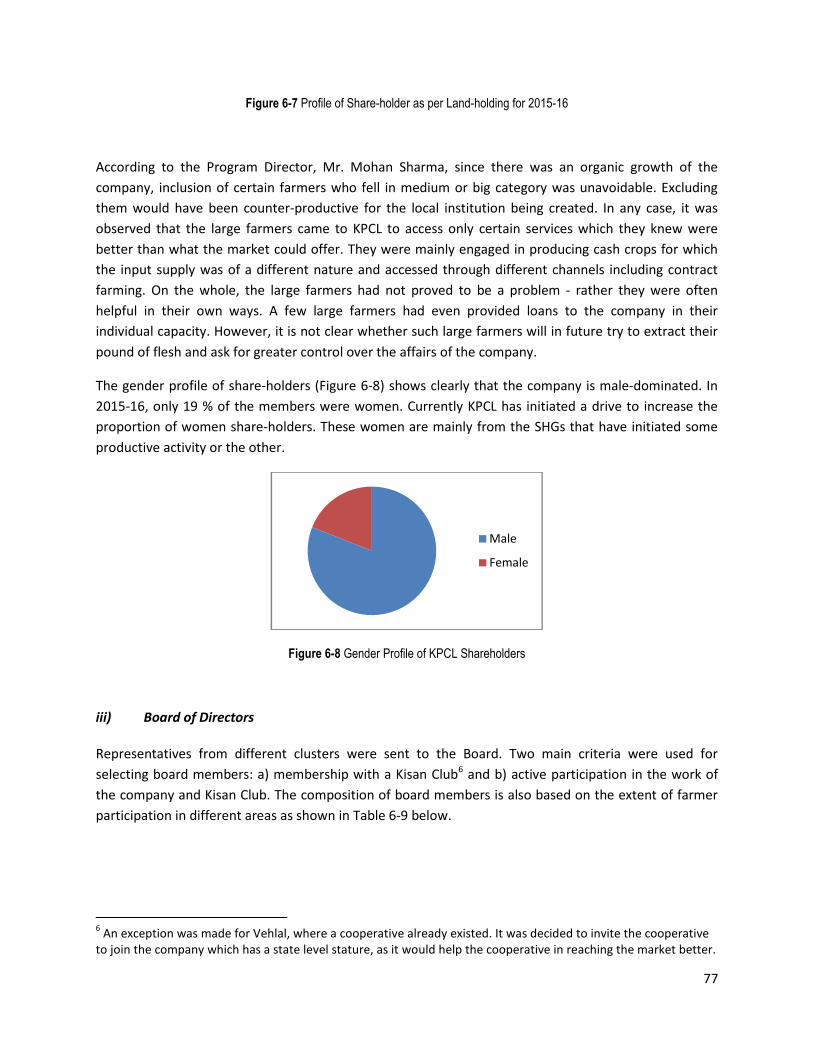
77
Figure 6-7 Profile of Share-holder as per Land-holding for 2015-16
According to the Program Director, Mr. Mohan Sharma, since there was an organic growth of the
company, inclusion of certain farmers who fell in medium or big category was unavoidable. Excluding
them would have been counter-productive for the local institution being created. In any case, it was
observed that the large farmers came to KPCL to access only certain services which they knew were
better than what the market could offer. They were mainly engaged in producing cash crops for which
the input supply was of a different nature and accessed through different channels including contract
farming. On the whole, the large farmers had not proved to be a problem - rather they were often
helpful in their own ways. A few large farmers had even provided loans to the company in their
individual capacity. However, it is not clear whether such large farmers will in future try to extract their
pound of flesh and ask for greater control over the affairs of the company.
The gender profile of share-holders (Figure 6-8) shows clearly that the company is male-dominated. In
2015-16, only 19 % of the members were women. Currently KPCL has initiated a drive to increase the
proportion of women share-holders. These women are mainly from the SHGs that have initiated some
productive activity or the other.
Figure 6-8 Gender Profile of KPCL Shareholders
iii) Board of Directors
Representatives from different clusters were sent to the Board. Two main criteria were used for
selecting board members: a) membership with a Kisan Club6and b) active participation in the work of
the company and Kisan Club. The composition of board members is also based on the extent of farmer
participation in different areas as shown in Table 6-9 below.
6An exception was made for Vehlal, where a cooperative already existed. It was decided to invite the cooperative
to join the company which has a state level stature, as it would help the cooperative in reaching the market better.
Male
Female

78
Table 6-9: Representation Pattern in Board of Directors
Area No of Villages* No of Kisan
Clubs/cooperatives
No. of Directors
Visnagar 69 60 5
Himmatnagar 28 37 2
Modasa 18 38 2
Meghraj 18 33 1
Dhari 20 30 1
Vehlal 18 1 cooperative 1
Total 151 12
*These figures have undergone minor changes since the beginning of Phase II
as a few villages have been added while some have dropped out; hence the
discrepancy between figures shown in Table 1.1 and this table.
Hence Visnagar which has the maximum participation of farmers also has the maximum number of Kisan
Clubs and is therefore eligible for a larger representation in the Board.
Regarding gender balance within the Board, at present there are only two women board members. This
is a good beginning considering that farming decisions are traditionally dominated by the men. In due
course this ratio would also change as more women shareholders join the company.
iv) Professional staff and organisational structure
The company is currently staffed by 17 employees which are of three categories. The break-up is as
given below:
Office staff – 3
Supervisory staff – 7
Field staff - 7
The CEO looks after four departments as shown in the organogram in Figure 6-9.

79
Figure 6-9 Organogram of Krushidhan’s Professional Staff
The cost of the CEO, managers and accountant is borne by DSC while the supervisory staff is supported
by Krushidhan. The total salary bill per year comes to approximately Rs. 13 lakhs which represents about
70% of the office overheads in the year 2014-15, but is increasing year on year.
The present field and supervisory staff appears to be comfortable in the tasks that have been given to
them. The most challenging task is that of the CEO as he has to balance the needs of the market and
enterprise on one hand and the needs of the members and elected representatives on the other. The
present CEO spends considerable time in assessing markets for various products, establishing both
forward and backward linkages in the market. In the near future, as the company moves into collective
marketing in a bigger way, there may be a need to appoint a separate manager for forward linkages.
This would leave enough time for the CEO to keep track of the performance on different aspects of the
enterprise. Within the administration, the sub-accountant may be trained to maintain data on
monitoring indicators and prepare reports from time to time, which would serve as the basis for review
meetings of the FPO.
It is suggested that a separate review of all staff and their training needs may be carried out internally or
with the help of an HR consultant. The same may be done for Board of Directors. This is linked to the
issue of leadership of Krushidhan discussed in point number v) below.
v) Member Satisfaction and Allegiance
CEO
Manager - Retail
business
Manager -
Input Supply
Manager - Seed
Processing
Head -
Accounts &
Administration
Field accountantDeputy Mngr
Field supervisor

In 2015-16, a team of three student
carried out a consumer survey of bot
study was useful in understanding am
provided by KPCL. The responses o
relevant findings are reported below
allegiance to their company.
Satisfaction with SMS Service
One of the privileges that members
the company. The service provides m
outlets as well as short technical adv
approval of the members, although
About 9.9 % were not able to access t
of the telecom service provider. This
trying to expand their area of coverag
remained unsatisfied while the large m
Figu
Loyalty of Members Expressed in Buye
The buyer behaviour of shareholder
product. In general, a very high loyalt
its credibility. Loyalty was not very st
shareholders may be accustomed to
7Bhartendre Singh, Varun Kumar and Ashok
Supply Analysis of Vermicompost, a report s
Graduate Diploma in Rural Planning and Manag
students from School of Rural Management, NLRI (GVT)
y of both member and non-member farmers within the tar
anding among other things, the farmer as a consumer of agr
onses of both shareholders and non-shareholders were
d below in an effort to understand the extent of member
mbers (share-holders) of KPCL enjoy is the free SMS servi
rovides messages about the availability of various product
nical advisories in a timely fashion. This service has largel
although as shown in Figure 6-10, there is some scope fo
access the messages. This may be because they stay outsid
er. This situation may improve in future as the companies
f coverage. Of the 90% who are able to access the messag
e large majority (92.5 %) expressed satisfaction.
Figure 6-10 Satisfaction Level with SMS Service
in Buyer Behaviour
areholders (Error! Reference source not found.) varied fr
igh loyalty was shown when it came to seeds, where KPCL
t very strong for pesticides and vermi-compost. In the cas
med to purchasing on credit from the usual dealers. In the
d Ashok Tandi, Customer Review of Krushidhan Producer Company Lt
report submitted to Mr. Mohan Sharma, DSC and NLRI in partial ful
and Management (2016).
Getting SMS Satisfied Want to
continue it
with own cost
831 769570
91 62261
Message Service Analysis
Yes No
80
RI (GVT), Ratlam, M. P.
in the target area7. The
er of agri-input services
rs were provided. The
ember satisfaction and
S services provided by
oducts in the retail
as largely met with the
cope for improvement.
ay outside the coverage
mpanies are constantly
messages, about 7.5 %
varied from product to
re KPCL has established
the case of pesticides,
rs. In the case of vermi-
pany Ltd. and Demand and
artial fulfillment of the Post

81
compost, the company only sells the surplus material produced by producer groups. Hence most
farmers purchase it locally from the producer groups.
Figure 6-11 Buyer behaviour of shareholders
In another section of the study, the authors conclude that 98% of all farmers in the target area have
started accessing products from KPCL outlets. The primary reason is not accessibility but a perception
and experience of high quality of services provided by the company. This should be a matter of great
satisfaction for the professional staff of the company. One may conclude that one way to ensure
member allegiance is to provide them with high quality of services. The fact that the company does not
insist that members purchase only from its outlets provides them flexibility of accessing other services in
the market when they feel that they are not getting what they want from their own company. This too
augurs well for member allegiance as it builds respect for the company policy and board of directors.
vi) Emerging Issues of Governance
In order to understand the Governance issues better, it is necessary to provide to the reader a little
background to the producer company in its present form. This background is drawn largely from a
process documentation on the evolution of Krushidhan brought out by DSC in 20158. It is worth
mentioning that Krushidhan is a re-incarnation of an earlier FPO promoted by DSC in 2005 at Dhari
where it had been implementing its watershed plus programme. Taking advantage of the recently
enacted Act on Producer Company under Companies Act (1956) DSC sought to transform the watershed
federation at Dhari into a producer company. Hence the Dhari Krushak Vikas Producer Company Ltd.
(DKVPCL) was registered on 23rd June 2005, being the first such company to be registered under the
8Authored jointly by Mohan Sharma and Jasvant Chauhan from DSC with Center for Integrated Development,
Ahmedabad
0
100
200
300
400
500
600
Always from KPCl
Always from others
Both

82
new enactment. At that point in time, DSC had little to nil experience in facilitating the incubation of
such an enterprise. Not surprisingly, it made several mistakes and the company began to decline till it
became non-functional.
Around the same time, LEPNRM Phase I was completed where a need was clearly felt for a people’s
organisation which would provide the services of collective input supply and collective marketing of
farmers’ produce. Rather than to create a new institution with attendant start-up costs, DSC decided to
restructure DKVPCL into a multi-district, state level producer company under LEPNRM Phase II. DSC’s
facilitators had by now learnt the ropes on facilitating such an institution and were fully aware of the
various pitfalls involved. It was determined to make the company in its new avatar a success by
overcoming all the previous shortfalls – see Table 6-10 for a summary.
Table 6-10: Measures taken by DSC while incubating KPCL from its previous avatar
No.Limitations of DKVPCL Measures taken for KPCL
1 Shareholding provided externally, lack
of ownership of farmers
Emphasis on farmer’s shareholding in order to build their stakes in the
company; institutional support provided to strengthen shareholding which
is critical for leveraging commercial funds
2 Coverage limited to Dhari region Geographic coverage was expanded from just one block to 11 blocks
covering north and central districts of Gujarat, in order to increase
shareholding as well as business opportunities
3 Services lmited to input supply Services expanded to include technical advisory, collective marketing,
value addition etc.
4 Limited women’s involvement Women involved at all levels in the three tier structure of the company
5 Lack of collaborative initiatives Increased partnerships with various technology institutions, market
players, government agencies, NGOs etc. in order to provide
comprehensive services to the marginal farmer who was the central focus
of all activities
6 Lack of sufficient inputs for capacity
building of the governance body
Increased involvement of DSC staff to build capacities of board as well as
professional staff with training and handholding
7 Poor leadership of the board Revamped entire structure and governance of the company with an
approach to build from bottom upwards; criteria for allowing only interested
and apolitical farmers as shareholders; focus on building a three-tier
pyramid structure with a broad base
8 Lack of professional management Deployed professional staff from day one with financial support under
LEPNRM, with a clear plan of the company paying for the salaries once it
had reached financial self-sufficiency
From the above background the following points become very clear:

83
i) KPCL is a re-incarnation of an earlier failed attempt at promoting an FPO
ii) KPCL is a crafted institution with DSC as its incubation center
iii) The earlier experience of failure had proved invaluable to DSC staff in learning the
science and art of facilitating a collective enterprise institution
Hence it is not surprising that KPCL had posted positive financial results during the first three years of its
operation and had grown not only in terms of membership and ownership but also in terms of the range
and scale of services provided to members, member allegiance and loyalty and a larger vision among
members for self-reliance on a sustainable basis.
The important role of expert facilitation/mentoring in creating such crafted institutions cannot be over-
emphasised. DSC provided intensive capacity building and hand-holding support including exposure
visits for directors of Krushidhan and staff members. This helped the DSC field staff as well as that of
Krushidhan to learn from other agri-enterprises across the country. In addition, structured training
programmes on business plan development, accounts and administration etc. was provided. Continuous
guidance provided by Mohan Sharma, the then Programme Director, helped in building the confidence
of Jasvant bhai, CEO of Krushidhan and other Krushidhan staff. All this contributed to the success of the
start up which had grown largely on its internal resources, managed its working capital in a professional
manner and steered clear of all the known pitfalls of such a collective enterprise.
Not withstanding the above, the company was at this point in time facing a few governance issues which
are discussed below.
a) Leadership
While professional guidance and mentorship provided by the Programme Director continued to support
the FPO from outside, in the initial stages it was felt that an expert director should be inducted to the
Board of the Company to provide leadership, help establish systems and take strategic decisions. To this
end, Mr. Arvind Gupta, a retired professional with expertise in cooperative management was appointed
as external chairperson but actually served as a mentor and advisor.
About a year ago, Mr. Gupta tendered his resignation due to personal reasons. The Board was not able
to identify a suitable person to fill the shoes of the previous chairperson from within. Among the
available choices, the perception was that Vasantbhai lacked consensus. Lalitbhai on the other hand,
had both, the capacity and acceptability, but was preoccupied with his own business and would
therefore not be able to give time to the affairs of the company. The Board in its wisdom, decided on
collective leadership with temporary chairpersons elected for each board meeting. This arrangement
has continued for about a year.
By default the leadership was provided by professionals in the form of CEO appointed by DSC (Jasvant
bhai) and mentoring provided by the Program Director. As long as this support from the professionals
was forthcoming, the Board members did not feel the absence of a chairperson and felt comfortable
allowing the professionals to call the shots. However, it is suggested that the issue of local leadership

84
should be resolved at an early date as it has an important psychological bearing on the people’s
institution. If the institution is perceived to be ‘headless’ it can affect the morale of the members. Even if
the ideal candidate for chairperson is not found, the chair should not be allowed to go vacant. Over time
the person would grow into the role and if not, some other aspirant would challenge him and come
forward to take the leadership.
It is in this context that the discussion on the role of leadership and alternative models for leadership
that we had with Mr. Arvind Gupta is both relevant and instructive. A few excerpts from the interview
are given below:
“The chairman plays the role of balancing the professional group with the elected
representatives. Getting a Chairperson who understands both and plays the balancing
role is therefore a big challenge.”
“The Chairperson plays a role of providing leadership in the following ways:
- Strategic thinking for the business of the company
- Vision building
- Motivating the professional team and
- Managing the balance between professional staff and the board”
“The day-to-day responsibilities of the leader include the following:
- To sign documents
- To respond to audit inquiries
- To carryout dispute resolution
- To represent the organization at various forums
- To chair board meetings”
Mr. Gupta added that the Chief Executive Officer (CEO), a professional appointed by the Board, also
played a critical role of providing leadership as well as educating and empowering the members:
“The CEO must become the member secretary. The leadership of paid employees is equally
important. In fact Dr. Kurien retained the secretary position of Gujarat Milk Marketing
Federation precisely to maintain this balance between professional staff and elected
representatives, between business and social goals.”
Hence this represents a different model of leadership which could be termed ‘Social Intrapreneurship
Model’ as opposed to the ‘Empowerment Model’ of leadership which is generally followed by most
NGOs. This model requires hand-holding of the Board over a long time frame. The nature of support
changes gradually from hand-holding to one of “friend, philosopher and guide” as the leadership of the
elected representatives matures over time.
DSC’s previous director Mr. Sachin Oza, felt that the organization was fortunate enough to have the
support of a donor agency like RBS Foundation which was quick to grasp this fact and was willing to give
a long term commitment so necessary for an intervention like this. In his words:

85
“Unlike a paper-tight project which hardly gives any flexibility to a facilitating agency as
well as the FPO, RBS helped Krushidhan to grow at its own pace. They provided
guidance when required and did not prescribe or micro-manage the project. Given the
uncertainties of production and markets, such flexibility is required if the FPO has to
grow and adapt to changing times.”
“In addition, RBS gave the space to DSC to develop and disseminate Information
Education and Communication (IEC) material such as Divadandi, crop specific booklets,
video films etc. for agriculture extension and promotion of good practices. This is one of
the critical elements often overlooked and not supported by funding agencies.”
The scaling up by Krushidhan would entail a need for modifications in its present systems – financial, HR,
project monitoring and management. As the FPO moves into collective marketing and value addition, it
will need set up a dedicated team to handle market research and marketing of the produce. If it gets
into backward integration for seed production which needs greater technical expertise, it may need to
hire the part-time expertise of a suitable scientist. But these are strategic decisions that the organisation
has to make after evaluating the performance of different pilots and assessing the markets for these
options.
b) Member Satisfaction and Allegiance
Although the study carried out by students of NLRI (GVT) shows very positive results, the professional
team must constantly monitor member satisfaction and strive to increase the value of services provided
to them. The next move of the company will be to establish forward linkages so that farmers realise a
higher price in the market for their produce. When this happens member satisfaction and allegiance is
likely to increase further.
Other ways to improve allegiance is to improve the stakes of the farmer member in the organisation.
This means increasing the share holding per member and establishing a sense of belonging and pride in
the institution. Constant dialogue of the board of directors with common members is a pre-requisite.
The ability of the leadership in creating a shared vision for all members and farmers of the region would
also go a long way in creating higher member allegiance. This is important because when the
organisation faces a backlash from market forces, the professional team should be backed up by the
members. Willingness to forego short term gains in order to ensure the success of the enterprise in the
market place would indicate that the members have truly imbibed the vision and spirit of the company.
c) Increasing shareholders for future growth
Clearly there is a need to improve share-holding if the company is to grow aggressively. The debate on
how to go about it has brought out various considerations that impinge on the design and architecture
of a pyramid institution such as an FPO like Krushidhan. In the short run it would be easy to grow by
expanding the number of villages. However, in the long run this would be difficult for the company as it

86
would be spreading out too thin. This would have implications on the cost of providing services to a
clientele that is spread out over a larger area. Another easy way out would be to make women of all
male members shareholders. This would double the share capital while improve the gender balance at
one stroke. However, most of the staff felt that such a decision may not bring forth gender parity.
Instead it would be better to recruit share-holders from women’s groups that are active. A third
alternative would be to intensify the drive among non-members within the existing project area who
have already tasted the benefits of the company’s services. One way would be to announce schemes
that link provision of shares to the volume of sales. However, this would favour large farmers who tend
to buy more than marginal farmers. Decision making in FPOs becomes very complex because the
management and the board has to constantly balance the economic growth needs with the social
objectives of the company.
In this context, the advice provided by Mr. Arvind Gupta, Ex-Chairperson, KPCL, seems appropriate:
“Expansion must be done in a cost effective way. It has to be charted out. There should be no
compromise on quality and process. New KCs should be set up within the same target area.
The screening process for shareholders should continue to be KC membership and active
participation of farmers.”

87
6.3 Strategic Planning for Next Phase
Mapping of Activities Undertaken by Krushidhan
The framework described in section 3 was used to first map out all the major activities undertaken by
KPCL so far. These activities were further divided into two categories based on their scale viz. a)
mainstream and b) pilot. Table 6-11 provides the mapping of activities.
Table 6-11: Mapping of Activities by KPCL (2015-16)
Stage Mainstream Pilot Remarks
Stage 1: Stabilizing Cost and Production
1) Human Capital-
Input Quality
Orientation
Mobile Soil Testing Services;
awareness about soil health and
sustainability
Farm Demonstrations; exposure
visits; extension activities
Market
Orientation
Wheat processing (cleaning and
grading with machine)
(Good potential for scaling up)
Cleaning, grading (manual) in
Vahariali
Pilot not very successful but
lot of learning took place
Groundnut marketing with NCDX
quality standards
Sustainability
Orientation
Promotion of bio-fertilizers and bio-
pesticides to be produced by
SHGs/producer groups and supplied
locally
2) Social Capital Creation of peoples institutions
starting from SHGs and Kisan Clubs
to KPCL
3) Technology Drip Irrigation Good potential for scaling up
SRI initiated in Vehlal Can be expanded to other
crops
Solar and group fencing Good potential for scaling up
Crop and varietal diversification;

88
Improving seed replacement ratio
through supply of certified seed
Promoting Bio-products and organic
farming
Promoting improved hand tools to
reduce drudgery
Supply of micro-nutrients for better
crop health based on soil testing
reports
4) Asset Building Earlier and on-going work on PIM,
watershed management
Investments in solar and group
fencing, drip irrigation etc.
Stage 2: Understanding and Dealing with Markets
1) Backward
linkages
Supply of quality seeds at farmers’
door-step
Supply of micronutrients, chemical,
pesticides, bio-pesticides and agri-
implements
2) Forward
linkages
Groundnut marketing to government
through NCDX
Vahariaii marketing experiment Not very successful, but
potential exists
Tie-ups with cotton ginners in
Dhari
Moderately successful in
Dhari, but price difference not
significant in other project
areas
Construction of five godowns planned
but not accomplished
Need still exists
Stage 3: Backward and Forward Integration
1) Backward
integration
Production of vermi-compost and bio-
pesticides by SHGs/individual farmers
Certified and Foundation seed
production in wheat and
groundnut
Very successful and needs to
be scaled up; can also
diversify into other crops
2) Forward
integration
Processing of pulses by
women’s SHGs
Potential to scale up through
mechanization and
diversification into processed
food snacks

89
Among other things, the mapping exercise shows that KPCL and DSC are constantly exploring and testing
new ideas which could be scaled up in the near future and help the company to graduate to the next
level. Some of the pilots that were done during LEPNRM –II which have done well and are therefore
worthy of scaling up include:
i) Wheat processing (cleaning and grading with machine)
ii) Drip irrigation to improve both water and land productivity
iii) Solar and group fencing
iv) Certified and foundation seed production, mainly in wheat but also initiated in groundnut
v) Food processing of pulses by women’s SHGs
vi) Expansion of SRI methodology to other crops
Activities which did not work out for some reason or the other but are still worthy of consideration
were:
i) Godown construction could not be taken up due to difficulty in procuring land for the purpose;
however this is an important felt need and must be pursued more vigorously
ii) Vahariali (fennel) processing was not successful manually but can be taken up with proper
machines and technology
Processing of Ideas for Scaling Up
A day-long workshop was organized on the 25thof May, 2016 involving key officers of Krushidhan
Producer Company and all concerned LEPNRM staff of DSC. The complete list of ideas shortlisted during
the meeting is shown in Annexure 2. The participants were divided into two groups, each of which took
up the assessment of 14 business ideas. The criteria used to make the assessment are explained below.
Criteria for Selecting Business Opportunities
• Scalability
What is the potential for scaling up production in the project area?
• Profitability
What is the margin for the FPO? What should be the minimum margin to become economically
viable?
• Entry barriers
What are the entry barriers such as access to technology, markets, capital, trained manpower
etc.? What are the chances that the company can overcome these barriers and make the
business opportunity a success?
• Potential Markets
What is the potential market like and what kind of investments will be needed to actually realise
that market? Is the market highly competitive and saturated or is it growing fast? What are the

chances of getting a foothold
can use tools such as BCGmat
• Strategic Potential
What is the strategic potential
long term goals set out by KP
following stated goals of KPCL
– Self-reliance of small an
– Timely and cost eff
aggregation and plann
– Value addition to pr
arrangement
– Promoting sustainable
– Promoting market ori
• Social Benefits
What are the potential econo
opportunity should be includ
social benefits with econom
assessing opportunities such t
Figure 6-12 Balan
foothold in the market with what kind of market share? KPCL
BCGmatrix in future if enough information on market is avai
potential of the business opportunity? How much will it co
ut by KPCL? How well does the new opportunity contribut
s of KPCL?
of small and marginal farmers in project area
cost effective supply of quality inputs to farmer throu
and planning
n to produce through collective marketing and sustain
stainable agriculture
arket orientation among farmers
ial economic and social benefits to farmer families because
included even if profitability is low? How can the compan
economic viability of KPCL? Figure 6-12 provides a matr
es such that this balance is maintained).
Balancing Act for FPO: Social benefits versus economic viability
90
KPCL management
ket is available.
will it contribute to the
contribute to any of the
er through process of
sustainable marketing
s because of which the
e company balance the
a matrix as a tool for

91
Selected Business Opportunities
For each opportunity the groups came up with clear recommendations which could be any one of the
following:
– Recommended for scaling up as such
– Recommended for pilot testing the idea
– Recommended for feasibility study
– Not recommended in the near future due to XYZ constraints
A three-point scoring system (for high-medium-low) was decided upon giving equal weight to each of
the criteria mentioned above. The activities that scored 10 or less points were selected as a first cut. The
results of the evaluation are summarized in the chart provided in Annexure 2. The selected
opportunities along with rough estimates of the amount of investment needed are indicated in Table
6-12 below.
Table 6-12: Business Opportunities Selected by Workshop Participants
SNo
Business Idea Total Yes ScaleUp
Pilot Study No Reason
1 Seed trading 11 Y Y
2 Wheat / groundnut/ grass Seed Production(truthful/ certified/foundation)
8 Y Y
3 Cotton seed / castor seed production withcompanies
11 Y Y
4 Production of organic seed materials 15 Y Y
5 Production of bio pesticide/fertilisers 9 Y Y
6 Production of trichoderma 12 Y Y
7 Production of liquid nitrogenous fertiliser and liquidmicro nutrient
14 Y Y
8 Production of neem cake/ oil/ trichoderma 10 Y Y
9 Fennel seed processing and by products 10 Y Y
10 Value addition of spices 11 Y Y
11 Market camp of spice selling 17 N competition/unavailability ofmanpower
12 APMC trading 12 Y Y
13 Trading of seeds, and other commodities withother states
11 Y Y
14 Wheat and gram flour production and marketing 10 Y Y
15 Storage facility at cluster level

92
Summary of plans for next phase
As communicated by the Programme Director, in the next phase of LEPNRM, DSC would like to:
• Cover 199 villages reaching out to about 35,000-45,000 farmers
• Increase share capital of the company to about Rs. 45 lakhs
• Build fixed assets viz. land and godown worth Rs. 35-40 lakhs
• Achieve average 12-15 % profit annually to accumulate Rs. 55 lakhs net surplus after tax in next
three years
• Evolve a business model for achieving these targets while making the company financially
sustainable.
93
7 Conclusions and Recommendations
The authors are of the opinion that during Phase II, LEPNRM project has made considerable progress in
terms of improved delivery of extension resulting in significant impacts on sustainability of agriculture in
the targeted regions. An important gain has been the establishment of an FPO with strong backward
linkages resulting in supply of quality agri-inputs in a timely fashion. DSC as a facilitating organisation has
gained valuable experience in promoting a collective enterprise of farmers that has established strong
ownership along with professional management. Financially the company has been profitable while
providing valuable services to the farmer. It appears that the management of the company has made all
the right moves so far and stayed away from the usual pitfalls which such organisations are prone to.
When asessed against eight most important parameters of high growth, successful FPOs identified by
Dr. Tushar Shah (2016), Krushidhan comes out a winner, having followed intuitively all these eight
underlying principles (elaborated in Section 7.2 below). This bodes well for the company.
The authors have taken this opportunity to propose a conceptual model which represents the
underlying ‘theory of change’ of the project. The model underlines the ‘value chain approach’ adopted
by DSC through a multi-tier system of people’s institutions, which goes into three distinct stages. The
model was designed not only to put in perspective the work done by DSC through LEPNRM but also to
provide a roadmap for the future. The framework was used effectively to plan out strategic initiatives
for the third phase of LEPNRM. The report also provides details of the brainstorming session held with
DSC and Krushidhan staff and the selection of most promising activities for Phase III.
This section provides the emerging conclusions and recommendations separately for DSC’s extension
system and for Krushidhan the FPO. As the company makes plans to encourage more and more farmers
within the target area to join the collective movement, a stronger convergence between the efforts of
the extension team and those of the company is envisaged.
7.1 DSC’s Extension System
DSC’s extension system targets 38,500 small and marginal farmers located in five regions of north and
central Gujarat and is therefore organised into five units as per the demands and needs of the regions.
An exercise of mapping the social composition, soil types, irrigation facilities and cropping patterns for
each area and making explicit the relationships between these, was facilitated during the review, so that
the extension teams could plan their future work in a better way. About 6000 of these farmers are
estimated to have taken advantage of the services of the company so far. Only about 2000 of these
farmers have opted to become share-holders of the company. While data was collected separately for
all three categories of farmers, it made more sense to understand the impacts on the sustainability of
agriculture in the region by focusing on specific crops where DSC has made interventions.

94
Characteristics of the sample farmers
• The average per farmer cultivated land is lowest in Meghraj at 1 Ha and highest in Guhai at 2.3 Ha.
About 80 to 100 per cent of this cultivated land across the five project locations is irrigated either
through bore-wells or canal network or both.
Significant changes in the farming systems
• Over the past 3 years, milch animal population has shown a decline in Dharoi, Guhai and Mazum
due to social changes and reduced fodder availability as a result of shift in cropping pattern towards
cash crops.
• Decline in number of draught animals like bullock, ox etc. has also been witnessed, especially in
Dharoi and Guhai where increasing mechanization in agriculture is seen as the primary reason
behind this trend.
• Increase in menace of wild animals like nilgai and wild pig in agriculture has been reported from
across all project locations. Farmers’ efforts to deal with this menace by adopting a range of
different measures have met with varying levels of success. DSC’s extension system has also
responded to this challenge recently by introducing solar fencing and group fencing on a trial basis.
Other adaptations include changes in cropping pattern towards crops that are not attacked by the
ungulates.
• The effects of climate change have been felt in the project area during recent years. Some crops
like wheat are more sensitive to climate change. Adaptations are being made intuitively by farmers
as well as through recommendations from the Agricultural Research Centers located in the area
(particularly the Wheat research center). Chief among these are the adoption of shorter duration
varieties and varieties more suited to higher temperature. Better soil and water management
practices are also recommended.
• The above changes have resulted in an adjusted cropping pattern which was captured as follows:
Cotton and castor are the main Kharif crops in Dharoi, Guhai and Mazum. In Meghraj, cotton and
maize - which is grown in place of castor – are the predominant Kharif crops whereas in Vehlal,
paddy and vegetables are commonly grown. Wheat dominates Rabi season cultivation across all
five project locations while fennel is also grown in Dharoi. In Summer, there is some vegetable
cultivation that is carried out in Vehlal; however, farmers in other locations are not able to take any
crops due to lack of water.
Table 7-1: Percentage of cultivated land under different crops
Kharif Rabi Summer
Project area Cotton Paddy Castor Maize Vegetables Wheat Fennel Vegetables
Dharoi 31 0 26 0 0 18 40 0
Guhai 46 0 38 0 0 50 0 0
Mazum 23 0 35 0 0 35 0 0
Meghraj 37 0 0 40 0 37 0 0
Vehlal 0 49 0 0 21 37 0 17

95
Impact of DSC’s extension services
• DSC’s extension services have had an extremely positive impact in terms of reducing farmers’
expenses on agriculture inputs like seeds, chemical pesticides, fertilisers, weedicides, irrigation
water and labour as well as improving their incomes as a result of higher crop productivity and
better price realisation.
• This impact is seen not just across Kharif but also Rabi and summer crops. Adoption of
recommended seed rates in cotton, hybrid/high yielding variety seeds in maize and vegetables and
SRI in paddy have reduced the quantity of seed required per hectare by 9% in cotton, 47% in maize,
20% in vegetables and 42% in paddy. Similarly, seed requirement has reduced by 10% in wheat and
upto 25% in the case of vegetables. This has resulted in seed expense savings of nearly 90 lakhs at
the project level.
• Use of bio-pesticide among cotton farmers has gone up from 13 litres to 21 litres per hectare – an
increase of 67% - and from 16 litres to 27 litres per hectare in wheat – an increase of 69%. Its use
has also been initiated by farmers in crops like paddy, maize and vegetables for the first time after
the project. Although chemical pesticides still continue to be used for cash crops like cotton and
castor, their gradual substitution with bio-pesticide has reduced the chemical load by 49%, 13%,
11% and 11% in maize, vegetables, paddy and fennel. The reduced requirement of chemical
pesticides as well as the lower cost of bio-pesticide has led to significant farmer savings. The
combined project-level savings resulting from this are almost Rs. 1.15 crores.
• Similarly, adoption of bio-fertilisers such as vermi-compost and FYM has led to a decrease in the
quantity of chemical fertilisers such as urea and DAP in the case of paddy, maize and vegetables by
18%, 11% and 9% respectively. However, due to insufficient N,P,K content and the fact that they
are usually required in bulk quantities, bio-fertilisers remain a less effective replacement for their
chemical counterpart than bio-pesticide. Nevertheless, a reduction of more than Rs. 86 lakhs in
farmer expenses on chemical fertilisers has been witnessed as a result of the project.
• Post-project weedicide usage of farmers has fallen across nearly all crops - by 29% in cotton, 11% in
castor, 58% in paddy, 21% in maize, 20% in vegetables and 11% in wheat. This has been possible
due to adoption of practices such as mulching, preparing modified bed and furrow and
decomposing the FYM before application, which help minimise weed growth. Among chemical
inputs, savings in weedicide expenses of farmers have been most significant to the tune of over Rs.
1.63 crores.
• The project has been able to bring about greater awareness among farmers about using water
more judiciously. This has had a direct impact on the number of waterings required for crops - for
instance, in the case of a water intensive crop like paddy, there has been a reduction of 8 waterings
per hectare before and after the project. Although this reduction may be less spectacular in the
case of other crops, it is a sign that farmers have started making efforts towards using irrigation
water more efficiently.

96
• Along with low-cost methods of water saving and better water management practices, farmers are
also increasingly adopting drip irrigation technology. Over the past 3 years, the proportion of
project farmers installing drip systems has increased from 9% to 19% while in the case of control
farmers, it has decreased from 8% to 5%. This has led to project-level savings due to reduction in
water use of more than Rs. 1.98 crores.
• Labour and miscellaneous (L&M) expenses account for the highest proportion of agriculture input
expense for a farmer. Broadly, L&M expenses have come down in the case of food crops like paddy,
maize and vegetables, in line with reduction in the quantity of seeds and chemical inputs since L&M
expenses are directly proportional to the level of input. Adoption of new agriculture tools and
technology such as chipiyas and drip irrigation by farmers has also played a part in bringing down
these expenses. At the project level, savings of nearly Rs. 76 lakhs have been achieved under this
head.
• Significant differences in productivity have been found between farmers who benefitted from DSC’s
agriculture extension services and those who did not, across all crops surveyed. Higher productivity
and better price realisation on account of cleaning and grading of produce have been the biggest
contributors of economic impact, totaling about Rs. 82 crores at the project level. Approximately
51% of project beneficiaries have undertaken cleaning and grading of produce under the project
and benefitted from average price premiums of Rs. 2/- per kg in wheat, Rs. 5/- per kg in vegetables
and Rs. 13/- per kg in fennel.
• The overall impact of DSC’s extension services has been extremely positive, not just from an
economic but also environmental point of view. The total economic benefit at the project level due
to savings in agriculture input expenses and improved income is nearly Rs. 90 crores which
translates to about Rs. 23,000/- per farmer household. Similarly, the increasing substitution of
chemical inputs with bio-inputs and adoption of water-efficient practices and technologies by
farmers has led to improved soil health and water savings, which have begun to reverse some of
the harmful effects of sustained and excessive use of chemicals in agriculture.
• KPCL plays a central role in the delivery and effectiveness of DSC’s extension efforts, at least in as
far as agriculture input supply in concerned. This is corroborated by the fact that 100% of the
farmers in Himmatnagar and Meghraj, 92% of the farmers in Visnagar and Vehlal and 88% of the
farmers in Modasa claim that input supply has improved after formation of KPCL. The availability of
new variety seeds at fair prices from KPCL outlets has been able to bring down seed failure rates,
improve productivity and ensure higher savings for farmers. Sale of genuine chemical pesticides
and weedicides from the company retail outlets has helped reduce crop damage due to disease and
pest attack. Farmers are now able to buy bio-pesticide, vermi-compost and other bio-inputs such as
trichoderma viride,madhyam etc. from these outlets, bringing down their dependence on chemical
inputs and ensuring better soil and plant health. Also, new agriculture tools and equipment such as
chipiyas, cutters and spray pumps sold through KPCL outlets not only reduce time and effort, but
also the drudgery of labour, helping bring down labour costs.

97
Recommendations for DSC’s Extension System
• Despite the expectation of improved productivity due to adoption of scientific agriculture practices
by farmers as part of the project, yields of cotton, castor and paddy have suffered. This is due to a
variety of factors including adverse weather conditions, disease, pest attack and the growing
menace of wild animals. While little can be done in the case of natural events, dealing with the wild
animal menace needs to be accorded top priority. Although DSC has initiated a few pilots in the
form of group fencing and solar electric fencing, these options will have to be thoroughly evaluated
in terms of their scalability and feasibility in order to come up with an effective long-term solution
to this problem.
• By and large, the agriculture extension information provided by DSC has been well received, with
farmers in each project location deriving varying levels of satisfaction from the different sources of
information. Going forward however, it is important to bear in mind that in order to be more
effective, a bouquet of different sources of information will have to be offered in each project
location, rather than what has been most useful in a particular location. Also, the aim must be to
achieve a minimum rating of ‘3’ or higher for each source of information. The challenge though is
that with very low levels of willingness to pay among farmers, DSC might have to look for other
sources of funding to support its agriculture extension information programme.
• Some of the key suggestions received from farmers to improve usefulness of the extension services
include:
i. Direct procurement of produce by KPCL from the farm-gate
ii. Assistance in grading, packing and marketing of farmers’ produce, especially spices and
vegetables.
iii. Permanent access to services of an agriculture expert
iv. Greater farmer-to-farmer interaction and experience sharing
v. Information on improved seed varieties, latest/low-cost agriculture techniques and available
government subsidies
vi. More emphasis on making farmers aware about the importance of putting agri-related advice
and information to use.
vii. Assistance in carrying out animal husbandry in a scientific manner
viii. Expansion in KPCL’s outreach through increase in its shareholder strength, setting up more Kisan
Clubs and KPCL outlets, encouraging greater women participation and targeting non-member
farmers.
• DSC needs to remodel its extension system to meet the changing needs of farmers in different
project locations. While farmers in newer project locations such as Meghraj and Vehlal want
extension activities to continue to focus on agri advisory information dissemination, package of
practices and knowledge transfer, those in DSC’s traditional project locations such as Visnagar,
Himmatnagar and Modasa seek a higher level of engagement. This may include services such as
assistance in crop diversification, infrastructure in the form of godowns, cold storage facilities etc.,

98
support for marketing of produce and promotion of entrepreneurship among farmers. By offering
differentiated levels of extension services to suit different requirements, DSC will be able to retain
its appeal and relevance among its farmer members.
• In order to maintain and strengthen the network of grassroots-level institutions that form the base
of its extension efforts, DSC needs to encourage membership of Kisan Clubs, bio-pesticide and
vermi-compost groups. According to the primary survey, one of the main reasons for people not
joining these institutions was the absence - and therefore lack of information about activities - of
bio-pesticide/vermi groups and Kisan Clubs. Greater efforts therefore need to be made to set up
more groups/Clubs and increase visibility of the benefits they offer, so that people are able to see
value in becoming a member.
• KPCL is currently at a stage of growth where it is well placed to leverage its inherent strengths for
expanding its membership base. It enjoys huge appeal not just among its member-shareholders but
also non-member farmers who prefer KPCL over other market players, primarily due to the
assurance of quality and fair price of agriculture inputs. Considering that a very small proportion of
the total project beneficiary farmers are KPCL members, there exists a huge potential for scaling up.
To translate this potential into membership, a good starting point will be to consider allowing
payment of KPCL membership fee on an installment basis as suggested by some farmers and
improve visibility/information about KPCL’s activities among non-members to generate their
interest in participation.
7.2 Krushidhan Producer Company
In his research paper published in EPW in Feburary this year, eminent researcher Dr. Tushar Shah,
reviews the state of FPOs in the country. Dr Shah made a disparaging reference to Krushidhan in an
otherwise scholarly and interesting article. We quote from the paper below:
“In Gujarat, DSC and AKRSP formed FPCs of farmers they were working with; but there was
no clarity about how they will grow and become viable.”
This has prompted us to look at the article critically, if only to learn a few lessons from it.
Drawing evidence from the rapid growth of the “new generation milk cooperatives” established by
NDDB three to four years ago, Shah extracts a set of underlying principles that make Milk Producer
Companies (MPCs) successful. It is worth examining these critically to see how far Krushidhan’s
experience meets these criteria (Table 7-2) and what lessons if any it can learn from the experience of
these MPCs.

99
Table 7-2: Assessment of Krushidhan on Eight Principles of Successful MPCs
No. Principles used by high Growth MPCs Krushidhan’s Experience Remarks
1Direct payment of milk price to member’s bank
account to ensure transparency and reduce
transaction cost
This was done during the groundnut
MSP collective marketing exercise
2Use of a sahayog to operate a frugal village-
based milk procurement system in place of the
Dairy Cooperative to ensure transparency, cut
pooling costs, reduce storage and improve
quality
Krushidhan retail outlets are of a similar
nature
3Asset-light business model of owning low fixed
asset and maintaining high asset turnover (i.e.
taking assets on rent)
So far Krushidhan has remained asset-
light by running outlets from low-rent
premises and processing and
packaging of seed on custom hiring
basis
This suggests that taking several godowns
on rent may be a better option than getting
stuck with one or two company owned
godowns which cannot be easily relocated.
However, the assumption here is that such
assets are easily available.
4Low or zero debt capital structure with member
equity dominating capital structure*
So far Krushidhan has followed a zero
debt capital structure with high
contributions from members and KCs
5Working capital generation through continuous
cash generation and limited use of commercial
bank credit
So far Krushidhan has followed this
principle
However, in the seed business it is
compelled to invest in working capital as
this is a precondition for getting high
margins
6Variable cost model that reduces the business
risk of sales slowdown (implies minimal
overheads)
Overheads are minimal as of now as
the staff is supported by DSC and office
is frugal and located in rented premises
7Healthy retention of earnings to build reserves
and net worth to raise credit-worthiness
This has also been practiced by
Krushidhan
8Constant effort to accelerate value addition by
reducing bulk institutional sales and enhancing
branded retail sales
This has been practiced on the
backward linkages side. On the forward
linkage side efforts have been made to
add value through cleaning and grading
of produce. Branded retail sales have
been initiated to a limited extent for
produce made by producer groups and
for certified seed material produced by
farmers themselves.
*However, even MPCs do not seem to have stuck to this principle fully. It may be noted that NDDB provided medium term
loans to all the MPCs, the terms of which are not known. Dr Shah’s article states that Maahi MPC had a seven-year loan of Rs
19.26 crore which was due in 2019 but repaid fully by 2015 in order to reduce the interest burden.
The above analysis shows that Krushidhan has followed almost all the principles for success identified by
Dr. Tushar in his paper. The only major difference between the MPCs and Krushidhan is the scale of

100
operations. This could be because of higher membership per village in the case of milk sector and high
value of milk as a commodity, readily available on a daily basis for sale. The membership in MPCs ranged
from 22,972 in Baani, Punjab to 86,938 in Mahi MPC of Saurashtra and Kutch. In comparison Krushidhan
has been able to reach a membership of only 2000. Hence the key to Krushidhan’s future growth is to
improve the membership in absolute terms as well as ratio of membership/village.
An analysis of business turnover to membership ratio was carried out to examine the relative
performance of Krushidhan with MPCs (Error! Reference source not found.). The table shows that in
general, as the size of the FPO increases, the turnover per shareholder also increases. Hence achieving
scale is important for financial stability. However, this is not universally true and much depends on the
business strategy as well as sector in which business is being done. For instance, Baani with
approximately half the shareholders of Saahaj has achieved a higher turnover than the latter.
Table 7-3: Comparison of Growth Performance with MPCs
ParameterPaayas,
Rajasthan
Maahi,
Saurashtra-
Kutch
Shreeja,
Andhra
Pradesh
Baani,
Punjab
Saahaj,
Uttar
Pradesh
Krushidhan
No of members69,647 86,938 41,292 22,972 44,999 2,035
Business turnover after
three years (Rs million)
5,968 9,793 1,381 868 1,582 10.63
Business turnover per
shareholder
85,689 112,643 33,445 37,785 35,156 5,224
The table shows that the ratio in case of Krushidhan is almost a sixth lower than that of the lowest
among the MPCs. However, it should be noted that there is a qualitative difference between the sales of
Krushidhan and MPCs. Most of its sale has been restricted to inputs rather than outputs. When
Krushidhan gets into collective marketing of outputs, the trunover is bound to increase significantly as
outputs are both bulky and of high value.
This difference has arisen also because Krushidhan works in agriculture with a social mission of making it
environmentally sustainable while ensuring the economic viability of the marginal farmer. This mission
has guided the portfolio of activities in the first three years where creating backward linkages was
considered critical for higher and more sustainable productivity. Also given the diversity of cropping
patterns, Krushidhan has to deal with a diverse portfolio of inputs. The company has therefore been
more in the service sector rather than commodity business, although it did not charge a penny for its
services. The economic benefits derived by farmers due to reduced costs, increased productivity,
reduced risk and increased price realisation are to the tune of nearly Rs. 90 crores. When these as well
as the enviornmental and social gains are factored in, the figures will look more comparable.

101
Recommendations for Krushidhan
In summary, Krushidhan needs to continue its trajectory of growth using a value chain approach while
adhering to the eight principles identified by Dr. Shah. Two factors will enable it to meet its projected
targets; a) increasing its share-holder base and thereby available internal funds for doing business while
simultaneously increasing member allegiance b) getting into building collective marketing of produce
through aggregation, cleaning and grading, storage, market information based selling, value addition
and whatever needs to be done to get the farmer a better price for her or his produce. At the same time
DSC will need to make its extension services more aligned and synchronised with the activities of the
company so that members perceive greater benefits and experience greater loyalty to the company,
which is so crucial for collective action.
Some of the issues related to governance and management of the company being faced by the board
and facilitators from DSC were discussed in the report. The possible solutions/ recommendations for
these are listed below:
i) Augmenting storage facility:
Past efforts of KPCL to procure godowns for its commercial activities did not meet with success.
However, looking at the future plans of expansion as well as the need to invest in assets, KPCL will
need to intensify its efforts to procure/ build godowns at central places.
DSC may like to explore the support of donor agencies or government for the purpose. It was felt
that centers located at cross-roads which can be easily accessed by farmers from maximum number
of villages in a given region would be ideal to set up sub-centers in different regions. These sub-
centers could include minimal storage facilities, office and training center, retail outlets for supply
of agri-inputs as well as other commodities that the farming communities need etc.. Keeping in
view Dr Shah’s recommendation, additional godown space could be taken on rent depending on
the need.
ii) Use of economic incentives to increase share-holding:
Clearly there is a need to improve share-holding if the company is to grow aggressively. The debate
on how to go about it has brought out various considerations that impinge on the design and
architecture of a pyramid institution such as an FPO like Krushidhan.
Using economic incentives such as retaining 5% of sales proceeds as member deposit to raise
capital has been suggested as done by Mulukanoor Women’s Cooperative Dairy Union. However,
judicious use of such instruments is called for so as to balance economic growth with social equity
and justice.

102
As suggested by Mr. Arvind Gupta, expansion must be done in a planned and cost effective way.
There should be no compromise on quality and process. New KCs should be set up within the same
target area. The screening process for shareholders should continue to be KC membership and
active participation of farmers
iii) Leadership issues:
After his retirement, the Board of KPCL was not able to identify a suitable person to fill the shoes of
the previous chairperson from within. The Board in its wisdom decided not to have a permanent
Chairman. It was decided that the Board meetings would be chaired by temporary Chairpersons
appointed separately for each meeting.
By default, the leadership is being provided by the present CEO and Programme Director, DSC who
has been mentoring and guiding both the professional staff as well as the elected representatives.
Hence the model of leadership adopted by Krushidhan and DSC is one of Intrapreneurship which
also happens to be the model adopted by Dr. Kurien when he retained the position of secretary of
Gujarat Milk Marketing Federation. The role of leadership is to maintain the balance between
professional staff and elected representatives, between business and social goals. Under the
Intrapreneurship model, an enlightened professional plays this role until such time that the local
leadership matures enough to take it up.
This model requires hand-holding of the Board over a long time frame. The nature of support
changes gradually from hand-holding to becoming a friend, philosopher and guide, as the
leadership of the elected representatives matures over time. Both DSC and RBS Foundation
recognize that their commitment to Krushidhan should be a long-term one. This is what separates
Krushidhan from other FPOs which are left to fend for themselves after the initial package of
support is exhausted. However, it is imperative to identify an internal candidate to assume
leadership as a ‘headless’ organization can give the wrong psychological message to the ordinary
members of the company as well as to outsiders.
iv) Improving member allegiance:
There is a need to constantly increase the member allegiance and loyalty in a collective enterprise
that has to deal with market forces and win.
Some of the known ways to achieve this is to improve the stakes of the farmer members in the
organisation. This means increasing the share-holding per member and establishing a sense of
belonging and pride in the institution. Constant dialogue of the board of directors with common
members is a pre-requisite. The ability of the leadership in creating a shared vision for all members
and farmers of the region would also go a long way in creating higher member allegiance. This is
important because when the organisation faces a backlash from the market forces, the professional
team should be backed up by the members. Willingness to forego short term gains in order to

103
ensure the success of the enterprise in the market place would indicate that the members have
truly imbibed the vision and spirit of the company.
v) Re-organisation of professional staff:
Given the fact that in the next phase, the company is likely to move into commodity marketing and
value addition in a big way, the product mix will undergo a major shift. Establishing forward
linkages in different sub-sectors such as food grains, cash crops and spices etc will not be easy and
call for at least one more full time manager for marketing. Internal reorganisation would also be
needed to reflect the changing portfolio of products.

104
Annexures
Annexure 1
Questionnaire for Sample Survey
hTi\D�da±�ĕha�_
LEPNRM�sȐƈNWh�ZjĤ�SZïhWh�X�^Rh\��9ƠXpƈN(ની આકારણી
Sh^�E: _______________ da±�D^Wh^ȵk5�Wh\: _______________________________
sȐƈNȵk5�ƨT`�: ધરોઇ ��ƈ_ƨN^: ______________________ગામ: ___________________
ભાગ 1: dh\hƛ]�\h�eSj
1. EpȮlSȵk5�Wh\ _______________________________________________________________
2. d5XD½�\hN°Ws�YsW�W5Z^ _______________________________
3. EpȮlSWs�aF½� �Dh^ :
i . Ȣmic�VW��eƨdh�Vh^D i i__________ . �DdhW�ƈ_ZWh�dƟ]�Jp�XR��eƨdh�Vh^D�WTj _______
i i i . dh\hƛ]�EpȮlS�_____________

105
4. EpȮlSWj�K\jWWj�iaFSs� )વીઘામા(
i . EpSj�e°O`Wj� )ખડાણની(Ȣk_�K\jW _________________
Ȑ\h5Tj i i . id��IS�K\jW� i i i__________________ . �ZW �id� �IS�K\jW� _________________
5. S\h^h�X�^ah^Wj�\h�_D�Wh5�ȳlVh`h5�XɃkB� )ગાય ,[Ҫd(ની d5Ɖ]h�KRhas
i . 3 acҴ�Xe°_h5� i i______________________ . હાલ _________________________
6. S\h^h�X�^ah^Wj�\h�_D�Wh5�[h^ahe��hRjB� )બળદ ,પાડો(Wj�d5Ɖ]h�KRhas.
i . 3 acҴ�Xe°_h5� i i______________________ . હાલ _________________________
i7. . Ƀk5�S\h^h EpS^\h5�K 5F_j�hRjB� )નીલ ગાય ,K 5F_j�Ȯkï^�aFp °(Ws�;Xa�Jp ? હા/ના ______
i i . જો હા ,Ss�Ƀk5�Jpƣ_h�R�Ih^�ac½\h5�8�;Xa�BJs�T]s�Jp ? ?N_sWp�?N_s�K�^Ĝs�Jp? D°�aƚ]s�
છ?
a. ઓછો થયો છ b________________ . એટલો જ છ c______________ . aƚ]s�Jp _____________
8. 8�;Xa�ȳl^�D^ah�\hN°�S\p�D]h5�XF_h5�[]h¿�Jp?
IjKaƨȱ k ઘણા જ
અસરકારક
7ȺkD�Ӕbp�
અસરકારક
અસરકારક
નથીi aW�ia[hF\h5�Y�^]hU�WҭVhaj�Jpii Lp^Ws�;X]sF�D]Ҵiii ȑiaD�K 5ȱ kWhbDWs�;X]sF�D]Ҵiv ȢkU^Sj�Y°�ƛd�F� �ahP�Ws�;X]sF�D]Ҵv ah]^�Y°�ƛd�F� �ahP�Ws�;X]sF�D]Ҵvi 9_p�ƈ˼D�Y°�ƛd�FWs�;X]sF�D]Ҵ
vi i 7RF\s�XpUh�D °�Spaj�DhXPWj�ahP

106
ભાગ 2 - E^�Y�XhDWj�iaFSs
કપાસ
9. iaƨSh^� �વીઘામા( __________________________
10. કપાસ \hN°Ws�S\h^s�8FS�EI½�WjIp�Ubh½as:
IjKaƨȱ k એકમ 3ac½�Xe°_h5 હાલ
1 �Z]h^R ˴h\/વીઘા
2 D°\jD_�Y�N�_h9L^� �^hdh]�RD�EhS^ EI½� �Į� /વીઘા(
3 ^hdh]�RD�K 5ȱ kWhbD EI½� �Į� /વીઘા(
4 ȑiaD�K 5ȱ kWhbD લીટર/વીઘા
5 ȑiaD�EhS^� �JhR��a\��DƠXsƨN�aFp ° �D˴h/વીઘા
6 WӄUR�ȳl^�D^ah�\hN°Wj�Uah EI½� �Į� /વીઘા(
7 id�Ih:
અ D°Wh_ XhRj�8Xɂk5/વીઘા
બ બોરવલ/Ȣlas X�ƠX�FWh�D_hD/વીઘા
8 \ȩl^��EI½� �ahaRj��ƨ pWs�J5NDha��ƨ pӖF��
XhRjWs�J5NDha ��_RRj�aFp °�d�eS
EI½� �Į� /વીઘા(
9 7ƛ]�EI½� �Ȑ\�D°�K\jW�Sq]h^�D^aj��°˼ƈN^��
રોટાવટર, pb^ȵk5�[hȮk 5�aFp °(
EI½� �Į� /વીઘા(
11 . કપાસȵk5�ajGhU�O�d °^hb�;ƗXhUW
i. 3ac½�Xe°_h5....................................... ii . હાલ .......................................
12.i. dh\hƛ]�acҴWj�d^Eh\Rj\h5�8�ac½ȵk5�;ƗXhUW�
a. dh\hƛ]�D^Sh5�BĠ5�^ɖk5�.......................................
b. dh\hƛ]�^ɖk5�.......................................
c. dh\hƛ]�D^Sh5�aȴk�^ɖk5�.......................................
ii. Ks�dh\hƛ]�D^Sh5�BĠ5�^ɖk5�es] ,Ss�Spȵk5�Dh^R�KRhas_______________________________

107
13 . કપાસ \hN°�S\p�D°N_j��D�\S�\p`aj�bðh� �ĮiX]h�iS�\R )
i. 3ac½�Xe°_h5....................................... ii . હાલ .......................................
14 . કપાસ માથી તમ કઈ આડ પદાશ મળવો છો?.......................................
15. Ɨ]pD�ajGhU�O�8P�XpUhbȵk5�d °^hb�;ƗXhUW
ii. 3ac½�Xe°_h5....................................... ii . હાલ .......................................
16. 8P�XpUhb\h5Tj�TSj�d °^hb�8aD
i. 3ac½�Xe°_h5....................................... ii . હાલ .......................................
17. EpS^\h5�;X]sF\h5�_pah]p_h��Z]h^RWs�Dh^
i. ƨThiWD��Z]h^R�����������������������������
ii. \5ȩl^��hƜS�ȤkRaĂhȻkƈS��Z]h^R�............................
iii. S\p�D°N_h5�acҴTj�8��Z]h^R�વાપરો છો?............................
iv. S\p�Jpƣ_p�ðh °��Z]h^R�ZUƣȻk5�eȱ k5?............................
�Uap_j
���� iaƨSh^� �વીઘામા................................ (
19. �Uap_j \hN°Ws�ajGhU�O�8FS�EI½�WjIp�Ubh½as6-
IjKaƨȱ k એકમ 3ac½�Xe°_h5 હાલ
1 �Z]h^R ˴h\/વીઘા
2 D°\jD_�Y�N�_h9L^� �^hdh]�RD�EhS^ EI½� �Į� /વીઘા(
3 ^hdh]�RD�K 5ȱ kWhbD EI½� �Į� /વીઘા(
4 ȑiaD�K 5ȱ kWhbD લીટર/વીઘા
5 ȑiaD�EhS^� �JhR��a\�� DƠXsƨN�aFp ° �D˴h/વીઘા
6 WӄUR�ȳl^�D^ah�\hN°Wj�Uah EI½� �Į� /વીઘા(

108
20. �Uap_jȵk5�ajGhU�O�d °^hb�;ƗXhUW
i. 3ac½�Xe°_h5....................................... ii . હાલ .......................................
21. i . dh\hƛ]�acҴWj�d^Eh\Rj?�8�ac½ȵk5�;ƗXhUW� )ઉપજ(
અ .dh\hƛ]�D^Sh5�BĠ5�^ɖk5.......................................
બ .dh\hƛ]�^ɖk5.......................................
ક .dh\hƛ]�D^Sh5�dhĮ5�^ɖk5.......................................
i i ��Ks�dh\hƛ]� D^Sh5�BĠ5�^ɖk5�es] ,તો ત પાછળના કારણો જણાવો_________________________
______________________________________________________________________________
22. �Uap_j \hN°�S\Wp�\`Sj��D�\S� �ĮiX]h�iS�\R�U�O
i. 3ac½�Xe°_h5....................................... ii . હાલ .......................................
23. �Uap_j માથી તમ કઈ આડ પદાશ મળવો છો?.......................................
24. 8P�XpUhbȵk5�ajGhU�O�d °^hb�;ƗXhUW
i. 3ac½�Xe°_h5....................................... ii . હાલ .......................................
25. 8P�XpUhb\h5Tj�TSj�d °^hશ આવક
i. 3ac½�Xe°_h5....................................... ii . હાલ .......................................
26. EpS^\h5�;X]sF\h5�_pah]p_h��Z]h^RWs�Dh^
I . ƨThiWD��Z]h^R�����������������������������
I I . \5ȩl^��hƜS�ȤkRaĂhȻkƈS��Z]h^R�............................
I I I . S\p�D°N_h5�acҴTj�8��Z]h^R�ahX^s�Js?............................
I V. S\p�Jpƣ_p�ðh °��Z]h^R�ZUƣȻk5�eȱ k5?............................
7 id�Ih:
અ D°Wh_ XhRj�8Xɂk5/વીઘા
બ બોરવલ/Ȣlas X�ƠX�FWh�D_hD/વીઘા
8 \ȩl^��EI½� �ahaRj��ƨ pWs�J5NDha��ƨ pӖF��
XhRjWs�J5NDha ��_RRj�aFp °�d�eS
EI½� �Į� /વીઘા(
9 7ƛ]�EI½� �Ȑ\�D°�K\jW�Sq]h^�D^aj��°˼ƈN^��
રોટાવટર, pb^ȵk5�[hȮk 5�aFp °(
EI½� �Į� /વીઘા(

109
ભાગ 3 - રિવ પાકની િવગતો
GӘ
���� iaƨSh^� �વીઘામા(.........................................
���� GӘ \hN°Ws�S\h^s�ajGhU�O�8FS�EI½�WjIp�KRhas
���� GӘȵk5�ajGhU�O�d °^hb�;ƗXhUW� )મણ(
i. 3ac½�Xe°_h5....................................... ii . હાલ .......................................
30.i. dh\hƛ]�acҴWj�d^Eh\Rj\h5�8�ac½ȵk5�;ƗXhUW�
અ .dh\hƛ]�D^Sh5�BĠ5�^ɖk5...........................
બ .dh\hƛ]�^ɖk5...........................
D ��dh\hƛ]� D^Sh5�dhĮ5�^ɖk5�...........................
ii. Ks�dh\hƛ]�D^Sh5�BĠ5�^ɖk5�es] ,તો તના કારણો જણાવો ________________________________
_____________________________________________________________________________
IjKaƨȱ k એકમ 3ac½�Xe°_h5 હાલ1 �Z]h^R ˴h\/વીઘા2 D°\jD_�Y�N�_h9L^� �^hdh]�RD�EhS^ EI½� �Į� /વીઘા(3 ^hdh]�RD�K 5ȱ kWhbD EI½� �Į� /વીઘા(4 ȑiaD�K 5ȱ kWhbD લીટર/વીઘા5 ȑiaD�EhS^� �JhR��a\��DƠXsƨN�aFp ° �D˴h/વીઘા6 WӄUR�ȳl^�D^ah�\hN°Wj�Uah EI½� �Į� /વીઘા(7 id�Ih:અ D°Wh_ XhRj�8Xɂk5/વીઘાબ બોરવલ/Ȣlas X�ƠX�FWh�D_hD/વીઘા8 \ȩl^��EI½� �ahaRj��ƨ pWs�J5NDha��ƨ pӖF��
XhRjWs�J5NDha ��_RRj�aFp °�d�eSEI½� �Į� /વીઘા(
9 7ƛ]�EI½� �Ȑ\�D°�K\jW�Sq]h^�D^aj��°˼ƈN^��રોટાવટર, pb^ȵk5�[hȮk 5�aFp °(
EI½� �Į� /વીઘા(

110
���� GӘ�\h5Tj�S\Wp�\ p_j��D�\S� �ĮiX]h�iS�\R
i. 3ac½�Xe°_h5....................................... ii . હાલ .......................................
���� GӘ�માથી તમ કઈ આડ પદાશ મળવો છો?.......................................
33. 8P�XpUhbȵk5�ajGhU�O�d °^hb�;ƗXhUW� )મણ(
i. 3ac½�Xe°_h5....................................... ii . હાલ .......................................
34. 8P�XpUhb\h5Tj�TSj�d °^hb�8aD� �Į� /વીઘા(
i. 3ac½�Xe°_h5....................................... ii . હાલ .......................................
35. ખતરમા ઉપયોગમા _pah]p_h��Z]h^RWs�Dh^I . ƨThiWD��Z]h^R�����������������������������
I I . \5ȩl^��hƜS�ȤkRaĂhȻkƈS��Z]h^R�............................I I I . S\p�D°N_h5�acҴTj�8��Z]h^R�ahX^s�Js?............................I V. S\p�Jpƣ_p�ðh °��Z]h^R�ZUƣȻk5�eȱ k5?............................
a^�]h`�
���� iaƨSh^� �વીઘામા........................... (
���� a^�]h`��\hN°Ws�S\h^s�ajGhU�O�8FS�EI½�WjIp�KRhas�-
IjKaƨȱ k એકમ 3ac½�Xe°_h5 હાલ1 �Z]h^R ˴h\/વીઘા2 D°\jD_�Y�N�_h9L^� �^hdh]�RD�EhS^ EI½� �Į� /વીઘા(3 ^hdh]�RD�K 5ȱ kWhbD EI½� �Į� /વીઘા(4 ȑiaD�K 5ȱ kWhbD લીટર/વીઘા5 ȑiaD�EhS^� �JhR��a\��DƠXsƨN�aFp ° �D˴h/વીઘા6 WӄUR�ȳl^�D^ah�\hN°Wj�Uah EI½� �Į� /વીઘા(7 id�Ih:અ D°Wh_ XhRj�8Xɂk5/વીઘાબ બોરવલ/Ȣlas X�ƠX�FWh�D_hD/વીઘા

111
���� a^�]h`�ȵk5�ajGhU�O�d °^hb�;ƗXhUW� )મણ(
i. 3ac½�Xe°_h5�....................................... ii . હાલ .......................................
39.i. dh\hƛ]�acҴWj�d^Eh\Rj\h5�8�ac½ȵk5�;ƗXhUW�
અ .dh\hƛ]�D^Sh5�BĠ5�^ɖk5...........................
બ .dh\hƛ]�^ɖk5...........................
ક .dh\hƛ]�D^Sh5�dhĮ5�^ɖk5...........................
ii. Ks�dh\hƛ]�D^Sh5�BĠ5�^ɖk5�es] ,તો તના કારણો જણાવો ________________________________
_____________________________________________________________________________
���� a^�]h`��\hN°�S\Wp�\ p_j��D�\S� �ĮiX]h�iS�\R
i. 3ac½�Xe°_h5....................................... ii . હાલ .......................................
���� a^�]h`��માથી તમ કઈ આડ પદાશ મળવો છો?.......................................
42. 8P�XpUhbȵk5�ajGhU�O�d °^hb�;ƗXhUW
i. 3ac½�Xe°_h5....................................... ii . હાલ .......................................
43. 8P�XpUhb\h5Tj�T]p_j�d °^hb�8aD
i. 3ac½�Xe°_h5....................................... ii . હાલ .......................................
44. EpS^\h5�;X]sF\h5�_pah]p_h��Z]h^RWs�Dh^
I . ƨThiWD��Z]h^R�����������������������������
I I . \5ȩl^��hƜS�ȤkRaĂhȻkƈS��Z]h^R�............................
I I I . S\p�D°N_h5�acҴTj�8��Z]h^R�ahX^s�Js?............................
I V. S\p�Jpƣ_p�ðh °��Z]h^R�ZUƣȻk5�eȱ k5?............................
8 \ȩl^��EI½� �ahaRj��ƨ pWs�J5NDha��ƨ pӖF��XhRjWs�J5NDha ��_RRj�aFp °�d�eS
EI½� �Į� /વીઘા(
9 7ƛ]�EI½� �Ȑ\�D°�K\jW�Sq]h^�D^aj��°˼ƈN^��રોટાવટર, pb^ȵk5�[hȮk 5�aFp °(
EI½� �Į� /વીઘા(

112
ભાગ 4 - <Whį�XhDWj�iaFSs
45.i�� <Whį�XhD���������������������������� ii�� iaƨSh^� �વીઘામા........................... (
���� <Whį�XhD ��� \hN°Ws�S\h^s�ajGhU�O�8FS�EI½�WjIp�KRhas6-
47. <Whį�XhDȵk5�ajGhU�O�d °^hb�;ƗXhUW
i. 3ac½�Xe°_h5....................................... ii . હાલ .......................................
48.i. dh\hƛ]�acҴWj�d^Eh\Rj?�8�ac½ȵk5�;ƗXhUW
અ .dh\hƛ]�D^Sh5�BĠ5�^ɖk5.....................................
બ .dh\hƛ]�^ɖk5.............................
ક .dh\hƛ]�D^Sh5�dhĮ5�^ɖk5.................................
ii. Ks�dh\hƛ]�D^Sh5�BĠ5�^ɖk5�es] ,તો તના કારણો જણાવો ____________________________
IjKaƨȱ k એકમ 3ac½�Xe°_h5 હાલ
1 �Z]h^R ˴h\/વીઘા
2 D°\jD_�Y�N�_h9L^� �^hdh]�RD�EhS^ EI½� �Į� /વીઘા(
3 ^hdh]�RD�K 5ȱ kWhbD EI½� �Į� /વીઘા(
4 ȑiaD�K 5ȱ kWhbD લીટર/વીઘા
5 ȑiaD�EhS^� �JhR��a\��DƠXsƨN�aFp ° �D˴h/વીઘા
6 WӄUR�ȳl^�D^ah�\hN°Wj�Uah EI½� �Į� /વીઘા(
7 id�Ih:
અ D°Wh_ XhRj�8Xɂk5/વીઘા
બ બોરવલ/Ȣlas X�ƠX�FWh�D_hD/વીઘા
8 \ȩl^��EI½� �ahaRj��ƨ pWs�J5NDha��ƨ pӖF��
XhRjWs�J5NDha ��_RRj�aFp °�d�eS
EI½� �Į� /વીઘા(
9 7ƛ]�EI½� �Ȑ\�D°�K\jW�Sq]h^�D^aj��°˼ƈN^��
રોટાવટર, pb^ȵk5�[hȮk 5�aFp °(
EI½� �Į� /વીઘા(

113
49. <Whį�XhD\h5Tj�\`Sj��D�\S� �ĮiX]h�iS�\R
i. 3ac½�Xe°_h5....................................... ii . હાલ .......................................
50. <Whį�XhD�\h5Tj�S\p�D:�8P�XpUhb�\p`as�Js?.......................................
51. 8P�XpUhbȵk5�ajGhU�O�d °^hb�;ƗXhUW
i. 3ac½�Xe°_h5....................................... ii . હાલ .......................................
52. 8P�XpUhb\h5Tj�TSj�d °^hb�8aD
i. 3ac½�Xe°_h5....................................... ii . હાલ .......................................
53. EpS^\h5�;X]sF\h5�_pah]p_h��Z]h^RWs�Dh^
I . ƨThiWD��Z]h^R�����������������������������
I I . \5ȩl^��hƜS�ȤkRaĂhȻkƈS��Z]h^R�............................
I I I . S\p�D°N_h5�acҴTj�8��Z]h^R�ahX^s�Js?............................
I V. S\p�Jpƣ_p�ðh °��Z]h^R�ZUƣȻk5�eȱ k5?............................
ભાગ 4 - Ze°S^�ƥ]aƨThXW�\hN°Wh5�XF_h5�7XWhaah5�
54.i. sȐƈNWh�X�^Rh\ĮXp�S\p�id�Ih:ȵk5�XhRj�ZIhaah�\hN°�S\p�Ds:�]ƗW�D]Ҵ�Jp? હા/ના _____
ii . જો હા ,તો િવગતો આપો _________________________________________________________
55.i.3ac½�Xe°_h5Ws�NXD�id�Ih:�e°O`Ws�EpS^Ws�iaƨSh^ )વીઘા........................... (
ii. eh_\h5�NXD�id�Ih:�e°O`Ws�EpS^Ws�iaƨSh^� )વીઘા........................... (
���� NXD�XćiSWs�;X]sF�D^�Wp�S\p�D°N_h�aVh^hWh�iaƨSh^Wj�id�Ih:�D^��bðh�Js?....................
57.i. R�ac½�Xe°_h5�Ihd�id�Ih:�e°O`Ws�EpS^Ws�iaƨSh^� )વીઘામા........................ (
ii. eh_\h5�Ihd�id�Ih:�e°O`Ws�EpS^Ws�iaƨSh^� )વીઘામા........................... (

114
58.i. sȐƈN\h5�KsPhSh5�Xe°_h5�S\p�S\h^��K\jWȵk5�X^�ëR�D^haSh�eSh? હા/ના ..................
ii . જો હા ,ðh5Tj�D^haSh�eSh ? ...........................
59. Ƀk5�sȐƈN\h5�KsPh]h�7Fh;�S\p�ȑiaD�K 5ȱ kWhbD�7Wp�a\��DƠXsƨN�D°aj�^�Sp�Sq]h^�D^ɂk5�Sp�iabp�
ĤRSh�eSh? હા/ના ...........................
60. Ƀk5�sȐƈN\h5�KsPh]h�7Fh;�S\p� )U�ap_ȵk5�EP,S\hȢkWh5�Zj�7Wp�_ӄZs`�Wh5�YsS^h5�aFp °\h5Tj�
બનાવવામા આવતા(ȑiaD�EhS^�iabp�ĤRDh^��V^haSh�eSh ? હા/ના ................................
61. Ƀk5� sȐƈN\h5� KsPh]h� ZhU� S\p� Ds:� XR� Dh^Wh� ^dh]RsWs� ;X]sF� D]h½� iaWh� Ds:� XhDȵk5�
;ƗXhUW�DȻk¿�Jp? હા/ના ............................
જો હા તો ,
I . XhDȵk5�Wh\�............................
I I . D°N_h�ajGh\h5�............................
62. i . Ƀk5� sȐƈN\h5� KsPh]h� ZhU� S\p� XhD� D^\h:� KahWh� ^sFWp� iW]5iS� D^ah� \hN°� ˼h9DsP\h½�
ah9^h9PWs�;X]sF�bĮ�D]Ҵ�Jp? હા/ના .........................
i i . જો હા ,Ss�Sp�D°N_j�7d^Dh^D�^e��Jp ?
અ .ઘણી અસરકારક ............................
બ .7ȺkD�Ӕbp�7d^Dh^D............................
ક .અસરકારક નથી ............................
63.iɃk5�sȐ ƈN\h5�KsPh]h�ZhU�K 5ȱ kBWp� iW]5iS�D^ah�\hN°�S\p�_j\PhWh�Sp_Ws�;X]sF�bĮ�D]Ҵ�
છ? હા/ના.....
i i જો હા તો ,8�;X]sF�D°N_s�7d^Dh^D�WjaPÈs�Jp ?
અ .ઘણો જ અસરકારક ............................
બ .7ȺkD�Ӕbp�7d^Dh^D............................
ક .અસરકારક નથી

115
64.iɃk5�sȐƈN\h5�KsPh]h�ZhU�K 5ȱ kBWp� iW]5iS�D^ah�\hN°�Xj`h�IjDRh�XhNhWs�;X]sF�bĮ�D]Ҵ�
છ? હા/ના.....
i i જો હા ,Ss�8�;X]sF�D°N_s�7d^Dh^D�^Ĝs�Jp ?
અ .ઘણો અસરકારક ............................
બ .7ȺkD�Ӕbp�7d^Dh^D............................
ક .અસરકારક નથી ............................
65.iɃk5�sȐƈN\h5�KsPh]h�ZhU�S\p�S\h^h�EpS^\h5�Ʌ lǛ\�XscRWs)Ȑ\�D°�LӄD,dƣY^�aFp ° (ઉપયોગ
bĮ�D]Ҵ�Jp? હા/ના ...........................
i i જો હા તો ,XhD�X^�SpWj�Ƀk5�7d^�T:�Jp ?_______________________________________
66.i. Ƀk5� sȐƈN\h5� KsPh]h� ZhU� S\p� ;ƗXhUW� )ઉપજ(ની સફાઈ /˴p�P�FWj� Dh\Fj^�� bĮ� D^�� Jp?
હા/ના_______
i i જો હા ,Ss�D]h�XhD�\hN°�8�Dh\Fj^��D^s�Js ? _______________________________________
67.i . Ƀk5�dYh:� ��ƈ_WӄF / ˴p�P�FWp�XF_p�S\Wp�\`Sj� )ઉપજની (�D�\S\h5�Ds:�Y°^�XPÈs�Jp ? હા/ના
___________
i i . જો હા ,Ss�ĮiX]h�iS�\R�\h5�Ƀk5�Y°^�XPÈs�Jp ? _______________________________________

116
ભાગ 5 - sȐƈNWj�Dh\Fj^�Wj�7d^Dh^DSh
68. P�?ddj�XhdpTj�\ p_j�\h�eSjWj�;X]s�FSh
\h�eSjWs�sS ;X]s�FShWs� ˲\� �°ƛD�� °ƛD��� = �Z_Ȣk_� BJ��
7d^Dh^D ��°ƛD��� = ȣ lZ�7d^Dh^D
1 મોબાઇલ એસએમએસ
2 ĤȤmiS�7�[]hW
3 EpȮlSsWj�ZpOD/ Dh]½�ib�Z^/તાલીમ
4 પરા aD½d½/�P�?ddj�ƨNhY
5 iƛN� dh\˴j� ��XpƠƝ_pd� �XhD� \hN°Wj� \h�eSj�
ȶk�ƨSDh ��U�ahUh5P���EpȮlS�Ph]^��aFp °
6 ajP�]s��Yƣ\
7 ?ƈƨXsL^�ia�LN
69. P�?ddj�S\Wp�Ȑ�\h�eSj�ȶ l ��XhP°�Jp�SpWj�;X]s�FSh\h5�D°aj�^�Sp�ɅkVh^s�_haj�bDh]�Sp� iabp�
S\h^h5�Ʌ lIWs�KRhas�____________________________________________________________
70.i. Ƀk5�8�\h�eSj�\hN°�S\p�WhRh5�ȧ lDaah�:ƍJs�Js? હા/ના ...........................
i i .જો હા ,Ss�U^�\�eWp�aȴk\h5�aȴk�D°N_j�^D\�S\p�ȧ lDaj�bDbs ? ........................................
71.i . Ƀk5�S\p�a\��DƠXsƨNȵk5�;ƗXhUW�D^Sh�ȩlTWh�dƟ]�Js? હા/ના ...................................
i i . જો ના ,Ss�S\p�bh�\hN°�dƟ]�W�Zƛ]h ? _______________________________________
72.i . Ƀk5�S\p�\dh_hȵk5�;ƗXhUW�D^Sh�ȩlTWh�dƟ]�Js? હા/ના .................................
i i .જો ના ,Ss�S\p�bh�\hN°�dƟ]�W�Zƛ]h ? ________________________
73.iɃk5�S\p�ȑiaD�K 5ȱ kWhbD�;ƗXhUW�ȩlTWh�dƟ]�Js ? હા/ના .................................
i i જો ના ,Ss�S\p�bh�\hN°�dƟ]�WTj�Zƛ]h ? ____________________________

117
74. Ƀk5�S\p��DdhW�ƈ_ZWh�dƟ]�Js? હા/ના .................................
75 . જો ના ,Ss�S\p�bh�\hN°�dƟ]�W�Zƛ]h ? __________________________________
WҭV6�ĕ� �������YƈS��DdhW�ƈ_ZWh�dƟ]sWp�K�ȶ lJah
76. �DdhW�ƈ_ZWj�^IWh�D]h�ac±�D^ah\h5�8aj�eSj? .................................
77. S\p�D°N_h�d\]Wh�ӔS °�\`s�Js?
અ .U^�7Oah�P]p ............................. બ .Zp�7Oah�P]p�?D�ah^ .................................
ક .U^�\�eWp ................................. ડ .U^�R�\�eWp .................................
78. S\h^���DdhW�ƈ_Z�D:�D:�ɂ miĂB�ehT�V °�Jp?
ɂ miĂB હા/ના િવગતો
1 બચત અન િધરાણ
U^�\�eWp�ZIhaah\h5�8aSj�^D\
Ȣk_�ZIS
Ƀk5�ӕS�^D�iV^hR�bĮ�D^ah\h5�8ƥȻk5�Jp?
2 EpȮlSs�\hN°�?ƈdXsL^�ia�LN
ðh5� ��ƨThiWD�D°�7ƛ]��Kƣ_h\h5 ?
IhajĮX�ibëR� �ĤRDh^�
3 �^dI½� �d5bsVW�ƨN°bW�dhTp�KsPhR
DȻk5��^dI½�ƨN°bW?
KsPhRȵk5�X�^Rh\
4 ZĤ^�dhTp�KsPhR
apXh^Wj�IjKaƨȱ k� �Ds\s�PN�
Ƀk5�S\Wp�aȴk�dh^���D�\S�\ p �Jp?
118
5 આગત ȶk aOs - KƘThZ5V�E^�U�
D:�IjKaƨȱ k�\hN°?
D°N_h�d\]Wh�ӔS °?
6 બીજ ;ƗXhUW KƊ]h (જમીન)
apXh^Wj�IjKaƨȱ k� �Ds\s�PN�
ac½ દરિમયાન ;ƗXW D °_
બીજ નો KƘTs
79.i �DdhW�ƈ_ZWj�D:�ɂ miĂ�S\Wp�dtTj�aȴk�;X]sFj�KRh]�Jp? .................................
i i . bh�\hN°? .................................
80.i Ƀk5�S\p�Ȣmic�VW�;ƗXhUW�D5XWjWh��eƨdhVh^D�dƟ]�Js? હા/ના .................................
i i . જો ના ,Ss�bh�\hN°�S\p�dƟ]�W�Zƛ]h ?
અ .dƟ]XU�\hN°Wj�Y��WTj�ȧ lDaj�bDSs ......................... Z � ��DdhW� ƈ_ZWs� dƟ]� WTj�
.................................ક .Ȣmic�VWWj�ɂ miĂBTj�ahD°Y�WTj ............................
ડ .રસ નથી .................................9 ��7ƛ]��iaFS�KRhas� …………………………………..
81.i. Ks�S\p�dƟ]�W�es ,Ss�XR�Ƀk5�S\p� Ȣmic�VWWh�8;N_pd\h5Tj�EpSjWj�8FS�E^�Us�Js ?
હા/ના ...............
i i . જો હા ,Ss�bh�\hN° ? ________________________________________
82. Ȣmic�VWWj�dƟ]d5Ɖ]h�D°aj�^�Sp�aVh^��bDh]�Sp�\hN°Wh5�Ʌ lIWs�KRhaશો __________________
83.i Ƀk5�S\h^��<XK�apIah�\hN°�S\Wp�Ȣmic�VW\h5Tj�Ds:�deh]�\`��Jp? હા/ના ______________
i i .જો હા ,તો િવગતો આપો ________________________________________________________

119
84.i. Ƀk5�Ȣmic�VWWj�^IWh�T]h�ZhU�EpSjWh�9WȶkN�ȶk aOh\h5�ɅkVh^s�T]s�Jp? હા/ના _______
i i . જો હા તો ,WjIp�XqD�Wj�D:�IjKaƨȱ k��Ds\s�PN��Wh�9WȶkN�ȶk aOh\h5�ɅkVh^s�T]s�Jp ?
7 ���Z]h^R������ ........................ બ .^hdh]�RD�K 5ȱ kWhbDs ......................... ક .ȑiaD�K 5ȱ kWhbDs _____
ડ .ખતીના સાધનો ................................. ઇ .a\��DƠXsƨN�7Wp�a\��DƠXsƨN�\hN°ȵ k5�XhT^R _______
85. WjIp�XqD�Wh�D]h�\hXU5PWh�8Vh °�S\p�EpSjWj�8FSWj�E^�U��D^ah�\hN°�ZĤ^Wh�Ep_hP�B�
D^Sh5�Ȣmic�VWWp�hTi\DSh�8Xs�Js?
i. WĥD i i................... .ahKZj�[ha� ��D�\S� i i i....................... . 8FSWj�dh^��ȤkRaĂh...............
i v. apIhR�ZhUWj�aȴk�dh^��dpah� v........................ . Dh^R�D°�Sp�S\h^��XsShWj�D5XWj�Jp.....................
86. S\h^h�iaƨSh^\h5�S\p�D°N_h�d\]Wh�ӔS °�Ȣmic�VW�8;N_pNWj�Ⱥk_hDhS�_s�Js? __________
87. S\p�Ȣmic�VWWj�dh\hƛ]�d[h� �KW^_�ZsP��i\�N�F\h5�D°N_j�ah^�ehK^�^es�Js ?____________
88.i P�?ddjWj� deh]Wh� X�^Rh\ĮXp� Ƀk5� S\p� 7ƛ]� d5ƨTh� )Ȑ\� D°, WhZhP½ ,D°ajD°,ȻkiWaid�N�,
d5bsVW�D°ƛ,EhWFj�D5XWj�aFp °(માથી મદદ મળવી છ ? હા/ના .................................
i i . જો હા ,તો તમન મળલી મદદની િવગતો જણાવશો
______________________________________
89.i . તમારા મત ,Ƀk5�Ȣmic�VW\h5�\�e_hBWj�aȴk�d e[h�FSh�esaj�Ks:?? હા/ના __________
i i . જો હા ,Ss�Sp\Rp�D:�^�Sp�de[hFj�Tɂk5�Ks:? ?
અ .ae�aN��ZsP½Wh�dƟ]�S^�D°���������������������������Z�dƟ]��eƨdh�Vh^D�S^�D° .................................
ક .dpah�\p`aWh^�S^�D° .................................
90. તમારા મત ,Ȣmic� VWp� SpWh� dƟ]sWp� 7ƛ]� D:� D:� dpahB� ȶ l �� XhPaj� Ks:? ?
_____________________________________________________________________________

120

121

122

123
Annexure 3
Legal requirements for Production of Bio-pesticides and Bio-fertilizers9
For bio-pesticides registration from Central Insecticides Board, Faridabad is required. This is given by a
registration committee. Applications can be made online. Data on toxicity (both oral and dermal) and
bio-efficacy need to be generated by testing the product for at least two seasons in at least three
centres (State Agricultural universities). This process is somewhat expensive as the SAUs will charge at
least Rs. 7.5 lakhs for the services of testing the product.
For bio-fertilizers one may approach the organic farming cell of the fertilizer corporation of India,
located in Ahmedabad. There are no standards for vermicompost as it is considered a living material
where variability is high. However, the acceptable ranges for various parameters have been identified as
shown below:
Sl No. Parameter Acceptable Range
1 Nitrogen content 1.5 to 2.5 %
2 Phosphorus content 1.2 to 1.8 %
3 Potash content 1.6 to 2.4 %
4 Carbon content > 30%
5 CN Ratio 1 : 20
6 Ph 7.5
7 Microbial count (colony forming unit – CFU) 108
8 Moisture content 20-30%
The major difference between FYM and vermicompost is that microbial activity in FYM is restricted to
anaerobic bacteria. The microbial count is around 103-4. Due to microbial activity various enzymes are
available. The decomposting bacteria narrow down the CN ratio making the nutrients available to plants.
The calciferous gland that earthworms possess helps to add calcium to the salt.
GAU also produces vermicompost worth Rs. 50 lakhs annually. It is sold at a price of about Rs. 6/kg.
9Based on interview with Dr. P.K. Borad, Head of Department, Entomology, on 14
thJune at GAU, Anand campus.

124
The production cycle for compost is about 3 months. It is recommended to plant trees around the
production facility so that it gets shade thus preventing loss of nitrogen. Cowdung and biomass can be
used as inputs in the ratio of 2:8. The expiry for most bio-fertilizers is around one year.
Neem based formulations are also available in the market. NTGCF and other private companies makes
azadirachtin. SHGs can produce neem oil and sell to the companies.
GAU has been involved in training of farmers nominated by DSC. Each training lasts for about 3-5 days. 6
groups of 35 farmers (mostly male) each were trained last year. The topics included integrated pest
management (IPM), organic farming, integrated weed management and medicinal crops. The farmers
showed keen interest and had very good interactions with the trainers.
Some contact details of resource persons were provided as follows:
Name Affiliation Phone No Notes
Raman Oza GOPCA 9426833660 For bio-pesticide certification
Dr. Mahesh B Patel Agronomy Dept. 9737071848
Dr. R.N. Pandey Pathology Dept. 9925952458 For trichoderma
Dr. R.V. Vyas 9924938018 For bio-fertilizer