Carrollton-Farmers Branch Independent School District
269
-
Upload
khangminh22 -
Category
Documents
-
view
0 -
download
0
Transcript of Carrollton-Farmers Branch Independent School District


Carrollton-Farmers Branch Independent School District
1445 North Perry Road Carrollton, Texas 75011-5186
2011-2012 Official Budget
Effective September 1, 2011 - August 31, 2012
Issued by: Mark Hyatt, CPA Associate Superintendent Administrative & Support Services Bonnie Halsey, CPA/RTSBA Executive Director of Finance Vicki Pippin, CPA/RTSBA Accountant Scott Roderick, CPA Director Financial Reporting

Carrollton-Farmers BranchIndependent School
District

Table of Contents
General District Information District Map ............................................................................................................................1 2011-201 School Calendar ......................................................................................................2 Schools/Centers/Central Administration ................................................................................3 Miscellaneous District Information ........................................................................................4 2011-2012 Assessment Calendar ............................................................................................6
Introduction Section Principal Officials ...................................................................................................................8 Distinguished Budget Presentation Award for Fiscal Year beginning September 1, 2010 ....9 Meritorious Budget Award for Fiscal Year 2010-2011 ........................................................10 Consultants and Advisors .....................................................................................................11
Executive Summary Budget Information ...............................................................................................................12 Budget Process and Significant Changes ..............................................................................13 Budget Overview and Highlights..........................................................................................16 Budget-in-Brief .....................................................................................................................17 General Fund .........................................................................................................................17 Tax Increment Finance Zones (TIFs) ...................................................................................28 Debt Service Fund.................................................................................................................29 Food Service Fund ................................................................................................................32 Future Outlook ......................................................................................................................37 The Product ...........................................................................................................................40 District Improvement Plan (summary) and Mission Statement ............................................55 Personnel ...............................................................................................................................63
Organization Section Organization Chart ................................................................................................................74 District Improvement Plan ....................................................................................................75 Description of Organization Units ........................................................................................95 Financial Structure and Basis of Accounting Description of Entity ....................................................................................................98 Statistical Information ..................................................................................................98 Fund Accounting ........................................................................................................104 Classification of Revenues and Expenditures ............................................................106 Relationship of Organizational Units .........................................................................107 Significant Financial Policies and Procedures
Balanced Budget ...............................................................................................112 Cash Management .............................................................................................112 Investment Policies ...........................................................................................112 Debt Administration ..........................................................................................113
PDF bookmarks are available to assist in viewing the book. The Table of Contents is hyperlinked throughout.

Table of Contents continued Reserve Policies ................................................................................................114 Risk Management .............................................................................................114 Independent Audit and Financial Reporting .....................................................114
Budget Policies and Development Procedures Legal Requirements ..........................................................................................115 Budget Development Process ...........................................................................116 Capital Improvement Budget Policies ..............................................................117 Budget Calendar ................................................................................................118
Budget Administration and Management Process Expenditure Control and Approvals .................................................................120 Amending the Budget .......................................................................................121 Monitoring the Budget ......................................................................................121 Reporting to the Texas Education Agency .......................................................121
Financial Plan Section Revenues .............................................................................................................................124 2011-2012 Budget Short Summary ....................................................................................125 Estimated Revenues, Expenditures, Other Resources & Fund Balance Official Budgets ..126 Combined Budget Summary, General Fund, Food Service Fund & Debt Service Fund ...132 General Fund Overview ....................................................................................................................136 Revenue Trends and Assumptions .............................................................................136 Expenditure Summary ...............................................................................................139 Expenditures by Object Comparison to Prior Year ...................................................140 Impact on Fund Balance ............................................................................................141 Five-Year Summary of Revenues and Expenditures .................................................144 Budget by Location and Major Object .......................................................................145 Debt Service Fund Overview ....................................................................................................................148 Revenue Sources and Trends .....................................................................................149 Expenditures ..............................................................................................................151 Five-Year Summary of Revenues and Expenditures .................................................152 Debt Retirement Summary ........................................................................................153 Computation of Direct and Overlapping Debt ...........................................................154 Computation of Legal Debt Margin ...........................................................................155 Debt Service Fund Balance and Percentage Expenditures ........................................156
Food Service Fund Overview ....................................................................................................................158 Revenue Sources ........................................................................................................158 Expenditure Sources ..................................................................................................159 Five-Year Summary of Revenues and Expenditures .................................................159 Expenditures by Object Comparison to Prior Year ...................................................160 Fund Balance .............................................................................................................160
PDF bookmarks are available to assist in viewing the book. The Table of Contents is hyperlinked throughout.

Table of Contents continued Other Food Service Information ...............................................................................161
Capital Budget Capital Improvement Plan .........................................................................................164 Bond Proceeds ...........................................................................................................165 2003 Bond Referendum Expenditures .......................................................................166 District Technology Initiative ....................................................................................167 Good Elementary School Replacement .....................................................................168 Miscellaneous Statistical Data Elementary Schools .............................................................................................169 Middle Schools ....................................................................................................169 High Schools ........................................................................................................169
Informational Section
Student Data 2005, 2006, and 2007 Texas Assessment of Knowledge and Skills (TAKS) ...........173 2008, 2009, and 2010 Texas Assessment of Knowledge and Skills (TAKS) ...........174 High School Advanced Placement 2007-08, 2008-09, and 2009-10 .........................175 Students by Category .................................................................................................176 Student Dropout Information .....................................................................................177 Change in Ethnicity Over Time .................................................................................178 Students Economically Disadvantaged ......................................................................179 Campus Enrollment ...................................................................................................180 At Risk Students by Sex, Ethnicity, and Grade .........................................................181 2010 Adequate Yearly Progress (AYP) .....................................................................182 2009 Adequate Yearly Progress (AYP) ....................................................................183 2008 Adequate Yearly Progress (AYP) ....................................................................184 SAT Results for 2010, 2009 and 2008 .......................................................................185 ACT Results for 2010, 2009, and 2008 .....................................................................186 Salary Schedules New Hire Salary Schedule .........................................................................................188 Professional/Administrative Salary Schedule ............................................................189 Clerical/Technical Salary Schedule ...........................................................................190 Specialist/Technical ...................................................................................................192 Manual Trades (Hourly Positions) .............................................................................193 Manual Trades (Salaried Positions) ...........................................................................194 Miscellaneous Financial Information Current School Finance System .................................................................................196 State Funding for Local School Districts ...................................................................197
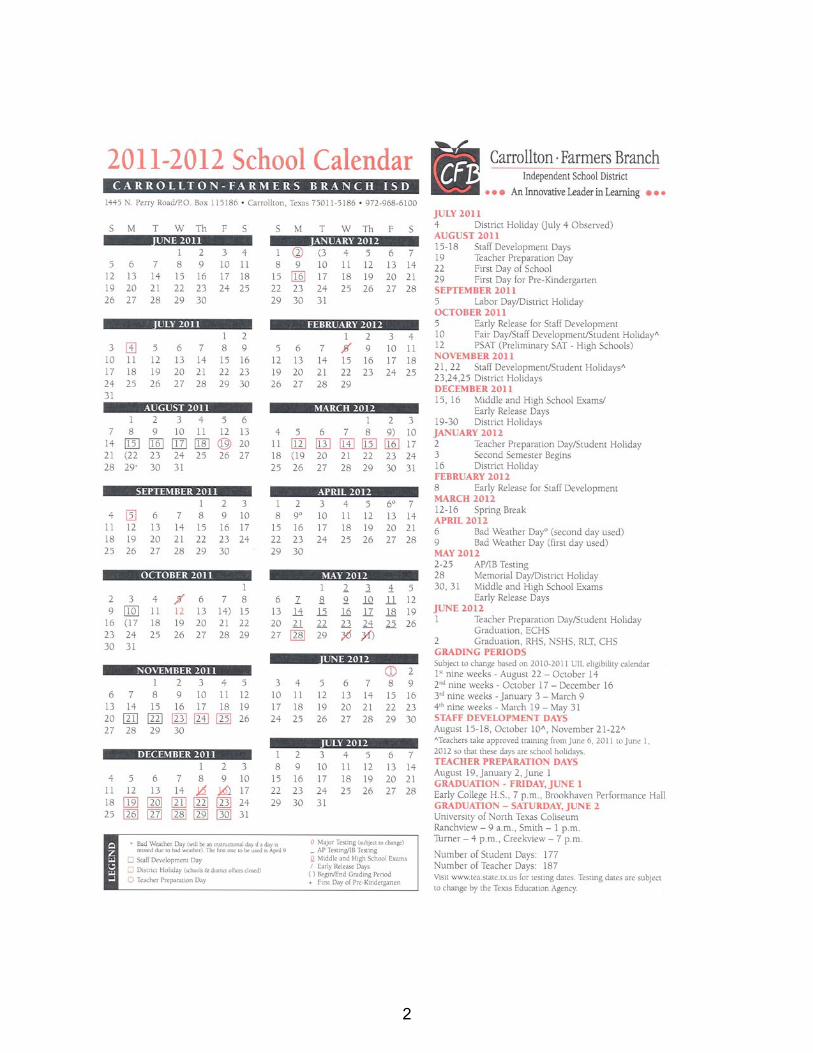
Table of Contents continued Wealth Transfer Provisions........................................................................................201 Possible Effects of Wealth Transfer Provisions and HB 1 on the District’s
Financial Condition ..............................................................................................202 Tax Information .........................................................................................................203 Ad Valorem Tax Law ................................................................................................203 Tax Rate Limitation ...................................................................................................207 Public Hearing and Rollback Tax Rate ......................................................................209 Property Assessment and Tax Payment .....................................................................210 District Application of Tax Code ...............................................................................211 Tax Increment Finance Zones ....................................................................................212 Certification of Appraisal Roll...................................................................................214 Preliminary Estimate of State Aid .............................................................................215 Tax Rate Impact .........................................................................................................225 Impact of Budget on Selected Taxpayers ..................................................................226 Comparison of Tax Rates...........................................................................................226 Comparison of Tax Collections to Levy ....................................................................227 Current Tax Revenue Calculation ..............................................................................228 General Fund Revenue Source Trends – Ten years ...................................................229 Full Time Staff Counts...............................................................................................230 General Fund Payroll by Major Object ......................................................................231 Staff Salaries ..............................................................................................................232 Staff Average Salaries ................................................................................................233 Bond Schedule ...........................................................................................................234 Long Range Financial Forecasts General and Debt Service Forecasts ..........................................................................238 Food Service Special Revenue Fund .........................................................................240 Average Daily Attendance (ADA) and Enrollment Projections ................................241 Percentage Refined Average Daily Attendance (ADA) to Enrollment Over Time ...242 Projected Tax Collections ..........................................................................................243 General Fund .............................................................................................................244 Debt Service Fund......................................................................................................246 Food Service Fund .....................................................................................................247 Glossary ..........................................................................................................................304
PDF bookmarks are available to assist in viewing the book. The Table of Contents is hyperlinked throughout.

1
2

SCHOOLS/CENTERS/CENTRAL ADMINISTRATION
ELEMENTARY SCHOOLS
Dave Blair 972-968-1000
14055 Heartside Farmers Branch, TX 75234
L. F. Blanton 972-968-1100
2525 Scott Mill Carrollton, TX 75006
Carrollton 972-968-1200
1805 Pearl Carrollton, TX 75006
Central 972-968-1300
1600 S. Perry Carrollton, TX 75006
Country Place 972-968-1400
2115 Raintree Carrollton, TX 75006
Dale B. Davis 972-968-1500
3205 Dorchester Carrollton, TX 75007
Farmers Branch 972-968-1600
13521 Tom Field Farmers Branch, TX 75234
Bernice Chatman Freeman 972-968-1700
8757 Valley Ranch Parkway Irving, TX 75063
Furneaux 972-968-1800
3210 Furneaux Carrollton, TX 75007
R. E. Good 972-968-1900
1012 Study Carrollton, TX 75006
E. L. Kent 972-968-2000
1800 W. Rosemeade Parkway Carrollton, TX 75007
Tom Landry 972-968-2100
265 Red River Trail Irving, TX 75063
Las Colinas 972-968-2200
2200 Kinwest Parkway Irving, TX 75063 LaVillita 972-968-6900
1601 Camino Lago Way Irving, TX 75039
McCoy 972-968-2300
2425 McCoy Carrollton, TX 75006
Charlie McKamy 972-968-2400
3443 Briargrove Dallas, TX 75287
Neil Ray McLaughlin Primary 972-968-2500
1500 Webb Chapel Carrollton, TX 75006
Kathryn S. McWhorter 972-968-2600
3678 Timberglen Dallas, TX 75287
Annie H. Rainwater 972-968-2800
1408 E. Frankford Carrollton, TX 75007
Riverchase 972-968-2900
272 S. MacArthur Coppell, TX 75019
Rosemeade 972-968-3000
3550 Kimberly Carrollton, TX 75007
Donald H. Sheffield Primary 972-968-3100
18111 Kelly Dallas,TX 75287
Donald H. Sheffield Intermediate 972-968-3200
18110 Kelly Dallas, TX 75287 Nancy H. Strickland Intermediate 972-968-5700
3030 Fyke Farmers Branch, TX 75234
Janie Stark 972-968-3300
12400 Josey Farmers Branch, TX 75234
June R. Thompson 972-968-3400
2915 Scott Mill Carrollton, TX 75007
MIDDLE SCHOOLS
Charles M. Blalack 972-968-3500
1706 Peters Colony Carrollton, TX 75007
Barbara Bush 972-968-3700
515 Cowboys Parkway Irving, TX 75063
Vivian Field 972-968-3900
13551 Dennis Farmers Branch, TX 75234
Dan F. Long 972-968-4100
2525 Frankford Dallas, TX 75287
DeWitt Perry 972-968-4400
1709 Belt Line Carrollton, TX 75006
Ted Polk 972-968-4600
2001 Kelly Carrollton, TX 75006
HIGH SCHOOLS
Creekview 972-968-4800
3201 Old Denton Carrollton, TX 75007 Early College High School Brookhaven College Campus 972-968-6200
3939 Valley View Farmers Branch, TX 75234
Ranchview 214-968-5000
8401 Valley Ranch Parkway E Irving, TX 75063
Newman Smith 972-968-5200
2335 N. Josey Carrollton, TX 75006
R. L. Turner 972-968-5400
1600 Josey Carrollton, TX 75006
CENTERS & OTHER
Community Learning Complex 972-968-6500
1820 Pearl Carrollton, TX 75006
Kelly Pre-K Center 972-968-6000
2325 Heads Carrollton, TX 75006
Mary Grimes Education Center 972-968-5600
1745 Hutton Carrollton, TX 75006
Marie Huie Special Education 972-968-5800
2115 Frankford Carrollton, TX 75007
Bea Salazar School 972-968-5900
2416 Keller Springs Carrollton, TX 75006
Technology/Learning Center 972-968-4300
2427 Carrick Farmers Branch, TX 75234
Service Center 972-968-6300
1505 Randolph Carrollton, TX 75006
Standridge Stadium 972-968-5660
Natatorium 972-968-5667
1330 W. Valwood Carrollton, TX 75006
Montgomery Building 972-968-2700
2807 Amber Lane Farmers Branch, TX 75234
CENTRAL ADMINISTRATION
Administration Building 972-968-6100
1445 N. Perry
P. O. Box 115186 Carrollton, TX 75006
3

Superintendent
Dr. Bobby Burns 972-968-6102
Associate Supt. for Educational Services
Dr. Sheila Maher 972-968-6129
Associate. Supt. for Administration & Support Services
Mark Hyatt 972-968-6104
Public Information 972-968-6105
Tax Office 972-968-6106
TRANSPORTATION Transportation service is provided by Dallas County Schools for children who live two miles or more from the school which they would normally attend. Students who attend more than one school to participate in vocational programs receive transportation between schools during school hours. Special Education students are eligible for transportation services when need is established. Transportation is not provided for students not meeting these qualifications. Any questions regarding eligibility should be verified by the transportation office at 972-968-6320. Bus routes are listed on the district’s website, www.cfbisd.edu.
STUDENT HEALTH Immunization requirements for students are as follows: Diphtheria/Tetanus, DTap, DPT, DT, Td, Tdap: Four years of age through 6 years of age must enter with a minimum of four (4) doses one having been since their 4th birthday. Students who started their vaccinations after age 7 are required to have at least three doses of a tetanus-diphtheria containing vaccine. A booster of Tdap (tetanus with pertussis) is required entry to 7th grade. A Tdap booster is required for grades 8-12, after their last DPT. Polio: Students 4 years of age and older are required to have a minimum of three (3) doses of vaccine with the 3rd dose being given on or after the 4th birthday. Rubeola (Measles): Two (2) doses of vaccine are required. The first dose shall be administered on or after the 1st birthday. The two doses are to be a minimum of 28 days apart. Rubella (3 day or German Measles): Two (2) doses of vaccine are required for Kindergarten and 1st grade. The first dose shall be administered on or after the 1st birthday. Grades 1-12 only need one (1) dose. The doses must be a minimum of 28 days apart. Mumps: Two (2) doses of vaccine are required for Kindergarten and 1st grade. The first dose shall be administered on or after the 1st birthday. Grades 1-12 only need one (1) dose. The doses must be a minimum of 28 days of apart. Haemophilus Influenzae (HIB): One (1) dose of vaccine on or after 15 months to the 5th birthday unless a schedule for a primary series was met at 12 months of age. Not required for students age 5 and older. Hepatitis B: Three (3) doses of vaccine are required for all students through the 12th grade. Pneumococcal: One (1) dose of vaccine is required if received between 24 and 59 months of age, unless two (2) or
three (3) doses are given before 12 months with a booster on or after 12 months. Not required for students age 5 and older. Hepatitis A: Two (2) doses on or after the 1st birthday. Doses should be given a minimum of 6 months apart. Required for Pre-Kindergarten, Kindergarten, and 1st grade students. Meningococcal: One (1) dose before entering 7th and 8th grades. Varicella (Chickenpox): Two (2) doses of vaccine on or after the first birthday are required for students entering Kindergarten, 1st grade, 7th grade, and 8th grade. One (1) dose of vaccine on or after the first birthday is required for all other grades. Two (2) doses of vaccine are required if the student was 13 years old or older at the time of the first dose of varicella. Written validation from the parent or physician giving the approximate date of varicella (chickenpox) illness is acceptable in lieu of vaccine.
All immunizations must be validated by a physician or health clinic.
MEDICATION PROCEDURE No prescription or non-prescription medication can be administered by school personnel unless the container, label, and written request comply with board policy. A prescription bottle must have a pharmacy label stating the student’s name, medication’s name, dosage, doctor’s name, and prescription date. The prescription is to be current within the last 12 calendar months. Non-prescription medication must be in its original container with the student’s name affixed to it. Non-prescription drugs cannot be given “as needed” except by a doctor’s order. Written requests to administer medication must include the following: date, pupil’s name, medication name, dosage, times dosage is to be administered, and signature of parent or legal guardian.
BOARD OF TRUSTEES Citizens are welcome to attend the Board of Trustees meetings. The regular meetings are held the first Thursday of each month at 7 p.m., except in July in the district’s Administration Building, 1445 North Perry Road, Carrollton. For specific dates, please visit the district website, www.cfbisd.edu. Citizens interested in speaking at the meetings should contact the superintendent’s office (972-968-6185) in order to be placed on the agenda. At the beginning of each meeting, citizens may address items not on the agenda, although the Open Meetings Laws prohibit Board action on such items.
SCHOOL CLOSINGS During inclement weather or other emergencies, citizens should listen to these stations concerning school closings: KDFW Television, Channel 4; WFAA Television, Channel 8; KXAS Television, Channel 5; KTVT Television, Channel 11; KVIL Radio; KRLD Radio; and WBAP Radio. Check the district’s website www.cfbisd.edu or CFB-TV Channel 98 in Carrollton or Channel 95 in Farmers Branch on Time Warner
4

Cable or Channel 38 on Verizon. The school district will use the Connect-ED phone notification system to notify families of school closings or delayed openings.
MEALS Lunch and breakfast are served daily in each school cafeteria. Free/reduced meal benefit applications are mailed to each household prior to the start of school. Parents wishing to apply should do so as soon as applications are received. Additional free/reduced applications will be available in the main office at each campus. Once an application is processed, a letter will be sent home advising the parents of eligibility.
AGE REQUIREMENTS To attend C-FB schools, kindergarten students must be five years old on or before September 1, 2010. To attend first
grade, youngsters must be six years old on or before September 1, 2010. Special programs are available for eligible four-year-olds and for children (ages 3-5) who are handicapped and for infants who are deaf and/or blind.
REGISTRATION DOCUMENTS Students who are new to the district need certain documents when they register. For students entering the district’s kindergarten or first grade for the first time, a document such as a birth certificate, affidavit of a physician or hospital, or passport, and valid immunization records signed by a physician or health department are required. Students who have been enrolled in another school should have their records, including immunization records, transferred to the appropriate C-FB school. New students to the district must show two proofs of residency and provide social security numbers if available
5

2011-2012 Assessment Calendar
6

Introduction Section
7

Carrollton-Farmers Branch Independent School District
Principal Officials
Board of Trustees Nancy Cline ............................................................................................................................................... President James Goode ..................................................................................................................................... Vice-President Richard Fleming ........................................................................................................................................ Secretary Lynn Chaffin ............................................................................................................................. Assistant Secretary Frank Shor ................................................................................................................................................. Member Nancy Watten ............................................................................................................................................. Member Karin Webb ................................................................................................................................................ Member Appointed Officials Bobby Burns, Ed.D.. ......................................................................................................................... Superintendent Mark Hyatt, CPA .................................................... Associate Superintendent Administration & Support Services Sheila Maher Ed.D. ....................................................................... Associate Superintendent Educational Services Officials Issuing Report Mark Hyatt, CPA .................................................... Associate Superintendent Administration & Support Services Bonnie Halsey, CPA/RTSBA ....................................................................................... Executive Director Finance Sara Gambrell, CTSBO ........................................................................................................... Accounting Director Vicki Pippin, CPA/RTSBA .................................................................................................................. .Accountant Scott Roderick, CPA ................................................................................................... Director Financial Reporting
8

9

10

Carrollton-Farmers BranchIndependent School District
Consultants and Advisors
Architects General CounselSHW Group Robert Luna, Attorney at Law5717 Legacy Drive, Suite 250 4411 North Central ExpresswayPlano, Texas 75024 Dallas, Texas 75205
Corgan Associates Depository Bank401 North Houston Street Bank of AmericaDallas, Texas 75202 901 Main Street
Dallas, Texas 75202-3714
AuditorsHankins, Eastup, Deaton, Tonn & Seay Fiscal Agents902 North Locust The Bank of New York MelonDenton, Texas 76202 2001 Bryan Street 10th Floor
Dallas, Texas 75201
Bond CounselFulbright & Jaworski, LLP2200 Ross Avenue, Suite 2800Dallas, Texas 75201
Financial AdvisorFirst Southwest Company777 Main Street, Suite 1200Fort Worth, Texas 76102
11

Executive Summary Carrollton-Farmers Branch Independent School District
Fiscal Year 2011-12 BUDGET INFORMATION
The following document represents the financial plan for the Carrollton-Farmers Branch Independent School District for the 2011-2012 fiscal year. This document culminates an intensive process involving input from parents, citizens, campus and administrative staff, the Superintendent, and the Board of Trustees. This budget provides the financial resources necessary to offer a competitive compensation package to our employees, maintain our existing facilities and provide the necessary funds to our campuses and central departments. The budget document and the year-end Comprehensive Annual Financial Report (CAFR) are the primary vehicles used to present the financial plan and the results of operations of the District. The primary purpose of this document is to provide timely and useful information concerning the past, current, and projected financial status of the District, in order to facilitate financial decisions that support the education goals of the District. The information included in the budget document is structured to meet the requirements of the Meritorious Budget Award (MBA) of the Association of School Business Officials International (ASBO) and the Distinguished Budget Presentation Award for the Government Finance Officers Association (GFOA). To receive these awards, a school entity must publish a budget document as a policy document, an operations guide, as a financial plan and as a communications devise. We believe our current budget conforms to the requirements of both programs, and we are submitting this document to ASBO and the GFOA to determine its continuing eligibility for these awards. These awards represent the highest level of recognition in budgeting for school entities. Our attainment represents a significant accomplishment by a school entity and its management. The awards are made after comprehensive review by a panel of independent budget professionals. Using extensive criteria, the reviewers not only evaluate the effectiveness of the budget in meeting the program criteria, but also provide commentary and feedback to the submitting entity as a basis for improving the presentation of the district’s financial and operational plan. The Carrollton-Farmers Branch Independent School District has been awarded the Distinguished Budget Presentation Award by the GFOA for the fiscal years 2002-03 – 2010-11. C-FB ISD has also been awarded the Meritorious Budget Award by ASBO for the same fiscal years. However, our most important concern is the presentation of the budget data to improve the quality of information provided to our community about the financial plan for the district’s educational programs and services for the 2011-12 fiscal year. The material in the budget document includes information that has been suggested by Board Members, patrons, community members and staff. Copies of this document are posted on the district webpage, http://www.cfbisd.edu/budgetbook and have been provided for the city libraries, Moody’s Investment Service, Fitch Investor Service and Standard and Poor’s.
12

Executive Summary continued
Budget Process and Significant Changes The State, the Texas Education Agency (TEA), and the local district formulate legal requirements for the school district budgets. These requirements are stipulated in detail with the subsequent sections of this document. The budget process begins in September with preliminary budget planning meetings for all staff members primarily responsible for budgeting. From December to May, staff developed their portions of the budget; individual school and department budgets were reviewed; projected enrollment figures were determined; and revenue estimates were calculated based on preliminary tax estimates (later, adjusted to match the final tax certified roll as provided by the Dallas Central Appraisal District and Denton County Appraisal District). The enrollment forecasts are used extensively during the budget development stage to determine campus allotments and staffing allocations. In order to decentralize the budget process, site-based decision making teams, working under the direction of each campus principal, contribute extensively to campus budget decisions. Each campus receives a basic allotment per student to be used for supplies, materials, equipment, staff development, and other appropriate instructional costs. The site-based decision making teams make decisions concerning utilization of this allocation. Budgets for non-campus units are developed by Central Administrators. These budgets are then reviewed by District financial management staff and altered, if appropriate. Payroll budgets are developed based on current school economic conditions and a determination is made whether to include a proposed raise package. Personnel units are allocated to each campus based on projected student enrollment which follows state mandated ratios, if applicable. Non-campus personnel units are added as necessary to cover the workload. Finally a complete payroll budget is presented to the Board of Trustees. To discuss the 2011-12 C-FB ISD budget, we have to discuss two factors that are significant to budget decisions:
First, the District’s student population is currently shrinking at a slow pace, which may be a temporary result of several city planning projects that involve the razing of existing apartment complexes to be replaced with more high-end housing. At the same time our student population continues to become more economically disadvantaged (up 81.04% since 2001) and lacking language skills. This combination generates a need for additional resources: human, financial, and infrastructure;
Second, the state funding formulas have changed significantly with the passage of HB One (80th Legislature) and the target revenue concept. Although the 81st and 82nd Legislatures altered some of the state funding formulas, the target revenue system remains in place. Basically, the only way to generate additional revenue is to ask local taxpayers for a tax increase.
13

Executive Summary continued
Budget Formulation 2011-12 Increasing student achievement is the primary function the Carrollton-Farmers Branch ISD. The District vision statement, the Standards-Based Instructional System, and the Principles of Teaching, Learning and Curriculum all serve as anchors that guide our decision-making in the budgeting process. The District aligns its budget according to student achievement data. For example, the District has allocated resources to hire Instructional Specialists who work on campuses with teachers in math and science to improve scores in these areas. Continual monitoring of student achievement data on multiple measures guides the District’s decision making on instructional materials, personnel, and programs. The HB 1 funding mechanism is designed to keep the revenue per weighted average daily attendance flat from one year to the next; this is called a target revenue model. Although HB 3646 (passed in 2009) adjusted the target revenue amount by $120/per student most of this increase was used for a mandated raise for teachers, librarians, counselors, nurses and speech pathologists (called the Fab 5 group). The passage of Senate Bill 1 (SB 1) by the 82nd Legislature will reduce the basic regular allotment to districts over the next two fiscal years. The target revenue design does not allow for inflation, program increases and raises for non-Fab 5 district employees. In the future, to fund those types of increases with a balanced budget, the district will be required to go to our voters to authorize additional pennies on the tax rate. The district has adopted deficit budgets in the past, however, district leadership knows that continued realized deficits are not sustainable. Due to conservative practices, the district has had only minimal actual deficits. Under current state funding formulas, the district must cut budgets to remain fiscally sound. As such, a massive campaign to obtain input regarding budget cuts was undertaken by the district using the situation appraisal method. This method allows instructional priorities and data driven information to help drive decisions. Situation appraisals were conducted with: District Improvement Council Superintendent’s Advisory Council Secondary Teacher Leaders Council of PTA Executive Committee/School PTA Presidents Principals School Board Work-Study Sessions and meetings.
The result of all this work was a list of guiding objectives to be used when deciding budget cuts. The Guiding Objectives are to Minimize Impact on:
Student achievement Ability to offer competitive salaries/benefits High quality professional development Student/teacher ratios Preparatory programs for college-bound and work-force graduates Safety
14

Executive Summary continued
Current and efficient technology programs Extra-curricular programs for all students Quality facilities including general upkeep
Note: all Staffing cuts were to be made through normal attrition – not layoffs. This process resulted in the multiple staffing reductions outlined previously in this document. Since these reductions are to be made using attrition, savings will be realized over time and not all in one fiscal year. Significant changes in the 2011-12 budget from the prior year are listed below:
Payroll decrease of $2.5 million; Supplies & materials decrease $162,762;
15
Executive Summary continued
BUDGET OVERVIEW AND HIGHLIGHTS
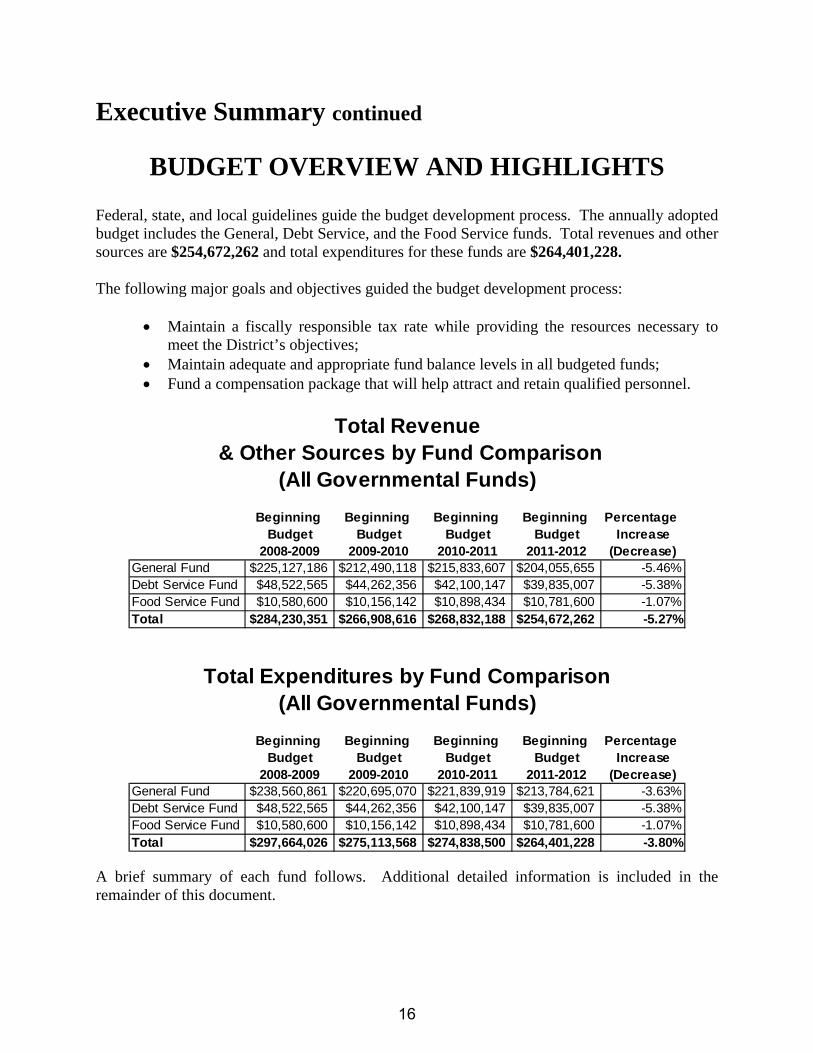
Federal, state, and local guidelines guide the budget development process. The annually adopted budget includes the General, Debt Service, and the Food Service funds. Total revenues and other sources are $254,672,262 and total expenditures for these funds are $264,401,228. The following major goals and objectives guided the budget development process:
Maintain a fiscally responsible tax rate while providing the resources necessary to meet the District’s objectives;
Maintain adequate and appropriate fund balance levels in all budgeted funds; Fund a compensation package that will help attract and retain qualified personnel.
Total Revenue & Other Sources by Fund Comparison
(All Governmental Funds)
Beginning Beginning Beginning Beginning Percentage Budget Budget Budget Budget Increase
2008-2009 2009-2010 2010-2011 2011-2012 (Decrease)General Fund $225,127,186 $212,490,118 $215,833,607 $204,055,655 -5.46%Debt Service Fund $48,522,565 $44,262,356 $42,100,147 $39,835,007 -5.38%Food Service Fund $10,580,600 $10,156,142 $10,898,434 $10,781,600 -1.07%Total $284,230,351 $266,908,616 $268,832,188 $254,672,262 -5.27%
Total Expenditures by Fund Comparison(All Governmental Funds)
Beginning Beginning Beginning Beginning Percentage Budget Budget Budget Budget Increase
2008-2009 2009-2010 2010-2011 2011-2012 (Decrease)General Fund $238,560,861 $220,695,070 $221,839,919 $213,784,621 -3.63%Debt Service Fund $48,522,565 $44,262,356 $42,100,147 $39,835,007 -5.38%Food Service Fund $10,580,600 $10,156,142 $10,898,434 $10,781,600 -1.07%Total $297,664,026 $275,113,568 $274,838,500 $264,401,228 -3.80%
A brief summary of each fund follows. Additional detailed information is included in the remainder of this document.
16

Executive Summary continued
Budget-in-Brief General Fund – Current year property values are down; state revenue is allocated based on a target revenue system; the district is evaluating all operations to continually become more cost effective. The budget utilizes $9.7 million in fund balance, however, existing balances are adequate to absorb the reduction. Plans continue to reduce future use of fund balances. More detailed information is included below and in the Financial Section of this book. Debt Service Fund – In an effort to reduce the debt service tax rate, the District has not issued any new debt but has executed an advance bond refunding in November 2010 in order to reduce current requirements. However, current year property values are down requiring a slight increase in the debt service tax rate. The District continues to have favorable bond ratings. More detailed information is included below and in the Financial Section of this book. Food Service Fund – The streamlining of operations has allowed a decrease of total budgeted expenditures in the Food Service Fund. More detailed information is included below and in the Financial Section of this book.
General Fund Revenues General fund revenues are budgeted to decrease $11,777,952 or -5.46% over the 2010-11 beginning budgeted revenue and Other Sources. The decrease is attributable to several factors including taxable values going down 1.72% and the tax rate staying the same (under the Target Revenue State funding system, state revenue goes up to compensate for losses of tax revenue up to the compressed tax rate of $1.00) as well as the state funding formula changes implemented with Senate Bill 1 (SB 1) passed in the summer of 2011. The expiration of federal funds included in the general fund state formula calculations were eliminated for the 2011-12 fiscal year. Additionally, the state funding model is to hold harmless the district for our tax increment finance zones (TIFs). Interest income was down. More information about the increase in State Funding and Tax Increment Finance Zones will be given in the following sections of this book. The Dallas Central Appraisal District and the Denton County Appraisal District (Appraisal Districts) certify the tax roll on or about July 25th of every tax year based on property values as of January 1st of the tax year. All properties are assessed at 100% of market value. The July 25, 2011, Certification of the 2011 Appraisal Records were used for the August 25, 2011 tax rate adoption after being reduced by 2.50%. The district has elected to reduce the certified values in response to past trending that has shown consistent loss in values that occur as taxpayer’s property value protests to the Appraisal Districts are resolved. The district calls this loss “shrinkage”. For the future, the district will continue to monitor the shrinkage loss and adjust according to trend analysis, if deemed appropriate. The Texas Comptroller of Public Accounts
17

Executive Summary continued
annually certifies the final value property values on or before July 1, of the following year. The Commissioner of Education uses the final values in the process of allocating state funds to school districts. This includes wealth equalization under the Texas Education Code Chapter 41 provisions. Key assumptions used in developing revenue estimates are discussed in more detail in the following sections of this summary. The following table provides a comparison of revenues by source for the 2008-09 beginning budget through 2011-12 beginning budget.
General Fund Revenue
Beginning Beginning Beginning Beginning Percentage Budget Budget Budget Budget Increase
2008-2009 2009-2010 2010-2011 2011-2012 (Decrease)Local Sources $159,977,433 $154,020,606 $144,540,912 $132,575,835 -8.28%State Sources $64,789,753 $58,269,512 $62,851,086 $70,929,820 12.85%Federal Sources $360,000 $200,000 $8,441,609 $550,000 -93.48% Sub-Total $225,127,186 $212,490,118 $215,833,607 $204,055,655 -5.46%Other Sources $0 $0 $0 $0 0.00%Total $225,127,186 $212,490,118 $215,833,607 $204,055,655 -5.46%
In May 2004, the school district granted a Freeport Exemption. “Triple Freeport Zone” (school district, city and county) is the commonly used term for an area where all major taxing jurisdictions have exempted from property taxes certain “Freeport” inventory. In concept, granting Freeport exemptions allows the district to keep and attract new businesses to the district. Under current law, the amount of the Freeport property is deducted from the taxable values that are used to calculate Chapter 41 recapture payments in the General Fund; thereby offsetting the loss. For the Debt Service Fund, the loss would be faced every year forward. The overall economy of the nation continues to be sluggish with limited upside in the near future. However, the D-FW metroplex has felt the recession somewhat less than other areas of the country. Although our tax values are down a third year in a row from the previous years, this loss is expected to be made up in the coming period as the local economy rebounds at a slow pace. For the 2011-12 fiscal year, approximately 33.18% of the General Fund expenditures will be funded through State contributions. Federal contributions are estimated at $550,000 or 0.26%; local contributions are estimated at 62.01%; fund balance contributions at 4.55%. The district has elected to use a portion of the fund balance to balance the General Fund budget. This philosophy has been utilized for the 2011-12 fiscal year in an attempt to minimize the staffing, programmatic and other changes that would be necessary to balance the budget. Description of the elaborate process the district used to cut the budget to minimize the drain on the fund balance will be
18

Executive Summary continued
described in detail in following sections of this summary. For future budgets, the district plans to again review all budget details to determine where future cuts can be made without hurting district instructional goals in order to achieve a balanced budget (balanced budget definition: revenues = expenditures). In order to fund new, innovative programs and employee raises in the future, the district will need additional funds to operate. The fund balance has increased in prior years due to conservative budget practices and is considered adequate to absorb this deficit. The school finance law continues to attempt to equalize available revenues among public school districts by requiring the redistribution of local tax revenues. Due to changes in the equalized wealth level under newly passed legislation, the district will not be required to contribute ad valorem taxes for wealth equalization during the 2011-12 fiscal year. This reduction in our Chapter 41 payments should not be understood as an overall increase in the district’s net revenue due to the target revenue state funding concept. More about the state funding calculations will be in the following sections of this book. For fiscal years beyond 2011-12, the District projects that total general fund revenues will decrease $5.0 million for 2012-13 due to the expiration of federal funding sources and changes in funding formulas. For fiscal year 2013-14, the District projects a slight increase in student population which will have a positive impact on revenues. More about long range forecasts are presented later in this book.
19

Executive Summary continued
2003
2004
2005
2006
2007
2008
2009
2010
2011
*2012
General Fund Source TrendsLast 10 years
*Budget
Property Tax Other Local State Federal
Source: District’s audited Financial Statements unless budgeted. The graph above is the result of applying the formulas described in Texas school finance law, where applicable, to C-FB ISD data. The graph depicts the decrease of Property Tax revenue; decrease in Other Local funds (mostly interest income); and increase in state funding, which is tied to District enrollment and funding allocation formulas. The state chose to use Federal Stimulus funds to supplant state funding for the 2009-10 and 2010-11 fiscal year but for the 2011-12 fiscal year the Federal Stimulus funds have been eliminated. This accounts for the large decrease in Federal funding shown on the graph. The graph on the next page depicts C-FB ISD’s property tax base over time.
20

Executive Summary continued
$13,701,922,632
$13,086,848,046
$12,841,971,550
$12,946,780,825
$13,443,649,465
$14,847,932,832
$15,245,409,459
$14,909,785,600
$14,133,013,647
$13,889,472,257
Tax Value Trend(Assessed Value Equals Taxable Value)
Source: Certified Tax Rolls
2012 ‐1.72%
2011 ‐5.21%
2010 ‐2.20%
2009 2.68%
2008 10.45%
2007 3.84%
2006 0.82%
2005 ‐1.87%
2004 ‐4.49%
2003 2.04%
Source: The number is equal to the beginning certified taxable values. As the ten year history graph above depicts, the District’s tax base had been decreasing over time until fiscal year 2006, which had a 0.82% increase. Then the tax base began rising again with a substantial increase for 2007-08, 10.45% and a smaller increase for 2008-09, 2.68%. The District has experienced a tax base decline in every year since the 2008-09 fiscal year with the most dramatic loss happening in 2010-11, -5.21%.
21

Executive Summary continued
The graph below depicts the tax rate trend.
Funds 2002-03 2003-04 2004-05 2005-06 2006-07 2007-08 2008-09 2009-10 2010-11 2011-12
General Fund 1.5000$ 1.5000$ 1.5000$ 1.5000$ 1.3501$ 1.0400$ 1.0400$ 1.0400$ 1.0400$ 1.0400$
Debt Service 0.2224$ 0.2358$ 0.2824$ 0.3259$ 0.3329$ 0.3270$ 0.3223$ 0.3022$ 0.3069$ 0.3168$
Total 1.7224$ 1.7358$ 1.7824$ 1.8259$ 1.6830$ 1.3670$ 1.3623$ 1.3422$ 1.3469$ 1.3568$
C-FB ISD TAX RATEDistribution per $100 Valuation
To make a substantial budget cut in a school district budget, the district must decrease the number of employees. This is because the majority of the expenditures are personnel related (83.05% of the total General Fund budget when you exclude the Tax Increment Finance Zone payment of $14.1 million.) Although the District was not able to balance the budget for several years, substantial budget reductions were made from the originally submitted budgets. These reductions were made even though enrollment continued to grow for students at risk, economically disadvantaged and English as a second language populations. The Board of Trustees remains committed to balancing the budget (revenues = expenditures) through further budget reductions. However, most of the reductions are planned for staff as they retire or otherwise leave the district, which may take several fiscal years to fully achieve.
22

Executive Summary continued
Expenditures General Fund expenditures are budgeted to decrease $8,055,298 or -3.63% over 2010-11 beginning budget expenditures. The following table provides a comparison of expenditures by object for the 2010-11 beginning budget and the 2011-12 budget.
General Fund Expenditures by Object
Comparison to Prior Year
Beginning Beginning Percentage Budget Budget Increase Percentage
2010-2011 2011-2012 (Decrease) of TotalPayroll $171,300,000 $165,809,141 -3.21% 77.56%Purchased Services $21,994,660 $21,693,645 -1.37% 10.15%Supplies & Materials $8,858,925 $8,696,163 -1.84% 4.07%Other Operating $19,195,826 $17,122,548 -10.80% 8.01%Capital Outlay $490,508 $463,124 -5.58% 0.22%Total $221,839,919 $213,784,621 -3.63% 100.00%
Since the education of students is a labor-intensive process, payroll expenditures comprise about 77.56% of the General Fund expenditures. If the Tax Increment Financing payment of $14.1 million is excluded, then the payroll costs account for 83.05% of the district’s General Fund expenditures. The district bases its payroll budget on established staffing guidelines and enrollment projections at each campus. For the 2010-11 year, the district increased staffing guidelines (i.e. increase staff to student ratios) in non-legally mandated areas to reduce personnel costs. Additional information regarding staffing reductions will be included in sections following this summary. The increased staffing guidelines have been maintained for 2011-12. Since the state mandates a lower class size for elementary classrooms (state law mandates a maximum class size of 22 to 1 in grades kindergarten to 4), the elementary student/teacher ratios are expected to remain low. For fiscal years beyond 2011-12, the District anticipates decreased funding from legislative changes and the expiration of federal funding and plans to reduce expenditures in all functional areas to help offset the effect. The long range forecasts are presented in the following sections of this book.
23
Executive Summary continued
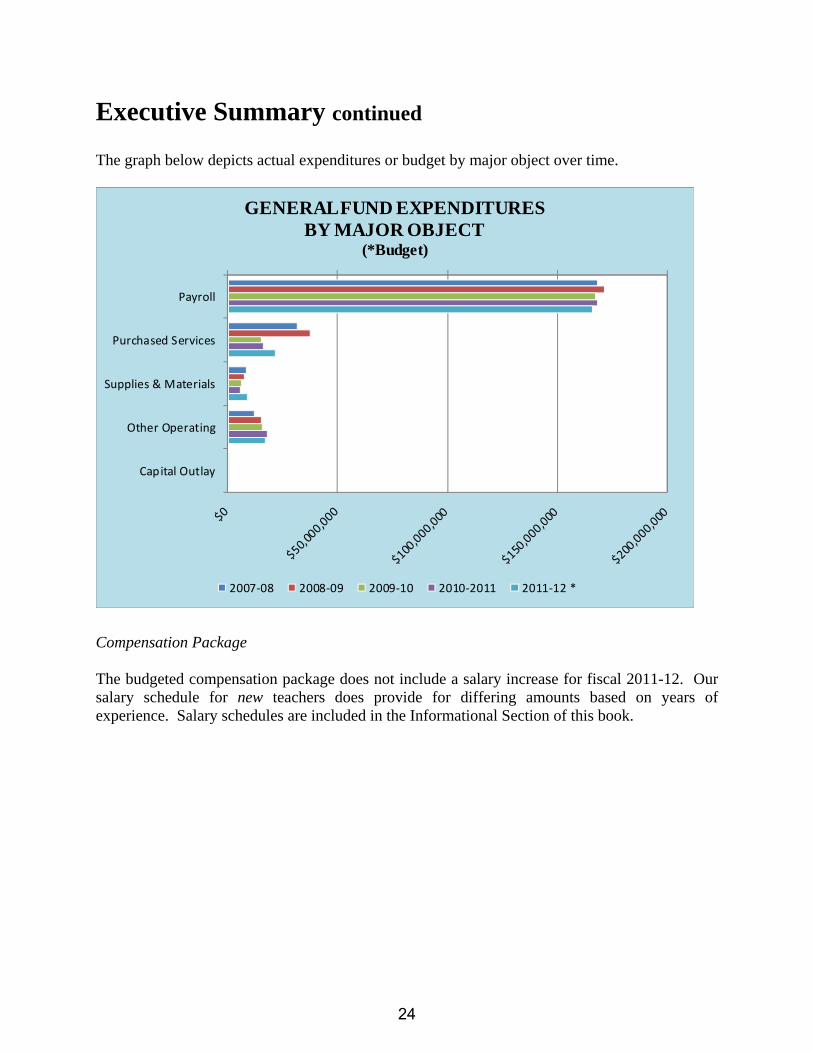
The graph below depicts actual expenditures or budget by major object over time.
Payroll
Purchased Services
Supplies & Materials
Other Operating
Capital Outlay
GENERAL FUND EXPENDITURESBY MAJOR OBJECT
(*Budget)
2007‐08 2008‐09 2009‐10 2010‐2011 2011‐12 *
Compensation Package The budgeted compensation package does not include a salary increase for fiscal 2011-12. Our salary schedule for new teachers does provide for differing amounts based on years of experience. Salary schedules are included in the Informational Section of this book.
24

Executive Summary continued
Personnel For 2009-10, in an effort to minimize utilization of our fund balance due to deficit budgets, the district endeavored to reduce numerous positions. Because the district used the attrition method instead of laying off staff, not all of the reductions will be realized in one year. The position reductions are below. Return pre-kindergarten to half-day (state only funds a half day program); Increase secondary class size and/or teaching load to 28; Increase fifth-grade class size to an average of 27; Reduce assistant principal positions; Reduce assistants and learning center managers; Reduce non-mandated summer school programs; Reduce sick leave and annual buy back program; Reduce central administration positions; Reduce curriculum and instruction division; Reduce technology division; Reduce English as a Second Language Instructional Facilitators; Reduce standard part-time positions and overtime; Reduce outside maintenance; Reduce security operations.
For 2010-11, savings from the 2009-10 staff reductions will be more fully realized in 2010-11 and beyond. Additional budget staffing changes are listed below: District facilities were consolidated – Montgomery to Blair Elementary; Community
Learning Complex Pre-kindergarten Center closed with students absorbed into their home campuses;
Additional Summer school reductions; Continued Administration reorganization.
For 2011-12, the District continues to evaluate operations in order to find cost savings with minimal effect on student performance. Additional savings is expected through attrition and consolidation of duties. Following are specific significant items: Staff receives no compensation increases for 2011-12; The District will pursue waivers for the state mandated 22:1 ratio for class size in grades
kindergarten to 4th grade with estimated savings of $2.5 million; Administration reductions and reorganizations at both central and campus levels.
25

Executive Summary continued
The graph below shows the student enrollment and total staff full-time equivalents over time. The 2010-11 information shows a substantial reduction in our staff counts as student enrollment is decreasing and the district begins the deliberate process of reducing staff through the attrition process. The 2011-12 information shows a slight increase in budgeted staff counts; primarily in the class size mandated lower grades. Actual staff counts are projected to be less as we continue to obtain savings from the attrition program.
‐ 5,000 10,000 15,000 20,000 25,000 30,000
2003‐04 2004‐05 2005‐06 2006‐07 2007‐08 2008‐09 2009‐10 2010‐11 2011‐12*
Total Personnel FTEs 3,131.75 3,040.44 3,154.90 3,257.87 3,366.62 3,371.30 3,201.17 3,132.60 3,064.10
Students 25,638 25,860 26,231 26,252 26,397 26,257 25,920 26,159 26,159
Total Personnel to StudentsAll Populations (*Budget)
Total Personnel FTEs Students
26

Executive Summary continued
The following graph depicts the District’s budget emphasis on curriculum and instruction, while continuing to control and monitor administrative expenditures.
Instruction & Instruction Related 58.76%
Expenditures by MajorFunctional Category
Instruction & Instruction Related Instructonal Leadership
Student Services Administrative
Non‐Student Based Support Ancillary Services
Debt Service Facilities Acquisition & Construct
Intergovernmental Charges
27

Executive Summary continued
TAX INCREMENT FINANCE ZONES (TIF’s) Background: Tax Increment Financing (“TIF”) is a special provision found in the Texas Property Tax Code §311.03. TIF zones enable taxing entities to fund certain improvements and provide for the revitalization of specific geographical areas. Typically, TIF zones are designed to finance infrastructure projects that encourage commercial growth. Each participating entity pays incremental taxes into the TIF fund on an annual basis. Then, a portion of this payment is returned to the entity (per the participation agreement) to fund its own capital projects within the zone. One benefit of a TIF zone is the increased tax revenue that is eventually realized for all entities involved due to the land improvements and real estate development. C-FB ISD TIF Agreements: C-FB ISD participates in three separate TIF agreements – City of Irving TIF #1, City of Farmers Branch TIF #1 and City of Farmers Branch TIF #2. The City of Irving TIF is located in the Las Colinas area and was adopted 12-22-98. The City of FB #1 TIF is located in the Southwest quadrant of Farmers Branch (also known as “Mercer Crossing”) and was adopted 12-21-98. The City of FB #2 TIF is located north and south of Valley View Lane, east of I-35, and was adopted 07-21-99. All TIF agreements are for a period of twenty years. Each TIF has a “base value” which is the sum of the taxable property values within the boundary lines of the zone in the first active year of the agreement. The “base year” is 1998 for Irving & FB #1 and 1999 for FB #2. The TIF payment for any given year is a function of the taxable values for the prior year less the base year values since C-FB elected to base the TIF payment on the “adjusted” value rather than the current value. This is known as the increment. The increment is then multiplied by C-FB ISD’s tax rate that was in effect for 2005, per Texas Tax Code 311.013(n) to compute the payment amount (there are many other variables, but this is the basic formula). Per the respective participation agreements, C-FB ISD receives a payment return of 67% from the Irving TIF, 65% from the FB #1 TIF, and 30% from the FB #2 TIF. These amounts are kept in separate special revenue funds and are to be used to build new schools or to improve existing structures.
28

Executive Summary continued
The following chart summarizes a few key elements of each TIF:
2010 Values To-Datefor 2012 Payment
TIF Name Pmt Calculation Base Values Payments Returns
Irving #1 $942,647,458 $241,945,218 $65,824,987 $44,102,741
Farmers Branch # 1 $105,266,183 $42,008,044 $8,720,406 $5,668,264
Farmers Branch # 2 $20,728,591 $15,815,680 $301,179 $90,355
Debt Service Fund The Debt Service Fund is used to account for the payment of interest and principal on all bonds of the District. The primary sources of revenue for the debt service fund are local property taxes and the state Instructional Facilities Allotment.
Revenue Debt Service Fund revenue is budgeted to decrease $2,265,140 or 5.38% less than the 2010-11 budget. The decrease is primarily due to a decrease in both the taxable values for 2011-12 and the interest income estimate. The Debt Service payment requirements have gone down for 2011-12 primarily due to a bond refunding executed in November 2010 which reduced current requirements and to the district not selling bonds in fiscal year 2008-09, 2009-10 or 2010-11. Had the taxable value stayed the same, the resulting decrease in bond payment requirements would have allowed the district to reduce the Debt Service tax rate. However, the taxable value decreased by 1.72% resulting in an increase in the Debt Service tax rate of $0.0099 to $0.3168 per $100 valuation. The following table provides a comparison of revenues by source for the 2011-12 budget compared to the 2010-11 budget. The District does not anticipate large fluctuations in debt service revenue beyond fiscal year 2011-12.
Debt Service Fund Revenue SourcesComparison
Beginning Beginning PercentageBudget Budget Increase
2010-2011 2011-2012 (Decrease)Taxes $42,069,997 $39,822,607 -5.34%Other Local Sources $30,150 12,400 -58.87%Total $42,100,147 $39,835,007 -5.38%
29

Executive Summary continued
Expenditures Debt Service Fund expenditures are budgeted at $39,835,007, a decrease of $2,265,140 or 5.38% over the 2010-11 budget. The debt service tax rate is set at the appropriate level to provide the necessary funds for these payments, after considering State (if applicable), and other sources of revenue. The graph below depicts the Debt Service Fund balance over time.
$1,485,405
$910,710
$696,204
$1,062,173
$2,981,793
$2,862,959
$2,233,800
$2,118,869
$3,003,709
$3,003,709
2002‐03
2003‐04
2004‐05
2005‐06
2006‐07
2007‐08
2008‐09
2009‐10
2010‐11
2011‐12*
Debt Service FundBalance Trend (*estimated)
Large increases in the Debt Service tax rate are not anticipated at this time. In the past the district had annual bond sales to provide funding for new facilities and necessary renovations. As mentioned above, due to budget constraints in the General Fund, the district elected not to issue any new bonds in the 2008-09, 2009-10, or 2010-11 fiscal year but executed a bond refunding in November 2010 to reduce current requirements. The District will strive to structure debt with a principal retirement schedule that allows us to issue bonds with minimal increases to the Debt Service tax rate. As of August 31, 2012, the District will have $297,605,000 in outstanding long-term debt. The general obligation bond requirements to maturity equal $395,946,216. The ratio of net bonded debt to assessed value for the District is 2.12%. Education legislation has eliminated limits on outstanding debt. However, prior law limited debt to 10% of assessed value, and the District is well below that level. All principal and interest payments are due February 15th and August 15th of each year. On February 1st of each year, outstanding taxes
30

Executive Summary continued
become delinquent, which permits the collection of a large majority of taxes levied before the long-term debt payments are due.
Quick Bonded Debt Facts
Outstanding Bonded Debt as of 08/31/12 $297,605,000
Bond Rate (Permanent School Foundation Guaranteed) Aaa - Moody's Investor ServiceAAA - Standard & Poor's Corp
Bond Rate (underlying) Aa1 - Moody's Investors ServiceAA - Standard & Poor's Corp
Authorized but Unissued School Building Bonds $70,865,000
31

Executive Summary continued
Food Service Fund
Revenue Food Service Fund revenue is budgeted to decrease $116,834 or 1.07% less than the 2010-11 budget. The following table provides a comparison of revenues by source for the 2010-11 year and the 2011-12 budget year.
Food Service Fund Revenue SourcesComparison
Beginning Beginning Percentage Budget Budget Increase
2010-2011 2011-2012 (Decrease)Local Sources $2,469,840 $2,610,100 5.68%State Sources $85,000 $85,000 0.00%Federal Sources $8,343,594 $8,086,500 -3.08%Total $10,898,434 $10,781,600 -1.07%
The Food Service Fund accounts for the operation of the district’s school cafeterias. The majority of the local revenues are derived from charges to users. Local revenues constitute 24.21% of the revenue budget. The federal revenue is received from the U. S. Department of Agriculture under the National School Lunch Program, the School Breakfast Program and the Food Distribution Program. Federal revenues equal 75.00% of the revenue budget.
Expenditures Food Service Fund expenditures are budgeted at $10,781,600, a decrease of $116,834 or 1.07% less than the 2010-11 budget. The vast majority of these expenditures are for labor and food costs. For fiscal years beyond 2011-12, the District projects slight increases in expenditures but does not anticipate a deficit budget in future years.
Food Service Fund Expenditures by Object Comparison to Prior Year
Beginning Beginning Percentage Budget Budget Increase Percentage2010-11 2011-12 (Decrease) of Total
Payroll $4,906,000 $4,850,000 -1.14% 44.98%Purchased Services $1,014,500 $1,293,000 27.45% 11.99%Supplies & Materials $4,918,934 $4,517,500 -8.16% 41.90%Other Operating $24,000 $18,000 -25.00% 0.17%Capital Outlay $35,000 $103,100 194.57% 0.96%Total $10,898,434 $10,781,600 -1.07% 100.00%
32

Executive Summary continued
No Child Left Behind Federal education reform legislation, commonly called No Child Left Behind (NCLB) (Public Law 107-110), which was signed by the President on January 8, 2002, reauthorizes and amends federal programs established under the Elementary and Secondary Education Act of 1965 (ESEA). Under NCLB, accountability provisions that formerly applied only to districts and campuses receiving Title 1, Part A funds now apply to all districts and campuses. NCLB has caused sweeping effects for school districts across the nation. Among the provisions of the law, teachers are to be “highly qualified”. Another provision of the law, calls for Adequate Yearly Progress (AYP). All public school districts, campuses, and the state are evaluated annually for Adequate Yearly Progress. The Texas AYP Plan approved by the United States Department of Education (USDE) in June 2003 meets the requirements of NCLB, maintains the integrity of the Texas assessment program, and provides a mechanism for evaluating district and campus AYP. AYP Status Labels: Each district and campus is assigned one of the following AYP Status labels:
Meets AYP: Designates a district or campus that meets all AYP criteria on which it is evaluated.
Needs Improvement: Designates a district or campus that does not meet one or more AYP criteria.
Status Pending: Designates a district or campus with fewer than 30 total students tested that did not meet all AYP criteria based on evaluation of 5 to 29 total students or based on the all students performance results of the district in which the campus is located for campuses with 1 to 4 students. This status remains pending until additional small numbers analyses (uniform averaging and confidence intervals) are calculated by the TEA.
Not Evaluated: Designates a district or campus not evaluated for AYP for one of the following reasons:
o The campus is new; o The campus does not serve students in grades above kindergarten; o The campus does not have students in attendance for the full academic
year; o Juvenile Justice Alternative Education Program (JJAEP) and Disciplinary
Alternative Education Program (DAEP); o Unusual circumstances (district with no students in grades tested; campus
test answer documents lost in mail); o Charter district; or o The charter campus does not have students enrolled in the grades tested.
Creekview High School, Smith High School, Bush Middle School, and Field Middle School failed to meet AYP and the district itself will fail to meet AYP for 2011. All other campuses within the district will meet AYP for 2011.
33

Executive Summary continued
The 2011 Preliminary Adequate Yearly Progress chart is below. Prior year AYP charts are located in the Information section of this book.
CampusMeets AYP
Missed AYP AEIS Rating
District X RecognizedCreekview X AcceptableEarly College X ExemplaryRanchview X AcceptableSmith X AcceptableTurner X AcceptableBlalack X RecognizedBush X AcceptableField X RecognizedLong X RecognizedPerry X RecognizedPolk X RecognizedBlair/Montgomer X RecognizedBlanton X ExemplaryCarrollton X RecognizedCentral X RecognizedCountry Place X ExemplaryDavis X ExemplaryFarmers Branch X ExemplaryFreeman X RecognizedFurneaux X RecognizedGood X RecognizedKent X ExemplaryLa Villita X ExemplaryLandry X RecognizedLas Colinas X RecognizedMcCoy X ExemplaryMcKamy X ExemplaryMcWhorter X RecognizedRainwater X RecognizedRiverchase X RecognizedRosemeade X ExemplarySheffield Int/Pri X RecognizedStark X ExemplaryStrickland/McLa X RecognizedThompson X Exemplary
2011 Final Adequate Yearly Progress (AYP)
34

Executive Summary continued
No Child Left Behind legislation requires districts to publicly report their annual progress of the district as a whole and by campus toward meeting the goal of 100% of core subject area teachers meeting Highly Qualified status. The 2010-11 Highly Qualified Teacher Report must be publicly reported by December 15, 2010.
2010-11 C-FB DISTRICT AND CAMPUS HIGHLY QUALIFIED TEACHER REPORT
State, Region, District, and Campus Percentage of HQ Teachers
Texas 99.44% Region 10 99.55% Carrollton-Farmers Branch ISD 100% Creekview HS 100% Early College High School 100% Mary Grimes Education Center 100% Bea Salazar Alternative Education Center 100% Newman Smith HS 100% Ranchview HS 100% Turner HS 100% Blalack MS 100% Barbara Bush MS 100% Vivian Field MS 100% Dan Long MS 100% Perry MS 100% Ted Polk MS 100% Kelly Pre-Kindergarten Center 100% Blair Elementary 100% Blanton Elementary 100% Carrollton Elementary 100% Central Elementary 100% Country Place Elem. 100% Davis Elementary 100% Farmers Branch Elem. 100% Freeman Elementary 100% Furneaux Elementary 100% Good Elementary 100% Kent Elementary 100% Landry Elementary 100% Las Colinas Elementary 100% La Villita Elementary 100% McCoy Elementary 100% McKamy Elementary 100% McLaughlin Elementary 100% McWhorter Elementary 100%
35

Executive Summary continued
State, Region, District, and Campus Percentage of HQ Teachers
Rainwater Elementary 100% Riverchase Elementary 100% Rosemeade Elementary 100% Sheffield Intermediate 100% Sheffield Primary 100% Stark Elementary 100% Strickland Elementary 100% Thompson Elementary 100%
36

Executive Summary continued
Future Outlook Carrollton-Farmers Branch Independent School District is located in north central Texas on the northern edge of Dallas. The District overlaps a small area of the City of Dallas, and includes most of the City of Carrollton and about 70% of the City of Farmers Branch as well as portions of the Cities of Irving, Addison and Coppell.
37

Executive Summary continued
MONEY magazine has named Carrollton, Texas as one of the Best Place’s to Live in America (August, 2008). Carrollton was ranked #15. Forbes Magazine also listed Carrollton as 12th best on their list of “America’s 25 Best Places to Move” (July, 2009). The local economy remains vibrant and strong, despite recent downturns. The diversity of the businesses located here and the range of housing available combined with the transportation grid and proximity to Dallas-Fort Worth and Alliance airports provide a degree of protection from the economic cycles that is not available to most school districts. The Dallas-Fort Worth area is an important center of trade, finance and other major services. It is also a critical point in the national transportation complex. The District itself is a primary warehousing and distribution center. Due in part to the transportation infrastructure, cost of doing business and workplace, the Metroplex draws many new corporations and individuals to the area each year. Major businesses, such as Exxon-Mobil, have located their corporate headquarters here. The district’s largest taxpayer is only 1.00% of the taxable value of the district. This lack of dependence on a single employer or business segment means that the loss of even a large business will not significantly have a negative impact on the education of children, or imperil the future payment of obligations. The location of the District along Interstate 35, Interstate 635, Bush Tollway and the Dallas North Tollway together with its proximity to the Dallas-Fort Worth International Airport (approximately eight miles from the District), has provided a major impetus for growth in the northwest quadrant of Dallas County and the school district. The upgrading of the road system within the metroplex continues to be a plus for the District. A combination of interstate highways, state highways, and toll roads insures that residents can easily commute to jobs anywhere in the metroplex and serves as a magnet for the location of new businesses coming into the area. In addition, the Dallas Area Rapid Transit, (DART) system has opened the Green Line extension of their light rail system in 2011. This extension has major stops in the District. The Cities of Carrollton and Farmers Branch have initiated plans in these transit areas, creating a lifestyle renaissance of high-density housing, retail, restaurants and offices. La Villita, a unique community in Las Colinas, has moved off the drawing board and into the construction phase of the 200 acre site. The project will contain multifamily, small office buildings, single-family and town home development. The project will include 300 single-family homes and up to 2,000 apartments, town homes and live/work units. Retail, restaurants and service-oriented businesses will follow the residential growth. La Villita’s master plan also calls for office development, which is envisioned as professional offices and small build-to-suites. The District opened an elementary school in La Villita in 2008 and has secured a site for a middle school. La Villita’s site is rich in water features, particularly the 30 acre Lake Royal and its two canals. Small parks and plazas will be scattered throughout the community, giving residents places to gather. There will also be a system of hiking and biking trails, both paved and natural-surface along the Elm Fork of the Trinity River.
38

Executive Summary continued
The Valwood Improvement Authority was created in 1974 as the Farmers Branch-Carrollton Flood Control District, thus extending the development of industrial land along the Trinity River flood plain as the largest planned industrial/business park in Dallas County. Wholly contained within the Cities of Carrollton and Farmers Branch, the Authority has major freeway access, rail and motor line services. Valley Ranch, a mixed-use development of 2,400 acres, is located south of Beltline Road and north of the LBJ Freeway and is the home of the Dallas Cowboys. Approximately 1,800 acres of the development is located within the District and approximately 1,200 of those acres will be devoted to residential property. Las Colinas, a mixed-use development of some 12,000 acres, lies immediately east of the Dallas-Fort Worth International Airport. This master-planned community contains quality residential areas, business parks, shopping centers, green-belt areas, several country clubs, an equestrian center, office parks, luxury hotels, a complete recording and sound studio for motion picture production, hospital facilities, and a community college. Some 4,300 acres of Las Colinas lie within the District. A major redevelopment project was initiated in Addison in 2007 where 2,400 older apartments are being torn down. This 99 acre project will replace those apartments with a complete new urban environment and will be known as Vitruvian Park. This development will include a 12 acre waterfront park with open spaces, an amphitheater, a neighborhood park, 500,000 sq. ft. of office space, 6,000 housing units and retail businesses. This total project will take 6 to 10 years to complete. The first elements of this project are complete. Our citizens have always put the education of children first because there is a realization that children are the leaders of tomorrow. With the exploding usage of technology, vast growth in student enrollment and the need to update aging facilities, all previous bond referendums in the District have been approved by the citizens who reside within the District boundaries. In addition to renovations and new construction, there are major renovation projects ongoing within the District. The technology initiatives include improvements to the network infrastructure, computer hardware and software. The District maintains a fiber optic network to provide connectivity for over 15,000 computers. The focus this year is on integrating wireless, mobile handheld devices into the classroom. The focus on this initiative is to enable students and staff flexible, wireless access to online instructional applications. The District has an extensive Internet website with individual home pages for all departments and campuses. At http://www.cfbisd.edu/pages/index.cfm families can locate a wealth of information, including a school locator package that identifies the schools which serve residential addresses.
39

Executive Summary continued
The Product
District Overview With the Mission Statement in mind, the Carrollton-Farmers Branch Independent School District believes that partnerships and collaborations combined with an integrated educational program of quality, equity, challenge, and innovation prepare each student for the world of tomorrow.
Location C-FB ISD encompasses 53.42 square miles in northwest Dallas County with a smaller portion in southeast Denton County. C-FB ISD provides instructional services to children who live in portions of Carrollton, Farmers Branch, Addison, Coppell, Dallas and Irving. Parent/Community Involvement Strong parental support and community alliances are keys to a successful public education system. C-FB ISD has a PTA or PTSA on every regular school campus, multi-school business partnerships and specialized parent booster clubs on secondary campuses. Educational Services Every student is valued in C-FB ISD, and the Division of Educational provides systemic support through an online curriculum, Community of Learns (COL). The COL provides additional specificity to the state standards. The district uses the framework of Understanding by Design to communicate expectations for all students in the district through grade 12 curriculums. Gifted Education C-FB ISD has had gifted education instructional programs in place since 1978. Over 2,600 identified students in grades kindergarten through twelfth participate in broad-based, advanced programs available on all campuses. The Leading Exceptional Academic Producers (LEAP) program is designed to challenge students who are performing several grade levels above their chronological age. This program is the only one of its kind in Texas to support the needs of the profoundly gifted student. Special Education The district offers a continuum of service options for students with disabilities, age 3 through 21, who require specially designed instruction and are eligible for special education and related services. An Individual Education Program is developed to meet the individual needs of each student who is eligible. Career & Technology Education The district has identified 16 career clusters, which are organized around broad career fields: Agriculture, Food & Natural Resources Architecture & Construction Arts, A/V Technology & Communications
40

Executive Summary continued
Business, Management & Administration Education & Training Finance Government & Public Administration Health Science Hospitality & Tourism Human Services Information Technology Law, Public Safety, Corrections & Security Manufacturing Marketing, Sales & Service Science, Technology, Engineering & Mathematics Transportation, Distribution & Logistics With careful consideration and discussion, each student can identify a specific and individualized cluster and then a “path.” There are 81 individual career pathways in the 16 career clusters. Students are urged to carefully consider the questions at the beginning of each cluster/pathway. When one or more cluster/pathway appears interesting, students look carefully at the possible degrees, careers and working conditions associated with these area(s). Then they choose the related high school elective courses that would help them prepare for each pathway. In addition, high schools provide in-depth career pathway study through the following academies. These academies are open to all incoming 9th grade C-FB ISD high school students through an application process.
Media Arts and Technology, Biomedical Professions, International Business, Law and Criminal Justice Math, Engineering, Technology & Sciences
In addition, students have the opportunity to choose from more than 100 Career & Technology Education courses offered in the 16 career clusters identified above. Athletics and Fine Arts Students can participate in a variety of extracurricular and co-curricular activities from football to orchestra. At the high school level, fourteen boys’ sports and fifteen girls’ sports are offered as well as art, band, choir, dance, drill team, orchestra, speech, debate and theatre. In middle school, seven sports are offered for girls and seven sports are offered for boys as well as band, choir, art, orchestra and theatre. Art and music are offered at the elementary level for every K-5 student. The high school sports are: cheerleading, athletic training, swim/diving, power lifting, football, volleyball, cross country, basketball, softball, baseball, soccer, track, tennis, golf and
41

Executive Summary continued
wrestling. At the middle school sports are: football, volleyball, basketball, track, swim, tennis, cheerleading and soccer. Facilities Since 1990, in four separate elections, the voters of the Carrollton-Farmers Branch ISD have authorized over $600 million in general obligation bonds. The most recent election in 2003 was for $300.165 million alone and passed by more than 78% of the votes. Accountability Ratings In August, 2011, the Texas Education Agency announced individual school ratings based on student performance on the most recent Texas Assessment of Knowledge and Skills (TAKS) tests, and the previous year’s dropout, completion and attendance rates. The state’s accountability ratings for schools and districts are based on scores of all students and each student group of qualified size (African-American, Hispanic, White and Economically Disadvantaged) with the indicators listed below.
Requirements for Each Ratings Category
Base Indicators Academically Acceptable
Recognized Exemplary
Spring 2011 TAKS All students and each student group that meets minimum size criteria: African American Hispanic White Econ Disadvantaged
Meet passing standard for each subject * Reading/ELA 70% * Writing 70% * Social Studies 70% * Mathematics 65% * Science 60%
OR Meet required improvement
Meet 80% passing standard for each subject
OR Meet 75% passing standard and meet required improvement
Meet 90% passing standard for each subject
Completion Rate Class of 2010 All students and each student group that meets minimum size criteria: African American Hispanic White Econ Disadvantaged
Meet 75% completion rate standard
OR Meet required improvement
Meets 85% completion rate standard
OR Meets 80% and required improvement
Meet 95% completion rate standard
42

Executive Summary continued
Annual Dropout Rate 2009-10 All students and each student group that meets minimum size criteria: African American Hispanic White Econ Disadvantaged
Meet 1.6% dropout rate standard
OR Meets Required Improvement
Meet 1.6% dropout rate standard
OR Meets Required Improvement
Meet 1.6% dropout rate standard
OR Meets Required Improvement
Additional Provisions Academically Acceptable
Recognized Exemplary
Exceptions Applied if the district or campus would be Academically Unacceptable solely due to not meeting the Academically Acceptable TAKS criteria. Other criteria provisions must be met.
Applied if the district or campus would be Academically Acceptable due to not meeting Recognized TAKS criteria. Other criteria provisions must be met.
Applied if the district or campus would be Recognized due to not meeting Exemplary TAKS criteria. Other criteria provisions must be met.
Check for Academically Unacceptable Campuses (District Only)
Does not apply to Academically Acceptable districts.
A district with a campus rated Academically Unacceptable cannot be Recognized.
A district with a campus rated Academically Unacceptable cannot be Exemplary.
Check for Underreported Students (District only)
Does not apply to Academically Acceptable districts.
A district that underreports more than 150 students or more than 3.0% of its prior year students cannot be rated Recognized.
A district that underreports more than 150 students or more than 3.0% of its prior year students cannot be rated Exemplary.
43

Executive Summary continued
The District received an overall accountability rating from the Texas Education Agency of “Recognized”. Exemplary and Recognized Campuses are listed below. All other campuses were acceptable.
Blanton Elementary Blair ElementaryCountry Place Elementary Blalack Middle SchoolDavis Elementary Carrollton ElementaryEarly College High School Central ElementaryFarmers Branch Elementary Freeman ElementaryKent Elementary Furneaux ElementaryLaVillita Elementary Good ElementaryMcCoy Elementary Landry ElementaryMcKamy Elementary Las Colinas ElementaryRosemeade Elementary Long Middle SchoolStark Elementary McLaughlin ElementaryThompson Elementary McWhorter Elementary
Perry Middle SchoolPolk Middle SchoolRainwater ElementaryRiverchase ElementarySheffield IntermediateSheffield PrimaryStrickland Intermediate
Exemplary Campuses Recognized Campuses
44

Executive Summary continued
Advanced Placement Advanced Placement (AP) is an accelerated level of instruction. AP courses provide college level coursework in a high school setting and are open to all C-FB students at each high school. Enrolling in an AP class provides a powerful opportunity for students to acquire the knowledge, sophisticated concepts, and skills needed for college success. Carrollton-Farmers Branch ISD strongly encourages all AP students to take the end of the course AP Exam. C-FB gives a vast selection of different AP course exams, including AP Spanish Language which included Native Spanish speaking middle school students. Scholastic Achievement Test (SAT) The SAT is administered by the College Board and is designed to measure the verbal and math aptitudes of high school students. The SAT takers are self-selected; that is, any students may opt to take the exam. C-FB seniors taking the Scholastic Aptitude Test out-performed students taking the exam throughout the state and the nation. C-FB ISD high school seniors continue to excel on the SAT. The district combined score for 2011 is 1,476 compared to 1,446 for the state and 1,500 for the nation.
SAT Results for 2011Mean Scores
CriticalCampus Count Reading Math Writing CombinedTurner High School 157 461 492 456 1409Smith High School 240 498 518 497 1513Creekview High School 320 503 540 487 1530Ranchview High School 123 475 492 476 1443Early College High School 75 436 460 426 1322
District 915 485 513 478 1476
National 1,647,123 497 514 489 1500Texas 166,012 479 502 465 1446
45

Executive Summary continued
American College Test (ACT) The American College Test (ACT) is an achievement test with four content exams including English, reading, mathematics, and science, plus an optional writing test and is used as a college entrance exam. More information about the ACT can be found at www.act.org. The overall composite score for the C-FB ISD seniors taking the ACT in 2011 was higher than both the state and national scores. Results for 2011 are listed in the chart below.
ACT Results for 2011
Campus Count English Math Reading Science CompositeTurner High School 92 18.2 21.3 19.5 20.1 19.9Smith High School 114 21.5 22.7 22.5 22.5 22.4Creekview High School 127 22.1 23.9 22.7 22.5 22.9Ranchview High School 44 20.0 21.6 21.1 21.4 21.1Early College High School 20 16.3 19.7 18.2 19.1 18.5
District 398 20.5 22.5 21.5 21.6 21.6
Nation 1,623,112 20.6 21.1 21.3 20.9 21.1Texas 101,569 19.6 21.5 20.7 20.8 20.8
46

Executive Summary continued
The Texas Assessment of Knowledge and Skills (TAKS) assesses student mastery of the Texas Essential Knowledge and Skills (TEKS) in English/Language Arts, Mathematics, Social Studies, and Science. Students must demonstrate mastery on each section of the EXIT-Level examination to be eligible for a high school diploma. Students in grades 3 - 11 take the TAKS test annually.
TAKS Results by Subject and Grade
Met MetSubject Area Group Expectation Commended Expectation CommendedReading/ELA All Students 91% 33% 92% 33%Math All Students 86% 30% 87% 31%Writing All Students 95% 34% 95% 33%Science All Students 87% 32% 87% 35%Social Studies All Students 96% 53% 97% 54%
Reading/ELA African Am. 90% 28% 90% 28%Math African Am. 79% 17% 80% 19%Writing African Am. 93% 29% 95% 26%Science African Am. 82% 20% 81% 21%Social Studies African Am. 95% 43% 95% 44%
Reading/ELA Hispanics 89% 24% 89% 26%Math Hispanics 83% 23% 85% 24%Writing Hispanics 94% 25% 93% 26%Science Hispanics 82% 24% 83% 26%Social Studies Hispanics 95% 42% 96% 44%
Reading/ELA White 97% 49% 97% 48%Math White 93% 43% 93% 43%Writing White 97% 52% 96% 45%Science White 96% 48% 95% 54%Social Studies White 99% 72% 99% 74%
Reading/ELA Econ.Disadv. 89% 25% 89% 26%Math Econ.Disadv. 83% 23% 84% 24%Writing Econ.Disadv. 94% 26% 93% 26%Science Econ.Disadv. 82% 24% 83% 26%Social Studies Econ.Disadv. 95% 41% 95% 43%The Results are Summed Across all Grades
2010 2011
47

Executive Summary continued
National Merit Semifinalist Eight students in the Carrollton-Farmers Branch school district were named national 2012 Merit semifinalists. The students are among 16,000 high school seniors who will continue in the National Merit Scholarship Corporation’s competition for 8,300 merit scholarship awards worth $34 million that will be offered in the spring. Students are selected based on performance on the Preliminary SAT/National Merit Scholarship Qualifying test. The pool of semifinalist represents less than one percent of the top high school seniors in the nation. Approximately 15,000 semifinalists become finalists. From the group of finalists, Merit Scholarship winners are determined according to the National Merit Scholarship Corporation. “Merit Scholar designees are selected on the basis of their skills, accomplishments and potential for success in rigorous college studies,” according to the National Merit Scholarship Corporation press release. More information about the National Merit Scholarship Program is available on the National Merit Scholarship Corporation website www.nationalmerit.org. National Achievement Scholarship Program One student was named 2012 National Merit Achievement Semifinalists. This exceptional student is among more than 1,600 Black American high school seniors who have been designated semifinalists in the 48th annual National Achievement Scholarship Program. For more information, visit http://www.nationalmerit.org/nasp.php . National Merit Commended Recipients Twenty-two students in the Carrollton-Farmers Branch school district were named 2012 National Merit Commended Recipients. These commended students were selected from over 1.5 million young adults who took the Preliminary Scholastic Aptitude Test/National Merit Scholarship Qualifying test (PSAT/NMSQT) during their junior year in high school. Commended students are selected from the highest scorers on the PSAT.
48

Executive Summary continued
The Carrollton-Farmers Branch ISD has received a “Superior Achievement” rating under Texas’ Schools FIRST financial accountability rating system. The Superior Achievement rating is the state’s highest, demonstrating the quality of C-FB ISD’s financial management and reporting system. This is the eighth year of Schools FIRST (Financial Accountability Rating System of Texas). School FIRST is a financial accountability system for Texas school districts developed by the Texas Education Agency in response to Senate Bill 875 of the 76th Texas Legislature in 1999. The primary goal of Schools FIRST is to achieve quality performance in the management of school districts’ financial resources, a goal made more significant due to the complexity of accounting associated with Texas’ school finance system. The Schools FIRST accountability rating system assigns one of four financial accountability ratings to Texas school districts, with the highest being “Superior Achievement”, followed by “Above-Standard Achievement”, Standard Achievement” and Substandard Achievement”.
Name: Carrollton-Farmers Branch ISDStatus: PassedRating: Superior AchievementDistrict Score: 75
Indicator Indicator Description Score1 Was the total Fund Balance Less Reserved Fund Balance Greater Yes
Than Zero in the General Fund2 Was the total Unrestricted Net Asset Balance (Net of Accretion of Yes
Interest on Capital Appreciation Bonds) in the Governmental ActivitiesColumn in the Statement of Net Assets Greater than Zero? (If theDistrict's 5 year % Change in Students was 10% or more).
3 Were there no Disclosures in the Annual Financial Report and/or YesOther Sources of Information Concerning Default on Bonded Indebtedness Obligations?
4 Was the Annual Financial Report filed within One Month after YesNovember 27th or January 28th Deadline Depending Upon theDistrict's Fiscal Year End Date (June 30th or August 31st)?
5 Was there an Unqualified Opinion in Annual Financial Report? Yes6 Did the Annual Financial Report not Disclose any Instance(s) of Yes
Material Weaknesses in Internal Controls?
Financial Integrity Rating System of Texas
FIRST
49

Executive Summary continued
Financial Integrity Rating System of Texas
FIRST
1 Multiplier7 Did the District's Academic Rating exceed Academically Unacceptable? 58 Was the Three-Year Average Percent of Total Tax Collections 5
(Including Delinquent) Greater than 98%?9 Did the Comparison of PEIMS Data to like information in Annual 5
Financial Report Result in an Aggregate Variance of Less than 3 percent of Expenditures Per Fund Type (Data Quality Measure)?
10 Were Debt Related Expenditures (Net of IFA and/or EDA Allotment) 5<$350.00 per Student? (If the District's five-year percent change in Students = or > 7%, or if Property Taxes Collected Per Penny of TaxEffort > $200,000 per Student).
11 Was there no Disclosure in the Annual Audit Report of Material 5Noncompliance?
12 Did the District have Full Accreditation Status in Relation to Financial 5Management Practices? (e.g. No Conservator or Monitor Assigned).
13 Was the Aggregate of Budgeted Expenditures and Other Uses Less 5than the Aggregate of Total Revenues, Other Resources and FundBalance in the General Fund?
14 If the District's Aggregate Fund Balance in the General Fund and 5Capital Projects Fund was less than zero, Were Construction ProjectsAdequately Financed? (To avoid creating or adding to the Fund Balance Deficit Situation)
15 Was the Ratio of Cash and Investments to Deferred Revenues 5(Excluding Amount equal to Net Delinquent Taxes Receivable) in the General Fund Greater than or Equal to 1:1? (If Deferred Revenuesare less than Net Delinquent Taxes Receivable)
16 Was the Administrative Cost Ratio less than the Threshold Ratio? 517 Was the Ratio of Students to Teachers Within the Ranges Shown 5
Below According to District Size?18 Was the Ratio of Students to Total Staff Within the Ranges Shown 5
Below According to District Size?19 Was the total Fund Balance in the General Fund More than 50% and 5
Less than 150% of Optimum According to the Fund Balance and Cash Flow Calculation Worksheet in the Annual Financial Report?
20 Was the Decrease in Undesignated Unreserved Fund Balance < 20% 5Over Two Fiscal Years? (If 1.5 Times Optimum Fund Balance < TotalFund Balance in General Fund or if Total Revenues > OperatingExpenditures in the General Fund, then the District receives 5 points)
50

Executive Summary continued
Financial Integrity Rating System of Texas
FIRST
21 Was the Aggregate Total of Cash and Investments in the General 5Fund more than $0?
22 Were Investment Earnings in All Funds (Excluding Debt Service Fund 0and Capital Projects Fund) More than $20 per Student?
75weighted
sum1 Multiplier
Sum75 Score
Determination of RatingA Did the District answer "No" to Indicators 1, 2, 3 or 4? OR Did the
District answer "No" to Both 5 and 6? If so, the District's Rating is Substandard Achievement.
B Determine Rating by Applicable Range for Summation of the indicator scores (Indicators 7-24)Superior Achievement
72-80 and Yes to Indicator 7Above Standard Achievement
64-71 or > = 72 and No to indicator 7Standard Achievement
56-63Substandard Achievement.
<56 or No to one default indicator
Indicator 17 & 18 Ratios17 Ranges for Ratios
District Size - Number of Students Between Low High<500 7 22500-999 10 221,000-4,999 11.5 225,000-9,999 13 22>= 10,000 13.5 22
Indicator 1818 Ranges for Ratios
District Size - Number of Students Between Low High<500 5 14500-999 5.8 141,000-4,999 6.3 145,000-9,999 6.8 14>= 10,000 7 14
51

Executive Summary continued
Financial Integrity Rating System of Texas
FIRST
PointsQuestion Possible
7 Y=5 N=08 5 4 3 2 1 0
>98 >95 =<98 >92 =<95 >89 =<92 >86 =<89 =<869 Y=5 N=0
10 5 4 3 2 1 0<$350 =>$350<$600 =>$600<$850 =>$850<$1,100 =>$1,100<$1,350 =>$1,350
11 Y=5 N=012 Y=5 N=013 Y=5 N=014 Y=5 N=015 5 4 3 2 1 0
=>1.00 =>0.95<1.00 =>0.90<0.95 =>0.85<0.90 =>0.8<0.85 <0.8016 Y=5 N=017 5 4 3 2 1 0
UL*<=100% >100%=<105% >105%=<110% >110%=<115% >115%=<120% >120%LL**=>100% =>95%<100% =>90%<95% =>85%<90% =>80%<85% <80%
18 5 4 3 2 1 0UL*<=100% >100%=<105% >105%=<110% >110%<115% >115%=<120% >120%LL**=>100% =>95%<100% =>90%<95% =>85%<90% =>80%<85% <80%
19 5 4 3 2 1 0UL*<150% >150%=<152.5% >152.5%=<155% >155%=<157.5% >157.5%=<160% >160%LL**>50% >47.5%=<50% >45%=<47.5% >42.5%=<45% >40%=<42.5% =<40%
20 5 4 3 2 1 0<20% =>20%<21% =>21%<22% =>22%<23% =>23%<24% =>24%
21 Y=5 N=022 5 4 3 2 1 0
>$20 >$19=<$20 >$18=<$19 >$17=<$18 >$16=<$17 =<$16 UL-Upper Limit LL-Lower Limit
52

Executive Summary continued
The graph below depicts the District’s past, present and future estimates for Student enrollment.
24,146
25,002
25,548
25,638
25,860
26,231
26,252
26,397
26,257
25,920
26,159
26,159
26,395
26,421
26,448
0 5,000 10,000 15,000 20,000 25,000 30,000
2001
2002
2003
2004
2005
2006
2007
2008
2009
2010
2011
*2012
*2013
*2014
*2015
Student Enrollment(*estimated based on district demographic information)
Based on current enrollment trends, the District’s growth is concentrated on its Western edge. Due to this current and anticipated growth, the District opened LaVillita Elementary School in August of 2008. Long-range plans include an additional elementary school and a middle school with an addition to Ranchview high school in this area. Enrollment trends in all other parts of the District indicate that current facilities will be adequate with minor renovation and additions.
53

Executive Summary continued
54

Executive Summary continued
District Mission Statement and Improvement Plan
55

Executive Summary continued
C-FB ISD VISION:
All students will meet the State of Texas Assessments of Academic Readiness (STAAR) at the satisfactory or advanced level and graduate college-ready and/or workforce
ready without remediation.
DISTRICT IMPROVEMENT PLAN 2011-2012
Carrollton-Farmers Branch Independent School District
Dr. Bobby Burns, Superintendent
56

Executive Summary continued
BOARD OF TRUSTEES
Nancy Cline, President James Goode, Vice President Richard Fleming, Secretary Lynn Chaffin, Assistant Secretary Frank Shor, Board Member Nancy Watten, Board Member Karin Webb, Board Member
CARROLLTON-FARMERS BRANCH
SCHOOLS
SENIOR HIGH SCHOOLS
Creekview
Early College Newman Smith
R. L. Turner Ranchview
MIDDLE SCHOOLS
Blalack Bush Field Long Perry Polk
SUPPORTING OBJECTIVES
Supporting Objective 1:
Continuously increase student achievement
Supporting Objective 2:
Continuously improve the learning environment for
students and staff
Supporting Objective 3:
Continuously increase operational effectiveness
Supporting Objective 4:
Continuously increase stakeholder confidence and support of our school system
ELEMENTARY
SCHOOLS
Blair Blanton
Carrollton Central
Country Place Davis
Farmers Branch Freeman Furneaux
Good Kent
Landry Las Colinas
La Villita McCoy
McKamy McLaughlin McWhorter Rainwater Riverchase Rosemeade
Sheffield Intermediate Sheffield Primary
Stark Strickland Thompson
CENTERS
Mary Grimes Education Center Salazar Transition
School Kelly Pre-K Center
Huie Education Center
CLC Learning Complex
C-FBISD GOAL The Goal of the Carrollton-Farmers Branch ISD is high
achievement for all students.
57

Executive Summary continued
C-FBISD VISION All students will meet the State of Texas Assessments of Academic Readiness (STAAR) at the satisfactory or advanced level and graduate college-ready and/or workforce ready without remediation.
MISSION
Together with families and community we commit all district resources to guide the learning of each student to graduate as:
A responsible individual A passionate life-long learner A complex thinker An effective communicator
STATEMENT OF BELIEFS
We believe that:
The economic, political and societal success of our country depends upon a quality education for all.
Diversity strengthens the community and enriches the fabric of our society. It is the responsibility of the entire community to partner in the educational process. Learning occurs best in a safe, orderly and nurturing environment. Belonging to a family, to a school and to a community is vital, and this sense of
belonging advances learning. People learn at different rates, have different capacities and that each person’s
educational path deserves to be valued equally. Learning empowers people to reach their full potential: physically, mentally, socially,
and emotionally Everyone is a teacher, everyone is a learner.
GRADUATE PROFILE
Graduates of the Carrollton-Farmers Branch ISD are:
Responsible individuals who: Model productive citizenship Practice successful personal management Demonstrate character values and ethical behavior Appreciate the value of diversity Function effectively as team members
Competent learners who:
Continually pursue and integrate knowledge Achieve academic standards
58
Executive Summary continued
Apply various forms of technology Seek educational and career options Produce quality products
Complex thinkers who: Solve problems critically Create original ideas and solutions Understand and apply systems thinking
Effective communicators who: Read with understanding Interpret information Interact through listening and speaking
Write clearly
BQ Local Policy
Planning and Decision-Making Process
DISTRICT MISSION, GOALS, AND OBJECTIVES AND CAMPUS OBJECTIVES
DISTRICT IMPROVEMENT PLANNING PROCESS PARENTAL INVOLVEMENT PLAN
The Board shall approve and periodically review the District’s mission and goals to improve student performance. The mission, goals, and the approved District and campus objectives shall be mutually supportive and shall support the state goals and objectives under Education Code, Chapter 4. [See AE(EXHIBIT)]
The District’s planning process to improve student performance includes the development of the District’s educational goals, the legal requirements for the District and campus improvement plans, all pertinent federal planning requirements, and administrative procedures. The Board shall approve the process under which the educational goals are developed and shall ensure that input is gathered from the District-level committee.
The Board shall ensure that the District and campus improvement plans, as applicable,
59

Executive Summary continued
ADMINISTRATIVE PROCEDURES AND REPORTS ADMINISTRATIVE PROCEDURES AND REPORTS - continued
EVALUATION
address all elements required by federal law for receipt of Title I, Part A funds, including elements pertaining to parental involvement. The District-level and campus-level committees shall involve parents in the development of such plans and in the process for campus review and improvement of student academic achievement and campus performance. [See EHBD]
The Board shall ensure that administrative procedures meet legal requirements in the areas of planning, budgeting, curriculum, staffing patterns, staff development, and school organization; adequately reflect the District’s planning process; and include implementation guidelines, time frames, and necessary resources. The Superintendent shall report periodically to the Board on the status of the planning process, including a review of the related administrative procedures, any revisions to improve the process, and progress on implementation of identified strategies.
The Board shall ensure that data are gathered and criteria are developed to undertake the required biennial evaluation to ensure that policies, procedures, and staff development activities related to planning and decision-making are effectively structured to positively impact student performance.
60

Executive Summary continued
PLANNING PROCESS
Needs Assessment
The campus staff elects members to the District Improvement Council. Parents, business and administrators also serve on the DIC. The purpose of the District Improvement Plan is to include:
1. Measurable District performance objectives for all appropriate academic excellence indicators for all student populations, including students in special education programs under Education Code Chapter 29, Subchapter A, and other measures of student performance that may be identified through the comprehensive needs assessment.
2. Strategies for improvement of student performance that include:
a. Instructional methods for addressing the needs of student groups not achieving
their full potential. b. Methods for addressing the needs of students for special programs, such as
suicide prevention, conflict resolution, violence prevention, or dyslexia treatment programs.
c. Dropout reduction. d. Integration of technology in instructional and administrative programs. e. Discipline management. f. Staff development for professional staff of the District. g. Career education to assist students in developing the knowledge, skills, and
competencies necessary for a broad range of career opportunities. h. Accelerated education.
Annual analysis of the plan and review of various assessment data are used to determine objectives that address District goals. Specific strategies and action steps are developed to address these objectives. This process ensures a commitment to excellence and a resolve to provide the best instructional plan for every student. (TD1)
TARGET AREAS
Title I – Targeted Assisted (TA)
Must address the 8 components of a Targeted Assisted Program TA 1. Resources used to help children meet state academic achievement standards TA 2. Planning for identified students incorporated into existing school planning
61

Executive Summary continued
TA 3. Methods and strategies based on scientifically based research TA 4. TA program is coordinated with and supports regular educational programs TA 5. Highly qualified teachers TA 6. Professional Development TA 7. Increase parental involvement TA 8. Coordination of federal, state, and local services
Title I – District Components (TD)
TD 1. Comprehensive needs assessment TD 2. School-wide reform strategies TD 3. Highly qualified teachers TD 4. Professional development TD 5. Strategies to attract high-quality highly qualified teachers to high-need schools TD 6. Parental involvement TD 7. Assisting preschool children in the transition from early childhood programs TD 8. Measures to include teachers in the decisions regarding use of academic assessments. TD 9. Students difficulties identified on a timely basis TD 10. Coordination and integration between federal, state, and local services. Detail strategic plans for accomplishment of the District’s goals are included in the Organization section of this book.
62

Executive Summary continued
PERSONNEL
63

Executive Summary continued
The graph below depicts District’s student/teacher ratio changes over time.
14.8
14.9
14.7
15.2
14.6
14.5
14.3
14.4
15
15.4
13.6
13.8
14
14.2
14.4
14.6
14.8
15
15.2
15.4
15.6
2001‐02 2002‐03 2003‐04 2004‐05 2005‐06 2006‐07 2007‐08 2008‐09 2009‐10 2010‐11
Student/Teacher Ratio(Source: PEIMS Edits+ Staff FTE Summary)
2001‐02 2002‐03 2003‐04 2004‐05 2005‐06
2006‐07 2007‐08 2008‐09 2009‐10 2010‐11
64

Executive Summary continued
The graph below depicts the Staff by Sex and Ethnicity for 2010-11.
Staff Summary by Sex and Ethnicity 2010-11 (Source: PEIMS Edit+ Report – Staff FTE Summary)
White Hispanic Black Other Totals
Male 428.1 121.7 53.3 68.7 671.8
Male Percentage 13.7% 3.9% 1.7% 2.2% 21.4%
Female 1,675.4 470.8 169.9 144.7 2,460.8
Female Percentage 53.5% 15.0% 5.4% 4.6% 78.6%
65

Executive Summary continued
The graph below depicts the Staff by Highest Degree-changes over time.
Teacher by Highest Degree Held (Source: PEIMS Edits+ Report – Staff FTE Summary)
2006-07 2006-07
% 2007-08
2007-08 %
2008-09 2008-09
% 2009-10
2009-10 %
2010-11 2010-11
%
No Degree
7.7 0.4% 4.8 0.3% 7.0 0.4% 8.0 0.5% 6.5 0.4%
Bachelors 1,348.2 74.4% 1393.7 75.4% 1,372.6 75.4% 1,278.7 74.0% 1278.6 75.1%
Masters 442.5 24.4% 437.0 23.7% 432.6 23.8% 431.7 25.0% 405.0 23.8%
Doctorate 14.3 0.8% 12.4 0.7% 9.0 0.5% 8.9 0.5% 12.0 0.7%
66

Executive Summary continued
The graph below depicts the Teachers by Years of Experience- changes over time.
Teachers by Years of Experience (Source: PEIMS Edit+ Report – Staff FTE Summary)
2002-03 2003-04 2004-05 2005-06 2006-07 2007-08 2008-09 2009-10 2010-11
Beginning Teachers
124.1 132.7 176.6 171.6
163.3 (9.0%)
178.4 (9.7%)
134.1 (7.4%)
74 (4.3%)
95.7 (5.6%)
1-5 Years Experience
656.8 650.7 607.8 645.8
678.2 (37.4%)
695.8 (37.7 %)
722.2 (39.7%)
653.7 (37.8%)
564 (33.1%)
6-10 Years Experience
307.2 344.0 385.0 420.1
433.9 (23.9%)
435.4 (23.6%)
403.2 (22.1%)
413.3 (23.9%)
430.1 (25.3%)
11-20 Years
Experience
344.2 345.5 309.9 320.4 315.4
(17.4%) 317.7
(17.2%) 341.0
(18.7%) 364.9
(21.1%) 394.2
(23.2%)
Over 20 Years
Experience
280.2 269.3 220.1 234.9 221.8
(12.2%) 220.5
(11.5%) 220.9
(12.1%) 221.3
(12.8%) 218.3
(12.8%)
Avg Exp Teachers-
TX
10.0 9.9 9.0 9.1 8.8 8.8 8.8 8.8 9.9
Avg Exp Teachers-District
6.0 5.9 5.5 5.6 5.4 5.6 5.4 5.6 6.8
67

Executive Summary continued
The graph below depicts Staff to Students – Special Education – changes over time. Note: The implementation of the Response to Intervention (RtI) three Tier model has resulted in a decrease in the number of students being referred for education evaluation. Additionally, a change in the eligibility criteria for Learning Disability has led to a decline in the number of identified students under this category.
173.2
2,635
178.4
2,700
188.2
2,770
194.4
2,742
188.8
2,470
176.6
2,506
177.7
2,555
Staff FTE
Students
Staff to Students - Special Education(Source: PEIMS Edit+ Reports- Staff FTE Summary & Student Data Review)
2004‐05 2005‐06 2006‐07 2007‐08 2008‐09 2009‐10 2010‐11
68

Executive Summary continued
The graph below depicts Staff to Students – Career & Technical- changes over time.
62.6
4,403
62.6
4,568
55.9
4,298
63.8
4,712
52.6
4,690
51.3
4,872
14.1
4,913
0 1,000 2,000 3,000 4,000 5,000 6,000
Staff FTE
Students
Staff to Students - Career and Technical(Source: PEIMS Edit+ Reports - Staff FTE Summary & Student Data Review)
2004‐05 2005‐06 2006‐07 2007‐08 2008‐09 2009‐10 2010‐11
69

Executive Summary continued
The graph below depicts Staff to Students – Gifted & Talented Education – changes over time.
34.1
2,226
35.5
2,332
38.7
2,467
37.1
2,502
40.5
2,494
47.4
2,419
28.7
2,387
Staff FTE
Students
Staff to Students - Gifted & Talented(Source: PEIMS Edit+ Reports - Staff FTE Summary & Student Data Review
2004‐05 2005‐06 2006‐07 2007‐08 2008‐09 2009‐10 2010‐11
70
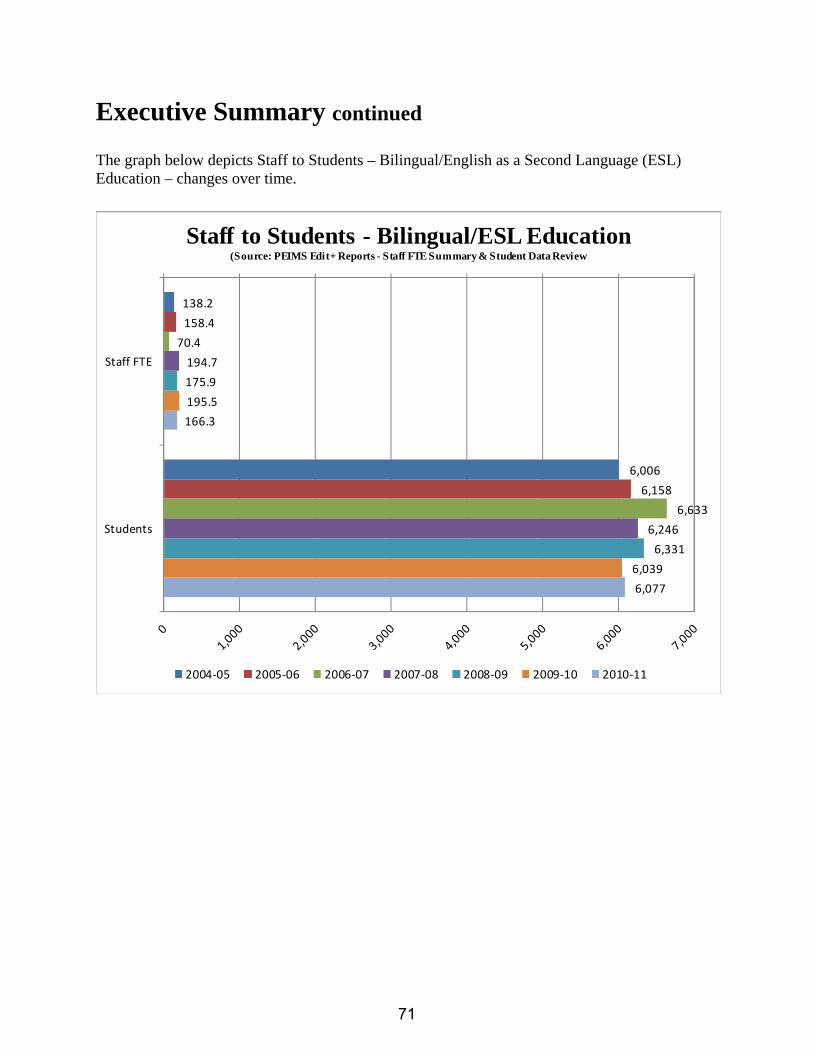
Executive Summary continued
The graph below depicts Staff to Students – Bilingual/English as a Second Language (ESL) Education – changes over time.
194.7
6,246
138.2
6,006
158.4
6,158
70.4
6,633
175.9
6,331
195.5
6,039
166.3
6,077
Staff FTE
Students
Staff to Students - Bilingual/ESL Education(Source: PEIMS Edit+ Reports - Staff FTE Summary & Student Data Review
2004‐05 2005‐06 2006‐07 2007‐08 2008‐09 2009‐10 2010‐11
71

Executive Summary continued
72

Organization Section
73

Organization Section continued
Carrollton-Farmers Branch Independent School District Organization Chart
2011-2012
Board of Trustees
Superintendent Dr. Bobby Burns
Educational Svcs Assoc Supt Dr.
Sheila Maher
Strategic Communica
- tions Exec Dir
Ms. Cindy
HR & Personnel Exec Dir Dr. Mary Hopkins
Technology & Infor Svcs Chief Tech Officer Dr.
Andy Berning
Admin & Support
Svcs Assoc Supt Mr.
Mark Hyatt
Principals
Adv Academic Svc Exec Dir Gerry Charlebois
Assessment/Accountability Exec Dir Cloyd Hastings
Career Tech Educ & Counsel Exec Dir Jo Gillen
Curr & Staff Development Exec Dir Holly Barber
School Improvement Exec Dir Tracy Smith
Special Education Exec Dir Randi Wells
Athletics Dir Renee Putter
Facilities & Maintenance Exec Dir Johnny Hibbs
Finance & Accounting Exec Dir Bonnie Halsey
Fine Arts Exec Dir Jim McDaniel
Materials Management Dir Rob McLaughlin
74

Organization Section continued
DISTRICT IMPROVEMENT PLAN 2011-2012
Carrollton-Farmers Branch Independent School District
Dr. Bobby Burns, Superintendent
C-FBISD VISION:
All students will meet the State of Texas Assessments of Academic Readiness (STAAR) at the satisfactory or advanced level and graduate college-ready and/or workforce
ready without remediation.
Carrollton-Farmers Branch ISD has one goal (high achievement for all students) and four supporting objectives. Each supporting objective has several performance targets by which the district will gauge growth toward meeting each objective. Each performance target has action steps to meet the goal. The action steps on the following pages are grouped to match the supporting objective and performance targets they will impact.
75

Organization Section continued
BOARD OF TRUSTEES
Nancy Cline, President James Goode, Vice President Richard Fleming, Secretary Lynn Chaffin, Assistant Secretary Frank Shor, Board Member Nancy Watten, Board Member Karin Webb, Board Member
CARROLLTON-FARMERS BRANCH
SCHOOLS
SENIOR HIGH SCHOOLS
Creekview
Early College Newman Smith
R. L. Turner Ranchview
MIDDLE SCHOOLS
Blalack Bush Field Long Perry Polk
SUPPORTING OBJECTIVES
Supporting Objective 1:
Continuously increase student achievement
Supporting Objective 2:
Continuously improve the learning environment for students and staff
Supporting Objective 3:
Continuously increase operational effectiveness
Supporting Objective 4:
Continuously increase stakeholder confidence and support of our school system
ELEMENTARY
SCHOOLS
Blair Blanton
Carrollton Central
Country Place Davis
Farmers Branch Freeman Furneaux
Good Kent
Landry Las Colinas
La Villita McCoy
McKamy McLaughlin McWhorter Rainwater Riverchase Rosemeade
Sheffield Intermediate Sheffield Primary
Stark Strickland Thompson
CENTERS
Mary Grimes Education Center Salazar Transition
School Kelly Pre-K Center
Huie Education Center
CLC Learning Complex
C-FBISD GOAL
The Goal of the Carrollton-Farmers Branch ISD is high
achievement for all students.
76

Organization Section continued
Strategic Improvement Plan 2011-2014
District Goal: High Achievement for All Students
Supporting Objective 1: Continuously improve student achievement
Data Source(s): Education Resource Group (ERG); AEIS ERG ranks the largest 200 school districts in Texas based on their EPI (Education Productivity Index), which is determined by academic and financial metrics referred to as API (Academic Performance Index) and FPI (Financial Performance Index). Through linear regression, ERG compares a district’s deviation from their expected score rather than absolute scores in order to take into account the impact economically disadvantaged students typically have on absolute scores allowing district comparisons regardless of the district's percentage of economically disadvantaged students. The API is calculated using performance on TAKS tests, 4 year graduation rates, and college admission tests (SAT and ACT) while the FPI is based on operational efficiency.
Performance Measure 2010 Results
2011 Target
2011 Results
2012 Target
2012 Results
2013 Target
2013 Results
2014 Target
2014 Results
Academic Performance Index (API)
17 15 10 5 1
Recognized/Exemplary District (Designated Distinction 2013-14)
R
R
R
N/A
R
R
E
Recognized/Exemplary Campuses (Designated Distinction 2013-2014)
34/38 89%
37/37 100%
31/37 84%
N/A
31/37 84%
35/37 95%
37/37 100%
District Met Adequately Yearly Progress AYP (Yes or No)
Y
Y
N
Y
Y
Y
Schools Met Adequately Yearly Progress AYP (% of schools)
37/38 97%
37/37 100%
33/37 89%
37/37 100%
37/37 100%
37/37 100%
77

Organization Section continued
Strategic Improvement Plan 2011-2014
District Goal: High Achievement for All Students
Supporting Objective 2: Continuously improve the learning environment for students and staff
Data Source(s): C-FB Texas Association of School Boards Employee Opinion Survey Results; AEIS Performance Measure
2010 Results
2011 Target
2011 Results
2012 Target
2012 Results
2013 Target
2013 Results
2014 Target
2014 Results
Employee Job Satisfaction – I would recommend this district to a friend as a good place to work.
93%
95%
92%
94%
97%
98%
Employee Working Conditions – I have the equipment, tools, and supplies to be successful in my job.
93%
95%
95%
97%
97%
97%
Employee Compensation & Benefits – Overall, I am satisfied with the pay and benefits offered by the district.
77%
80%
81%
85%
88%
90%
Student Attendance Rate
95.8% 96% 96% 97% 97% 98%
Students with Disciplinary Placements
13.4% (08-09)
13% (09-10)
12.5% (10-11)
12.5% (11-12)
12% (12-13)
78

Organization Section continued
Strategic Improvement Plan 2011-2014
District Goal: High Achievement for All Students
Supporting Objective 3: Continuously improve operational effectiveness
Data Source(s): Education Resource Group (ERG) Performance Measure
2010 Results
2011 Target
2011 Results
2012 Target
2012 Results
2013 Target
2013 Results
2014 Target
2014 Results
Financial Performance Index (FPI)
49 40 30 25 20
District Goal: High Achievement for All Students
Supporting Objective 4: Continuously increase stakeholder confidence and support of our school system
Data Source(s): Education Resource Group (ERG); C-FB Texas Association of School Boards Employee Opinion Survey Results; Achieving Quality Together District Survey Performance Measure
2010 Results
2011 Target
2011 Results
2012 Target
2012 Results
2013 Target
2013 Results
2014 Target
2014 Results
Education Productivity Index (EPI)
11 10 9 8 7
Employee District Communications – The district has my confidence and support.
94%
96%
93%
95%
95%
97%
Achieving Quality Together Parent Survey – Satisfied with school district
91.8*
94%
88.6%
90%
92%
95%
*Survey completed at elementary level only
79

Organization Section continued
Supporting Objective 1
Continuously increase student achievement
C-FBISD COMPLETION RATE / GRADUATION RATE
Class of 2009 Class of 2010 Class of 2011 Class of 2012 Completion Rate Comp
Rate Graduation
Rate Comp Rate
Graduation Rate
Completion Rate Graduation Rate Completion Rate Graduation Rate
Student Group
Target
Results
Target
Results
Target
Results
Target
Results
Afr. American 92.7 82.9 96.6 87.5 97 89
Hispanic 92.2 77.1 92.5 81.5 93 83
White 95.3 90.6 95.6 92.9 97 94
Econ. Dis. 93.7 83.8 93.8 87.4 94 89
All Students
94.1 84.5 94.7 87.3 95 90
Dropout Rate ANNUAL DROPOUT RATE
GRADES 7-8 C-FBISD 2008-2009 2009-2010 2010-2011 Student Group Rate Rate Target Results
Afr. American 1.1 .1 .1
Hispanic .5 .1 .1
White .4 .1 .1
Econ. Dis. .2 0 0
All Students .6 .1 .1
ADEQUATE YEARLY PROGRESS (AYP)
Met AYP
2008 Y
2009 Y
2010 Y
2011 N
Target 2012 Y
Results 2012
RESULTS - 2012
PROGRESS TOWARD TARGETS Completion Dropout
# of Targets Met
# of Targets Not Met
Percent at Target
80

Organization Section continued
Supporting Objective 1
Continuously increase student achievement
C-FBISD SAT MEAN SCORES
Subtests 2009 2010 2011 2012
Target Results
Critical Reading 497 488 485 497
Mathematics 533 519 513 521
Writing 489 482 478 489
Combined Score 1519 1489 1476 1507
Percent Tested 43% 47% 53% 55%
C-FBISD ACT MEAN SCORES
Subtests 2009 2010 2011 2012
Target Results
English 20.0 20.2 20.5 21
Mathematics 22.2 22.2 22.5 24
Reading 21.0 21.2 21.5 22
Science 21.2 21.6 21.6 21.8
Composite 21.2 21.4 21.6 22.5
Percent Tested 23% 25% 23% 25%
RESULTS - 2012 PROGRESS TOWARD TARGETS
SAT ACT
# of Targets Met
# of Targets Not Met
Percent at Target
81

Organization Section continued
C-FBISD VISION All students will meet the State of Texas Assessments of Academic Readiness (STAAR) at the satisfactory or advanced level and graduate college-ready and/or workforce ready without remediation.
MISSION
Together with families and community we commit all district resources to guide the learning of each student to graduate as:
A responsible individual
A passionate life-long learner
A complex thinker
An effective communicator
STATEMENT OF BELIEFS
We believe that:
The economic, political and societal success of our country depends upon a quality education for all.
Diversity strengthens the community and enriches the fabric of our society.
It is the responsibility of the entire community to partner in the educational process.
Learning occurs best in a safe, orderly and nurturing environment.
Belonging to a family, to a school and to a community is vital, and this sense of belonging advances learning.
People learn at different rates, have different capacities and that each person’s educational path deserves to be valued equally.
Learning empowers people to reach their full potential: physically, mentally, socially, and emotionally
Everyone is a teacher, everyone is a learner.
82
Organization Section continued
GRADUATE PROFILE
Graduates of the Carrollton-Farmers Branch ISD are:
Responsible individuals who: Model productive citizenship
Practice successful personal management
Demonstrate character values and ethical behavior
Appreciate the value of diversity
Function effectively as team members
Competent learners who:
Continually pursue and integrate knowledge
Achieve academic standards
Apply various forms of technology
Seek educational and career options
Produce quality products
Complex thinkers who: Solve problems critically
Create original ideas and solutions
Understand and apply systems thinking
Effective communicators who: Read with understanding
Interpret information
Interact through listening and speaking
Write clearly
83

Organization Section continued
BQ Local Policy Planning and Decision-Making Process
DISTRICT MISSION, GOALS, AND OBJECTIVES AND CAMPUS OBJECTIVES
DISTRICT IMPROVEMENT PLANNING PROCESS PARENTAL INVOLVEMENT PLAN
ADMINISTRATIVE PROCEDURES AND REPORTS
The Board shall approve and periodically review the District’s mission and goals to improve student performance. The mission, goals, and the approved District and campus objectives shall be mutually supportive and shall support the state goals and objectives under Education Code, Chapter 4. [See AE(EXHIBIT)]
The District’s planning process to improve student performance includes the development of the District’s educational goals, the legal requirements for the District and campus improvement plans, all pertinent federal planning requirements, and administrative procedures. The Board shall approve the process under which the educational goals are developed and shall ensure that input is gathered from the District-level committee.
The Board shall ensure that the District and campus improvement plans, as applicable, address all elements required by federal law for receipt of Title I, Part A funds, including elements pertaining to parental involvement. The District-level and campus-level committees shall involve parents in the development of such plans and in the process for campus review and improvement of student academic achievement and campus performance. [See EHBD]
The Board shall ensure that administrative procedures meet legal requirements in the areas of planning, budgeting, curriculum, staffing patterns, staff development, and school organization; adequately reflect the District’s planning process; and include implementation guidelines, time frames, and necessary
84
Organization Section continued
ADMINISTRATIVE PROCEDURES AND REPORTS - continued
EVALUATION
resources. The Superintendent shall report periodically to the Board on the status of the planning process, including a review of the related administrative procedures, any revisions to improve the process, and progress on implementation of identified strategies.
The Board shall ensure that data are gathered and criteria are developed to undertake the required biennial evaluation to ensure that policies, procedures, and staff development activities related to planning and decision-making are effectively structured to positively impact student performance.
TARGET AREAS
Title I – Targeted Assisted (TA)
Must address the 8 components of a Targeted Assisted Program TA 1. Resources used to help children meet state academic achievement standards TA 2. Planning for identified students incorporated into existing school planning TA 3. Methods and strategies based on scientifically based research TA 4. TA program is coordinated with and supports regular educational programs TA 5. Highly qualified teachers TA 6. Professional Development TA 7. Increase parental involvement TA 8. Coordination of federal, state, and local services
Title I – District Components (TD)
TD 1. Comprehensive needs assessment TD 2. School-wide reform strategies TD 3. Highly qualified teachers TD 4. Professional development TD 5. Strategies to attract high-quality highly qualified teachers to high-need schools TD 6. Parental involvement TD 7. Assisting preschool children in the transition from early childhood programs TD 8. Measures to include teachers in the decisions regarding use of academic assessments TD 9. Students difficulties identified on a timely basis TD 10. Coordination and integration between federal, state, and local services
85

Organization Section continued
THE GOAL OF THE CARROLLTON-FARMERS BRANCH ISD IS HIGH ACHIEVEMENT FOR ALL STUDENTS
SUPPORTING OBJECTIVE 1
SUPPORTING OBJECTIVE 2
SUPPORTING OBJECTIVE 3
SUPPORTING OBJECTIVE 4
CONTINUOUSLY INCREASE STUDENT
ACHIEVEMENT
CONTINUOUSY IMPROVE THE
LEARNING ENVIRONMENT FOR
STUDENTS AND STAFF
CONTINUOUSLY INCREASE
OPERATIONAL EFFECTIVENESS
CONTINUOUSLY INCREASE
STAKEHOLDER CONFIDENCE AND SUPPORT OF OUR SCHOOL SYSTEM
Performance Targets: Academic Performance Index (API) STAAR – Satisfactory
STAAR – Advanced
Graduation Rate
SAT Mean
ACT Mean
Recognized Distinction Designation AYP
Performance Targets: Employee Job Satisfaction
Working Conditions
Compensation and Benefits
Student: Attendance Rate
Disciplinary Placements
Performance Targets: Financial Performance Index (FPI) Instructional
Services
Leadership Services
Student Services
Non Student Services
Operating Services
Performance Targets: Education Productivity Index (EPI) API
FPI
Parent Satisfaction
Employee District Com-
munications
HIGH ACHIEVEMENT FOR ALL STUDENTS
The following table takes each supporting objective with related performance target(s) and outlines the action strategies necessary. The columns are self-explanatory showing who is responsible for the strategy, the timeline in which the strategy will be performed, how the strategy will be evaluated or measured, the resources necessary, and which Title I component is met, if applicable.
86

Organization Section continued
THE GOAL OF THE CARROLLTON-FARMERS BRANCH ISD IS HIGH ACHIEVEMENT FOR ALL STUDENTS
SUPPORTING OBJECTIVE 1 SUPPORTING OBJECTIVE 2 SUPPORTING OBJECTIVE 3 SUPPORTING OBJECTIVE 4
CONTINUOUSLY INCREASE STUDENT ACHIEVEMENT
CONTINUOUSY IMPROVE THE LEARNING ENVIRONMENT FOR STUDENTS AND STAFF
CONTINUOUSLY INCREASE OPERATIONAL EFFECTIVENESS
CONTINUOUSLY INCREASE STAKEHOLDER CONFIDENCE
AND SUPPORT OF OUR SCHOOL SYSTEM
Supporting Objective 1 Continuously increase student achievement
Performance Target: Academic Performance Index (API): STAAR – Satisfactory; Recognized Distinction Designation; AYP
ACTION STRATEGY PERSON
RESPONSIBLE TIME-LINE
EVALUATION/ MEASURE RESOURCES
TITLE I COMPON-
ENT
1. Expand Instructional Rounds Curriculum & Instruc- tion
August 2011- April 2012
STAAR; MAP; Survey Data
Staff Time Title II for Teacher Substitutes - $24,000
TA 3, 4 TD 2, 4, 7
2. Pilot updated Grading Procedures
Curriculum & Instruc- tion
August 2011- June 2012
STARR; MAP; SAT; Graduation Rate; Survey Data
Staff Time TA 1, 3 TD 2, 8, 9
3. Implement Readers’/Writers’ Workshop at the secondary level.
Curriculum & Instruc- tion
August 2011- June 2012
STAAR Reading/ELA Data; Classroom Observations
Title II for Teacher Substitutes- $15,000
TA 1, 2, 3, 6, 8 TD 1, 2, 4, 10
4. Strengthen the instructional infrastructure at the secondary level.
Curriculum & Instruc- tion
August 2011- June 2012
Proposal submitted to Superintendent by April 1, 2012
Staff Time TD 1, 2, 4, 9, 10
5. Design and monitor actions plans for the District and schools to meet AYP.
Curriculum & Instruc- tion and Special Education
August 2011- June 2012
District and all schools meet AYP
TA 1, 2, 3, 4 TD 1, 2, 9, 10
6. Develop leadership capacity throughout the District
Curriculum & Instruc- tion
August 2011- June 2012
Instructional Rounds training Coaching for Results Tregoe training API
Title II $58,500
TA 3, 4, 5, 6 TD 2, 3, 4, 9
7. Focus on Expectations for Instruction and Learning; Progress Monitoring
Curriculum & Instruc- tion
August 2011- June 2012
Principal campus visits
TA 1, 2, 8 TD 2, 7, 8, 9, 10
8. Implement a plan to ensure compliance with TEA Guidelines for participation requirements by ARD Committees making STAAR Modified decisions
Special Education
August 2011 – June 2012
Implementation of plan/ARD Committee Data
Staff training, campus visits, campus/ARD data
TA 1, 2, 3, 7 TD 1, 2, 3, 4, 6, 10
87

Organization Section continued
Supporting Objective 1 Continuously increase student achievement
Performance Target: Academic Performance Index (API): STAAR – Satisfactory; Recognized Distinction Designation; AYP
ACTION STRATEGY PERSON RESPONSIBLE
TIME-LINE
EVALUATION/ MEASURE
RESOURCES TITLE I
COMPON-ENT
collection
9. Implement plan to increase the graduation rate for students in special education
Special Education
August 2011 – June 2012
ERG Data
Campus Graduation Team Meetings
TA 1, 2, 4, 6, 7 TD 1, 2, 4, 6, 9, 10
10. Increase performance on the State Assessment for students in special education by promoting and monitoring the use of accommodations in the general education setting
Special Education
August 2011 – June 2012
STAAR Staff Time, Staff Training
TA 1, 2, 3, 4, 6 TD 2, 4, 9
11. Build Authentic Literacy in the Social Studies Classroom: “Thinking Through the End of Your Pencil – EVERY DAY!”
Curriculum & Instruc- tion
August 2011- June 2012
STAAR Social Studies Data; Classroom Observations
Title II funds for subs - Smokey Daniels on October 4 - $9,000
TA 1, 2, 6 TD 2, 4, 9
12. Implement new COL units of study for reading, writing, and word study at elementary level/coaching
Curriculum & Instruc- tion
August 2011- June 2012
STAAR Reading/Writing Classroom observations
TA 1, 3, 6 TD 1, 2, 4, 9
13. Provide training and implementation for CME Algebra I curriculum/ Coaching
Curriculum & Instruc- tion
August 2011- June 2012
STAAR EOC; Classroom Observations
Title II for PD- $21,000
TA 1, 3, 6 TD 1, 2, 4, 9
14. Implement Professional Learning Communities and Coaching at the Elementary and Middle School levels.
Curriculum & Instruc- tion
August 2011-2012
STAAR Math Data; MAP Data, Classroom Observations
Staff Time; Title II for PD $20,550
TA 3, 5 TD 2, 4, 9
15. Learn with and through others
PD/PLC to guide and support IIP process
Coaching Science accountable
discussion and writing Skilled Questioning Conference for the
Advancement of Science Teaching
Online training for Science Supplemental Materials
Curriculum & Instruc- tion
August 2011- May 2012
Classroom observations Unit test data STAAR Data
Science Specialist District science curriculum MACH B Title II $12,000
TA 3, 5 TD 2, 4, 9
16. Monitor student learning by providing fair assessments as part of the Standards-
Curriculum & Instruc- tion
August 2011- May
Unit tests Measure of Academic
District science curriculum
TA 2, 6 TD 4, 8, 9
88

Organization Section continued
Supporting Objective 1 Continuously increase student achievement
Performance Target: Academic Performance Index (API): STAAR – Satisfactory; Recognized Distinction Designation; AYP
ACTION STRATEGY PERSON RESPONSIBLE
TIME-LINE
EVALUATION/ MEASURE
RESOURCES TITLE I
COMPON-ENT
Based Instructional System. 2012 Progress (MAP) STAAR Data
MAP
17. Embed technology into classroom instruction where appropriate
Curriculum & Instruc- tion
August 2011- May 2012
Principal feedback surveys Technology Literacy Assessments (gr. 5, 8)
Instructional Technology Specialists, local funds
TA 1, TA3 TD 2, 4
18. Provide intervention to accelerate reading levels of struggling students
Curriculum & Instruc- tion
August 2011-2012
Beginning of Year, Middle of Year, End of Year reading levels
Title 1 $426,382 Title 2: $5,000
TA 1, 2, 3, 4, 8 TD 2, 4, 9
Supporting Objective 1 Continuously increase student achievement
Performance Target: Academic Performance Index (API): STAAR - Advanced; Recognized Distinction Designation; AYP
ACTION STRATEGY PERSON
RESPONSIBLE TIME-LINE
EVALUATION/ MEASURE
RESOURCES TITLE I
COMPON-ENT
1. Use Readistep data to explore instructional plans.
Curriculum & Instruc- tion and Gifted & Talented
Sep-tember 2011 – May 2012
Improved SAT/ACT scores
TA 1 TD 8, 10
Supporting Objective 1 Continuously increase student achievement
Performance Target: Academic Performance Index (API): Graduation Rate; AYP
ACTION STRATEGY PERSON
RESPONSIBLE TIME- LINE
EVALUATION/ MEASURE RESOURCES
TITLE I COMPON-
ENT
1. Create a plan to address timely safety nets at the high school level.
Curriculum & Instruc- tion
Proposal submit-ted by April 1, 2012
Implementation of the Plan; Improved Graduation Rate
Restructured District Resources
TA 1, 2 TD 1, 2, 9
2. Implement ninth grade graduation teams at the high school level.
Career Tech
August 2011- June 2012
Improved Graduation Rate TA 1, 2
TD 1, 2, 9
89

Organization Section continued
Supporting Objective 1 Continuously increase student achievement
Performance Target: Academic Performance Index (API): SAT/ACT Mean
ACTION STRATEGY PERSON RESPONSIBLE
TIME-LINE
EVALUATION/ MEASURE
RESOURCES TITLE I
COMPON-ENT
1. Implement PSAT/SAT/ACT student prep sessions: Revolution Prep & CFB Summer Prep Program
Gifted & Talented
Septem-ber 2011 – July 2012
Improved SAT/ACT scores
$50,000 TA 1 TD 8, 10A
2. Increase participation in student SAT/ACT programs by improving communication and advocacy for Superintendent’s 100.
Gifted & Talented
Septem-ber 2011 – July 2012
Increased number of students participating in prep programs
TA 1 TD 8, 10A
Supporting Objective 2 Continuously improve the learning environment for students and staff
Performance Target: Employee: Job Satisfaction – I would recommend this district to a friend as a good place to work.
ACTION STRATEGY PERSON RESPONSIBLE
TIME-LINE
EVALUATION/ MEASURE
RESOURCES TITLE I
COMPON-ENT
1. Provide professional development in the foundation and enrichment courses
Curriculum & Instruction
Aug. 2011 – Aug. 2012
Number of sessions and participants
Title II $44,700 Local funds
TA 6 TD 4
2. Provide instructional coaching and support from content specialists
Curriculum & Instruction
Aug. 2011 – May 2012
Increased job satisfaction
Title 1: $82,712 Title 2: $15,000 Title 3 $333,785
TA 6 TD 4, 5, 8
3. Provide modern technology tools to efficiently perform jobs
Technology
Aug. 2011 – May 2012
Increased job satisfaction
4. Conduct an annual review of teacher compensation with selected districts
Personnel
Sep-tember 2011- June 2012
Results of survey Current local resources
TA 5 TD 3
5. Participate in the TASB survey on Employee Job Satisfaction
Personnel
October 2011 – Febru-ary 2012
TASB survey results
Title II: $6,000
TA 5 TD 3
90

Organization Section continued
Supporting Objective 2 Continuously improve the learning environment for students and staff
Performance Target: Employee: Working Conditions – I have the equipment, tools, and supplies to be successful in my job.
ACTION STRATEGY PERSON
RESPONSIBLE TIME-LINE
EVALUATION/ MEASURE RESOURCES
TITLE I COMPON-
ENT
1. Finalize implementation of an integrated financial accounting and personnel software system to replace a non-sustainable system.
Financial Reporting
Com-plete and opera-tional by January 1, 2012
Operational System
Initiated with bond funds with final conversion completed within local funds.
TA 8 TD 10
2. Implement a new work-order management system.
Facility Mainten-ance
Com-plete and opera-tional by January 1, 2012
Operational System
Local funds and staff
3. Upgrade computers, projectors, and wireless access in high schools
Technol-ogy
Spring 2012
Completion of project
2003 bond funds
TA 8 TD 10
Supporting Objective 2 Continuously improve the learning environment for students and staff
Performance Target: Employee: Compensation and Benefits – Overall, I am satisfied with the pay and benefits offered by the district.
ACTION STRATEGY PERSON RESPONSIBLE
TIME-LINE
EVALUATION/ MEASURE
RESOURCES TITLE I
COMPON-ENT
1. Compile a teacher attrition report of top three reasons teachers left C-FB in 2010-11
Personnel
Octo-ber 2011-Novem-ber 2011
Comparison of attrition due to reason
Current local resources
TA 5 TD 3
2. Survey selected districts on teacher attrition due to pay and benefits in 2010-11
Personnel
Octo-ber 2011-June 2012
Review of ERG data on teacher attrition 2010-11
Current local resources
TA 5 TD 3
3. Participate in the TASB Employee Job Satisfaction Survey
Personnel
Com-plete by May 2012
Results from TASB Employee Job Satisfaction Survey
Title II: $6,000 (from above)
TA 5 TD 3
4. Utilize Gallup information to recruit highly qualified staff
Personnel May 2012
Highly Qualified Report
Title II: $34,000
TA 5 TD 3
91

Organization Section continued
Supporting Objective 2 Continuously improve the learning environment for students and staff
Performance Target: Student: Attendance Rate
ACTION STRATEGY PERSON
RESPONSIBLE TIME-LINE
EVALUATION/ MEASURE RESOURCES
TITLE I COMPON-
ENT 1. Utilize district-wide
communication system to update parents on students’ attendance
Administra-tive & Support Services
Through-out the year
Increased student attendance TA 7
TA 6
Supporting Objective 2 Continuously improve the learning environment for students and staff
Performance Target: Student: Disciplinary Placements
ACTION STRATEGY PERSON
RESPONSIBLE TIME-LINE
EVALUATION/ MEASURE
RESOURCES TITLE I
COMPON-ENT
1. Develop a plan to reduce disciplinary placements in DAEP and JJAEP
Student Services
Fully imple-mented August 1, 2012
Reduce DAEP and JJAEP placements (target 10% reduction)
Current local resources
TA3, 4, 7
2. Adopt new Student Code of Conduct
Administra-tive & Support Services
Sep-tember 2011
Reduce disciplinary placements by 10%
3. Revise policy of personal learning devices to provide flexibility for instructional use.
Technology Sep-tember 2011
Reduce disciplinary placements by 10%
4. Develop and implement strategies which foster a positive and safe environment for students.
Career Tech Decem-ber 2011
Reduction in dropouts and discipline referrals; meeting agendas, sign-in sheets
Local budget
5. Train on the prevention of suicide and substance abuse.
Career Tech Decem-ber 2011
Reduction in suicide attempts, dropouts, and discipline referrals; meeting agendas, sign-in sheets
Local budget
6. Identify and guide students involved in gang activity and those at risk of dropping out of school
Career Tech Decem-ber 2011
Reduction in dropouts and discipline referrals; meeting agendas, sign-in sheets
Local budget
92

Organization Section continued
Supporting Objective 3 Continuously increase operational effectiveness
Performance Target: Financial Performance Index (FPI)
ACTION STRATEGY PERSON
RESPONSIBLE TIME-LINE
EVALUATION/ MEASURE RESOURCES
TITLE I COMPON-
ENT
1. Develop an operations plan to address the budget circumstances of 2012-13
Administra-tive & Support Services
June 1, 2012
Budget plan that will sustain operations with available resources
Current local resources
TA8 TD 1, 10
2. Analyze data in ERG’s Financial Performance Index for top ten ranked districts for Instructional Services.
Administra-tive & Support Services
June 1, 2012
Recommendation plan to increase efficiency submitted to Cabinet
Current local resources
3. Analyze data in ERG’s Financial Performance Index for top ten ranked districts for Leadership Service.
Administra-tive & Support Services
June 1, 2012
Recommendation plan to increase efficiency submitted to Cabinet
Current local resources
4. Analyze data in ERG’s Financial Performance Index for top ten ranked districts for Student Services.
Administra-tive & Support Services
June 1, 2012
Recommendation plan to increase efficiency submitted to Cabinet
Current local resources
5. Analyze data in ERG’s Financial Performance Index for top ten ranked districts for Non-Student Services.
Administra-tive & Support Services
June 1, 2012
Recommendation plan to increase efficiency submitted to Cabinet
Current local resources
6. Analyze data in ERG’s Financial Performance Index for top ten ranked districts for Operating Services.
Administra-tive & Support Services
June 1, 2012
Recommendation plan to increase efficiency submitted to Cabinet
Current local resources
Supporting Objective 4 Continuously increase stakeholder confidence and support of our school system
Performance Target: Education Productivity Index (EPI)
ACTION STRATEGY PERSON
RESPONSIBLE TIME-LINE
EVALUATION/ MEASURE RESOURCES
TITLE I COMPON-
ENT
1. Create the online annual report for the 2010-2011 school year
Strategic Communi- cations
Com-pleted by Jan. 2012
Number of visits to site each month after launch
Staff Time $10,000
2. Build understanding of Education Productivity Index (EPI) through
Superintendent Sept. 22, 2011
Board feedback
93

Organization Section continued
training Board of Trustees
Supporting Objective 4 Continuously increase stakeholder confidence and support of our school system
Performance Target: Parent Satisfaction: Achieving Quality Together
ACTION STRATEGY PERSON RESPONSIBLE
TIME-LINE
EVALUATION/ MEASURE
RESOURCES TITLE I
COMPON-ENT
1. Use the Blackboard Con-nect system to contact parents regarding campus and district activities.
Principals & Strategic Communica-tions
2011-2012 school year
Number of phones called; number of messages sent
$64,000 Staff time
TA 7 TD 6
2. Distribute Bright Spots publication to stakeholders
Strategic Communica- tions
Through-out year TA 7
TD 6
Supporting Objective 4 Continuously increase stakeholder confidence and support of our school system
Performance Target: Employee: District Communications – The district has my confidence and support.
ACTION STRATEGY PERSON RESPONSIBLE
TIME-LINE
EVALUATION/ MEASURE
RESOURCES TITLE I
COMPON-ENT
1. Conduct faculty visits by the District’s leadership team
Superintendent 2011-2012
Visits completed; Employee Survey Results
Staff Time
94

Organization Section continued
Descriptions of Organization Units
Office of the Superintendent: The Superintendent is responsible for providing leadership and direction for the development on an educational system that is based on the needs of students, on standards of excellence and equity, and on community goals. This office is responsible for the coordination of the overall administration of the school district and liaison with the Board of Trustees. This office also oversees and manages district policies and procedures as well as directing district compliance with public information requests and open meetings requirements. Associate Superintendent for Administrative and Support Services: The Associate Superintendent for Administrative and Support Services oversees all of the business support activities for the school district including accounting, budget, finance, maintenance, purchasing, transportation, food service and construction. This position also guides general student services which include student discipline and grievances, attendance, transfers, nursing services, after school programs and adult education programs. District Fine Arts and Athletics programs are also guided by this office. Assistant Superintendent Curriculum and Instruction: The curriculum and instruction division is responsible for providing district curriculum documents based on the TEKS that identify specific knowledge and skills students will acquire by grade level and subject area. The division designs assessments and facilitates meetings to assure alignment of the written, taught and tested curriculum. The C&I division also is involved in regularly scheduled and ongoing study of the curricula designed to support collaborative planning and focus on student learning. Chief Information/Technology Officer: The Technology Division is responsible for supporting instructional, media, and business technology applications. The Division also supports telecommunications systems including voice, video, data, and Internet applications. Executive Director Personnel: This Department has responsibility for administering all of human resource operations including: personnel policies and practices; employment, and post employment; and, compensation for employees. Executive Director Strategic Communications: The Office of Strategic Communications promotes positive public relations between the school district and the community and within the school district. The office provides timely information to staff, faculty, students, parents and the community through print, broadcast and electronic mediums.
95

Organization Section continued
Organizational Unit Funding SourceOffice of Superintendent General Fund
Executive Director Personnel General Fund
Associate Superintendent Administration & Support Services General FundFood Service Fund
Construction/Capital Fund
Associate Superintendent Curriculum & Instruction General Fund
Chief Information/Technology Officer General Fund
Executive Director Public Information General Fund
96

Organization Section continued
Departments Supervision of FTEs Description of Responsibilities
Superintendent 4 Overall administration of school district & liaison with the Board of Trustees Public Information 4.5 Promote positve public realations with school district & the community
Associate Superintendent Administrative & Support Services Oversees business support, general student services & fine arts and athletics Tax Office 2 assessing & collection of district property taxes; administering refunds and exemptions Director of Student Services 11 directs all student services for the district Business Office 14 General Ledger, Budgeting, Cash and Investment Management, Asset Management,
Grants Administration, Cash Receipts, Accounts Payable & Cash Disbursements, Reporting of Financial Information, Bank Reconciliation,
Compliance with Government Reporting Requirements, and Annual Audit Benefits 5 coordinates health benefits; property & casualty; student & athletic insurance;
Workers Compensation; and 403(b) and 457(b) programs Payroll 7 prepare accurate and timely payrolls; customer service to employees; government
and state compliance and reporting Director of Financial Reporting 1 gather & compiling information for annual audit; coordinate software conversion Purchasing 6 procurement of goods & services according to state, local and district policies Textbook Coordinator 1 coordinates textbooks for district Student Nutrition 18 operation of district's school cafeterias Plant Maintenance 117 upkeep & maintenance of all district property; clean, healthy, environment Distribution Center 12 receives and delivers purchased goods throughout the district Stadium 1 setup and take down for all sports, events and rentals of the stadium, parking lot,
football field and natatorium; including for practices for athletic and band programs Athletics 4 directs extracurricular and co-curricular activities Fine Arts 3 directs fine arts activities including band, choir, art, orchestra & theatre Nurse Manager 1 supervises district nurses; work with student and staff on health and welfare issues Transportation Contracted transport students to and from school
Executive Director Personnel administering all human resource operations Personnel 6 administers district-wide human resource operations Records Management & Receptionist 2 manage all aspects of recrods management for the district; receptionist for Adminstration Bldg Personnel - Professional 4 administers all human resource operations that have to do with professional employees Personnel - ParaProfessional 2 administers all human resource operations that have to do with para-professional employees
Associate Superintendent responsible for providing district curriculum Curriculum and Instruction 55 Bilingual/ESL 4 for students identified as limited English proficient this department coordinates
a full educational opportunity in a bilingual education or English as a second language Special Programs 0 coordinates summer school, migrant education , communities in school, at-risk identification Advanced Academics (Gifted Education) 8 identifies & serves needs of gifted students Intervention Specialist 2 coordinator of student counseling ; works with students to develop appropriate social,
emotional and academic skills; counselors work with student academic schedules,social behavior and family concerns
Assessment & Accountability 1 supervises all testing other than TAKS, analysis of data generated through testing; presents annual AEIS report to the community and Board of Trustees
Career & Technical 7 directs career & technical program for the distrcit
Chief Technology Officer 17.16 directs technical support for the district Instructional Learning 1 oversight of classroom technology (hardware/software) implementation & evaluation Support Services 28 oversight of network electronics & workstations Library/Media 5 oversight of library technical media and logistics
Total Central Departments 353.66
97

Organization Section continued
Financial Structure and Basis of Accounting
Description of Entity The Carrollton-Farmers Branch ISD is an independent public educational agency operating under applicable laws and regulations of the State of Texas. A seven member Board of Trustees elected to staggered three-year terms by the District’s residents autonomously govern the District. The Carrollton-Farmers Branch ISD Board of Education (“Board”) is the level of government, which has oversight responsibility and control over all activities related to public school education within the District. The District receives funding from local, state and federal government sources and must comply with all the requirements of these funding source entities. However, the District is not included in any other governmental “ reporting entity” as defined in generally accepted accounting principles. The public elects board members who have decision-making authority, the power to designate management, the ability to significantly influence operations and primary accountability for fiscal matters. The Texas Education Agency and Southern Association of Colleges and Schools provide the District’s K-12 education accreditation. Enrollment in the District’s 5 high, 6 middle, 26 elementary, and alternative or special program centers is estimated to be 25,614 for the 2010-2011 budget year. C-FB ISD encompasses 53.42 square miles in northwest Dallas County with a smaller portion in southeast Denton County. C-FB ISD provides instructional services to children who live in portions of Carrollton, Farmers Branch, Addison, Coppell, Dallas and Irving. Demographic information for the largest of these cities is included below. City of Carrollton Demographics:
Population - 119,097; Male 48.9%, Female 51.1%
Population by Race: White 46.3% Black 8.1% Hispanic or Latino Origin 30.0% (of any race) American Indian 0.3% Asian or Pacific Islander 13.4% Other Race 0.2% Two or more races 1.8%
Median age - 35.6 Persons under 5 years old 6.7% Persons over 18 years old 74.0% Persons 65 and over 8.0%
98

Organization Section continued
City of Carrollton continued Demographics:
Economic Characteristics: Median household income $67,030 Median family income $74,822 Per capita income $30,923
Housing Characteristics: Owner-occupied housing units 60.0% Renter-occupied housing units 35.1% Vacant housing units 4.9%
Area - 36.6 square miles
Source: U.S. Census Bureau, American FactFinder, 2010 Census
City of Dallas Demographics:
Population - 1,197,816; Male 50.0%, Female 50.0%
Population by Race: White 28.8% Black 24.6% Hispanic or Latino Origin 42.4% (of any race) American Indian 0.3% Asian or Pacific Islander 2.8% Other Race 0.2% Two or more races 1.0%
Median age - 31.8 Persons under 5 years old 8.6% Persons over 18 years old 73.5% Persons 65 and over 8.8%
Economic Characteristics: Median household income $41,011 Median family income $44,042 Per capita income $26,032
Housing Characteristics: Owner-occupied housing units 39.1%
99
Organization Section continued
City of Dallas continued Demographics: Renter-occupied housing units 49.6% Vacant housing units 11.3%
Area - 384.7 square miles
Source: U.S. Census Bureau, American FactFinder, 2010 Census City of Farmers Branch Demographics:
Population - 28,616; Male 49.2%, Female 50.8%
Population by Race: White 44.2% Black 4.5% Hispanic or Latino Origin 45.4% (of any race) American Indian 0.3% Asian or Pacific Islander 4.3% Other Race 0.1% Two or more races 1.2%
Median age - 35.6 Persons under 5 years old 6.6% Persons over 18 years old 76.1% Persons 65 and over 13.3%
Economic Characteristics: Median household income $54,725 Median family income $60,000 Per capita income $28,715
Housing Characteristics: Owner-occupied housing units 56.4% Renter-occupied housing units 37.1% Vacant housing units 6.5%
Area - 12.1 square miles
Source: U.S. Census Bureau, American FactFinder, 2010 Census
100

Organization Section continued
City of Irving Demographics:
Population - 216,290; Male 50.0%, Female 50.0% Population by Race: White 30.8% Black 11.8% Hispanic or Latino Origin 41.1% (of any race) American Indian 0.4% Asian or Pacific Islander 14.0% Other Race 0.2% Two or more races 1.7%
Median age - 31.3 Persons under 5 years old 8.6% Persons over 18 years old 73.5% Persons 65 and over 6.9%
Economic Characteristics:
Median household income $46,354 Median family income $50,609 Per capita income $25,768
Housing Characteristics: Owner-occupied housing units 34.8% Renter-occupied housing units 55.8% Vacant housing units 9.4%
Area - 67.6 square miles
Source: U.S. Census Bureau, American FactFinder, 2010 Census
101

Organization Section continued
102

Organization Section continued
Selected Employers in the DistrictApproximateNumber of
Employer Type of Business EmployeesInternational Business Machines Computer sales and service 3,387Carrollton-Farmers Branch ISD School district 3,133JP Morgan Investment Services Financial Services 2,402Halliburton Energy Services Mining 1,308Federal Government - IRS Government 1,206GEICO Insurance 1,093GE Automation Services Inc Professional/Technical 879McKesson Corp Manufacturing 837Televista Telecommunications 754Accor North America Hotel/Food 731
Source: North Central Texas Council of Governments
Carrollton-Farmers Branch ISD2011 Tax Roll Principal Taxpayers
Percentof Total
Taxable TaxableTaxpayer Nature of Property Assessed Valuation Assessed Valuation Rank
AT&T Mobility/AT&T Services Inc./ Southwestern Bell/SWB Video Telephone Utility/Internet Services $139,406,720 1.00% 1
Wells Reit II/Wells Reit Las Colinas Rental Property $127,070,790 0.91% 2
Texas Utilities Electric Co./TXU Energy Retail Co./Oncor Delivery Power Utility $99,528,644 0.72% 3
Nokia / ISTAR Electronics $90,905,010 0.65% 4
Walmart/Sams Retail $85,659,640 0.62% 5
Verizon Data/Verizon Online/GTE Realty Corp./GTE Communications Telephone Utility/Internet Services $79,353,404 0.57% 6
Exxon/Mobile Industrial/Petroleum $70,535,698 0.51% 7
Cobalt Industrial/Cobalt Industrial REIT Industrial/Petroleum $65,524,373 0.47% 8
Trident Village/Trident Gardens Rental Property $63,589,580 0.46% 9
Haliburton Company Inc. Oilfield Services $57,391,783 0.41% 10
Totals $878,965,642 6.33%
Source: District Tax Office
Note: Freeport exemption is not in the "taxable" value
103

Organization Section continued
C-FB ISD offers a comprehensive instructional program from pre-kindergarten through grade 12. The Texas Education Agency accredits all schools in the District. Along with the regular curriculum, C-FB ISD offers gifted and talented, advanced placement, career and technology education, services for children with disabilities from birth through 22 years of age, and bilingual education programs. The District has one of the leading technology programs in the state. All campuses are connected to a wide-area network and have direct Internet access. The broad range of elective courses and extracurricular activities includes athletics, fine arts, intern work experience, and special-interest activities. Other programs include drug awareness, research skills, environmental topics, and advanced technology and after-school enrichment. During the summer, students participate in a variety of summer recreation programs and summer school academic and enrichment courses. A large community education program provides academic and enrichment opportunities for adults and youngsters.
Fund Accounting The funds and accounts of the District have been established under the rules prescribed in the Financial Accounting and Reporting Module of the Texas Education Agency Financial Accountability System Resource Guide. This budget document contains detailed information for all funds for which the Board of Trustees is required to adopt annual budgets. Budgets for all funds are prepared using the same method of accounting as for financial reports (modified accrual), except for the Capital Projects Fund budget, which is not legally adopted on an annual basis. Under the modified accrual basis of accounting, revenues are recognized in the accounting period in which they become both measurable and available. Expenditures are recorded in the accounting period in which the fund liability is incurred, if measurable (the ability to determine the value), except for principal and interest on general long-term debt, which is recorded when due. The District also includes government-wide statements which report information about the District as a whole using accounting methods similar to those used by private-sector companies in their Comprehensive Annual Financial Report. Following is a description of the funds for which annual budgets are adopted. What is “Budgetary Basis”? Budgetary Basis refers to the basis of accounting used to estimate financing sources and uses in
the budget. Cash Basis indicates transactions are recognized only when cash is increased or decreased; Accrual Basis indicates revenues are recorded when they are earned (whether or not cash is
received at the time) and expenditures are recorded when goods and services are received (whether cash disbursements are made at the time or not);
Modified Accrual is the method under which revenues and other financial resources increments are recognized when they become susceptible to accrual; that is, when they become both “measurable” and “available” to finance expenditures of the current period. “Available” means collectible in the current period or soon enough thereafter to be used to pay the liabilities of the current period.
104

Organization Section continued
The Carrollton-Farmers Branch Independent School District does not distinguish between Basis of Budgeting and Basis of Accounting. The principles set forth as the Basis of Accounting are observed in the budgeting process. All of the Carrollton-Farmers Branch ISD budgeted funds are maintained on a Modified Accrual basis. Revenues are recognized when measurable and available to be used to pay liabilities.
General Fund The General Fund is used to account for all financial transactions not properly includable in other funds. The principal sources of revenue include local property taxes, state reimbursement for professional salaries and other operating expenditures, and interest on fund investments. Expenditures include all costs necessary for the daily operation of the schools.
Special Revenue Funds Special Revenue Funds are used to account for funds awarded to the District for the purpose of accomplishing specific educational tasks as defined by grantors in contracts or other agreements. Food Service Fund The Food Service Fund is used to account for the District’s Food Service Program, including local, state, and federal revenue sources and all costs associated with the operation of the program. Debt Service Fund The Debt Service Fund is used to account for the payment of interest and principal on all bonds of the District. The primary sources of revenue for the debt service fund are local property taxes and the state Instructional Facilities Allotment. The following funds are reported in our Comprehensive Annual Financial Report, but are not required to be budgeted under guidelines supplied by the Texas Education Agency. Governmental Funds: Nonmajor Special Revenue Funds The District accounts for resources restricted to, or designated for, a specific purpose by the District or a grantor in a special revenue fund. Federal, State, and Local financial assistance is accounted for in a Federal, State, or Local Revenue Fund, and sometimes unused balances must be returned to the grantor at the close specified project periods. Proprietary Funds: Enterprise Funds and Internal Service Funds Enterprise funds are utilized by the District to account for activities for which outside users are charged a fee roughly equal to the cost of providing the goods or services of those activities. The District’s sole enterprise fund accounts for the After the Bell Program (a childcare service). Internal Service Funds are where revenues and expenses related to services provided to organizations inside the District on a cost reimbursement
105

Organization Section continued
basis are accounted for in an internal service fund. The District’s Internal Service Funds are Health Insurance (scheduled to be closed out in 2010 since the District is no longer self-insured after transferring to the Texas Teacher Retirement fund in January 2009) and Workers’ Compensation Funds. Fiduciary Funds: Agency Funds The District accounts for resources held for others in a custodial capacity in agency funds. The District’s Agency Fund is the Student Activity Fund.
The Texas Education Agency does not require annual adopted budgets for the Capital Projects Fund and for Special Revenue Funds (with the exception of the Food Service Fund listed above).
Capital Project Fund A capital projects fund is a governmental fund that must be used to account, on a project basis, for projects financed by the proceeds from bond issues, or for capital projects otherwise mandated to be accounted for in this fund. The capital projects fund utilizes the modified accrual basis of accounting.
Classification of Revenues and Expenditures Section 44.007 of the Texas Education Code requires that a standard school district fiscal accounting system be adopted by each school district. The system must meet at least the minimum requirements prescribed by the State Board of Education and also be subject to review and comment by the state auditor. Additionally, the accounting system must conform to Generally Accepted Accounting Principles (GAAP) as applied to governmental units in conjunction with the Texas Education Agency’s Financial Accountability System Resource Guide (FAR). The Governmental Accounting Standards Board (GASB) is the accepted standard setting body for establishing governmental accounting and financial reporting principles. This section further requires that a report be provided at the time the school district budget is filed, showing financial information sufficient to enable the State Board of Education to monitor the funding process, and to determine educational system costs by school district, campus, and program.
106

Organization Section continued
A major purpose of the accounting code structure is to establish the standard school district fiscal accounting system required by law. Although certain codes within the overview may be used at local option, the sequence of the codes within the structure, and the funds and chart of accounts, are to be uniformly used by Texas school districts in accordance with GAAP. Basic System Expenditure Code Composition
Fund Code – A mandatory 3 digit code is to be used for all financial transactions to identify the fund group and specific funds. The first digit refers to the fund group, and the second and third digits specify the fund.
Function Code – A mandatory 2-digit code that identifies the purpose of the transaction is used when coding expenditures. The first digit identifies the major service area and the second digit refers to the specific function within the area.
Object Code – A mandatory 4-digit code identifying the nature and object of an account, a transaction or a source. The first of the four digits identifies the type of account or transaction, the second digit identifies the major area, and the third and fourth digits provide further sub-classifications.
Sub-Object – Optional code. Used at C-FB ISD to provide special accountability for certain programs or areas.
Organization Code – A mandatory 3-digit code identifying the organization, i.e., campus, department.
Fiscal Year Code – A mandatory single digit code that identifies the fiscal year of the transaction or the project year of inception of a grant project.
Program Intent Code – A 2 digit code used to designate services provided to students. Optional Code 3, 4, and 5 – Optional code that may be used to further describe the
transaction. District revenues are classified by fund and object or source. There are three major sources: local sources, state sources, and federal sources. Expenditure budgets are legally adopted at the fund and function level. However, within this document we have included several additional presentations of expenditures. These presentations segregate expenditures by either organization or by major object. Major object codes are used to describe the type of items purchased or services obtained. The major object codes used in this document are: payroll and related costs, purchased and contracted services, supplies and materials, other operating expenditures, debt service, and capital outlay. Fund codes have been previously described. The following is a description of the function codes used throughout this document.
Relationship of Organizational Units The organizational chart (located at the beginning of this section) and personnel units have been coded with the appropriate function, and a description of those functions has been listed on the following pages. These function codes also pertain to the expenditure information presented in the Financial Plan Section of this book.
107

Organization Section continued
CODE FUNCTION TITLE 10 Instruction and Instructional Related Services
11 Instruction This function is used for activities that deal directly with the interaction between teachers and students. This function includes expenditures for direct classroom instruction and other activities that deliver, enhance, or direct the delivery of learning situations to students. Expenditures for the delivery of instruction in regular program basic skills, bilingual programs, compensatory, remedial or tutorial programs, gifted and talented educational programs, and vocational education programs are classified in function 11. For example, function 11 includes classroom teachers, teacher aides, and graders, but does not include curriculum development (13) or principals (23).
12 Instructional Resources and Media Services This function is used for expenditures that are directly and exclusively used for resource centers, establishing and maintaining libraries, and other major facilities dealing with educational resources and media. For example, function 12 includes librarians, but does not include textbooks (11) or reference books in the classroom (11).
13 Curriculum Development and Instructional Staff Development
This function is used for expenditures that are directly and exclusively used to aid instructional staff in planning, developing, and evaluating the process of providing learning experiences for students. This function also includes expenditures related to research and development activities that investigate, experiment and/or follow-through with the development of new or modified instructional methods, techniques, procedures, service, etc. For example, this function includes staff that research and develop innovative, new, or modified instruction and staff who prepare in-service training for instructional staff, but does not include salaries of instructional staff when attending in-service training (11 or 12).
20 Instructional and School Leadership 21 Instructional Leadership
This function encompasses those district-wide activities, which have as their purpose managing, directing, and supervising the general and specific instructional programs and activities. For example, function 21 includes instructional supervisors, and Associate Superintendent for Instruction, but does not include principals (23).
108

Organization Section continued
23 School Leadership This function includes expenditures for directing, managing, and supervising a school. It includes salaries and supplies for the principal, assistant principal, and other administrative and clerical staff, including attendance clerks.
30 Support Services – Student
31 Guidance, Counseling, and Evaluation Service This function includes expenditures for testing and assessing students’ abilities, aptitudes, and interests with respect to career and educational goals and opportunities. It includes psychological services, testing, and counseling.
32 Social Work Services
This function includes expenditures, which directly and exclusively promote and improve school attendance. Examples include visiting teachers, home aides, and truant officers.
33 Health Services This function embraces the area of responsibility providing health services, which are not a part of direct instruction. It includes medical, dental, and nursing services.
34 Student Transportation This function includes the cost of providing management and operational services for transporting students to and from school. Function 34 includes transportation supervisors and bus drivers, but does not include field trips (11) or student organization trips (36).
35 Food Services
This function includes the management of the Food Service program at the schools and the serving of meals, lunches, or snacks in connection with school activities. Function 35 includes salaries for cooks and food purchases, but does not include concession stands (36).
36 Extracurricular Activities This function incorporates those activities, which are student, and curricular related, but which are not necessary to the regular instructional services. Examples of cocurricular activities are scholastic competition, speech, debate, and band. Examples of extracurricular activities are football, baseball, etc. and the related activities (drill team, cheerleading) that exist because of athletics. Function 36 includes athletic salary supplements paid exclusively for coaching, directing, or sponsoring extracurricular athletics, but does not include salaries for teaching physical education (11).
109

Organization Section continued
40 Administrative Support Services
41 General Administration This function includes expenditures incurred for the overall administrative responsibilities of the school district. It includes expenditures for the school board, superintendent’s office, tax office, personnel services, financial services, and administrative attendance personnel.
50 Support Services – Non-Student Based
51 Maintenance
This function deals with expenditures made to keep buildings, grounds, and equipment safe for use and in efficient working condition. Examples include janitors, facility insurance premiums and utilities.
52 Security and Monitoring Services
A function for which expenditures are directly and exclusively for activities to keep student and staff surroundings safe, whether in transit to or from school, on a campus or participating in school-sponsored events at another location. Examples include security guards, crossing guards and police.
53 Data Processing Services
Non-instructional data processing services which include computer facility management, computer processing, systems development, analysis and design. Personal computers (PC’s) that are stand-alone are to be charged to the appropriate function. Peripherals including terminals and printers are to be charged to the appropriate function.
60 Ancillary Services
61 Community Services This function encompasses all other activities of the school district, which are designed to provide a service or benefit to the community as a whole or a portion of the community. Examples would include recreation programs, public library services, and parenting programs.
70 Debt Service
71 Debt Service This function includes expenditures for bond and lease purchase principal, and all types of interest paid.
80 Capital Outlay
110

Organization Section continued
81 Facilities Acquisition and Construction This function includes the acquisition of land and buildings, the remodeling of buildings and additions to buildings, and installation and extension of service systems and other build-in systems.
90 Intergovernmental Charges
91 Contracted Instructional Services Between Public Schools This function code is used for expenditures that are for (1) Obtaining instructional services from another public school for grade levels not served in a school district under Section 25.039 TEC. (2) Providing financial resources for services to another public school through a contract for education of nonresident students under Subchapter E, Chapter 41, TEC. (3) Purchasing attendance credits from the state under Subchapter D, Chapter 41, TEC.
92 Incremental Costs Associated with Chapter 41, TEC, Purchase or Sale of Weighted Average Daily Attendance (WADA) This function code is used for expenditures that are for the purpose of positioning a school district with excess wealth per WADA to purchase attendance credits either form the state or from other school district(s).
95 Payments to Juvenile Justice Alternative Education Programs
This function is used for expenditures that are for the purpose of providing financial resources for Juvenile Justice Alternative Education Programs.
97 Payments to Tax Increment Fund
This function code is used for expenditures that are for the purpose of providing financial resources paid into a tax increment fund under Chapter 311, Tax Code.
99 Other Intergovernmental Charges
This function code is used to record other intergovernmental charges not defined above. Examples would be amounts paid to other governmental entities such as county appraisal districts for costs related to the appraisal of property. This is a new definition for the 2008-09 fiscal year.
111

Organization Section continued
Significant Financial Policies and Procedures The following financial policies and procedures of the District significantly influence the development of the annual budget. Balanced Budget The District’s Board of Trustees are committed to having a balanced budget (revenue = expenditures per fund) under normal circumstances. When unforeseen circumstances require the District to adopt a budget that is not balanced, full disclosure of the circumstances surrounding the decision are itemized for all interested parties in budget documents, such as this one. Further, plans for balancing future budgets are also disclosed and timelines developed for implementing the plan. Cash Management The District’s cash management goals are safety, liquidity and yield. Specifically:
Ensure proper collateralization of deposits; Ensure adequate balances to cover cash disbursement needs; Maximize interest earnings while, at the same time, maximizing safety and liquidity; Minimize bank charges.
These goals are accomplished by keeping bank balances as low as possible through transferring all available dollars into either an investment pool used by the District, (TexPool) or investing the available dollars in other types of investments. The district also has an investment advisor who reviews our investments on a quarterly basis and makes recommendations annually as to types of investments such as commercial paper, government backed bonds, etc. Cash balances are monitored daily by the District through on-line banking. Using this system allows accounting personnel to minimize bank balances by only transferring into the accounts the funds necessary to cover the dollar amount of checks that are anticipated to be presented to the bank each day. This keeps the low interest bearing bank balances at a minimum, thus maximizing interest earnings through use of investment pools and other investments. Investment Policies The Board of Trustees has adopted a written investment policy regarding the investment of its funds as defined in the Public Funds Investment Act of 1995 (and amended by the legislature in 1997). This policy authorizes the District to invest in obligations of the U. S. Treasury, the State of Texas, or certain U. S. Agencies, certificates of deposit, repurchase agreements, commercial paper, money market, no-load mutual funds, and public funds investment pools as permitted by Chapter 2256, Texas Government code.
The main goal of the investment program is to ensure its safety, as well as to maximize financial returns within current market conditions in accordance with the District’s investment policy. Assets of the District shall be invested in instruments whose maturities do not exceed two years
112
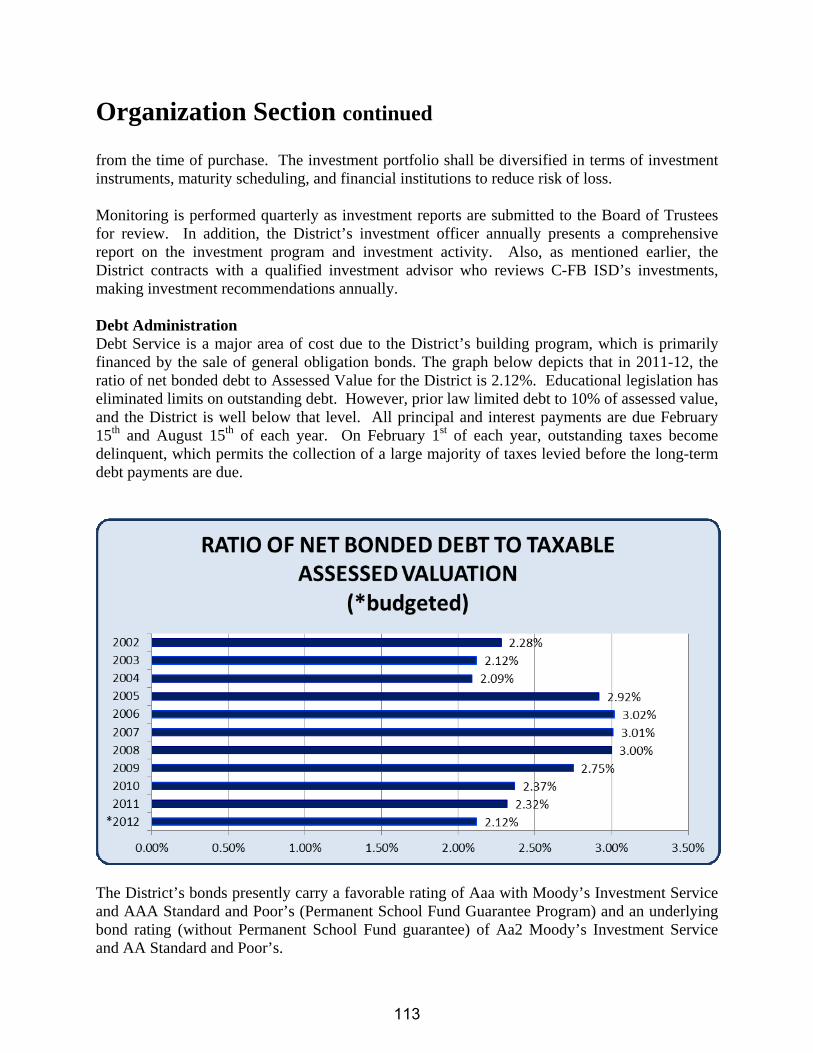
Organization Section continued
from the time of purchase. The investment portfolio shall be diversified in terms of investment instruments, maturity scheduling, and financial institutions to reduce risk of loss. Monitoring is performed quarterly as investment reports are submitted to the Board of Trustees for review. In addition, the District’s investment officer annually presents a comprehensive report on the investment program and investment activity. Also, as mentioned earlier, the District contracts with a qualified investment advisor who reviews C-FB ISD’s investments, making investment recommendations annually. Debt Administration Debt Service is a major area of cost due to the District’s building program, which is primarily financed by the sale of general obligation bonds. The graph below depicts that in 2011-12, the ratio of net bonded debt to Assessed Value for the District is 2.12%. Educational legislation has eliminated limits on outstanding debt. However, prior law limited debt to 10% of assessed value, and the District is well below that level. All principal and interest payments are due February 15th and August 15th of each year. On February 1st of each year, outstanding taxes become delinquent, which permits the collection of a large majority of taxes levied before the long-term debt payments are due.
The District’s bonds presently carry a favorable rating of Aaa with Moody’s Investment Service and AAA Standard and Poor’s (Permanent School Fund Guarantee Program) and an underlying bond rating (without Permanent School Fund guarantee) of Aa2 Moody’s Investment Service and AA Standard and Poor’s.
113

Organization Section continued
Reserve Policies General Fund – The District strives to maintain a General Fund balance equal to a
minimum of two months operating expenditures. The District is estimating a Fund balance equal to approximately 115 days’ operating expenditures. The district will continue to strive to maintain the stated fund balance level.
Food Service Fund – The fund balance for Food Service should not exceed three months of average Food Service operations expenditures. Average monthly Food Service expenditures are calculated by dividing the subsequent years budgeted expenditures by ten months since the Food Service department only operates for ten months out of the year. On August 31, 2011, the Food Service Fund is estimated to have a fund balance of $1,567,082 or 1.30 months’ operating expenditures.
Risk Management The District’s risk management program encompasses various means of protecting the District against loss. Property, casualty, and liability insurance is provided by commercial carriers. In addition, workers’ compensation risks are self-funded and include excess loss insurance policies for claims exceeding a specific limit and an aggregate limit. Beginning January 1, 2009, the District began participating in the Teacher Retirement System of Texas’ health insurance program. This is essentially a fully insured health plan which will eliminate the risk to the District of any large health insurance claim. Independent Audit and Financial Reporting In accordance with Section 221.256, Texas Education Code, public school districts in Texas shall have their accounts audited annually. The audit shall be made on an organization–wide basis, and shall involve all fund types and account groups of the school district. In addition to meeting the requirements set forth in State statutes, the audit is also designed to meet the requirements of the federal Single Audit Act of 1984 and the related provisions of OMB Circular A-133 “Audits of State, Local Governments, and Non-Profit Organizations.” Once the annual audit is complete, the Annual Financial Report is prepared and submitted to the Texas Education Agency for review. The Annual Financial Report is designed to meet the specific monitoring needs of the Texas Education Agency. Thus, a Comprehensive Annual Financial Report, conforming to the standards of both the Association of School Business Officials International and the Government Finance Officers Association, is also prepared to better serve the needs of taxpayers and other financial statement users. To date, the district has received financial reporting awards from the Association of School Business Officials International and the Government Finance Officers Association since 1976. The Carrollton-Farmers Branch School District Board Policy Manual is available through the Texas Association of School Boards Policy on Line at: http://www.tasb.org/policy/pol/private/057903/ .
114

Organization Section continued
Budget Policies and Development Procedures The state, the Texas Education Agency (TEA), and each local district formulate legal requirements for school district budgets. Legal Requirements Sections 44.002 through 44.006 of the Texas Education Code establish the legal basis for budget development in Texas school districts. The following items summarize the legal requirements from the code.
The Superintendent is the budget officer for the District and prepares or causes the budget to be prepared.
The district budget must be prepared by a date set by the State Board of Education, currently August 20.
The President of the Board of Trustees must call a public meeting of the Board of Trustees, giving ten days public notice in a newspaper, for the adoption of the district budget. Any taxpayer in the district may be present and participate in the meeting.
No funds may be expended in any manner other than as provided for in the adopted budget. The Board does have the authority to amend the budget or adopt supplementary emergency budgets to cover unforeseen expenditures.
The budget must be prepared in accordance with GAAP (Generally Accepted Accounting Principles) and State guidelines.
Annual budgets must be prepared for the following funds: General Fund, Debt Service Fund, and the Food Service Special Revenue Fund.
115

Organization Section continued
Budget Development Process Teachers, principals, community members, and other staff of the District, under the direction of the Assistant Superintendent of Support Services, Executive Director of Finance and the Superintendent develop the budget. All expenditure allocations are determined based on projected revenue from State and local sources with the goals of maintaining an appropriate fund balance and combined tax rate while still meeting the District’s educational goals. The budget process begins with the development of the Long-Range Plan that is presented to the Board of Trustees. The enrollment projections contained in this plan form the basis for significant budgetary decisions including per pupil allocations to each campus, instructional staffing allocations, and other required service levels. Once the Long-Range Plan is approved, the Board of Trustees can begin discussions concerning budget strategies and priorities, and establish the budget calendar. The Executive Director of Finance prepares revenue projections for all funds. These projections are based on enrollment projections, estimates of local tax revenue, State funding formulas, and other significant factors. The State funding formulas are extremely complex. This complexity is compounded by changes that the Legislature regularly makes when they meet every other year to consider changes to the State Funding formula and other issues. Salaries and benefits comprise approximately 77.56% of the annual General Fund operating budget. Therefore, the Board of Trustees gives careful consideration to staffing allocations for both instructional and non-instructional positions. The Superintendent evaluates additional personnel units and, after extensive review and analysis, recommendations are presented to the Board of Trustees. Personnel units are allocated to each campus based on projected student enrollment following State mandated ratios, as applicable. The budget amounts are then developed for each position based on the average cost of employees currently filling each position. Supplemental pay is approved on a year–to–year basis and does not become part of the base salary of an employee. A salary supplement may be increased, decreased, or eliminated as the Board of Trustees determines is in the best interest of the District. In order to decentralize the budget process for non-payroll related budget items, site-based decision making teams, working under the direction of each campus principal, determine how to use allocated monies. Each campus receives a basic allotment per student plus a weighted allotment increment for special populations such as Special Education, Career and Technology, Bilingual Education, Gifted and Talented, and At-Risk students. This allocation per student is to be used for supplies, materials, equipment, staff development, and other appropriate instructional costs. Decisions concerning utilization of these allocations are made by the site based decision-making teams.
116

Organization Section continued
Budgets for non-campus units are developed by the Central Administrators. The Assistant Superintendent for Support Services and the Executive Director of Finance review these budgets and make changes, as deemed appropriate. The Executive Director of Finance develops the Debt Service Fund budget. This budget is constructed based primarily on tax base assumptions (for local revenue projections), State funding estimates, if appropriate, and projected debt retirement requirements. Following the development process, consolidated budgetary information is presented to the Board of Trustees in workshops and regular meetings. This information is summarized in a variety of different presentations and line item detail is provided, as requested. Significant dates and events included in the budget development process are summarized on the budget calendars on the following pages of this document. Capital Improvement Budget Policies Capital Projects Funds are used to account for the proceeds of General Obligation bonds and related interest earnings and the expenditures of these funds for the construction and equipping of school facilities, to purchase school sites, and renovations or repair of existing facilities. The Board of Trustees does not formally adopt the Capital Projects Funds budgets annually. These budgets are prepared on a project basis, based on the proceeds available from bond issues and planned expenditures outlined in applicable bond ordinances. Each major construction contract is approved based on the existing availability of bond proceeds and/or approved but unissued bonds. However, the impact of the Capital Projects Funds budgets must be considered during the development of the annual budgets for all other funds. Future operating costs (staffing, utilities, etc.) associated with capital improvements and new facilities must be projected and included in the General Fund budget. Repayment of bonds issued for capital projects must be included in Debt Service Fund projections. Additionally, certain capital outlay expenditures (such as high cost/unit furniture, equipment, and technology) are budgeted both in the General Fund and the Capital Projects Funds. The Capital Projects Fund budget for 2011-2012 includes building expenditures and, as in past years, furniture, technology and other equipment.
117
Organization Section continued
Budget Calendar January, 2011 The Executive Director for Finance begins the payroll budgeting process for the coming year. The prior year payroll budget is a starting point; staff reductions as planned earlier in the year are taken into account as well as any new positions and changes in teacher retirement rates, workers compensation rates, etc. Note: in the current budget shortfall era, there are very few new positions allowed. Generally they are only allowed if state compliance warrants an increase. January 26, 2011 Budget preparation materials and budget training available for all Principals and Central Administrators; February 18, 2011 Deadline for budget entry into Access Budget System; March 25, 2011 Deadline for budget printout for proofing to be sent to all locations; March 31, 2011 Deadline for budget sign-off from all locations (attest to accuracy of their budget printout); April-May, 2011 Associate Superintendent for Administrative Support Services and the Executive Director for Finance review submitted budgets, interview central department administrators. Comparisons to prior year spending, analysis of “new” requests and reductions/additions are made to arrive at a final budgeted amount per location. June, 2011 Final decisions regarding pay for employees that are new to the district and raises are made with related adjustments to the payroll budget; June 2, 2011 Board of Trustees appoint Tax Assessor to calculate Rollback Tax Rate. Board considers time, place and location of a public meeting to discuss budget and proposed tax rate for the 2011-12 budget year. July 19, 2011 Truth in Taxation Webinar July 25, 2011 District receives certified appraisal roll from DCAD. Revenue projections completed.
118

Organization Section continued
August 4, 2011 Board considers approval of report from Tax Assessor/Collector:
a. total certified appraised and taxable property in the district b. certified collection rate and amount of excess debt collection in the prior year; Board to
consider approval of resolutions to accept the tax roll calculated from presented report on assessed values and to accept from its Assessor her certified estimate of the anticipated collection rate for the school district;
Executive Director of Finance adjusts revenue projections, based on certified tax roll (if appropriate). Significant changes in the revenue projection picture may require adjustments to the expenditures categories; August 8, 2011 Deadline to submit Notice of Public Meeting on budget to newspaper August 12, 2011 Notice of Budget Hearing to appear in the newspaper. Budget hearing notice to appear for 2011-12 Budget must be at least 10 days prior to public meeting and not more than 30 days before the meeting to discuss the budget. Education Code Sec. 44.007. August 22, 2011 72 hour notice for public meeting. August 25, 2011 Public Meeting to Discuss 2011-12 Budget and Proposed Tax Rate August 25, 2011 Consider all matters related to Adoption of the 2011-12 Budget (board may adopt the budget and tax rate at the public meeting). Or, the board may adopt the budget and wait to adopt the tax rate.) Consider all matters concerning the Adoption of the Proposed Tax Rate for 2011-2012. School districts subject to an equalized wealth notice must wait to adopt a tax rate until the Commission of Education certifies the wealth is equalized [if applicable] (Education Code Section 44.004c). School districts must adopt the tax rate by September 30th or within 60 days of receiving the certified appraisal roll.
119

Organization Section continued
Budget Administration and Management Process Adoption of the official budget by the Board of Trustees is only the first step in the budget process. Following adoption, the budget administration and management process begins. The budget administration and management process is the process of regulating expenditures throughout the fiscal year to ensure that they do not exceed authorized amounts and that they are used for intended, proper, and legal purposes. Expenditure Control and Approvals Expenditure appropriations are allocated between district campus/central organizations or cost centers (campuses, departments, divisions, etc.). Each organization is assigned a budget manager (i.e. principal, department head). The budget manager is accountable for their organization’s portion of the General Fund budgets. Each budget manager is authorized to approve the expenditure of funds within their respective organization, provided that funds are expended in accordance with District purchasing procedures and legal requirements. This is accomplished through the use of the standard account code system prescribed by the Texas Education Agency, which includes an organization code. The code system is described in detail within this document. Each budget manager (or designee) is granted on-line access to the accounting codes for their organization. This access includes account inquiry. Purchase Orders The Board of Trustees approves all bid awards and contracts. Purchase orders (POs) are prepared for all tangible goods. Once a purchase order is entered and approved at the campus/department level, administrative regulations require that all purchase orders be forwarded to the Purchasing Department for verification of proper coding and compliance with legal purchasing procedures. A software program is used to enter purchase orders. The program checks availability of funds. If the Purchasing Department approves the PO, then the funds are encumbered and the PO is printed and mailed/faxed to the appropriate vendor. Encumbrances are reservations of appropriations for goods/services that have not been received. The purpose of this encumbrance is to insure that obligations are recognized as soon as financial commitments are made in order to prevent inadvertent over expenditure of funds due to lack of information about future commitments.
120

Organization Section continued
After the goods are physically received (central receiving at the Warehouse), warehouse staff enters information on-line that shows what items have been received. The accounts payable department accesses this data and matches vendor invoice with “received” information and payment is made. The encumbrance is liquidated at the time of payment. Miscellaneous Payment Requisitions (MPRs) MPRs are used for travel expense, advances for travel, petty cash reimbursement, refunds, and payment for Athletic and/or Extracurricular officials. MPRs are entered on-line, appropriate supporting documents are forwarded to the Accounting Department for verification, approval, and payment.
Amending the Budget The budget is legally adopted at the fund and function level. The Board of Trustees has delegated authority for functional changes to the Accounting Department. {For example, budget transfers from one functional category (e.g. Library) to another functional category (e.g. Instruction) are reviewed and approved/disapproved by Accounting Department personnel.} However, budget changes that would increase/decrease the overall fund are taken to the Board of Trustees for their approval before any action regarding the proposed change is made.
Monitoring the Budget The District’s interactive, on-line budgetary accounting and control system provides many useful reports to assist Board Members, Business Services personnel, and budget managers in administering, monitoring and controlling the implementation of the budget. This system provides many checks on account balances to insure that funds are not over-expended at the budgetary control account level. If sufficient funds are not available at the budgetary control account level, purchase orders and check requisitions cannot be generated. The Accounting Director carefully monitors comparisons between budget and actual expenditures to maintain cost control and to insure against overspending for payroll and related accounts. Relevant financial reports are submitted to the Board of Trustees on a monthly basis and posted to the district’s website. The final step in the budget monitoring process is the evaluation of the results of operations, which are presented annually in the District’s Comprehensive Annual Financial Report (CAFR).
Reporting to the Texas Education Agency (TEA) The District budget must be submitted to the TEA via the Public Education Information Management System (PEIMS) transmission process as of the date established in the annual instructions for the system. The TEA monitors for compliance at the District level only. This monitoring is a legal requirement to ensure mandatory expenditure levels in certain areas. In
121

Organization Section continued
addition, amended budgets are reflected on the schedule comparing budget and actual results in the Annual Financial and Compliance Report. The requirement for filing the amended budget with the TEA is formally met when the District submits its Annual Financial and Compliance Report.
122

Financial Plan
Section
123

Financial Plan
Revenues General Fund The largest portion of funding in the General Fund consists of local revenue, which accounts for approximately 64.97% of the total budgeted funds and is primarily property taxes. The remainder of the revenues necessary to fund operating expenditures is derived from State and Federal funding sources. For additional information, see the General Fund section of this book. Debt Service A majority of funding is derived from a designated allocation of the property tax rate, 99.97% for 2011-2012. The remainder of the Debt Service revenue is from interest income derived from temporary investments, 0.03% for 2011-2012. Although the State has Debt Service Fund formula allocations, the District does not receive revenue from these programs. For additional information, see the Debt Service Fund section of this book. Food Service Approximately 75.00% of the revenue in this fund is received from the United States Department of Agriculture (USDA) under the National School Lunch Program, the School Breakfast Program, and the Food Distribution Program. The remaining revenue is primarily generated from user fees - i.e. student payments for meals, 24.21% for 2011-2012. For additional information, see the Food Service Fund section of this book.
124

Financial Plan continued
2011-2012 Budget Short SummaryGeneral Fund Debt Service Food Service Memo Totals
Revenue % of Total Revenue % of Total Revenue % of Total Revenue % of TotalLocal $132,575,835 64.97% $39,835,007 100.00% $2,610,100 24.21% $175,020,942 68.72%State $60,729,820 29.76% - - $85,000 0.79% $60,814,820 23.88%On Behalf Retirement Payment 10,200,000 5.00% - - - - $10,200,000 4.01%Federal $550,000 0.27% - - $8,086,500 75.00% $8,636,500 3.39% Total Revenue 204,055,655$ 100.00% 39,835,007$ 100.00% 10,781,600$ 100.00% 254,672,262$ 100.00%
Expenditures % of Total Expenditures % of Total Expenditures % of Total Expenditures % of TotalPayroll $165,809,141 77.56% -$ - $4,850,000 44.98% $170,659,141 64.55%Debt Service - - $39,835,007 100.00% - - $39,835,007 15.07%Bus Transportation $3,395,000 1.59% - - - - $3,395,000 1.28%Utilities 8,190,550 3.83% - - - - $8,190,550 3.10%Other Purchased Services $10,108,095 4.73% - - $1,293,000 11.99% $11,401,095 4.31%Chapter 41 - - - - - - $0 0.00%Supplies & Materials $8,696,163 4.07% - - $4,517,500 41.90% $13,213,663 5.00%Tax Increment Financing Zone 14,140,000 6.61% - - - - $14,140,000 5.35%Other Operating $2,982,548 1.40% - - $18,000 0.17% $3,000,548 1.13%Capital Outlay $463,124 0.22% - - $103,100 0 $566,224 0.21%
$213,784,621 100.00% $39,835,007 100.00% $10,781,600 100.00% $264,401,228 100.00%
Budgeted Deficit ($9,728,966) $0 $0 ($9,728,966)
Beginning Fund Balance 9/1/11 $72,950,332 $3,003,709 $816,856 $76,770,897
Projected Ending Fund Balance 08/31/11 $63,221,366 $3,003,709 $816,856 $67,041,931
125

Financial Plan continued
Carrollton-Farmers Branch Independent School DistrictEstimated Revenues, Expenditures, Other Resources and Fund Balances
Official Budgets2011-2012
General Food Service Debt Service Memorandum Estimated
Fund Fund Fund Totals Per Pupil
2011-12
ESTIMATED REVENUES
LOCAL AND INTERMEDIATE
5710 Local Real and Personal Property Taxes $131,376,991 -$ $39,822,607 $171,199,598 $6,545
5730 Tuition and Fees 449,194 - - 449,194 17
5740 Other Revenues from Local Sources 389,650 8,100 12,400 410,150 16
5750 Revenue from Co-Curricular/Enterprising 360,000 2,602,000 - 2,962,000 113
5700 Local and Intermediate Totals $132,575,835 $2,610,100 $39,835,007 $175,020,942 $6,691
STATE
5810 Per Capita and Foundation School Program $60,704,820 -$ -$ $60,704,820 $2,321
5820 State Program Revenue Distributed by the TEA 25,000 85,000 - 110,000 4
5830 TRS On-Behalf Payments 10,200,000 - - 10,200,000 390
5800 State Totals $70,929,820 $85,000 $0 $71,014,820 $2,715
FEDERAL
5920 Federal Revenues Distributed by the TEA -$ 8,086,500$ -$ $8,086,500 $309
5930 Federal Revenues Distributed by Other Government Agencies 550,000 - 550,000 21
(Other than the TEA) - - - - -
5900 Federal Totals $550,000 $8,086,500 $0 $8,636,500 $330
5000 TOTAL ALL REVENUES $204,055,655 $10,781,600 $39,835,007 $254,672,262 $9,736
APPROPRIATED EXPENDITURES
11 INSTRUCTION
6100 Payroll Costs $116,195,276 - - $116,195,276 $4,442
6200 Professional and Contracted Services 1,199,255 - - 1,199,255 46
6300 Supplies and Materials 1,832,477 - - 1,832,477 70
6400 Other Operating Costs 196,485 - - 196,485 8
Total Function 11 $119,423,493 $0 $0 $119,423,493 $4,565
12 INSTRUCTIONAL RESOURCES AND MEDIA SERVICES
6100 Payroll Costs $842,309 - - $842,309 $32
6200 Professional and Contracted Services 108,471 - - 108,471 4
6300 Supplies and Materials 610,488 - - 610,488 23
6400 Other Operating Costs 4,863 - - 4,863 0
6600 Capital Outlay 3,000 - - 3,000 0
Total Function 12 $1,569,131 $0 $0 $1,569,131 $60
126

Financial Plan continued
Carrollton-Farmers Branch Independent School DistrictEstimated Revenues, Expenditures, Other Resources and Fund Balances
Official Budgets2011-2012
General Food Service Debt Service Memorandum Estimated
Fund Fund Fund Totals Per Pupil
13 CURRICULUM DEVELOPMENT AND INSTRUCTIONAL STAFF DEVELOPMENT
6100 Payroll Costs $3,154,165 - - $3,154,165 $121
6200 Professional and Contracted Services 432,121 - - 432,121 17
6300 Supplies and Materials 816,338 - - 816,338 31
6400 Other Operating Costs 230,425 - - 230,425 9
Total Function 13 $4,633,049 $0 $0 $4,633,049 $177
21 INSTRUCTIONAL LEADERSHIP
6100 Payroll Costs $2,060,905 - - $2,060,905 $79
6200 Professional and Contracted Services 358,602 - - 358,602 14
6300 Supplies and Materials 899,145 - - 899,145 34
6400 Other Operating Costs 113,035 - - 113,035 4
6600 Capital Outlay 50,000 - - 50,000 2
Total Function 21 $3,481,687 $0 $0 $3,481,687 $133
23 SCHOOL LEADERSHIP
6100 Payroll Costs $12,665,755 - - $12,665,755 $484
6200 Professional and Contracted Services 80,853 - - 80,853 3
6300 Supplies and Materials 378,599 - - 378,599 14
6400 Other Operating Costs 88,655 - - 88,655 3
Total Function 23 $13,213,862 $0 $0 $13,213,862 $505
31 GUIDANCE, COUNSELING AND EVALUATION SERVICES
6100 Payroll Costs $8,409,870 - - $8,409,870 $321
6200 Professional and Contracted Services 196,057 - - 196,057 7
6300 Supplies and Materials 505,024 - - 505,024 19
6400 Other Operating Costs 22,058 - - 22,058 1
Total Function 31 $9,133,009 $0 $0 $9,133,009 $349
32 SOCIAL WORK SERVICES
6100 Payroll Costs 166,064 - - 166,064 6
Total Function 32 $166,064 $0 $0 $166,064 $6
33 HEALTH SERVICES
6100 Payroll Costs $649,132 - - $649,132 $25
6200 Professional and Contracted Services 4,004 - - 4,004 0
6300 Supplies and Materials 50,898 - - 50,898 2
6400 Other Operating Costs 2,614 - - 2,614 0
Total Function 33 $706,648 $0 $0 $706,648 $27
127

Financial Plan continued
Carrollton-Farmers Branch Independent School DistrictEstimated Revenues, Expenditures, Other Resources and Fund Balances
Official Budgets2011-2012
General Food Service Debt Service Memorandum Estimated
Fund Fund Fund Totals Per Pupil
34 STUDENT (PUPIL) TRANSPORTATION
6100 Payroll Costs $15 - - $15 $0
6200 Professional and Contracted Services 3,560,000 - 3,560,000 136
6300 Supplies and Materials - - - - -
Total Function 34 $3,560,015 $0 $0 $3,560,015 $136
35 FOOD SERVICES
6100 Payroll Costs - 4,850,000$ - 4,850,000$ 185$
6200 Professional and Contracted Services - 1,293,000 - 1,293,000 49
6300 Supplies and Materials - 4,517,500 - 4,517,500 173
6400 Other Operating Costs - 18,000 - 18,000 1
6600 Capital Outlay - $103,100 - $103,100 $4
Total Function 35 $0 $10,781,600 $0 $10,781,600 $412
36 COCURRICULAR/EXTRACURRICULAR ACTIVITIES
6100 Payroll Costs $2,284,841 - - $2,284,841 $87
6200 Professional and Contracted Services 667,828 - - 667,828 26
6300 Supplies and Materials 618,013 - - 618,013 24
6400 Other Operating Costs 1,112,838 - - 1,112,838 43
6600 Capital Outlay 7 - - 7 0
Total Function 36 $4,683,527 $0 $0 $4,683,527 $179
41 GENERAL ADMINISTRATION
6100 Payroll Costs $4,525,042 - - $4,525,042 $173
6200 Professional and Contracted Services 1,368,983 - - 1,368,983 52
6300 Supplies and Materials 237,117 - - 237,117 9
6400 Other Operating Costs 516,905 - - 516,905 20
6600 Capital Outlay 10,117 - - 10,117 0
Total Function 41 $6,658,164 $0 $0 $6,658,164 $255
51 PLANT MAINTENANCE
6100 Payroll Costs $10,894,703 - - $10,894,703 $416
6200 Professional and Contracted Services 10,266,688 - - 10,266,688 392
6300 Supplies and Materials 1,866,544 - - 1,866,544 71
6400 Other Operating Costs 590,838 - - 590,838 23
6600 Capital Outlay 380,000 - - 380,000 15
Total Function 51 $23,998,773 $0 $0 $23,998,773 $917
128

Financial Plan continued
Carrollton-Farmers Branch Independent School DistrictEstimated Revenues, Expenditures, Other Resources and Fund Balances
Official Budgets2011-2012
General Food Service Debt Service Memorandum Estimated
Fund Fund Fund Totals Per Pupil
52 SECURITY AND MONITORING SERVICES
6100 Payroll Costs $1,039,393 - - $1,039,393 $40
6200 Professional and Contracted Services 598,485 - - 598,485 23
6300 Supplies and Materials 15,110 - - 15,110 1
6400 Other Operating Costs 20,527 - - 20,527 1
6600 Capital Outlay 20,000 -
Total Function 52 $1,693,515 $0 $0 $1,673,515 $64
53 DATA PROCESSING SERVICES
6100 Payroll Costs $2,420,487 - - $2,420,487 $93
6200 Professional and Contracted Services 1,656,796 - - 1,656,796 63
6300 Supplies and Materials 859,350 - - 859,350 33
6400 Other Operating Costs 64,998 - - 64,998 2
Total Function 53 $5,001,631 $0 $0 $5,001,631 $191
61 COMMUNITY SERVICES
6100 Payroll Costs $412,420 - - $412,420 $16
6200 Professional and Contracted Services 14,751 - - 14,751 1
6300 Supplies and Materials 7,060 - - 7,060 0
6400 Other Operating Costs 18,307 - - 18,307 1
Total Function 61 $452,538 $0 $0 $452,538 $17
71 DEBT SERVICE
6500 Debt Service - - $39,835,007 $39,835,007 $1,523
Total Function 71 $0 $0 $39,835,007 $39,835,007 $1,523
81 FACILITIES ACQUISITION AND CONSTRUCTION
6100 Payroll Costs $88,764 - - $88,764 $3
Total Function 81 $88,764 $0 $0 $88,764 $3
91 CONTRACTED INSTRUCTIONAL SERVICES BETWEEN PUBLIC SCHOOLS
6200 Professional and Contracted Services -$ - - $0 $0
Total Function 91 $0 $0 $0 $0 $0
92 Incremental Costs Assoc with Chap 41
6200 Professional and Contracted Services -$ - - $0 $0
Total Function 92 $0 $0 $0 $0 $0
95 PAYMENTS TO JUVENILE JUSTICE ALTERNATIVE EDUCATION PROGRAMS
6200 Professional and Contracted Services $200,000 - - $200,000 $8
Total Function 95 $200,000 $0 $0 $200,000 $8
129

Financial Plan continued
Carrollton-Farmers Branch Independent School DistrictEstimated Revenues, Expenditures, Other Resources and Fund Balances
Official Budgets2011-2012
General Food Service Debt Service Memorandum Estimated
Fund Fund Fund Totals Per Pupil
97 PAYMENTS TO TAX INCREMENT FUND
6400 Other Operating Costs $14,140,000 - - $14,140,000 $541
Total Function 97 $14,140,000 $0 $0 $14,140,000 $541
99 OTHER INTERGOVERNMENTAL CHARGES
6200 Professional and Contracted Services $980,751 - - $980,751 $37
Total Function 99 $980,751 $0 $0 $980,751 $37
6000 TOTAL ALL EXPENDITURES $213,784,621 $10,781,600 $39,835,007 $264,401,228 $10,107
Excess (Deficiency) of Revenues Over (Under) Expenditures ($9,728,966) $0 $0 ($9,728,966) ($372)
OTHER RESOURCES/NON-OPERATING RESOURCES
7915 Operating Transfers In - - - $0 $0
7919 Extraordinary Item (Insurance Refund) - - - $0 $0
7000 Total Other Resources $0 $0 $0 $0 $0
Excess (Deficiency) of Revenues and Other Resources
Over (Under) Expenditures ($9,728,966) $0 $0 ($9,728,966) ($372)
FUND BALANCES
3110 Beginning Fund Balance 09/01 ESTIMATED $72,950,332 $816,856 $3,003,709 $76,770,897
3110 Ending Fund Balance 08/31 $63,221,366 $816,856 $3,003,709 $67,041,931
130

131

Financial Plan continued
Carrollton-Farmers Branch Independent School District
Combined Budget SummaryGeneral Fund, Debt Service Fund and Food Service Special Revenue Fund
2011-2012
2011-12 2010-11 2009-10
Revenues General Fund Debt Service Fund Food Service Fund Memo Total Memo Total Memo Total
Local and Intermediate Sources
5711 Taxes, Current Year Levy $130,726,991 $39,822,607 $170,549,598 $184,643,839 $196,122,591
5712-5719 Taxes, Prior Year, Penalty & Interest $650,000 $650,000 $650,000 $113,740
5737 - 5739 Tuition $449,194 $449,194 $502,420 $547,681
5742 Investment Earnings $50,000 $12,400 $8,000 $70,400 $138,150 $820,300
5743 Rent $260,000 $260,000 $250,000 $214,000
5744 Revenue from Foundations, $20,000 $20,000 $45,000 $45,000
Gifts & Bequests
5749 Other Revenue from Local Sources $59,650 $100 $59,750 $59,750 $59,750
5751 Food Service Activity $2,602,000 $2,602,000 $2,461,740 $2,526,230
5752 & 5759 Athletic& Enterprising Activity $360,000 $360,000 $360,000 $380,000
Total Local and Intermediate Revenue $132,575,835 $39,835,007 $2,610,100 $175,020,942 $189,110,899 $200,829,292
State Program Revenues
5811 Per Capita Apportionment $6,016,350 $6,016,350 $2,087,601 $2,631,637
5812-5819 Foundation School Program $54,688,470 $54,688,470 $51,098,794 $45,947,619
5829 State Revenue Distributed by TEA $25,000 $85,000 $110,000 $110,000 $105,091
5831 Teacher Retirement On-Behalf Payments $10,200,000 $10,200,000 $9,639,691 $9,665,256
Total State Program Revenue $70,929,820 $0 $85,000 $71,014,820 $62,936,086 $58,349,603
Federal Program Revenues
5921 School Breakfast Program $0 $1,205,000 $1,205,000 $1,331,305 $1,299,619
5922 National School Lunch Program $0 $6,140,000 $6,140,000 $6,262,835 $5,501,266
5923 United States Department of Agriculture
(USDA) Donated Commodities $0 $589,500 $589,500 $625,000 $625,000
5929 Federal Revenues Distributed by TEA $0 $152,000 $152,000 $8,266,063 $103,836
5931 School Health and Related Services
(SHARS) $550,000 $550,000 $300,000 $200,000
Total Federal Program Revenues $550,000 $0 $8,086,500 $8,636,500 $16,785,203 $7,729,721
Total Revenue $204,055,655 $39,835,007 $10,781,600 $254,672,262 $268,832,188 $266,908,616
132
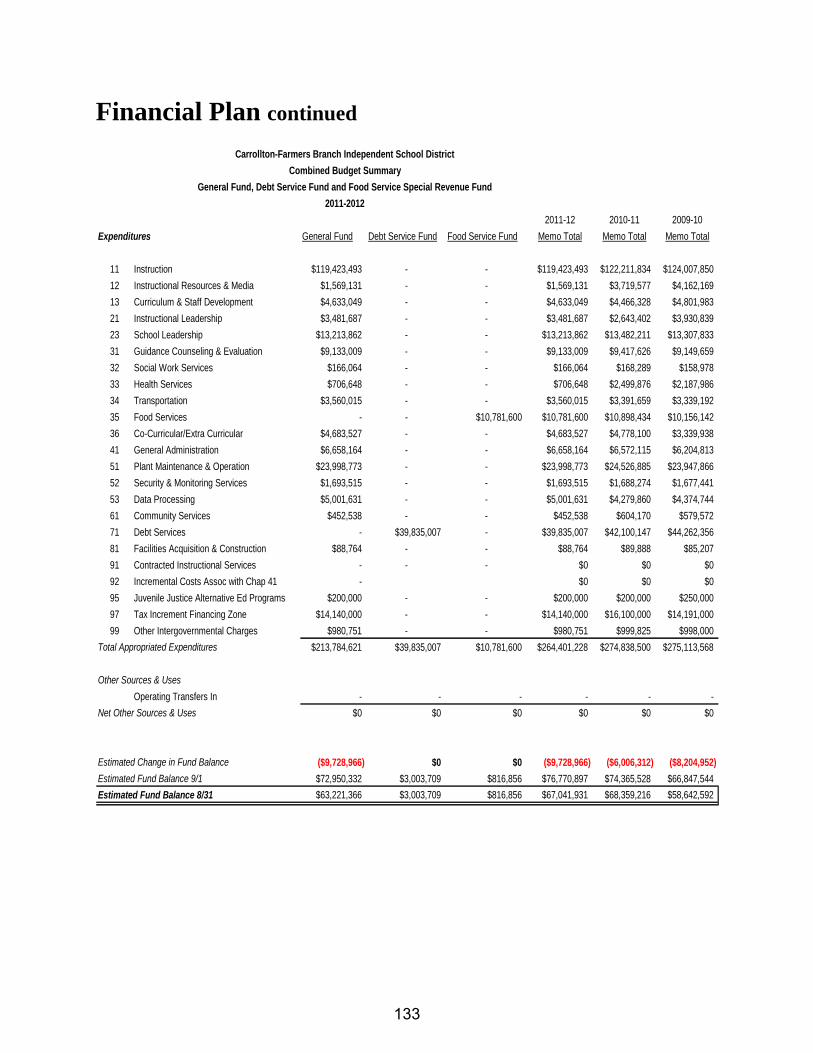
Financial Plan continued
Carrollton-Farmers Branch Independent School District
Combined Budget Summary
General Fund, Debt Service Fund and Food Service Special Revenue Fund
2011-2012
2011-12 2010-11 2009-10
Expenditures General Fund Debt Service Fund Food Service Fund Memo Total Memo Total Memo Total
11 Instruction $119,423,493 - - $119,423,493 $122,211,834 $124,007,850
12 Instructional Resources & Media $1,569,131 - - $1,569,131 $3,719,577 $4,162,169
13 Curriculum & Staff Development $4,633,049 - - $4,633,049 $4,466,328 $4,801,983
21 Instructional Leadership $3,481,687 - - $3,481,687 $2,643,402 $3,930,839
23 School Leadership $13,213,862 - - $13,213,862 $13,482,211 $13,307,833
31 Guidance Counseling & Evaluation $9,133,009 - - $9,133,009 $9,417,626 $9,149,659
32 Social Work Services $166,064 - - $166,064 $168,289 $158,978
33 Health Services $706,648 - - $706,648 $2,499,876 $2,187,986
34 Transportation $3,560,015 - - $3,560,015 $3,391,659 $3,339,192
35 Food Services - - $10,781,600 $10,781,600 $10,898,434 $10,156,142
36 Co-Curricular/Extra Curricular $4,683,527 - - $4,683,527 $4,778,100 $3,339,938
41 General Administration $6,658,164 - - $6,658,164 $6,572,115 $6,204,813
51 Plant Maintenance & Operation $23,998,773 - - $23,998,773 $24,526,885 $23,947,866
52 Security & Monitoring Services $1,693,515 - - $1,693,515 $1,688,274 $1,677,441
53 Data Processing $5,001,631 - - $5,001,631 $4,279,860 $4,374,744
61 Community Services $452,538 - - $452,538 $604,170 $579,572
71 Debt Services - $39,835,007 - $39,835,007 $42,100,147 $44,262,356
81 Facilities Acquisition & Construction $88,764 - - $88,764 $89,888 $85,207
91 Contracted Instructional Services - - - $0 $0 $0
92 Incremental Costs Assoc with Chap 41 - $0 $0 $0
95 Juvenile Justice Alternative Ed Programs $200,000 - - $200,000 $200,000 $250,000
97 Tax Increment Financing Zone $14,140,000 - - $14,140,000 $16,100,000 $14,191,000
99 Other Intergovernmental Charges $980,751 - - $980,751 $999,825 $998,000
Total Appropriated Expenditures $213,784,621 $39,835,007 $10,781,600 $264,401,228 $274,838,500 $275,113,568
Other Sources & Uses
Operating Transfers In - - - - - -
Net Other Sources & Uses $0 $0 $0 $0 $0 $0
Estimated Change in Fund Balance ($9,728,966) $0 $0 ($9,728,966) ($6,006,312) ($8,204,952)
Estimated Fund Balance 9/1 $72,950,332 $3,003,709 $816,856 $76,770,897 $74,365,528 $66,847,544
Estimated Fund Balance 8/31 $63,221,366 $3,003,709 $816,856 $67,041,931 $68,359,216 $58,642,592
133

134

GENERAL FUND
135

General Fund Overview
The General Fund is used to account for all financial transactions not properly included in other funds. The principal sources of revenue include local property taxes, State revenue, interest income, and federal revenue. Expenditures include all costs associated with the operations of the schools.
Revenue Trends and Assumptions The largest portion of funding in the General Fund consists of local revenue, which accounts for approximately 64.97% of total budgeted funds and is primarily property taxes. The remainder of the revenue necessary to fund operating expenditures is derived from State and Federal funding sources. Legislative History regarding Texas Public School funding In May 2006 the Texas Legislature passed House Bill 1. HB1 provided for a reduction to 88.67 percent of the 2005-06 Maintenance & Operations tax rate for 2006-07. Districts reducing tax rates by this amount were guaranteed the better of 2005-06 or 2006-07 state aid and local tax revenue. Under HB 1, during the 2007-08 school year, districts further reduced their tax rates to 66.67 percent of the 2005-06 Maintenance & Operations tax rate. After the initial tax rate reduction, districts had access to an equalized $0.04 without voter approval, and an additional equalized $0.02 in 2008-09 with voter approval at rates higher than the normal yield. The C-FB ISD Board of Trustees elected to set a Maintenance & Operations tax rate of $1.04 in 2007-08. This is equal to the compression rate of 66.67 percent times the 2005-06 tax rate of $1.50 plus $0.04 of the available $0.04 referenced in HB 1. Although the intent of HB1 was to equalize funding per student throughout the state (commonly called a target revenue system) large discrepancies exist. HB 3646 was passed with the 81st legislature (completed June 1, 2009) and is a modified continuation of the target revenue system. Districts with lower than average target revenue amounts were increased by up to a maximum of $350/per weighted average daily attendance (WADA); the rest of the districts were given a minimum of $120/per student in WADA. Accompanying the increase in state funds was a mandate to give a raise to a specific group of employees. This mandated raise used 74% of the new money allocated to the district. The state funded $1.866 billion for formula improvements and $1.3 billion to maintain the Foundation School Program from Federal American Recovery and Reinvestment Act (ARRA) funds. In July of 2011 the Texas Legislature passed Senate Bill 1. SB1 continues the target revenue concept with slight modification from previous legislation. With the State of Texas facing large deficits for the biennium, SB1 created a regular program adjustment factor (RPAF) that is set at 0.9239 in 2011-12 and 0.98 in 2012-13. The new funding formulas reduce the district’s regular program allotment by 7.61% in 2011-12 and 2.0% in 2012-13. Districts that tax more than the 2005-06 tax rate compressed plus $0.04 for the Maintenance & Operations tax rate, must call a rollback election (if their compressed tax rate is $1.00 like C-FB ISD’s). Rollback elections must coincide with strict timelines. If the voters of the district calling the rollback election defeat the election, the district must “roll back” the tax rate to the previous year’s tax rate. Tax rate election statistics through November 10, 2011 are listed in the chart below.
136

General Fund continued
Passed Failed Total %2006 14 1 15 93%2007 94 26 120 78%2008 71 46 117 61%2009 29 18 47 62%2010 57 14 71 80%2011 27 12 39 69%Totals 292 117 409 71%
Tax Rate Elections Statistics
HB 3646 changed the equalized wealth level for taxes up to the compressed rate to $476,500 per WADA in 2009-10 and 2010-11; no recapture for the next six cents. Pennies above the compressed tax rate plus six cents are recaptured at $319,500. This change reduced the amount of the District’s Chapter 41 payment to zero for 2010-11. However, under the target revenue concept, the loss of the Chapter 41 payment does not help the district’s net revenue picture since we are still tied to 2006-07 state aid plus local revenue caps. The District’s assessed value of taxable property declined from $14.13 billion to $13.89 billion or a loss of 1.72%. The Texas Comptroller of Public Accounts annually certifies the final property value on or before July 1. The district reduces the certified taxable by 2.5% when calculating tax revenue. This is because the District has been experiencing a “shrinkage” in the tax roll during the collection year as more property owners are protesting their taxes resulting in a lower net tax roll that taxes can be collected. There have also been increasing numbers of properties that are exempt from taxes. Finally, changes in the district’s assessed value – either increases or decreases do not harm nor benefit the district under the Target Revenue concept. In general, as the tax revenues go up, the State revenue goes down by a similar amount; hence although the relative value of the various funding sources may change the net bottom line will remain virtually the same. This is a problem for the district, as the current funding formulas do not allow for funding inflation, employee raises, new initiatives or other operating increases such as utility or gasoline increases.
137
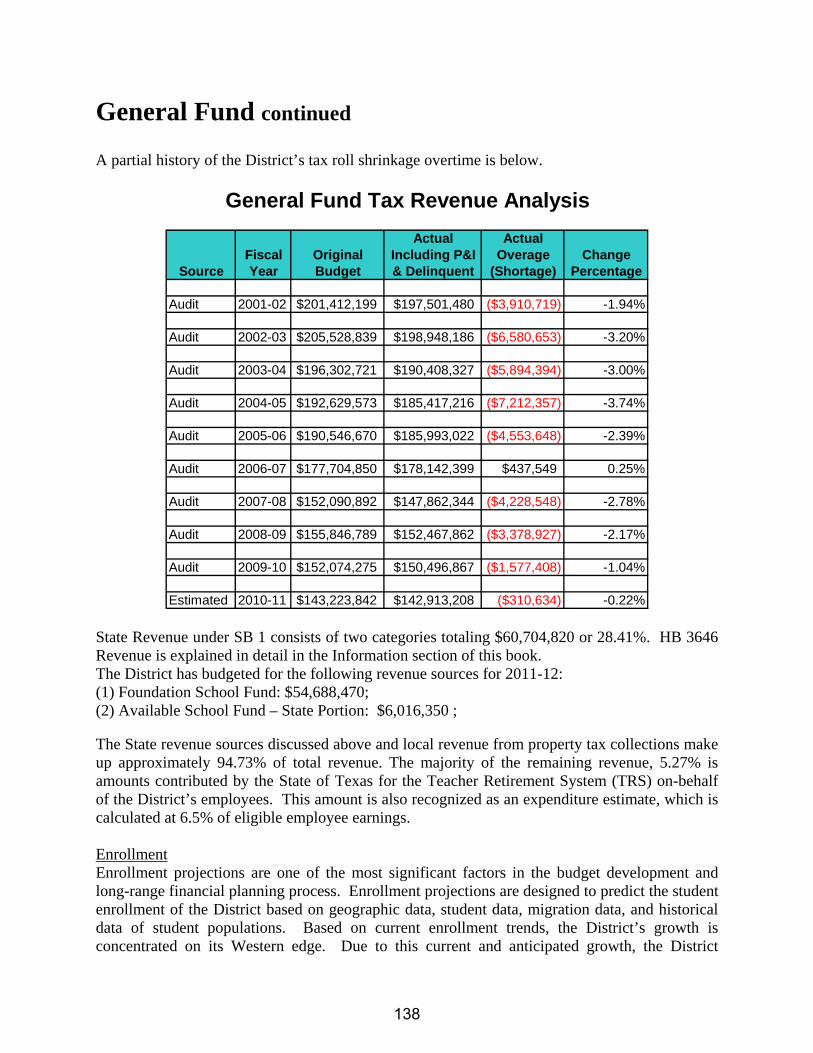
General Fund continued
A partial history of the District’s tax roll shrinkage overtime is below.
General Fund Tax Revenue Analysis
Actual ActualFiscal Original Including P&I Overage Change
Source Year Budget & Delinquent (Shortage) Percentage
Audit 2001-02 $201,412,199 $197,501,480 ($3,910,719) -1.94%
Audit 2002-03 $205,528,839 $198,948,186 ($6,580,653) -3.20%
Audit 2003-04 $196,302,721 $190,408,327 ($5,894,394) -3.00%
Audit 2004-05 $192,629,573 $185,417,216 ($7,212,357) -3.74%
Audit 2005-06 $190,546,670 $185,993,022 ($4,553,648) -2.39%
Audit 2006-07 $177,704,850 $178,142,399 $437,549 0.25%
Audit 2007-08 $152,090,892 $147,862,344 ($4,228,548) -2.78%
Audit 2008-09 $155,846,789 $152,467,862 ($3,378,927) -2.17%
Audit 2009-10 $152,074,275 $150,496,867 ($1,577,408) -1.04%
Estimated 2010-11 $143,223,842 $142,913,208 ($310,634) -0.22% State Revenue under SB 1 consists of two categories totaling $60,704,820 or 28.41%. HB 3646 Revenue is explained in detail in the Information section of this book. The District has budgeted for the following revenue sources for 2011-12: (1) Foundation School Fund: $54,688,470; (2) Available School Fund – State Portion: $6,016,350 ; The State revenue sources discussed above and local revenue from property tax collections make up approximately 94.73% of total revenue. The majority of the remaining revenue, 5.27% is amounts contributed by the State of Texas for the Teacher Retirement System (TRS) on-behalf of the District’s employees. This amount is also recognized as an expenditure estimate, which is calculated at 6.5% of eligible employee earnings. Enrollment Enrollment projections are one of the most significant factors in the budget development and long-range financial planning process. Enrollment projections are designed to predict the student enrollment of the District based on geographic data, student data, migration data, and historical data of student populations. Based on current enrollment trends, the District’s growth is concentrated on its Western edge. Due to this current and anticipated growth, the District
138

General Fund continued
opened LaVillita Elementary School in August of 2008. Long-range plans include an additional elementary school and a middle school with an addition to Ranchview high school in this area. Modest enrollment growth in the southern part of the District has been addressed by the construction of Strickland Intermediate School which also opened in August of 2008. Enrollment trends in all other parts of the District indicate that current facilities will be adequate with minor renovation and additions. Federal Funds The District is expecting federal funds to decrease and is budgeted at $550,000 or 0.27% of the total revenue budget. The federal funds come from the School Health and Related Services (SHARS) program ($300,000). School District Retiree Health Plan Plan Description. The Carrollton-Farmers Branch ISD contributes to the Texas Public School Retired Employees Group Insurance Program (TRS-Care), a cost-sharing multiple-employer defined benefit post-employment health care plan administered by the Teacher Retirement System of Texas. TRS-Care Retired Plan provides health care coverage for certain persons (and their dependents) who retired under the Teacher Retirement System of Texas. The statutory authority for the program is Texas Insurance Code, Chapter 1575. Section 1575.052 grants the TRS Board of Trustees the authority to establish and amend basic and optional group insurance coverage for participants. The TRS issues a publicly available financial report that includes financial statements and required supplementary information for the TRS-Care. That report may be obtained by visiting the TRS web site at www.trs.state.tx.us, by writing to the Communications Department of the Teacher Retirement System of Texas at 1000 Red River Street, Austin, Texas 78701, or by calling 1-800-223-8778. Funding Policy. Contribution requirements are not actuarially determined but are legally established each biennium by the Texas Legislature. Texas Insurance Code, Sections 1575.202, 203, and 204 establish state, active employee, and public school contributions, respectively. The State of Texas and active public school employee contribution rates were 1.0% and 0.65% of public school payroll, respectively, with school districts contributing a percentage of payroll set a 0.55% for fiscal years 2011, 2010 and 2009. Per Texas Insurance Code, Chapter 1575, the public school contribution may not be less than 0.25% or greater than 0.75% of the salary of each active employee of the public school. For years ended August 31, 2011, 2010, and 2009, the State’s contributions to TRS-Care were $1,537,508, $1,526,484, and $1,553,009, respectively, the active member contributions were $999,380, $992,215, and $1,009,456, respectively, and the school district’s contributions were $845,629, $839,566, and $854,155, respectively, which equaled the required contributions each year..
Expenditure Summary The General Fund expenditure budget for 2011-12 is $213,784,621. This is a decrease of $8,055,298 or -3.63% less than the 2010-11 expenditure budget. As discussed previously in this document, reductions in this budget were intentionally made to cut costs. Management knows
139

General Fund continued
that deficit budgets cannot be sustained over the long-run and is working toward a balanced budget in a deliberate manner; with the goal of cutting costs with the least amount of disruption as possible. Current state funding formulas do not allow for new programs, inflation or future compensation increases. Until the funding formulas change, the district will be required to continue to cut programs, staff and other expenditures to achieve a balanced budget. As always, the majority of a school district’s expenditures are for personnel costs, 77.22% (83.26% if exclude the Tax Increment Finance payment). The district’s compensation package did not include a salary increase for fiscal year 2011-12. C-FB ISD’s salary schedule for new teachers does provide for differing amounts based on years of experience. Salary schedules are included in the Information Section of this book. Other significant expenditure items include the following:
Category Budget Amount % of Total BudgetPayroll $165,809,141 77.56%Tax Increment Finance Payment $14,140,000 6.61%Utilities $8,190,550 3.83%Student Transportation $3,395,000 1.59%Appraisal District $980,751 0.46%Insurance & Bonding $861,030 0.40%Region Ten Computer Service Contract $802,025 0.38%Copier Rentals $687,358 0.32%Legal $500,000 0.23%Audit $65,000 0.03%Election Costs $50,000 0.02%
The above items equal 91.44% of the total 2011-12 budget.
General Fund Expenditures by Object Comparison to Prior Year
Beginning Beginning Percentage Budget Budget Increase Percentage
2010-2011 2011-2012 (Decrease) of TotalPayroll $171,300,000 $165,809,141 -3.21% 77.56%Purchased Services $21,994,660 $21,693,645 -1.37% 10.15%Supplies & Materials $8,858,925 $8,696,163 -1.84% 4.07%Other Operating $19,195,826 $17,122,548 -10.80% 8.01%Capital Outlay $490,508 $463,124 -5.58% 0.22%Total $221,839,919 $213,784,621 -3.63% 100.00%
140

General Fund continued
The graph below depicts the 2011-12 budget by major object.
Payroll
Purchased Services
Supplies & Materials
Other Operating
Capital Outlay
GENERAL FUND EXPENDITURES BYMAJOR OBJECT
Payroll Purchased Services Supplies & Materials Other Operating Capital Outlay
Budget $165,809,141 $21,693,645 $8,696,163 $17,122,548 $463,124% of Budget 77.56% 10.15% 4.07% 8.01% 0.22%
Impact on Fund Balance The District’s fund balance will decrease approximately $9,728,966; leaving a projected fund balance of $63,221,366. This projected balance represents 116 day’s expenditures or approximately 29.57% of the annual budgeted expenditures and provides some stability given significant uncertainty in projections of future revenue and expenditures.
Although progress was made at reducing the budget, the District has elected to use a portion of our fund balance to balance the General Fund budget. This philosophy has been utilized in an attempt to minimize drastic personnel staffing and other changes that would be necessary to balance the budget if completed in one year. For future budgets, the District plans to review all budget line items to determine where future cuts can be made without hurting District instructional goals. Also, the District will consider a rollback election asking voters for additional pennies on the tax rate. If operational reductions are made, state mandated student/teacher ratios for elementary students and other state mandated requirements will still need to be followed.
141

General Fund continued
The need for deficit budgets is a major concern to district management. On-going efforts to review programs in a cost vs. benefit manner continue as we look to the future. At the same time, sustained efforts to reduce cost as we go are in place. Even if central departments have money in their budget, they are encouraged to “stop-look-evaluate” first to make sure that the purchase is something required. Because of this philosophy, coupled with other factors, the district has had many more budgeted deficits than realized deficits.
FYE 2003 *FYE 2004 FYE 2005 FYE 2006 FYE 2007 FYE 2008**FYE2009
***FYE2010
FYE 2011
Original Budgeted Def icit ($6,724,525) ($13,616,486 ($7,746,958) ($6,549,776) ($3,292,462) ($5,991,426) ($13,433,675 ($8,204,952) ($6,006,312)
Actual Change in Fund Balance ($1,216,482) $2,144,144 $3,646,596 $2,241,055 $9,557,611 ($2,524,462) $557,419 $7,784,536 $2,119,134
($15,000,000)
($10,000,000)
($5,000,000)
$0
$5,000,000
$10,000,000
$15,000,000
Budgeted Deficits vs.Actual Year‐End Change in Fund Balance
General Fund
Original Budgeted Deficit Actual Change in Fund Balance
Unusual Items
2004* One-time payments related to the Freeport Exemption + $5,750,0002009** State revenue reimbursement related to the Tax Increment Finance Zone for the years of
2006-07, 2007-08, and 2008-09 + $5,998,9972010*** State revenue reimbursement due to audit of 2005 Taxable Values for the years
2006-07, 2007-08, 2008-09 + $2,389,017 State revenue reimbursement related to the Tax Increment Finance Zone for years 2006-07, 2007-08, 2008-09 + $1,471,602State revenue reimbursement of prior year Chapter 41 payment due to audit of the 2005 Taxable values + $1,282,506
142

General Fund continued
The graph below depicts our General Fund-fund balance as a percentage of the total expenditures over time.
2003 2004 2005 2006 2007 2008 2009 2010 2011 2012*
GF Fund Bal $47,424 $49,568 $53,215 $55,456 $65,014 $62,489 $63,047 $70,831 $72,950 $63,221
% TI Bdgt 21.69% 22.79% 25.56% 26.14% 30.36% 28.33% 27.30% 34.75% 35.15% 29.57%
Days Operating 108 110 119 117 130 115 115 135 138 116
$0
$10,000
$20,000
$30,000
$40,000
$50,000
$60,000
$70,000
$80,000
GENERAL FUND ‐ FUND BALANCEand PERCENTAGE of ACTUAL EXPENDITURES
Excluding Tax Increment Finance Zone & Chapter 41 Payments in $1,000's of dollars (*Budgeted)
Note: The District’s Board of Trustees recently adopted Board Policy CA (LOCAL) in response to the upcoming change in Governmental Accounting Standards Board Statement (GASB), which addresses changes in reporting of fund balances. GASB 54 does away with former fund balance terminology of reserved, designated, and unreserved and replaces it with five new fund balance classifications and became effective with fiscal year ending on June 30, 201l. In CA (LOCAL), there is language regarding the Board’s minimum fund balance aspirations for the General Fund. In an effort to provide adequate cash flow for its operations, the District shall make every effort to maintain an unassigned fund balance equal to a minimum of two months of operations costs. As the chart above shows, the District has been able to meet and exceed this guideline in the past and is projected to in the future.
143

General Fund continued
General FundFive Year Summary of Revenues and Expenditures
Beginning Estimated Beginning
Audited Audited Audited Budget Actual Budget Increase % %
2007-08 2008-09 2009-10 2010-11 2010-11 2011-12 (Decrease) Change Of Total
Estimated Revenues
LOCAL AND INTERMEDIATE
Tax Revenues $149,105,035 $153,622,695 $150,416,541 $143,223,842 $144,004,815 $131,376,991 ($11,846,851) -8.27% 64.38%
Other Local $4,721,748 $2,163,529 $2,974,453 $1,317,070 $1,565,389 1,198,844 ($118,226) -8.98% 0.59%
STATE
Per Capita and other state revenue $56,429,787 $65,099,747 $45,863,375 $53,211,395 $51,700,558 $60,729,820 $7,518,425 14.13% 29.76%
On-behalf Retirement Payment $9,194,969 $9,291,363 $9,646,767 $9,639,691 $9,873,417 10,200,000 $560,309 5.81% 5.00%
FEDERAL
Direct $193,196 $1,279,421 $1,288,605 $8,441,609 $1,593,507 $550,000 ($7,891,609) -93.48% 0.27%
Total Estimated Revenue $219,644,735 $231,456,756 $210,189,741 $215,833,607 $208,737,686 $204,055,655 ($11,777,952) -5.46% 100.00%
Appropriated Expenditures
11 Instruction $121,054,616 $123,154,566 $118,255,367 $122,211,834 $118,259,002 $119,423,493 ($2,788,341) -2.28% 55.86%
12 Instructional Resources & Media $3,562,641 $3,693,972 $3,200,334 $3,719,577 $3,051,610 $1,569,131 ($2,150,446) -57.81% 0.73%
13 Curriculum & Staff Development $4,294,296 $3,502,032 $3,513,648 $4,466,328 $3,553,807 $4,633,049 $166,721 3.73% 2.17%
21 Instructional Leadership $2,338,347 $2,275,539 $2,300,286 $2,643,402 $2,202,720 $3,481,687 $838,285 31.71% 1.63%
23 School Leadership $14,295,952 $13,901,870 $13,564,180 $13,482,211 $13,503,583 $13,213,862 ($268,349) -1.99% 6.18%
31 Guidance Counseling & Evaluation $8,768,605 $8,946,371 $9,186,273 $9,417,626 $8,768,294 $9,133,009 ($284,617) -3.02% 4.27%
32 Social Work Services $160,431 $166,968 $165,773 $168,289 $168,735 $166,064 ($2,225) -1.32% 0.08%
33 Health Services $2,121,034 $2,328,144 $2,495,402 $2,499,876 $2,376,385 $706,648 ($1,793,228) -71.73% 0.33%
34 Transportation $1,819,301 $2,150,573 $3,055,499 $3,391,659 $3,809,657 $3,560,015 $168,356 4.96% 1.67%
36 Co-Curricular/Extra Curricular $3,564,265 $4,158,976 $4,271,711 $4,778,100 $4,340,219 $4,683,527 ($94,573) -1.98% 2.19%
41 General Administration $6,143,262 $6,213,296 $6,504,660 $6,572,115 $6,484,862 $6,658,164 $86,049 1.31% 3.11%
51 Plant Maintenance & Operation $23,548,099 $22,300,393 $16,212,712 $24,526,885 $18,119,838 $23,998,773 ($528,112) -2.15% 11.23%
52 Security & Monitoring Services $1,646,289 $1,704,069 $1,507,175 $1,688,274 $1,561,476 $1,693,515 $5,241 0.31% 0.79%
53 Data Processing $3,662,881 $4,225,040 $4,713,646 $4,279,860 $4,634,090 $5,001,631 $721,771 16.86% 2.34%
61 Community Services $688,453 $515,109 $662,312 $604,170 $369,706 $452,538 ($151,632) -25.10% 0.21%
81 Facilities Acquisition & Construction $85,307 $88,694 $90,654 $89,888 $92,242 $88,764 ($1,124) -1.25% 0.04%
91 Contracted Instructional Services $12,636,919 $17,898,472 $0 $0 $0 $0 0.00% 0.00%
92 Incremental Costs Assoc with Chap 41 $12,705 $16,283 $0 $0 $0 $0 0.00% 0.00%
95 Juvenile Justice Alternative Ed Prgms $196,409 $136,225 $159,550 $200,000 $143,124 $200,000 $0 0.00% 0.09%
97 Tax Increment Financing Zone $9,039,482 $12,414,532 $12,995,177 $16,100,000 $15,139,211 $14,140,000 ($1,960,000) -12.17% 6.61%
99 Other Intergovernmental Charges $936,315 $1,159,125 $963,230 $999,825 $937,593 $980,751 ($19,074) -1.91% 0.46%
Total Appropriated Expenditures $220,575,609 $230,950,249 $203,817,589 $221,839,919 $207,516,154 $213,784,621 ($8,055,298) -3.63% 100.00%
Other Sources & Uses
Contractual Obligation Proceeds $0 $0 $0 $0 $0 $0 $0
Sale of Property $29,747 $76,043 $0 $0 $363,964 $0 $0
Other Resources $0 $0 $1,282,506 $0 $0 $0 $0
Operating Transfers In/Misc Non-Rev $106,300 $0 $131,898 $0 $533,638 $0 $0
Special Item $0 $0 $0 $0 $0 $0 $0
Operating Transfers out & Other Uses ($1,729,635) ($25,059) ($2,020) $0 $0 $0 $0
Net Other Sources & Uses ($1,593,588) $50,984 $1,412,384 $0 $897,602 $0 $0
Estimated Change in Fund Balance ($2,524,462) $557,491 $7,784,536 ($6,006,312) $2,119,134 ($9,728,966) ($3,722,654)
Estimated Fund Balance 9/1 $65,013,634 $62,489,171 $63,046,662 $70,831,198 $70,831,198 $72,950,332 $2,119,134
Estimated Year-end adjustment $8,125,446 ($8,125,446)
Estimated Fund Balance 8/31 $62,489,171 $63,046,662 $70,831,198 $72,950,332 $72,950,332 $63,221,366 ($9,728,966)
See IMPACT ON FUND BALANCE discussion for more detail regarding use of fund balance.
144
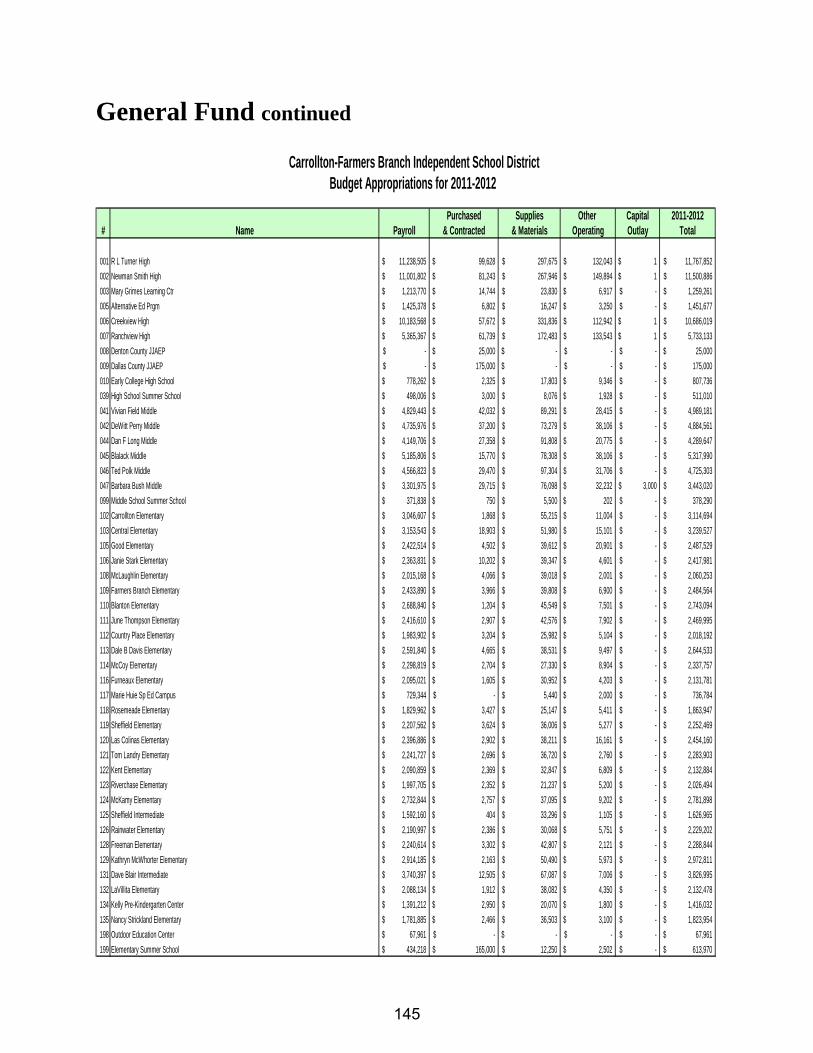
General Fund continued
Carrollton-Farmers Branch Independent School DistrictBudget Appropriations for 2011-2012
Purchased Supplies Other Capital 2011-2012# Name Payroll & Contracted & Materials Operating Outlay Total
001 R L Turner High 11,238,505$ 99,628$ 297,675$ 132,043$ 1$ 11,767,852$
002 Newman Smith High 11,001,802$ 81,243$ 267,946$ 149,894$ 1$ 11,500,886$
003 Mary Grimes Learning Ctr 1,213,770$ 14,744$ 23,830$ 6,917$ -$ 1,259,261$
005 Alternative Ed Prgm 1,425,378$ 6,802$ 16,247$ 3,250$ -$ 1,451,677$
006 Creekview High 10,183,568$ 57,672$ 331,836$ 112,942$ 1$ 10,686,019$
007 Ranchview High 5,365,367$ 61,739$ 172,483$ 133,543$ 1$ 5,733,133$
008 Denton County JJAEP -$ 25,000$ -$ -$ -$ 25,000$
009 Dallas County JJAEP -$ 175,000$ -$ -$ -$ 175,000$
010 Early College High School 778,262$ 2,325$ 17,803$ 9,346$ -$ 807,736$
039 High School Summer School 498,006$ 3,000$ 8,076$ 1,928$ -$ 511,010$
041 Vivian Field Middle 4,829,443$ 42,032$ 89,291$ 28,415$ -$ 4,989,181$
042 DeWitt Perry Middle 4,735,976$ 37,200$ 73,279$ 38,106$ -$ 4,884,561$
044 Dan F Long Middle 4,149,706$ 27,358$ 91,808$ 20,775$ -$ 4,289,647$
045 Blalack Middle 5,185,806$ 15,770$ 78,308$ 38,106$ -$ 5,317,990$
046 Ted Polk Middle 4,566,823$ 29,470$ 97,304$ 31,706$ -$ 4,725,303$
047 Barbara Bush Middle 3,301,975$ 29,715$ 76,098$ 32,232$ 3,000$ 3,443,020$
099 Middle School Summer School 371,838$ 750$ 5,500$ 202$ -$ 378,290$
102 Carrollton Elementary 3,046,607$ 1,868$ 55,215$ 11,004$ -$ 3,114,694$
103 Central Elementary 3,153,543$ 18,903$ 51,980$ 15,101$ -$ 3,239,527$
105 Good Elementary 2,422,514$ 4,502$ 39,612$ 20,901$ -$ 2,487,529$
106 Janie Stark Elementary 2,363,831$ 10,202$ 39,347$ 4,601$ -$ 2,417,981$
108 McLaughlin Elementary 2,015,168$ 4,066$ 39,018$ 2,001$ -$ 2,060,253$
109 Farmers Branch Elementary 2,433,890$ 3,966$ 39,808$ 6,900$ -$ 2,484,564$
110 Blanton Elementary 2,688,840$ 1,204$ 45,549$ 7,501$ -$ 2,743,094$
111 June Thompson Elementary 2,416,610$ 2,907$ 42,576$ 7,902$ -$ 2,469,995$
112 Country Place Elementary 1,983,902$ 3,204$ 25,982$ 5,104$ -$ 2,018,192$
113 Dale B Davis Elementary 2,591,840$ 4,665$ 38,531$ 9,497$ -$ 2,644,533$
114 McCoy Elementary 2,298,819$ 2,704$ 27,330$ 8,904$ -$ 2,337,757$
116 Furneaux Elementary 2,095,021$ 1,605$ 30,952$ 4,203$ -$ 2,131,781$
117 Marie Huie Sp Ed Campus 729,344$ -$ 5,440$ 2,000$ -$ 736,784$
118 Rosemeade Elementary 1,829,962$ 3,427$ 25,147$ 5,411$ -$ 1,863,947$
119 Sheffield Elementary 2,207,562$ 3,624$ 36,006$ 5,277$ -$ 2,252,469$
120 Las Colinas Elementary 2,396,886$ 2,902$ 38,211$ 16,161$ -$ 2,454,160$
121 Tom Landry Elementary 2,241,727$ 2,696$ 36,720$ 2,760$ -$ 2,283,903$
122 Kent Elementary 2,090,859$ 2,369$ 32,847$ 6,809$ -$ 2,132,884$
123 Riverchase Elementary 1,997,705$ 2,352$ 21,237$ 5,200$ -$ 2,026,494$
124 McKamy Elementary 2,732,844$ 2,757$ 37,095$ 9,202$ -$ 2,781,898$
125 Sheffield Intermediate 1,592,160$ 404$ 33,296$ 1,105$ -$ 1,626,965$
126 Rainwater Elementary 2,190,997$ 2,386$ 30,068$ 5,751$ -$ 2,229,202$
128 Freeman Elementary 2,240,614$ 3,302$ 42,807$ 2,121$ -$ 2,288,844$
129 Kathryn McWhorter Elementary 2,914,185$ 2,163$ 50,490$ 5,973$ -$ 2,972,811$
131 Dave Blair Intermediate 3,740,397$ 12,505$ 67,087$ 7,006$ -$ 3,826,995$
132 LaVillita Elementary 2,088,134$ 1,912$ 38,082$ 4,350$ -$ 2,132,478$
134 Kelly Pre-Kindergarten Center 1,391,212$ 2,950$ 20,070$ 1,800$ -$ 1,416,032$
135 Nancy Strickland Elementary 1,781,885$ 2,466$ 36,503$ 3,100$ -$ 1,823,954$
198 Outdoor Education Center 67,961$ -$ -$ -$ -$ 67,961$
199 Elementary Summer School 434,218$ 165,000$ 12,250$ 2,502$ -$ 613,970$
145

General Fund continued
Carrollton-Farmers Branch Independent School DistrictBudget Appropriations for 2011-2012 continued
Purchased Supplies Other Capital 2011-2012# Name Payroll & Contracted & Materials Operating Outlay Total
701 Superintendent 531,754$ 10,000$ 7,000$ 35,000$ -$ 583,754$
702 Board of Trustees -$ 511,000$ 5,200$ 104,000$ -$ 620,200$
703 Tax Office 144,369$ 1,009,302$ 20,001$ 7,400$ -$ 1,181,072$
719 Asst Supt Studt, Family & Community 328,891$ 79,927$ 68,152$ 40,208$ -$ 517,178$
726 Personnel 227,529$ -$ -$ -$ -$ 227,529$
727 Dir of Public Information 388,009$ 232,025$ 22,058$ 10,475$ -$ 652,567$
728 Assoc Supt Adm/Personnel 130,959$ -$ -$ -$ -$ 130,959$
729 Business Office 1,723,243$ 291,070$ 57,711$ 270,626$ 1$ 2,342,651$
731 Personnel-Professional 442,860$ 138,400$ 33,600$ 31,501$ -$ 646,361$
732 Personnel-Support 194,060$ 51,500$ 7,850$ 5,150$ 10,116$ 268,676$
734 Purchasing 301,560$ 51,060$ 14,975$ 6,195$ -$ 373,790$
735 Textbook Coordinator 48,942$ 200$ 570$ -$ -$ 49,712$
931 Maintenance 5,626,347$ 9,708,534$ 1,558,904$ 609,865$ 325,000$ 17,828,650$
932 Distribution Ctr 519,124$ 18,500$ 29,750$ 1,500$ 75,000$ 643,874$
933 Transportation -$ 3,525,000$ 5,000$ -$ -$ 3,530,000$
951 Stadium 29,721$ 5,000$ 9,500$ -$ 1$ 44,222$
954 Natatorium 133,633$ 1$ 19,000$ -$ 1$ 152,635$
960 Assoc Supt for Curriculum 2,483,240$ 260,883$ 483,568$ 143,669$ 50,000$ 3,421,360$
963 Adult Education 87,841$ 17,504$ 3,300$ 3,341$ -$ 111,986$
966 Dir of Special Programs 531,816$ 13,450$ 511,768$ 14,853$ -$ 1,071,887$
968 Coordinator of Bilingual/ESL 391,073$ 3,001$ 45,132$ 29,385$ -$ 468,591$
970 Dir of Learning Technology 1,481,147$ 1,377,779$ 503,760$ 52,248$ -$ 3,414,934$
971 Dir of Instructional Technology 119,014$ -$ -$ -$ -$ 119,014$
975 Coordinator of Admin Technology 1,455,497$ 1,228,100$ 380,450$ 21,500$ -$ 3,085,547$
976 Coordinator of Learning Media 305,612$ 148,739$ 115,169$ 15,935$ -$ 585,455$
977 Advanced Academic Services 706,142$ 67,302$ 45,178$ 59,850$ -$ 878,472$
979 Intervention Specialist 141,468$ 2,701$ 9,500$ 5,300$ -$ 158,969$
980 Director of Athletics 319,359$ 71,480$ 11,250$ 4,220$ -$ 406,309$
981 Student Services 8,652$ 4,000$ 25,200$ 1,650$ -$ 39,502$
982 Dir of Fine Arts 315,115$ 115,923$ 537,516$ 183,752$ -$ 1,152,306$
983 Dir of Career & Technology 283,171$ 96,877$ 371,202$ 48,995$ -$ 800,245$
984 Facilities Planning/Research 14,343$ 5,750$ 2,500$ 2,750$ -$ 25,343$
985 Coordinator Research & Planning 56,361$ 27,750$ 355,800$ 6,200$ -$ 446,111$
995 Dir of Special Education 2,615,100$ 248,050$ 104,300$ 26,500$ -$ 2,993,950$
999 Undistributed Organization 10,697,727$ 1,390,378$ 644,559$ 14,450,928$ 1$ 27,183,593$
Totals $165,809,141 $21,693,645 $8,696,163 $17,122,548 $463,124 $213,784,621
Percentage of Total 77.56% 10.15% 4.07% 8.01% 0.22% 100.00%
146

DEBT SERVICE
147

Debt Service Overview
The Debt Service Fund accounts for payments of principal, interest, and related fees on the District’s General Obligation bonds. Under Texas Law, only these Debt Service payments can be charged to this fund. Bonded indebtedness of the District is recorded in the General Long-Term Debt Account Group, and current requirements for principal and interest expenditures are accounted for in the Debt Service Fund. Proceeds of long-term issues are reflected as “other resources” in the operating statement of the recipient fund. The most recent bond election was held on October 25, 2003 for $300.165 million and passed by more than 78% of the votes. There are a number of limitations and restrictions contained in the various General Obligation bonds indentures. The following chart shows bond sales since the 2003 bond election.
Bond Sale Rates Amount UseUnlimited Tax Refunding Bonds, 2010 3.0% - 5.0% $63,565,000 Advance refund a portionNovember 4, 2010 of the outstanding debt.Unlimited Tax School Building & Refunding Bonds, 2008 3.5% - 5.0% $57,435,000 Refund a portion of the May 8, 2008 District's outstanding debt;
acquisition of school buses,constructing, renovating& equipping school buildings& the aquisition of land forschool buildings, & to payissuance costs of bonds.
Unlimited Tax School Building & Refunding Bonds, 2007 4.0% - 5.0% $105,775,000 Acquisition, construction, &February 22, 2007 equipping school buildings,
technology, pay costof issuance of bonds.Refund a portionof the outstanding debt.
School Building Unlimited Tax Bonds, Series 2006 4.5% - 5.0% $41,220,000 Acquisition, construction, &April 15, 2006 equipping school buildings,
technology, pay costof issuance of bonds.
School Building Unlimited Tax Bonds, Series 2005 3.0% - 5.0% $54,810,000 Acquisition, construction, &March 1, 2005 equipping school buildings,
technology, pay costof issuance of bonds.
Unlimited Tax Refunding Bonds, 2004 2.0% - 5.0% $23,855,000 Advance refund a portionMarch 15, 2004 of the outstanding debt.School Building Unlimited Tax Bonds, Series 2004 2.0% - 5.0% $54,350,000 Acquisition, construction, &March 15, 2004 equipping school buildings,
technology, pay costof issuance of bonds.
Unlimited Tax Refunding Bonds, 2003 3.0% - 4.0% $10,230,000 Advance refund a portionMarch 27, 2003 of the outstanding debt.
148

Debt Service continued
Refunding Bonds have been issued for the purpose of generating resources and decreasing the total Debt Service payments. These refunding issues defeased selected General Obligation bonds from the original issues. All future Debt Service payments on the original bonds have been provided for by placing the proceeds of the Refunding Bonds in irrevocable trust. Accordingly, the trust account assets and the liability for defeased bonds are not included in the District’s general purpose financial statements. At August 31, 2011, the district did not have any defeased bonds outstanding.
Revenue Sources and Trends A majority of funding is derived from a designated allocation of the property tax rate, 99.97% for 2011-12. The remainder of the Debt Service revenue is from interest income derived from temporary investments, 0.03% for 2011-12. Although the State has Debt Service Fund formula allocations (described below), the District does not receive revenue from these programs. Instructional Facilities Allotment Program
House Bill 4 (“H.B.4”) was enacted in 1997 and established the Instructional Facilities Allotment (IFA) to provide state assistance for debt service. The program provides a guaranteed level ($35) of state and local funds per student per penny of tax effort applicable to debt service on eligible bonds. However, there is a limit on funding for each biennium so the District must apply for funding. The District does not receive revenue from this program. The applications are ranked based on relative property wealth and funds are awarded up to the dollar limit available.
Existing Debt Allotment Additional State funding for existing debt approved initially by the Legislature in 1999: the Existing Debt Allotment (EDA) or Tier III guarantees $35 per student in average daily attendance in state and local funds for each cent of tax effort (up to a maximum of $0.29 per $100 of taxable value) to pay the principal and interest on eligible bonds. Eligible bonds are those that require a scheduled debt service payment during the last year of each biennium, based on recent legislative action to “roll forward’ eligibility to qualify bonds issued during future fiscal years. The District does not receive revenue from this program.
149

Debt Service continued
The graph below depicts the change in C-FB ISD’s Debt Service revenue sources over time.
Tax Revenue
Interest Income
Tax Revenue Interest Income*2011-12 $39,822,607 $12,400
2010-11 $42,432,110 $12,438
2009-10 $43,976,563 $17,458
2008-09 $47,515,600 $93,944
2007-08 $46,696,507 $384,206
2006-07 $44,218,476 $494,474
2005-06 $40,625,258 $387,817
2004-05 $35,097,971 $201,993
2003-04 $30,124,778 $78,474
2002-03 $29,670,034 $96,608
Debt Service FundRevenue Sources (*Budget)
150

Debt Service continued
Debt Service Expenditures The budget consists of the following amounts: $25,555,000 for bond principal payments, $14,274,007 for bond interest payments, and $6,000 for bond issuance costs. Detailed Debt Service requirements are located within this section of the budget document. The District continues to retire debt at a steady pace, but facility needs require issuance of new debt at a similar pace. District personnel continually work with the community to review the facility needs of the District and to provide for those needs through additional debt issuance, as necessary, while minimizing the financial impact on the taxpayer. Bonds authorized as part of the 2003 bond program were originally scheduled for sale through fiscal 2010. Due to student and economic slow downs, the sale of some of these bonds has been delayed through at least 2013. Historically, the District’s administration and Board have followed the advice of our financial advisors (First Southwest Company) and structured debt with a principal retirement schedule that allows the District to continue to issue bonds without significantly increasing the Debt Service tax rate. Although the district intentionally did not sell bonds the last two fiscal years to lower the debt service tax rate, the tax rate for 2011-12 reflects an increase of $0.0099. The tax rate increase was required due to a taxable value decrease of 1.72%. Debt Service is a major area of cost due to the District’s building program, which is primarily financed by the sale of general obligation bonds. The ratio of net bonded debt to assessed value for the District is 2.12%. Education legislation has eliminated limits on outstanding debt. However, prior law limited debt to 10% of assessed value, and the District is well below that level. All principal and interest payments are due February 15th and August 15th of each year. On February 1st of each year, outstanding taxes become delinquent, which permits the collection of a large majority of taxes levied before the long-term debt payments are due. The General Obligation bond requirements to maturity equal $395,946,216 . The District used the proceeds from bond sales to fund construction of new campuses, remodeling of campuses and other district buildings, furnishing new buildings, and purchase large technology expenditures.
151

Debt Service continued
Carrollton-Farmers Branch ISD
Debt Service Fund
Five Year Summary of Revenues and Expenditures
Beginning Estimated Beginning
Audited Audited Audited Budget Actual Budget Increase % %
2007-08 2008-09 2009-10 2010-11 2010-11 2011-12 (Decrease) Change Of Total
Revenues
Local & Intermediate
Tax Revenues $46,696,507 $47,515,600 $43,976,563 $42,069,997 $42,432,110 $39,822,607 ($2,247,390) -5.34% 99.97%
Interest Income $384,206 $93,944 $17,458 $30,150 $12,438 12,400 (17,750) -58.87% 0.03%
Total Revenue $47,080,712 $47,609,544 $43,994,021 $42,100,147 $42,444,548 $39,835,007 ($2,265,140) -5.38% 100.00%
Expenditures
71 Debt Services
Principal $23,667,961 $28,648,711 $27,060,000 $26,135,000 $27,415,000 $25,555,000 ($580,000) -2.22% 64.15%
Interest $23,177,464 $19,586,494 $17,265,964 $15,959,147 $14,543,756 $14,274,007 ($1,685,140) -10.56% 35.83%
Issuance Costs & Fees $74,019 $3,498 $3,825 $6,000 $261,369 $6,000 $0 0.00% 0.02%
Total Expenditures $46,919,444 $48,238,703 $44,329,789 $42,100,147 $42,220,125 $39,835,007 ($2,265,140) -5.38% 100.00%
Other Sources & Uses
Sale of Bonds $27,435,000 $0 $0 $0 $63,565,000 $0 $0 0.00% 0.00%
Operating Transfers In/Misc Non-Rev $100,560 $0 $220,837 $0 $377,814 $0 $0 0.00% 0.00%
Premium or Discount on Issuance of Bonds $1,097,708 $0 $0 $0 $6,914,124 $0 $0 0.00% 0.00%
Other (Uses) $0 $0 $0 $0 $0 $0 $0 0.00% 0.00%
Payment to Bond Refunding Escrow Agent ($28,913,368) $0 $0 $0 ($70,196,521) $0 $0 0.00% 0.00%
Net Other Sources & Uses ($280,100) $0 $220,837 $0 $660,417 $0 $0 0.00% 0.00%
Estimated Change in Fund Balance ($118,832) ($629,159) ($114,931) $0 $884,840 $0 $0
Estimated Fund Balance 9/1 $2,981,791 $2,862,959 $2,233,800 $2,118,869 $2,118,869 $3,003,709 $884,840
Estimated Year End Adjustment $884,840 ($884,840)
Estimated Fund Balance 8/31 $2,862,959 $2,233,800 $2,118,869 $3,003,709 $3,003,709 $3,003,709 $0
152

Debt Service continued
Carrollton-Farmers Branch ISDDebt Service Fund
Debt Retirement Summary
Fiscal Year PercentEnded 8/31 Principal Interest Total Retired
2012 25,555,000 14,274,006 39,829,006 7.91%2013 25,060,000 13,143,588 38,203,588 7.75%2014 25,080,000 11,974,769 37,054,769 7.76%2015 25,830,000 10,803,991 36,633,991 7.99%2016 27,130,000 9,566,638 36,696,638 8.40%2017 28,490,000 8,268,444 36,758,444 8.82%2018 20,955,000 7,149,256 28,104,256 6.48%2019 21,980,000 6,212,588 28,192,588 6.80%2020 17,470,000 5,353,138 22,823,138 5.41%2021 14,645,000 4,637,513 19,282,513 4.53%2022 9,460,000 4,077,719 13,537,719 2.93%2023 9,920,000 3,615,928 13,535,928 3.07%2024 10,405,000 3,127,909 13,532,909 3.22%2025 10,920,000 2,617,850 13,537,850 3.38%2026 7,555,000 2,181,266 9,736,266 2.34%2027 7,930,000 1,817,059 9,747,059 2.45%2028 8,320,000 1,436,278 9,756,278 2.57%2029 8,730,000 1,039,341 9,769,341 2.70%2030 5,865,000 696,806 6,561,806 1.81%2031 6,160,000 412,138 6,572,138 1.91%2032 4,065,000 171,191 4,236,191 1.26%2033 1,635,000 37,809 1,672,809 0.51%
Totals 323,160,000$ 112,615,222$ 435,775,222$ 100.00%
153

Debt Service continued
CARROLLTON-FARMERS BRANCH INDEPENDENT SCHOOL DISTRICT COMPUTATION OF DIRECT AND OVERLAPPING DEBT AUGUST 31, 2011 (UNAUDITED) District's Overlapping 2010-11 Total Tax Tax Taxable 2010-11 Supported Estimated Supported Assessed Tax Debt as of % Debt as of
Taxing Jurisdiction Value Rate 08/31/11 Applicable 08/31/11
Carrollton-Farmers Branch ISD
$13,031,604,540
$1.35680
$323,160,000 100.00%
$323,160,000
Town of Addison
3,058,773,717 0.49600
66,470,000 3.74%
2,485,978
City of Carrollton
4,411,563,806 0.61788
172,530,000 55.64%
95,995,692
City of Coppell
4,696,385,025 0.64146
88,920,000 7.63%
6,784,596
City of Dallas
78,535,944,407 0.74790
1,798,332,086 1.01%
18,163,154
Dallas County
158,179,482,962 0.22810
143,932,642 6.45%
9,283,655
Dallas County Community College District
164,219,576,805 0.09490
396,140,000 6.45%
25,551,030
Dallas County Hospital District
158,295,231,580 0.27400
705,000,000 6.45%
45,472,500
Dallas Co. Utility and Reclamation District
2,109,738,908 1.76300
267,792,655 51.86%
138,877,271
Denton County
52,046,669,565 0.27390
477,705,000 4.99%
23,837,480
City of Farmers Branch
3.769,497,341 0.51950
24,330,000 59.30% 14,427,690
City of Irving
16,778,440,618 0.54060
343,280,000 26.10%
89,596,080
Irving Flood Control District III
1,373,081,919 0.27400
2,397,071 66.03%
1,582,786
NW Dallas County Flood Control District
390,694,098 0.30000
8,424,000 64.81%
5,459,594
Valwood Improvement Authority
1,511,812,468 0.30750
6,874,888 92.45%
6,355,834
Total Direct and Overlapping Tax Supported Debt $807,003,340
Ratio of Direct and Overlapping Tax Supported Debt to Taxable Assessed Valuation 6.19%
Per Capita Overlapping Total Tax Supported Debt
$4,568.21
Source: Municipal Advisory Council of Texas
154

Debt Service continued
CARROLLTON-FARMERS BRANCH INDEPENDENT SCHOOL DISTRICTCOMPUTATION OF LEGAL DEBT MARGINAUGUST 31, 2011(UNAUDITED)
Assessed value $ 13,889,472,257
Debt limit ten percent of assessed value* $ 1,388,947,226
Amount of debt applicable to debt limit:
Total bonded debt $ 297,605,000
Less:
Net assets in debt service funds 3,003,709
Total amount of debt applicable to debt limit 294,601,291
Legal debt margin $ 1,094,345,935
* This percentage is in accordance with the recommendations of the Texas Education Agency as stated in the Texas Education Code, Bulletin 721, Sec. 20.04.
Source: District provided information
155

Debt Service continued
2003 2004 2005 2006 2007 2008 2009 2010 2011 2012*
Fund Balance $1,485,405 $910,710 $696,204 $1,062,173 $2,981,793 $2,862,959 $2,233,800 $2,118,869 $3,003,709 $3,003,709
% Exp 4.83% 2.96% 1.93% 2.59% 7.02% 6.10% 4.63% 4.78% 7.11% 7.54%
0.00%
1.00%
2.00%
3.00%
4.00%
5.00%
6.00%
7.00%
8.00%
$0
$500,000
$1,000,000
$1,500,000
$2,000,000
$2,500,000
$3,000,000
$3,500,000
Debt Service Fund Balance & % ExpendituresSource : Audit or *Budget
Note: From 2003 to 2005, the Debt Service Fund balance declined from 4.83% of debt service expenditures to less than 1.93%. This decline was the result of a few significant changes in our tax roll. While this fund balance should not be excessive, we believe, to ensure stability, this fund balance should maintain 7% to 10% of debt service expenditures in fund balance. In 2006 and 2007 we increased fund balance. This balance declined again from 2008 to 2010. In 2011, fund balance increased because of significant savings achieved through a bond refunding executed in November 2010. The district will monitor the balance for the future and consider placing additional residual construction funds into the Debt Service Fund as projects are completed to further increase the fund balance.
156

FOOD SERVICE FUND
157

Food Service Fund Overview
The District’s Food Service Fund operations are accounted for in the Food Service Special Revenue Fund. Although Special Revenue Funds are generally not included in the annual budget adopted by the Board of Trustees, the Texas Education Agency’s regulations require inclusion of the Food Service Fund.
Revenue Sources Approximately 75.00% of the revenue in this fund is received from the United States Department of Agriculture (USDA) under the National School Lunch Program, the School Breakfast Program, and the Food Distribution Program. The remaining revenue is primarily generated from user fees - i.e. student payments for meals, 25.00% for 2011-12. The graph below depicts Food Service Sources of Revenue over time.
$3,291,541
$79,537
$4,463,015
$3,257,950
$80,666
$4,902,360
$3,021,409
$79,473
$5,499,545
$3,180,398
$75,996
$5,922,740
$3,045,184
$76,981
$6,292,642
$3,278,092
$79,522
$7,327,118
$3,105,671
$82,738
$8,033,902
$2,736,308
$82,181
$8,088,132
$2,387,846
$74,037
$8,070,064
$2,610,100
$85,000
$8,086,500
Local & Intermediate Revenue
State Revenue
Federal Revenue
FOOD SERVICE REVENUE SOURCES(*Budget)
2002‐03
2003‐04
2004‐05
2005‐06
2006‐07
2007‐08
2008‐09
2009‐10
2010‐11
*2011‐12
158

Food Service Fund continued
Expenditure Sources Food Service expenditures primarily consist of Payroll, 44.98%, and Supplies and Materials, 41.90%. The majority of the supplies and materials’ budget consists of expenditures for food.
Carrollton-Farmers Branch ISD
Food Service Fund
Five Year Summary of Revenues and Expenditures
Beginning Estimated Beginning
Audited Audited Audited Budget Actual Budget Increase % %
2007-08 2008-09 2009-10 2010-11 2010-11 2011-12 (Decrease) Change Of Total
Revenues
Local & Intermediate Revenue $3,278,092 $3,105,671 $2,736,308 $2,469,840 $2,387,846 $2,610,100 $140,260 5.68% 24.21%
State Revenue $79,522 $82,738 $82,181 $85,000 $74,037 $85,000 $0 0.00% 0.79%
Federal Revenue $7,327,118 $8,033,902 $8,088,131 $8,343,594 $8,070,064 $8,086,500 ($257,094) -3.08% 75.00%
Total Revenue $10,684,732 $11,222,311 $10,906,620 $10,898,434 $10,531,947 $10,781,600 ($116,834) -1.07% 100.00%
Expenditures
35 Food Service $11,067,175 $11,116,448 $11,058,241 $10,898,434 $11,130,552 $10,781,600 ($116,834) -1.07% 100.00%
Total Expenditures $11,067,175 $11,116,448 $11,058,241 $10,898,434 $11,130,552 $10,781,600 ($116,834) -1.07% 100.00%
Other Sources & Uses
Operating Transfers In/Misc Non-Rev $6,716 $0 $0 $0 $0 $0 $0
Net Other Sources & Uses $6,716 $0 $0 $0 $0 $0 $0
$0
Estimated Change in Fund Balance ($375,727) $105,863 ($151,621) $0 ($598,605) $0 $0
Estimated Fund Balance 9/1 $1,836,947 $1,461,219 $1,567,082 $1,415,461 $1,415,461 $816,856 ($598,605)
Estimated Year End Adjustment ($598,605) $598,605
Estimated Fund Balance 8/31 $1,461,219 $1,567,082 $1,415,461 $816,856 $816,856 $816,856 $0
159

Food Service Fund continued
Food Service Fund Expenditures by Object Comparison to Prior Year
Beginning Beginning Percentage Budget Budget Increase Percentage2010-11 2011-12 (Decrease) of Total
Payroll $4,906,000 $4,850,000 -1.14% 44.98%Purchased Services $1,014,500 $1,293,000 27.45% 11.99%Supplies & Materials $4,918,934 $4,517,500 -8.16% 41.90%Other Operating $24,000 $18,000 -25.00% 0.17%Capital Outlay $35,000 $103,100 194.57% 0.96%Total $10,898,434 $10,781,600 -1.07% 100.00%
Fund Balance The fund balance for Food Service should not exceed three months of average food service operations expenditures. Currently, the fund balance is projected to be $816,856 at August 31, 2012. This represents approximately 0.76 months’ operating expenditures (Budget/10 months; use 10 months since the Food Service Fund does not operate in the summer). The graph below depicts Food Service budgeted expenditures by major object.
PayrollPurchasedServices
Supplies &Materials
Other Operating Capital Outlay
Budget $4,850,000 $1,293,000 $4,517,500 $18,000 $103,100
% of Budget 44.98% 11.99% 41.90% 0.17% 0.96%
$0
$1,000,000
$2,000,000
$3,000,000
$4,000,000
$5,000,000
$6,000,000
FOOD SERVICE FUNDEXPENDITURE BY MAJOR OBJECT
160

Food Service Fund continued
Other Food Service Information: For the 2010-11 fiscal year, the Food Service Department employed approximately 229 people. The Food Service Department participates in:
School breakfast program; National school lunch program; After school snack program and The summer food program.
School Breakfast Program:
Texas has mandated breakfast programs in schools with more than 10% free/reduced students.
Schools serving 40% or more of their lunches to free/reduced students receive severe need reimbursements ($.28 cents).
Over 725,000 breakfasts were served last year to C-FB ISD students. 37 C-FB ISD schools qualify for severe need reimbursements.
Breakfast Revenues
Free Reduced PaidFederal Funds $1.48 $1.18 $0.26Price Charged $0.00 $0.30 $1.25Severe Need $0.28 $0.28 $0.00Total Revenue $1.48 to $1.76 $1.48 to $1.76 $1.51
Lunch Program:
Over 2.8 million lunches were served last year to C-FB ISD students.
Lunch Revenues
Free Reduced PaidFederal Funds $2.74 $2.34 $0.28Price Charged $0.00 $0.40 $2.25 to $2.50Commodity Value $0.21 $0.21 $0.21Total Revenue $2.95 $2.95 $2.74 to $2.99
161

Food Service Fund continued
Nutritional Requirements for Lunch
1/3 of the RDA (Recommended Dietary Allowances) for:ProteinVitamin AVitamin CIronCalciumCalories30% calories from fat and 10% from Saturated Fat.
After School Snack Program:
Schools with 50% free/reduced can become area eligible. Partnered with the After the Bell and tutorial programs to provide snacks. Offering snacks in 23 of the C-FB ISD schools.
After School Revenues
Free Reduced PaidFederal Funds $0.74 $0.37 $0.06Price Charged $0.00 $0.15 $0.50Total Revenue $0.74 $0.52 $0.56Area Eligible $0.74 N/A N/A
Requirements for an After School Snack:
Must include two servings of any combination of meat, bread, milk and fruit/vegetable. Summer Food Program:
Provides breakfast and lunch in conjunction with summer school and Summer Funshine programs.
For the summer of 2011 provided over 21,000 breakfasts and 22,800 lunches for a total revenue of approximately $99,000.
Follows the same requirements and has the same reimbursement as the National School Lunch Program.
New Initiatives: To further improve our efficiency and manage our food inventory, the department is in the process of implementing ordering and inventory software. This software will eliminate much of the data entry. In addition to posting deliveries to each school’s perpetual inventory and depleting usage according to the automated production records maintained by the cafeteria managers. This requirement for Production Specialists will increase the food safety knowledge and safe food handling practices at each school’s cafeteria to better serve our students. In addition, this will encourage staff to obtain the necessary knowledge and skills for advancement to a cafeteria manager position.
162

CAPITAL BUDGET
163

Capital Improvements Plan continued
Following is a description of the District’s capital improvements plan, which includes budgeted capital expenditures as well as summary descriptions of capital improvements projects. Current works-in-progress will be described, including all planned expenditures for the 2011-12 budget, plus a brief narrative will be provided for each project. Finally, capital improvements projectedfor future budget years will be summarized. The District defines capital expenditures and projects as follows: Capital Expenditures – total charges incurred for the acquisition of a capital asset such as land, buildings, equipment, or permanent improvements to such items. The item must cost $5,000 minimum per unit and have a useful life of one year or more to be considered a capital asset. Capital Project – an activity that is distinguishable from other tasks or work being performed, has a scheduled and definitive beginning and ending, does not occur routinely or annually, and results in a capital improvement or acquisition of some kind. Capital Budget Development - Carrollton-Farmers Branch ISD utilizes large, comprehensive bond programs to address facility and major technology needs. As a part of the bond election process, the District develops a framework of projects to be addressed. These projects are determined through internal staff analysis and input from the community. Each year this framework is re-analyzed to determine which projects should be started. Enrollment and program changes are major considerations in identifying the current year’s projects. Once the projects are identified, specific project budgets are established on a project basis. History Since 1990, in four separate elections, the voters of the Carrollton-Farmers Branch Independent School District have authorized over $600 million in general obligation bonds. The most recent election held on October 25, 2003 was for $300.165 million alone and passed by more than 78% of the votes.
164

Capital Improvements Plan continued
The status of the 2003 bond referendum is as follows:
Bond Proceeds
Disposition of Authorized Bonds
Bonds Sold:March 15, 2004 $56,400,000
March 1, 2005 $56,600,000
April 15, 2006 $41,300,000
February 22, 2007 $45,000,000
May 8, 2008 $30,000,000
Authorized but Unissued $70,865,000
Total $300,165,000
Bonds authorized as part of the 2003 bond program were originally scheduled for sale through fiscal 2010. Due to student and economic slow downs, the sale of some of these bonds has been delayed through at least 2013.
165

Capital Improvements Plan continued
Organization School Name FY 2004 FY 2005 FY 2006 FY 2007 FY 2008 FY 2009 FY 2010 FY 2011 All Years
Actual Actual Actual Actual Actual Actual Actual Actual Total
001 R. L. Turner $49,996 $1,007,151 $7,510,282 $17,437,391 $1,011,202 $196,043 $81,217 $276,022 $27,569,304
002 Newman Smith $22,062 $9,927,123 $13,280,312 $820,556 $363,814 $39,672 $0 $189,126 $24,642,665
003 Mary Grimes $0 $33,141 $31,813 $88,625 $193,674 $11,775 $31,080 $0 $390,108
005 Bea Salazar $3,501 $113,982 $14,136 $32,923 $62,273 $1,999 $0 $0 $228,814
006 Creekview $20,889 $500,971 $582,007 $1,769,086 $9,030,602 $569,363 $19,387 $205,212 $12,697,517
007 Ranchview $68,756 $315,581 $20,986 $634,061 $241,493 $11,359 $21,000 $314,447 $1,627,683
010 Early College HS $0 $0 $81,019 $29,092 $4,316 $0 $76,637 $1,749 $192,813
Sub-Total $165,204 $11,897,949 $21,520,555 $20,811,734 $10,907,374 $830,211 $229,321 $986,556 $67,348,904
041 Vivian Field $73,951 $257,814 $48,212 $330,933 $202,176 $204,519 $4,474,703 $547,793 $6,140,101
042 DeWitt Perry $72,888 $178,340 $571,802 $346,161 $357,494 $4,070,807 $1,709,863 $42,800 $7,350,155
044 Dan Long $76,373 $221,090 $149,923 $318,905 $227,111 $54,505 $0 $370,215 $1,418,122
045 Charles Blalack $74,041 $241,331 $88,790 $306,585 $6,263,373 $5,981,008 $32,367 $319 $12,987,814
046 Ted Polk $57,879 $284,578 $68,212 $209,117 $188,158 $2,896 $0 $0 $810,840
047 Barbara Bush $56,084 $121,680 $55,301 $277,317 $236,951 $11,240 $0 $1,205 $759,778
Sub-Total $411,216 $1,304,833 $982,240 $1,789,018 $7,475,262 $10,324,975 $6,216,933 $962,332 $29,466,809
102 Carrollton $10,684 $146,839 $34,412 $113,011 $247,452 $38,386 $0 $0 $590,784
103 Central $13,424 $154,352 $43,734 $90,559 $247,631 $31,880 $0 $739 $582,319
105 R. E. Good $10,684 $124,499 $31,190 $69,802 $207,219 $32,621 $274,520 $2,644,225 $3,394,760
106 Janie Stark $81,489 $3,097,690 $7,588,275 $850,994 $90,347 $34,020 $799 $0 $11,743,614
107 Montgomery $31,558 $90,569 $28,160 $125,234 $83,579 $29,882 $0 $0 $388,982
108 McLaughlin $12,404 $121,198 $119,150 $104,132 $933,842 $80,343 $0 $0 $1,371,069
109 Farmers Branch $38,843 $103,372 $39,883 $68,924 $257,768 $3,658,848 $808,906 $1,057 $4,977,601
110 L. F. Blanton $17,276 $259,145 $1,036,945 $10,267,658 $564,809 $30,454 $970 $0 $12,177,257
111 Thompson $108,990 $1,413,109 $7,145,431 $1,558,069 $88,093 $51,606 $0 $0 $10,365,298
112 Country Place $10,684 $77,405 $40,277 $259,444 $4,302,893 $4,922,913 $139,719 $0 $9,753,335
113 Dale B. Davis $35,088 $81,754 $18,456 $83,145 $194,568 $31,778 $0 $10,781 $455,570
114 McCoy $12,404 $96,350 $35,380 $62,635 $319,242 $3,193,307 $360,548 $0 $4,079,866
116 Furneaux $12,843 $105,201 $57,856 $1,465,096 $1,930,678 $123,105 $0 $0 $3,694,779
117 Marie Huie Sp Ed $0 $0 $72,827 $15,237 $71,812 $1,067 $0 $0 $160,943
118 Rosemeade $10,684 $83,992 $73,614 $46,195 $170,330 $268,364 $4,506,689 $229,897 $5,389,765
119 Sheffield Primary $10,429 $105,866 $31,179 $1,623,910 $1,693,276 $29,355 $0 $0 $3,494,015
120 Las Colinas $10,684 $110,064 $23,417 $55,249 $219,369 $32,947 $0 $0 $451,730
121 Tom Landry $11,069 $89,058 $26,151 $60,494 $184,938 $38,989 $0 $0 $410,699
122 E. L. Kent $10,684 $103,178 $39,368 $52,169 $229,985 $29,882 $746,627 $0 $1,211,893
123 Riverchase $19,271 $111,508 $47,710 $43,577 $224,081 $36,869 $0 $0 $483,016
124 McKamy $33,917 $90,387 $55,763 $62,822 $306,533 $150,921 $13,325 $0 $713,668
125 Sheffield Interm. $10,940 $97,818 $27,842 $30,223 $212,357 $36,869 $0 $0 $416,049
126 Rainwater $11,343 $108,147 $25,050 $50,207 $203,170 $30,889 $0 $0 $428,806
128 Freeman $0 $36,770 $27,612 $12,500 $45,316 $41,957 $0 $79,287 $243,442
129 McWhorter $10,684 $138,025 $207,973 $1,285,535 $576,145 $49,967 $191 $0 $2,268,520
131 Blair Intermed. $32,252 $56,520 $95,130 $129,333 $369,526 $96,502 $3,366,565 $342,290 $4,488,118
132 LaVillita $0 $0 $0 $0 $11,300 $10,069 $0 $0 $21,369
133 Pre-K Center II $0 $780 $11,464 $135 $1,485 $0 $0 $0 $13,864
134 Kelly Center $0 $160,022 $4,431,122 $2,641,422 $36,700 $0 $0 $0 $7,269,266
135 Strickland Interm. $0 $0 $0 $2,361,988 $10,570,076 $466,137 $1,598 $0 $13,399,799
Sub-Total $568,328 $7,163,618 $21,415,371 $23,589,699 $24,594,520 $13,579,927 $10,220,457 $3,308,276 $104,440,196
$387,925 $8,726,695 $3,369,373 $2,009,080 $2,312,828 $3,039,293 $863,782 $419,802 $21,128,778
TOTALS $1,532,673 $29,093,095 $47,287,539 $48,199,531 $45,289,984 $27,774,406 $17,530,493 $5,676,966 $222,384,687
Middle Schools:
Elementary Schools:
Administration/Support
CARROLLTON-FARMERS BRANCH ISD2003 BOND REFERENDUM EXPENDITURES
TOTAL AUTHORIZED - $300,165,000
High Schools:
166

Capital Improvements Plan continued
Work in Progress: Only one major project is in progress at this time along with the ongoing technology initiatives. Following is a brief summary of this project, its estimated impact on the operating budget and estimated total cost and completion dates.
PROJECT: District Technology Initiative Description:
This is a comprehensive technology project designed to significantly enhance desktop computer performance for both office and student use. This plan includes upgrades in classroom presentation equipment and District telephone systems.
Operating Budget Impact:
Typically, this type of project would add to district’s cost to maintain basic (technology) infrastructure and instructional technology support. In this case, net annual costs should decrease due to the following: 1. Instructional Technology Specialists have been re-purposed to provide rollout and training for technology initiatives. Centralized help-desk tools are implemented to decrease technician response time and associated costs (mileage, time-to-fix, etc.). 2. The total net number of computers will decrease, yet access will increase due to the wireless infrastructure. 3. Telecommunications costs will decrease due to implementation of fiber modems to route voice traffic over (existing) Private Fiber Network and cutting monthly, ongoing costs associated with individual telephone lines.
Overall estimated annual savings due to the use of private fiber modems $328,000.
Project Costs/Status: These costs will ultimately be distributed among all the District facilities and total $38.955 million. Total cost of the first five phases is $33 million.
167

Capital Improvements Plan continued
PROJECT: Good Elementary School Replacement Description:
This is a complete demolition and reconstruction of Good Elementary School. This 70,000 plus square foot building was originally built in 1957. Although it has had several renovations, the District believes a complete replacement is the best solution.
Operating Budget Impact:
The new Good Elementary School will be a state-of-the art facility of over 70,000 square feet housing K-5 students. With new, more efficient equipment we expect small cost savings with this building. No additional staff will be required. The District plans on expending approximately $11.2 million on this project in the 2011-12 fiscal year.
Project Costs/Status: The total project costs are estimated to be $14.0 million. Construction began in the summer of 2011. Final completion is expected in July, 2012.
Building Rendering
5.0
168

Capital Improvements Plan continued
Carrollton-Farmers Branch Independent School DistrictMiscellaneous Statistical DataAugust 31, 2011 (unaudited)Geographic Area: 53.41 Square MilesStudent Enrollment: 26,159
OriginallyOpened/ Capacity/
Instructional Sites: Replaced Square Feet Acreage Senior High Schools: Creekview 1998 368,182 70 Grimes Learning Ctr 1989 32,700 5 Smith 1973 496,782 29 Turner 1960 564,006 54.8 Ranchview 2002 250,000 54 Middle Schools: Blalack 1986 171,150 21 Bush 1998 142,000 23 Field 1959 182,525 16 Long 1981 164,500 21 Perry 1936 195,067 21 Polk 1997 140,000 32 Alternative Campuses: Huie Ctr 1982 29,750 5 Salazar - Academic Character Training 1993 32,400 5 Elementary Schools: Blair Intermediate 2002 97,228 5 Blanton 2007 75,160 10 Carrollton 1951 83,180 9 Central 1965 93,690 19 Country Place 1982 64,801 8 Davis 1975 76,485 8 Farmers Branch 1968 72,005 10 Freeman 2004 75,160 11.6 Furneaux 1982 59,406 9 Good 1957 66,944 11 Kelly Pre-K Ctr 2007 47,513 9.5 Kent 1989 89,742 17 La Villita 2008 87,787 10 Landry 1996 73,500 10 Las Colinas 1986 75,099 10 McCoy 1979 65,849 10 McKamy 1992 79,577 15 McLaughlin 1960 73,300 10 McWhorter 2001 88,418 13.5 Rainwater 1994 80,000 12 Riverchase 2000 75,160 10 Rosemeade 1984 61,396 11 Sheffield Intermediate 1989 66,767 11.5 Sheffield Primary 1985 59,406 8 Stark 2006 83,400 11 Strickland 2008 77,631 7 Thompson 2006 75,160 15
Totals 4,792,826 647.9
169

170

Informational
Section
171

Student Data
172

Student Data
TAKS Results by Subject and Grade
Met Met Met
Subject Area Group Expectation Commended Expectation Commended Expectation Commended
Reading/ELA All Students 86% 30% 89% 30% 91% 36%Math All Students 79% 27% 80% 29% 82% 31%Writing All Students 92% 34% 93% 33% 94% 33%Science All Students 74% 18% 78% 21% 76% 26%Social Studies All Students 92% 37% 92% 39% 92% 45%
Reading/ELA African Am. 83% 21% 88% 21% 90% 28%Math African Am. 68% 13% 70% 16% 74% 17%Writing African Am. 93% 29% 93% 26% 92% 30%Science African Am. 62% 9% 67% 12% 65% 13%Social Studies African Am. 91% 23% 91% 31% 90% 33%
Reading/ELA Hispanics 79% 21% 83% 19% 86% 25%Math Hispanics 69% 17% 72% 19% 75% 21%Writing Hispanics 88% 22% 90% 21% 91% 24%Science Hispanics 58% 9% 66% 12% 64% 15%Social Studies Hispanics 84% 19% 85% 22% 85% 30%
Reading/ELA White 94% 44% 96% 44% 97% 54%Math White 90% 37% 91% 41% 91% 43%Writing White 96% 49% 96% 45% 97% 47%Science White 89% 27% 91% 33% 90% 40%Social Studies White 97% 53% 98% 56% 97% 62%
Reading/ELA Econ.Disadv. 79% 18% 83% 19% 86% 25%Math Econ.Disadv. 69% 17% 72% 20% 75% 22%Writing Econ.Disadv. 88% 20% 90% 22% 91% 24%Science Econ.Disadv. 59% 10% 67% 14% 65% 15%Social Studies Econ.Disadv. 85% 21% 86% 25% 87% 31%The Results are Summed Across all Grades
200720062005
173

Student Data continued
TAKS Results by Subject and Grade
Met Met Met
Subject Area Group Expectation Commended Expectation Commended Expectation Commended
Reading/ELA All Students 92% 36% 89% 34% 91% 33%Math All Students 84% 32% 83% 33% 86% 30%Writing All Students 94% 37% 94% 37% 95% 34%Science All Students 79% 28% 83% 32% 87% 32%Social Studies All Students 94% 45% 96% 54% 96% 53%
Reading/ELA African Am. 91% 31% 87% 28% 90% 28%Math African Am. 77% 19% 74% 21% 79% 17%Writing African Am. 94% 33% 95% 31% 93% 29%Science African Am. 71% 18% 76% 20% 82% 20%Social Studies African Am. 91% 33% 95% 44% 95% 43%
Reading/ELA Hispanics 88% 25% 85% 25% 89% 24%Math Hispanics 79% 23% 79% 25% 83% 23%Writing Hispanics 92% 27% 92% 30% 94% 25%Science Hispanics 71% 18% 77% 22% 82% 24%Social Studies Hispanics 90% 33% 94% 41% 95% 42%
Reading/ELA White 97% 53% 96% 50% 97% 49%Math White 92% 46% 92% 46% 93% 43%Writing White 97% 52% 96% 49% 97% 52%Science White 93% 44% 94% 50% 96% 48%Social Studies White 98% 64% 99% 74% 99% 72%
Reading/ELA Econ.Disadv. 88% 25% 85% 25% 89% 25%Math Econ.Disadv. 79% 23% 78% 26% 83% 23%Writing Econ.Disadv. 92% 28% 92% 29% 94% 26%Science Econ.Disadv. 71% 18% 77% 23% 82% 24%Social Studies Econ.Disadv. 90% 33% 94% 42% 95% 41%The Results are Summed Across all Grades
2008 2009 2010
174

Student Data continued
High School Advanced Placement - 2009-2010
Turner
Smith
Creekview
Ranchview
C-FB
Total Campus Enrollment
1874 1881 1975 803 6533
AP/IB Class Enrollment
791 1069 744 7/515 2611/515
% Campus AP Enrollment
42% 57% 38% 1%/64% 40%/8%
High School Advanced Placement - 2008-2009
Turner
Smith
Creekview
Ranchview
C-FB
Total Campus Enrollment
2076 2126 2081 831
7114
AP Class Enrollment
946 1008 812 274
3040
% Campus AP Enrollment
46% 47% 39% 33%
43%
High School Advanced Placement - 2007-2008
Turner
Smith
Creekview
Ranchview
C-FB
Total Campus Enrollment
1886 1975 2075 773
6711
AP Class Enrollment
676 806 759 229
2470
% Campus AP Enrollment
36% 41% 37% 30%
37%
175

Student Data continued
The chart below depicts Students by Category- changes over time.
Students by Category(Source: PEIMS Edits + Student Data Review Report)
2001-02 2002-03 2003-04 2004-05 2005-06 2006-07 2007-08 2008-09 2009-10 2010-11
All Students 25,060 25,520 25,638 25,860 26,231 26,252 26,397 26,257 25,920 26,159 Title I 8,366 10,554 11,637 15,124 16,884 17,606 17,598 18,088 19,604 20,320
Special Ed 2,406 2,438 2,536 2,635 2,700 2,770 2,742 2,470 2,506 2,555 Gifted & Talented 2,393 2,427 2,278 2,226 2,332 2,467 2,502 2,494 2,419 2,387
Career & Tech 4,486 4,698 5,870 4,403 4,568 4,298 4,712 4,690 4,872 4,913 LEP 5,507 5,581 5,854 6,116 6,234 6,685 6,262 6,293 5,985 5,995
Bilingual 1,895 2,269 2,348 2,479 2,761 2,980 2,901 2,922 2,912 2,967 ESL 3,188 3,175 3,368 3,527 3,397 3,653 3,345 3,409 3,127 3,110
Migrant 36 35 34 2 0 2 8 5 3 3 Eco Disadv 9,447 10,278 11,633 12,228 13,379 13,418 14,302 15,002 15,393 15,376
At Risk 10,304 10,482 10,997 11,789 13,025 12,828 12,494 12,908 12,528 12,031 Immigrant 1,439 1,201 937 872 782 1,180 1,043 1,167 219 851
Transfer Students 38 91 108 133 136 149 180 188 169 188
176
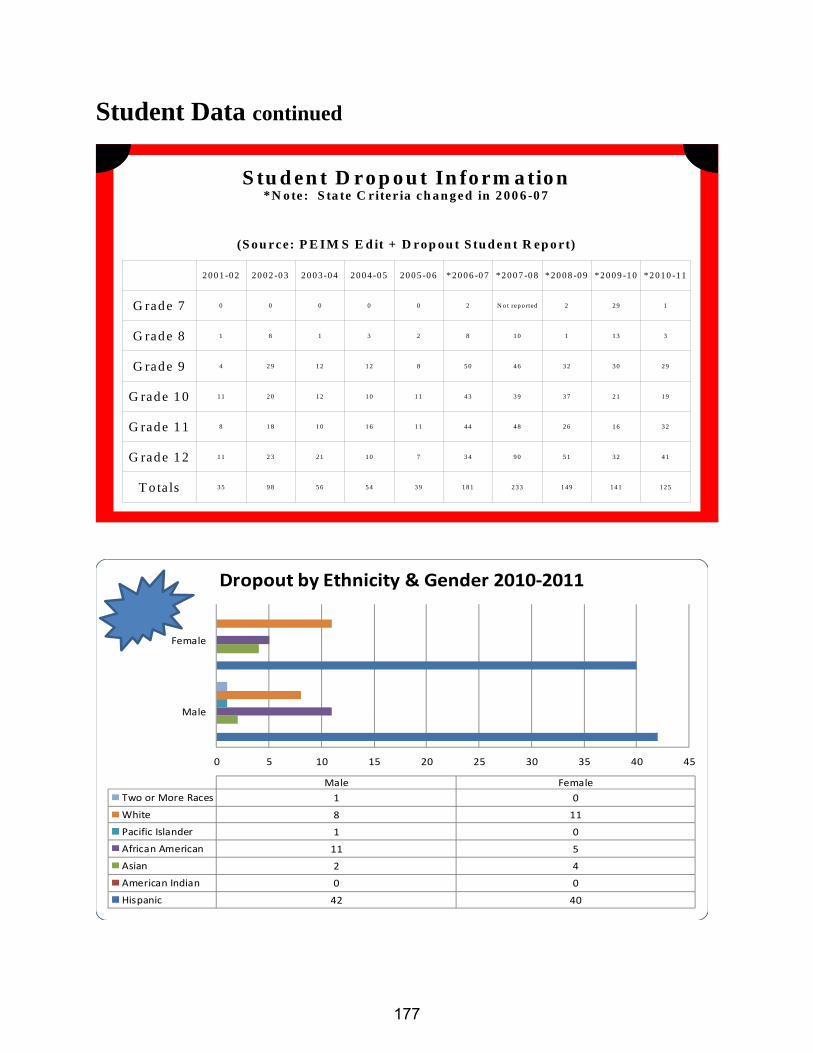
Student Data continued
S tu d en t D ro p o u t In fo rm a tio n
*N o te : S ta te C riter ia ch a n g ed in 2 00 6 -0 7
(S ou rce: P E IM S E d it + D rop ou t S tu d en t R ep o rt)
G rad e 7
G rad e 8
G rad e 9
G rad e 1 0
G rad e 1 1
G rad e 1 2
T o ta ls
0
1
4
1 1
8
1 1
3 5
0
8
2 9
2 0
1 8
2 3
9 8
0
1
1 2
1 2
1 0
2 1
5 6
0
3
1 2
1 0
1 6
1 0
5 4
0
2
8
1 1
1 1
7
3 9
2
8
5 0
4 3
4 4
3 4
1 8 1
N o t rep o rted
1 0
4 6
3 9
4 8
9 0
2 3 3
2
1
3 2
3 7
2 6
5 1
1 4 9
2 9
1 3
3 0
2 1
1 6
3 2
1 4 1
1
3
2 9
1 9
3 2
4 1
1 2 5
2 0 0 1-0 2 20 0 2 -0 3 2 0 0 3-0 4 20 0 4 -05 20 0 5 -0 6 *2 0 0 6 -0 7 *2 0 0 7 -0 8 * 20 0 8 -0 9 *2 0 0 9 -1 0 * 2 01 0 -11
0 5 10 15 20 25 30 35 40 45
Male
Female
Male Female
Two or More Races 1 0
White 8 11
Pacific Islander 1 0
African American 11 5
Asian 2 4
American Indian 0 0
Hispanic 42 40
Dropout by Ethnicity & Gender 2010‐2011
177
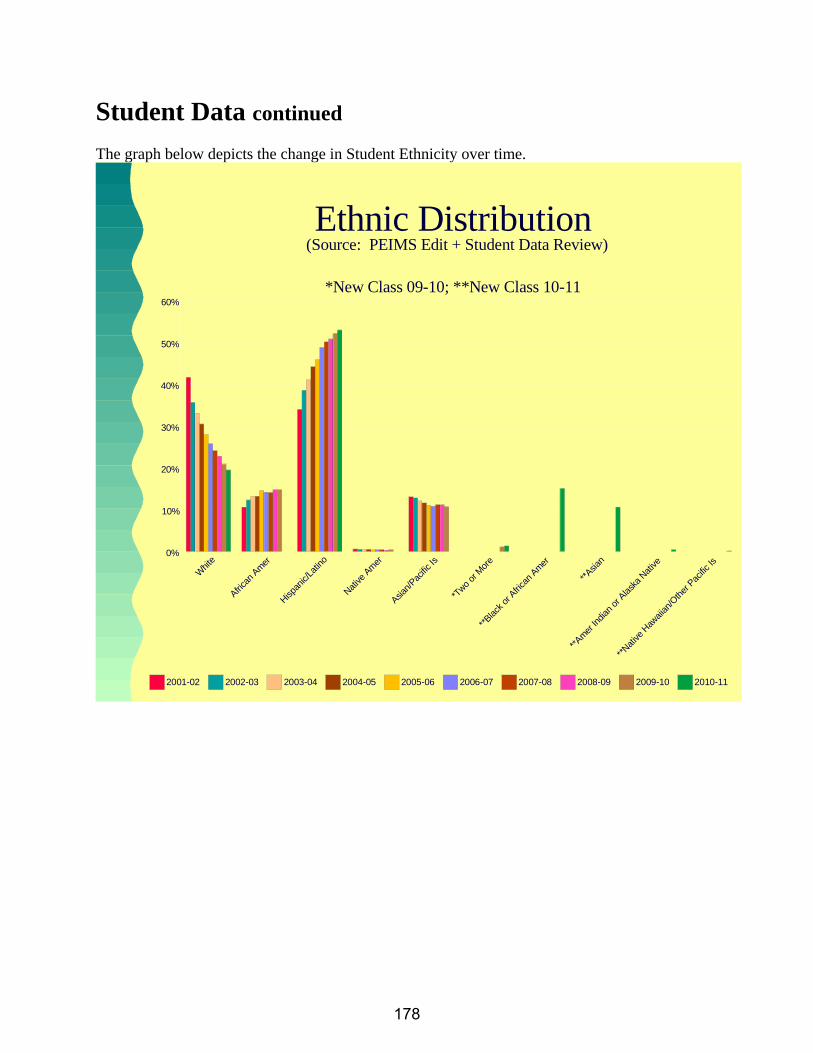
Student Data continued
The graph below depicts the change in Student Ethnicity over time.
Ethnic Distribution (Source: PEIMS Edit + Student Data Review)
*New Class 09-10; **New Class 10-11
Whit
e
Africa
n Am
er
Hispan
ic/La
tino
Native
Am
er
Asian/
Pacific
Is
*Two
or M
ore
**Blac
k or A
frica
n Am
er
**Asia
n
**Am
er In
dian
or A
laska
Nat
ive
**Nat
ive H
awaii
an/O
ther
Pac
ific Is
0%
10%
20%
30%
40%
50%
60%
2001-02 2002-03 2003-04 2004-05 2005-06 2006-07 2007-08 2008-09 2009-10 2010-11
178

Student Data continued
The graph below depicts the Students Economically Disadvantaged by Count
Students Economically Disadvantaged
(Source: PEIMS Edits + Economically Disadvantaged Students Report)
Eligible for Free Meals
Eligible for Reduced Meals
Assist to need familiies (TANF)
Not Econ Disadv
0 5,000 10,000 15,000 20,000Eligible for Free Meals Eligible for Reduced Meals Assist to need familiies (TANF) Not Econ Disadv
7,317 2,095 35 15,5558,083 2,045 150 15,2709,023 2,341 269 14,00510,596 2,606 26 12,22810,717 2,662 0 12,85211,237 2,181 0 12,83411,338 2,964 0 12,09511,913 3,089 0 11,25512,774 2,618 1 10,52713,514 2,222 0 10,423
2001-022002-032003-042004-052005-062006-072007-082008-092009-102010-11
2001-02 2002-03 2003-04 2004-05 2005-06 2006-07 2007-08 2008-09 2009-10 2010-11
179

Student Data continued
C-FB ISD CAMPUS ENROLLMENTEstimated
# Name 2005-06 2006-07 2007-08 2008-09 2009-10 2010-11 2011-12
001 Turner High 2,014 2,013 1,956 2,011 1,975 2,019 2,019002 Smith High 2,142 2,086 2,069 2,080 1,991 2,030 2,030003 Grimes Learning Ctr 183 227 240 214 263 251 251005 Alternative Ed Prgm 170 144 138 145 103 94 94006 Creekview High 2,172 2,161 2,150 2,037 2,056 2,082 2,082007 Ranchview High 756 756 773 761 833 807 807009 Dallas/Denton County JJAEP 15 13 30 24 15 15 15010 Early College High School 0 79 161 211 213 252 252041 Field Middle 1,102 1,087 1,014 999 963 930 930042 Perry Middle 980 982 1,010 971 999 933 933044 Long Middle 905 861 806 850 784 796 796045 Blalack Middle 1,134 1,152 1,141 1,120 1,064 972 972046 Polk Middle 938 970 1,056 1,026 1,057 1,042 1,042047 Bush Middle 648 616 622 654 703 767 767102 Carrollton Elementary 611 679 719 684 640 650 650103 Central Elementary 680 654 625 645 600 726 726105 Good Elementary 538 517 527 496 498 503 503106 Stark Elementary 725 613 471 388 417 533 533107 Montgomery Elementary 456 560 549 463 414 0 0108 McLaughlin Elementary 863 856 636 389 393 396 396109 Farmers Branch Elementary 524 508 516 493 493 506 506110 Blanton Elementary 416 444 459 539 563 555 555111 Thompson Elementary 479 501 504 490 479 515 515112 Country Place Elementary 354 361 363 363 374 362 362113 Davis Elementary 657 591 566 575 552 535 535114 McCoy Elementary 431 434 442 425 452 411 411116 Furneaux Elementary 459 442 437 407 395 365 365117 Huie Sp Ed Campus 46 33 1 2 3 4 4118 Rosemeade Elementary 335 342 349 365 336 338 338119 Sheffield Primary 477 414 455 419 446 498 498120 Las Colinas Elementary 443 455 490 493 503 505 505121 Landry Elementary 509 487 459 472 462 462 462122 Kent Elementary 569 566 546 513 446 472 472123 Riverchase Elementary 394 398 405 388 369 362 362124 McKamy Elementary 535 537 469 478 450 575 575125 Sheffield Intermediate 449 399 387 383 354 339 339126 Rainwater Elementary 342 364 418 457 469 451 451128 Freeman Elementary 528 550 668 503 510 560 560129 McWhorter Elementary 539 533 645 673 697 626 626131 Blair Intermediate 404 521 522 419 405 776 776132 LaVillita Elementary 0 0 0 296 326 459 459133 Pre-Kindergarten Center 439 346 222 204 192 0 0134 Kelly Pre-Kindergarten Center 0 0 381 366 295 313 313135 Strickland Intermediate 0 0 0 368 368 372 372
Totals 26,361 26,252 26,397 26,259 25,920 26,159 26,159Percentage Change -0.41% 0.55% -0.52% -1.29% 0.92% 0
180

Student Data continued
PEIMS EDIT+ REPORTS DATA REVIEWAt Risk Students by Sex, Ethnicity, and Grade
2010-2011 Fall Collecton
Native African Pacific Two or
Hispanic American Asian American White Islander More
Grade Male Female Male Female Male Female Male Female Male Female Male Female Male Female Total %
EE 2 0 0 0 0 0 1 0 0 0 0 0 0 0 3 0.0%
PK 259 235 2 1 74 76 4 4 8 7 0 0 0 0 670 5.6%
KG 342 397 1 0 70 56 17 3 13 10 0 0 2 1 912 7.6%
01 450 399 1 0 72 66 46 23 32 23 0 0 7 4 1,123 9.3%
02 448 399 0 0 69 61 63 45 41 35 1 0 8 2 1,172 9.7%
03 387 421 2 3 55 53 52 44 39 35 0 0 2 2 1,095 9.1%
04 358 281 1 0 46 30 64 43 32 27 0 0 2 1 885 7.4%
05 261 242 0 0 36 28 53 48 34 26 0 0 3 3 734 6.1%
06 275 238 3 0 36 16 59 50 30 26 0 0 4 6 743 6.2%
07 271 200 2 3 25 17 69 49 44 22 1 0 3 1 707 5.9%
08 310 227 1 1 33 17 62 59 51 25 0 1 4 5 796 6.6%
09 330 295 1 2 20 26 94 68 67 40 1 0 2 5 951 7.9%
10 274 209 3 0 38 30 61 64 66 46 1 0 1 1 794 6.6%
11 238 243 2 1 28 16 91 54 88 49 0 0 12 1 823 6.8%
12 143 210 1 0 32 32 49 40 65 43 2 1 1 4 623 5.2%
Totals 4,348 3,996 20 11 634 524 785 594 610 414 6 2 51 36 12,031 100.0%
Percent 36.1% 33.2% 0.2% 0.1% 5.3% 4.4% 6.5% 4.9% 5.1% 3.4% 0.0% 0.0% 0.4% 0.3% 100.0%
181

Student Data continued
2010 Adequate Yearly Progress (AYP)
And Academic Excellence Indicator System (AEIS)
CampusMeets AYP
Missed AYP
AEIS Rating
District X RecognizedCreekview X RecognizedEarly College X ExemplaryRanchview X RecognizedSmith X RecognizedTurner X RecognizedBlalack X RecognizedBush X AcceptableField X RecognizedLong X RecognizedPerry X RecognizedPolk X RecognizedBlair/Montgomery X AcceptableBlanton X ExemplaryCarrollton X ExemplaryCentral X RecognizedCountry Place X ExemplaryDavis X ExemplaryFarmers Branch X RecognizedFreeman X RecognizedFurneaux X AcceptableGood X ExemplaryKent X ExemplaryLa Villita X ExemplaryLandry X RecognizedLas Colinas X ExemplaryMcCoy X ExemplaryMcKamy X RecognizedMcWhorter X RecognizedRainwater X ExemplaryRiverchase X RecognizedRosemeade X ExemplarySheffield Int/Pri X RecognizedStark X ExemplaryStrickland/McLaughlin X ExemplaryThompson X Exemplary
182

Student Data continued
2009 Adequate Yearly Progress (AYP) And Academic Excellence Indicator System (AEIS)
CampusMeets AYP
Missed AYP AEIS Rating
District X Acceptable*Creekview X Acceptable*Early College X ExemplaryRanchview X AcceptableSmith X RecognizedTurner X AcceptableBlalack X RecognizedBush X RecognizedField X RecognizedLong X AcceptablePerry X RecognizedPolk X RecognizedBlair/Montgomery X RecognizedBlanton X ExemplaryCarrollton X ExemplaryCentral X RecognizedCountry Place X ExemplaryDavis X ExemplaryFarmers Branch X ExemplaryFreeman X ExemplaryFurneaux X RecognizedGood X ExemplaryKent X ExemplaryLa Villita X RecognizedLandry X ExemplaryLas Colinas X ExemplaryMcCoy X ExemplaryMcKamy X ExemplaryMcWhorter X RecognizedRainwater X ExemplaryRiverchase X ExemplaryRosemeade X ExemplarySheffield Int/Pri X RecognizedStark X ExemplaryStrickland/McLaughlin X ExemplaryThompson X Recognized*Rating is being appealed
183

Student Data continued
2008 Adequate Yearly Progress (AYP) And Academic Excellence Indicator System (AEIS)
CampusMeets AYP
Missed AYP AEIS Rating
District X RecognizedCreekview X AcceptableEarly Colleg X AcceptableRanchview X AcceptableSmith X AcceptableTurner X AcceptableBlalack X RecognizedBush X RecognizedField X AcceptableLong X AcceptablePerry X AcceptablePolk X AcceptableBlair/Montgomery X RecognizedBlanton X ExemplaryCarrollton X RecognizedCentral X RecognizedCountry Place X ExemplaryDavis X ExemplaryFarmers Branch X RecognizedFreeman X RecognizedFurneaux X AcceptableGood X RecognizedKent X ExemplaryLandry X RecognizedLas Colinas X ExemplaryMcCoy X RecognizedMcKamy X ExemplaryMcLaughlin X RecognizedMcWhorter X RecognizedRainwater X ExemplaryRiverchase X RecognizedRosemeade X ExemplarySheffield Int/Pri X AcceptableStark X AcceptableThompson X Acceptable
184

Student Data continued
SAT Results for 2010Mean ScoresCampus Count Critical Reading Math Writing CombinedTurner High School 174 477 516 473 1,466Smith High School 222 506 527 502 1,535Creekview High School 282 501 533 488 1,522Ranchview High School 98 449 483 457 1,389Early College High School 34 422 471 420 1313
District 810 488 519 482 1489
National 1,547,990 501 505 473 1,479Texas 148,102 484 506 475 1,465
SAT Results for 2009Mean ScoresCampus Count Critical Reading Math Writing CombinedTurner High School 155 490 530 481 1501Smith High School 213 502 538 502 1542Creekview High School 274 495 534 484 1513Ranchview High School 100 502 528 498 1528
District 742 497 533 489 1519
National 1,530,128 501 515 493 1,509Texas 141,723 486 506 475 1,467
SAT Results for 2008Mean ScoresCampus Count Critical Reading Math Writing CombinedTurner High School 142 498 545 504 1547Smith High School 227 512 524 515 1551Creekview High School 320 503 538 501 1542Ranchview High School 92 458 505 455 1418
District 781 499 531 500 1530
National 1,518,859 502 515 494 1,511Texas 137,024 488 505 480 1,473
185

Student Data continued
ACT Results for 2010
Campus Count English Math Reading Science CompositeTurner High School 103.0 18.9 22.1 20.1 21.3 20.7Smith High School 126.0 20.9 22.1 21.5 21.8 21.7Creekview High School 137.0 20.7 22.6 22.3 22.1 22Ranchview High School 63.0 19.7 21.7 20.4 20.6 20.7
District 429.0 20.2 22.2 21.2 21.6 21.4
Nation 1,568,835 20.5 21.0 21.3 20.9 21Texas 92,615 19.7 21.4 20.8 20.9 21
ACT Results for 2009
Campus Count English Math Reading Science CompositeTurner High School 78.0 20.2 23.1 21.2 21.3 21.5Smith High School 133.0 19.2 21.1 19.9 20.7 20.3Creekview High School 132.0 20.3 22.8 21.6 21.7 21.7Ranchview High School 43.0 20.8 22.0 22.6 21.6 21.9
District 386.0 20.0 22.2 21.0 21.2 21.2
Nation 1,480,469 20.6 21.0 21.4 20.9 21Texas 82,640 19.9 21.3 20.9 20.6 21
ACT Results for 2008
Campus Count English Math Reading Science CompositeTurner High School 53.0 20.2 23.7 21.8 22.2 22.2Smith High School 89.0 20.3 21.7 21.2 20.2 21Creekview High School 125.0 21.8 23.2 22.6 22 22.5Ranchview High School 57.0 18.2 21.1 18.6 19.2 19.4
District 324.0 20.5 22.5 21.4 21 21.5
Nation 1,421,941 20.6 21.0 21.4 20.8 21Texas 79,050 19.8 21.2 20.9 20.6 21
186

Salary Schedules
187

Salary Schedules
2011-2012 Carrollton Farmers Branch ISD Teacher New Hire - 187 DAYS
YEARS OF EXPERIENCE
DAILY RATE SALARY
0 $247.81 $46,340 1 $248.81 $46,527 2 $249.81 $46,714 3 $251.31 $46,995 4 $252.81 $47,275 5 $254.31 $47,556 6 $255.81 $47,836 7 $257.31 $48,117 8 $259.31 $48,491 9 $261.31 $48,865
10 $263.31 $49,239 11 $265.31 $49,613 12 $267.31 $49,987 13 $269.31 $50,361 14 $271.31 $50,735 15 $273.31 $51,109 16 $275.31 $51,483 17 $277.31 $51,857 18 $279.31 $52,231 19 $281.31 $52,605 20 $283.31 $52,979 21 $285.31 $53,353 22 $287.31 $53,727 23 $289.31 $54,101 24 $291.31 $54,475 25 $293.31 $54,849 26 $295.31 $55,223 27 $297.31 $55,597 28 $299.31 $55,971 29 $301.31 $56,345
30+ $303.31 $56,719 An annual stipend of $1,545 will be paid to classroom teachers with a Master’s Degree that is confirmed as having been completed prior to the beginning of the school year. An annual stipend of $2,470 will be paid to classroom teachers with a Doctorate that is confirmed as having been completed prior to the beginning of the school year. This is a hiring schedule for the 2011-2012 school year only. Neither past nor future salaries can be accurately calculated from this hiring schedule. .
188

Salary Schedules continued
Carrollton Farmers Branch Independent School District Salary Schedule - 2011-2012 Professional / Administrative
Grade 1
Grade 2
Grade 3
Grade 4
Grade 5
Grade 6
Grade 7
Grade 8
Grade 9
Grade 10
Grade 11
MAXIMUM DAILY RATE
300.51
332.61
349.03
358.82
386.64
416.59
448.88
483.67
521.17
548.23
590.72
MIDPOINT DAILY RATE
264.27
284.44
306.97
322.26
347.24
374.15
403.14
434.38
468.07
504.35
543.43
MINIMUM DAILY RATE
203.76
247.81
266.06
286.45
308.30
332.56
358.34
386.12
416.06
461.63
497.40
Grade 1 Grade 2 - continued - Grade 3 - continued - Grade 6 Grade 9 Child Daycare Dir (215)* Math Instr Facil (187) Occup Therapist (188) Asst Dir Stud Info (230) Early College HS Comm Relatn Spec (230)* Nurse (187) Physical Therapist (188) Asst Principal HS (212) Principal (226) Educ Foundation Occupational Health Purchasing Supv (230)* Coord Staff Devel (230) Exec Dir Curriculum/Staff Program Spec (230)* Nurse (230)* Science Instr Spec (187) Director After School Development (230) Folklorico (187)* Parent Educator (198)* School Psychologist (198) Program (230) Exec Dir Finance (230) Language Services Registrar (220) Social Worker (193) Director Acctg (230)* Exec Dir Fine Arts (230) Specialist (197)* Science Instr Facil (187) Speech Pathologist (187) Director Payroll (230)* Exec Dir Mtls Mgt (230)* Multimedia Spec (230)* Social Studies Instr Student Asst Spec (188)* Director Program Exec Dir Personnel (230) P.R. Web Spec (230)* Facilitator (187) Compliance (230) Exec Director Public Prof Cataloger (220) Teacher (187,190,193,197 Director Tech Svcs (230) Information (230) Personnel Cert Off (230)* 200,202,205,210,212, Grade 4 Exec Director School Sp Ed Emergency Action 213,220,226) Asst Principal Elem (207) Improvement (230) Spec (187)* Coord Campus Athletics Exec Director Special Supervisor Whse (230)* (226) Education (230) Title I Community Grade 3 Coord Media Svcs (230) Principal, Middle School Liaison (197)* Accountant (230)* Coord State Testing & (226) Translator (187) Adv Academic Specialist Data Analyst (230) (230) (215) Lead Sp School Grade 7 Grade 2 Aquatics Supv (230) Psychologist (220) AEP Administrator (230) Academy Facil (230,212) Asst Director Student Supv Hlth Svcs (220) Asst Dir Personnel (230) Adult Educator/GED Nutrition (230) Assoc Principal HS (220) (198,202)* Audiologist (187) Grade 5 Director Athletics (230) Grade 10 Advanced Academic Autism Specialist (200) Asst Director Public Director Fin Rpt (230) Chief Information/Tech Spec (210) Bil Inst Specialist (197) Info (230)* Dir Student Info (230) Officer (230) At-Risk Support Counselor (188,200,202) Asst Principal AEP (207) Exec Dir Facility Svcs/ Facilitator (200) Counselor Career Asst Principal Middle Transportation (230)* Attendance Officer (187) Technology (220) School (207,210) Exec Director Student Behavior Resource Counselor, Creekview & Coord BIL/ESL (230) Grade 8 Services (230) Specialist (187) Grimes (212) Coord Elem Language Director Advanced Principal, High School Bilingual Instructional Educational Diagnos- Arts (230) Academics (215) (226) Spec (197) tician (193,198) Coord Empl Benef (230)* Director Instructional Principal, Virtual Campus Community Liaison (212) ESL Inst Spec (197,202) Coord Federal Fnds (230) Technology (230) (226) Elem Asst Principal Intervention Spec (210) Coord Lang Arts (230) Director Personnel (230) Intern (207) Instructional Spec (197) Coord Math (230) Director Security/ Grade 11 English Language Instr Tech Spec (202) Coord Science (230) Operations (230) Advisor to Supt for Learn ITS (197) GED Appraiser (193) Coord Soc Studies (230) Exec Director Advanced Comm Relations (230) ESL Instr Facil (202) Lead Behavior Res Coord Sp Ed (230) Academics (230) Assoc Supt Admin & Even Start Proj Mgr (200) Specialist (193) Director, Student Exec Director Career Support Services (230) Instructional Facil (202) Lead Educational Nutrition (230)* Tech (230) Assoc Supt Educational Instructional Technology Diagnostician (220) Supv Construction (230)* Principal, Early Read. Services (230) Spec (187,197) Math Instr Spec K-5 (197) Supv Maintenance (230)* Tech (215) Instructional Technology Math Specialist (187) Supv Special Ed (230) Principal, Elem (215) Spec Facil (205) Multimedia Spec Public Supv Tech Svcs (230) Principal, Grimes (226) *Non-ContractedLibrarian (188,197) Information (230)* Tax Assessor/Coll (230)* Project Manager (200) Position
189

Salary Schedules continued
Carrollton Farmers Branch Independent School District Salary Schedule
2011-2012 Clerical / Technical
Grade 2 Grade 3 Grade 4
MAXIMUM HOURLY RATE 16.54 18.72 19.98 MIDPOINT HOURLY RATE 14.23 16.31 17.80 MINIMUM HOURLY RATE 12.33 13.97 14.90 Grade 2 Grade 3 Grade 4 Assistant Clinic Clerk Attendance MS Clerk Assist Principal HS Assistant Bilingual Clerk Counselor MS & HS Clerk Attendance HS Assistant Bilingual Title I Clerk Data Entry Tech Clerk Bookkeeper Assistant Comp Lab HS Clerk Diag 193 Clerk Career Tech Assistant/DMC Clerk Diag 198 Clerk Counselor 003 Assistant ELL Title I Clerk Diag 202 Clerk Fine Arts Assistant ESL Elem Clerk MS Clerk Itinerant Assistant ESL Pre-K Clerk Receptionist Clerk LPAC-BIL-ESL Assistant Inst Bldg Elem Clerk Student Serv MS Clerk Media Assistant Inst Bldg HS SP Receptionist Clerk Recpt Ad Bldg Assistant Pre-K Title I SP Assistant AA Clerk Records 193 Assistant Pre-K SP Assistant Autism Clerk Records 210 Assistant Pre-K Bil SP Assistant BRS/CI Clerk Records 220 Assistant Specials SP Assistant Dev Ctr Clerk Records 226 Assistant Title I SP Assistant Inclusion MS & HS Clerk SNS Purchasing Clerk Elementary SP Assistant MAC MS & HS Clerk SP Medicaid Clerk Family Services SP Assistant PAS Clerk SP TEAMS SP Assistant Bil Speech SP Assistant Sup Ctr Elem Clerk SP Purchasing SP Assistant BRS HS SP Assistant Sup Ctr HS Clerk SP Records SP Assistant BRS MS SP Assistant VAC MS & HS Secretary Security SP Assistant CM Secretary SP Supervisor SP Assistant CM Resource Secretary Technology SP Assistant MOU SP Assistant PPCD
190

Salary Schedules continued
Grade 5 Grade 6 Grade 7 Grade 8 Grade 9 22.13 24.63 27.31 30.36 33.76 19.71 21.89 24.31 27.03 30.03 16.48 18.30 20.32 22.58 25.09
Grade 5 Grade 6 Grade 8 Clerk Accounts Payable Secretary After the Bell Secretary Assistant Superintendent Clerk Advanced Academics Secretary Dir Athletics Clerk Auxiliary Personnel Secretary Dir Prog Comp Clerk Business Secretary Principal HS Clerk Data Entry Bilingual Secretary Asst Dir Personnel Clerk Payroll Clerk Payroll Split Clerk Personnel Appl Clerk SFC Serv Clerk SNS Meal Benefits Clerk SNS Personnel Clerk Tax Office Grade 7 Grade 9 Clerk Assoc Principal Secretary Advance Academics Secretary Superintendent Secretary Athletics Secretary Chief Tech Secretary Bilingual-ESL Curr Secretary Dir Personnel Secretary Distribution Center Secretary Ex Dir Assmnt/Acc Secretary District Media Ctr Secretary Ex Dir Career Tech Secretary Facility Serv Secretary Ex Dir Facility Serv Secretary Instruction Secretary Ex Dir Fine Arts Secretary Aux Personnel Rec Secretary Ex Dir Personnel Secretary/Principal Alternative Secretary Ex Dir SP ED Secretary/Principal Elem Secretary Ex Dir Staff Dev Secretary/Principal MS Secretary Purchasing Secretary Special Programs Secretary Stu/Fam Com Serv
191

Salary Schedules continued
Carrollton Farmers Branch Independent School District Salary Schedule
2011-2012 Specialist/Technical
Grade 1 Grade 2 Grade 3 Grade 4 Grade 5 Grade 6 Grade 7 Grade 8 Grade 9 Grade 10
HOURLY HOURLY HOURLY HOURLY DAILY DAILY DAILY DAILY DAILY DAILY
MAXIMUM RATE
22.13
24.59
27.31
30.37
265.18
294.03
336.22
348.81
379.99
386.64
MIDPOINT RATE
19.71
21.89
24.31
27.03
235.51
261.98
286.12
310.39
338.11
347.24
MINIMUM RATE
16.62
18.46
20.49
22.78
191.42
220.50
240.31
261.45
284.76
308.30
Grade 1 - [Non-Exempt] Grade 5 - [Exempt] Environmental Technician SNS Supervisor I SNS Supervisor II Grade 2 - [Non-Exempt] Grade 6 - [Exempt] Specialist Computer Help Desk I Payroll System Specialist Specialist Employee Benefits Assistant Records Management Officer Specialist Purchasing Tech Specialist Special Project Manager Specialist Student Data Specialist Telecom Analyst Grade 3 - [Non-Exempt] Bookkeeper-Administrative Database Manager Grade 7 - [Exempt] Office Manager Specialist Asst. Network Systems Purchasing Agent Purchasing Buyer Specialist Payroll Specialist SNS Accounts Visual Service Prod Assistant Grade 8 - [Exempt] Grade 4 - [Non-Exempt] Coordinator PEIMS Grade 9 - [Exempt] Specialist Assistant Payroll Director Specialist Network Systems Manager Specialist Cabling Tech Specialist Computer Help Desk II Specialist Computer Tech III Specialist Employee Benefits Specialist Personnel Records Grade 10 - [Exempt] Specialist Property Insurance Technology Services Supervisor
192

Salary Schedules continued
Carrollton Farmers Branch Independent School District Salary Schedule
2010-2012 Manual Trades (Hourly Positions)
Grade 1 Grade 2 Grade 3 Grade 4 Grade 5 Grade 6 Grade 7 MAXIMUM HOURLY RATE
13.42
15.01
17.26
18.88
21.11
23.62
26.39
MIDPOINT HOURLY RATE
11.90
13.39
15.38
16.92
18.91
21.13
23.64
MINIMUM HOURLY RATE
9.96
11.22
12.89
14.26
15.95
17.83
19.92
Grade 1 Grade 4 Grade 6 Custodian Carpentry Locksmith Custodian/Lead Rover Production Assistant, SNS Custodian, Head-Middle School Electrical/Fire Alarm Tech Custodian, Lead-High School Grounds Licensed Irrigator Distribution Center Support Lead Grounds Lead Athletics Crew Electrical Tech II Grounds Lead Campus Crew General Maintenance Roofer Grounds Lead Equipment Tech Grade 2 General Maintenance Worker Plumbing Plumber Tech III Custodian/Flex Crew Grounds/Equipment Operator Custodian/Lead Grimes Grounds Head Athletic Painter Daycare/Caregiver Grounds/Irrigator Grounds/Athletics Grounds Lead Athletics Grounds/Groundskeeper HVAC Tech I Grounds/Painter Security Campus Production Specialist, SNS Security Rover Grade 3 Custodian Full Time Sub I Custodian, Head-Elementary School Grade 5 Custodian, Lead-Middle School Carpentry Carpenter Distribution Center Receiving Custodian, Head-High School Grade 7Distribution Center Support Custodian, Rover Carpenter/Lead Grounds/Landscape Daycare Teacher Carpenter/Lead Locksmith Grounds/Lead Crew Distribution Center/Inventory Ctrl Electrical Lead Electrician Paint/Painter Distribution Center/Textbooks General Maintenance Lead Plumbing/Plumber Apprentice General Maintenance Herbicide Appl HVAC Lead Security/Radio Specialist General Maintenance/High School Paint Lead SNS Manager Trainee Grounds/Sprinkler Repair Plumbing/Lead
193

Salary Schedules continued
Carrollton Farmers Branch Independent School District Salary Schedule
2011-2012 Manual Trades (Salaried Positions)
MTB MTC MTD MTE MTF MTG MAXIMUM DAILY RATE
138.96
151.74
170.23
189.64
213.38
236.30
MIDPOINT DAILY RATE
123.76
136.02
152.02
169.84
191.06
211.46
MINIMUM DAILY RATE
109.83
123.01
136.77
149.80
165.15
180.01
Grade MTB Grade G Assistant Manager/High School Carpentry Department Head Custodial Department Head Grade MTC Electrical Department Head Student Nutrition Manager – Elementary School General Maintenance Department Head Field Cashier Trainer HVAC Department Head Outside Maintenance Department Head Grade MTD Paint Department Head Student Nutrition Manager – Middle School Plumbing Department Head Security/Building Rental Department Head Grade MTE Supervisor/Security Technology Student Nutrition Manager – High School Student Nutrition Manager – Cluster Schools Grade F SNS Training and Catering Specialist (198 days)
194

Miscellaneous Financial Information
195
Miscellaneous Financial Information
State Funding Formulas (Source: First Southwest Company and District provided information)
CURRENT SCHOOL FINANCE SYSTEM
General
The following description of the Finance System is a summary of the Reform Legislation and the changes made by the State Legislature to the Reform Legislation since its enactment, including modifications made during the special session of the 82nd Texas Legislature (the “2011 Special Legislative Session”). For a more complete description of school finance and fiscal management in the State, reference is made to Vernon’s Texas Codes Annotated, Education Code, Chapters 41 through 46, as amended.
The reform legislation, which generally became effective at the beginning of the 2006-07 fiscal year of each district, made substantive changes to the manner in which the finance system is funded, but did not modify the basic structure of the finance system. The changes to the manner in which the finance system is funded are intended to reduce local Maintenance & Operation tax rates by one third over two years, with Maintenance & Operation tax levies declining by approximately 11% in fiscal year 2006-07 and approximately another 22% in fiscal year 2007-08, subject to local referenda that may increase local Maintenance & Operations (M&O) Tax levies, thus offsetting a part of the compression in local M&O Tax levies (see “TAX INFORMATION – Tax Rate Limitations”). Additional state funding needed to offset local tax rate reductions must be generated by the modified state franchise, motor vehicle and tobacco taxes or any other revenue source appropriated by the Legislature.
Under the previous finance system, as modified by the 2009 Regular Legislative session, a school district that imposed a M&O Tax at least equal the produce of the “state compression percentage” (as defined below) multiplied by the district’s 2005-06 M&O Tax rate is entitled to at least the amount of state funding necessary to provide the district with the sum of (A) the amount of state and local revenue per weighted average daily attendance (WADA) to which the school district would be entitled for the 2009-10 school year as calculated under the law as it existed on January 1, 2009, (B) an additional $120 per WADA, (C) an amount to which the district is entitled based on supplemental payments owed to any Tax Increment Fund for a reinvestment zone and (D) any amount due to the district to the extent the district contract for students residing in the district to be educated in another district (i.e., tuition allotment). If a district adopts an M&O Tax rate in any fiscal year below a rate equal to the state compression percentage for the district in that year multiplied by the M&O Tax rate adopted by the district for the 2005-06 fiscal year, the district’s guaranteed amount is reduced in a proportional amount.
196

Miscellaneous Financial Information continued
Current School Finance System General continued If a district would receive more State and local revenue from the Tier I and Tier II allotments (each as hereinafter defined) and wealth equalization than the guaranteed amount described above, the amount of state funding will be reduced by the amount of such surplus over the guaranteed amount described above. The 2011 Special Legislative session slightly modified the existing finance system by creating a regular program adjustment factor that is set at 0.9239 in 2011-12 and 0.98 in 2012-13. School districts will receive 92.39% of their regular program allotment for 2011-12 and 98% for 2012-13. The 7.61% reduction for 2011-12 and 2.0% reduction for 2012-13 is based on the funding a district would have received under prior law.
In general terms, funds are allocated to districts in a manner that requires districts to “compress” their tax rates in order to receive increased state funding at a level that equalizes local tax wealth at the 88th percentile yield for the 2006-07 fiscal year. A basic component of the funding formulas is the “state compression percentage”. The state compression percentage was 66.67% for fiscal years 2007-08, 2008-09 and 2009-10. For fiscal year 2010-11 and thereafter, the Commissioner is required to determine the state compression percentage for each fiscal year based on the percentage by which a district is able to reduce its M&O tax rate for that year, as compared to such district’s adopted M&O tax rate for the 2005-06 fiscal year, as a result of state funds appropriated for distribution for the current fiscal year from the property tax relief fund established under the reform legislation, or from any other funding source made available by the Legislature for school district property tax relief. For fiscal year 2011-12, the Commissioner has determined to maintain the State compression percentage at 66.67%.
State Funding for Local School Districts
To limit disparities in school district funding abilities, the finance system (1) compels districts with taxable property wealth per weighted student higher than the “equalized wealth level” (described under “WEALTH TRANSFER PROVISONS”) to reduce their wealth to such amount or to divert a portion of their tax revenues to other districts as described below and (2) provides various state funding allotments, including a basic funding allotment and other allotments for “enrichment” of the basic program, for debt service tax assistance and for new facilities construction.
The Finance System provides for (1) State guaranteed basic funding allotments per student (“Tier One”) and (2) State guaranteed revenues per student for each cent of local tax effort that exceeds the compressed tax rate to provide operational funding for an “enriched” educational program (“Tier Two”). In addition, to the extent funded by the Legislature, the Finance System includes, among other funding allotments, an allotment to subsidize existing debt service up to
197

Miscellaneous Financial Information continued
State Funding for Local School Districts continued
certain limits (“EDA”), the Instructional Facilities Allotment (“IFA”), and an allotment to pay operational expenses associated with the opening of a new instructional facility. Tier One, Tier Two, EDA and IFA are generally referred to as the Foundation School Program. Tier One and Tier Two allotments represent the State funding share of the cost of maintenance and operations of school districts and supplement local ad valorem M&O Taxes levied for that purpose. Tier One and Tier Two allotments and prior year IFA allotments are generally required to be funded each year by the Legislature. EDA and future year IFA allotments supplement local ad valorem taxes levied for debt service on bonds issued by districts to construct, acquire and improve facilities and are generally subject to appropriation by the Legislature. State funding allotments may be altered and adjusted to penalize school districts with high administrative costs and, in certain circumstances, to account for shortages in State appropriations or to allocate available funds in accordance with wealth equalization goals.
Tier One allotments are intended to provide all districts a basic program of education rated academically acceptable and meeting other applicable legal standards. If needed, the State will subsidize local tax receipts at a tax rate of the state compression percentage multiplied by the lesser (a) $1.50 or (b) the district’s 2005 M&O Tax to insure that the cost to a district of the basic program is met. Tier Two allotments are intended to guarantee each school district that is not subject to the wealth transfer provisions described below an opportunity to supplement that program at a level of its own choice, however Tier Two allotments may not be used for the payment of debt service or capital outlay. The cost of the basic program is based on an allotment per student known as the “Tier One Basic Allotment.” The Tier One Basic Allotment is adjusted for all districts by a cost-of-living factor known as the “cost of education index.” In addition, a district-size adjustment further adjusts the Tier One Basic Allotment for districts that (i) have not more than 1,600 students in average daily attendance (with alternative formulas established for such districts that contain at least 300 square miles and those districts that contain less than 300 square miles) or (ii) offer kindergarten through grade 12 program and have less than 500 students in average daily attendance. For the 2007-08 fiscal year, the Tier One Basic Allotment was funded at $3,135 based on a guaranteed yield of $36.45 for each cent of tax effort. For fiscal year 2008-09, the Tier One Basic Allotment is $3,218 based upon a guaranteed yield of $37.42 for each cent of tax effort. For 2009-10 through 2012-13, the Tier One Basic Allotment is set at the greater of $4,765 or 1.65 percent of the statewide average property value per student in WADA and, thereafter, at the lesser of $4,765 or that amount multiplied by the quotient of the district’s compressed tax rate divided by the state maximum compressed tax rate of $1.00. This increase was due to changes in law effective by the Legislature during the 2009 Regular Legislative Session, which combined certain funding allotments that previously were separate components of Tier II funding into the Tier I Basic Allotment. An additional change made during the 2009 Regular Legislative Session limits, beginning with 2010-11 school year, the annual increases in a district’s M&O Tax Revenue per WADA for purposes of state funding to not more than $350, excluding Tier II funds. For the 2009-10 school year, the revenue increases are limited to the funds that a district would have received under the school finance formulas as
198

Miscellaneous Financial Information continued
State Funding for Local School Districts continued
they existed on January 1, 2009, plus an additional $350 per WADA, excluding Tier II funds. The 2011 Special Legislative session reduces the regular program allotment 7.61% in fiscal year 2011-12 and 2.0% in fiscal year 2012-13.
Tier II currently provides two levels of enrichment with different guaranteed yields depending on the district’s local tax effort. For fiscal year 2009-10, the first six cents of tax effort that exceeds the compressed tax rate will generate a guaranteed yield equivalent to (a) that of the Austin Independent School District or (b) the amount of tax revenue per WADA received on that tax effort in the previous year, whichever is greater. The second level of Tier II is generated by the tax effort that exceeds the compressed tax rate plus six cents and has a guaranteed yield per penny of local tax effort of $31.95. Before 2009-10, Tier II consisted of a district’s tax levy above $0.86. For 2008-09, state funding to equalize local M&O tax levies above $0.86, up to a district’s compressed rate was funded at a guaranteed yield of $37.42 per student in WADA for each cent of tax effort; any amount above a district’s compressed rate up to $0.04 was funded at a guaranteed yield of $50.98 per WADA for each cent of tax effort; any tax effort associated with the tax approved by voters at a rollback election was funded at a guaranteed yield of $31.95 per WADA for each cent of tax effort above a district’s compressed rate plus four cents. See “CURRENT SCHOOL FINANCE SYSTEM” – General” for a discussion of the state compression percentage.
The IFA guarantees each school district a specified amount per student (the “IFA Guaranteed Yield”) in State and local funds for each cent of tax effort to pay principal of and interest on eligible bonds issued to construct, acquire, renovate or improve instructional facilities. To receive an IFA, a school district must apply to the Commissioner in accordance with rules adopted by the Commissioner before issuing the bonds to be paid with State assistance. The total amount of debt service assistance over a biennium for which a district may be awarded is limited to the lesser of (1) the actual debt service payments made by the district in the biennium in which the bonds are issued; or (2) the greater of (a) $100,000 or (b) $250 multiplied by the number of students in average daily attendance. The IFA is also available for lease-purchase agreements and refunding bonds meeting certain prescribed conditions. If the total amount appropriated by the State for IFA in a year is less than the amount of money school districts applying for IFA are entitled to for that year, districts applying will be ranked by the Commissioner by wealth per student, and State assistance will be awarded to applying districts in ascending order of adjusted wealth per student beginning with the district with the lowest adjusted wealth per student. In determining wealth per student for purposes of IFA, adjustments are made to reduce wealth for certain fast growing districts. Once a district receives an IFA award for bonds, it is entitled to continue receiving State assistance without reapplying to the Commissioner and the guaranteed level of State and local funds per student per cent of tax effort applicable to the bonds may not be reduced below the level provided for the year in which the bonds were issued. In 2007, the Legislature appropriated funds for outstanding school district bonds that qualified in prior budget cycles for IFA allotments and added funding for qualified
199

Miscellaneous Financial Information continued
State Funding for Local School Districts continued
debt to be issued for instructional facilities in the state’s 2008-09 fiscal biennium, however, the Texas Education Agency has indicated that it intends to reserve all such new appropriation for the second year of the biennium.
State financial assistance is provided for certain existing debt issued by school districts (referred to herein as EDA) to produce a guaranteed yield (the “EDA Yield”), which for the 2011-13 State Biennium is $35.00 (subject to adjustment as described below) in State and local revenue per student for each cent of debt service tax levy; however, for bonds that became eligible for EDA funding after August 31, 2001, and prior to August 31, 2005, EDA assistance for such eligible bonds may be less than $35 in revenue per student for each cent of debt service tax, as a result of certain administrative delegations to the Commissioner under State law. Effective September 1, 2003, the portion of the local debt service rate that has qualified for equalization funding by the State has been limited to the first 29 cents of debt service tax or a greater amount for any year provided by appropriation by the Legislature. In general, a district’s bonds are eligible for EDA assistance if (i) the district made payments on the bonds during the final school year of the proceeding state fiscal biennium or (ii) levied taxes to pay the principal of and interest on the bonds for that school year. Access to EDA funding will be determined by the debt service taxes collected in the final year of the preceding biennium. A district may not receive EDA funding for the principal and interest on a series of otherwise eligible bonds for which the district received IFA funding.
A district may also qualify for an allotment for operational expenses associated with opening new instructional facilities. This funding source may not exceed $25,000,000 in one school year on a State-wide basis. For the first school year in which students attend a new instructional facility, a district is entitled to an allotment of $250 for each student in average daily attendance at the facility. For the second school year in which students attend that facility, a district is entitled to an allotment of $250 for each additional student in average daily attendance at the facility. The new facility operational expense allotment will be deducted from wealth per student for purposes of calculating a district's Tier Two State funding.
Local Revenue Sources - Property Tax Authority
The primary source of local funding for school districts is ad valorem taxes levied against the local tax base. The former provision of the Education Code Section 45.003, that in general limited the M&O tax rate to $1.50 per $100 of taxable assessed value, was replaced by the Reform Legislation with a formula using the state compression percentage so that the maximum tax rate that may be adopted by a district in any fiscal year is limited based on the amount of State funds to be received by the district in that year. For the 2006-07 and 2007-08 fiscal years, districts may generate additional local funds by raising their M&O tax rate by $0.04 above the compressed tax rates (without taking into account changes in taxable valuation) without voter approval, and such amounts will generate equalized funding dollars from the State under the Tier
200

Miscellaneous Financial Information continued
Local Revenue Sources - Property Tax Authority continued
Two program. In fiscal year 2008-09 and thereafter, districts may, in general, increase their tax rate by an additional two or more cents and receive State equalization funds for such taxing effort so long as the voters approve such tax rate increase. Many school districts, however, voted their M&O tax under prior law and may be subject to other limitations on the M&O tax rate. School districts are also authorized to levy a bond debt service tax that may be unlimited in rate. See “TAX INFORMATON – Tax Rate Limitations” herein. The governing body of a school district cannot adopt an annual tax rate which exceeds the district’s “rollback tax rate” without submitting such proposed tax rate to the voters at a referendum election. See “TAX INFORMATION – Public Hearing and Rollback Tax Rate” herein.
Wealth Transfer Provisions
Under the Finance System, districts are required, with certain limited exceptions, to effectively adjust taxable property wealth per weighted student (“wealth per student”) for each school year to no greater than the “equalized wealth level”, determined in accordance with a formula set forth in the Reform Legislation. A district may effectively reduce its wealth per student either by reducing the amount of taxable property within the district relative to the number of weighted students, by transferring revenue out of the district or by exercising any combination of these remedies.
The wealth level that required wealth reduction measures for fiscal year 2006-07 was $319,500 per student in average daily attendance. For 2007-08 that wealth level has been increased to $364,500 per student in average daily attendance with respect to that portion of a district’s M&O tax effort that does not exceed its compressed tax rate, and remains at $319,500 with respect to that portion of a district’s local tax effort that is beyond its compressed rate plus $0.04. For 2008-09 the wealth level was increased to $374,200 per student in average daily attendance with respect to that portion of a district’s M&O tax effort that does not exceed its compressed tax rate, and remained at $319,500 with respect to that portion of a district’s local tax effort that was beyond its compressed rate plus $0.06. For 2009-10 that wealth level was increased to, and in fiscal year 2010-11 and beyond that wealth level will remain at, $476,500 per student in average daily attendance with respect to that portion of a district’s M&O tax effort that does not exceed its compressed tax rate, and remains at $319,500 with respect to that portion of a district’s local tax effort that is beyond it compressed rate plus $0.06. Property wealthy districts may also be able to levy up to an additional $0.06 per $100 of assessed valuation of M&O Taxes above their compressed rate to provide revenue that is not subject to recapture.
A district has four options to reduce its wealth per student so that it does not exceed the equalized wealth level: (1) A district may consolidate by agreement with one or more districts to form a consolidated district. All property and debt of the consolidating districts vest in the consolidated district. (2) Subject to approval by the voters of all affected districts, a district may consolidate by agreement with one or more districts to form a consolidated taxing district solely
201

Miscellaneous Financial Information continued
Wealth Transfer Provisions continued
to levy and distribute either M&O Taxes or both M&O Taxes and debt service taxes. (3) A district may detach property from its territory for annexation by a property-poor district. (4) A district may educate students from other districts who transfer to the district without charging tuition to such students.
A district has three options to transfer tax revenues from its excess property wealth. First, a district with excess wealth per student may purchase “attendance credits” by paying the tax revenues to the State for redistribution under the Foundation School Program. Second, it can contract to disburse the tax revenues to educate students in another district, if the payment does not result in effective wealth per student in the other district to be greater than the equalized wealth level. Both options to transfer property wealth are subject to approving elections by the transferring district’s qualified voters. Third, a wealthy district may reduce its wealth by paying tuition to a non-wealthy district for the education of students that reside in the wealthy district.
A district may not adopt a tax rate until its effective wealth per student is the equalized wealth level or less. If a final court decision holds any of the preceding permitted remedial options unlawful, districts may exercise any remaining option under a revised schedule approved by the Commissioner.
If a district fails to exercise a permitted option, the Commissioner must reduce the district's property wealth per student to the equalized wealth level by detaching certain types of property from the district and annexing the property to a property-poor district or, if necessary, consolidate the district with a property-poor district. Provisions governing detachment and annexation of taxable property by the Commissioner do not provide for assumption of any of the transferring district's existing debt.
Possible Effects of Wealth Transfer Provisions on the District's Financial Condition
The District's wealth per student for the 2011-12 school year is approximately $428,903 and is less than the equalized wealth value. Accordingly, the District has not been required to exercise one of the permitted wealth equalization options. As a district with wealth per student less than the equalized wealth values, the District may benefit in the future by agreeing to accept taxable property or funding assistance from or agreeing to consolidate with a property rich district to enable such district to reduce its wealth per student to the permitted level.
A district's wealth per student must be tested for each future school year and, if it exceeds the maximum permitted level, must be reduced by exercise of one of the permitted wealth equalization options. Accordingly, if the District's wealth per student should exceed the maximum permitted level in future school years, it will be required each year to exercise one or
202

Miscellaneous Financial Information continued
Possible Effects of Wealth Transfer Provisions on the District's Financial Condition continued
more of the wealth reduction options. If the District were to consolidate (or consolidate its tax base for all purposes) with a property-poor district, the outstanding debt of each district could become payable from the consolidated district's combined property tax base, and the District's ratio of taxable property to debt could become diluted. If the District were to detach property voluntarily, a portion of its outstanding debt (including the Bonds) could be assumed by the district to which the property is annexed, in which case timely payment of the Bonds could become dependent in part on the financial performance of the annexing district.
Tax Information Ad Valorem Tax Law The appraisal of property within the District is the responsibility of the Dallas Central Appraisal District and the Denton County Appraisal District (the “Appraisal District”). Excluding agricultural and open-space land, which may be taxed on the basis of productive capacity, the Appraisal District is required under the Property Tax Code to appraise all property within the Appraisal District on the basis of 100% of its market value and is prohibited from applying any assessment ratios. In determining market value of property, different methods of appraisal may be used, including the cost method of appraisal, the income method of appraisal and market data comparison method of appraisal, and the method considered most appropriate by the chief appraiser is to be used. Article VIII of the State Constitution (“Article VIII”) and State law limit the appraised value of a residence homestead to be based solely on the property’s value as a residence homestead, regardless of whether residential use is considered to be the highest and best use of the property. State law further limits the appraised value of a residence homestead for a tax year to an amount not to exceed the lesser of (1) the property’s market value in the most recent tax year in which market value was determined by the appraisal office or (2) the sum of (a) 10% of the property’s appraised value in the preceding tax year, plus (b) the property’s appraised value the preceding tax year, plus (c) the market value of all new improvements to the property. The value placed upon property within the Appraisal District is subject to review by an Appraisal Review Board consisting of members appointed by the Board of Directors of the Appraisal District. The Appraisal Districts are required to review the value of property within the Appraisal Districts at least every three years. The District may require annual review at its own expense, and is entitled to challenge the determination of appraised value of property within the District by petition filed with the Appraisal Review Board. Reference is made to the Property Tax Code for identification of property subject to taxation; property exempt or which may be exempted from taxation, if claimed: the appraisal of property of ad valorem taxation purposes: and the procedures and limitations applicable to the levy and collection of ad valorem taxes.
203

Miscellaneous Financial Information continued
Ad Valorem Tax Law continued Article VIII and State law provide for certain exemptions from property taxes, the valuation of agricultural and open-space lands at productivity value, and the exemption of certain personal property from ad valorem taxation. Certain residence homestead exemptions from ad valorem taxes for public school purposes are mandated by Section 1-b, Article VIII, and State law and apply to the market value of residence homesteads in the following sequence: $15,000; and an additional $10,000 for those 65 years of age or older, or the disabled. A person over 65 and disabled may receive only one $10,000 exemption, and only one such exemption may be received per family, per residence homestead. State law also mandates a freeze on taxes paid on residence homesteads of persons 65 years of age or older which receive the $10,000 exemption. Such residence homesteads shall be appraised and taxes calculated as on any other property, but taxes shall never exceed the amount imposed in the first year in which the property received the $10,000 exemption. The freeze on Ad Valorem Taxes on the homestead of persons who are 65 years of age or older or disabled is also transferable to a different residence homestead. If improvements (other than maintenance or repairs) are made to the property, the value of the improvements is taxed at the then current tax rate, and the total amount of taxes imposed is increased to reflect the new improvements with the new amount of taxes then serving as the ceiling on the taxes for the following years. A “disabled” person is one who is “under a disability for purposes of payment of disability insurance benefits under the Federal Old Age, Survivors and Disability Insurance.” Also, a surviving spouse of a taxpayer who qualifies for the freeze on Ad Valorem taxes is entitled to the same exemption so long as the property was the residence homestead of the surviving spouse when the deceased spouse died and remains the residence homestead of the surviving spouse and the spouse was at least 55 years of age at the time of the death of the individual’s spouse. Pursuant to a Constitutional amendment approved by the voters on May 12, 2007, legislation was enacted to reduce the school property tax limitation imposed by the freeze on taxes paid on residence homestead of persons who are 65 years of age or over or disabled to correspond to reductions in local school district tax rates from the 2005 tax year to the 2006 tax year and from the 2006 tax year to the 2007 tax year (See the “CURRENT PUBLIC SCHOOL FINANCE SYSTEM – General”). The school property tax limitation provided by the constitutional amendment and enabling legislation applies to the 2007 and subsequent tax years. In addition, under Section 1-b, Article VIII, the State law, the governing body of a political subdivision, at its option, may grant either or both of the following:
a. an exemption of not less than $3,000 of the market value of residence homestead of persons 65 years of age or older and the disabled from all ad valorem taxes thereafter levied by the political subdivision;
b. an exemption of up to 20% of the market value of residence homesteads; minimum exemption $5,000.
204

Miscellaneous Financial Information continued
Ad Valorem Tax Law continued After the exemption described in (a) above is authorized, such exemption may be repealed or decreased or increased in amount (a) by the governing body of the political subdivision or (b) by a favorable vote of a majority of the qualified voters at an election called by the governing body of the political subdivision, which election must be called upon receipt of a petition signed by a least 20% of the number of qualified voters who voted in the preceding election of the political subdivision. In the case of a decrease, the amount of the exemption may not be reduced to less than $3,000 of the market value. The surviving spouse of an individual who qualifies for the exemptions listed in (a) above for the residence homestead of a person 65 or older (but not the disabled) is entitled to an exemption for the same property in an amount equal to that of the exemptions for which the deceased spouse qualified if (i) the deceased spouse died in a year in which the deceased spouse qualified for the exemption, (ii) the surviving spouse was at least 55 years of age at the time of the death of the individual’s spouse and (iii) the property was the residence homestead of the surviving spouse when the deceased spouse died and remains the residence homestead of the surviving spouse. In the case of residence homestead exemptions granted under Section 1-b, Article VIII, ad valorem taxes may continue to be levied against the value of homesteads exempted where ad valorem taxes have previously been pledged for the payment of debt in cessation of the levy would impair the obligation of the contract by which the debt was created. State law and Section 2, Article VIII, mandate an additional property tax exemption for disabled veterans or the surviving spouse or children of a deceased veteran who died while on active duty in the armed forces; the exemption applies to either real or personal property with the amount of assessed valuation exempted ranging for $5,000 to a maximum of $1l2,000; provided however, that beginning in the 2009 tax year, a disabled veteran who receives from the United States Department of Veterans Affairs or it successor 100 percent disability compensation due to a service-connected disability and a rating of 100 percent disabled or of individual unemployability is entitled to an exemption from taxation of the total appraised value of the veteran’s residence homestead. Article VIII provides that eligible owners of both agricultural land (Section 1-3) and open-space land (Section 1-d-I), including open-space land devoted to farm or ranch purposes or open-space land devoted to timber production, may elect to have such property appraised for property taxation on the basis of its productive capacity. The same land may not be qualified under both Section 1-d and 1-d-I. Nonbusiness personal property, such as automobiles or light trucks, are exempt from ad valorem taxation unless the governing body of a political subdivision elects to tax this property. Boats owned as nonbusiness property are exempt from ad valorem taxation.
205

Miscellaneous Financial Information continued
Ad Valorem Tax Law continued Article VIII, Section 1-j of the Texas Constitution provides for “Freeport property” to be exempted from ad valorem taxation. Freeport property is defined as goods detained in Texas for 175 days or less for the purpose of assembly, storage, manufacturing, processing or fabrication. Notwithstanding such exemption, counties, school districts, junior college districts and cities may tax such tangible personal property provided official action to tax the same was taken before April 1, 1990. Decisions to continue to tax may be reversed in the future; decisions to exempt Freeport property are not subject to reversal. Article VIII, Section 1-n of the Texas Constitution provides for the exemption from taxation of “goods-in-transit.” “Goods-in transit” is defined by Section 11.253 of the Tax Code, which is effective for tax years 2008 and thereafter, as personal property acquired or imported into Texas and transported to another location in the State or outside of the State within 175 days of the date the property was acquired or imported into Texas. The exemption excludes oil, natural gas, petroleum products, aircraft and special inventory, including motor vehicle, vessel and out-board motor, heavy equipment and manufactured housing inventory. Section 11.253 permits local governmental entities, on a local option basis, to take official action by January 1 of the year preceding a tax year, after holding a public hearing, to tax goods-in-transit during the following tax year. A taxpayer may receive only one of the Freeport exemption or the goods-in-transit exemption for items of personal property. A city or county may create a tax increment financing district (“TIF”) within the city or county with defined boundaries and establish a base value of taxable property in the TIF at the time of its creation. Overlapping taxing units, including school districts, may agree with the city or county to contribute all or part of future ad valorem taxes levied and collected against the “incremental value” (taxable value in excess of the base value) of taxable real property in the TIF to pay or finance the costs of certain public improvements in the TIF, and such taxes levied and collected for and on behalf of the TIF are not available for general use by such contributing taxing units. Prior to September 1, 2001, school districts were allowed to enter into tax abatement agreements to encourage economic development. Under such agreements a property owner agrees to construct certain improvements on the property. The school district in turn agrees not to levy a tax on all or part of the increased value attributable to the improvements until the expiration of the agreement. The abatement agreement could last for a period up to ten years. School districts have been prohibited from entering into new tax abatement agreements since September 1, 2001. In addition, credit will not be given by the Commissioner of Education in determining a district’s property value wealth per student for (1) the appraised value, in excess of the “frozen value” , of property that is located in a TIF created after May 31, 1999 (except in certain limited circumstances where the municipality creating the tax increment financing zone gave notice prior to May 31, 1999 to all other taxing units that levy ad valorem taxes in the TIF of its intention to create the TIF and the TIF was created and had its final project and financing plan approved by the municipality prior to August 31, 1999), or (2) for the loss of value of abated property under any abatement agreement entered into after May 31, 1993.
206

Miscellaneous Financial Information continued
Ad Valorem Tax Law continued Notwithstanding the forgoing, in 2001 the Legislature enacted legislation known as the Texas Economic Development Act, which provides incentives for school districts to grant limitations on appraised property values and provide ad valorem tax credits to certain corporations and limited liability companies to encourage economic development within the district. Generally, during the last eight years of the ten year term of a tax limitation agreement, the school district may only levy and collect ad valorem taxes for maintenance and operation taxes on the agreed-to limited appraised property value. The taxpayer is entitled to a tax credit from the school district for the amount of taxes imposed during the first two years of the tax limitation agreement on the appraised value of the property above the agreed-to limited value. Additional state funding is provided to a school district for each year of such tax limitation in the amount of the tax credit provided to the taxpayer. During the first two years of a tax limitation agreement, the school district may not adopt a tax rate that exceeds the district’s rollback tax rate. (See “TAX INFORMATION – Public Hearing and Rollback Tax Rate” and “TAX INFORMATION – District application of tax code”).
Tax Rate Limitation A school district is authorized to levy maintenance and operation taxes subject to approval of a proposition submitted to district voters. The maximum voted maintenance tax rate for the District is $1.50 per $100 of assessed valuation as approved by the voters at an election held on February 28, 1959 pursuant to the Article 2784e-1, Texas Revised Civil Statues Annotated, as amended (“Article 2784e-1”). Article 2784e-1 limits the District’s annual, local maintenance and operations tax levy based upon a comparison between the District’s outstanding bonded indebtedness and the District’s taxable assessed valuation per $100 of assessed valuation. Article 2784e-1 provides for a reduction of $0.10 for each one percent (1%) or major fraction thereof increase in bonded indebtedness beyond seven percent (7%) of assessed value of property in the District. This limitation is capped when the District’s bonded indebtedness is ten percent (10%) (or greater) of the District’s assessed valuation which would result in an annual maintenance and operations tax levy not to exceed $1.20. Lastly, the Texas Attorney General in reviewing the District’s transcript of proceedings will allow the District to reduce the amount of its outstanding bonded indebtedness by the amount of funds (on a percentage basis) that the District receives in State assistance for the repayment of this bonded indebtedness (for example, if the District anticipates that it will pay 75% of its bonded indebtedness from State assistance, for the purposes of Article 2784e-1, the Texas Attorney General will assume that only 25% of the District’s bonded indebtedness is outstanding and payable from local ad valorem taxes). With the adoption of the Reform Legislation, the maximum tax rate per $100 assessed valuation that may be adopted by the district may not exceed the lessor or (A) $1.50, or such lower rate as described in the preceding paragraph, and (B) the sum of (1) the rate of $0.17, and (2) the
207

Miscellaneous Financial Information continued
Tax Rate Limitation continued product of the “state compression percentage” multiplied by $1.50. The state compression percentage was 67.67% for fiscal years 2007-08, 2008-09, and 2009-10. For fiscal year 2010-11 and thereafter, the Commissioner is required to determine the state compression percentage for each fiscal year which is based on the amount of State funds appropriated for distribution to the District for the current fiscal year. For fiscal year 2011-1, the Commissioner has determined to 2maintain the state compression percentage at 66.67%. For a more detailed description of the state compression percentage, see “CURRENT PUBLIC SCHOOL FINANCE SYSTEM – General”. Furthermore, a school district cannot annually increase its tax rate in excess of the district’s “rollback tax rate” without submitting such tax rate to a referendum election and a majority of the voters voting at such election approving the adopted rate. See ‘TAX INFORMATION – Public Hearing and Rollback Tax Rate”. A school district is also authorized to issue bonds and levy taxes for payment of bonds subject to voter approval of one or more propositions submitted to the voters under Section 45.003(b)(1), Texas Education Code, as amended, which provides a tax unlimited as to rate or amount for the support of school district bonded indebtedness. (See “THE BONDS – Security and Source of Payments”). Chapter 45 of the Texas Education Code, as amended, requires a district to demonstrate to the Texas Attorney General that it has the prospective ability to pay debt service on a proposed issue of bonds, together with debt service on other outstanding “new debt” of the district, from a tax levied at a rate of $0.50 per $100 of assessed valuation before bonds may be issued. In demonstrating the ability to pay debt service at a rate of $0.50, a district may take into account State allotments to the district which effectively reduces the district’s local share of debt service. Once the prospective ability to pay such tax has been shown and the bonds are issued, a district may levy an unlimited tax to pay debt service. Taxes levied to pay debt service on bonds approved by district voters at an election held on or before April 1, 1991 and issued before September 1, 1992 (or debt issued to refund such bonds) are not subject to the foregoing threshold tax rate test. In addition, taxes levied to pay refunding bonds issued pursuant to Chapter 1207, Texas Government Code, are not subject to the $0.50 tax rate test; however, taxes levied to pay debt service on such bonds are included in the calculation of the $0.50 tax rate test as applied to subsequent issues of “new debt”. The Bonds are issued, in part, as “new debt” and are subject to the $0.50 threshold tax rate test. Under current law, a district may demonstrate its ability to comply with the $0.50 threshold tax rate test by applying the $0.50 tax rate to an amount equal to 90% of projected future taxable value of property in the district, as certified by a registered professional appraiser, anticipated for the earlier of the tax year five years after the current tax year or the tax year in which the final payment for the bonds is due. However, if a district uses projected future taxable values to meet the $0.50 threshold test, then for subsequent bond issues, the Attorney General must find that the district has the projected ability to pay principal and interest on the proposed bonds and all previously issued bonds subject to the $0.50
208

Miscellaneous Financial Information continued
Tax Rate Limitation continued threshold tax rate test from a tax rate of $0.45 per $100 valuation. The District has not used projected property values to satisfy this threshold test.
Public Hearing and Rollback Tax Rate In setting its annual tax rate, the governing body of a school district generally cannot adopt a tax rate exceeding the district’s “rollback tax rate” without approval by a majority of the voters at an election approving the higher rate. The tax rate consists of two components: (1) a rate for funding maintenance and operating expenditures and (2) a rate for debt service. For 2007-08 fiscal year and thereafter, the rollback tax rate for a school district is the lesser of (A) the sum of (1) the product of the district’s “state compression percentage” for that year multiplied by $1.50, (2) the rate of $0.04, (3) any rate increase above the rollback tax rate in prior years that were approved by voters, and (4) the district’s current debt rate, or (B) the sum of (1) the district’s effective Maintenance and Operations tax rate, (2) the product of the district’s state compression percentage for that year multiplied by $0.06; and (3) the district’s current debt rate. (See “CURRENT PUBLIC SCHOOL FINANCE SYSTEM – General” for a description of the “State compression percentage”). Effective June 19, 2009, if for the preceding tax year a district adopted an M&O tax rate that was less than its effective M&O tax rate for that preceding tax year, the district’s rollback tax rate for the current year is calculated as if the district had adopted an M&O tax rate for the preceding tax year equal to its effective M&O tax rate for that preceding tax year. The “effective maintenance and operations tax rate” for a school district is the tax rate that, applied to the current tax values, would provide local maintenance and operation funds, when added to State funds to be distributed to the district pursuant to Chapter 42 of the Texas Education Code for the school year beginning in the current tax year, in the same amount as would have been available to the district in the preceding year if the funding elements of wealth equalization and State funding for the current year had been in effect for the preceding year. By each September 1 or as soon thereafter as practicable, the Board of Trustees adopts a tax rate of $100 taxable value for the current year. Before adopting its annual tax rate, a public meeting must be held for the purpose of adopting a budget for the succeeding year. A notice of public meeting to discuss budget and proposed tax rate must be published in the time, format and manner prescribed in Section 44.004 of the Texas Education Code. Section 44.004(e) of the Texas Education Code provides that a person who owns taxable property in a school district is entitled to an injunction restraining the collection of taxes by the district if the district has not complied with such notice requirements or the language and format requirements of such notice as set forth in Section 44.004(b), (c) and (d) and if such failure to comply was not in good faith. Section 44.004(e) further provides the action to enjoin the collection of taxes must be filed before the date the district delivers substantially all of its tax bills. Furthermore, Section 26.05 of
209

Miscellaneous Financial Information continued
Public Hearing and Rollback Tax Rate continued the Property Tax Code that provides that governing body of a taxing unit is required to adopt the annual tax rate for the unit before the later of September 30 or the 60th day after the date the certified appraisal roll is received by the taxing unit, and a failure to adopt a tax rate by such required date will result in the tax rate for the taxing unit for the tax year to be the lower of the effective tax rate calculated for that tax year or the tax rate adopted by the taxing unit for the preceding tax year. Beginning September 1, 2009, a district may adopt its budget after adopting tax rate for the tax year in which the fiscal year covered by the budget begins if the district elects to adopt its tax rate before receiving the certified appraisal roll. A district that adopts a tax rate before adopting its budget must hold a public hearing on the proposed tax rate followed by another public hearing on the proposed budget rather than holding a single hearing on the two items period.
Property Assessment and Tax Payment Property within the District is generally assessed as of January 1 of each year. Business inventory may, at the option of the taxpayer, be assessed as of September 1. Oil and gas reserves are assessed on the basis of a valuation process which uses an average of the daily price of oil and gas for the prior year. Taxes become due October 1 of the same year, and become delinquent on February 1 of the following year. Taxpayers 65 years old or older are permitted by State law to pay taxes on homesteads in four installments with the first installment due before February 1 of each year and the final installment due before August 1.
Penalties and Interest Charges for penalty and interest on the unpaid balance of delinquent taxes are made as follows:
Cumulative CumulativeMonth Penalty Interest Total
February 6.00% 1.00% 7.00%March 7.00% 2.00% 9.00%April 8.00% 3.00% 11.00%May 9.00% 4.00% 13.00%June 10.00% 5.00% 15.00%July 12.00% 6.00% 18.00%
After July, penalty remains at 12%, and interest increases at the rate of 1% each month or a portion of a month the tax remains unpaid. A delinquent tax continues to accrue interest as long as the tax remains unpaid, regardless of whether a judgment for the delinquent tax has been rendered. The purpose of imposing such interest is to compensate the taxing unit for revenue lost because of the delinquency. In addition, if an account is delinquent in July, an attorney’s collection fee of up to 20% may be added to the total tax penalty and interest charge.
210

Miscellaneous Financial Information continued
Penalties and Interest continued Taxes levied by the District are a personal obligation of the owner of the property. On January 1 of each year, a tax lien attaches to property to secure the payment of all taxes, penalties and interest ultimately imposed for the year on the property. The lien exists in favor of the state and each taxing unit, including the District, having the power to tax the property. The District’s tax lien is on a parity with tax liens of all other such taxing units. A tax lien on real property has priority over the claim of most creditors and other holders of liens on the property encumbered by the tax lien, whether or not the debt or lien existing before the attachment of the tax lien. Personal property under certain circumstances is subject to seizure and sale for the payment of delinquent taxes, penalty and interest. At any time after taxes on property become delinquent, the District may file suit to foreclose the lien securing payment of the tax, to enforce personal liability for the tax, or both. In filing a suit to foreclose a tax lien on real property, the District must join other taxing units that have claims for delinquent taxes against all or part of the same property. The ability of the District to collect delinquent taxes by foreclosure may be adversely affected by the amount of taxes owed to other taxing units, adverse market conditions, taxpayer redemption rights, or bankruptcy proceedings which restrain the collection of a taxpayer’s debt. Federal bankruptcy law provides that an automatic stay of actions by creditors and other entities, including governmental units, goes into effect with the filing of any petition in bankruptcy. The automatic stay prevents governmental units from foreclosing on property and prevents liens for post-petition taxes from attaching to property and obtaining secured creditor status unless, in either case, an order lifting the stay is obtained from the bankruptcy court. In many cases post-petition taxes are paid as an administrative expense of the estate in bankruptcy or by order of the bankruptcy court. The District does grant an exemption to the market value of the residence homestead of persons 65 years of age or the disabled.
District Application of Tax Code The District has not granted any part of the additional exemption of up to 20% of the market value of residence homesteads; minimum exemption of $5,000. Ad valorem taxes are not levied by the District against the exempt value of residence homesteads for the payment of debt. The District does not tax nonbusiness personal property; and the District collects its own taxes. The District does not permit split payments of taxes, and discounts for the early payment of taxes are not allowed. The District does not tax Freeport property.
211

Miscellaneous Financial Information continued
District Application of Tax Code continued The District does not tax “goods-in-transit”. The District has not adopted a tax abatement policy.
Tax Increment Finance Zones The District participates in the Farmers Branch Tax Increment Reinvestment Zone #1 (“Farmers Branch TIF #1). The tax increment base of the Farmers Branch TIF #1 established on January 1, 1998 was $42,008,044. As of September 2011, the Farmers Branch TIF #1 Taxable Assessed Value was $91,915,353. The District has agreed to pay to Farmers Branch TIF #1 the proceeds received from the District’s property taxes pursuant to the District’s total maintenance and operations tax rate (as of the 2005-06 fiscal year; $1.50) plus the 2005-06 debt service tax rate, $0.3259 on the total incremental taxable assessed value located with TIF #1 (the “FB #1 Tax Increment Payments”). Under the terms of the tax increment reinvestment zone participation agreement (the “Farmers Branch TIF #1 Agreement”), the District is to receive a reimbursement of 65% of the FB #1 Tax Increment Payments actually received for the purpose of paying all or a portion of Zone School Project Costs in the TIF. The FB #1 Tax Increment Payments are due to be paid in April of each year. As of September 2011, the payments to date into the Farmers Branch TIF #1 have been $8,720,406 and the return payments to the District have totaled $5,668,264. The Farmers Branch TIF #1 Agreement is scheduled to terminate on December 20, 2018. The current school Finance System, including the Reform Legislation, includes provisions that are designed to “hold harmless” districts that have entered into certain qualifying tax increment agreements, such as the Farmers Branch #1 Agreement. In addition, the Farmers Branch TIF #1 agreement includes provisions that release the District from its obligations to make payments to Farmers Branch TIF #1 should applicable law governing the District adversely affect the District financially as a result of its participation in the Farmers Branch TIF #1 Agreement. The District participates in the Farmers Branch Tax Increment Reinvestment Zone #2 (Farmers Branch TIF #2”). The tax increment base for the Farmers Branch TIF #2 adopted on July 21, 1999 was $15,815,680. As of September 2011, the Farmers Branch TIF #2 Taxable Assessed Valuation was $19,021,350. The District has agreed to pay to Farmers Branch TIF #2 the proceeds received from the District’s property taxes pursuant to the District’s total maintenance and operations tax rate (as of the 2005-06 fiscal year; $1.50) plus the 2005-06 debt service tax rate, $0.3259 on the total incremental taxable assessed value located with TIF #2 (the “FB #2 Tax Increment Payments”). Under the terms of the tax increment reinvestment zone participation agreement (the “Farmers Branch TIF #2 Agreement”), the District is to receive a reimbursement of 30% of the FB #2 Tax Increment Payments actually received for the purpose of paying all or a portion of Zone School Project Costs in the TIF. The FB #2 Tax Increment Payments are due to be paid in April of each year. As of September 2011, the payments to date
212

Miscellaneous Financial Information continued
Tax Increment Finance Zones continued into the Farmers Branch TIF #2 have been $301,179 and the return payments to the District have totaled $90,355. The Farmers Branch TIF #2 Agreement is scheduled to terminate on July 20, 2019. The current school Finance System, including the Reform Legislation, includes provisions that are designed to “hold harmless” districts that have entered into certain qualifying tax increment agreements, such as the Farmers Branch #2 Agreement. In addition, the Farmers Branch TIF #2 agreement includes provisions that release the District from its obligations to make payments to Farmers Branch TIF #2 should applicable law governing the District adversely affect the District financially as a result of its participation in the Farmers Branch TIF #2 Agreement. The District participates in the Irving Tax Increment Reinvestment Zone #1 (“Irving TIF #1”). The tax increment base for the Irving TIF #1 adopted on December 22, 1998 was $241,945,218. As of September 2011, the Irving TIF #1 Taxable Assessed Valuation was $968,920,948. The District has agreed to pay to Irving TIF #1 the proceeds received from the District’s property taxes pursuant to the District’s total maintenance and operations tax rate (as of the 2005-06 fiscal year; $1.50) plus the 2005-06 debt service tax rate, $0.3259 on the total incremental taxable assessed value located with TIF #1 (the “Irving #1 Tax Increment Payments”). Under the terms of the tax increment reinvestment zone participation agreement (the “Irving TIF #1 Agreement”), the District is to receive a reimbursement of 67% of the Irving #1 Tax Increment Payments actually received for the purpose of paying all or a portion of Zone School Project Costs in the TIF. The Irving #1 Tax Increment Payments are due to be paid in April of each year. As of September 2011, the payments to date into the Irving TIF #1 have been $65,824,987 and the return payments to the District have totaled $44,102,741. The Irving TIF #1 Agreement is scheduled to terminate on December 31, 2018. The current school Finance System, including the Reform Legislation, includes provisions that are designed to “hold harmless” districts that have entered into certain qualifying tax increment agreements, such as the Irving #1 Agreement. In addition, the Irving TIF #1 agreement includes provisions that release the District from its obligations to make payments to Irving TIF #1 should applicable law governing the District adversely affect the District financially as a result of its participation in the Irving TIF #1 Agreement.
213

Miscellaneous Financial Information continued
2011 Certification of Appraisal Rolls
Totals Combined
Dallas Denton # of Parcels 31,930 13,515 45,445
Personal Property 2,762,509,590$ 178,331,954$ 2,940,841,544$ Land 3,148,590,630$ 899,795,728$ 4,048,386,358$ Improvements 6,910,664,810$ 1,974,775,126$ 8,885,439,936$
Total Market Value 12,821,765,030$ 3,052,902,808$ 15,874,667,838$
Less ExemptionsHomestead (253,969,530)$ (138,777,880)$ (392,747,410)$
Over 65 (41,394,915)$ (17,348,000)$ (58,742,915)$ Homestead Cap Adj (874,271)$ (3,017,417)$ (3,891,688)$
Absolute (928,529,860)$ (155,061,683)$ (1,083,591,543)$ Ag Deferal (61,583,162)$ -$ (61,583,162)$
Disabled Veteran (5,802,970)$ (3,037,456)$ (8,840,426)$ Disabled Person (2,745,564)$ (1,263,900)$ (4,009,464)$
PP Nominal Value (74,130)$ (7,372)$ (81,502)$ Mineral Rights -$ -$ -$
Freeport (534,486,678)$ (24,692,825)$ (559,179,503)$ Pollution Control (979,450)$ -$ (979,450)$
Taxable Value 10,991,324,500$ 2,709,696,275$ 13,701,020,775$
Est. Net Taxable Under Protest 146,911,204$ 41,540,278$ 188,451,482$
Total Taxable & Under Protest 11,138,235,704$ 2,751,236,553$ 13,889,472,257$
*New Construction Included in Market Value 5,034,244$ 94,817,752$
Totals of Dallas and Denton
214
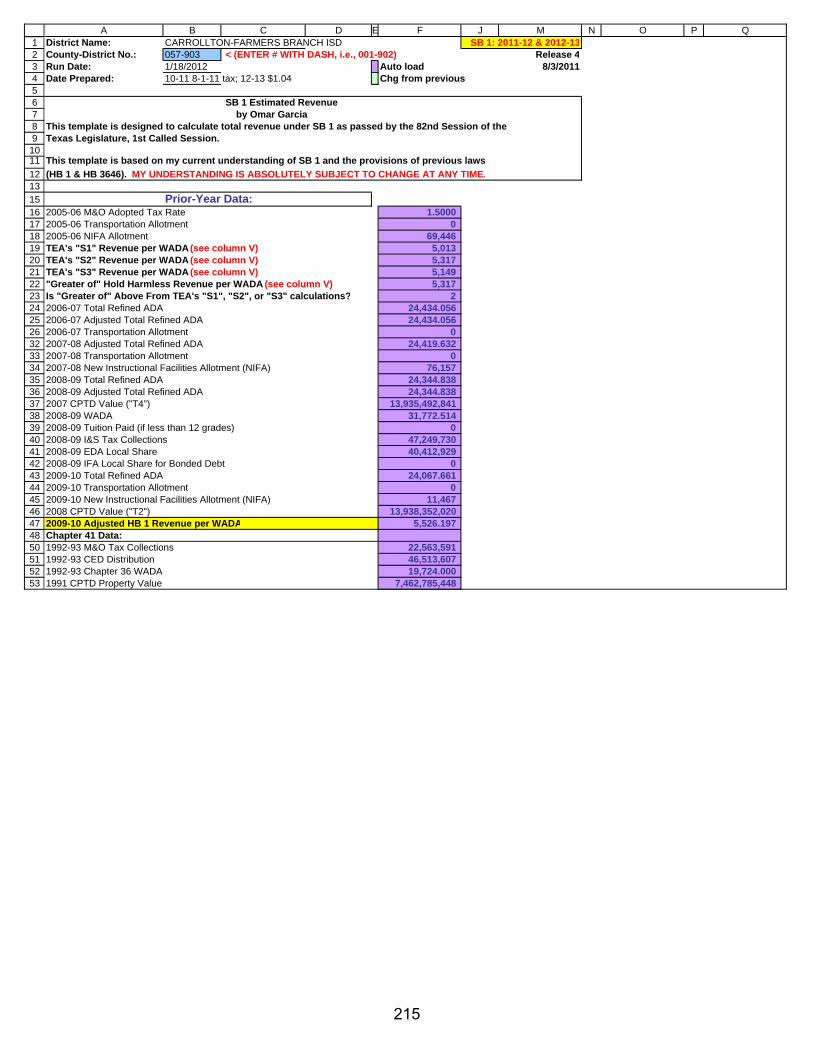
123456789
1011
1213151617181920212223242526323334353637383940414243444546474850515253
A B C D E F J M N O P QDistrict Name: CARROLLTON-FARMERS BRANCH ISD SB 1: 2011-12 & 2012-13County-District No.: 057-903 < (ENTER # WITH DASH, i.e., 001-902) Release 4Run Date: 1/18/2012 Auto load 8/3/2011Date Prepared: 10-11 8-1-11 tax; 12-13 $1.04 Chg from previous
SB 1 Estimated Revenue by Omar Garcia
This template is designed to calculate total revenue under SB 1 as passed by the 82nd Session of the Texas Legislature, 1st Called Session.
This template is based on my current understanding of SB 1 and the provisions of previous laws
(HB 1 & HB 3646). MY UNDERSTANDING IS ABSOLUTELY SUBJECT TO CHANGE AT ANY TIME.
Prior-Year Data:2005-06 M&O Adopted Tax Rate 1.50002005-06 Transportation Allotment 02005-06 NIFA Allotment 69,446TEA's "S1" Revenue per WADA (see column V) 5,013TEA's "S2" Revenue per WADA (see column V) 5,317TEA's "S3" Revenue per WADA (see column V) 5,149"Greater of" Hold Harmless Revenue per WADA (see column V) 5,317Is "Greater of" Above From TEA's "S1", "S2", or "S3" calculations? 22006-07 Total Refined ADA 24,434.0562006-07 Adjusted Total Refined ADA 24,434.0562006-07 Transportation Allotment 02007-08 Adjusted Total Refined ADA 24,419.6322007-08 Transportation Allotment 02007-08 New Instructional Facilities Allotment (NIFA) 76,1572008-09 Total Refined ADA 24,344.8382008-09 Adjusted Total Refined ADA 24,344.8382007 CPTD Value ("T4") 13,935,492,8412008-09 WADA 31,772.5142008-09 Tuition Paid (if less than 12 grades) 02008-09 I&S Tax Collections 47,249,7302008-09 EDA Local Share 40,412,9292008-09 IFA Local Share for Bonded Debt 02009-10 Total Refined ADA 24,067.6612009-10 Transportation Allotment 02009-10 New Instructional Facilities Allotment (NIFA) 11,4672008 CPTD Value ("T2") 13,938,352,0202009-10 Adjusted HB 1 Revenue per WADA 5,526.197Chapter 41 Data:1992-93 M&O Tax Collections 22,563,5911992-93 CED Distribution 46,513,6071992-93 Chapter 36 WADA 19,724.0001991 CPTD Property Value 7,462,785,448
215

555657585960616263646566676869707273747576777880818283848586879192939495969899
A B C D E F J M N O P Q
10-11 ACTUAL YOUR 11-12 YOUR 12-13Student Counts: DATA ESTIMATES ESTIMATESRefined ADA (PreK - 12) 24,456.706 24,456.706 24,456.706Refined ADA (Grades 9 thru 12 only) 6,956.068 6,956.068 6,956.068Special Education Instructional Arrangement FTEs: Homebound (Code 01) 0.343 0.343 0.343 Hospital Class (Code 02) 0.000 0.000 0.000 Speech Therapy (Code 00) 49.834 49.834 49.834 Resource Room (Code 41,42) 594.592 594.592 594.592 S/C Mild/Mod/Severe (Code 43, 44, & 45) 240.342 240.342 240.342 Off Home Campus (Codes 91-98) 0.000 0.000 0.000 VAC (Code 08) 8.891 8.891 8.891 State Schools (Code 30) 0.000 0.000 0.000 Nonpublic Contracts 0.000 0.000 0.000 Res Care & Treatment (Code 81-89) 3.570 3.570 3.570Mainstream ADA 85.300 85.300 85.300Career & Technology FTEs 840.249 840.249 840.249Advanced Career & Technology FTEs 0.000 0.000 0.000# of Students Completing an Electronic Course Provided by the District 0.000 0.000 0.000# of Students Completing an Electronic Course Provided by Another District 0.000 0.000 0.000Compensatory Ed Enrollment 16,352.300 16,352.300 16,352.300FTEs of Pregnant Students 10.335 10.335 10.335Bilingual ADA 5,297.100 5,297.100 5,297.100G & T Enrollment 1,222.835 1,222.835 1,222.835Public Ed Grant Student ADA 0.000 0.000 0.000New Instructional Facility ADA 0.000
2009 TAX YEAR 2010 TAX YEAR 2011 TAX YEARProperty Value Data: CPTD VALUE CPTD VALUE CPTD VALUECPTD Value ("T2") 13,731,300,913 13,047,986,849 12,892,208,149
10-11 ACTUAL YOUR 11-12 YOUR 12-13Tax Collection Data: DATA ESTIMATES ESTIMATESM&O Compressed Rate 1.0000 1.0000 1.0000M&O Adopted Tax Rate (See Note Below) 1.0400 1.0400 1.0400M&O Tax Collections @ Adopted M&O Rate (see Column V) Tax shrinkage 8/1 135,427,255 122,594,648 123,901,918I&S Tax Collections (see definition in Column V) Tax shrinkage 8/1 41,640,816 39,835,006 38,209,588
216

105106107108109110111112113114115116118119120121122126128129130133134136137138139140142
A B C D E F J M N O P Q10-11 ACTUAL YOUR 11-12 YOUR 12-13
Other Data: DATA ESTIMATES ESTIMATESHighest Grade Taught 12 12 12Square Miles 49 49 49Miles From Nearest HS 0 0 0Unadjusted Cost of Ed Index 1.1400 1.1400 1.1400Transportation Allocation 0 0 0TSD Students 0.0000 0.000 0.000TSB Students 0.0000 0.000 0.000Total Tax Levy 0 0 0Reduction for WADA Sold 0 0 0Charge for AP Testing 0 0 0Charge for Spec. Ed. Project 0 0 0District Status - 'Y' if Ch 41 (see column V) y y yNew Chapter 41 district? (see instructions in column V) n n nTuition Pd If < 12 Grades 0 0 0Bond Payment 41,964,756 39,835,007 38,209,588Supplemental TIF Payment (get from TEA) 3,489,801 3,596,998 3,596,998# of Full-time Employees (excluding admin & teachers, etc) 1,195 1,195 1,195.00# of Part-time Employees (excluding administrators) 22 22 22.00Chapter 41 Data:Enrollment 26,159 26,159 26,159# of Non-Resident Students Who Are Charged Tuition 0 0 0CAD Cost 999,825 980,751 980,751CAD Cost Paid by Partner's, if applicable 0 0 0# of Resident Students Being Educated by Another District for which the District is Paying Tuition 0 0 0Amount of Tuition Paid per Student 0 0 0
217

Some of the calculations needed to compute state aid appear below.
@ AdjReg Prog
CALCULATED DATA SECTION: HB 3646 SB 12010-11 HB 3646 2011-12 SB 1
Total Refined ADA 24,456.706 24,456.706Total Adjusted Refined ADA * 24,456.706 24,456.706Total Special Ed FTEs 897.572 897.572Total Spec Ed Weighted FTEs 2,776.136 2,776.136Regular Program ADA 22,718.885 22,718.885Minimum ADA 0.000 0.000
HB 36462010-11 HB 3646 2011-12 SB 1
Small District Adj Weight 0.00025 0.00025Basic Allotment (BA) 4,765 4,765Adjusted Basic Allotment (ABA) 5,239 5,239Small District Adjustment 5,239 5,239Mid-Sized District Adjustment 0 0Adjusted Allotment (AA) 5,239 5,239Tax Collection Limit for DTR
Weighted ADA (WADA) 32,236.693 30,421.795HB 3646:Amount of M&O Taxes Collected per Penny of Adopted Rate 1,302,185 1,178,795M&O Collections Attributed to Compressed Rate (or lower rate, if applicable) 130,218,514 117,879,469Tax Effort @ Compressed Rate (or lower rate, if applicable)DTR for First Level of Tier II (compressed rate - .86)# of M&O Pennies Adopted Above Compressed Rate (max = 6) 4.0000 4.0000M&O Collections Attributed to # of Pennies (max = 6) Above Compressed Rate 5,208,741 4,715,179DTR for Second Level of Tier II 0.0379 0.0361# of M&O Pennies Beyond the 6 Pennies Above the Compressed Rate 0.0000 0.0000M&O Collections Attributed to the Pennies Beyond the 6 Pennies Above the Compressed Rate 0 0DTR for Third Level of Tier II 0.0000 0.0000
LR for First Level of Tier II LR for Second Level of Tier II 5,208,741 4,715,179LR for Third Level of Tier II 0 0
218

SB 1: 2011-12 & 2012-13Release 4
8/3/2011
Calculation of ASATRLine 2011-12 SB 1
1 2009-10 Rev per WADA - HB 3646 (11-12 = 100%; 12-13 = 92.35%) 5,526.1972 Add: $120 per WADA (11-12 = 100%; 12-13 = 92.35%) 120.0003 SB 1 Base Revenue per WADA 5,646.1974 SB 1 WADA 30,421.79505 Base Target Revenue 171,767,4626 2009-10 Tuition Adjustment (Current Year vs 2009-10) - See Note Below 07 SB 1 Minimum Revenue 171,767,4628 NIFA Adjustment (Current Year vs 2009-10) (11,467)9 Transportation Adjustment (Current Year vs 2009-10) 010 Chapter 313 Tax Credit - See Note Below 011 2008-09 Educator Salary Increase ($23.63 x 08-09 WADA) (100%; 92.35%) 750,785
12 SB 1 Adjusted Target Revenue 172,506,779
13 Tier I State Aid 23,261,25114 M&O Collections @ Compressed Rate 117,879,46915 Recapture @ Compressed Rate 0
16 State & Local Revenue 141,140,721
17 Additional State Aid for Tax Reduction 31,366,059
18 SB 1 Revenue @ Compressed Rate 172,506,77919 SB 1 Revenue per WADA @ Compressed Rate 5,670.500
NOTE1: The amounts for Lines 6 and 10 will be determined by TEA.As of this date, they have not been calculated and are thus set tozero. If these affect you, please be aware that at some point, TEAwill have the amounts that go in these cells, and at that point,you will have to enter them in order for Line 19 to match their results.
219

District Name: CARROLLTON-FARMERS BRANCH ISD SB 1: 2011-12 & 2012-13County-District No.: 057-903 Release 4Run Date: 18-Jan-12 8/3/2011
Summary of Finances - SB 12011-12 School Year
Basic Information: Total Refined ADA (adj. for decline, if applicable) 24,456.7060 Special Education FTE 897.5720 Career & Technology FTE 840.2490 Regular Program ADA 22,718.8850 CPTD Property Value 13,047,986,849 Adjusted CPTD Property Value 13,047,986,849 Unadjusted Cost of Education Index 1.1400 Adjusted Cost of Education Index 1.1400 Total M&O Tax Collections 122,594,648
If "FORMULA" district, did the commissioner approve the use of ASATR DISTProgram Intent Code 95.195% instead of the 92.39%? (if applicable, change N to Y) N
11 REGULAR PROGRAM ALLOTMENT @ 92.39% or 95.195% 109,966,49423 Regular Special Education Block Grant 14,544,178
Other Special Education Allotments:23 Mainstream Special Education Allotment 491,57523 Residential Care & Treatment Allotment 74,81323 State Schools Allotment 023 Non-public Contracts Allotment 0
Less: Charge for Dist. Share of ECI Project 022 Career & Technology Block Grant 5,942,787
Advanced Career & Technology Allotment 0State Virtual School Network Student Allotment 0State Virtual School Network Administrative Cost Allotment 0
21 Gifted & Talented Block Grant 768,772 Less: Charge for Dist. Share of AP Tests 0
24/30 Compensatory Education Block Grant 17,133,94024/30 Compensatory Ed Pregnant Allotment 130,490
25 Bilingual Education Block Grant 2,775,15131 High School Allotment 1,912,919
Public Education Grant Allotment 0
New Instruct Facilities Allot (NIFA) - Eliminated 099 Transportation 0
Total Cost of Tier I 153,741,119LESS: Local Share 130,479,868Tier I State Aid 23,261,251
FOUNDATION SCHOOL FUND DETAIL:Tier I State Aid 23,261,251
Tier II State Aid for "Golden" Level ($59.97) 1,877,676Tier II State Aid for $31.95 Level (or $33.95) 0Total Tier II State Aid 1,877,676
Other Programs:Additional State Aid for Tax Reduction (ASATR) 31,366,059Supplemental TIF Payment 3,596,998Penalty for Setting M&O Rate Below Compressed Rate 0Staff Allotment 603,000TSD Charge 0TSB Charge 0 Total Other Programs 35,566,056
Less: Available School Fund (estimated) (6,016,350)
220

District Name: CARROLLTON-FARMERS BRANCH ISD SB 1: 2011-12 & 2012-13County-District No.: 057-903 Release 4Run Date: 18-Jan-12 8/3/2011
Summary of Finances - SB 12011-12 School Year
Fund / Revenue Code199 / 5812 FOUNDATION SCHOOL FUND 54,688,634199 / 5811 AVAILABLE SCHOOL FUND - STATE PORTION 6,016,350
411 / 5829 TECHNOLOGY ALLOTMENT - ELIMINATED 0599 / 5829 CHAPTER 46 EXISTING DEBT ALLOTMENT (EDA) 0
199 / 599 / 5829 CHAPTER 46 IFA 0
TOTAL STATE AID - ALL FUNDS 60,704,983
SUMMARY OF TOTAL STATE/LOCAL M&O REVENUE:
M&O Revenue From State (not including Fund 599) (includes TIF & tuition reimbursement, if applicable) 60,704,983M&O Revenue From Local Taxes (net of recapture and up to compressed rate) 117,879,469M&O Revenue From Local Taxes (for first $.06 above compressed rate; no recapture) 4,715,179M&O Revenue From Local Taxes (net of recapture for pennies beyond compressed rate + $.06) 02011-12 TOTAL STATE/LOCAL M&O REVENUE 183,299,632Less: Credit Balance Due State (See FSF balance above) 02011-12 NET TOTAL STATE/LOCAL M&O REVENUE 183,299,632
221

CHAPTER 41 WADA CALCULATIONS:
@ 100% Reg @ Adj Reg
Adjustments for Non-resident Students: 2010-11 2011-12 2011-12 WADA-to-Enrollment Ratio 1.2323 1.2323 1.2323 1.2323 1.1630 Tuition-paying Non-Residents Converted to WADA 0.0000 0.0000 0.0000 0.0000 0.0000
Chapter 41 WADA =
@ 100% Reg @ Adj RegHB 3646 HB 3646 HB 3646 SB 1 SB 12010-11 2011-12 2012-13 2011-12 2011-12
1.2323 1.2323 1.2323 1.2323 1.163032,236.6930 32,236.6930 32,236.6930 32,236.6930 30,421.795032,236.6930 32,236.6930 32,236.6930 32,236.6930 30,421.7950
30421.79530,421.7950 10-11 wada for eff rate
222

This sheet estimates the district's recapture costs (both Option 3 and Option 4) for the 2010-11 thru 2012-13 school years.
@ Adj Reg Prog @ Adj Reg Prog @ Adj Reg Prog @ Adj Reg ProgSB 1 SB 1 SB 1 SB 1
2011-12 2011-12 2011-12 2011-12OPTION 3 COST OPTION 4 COST OPTION 3 COST OPTION 4 COST
476,500 476,500 319,500 319,500(or $339,500, if applic) (or $339,500, if applic)
Hold Harmless Tax Rate: YOUR DATA YOUR DATA YOUR DATA YOUR DATA 1992-93 Total M&O Revenue 69,077,198 69,077,198 69,077,198 69,077,198 1992-93 WADA 19,724.0000 19,724.0000 19,724.0000 19,724.0000 Chapter 41 WADA 30,421.7950 30,421.7950 30,421.7950 30,421.7950 WADA Ratio (YEAR to 1992-93) 1.6344 1.5424 1.5424 1.5424 1992-93 Total M&O Rev Adj for WADA change 112,899,028 106,542,910 106,542,910 106,542,910 ASF Distribution 6,016,350 6,016,350 6,016,350 6,016,350 1992-93 Adjusted Revenue Less ASF 106,882,678 100,526,560 100,526,560 100,526,560 1992-93 M&O Effective Rate 0.0112 0.0112 0.0112 0.0112 Hold Harmless Effective Rate 0.0150 0.0150 0.0150 0.0150
Tax Base at Equalized Level: Tax Base at Equalized Level 14,495,985,318 14,495,985,318 9,719,763,503 9,719,763,503
Tax Base at Hold Harmless Level: 1992-93 Hold Harmless Tax Base 7,125,511,878 N/A 6,701,770,688 N/A Hold Harmless Tax Base per WADA 234,224 N/A 220,295 N/A Adjusted Hold Harmless Tax Base per WADA 380,335 N/A 247,919 N/A Adjusted Tax Base Retained at HH Level 11,570,474,049 N/A 6,701,770,688 N/A
Tax Base Reduction: Tax Base Retained 14,495,985,318 14,495,985,318 9,719,763,503 9,719,763,503 Excess Tax Base 0 0 3,328,223,347 3,328,223,347 Proportional Tax Base Reduction 0.0000 0.0000 0.2551 0.2551 Tax Base Retained per WADA 476,500 476,500 319,500 319,500
Cost of Buying WADA: M&O Taxes Collected Up to Compressed Rate 117,879,469 117,879,469 M&O Taxes Collected Beyond Compressed Rate + $.06 0 0 Total M&O Taxes Subject to Recapture 117,879,469 117,879,469 0 0 Initial Cost of Buying WADA 0 0 0 0 WADA Needed to Equalize Wealth * 0.0000 0.0000 0.0000 0.0000 Initial Cost per WADA 0.00 0.00 0.00 0.00 WADA Credit for Tuition Paid 0.0000 0.0000 0.0000 0.0000 WADA Credit for New Instr. Facilities Allot. 0.0000 0.0000 0.0000 0.0000 WADA Needed to be Purchased 0.0000 0.0000 0.0000 0.0000 Adjusted Cost After WADA Credits 0 0 0 0
Credits Against Initial Cost: Early Agreement/Efficiency Credit 0 0 0 0 Credit for Appraisal Costs 0 0 0 0
Discounted Cost 0 0 0 0
Discounted Cost per WADA 0 0 0 0
Was the Option chosen the least expensive? n n(if it was not, change the Y to N for the applicable year)Note: You have to add recapture at the compressed rate and recapture at $319,500 level to get total recapture.
* If district has "excess revenue" on the Calc Data worksheet (Cell D94, E94, or H94), the district must purchase additional WADA at a cost equal to the amount of the excess, as determined by the commissioner.
223

Funding Elements:
2009-10 HB 3646Basic Allotment 4,765Level 1 Guaranteed YieldLevel 2 Guaranteed Yield 59.02Level 3 Guaranteed Yield 31.95Level 1 Equalized Wealth Level 476,500Level 2 Equalized Wealth Level 319,500
2010-11 HB 3646Basic Allotment 4,765Level 1 Guaranteed YieldLevel 2 Guaranteed Yield 59.97Level 3 Guaranteed Yield 31.95Level 1 Equalized Wealth Level 476,500Level 2 Equalized Wealth Level 319,500
2011-12 HB 3646Basic Allotment 4,765Level 1 Guaranteed YieldLevel 2 Guaranteed Yield 59.97Level 3 Guaranteed Yield 31.95Level 3 Guaranteed Yield if @$1.17 in 10-11 33.95Level 1 Equalized Wealth Level 476,500Level 2 Equalized Wealth Level 319,500Level 2 Equalized Wealth Level if @ $1.17 339,500
2012-13 HB 3646Basic Allotment 4,765Level 1 Guaranteed YieldLevel 2 Guaranteed Yield 59.97Level 3 Guaranteed Yield 31.95Level 1 Equalized Wealth Level 476,500Level 2 Equalized Wealth Level 319,500
* NOTE: The Basic Allotment indicated pertains to districts that have a $1.00 compressed rate. If adistrict's compressed rate is less than $1.00, the Basic Allotment is reduced proportionally.
224

Miscellaneous Financial Information continued
Tax Rate Impact The District’s tax rate consists of two separate components, a General Fund (sometimes called Maintenance & Operations) rate and a Debt Service rate. Taxes are calculated by dividing the assessed property value (less exemptions, if applicable) by 100 and multiplying the result by the tax rate. The Dallas Central Appraisal District and Denton County Appraisal District determine property values for Carrollton-Farmers Branch Independent School District. The graph below depicts the tax rate trend.
C-FB ISD Tax Rate
Distribution per $100 Valuation
2002-03 2003-04 2004-05 2005-06 2006-07 2007-08 2008-09 2009-10 2010-11 2011-12
General
Fund
$1.5000
$1.5000
$1.5000
$1.5000
$1.3501
$1.0400
$1.0400
$1.0400
$1.0400
$1.0400
Debt
Service
$ .2224
$ .2358
$ .2824
$ .3259
$ .3329
$ .3270
$ .3223
$ .3022
$ .3069
$ .3168
Total Rate
$1.7224
$1.7358
$1.7824
$1.8259
$1.6830
$1.3670
$1.3623
$1.3422
$1.3469
$1.3568
225

Miscellaneous Financial Information continued
Carrollton-Farmers Branch ISDImpact of Budget on Selected Taxpayers
Based on Assessed/Market Value of a Home
Assessed Values Less $15,000 Taxable Value IncreaseCombined Homestead (Assessed - Homestead 2010 Taxes 2011 Taxes 2012 Taxes (Decrease) Monthly Tax Rate Exemption Exemption) $1.3422 $1.3469 $1.3568 $0.0099 Impact
$50,000 ($15,000) $35,000 $469.77 $471.42 $474.88 $3.46 $0.29$75,000 ($15,000) $60,000 $805.32 $808.14 $814.08 $5.94 $0.50
$100,000 ($15,000) $85,000 $1,140.87 $1,144.87 $1,153.28 $8.41 $0.70$125,000 ($15,000) $110,000 $1,476.42 $1,481.59 $1,492.48 $10.89 $0.91$150,000 ($15,000) $135,000 $1,811.97 $1,818.32 $1,831.68 $13.37 $1.11$175,000 ($15,000) $160,000 $2,147.52 $2,155.04 $2,170.88 $15.84 $1.32$200,000 ($15,000) $185,000 $2,483.07 $2,491.77 $2,510.08 $18.32 $1.53$250,000 ($15,000) $235,000 $3,154.17 $3,165.22 $3,188.48 $23.26 $1.94
Carrollton-Farmers Branch ISDComparison of Tax Rates
(Per $100 Assessed Valuation)
General Debt Increase Year Ending 8/31 Fund Service Total (Decrease) %
2003 $1.5000 $0.2224 $1.7224 ($0.0018) -0.10%2004 $1.5000 $0.2358 $1.7358 $0.0134 0.78%2005 $1.5000 $0.2824 $1.7824 $0.0466 2.68%2006 $1.5000 $0.3259 $1.8259 $0.0435 2.44%2007 $1.3501 $0.3329 $1.6830 ($0.1429) -7.83%2008 $1.0400 $0.3270 $1.3670 ($0.3160) -18.78%2009 $1.0400 $0.3223 $1.3623 ($0.0047) -0.34%2010 $1.0400 $0.3022 $1.3422 ($0.0201) -1.48%2011 $1.0400 $0.3069 $1.3469 $0.0047 0.35%2012 $1.0400 $0.3168 $1.3568 $0.0099 0.74%
226

Miscellaneous Financial Information continued
Carrollton-Farmers Branch ISDComparison of Tax Collections to Levy
Delinquent Taxes Total Taxes Collected Delinquent
Percent Collected Collected as Percent Outstanding Taxes as
Fiscal Year Total Tax Current Tax Of Levy Delinquent Interest Plus Interest of Current Delinquent Percent of
Ended 8/31 Levy Collections Collected Taxes & Penalty & Penalty Tax Levy Taxes Tax Levy
2002 $226,866,502 $225,828,582 99.54% $1,187,640 $1,273,584 $228,289,806 100.63% $5,553,181 2.45%
2003 $230,253,042 $227,885,716 98.97% $555,129 $1,335,485 $229,776,330 99.79% $6,124,465 2.66%
2004 $222,869,856 $219,194,266 98.40% $912,422 $1,412,601 $221,519,289 99.40% $7,130,365 3.20%
2005 $221,529,024 $217,965,165 98.40% $2,293,208 $1,336,185 $221,594,558 100.03% $8,249,458 3.70%
2006 $226,478,279 $226,195,686 99.90% $195,838 $1,492,295 $227,883,819 99.36% $5,845,187 2.55%
2007 $223,255,525 $221,175,531 99.07% $852,020 $1,695,042 $223,722,593 100.21% $5,820,029 2.61%
2008 $195,655,990 $193,698,097 99.00% $599,179 $1,382,558 $195,679,834 100.01% $4,634,946 2.37%
2009 $202,093,926 $200,374,994 99.15% ($657,402) $1,236,064 $200,953,656 99.44% $4,797,973 2.37%
2010 $195,089,303 $193,396,978 99.13% $820,636 $1,254,948 $195,472,563 100.20% $3,803,121 1.95%
2011 $186,476,139 $184,834,361 99.12% $247,219 $1,063,818 $186,145,398 99.82% $4,134,227 2.22%
P ercen t o f T a x L ev y C o llec ted S o u rce: A u d it fo r T a x L ev y Y e a r
9 9 .7 0 %
9 9 .5 0 %
9 9 .0 0 %
9 8 .4 0 %
9 8 .4 0 %
9 9 .9 0 %
9 9 .0 7 %
9 9 .0 0 %
9 9 .1 5 %
9 9 .1 3 %
20 01
20 02
20 03
20 04
20 05
20 06
20 07
20 08
20 09
20 10
2 0 0 1 2 0 0 2 2 0 0 3 2 0 0 4 2 0 0 5 2 0 0 6 2 0 0 7 2 0 0 8 2 0 0 9 2 0 1 0
99 .7 0% 99 .5 0% 99 .0 0% 98 .4 0% 98 .4 0% 99 .9 0% 99 .0 7% 99 .0 0% 99 .1 5% 99 .1 3%P ercen tag e
227

Miscellaneous Financial Information continued
Carrollton-Farmers Branch Independent School DistrictCurrent Tax Revenue Calculation
2011-2012
General Fund Debt Service Fund
Taxable Value $12,892,208,149 $12,892,208,149Shrinkage Factor 3.00% 3.00%Tax Rate $1.0400 $0.3168
Total Current Taxes $142,573,842 $42,069,997
Carrollton-Farmers Branch Independent School DistrictCombined Property Tax Rate Calculation Worksheet
2011-2012
General Fund Debt Service Fund Memo Total
RequirementsProposed Expenditure Budget $213,784,621 $39,835,007 $253,619,628 Total Requirements $213,784,621 $39,835,007 $253,619,628
ResourcesOther than Tax Levy: State Revenue $60,393,301 $0 $60,393,301 Federal Revenue $550,000 $0 $550,000 TRS On-Behalf $10,200,000 $0 $10,200,000 Other Local Revenues $1,848,844 $12,400 $1,861,244 Total Non-Tax Revenues $72,992,145 $12,400 $73,004,545
Revenue Required from Current Tax Levy $140,792,476 $39,822,607 $180,615,083
Computation of Tax Rate Revenue Required from Property Tax Levy $140,792,476 $39,822,607 $180,615,083 Collection Rate Factor (Shrinkage) 97.50% 97.50% 97.50% Total Required Property Tax Levy $144,402,539 $40,843,699 $185,246,238
Taxable Value as adjusted $12,892,208,149 $12,892,208,149 $12,892,208,149
Tax Rate Needed $1.1201 $0.3168 $1.4369
Tax Rate Recommended $1.0400 $0.3168 $1.3568
Prior Year Tax Rate $1.0400 $0.3069 $1.3469
228

Miscellaneous Financial Information continued
The graph below depicts changes in revenue source leves over time for C-FB ISD.
General FundRevenue Source Trends - Last Ten Years
Year Property Tax Other Local State Federal Total2003 $200,416,971 $3,315,605 $15,663,623 $398,436 $219,794,6342004 $191,677,246 $3,415,659 $18,465,263 $493,711 $214,051,8792005 $187,394,100 $5,580,545 $18,852,608 $223,871 $212,051,1242006 $188,699,529 $4,275,116 $19,555,813 $1,098,375 $213,628,8342007 $179,732,968 $6,896,633 $36,716,032 $335,672 $223,681,3052008 $149,105,035 $4,721,748 $65,624,756 $193,196 $219,644,7352009 $153,622,695 $2,163,529 $74,391,110 $1,279,421 $231,456,7562010 $151,545,214 $1,752,427 $55,508,661 $8,850,510 $217,656,8112011 $144,004,815 $1,565,389 $61,573,975 $1,593,507 $208,737,686
*2012 $131,376,991 $1,198,844 $70,929,820 $550,000 $204,055,655*Budget Source: District's audited financial statements
General Fund Revenue Source Trends 10 years *budget
2003
2004
2005
2006
2007
2008
2009
2010
2011
*2012
$0
$50,0
00,0
00
$100,
000,
000
$150,
000,
000
$200,
000,0
00
$250,
000,
000
Property Tax Other Local State Federal
Note: For fiscal years 2009-2011, the State used Federal Stimulus dollars to supplant State funding.
229

Miscellaneous Financial Information continued
The graph below depicts the District’s past actual counts for staff full-time equivalents (FTEs). Full-Time Staff Counts
Actual Actual Actual Actual Actual Actual Actual2004-05 2005-06 2006-07 2007-08 2008-09 2009-10 2010-11
Total Personnel 3,040.44 3,154.90 3,257.87 3,366.62 3,371.30 3,201.17 3,132.60Teachers 1,699.52 1,792.70 1,812.63 1,847.85 1,821.29 1,727.22 1,702.20 Pre-K & Kindergarten 155.94 165.60 170.65 * Pre-Kindergarten 54.71 60.81 34.49 42.35 Kindergarten 119.17 132.08 138.87 134.86 Combined Pre-K & Kindergarten 12.91 Elementary (Grades 1-6) 721.66 745.40 713.48 724.72 714.08 712.01 721.79 Secondary 641.56 693.30 730.96 * Middle School (Grades 6-8) 9.29 7.76 7.90 Secondary (Grades 7-12) 757.92 740.14 703.87 677.34 Special Education 173.15 179.00 188.19 * All Grade Levels 7.21 10.10 9.35 169.15 166.42 130.08 125.87Support Staff 282.99 284.10 351.93 335.16 346.53 358.08 354.92 Athletic Trainer 5.51 2.59 1.90 6.44 Audiologist 1.00 Corrective Therapist 0.52 Supervisors 3.00 3.50 9.44 * Counselors 44.90 43.40 47.14 47.60 49.48 52.18 58.91 Department Head 1.48 13.71 7.00 3.00 Ed Diagnosticians 29.03 31.00 30.98 30.52 30.33 33.44 31.94 Librarians 37.68 38.00 36.66 37.79 41.00 40.96 39.96 Nurses/Physicians 30.93 31.80 30.75 31.79 33.00 36.00 35.45 Therapists 29.45 34.20 36.20 * Occupational Therapist 7.00 6.93 7.00 6.99 Orientation/Mobility Specalist 1.00 0.50 1.00 1.00 Other Campus Professional 58.85 70.69 76.78 59.58 Other Non-Campus Prof Personnel 62.41 50.69 51.30 67.68 Other Support Staff 101.00 95.80 154.26 * Physical Therapist 2.00 1.00 2.00 2.00 Psychologist/Assoc Psychologists 7.00 6.00 6.50 6.60 6.60 6.04 6.08 Social Worker 1.00 1.00 1.00 1.00 Speech Thrpst/Speech Lang Pathologist 29.06 27.48 31.48 33.90 Teacher Facilitator 12.50 11.00 10.00 Work-Based Learning Site Coordinator 0.05Administrators 122.00 121.00 122.74 143.72 156.48 139.48 131.09 Admin/Instructional Officers 24.42 22.60 22.30 24.67 42.19 35.87 33.57 Principals 37.00 37.00 38.88 38.56 38.24 39.00 39.91 Assistant Principals 56.19 56.40 56.56 58.33 52.48 45.92 46.11 Superintendents 1.00 1.00 1.00 1.00 1.00 1.00 1.00 Assistant Superintendents 4.00 4.00 4.00 4.00 4.00 3.00 2.00 Athletic Director 6.75 6.44 5.19 1.00 Business Manager 1.00 2.00 1.00 1.00 Dir-Personnel/Human Resources 2.00 4.00 4.00 2.00 Registrar 3.00 3.00 3.00 3.00 Tax Assessor/Collector 1.00 1.00 1.00 1.00 Teacher Supervisor 3.40 2.13 0.50 0.50Total Professional 2,105.13 2,197.80 2,287.31 2,326.73 2,324.30 2,224.79 2,188.21Educational Aides 224.43 233.60 230.58 259.40 262.31 199.50 219.51Auxiliary Staff 710.88 723.40 739.99 780.49 784.69 776.89 724.88
Percentage increase (decrease) from Prior Year -2.92% 3.76% 3.26% 3.34% 0.14% -5.05% -2.14%
Source: Texas Education Agency's Standard Reports*Change in Classification by the Texas Education Agency
230
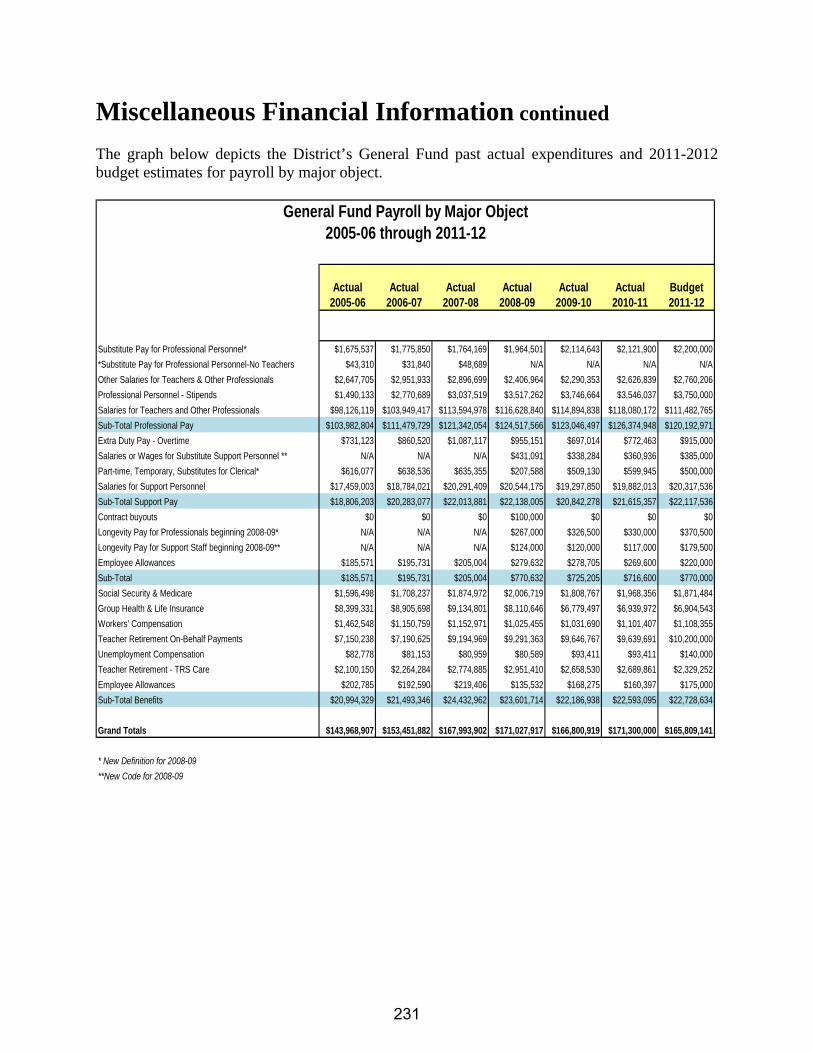
Miscellaneous Financial Information continued
The graph below depicts the District’s General Fund past actual expenditures and 2011-2012 budget estimates for payroll by major object.
General Fund Payroll by Major Object2005-06 through 2011-12
Actual Actual Actual Actual Actual Actual Budget2005-06 2006-07 2007-08 2008-09 2009-10 2010-11 2011-12
Substitute Pay for Professional Personnel* $1,675,537 $1,775,850 $1,764,169 $1,964,501 $2,114,643 $2,121,900 $2,200,000
*Substitute Pay for Professional Personnel-No Teachers $43,310 $31,840 $48,689 N/A N/A N/A N/A
Other Salaries for Teachers & Other Professionals $2,647,705 $2,951,933 $2,896,699 $2,406,964 $2,290,353 $2,626,839 $2,760,206
Professional Personnel - Stipends $1,490,133 $2,770,689 $3,037,519 $3,517,262 $3,746,664 $3,546,037 $3,750,000
Salaries for Teachers and Other Professionals $98,126,119 $103,949,417 $113,594,978 $116,628,840 $114,894,838 $118,080,172 $111,482,765
Sub-Total Professional Pay $103,982,804 $111,479,729 $121,342,054 $124,517,566 $123,046,497 $126,374,948 $120,192,971
Extra Duty Pay - Overtime $731,123 $860,520 $1,087,117 $955,151 $697,014 $772,463 $915,000
Salaries or Wages for Substitute Support Personnel ** N/A N/A N/A $431,091 $338,284 $360,936 $385,000
Part-time, Temporary, Substitutes for Clerical* $616,077 $638,536 $635,355 $207,588 $509,130 $599,945 $500,000
Salaries for Support Personnel $17,459,003 $18,784,021 $20,291,409 $20,544,175 $19,297,850 $19,882,013 $20,317,536
Sub-Total Support Pay $18,806,203 $20,283,077 $22,013,881 $22,138,005 $20,842,278 $21,615,357 $22,117,536
Contract buyouts $0 $0 $0 $100,000 $0 $0 $0
Longevity Pay for Professionals beginning 2008-09* N/A N/A N/A $267,000 $326,500 $330,000 $370,500
Longevity Pay for Support Staff beginning 2008-09** N/A N/A N/A $124,000 $120,000 $117,000 $179,500
Employee Allowances $185,571 $195,731 $205,004 $279,632 $278,705 $269,600 $220,000
Sub-Total $185,571 $195,731 $205,004 $770,632 $725,205 $716,600 $770,000
Social Security & Medicare $1,596,498 $1,708,237 $1,874,972 $2,006,719 $1,808,767 $1,968,356 $1,871,484
Group Health & Life Insurance $8,399,331 $8,905,698 $9,134,801 $8,110,646 $6,779,497 $6,939,972 $6,904,543
Workers' Compensation $1,462,548 $1,150,759 $1,152,971 $1,025,455 $1,031,690 $1,101,407 $1,108,355
Teacher Retirement On-Behalf Payments $7,150,238 $7,190,625 $9,194,969 $9,291,363 $9,646,767 $9,639,691 $10,200,000
Unemployment Compensation $82,778 $81,153 $80,959 $80,589 $93,411 $93,411 $140,000
Teacher Retirement - TRS Care $2,100,150 $2,264,284 $2,774,885 $2,951,410 $2,658,530 $2,689,861 $2,329,252
Employee Allowances $202,785 $192,590 $219,406 $135,532 $168,275 $160,397 $175,000
Sub-Total Benefits $20,994,329 $21,493,346 $24,432,962 $23,601,714 $22,186,938 $22,593,095 $22,728,634
Grand Totals $143,968,907 $153,451,882 $167,993,902 $171,027,917 $166,800,919 $171,300,000 $165,809,141
* New Definition for 2008-09
**New Code for 2008-09
231

Miscellaneous Financial Information continued
Staff Salaries2004-05 through 2010-11
Actual Actual Actual Actual Actual Actual Actual 2004-05 2005-06 2006-07 2007-08 2008-09 2009-10 2010-11
Total Personnel $116,635,441 $124,990,332 $136,901,630 $145,384,000 $151,228,358 $147,243,394 $146,453,312Teachers $71,979,995 $78,465,504 $84,050,796 $88,585,898 $91,136,984 $88,562,642 $88,620,699 Pre-K & Kindergarten $6,458,983 $7,074,550 $7,755,832 * Pre-Kindergarten $2,563,920 $2,959,291 $1,754,847 $2,193,488 Kindergarten $5,618,497 $6,555,334 $6,984,322 $6,916,937 Combined Pre-K & Kindergarten $648,031 Elementary (Grades 1-6) $30,148,297 $32,273,601 $32,679,341 $34,509,467 $35,334,230 $36,184,628 $37,240,243 Secondary $27,937,431 $31,102,902 $34,464,492 * Middle School (Grades 6-8) $454,551 $404,082 $419,542 * Secondary (Grades 7-12) $36,824,059 $37,657,216 $36,531,475 $35,849,776 Special Education $7,221,289 $7,731,722 $8,657,993 * All Grade Levels $213,995 $282,729 $344,556 $7,967,373 $8,226,831 $6,687,828 $6,420,255Support Staff $14,763,936 $15,291,351 $19,878,190 $19,513,164 $20,630,284 $21,653,776 $21,914,383 Athletic Trainer $258,579 $125,131 $92,499 $363,215 Corrective Therapist $26,811 $67,166 Supervisors $235,350 $271,803 $589,821 * Counselors $2,485,890 $2,458,994 $2,786,130 $2,878,227 $3,038,774 $3,246,537 $3,688,480 Department Head $85,977 $806,315 $460,313 $243,716 Ed Diagnosticians $1,499,559 $1,655,387 $1,743,780 $1,793,718 $1,847,486 $2,017,723 $1,964,440 Librarians $1,805,012 $1,880,287 $1,943,122 $2,070,220 $2,262,257 $2,272,120 $2,269,520 Nurses/Physicians $1,295,371 $1,365,869 $1,393,009 $1,504,294 $1,618,479 $1,794,182 $1,792,616 Therapists $1,427,864 $1,720,369 $1,899,970 * Occupational Therapist $391,924 $405,273 $418,284 $430,303 Orientation/Mobility Specalist $50,572 $26,628 $54,672 $52,324 Other Campus Professional $3,160,311 $3,909,910 $4,351,491 $3,407,970 Other Non-Campus Prof Personnel $4,541,733 $3,895,632 $4,084,984 $5,188,288 Other Support Staff $5,649,997 $5,591,476 $9,149,075 * Physical Therapist $126,508 $66,507 $115,007 $116,443 Psychologist/Assoc Psychologists $364,893 $347,166 $373,283 $391,453 $401,743 $359,168 $368,457 Social Worker $54,851 $57,477 $58,828 $60,299 Speech Thrpst/Speech Lang Pathologist $1,518,333 $1,503,560 $1,721,696 $1,901,146 Teacher Facilitator $684,502 $638,301 $606,272 Work-Based Learning Site Coordinator $1,962Administrators $9,277,443 $9,426,091 $9,928,250 $11,664,687 $12,712,406 $11,558,405 $10,809,467 Admin/Instructional Officers $2,066,051 $1,949,780 $1,940,866 $1,910,305 $3,002,312 $2,660,885 $2,512,148 Principals $3,088,399 $3,189,823 $3,472,112 $3,512,601 $3,557,120 $3,692,419 $3,725,105 Assistant Principals $3,311,820 $3,445,597 $3,648,322 $3,894,382 $3,666,910 $3,273,262 $3,277,275 Superintendents $275,000 $275,000 $275,000 $285,000 $285,000 $235,630 $233,095 Assistant Superintendents $536,173 $565,891 $591,950 $677,441 $657,240 $522,291 $340,117 Athletic Director $523,107 $515,971 $410,009 $96,502 Business Manager $107,328 $199,838 $111,286 $112,469 Dir-Personnel/Human Resources $207,954 $343,165 $354,979 $204,770 Registrar $194,072 $177,820 $192,853 $197,635 Tax Assessor/Collector $72,567 $69,741 $70,438 $72,198 Teacher Supervisor $279,930 $237,289 $34,353 $38,153Total Professional $96,021,374 $103,182,946 $113,782,945 $119,763,749 $124,479,674 $121,774,823 $121,344,549Educational Aides $3,955,423 $4,190,925 $4,314,584 $5,016,890 $5,294,628 $4,086,186 $4,576,679Auxiliary Staff $16,658,644 $17,616,461 $18,804,101 $20,603,361 $21,454,056 $21,382,385 $20,532,084
Percentage increase (decrease) from Prior Year -1.16% 7.16% 9.53% 6.20% 4.02% -2.64% -0.54%
Source: Texas Education Agency's Standard Reports* Change in Classification by the Texas Education Agency
232
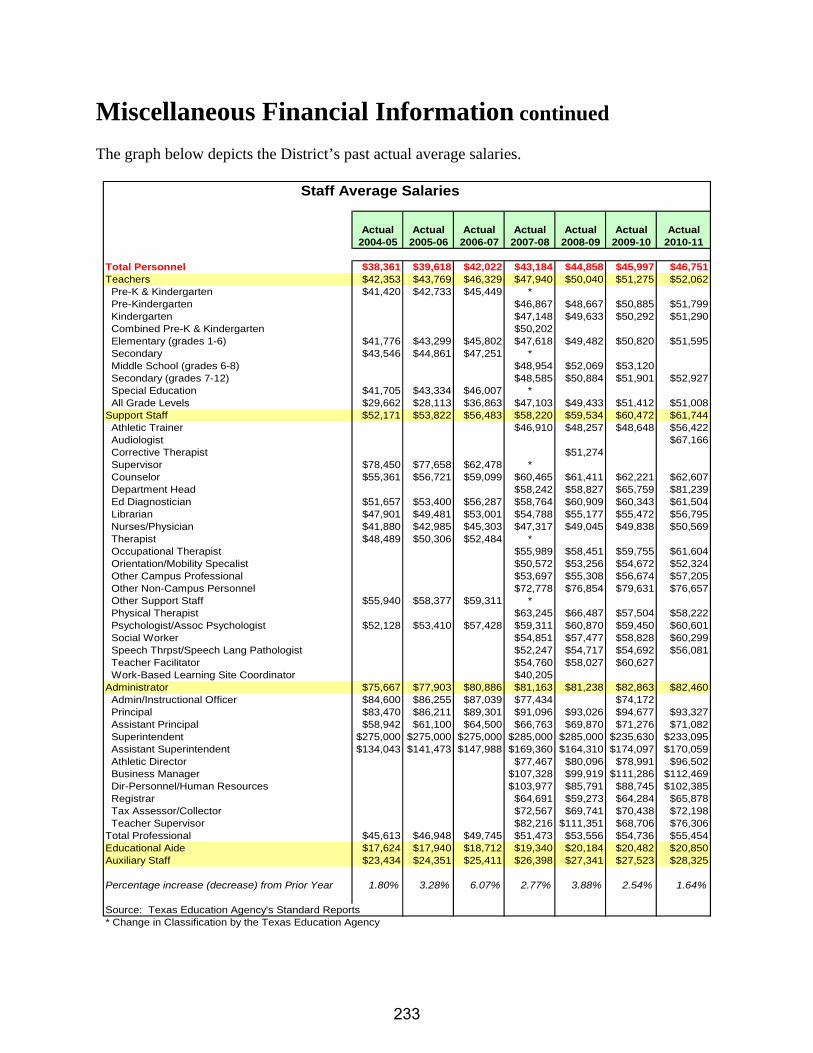
Miscellaneous Financial Information continued
The graph below depicts the District’s past actual average salaries.
Staff Average Salaries
Actual Actual Actual Actual Actual Actual Actual2004-05 2005-06 2006-07 2007-08 2008-09 2009-10 2010-11
Total Personnel $38,361 $39,618 $42,022 $43,184 $44,858 $45,997 $46,751Teachers $42,353 $43,769 $46,329 $47,940 $50,040 $51,275 $52,062 Pre-K & Kindergarten $41,420 $42,733 $45,449 * Pre-Kindergarten $46,867 $48,667 $50,885 $51,799 Kindergarten $47,148 $49,633 $50,292 $51,290 Combined Pre-K & Kindergarten $50,202 Elementary (grades 1-6) $41,776 $43,299 $45,802 $47,618 $49,482 $50,820 $51,595 Secondary $43,546 $44,861 $47,251 * Middle School (grades 6-8) $48,954 $52,069 $53,120 Secondary (grades 7-12) $48,585 $50,884 $51,901 $52,927 Special Education $41,705 $43,334 $46,007 * All Grade Levels $29,662 $28,113 $36,863 $47,103 $49,433 $51,412 $51,008Support Staff $52,171 $53,822 $56,483 $58,220 $59,534 $60,472 $61,744 Athletic Trainer $46,910 $48,257 $48,648 $56,422 Audiologist $67,166 Corrective Therapist $51,274 Supervisor $78,450 $77,658 $62,478 * Counselor $55,361 $56,721 $59,099 $60,465 $61,411 $62,221 $62,607 Department Head $58,242 $58,827 $65,759 $81,239 Ed Diagnostician $51,657 $53,400 $56,287 $58,764 $60,909 $60,343 $61,504 Librarian $47,901 $49,481 $53,001 $54,788 $55,177 $55,472 $56,795 Nurses/Physician $41,880 $42,985 $45,303 $47,317 $49,045 $49,838 $50,569 Therapist $48,489 $50,306 $52,484 * Occupational Therapist $55,989 $58,451 $59,755 $61,604 Orientation/Mobility Specalist $50,572 $53,256 $54,672 $52,324 Other Campus Professional $53,697 $55,308 $56,674 $57,205 Other Non-Campus Personnel $72,778 $76,854 $79,631 $76,657 Other Support Staff $55,940 $58,377 $59,311 * Physical Therapist $63,245 $66,487 $57,504 $58,222 Psychologist/Assoc Psychologist $52,128 $53,410 $57,428 $59,311 $60,870 $59,450 $60,601 Social Worker $54,851 $57,477 $58,828 $60,299 Speech Thrpst/Speech Lang Pathologist $52,247 $54,717 $54,692 $56,081 Teacher Facilitator $54,760 $58,027 $60,627 Work-Based Learning Site Coordinator $40,205Administrator $75,667 $77,903 $80,886 $81,163 $81,238 $82,863 $82,460 Admin/Instructional Officer $84,600 $86,255 $87,039 $77,434 $74,172 Principal $83,470 $86,211 $89,301 $91,096 $93,026 $94,677 $93,327 Assistant Principal $58,942 $61,100 $64,500 $66,763 $69,870 $71,276 $71,082 Superintendent $275,000 $275,000 $275,000 $285,000 $285,000 $235,630 $233,095 Assistant Superintendent $134,043 $141,473 $147,988 $169,360 $164,310 $174,097 $170,059 Athletic Director $77,467 $80,096 $78,991 $96,502 Business Manager $107,328 $99,919 $111,286 $112,469 Dir-Personnel/Human Resources $103,977 $85,791 $88,745 $102,385 Registrar $64,691 $59,273 $64,284 $65,878 Tax Assessor/Collector $72,567 $69,741 $70,438 $72,198 Teacher Supervisor $82,216 $111,351 $68,706 $76,306Total Professional $45,613 $46,948 $49,745 $51,473 $53,556 $54,736 $55,454Educational Aide $17,624 $17,940 $18,712 $19,340 $20,184 $20,482 $20,850Auxiliary Staff $23,434 $24,351 $25,411 $26,398 $27,341 $27,523 $28,325
Percentage increase (decrease) from Prior Year 1.80% 3.28% 6.07% 2.77% 3.88% 2.54% 1.64%
Source: Texas Education Agency's Standard Reports* Change in Classification by the Texas Education Agency
233

Miscellaneous Financial Information continued
Carrollton-Farmers Branch ISDDebt Service Fund
Bond Schedule
Interest Amounts Amounts IssuedRate Original Outstanding Current Retired
Description Payable Issue September 1, 2011 Year/Budgeted Current Year
Series 1987 Refunding 0 to 6.7% $23,428,184 - -
Series 1993 Refunding 0 to 5.375% $21,349,988 - -
Series 1995 Building 5% to 6.125% $36,700,000 - -
Series 1996 Building 5.1% to 5.7% $50,900,000 - -
Series 1997 Building 5% to 7% $1,605,000 - -
Series 1998 Building/Refunding 1.653% to 5% $15,299,988 - -
Series 1998 Building 4.3% to 5.875% $64,000,000 - -
Series 1999 Building 5% to 6% $60,000,000 - - -
Series 2000 Building 4.625% to 5.5% $74,600,000 - - -
Series 2001 Refunding 3% to 5.5% $83,899,962 - - -
Series 2003 Refunding 3% to 4% $10,230,000 905,000 - -
Series 2004 Refunding 2% to 5% $23,740,000 20,130,000 - 2,880,000
Series 2004 Building 2% to 5% $54,350,000 38,850,000 - 1,395,000
Series 2005 Building 3% to 5% $54,810,000 38,770,000 - 2,025,000
Series 2006 Building 4.5% to 5% $41,220,000 30,390,000 - 980,000
Series 2007 Building/Refunding 4.0% to 5.0% $105,775,000 97,475,000 - 2,790,000
Series 2008 Building/Refunding 2.05% to 4.280% $57,435,000 37,650,000 - 5,310,000
Series 2010 Building/Refunding 1.38% to 5.0% $63,565,000 58,990,000 - 10,175,000 Total Bonded Indebtedness $842,908,122 $323,160,000 $0 $25,555,000
234

Miscellaneous Financial Information continued
Amounts Interest September 1, 2014Outstanding Current Year Ending 8/31/2013 Year Ending 8/31/2014 To Maturity
August 31, 2012 Year Principal Interest Principal Interest Interest
- - - - - - -
- - - - - - -
- - - - - - -
- - - - - - -
- - - - - - -
- - - - - - -
- - - - - - -
- - - - - - -
- - - - - - -
- - - - - - -
905,000 36,200 440,000 27,400 465,000 9,300 -
17,250,000 875,600 3,010,000 772,200 3,170,000 632,750 852,000
37,455,000 1,792,600 1,450,000 1,721,475 1,520,000 1,647,225 13,337,963
36,745,000 1,781,938 2,120,000 1,688,438 2,225,000 1,579,813 9,482,806
29,410,000 1,403,713 1,015,000 1,361,319 1,060,000 1,318,550 12,398,975
94,685,000 4,347,313 1,295,000 4,265,613 5,245,000 4,134,813 23,550,794
32,340,000 $1,569,831 5,545,000 1,298,456 4,660,000 1,066,631 10,474,628
48,815,000 $2,466,813 10,185,000 2,008,688 6,735,000 1,585,688 3,125,694 $297,605,000 $14,274,006 $25,060,000 $13,143,588 $25,080,000 $11,974,769 $73,222,860
235

236

LONG RANGE FINANCIAL FORECASTS
237

Long Range Financial Forecasts continued
General and Debt Service Forecasts The following financial forecasts are used to determine the impact of current financial decisions on subsequent fiscal years. The model used for the General and Debt Service Funds is much more detailed than the one used for the Food Service Special Revenue Fund, since many more factors and assumptions are involved. Review and evaluation of these plans, in conjunction with the budget development process, ensures that the short-term financial decisions are made only after consideration of the long-term consequences. Future budget projections predict deficit General Fund budgets through 2011-15. If projections are accurate, the District will consider program/operation reductions or additional pennies on the tax rate to balance the budget. Any additional pennies on the tax rate will require an election and voter approval.
Projection Model Summary Throughout this model we projected future revenue and expenditures by reviewing past trends. The Debt Service schedule included here is based on currently known debt. When the district has future bond sales, this projection will need to be changed to incorporate the new debt. Therefore, the debt schedule included here is preliminarily presented for discussion and estimation purposes only. Each component of the projection model will be discussed in the following section. Projection Model Components Projected Revenue The Revenue portion of each fund’s projected revenue schedule combines data reflected on the State Revenue and current tax collection worksheets. Also included are estimates for other categories based on historical trends. Projected Tax Collections This worksheet estimates the amount of tax revenue to be generated from the current levy by attempting to predict taxable values, collection rates and tax rates. Prediction is made more complicated by the fact that C-FB ISD’s taxable value has fluctuated over time from an increase of 10.45% in 2007-08 to a decrease of 5.21% in 2010-11. We used what we believe are conservative estimates, including a 1.0% increase for 2012-13, 1.5% increase for 2013-14 and 1.5% increase for 2014-15 in our projection model.
238

Long Range Financial Forecasts continued
General and Debt Service Forecasts continued State Revenue Estimate Worksheet The calculations on these worksheets are based on the current funding formula. Three of the most critical factors in estimating General Fund State Aid are Average Daily Attendance (ADA) projections, Full-Time Equivalents (FTE’s) for special program students (such as Special Education, Career and Technology, Compensatory Education, Bilingual, and Gifted and Talented), and taxable values. Special Education FTE’s are projected based on historical percentage growth rates for each instructional arrangement. The most critical factor in calculating Debt Service budgets is our debt service requirements. (Under the current State funding formula, C-FB ISD does not qualify for State Debt Service funding such as the Instructional Facility Allotments and Existing Debt Allotments due to our taxable value level). Significant Revenue Trends:
If the future follows recent trends, our taxable values will increase. We are projecting a slow incremental increase since the District had a taxable value decline for the 2009-10 through 2011-12 budget years.
Unless current law changes, we will be held to a General Fund tax rate cap of $1.17/$100 assessed value (HB 1 compressed rate of 66.67% times the 2005-06 rate of $1.50 + $0.17). Amounts over $1.04 will require a tax authorization election.
Based on past history, our collection percentages will remain at 98% or more. Federal revenue sources are not expected to increase significantly over current levels. Unless current law changes, State sources of revenue will not increase over 2006-07
levels. Projected Expenditures This worksheet includes data from the projected Debt schedule and estimates other categories based on historical trends. The General Fund projected expenditures are based on a per pupil cost per functional category (based on 2010-11 actual expenditures budget divided by projected enrollment) and then multiplied times the new year enrollment estimate for all functions except for 71, Debt Service; 91, Contracted Instructional Services (Chapter 41 payment); 92, Incremental Costs Associated with Chapter 41, Texas Education Code, Purchase or Sale of WADA; 97, Tax Increment Financing Zone; and 99, Other Intergovernmental Charges (Tax Appraisal Services). The District plans to reduce costs in all possible functional categories over the upcoming fiscal years. The focus of cost reductions will be in areas that will have the least impact on student achievement. Employment savings will try to be achieved through consolidation and reorganization and through attrition rather than layoffs. Debt Service comes from our existing Contractual Obligation Debt Schedule. The Chapter 41 expenditure amount, if required, comes from estimated student counts and taxable wealth applied to the current funding formula. Function 92 is calculated as the percentage of our Chapter 41 payment times the
239
Long Range Financial Forecasts continued
General and Debt Service Forecasts continued estimated Appraisal District Costs. The Tax Increment Financing Zone expenditures are based on estimates of the value of the Zones for the period being budgeted. Debt Service This debt requirement worksheet is based on currently known debt requirements. When the District has future bond sales, this projection will need to be changed to incorporate the new debt. Enrollment Enrollment projections are one of the most significant factors in the budget development and long-range financial planning process. Enrollment projections are designed to predict the student enrollment of the District based on geographic data, student data, migration data, and historical data of student populations. Enrollment projections are generally estimated using local information, such as changing housing - both when razed and when constructed. From time-to-time, the District also uses a third party demographic study to produce enrollment projections.
Food Service Special Revenue Fund
Forecasts for this fund are based on past trends with increases for student growth, if applicable, and inflation. Capital outlay projections are based on estimated opening dates of new facilities and capital outlay replacement requirements at existing facilities.
240
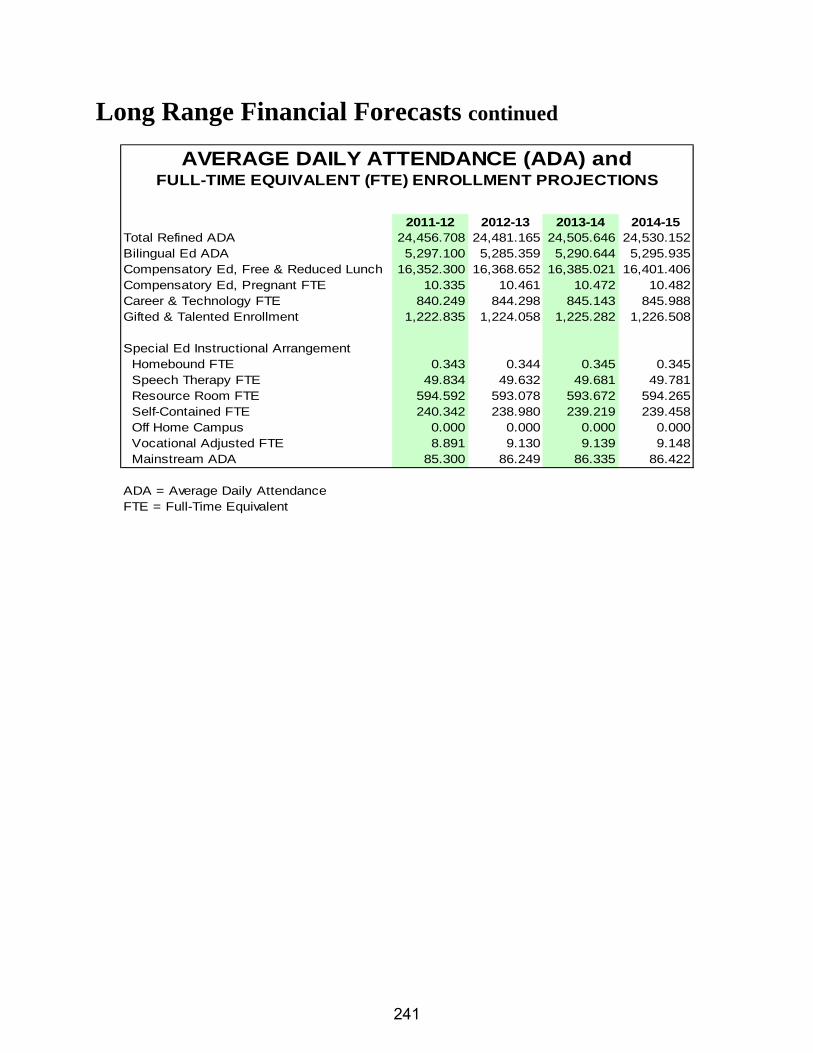
Long Range Financial Forecasts continued
AVERAGE DAILY ATTENDANCE (ADA) andFULL-TIME EQUIVALENT (FTE) ENROLLMENT PROJECTIONS
2011-12 2012-13 2013-14 2014-15Total Refined ADA 24,456.708 24,481.165 24,505.646 24,530.152Bilingual Ed ADA 5,297.100 5,285.359 5,290.644 5,295.935Compensatory Ed, Free & Reduced Lunch 16,352.300 16,368.652 16,385.021 16,401.406Compensatory Ed, Pregnant FTE 10.335 10.461 10.472 10.482Career & Technology FTE 840.249 844.298 845.143 845.988Gifted & Talented Enrollment 1,222.835 1,224.058 1,225.282 1,226.508
Special Ed Instructional Arrangement Homebound FTE 0.343 0.344 0.345 0.345 Speech Therapy FTE 49.834 49.632 49.681 49.781 Resource Room FTE 594.592 593.078 593.672 594.265 Self-Contained FTE 240.342 238.980 239.219 239.458 Off Home Campus 0.000 0.000 0.000 0.000 Vocational Adjusted FTE 8.891 9.130 9.139 9.148 Mainstream ADA 85.300 86.249 86.335 86.422
ADA = Average Daily AttendanceFTE = Full-Time Equivalent
241

Long Range Financial Forecasts continued
Percentage Refined Average Daily Attendance (ADA)to Enrollment Over Time
Refined PercentageFiscal Year Ending 8/31 Enrollment ADA ADA to Enrollment
1999 22,519 20,171.926 89.58%2000 23,229 21,594.772 92.96%2001 24,146 22,454.115 92.99%2002 25,002 23,339.644 93.35%2003 25,548 23,880.979 93.47%2004 25,638 24,041.034 93.77%2005 25,860 24,213.021 93.63%2006 26,231 24,445.351 93.19%2007 26,252 24,434.056 93.08%2008 26,397 24,419.632 92.51%2009 26,257 24,344.838 92.72%2010 25,920 24,067.661 92.85%2011 26,159 24,456.708 93.49%
*2012 26,159 24,456.708 93.49%*2013 26,395 24,481.165 92.75%*2014 26,421 24,505.646 92.75%*2015 26,448 24,530.152 92.75%
* Estimated by CFB Personnel
24,146
25,002
25,548
25,638
25,860
26,231
26,252
26,397
26,257
25,920
26,159
26,159
26,395
26,421
26,448
0 5,000 10,000 15,000 20,000 25,000 30,000
2001
2002
2003
2004
2005
2006
2007
2008
2009
2010
2011
*2012
*2013
*2014
*2015
Student Enrollment(*estimated based on district demographic information)
242

Long Range Financial Forecasts continued
Projected Tax Collections
General Fund 2011-12 2012-13 2013-14 2014-15Tax Revenue
Tax Value $12,892,208,149 $14,028,366,980 $14,238,792,484 $14,452,374,372
Tax Rate $1.0400 $1.0400 $1.0400 $1.0800
Sub-Total Tax Revenue
@ 98% Rate of Collection $130,726,991 $142,977,116 $145,121,773 $152,963,930
Taxes, Prior Year, Penalty
& Interest $650,000 $659,750 $669,646 $679,691
Total General Fund Tax Revenue $131,376,991 $143,636,866 $145,791,419 $153,643,621
Debt Service Fund
Tax Rate $0.3168 $0.2779 $0.2655 $0.2586
Debt Service Tax Revenue
@ 98% Rate of Collection $39,822,607 $38,205,135 $37,047,914 $36,626,363
Total Tax Revenue $171,199,597 $181,842,001 $182,839,333 $190,269,985
Tax Increment Finance Zone Estimate
TIF payment yr of book $14,140,000 $14,140,000 $14,774,478 $15,078,197
243

Long Range Financial Forecasts continued
General FundProjected Revenue
2011-12 2012-13 2013-14 2014-15Local Revenue
Tax Revenue
Tax Value $12,892,208,149 $14,028,366,980 $14,238,792,484 $14,452,374,372
Tax Rate $1.0400 $1.0400 $1.0400 $1.0800
Tax Revenue
Rate of Collection 98% $130,726,991 $142,977,116 $145,121,773 $152,963,930
Taxes, Prior Year, Penalty & Interest $650,000 $659,750 $669,646 $679,691
Other Local 1,198,844 $1,216,827 $1,235,079 $1,253,605
Total Projected Local Revenue $132,575,835 $144,853,693 $147,026,498 $154,897,227
State Revenue
State Funding Formula $60,729,820 $43,434,447 $41,694,668 $43,059,607
Teacher Retirement On-Behalf $10,200,000 $10,200,000 $10,200,000 $10,200,000
Total Projected State Revenue $70,929,820 $53,634,447 $51,894,668 $53,259,607
Total Projected Federal Revenue $550,000 $555,500 $561,055 $566,666
Grand Total Projected Revenue $204,055,655 $199,043,640 $199,482,221 $208,723,499
Projected Expenditures11 Instruction $119,423,493 $118,179,258 $116,997,465 $115,827,491
12 Instructional Resources & Media $1,569,131 $1,553,440 $1,537,906 $1,522,527
13 Curriculum & Staff Development $4,633,049 $4,586,719 $4,540,852 $4,495,443
21 Instructional Leadership $3,481,687 $3,446,870 $3,412,401 $3,378,277
23 School Leadership $13,213,862 $13,081,723 $12,950,906 $12,821,397
31 Guidance Counseling & Evaluation $9,133,009 $9,041,679 $8,951,262 $8,861,750
32 Social Work Services $166,064 $164,403 $162,759 $161,131
33 Health Services $706,648 $699,582 $692,586 $685,660
34 Transportation $3,560,015 $3,524,415 $3,489,171 $3,454,279
36 Co-Curricular/Extra Curricular $4,683,527 $4,636,692 $4,590,325 $4,544,422
41 General Administration $6,658,164 $6,591,582 $6,525,666 $6,460,410
51 Plant Maintenance & Operation $23,998,773 $23,758,785 $23,521,197 $23,285,985
52 Security & Monitoring Services $1,693,515 $1,676,580 $1,659,814 $1,643,216
53 Data Processing $5,001,631 $4,951,615 $4,902,099 $4,853,078
61 Community Services $452,538 $448,013 $443,533 $439,098
81 Facilities Acquisition & Construction $88,764 $87,876 $86,997 $86,127
91 Contracted Instructional Services $0 $0 $0 $1,260,003
92 Incremental Costs Assoc with Chap 41 $0 $0 $0 $1,260
95 Juvenile Justice Alternative Ed Prgms $200,000 $198,000 $198,000 $198,000
97 Tax Increment Financing Zone $14,140,000 $14,140,000 $14,774,478 $15,078,197
99 Other Intergovernmental Charges $980,751 $990,751 $1,000,464 $1,010,469
Total Projected Expenditures $213,784,621 $211,757,983 $210,437,881 $210,068,219
Other Sources & Uses
Operating Transfers In $0 $0 $0 $0
Total Other Sources & Uses $0 $0 $0 $0
Projected Change in Fund Balance ($9,728,966) ($12,714,343) ($10,955,660) ($1,344,720)
Estimated Beginning Fund Balance 9/1 $72,950,332 $63,221,365 $50,507,022 $39,551,362
Estimated Actual adjustment
Estimated Ending Fund Balance 8/31 $63,221,365 $50,507,022 $39,551,362 $38,206,642
Percentage expenditure increase/(decrease) over prior year budget -3.63% -0.95% -0.62% -0.18% as a Percentage of Total Expenditure Budget
Estimated Days Operating in Fund Balance 116 93 74 72
244

Long Range Financial Forecasts continued
The graph depicts the disparity between general fund revenues and expenditures for fiscal year 2011-12 through 2014-15. The District plans to decrease the general fund deficit for fiscal year 2014-15 by asking voters for a tax increase of $.04 from 1.04 to $1.08. If the tax election does not pass the deficit of the district will continue to increase. If a tax election passes for fiscal year 2014-15 then the $.04 tax increase would only decrease the operating deficit and not eliminate it entirely. The assumptions made involve no increases in compensation associated with each fiscal year presented; if the Board of Trustees wants to present an increased compensation package then a greater tax increase would have to be presented to voters.
$190
$195
$200
$205
$210
$215
2011‐12 2012‐13 2013‐14 2014‐15
Projected General Fund Revenues vs. Expenditures
(In Millions)
Revenues Expenditures
245

Long Range Financial Forecasts continued
Debt Service FundProjected Revenue
2011-12 2012-13 2013-14 2014-15Local Revenue
Tax Revenue
Tax Value $12,892,208,149 $14,028,366,980 $14,238,792,484 $14,452,374,372
Tax Rate $0.3168 $0.2779 $0.2655 $0.2586
Tax Revenue
@ 98% Rate of Collection $39,822,607 $38,205,135 $37,047,914 $36,626,363
Other Local $12,399 $4,453 $12,855 $13,628
Total Projected Local Revenue $39,835,006 $38,209,588 $37,060,769 $36,639,991
State Revenue
State Funding Formula $0 $0 $0 $0
Total Projected State Revenue $0 $0 $0 $0
Total Projected Federal Revenue $0 $0 $0 $0
Grand Total Projected Revenue $39,835,006 $38,209,588 $37,060,769 $36,639,991
Projected Expenditures71 Debt Services
Principal $25,555,000 $25,060,000 $25,080,000 $25,830,000
Interest $14,274,006 $13,143,588 $11,974,769 $10,803,991
Fees $6,000 $6,000 $6,000 $6,000
Total Projected Expenditures $39,835,006 $38,209,588 $37,060,769 $36,639,991
Projected Change in Fund Balance $0 $0 $0 $0
Estimated Beginning Fund Balance 9/1 $3,003,709 $3,003,709 $3,003,709 $3,003,709
Projected Ending Fund Balance 8/31 $3,003,709 $3,003,709 $3,003,709 $3,003,709
Percentage expenditure increase over prior year budget -5.38% -4.08% -3.01% -1.14%
246

Long Range Financial Forecasts continued
Food Service FundProjected Revenue and Expenditures
2011-2012 2012-2013 2013-2014 2014-2015
Estimated Revenues
Local & Intermediate Revenue $2,610,100 $2,688,403 $2,769,055 $2,852,127
State Revenue $85,000 $87,550 $90,177 $92,882
Federal Revenue $8,086,500 $8,329,095 $8,578,968 $8,836,337
Total Estimated Revenue $10,781,600 $11,105,048 $11,438,199 $11,781,345
Appropriated Expenditures
35 Food Service $10,781,600 $11,105,048 $11,438,199 $11,781,345
Total Appropriated Expenditures $10,781,600 $11,105,048 $11,438,199 $11,781,345
Estimated Change in Fund Balance $0 $0 $0 $0
Estimated Beginning Fund Balance 9/1 $816,856 $816,856 $816,856 $816,856
Estimated Fund Balance 8/31 $816,856 $816,856 $816,856 $816,856
Percentage expenditure increase over prior year budget -3.14% 3.00% 3.00% 3.00%
247

248

GLOSSARY
249

Glossary continued
This glossary contains definitions of terms used in this guide and such additional terms as seem necessary to common understandings concerning financial accounting procedures for schools. Several terms, which are not primarily financial accounting terms, have been included because of their significance for school financial accounting. The glossary is arranged alphabetically with appropriate cross-referencing where necessary. Abatement – A complete or partial cancellation of a levy imposed by a governmental unit. Abatements usually apply to tax levies or special assessments. Account – A descriptive heading under which are recorded financial transactions that are similar in terms of a given frame of reference, such as purpose, object, or source. Accounting Period – A period at the end of which and for which financial statements are prepared; for example, September 1 through August 31. ACT - Acronym for American College Test. Accrual Basis of Accounting - A method of accounting that recognizes the financial effect of transactions, events, and interfund activities when they occur, regardless of the timing of related cash flows. ADA - Acronym for Average Daily Attendance. Administration – Those activities which have as their purpose the general regulation, direction, and control of the affairs of the local education agency that are system-wide and not confined to one school, subject, or narrow phase of school activity. Ad Valorem Tax – The primary source of local funding for school districts is ad valorem taxes levied against the local tax base. Ad valorem means according to the value. AEIS – Acronym for Academic Excellence Indicator System. AIS - Acronym for Accelerated Instructional Services. Allocation – A part of a lump-sum appropriation, which is designated for expenditure by specific organization units and/or for special purposes, activities, or objects. Ancillary services – Auxiliary services that give support or assistance. AP - Acronym for Advanced Placement. Appraisal – (1) The act of appraising. (2) The estimated value resulting from such action.
250

Glossary continued
Appraise – To make an estimate of value, particularly of the value of property. Note, if the property is valued for purposes of taxation, the less-inclusive term “assess” is substituted for the above term. Appropriation Account – A budgetary account set up to record specific authorization to spend. The account is credited with original and any supplemental appropriations and is charged with expenditures and encumbrances. Appropriated Budget - The expenditure authority created by the appropriation bills or ordinances that are signed into law and related estimated revenues. The appropriated budget would include all reserves, transfers, allocations, supplemental appropriations, and other legally authorized legislative and executive changes. [NCGA Interpretation 10] ARD – Acronym for Admission, Review and Dismissal. ARRA – Acronym for American Recovery and Reinvestment Act of 2009 ASCD – Acronym for Association of Supervisors and Curriculum Development. Assess - To value property officially for the purpose of taxation. Note, the term is also sometimes used to denote the levy of taxes, but such usage is not correct because it fails to distinguish between the valuation process and the tax levy process. Assessed Valuation - A valuation set upon real estate or other property by a government as a basis for levying taxes. Assets – Property owned by a local education agency, which has a monetary value. Attrition – A gradual, natural reduction in membership of personnel, as through retirement. AYP – Acronym for Adequate Yearly Progress; a term associated with the No Child Left Behind federal legislation. Balanced Budget – A budget where the budgeted revenues equal the budgeted expenditures. Bill – (1) A term used to denote a law or statute passed by certain legislative bodies. A bill has greater legal formality and standing than a resolution. (2) A statement of an amount owing for goods and services sold on open account. Board of Education – The elected or appointed body, which has been created according to State law and vested with responsibilities for educational activities in a given geographical area. These bodies are sometimes called school boards, governing boards, boards of directors, school
251

Glossary continued
committees, school trustees, etc. This definition relates to the general term and covers State boards, intermediate administrative unit boards, and local basic administrative unit boards. Bond – A written promise, generally under seal, to pay a specified sum of money, called the face value, at a fixed time in the future, called the date of maturity, and carrying interest at a fixed rate, usually payable periodically. The difference between a note and a bond is that the latter usually runs for a longer periods of time and requires greater legal formality. Bonded Debt – The part of the school district debt, which is covered by outstanding bonds of the district. Sometimes called “Funded Debt or Bonded Indebtedness.” Bonds Authorized and Unissued – Bonds, which have been legally authorized, but not issued, and which can be issued and sold without further authorization. Bonds Issued – Bonds sold. Bonds Payable – The face value of bonds issued and unpaid. Budgetary Accounts – Those accounts necessary to reflect budget operations and conditions, such as estimated revenues, appropriations, and encumbrances, the net balance, and other related information. Capital Budget – A plan of proposed capital outlays and the means of financing them for the fiscal period. It is usually a part of the current budget. A capital program is sometimes referred to as a capital budget. Capital Outlays – Expenditures which result in the acquisition of or addition to fixed assets (see definition of Fixed Assets). Capital Program – A plan for capital expenditures to be incurred each year over a fixed period of years to meet capital needs arising from the long term work program or otherwise. It sets forth each project or other contemplated expenditure in which the local education agency is to have a part and specifies the full resources estimated to be available to finance the projected expenditures. Capital Projects Fund - Fund type used to account for financial resources to be used for the acquisition or construction of major capital facilities (other than those financed by proprietary funds and trust funds.) [NCGA Statement 1] CLC – Acronym for Community Learning Center. CLT – Acronym for Campus Leadership Team.
252

Glossary continued
Cocurricular Activities – Direct and personal services for public school pupils, such as interscholastic athletics, entertainments, publications, clubs, band, and orchestra, that are managed or operated by the student body under the guidance and direction of an adult, and are not part of the regular instructional program.
Community Services – Those services which are provided for the community as a whole or some segment of the community and which are not restricted to the public schools or adult education programs. Consultant – A resource person who provides assistance to the regular personnel through conference, demonstration, research, or other means. There are two types of consultants; those retained on a temporary basis and those who are permanently employed. Contracted Services – Labor, material, and other costs for services rendered by personnel who are not on the payroll of the local education agency. CPE – Acronym for Continuing Professional Education. Current – As used in this manual, the term has reference to the fiscal year in progress. Current Budget – The annual budget prepared for and effective during the present fiscal year. Current Expenditures per Pupil – Current expenditures for a given period of time divided by a pupil unit of measure (average daily membership, average daily attendance, etc.) Current Year’s Tax Levy – Taxes levied for the current fiscal period.
DAEP - Acronym for Disciplinary Alternative Education Program. DCAD – Acronym for Dallas County Appraisal District. Debt – An obligation resulting from the borrowing of money or from the purchase of goods and services. Debts of local education agencies include bonds, warrants, and notes, etc. Debt Limit – The maximum amount of gross or net debt, which is legally permitted. Debt Service Fund – A fund used to account for the accumulation of resources and payment of principal and interest on all bonds. Deficit – The excess of the obligations of a fund over the fund’s resources. Delinquent Taxes – Taxes remaining unpaid on and after the date on which they become delinquent by statute.
253

Glossary continued
DIC – Acronym for District Improvement Committee. DTR - Acronym for District Tax Rate. ELA – Acronym for English Language Arts Encumbrances - Commitments related to unperformed (executory) contracts for goods or services. For financial reporting purposes, encumbrance accounting is restricted to governmental funds. [NCGA Statement 1] EOC – Acronym for End of Course. EOY – Acronym for End of Year. ES – Acronym for Elementary School. ESEA – Acronym for Elementary and Secondary Education Act of 1965. ESL – Acronym for English as a Second Language. Estimated Revenue – When the accounts are kept on an accrual basis, this term designates the amount of revenue estimated to accrue during a given period regardless of whether or not it is all to be collected during the period. ExCet – Abbreviation for Examination for the Certification of Educators in Texas. Existing Debt Allotment (EDA) – Sometimes referred to as Tier III funding. Granted by the 1999 Legislature guarantees $35 per student in state and local funds for each cent of effort (up to a maximum of $.12 per $100 valuation) to pay the principal and interest on eligible bonds. Eligible bonds are those that require a debt service payment during the 1998-99 fiscal year. Expenditures- This includes total charges incurred, whether paid or unpaid, for current expense, capital outlay, and debt service. (Transfers between funds, encumbrances, and payments of cash in settlement of liabilities already accounted as expenditures are not considered as expenditures.) Expenses - Charges incurred, whether paid or unpaid, for operation, maintenance, interest, and other charges, which are presumed to benefit the current fiscal period. Note legal provisions sometimes make it necessary to treat as expenses some charges whose benefits extend over future periods. For example, purchases of materials and supplies which may be used over a period of more than one year and payments for insurance which is to be in force for a period longer than one year frequently must be charged in their entirety to the appropriation of the year
254

Glossary continued
in which they are incurred and classified as expenses of that year even though their benefits extend also to other periods. Fiscal Year – A twelve-month period of time to which the annual budget applies and at the end of which a local education agency determines its financial position and the results of its operations. Fixed Assets – Land, building, machinery, furniture, and other equipment which the school district intends to hold or continue in use over a long period of time. “Fixed” denotes probability or intent to continue use or possession, and does not indicate immobility of an asset. Food Service – Those activities which have as their purpose the preparation and serving of regular and incidental meals, lunches, or snacks in connection with school activities. FTE - Acronym for Full-Time Equivalent. Function – As applied to expenditures, this term has reference to an activity or service aimed at accomplishing a certain purpose or end; for example, Instruction, Instructional Administration, Plant Maintenance and Operations. Fund – A sum of money or other resource set-aside for specific activities of a school district. The fund accounts constitute a complete entity and all of the financial transactions for the particular fund are recorded in them. Fund Balance – The excess of assets of a fund over its liabilities and reserves. During the fiscal year prior to closing, it represents the excess of the fund’s assets and estimated revenues for the period over its liabilities, reserves, and appropriations for the period. GAAP - Acronym for Generally Accepted Accounting Principles. GED - Acronym for General Educational Development. General Fund – A fund used to finance the ordinary operations of the local education agency. It is available for a legally authorized purpose and consists of money not specifically designated for some other particular purpose. General Obligation Bonds – Bonds backed by the full faith and credit of the government. G/T – Acronym for Gifted and Talented. HB – Acronym for House Bill HB1 – Acronym for House Bill One, reference to the appropriations bill that changed public school funding, 80th Legislature state of Texas.
255

Glossary continued
HOUSE – Acronym for High, Objective, Uniform Standard of Evaluation.
HS - Acronym for High School. Infrastructure - Long-lived capital assets that normally are stationary in nature and normally can be preserved for a significantly greater number of years than most capital assets. Examples of infrastructure assets include roads, bridges, tunnels, drainage systems, water and sewer systems, dams, and lighting systems. [SGAS 34] Instruction – The activities dealing directly with the teaching of students or improving the quality of teaching. Instructional Facilities Allotment (IFA)- Granted by House Bill 4 in 1997, this program provides a guaranteed level ($35) of state and local funds per student per penny of tax effort applicable to debt service on eligible bonds. However, there is a limit on funding for each biennium so the District must apply for funding. The applications are ranked based on relative property wealth and funds are awarded up to the dollar limit available. Interest - A fee charged a borrower for the use of money. Inventory – A detailed list or record showing quantities, descriptions, values, units of measure, and unit prices of property on hand. IRI – Acronym for Intermediate Reading Inventory. I & S - Acronym for Interest & Sinking Fund (Debt Service Fund). ISD - Acronym for Independent School District. JJAEP – Acronym for Juvenile Justice Alternative Education Program. LAN- Acronym for Local Area Network. LBB – Acronym for Legislative Budget Board. LDAA – Acronym for Locally Determined Alternative Assessment. LEP – Acronym for Limited English Proficiency. Levy – (Verb) To impose taxes or special assessments. (Noun) The total of taxes or special assessments imposed by a governmental unit.
256

Glossary continued
Liability – An obligation, based on a past transaction, to convey assets or perform services in the future. Long-Term Loan- A loan which extends for more than 5 years from the date the loan was obtained and is not secured by serial or term bonds. Such loans are not legal in Texas under the general statutes. LPAC – Acronym for Language Proficiency Assessment Committee. MGEC – Acronym for Mary Grimes Education Center. M & O - Acronym for Maintenance and Operations Fund (General Fund). Modified Accrual Basis of Accounting - Basis of accounting according to which (a) revenues are recognized in the accounting period in which they become available and measurable and (b) expenditures are recognized in the accounting period in which the fund liability is incurred, if measurable, except for un-matured interest on general long-term debt and certain similar accrued obligations, which should be recognized when due. [NCGA Statement 1] MS - Acronym for Middle School. National Council on Governmental Accounting (NCGA) - The immediate predecessor of the GASB as the authoritative accounting and financial reporting standard-setting body for state and local governments. The NCGA issued 7 statements and 11 interpretations prior to its dissolution in June 1984. These statements and interpretations remain effective unless superseded by a subsequent GASB pronouncement. NCLB – Acronym for No Child Left Behind. NSDC – Acronym for National Staff Development Council. O&M – Acronym for Operation and Maintenance. Object – As applied to expenditures, this term has reference to an article or service received; for example, payroll costs, purchased and contracted services, materials, and supplies. Operating Activities- Term used in connection with cash flows reporting. Operating activities generally result from providing services and producing and delivering goods, and include all transactions and other events that are not defined as capital and related financing, non-capital financing, or investing activities. [SGAS 9]
257

Glossary continued
Other Financing Source- An increase in current financial resources that is reported separately from revenues to avoid distorting revenue trends. The use of the other financing sources category is limited to items so classified by GAAP. Other Financing Use- A decrease in current financial resources that is reported separately from expenditures to avoid distorting expenditure trends. The use of the other financing uses category is limited to items so classified by GAAP. Other Postemployment Benefits (OPEB) – Post-employment benefits other than pension benefits. OPEB include post-employment health care benefits, regardless of the type of plan that provides them, and all post-employment benefits provided separately from a pension plan, excluding benefits defined as termination offers and benefits. [SGAS 43] Overlapping Debt - In the context of the statistical section, the outstanding long-term debt instruments of governments that overlap geographically, at least in part, with the government preparing the statistical section information. That is, debt of another government that at least some of the reporting government’s taxpayers will also have to pay in whole or in part. Lower levels of government are not required to treat debt of the state as overlapping debt, even though it technically meets this definition. Furthermore, states, regional governments, and counties are exempted from the requirement to present overlapping debt, although counties are still encouraged to do so. [SGAS 44] Payroll – A list of individual employees entitled to pay, with the amounts due to each for personal services rendered. PEIMS - Acronym for Public Education Information Management System. Personnel, Full-Time – School employees who occupy positions, the duties of which require them to be on the job on school days, throughout the school year, at least the number of hours the schools in the system are in session. Personnel, Part-Time – Personnel who occupy positions, the duties of which require less than full time-service. This includes those employed full-time for part of the school year, part-time for all of the school year, and part-time for part of the school year. See also Personnel, Full-Time. Plant Maintenance (Plant Repairs and Repairs and Replacements of Equipment) – Those activities which are concerned with keeping the grounds, buildings, and equipment at their original condition or completeness or efficiency, either through repairs or by replacements of property (anything less than replacement of a total building).
PO - Acronym for Purchase Order.
258

Glossary continued
PRI - Acronym for Primary Reading Inventory. Principal of a School – The administrative head of a school (not school district) to whom has been delegated the major responsibility for the coordination and supervision of the activities of the school. Principal of Bonds – The face value of bonds. Program – The definition of an effort to accomplish a specific objective or objectives consistent with funds or resources available. Budgets and actual revenue and expenditure records may be maintained per program. Program Budget – A budget wherein expenditures are based primarily on programs of work and secondarily on character and object. A program budget is a transitional type of budget between the traditional character and object number, on the one hand, and the performance budget on the other. PSAT- Acronym for Preliminary Standardized Achievement Tests. RADA – Acronym for Refined Average Daily Attendance. Refunding Bonds – Bonds issued to pay off bonds already outstanding. Reimbursement – Cash or other assets received as a repayment of the cost of work or services performed, or of other expenditures made for or on behalf of another governmental unit or department, or for an individual, firm, or corporation. Reserve – An amount set aside for a specified purpose, or an account, which records a portion of the fund balance that is to be segregated for some future use and, therefore, is not available for further appropriation and expenditure. Rollback Tax – Reference to current State of Texas school finance laws that require Maintenance and Operations tax rate increases (above a certain limit) to be voted on by the public. Rollback elections that fail roll the tax rate back to the previous lower level. RPTE – Acronym for Reading Proficiency Tests in English. RtI – Acronym for Response to Intervention. RTUSA – Acronym for Reading Together USA.
259

Glossary continued
Salary – The total amount regularly paid or stipulated to be paid to an individual, before deductions, for personal services rendered while on the payroll of the school district. Payments for sabbatical leave are also considered as salary. SASI – Acronym for Schools Administration of Student Information. SAT - Acronym for Standardized Achievement Tests. SBEC – Acronym for State Board for Educator Certification. SCE – Acronym for State Compensatory Education. School – A division of the school system consisting of a group of pupils composed of one or more teachers to give instruction of a defined type, and housed in a school plant of one or more buildings. More than one school may be housed in one school plant, as is the case when the elementary and secondary programs are housed in the same school plant. School, Elementary – A school classified as elementary by State and local practice and composed of any span of grades not above grade six. In this District this term includes kindergartens and pre-kindergartens if they are under the control of the local board of education. School, Intermediate – A separately organized elementary school intermediate between early elementary and middle school. School, Middle – A separately organized secondary school intermediate between elementary, intermediate, and senior high school. In this District middle schools include grades six through eight. School, Public – A school operated by publicly elected or appointed school officials in which the program and activities are under the control of these officials and which is supported by public funds. School, Secondary – In this handbook a secondary school comprises any span of grades beginning with the next grade following the elementary/intermediate school and ending with or below grade 12, including middle schools, the different types of high schools, and alternative high schools. School, Senior High – A school offering the final years of high school work necessary for graduation; invariably proceeded by a middle school in the same system. School, Summer – The name applied to the school session carried on during the period between the end of the regular school term and the beginning of the next regular school term.
260

Glossary continued
SDAA – Acronym for State Developed Alternative Assessment. Section 504 – For school districts, any child eligible for a district’s public education program is qualified. 34 CFR104.3(k), 104.38 Parents who have a handicapping condition may also be protected by Section 504. For example, parents who are deaf may be entitled to an interpreter if they need it to have an equal opportunity to participate in school initiated activities regarding their child. Serial Bonds – Bonds whose principal is to be repaid in periodic installments over the life of the issue. SF&CS – Acronym for Student, Family and Community Services Department. SHARS- Acronym for School Health and Related Services SOAR – Acronym for Strengthening Opportunities to Accelerate Reading. SMU – Acronym for Southern Methodist University. Special Revenue Fund - A governmental fund type used to account for the proceeds of specific revenue sources (other than for major capital projects) that are legally restricted to expenditures for specified purposes. SSI – Acronym for Student Success Initiative. State Aid for Education – Any grant made by a State government for the support of education. Student Wealth – Assessed value of property divided by school enrollment. Supplemental Taxes – Taxes levied subsequent to the initial levy to add property omitted from the original tax roll(s). Supply – A material item of an expendable nature that is consumed, worn out, or deteriorated in use; or one that loses its identity through fabrication or incorporation into a different or more complex unit or substance. TAAS - Acronym for Texas Assessment Academic Skills exam. TAKS – Acronym for Texas Assessment of Knowledge and Skills exam. TASP – Acronym for Texas Academic Skills Program.
261

Glossary continued
Taxes – Compulsory charges levied by a governmental unit for the purpose of financing services performed for the common benefit. The term includes licenses and permits. It does not include special assessments. Tax Increment Financing. Financing secured by the anticipated incremental increase in tax revenues, resulting from the redevelopment of an area. TEA - Acronym for the Texas Education Agency. TEKS - Acronym for Texas Essential Knowledge and Skills. TExES – Acronym for Texas Examination of Educator Standards. TIF – Acronym for Tax Increment Finance Zone. TLI - Acronym for Texas Learning Index. TRS – Acronym for Teacher Retirement System. Underlying Bond Rating – The rating the district would be given by investor services to give relative indications of credit quality to stand alone without the permanent bond guarantee by the State. Unencumbered Balance of Appropriation – That portion of an appropriation not yet expended or encumbered; the balance remaining after deducting from the appropriation the accumulated expenditures and outstanding encumbrances. Unexpended Balance of Appropriation – That portion of an appropriation not yet expended; the balance remaining after deducting from the appropriation the accumulated expenditures. Unit Cost – Expenditures for a function, activity, or service divided by the total number of units for which the function, activity, or service was provided. USDE – Acronym for United States Department of Education. WADA - Acronym for Weighted Average Daily Attendance. WAN - Acronym for Wide Area Network. Wealth Transfer Provisions - Reference to the provision of the State of Texas school finance system that effectively adjusts taxable property wealth per weighted student for each school year to no greater than the “equalized wealth level”, determined in accordance with a formula set for the in the school funding legislation.
Thank you for your
interest in C-FB ISD’s 2011-2012
Budget.
262