census of india9 1941 - Linguistic Survey Of India
71
CENSUS OF INDIA9 1941 VOLUME IX ASSAM TABLES by K. w. P. MARAR, Superintendent of Census Operations, Assam PUBLISHED BY THE MANAGER OF PUBLICATIONS, DELHI PRlNTED BY THE MANAGER, GOVERNMENT OF INDIA PRESS, SIMLA., 1942
-
Upload
khangminh22 -
Category
Documents
-
view
1 -
download
0
Transcript of census of india9 1941 - Linguistic Survey Of India

CENSUS OF INDIA9 1941
VOLUME IX
ASSAM
TABLES by
K. w. P. MARAR, I.C.S~,
Superintendent of Census Operations, Assam
PUBLISHED BY THE MANAGER OF PUBLICATIONS, DELHI
PRlNTED BY THE MANAGER, GOVERNMENT OF INDIA PRESS, SIMLA., 1942

List of Agents in India and Burma from whom Government of India Publications are available
ABBOTTABAD-English Book Store.
AGRA-English Book Depot, Taj Road. Indian Army Book Depot, Dayalbagh.
AHMEDABAD-H. L. College of Commerce Co-opera.-tive Store. Ltd.
.A,TME~Banthiya & Co., Ltd., Station Road.
AKOLA-Bakshi, Mr. M. G.
ALLAHABAD-Central Book Depot, 44, Johnstonganj. Kitabistan, 17 -A, City Road. Ram Narain Lal, 1, Bank Road.· Superintendent, Printing and Stationery, U. P. Wheeler & Co., Messrs. A. H.
BOMBAY-Co-operators' Book Depot, 9, Bakehouse Lane, Fort. International Book House, Ash Lane, Esplanade Road. Joshi, Mr. V. G., News Agent, Devgad Baria, Via
Piplod. Kothari Book Depot. Lakhani Book Depot, Bombay, 4. New Book Co, Kitab Mahal, 188-90, Hornby Road. Popular Book Depot, Gr?,n~ Road. . , I:luperintendent, Govt. Prmtmg & Statwnery, Queen s Road.
Taraporevala Sons & Co., Messrs. D. B. Thacker & Co., Ltd. Tripathi & Co., Messrs. N. M., Princess Street, Kalbadevi Road.
Wheeler & Co., Messrs. A. H.
CAI.CUTTA-Book Company. . Chatterjee & Co., 3, Bacharam ChatterJee Lane. Chukervertty, Chatterjee & Co., Ltd., 13, College Square.
Das Gupta & Co., 54/3, Conege Street. Hindu Library, 137-F, Ealaram De Street, La.hiri & Co., Ltd., Messrs. S. K. Macmillan & Co., Ltd., 294, Bow Bazar Street. Newman & Co., Ltd., Messrs. W. Roy Chowdhury & Co., Messrs. N. M., 72, Harrison Road.
f'arcar & Sons., Messrs. M. C., 15, College Square, Sarkar & Som, Ltd., :Messrs. S. C., l/l/I-C, College Square.
Standard Law Book Society, 79/1, Harrison Road. Thacker, Spink & Co. (1933), Ltd. \'\ heeler & Co., Messrs. A. H.
CAWNPORE-Adval1i & Co., P. O. Box No. 100. Indian Army Depot, J uhi.
CUTTACK-PresB Officer, Orissa Secretariat.
DEHRADUN-. Jugal Kishore & Co. Ideal Book Depot, Rajpur Road.
DELHI-Jl11perial Book Depot and Pross, Near Jams, Masjid
(:r.lachhliwalan) . Income-tax Law Publishing House, Chandni Chowk.* Indian Army Beok Depot, Daryaganj. Ja.ina & BIOS., ltessrs. J. M., :Mori Gate. OAford Book and tltationery Co. Sharda Mandir, Ltd., Nai Barak. Young Man & Co. (Regd.), Egerton Road.
DUM DUM CANTT.-Bengal Flying Club,t I<EROZEPORE-English Book Depot. GWAI.IOR--Jain & Bros., Messrs. M. B., Sarafa Road. HYDERABAD (DECCAN)-Hyderabad Book Depot,
Chanderghat. ,JAIPUR-Garg Book Co., Tripolia Bazar.
KARACHI-Aero Stores. English Bookstall. Standard Bookstall.
KARACHI (SADAR)-Manager, S'md Government Book Depot and Record Office.
LAHORE-Kansil & Co., Messrs. N. C., 9, Commercial Building""
The Mall. Malhotra & Co., Messrs. U. P., Post Box No. 94. Minerva Book Shop, Ana.rkali Street. Punjab Religious Book SOCiety. Rama Krishna & Sons, Anarka,1i. Superintendent, Govt. Printing, Punjab. University Book Agency, Kacheri Road.
LUCKNOW -Upper India Publishing House, Ltd., Literature Palace, Aminuddaula Park.
LYALLPORE-Lyall Book Depot. MADRAS-
Higginbothams. Superintendent, Govt. Press, Mount Road. Varadachary & Co., Messrs. P.
MHOW-British Book Depot. MOGA-Army Musketry Stores. NAGAPATAM-Venkataraman, Mr. B. NAGPUR-
Khot & SallS, Messrs. G. G.,-Sita Burdi, 3rd Modi Lane.
Superintendent, Oovt. Printing, Central Provinces. NEW DELHI-
Bawa Harkishen Das Bedi, Ferozeshah Road. Bhawnani & Sons. Delhi and U. P. Flying Club, Ltd.t Jaina & Bros., ]\,f"essrs. J. M., Counaught Place. Ramesh Book Depot & Stationery Mart, Connaugbt Place.
Saraswati Book Depot, 15, Lady Hardinge Road. PATNA-Superinteudent, Government Printing, Bihar,
P. O. Gulzarbagh. PATNACITY-
Lakshmi Trading Co., Padri.Ki-Haveli. Raghunath Prasad & Sons. . Sinha & Bros. Messrs. l'l,. P., GUZfl Ba.zar.
PESHAWAR-British Stationery Mart. London Book Co. (India), Arbab Road. Manager, Govt. Printing & Stationery, N.-W.F. P.
l'ESHAWAR CANTT.-Faqir Chand Marwah. POONA-
Deccan Bookstall, Fergusson College Road. Dastance Bros., Home Service, 456, Rawiwar Peth. International Book Service. Ram Krishna Bros., OpPosite Bishram Bagh.
QUETTA-Standard Bookstall. RAJKOT-Mohanlal Dossabhai Shah. RANGOON-
Burma Book Club, Ltd. Curator, Govt. Book Depot, Burma.
RAWALPINDI-Ray & Sons, Messrs. J., 43, K. & L. Edwardes Roa.d.
SHILLONG-Superintendent, Assam Secretariat Press. SIALKOT CANTT .-Modern Book Depot, Bazar Road. SIALKOT CITY-
Buckingham & Co., Booksellers & Stationers, Green· wood Street.
Clifton & Co. TRICHINOPOLY FORT-Krishnaswami & Co.,
Messrs. S., TeppakulaIll. TRIVANDRUM
Booklovers' Resort, Taikad. P. R. Bros., Ma.jn Road.
VELLORE-Venkatasubban, Mr. A., Law 13ook~elJe1'.
'" Agents for Income.tax, Law Md allied Publications anly.
t .Agents for Pllblit'~tions on Aviation only.

NOTE
The oonsus enumeration was carried out in full according to plan but the Government of India decided to restrict the tabulation for British India. Consequently the tables in this volume cover less than half the oontemplated range and offer in effect only the distribution of the population by community by province or state, district, tehsil and town.
2. The slips in which the remaining unsorted information is to be found are stored in each provinoe against a possible Ieopening of tabulation in .happier circumstances.

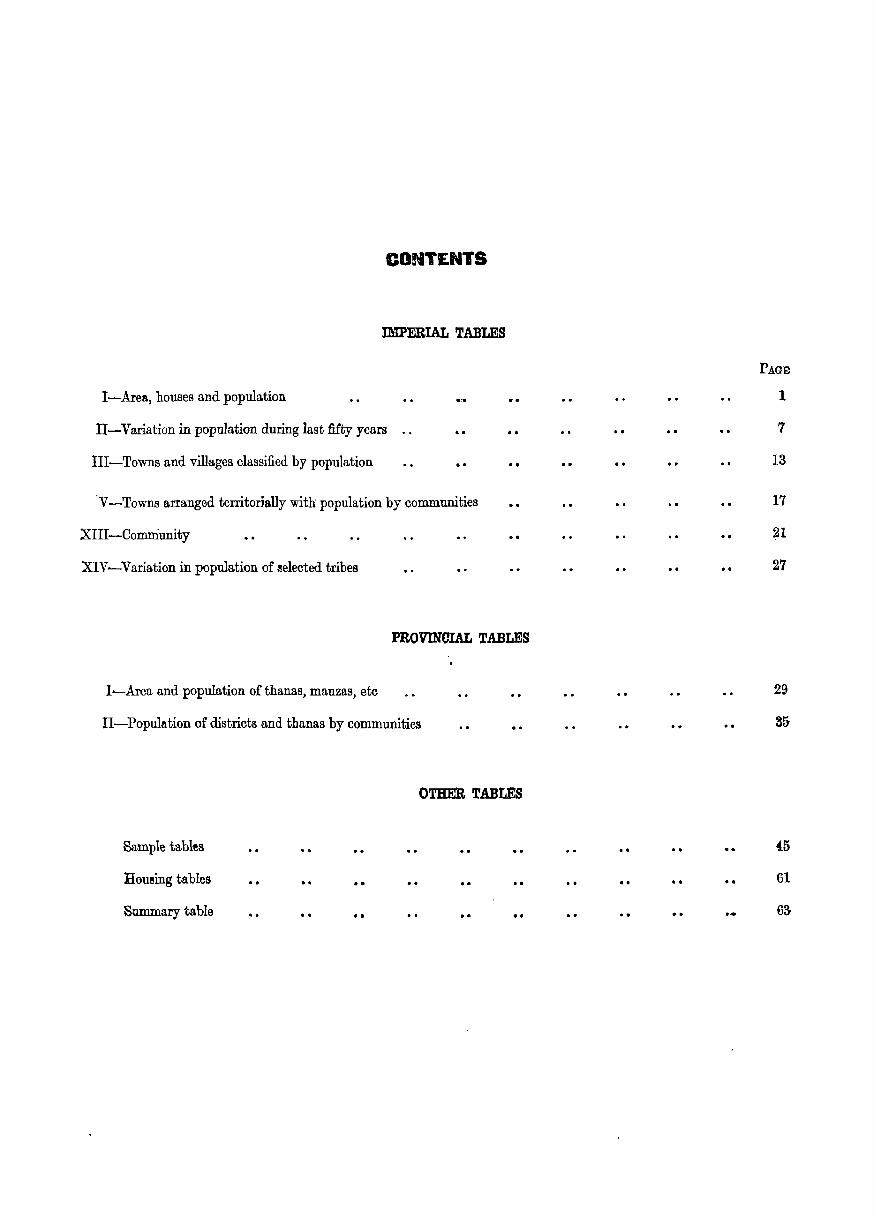
CONTENTS
IMPERIAL TABLES
I-Are!!., houses and population
II-Variation in population during last fifty years
III-Towns and villages classified by population
. .
V -Towns arranged territorially with population by communities
XIII-Community
XIV-Variation in population of l!elected tribes
••
..
PROVINCIAL TABLES
I-Area and population of thanas, mauzas, etc
II-Popul3tion of districts and thanas by communities
Sample tables
lIoueing tables
Summary table
. .
OTHER TABLES
.. . . ..
PAGE
1
7
13
17
21
27
29
35
{5
61
63


I--AREA, HOUSES AND POPULATION
1. This table shows the area, the number of towns and villages and of occupied houses, and the urban and rural population for the districts and states in Assam.
2. The areas in column 2 are the latest determinations of the Survey of India. In the Sadiya Frontier tract and Balipara Frontier tract however the areas locally determined have been adopted, as the Survey of India figures relate to the whole of the- tract but not to the administered and censused area. The total mapped area of these tracts is 20,034 and 12,043 sq miles respectively. Changes from the 1931 area are due to boundary revisions, resurvey or revised calculations.
The areas given in Provincial Table I differ from those given here. The gurvey of India do not take out figures for units smaller than the districts. In Provincial Table I, therefore, areas locally available were adopted.
3 .• ' House" is defined as the buildings, one or many, inhabited by one family.
4. "Towns" are places of usually not less than 5,000 inhabitants possessing" definite urban characteristics. Some places with less than 5,000 inhabitants have also been treated as towns. The urban: rural ratio calGulated on the popUlation living in towns of 5,000 and over is 1 : 28, that is, for every person living in town there are 28 persons living in villages.

2
I-AREA, HOUSES AND POPULATION
Occupied houses Persons District or State Area in """l
sq :niles Towns Villages Total In towns In villages Total Urban Rural 1 2 3 4 I) 6 'I 8 9 10
ASSAM 67,359 3236,590 2,151,479 82,452 2,069,027 10,930,388 405,328 10,525,060 British Territory .. 54,951 30 33,560 2,006,741 57,917 1,948,824 10,204,733 280,622~ 9,924,111
Surma VaUey and 24,124 10 14,923 827,645 18,298 809,347 4,218,875 101,524 \ 4,117,351 Hill Division
Oachar 3,862 3 1,516 130,540 3,870 126,670 641,181 21,156 620,025 Sylhet 5,478 6 11,449 599,315 10,774 588,541 3,116,602 63,659 3,052,943 Khasi and J aintia 2,353 953 23,769 2,710 21,059 118,665 13,202 105,463
Hills (British) '944 Naga Hills 4,289 I 497 48,919 47,975 189,641 3,507 186,134
Lushai Hills 8,142 508 25,102 25,102 152,786 152,786 Assam Valley 26,947 19 18,174 1,165,787 39,146 1,126,641 5,919,228 177,042 5,742,186
Division Goalpara 3,969 3 3,765 183;850 4,760 179,090 1,014,285 26,275 988,010 Kamrup 3,840 4 2,865 228,191 10,785 217,406 1,264,200 55,334 1,208,866 Darrang 2,804 2 2,037 157,938 3,254 154,684 736,791 13,972 722,819 Nowgong 3,898 2 2,391 126,775 5,938 120,837 7.10,800 16,836 693,964 Sibsagar 5,128 4 2,324 219,722 5,633 214,089 1,074,741 28,129 1,046,612 Lakhimpur 4,156 4: 2,596 203,272 8,776 194,496 894,842 36,496 858,346 Garo Hills 3,152 2,196 46,039 46,039 223,569 223,569 Sadiya Frontier 3,309 1 427 11,931 473 11,458 60,118 2,056 58,06'2
Tract
Balipara Frontier 571 36 1,378 1,378 6,512 6,51'2 Tract
#
Assam States 12,408 2 3,030 144,'138 24,535 120,203 '125,655 124,700 600,949 Manipur State ., 8,620 1 1,521 98,969 19,134 79,835 512,069 99,716 412,353 Khasi State8 3,788 1 1,509 45,769 5,401 40,368 213,586 24,990 188,596
Males Female8 ~ r-
Total Urban Rural Total Urban Rural 11 12 13 14 IS 16
ASSAM .. 5,740,746 236,214 5,504,532 5,189,642 169,114 5,020,528 British Territory .. 5,382,795 . 175,3Q7 5,207,488 4,821,938 105,315 4,716,623
Surma Valley and 2,190,921 63,990 2,1'26,931 2,027,954 37,534: 1,990,420 Hill Division
Cachar 337,701 18,185 324,516 303,480 7,971 295,509 Sylhet . 1,62'1,816 39,439 1,585,377 1,491,786 24,,220 1,467,566 Khasi and J aintia 60,718 9,237 51,481 57,947 3,965 53,982
Hills (British) Naga Hills 93,831 2,129 91,702 95,810 1,378 94,432 L ushai Hills 73,855 73,855 78,931 78,931 As:;arn Valley 3,156,087 110,048 3,046,039 2,763,141 fJ6,994 2,696,147
Division Goalpara 539,437 1.5,678 523,759 474,818 10,697 464,251 l~amrup 673,403 33,688 639,715 590,797 21,646 569,151 Darrang 394,114 9,387 385,027 342,377 4,585 337,792 Nowgong 379,911 10,572 369,339 330,889 6,264 321,625 Sibsagar 570,591 17,144 553,147 504,150 10,985 493,165 Lakhimpur 485,151 23,579 461,572 409,691 12,.917 396,774 Garo Hills 113,180 .. 113,180 J10,389 . . 110,389 Sadiya Frontier 31,998 1,269 30,729 28,120 787 27,333
Tract Ralipara Frontier. :;,789 3,789 2,723 2,723
Tract
M,sam States 357,951 60,907 29'1,044 367,704 63,799 303,905 llianivur State .. 249,183 47,448 201,785 262,886 52,268 210,618 1{ha~~ Stales 108,768 13,459 95,309 104,818 11,531 93,287

3
BUBSIDIARY TABLE. (i) Density, Water Supply and Crops
Percentage of total Percentage of cultivable Percenta.ge De~ity area area of
Natural division and district In r- " ...., cultivated Rainfall 1941 Cultivable Net Net Double area
cultivated cultivated cropped irrigated 1 2 a 4 5 (I f 8
ASSAM 162 56'1 15°3 26'2 3'4 8-7 118-2
Brahmaputra Valley 239 68·6 21·7 31,6 0,2 7·8 98·1 Goalpara 256 55·8 18·3 32,9 13,1 26·6 109-1 Kamrup 329 56·9 42,2 74,4 16,3 4,4 81·1 Darrang 263 68·8 31·4 45·6 4·8 18·9 84·5 Nowgoug 182 77·2 20'9 27·2 5·2 68-4 Sibsagar 210 68-6 22·9 33-3 2-07 88-2 Lakhimpur 215 73·3 19·8 27·0 1-04 113-2 Sadiya 18 88·8 0·6 0,7 0,09 19'7 14:3'8 Balipara II 44·1 0·4 0·9 0'07 96'0
Surma Valley 500 72·4 39·3 54'3 4·9 7-4 128-3 Cachar Plains 306 60·1 15·8 26·0 3·6 1·0 121·2 Sylhet 569 80·6 55·8 69·3 5·7 8,8 135·5
Bills 45 62·4 2,8 4·5 0,1 9·6 1.28,1
Garo Hills .. 71 89'6 5·5 6'1 0·6 29·5 107'1 Khasj and J aintia Hills .. 54 28·5 2·0 7·1 28·4 229·2 North Cachar Hills 20 109,2 Naga Hills 44 77·0 4·2 5·4 40·8 86·9 Lu:;;hai Hills 19 69·7 1·5 2·2 0'005 0·5 108·0 Manipur 59 59-il
Percentage 01 gross cultivated area undeI ,
Fruits Food and
Rice grains Oil- Jute Tea. vegetables Other otheI seeds including crops
than rice root crops 9 10 11 12 13 14 16
ASSAM 71'3 3-5 5-9 4-3 5'8 6-1 8-1 Brahmaputra Valley 62·8 4·4 9·0 6·1 6·5 8-5 2'7
Goalpara. 62·3 2·9 13·2 15'2 0·6 S·8 2·0 Karnrup 67·1 6·7 10'3 5·5 0·3 6·9 3·1 Darrang 63·8 3·9 9·2 4·1 9·6 8·2 2·1 Nowgong 59·8 6·7 12·0 12·1 2·0 5·0 2·6 Sibsagar 60·9 2·6 °4·5 0·1 13·1 16·4: 2·4 Lakhimpur 59·9 1·8 3·8 0·7 19·8 9·8 4-2 Sadiya
II' 64·3 7·4 6·4 4·2 5·9 11·4:
Balipara 79-6 0-4 1-0 1-0 18·0 ·1
87·6 Su~fu,a. Valley 0·6 1·0 1·7 5·5 2-5 I-I
bachar Plains 73·8 1'0 3·1 0,1 12·0 6·5 3·5 Sylhet 90·5 0·5 0·6 2,,0 4·2 1·6 0·6
Hills 62·3 10-8 2·4 1-3 0·02 3·8 19·1
Garo Hills 58·9 3·6 6·4 4·2 2·4 24·9 Khasi and .Jaintia Hills .. 45·1 10·0 1·4 0·1 15·1 28·3 N ortb Cachar Hills Naga Hills 73·6 15·5 10·9 Lushai Hills 70·0 16·2 0·7 0·2 12·8
Manipul'
N.B.-In the calculation for the province as a. wholE) a.nd for na.tural divisions those arC!18 for whiClh figures are not available have been left oul; of account.
The agricuitural statisties of Cacha.t include thoae of North Cachar, and tho&l of the Khasi and Jaintia Hillil are for British villo.gei only. M176CensuB

4
(ii) Area and Population (000 omitted), actual and percentage by Thana Density
Thanas with density
Natural ditision
1
ASSAM
Brahmaputra Valley
Surma Valley
Hill Districts and Frontier Tracts
Manipur "
ASSAM .•
Brahmaputra Valley
Surma. Valley
Natural division and district
1
ASSAM .Brahmaputra Valley ..
Goalpara Kamrup .. Darrang Nowgong Sibsagar ..
Lakhimpur Sadiya ., Balipara .,
Surma Valley Cachar Plains Sylhet .,
Hills Garo Hills Khasi and J aintia
Hills North Cachar Hills Naga Hills Lushai Hills
Manipur ..
Under 100
Area 2
40,262 60%
4,136 17%
2'7.506 1()0%
8,620 100%
Population
J
1,785 16%
271 5%
1.002 100%
512 100%
100-150 (,..... __ ~A.._, __ ..........,
Area 4
4,101 6%
3,774 16%
327 4%
Populaticn
5
517 5%
474 8% 43
1%
150-200 r-------'\..,-----..
Area Population
6
2,690 4%
2,517 11%
173·0 2%
7
450 4% 422 8% 28 1%
200-300 r-,--....A...--~
Area ') 8
8,746 13%
6,551 27%
2,195 30]10
PopUlation 9
2,205 20%
1.658 29 Yo 547
15%
Thanas with density-,ontd ____ ____A.._ ________________________ ~
300-450
Area Population
10 11
5,152 8%
5.052 21%
100 1%
1,816 17%
1,778 31%
38 1%
450-600 60)--750
Area Population
12 13
3,496 5%
1,185 5%
2,311 32%
1,821 17%
617 11%
1,204 32%
Area PopulatiJn
14 IS
1,139 2% 452 2% 687 7%
74,0 7%
297 510 443
12%
(iii) PersO'Yl.s per 1,000 houses and Houses per 100 square miles
750 & over
-.. Area Population
1,6 17
1,822 2% 199 1%
1,623 2210
1,577 14% 165 3%
1,412 38~~
Persons per 1,000 houses r-~
Houses per 100 square miles
1941 1931 1921 1911 2
5,080
5,091
5,517 5,540 4,662 5,610 4,892
4,402 5,040 4,726
5,163
4,977 5,200
4,855 4,860 4,778
4,057 3,877 6,087
5,174
3
4,900
4,901)
5,600 5,200 4,500 5,400 4,600
4,200 5,000 5,100
4,900 4,700 5,000
4,700
4,800 4,800
4,300 3,800 5,600
5,000
4
4,700
4,70()
5,600 5,000 4,300 5,100 4,400
4,100 4,900 6,300
4,800
4,200 4,900
4.601}
4,900 4,700
4,400 3,600 5,200
5,000
5
4,600
4,700
5,300 5,100 4,300 4,900 4,600
4,100
* *
4,500
4,300 4,500
4,901)
4,800 6,200
3,80G 3,600 5,000
5,000
* Not available
1901
6
4,700
4,601)
5,30~ 4,900 4,200 4,700 4,400
4,000 * *
4,800
4,300 4,900
4,6{)1}
4,900 4,800
4,201) 3,401) 5,30()
4,700
1941
7
3,194
4,026
4,632 5,942 5,633 3,254 4)285
4,891 361 241
7,845
6,156 11,009
924 1,461 1,132
496 1,138
308
1,148
1931
8
2,800
3,500 4,0)0 4,900 4,500 2,700 4,000
4,100 300 200
9,100 5,846
10,000
800 1,300 1,000
400 1;100
300
1,000
1921
9
2,700
2,9al)
3,400 3,900 3,800 2,100 3,700
3,500 200 100
8,500 6,100 9,400
800 1,200
900
400 1,200
300
900
1911
10
2,500
2,700
2,800 3,400 2,1300 1,600 3,100
2,500
* *
8,80l}
5,500 10,000
701)
1,000 800
400 1,100
300
80D
---., 1901
11
2,300
2,30{)
2,20~ 3,100 2,300 1,40J 2,700
2,200
* 7.400 4,600 8,400
800 900 700
60G 1,00()
200
700,

5
(iv) Proportion of sexes by natural divisions and districts
Females per 1,000 males Natural division and district
1941 1931 1921 1911 1901
1 2 3 4 5 6
ASSAM 904 909 926 940 949 •
Brahmaputra Valley 872 869 892 913 924
Goalpara. 880 877 875 886 904 Kamrup 877 903 920 968 1,012 Darrang 868 844 888 900 916 Nowgong 871 884 901 959 964 Sibsagar 88<1 881 897 892 886
Lakhimpur 845 816 B75 883 863 Sadiya 879 860 796 * * Balipara 719 593 477 '" 1)0
Surma Valley 915 928 937 943 947
Cachar Plains .. 896 893 913 909 974 Sylhet 918 935 942 949 965
Hills .. 992 1,011 1,023 1,026 1,037
Gara Hilla .. 975 959 959 956 974 Khasi and J aintia Hills .. 960 978 1,031 1,054 1,080 North Cachar Hills 936 898 883 917 492 Naga Hills 1,021 997 993 1,002 982 Lushai Hills 1,069 1,102 1,109 1,120 1,113
Ma.rupur 1,055 1,065 1,041 1,029 1,037
... Not availabw
( ,6 )


U-VARIATION IN POPULATIONlDURING LAST FIFTY YEARS
The populations fo1' previous censuses have been adjusted for between-province and between-district tr.aJ1Sfer8. .
( 7 )

'B
11-VARIATION IN POPULATION DURING LAST FIFTY YEARS
Net Year Persons Variation variation Males Variation Fem'lles Variation
(1891-1941)
1 2 .3 4 5 (j 7 8
,ASSAM-
1891 5;1'78.343 , . 2,820,491 2,857,852 1901 , , 6,127,411 +649,068 3,144,262 +323,771 2,983,149 +325,297 1911 , , 7,Of)1,034 +933,623 3,638,916 +494,654 3,422,118 +438,969 1921 '799,775 +929,741 4,149,506 +510,590 3,841,269 +419,151 1931 · . 9~1:8,397 +1,257,622 4,844,417 +694,911 4,403,980 +562,711 1941 · . ',' 10.9aO.388 +1,681,991 +5,452,045 5,740,746 +896,329 5,189,642 +785,662
iBritish Territory-1891 · . 5.364,240 , . 2,765,945 , , 2,598,295 1901 .. 5,726,337 +362,097 2,948,576 +182,631 2,777,761 +179,466 1911 · . 6.579,281 +852,944 3,401,579 +453,003 3,177,702 +399,941 1921 · . 7,459,657 +880,376 3,888,158 +486,579 3,571,499 +393,797 1931 · . 8.622,791 +1,163,134 4,537,490 +649,332 4,085,301 +513,802 1941 · . , . 10,204,733 +1,5,81,942 +4,840,493 5,382,795 +845,305 4,821,938 +736,637
;SUR1I1A VALLEY AND HILL DIVISION-
1891 · . 2,766,645 .. 1,417,555 · . 1,349,090 · . .1901 · , 2,969,497 +202,852 1,518,057 +100,502 1,451,440 +102,350 .1911 · . 3,312,590 +343,093 1,695,821 +177,764 1,616,769 +165,329 1921 · . 3,424,010 +111,420 1,758,423 +62,602 1,665,587 +48,818 1931 · . 3,708,047 +284,037 1,913,144 +154,721 1,794,903 +129,316 1941 · . 4,218,876 +510,828 +1,452,230 2,190,921 +277,777 2,027,954 +233,051
,CACHAR-
1891 · . 338,255 204,505 · . 183,720 1901 · . 457.422 +69,197 245,028 +40,523 212,394 +28,674 1911 · , 499,475 +42,053 261,398 +16,370 238,077 +25,683 1921 · . 529,301 +29,826 276,778 +15,380 252,523 +14,446 1931 · . 570,531 +41,230 301,338 +24,560 269,193 +16,670 1941 · . 641.181 +70,650 +252,956 337',701 +36,363 303,480 +34,287 ..
SYLHET -
1891 · . 2,155,171 1,101,250 . · . 1,053,921 · . 1901 · . 2,242,450 +87,279 1,141,385 +40,135 1,101,065 +47,144 1911 · . 2,473.335 +230,885 1,268,828 +127,443 1,204,507 +103,442 1921 · . 2,541,341 +68,006 1,308,734 +39,906 1,232,607 +28,100 1931 · . 2,724,342 +183,001 1,407,645 +98,911 1,316,697 +84,090 1941 · . 3,116,602 +392,260 +961,431 1,624,816 +217,171 1,491,786 +175,089
KHASI AND JAINTIA HILLS (BRITISH)-
1891 · . 83,801 40,060 · . 43,741 · . 1901 · . 85,641 +1,840 41,167 +1,101 44,474 +733 1911 · . 99,538 +13,897 47,771 +6,604 51,767 +7,293 1921 · . 96,161 -3,377 46,521 -1,250 49,640 -2,127 1931 · . 109,926 +13,765 55,439 +8,918 54,487 +4,847 1941 · . 118.665 +8,739 +34,864 60,718 +5,279 57,947 +3,460
NAGA HILLS-
1891 · . 95,814 48,901 . . 46,913 . . 1901 .. 101,55G +5,736 51,473 +2,572 50,077 +3,164 1911 .. ' 149,038 +47,488 74,796 +23,323 74,242 +24,165 1921 · . 158,801 +9,763 79,738 +4,942 79,063 +4,821 1931 · . 178,844 +20,043 89,536 +9,798 89,308 +10,245 1941 · . 189,641 , +10,797 +93,827 93,831 +4,295 95,810 +6,502

9'
II-VARIATION IN POPULATION DURING LAST FIFTY YEARS-contd-
Net "
Year Persons Variation variation Males Variation FemdelJ Variation, (1891-1941)
1 2 3 ,/, 5 tJ ;' I
LUSHAI I-UI,LE-
1891 · . 43,634 22,839 20,79.5 . " 1901 · . 82,434 +38.800 39,004 +16,165 43,430 +22,63ti 1911 · . 91,204 +8,770 43,028 +4,024 48,176 +4,74fS 1921 · . 98,406 - +7,202 46,652 +3,624 51,754 +3,578 1931 · . 124,404 +25,998 -.59,186 +12,534 65,218 +13,464 1941 · . 152,786 +28,382 +109,152 73,855 +14,669 78,931 +13,713
ASSAM VALLEY DIVISION-
1891 · . 2,685,940 . . 1,341,794 . . 1,244,146 .. 1901 · . 2,740,744 +1.54,804 1,421,379 +79.585 1,319,365 +75,219 1911 · . 3,246,838 +506,094 1,694,4G2 +273,083 1,552,376 +233,011 1921 · . 3,990,269 +743,431 2,104,04-6 +409,584' 1,886,223 +333,847 1n1 · . 4,855,451 +865,182 . . 2,5DJ,971 +t87,925 2,263,480 +377,257 1941 · . 5,919,228 +1,063,7'1'7 +3,333,288 3,lU;,087 +564,116 2,763,141 +499,661'
GOALPARA-
1891 · . 453,275 237,136 216,140 1901 · . 462,555 +9,280 242,957 +5,822 219,598 +3,458 1911 · . 601,198 +138,643 318,776 +75;819 282,422 +62,824 1921 · . 763,052 +161,854 406,906 +88,130 356,146 +73,724 1931 · . 883,288 +120,236 470,557 +63,651 412,731 +56,585 1941 · . 1,014,285 +130,,997 +561,010, 539,437 +68,880, 474,848 +62,117
KAMRUP-
1891 · . 635,070 .. 321,43(1 313,640 1901 · . 590.010 -45,060 293,272 -28,158 296,738 -16,902 1911 · . 668.646 +78,636 339,797 +46,525 328,849 +32,111 1921 · . 763,571 +94,925 397,736 +57,939 365,836 +36,986 1931 · . 976,746 +213,175 513,345 +115,609 463,401 +97,566 1941 · . 1,264,200 +287,454 +629,130 673,403 +160,058, 590,797 +127,396
DARRANG-
1891 · . 305,878 160,376 . . 145,502 .. 1901 · . 335,684 +29,806 175,148 +14,772 160,536 +15,034: 1911 · . 375,591 +39,907 197,643 +22,495 177,948 +17,412 1921 · . 477,188 +101,597 252,716 +55,073 224,472 +46,524: 1931 · . 584.817 +107,629 . . 317,103 +64,387 267,714 +43,242 1941 736,791 +151,974 +430,913 394,414 +77,311 342,377 +74,663
NOWGONG-
1891 · . 346.423 178,914 .. 167,609 1S01 · . 260,411 -86,012 132,605 -46,309 127,806 -39,703 1911 · . .. 301,655 +4],244 153,938 +21,333 147,717 +19,911 1921 " . 398,007 +96,352 208,731 +54,793 189,276 +41,559 1931 · . 562,581 +164,574 298,585 +89,854 263,996 +74,720 1941 .. ' no,soo +148,219 +3.64,377 379;911 +81,326 330,889 +66,893,
SIBSAGAR-
1891 · . 481.033 252,726 228,307 1901 · . 598,251 +117,218 316,968 +64,242 281,283 +52,976, 1911 · . 691,402 +93,151 365,131 +48,163 326,271 +44,988 1921 · . 823,197 +131,795 433,913 +68,782' 389,284 +63,013 1931 · . 933,326 +110,129 496,288 +62,375 437,038 +47,754 1941 .. 1,,074,741 +141,415 +593,708 570,591 +74,303 504,150 +67,11~

10
II-VARIATION IN POPULATION DURING LAST FIFTY YEARS-concld
Net Year Persons Variation variation Males Variation Female. Variation
(1891-1941)
1 Z 3 4 5 (J 7 i
LAKHIMPUR-
1891 · . 242,691 130,000 · . 112,691 · . 1901 · . 355,559 +112,868 190,394 +60,394 165,165 +52,474 1911 · . 449,410 +93,851 237,913 +47,519 211,497 +46,332 1921 · . 586.114 +136,704 312,578 +74,665 273,536 +62,039 1931 · . 723,782 +137,668 398,651 +86,073 325,131 +51,595 1941 · . 894,842 +171,060 +652,151 485,151 +86,500 409,691 +84,560
GARO HILLS-
1891 · . 121,570 61,213 · . 60,357 · . 1901 · . 138,274 +16,704 70,035 +8,822 68,239 +7,882 1911 · . 158.936 +20,662 81,264 +11,229 77,672 +9,433, 1921 · . 179,140 +20,204 91,466 +10,202 87,674 +10.002 1931 · . 190,911 +11,771 97,442 +5,976 93,469 +5,795 1941 · . 223.569 +32,658 +101,999 113,180 +15,738 110,389 +16,920
SADlY A FRO"YXIER TRACT-
1891 · . 11,020 · . 6,221 4,799 · . 1901 · . 15,398 +4,378 8,728 +2,507 6,670 +1,8'71 1911 · . 19,070 +.3,672 10,8.33 +2,105 8,2.37 +1,567 1921 · . 41,987 +22,917 23,307 +12,474 18,680 +10,443 1931 · . 54,531 +12,544 · . 29,361 +6,0-54 25,170 +6,490 1941 · . 60,118 +5,587 +49,098 31,998 +2,637 28,120 +2,950
BALIPARA FRONTIER TRACT-
1891 · . ,. 63/; · . 375 · . 260 · . 1901 · . 698 +63 412 +37 286 +25 1911 · . 783 +85 463 +51 3.'20 +34 1921 · . 3,391 +2,608 2,382 +1,919 I,OOg +689 1931 · . 4,762 +1,371 · . 3,014 +632 1,748 +739 1941 · . 6,512 +1,750 +5,877 3,789 +775 2,723 +975
Assam States-
1891 · . .. ., .. 1901 · . 401,074 · . 195,685 205,388 · . 1911 · . 481.753 +80,679 237,337 +41,651 244,416 +39,028 1921 · . 531.118 +49,365 281,848 +24,011 26.9,770 +25,354 1931 · . 625.606 +94,488 306,927 +45,579 318,679 +48,909 1941 · . 725.655 +100,049 +324,581 357,951 +51,024 367,704 +49,025
MANIPUR STATE-
1891 · . . . . . 1901 · . 284,465 139,63,,! · . 144,833 · . 1911 346,222 +61,757 170,666 +31,034 175,556 +30,723' 192) · . 384,016 +37,794 188,119 +17,453 195,897 +20,341 1931 · . 445,606 +61,590 · . 215,815 +27,696 229,791 +33,89/ 1941 · . 512,069 +68,463 +227,604 249,183 +3'3,388 262,886 +33,095
KRASI STATES-
1891 · . 114,103 54,516 . . 59,557 · . 1901 · . 116,609 +2,508 56,054 +1,508 60,555 +998 1911 · . 135,531 +18,922 66,671 +10,617 68,860 +8,305 1921 · . 147,102 +11,571 73,229 +6,558 73,873 +5,013 ls;n · . 180,000 +3Z,898 · . 91,112 +17,883 88,888 +15,015 194.1 · . 213,586 +33,686 +99.483 108,768 +17,656 104,.818 +15,930

Jl
SUBSIDIARY TABLES
(i) Variation and Density
Percentage variation r- --A.-
""" Natural division amhdistrict 1931 to 1921 to 1911 to 1901 to 1891 to 1941 1931 1921 19H 1901
1 2 .3 4 5 6
ASSAM +18'2 +15'7 +13'2 +15'2 +11'8 Brahmaputra Valley .. +22'0 +22·5 +24·1 +18·7 +5·8
Goalpara .. +14·8 +15'8 +26·9 +30'0 +2'0 Kmnrup .. +29'4 +27'9 +14·2 +13·3 -7·1 Darrang ... +26'0 +22'6 +27·0 +11-9 +9·7 Now-gong .. +26'4 +41·3 +31·9 +15·8 -24·8 Sibsagar .. +15'2 +13·4 +19·1 +15·6 +24·4
I,aliliimpur +23'6 +23'5 +30·4 +26'4 +46'!J Sadiya .. +10'2 +2\)'9 +120-2 Balipara ._ +36·7 +40·4 +324·8
Sunna Valley +14·1 +7·2 +3·3 +10·8 +5·3
Cachar Plains +12'3 +7'5 +6·4 +13·4 +12'9 Sylhet .. +12'6 +7'2 +2·7 +10·3 +4'0
Hills +14,,, +15·6 +8·2 +18-5 +7'1·7
Garo Hills -. +17'1 +6'6 +12-7 +14'9 +13·7 Khasi and Jaintia Hills +14'6 +19·2 +3·5 +16·2 +2'2 North Cachar Hills +13-8 +13'6 -1·3 -33,1 +1l5'Q Naga Ei11s +6'0 +12·6 +6·6 +46·1 +6'0 Lushai Hills +22'8 +26-4 +7·9 +10·6 +88'9
1IIanipur +14-9 +16'0 +10·9 +21·7
Percentage variation Density
r- ----A..---"l r-1891 to 1941 1941 1931 1921 1911 1901
7 8 9 10 11 12
ASSAM +99'5 162 137 120 107 100 Brahmaputra Valley .. +132·7 239 171 141 114 100
Goalpara _. +123·8 256 222 191 151 117 Kamrup _. +99'1 329 2M 199 174 153 Darrang ._ +140-9 263 206 168 132 99 Nowgong. _ +105·2 182 144 1{)2 77 68 Sibsagar ., +123-4 210 182 160 135 120
JJakhirnpur +268-7 215 171 139 106 82 Sadiya . - +445·5 18 17 14 6 Balipara .. +925·6 11 9 7 2
Surma Valley +47·4 500 438 408 395 367
Cachar Plains +64'3 3Q6 273 254 238 223 Sylhet +44-6 569 497 464 452 416
'Bills +202·9 45 39 35 33 29
Garo Hills +83-9 71 61 57 50 44 Khasi arrd J aiv.tia Hills +67·9 45 47 40 38 34 North Cachg,r Hills ;t-97 -3 20 17 15 16 24 Naga Hills +97-7 44 42 41 41 33 Lushai Hills +250·2 19 15 12 11 11
Manipur .. 59 52 45 4:() 34 M176C<1nsus

12
(Census 0 ••
(ii) Population variation according to~ l Vital statistics
+1,489,512
+7941466
Per 1,000 ofl931 1931-1941 popufation Columns 2-3
Natural division and district , A ~ (000 omit-·
Births Deaths Births Deaths ted)
1 2 a 4 /j 6
ASSAM 2,401,787 1,607,321 303 203 +794
Brahmaputra Valley 1,267,818 855,333 272 183 +412
Goalpara 293,426 210,676 332 239 +83 Kamrup 206,198 129,930 211 133 +76 Darrang 176,267 123,160 301 211 +53 Nowgong 113,338 74,748 201 133 +39 Sibsagar 264,161 169,824 283- 182 +94
Lakhimpur 214,428 146,995 296 200 +67
Surma Valley 1~133,969 751,988 348 231 +382
Cachar Plains 187,231 121,052 310 206 +66 Sylhet .• 946,738 630,936 348 232 +316
1941 minus 1931 (Census} (000 omitted)
7
+1,490"
+1,031
+131 +287 +152: +148 +141
+171
+458
+6& +39~
NOTE.-The statement is exclusive of the figures of the hill districts and. Frontier 'fracts.as birth and death sta.tisties are nob. recolded iII them as a whole.

III-TOWNS AND VILLAGES CLASSIFIED BY POPULATION
For the purpos~ of this table the floating populath:m is shown separately from the populations gathered under ccolumns 5, 7, 9 etc. This element however is included in town populatjons for the purposes of Imperial Table V and hence slight differences in totals.
13 )

14
III-TOWNS AND VILLAGES
(N=Number
Total number Under 500 1500-1,000 1,000-2,000 ofinha- (
__A,.__ , ( _A. --,
DistIict OI Stat-e bited Population N P N 1> N 1> towllB
and villages .-
1 2 a 4 6 6 7 8 9
ASSAM .. 36,622 10,930,388 30,714 5,047,551 4,298 2,972,047 1,310 1,732,013
British Territory 33,590 10,204,733 27,967 4,714,599 4,098 2,834,634 1,241 1,642,349
Surma Valley and Hill 14,933 4,'218,875 1'2,63() 2,(fl1,14'2 1,751 1,197,600 451 597,735 Division
Cachar •. 1,519 641,181 1,040 180,501 349 247,435 107 134,667 Sylhet .. .. 11,455 3,116,602 9,869 1,639,905 1,209 819,633 303 410,368 Khasi & Jaintia Hills 953 118,665 923 84,947 29 19,349 1 1,167
(British) Naga Hills 498 189,641 380 76,673 80 57,704 35 46,122 L ushai Hills 508 152,786 418 89,116 84 53,479 5 5,411
Assam l' aTley Division 18,193 5,919,228 14,889 2,592,990 2,337 1,630,702 786 1,039,661
Goalpara 1/ 3,768 1,014,285 3,365 614,802 297 202,015 82 102,439 Kamrup 2,869 1,264,200 2,053 443,087 590 409,778 186 248,203 Darrang 2,039 736,791 1,638 358,258 291 197,281 91 124,024 Nowgong 2,393 710,800 1,908 247,805 327 240.318 152 195,079 Sibsagar 2,328 1,074,741 1,532 307,830 583 412,245 171 222,880
Lakhimpur 2,600 894,842 2,210 410,899 239 162,272 102 144:,388 Garo Hills 2,196 223,569 2,183 210,309 10 . 6,793 2 2,648
Sadiya Frontier Tract 428 60,118 415 46,093 7 4,464 4 4,953
Balipara Frontier Tract 36 6,512 33 4,374 a 1,868
Assam States 3,032 725,655 ~,747 332.952 200 137,413 69 89,664
Manipur State 1,522 512,069 1,'297 190,582 148 103,500 64 83,811 Khasi States 1,510 213,586 1,450 142,370 52 33,913 5 5,853

,)
CLASSIFIED BY POPULATION
P=Population)
2,000,--5,000 5,000-10,000 10,000-20,000 20,000-50,000 50,000-100,000 100,000 & over ,..------A.----.., ( .A
""""'If A..~ "-----" "-~ Floating N P N P N P N P N P N P population
unclassed
10 11 12 13 14 15 1~ 17 18 19 20 21 22
272 734,581 16 107,097 7 109,339 4 106~565 1 99,716 21,479
259 698,820 15 101,948 'i 109,339 3 81,575 2~.,469
94 250,230 4: 27,822 :2 41,659 1 28,128 4,559
21 54,968 1 6,670 1 16,601 339 69 181,340 3 21,152 1 11,856 1 28,128 4,220
II< 13,202
3 9,142 1 4,780
163 444,366 11 74,126 /j 67,680 2 53,447 16,256
• 20 52,127 3 20,865 1 12,699 9,338 36 99,554 2 12,732 1 18,466 1 30,256 2,124 18 44,859 1 11,879 490 5 14,591 .. 1 12,972 35
39 106,767 2 13,029 1 11,664 , ,0 326
44 123,595 4: 27,500 1 23,191 2,997 1 2,873 946
2 4,224 384
• ° 270
13 35,761 1 5,149 1 24,990 1 99,716 10
11 29,302 1 5,149 .. 1 99,716 -9 :2 6,459 '0' 1 24,990 L.z
• This forms part of the munici.Pality of ShillQng which is shown in columns 16·17 against Assam States

16
SUBSIDIARY TABLE
Distribution of Population between Towns and Villages
Population per Number per 1,000 in Natural division (
A
"' ( A._
Town Village Towns Villages
1 2 a 4 5
ASS,AM · . 12,283 288 37 963
Brabmaputra Valley · . 9,318 3015 31 969 Surma Valley . . · . 9,423 283 23 977 Hills and Frontier Tracts · . 14,585 15'( 45 955
Manipur · . 99,716 271 195 805
Number per 1,000 of urban population in towns with a population of
20,000 10,000 5,000 & to to Under
over 20,000 10,000 5,000
6 7 8 9
ASSAM · . 507 237 171 85
Brahamputra Valley · , 295 378 195 132 Surma Valley . . · . 332 336 249 83 Hills and Frontier Tracts · . 599 317 84
Manipur · . 1,000
Number per 1,000 of rural population in villages with a population of
r-5,000 2,000 500
& to to Under over 5,000 2,000 500
10 11 12 13
ASSAM 5 67 448 480
Braluttaputra Valley 7 76 484 433 Surma Valley 2 63 439 496 Hills and Frontier Tracts 24 265 'ill
}i1&nipUl .. 13 71 454 462

V-TOWNS ARRANGED TERRITORIALLY WITH POPULATION BY COMMUNITIES
" Others" under Christians include the following :-
Total British territory States ( A...~ ( A....
"""' , A....
M:aies Females Males Females Males Females
European and Allied Races 374 317 274 218 100 99
Anglo-Indians 147 114 83 82 64 32
( 1'1 )

District or
State
1
Town, Municipality, Suburb, Oantonment, etc
2
ASSAM
British Territory
Surma Valley and Hill Division
Cachar Silchar Hailakandi .. Haflong
Syihet Sylhet Habiganj Sunamganj Karimganj Maulvibazar .. Srimangal
Khasi and Shillong Jaintia Hills (British portion)
Shillong (Oantonment)
Naga Hills •• Rollia
Assam Valley Division
Goalpara. •• Dhubri Gauripur Goalpara
Kamrup .. Gauhati Palasbari Nalbari Barpeta
Darrang Tezpur Mangaldai
Nowgong Nowgong Lumding
Sibsagar Jorhat
LakhimVu.r
Sibsagar Nazira Golaghat
j;lbrugarh l)l)QmDooma Tin:mkia N Lakhimpnr
Sadiya irontier Tmcl, Sadiy'l
Assa.m States
.M anipur I mphal ]{IJasi ::)Iatcs Shillorlg (Pein)
18
V-TOWNS ARRANGED TERRITORIALLY WITH
Hindus
Population Scheduled castes Others Sikhs ( A..~ ( _.)I.... "") ( A. 1
Persons Males
4
Females Males Female.s Males F~males Males Females
3 6 8 9 10
405,328 236,214 169,114 14,289 10,651 162,643 117,117 849
280,622
101,524
16,601 3,084 1,471
28.128 11,856 7,484 7,813 5,855 2,523
5,'744
7.458
3,50'(
177,042
12,699 5,783 7,793
29,598* 3.692 3,578
18,466
11,879 . 2,093
12,972 3,864
11,664 7,559 3,436 5,4'70
23,191 2,177 8,338 2.790
2,056
124,705
99,716 24,990
175,307
63,990
10,369 1,884
932
16,909 7,522 4,617 5,116 3,685 1,590
3,804
5,433
2,129
110,048
7,847 3,313 4,518
18,883 2,129 2,362
10,314
7,946 1,4.41
8,069 2,503
7,339 4,405 1,959 3,441
14,676 1,56:3. 5,6Ql
- 1,739
1,269
tltl,907
47,448 13,459
105,315
37,534
6,232 1,200
539
11,219 4,334 2,867 2,697 2,170
933
1,940
2,025
1,378
66,994
4,852 2,47() 3,275
10,715 1,563 1,216 8,152
3,933 652
4,903 1,361
4,325 3,154 1,477 2,029
8,515 614
2,737 1,051
787
63.799
.52,'268 11,.531
14,149 10,570
31694 2,461
738 192
53
805 652 340 586 221
67
5
32
3
1(),267
309 259 653
1,371 331 374
1,509
439 192
935 1
718 332 424 54
1,671 133 483 78
188
14()
140
455 121
27
512 506 247 404 107 67
4
8
3
7,977
287 256 620
1,112 254 215
1,314
361 155
502
582 300 284 2l
1,266 72
314 621
132
81
81 * EJ>duding raihTay premiws
111,967
39,691
7,146 1,119
464
9,386 4,864 2,384 3,095 1,759 1,213
2,811
4,385
1,035
71,411
5,212 2,410 2,016
13,534 1,469
11,532 ·8,479
5,601 647
4;289 2,008
4,730 2,613 1,On 2,278
8,218 94:1
3,492 931
865
50.676
44,873 6,803
63,772
21,890
4,178 724 265
5,507 2,795 1,118 1,567
990 741
-1,471
1,820
714
41,349
3,129 1,695 1,265
6,865 1,085
653 6,699
2,704 303
2,452 1,108
2,602 1,751
781 1,290
4,494 322
1,634 517
.533
53,345
49,693 3,652
611
238
15
9
35
173
6
360
6
5
19 3
1 1
73 10
56 4 6
27
76 18 42 13
13
238
27 211 -
11
839
255
afj
9
7
20
3
6
205
8
4
10 2
3
33 8
40 5
9
44 6
25 8
{)
84
15 69

19
POPULATION BY COMMUNITIES
Tribes Ohristians r-,--------~'--------~
,--- Tea Garden Jains Buddhists Muslims Indian Christians Others Tribes
,---_ ___A.__----, ,---_JL<.._------, ,-----A__~ ,-_____.A._----, ,.---''--------, ,-__.)"------. Males Females Males Females Males Females Males Females Males Females Males Females
12 15 16 1'1 18 19 20 21 22 23
Assam Tribes r---..A..~ Males Female.
24
1,935 1,201 346 152 43,391 27,492 1,355 1,137 533 442 537 200 10,336 10,383
1,824
223
12
5
..30 44 83
49
1,123
94
7
14 16 23
1,COO 1,029
80 8
91
44 247 48
6 4
171
9 2
7
573 14
296
1
III
111
Ml76Con8us
3 13 8
5 197
31
99
1
6
430 10
226
78,
78
294
127
7
7
106
6
1
165
1
3
6
3
3 5
67 2
74 1
2
52
3 49
130
43
5
2
35
1
41,121
17,667
2,181 573 108
6,482 1,986 1,873 1,389 1,644
223
525
060
23
25,802
11,328
1,293 351 53
5,086 1,014-1,494
678 1,046
98
14.6
55
84 23,358 14,409
1
3
3
a1 11 35
3
2,193 631
1,708
3,279 76
404 319 '
1,550 482
2,327 416
1,712 1,342
505 925
3,440 413
1,063 573
96
1,399 502
1,333
2,143 25
3]6 138
641 164
1,558 217
.1,051 1,025
402 536
1,9S5 174 376 424
65
22 2,270 1,690
2 1,147 1,173 20 1,123 517
1,151
315
89
2
66 19 20 14 17
4
52
32
833
2 4 •
203
109 2
180 23
42 68 1
145
38 3 8 2
3
204
105 99
1,025
299
138 4 4
55 18
8 26 11 4
25
6
362
190
12
13
10 1
88
58
8
301
1'72
8
31
10 1
2
79
37
4
537
74
72
1
1
200
31
31
726 1'71 129 46J 169
5 4 4
4 2
111 46 51 • 1
72 8
222 7
26 58 1
167
29 2 6 3
8
44
11 2 6
33 2
14 1
1
15
20
4
88
1 1 2
27 192 18
6 83 1 79
2
112 171 141
36 7 6 76 164 135
15
33 7
82 28
3,291
1,'771
112
269
145
2
182
87
974
1,422
42 3
41
384 ' 3 4 4
226 25
93 1
58 41 3
368 19 46 61
98
2.137
1,171
111
148
4~
6
160
95
603
917
18
41
418
1
134 7
37 1
17 9 7
170 10 33 8
49
7,045 8,246
1,175 1,265 5,8'70 6,981

20
SUBSIDIARY TABLES
()
(i) Number per 1,000 of the total population and oj each rna'in community who live in towns
Number per 1,000 who live in towns Natural division
Popula- Hindus Muslims Christians Tribes Jams Buddhists Parsees Jews tion
1 2 3 !l 6 Ii 1 8 If)
ASSAM 37 67 20 52 8 458 60
Brahmaputra Valley 31 47 29 57 2 419 34 Surma Valley .. 23 40 13 83 4: 857 3M Hill Districts and Frontier 45 301 213 506 19 748 248
Tracts
Manipur 195 311 78 6 15 940 119
(ai) Communities of Urban and Rural PopulatiOA
Per 10,000 of urban population ~atural dlvision
Hindus Muslims Christians Tribes Jains Others
1 B 3 4 i IS , ASSAM 7,517 1,749 86 529 71 42
Brahmaputra Valley .. 7,400 2.132 105 168 149 46 Surma Valley .. 6,534 3,251 69 112 28 6 Bill Districts and Frontier Ttacts 5,420 737 198 3.451 19 175
Mawpur .• 9,483 233 II} 24~ 19 &
Per 10,000 of rural population
Hindus Muslims Christians Tribes Jains ----Othets
8 11 10 11 IS 11
ASSAM 4,021 8,234 61 2,665 4 15
Brahmaputra Valley .. 4.801 2,294 66 2,824 7 18 Surma Valley 3,593 5,710 18 674 5 Bill Districts and Frontier Tracts 585 134 9 9,230 42
Manipur •• 5,070 661 620 3,647 2

XllI-COMMUNITY
The community figures in the Imperial alid Subsidiary tables may appear at first sight perplexing. Rence this' explana<;ory note.
The essential point is that the table shows the community origin not the religious attribution. Had time and finances permitted other details would have been given to link up fully with 1931 but in this truncated census this was not possible. Community and religion may seem to many as one and the same and inseparable and are in fact so in most Ca3e'l. But where there are tribes community and religion need not always be the same and in the present census they have all been classified on the basis of community and not of religion. Thus a Khasi returning himself as a Hindu, Christian, Muslim or Animist at the last census would have been classified under any of those headings of religion according to the faith he professed or attributed to him, but this time he has been classified as a Khasi. This is the main reason for the great apparent fall in the proportion, in the whole population, of Christians and to a less extent of Hindus and Buddhists. At the same time there is more than a corresponding increase in the proportion of the tribal people.
All the communities ment'oned in the Gc.vernment of Inc:i:L Act as tribes in Assam have been treated as such and in addition some tribes, Dot indigenous to Assam, but treated as tribal communities in their own provinces. The chief tribes under the latter category are Mundas, Oraons, Gonds, Konds and Santhals. There are some other minor tribes as well but to classify them would have been difficult and perplexing to the enumerator. These five tribes, foreign to Assam, have been grouped together as tea garden tribes as their presence in Assam is largely due to that industry. The only other community from outside Assam which has been treated as a tribe is He Chakmas ; their number is small and they are found only in the Lushai Hills where they have migrated from their origi1l81 home, the Chittagong Hill tract in Bengal. The members of all these tribal communities, indigenous or foreign to Assam, have been shown together under " Tribes" in the Imperial, Provincial and Subsidiary tables.
Subsidiary tables XIII (i) and (ii) clearly show the result of the change from a religion to a community basis of classification. In numbers as well as in proportion in the general population the Hindu figure shows a decrease both in the Brahmaputra and Surma Valleys. In the Brahmaputra Valley tribal people like Kacharis, Miris, Raves, Lalungs were in the past mostly classified on the religion basis as Hindus; in addition there are large numbers of tea garden tribes there who were similarly classified. With their grouping together now by origin the figure for Hindus show an apparent decline. In the Surma Valley indigenous tribal people are few in number but there are many belonging to the tea garden tribes; this has affected the Hindu figure there, but to a much less extent than in the Assam Valley. In the Hills, even in the past censuses there were few tribal people returned as Hindus except in North Cachar Hills and that is why the Hindu proportion has not been affected to a very appreciable extent in the Hill areas. The Christian figure shows much larger decrease than the Hindu figures; this is because the aggregate number of the former is very much smaller than the latter and it is among the tribal communities particularly that Christianity has been able to count many of its followers in Assam. The large decrease in the Brahmaputra Valley is due to the classification of many Christians among the Kacharis, Garos etc. The decrease is greatest in the Hills as apart from Animism Christianity was the main religion these Hill tribes returned at the previous censuses; the decrease should in fact have been more had it not been for a wrong classifi.ca~ tion of over 25,000 people, most probably tribal, as Indian Christians in Manipur .. Figures for Christians in Surma Valley do not show any decrease as there are few tribal people there except in tea gardens and fewer still of Christians among them. The decrease in the number of Buddhists is also due to the same reason. Khamptis and Singphos who were classified as Buddhists before have been now shown against their tribe. The figure for Buddhists has come down from 974 to IS in Lushai Hills; the Chakmas are mostly Buddhists and their classification now as a tribe is responsible for the apparent decrease in the number of Buddhists in Lushai Hills. The decrease in Darrang and Kamrup is due to the fewer Bhutias who have come down this time than in 1931.
If the figures be ef(amined in the light of what is stated above tlley wll1 be found' to disclose no " alarming" tendencies. All the communities have shown natural increases in varying degree and in no district have the pre-existing communal proportions been disturbed to any appreciable extent except by migration.
( 21 )

22
There is no question of removal of Hindus or of Ohristians. A separate note on Ohristians follows and Hindus are present in the same proportions as before; in the absence of caste or reEgion sorting the 1931 practice would have meant that no record of the number of persons of tribal origin, which is so important a matter in Assem and represents one of the reasons for the extensive reserved areas in that. province, would have been forthcoming.

Natural division and district
1
ASSAM
Surma valley
Cachar Plains Sylhet
Brahmaputra Valley
Goalpara Kamrup .. Darrang .. Nowgong .. Sibsagar ..
Hills
Lakhimpur Sadiya Balipara ..
Garo Hills Khasi and Jaintia Hills North Cachar Hills Naga Hills
I Lushai Hills
Manipur ..
23
APPENIUX
CHRISTIANS IN ASSAM
Estimated number of
Christians by rel"gion
2
386,000
fI, "I~O
4,000 4,000
113~500
28,000 8,000
27,000 7,50Q
19,000
23,000 600 400
264,500
25,000 79,000 3,500
34,000 97,000
26,000
Number Estimated recorded as number of
Christians by tribal Christiall8 community
3 4
67,184 319,000
6,982 1,000
3,927 100 3,055 900
33,242 80,500
285 28,000, 1,168 7,000 6,643 20,000 4,147 3,1)00
15,707 3,500
4,745 18,000 516. 100
31 400
26.960 237,500
29 25,000 1,055 78,000
52 3,500 30 34,000 51 97,000
25,743
The above estimate has been prepared on the basis of the 1931 figures, natural increase in areas where the Christians are chiefly found and the extent of missionary activity as far as is known or can be gathered from previous reports. The figure thus arrived at shows an increase of 55% over 1931. Of this 16% will be due to natural increase and the balance to fresh conversions during the decade.
Christians are most numerous among the tribal people of the Hills where there is nothing to suppose that th.e spread of Christianity has not. kept the same pace as in the previous decade. It is ,however reported from Lushai Hills that there has been a tendency in the opposite direction also, Christians reverting to their old beliefs and sacrifices, this has been indicated in the house-lists, but has not been examined to ascertain its extent. In Manipur the Christians recorded are actually tribal (Kukis and Nagas) have been shown as non-tribal Christians. In Naga Hills Christianity has spread most among the Aos and Semas.
Outside the Hills Christianity has spread largely among tribal people and ex-garden labour s.ettlers. There is little missionary activity in the tea gardens themselves, the Christians enumerated there having come as such from their home districts. In the case of ex-garden labourers it is difficult to ascertain whether they were originally tribal people or not, for they assume the name" A. B. Christian". For this reason tribal Christians are very few in the Surma valley where the Christians are mainly among garden and ex-garden labour. In Nowgong and Sibsagar districts also Cllristians among ex-garden labourers seem to have returned themselves as such whether they were tribal or not. In these two districts tribal Christians now shown are mostly Mikirs. Most of the tribal Christians in Goalpara, Darrang and Lakhimpur are among tea-garden tribes: and to a less extent among Kacharis.

Populntion Pro"Vince, Sta.te or Agency r------------~'----------~
Persons Males Femalos
1 2 3 4
ASSAM 10,930,388 5,740,'146 5,189,642
British Territory
Surma Valley and Hill Division
Cacha.r Sylhet ., " Khasi & Ja.intia HUla (British) Naga lliIls Luahai Hilli
,As8am Valley Division
Goalpara Kamrup Darrang Nowgong Sibsagar
Lakhimpur Ga.ro Hills
Sadiya Fron.tier Tra.ct
Balipara Frontier Tr(lct
,Asam states
lfanipUf State
Khasi Blate.
10,204,733
4,218,875
641,181 3,116,602
118,665 189,61,1 152,786
5,919,228
1,014,285 1,264,200 '
736,791 710,800 '
1,074,741
894,842 223,569
60,118
6,512
725,655
1)]2,069
213,586
5,382,795
2,190,921
337,701 1,624,816
60,718 93,&31 73,855
3,156,087
539,437 673,4()3 394,414 379,911 670,591
485,151 113,180
31,998
3,789
357,951
249,183
108,768
Sikha
4,821,938
2,027,954
303,480 1,491,786
57,9.!7 95,810 7&,931
2,763,H1
474,8.!8 590,797 342,377 330,889 504,150
409,691 llO,3S9
28,121)
2,723
3a7,704
262,886
104,818
24
XIII-
Hindus ~--------------------~---------------
Scheduled Castes OtherR r------------A.----------___ r-,-----------A.----------~
Persons M.a,lcs Females Persons Females
5
6'16,556
676,291
416,601
51,961 364,510
63 45 Z2
25.5,715
23,434 59,032 19,415 59,214-50,184
43,527 789
3,901
74
265
265
6
359,28'1
359,115
218,508
27,917 190,496
49 30 Ii)
138,.39 1
12,533 32,32~
10,60.! 32,194 26,706
23,583 439
2,181
35
172
172
Jains
'I 8 9 10
31'1,269 3,864,394 2,065,662 1,,(98,732
317,176
198,093
24,044 174,014
14 15 6
117,3.24
10,901 26,763
8,871 27,020 23,478
19,9il 3J()
1,72{)
39
93 ,
3,536,932
978,118
173,855 785,004-
12,676 4,153 2,425
2,5J1,700
282,789 637,457 323,283 229,137 593,007
457,5!l9 13,518
14,605
2,514
327,462
303,636
23,826
1,901,756
516,859
92,811 411,300
8,628 2,660 1,46\)
1,374,683
154,706 341,974 178,905 124,131 316,871
250,558 7,538
8,562
1,652
163.906
147,932
15,974
Par;,ees
1,635,176
461,254
81,044 373,704
4,0.t8 1.493
965
1,167,017
12S,083 ZiJ5,48:l 149,378 105,OOf) 276,136
206,9M 5,981}
6,043
862
163,556
155,704
7,852
,. _____ -..A ______ ---, r- . ____ .A..._ _____ --,
Persons Males Femlles Persons Mlles Fem,lles Persons Males l"dmales.
ASSAM
Jlritish Territory
B u,fm'l Valley arul Hill" Division
Ca.ch..r Sylhet Khasi &. ,Ta.iotia Hills (British) Na,ga Hills Lushai Hilla
.Assam Valley Division
Goalpa.ra. Kamrup Darmng Nowgong Sibsagar
:Lakbimpur Gnro Hills
iSadiya Frontier Trad
J,Ja1ipan:~ ,Frontier Tmct
Manipur State
~ha,8i S_tal~ . '.
23
3,845
3,464
314-
37 25
232 17 3
3,122
42 38 62
931 413
1.635 1
:16
:
381
8()
301,
24
2,243
259
23 15
209 10
Z
1,951
2~ 25 39
5..18. 24!)
1,086. 1
21
2.
:m 50
22'(
25
1,325
1.221
55
14 10 23 7 1
1,161
19 13 23
393 16!
549
104-
30
U,
26
6,840
6,639
373
30 243
94 6
0,$55
406 603
52 692 91
4,4tO 1
7
4
201
201
Z'l
4.326
4,203
264
23 182
55 4
3,fJ32
32'1 359
42 461
65
2,679 1
6
J
120
If 0
28
2,514
2,433
109
7 61
39 2
2,323
84 244 10
223 26
1,731
1
81
81
29 30 31
2 2
2
2 2
2 2
,"

25
COMMUNITY
Christians
r-,--------------------------------~ Muslims Indian Christians Anglo-Indians 'Others
,. _______ _A_. ______ ---. ~ __ -----A-.----~~ • _____ J..... ________ ""'"\ • •
Persons Males Females Persons Mal68 Females Persons Males Females Persons Males Fema.les
11 12 13
3,474,141 1,831,798 1,642,343
3,442,479" 1,815,613 1,625,855
232,950 1,892,117
1,555 531 101
1,31J,.300
468,924 367,522 120,995 250,113 51,769
44,579 10,398
804
61
31,662
29,.';fJ'J
'1,100
1,10S,019
122,196 984,066
1,301 369
87
708,978
248,332 195,760 65,662
134,610 29,038
28,100 5,475
568
48
16,185
14,71tJ
1,469
Buddhists
1,019,Z3'j
110,754 908,051
254 162 ·14
6)7,322
220,592 171,762
.. 55,333 115,503
22,731
16,479 4,922
296
13
15,477
14,846
631
63,663
37,750
6,463
3,744 2,590
120 9
30,778
269 1,038 6,367 4,049
15,268
3,786 1
486
23
25,913
2.5,727
186
15
32,845
19,925
3,353
1,881 1,381
88 3
16,293
133 583
3,374 2,129 8,102
1,971 1
264
15
12,920
12,814
106
Jews
16
30,818
17,825
3,110
1,863 1,209
32 6
14,485
136 455
2,993 1,920 7,165
1,815
222
8
12,993
12,913
80
17
770
634
36 209 33 .. 15
336
1 85 3
66 110
74 7
5
13S
{}
131
18
452
364
144
13 101
22 , . 8
217
1 44 3
34 81
4R 6
3
88
2
86
Tribes
19
318
270
149
23 108
11
.' 7
119
., 41 .. 22 29
26 1
2
48
3
45
20
2,751
2,426
783
199 256 271
21 36
1,610
15 45
273 42
329
885 21
25
8
325
11.
314
21
1,586
1,408
4,1,5
120 154 145
12 14
943
7 24
155 31
193
523 10
16
4
178
7
171
Othrr~ Unclassified
22
1.165
1,018
338
79 102 126
9 22
667
8 21
lIS 11
136
a6! 11
~
4
147
4
UJ
~. ________ J'-____ --~
Persons r----------·-J~--------~ ~,----------~.----------~
Femaloo Persons Males' Females Persons Males Females Persons Maloo Females Males
32
8,317.
8,144
232
88 23
148 5
18
7,673
412 391 531
31 2.751
8,198 359
:w;
14
178
~Z
lSI
83
4,655
4,550
160
23 H
112 2 9
4,200
215 281 280
21 1,436
1,777 100
177
18
106
ZZ
U
84
3,662
8,594
72
15 \}
36 3 \}
3,473
197 no 251
10 1,315
1,421 169
48
1
es flO
41
35 36
9 2
9 :3
9
"
87 38 89 40
"J 2,824,133 1,435,061 1,389,072
7 2,484,996 1,271,061 1,218,935
683,546
178,260\ 69,907
103,567 184,766 147,04a
7 1,757,664
.7
237,993 197,926 260,748 166,525 860,768
835,230 198,474.
39,97!l.
3,812
839,137
162,805
186,332
341),407
92,660 36,229 50,164 90,690 70,664
908,438
123,165 102,021 135,348
85,753 187,812
174,821 99.518
20,200
2,016
164,000
73.620
90,'180
343,139
85,604 33,678 53,403 94,076 76,378
849,226
114,828 95,905
125,400 80,772
172,956
160,409 98,956
19,774
1,796
175,137
79,285
96,852
~1
4,967
4,961
4,903
67 "1,718
8,118
64
1 2
10 61
42
2,550
2,550
2,503
34 878
1,591
1 2 6
as
43
2.411
2,417
2,400
33 840
1,(121
17
4 13

Community and )ocrtlity
1 IDNDUS-Assam ..
26
SUBSIDIARY TABLES (i) General Distribution of Population by Communities
. Actual number P.op0rtion per 10,000 of popUlation in Variation per-cent
in 1941
2
4,540,950
r---------------~.------
1941 1031 1921 1911
3 4 5 6
5,461
----, r------------ --------, 1901 1931-41 1921-31 1911-21 1901-11 1901-41
7 8 9 10 11 12
5,598 -12'8 +19'3 +13'6 +11'9 +32'4 Brahmaputra Valley 2,804,202
4,154 4,865 3,682 2,533
5,628 7,219 4,437 2,753
6,878 4,665 2,668 _
5,438 7,014 4,771 2,523
7,182 5,000 2,584
-17·8 +28·6 +2·0
+19·2
+21·6 +1'1
+14'5
+15·9 +5-7
+15-7
+49·1 +3·1
+66'8 Snrma Valley 1,370,024 -5·3 Hills 366,724 +5'5
MUSLIMS-Assam ..
Brahmaputra Valley Surma Valley Hills
TRlBESAssam
Brahmaputra Valley Surma Valley Hills
CHRISTIANSAssam ..
Brahmf1,putra Valley Snrl~Ja Valley Hills
BUDDHISTSAssam ..
Brahmaputra Valley Surma Valley Hills
OTHERSAssam ..
Brahmaputra Valley Surma Valley Hills .•
Natural divi&ion and district
1
Assam Brahmaputra Valley
Goalpara Kamrllp Darrang Nowgong Sibsagar
Lakhimpur Sadiya BaJipara
Surma Valley
CachaI' Plains Syihet
HilllJ
Garo Hills North CachaI'
3,474,141 1,'304,827 2,124,635
44,679
2,824,133 1,602,976
216,642 1,001,515
61',184 33,2'12
6,982 26,060
8,317 7,553
52 712
15,663 9,489 2,087 4,087
3,178 2,264 5,711
309
2,584 2,783
582 6,939
62 58 19
186
8 l3
5
14 17 6
28
3,007 1,999 5,517
292
1,073 587 28
5,590
2('0 156
17 1,346
16 29
11
6 10 1 8
2,778 1,520 5,273
272
1,573 1,459
49 6,215
165 ]00 II
824
17 31
13'
6 10 1 6
2,693 1,143 5,166
251
1,755 1,734
53 6,790
94 68
9 423
15 31
7
'5
9 1 3
2,581 950
4,920 299
+24'9 +25'3 +16'8
1,744 1,782
73 6,845
+38-2 +18'1 +21·3
+184'6 +477-7
+2,266'0 +42-3
59 -73'0 48 -54-9
6 +24'3 256 -84-1
14 30
11
4 7 1 3
-44'7 --44-3 -35-8 --49-5
+160'5
+105-7 +405-3 +314'1
+61·1 +12·2 +23-8
-21'0 ,-50-7 -38-4 +3·9
+88'7 +90'3 +66-9 +88-8
+11'3 +12·2 +3·8 +3'1
+22'6 +20·5 +1·2
+47'8
+65·0 +5·5
+17·5
+1'4 +4-4 --4·5 --0·8
+98'5 +82-0 +28-0
+111-0
+28'6 +23·3 +13'6
+105·8
+47'5 +36·5
+153·8 +67'0
+20-2 +119'7 +42·8 +16·3 --0·5
+424·4 +62·6 +75·5
+16'0 +164'3 +15-5 +243,5 -19·8 +1,015'8 +17'6 +72·5
+85'1 +69-8 +54·6 +96·2
+18'0 +23·3
+109'5 -28·6
+86'8
+165'4 +310·5 +24·0
-6'7 --4·9
+147-6 -25·5
+36'4 +1,609-9 +40'6 +1,794'0 -19·1 +2,008'1 +52'1 +1,193'4
(ii) Distribution of Main Communities by Districts
Number per 10,000 of the population r-------------------------------------A---------------------~-------------~
Hindus Muslims Tribes r--------.A. ----, r- r---------..A., 1941 1931 1921 1911 1901 1941 1931 1921 1911 1901 1941 1931 1921 1911 1901 2345678
4,154 5,628 5,461 5,4!38 5,598 3,178 3,007
4,865 7,219 6,878 7,014 7,182
3,019 4,372 4,844 5,573 4,409 5,510 7,269 7,141 6,876 6,914 4,720 7,7!H 7,077 6,502 7,095 4,057 5,790 5,579 5,856 6,422 5,985 9,Oll 8,443 8,623 8,855
5,599 9,132 7,834 7,846 8,979 3,078 4,874 4,871 3,974 7,403 7,172
3,682 4,437 4,465 4,771 5,000
2,264
4,623 2,907 1,642 3,519
482
498 144 94
5,711
1,999
4,392 2,461 1,154 3,160
471
358 151 140
5,517
9 10 11 12 13 14 15 16
2,778 2,693 2,581 2,584 1,073 1,573 1,755 1,744
1,520 1,143 950 2,783 687 1,469 1,734 1,782
4,151 3,5.22 2,779 2,346 1,013 848 788 2,719 1,463 968 911 1,566 200 1,336 2,105 2,132
764 538 515 3,539 759 2,023 2,882 2,326 1,774 517 482 2,343 944 2,553 3,560 3,054
425 431 416 3,357 343 991 834 656
263 286 321 3,746 204 1,681 1,635 484 145 6,649 4,403 4,186 68 5,854 1,579 2,223
5,273 5,166 4,920 582 28 49 53 73
3,652 6,208 6,379 6,488. 6,725 3,851 3,641 3,409 3,311 3,055 2,430 101 177 177 3,688 4,087 4,327 4,444 4,680 6,071 5,887 5;040 .5,519 5,265 224 14 24 29
194 50
2,5.13 2,753 2,668 2,523 2,584 309 292 272 251 299 6,939 5,690 6,215 6,790 6,8d5
640 1,464 1,420 7,758
960 564 8,878 7,161 7,988 7,811 8,192
Khasi and J aintia Hills Naga Hills
1,074 913 221 361
1,049 7,165
540 390 397
1,310 5,521
402 282 385
5,858 265 327 409
465 116 131
28 7
526 137 90 39 12
524 153 58 43 37
517 162 65 21 34
1,422 8,439 1,493 2,376 4,283 2,565 55 8,728 6,930 7,682 8,187 8,192 14 9,743 8,291 9,019 9,473 9,505 25 9,624 4,835 6,675 9,274 9,542 Lushai Hills 160 321
Manipur 5,930 -5,773 5,994 5,816 5,996 577 513 455 4111 365 2,984 3,474 3,433 3,758 '3,631
., r

XlV-VARIATION IN POPULATION OF SELECTED TBIBES
lIB 760lnsus

28
XIV-VARIATION IN POPULATION OF SELECTED TRIBES
Tribe and locality where PerSons Males Females chiefly found
1941 1931 Variation 1941 1931 Variation 1941 1931
1 2 3 4 6 6 7 8 9
*AHOM-Lakhimpur and Sib- 300,214 249,434 +50,780 157,743 129,989 +27,754 142,471 119,445 sagar
*KACHARI-Brahmaputra Valley anQ. . North Cachar
428,733 342,29'( +86,436 220,887 176,261 +44,626 207,846 166,036
Hills
*GARO-Garo Hills and 226,273 193,473 +32,800 113,747 97,611 +16,136 112,526 95,862 Goalpara
*MIKm-Nowgong and Sibsagar 149,746 129,797 +19,949 77,108 66,045 +11,063 72,638 63,752
*KUKlt-Manipur, North Cachar Hills and N aga Hills
*LUSHAI-Lushai Hills
*RABHA-Garo Hills, Goalpara and Kamrup
*MIRI-Lakhimpur and Sib-sagar
*LALUNG-Nowgong
*KHASI-Khasi and Jaintia Hills
*SYNTENG-Khasi and Jaintia Hills
*NAGA-Naga Hills Manipur
tANGAMI-Naga Hills
tAO-Naga Hills
tKONYAK-Naga Hills
tLHOTA-Naga Hills
1RENGMA-Naga Hills
,SEMA-Naga Hills
and
>I< Figures relate to Assam.
84,479 91,690 -7,211 40,716 45,005 -4,289 43,763 46,685
142,302 114,158 +28,144 68,181 53,859 +14,322 74,121 60,299
84,269 69,154 +15,115 43,598 35,616 +7,982 40,671 33,538
106,950 85,038 +21,912 54,857 43,669 +11,188 52,093 41,369
51,308 43,448 +7,860 25,957 21,607 +4,350 25,351 21,841
192,919 1'11,957 +20,962 93,595 83,717 +9,878 99,324 88,240
63,741 60,5'i3 +3,168 30,170 29,122 +1,048 33,571 31,451
280,370 268,303 +12,067 137,250 131,546 +5,704 143,120 136,757
52,080 48,702 +3,378 26,375 24,727 +1,648 25,705 23,975
40,063 32,'i'il +7,292 19,332 15,184 +4,148 20;731 17,587
9,744 9,493 +251 4,690 4,553 +137 5,054 4,940
19,374 18.228 +1,146 9,471 8,950 +521 9,903 9,278
4,9~8 6,329 -1,361 2,338 3,151 ~813 2,630 3,178
35;741 37,322 -1,581 17,277 18,542 -1,265 18,464 18,780
t Figures rel:l.te to Naga Hills District.
l
Variation
10
+23,026
+41,810
+16,664
+8,886
-2,922
+13,822
+7,133
+10,724
+3,510
+11,084
+2,120
+6,363
+1,730
+3,144
+114
+625
-548
-316
t The large decrease in the number of Kukis is due to the wrong classification of many of them as Indian Christ:ans by Mair,pur State, If the probable figure of those Christians is. added the Kulri population shows a slight increase.

PROVINCIAL TABLE I-AREA AND POPULATION OF THANAS" MAUZAS ... ErC~
f 29)

30
PROVINCIAL TABLE I-AREA AND POPULATION OF THANAS, MAUZAS, ETC
Number or Population
Thana, II)aUZa. or other looaI unit
Area in r---.A----.Occupied aq milea Towns Villages houses
1941 1931 Percent:tge variation Density
r----"----, (sq mile)
1 :
87,357
British ferritr:rry 55,043
Surma Valley and Hill 24,195 Division
Cachar district
Bilchar BubliiviailJ'll
Katigon, Barkhola Udarbond Lakhimpur Sonai
Silchar Railway area
HailaKandi Subdivi8'ioo
3,859
1.459
244'7 144'0 169'0 279'1 374'~
248"4
512
Hailakandi .• 185'5 Katlicherm •• 326'9 Railway area
North Oachar-Hilla Bub· 1,888 division
Sylhet district North Sylhet BubdivWoo
Gosainghat. .Taintapur Kanaighat 13ylhct Biswana.th
Balaganj Golapganj Fenchuganj .• Railwa.y area
South fi.ylhet (Maulvi Bazar) Subdivisioo
Maulvi Bazar Srimangal Kamalganj •• Raj Nagar •• Kulaura
Railway area
Habiganj Subdivi8'i1)ll
Ajmiriganj •• Nabiganj Balliyachung Lakhai lIladhabpur ••
Habiganj Bahubal Chunarighat .• Railway area
Sunamganj Subdivision .•
Dbarmapasa Tahirpur Sachna Dirai Sunamga.nj
Chhatta.k J aga.nnathpur Sulla
K arimganj Subdivision. .•
Beani haza.r •• B'Lrlekha. Pathar Kandi Rat.ha Bari Karimganj .•
Bada.rpur Railway are!\
5,444
1,083
248 78
1'54 227 81
149 105 41
864
131 154 188 131 260
990
83 163 189 74
109
95 87
190
1,436
161 141 173 158 287
276 140 100
1,071
96 152 277 240 259
47
1931 1921 1941 Persons Males Females Persons to to
1941 1931 6 6 7 8 10 11 12
32 36,5902,151,47910,930,388 5,740,746 5,189,642 9,248,397 +18'2 +15·7 162
31 33,5602,006,74110,204,733 5,382,795 4,821,938 8,622,791 +18·3 +15·6 185
11 14.923 827,645 4,218,875 2,190,921 2,027.954 3,708,047 +13'8 +8'3 174
3
1
1
1
1
1
6 1
I
1 1
1
1
1
.. I
1
1,516' 130,540
880 89,493
162 79 98
167 179
194 1
295 198
96 1
341
12,708 7,569 8,481
17,309 16,503
26,706 217
31,838
22,789 8,877
172
9,209
11,449 599,315 2,707 128,601
307 12,353 !l2 '4,409
211 15,470 842 35,541 462 15,616
51.5 21,437 209 18,038 68 5,63t)
1 101
1.833 104,019
477 194 268 375 518
1
2,376
117 450 353 63
29§
311 353 433
1
2,695
368 204 82
240 589
678 411 123
1,838
241 312 294 236 640
114 1
23,411 18,064 18,206 15,406 28,649
283
147,017
8,374 23,698 23,940 12,625 20,318
21,286 14,980 21,578
218
106,629
14,708 5,714 4,296
13,985 19,300
25,858 16,200 6,568
113,049 18,587 16,366 15,604 14,132 39,423
8,190 747
641,181
437,284
63,273 34,654 35,220 78,595 85,402
139,522 618
166,536
123,183 43,176
177
37,361
3,116,602
664,172
59,027 'i8,902 74,504
187,885 83,726
113,476 97,003 29,374
275
:515,154
122,837 79,260 86,708 '19,559
146,006
784
,731,151
46,297 124,246 122,692 61,186 98,025
107,632 70,523 99,782
768
637,897
82,729 33,490 27,512 81,526
140,717
145,397 88,589 37,937
,668,228
100,899 81,459 70,788 67,599
202,341
42,672 . 2,473
337,701
230,600
33,020 18,085 18,671 41,332 44,446
74,627 419
87,802
64,649 23,039
114
19,299
1,624,816
348,048
31,462 10,103 38,939
100,059 42,824
58,522 49,944 15,999
196
266,967
63,825 40,917 44,887 41,133 75,709
496
376,271
24,226 64,249 63,285 30,602 50,024
56,382 36,026 51,025
452
337,131
44,293 18,272 14,604 42,000 75~009
77,093 46,136 19,724
296,399
51,840 41,777 37,040 35,624
106,508
22,102 1,508
803,480
206,684
30,253 16,569 16,549 37,263 40,956
64,895 199
78,734
58,534 20,137
63
18,062
1,491,786
316,124
27,565 8,799
35,565 87,826 40,902
54,954 47,059 13,375
79
248,187
59,012 38,343 41,821 38,426. 70,297
288
354,880
22,071 59,997 59,407 30,584 48,001
51,250 34,497 48,757
316
300,766
38,436 15,218 12,908 39,526 65,708
68,304 42,453 18,213
271,829
49,059 39,679 33,748 31.975 9.5.833
20,570 965
670,531 +12'4 +7'8
386,695 +13·1 +7·6
56,205 82,484 32,846 71,712 75,757
117,691
150,992
+12'6 +6'7 +7'2 +9'6
+12'7
+18'5
+10'3
+7'1 -1'9 +5'4 +9'1
+11'4
+S'l
+7·1
108,736 +13'3 +6·1 42,256 +2'2 +9'7
32,844 +13'8 +13'6
2,724,342
580,560
58,377 ,..t7,782 68,835
159,983 72,937
97,173 81,452 24,021
451,31J4
104,331 68,720 78,841 69,576
129,896
632,521
39,101 105,535 104,898 52,288 87,714
91,835 61,330 89,820
550,263
72,033* 29,159* 23,954 70,909
122,512*
122,067 74,995 34,634
609,634
96,126 65,708 65,620 64,213
179,735
88,232
+14'4
+14·4
+1'1 +6'3 +8'2
+17'4 +14'8
+16'9 +19'1 +22'3
+14'1
+17'7 +15'4 +9'9
+14'4 +12'4
+14'0
+IS'5 +17'8 +16'9 +17'0 +11'8
+17'2 +14'9 +11'1
+15·9
+14'8 +14·8 +14'9 +14'9 +14'8
+7'2
+7·7
+lS'1 +13'7 -f-4. 6
+11'4 +2'0
+3'2 +6·2 +8'9
+8'0
+7'5 +2'9 +7'4 +5'8
+13'0
H'7 -1·5 +4'8 -0'4 +5'7
+10'8
+12'9 +13'5 +5'4
+7·6
+6'1 +15'6
N('w thana +7'1
+10'0
+19'1 +11'0 +18'1 +2'1 +0'6 +0'6
+11'5 +6·1 +4.g 1.
+23'9 f +6·0 +7'9 +1'9 +5'3 +7'0
+12'6 +6'9
+11'6 +8'7
166
3011
2.58 241 208 282 228
562
325
664 132
20
572
613
~3S 242 48-1 828
1,034
762 024 716
595
938 514 461 607 565
738
557 762 649 826 899
1,133 810 525
411
1514 238 159 516 400
527 633 379
531
1,054 536 256 282 781
908
• Approxima.te population calculated, final delimitation of jurif'dietion not yet m;;>.de

:n
PROVINCIAL TABLE I-AREA AND POPULATION OF THANAS, MAUZAS, ETC-contd
'I'hana, mauza or other tocltl unit
1
Kha~1 ami Jalntla Hills' dis-trict '
Sadar Subdivision
British Territory Khasi States ..
.J oll'a; Subdivision (all British)
'Naga Hills district
Kohima (Hadar) Subdivi. 8ion
lJ1okokchiLn'} Subdivision
L'ushai Hills district
AiJal (Sadar) Subdivision
Lunyleh Subdivision
Assam Valley Division
Goalpara district ..
Dhubri (Sadar) Subdivi-sion
Golalrgltnj .• Db.ubri )iankltchar .• South Salmara Bilashiparlt ..
Kokrajhar .. Gossltingaon .• Ridhy 13ijni Railway area
G?alpara Subdivisio"
North Sal mara I,akhipur Goalpara. Dlldnai Railway area
llarrang district .•
Tezpllr Subdivision
Dhekiajuli 'l'ezpur Sooth}. Behali Gohpur
R lilway area
}If anJaldai Subdivision
Paneri l'dalguri Majbat ,Kalaigaon ~[angald"i
Dllgaon Rlilwayarea
N'owgong i:listi'ict .. Lahorighat Dhing ~Iariga,on P"oha Nowgol1g
Rupahihat Kaliabor Samaguri .J amunaIilukh },umding -
Railway area
Number of Area. iil r-___"_~ sCI miles Towns Villages
2
6,145
4,039
345 3,G!l!
2,106
4,298
2,780
1,518
8,143
4,861
3,282
J
1
1
'1
1
2,462
1,fJ85
176 1,509
777
497
28'1
210
50S
289
219
Occupied hOlliles
5
69,538
53,09'1
7,3~S 45,769
16,441
48,919
26,110
22,809
25,102
17,685
7,417
Population r-------------~~-------------_. , Per(,(,l1tage
variation r----"-~
Ill41 r-------J'------_.
Persons
6
332,251
24!3,4U
32,858 213,58S
85,807
189,641
98,747
90,894
152,788
108,719
4J,01}7
J\bles
'1
169,488
127,879
19,111 10S,768
41,607
93,831
49,597
44,234
73,855
52,623
21,232
Females
8
162,765
118,565
13,747 104,818
44,200
95,81()
49,15(}
46,1](j(}
78,931
56,096
22,835
1!J31
1931 1921 Persons to to
1941 1931 9 10 11
2S9,926 +14'6 +19'2
208,781 +18·0 +22·4
23,701 +14'2 +14-3 i80,OOl) +18'7 +22'4
81,U;; +5'7 +11·'1-
178,844
94,129
+6'0 +12'6
+4·9 +11·8
84,7.l5 +7,3 +13-"
124,404 +22'9 +26'4
89,376 +21·7 +27·1
35,028 +25·9 +24'8
Density (sq mile)
1941
12
61
g •• 58
41
44
31;
60
19
22
13
26,968 19 18,1741,165,787 5,919,228 3,156,087 2,763,141 4,855,451 +21'9 +21'7 219
3,979
2,881
182'8 16-!'2 <:61'4 271'6 374'0
1505"4 499-3 410"4 411'4
1,098
340'6 266'8 2+1'6 248'6
2,806
1,.534
401'3 375'0 317'5 255'9 184:2
1,272
277'8 142',1, 110'\) 166·0 372'1
203'1
3,S96
214'5 78'5
495'2 178'2 143'0
1139"2 174'2 508'8
1,042'9 '801'5
3
2
2
1
2
1
1
1
2
1
1
3,765
2,406
94 143 !JO
296 404
420 407 260 291
I
1,359
360 389 2J.5 364
1
2,037
1,020
249 282 2(H 1513 128
1,017
212 113
92 171 204
134 1
2,391
214 68
377 1!9 136 135 125 224 808 174
1
183,850
12.9,(J37
17,617 15,911 8,H6
15,437 18,096
lS.942 U,468 10,537 13,037
446
M,213
190462 14,064 10,8]'! 9,791
22
157,938
91,948
18,986 30.222 19,921 14,684 7>90~
232
65,990
16,091) 4.6Si) 5,785 7,6!!
22,235
!J,3:;1 200
126,775
13,517 8,060
13,270 11,109 17,448
lG,188 8,849
13,779 20,175 2,110
2,270
1,014,285
715,924
85,464 94,146 39,671 89,847
101,584
85,928 86,893 59,165 71,996 1,232
298,.301
106,463 81,391 56,418 53,995
94
736,791
412,545
84,863 132,463
00,646 65,123 38,909
5U
324,216
68,255 24,682
24,493 3'3,221
119,561.
43,682 349
710,800
85,752 53,253 7&,995 60,418 96,234
107,844 39,013 67,372
107,355 11,904
5,660
539,437
382,378
44,910 51.4097 20,649 47,574 53,552
45,45!J 47,f>7:-! 31,403 38,6:14
838
157,059
56,236 42,802 2\),935 27,989
77
394,414
221.951
46,001 71,902 4SA!J3 34,M>5 20,698
387
172,463
36,+32 1:3,:35~ 13,153 20,018:') 62,824
25,9H 274
379,911
41),924 28,328 39,902 31,661 51,755
5'7,943 20,878 3fl,527 57,975 6,217
3,801
474,E48
333,54fJ
40.554 42,649 19,022 42,273 48,03Z
40,467 39.021 27.762 33,362
40-1,
141,302
50,227 38,589 26,463 26,006
17
242,377
190,591
38.862 60,561 (2,]4.8 30,658 l8,211
Li!
151,783
31,823 1l,~2j,
11.:;40 17,736 56,741)
22,745 75
330,889
39,828 21,9;;5 36,093 2S,757 44,479
4!l,n01 1&135 3J.S¥. 49~380 5,687
1,859
883,288
621,255
80,327 80,681 36,820 92,118 82,631
75,166 74,575 50,375 48,562
262,013
+14'9
+15·2
+6'4 +16'7 +7'7 -2'5
+22'9
+14'3 +16-5 +17'4 +48-3
+13·8
83,599 +27-3 81,850 -'5 50,665 +11'3 45,919 + 16' 5
5S1-,817
145,168
64,217 114,637
79,412 54,359 32,543
239,649
56,989 14,634 18,289 27.967 97,136
24,634
562,581
62,269 40,455 ~!l,7S6 51,675 81,093
85,052 34,009 57,047 76,785 14,409
+26'9
+19·5
+32-3 +15'6 +14'1 +19'8 +19'6
+35·.1
+19'8 +68'!J
+34-1 +36'7 +22'!)
+9;'6
+26'9
+37-7 +:n'4 +27'1 +IIH) +18'6
+26'9 +14'8 +18'0 +39'8
--2
.,
+15'8, 254
+12-6 218
+'8 462 +15- 7 573 +6'5 64(; +3'5 331 +4- 7 272
+21-1 170 +35"1 174
144 +21'1 175
+24·1 • 271
+32'8 +21'4 +20'1 +18'9
+22-6
+20,'1
+32'9 +10'0 +2'~'!J +14-8 +41-6
+25'3
+15'1 +47'!J
+5'4 +17-4
+150-7
+41'3 +1+1';:) +126-4
-)-17·8 ~-lD'2 +37'1
+]7·0 +40·1 +4~'1 +12-1
3 t:1 305 23:! 217
263
269
2H 3i'i;{ 285 255 2U
255
2,W
182 401) G78 15:J a;~!)
67:1
637 2:?4: 132 HI;~
13

32
PROVINCIAL TABLE I--AREA AND POPULATION OF THANAS, MAUZAS, ETC-contd
Thana, manza· or other local unit
1
Kamrup district
Gauhati Subdivisim!
Barama Nalbari Rangiya Rajo Kamalpur
Bako Chhayagaon . _ Pala~h Rari .• Gallhati Railway area
Barpeta Subdivision
i'lorBho_g Patachar KUl'hi Barpeta Tara Bari Railway area
Sibsagar district ..
Jorhat Subdivision
lI[ajllli Teok Jorhat Titahar Railway area
Sib8agar Subdivision
" Amgnri RihRA,~ar Nazil:a' SOllari R'1ilwayarea
Golagltal Su1Jdivisio1l.
Tbk,ddlat Derftaoll Gol~ghat I~ailway area
Lakhimpur district
Sadar Subdivision
Morar Dhemaji Dibrugarh Dordhubri Jaipur
Tinsukia Doom Dooma Digboi Margherita ._ Railway area
l' Drill, Lakkimpur Subdit"i8ion
1~ihupuria .. North Lakhimpur Dhakua Khana
Area, in sCj l11il~s
3,'3H
2,590
2&3 10~ 491 296 167
410 168 267 307
1,254
3!l7 230 360 267
5,138
1,094
3::;9 188 311 236
1,019
f40 315 2)7 357
3,02.5
·1-38 277
2,1J(}
4,153
2,808
158 4-l-G 518 275 32))
278 313 27'J 190
1,345
302 570 413
Nnl11b~r of ,-------"-_-,
TOWIls Vi~lages Oc~upied
houses
3
3
1 1
1
1
2
1
4
3
I
1 1
1
_, . 1
4
2,833
1,888
177 2:;8 358 171 181
216 160 172 194
1
978
2Si lil5 3ll!! 116
1
5
228,191
148.758
14,00:1 29.210 23,9!~ 18,707 lfi,113
0.6()3 7.739
14.060 15,286
1,005
78,433
22,549 15,440 :m,816 1O,4-H
184
2,324 219,722
726 78,007
.178 129
153 1
726
107 245 148 225
1
872
154 H\8 5"i!
1
2,595
1,893
240 215 3J.1 233 327
199 192
79 89 1
702'
225 291 183.
8,494, 15,865 35,041 18,1:15
466
77,.352
1],995 21,199 10,059 23,73!
465
64,363
9,l-!8 15,9,)2 33,907
316
203~n
163,857
II ,102 5,139
31,793 18,888 19,421
25,299 31,558 12,617
8,989 1,101
37,415
12,145 17,399
7,871
Population ,------
-..A. _____ _ Percentage variation
,-------"---....... 1941
,--------''--
PersCl:lS Males Females
6
1,2'34,20()
810,032
76,097 1M,5at 129,073 104,346 85,587
53,738 43.774 75~162 74,711 3,010
454,168
122,381 85,434
180,520 65,235
568
(.074,741
377,358
53,065 73,721
170,8D3 78,620
1,149
382,831
62,880 122,667
92,827 103,656
801
311,5.52
4:3,870 8t,333
188,617 677
894,842
6.SJJ,345
53,836 29,757
144,229 78,430 85,400
102,332 119,104
43,825 29,009 3,363
205,497
71,809 82,617 5-1,071
7
673,403
429,903
39,7RO S6,O~9 68,167 54,827 45,073
28,456 23,403 39,105 42,918 2,116
243,500
65,368 45,011 07.6H 35,077
370
570,591
201,154
28,337 39,097 91,389
. 41,558 773
202,489
32,930 64,752 48,889 55,369
519
166,9,18
21,752 41,396
100,310 490
485,151
37.5,956.
23,874 15,652 78,693 41,858 45,623
55;260 63,342 27,218 16,868
2,278
109,195
38,541 43,951 26,703
8
590,797
380,129
36,308 78,485 60,906 49,519 40,514
25,282 20',371 35,057 31;793
894
210,668
57,013 40,423 82,8.46 30.188
198
504,150
176;204
24,728 34,624 79,414, 37,(l62
:l76
180,342
29,960 57,915 4:1,!)~8
48,,287 252
147,604
H\1l8 39,992 88,307
187
409,691
313,J89
24,962 14,095 65,266 36,5'62 39,837
47,072 55.762 16,607 12,141
1,085
96,302
33,268 38,666 24,368
1931
Persons 1031 1921 to to
1941 1931
Densitv (sf! milE;)
1941
9 10 11 12
976,476 +29'4 +27'9 329
661,491 - +22·5 +14·6 313
60,885 136,·l82 100,063
81,754 77,584
44,293 35,150 62,356 62,924
315,255
82,186 69,221
113,635 50,207
+25·0 +20'6 +29'0 +27'6 +10'3
+21·3 +24·5 +20'5 +18'7
+44·1
+48'9 +23'4 +58'9 +30'0
New thana 267 +7-4 827
+17, ° 263 +17'0 353 +7'8 512
+32'5 +39·1 +1l'7 +15'7
+69·0
131 261 282 243
362
+8,1·5 308 +14·5 371
+101-5 501 Newthana 2H
933,326 +15'2 +13'4 209
44,235 66,895
147,345 69,018
+20-0 +10'2 +16'0 +13'9
+19·(J +6'1 +8'0 +5'6
331,052 +13·6 +14'4
54,363 104,166
87,2<16 85,277
+lG'7 +17'8 +6·4
+21-6
+5·9 +17'6 +7·2
+25'3
274,781 +]4'5 +18·4
37,969 73,790
163,022
723,782
571,958
40,978 28,190
125,792 65,322 62,394
89,622 96,626 38,556 23,292
153,010
43,347 66,385 43,278
+20·1
+31'4 +5'6
+14-7 +20'1 +37-0
+14·2 +23'3 +13'7 +24'5
+34·3
+65'7 +24'4 +18'0
+23·1
+41'1 +18'7 +4'7
New thana +30'8
+39-1 +9'9
+60'8 +60'8
+25·0
345
148 392 549 330
376
449 389 448 290
104
93 372
SO
279
245
345 67
263 285 259
368 379 160 153
153
~38 145 108

33
PROVINCIAL TABLE I-AREA AND POPULATION OF THANAS, MAUZAS, ETC-concld
Population Number of r- -. Percentage
Thana, lliaUla or other 10c[)'1 Area in r-__A..------, Ocrupied 1941 1931 variation Density unit sq miles Towns Villages houses r- -. r-__A..---. (sq mile)
1931 1921 1941 Persons 1fales Females Persons to to
1941 1931
1 Z 3 4 5 6 7 8 9 10 11 12
Garo Hills district 3,152 2,196 46,039 223,569 113,180 110,389 190,911 +17'1 +6·6 71
:Mauza No I (HiUs) 484 5,633 29,334 14,658 14,676 24,753 +18'5 -10·8 II 508 9,049 45,776 23,187 22)589 39,994 +14"~ +12·7
III 476 9,674 403,345 21,494 21,851 39,403 +10'0 +8'9 IV :14-1 7,931 40,029 20,239 19,790 33,526 +19'4 +8'5 V (Nibal'i) 156 3,917 19,905 10,188 • 9,718 15,884 +25'4 -9'2
plains
VI (Fulbari) 51 2,116 10,850 5,619 5,241 9,849 +10'3 +7·6 plains
VII (Ranga- 70 2,208 10,755 5,539 5,217 7,660 +40'4 +4·2 pani) plains
VIII (Ma- 38 1,993 9,470 4,879 4,591 8,623 +9'8 +1'5 .. hendraganj) plains
IX (Ghosh- 71 2,285 11,185 5,688 5,497 8,861 +25'8 +95·6 gaon) plains
X (Tura 1 633 2,908 },689 1,219 2,358 +23'3 +34·7 town) plains
Sadiya F. T. 3,309 1 427 11,931 60.118 31.998 23,120 54.531 +10'2 29'3 18
Sadar Subdivision 2,189 1 308 8,.311 42,472 22,600 19,872 37,325 +13·9 +39·3 19
Pasighat Subdivision 1,120 119 3,620 17,646 9,398 8,248 17,206 +2·6 +12·5 J(;
Balipara F. T. .. 571 36 1,378 6,512 3,'1'89 2,723 4,762 +36'7 +20-4 11
Manipur State 8,620 1 1,521 98,969 512,069 249,183 262,886 445,606 +12'9 +16'0 59
Valley Section 1 64,593 343,657 167,570 176,097 294,767 +16·6 +13·5
Naharup panah 7,411 .34,682 17,077 17,605 31,877 +8·8 +10·4 Ahalup .. 12,282 71,468 35,225 36,243 61,674 +15·9 +14·9 lmphal 1 2},2a9 110,995 52,863 58,132 95,445 +](J·3 +8·9 i{lia/'am 10,914 .54,161 26,592 27,569 46,430 +16·7 +15·7 Laijam 11,337 66,215 32,573 33,642 54,417 +21'7 +15·6
Jiri{lhat 1,385 6,146 3,240 2,90fJ l,924 +24·8 +118·2
HiIlSdion 1,006 34,371 168,402 81,613 86,789 150,839 +11'6 +21'3
Hill East 11,152 53,720· 25,877 27,843 47,991* +11·9 Hill Sadar 11,620 61,360 25,075 26,286 40,266* +11-0 lJill West 11,599 63,322 30,661 32,(]61 56,682* +11·9
* Approximate figures are calculated
{ :M )


Ml7aOert~us
PROVINCIAL TABLE II-POPULATION OF DISTRICTS AND THANAS BY COMMUNITIES
( 3G )

36
PROVINCIAL TABLE II-POPULATION OF DISTRICTS
Hindus
Dil.ri~ au.d thlll!.lil Scheduled castes Other Hindus Muslims Jains Buddhists ,---"----, ,.-----A------, ,--------A-----
M F M F M F M F M F
1 Z 3 4 5 6 r 8 9 10 11
ASSAM 359,287 317,269 2,065,662 1,798,732 1,831,798 1,642,343 4,326 2J)14 4,655 3,662
British Territory 359,115 317,176 1,901,756 1,635,176 1,815,613 1,626,866 4,'206 2,433 4,550 3,594
Surma Valley and 218,508 198,093 516.859 461,254 1,108.019 1,019.235 264 109 160 72 Hill Division
Cachar district 27,917 24,044 92$11 81,044 122,196 110,754 23 7 23 11)
Silchar SuO-division 21,529 18,866 69,981 60,9fJ6 76,752 69,803 12 '1 18 12
Kattgora 2,776 2,507 9,432 8,641 14,393 13,282 Bor khola 1,041 944 4,265 4,034 6,157 5,632 Uda-rhond 1,138 971 3,447 2,937 3,522 3,075 Lakhimpur 847 647 14,839 13,102 9,042 8,215 Sonai .. 7,625 6,945 14,988 13,727 17;286 15,963
Silchar 8,051 6,824 22,S30 IS,431 26,299 23,629 12 7 16 12 Railwlly area .• 51 28 ISO 94 53 7
Hailahandi Suo. 6,281 5,114 19,773 18,014 45,145 40,818 11 1 division
Hailakandi 4,294 3,481 15,984 14,801 35,446 32,100 11 I Katlicherra 1,954 1,626 3,710 3,167 9,683 8,708 Railway a:rea 19 7 79 4.6 16 10
North Cachar Hill 121 64 3,057 2,064 299 133 '1 2 Subdivision .,.
Sylhet DistrIct 190,49B 174,01<1. 411,300 373,104 981,066 908,051 182 61 14 9
_Vorill Sylhe! Suo. 25,074 22,387 59,437 52,119 256,813 234,621 r5 d,vision
Goainghllt 2,604 2;074 3,182 2,552 23,744 21,145 Jaintapur 1,029 842 1,495 1,239 6,904 6,038 Kanaighllt 3,857 3,643 1,796 1,745 32,609 29,555 Sylhet 4,348 3,581 22,33S 17,252 59,771 63,817 5 Biswanllth 2,424 2,314 6,633 6,587 33,763 32,001
Balaganj 5,317 4,925 13,733 13,211 39,471 36,818 Golapgarrf 3,696 3,385 7,762
0 7,405 38,478 313,262
Fenchuganj 1,795 I,BI9 2,336 2,057 11,039 8,980 Railway 4 4 162 71 30 4
&uth S,I/lhet (Maul.ri 34,991 32,903 102,1344 91],592 124,008 11.1,753 nr 47 1~ /,
Bazar) Subdivision
Maulvi Bazar .• 8,424 7,968 19,300 18,345 35,889 32,642 66 20 .. Srimangal 4,159 4,024 24,276 22,998 11,527 10,473 83 23 2 Kamalganj 5,879 5,671 19,577 18,028 17,567 16,358 "
Raj Nagar 5,024 4,653 12,881 12,611 22,640 20,607 1 Kulaura 11,468 10,577 26,135 24,372 36,303 33,644 8 4 7 4
Railway area, .• 37 20 3-75 238 82 29
Habiganj Sub. 14,992 42,6D3 89,477 83,385 223,133 211,403 4 5 division
Ajmiriganj 5,540 4,982 6,775 5,871 11,911 11,218 Nabiganj 7,379 6,592 15,773 14,981 41,097 38,324 Bania Chung 10,032 9,316 14,603 13,975 38,649
~ Lakhai 5,378 5,461 5,853 5,971 19,371 2 .. Madhabpur 7,588 7,106 11,824 11,448 26,586 5, 3 ::
Habiganj 5,057 4,958 14,860 12,144 36~406 34,108 Bahubal 2,085 2,138 8,361 8,231 22,889 21,7.49 Chunarighat .. 1,816 1,879 1l,197 10,591 26,119 25,037 1 3 Railway area 117 71 228 173 105 72
Sunamganj Sub· ~9,494 33,853 '17,721 68,925 218,625 198,88IJ di~i8ion
Dharmapas& " 6,629 5,263 10,914 9,575 26,734 23,585 Tahirpur 2,292 1,8.24 4,070 3,358 11,801 9,953 Sachua 1,764 !,541 4,377 3,579 8,463 7,788 Dirai .. 6,243 5,737 12,534 11,730 23,223 22,059 Sunamganj 7,924 6,727 15,722 12,416 50,800 46,097
Chhatak 4,318 3,536 11,594 9,571 60,578 54,653 Jagannathpur .. 4,664 3,923 1l.29~ 10,353 30,173 28,177 Bulla .• 6,660 1i,302 7,211 6,343 6,853 6,568

87
AND THANAS BY COMMUNITmS
12
2.520
2,243
259
23
J
.. 3
2
18
25
11
1
,. <;)
2
2
Indian Christiana ~
:!II F
13 16
1.325 32,845 30,818
1,221 19,925 17,825
55
14
Ii
.. l5
9
jO
9
.. " .. 7
1
1
3,353
1,881
1,84'1
121 .90
358 ri";,2 176
230
30
2 28
4
1,381
3,110
1,863
1,818
118 88
312 828 20g
2tll
41
'" 37
1,209
162 '1) 137
6 5 2 2 ..
142 120
.. 7 5
229
fj7 58 6B II} 30
149
.. 1
.. 29
43 .. 74 2
1178
16 70
.. 4.67
125
.. 7 3
204
47 54 66 13 24
167
.. 69
35 .. 63
J3 54
.. 375
75
Christ iAlls
Anglo. Indiana Others
~7r-~ 16 18 IP
TriheS Otirel"!
r----A----.. ~M p' hi F 20 21 23
Literate r------A---......
M F '24 ,25
452
364 144
318 1,586 1t16'S 1,435,061 l,3S9,072 2,554 2,4'24 1,015,654 196,996
270 1,408 1,018 1,271,061 1,213,935 2,554 2,424 971,475 185,459
13
J
1
2
.. 6
4
101
.. 2 3
1
1
149
23
Z
1 .4
4
18
108
2
. , 2
7
o-
S 4,
I
.. 1
445 338 340,407
121)
102
13 9
17 26 4
33
9
'" 5
9
154
20
2 1 1
16
65
.. 29 13
7 16
28
.. 6
1
'" 17
'1
7
79
17
3 6
10 16 1
21
9
6 3
13
102
16
2
.. 13
49
.. 18
7 [)
19
9
.. 2
1 2 4
6
92,660
60,326
6,284 6,523
10,189 15,702 4,345
17,147 135
16.559
8,906 7,653
15,776
36,229
7.526
1,923 672 676
3,130
1 .. 824
.,' 7Bl
1,780 564
l,7n
18,487
., 3.988
15 2,684
11,800
606
. , 311
. , 95
471
343,139 2.503 2,400
85,604
55,118
5,702 0,865 9,244
14,450 4,081
15,70'6 70
14,733
8,141 6,592
15,753
33,678
6,834
1,786 6'10 622
3,034
" 716
4,627
.. 750
1,687 537
1,653
17,307
.. 3,747
4 2.377
11,179
~85
.. 29
. . 93
4,63
34
30
" I
22
'1
83
;31
., 31
418,715 93,501)
74,007 13,478
.57,765 10,286
8.627 ~':U7 3,449 8,209
12,466
20,'595 172
15,436
12,153 3,225
58
1,406
lro2,606
64.0M
2,154 1,038 4,917
24,115 7,464
11,620 9,133 3,561
92
62,395
18,224 9,563 8,890 8,951
16,503
264
76,899
5,836 14,868 10,339 5,162
10,154
13,705 7,225 9,412
lO8
12,014
4,497 2,234 1,732 5,442 9,081
8,060 B,I!J2 2,776
1,407 708 607 814,
2,434
4,378 38
2,8'iT
2,380 477
20
315
67,587
15,02f)
224 165 736
6,081 1,789
2,998 2,191
801 35
13,677
4,523 1.792 1,551 2,512 3,208
91
18,487
1,265 3,378 2,260 1,215 2,347
3,796 1.785 2,324
97
9,412
952 414 331
1,226 2,171
1,526 2,3-73
419

38
PROVINCIAL TABLE II-POPULATION OF DISTRICTS
Hindus
" J)istrlct and thana Scheduled castes Other Hindus UUBIims Jains Buddhists ,-----"- r-~ ,--'---,
11 F M F M F M F M F
1 Z 3 4 a 6 7 8 9 10 11
5ylh&t Disulct-contd
Karimganj Sub. 45,9<15 42,268 82,OZl 74,683 162,487 149,;;g4 30 14 divisicm
Beani Ba71u 6,182 5,001 9,396 9,050 36,262 34,428 Barlekha 5,617 5,365 14,379 13,645 20,075 19,175 Pathar Kandi 2,908 2,778 17,209 15))00 14,530 13,134 Ratha Barl 5,530 4,993 16,072 14,399 13,041 11,683 .. Karimg:mj 21,722 19,911 19,113 16,736 65,052 68,681 30 14
Badarpur 3,847 3,555 5,O()l 4,761 13,113 12,1l5 Railway area 139 85 851 592 408 178
\
Khasl anil Jaintla Hills 49 14 8,6211 4,048 :t,SOl 25' 112 S6 district
Shillong Subdivision 44 12 7,826 3,6111 1,267 Z35 112 36
Jowai Subdivision 5 Z lJ()Z 429 34 19 (all Bfitiah)
Naga Hills district sa 15 2,660 1,498 369 162 55 39 2 8
Kokima ( Sadar) I 3 2,070 1,290 193 124 ~ 39 1 Sub·division
M okok Ohung 811'6· Z2 12 590 203 176 38 1 3 division
Lushai Hill district .• 16 6 1,460 965 fr1 14- 4 ~ 9 9
Aijal (Sadar) Sub. 16 6 1,225 873 35 9 4 !l divi8ion
Lu"gl~h Subdivisicm 235 92 52 5 9 9
Assam Valley Division 138.391 117,324 1,374,683 1,167,017 706.978 607,322 3,932 2,323 4,200 3,473
Goalpara district 12,533 10,901 154,706 128,088 248,832 220,592 322 84 215 197
Dhubri Sadar Sub· 4,86/; 4,19(J 107,828 86,494 178,468 168,604 218 71 211 194 division
Golakganj 739 685 23,953 21,656 19,686 17,710 3 Dhubri 1_,321 1,250 14,757 10,836 33,055 28,414 105 23 1 1 Mankachar li63 471 3,472 2,665 16,1l9 15,424 38 23 40 49 South Sa1mara 493 407 3,476 2,595 43,568 39,226 2 35 45 Bihwhipara 1,182 1,004 17,741 lli,454 27,762 25,176 63 25 21 13
Kokrajhar 52 32 12,782 10,008 7;481- 6,437 51 41 Gossaigaon 128 78 9,611 6,285 11,262 9,6_?2 7 Sidhy 39 36 8,459 7,046 5,751 4,858 63 45 Bijni 289 195 12,861 10,607 13,738 11,669 Railway aroa .• 59 32 716 342 46 28
Goalpara Subdivision 7,668 6,711 46,878 41,589 69,864 61,IIS8 104 13 4 J
North Salmara 3,744 ~,I07 24,815 22,398 27,603 24,659 13 5 4 3 Lakhimpur III 81 7,371 6,580 29,833 26,634 Goalpara 2,128 2,004 8,769 7,257 9,513 8,181 91 8 Dudnai .. 1,657 1,515 5,875 5,341 2,915 2,514 ltailway area •. 28 4 48 13

AND THANAS BY COMMUNITIES-conid
Christians
r-----------------~---------------~ Sikhs Indian Christians Anglo-Indians Others
~"\ .--------"--, ,.....~ ,---A-~ M F M F M F M F
12 13 14 15 16 IT 18 If)
16S 184 95 98 J,J 23
.. Ii :I .. 44 53 18 10 2 .. 9 7
20 29 2
86 91 .. .. .. .. 13 11 115 118 2 1
20) 23 83 S2 22 11 145 126
ZO!) 23 87 31 20 9 135 108
1 1 2 2 10 13
10 7 S 6 12 9
10 7 I t) 5 8 4
2 1 4 5
2 1 8 7 14 22
% 1 3 9 13
.f 4 5 9
1.001 1.161 16,293 14.485 217 119 943 667
23 19 133 136 1 7 8
IJ 12 76 80 1 'I 8
.. .. 1 .. .. .. . . 6 S 2 9 I 4 3 7 4 ..
.. .. .. . . 65 61 3 8
1 2 8 9
16 r 57 56
• 3 53 52 .. .. . .
5 4 4 4 .. 1
ilO 21
1:.744 4.325
.. .. 1,701 1,491 1,743 1,728
674 598 571 460
55 48
50,164 53,403
9,411 9,6/4
40,753 43.1'29
90,690 94,076
47,261 47,678
43,439 46,398
70,664 76,378
50,492 54,378
20,172 22,000
908.438 849,226
123,165 114,828
90,691 8?,893
528 503 2,245 2,105
410 386 .. . .
6,783 6,360
25,093 23,949 26,796 23,932 17,091 15,774 11,738 10,882
7 2
32,4'14 30,935
.. 5,487 5,294 9,445 9,005
17,542 16,636
Others r---~ M F
22 2S
878 840
., .. 588 545 290 295
1.591 1.527
840 811
751 WI
51 24
Literate ,~
M F
25
6T,2011 11,011
11,1151 2,587 8,157 1,570 4,932 632 5,905 666
21,636 4,203
4,112 882 1111 471
9,933 4,592
6,SU2 2,301
3,081 2,291
7,448 2,199
2,432 3S4
5,016 1,815
24.211 5.6440
IS,937 4,465
5,184 1,1'19
548.058 91,473
83,874 13.812
52,915 7,86S
.8,017 757 10,827 2,561
2,798 636 4,590 557 7,731 1,192
6,843 576 4,306 729 2,993 283 4,578 480
230 97
30,959 6,944
12,043 1,723 4,220 453 7,402 2,391 7,261 1.367
33 10

40
PROVINCIAL TABLE II-POPULATION OF DISTRICTS
HindUB •
District and thana Scheduled castes Other Hindus Muslims Jains Buddhists ....A... ,.....----A---- ~
1'1[ F M F M F M F M F
1 2 3 4 I) 6 1 8 9 10 11
Kamrup district 32,329 26,763 841,974 295,483 195,760 171,762 869 244 281 110
Gauhati Subdivisj()TI 25,729 21,560 247,038 216,292 77,171 67,577 359 244 271 102
Barama 1,252 1,078 20,474 18,446 1,853 1,445 42 6 Nalbari 7,297 6,121 62,855 57,844 12,576 ll,320 66 36 Rangiya 1,433 1,123 32,621 28,913 13,004 1l,471 216 91 Ha,jo .. 4,325 3,555 31,148 28,324 17,962 16,241 Kamalpur 2,490 2,ll4 31,298 27,927 8,795 7,978
Eako 1,351 947 7,072 5,954 6,553 6,881 7 4 1 Chhayagaon 2,144 1,78l} 9,iH5 8,025 8,750 7,641 Palashbari 2,963 2,791 27,467 25,448 2,046 1,809 252 199 Gauhati 2,326 1,957 23,30() 14,697 5,270 3,717 44 IS 8 2 Ra,ilway area 148 78 1,488 714 362 74 4 II
Barpeta Subdivisi<?n 6,600 5,203 94,936 79,191 118,589 104,185 10 8
Sor Bhog 616 365 20,259 16,683 33,783 29,8B 9 8 Patachar Kurhi 424 299 32,890 29,329 3,023 2,712 Earpeta 4,929 4,OU8 36,820 29,474 62,254 45,787 Tara Ban 599 443 4,678 3,547 29,481 25,858 Railway area .• 32 23 289 158 48 17
Dltrrang di~t.r!ct 10,61)4 8,871 17S,9(}5 149,373 65,662 55,333 42 10 280 251
Te<pur Subdivision 6,109 5,190 124,622 102,790 18.696 14,274 25 2 256 247
Dhekiajuli 558 402 26,018 21,461 3,935 2,715 10 2 23 18 Te~pur 2,081 1,857 35,840 28,193 9,753 7,630 10 63 24 Sootia 1,968 1,713 31,363 26,338 2,477 1,967 5 61 87 Echall '., 881 719 17,534 14,927 2,197 1,828 112 108 Gohpur (J]2 492 13,539 11,740 307 123 7 10
Railway area. 9 7 328 131 27 11 r ..
Mangald'li Sltb· 4,495 3,681 54,383 46,588 46,966 41,059 17 8 IU 4 division
Paneri 432 314 4,416 2,96! 1,347 712 Udalguri 39 22 2,950 2,138 26 5 Majbat 70 36 1,547 I,OIl 143 36 KaJa.igaol1 532 428 8,838 7,363 2,664 2,215 Mangaluai 3,211 2,767 34,506 31,616 22,307 19,879 4
Dalllaon 191 103 1,917 1,465 20,427 18,199 12 8 RailwlLy area 20 11 109 31 52 13 1
Nowgong district 32,194 27,020 124,131 105,O3~ 134,lW) 115,503 464. 'a2S 21 10
LnharigIJat 4,079 3,380 8,737 7,321 27,754 24,256 10 2 Dhing 1,2·11 1,062 6,754 5,520 19,563 17,492 47 14 Marigaon 4,420 3,951 13,555 11,724 4,770 4,026 24 10 Roha 5,763 5,033 14,543 13,391 3,881 3,132 139 66 Nowgong 6,323 5,499 31,424 27,05\} 11,184 9,386 176 103
Rupahihat 4,893 3,346 6,384 0,230 46,082 40,778 6 8 Kaliabor 764 642 11,592 9,771 1 '>')') 1,032 12 3 , ........... Samaguri 1,489 1,229 ll,676 10,108 4,463 3,834 2 6 Jamunamukh 3,209 2,872 15,482 12,633 15,000 11,251 48 22 1 Lumding 970 745 19 19
Railway Area in- 13 6 3,104 1,504 672 297 14 10 dnding Lumding tawn
Sibngar district 23,708 23,473 316,871 276,135 29,038 22,731 65 26 1,436 1,315
J arhat subdivi8ion. 12,-548 10,899 105,122 91),617 8,196 6,190 19 1 405 33r
Majuli 3,1>20 3,020 15,295 12,731 81 47 Teok 1,235 1,081 21,808 19,156 1,020 756 Jorhat 6,517 0,727 53,858 46,!277 li,215 3,853 19 1 38 16 Titahar 1,134 1,056 13,945 12,178 1,695 1,472 359 319 RailwlLy area " 42 15 516 275 185 62 S 2
Sibs'2'pr Subdivision 7,131 6,·379 121,656 107,371 12,985 10,423 28 18 1J04 492
Amgllri 1,250 1,290 25,257 22,837 1,218 1,039 1 2 Sibsagar 3,664 3,191 42,765 38,064 6,093 4,912 7 8 21 19 Nazim 8GS 669 27,053 23,899 3,863 3,369 2() 8 14,7 126 Sonari 1,347 1,220 26,160 22,354 1,698 1,078 336 347 Railway area .. 15 \) 421 217 113 25
Goiaglw,t Subdivision 7,OfN 6,200 89,793 78,148 '1,857 {I,1l8 18 r .12., 486
Bokakhat 593 500 1l,068 9,753 378 176 7 3 Dergaon 2,613 2,416 26,228 23,273 3,246 2,902 1 1 liDiaghat 3,818 3,284. 52,177 44,977 4,065 2,979 10 'J 623 486 Hailway area 320 145 168 41
, ~

AND THANAS BY COMMUNITIES-contd
12
25
24
3 19 2
1
.. 1
39
32
7 1 .. 23 1
7
3
1
3'
533
.. I
.. 155 256
1 .. 6
103 6
10
249
12Z
19 2
75 19
7
60
9 13 23 15
67
22
13
13
13
.. 2
10 1
23
20
6 3 .. II
2
1
893
.. 134 201
.. 1
44 5
8
164.
86
.. 57 23
5
60
6 8
28 8
28
7 .. 21
Indian Christians ,..------A----.
M F
14
683
628
4 ..
136
9 13
361 5
65
41 10 3
.. 1
8,374
3,372
1,516 749 735 254 117
15
455
406
3 1
105
.. 14
~80 3
49
41 8
2,993
2,985
1,385 653 613 235 96
1 Q 3
2
. , 2
2,129
. , 26
174 189
1 359
1,041 267
40
32
8,102
2,107
5 233 631
1,230 8
2,483
44 514 587
1,338
3,1:112
163 59
3,288 2
8
8
1,920
.. 25
138 225 ..
296 909 255 59 13
7,166
1,662
3 2Il 356
1,072 10
2,267
30 523 622
1,082
3,257
136 45
3,076
Christiana
Anglo· Indians .----"--------,
M F
16
44
44
.. 29 15
8
3
.. 1
2
34
.. S
.. 1 3
22
81 10
.. 6
,. 4
64
1 5 3
155
7
.. 7
1'1
41
41
.. 33 8
22
.. 3
.. 3
16
29
17
.. 12
5
7
.. 3 2 2
5 '
.. 4 1
41
Others ,-~
M F
24
24
4
18 2
165
121
8 52 25 16 19
22 .. 10 .. 1
I
81
.. 2 .. 1
,. 5 1
22
193
-8J.
.. 13 53 14 1
61
9 10 22 20
51 10 15 26
18 19
21
21
18 3
118
96
9 46 14 18 8
1
22
18 .. 4.
11
.. 1
.. 5 1
,
136
54
.. 12 35
5 2
35
6 3
14 12
47
10 19 18
Tribes ,___J'------.,
M F
20
102,021
78,712
16,160 3,265
20,756 1,392 2,490
13,463 3,181 6,374
11,542 89
23,309
10,660 8,664 3,668
317
135,348
68,715
13,926 23,362 11,864 13,448 6,096
19
66,633
30,188 10,343 11,383 8,451 2,790
3,389 89
85,753
5,344 722
17,097 7,006 2,202
576 6,924
16,836 23,862
5,182
2
187,812
72,212
9,285 14,786 24,977 23,162
2
57,608
5,141 11,660 16,313 24,394
58,092
9,508 12,233 36,351
21
95,905
73,873
15,330 3,163
19,203 1,399 2,495
12,496 2,905 5,808
11,064 10
22,032
10,105 8,075 3,517
335
125,400
64,990
12,864, 22,155 1l,416 12,812 5,742
60,410
27,809 9,159
10,253 7,730 2,470
2,970 19
80,772
4,869 837
16,354 6,863 2,005
539 6,386
15,759 22,300
4,859
1
172,956
66,342
8,917 13,408 23,080 20,937
53,306
4,740 11,184 15,201 22,180
1
53,308
8,576 Il,337 33,455
22
3
3
.. 1
2
2
.. 2
6
.. 6
88 32
32
6
.. 6
23
4
.. 4,
13 9
9
4
.. 4
Literate r---"----,
]\f F
135,628
93,36'1
7,395 24,187
9,368 10,960 10,167
4,911 2,231 8,959
14,397 792
42,261
7,555 11,094 19,667 3,844
101
63,358
36,075
3,556 13,704 10,215 3,326 4,121
153
18,283
2,769 948 625
1,926 10,401
1,514 100
64,703
3,820 5,269 5,570 8,092
16,2-19
7,510 4,191 5,280 6,874
323
1,525
124,999 49,925
6,782 9,162
26,208 7,306
467
45,698
9,129 18,344
~0,129 7,842
254
29,376
2,474 9,538
17,146 218
25
19,584
14,246
717 3,456
654 920
1,228
999 182
1,040 4,774
276
5,338
1,024 1,129 2,733
410 42
7,977
6,270
326 2,994 1,919
511 478
42
1,707
343 57 90
126 948
127 16
10,300
396 800 457
1,012 3,255
1,296 854
1,092 721
24
393
24,440
9,326
4GS 1,388 6,419 1,015
36
9,908
1,376 3,867 2,111 2,468
86
5,206
318 1,782 3,047
59

District and thana. Sch.eduled castes ,--~
M F
1 2 3
Lakhlmpur district·' . • ,.23,586
DibrILgarh Sub· divisio'))
Moran Dhemllji Dibrugarh Bordhubri Jaipur
Tinsukia Doomdooma Digboi l1argherita •. RailwlI y area .•
North Lakhimp'Uf' . Subdivision
Bihnpuria .• North Lakhimpnr Dhakuakhana
Garo Hills district .•
Hills-
Mlluza
Plains--
(Nibari)
I .. II .. Ill .. IV .•
v VI
(Fulbari) VII
(Rangapani) VIII
(Mahendraganj) IX
(Ghoshgaon)
X (Tura town)
Sadlya F. T.
Sadar Subdivision
Pasighat Subdivi8ion
llaUpara F. T.
Assam States .
Ma.nipnr State
Valley Section
N aharup panah Ahalup Imphal }{habam Laifam
Jiriuhal
Hill Section
Hill East Hill Sadar HiU TVe.!1
Khasi states
17,466
790 396
5,825 1,285
943
3,088 3,180 1,200
615 134
6,130
2,100 2,411 1,619
439
.. 1
64
146
160
7
71
2,181
1,82Z
359
35
172
172
19,941
14,646
716 345
4,845 1,088
862
2,692 3,001
499 632 66
6,295
1,848 2,0,31 1,416
350
49
101'1
146
49
1,720
1,457
263
89
93
93
42
PROVINCIAL TABLE II-POPULATION OF DISTRICTS
Hindus
Other Hindus ,----.J'-,,\
M F
4
250,558
201,688
16,995 7,893
44,556 20,398 26,100
33,257 30,!52 12,894
7,708 1,335
45,970
17,982 14,955 16,033
7,538
42 440 264 726
489
300
2,511
1,315
810
641
8,562
7,139
1,423
1,652
163,906
147,932
147,371
16,245 31,873 49.795 21,950 26,502
2,006
551
120 90
351
15,974
5
206,951
165,408
14,382 6,892
36,1,81 17,546 22,336
28,242 26,381 7,581 5,173
69·j
41,643
14,807 12,368 14,368
5,980
22 244 205 137
313
249
2,415
1,205
806
384
6,043
6,422
621
862
163,556
155,704
155,328
16,669 32,705 55,261 22,628 26,276
1,789
376
62 69
255
7,852
Muslims
M
6
23,10()
18,023
777 70
0,469 694
1,056
2,428 1,397 3,824 1,717
691
10,1)77
7,940 2,063
74
5,476
2
.. 3
57
3,167
'226
1,869
12
140
421
147
48
16,185
14,716
14,711
485 2,029 1,465 3,368 6,'115
684
5
1 1 &
1,469
F
'1
16,479
8,239
442 53
3,466 410 674
1,218 665 863 463 185
8,240
6,568 1,635
37
4,922
23
2,911
161
1,800
1
26
296
24'1
49
18
15,477
14,846
14,841
517 2,039 1.243 3,537 6,971
531
I>
4 " 1
631
Jains r----'-----.
:M F
8
2,679
2,659
173 82
913 171 163
685 224 106
65 74
20
3 1
16
1
1
6
4
2
120
120
118
'1 "
111
2
,
9
1,731
1,720
109 51
674 101 97
491 104 38 19 36
11
1 .. 10
1
1
81
81
81
3
'18
Buddhists ~
M ]'
10
1,777
1,757
20 ..
104 52
230
149 51
432 708 11
20
18, 2
190
.. I
149
37
3
177
1'16
1
18
105
22
S
.. 3
19
19
83
11
1,421
1,1112
.. 57 27
209
72 23
392 622
5
9
.. 9
169
146
28
48
48
1
68
20
2
.. fl
18
18
48

43
AND THANAS BY COMMUNITIES-concld
Sikhs Indian Christians .----"-_, .. ____.J,---, M F M F
12
1,083
1,061
17 .. 96 8
50
106 65
64,2 26 51
25
2 23
1
21
13
8
2
277
fiO
50
23 .,
27
227 M176Census
13
549
537
13 .. 60 10 BS
57 51
271 7
30
12
.. 12
5
5
14
1,971
1,402
166
193 84
)12
404 262 139 27 15
569
416 91 2
1
1
264
255
9
15
15
1,815
1,279
136 ..
180 117 102
365 253 85 29 12
536
-HI) 85
2
222
215
7
8
104 12,9'20 12,993
30 12,814 12,913
30
15 " 15
74
743
27 197 136
65 24
294
12,071
4,145 1,673 6,J53
106
718
28 222 71 81 26
290
12,195
4,389 1,497 6,309
80
Cbristians
Anglo-Indians Others ~,--~ M F M F
16
" 8 1
2 3
22 3 Ii
:\ 1
6
6
3
1
2
17
26
U
o'
3 1
1 ..
12 1 6
2
1 1
1
2
18
523
507
15 .. 84 34 27
79 80
136 46 10
16
.. 16
10
1
9
16
12
4
19
362
341
13 .. 68 21 11
54 37
107 31
5
11
.. 11
11
11
9
7
2
Tribes r----.J'----, ]If F 20
174,821
131,457
9,921 7,221
21,715 19,141 16,942
15,059 27,628 7,827 5,953
50
!l3,3(]/'
lO,()35 24,372
8,957
99,518
14,614 22,747 21,230 19,508
9,577
1,856
2,765
1,545
4,859
817
20,20{)
12,757
7,443
2,016
21
160,409
119,766
9,146 6,754
19,732 17,241 15,60S
13,880 25,347 6,755 5,257
46
40,643
9,59-1 22,514
8,535
98,956
14,654 22,345 21,646 19,653
9,333
1,835
2,613
1,440
4,690
747
19.774
12,471
7,303
1,796
88 48 178 147 164,000 175,137
2
2
1 .. 1
86
3 7
2 7
.. 2 T
1
.. 1
45 171 ( "'4 )
4 73,520 79.285
4
.. 4
143
4,567
289 1,126 1,319 1,209
332
292
68,953
21,591 23,409 23,953
90,480
5.091
373 1,277 1,456 1,323
366
296
74,194
23,370 24,729 26,095
95,852
22
2
2
.. 2
23
7
'{
.. 7
Literate ,---A.~
M F 24
77,518
56,590
2,884 3,220
17,272 4,503 13,297
7,296 . 5,110
6,898 2,072 1,038
20,928
6,839 7,552 6,537
7,978
536 648 205 984,
2,059
313
497
893
941
866
4,133
3,0';'4
1,059
25
12,856
1(},821,
266 247
5,114, 658 572
1,275 826
1,187 409 270
2,032
{lG" 983 443
2,504
163 248 83
285
831
19
36
105
305
429
396
311,
88
44,1'l9 11,537
23,242 1.663
18,D78
83Z 2,587
10,743 1,190 2,025
701
5,164
1,913 793
2,458
20.937
855
15 29
728 6
2IJ
57
80S
28IJ 187 341
9.874


SAMPLE TABLES
This census has seen the beginning of sampling.
Every fiftieth slip for the communities in the areas noted below was taken for sample study :
(i) Cachar Tea Garden labourers.
(ii) Muslims of North Sylhet subdivision.
(iii) Scheduled castes and other Hindus of North Sylhet subdivision and northern part of Habiganj subdivisiow .
(iv) Hindus of all thanas of Gauhati subdivision except Gauhati. (v) Khasis of Shillong Sadar subdivision. (vi) N agas of the N aga Hills district.
Tables VII, XI and fertility tables have been prepared from the sample slips.
The sample does not cover the province as a whole, as only a few select communities have been taken and the areas from which sample slips were taken are restricted.
(45)

4:6
(i) CACHAR TEA GARDENS
LABOURERS
VII-Age and civil condition
Males Females Age
Unmarried Married Widowed Divorced Total Unmarried Married Widowed Divorced Total
0 · . 33 33 35 35 1 31 31 48 48 2 · . 34 • 34 32 32 3 · . 39 39 47 47 4 · . 48 48 33 33
5-9 241 241 212 2 214 10-14 178 1 179 120 15 135 15-19 91 10 101 28 80 1 • 1 110 20-24 63 53 2 118 7 113 3 2 125 25-29 28 102 8 138 1 115 5 1 122
30-34 13 120 7 140 101 7 1 109 35-39 7 99 7 113 2 77 12 91 40-44 2 88 7 97 2 51 19 72 45-49 3 71 6 80 33 21 54 50-54: 3 41 6 50 16 18 34
55-59 2 33 4: 39 9 21 30 60-64 1 20 2 23 6 16 22 65-69 10 3 13 2 c 8 10 70 & over 15 1 16 7 'i
Total 817 663 53 1,533 567 620 138 5 1,330
Fertility tables
('i) Present age of mother and number of children born
Number of children born Present age c-of mother 0 1 2 3 4: 5 6 7 8 9 10 11 12 Total
13-14 4: 4 15-16 23 4 27 17-18 24: 14: 4 42 19-20 9 23 7 3 42 21-22 4: 9 6 5 24
23-24 10 9 17 15 6 1 1 59 25-29 17 16 15 20 20 14 8 1 111 30-34 7 11 9 14 21 7 15 10 2 2 98 35-39 5 5 10 6 17 9 15 7 6 2 2 1 85 40-44 2 6 3 4 6 6 7 6 2 4: 3 1 3 53
45-49 5 1 4 2 5 ' 5 4 3 1 1 1 1 1 34 50-54 2 1 3 1 2 3 2 1 1 16 55-59 2 I 1 3 1 1 1 1 11 60-64 1 1 1 1 1 5 65-69 1 2 .. \ 1 4
Total 115 98 77 73 78 45 5$ 29 14 10 7 6 5 615

. 47
(i) CACHAR TEA GARDENS-conta LABOURERs---contd j
(ii) Present age of mother and number of children surviving
Number of children surviving Present ttge r-of mother \ 0 1 2 3 4: 5 6 7 8 9 Total
13-14 <1 .. 4 15-16 24 3 27 17-18 27 14 1 42 19-20 .. 11 21 8 2 42 21-22 5 12 7 24
23-24 12 13 21 12 1 59 25-29 22 23 26 22 11 6 1 111 30-34 13 18 15 16 21 8 4: 3 98 35-39 8 9 21 13 13 8 8 4: 1 55 40-44 2 9 9 8 7 " 5 I 4 I 53
45:_49 6 4 6 9 3 1 2 2 1 34 50-54 3 2 2 3 3 1 1 1 16 55-59 2 2 2 4: 1 11 60-64 2 1 1 1 5 65-69 2 1 I 4
Total 143 130 120 91 60 31 21 12 5 2 615 (iii) Number of children born and surviving
No of Number of children surviving Survi. children
..A. __ val
born 0 1 2 3 4: 5 6 7 8 9 Total ratio
1 13 ~85 98 0,9 2 5 25 47 77 0,8 3 3 9 29 32 'i3 0·7 4 2 5 23 27 21 'i8 0·7 {} 4 9 11 13 8 45 0·6
6 1 1 7 13 14 15 7 58 0·7 7 1 2 3 7 6 5 5 29 0·7 8 2 1 I " 3 1 3 3 14 0·5 9 1 1 4: 1 2 1 10 0·7
10 I 1 2 I I 1 7 0,6
11 1 1 1 2 1 6 0·5 12 I 1 2 I 5 0·3
Total 28 130 120 91 60 31 21 12 5 2 500 .. Xl-Literacy by age
Males Females
c-Able to Literate in Literate Able to Literate in Literate
Age group Popula- read languages III Total Popula- read languages in Total other than other than
tion only English Engli1'ih literate tio!). only English English literate
D-4 185 195 .. 5-9 242 1 8 8 214 1 1
10-14 178 20 20 135 2 1 3 15-19 101 18 18 110 1 :3 3 20-24 118 3 25 25 125 2 2
25-29 138 2 31 31 122 :3 3 30-34 140 33 33 109 2 2 35-39 113 1 24 24 91 1 1 40-H 97 2 15 15 72 45-49 80 1 11 11 54 50 & over .. 141 14 14 103
Total 1,533 10 19.9 ' 199 1,3&0 1- 14 1- 1P

48
(ii) NORTH SYLHET SUB-DIVISION MUSLIMS
VII-Age and civil condition
Males Females Age r- r-
Unmarried Married Widowed Divorced Total Unmarried Married Widowed~ Divorced Total
0 162 162 154 154 1 164 164 149 149 2 171 In 194 194 3 188 188 175 175
4: 216 .. 216 213 213
5-9 1,015 4: 1,019 963 1 964
10-14 789 6 'i95 442 89 2 4 537 15-19 430 75 1 1 507 64 416 15 10 505 20:'__24 287 239 6 2 534 11 546 30 7 594 25-29 133 371 9 3 516 7 486 42 7 542
30-34 36 409 8 2 455 3 333 63 3 402 35-39 16 336 7 1 360 3 232 74 1 -31O 40-44 10 253 6 269 2 132 84 218 45-49 5 201 12 218 3 71 III 185 50-54 1 135 9 1 ' 146 1 34 86 1 122
55-59 2 115 6 1 124 13 78 1 92 60-64 1 71 5 77 1 8 53 62 65-69 2 45 3 50 2 6 33 41 10 & over 2 58 11 71 1 3 4S} • 53
(-
Total 3,630 27318 83 11 6,042 2,388 2,370 720 34 5,512
Fertility tables
(i) Present age of mother and number of children born
Number of children born Present age of r-
mother 0 1 2 3 4 5 6 7 8 9 10 11 12 13 Total
11-12 18 18 13-14 42 1 43 15-16 138 20 3 161 17-18 96 70 21 3 3 193 19-20 61 91 66 20 8 1 1 248
21-22 22 30 50 34 14 7 2 1 160 23-24 10 19 28 35 15 19 3 2 131 25-29 39 45 87 102 97 80 41 19 11 6 2 529 30-34 13 13 29 48 54 45 38 40 21 10 4 3 318 35-39 10 5 10 24 20 28 36 30 27 17 8 2 3 2 222
40-44 10 9 9 7 23 23 23 32 17 .16 14 2 3 1 189 45-49 5 2 1 2 6 6 10 11 5 8 8 6 1 'il 50-54 2 2 1 2 5 4 12 8 2 1 1 1 41 55-59 1 1 1 4 1 2 1 2 1 2 16 60-64, 2 1 '" . 2 1 2 1 1 1 11
65-69 1 1 1 1 1 1 6 70 & over .'. 1 1 3 5
Total 470 305 309 280 242 215 164 149 93 62 43 16 11 3 2,362

49
(ii) NORTH SYLHET SUB-DIVISION-contd MUSLIMs-contd
(ii) Present age oj mother and number oj children surviving Number of children surviving
Present age of mother 0 1 2 3 4 5 6 7 8 9 10 11 Tota
11-12 18 . / 18 13-14 42 I 43 15-16 140 18 3 161 17-18 .. III 68 14 193 19-20 81 105 49 8 5 248
21-22 32 54 48 15 8 3 160 23-24 14 37 41 25 11 2 1 131 25---29 55 100 133 122 72 31 10 3 3 529 30-34 20 36 62 53 61 45 24 II 6 31S 35---39 17 21 25 43 33 44 22 13 I 2 1 222
40-44 12 24 20 27· 36 26 16 14 7 6 I 189 45---49 7 2 7 12 12 13 6 8 2 2 71 50-54 3 1 () 10 6 2 6 5 2 41 55-59 1 3 2 4 4 1 1 16 60-64 2 2 1 1 3 1 1 11
65-69 2 1 2 5 70 & over 2 I 1 1 1 6
Total 557 470 414 320 252 173 86 56 22 10 1 1 2,362 (iii) Number oj children bom and surviving
No of Number of children surviving Survival ~hildren born -, ratio
0 1 2 3 4 5 6 7 8 9 10 11 Total
1 48 257 'Q 305 0'8 2 16 105 188 309 0'8 3 14 57 112 97 280 0'7 4 4 23 49 88 78 242 0'7 5 3 11 29 65 65 42 21J1 0'7
6 1 5 23 29 49 35 22 164 0'6 7 1 6 7 22 29 48 22 14 149 0'6 8 4 3 11 17 20 16 14 8 93 0'6 9 1 2 3 6 13 16 9 6 6 62 0'7
10 1 I 2 7 7 7 11 5 1 1 43 0'6
11 .. 6 2 5 2 1 16 0'6 12 2 1 1 2 2 1 2 11 0'5 13 1 1 1 1 4 0'5
Total 87 470 414 320 252 173 87 56 22 10 1 1 1,893
XI-Literacy by age Males Females
,- r-Age group Able to Literate in Literate Able to Literate in Literate
Population d languagea In Total Population read languages In Total rea other than other than only English EngliSh literate only English English literate
0-4 .. 901 . , 885 . , 5-9 .. 1,019 5 59 1 60 964 5 5
10--14 .• 795 8 96 12 108 537 7 14 1 15 15-19 .. 507 9 80 22 102 505 10 15 1 16 20-24 ,. ,534 12 90 22 112 594 11 13 1 14
25-29 .. 516 11 73 13 86 542 11 11 11 30-34 .• 455 9 58 7 65 402 9 9 9 35-39 .. 360 7 53 7 60 310 6 7 7 40-44 ,. 269 5 42 8 50 218 6 5 5 45-49 ,. 218 3 31 7 38 185 I) 2 2
liO & over 468 11'5 54 6 60 370 8 6 6
Total 6,042 84 636 105 741 5,512 73 87 3 90

50
(iii) NORTH SYLHET SUBDIVISION AND NORTHERN PART OF HABIGANJ
SCHEDULED CASTES
VII-Age and civil condition
Males Females
r-Age Unmarried Married Widowed Divorced Total Unmarried Married Widowed Divorced Total
0 18 18 11 11 1 12 12 23 23 2 17 17 18 18 3 28 28 33 33 4: 14: 14 12 12
5-9 115 115 102 1 103 10-14 •. 80 1 1 82 31 21 1 53 15-19 .. 4:8 8 1 57 2 54: 4 60 20-24 .. 35 32 1 68 1 72 10 83 25-29 .. 27 49 1 77 1 67 19 87
30-34 .. 15 54 1 70 2 51 22 75 35-39 .. 6 53 2 61 41 17 58 40-44 •. 1 42 3 46 26 16 42 45-49 .. 2 32 3 37 1 13 19 33 50-54 •. 2 25 3 30 7 19 26
55-59 .. 3 21 5 29 4: 18 1 23 60-64 .. 1 16 4: 21 2 11 13 65-69 " 1 7 1 9 1 7 8 70 & over 1 6 7 1 .- 7 8
Total 426 346 24 ,
2 798 238 360 170 1 769
Fertility tables
(i) Present age of mother and number of children born
Number of children born
Present age --.. of mother 0 1 2 3 4: 5 6 7 8 9 10 11 12 Total
11-12 5 5 13-14 ~ . 14 1 15 15-16 16 5 1 22 17-18 12 10 2 2 26 19-20 3 11 6 2 1 23
21-22 6 5 8 7 1 27 23-24 2 1 5 2 3 1 1 15 25-29 10 8 8 11 16 6 10 1 1 'il 30-34 2 3 5 8 10 9 4 1 2 2 46 35-39 1 3 3 5 5 7 4 6 2 1 2 I 1 41
40-44 4 1 3 3 2 3 2 2 5 3 2 30 45-49 3 1 3 2 3 1 1 1 1 16 50-54 2 1 1 1 2 2 2 11 55-59 1 1 2 60-64 1 1 1 1 4
65-69 70 & over 1 .. 1 ,
Total 80 48 45 45 39 34 24 11 13 7 5 1 3 355

51
(iii) NORTH SYLHET SUBDIVISION AND NORTHERN PART OF HABIGANJ-contd SCHEDULED CASTEs-contd
(ii) Present age of mother arul number oj children surviving Number of children surviving
r- ..A. ~
Present age 0 1 2 3 4: .5 6 7 8 9 10 11 Total of mother
11-12 5 .5 13-14 14 1 15 15-16 17 5 22 17-13 16 10 26 19-20 4 12 6 1 23 21-22 8 9 4 5 1 2"1 23-24 2 3 7 2 1 15 25-29 14 15 12 16 11 2 1 n 30-34 3 10 10 12 4 5 1 1 46 35-39 1 5 8 13 8 3 2 1 41 40-44 .5 4 1 4: (j 3 3 3 1 30 45-49 5 4 1 2 1 1 1 1 16 50-54: 2 2 1 3 2 1 11 55-59 1 1 2 60-64: 1 1 1 1 4
_ 65--63 70 & over 1 1
Total 96 80 52 57 35 17 9 6 2 1 355 (iii) Number oj children born and surviving
Number of children surviving No of children
r-:;y-___________ __.A._ ~ Survival
born D 1 2 3 4 5 6 7 8 9 10 Total ratio
1 7 42 49 O·g 2 5 17 22 44 0·7 3 3 12 7 24 46 0·7 4 6 10 12 11 39 0·7 5 3 5 9 11 6 M 0·7 (j 1 2 6 6 2 5 2 24 0·5 7 1 2 4 1 2 1 11 0·6 8 1 1 4 3 2 2 13 0·6 9 1 2 2 1 2 8 0·6
10 1 1 1 3 0·6 U 1 1 0·5 12 1 1 1 3 0·6
Total 16 82 52 56 35 17 9 6 1 1 275
XI-Literacy by age Males Females
r-Age group Able to Liter'lte in Literate Able to Literate in Literate
Population read languages III Total Population read languages
III Total other than other tha.u only English English literate only English English literate
0-4 .. 89 97 5-9 .. 115 9 9 103 2 2
10-14 .. 82 11 11 53 2 2 15-19 .. 57 1 10 1 11 60 20-24 .. 68 1 9 1 10 83 1 1 25-29 77 1 9 1 10 87 30-34 .. 70 6 2 8 75 1 1 35-39 .. 61 6 2 8 58 1 1 .40-44 .. 48 1 6 1 '7 42 45-49 .. 37 4 4- 33 nO & over 96 10 10 78 1 1
Total 798 4 80 8 88 769 8 S nU7tiCens1l1

52
(iii) ~ORTH SYLHET SUBDIVISION AND NORTHERN PAR.T OF HABIGANJ-conld
OTJIER HINDUS
VII-Age and civil condition
Males- Females r- _A._
.Age Unmarried Married Widowed Divorced 'rotal Unmarried Married. Widowed Divorced Total
0 38 38 37 37' 1 38 38 44- 44 2: 41 41 42 42 3 51 51 45 45 4 45 45 47 47
5- 9 .. 268 268 220 2' 222 10-14 .. 190 3 193 121 29- 1 ., 151 15-19 ... 136 11 147 23 103 4 lao-20-24 .. 133 46 179 4- 126 IO 140 25-29 .. 76 92 2 1'1'0 1 118 20 139
30-34 .. 26 118 4 148 2 93 25 120 35-39 .. s: 113 2 123 2 70 27 99 . 40-44 .. 4: 85 5 94 44 34 'i8 45-49 " 5 76 5 86 I 27 37 65 50-54 " .. 69 4 77 1 18 3-2 51
55-5'9 .. 3 57 3 63 23 32 65 60-64 .. 2' 41 2 45 15 20 35 65-69 .. 2 22 1 25 1 14 15 70 & over 3 22 5 3D 1 5 17 23
,,-
Total 1,073 755 38 1,861 591 674 273 1,538
Fertility tables
(%) Present age of mother and number of children born
Number of children born
r- -.... Present age of 0 1 2 3 4- 5 6 7 8 9 10 11 12 13 16 17 Total
mother
10 2 ~
11-12 13-14 20 20 15-16 39 5 44 17-18 24 11 4 2 41
~
19-20 14 19 12 7 1 53 21-22 9 10 19 8 10 1 57 23-24 2 2 5 5 3 3 1 1 22-25-29 10 10 22 27 32 12 8 2 1 124 30-34- 8 5 6 15 12 20 14- 5 4: I 1 91
35-39 8 3 3 4 10 8 14 7 2 4: 3 65 40-44 4 4: 5 2 8 8 4 7 4: 3 [) 1 5~ 45-49 3 1 3 2 3 4 4 I 3 1 25 50-54 5 2 3 3 2 2 1 2 4: 24-55-59 2 1 1 2 2 1 9
60-64- 1 1 1 2 1 2 1 9 65-69 .Ii • 1 I 1 1 4 '70-14 2 1 1 4
99 1 1
Total 149 71 83 79 83 58 47 29 21 , 13 9 5 1 1 1 1 651

53 -
{iit} NORTH SY1HE1f SUBDIVISION AND NORTHERN PART OF HABIGANJ-concld
OTI'iER HI~TDUs-contd
(ii) Present age oj maUler and number oj children surviving Number of children ,surviving
!Present age QJ r- _______.l\._,.
mother 0 1 2 S 4 5 -6 'I -8 9 10 Total 10 2 2 11-12 13-14 20 20 15-16 .39 5 44 17-18 28 11 3 I 41 19-2Q 17 23 1'0 2 1 68 2[-22 13 15 17 7 ·5 57 23-24 3 2 II 3 2 1 ... 29 '25-29 12 28 36 29 13 3 2 I 124 20--34 13 l() 17 19 14 13 5 91 a5-39 '9 5 I() 10 9 14 5 4, 00 40-44 7 7 8 10 5 6 3 {) '2 1 I 5"5 45-49 3 3 4 3 '2 3 4: 2 I 25 50-54 '6 3 {) 2 4: 3 1 24 fiG--59 2 1 <1 1 1 9 tiO--M '2 I 1 I I '2 1 9 65--69 3 1 4 70 & over 1 .3 1 5
Total 173 115 125 89 56 45 25 15 6 1 1 651 (iii) Number of children bom and surviving
Number of children surviving No. of children r- Survival
born oC> 1 2 3 4 5 6 7 8 9 10 11 Total ratio I ]2 59 71 O'S 2 3 25 55 83 O'B 2 ti 17 29 28 79 0'7 4 3 7 27 25 21 83 0·7 5 5 10 17 12 14 58 0'7 6 I 3 11 17 6 9 47 0.7 7 I 4 12 5 , 7 29 O·S 8 1 1 I 2 6 4 3 3 21 0·6 9 3 I 4 2 2 1 13 0'6
10 1 3 2 2 1 9 0.6 11 1 J 2 I [) 0'6 12 1 1 0'5 13 1 1 0.5 16 1 1 0'-1 17 I 1 0'4:
Total 24 115 125 89 56 45 25 15 6 1 1 502
XI-Literacy by age 'MAles Femalee
r- ___.., Age group Able to Literate in LiterRto Able to Literate in Literate
Population read languages in Tot",! PopUlation read InnguagoB in Toto.l only other than English literato only other than English litorate
English English 0- 4 .. 213 215 5- 9 .. 268 62 8 70 222 26 1 27
10-14 .. ]93 1 62 26 88 151 1 39 5 44 15-19 .. 147 1 52 36 88 130 1 33 6 39 20--24 .. 179 2 65 35 100 140 37 3 40 25-29 .. 170 2 66 26 92 139 31 2 a3 30--34 .. 14'8· 1 57 18 75 120 19 1 20 35-39 .. 12Z 1 42 21 63 99 14 1 15 40--44 " 94 I 27 16 43 78 10 10 -4,5-49 .. 86 33 11 44 65 {) 6 :SO & over 240 3 96 30 126 179 12 12
Total 1,861 12 562 227 789 1,538 2 227 19 246
" ~

54
(iv) GAUHATI SUBDIVISION EXCEPT GAUHATI THANA
HINDUS
VTI-Age and civil condition
Males Females
r ~
Age Unmarried Married Widowed Divorced Total U mnarried Married Widowed Divorced Total
0 97 97 78 'is 1 99 99 104 104 2 105 105 91 91 3 110 110 104 104 4: 118 118 9o. 90
5-9 .. 561 1 2 564 512 4- 516 10-14 .. 426 7 433 307 54 2: 363-15-19 .. 265 30 1 297 69 196 I) 1 211 20-24 .. 178 105 5 288 16 2H 14 2 276 . 25-29 .. 79 197 11 287 9 246 30 2 287
30-34 .. 20 223 12 I 256 8 194 48 1 251 35-39 .. 7 196 11 1 215 10 12.5 55 190 40-44 .. 4 148 10 162 6 79 51 136 45-49 .. 3 125 8: 136 2 54 58 ! 115 50-54 .. I 89 8 98 2 33 49 84
515-59 .. 3 63 14- 1 81 2: 22 47 'i1 60-64 .. 2 37 9 48 1 10 36 47 65-69 .. 2 17 7 26 2 r 21 23 70 &ove:r 4 26 14 44 2 3 29 34
Total 2,085 1,264 112 3 3,464 1,413 1,266 445 7 3,131
Fertility tables
(i) Present age oj m'Jther and number of chiUIren born
Number of children born Present age of --..A._
mother 0 1 2 3 4 5 6 7 8 9 10 11 12 13 14 15 16 Total
13-14 32 3 35 15-16 59 8 1 68 17-18 56 40 7 1 104 19-20 21 37 21 9 2 90 21-22 14 19 31 8 9 2 83
23-24 1 9 12 21 14 4 4 1 66 25-29 25 16 42 38 62 47 22 12 5 1 1 271 30-34 11 2 8 21 27 35 39 24 17 4 2 2 1 193 35-39 8 1 8 5 12 11 22 22 16 8 6 2 3 1 125 40-44 4 3 10 6 15 10 16 5 6 1 3 "'9
45-49 2 1 2 5 5 5 6 8 4 9 7 1 3 1 1 1 61 50-54 3 2 2 3 2 5 2 6 5 2 5 2 2 41 55-59 3 1 1 2 2 1 2 1 13 60-64 2 1 4 1 2 . 3 1 2 1 17 65-69 2 . 2
70 & over 1 1 1 3
Total .. 242 138 137 115 144 119 113 80 67 35 26 13 15 4 1 1 1 1,251

55
(iv) GAUHATI SUBDIVISION EXCEPT GAUHATI THANA-concld'
HINDus-contd
(ii) Present age of mother and number of children surviving
Pre3cut age Number of children surviving of mother r-
0 1 2 3 4 5 6 7 8 9 10 11 Total 13-14 32 3 35 15-16 60 7 1 68 17-18 60 40 4 104 19-20 28 42 14 4 1 1 90 21-22 22 29 23 7 2 83
23-21 2 18 22 19 3 1 1 66 25-29 32 40 64 68 48 13 6 211 30-34 14 15 31 44 40 28 13 7 1 193 35-39 9 12 15 21 22 18 16 7 4: 1 125 40-44 7 8 12 11 12 21 4: 3 1 79
45-49 :~ 4: 14 10 12 7 3 4: 1 2 2 61 50-54 5 7 5 4: 4: 4 3 3 4: 1 1 41 55-59 3 1 1 1 2 3 1 1 13 60-64 3 3 3 2 3 1 1 1 17 65-69 1 1 2
70 & over 1 1 1 3
Total 280 230 210 192 149 98 46 26 10 5 4 1 1,251
(iii) Number oj children born and surviving Number of children surviving
Survival No of children r-born 0 1 2 3 4: 5 6 7 8 9 10 11 Total ratio
1 1~ 121 138 0·9 2 8 44 85 13? 0·8 3 4: 2c1 44 43 115 0·7 4 5 11 32 62 34 144 0·7 5 I 13 16 37 31 21 l19 0·6
6 4: 16 21 32 29 11 113 0·6 7 2 3 5 16 22 15 11 6 80 0·6 8 6 5 9 11 18 14 6 69 0·5 9 1 4 3 10 4: 4 7 1 1 35 0·5
10 2 2 4 6 4: 2 3 3 26 0·6
11 2 1 1 3 1 2 2 1 13 0·5 12 1 1 1 2 2 2 3 3 15 0·5 13 1 1 1 1 4 0·4' 14 1 1 0·6 15 1 1 0·5
16 1 1 0'-2
Total as 228 21.2 194 148 98 47 26 10 5 4 1 1,011
XI-Literacy by age Males Females
r-Age group Popula- Able to Literate in Literate Able to Literate In Literate
tion read languages In Total Popula- read hmgua.ges In Total other than other tha.n
only English English literate tion only English English literate
0-4 .. 529 467 12 1 13 5-9 . - 564 2 53 1 54 516 18 18
10-14 ._ 433 5 98 12 110 363 16 1 17 15-19 ._ 297 4 88 20 108 271 11 11 20-24 ._ 288 5 81 19 100 276 1 6 6
25-29 ._ 287 6 72 19 91 287 5 5 30-34 .. 256 7 62 13 75 251 1 1 35-39 215 4 46 8 54 190 40-44 _. 162 3 33 6 39 136 1 1 1 45-49 .. 136 4 30 5 35 115 4 4
E{I & over 297 8 64 5 69 259
Total 3,464 48 627 108 735 3,131 2 74 2 76

56
(v) SHILLONG SADAR SUBDIVISION
KHASIS
VII-Age and civil condition
Males ]'emales Age r- "- ---, r-
Un- Married Widowed Divorced Total Un- Married Widowed Divorced Total married married
0 58 58 63 63 1 24 24 63 63 ~ 70 70 53 53 3 53 53 60 60 4 , . 62 62 66 66
u-9 .. 298 298 303 303 10-14 ., 229 3 232 220 4 1 225 15-19 " 144 14 1 2 161 119 62 3 11 195 20-24 " 82 55 3 7 147 37 110 9 20 176 25-29 " 36 114 5 5 160 12 124 11 17 164
30-34 " 17 113 4 - 4 138 3 106 9 11 129 35-39 " 8 89 7 4 108 1 75 13 7 96 40-44 " 5 65 7 3 80 3 48 13 11 75 45-49 ., 4 53 4: 3 64 1 31 17 11 60 50-54 " 2 33 6 1 42 1 20 25 8 54
55-59 " 1 23 8 1 33 2 17 27 7 53 -60-64 .• 17 4 1 22 -I 10 16 3 30 65-69 ., 13 5 18 1 4 14 2 21 70 & over 1 16 8 25 3 27 4: 34
Total 1,094 60S 62 31 1,795 1,0')9 614 184 113 1,920
Fertility tables
(i) Present age of m'Jther and number of children born
Number of children born Present age r------------
of mother 0 1 2 3 4 5 6 7 8 9 10 11 12 13 14 15 16 Total
13-14 1 1 15-16 8 :3 11 17-18 19 11 2 1 33 19-20 14 .13 11 2 1 2 43 21-22 7 11 9 3 1 1 32
23-24 9 6 12 5 6 1 39 25-29 13 15 22 31 25 15 8 5 134 30-34 5 5 10 16 21 19 22 6 5 1 110 35-39 1 2 3 7 7 10 11 11 6 4 3 1 1 67 40-44 5 3 6 3 9 fj 5 10 3 2 1 2 1 1 66
45-49 2 1 1 4 4 1 8 4 3 1 2 31 50-54 1 1 5 2 3 2 2 1 4: I 1 22 55-59 1 2 1 2 2 2 1 1 12 60-64 1 1 1 2 3 2 2 2 14 65-69 1 1 1 1 4
7f) 1 '.' 3 1 5
Total 80 69 74 69 73 58 59 87 82 25 17 3 8 2 3 1 4 614 I C
~ ~

lS7
(11) SHILLONG SADAR SUBDIVISION-conold
KHASIS-COntd
(ii) Present age oj mother and number of children surviving
Number of children surviving Present. age r--- __A._
of mother 0 1 2 3 4 5 6 7 8 9 10 Total 1:3-14 1 1 15-1G 9 2 11 17-18 19 11 3 ' .. 33 19-20 15 17 9 1 1 43
. '2i-22 11 14 7 32 23-24 11 7 12 7 2 39 25-29 15 34 32 28 16 7 1 1 134 30-34 8 14 18 27 21 12 7 3 110 :~5-39 1 9 6 16 16 5 <l 5 4 1 67 40-44 1 1 10 11 5 9 11 4 3 1 56 4.5':_49 3 1 1 3 7 2 7 3 2 2 31 50-54 1 2 2 1 4: 6 3 2 1 22 55-59 1 0 3 2 2 1 12 .>
60-64 3 1 4 2 3 1 14 65-69 1 1 1 1 4
70 1 1 1 1 1 IS
Total 97 115 106 103 77 47 34 20 . 10 3 2 614 f iii) Number oj children born and surviving
Number of children surviving No of r- Survival
c11ildren born 0 1 2 3 4 5 6 7 8 9 10 Total ratio 1 ~ 61 69 0·9 2 6 22 46 74 0·7 :3 1 13 23 32 69 0·1 4 8 16 25 24 73 0·7 l5 3 9 23 16 7 68 0·6 G 1 4 4: 8 16 17 9 69 0·7 7 1 4: 4: 8 11 6 3 37 0·6 8 2 2 1 6 3 9 8 1 32 0·6 9 3 3 4 5 !5 3 2 25 0·7
10 1 3 2 2 3 2 3 1 17 0·6
11 1 1 1 3 0'4 1'2 1 1 2 1 1 1 1 8 0·5 13 1 1 2 0·4 14 1 1 1 3 0·2 15 1 1 0·2
18 1 1 1 1 4 0·3
Total 17 115 106 103 77 47 34 20 10 3 2 534
XI--'-Literacy by age Males Females
r- ..A.. r-Popuh- Able to Litero.te in Literate Total Popu Able to Literate in Literate Total
Age group lation read languages In literate latiou- read languages In literate other than other than
only English English only English Englisb ()-4 .. 267 305 1 1 5-9 .. 298 6 12 5 17 303 7 12 12
10-14: .. 232 14: 15 12 27 225 10 24 24 15-19 .. 161 14 16 22 38 195 12 29 4 38 20-24: .. 147 8 15 24 39 176 14 27 4 31 25-29 .. 160 9. 18 21 39 164 9 20 2 22 30-34: .. 13S 10 11 18 29 129 2 10 2 12 35-39 .. 108 9 8 13 21 96 4, 7 1 8 4:0-44 .. SO 7 8 8 16 75 6 lS 6 15-49 " 64 4 8 7 15 60 3 3 3 50 & over 140 3 9 14 23 192 11 4 4
Total 1,795 84 120 144 . 264 1,920 78 142 13 155 -$ ~ ~

58
(vi) NAGA HILLS DISTRICT
NAGAS
VII-Age and civil condition
Males Females Age ___A_ --.... r- ..A..
~
Unmarried Married Widowed Divorced Total Unmarried Married Widowed Di vorced Total
0 37 ... 37 38 38 1 34 34 31 31 2 62 62 72 '12 3 63 63 60 60 i 53 53 60 60
15-9 261 261 272 272 10-14 .. 225 1 1 227 185 1 183 15-19 ., 153 10 1 1 165 147 20 2 2 171 20-24 ., 78 36 5 6 125 68 59 5 9 141 25-29 .. 34 70 7 8 119 ]8 98 15 9 140
30-34, .. '17 79 10 4: 110 8 93 16 I) 122 35-39 ., 9 83 10 6 108 5 97 20 5 127 40---44 ., 4 73 9 4 90 4 67 19 4: g4
4:5-49 .• 3 59 7 3 72 1 42 21 5 69 50-54 ., 3 39 7 I 50 1 32 17 4: 54
55-59 .. 1 29 9 2 41 2 29 I 20 3 511 60-64 •. 1 19 5 2 27 1 17 20 2 40 65-69 ., 2 16 ... 21 1 8 21 2 32 i)
70 & over 2 43 19 2 66 1 23 42 66
Total 1,042 557 93 39 1,731 975 586 218 50 1,829
Fertility tables
( i) Present age of mother and number oj children born
, Number of children born Present age r-
_ __..J
o£mother 0 1 2 3 4 5 6 7 8 9 10 11 12 13 Total
15-16 .. 2 2 17-18 .. 4 4 19-20 ,. 13 6 3 1 23 21-22 .. 7 3 3 13 23-24 ., 3 11 2 3 2 21
25-29 .. 7 14 29 28 14 8 5 2 107 30-34 ., 6 8 11 13 21 11 9 5 2 86 35-39 ., 5 3 11 10 17 11 14 11 6 4 1 93 40--44 .. 6 4 2 8 10 7 9 9 8 6 7 3 1 SO 45-49 ., 4 1 2 2 5 2 7 2 4 2 2 1 34
,50-54 ., [) 2 3 2 4 1 5 2 8 3 1 3 2 41 55-59 ., 1 3 1 3 2 4 2 3 2 3 1 1 1 27 60-64 ., 3 1 3 1 2 5 3 3 1 1 23 ~5-69 .. 1 1 1 1 4 70 & over -4 2 ti 2 3 2 1 2 5 1 1 28
Total 70 58 72 74 81 44 60 37 36 21 14 11 6 2 586

59
(vi) NAGA HILLS DISTRICT-concld
NAGAs-contd
(ii) Present age of mother and number of children surviving Number of children surviving
Present age ---A.. ------., of mother 0 1 2 3 4 5 6 7 8 9 Total
15-16 2 2 17-18 4 4 19-20 17 4 1 1 23 21-22 8 4 1 13 23-24 8 9 3 1 21
25-29 16 30 34 19 6 2 10'7 30-34 13 8 15 23 14 8 4 1 86 35-39 10 12 18 17 15 15 5 1 93 40--44 10 9 7 16 10 10 11 6 1 80 45-49 5 3 5 5 8 6 2 34
50-54 8 3 10 1 7 4 6 2 41 55-59 3 4 3 2 4 6 3 1 1 27 60-64 3 1 2 3 7 5 2 23 65-69 1 1 1 1 4 70 & over .. 9 6 3 2 3 3 2 28
Total 117 • 94 103 90 74 59 35 11 1 2 536
(iii) Number of children born and surviving Number of children surviving
Number of ,. .A.. -----, Survival children 0 J 2 3 4 5 6 7 8 9 Tutal ratio
born 1 18 40 58 0·7 2 10 28 34 72 0·7 3 7 16 31 20 74 0·6 4 5 6 22 27 21 81 0·7 [> 1 2, 4 15 15 7 44 0·1
6 1 2 16 15 18 8 60 0·6 7 1 3 [) 9 13 4 2 37 0·6 8 2 1 4 6 5 7 8 2 1. 36 0'5 9 1 1 3 9 5 2 21 0·6
10 1 3 3 2 4 1 14 0·5
11 1 1 2 1 5 1 11 0·4 12 1 1 1 1 1 1 6 0'3 13 2 2 0·5
Total 47 94 103 90 74 59 35 11 1 2 516
XI-Literacy by age Males Females
r- -----, ..A..
Age group Able to Literate. in Literate Able to Literatp, in Literate Popula- read languages in ]!;ng- Total Popula- read langunges in Eng- Total other than other tlmn
tion only English lish literate tion only English lish literate 0-4 .. 249 261 5-9 .. 261 1 5 5 272
10-14 .. 22'( 4 18 3 21 186 1 5 5 16-19 .. 165 2 23 5 28 171 1 7 7 20-24 .. 125 1 15 3 18 141 6 6
25-29 .. 119 1 11 1 12 140 4 4 30-34 110 8 1 9 122 1 2 2 35-39 .. 108 4 1 5 127 3 3 40-44 .. 90 1 1 2 3 94 2 2 45-49 .. 72 1 1 69
150 & over 205 246
Total 1~731 10 85 17 102 1,829 3 29 29 i76CenSUi

Age at birth
60
FERTILITY TABLES All Communities
Table (a) Age oj mother at birth of first child and number of children born
Number of children born ofl~ r -------------------------------~----------------------------~ child 1 2
12 .. .. .. I3 .. .. .. 14 15 16 17
\ 18 19 20 21 22 23
1 1 4
I 1 5 2 4: 5
4 10 1 2
2 1
~-1 1 1 ~5 2 2 26 2 .. 27 1 28 1 1 29 30 31
2 1
3
1
2 6
4 11 1 8 3 6 1 2 3
1
4:
1
3 8 3 9 5
11 1 2 3 4 2 1
5
2 9 7 3
12 8
14 1 1 1
1
3
6 7 2
8 9 10 11 12 13 14 15 16 17 .. - I I 1
1 1 3 2 3 2 3 5 2 2 6 1
16 11 13 8 8 6 8 3 12 11 10 7 4 3 8 I 15 14 16 11 14 6 1 1 1 5478352 1
17 11 13 15 6 7 4 1 21514 217 1 2 1 2 3 2 2 1 1 4 3 1 2 1 5 3 1 1 1
1 1 1 1
1 1 1 1 1 .. ' ..
1 1
2 1
18 Total 5 3
14 34
.. 100 1 72 1 121 1 55 1 122
21 26 16 19 21 6 3 5 2 8 1
Aver-age
8'80 5-33 8·29 6'68 7'26 7'93 6'90 7'27 6'52 6'24-5'81 6'75 5'68 5·19 5·83 5'67 5·00 5·00 4;13 4·00
32 33 34 :15 36 37 38
1 ., 1 1 1 I 4 4·00
1 1 1 ..
1
1 I
1
3 2 1 1
39 _ _ " ._
Total 22 38 51 57 62 87 75 82 62 52 33 28 5 3 1 1 2 4 665
Age at birth of
1st child 12 13 14 Hi 16 17 18 19 20 21 22 23 24 26 26 27 28 29 30 31 32 33 34-35 36 37 38 39
Table (b) , Age of mother at birth of first child and number of qhildren surviving
Number of children surviving r--------------------------~--------------------------,
o I 2 ;) 4 5 G 7 8 9 10 11 TvtaI Average 4·00 2·33 4·71 4·15 4·05
1
5 2 3 3 5 1 2 I 1 3 1 1
1 I 2 1 5 123
1 1 1 2 1 4 1 2 14 3 5 6 6 .4 6 3 1 34 9 11 15 18 .20 10 6 2 1 3 100 7 10 15 7 11 7 8 3 I I '12
10 19 22 19 13 13 13 4 4 I 121 4- II 10 12 5 3 4 2 I .55
16 22 16 29 15 10 5 2 2 122 1 532 2 322 n 4 5
3 3 2 3 2 2 1 1 I 2 1 1
I 2
3 1
4 2 2 3
1
2
- --
5 2 3 6
1
1
1
I
2 4 5 2 2
2
1
2 2 ~ 2 3 1
2 16
1
1
19 21
6 3 5 2 8 1 4
3 2
4·n 4·16 3·G4 3·51 4·10 3·15 4·13 3·58 3·GO 2·33 1·00 3·60 1·50 2·88 2·00 2·75
2·00 2·50
1 I
1 5·00 1 2·00
Total 29 75 104 105 115 92 65 47 17 11 4 1 665
5·00 3·50 9-00 4-00
Survival ratiQ 0-45 0·44 0-57 0·62 0·56 0·52 0·60 0·50 0-54 0-66 0·54 0·61 0·63 0·58 0·40 0·18 0·72 0·30 0·70 0·50 0·69
0·40 0·72 0,5(:,
0·5("

HOUSING TABLES
The two tables below show the result of an examination on a sample basis of houselists in regard to housing conditions.
The first table relates to tea gardens and mines in the Assam valley and Surma valley. The sample was taken on the basis ob the two valleys. In the Assam valley Kamrup and Goalpara were excluded as there are only a few small tea gardens.
The second table relates to villages. The villages were taken for the whole province on a district basig.
The following represent the classes of dwelling houses mentioned in the tables :-
1st class.-Pucca, with pucca or wooden floor, with wooden frame throughout, and roof of thatch, or corrugated iron.
2nd class.-Semi-pucca i.e., katcha floor, but the structure more or less of a permanent nature.
:3rd class.-Katcha houses.
( 01 )

62
TABLE I
TEA GARDENS AND MINES IN ASSAM V ALLEY AND SURMA VALLEY
No Dwelling-houses Religious Other
FatUla] division and district of tea r :.J.- bouses Shops house~
gardens 1st 2nd 3rd
Assam Valley-
Darrang 4 19 654 788 2 5 (c) 2
Sibsagar 6 11 28 469 2 3 (c)
Lakhimpur 5 22 154 1,725 1 4 plus 9 (c) 4
Total 16 52 836 2,982 5 4 plus 17 (0) 6
Surma Valley-
Cachar :. 4 3 39 1,090 I) 4 (c) 2
Sylliet .. 4 4 107 I 588 1 plus 8 (c) 1
Total S , 146 1,678 6 1 plus 12 (0) 3
(e) denotes combined with. residence
TABLE II
VILLAGES
Natural division and district Number Dwell:ing-houses Religious Other
of houses Shops houseS'
villages 1st 2nd 3rd
Assam Valley- .
Gbalpara 74 1 69 3,231 Z6 26 (cJ 9
Kamrup 56 35 371 3,486 65 12 plus 88 (c) 71
Darrang 37 13 91 2,027 II 24 (c) 9
Nowgong 44: 2 49 1,763 21 1 plus 17 (c) 8
Sibs agar 41 28 200 3,231 76 18 pius 124 (c) 32
LakhimpUT 48 149 172 1,92() 30 5 plus 87 (c) n
Total 300 228 952 15,658 229 36 plus 366 (c) 151
Surma Valley-
Cachar 20 1 100 1,439 10 8(c) 5,
Sylhet .. 216 148 1,729 7,370 3 (c) plus 41 27 plus 103 (0) 25
Total 2SS 14S 1,829 8,809 3 (c) plrus 57 27 plus 111 (c} 30.'
Hill Distlicti-
Garo Hills . - 44 . . 13 900 1 .. 65,
Khasi and Jaintia Hills 49 257 579 255 7 1 plus 2 (e) I (0) plus 9'
Naga Hill'! 10 581 7 2 (c) 9
Lushai Hills . '. 11 18 17 613 7 11 11
Total 114 2'75 609 2,34g 22 12 plus 4 (c) 1 (c) pluB 9"
(c) denotes combined with residence

SUMMARY TABLE
A brjef summary table is given for Assatn as a whole and for the two constituent valleys; Manipur Stat~, and the Hill and Frontier Tracts.
(63 )

64
SUmMARY TABLE
Hill Manipur Surma Brahma- Districr,s, and
Assam State Valley putra Frontier Valley Tracts
Al'aa. in SCI miles 6i,351 8,620 9,303 23,816 25,618
Density per sq mile 162 59 404 239 38
Total population 10,930,333 512,069 3,757,783 5,695,659 964,877
Males 5,74),7,43 219,183 1,962,517 3,042,907 486,139 Females 5,189,6~2 262,886 1,795,266 2,652,752 478,738
Towns 405,328 99,716 84,815 177,042 43,755
Males · . 236,214 47,448 52,624 110,048 26,094 Females 169,114 52,268 32,191 66,994 17,661
Villages 9,317,203 412,344 3,305,362 4,711,839 917,658
Males 4,870,560 201,726 1,715,222 2,496,099 457,513 Females 4,476,6~3 210,618 1,590,140 2,215,740 460,145
Tea gardens 1,131,031 354,662 777,888 1,484 Males 600,653 186,059 413,769 825 Females 533,381 168,603 364,119 659
Railway areas 22,314 8,385 13,580 379 Males 14,852 5,160 9,440 252 Females 7,492 3,225 4,140 127
Floating · . 21,479 9 4,559 15,710 1,601 Males · . 18,46'i 9 3,452 13,551 1,455 Females 3,012 1,107 1,759 146
No of towns 33 1 9 19 4 No of villages 35,352 1,521 12,559 15,152 6,120 No of tea gardens 1,215 399 815 2 No of Railway areas No of occupied house 2,151,479 98,969 729,855 1,119,748 202,907
Towns 82,452 19,134 14,644 39,146 9,528 Villages ., 1,754,402 79,835 623,576 858,110 192,881 Tea gardens 305,539 88,064 217,103 372 Railway areas 9,086 3,571 5,389 126
No of literat& 1,212,640 24,905 458,268 629,049 100,418
Towns 144,539 11,209 42,280 72,587 18,463
Males 107,809 10,481 30,544: 53,842 12,942 (45·6%) (22,8%) (58·0%) (48·9%) (49·8%)
Fema.les 36,730 728 11,736 18,745 5,521 (21,7%) (1,3%) (36,6%) (28,0%) (31,4%)
Villages 985,826 13,696 382,955 507,497 81,677
Males 838,523 12,761 318,331 445,501 61,930 (17,2%) ( 6·3%) (18'6%) (17·8%) (13,6%)
Females 147,303 935 64,625 61,996 19,747 ( 3·3%) (0·5%) (4·0%) (2·8%) (4·3%)
Tea gardens 72,253 29,546 42,616 81
Males · . 61,211 25,686 35,463 62 (10·2%) (13,8%) (8·6%) ( 7·8%)
Females 11,042 .. 3,860 7,153 19 (2,1%) (2·3%) (2·0%) (2·7%)
Railway areas 7,784 2,871 4,845 68 Males · . 5,888 2,038 3,793 57
(39.6%) Females 1,896 833 1,052 11
(25·3%) Floating · . 2,248 615 1,504 129
Males 2,223 614 1,481 128 Females 25 1 23 1
Y176Qe~Bu8-450-7 ·4· 42-GIPS